Embed Size (px)
Citation preview

DISCUSSION PAPER
/ / R A P H A E L M Ü L L E R , C H R I S T O P H S P E N G E L , A N D S T E F A N W E C K
/ / N O . 2 1 - 0 7 7 | 1 0 / 2 0 2 1
How Do Investors Value the Publication of Tax Information? Evidence From the European Public Country-By-Country Reporting

How Do Investors Value the Publication of Tax Information? Evidence from the European Public Country-by-Country Reporting
Raphael Müller University of Mannheima
Christoph Spengel University of Mannheima
ZEW Mannheimb [email protected]
Stefan Weck ZEW Mannheimb
University of Mannheima [email protected]
This version: October 2021
Abstract:
We examine the capital market reaction to the announcement of the European Union (EU) to introduce a public tax country-by-country reporting (CbCR) regime. By employing an event study methodology, we find a significant cumulative average abnormal return (CAAR) of -0.699%, which translates into a monetary value drop of approximately EUR 65 billion. We conclude that investors evaluate reputational risks arising from public scrutiny and competitive disadvantages to outweigh potential benefits of an extended information environment or more sustainable corporate tax strategies. In cross-sectional tests, we find that the average investor reaction is more pronounced for firms with low effective book tax rates, indicating that reputational concerns play a significant role in the marginal investor's investment behavior. Furthermore, our cross-sectional results indicate that the market reaction is stronger for firms operating in industries with high growth in market participants, providing an initial indication for the role of the competitive environment as an additional channel. Our inferences are of particular importance in light of the current ongoing debates on similar disclosure rules (particularly in the United States; cf. "Disclosure of Tax Havens and Offshoring Act") as well as for sustainability standard setters.
JEL Classification: F23; G14; G38; H25; H26; M41 Keywords: tax transparency; tax disclosure; tax avoidance; event study; country-by-country reporting
Acknowledgments: We thank Christopher Ludwig for helpful comments. We gratefully acknowledge funding from the Leibniz Science Campus MannheimTaxation, from the Deutsche Forschungsgemeinschaft (DFG, German Research Foundation) – Project-ID 403041268 – TRR 266, and from the Graduate School of Economic and Social Sciences of the University of Mannheim.
a University of Mannheim, Castle, East Wing, 68131 Mannheim, Fax: +49 621 181-1706. b ZEW Mannheim, L 7, 1, 68161 Mannheim, Fax: +49 621 1235-224.

1
1 Introduction
Over the last decade, the revelation of so-called "aggressive" tax planning strategies
of multinational enterprises (MNE) created considerable pressure for politicians to take action
against such harmful tax practices. The apparent lack of information about sophisticated tax
arrangements was considered a major impediment to effective tax enforcement. With the
implementation of the confidential CbCR for large MNE, legislators aimed at deterring
aggressive tax planning by increasing tax transparency of corporate taxpayers towards tax
authorities (OECD 2015). At the same time, there is a rising perception that firms should be
held publicly accountable for paying their fair share of taxes where they operate.
In the EU, several attempts were made to adopt a public CbCR but failed due to a lack
of majority support among member states. During the Portuguese EU Council Presidency in the
first half of 2021, the discussions re-gained momentum with a new compromise draft. According
to this compromise draft, affected firms would be required to publicly disclose their
international activities and financial figures aggregated at the country-level. After initial
confusion about whether this new draft would be able to secure majority support, the legislative
bodies of the EU announced a political agreement on the introduction of a public CbCR
mandate for large EU firms across industries in June 2021. This political breakthrough was
enabled as several member states changed their opinions due to rising public demand for
stronger corporate tax transparency.1
The decision to implement a public CbCR constitutes a substantial shift towards public
tax transparency. However, the measure is highly controversial as firms are concerned about
reputational and competitive risks resulting from such measures.2 The growing popularity of
tax transparency measures underscores the need to understand the economic consequences of
public tax disclosure, but, as Müller et al. (2020) point out, the empirical literature is divided
about whether and to what extent the expected risks materialize. This study builds on prior
evidence and provides novel insights into the costs and benefits of public tax transparency.
We exploit the EU’s announcement of the public CbCR to analyze how investors value
the mandatory tax disclosure for EU firms. More precisely, the change in stock prices should
1 For instance, Austria and Estonia, who previously seemed to have voted against public CbCR, indicated to have
revised their positions. 2 In a public consultation by the Organisation for Economic Co-operation and Development (OECD), the lobby
group Business at OECD (2020), for example, emphasizes that “[m]any members remain strongly opposed to any attempt to make CbC report information public, for a number of reasons, including that the reports contain commercially sensitive data.” Similarly, the association Technology Industries of Finland (2020) argues that “[p]ublic reporting is an unnecessary administrative burden, including high risk for misinterpretations and request to reveal commercially sensitive data.”

2
reflect investors' aggregated assessment of the possible effects of the new directive. The main
advantage of our setting is that the content of the new reports is already available to national
tax authorities.3 This implies that investor reactions are not attributable to expected increases
in tax enforcement or compliance costs, i.e., costs of preparing the reports. Thus, our setting
provides a unique opportunity to examine the non-tax costs of public CbCR.
From the perspective of investors, several conflicting channels may be relevant. First,
higher tax transparency could be beneficial for investors as it improves the information
environment of investors leading to more accurate earnings forecasts (Bratten et al. 2017) and
lower information asymmetries (Desai and Dharmapala 2006). Second, the disclosure may
enable investors to better assess the tax risks associated with financial sustainability
performance. However, the public disclosure could also negatively affect firms' future
profitability due to reputational costs resulting from public discussions about low effective tax
rates (Graham et al. 2014). Alternatively, firms may adjust legal tax arrangements to avoid
public scrutiny (Dyreng et al. 2016). Another threat to firm value is the competitive
disadvantage from the disclosure of commercially sensitive information to competitors and
business partners. In light of the heterogeneous effects, it remains an empirical question, which
channel ultimately dominates.
To identify an investor reaction to the introduction of a mandatory public CbCR, we
employ a short-term event study design. Using the Factiva database, we measure media
attention and identify a 3-day event window from June 2-4 in which we expect an investor
reaction to take place. Based on a sample of 680 potentially affected firms, we find a significant
negative investor reaction on the capital markets. The corresponding short-term CAARs
amount to -0.699%, which translates into a value drop of EUR 65.487 billion. We conclude that
investors evaluate reputational risks arising from public scrutiny and potential competitive
disadvantages to outweigh potential benefits of an extended information environment or more
sustainable corporate tax strategies.
Subsequently, we try to disentangle the drivers of the observed overall negative
investor reaction and explore the two potential cost channels. We first examine the role of
reputational risk exposure in the marginal investor's response behavior. Conducting various
cross-sectional analyses, we find a significantly stronger response to firms that are regarded as
more tax aggressive. Our finding suggests that investors expect a deterrence effect. That is,
investors expect affected firms to refrain from more aggressive tax avoidance strategies to avoid
3 The affected MNE have to provide even more detailed information to tax authorities under the confidential CbCR.

3
(net costly) reputational costs. Thereby, affected firms do not fully exploit their tax savings
potential, which negatively impacts the expected cash flows.
In a second step, we examine the role of the competitive environment of our sample
firms, using additional cross-sectional analyses. We find a significantly stronger response for
firms operating in industries with high short- and long-term competitor growth rates. In
contrast, we find no significant effects using industry concentration ratios, which are more
established indicators for industry competition. Our results, therefore, suggest that the
competitive environment is likely to play a role for investors. Due to the general limitations of
competitive intensity measures, however, we are reluctant to imply causality and consider this
finding rather indicative.
Located at the intersection of tax accounting and non-financial (sustainability)
reporting, our analysis contributes to the extant literature in multiple ways. Prior studies
examining the investor reaction to public CbCR were based on regimes that were originally
introduced as public CbCR regimes. Hence, the investor reaction also reflected the expected
cost of increased enforcement by tax authorities which made it difficult to assess the relevance
of non-tax costs of public tax transparency. By contrast, the focal EU draft proposal subject to
our analysis only requires the publication of previously confidentially reported information.
Therefore, our setting offers a rare opportunity to exclude direct compliance costs resulting
from a new obligation and indirect costs resulting from increased tax authority scrutiny and
potential double taxation as potential drivers of the effect.
Furthermore, prior tax accounting literature examined investor reactions to CbCR in
the context of the public CbCR regimes for either the extractive and logging industry
(Johannesen and Larsen 2016) or the banking sector (Dutt et al. 2019). Notably, the CbCR
regime for the extractive and logging industry was initially designed as a measure to combat
corruption, which is a particularly prevalent issue in this specific industry. The CbCR regime
for the banking sector, on the other hand, was implemented as part of a whole battery of
measures intended to stabilize the EU banking sector in the course of the Basel III resolutions
after the global financial crisis. Although the banking CbCR was included as a tax-motivated
instrument via detours in this catalog, the attention of investors was presumably centered on
other, more drastic measures within the bundle. Consequently, previous event studies drew tax
implications from settings that were not primarily tax-driven or potentially confounded due to
their course of introduction. By contrast, our study is the first to examine the investor reaction
to public CbCR as a purely tax-motivated regime that is introduced as a stand-alone measure

4
and with a cross-industry scope. Thus, our setting allows for an unambiguous identification of
the investor reaction to public tax transparency.
Regarding the discussion about public CbCR representing a component of
sustainability reporting, we add to an emerging stream of literature. In particular, our results
corroborate prior findings that investors do not appreciate CSR disclosures at any cost. Grewal
et al. (2019) examine investor reactions to the passage of the EU directive on disclosure of non-
financial information and find positive abnormal returns for firms with strong pre-regulation
environmental, social and governmental (ESG) disclosure and performance but even stronger
negative abnormal returns for firms with low pre-regulation ESG disclosure and performance.
Hombach and Sellhorn (2019) examine an SEC disclosure rule, which requires oil and gas firms
to publish details about their payments to host governments and find a negative investor reaction
that is particularly pronounced for firms with greater reputational risks. Both studies focus on
ESG reporting in general but do not provide evidence for its individual components. To the best
of our knowledge, we are the first in this context to add more granular evidence on tax
transparency, which is a momentum-gaining component of non-financial sustainability
reporting.
The inherent characteristics of our setting provide for a high external validity of our
findings. Our implications are equally applicable to similar measures and very timely given
ongoing political efforts in the USA to expand the confidential CbCR regime into a public
regime. With the "Disclosure of Tax Havens and Offshoring Act", a corresponding draft bill
has already been submitted to the Senate and awaits approval for further legislative actions. In
addition, the globally most widely applied standard for the non-financial (sustainability)
reporting, Global Reporting Initiative (GRI), was augmented by an additional module on
taxation (GRI 207: Tax), providing for a de facto voluntary public CbCR. Against this
background, our findings provide a meaningful contribution for the design of similar tax
transparency measures. Our results imply that, in case of a mandatory public CbCR measure,
decision-makers should take into account that affected firms will incur substantial costs that
significantly exceed the benefits from an investor perspective.
The remainder of this paper is organized as follows. Section 2 describes the setting of
our event study, contextualizes it against the extant literature, and presents our hypothesis.
Section 3 describes our sample selection procedure and methodological approach to identify
the investor reaction. Section 4 presents the corresponding findings from our main analysis and

5
robustness tests. Section 5 examines the relevance of reputational and competitive costs
associated with the public CbCR for investors in cross-sectional analyses. Section 6 concludes.
2 Institutional Background
2.1 EU Proposal on public CbCR
The idea to require large MNE to publicly disclose a detailed CbCR was first discussed
in 2016 when the EU legislative bodies adopted the confidential CbCR to tax authorities. The
confidential CbCR was part of Action 13 of the OECD/G20 project on base erosion and profit
shifting (BEPS). In its final report, the OECD emphasized that the measure was developed to
facilitate high-level risk assessments by tax authorities and that the reports should remain
confidential (OECD 2015).
In parallel to the adoption of the confidential CbCR in the EU and despite the clear
guideline by the OECD, the European Commission published a draft proposal for the public
disclosure of income tax information on April 12, 2016. The measure was intended to
complement the confidential CbCR. The European Parliament expressed support for the
initiative arguing that additional tax transparency would allow for better public monitoring of
multinational firms. Subsequently, the European Parliament defined its negotiation position in
a plenary vote on July 4, 2017. The negotiations in the Council of the EU proceeded slowly in
the following months and were delayed due to substantial disagreement between member
states.4 On November 13, 2019, the Finish Presidency of the Council released a compromise
draft. However, the negotiations reached a deadlock in the Council as the majority of countries
disapproved the proposal. Under the successive two presidencies, no further attempt was made
to advance the process.
At the beginning of its Presidency, Portugal published a new compromise draft to
revive the negotiations in the Council (January 13, 2021). The draft was discussed in various
committees and working groups, but it was questionable whether Portugal could secure the
required majority vote. On February 25, the Portuguese Council Presidency invited the Member
States to exchange their views on the latest compromise draft during an informal video
conference. At the end of the meeting, the Presidency noted that there was sufficient support
from the member states for a further procedure with the draft proposal. While the outcome of
the informal meeting was not legally binding, it set the ground for the Council to enter into
4 Officially, the main concern was related to procedural rules for a public CbCR. Directives on direct taxation
require unanimity among member states whereas directives on financial reporting may be adopted by qualified majority in the Council.
6
interinstitutional negotiations with the European Parliament and the European Commission
("trilogue"). These formal negotiations usually take several months and may fail if the
institutions do not strike a compromise. The early breakthrough after the third trilogue meeting
was, therefore, quite a surprise. In the late evening of June 1, 2021, the European Parliament
announced that a provisional agreement on the directive had been reached. This political
agreement of the legislative bodies constitutes our main event since it resolved investors' long-
lasting uncertainty on the legislative process. Moreover, the agreed-upon compromise draft
clearly defined the scope of the new directive. To support our choice of the main event, we
assess the media coverage of the legislative process by searching the Factiva database for
relevant news articles (see Section 3.1).
The comprise draft requires large MNE headquartered in the EU with consolidated
revenues above €750 million in each of the last two preceding financial years to prepare and
disclose a detailed report on its geographic operations together with financial figures aggregated
on country-level.5 The requirements are similar to the confidential CbCR, but the proposal
constitutes a reduced version of the OECD approach in terms of scope and financial items. The
geographic coverage is limited to activities in European member states and a number of other
jurisdictions that are blacklisted as non-cooperative jurisdictions for tax purposes ("tax
havens").6 In contrast to the confidential CbCR, firms are not required to separate related-party
revenues and third-party revenues. Moreover, stated capital and tangible assets are not included
in the public version. The reports must be made available to the public free of charge on the
firm's website or public registers within 12 months after the financial year. Affected firms may
obtain a deferral of disclosure of certain commercially sensitive items for a maximum of five
years.7 In sum, the proposed reporting requirement is less comprehensive than previous CbCR
regimes and the voluntary sustainability reporting standard on taxation, GRI 207, which
requires a public CbCR on worldwide activities (GSSB 2019a).
5 The reporting obligation also applies to EU subsidiaries of non-EU multinationals if consolidated group revenues
exceed the threshold. 6 This list is compiled and regularly updated by the Council. The current version includes mostly small pacific
islands but also more prominent countries like Panama, Turkey, and Australia (EU Council, 26.02.2021, 2021/C 66/10).
7 However, information on jurisdictions listed as tax havens may never be omitted.

7
2.2 Related Literature and Hypothesis
The capital market reaction to the new directive depends on investors' expectations
about how the higher level of tax transparency will impact future cash flows of affected firms.
The information contained in the reports provides novel insights on the international business
structures of affected firms to investors and several stakeholders, including analysts, business
partners, competitors, NGOs, the media, and customers. Rational investors will take the
reactions of all stakeholders into account when assessing the consequences of the new measure.
In principle, investors may appreciate the additional disclosure as it helps to evaluate
firm fundamentals and future cash flows. Prior studies suggest that tax-related disclosure is
associated with more accurate forecasts on future earnings (Bratten et al. 2017; Hanlon et al.
2005). Public CbCR makes detailed information about the profitability and tax payments in
foreign markets available. The geographic segment reporting under current financial reporting
standards does not provide this level of granularity.
Moreover, CbCR may enable investors to evaluate the efficiency of managers' tax
avoidance strategies (Frischmann et al. 2008). Tax savings from legal tax planning increase
corporate profits and are, thus, in the interest of shareholders. In line with this argument, prior
literature documents positive stock price reactions to news on legal corporate tax avoidance
(Blaufus et al. 2019) or the disclosure of advance tax rulings in Luxembourg (Huesecken et al.
2018). While tax planning is, per se, beneficial for investors, it might also give rise to agency
conflicts if managers set up complex structures to divert private rents (Desai and Dharmapala
2006). This problem seems to be more pronounced for firms with weak corporate governance
mechanisms. Desai and Dharmapala (2009) examine the ambivalent relationship between tax
avoidance and firm value. The authors find that tax planning increases firm value only for firms
with a high share of institutional owners. The agency perspective helps to explain positive
market reactions to increased tax enforcement (Desai et al. 2007). Similarly, public CbCR could
reduce information asymmetries between shareholders and managers and allow for better
monitoring of firm insiders.
Several NGOs and investors supported the inclusion of a public CbCR in the new GRI
reporting standard on taxation. According to the public comments, CbCR can be used as an
informative source for evaluating firms' performance on sustainability and its value
implications (GSSB 2019b). The positions are not representative of all capital market
participants but reflect the growing demand for non-financial disclosure and investment
opportunities in sustainable firms. Yet, even if all investors appreciate the reporting mandate,

8
they might still conclude that the disclosure will be costly for affected firms. Grewal et al.
(2019) examine capital market reactions to events around the passage of the non-financial
reporting directive in the EU. The authors show that stock prices of affected firms decline
significantly, suggesting that the disclosure mandate is expected to lead, on average, to net costs
for affected firms.8 Moreover, their empirical results imply that the negative reaction is mainly
attributable to proprietary and reputational costs.9
Reputational risks and public pressure are important determinants for corporate tax
strategies (Austin and Wilson 2017; Graham et al. 2014). For instance, Dyreng et al. (2016)
find that UK firms reduce the level of tax avoidance following public scrutiny on their
disclosures provoked by an activist group. Such adjustments decrease after-tax profits and
subsequently shareholder wealth if alternative schemes cannot sustain the tax savings. Under
public CbCR, activist groups or the media could utilize the tax information in the reports to
exert pressure on firms to "pay their fair share". In fact, holding firms publicly accountable for
their tax payments has been an explicit goal of the measure (European Parliament 2019). If
investors predict that public CbCR increases the probability of public pressure and causes firms
to adjust their tax planning strategies, we should observe a negative reaction around the event.
Besides reputational risks, investors might be concerned about competitive
disadvantages arising from the disclosure of commercially sensitive information. Non-EU
competitors may use the information about geographic exposure and profitability. Similarly,
suppliers and business clients benefit from insights into the international value chains of their
partners. Direct evidence on proprietary costs is scant, but recent studies suggest that
proprietary costs are responsible for reduced voluntary corporate disclosure in competitive
markets (Huang et al. 2017; Ellis et al. 2012). In the context of geographic segment reporting
under IFRS 8, Leung and Verriest (2019) find that firms aggregate financial items for growing
and profitable regions consistent with high proprietary costs.
In sum, all channels likely influence investors' response to the new public CbCR-
requirement, but with different weights. Two related studies analyze capital market reactions to
the introduction of industry-specific CbCR initiatives in the EU. Johannesen and Larsen (2016)
examine firms' stock prices in the extractive industries (i.e., oil, gas, and mining firms) around
key dates in the legislative process. Notably, the primary purpose of the regulation was to
8 However, Grewal et al. (2019) document positive investor reactions for firms that had good CSR performance
and voluntary reporting scheme prior to the directive. 9 The results are similar to the findings by Hombach and Sellhorn (2019) who assess capital market reactions to
the SEC’s extractive payments disclosure rules.

9
increase financial transparency in a sector that is prone to bribery and fraud, especially in
developing countries (Rauter 2020). The authors document very strong decreases in firm value
but do not test for potential channels that drive the effect. In contrast, Dutt et al. (2019) find no
significant market response to the introduction of a public CbCR in the banking sector.10 Both
studies conclude that increased tax transparency led to a reduction in tax avoidance
opportunities as it facilitates the detection of aggressive tax planning schemes for tax
authorities. This interpretation is supported by several studies that find evidence consistent with
banks reducing profit shifting activities among affiliates and tax havens following the disclosure
requirement (Eberhartinger et al. 2020; Joshi et al. 2020; Overesch and Wolff 2021).
The main difference between our setting and the two industry-specific CbCR regimes
is that tax authorities had no information about foreign activities and tax payments prior to the
publication of the industry-specific reports. Thus, the results above imply that the authorities
may have used the reports for unilateral transfer pricing adjustments. However, in our setting,
the disclosed reports should not reveal any additional information to tax authorities as they
receive the more detailed confidential reports for their tax assessments.11 Therefore, we can
effectively rule out that investors anticipate negative effects on future cash flows because of
improved tax enforcement or direct costs from preparing the reports. Thus, absent this
mechanism, we analyze whether the costs of disclosure (reputational or proprietary costs) still
outweigh the benefits of reduced information asymmetries. In that sense, our analysis is also
related to the setting in Hoopes et al. (2018), who examine an Australian tax disclosure rule.
The regulation mandated the Australian Taxation Office (ATO) to disclose taxable income and
tax payable for large public Australian and foreign-owned firms. Their event study analysis
shows that stock prices of affected firms decline significantly around the enactment of the law.
The authors focus on firms with zero tax expense reported in financial statements, hence, those
firms with presumably the highest public scrutiny. The results suggest that investors anticipated
higher costs for these firms. Even though the scope of the Australian disclosure regime is
limited to few financial items and one country only, similar considerations might apply in the
case of a public CbCR.
10 The transparency measure was part of the Capital Requirement Directive (CRD) IV, which implemented the
Basel III standards into EU law. The main purpose of the directive was to ensure the financial stability of the EU banking system (Dutt et al. 2019).
11 First empirical evidence indicates that multinational firms reduce the level of tax avoidance and shift real investments to European tax havens following the confidential CbCR (De Simone and Olbert 2021; Joshi 2020).

10
Based on these findings, we expect that investors perceive the disclosure of a public
country-by-country report as costly. In particular, we conjecture that the benefits of the new
information do not compensate for the reputational risks arising from the disclosure. Our
hypothesis is:
H1: Investors respond negatively to the political agreement on a public CbCR for
large European firms.
3 Empirical Strategy
3.1 Event Date
As discussed in Section 2.1, the unexpected trilogue agreement to introduce a public
CbCR regime in the EU was communicated in the evening of June 1, at around 9:15 pm. Given
that the major stock exchanges were already closed or about to close at the time of the
announcement,12 we expect a stock price reaction to take place on June 2 at the earliest. To
validate our expectation, we measure international media attention using the Dow Jones Factiva
database (Borghesi et al. 2014; Chen et al. 2019). Figure 1 depicts the corresponding result.
The graph shows particularly strong media attention between June 1 to June 4,
confirming our expectation. The cumulative media coverage around the June event
(i.e., June 1-4) accounts for 43.1% (i.e., (33+68+24+3)/325) of the overall media coverage
measured. Consequently, we identify June 2 as the event date of interest for our analysis.
Moreover, we observe above-average media attention around the event on
February 25 (13.5% of the overall media coverage measured). However, after inspecting the
articles, we do not expect an investor reaction around this event despite the high media coverage
for two reasons. First, the agreement in February was only of preliminary and unofficial nature,
which is also reflected in the media reports. For example, the British newspaper The Guardian
headlined "EU states back plan to expose big companies' tax avoidance"13 on February 26. In
contrast, on June 2, the respective headline was "EU agrees to force multinationals to disclose
tax, piling pressure on UK"14. Second, it is especially smaller and local media with a
geographically limited target audience that pick up the agreement in February. Except for The
Guardian, we could not identify any further outlets with an international target audience around
the February event. In contrast, the main event in June is also covered by the Financial Times
12 The major European and Asian Stock exchanges (i.e., London, Frankfurt, Paris, Hong Kong, Tokyo, Singapore,
Shanghai) were already closed at the time of the announcement. The stock exchanges in New York and Toronto closed 45 minutes after the announcement.
13 Italic emphasis was subsequently added. We refer to Figure 2 for a screenshot of the headline. 14 Italic emphasis was subsequently added. We refer to Figure 3 for a screenshot of the headline.

11
and Shanghai Daily, for example. Moreover, while we do not find an official press release from
a constitutional organ of the EU in February, the European Parliament published a press release
on June 1, which was headlined "EU lawmakers strike milestone deal for corporate tax
transparency". Nevertheless, we assess the capital market reaction around February 25 as an
alternative event date.
3.2 Data and Methodological Approach
To analyze the investor reaction to the EU announcement, we examine the stock
returns of affected firms around the identified event, as described by Kothari and Warner (2007)
and applied in recent literature (Kajüter et al. 2019). That is, we estimate the magnitude of
abnormal returns based on the stock price development of a suitable benchmark (i.e., market)
portfolio.
We identify firms that are likely to be subject to the directive using Bureau van Dijk's
(BvD) flagship database Orbis, based on the scope of the EU draft proposal. That is, we require
sample firms to exceed the turnover threshold of EUR 750 million in their last two available
reporting periods. Moreover, we require firms to be active and publicly listed to be able to
observe stock returns. To ensure the timeliness of our data, we exclude firms whose last
available reporting year is prior to 2019. Furthermore, we require firms to be headquartered
within the EU to ensure that the selected firms fall under the scope of the directive. We exclude
firms that operate either in the extractive and logging industry,15 respectively the banking
sector,16 as these firms are already subject to an industry-specific CbCR regime. We merge the
resulting 715 firms with the Thomson Reuters EIKON database to obtain accounting data from
Worldscope and stock market information from Datastream. We lose 30 firms that cannot be
merged in this step.
We retrieve return information for our treatment firms and the benchmark portfolio
from Datastream for the period starting January 1, 2020, and ending June 17, 2021, resulting in
stock return information on 382 trading days for each firm. We use Datastream's Total Return
Index (RI),17 which represents a theoretical value growth by assuming that dividends are
reinvested to purchase additional units of the respective stock. Due to the international scope
15 The corresponding NACE Rev. 2 codes are 6411-6499 and 6611-6630. 16 The corresponding NACE Rev. 2 codes are 0110-0322 and 0510-0990. 17 The index value RI is calculated using a method in which the discrete quantity of dividend paid is added to the
price on the ex-dividend date. That is, RI is computed as follows: 𝑅𝑅𝐼𝐼𝑡𝑡 = 𝑅𝑅𝐼𝐼𝑡𝑡−1 ∗𝑝𝑝𝑡𝑡𝑝𝑝𝑡𝑡−1
, where 𝑝𝑝𝑡𝑡 equals the price on date 𝑡𝑡 and 𝑝𝑝𝑡𝑡−1 equals the price on the previous date. If 𝑡𝑡 equals the ex-date of dividend payment 𝐷𝐷𝑡𝑡 , the method adjusts as follows: 𝑅𝑅𝐼𝐼𝑡𝑡 = 𝑅𝑅𝐼𝐼𝑡𝑡−1 ∗
𝑝𝑝𝑡𝑡 +𝐷𝐷𝑡𝑡𝑝𝑝𝑡𝑡−1
.

12
of our sample, we consider the MSCI World to be the most suitable available proxy for the
market portfolio. The MSCI World is a global stock index that tracks the performance of more
than 1,600 firms from 23 countries. The firms in our sample account for 10.8% of the MSCI
World, mitigating concerns that treatment firms considerably impact the return of the
benchmark portfolio.
Our Factiva analysis shows that the media coverage spike for our main event lasts until
June 4 and subsequently reverts to the average level of media attention. Therefore, we expect a
reaction to take place within the first two days following the event, i.e., our event day June 2
and the two subsequent days.18 Thereby, we allow capital markets to impound the reactions into
firms' stock prices (Grewal et al. 2019). For the estimation period, we follow Johannesen and
Larsen (2016) and Dutt et al. (2019) and use a 1-year period ending six days before the
respective events.19 We only keep firms with at least 70% non-zero returns in our estimation
and event period to ensure that sample firms are actively traded to mitigate difficulties during
the estimation of the market model (Dutt et al. 2019). Based on this identification strategy, we
end up with a final sample of 680 treatment firms. Table 1 provides a detailed overview of our
selection process.
Table 2 shows the descriptive statistics of our sample. The average daily stock return
amounts to 0.09 percent, slightly higher than the average daily return of the benchmark portfolio
MSCI World (0.07 percent). The minimum turnover value of EUR 750 million in the last
available year indicates that at least one firm is located close to the reporting threshold. The
median firm accounts for a turnover of EUR 2.74 billion, operates in the B2C sector, has a
GAAP effective tax rate of 24.75% (respectively a cash effective tax rate of 23.50%), and an
intangible-to-total-assets ratio of 19.28%. We provide a country breakdown of our sample in
Table 3.
For our main analysis, we use the event study design of Thompson (1985) and
Eckbo (2007), assuming the Sharpe-Lintner Capital Asset Pricing Model (CAPM) to be the
applicable return-generating process. This procedure implies the following regression model
for the estimation of abnormal returns:
𝑟𝑟𝑖𝑖𝑡𝑡 = 𝛼𝛼𝑖𝑖 + 𝛽𝛽𝑖𝑖𝑟𝑟𝑚𝑚𝑡𝑡 + 𝛾𝛾𝑖𝑖𝐸𝐸𝐸𝐸𝐸𝐸𝐸𝐸𝑡𝑡𝑡𝑡 + 𝜀𝜀𝑖𝑖𝑡𝑡 (1)
18 This is also our specification of choice for the alternative event day, given that the media reaction reaches a
spike on February 25 and decays until February 27. 19 To test the robustness of our results, we also employ a short-term estimation period of three months in Section
4.2 and find that our results are robust to alternative estimation period specifications.

13
where 𝑟𝑟𝑖𝑖𝑡𝑡 is the realized return of firm i on trading day t, 𝑟𝑟𝑚𝑚𝑡𝑡 is the realized return of
the benchmark portfolio (i.e., in our main analysis the MSCI World) and 𝐸𝐸𝐸𝐸𝐸𝐸𝐸𝐸𝑡𝑡𝑡𝑡 is a dummy
variable indicating trading days within the event period. 𝜀𝜀𝑖𝑖𝑡𝑡 is the error term and captures all
effects that are not included in the model. The constant 𝛼𝛼𝑖𝑖 represents an estimate for the alpha
of an equally-weighted portfolio of our treatment firms and 𝛽𝛽𝑖𝑖 is an estimate for the portfolio's
market beta. 𝛾𝛾𝑖𝑖 represents an estimate for the average abnormal return during the event window
and is, therefore, our coefficient of interest. To compute the CAAR, we multiply each 𝛾𝛾𝑖𝑖 by the
number of days in our event window (Doidge and Dyck 2015; Klein et al. 2019).
4 Results
4.1 Main Findings
The results for our main event are presented in Table 4. In both specifications, we use
the 1-year period estimation window (-267,-6) and cluster standard errors on firm-level and
trading day-level. Column 1 depicts the results of our baseline analysis. For the 3-day event
window (0,2), we find that the average sample firm experiences an abnormal return of -0.699%,
statistically significant at the 1%-level. Considering the total market capitalization of our
sample firms on June 1 (i.e., the day before the event) of EUR 8,131.5 billion, this translates
into a value drop of EUR 65.487 billion within the first two days after the event. Our regression
results further indicate a market beta of 0.674 (significant at the 1%-level) and a portfolio alpha
of 0.109 (significant at the 5%-level).
Column 2 shows our regression results using an alternative 2-day event window (0,1).
We find that the average firm accounts for an abnormal return of -0.499%, which translates into
a value drop of EUR 48.532 billion. Estimates for the market beta and portfolio alpha are
unaffected by this change, both in terms of magnitude and statistical significance.
Next, we analyze the alternative event on February 25, which was identified in the
Factiva media coverage analysis. We follow our main event analysis and use (0,2) and (0,1) as
event window specifications. The corresponding results are depicted in Table 5. We find
positive CAARs for both specifications, amounting to 0.572% and 0.904% for the (0,2) and
(0,1) event windows, respectively. In both cases, however, our estimates are statistically
insignificant.
In conclusion, we find an average negative investor reaction to the EU's announcement
of a public CbCR regime in our main analysis. Our findings are consistent with the notion that
the average investor evaluates the associated costs of public disclosure to exceed the benefits

14
from a more extensive information environment and a potentially improved financial
sustainability position associated with the increasing public pressure to be a "good corporate
citizen".
Moreover, these findings are consistent with the results of Johannesen and Larsen
(2016), who also find a negative investor response for the introduction of a public CbCR in the
extractive sector. The smaller effect size of our estimations is likely due to the divergent
backgrounds of the CbCR regimes. As explained in Section 2.2, the CbCR regime for the
extractive and logging sector was developed primarily to combat criminal business practices,
such as corruption in developing countries. In addition to reputational costs, the discovery of
illegal activities also leads to direct costs from legal proceedings and potential fines. The tax
CbCR on the other hand, was primarily designed to reveal tax avoidance resulting from mostly
legal practices that exploit loopholes in the global system of national tax laws.
4.2 Robustness Tests
To increase the confidence in our results, we run a series of robustness tests, in which
we alter the assumptions and parameters of our baseline analysis.20 Table 6 shows the
corresponding results. In column 1, we follow prior literature and employ the S&P Global 1200
as an alternative market proxy to the MSCI World (Dutt et al. 2019; Johannesen and Larsen
2016). The coefficient of interest remains unchanged by this alteration, both in terms of
magnitude and statistical significance. In column 2, we winsorize firm and market returns
within the estimation and event periods at the 1st and 99th percentile. The outbreak of the
COVID-19 crisis has led to increased volatility in the global capital market. By winsorizing,
we aim to account for the impact of COVID shocks, such as the discovery of a new virus variant
or the successful test phase of a vaccine candidate. The corresponding results show that the
alteration leads to a decrease in effect size by 0.082 percentage points to -0.617%, but an
increase in statistical significance. In column 3, we control for potential confounding events
and exclude firms with an earnings announcement within a (-2,2) window around the event
date. We retrieve earnings announcement dates from I/B/E/S and identify four firms that made
announcements during that period. Given the small share of affected sample firms, it is not
surprising that our coefficient of interest is hardly affected by their exclusion. The effect size
drops by 0.013 percentage points to -0.686% and remains statistically significant at the 1%-
level. In column 4, we combine the winsorization and exclusion of firms with earnings
20 Our baseline regression is shown in Table 4, column 1. I.e., for our robustness tests, we analyze the main event
(June 2), using a 1-year estimation period (-267, -6) and a 3-day event-window (0,2).
15
announcements tests. The CAAR drops to -0.604% while remaining statistically significant at
the 1%-level.
In a second step, we alter the estimation period to a short-term 3-month window
starting 68 days and ending 6 days before the event date and replicate our baseline analysis and
the robustness tests from Table 6. The corresponding results are depicted in Table 7. Column 1
shows the results of the baseline analysis but with the altered estimation period. We find that
the CAAR drops to -0.509% but remains statistically significant at the 5%-level. Column 2
shows the results for using the S&P Global 1200 as an alternative benchmark portfolio. Here,
the coefficient of interest amounts to -0.523%, significant just above the 5%-level (p-value of
5.5%). Winsorizing the return information in the estimation and event period reduces the effect
size to -0.478% (column 3) and the exclusion of firms with earnings announcements during the
(-2,2) window around the event date yields CAARs of -0.497% (column 4). In column 5, we
find that the combination of a short-term estimation period, winsorization of return data, and
exclusion of firms that have earnings announcements around the event date results in the
smallest overall effect size in our test series. The CAAR amounts to -0.465% and is statistically
significant at conventional levels.
Taken together, the analyses in this Section show that our results are robust to changes
in assumptions or parameters of our estimation model. Our results remain similar in terms of
magnitude and statistical significance, and our main inference from the previous Section does
not change. This supports our view that the marginal capital market investor is negatively
pricing in the EU announcement of the introduction of a public CbCR.
5 Heterogeneity Analysis
5.1 Data and Methodological Approach
After identifying an overall negative investor reaction, we aim to better understand the
firm characteristics the marginal investor takes into consideration. As laid out in Section 2.2,
our setting allows us to exclude direct implementation costs and indirect costs from tax
authority scrutiny as potential reasons for an adverse reaction. The remaining indirect costs can
be classified as reputational costs from being publicly exposed as an aggressive tax avoider
(regardless of whether such exposure was justified or not) and costs resulting from competitive
disadvantages. We, therefore, expect that the effect size should be larger for firms that are more
sensitive to reputational concerns and firms situated in fierce competition. For our analyses, we
thus extend our baseline model as follows:

16
𝑟𝑟𝑖𝑖𝑡𝑡 = 𝛼𝛼𝑖𝑖 + 𝛽𝛽𝑖𝑖𝑟𝑟𝑚𝑚𝑡𝑡 + 𝛾𝛾𝑖𝑖𝐸𝐸𝐸𝐸𝐸𝐸𝐸𝐸𝑡𝑡𝑡𝑡 + 𝜑𝜑𝑖𝑖𝐼𝐼𝑖𝑖 + 𝛿𝛿𝑖𝑖𝐼𝐼𝑖𝑖 ∗ 𝐸𝐸𝐸𝐸𝐸𝐸𝐸𝐸𝑡𝑡𝑡𝑡 + 𝜀𝜀𝑖𝑖𝑡𝑡 (2)
where 𝐼𝐼𝑖𝑖 is a vector of firm-specific indicators. 𝐼𝐼𝑖𝑖 ∗ 𝐸𝐸𝐸𝐸𝐸𝐸𝐸𝐸𝑡𝑡𝑡𝑡 is the interaction term of
the indicator vector 𝐼𝐼𝑖𝑖 and our dummy variable that indicates trading days within the event
window. All other variables are as explained in equation 1. The new coefficient of interest is
the coefficient of the interaction vector 𝛿𝛿𝑖𝑖. To examine the role of the two cost channels
separately, we determine meaningful measures that indicate the degree of reputational concerns
and the fierceness of the competitive environment based on the extant literature. We describe
the choice of the respective measures in the following.
Identification of reputational concerns
Two common measures of tax avoidance are the effective tax rate (ETR) of a firm
based on accounting figures (so-called GAAP ETR), respectively based on the actual taxes paid
(so-called Cash ETR) (Hanlon and Heitzman 2010). Using data from the consolidated financial
statements for the financial year 2020 from Worldscope, we compute the GAAP ETR by
dividing the income taxes (as stated in the profit and loss statement) by the pretax income of
the respective firm and the Cash ETR by dividing the income taxes paid (as stated in the cash
flow statement) by the pretax income of the respective firms. It is important to mention that
GAAP ETR, unlike Cash ETR, does not capture a deferral of tax payments (Hanlon and
Heitzman 2010) and might therefore not be the measure of choice for all instances. At the same
time, an investor might prefer the GAAP ETR, given that it is easier to determine. For the
computation of the GAAP ETR, both numerator and denominator can be retrieved from the
same document (i.e., the profit and loss statement), whereas the Cash ETR requires information
from both the profit and loss statement and the cash flow statement. We subsequently divide
our sample firms into quintiles for each variable and define "Low-EBTR" and "Low-ECTR" as
dummy variables that assume the value of 1 for firms in the first and second quintile of the
GAAP ETR variable (EBTR), respectively the Cash ETR (ECTR) variable. We assume that
investors consider potentially more tax aggressive firms to suffer from greater reputational
risks.
Furthermore, we acknowledge that several empirical studies provide evidence for a
tax-driven allocation of intangible assets within a multinational corporation. Dischinger and
Riedel (2011) document that a decrease in the average tax difference to the remaining group
affiliates by one percentage point increases the focal affiliate's level of intangible assets by
1.7%. Karkinsky and Riedel (2012) examine the impact of tax rates on patent locations and find
that an increase in the corporate tax rate of 1 percentage point reduces the number of patent

17
applications by 3.5-3.8%. Estimating a model of firm decisions, Griffith et al. (2014) identify
corporate tax rates as significant determinants in corporate patent location decisions.
Heckemeyer et al. (2014) document that, conditional on the intensity of research &
development activities of a firm, the level of intangible assets in the firm is associated with
more tax planning efforts and ambitions. Thus, we argue that a higher intangible-to-total asset
ratio might indicate higher and more sophisticated tax planning potential and could, therefore,
serve as a proxy for investors to identify larger reputational risks. We, therefore, compute the
respective ratio based on the 2020 financial information in Worldscope and allocate our sample
firms into quintiles. We define "High-Int" as a dummy variable that assumes the value of 1 for
firms in the fourth and fifth quintile with regard to the intangible-to-total-assets ratio.
Moreover, we consider the results of Eberhartinger et al. (2020), who document that
banks reduce their presence in tax havens in response to the introduction of a public industry-
specific CbCR. We retrieve ownership information for our sample firms from Orbis. With
regard to the classification of tax haven jurisdictions, we follow the list provided by Fuest et al.
(2021). We compute the relative share of subsidiaries located in tax haven jurisdictions and
allocate our sample firms into quintiles. We define "High-Haven" as a dummy variable that
assumes the value of 1 for firms in the fourth and fifth quintile with regard to the relative share
of tax haven subsidiaries.
Finally, we consider that firms operating in the B2C sector are more exposed to public
attention than B2B firms. In line with Dutt et al. (2019), we, therefore, examine the difference
in the effect size along the B2C vs. B2B sector. We define "B2C" as a dummy variable that
assumes the value of 1 for firms operating in the B2C sector and 0 for firms operating in the
B2B sector. We apply the classification in Boyd and Kannan (2018) to allocate firms to the
B2C sector based on their 4-digit SIC codes available in Orbis.
To be included in the sample, we require firms to have the necessary information for
the computation of all indicator variables available. We drop firms with a negative pretax
income, as ETR measures are otherwise difficult to interpret (Dyreng et al. 2017; Robinson et
al. 2010; Bilicka et al. 2021). To reduce the impact of outliers, we cut GAAP ETR, Cash ETR,
and the intangible-to-total-assets ratios at 0 and 1 (e.g., Joshi et al. 2020; Joshi 2020; Chyz et
al. 2019). This procedure ultimately leads to a final sample of 480 firms for our cross-sectional
heterogeneity analyses regarding reputational concerns. We estimate equation 2 using the
parameter values from our baseline analysis. That is, we analyze the investor reaction to the EU
18
announcement on June 2, using a 1-year estimation window (-266,-6) and a 3-day event window
(0,2).
Identification of the competitive environment
One of the most established metrics to measure the level of competition is the
Herfindahl-Hirschman Index (HHI), which is frequently used by national antitrust agencies21
and in the extant literature (Francis et al. 2013; Borenstein et al. 1999). The index measures the
industry concentration by incorporating the relative market share of all firms in a given industry.
It is computed by summing up the squared market shares of each market player in a given
industry. After multiplying the market shares by 100, the HHI assumes values between 10,000𝑁𝑁
≤
𝐻𝐻𝐻𝐻𝐼𝐼 ≤ 10,000 whereby N represents the number of market players in the given industry.
Higher index values indicate higher concentrations of market shares within a given industry
and, thus, lower competition among firms in that industry. To calculate the HHI, we use BvD's
classification of industry peers in Orbis,22 which allows us to identify potential competitors of
our sample firms and calculate the total turnover volume per industry as well as the individual
market shares based on the available turnover information for the financial year 2019.23 In our
analysis, we include the dummy "Low-HHI", which assumes the value of 1 for firms in
industries in the lowest two quintiles with regard to the HHI (i.e., industries with high
competitive pressure) and 0 otherwise.
Another established group of concentration measures is represented by the so-called
Concentration Ratios (OECD 2021). Concentration Ratios measure the cumulative market
share of the top N-firms in a given industry. A low Concentration Ratio implies that the market
is less dominated by the N-largest firms (Francis et al. 2013). By focusing on the largest firms,
the measure neglects the distribution of market shares of the remaining competitors (contrary
to the HHI). We measure the Concentration Ratio for the ten largest firms in terms of turnover
("CR10") and define "Low-CR10" as a dummy variable that assumes the value of 1 for firms
operating in industries allocated to the first and second quintile with regard to CR10.
We acknowledge that concentration measures, in general, are imperfect proxies for the
actual competitive environment within industries. Most importantly, they do not measure
competition directly but the structural market outcome of competition (OECD 2021).24
21 For instance the Norwegian Competition Authority, see https://konkurransetilsynet.no/competition-has-been-
stable-in-norway-for-the-last-decades/?lang=en (01.10.2021). 22 The classification is based on the four-digit NACE-industry codes, but more granular due to additional
adjustments by BvD. 23 The year 2019 represents the most recent year for which we have financial information available in Orbis. 24 For further shortcomings, see among others, Matsumoto et al. (2012) and Borenstein et al. (1999).

19
Furthermore, we note that concentration measures on a stand-alone basis are limited to a static
description of the market structure but do not account for dynamic developments. We address
this issue and complement our analyses by using two additional dynamic indicators.
Our first indicator measures the 1-year (5-year) industry growth in terms of total
turnover. We argue that industries with low industry growth rates suggest higher competitive
pressure on firms, as a firm's market position may primarily be strengthened by retaining its
customers and attracting the existing customers of competing firms, yet not through the
attraction of new customers. Thus, we define "Low-1yr turnover growth" ("Low-5yr turnover
growth") as a dummy taking the value of 1 for firms in industries belonging to the first and
second quintile in terms of the 1-year (5-year) turnover growth.
The second indicator is derived from Porter's Five Forces Model, in which the threat
of an entry of new market participants is presented as a determinant for the dynamic rivalry
within a given industry (Porter 1980). Our approach is similar to Buijink et al. (1998), but we
define a combined measure accounting for market entries and exits. More precisely, we
calculate the 1-year (5-year) growth rate in the number of competitors for each industry.
Industries with high growth rates are considered more competitive. The dummy variable "High-
1yr competitor growth" ("High-5yr competitor growth") equals 1 for firms in industries
belonging to the fourth and fifth quintile of the respective variables.
In the absence of observable characteristics that would enable us to delineate product
markets,25 we emphasize that our approach to identify the competitive environment is based on
industry classifications. Industry classifications are typically more broadly defined than product
markets. In combination with the above-mentioned general shortcomings of concentration
measures, we are cautious to interpret the results of our analyses regarding the competitive
environment as causal links and consider them rather indicative.
5.2 Findings
Heterogeneous effects for different levels of reputational concerns
Our results for the heterogeneity analyses regarding different levels of reputational
concerns are shown in Table 8. In columns 1-5, vector 𝐼𝐼𝑖𝑖 contains the indicator variables
individually, whereas, in column 6, we include all five indicator variables.
25 A common measure is the similarity of product descriptions in firms’ 10-K filings (e.g., Hoberg and Phillips
2016). However, such information is not available for our European sample.

20
Column 1 depicts the results for the GAAP ETR analysis. In line with our expectation,
our results show that the investor reaction is considerably stronger for more tax aggressive firms
in terms of the GAAP ETR. While the average firm in the less tax aggressive sample
experiences an abnormal stock price reaction of -0.595% in the 3-day event window, the
average tax aggressive firm in terms of GAAP ETR experiences a -0.247 percentage points
lower 3-day CAAR. This finding is in line with the notion that investors expect firms to
converge towards more conservative tax planning strategies in anticipation of increasing public
pressure, which indirectly affects the expected value of cash flows due to foregone tax savings.
Interestingly, we find no significant difference in effect sizes in the cash ETR analysis (column
2). The marginal investor thus seems to rely on the readily available but, in some instances, less
informative ETR measure.
Column 3 shows the results for the intangible-to-total-assets ratio analysis. The
corresponding coefficient of interest is negative with a considerable effect size of -0.227% but
is not statistically significant at conventional levels. Similarly, we do not find a significant
difference between firms with high versus low shares of tax haven subsidiaries (column 4). The
coefficient of interest is close to 0 and insignificant, for which we identify two possible reasons.
First, it is comparatively costly to obtain the ratio. Unlike the basic values used to compute the
ETR measures or the intangible-to-total-assets ratio, the number of subsidiaries is generally not
directly available from the financial statements but has to be compiled on the basis of news or
legal documents or via paid access to corresponding databases. The high number of subsidiaries
for MNE of this size (our median sample firm accounts for 195 subsidiaries, the average is just
over 591) also complicates the manual allocation into tax haven and non-tax haven subsidiaries.
Secondly, as Table 2 shows, 75% of our sample firms account for a share of tax-haven
subsidiaries between 0% and 5.51%. Consequently, the marginal investor might lack sufficient
variation to expect a reputational risk differential and to react accordingly.
Similar to the tax haven and intangible ratio analyses, we cannot draw any new
conclusions from the B2C analysis (column 5). Again, this finding could be related to the low
degree of variation in the data, as 87% of our sample firms operate in the B2C sector. However,
the combined regression (column 6), including the whole vector of indicators, confirms our
finding that more tax aggressive firms with regard to GAAP ETR are more affected than other
firms. The respective coefficient indicates -0.318 percentage points lower CAARs. The event
coefficient shifts close to 0 and becomes insignificant, which we attribute to the high degree of
partitioning via five interaction terms. In sum, our findings imply that the marginal investor
factors in the reputational risks of more tax aggressive firms.
21
Heterogeneous effects for different levels of competition
Next, we explore the potential role of the second cost channel as a complementary
driver of the overall negative investor reaction. Our results for the heterogeneity analyses
regarding different levels of competition are presented in Table 9. We estimate equation 2 using
each of our six competitive intensity indicators individually.
Columns 1 and 2 show the results for our concentration measures. The CAARs of firms
operating in medium-to higher-concentrated industries amount to -0.600% in the HHI analysis
(column 1) and -0.619% in the CR10 analysis (column 2), both statistically significant at the
1%-level. In line with our expectation, we find that firms operating in industries with lower
concentrations experience more negative CAARs than firms operating in more concentrated
industries. The effect size differential is stronger when using the HHI measure (-0.137
percentage points) than the CR10 measure (-0.094 percentage points). In both cases, however,
our coefficients of interest are not significant at conventional levels. In untabulated results, we
also test CR3 and CR5 as commonly applied Concentration Ratio alternatives (OECD 2021)
but do not find any significant differences in effect size.
In the next step, we look at turnover growth as a measure reflecting the dynamic
development of our sample firm industries. Columns 3 depicts the results for the (short-term)
1-year turnover growth rate analysis, whereas column 4 shows the results for the (long-term)
5-year turnover growth rate. Again, we find significant negative CAARs for firms operating in
medium- to high-growth industries. The event coefficients yield CAARs of -0.635% (-0.710%)
for the short-term (long-term) growth rates. Our coefficients of interest, however, yield mixed
results. While firms with lower short-term growth rates experience on average a -0.078
percentage points lower CAARs, firms with lower long-term growth rates seem to yield less
negative CAARs. However, similar to the concentration analyses, both coefficients of interest
are insignificant and therefore fail to support our initial assumption about heterogenous effects
for different levels of competitive intensity.
In a final step, we examine differences in competitive intensity levels by means of
competitor growth within a given industry. Similar to turnover growth, the competitor growth
measure reflects the dynamic developments of our sample firm industries. The corresponding
results of our (short-term) 1-year and (long-term) 5-year competitor growth rate analyses are
shown in columns 5 and 6. Here, we find evidence supporting our expectation that differences
in competitive intensity are priced in by the marginal investor. Our estimates suggest that firms
operating in industries with high short-term (long-term) competitor growth rates experience

22
significantly stronger negative CAARs, amounting to -0.263 (-0.281) percentage points. In
untabulated results, we confirm the robustness of our finding employing a (medium-term) 3-
year competitor growth rate.
Taken together, we do not find comprehensive evidence to support our assumption
concerning the competitive distortion channel. We document that firms in industries with higher
growth rates in terms of the number of competitors are more affected by the regulation.
However, we acknowledge the weaknesses of the measurement approach outlined in
Section 5.1 and interpret our results as indicative of competitive risks associated with the
introduction of a public CbCR in the EU. The assumption of a causal relationship requires a
more precise measurement approach based on observable delineations of product markets.
6 Conclusion
In this study, we examine the EU's announcement to introduce a public CbCR scheme
in the night of June 1 to June 2, 2021. According to the draft directive, large European
multinational enterprises would be required to publicly disclose formerly confidentially
reported key financials on a CbC basis. We employ an event study methodology to analyze the
investor reaction on the capital market around the day of the announcement of a political
agreement to introduce the public CbCR scheme. Based on BvD's Orbis database, we identify
a set of 680 EU-based listed firms to fall under the public reporting obligation. Using daily
stock return data from Datastream, we document negative CAARs for up to two days after the
event day. Contingent on the specification, the CAARs range between -0.499% and -0.699%
for the firms in our sample, which translates into a monetary value drop between EUR 48 billion
and EUR 65 billion. Our findings suggest that investors expect non-tax risks associated with
public CbCR to outweigh potential benefits from a better information environment.
Adding upon these findings, we further identify potential channels to explain our
results. Our setting enables us to rule out direct costs of compliance and indirect costs resulting
from increased tax authority scrutiny as potential drivers of a negative investor reaction, given
that firms were previously already required to confidentially report CbCR data to the national
tax authorities. That leaves reputational concerns from public scrutiny and potential competitive
disadvantages as possible drivers. The results of our cross-sectional analyses indicate that
investors are indeed concerned about reputational risks associated with the disclosure
requirement. We find significant differences in effect sizes between firms with lower GAAP
ETRs, amounting to stronger negative abnormal returns of -0.247 percentage points over the
three days following the EU announcement. Furthermore, we find that firms with higher short-

23
and long-term competitor growth rates experience significantly stronger negative abnormal
returns than firms with lower growth rates. Our estimates indicate a -0.263 (-0.281) percentage
points stronger negative CAARs for firms with higher 1-year (5-year) competitor growth rates
over the 3-day event period. These findings are consistent with the notion that investors price
in different levels of competition of affected firms. Yet, due to limitations of our competition
measures, we interpret the heterogenous effect sizes as indicative evidence for the role of
competitive risks arising from the public CbCR. We leave a more sophisticated measurement
approach as an interesting avenue for future research.
Overall, our findings provide a meaningful contribution to currently ongoing
discussions among politicians and standard setters on increasing tax transparency. In the U.S.,
for instance, the Disclosure of Tax Havens and Offshoring Act, which provides a similar
extension of the existing confidential CbCR to a public CbCR, awaits approval by the Senate.
Additionally, the world's most widely applied non-financial reporting standard, GRI, introduced
a new module on taxation, including a public CbCR, effective as of 2021. When considering
the introduction or particular design of comparable public CbCRs, legislators and standard
setters should be aware that mandatory public tax transparency results in substantial non-tax
costs. Against this background, decision-makers should carefully consider the merits of such
public disclosure schemes.

24
References
Austin, Chelsea Rae; Wilson, Ryan J. (2017): An Examination of Reputational Costs and Tax
Avoidance: Evidence from Firms with Valuable Consumer Brands. In Journal of the
American Taxation Association 39 (1), pp. 67–93. DOI: 10.2308/atax-51634.
Bilicka, Katarzyna Anna; Casi, Elisa; Seregni, Carol; Stage, Barbara (2021): Qualitative
Information Disclosure: Is Mandating Additional Tax Information Disclosure Always
Useful? ZEW - Leibniz-Zentrum für Europäische Wirtschfatsforschung. Mannheim (ZEW
- Centre for European Economic Research Discussion Paper, 21-047). Available online at
http://hdl.handle.net/10419/234982, checked on 8/11/2021.
Blaufus, Kay; Möhlmann, Axel; Schwäbe, Alexander N. (2019): Stock price reactions to
news about corporate tax avoidance and evasion. In Journal of Economic Psychology 72,
pp. 278–292. DOI: 10.1016/j.joep.2019.04.007.
Borenstein, Severin; Bushnell, James; Knittel, Christopher R. (1999): Market Power in
Electricity Markets: Beyond Concentration Measures. In The Energy Journal 20 (4),
pp. 65–88.
Borghesi, Richard; Houston, Joel F.; Naranjo, Andy (2014): Corporate socially responsible
investments: CEO altruism, reputation, and shareholder interests. In Journal of Corporate
Finance 26, pp. 164–181. DOI: 10.1016/j.jcorpfin.2014.03.008.
Boyd, D. Eric; Kannan, P. K. (2018): (When) Does Third-Party Recognition for Design
Excellence Affect Financial Performance in Business-to-Business Markets? In Journal of
Marketing 82 (3), pp. 108–123. DOI: 10.1509/jm.15.0150.
Bratten, Brian; Gleason, Cristi A.; Larocque, Stephannie A.; Mills, Lillian F. (2017):
Forecasting Taxes: New Evidence from Analysts. In The Accounting Review 92 (3), pp. 1–
29. DOI: 10.2308/accr-51557.
Buijink, Willem F. J.; Maijoor, Steven J.; Meuwissen, Roger H. G. (1998): Competition in
Auditing: Evidence from Entry, Exit, and Market Share Mobility in Germany versus The
Netherlands. In Contemporary Accounting Research 15 (3), pp. 385–404. DOI:
10.1111/j.1911-3846.1998.tb00565.x.
Business at OECD (2020): Comment on Public Review of Country-by-Country Reporting
(BEPS Action 13). OECD. Available online at
https://www.dropbox.com/s/qovaugzkxsym3ia/oecd-public-comments-received-2020-cbc-
review.zip?dl=0, checked on 8/21/2021.
25
Chen, Shannon; Schuchard, Kathleen; Stomberg, Bridget (2019): Media Coverage of
Corporate Taxes. In The Accounting Review 94 (5), pp. 83–116. DOI: 10.2308/accr-52342.
Chyz, James A.; Gaertner, Fabio B.; Kausar, Asad; Watson, Luke (2019): Overconfidence
and Corporate Tax Policy. In Review of Accounting Studies 24 (3), pp. 1114–1145. DOI:
10.1007/s11142-019-09494-z.
De Simone, Lisa; Olbert, Marcel (2021): Real Effects of Private Country-by-Country
Disclosure. Available online at
https://papers.ssrn.com/sol3/papers.cfm?abstract_id=3398116, checked on 7/9/2021.
Desai, Mihir A.; Dharmapala, Dhammika (2006): Corporate tax avoidance and high-powered
incentives. In Journal of Financial Economics 79 (1), pp. 145–179. DOI:
10.1016/j.jfineco.2005.02.002.
Desai, Mihir A.; Dharmapala, Dhammika (2009): Corporate Tax Avoidance and Firm Value.
In Review of Economics and Statistics 91 (3), pp. 537–546. DOI: 10.1162/rest.91.3.537.
Desai, Mihir A.; Dyck, Alexander; ZINGALES, L. (2007): Theft and taxes. In Journal of
Financial Economics 84 (3), pp. 591–623. DOI: 10.1016/j.jfineco.2006.05.005.
Dischinger, Matthias; Riedel, Nadine (2011): Corporate taxes and the location of intangible
assets within multinational firms. In Journal of Public Economics 95 (7-8), pp. 691–707.
DOI: 10.1016/j.jpubeco.2010.12.002.
Doidge, Craig; Dyck, Alexander (2015): Taxes and Corporate Policies: Evidence from a
Quasi Natural Experiment. In The Journal of Finance 70 (1), pp. 45–89. DOI:
10.1111/jofi.12101.
Dutt, Verena K.; Ludwig, Christopher A.; Nicolay, Katharina; Vay, Heiko; Voget, Johannes
(2019): Increasing tax transparency: investor reactions to the country-by-country reporting
requirement for EU financial institutions. In Int Tax Public Finance 26 (6), pp. 1259–1290.
DOI: 10.1007/s10797-019-09575-4.
Dyreng, S.; Hanlon, Michelle; Maydew, Edward L.; Thornock, Jacob R. (2017): Changes in
corporate effective tax rates over the past 25 years. In Journal of Financial Economics 124
(3), pp. 441–463. DOI: 10.1016/j.jfineco.2017.04.001.
Dyreng, S.; Hoopes, Jeffrey L.; Wilde, Jaron H. (2016): Public Pressure and Corporate Tax
Behavior. In Journal of Accounting Research 54 (1), pp. 147–186. DOI: 10.1111/1475-
679X.12101.
26
Eberhartinger, Eva; Speitmann, Raffael; Sureth-Sloane, Caren (2020): Real Effects of Public
Country-by-Country Reporting and the Firm Structure of European Banks. In SSRN
Journal. DOI: 10.2139/ssrn.3523909.
Eckbo, B. Espen (Ed.) (2007): Handbook of Corporate Finance. Empirical Corporate Finance.
Amsterdam: North-Holland (1).
Ellis, J. A.; Fee, C. E.; Thomas, S. E. (2012): Proprietary Costs and the Disclosure of
Information About Customers. In Journal of Accounting Research 50 (3), pp. 685–727.
DOI: 10.1111/j.1475-679X.2012.00441.x.
European Parliament (2019): Legislative resolution on disclosure of income tax information
by certain undertakings and branches. European Parliament. Available online at
https://www.europarl.europa.eu/RegData/seance_pleniere/textes_adoptes/provisoire/2019/
03-27/0309/P8_TA-PROV(2019)0309_EN.pdf, checked on 8/20/2021.
Francis, Jere R.; Michas, Paul N.; Seavey, Scott E. (2013): Does Audit Market Concentration
Harm the Quality of Audited Earnings? Evidence from Audit Markets in 42 Countries. In
Contemporary Accounting Research 30 (1), pp. 325–355. DOI: 10.1111/j.1911-
3846.2012.01156.x.
Frischmann, Peter J.; Shevlin, Terry; Wilson, Ryan (2008): Economic consequences of
increasing the conformity in accounting for uncertain tax benefits. In Journal of
Accounting and Economics 46 (2-3), pp. 261–278. DOI: 10.1016/j.jacceco.2008.08.002.
Fuest, Clemens; Hugger, Felix; Neumeier, Florian (2021): Corporate Profit Shifting and the
Role of Tax Havens: Evidence from German Country-by-Country Reporting Data. CESifo.
Munich (CESifo Working Paper, 8838). Available online at
http://hdl.handle.net/10419/232435, checked on 8/11/2021.
Graham, John R.; Hanlon, Michelle; Shevlin, Terry; Shroff, Nemit (2014): Incentives for Tax
Planning and Avoidance: Evidence from the Field. In The Accounting Review 89 (3),
pp. 991–1023. DOI: 10.2308/accr-50678.
Grewal, Jody; Riedl, Edward J.; Serafeim, George (2019): Market Reaction to Mandatory
Nonfinancial Disclosure. In Management Science 65 (7), pp. 3061–3084. DOI:
10.1287/mnsc.2018.3099.
Griffith, Rachel; Miller, Helen; O'Connell, Martin (2014): Ownership of intellectual property
and corporate taxation. In Journal of Public Economics 112, pp. 12–23. DOI:
10.1016/j.jpubeco.2014.01.009.

27
GSSB (2019a): GRI 207: TAX 2019. Available online at
https://www.globalreporting.org/search/?query=GRI+207, checked on 8/13/2021.
GSSB (2019b): Basis for Conclusions for GRI 207: Tax 2019. Summary of Public Comments
on the Exposure Draft of the Standard, and GSSB Responses. GRI. Amsterdam. Available
online at https://www.globalreporting.org/media/50wfs120/gssb-basis-for-conclusions-for-
gri-207-tax-2019.pdf, checked on 8/17/2021.
Hanlon, Michelle; Heitzman, Shane (2010): A review of tax research. In Journal of
Accounting and Economics 50 (2-3), pp. 127–178. DOI: 10.1016/j.jacceco.2010.09.002.
Hanlon, Michelle; Laplante, Stacie Kelley; Shevlin, Terry (2005): Evidence for the possible
information loss of conforming book income and taxable income. In Journal of Law and
Economics 48 (2), pp. 407–442.
Heckemeyer, Jost; Richter, Katharina; Spengel, Christoph (2014): Tax Planning of R&D
Intensive Multinationals. In SSRN Journal. DOI: 10.2139/ssrn.2557353.
Hoberg, Gerard; Phillips, Gordon (2016): Text-Based Network Industries and Endogenous
Product Differentiation. In Journal of Political Economy 124 (51), pp. 1423–1465. DOI:
10.3386/w15991.
Hombach, Katharina; Sellhorn, Thorsten (2019): Firm Value Effects of Targeted Disclosure
Regulation: The Role of Reputational Costs (TRR 266 Accounting for Transparency
Working Paper Series No. 18). Available online at
https://papers.ssrn.com/sol3/papers.cfm?abstract_id=3204505, checked on 8/13/2021.
Hoopes, Jeffrey L.; Robinson, Leslie; Slemrod, joel (2018): Public tax-return disclosure. In
Journal of Accounting and Economics 66, pp. 142–162.
Huang, Ying; Jennings, Ross; Yu, Yong (2017): Product Market Competition and Managerial
Disclosure of Earnings Forecasts: Evidence from Import Tariff Rate Reductions. In The
Accounting Review 92 (3), pp. 185–207. DOI: 10.2308/accr-51558.
Huesecken, Birgit; Overesch, Michael; Tassius, Alexander (2018): Effects of Disclosing Tax
Avoidance: Capital Market Reaction to LuxLeaks (Working Paper). Available online at
https://papers.ssrn.com/sol3/papers.cfm?abstract_id=2848757, checked on 8/13/2021.
Johannesen, Niels; Larsen, Dan Thor (2016): The power of financial transparency: An event
study of country-by-country reporting standards. In Economics Letters 145, pp. 120–122.
DOI: 10.1016/j.econlet.2016.05.029.

28
Joshi, Preetika (2020): Does Private Country‐by‐Country Reporting Deter Tax Avoidance and
Income Shifting? Evidence from BEPS Action Item 13. In Journal of Accounting Research
58 (2), pp. 333–381. DOI: 10.1111/1475-679X.12304.
Joshi, Preetika; Outslay, Edmund; Persson, Anh; Shevlin, Terry; Venkat, Aruhn (2020): Does
Public Country‐by‐Country Reporting Deter Tax Avoidance and Income Shifting?
Evidence from the European Banking Industry*. In Contemp Account Res 37 (4),
pp. 2357–2397. DOI: 10.1111/1911-3846.12601.
Kajüter, Peter; Klassmann, Florian; Nienhaus, Martin (2019): The Effect of Mandatory
Quarterly Reporting on Firm Value. In The Accounting Review 94 (3), pp. 251–277. DOI:
10.2308/accr-52212.
Karkinsky, Tom; Riedel, Nadine (2012): Corporate taxation and the choice of patent location
within multinational firms. In Journal of International Economics 88 (1), pp. 176–185.
DOI: 10.1016/j.jinteco.2012.04.002.
Klein, Daniel; Ludwig, Christopher; Spengel, Christoph (2019): Ring-Fencing Digital
Corporations: Investor Reaction to the European Commission’s Digital Tax Proposals. In
SSRN Journal. DOI: 10.2139/ssrn.3498183.
Kothari, S. P.; Warner, J. (2007): Econometrics of event studies. In B. Espen Eckbo (Ed.):
Handbook of Corporate Finance. Empirical Corporate Finance, vol. 1. Amsterdam: North-
Holland (1), pp. 3–36.
Leung, Edith; Verriest, Arnt (2019): Does location matter for disclosure? Evidence from
geographic segments. In J Bus Fin Acc 46 (5-6), pp. 541–568. DOI: 10.1111/jbfa.12375.
Matsumoto, Akio; Merlone, Ugo; Szidarovszky, Ferenc (2012): Some notes on applying the
Herfindahl–Hirschman Index. In Applied Economics Letters 19 (2), pp. 181–184. DOI:
10.1080/13504851.2011.570705.
Müller, Raphael; Spengel, Christoph; Vay, Heiko (2020): On the Determinants and Effects of
Corporate Tax Transparency: Review of an Emerging Literature: ZEW Discussion Paper
(ZEW - Centre for European Economic Research Discussion Paper No. 20-063).
OECD (2015): Transfer Pricing Documentation and Country-by-Country Reporting. Action
13 - 2015 Final Report. Edited by OECD Publishing. OECD. Paris. Available online at
https://www.oecd-ilibrary.org/docserver/9789264241480-
en.pdf?expires=1625825947&id=id&accname=ocid41023547&checksum=E1E6ABE59C
B96A17ACD3189C59205ED3, checked on 7/9/2021.

29
OECD (2021): Methodologies to Measure Market Competition. Edited by OECD Publishing.
OECD. Paris (OECD Competition Committee Issues Paper). Available online at https:
//oe.cd/mmmc.
Overesch, Michael; Wolff, Hubertus (2021): Financial Transparency to the Rescue: Effects of
Public Country‐by‐Country Reporting in the EU Banking Sector on Tax Avoidance*. In
Contemp Account Res. DOI: 10.1111/1911-3846.12669.
Porter, Michael E. (1980): Industry Structure and Competitive Strategy: Keys to Profitability.
In Financial Analysts Journal 36 (4), pp. 30–41. Available online at
https://www.jstor.org/stable/4478361.
Rauter, Thomas (2020): The Effect of Mandatory Extraction Payment Disclosures on
Corporate Payment and Investment Policies Abroad. In Journal of Accounting Research 58
(5), pp. 1075–1116. DOI: 10.1111/1475-679X.12332.
Robinson, John R.; Sikes, Stephanie A.; Weaver, Connie D. (2010): Performance
Measurement of Corporate Tax Departments. In The Accounting Review 85 (3), pp. 1035–
1064.
Technology Industries of Finland (2020): Comment on Public Review of Country-by-Country
Reporting (BEPS Action 13). OECD. Available online at
https://www.dropbox.com/s/qovaugzkxsym3ia/oecd-public-comments-received-2020-cbc-
review.zip?dl=0, checked on 8/20/2021.
Thompson, Rex (1985): Conditioning the Return-Generating Process on Firm-Specific
Events: A Discussion of Event Study Methods. In The Journal of Financial and
Quantitative Analysis 20 (2), p. 151. DOI: 10.2307/2330952.

30
Table 1: Sample selection process
Search step Search result
All active firms in Orbis 288,485,396
Require firms to be publicly listed -288,397,152
Require firms to exceed the turnover threshold of EUR 750 million in their last two
available years -81,710
Require firms to have financial data available until at least 2019 -19
Exclude non-EU based firms -5,685
Exclude firms in the extractive & logging industry -32
Exclude firms in the banking sector -83
Exclude firms that could not be identified in Datastream -30
Require at least 30% of non-zero returns in the sample period -5
Final sample 680
Note: The EU draft proposal requires firms exceeding a turnover threshold of EUR 750 million in two consecutive years to fall under the disclosure obligation. The term "turnover" in the table refers to the Orbis variable "Operating Revenue (Turnover)". Firms without data in reporting years 2021-2019 are excluded to ensure the temporal relevance of the dataset. Non-EU-based firms are excluded, as they are only subject to a reduced disclosure obligation under the draft proposal (i.e., they are only required to disclose their business activities within, but not outside of the EU on a CbC basis). Firms in the extractive & logging industry (NACE Rev. 2 codes: 6411-6499 and 6611-6630) and the banking sector (NACE Rev. 2 codes: 0110-0322 and 0510-0990) are excluded as they are subject to an industry-specific CbCR regime in the EU. Given that firms operating in the public sector (NACE Rev. 2 codes: 8411-8430) are not necessarily comparable to those operating in the non-public sector (e.g., because national governments typically hold significant stakes in those firms), we also exclude those firms. To mitigate difficulties resulting from the estimation of the market model with a zero-return high ratio, we require at least 30% of non-zero return days in our sample (Dutt et al. 2019).

31
Table 2: Descriptive statistics
Variable N Mean SD P25 Median P75 Min Max
Stock Return 259,080 0.09 2.90 -1.07 0 1.19 -66.67 184.44
MSCI World Return 259,080 0.07 1.54 -0.38 0.11 0.68 -10.06 8.40
S&P Global 1200 Return 259,080 0.06 1.52 -0.46 0.14 0.67 -9.82 8.36
Turnover in last available year 183,360 9.16 18.90 1.44 2.74 8.36 0.75 231.00
B2C 183,360 0.87 0.34 1 1 1 0 1
GAAP ETR 183,360 29.01 20.93 18.96 24.75 31.25 0 100
Cash ETR 183,360 30.83 25.86 15.02 23.50 37.70 0 100
Intangible-to-total assets ratio 183,360 23.72 19.38 6.07 19.28 37.70 0 88.58
Total number of subsidiaries 183,360 591.53 1205.60 76.5 195 508.5 1 9,463
Relative share of tax haven subsidiaries
183,360 4.02 5.86 0.41 2.72 5.51 0 75
HHI 247,154 333.62 428.86 118.05 207.72 368.06 6.03 4013.53
CR10 247,154 0.38 0.16 0.25 0.36 0.47 0.06 0.94
1yr turnover growth 247,154 -0.03 0.54 -0.19 -0.08 0.00 -0.75 7.29
5yr turnover growth 247,154 0.30 0.62 0.01 0.18 0.43 -0.99 7.45
1yr competitor growth 247,154 1.34 5.97 -0.19 0.07 0.93 -0.66 81.88
5yr competitor growth 247,154 1.54 6.72 -0.23 0.03 1.68 -0.73 90.81
Note: The table shows descriptive statistics of our sample firms. Turnover is stated in billion EUR. B2C is an indicator variable assuming 0 for B2B firms and 1 for B2C firms. HHI is the Herfindahl-Hirschman Index after multiplying the percent market shares by 100 (i.e., HHI may assume values of up to 10,000). All other variables are stated in percent. GAAP ETR, Cash ETR, and Intangible-to-total-assets ratio are restricted to values between [0, 100] to limit the influence of outliers (Joshi et al. 2020; Joshi 2020). The sample selection process is described in detail in Table 1. We provide a detailed overview of our variable definitions in Table 10.

32
Table 3: Country breakdown of sample firms
Country Frequency Percent Austria 20 2.94% Belgium 26 3.82% Cyprus 6 0.88% Czech Republic 2 0.29% Germany 129 18.97% Denmark 25 3.68% Spain 44 6.47% Finland 37 5.44% France 126 18.53% Greece 7 1.03% Croatia 2 0.29% Hungary 2 0.29% Ireland 33 4.85% Italy 53 7.79% Luxembourg 23 3.38% Malta 1 0.15% Netherlands 49 7.21% Poland 27 3.97% Portugal 10 1.47% Romania 2 0.29% Sweden 55 8.09% Slovenia 1 0.15%
Total 680 100.0%
Note: The table shows a geographic breakdown by countries of our sample. The assignment of a firm to a country is based on the ISO 3166-1 alpha-2 (ISO-2) country code provided by Orbis. The sample selection process is described in detail in Table 1.

33
Table 4: Results for main event date (June 2)
(1)
(0,2) Event window (2)
(0,1) Event window Constant 0.109**
(2.478) 0.109** (2.478)
Market Return 0.674*** (10.873)
0.674*** (10.868)
Event -0.699*** (-4.056)
-0.499*** (-3.842)
Observations 179,520 178,840 Standard errors clustered on firm-level Yes Yes Standard errors clustered on trading days Yes Yes Firms 680 680 Adj.-R2 0.06 0.06 Value Effect -65.487 -48.532
Note: The Table presents the estimation results of equation 1: 𝑟𝑟𝑖𝑖𝑡𝑡 = 𝛼𝛼𝑖𝑖 + 𝛽𝛽𝑖𝑖𝑟𝑟𝑚𝑚𝑡𝑡 + 𝛾𝛾𝑖𝑖𝐸𝐸𝐸𝐸𝐸𝐸𝐸𝐸𝑡𝑡𝑡𝑡 + 𝜀𝜀𝑖𝑖𝑡𝑡 for the main event (June 2). 𝑟𝑟𝑖𝑖𝑡𝑡 is the realized return of firm 𝑖𝑖 on trading day 𝑡𝑡, 𝑟𝑟𝑚𝑚𝑡𝑡 is the realized return of the market portfolio (MSCI World) and 𝐸𝐸𝐸𝐸𝐸𝐸𝐸𝐸𝑡𝑡𝑡𝑡 is a dummy variable indicating trading days within the (0,2) event window. 𝜀𝜀𝑖𝑖𝑡𝑡 is the error term and captures all effects that are not included in the model. Column 1 shows the regression results using a 3-day event window starting on the event date, i.e., June 2. Column 2 shows the regression results using a 2-day event window starting on the event date. The event coefficient is already multiplied by the number of days in the respective event window and therefore represents the CAARs. Value effect translates the CAARs into a monetary value, by multiplying the firm CAARs with their respective market capitalization on June 1. Value effect is stated in billion EUR. Test statistics in parentheses. *, **, and *** indicate statistical significance at the 10, 5, and 1 percent levels, respectively.
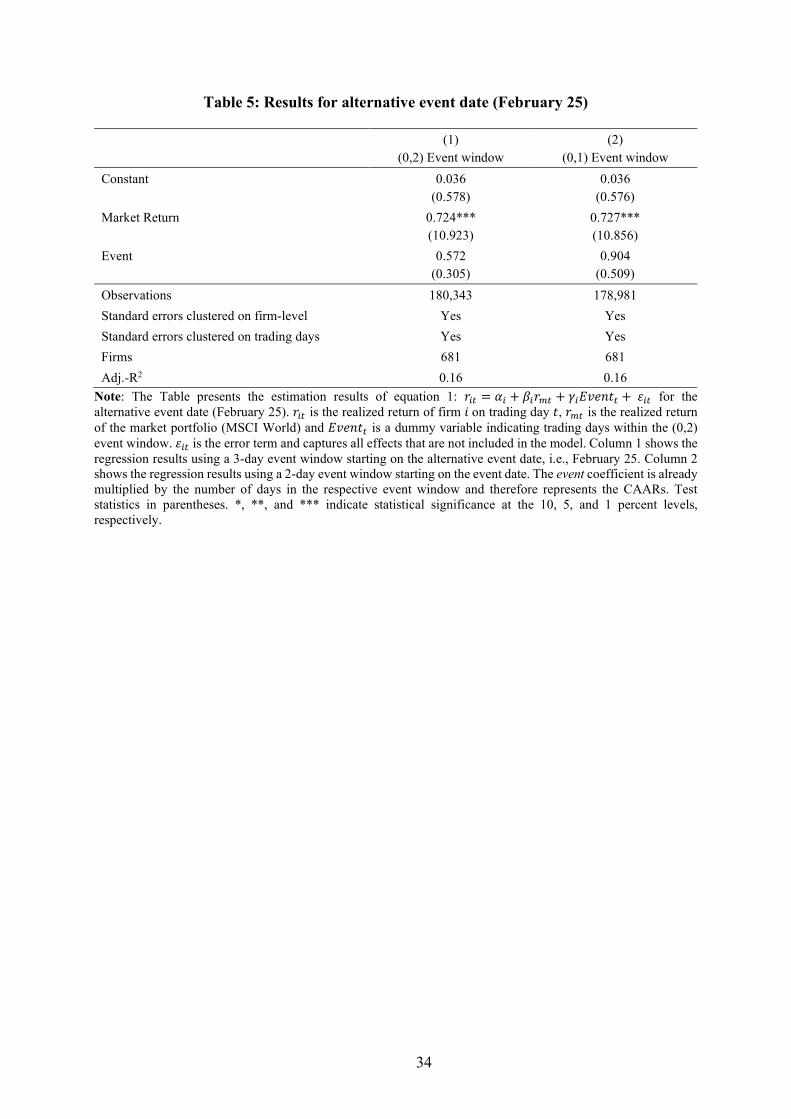
34
Table 5: Results for alternative event date (February 25)
(1)
(0,2) Event window (2)
(0,1) Event window Constant 0.036
(0.578) 0.036
(0.576) Market Return 0.724***
(10.923) 0.727*** (10.856)
Event 0.572 (0.305)
0.904 (0.509)
Observations 180,343 178,981 Standard errors clustered on firm-level Yes Yes Standard errors clustered on trading days Yes Yes Firms 681 681 Adj.-R2 0.16 0.16
Note: The Table presents the estimation results of equation 1: 𝑟𝑟𝑖𝑖𝑡𝑡 = 𝛼𝛼𝑖𝑖 + 𝛽𝛽𝑖𝑖𝑟𝑟𝑚𝑚𝑡𝑡 + 𝛾𝛾𝑖𝑖𝐸𝐸𝐸𝐸𝐸𝐸𝐸𝐸𝑡𝑡𝑡𝑡 + 𝜀𝜀𝑖𝑖𝑡𝑡 for the alternative event date (February 25). 𝑟𝑟𝑖𝑖𝑡𝑡 is the realized return of firm 𝑖𝑖 on trading day 𝑡𝑡, 𝑟𝑟𝑚𝑚𝑡𝑡 is the realized return of the market portfolio (MSCI World) and 𝐸𝐸𝐸𝐸𝐸𝐸𝐸𝐸𝑡𝑡𝑡𝑡 is a dummy variable indicating trading days within the (0,2) event window. 𝜀𝜀𝑖𝑖𝑡𝑡 is the error term and captures all effects that are not included in the model. Column 1 shows the regression results using a 3-day event window starting on the alternative event date, i.e., February 25. Column 2 shows the regression results using a 2-day event window starting on the event date. The event coefficient is already multiplied by the number of days in the respective event window and therefore represents the CAARs. Test statistics in parentheses. *, **, and *** indicate statistical significance at the 10, 5, and 1 percent levels, respectively.

35
Table 6: Robustness tests for (0,2) event window and 1-year estimation period
(1)
S&P Global 1200
(2) Winsorize
(3) Announcements
(4) Winsorize &
Announcements Constant 0.110**
(2.514) 0.087** (2.022)
0.109** (2.477)
0.087** (2.022)
Market Return 0.663*** (10.749)
0.655*** (10.043)
0.675*** (10.867)
0.656*** (10.039)
Event -0.699*** (-3.471)
-0.617*** (-3.807)
-0.686*** (-4.080)
-0.604*** (-3.831)
Observations 179,520 179,520 178,464 178,464 Standard errors clustered on firm-level Yes Yes Yes Yes Standard errors clustered on trading days Yes Yes Yes Yes
Firms 680 680 676 676 Adj.-R2 0.06 0.07 0.06 0.07
Note: The Table presents the regression results for a series of robustness checks, using the market model in equation 1: 𝑟𝑟𝑖𝑖𝑡𝑡 = 𝛼𝛼𝑖𝑖 + 𝛽𝛽𝑖𝑖𝑟𝑟𝑚𝑚𝑡𝑡 + 𝛾𝛾𝑖𝑖𝐸𝐸𝐸𝐸𝐸𝐸𝐸𝐸𝑡𝑡𝑡𝑡 + 𝜀𝜀𝑖𝑖𝑡𝑡. 𝑟𝑟𝑖𝑖𝑡𝑡 is the realized return of firm 𝑖𝑖 on trading day 𝑡𝑡, 𝑟𝑟𝑚𝑚𝑡𝑡 is the realized return of the market portfolio (MSCI World) and 𝐸𝐸𝐸𝐸𝐸𝐸𝐸𝐸𝑡𝑡𝑡𝑡 is a dummy variable indicating trading days within the (0,2) event window. 𝜀𝜀𝑖𝑖𝑡𝑡 is the error term and captures all effects that are not included in the model. Using the initial specification from our baseline analysis, we analyze the main event on June 2 using a (0,2) event window and an estimation windows of one year (i.e., (-266,-6)) across all specifications. Column 1 shows the results when using the S&P Global 1200 as an alternative benchmark portfolio to the MSCI World. Column 2 shows the results when winsorizing firm and market returns at the 1st and 99th percentile to limit the effect of potential outliers. Column 3 shows the results when excluding firms that made an earnings announcement in a (-2,2) window around the event date. In Column 4, we winsorize firm and market returns and additionally exclude firms with earnings announcements in a (-2,2) window around the event date. Test statistics in parentheses. *, **, and *** indicate statistical significance at the 10, 5, and 1 percent levels, respectively.

36
Table 7: Robustness tests for (0,2) event window and 3-month estimation period
(1) Baseline
(2) S&P
Global 1200
(3) Winsorize
(4) Announcements
(5) Winsorize &
Announcements
Constant 0.108 (1.556)
0.110 (1.604)
0.100 (1.481)
0.108 (1.554)
0.100 (1.478)
Market Return 0.507*** (4.333)
0.509*** (4.087)
0.495*** (4.355)
0.508*** (4.337)
0.496*** (4.360)
Event -0.509** (-2.102)
-0.523* (-1.953)
-0.478*** (-2.007)
-0.497** (-2.065)
-0.465* (-1.968)
Observations 44,814 44,814 44,814 44,550 44,550 Standard errors clustered on firm-level Yes Yes Yes Yes Yes
Standard errors clustered on trading days Yes Yes Yes Yes Yes
Firms 679 679 679 675 675 Adj.-R2 0.03 0.04 0.04 0.03 0.04
Note: The Table presents the regression results for a series of robustness checks, using the market model in equation 1: 𝑟𝑟𝑖𝑖𝑡𝑡 = 𝛼𝛼𝑖𝑖 + 𝛽𝛽𝑖𝑖𝑟𝑟𝑚𝑚𝑡𝑡 + 𝛾𝛾𝑖𝑖𝐸𝐸𝐸𝐸𝐸𝐸𝐸𝐸𝑡𝑡𝑡𝑡 + 𝜀𝜀𝑖𝑖𝑡𝑡. 𝑟𝑟𝑖𝑖𝑡𝑡 is the realized return of firm 𝑖𝑖 on trading day 𝑡𝑡, 𝑟𝑟𝑚𝑚𝑡𝑡 is the realized return of the market portfolio (MSCI World) and 𝐸𝐸𝐸𝐸𝐸𝐸𝐸𝐸𝑡𝑡𝑡𝑡 is a dummy variable indicating trading days within the (0,2) event window. 𝜀𝜀𝑖𝑖𝑡𝑡 is the error term and captures all effects that are not included in the model. In column 1, we conduct our baseline analysis with the shorter estimation window of three months (i.e., (-68,-6)). Columns 2-5 repeat the robustness tests from Table 6, using the shorter estimation window. Column 2 shows the results when using the S&P Global 1200 as an alternative benchmark portfolio to the MSCI World. Column 3 shows the results when winsorizing firm and market returns at the 1st and 99th percentile to limit the effect of potential outliers. Column 4 shows the results when excluding firms that made an earnings announcement in a (-2,2) window around the event date. In Column 5, we winsorize and additionally exclude firms with earnings announcements in a (-2,2) window around the event date. Test statistics in parentheses. *, **, and *** indicate statistical significance at the 10, 5, and 1 percent levels, respectively.
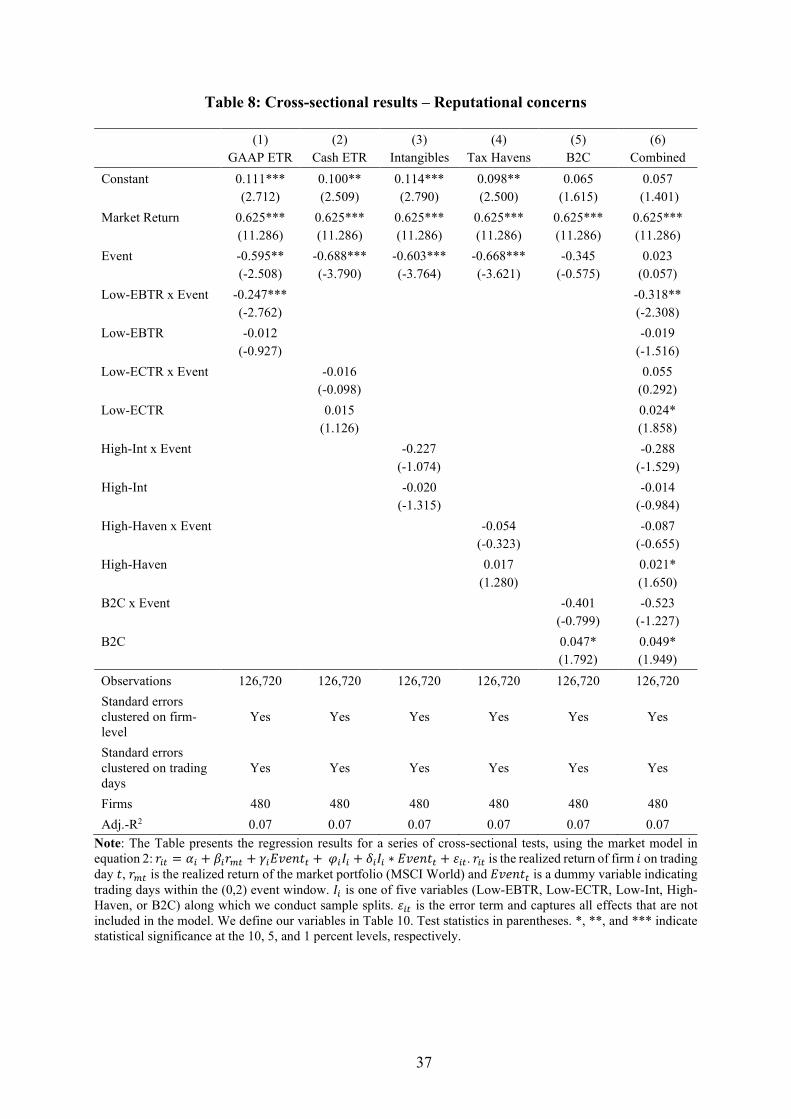
37
Table 8: Cross-sectional results – Reputational concerns
(1)
GAAP ETR (2)
Cash ETR (3)
Intangibles (4)
Tax Havens (5)
B2C (6)
Combined Constant 0.111***
(2.712) 0.100** (2.509)
0.114*** (2.790)
0.098** (2.500)
0.065 (1.615)
0.057 (1.401)
Market Return 0.625*** (11.286)
0.625*** (11.286)
0.625*** (11.286)
0.625*** (11.286)
0.625*** (11.286)
0.625*** (11.286)
Event -0.595** (-2.508)
-0.688*** (-3.790)
-0.603*** (-3.764)
-0.668*** (-3.621)
-0.345 (-0.575)
0.023 (0.057)
Low-EBTR x Event -0.247*** (-2.762)
-0.318**
(-2.308) Low-EBTR -0.012
(-0.927)
-0.019 (-1.516)
Low-ECTR x Event
-0.016 (-0.098)
0.055
(0.292) Low-ECTR
0.015
(1.126)
0.024* (1.858)
High-Int x Event
-0.227 (-1.074)
-0.288
(-1.529) High-Int
-0.020
(-1.315)
-0.014 (-0.984)
High-Haven x Event
-0.054 (-0.323)
-0.087 (-0.655)
High-Haven
0.017 (1.280)
0.021* (1.650)
B2C x Event
-0.401 (-0.799)
-0.523 (-1.227)
B2C
0.047* (1.792)
0.049* (1.949)
Observations 126,720 126,720 126,720 126,720 126,720 126,720 Standard errors clustered on firm-level
Yes Yes Yes Yes Yes Yes
Standard errors clustered on trading days
Yes Yes Yes Yes Yes Yes
Firms 480 480 480 480 480 480 Adj.-R2 0.07 0.07 0.07 0.07 0.07 0.07
Note: The Table presents the regression results for a series of cross-sectional tests, using the market model in equation 2: 𝑟𝑟𝑖𝑖𝑡𝑡 = 𝛼𝛼𝑖𝑖 + 𝛽𝛽𝑖𝑖𝑟𝑟𝑚𝑚𝑡𝑡 + 𝛾𝛾𝑖𝑖𝐸𝐸𝐸𝐸𝐸𝐸𝐸𝐸𝑡𝑡𝑡𝑡 + 𝜑𝜑𝑖𝑖𝐼𝐼𝑖𝑖 + 𝛿𝛿𝑖𝑖𝐼𝐼𝑖𝑖 ∗ 𝐸𝐸𝐸𝐸𝐸𝐸𝐸𝐸𝑡𝑡𝑡𝑡 + 𝜀𝜀𝑖𝑖𝑡𝑡. 𝑟𝑟𝑖𝑖𝑡𝑡 is the realized return of firm 𝑖𝑖 on trading day 𝑡𝑡, 𝑟𝑟𝑚𝑚𝑡𝑡 is the realized return of the market portfolio (MSCI World) and 𝐸𝐸𝐸𝐸𝐸𝐸𝐸𝐸𝑡𝑡𝑡𝑡 is a dummy variable indicating trading days within the (0,2) event window. 𝐼𝐼𝑖𝑖 is one of five variables (Low-EBTR, Low-ECTR, Low-Int, High-Haven, or B2C) along which we conduct sample splits. 𝜀𝜀𝑖𝑖𝑡𝑡 is the error term and captures all effects that are not included in the model. We define our variables in Table 10. Test statistics in parentheses. *, **, and *** indicate statistical significance at the 10, 5, and 1 percent levels, respectively.

38
Table 9: Cross-sectional results – Intensity of competition
(1) HHI
(2) CR10
(3) 1yr
turnover growth
(4) 5yr
turnover growth
(5) 1yr
competitor growth
(6) 5yr
competitor growth
Constant 0.113*** (2.622)
0.113*** (2.599)
0.099** (2.347)
0.100** (2.303)
0.110*** (2.600)
0.111*** (2.605)
Market Return 0.671*** (10.836)
0.671*** (10.836)
0.671*** (10.836)
0.671*** (10.836)
0.671*** (10.836)
0.671*** (10.836)
Event -0.600*** (-4.445)
-0.619*** (-4.587)
-0.635*** (-3.145)
-0.710*** (-3.795)
-0.563*** (-3.446)
-0.552*** (-2.900)
Low-HHI x Event -0.137 (-0.468)
Low-HHI -0.010 (-0.795)
Low-CR10 x Event
-0.094 (-0.352)
Low- CR10
-0.008 (-0.705)
Low-1yr turnover growth x Event
-0.078 (-0.313)
Low-1yr turnover growth
0.028 (2.120)
Low-5yr turnover growth x Event
0.139 (0.878)
Low-5yr turnover growth
0.025 (1.606)
High-1yr competitor growth x Event
-0.263*** (-3.443)
High-1yr competitor growth
-0.004 (-0.252)
High-5yr competitor growth x Event
-0.281*** (-2.598)
High-5yr competitor growth
-0.006 (-0.340)
Observations 170,808 170,808 170,808 170,808 170,808 170,808 Standard errors clustered on firm-level
Yes Yes Yes Yes Yes Yes
Standard errors clustered on trading days
Yes Yes Yes Yes Yes Yes
Firms 647 647 647 647 647 647 Adj.-R2 0.06 0.06 0.06 0.06 0.06 0.06
Note: The Table presents the regression results for a series of cross-sectional tests, using the market model in equation 2: 𝑟𝑟𝑖𝑖𝑡𝑡 = 𝛼𝛼𝑖𝑖 + 𝛽𝛽𝑖𝑖𝑟𝑟𝑚𝑚𝑡𝑡 + 𝛾𝛾𝑖𝑖𝐸𝐸𝐸𝐸𝐸𝐸𝐸𝐸𝑡𝑡𝑡𝑡 + 𝜑𝜑𝑖𝑖𝐼𝐼𝑖𝑖 + 𝛿𝛿𝑖𝑖𝐼𝐼𝑖𝑖 ∗ 𝐸𝐸𝐸𝐸𝐸𝐸𝐸𝐸𝑡𝑡𝑡𝑡 + 𝜀𝜀𝑖𝑖𝑡𝑡. 𝑟𝑟𝑖𝑖𝑡𝑡 is the realized return of firm 𝑖𝑖 on trading day 𝑡𝑡, 𝑟𝑟𝑚𝑚𝑡𝑡 is the realized return of the market portfolio (MSCI World) and 𝐸𝐸𝐸𝐸𝐸𝐸𝐸𝐸𝑡𝑡𝑡𝑡 is a dummy variable indicating trading days within the (0,2) event window. 𝐼𝐼𝑖𝑖 is one of six variables (HHI, CR10, the 1- and 5-year turnover growth, and the 1- and 5-year competitor growth within a given firm's industry) along which we conduct sample splits. 𝜀𝜀𝑖𝑖𝑡𝑡 is the error term and captures all effects that are not included in the model. We define our variables in

39
Table 10. Test statistics in parentheses. *, **, and *** indicate statistical significance at the 10, 5, and 1 percent levels, respectively.

40
Table 10: Description of employed variables
Variable Description Data Source 1yr competitor growth
(Number of identified industry peers in 2019 / Number of identified industry peers in 2018) - 1
Industry classification and industry peer information retrieved from Orbis.
1yr turnover growth
(Total industry turnover in 2019 / Total industry turnover in 2018) - 1
Turnover, industry classification, and industry peer information retrieved from Orbis.
5yr competitor growth
(Number of identified industry peers in 2019 / Number of identified industry peers in 2014) - 1
Industry classification and industry peer information retrieved from Orbis.
5yr turnover growth
(Total industry turnover in 2019 / Total industry turnover in 2014) - 1
Turnover, industry classification, and industry peer information retrieved from Orbis.
B2C Dummy variable indicating observations from firms operating in the B2C sector (value = 1), respectively in the B2B sector (value =0).
SIC codes are retrieved from Orbis. The classification into B2C vs. B2B sector industries follows Boyd and Kannan (2018).
Cash ETR Income taxes paid as stated in the cash flow statement / pretax income * 100.
Income taxes paid and pretax income are retrieved from Worldscope.
CR10 Market share of the top ten firms in focal firm's industry.
Turnover, industry classification, and industry peer information retrieved from Orbis.
Event Dummy variable indicating observations that fall into the respective event window.
-
GAAP ETR Income taxes as stated in the profit and loss statement / pretax income * 100.
Income taxes and pretax income are retrieved from Worldscope.
HHI Herfindahl-Hirschman Index, computed as follows: 𝑯𝑯𝑯𝑯𝑯𝑯 = 𝟏𝟏𝟏𝟏,𝟏𝟏𝟏𝟏𝟏𝟏 ∗ ∑ 𝒂𝒂𝒊𝒊𝟐𝟐𝑵𝑵
𝒊𝒊=𝟏𝟏 , where 𝒂𝒂𝒊𝒊 represents the individual market share of industry peer 𝒊𝒊.
Turnover, industry classification, and industry peer information retrieved from Orbis.
High-1yr competitor growth
Dummy variable indicating observations in the 4th and 5th quintile in terms of 1yr competitor growth.
See 1yr competitor growth.
High-5yr competitor growth
Dummy variable indicating observations in the 4th and 5th quintile in terms of 5yr turnover growth.
See 5yr competitor growth.
High-Haven Dummy variable indicating observations in the 4th and 5th quintile in terms of Relative share of tax haven subsidiaries.
Ownership information is retrieved from Orbis.
High-Int Dummy variable indicating observations in the 4th and 5th quintile in terms of Intangible-to-total assets ratio.
See Intangible-to-total assets ratio.
Intangible-to-total assets ratio
Intangible assets / Total assets * 100. Intangible and total asset figures are retrieved from Worldscope.
Low-1yr turnover growth
Dummy variable indicating observations in the 1st and 2nd quintile in terms of 1yr turnover growth.
See 1yr turnover growth.
Low-5yr turnover growth
Dummy variable indicating observations in the 1st and 2nd quintile in terms of 5yr turnover growth.
See 5yr turnover growth.
Low-CR10 Dummy variable indicating observations in the 1st and 2nd quintile in terms of CR10.
See CR10.
41
Low-EBTR Dummy variable indicating observations in the 1st and 2nd quintile in terms of GAAP ETR.
See GAAP ETR.
Low-ECTR Dummy variable indicating observations in the 1st and 2nd quintile in terms of Cash ETR.
See Cash ETR.
Low-HHI Dummy variable indicating observations in the 1st and 2nd quintile in terms of HHI.
See HHI.
Market Return Daily stock return stated in percent, based on the Total Return Index (RI). Contingent on the specification, the market return either depicts the return of the MSCI World or the S&P Global 1200.
Datastream.
MSCI World Return
Daily stock return of the MSCI World stated in percent, based on the Total Return Index (RI).
Datastream.
Relative share of tax haven subsidiaries
Number of subsidiaries located in tax haven jurisdictions / Total number of subsidiaries * 100.
Ownership information is retrieved from Orbis. The classification of jurisdictions into tax havens and non-tax havens follows Fuest et al. (2021).
Total Return Index (RI)
The Total Return Index (RI) represents a theoretical value growth by assuming that dividends are reinvested to purchase additional units of the respective stock. It is calculated using a method in which the discrete quantity of dividend paid is added to the price on the ex-dividend date. That is, RI is computed as follows: 𝑹𝑹𝑯𝑯𝒕𝒕 = 𝑹𝑹𝑯𝑯𝒕𝒕−𝟏𝟏 ∗
𝒑𝒑𝒕𝒕𝒑𝒑𝒕𝒕−𝟏𝟏
where 𝒑𝒑𝒕𝒕 equals the price on date 𝒕𝒕 and 𝒑𝒑𝒕𝒕−𝟏𝟏 equals the price on the previous date. If 𝒕𝒕 equals the ex-date of dividend payment 𝑫𝑫𝒕𝒕, the method adjusts as follows: 𝑹𝑹𝑯𝑯𝒕𝒕 = 𝑹𝑹𝑯𝑯𝒕𝒕−𝟏𝟏 ∗
𝒑𝒑𝒕𝒕 +𝑫𝑫𝒕𝒕𝒑𝒑𝒕𝒕−𝟏𝟏
.
Datastream.
S&P Global 1200 Return
Daily stock return of the S&P Global 1200 stated in percent, based on the Total Return Index (RI).
Datastream.
Stock Return Daily stock return of our sample firms stated in percent, based on the Total Return Index (RI).
Datastream.
Total number of subsidiaries
Indicates a firm's total number of controlled subsidiaries, as disclosed in the Orbis database.
Orbis.
Turnover in last available year
Turnover or operating revenue in the last available accounting period of the respective firm.
Orbis.
Note: This table lists all variables used for analyses in this paper, including a description and the respective data sources.

42
Figure 1 – Media Coverage Analysis
Note: The figure depicts the number of search results in the Dow Jones Factiva database, using the search term "country by country reporting" for the period from January 1, 2021, to July 31, 2021. Our search query results in 912 publications. 301 search results are identified as duplicates in Factiva and therefore excluded, leaving 611 publications. We manually inspect all 611 articles to determine if an article actually deals with the EU's public CbCR proposal or its legislative process. The remaining 325 relevant articles are depicted in the figure. The graph displays two extraordinary spikes, on February 25 and June 2, respectively. We note that the spike in June starts building up on June 1. However, given that the major stock exchanges were either already closed or about to close after the announcement on June 1, the graph confirms our expectation that June 2 represents a suitable event date.
February 25; 24
February 26; 17
June 3; 24
June 2; 68
June 1; 33
June 4; 3 February 27; 3

43
Figure 2 – Guardian headline on February 26
https://www.theguardian.com/world/2021/feb/26/eu-states-back-plan-to-expose-big-companies-tax-avoidance (13.10.2021)
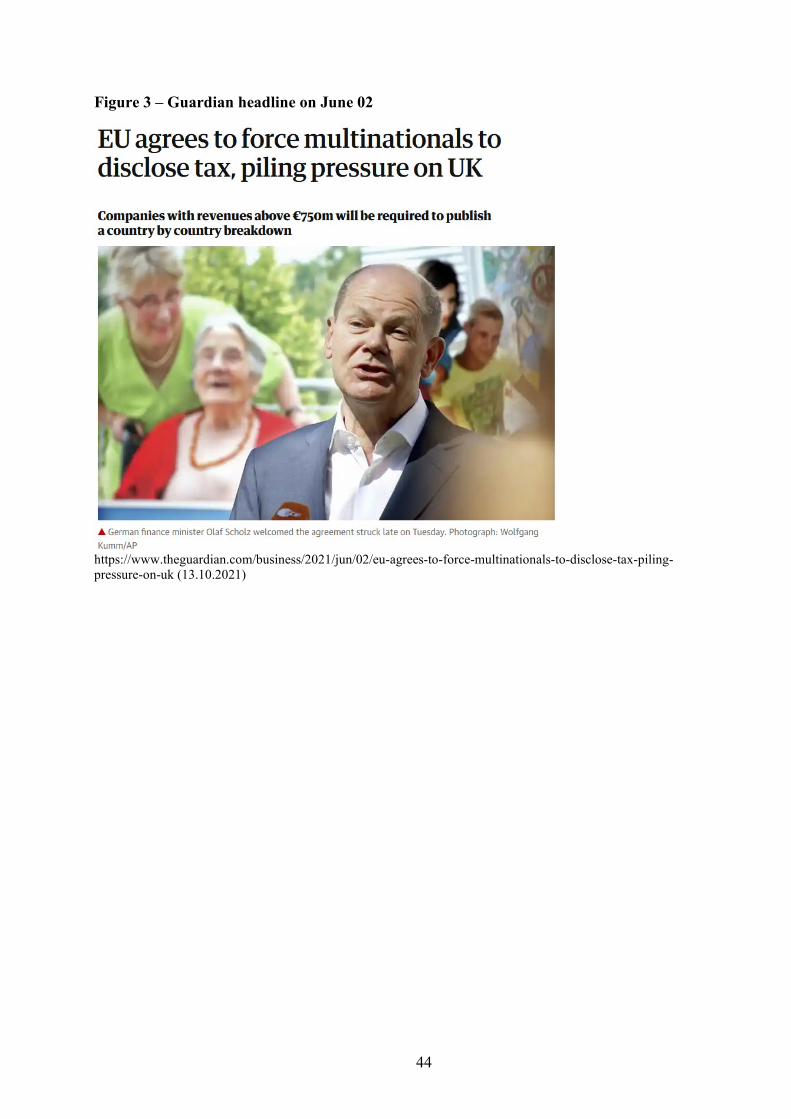
44
Figure 3 – Guardian headline on June 02
https://www.theguardian.com/business/2021/jun/02/eu-agrees-to-force-multinationals-to-disclose-tax-piling-pressure-on-uk (13.10.2021)

ZEW – Leibniz-Zentrum für Europäische Wirtschaftsforschung GmbH MannheimZEW – Leibniz Centre for European Economic Research
L 7,1 · 68161 Mannheim · Germany Phone +49 621 1235-01 [email protected] · zew.de
Discussion Papers are intended to make results of ZEW research promptly avail able to other economists in order to encourage discussion and suggestions for revisions. The authors are solely respons ible for the contents which do not necessarily represent the opinion of the ZEW.
IMPRINT
//
Download ZEW Discussion Papers from our ftp server:
http://ftp.zew.de/pub/zew-docs/dp/
or see:
https://www.ssrn.com/link/ZEW-Ctr-Euro-Econ-Research.html https://ideas.repec.org/s/zbw/zewdip.html


