Embed Size (px)
Citation preview

1
Cash Constraints and Sticky Input Expenditures:
-Experimental Evidence from Malawi
By Stein T. Holden and Rodney Lunduka
School of Economics and Business
Norwegian University of Life Sciences
P. O. Box 5033, 1432 Ås, Norway
Email: [email protected]
Tel: +47-64965699
Fax: +47-64965701
Abstract
The study investigated the proposal by Duflo et al. (2009) that rural households may be
stochastically present-biased and face small fixed costs in input markets, causing them to under-
invest in inputs. Supply of inputs at harvest time may then lead to higher investments than when
inputs are supplied at planting time. Investment in inputs at harvest time can potentially serve as
a commitment device (DellaVigna 2009). Experiments were run at harvest time and planting
time to assess how a given budget was allocated for inputs or for food. Households were found to
be willing to spend a significantly higher proportion of a given budget on inputs at planting time
than at harvest time. A large gap between WTP and WTA prices still supports that input sales at
harvest time may enhance input investments.
Key words: Malawi, input subsidies, cash constraints, time inconsistency, input delivery timing.
JEL Classification codes: Q12, Q18

2
1. Introduction
Malawi has implemented a large-scale agricultural input subsidy program since 2005 after a
period with severe food shortages and the program has contributed to increased food availability,
higher real wages, economic growth and poverty reduction (Dorward and Chirwa 2011). The
targeted input subsidy program distributes coupons (providing more than 90% subsidy in the
2008/09 season) to about two million of about two and a half million smallholder farm
households where priority should be given to poor and vulnerable households (Dorward et al.
2008; Ricker-Gilbert and Jayne 2008; 2009; MoAFS 2008).
Important reasons for the reintroduction of large-scale subsidies were that the inputs were not
affordable for the poor smallholder farmers and that it was cheaper to import fertilizer than to
import food. The fact that the country managed to quickly switch from being a “beggar for food”
to becoming a net exporter has also been very important for the national pride. While the
program contributed to national and household food security and maize export to neighboring
countries, the costs of the program also rose sharply with the increasing international fertilizer
and oil prices. The budgetary costs of the input subsidy program therefore increased from 50
million US$ in 2005/06 to 360 million US$ in 2008/09 or close to 15% of Malawi’s total
government expenditure. There is therefore a need to reduce the costs of the program without
reducing the food production. This paper investigates one possible approach to reducing such
costs without affecting the food production negatively.
An important reason for advocacy of fertilizer subsidies is that rural households in Malawi are
very poor and typically lack cash resources to buy profitable inputs and this causes too low input
use. Poverty in combination with liquidity constraints may cause high discount rates and this
may lead to low investment (Holden et al. 1998). Time inconsistent behavior in form of present

3
bias has been observed in many social experiments and may also contribute to explain low input
use and investment levels in developing countries (Duflo et al. 2009).
The seasonality of rain-fed agricultural production which dominates in Malawi make food
shortages seasonal and food has to be stored from one harvest season and up to the next harvest
season. More than 60% of the rural households in Malawi are still net buyers of maize (the main
staple food) after the introduction of the subsidy program. At planting time they may face a
dilemma between using scarce cash resources to buy food to meet more immediate needs or to
buy inputs to meet next year’s needs. Time inconsistent behavior may then cause too low
investment in inputs. The two standard approaches to deal with this problem have been to
provide credit for input purchase or to subsidize the inputs. Input credit programs have had
greater success in reaching net sellers than net buyers of agricultural outputs, however, as
payback has often been in form of production output. Input credit programs have also faced large
moral hazard problems contributing to high default rates and covariate risk has made it hard to
sustain such programs in environments with substantial weather risk.
Use of subsidies could then be a way of internalizing the externality related to sub-optimal input
use and such subsidies could enhance both productivity and equity. One may, however, question
whether such subsidies are the most appropriate and cost-effective instrument to address this
market failure. Duflo et al. (2009), based on a study and social experiments in Kenya, found that
poor households are willing to invest in response to small, time-limited discounts in form of free
delivery of fertilizer just after harvest. Their finding may indicate that distribution and selling of
fertilizer just after harvest can be a better system than selling fertilizers at planting time when
households may no longer have sufficient cash from the selling of their harvest. Buying of inputs
at harvesting time for the next growing season may then serve as an commitment device

4
(DellaVigna 2009) and reduce the need for subsidies. It could also reduce the pressure on the
input delivery system at planting time and reduce to risks of too late delivery of inputs with
subsequent productivity losses.
This study investigates the willingness of rural households in Malawi to allocate funds for input
purchase at harvest time and whether this willingness is as high or higher at harvest time than at
planting time. Rural households do not face food shortages at harvest time and may then be more
willing and able to spend funds on inputs. On the other hand, net buyers of food may still prefer
to buy additional food at harvest time when food prices are at their lowest. More than 60% of
rural households in Malawi are net buyers of food also after the input subsidy program has been
implemented (Holden and Lunduka 2010a). It is therefore not obvious that the willingness to buy
inputs at harvest time is high or higher than at planting time.
There may be reasons to worry that the large scale input subsidy program in Malawi has
undermined household incentives to spend funds on inputs. On the other hand, access to
subsidized inputs is constrained and the subsidized prices therefore do not reflect the true shadow
prices of inputs for the households. A novel contribution of this paper was to use an experimental
approach to elicit shadow prices for fertilizers in a context where actual prices paid were
endogenous and dependent on unobservable household characteristics.
Cash constraints may limit the ability of households to purchase inputs. The experiments were
designed to control for this to obtain estimates of marginal expenditure shares and unconstrained
shadow prices for fertilizer inputs. In addition an experiment was conducted to assess the gap
between WTP and WTA prices for an input package where this gap could be assessed.

5
The results showed that households were willing to allocate a significantly larger share of the
given budget to fertilizer purchase and a significantly lower share to food purchase at planting
time than at harvesting time. Households had high WTP prices for fertilizer when relieved from
their cash constraint. Only 20-25% of the households were willing to buy the input package at
the commercial price while only 10-20% of households who were lucky to win the input package
were willing to resell the package at the commercial price if it first were given to them. The gap
may be explained as a cash constraint rather than as an “endowment effect” (Plott and Zeiler
2005; 2007; Horowitz and McConnel 2002).
The paper is organized as follows. Part 2 gives an overview of the setting with the input subsidy
program. Part 3 presents a theoretical framework followed by a description of the experimental
approach in part 4. The results are presented and discussed in part 5, followed by the
conclusions.
2. The setting
Malawi is a small landlocked country in Southern Africa where more than 80% of the
households depend on agriculture for their livelihood. Weather risk and bad policies have
contributed to severe household and national food insecurity. The last severe food shortages
occurred in 2004/05 with the consequence that the newly elected president, Bingu wa Mutharika,
embarked upon a comprehensive input subsidy program quite contradictory to the
recommendations from IMF and the World Bank. Arguments for the subsidy program were that
it is cheaper to import fertilizer than to import food. Food production in the country increased
dramatically and Malawi became a net exporter of food (maize) in the following years and the
program has been coined a success story (Denning et al. 2009).

6
The rural population in Malawi constitutes 88% of the total population and the country has one
of the highest rural population densities in Africa of about 2.3 persons per ha. The average farm
size is about 1.12ha. Farm sizes are smaller in the southern region of the country where
population density is higher (SOAS 2008). The incidence of poverty is also higher in the
southern region where 64% of the households are estimated to fall below the poverty line against
52% at the national level. Maize is the main staple crop grown by 97% of the rural households
(SOAS 2008). Some households also grow cash crops such as tobacco, sugarcane and cotton but
such crops are on average grown on less than 10% of the farm area while maize covers 65-70%
of the farm area (Holden and Lunduka 2010a).
More than 60% of the rural households in the central and southern regions of the country are net
buyers of maize even with the input subsidy program (Holden and Lunduka 2010b). Access to
input subsidies has, however, reduced the food deficit of net buyers of food and more households
have become self-sufficient or even net sellers (ibid.). Most of the agricultural production is
rain-fed and the rainfall is uni-modal with a rainy season from December to April. This implies
that the planting season is in December and harvesting season is in May-June for the main staple
crop, maize.
The Government of Malawi has increased its budget share for agriculture from 6.1% in the
period 200-2005 to 15.9% in 2006-2009 and is aiming to increase it further to 24% by 2015 with
the implementation of the Agricultural Sector Wide Approach (ASWAp) (GoM 2010).
The Ministry of Agriculture and Food Security (MoAFS) in Malawi has developed targeting
criteria for the distribution of input subsidies that emphasize targeting land-owning rural resident
households and particularly poor and vulnerable households (MoAFS, 2008). The MoAFS is

7
issuing and distributing free coupons through their local staff in collaboration with local leaders
to identified beneficiary households. Households receiving the coupons can take the coupon to
the nearest depot where inputs are sold and pay a small amount (MK1500 per 50 kg bag in the
2009/10 season) to get the inputs. In the 2008/09 season about 2 million input packages were
distributed to the about 2.5 million rural households in the country, indicating coverage of close
to 80% of the households. A recent study (Holden and Lunduka 2010a) has identified substantial
leakages of coupons, secondary markets for coupons and cheap fertilizers, and substantial
targeting errors. Access to inputs and the actual prices paid therefore depend on household
characteristics, including households’ social capital in terms of social networks, access to
information and ability to negotiate. Wealthier households have been found to be more
successful while female-headed households have been less successful in obtaining subsidized
inputs (Dorward et al. 2008; Holden and Lunduka 2010a).
The costs of fertilizer subsidies to the Malawian government have increased with the increase in
international fertilizer prices. In 2006/07 the fertilizers represented 40% of the agricultural
budget (Dorward et al., 2008). With the very high fertilizer prices in 2008/09 the spending on
fertilizer imports and the fertilizer subsidy program exceeded the initial budget by more than
100% (Logistic Unit, 2009). Table 1 gives an overview of the costs of the input subsidy program
versus some benchmarks. After the 2008/09 the country has experienced shortages of foreign
exchange which also have lead to fuel shortages. Tobacco is the main export crop but tobacco
export is also limited by international agreements. Maize exports have to some extent
compensated for the fertilizer import cost.
1 1 US$=140 Malawi Kwacha(MK).

8
Table 1. Costs of the Farm Input Subsidy Program
Year Costs (million US$)
Cost of importing food in drought year 2004/05 110
Cost of fertilizer subsidy program 2005/06 50
Cost of fertilizer subsidy program 2006/07 91
Cost of fertilizer subsidy program 2008/09 360
Total donor assistance to Malawi 2007 500
Sources: Harrigan 2005; Dorward et al. 2008; Denning et al. 2009; Logistic Unit 2009.
The donor community sees the input subsidy program as a temporary solution to the food
insecurity problems of the country and provides conditional support to the program as general
budget support or through funding of particular elements of the program such as the seed
component.
Malawi’s president argues that the subsidies have come to stay and has become the chairman of
the African Union and other African countries are looking to Malawi and consider implementing
similar policies. International fertilizer prices are again on the increase, however, and there is a
need to keep the budgetary costs down. The main argument for the program is that rural
households cannot afford to buy the inputs if they are not subsidized and their removal will lead
to new food shortages. Provision of credit has been an alternative approach that also has given
mixed results due to high default rates. It is in this perspective that this study explores the
alternative proposal to sell inputs at harvest time to reduce the need for subsidies and provide a
commitment devise that can reduce the need for credit as well.

9
3. Theoretical framework
Duflo et al. (2008) found that small investments in fertilizers generated returns of 36 percent on a
seasonal basis equivalent to 70 percent per year without changes in additional practices in a
study in Kenya. They were puzzled that farmers invested so little in fertilizers when profits were
so large and the technology is well known and divisible. One possible explanation could be fixed
costs related to buying and learning about the technology but they found that these could not be
large enough to provide an explanation. They therefore looked for a behavioral explanation in
form of present-bias such as has been observed also in relation to investments in pension plans in
the United States (Choi et al. 2008) and drew on models of procrastination in psychology and
economics. Strong presence bias has been observed among poor rural households in developing
countries and is related to liquidity constraints and poverty (Holden et al. 1998). Empirical
evidence shows that the discounted utility model (Samuelson 1937) represents a poor fit to the
reality of inter-temporal choices (Frederick et al. 2002).
Laibson (1997) and O’Donoghue and Rabin (1999) have formulated an alternative ( , )β δ
preference model
1) 2 31 2 3 ....t t t t tU u u u uβδ βδ βδ+ + += + + + +
where the difference from the standard discounted utility model is the parameter β≤1 which
captures self-control problems. The model has also been expanded by O’Donoghue and Rabin
(2001) to handle naïve expectations (overconfidence) related to future self-control.
We take this alternative ( , )β δ preference model as a basis for analyzing behavior of poor rural
producer-consumer households who make consumption and investment decisions facing cash
constraints and imperfections in factor markets. Self-control problems could cause the timing of

10
offering of investment opportunities to rural households to matter for how much they are willing
to invest, like suggested by Duflo et al.(2008). This could cause households to be willing to
invest more if offered to buy inputs at harvest time rather than waiting and offering them to buy
the inputs at planting time when the inputs are to be used but when also more of the cash
resources have been spent on other items. Purchase of inputs at harvest time may be a self-
control device leading to higher investments.
The model covers three points in time, first harvest time (t=1), planting time (t=2), and second
harvest time (t=3). Households are offered to allocate a fixed budget, Y, for food consumption, C,
input investments, F, or other goods expenditure, X, such that Y=C+F+X. This offer is made
either at harvest time (t=1) or at planting time (t=2) and the budget offered at the two points in
time is the same, Y1=Y
2. For a household i that receives the offer at harvest time (t=1), it will
allocate the budget as Y1=C
1+F
1+X
1such that it maximizes expected utility. Producer-consumer
households do not have an immediate need for food at harvest time. If they prefer to spend extra
funds on food at this point in time it is done in order to save the food and consume it later, e.g. at
planting time. With ( , )β δ preferences, the expected utility of the food expenditure at first
harvest time (t=1) may be formulated as: 1 1 12( ) ( )U C u Cβδ= . On the other hand, if the offer is
made at planting time, food expenditure may be for immediate consumption and the utility may
be formulated as: 2 2 22( ) ( )U C u C= . The expected utility of the allocation of the budget for
inputs when the offer is made at harvest time (t=1) and when inputs only can be used in the
following planting time and yield benefits after the next harvest time (t=3), can be formulated as:
( ){ }1 1 2 13( ) 1 F
U F u r Fβδ= + where rF is the expected return to input investment. When the

11
budget offer is made at planting time the expected utility may be formulated as:
( ){ }2 2 23( ) 1 F
U F u r Fβδ= + . Optimal budget allocations at the two points in time imply:
2) 1 1 1 1 2 2 2 2
1 1 2 2
( ) ( ) ( ) ( ) and
U C U F U C U F
Y Y Y Y
∂ ∂ ∂ ∂= =
∂ ∂ ∂ ∂
Substituting in the expected utilities with ( , )β δ preferences yields
( ){ }2 1132
1 1
1( ) which reduces to
Fu r Fu C
Y Y
βδβδ ∂ +∂=
∂ ∂
3) ( ){ }11
321 1
1( )F
u r Fu C
Y Y
δ∂ +∂=
∂ ∂
for harvest time budget allocation decisions and to
4) ( ){ }22
322 2
1( )F
u r Fu C
Y Y
βδ∂ +∂=
∂ ∂
for planting time budget allocation decisions.
It follows that, ceteris paribus, 1 2 1 2 and if 1C C F F β< > < . Offering of inputs at harvest time
may then be a commitment devise that enhances input expenditure and use.
But what if food prices vary systematically across seasons and typically are much lower at
harvest time than at planting time such that 1 2p p< ? We then get
5) ( ){ }11 1
321 1
1( )F
u r Fu p C
Y Y
δ∂ +∂=
∂ ∂

12
6) ( ){ }22 2
322 2
1( )F
u r Fu p C
Y Y
βδ∂ +∂=
∂ ∂
It then follows that 1
1 2 1 22
and only if p
C C F Fp
β< > < and households with rational price
expectations will allocate more of a given budget for inputs relative to food at planting time than
at harvest time when 1
2< 1
p
pβ ≤ .
Transaction costs in commodity markets cause selling prices to be lower than buying prices and
this is likely to be the case both for food and inputs. However, transaction costs are typically
relatively larger in input markets than in food markets (Binswanger and Rosenzweig 1986).
Rural households are therefore likely to be hesitant to sell inputs and food that they have bought
and they are not likely to do so unless they have been exposed to some form of shock because
7) ( ){ }1 11 1
3 221 1 1
1 ( )( )F
Fsu r F u p Fu p C
Y Y Y
δ∂ + ∂∂= >
∂ ∂ ∂
where Fs Fb
p p< and represent the selling and buying prices of inputs. Such a gap between selling
and buying prices is sufficient for input expenditures to be “sticky”. This could also facilitate
higher input investments if inputs are offered at harvesting time when food prices are lower than
if inputs only are offered at planting time when also the available cash budget may have become
lower, 2 1Y Y< . A severe shock may, however, destabilize the inter-temporal balance and cause
households to resell the inputs at a lower price. The risk that they would do so depends on how
the shock would affect a number of the parameters that become household-specific in the
reformulated model:

13
8) ( ){ }11 1
321 1
1( )F
i i ii
u r Fu p C
Y Y
δ ∂ +∂=
∂ ∂
9) ( ){ }22 2
322 2
1( )F
i i i ii
u r Fu p C
Y Y
β δ ∂ +∂=
∂ ∂
This implies that the discount factor, i
δ , the expected return to inputs, F
ir , and the present bias
parameter, i
β , are household specific and may be affected by shocks. Shocks may cause the
discount rate and the present bias parameter to increase and the expected return to inputs to
decrease. A possible consequence of a shock could then be distress sales of assets or inputs that
were bought at harvest time and before the shock occurred and this may further affect expected
returns.
The discount rate, the present bias parameter and the expected return functions cannot be directly
observed but experiments are constructed to assess the existence of presence bias and whether
this can be utilized to design a commitment device something which also depends on the
transaction costs in the input market. It is commonly assumed that poor people have high
discount rates and have a tendency towards stronger present bias and are more vulnerability to
shocks and empirical evidence is also in line with this (Holden et al. 1998). Wealth accumulation
substitutes for missing markets and alleviates constraint sets (Yesuf and Bluffstone 2009). This
implies that risk aversion that is related to wealth also can affect input decisions as poorer
households tend to be more risk averse and less able and willing to go for risky investments.
Loss aversion may also cause households to be willing to take less risk when they face a
downside risk versus a situation where they do not face such downside risk (Binswanger 1980;
Wik et al. 2004; Yesuf and Bluffstone 2009). Risk and risk aversion may therefore also affect

14
input demand and the responses in our experiments but this was not directly tested in our
experiments. It could, however, be an interesting area for follow up research.
4. Experimental methods and data
The survey covered a random sample of 450 households in two districts in Central Malawi
(Kasungu and Lilongwe) and four districts in Southern Malawi (Chiradzulu, Machinga, Thyolo,
and Zomba) (Lunduka, 2010). About 89% of the Malawian population lives in Central and
Southern Malawi. Our survey should therefore be fairly representative of a large share of the
population. The data were collected in three rounds, in 2006, 2007 and 2009. Only 378 of the
initial 450 households were found and interviewed in the third round. The experiments were
added to the survey instrument in the 2009 survey round.
The budget allocation experiment was hypothetical. The households were asked to allocate a
cash amount of MK 10 0002 that they were free to decide on how to use among a) buying
fertilizer, b) buying food, c) buying other important/urgent commodities, d) investing or saving
for later use. The households were exposed to this experiment either at harvest time (June) or at
planting time (December) for a part of the sample.
A real experiment was conducted where the households had the choice between 5 kg (1/10th of a
bag) basal fertilizer and a varying amount of money determined by the throw of a dice. The
amount of money varied between MK 200 and 1500. These amounts range from 50 to 375
percent of the commercial price of fertilizer at the time of the experiments.
The next experiment involved randomly allocating the households with an input package for
maize production consisting of one bag of basal fertilizer, one bag of urea, and one bag of hybrid
2 The daily wage in unskilled rural employment was about MK 300 at the time of the survey. An input package of 2
bags of fertilizer and seeds costed about MK 9 000.

15
maize seeds, or if they were not lucky to “win” the package, they were offered the opportunity to
buy the same package. The allocation of the package for free was determined by the toss of a
coin. The lucky winners were then offered the possibility of reselling the package at an amount
determined by throwing a dice. Similarly, those that were not lucky were offered to buy the
package at an amount determined by throwing the dice. The price range for the package was
from MK1000 (full subsidy) to MK9000 (no subsidy) based on the price and subsidy rates
decided by the Malawian government for the 2009/10 growing season. The experiment should
establish whether there is a gap between WTP and WTA prices when households’ cash
constraints are affecting the WTP prices unlike in the real experiment where the households had
the choice between 5 kg fertilizer and a randomized amount of cash. However, the cash
constraint effect may be confounded with an “endowment effect” such that we have to be careful
with the interpretation here (Plott and Zeiler, 2005; 2007; Horowitz and McConnell, 2002). In
any case the experiment investigates the incentives to resell an input package when prices are
known and exogenously given. A gap between WTA and WTP prices implies a lower probability
that inputs are resold when they first have been acquired.
To assess factors affecting budget allocation priorities Tobit models were used because there
were substantial number of zero responses for each commodity (demands for fertilizer and food).
To further investigate factors that affect households’ choices between cash and fertilizer the data
from the price experiment were regressed on household characteristics, and geographical
location (district). Random effects logit models were used for this. Similar econometric analysis
was also made for the WTA and WTP for the input package.

16
5. Experimental results and discussion
The basic findings from the experiments are presented in this section. In the hypothetical budget
allocation experiment households were asked how they would allocate a cash amount of MK
10 000 that they were free to decide on how to use among; a) buying fertilizer; b) buying food;
c) buying other important/urgent commodities; and d) saving and investing in business.
Summary statistics by type of expenditure and time of the experiment are summarized in Table
2. It can be seen that the allocation for fertilizer was significantly higher at planting time than at
harvest time while the opposite was the case for food. Econometric analyses of the determinants
of household allocation for fertilizers and food are analyzed with Tobit models with district fixed
and random effects in Table 3 below.
We see also from the regression analyses in Table 3 that the willingness to allocate money for
fertilizer out of a given budget in December (planting time) was significantly higher than at
harvest time in June-July. The difference was a large as about 30% of the total budget. The
willingness to allocate money for food was significantly lower at planting time in December than
at harvest time in June-July. This could be because food prices are lower at harvest time than at
planting time.
Significant wealth effects are also observed. Households with better quality houses and higher
asset values allocated significantly more cash for fertilizer. This is in line with the general theory
that poverty can reduce the willingness and ability to invest and result in higher discount rates as
immediate needs are given higher priority. There was a weak indication that households with
smaller farm sizes were willing to allocate a larger share of the budget for fertilizers as farm size
was negative and significant at 10% level in one of the models. Land shortage may increase the
need to intensify farm production by use of more fertilizer.

17
Table 2. Allocation of a budget of MK10000 by type of expenditure and time of experiment
Time of experiment Fertilizer Food Other needs Save-Invest
Harvest time Mean 4295 2453 1660 1592
Standard error 175 128 113 133
Sample size 280 280 280 280
Planting time Mean 6563 1510 1296 630
Standard error 368 246 233 161
Sample size 79 79 79 79

18
Table 3. Determinants of preferences for cash allocation for fertilizer versus for food
purchase
Fertilizer Fertilizer Food Food
Tobit FE Tobit RE Tobit FE Tobit RE
Sex of household head -764.337 -687.772 467.864 325.096
1=Male (466.93) (471.07) (442.62) (435.59)
Age of household head 5.155 3.255 16.786 20.124*
(12.74) (12.87) (11.77) (11.67)
Education of household head -3.978 -13.579 75.582 90.943*
(55.38) (56.00) (51.82) (51.22)
Male labor force -5.402 -2.376 143.88 131.412
(184.27) (185.98) (173.54) (174.03)
Female labor force -288.516 -271.198 258.526 237.836
(259.15) (261.42) (240.79) (240.66)
Number of children 36.521 25.317 -25.654 -3.996
(125.88) (127.07) (118.02) (117.92)
Quality of house 189.232*** 171.256** -110.244* -87.779
(71.51) (71.65) (66.8) (63.42)
Value of assets 0.024* 0.025** -0.02 -0.023*
(0.01) (0.01) (0.01) (0.01)
Tropical livestock units 153.458 154.448 -179.843 -172.627
(134.68) (135.56) (137.46) (136.11)
Farm size, ha -355.437* -333.911 -2.137 -38.862
(207.91) (209.07) (207.46) (205.57)

19
Planting time sample 3158.241** 2973.820**** -703.682 -1506.842****
(1264.25) (810.56) (1183.85) -438.66
Zomba 393.888 105.355
(601.16) (550.8)
Chiradzulu 258.717 174.888
(728.75) (668.59)
Machinga 786.018 -19.367
(710.67) (650.58)
Kasungu 577.093 -987.958
(1324.12) (1231.86)
Lilongwe 2688.630**** -755.839
(630.03) (588.18)
Constant 2237.240** 3284.361*** 1321.053 881.817
(1099.29) (1062.01) (1017.71) (909.9)
Sigma_u 772.114*** 0.000
Constant (293.77) (251.36)
Sigma_e 3118.604**** 3149.101**** 2823.361**** 2838.961****
Constant (130.97) (133.43) (139.62) (140.45)
Prob > chi2 0.000 0.002 0.010 0.004
Number of observations 344 344 344 344
Left censored observations 41 41 107 107
Note: Standard errors in parentheses. Significance levels: *:10%, **:5%, ***:1%, ****:0.1%. Models with district fixed effects and random
effects.
We may ask whether the lower willingness to spend the given budget on fertilizer at harvest time
than at planting time could be due to the lower food prices at harvest time. While we cannot test

20
this directly, we have assessed the food prices at harvest time vs. at planting time in the previous
two years as price expectations may be formed on the basis of these relative price changes. The
prices are summarized in Table 4.
Table 4. Average monthly maize prices at harvest time and planting time by year
Month 2007 2008
June (Harvest time) 14.55 37.91
December (Planting time) 30.01 63.35
Source: MoAFS (2009)
It can be seen that maize prices were much higher (near double) at planting time as compared to
at harvest time. This should give a good reason for net buyers of food to buy the additional maize
requirement at harvest time rather than later and this effect dominates the eventual effect of
present bias causing low fertilizer demand at planting time.
The results from the real experiment for the choice between 5 kg fertilizer and randomized
amounts of cash varying between MK 200 and 1500 are summarized in Figure 1 and Table 5.
We see that the preference for fertilizer was reduced from above 90 percent for the two lowest
amounts of money to about 40 percent for the two highest amounts of money where we recall
that the highest price is 375% of the commercial price of fertilizer at the time of the experiment.
This illustrates that there is a substantial demand for small amounts of fertilizer among many
households where they are willing to forsake cash that they have available. The input subsidy
program appears not to have undermined the valuation of these inputs. The high prices also
indicate that few households are willing to resell inputs unless the price offered is raised high
above the commercial price for fertilizer. The results may also indicate that input demand could

21
be stimulated by offering fertilizers in smaller bags than the standard 50 kg bags. Repacking and
selling in small bags could potentially be a lucrative business.
The logit model (Table 5) assessing the factors correlated with the choices in the real experiment
revealed that households with more male labor force and higher asset endowment and smaller
farm size were significantly more likely to prefer fertilizer rather than cash, ceteris paribus. This
indicates that poverty in labor and assets reduces the shadow price of fertilizer while land
scarcity increases the shadow price of fertilizer. Offering the experiment at planting time rather
than at harvest time also increased the probability that households preferred fertilizer rather than
cash. This is consistent with the finding in the hypothetical budget allocation experiment.
Figure 1. Choice experiment between receiving 5 kg basal fertilizer and a varying amount
of cash.
0
20
40
60
80
100
120
200 400 600 900 1200 1500
Percentage prefering fertilizer to amount of
money in MK

22
Table 5. Real experiment for choice between 5 kg basal fertilizer and a random amount of
cash
Real experiment
Cash amount offered -0.003****
(0.0003)
Sex of household head -0.139
1=Male, 0=Female (0.380)
Age of household head 0.0001
(0.010)
Education of household head -0.042
(0.050)
Male labor force 0.291*
(0.150)
Female labor force -0.129
(0.230)
Number of children -0.123
(0.100)
Quality of house 0.024
(0.060)
Value of assets 0.00004***
(0.000015)
Tropical livestock units 0.116
(0.090)

23
Farm size, ha -0.301**
(0.140)
Planting time dummy 1.387**
(0.670)
District dummies:
Zomba 1.503***
(0.550)
Chiradzulu 0.710
(0.570)
Machinga -0.255
(0.560)
Kasungu -0.191
(0.710)
Lilongwe 0.178
(0.510)
Constant 2.980****
(0.880)
Prob > chi2 0.000
Number of observations 341
Note: Standard errors in parentheses. Significance levels: *:10%, **:5%, ***:1%, ****:0.1%.
The next experiment involved randomly allocating the households with an input package for
maize production consisting of one bag of basal fertilizer, one bag of urea (top dressing), and one
bag of hybrid maize seeds, or if they were not lucky to “win” the package, they were offered the
24
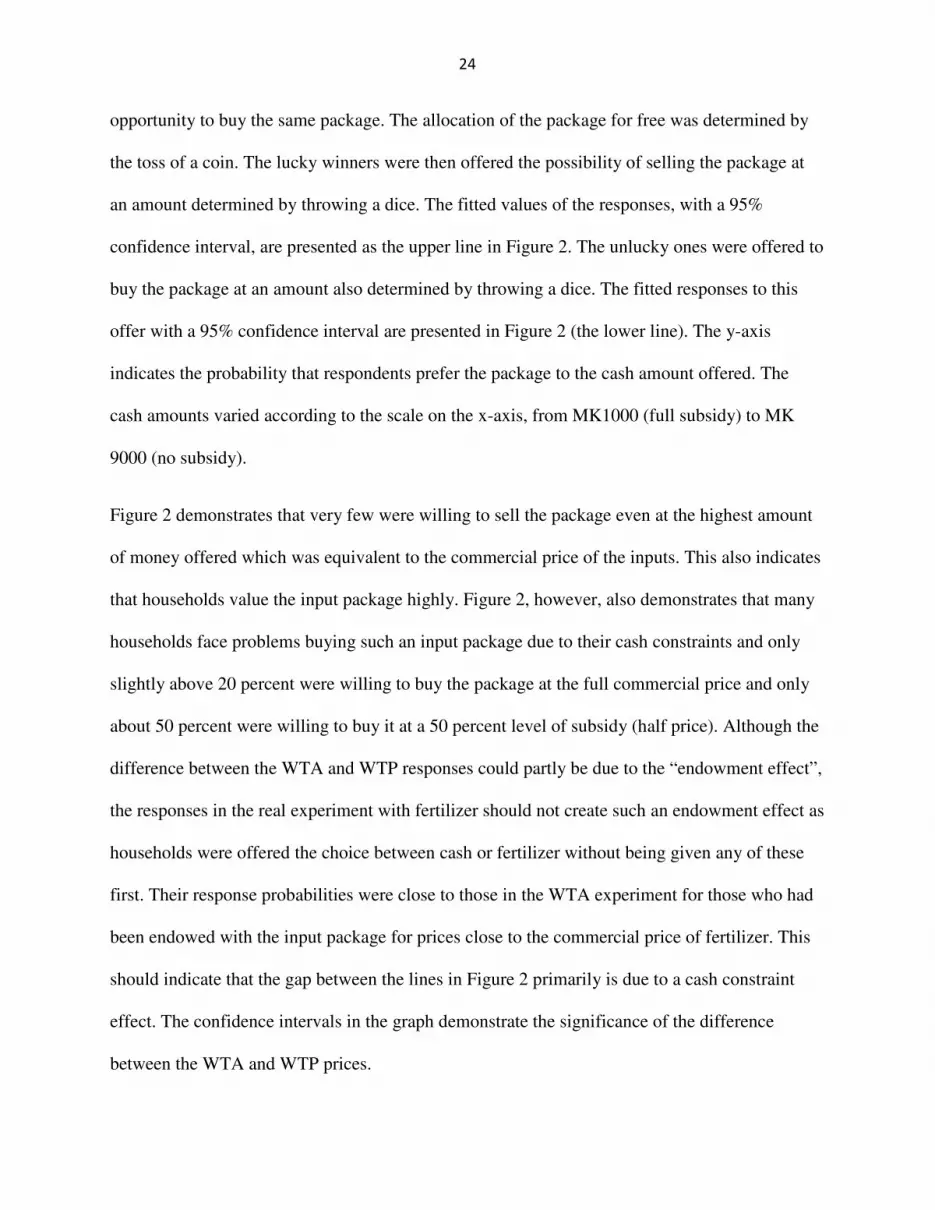
opportunity to buy the same package. The allocation of the package for free was determined by
the toss of a coin. The lucky winners were then offered the possibility of selling the package at
an amount determined by throwing a dice. The fitted values of the responses, with a 95%
confidence interval, are presented as the upper line in Figure 2. The unlucky ones were offered to
buy the package at an amount also determined by throwing a dice. The fitted responses to this
offer with a 95% confidence interval are presented in Figure 2 (the lower line). The y-axis
indicates the probability that respondents prefer the package to the cash amount offered. The
cash amounts varied according to the scale on the x-axis, from MK1000 (full subsidy) to MK
9000 (no subsidy).
Figure 2 demonstrates that very few were willing to sell the package even at the highest amount
of money offered which was equivalent to the commercial price of the inputs. This also indicates
that households value the input package highly. Figure 2, however, also demonstrates that many
households face problems buying such an input package due to their cash constraints and only
slightly above 20 percent were willing to buy the package at the full commercial price and only
about 50 percent were willing to buy it at a 50 percent level of subsidy (half price). Although the
difference between the WTA and WTP responses could partly be due to the “endowment effect”,
the responses in the real experiment with fertilizer should not create such an endowment effect as
households were offered the choice between cash or fertilizer without being given any of these
first. Their response probabilities were close to those in the WTA experiment for those who had
been endowed with the input package for prices close to the commercial price of fertilizer. This
should indicate that the gap between the lines in Figure 2 primarily is due to a cash constraint
effect. The confidence intervals in the graph demonstrate the significance of the difference
between the WTA and WTP prices.

25
Figure 2. Ratio preferring input package to cash in WTA (upper line) and WTP (bottom
line) experiments with varying cash amounts (MK).
Conclusion
Overall this study revealed that rural Malawian households value fertilizers highly even though
they have been exposed to very high fertilizer subsidies over several years. More than 50 percent
of the households preferred small amounts of fertilizer to a cash amount that was 50 percent
higher than the current commercial price for fertilizer during our experiments carried out in
2009. Access constraints for commercial as well as subsidized fertilizer may explain these
remarkably high shadow prices together with the nature of these experiments which were
designed to avoid a direct effect of households’ cash constraint.
0.5
1
0 2000 4000 6000 8000 10000
95% CI Fitted values
Fitted values

26
The study tested out Duflo et al.’s (2009) proposal to stimulate input demand by supplying inputs
at harvest time rather than at planting time. A hypothetical budget allocation experiment revealed
that households were willing to allocate about 40 percent of a cash budget of MK10000 for
fertilizer at harvest time while this budget share increased to about 60 percent at planting time. A
real choice experiment between cash and fertilizer revealed a significantly higher share of
households preferring fertilizer to cash at given prices at planting time than at harvest time. This
may imply that the price difference effect due to lower food price at harvest time than at planting
time dominates over the potential present bias effect.
However, the facts that households were willing to allocate a substantial budget share to input
purchase at harvest time and were not likely to resell these inputs later, point in direction of a
potential positive effect of this approach on input demand especially if or when the input subsidy
program has to be scaled down.
On the other hand, when households were offered a full input package consisting of two bags of
fertilizer and a bag of hybrid seeds, the share of households preferring the input package rather
than the cash amount declined to 22 percent when the WTP price increased to MK9000,
equivalent to the commercial price of the package. This demonstrates the significance of the cash
constraint that households face. When households who have been offered the same package for
free were asked about their WTA selling price, more than 80 percent of the households preferred
to keep the package even when they were offered a WTA price of MK9000, equivalent to the
commercial price. This fits well with the finding of Holden and Lunduka (2010) who found that
a very small share of the households that were given subsidized fertilizers resold these inputs in
the informal market. This implies that such input expenditures are “sticky” and sale of inputs at
harvest time may serve as a commitment device (DellaVigna, 2009).

27
Due to high international fertilizer and oil prices which recently have contributed to fuel and
foreign exchange shortages, Malawi may face problems sustaining the input subsidy program
even though it has contributed substantially to improve national and household food security. An
advantage of distributing inputs at harvest time is also that the same trucks that collect the maize
can at the same time bring out the inputs and thus save on the transportation costs. One would
also reduce the credit default problems that are linked to supplying inputs on credit at planting
time.
Acknowledgements
We acknowledge valuable comments from Kjell Arne Brekke, Erik Sørensen and participants at
the Norwegian Economists’ Annual Conference in Bergen January 2011. Remaining errors are
our own. We acknowledge funding of this project through the NOMA MSc-program and
valuable efforts of students and enumerators during the fieldwork and data cleaning. The project
has also been supported and funded by the Embassy of Norway and NORAD.
References
Binswanger, H. P. And M. R. Rosenzweig (1986). Behavioural and Material Determinants of
Production Relations in Agriculture. J. Dev. Stud. 22, 503-539.
Choi, J., D. Laibson and B. Madrian (2008). $100 Bills on the Sidewalk: Suboptimal Investment
in 401(k) Plans. NBER Working Paper No. 11554.
DellaVigna, S. (2009). Psychology and Economics: Evidence from the Field. J. Econ. Lit. 47(2),
315–372.

28
Denning, G., P. Kabembe, P. Sanchez, A. Malik, R. Flor, R. Harawa, P. Nkhoma, C. Zamba, C.
Banda, C. Magombo, M. Keating, J. Wangila, and J. Sachs (2009). Input Subsdies to Improve
Smallholder Maize Productivity in Malawi: Toward an African Green Revolution. Plos Biology
7, 1. www.plosbiology.org
Dorward, A., E. Chirwa, V. Kelly, T. Jayne, R. Slater, and D. Boughton (2008). Evaluation of
the 2006/07 Agricultural Input Subsidy Programme, Malawi. Final Report. Study undertaken for
the Ministry of Agriculture and Food Security, Malawi, DFID, USAID and Future Agricultures
Consortium.
Duflo, E., M. Kremer and J. Robinson (2008). How High are Rates of Return to Fertilizer?
Evidence from Field Experiments in Kenya. Am. Econ. Rev. Papers (Papers and Proceedings
Issue) 98 (2): 482–488.
Duflo, E., M. Kremer and J. Robinson (2009). Nudging Farmers to Use Fertilizer: Theory and
Experimental Evidence from Kenya. NBER Working Paper No. w15131.
Frederick, S., G. Loewenstein and T. O'Donoghue (2002). Time Discounting and Time
Preference: A Critical Review. J. Econ. Lit. 40 (2), 351-401.
Government of Malawi (2010). Malawi CAADP Post Compact Review. Country Technical
Review Report. Lilongwe.

29
Harrigan, J. (2005). Food Security Policies and Starter Pack: a Challenge for Donors? In S. Levy
(ed.) Starter Packs: A Strategy to Fight Hunger in Developing Countries? CABI Publishing,
Wallingford.
Holden, S. T. and Lunduka, R. (2010a). Too Poor to be Efficient? Impacts of the Targeted
Fertilizer Subsidy Program in Malawi on Farm Plot Level Input Use, Crop Choice and Land
Productivity. Report to NORAD. Noragric Report No.55, Norwegian University of Life
Sciences, Ås.
Holden, S. T. and Lunduka, R. (2010b). The Political Economy of Input Subsidies in Malawi:
Targeting Efficiency and Household Perceptions. Paper presented at the NFU-conference, Oslo,
25-26. November, 2010.
Holden, S. T., Shiferaw, B. and Wik, M.(1998). Poverty, Market Imperfections, and Time
Preferences: Of Relevance for Environmental Policy? Env. & Dev. Econ. 3, 105-130.
Horowitz, J. K. and K. E. McConnell (2002). A Review of WTA/WTP Studies. J. Env. Econ.&
Mgmt. 44, 426-447.
Laibson, D. (1997). Golden Eggs and Hyperbolic Discounting. Q. J. Econ. 112 (2), 443-477.
Logistic Unit (2009). Final Report. Implementation of Agricultural Input Subsidy Programme
2008/09. Logistic Unit, April 2009.

30
Lunduka, R. (2010). Land Rental Markets, Investment and productivity under customary land
tenure systems in Malawi. Unpublished PhD-dissertation, Department of Economics and
Resource Management, Norwegian University of Life Sciences, Ås, Norway.
O’Donoghue, T. and M. Rabin (1999). Doing It Now or Later. Am. Econ. Rev. 89 (1), 103-124.
O’Donoghue, T. and M. Rabin (2001). Choice and Procrastination. Q. J. Econ. 116 (1), 121-160.
Plott, C. R. and K. Zeiler (2005). The Willingness to Pay-Willingness to Accept Gap, the
“Endowment Effect,” Subject Misconceptions, and Experimental Procedures for Eliciting
Valuations. Am. Econ. Rev. 95(3), 530-545.
Plott, C. R. and K. Zeiler (2007). Exchange Asymmetries Incorrectly Interpreted as Evidence of
Endowment Effect Theory and Prospect Theory? Am. Econ. Rev. 97(4), 1449-1466.
Ricker-Gilbert, J. and T. S. Jayne (2008). The Impact of Fertilizer Subsidies on National
Fertilizer Use: An Example from Malawi. Paper presented at the American Agricultural
Economics Association Annual Meeting, Orlando, July 27-29, 2008.
Ricker-Gilbert, J. and T. S. Jayne (2009). Do Fertilizer Subsidies Affect the Demand for
Commercial Fertilizer? An Example from Malawi. Contributed Paper presented at the
International Association of Agricultural Economists Conference, Beijing, China, August 16-22,
2009.
Samuelson, P. (1937). A note on measurement of utility. Rev. Econ. Stud. 4, 155-161.

31
School of Oriental and African Studies (SOAS), Wadonda Consult, Overseas Development
Institute and Michigan State University (2008). Evaluation of the 2006/7 Agricultural Input
Supply Programme, Malawi: Final Report. London, School of Oriental and African Studies;
March 2008.
Wik, M., Aragie, T. K., Bergland, O. and Holden, S. T. (2004). On the Measurement of Risk
Aversion from Experimental Data. Applied Econ. 36, 2443-2451.
Yesuf, M. and R. A. Bluffstone (2009). Poverty, Risk aversion, and Path Dependence in Low-
income Countries: Experimental Evidence from Ethiopia. Am. J. Ag. Econ. 91(4), 1022-1037.