Embed Size (px)
Citation preview
1086 IEEE TRANSACTIONS ON INDUSTRY APPLICATIONS, VOL. 45, NO. 3, MAY/JUNE 2009
Capability Evaluation and Statistical Control ofElectrostatic Separation Processes
Karim Medles, Khouira Senouci, Amar Tilmatine, Abdelber Bendaoud, Adrian Mihalcioiu, Member, IEEE,and Lucian Dascalescu, Fellow, IEEE
Abstract—The variability of the outcome is often deplored bythe users of electrostatic separation equipment. A slight modifica-tion of the composition of the processed material, a change in theenvironmental conditions, or an alteration of the electrode con-figuration may cause objectionable fluctuation of product quality.Thus, the purity of the copper product recovered from electriccable wastes can easily diminish from 98%, which is fully accept-able for recycling purposes, to a value below the standard level of97%. This paper is written with the aim of showing how statisticalprocess control methods could contribute to the improvement ofusers’ overall satisfaction. In order to validate a procedure forevaluating the short- and long-term capabilities of the electrostaticseparation process, the authors carried out a series of experimentson subgroups of chopped electric cable wastes, which are similar tothose currently processed in the recycling industry (95% polyvinylchloride; 5% copper). The first set of experimental data showedthat an “in-control” electrostatic separation process can easilysatisfy the level of performance required by the customers (i.e., acapability index of > 1.33). The same set of data enabled the com-
Paper MSDAD-08-28, presented at the 2005 Industry Applications SocietyAnnual Meeting, Hong Kong, October 2–6, and approved for publication inthe IEEE TRANSACTIONS ON INDUSTRY APPLICATIONS by the Electrosta-tic Processes Committee of the IEEE Industry Applications Society. Manu-script submitted for review December 31, 2007 and released for publicationNovember 4, 2008. Current version published May 20, 2009. This work wassupported in part by the TASSILI (CMEP) Program, financed by the French andAlgerian Governments, and in part by grants from the European Commission(FEDER program) and Poitou-Charentes Regional Council.
K. Medles and K. Senouci were with the Electronics and ElectrostaticsResearch Unit, Laboratoire d’Automatique et d’Informatique Industrielle,Ecole Supérieure d’Ingénieurs de Poitiers, University Institute of Technol-ogy, 16021 Angoulême, France. They are now with the Electrostatics andHigh-Voltage Engineering Research Unit, Interaction Réseaux Electriques-Convertisseurs Machines Laboratory, Electrical Engineering Department, Uni-versity Djillali Liabes, Sidi Bel Abbes 22000, Algeria (e-mail: [email protected]; [email protected]).
A. Tilmatine is with the Electrostatics and High-Voltage EngineeringResearch Unit, Interaction Réseaux Electriques-Convertisseurs MachinesLaboratory, Electrical Engineering Department, University Djillali Liabes,Sidi Bel Abbes 22000, Algeria (e-mail: [email protected]).
A. Bendaoud is with the Intelligent Control Electrical Power SystemLaboratory, Electrical Engineering Department, University Djillali Liabes,Sidi Bel Abbes 22000, Algeria (e-mail: [email protected]).
A. Mihalcioiu was with the Electronics and Electrostatics ResearchUnit, Laboratoire d’Automatique et d’Informatique Industrielle, EcoleSupérieure d’Ingénieurs de Poitiers, University Institute of Technology, 16021Angoulême, France. He is now with the Department of Ecological Engineering,Toyohashi University of Technology, Toyohashi 441-8580, Japan (e-mail:[email protected]).
L. Dascalescu was with the Electronics and Electrostatics Research Unit,Laboratoire d’Automatique et d’Informatique Industrielle, Ecole Supérieured’Ingénieurs de Poitiers, University Institute of Technology, 16021 Angoulême,France. He is now with the Laboratory of Aerodynamic Studies, University ofPoitiers, University Institute of Technology, 16021 Angoulême, France (e-mail:[email protected]).
Color versions of one or more of the figures in this paper are available onlineat http://ieeexplore.ieee.org.
Digital Object Identifier 10.1109/TIA.2009.2018903
putation of the upper and lower limits of the R- and X -bar controlcharts. The second set of experiments was designed to evaluatethe ability of these charts to detect the following typical situationsof abnormal operation of the electrostatic separation equipment:1) a change in the composition of the processed material;2) a failed connection of the static electrode to the high-voltagesupply; and 3) the accumulation of dust on the surface of thecorona electrode. Based on the authors’ experience as consultantsfor the recycling industry, the following several recommendationshave been formulated: 1) Evaluate the capability of the electro-static separation process by performing no more than ten obser-vations and making use of the confidence indexes; 2) use movingR- and X -bar control charts to obviate the difficulty of sampling;and 3) prepare a “Corrective Actions Guide” for the operatorsusing control charts for monitoring.
Index Terms—Control chart, electrostatic separation, processcapability, statistical process control (SPC).
I. INTRODUCTION
DURING recent years, new electrostatic separationprocesses have been developed for ore processing and
waste recycling [1]–[4]. For each one of these applications, thequality of the products is a crucial issue. Thus, the purity of thecopper recovered by electrostatic separation from electric wireand cable wastes should exceed 97%. The insulating materialsrecovered from the same type of wastes could not be recycledunless they contain less than 0.02% of metallic impurities [5].
The statistical process control (SPC) proved to be an effectivetool for improving manufacturing quality in many industries[6]. Since the pioneer works of Shewhart, 80 years ago, theSPC methodology has been widely used for detecting noncon-forming products by monitoring the process through samples.The statistical analysis of sample characteristics prompts theadjustments to be made to the process in order to keep it withinthe specifications.
The keywords of SPC are capability and control charts. Thecapability index quantifies the variability in process character-istics. A process having a high capability index will constantlyrespect the quality requirements imposed to its products. Thecontrol charts are graphical representations of process charac-teristics. They make the control of a process easier, in order tomaintain or improve its capability.
This paper aims at answering the question: How can theseconcepts be applied to electrostatic separation processes? Thevariability of the outcome (quantities of recovered materials;purity of the products) is a serious drawback for any newelectrostatic separation application. SPC could be a promisingsolution to this problem.
0093-9994/$25.00 © 2009 IEEE

MEDLES et al.: CAPABILITY EVALUATION AND STATISTIC CONTROL OF SEPARATION PROCESSES 1087
Fig. 1. Variables of an electrostatic separation process: high-voltage level U ,roll speed n, angular α1 and radial d1 positions of the corona electrode, angularα2 and radial d2 positions of the electrostatic electrode, and angular position γof the splitter.
The difficulty of the problem resides in the fact that theelectrostatic separation is a continuous process, the outcomeof which is a function of numerous factors: flow rate, granulesize, high-voltage level, electrode configuration, and the rollspeed [7]. In a typical roll-type corona-electrostatic separator[8], the granular mixture to be sorted is fed onto the surface ofa grounded roll electrode, which rotates at a controlled speed.The electric field in which separation takes place is producedbetween this roll and one or several electrodes connected toa dc high-voltage supply (Fig. 1). The insulating particles arecharged by ionic bombardment in the corona field zone andadhere to the surface of the rotating roll electrode due tothe electric image force. The conducting particles, which arenot affected by the corona field, are charged by electrostaticinduction in contact with the grounded roll and are attracted bythe static electrode.
This paper presents a series of experiments that enabledthe authors to evaluate the capability of such electrostaticseparation processes and to establish appropriate control charts.In order to show how SPC methods could contribute to theimprovement of users’ overall satisfaction, several typical sit-uations of abnormal operation were simulated.
II. SPC CONCEPTS
SPC techniques are widely used in manufacturing industriesfor monitoring repetitive processes to determine whether theyare operating properly. The variability of process characteristicis the key concept of these techniques. Thus, the common causeof variation is the naturally occurring oscillations of systemresponse around a long-term average value, due to inherentfluctuations of system parameters. Special cause variation istypically caused by some problem in the system and can bequickly detected with SPC techniques.
A. Capability
Process capability studies distinguish between conformanceto control limits [upper control limit (UCL) and lower con-trol limit (LCL)] and specification limits [upper specificationlimit (USL) and lower specification limit (LSL)]. Specifically,
control limits characterize the inherent variability in a process,whereas specification limits define acceptable product charac-teristics. The products that are outside the specification limitsrepresent wastes that must be discarded or reprocessed.
The difference between the USL and LSL defines the intervalof tolerance (IT). The inherent variability of a process, asdefined by the control limits, must be well within this IT. Theprocess capability index Cp is defined as [9]
Cp =IT
6σ=
USL − LSL
6σ(1)
where σ is the standard deviation of the process characteristicbeing monitored. In most cases, σ is replaced in the aforemen-tioned formula by an estimation given by the following:
s =
√√√√√n∑
i=1
(Xi − m)2
n − 1(2)
where
m =1n
n∑i=1
Xi (3)
is the mean of n measured values Xi, (i = 1.n).The capability index shows how well a process is able to
meet specifications. The higher the value of the index, the morecapable is the process: Cp < 1 (unsatisfactory), 1 < Cp < 1.33(low capability), 1.33 < Cp < 1.66 (medium capability), andCp > 1.66 (high capability).
This index considers only the spread of the characteristic inrelation to specification limits, assumed to be two-sided. Theprocess performance index Cpk takes into account the positionof m with respect of the two specification limits [9]
Cpk = Min(
USL − m
3s,m − LSL
3s
). (4)
These two indexes should be jointly employed in order toaccurately assess the capability of a process. A higher capabilityindex can be achieved by reducing the variation in the process.The effect of shifting the mean of the process toward the targetis an increase of the process performance index.
An easier way to assess the capability of a process is to usethe Cpm index introduced by Taguchi et al. [10]. This indicatorconsiders at the same time the variability of the process charac-teristic and the position of each measured value with respect tothe target. As any variation of a process characteristic comparedto the target value affects the quality of the product, Taguchirecommended to evaluate the “nonquality” by calculating theaverage standard deviation from the target.
The loss generated by an individual value is evaluated by
L = K(X − Target)2 (5)
where K is a constant which depends on the problem understudy, and X is the value taken by the characteristic. In thecase of a sample of mean m and standard deviation s, the
1088 IEEE TRANSACTIONS ON INDUSTRY APPLICATIONS, VOL. 45, NO. 3, MAY/JUNE 2009
Fig. 2. Unstable and stable processes.
average loss is given by the following, known as “Taguchi’sloss function”:
L = K(s2 + (m − Target)2
). (6)
The Cpm indicator is defined by
Cpm =IT
6√
s2 + (m − Target)2. (7)
Experts agree to list five elementary sources of variability,which are also the causes of low capability: machine, operator,material, method, and environment [6]. The most difficult toact on is machine variability. This residual variability, whichis also designated as “natural (or common cause) variability,”determines the maximum values of Cp, Cpk, and Cpm that canbe attained. Therefore, a process can be characterized by twotypes of variability (Fig. 2): the instantaneous (“short-term”)variability, caused by the machine and, to a lesser extent, bythe other four factors listed earlier, and the total (“long-term”)variability, which is a resultant of the variations caused by allfive factors over a longer period of time. The stability of aprocess can be characterized by the index
RS% =Pp
Cp∗ 100 (8)
with Pp as the long-term capability. The computation formulasof indicators Pp, Ppk, and Ppm (long term) are strictly identicalto the formulas of Cp, Cpm, and Cpk (short term).
B. Control Charts
High capability indexes are obtained by limiting the variabil-ity of process characteristic being monitored. The difficulty is todistinguish between natural variations and those assignable tospecial causes. The adjustment of process variables is justifiedonly in the latter case. Control charts enable the detection ofthis kind of situations.
To monitor the process, samplings are carried out regularly.The mean and the range of the measured process characteristicsare calculated for each sample and then plotted on graphscalled control charts. In this way, process evolution is visual-ized. The frequency of sampling is chosen so that, if specialcause variation is present, the control charts can identify it[5], [6].
The control charts are established based on measurementsmade on n subgroups (samples), each one having a number Nof elements. The experts recommend n ≥ 30; N ≥ 3 [6].
TABLE ICOEFFICIENTS FOR THE CALCULATION OF CONTROL CHART LIMITS
The centerline of the X-bar chart that will be employedin this paper is the mean of the means Xi of the subgroups,expressed by the following relation:
X =1n
n∑i=1
(Xi). (9)
The upper (UCLX) and lower (LCLX) control limits of thischart are
UCLX = X + KR (10)
LCLX = X − KR (11)
where K is given in tables as a function of the number N ofelements in a subgroup (Table I) and
R =1n
n∑i=1
Ri (12)
with Ri being the range of the values measured for thesubgroup i. The upper (UCLR) and lower (LCLR) controllimits of the R-bar chart are
UCLR = AR (13)LCLR = BR. (14)
III. MATERIALS AND METHOD
A laboratory-scale role-type corona-electrostatic separatormanufactured by CARPCO Inc., Jacksonville, FL, was em-ployed for the experimental study. In order to simulate theconditions of an industrial installation, the angular and radialpositions of the corona electrode (α1 = 30◦ and d1 = 40 mm),the angular and radial positions of the static electrode (α2 =70◦ and d2 = 70 mm), and the angular position γ1 of the splitterof the collector were maintained fixed for all experiments(see again Fig. 1).
The tests were carried out on three granular subgroups(S1, S2, and S3), obtained from genuine chopped electriccable wastes (RIPS-ALCATEL, France). The mass of eachsample was 100 g [5 g of copper + 95 g of polyvinylchloride (PVC)], the characteristic size of the granules rang-ing between 1 and 2 mm. The products are recovered inthree different compartments: conductor, nonconductor, andmiddling.
The process characteristic being monitored was the mass ofthe middling product, which was measured with an electronicbalance (precision: 0.01 g). Laboratory studies and industrialpractice have proven the pertinence of this output variable forthe characterization of the overall performance of the process.Smaller quantities of middling are naturally correlated with
MEDLES et al.: CAPABILITY EVALUATION AND STATISTIC CONTROL OF SEPARATION PROCESSES 1089
higher recovery and purity indexes of both conducting and insu-lating materials. With copper representing only 5% of the feed,the acceptable mass of middling collected after electrostaticseparation should not exceed 1%.
A four-step experimental procedure was adopted.
Step 1) Identification of the optimal point of operation(Uopt, nopt, and γpt) by using a 17-run compositeexperimental design [11]. The procedure was similarto the one thoroughly described in [12].
Step 2) Assessment of the short- and long-term capabilitiesof the process. During one day, characterized bystable ambient conditions (20.2 ◦C–22.2 ◦C; RH =27.5%–30%), each of the three samples was sub-jected to 20 electrostatic separation tests (one testevery half an hour, the three products of the separa-tion being remixed after having measured the massof the middling fraction). The tests were performedusing the optimal operating conditions obtained atStep 1).
Step 3) Setup of the control charts. The experimental dataobtained at Step 2) were employed for calculatingthe UCL and LCL of the X- and R-bar charts, usingthe formulas given in the previous section of thispaper, with n = 20 and N = 3. Taking into accountthe fact that the electrostatic separation is a con-tinuous process, sampling is not economically andpractically feasible, in an industrial environment.Therefore, “moving X-bar” and “moving R-bar”control charts were set up, using only the individualmeasurements on sample 1.
Step 4) Simulate several “out-of-control” situations. Threesets of experiments were performed in order to sim-ulate the following: 1) a change in the compositionof the processed material (four tests with a samplecontaining 4% Cu and four with a sample containing6% Cu); 2) a failed connection of the static elec-trode to high-voltage supply (the static electrode wasdisconnected from the high-voltage terminal of theelectrostatic separator); and 3) the accumulation ofdust on the surface of the corona electrode (threesuccessive groups of four tests with the wire coveredwith starch powder on 5%, 10%, and 15% of itssurface, respectively).
Each of these situations has been encountered by the authorsduring their activities as consultants for the recycling industry.The problem with such “out-of-control” situations is that theygenerate only a small shift of process outcome, which cannotbe detected by plain visual monitoring of the products collectedafter the electrostatic separation. A disconnection of the coronaelectrode is an event that cannot pass unobserved, as the deteri-oration of the separation process is radical. This is not the casewith a failed connection of the static electrode, which mightarrive in installations, the electrode configuration of whichis often modified for technological reasons. Such an eventcannot be detected by the operator without the use of a controlchart.
TABLE IIRESULTS OF THE 17 RUNS OF THE COMPOSITE EXPERIMENTAL DESIGN
IV. RESULTS AND DISCUSSION
A. Set-Point Identification
The optimal values of the high voltage U , the speed n, andthe angular position γ2 were established based on the resultsgiven in Table II, which were obtained under stable ambientconditions (temperature: T = 20 ◦C–21 ◦C; relative humidity:RH = 27%–30%). The optimal values of the control variables(i.e., those that simultaneously maximize metal recovery andinsulator purity), the minimum middling mass (i.e., the target ofthe process), and the 95% confidence interval of this predictedvalue were computed with a commercial software of experi-mental design (MODDE 5.0 [11]), and they are as follows:Uopt = 31.6 kV, nopt = 75 tr/min, γopt = −6◦, Target =0.76 g, TU = 0.91 g, and TL = 0.51 g. The upper (TU ) andlower (TL) limits of the confidence interval were adopted asUSL and LSL (TU = USL; TL = LSL). These limits corre-spond to what is commonly accepted in industrial practice, forthis particular application.
B. Capability Assessment
The results of the 60 electrostatic separation tests that willbe employed for calculating the process capability indexesare given in Table III. From a purely statistical point ofview, both the “short term” and “long term” capabilities ofa process should be evaluated based on at least 30 observa-tions. In industrial practice, this might be a very constrainingrequirement, taking into account the difficulty and the cost ofsampling. Therefore, at this stage of the study, a comparisonwas performed between the capability indexes evaluated from alower number of observations, but making use of the so-calledconfidence index [13]. This index is a function of the number ofobservations. The higher the number of observation, the closer

1090 IEEE TRANSACTIONS ON INDUSTRY APPLICATIONS, VOL. 45, NO. 3, MAY/JUNE 2009
TABLE IIIRESULTS OF 60 ELECTROSTATIC SEPARATION EXPERIMENTS CARRIED OUT WITH
THREE SUBGROUPS OF CHOPPED ELECTRIC WIRE WASTES (5-g Cu–9-g PVC)
to one is this index. With the data from the first ten experimentscarried out on sample 1
Cp(10) =0.91 − 0.51
6 ∗ 0.03= 2.3 (15)
Cpk(10) = Min(
0.91 − 0.763 ∗ 0.03
,0.76 − 0.51
3 ∗ 0.03
)= 1.6 (16)
Cpm(10) =0.91 − 0.51
6√
(0.03)2 + (0.76 − 0.76)2= 2.3. (17)
Using the data from all the 20 experiments performed with thatsample, the same indexes are
Cp(20) = 1.9 Cpk(20) = 1.5 Cpm(20) = 1.9. (18)
In order to assess the capability of the process, these valueswere multiplied by the confidence index [[13]]. The correctedvalues derived from the two sets of data are
C∗p(10) = 1.396 C∗
pk(10) = 1.151 Cpm(10) = 2.3 (19)
C∗p(20) = 1.387 C∗
pk(20) = 1.186 Cpm(20) = 2.3. (20)
As C∗p(10) ≈ C∗
p(20), it can be concluded that ten experimentsare enough for assessing the capability of an electrostaticseparation process, with the condition of using the appropriateconfidence index.
Using the data of the 60 experiments, which model thelong-term behavior of the process, the following indexes werecomputed:
Pp = 1.6 Ppk = 1.6 Ppm = 1.5. (21)
After corrections,
P ∗p = 1.349 P ∗
p = 1.405 P ∗pm = 1.50. (22)
The stability of the process characteristic being monitored isvery good, as
RS% =P ∗
p
C∗p
∗ 100 =1.3841.387
= ∗100 = 99.50%. (23)
This means that the control charts can be confidently employedfor supervising the process.
C. Setup of Control Charts
Using the data in Table III, (10)–(14), with N = 3 andn = 20, lead to the following values for the central line:
X = 0.71 g (24)
and for the UCL and LCL of the X-bar chart
UCLX = 0.71 + 0.729 ∗ 0.08 = 0.78 g (25)LCLX = 0.71 − 0.729 ∗ 0.08 = 0.63 g. (26)
For the same set of data, the computed upper and lower limitsof the R-bar chart were
UCLR = 2.282 ∗ 0.08 = 0.19 g (27)LCLR = 0 ∗ 0.08 = 0 g. (28)
Fig. 3 shows the X- and R-bar chart setups in accordancewith the aforementioned UCL and LCL. The USL and LSLare represented on the same charts, to facilitate the analysisof the situation from the customer’s point of view. The plottedvalues are the mean and the range of 20 subgroups simulated bythe 3 × 20 experiments in Table III. All the values are withinthe control limits. The process was under control, during those60 experiments.
The characteristic lines of the moving X- and R-bar chartsin Fig. 4 were computed in a different way, which simulates ina better way, the condition in which SPC could be appliedin an industrial environment. Thus, 18 moving means Xi and18 moving ranges Ri were computed using the 18 subgroups ofthree consecutive values of the middling mass measured for S1.

MEDLES et al.: CAPABILITY EVALUATION AND STATISTIC CONTROL OF SEPARATION PROCESSES 1091
Fig. 3. (a) X- and (b) R-bar control charts for the electrostatic separationprocess simulated by the tests i = 1, . . . , 20 in Table III.
Fig. 4. (a) Moving X- and (b) R-bar control charts for the electrostaticseparation process simulated by the tests i = 3, . . . , 20 on sample S1 inTable III.
The values are given in the two bottom lines of Table III andserved for the computation of the centerline
X = 0.71 g (29)
and for the UCL and LCL of the X-bar chart
UCLX(m) = 0.71 + 3 ∗ 0.04 = 0.82 g (30)LCLX(m) = 0.71 − 3 ∗ 0.04 = 0.59 g. (31)
For the same set of data, the computed upper and lower limitsof the R-bar chart were
UCLR(m) = 2.822 ∗ 0.04 = 0.11 g (32)
LCLR(m) = 0 ∗ 0.03 = 0 g. (33)
Fig. 5. Detection of the variation of metal concentration in the feed, by using(a) X- and (b) R-bar control charts.
Fig. 6. Detection of the variation of metal concentration in the feed, by usingmoving (a) X- and (b) R-bar control charts.
The values shown in Figs. 3 and 4 represent the result ofa laboratory simulation of an industrial process. Sample 1contained a slightly higher content of copper than the others,which can explain the higher values recorded on R-bar chart inFig. 3(b), and the values beyond the mean on the moving X-barchart in Fig. 4(a). A correction was done after test #10, in orderto center the process on the target.
D. Simulation of “Out-of-Control” Situations
1) Variation of Metal Concentration in the Feed: The resultsof the experiments are shown in Figs. 5 and 6 (tests #1 and #2were pertained with a 5% Cu sample, tests #3–#6 with sam-ples containing 6% Cu, and tests #7–#10 samples containing4% Cu). The “out-of- control” situation could be easily detectedon any of the control charts employed. Fluctuations in thecomposition are likely to be detected by a series of pointsoscillating on one side and the other of the centerline of the
1092 IEEE TRANSACTIONS ON INDUSTRY APPLICATIONS, VOL. 45, NO. 3, MAY/JUNE 2009
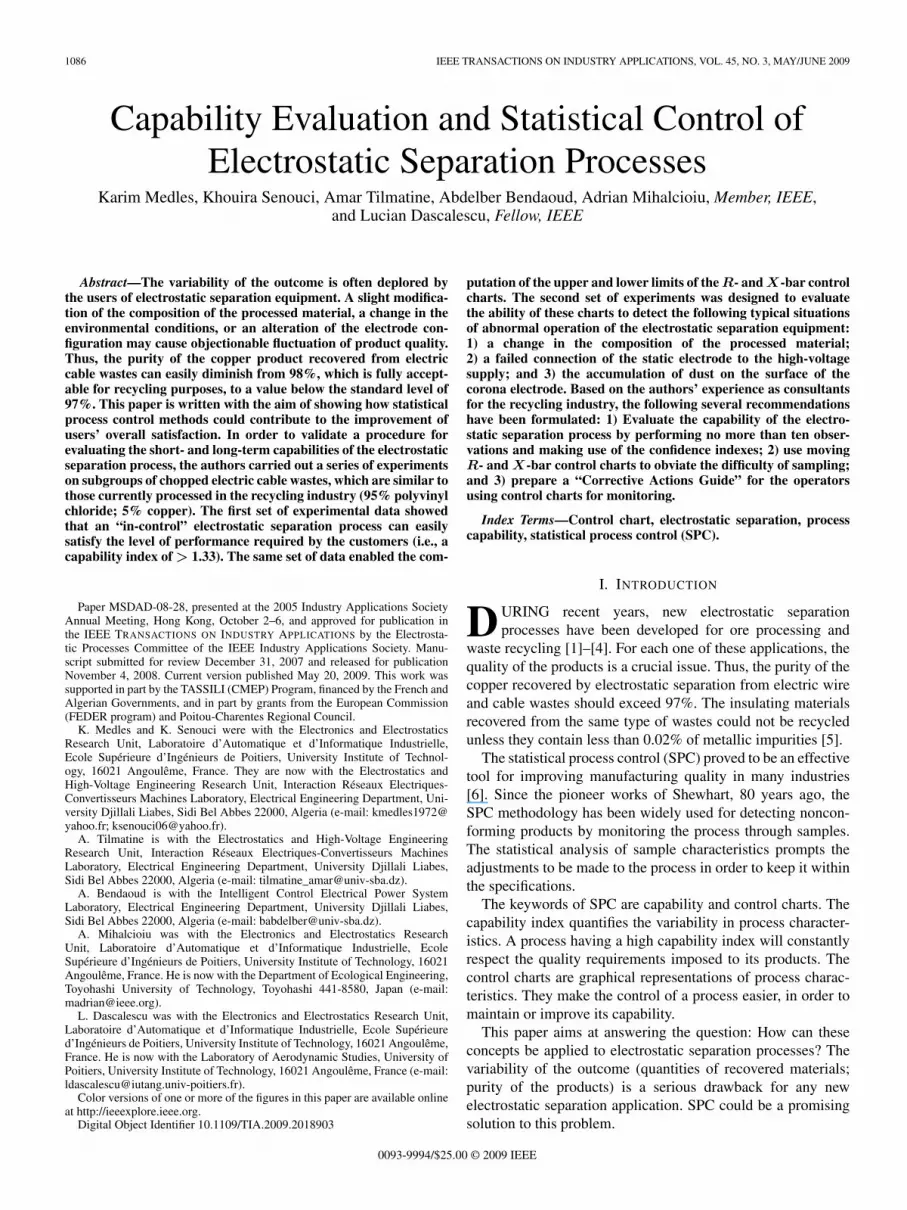
Fig. 7. Detection of a failed connection of the static electrode, by using(a) X- and (b) R-bar control charts.
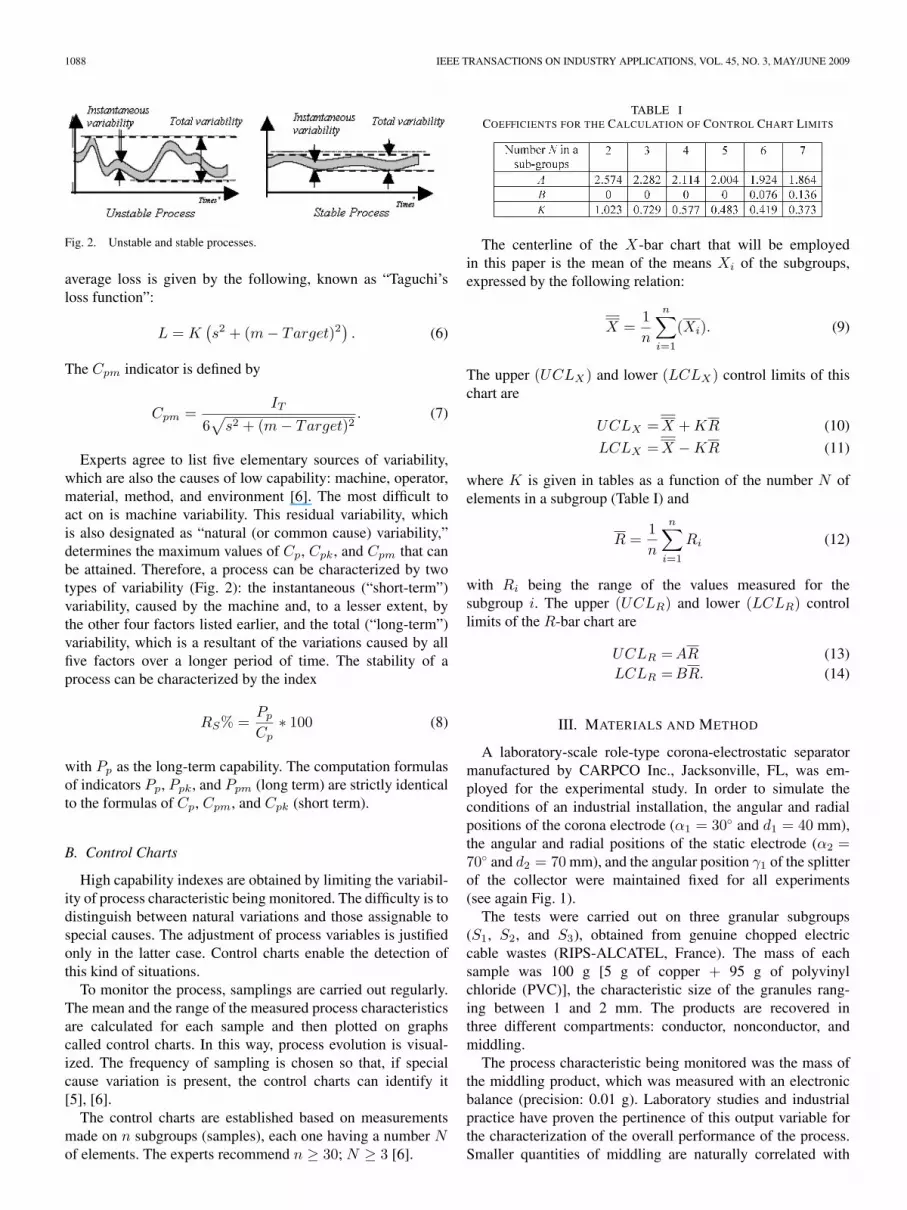
Fig. 8. Detection of a failed connection of the static electrode, by usingmoving (a) X- and (b) R-bar control charts.
X-bar and moving X-bar charts, and by points beyond the UCLon the R-bar chart.
2) Failed Connection of the Static Electrode: The controlcharts in Figs. 7 and 8 illustrates this “out-of-control” situation:The measured middling mass passes from 0.74 g under normaloperating conditions to 2.57 g when the static electrode wasdisconnected from the high-voltage terminal of the electrostaticseparator.
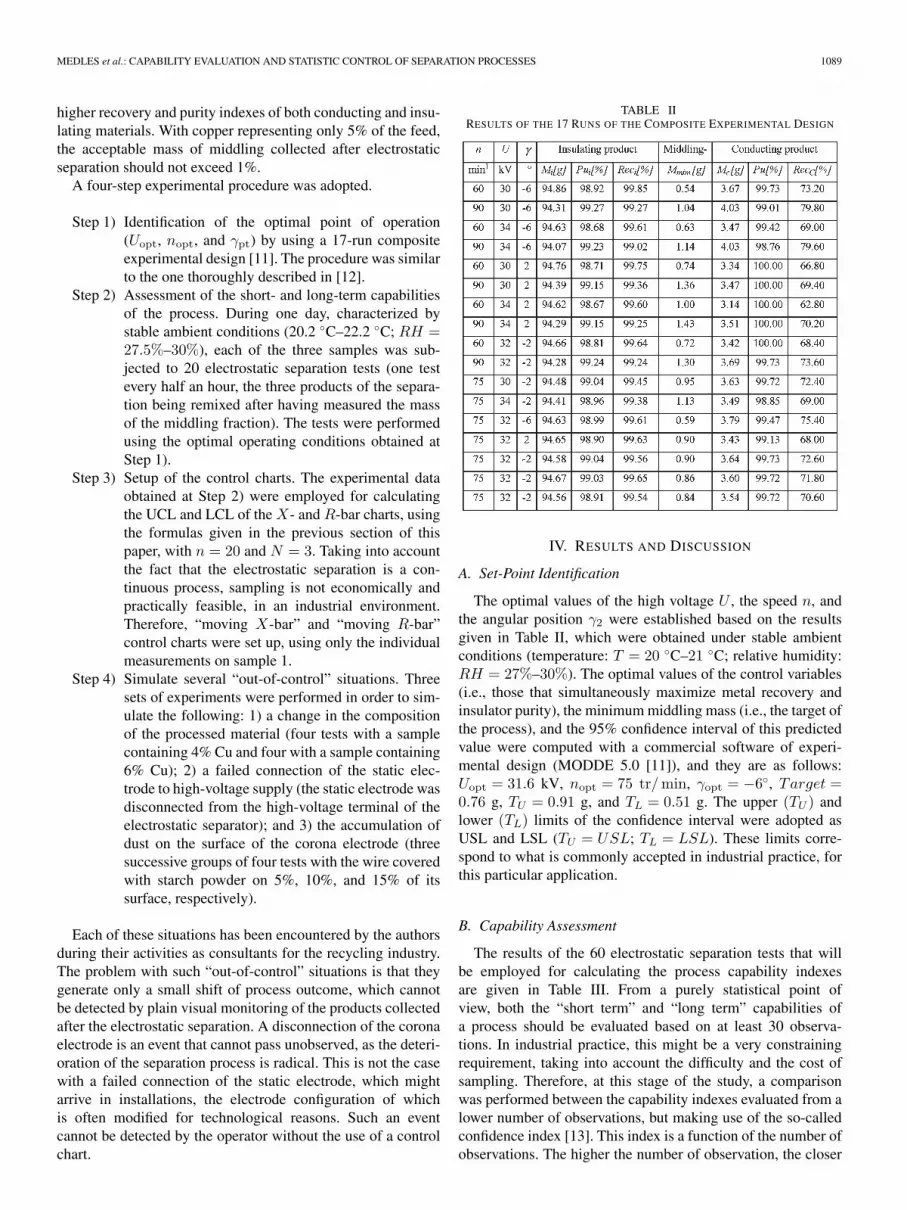
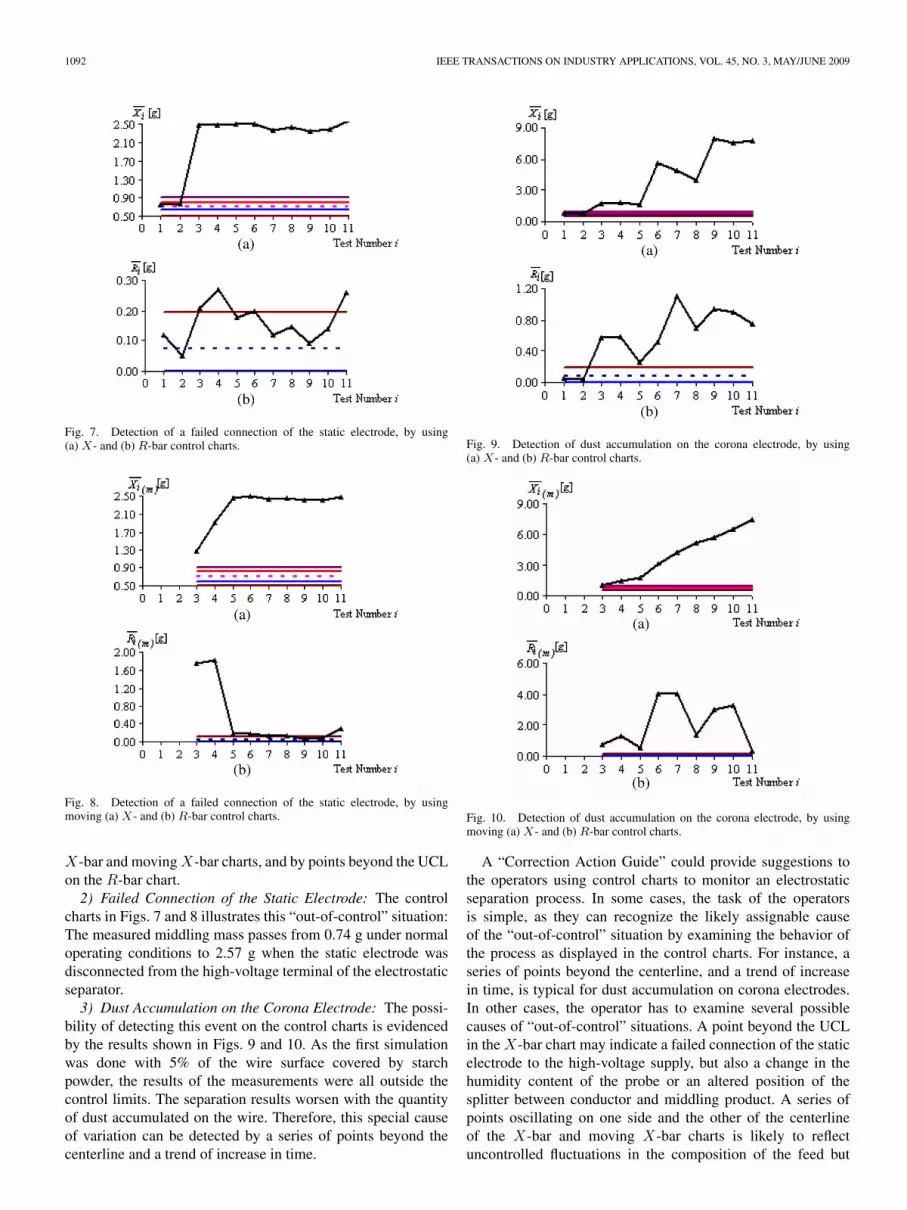
3) Dust Accumulation on the Corona Electrode: The possi-bility of detecting this event on the control charts is evidencedby the results shown in Figs. 9 and 10. As the first simulationwas done with 5% of the wire surface covered by starchpowder, the results of the measurements were all outside thecontrol limits. The separation results worsen with the quantityof dust accumulated on the wire. Therefore, this special causeof variation can be detected by a series of points beyond thecenterline and a trend of increase in time.
Fig. 9. Detection of dust accumulation on the corona electrode, by using(a) X- and (b) R-bar control charts.
Fig. 10. Detection of dust accumulation on the corona electrode, by usingmoving (a) X- and (b) R-bar control charts.
A “Correction Action Guide” could provide suggestions tothe operators using control charts to monitor an electrostaticseparation process. In some cases, the task of the operatorsis simple, as they can recognize the likely assignable causeof the “out-of-control” situation by examining the behavior ofthe process as displayed in the control charts. For instance, aseries of points beyond the centerline, and a trend of increasein time, is typical for dust accumulation on corona electrodes.In other cases, the operator has to examine several possiblecauses of “out-of-control” situations. A point beyond the UCLin the X-bar chart may indicate a failed connection of the staticelectrode to the high-voltage supply, but also a change in thehumidity content of the probe or an altered position of thesplitter between conductor and middling product. A series ofpoints oscillating on one side and the other of the centerlineof the X-bar and moving X-bar charts is likely to reflectuncontrolled fluctuations in the composition of the feed but

MEDLES et al.: CAPABILITY EVALUATION AND STATISTIC CONTROL OF SEPARATION PROCESSES 1093
also changes in the relative humidity of the ambient air or inthe velocity of the rotating roll electrode. In such cases, if anelementary corrective action does not have the estimated effect,it means that the “out-of-control” situation is the associationof several adverse factors, and the process cannot be restoredwithout involving an expert capable to make use of more refineddiagnosis tools.
V. CONCLUSION
The application of SPC to electrostatic separation of granularmaterials could reduce the variability that affects the outputof such processes and limits their industrial application. Thispaper validated a three-step procedure, consisting in the fol-lowing: 1) set-point identification, using design of experimenttechniques; 2) capability assessment; and 3) setup of X- andR-bar control charts.
The data presented in this paper demonstrate that capabilitystudies can be performed with no more than ten observations,if good use is made by the confidence index recommended bythe SPC experts. For the particular process investigated in thispaper, both “short-term” and “long-term” capability indexeswere higher than 1.33, indicating that the level of performancesatisfies customers.
Sampling difficulties impose the use of moving X- and R-barcontrol charts for monitoring electrostatic separation processcharacteristics. Choosing the UCL and LCL in accordance withthe recommendations of SPC methodology is a guarantee of thefact that all deviations in performance can be readily detected,to prevent a more severe deterioration of the process that couldyield products outside the specification limits.
The study was performed for a well-defined category ofprocessed materials (wastes of chopped electric cables), but asimilar approach could be adopted for a range of electrostaticapplications of separation. At this time, only several “out-of-control” situations that were considered to most frequentlycause user dissatisfaction could be examined. Deviations fromoptimal set points of the high voltage, roll speed, splitterposition, ambient temperature, and relative humidity are othercommon sources of “assignable cause” variation in the electro-static separation process and deserve a distinct study.
ACKNOWLEDGMENT
The author K. Medles would like to thank the French andAlgerian Governments for the doctoral scholarship.
REFERENCES
[1] I. I. Inculet, G. S. P. Castle, and J. D. Brown, “Electrostatic separation ofplastics for recycling,” Part. Sci. Technol., vol. 16, no. 1, pp. 77–90, 1998.
[2] K. B. Tennal, D. Lindquist, M. K. Mazumder, R. Rajan, and W. Guo,“Efficiency of electrostatic separation of minerals from coal as a functionof size and charge distributions of coal particles,” in Conf. Rec. IEEE IASAnnu. Meeting, Pheonix, AZ, 1999, pp. 2137–2142.
[3] L. Brands, P. M. Beier, and I. Stahl, “Electrostatic separation,” inUllmann’s Encyclopedia of Industrial Chemistry. Weinheim, Germany:Wiley-VCH Verlag, 2001.
[4] A. Iuga, I. Cuglesan, A. Samuila, M. Blajan, D. Vadan, and L. Dascalescu,“Electrostatic separation of muscovite mica from feldspathic pegmatite,”IEEE Trans. Ind. Appl., vol. 40, no. 2, pp. 422–429, Mar./Apr. 2004.
[5] L. Dascalescu, R. Morar, A. Iuga, A. Samuila, and V. Neamtu, “Elec-trostatic separation of insulating and conductive particles from granularmixes,” Part. Sci. Technol., vol. 16, no. 1, pp. 25–42, 1998.
[6] D. C. Montgomery, Introduction to Statistical Quality Control.New York: Wiley, 1996.
[7] R. Morar, A. Iuga, L. Dascalescu, and A. Samuila, “Factors which in-fluence the insulation-metal electro separation,” J. Electrostat., vol. 30,pp. 403–412, 1993.
[8] L. Dascalescu, A. Mizuno, R. Tobazéon, A. Iuga, R. Morar,M. Mihailescu, and A. Samilla, “Charges and forces on conductive parti-cles in roll-type corona-electrostatic separators,” IEEE Trans. Ind. Appl.,vol. 31, no. 5, pp. 947–956, Sep./Oct. 1995.
[9] N. L. Johnson and S. Kotz, Process Capability Indices. London, U.K.:Chapman & Hall, 1993.
[10] G. Taguchi, E. A. Elsayed, and T. C. Hsiang, Quality Engineering inProduction Systems. New York: McGraw-Hill, 1989.
[11] L. Eriksson, E. Johansson, N. Kettaneh-Wold, C. Wikstöm, and S. Wold,“Design of experiments,” in Principles and Application. Umea, Sweden:Umetrics, 2000.
[12] K. Medles, A. Tilmatine, M. Younes, S. Flazi, and L. Dascalescu, “Setpoint identification and robustness testing of electrostatic separationprocesses,” in Conf. Rec. IEEE IAS Annu. Meeting, Seattle, WA, 2004,pp. 1959–1966.
[13] M. Pillet, Appliquer la Maîtrise Statistique des Processus MSP/SPC.Paris, France: Editions d’Organisation, 2005.
Karim Medles was born in Tipaza, Algeria, in1972. He received the M.S. degree and Magister(Dr. Eng.) degree in electrical engineering from theUniversity Djillali Liabes, Sidi Bel Abbes, Algeria,in 1994 and 1999, respectively, and the Ph.D. degreefrom the Electrical Engineering Institute, Univer-sity Djillali Liabes, in 2006 with a thesis he partlyprepared at the University Institute of Technology,Angoulême, France, with an 18-month researchscholarship awarded by the French Government.
He joined the University Djillali Liabes in 1999as a Senior Lecturer in the Electrical Engineering Department, where heis currently an Assistant Professor and a member of the Electrostatics andHigh-Voltage Engineering Research Unit, Interaction Réseaux Electriques-Convertisseurs Machines Laboratory. He has published several scientific papersin international and national journals, as well as in conference proceedings.He was invited as a Visiting Scientist in France. His current research interestsinclude power systems, high-voltage engineering, and electrostatics.
Khouira Senouci was born in Sidi Bel Abbes,Algeria, in 1974. She received the M.S. degree andthe Magister (Dr. Eng.) degree in electrical engi-neering from the University Djillali Liabes, Sidi BelAbbes, in 2004 and 2006, respectively.
She joined the University Djillali Liabes in 2006as a Senior Lecturer in the Electrical EngineeringDepartment, where she is currently an AssistantProfessor and a member of the Electrostatics andHigh-Voltage Engineering Research Unit, Interac-tion Réseaux Electriques-Convertisseurs Machines
Laboratory. She has published several scientific papers in international andnational journals, as well as in conference proceedings, and she was invited as aVisiting Scientist in France. Her current research interests include high-voltageengineering, statistical process control, and electrostatics.

1094 IEEE TRANSACTIONS ON INDUSTRY APPLICATIONS, VOL. 45, NO. 3, MAY/JUNE 2009
Amar Tilmatine received the M.S. degree in elec-trical engineering and the Magister (Dr. Eng.) de-gree from the University of Science and Technology,Oran, Algeria, in 1988 and 1991, respectively.
Since 1991, he has been teaching courses onelectric field theory and high-voltage techniques inthe Electrical Engineering Department, UniversityDjillali Liabes, Sidi Bel Abbes, Algeria, where hewas the Chairman of the Scientific Committee fromNovember 2002 to November 2005 and is the Headof the Electrostatics and High-Voltage Engineering
Research Unit, Interaction Réseaux Electriques-Convertisseurs Machines Lab-oratory. From 2001 to 2006, he visited the Electronics and ElectrostaticsResearch Unit, University Institute of Technology, Angoulême, France, at leastonce a year, as an Invited Scientist, to work on a joint research project onnew electrostatic separation technologies. His other fields of interest are high-voltage insulation and gas discharges.
Abdelber Bendaoud was born in Oujda, Morocco,in 1957. He received the Engineering degree in elec-trical engineering from the University of Sciencesand Technology, Oran, Algeria, in 1982, and theMagister (Dr. Eng.) and Ph.D. degrees from theElectrical Engineering Institute, University DjillaliLiabes, Sidi Bel Abbes, Algeria, in 1999 and 2004,respectively.
Since 1994, he has been a Professor of electric ma-chines with the Electrical Engineering Department,University Djillali Liabes, where he is a member
of the Intelligent Control Electrical Power System Laboratory. His currentresearch interests include electrostatic separation technologies, high-voltageinsulation and gas discharges, electric and magnetic fields, and electromagneticcompatibility.
Adrian Mihalcioiu (S’04–M’06) received the M.S.degree in electrical engineering from the TechnicalUniversity of Cluj-Napoca, Cluj-Napoca, Romania,in 2002, and the Ph.D. degree (magna cum laude)from the University of Poitiers, Angoulême, France,in 2005. His graduate research work was carried outat the Electronics and Electrostatics Research Unit,University Institute of Technology, Angoulême,within the framework of the ERASMUS studentmobility program, financed by the European Com-munity. His Ph.D. was jointly sponsored by the Uni-
versity of Poitiers and the Technical University of Cluj-Napoca. During part ofthis program, he was associated with a major project in the R&D Department,Hamos GmbH, Penzberg, Germany. His thesis involved the development ofmeasurement techniques and virtual instrumentation for the study and controlof electrostatic processes.
After obtaining his Ph.D. degree, he was with the University of Osaka,Osaka, Japan, as a Postdoctoral Fellow. He is currently a Research Associatewith the Department of Ecological Engineering, Toyohashi University of Tech-nology, Toyohashi, Japan.
Lucian Dascalescu (M’93–SM’95–F’09) receivedthe M.S. degree (with first class honors) from theFaculty of Electrical Engineering, Technical Uni-versity of Cluj-Napoca, Cluj-Napoca, Romania, in1978, the Dr. Eng. degree in electrotechnical ma-terials from the Polytechnic Institute of Bucharest,Bucharest, Romania, and the Dr. Sci. degree andthe “Habilitation à Diriger de Recherches” Diplomain physics from the University “Joseph Fourier,”Grenoble, France.
His professional carrier began at the Combinatulde Utilaj Greu Cluj-Napoca (Heavy Equipment Works), Cluj-Napoca. In 1983,he was with the Technical University of Cluj-Napoca as an Assistant Professor,where he later became an Associate Professor of electrical engineering. FromOctober 1991 to June 1992, he received a Research Fellowship at the Labora-tory of Electrostatics and Dielectric Materials, Grenoble, where he returned inJanuary 1994, after one year as an Invited Research Associate and a Lecturer atthe Toyohashi University of Technology, Toyohashi, Japan, and three months asa Visiting Scientist at the University of Poitiers, Angoulême, France. For fouryears, he was with the University Institute of Technology, Grenoble, where hetaught a course in electromechanical conversion of energy. In September 1997,he was appointed Professor of electrical engineering and automated systemsand the Head of the Electronics and Electrostatics Research Unit, UniversityInstitute of Technology, Angoulême. Since 1999, he has also been the Head ofthe Department of Management and Engineering of Manufacturing Systems,University Institute of Technology, Angoulême, France. He is currently theHead of the Electrostatics of Dispersed Media Research Unit, which is partof the Electrohydrodynamic Group, Laboratory of Aerodynamic Studies, Uni-versity of Poitiers. He is the author of several textbooks in the field of electricalengineering and ionized gases. He is the holder of 14 patents and the author ofmore than 110 papers. He was invited to lecture on the electrostatics of granularmaterials at various universities and international conferences in China (1988),Poland (1990), the U.S. (1990, 1997, 1999, and 2008), Japan (1993), France(1993 and 2008), the U.K. (1998), Romania (1999, 2004, 2006, and 2008),Canada (2001), Belgium (2002), and Algeria (2005 and 2006).
Prof. Dascalescu is a Fellow of the IEEE Industry Applications Society(IAS), the Vice-President of the IEEE France Section, and the TechnicalProgram Chair of the IAS Electrostatic Processes Committee. He is a memberof the Electrostatics Society of America, Electrostatics Society of Romania,Société des Electriciens et Electroniciens, and Club Electrotechnique, Electron-ique, Automatique, France.