Embed Size (px)
Citation preview
Industrial Developm
ent Report 2005
Industrial Development Report 2005
Capability building for catching-upHistorical, empirical and policy dimensions
The Industrial Development Report 2005, UNIDO’s flagship publication, addresses two keyquestions. First, why have most developing countries failed to narrow the gap in incomeand productivity with more advanced economies? Second, what strategies and policiescan those countries adopt to build the capabilities that are necessary for catching-upunder the current international environment?
From the perspective of domestic policy making and international cooperation, more effort – both in terms of ideas and resources – needs to be directed to structural issuesso far largely neglected, where substantial degrees of freedom remain vis-à-vis the WTOrules. These issues largely relate to the building and co-evolution of domestic institutionsthat promote private sector development and domestic capability building. In a world increasingly driven by innovation, framework conditions that are a prerequisite of economic catch-up have been transformed so as to encompass the various dimensionsof innovative development as key ingredient.
With this in mind, the Special Topic Section of the Report first takes stock of lessonslearned throughout modern history. On this basis, it then provides a framework foroperational policy analysis as well as a methodology for the assessment of capabilitybuilding needs to help overcome clear limitations in the current understanding ofeconomic development.
The Second Part of the Special Topic focuses on the interactions between the knowledge,business innovation and policymaking subsystems, and addresses the policy capabilitiesthat are necessary to overcome the often intractable problem of matching demand and supply of innovative resources. Two specific areas – food safety requirements andstandards – are explored to highlight these interactions and test the suggested policyanalysis framework.
The Second Section of the Report reviews industrial activity worldwide including meas-ures of technological advance following the tradition of previous Industrial DevelopmentReports. The interaction of industrial and technological advance yields a new indicator,the industrial-cum-technological-advance index, which highlights the significant structuraldifferences between and within regions.
About the cover illustration:The graph on the cover, generated by means of a fractal geometry model, simulates a patternformed by three ring vortices playing catch up with one another (also called ‘chaotic leapfrogging’).
UNITED NATIONS INDUSTRIAL DEVELOPMENT ORGANIZATION
IRD-05_coverSilv2.qxd 27.10.2005 20:40 Uhr Seite 1

Industrial Development Report 2005
Capability building for catching-up
Historical, empirical and policy dimensions
UNITED NATIONS INDUSTRIAL DEVELOPMENT ORGANIZATIONVienna, 2005
Copyright © 2005 United Nations Industrial Development Organization
The designations employed and the presentation of material in this publication do not imply the expression of any opinionwhatsoever on the part of the Secretariat concerning the legal status of any country, territory, city or area, or of its authorities, or concerning the delimitation of its frontiers or boundaries.
Designations such as “developed”, “industrialised” and “developing” are intended for statistical convenience, and do notnecessarily express a judgement about the state reached by a particular country or area in the development process.
This publication has not been formally edited.
The mention of firm names or commercial products does not imply endorsement by UNIDO.
Material in this publication may be freely quoted or reprinted, but acknowledgement is requested, together with a copy ofthe publication containing the quotation or reprint.
ID/424
UNIDO Publication
Sales No.: E.05.II.B.25
ISBN 92-1-106431-7
Contents
Foreword viiAcknowledgements viiiExplanatory notes ixAbbreviations xExecutive Summary xiii
SECTION I
Part 1: A historical, emprical and conceptual perspective
Chapter 1 The pivotal role of technological capabilities and domestic knowledge systems 5
Homegrown knowledge systems matter 5The growing impact of knowledge systems 7Catch-up: many paths, some key common features 8Seeing through a blind spot in economic thinking 8Conclusions 12Notes 12
Chapter 2 Critical factors for catching-up: assessing the evidenceThe knowledge dimension 13Other variables 13
History and geography 14The five main factors 14Capabilities and income levels 15Capabilities and economic growth 16Summary and conclusions 20Annex 2.1: Sources and methodology 21Notes 33
Chapter 3 Catching-up and falling behind: accounting for success and failure over timeCatching-up in historical perspective 35Diversity in long-run performance 37Notes 41
Chapter 4 Role of knowledge systems in catching-up experiencesIntroduction 43
Early biases 43The utilitarian higher-education model of the US 46Brain circulation and university research 47Public funding of applied science in universities 47
Role of public research and technology support institutes 49
Technology support institutions in the Republic of Korea and Taiwan Province of China 49
Technological infrastructure and industry 52Interaction between universities and industrial firms 52Skill development 53Entrepreneurship development 55Engineering Research Associations 55Metrology, quality and standards institutions 56
Conclusion 57Notes 57
Chapter 5 Accessing and mastering knowledgeAccess to the knowledge itself 59Restrictions on the use of accessed knowledge 60Enter the capability issue 61
Complex and costly infrastructure 61Mastery of tacit knowledge 61
Standards and regulations 62Generics and semiconductors 62
The collective dimension 62Conclusion 62Notes 64
Part 2: The Policy Dimension
Chapter 6 Policy, knowledge and business innovationIntroduction 67Upgrading the policymakers’ compasses 67Innovation and knowledge systems 68
Triggering factors 69Components 69Subsystems 69Functions 69
Innovation systems development: patterns and hurdles 70Three phases in innovation systems growth 73Final reflections 74Annex 6.1: Metrics for capability-building: The case of the measurement and testing industry 76Annex 6.2: Catching-up Ireland 77Notes 82
Chapter 7 Standards, technical change and catching-up: the policy issuesIntroduction 85
Regulatory quandaries 85
Contents
General implications for prospective catching-up countries 86
Direction and strength of the influence 86Implications for standard-setting activity 87
Intellectual property rights and standardisation 88Interaction between intellectual property rights and formal standardisation 88Key aspects of an emerging conflict 89
General policy implications 90Research 91Intellectual property rights 91Standardisation 92Competition 92
Policy implications for developing countries 93Research 93Intellectual property rights 93Standardisation 93Competition 93
Standards and developing country competitiveness 94Determinants of the decision to invest in quality-related capabilities 94Characteristics specific to industries and firms 95
Size 96Foreign capital participation 96
Compliance costs 96Assessing the needs for a trade related knowledge/business infrastructure 98Final remarks 98Annex 7.1: National and international standard development activities 101Annex 7.2: The 3G Patent Platform 104Annex 7.3: Disclosure rules, licensing policy and
patent pools 108Notes 109
Chapter 8 Building Capabilities for Food SafetyIntroduction 115The driving forces 116Upgrading capabilities of the actors and institutionsin food safety 118
Interactions between the subsystems 118Building capabilities in the knowledge and policy/governance subsystems 119
Assessing the upgrading needs of food control agencies 119
Sanitary and phytosanitary measures in the development of business innovation system 121Future challenges and technical assistance needs 122Notes 123
SECTION II
A review of world industry
Introduction to this section 127
Chapter 9 Monitoring global industrial activityMeasuring ‘manufacturing income’ 129The disparate geography of industry 129
Representing industrial unevenness 130The core ranking 134
The highest quarter: the big ‘divide’ 136The second quarter: leaders of developing regions 136The third quarter: between the mid-point and Sub-Saharan Africa 137The fourth quarter: the least industrialised 137
Levels of activity and growth rates 137Manufacturing trade: the international dimension 138Notes 139
Chapter 10 Structural traits in industrial developmentSix performance indicators 141ITA: an index of industrial and technological advancement 142
Bottom-up approach 142Top-down approach 142
Patterns in industrial-cum-technological advance 143High performers 144Distant followers 145Third tier countries 146Least industrialised countries 146
Structural diamonds 146The industry dimension 148
The technology dimension 149Industrial indicators and level of development 150Notes 154Section II Annex: Statistical Notes and Tables 155
References 165Author Index 173Subject Index 177
Figures
2.1 Factor loadings: knowledge 142.2 Factor loadings: financial system 152.3 Factor loading: inward openness 152.4 Factor loadings: governance 152.5 Deviation from average GDP per capita explained by
factors (in % value and US$, 2000–2002) 162.6 Initial level of GDP per capita, PPP vs. initial stock of
knowledge (1992–1994) 172.7 Knowledge and GDP per capita (2000–2002) 182.8 Contribution of initial GDP per capita to catching-up
potential in regions (1992–2002) 182.9 Contribution of change in knowledge to GDP
per capita growth in regions (1992–2002) 192.10 Contribution of finance and change in finance to GDP
per capita growth (1992–2002) 192.11 Difference in potential growth explained by factors,
LDCs vs. East Asian tigers (1992–2002) 203.1 Catching-up experiences: East Asia 373.2 Catching-up experiences: Europe 383.3 Catching-up and falling behind 393.4 On the road to catching up? 393.5 Stagnating or falling further behind 40
UNIDO Industrial Development Report 2005
3.6 Convergence vs. divergence in GDP per capita over1960s–1990s 40
4.1 GDP per capita vs. share of natural science and engineering degrees in total first degrees (2000 or most recent year) 45
4.2 Share of natural science and engineering degrees to all first degrees (2000 or most recent year) 45
4B.1 University students per 10 000 population (1870–1920) 44
4B.2 University students per 10 000 population (1950–2000) 44
4B.3 Funding for U.S. agricultural R&D institutions (1895–1985) 48
5B.1 R&D as percentage of GDP (1997 vs. 2002 or most recent year) 63
6.1 Innovation Systems: triggering factors, components,subsystems and functions in the policy space 68
6.2 Steering the transformation of the innovation system 697.1 Technologies in the Patent-Standards-Space 917.2 Manufacturing exports and ISO 9001 certifications 957E.1 Development of product variety within a company 1099.1 Industrial output, by region (1990 and 2002) 1309.2 Global industrial inequality (1990 and 2002) 1319.3 Industrial inequality among developing economies
(1990 and 2002) 1339.4 The North-South divide in world industry (2002) 1339.5 Industrial-production levels in developing regions
(1990 and 2002) 13610.1 Six performance indicators 14110.2 Industrial-cum-technological advance, by developing
region (1990 and 2002) 14310.3 The industrial-cum-technological advance cone (2002) 14510.4 A structural diamond 14610.5 A dozen diamonds (2002) 14710.6 Advance indicators and income levels (scatter plots,
2002) 15210.7 Industrial-cum-technological advance vs. income
(estimated curves, by country size) 153
Tables
2.1 Estimated versus actual rate of growth: how much is explained by the model? 18
2A.1 Indicators and definitions 222A.2 Results of factors analysis 272A.3 Composites of social capabilities 282A.4 Regression results – income levels 302A.5 Regression results – growth 312A.6 Regression results – growth (excluding countries with
the most missing data and wars) 322A.7 The β-convergence hypothesis 332A.8 The σ-convergence hypothesis 333.1 GDP per capita over 1820–2003 (thousands, in 1990
International Geary-Khamis dollars) 365.1 Taxonomy of various forms of codified knowledge in
terms of conditions of use and conditions of access 615.2 Sources of codified knowledge and related
components of the technology infrastructure 62
6A.1 Growth of real GDP/head and abour productivity (% per year) 77
6A.2 Educational attainment of the Irish labour force (%) 776A.3 Aspects of today’s supply-side policy in Ireland 786A.4 Patenting and journal articles 786A.5 Growth of living standards (% per year) 796A.6 Real GDP and GNP per head and per hour worked
(% United States) 796A.7 Sources of labour productivity growth (% per year) 796A.8 Contributions to labour productivity growth: Ireland
vs EU (% per year) 796A.9 Revealed Comparative Advantage, 2002 796A.10 Inward FDI Stock/Person (US$) 796A.11 Sectoral Allocation of FDI Employment (2000) 806A.12 Export-Oriented FDI Projects (2002–2003) 807.1 Overview of the influence of standards on technical
change 857.2 Co-ordination mechanisms 867.3 Diffusion of quality management systems 947.4 Inter-industry distribution of quality expenditures 967.5 Certification costs 977.6 Basic and incremental STR-related expenses 977.7 Private sector views on the supply of SCA-related
services 997.8 Evolution of certification activity 1994–2004 997.A.1 Standard development activities – selected variables 1018.1 Expenditures of the food safety system institutions –
Argentina vs. Chile and USA 1208.2 Summary of SENASA’s investment needs (annual
totals, in US$ millions) 1208.3 Summary of SENASA’s investment needs (total for
five years, in US$ millions) 1219.1 Industrial output, by region (1990 and 2002) 1309.2 Industrial output: the top ten economies 1319.3 Industrial inequality, by region (1990 and 2002) 1329.4 Industrially rich versus poor economies (1990 and 2002) 1339.5 Country impact on industrial inequality (1990 and 2002) 1349.6 Industrial-production level, by region population-
weighted averages (1990 and 2002) 1349.7 Industrial-production level, by country (1990 and 2002) 1359.8 Industrial-trade level, by country (1990 and 2002) 13910.1 Industrial-cum-technological advance (2002) 14410.2 Relationships among indicators (2002) 15010.3 Indicators and income levels: correlations 15110.4 Structure, income and size with GDP per capita (2002) 151A2.1 Six indicators of industrial performance (1990 and
2002) 157A2.2 Industrial-cum-technological advance (1990 and
2002) 161
Boxes
1.1 Information and knowledge: limits to and uses of codification 6
1.2 ‘Absorptive capacity’: new wine with an old label? 114.1 Tertiary enrolment and catching-up in cross-century
perspective 444.2 The US public agricultural research infrastructure 48
Contents
4.3 R&D matching grant system in Costa Rica 494.4 Federal R&D spending and creation of IT industries 514.5 Emerging innovation system in satellite and
geographic information in South Africa 524.6 Role of public research institutions in sectoral
IS – Japan vs. Brazil iron industry 545.1 Declining trends in investment for capability-building
in developing economies 636.1 Capability-building in cutting-edge activities 706.2 Phases in IS development 716.3 A sectoral IS in the formative phase: the German solar
cell case 72
6.4 Salmon farming in Chile 736.5 Functional requirements in ‘catching-up’ countries’
emerging innovation systems 746.6 Capability-building spill-overs from FDI 757.1 Defensive bulwarks and patent ambushes 887.2 Open Source: beyond the IPR/standards conflict? 897.3 Surveying IPR and standards conflicts 907.4 The GSM case 928.1 European Commission’s new rules on hygiene of
foodstuffs and official controls 1168.2 The International Governance of SPS measures 1178.3 ISO 22000 standard for safe food supply chains 118
UNIDO Industrial Development Report 2005
In my foreword to last year’s Industrial Development Report2004 I announced that this Report would address the issue
of capability building metrics with a view to assist in the def-inition of policies and help bridge the gap between highlyquantifiable macroeconomic targets and microeconomicones which still remain highly notional and qualitative.
By placing the issue in historical, empirical and policy per-spective, this Report brings home a number of insights ofgreat importance relating to the conceptualisation, designand implementation of capability-building policies.
Developing countries enjoy the potential advantage ofbeing able to draw on knowledge that has already beendeveloped in the more advanced countries. But they confronta paradox, largely neglected in conventional policy prescrip-tions: to leverage knowledge you need to possess knowl-edge. It is not surprising that, throughout history, only a fewcountries have managed to free themselves from this para-dox and acquire the ability to catch-up – which they did alongdifferent paths, including reliance on foreign direct invest-ment, fostering infant industries while securing access totechnology through arm’s-length transactions and migratoryflows. Within this diversity, the rapid rise of their domesticknowledge systems has been a common feature.
The importance of this fact is highlighted by the finding thatalmost 60 per cent of the difference in income between Sub-Saharan African countries and the advanced industrial coun-tries can be attributed to gaps in the stock of knowledge.
In seeking to overcome this disadvantage, one crucial factto be kept in mind is that the target is a moving one. Becauseadvanced-country technologies are increasingly science-based, rights protecting their ownership stronger, and tech-nical standards more stringent, the minimum threshold capa-bilities required to take advantage of the latecomer statuskeep rising, slowly but steadily. This imposes growingdemands on developing countries’ domestic knowledge sub-systems and their interactions with the domestic businessinnovation and policy/governance subsystems. The requiredpolicies are largely outside the scope of the WTO agreements.
Policymakers facing this challenge find themselves in aquandary, because they largely lack the metrics, heuristicsand needs-assessment methodologies required to design andimplement competence-building policies. This is becauseconventional policy prescriptions have focused instead ontinkering with market-based incentives and macroeconomic
framework conditions. For all their importance, these havebecome increasingly insufficient to meet the challenges ofdevelopment.
Accurately identifying resource-allocation needs for com-petence building, particularly in the field of science and tech-nology, takes more than conventional benchmarking exer-cises, relevant as these are. Fundamentally, it involves pin-pointing the specific requirements posed to the developingeconomy, opened to international trade, capital and technol-ogy flows, that attempts to develop the technical, entrepre-neurial and management skills, as well as the institutions andpolicies that can ensure a concurrent development in thedomestic supply and demand of innovative resources.
This Report provides a framework for operational policyanalysis and a guide for the assessment of capability-build-ing needs to help overcome limitations in the current under-standing of economic development. The Report tests thisapproach by reference to technical standards and food safetysystems. Metrics and needs assessments are developed inboth respects to help bridge gaps in knowledge that affectthe innovative development of developing countries.
This approach is part of our efforts aimed at strengtheningthe role of the United Nations system in the economic devel-opment domain by contributing to redress the undersupplyof specific public goods in the fields of environment, knowl-edge and market efficiency.
Finally, I would like to leave on record how proud andrewarded I feel by the feedback on the efforts that went intothis revitalized series of UNIDO’s flagship publication.
vii
Foreword
CARLOS MAGARIÑOSDirector-General
UNIDO
viii UNIDO Industrial Development Report 2005
This Report has been prepared under the overall guidanceof Carlos Magariños, Director-General of UNIDO and the
direction of Francisco C. Sercovich. The in-house teamincluded Muge Dolun and Helmut Forstner.
Knut Blind, Nick Crafts, Jan Fagerberg, Steffan Jacobsson,Roberto Mazzoleni, David Mowery, Gabriel Sánchez, MorrisTeubal and Caroline Wagner were principal consultants. Theyprovided valuable comments and feedback. Their contribu-tions are indicated in the respective chapters. Roberto Maz-zoleni collaborated in the drafting of Part I of the Special TopicSection.
Additional inputs were provided by: Rodrigo Arocena, Ger-ardo Gargiulo, Martin Srholec, Smita Srinivas, Judith Sutz,Christian Viand, Jebamalai Vinanchiarachi and Mario Wittner.
Many of the above-mentioned participated in consultationsfor this Report, including a workshop in Vienna.
This Report benefited greatly from the University of Colum-bia Catch-up Project, led by Richard R. Nelson.
Special thanks are due to Peter Evans, Erik Iversen and DaniRodrik for their reactions on or contributions to specificaspects of the Report.
Thanks are also due to Sam Hobohm and Paul Makin, whocollaborated with proof-reading.
Eduardo Crawley was in charge of style editing.
Michelle-Anne Yap provided clerical and secretarial support.
Acknowledgements
This Report is dedicated to the memory of Sanjaya Lall, dear colleague and friend, whose untimely death on June 18, 2005 deprived the international development community from one of its most lucid members.
ix1 | Explanatory notes
Designation of least developed countries (LDCs) followsthe United Nations definitions, which is based on three
criteria: low income (less than $900 estimated GDP percapita, three year average), weak human resources (a com-posite index based on health, nutrition and education indi-cators) and high economic vulnerability (a composite indexbased on indicators of instability of agricultural productionand exports, inadequate diversification and economicsmallness).
The description and classifications of countries and territoriesused, and the arrangements of the material, do not imply the
expression of any opinion whatsoever on the part of the Sec-retariat concerning the legal status of any country, territory,city or area, or of its authorities, concerning the delimitationof its frontiers or boundaries, or regarding its economicsystem or degree of development.
The following symbols are used in tables:Two dots (..) indicate that the data are not available or notseparately reported.na is not applicable.
Totals may not add precisely because of rounding.
Explanatory notes
x UNIDO Industrial Development Report 2005
3G third generation3G3P 3G Patent Platform Partnership 3GPP Third Generation Partnership Project A*STAR Agency for Science, Technology and Research ALOP acceptable level of protectionAPSTCH Asociación de Productores de Salmón y Trucha
de Chile AGARIB Association of Radio Industries and Businesses,
JapanARPANET Advanced Research Projects Agency NetworkBBN Bolt, Beranek and NewmanBRC British Retail ConsortiumBSE bovine spongiform encephalopathyBTU Basic Transmission UnitCAD computer aided design CEO chief executive officerCEPD Council for Economic Planning and
Development CIAA Confederation of Food and Drink Industries
of the European UnionCID Centre for International DevelopmentCIM contract intensive moneyCIS Commonwealth of Independent StatesC-MOS Complementary Metal-Oxide SemiconductorCOPAL Coordinadora de Industria de la AlimentaciónCORFO Chilean Economic Development AgencyCPI Corruption Perceptions IndexCRADA cooperative R&D agreements CSIR Council for Scientific and Industrial Research CSNET Computer Science NetworkCTA Centro Técnico de AeronauticaCURL Consortium of University Research LibrariesDARPA Defense Advanced Research Projects AgencyDGBAS Directorate General of the Budget, Accounting
and StatisticsDOD Department of Defense, US DPI Database of Political Institutions DRAM dynamic random access memoryEC European CommissionECAM École Central des Arts et ManufacturesEIEC Executive index of political competitivenessEMI electromagnetic interference EPO European Patent Office ERA Engineering Research Association
ERL Energy and Resources Laboratories ERSO Electronics Research and Services Organisation ETNO European Telecommunications Network
Operators’ AssociationETRI Electronics and Telecommunications Research
InstituteETSI European Telecommunications Standards Insti-
tuteEU European Union EUREPGAP Euro-Retailer Produce Working Group Good
Agricultural PracticesEUROMET European Collaboration in Measurement
StandardsFAO Food and Agriculture OrganisationFDA Food and Drug AdministrationFDI foreign direct investmentFRAND fair, reasonable and non-discriminatoryFRC Fondo de Recursos ConcursablesG-8 Group of Eight leading economistsGAO General Accounting OfficeGAP Good Agricultural PracticesGATT General Agreement on Tariffs and TradeGDP gross domestic productGEM Global Entrepreneurship Monitor GERD Gross domestic expenditure on research and
developmentGFSI Global Food Safety Initiative GGDC Groningen Growth and Development Centre GM genetically modifiedGMO genetically modified organismsGMP Good Manufacturing PracticesGNP gross national productGPL General Public License GSM Global System for Mobile CommunicationsHACCP Hazard Analysis and Critical Control Points HDI Human Development Index IAF International Accreditation Forum IAS Argentine Institute for the Steel Industry IC integrated-circuit ICT information and communications technologyIDA Industrial Development Agency IDB Industrial Development Board IEC International Electrotechnical CommissionIFCO International Fruit Container Organisation
Abbreviations
xiAbbreviations
IFOP Instituto de Fomento PesqueroIFPRI International Food Policy Research Institute IFS International Food StandardIII Korean Institute for Information Industry IIT India Institute of Technology ILA Interim License AgreementILAC International Laboratory Accreditation IMP Interface Messaging Processor INAL Instituto Nacional De AlimentosINIA Instituto Nacional de Investigación
Agropecuaria INTA National Institute of Agricultural Technology INTI Instituto Nacional de Tecnología IndustrialIPPC International Plant Protection Convention IPR intellectual property right IPTO Information Processing Techniques Office IPTS Institute for Prospective Technological Studies IRAM Instituto Argentino de Normalización y Certifi-
caciónIRMM Institute for Reference Materials and Measures IS innovation systems ISIC International Standards Industrial
ClassificationISO International Standardisation Organisation ISO/TMB International Standardisation Organisation
Technical Management boardIT Information technologyITA industrial-cum-technological advanceITP Innovation and Technology Policy ITRI Industrial Technology Research Institute ITU International Telecommunication UnionJAPIA Japan Auto Parts Association JITAP Joint Integrated Technical Assistance Pro-
grammeJLA Joint License Agreement JPO Japan Patent Office KAIST Korean Advanced Institute of Science and
Technology KIET Korea Institute for Electronics TechnologyKIMM Korea Institute of Machinery and Materials KPN Koninklijke PTT NederlandKRISS Korean Research Institute on Standards and
Science KSA Korean Standards AssociationLA Licensing AdministratorLDC least developed countryLIEC legislative index of political competitiveness LIUP Local Industries Upgrading ProgrammeM&T measurement and testingMCR Maximum Cumulative Royalty MENA Middle East and North AfricaLAC Latin American and Caribbean countriesMIC Market Intelligence CenterMICIT Ministry of Science and Technology MIT Massachusetts Institute of TechnologyMITI Ministry of International Trade and Industry MNC multinational corporation MOEA Ministry of Economic Affairs
MSTI Main Science and Technology IndicatorsMVA manufacturing value addedNBER National Bureau of Economic ResearchNBS National Bureau of Standards NIC newly industrialised countriesNMI national measurement institutions NSB National Science Board NSC National Science Council NSF National Science FoundationOBM original brand manufacturing ODI Overseas Development InstituteODM original design manufacturing OECD Organisation for Economic Co-operation
and DevelopmentOEM original equipment manufacturing OIE Office International des EpizootiesOLS ordinary least squaresOS open sourceOSS open source system PC personal computersPCR polymerase chain reaction PFI Integrated Fruit ProductionPPP purchasing power parityPSD private sector development PSTN public switched telephone network R&D research and development RICYT Red Iberoamericana de Indicadores de
Ciencia y TecnologíaRMV Reference Market ValueROHS Reduction of Hazardous Wastes InitiativeRTD research and technological developmentS&T science and technologySAC Satellite Applications Centre SAG Servicio Agrícola y Ganadero SCA standards and conformity assessmentSCONUL Society of College, National and University
LibrariesSDO standard development organisationsSEMATECH Semiconductor Manufacturing TechnologySENASA Servicio Nacional de Sanidad y Calidad
AgroalimentariaSERNAPESCA National Fisheries Service SIS sectoral innovation systemSLA Standard License AgreementSMEs small- and medium-sized enterprisesSMS short message servicesSPS Sanitary and Phytosanitary MeasuresSRR Standard Royalty Rate SSA Sub-Saharan AfricaSTDF Standards and Trade Development Facility STR standards and technical regulationsTCP/IP Transmission Control Protocol/Internet
ProtocolTFP total factor productivityTFT-LCD Thin Film Transistor Liquid Crystal DisplayTIA Telecommunications Industry AssociationTNC transnational corporationTPG Technological Public Goods
TRIPS Trade-Related Intellectual Property RightsTSMC Taiwan Semiconductor Manufacturing
CorporationTTA Telecommunications Technology AssociationTTC Telecom Training CentreUAE United Arab Emirates UIPA UMTS Intellectual Property Association UK United KingdomUL Underwriters LaboratoryUMC United Microelectronics Corporation UMTS Universal Mobile Telecommunications SystemUN United NationsUNCTAD United Nations Conference on Trade and
DevelopmentUNDP United Nations Development ProgrammeUNESCO United Nations Educational, Scientific and
Cultural OrganisationUNIDO United Nations Industrial Development
Organisation
UNSD Statistical Division of the United Nations Secretariat
US United StatesUSAID United States Agency for International
DevelopmentUSDA United States Department of Agriculture USTPTO United States Patent and Trademark Office UTRA UMTS Terrestrial Radio AccessVLSI very large scale integrationVTFS Vocational Training Fund StatuteWBTBTS World Bank Technical Barriers to Trade
Survey WEEE Waste Electrical and Electronic EquipmentWEF World Economic ForumWHO World Health OrganisationWIPO World Intellectual Property Organisation WTO World Trade OrganisationWWI World War IWWII World War II
xii UNIDO Industrial Development Report 2005

Section I Special Topic: Capability building for catching-up
Much of the recent debate on economic development policyfor low- and middle-income economies has operated in avacuum of evidence about the factors that weigh most deci-sively in their ability to catch-up with the more developedeconomies. It is widely accepted that the new internationaltrade rules significantly constrain the degrees of freedomavailable to developing-country policymakers in their questfor successful economic catch-up. However, the efforts tobridge that gap have overwhelmingly emphasised market-based incentives or macroeconomic framework conditions.Tinkering with policy on this plane has often happened at theexpense of a broader perspective and policy design incorpo-rating genuine needs assessment for domestic capabilitybuilding and private sector development.
This year’s Industrial Development Report focuses on anumber of structural issues that have passed largely unno-ticed and where substantial degrees of freedom remain fordomestic policymaking vis-à-vis the international trade rules.Its key concern is the building and co-evolution of domesticinstitutions that promote innovative economic and socialdevelopment. Its approach is based on the understandingthat, in a world increasingly driven by innovation, the frame-work conditions indispensable to economic catch-up arebeing transformed, and this calls for updated responses. Thetransformation that business needs in order to rely on inno-vation as a competitive weapon cannot be delivered solely bymarket-based incentives or the supply of generic publicgoods such as macroeconomic stability, the rule of law, andfunctioning financial markets. The specific policies requiredto build capabilities within the knowledge, business and pol-icymaking/governance subsystems largely fall below theradar of WTO agreements.
Catching-up is never a case of straightforward adoption orimitation of industrial technologies or institutions fromadvanced countries. This, as strongly suggested by the evi-dence compiled over more than a hundred years on the insti-tutional and policy strategies associated with successful eco-nomic catch-up and development, reflects the considerablesectoral, geographical and cultural diversity in play. Since
knowledge is hard to move around, as much of it is people-embodied and context-specific, domestic capabilities are cru-cial to the adaptation of industrial technologies, policies andinstitutions to a different economic environment. The trendtowards increasing codification of knowledge does not lessenthe need to build domestic capabilities to access and use it.
Past catching-up experiences – assessed in the first fivechapters – reflect the variety of institutional mechanismsavailable to support the accumulation of technological capa-bilities. Some countries have relied extensively on multina-tional corporations, others on protecting domestic infantindustries while securing access to technology through licens-ing, and still others on the immigration of skilled personnelto foster the dissemination of technological knowledge. Butbeyond this variety, the successful catching-up experiences ofthe past display some commonalities. One common featureis a rapid increase in the level of education and an emphasison higher education in science and engineering. Another isthe creation of public institutions to conduct industrialresearch and provide services to industrial firms. Last, but notleast, important benefits were drawn from relatively unfet-tered access to S&T knowledge through the participation ininternational networks of scientific and engineering compe-tence, and often from weak, if any, enforcement of IPRs onexisting technology.
Taking stock of the above, the Report provides a frameworkfor operational policy analysis and a guide for the assessmentof capability building needs to help overcome evident limita-tions in the current understanding of economic development.Thus, the Second Part of the Special Topic focuses on theinteractions between the knowledge, business innovation andpolicymaking subsystems, and addresses the policy capabili-ties needed to match the demand and supply of innovativeresources – one of the most intractable problems still plagu-ing policymaking in the developing world. Two specific areas,standards and food safety, are explored to highlight theseinteractions and test the suggested policy analysis framework.
The pivotal role of technological capabilities anddomestic learning systems
Technological capabilities are crucial to national economicperformance – all the more so due to the introduction ofstronger IPRs, regulatory harmonisation and standardisation,
xiiiExecutive Summary
Executive Summary
and the worldwide spread of emerging science-based indus-trial technologies. In the Doha Round era developing coun-tries’ prospects for catching-up with more advanced coun-tries in productivity and income hinge increasingly on theirability to rapidly build up competences. This places domesticknowledge systems at the core of industrial developmentstrategies. This is not new, but has acquired far greater impor-tance in recent times.
Owing to the cumulative nature of learning, differences inthe rate of accumulation of technological capabilities have aninherent tendency to translate into gaps in economic prosper-ity across countries. Narrowing these gaps has required sus-tained catch-up efforts of various kinds. Pivotal among theseefforts has been the swift accumulation of technologicalcapabilities. Contrary to views once popular among econo-mists, domestic knowledge generation has been a requisiteof catching-up. Tapping into the global pool of knowledgeand building domestic knowledge systems go hand in hand.
Collective learning, both within single organisations and atmore aggregated levels, is a vital feature of domestic compe-tence building. Indeed, the effectiveness with which a firm isable to participate in and benefit from the generation of tech-nologies is largely given by factors that lie outside the scopeof the individual enterprise. The institutional environmentwithin which a firm operates determines its incentives andopportunities and thus affects the scope of the capabilities itneeds to master. The intervening factors include incentives toinnovation, conditions of access to various kinds of inputs(including finance, skills and knowledge) and to relevantmarkets and regulatory requirements. Behind many of thesefactors lie the capabilities of a multiplicity of organisations,including input suppliers, educational and training institutions,research organisations, financial institutions, regulatory agen-cies and specialised service providers. Clearly then, both thequality of firms’ technological capabilities and the scope foracquiring new capabilities can only be properly understood byconsidering the context within which both are shaped. Theprocess of competence building is hence not only cumulativeat an individual level but also systemic in character.
Effective public policies must aim not just at creating a func-tional S&T infrastructure adapted to the specific needs of theproductive sector, but also at enabling the emergence ofdomestic demand for technological capabilities. In the privatesector of the economy such demand depends on how farbusiness firms internalise innovative activities as a key ingre-dient of their competitive performance. This critical pre-con-dition entails addressing the interplay and complementationbetween the incentives framework and the services of the S&T
infrastructure, on the one hand and, on the other, the impactof various kinds of externalities (technological, informational,coordination) on companies’ ability to conduct the risky busi-ness of exploring new production areas and new markets.
Critical factors for catching-up: assessing the evidence
The idea that social capabilities lie at the heart of economicdevelopment processes is not new. Until recently, however,
attempts to rigorously assess the critical factors affectingcatching-up potential – a precondition for effective policydesign in developing countries – were handicapped by insuf-ficient data and lack of relevant metrics.
The Report shows that this gap can be narrowed by apply-ing factor analysis to recently collected data, by discerningbroad dynamic trends for a cross-section of countries andidentifying factors that affect growth.
Overall, the variables considered depict various facets oftechnological capability, institutions, policies and geography,which are broadly aligned with various theories of growthand convergence found in the economic literature. Whencommon vectors underlying these variables are extractedfrom the data, five composite factors emerge. The first oneis knowledge, by far the most important one, comprising vari-ables highly correlated with the creation, diffusion and useof knowledge, such as R&D and innovation, scientific publica-tions, ICT infrastructure, quality management and education.The second factor is inward openness, which comprises indi-cators of import trade and inward FDI. The third factor, finan-cial system, concerns overall aspects of market capitalisation,country risk and access to credit. Together with governanceand the political system, as well as a range of control variablescovering geography and history, these factors are used toprobe the issue of catching-up empirically.
As expected, social capabilities – including knowledge,governance and financial structure – are found to be posi-tively and significantly associated with development level.The stock of knowledge seems to be a major source of dif-ference in income levels across regions in 2002. Most strik-ingly, almost 60 per cent of the difference in income levelbetween Sub-Saharan African (SSA) countries and the indus-trialised countries can be attributed to the difference in thestock of knowledge. However, low current levels of socialcapabilities do not necessarily mean that low-income coun-tries are doomed to stay poor.
In fact, initially low levels of development (measured eitherin terms of income or knowledge stock) can signal a largerpotential for faster growth and catch-up. Whether this poten-tial for catching-up is or not realised depends on the rapidaccumulation of capabilities. Low-income countries can beexpected to grow more than two percentage points fasterthan the rich ones, other conditions (such as knowledge andgovernance) being equal. However, these other conditions areoften not equal: the developing countries’ higher potential fortechnological catch-up may be more than offset, for instance,by the better quality of the financial system and faster growthof knowledge in the rich countries. Hence, the difference in GDP
per capita between rich and poor countries may end up widen-ing rather than narrowing. In other words, in addition to fac-ing the challenge of coordinating capability building policiesacross a wide range of areas, developing countries must alsokeep adjusting their aim to a moving target, due to the rapidgrowth of capabilities within rich countries.
Although the initial gap in income suggests a greatergrowth potential for the least developed countries, in themodel used in the Report this is actually more than offset bythe other factors taken into account. The result is a growth
xiv Industrial Development Report 2005
rate 2.1 percentage points lower than that of the successfulindustrialising countries of East Asia. The three factors cited –the financial system; governance; and the knowledge gap, agood proxy for overall social capabilities – account for approx-imately 80 per cent of the income growth differentialbetween the two regions.
Empirical evidence presented in this Report suggests thatcountries wishing to strengthen their competitive positionand to catch-up need to invest steadily in the generation ofknowledge. This is a clear priority for development, but it isnot sufficient. Well-developed knowledge capabilities needto be supported by an enabling environment such as a well-working financial system and governance capabilities. Thehistorical and descriptive evidence presented in Chapters 3and 4 provide further insights into the role of domestic capa-bility building in catching-up.
Catching-up and falling behind: accounting for success and failure over time
What determines success or failure in the bid to catch-up?This question has intrigued policymakers, academics andindustrialists for more than a century. At the extremes, thelong-run trend since the Industrial Revolution seems to betowards divergence, not convergence, in productivity andincome. But, in accordance with the empirical evidence pro-vided above, what history shows is that in the few countriesthat have managed to catch-up with, even overtake, theleaders at different points in time, the key driving forces weretechnology and the environment that fosters it.
Data on per capita income across countries and regionssince 1820 shows a long-run tendency towards divergencein the global economy. Not only have high-income countriesgrown faster on average than those with low income, but thedistribution has also widened, so the gaps between the rich-est and poorest have grown. While the period between 1820and 1950 was one of divergence in economic performancebetween the leading advanced countries, the decades thatfollowed were characterised by ‘club convergence’ in incomeand GDP per capita among the industrialised economies, andfurther divergence between them and the lower-incomeeconomies. In particular, this tendency seems to have gainedmomentum after 1980.
Probably the most striking feature of the long-run evidenceis the great variation in performance between countries withcomparable initial levels of productivity and income. Thatsaid, the data helps to distinguish clearly between fourgroups of countries: ● countries that, having started with high level of initial
income, are still moving ahead with high growth rates, ● high-income countries that have started to lose momentum, ● countries that, having started with low levels of income,
enjoy high growth rates and are in the process of catching-up, and
● countries that are falling further behind.
Productivity catch-up requires higher-than-average growthfor a sufficiently long time. How long this period must be
depends on the size of the initial gap with respect to thetarget level. However, the aim of catching-up efforts cannotbe expressed solely as that of achieving higher-than-averagelevels of GDP per capita. In order to better account for patternsof convergence and divergence, it is necessary to undertakea historical assessment of institutional developments thathave influenced the accumulation of technological and socialcapabilities in catching-up countries.
Role of knowledge systems in catching-upexperiences
The diversity of growth processes at the country level reflectsdifferences in institutional patterns, interactions between thesocial actors and the pace at which social and technologicalcapabilities have been accumulated. A privileged vantagepoint to assess the role of institutions in catching-up scenar-ios is that of focusing on the components of domestic knowl-edge systems such as higher education, technical and voca-tional training, research, technical associations, standards,metrology and technical regulatory bodies and institutionsthat support the interactions between training and researchactivities in the public sector and the formation of entrepre-neurial and technological capabilities in emerging industries.
The institutional evolution of domestic knowledge systemsin countries such as Germany, the US and Japan in the 19th
century as well as in Taiwan Province of China and the Repub-lic of Korea more recently illuminates the role of collectivecompetence-building in economic catch-up. In all these casessignificant institutional adaptation and innovation took placein response to particular local conditions. Amid the resultingdiversity, however, important similarities are found, whichprovide useful lessons for contemporary policies. The successof the respective policies often relied on achieving a balancebetween rapid accumulation and enhancing the demand fortechnological skills and capabilities.
Since the 19th century catching-up experiences have ofteninvolved significant increases in enrolment in tertiary educa-tion – especially in science and engineering fields – as well asimportant adaptations to the needs of emerging industrialsectors. Not only was access to education greatly broadened,but also the scope of academic education, both by advancesin natural science research and changes in attitude towardsprofessional training. The international movement of stu-dents made another important contribution to the spread ofS&T during the 19th and 20th century, coupled with movementsof skilled industrial personnel. These changes coincided withthe emergence of science-based industries – such as chemi-cals and electrical equipment – and of formal R&D laborato-ries in firms in these industries, both of which had an impacton the concept of the contribution expected from modernuniversities. Public policies and especially public fundingoften helped bring about greater closeness between indus-trial practice and academic education. The experiences fromcountries such as Japan and the US show that, while it isimportant to ensure continuity and pertinence, it is alsonecessary to strike a balance between supporting researchthat responds to the current needs of industry and making
xvExecutive Summary
sure that part of the funding is allocated more flexibly toresearch with potential future returns.
Creating a domestic supply of scientists and engineers maynot be sufficient to induce the emergence of private sectordemand for their knowledge. Particularly during the earlyphase of industrial development, the creation of an effectivetechnological infrastructure is likely to require a set of com-plementary policies and institutions to support private entre-preneurial efforts. A crucial determinant of an effective rela-tionship between university and industry is the degree ofresponsiveness of educational curricula and activities to theemergence of new areas of industrial technology or spe-cialised sectors. This often entails establishing effective net-works between institutions of higher education, technicaland vocational training, research units, technical associationsand industry.
Competence building policies in Taiwan Province of Chinaand the Republic of Korea provide useful examples of thedesign of institutions and investment in capabilities for whichthere is little initial demand. Imbalances in the national sup-ply and demand of skilled personnel in these economies wereremedied through private-sector development and policiesthat struck a balance between catering to current needs andanticipating the future needs of industry. Particular attentionwent to the efforts of public research labs in transferring anddisseminating technology – such as ITRI in Taiwan Province ofChina and KIET in Republic of Korea.
The scope of the contributions of universities and publicresearch institutes to capability building in a sector mustevolve in tune with the nature of the technological activitiescarried out by national firms, their access to other sources oftechnological knowledge, and the structural characteristicsof the evolving industry. Skill formation in the private indus-trial sector has been a critical component of the technolog-ical capability building efforts in virtually all catching-upcountries. Public policy has often helped to shape theseefforts, both by means of legislation on accreditation andcertification and by encouraging skill formation through theuse of levies and incentives. Another institutional set-up forwhich a wealth of experience exists is the establishment ofindustry research organisations such as the EngineeringResearch Associations in the UK and Japan, which wereimportant means of raising technological capabilities acrossthe board in a given industry by facilitating the exchange oftechnical information and the creation of opportunities forrisk and cost sharing between participants. Entrepreneurshipdevelopment policies, including incubator programs andventure capital support can also, given appropriate frame-work conditions, greatly assist in encouraging innovativeactivity.
The role played by standards, quality and metrology insti-tutions in the formation of innovation systems is a muchunder-studied aspect of technological infrastructure. Chap-ter 4 closes with a review of the role of such infrastructure inthe recent catch-up experiences in Taiwan Province of Chinaand the Republic of Korea, which suggests that the capabil-ities embedded in these institutions can also promote indus-trial deepening and technological catch-up.
Accessing and mastering knowledge
Unequal access to codified information has been at the cen-tre of public debates on the so-called knowledge divide.These debates have coincided with an explosive growth in thestock of codified S&T knowledge. The amount of new infor-mation stored on various forms of media doubled between1999 and 2002, implying a 30 per cent yearly growth rate.Information flows through electronic channels have alsoincreased at breathtaking speed, a phenomenon fuelledpartly by the growth in the number of Internet users and theamount of information stored on the web. What is the poten-tial significance of this trend for developing countries’ strate-gies and prospects?
Specific features of these trends create challenges andopportunities for developing countries, whose developmentprospects are at least partly defined by their ability to adoptand adapt technologies (physical and social) originated else-where, that is, their ability to learn to apply S&T knowledge tothe implementation of locally innovative economic activities.This in turn depends on the systematic nurturing of indige-nous technological capabilities and the development of adomestic technology infrastructure, which can foster greateraccess to the available sources of codified knowledge.
Developing countries face two kinds of challenges in thisrespect. The first one arises from barriers to access that oftenaccompany the codification of knowledge, imposed by thesources of that knowledge. Among these, pricing is pivotal.The second challenge is posed by the limitations on the useof codified knowledge, even when access is granted. Accessto codified knowledge may be opened, but IPR enforcementmay substantially restrict its use.
From a developing country’s standpoint, the impact of theTRIPS agreement results from a balance between two forces:the marginal impact on domestic learning and innovativeactivities from increased access to patent disclosures, and theconsequences of the creation or strengthening of IPRs oninward technology transfer. With respect to the former, theeffect can be expected to be more significant for patentingactivities by resident firms or individuals than by foreign hold-ers. As to the latter, stronger IPRs protection might curb activ-ities of reverse engineering and imitation of foreign products,but it might also support technology transfer activities struc-tured around licensing agreements.
The capabilities required to take advantage of codifiedknowledge depend on the intended uses of the knowledge tobe acquired. These may range widely, from merely transmittingit to third parties to reproducing it in an experimental setting.There are also differences across sectors regarding how perva-sively codified knowledge is available as a carrier of commer-cially useful technology, and how complex are the capabilitiesrequired by the potential users of available knowledge.
Questions arise as to why dissemination is difficult, whyadvances in scientific knowledge do not lead immediately tonew technological applications, and why the effectiveness ofboth processes varies significantly across sectors. Two funda-mental explanations have been put forth. The first one is thatthe output of scientific research is not information that can
xvi Industrial Development Report 2005
be used at trivially low costs in the production and implemen-tation of new technology. Scientific activity relies on a com-plex enabling infrastructure. Second, the mastery of tacitknowledge affects the efficacy of technology disseminationprocesses across firms or countries. (e.g. standards and tech-nical regulations, generic drugs and semiconductors)
The capabilities required for exploiting various forms ofcodified knowledge reside only partly within any given firm.A distinctive feature of an innovation system is the presenceof multiple, interacting actors and institutions, whereby firms’capabilities are enhanced by access to those of other actorsin the system. The extent to which developing country firmscan access and use available sources of codified knowledgedepends on the diversity of the collective skills and capabili-ties they can rely upon in order to introduce locally innova-tive technologies. A remarkable mismatch is to be noted,however, between the increasing recognition of the need fordomestic knowledge systems and a quite generalised recentdecline in the allocation of resources to capability building inmost of the developing world. This trend runs contrary to thatfound in the experience of the successful catching-up coun-tries highlighted above.
Policy, knowledge and business innovation
In modern societies development and economic welfare reston the permanent creation and destruction of knowledge.Rapid acquisition of new knowledge is fundamental tosuccessful economic performance. Seizing opportunities forcatching-up depends on the systematic mastery of knowl-edge and skills. This mastery does not develop more thanminimally unless societies invest in acquiring it.
Competence building has yet to be given the centre-stageposition it warrants both in the formulation of developmentpolicies and in the conceptual framework underlying thesepolicies. This is because, first, theoretical considerations pro-vide a very limited guide for policy and, second, there is adearth of appropriate tools, metrics, heuristics and needs-assessment methodologies.
Although few would dispute that economic restructuringand productivity growth are increasingly driven by innova-tion, conventional policy approaches still do not adequatelydeal with this reality, particularly with the need to match thedemand and supply of innovative resources. While the pricesystem understates the demand for innovation because mar-kets tend to under-reward innovation, system weaknessesoften block the supply skills and expertise as well as theirapplication to innovative activity.
A major inadequacy of conventional policy approaches todevelopment stems from the insufficient attention paid to thedynamic correspondence between competence building poli-cies and private sector development. Policymaking to fostereconomic transformation from this perspective still awaitsformulation both in terms of a general framework and of spe-cific guidelines.
The capability approach provides a privileged vantage pointto address these issues. In articulating such an approach forthe emergence and growth of innovation systems (IS) in
developing economies, key phases of transformation need tobe identified.
As poor countries get richer, sectoral production andemployment become less concentrated and more diversified.This pattern lasts until fairly late in the development process.Then, incentives to specialise take over as the major force.Beyond a few specialised, export-oriented activities, a similarpattern can be expected in the allocation of resources totechnological effort where technological learning tends firstto spread across a broad range of activities, to becomeincreasingly specialised and differentiated as the economyattains higher levels of development. Once business enter-prises, along with complementary agents, have acquiredbroad-spectrum innovative competences, can they afford toseek more specialised innovative capability developmenttracks.
Information externalities, asymmetries and complementar-ities call for non-market interventions to overcome hurdles inthe process of innovative development. These hurdles giverise to various kinds of mismatches in the pace of advance ofcapability building in the domestic knowledge, the businessinnovation and the policy/governance subsystems. Onlywhen these subsystems advance in step does a potential forcatching-up emerge. This potential normally develops alongsectoral lines, in the context of conducive overall frameworkconditions, including those relevant to economy-wide inno-vative capability development.
Three phases can be discerned in IS growth. They consistin: first, establishing threshold conditions for the emergenceof IS; second, promoting innovation-based growth; and third,prompting the growth of differentiated and specialised func-tions to generate systemic innovative responses to emergingopportunities. As we move across these phases, strategic pri-orities shift from stimulating generic innovative skills in thebusiness sector to generating a critical mass of innovativeSMEs, to the emergence of a venture capital/private equityindustry market. Similarly, the private sector’s share of totalR&D increases, whereas the emphasis of the support infra-structure shifts from basic vocational training, informationdiffusion, metrology and standards to fostering specialisedinfrastructures and frontier technologies.
The experience of Ireland and the successful Asian catch-ing-up countries highlight the fact that, although the respec-tive strategies may differ in their degree of reliance on FDI andways of mastering technology and skills, catching-up ishighly unlikely to take place in the absence of openness tointernational trade, investment and technology flows. Devel-oping-country policymakers must operate under severelimitations that did not exist back in the 1970 and 1980s,particularly those relating to stronger IPRs and the prohibitionof export subsidies. These constraints do pose very stringentdemands on the ability to assimilate technology and toexport. However, the loss of policy autonomy ought not beexaggerated.
The crucial constraint on the pursuit of catching-up policiestoday resides in the national capability to articulate the co-evolution of the domestic knowledge, business innovationand policy/governance subsystems so as to move IS forward.
xviiExecutive Summary
The emergence of this capability depends essentially on indis-pensable domestic factors such as social consensus andframework conditions. These conditions are not confined tothe generic public goods of the conventional discourse(macroeconomic stability, rule of law, good governance) butalso comprise stimuli to technological capability formationand innovative development.
Standards, technical change and catching-up
Technical standards help focus the direction of technologicalsearch efforts by limiting product diversity and speeding upselection. This entails the need for policy to watch the bal-ance between gains in innovative efficiency and reductionsin the necessary degree of diversity of innovative endeavours.
The ensuing challenges for policy are not trivial. Forinstance, a new technology may have a lower potential forimprovement than an old one it intends to replace, or thecosts of shifting to a new, more promising technology, maybe perceived as higher that those of continuing with the oldone. As policymakers are rarely able to anticipate technolog-ical change and time their decisions optimally, they are nor-mally left with the responsibility of creating appropriateframework conditions for standardisation, letting privatecommittees manage the standard-setting process.
The nature of the incentives provided by standards and IPRs
differs sharply. The former are largely market-driven devicesfor collective processes of innovation convergence, whichpromotes selection, while the latter are aimed at rewardingindividual inventions, thus fostering diversity. Since they influ-ence the trade-offs between the public and private dimen-sions of knowledge differently, a potential for conflict ensues.Such is the case when applying standards requires the use ofproprietary technologies with high patent and standardsintensities.
While potentially moving towards the coordination of tech-nologies, standardisation has also been taking a more pivotalrole in the knowledge-creation process. The influence of IPR
pooling is heightened by the increasing intensity of patent-ing in particular areas such as mobile telecommunicationsand semi-conductors. The ensuing effects on the use of IPRs
and standards, combined with trends such as market integra-tion across borders, convergence of technologies and theincreasing pace of technological change have put them on acollision course.
IPRs and standards may be designed to complement oneanother, thus fostering the creation and diffusion of knowl-edge; or IPRs may be used to block standards; or the conflictsmay be mitigated by efficient licensing mechanisms such asequitable patent-pool schemes allowing IPRs to be factoredinto standards without infringing property rights. This is anemerging intermediate scenario.
The key conclusion coming out of this analysis is that onlyfirms that possess technological assets to trade will be placedin a position to exert influence on the outcome.
From the perspective of countries attempting to catch-up,actual disadvantages in this field may be offset, at least par-tially, by paying particular attention to the early integration
between R&D and standardisation activities at the project,program and institutional levels. A window of opportunity inthis respect arises when building up new research and stand-ardisation capabilities, in contrast with the often broken-upsystems in industrialised countries, which are just beginningto address the problem.
The extent to which developing country domestic firmscan influence the specification of international standards willdepend largely on the quality of their own patent portfolios.
As technological pace-setters, advanced countries exertgreat influence on developing-country standardisationprocesses. Yet, involvement by developing-country experts ininternational standard-setting activities contributes to enrichtheir tacit knowledge – in addition to the access to codifiedknowledge that the standards themselves entail. However,these experts cannot be expected to exert much influenceover them. While accounting for the overwhelming majorityof ISO members, for instance, developing countries account forjust three out of the 12 members of the Technical Manage-ment board and are responsible for barely five per cent of itsTechnical Subcommittees, which set policies, actions and stand-ards. In contrast, the US, Germany, the UK, France and Japanhold among them 65 per cent. The remaining 30 per cent isheld by other developed nations. Nevertheless, active involve-ment in international standardisation processes may contributeto developing countries’ awareness about developed-countrypreferences. Since standards are shaped not just according totechnological requirements, but also to market needs andusers’ preferences, this may ultimately have a knock-on effecton the final specification of international standards and on thecompetitiveness of developing-country firms.
From a developing, potential catching-up country stand-point, the information and the practices and routines entailedby standards (particularly those relating to quality manage-ment) are an input for improved competitiveness, credibilityand reputation. As is only to be expected for the case of astandard-follower country, this occurs pretty much across theboard, rather than just in frontier technology areas. Becauseof the very recent and rapid diffusion of public technical stan-dards in developing countries, governments have a key rolein helping set up the necessary standards and conformityassessment infrastructure as part of the threshold frameworkconditions for private-sector development. An efficient infra-structure of this kind, still largely absent in most of the devel-oping world, is indispensable to offset the competitive disad-vantages suffered by manufacturing firms from latecomercountries.
Standards are also important for developing countriesembarking upon high-technology sectors whose productsand services are becoming rapidly diffused globally. Adoptionof standards in this case may entail important trade-offsrequiring careful monitoring of technological trends.
Because of the different role of standards in advanced anddeveloping economies, the policy implications also differgreatly. While in the former public policy issues are largelyabout stimulating the private sector to better handle the pro-duction and distribution of knowledge by means of the nec-essary institutional innovations, in the latter they are essen-
xviii Industrial Development Report 2005
tially about investing in capability building and in creating theincentives and institutions for the development of a respon-sive standards and conformity-assessment infrastructure tohelp enhance firms’ quality management and internationalcompetitiveness. Only in very few cases are potential catch-ing-up countries beginning to play a role in standard-settingin emerging technology fields. This experience may show theway for the countries that follow and for that reasons it callsfor close monitoring.
Building Capabilities for Food Safety
Forty per cent of world trade in agricultural products (US$583billion in 2002) comes from developing regions (WTO, 2003).While the international debate has largely focused on thecontroversy over agricultural subsidies in trade negotiations,much less attention has been paid to the capability buildingneeds of developing countries in the face of ever more strin-gent requirements to the trade in agricultural products. Asthe volume of international trade in agricultural productsoriginating from developing countries suggests, much is atstake, even after discounting the effect of trade distortionscreated by subsidies.
The ability to compete in agricultural and food products isincreasingly about meeting safety, quality, and environmen-tal requirements (above and beyond price and basic condi-tions). In the last decade, changes in how the risks involvedin the food chain are perceived by the public and approachedby the scientific and policymaking community have resultedin increasingly stringent standards and regulations. Not onlyis there greater scrutiny of production and processing tech-niques, but there are also stricter traceability and labellingrequisites across the food supply chain. While most SPS meas-ures, such as those relating to human health and safety, areembodied in technical regulations, there is also a discernibleupward trend in the development of private standards, asretailers in developed economies, motivated by commercialstrategies of mitigation and differentiation, impose condi-tions along the supply chain.
While many in the developing countries perceive theincreasing requirements as a potential and significant barrierto trade, the ability to raise capabilities in this field also pre-sents a major opportunity for upgrading and catching-upwith other high-value food-exporting developing countries.Unfortunately, while costs are immediate and easy toaccount for, the benefits from compliance tend to be muchmore difficult to ascertain. Since SPS compliance is also a‘moving target’, the three subsystems of the IS – the knowl-edge, the business innovation and the policy/governancesubsystems – need to co-evolve to keep up with changingdemands.
In order to continue to trade, developing countries need toenhance private firms’ ability to comply with these require-ments as well as strengthen the institutional infrastructure,that helps demonstrate compliance. SPS-related risks are oftennot limited to one stage of production or processing. Dealingwith such complex challenges in a dynamic context requiresmore than adopting good practices and new technologies –
it involves raising domestic capacity to interact with the inter-national system, enhancing the knowledge base, buildinglegitimacy and trust in the domestic institutions and guidingthe direction of search, experimentation and market-buildingfor a growing business innovation system.
Since the requirements of a well-functioning SPS system arerelatively complex, it would not be realistic to expect that allthe actors and sub-sectors in developing economies (andespecially the least developed ones) to evolve concurrently ina smooth fashion and to achieve sufficient capabilities toundertake a decisive approach to food safety in a short periodof time. In fact, even in semi-industrialised economies withdeveloping IS, growth of capabilities in the food safety areaare uneven.
As a result, interventions are required not only at the finalproduct-testing level but also upstream of the supply chainfor effective quality and food safety control. This involves: ● Building policymaking capabilities, including the updating
of legislation to enable food safety control agencies torespond to current challenges that go beyond basic controlof hygiene and supporting participation in internationalstandard setting and planning activities. Critically, the wayin which risk management is handled by food safety insti-tutions and reflected in relevant legislation can drasticallyenhance or diminish the potential for technological andentrepreneurial innovation in the private sector.
● Reinforcing the technological capabilities within the insti-tutions of the domestic knowledge subsystem, particularlythose of the food standards and quality control agencies,through investments to upgrade their testing and measure-ment, risk analysis and certification capacity, R&D efforts, ICT
resources, training and organisational changes forenhanced performance.
● Setting and fine-tuning public-private cooperation for theeffective functioning of the food safety system. This islargely due to the need to adapt the technologies to localconditions, so catching-up in this area requires indigenouscapabilities to co-evolve within the firms as well as withinthe technological support infrastructure to help absorb andadapt necessary technologies to the local needs.
● Helping to build capabilities in the private sector to dealwith increasingly stringent standards and to gain compet-itive advantages. The business innovation subsystem is acritical but often the weakest component of an emergingdeveloping-country IS. An emerging IS assumes a thresholdlevel of technical competence such as those required tointroduce new production methods to comply with SPS
measures and other requirements involving technologicalchoices, in addition to financial resources and legal/techni-cal knowledge about how to access low-cost technologiesand transfer them. Support to the business sector shouldpromote experimentation and new market formation byenabling investments in HACCP, GAP and GMP, informationsystems for traceability and labelling, and uptake of envi-ronmental technologies.
A UNIDO-sponsored needs assessment exercise conducted incooperation with SENASA (Servicio Nacional de Sanidad y Cal-
xixExecutive Summary
idad Agroalimentaria) in Argentina reveals cost estimates ofthe upgrading needs of the Agency based on reactive andproactive strategies. The investments in the case of the reac-tive scenario would require US$53.4 million over five yearswhereas the proactive scenario would require US$ 133.6 mil-lion. These figures represent increases of 32 per cent and 80per cent, respectively, on the current budget of US$33.5 mil-lion. While some one-off investments are required initially toupgrade existing capacity, recurrent expenditures are alsorequired to ensure that dynamic capabilities are built to man-age emerging needs. Such resource mobilisation is a neces-sary but not a sufficient condition to build a legitimate andtrusted institution, which requires significant policy/govern-ance capabilities as well as effective links with the businessinnovation subsystem.
Comparing the assessed needs of a single country with theUS$65 to 75 million spent worldwide by bilateral and multi-lateral agencies in recent years to build trade-related capaci-ties, it is clear that there is a strong rationale for significantlyextending and improving the delivery of international tech-nical assistance for specific supply-side constraints and con-formity with requirements.
Section II A Review of World Industry
The review focuses on salient features of global industrial per-formance during 1990-2002. Quantitative assessments areobtained by the use of six industrial indicators. The narrativeaddresses industrial performance in three dimensions: activ-ity, industry and technology.
Levels of industrial activity are measured and discussedunder two aspects and with reference to the pivotal develop-ment indicator of per capita income. The first aspect isdomestic and involves the potential of ‘manufacturingincome’ of each economy. The second is international andintroduces the perspective of comparative advantage inindustry, which is associated with the potential of ‘manufac-turing trade’.
Structural characteristics are used to assess economies in theother two dimensions. The industry dimension is representedby the weight of industrial production and trade in the entireeconomy, which provides an indicator of ‘industrial advance’.The technology dimension is assessed via the weight ofmedium- or high-technology branches in industry, which pro-vides an indicator of ‘technological advance’. The rationalebehind emphasizing this view of structural traits is the key roleof industry-cum-technology for economic growth.
Activity levels
Between 1990 and 2002 developing economies increasedtheir share in world production from less than 16 per cent tomore than 23 per cent. While this is a formidable rise ofindustry in the developing world as a whole, its result still fallsshort of the ‘Lima target’ of a quarter of global output.
Changes in the other two broad country groups were alsosignificant: transition economies saw their share halved overthe twelve years, and that of the industrialised economies –still the lion’s share – shrank nearly five percentage points toless than three-quarters of world industrial production.
The performance of individual regions and countries withinthe above broad categories varied widely – particularly sobetween the geographic regions of developing countries.East and Southeast Asia, already the leading region in 1990,doubled its share in world production by 2002, reaching apercentage three times larger than that of the runner-upregion, Latin America. Unlike all other regions, with theexception only of Sub-Saharan Africa, Latin America evenexperienced a slight decline of its share. In addition, there wasa faint sign of improvement visible for the LDCs, whose sharein world industry remains, however, still minuscule.
When industrial production is related to the number ofpeople who benefit from it, directly or indirectly, the globalpicture is one of glaring unevenness. Differences are over-whelming in comparisons between individual countries. Thesame is true for the gap between the industrially richest andpoorest parts of the world, a gap which, moreover, has beensignificantly widening rather than narrowing. A comprehen-sive assessment of global industrial unevenness, however,produces a picture that is less dark and in which significantimprovements can be traced. In this context, the special posi-tion of China in today’s world development can be seen inthe light of its impact on reducing industrial unevenness.
In comparisons between individual countries or geographicregions, industrial production per capita is the natural indica-tor of the level of domestic activity and, more broadly, of thelevel of industrial development at large. Here too, differencesbetween country groups and regions are striking. Industrialactivity in the industrialised economies is at a level ten timeshigher than that of transition economies and sixteen timesthat of developing economies. Among the developingregions, too, gaps in activity are wide, with a ratio of aboutnine between the highest and the lowest regional averages.The highest level of per capita output throughout the periodis that of Latin America. By 2002, East and Southeast Asia hadattained the second place with activity not far below that ofthe leading region. The Middle East and North Africa hold amiddle position, whereas South Asia and Sub-Saharan Africarank at the low end.
Comparisons between countries reveal an almost unimag-inably broad range of activity. The ratio between the level ofthe leading economy (Switzerland) and the trailingeconomies is of the order of one thousand. And for only ahandful of developing economies, the so-called Asian Tigers,GDP per capita is higher than Switzerland’s industrial outputper capita. While the size of gaps is certainly exacerbated bythe standard method of international comparison chosenhere, their qualitative nature remains unchanged when meas-urement changes.
The same holds for the salient features of the core rankingof countries by industrial output per capita. All the industri-alised economies are found in the highest quarter of thisranking. So are three of the four Asian Tigers, and Malaysia.
xx Industrial Development Report 2005
In this connection, the outstanding performance of Singa-pore is underscored by its being the only developing economyamong the top ten in terms of domestic-activity level. Thesecond quarter of the ranking contains a number of largedeveloping countries, among them China, which attained aposition close to the middle (the median) of the global distri-bution by activity levels. In the lowest quarter all the LDCs areclustered with activity levels below a sixth of the average ofall developing economies.
When economies are compared with respect to the inter-national level of industrial activity, Singapore moves to thetop of the world ranking. Apart from individual cases such asthat of the star-performing Asian Tiger economy, the inter-national ranking is quite similar to that produced by thedomestic assessment. With respect to both, the evidence isthat of high levels of industrial activity being the prerogativeof the industrialised economies – with the most impressiveexceptions to this rule constituted by a handful of Asianeconomies.
Structural traits
Four out of the six indicators used in this review reflect struc-tural properties of an economy. Two of them measure therelative importance of industry within the entire economy.Their combination gives rise to an indicator of ‘industrialadvance’, a tool for assessing the position of an economy inthe industry dimension. The other two capture, in analogousfashion, technology within industry as well as ‘technologicaladvance’ and allow for country assessment in the technologydimension. The interaction of industrial and technologicaladvance yields a new indicator, the ‘industrial-cum-techno-logical-advance’ (ITA) index.
The joint criteria of industry-cum-technology lead to assess-ments of country groups and of individual countries that par-allel those based on activity levels. In particular, within thedeveloping world structural differences between regions areimmense. In an assessment by the ITA index, East and South-east Asia clearly leads among the developing regions, whereasdifferences among other regions are modest. For the latter asa whole, the average ITA value remains below a third of the levelof industrialised economies, despite a remarkable increase ofdeveloping economies ITA over the 1990s. By contrast, a sam-ple of LDCs average an ITA value of only about half the level ofdeveloping economies (excluding East and Southeast Asia).
It is, again, the inter-country comparison that bears out thefull variation of structural differences in the industry and thetechnology dimensions. For the roughly one hundred coun-tries assessed in the review the index of ‘industrial-cum-tech-nological advance’ ranges from a maximum of slightly over0.5 to a minimum of virtually zero. Once more Singaporetakes the lead, ahead of industrialised economies, and threeother Asian economies are among the top ten in the world.
Overall, there has been ‘industry-cum-technology advance’between 1990 and 2002, as the number of economies in theupper half of the ITA range increased from 22 at the begin-ning to 28 at the end of the period. In this increase,economies from East and Southeast Asia (among themChina) are prominent. By and large, the North-South divideobserved for activity levels is reproduced with respect tostructural characteristics. Industrialised economies still dom-inate the upper half of the ITA range while Asian star-perform-ers are moving in rapidly. In the ITA interval between 0.25 and0.125 – that is, half of the upper half – economies from allgroups and regions are found, including large countries likeTurkey, Indonesia and the ‘giant’ India. On the other hand,all the LDCs (except Bangladesh) covered in the review areclustered around the low end.
Of the two constituents of the notion of ‘industrial-cum-technological advance’, the industry dimension plays the con-ventional part, both conceptually and with regard to meas-urement. This is reflected in the ranking of countries by‘industrial advance’. Nevertheless, this ‘conventional’ assess-ment produces some surprise results. Thus, among the topten economies in the ranking, eight are East or SoutheastAsian countries, while most industrialised economies arefound in lower ranges. And for half of these surprise-coun-tries, which include China, the unexpectedly high ranks arethe result of a spectacular increase in the ‘industrial advance’indicator over the 1990s. Another astonishing fact is thehighly mixed composition of the lower half of the country dis-tribution by industrial advance, which includes even fourindustrialised economies.
The ‘modern’ component of the ITA index – that of ‘tech-nological advance’ – produces a considerably wider rangeand a different ranking of economies. While Singapore isagain the leader, the top ten economies are equally spreadbetween industrialised and (mostly Asian) developing coun-tries. The highest quarter of the technological-advance rank-ing ‘belongs’ to a large extent to the industrialisedeconomies. However, about a third of the economies in thesehigh ranks are of developing countries. At the low end of the‘technological-advance’ ranking there are countries from alldeveloping regions, except East and Southeast Asia. All theLDCs in the sample are found there, though with some varia-tion in the values of the corresponding indicator.
Finally, taking up the time-honoured analysis of structuralchange, the association between the central structural meas-ure – that of ‘industrial-cum-technological advance’ – on theone side and the income level on the other is examined. Theresults lend plausibility to the notion that ‘industrial-cum-technological advance’, as indicated by the ITA index, startsfrom a low level at low incomes, reaches high rates ofprogress over a fairly wide middle range of income and lev-els off at the highest income levels – which bodes well withthe evolution of IS depicted in Chapter 6.
xxiExecutive Summary


Section I


A historical, emprical and conceptual perspective
Part 1

Technological capabilities have become crucial to nationaleconomic performance – all the more so due to the intro-
duction of stronger intellectual property rights (IPRs), regula-tory harmonisation and standardisation, and the spread ofemerging science-based industrial technologies worldwide.In the Doha Round era the developing countries’ prospectsfor catching-up with more advanced countries in productiv-ity and income hinge increasingly on their ability to build upcompetences rapidly. This places domestic knowledge sys-tems at the core of industrial development strategies.Although not entirely new, this feature has acquired fargreater importance in recent times.
Insights in this regard have been emerging at least since theearly 1960s. Alexander Gerschenkron (1962) noted that late-comer countries could achieve rapid economic growth byexploiting technological knowledge accumulated by firms inadvanced economies through painstaking trial-and-errorlearning. However, the complexities of inward technologyabsorption and the requisite institutional underpinningsremained neglected, indeed unseen, for several decades,largely because the prevailing view among economists focus-ing on growth was that catching-up would follow as a mat-ter of course by virtue of capital flows towards the countrieswhere capital was relatively scarcer. Over time, these percep-tions about the ineluctability of catching-up have beensteadily undermined by empirical evidence showing patternsof persistent divergence in per capita income across coun-tries, and by the realisation that convergence is not at allunconditional.
The process of economic catch-up consists of much morethan imitation of the industrial technologies, prescriptionsand institutions in leading economies (Nelson, 2003a).Inward flows and ‘imitation’ of industrial technologies com-ing from these economies involve a good deal of adaptation
to a different economic environment, often resulting in thedevelopment of entirely new technologies in the ‘late-comer’economy (for example, the ‘Toyota production system’). Pol-icy and institutional adaptations are also part of the catching-up process. Both the United States (US) and Germany used tar-iffs to protect domestic producers during a good deal of theireconomic catch-up with Britain, a nation that adhered to freetrade during much of the 19th and early 20th centuries. Like-wise, German economic catch-up drew heavily on the devel-opment of a homegrown institution, the large industrialbanks that financed and invested in many leading firms,notably in the chemical industry. A similar mix of institutional,economic and policy imitation and innovation has beenobserved in the economic catch-up processes of the Repub-lic of Korea and Taiwan Province of China.
Homegrown knowledge systemsmatterIn the past, sustained economic growth at country level hascoincided with the development of domestic innovation sys-tems (IS). This is not accidental. Some features of these sys-tems differ across countries, but others are quite similar. Inparticular, advanced economies’ IS are characterised by acomplex web of relations between economic actors involvedin the production, transmission and absorption of technolog-ical knowledge. Although firms are key actors in these webs,the effectiveness of the system rests also upon contributionsby other institutions, such as public and private universitiesand research laboratories; technology extension and diffu-sion agencies; vocational and professional training institu-tions; and agencies for quality, metrology, standards and con-formity.
The limited technological capabilities of developingeconomies match weaknesses in the variety of their IS insti-tutions and, particularly, in the intensity of the interactionsbetween these institutions and between them and privatefirms. These weaknesses cannot be dismissed on the strengthof the oft-heard notion that in their quest for growth mostof those economies do not require local actors to create newtechnological knowledge. This notion presumes that technol-ogy absorption does not require innovative capabilities. Buttechnology is not a body of knowledge that can be used off
51 | The pivotal role of technological capabilities and domestic knowledge systems
CHAPTER 1 The pivotal role of technologicalcapabilities anddomestic knowledgesystems
Catch-up consists of much morethan imitation of the industrialtechnologies, prescriptions and
institutions in leading economies.
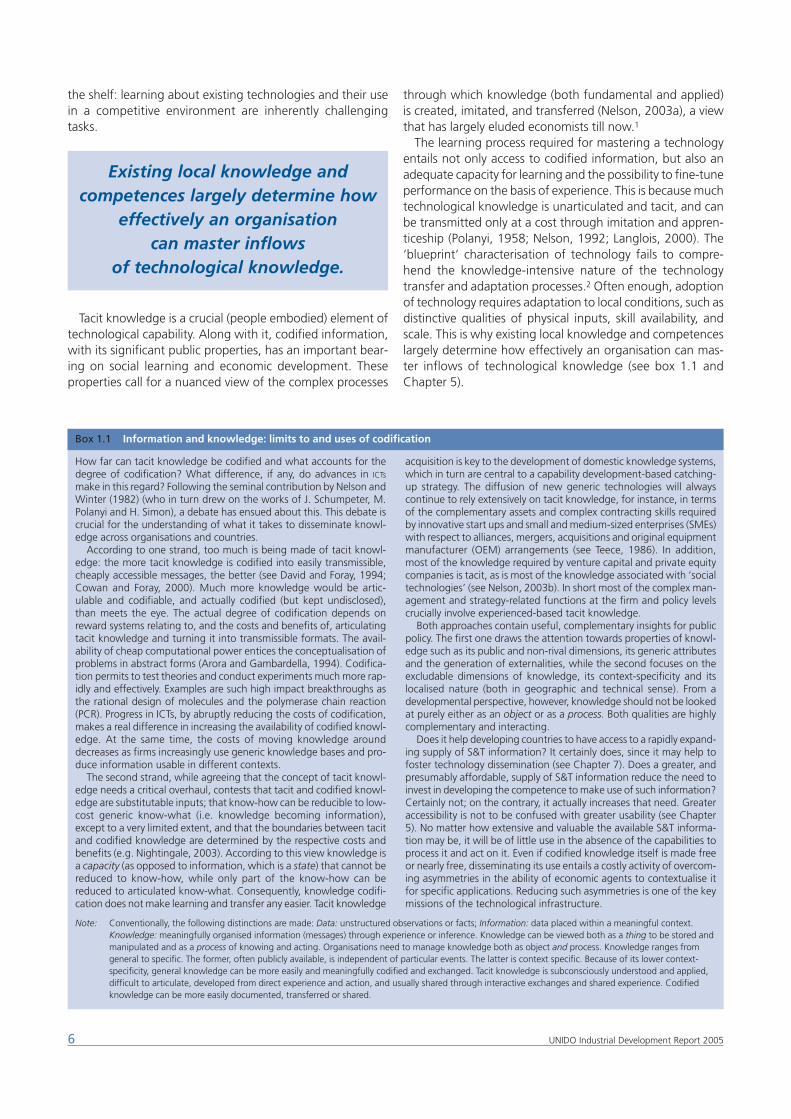
the shelf: learning about existing technologies and their usein a competitive environment are inherently challengingtasks.
Tacit knowledge is a crucial (people embodied) element oftechnological capability. Along with it, codified information,with its significant public properties, has an important bear-ing on social learning and economic development. Theseproperties call for a nuanced view of the complex processes
through which knowledge (both fundamental and applied)is created, imitated, and transferred (Nelson, 2003a), a viewthat has largely eluded economists till now.1
The learning process required for mastering a technologyentails not only access to codified information, but also anadequate capacity for learning and the possibility to fine-tuneperformance on the basis of experience. This is because muchtechnological knowledge is unarticulated and tacit, and canbe transmitted only at a cost through imitation and appren-ticeship (Polanyi, 1958; Nelson, 1992; Langlois, 2000). The‘blueprint’ characterisation of technology fails to compre-hend the knowledge-intensive nature of the technologytransfer and adaptation processes.2 Often enough, adoptionof technology requires adaptation to local conditions, such asdistinctive qualities of physical inputs, skill availability, andscale. This is why existing local knowledge and competenceslargely determine how effectively an organisation can mas-ter inflows of technological knowledge (see box 1.1 andChapter 5).
6 UNIDO Industrial Development Report 2005
Existing local knowledge and competences largely determine how
effectively an organisation can master inflows
of technological knowledge.
Box 1.1 Information and knowledge: limits to and uses of codification
Note: Conventionally, the following distinctions are made: Data: unstructured observations or facts; Information: data placed within a meaningful context.Knowledge: meaningfully organised information (messages) through experience or inference. Knowledge can be viewed both as a thing to be stored andmanipulated and as a process of knowing and acting. Organisations need to manage knowledge both as object and process. Knowledge ranges fromgeneral to specific. The former, often publicly available, is independent of particular events. The latter is context specific. Because of its lower context-specificity, general knowledge can be more easily and meaningfully codified and exchanged. Tacit knowledge is subconsciously understood and applied,difficult to articulate, developed from direct experience and action, and usually shared through interactive exchanges and shared experience. Codifiedknowledge can be more easily documented, transferred or shared.
How far can tacit knowledge be codified and what accounts for thedegree of codification? What difference, if any, do advances in ICTs
make in this regard? Following the seminal contribution by Nelson andWinter (1982) (who in turn drew on the works of J. Schumpeter, M.Polanyi and H. Simon), a debate has ensued about this. This debate iscrucial for the understanding of what it takes to disseminate knowl-edge across organisations and countries.
According to one strand, too much is being made of tacit knowl-edge: the more tacit knowledge is codified into easily transmissible,cheaply accessible messages, the better (see David and Foray, 1994;Cowan and Foray, 2000). Much more knowledge would be artic-ulable and codifiable, and actually codified (but kept undisclosed),than meets the eye. The actual degree of codification depends onreward systems relating to, and the costs and benefits of, articulatingtacit knowledge and turning it into transmissible formats. The avail-ability of cheap computational power entices the conceptualisation ofproblems in abstract forms (Arora and Gambardella, 1994). Codifica-tion permits to test theories and conduct experiments much more rap-idly and effectively. Examples are such high impact breakthroughs asthe rational design of molecules and the polymerase chain reaction(PCR). Progress in ICTs, by abruptly reducing the costs of codification,makes a real difference in increasing the availability of codified knowl-edge. At the same time, the costs of moving knowledge arounddecreases as firms increasingly use generic knowledge bases and pro-duce information usable in different contexts.
The second strand, while agreeing that the concept of tacit knowl-edge needs a critical overhaul, contests that tacit and codified knowl-edge are substitutable inputs; that know-how can be reducible to low-cost generic know-what (i.e. knowledge becoming information),except to a very limited extent, and that the boundaries between tacitand codified knowledge are determined by the respective costs andbenefits (e.g. Nightingale, 2003). According to this view knowledge isa capacity (as opposed to information, which is a state) that cannot bereduced to know-how, while only part of the know-how can bereduced to articulated know-what. Consequently, knowledge codifi-cation does not make learning and transfer any easier. Tacit knowledge
acquisition is key to the development of domestic knowledge systems,which in turn are central to a capability development-based catching-up strategy. The diffusion of new generic technologies will alwayscontinue to rely extensively on tacit knowledge, for instance, in termsof the complementary assets and complex contracting skills requiredby innovative start ups and small and medium-sized enterprises (SMEs)with respect to alliances, mergers, acquisitions and original equipmentmanufacturer (OEM) arrangements (see Teece, 1986). In addition,most of the knowledge required by venture capital and private equitycompanies is tacit, as is most of the knowledge associated with ‘socialtechnologies’ (see Nelson, 2003b). In short most of the complex man-agement and strategy-related functions at the firm and policy levelscrucially involve experienced-based tacit knowledge.
Both approaches contain useful, complementary insights for publicpolicy. The first one draws the attention towards properties of knowl-edge such as its public and non-rival dimensions, its generic attributesand the generation of externalities, while the second focuses on theexcludable dimensions of knowledge, its context-specificity and itslocalised nature (both in geographic and technical sense). From adevelopmental perspective, however, knowledge should not be lookedat purely either as an object or as a process. Both qualities are highlycomplementary and interacting.
Does it help developing countries to have access to a rapidly expand-ing supply of S&T information? It certainly does, since it may help tofoster technology dissemination (see Chapter 7). Does a greater, andpresumably affordable, supply of S&T information reduce the need toinvest in developing the competence to make use of such information?Certainly not; on the contrary, it actually increases that need. Greateraccessibility is not to be confused with greater usability (see Chapter5). No matter how extensive and valuable the available S&T informa-tion may be, it will be of little use in the absence of the capabilities toprocess it and act on it. Even if codified knowledge itself is made freeor nearly free, disseminating its use entails a costly activity of overcom-ing asymmetries in the ability of economic agents to contextualise itfor specific applications. Reducing such asymmetries is one of the keymissions of the technological infrastructure.
The growing impact of knowledge systemsAdvances in information and communication technologies(ICTs) over the last few decades have had a profound impacton the way in which information is disseminated andaccessed. There has been a geometric growth of theamount of codified information and a sharp reduction inthe cost of accessing it. As this trend has also embracedscience and technology (S&T) knowledge, it has momentousimplications for developing countries, in terms both ofaccess to knowledge and of their ability to be part of andincreasingly global process of knowledge creation and dis-semination.
The roots of this process can be traced quite far back.Access to and generation of knowledge have played a cru-cial role in economic growth since at least the 18th century(Mokyr, 2003). Two things helped make it a central drivingforce. First, the belief that nature is understandable and canbe controlled for the purpose of improving living conditions.Second, the ethos of open disclosure of knowledge that per-meated the Enlightenment movement and the nascent sci-entific community of the 17th and 18th centuries. These con-ditions promoted a positive feedback between the acquisi-tion and dissemination of knowledge about techniques(know-how) and knowledge about why techniques work(know-why). This feedback arose from interactions betweenindividuals and fostered the emergence of institutions sup-porting these interactions and individual efforts. Positivefeedback in the acquisition and dissemination of knowledgespurred improvements in production systems in those coun-tries where institutional developments provided a relativelyfree and widespread circulation of knowledge and incentivesfor individuals and firms to undertake the risky activity ofinnovating.
This insight from history helps discern the pattern behindmore recent developments. Thus, we see that the pace anddirection of innovative activities reflect:● perceptions of the demand for new products and
processes;● the efficacy of the means whereby firms can appropriate a
sufficient share of the returns from their investment ininnovative activity; and
● the opportunities for innovating which result from the cur-rent state of S&T knowledge.
In particular, the renewal of opportunities for innovating isencouraged by the commitment of resources to the ‘produc-tion’ of knowledge that is made widely accessible to the pub-lic at relatively low cost (Nelson, 1990; Machlup, 1962).3 Thisbody of public knowledge is a crucial input to the generationof proprietary knowledge by means of business research anddevelopment (R&D) and other firm-specific innovative activi-ties (see Chapter 6).
As the influence of knowledge-intensive activities on eco-nomic growth increases, the conditions of access to codifiedknowledge for the production of goods and services becomemore important. Users of knowledge must not only have
access to codified forms of knowledge but also the ability tomake use of it. That ability is constrained by what usersalready know and are capable of doing.
Collective learning, both by single organisations and atmore aggregated levels, is a key feature of domestic compe-tence-building processes.4 Indeed, the effectiveness withwhich a firm is able to participate in and benefit from the gen-eration of technologies is largely given by factors that lie out-side the scope of the individual enterprise. The institutionalenvironment within which a firm operates determines itsincentives and opportunities and thus the scope of the capa-bilities it needs to master. The intervening factors includeincentives to innovation, conditions of access to various kindsof inputs (including finance, skills and knowledge) and to rel-evant markets and regulatory constraints. Behind many ofthese factors lie the capabilities of a multiplicity of organisa-tions, including input suppliers, educational and traininginstitutions, research organisations, financial institutions, reg-ulatory agencies and specialised service providers. Clearlythen, both the quality of firms’ technological capabilities andscope for acquiring new capabilities can only be properlyunderstood by considering the context within which both areshaped. The process of competence-building is hence notonly cumulative at an individual level but also systemic incharacter.
Throughout modern history sustained economic growthand catching-up have been underpinned by a country’s abil-ity to produce and disseminate S&T knowledge. Access toknowledge has been important, as have been the institu-tional conditions enabling the continuing production ofknowledge and its embodiment in capabilities. To a signifi-cant extent, these things are shaped at the national level.Accordingly, they play a key role in determining a country’sability to share in the bounty of sustained technologicalprogress. Also, owing to the cumulative nature of learning,differences in the rate of accumulation of technological capa-bilities have an inherent tendency to translate into gaps ineconomic prosperity across countries. Narrowing these gapshas required sustained catch-up efforts of various kinds.Pivotal among these efforts has been the rapid accumulationof technological capabilities. Contrary to views once popularamong economists, domestic knowledge generation hasbeen necessary for catching-up. Tapping into the global poolof knowledge and building domestic knowledge systems gohand in hand.5
71 | The pivotal role of technological capabilities and domestic knowledge systems
Throughout modern historysustained economic growth and
catching-up have been underpinned by a country’s ability
to produce and disseminate S&T knowledge.
Catch-up: many paths, some key common featuresCountries can succeed in narrowing the gap in economicconditions with more advanced countries in a variety ofways. National experiences have, of course, varied, as aresult of the interplay among a number of factors, such asthe sectorally specific knowledge they had to acquire, thematching requisite capabilities and the features influencingsectoral patterns of diversification of the national economy(geography, resource endowments, culture). They have alsoreflected the variety of institutional mechanisms available tosupport the accumulation of technological capabilities: somecountries have relied more extensively on multinationalcorporations (MNCs), while others have relied upon protect-ing domestic infant industries while securing access to tech-nology through licensing, and still others benefited from theimmigration of skilled personnel to foster the disseminationof technological knowledge (see Chapters 4 and 6, andannex 6.2).
But beyond this variety, one can identify commonalitiesacross the successful catching-up experiences of the past.One common feature is a rapid increase in the level of edu-cation and the development of higher science and engineer-ing educational institutions. Another is the creation of pub-lic institutions to conduct industrial research and provide serv-ices to industrial firms. Last, but not least, important benefitswere drawn from relatively unfettered access to S&T knowl-edge through the participation in international networks ofscientific and engineering competence and often thanks toweak, if any, enforcement of IPRs on existing technology.
Public policies have played a fundamental role in theseprocesses and remain today at least as central to national eco-nomic development prospects as they have been in the past,particularly with regard to competence-building, includinginvestment in education, training and research institutions,and in agencies dedicated to extension, metrology, stand-ards, and certification services. In other words, there is a needfor policies aimed at the creation of an infrastructure for S&Twith differing emphases according to level of development(see Chapter 6). Critically, effective public policies must alsoaim at enabling the emergence of domestic demand for tech-nological capabilities. In the private sector of the economysuch demand will depend on how far business firms inter-nalise innovative activities as a key ingredient of their com-petitive performance. This critical pre-condition entails
addressing the interplay and complementation between theincentives framework and the services of the S&T infrastruc-ture, on the one hand, and on the other, the impact of vari-ous kinds of externalities (technological, informational, coor-dination) on companies’ ability to conduct the risky businessof exploring new production areas and new markets.
Economic catch-up has always involved some adaptationof leader nations’ policies and institutions to a different setof circumstances, along with other forms of institutional, pol-icy or technological innovation. The economic environmentof the 21st century has shifted in ways that demand more far-reaching institutional innovations on the part of those whowish to catch-up. Contemporary conditions make the incep-tion and growth of effective domestic knowledge systems aneven more pressing priority for economic development andbeg for renewed efforts to articulate the rationale for nationalinvestments in competence-building. The scope and contextof the required public policies differ from those that prevailedin earlier times.
A much-noted aspect of the global trade regime overseenby the World Trade Organisation (WTO), the strengthening ofinternational IPRs incorporated in the Trade-Related Intellec-tual Property Rights (TRIPS) agreement, limits the scope for‘reverse engineering’ and other forms of imitation ofadvanced-nation industrial technologies by those seeking tocatch-up (Nelson, 2003). A possible remedy for this may beinvesting more heavily in institutions and policies that cansupport the creation of new technologies. Similarly, the thrusttowards trade liberalisation limits the ability of latecomers toresort to the industrial protection that historically played arole in economic catch-up in the US, Germany, Japan, Repub-lic of Korea and Taiwan Province of China. Similarly, the grow-ing adoption of standards and sanitary, phytosanitary andenvironmental regulations related to international trade,while offsetting information asymmetries, also increases theneed for sophisticated domestic technological capabilities indeveloping countries both to leverage access to technicalinformation and to avoid being excluded from actual orpotential export markets (see Chapters 7 and 8).
Seeing through a blind spot in economic thinkingMuch of the debate of the recent past over economic devel-opment policy for low- and middle-income economies hasoperated in an evidentiary vacuum. The emphasis on eco-nomic liberalisation and market-opening strategies of the1990s replaced the focus of conventional policy prescriptionsduring the 1970s and 1980s on investment-led growth.6 Yet,neither strategy has enjoyed great success and neither strat-egy, in and of itself, seems to dovetail well with the evidencecompiled during the past hundred-plus years on the institu-tional and policy strategies associated with successful eco-nomic catch-up and development. For example, the remark-able economic transformation of the Republic of Korea andTaiwan Province of China since 1960 incorporates some ele-ments of both frameworks, but adheres fully to neither, while
8 UNIDO Industrial Development Report 2005
The economic environment of the 21st century has shifted
in ways that demand more far-reaching institutional
innovations on the part of thosewho wish to catch-up.
including other important policies and institutions. Nor doesthe experience in economic catch-up of Germany and the USin the late 19th century relate closely to the prescriptions ofeither view.
One area in which historical evidence seems to disagreemost sharply with prevailing wisdom concerns the contribu-tion of systematic investments in institutions and activitiesrelated to the creation, transfer, application, and dissemina-tion of knowledge to economic development. The designand role of a knowledge-based infrastructure for economiccatch-up has received remarkably little attention in recentstudies on economic development.7
Most people intuitively accept the idea that knowledgeand economic development are intimately related, and hencethat access to knowledge should be regarded as a vital fac-tor. However, this is not the way different levels of develop-ment used to be explained by economists. From the birth ofthe so-called classical political economy two centuries ago,what economists have focused on when trying to explain dif-ferences in income or productivity is accumulated capital perworker. Similarly, differences in economic growth have beenseen as reflecting different rates of capital accumulation. Thisperspective is probably an offshoot of the important roleplayed by ‘mechanisation’ as a mean for productivity growthduring the (first) Industrial Revolution, the period duringwhich the frame of reference for much of economic reason-ing was formulated.
Closer to our own age Robert Solow adopted this perspec-tive in his so-called neoclassical growth theory (Solow, 1956,1957). His analysis made it clear, however, that this could notbe the whole story. When students of economic growthstarted applying this perspective to long-run growthprocesses in the US and elsewhere, they found that capitalaccumulation, or factor accumulation more generally, couldonly explain a relatively small share of actual growth(Abramovitz, 1956; Solow, 1957; Fagerberg, 1994). This find-ing has since been repeated many times for different datasets.8 It also provided the impetus over the following decadesto the development of: (1) the so-called growth accounting,concerned with the measurement of the contribution ofadditional factors to economic growth; and (2) theoreticalmodels where technological change is shaped by economicforces rather than being treated as an exogenous variable(the ‘new growth theory’).
While not intended for such a purpose, Solow’s growthmodel became the basis for theoretical predictions about
cross-country economic performance. The theory predictedthat, under otherwise similar circumstances, investment inpoor countries (that is, those with little capital) would bemore profitable than in the richer ones, and so the formerwould enjoy higher investment and faster economic growththan the latter. This conclusion rested largely on two assump-tions: that technological change is exogenous, and that allcountries had access to the same body of technologicalknowledge. As a consequence of this logic, a narrowing ofthe development gap (so-called ‘beta-convergence’) was tobe expected (see annex 2.1 and Chapter 3). The predictionthat global capitalist dynamics would be accompanied by aconvergence in income and productivity between initiallypoor and rich countries was not borne out of the facts (Lucas,2002). Indeed, rarely has a prediction been so completely fal-sified by the evidence as this one.
Awaking to the role of institutions andenvironment
Admittedly, Solow’s theory was based on standard neoclas-sical assumptions on how markets and agents perform,which might not be wholly applicable to developing coun-tries. Hence, one possible explanation for the failure of manycountries to catch-up could be that markets did not workproperly, agents did not receive the right incentives, govern-ments interfered too much in the economy, etc. – in short,that ‘the rules of the game’ were not adhered to. In the ter-minology used by Douglas North (1981), such rules are cus-tomarily called institutions. However, in common parlance aswell as in some scholarly work, the concept of institutions isalso used in a broader sense, to include not only rules andnorms, but also organisations and other types of collabora-tive activities. In fact, in the sizeable empirical literature thathas emerged on the subject, both definitions are used, andthis can create some confusion.
As regards the role of institutions for growth and develop-ment, it has been argued that institutions in the narrow senseof the term (rules, norms) should be assumed to be relativelystable over time (Glaeser et al., 2004). However, many indi-cators of ‘institutions’ suggested in the recent scholarly liter-ature are far from stable; indeed, they are rather volatile.Hence, it can be held that such indicators in most cases donot reflect ‘institutions’ in the above sense, but politicalchoices, policies pursued by governments, etc. (Ibid.). If theanalysis is restricted to indicators of institutions in the narrowsense (constitution, judicial checks and the like) and theirrelationship with levels and growth of gross domestic prod-uct (GDP), the correlations are in fact rather weak, in contrastto what holds for the more broadly defined ‘institutional vari-ables’ (seen as reflecting political choices). Thus, institutionsin the narrower sense are not good predictors of successfulcatch-up. Apparently of greater importance are the policiespursued. The available econometric evidence seems to con-firm casual observation, ie that the political and legal systemsof successful countries (and unsuccessful ones as well) candiffer considerably. There is no ‘one best way’. Policiesamenable to catching-up, it seems, may originate in very dif-
91 | The pivotal role of technological capabilities and domestic knowledge systems
Economists have largely donewithout a nuanced view of
the complex processes throughwhich knowledge (both funda-mental and applied) is created,
imitated, and transferred.
ferent political and legal systems (from communist China todemocratic Ireland, to take just one dissimilar pair).9
In recent years, many empirical studies have been con-ducted along similar lines by pushing the search for explana-tory factors far back in time, such as what kind of systems(countries) the colonial settlers came from (Acemoglu, John-son and Robinson, 2001), or by taking into account otherexogenous variables that might have an impact on develop-ment (and policies), such as climate, exposure to diseases,geography (access to the sea, for instance), and ethnic diver-sity (Sachs et al., 2004; Masters and MacMillan, 2001; Bloomet al., 2003; Alesina et al., 2003). It is difficult to deny thathistorical or geographical factors may have an impact onlong-run growth. However, it must be noted that in mostcases there is conflicting evidence and interpretation aboutthe impact of history, geography and nature on growth.10
One reason for this may be that variables reflecting differentcauses are sometimes so strongly correlated that little can beasserted with certainty (except, perhaps, that there is a jointimpact).11 Another possibility, pointed out already by MosesAbramovitz (1994a), is that the problems arising from suchconditions may spur the creation of new knowledge and newsocial arrangements, which may eventually eliminate theproblems (and even make society better off in the long run).This leads us to the role of knowledge in growth.
From knowing what to knowing how
The first systematic attempts to conceptualise the relation-ship between knowledge and development did not comefrom mainstream economists but from economic historians(who looked at knowledge or technology in a different way).Rather than something that exists in the public domain andcan be exploited by anybody everywhere free of charge, tech-nological knowledge, whether created through learning ororganised R&D, is in this tradition seen as deeply rooted in thespecific capabilities of private firms and their networks orenvironments, and hence not easily transferable. Comparedwith the traditional neoclassical growth theory discussed ear-lier, these writers painted a much bleaker picture of theprospects for catch-up. According to this latter view, catch-up is not something that can be expected to occur only bymarket forces left to themselves, but something that requiresa lot of effort and institution building on the part of thecountry determined to catch-up.
The stage for much of the subsequent research on the sub-ject was set in the early 1960s (Gerschenkron, 1962).12 Somecountries are at the technological frontier, Gerschenkronpointed out, while others lag behind. Although the techno-logical gap between a frontier country and a laggard repre-sents ‘a great promise’ for the latter (a potential for highgrowth through imitating frontier technologies), there arealso various problems that may prevent backward countriesfrom reaping the potential benefits to their full extent. Hisfavourite example was the German attempt to catch-up withBritain more than a century ago. When Britain industrialised,technology was relatively labour-intensive and small-scale.But in the course of time technology became much more cap-
ital- and scale-intensive, so when Germany entered thescene, the conditions for entry had changed considerably.Because of this, Gerschenkron argued, Germany had todevelop new institutional instruments for overcoming theseobstacles, above all in the financial sector; ‘instruments forwhich there was little or no counterpart in an establishedindustrial country’. He held these experiences to be valid alsofor other technologically lagging countries.
Arguing along similar lines, Abramovitz also placedemphasis on the potential for catch-up by latecomers. Hedefined it as follows: ‘This is a potential that reflects thesecountries’ greater opportunity to advance by borrowing andadapting the best practice technology and organisation ofmore productive economies’ (Abramovitz, 1994b, p. 87).He suggested that differences in countries’ abilities toexploit this potential might to some extent be explainedwith the help of two concepts: technological congruenceand social capability.13 The first concept refers to the degreeto which characteristics of both leader and follower coun-try are congruent in areas such as market size, factor sup-ply, etc. As mentioned above, the technological system thatemerged in the US towards the end of the 19th century washighly dependent on access to a large, homogenous mar-ket, something that hardly existed in Europe at the time,which may help to explain its slow spread there. The sec-ond concept points to the capabilities that developingcountries have to develop in order to catch-up, especiallythe improvement of education (particularly technical) andthe business infrastructure (including the financial system).Abramovitz explained the successful catch-up of WesternEurope in relation to the US in the first half of the post-WorldWar II (WWII) period as the result of both increasing techno-logical congruence and improved social capabilities. As anexample of the former he mentioned how European eco-nomic integration led to the creation of larger and morehomogenous markets in Europe, facilitating the transfer ofscale-intensive technologies initially developed for US con-ditions. Regarding the latter, he pointed to such factors asthe general increases in educational levels and how effec-tive the financial system had become in mobilising resourcesfor change.
A pertinent concept in the applied literature on growth anddevelopment in this context is ‘absorptive capacity’. It hasbeen defined as ‘the ability of a firm to recognise the valueof new, external information, assimilate it and apply it tocommercial ends’ (Cohen and Levinthal, 1990, p. 128). Assuch, it is largely dependent on the firm’s prior related knowl-
10 UNIDO Industrial Development Report 2005
Catch-up is not something that can be expected to occur only
by market forces left to themselves,but something that requires a lot of effort and institution building.
edge, which in turn reflects its cumulative technologicaleffort. However, the path-dependent nature of cumulativelearning might make it difficult for a firm to acquire newknowledge created outside its own specialised field; it istherefore important for firms to retain a certain degree ofdiversity in their knowledge base through, among otherthings, nurturing linkages with holders of knowledge outsidetheir own organisation (Ibid.).14 As with social capability it isnot obvious how to measure it, but the following three fac-tors seem to be fundamental: (1) cumulative (formal andinformal) R&D, (2) diversity of the knowledge base and (3)degree of openness and interaction across organisationalboundaries. In this context, the concept can be expandedfrom a systemic perspective (see box 1.2).
Although the above focus was on firms, many of the sameconsiderations apply at more aggregate levels, such asregions or countries, and the concept has won quite generalacceptance. It should be noted, however, that the concept bydefinition collapses three different processes into one,namely (1) search, (2) assimilation (or absorption) of what isfound and (3) its commercial application. Hence, it refers notonly to ‘absorption’ in the received meaning of the term, butalso on the ability to exploit and create knowledge more gen-erally, recognising that the ability to assimilate existing knowl-edge and the ability to create new knowledge have so muchin common that the distinction cannot be taken very far. Thisis particularly the case when the focus, rather than on formalR&D, is on innovative activities in a much broader, Schum-peterian sense, of particular relevance for developing coun-tries.15
The interplay between in-house or domestic knowledgecreation and absorption of external knowledge can takeplace either across firms (through cooperation or arms-lengthtransactions) or by firms tapping knowledge available in thedomestic and international S&T system, either freely or at lowaccess cost. Developing country firms engage in both, but the
scope and indeed the need for the second form of interac-tion appears to have attracted less attention than it warrants.As noted earlier, this need arises from the hardening of con-ditions for access to proprietary knowledge and the increas-ingly science-based underpinnings of evolving technologies.Addressing the question of how entrepreneurship develop-ment and innovation in developing countries’ private sectorcan best be fostered thus becomes central.
From a policy perspective, the dichotomy between the(public) dimension of codified information, on the one hand,and the (private) dimension of tacit knowledge as firm spe-cific, path-dependent, localised and tacit, on the other, needsparticular attention. It has been pointed out that, ‘technol-ogy needs to be understood as a collection of many differentkinds of goods. These goods can have the attributes of pub-
111 | The pivotal role of technological capabilities and domestic knowledge systems
Differences in countries’ abilities to exploit the potential to catch-upmight be explained with the help of
two concepts: technologicalcongruence and social capability.
Current conditions call fordeveloping countries to pay much
greater attention to allocatingresources to the development of
their domestic knowledge systems.
Box 1.2 ‘Absorptive capacity’: new wine with an old label?
The recommendations of the United Nations (UN) Millennium Project(UNMP) and the Commission of Africa, as well as Britain’s advocacyat the 2005 Group of Eight (G8) summit for massive increases in aidto Sub-Saharan Africa (SSA) have reinstated an old debate, this timein terms of a conflict between ‘absorptive capacity’ constraints andthe need for ‘scaling up’ aid to end abject poverty. Concerns aboutmacroeconomic, institutional and managerial constraints are beingraised in relation to the effectiveness of aid.
The concept of ‘absorptive capacity’ used in this Report relates par-ticularly to the ability to draw on external sources of knowledge tocreate wealth. As such, it can be applied as much at the firm as atmore aggregated levels, where systemic features become pivotal.Although this concept is narrower than that normally used, ‘absorp-tive capacity’ in this sense is a key enabler of economic developmentand thus it also matters for aid effectiveness.
Aid effectiveness and its contribution to growth have been exten-sively studied for the past 40 years. Chenery and Strout (1966) madeone of the first studies tying effectiveness to binding constraints suchas ‘absorptive capacity’ (i.e., human capital), savings, and foreignexchange (also Millikan and Rostow, 1957; Rosenstein-Rodan, 1961;Adler, 1965; Guillaumont, 1971). The so-called three-gap approachto foreign transfers and GDP growth has largely focused on capacityconstraints in financial and human capital terms. The debate on aideffectiveness entered a new phase with the publication of the Assess-ing Aid report by the World Bank in 1998. The report was based onBurnside and Dollar’s analysis of the conditions of aid effectiveness,which found a positive impact of good economic policies on aid per-formance (1997, 2000).
One of the difficulties in appraising the issue lies in that ‘absorp-tive capacity’ is not a fixed factor. The elasticity of macroeconomic‘absorptive capacity’ to aid – along with its impact on aid effective-ness – largely depends on how aid is allocated. To put it simply, thatelasticity can be expected to raise, at least for some time, when aidis directly addressed to breaking the most egregious factors blockingproductivity growth (such as lack of irrigation, low soil fertility, short-age of feeder roads and low nutrition) than when it is directed towardmore generic aims. Nevertheless, ‘absorptive capacity’, in the senseused in this Report, needs to be addressed sooner rather than laterin order to avoid even very well focused aid efforts falling into rap-idly decreasing returns after not long.
For this reason, ‘absorptive capacity’ matters from the perspectiveof the financing gap through its influence on economic development.Many of the policies directed to raising it in the narrow sense directlyrelate to the sustainability of long term financing for development.Cumulative capabilities in the domestic knowledge systems and theinteraction between agents in this system enable the private sectorto take up a more substantive role in development strategy, and thusincrease the effectiveness of overseas aid.
Sources: ODI (2005); Guillaumont and Chauvet (1999).
lic goods and private goods in varying proportions’ (Nelsonand Romer, 1996, p. 14).
The policy implications of this insight are momentous. Ashas been pointed out, current conditions call for developingcountries to pay much greater attention to allocatingresources to the development of their domestic knowledgesystems. This implies growing demands on the managementof the collective-action dimensions of technological knowl-edge, which will be the focus of the Second Part of this Spe-cial Topic section, starting in Chapter 6.16
Conclusions
Because local knowledge and competences largely deter-mine how effectively inflows of technological knowledge canbe mastered, catch-up consists of much more than the mereimitation of more advanced countries’ industrial technolo-gies, policies and institutions. A review of modern historyshows that sustained economic growth and catching-up havebeen underpinned by countries’ ability to produce and dis-seminate S&T knowledge. In addition, the economic environ-ment of the 21st century has shifted in ways that demandeven more far-reaching institutional innovations to catch-upthan those of the past.
The above realization has taken long to come to fruitionowing largely to the lack of a graded view of the multi-faceted processes through which knowledge is created, imi-tated, and transferred. In fact, the evidence strongly sug-gests that successful countries differ considerably in theirpolitical and legal arrangements. Beyond the working of mar-ket forces, catch-up requires substantial domestic capability-building efforts. Current conditions call for developing coun-tries to pay much greater attention to the allocation ofresources to the development of their domestic knowledgesystems.
Notes
This chapter draws on background papers by Fagerberg and Srholec(2005) and Mowery (2005). However, the views expressed here are ofUNIDO and do not necessarily reflect those of the authors.1 For example, Mancur Olson argues that the Republic of Korea’s case
‘certainly supports the long-familiar assumption that the world’s pro-ductive knowledge is, for the most part, available to poor countries,and even at a relatively modest cost’ (Olson, 1996, p.8), without
considering the particular institutional innovations and capability-building in the Republic of Korea that has allowed such technologytransfer. The key distinction seems to be between a broad concept of‘knowledge’ that has significant tacit elements as it can take manyforms and may be created through research or learning but alsoacquired through education or training or simply by observing and try-ing to imitate – and ‘codified knowledge’ which refers to packages ofknowledge that have been (or can be) converted into symbols for easytransmission, replication, and storage (Boisot, 1995 and Saviotti,1998) (see box 1.1).
2 This oversight has been remedied to some extent in recent work.Word Bank (2002a) is one example but, unfortunately, it devotes lit-tle attention to the role of institutions in technological innovation andadoption outside of agriculture.
3 For a pioneering and critical orthodox approach to the concept andmeasurement of knowledge production please refer to Machlup(1962).
4 On collective learning, see Lundvall (1988).5 In the second part of this Special Topic, we refer to the knowledge
institutions as a ‘subsystem’ once we start looking at its interactionswith other subsystems within an innovation system (IS).
6 See, for instance, Easterly (2003).7 One exception is World Bank (1999). On the other hand, the exten-
sive literature on ‘national innovation systems’ has focused primarilyon innovation and economic performance in the industrial economies(Edquist, 2004).
8 Easterly and Levine (2001) provide a good overview of the more recentevidence on the subject.
9 However, successful catch-up may feed back to the political and legalsystem, as for instance the evidence from the Republic of Korea andTaiwan Province of China shows.
10 For instance, Glaeser et al. (2004) question the interpretation of thesettler argument, suggesting that what the settlers brought with themwas not so much their institutions as their human capital.
11 Alesina et al. (2003), for instance, conclude on this basis that, ‘in theend one has to use theory and priors to interpret our correlations’(p. 183).
12 However, Thorstein Veblen (1915) is usually credited with initiating theapproach. See Fagerberg and Godinho (2004) for details.
13 The term ‘social capability’ comes from Ohkawa and Rosovsky (1973).14 In a similar vein, Nelson and Phelps (1966) present a model of eco-
nomic growth where the rate of absorption of external technologicalknowledge depends on the level of human capital in the economy.Contrast this position with the one discussed earlier according towhich all countries would have access to the same body of techno-logical knowledge.
15 Zahra and George (2002), in a review of the literature, argue that theskills required for creating and managing knowledge differ from thoserelated to its exploitation and that the two therefore deserve to betreated and measured separately. They term the latter ‘transformativecapacity’.
16 Even firm-specific routines have important attributes of ‘publicness’(Nelson and Sampat, 2001).
12 UNIDO Industrial Development Report 2005
Knowledge and capabilities are increasingly critical tocatching-up, a trend that is further accentuated by
advances in ICTs – that is the view we have been examining.Can this be tested empirically? Using factor analysis, we seekto discern broad dynamic trends for a cross-section of coun-tries and identify vectors of underlining factors that affectgrowth.
As we have seen, the idea that social capabilities lie at theheart of economic development processes is not new. Thepioneering work by Irma Adelman and Cynthia Morris dur-ing the 1960s, later continued by Jonathan Temple and PaulJohnson (1998), used factor analysis to identify and measurea wide set of economic, social and political indicators for alarge group of developing countries. These authors showthat the variation in the data could be reduced to four com-mon factors, one of which was deemed especially significant.This factor, an amalgam of structural variables (share of agri-culture, urbanisation, etc.), socio-economic characteristics(role of the middle class, social mobility, literacy, etc.) and thedevelopment of mass communications (measured throughthe spread of newspapers and radios in the population), iswhat Temple and Johnson use to gauge ‘social capability’.1
Potential factors critical to catching-up and their indicatorscan be discerned within the conceptual framework laid outin the first chapter.2 These variables – technological capabil-ities, institutions, geography – broadly align with various the-ories of growth and convergence presented in the economicliterature.
The knowledge dimension
Technological capability can be largely captured by variablesgauging the public and private activities aimed at absorbing,disseminating and creating technological knowledge. On theinput side, R&D expenditures measure some – but by nomeans all – of the resources allocated to developing newproducts or processes. On the output side, the number ofpatents is one measure of inventive activity; while articlespublished in scientific and technical journals reflect the qual-ity of a country’s science base (on which, to some extent,innovation and invention depend).3
A well-developed ICT infrastructure is widely acknowledgedas a critical factor for the ability to benefit from new technol-
ogy. Three indicators of ICT dissemination in the economy arewidely available: the numbers of personal computers, Inter-net users and fixed/mobile phone subscribers.
Another important aspect of the knowledge infrastructureis quality standards, for which the ISO 9000 certification seemsto be a reasonably good and broadly available indicator. Infact, together with the more traditional measures of techno-logical effort such as R&D expenditure and patents, ISO 9000
certifications provide quite a robust indicator of capabilities(see, however, Chapter 7 for some clarifications).
In addition, five indicators reflect different aspects ofhuman capital. First, there are broad measures of humancapital such as the number of years in school, the teacher-pupil ratio in primary education and life expectancy at birth.The teacher-pupil ratio is included to reflect the qualitativedimension of education, while life expectancy is a measureof the time horizon for individual investments in education.In addition, higher education as reflected in the share of pop-ulation that completed higher education and the rate ofenrolment in tertiary education, is also factored in.4
Other variables
Studies on absorptive capacity have noted that interactionacross borders may serve as an important channel of tech-nology transfer and spillovers from abroad. This issue is alsovery much emphasised in work inspired by the ‘new growththeories’ (see, for instance, Grossman and Helpman, 1991;Coe and Helpman, 1995). Four channels of technologytransfer across country borders have been examined in theliterature: migration, licensing, trade, and foreign directinvestment (FDI) (for an overview see Cincera and van Pottels-berghe de la Potterie, 2001). However, due to lack of dataonly merchandise imports and stock of inward FDI, nor-malised by GDP, are used.
The crucial role of a country’s financial system for mobilis-ing resources for catching-up has been emphasised repeat-edly. This aspect can be partially captured by the amount ofcredit to the private sector and by capitalisation of compa-nies listed in domestic capital markets. These quantitativemeasures are complemented by the interest rate spread(lending rate minus deposit rate), which is included as ameasure of the efficiency of the financial system.5
132 | Critical factors for catching-up: assessing the evidence
CHAPTER 2 Critical factors forcatching-up: assessingthe evidence
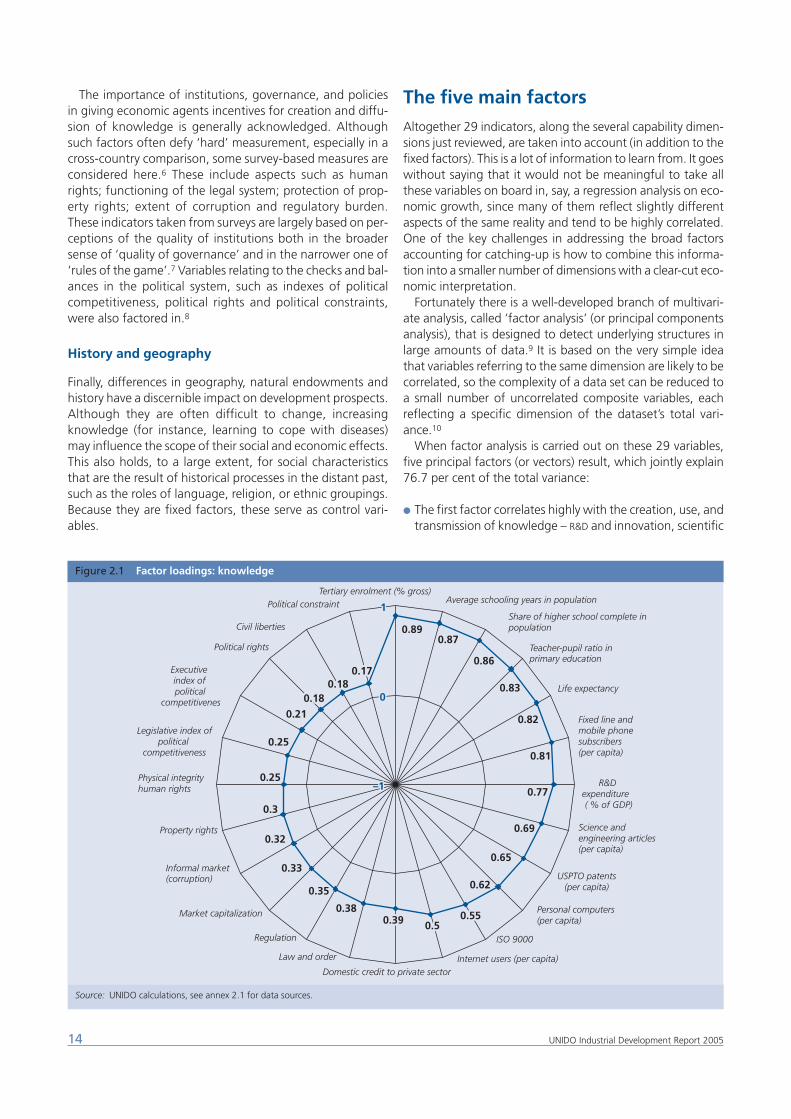
The importance of institutions, governance, and policiesin giving economic agents incentives for creation and diffu-sion of knowledge is generally acknowledged. Althoughsuch factors often defy ‘hard’ measurement, especially in across-country comparison, some survey-based measures areconsidered here.6 These include aspects such as humanrights; functioning of the legal system; protection of prop-erty rights; extent of corruption and regulatory burden.These indicators taken from surveys are largely based on per-ceptions of the quality of institutions both in the broadersense of ‘quality of governance’ and in the narrower one of‘rules of the game’.7 Variables relating to the checks and bal-ances in the political system, such as indexes of politicalcompetitiveness, political rights and political constraints,were also factored in.8
History and geography
Finally, differences in geography, natural endowments andhistory have a discernible impact on development prospects.Although they are often difficult to change, increasingknowledge (for instance, learning to cope with diseases)may influence the scope of their social and economic effects.This also holds, to a large extent, for social characteristicsthat are the result of historical processes in the distant past,such as the roles of language, religion, or ethnic groupings.Because they are fixed factors, these serve as control vari-ables.
The five main factorsAltogether 29 indicators, along the several capability dimen-sions just reviewed, are taken into account (in addition to thefixed factors). This is a lot of information to learn from. It goeswithout saying that it would not be meaningful to take allthese variables on board in, say, a regression analysis on eco-nomic growth, since many of them reflect slightly differentaspects of the same reality and tend to be highly correlated.One of the key challenges in addressing the broad factorsaccounting for catching-up is how to combine this informa-tion into a smaller number of dimensions with a clear-cut eco-nomic interpretation.
Fortunately there is a well-developed branch of multivari-ate analysis, called ‘factor analysis’ (or principal componentsanalysis), that is designed to detect underlying structures inlarge amounts of data.9 It is based on the very simple ideathat variables referring to the same dimension are likely to becorrelated, so the complexity of a data set can be reduced toa small number of uncorrelated composite variables, eachreflecting a specific dimension of the dataset’s total vari-ance.10
When factor analysis is carried out on these 29 variables,five principal factors (or vectors) result, which jointly explain76.7 per cent of the total variance:
● The first factor correlates highly with the creation, use, andtransmission of knowledge – R&D and innovation, scientific
14 UNIDO Industrial Development Report 2005
Figure 2.1 Factor loadings: knowledge
Source: UNIDO calculations, see annex 2.1 for data sources.
0.890.87
0.86
0.83
0.82
0.81
0.77
0.69
0.65
0.62
0.550.50.39 0.550.50.39
0.38
0.35
0.33
0.32
0.3
0.25
0.25
0.210.18
0.180.17
0.180.18
0.17
–1
0
1
–1
0
1
R&D expenditure ( % of GDP)
Internet users (per capita)
Physical integrity human rights
ISO 9000
Fixed line and mobile phone subscribers (per capita)
Personal computers (per capita)
Informal market (corruption) USPTO patents
(per capita)
Science and engineering articles (per capita)
Life expectancy
Regulation
Property rights
Law and order
Domestic credit to private sector
Market capitalization
Teacher-pupil ratio in primary education
Share of higher school complete in population
Average schooling years in populationTertiary enrolment (% gross)
Political constraint
Civil liberties
Political rights
Executive index of political
competitivenes
Legislative index of political
competitiveness
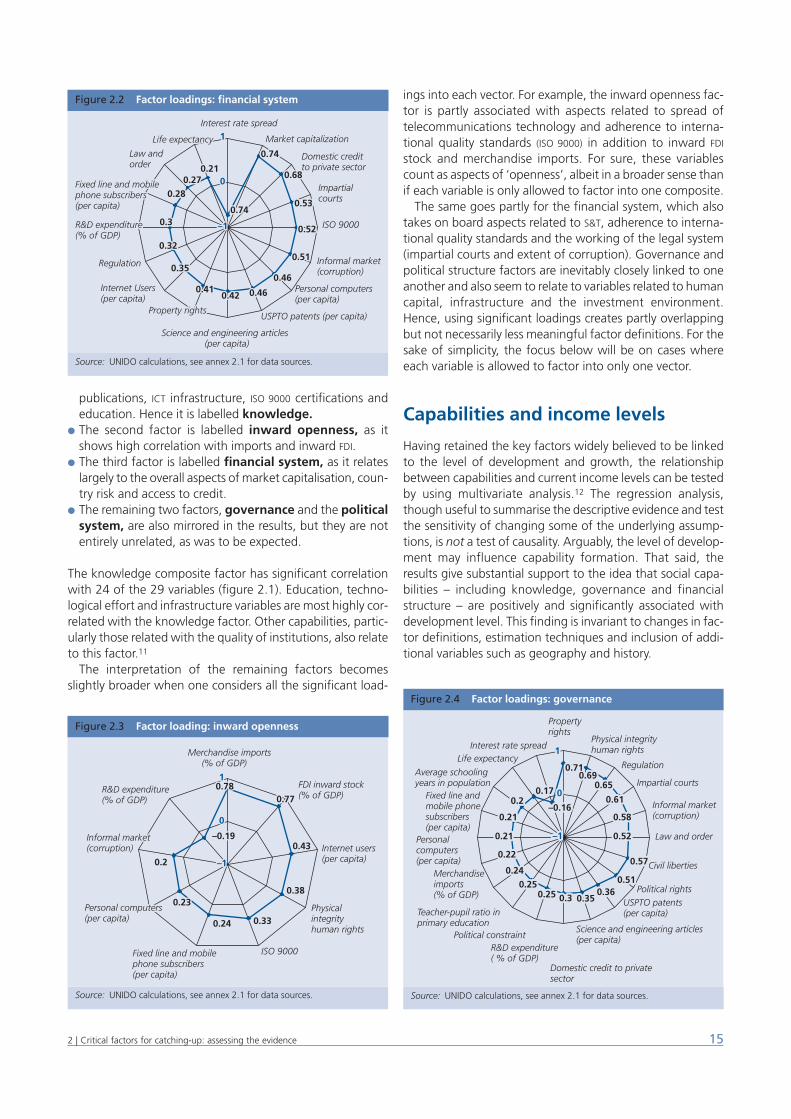
publications, ICT infrastructure, ISO 9000 certifications andeducation. Hence it is labelled knowledge.
● The second factor is labelled inward openness, as itshows high correlation with imports and inward FDI.
● The third factor is labelled financial system, as it relateslargely to the overall aspects of market capitalisation, coun-try risk and access to credit.
● The remaining two factors, governance and the politicalsystem, are also mirrored in the results, but they are notentirely unrelated, as was to be expected.
The knowledge composite factor has significant correlationwith 24 of the 29 variables (figure 2.1). Education, techno-logical effort and infrastructure variables are most highly cor-related with the knowledge factor. Other capabilities, partic-ularly those related with the quality of institutions, also relateto this factor.11
The interpretation of the remaining factors becomesslightly broader when one considers all the significant load-
ings into each vector. For example, the inward openness fac-tor is partly associated with aspects related to spread oftelecommunications technology and adherence to interna-tional quality standards (ISO 9000) in addition to inward FDI
stock and merchandise imports. For sure, these variablescount as aspects of ‘openness’, albeit in a broader sense thanif each variable is only allowed to factor into one composite.
The same goes partly for the financial system, which alsotakes on board aspects related to S&T, adherence to interna-tional quality standards and the working of the legal system(impartial courts and extent of corruption). Governance andpolitical structure factors are inevitably closely linked to oneanother and also seem to relate to variables related to humancapital, infrastructure and the investment environment.Hence, using significant loadings creates partly overlappingbut not necessarily less meaningful factor definitions. For thesake of simplicity, the focus below will be on cases whereeach variable is allowed to factor into only one vector.
Capabilities and income levels
Having retained the key factors widely believed to be linkedto the level of development and growth, the relationshipbetween capabilities and current income levels can be testedby using multivariate analysis.12 The regression analysis,though useful to summarise the descriptive evidence and testthe sensitivity of changing some of the underlying assump-tions, is not a test of causality. Arguably, the level of develop-ment may influence capability formation. That said, theresults give substantial support to the idea that social capa-bilities – including knowledge, governance and financialstructure – are positively and significantly associated withdevelopment level. This finding is invariant to changes in fac-tor definitions, estimation techniques and inclusion of addi-tional variables such as geography and history.
152 | Critical factors for catching-up: assessing the evidence
Figure 2.2 Factor loadings: financial system
Source: UNIDO calculations, see annex 2.1 for data sources.
0.210.68
0.74
0.74
0.27
0.28
0.3
0.32
0.35
0.410.42 0.46
0.46
0.51
0.52
0.53
–1
0
1
0.210.68
0.74
0.74
0.27
0.28
0.3
0.32
0.35
0.410.42 0.46
0.46
0.51
0.52
0.53
–1
0
1
Domestic creditto private sector
Market capitalization
Interest rate spread
Life expectancy
Fixed line and mobilephone subscribers(per capita)
R&D expenditure (% of GDP)
Property rights
Life expectancy
ISO 9000
Fixed line and mobilephone subscribers(per capita)
Internet Users(per capita)
Personal computers(per capita)
Science and engineering articles(per capita)
USPTO patents (per capita)
R&D expenditure (% of GDP)
Informal market(corruption)
Regulation
Property rights
Law andorder
Impartialcourts
Figure 2.3 Factor loading: inward openness
Source: UNIDO calculations, see annex 2.1 for data sources.
0.24
0.23
Informal market(corruption)
Personal computers(per capita)
0.23
0.2
–0.19–0.19
0.780.780.770.77
0.43
0.38
0.33
–1
0
1
–1
0
1
Merchandise imports(% of GDP)
FDI inward stock(% of GDP)
Physicalintegrityhuman rights
Informal market(corruption)
R&D expenditure(% of GDP)
Personal computers(per capita)
Internet users(per capita)
Fixed line and mobilephone subscribers(per capita)
ISO 9000
Figure 2.4 Factor loadings: governance
Source: UNIDO calculations, see annex 2.1 for data sources.
–0.16
0.170.2
0.21
0.21
0.22
0.24
0.250.25 0.3 0.35
0.360.51
0.57
0.52
0.58
0.61
0.650.69
0.71
–1
0
1
–0.16
0.170.2
0.21
0.21
0.22
0.24
0.250.25 0.3 0.35
0.360.51
0.57
0.52
0.58
0.61
0.650.69
0.71
–1
0
1
R&D expenditure ( % of GDP)
USPTO patents(per capita)
Science and engineering articles (per capita)
Personal computers (per capita)
Fixed line and mobile phone subscribers(per capita)
Teacher-pupil ratio in primary education
Life expectancy
Average schooling years in population
Merchandise imports (% of GDP)
Property rights
Physical integrity human rights
Regulation
Political rights
Civil liberties
Law and order
Informal market (corruption)
Political constraint
Domestic credit to private sector
Interest rate spread
Impartial courts
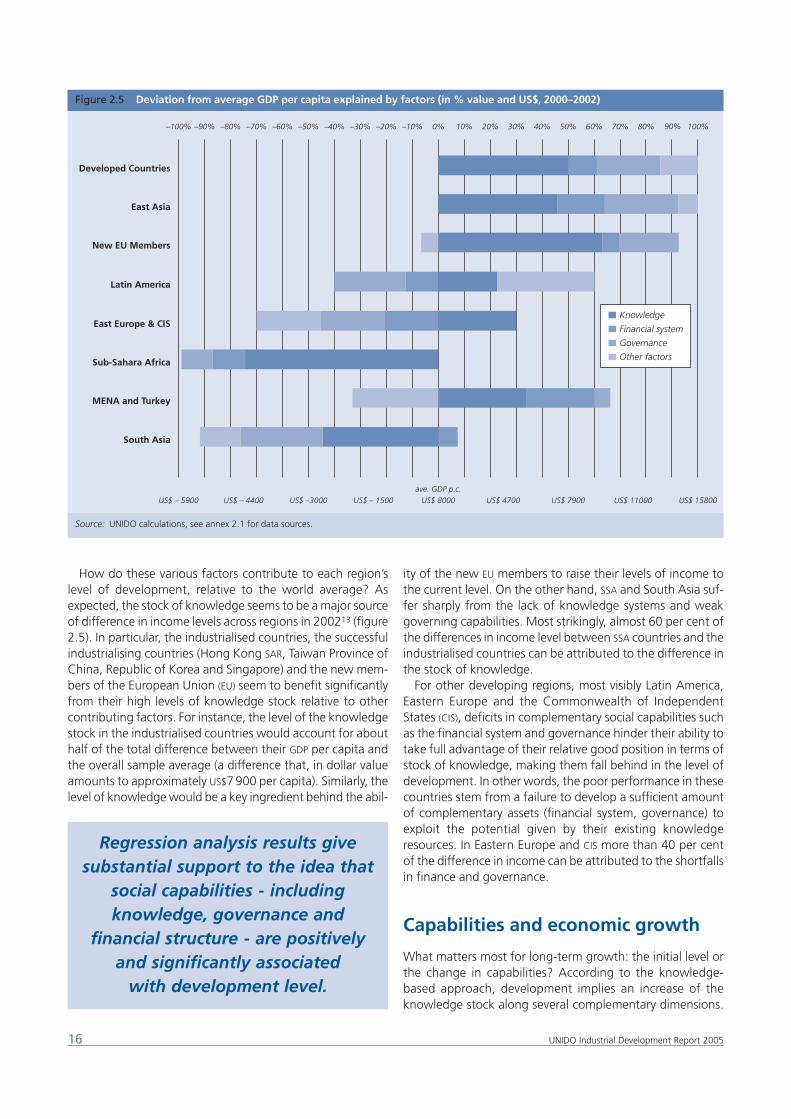
How do these various factors contribute to each region’slevel of development, relative to the world average? Asexpected, the stock of knowledge seems to be a major sourceof difference in income levels across regions in 200213 (figure2.5). In particular, the industrialised countries, the successfulindustrialising countries (Hong Kong SAR, Taiwan Province ofChina, Republic of Korea and Singapore) and the new mem-bers of the European Union (EU) seem to benefit significantlyfrom their high levels of knowledge stock relative to othercontributing factors. For instance, the level of the knowledgestock in the industrialised countries would account for abouthalf of the total difference between their GDP per capita andthe overall sample average (a difference that, in dollar valueamounts to approximately US$7900 per capita). Similarly, thelevel of knowledge would be a key ingredient behind the abil-
ity of the new EU members to raise their levels of income tothe current level. On the other hand, SSA and South Asia suf-fer sharply from the lack of knowledge systems and weakgoverning capabilities. Most strikingly, almost 60 per cent ofthe differences in income level between SSA countries and theindustrialised countries can be attributed to the difference inthe stock of knowledge.
For other developing regions, most visibly Latin America,Eastern Europe and the Commonwealth of IndependentStates (CIS), deficits in complementary social capabilities suchas the financial system and governance hinder their ability totake full advantage of their relative good position in terms ofstock of knowledge, making them fall behind in the level ofdevelopment. In other words, the poor performance in thesecountries stem from a failure to develop a sufficient amountof complementary assets (financial system, governance) toexploit the potential given by their existing knowledgeresources. In Eastern Europe and CIS more than 40 per centof the difference in income can be attributed to the shortfallsin finance and governance.
Capabilities and economic growth
What matters most for long-term growth: the initial level orthe change in capabilities? According to the knowledge-based approach, development implies an increase of theknowledge stock along several complementary dimensions.
16 UNIDO Industrial Development Report 2005
Regression analysis results givesubstantial support to the idea that
social capabilities - includingknowledge, governance and
financial structure - are positivelyand significantly associated
with development level.
Figure 2.5 Deviation from average GDP per capita explained by factors (in % value and US$, 2000–2002)
Source: UNIDO calculations, see annex 2.1 for data sources.
–100% –90% –80% –70% –60% –50% –40% –30% –20% –10% 0% 10% 20% 30% 40% 50% 60% 70% 80% 90% 100%
US$ – 5900 US$ – 4400 US$ –3000 US$ – 1500 US$ 8000ave. GDP p.c.
US$ 4700 US$ 7900 US$ 11000 US$ 15800
Developed Countries
East Asia
New EU Members
Latin America
East Europe & CIS
Sub-Sahara Africa
MENA and Turkey
South Asia
Knowledge
Financial system
Governance
Other factors
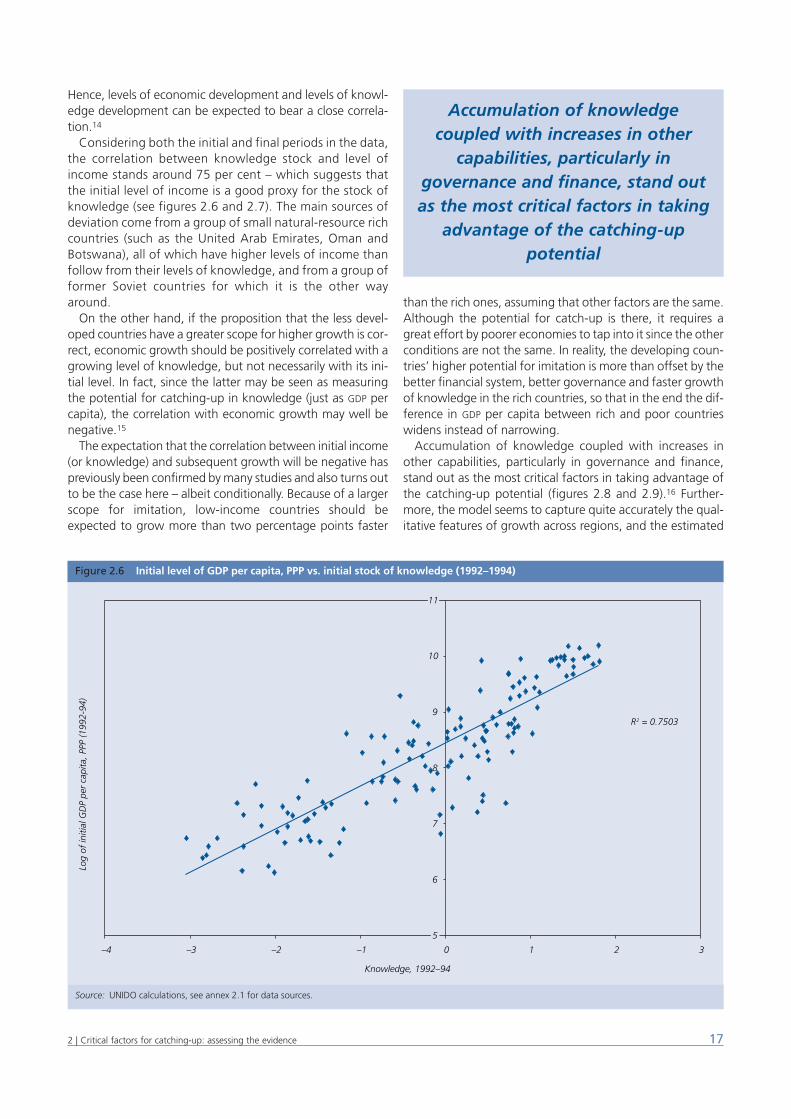
Hence, levels of economic development and levels of knowl-edge development can be expected to bear a close correla-tion.14
Considering both the initial and final periods in the data,the correlation between knowledge stock and level ofincome stands around 75 per cent – which suggests thatthe initial level of income is a good proxy for the stock ofknowledge (see figures 2.6 and 2.7). The main sources ofdeviation come from a group of small natural-resource richcountries (such as the United Arab Emirates, Oman andBotswana), all of which have higher levels of income thanfollow from their levels of knowledge, and from a group offormer Soviet countries for which it is the other wayaround.
On the other hand, if the proposition that the less devel-oped countries have a greater scope for higher growth is cor-rect, economic growth should be positively correlated with agrowing level of knowledge, but not necessarily with its ini-tial level. In fact, since the latter may be seen as measuringthe potential for catching-up in knowledge (just as GDP percapita), the correlation with economic growth may well benegative.15
The expectation that the correlation between initial income(or knowledge) and subsequent growth will be negative haspreviously been confirmed by many studies and also turns outto be the case here – albeit conditionally. Because of a largerscope for imitation, low-income countries should beexpected to grow more than two percentage points faster
than the rich ones, assuming that other factors are the same.Although the potential for catch-up is there, it requires agreat effort by poorer economies to tap into it since the otherconditions are not the same. In reality, the developing coun-tries’ higher potential for imitation is more than offset by thebetter financial system, better governance and faster growthof knowledge in the rich countries, so that in the end the dif-ference in GDP per capita between rich and poor countrieswidens instead of narrowing.
Accumulation of knowledge coupled with increases inother capabilities, particularly in governance and finance,stand out as the most critical factors in taking advantage ofthe catching-up potential (figures 2.8 and 2.9).16 Further-more, the model seems to capture quite accurately the qual-itative features of growth across regions, and the estimated
172 | Critical factors for catching-up: assessing the evidence
Figure 2.6 Initial level of GDP per capita, PPP vs. initial stock of knowledge (1992–1994)
Source: UNIDO calculations, see annex 2.1 for data sources.
R2 = 0.7503
5
6
7
9
10
11
5
6
7
8
9
10
11
–4 –3 –2 –1 0 1 2 3
Knowledge, 1992–94
Log
of in
itial
GD
P pe
r ca
pita
, PPP
(199
2-94
)
Accumulation of knowledgecoupled with increases in other
capabilities, particularly ingovernance and finance, stand outas the most critical factors in taking
advantage of the catching-uppotential
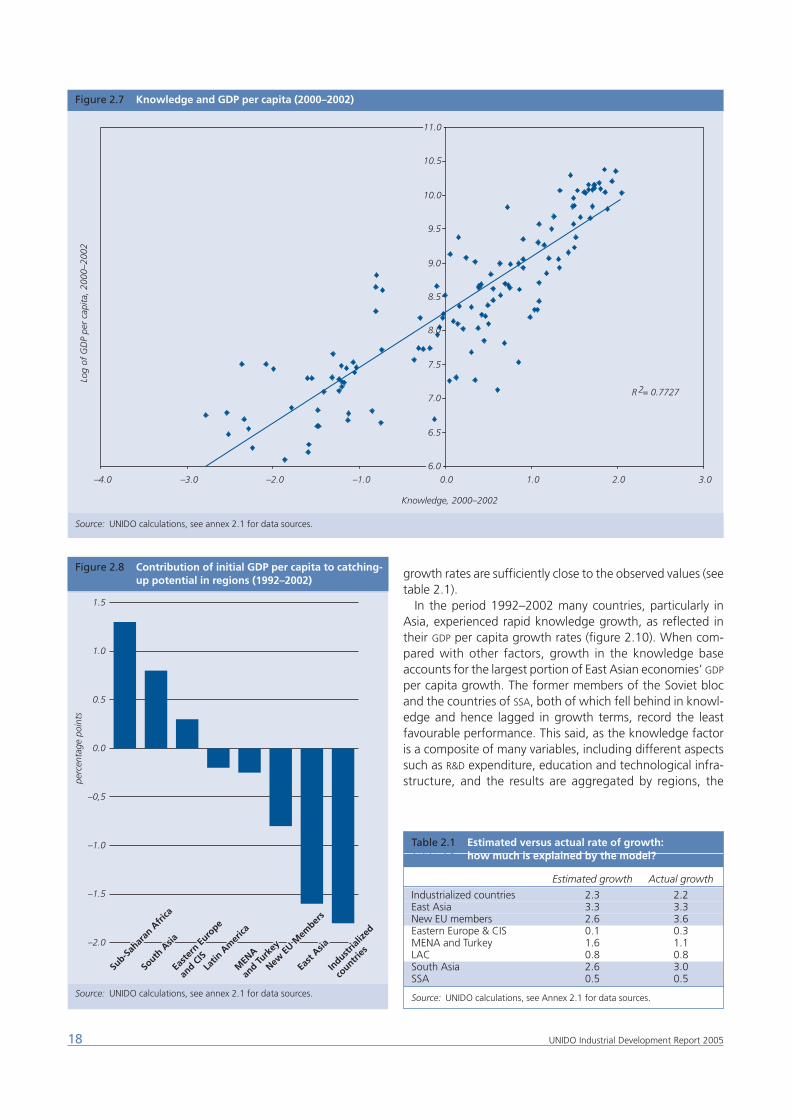
growth rates are sufficiently close to the observed values (seetable 2.1).
In the period 1992–2002 many countries, particularly inAsia, experienced rapid knowledge growth, as reflected intheir GDP per capita growth rates (figure 2.10). When com-pared with other factors, growth in the knowledge baseaccounts for the largest portion of East Asian economies’ GDP
per capita growth. The former members of the Soviet blocand the countries of SSA, both of which fell behind in knowl-edge and hence lagged in growth terms, record the leastfavourable performance. This said, as the knowledge factoris a composite of many variables, including different aspectssuch as R&D expenditure, education and technological infra-structure, and the results are aggregated by regions, the
18 UNIDO Industrial Development Report 2005
Figure 2.7 Knowledge and GDP per capita (2000–2002)
Source: UNIDO calculations, see annex 2.1 for data sources.
R 2 = 0.7727
6.0
11.0
6.0
6.5
7.0
7.5
8.0
8.5
9.0
9.5
10.0
10.5
11.0
–4.0 –3.0 –2.0 –1.0 0.0 1.0 2.0 3.0
Knowledge, 2000–2002
Log
of G
DP
per
capi
ta, 2
000–
2002
Figure 2.8 Contribution of initial GDP per capita to catching- Figure 2.8 up potential in regions (1992–2002)
Source: UNIDO calculations, see annex 2.1 for data sources.
–2.0
–1.5
–1.0
–0,5
0.0
0.5
1.0
1.5
Industr
ialize
d
countri
es
East
Asia
New EU
Mem
bers
MEN
A
and Tu
rkey
Latin
Am
erica
Easte
rn Eu
rope
and C
ISSo
uth A
sia
Sub-S
ahar
an A
frica
Industr
ialize
d
countri
es
East
Asia
New EU
Mem
bers
MEN
A
and Tu
rkey
Latin
Am
erica
Easte
rn Eu
rope
and C
ISSo
uth A
sia
Sub-S
ahar
an A
frica
perc
enta
ge p
oint
s
Table 2.1 Estimated versus actual rate of growth:Table 2.1 how much is explained by the model?
Estimated growth Actual growth
Industrialized countries 2.3 2.2East Asia 3.3 3.3New EU members 2.6 3.6Eastern Europe & CIS 0.1 0.3MENA and Turkey 1.6 1.1LAC 0.8 0.8South Asia 2.6 3.0SSA 0.5 0.5
Source: UNIDO calculations, see Annex 2.1 for data sources.
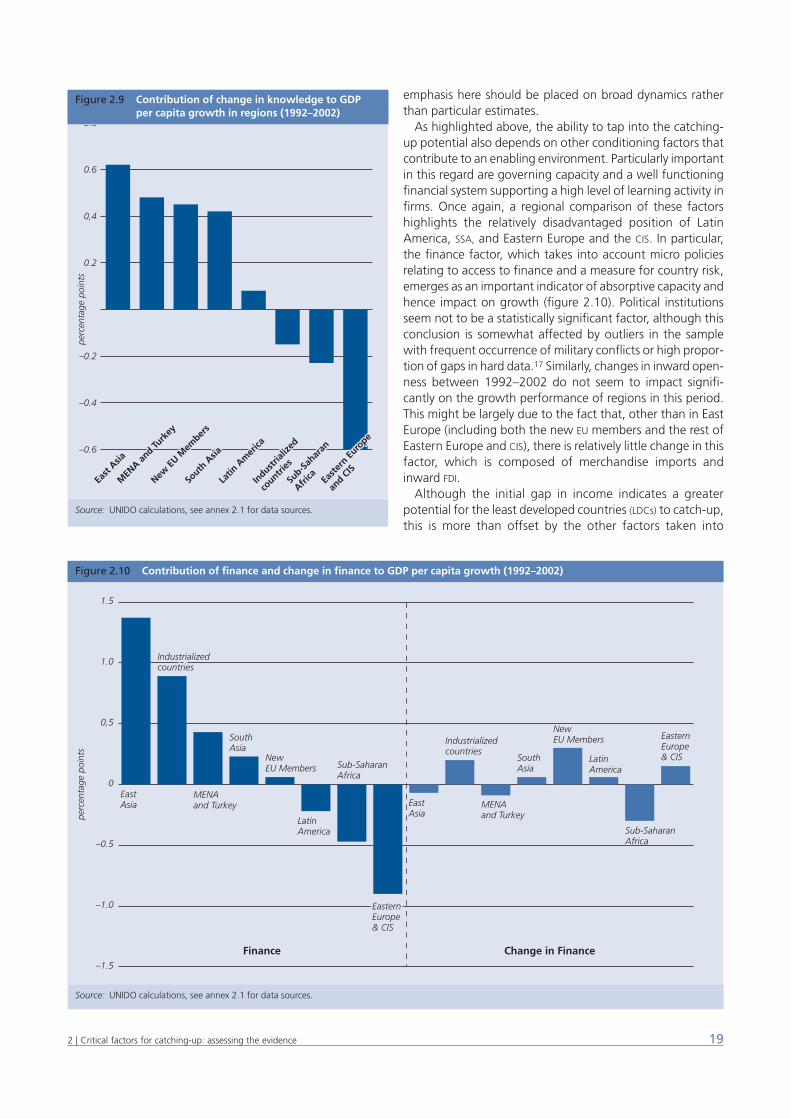
emphasis here should be placed on broad dynamics ratherthan particular estimates.
As highlighted above, the ability to tap into the catching-up potential also depends on other conditioning factors thatcontribute to an enabling environment. Particularly importantin this regard are governing capacity and a well functioningfinancial system supporting a high level of learning activity infirms. Once again, a regional comparison of these factorshighlights the relatively disadvantaged position of LatinAmerica, SSA, and Eastern Europe and the CIS. In particular,the finance factor, which takes into account micro policiesrelating to access to finance and a measure for country risk,emerges as an important indicator of absorptive capacity andhence impact on growth (figure 2.10). Political institutionsseem not to be a statistically significant factor, although thisconclusion is somewhat affected by outliers in the samplewith frequent occurrence of military conflicts or high propor-tion of gaps in hard data.17 Similarly, changes in inward open-ness between 1992–2002 do not seem to impact signifi-cantly on the growth performance of regions in this period.This might be largely due to the fact that, other than in EastEurope (including both the new EU members and the rest ofEastern Europe and CIS), there is relatively little change in thisfactor, which is composed of merchandise imports andinward FDI.
Although the initial gap in income indicates a greaterpotential for the least developed countries (LDCs) to catch-up,this is more than offset by the other factors taken into
192 | Critical factors for catching-up: assessing the evidence
Figure 2.9 Contribution of change in knowledge to GDP Figure 2.9 per capita growth in regions (1992–2002)
Source: UNIDO calculations, see annex 2.1 for data sources.
–0.6
–0.4
–0.2
0.2
0,4
0.6
0.8
Easte
rn Eu
rope
and C
ISSu
b-Sah
aran
AfricaIn
dustrial
ized
countri
es
Latin
Am
erica
South
Asia
New EU
Mem
bers
MEN
A
and Tu
rkey
East
Asia
Easte
rn Eu
rope
and C
ISSu
b-Sah
aran
AfricaIn
dustrial
ized
countri
es
Latin
Am
erica
South
Asia
New EU
Mem
bers
MEN
A and Tu
rkey
MEN
A and Tu
rkey
East
Asia
perc
enta
ge p
oint
s
Figure 2.10 Contribution of finance and change in finance to GDP per capita growth (1992–2002)
Source: UNIDO calculations, see annex 2.1 for data sources.
–1.5
–1.0
–0.5
0
0,5
1.0
1.5
EasternEurope& CIS
Industrializedcountries
EasternEurope& CIS
Sub-SaharanAfrica
LatinAmerica
NewEU Members
SouthAsia
MENAand Turkey
Industrializedcountries
EastAsia East
Asia
Industrializedcountries
MENAand Turkey
SouthAsia
NewEU Members
LatinAmerica
Sub-SaharanAfrica
EasternEurope& CIS
Finance Change in Finance
perc
enta
ge p
oint
s
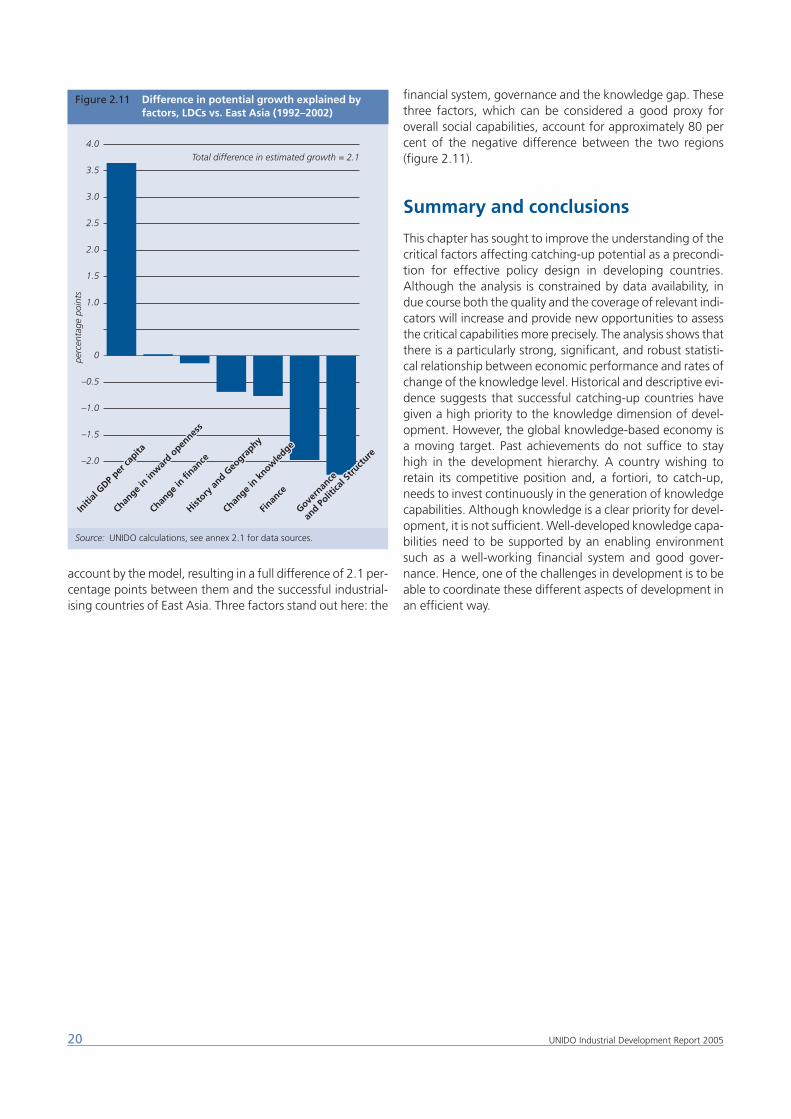
account by the model, resulting in a full difference of 2.1 per-centage points between them and the successful industrial-ising countries of East Asia. Three factors stand out here: the
financial system, governance and the knowledge gap. Thesethree factors, which can be considered a good proxy foroverall social capabilities, account for approximately 80 percent of the negative difference between the two regions(figure 2.11).
Summary and conclusions
This chapter has sought to improve the understanding of thecritical factors affecting catching-up potential as a precondi-tion for effective policy design in developing countries.Although the analysis is constrained by data availability, indue course both the quality and the coverage of relevant indi-cators will increase and provide new opportunities to assessthe critical capabilities more precisely. The analysis shows thatthere is a particularly strong, significant, and robust statisti-cal relationship between economic performance and rates ofchange of the knowledge level. Historical and descriptive evi-dence suggests that successful catching-up countries havegiven a high priority to the knowledge dimension of devel-opment. However, the global knowledge-based economy isa moving target. Past achievements do not suffice to stayhigh in the development hierarchy. A country wishing toretain its competitive position and, a fortiori, to catch-up,needs to invest continuously in the generation of knowledgecapabilities. Although knowledge is a clear priority for devel-opment, it is not sufficient. Well-developed knowledge capa-bilities need to be supported by an enabling environmentsuch as a well-working financial system and good gover-nance. Hence, one of the challenges in development is to beable to coordinate these different aspects of development inan efficient way.
20 UNIDO Industrial Development Report 2005
Figure 2.11 Difference in potential growth explained by Figure 2.11 factors, LDCs vs. East Asia (1992–2002)
Source: UNIDO calculations, see annex 2.1 for data sources.
–2.0
–1.5
–1.0
–0.5
0
1.0
1.5
2.0
2.5
3.0
3.5
4.0
Govern
ance
and Po
litica
l Stru
cture
Finan
ce
Change i
n know
ledge
History
and G
eogra
phy
Change i
n finan
ce
Change i
n inw
ard o
pennes
s
Initi
al GDP p
er ca
pita
Govern
ance
and Po
litica
l Stru
cture
Finan
ce
Change i
n know
ledge
History
and G
eogra
phy
Change i
n finan
ce
Change i
n inw
ard o
pennes
s
Initi
al GDP p
er ca
pita
perc
enta
ge p
oint
s
Total difference in estimated growth = 2.1
Annex 2.1:
Sources and methodologyData for the analysis in this chapter was originally collectedfor all independent states (approximately 175 countries) anda large pool of indicators (approximately 100 indicators). Thescreening revealed that a group of (mostly least developed)countries suffers from a lot of missing data. Similarly data fora large number of relevant indicators are available only for agroup of high and medium income countries or only for themost recent period (from the second half of the 1990s). Acloser look, furthermore, revealed that some indicators suf-fer from high volatility (primarily in the developing world),methodological changes over the period or are merely varia-tions of each other. These indicators were then skipped.
In order to strike a balance between the need to bring richevidence for as many countries as possible and data availabil-ity and methodological coherence, 135 countries and 29 indi-cators on social capabilities (plus ten ‘fixed factors’) wereselected. The indicators were used in the form of three-yearaverages (1992–1994 and 2000–2002) to limit influence ofshocks and measurement errors occurring in specific years. Toensure comparability over time and across countries, all indi-cators were measured in real units (quantity), deflated (ifapplicable) with population or GDP and on an increasing scale– from low score (weak) to high score (strong). Where nec-essary, scales of the indicators were reversed to have all ofthem in an increasing order, e.g. teacher-pupil ratio insteadof the opposite.
A brief overview of definitions, sources and time/countrycoverage of the indicators is given in table 2A.1 below. Themain source of data is the World Bank (World DevelopmentIndicators 2004), which combines various sources of data fora large sample of countries. The database has been comple-mented by data from other organisations such as the UnitedNations Conference on Trade and Development (UNCTAD) (FDI
Database), the Organisation for Economic Co-operation andDevelopment (OECD) (Main Science and Technology Indicators(MSTI) and Patent Databases), the International Organisationfor Standardisation (ISO), the Heritage Foundation, the FrazerInstitute. National sources were only used for Taiwan Provinceof China and in a few cases for R&D data when necessary.
However, in spite of this short timeframe, there were somemissing observations for certain indicators/countries, espe-cially for the initial period. In general, a fully complete dataset was available for one third of the countries only; anotherthird was in the 90–99 per cent range, while the remaininghad between 70–90 per cent of the data needed.18 A fewmissing observations among the fixed factors (geography,etc.) have been filled in from other sources or estimated onthe basis of regional averages. Full coverage of the indicatorsfor social capabilities, however, is available for only one thirdof the countries and six indicators. In these cases, the imputeprocedure in Stata 8.2. was used to fill in the missing values(see the Stata 8.2. Manual for details). In each case the esti-mation was based on data for other indicators in the data set.
In many cases only a few observations had to be estimated.
But in some cases larger amounts of data had to be estimatedto keep the country or indicator in the analysis. The propor-tion of countries estimated for each indicator is given in thelast column of the following table. Missing values were mostfrequent for stocks of human capital, market capitalisation oflisted companies and some of the governance indicators. R&D
expenditures were not available for most of the low-incomecountries. We assumed that a country with zero patentsjointly with zero scientific articles has also zero R&D expendi-tures, which was the case for approximately 40 of the LDCs.The remaining missing R&D figures were estimated using theprocedure described above.
Countries with a lot of missing data (between 15 and 30per cent) include Turkmenistan, Uzbekistan, Lebanon, Kaza-khstan, Saudi Arabia, Hong Kong SAR, China, Tajikistan, Azer-baijan, Macedonia, Burkina Faso, Georgia, Armenia, Cambo-dia, Kyrgyzstan, Laos, Mauritania, United Arab Emirates,Belarus, Ethiopia, and Viet Nam (these countries are markedwith stars in table 2A.3). It should be stressed that consider-able care was taken to check the estimated data againstobserved figures in countries with similar characteristics (levelof development, region, history, etc.). In some cases the esti-mated data would exceed the maximum observed value ofan indicator elsewhere. In such cases the data was truncatedby replacing the estimated values by the maximum observedfigure.
Finally, some indicators deserved special care due to theirnature or methodology. It is customary, for instance, to sup-press the ‘home country advantage’ of the US in the UnitedStates Patent and Trademark Office (USPTO) patent countsindicator, since the propensity of US residents to registerinventions in their own national patent office is higher thanthat of non-residents. This home-base bias was adjusteddownwards based on a comparison between the Japaneseand the US patents registered at the European Patent Office(EPO), which represents a foreign institution for both US andJapanese inventors. The estimation method proposed byArchibugi and Coco (2004, p. 633) is:
Adjusted US patents at the USPTO = (JAPUSA * USAEPO)/JAPEPO
where JAPUSA represents patents granted to Japanese resi-dents in the US, while USAEPO and JAPEPO capture patentsgranted to Japanese and American residents at the EPO.
The scale for some of the governance indicators wasreversed in order to have the indicator in increasing order(with low value signalling weak governance and vice versa).Note that this change of scale does not alter any property ofthe data but simplifies the interpretation of loadings in thefactor analysis.
212 | Critical factors for catching-up: assessing the evidence
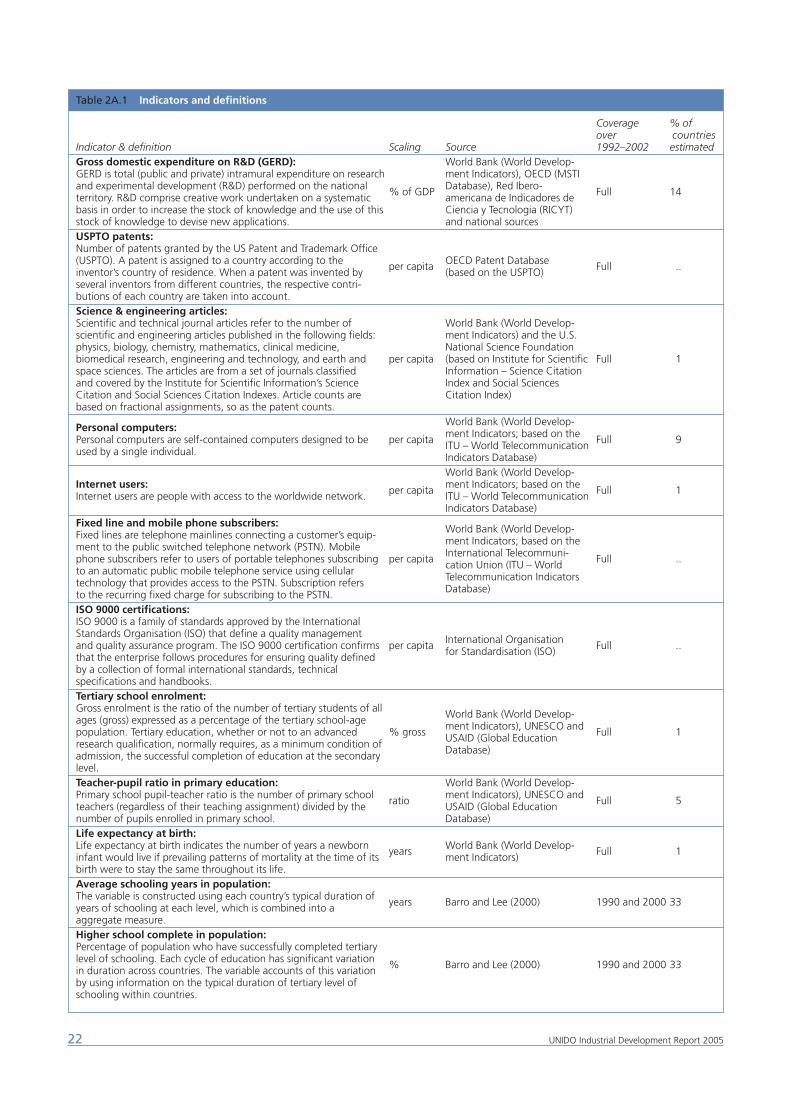
22 UNIDO Industrial Development Report 2005
Table 2A.1 Indicators and definitions
Coverage % of over countries
Indicator & definition Scaling Source 1992–2002 estimatedGross domestic expenditure on R&D (GERD): World Bank (World Develop-GERD is total (public and private) intramural expenditure on research ment Indicators), OECD (MSTI and experimental development (R&D) performed on the national Database), Red Ibero-territory. R&D comprise creative work undertaken on a systematic % of GDP americana de Indicadores de Full 14
basis in order to increase the stock of knowledge and the use of this Ciencia y Tecnologia (RICYT) stock of knowledge to devise new applications. and national sourcesUSPTO patents:Number of patents granted by the US Patent and Trademark Office (USPTO). A patent is assigned to a country according to the OECD Patent Databaseinventor’s country of residence. When a patent was invented by per capita (based on the USPTO) Full ..
several inventors from different countries, the respective contri-butions of each country are taken into account.Science & engineering articles:Scientific and technical journal articles refer to the number of World Bank (World Develop-scientific and engineering articles published in the following fields: ment Indicators) and the U.S. physics, biology, chemistry, mathematics, clinical medicine, National Science Foundation biomedical research, engineering and technology, and earth and per capita (based on Institute for Scientific Full 1space sciences. The articles are from a set of journals classified Information – Science Citation and covered by the Institute for Scientific Information’s Science Index and Social Sciences Citation and Social Sciences Citation Indexes. Article counts are Citation Index)based on fractional assignments, so as the patent counts.
World Bank (World Develop-Personal computers: ment Indicators; based on the Personal computers are self-contained computers designed to be per capita ITU – World Telecommunication Full 9used by a single individual. Indicators Database)
World Bank (World Develop-Internet users: ment Indicators; based on the Internet users are people with access to the worldwide network. per capita ITU – World Telecommunication Full 1
Indicators Database)Fixed line and mobile phone subscribers:Fixed lines are telephone mainlines connecting a customer’s equip- World Bank (World Develop-
ment to the public switched telephone network (PSTN). Mobile ment Indicators; based on the
phone subscribers refer to users of portable telephones subscribing per capita International Telecommuni- Full ..to an automatic public mobile telephone service using cellular cation Union (ITU – World
technology that provides access to the PSTN. Subscription refers Telecommunication Indicators
to the recurring fixed charge for subscribing to the PSTN. Database)
ISO 9000 certifications: ISO 9000 is a family of standards approved by the International Standards Organisation (ISO) that define a quality management and quality assurance program. The ISO 9000 certification confirms per capita International Organisation Full ..that the enterprise follows procedures for ensuring quality defined for Standardisation (ISO)
by a collection of formal international standards, technical specifications and handbooks.Tertiary school enrolment: Gross enrolment is the ratio of the number of tertiary students of all ages (gross) expressed as a percentage of the tertiary school-age World Bank (World Develop-
population. Tertiary education, whether or not to an advanced % gross ment Indicators), UNESCO and Full 1research qualification, normally requires, as a minimum condition of USAID (Global Education
admission, the successful completion of education at the secondary Database)
level.Teacher-pupil ratio in primary education: World Bank (World Develop-Primary school pupil-teacher ratio is the number of primary school ment Indicators), UNESCO and teachers (regardless of their teaching assignment) divided by the ratio USAID (Global Education Full 5
number of pupils enrolled in primary school. Database)Life expectancy at birth:Life expectancy at birth indicates the number of years a newborn World Bank (World Develop-infant would live if prevailing patterns of mortality at the time of its years ment Indicators) Full 1
birth were to stay the same throughout its life.Average schooling years in population:The variable is constructed using each country’s typical duration of years of schooling at each level, which is combined into a years Barro and Lee (2000) 1990 and 2000 33
aggregate measure.Higher school complete in population:Percentage of population who have successfully completed tertiary level of schooling. Each cycle of education has significant variation in duration across countries. The variable accounts of this variation % Barro and Lee (2000) 1990 and 2000 33
by using information on the typical duration of tertiary level of schooling within countries.
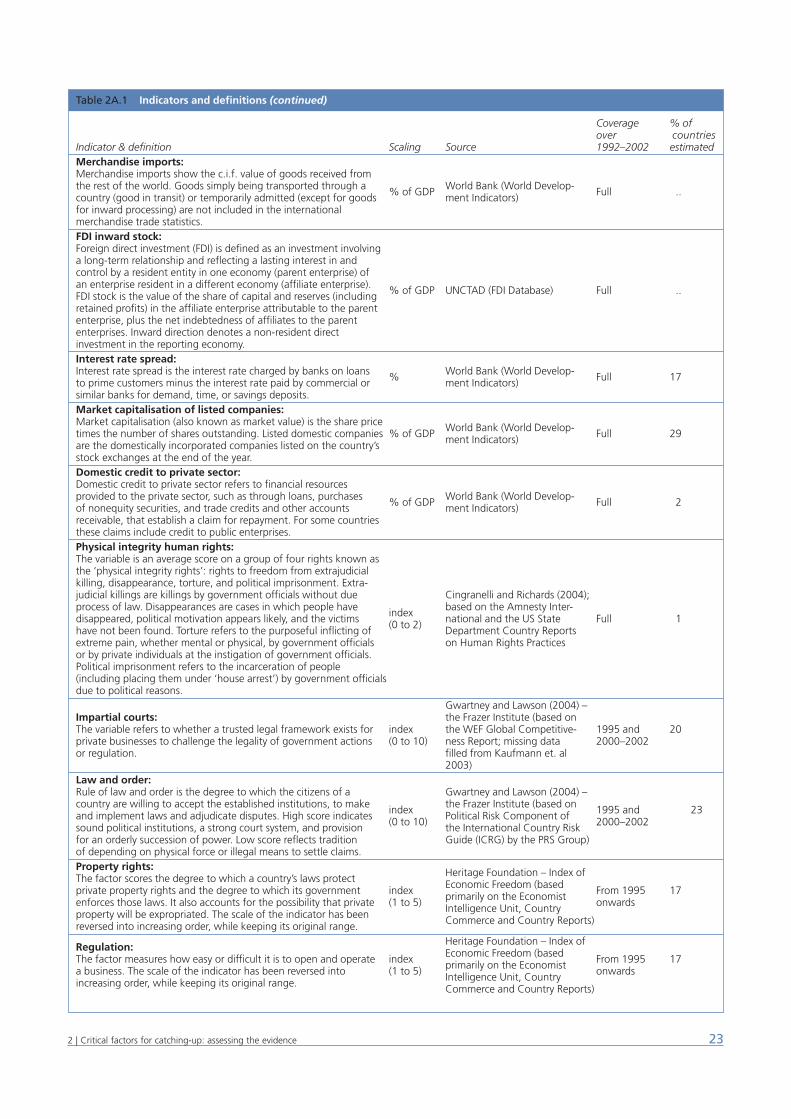
232 | Critical factors for catching-up: assessing the evidence
Table 2A.1 Indicators and definitions (continued)
Coverage % of over countries
Indicator & definition Scaling Source 1992–2002 estimatedMerchandise imports: Merchandise imports show the c.i.f. value of goods received from the rest of the world. Goods simply being transported through a World Bank (World Develop-country (good in transit) or temporarily admitted (except for goods % of GDP ment Indicators) Full ..
for inward processing) are not included in the international merchandise trade statistics.FDI inward stock: Foreign direct investment (FDI) is defined as an investment involving a long-term relationship and reflecting a lasting interest in and control by a resident entity in one economy (parent enterprise) of an enterprise resident in a different economy (affiliate enterprise). FDI stock is the value of the share of capital and reserves (including % of GDP UNCTAD (FDI Database) Full ..
retained profits) in the affiliate enterprise attributable to the parent enterprise, plus the net indebtedness of affiliates to the parent enterprises. Inward direction denotes a non-resident direct investment in the reporting economy.Interest rate spread:Interest rate spread is the interest rate charged by banks on loans World Bank (World Develop-to prime customers minus the interest rate paid by commercial or % ment Indicators) Full 17
similar banks for demand, time, or savings deposits.Market capitalisation of listed companies:Market capitalisation (also known as market value) is the share price times the number of shares outstanding. Listed domestic companies % of GDP World Bank (World Develop- Full 29are the domestically incorporated companies listed on the country’s ment Indicators)
stock exchanges at the end of the year.Domestic credit to private sector: Domestic credit to private sector refers to financial resources provided to the private sector, such as through loans, purchases World Bank (World Develop-of nonequity securities, and trade credits and other accounts % of GDP ment Indicators) Full 2
receivable, that establish a claim for repayment. For some countries these claims include credit to public enterprises.Physical integrity human rights:The variable is an average score on a group of four rights known as the ‘physical integrity rights’: rights to freedom from extrajudicial killing, disappearance, torture, and political imprisonment. Extra-judicial killings are killings by government officials without due Cingranelli and Richards (2004);process of law. Disappearances are cases in which people have based on the Amnesty Inter-disappeared, political motivation appears likely, and the victims index national and the US State Full 1have not been found. Torture refers to the purposeful inflicting of (0 to 2) Department Country Reports extreme pain, whether mental or physical, by government officials on Human Rights Practicesor by private individuals at the instigation of government officials. Political imprisonment refers to the incarceration of people (including placing them under ‘house arrest’) by government officials due to political reasons.
Gwartney and Lawson (2004) – Impartial courts: the Frazer Institute (based on The variable refers to whether a trusted legal framework exists for index the WEF Global Competitive- 1995 and 20private businesses to challenge the legality of government actions (0 to 10) ness Report; missing data 2000–2002or regulation. filled from Kaufmann et. al
2003)Law and order:Rule of law and order is the degree to which the citizens of a Gwartney and Lawson (2004) – country are willing to accept the established institutions, to make the Frazer Institute (based on and implement laws and adjudicate disputes. High score indicates index Political Risk Component of 1995 and 23
sound political institutions, a strong court system, and provision (0 to 10) the International Country Risk 2000–2002
for an orderly succession of power. Low score reflects tradition Guide (ICRG) by the PRS Group)of depending on physical force or illegal means to settle claims.Property rights:The factor scores the degree to which a country’s laws protect Heritage Foundation – Index of
private property rights and the degree to which its government index Economic Freedom (based From 1995 17enforces those laws. It also accounts for the possibility that private (1 to 5) primarily on the Economist onwardsproperty will be expropriated. The scale of the indicator has been Intelligence Unit, Country
reversed into increasing order, while keeping its original range. Commerce and Country Reports)
Heritage Foundation – Index of Regulation: Economic Freedom (based The factor measures how easy or difficult it is to open and operate index primarily on the Economist From 1995 17a business. The scale of the indicator has been reversed into (1 to 5) Intelligence Unit, Country onwardsincreasing order, while keeping its original range. Commerce and Country Reports)
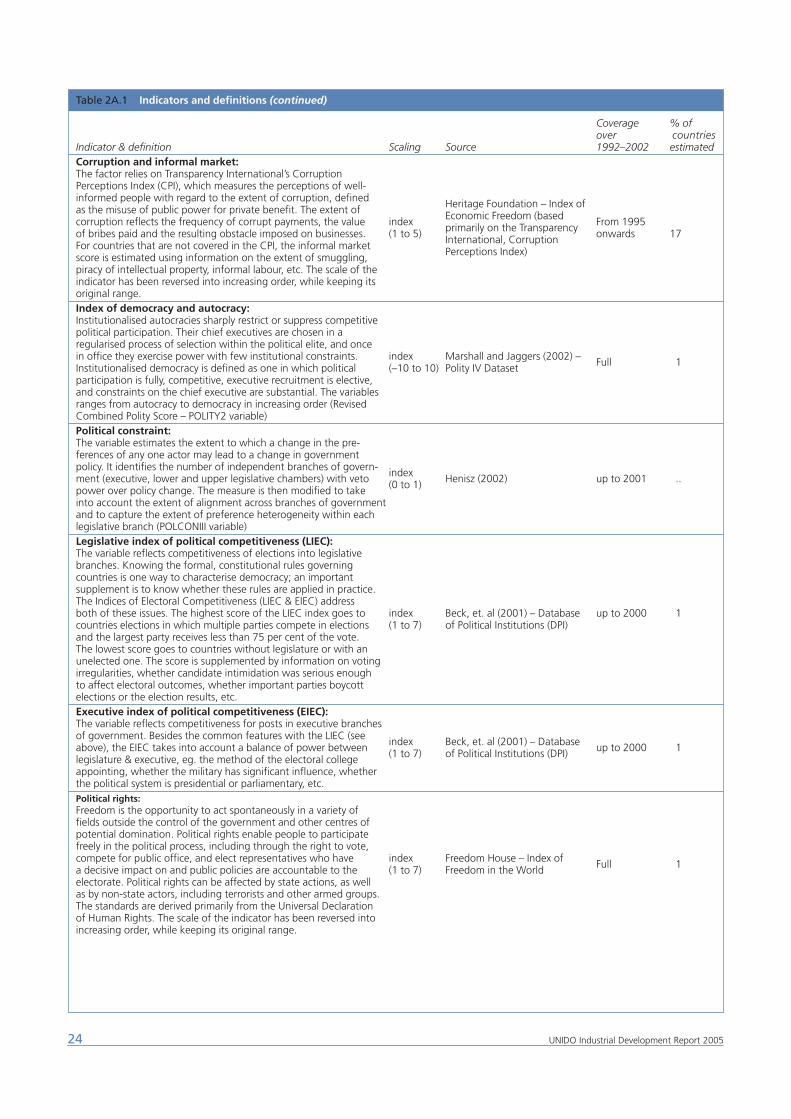
24 UNIDO Industrial Development Report 2005
Table 2A.1 Indicators and definitions (continued)
Coverage % of over countries
Indicator & definition Scaling Source 1992–2002 estimatedCorruption and informal market:The factor relies on Transparency International’s Corruption Perceptions Index (CPI), which measures the perceptions of well-informed people with regard to the extent of corruption, defined as the misuse of public power for private benefit. The extent of Heritage Foundation – Index of
corruption reflects the frequency of corrupt payments, the value index Economic Freedom (based From 1995 of bribes paid and the resulting obstacle imposed on businesses. (1 to 5) primarily on the Transparency onwards 17For countries that are not covered in the CPI, the informal market International, Corruption
score is estimated using information on the extent of smuggling, Perceptions Index)
piracy of intellectual property, informal labour, etc. The scale of the indicator has been reversed into increasing order, while keeping its original range.Index of democracy and autocracy:Institutionalised autocracies sharply restrict or suppress competitive political participation. Their chief executives are chosen in a regularised process of selection within the political elite, and once in office they exercise power with few institutional constraints. index Marshall and Jaggers (2002) – Institutionalised democracy is defined as one in which political (–10 to 10) Polity IV Dataset Full 1
participation is fully, competitive, executive recruitment is elective, and constraints on the chief executive are substantial. The variables ranges from autocracy to democracy in increasing order (Revised Combined Polity Score – POLITY2 variable)Political constraint:The variable estimates the extent to which a change in the pre-ferences of any one actor may lead to a change in government policy. It identifies the number of independent branches of govern-ment (executive, lower and upper legislative chambers) with veto index Henisz (2002) up to 2001 ..power over policy change. The measure is then modified to take (0 to 1)
into account the extent of alignment across branches of government and to capture the extent of preference heterogeneity within each legislative branch (POLCONIII variable)Legislative index of political competitiveness (LIEC):The variable reflects competitiveness of elections into legislative branches. Knowing the formal, constitutional rules governing countries is one way to characterise democracy; an important supplement is to know whether these rules are applied in practice. The Indices of Electoral Competitiveness (LIEC & EIEC) address both of these issues. The highest score of the LIEC index goes to index Beck, et. al (2001) – Database up to 2000 1countries elections in which multiple parties compete in elections (1 to 7) of Political Institutions (DPI)and the largest party receives less than 75 per cent of the vote. The lowest score goes to countries without legislature or with an unelected one. The score is supplemented by information on voting irregularities, whether candidate intimidation was serious enough to affect electoral outcomes, whether important parties boycott elections or the election results, etc.Executive index of political competitiveness (EIEC):The variable reflects competitiveness for posts in executive branches of government. Besides the common features with the LIEC (see above), the EIEC takes into account a balance of power between index Beck, et. al (2001) – Database up to 2000 1legislature & executive, eg. the method of the electoral college (1 to 7) of Political Institutions (DPI)
appointing, whether the military has significant influence, whether the political system is presidential or parliamentary, etc.Political rights:Freedom is the opportunity to act spontaneously in a variety of fields outside the control of the government and other centres of potential domination. Political rights enable people to participate freely in the political process, including through the right to vote, compete for public office, and elect representatives who have index Freedom House – Index of a decisive impact on and public policies are accountable to the (1 to 7) Freedom in the World Full 1
electorate. Political rights can be affected by state actions, as well as by non-state actors, including terrorists and other armed groups. The standards are derived primarily from the Universal Declaration of Human Rights. The scale of the indicator has been reversed into increasing order, while keeping its original range.
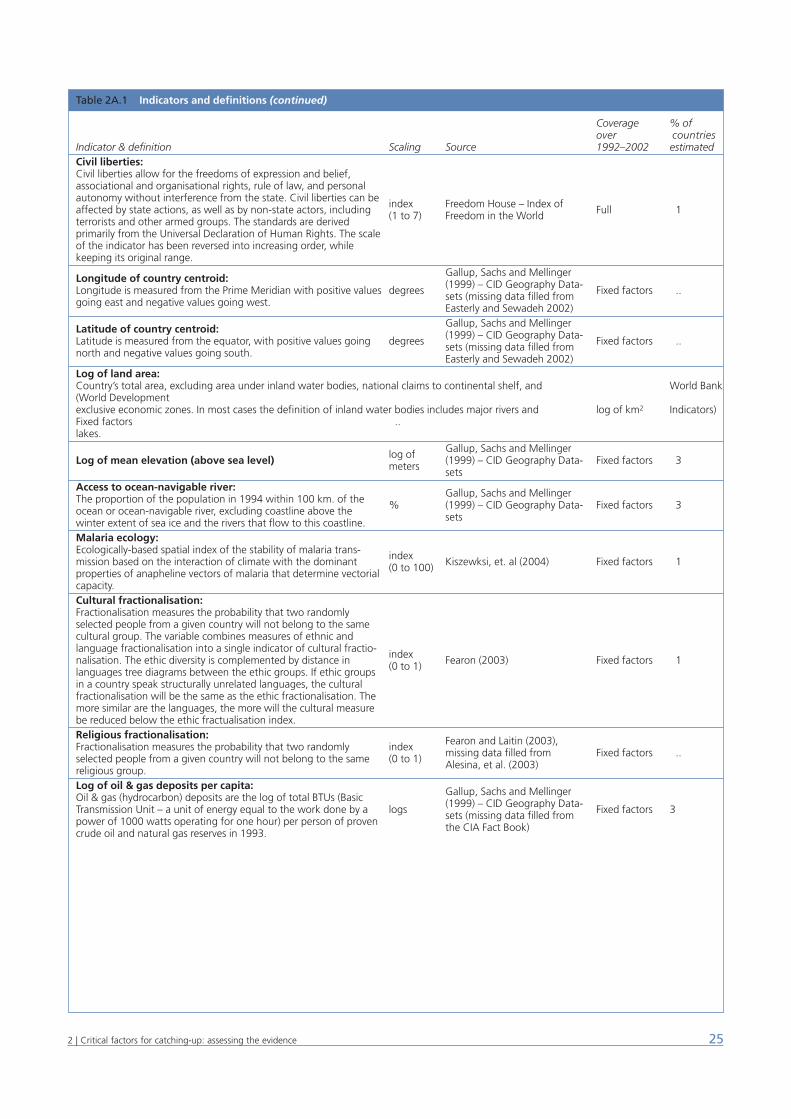
252 | Critical factors for catching-up: assessing the evidence
Table 2A.1 Indicators and definitions (continued)
Coverage % of over countries
Indicator & definition Scaling Source 1992–2002 estimatedCivil liberties:Civil liberties allow for the freedoms of expression and belief, associational and organisational rights, rule of law, and personal autonomy without interference from the state. Civil liberties can be affected by state actions, as well as by non-state actors, including index Freedom House – Index of Full 1terrorists and other armed groups. The standards are derived (1 to 7) Freedom in the World
primarily from the Universal Declaration of Human Rights. The scale of the indicator has been reversed into increasing order, while keeping its original range.
Gallup, Sachs and Mellinger Longitude of country centroid: (1999) – CID Geography Data-Longitude is measured from the Prime Meridian with positive values degrees sets (missing data filled from Fixed factors ..going east and negative values going west. Easterly and Sewadeh 2002)
Gallup, Sachs and Mellinger Latitude of country centroid: (1999) – CID Geography Data-Latitude is measured from the equator, with positive values going degrees sets (missing data filled from Fixed factors ..north and negative values going south. Easterly and Sewadeh 2002)Log of land area:Country’s total area, excluding area under inland water bodies, national claims to continental shelf, and World Bank(World Development exclusive economic zones. In most cases the definition of inland water bodies includes major rivers and log of km2 Indicators)Fixed factors ..lakes.
Gallup, Sachs and Mellinger Log of mean elevation (above sea level) log of (1999) – CID Geography Data- Fixed factors 3meters setsAccess to ocean-navigable river:The proportion of the population in 1994 within 100 km. of the Gallup, Sachs and Mellinger
ocean or ocean-navigable river, excluding coastline above the % (1999) – CID Geography Data- Fixed factors 3
winter extent of sea ice and the rivers that flow to this coastline. sets
Malaria ecology:Ecologically-based spatial index of the stability of malaria trans-mission based on the interaction of climate with the dominant index Kiszewksi, et. al (2004) Fixed factors 1properties of anapheline vectors of malaria that determine vectorial (0 to 100)
capacity.Cultural fractionalisation:Fractionalisation measures the probability that two randomly selected people from a given country will not belong to the same cultural group. The variable combines measures of ethnic and language fractionalisation into a single indicator of cultural fractio-nalisation. The ethic diversity is complemented by distance in index Fearon (2003) Fixed factors 1languages tree diagrams between the ethic groups. If ethic groups (0 to 1)
in a country speak structurally unrelated languages, the cultural fractionalisation will be the same as the ethic fractionalisation. The more similar are the languages, the more will the cultural measure be reduced below the ethic fractualisation index.Religious fractionalisation:Fractionalisation measures the probability that two randomly index Fearon and Laitin (2003),
selected people from a given country will not belong to the same (0 to 1) missing data filled from Fixed factors ..
religious group. Alesina, et al. (2003)
Log of oil & gas deposits per capita:Oil & gas (hydrocarbon) deposits are the log of total BTUs (Basic Gallup, Sachs and Mellinger
Transmission Unit – a unit of energy equal to the work done by a logs (1999) – CID Geography Data- Fixed factors 3power of 1000 watts operating for one hour) per person of proven sets (missing data filled from
crude oil and natural gas reserves in 1993. the CIA Fact Book)
Methodology
Factor analysis
Factor analysis is used to reduce a complex set of variablesinto a small number of (principal) factors that account for ahigh proportion of variance. First a matrix of correlations iscomputed. Then a vector explaining as much variance in thematrix as possible is identified and extracted from the data.The procedure is repeated as long as the last factor identifiedexplains more of the total variance than an original variable(more than the inverse value of the number of variables). Inanalytic terminology this means that eigenvalue of eachextracted factor should be higher than unity. This simple ruleensures that we will end up with fewer principal factors thanthe original number of variables. Note that the eigenvaluesare the variance of the new factors that are successivelyextracted. The sum of eigenvalues is equal to the originalnumber of variables. The result of this iterative process is aset of new (latent) variables that are linear combinations ofthe underlying indicators.
The problem, of course, is how to interpret the retainedfactors. In doing so it is helpful to look at the correlations withthe original set of variables (the so-called ‘factor loadings’).These ‘factor loadings’ show the proportion of the total vari-ance of an original variable that is accounted for by the newcomposite factor, e.g., a loading 0.60 of a variable indicatesthat 36 per cent of its variance is explained by the compos-ite factor.
The first factor identified typically explains by far the largestproportion of the variance, with most of the variables highlyloaded in it. However, such a general factor – with many highloadings – is difficult to interpret. Furthermore, it is an arte-fact of the method that the general factor is followed by aseries of bipolar factors with mixed positive and negativeloadings, the interpretation of which are even more difficult.
Therefore, in a second step of the factor analysis, the solu-tion is rotated to maximise differences in loadings of the orig-inal variables across the extracted factors. A number of com-putational methods have been developed for factor analysisand rotation. Although results were computed with moresophisticated extraction methods and rotations (such as max-imum likelihood factor analysis and (bi)quartimax rotation)since the solutions are broadly the same, the analysis pro-vided in Chapter 2 was based on principal component analy-sis and normalised varimax rotation. After the rotation, onlya limited number of variables load high on each factor, whichsimplifies the interpretation. Although the rotation changesfactor loadings (meaning of the factors) and distribution ofthe accounted variance across the factors, it does not changethe amount of total variance explained by the solution. Thissecond step also provides us with the weights used to calcu-late the composite indicators (the ‘factor score coefficients’).
The composite indicators that follow from weighingtogether the original variables with the ‘factor score coeffi-cients’ (so-called ‘factor scores’) are uncorrelated with eachother, which is of course a highly desirable property in regres-sion analysis. However, since each factor score is a linear
combination of all the original variables (although only a fewof them may have high weights), doubts may be expressedabout the interpretation. To reduce such interpretation prob-lems one possibility might be to only take into account thoseoriginal variables that load highly when constructing a par-ticular indicator (and disregard the other, less important vari-ables).
For instance, one might choose to include only those orig-inal variables, for which the factor loadings are shown to besignificantly different from zero at, say, a one per cent levelof significance. In a sample of 270 observations, an absolutevalue of the correlation coefficient above 0.15 is significantlydifferent from zero at one per cent level, which is the thresh-old used in the following. Alternatively one might allow eachoriginal variable to be included in only one of the compositeindicators, which would of course be preferable from aninterpretation point of view. However, one less desirable con-sequence of this may be that the property of uncorrelated-ness may no longer apply.
In addition to these there are two data issues that need tobe highlighted:
First, the indicators have to be standardised (deductingmean and dividing by standard deviation) before aggregat-ing them into a composite. The indicators were standardisedwith the mean and standard deviation of the pooled data(from the initial and final period). This means that the changeof a composite indicator over time will reflect both changesin each country’s relative position (across countries) andchanges in the absolute level of the underlying variables (overtime).
Second, variables should be relatively evenly distributed,e.g., variables with a ‘two sample split’ (for example very highvalues for the developed countries and close to zero for thepoorer ones) should be avoided. For the very same reasonoutliers need to be dealt with. Simply excluding outliers fromthe sample may not be the best solution, as important obser-vations may be lost. A log-transformation of the data set wasused to significantly reduce these problems. Some variablescontaining zeroes or negative scale had to be rescaled to pos-itive values. To achieve this transformation the minimumobserved value in the sample was added to all of the obser-vations.
Table 2A.2 presents the factor loadings after rotation andthe corresponding factor score coefficients that result from afactor analysis on pooled data for the initial and final periodfor the 135 countries (270 observations). Entries in bold rep-resent significant correlation coefficients (absolute valueabove 0.15). The boxed areas show the variables associatedwith the various factors when only one link is allowedbetween a variable and a factor.
26 UNIDO Industrial Development Report 2005
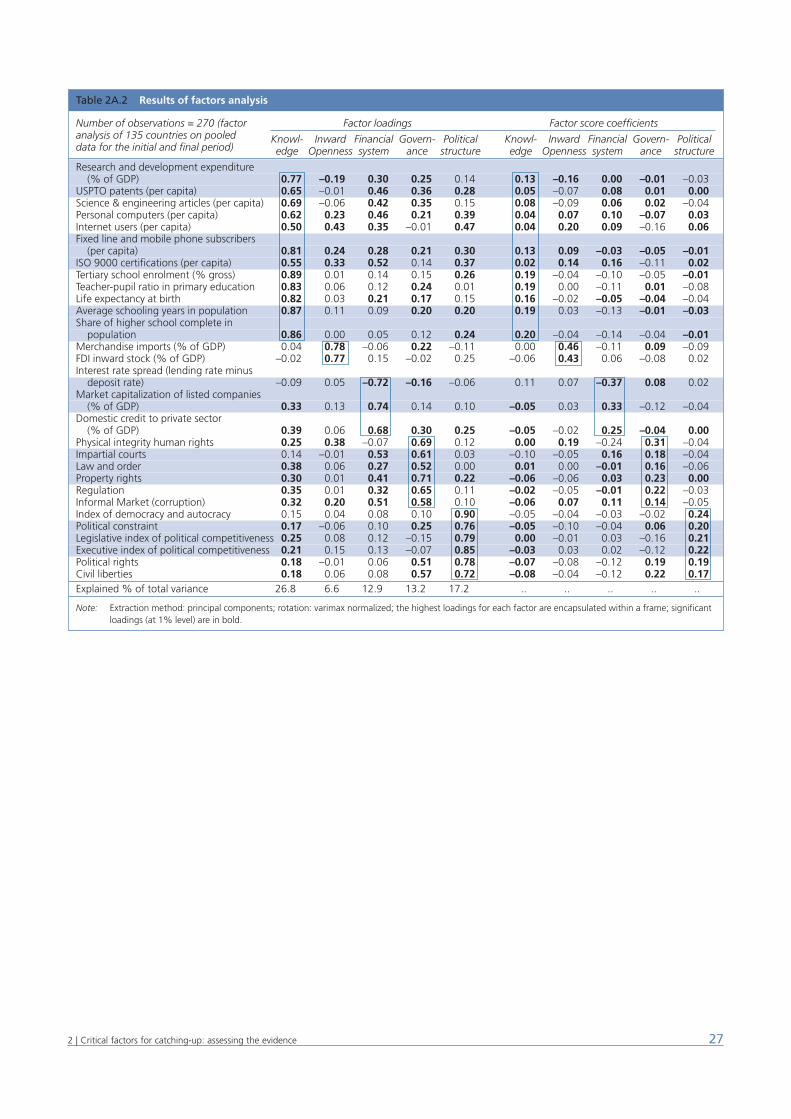
272 | Critical factors for catching-up: assessing the evidence
Table 2A.2 Results of factors analysis
Number of observations = 270 (factor Factor loadings Factor score coefficientsanalysis of 135 countries on pooled Knowl- Inward Financial Govern- Political Knowl- Inward Financial Govern- Politicaldata for the initial and final period) edge Openness system ance structure edge Openness system ance structure
Research and development expenditure (% of GDP) 0.77 –0.19 0.30 0.25 0.14 0.13 –0.16 0.00 –0.01 –0.03
USPTO patents (per capita) 0.65 –0.01 0.46 0.36 0.28 0.05 –0.07 0.08 0.01 0.00Science & engineering articles (per capita) 0.69 –0.06 0.42 0.35 0.15 0.08 –0.09 0.06 0.02 –0.04Personal computers (per capita) 0.62 0.23 0.46 0.21 0.39 0.04 0.07 0.10 –0.07 0.03Internet users (per capita) 0.50 0.43 0.35 –0.01 0.47 0.04 0.20 0.09 –0.16 0.06Fixed line and mobile phone subscribers
(per capita) 0.81 0.24 0.28 0.21 0.30 0.13 0.09 –0.03 –0.05 –0.01ISO 9000 certifications (per capita) 0.55 0.33 0.52 0.14 0.37 0.02 0.14 0.16 –0.11 0.02Tertiary school enrolment (% gross) 0.89 0.01 0.14 0.15 0.26 0.19 –0.04 –0.10 –0.05 –0.01Teacher-pupil ratio in primary education 0.83 0.06 0.12 0.24 0.01 0.19 0.00 –0.11 0.01 –0.08Life expectancy at birth 0.82 0.03 0.21 0.17 0.15 0.16 –0.02 –0.05 –0.04 –0.04Average schooling years in population 0.87 0.11 0.09 0.20 0.20 0.19 0.03 –0.13 –0.01 –0.03Share of higher school complete in
population 0.86 0.00 0.05 0.12 0.24 0.20 –0.04 –0.14 –0.04 –0.01Merchandise imports (% of GDP) 0.04 0.78 –0.06 0.22 –0.11 0.00 0.46 –0.11 0.09 –0.09FDI inward stock (% of GDP) –0.02 0.77 0.15 –0.02 0.25 –0.06 0.43 0.06 –0.08 0.02Interest rate spread (lending rate minus
deposit rate) –0.09 0.05 –0.72 –0.16 –0.06 0.11 0.07 –0.37 0.08 0.02Market capitalization of listed companies
(% of GDP) 0.33 0.13 0.74 0.14 0.10 –0.05 0.03 0.33 –0.12 –0.04Domestic credit to private sector
(% of GDP) 0.39 0.06 0.68 0.30 0.25 –0.05 –0.02 0.25 –0.04 0.00Physical integrity human rights 0.25 0.38 –0.07 0.69 0.12 0.00 0.19 –0.24 0.31 –0.04Impartial courts 0.14 –0.01 0.53 0.61 0.03 –0.10 –0.05 0.16 0.18 –0.04Law and order 0.38 0.06 0.27 0.52 0.00 0.01 0.00 –0.01 0.16 –0.06Property rights 0.30 0.01 0.41 0.71 0.22 –0.06 –0.06 0.03 0.23 0.00Regulation 0.35 0.01 0.32 0.65 0.11 –0.02 –0.05 –0.01 0.22 –0.03Informal Market (corruption) 0.32 0.20 0.51 0.58 0.10 –0.06 0.07 0.11 0.14 –0.05Index of democracy and autocracy 0.15 0.04 0.08 0.10 0.90 –0.05 –0.04 –0.03 –0.02 0.24Political constraint 0.17 –0.06 0.10 0.25 0.76 –0.05 –0.10 –0.04 0.06 0.20Legislative index of political competitiveness 0.25 0.08 0.12 –0.15 0.79 0.00 –0.01 0.03 –0.16 0.21Executive index of political competitiveness 0.21 0.15 0.13 –0.07 0.85 –0.03 0.03 0.02 –0.12 0.22Political rights 0.18 –0.01 0.06 0.51 0.78 –0.07 –0.08 –0.12 0.19 0.19Civil liberties 0.18 0.06 0.08 0.57 0.72 –0.08 –0.04 –0.12 0.22 0.17Explained % of total variance 26.8 6.6 12.9 13.2 17.2 .. .. .. .. ..
Note: Extraction method: principal components; rotation: varimax normalized; the highest loadings for each factor are encapsulated within a frame; significant loadings (at 1% level) are in bold.
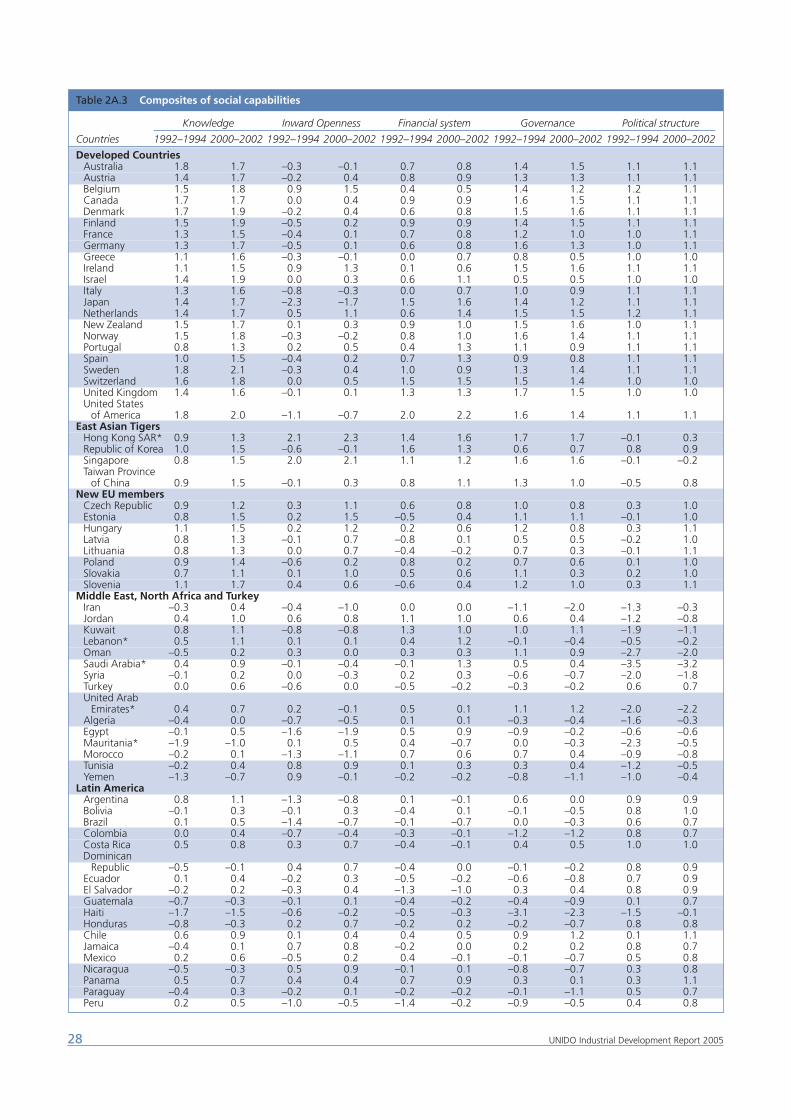
28 UNIDO Industrial Development Report 2005
Table 2A.3 Composites of social capabilities
Knowledge Inward Openness Financial system Governance Political structure
Countries 1992–1994 2000–2002 1992–1994 2000–2002 1992–1994 2000–2002 1992–1994 2000–2002 1992–1994 2000–2002
Developed CountriesAustralia 1.8 1.7 –0.3 –0.1 0.7 0.8 1.4 1.5 1.1 1.1Austria 1.4 1.7 –0.2 0.4 0.8 0.9 1.3 1.3 1.1 1.1Belgium 1.5 1.8 0.9 1.5 0.4 0.5 1.4 1.2 1.2 1.1Canada 1.7 1.7 0.0 0.4 0.9 0.9 1.6 1.5 1.1 1.1Denmark 1.7 1.9 –0.2 0.4 0.6 0.8 1.5 1.6 1.1 1.1Finland 1.5 1.9 –0.5 0.2 0.9 0.9 1.4 1.5 1.1 1.1France 1.3 1.5 –0.4 0.1 0.7 0.8 1.2 1.0 1.0 1.1Germany 1.3 1.7 –0.5 0.1 0.6 0.8 1.6 1.3 1.0 1.1Greece 1.1 1.6 –0.3 –0.1 0.0 0.7 0.8 0.5 1.0 1.0Ireland 1.1 1.5 0.9 1.3 0.1 0.6 1.5 1.6 1.1 1.1Israel 1.4 1.9 0.0 0.3 0.6 1.1 0.5 0.5 1.0 1.0Italy 1.3 1.6 –0.8 –0.3 0.0 0.7 1.0 0.9 1.1 1.1Japan 1.4 1.7 –2.3 –1.7 1.5 1.6 1.4 1.2 1.1 1.1Netherlands 1.4 1.7 0.5 1.1 0.6 1.4 1.5 1.5 1.2 1.1New Zealand 1.5 1.7 0.1 0.3 0.9 1.0 1.5 1.6 1.0 1.1Norway 1.5 1.8 –0.3 –0.2 0.8 1.0 1.6 1.4 1.1 1.1Portugal 0.8 1.3 0.2 0.5 0.4 1.3 1.1 0.9 1.1 1.1Spain 1.0 1.5 –0.4 0.2 0.7 1.3 0.9 0.8 1.1 1.1Sweden 1.8 2.1 –0.3 0.4 1.0 0.9 1.3 1.4 1.1 1.1Switzerland 1.6 1.8 0.0 0.5 1.5 1.5 1.5 1.4 1.0 1.0United Kingdom 1.4 1.6 –0.1 0.1 1.3 1.3 1.7 1.5 1.0 1.0United States
of America 1.8 2.0 –1.1 –0.7 2.0 2.2 1.6 1.4 1.1 1.1East Asian Tigers
Hong Kong SAR* 0.9 1.3 2.1 2.3 1.4 1.6 1.7 1.7 –0.1 0.3Republic of Korea 1.0 1.5 –0.6 –0.1 1.6 1.3 0.6 0.7 0.8 0.9Singapore 0.8 1.5 2.0 2.1 1.1 1.2 1.6 1.6 –0.1 –0.2Taiwan Province
of China 0.9 1.5 –0.1 0.3 0.8 1.1 1.3 1.0 –0.5 0.8New EU members
Czech Republic 0.9 1.2 0.3 1.1 0.6 0.8 1.0 0.8 0.3 1.0Estonia 0.8 1.5 0.2 1.5 –0.5 0.4 1.1 1.1 –0.1 1.0Hungary 1.1 1.5 0.2 1.2 0.2 0.6 1.2 0.8 0.3 1.1Latvia 0.8 1.3 –0.1 0.7 –0.8 0.1 0.5 0.5 –0.2 1.0Lithuania 0.8 1.3 0.0 0.7 –0.4 –0.2 0.7 0.3 –0.1 1.1Poland 0.9 1.4 –0.6 0.2 0.8 0.2 0.7 0.6 0.1 1.0Slovakia 0.7 1.1 0.1 1.0 0.5 0.6 1.1 0.3 0.2 1.0Slovenia 1.1 1.7 0.4 0.6 –0.6 0.4 1.2 1.0 0.3 1.1
Middle East, North Africa and TurkeyIran –0.3 0.4 –0.4 –1.0 0.0 0.0 –1.1 –2.0 –1.3 –0.3Jordan 0.4 1.0 0.6 0.8 1.1 1.0 0.6 0.4 –1.2 –0.8Kuwait 0.8 1.1 –0.8 –0.8 1.3 1.0 1.0 1.1 –1.9 –1.1Lebanon* 0.5 1.1 0.1 0.1 0.4 1.2 –0.1 –0.4 –0.5 –0.2Oman –0.5 0.2 0.3 0.0 0.3 0.3 1.1 0.9 –2.7 –2.0Saudi Arabia* 0.4 0.9 –0.1 –0.4 –0.1 1.3 0.5 0.4 –3.5 –3.2Syria –0.1 0.2 0.0 –0.3 0.2 0.3 –0.6 –0.7 –2.0 –1.8Turkey 0.0 0.6 –0.6 0.0 –0.5 –0.2 –0.3 –0.2 0.6 0.7United Arab
Emirates* 0.4 0.7 0.2 –0.1 0.5 0.1 1.1 1.2 –2.0 –2.2Algeria –0.4 0.0 –0.7 –0.5 0.1 0.1 –0.3 –0.4 –1.6 –0.3Egypt –0.1 0.5 –1.6 –1.9 0.5 0.9 –0.9 –0.2 –0.6 –0.6Mauritania* –1.9 –1.0 0.1 0.5 0.4 –0.7 0.0 –0.3 –2.3 –0.5Morocco –0.2 0.1 –1.3 –1.1 0.7 0.6 0.7 0.4 –0.9 –0.8Tunisia –0.2 0.4 0.8 0.9 0.1 0.3 0.3 0.4 –1.2 –0.5Yemen –1.3 –0.7 0.9 –0.1 –0.2 –0.2 –0.8 –1.1 –1.0 –0.4
Latin AmericaArgentina 0.8 1.1 –1.3 –0.8 0.1 –0.1 0.6 0.0 0.9 0.9Bolivia –0.1 0.3 –0.1 0.3 –0.4 0.1 –0.1 –0.5 0.8 1.0Brazil 0.1 0.5 –1.4 –0.7 –0.1 –0.7 0.0 –0.3 0.6 0.7Colombia 0.0 0.4 –0.7 –0.4 –0.3 –0.1 –1.2 –1.2 0.8 0.7Costa Rica 0.5 0.8 0.3 0.7 –0.4 –0.1 0.4 0.5 1.0 1.0Dominican
Republic –0.5 –0.1 0.4 0.7 –0.4 0.0 –0.1 –0.2 0.8 0.9Ecuador 0.1 0.4 –0.2 0.3 –0.5 –0.2 –0.6 –0.8 0.7 0.9El Salvador –0.2 0.2 –0.3 0.4 –1.3 –1.0 0.3 0.4 0.8 0.9Guatemala –0.7 –0.3 –0.1 0.1 –0.4 –0.2 –0.4 –0.9 0.1 0.7Haiti –1.7 –1.5 –0.6 –0.2 –0.5 –0.3 –3.1 –2.3 –1.5 –0.1Honduras –0.8 –0.3 0.2 0.7 –0.2 0.2 –0.2 –0.7 0.8 0.8Chile 0.6 0.9 0.1 0.4 0.4 0.5 0.9 1.2 0.1 1.1Jamaica –0.4 0.1 0.7 0.8 –0.2 0.0 0.2 0.2 0.8 0.7Mexico 0.2 0.6 –0.5 0.2 0.4 –0.1 –0.1 –0.7 0.5 0.8Nicaragua –0.5 –0.3 0.5 0.9 –0.1 0.1 –0.8 –0.7 0.3 0.8Panama 0.5 0.7 0.4 0.4 0.7 0.9 0.3 0.1 0.3 1.1Paraguay –0.4 0.3 –0.2 0.1 –0.2 –0.2 –0.1 –1.1 0.5 0.7Peru 0.2 0.5 –1.0 –0.5 –1.4 –0.2 –0.9 –0.5 0.4 0.8
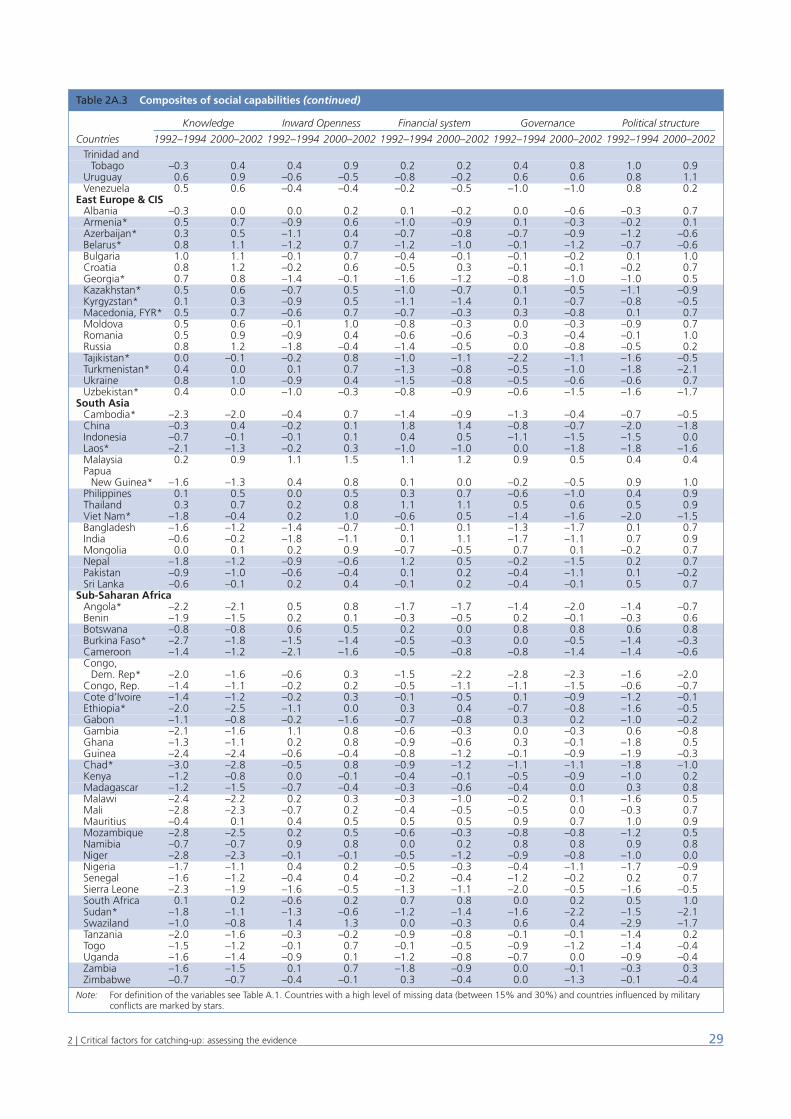
292 | Critical factors for catching-up: assessing the evidence
Table 2A.3 Composites of social capabilities (continued)
Knowledge Inward Openness Financial system Governance Political structure
Countries 1992–1994 2000–2002 1992–1994 2000–2002 1992–1994 2000–2002 1992–1994 2000–2002 1992–1994 2000–2002Trinidad and
Tobago –0.3 0.4 0.4 0.9 0.2 0.2 0.4 0.8 1.0 0.9Uruguay 0.6 0.9 –0.6 –0.5 –0.8 –0.2 0.6 0.6 0.8 1.1Venezuela 0.5 0.6 –0.4 –0.4 –0.2 –0.5 –1.0 –1.0 0.8 0.2
East Europe & CISAlbania –0.3 0.0 0.0 0.2 0.1 –0.2 0.0 –0.6 –0.3 0.7Armenia* 0.5 0.7 –0.9 0.6 –1.0 –0.9 0.1 –0.3 –0.2 0.1Azerbaijan* 0.3 0.5 –1.1 0.4 –0.7 –0.8 –0.7 –0.9 –1.2 –0.6Belarus* 0.8 1.1 –1.2 0.7 –1.2 –1.0 –0.1 –1.2 –0.7 –0.6Bulgaria 1.0 1.1 –0.1 0.7 –0.4 –0.1 –0.1 –0.2 0.1 1.0Croatia 0.8 1.2 –0.2 0.6 –0.5 0.3 –0.1 –0.1 –0.2 0.7Georgia* 0.7 0.8 –1.4 –0.1 –1.6 –1.2 –0.8 –1.0 –1.0 0.5Kazakhstan* 0.5 0.6 –0.7 0.5 –1.0 –0.7 0.1 –0.5 –1.1 –0.9Kyrgyzstan* 0.1 0.3 –0.9 0.5 –1.1 –1.4 0.1 –0.7 –0.8 –0.5Macedonia, FYR* 0.5 0.7 –0.6 0.7 –0.7 –0.3 0.3 –0.8 0.1 0.7Moldova 0.5 0.6 –0.1 1.0 –0.8 –0.3 0.0 –0.3 –0.9 0.7Romania 0.5 0.9 –0.9 0.4 –0.6 –0.6 –0.3 –0.4 –0.1 1.0Russia 0.8 1.2 –1.8 –0.4 –1.4 –0.5 0.0 –0.8 –0.5 0.2Tajikistan* 0.0 –0.1 –0.2 0.8 –1.0 –1.1 –2.2 –1.1 –1.6 –0.5Turkmenistan* 0.4 0.0 0.1 0.7 –1.3 –0.8 –0.5 –1.0 –1.8 –2.1Ukraine 0.8 1.0 –0.9 0.4 –1.5 –0.8 –0.5 –0.6 –0.6 0.7Uzbekistan* 0.4 0.0 –1.0 –0.3 –0.8 –0.9 –0.6 –1.5 –1.6 –1.7
South AsiaCambodia* –2.3 –2.0 –0.4 0.7 –1.4 –0.9 –1.3 –0.4 –0.7 –0.5China –0.3 0.4 –0.2 0.1 1.8 1.4 –0.8 –0.7 –2.0 –1.8Indonesia –0.7 –0.1 –0.1 0.1 0.4 0.5 –1.1 –1.5 –1.5 0.0Laos* –2.1 –1.3 –0.2 0.3 –1.0 –1.0 0.0 –1.8 –1.8 –1.6Malaysia 0.2 0.9 1.1 1.5 1.1 1.2 0.9 0.5 0.4 0.4Papua
New Guinea* –1.6 –1.3 0.4 0.8 0.1 0.0 –0.2 –0.5 0.9 1.0Philippines 0.1 0.5 0.0 0.5 0.3 0.7 –0.6 –1.0 0.4 0.9Thailand 0.3 0.7 0.2 0.8 1.1 1.1 0.5 0.6 0.5 0.9Viet Nam* –1.8 –0.4 0.2 1.0 –0.6 0.5 –1.4 –1.6 –2.0 –1.5Bangladesh –1.6 –1.2 –1.4 –0.7 –0.1 0.1 –1.3 –1.7 0.1 0.7India –0.6 –0.2 –1.8 –1.1 0.1 1.1 –1.7 –1.1 0.7 0.9Mongolia 0.0 0.1 0.2 0.9 –0.7 –0.5 0.7 0.1 –0.2 0.7Nepal –1.8 –1.2 –0.9 –0.6 1.2 0.5 –0.2 –1.5 0.2 0.7Pakistan –0.9 –1.0 –0.6 –0.4 0.1 0.2 –0.4 –1.1 0.1 –0.2Sri Lanka –0.6 –0.1 0.2 0.4 –0.1 0.2 –0.4 –0.1 0.5 0.7
Sub-Saharan AfricaAngola* –2.2 –2.1 0.5 0.8 –1.7 –1.7 –1.4 –2.0 –1.4 –0.7Benin –1.9 –1.5 0.2 0.1 –0.3 –0.5 0.2 –0.1 –0.3 0.6Botswana –0.8 –0.8 0.6 0.5 0.2 0.0 0.8 0.8 0.6 0.8Burkina Faso* –2.7 –1.8 –1.5 –1.4 –0.5 –0.3 0.0 –0.5 –1.4 –0.3Cameroon –1.4 –1.2 –2.1 –1.6 –0.5 –0.8 –0.8 –1.4 –1.4 –0.6Congo,
Dem. Rep* –2.0 –1.6 –0.6 0.3 –1.5 –2.2 –2.8 –2.3 –1.6 –2.0Congo, Rep. –1.4 –1.1 –0.2 0.2 –0.5 –1.1 –1.1 –1.5 –0.6 –0.7Cote d’Ivoire –1.4 –1.2 –0.2 0.3 –0.1 –0.5 0.1 –0.9 –1.2 –0.1Ethiopia* –2.0 –2.5 –1.1 0.0 0.3 0.4 –0.7 –0.8 –1.6 –0.5Gabon –1.1 –0.8 –0.2 –1.6 –0.7 –0.8 0.3 0.2 –1.0 –0.2Gambia –2.1 –1.6 1.1 0.8 –0.6 –0.3 0.0 –0.3 0.6 –0.8Ghana –1.3 –1.1 0.2 0.8 –0.9 –0.6 0.3 –0.1 –1.8 0.5Guinea –2.4 –2.4 –0.6 –0.4 –0.8 –1.2 –0.1 –0.9 –1.9 –0.3Chad* –3.0 –2.8 –0.5 0.8 –0.9 –1.2 –1.1 –1.1 –1.8 –1.0Kenya –1.2 –0.8 0.0 –0.1 –0.4 –0.1 –0.5 –0.9 –1.0 0.2Madagascar –1.2 –1.5 –0.7 –0.4 –0.3 –0.6 –0.4 0.0 0.3 0.8Malawi –2.4 –2.2 0.2 0.3 –0.3 –1.0 –0.2 0.1 –1.6 0.5Mali –2.8 –2.3 –0.7 0.2 –0.4 –0.5 –0.5 0.0 –0.3 0.7Mauritius –0.4 0.1 0.4 0.5 0.5 0.5 0.9 0.7 1.0 0.9Mozambique –2.8 –2.5 0.2 0.5 –0.6 –0.3 –0.8 –0.8 –1.2 0.5Namibia –0.7 –0.7 0.9 0.8 0.0 0.2 0.8 0.8 0.9 0.8Niger –2.8 –2.3 –0.1 –0.1 –0.5 –1.2 –0.9 –0.8 –1.0 0.0Nigeria –1.7 –1.1 0.4 0.2 –0.5 –0.3 –0.4 –1.1 –1.7 –0.9Senegal –1.6 –1.2 –0.4 0.4 –0.2 –0.4 –1.2 –0.2 0.2 0.7Sierra Leone –2.3 –1.9 –1.6 –0.5 –1.3 –1.1 –2.0 –0.5 –1.6 –0.5South Africa 0.1 0.2 –0.6 0.2 0.7 0.8 0.0 0.2 0.5 1.0Sudan* –1.8 –1.1 –1.3 –0.6 –1.2 –1.4 –1.6 –2.2 –1.5 –2.1Swaziland –1.0 –0.8 1.4 1.3 0.0 –0.3 0.6 0.4 –2.9 –1.7Tanzania –2.0 –1.6 –0.3 –0.2 –0.9 –0.8 –0.1 –0.1 –1.4 0.2Togo –1.5 –1.2 –0.1 0.7 –0.1 –0.5 –0.9 –1.2 –1.4 –0.4Uganda –1.6 –1.4 –0.9 0.1 –1.2 –0.8 –0.7 0.0 –0.9 –0.4Zambia –1.6 –1.5 0.1 0.7 –1.8 –0.9 0.0 –0.1 –0.3 0.3Zimbabwe –0.7 –0.7 –0.4 –0.1 0.3 –0.4 0.0 –1.3 –0.1 –0.4
Note: For definition of the variables see Table A.1. Countries with a high level of missing data (between 15% and 30%) and countries influenced by militaryconflicts are marked by stars.
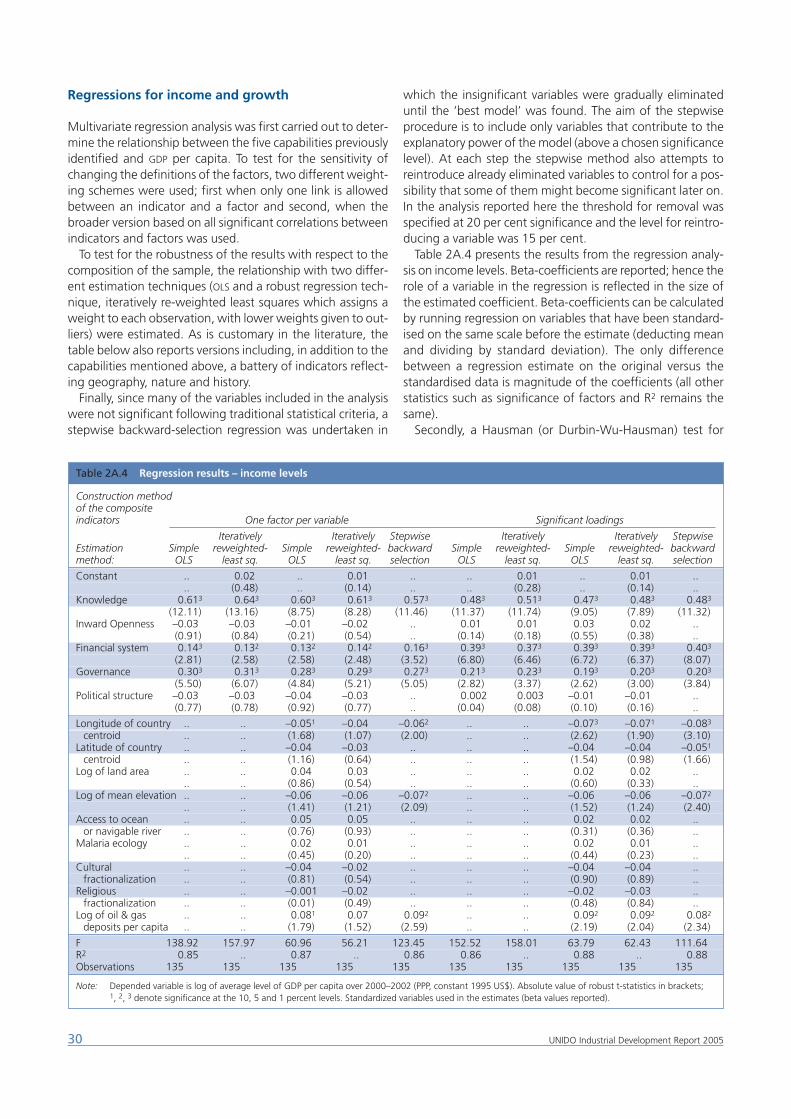
Regressions for income and growth
Multivariate regression analysis was first carried out to deter-mine the relationship between the five capabilities previouslyidentified and GDP per capita. To test for the sensitivity ofchanging the definitions of the factors, two different weight-ing schemes were used; first when only one link is allowedbetween an indicator and a factor and second, when thebroader version based on all significant correlations betweenindicators and factors was used.
To test for the robustness of the results with respect to thecomposition of the sample, the relationship with two differ-ent estimation techniques (OLS and a robust regression tech-nique, iteratively re-weighted least squares which assigns aweight to each observation, with lower weights given to out-liers) were estimated. As is customary in the literature, thetable below also reports versions including, in addition to thecapabilities mentioned above, a battery of indicators reflect-ing geography, nature and history.
Finally, since many of the variables included in the analysiswere not significant following traditional statistical criteria, astepwise backward-selection regression was undertaken in
which the insignificant variables were gradually eliminateduntil the ‘best model’ was found. The aim of the stepwiseprocedure is to include only variables that contribute to theexplanatory power of the model (above a chosen significancelevel). At each step the stepwise method also attempts toreintroduce already eliminated variables to control for a pos-sibility that some of them might become significant later on.In the analysis reported here the threshold for removal wasspecified at 20 per cent significance and the level for reintro-ducing a variable was 15 per cent.
Table 2A.4 presents the results from the regression analy-sis on income levels. Beta-coefficients are reported; hence therole of a variable in the regression is reflected in the size ofthe estimated coefficient. Beta-coefficients can be calculatedby running regression on variables that have been standard-ised on the same scale before the estimate (deducting meanand dividing by standard deviation). The only differencebetween a regression estimate on the original versus thestandardised data is magnitude of the coefficients (all otherstatistics such as significance of factors and R2 remains thesame).
Secondly, a Hausman (or Durbin-Wu-Hausman) test for
30 UNIDO Industrial Development Report 2005
Table 2A.4 Regression results – income levels
Construction methodof the compositeindicators One factor per variable Significant loadings
Iteratively Iteratively Stepwise Iteratively Iteratively StepwiseEstimation Simple reweighted- Simple reweighted- backward Simple reweighted- Simple reweighted- backwardmethod: OLS least sq. OLS least sq. selection OLS least sq. OLS least sq. selection
Constant .. 0.02 .. 0.01 .. .. 0.01 .. 0.01 .... (0.48) .. (0.14) .. .. (0.28) .. (0.14) ..
Knowledge 0.613 0.643 0.603 0.613 0.573 0.483 0.513 0.473 0.483 0.483
(12.11) (13.16) (8.75) (8.28) (11.46) (11.37) (11.74) (9.05) (7.89) (11.32)Inward Openness –0.03 –0.03 –0.01 –0.02 .. 0.01 0.01 0.03 0.02 ..
(0.91) (0.84) (0.21) (0.54) .. (0.14) (0.18) (0.55) (0.38) ..Financial system 0.143 0.132 0.132 0.142 0.163 0.393 0.373 0.393 0.393 0.403
(2.81) (2.58) (2.58) (2.48) (3.52) (6.80) (6.46) (6.72) (6.37) (8.07)Governance 0.303 0.313 0.283 0.293 0.273 0.213 0.233 0.193 0.203 0.203
(5.50) (6.07) (4.84) (5.21) (5.05) (2.82) (3.37) (2.62) (3.00) (3.84)Political structure –0.03 –0.03 –0.04 –0.03 .. 0.002 0.003 –0.01 –0.01 ..
(0.77) (0.78) (0.92) (0.77) .. (0.04) (0.08) (0.10) (0.16) ..
Longitude of country .. .. –0.051 –0.04 –0.062 .. .. –0.073 –0.071 –0.083
centroid .. .. (1.68) (1.07) (2.00) .. .. (2.62) (1.90) (3.10)Latitude of country .. .. –0.04 –0.03 .. .. .. –0.04 –0.04 –0.051
centroid .. .. (1.16) (0.64) .. .. .. (1.54) (0.98) (1.66)Log of land area .. .. 0.04 0.03 .. .. .. 0.02 0.02 ..
.. .. (0.86) (0.54) .. .. .. (0.60) (0.33) ..Log of mean elevation .. .. –0.06 –0.06 –0.072 .. .. –0.06 –0.06 –0.072
.. .. (1.41) (1.21) (2.09) .. .. (1.52) (1.24) (2.40)Access to ocean .. .. 0.05 0.05 .. .. .. 0.02 0.02 ..
or navigable river .. .. (0.76) (0.93) .. .. .. (0.31) (0.36) ..Malaria ecology .. .. 0.02 0.01 .. .. .. 0.02 0.01 ..
.. .. (0.45) (0.20) .. .. .. (0.44) (0.23) ..Cultural .. .. –0.04 –0.02 .. .. .. –0.04 –0.04 ..
fractionalization .. .. (0.81) (0.54) .. .. .. (0.90) (0.89) ..Religious .. .. –0.001 –0.02 .. .. .. –0.02 –0.03 ..
fractionalization .. .. (0.01) (0.49) .. .. .. (0.48) (0.84) ..Log of oil & gas .. .. 0.081 0.07 0.092 .. .. 0.092 0.092 0.082
deposits per capita .. .. (1.79) (1.52) (2.59) .. .. (2.19) (2.04) (2.34)
F 138.92 157.97 60.96 56.21 123.45 152.52 158.01 63.79 62.43 111.64R2 0.85 .. 0.87 .. 0.86 0.86 .. 0.88 .. 0.88Observations 135 135 135 135 135 135 135 135 135 135
Note: Depended variable is log of average level of GDP per capita over 2000–2002 (PPP, constant 1995 US$). Absolute value of robust t-statistics in brackets;1, 2, 3 denote significance at the 10, 5 and 1 percent levels. Standardized variables used in the estimates (beta values reported).
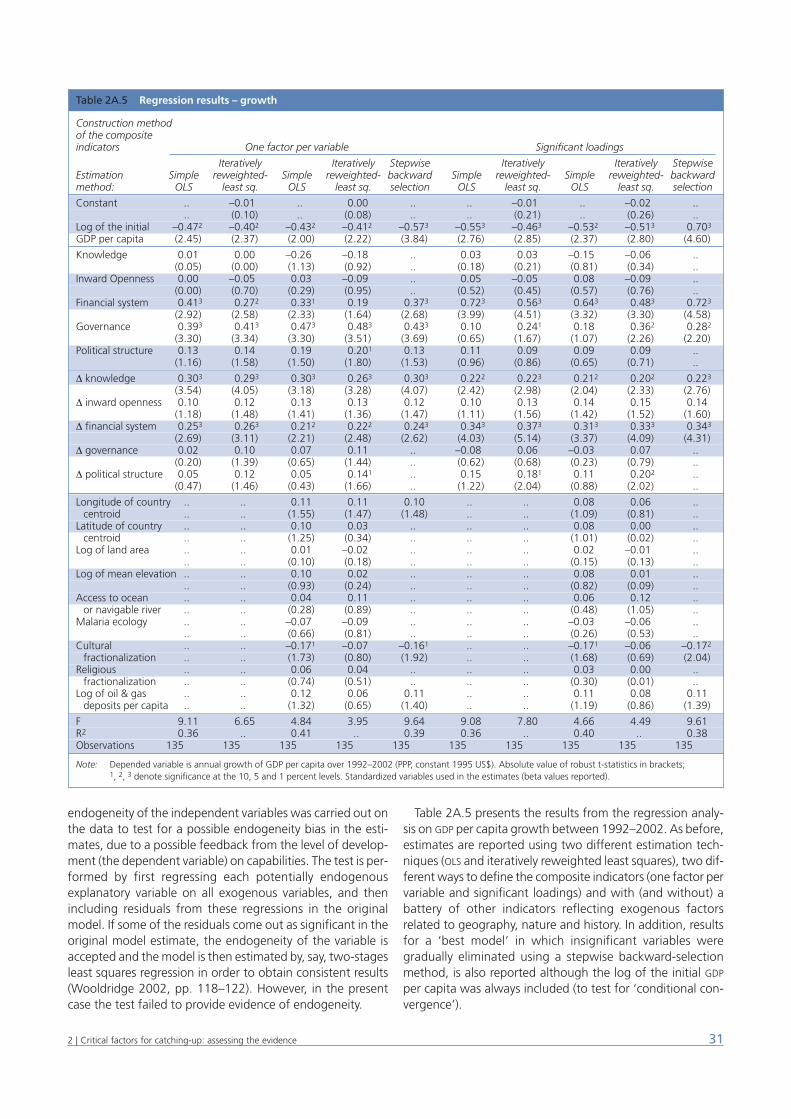
endogeneity of the independent variables was carried out onthe data to test for a possible endogeneity bias in the esti-mates, due to a possible feedback from the level of develop-ment (the dependent variable) on capabilities. The test is per-formed by first regressing each potentially endogenousexplanatory variable on all exogenous variables, and thenincluding residuals from these regressions in the originalmodel. If some of the residuals come out as significant in theoriginal model estimate, the endogeneity of the variable isaccepted and the model is then estimated by, say, two-stagesleast squares regression in order to obtain consistent results(Wooldridge 2002, pp. 118–122). However, in the presentcase the test failed to provide evidence of endogeneity.
Table 2A.5 presents the results from the regression analy-sis on GDP per capita growth between 1992–2002. As before,estimates are reported using two different estimation tech-niques (OLS and iteratively reweighted least squares), two dif-ferent ways to define the composite indicators (one factor pervariable and significant loadings) and with (and without) abattery of other indicators reflecting exogenous factorsrelated to geography, nature and history. In addition, resultsfor a ‘best model’ in which insignificant variables weregradually eliminated using a stepwise backward-selectionmethod, is also reported although the log of the initial GDP
per capita was always included (to test for ‘conditional con-vergence’).
312 | Critical factors for catching-up: assessing the evidence
Table 2A.5 Regression results – growth
Construction methodof the compositeindicators One factor per variable Significant loadings
Iteratively Iteratively Stepwise Iteratively Iteratively StepwiseEstimation Simple reweighted- Simple reweighted- backward Simple reweighted- Simple reweighted- backwardmethod: OLS least sq. OLS least sq. selection OLS least sq. OLS least sq. selection
Constant .. –0.01 .. 0.00 .. .. –0.01 .. –0.02 .... (0.10) .. (0.08) .. .. (0.21) .. (0.26) ..
Log of the initial –0.472 –0.402 –0.432 –0.412 –0.573 –0.553 –0.463 –0.532 –0.513 0.703
GDP per capita (2.45) (2.37) (2.00) (2.22) (3.84) (2.76) (2.85) (2.37) (2.80) (4.60)
Knowledge 0.01 0.00 –0.26 –0.18 .. 0.03 0.03 –0.15 –0.06 ..(0.05) (0.00) (1.13) (0.92) .. (0.18) (0.21) (0.81) (0.34) ..
Inward Openness 0.00 –0.05 0.03 –0.09 .. 0.05 –0.05 0.08 –0.09 ..(0.00) (0.70) (0.29) (0.95) .. (0.52) (0.45) (0.57) (0.76) ..
Financial system 0.413 0.272 0.331 0.19 0.373 0.723 0.563 0.643 0.483 0.723
(2.92) (2.58) (2.33) (1.64) (2.68) (3.99) (4.51) (3.32) (3.30) (4.58)Governance 0.393 0.413 0.473 0.483 0.433 0.10 0.241 0.18 0.362 0.282
(3.30) (3.34) (3.30) (3.51) (3.69) (0.65) (1.67) (1.07) (2.26) (2.20)Political structure 0.13 0.14 0.19 0.201 0.13 0.11 0.09 0.09 0.09 ..
(1.16) (1.58) (1.50) (1.80) (1.53) (0.96) (0.86) (0.65) (0.71) ..
∆ knowledge 0.303 0.293 0.303 0.263 0.303 0.222 0.223 0.212 0.202 0.223
(3.54) (4.05) (3.18) (3.28) (4.07) (2.42) (2.98) (2.04) (2.33) (2.76)∆ inward openness 0.10 0.12 0.13 0.13 0.12 0.10 0.13 0.14 0.15 0.14
(1.18) (1.48) (1.41) (1.36) (1.47) (1.11) (1.56) (1.42) (1.52) (1.60)∆ financial system 0.253 0.263 0.212 0.222 0.243 0.343 0.373 0.313 0.333 0.343
(2.69) (3.11) (2.21) (2.48) (2.62) (4.03) (5.14) (3.37) (4.09) (4.31)∆ governance 0.02 0.10 0.07 0.11 .. –0.08 0.06 –0.03 0.07 ..
(0.20) (1.39) (0.65) (1.44) .. (0.62) (0.68) (0.23) (0.79) ..∆ political structure 0.05 0.12 0.05 0.141 .. 0.15 0.181 0.11 0.202 ..
(0.47) (1.46) (0.43) (1.66) .. (1.22) (2.04) (0.88) (2.02) ..
Longitude of country .. .. 0.11 0.11 0.10 .. .. 0.08 0.06 ..centroid .. .. (1.55) (1.47) (1.48) .. .. (1.09) (0.81) ..
Latitude of country .. .. 0.10 0.03 .. .. .. 0.08 0.00 ..centroid .. .. (1.25) (0.34) .. .. .. (1.01) (0.02) ..
Log of land area .. .. 0.01 –0.02 .. .. .. 0.02 –0.01 .... .. (0.10) (0.18) .. .. .. (0.15) (0.13) ..
Log of mean elevation .. .. 0.10 0.02 .. .. .. 0.08 0.01 .... .. (0.93) (0.24) .. .. .. (0.82) (0.09) ..
Access to ocean .. .. 0.04 0.11 .. .. .. 0.06 0.12 ..or navigable river .. .. (0.28) (0.89) .. .. .. (0.48) (1.05) ..
Malaria ecology .. .. –0.07 –0.09 .. .. .. –0.03 –0.06 .... .. (0.66) (0.81) .. .. .. (0.26) (0.53) ..
Cultural .. .. –0.171 –0.07 –0.161 .. .. –0.171 –0.06 –0.172
fractionalization .. .. (1.73) (0.80) (1.92) .. .. (1.68) (0.69) (2.04)Religious .. .. 0.06 0.04 .. .. .. 0.03 0.00 ..
fractionalization .. .. (0.74) (0.51) .. .. .. (0.30) (0.01) ..Log of oil & gas .. .. 0.12 0.06 0.11 .. .. 0.11 0.08 0.11
deposits per capita .. .. (1.32) (0.65) (1.40) .. .. (1.19) (0.86) (1.39)
F 9.11 6.65 4.84 3.95 9.64 9.08 7.80 4.66 4.49 9.61R2 0.36 .. 0.41 .. 0.39 0.36 .. 0.40 .. 0.38Observations 135 135 135 135 135 135 135 135 135 135
Note: Depended variable is annual growth of GDP per capita over 1992–2002 (PPP, constant 1995 US$). Absolute value of robust t-statistics in brackets;1, 2, 3 denote significance at the 10, 5 and 1 percent levels. Standardized variables used in the estimates (beta values reported).
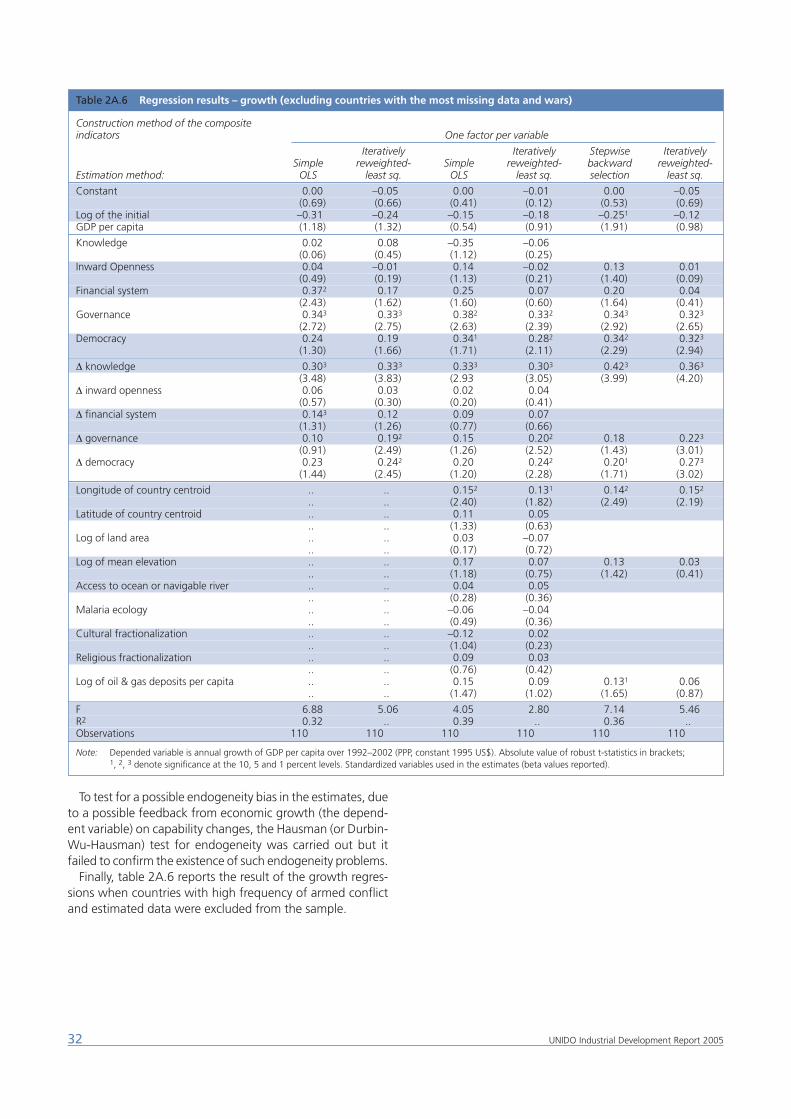
To test for a possible endogeneity bias in the estimates, dueto a possible feedback from economic growth (the depend-ent variable) on capability changes, the Hausman (or Durbin-Wu-Hausman) test for endogeneity was carried out but itfailed to confirm the existence of such endogeneity problems.
Finally, table 2A.6 reports the result of the growth regres-sions when countries with high frequency of armed conflictand estimated data were excluded from the sample.
32 UNIDO Industrial Development Report 2005
Table 2A.6 Regression results – growth (excluding countries with the most missing data and wars)
Construction method of the composite indicators One factor per variable
Iteratively Iteratively Stepwise IterativelySimple reweighted- Simple reweighted- backward reweighted-
Estimation method: OLS least sq. OLS least sq. selection least sq.
Constant 0.00 –0.05 0.00 –0.01 0.00 –0.05(0.69) (0.66) (0.41) (0.12) (0.53) (0.69)
Log of the initial –0.31 –0.24 –0.15 –0.18 –0.251 –0.12GDP per capita (1.18) (1.32) (0.54) (0.91) (1.91) (0.98)
Knowledge 0.02 0.08 –0.35 –0.06(0.06) (0.45) (1.12) (0.25)
Inward Openness 0.04 –0.01 0.14 –0.02 0.13 0.01(0.49) (0.19) (1.13) (0.21) (1.40) (0.09)
Financial system 0.372 0.17 0.25 0.07 0.20 0.04(2.43) (1.62) (1.60) (0.60) (1.64) (0.41)
Governance 0.343 0.333 0.382 0.332 0.343 0.323
(2.72) (2.75) (2.63) (2.39) (2.92) (2.65)Democracy 0.24 0.19 0.341 0.282 0.342 0.323
(1.30) (1.66) (1.71) (2.11) (2.29) (2.94)
∆ knowledge 0.303 0.333 0.333 0.303 0.423 0.363
(3.48) (3.83) (2.93 (3.05) (3.99) (4.20)∆ inward openness 0.06 0.03 0.02 0.04
(0.57) (0.30) (0.20) (0.41)∆ financial system 0.143 0.12 0.09 0.07
(1.31) (1.26) (0.77) (0.66)∆ governance 0.10 0.192 0.15 0.202 0.18 0.223
(0.91) (2.49) (1.26) (2.52) (1.43) (3.01)∆ democracy 0.23 0.242 0.20 0.242 0.201 0.273
(1.44) (2.45) (1.20) (2.28) (1.71) (3.02)
Longitude of country centroid .. .. 0.152 0.131 0.142 0.152
.. .. (2.40) (1.82) (2.49) (2.19)Latitude of country centroid .. .. 0.11 0.05
.. .. (1.33) (0.63)Log of land area .. .. 0.03 –0.07
.. .. (0.17) (0.72)Log of mean elevation .. .. 0.17 0.07 0.13 0.03
.. .. (1.18) (0.75) (1.42) (0.41)Access to ocean or navigable river .. .. 0.04 0.05
.. .. (0.28) (0.36)Malaria ecology .. .. –0.06 –0.04
.. .. (0.49) (0.36)Cultural fractionalization .. .. –0.12 0.02
.. .. (1.04) (0.23)Religious fractionalization .. .. 0.09 0.03
.. .. (0.76) (0.42)Log of oil & gas deposits per capita .. .. 0.15 0.09 0.131 0.06
.. .. (1.47) (1.02) (1.65) (0.87)
F 6.88 5.06 4.05 2.80 7.14 5.46R2 0.32 .. 0.39 .. 0.36 ..Observations 110 110 110 110 110 110
Note: Depended variable is annual growth of GDP per capita over 1992–2002 (PPP, constant 1995 US$). Absolute value of robust t-statistics in brackets;1, 2, 3 denote significance at the 10, 5 and 1 percent levels. Standardized variables used in the estimates (beta values reported).
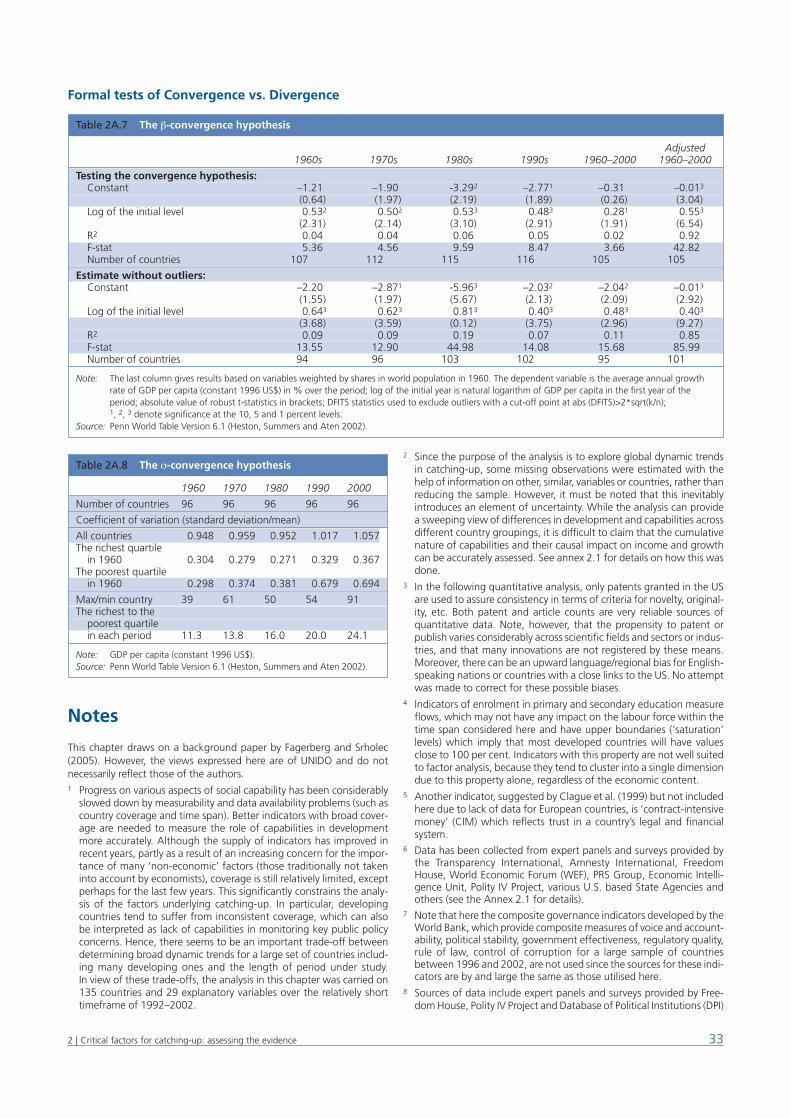
Formal tests of Convergence vs. Divergence
Notes
This chapter draws on a background paper by Fagerberg and Srholec(2005). However, the views expressed here are of UNIDO and do notnecessarily reflect those of the authors.1 Progress on various aspects of social capability has been considerably
slowed down by measurability and data availability problems (such ascountry coverage and time span). Better indicators with broad cover-age are needed to measure the role of capabilities in developmentmore accurately. Although the supply of indicators has improved inrecent years, partly as a result of an increasing concern for the impor-tance of many ‘non-economic’ factors (those traditionally not takeninto account by economists), coverage is still relatively limited, exceptperhaps for the last few years. This significantly constrains the analy-sis of the factors underlying catching-up. In particular, developingcountries tend to suffer from inconsistent coverage, which can alsobe interpreted as lack of capabilities in monitoring key public policyconcerns. Hence, there seems to be an important trade-off betweendetermining broad dynamic trends for a large set of countries includ-ing many developing ones and the length of period under study. In view of these trade-offs, the analysis in this chapter was carried on135 countries and 29 explanatory variables over the relatively shorttimeframe of 1992–2002.
2 Since the purpose of the analysis is to explore global dynamic trendsin catching-up, some missing observations were estimated with thehelp of information on other, similar, variables or countries, rather thanreducing the sample. However, it must be noted that this inevitablyintroduces an element of uncertainty. While the analysis can providea sweeping view of differences in development and capabilities acrossdifferent country groupings, it is difficult to claim that the cumulativenature of capabilities and their causal impact on income and growthcan be accurately assessed. See annex 2.1 for details on how this wasdone.
3 In the following quantitative analysis, only patents granted in the USare used to assure consistency in terms of criteria for novelty, original-ity, etc. Both patent and article counts are very reliable sources ofquantitative data. Note, however, that the propensity to patent orpublish varies considerably across scientific fields and sectors or indus-tries, and that many innovations are not registered by these means.Moreover, there can be an upward language/regional bias for English-speaking nations or countries with a close links to the US. No attemptwas made to correct for these possible biases.
4 Indicators of enrolment in primary and secondary education measureflows, which may not have any impact on the labour force within thetime span considered here and have upper boundaries (‘saturation’levels) which imply that most developed countries will have valuesclose to 100 per cent. Indicators with this property are not well suitedto factor analysis, because they tend to cluster into a single dimensiondue to this property alone, regardless of the economic content.
5 Another indicator, suggested by Clague et al. (1999) but not includedhere due to lack of data for European countries, is ‘contract-intensivemoney’ (CIM) which reflects trust in a country’s legal and financialsystem.
6 Data has been collected from expert panels and surveys provided bythe Transparency International, Amnesty International, FreedomHouse, World Economic Forum (WEF), PRS Group, Economic Intelli-gence Unit, Polity IV Project, various U.S. based State Agencies andothers (see the Annex 2.1 for details).
7 Note that here the composite governance indicators developed by theWorld Bank, which provide composite measures of voice and account-ability, political stability, government effectiveness, regulatory quality,rule of law, control of corruption for a large sample of countriesbetween 1996 and 2002, are not used since the sources for these indi-cators are by and large the same as those utilised here.
8 Sources of data include expert panels and surveys provided by Free-dom House, Polity IV Project and Database of Political Institutions (DPI)
332 | Critical factors for catching-up: assessing the evidence
Table 2A.7 The β-convergence hypothesis
Adjusted1960s 1970s 1980s 1990s 1960–2000 1960–2000
Testing the convergence hypothesis:Constant –1.21 –1.90 -3.292 –2.771 –0.31 –0.013
(0.64) (1.97) (2.19) (1.89) (0.26) (3.04)Log of the initial level 0.532 0.502 0.533 0.483 0.281 0.553
(2.31) (2.14) (3.10) (2.91) (1.91) (6.54)R2 0.04 0.04 0.06 0.05 0.02 0.92F-stat 5.36 4.56 9.59 8.47 3.66 42.82Number of countries 107 112 115 116 105 105
Estimate without outliers:Constant –2.20 –2.871 -5.963 –2.032 –2.042 –0.013
(1.55) (1.97) (5.67) (2.13) (2.09) (2.92)Log of the initial level 0.643 0.623 0.813 0.403 0.483 0.403
(3.68) (3.59) (0.12) (3.75) (2.96) (9.27)R2 0.09 0.09 0.19 0.07 0.11 0.85F-stat 13.55 12.90 44.98 14.08 15.68 85.99Number of countries 94 96 103 102 95 101
Note: The last column gives results based on variables weighted by shares in world population in 1960. The dependent variable is the average annual growthrate of GDP per capita (constant 1996 US$) in % over the period; log of the initial year is natural logarithm of GDP per capita in the first year of theperiod; absolute value of robust t-statistics in brackets; DFITS statistics used to exclude outliers with a cut-off point at abs (DFITS)>2*sqrt(k/n);1, 2, 3 denote significance at the 10, 5 and 1 percent levels.
Source: Penn World Table Version 6.1 (Heston, Summers and Aten 2002).
Table 2A.8 The σ-convergence hypothesis
1960 1970 1980 1990 2000
Number of countries 96 96 96 96 96
Coefficient of variation (standard deviation/mean)
All countries 0.948 0.959 0.952 1.017 1.057The richest quartile
in 1960 0.304 0.279 0.271 0.329 0.367The poorest quartile
in 1960 0.298 0.374 0.381 0.679 0.694
Max/min country 39 61 50 54 91The richest to the
poorest quartile in each period 11.3 13.8 16.0 20.0 24.1
Note: GDP per capita (constant 1996 US$).Source: Penn World Table Version 6.1 (Heston, Summers and Aten 2002).
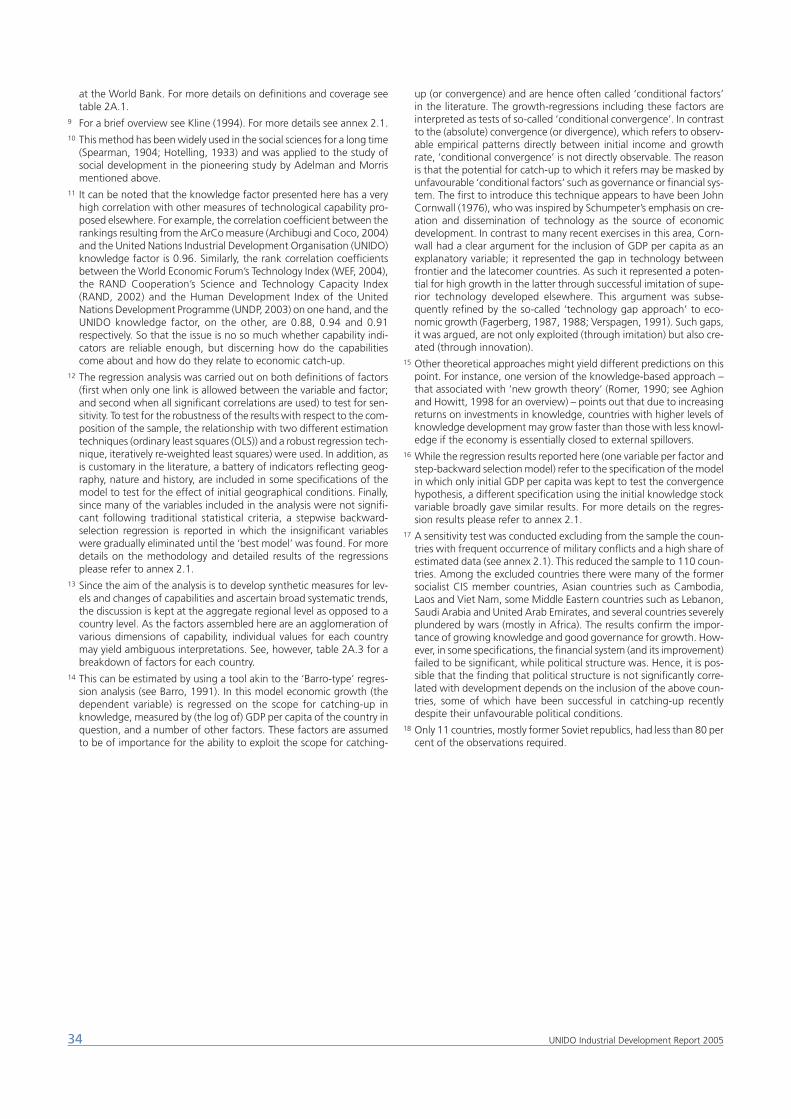
at the World Bank. For more details on definitions and coverage seetable 2A.1.
9 For a brief overview see Kline (1994). For more details see annex 2.1.10 This method has been widely used in the social sciences for a long time
(Spearman, 1904; Hotelling, 1933) and was applied to the study ofsocial development in the pioneering study by Adelman and Morrismentioned above.
11 It can be noted that the knowledge factor presented here has a veryhigh correlation with other measures of technological capability pro-posed elsewhere. For example, the correlation coefficient between therankings resulting from the ArCo measure (Archibugi and Coco, 2004)and the United Nations Industrial Development Organisation (UNIDO)knowledge factor is 0.96. Similarly, the rank correlation coefficientsbetween the World Economic Forum’s Technology Index (WEF, 2004),the RAND Cooperation’s Science and Technology Capacity Index(RAND, 2002) and the Human Development Index of the UnitedNations Development Programme (UNDP, 2003) on one hand, and theUNIDO knowledge factor, on the other, are 0.88, 0.94 and 0.91respectively. So that the issue is no so much whether capability indi-cators are reliable enough, but discerning how do the capabilitiescome about and how do they relate to economic catch-up.
12 The regression analysis was carried out on both definitions of factors(first when only one link is allowed between the variable and factor;and second when all significant correlations are used) to test for sen-sitivity. To test for the robustness of the results with respect to the com-position of the sample, the relationship with two different estimationtechniques (ordinary least squares (OLS)) and a robust regression tech-nique, iteratively re-weighted least squares) were used. In addition, asis customary in the literature, a battery of indicators reflecting geog-raphy, nature and history, are included in some specifications of themodel to test for the effect of initial geographical conditions. Finally,since many of the variables included in the analysis were not signifi-cant following traditional statistical criteria, a stepwise backward-selection regression is reported in which the insignificant variableswere gradually eliminated until the ‘best model’ was found. For moredetails on the methodology and detailed results of the regressionsplease refer to annex 2.1.
13 Since the aim of the analysis is to develop synthetic measures for lev-els and changes of capabilities and ascertain broad systematic trends,the discussion is kept at the aggregate regional level as opposed to acountry level. As the factors assembled here are an agglomeration ofvarious dimensions of capability, individual values for each countrymay yield ambiguous interpretations. See, however, table 2A.3 for abreakdown of factors for each country.
14 This can be estimated by using a tool akin to the ‘Barro-type’ regres-sion analysis (see Barro, 1991). In this model economic growth (thedependent variable) is regressed on the scope for catching-up inknowledge, measured by (the log of) GDP per capita of the country inquestion, and a number of other factors. These factors are assumedto be of importance for the ability to exploit the scope for catching-
up (or convergence) and are hence often called ‘conditional factors’in the literature. The growth-regressions including these factors areinterpreted as tests of so-called ‘conditional convergence’. In contrastto the (absolute) convergence (or divergence), which refers to observ-able empirical patterns directly between initial income and growthrate, ‘conditional convergence’ is not directly observable. The reasonis that the potential for catch-up to which it refers may be masked byunfavourable ‘conditional factors’ such as governance or financial sys-tem. The first to introduce this technique appears to have been JohnCornwall (1976), who was inspired by Schumpeter’s emphasis on cre-ation and dissemination of technology as the source of economicdevelopment. In contrast to many recent exercises in this area, Corn-wall had a clear argument for the inclusion of GDP per capita as anexplanatory variable; it represented the gap in technology betweenfrontier and the latecomer countries. As such it represented a poten-tial for high growth in the latter through successful imitation of supe-rior technology developed elsewhere. This argument was subse-quently refined by the so-called ‘technology gap approach’ to eco-nomic growth (Fagerberg, 1987, 1988; Verspagen, 1991). Such gaps,it was argued, are not only exploited (through imitation) but also cre-ated (through innovation).
15 Other theoretical approaches might yield different predictions on thispoint. For instance, one version of the knowledge-based approach –that associated with ‘new growth theory’ (Romer, 1990; see Aghionand Howitt, 1998 for an overview) – points out that due to increasingreturns on investments in knowledge, countries with higher levels ofknowledge development may grow faster than those with less knowl-edge if the economy is essentially closed to external spillovers.
16 While the regression results reported here (one variable per factor andstep-backward selection model) refer to the specification of the modelin which only initial GDP per capita was kept to test the convergencehypothesis, a different specification using the initial knowledge stockvariable broadly gave similar results. For more details on the regres-sion results please refer to annex 2.1.
17 A sensitivity test was conducted excluding from the sample the coun-tries with frequent occurrence of military conflicts and a high share ofestimated data (see annex 2.1). This reduced the sample to 110 coun-tries. Among the excluded countries there were many of the formersocialist CIS member countries, Asian countries such as Cambodia,Laos and Viet Nam, some Middle Eastern countries such as Lebanon,Saudi Arabia and United Arab Emirates, and several countries severelyplundered by wars (mostly in Africa). The results confirm the impor-tance of growing knowledge and good governance for growth. How-ever, in some specifications, the financial system (and its improvement)failed to be significant, while political structure was. Hence, it is pos-sible that the finding that political structure is not significantly corre-lated with development depends on the inclusion of the above coun-tries, some of which have been successful in catching-up recentlydespite their unfavourable political conditions.
18 Only 11 countries, mostly former Soviet republics, had less than 80 percent of the observations required.
34 UNIDO Industrial Development Report 2005
Why do some countries succeed in catching-up whileothers fall behind? This question has intrigued policy-
makers, academics and industrialists alike for more than acentury.1 At the extremes, the long-run trend since the Indus-trial Revolution seems to be towards divergence, not conver-gence, in productivity and income. But what history shows isthat some countries have managed to catch-up, even over-take the leaders at different points in time, and when this hashappened, technology and the environment that fosters itregularly turn up among the driving forces.
Catching-up in historical perspective
The divergence at the extremes has been dramatic: 250 yearsago the difference in income or productivity per headbetween the richest and poorest country in the world wasapproximately 5:1; today this difference has increased to400:1 (Landes, 1998). Other sources may give different num-bers but the qualitative interpretation remains the same.However, the view at the top has changed over time, severaltimes.
During most of the 19th century the United Kingdom (UK)
was the leading capitalist country in the world, with a GDP percapita about 50 per cent above the advanced country aver-age (table 3.1). This lead reflected, among other things, theprocess of economic, social and institutional change that hadtaken place in Britain already in the course of the IndustrialRevolution (Von Tunzelmann, 1995). However, during thesecond half of the century, the US started to catch-up withthe UK and eventually, during the early part of the 20th cen-tury, overcame it. It is clear, in retrospect, that US growth wasbased on the development of a new technological system,based not so much on new products as on new ways oforganising production and distribution (Taylorism, Fordism,etc.). Significant productivity gains were obtained throughthe development of large-scale production and distributionsystems well suited to the large, fast-growing and relativelyhomogenous American market (Chandler, 1990; Nelson andWright, 1992).
Europe initially failed to take advantage of these innova-tions. One main difference between the US and Europe in thefirst half of this century was market size: the European mar-kets were smaller and less homogenous. Hence, it is not obvi-
ous that US methods, if applied to European conditions in thisperiod, would have yielded better results. This is whatAbramovitz (1994a) called lack of ‘technological congruence’(see Chapter 1). Two world wars and an intermediate periodof protectionism and slow growth added to these problems(Abramovitz, 1994a). The US lead increased even further andpeaked around 1950, when GDP per capita in the US wasabout twice the European level.
While the period between 1820 and 1950 was one ofdivergence in economic performance between the leadingcapitalist countries, the decades that followed were charac-terised by ‘club convergence’ in income and GDP per capitaamong the industrialised economies. The productivity gapbetween the US and other developed countries was halved –arguably as a result of imitation of superior US technology. Forinstance, European production and exports in industries suchas cars, domestic electrical equipment, electronics and thelike grew rapidly from the 1950s onwards. The gradual reduc-tion of barriers to trade within Europe from the 1950sonwards has generally been regarded a key contributing fac-tor to this process, as has the general rise in incomes and liv-ing standards (Abramovitz, 1994b; Maddison, 1982, 1991).
European countries were not alone, however, in exploitingthe window of opportunity given by superior US technology.From the 1950s onwards Japan, and later other Asianeconomies, aggressively targeted the very same industries asthose that had grown rapidly in Europe (Johnson, 1982;Wade, 1990). Initially this did not attract much attentionamong policymakers or industrialists. This changed when,during the 1970s and 1980s, it became evident that Japanesesuppliers often outperformed their European and US competi-tors, and that this could not be explained solely by low wages.Closer attention revealed that the Japanese, like the Ameri-cans before them, had made important innovations in theorganisation of production that led to both increased qualityand higher productivity (Von Tunzelmann, 1995).
As Europe, Japan and other countries started to catch-upin many typical mass consumption goods, US industry leapedforward in another area: science-based industry. Before theFirst World War (WWI) – and arguably in the interwar periodas well – Europe, and Germany in particular, had been at theforefront in this area. In fact, science-based industry, charac-terised by high R&D investments, highly-educated (and qual-ified) labour and close interaction between industry, research
353 | Catching-up and falling behind: accounting for success and failure over time
CHAPTER 3 Catching-up andfalling behind:accounting for successand failure over time
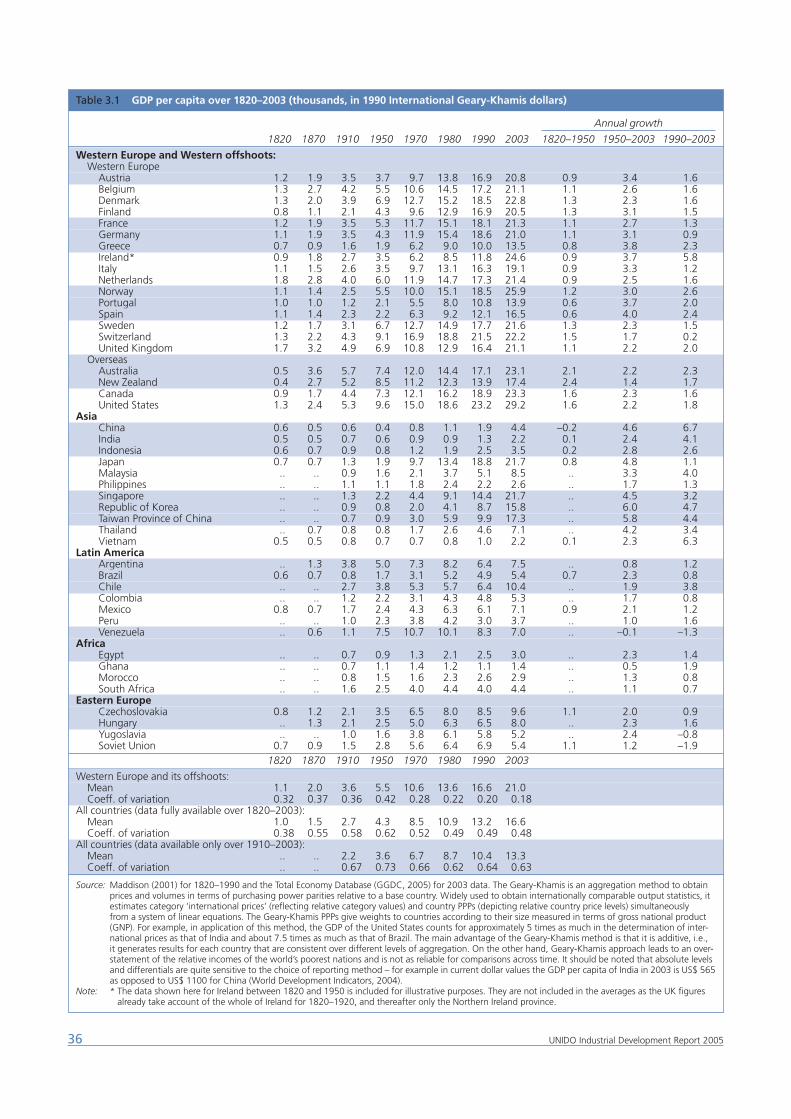
36 UNIDO Industrial Development Report 2005
Table 3.1 GDP per capita over 1820–2003 (thousands, in 1990 International Geary-Khamis dollars)
Annual growth
1820 1870 1910 1950 1970 1980 1990 2003 1820–1950 1950–2003 1990–2003
Western Europe and Western offshoots:Western Europe
Austria 1.2 1.9 3.5 3.7 9.7 13.8 16.9 20.8 0.9 3.4 1.6Belgium 1.3 2.7 4.2 5.5 10.6 14.5 17.2 21.1 1.1 2.6 1.6Denmark 1.3 2.0 3.9 6.9 12.7 15.2 18.5 22.8 1.3 2.3 1.6Finland 0.8 1.1 2.1 4.3 9.6 12.9 16.9 20.5 1.3 3.1 1.5France 1.2 1.9 3.5 5.3 11.7 15.1 18.1 21.3 1.1 2.7 1.3Germany 1.1 1.9 3.5 4.3 11.9 15.4 18.6 21.0 1.1 3.1 0.9Greece 0.7 0.9 1.6 1.9 6.2 9.0 10.0 13.5 0.8 3.8 2.3Ireland* 0.9 1.8 2.7 3.5 6.2 8.5 11.8 24.6 0.9 3.7 5.8Italy 1.1 1.5 2.6 3.5 9.7 13.1 16.3 19.1 0.9 3.3 1.2Netherlands 1.8 2.8 4.0 6.0 11.9 14.7 17.3 21.4 0.9 2.5 1.6Norway 1.1 1.4 2.5 5.5 10.0 15.1 18.5 25.9 1.2 3.0 2.6Portugal 1.0 1.0 1.2 2.1 5.5 8.0 10.8 13.9 0.6 3.7 2.0Spain 1.1 1.4 2.3 2.2 6.3 9.2 12.1 16.5 0.6 4.0 2.4Sweden 1.2 1.7 3.1 6.7 12.7 14.9 17.7 21.6 1.3 2.3 1.5Switzerland 1.3 2.2 4.3 9.1 16.9 18.8 21.5 22.2 1.5 1.7 0.2United Kingdom 1.7 3.2 4.9 6.9 10.8 12.9 16.4 21.1 1.1 2.2 2.0
OverseasAustralia 0.5 3.6 5.7 7.4 12.0 14.4 17.1 23.1 2.1 2.2 2.3New Zealand 0.4 2.7 5.2 8.5 11.2 12.3 13.9 17.4 2.4 1.4 1.7Canada 0.9 1.7 4.4 7.3 12.1 16.2 18.9 23.3 1.6 2.3 1.6United States 1.3 2.4 5.3 9.6 15.0 18.6 23.2 29.2 1.6 2.2 1.8
AsiaChina 0.6 0.5 0.6 0.4 0.8 1.1 1.9 4.4 –0.2 4.6 6.7India 0.5 0.5 0.7 0.6 0.9 0.9 1.3 2.2 0.1 2.4 4.1Indonesia 0.6 0.7 0.9 0.8 1.2 1.9 2.5 3.5 0.2 2.8 2.6Japan 0.7 0.7 1.3 1.9 9.7 13.4 18.8 21.7 0.8 4.8 1.1Malaysia .. .. 0.9 1.6 2.1 3.7 5.1 8.5 .. 3.3 4.0Philippines .. .. 1.1 1.1 1.8 2.4 2.2 2.6 .. 1.7 1.3Singapore .. .. 1.3 2.2 4.4 9.1 14.4 21.7 .. 4.5 3.2Republic of Korea .. .. 0.9 0.8 2.0 4.1 8.7 15.8 .. 6.0 4.7Taiwan Province of China .. .. 0.7 0.9 3.0 5.9 9.9 17.3 .. 5.8 4.4Thailand .. 0.7 0.8 0.8 1.7 2.6 4.6 7.1 .. 4.2 3.4Vietnam 0.5 0.5 0.8 0.7 0.7 0.8 1.0 2.2 0.1 2.3 6.3
Latin AmericaArgentina .. 1.3 3.8 5.0 7.3 8.2 6.4 7.5 .. 0.8 1.2Brazil 0.6 0.7 0.8 1.7 3.1 5.2 4.9 5.4 0.7 2.3 0.8Chile .. .. 2.7 3.8 5.3 5.7 6.4 10.4 .. 1.9 3.8Colombia .. .. 1.2 2.2 3.1 4.3 4.8 5.3 .. 1.7 0.8Mexico 0.8 0.7 1.7 2.4 4.3 6.3 6.1 7.1 0.9 2.1 1.2Peru .. .. 1.0 2.3 3.8 4.2 3.0 3.7 .. 1.0 1.6Venezuela .. 0.6 1.1 7.5 10.7 10.1 8.3 7.0 .. –0.1 –1.3
AfricaEgypt .. .. 0.7 0.9 1.3 2.1 2.5 3.0 .. 2.3 1.4Ghana .. .. 0.7 1.1 1.4 1.2 1.1 1.4 .. 0.5 1.9Morocco .. .. 0.8 1.5 1.6 2.3 2.6 2.9 .. 1.3 0.8South Africa .. .. 1.6 2.5 4.0 4.4 4.0 4.4 .. 1.1 0.7
Eastern EuropeCzechoslovakia 0.8 1.2 2.1 3.5 6.5 8.0 8.5 9.6 1.1 2.0 0.9Hungary .. 1.3 2.1 2.5 5.0 6.3 6.5 8.0 .. 2.3 1.6Yugoslavia .. .. 1.0 1.6 3.8 6.1 5.8 5.2 .. 2.4 –0.8Soviet Union 0.7 0.9 1.5 2.8 5.6 6.4 6.9 5.4 1.1 1.2 –1.9
1820 1870 1910 1950 1970 1980 1990 2003
Western Europe and its offshoots:Mean 1.1 2.0 3.6 5.5 10.6 13.6 16.6 21.0Coeff. of variation 0.32 0.37 0.36 0.42 0.28 0.22 0.20 0.18
All countries (data fully available over 1820–2003):Mean 1.0 1.5 2.7 4.3 8.5 10.9 13.2 16.6Coeff. of variation 0.38 0.55 0.58 0.62 0.52 0.49 0.49 0.48
All countries (data available only over 1910–2003):Mean .. .. 2.2 3.6 6.7 8.7 10.4 13.3Coeff. of variation .. .. 0.67 0.73 0.66 0.62 0.64 0.63
Source: Maddison (2001) for 1820–1990 and the Total Economy Database (GGDC, 2005) for 2003 data. The Geary-Khamis is an aggregation method to obtain prices and volumes in terms of purchasing power parities relative to a base country. Widely used to obtain internationally comparable output statistics, it estimates category ‘international prices’ (reflecting relative category values) and country PPPs (depicting relative country price levels) simultaneously from a system of linear equations. The Geary-Khamis PPPs give weights to countries according to their size measured in terms of gross national product (GNP). For example, in application of this method, the GDP of the United States counts for approximately 5 times as much in the determination of inter-national prices as that of India and about 7.5 times as much as that of Brazil. The main advantage of the Geary-Khamis method is that it is additive, i.e., it generates results for each country that are consistent over different levels of aggregation. On the other hand, Geary-Khamis approach leads to an over-statement of the relative incomes of the world’s poorest nations and is not as reliable for comparisons across time. It should be noted that absolute levels and differentials are quite sensitive to the choice of reporting method – for example in current dollar values the GDP per capita of India in 2003 is US$ 565as opposed to US$ 1100 for China (World Development Indicators, 2004).
Note: * The data shown here for Ireland between 1820 and 1950 is included for illustrative purposes. They are not included in the averages as the UK figuresalready take account of the whole of Ireland for 1820–1920, and thereafter only the Northern Ireland province.
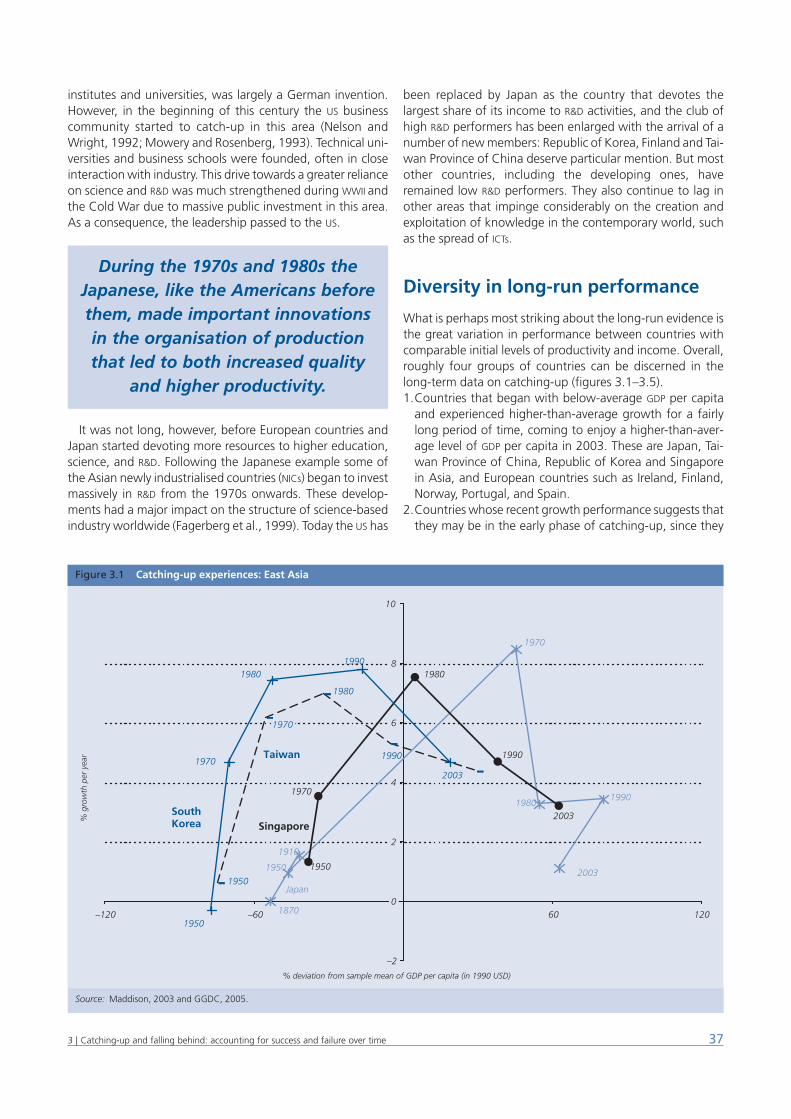
institutes and universities, was largely a German invention.However, in the beginning of this century the US businesscommunity started to catch-up in this area (Nelson andWright, 1992; Mowery and Rosenberg, 1993). Technical uni-versities and business schools were founded, often in closeinteraction with industry. This drive towards a greater relianceon science and R&D was much strengthened during WWII andthe Cold War due to massive public investment in this area.As a consequence, the leadership passed to the US.
It was not long, however, before European countries andJapan started devoting more resources to higher education,science, and R&D. Following the Japanese example some ofthe Asian newly industrialised countries (NICs) began to investmassively in R&D from the 1970s onwards. These develop-ments had a major impact on the structure of science-basedindustry worldwide (Fagerberg et al., 1999). Today the US has
been replaced by Japan as the country that devotes thelargest share of its income to R&D activities, and the club ofhigh R&D performers has been enlarged with the arrival of anumber of new members: Republic of Korea, Finland and Tai-wan Province of China deserve particular mention. But mostother countries, including the developing ones, haveremained low R&D performers. They also continue to lag inother areas that impinge considerably on the creation andexploitation of knowledge in the contemporary world, suchas the spread of ICTs.
Diversity in long-run performance
What is perhaps most striking about the long-run evidence isthe great variation in performance between countries withcomparable initial levels of productivity and income. Overall,roughly four groups of countries can be discerned in thelong-term data on catching-up (figures 3.1–3.5).1.Countries that began with below-average GDP per capita
and experienced higher-than-average growth for a fairlylong period of time, coming to enjoy a higher-than-aver-age level of GDP per capita in 2003. These are Japan, Tai-wan Province of China, Republic of Korea and Singaporein Asia, and European countries such as Ireland, Finland,Norway, Portugal, and Spain.
2.Countries whose recent growth performance suggests thatthey may be in the early phase of catching-up, since they
373 | Catching-up and falling behind: accounting for success and failure over time
During the 1970s and 1980s theJapanese, like the Americans beforethem, made important innovationsin the organisation of productionthat led to both increased quality
and higher productivity.
Figure 3.1 Catching-up experiences: East Asia
Source: Maddison, 2003 and GGDC, 2005.
-2
2
4
6
8
-120 -60 60 120
–2
00
2
4
6
8
10
–120 –60 60 120
% deviation from sample mean of GDP per capita (in 1990 USD)
% g
row
th p
er y
ear
1950
1970
19801990
2003
South Korea
1950
19701970
1980
1990Taiwan
1870
1910
1950
1970
19801990
2003
Japan
1950
1970
1980
1990
2003Singapore
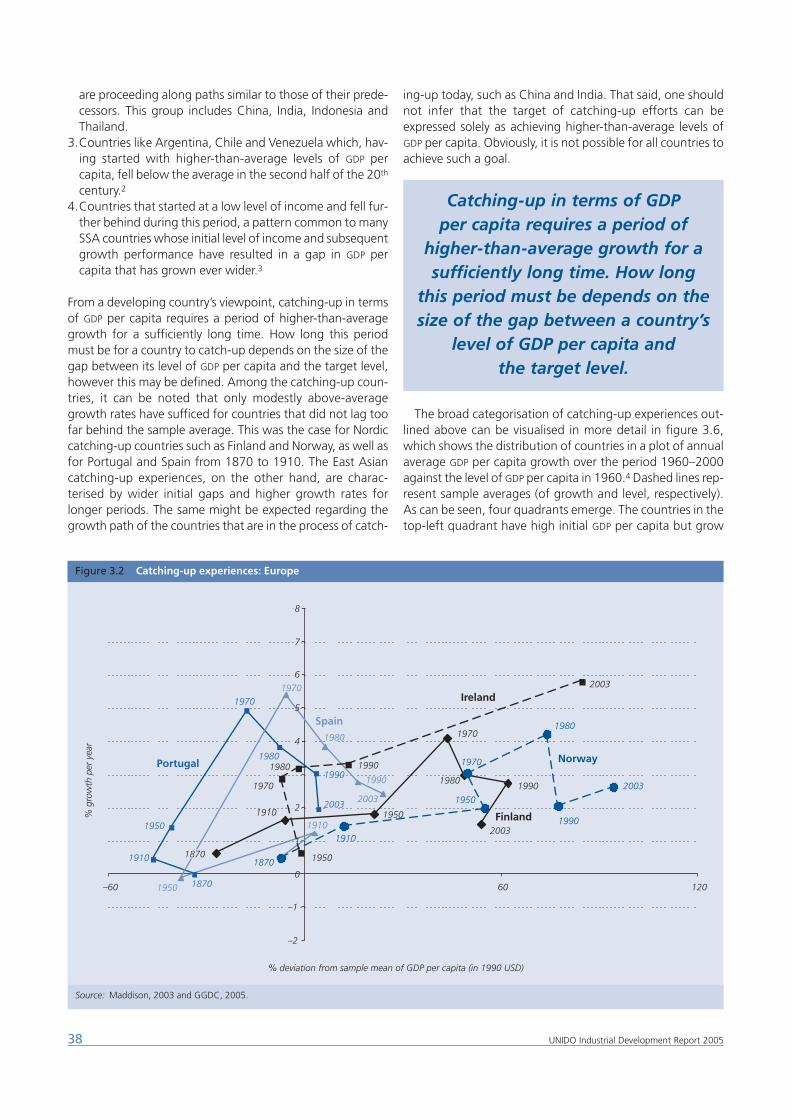
are proceeding along paths similar to those of their prede-cessors. This group includes China, India, Indonesia andThailand.
3.Countries like Argentina, Chile and Venezuela which, hav-ing started with higher-than-average levels of GDP percapita, fell below the average in the second half of the 20th
century.2
4.Countries that started at a low level of income and fell fur-ther behind during this period, a pattern common to manySSA countries whose initial level of income and subsequentgrowth performance have resulted in a gap in GDP percapita that has grown ever wider.3
From a developing country’s viewpoint, catching-up in termsof GDP per capita requires a period of higher-than-averagegrowth for a sufficiently long time. How long this periodmust be for a country to catch-up depends on the size of thegap between its level of GDP per capita and the target level,however this may be defined. Among the catching-up coun-tries, it can be noted that only modestly above-averagegrowth rates have sufficed for countries that did not lag toofar behind the sample average. This was the case for Nordiccatching-up countries such as Finland and Norway, as well asfor Portugal and Spain from 1870 to 1910. The East Asiancatching-up experiences, on the other hand, are charac-terised by wider initial gaps and higher growth rates forlonger periods. The same might be expected regarding thegrowth path of the countries that are in the process of catch-
ing-up today, such as China and India. That said, one shouldnot infer that the target of catching-up efforts can beexpressed solely as achieving higher-than-average levels ofGDP per capita. Obviously, it is not possible for all countries toachieve such a goal.
The broad categorisation of catching-up experiences out-lined above can be visualised in more detail in figure 3.6,which shows the distribution of countries in a plot of annualaverage GDP per capita growth over the period 1960–2000against the level of GDP per capita in 1960.4 Dashed lines rep-resent sample averages (of growth and level, respectively).As can be seen, four quadrants emerge. The countries in thetop-left quadrant have high initial GDP per capita but grow
38 UNIDO Industrial Development Report 2005
Catching-up in terms of GDP per capita requires a period of
higher-than-average growth for asufficiently long time. How long
this period must be depends on thesize of the gap between a country’s
level of GDP per capita and the target level.
Figure 3.2 Catching-up experiences: Europe
Source: Maddison, 2003 and GGDC, 2005.
–2
–1
2
4
6
7
8
–2
–1
0
1
2
4
5
6
7
8
–60 60 120
% deviation from sample mean of GDP per capita (in 1990 USD)
% g
row
th p
er y
ear
2003
2003
20032003
Norway
Finland
Spain
Portugal
1990
199019901990
1980
1980
1980
1970
1970
19701970
1950
1950
1950
19501910
1910
1910
1870
1870
1910
2003
19901980
1970
1950
Ireland
18701870
1980
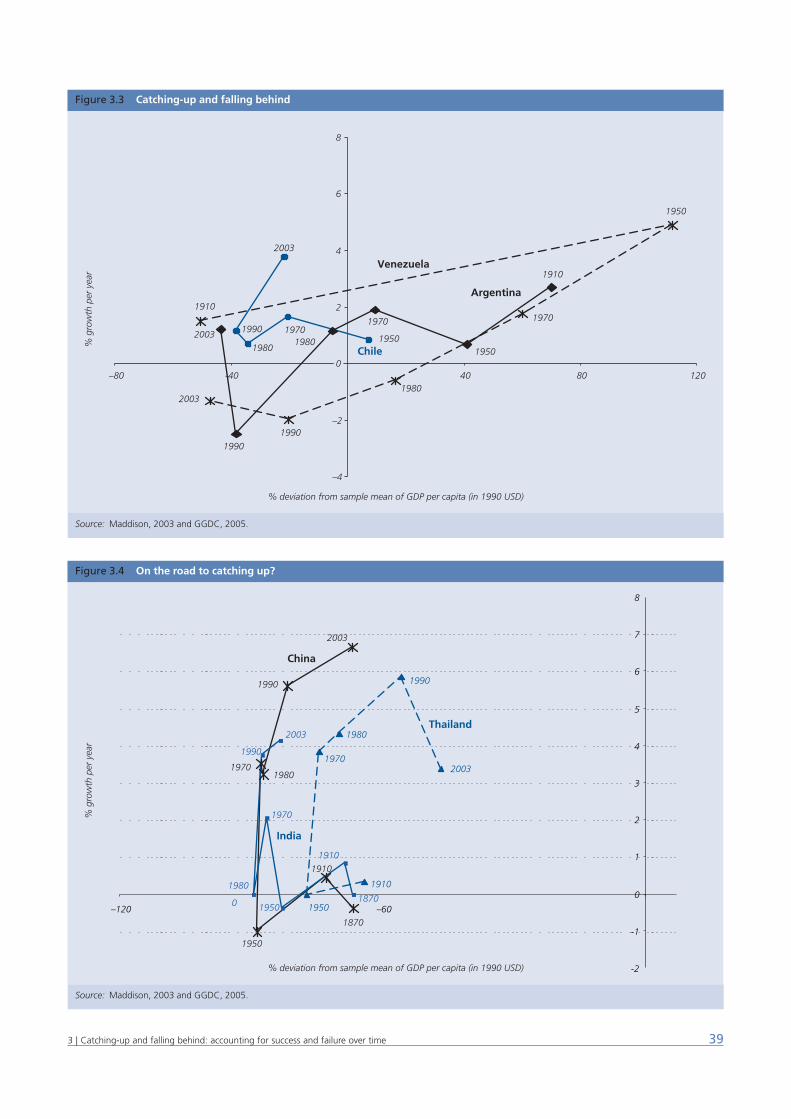
393 | Catching-up and falling behind: accounting for success and failure over time
Figure 3.3 Catching-up and falling behind
Source: Maddison, 2003 and GGDC, 2005.
% deviation from sample mean of GDP per capita (in 1990 USD)
% g
row
th p
er y
ear
–4
–2
00
2
4
6
8
–80 -40 40 80 120
2003
1990
1980
1970
1950
1910
Venezuela
2003
1990
1980
1970
1950
1910
Argentina
2003
1990
1980
19701950
Chile
Figure 3.4 On the road to catching up?
Source: Maddison, 2003 and GGDC, 2005.
% deviation from sample mean of GDP per capita (in 1990 USD)
% g
row
th p
er y
ear
-2
-1
0
1
2
3
4
5
6
7
8
–120 –60
2003
1990
1980
1970
1910
Thailand
China
2003
1990
19801970
1870
1950
1910
1870
1910
1950
1970
1980
0
1990
2003
India
1950
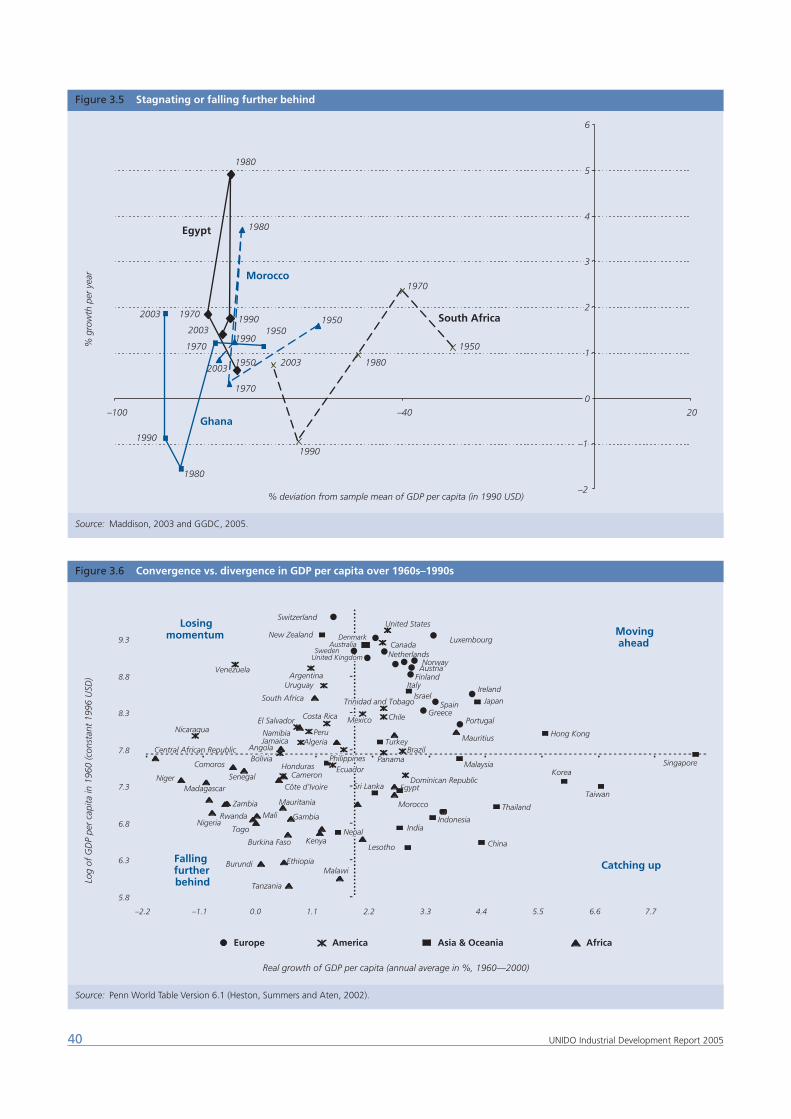
40 UNIDO Industrial Development Report 2005
Figure 3.5 Stagnating or falling further behind
Source: Maddison, 2003 and GGDC, 2005.
% deviation from sample mean of GDP per capita (in 1990 USD)
% g
row
th p
er y
ear
–2
–1
0
1
2
3
4
5
–1
0
1
2
3
4
5
6
–100 –40 20
2003
1990
1980
1970
1950
1950
1970
1980
1990
20031950
1970
1980
19902003
2003
1980
1990
1970
1950South Africa
Morocco
Egypt
Ghana
Figure 3.6 Convergence vs. divergence in GDP per capita over 1960s–1990s
Source: Penn World Table Version 6.1 (Heston, Summers and Aten, 2002).
Real growth of GDP per capita (annual average in %, 1960—2000)
Log
of G
DP
per
capi
ta in
196
0 (c
onst
ant
1996
USD
)
5.8
6.3
6.8
7.3
7.8
8.3
8.8
9.3
–2.2 –1.1 0.0 1.1 2.2 3.3 4.4 5.5 6.6 7.7
Movingahead
Losingmomentum
Falling further behind
Catching up
Europe America Asia & Oceania Africa
Luxembourg
United States
NetherlandsNorway
Austria
Canada
Japan
Portugal
Ireland
Greece
Mauritius
Mexico
PhilippinesEcuador
Bolivia
AustraliaSweden
United Kingdom
DenmarkAustralia
SwedenUnited Kingdom
Denmark
Switzerland
Hong Kong
Dominican Republic
Taiwan
KoreaMalaysia
SpainIsrael
ItalyFinland
Egypt
Morocco
Indonesia
Thailand
Singapore
Nicaragua
China
India
Lesotho
Tanzania
MalawiEthiopiaBurundi
KenyaBurkina Faso
Nigeria
Zambia
Madagascar
Central African Republic
Senegal
Comoros
Niger
HondurasCameron
Côte d’Ivoire
Venezuela
AlgeriaJamaica TurkeyBrazil
Sri Lanka
Gambia
Trinidad and Tobago Trinidad and Tobago
ChileMexico
PhilippinesEcuador
NepalNepal
New Zealand
Namibia
El Salvador
Peru
Costa Rica
South Africa
UruguayArgentina
BoliviaAngola
Togo
Rwanda Mali
Mauritania
Panama
413 | Catching-up and falling behind: accounting for success and failure over time
relatively slowly; they may be said to ‘lose momentum.’ Incontrast, the countries in the top-right quadrant continue togrow fast despite being relatively wealthy at the outset;these countries are ‘moving ahead’. In the bottom-rightquadrant there are countries that also grow at above-aver-age rates but from a lower initial level – these are the coun-tries that succeed in catching-up. Finally, the bottom-leftquadrant is occupied by countries with the least fortunateoutcome, initially poor countries that grow slowly and there-fore ‘fall behind’.
Quite clearly, there is much diversity in performance: allfour quadrants are relatively well populated. But closerinspection reveals that there is a greater tendency for coun-tries to cluster in the bottom-left and top-right quadrants –in the groups that are ‘falling behind’ or ‘moving ahead’ –than in the two other quadrants. This is consistent with a long-run tendency towards divergence in the globaleconomy.
Formal tests of the tendency towards absolute conver-gence (or divergence) in income levels can be made byregressing the GDP per capita on its initial level and observingthe sign of the correlation coefficient. A negative relationshipwould imply that rich countries tend to grow slower than thepoorer ones, the so called β-convergence (Barro and Sala-i-Martin, 1992). However, a positive association is found foreach decade as well as the period as a whole, indicating thathigh-income countries grow faster on average than thosewith low income. If the hypothesis that the distribution nar-rows through time is tested – the so-called σ-convergence –the results confirm, again, that for the sample as a whole thelong-run tendency is towards divergence, and this tendencygains force after 1980.
But when the sample is divided into subgroups on the basisof the initial level of GDP per capita a more complex pattern
emerges. For those in the richest quartile, there actually wasa tendency towards convergence between 1960 and 1980,after which a trend towards divergence sets in. However, asimilar tendency cannot be detected among the countries inthe poorest quartile. For these countries the tendency pointsconsistently towards divergence, albeit less so before the1980s than afterwards (see tables 2A.7 and 2A.8 for details).
The long-term patterns of divergence and convergence incountry-level GDP per capita invites further reflection on suchpatterns and their relation to the accumulation of technolog-ical capabilities at the country level.
Notes
This chapter draws on a background paper by Fagerberg and Srholec(2005) and inputs from Roberto Mazzoleni. However, the viewsexpressed here are of UNIDO and do not necessarily reflect those of theauthors.1 Some of the earlier examples can be found in the debates in Germany
and the US during the 19th century about what was needed to be ableto catch-up with the UK, then the world leader (Chang, 2002).
2 Argentina and Venezuela experienced very large relative improve-ments in GDP per capita at different times – Venezuela in 1910–1950and Argentina in 1820–1870 – but later experienced large fluctua-tions.
3 It may seem surprising that countries like South Africa and Chile,which are star performers in their respective regions, appear as hav-ing done rather poorly in terms of catching-up. However, it should beborne in mind that, in this analysis, what matters is performance withrespect to the sample average, which is in turn influenced by therelative weights of the whole set of above-average versus below-average performers.
4 These data, which cover more than 90 countries at different levels of development, are drawn from The Penn World Table (Heston,Summers and Aten, 2002).

The diversity of growth processes at country level undoubt-edly reflects the existence of different institutional infra-
structures, the interactions between various actors and thepace at which social and technological capabilities have beenaccumulated. This calls for a closer look at institutional evo-lution in different catching-up contexts, examining the roleplayed by components of domestic knowledge systems suchas higher education, technical and vocational training,research units, technical associations and other agencies ofthe technological infrastructure like standards and metrologybodies. Also meriting attention are the different institutionalinfrastructures to support effective interactions betweentraining and research activities in the public sector and theformation of entrepreneurial and technological capabilities inemerging industries.
Introduction
The actual extent to which overall educational capital deter-mines economic growth is still in debate.1 However, cross-country data show a positive correlation between tertiaryenrolment rates and measures of per capita income (Fager-berg and Godino, 2004). Furthermore, evidence on the cen-trality of scientific and engineering education to technologi-cal capability formation and on the latter’s effects on eco-nomic growth is sufficiently strong to invite further qualitativeinvestigation. Although investing in higher education indeveloping countries had been previously seen as a non-pri-ority, this has changed in recent years.2
As clearly illustrated by the catching-up processes of the US
and Germany in the 19th century and the more recent onesof Japan, the Republic of Korea and Taiwan Province ofChina, the international dissemination of educational andresearch models is subject to adaptation to local economic,social, and political conditions, not unlike production tech-nologies. Amid the resulting diversity, however, there areimportant similarities which provide useful lessons for con-temporary policies. Among these are significant increases inenrolment in tertiary education – especially in science andengineering fields – as well as important adaptations to theneeds of emerging industrial sectors (see box 4.1).
In particular, significant growth of science and engineeringeducation among catching-up countries has been quite
visible: Taiwan Province of China and the Republic of Koreaare eloquent examples. In fact when the share of science andengineering degrees in total degrees is compared with thecountry’s level of development (as measured by GDP percapita) a cross-country pattern of catching-up potential sim-ilar to that highlighted in Chapter 3 emerges (figure 4.1). Onthe one hand, some countries are generating a lot of scienceand engineering talent and are on their way to technologicalcatch-up (China is a good example); on the other hand, coun-tries such as the Latin American ones in the sample are fallingbehind in terms of competences and economic performance.Among early and more recent catching-up countries thereare cases in which this expansion has overtaken that of theUS. For example, in 2000 Japan, with less than half the pop-ulation of the US, graduated twice as many engineers, andChina is graduating four times as many (National ScienceFoundation, 2004) (figure 4.2). That said, it is important topoint that significant increases in enrolment do not alwaysaccompany improvements in the quality of competence-building efforts.3 The effectiveness of expansion in scienceand engineering education depends on the institutionaldesign and a whole host of complementary factors such asthe interaction between industry and academia.
Early biases
During the 19th century catching-up experiences the scope ofacademic education was broadened both by advances in nat-ural sciences research and changes in attitude towards pro-fessional training.4 These changes coincided with the emer-gence of science-based industries – such as chemicals andelectrical equipment – and of formal R&D laboratories in busi-ness firms in these industries, both of which had an impacton the concept of the role modern universities should play.These trends started to take hold first in German universitiesand later spread to the academic systems of other countriessuch as the US and Japan.
Training programs focused on engineering and industrialtechnology started to spring up in Europe at the end of 18th
century. Notable examples are the École des Ponts etChaussées (1775), the École de Mines (1783) and the ÉcolePolytechnique (1794), all in France. These institutions,though, were designed to train engineers for careers in pub-lic service, which limited their pertinence to industrial devel-
434 | Role of knowledge systems in catching-up experiences
CHAPTER 4 Role of knowledgesystems in catching-upexperiences
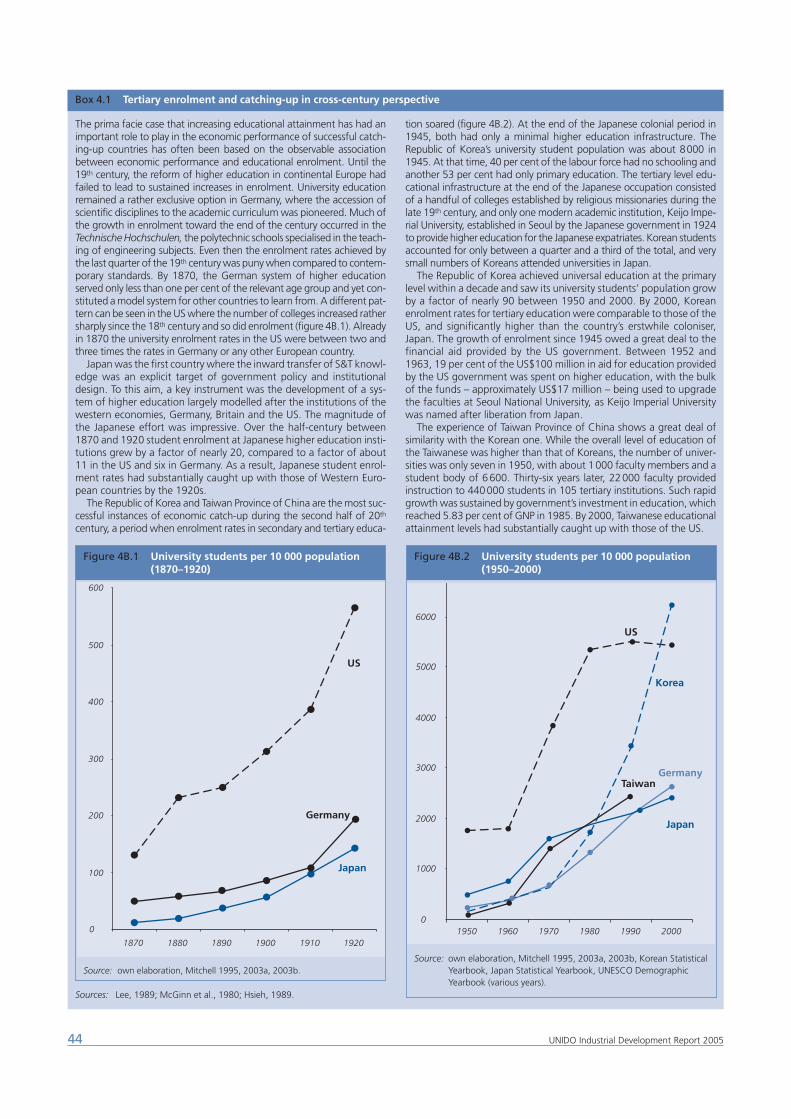
44 UNIDO Industrial Development Report 2005
Box 4.1 Tertiary enrolment and catching-up in cross-century perspective
Sources: Lee, 1989; McGinn et al., 1980; Hsieh, 1989.
The prima facie case that increasing educational attainment has had animportant role to play in the economic performance of successful catch-ing-up countries has often been based on the observable associationbetween economic performance and educational enrolment. Until the19th century, the reform of higher education in continental Europe hadfailed to lead to sustained increases in enrolment. University educationremained a rather exclusive option in Germany, where the accession ofscientific disciplines to the academic curriculum was pioneered. Much ofthe growth in enrolment toward the end of the century occurred in theTechnische Hochschulen, the polytechnic schools specialised in the teach-ing of engineering subjects. Even then the enrolment rates achieved bythe last quarter of the 19th century was puny when compared to contem-porary standards. By 1870, the German system of higher educationserved only less than one per cent of the relevant age group and yet con-stituted a model system for other countries to learn from. A different pat-tern can be seen in the US where the number of colleges increased rathersharply since the 18th century and so did enrolment (figure 4B.1). Alreadyin 1870 the university enrolment rates in the US were between two andthree times the rates in Germany or any other European country.
Japan was the first country where the inward transfer of S&T knowl-edge was an explicit target of government policy and institutionaldesign. To this aim, a key instrument was the development of a sys-tem of higher education largely modelled after the institutions of thewestern economies, Germany, Britain and the US. The magnitude ofthe Japanese effort was impressive. Over the half-century between1870 and 1920 student enrolment at Japanese higher education insti-tutions grew by a factor of nearly 20, compared to a factor of about11 in the US and six in Germany. As a result, Japanese student enrol-ment rates had substantially caught up with those of Western Euro-pean countries by the 1920s.
The Republic of Korea and Taiwan Province of China are the most suc-cessful instances of economic catch-up during the second half of 20th
century, a period when enrolment rates in secondary and tertiary educa-
tion soared (figure 4B.2). At the end of the Japanese colonial period in1945, both had only a minimal higher education infrastructure. TheRepublic of Korea’s university student population was about 8000 in1945. At that time, 40 per cent of the labour force had no schooling andanother 53 per cent had only primary education. The tertiary level edu-cational infrastructure at the end of the Japanese occupation consistedof a handful of colleges established by religious missionaries during thelate 19th century, and only one modern academic institution, Keijo Impe-rial University, established in Seoul by the Japanese government in 1924to provide higher education for the Japanese expatriates. Korean studentsaccounted for only between a quarter and a third of the total, and verysmall numbers of Koreans attended universities in Japan.
The Republic of Korea achieved universal education at the primarylevel within a decade and saw its university students’ population growby a factor of nearly 90 between 1950 and 2000. By 2000, Koreanenrolment rates for tertiary education were comparable to those of theUS, and significantly higher than the country’s erstwhile coloniser,Japan. The growth of enrolment since 1945 owed a great deal to thefinancial aid provided by the US government. Between 1952 and1963, 19 per cent of the US$100 million in aid for education providedby the US government was spent on higher education, with the bulkof the funds – approximately US$17 million – being used to upgradethe faculties at Seoul National University, as Keijo Imperial Universitywas named after liberation from Japan.
The experience of Taiwan Province of China shows a great deal ofsimilarity with the Korean one. While the overall level of education ofthe Taiwanese was higher than that of Koreans, the number of univer-sities was only seven in 1950, with about 1000 faculty members and astudent body of 6600. Thirty-six years later, 22000 faculty providedinstruction to 440000 students in 105 tertiary institutions. Such rapidgrowth was sustained by government’s investment in education, whichreached 5.83 per cent of GNP in 1985. By 2000, Taiwanese educationalattainment levels had substantially caught up with those of the US.
Figure 4B.1 University students per 10 000 population Figure 4B.1 (1870–1920)
Source: own elaboration, Mitchell 1995, 2003a, 2003b.
0
100
200
300
400
500
600
1870 1880 1890 1900 1910 1920
US
Germany
Japan
Figure 4B.2 University students per 10 000 population Figure 4B.2 (1950–2000)
Source: own elaboration, Mitchell 1995, 2003a, 2003b, Korean StatisticalYearbook, Japan Statistical Yearbook, UNESCO DemographicYearbook (various years).
0
1000
2000
3000
4000
5000
6000
1950 1960 1970 1980 1990 2000
Korea
US
Taiwan
Japan
Germany
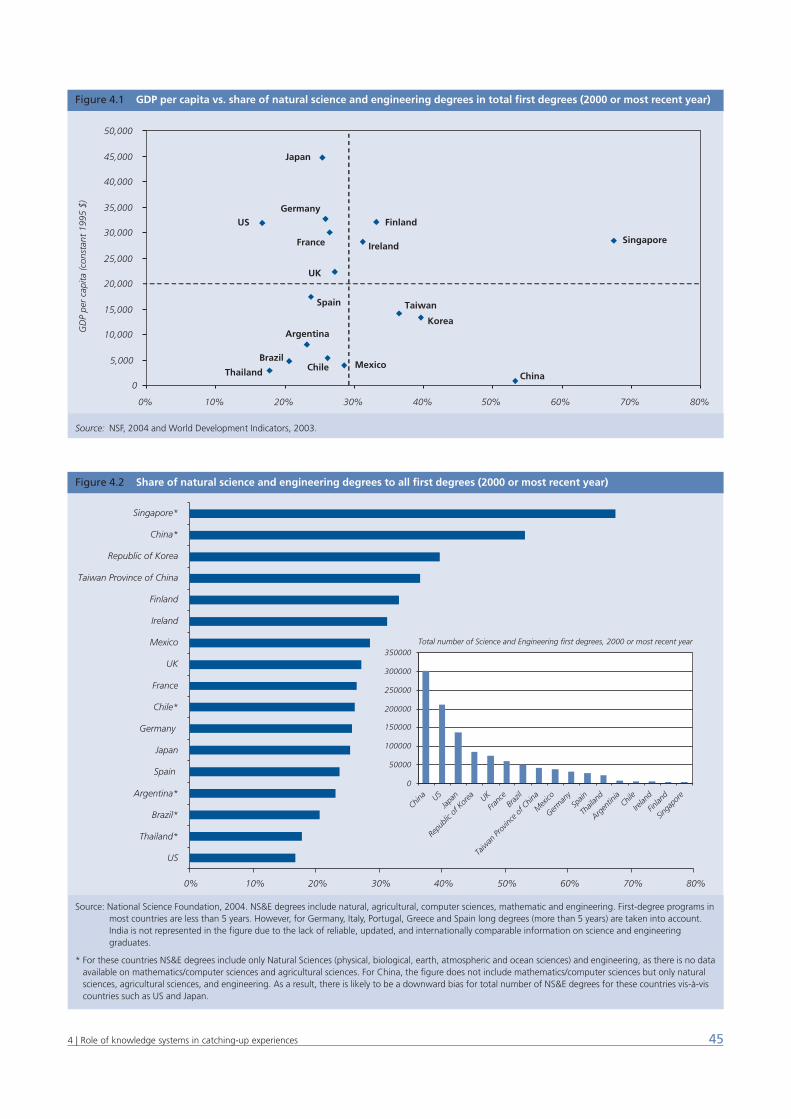
454 | Role of knowledge systems in catching-up experiences
Figure 4.1 GDP per capita vs. share of natural science and engineering degrees in total first degrees (2000 or most recent year)
Source: NSF, 2004 and World Development Indicators, 2003.
0
5,000
10,000
15,000
20,000
25,000
30,000
35,000
40,000
45,000
50,000
0% 10% 20% 30% 40% 50% 60% 70% 80%
GD
P pe
r ca
pita
(con
stan
t 19
95 $
)
Singapore
Japan
Finland
China
Korea
Taiwan
MexicoChile
Argentina
Brazil
Thailand
Spain
UK
IrelandFrance
GermanyUS
Figure 4.2 Share of natural science and engineering degrees to all first degrees (2000 or most recent year)
Source: National Science Foundation, 2004. NS&E degrees include natural, agricultural, computer sciences, mathematic and engineering. First-degree programs inmost countries are less than 5 years. However, for Germany, Italy, Portugal, Greece and Spain long degrees (more than 5 years) are taken into account.India is not represented in the figure due to the lack of reliable, updated, and internationally comparable information on science and engineeringgraduates.
* For these countries NS&E degrees include only Natural Sciences (physical, biological, earth, atmospheric and ocean sciences) and engineering, as there is no dataavailable on mathematics/computer sciences and agricultural sciences. For China, the figure does not include mathematics/computer sciences but only naturalsciences, agricultural sciences, and engineering. As a result, there is likely to be a downward bias for total number of NS&E degrees for these countries vis-à-viscountries such as US and Japan.
0% 10% 20% 30% 40% 50% 60% 70% 80%
US
Thailand*
Brazil*
Argentina*
Spain
Japan
Germany
Chile*
France
UK
Mexico
Ireland
Finland
Taiwan Province of China
Republic of Korea
China*
Singapore*
Total number of Science and Engineering first degrees, 2000 or most recent year
0
50000
100000
150000
200000
250000
300000
350000
China US
Japa
n
Repu
blic o
f Kor
ea UK
Franc
eBr
azil
Taiw
an Pr
ovinc
e of C
hina
Mex
ico
Germ
any
Spain
Thail
and
Argen
tinia
Chile
Irelan
d
Finlan
d
Singa
pore
opment. The unmet need for high-skilled technical person-nel led to the establishment in 1829, by a private industrial-ist, of the École Central des Arts et Manufactures (ECAM).However, the graduates of the school were predominantlyemployed in administrative and managerial duties in indus-try (Mazzoleni, 2003).
The tension between the emphasis on academic teachingcovering math and natural sciences and the provision of prac-tical training haunted many educational institutions in thefirst half of the 19th century. A good example is the ‘academi-sation’ of engineering in German universities and technicalschools (Hochschulen) for most of the 19th century, whichgave rise to a reform movement that emphasised laboratoryresearch and training. This movement gained momentumafter the 1890s. The same tension also created an increasingoverlap between the focus of university teaching andresearch and that of the technical schools. Unlike France,where the specialised engineering schools had a higher sta-tus than universities in the resulting two-tier system, the Ger-man polytechnic schools had a vocational orientationthrough at least the first half of the century, and were con-sidered of lower status than the universities.
The lack of opportunities for practical work and laboratorypractice greatly reduced the effectiveness of the knowledgeacquired by students for the development of enterprise-based technological capabilities, and this led to the estrange-ment of the industrial community from the evolution of theHochschulen. As practical workshop experience was neithera requirement for admission to the Hochschulen, nor a com-ponent of their curricula, the graduates were shunned byindustrialists who often preferred to recruit their technicalworkforce from among the alumni of the secondary-leveltrade schools. Overall, the Hochschulen graduates’ predilec-tion for abstract theorising and their disdain for practical con-siderations such as manufacturability of product designs andproduction costs diminished their appeal for industrialistsuntil the end of 19th century.
The utilitarian higher-education model of the US
The prominence attained by the German polytechnic schoolsin international academic circles provided the inspiration forAmerican engineering schools. Although inspired by the Ger-man model, the system of higher education in the US wascharacterised by an enormous adaptive capacity that ulti-mately gave it significant originality. The characteristics ofprofessional education in the curricula and the formation ofnew institutes reflected the US penchant for the practicalapplications of science noted by Tocqueville (1876), and thedominance of a utilitarian conception of education.
Two features of the US higher education system are partic-ularly noteworthy. First, the segregation of engineering fromthe universities that emerged in continental Europe was notreplicated in the US. Second, the growth of the system wasto a much larger extent the result of private initiative, so thatinstitutional arrangements were much more varied than inEurope5 (see box 4.1).
The dissemination of engineering education in the US pro-ceeded largely through the creation of new specialised insti-tutes, such as Union College or the Massachusetts Instituteof Technology (MIT). Older elite colleges which did not con-sider engineering a suitable discipline for their students’ edu-cation, established sister institutions aimed at providing sci-entific and engineering training. Thus, the Lawrence Scien-tific School was established in 1847 as a branch of HarvardUniversity thanks to a private endowment aimed at promot-ing the application of scientific education to engineering andmining and the invention and manufacture of machinery(though ultimately the school program emphasised theteaching of sciences, rather than engineering). Yale Collegefollowed in Harvard’s footsteps with the creation of theSheffield Scientific School in 1858, again thanks to a gift bya private entrepreneur. MIT provides another excellent exam-ple: Boston industrialists created it to support their produc-tion activities through research and education in the appliedsciences and engineering. By 1985 there were 85 engineer-ing schools active at college level. US universities have also dis-tinguished themselves for the speed with which study pro-grams are formed to support training and research in newfields of knowledge (Nelson and Rosenberg, 1994).
To a considerable extent, the engineering curricula in US
colleges represented an adaptation of European models tolocal conditions, among which the differences in the stand-ards of secondary education and the much greater emphasisgiven to practical work were of paramount importance.6 Asa result of these factors, the ‘academisation’ of engineeringthat characterised developments in Germany and France washardly a problem in the US, in spite of the fact that many engi-neering schools drew inspiration from European institutionsand very often adopted the same textbooks.
An important characteristic of engineering education inthe US was its emphasis on shop culture and an orientationtowards practical problem-solving and industrial practice.These were cultivated in part through the consulting relation-ships that members of the faculty established with industrialfirms, often with the encouragement of administrators whothus hoped to attract industry funding for their colleges.Sponsored research activities at engineering collegesincreased since the 1880s and by the early decades of the20th century several of them had established departments ofindustrial research, research foundations and engineeringexperimental stations, whose activities consisted in carryingout research projects as a public service to local governmentagencies as well as local industry. The creation of the engi-
46 UNIDO Industrial Development Report 2005
An important characteristic of engineering education in the US
was its emphasis on shop cultureand an orientation towards
practical problem-solving andindustrial practice.
neering experimental stations found inspiration in the insti-tutions that had emerged in the US farming sector to carryout research and extension services with federal and stategovernment funds. The public R&D infrastructure in US agri-culture benefited from the establishment of the agriculturalexperimentation stations through which federal support toagricultural R&D was channelled since the late 1880s7 (seebox 4.2).
Reciprocal influence across countries in the design of scien-tific institutions continued to manifest itself through the 19th
and 20th centuries, and not just among Western Europeancountries and their colonies. Nineteenth century Japan is anoutstanding example: the Japanese system had great influ-ence on the academic systems that evolved since the mid-20th
century in the Republic of Korea and Taiwan Province of Chinawhile they were under Japanese colonial rule.
Brain circulation and university research
The international movement of students was an importantaspect of the spread of S&T during the 19th and 20th centurycatching-up experiences, complementary to the movementsof skilled industrial personnel (Mazzoleni, 2003; Pollard,1981). For example, a significant number of scientists work-ing in the US chemical industry had been trained in Germany.Cross-border academic education in sciences did not onlycontribute to technological progress in countries and sectorslacking a strong domestic scientific base; the transfer of stu-dents and scholars also helped the development of nationalacademic institutions. The trend towards recruiting foreignscientists for teaching and research positions was very visiblein Japan in the early years of Meiji restoration, which beganin 1868. The acquisition of knowledge and the creation of ahigher education system were believed essential to catching-up with the advanced western economies. Foreign-trainedJapanese students and educators, as well as the large num-ber of foreign professors who were invited to Japan, playeda significant role in laying the foundations of a system thatwithin about 50 years achieved a standard comparable tothose of most western European countries.
In Taiwan Province of China and the Republic of Korea thepattern of circulation of educated labour and academic per-sonnel was different. The growth of the university system inthese cases was so spectacular that it led to a temporaryproblem of unemployment among university graduates, asthe increases in supply exceeded the economy’s capacity tocreate adequate job opportunities. This was particularly truefor large numbers of science and engineering students, whohad to go abroad to pursue graduate studies or professionalopportunities. About 20 per cent of Taiwanese studentsenroled in tertiary degree programs were studying abroadduring the 1960s and 1970s. The percentage was evenhigher in the sciences, where a third of students migratedto foreign institutions (UNESCO, 1972). The governmentattempted to reverse this brain drain. Those who held foreignacademic degrees – whose skills were often enriched by workexperience abroad – were encouraged to play a dual role,contributing to the upgrading of technological capabilities in
industrial firms and improving the quality and quantity ofeducation, especially at graduate level.8
In spite of these efforts, research activities in universitiesremained underdeveloped. One of the most insightful schol-ars of Korean industrialisation noted in 1993 that the rapidgrowth of university enrolment in the Republic of Korea hadsignificantly outstripped the growth in financial support foreducation and research in both the public and private univer-sities, and that ‘the student-professor ratio ha[d] retrogressedfrom 22.6 in 1966 to 35.8 in 1985, making all universitiesprimarily undergraduate teaching-oriented rather thanresearch-oriented’ (Kim, 1993, p. 371). This highlights thefailure to develop in the Republic of Korea’s university systemthe type of strong complementarities between teaching andresearch that have proven to be effective for both activitiesin other national higher education systems, notably that ofthe US – and also highlights the critical role played in revers-ing the brain drain in both Taiwan Province of China and theRepublic of Korea by the public research laboratories con-nected to the electronics and computer industry and the cre-ation of science-based industrial parks. For example, morethan half of the new firms based in Hsinchu Science-basedIndustrial Park has been established or supported by return-ing foreign-trained Taiwanese since 1980 (National ScienceCouncil, 1997).
Public funding of applied science in universities
The rise of applied science often depends on the universities’success at securing greater public funds for their institutesand labs. In Germany, for example, increases in public fund-ing fed the accumulation of technological capabilities duringthe 1820–1870 period, as a result of a growing recognitionthat valuable research in natural sciences and medicinerequired adequate funding and as a response to the depend-ence of a growing number of doctoral students on labresearch.
The contrast between Germany and Britain in universityfunding is especially striking.9 British universities received farless public funding, supported less technical education, andwere less closely linked with industrial research (especially insuch industries as chemicals) than was true in Germany by the1880s. British university enrolment increased between 1900and 1913 by 20 per cent, far less than the 60 per centincrease in German university enrolment during the same
474 | Role of knowledge systems in catching-up experiences
It is necessary to strike a balancebetween supporting research that
responds to the current needs of industry and making sure that part of the funding is allocated
more flexibly to research with potential future returns.
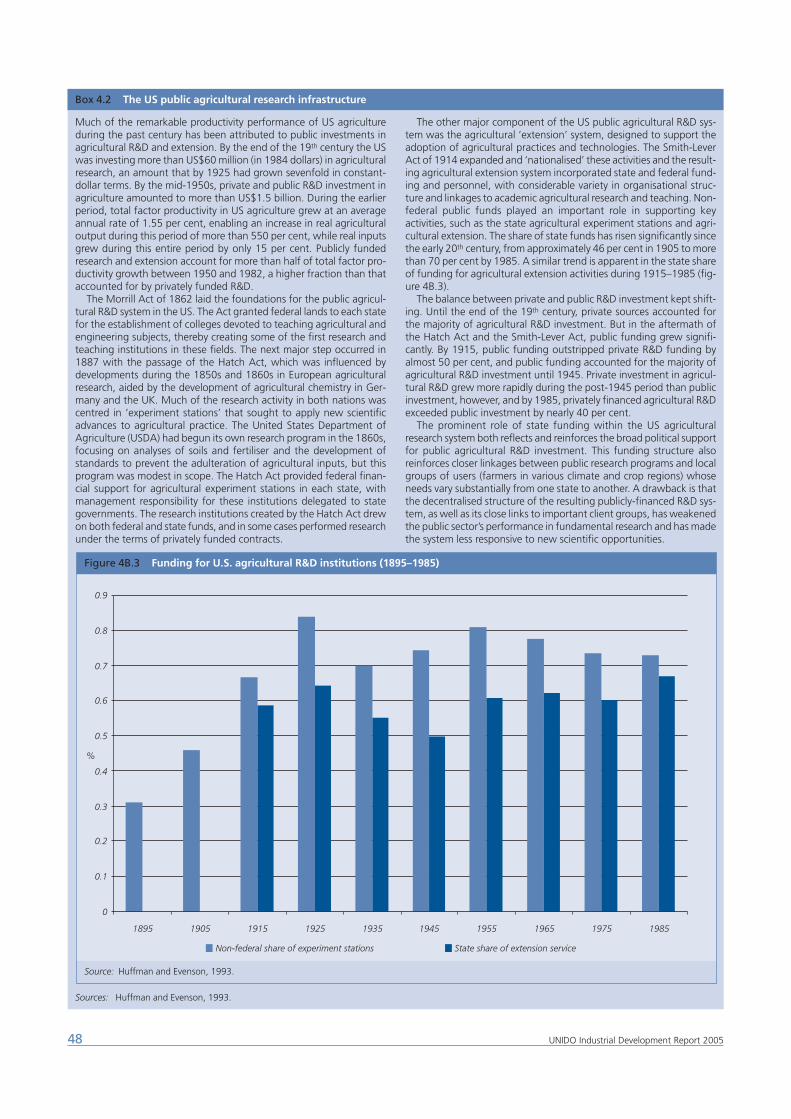
48 UNIDO Industrial Development Report 2005
Box 4.2 The US public agricultural research infrastructure
Sources: Huffman and Evenson, 1993.
Much of the remarkable productivity performance of US agricultureduring the past century has been attributed to public investments inagricultural R&D and extension. By the end of the 19th century the USwas investing more than US$60 million (in 1984 dollars) in agriculturalresearch, an amount that by 1925 had grown sevenfold in constant-dollar terms. By the mid-1950s, private and public R&D investment inagriculture amounted to more than US$1.5 billion. During the earlierperiod, total factor productivity in US agriculture grew at an averageannual rate of 1.55 per cent, enabling an increase in real agriculturaloutput during this period of more than 550 per cent, while real inputsgrew during this entire period by only 15 per cent. Publicly fundedresearch and extension account for more than half of total factor pro-ductivity growth between 1950 and 1982, a higher fraction than thataccounted for by privately funded R&D.
The Morrill Act of 1862 laid the foundations for the public agricul-tural R&D system in the US. The Act granted federal lands to each statefor the establishment of colleges devoted to teaching agricultural andengineering subjects, thereby creating some of the first research andteaching institutions in these fields. The next major step occurred in1887 with the passage of the Hatch Act, which was influenced bydevelopments during the 1850s and 1860s in European agriculturalresearch, aided by the development of agricultural chemistry in Ger-many and the UK. Much of the research activity in both nations wascentred in ‘experiment stations’ that sought to apply new scientificadvances to agricultural practice. The United States Department ofAgriculture (USDA) had begun its own research program in the 1860s,focusing on analyses of soils and fertiliser and the development ofstandards to prevent the adulteration of agricultural inputs, but thisprogram was modest in scope. The Hatch Act provided federal finan-cial support for agricultural experiment stations in each state, withmanagement responsibility for these institutions delegated to stategovernments. The research institutions created by the Hatch Act drewon both federal and state funds, and in some cases performed researchunder the terms of privately funded contracts.
The other major component of the US public agricultural R&D sys-tem was the agricultural ‘extension’ system, designed to support theadoption of agricultural practices and technologies. The Smith-LeverAct of 1914 expanded and ‘nationalised’ these activities and the result-ing agricultural extension system incorporated state and federal fund-ing and personnel, with considerable variety in organisational struc-ture and linkages to academic agricultural research and teaching. Non-federal public funds played an important role in supporting keyactivities, such as the state agricultural experiment stations and agri-cultural extension. The share of state funds has risen significantly sincethe early 20th century, from approximately 46 per cent in 1905 to morethan 70 per cent by 1985. A similar trend is apparent in the state shareof funding for agricultural extension activities during 1915–1985 (fig-ure 4B.3).
The balance between private and public R&D investment kept shift-ing. Until the end of the 19th century, private sources accounted forthe majority of agricultural R&D investment. But in the aftermath ofthe Hatch Act and the Smith-Lever Act, public funding grew signifi-cantly. By 1915, public funding outstripped private R&D funding byalmost 50 per cent, and public funding accounted for the majority ofagricultural R&D investment until 1945. Private investment in agricul-tural R&D grew more rapidly during the post-1945 period than publicinvestment, however, and by 1985, privately financed agricultural R&Dexceeded public investment by nearly 40 per cent.
The prominent role of state funding within the US agriculturalresearch system both reflects and reinforces the broad political supportfor public agricultural R&D investment. This funding structure alsoreinforces closer linkages between public research programs and localgroups of users (farmers in various climate and crop regions) whoseneeds vary substantially from one state to another. A drawback is thatthe decentralised structure of the resulting publicly-financed R&D sys-tem, as well as its close links to important client groups, has weakenedthe public sector’s performance in fundamental research and has madethe system less responsive to new scientific opportunities.
Figure 4B.3 Funding for U.S. agricultural R&D institutions (1895–1985)
Source: Huffman and Evenson, 1993.
0
0.1
0.2
0.3
0.4
0.5
0.6
0.7
0.8
0.9
1895 1905 1915 1925 1935 1945 1955 1965 1975 1985
%
Non-federal share of experiment stations State share of extension service
period.10 In Germany, lobbying by chemical industry organi-sations, the election to legislative bodies of leading figuresfrom the chemicals industry,11 and industry-academic collab-oration for the support of applied research all played a rolein prompting the expansion of public funding for academicresearch in chemistry, which culminated in the establishmentof the Kaiser Wilhelm Institute for Chemistry in 1911.
The system whereby funds are allocated has been a key ele-ment in the design of public support programs for academicresearch. The Japanese experience suggests that increases inresearch funding that are not accompanied by greateremphasis on competitive allocation will have limited effectson the overall quality of the academic research enterprise.While it matters to ensure continuity and relevance, it is alsonecessary to strike a balance between supporting researchthat responds to the current needs of industry and makingsure that part of the funding is allocated more flexibly toresearch with potential future returns (box 4.3). Furthermore,the experience of Korean universities discussed above high-lights the importance of teaching-research complementari-ties and the role of public funding in promoting (or hamper-ing) these linkages.
Role of public research andtechnology support institutesThe relationship between tertiary education in science andengineering and technological capability building is oftenmediated by public research institutions. These have bene-fited, on the input side, from the domestic scientific and engi-neering talent produced by the local universities and poly-technics. On the output side, they have provided assistanceto indigenous firms in inward technology absorption and inperforming domestic R&D and other kinds of technology-based business services.
Creating a domestic supply of scientists and engineers maynot be sufficient to induce the emergence of private sector’sdemand for their knowledge. Particularly during the earlyphase of industrial development, the creation of an effective
technology infrastructure is likely to require a set of comple-mentary policies and institutions to support private entrepre-neurial efforts. This was perceived to be an important policytool in Japan, where instead of focusing on supportingresearch activities within universities, the government estab-lished a rather extensive system of public institutes and lab-oratories where various kinds of research activities related toindustry and agriculture were carried out12 (Bartholomew,1989). Japanese government policy was influenced at leastpartly by the German system of universities, Hochschulen,and research institutes such as the Kaiser WilhelmGesellschaft laboratories, as well as the National Laboratoryin Britain and the US National Bureau of Standards (whichwere perceived as having provided critical support to thecountry’s industrial development). Private firms in these coun-tries, particularly in sectors like chemicals and electrical equip-ment, had begun carrying out R&D activities in-house (Oda-giri and Goto, 1993 and Uchida, 1980). The same was nottrue in Japan, where domestic firms in these industries reliedupon the adoption of foreign technology and to a lesserextent on publicly funded research. In fact, public support forresearch aimed at industrial development increased as theaccess to foreign technology began to be restricted.
Technology support institutions in the Republic of Korea and Taiwan Province of China
Competence-building in the Taiwan Province of China andthe Republic of Korea required policymakers to design insti-tutions and invest in capabilities for which there was little ini-tial demand. Imbalances in the national supply and demandof skilled personnel were remedied through private-sectordevelopment and policies that struck a balance betweencatering to current needs and anticipating future needs ofindustry. This was achieved to some extent by ensuring two-way information exchanges between research labs anduniversities and the private sector through personnel andtechnical knowledge flows.
Unlike their counterparts in industrialised nations, publicR&D and technology support institutions were primarily
494 | Role of knowledge systems in catching-up experiences
Box 4.3 R&D matching grant system in Costa Rica
Source: Rodríguez-Clare, 2003.
In 2000, the government of Costa Rica introduced the Fondo de Recur-sos Concursables (FRC) – an R&D matching grant system to financeprojects that contribute to innovation and technological change. TheFRC is assigned approximately US$1.3 million yearly and is adminis-tered by the Ministry of Science and Technology (MICIT). By 2003MICIT had financed 30 projects as part of the FRC, 25 of which wereassociated with agriculture and agro-manufacturing sectors, while therest targeted industrial projects.
FRC is open to all SMEs and industry associations. In the first phase,these submit proposals for evaluation by MICIT according to theirquality, clarity of objectives, justification of the technological need ofthe sector, the promised financial contribution, creativity and noveltyof the proposal and the potential impact of the technology on the envi-ronment and economy. The selected projects receive a grant as a con-tribution share in line with their perceived externality. In a secondphase, certified research institutes present their proposals for the proj-
ects selected in the first phase, and these proposals are selectedaccording to the criteria of quality and price.
Costa Rica’s R&D matching grant system responds to demandsfrom the private sector, creating an environment of competition withthe aim of both increasing the pertinence of projects to industrialdevelopment and reducing costs. The more applied the projects are,the less are the externalities that may be reaped, so the system isdesigned such that the government’s contribution falls down as thebenefits to the sector and economy at large decrease. Furthermore,the formal and periodic evaluation of presented and financed proj-ects generate useful information both for the private sector and thepolicy makers. As technological, managerial and fund-raising capa-bilities of both the firms, industry associations and research centresincrease, the system can also be expected to evolve and generatehigher returns in terms of innovative activity and economic perform-ance.
engaged in technology development rather than in basic andapplied research at the frontier of innovation. This was neces-sitated by the particular capability building needs of theindustry as perceived by the government.
The efforts of public research labs in transferring and dis-seminating technology preceded the high-tech era. The insti-tutional framework for capability building was establishedmuch earlier with the rise of agricultural support institutionsand technology extension services with a mandate to demon-strate improved production and quality control methods andto provide management training courses. In the case of Tai-wan Province of China, most of these institutions were putin place in the late 1950s and early 1960s, following the for-mulation of the first economic development plan in 1953.13
Numerous Taiwanese technology support institutions wereestablished in the 1960s and early 1970s in order to facilitatethe early phase of industrial development. The Metal Indus-tries Development Centre, founded in 1963, was followed bysimilar technology development centres for chemicals, min-ing, energy, glass, textiles and food processing. State-runenterprises also set up research units, such as the Telecom-munications Laboratories. In addition to these, the govern-ment sponsored the formation of a joint public-private con-sulting service to promote exports of machinery and wholeproduction plants (Amsden, 1984 qtd. in Wade, 1990, p. 95).The National Science Council (NSC), established in the 1950sto oversee industrial technology development, monitored thecreation of the Council for Economic Planning and Develop-ment (CEPD) and the Industrial Development Board (IDB). Fur-thermore, in order to collect, analyse and process informationon S&T gathered domestically and abroad, as well as to serveas a contact point for all Taiwanese S&T institutions, the NSC
established the S&T Information Centre in 1974.The consolidation in 1973 of three existing public research
laboratories (Union Industrial Research Laboratories, MiningResearch and Service Organisation and Metal IndustrialResearch Institute) into the Industrial Technology ResearchInstitute (ITRI) marked a watershed in Taiwanese competence-building policies. In subsequent years, ITRI played a key role indeveloping applied industrial technologies for key compo-nents and capital equipment; as an important source of tech-nology training in process engineering, equipment engineer-ing, product engineering, facilities and testing; and of man-agement training in such areas as quality assurance, industrialengineering, production control and materials control.
These laboratories were soon complemented by a newone, the Electronics Industrial Research Centre (later renamedElectronics Research and Services Organisation, ERSO). ERSO
was established to spearhead a national effort to developindigenous capabilities in designing and manufacturing semi-conductors. Through a license agreement with RCA, ERSO
acquired its C-MOS technology in 1976 and established in1977 a pilot production plant that could serve as a trainingfacility. Later on, the technology was handed over to a spin-off firm, the United Microelectronics Corporation (UMC),whose ownership was turned over to private investors instages. UMC’s technical staff at birth included many engineersfrom ERSO.
ERSO promoted capability-building in the industry throughboth the transfer of technology to firms and the training ofspecialised engineering and scientific talent.14 The same strat-egy was adopted through the 1980s and 1990s in order todevelop a capability in component technologies for the elec-tronics sectors. These included design and manufacturing ofvery large scale integration (VLSI) and dynamic random accessmemory (DRAM) chips, fabrication masks, CD-ROM, DVD-ROM,and Thin Film Transistor Liquid Crystal Display (TFT-LCD) displaytechnology, among others. For virtually all these technolo-gies, ERSO identified suitable foreign partners to acquire alicense or enter a technology transfer agreement, and pro-ceeded to establish a laboratory or pilot plant as a centre fortechnological learning and capability-building based on train-ing and experimentation. In most cases, technologies andcapabilities developed in this way were then spun off tonewly formed enterprises.
In other cases, the technology would be licensed to the rel-evant firms or the firms would simply rely upon capabilitieslearned through their cooperation with ERSO to develop theirown technology or enter licensing agreements with otherfirms. The interactions between firms were concentratedaround ERSO headquarters and the neighbouring HsinchuScience Park. The growth of chip design firms was facilitatedby the Multi Project Chip undertaken by ITRI to provide uni-versities with computer aided design (CAD) tools for chipdesign as well as chip foundry services. Nine universitiesparticipated in this initiative, training scores of specialists inchip design whose firms were then able to contract out toother firms in the cluster for manufacturing and other down-stream activities.15
The electronics industry in Taiwan Province of China hasuntil recently been very much fuelled by the creation of newentrepreneurial firms based on the technology transfer activ-ities carried out by various divisions of ITRI, such as ERSO andthe Computer and Communications Laboratory. Between1979 and 1983, ITRI invested approximately US$18 million tofurther upgrade integrated-circuit (IC) technology andimprove design technology through the introduction of com-puter simulation programs. At this stage, ITRI also developedlogic simulation programs for mask design and developedcapability to produce masks through transfer of technologyfrom abroad. Later, between 1983 and 1988, process tech-nology was improved and a Common Design Centre was ini-tiated to disseminate application-specific IC technology tofirms. In order to achieve widespread technology transfer ofthe basic design methodology and CAD tools to enterprises,the Common Design Centre offered training courses, CAD
design software tools, design handbooks and conferences.The model has been replicated by other government agen-
cies, including the Institute for Information Industry (III), estab-lished in 1979 to support the development of domestic per-sonal computer (PC) manufacturers, as well as laboratories andinstitutes aimed at other technology areas in Taiwan Provinceof China. In particular, the Market Intelligence Centre (MIC)was established by the III with the aim of assisting the govern-ment and industry in assessing and understanding the globalbusiness trends, while also allowing foreign companies and
50 UNIDO Industrial Development Report 2005
investors to understand the local IT business environment.Similarly, the Exhibition Centre for IT Promotion was estab-lished with the aim of educating the public particularly in ruralareas on the growing applications of IT16 (box 4.4).
In the early 1970s the Republic of Korea’s governmentdecided to make a big push for an indigenous technologicalcapacity in electronics and informatics. The electronics indus-try was selected as one of the six industries to be promotedunder the Heavy and Chemical Industry Plan of 1973. First,the government set out to create industry-oriented researchinstitutes, both public and private, and to expand advancedtraining capacity in electronics. In addition it started toencourage technology transfer via licensing and consultants,rather than rely on FDI. In 1976 the Korea Institute for Elec-tronics Technology (KIET) was established to plan and coordi-nate semiconductor R&D, provide technical assistance tofirms, assist technology transfer from abroad and conductmarket research. KIET indeed helped to pioneer the masteryof medium-scale semiconductor technology, but found that
by about 1984 the chaebols had far superior production facil-ities and were rapidly expanding their in-house R&D capacity.So it changed its mandate (as well as its name, to Electronicsand Telecommunications Research Institute) and sold most ofits fabrication facilities to the private sector. It turned to initi-ating parallel basic research in semiconductors, computers,
514 | Role of knowledge systems in catching-up experiences
The dissemination of environmental technologies
through public research and extension services illustrates how
public research institutions can help create new capabilities
within the private sector.
Box 4.4 Federal R&D spending and creation of IT industries
Sources: National Research Council, 1999; Langlois and Mowery, 1996; Cerf, 2000; Nelson, 1984.
Federal R&D spending in the US, much of which was defence-related,played an important role in the creation of an entire complex of ‘new’post-war IT industries, including semiconductors, computers, andcomputer software. The origins of the Internet can be traced back tothese efforts. Internet-related projects funded through the Depart-ment of Defense (DOD) include Paul Baran’s early work on packetswitching, the Advanced Research Projects Agency Network(ARPANET), and research on a variety of protocols, including the Trans-mission Control Protocol/Internet Protocol (TCP/IP). These public R&Dinvestments in networking technology were preceded by 15 years ofDOD investment in hardware and software technology that beganwith the earliest work on numerical computing. Federal R&D invest-ments strengthened US universities’ research capabilities in computerscience, bankrolled the early deployment of the ARPANET, facilitatedthe formation of university spin-offs like BBN and Sun, and trained alarge cohort of technical experts who aided in the development, adop-tion, and commercialisation of the Internet.
There is little data to estimate the total federal investment in Inter-net-related R&D. Even were such data available, the complex originsof the Internet’s various components would make construction of suchan estimate very difficult. Nevertheless, it is clear that federal invest-ment in the academic computer science research and training infra-structure that contributed to the Internet’s development was substan-tial. According to a recent report from the National Research Council’sComputer Science and Telecommunications Board, federal investmentin computer science research increased five-fold during the1976–1995 period, from US$180 million in 1976 to US$960 million in1995 in constant (1995) dollars. Federally funded basic research incomputer science, roughly 70 per cent of which was performed in USuniversities, grew from US$65 million in 1976 to US$265 million in1995.
Between 1956 and 1980 the cumulative National Science Founda-tion (NSF) funding for research in ‘software and related areas’amounted to more than US$250 million, in 1987 dollars. Most of thisfunding went to US universities. Funding from the Defense AdvancedResearch Projects Agency’s (DARPA) Information Processing TechniquesOffice (IPTO), which went to both universities and industry, averagedroughly US$70 million annually (1987 dollars) between 1964 and1980, before growing sharply to more than US$160 million in1984–1985. Between 1986 and 1995, the NSF spent roughly US$200million to expand the NSFNET. The investments of NSF and DARPA inalmost certainly constituted a majority of Internet-related R&D fund-
ing, especially in academia. These federal R&D expenditures were size-able and importantly, contributed to both research and training ofskilled engineers and scientists.
In addition to their size, the structure of these substantial federalR&D investments enhanced their effectiveness. DARPA’s researchagenda and managerial style gave researchers considerable autonomyand the agency spread its investments among a group of academic‘centres of excellence’. In its efforts to encourage exploration of a vari-ety of technical approaches to research priorities, DARPA frequentlyfunded similar projects in several different universities and private R&Dlaboratories. Moreover, the DOD’s procurement policy complementedDARPA’s broad-based approach to R&D funding. Contracts were oftenawarded to small firms such as Bolt, Beranek and Newman (BBN),which received the contract to build the first Interface MessagingProcessor (IMP). This policy helped foster entry by new firms into theemerging Internet industry, supporting intense competition and rapidinnovation.
The large scale of the US defence-related programs in computer sci-ence research and networking distinguished them from those in theUK and France; but the contrasts extend beyond the scale of these R&Dprograms. Unlike their counterparts in the Soviet Union or the UK,DOD program managers in information technologies, even before theestablishment of DARPA, sought to establish a broad national researchinfrastructure in computer science that would be accessible to bothcivilian and defence-related firms and applications, and disseminatedtechnical information to academic, industrial, and defence audiences.Classified R&D was important, but a great deal of US defence-relatedR&D consisted of long-term research that was conducted in universi-ties, which by their nature are relatively open institutions.
Another factor in the success of federal R&D programs was their‘technology-neutral’ character. US research programs avoided the earlypromotion of specific product architectures, technologies, or suppliers,in contrast to efforts in other industrial economies, such as the French‘Minitel’ program, or celebrated post-war US technology policy fail-ures, such as the supersonic transport or the fast-breeder nuclear reac-tor. The NSF, for example, focused on funding a variety of academicresearch projects, largely through grants to university-based computerscientists which formed a key component of the research and traininginfrastructure that supported the development and diffusion of theInternet. In addition to their research contributions, university com-puter science departments and Computer Science Networks (CSNET)formed the core of the early Internet.
and telecommunications, more focused on technology fron-tiers rather than on commercialisation, which was now leftto the chaebols (Wade, 1990).
The dissemination of environmental technologies throughpublic research and extension services illustrates how publicresearch institutions can help create new capabilities withinthe private sector to respond to the emerging competitivechallenges while promoting sustainability. The Taiwanesegovernment vested in IDB the authority for identifying cost-minimizing treatment technologies, lowering costs of abate-ment and reducing energy and water input intensities of pro-duction. Perceiving the opportunities for product differenti-ation and productivity gains, IDB invested in informationgathering about the costs of alternatives and established withthe Taiwan Environmental Protection Administration a jointprogram in pollution prevention and waste control. It alsosubsidised the purchase of pollution-control equipment byoffering tax reduction, accelerated depreciation and access tosubsidised credit for pollution control equipment purchase.ITRI was used to engage in state-of-the-art research on energy,water, materials and pollution intensity of sectors, includingestablishing performance benchmarks against internationalbest practices. The Energy Research Organisation was estab-lished within ITRI in 1981, evolving into the Energy and Min-ing Research Service Organisation in 1983 and later theEnergy and Resources Laboratories (ERL) in 1989. Since theearly 1980s, ERL has played an important role in promotingclean production by benchmarking critical measures ofresource use in important sectors, such as in wafer fabrica-tion and cement production. Subsequently, IDB began provid-ing technical assistance through private sector consultingfirms and ITRI to help firms reach these standards and bench-marks (Angel and Rock, 2003) (box 4.5).
Technological infrastructure and industry
Interaction between universities and industrial firms
Since technologies cannot be taken ‘off the shelf’ and sim-ply put into use by industrial firms, very little can be accom-plished by way of assimilation of imported technologies with-out infrastructural investments in education, training, R&D,and other scientific and technological activities (Freeman,2002, p. 156). On the other hand, the scope of the contribu-tions of universities and public research institutes to capabil-ity building in a sector must evolve with the nature of thetechnological activities carried out by national firms, theiraccess to other sources of technological knowledge, and thestructural characteristics of the evolving industry (i.e. thepresence of large corporations, or clusters of small- andmedium-sized enterprises, etc.) (see further Chapter 6).
The role of universities and public research in technologi-cal catch-up is manifold and extends beyond the supply ofdomestic scientific and engineering talent. Universities andpublic research institutions contribute by providing assistanceto indigenous private and public firms with the inward trans-fer of technology and other technology-based business serv-
52 UNIDO Industrial Development Report 2005
Policies aimed at creating demandfor technological skills may be
necessary if investment in advancededucational institutions is to be at
all successful in assisting local firmswith the accumulation of techno-
logical capabilities.
Box 4.5 Emerging innovation system in satellite and geographic information in South Africa
Sources: CSIR, 2005; Schoonwinkel and Milne, 1997.
Universities and publicly funded research institutes in South Africahave been making impressive strides in raising technological capabili-ties in geographic information and satellite technologies, forming inrecent years the basis of a sectoral IS. In the southern African context,satellite-based information can make a powerful contribution to sup-porting sustainable development by developing and implementingproducts and services to address the needs of many users spread overa large area. Satellites currently in earth orbit provide monitoring infor-mation on the status of the earth’s resources, environment, urbanisa-tion and weather patterns. They are ideal for a wide range of applica-tions to monitoring fires, marine phenomena, changing demograph-ics, crop yields, land cover and droughts.
A good example of the emerging IS is the pioneering work done bythe University of Stellenbosch by developing South Africa’s first satel-lite, SUNSAT 1, launched into space in 1999. This micro satellite wasdesigned, built, and tested by 22 Masters of Engineering students and
the faculty at the Electronic Systems Laboratory in the Department ofElectrical and Electronic Engineering. The development of SUNSAT 2,using new generation micro satellite technology, has been under way.This program combines both challenging research at the graduatelevel and train engineering students for an R&D career, while alsorequiring the adoption of systematic processes for product develop-ment from industry.
Simultaneously, the council for Scientific and Industrial Research(CSIR), the largest scientific and technological research, developmentand implementation organisation in Africa, and its stand-alone TheSatellite Applications Centre (SAC) have been carrying out researchand training to support the emerging satellite and remote sensingapplications in the region. The Earth Observation unit at SAC offerstraining courses aimed at encouraging and supporting the growth andscope of indigenous remote-sensing techniques and capabilities inAfrica.
ices. A crucial determinant of an effective relationshipbetween university and industry is the degree of responsive-ness of educational curricula and activities to the emergenceof new areas of industrial technology or specialised sectors.
Complementary policies aimed at creating demand fortechnological skills may be necessary if investment inadvanced educational institutions is to be at all successful inassisting local firms with the accumulation of technologicalcapabilities. As mentioned earlier, most instances of braindrain can be ascribed in part to the imbalance between thedomestic supply of scientific and engineering talent and thedemand for it by national firms.
It is well known from contemporary research on innovationsystems that industrial sectors differ in their reliance on sci-entific and engineering knowledge and research results.There are also differences between sectors with respect to themechanisms and channels for the transmission of knowledgeand information across the university-industry interface.
The 19th century chemical and electrical equipment indus-tries are often reputed to have been the first science-basedindustries, which makes it useful to review the role played byuniversities and Hochschulen in their development. Univer-sity-based laboratory training in chemistry supported theacquisition of technological capabilities for chemical firmswhose activities included the first forms of systematic R&D inan industrial setting. After undergoing reforms to increasethe influence of lab-based training in the Hochschulen, by the1870s Germany had nearly 30 university and technical uni-versity departments in organic chemistry, and seven majorcentres of organic chemistry research and teaching. Many ofthose who were technically trained in them moved into sen-ior management positions within German industry, furtherstrengthening the links between corporate strategy andindustrial research (Murmann, 1998). Interaction with thechemical research conducted by the university system wasamong the main reasons for the rise to leadership of Germanfirms in the production of synthetic dyes.
Broadly speaking, the growth of Germany’s chemicalsindustry followed the development of strong research capa-bilities in German universities during the 19th century, and asimilar pattern is apparent in the development of the Germanelectrical equipment industry. The same cannot be said ofeither Japan or the US, however, where domestic universities’contributions to training of scientists and engineers out-stripped their contributions to research throughout thisperiod. In the case of Japan, university contributions to train-ing remained more significant than academic research excel-lence through much of the post-1945 period, although uni-versity faculty were important technical consultants for manylarge Japanese industrial firms. Indeed, the weakness of sci-entific research in Japan’s national universities reflected thelegacy of the structure established in the late 19th century (seebox 4.6).
On the other hand, the reliance of many US universities onstate government funding, the modest scope of this funding,and the rapid expansion of their training activities all sup-ported the growth of formal and informal linkages betweenindustry and university research. US universities formed a focal
point for the external technology monitoring activities ofmany US industrial research laboratories before 1940, and atleast some of these university-industry linkages involved thedevelopment and commercialisation of new technologiesand products. Linkages were often created through the useof industry-sponsored research contracts. One of the pio-neers of this institutional adaptation was MIT. Although MIT
did not have an engineering station, it adopted in 1920 aTechnology Plan which established the framework for indus-try-sponsored research contracts for its faculty. Public institu-tions replicated this model through the creation of affiliatedresearch foundations, circumventing restrictions on their con-tractual relations with specific firms.
Skill development
Skill formation in the private industrial sector has been a crit-ical component of the technological capability-buildingefforts in virtually all catching-up countries. Public policy hasoften helped to shape these efforts, both by means of legis-lation on accreditation and certification and by active govern-ment policies to encourage skill formation through the useof levies and incentives.
The development of skill-building institutions in Germanyduring the late 19th century provides a good example on therole of public policy in this area. Germany has long been con-sidered exemplary for its vocational system, which to this dayattracts large numbers of youths and produces high-qualityskills. However, the roots of the skill formation system in Ger-many goes back to the presence of an independent artisansector which was formally and legally endowed with rightsto regulate training and certify skills. Foundational legislationin 1897 created a framework for apprentice training underthe control of an organised handicraft (Handwerk) sector,which was composed of self-employed master craftsmenwho were distinguished in legal terms and social status bothfrom industry and from the journeymen and apprentices theyemployed. This framework had important implications for theemerging labour unions and skill-intensive sectors such asmachine industry, since it meant that the industry could relyon a relatively steady stream of certified skilled workers fromthe artisan sector. Later on, though, as the technologicalsophistication of industry increased and the skills provided byHandwerk proved increasingly insufficient, private machineryfirms started internalising skill formation at company leveland providing training as part of internal social programs.However, the legislation did not allow the firms to certify theskills their training conferred. The machine industry found itunacceptable that while they still had to contribute financialresources for public training, their needs were not being metand the training they dispensed was not recognised. As aresult, large industrial firms started collaborating to demandthe creation of a parallel system for promoting and certifyingindustrial training under the collective control of the Industryand Trade Chambers. An important turning point was thefounding of the German Committee for Technical Education,jointly sponsored by Association of German Engineers andAssociation of German Machine-Building Firms. These efforts
534 | Role of knowledge systems in catching-up experiences
culminated in a layered system of skill formation that gaveGermany a distinct advantage in the development of techno-logical capabilities in the machine industry (Thelen, 2004).
On the other hand, governments in Japan, the Republic ofKorea and Taiwan Province of China deliberately pursuedpolicies to encourage skill formation in industry. In TaiwanProvince of China, government policies were largely moti-vated by the perception that private training left to its ownmeans was inadequate. While available data about trends inpublic and private training is rather sparse, the last and mostrecent survey of in-firm training in Taiwan Province of Chinaseems to have taken place in 1986 when the manufacturingcensus polled 56047 firms. It found that only nine per centof the sampled firms were engaged in formal training of anykind – roughly equal to the percentage of firms carrying outR&D (Tan and Batra, 1996). A smaller 1985 sample of datacovering 5619 firms from the Vocational Training Needs Sur-vey conducted by the Directorate General of the Budget,Accounting and Statistics (DGBAS) shows that 21 per cent ofthe sampled firms had engaged in vocational training lastingmore than one month. While the size and sector of the firmsclearly affected their propensity to conduct training, traininginstitutes provided 28 per cent of this training, another two
per cent were trained abroad and approximately ten per centof in-firm training of skilled labour was carried out throughtraining programs contracted between factories and voca-tional schools (San, 1990). Large corporations such as Rexonand Acer made up most of in-firm formal training, but as SMEs
account for up to 85–90 per cent of Taiwan Province ofChina’s trade sector, the government has found it difficult toencourage in-firm training on a large scale.
As a response to low levels of in-firm training, many Asiancountries experimented with skill levies to encourage skill for-mation, but without much success. Similar to the Taiwaneseexperiment with the Vocational Training Fund Statute (VTFS),which required all public and private enterprises with over 40employees to contribute at least 1.5 per cent of their payrollto a vocational training fund and get reimbursed for provid-ing training, the Republic of Korea’s Special Law for VocationalTraining was largely unsuccessful in promoting in-firm train-ing as most companies preferred to pay the fine rather thanprovide the required six months of instruction. Singapore mayhave been one of the few successful exceptions in the use oftraining incentives to promote IT skills among firms.17 The dif-ficulties in encouraging in-firm training especially in the earlystages of catching-up, compelled Taiwan Province of China to
54 UNIDO Industrial Development Report 2005
Box 4.6 Role of public research institutions in sectoral IS – Japan vs. Brazil iron industry
Sources: Yonekura, 1994; Carvalho, 2002; Gomes, 1983; Mazzoleni, 2005; Paula, 1983; Dahlman, 1984.
The beginnings of the iron and steel industry in Japan vs. Brazil reflectthe important fact that the institutional components of technologyinfrastructure differ across industrial sectors and across the phases ofthe life cycle of national industries. These differences reflect amongother things the nature of the learning processes associated withacquiring capabilities.
In Japan, the Industrial Experiment Laboratory was putatively incharge of conducting some research and testing on iron and steelbeginning around 1906. However, until 1915 its contributions in thisarea of industry were overshadowed by the activities of the state-owned steel firm Yawata Works, and later on by the research activi-ties of the Iron and Steel Institute of Japan and of the Institute forMetals Research at Tohoku University. Production at Yawata Worksrepresented the first foray by a Japanese company into the area oflarge-scale steel production. Yawata became a centre of technologi-cal learning and of technology diffusion, partly by providing techni-cal assistance to other firms and partly through the migration to othercompanies of trained personnel. Indeed, the Iron and Steel Instituteof Japan, established in 1915, became the industry’s institutionalvenue for conducting cooperative research and broadly disseminat-ing technological knowledge. The Institute’s membership enjoyedextensive representation from both the academic and the industrialcommunity, including not only iron and steel producers but also users.The Institute played an important role in the standardisation of ironand steel products, and the dissemination among domestic firms. Thesame form of partnership between institutions was also responsiblefor the establishment of the Institute for Metals Research, whichstarted operating in 1916 with support from the government andSumitomo Metals.
The iron and steel sector was in fact characterised by the importanceof experience-based learning. Moreover, scale economies and thecomplexity of integrating vertically-related productive processes raisethe financial requirements for entry. Under these conditions, a largepublic steel works was an essential component of the sectoral systemof technological learning. While the industry benefited from the train-ing of metallurgists and mining engineers at domestic universities,Yawata Works appears to have been a crucial element in the develop-
ment of indigenous technological capabilities, by supporting their for-mation at the birth of a substantial number of private firms.
On the other hand, in Brazil the lack of policies to increase demandfor skills in the private sector limited the impact of public training andresearch institutes in promoting sectoral development in its iron andsteel industry. As early as the 1850s the owner of what was then thelargest forge in Brazil, Jean Monlevade, had noted the importance ofa model iron works as a centre for technological learning necessary forthe creation of indigenous capabilities. However, financial support forsuch an investment failed to materialise. A couple of decades later, in1876, the Escola de Minas, a school dedicated to mining and metal-lurgical engineering was established, modelled after the French Ecoledes Mines. However, until the 1910s there was insignificant level ofinvestment and enterprise formation in the industry and hence therewas no demand for scientific and technological capabilities such asthose provided by the Escola de Minas. Indeed, the school’s survivalwas secured during the 1880s by the decision to provide training forcivil engineers rather than persevering as a specialised school for min-ing engineering, a condition laid down by the provincial governmentof Minas Gerais in exchange for financial support.
Both members of the faculty and graduates of the Escola becameinvolved with furnace design and plant management activities duringthe 1910s and 1920s, when a number of new iron and steel firms wasformed, thanks in part to government financial support. But even thenew plants were of limited scale by contemporary global standards.Since the 1930s, production experience and foreign technical assis-tance became the most relevant channels for technological learning.This was the case during the construction of the plant of the Compan-hia Siderurgica Belgo-Mineira in Monlevade, of the plant of the Com-panhia Siderurgica Nacional in Volta Redonda, and the plant of Usim-inas in Ipatinga.
These examples show that creating a domestic supply of scientists andengineers may not be sufficient to induce the emergence of a privatesector’s demand for their knowledge. Particularly during the early phaseof industrial development, the creation of an effective technology infra-structure is likely to require that a set of complementary policies and insti-tutions be in place to support private entrepreneurial efforts.
rely more on the public vocational education system as asource of technological capability building.
Entrepreneurship development
The promotion of entrepreneurship development is largelyinspired in the Schumpeterian concept of entrepreneurialventure, that this author called ‘the fundamental phenome-non of economic development’, since it means creating newgoods, investing in new methods of production, devisingnew business models and opening new markets (Schum-peter, 1942, p. 83). Entrepreneurial development policies aimto foster such venturing, both by supporting existing entre-preneurs and, perhaps more significantly in a developmentcontext, by fostering nascent entrepreneurs. University andpublic research lab spin-offs, incubator programs and otherforms of clustering, managerial and entrepreneurial trainingand venture capital support are some of the tools of entre-preneurship development policy.
Although entrepreneurship development policies havebeen gaining growing recognition rather recently both indeveloped and developing countries, their impact on encour-aging innovative activity is most clearly revealed by the catch-ing-up experience of Taiwan Province of China.18 Morerecently, entrepreneurial development in certain high-tech-nology sectors through brain circulation of expatriates andemerging venture capital schemes in countries such as Indiaand Costa Rica attest to the increasing significance of poli-cies in this area.19
One of the most significant venues of entrepreneurshipdevelopment policy in Taiwan Province of China was the closeinteraction between public research labs and start-ups. Thisinteraction gave raise to some of Taiwan Province of China’smost successful spin-offs. This was the case with TaiwanSemiconductor Manufacturing Corporation (TSMC), formed asa joint venture with Phillips for manufacturing VLSI chips, withTaiwan Mask Corporation, spun off from ERSO in 1989 as aspecialised producer of fabrication masks, and with VanguardInternational Semiconductor, a spin-off firm that establisheditself as the leading DRAM manufacturer. A considerable num-ber of the start-up electronics firms that over time wereformed in Taiwan Province of China featured ERSO-trainedpeople as managers and CEOs. By 2000 more than 15000professionals had worked for ITRI, and 12 000 had gone on tohold positions in the high-tech sectors of the economy (Ams-den and Chu, 2003). The establishment of the Hsinchu Sci-ence Park in 1980 and subsequent efforts at promotingentrepreneurship and high-tech start-ups in ten science parksacross Taiwan Province of China has been a major policy toolin development of ventures. The pioneering Taiwanese expe-rience has had a considerable demonstration effect acrossdeveloping Asia and elsewhere.
Engineering Research Associations20
Engineering Research Associations (ERAs) are an institutionalmeans of promoting collaborative R&D work between com-panies, either on their own initiative or in partnership with a
public agency. They have been used to great effect by theJapanese in their technological catch-up efforts, particularlyduring the 1960s and 1970s. But the origin of ERAs dates backto previously existing research institutions, notably in Britainduring the WWI. In 1917 the British government started togive financial aid to industries, which organised research andtechnical activities on a cooperative basis. The scheme wasintroduced with the aim of meeting the acute technologicalneeds of British industry, the shortcomings of which had beenrevealed during the war. The government provided grantsmatching those of member companies in each of theseresearch associations. Originally the intention was to discon-tinue the grants once a research association was established,but the policy was changed in 1945 to provide for permanentgrants. The British research associations were successful inpromoting certain industrial areas, particularly in enablingconsortia of SMEs to match the scale and resources of largefirms.
The engineering research associations in Japan drew on theBritish model, but embarked upon a dynamic developmenton their own. ERAs were used as a policy instrument in theaftermath of WWII in Japan, and enjoyed significant success,unlike many other experiments with research associations ortheir functional equivalents elsewhere. The initiative forestablishing an ERA came in the earlier period from industry,to serve their basic needs, not from the government. Further-more, as an adaptation of British research association model,none of the Japanese ERAs were intended to become perma-nent organisations. The average length of existence was 11.5years for the ERAs established in the 1960s. The ERAs wereestablished as non-profit making associations under a specialregulation promulgated in 1961 and between then and 1983a total of 71 ERAs were established.
Some of the earliest ERAs were created under the direct con-trol of Japan Auto Parts Association (JAPIA) at a time whenJapan did not manufacture passenger cars, so the companiesinvolved with research associations were largely concernedwith establishing practical results for testing components andimproved production methods for buses and trucks. Further-more, the ERAs played a very important educational role as theparticipating companies sent their engineers to the joint facil-ities for varying amounts of time.
Later on ERAs were seen by Ministry of International Tradeand Industry (MITI) as a powerful policy instrument to supportcompetitiveness in certain sectors such as information tech-nologies. As opposed to other alternatives for channelling
554 | Role of knowledge systems in catching-up experiences
Industry research associations are an important means of raisingtechnological capabilities across the board in a given industry, as they facilitate the exchange
of technical information.
funds to support company-based industrial research – suchas joint contracts, individual contracts for separate companiesor even, to some extent, non-profit foundations – ERAs wereperceived to be much more efficient in terms of resourcesrequired for their initiation and supervision. The length of theassociations’ lifespan seems to have shortened over time,and the MITI-supported laboratories often served more as abreeding ground for new technologies than as a means ofaddressing the immediate needs of industry.
Clearly, industry research associations are an importantmeans of raising technological capabilities across the boardin a given industry, as they facilitate the exchange of techni-cal information. In addition to the opportunities for risk andcost sharing between participating units, the pooling ofresources tends to speed up the research process and elimi-nate overlaps while ensuring that the research effort coversall aspects of product development.
Metrology, quality and standards institutions
A much under-studied aspect of technological infrastruc-ture is the role played by standards, quality and metrologyinstitutions in the formation of sectoral innovation systems.Although the proliferation of international standards andtechnical regulations is a relatively recent phenomenon, thecurrent trends can be expected to increase the significanceof capabilities embedded in these institutions and their rolein promoting industrial deepening and technological catch-up (see further Chapters 7 and 8). Taiwan Province of Chinaand the Republic of Korea provide valuable lessons in therole of standards and quality institutions in promoting indus-trial development, especially in certain sectors such as elec-tronics.
The origins of the metrology, standards and quality controllegislation and institutions in Taiwan Province of China andthe Republic of Korea go back to the Japanese occupation.After their departure, the former Department of Administra-tion in Taiwan Province of China combined the inspectioninstitutions that were established during the Japanese occu-pation for fertilisers, plants, rice, canned food, and tea leavesinto the Inspection Bureau under the jurisdiction of theProvincial Department of Agriculture and Forestry in 1945. In1947, the National Bureau of Standards (NBS) was foundedunder the Ministry of Economic Affairs (MOEA), merging theNational Weights and Measures Bureau and the IndustrialStandards Committee originally established in the 1930s.
A good example of government’s efforts to increase thequality of exported products through technical assistance andquality control is the export of bicycles to the US in the 1970s.In order to ensure that Taiwanese bicycle manufacturerscould access US markets more easily and establish a reputa-tion for high-quality exports, the government commissionedthe Metal Industries Development Centre to design testingequipment for bicycle quality control and provided technicalassistance to the firms to comply with the established stand-ards. This was instrumental in improving the quality and mar-ketability of bicycles and as a result by the end of 1970s Tai-wan Province of China was exporting several million of them,
having started with almost none at the beginning of thedecade21 (Dahlman and Sananikone, 1990).
As the phase of export promotion exerted more pressureon the standards and quality institutions, the system wasredesigned in mid-1970s to concentrate more on each firm’squality control procedures rather than on inspecting eachexported good for defects. Factories were classified into threecategories based on inspection of their quality control proce-dures. Those scoring below the minimum were not given alicense to export; those scoring the highest were allowed toexport without inspection of their merchandise; only theirquality control system was re-inspected yearly. In addition tohaving their systems inspected twice a year, those scoring inthe middle had a one-in-thirty chance of having individualshipments inspected. The quality control systems of those inthe third category were inspected three to four times a yearand individual shipments faced a one-in-fifteen chance ofbeing inspected.
The development of the IT and semiconductor industriesheralded in a period of rapid expansion in needs for efficientstandards and metrology institutions in Taiwan Province ofChina. For example, in order to aid the increasing sophistica-tion of basic scientific research and establishment of moreaccurate measurement and standards within the industry,the National Science Council of Taiwan decided in 1974 toestablish the Precision Instrument Development Centre todevelop the professional skills in the manufacture of precisionand testing instruments.
Since the production of silicon wafers required the obser-vance of exceptionally high levels of technical standards, ERSO
and ITRI together with the NBS established a number of cen-tres and laboratories to answer the needs of private sector inthese fields. In 1983 the Centre for Measurement Standardswas formed as part of ITRI and four years later the NationalMeasurement Laboratory was founded under contract to NBS.Subsequently, ITRI started to offer test and certification serv-ices to firms to see if a product met generally accepted spec-ifications or safety requirements, particularly for exports.
As the sophistication of Taiwanese exports increasedthese specialised services from ITRI made an important con-tribution. For example, EU’s Reduction of Hazardous WastesInitiative (ROHS) and Waste Electrical and Electronic Equip-ment (WEEE) initiative affect both the MNCs and their suppli-ers who market electronic and electric equipment to the EU.Through the initiative of IDB and ITRI, the government hashelped to improve conformity with these standards as wellas providing the institutional framework to test and provethat those standards are being adhered to (Angel and Rock,2003).
Today ITRI has a DVD Class-A Verification lab (one of eight inthe world, and the only one in Asia outside Japan), an Avia-tion Quality Assurance and Inspection Lab, an Electromag-netic Testing Lab to meet safety standards set by the EU,Japan, New Zealand, Australia and the US, and an Office ofMedical Devices Evaluation to help with review of certainmedical supplies, as required by the Food and Drug Admin-istration (FDA) of the US. Clearly these specialised and cost-effective services had significant impact on the development
56 UNIDO Industrial Development Report 2005
of the respective industries in Taiwan Province of China (ITRI,2004).
Similarly, in the Republic of Korea the roots of the nationalstandards, testing and quality institutions such as the KoreanAgency for Technology and Standards go back to the early20th century. With the onset of an era of rapid technologicalcapability-building, the government invested in expandingthe supply of these specific public goods by establishing theKorean Standards Institute (now Korean Standards Associa-tion (KSA)) in 1962 and the Korean Research Institute onStandards and Science (KRISS) in 1975. While KSA was man-dated largely to provide quality management training andpromote research in quality management, the KRISS becamethe central authority of the national standards system by pro-viding national calibration services and disseminatingnational and international standards. Moreover, the Repub-lic of Korea has been affiliated with numerous internationalstandards and accreditation bodies such as ISO since the early1960s. The development and promotion of technical stand-ards in the electronic industry was an important contributionto the success of this sector: by affiliating with the Interna-tional Electrotechnical Commission and ISO in 1963, Koreanpublic standards bodies initiated the efforts to develop tech-nological capabilities in this sector (see further Chapter 7).
Conclusion
The institutional evolution of domestic knowledge systems incountries such as Germany, US and Japan in the 19th centuryas well as in the Taiwan Province of China and the Republicof Korea more recently illuminates the role of collective com-petence-building in economic catch-up. In all these cases sig-nificant institutional adaptation and innovation due to differ-ing local conditions took place. The success of the respectivepolicies often relied on achieving a balance between rapidaccumulation and enhancing the demand for technologicalskills and capabilities. This often resulted from establishingeffective networks between institutions of higher education,technical and vocational training, research units, technicalassociations and industry. The next chapter will focus on thecurrent challenges and opportunities facing developing coun-tries in accessing and mastering knowledge, in order to high-light the increasing importance of competence-building poli-cies for catching-up.
Notes
This chapter draws on background papers by Mazzoleni (2005), Mow-ery (2005) and Sercovich and Dolun (2005). However, the viewsexpressed here are of UNIDO and do not necessarily reflect those of theauthors.1 Remaining questions about causal relationships between education,
technological progress, and economic growth warrant furtherresearch. The hypotheses formulated in this respect include thegrowth impact of greater schooling (including at the tertiary level) onGDP growth, and, for example, the extent to which technologicalprogress affects the demand for educated labour (see Pritchett, 2001).
2 See, for instance, World Bank (2002).3 India is a case in point. Although it has several reputed and world-class
institutions such as India Institute of Technology (IIT) and the IndianInstitute of Science, it also has hundreds of recently established engi-neering colleges that do not meet quality standards. They offer out-dated programs with inflexible structures and content. Quality assur-ance mechanisms are weak and programs in less than 15 per cent ofinstitutions are accredited by the National Accreditation Board. Infor-mation technology (IT) is not significantly used for teaching. No morethan six per cent of institutions have any noteworthy research activ-ity. Most are essentially unconnected with industry (World Bank,2005).
4 This occurred, in particular, through establishment of engineering pro-grams, which were the province of vocational secondary schools untilthe end of 18th century.
5 In particular, the Morrill Act of 1862 was instrumental in promoting autilitarian view of university education.
6 The differences in the approach to engineering typical of 19th centuryUS and French professors can be illustrated comparing their scientificwork on essentially identical topics (Kranakis, 1989). Abstract mathe-matical formulation of engineering problems and solutions were typ-ical of the French scientific literature, much as tables of data evincedfrom extensive laboratory testing were the hallmark of US engineer-ing work. Workshop and laboratory experience was considered anessential, if not dominant, component of the training of the engineers.Around 1900, the hours of laboratory and workshop experienceincluded in the mechanical engineering program at Cornell exceededhours of lecture by 25 per cent.
7 In spite of this, support for engineering research at the experimentalstations remained rather small when compared to the support for agri-cultural research. Indeed, the employment levels and overall researchbudget of the US agricultural experiment stations dwarfed those oftheir counterparts in engineering. In 1936, the former had a researchstaff of 3 818 units and an overall budget of US$16.4 million. Engi-neering stations employed 960 researchers and spent US$1.3 millionof research funds (Seely, 1993).
8 For example, the Korean Advanced Institute of Science and Technol-ogy (KAIST) – intended to be a research institution to assist the indus-trial community – was almost wholly staffed by faculty members withforeign doctoral degrees. Similarly in Taiwan Province of China thegovernment tried during the 1980s to lure back its foreign-educatedcitizens by supporting graduate programs in science and engineering.A 1989 study of the National Taiwan University and the National TsingHua University revealed that 74 per cent and 84 per cent of their fac-ulty, respectively, had received their degrees abroad (Hsieh, 1989).Likewise, the Academia Sinica, a public research institute, was in thelate 1980s almost entirely staffed by Chinese Americans who hadmaintained their ties with academic activity in their native land.
9 See Murmann (1998, 2003a, 2003b).10 Enrolment in Britain’s ‘redbrick’ British universities (largely founded
during the 19th century, (this group excludes the ancient English uni-versities of Oxford and Cambridge) grew from roughly 6 400 to 9 000during 1893–1911, but only 1 000 of those enrolled in these univer-sities as of 1911 were engineering students, while 1 700 were pursu-ing degrees in the sciences. By contrast, the German technical univer-sities alone enrolled 11 000 students in engineering and scientificdegree programs by 1911. British government funding of higher edu-cation amounted to roughly £26 000 in 1899, while the Prussian gov-ernment alone allocated the equivalent of £476 000 to support highereducation. By 1911, the respective amounts stood at £123 000 and£700 000 (Haber, 1971, p. 45 and p. 51).
11 Murmann (2003a) highlights the important political role of the Ger-man chemicals industry in mobilising and maintaining political supportfor expanded public funding of research within German universitiesand elsewhere.
12 There were 15 non-academic laboratories in 1885. Another 15 wereestablished before 1900. These laboratories included agriculturalexperiment stations, the Institute of Infectious Diseases, the Serolog-ical Institute, and in 1900 the Industrial Experiment Laboratory. Japan’s
574 | Role of knowledge systems in catching-up experiences
minister of education at the time, Mori Arinori, intended these effortsto serve purely utilitarian goals, having little regard for people whosepursuit of knowledge was not useful to action.
13 It is arguable that the early success of Taiwan Province of China withrapid agricultural development relied on technology policies and heavyinvestment in infrastructure and irrigation during the 1950s ratherthan on government protection and distorted prices (Wade, 1990).The promotion of research in agricultural technology proved to be asuccess in such specialised areas as asparagus cultivation and the arti-ficial breeding of grass carp, silver carp, and shrimp. Linear program-ming concepts were successfully applied to create a fixed comput-erised formula to increase production of hogs and other livestock. Inthe early 1970s, the Asian Vegetable R&D Centre and the Taiwan PlantProtection Centre helped to consolidate capabilities in agriculturaltechnology. Furthermore, the productivity increases in agricultureallowed the industrial sector to develop more rapidly as the govern-ment heavily taxed the resulting surpluses in agriculture for use inindustrialisation (Wade, 1990).
14 Amsden and Chu (2003) report that by 2000 more than 15 000 pro-fessionals had worked for ITRI, and 12 000 had gone on to hold posi-tions in the high-tech sectors of the economy in Taiwan Province ofChina (see section on entrepreneurial development policies below).
15 A similar initiative was taken later on in the Republic of Korea.16 Today, however, the III works largely as an R&D centre for the informa-
tion industry, having established six labs during the 1990s focused onadvanced information system technologies, network and communica-tions, multimedia technologies, embedded systems, and e-commerce.
17 On Singapore’s success with training incentives the World Bank’s TheEast Asian Miracle noted, ‘This success illustrates the importance ofgovernment’s ability to foresee a major trend and coordinate comple-mentary private investments. At the same time, businesses must standready to take advantage of the comprehensive support that the gov-ernment provides’ (World Bank, 1993, p. 202).
18 The lack of business innovation development is not an issue that onlyaffects developing countries. For example, according to the EU greenpaper on Entrepreneurship in Europe (COM 2003 27) and the GlobalEntrepreneurship Monitor, (2002) 93 per cent of the European entre-preneurs consider their business to be replication of existing businessactivity, hence having little innovative input. This is also related to the
unevenness of development in different subsystems of an innovationsystem, which is taken up further in Chapter 6 of this Report.
19 The impact of Intel’s Venture Capital business based in Costa Rica inencouraging entrepreneurial experimentation and innovation providesan interesting example. To date Intel Capital has invested more thanUS$60 million in 20 companies in Latin America. Also, the Indian dias-pora in the US features an immense entrepreneurial potential, alreadymaking strides back home. The Indian-American community boasts1.68 million people, with an average per capita income of US$60 093.More than 87 per cent of them have completed high school and 62per cent have some college education (over three times the average inthe US). In 1998 4 092 Indian professors were teaching in US universi-ties. In 1997 Indian students obtained 3.2 per cent of the total num-ber of doctorates granted by US universities. Approximately 300 000Indian-Americans work in Silicon Valley, accounting for more than 15per cent of start-ups in the US and have an average annual income ofaround US$200 000. Although diaspora members’ investment inIndia’s software industry and business services still accounts for onlythree per cent of FDI, they are making a significant contribution in theform of knowledge linkages, helping Indian firms to absorb technicaland managerial knowledge. Outsourcing to India often comes by ini-tiative of employees of Indian origin (World Bank, 2005). ‘With the helpof its diaspora, China has won the race to be the world’s factory. Withthe help of its diaspora, India could become the world’s technology lab’(Huang and Khanna, 2003).
20 This section draws heavily from Jon Sidgurdson (1986) ‘Industry andState Partnership: The historical role of the engineering research asso-ciations in Japan’.
21 After 1986 the government intensified industrial upgrading in thebicycle industry. The Taiwan Bicycle Industry R&D Centre receivedgrants from IDB to undertake R&D and provide consulting services. In1987, the Materials Research Lab of ITRI helped the firm Giant developa carbon-fibre bicycle frame. By the 1990s Materials Research Lab hadsecured 17 patents pertaining to the bicycle derailleur (Amsden andChu, 2003). Today, Taiwanese bike manufacturers are increasinglyfocusing on high-value products such as composite materials bikesand electric bikes. In fact, at a time when global bicycle market is con-tracting, Taiwan Province of China is exporting an increasing volumeof electric bikes, to the tune of US$700 million in 2004 (IndustryNews, 12/02/2004).
58 UNIDO Industrial Development Report 2005
The explosive growth in the stock of codified knowledgerelated to S&T is one of the most striking trends in history.
This trend is of course part of a broader one toward increas-ing levels of production of information and its storage in avariety of formats, including paper, film, magnetic, and opti-cal media. The amount of new information stored on any ofthese media doubled between 1999 and 2002, which impliesa yearly growth rate of 30 per cent. Likewise, informationflows through electronic channels have increased at breath-taking speed, a phenomenon fuelled partly by the growth inthe number of Internet users and the amount of informationstored on the web (Lyman and Varian, 2003). What is thepotential significance of this trend for developing countries’strategies and prospects?
Unequal access to codified information has been at the cen-ter of public debates regarding the so-called knowledgedivide. One way to bridge it is the systematic nurturing ofindigenous technological capabilities and the development ofa domestic technology infrastructure which can foster greateraccess to the available sources of codified knowledge. Specificfeatures of these trends create challenges and opportunitiesfor developing countries, whose development prospects areat least partly defined by their ability to adopt and adapt tech-nologies (physical and social) originated elsewhere, that is,their ability to learn to apply S&T knowledge to the implemen-tation of locally innovative economic activities.
Developing countries face two kinds of challenges in thisrespect. The first one arises from barriers to access that oftenaccompany the codification of knowledge imposed by thesources of that knowledge. Among these, pricing is pivotal.The second challenge is posed by the limitations on the useof codified knowledge, even if access is granted. Codifiedstatements can be used only to the extent that the recipientis able to decode them and to carry out the tasks called forby the specific use envisaged. Developing country technolog-ical capabilities largely determine the potential uses to whichcodified knowledge can be put.
Access to the knowledge itself
Some restrictions affect access to the codified knowledgeitself. Proprietary databases are an evident instance. Anotheris the rising price of electronically accessible scientific litera-
ture. This has been linked to a very visible trend: the growthin the number of electronically accessible scientific journalshas been coupled by growing concentration in the publish-ing industry, to the point where only five publishers came toaccount for 44 per cent of all articles in the scientific jour-nals included in the databases of the Institute of ScientificInformation (Morgan Stanley Equity Research, 2002). Thisconcentration has been accompanied by significant growthin the price of access to scientific journals, estimated atsomewhere between 400 and 650 per cent in the1984–2002 period (id, p.11). Between 1998 and 2003 theaverage price of an academic journal increased by 58 percent according to the UK’s Consortium of University ResearchLibraries (2003).
Concern over the growing cost of access to the scientificliterature has recently led to various efforts to counter thetrend. Although developing-country subscribers often bene-fit from differential pricing, it is noticeable that several initia-tives have been taken in the developed countries to promotethe notion of open access to scientific literature, realisedthrough the creation of peer-reviewed open-access electronicjournals available free of charge to readers, or self-archivinginitiatives. Commitments to open access to the results ofpublicly funded research have been made by national as wellas international organisations; among them are UNESCO (1999Budapest Declaration) and the OECD Committee for Scientificand Technological Policy. The latter’s 2004 ‘Declaration onAccess to Research Data from Public Funding’, however,
595 | Accessing and mastering knowledge
CHAPTER 5 Accessing andmastering knowledge
Several initiatives have been takenin the developed countries to
promote the notion of open accessto scientific literature.
Commitments to open access to theresults of publicly funded research
have been made by national as wellas international organisations.
notes that the commitment to openness is to be balanced bythe desire to protect social, scientific, and economic interests.This concern leads us to the second form of restrictions onaccess.
Restrictions on the use of accessed knowledgeAccess to codified knowledge may be opened, but IPR
enforcement may substantially restrict its use. Thus, for exam-ple, open access to a patents database provides an individualor organisation with access to codified statements regardinga technology, but many important uses of the informationdisclosed in a patent are subject to the patent-holder’s con-trol. On the other hand, access to scientific publications maybe restricted to subscribers of a journal or of a database, yetthe use of the information is not constrained unless theunderlying knowledge is also the subject of IPRs. Variousnational and international trends have increased the poten-tial scope of IPR protection, both in terms of content and ofthe growing number of countries providing IPR protection todomestic and foreign applicants.
The growing economic significance of IPRs can be gleanedfrom a variety of indicators. Patenting has increased quiterapidly since the early 1990s in the advanced economies (US,Japan, EU).1 The progressive implementation of the TRIPS
agreement will expand the scope of patent protection avail-able to inventors under national patent laws. These trendshave become the matter of public debate in the context ofpatents on pharmaceuticals. Of course, the extension ofpatent systems has in principle the dual effect of enablingthe disclosure of technological knowledge through the pub-lication of patents and of reserving to the patent-holderexclusive control over the use of the knowledge disclosed.2
From a developing country’s standpoint, the impact of theTRIPS agreement results from a balance between, on the onehand, the marginal impact on domestic learning and innova-tive activities from increased access to patent disclosures and,on the other, the consequences on the extent of inward tech-nology transfer resulting from the creation of IPRs. Withrespect to the former, the effect can be expected to be moresignificant with respect to patenting activities by residentfirms or individuals than by foreign holders. As to the latter,the creation of IPRs might curb activities of reverse engineer-ing and imitation of foreign products, but it might also sup-
port technology transfer activities structured around licens-ing agreements.
Economists and business analysts have long been dis-cussing how effective IPRs are as a means of protecting thereturns from R&D investment. Empirical investigations of thisquestion in the advanced economies reveal important cross-sectoral differences. They also illustrate how business enter-prises rely upon means other than patenting to protect theirintellectual property, including secrecy. Thus, what is likely todetermine the effects of the extension of the IPR regime onthe innovative activities of developing-country firms is theextent to which the availability of IPRs will induce firms to availthemselves of the protection they offer.
Of potentially greater significance for development is thegrowing propensity of academic research institutions topatent the results of their R&D. Following the lead set by theBayh-Dole Act of 1980 in the US, legislative measures encour-aging or requiring recipients of public research funds topatent have spread among many OECD countries.3 In the US,universities and other public research organisations receivenow a significantly larger share of patents than was the casea quarter of a century ago. Thus, while commitments havebeen made to promote the principle of openness in the dis-semination of the scientific publications resulting from pub-licly funded research, there has been increasing recourse toIPRs on the results of such research to enhance the yield ofensuing commercial innovations. Concern over the effects ofthe encroachment of IPRs on S&T knowledge that was onceplaced in the public domain has been expressed with increas-ing intensity, particularly in areas such as molecular biologyor software, where the proliferation of patents has threat-ened to create significant difficulties for researchers.4
The key distinction between accessing codified knowledgeand using it is the focus of table 5.1, where knowledge isregarded as private or public depending on conditions ofaccess, and as proprietary or non-proprietary depending onconditions of actual use. Examples in the table highlight thatwithin the trend toward the growing codification of S&T
knowledge questions of access and use should be clearly dis-tinguished. Admittedly, the conditions of use for many itemsof codified knowledge cannot be defined unambiguously forthe whole universe. Thus, having access to an electronic ver-sion of a copyrighted scientific paper enables use of theknowledge revealed in the paper (provided that the knowl-edge disclosed is not IPR-protected), but not the reproductionand sale of the paper. Access to an open-source software pro-gram under the ‘copyleft’ system makes it possible to use thesoftware, but it requires that modifications to the softwarebe made available to anyone through a general public license(see Chapter 7, box 7.1).5
Both sets of conditions presented in the taxonomy relateto the concept of excludability that economists use to char-acterise properties of private vs. public goods. Access to cod-ified knowledge and its uses are two sharply different things:the exclusionary effects of property rights can apply to eitheror both. To the extent that codified knowledge is a significantinput to the innovative activities of developing country firms,the different sets of capabilities associated with the act of
60 UNIDO Industrial Development Report 2005
The creation of IPRs might curbactivities of reverse engineering
and imitation of foreign products,but it might also support tech-
nology transfer activities structuredaround licensing agreements.
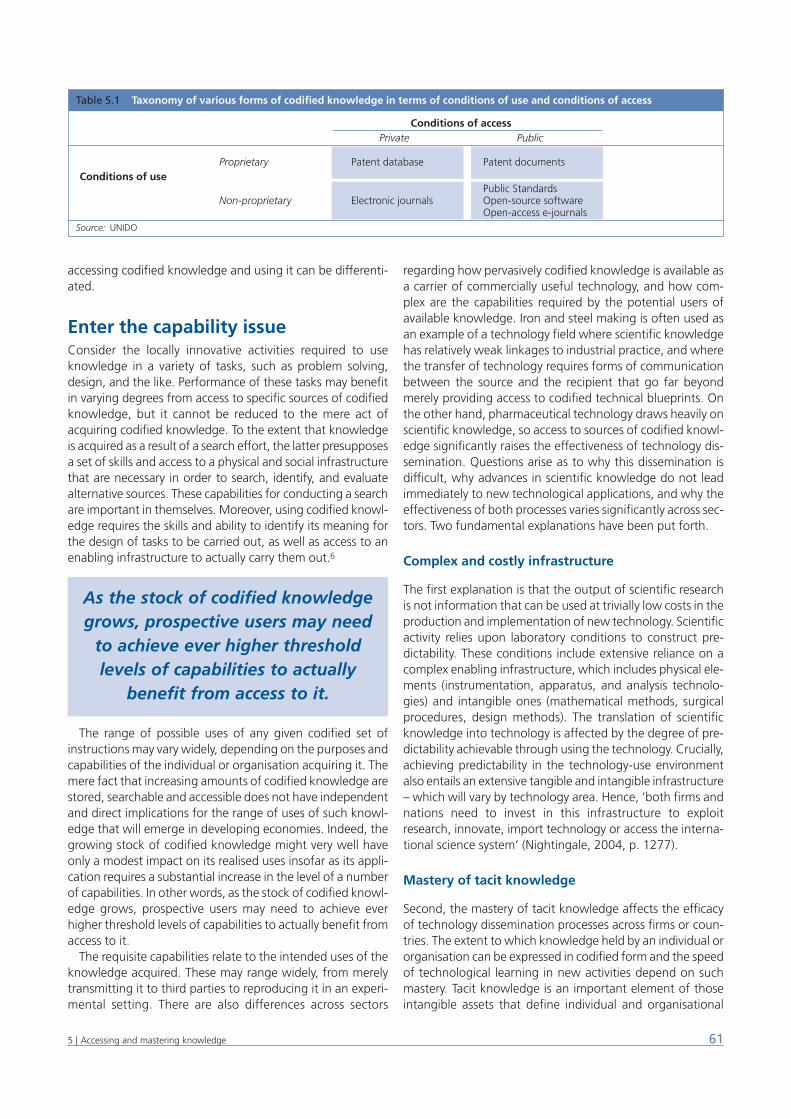
accessing codified knowledge and using it can be differenti-ated.
Enter the capability issueConsider the locally innovative activities required to useknowledge in a variety of tasks, such as problem solving,design, and the like. Performance of these tasks may benefitin varying degrees from access to specific sources of codifiedknowledge, but it cannot be reduced to the mere act ofacquiring codified knowledge. To the extent that knowledgeis acquired as a result of a search effort, the latter presupposesa set of skills and access to a physical and social infrastructurethat are necessary in order to search, identify, and evaluatealternative sources. These capabilities for conducting a searchare important in themselves. Moreover, using codified knowl-edge requires the skills and ability to identify its meaning forthe design of tasks to be carried out, as well as access to anenabling infrastructure to actually carry them out.6
The range of possible uses of any given codified set ofinstructions may vary widely, depending on the purposes andcapabilities of the individual or organisation acquiring it. Themere fact that increasing amounts of codified knowledge arestored, searchable and accessible does not have independentand direct implications for the range of uses of such knowl-edge that will emerge in developing economies. Indeed, thegrowing stock of codified knowledge might very well haveonly a modest impact on its realised uses insofar as its appli-cation requires a substantial increase in the level of a numberof capabilities. In other words, as the stock of codified knowl-edge grows, prospective users may need to achieve everhigher threshold levels of capabilities to actually benefit fromaccess to it.
The requisite capabilities relate to the intended uses of theknowledge acquired. These may range widely, from merelytransmitting it to third parties to reproducing it in an experi-mental setting. There are also differences across sectors
regarding how pervasively codified knowledge is available asa carrier of commercially useful technology, and how com-plex are the capabilities required by the potential users ofavailable knowledge. Iron and steel making is often used asan example of a technology field where scientific knowledgehas relatively weak linkages to industrial practice, and wherethe transfer of technology requires forms of communicationbetween the source and the recipient that go far beyondmerely providing access to codified technical blueprints. Onthe other hand, pharmaceutical technology draws heavily onscientific knowledge, so access to sources of codified knowl-edge significantly raises the effectiveness of technology dis-semination. Questions arise as to why this dissemination isdifficult, why advances in scientific knowledge do not leadimmediately to new technological applications, and why theeffectiveness of both processes varies significantly across sec-tors. Two fundamental explanations have been put forth.
Complex and costly infrastructure
The first explanation is that the output of scientific researchis not information that can be used at trivially low costs in theproduction and implementation of new technology. Scientificactivity relies upon laboratory conditions to construct pre-dictability. These conditions include extensive reliance on acomplex enabling infrastructure, which includes physical ele-ments (instrumentation, apparatus, and analysis technolo-gies) and intangible ones (mathematical methods, surgicalprocedures, design methods). The translation of scientificknowledge into technology is affected by the degree of pre-dictability achievable through using the technology. Crucially,achieving predictability in the technology-use environmentalso entails an extensive tangible and intangible infrastructure– which will vary by technology area. Hence, ‘both firms andnations need to invest in this infrastructure to exploitresearch, innovate, import technology or access the interna-tional science system’ (Nightingale, 2004, p. 1277).
Mastery of tacit knowledge
Second, the mastery of tacit knowledge affects the efficacyof technology dissemination processes across firms or coun-tries. The extent to which knowledge held by an individual ororganisation can be expressed in codified form and the speedof technological learning in new activities depend on suchmastery. Tacit knowledge is an important element of thoseintangible assets that define individual and organisational
615 | Accessing and mastering knowledge
Table 5.1 Taxonomy of various forms of codified knowledge in terms of conditions of use and conditions of access
Conditions of accessPrivate Public
Proprietary Patent database Patent documentsConditions of use
Public StandardsNon-proprietary Electronic journals Open-source software
Open-access e-journalsSource: UNIDO
As the stock of codified knowledgegrows, prospective users may need
to achieve ever higher thresholdlevels of capabilities to actually
benefit from access to it.
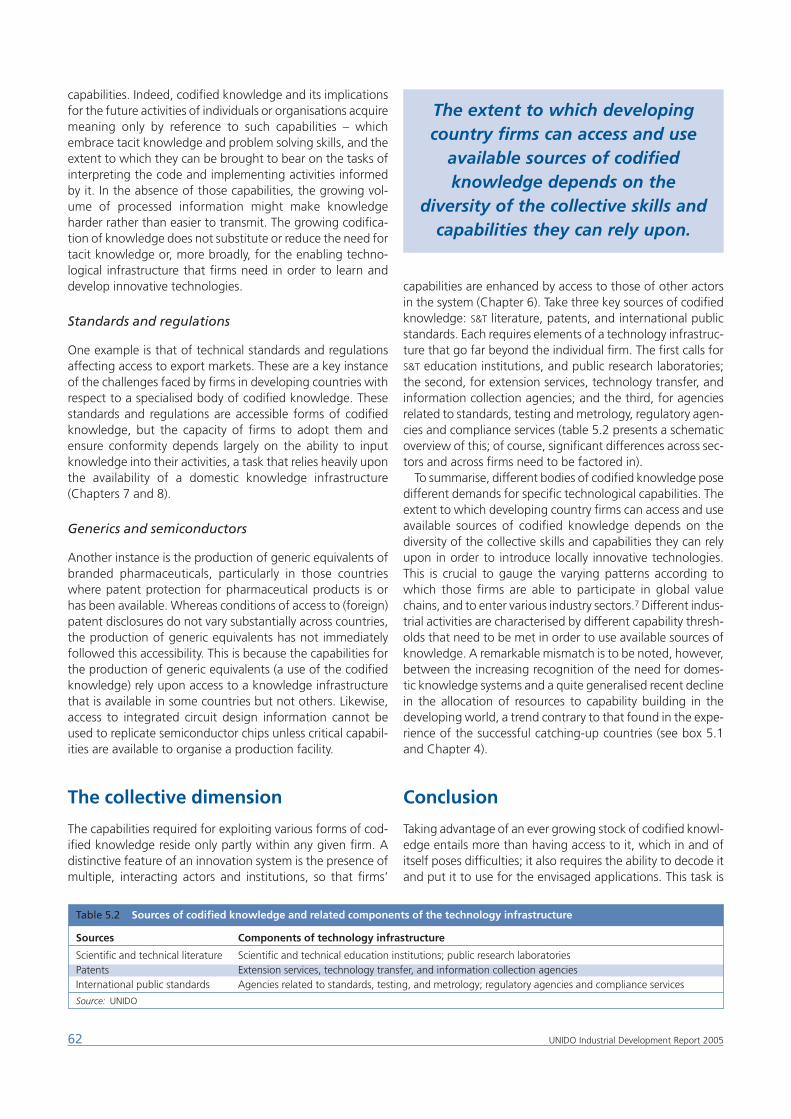
capabilities. Indeed, codified knowledge and its implicationsfor the future activities of individuals or organisations acquiremeaning only by reference to such capabilities – whichembrace tacit knowledge and problem solving skills, and theextent to which they can be brought to bear on the tasks ofinterpreting the code and implementing activities informedby it. In the absence of those capabilities, the growing vol-ume of processed information might make knowledgeharder rather than easier to transmit. The growing codifica-tion of knowledge does not substitute or reduce the need fortacit knowledge or, more broadly, for the enabling techno-logical infrastructure that firms need in order to learn anddevelop innovative technologies.
Standards and regulations
One example is that of technical standards and regulationsaffecting access to export markets. These are a key instanceof the challenges faced by firms in developing countries withrespect to a specialised body of codified knowledge. Thesestandards and regulations are accessible forms of codifiedknowledge, but the capacity of firms to adopt them andensure conformity depends largely on the ability to inputknowledge into their activities, a task that relies heavily uponthe availability of a domestic knowledge infrastructure(Chapters 7 and 8).
Generics and semiconductors
Another instance is the production of generic equivalents ofbranded pharmaceuticals, particularly in those countrieswhere patent protection for pharmaceutical products is orhas been available. Whereas conditions of access to (foreign)patent disclosures do not vary substantially across countries,the production of generic equivalents has not immediatelyfollowed this accessibility. This is because the capabilities forthe production of generic equivalents (a use of the codifiedknowledge) rely upon access to a knowledge infrastructurethat is available in some countries but not others. Likewise,access to integrated circuit design information cannot beused to replicate semiconductor chips unless critical capabil-ities are available to organise a production facility.
The collective dimension
The capabilities required for exploiting various forms of cod-ified knowledge reside only partly within any given firm. Adistinctive feature of an innovation system is the presence ofmultiple, interacting actors and institutions, so that firms’
capabilities are enhanced by access to those of other actorsin the system (Chapter 6). Take three key sources of codifiedknowledge: S&T literature, patents, and international publicstandards. Each requires elements of a technology infrastruc-ture that go far beyond the individual firm. The first calls forS&T education institutions, and public research laboratories;the second, for extension services, technology transfer, andinformation collection agencies; and the third, for agenciesrelated to standards, testing and metrology, regulatory agen-cies and compliance services (table 5.2 presents a schematicoverview of this; of course, significant differences across sec-tors and across firms need to be factored in).
To summarise, different bodies of codified knowledge posedifferent demands for specific technological capabilities. Theextent to which developing country firms can access and useavailable sources of codified knowledge depends on thediversity of the collective skills and capabilities they can relyupon in order to introduce locally innovative technologies.This is crucial to gauge the varying patterns according towhich those firms are able to participate in global valuechains, and to enter various industry sectors.7 Different indus-trial activities are characterised by different capability thresh-olds that need to be met in order to use available sources ofknowledge. A remarkable mismatch is to be noted, however,between the increasing recognition of the need for domes-tic knowledge systems and a quite generalised recent declinein the allocation of resources to capability building in thedeveloping world, a trend contrary to that found in the expe-rience of the successful catching-up countries (see box 5.1and Chapter 4).
Conclusion
Taking advantage of an ever growing stock of codified knowl-edge entails more than having access to it, which in and ofitself poses difficulties; it also requires the ability to decode itand put it to use for the envisaged applications. This task is
62 UNIDO Industrial Development Report 2005
Table 5.2 Sources of codified knowledge and related components of the technology infrastructure
Sources Components of technology infrastructure
Scientific and technical literature Scientific and technical education institutions; public research laboratoriesPatents Extension services, technology transfer, and information collection agenciesInternational public standards Agencies related to standards, testing, and metrology; regulatory agencies and compliance services
Source: UNIDO
The extent to which developingcountry firms can access and use
available sources of codifiedknowledge depends on the
diversity of the collective skills andcapabilities they can rely upon.
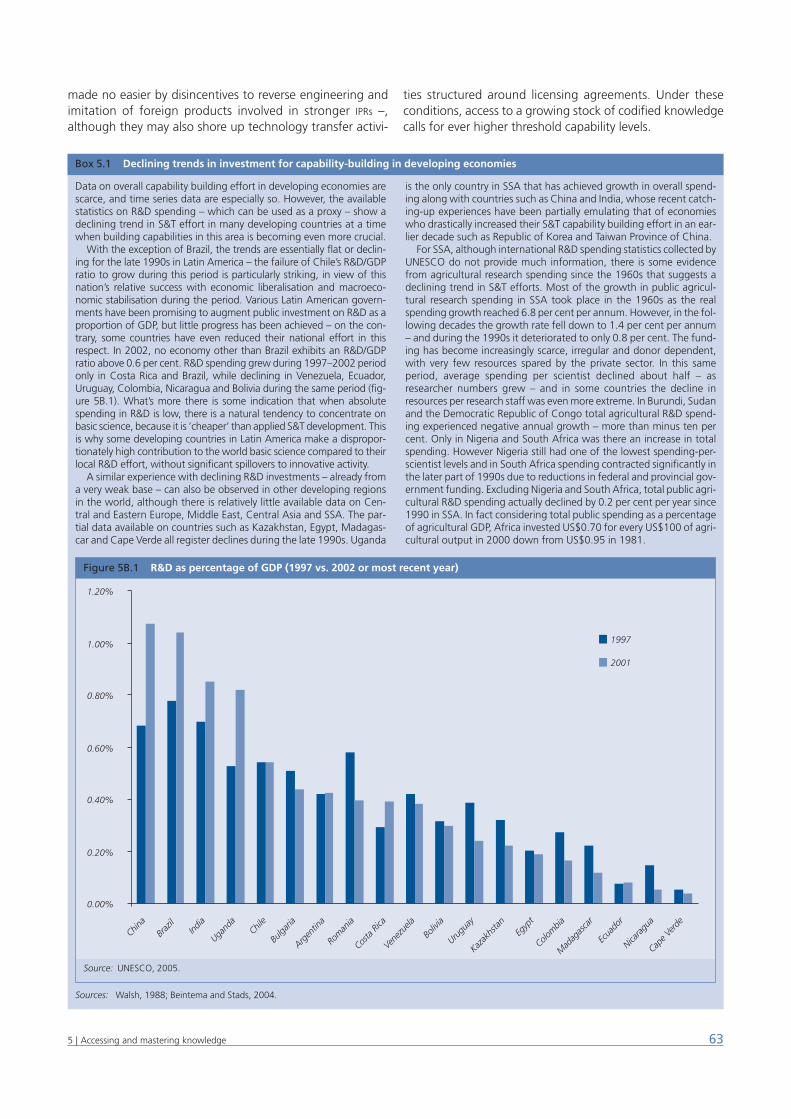
made no easier by disincentives to reverse engineering andimitation of foreign products involved in stronger IPRs –,although they may also shore up technology transfer activi-
ties structured around licensing agreements. Under theseconditions, access to a growing stock of codified knowledgecalls for ever higher threshold capability levels.
635 | Accessing and mastering knowledge
Box 5.1 Declining trends in investment for capability-building in developing economies
Sources: Walsh, 1988; Beintema and Stads, 2004.
Data on overall capability building effort in developing economies arescarce, and time series data are especially so. However, the availablestatistics on R&D spending – which can be used as a proxy – show adeclining trend in S&T effort in many developing countries at a timewhen building capabilities in this area is becoming even more crucial.
With the exception of Brazil, the trends are essentially flat or declin-ing for the late 1990s in Latin America – the failure of Chile’s R&D/GDPratio to grow during this period is particularly striking, in view of thisnation’s relative success with economic liberalisation and macroeco-nomic stabilisation during the period. Various Latin American govern-ments have been promising to augment public investment on R&D as aproportion of GDP, but little progress has been achieved – on the con-trary, some countries have even reduced their national effort in thisrespect. In 2002, no economy other than Brazil exhibits an R&D/GDPratio above 0.6 per cent. R&D spending grew during 1997–2002 periodonly in Costa Rica and Brazil, while declining in Venezuela, Ecuador,Uruguay, Colombia, Nicaragua and Bolivia during the same period (fig-ure 5B.1). What’s more there is some indication that when absolutespending in R&D is low, there is a natural tendency to concentrate onbasic science, because it is ‘cheaper’ than applied S&T development. Thisis why some developing countries in Latin America make a dispropor-tionately high contribution to the world basic science compared to theirlocal R&D effort, without significant spillovers to innovative activity.
A similar experience with declining R&D investments – already froma very weak base – can also be observed in other developing regionsin the world, although there is relatively little available data on Cen-tral and Eastern Europe, Middle East, Central Asia and SSA. The par-tial data available on countries such as Kazakhstan, Egypt, Madagas-car and Cape Verde all register declines during the late 1990s. Uganda
is the only country in SSA that has achieved growth in overall spend-ing along with countries such as China and India, whose recent catch-ing-up experiences have been partially emulating that of economieswho drastically increased their S&T capability building effort in an ear-lier decade such as Republic of Korea and Taiwan Province of China.
For SSA, although international R&D spending statistics collected byUNESCO do not provide much information, there is some evidencefrom agricultural research spending since the 1960s that suggests adeclining trend in S&T efforts. Most of the growth in public agricul-tural research spending in SSA took place in the 1960s as the realspending growth reached 6.8 per cent per annum. However, in the fol-lowing decades the growth rate fell down to 1.4 per cent per annum– and during the 1990s it deteriorated to only 0.8 per cent. The fund-ing has become increasingly scarce, irregular and donor dependent,with very few resources spared by the private sector. In this sameperiod, average spending per scientist declined about half – asresearcher numbers grew – and in some countries the decline inresources per research staff was even more extreme. In Burundi, Sudanand the Democratic Republic of Congo total agricultural R&D spend-ing experienced negative annual growth – more than minus ten percent. Only in Nigeria and South Africa was there an increase in totalspending. However Nigeria still had one of the lowest spending-per-scientist levels and in South Africa spending contracted significantly inthe later part of 1990s due to reductions in federal and provincial gov-ernment funding. Excluding Nigeria and South Africa, total public agri-cultural R&D spending actually declined by 0.2 per cent per year since1990 in SSA. In fact considering total public spending as a percentageof agricultural GDP, Africa invested US$0.70 for every US$100 of agri-cultural output in 2000 down from US$0.95 in 1981.
Figure 5B.1 R&D as percentage of GDP (1997 vs. 2002 or most recent year)
Source: UNESCO, 2005.
0.00%
0.20%
0.40%
0.60%
0.80%
1.00%
1.20%
China
Braz
il Ind
ia
Ugand
aChil
e
Bulga
ria
Argen
tina
Rom
ania
Costa
Rica
Vene
zuela
Boliv
ia
Urugu
ay
Kazak
hsta
nEg
ypt
Colom
bia
Mad
agas
car
Ecua
dor
Nicara
gua
Cape V
erde
1997
2001
Notes1 The number of patent applications filed with the USPTO and the EPO
increased from 107 039 and 60 104 in 1991 to 179 658 and 109 609,respectively, in 2000 (Compendium of Patent Statistics, OECD, 2004c).The growth in patenting has been particularly noticeable in the fieldsof biotechnology and ICT, partly as a result of the broadening scopeof patentability in these areas endorsed by the countries involved. (Justone company, Microsoft, has recently announced plans to substan-tially pick up the pace of patenting, raising its goal of patent appli-cations submitted annually to 3 000 from 2 000. Indeed in 2004,Microsoft filed 3000 applications with the USPTO according to itsown sources. This would not have been possible up to the late 1980s,when the US courts still regarded software as a collection of mathe-matical algorithms, not as an invention, and thus not patentable.However when the number of patent applications filed by Microsoftin the US is compared with the actual patents granted internationallyto countries such as Italy, Switzerland or Finland, the sheer volume ofMicrosoft’s patenting activity becomes clear. In fact in 2002 only eightcountries out of 115 had more than 3 000 patents filed in the US). Onthe other hand, while patenting activity by developing countries at theUSPTO and the EPO has increased quite rapidly, their global share ofpatents still remains pretty low.
2 Chapter 7 discusses the relationships between IPRs and standards.
3 See D. Mowery’s chapter in Magariños and Sercovich (2003).4 An important aspect of the reaction against this trend has been the
emergence of the open-source software movement. Open-sourcesoftware constitutes an important form of codified knowledge thatis freely accessible to users, who may or not be interested in mak-ing contributions to improving the software code (see further Chap-ter 7).
5 A wordplay on copyright, ‘copyleft’ ensures that nobody can appro-priate what is offered free to all; in a sense, it turns copyright on itshead.
6 Accessing a recipe from a database is not the same as using it. The lat-ter requires various kitchen tools, measuring instruments, and theknowledge and skills necessary to carry out various tasks (such as dic-ing, whipping, sautéing, etc.) and to interpret the implications ofambiguous statements (cook at medium heat, until golden brown,etc.). At a more complex level, accessing the patent description of thetechnique of polymerase chain reaction is one thing, but actually usingit requires a considerable range of capabilities and a great deal of infra-structure.
7 To the extent that machinery is a form of codification of knowledge,this argument can be applied to the analysis of the range of capitalgoods imported by domestic firms in terms of the capabilities that arenecessary for their effective use.
64 UNIDO Industrial Development Report 2005
The Policy Dimension
Part 2

Introduction
Domestic knowledge systems and, more broadly, knowledge-related variables, have – as we have seen – been crucial inaccounting for countries’ ability to catch-up throughoutmodern history. And their importance is on the rise. The nextissue to address is how policy should factor this. For this, it isnecessary to bear in mind that policy prescriptions do notstem straight from the historical and empirical analysis, nomatter how persuasive or conclusive that analysis may be.Before moving to policy prescriptions it is necessary to spellout how policy may be expected to achieve the outcomessought and how these outcomes, in turn, feed back on pol-icy and forward on the IS development.1
We shall broach this by stages, over the three chapters ofthis second Part of the Special Topic section. This chapter isdevoted to the overall policy analysis. The next two chaptersexamine two important dimensions of the policy issues atstake; first, the case of standards systems in relation to IPRs
and competition policies (Chapter 7) and, second, that offood safety systems, including related technical regulations(Chapter 8). These two sets of issues are eliciting increasingattention. Yet, the capability implications involved still remainlargely implicit, if and when dealt with.2
Upgrading the policymakers’compassesSizing the opportunities made available by entering and sus-taining a path of industrialisation entails relying increasinglyon the mastery of knowledge and skills. The diffusion of thismastery, however, is neither spontaneous nor instantaneous,nor can be taken for granted. This means that catching-upcountries must pay much greater attention to domestic com-petence-building systems than has hitherto been the case.
Market failures, including those stemming from informa-tion asymmetries, incomplete or missing markets, increasingreturns to scale, coordination problems, externalities anduncertainties, may serve as a partial guide for policy makers.However, because of their very ubiquity and pervasiveness,diagnoses of these failures, when at all possible, may not suf-fice to orient action. Policymakers may sense the search forPareto optima, which assumes a full set of complete and
contingent markets extending indefinitely into the future, assomething much akin to a will-o’-the-wisp.3
Also hindering the generation of capability-focused policyresponses is the dearth of appropriate tools, metrics, heuris-tics and needs assessment methodologies, including thoserelating to the policy capabilities themselves (see annex 6.1and Chapters 7 and 8).
These constraints to the policymaking process help explainwhy factoring competence-building into the policy frame-work is still far from systematic and why competence-build-ing has yet to be given the centre-stage position it merits bothin the formulation of development policies and in the con-ceptual framework underlying these policies.
A major inadequacy of conventional policy approaches todevelopment is the insufficient attention paid to the dynamiccorrespondence between competence-building policies and pri-vate sector development (PSD). To the extent that the mastery ofinnovative entrepreneurial capabilities (in a Schumpeteriansense of producing new combinations of resources leading towealth creation) is the pivot of PSD, we shall use the expression‘business innovation’ as a proxy for PSD from now onwards.4 Pol-icy-making to foster economic transformation from this per-spective still awaits formulation both in terms of a generalframework and of specific guidelines.5 This is attempted below.
In this it is worth bearing in mind that economic restructur-ing and productivity growth are increasingly driven by inno-vation. As seen in Chapter 4, one of the keys to successfulcatching-up has been the matching of demand and supplyof resources for innovative development. Often the lack ofscientists and engineers or R&D labs is a problem, but just as
676 | Policy, knowledge and business innovation
CHAPTER 6 Policy, knowledge and business innovation
The major inadequacy ofconventional policy approaches to
development is the insufficientattention paid to the dynamic
correspondence between competence-building policies and
private sector development.
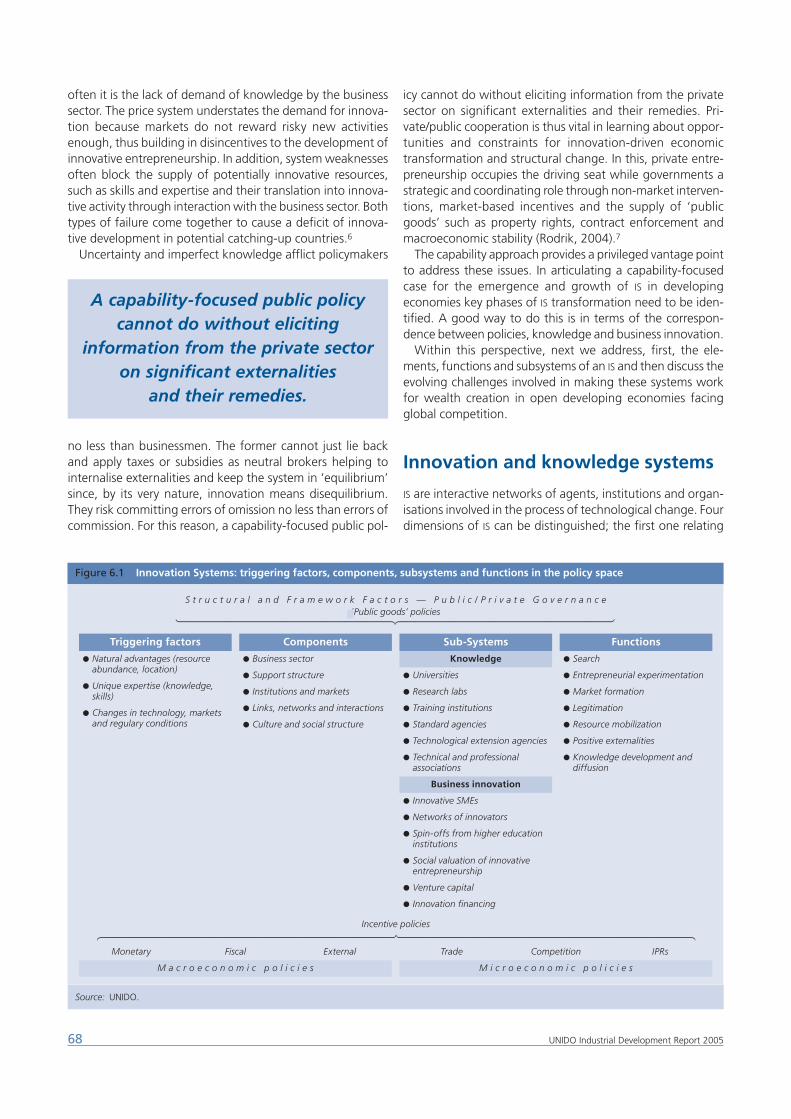
often it is the lack of demand of knowledge by the businesssector. The price system understates the demand for innova-tion because markets do not reward risky new activitiesenough, thus building in disincentives to the development ofinnovative entrepreneurship. In addition, system weaknessesoften block the supply of potentially innovative resources,such as skills and expertise and their translation into innova-tive activity through interaction with the business sector. Bothtypes of failure come together to cause a deficit of innova-tive development in potential catching-up countries.6
Uncertainty and imperfect knowledge afflict policymakers
no less than businessmen. The former cannot just lie backand apply taxes or subsidies as neutral brokers helping tointernalise externalities and keep the system in ‘equilibrium’since, by its very nature, innovation means disequilibrium.They risk committing errors of omission no less than errors ofcommission. For this reason, a capability-focused public pol-
icy cannot do without eliciting information from the privatesector on significant externalities and their remedies. Pri-vate/public cooperation is thus vital in learning about oppor-tunities and constraints for innovation-driven economictransformation and structural change. In this, private entre-preneurship occupies the driving seat while governments astrategic and coordinating role through non-market interven-tions, market-based incentives and the supply of ‘publicgoods’ such as property rights, contract enforcement andmacroeconomic stability (Rodrik, 2004).7
The capability approach provides a privileged vantage pointto address these issues. In articulating a capability-focusedcase for the emergence and growth of IS in developingeconomies key phases of IS transformation need to be iden-tified. A good way to do this is in terms of the correspon-dence between policies, knowledge and business innovation.
Within this perspective, next we address, first, the ele-ments, functions and subsystems of an IS and then discuss theevolving challenges involved in making these systems workfor wealth creation in open developing economies facingglobal competition.
Innovation and knowledge systems
IS are interactive networks of agents, institutions and organ-isations involved in the process of technological change. Fourdimensions of IS can be distinguished; the first one relating
68 UNIDO Industrial Development Report 2005
A capability-focused public policycannot do without eliciting
information from the private sectoron significant externalities
and their remedies.
Figure 6.1 Innovation Systems: triggering factors, components, subsystems and functions in the policy space
Source: UNIDO.
Triggering factors
● Natural advantages (resource abundance, location)
● Unique expertise (knowledge, skills)
● Changes in technology, markets and regulary conditions
Components
● Business sector
● Support structure
● Institutions and markets
● Links, networks and interactions
● Culture and social structure
Sub-Systems
Knowledge
● Universities
● Research labs
● Training institutions
● Standard agencies
● Technological extension agencies
● Technical and professional associations
Business innovation
● Innovative SMEs
● Networks of innovators
● Spin-offs from higher education institutions
● Social valuation of innovative entrepreneurship
● Venture capital
● Innovation financing
Functions
● Search
● Entrepreneurial experimentation
● Market formation
● Legitimation
● Resource mobilization
● Positive externalities
● Knowledge development and diffusion
S t r u c t u r a l a n d F r a m e w o r k F a c t o r s — P u b l i c / P r i v a t e G o v e r n a n c eíPublic goods’ policies
Monetary Fiscal External
M a c r o e c o n o m i c p o l i c i e s
Trade Competition IPRs
M i c r o e c o n o m i c p o l i c i e s
Incentive policies
⎧ ⎪ ⎪ ⎪ ⎪ ⎪ ⎪ ⎪ ⎪ ⎪ ⎪ ⎪ ⎪ ⎪ ⎪ ⎪ ⎨ ⎪ ⎪ ⎪ ⎪ ⎪ ⎪ ⎪ ⎪ ⎪ ⎪ ⎪ ⎪ ⎪ ⎪ ⎪ ⎩
⎧⎪⎪⎪⎪⎪⎪⎪⎪⎪⎪⎪⎪⎪⎪⎪⎪⎪⎪⎪⎪⎪⎨⎪⎪⎪⎪⎪⎪⎪⎪⎪⎪⎪⎪⎪⎪⎪⎪⎪⎪⎪⎪⎪⎩
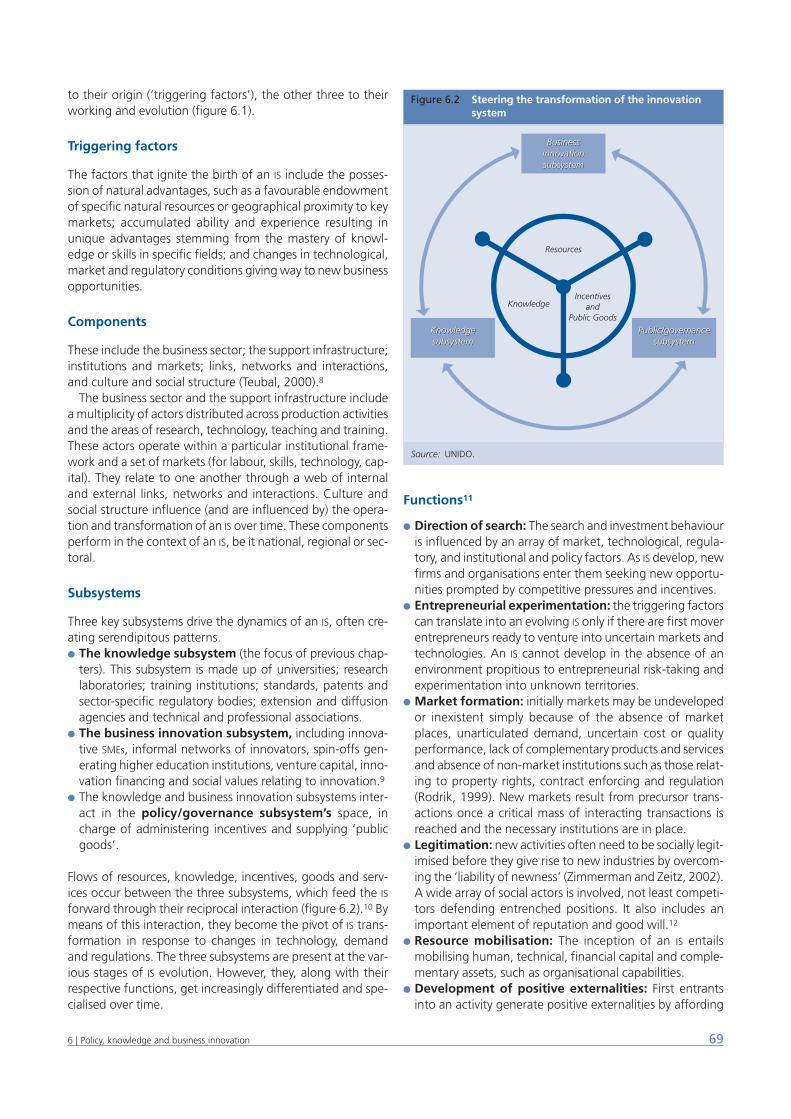
to their origin (‘triggering factors’), the other three to theirworking and evolution (figure 6.1).
Triggering factors
The factors that ignite the birth of an IS include the posses-sion of natural advantages, such as a favourable endowmentof specific natural resources or geographical proximity to keymarkets; accumulated ability and experience resulting inunique advantages stemming from the mastery of knowl-edge or skills in specific fields; and changes in technological,market and regulatory conditions giving way to new businessopportunities.
Components
These include the business sector; the support infrastructure;institutions and markets; links, networks and interactions,and culture and social structure (Teubal, 2000).8
The business sector and the support infrastructure includea multiplicity of actors distributed across production activitiesand the areas of research, technology, teaching and training.These actors operate within a particular institutional frame-work and a set of markets (for labour, skills, technology, cap-ital). They relate to one another through a web of internaland external links, networks and interactions. Culture andsocial structure influence (and are influenced by) the opera-tion and transformation of an IS over time. These componentsperform in the context of an IS, be it national, regional or sec-toral.
Subsystems
Three key subsystems drive the dynamics of an IS, often cre-ating serendipitous patterns.● The knowledge subsystem (the focus of previous chap-
ters). This subsystem is made up of universities; researchlaboratories; training institutions; standards, patents andsector-specific regulatory bodies; extension and diffusionagencies and technical and professional associations.
● The business innovation subsystem, including innova-tive SMEs, informal networks of innovators, spin-offs gen-erating higher education institutions, venture capital, inno-vation financing and social values relating to innovation.9
● The knowledge and business innovation subsystems inter-act in the policy/governance subsystem’s space, incharge of administering incentives and supplying ‘publicgoods’.
Flows of resources, knowledge, incentives, goods and serv-ices occur between the three subsystems, which feed the ISforward through their reciprocal interaction (figure 6.2).10 Bymeans of this interaction, they become the pivot of IS trans-formation in response to changes in technology, demandand regulations. The three subsystems are present at the var-ious stages of IS evolution. However, they, along with theirrespective functions, get increasingly differentiated and spe-cialised over time.
Functions11
● Direction of search: The search and investment behaviouris influenced by an array of market, technological, regula-tory, and institutional and policy factors. As IS develop, newfirms and organisations enter them seeking new opportu-nities prompted by competitive pressures and incentives.
● Entrepreneurial experimentation: the triggering factorscan translate into an evolving IS only if there are first moverentrepreneurs ready to venture into uncertain markets andtechnologies. An IS cannot develop in the absence of anenvironment propitious to entrepreneurial risk-taking andexperimentation into unknown territories.
● Market formation: initially markets may be undevelopedor inexistent simply because of the absence of marketplaces, unarticulated demand, uncertain cost or qualityperformance, lack of complementary products and servicesand absence of non-market institutions such as those relat-ing to property rights, contract enforcing and regulation(Rodrik, 1999). New markets result from precursor trans-actions once a critical mass of interacting transactions isreached and the necessary institutions are in place.
● Legitimation: new activities often need to be socially legit-imised before they give rise to new industries by overcom-ing the ‘liability of newness’ (Zimmerman and Zeitz, 2002).A wide array of social actors is involved, not least competi-tors defending entrenched positions. It also includes animportant element of reputation and good will.12
● Resource mobilisation: The inception of an IS entailsmobilising human, technical, financial capital and comple-mentary assets, such as organisational capabilities.
● Development of positive externalities: First entrantsinto an activity generate positive externalities by affording
696 | Policy, knowledge and business innovation
Figure 6.2 Steering the transformation of the innovationFigure 6.2 system
Source: UNIDO.
Resources
Incentivesand
Public Goods
Knowledge
Businessinnovationsubsystem
Public/governancesubsystem
Knowledgesubsystem
Businessinnovationsubsystem
Public/governancesubsystem
Knowledgesubsystem
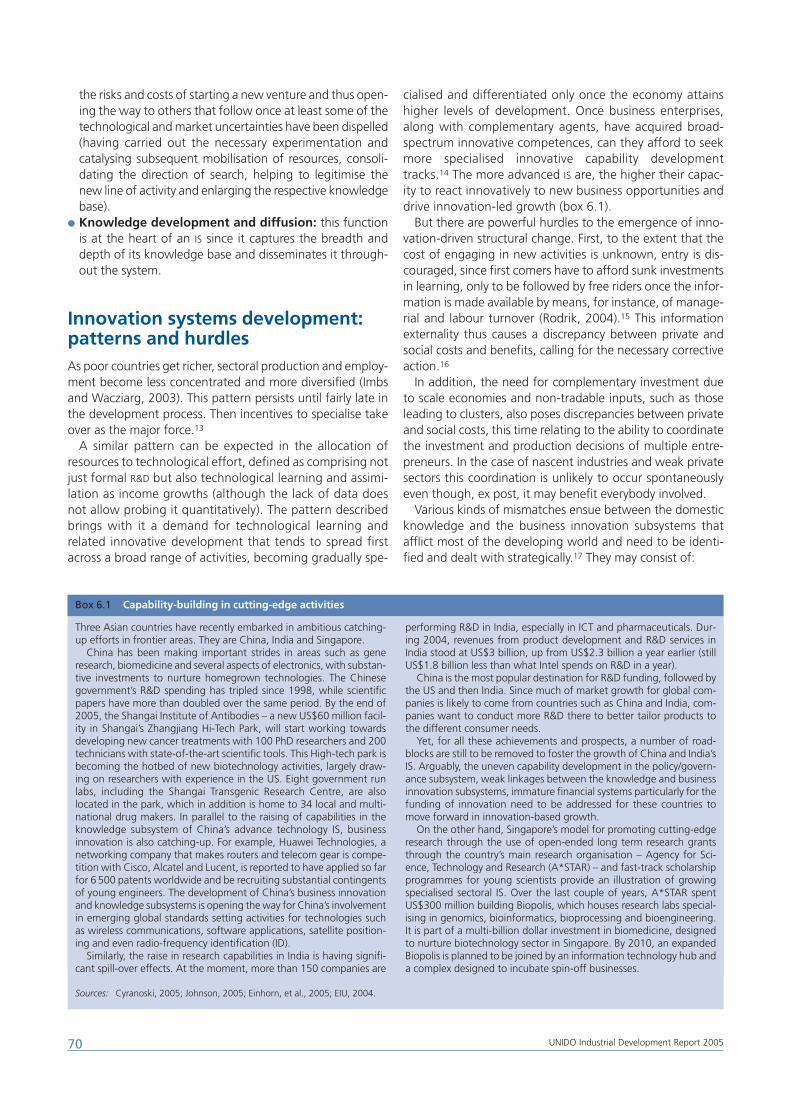
the risks and costs of starting a new venture and thus open-ing the way to others that follow once at least some of thetechnological and market uncertainties have been dispelled(having carried out the necessary experimentation andcatalysing subsequent mobilisation of resources, consoli-dating the direction of search, helping to legitimise thenew line of activity and enlarging the respective knowledgebase).
● Knowledge development and diffusion: this functionis at the heart of an IS since it captures the breadth anddepth of its knowledge base and disseminates it through-out the system.
Innovation systems development:patterns and hurdlesAs poor countries get richer, sectoral production and employ-ment become less concentrated and more diversified (Imbsand Wacziarg, 2003). This pattern persists until fairly late inthe development process. Then incentives to specialise takeover as the major force.13
A similar pattern can be expected in the allocation ofresources to technological effort, defined as comprising notjust formal R&D but also technological learning and assimi-lation as income growths (although the lack of data doesnot allow probing it quantitatively). The pattern describedbrings with it a demand for technological learning andrelated innovative development that tends to spread firstacross a broad range of activities, becoming gradually spe-
cialised and differentiated only once the economy attainshigher levels of development. Once business enterprises,along with complementary agents, have acquired broad-spectrum innovative competences, can they afford to seekmore specialised innovative capability developmenttracks.14 The more advanced IS are, the higher their capac-ity to react innovatively to new business opportunities anddrive innovation-led growth (box 6.1).
But there are powerful hurdles to the emergence of inno-vation-driven structural change. First, to the extent that thecost of engaging in new activities is unknown, entry is dis-couraged, since first comers have to afford sunk investmentsin learning, only to be followed by free riders once the infor-mation is made available by means, for instance, of manage-rial and labour turnover (Rodrik, 2004).15 This informationexternality thus causes a discrepancy between private andsocial costs and benefits, calling for the necessary correctiveaction.16
In addition, the need for complementary investment dueto scale economies and non-tradable inputs, such as thoseleading to clusters, also poses discrepancies between privateand social costs, this time relating to the ability to coordinatethe investment and production decisions of multiple entre-preneurs. In the case of nascent industries and weak privatesectors this coordination is unlikely to occur spontaneouslyeven though, ex post, it may benefit everybody involved.
Various kinds of mismatches ensue between the domesticknowledge and the business innovation subsystems thatafflict most of the developing world and need to be identi-fied and dealt with strategically.17 They may consist of:
70 UNIDO Industrial Development Report 2005
Box 6.1 Capability-building in cutting-edge activities
Sources: Cyranoski, 2005; Johnson, 2005; Einhorn, et al., 2005; EIU, 2004.
Three Asian countries have recently embarked in ambitious catching-up efforts in frontier areas. They are China, India and Singapore.
China has been making important strides in areas such as generesearch, biomedicine and several aspects of electronics, with substan-tive investments to nurture homegrown technologies. The Chinesegovernment’s R&D spending has tripled since 1998, while scientificpapers have more than doubled over the same period. By the end of2005, the Shangai Institute of Antibodies – a new US$60 million facil-ity in Shangai’s Zhangjiang Hi-Tech Park, will start working towardsdeveloping new cancer treatments with 100 PhD researchers and 200technicians with state-of-the-art scientific tools. This High-tech park isbecoming the hotbed of new biotechnology activities, largely draw-ing on researchers with experience in the US. Eight government runlabs, including the Shangai Transgenic Research Centre, are alsolocated in the park, which in addition is home to 34 local and multi-national drug makers. In parallel to the raising of capabilities in theknowledge subsystem of China’s advance technology IS, businessinnovation is also catching-up. For example, Huawei Technologies, anetworking company that makes routers and telecom gear is compe-tition with Cisco, Alcatel and Lucent, is reported to have applied so farfor 6500 patents worldwide and be recruiting substantial contingentsof young engineers. The development of China’s business innovationand knowledge subsystems is opening the way for China’s involvementin emerging global standards setting activities for technologies suchas wireless communications, software applications, satellite position-ing and even radio-frequency identification (ID).
Similarly, the raise in research capabilities in India is having signifi-cant spill-over effects. At the moment, more than 150 companies are
performing R&D in India, especially in ICT and pharmaceuticals. Dur-ing 2004, revenues from product development and R&D services inIndia stood at US$3 billion, up from US$2.3 billion a year earlier (stillUS$1.8 billion less than what Intel spends on R&D in a year).
China is the most popular destination for R&D funding, followed bythe US and then India. Since much of market growth for global com-panies is likely to come from countries such as China and India, com-panies want to conduct more R&D there to better tailor products tothe different consumer needs.
Yet, for all these achievements and prospects, a number of road-blocks are still to be removed to foster the growth of China and India’sIS. Arguably, the uneven capability development in the policy/govern-ance subsystem, weak linkages between the knowledge and businessinnovation subsystems, immature financial systems particularly for thefunding of innovation need to be addressed for these countries tomove forward in innovation-based growth.
On the other hand, Singapore’s model for promoting cutting-edgeresearch through the use of open-ended long term research grantsthrough the country’s main research organisation – Agency for Sci-ence, Technology and Research (A*STAR) – and fast-track scholarshipprogrammes for young scientists provide an illustration of growingspecialised sectoral IS. Over the last couple of years, A*STAR spentUS$300 million building Biopolis, which houses research labs special-ising in genomics, bioinformatics, bioprocessing and bioengineering.It is part of a multi-billion dollar investment in biomedicine, designedto nurture biotechnology sector in Singapore. By 2010, an expandedBiopolis is planned to be joined by an information technology hub anda complex designed to incubate spin-off businesses.
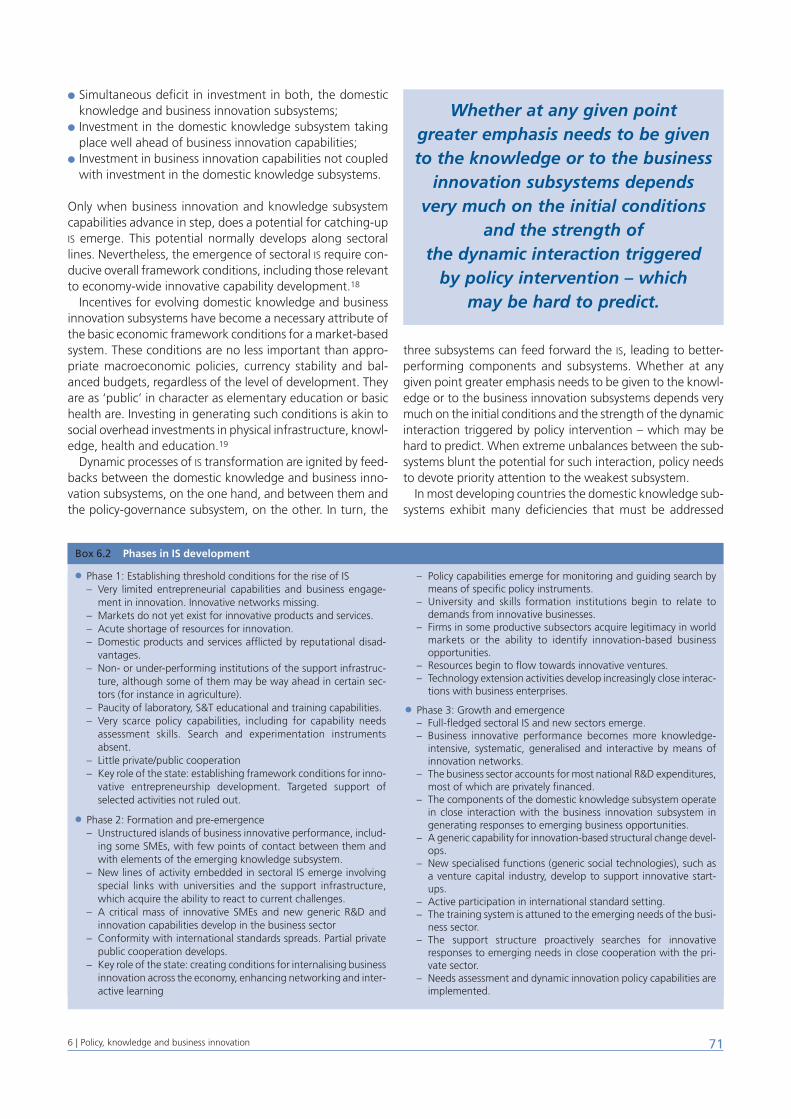
● Simultaneous deficit in investment in both, the domesticknowledge and business innovation subsystems;
● Investment in the domestic knowledge subsystem takingplace well ahead of business innovation capabilities;
● Investment in business innovation capabilities not coupledwith investment in the domestic knowledge subsystems.
Only when business innovation and knowledge subsystemcapabilities advance in step, does a potential for catching-upIS emerge. This potential normally develops along sectorallines. Nevertheless, the emergence of sectoral IS require con-ducive overall framework conditions, including those relevantto economy-wide innovative capability development.18
Incentives for evolving domestic knowledge and businessinnovation subsystems have become a necessary attribute ofthe basic economic framework conditions for a market-basedsystem. These conditions are no less important than appro-priate macroeconomic policies, currency stability and bal-anced budgets, regardless of the level of development. Theyare as ‘public’ in character as elementary education or basichealth are. Investing in generating such conditions is akin tosocial overhead investments in physical infrastructure, knowl-edge, health and education.19
Dynamic processes of IS transformation are ignited by feed-backs between the domestic knowledge and business inno-vation subsystems, on the one hand, and between them andthe policy-governance subsystem, on the other. In turn, the
three subsystems can feed forward the IS, leading to better-performing components and subsystems. Whether at anygiven point greater emphasis needs to be given to the knowl-edge or to the business innovation subsystems depends verymuch on the initial conditions and the strength of the dynamicinteraction triggered by policy intervention – which may behard to predict. When extreme unbalances between the sub-systems blunt the potential for such interaction, policy needsto devote priority attention to the weakest subsystem.
In most developing countries the domestic knowledge sub-systems exhibit many deficiencies that must be addressed
716 | Policy, knowledge and business innovation
Whether at any given point greater emphasis needs to be givento the knowledge or to the business
innovation subsystems dependsvery much on the initial conditions
and the strength of the dynamic interaction triggered
by policy intervention – which may be hard to predict.
Box 6.2 Phases in IS development
● Phase 1: Establishing threshold conditions for the rise of IS– Very limited entrepreneurial capabilities and business engage-
ment in innovation. Innovative networks missing.– Markets do not yet exist for innovative products and services.– Acute shortage of resources for innovation.– Domestic products and services afflicted by reputational disad-
vantages.– Non- or under-performing institutions of the support infrastruc-
ture, although some of them may be way ahead in certain sec-tors (for instance in agriculture).
– Paucity of laboratory, S&T educational and training capabilities.– Very scarce policy capabilities, including for capability needs
assessment skills. Search and experimentation instrumentsabsent.
– Little private/public cooperation– Key role of the state: establishing framework conditions for inno-
vative entrepreneurship development. Targeted support ofselected activities not ruled out.
● Phase 2: Formation and pre-emergence– Unstructured islands of business innovative performance, includ-
ing some SMEs, with few points of contact between them andwith elements of the emerging knowledge subsystem.
– New lines of activity embedded in sectoral IS emerge involvingspecial links with universities and the support infrastructure,which acquire the ability to react to current challenges.
– A critical mass of innovative SMEs and new generic R&D andinnovation capabilities develop in the business sector
– Conformity with international standards spreads. Partial privatepublic cooperation develops.
– Key role of the state: creating conditions for internalising businessinnovation across the economy, enhancing networking and inter-active learning
– Policy capabilities emerge for monitoring and guiding search bymeans of specific policy instruments.
– University and skills formation institutions begin to relate todemands from innovative businesses.
– Firms in some productive subsectors acquire legitimacy in worldmarkets or the ability to identify innovation-based businessopportunities.
– Resources begin to flow towards innovative ventures.– Technology extension activities develop increasingly close interac-
tions with business enterprises.
● Phase 3: Growth and emergence– Full-fledged sectoral IS and new sectors emerge.– Business innovative performance becomes more knowledge-
intensive, systematic, generalised and interactive by means ofinnovation networks.
– The business sector accounts for most national R&D expenditures,most of which are privately financed.
– The components of the domestic knowledge subsystem operatein close interaction with the business innovation subsystem ingenerating responses to emerging business opportunities.
– A generic capability for innovation-based structural change devel-ops.
– New specialised functions (generic social technologies), such asa venture capital industry, develop to support innovative start-ups.
– Active participation in international standard setting.– The training system is attuned to the emerging needs of the busi-
ness sector.– The support structure proactively searches for innovative
responses to emerging needs in close cooperation with the pri-vate sector.
– Needs assessment and dynamic innovation policy capabilities areimplemented.
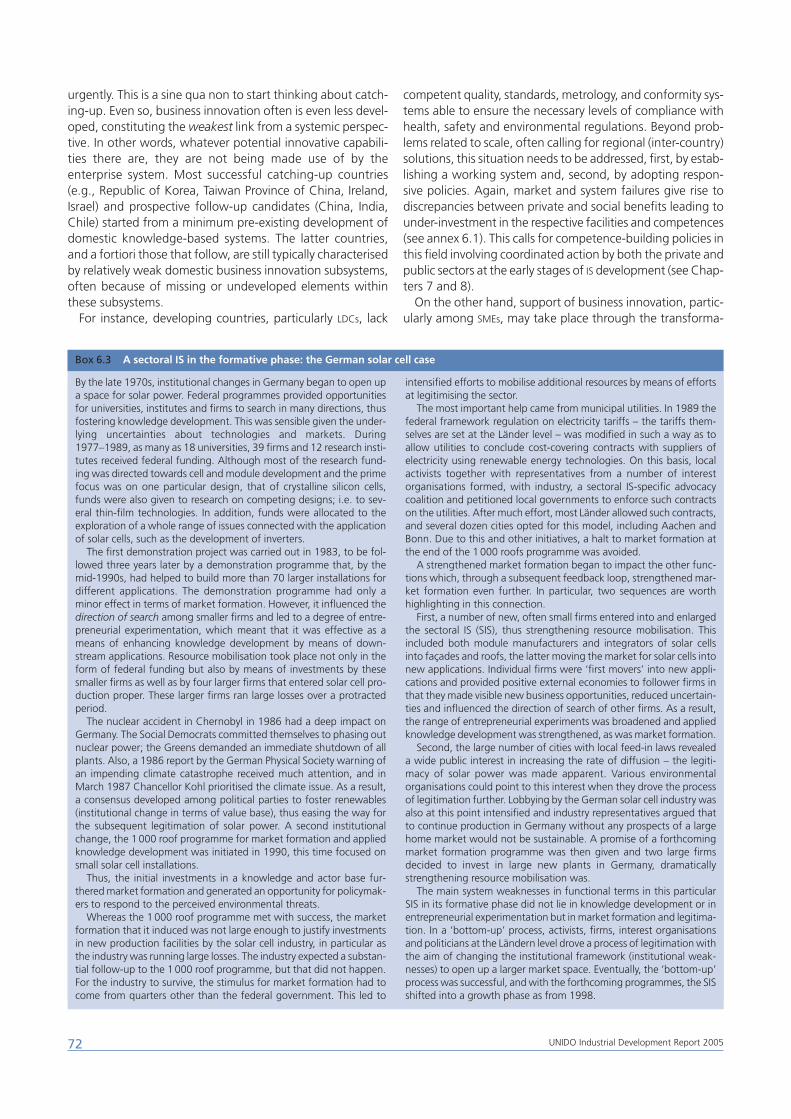
urgently. This is a sine qua non to start thinking about catch-ing-up. Even so, business innovation often is even less devel-oped, constituting the weakest link from a systemic perspec-tive. In other words, whatever potential innovative capabili-ties there are, they are not being made use of by theenterprise system. Most successful catching-up countries(e.g., Republic of Korea, Taiwan Province of China, Ireland,Israel) and prospective follow-up candidates (China, India,Chile) started from a minimum pre-existing development ofdomestic knowledge-based systems. The latter countries,and a fortiori those that follow, are still typically characterisedby relatively weak domestic business innovation subsystems,often because of missing or undeveloped elements withinthese subsystems.
For instance, developing countries, particularly LDCs, lack
competent quality, standards, metrology, and conformity sys-tems able to ensure the necessary levels of compliance withhealth, safety and environmental regulations. Beyond prob-lems related to scale, often calling for regional (inter-country)solutions, this situation needs to be addressed, first, by estab-lishing a working system and, second, by adopting respon-sive policies. Again, market and system failures give rise todiscrepancies between private and social benefits leading tounder-investment in the respective facilities and competences(see annex 6.1). This calls for competence-building policies inthis field involving coordinated action by both the private andpublic sectors at the early stages of IS development (see Chap-ters 7 and 8).
On the other hand, support of business innovation, partic-ularly among SMEs, may take place through the transforma-
72 UNIDO Industrial Development Report 2005
Box 6.3 A sectoral IS in the formative phase: the German solar cell case
By the late 1970s, institutional changes in Germany began to open upa space for solar power. Federal programmes provided opportunitiesfor universities, institutes and firms to search in many directions, thusfostering knowledge development. This was sensible given the under-lying uncertainties about technologies and markets. During1977–1989, as many as 18 universities, 39 firms and 12 research insti-tutes received federal funding. Although most of the research fund-ing was directed towards cell and module development and the primefocus was on one particular design, that of crystalline silicon cells,funds were also given to research on competing designs; i.e. to sev-eral thin-film technologies. In addition, funds were allocated to theexploration of a whole range of issues connected with the applicationof solar cells, such as the development of inverters.
The first demonstration project was carried out in 1983, to be fol-lowed three years later by a demonstration programme that, by themid-1990s, had helped to build more than 70 larger installations fordifferent applications. The demonstration programme had only aminor effect in terms of market formation. However, it influenced thedirection of search among smaller firms and led to a degree of entre-preneurial experimentation, which meant that it was effective as ameans of enhancing knowledge development by means of down-stream applications. Resource mobilisation took place not only in theform of federal funding but also by means of investments by thesesmaller firms as well as by four larger firms that entered solar cell pro-duction proper. These larger firms ran large losses over a protractedperiod.
The nuclear accident in Chernobyl in 1986 had a deep impact onGermany. The Social Democrats committed themselves to phasing outnuclear power; the Greens demanded an immediate shutdown of allplants. Also, a 1986 report by the German Physical Society warning ofan impending climate catastrophe received much attention, and inMarch 1987 Chancellor Kohl prioritised the climate issue. As a result,a consensus developed among political parties to foster renewables(institutional change in terms of value base), thus easing the way forthe subsequent legitimation of solar power. A second institutionalchange, the 1000 roof programme for market formation and appliedknowledge development was initiated in 1990, this time focused onsmall solar cell installations.
Thus, the initial investments in a knowledge and actor base fur-thered market formation and generated an opportunity for policymak-ers to respond to the perceived environmental threats.
Whereas the 1000 roof programme met with success, the marketformation that it induced was not large enough to justify investmentsin new production facilities by the solar cell industry, in particular asthe industry was running large losses. The industry expected a substan-tial follow-up to the 1000 roof programme, but that did not happen.For the industry to survive, the stimulus for market formation had tocome from quarters other than the federal government. This led to
intensified efforts to mobilise additional resources by means of effortsat legitimising the sector.
The most important help came from municipal utilities. In 1989 thefederal framework regulation on electricity tariffs – the tariffs them-selves are set at the Länder level – was modified in such a way as toallow utilities to conclude cost-covering contracts with suppliers ofelectricity using renewable energy technologies. On this basis, localactivists together with representatives from a number of interestorganisations formed, with industry, a sectoral IS-specific advocacycoalition and petitioned local governments to enforce such contractson the utilities. After much effort, most Länder allowed such contracts,and several dozen cities opted for this model, including Aachen andBonn. Due to this and other initiatives, a halt to market formation atthe end of the 1000 roofs programme was avoided.
A strengthened market formation began to impact the other func-tions which, through a subsequent feedback loop, strengthened mar-ket formation even further. In particular, two sequences are worthhighlighting in this connection.
First, a number of new, often small firms entered into and enlargedthe sectoral IS (SIS), thus strengthening resource mobilisation. Thisincluded both module manufacturers and integrators of solar cellsinto façades and roofs, the latter moving the market for solar cells intonew applications. Individual firms were ‘first movers’ into new appli-cations and provided positive external economies to follower firms inthat they made visible new business opportunities, reduced uncertain-ties and influenced the direction of search of other firms. As a result,the range of entrepreneurial experiments was broadened and appliedknowledge development was strengthened, as was market formation.
Second, the large number of cities with local feed-in laws revealeda wide public interest in increasing the rate of diffusion – the legiti-macy of solar power was made apparent. Various environmentalorganisations could point to this interest when they drove the processof legitimation further. Lobbying by the German solar cell industry wasalso at this point intensified and industry representatives argued thatto continue production in Germany without any prospects of a largehome market would not be sustainable. A promise of a forthcomingmarket formation programme was then given and two large firmsdecided to invest in large new plants in Germany, dramaticallystrengthening resource mobilisation was.
The main system weaknesses in functional terms in this particularSIS in its formative phase did not lie in knowledge development or inentrepreneurial experimentation but in market formation and legitima-tion. In a ‘bottom-up’ process, activists, firms, interest organisationsand politicians at the Ländern level drove a process of legitimation withthe aim of changing the institutional framework (institutional weak-nesses) to open up a larger market space. Eventually, the ‘bottom-up’process was successful, and with the forthcoming programmes, the SISshifted into a growth phase as from 1998.
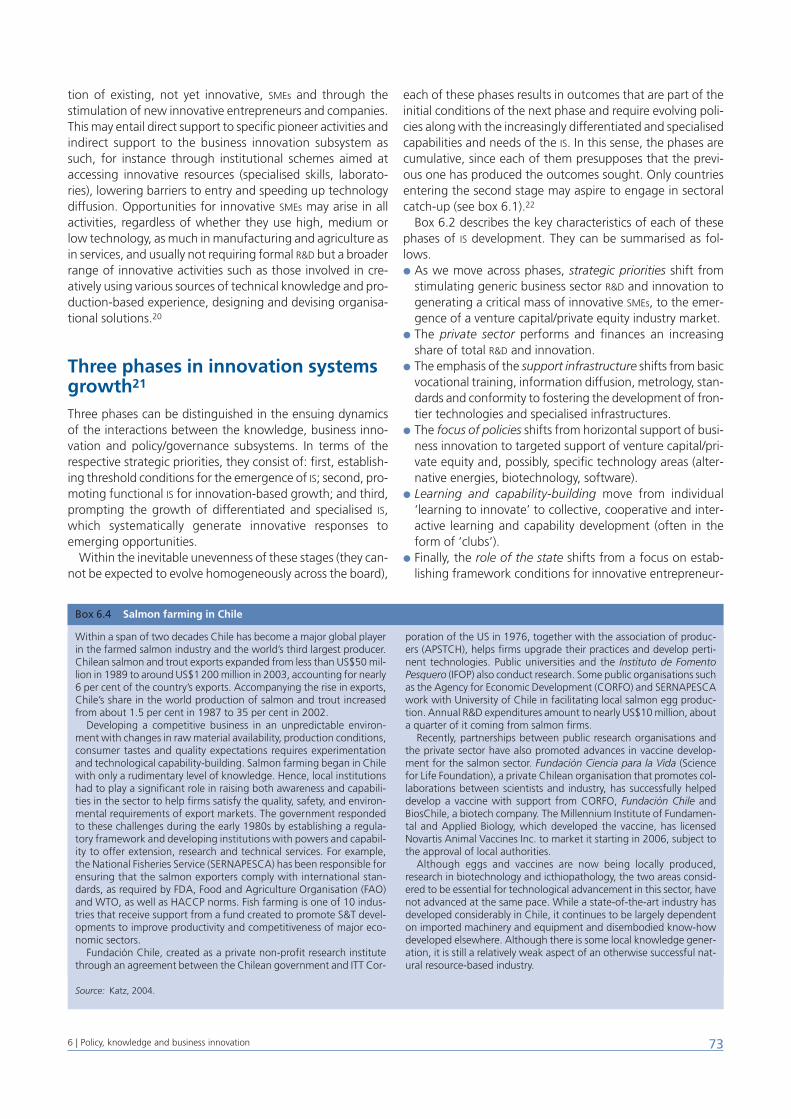
tion of existing, not yet innovative, SMEs and through thestimulation of new innovative entrepreneurs and companies.This may entail direct support to specific pioneer activities andindirect support to the business innovation subsystem assuch, for instance through institutional schemes aimed ataccessing innovative resources (specialised skills, laborato-ries), lowering barriers to entry and speeding up technologydiffusion. Opportunities for innovative SMEs may arise in allactivities, regardless of whether they use high, medium orlow technology, as much in manufacturing and agriculture asin services, and usually not requiring formal R&D but a broaderrange of innovative activities such as those involved in cre-atively using various sources of technical knowledge and pro-duction-based experience, designing and devising organisa-tional solutions.20
Three phases in innovation systemsgrowth21
Three phases can be distinguished in the ensuing dynamicsof the interactions between the knowledge, business inno-vation and policy/governance subsystems. In terms of therespective strategic priorities, they consist of: first, establish-ing threshold conditions for the emergence of IS; second, pro-moting functional IS for innovation-based growth; and third,prompting the growth of differentiated and specialised IS,which systematically generate innovative responses toemerging opportunities.
Within the inevitable unevenness of these stages (they can-not be expected to evolve homogeneously across the board),
each of these phases results in outcomes that are part of theinitial conditions of the next phase and require evolving poli-cies along with the increasingly differentiated and specialisedcapabilities and needs of the IS. In this sense, the phases arecumulative, since each of them presupposes that the previ-ous one has produced the outcomes sought. Only countriesentering the second stage may aspire to engage in sectoralcatch-up (see box 6.1).22
Box 6.2 describes the key characteristics of each of thesephases of IS development. They can be summarised as fol-lows.● As we move across phases, strategic priorities shift from
stimulating generic business sector R&D and innovation togenerating a critical mass of innovative SMEs, to the emer-gence of a venture capital/private equity industry market.
● The private sector performs and finances an increasingshare of total R&D and innovation.
● The emphasis of the support infrastructure shifts from basicvocational training, information diffusion, metrology, stan-dards and conformity to fostering the development of fron-tier technologies and specialised infrastructures.
● The focus of policies shifts from horizontal support of busi-ness innovation to targeted support of venture capital/pri-vate equity and, possibly, specific technology areas (alter-native energies, biotechnology, software).
● Learning and capability-building move from individual‘learning to innovate’ to collective, cooperative and inter-active learning and capability development (often in theform of ‘clubs’).
● Finally, the role of the state shifts from a focus on estab-lishing framework conditions for innovative entrepreneur-
736 | Policy, knowledge and business innovation
Box 6.4 Salmon farming in Chile
Source: Katz, 2004.
Within a span of two decades Chile has become a major global playerin the farmed salmon industry and the world’s third largest producer.Chilean salmon and trout exports expanded from less than US$50 mil-lion in 1989 to around US$1200 million in 2003, accounting for nearly6 per cent of the country’s exports. Accompanying the rise in exports,Chile’s share in the world production of salmon and trout increasedfrom about 1.5 per cent in 1987 to 35 per cent in 2002.
Developing a competitive business in an unpredictable environ-ment with changes in raw material availability, production conditions,consumer tastes and quality expectations requires experimentationand technological capability-building. Salmon farming began in Chilewith only a rudimentary level of knowledge. Hence, local institutionshad to play a significant role in raising both awareness and capabili-ties in the sector to help firms satisfy the quality, safety, and environ-mental requirements of export markets. The government respondedto these challenges during the early 1980s by establishing a regula-tory framework and developing institutions with powers and capabil-ity to offer extension, research and technical services. For example,the National Fisheries Service (SERNAPESCA) has been responsible forensuring that the salmon exporters comply with international stan-dards, as required by FDA, Food and Agriculture Organisation (FAO)and WTO, as well as HACCP norms. Fish farming is one of 10 indus-tries that receive support from a fund created to promote S&T devel-opments to improve productivity and competitiveness of major eco-nomic sectors.
Fundación Chile, created as a private non-profit research institutethrough an agreement between the Chilean government and ITT Cor-
poration of the US in 1976, together with the association of produc-ers (APSTCH), helps firms upgrade their practices and develop perti-nent technologies. Public universities and the Instituto de FomentoPesquero (IFOP) also conduct research. Some public organisations suchas the Agency for Economic Development (CORFO) and SERNAPESCAwork with University of Chile in facilitating local salmon egg produc-tion. Annual R&D expenditures amount to nearly US$10 million, abouta quarter of it coming from salmon firms.
Recently, partnerships between public research organisations andthe private sector have also promoted advances in vaccine develop-ment for the salmon sector. Fundación Ciencia para la Vida (Sciencefor Life Foundation), a private Chilean organisation that promotes col-laborations between scientists and industry, has successfully helpeddevelop a vaccine with support from CORFO, Fundación Chile andBiosChile, a biotech company. The Millennium Institute of Fundamen-tal and Applied Biology, which developed the vaccine, has licensedNovartis Animal Vaccines Inc. to market it starting in 2006, subject tothe approval of local authorities.
Although eggs and vaccines are now being locally produced,research in biotechnology and icthiopathology, the two areas consid-ered to be essential for technological advancement in this sector, havenot advanced at the same pace. While a state-of-the-art industry hasdeveloped considerably in Chile, it continues to be largely dependenton imported machinery and equipment and disembodied know-howdeveloped elsewhere. Although there is some local knowledge gener-ation, it is still a relatively weak aspect of an otherwise successful nat-ural resource-based industry.
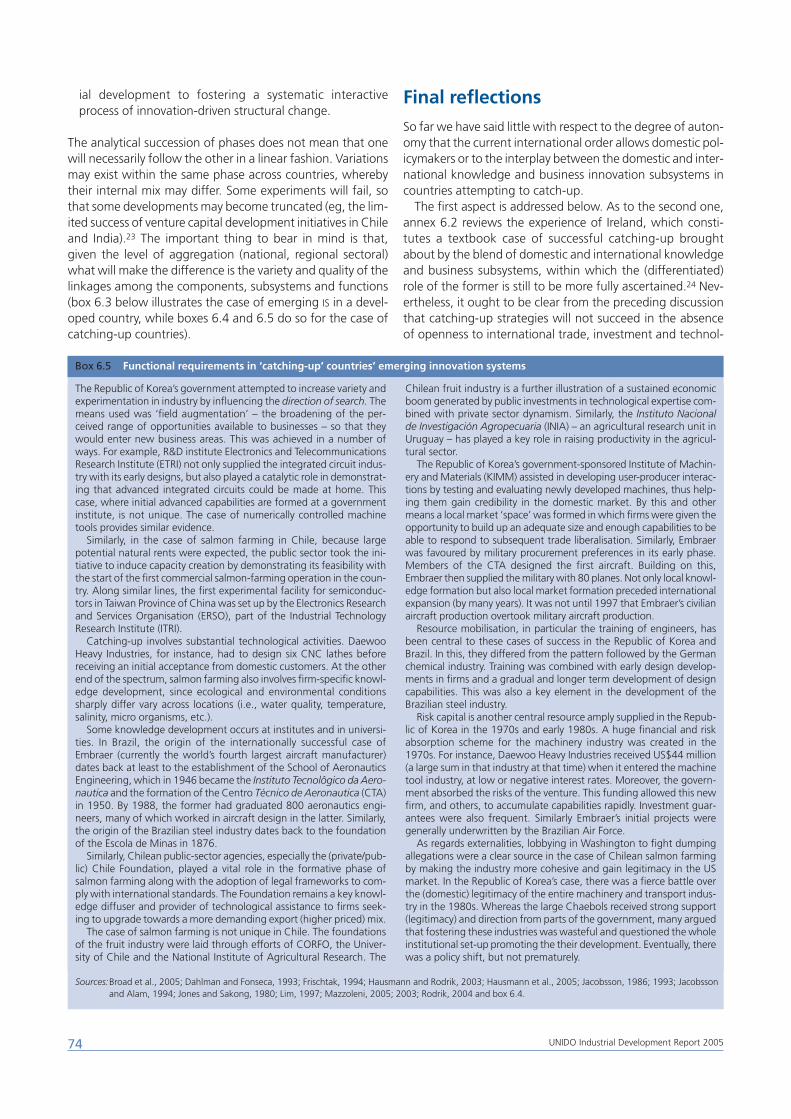
ial development to fostering a systematic interactiveprocess of innovation-driven structural change.
The analytical succession of phases does not mean that onewill necessarily follow the other in a linear fashion. Variationsmay exist within the same phase across countries, wherebytheir internal mix may differ. Some experiments will fail, sothat some developments may become truncated (eg, the lim-ited success of venture capital development initiatives in Chileand India).23 The important thing to bear in mind is that,given the level of aggregation (national, regional sectoral)what will make the difference is the variety and quality of thelinkages among the components, subsystems and functions(box 6.3 below illustrates the case of emerging IS in a devel-oped country, while boxes 6.4 and 6.5 do so for the case ofcatching-up countries).
Final reflectionsSo far we have said little with respect to the degree of auton-omy that the current international order allows domestic pol-icymakers or to the interplay between the domestic and inter-national knowledge and business innovation subsystems incountries attempting to catch-up.
The first aspect is addressed below. As to the second one,annex 6.2 reviews the experience of Ireland, which consti-tutes a textbook case of successful catching-up broughtabout by the blend of domestic and international knowledgeand business subsystems, within which the (differentiated)role of the former is still to be more fully ascertained.24 Nev-ertheless, it ought to be clear from the preceding discussionthat catching-up strategies will not succeed in the absenceof openness to international trade, investment and technol-
74 UNIDO Industrial Development Report 2005
Box 6.5 Functional requirements in ‘catching-up’ countries’ emerging innovation systems
Sources:Broad et al., 2005; Dahlman and Fonseca, 1993; Frischtak, 1994; Hausmann and Rodrik, 2003; Hausmann et al., 2005; Jacobsson, 1986; 1993; Jacobssonand Alam, 1994; Jones and Sakong, 1980; Lim, 1997; Mazzoleni, 2005; 2003; Rodrik, 2004 and box 6.4.
The Republic of Korea’s government attempted to increase variety andexperimentation in industry by influencing the direction of search. Themeans used was ‘field augmentation’ – the broadening of the per-ceived range of opportunities available to businesses – so that theywould enter new business areas. This was achieved in a number ofways. For example, R&D institute Electronics and TelecommunicationsResearch Institute (ETRI) not only supplied the integrated circuit indus-try with its early designs, but also played a catalytic role in demonstrat-ing that advanced integrated circuits could be made at home. Thiscase, where initial advanced capabilities are formed at a governmentinstitute, is not unique. The case of numerically controlled machinetools provides similar evidence.
Similarly, in the case of salmon farming in Chile, because largepotential natural rents were expected, the public sector took the ini-tiative to induce capacity creation by demonstrating its feasibility withthe start of the first commercial salmon-farming operation in the coun-try. Along similar lines, the first experimental facility for semiconduc-tors in Taiwan Province of China was set up by the Electronics Researchand Services Organisation (ERSO), part of the Industrial TechnologyResearch Institute (ITRI).
Catching-up involves substantial technological activities. DaewooHeavy Industries, for instance, had to design six CNC lathes beforereceiving an initial acceptance from domestic customers. At the otherend of the spectrum, salmon farming also involves firm-specific knowl-edge development, since ecological and environmental conditionssharply differ vary across locations (i.e., water quality, temperature,salinity, micro organisms, etc.).
Some knowledge development occurs at institutes and in universi-ties. In Brazil, the origin of the internationally successful case ofEmbraer (currently the world’s fourth largest aircraft manufacturer)dates back at least to the establishment of the School of AeronauticsEngineering, which in 1946 became the Instituto Tecnolôgico da Aero-nautica and the formation of the Centro Técnico de Aeronautica (CTA)in 1950. By 1988, the former had graduated 800 aeronautics engi-neers, many of which worked in aircraft design in the latter. Similarly,the origin of the Brazilian steel industry dates back to the foundationof the Escola de Minas in 1876.
Similarly, Chilean public-sector agencies, especially the (private/pub-lic) Chile Foundation, played a vital role in the formative phase ofsalmon farming along with the adoption of legal frameworks to com-ply with international standards. The Foundation remains a key knowl-edge diffuser and provider of technological assistance to firms seek-ing to upgrade towards a more demanding export (higher priced) mix.
The case of salmon farming is not unique in Chile. The foundationsof the fruit industry were laid through efforts of CORFO, the Univer-sity of Chile and the National Institute of Agricultural Research. The
Chilean fruit industry is a further illustration of a sustained economicboom generated by public investments in technological expertise com-bined with private sector dynamism. Similarly, the Instituto Nacionalde Investigación Agropecuaria (INIA) – an agricultural research unit inUruguay – has played a key role in raising productivity in the agricul-tural sector.
The Republic of Korea’s government-sponsored Institute of Machin-ery and Materials (KIMM) assisted in developing user-producer interac-tions by testing and evaluating newly developed machines, thus help-ing them gain credibility in the domestic market. By this and othermeans a local market ‘space’ was formed in which firms were given theopportunity to build up an adequate size and enough capabilities to beable to respond to subsequent trade liberalisation. Similarly, Embraerwas favoured by military procurement preferences in its early phase.Members of the CTA designed the first aircraft. Building on this,Embraer then supplied the military with 80 planes. Not only local knowl-edge formation but also local market formation preceded internationalexpansion (by many years). It was not until 1997 that Embraer’s civilianaircraft production overtook military aircraft production.
Resource mobilisation, in particular the training of engineers, hasbeen central to these cases of success in the Republic of Korea andBrazil. In this, they differed from the pattern followed by the Germanchemical industry. Training was combined with early design develop-ments in firms and a gradual and longer term development of designcapabilities. This was also a key element in the development of theBrazilian steel industry.
Risk capital is another central resource amply supplied in the Repub-lic of Korea in the 1970s and early 1980s. A huge financial and riskabsorption scheme for the machinery industry was created in the1970s. For instance, Daewoo Heavy Industries received US$44 million(a large sum in that industry at that time) when it entered the machinetool industry, at low or negative interest rates. Moreover, the govern-ment absorbed the risks of the venture. This funding allowed this newfirm, and others, to accumulate capabilities rapidly. Investment guar-antees were also frequent. Similarly Embraer’s initial projects weregenerally underwritten by the Brazilian Air Force.
As regards externalities, lobbying in Washington to fight dumpingallegations were a clear source in the case of Chilean salmon farmingby making the industry more cohesive and gain legitimacy in the USmarket. In the Republic of Korea’s case, there was a fierce battle overthe (domestic) legitimacy of the entire machinery and transport indus-try in the 1980s. Whereas the large Chaebols received strong support(legitimacy) and direction from parts of the government, many arguedthat fostering these industries was wasteful and questioned the wholeinstitutional set-up promoting the their development. Eventually, therewas a policy shift, but not prematurely.
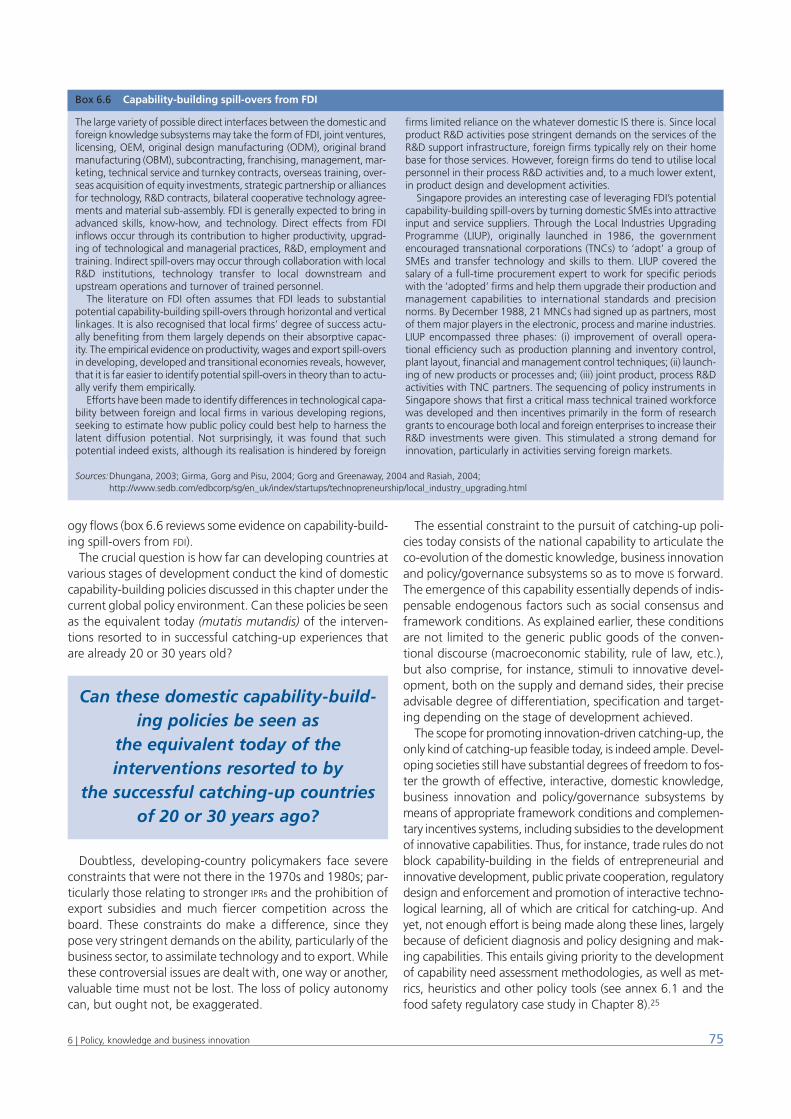
ogy flows (box 6.6 reviews some evidence on capability-build-ing spill-overs from FDI).
The crucial question is how far can developing countries atvarious stages of development conduct the kind of domesticcapability-building policies discussed in this chapter under thecurrent global policy environment. Can these policies be seenas the equivalent today (mutatis mutandis) of the interven-tions resorted to in successful catching-up experiences thatare already 20 or 30 years old?
Doubtless, developing-country policymakers face severeconstraints that were not there in the 1970s and 1980s; par-ticularly those relating to stronger IPRs and the prohibition ofexport subsidies and much fiercer competition across theboard. These constraints do make a difference, since theypose very stringent demands on the ability, particularly of thebusiness sector, to assimilate technology and to export. Whilethese controversial issues are dealt with, one way or another,valuable time must not be lost. The loss of policy autonomycan, but ought not, be exaggerated.
The essential constraint to the pursuit of catching-up poli-cies today consists of the national capability to articulate theco-evolution of the domestic knowledge, business innovationand policy/governance subsystems so as to move IS forward.The emergence of this capability essentially depends of indis-pensable endogenous factors such as social consensus andframework conditions. As explained earlier, these conditionsare not limited to the generic public goods of the conven-tional discourse (macroeconomic stability, rule of law, etc.),but also comprise, for instance, stimuli to innovative devel-opment, both on the supply and demand sides, their preciseadvisable degree of differentiation, specification and target-ing depending on the stage of development achieved.
The scope for promoting innovation-driven catching-up, theonly kind of catching-up feasible today, is indeed ample. Devel-oping societies still have substantial degrees of freedom to fos-ter the growth of effective, interactive, domestic knowledge,business innovation and policy/governance subsystems bymeans of appropriate framework conditions and complemen-tary incentives systems, including subsidies to the developmentof innovative capabilities. Thus, for instance, trade rules do notblock capability-building in the fields of entrepreneurial andinnovative development, public private cooperation, regulatorydesign and enforcement and promotion of interactive techno-logical learning, all of which are critical for catching-up. Andyet, not enough effort is being made along these lines, largelybecause of deficient diagnosis and policy designing and mak-ing capabilities. This entails giving priority to the developmentof capability need assessment methodologies, as well as met-rics, heuristics and other policy tools (see annex 6.1 and thefood safety regulatory case study in Chapter 8).25
756 | Policy, knowledge and business innovation
Box 6.6 Capability-building spill-overs from FDI
Sources:Dhungana, 2003; Girma, Gorg and Pisu, 2004; Gorg and Greenaway, 2004 and Rasiah, 2004;http://www.sedb.com/edbcorp/sg/en_uk/index/startups/technopreneurship/local_industry_upgrading.html
The large variety of possible direct interfaces between the domestic andforeign knowledge subsystems may take the form of FDI, joint ventures,licensing, OEM, original design manufacturing (ODM), original brandmanufacturing (OBM), subcontracting, franchising, management, mar-keting, technical service and turnkey contracts, overseas training, over-seas acquisition of equity investments, strategic partnership or alliancesfor technology, R&D contracts, bilateral cooperative technology agree-ments and material sub-assembly. FDI is generally expected to bring inadvanced skills, know-how, and technology. Direct effects from FDIinflows occur through its contribution to higher productivity, upgrad-ing of technological and managerial practices, R&D, employment andtraining. Indirect spill-overs may occur through collaboration with localR&D institutions, technology transfer to local downstream andupstream operations and turnover of trained personnel.
The literature on FDI often assumes that FDI leads to substantialpotential capability-building spill-overs through horizontal and verticallinkages. It is also recognised that local firms’ degree of success actu-ally benefiting from them largely depends on their absorptive capac-ity. The empirical evidence on productivity, wages and export spill-oversin developing, developed and transitional economies reveals, however,that it is far easier to identify potential spill-overs in theory than to actu-ally verify them empirically.
Efforts have been made to identify differences in technological capa-bility between foreign and local firms in various developing regions,seeking to estimate how public policy could best help to harness thelatent diffusion potential. Not surprisingly, it was found that suchpotential indeed exists, although its realisation is hindered by foreign
firms limited reliance on the whatever domestic IS there is. Since localproduct R&D activities pose stringent demands on the services of theR&D support infrastructure, foreign firms typically rely on their homebase for those services. However, foreign firms do tend to utilise localpersonnel in their process R&D activities and, to a much lower extent,in product design and development activities.
Singapore provides an interesting case of leveraging FDI’s potentialcapability-building spill-overs by turning domestic SMEs into attractiveinput and service suppliers. Through the Local Industries UpgradingProgramme (LIUP), originally launched in 1986, the governmentencouraged transnational corporations (TNCs) to ‘adopt’ a group ofSMEs and transfer technology and skills to them. LIUP covered thesalary of a full-time procurement expert to work for specific periodswith the ‘adopted’ firms and help them upgrade their production andmanagement capabilities to international standards and precisionnorms. By December 1988, 21 MNCs had signed up as partners, mostof them major players in the electronic, process and marine industries.LIUP encompassed three phases: (i) improvement of overall opera-tional efficiency such as production planning and inventory control,plant layout, financial and management control techniques; (ii) launch-ing of new products or processes and; (iii) joint product, process R&Dactivities with TNC partners. The sequencing of policy instruments inSingapore shows that first a critical mass technical trained workforcewas developed and then incentives primarily in the form of researchgrants to encourage both local and foreign enterprises to increase theirR&D investments were given. This stimulated a strong demand forinnovation, particularly in activities serving foreign markets.
Can these domestic capability-build-ing policies be seen as
the equivalent today of the interventions resorted to by
the successful catching-up countriesof 20 or 30 years ago?
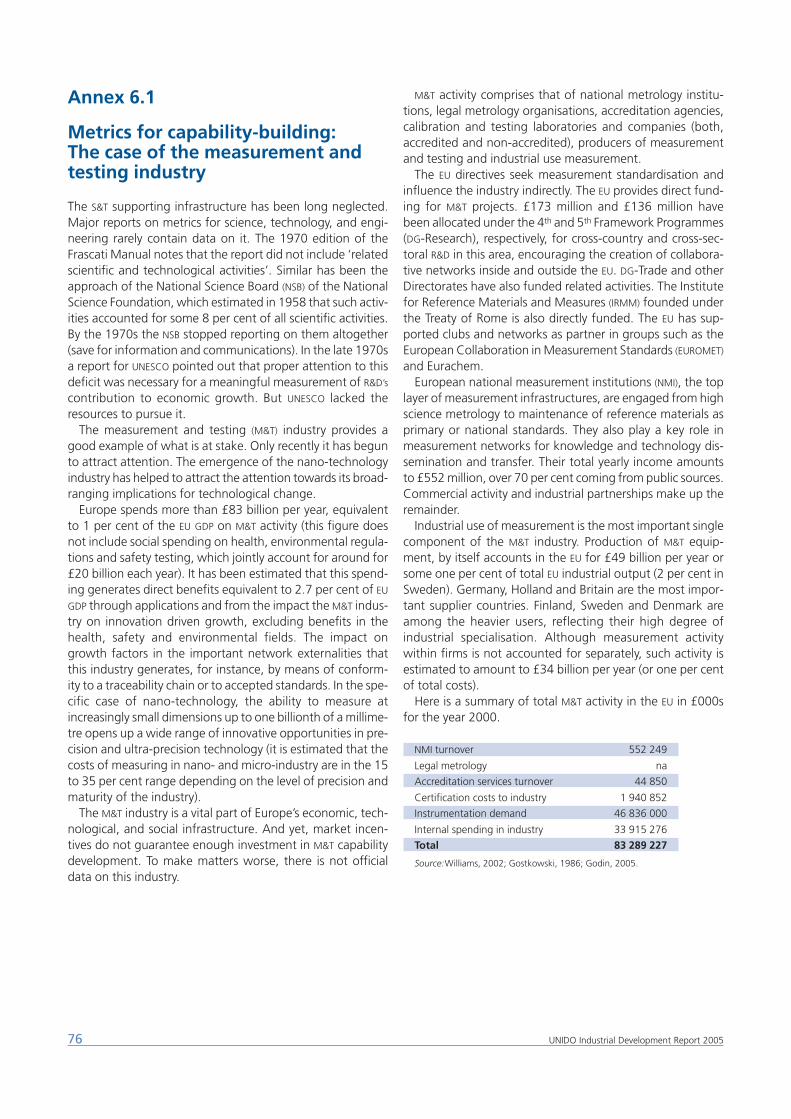
Annex 6.1
Metrics for capability-building: The case of the measurement andtesting industry
The S&T supporting infrastructure has been long neglected.Major reports on metrics for science, technology, and engi-neering rarely contain data on it. The 1970 edition of theFrascati Manual notes that the report did not include ‘relatedscientific and technological activities’. Similar has been theapproach of the National Science Board (NSB) of the NationalScience Foundation, which estimated in 1958 that such activ-ities accounted for some 8 per cent of all scientific activities.By the 1970s the NSB stopped reporting on them altogether(save for information and communications). In the late 1970sa report for UNESCO pointed out that proper attention to thisdeficit was necessary for a meaningful measurement of R&D’s
contribution to economic growth. But UNESCO lacked theresources to pursue it.
The measurement and testing (M&T) industry provides agood example of what is at stake. Only recently it has begunto attract attention. The emergence of the nano-technologyindustry has helped to attract the attention towards its broad-ranging implications for technological change.
Europe spends more than £83 billion per year, equivalentto 1 per cent of the EU GDP on M&T activity (this figure doesnot include social spending on health, environmental regula-tions and safety testing, which jointly account for around for£20 billion each year). It has been estimated that this spend-ing generates direct benefits equivalent to 2.7 per cent of EU
GDP through applications and from the impact the M&T indus-try on innovation driven growth, excluding benefits in thehealth, safety and environmental fields. The impact ongrowth factors in the important network externalities thatthis industry generates, for instance, by means of conform-ity to a traceability chain or to accepted standards. In the spe-cific case of nano-technology, the ability to measure atincreasingly small dimensions up to one billionth of a millime-tre opens up a wide range of innovative opportunities in pre-cision and ultra-precision technology (it is estimated that thecosts of measuring in nano- and micro-industry are in the 15to 35 per cent range depending on the level of precision andmaturity of the industry).
The M&T industry is a vital part of Europe’s economic, tech-nological, and social infrastructure. And yet, market incen-tives do not guarantee enough investment in M&T capabilitydevelopment. To make matters worse, there is not officialdata on this industry.
M&T activity comprises that of national metrology institu-tions, legal metrology organisations, accreditation agencies,calibration and testing laboratories and companies (both,accredited and non-accredited), producers of measurementand testing and industrial use measurement.
The EU directives seek measurement standardisation andinfluence the industry indirectly. The EU provides direct fund-ing for M&T projects. £173 million and £136 million havebeen allocated under the 4th and 5th Framework Programmes(DG-Research), respectively, for cross-country and cross-sec-toral R&D in this area, encouraging the creation of collabora-tive networks inside and outside the EU. DG-Trade and otherDirectorates have also funded related activities. The Institutefor Reference Materials and Measures (IRMM) founded underthe Treaty of Rome is also directly funded. The EU has sup-ported clubs and networks as partner in groups such as theEuropean Collaboration in Measurement Standards (EUROMET)
and Eurachem.European national measurement institutions (NMI), the top
layer of measurement infrastructures, are engaged from highscience metrology to maintenance of reference materials asprimary or national standards. They also play a key role inmeasurement networks for knowledge and technology dis-semination and transfer. Their total yearly income amountsto £552 million, over 70 per cent coming from public sources.Commercial activity and industrial partnerships make up theremainder.
Industrial use of measurement is the most important singlecomponent of the M&T industry. Production of M&T equip-ment, by itself accounts in the EU for £49 billion per year orsome one per cent of total EU industrial output (2 per cent inSweden). Germany, Holland and Britain are the most impor-tant supplier countries. Finland, Sweden and Denmark areamong the heavier users, reflecting their high degree ofindustrial specialisation. Although measurement activitywithin firms is not accounted for separately, such activity isestimated to amount to £34 billion per year (or one per centof total costs).
Here is a summary of total M&T activity in the EU in £000sfor the year 2000.
NMI turnover 552 249
Legal metrology na
Accreditation services turnover 44 850
Certification costs to industry 1 940 852
Instrumentation demand 46 836 000
Internal spending in industry 33 915 276
Total 83 289 227
Source:Williams, 2002; Gostkowski, 1986; Godin, 2005.
76 UNIDO Industrial Development Report 2005
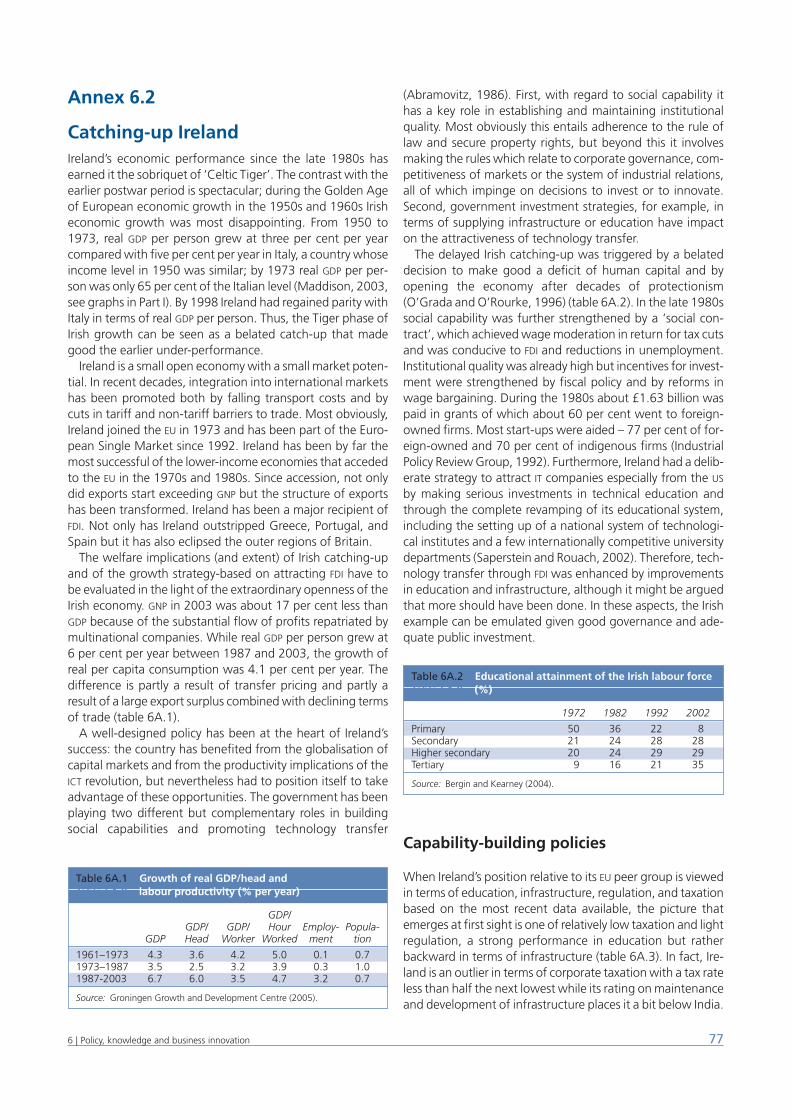
Annex 6.2
Catching-up IrelandIreland’s economic performance since the late 1980s hasearned it the sobriquet of ‘Celtic Tiger’. The contrast with theearlier postwar period is spectacular; during the Golden Ageof European economic growth in the 1950s and 1960s Irisheconomic growth was most disappointing. From 1950 to1973, real GDP per person grew at three per cent per yearcompared with five per cent per year in Italy, a country whoseincome level in 1950 was similar; by 1973 real GDP per per-son was only 65 per cent of the Italian level (Maddison, 2003,see graphs in Part I). By 1998 Ireland had regained parity withItaly in terms of real GDP per person. Thus, the Tiger phase ofIrish growth can be seen as a belated catch-up that madegood the earlier under-performance.
Ireland is a small open economy with a small market poten-tial. In recent decades, integration into international marketshas been promoted both by falling transport costs and bycuts in tariff and non-tariff barriers to trade. Most obviously,Ireland joined the EU in 1973 and has been part of the Euro-pean Single Market since 1992. Ireland has been by far themost successful of the lower-income economies that accededto the EU in the 1970s and 1980s. Since accession, not onlydid exports start exceeding GNP but the structure of exportshas been transformed. Ireland has been a major recipient ofFDI. Not only has Ireland outstripped Greece, Portugal, andSpain but it has also eclipsed the outer regions of Britain.
The welfare implications (and extent) of Irish catching-upand of the growth strategy-based on attracting FDI have tobe evaluated in the light of the extraordinary openness of theIrish economy. GNP in 2003 was about 17 per cent less thanGDP because of the substantial flow of profits repatriated bymultinational companies. While real GDP per person grew at6 per cent per year between 1987 and 2003, the growth ofreal per capita consumption was 4.1 per cent per year. Thedifference is partly a result of transfer pricing and partly aresult of a large export surplus combined with declining termsof trade (table 6A.1).
A well-designed policy has been at the heart of Ireland’ssuccess: the country has benefited from the globalisation ofcapital markets and from the productivity implications of theICT revolution, but nevertheless had to position itself to takeadvantage of these opportunities. The government has beenplaying two different but complementary roles in buildingsocial capabilities and promoting technology transfer
(Abramovitz, 1986). First, with regard to social capability ithas a key role in establishing and maintaining institutionalquality. Most obviously this entails adherence to the rule oflaw and secure property rights, but beyond this it involvesmaking the rules which relate to corporate governance, com-petitiveness of markets or the system of industrial relations,all of which impinge on decisions to invest or to innovate.Second, government investment strategies, for example, interms of supplying infrastructure or education have impacton the attractiveness of technology transfer.
The delayed Irish catching-up was triggered by a belateddecision to make good a deficit of human capital and byopening the economy after decades of protectionism(O’Grada and O’Rourke, 1996) (table 6A.2). In the late 1980ssocial capability was further strengthened by a ‘social con-tract’, which achieved wage moderation in return for tax cutsand was conducive to FDI and reductions in unemployment.Institutional quality was already high but incentives for invest-ment were strengthened by fiscal policy and by reforms inwage bargaining. During the 1980s about £1.63 billion waspaid in grants of which about 60 per cent went to foreign-owned firms. Most start-ups were aided – 77 per cent of for-eign-owned and 70 per cent of indigenous firms (IndustrialPolicy Review Group, 1992). Furthermore, Ireland had a delib-erate strategy to attract IT companies especially from the US
by making serious investments in technical education andthrough the complete revamping of its educational system,including the setting up of a national system of technologi-cal institutes and a few internationally competitive universitydepartments (Saperstein and Rouach, 2002). Therefore, tech-nology transfer through FDI was enhanced by improvementsin education and infrastructure, although it might be arguedthat more should have been done. In these aspects, the Irishexample can be emulated given good governance and ade-quate public investment.
Capability-building policies
When Ireland’s position relative to its EU peer group is viewedin terms of education, infrastructure, regulation, and taxationbased on the most recent data available, the picture thatemerges at first sight is one of relatively low taxation and lightregulation, a strong performance in education but ratherbackward in terms of infrastructure (table 6A.3). In fact, Ire-land is an outlier in terms of corporate taxation with a tax rateless than half the next lowest while its rating on maintenanceand development of infrastructure places it a bit below India.
776 | Policy, knowledge and business innovation
Table 6A.1 Growth of real GDP/head andTable 6A.9 labour productivity (% per year)
GDP/GDP/ GDP/ Hour Employ- Popula-
GDP Head Worker Worked ment tion
1961–1973 4.3 3.6 4.2 5.0 0.1 0.71973–1987 3.5 2.5 3.2 3.9 0.3 1.01987-2003 6.7 6.0 3.5 4.7 3.2 0.7
Source: Groningen Growth and Development Centre (2005).
Table 6A.2 Educational attainment of the Irish labour forceTable 6A.9 (%)
1972 1982 1992 2002
Primary 50 36 22 8Secondary 21 24 28 28Higher secondary 20 24 29 29Tertiary 9 16 21 35
Source: Bergin and Kearney (2004).
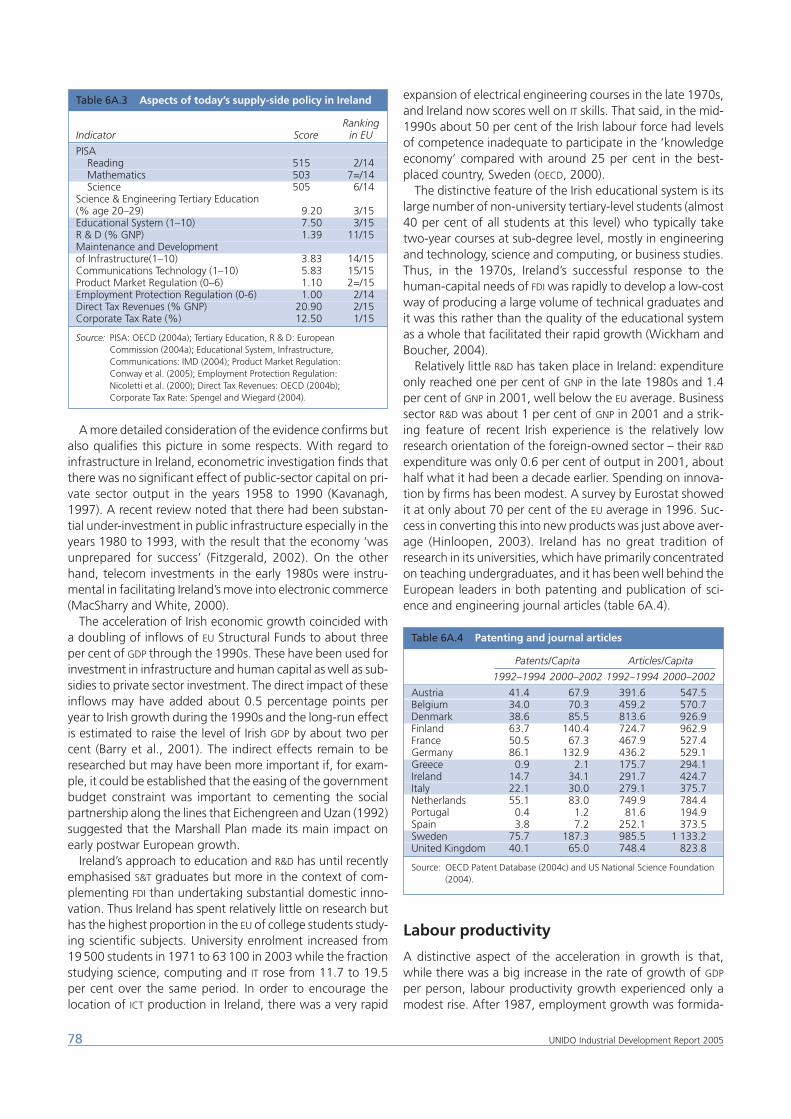
A more detailed consideration of the evidence confirms butalso qualifies this picture in some respects. With regard toinfrastructure in Ireland, econometric investigation finds thatthere was no significant effect of public-sector capital on pri-vate sector output in the years 1958 to 1990 (Kavanagh,1997). A recent review noted that there had been substan-tial under-investment in public infrastructure especially in theyears 1980 to 1993, with the result that the economy ‘wasunprepared for success’ (Fitzgerald, 2002). On the otherhand, telecom investments in the early 1980s were instru-mental in facilitating Ireland’s move into electronic commerce(MacSharry and White, 2000).
The acceleration of Irish economic growth coincided witha doubling of inflows of EU Structural Funds to about threeper cent of GDP through the 1990s. These have been used forinvestment in infrastructure and human capital as well as sub-sidies to private sector investment. The direct impact of theseinflows may have added about 0.5 percentage points peryear to Irish growth during the 1990s and the long-run effectis estimated to raise the level of Irish GDP by about two percent (Barry et al., 2001). The indirect effects remain to beresearched but may have been more important if, for exam-ple, it could be established that the easing of the governmentbudget constraint was important to cementing the socialpartnership along the lines that Eichengreen and Uzan (1992)suggested that the Marshall Plan made its main impact onearly postwar European growth.
Ireland’s approach to education and R&D has until recentlyemphasised S&T graduates but more in the context of com-plementing FDI than undertaking substantial domestic inno-vation. Thus Ireland has spent relatively little on research buthas the highest proportion in the EU of college students study-ing scientific subjects. University enrolment increased from19500 students in 1971 to 63100 in 2003 while the fractionstudying science, computing and IT rose from 11.7 to 19.5per cent over the same period. In order to encourage thelocation of ICT production in Ireland, there was a very rapid
expansion of electrical engineering courses in the late 1970s,and Ireland now scores well on IT skills. That said, in the mid-1990s about 50 per cent of the Irish labour force had levelsof competence inadequate to participate in the ‘knowledgeeconomy’ compared with around 25 per cent in the best-placed country, Sweden (OECD, 2000).
The distinctive feature of the Irish educational system is itslarge number of non-university tertiary-level students (almost40 per cent of all students at this level) who typically taketwo-year courses at sub-degree level, mostly in engineeringand technology, science and computing, or business studies.Thus, in the 1970s, Ireland’s successful response to thehuman-capital needs of FDI was rapidly to develop a low-costway of producing a large volume of technical graduates andit was this rather than the quality of the educational systemas a whole that facilitated their rapid growth (Wickham andBoucher, 2004).
Relatively little R&D has taken place in Ireland: expenditureonly reached one per cent of GNP in the late 1980s and 1.4per cent of GNP in 2001, well below the EU average. Businesssector R&D was about 1 per cent of GNP in 2001 and a strik-ing feature of recent Irish experience is the relatively lowresearch orientation of the foreign-owned sector – their R&D
expenditure was only 0.6 per cent of output in 2001, abouthalf what it had been a decade earlier. Spending on innova-tion by firms has been modest. A survey by Eurostat showedit at only about 70 per cent of the EU average in 1996. Suc-cess in converting this into new products was just above aver-age (Hinloopen, 2003). Ireland has no great tradition ofresearch in its universities, which have primarily concentratedon teaching undergraduates, and it has been well behind theEuropean leaders in both patenting and publication of sci-ence and engineering journal articles (table 6A.4).
Labour productivity
A distinctive aspect of the acceleration in growth is that,while there was a big increase in the rate of growth of GDP
per person, labour productivity growth experienced only amodest rise. After 1987, employment growth was formida-
78 UNIDO Industrial Development Report 2005
Table 6A.4 Patenting and journal articles
Patents/Capita Articles/Capita
1992–1994 2000–2002 1992–1994 2000–2002
Austria 41.4 67.9 391.6 547.5Belgium 34.0 70.3 459.2 570.7Denmark 38.6 85.5 813.6 926.9Finland 63.7 140.4 724.7 962.9France 50.5 67.3 467.9 527.4Germany 86.1 132.9 436.2 529.1Greece 0.9 2.1 175.7 294.1Ireland 14.7 34.1 291.7 424.7Italy 22.1 30.0 279.1 375.7Netherlands 55.1 83.0 749.9 784.4Portugal 0.4 1.2 81.6 194.9Spain 3.8 7.2 252.1 373.5Sweden 75.7 187.3 985.5 1 133.2United Kingdom 40.1 65.0 748.4 823.8
Source: OECD Patent Database (2004c) and US National Science Foundation(2004).
Table 6A.3 Aspects of today’s supply-side policy in Ireland
RankingIndicator Score in EU
PISAReading 515.0 2/14Mathematics 503.0 7=/14Science 505.0 6/14
Science & Engineering Tertiary Education (% age 20–29) 9.20 3/15Educational System (1–10) 7.50 3/15R & D (% GNP) 1.39 11/15Maintenance and Development of Infrastructure(1–10) 3.83 14/15Communications Technology (1–10) 5.83 15/15Product Market Regulation (0–6) 1.10 2=/15Employment Protection Regulation (0-6) 1.00 2/14Direct Tax Revenues (% GNP) 20.90 2/15Corporate Tax Rate (%) 12.50 1/15
Source: PISA: OECD (2004a); Tertiary Education, R & D: EuropeanCommission (2004a); Educational System, Infrastructure,Communications: IMD (2004); Product Market Regulation: Conway et al. (2005); Employment Protection Regulation: Nicoletti et al. (2000); Direct Tax Revenues: OECD (2004b);Corporate Tax Rate: Spengel and Wiegard (2004).
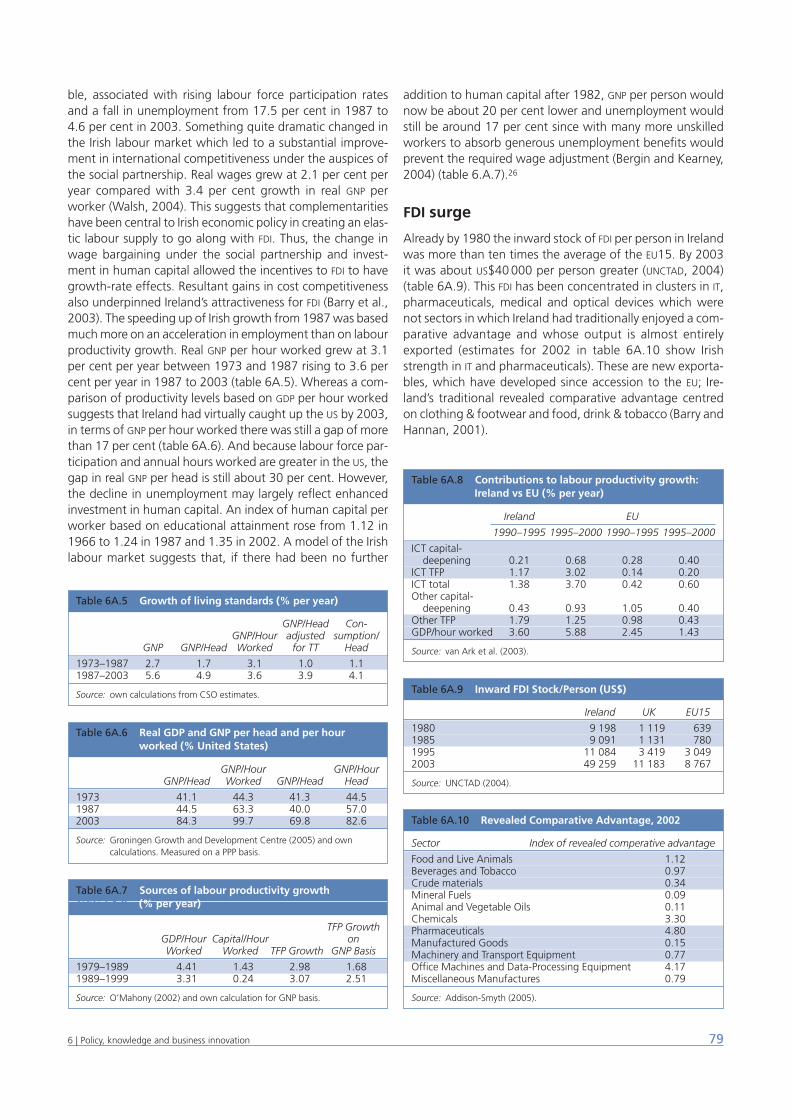
ble, associated with rising labour force participation ratesand a fall in unemployment from 17.5 per cent in 1987 to4.6 per cent in 2003. Something quite dramatic changed inthe Irish labour market which led to a substantial improve-ment in international competitiveness under the auspices ofthe social partnership. Real wages grew at 2.1 per cent peryear compared with 3.4 per cent growth in real GNP perworker (Walsh, 2004). This suggests that complementaritieshave been central to Irish economic policy in creating an elas-tic labour supply to go along with FDI. Thus, the change inwage bargaining under the social partnership and invest-ment in human capital allowed the incentives to FDI to havegrowth-rate effects. Resultant gains in cost competitivenessalso underpinned Ireland’s attractiveness for FDI (Barry et al.,2003). The speeding up of Irish growth from 1987 was basedmuch more on an acceleration in employment than on labourproductivity growth. Real GNP per hour worked grew at 3.1per cent per year between 1973 and 1987 rising to 3.6 percent per year in 1987 to 2003 (table 6A.5). Whereas a com-parison of productivity levels based on GDP per hour workedsuggests that Ireland had virtually caught up the US by 2003,in terms of GNP per hour worked there was still a gap of morethan 17 per cent (table 6A.6). And because labour force par-ticipation and annual hours worked are greater in the US, thegap in real GNP per head is still about 30 per cent. However,the decline in unemployment may largely reflect enhancedinvestment in human capital. An index of human capital perworker based on educational attainment rose from 1.12 in1966 to 1.24 in 1987 and 1.35 in 2002. A model of the Irishlabour market suggests that, if there had been no further
addition to human capital after 1982, GNP per person wouldnow be about 20 per cent lower and unemployment wouldstill be around 17 per cent since with many more unskilledworkers to absorb generous unemployment benefits wouldprevent the required wage adjustment (Bergin and Kearney,2004) (table 6.A.7).26
FDI surge
Already by 1980 the inward stock of FDI per person in Irelandwas more than ten times the average of the EU15. By 2003it was about US$40 000 per person greater (UNCTAD, 2004)(table 6A.9). This FDI has been concentrated in clusters in IT,pharmaceuticals, medical and optical devices which werenot sectors in which Ireland had traditionally enjoyed a com-parative advantage and whose output is almost entirelyexported (estimates for 2002 in table 6A.10 show Irishstrength in IT and pharmaceuticals). These are new exporta-bles, which have developed since accession to the EU; Ire-land’s traditional revealed comparative advantage centredon clothing & footwear and food, drink & tobacco (Barry andHannan, 2001).
796 | Policy, knowledge and business innovation
Table 6A.5 Growth of living standards (% per year)
GNP/Head Con-GNP/Hour adjusted sumption/
GNP GNP/Head Worked for TT Head
1973–1987 2.7 1.7 3.1 1.0 1.11987–2003 5.6 4.9 3.6 3.9 4.1
Source: own calculations from CSO estimates.
Table 6A.6 Real GDP and GNP per head and per hourTable 6A.9 worked (% United States)
GNP/Hour GNP/HourGNP/Head Worked GNP/Head Head
1973 41.1 44.3 41.3 44.51987 44.5 63.3 40.0 57.02003 84.3 99.7 69.8 82.6
Source: Groningen Growth and Development Centre (2005) and owncalculations. Measured on a PPP basis.
Table 6A.7 Sources of labour productivity growthTable 6A.9 (% per year)
TFP GrowthGDP/Hour Capital/Hour onWorked Worked TFP Growth GNP Basis
1979–1989 4.41 1.43 2.98 1.681989–1999 3.31 0.24 3.07 2.51
Source: O’Mahony (2002) and own calculation for GNP basis.
Table 6A.8 Contributions to labour productivity growth:Table 6A.9 Ireland vs EU (% per year)
Ireland EU
1990–1995 1995–2000 1990–1995 1995–2000
ICT capital-deepening 0.21 0.68 0.28 0.40
ICT TFP 1.17 3.02 0.14 0.20ICT total 1.38 3.70 0.42 0.60Other capital-
deepening 0.43 0.93 1.05 0.40Other TFP 1.79 1.25 0.98 0.43GDP/hour worked 3.60 5.88 2.45 1.43
Source: van Ark et al. (2003).
Table 6A.10 Revealed Comparative Advantage, 2002
Sector Index of revealed comperative advantage
Food and Live Animals 1.12Beverages and Tobacco 0.97Crude materials 0.34Mineral Fuels 0.09Animal and Vegetable Oils 0.11Chemicals 3.30Pharmaceuticals 4.80Manufactured Goods 0.15Machinery and Transport Equipment 0.77Office Machines and Data-Processing Equipment 4.17Miscellaneous Manufactures 0.79
Source: Addison-Smyth (2005).
Table 6A.9 Inward FDI Stock/Person (US$)
Ireland UK EU15
1980 9 198 1 119 6391985 9 091 1 131 7801995 11 084 3 419 3 0492003 49 259 11 183 8 767
Source: UNCTAD (2004).
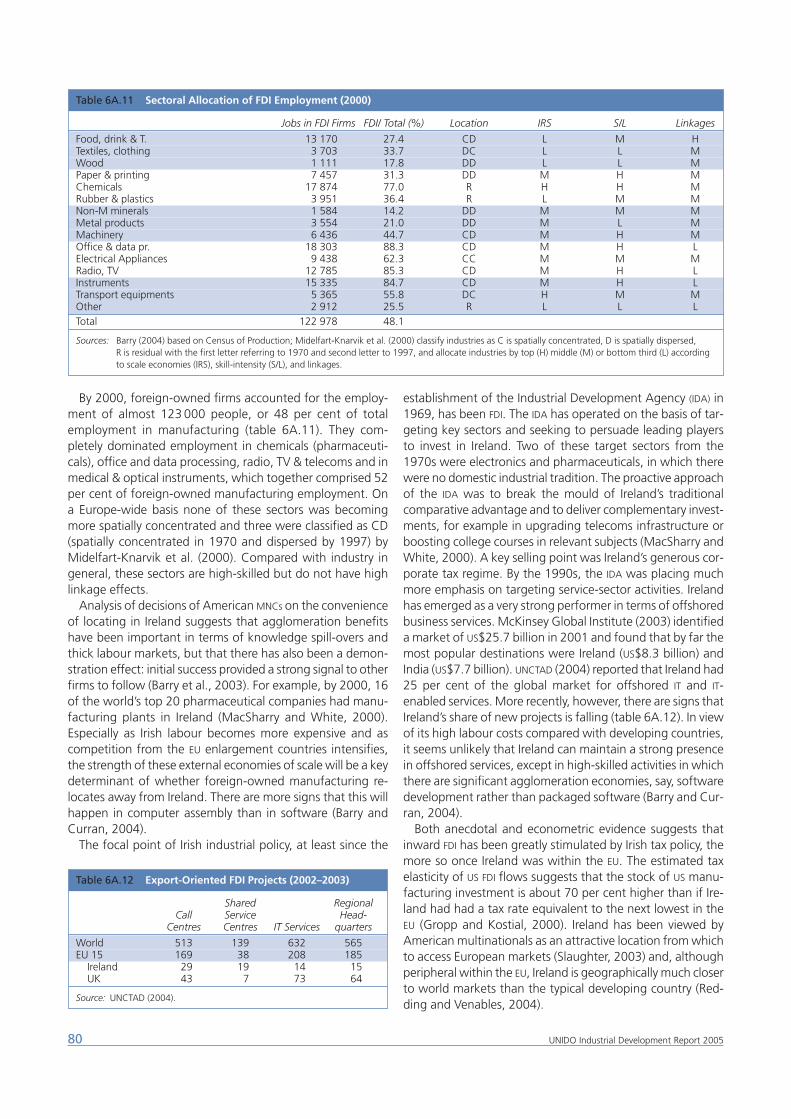
By 2000, foreign-owned firms accounted for the employ-ment of almost 123 000 people, or 48 per cent of totalemployment in manufacturing (table 6A.11). They com-pletely dominated employment in chemicals (pharmaceuti-cals), office and data processing, radio, TV & telecoms and inmedical & optical instruments, which together comprised 52per cent of foreign-owned manufacturing employment. Ona Europe-wide basis none of these sectors was becomingmore spatially concentrated and three were classified as CD(spatially concentrated in 1970 and dispersed by 1997) byMidelfart-Knarvik et al. (2000). Compared with industry ingeneral, these sectors are high-skilled but do not have highlinkage effects.
Analysis of decisions of American MNCs on the convenienceof locating in Ireland suggests that agglomeration benefitshave been important in terms of knowledge spill-overs andthick labour markets, but that there has also been a demon-stration effect: initial success provided a strong signal to otherfirms to follow (Barry et al., 2003). For example, by 2000, 16of the world’s top 20 pharmaceutical companies had manu-facturing plants in Ireland (MacSharry and White, 2000).Especially as Irish labour becomes more expensive and ascompetition from the EU enlargement countries intensifies,the strength of these external economies of scale will be a keydeterminant of whether foreign-owned manufacturing re-locates away from Ireland. There are more signs that this willhappen in computer assembly than in software (Barry andCurran, 2004).
The focal point of Irish industrial policy, at least since the
establishment of the Industrial Development Agency (IDA) in1969, has been FDI. The IDA has operated on the basis of tar-geting key sectors and seeking to persuade leading playersto invest in Ireland. Two of these target sectors from the1970s were electronics and pharmaceuticals, in which therewere no domestic industrial tradition. The proactive approachof the IDA was to break the mould of Ireland’s traditionalcomparative advantage and to deliver complementary invest-ments, for example in upgrading telecoms infrastructure orboosting college courses in relevant subjects (MacSharry andWhite, 2000). A key selling point was Ireland’s generous cor-porate tax regime. By the 1990s, the IDA was placing muchmore emphasis on targeting service-sector activities. Irelandhas emerged as a very strong performer in terms of offshoredbusiness services. McKinsey Global Institute (2003) identifieda market of US$25.7 billion in 2001 and found that by far themost popular destinations were Ireland (US$8.3 billion) andIndia (US$7.7 billion). UNCTAD (2004) reported that Ireland had25 per cent of the global market for offshored IT and IT-enabled services. More recently, however, there are signs thatIreland’s share of new projects is falling (table 6A.12). In viewof its high labour costs compared with developing countries,it seems unlikely that Ireland can maintain a strong presencein offshored services, except in high-skilled activities in whichthere are significant agglomeration economies, say, softwaredevelopment rather than packaged software (Barry and Cur-ran, 2004).
Both anecdotal and econometric evidence suggests thatinward FDI has been greatly stimulated by Irish tax policy, themore so once Ireland was within the EU. The estimated taxelasticity of US FDI flows suggests that the stock of US manu-facturing investment is about 70 per cent higher than if Ire-land had had a tax rate equivalent to the next lowest in theEU (Gropp and Kostial, 2000). Ireland has been viewed byAmerican multinationals as an attractive location from whichto access European markets (Slaughter, 2003) and, althoughperipheral within the EU, Ireland is geographically much closerto world markets than the typical developing country (Red-ding and Venables, 2004).
80 UNIDO Industrial Development Report 2005
Table 6A.11 Sectoral Allocation of FDI Employment (2000)
Jobs in FDI Firms FDI/ Total (%) Location IRS S/L Linkages
Food, drink & T. 13 170 27.4 CD L M HTextiles, clothing 3 703 33.7 DC L L MWood 1 111 17.8 DD L L MPaper & printing 7 457 31.3 DD M H MChemicals 17 874 77.0 R H H MRubber & plastics 3 951 36.4 R L M MNon-M minerals 1 584 14.2 DD M M MMetal products 3 554 21.0 DD M L MMachinery 6 436 44.7 CD M H MOffice & data pr. 18 303 88.3 CD M H LElectrical Appliances 9 438 62.3 CC M M MRadio, TV 12 785 85.3 CD M H LInstruments 15 335 84.7 CD M H LTransport equipments 5 365 55.8 DC H M MOther 2 912 25.5 R L L LTotal 122 978 48.1
Sources: Barry (2004) based on Census of Production; Midelfart-Knarvik et al. (2000) classify industries as C is spatially concentrated, D is spatially dispersed, R is residual with the first letter referring to 1970 and second letter to 1997, and allocate industries by top (H) middle (M) or bottom third (L) accordingto scale economies (IRS), skill-intensity (S/L), and linkages.
Table 6A.12 Export-Oriented FDI Projects (2002–2003)
Shared RegionalCall Service Head-
Centres Centres IT Services quarters
World 513 139 632 565EU 15 169 38 208 185
Ireland 29 19 14 15UK 43 7 73 64
Source: UNCTAD (2004).
Economic theory suggests that a massive inflow of FDI
resulting in the development of a large foreign-owned man-ufacturing presence might have both negative and positiveimplications for indigenous firms. Adverse effects wouldcome in the form of some sort of ‘crowding out’. This mightbe direct competition at the micro level, where more efficientforeign entrants displace incumbent domestic producers.Alternatively, the mechanism might be indirect, workingthrough the price mechanism. For example, increaseddemand for labour might raise wage rates, or exports by for-eign-owned firms might push the exchange rate up, affect-ing the international competitiveness of the Irish-owned sec-tor. Positive effects could result either from technologicalspill-overs or pecuniary externalities resulting from backwardlinkages. The latter would not be relevant under perfect com-petition and constant returns to scale, but could benefit theeconomy if production in the indigenous sector is charac-terised by imperfect competition and scale economies, inwhich case costs may fall as employment rises (Markusen andVenables, 1999).
It is certainly true that employment in indigenous manufac-turing has fallen in the last 30 years. From 1973 to 2000, thisfell from 73 to 52 per cent of manufacturing employmentand from 158000 workers to 133000. However, during the‘Celtic Tiger’ phase employment in Irish-owned manufactur-ing rose by about 10 per cent. There is in fact relatively littledirect competition between foreign-owned and indigenousfirms either in the product or labour markets. Foreign-ownedfirms mainly produce for export and in sectors where there islittle domestic-firm presence and they mainly employ work-ers who are much more highly-skilled. Investigations ofcrowding out through macroeconomic feedbacks havefocused on the labour market and have concluded that thesewere of no importance throughout the 1990s given the elas-ticity of the Irish labour supply (Barry, 2004).
Over time backward linkages have become stronger. In themid-1980s purchases of Irish raw materials and componentswere about 15 per cent of total purchases of foreign-ownedmanufacturing firms, but by 1997 this had risen to 21 percent (Forfas, 1999). For the electronics sector the rise of pur-chases from Irish suppliers was greater, from eight to 24 percent of total purchases, and there is a clear pattern that asthe length of stay of a multinational increases it buys moreintermediates from the local economy (Gorg and Ruane,2001). Investigation of the input-output implications foundthat for each 100 jobs in foreign-owned manufacturing,backward linkages created about 100 jobs in services andabout 10 indigenous manufacturing jobs (O’Malley, 1995).Econometric analysis also indicates that the arrival of multi-nationals has positive effects on the growth of domesticfirms; a recent estimate is that holding constant multina-tional presence at the 1972 level would have implied about800 fewer indigenous plants in 2000 (Gorg and Strobl,2004).
The existence of these backward linkages opens up thepossibility of favourable impacts on indigenous productivitythrough pecuniary externalities, but the magnitude of anysuch effects has not yet been established. However, there is
evidence that the presence of foreign-owned firms has smallpositive effects on the productivity performance of domesticfirms in the same sector, presumably through technologicalspill-overs. Ruane and Uour (2002) found for 1991–1998that, controlling for use of physical capital and for labourforce skills, at the four-digit level the larger the absolute sizeof employment in multinationals the higher the level oflabour productivity in domestic firms.
In fact, there is now a clear recognition across Ireland’senterprise development agencies that the original ‘CelticTiger’ model is under threat since costs have risen and com-petition for FDI has intensified. This is informing a desire toattract ‘higher-quality’ FDI. A transition to higher-value man-ufacturing and more internationally-traded services is seen asthe next phase of Irish growth (Forfas, 2004b). Among thesectors that might be in the forefront of this are bio-pharma-ceuticals, supply chain management, cardiovascular tech-nologies, and healthcare services. The aim is to build onexpertise and clusters.
Looking into the future
The ‘Celtic Tiger’ model of growth that was so successfulfrom the late 1980s to the turn of the century requires adap-tation and, in any event, growth will be less rapid in future.The most obvious reason for this is that employment growthwill be slower now that reserves of unemployed workers havebeen exhausted. The real challenge to policymakers, how-ever, is to assist in enhancing Ireland’s innovative capabilitiesand to facilitate a move to a more knowledge-intensive econ-omy and thereby to reduce exposure to competition for FDI
from low-tax, low-wage economies. The emphasis will switchtowards provision of highly educated personnel and supportfor advanced technologies, with rather less reliance on lowcorporate taxes to underpin technology transfer through FDI.
Indeed, since the late 1990s there has been a new empha-sis in supply-side policy on strengthening Ireland’s capabilitiesin R&D with a view to making a transition towards a moreknowledge-intensive economy, so as to move further up theladder of comparative advantage. The National DevelopmentPlan has allocated €248 billion to public support for R&D inthe period 2000–2006. A new agency, Science FoundationIreland, was created in 2000 to administer a €646 millionTechnology Foresight Fund designed to improve linksbetween the research community and the enterprise sector.The Programme for Research in Third-Level Institutions hasestablished 24 major research centres with a particularemphasis on bio-science/medical research. The governmenteconomic development agency, Forfas (2004a), has statedthat by 2010 it wishes R&D to be 2.5 per cent of GNP of whichthe business sector should do about two-thirds. A new R&D
tax credit was introduced in 2004.From the perspective of developing countries, however,
Ireland may be a special case and not a role mode in somerespects. First, very few countries can expect to equal theexceptional contribution of ICT to labour productivity growthbecause it will not be possible to establish similarly big ICT pro-duction sectors for export. Second, Ireland’s attractiveness to
816 | Policy, knowledge and business innovation
FDI has been based partly on its location close to Europeanmarkets and its EU membership. Clearly, countries like theCzech Republic are similarly favoured, but most are not.Third, Irish practitioners themselves think that the IDA modelis very hard to copy because it meets resistance from vestedinterests in the bureaucracy, is vulnerable to corruption andis unlikely to be adequately funded (MacSharry and White,2000).
Notes
This chapter draws on background papers by Teubal (2005) and Jacobsson(2005). The annexes draw on Crafts (2005) and Wagner (2005). How-ever, the views expressed here are of UNIDO and do not necessarilyreflect those of the authors.1 Except when indicated otherwise, the expression ‘IS’ refers to either
national, sectoral or regional IS, with the necessary adaptations. Foran elaboration see Edquist, 1997 (especially Chapter 1); Malerba,2004 and Asheim and Gertler, 2005.
2 Usually the trade perspective is given most of the attention.3 In a Pareto efficient state it is impossible to improve one agent’s state
without worsening the lot of at least one other agent. With incom-plete information about the agents’ preferences, the notion of Paretoefficiency becomes ambiguous. An operational criterion of efficiencythen depends on the resolution of uncertainty. The location and mag-nitude of market failures is often highly uncertain (Rodrik, 2004).
4 Innovative SMEs are major actors within the business innovation sub-system. They seek to exploit new technological and market opportu-nities. While large companies are also involved, the wide range of pos-sible approaches and applications involved requires a large number offlexible and entrepreneurially oriented actors which, further along theway, may (and often do) become new, high impact, large companiesoperating in world markets, thus pivoting the emergence of newvibrant sectoral IS.
5 This is one of the reasons why, for example, so little is still known abouthow aid may help to develop absorptive capacity and thus the ability,particularly of LDCs, to use aid in a progressively more effective way(see box 1.2).
6 A system failure exists when the working of a subsystem or of specificcomponents thereof is not functional to achieving the strategic prior-ities of the IS (for the concept of ‘strategic priority’ see below). Sucha failure should not be confused with a market failure, i.e. one con-sisting of misallocation of resources due to lack of incentives. The for-mer is due to more fundamental causes. Examples are lack of R&Dcapabilities due to remediable deficiencies in the higher education sys-tem or an inadequate institutional framework governing the workingof the business sector. The system failures confronted by potentiallyinnovative SMEs relate to innovation and information externalities,collective learning, cultural and institutional constraints, financing,network creation and coordination problems. Frequently, sociallydesirable new market building processes do not provide enoughincentives to pioneers, inventors and discoverers to undertake the crit-ical initial actions (see Teubal, 2002 and Avnimelech and Teubal, 2005).
7 Two extremes need to be avoided. One is to consider private firms as‘agents’ of the policymakers (or ‘principals’). The other is fully embed-ding policymakers in the private sector (Rodrik, 2004). Further, a dis-tinction needs to be drawn between the strategic and operational lev-els of policy. The former is focused on scanning the environment, set-ting a vision and translating it into strategic priorities. The latter isabout implementation.
8 In this context institutions are regarded (following Douglas North) asrules of the game. This includes organisations in charge of creating therules and overseeing their application; thus, both IPRs and the PatentOffice are ‘institutions’. The creation of new markets (e.g. for skills,technology or advisory services) is a critical aspect of IS transformation.Completely new industries in their early phase do not yet operate in
markets, although transactions may be taking place. Markets requirea number of institutional underpinnings such as those relating to theirregulatory and legal framework. While markets develop, intermedi-aries may vouch for the honesty and reliability of the parties to a trans-action. Venture capitalists, for instance, perform such a role by linkinginnovative SMEs to clients, investors, suppliers and partners. Policy net-works involving policymakers, stakeholders, experts, etc. may helpdefine new policy priorities. The social value attached to innovativeentrepreneurship is an important legitimising variable. In turn, the suc-cessful development of entrepreneurial activities may contribute tochange perceptions about this.
9 Also included are the respective capabilities and institutions, such asthose relating to bankruptcy laws, the ease of creating a company orhiring and firing employees, arrangements for stock options to R&Dpersonnel and business associations.
10 ‘Feed-forward activation’ is defined in biology as the ‘activation of anenzyme by a precursor of the substrate of that enzyme’. SubstitutingIS for ‘enzyme’; business innovation and knowledge subsystems for‘precursor’ and functions for ‘substrate’ one get pretty close to theview in the text. The present approach also involves an integration ofthe synchronic (coetaneous) and diachronic (sequential, time) dimen-sions of IS (see below).
11 See Carlsson, et al. (2004).12 For example, complying with standards may contribute to reduce rep-
utation barriers to market entry. Standards setting and regulatoryframeworks may support firms not just in knowledge developmentbut also in their legitimating process in domestic and internationalmarkets (see Chapters 7 and 8).
13 The actual pattern of diversification results from the interplay betweenproductivity growth and trade costs. Imbs and Wacziarg (2003) sug-gest that a first phase of diversification followed by one of concentra-tion will occur, for instance, if it is increasingly harder to close the tech-nological gap while transport costs decline linearly or if the techno-logical gap falls at a constant rate but the decline in transport costsaccelerates as capital is accumulated.
14 This certainly does not exclude that competitive capability in someactivities may develop far ahead of the rest. Actually, this may be a pre-requisite to allow progress in competence-building across-the-boardto the extent that those activities may serve as ‘cash cows’.
15 It should be noted, however, that most new activities in a developingcountry involve products that were previously imported or could havebeen imported, so the respective landed price in the domestic marketis normally taken as the tap for local costs. In addition, there are oftenprogressive learning steps towards local production, such as thoserelated to performing as import agents and distributors, servicingagents; partial assemblers, etc., which may considerably narrow themargin of private uncertainty as to what those costs may be. Yet, tothe extent that, even with the benefit of having gone through someor all of these stages, and having started local production, technolog-ical change continues affecting production, organisational and man-agement practices and requiring a good deal of local adaptive inno-vation, a substantial scope for cost discovery will still remain. This is ofcourse, a fortiori, the case for products developed locally under con-ditions that differ substantially from those prevailing elsewhere (seebox 6.5). Note that the emphasis is not about ‘new products’ butabout ‘new’ activities.
16 This is not at all rare. It is hard to figure on grounds of comparativeadvantage rather than of the random offsetting of these externalitieswhy, for instance, countries with similar resource bases and factorendowments specialise in very different types of products (for exam-ple, Bangladesh in hats and Pakistan in soccer balls or the Republic ofKorea in microwave ovens and Taiwan Province of China in bicycles).
17 The strategic dimension may be lost when looking into these mis-matches as purely a matter of whether it is the market or the govern-ment who should lead the process.
18 Developing countries face the challenges of seizing new technologi-cal, world-market and growth opportunities along with new con-straints. These consist not just of international and bilateral tradeagreements regulating sensitive areas such as IPRs and export subsi-dies, but also extremely harsh competition from other developing
82 UNIDO Industrial Development Report 2005
countries (much harsher than that experienced by the Republic ofKorea and Taiwan Province of China in the 1970s and 1980s). Alto-gether, these factors would appear to lead to a small number of win-ners and a vast number of losers, except if the latter awake to the needto enlist national energies in prioritising rapid capability-building. Onlythis way can the distance between catching-up leaders and followersbe narrowed. See this chapter’s final policy reflections.
19 Many of the new infrastructures, such as technology centres, mayeventually become privately owned (thus becoming ‘club goods’), butthe state and the international community should nevertheless assistin their initial establishment. Framework conditions partake the char-acter of public goods whose wide availability is required for the effi-cient operation of a market economy. The act of consumption or useof these goods by an agent generates externalities to other agents inthe system (use or consumption externalities). This applies to networkexternalities (see Chapters 7 and 8), whereby including initially disen-franchised groups of society may contribute to raise overall economicwelfare.
20 The boundaries between the business innovation and the knowledgesubsystems are fuzzy and changing. For instance, the first venture cap-ital schemes and laboratory certification facilities may be initially gov-ernment-run and then become part of the private sector. A technol-ogy centre collectively run and owned by an industry associationwould qualify as part of the knowledge subsystem. As a general prin-ciple, such would be the case whenever externality creating actions,rather than profit making, is the main motive.
21 See, for instance, Avnimelech and Teubal, 2004.22 During the course of Phase 1 firms learn to search for market and tech-
nological information; to identify, screen, evaluate and choose newinnovation projects; to generate increasingly complex new projects; tomanage the innovation process and to leverage R&D to access com-plementary assets, particularly for export markets. Phase 2 consists ofgeneralising the ability to generate innovation-driven structuralchange, particularly among SMEs, for instance by means of incuba-tors and specific incentives schemes alongside increasingly well-defined search and entrepreneurial experimentation tracks. Marketsfor knowledge assets and services experience incipient developmentalong with the evolving functions of emerging sectoral IS (eg, resourcemobilisation and legitimation to facilitate market entry and the devel-opment of positive externalities, such as making essential inputs avail-able early in the game (e.g. fishmeal, see box 6.4). Policy learningthrough, for example, experimental targeting of new activities, is cru-cial in Phase 2 as are supply/demand coordination by means such asthe temporary absorption of high-skill returnees prior to the creationof a market for highly skilled personnel and the setting up of newknowledge-creating and training mechanisms. Progress in the govern-ance of innovation by means, for example, of private non-profit organ-isations such as the Chile Foundation and the Pasteur Institute alsobecomes vital in this stage.
23 The rise of a venture capital industry is particularly tricky because ofthe wide range of market and system failures affecting it. The financeliterature emphasises market failures faced by innovative SMEs in tra-ditional bank-based loan/credit markets, such as asymmetric informa-tion and agency problems, high uncertainties in the markets and tech-nologies underlying the activity, the fact that knowledge assets can-not be easily used as collateral and the lack of a track record. Underthese conditions, banks are reluctant to extend loans or only do so atvery high interest rates. The solution to this intermediation problem
may come through a new form of financial institution, which offersequity finance to promising innovative SMEs, raising funds from out-side investors and investing them in portfolio companies. These com-panies also provide value-added services (Gompers and Lerner, 2001).Only recently have studies been made of the system failures poten-tially blocking the emergence of an infant venture capital industrymarket (Avnimelech and Teubal, 2004; 2005). In the case of Chile thefailure was owed to a limited deal flow (few innovative SMEs) and aweak business innovation subsystem, which in turn reflected the lowscale of government support during the 1990s. A significant expan-sion of such support, now in the works, could lead to a deepening ofthe business innovation subsystem and promote the establishment ofseveral hundred new innovative SMEs, thus offsetting the currentdeficit and opening up a promising market for the emerging venturecapital industry. A continuation and expansion of public/private ven-tures similar to that in salmon farming (box 6.4) would also berequired.
24 Ireland is no doubt a very special, idiosyncratic case, some of whosefeatures may be relevant for other potential catching-up countries.Because most of the latter are highly unlikely to draw on the globalhigh-tech dynamics to the extent that Ireland has, we have chosen toemphasise here the endogenous capability and policy processes thatare in any case involved.
25 Aspiring catching-up countries may chose to heed the lessons stem-ming from the relevant priorities set by developed countries in theirWTO negotiations. Thus, for instance, noting that, if enforced accord-ing to the ‘Dunkel version’, the subsidy agreement would have jeop-ardised by means of potential countervailing duty actions most of thegovernment-sponsored R&D cooperative programs with industry (atthat time the US was spending nearly US$30 billion in civilian R&D),the US Representative achieved an increase in non-actionable subsi-dies from 50 per cent for basic industrial R&D and 25 per cent forapplied R&D to 75 and 50 per cent, respectively. The programs at stakeat the time included biomedical research at the National Institutes ofHealth expected to develop commercial pharmaceutical and prod-ucts; Semiconductor Manufacturing Technology (SEMATECH), thegovernment-industry consortium to improve semiconductor manufac-turing technology aimed at restoring the competitive edge of the USsemiconductor industry and strengthening the semiconductor equip-ment industry; the Technology Reinvestment Program, on the devel-opment and commercialisation of dual-use technologies; and thou-sands of cooperative R&D agreements (CRADA’s) that industry hadsigned with fed labs to develop new competitive technologies.Another lesson to heed is that of taking full advantage of protectionto minor innovations, through utility models and industrial designs, arouted being pursued by Japan, the Republic of Korea and TaiwanProvince of China. The East Asian experience suggests that pettypatents and industrial design patents can be effective means ofencouraging domestic enterprises to undertake minor adaptive inno-vations and foster innovation-based rivalry among them.
26 Ireland, however, is an exception to this generalisation since it has a verylarge ICT production sector based on American FDI. Irish total factor pro-ductivity (TFP) growth was given a large boost because of this as tech-nological progress in ICT production accelerated. As table 6A.8 reports,growth accounting estimates by van Ark et al. (2003) attribute 3.70 per-centage points per year of Irish labour productivity growth to ICT in theperiod 1995 to 2000 with 3.02 percentage points from ICT productionwhile the contribution of other TFP growth at 1.25 percentage pointswas unremarkable, although well above the EU average.
836 | Policy, knowledge and business innovation

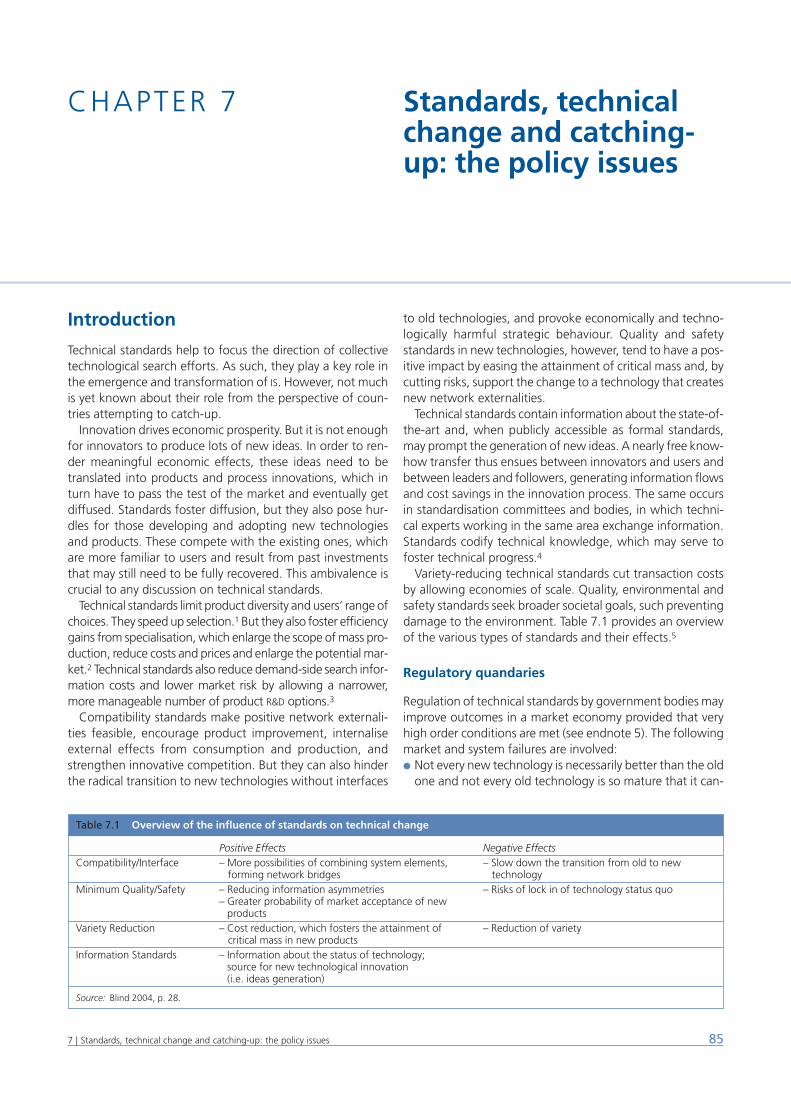
Introduction
Technical standards help to focus the direction of collectivetechnological search efforts. As such, they play a key role inthe emergence and transformation of IS. However, not muchis yet known about their role from the perspective of coun-tries attempting to catch-up.
Innovation drives economic prosperity. But it is not enoughfor innovators to produce lots of new ideas. In order to ren-der meaningful economic effects, these ideas need to betranslated into products and process innovations, which inturn have to pass the test of the market and eventually getdiffused. Standards foster diffusion, but they also pose hur-dles for those developing and adopting new technologiesand products. These compete with the existing ones, whichare more familiar to users and result from past investmentsthat may still need to be fully recovered. This ambivalence iscrucial to any discussion on technical standards.
Technical standards limit product diversity and users’ range ofchoices. They speed up selection.1 But they also foster efficiencygains from specialisation, which enlarge the scope of mass pro-duction, reduce costs and prices and enlarge the potential mar-ket.2 Technical standards also reduce demand-side search infor-mation costs and lower market risk by allowing a narrower,more manageable number of product R&D options.3
Compatibility standards make positive network externali-ties feasible, encourage product improvement, internaliseexternal effects from consumption and production, andstrengthen innovative competition. But they can also hinderthe radical transition to new technologies without interfaces
to old technologies, and provoke economically and techno-logically harmful strategic behaviour. Quality and safetystandards in new technologies, however, tend to have a pos-itive impact by easing the attainment of critical mass and, bycutting risks, support the change to a technology that createsnew network externalities.
Technical standards contain information about the state-of-the-art and, when publicly accessible as formal standards,may prompt the generation of new ideas. A nearly free know-how transfer thus ensues between innovators and users andbetween leaders and followers, generating information flowsand cost savings in the innovation process. The same occursin standardisation committees and bodies, in which techni-cal experts working in the same area exchange information.Standards codify technical knowledge, which may serve tofoster technical progress.4
Variety-reducing technical standards cut transaction costsby allowing economies of scale. Quality, environmental andsafety standards seek broader societal goals, such preventingdamage to the environment. Table 7.1 provides an overviewof the various types of standards and their effects.5
Regulatory quandaries
Regulation of technical standards by government bodies mayimprove outcomes in a market economy provided that veryhigh order conditions are met (see endnote 5). The followingmarket and system failures are involved:● Not every new technology is necessarily better than the old
one and not every old technology is so mature that it can-
857 | Standards, technical change and catching-up: the policy issues
CHAPTER 7 Standards, technicalchange and catching-up: the policy issues
Table 7.1 Overview of the influence of standards on technical change
Positive Effects Negative EffectsCompatibility/Interface – More possibilities of combining system elements, – Slow down the transition from old to new
forming network bridges technologyMinimum Quality/Safety – Reducing information asymmetries – Risks of lock in of technology status quo
– Greater probability of market acceptance of new products
Variety Reduction – Cost reduction, which fosters the attainment of – Reduction of varietycritical mass in new products
Information Standards – Information about the status of technology; source for new technological innovation (i.e. ideas generation)
Source: Blind 2004, p. 28.
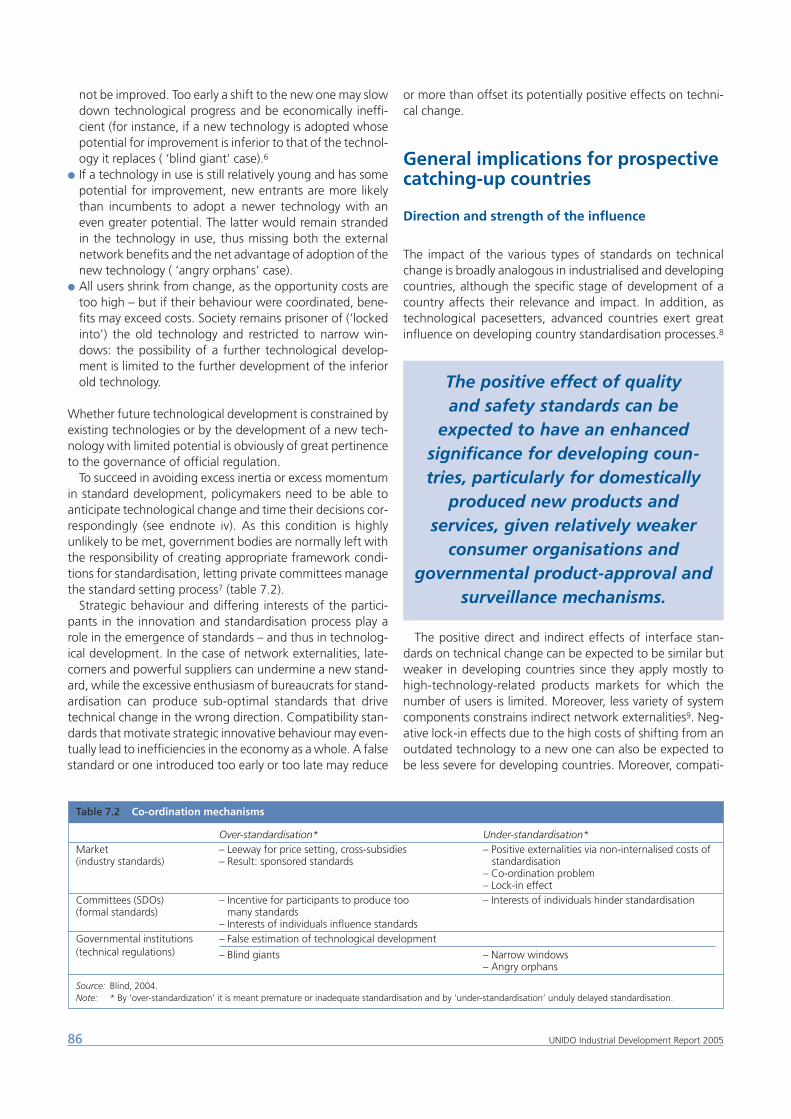
not be improved. Too early a shift to the new one may slowdown technological progress and be economically ineffi-cient (for instance, if a new technology is adopted whosepotential for improvement is inferior to that of the technol-ogy it replaces ( ‘blind giant’ case).6
● If a technology in use is still relatively young and has somepotential for improvement, new entrants are more likelythan incumbents to adopt a newer technology with aneven greater potential. The latter would remain strandedin the technology in use, thus missing both the externalnetwork benefits and the net advantage of adoption of thenew technology ( ‘angry orphans’ case).
● All users shrink from change, as the opportunity costs aretoo high – but if their behaviour were coordinated, bene-fits may exceed costs. Society remains prisoner of (‘lockedinto’) the old technology and restricted to narrow win-dows: the possibility of a further technological develop-ment is limited to the further development of the inferiorold technology.
Whether future technological development is constrained byexisting technologies or by the development of a new tech-nology with limited potential is obviously of great pertinenceto the governance of official regulation.
To succeed in avoiding excess inertia or excess momentumin standard development, policymakers need to be able toanticipate technological change and time their decisions cor-respondingly (see endnote iv). As this condition is highlyunlikely to be met, government bodies are normally left withthe responsibility of creating appropriate framework condi-tions for standardisation, letting private committees managethe standard setting process7 (table 7.2).
Strategic behaviour and differing interests of the partici-pants in the innovation and standardisation process play arole in the emergence of standards – and thus in technolog-ical development. In the case of network externalities, late-comers and powerful suppliers can undermine a new stand-ard, while the excessive enthusiasm of bureaucrats for stand-ardisation can produce sub-optimal standards that drivetechnical change in the wrong direction. Compatibility stan-dards that motivate strategic innovative behaviour may even-tually lead to inefficiencies in the economy as a whole. A falsestandard or one introduced too early or too late may reduce
or more than offset its potentially positive effects on techni-cal change.
General implications for prospectivecatching-up countries
Direction and strength of the influence
The impact of the various types of standards on technicalchange is broadly analogous in industrialised and developingcountries, although the specific stage of development of acountry affects their relevance and impact. In addition, astechnological pacesetters, advanced countries exert greatinfluence on developing country standardisation processes.8
The positive direct and indirect effects of interface stan-dards on technical change can be expected to be similar butweaker in developing countries since they apply mostly tohigh-technology-related products markets for which thenumber of users is limited. Moreover, less variety of systemcomponents constrains indirect network externalities9. Neg-ative lock-in effects due to the high costs of shifting from anoutdated technology to a new one can also be expected tobe less severe for developing countries. Moreover, compati-
86 UNIDO Industrial Development Report 2005
Table 7.2 Co-ordination mechanisms
Over-standardisation* Under-standardisation*Market – Leeway for price setting, cross-subsidies – Positive externalities via non-internalised costs of (industry standards) – Result: sponsored standards standardisation
– Co-ordination problem– Lock-in effect
Committees (SDOs) – Incentive for participants to produce too – Interests of individuals hinder standardisation(formal standards) – many standards
– Interests of individuals influence standardsGovernmental institutions – False estimation of technological development(technical regulations) – Blind giants – Narrow windows
– Angry orphans
Source: Blind, 2004. Note: * By ‘over-standardization’ it is meant premature or inadequate standardisation and by ‘under-standardisation’ unduly delayed standardisation.
The positive effect of quality and safety standards can be
expected to have an enhanced significance for developing coun-tries, particularly for domestically
produced new products and services, given relatively weaker
consumer organisations and governmental product-approval and
surveillance mechanisms.
bility and interface standards can trigger a fast diffusion ofrelated new products and services in emerging mass markets(e.g. mobile communications).
Quality and safety standards – affected more directly byregulations than interface standards – help to structure therelationship between demand and supply by reducing users’information asymmetries about the characteristics of prod-ucts and services. This offsets users’ risk and uncertainties cre-ated by technical change. Quality and safety standards mat-ter especially for new products and services since factorsreducing information asymmetry, such as company reputa-tion and users’ experience, become the more relevant andreliable the longer new products and services are in exis-tence. The positive effect of quality and safety standards canbe expected to have an enhanced significance in developingcountries, particularly for domestically produced new prod-ucts and services, given relatively weaker consumer organi-sations and governmental product approval and surveillancemechanisms (see Chapter 8).10
Information standards codify technical information aboutthe status quo of technology and provide a source of infor-mation for new products and services. Their relevance fordeveloping countries depends critically on their ability tomake use of this information. The greater their competence,the broader the contribution of standards to domestic tech-nological development.11
Most international standards originate in the advancedcountries. This affects developing countries, for examplethrough the efforts of industrial country Standard Develop-ment Organisations (SDOs) to foster the harmonisation or inte-gration of standards across borders (see annex 7.1).
By embodying information about a particular technology,standards can spread know-how across borders. By expand-ing the scope for network externalities, compatibility andinterface standards are likely to stimulate exports fromadvanced to developing countries. When large potential usergroups abroad adopt international standards, industrialcountry firms can realise economies of scale and strategicallyexploit network externalities (Gandal and Shy, 2001). Devel-oping country firms may find hard to compete with foreignfirms serving much larger user bases and exploitingeconomies of scale and learning effects. Because of smallermarkets, developing countries have little chance of creatinga strong enough bandwagon effect to convince foreign sup-pliers to switch to the national firms’ standard. However,while favouring imports initially, the technology based oninternational standards may later open opportunities for imi-tation and learning, the extent of the ensuing benefitsdepending on the domestic competence building effortsapplied to this end.
Minimum quality and safety standards are on the wholemore rigorous in industrial than in developing countries. Forthis reason, international spillovers in this area often createtension in the latter. This problem can best be addressedthrough convergence in income levels. However, the impacton developing country technical change of spillovers fromquality and safety standards originated in industrialeconomies can be positive by reducing information asymme-
tries between users and suppliers of innovative products, andby increasing the acceptance of new products among leadusers. But these effects are restricted when the relativeincome levels are so low that only a small group of users isinvolved. The negative impacts of safety and quality stand-ards on technical change through lock-ins are also less severein developing countries since the standards driven by theindustrial countries are normally ahead of theirs, whichreduces the danger of them becoming locked-into in out-dated technologies.
In conclusion, the effects of the different types of standardson developing country technical change can be expected todiffer in intensity rather than in direction, particularly owingto a lower diffusion of high technology products and systemsbased on complex standards. More important effects stemfrom international spillovers. In the short run, this may workby increasing import competition. In the longer run, importsthat embody high technology and the progressive outsourc-ing by TNCs can foster imitation and, along with it, stimulateinnovation capabilities. Large discrepancies in quality andsafety preferences between industrial and developing coun-tries may prompt the latter to create their own quality andsafety standards. This strategy may serve domestic prefer-ences, but it may also hinder export possibilities The foster-ing of areas with potential domestic competitive advantagein world markets must be accompanied by domestic stan-dardisation activities, driven by innovative firms determinedto acquire the competence to define standards reflecting thestate-of-the-art and to adopt export friendly-specifications(see below).
Implications for standard-setting activity
Involvement of developing country experts in internationalstandard setting activities contributes to enrich their tacitknowledge. However, the distribution of power in interna-tional standardisation processes is such that those experts can-not be expected to exert much influence over them12. Never-theless, their active involvement in international standardisa-tion processes may increase awareness about developingcountry preferences. Since standards are shaped not justaccording to technology requirements, but also to marketneeds and users’ preferences, this may ultimately have a knock-on effect on the final specification of international standardsand on the competitiveness of developing country firms’.
Meaningful participation in international standardisationprocesses requires developing country experts endowed withsolid education and training. One way to address this is by pro-viding training for these experts at developed country techni-cal universities. They also need to have an in-depth understand-ing of the needs of both domestic users and producers.
Another step towards an effective interface with interna-tional standards is their timely linkage with the national stan-dards. Although this is a responsibility of the national SDOs,what is crucially important is the absorptive capacity of thedomestic companies to implement the international stand-ards via the interaction between the domestic knowledgeand business innovation subsystems.
877 | Standards, technical change and catching-up: the policy issues
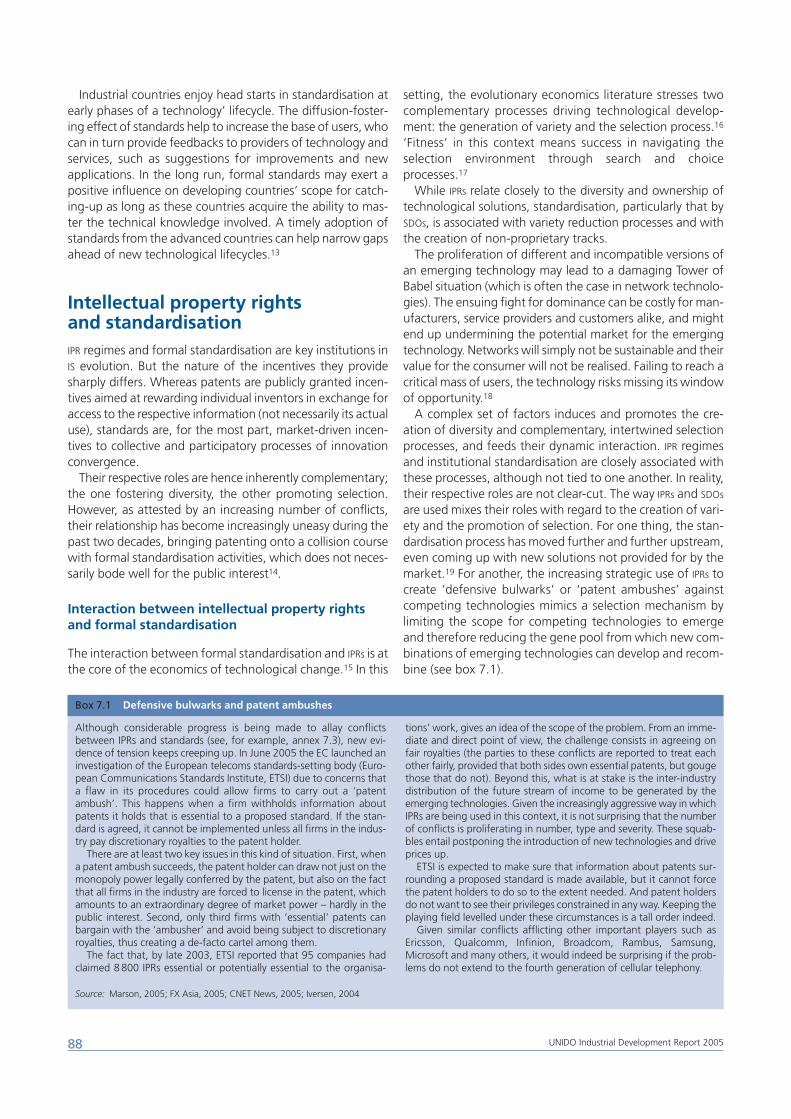
Industrial countries enjoy head starts in standardisation atearly phases of a technology’ lifecycle. The diffusion-foster-ing effect of standards help to increase the base of users, whocan in turn provide feedbacks to providers of technology andservices, such as suggestions for improvements and newapplications. In the long run, formal standards may exert apositive influence on developing countries’ scope for catch-ing-up as long as these countries acquire the ability to mas-ter the technical knowledge involved. A timely adoption ofstandards from the advanced countries can help narrow gapsahead of new technological lifecycles.13
Intellectual property rights and standardisationIPR regimes and formal standardisation are key institutions inIS evolution. But the nature of the incentives they providesharply differs. Whereas patents are publicly granted incen-tives aimed at rewarding individual inventors in exchange foraccess to the respective information (not necessarily its actualuse), standards are, for the most part, market-driven incen-tives to collective and participatory processes of innovationconvergence.
Their respective roles are hence inherently complementary;the one fostering diversity, the other promoting selection.However, as attested by an increasing number of conflicts,their relationship has become increasingly uneasy during thepast two decades, bringing patenting onto a collision coursewith formal standardisation activities, which does not neces-sarily bode well for the public interest14.
Interaction between intellectual property rightsand formal standardisation
The interaction between formal standardisation and IPRs is atthe core of the economics of technological change.15 In this
setting, the evolutionary economics literature stresses twocomplementary processes driving technological develop-ment: the generation of variety and the selection process.16
‘Fitness’ in this context means success in navigating theselection environment through search and choiceprocesses.17
While IPRs relate closely to the diversity and ownership oftechnological solutions, standardisation, particularly that bySDOs, is associated with variety reduction processes and withthe creation of non-proprietary tracks.
The proliferation of different and incompatible versions ofan emerging technology may lead to a damaging Tower ofBabel situation (which is often the case in network technolo-gies). The ensuing fight for dominance can be costly for man-ufacturers, service providers and customers alike, and mightend up undermining the potential market for the emergingtechnology. Networks will simply not be sustainable and theirvalue for the consumer will not be realised. Failing to reach acritical mass of users, the technology risks missing its windowof opportunity.18
A complex set of factors induces and promotes the cre-ation of diversity and complementary, intertwined selectionprocesses, and feeds their dynamic interaction. IPR regimesand institutional standardisation are closely associated withthese processes, although not tied to one another. In reality,their respective roles are not clear-cut. The way IPRs and SDOs
are used mixes their roles with regard to the creation of vari-ety and the promotion of selection. For one thing, the stan-dardisation process has moved further and further upstream,even coming up with new solutions not provided for by themarket.19 For another, the increasing strategic use of IPRs tocreate ‘defensive bulwarks’ or ‘patent ambushes’ againstcompeting technologies mimics a selection mechanism bylimiting the scope for competing technologies to emergeand therefore reducing the gene pool from which new com-binations of emerging technologies can develop and recom-bine (see box 7.1).
88 UNIDO Industrial Development Report 2005
Box 7.1 Defensive bulwarks and patent ambushes
Source: Marson, 2005; FX Asia, 2005; CNET News, 2005; Iversen, 2004
Although considerable progress is being made to allay conflictsbetween IPRs and standards (see, for example, annex 7.3), new evi-dence of tension keeps creeping up. In June 2005 the EC launched aninvestigation of the European telecoms standards-setting body (Euro-pean Communications Standards Institute, ETSI) due to concerns thata flaw in its procedures could allow firms to carry out a ‘patentambush’. This happens when a firm withholds information aboutpatents it holds that is essential to a proposed standard. If the stan-dard is agreed, it cannot be implemented unless all firms in the indus-try pay discretionary royalties to the patent holder.
There are at least two key issues in this kind of situation. First, whena patent ambush succeeds, the patent holder can draw not just on themonopoly power legally conferred by the patent, but also on the factthat all firms in the industry are forced to license in the patent, whichamounts to an extraordinary degree of market power – hardly in thepublic interest. Second, only third firms with ‘essential’ patents canbargain with the ‘ambusher’ and avoid being subject to discretionaryroyalties, thus creating a de-facto cartel among them.
The fact that, by late 2003, ETSI reported that 95 companies hadclaimed 8800 IPRs essential or potentially essential to the organisa-
tions’ work, gives an idea of the scope of the problem. From an imme-diate and direct point of view, the challenge consists in agreeing onfair royalties (the parties to these conflicts are reported to treat eachother fairly, provided that both sides own essential patents, but gougethose that do not). Beyond this, what is at stake is the inter-industrydistribution of the future stream of income to be generated by theemerging technologies. Given the increasingly aggressive way in whichIPRs are being used in this context, it is not surprising that the numberof conflicts is proliferating in number, type and severity. These squab-bles entail postponing the introduction of new technologies and driveprices up.
ETSI is expected to make sure that information about patents sur-rounding a proposed standard is made available, but it cannot forcethe patent holders to do so to the extent needed. And patent holdersdo not want to see their privileges constrained in any way. Keeping theplaying field levelled under these circumstances is a tall order indeed.
Given similar conflicts afflicting other important players such asEricsson, Qualcomm, Infinion, Broadcom, Rambus, Samsung,Microsoft and many others, it would indeed be surprising if the prob-lems do not extend to the fourth generation of cellular telephony.
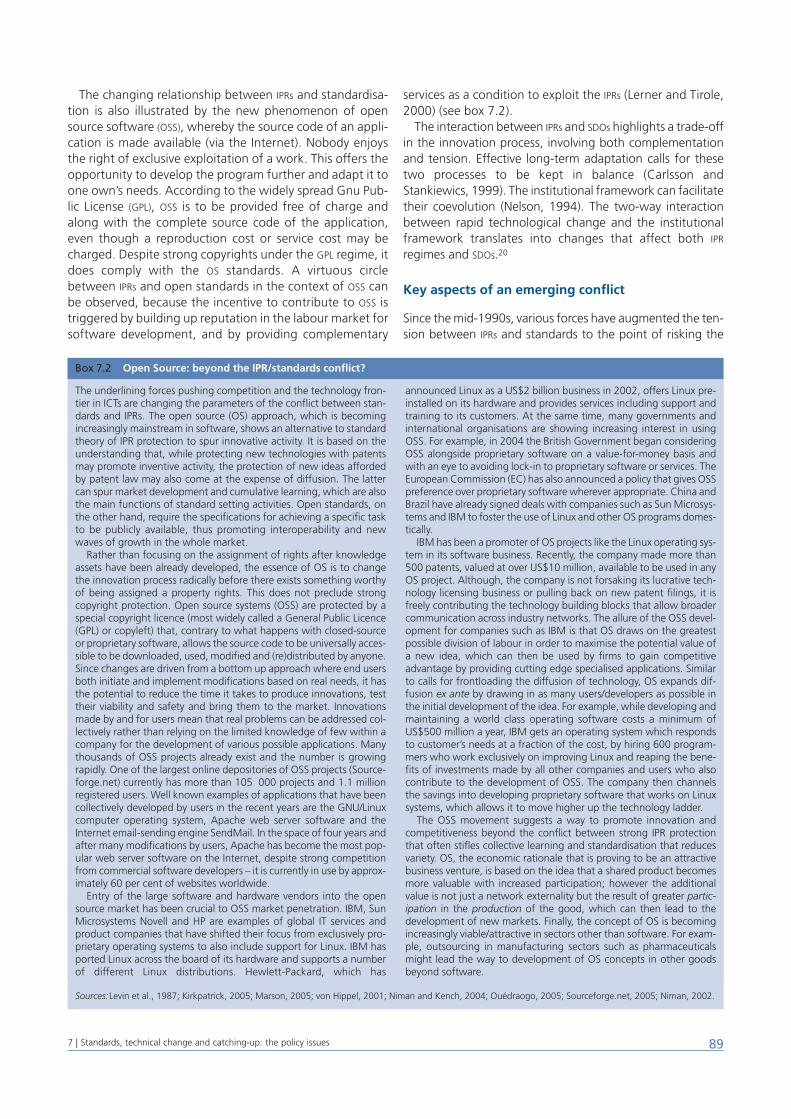
The changing relationship between IPRs and standardisa-tion is also illustrated by the new phenomenon of opensource software (OSS), whereby the source code of an appli-cation is made available (via the Internet). Nobody enjoysthe right of exclusive exploitation of a work. This offers theopportunity to develop the program further and adapt it toone own’s needs. According to the widely spread Gnu Pub-lic License (GPL), OSS is to be provided free of charge andalong with the complete source code of the application,even though a reproduction cost or service cost may becharged. Despite strong copyrights under the GPL regime, itdoes comply with the OS standards. A virtuous circlebetween IPRs and open standards in the context of OSS canbe observed, because the incentive to contribute to OSS istriggered by building up reputation in the labour market forsoftware development, and by providing complementary
services as a condition to exploit the IPRs (Lerner and Tirole,2000) (see box 7.2).
The interaction between IPRs and SDOs highlights a trade-offin the innovation process, involving both complementationand tension. Effective long-term adaptation calls for thesetwo processes to be kept in balance (Carlsson andStankiewics, 1999). The institutional framework can facilitatetheir coevolution (Nelson, 1994). The two-way interactionbetween rapid technological change and the institutionalframework translates into changes that affect both IPR
regimes and SDOs.20
Key aspects of an emerging conflict
Since the mid-1990s, various forces have augmented the ten-sion between IPRs and standards to the point of risking the
897 | Standards, technical change and catching-up: the policy issues
Box 7.2 Open Source: beyond the IPR/standards conflict?
Sources:Levin et al., 1987; Kirkpatrick, 2005; Marson, 2005; von Hippel, 2001; Niman and Kench, 2004; Ouédraogo, 2005; Sourceforge.net, 2005; Niman, 2002.
The underlining forces pushing competition and the technology fron-tier in ICTs are changing the parameters of the conflict between stan-dards and IPRs. The open source (OS) approach, which is becomingincreasingly mainstream in software, shows an alternative to standardtheory of IPR protection to spur innovative activity. It is based on theunderstanding that, while protecting new technologies with patentsmay promote inventive activity, the protection of new ideas affordedby patent law may also come at the expense of diffusion. The lattercan spur market development and cumulative learning, which are alsothe main functions of standard setting activities. Open standards, onthe other hand, require the specifications for achieving a specific taskto be publicly available, thus promoting interoperability and newwaves of growth in the whole market.
Rather than focusing on the assignment of rights after knowledgeassets have been already developed, the essence of OS is to changethe innovation process radically before there exists something worthyof being assigned a property rights. This does not preclude strongcopyright protection. Open source systems (OSS) are protected by aspecial copyright licence (most widely called a General Public Licence(GPL) or copyleft) that, contrary to what happens with closed-sourceor proprietary software, allows the source code to be universally acces-sible to be downloaded, used, modified and (re)distributed by anyone.Since changes are driven from a bottom up approach where end usersboth initiate and implement modifications based on real needs, it hasthe potential to reduce the time it takes to produce innovations, testtheir viability and safety and bring them to the market. Innovationsmade by and for users mean that real problems can be addressed col-lectively rather than relying on the limited knowledge of few within acompany for the development of various possible applications. Manythousands of OSS projects already exist and the number is growingrapidly. One of the largest online depositories of OSS projects (Source-forge.net) currently has more than 105 000 projects and 1.1 millionregistered users. Well known examples of applications that have beencollectively developed by users in the recent years are the GNU/Linuxcomputer operating system, Apache web server software and theInternet email-sending engine SendMail. In the space of four years andafter many modifications by users, Apache has become the most pop-ular web server software on the Internet, despite strong competitionfrom commercial software developers – it is currently in use by approx-imately 60 per cent of websites worldwide.
Entry of the large software and hardware vendors into the opensource market has been crucial to OSS market penetration. IBM, SunMicrosystems Novell and HP are examples of global IT services andproduct companies that have shifted their focus from exclusively pro-prietary operating systems to also include support for Linux. IBM hasported Linux across the board of its hardware and supports a numberof different Linux distributions. Hewlett-Packard, which has
announced Linux as a US$2 billion business in 2002, offers Linux pre-installed on its hardware and provides services including support andtraining to its customers. At the same time, many governments andinternational organisations are showing increasing interest in usingOSS. For example, in 2004 the British Government began consideringOSS alongside proprietary software on a value-for-money basis andwith an eye to avoiding lock-in to proprietary software or services. TheEuropean Commission (EC) has also announced a policy that gives OSSpreference over proprietary software wherever appropriate. China andBrazil have already signed deals with companies such as Sun Microsys-tems and IBM to foster the use of Linux and other OS programs domes-tically.
IBM has been a promoter of OS projects like the Linux operating sys-tem in its software business. Recently, the company made more than500 patents, valued at over US$10 million, available to be used in anyOS project. Although, the company is not forsaking its lucrative tech-nology licensing business or pulling back on new patent filings, it isfreely contributing the technology building blocks that allow broadercommunication across industry networks. The allure of the OSS devel-opment for companies such as IBM is that OS draws on the greatestpossible division of labour in order to maximise the potential value ofa new idea, which can then be used by firms to gain competitiveadvantage by providing cutting edge specialised applications. Similarto calls for frontloading the diffusion of technology, OS expands dif-fusion ex ante by drawing in as many users/developers as possible inthe initial development of the idea. For example, while developing andmaintaining a world class operating software costs a minimum ofUS$500 million a year, IBM gets an operating system which respondsto customer’s needs at a fraction of the cost, by hiring 600 program-mers who work exclusively on improving Linux and reaping the bene-fits of investments made by all other companies and users who alsocontribute to the development of OSS. The company then channelsthe savings into developing proprietary software that works on Linuxsystems, which allows it to move higher up the technology ladder.
The OSS movement suggests a way to promote innovation andcompetitiveness beyond the conflict between strong IPR protectionthat often stifles collective learning and standardisation that reducesvariety. OS, the economic rationale that is proving to be an attractivebusiness venture, is based on the idea that a shared product becomesmore valuable with increased participation; however the additionalvalue is not just a network externality but the result of greater partic-ipation in the production of the good, which can then lead to thedevelopment of new markets. Finally, the concept of OS is becomingincreasingly viable/attractive in sectors other than software. For exam-ple, outsourcing in manufacturing sectors such as pharmaceuticalsmight lead the way to development of OS concepts in other goodsbeyond software.
balance between them (Iversen, 2000). There is a potentialfor conflict when applying standards requires the use of pro-prietary technology (the case of ‘essential’ patents). The cod-ification of standards specifications may infringe the propri-etary rights of one or more agents. When this is the case, thecollective interest for the standard may collide with the pri-vate interest of the IPR holder21 (see boxes 7.1 and 7.3). Theconflict can be settled either by agreement between the par-ties or in a court of law.22
While progressively moving towards the coordination oftechnologies, standardisation has also been taking a morepivotal role in the knowledge-creation process. In this con-text, the influence of IPR pooling is exacerbated by the increas-ing intensity of patenting in particular areas such as mobiletelecommunications and semi-conductors. The ensuingeffects on the use of IPRs and standards, combined withtrends such as market globalisation, convergence of tech-nologies and the increasing pace of technological change,
have put them on a collision course. Consequently, thedynamic balancing of the private and public dimensions ofknowledge becomes a priority policy issue.
IPRs and standards may interrelate in three possible ways:● Both are designed to complement one another, thus pro-
moting a ‘virtuous circle’ of creation and diffusion of newknowledge;
● IPR, especially patents, are used to block standards;23 or● Efficient licensing mechanisms are adopted, such as equi-
table patent-pool schemes that allow the factoring IPRs intostandards without infringing ownership rights. This is anemerging intermediate scenario, as the 3G patent platformillustrates (see annex 7.2).
Telecommunication technology, with by a high patent- andstandards-intensity, suffer a higher likelihood of potentialconflicts. The chemical industry, in contrast, has high patentand low standard intensity. The trend towards higher patent-ing across technologies increases the likelihood of conflictsbetween IPRs and standardisation activities, accentuating theneed for new approaches. Figure 7.1 illustrates various tech-nologies in the patent-standard-space based on the numberof German patent applications at the EPO and the stock ofGerman standards in 1999.
General policy implications
The interface between IPRs and standardisation can occurupstream or downstream of the value chain, from R&D to mar-keting. Policy approaches need to address R&D, IPRs, standardsand competitive issues in a consistent manner. The following
90 UNIDO Industrial Development Report 2005
Box 7.3 Surveying IPR and standards conflicts
Note: Some 60 per cent of the responding firms received funding from the EU’s 4th or 5th Framework Programmes for research and technological development(RTD). 46 per cent of respondents suggest that these programmes’ IPR provisions should be reduced to a minimum. More than 50 per cent of the firms havebeen involved in standardisation activities within the past three years, seeking to exert influence and to prevent certain specifications from being adopted.
Source: Blind et al., 2004.
A EC-sponsored survey conducted among 800 R&D, IPR and standard-isation managers of European manufacturing firms in 2001 producedthe following results relating to the relationship between standardsand IPRs:● Many firms had problems in their standardisation activities relating
to either their own patents (over 30 per cent of the firms) or to third-party patents (40 per cent). The incidence of these problems washigher than average for large and patent/R&D intensive firms.
● The most frequent reasons why standardisation/IPR conflicts are dis-cretional licensing conditions and patent circumvention or infringe-ment. Patents had been circumvented in over 40 per cent of thecases. More than 40 per cent of the large firms (which composedmost of the sample) had their licensing conditions rejected andmore than 35 per cent of patent-intensive firms reported infringe-ment of their IPRs.
● 30 per cent of the firms reported infringement suits, too high licencefees, unclear IPR structures and problems with cross licensing withforeign patent holders. High R&D intensive firms get most fre-quently into conflict with foreign IPRs. Almost 50 per cent of thefirms do not find a solution to their conflicts (the incidence rises tomore than 55 per cent in the case of high R&D intensive andmedium-sized firms).
● The most frequent reasons for not reaching agreement are exces-sively high licensing costs and failure to circumvent the IPRs or tocreate a patent pool. Mergers and acquisitions of the IPR holdingfirms are very rare. IPR-related problems are most crucial for R&Dintensive and small firms.
● Except for R&D and small firms, mandatory licensing, reduced termsof patents and a shift of responsibility for screening of IPR involve-ment in standards to the IPR holders are not regarded as adequatesolutions.
● Secrecy and related measures such as customer relations manage-ment, lead-time advantages and complex product designs are con-sidered more important than patents for the firms to protect theirinventions and innovations.
● Companies involved in standardisation procedures are much lesspatent intensive than those not involved, indicating that standardi-sation and patenting are often dealt with as alternative strategies.
● The most important barriers to transfer of research results into stan-dardisation are institutional problems with the standardisationprocess. It is considered too expensive, particularly by SMEs, slowand inflexible.
● There is not enough coordination between research and standard-isation.
There is a potential for conflictwhen applying standards requiresthe use of proprietary technology
(the case of ‘essential’ patents). ICTs,with high patent and standardsintensities, suffer a higher likeli-
hood of potential conflicts.
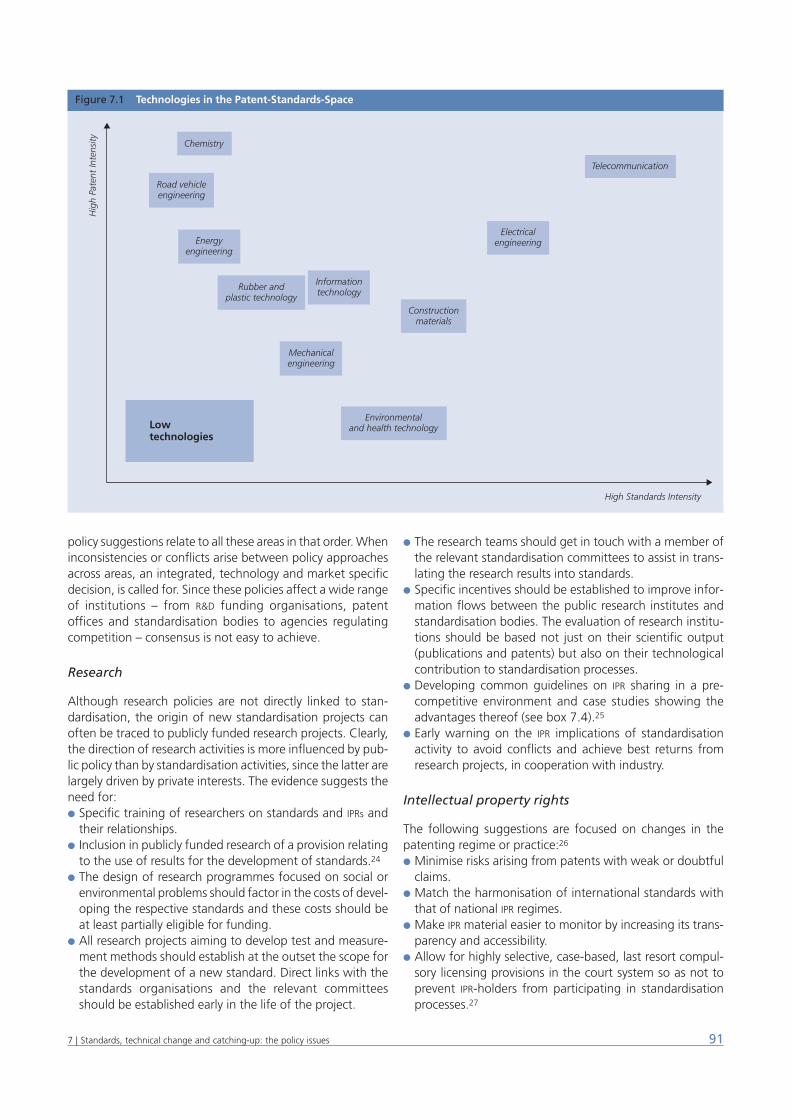
policy suggestions relate to all these areas in that order. Wheninconsistencies or conflicts arise between policy approachesacross areas, an integrated, technology and market specificdecision, is called for. Since these policies affect a wide rangeof institutions – from R&D funding organisations, patentoffices and standardisation bodies to agencies regulatingcompetition – consensus is not easy to achieve.
Research
Although research policies are not directly linked to stan-dardisation, the origin of new standardisation projects canoften be traced to publicly funded research projects. Clearly,the direction of research activities is more influenced by pub-lic policy than by standardisation activities, since the latter arelargely driven by private interests. The evidence suggests theneed for:● Specific training of researchers on standards and IPRs and
their relationships.● Inclusion in publicly funded research of a provision relating
to the use of results for the development of standards.24
● The design of research programmes focused on social orenvironmental problems should factor in the costs of devel-oping the respective standards and these costs should beat least partially eligible for funding.
● All research projects aiming to develop test and measure-ment methods should establish at the outset the scope forthe development of a new standard. Direct links with thestandards organisations and the relevant committeesshould be established early in the life of the project.
● The research teams should get in touch with a member ofthe relevant standardisation committees to assist in trans-lating the research results into standards.
● Specific incentives should be established to improve infor-mation flows between the public research institutes andstandardisation bodies. The evaluation of research institu-tions should be based not just on their scientific output(publications and patents) but also on their technologicalcontribution to standardisation processes.
● Developing common guidelines on IPR sharing in a pre-competitive environment and case studies showing theadvantages thereof (see box 7.4).25
● Early warning on the IPR implications of standardisationactivity to avoid conflicts and achieve best returns fromresearch projects, in cooperation with industry.
Intellectual property rights
The following suggestions are focused on changes in thepatenting regime or practice:26
● Minimise risks arising from patents with weak or doubtfulclaims.
● Match the harmonisation of international standards withthat of national IPR regimes.
● Make IPR material easier to monitor by increasing its trans-parency and accessibility.
● Allow for highly selective, case-based, last resort compul-sory licensing provisions in the court system so as not toprevent IPR-holders from participating in standardisationprocesses.27
917 | Standards, technical change and catching-up: the policy issues
Figure 7.1 Technologies in the Patent-Standards-Space
Environmentaland health technology
Road vehicleengineering
Energyengineering
Rubber andplastic technology
Mechanicalengineering
Constructionmaterials
Electricalengineering
Telecommunication
Chemistry
Informationtechnology
High Standards Intensity
Hig
h Pa
tent
Inte
nsity
Lowtechnologies
● Set up IPR helpdesks to increase awareness about conflictsbetween IPR and standardisation.
Standardisation
The proposals that follow are addressed to the SDOs.28
● Encourage SDOs to identify promising new technologies attheir very early stages, when basic research activities are all-important, and to start related standardisation processesstraight away, rather than waiting until private firms arealready involved in pilot production and therefore less inclinedto share their knowledge in standardisation processes.29
● Promote awareness among those participating in standard-isation processes of possible inputs from elsewhere in theknowledge subsystem, especially regarding incipient tech-nologies.
● Establish incentives for standards that do not specify thedesign of components but their performance, so as toavoid conflicts with patents protecting these compo-nents.30
● Limit the duration, scope and level of detail of standardi-sation processes. Develop guidelines for the treatment ofIPRs during (long) standardisation processes.31
● Provide incentives for innovative R&D-intensive companiesto join standardisation processes (e.g. attractive licensingschemes).
● Improve SDOs performance by making them more expedi-tious and flexible, reducing participants’ costs and facilitat-ing the transfer of research results into standards.
Annex 7.3 contains additional policy suggestions in threespecific fields, that is, disclosure rules, licensing policy andpatent pools.
Competition
Standards may impose a number of costs on users’, but theymay also foster competition by levelling the playing field.Competition policymakers would benefit from a betterunderstanding of the scope of conflict between IPRs andstandardisation and its impact on competition policy issues.A closer dialogue between all parties involved is a first stepin this direction. The following proposals focus on the conse-quences for competition of the interaction between IPR andstandards.● Consider the restrictive use of compulsory licenses when
IPR-protected technologies integrated in a standard lead toan increase of the monopoly power of the IPR holder.
● In the case of mandatory standards, regulate the case of IPR
holders who refuse to give licenses at reasonable fees orgratis.
● Use standardisation as a substitute for regulation to solvesome competition problems.32
● Consider standards as a means to speed up the substitu-tion of a patented technology when the patent holdersattempt to extend their monopoly after the protectioncomes to an end by means of relying on brand loyalty builtup during the terms of patents.
● Encourage policies seeking to increase the net pro-compet-
92 UNIDO Industrial Development Report 2005
Box 7.4 The GSM case
Source: Iversen, 2004
The Global System for Mobile Communications (GSM) standards, themost widely spread platform for digital mobile communications, areused in more than 60 countries around the world. The standardisationprocess culminating in GSM got under way in Europe 1982. At thattime national operational and administration monopolies were still keyplayers. But their position began to weaken when the radio-bandwidtharound 900 Mhz was reserved for mobile communications in 1978.Bandwidth became a scarce resource. Analogue systems were facingcapacity problems and they lacked cross-country roaming capability,which sealed-off markets and made cellular telephony unattractive tobusiness.
Standardisation promised economies of scale in cellular telephonyby unifying the hitherto isolated European markets, providing exportopportunities for equipment manufacturers and new services, such asSMS (short message services). And it did set in motion the next-gen-eration of the Universal Mobile Telecommunications System (UMTS)coalition (SMG5).
During the late 1980s, work towards GSM changed playing field:from that of the national telecoms monopolies to that of the ETSI. Thiswas influenced by equipment manufacturers seeking to realiseeconomies of scale across Europe. Traditional allegiances between themand the national post and telecoms administrators began to be dis-rupted. The wild-card presence of Motorola, the fifth largest equipmentmanufacturer after Ericsson, Nokia, Siemens and Alcatel, which waslooking for a stronger position in the European market, also helped.Moreover, EC was actively pursuing a unified European market.
Telecoms operators and equipment manufacturers pursued very dif-ferent IPR strategies. There were also differences among the latter, par-ticular between those European-based (as part of their alliances withthe national telecoms monopolies, which discouraged IPR-based
strategies) and Motorola. While the EC was seeking the deregulationof the European telecoms markets, the national telecoms operatorswere still stipulating that, when tendering for network technologies,suppliers had to grant their IPRs freely and without geographical lim-itations. The most vocal opponents to this were not the traditionalnational champions (Alcatel, Siemens) but Motorola. This stand waseventually also adopted by the European suppliers, which forced inmost cases an abandonment of that approach to IPRs. Motorola, byrefusing to such agreements and entering a limited number of crosslicenses arrangements, helped reduce the number of equipment sup-pliers to itself, Alcatel, Ericsson, Nokia and Siemens.
GSM entailed a co-ordinated design for the digital mobile systemand its orchestrated launch in the whole of Western Europe in a timelymanner. The underlying imbalance between the IPR portfolios of thevarious players was made evident by the comprehensiveness of thestandardisation process. The duration of this process (over a decade),its scope (comprising several interfaces) and level of detail (over-spec-ified to ensure interoperability) increased the probability of IPR-centredconflicts. ‘Essential patents’ were claimed at all levels by various actors.By the late 1990s over 20 companies claimed to hold about 140 cumu-lative patents, which they construed as essential to the GSM standard,comprising several types of technologies (switching, speech-coding,radio transmission). More than 60 per cent of the patents had beenapplied for after the GSM system took shape. Many of these may havebeen motivated by Motorola’s use of its patent portfolio, an approachthat extended progressively to its European rivals.
The conflicts re-emerged in connection with the UMTS system,partly ignited by the growing use of IPRs as strategic tool among theEuropean companies (including events such as Ericsson purchase ofQualcomm’s infrastructure business).
itive effects of patent pools, for instance by involving com-petition authorities in laying out allowable licensing termsor promoting a patent pool notification scheme to increaseawareness on the scope of conflict between IPRs and stand-ardisation and simplify the decision making process.
All in all, since the rationale and objectives of the four policyareas differ, there are inevitable tensions between them,which are dealt with by various institutions. The best way todeal with this multiplicity would appear by means of coordi-nated action seeking to improve the relationship betweenstandardisation and IPR, taking research and competition pol-icy aspects also into account. A first step towards this is tobring the responsible authorities together and encourage anintensive exchange of ideas.
Policy implications for developingcountriesThe policy recommendations above are broadly applicable todeveloping countries, keeping in mind the asymmetries stem-ming from their status as latecomers. Some aspects, however,require adaptation their specific conditions.33 These areexamined below.
Research
Clearly, shortage of resources (financial or human skills)inevitably imposes severe constraints to the range of areas tobe targeted for investment in domestic R&D capability. Hence,there is a need to pay particular attention to the early inte-gration between R&D and standardisation activities at theproject, programme and institutional levels. Developingcountries building up new research and standardisationcapacities have a window of opportunity to do so, in contrastwith the often broken up systems in industrialised countries,which are just beginning to address the problem.
Intellectual property rights
The economic costs and benefits from stronger IPRs vary con-siderably according to a country’s level of industrial and tech-nological development (Lall, 2003). Because of their rela-tively low inventive intensity, developing countries face lessmanifest conflicts between national standardisation activi-ties and domestic IPR holders. However, their national stan-dardisation activities do confront the massive accumulationof patents in industrialised countries. In order to gain inter-national acceptance, national standards set by the domesticSDOs need to take into consideration the IPRs held by firms inindustrial economies. Furthermore, the domestic institutionsinvolved need to ensure a high quality of patents and servealso as information providers both about domestic and inter-national IPRs. Domestic companies also need to be encour-aged to build up high quality patent portfolios as a precon-dition to being able to influence the specification of interna-tional standards.
Standardisation
Since most developing countries are members of or havelinks with ISO, they are aware of their various guidelines,including IPR rules. These should also be followed in thedomestic standardisation system. By setting integrated incen-tives and institutions for a stronger integration between R&D
and standardisation, developing countries can take advan-tage of the lessons from the potential conflicts reviewedabove.
Clearly, disclosing IPRs relevant for standardisationprocesses in developing countries affects especially the rightsof foreign residents. Therefore, the standardisation bodies indeveloping countries need to have expeditious access to thedatabases of the most important IPR offices, including theWorld Intellectual Property Organisation (WIPO), USPTO, EPO
and the Japan Patent Office (JPO).
Securing reasonable licensing fees is as important as secur-ing the transparency of IPRs pertinent to standardisation.However, mandating that a royalty should be ‘fair, reasonableand non-discriminatory’ (FRAND) gives little guidance for thedetermination of the final price. There may be large differ-ences of opinion about the meaning of FRAND when dealingwith the typical relation between an advance-country IPR
holder and an SDO or firm based in a developing country. Theinfringement of foreign IPRs involved in a domestic standardneeds to be avoided. To facilitate and speed up the respec-tive negotiation process, an international database on thisarea, including information exchange capabilities, should bebuilt up.
Patent pools may enable developing country firms with IPR
portfolios relevant to specific international standardisation togain influence in international standardisation processes, asentry tickets into pools of international firms trying to co-ordi-nate their technological capacities and find a common con-sensus within a standardisation process. Besides their patentportfolio, the former firms also possess know-how aboutspecific user and consumer preferences. This expertise mayincrease the likelihood that an international standard willbecome successful worldwide.
Competition
Developing country markets are often exposed to large inter-national companies that strongly influence the specificationof a standard based on the possession of the relevant IPRs.
937 | Standards, technical change and catching-up: the policy issues
Patent pools may enabledeveloping-country firms with
IPR portfolios pertinent to specificinternational standardisation
to gain influence in internationalstandardisation processes.
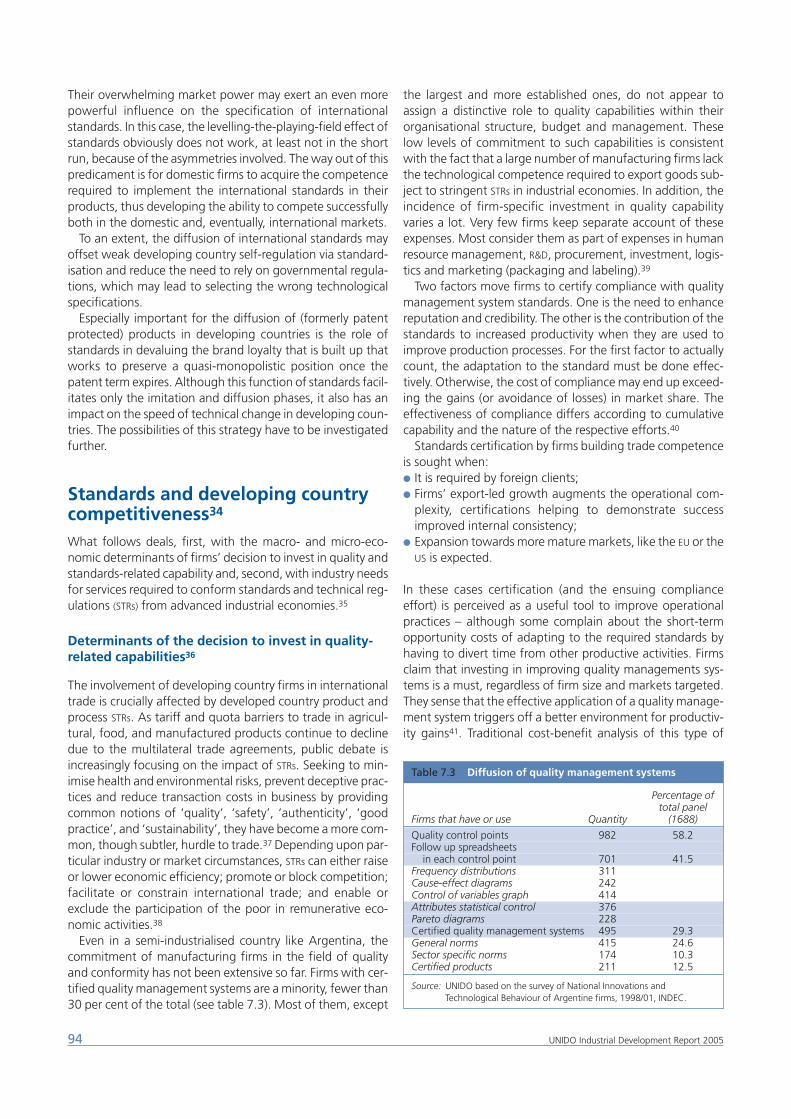
Their overwhelming market power may exert an even morepowerful influence on the specification of internationalstandards. In this case, the levelling-the-playing-field effect ofstandards obviously does not work, at least not in the shortrun, because of the asymmetries involved. The way out of thispredicament is for domestic firms to acquire the competencerequired to implement the international standards in theirproducts, thus developing the ability to compete successfullyboth in the domestic and, eventually, international markets.
To an extent, the diffusion of international standards mayoffset weak developing country self-regulation via standard-isation and reduce the need to rely on governmental regula-tions, which may lead to selecting the wrong technologicalspecifications.
Especially important for the diffusion of (formerly patentprotected) products in developing countries is the role ofstandards in devaluing the brand loyalty that is built up thatworks to preserve a quasi-monopolistic position once thepatent term expires. Although this function of standards facil-itates only the imitation and diffusion phases, it also has animpact on the speed of technical change in developing coun-tries. The possibilities of this strategy have to be investigatedfurther.
Standards and developing countrycompetitiveness34
What follows deals, first, with the macro- and micro-eco-nomic determinants of firms’ decision to invest in quality andstandards-related capability and, second, with industry needsfor services required to conform standards and technical reg-ulations (STRs) from advanced industrial economies.35
Determinants of the decision to invest in quality-related capabilities36
The involvement of developing country firms in internationaltrade is crucially affected by developed country product andprocess STRs. As tariff and quota barriers to trade in agricul-tural, food, and manufactured products continue to declinedue to the multilateral trade agreements, public debate isincreasingly focusing on the impact of STRs. Seeking to min-imise health and environmental risks, prevent deceptive prac-tices and reduce transaction costs in business by providingcommon notions of ‘quality’, ‘safety’, ‘authenticity’, ‘goodpractice’, and ‘sustainability’, they have become a more com-mon, though subtler, hurdle to trade.37 Depending upon par-ticular industry or market circumstances, STRs can either raiseor lower economic efficiency; promote or block competition;facilitate or constrain international trade; and enable orexclude the participation of the poor in remunerative eco-nomic activities.38
Even in a semi-industrialised country like Argentina, thecommitment of manufacturing firms in the field of qualityand conformity has not been extensive so far. Firms with cer-tified quality management systems are a minority, fewer than30 per cent of the total (see table 7.3). Most of them, except
the largest and more established ones, do not appear toassign a distinctive role to quality capabilities within theirorganisational structure, budget and management. Theselow levels of commitment to such capabilities is consistentwith the fact that a large number of manufacturing firms lackthe technological competence required to export goods sub-ject to stringent STRs in industrial economies. In addition, theincidence of firm-specific investment in quality capabilityvaries a lot. Very few firms keep separate account of theseexpenses. Most consider them as part of expenses in humanresource management, R&D, procurement, investment, logis-tics and marketing (packaging and labeling).39
Two factors move firms to certify compliance with qualitymanagement system standards. One is the need to enhancereputation and credibility. The other is the contribution of thestandards to increased productivity when they are used toimprove production processes. For the first factor to actuallycount, the adaptation to the standard must be done effec-tively. Otherwise, the cost of compliance may end up exceed-ing the gains (or avoidance of losses) in market share. Theeffectiveness of compliance differs according to cumulativecapability and the nature of the respective efforts.40
Standards certification by firms building trade competenceis sought when:● It is required by foreign clients;● Firms’ export-led growth augments the operational com-
plexity, certifications helping to demonstrate successimproved internal consistency;
● Expansion towards more mature markets, like the EU or theUS is expected.
In these cases certification (and the ensuing complianceeffort) is perceived as a useful tool to improve operationalpractices – although some complain about the short-termopportunity costs of adapting to the required standards byhaving to divert time from other productive activities. Firmsclaim that investing in improving quality managements sys-tems is a must, regardless of firm size and markets targeted.They sense that the effective application of a quality manage-ment system triggers off a better environment for productiv-ity gains41. Traditional cost-benefit analysis of this type of
94 UNIDO Industrial Development Report 2005
Table 7.3 Diffusion of quality management systems
Percentage oftotal panel
Firms that have or use Quantity (1688)
Quality control points 982 58.2Follow up spreadsheets
in each control point 701 41.5Frequency distributions 311Cause-effect diagrams 242Control of variables graph 414Attributes statistical control 376Pareto diagrams 228Certified quality management systems 495 29.3General norms 415 24.6Sector specific norms 174 10.3Certified products 211 12.5
Source: UNIDO based on the survey of National Innovations andTechnological Behaviour of Argentine firms, 1998/01, INDEC.
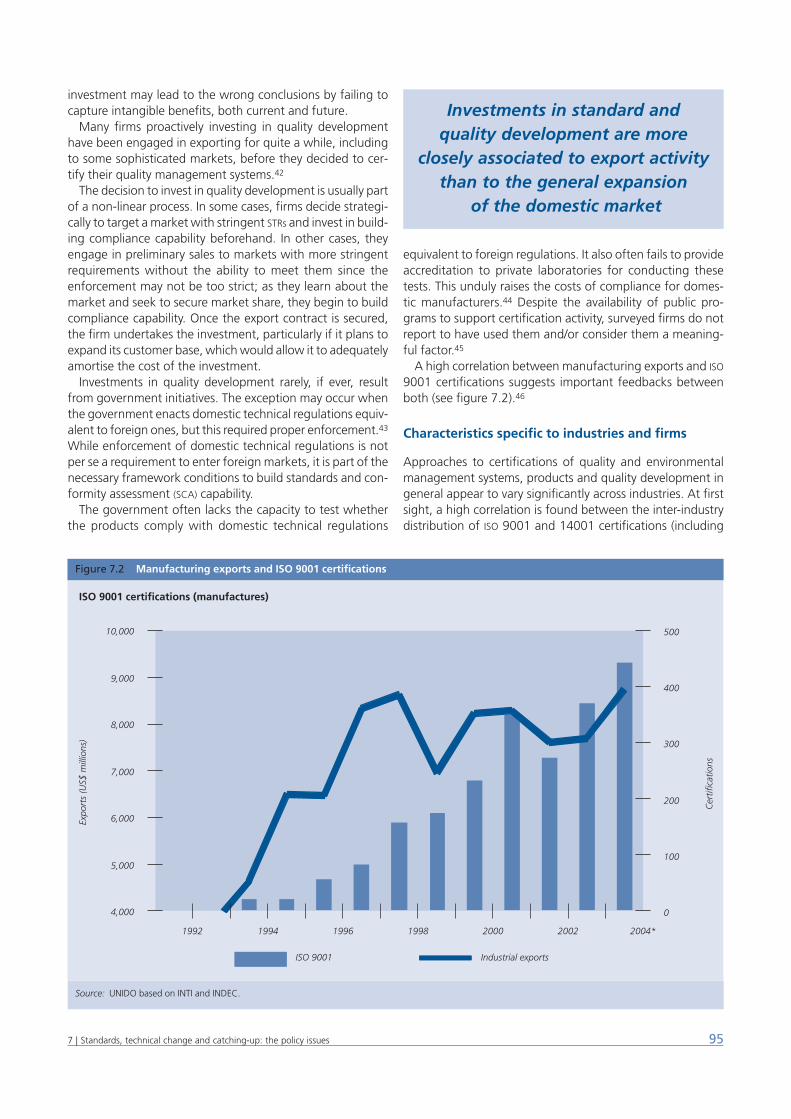
investment may lead to the wrong conclusions by failing tocapture intangible benefits, both current and future.
Many firms proactively investing in quality developmenthave been engaged in exporting for quite a while, includingto some sophisticated markets, before they decided to cer-tify their quality management systems.42
The decision to invest in quality development is usually partof a non-linear process. In some cases, firms decide strategi-cally to target a market with stringent STRs and invest in build-ing compliance capability beforehand. In other cases, theyengage in preliminary sales to markets with more stringentrequirements without the ability to meet them since theenforcement may not be too strict; as they learn about themarket and seek to secure market share, they begin to buildcompliance capability. Once the export contract is secured,the firm undertakes the investment, particularly if it plans toexpand its customer base, which would allow it to adequatelyamortise the cost of the investment.
Investments in quality development rarely, if ever, resultfrom government initiatives. The exception may occur whenthe government enacts domestic technical regulations equiv-alent to foreign ones, but this required proper enforcement.43
While enforcement of domestic technical regulations is notper se a requirement to enter foreign markets, it is part of thenecessary framework conditions to build standards and con-formity assessment (SCA) capability.
The government often lacks the capacity to test whetherthe products comply with domestic technical regulations
equivalent to foreign regulations. It also often fails to provideaccreditation to private laboratories for conducting thesetests. This unduly raises the costs of compliance for domes-tic manufacturers.44 Despite the availability of public pro-grams to support certification activity, surveyed firms do notreport to have used them and/or consider them a meaning-ful factor.45
A high correlation between manufacturing exports and ISO
9001 certifications suggests important feedbacks betweenboth (see figure 7.2).46
Characteristics specific to industries and firms
Approaches to certifications of quality and environmentalmanagement systems, products and quality development ingeneral appear to vary significantly across industries. At firstsight, a high correlation is found between the inter-industrydistribution of ISO 9001 and 14001 certifications (including
957 | Standards, technical change and catching-up: the policy issues
Figure 7.2 Manufacturing exports and ISO 9001 certifications
Source: UNIDO based on INTI and INDEC.
1992 1994 1996 1998 2000 2002 2004*
ISO 9001 Industrial exports
ISO 9001 certifications (manufactures)
4,000
5,000
6,000
7,000
8,000
9,000
10,000
Expo
rts
(US$
mill
ions
)
0
100
200
300
400
500
Cer
tific
atio
ns
Investments in standard and quality development are more
closely associated to export activitythan to the general expansion
of the domestic market
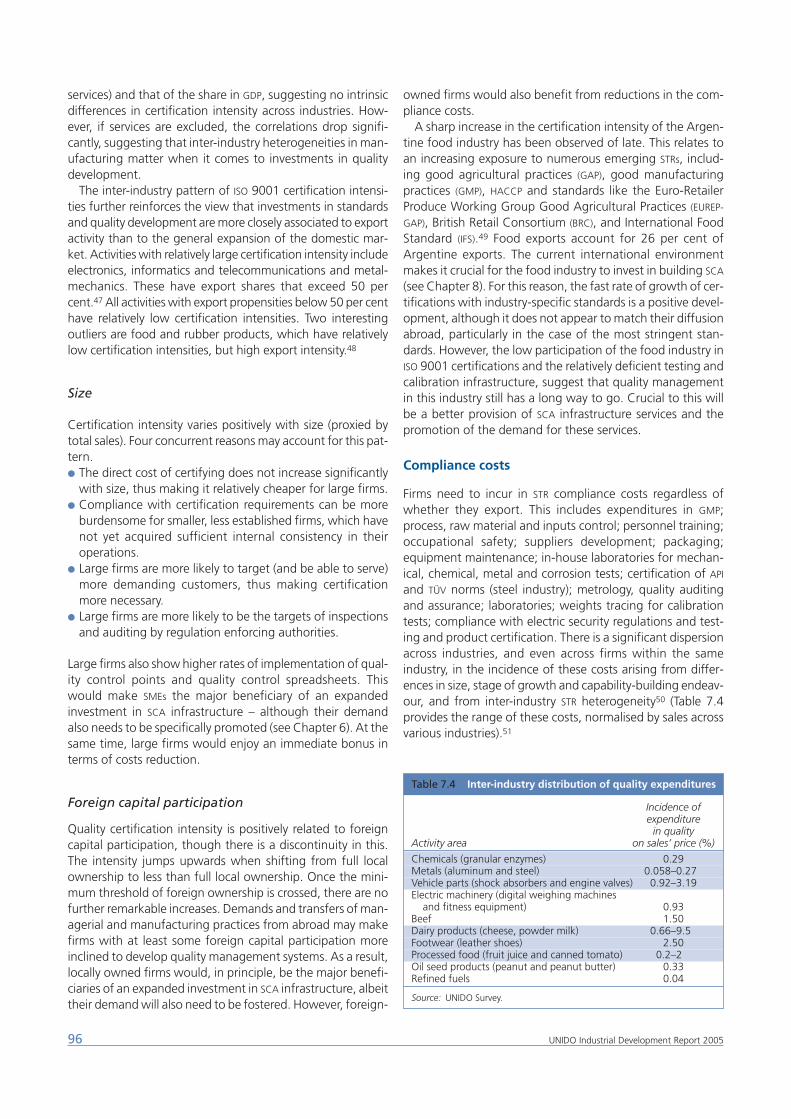
services) and that of the share in GDP, suggesting no intrinsicdifferences in certification intensity across industries. How-ever, if services are excluded, the correlations drop signifi-cantly, suggesting that inter-industry heterogeneities in man-ufacturing matter when it comes to investments in qualitydevelopment.
The inter-industry pattern of ISO 9001 certification intensi-ties further reinforces the view that investments in standardsand quality development are more closely associated to exportactivity than to the general expansion of the domestic mar-ket. Activities with relatively large certification intensity includeelectronics, informatics and telecommunications and metal-mechanics. These have export shares that exceed 50 percent.47 All activities with export propensities below 50 per centhave relatively low certification intensities. Two interestingoutliers are food and rubber products, which have relativelylow certification intensities, but high export intensity.48
Size
Certification intensity varies positively with size (proxied bytotal sales). Four concurrent reasons may account for this pat-tern.● The direct cost of certifying does not increase significantly
with size, thus making it relatively cheaper for large firms.● Compliance with certification requirements can be more
burdensome for smaller, less established firms, which havenot yet acquired sufficient internal consistency in theiroperations.
● Large firms are more likely to target (and be able to serve)more demanding customers, thus making certificationmore necessary.
● Large firms are more likely to be the targets of inspectionsand auditing by regulation enforcing authorities.
Large firms also show higher rates of implementation of qual-ity control points and quality control spreadsheets. Thiswould make SMEs the major beneficiary of an expandedinvestment in SCA infrastructure – although their demandalso needs to be specifically promoted (see Chapter 6). At thesame time, large firms would enjoy an immediate bonus interms of costs reduction.
Foreign capital participation
Quality certification intensity is positively related to foreigncapital participation, though there is a discontinuity in this.The intensity jumps upwards when shifting from full localownership to less than full local ownership. Once the mini-mum threshold of foreign ownership is crossed, there are nofurther remarkable increases. Demands and transfers of man-agerial and manufacturing practices from abroad may makefirms with at least some foreign capital participation moreinclined to develop quality management systems. As a result,locally owned firms would, in principle, be the major benefi-ciaries of an expanded investment in SCA infrastructure, albeittheir demand will also need to be fostered. However, foreign-
owned firms would also benefit from reductions in the com-pliance costs.
A sharp increase in the certification intensity of the Argen-tine food industry has been observed of late. This relates toan increasing exposure to numerous emerging STRs, includ-ing good agricultural practices (GAP), good manufacturingpractices (GMP), HACCP and standards like the Euro-RetailerProduce Working Group Good Agricultural Practices (EUREP-
GAP), British Retail Consortium (BRC), and International FoodStandard (IFS).49 Food exports account for 26 per cent ofArgentine exports. The current international environmentmakes it crucial for the food industry to invest in building SCA
(see Chapter 8). For this reason, the fast rate of growth of cer-tifications with industry-specific standards is a positive devel-opment, although it does not appear to match their diffusionabroad, particularly in the case of the most stringent stan-dards. However, the low participation of the food industry inISO 9001 certifications and the relatively deficient testing andcalibration infrastructure, suggest that quality managementin this industry still has a long way to go. Crucial to this willbe a better provision of SCA infrastructure services and thepromotion of the demand for these services.
Compliance costs
Firms need to incur in STR compliance costs regardless ofwhether they export. This includes expenditures in GMP;process, raw material and inputs control; personnel training;occupational safety; suppliers development; packaging;equipment maintenance; in-house laboratories for mechan-ical, chemical, metal and corrosion tests; certification of API
and TÜV norms (steel industry); metrology, quality auditingand assurance; laboratories; weights tracing for calibrationtests; compliance with electric security regulations and test-ing and product certification. There is a significant dispersionacross industries, and even across firms within the sameindustry, in the incidence of these costs arising from differ-ences in size, stage of growth and capability-building endeav-our, and from inter-industry STR heterogeneity50 (Table 7.4provides the range of these costs, normalised by sales acrossvarious industries).51
96 UNIDO Industrial Development Report 2005
Table 7.4 Inter-industry distribution of quality expenditures
Incidence ofexpenditure
in qualityActivity area on sales’ price (%)
Chemicals (granular enzymes) 0.29Metals (aluminum and steel) 0.058–0.270Vehicle parts (shock absorbers and engine valves) 0.92–3.19Electric machinery (digital weighing machines
and fitness equipment) 0.93Beef 1.50Dairy products (cheese, powder milk) 0.66–9.50Footwear (leather shoes) 2.50Processed food (fruit juice and canned tomato) 0.2–2.00Oil seed products (peanut and peanut butter) 0.33Refined fuels 0.04
Source: UNIDO Survey.
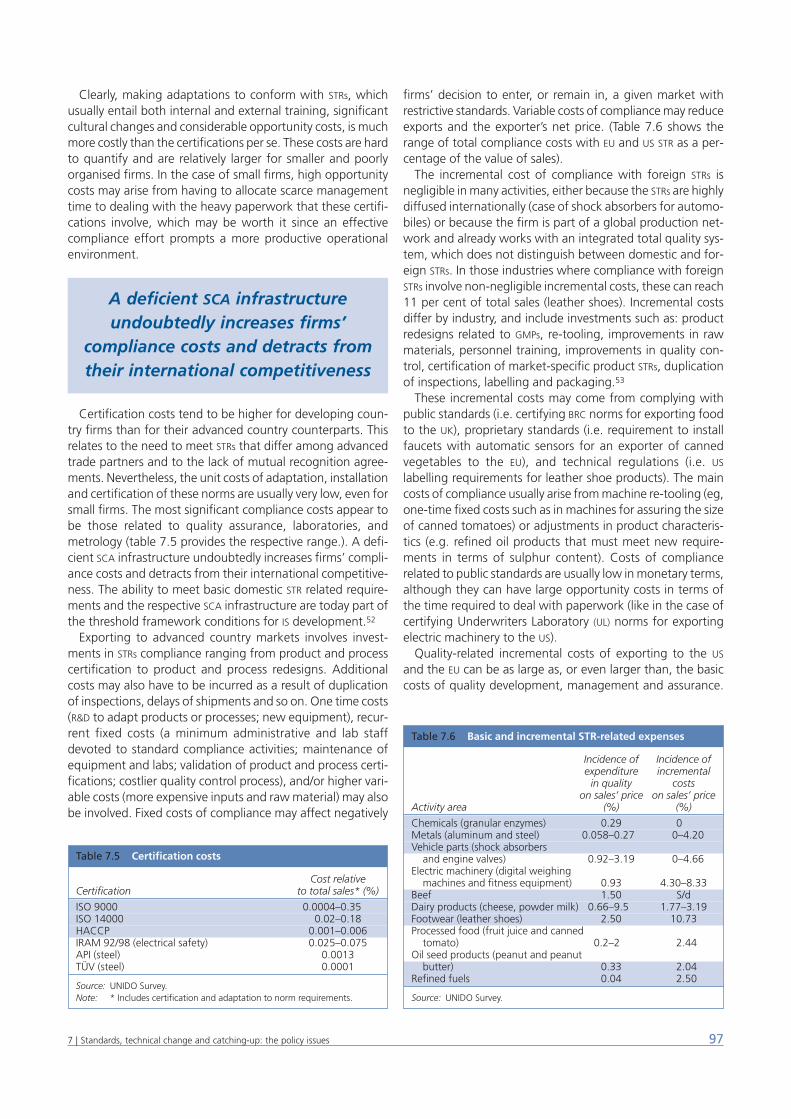
Clearly, making adaptations to conform with STRs, whichusually entail both internal and external training, significantcultural changes and considerable opportunity costs, is muchmore costly than the certifications per se. These costs are hardto quantify and are relatively larger for smaller and poorlyorganised firms. In the case of small firms, high opportunitycosts may arise from having to allocate scarce managementtime to dealing with the heavy paperwork that these certifi-cations involve, which may be worth it since an effectivecompliance effort prompts a more productive operationalenvironment.
Certification costs tend to be higher for developing coun-try firms than for their advanced country counterparts. Thisrelates to the need to meet STRs that differ among advancedtrade partners and to the lack of mutual recognition agree-ments. Nevertheless, the unit costs of adaptation, installationand certification of these norms are usually very low, even forsmall firms. The most significant compliance costs appear tobe those related to quality assurance, laboratories, andmetrology (table 7.5 provides the respective range.). A defi-cient SCA infrastructure undoubtedly increases firms’ compli-ance costs and detracts from their international competitive-ness. The ability to meet basic domestic STR related require-ments and the respective SCA infrastructure are today part ofthe threshold framework conditions for IS development.52
Exporting to advanced country markets involves invest-ments in STRs compliance ranging from product and processcertification to product and process redesigns. Additionalcosts may also have to be incurred as a result of duplicationof inspections, delays of shipments and so on. One time costs(R&D to adapt products or processes; new equipment), recur-rent fixed costs (a minimum administrative and lab staffdevoted to standard compliance activities; maintenance ofequipment and labs; validation of product and process certi-fications; costlier quality control process), and/or higher vari-able costs (more expensive inputs and raw material) may alsobe involved. Fixed costs of compliance may affect negatively
firms’ decision to enter, or remain in, a given market withrestrictive standards. Variable costs of compliance may reduceexports and the exporter’s net price. (Table 7.6 shows therange of total compliance costs with EU and US STR as a per-centage of the value of sales).
The incremental cost of compliance with foreign STRs isnegligible in many activities, either because the STRs are highlydiffused internationally (case of shock absorbers for automo-biles) or because the firm is part of a global production net-work and already works with an integrated total quality sys-tem, which does not distinguish between domestic and for-eign STRs. In those industries where compliance with foreignSTRs involve non-negligible incremental costs, these can reach11 per cent of total sales (leather shoes). Incremental costsdiffer by industry, and include investments such as: productredesigns related to GMPs, re-tooling, improvements in rawmaterials, personnel training, improvements in quality con-trol, certification of market-specific product STRs, duplicationof inspections, labelling and packaging.53
These incremental costs may come from complying withpublic standards (i.e. certifying BRC norms for exporting foodto the UK), proprietary standards (i.e. requirement to installfaucets with automatic sensors for an exporter of cannedvegetables to the EU), and technical regulations (i.e. US
labelling requirements for leather shoe products). The maincosts of compliance usually arise from machine re-tooling (eg,one-time fixed costs such as in machines for assuring the sizeof canned tomatoes) or adjustments in product characteris-tics (e.g. refined oil products that must meet new require-ments in terms of sulphur content). Costs of compliancerelated to public standards are usually low in monetary terms,although they can have large opportunity costs in terms ofthe time required to deal with paperwork (like in the case ofcertifying Underwriters Laboratory (UL) norms for exportingelectric machinery to the US).
Quality-related incremental costs of exporting to the US
and the EU can be as large as, or even larger than, the basiccosts of quality development, management and assurance.
977 | Standards, technical change and catching-up: the policy issues
A deficient SCA infrastructureundoubtedly increases firms’
compliance costs and detracts fromtheir international competitiveness
Table 7.5 Certification costs
Cost relativeCertification to total sales* (%)
ISO 9000 0.0004–0.3500ISO 14000 0.02–0.18HACCP 0.001–0.006IRAM 92/98 (electrical safety) 0.025–0.075API (steel) 0.0013TÜV (steel) 0.0001
Source: UNIDO Survey.Note: * Includes certification and adaptation to norm requirements.
Table 7.6 Basic and incremental STR-related expenses
Incidence of Incidence ofexpenditure incremental
in quality costson sales’ price on sales’ price
Activity area (%) (%)
Chemicals (granular enzymes) 0.29 0.00Metals (aluminum and steel) 0.058–0.270 0–4.20Vehicle parts (shock absorbers
and engine valves) 0.92–3.19 0–4.66Electric machinery (digital weighing
machines and fitness equipment) 0.93 4.30–8.33Beef 1.50 S/dDairy products (cheese, powder milk) 0.66–9.50 1.77–3.19Footwear (leather shoes) 2.50 10.73Processed food (fruit juice and canned
tomato) 0.2–2.00 2.44Oil seed products (peanut and peanut
butter) 0.33 2.04Refined fuels 0.04 2.50
Source: UNIDO Survey.
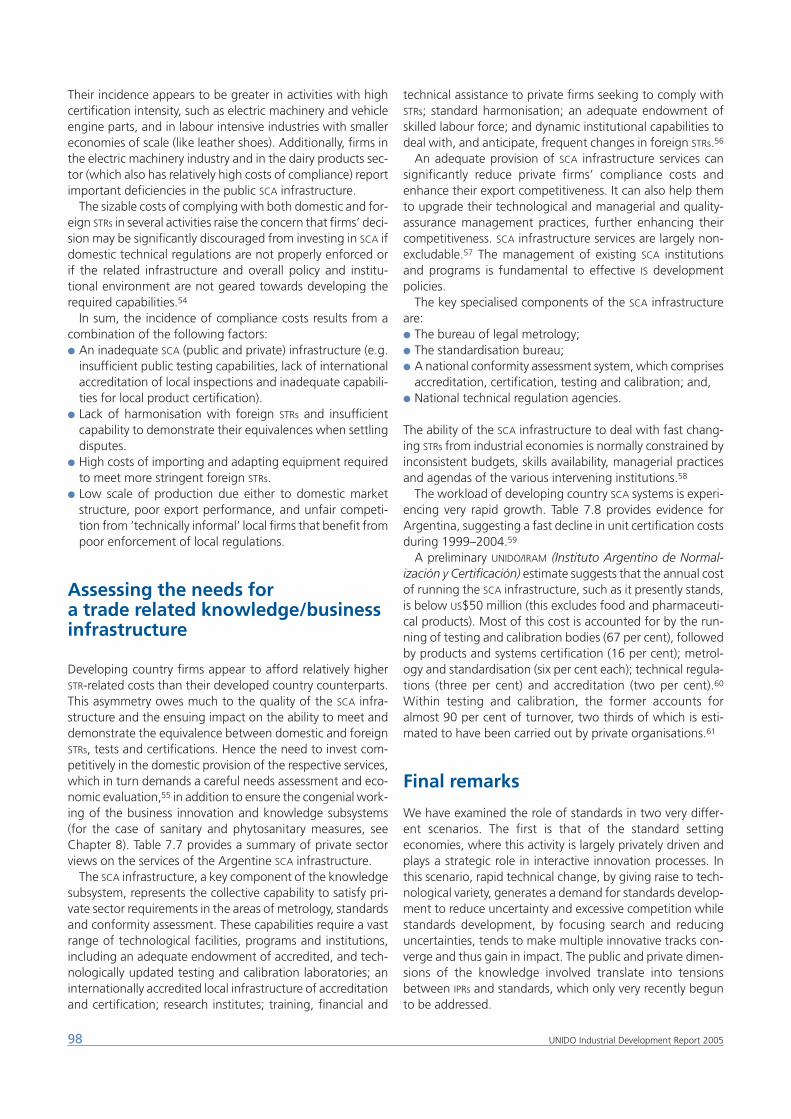
Their incidence appears to be greater in activities with highcertification intensity, such as electric machinery and vehicleengine parts, and in labour intensive industries with smallereconomies of scale (like leather shoes). Additionally, firms inthe electric machinery industry and in the dairy products sec-tor (which also has relatively high costs of compliance) reportimportant deficiencies in the public SCA infrastructure.
The sizable costs of complying with both domestic and for-eign STRs in several activities raise the concern that firms’ deci-sion may be significantly discouraged from investing in SCA ifdomestic technical regulations are not properly enforced orif the related infrastructure and overall policy and institu-tional environment are not geared towards developing therequired capabilities.54
In sum, the incidence of compliance costs results from acombination of the following factors:● An inadequate SCA (public and private) infrastructure (e.g.
insufficient public testing capabilities, lack of internationalaccreditation of local inspections and inadequate capabili-ties for local product certification).
● Lack of harmonisation with foreign STRs and insufficientcapability to demonstrate their equivalences when settlingdisputes.
● High costs of importing and adapting equipment requiredto meet more stringent foreign STRs.
● Low scale of production due either to domestic marketstructure, poor export performance, and unfair competi-tion from ‘technically informal’ local firms that benefit frompoor enforcement of local regulations.
Assessing the needs for a trade related knowledge/businessinfrastructure
Developing country firms appear to afford relatively higherSTR-related costs than their developed country counterparts.This asymmetry owes much to the quality of the SCA infra-structure and the ensuing impact on the ability to meet anddemonstrate the equivalence between domestic and foreignSTRs, tests and certifications. Hence the need to invest com-petitively in the domestic provision of the respective services,which in turn demands a careful needs assessment and eco-nomic evaluation,55 in addition to ensure the congenial work-ing of the business innovation and knowledge subsystems(for the case of sanitary and phytosanitary measures, seeChapter 8). Table 7.7 provides a summary of private sectorviews on the services of the Argentine SCA infrastructure.
The SCA infrastructure, a key component of the knowledgesubsystem, represents the collective capability to satisfy pri-vate sector requirements in the areas of metrology, standardsand conformity assessment. These capabilities require a vastrange of technological facilities, programs and institutions,including an adequate endowment of accredited, and tech-nologically updated testing and calibration laboratories; aninternationally accredited local infrastructure of accreditationand certification; research institutes; training, financial and
technical assistance to private firms seeking to comply withSTRs; standard harmonisation; an adequate endowment ofskilled labour force; and dynamic institutional capabilities todeal with, and anticipate, frequent changes in foreign STRs.56
An adequate provision of SCA infrastructure services cansignificantly reduce private firms’ compliance costs andenhance their export competitiveness. It can also help themto upgrade their technological and managerial and quality-assurance management practices, further enhancing theircompetitiveness. SCA infrastructure services are largely non-excludable.57 The management of existing SCA institutionsand programs is fundamental to effective IS developmentpolicies.
The key specialised components of the SCA infrastructureare:● The bureau of legal metrology;● The standardisation bureau;● A national conformity assessment system, which comprises
accreditation, certification, testing and calibration; and,● National technical regulation agencies.
The ability of the SCA infrastructure to deal with fast chang-ing STRs from industrial economies is normally constrained byinconsistent budgets, skills availability, managerial practicesand agendas of the various intervening institutions.58
The workload of developing country SCA systems is experi-encing very rapid growth. Table 7.8 provides evidence forArgentina, suggesting a fast decline in unit certification costsduring 1999–2004.59
A preliminary UNIDO/IRAM (Instituto Argentino de Normal-ización y Certificación) estimate suggests that the annual costof running the SCA infrastructure, such as it presently stands,is below US$50 million (this excludes food and pharmaceuti-cal products). Most of this cost is accounted for by the run-ning of testing and calibration bodies (67 per cent), followedby products and systems certification (16 per cent); metrol-ogy and standardisation (six per cent each); technical regula-tions (three per cent) and accreditation (two per cent).60
Within testing and calibration, the former accounts foralmost 90 per cent of turnover, two thirds of which is esti-mated to have been carried out by private organisations.61
Final remarks
We have examined the role of standards in two very differ-ent scenarios. The first is that of the standard settingeconomies, where this activity is largely privately driven andplays a strategic role in interactive innovation processes. Inthis scenario, rapid technical change, by giving raise to tech-nological variety, generates a demand for standards develop-ment to reduce uncertainty and excessive competition whilestandards development, by focusing search and reducinguncertainties, tends to make multiple innovative tracks con-verge and thus gain in impact. The public and private dimen-sions of the knowledge involved translate into tensionsbetween IPRs and standards, which only very recently begunto be addressed.
98 UNIDO Industrial Development Report 2005
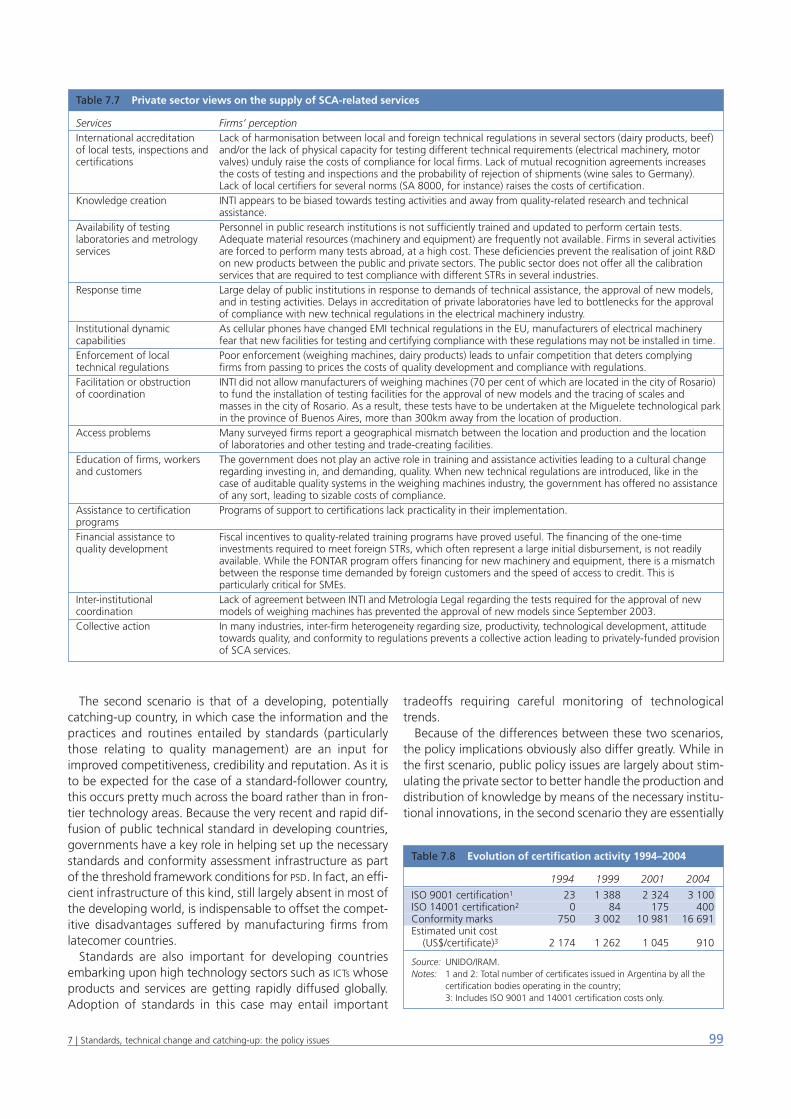
The second scenario is that of a developing, potentiallycatching-up country, in which case the information and thepractices and routines entailed by standards (particularlythose relating to quality management) are an input forimproved competitiveness, credibility and reputation. As it isto be expected for the case of a standard-follower country,this occurs pretty much across the board rather than in fron-tier technology areas. Because the very recent and rapid dif-fusion of public technical standard in developing countries,governments have a key role in helping set up the necessarystandards and conformity assessment infrastructure as partof the threshold framework conditions for PSD. In fact, an effi-cient infrastructure of this kind, still largely absent in most ofthe developing world, is indispensable to offset the compet-itive disadvantages suffered by manufacturing firms fromlatecomer countries.
Standards are also important for developing countriesembarking upon high technology sectors such as ICTs whoseproducts and services are getting rapidly diffused globally.Adoption of standards in this case may entail important
tradeoffs requiring careful monitoring of technologicaltrends.
Because of the differences between these two scenarios,the policy implications obviously also differ greatly. While inthe first scenario, public policy issues are largely about stim-ulating the private sector to better handle the production anddistribution of knowledge by means of the necessary institu-tional innovations, in the second scenario they are essentially
997 | Standards, technical change and catching-up: the policy issues
Table 7.7 Private sector views on the supply of SCA-related services
Services Firms’ perceptionInternational accreditation Lack of harmonisation between local and foreign technical regulations in several sectors (dairy products, beef)of local tests, inspections and and/or the lack of physical capacity for testing different technical requirements (electrical machinery, motorcertifications valves) unduly raise the costs of compliance for local firms. Lack of mutual recognition agreements increases
the costs of testing and inspections and the probability of rejection of shipments (wine sales to Germany). Lack of local certifiers for several norms (SA 8000, for instance) raises the costs of certification.
Knowledge creation INTI appears to be biased towards testing activities and away from quality-related research and technicalassistance.
Availability of testing Personnel in public research institutions is not sufficiently trained and updated to perform certain tests. laboratories and metrology Adequate material resources (machinery and equipment) are frequently not available. Firms in several activities services are forced to perform many tests abroad, at a high cost. These deficiencies prevent the realisation of joint R&D
on new products between the public and private sectors. The public sector does not offer all the calibration services that are required to test compliance with different STRs in several industries.
Response time Large delay of public institutions in response to demands of technical assistance, the approval of new models, and in testing activities. Delays in accreditation of private laboratories have led to bottlenecks for the approval of compliance with new technical regulations in the electrical machinery industry.
Institutional dynamic As cellular phones have changed EMI technical regulations in the EU, manufacturers of electrical machinery capabilities fear that new facilities for testing and certifying compliance with these regulations may not be installed in time.Enforcement of local Poor enforcement (weighing machines, dairy products) leads to unfair competition that deters complying technical regulations firms from passing to prices the costs of quality development and compliance with regulations.Facilitation or obstruction INTI did not allow manufacturers of weighing machines (70 per cent of which are located in the city of Rosario) of coordination to fund the installation of testing facilities for the approval of new models and the tracing of scales and
masses in the city of Rosario. As a result, these tests have to be undertaken at the Miguelete technological parkin the province of Buenos Aires, more than 300km away from the location of production.
Access problems Many surveyed firms report a geographical mismatch between the location and production and the location of laboratories and other testing and trade-creating facilities.
Education of firms, workers The government does not play an active role in training and assistance activities leading to a cultural change and customers regarding investing in, and demanding, quality. When new technical regulations are introduced, like in the
case of auditable quality systems in the weighing machines industry, the government has offered no assistance of any sort, leading to sizable costs of compliance.
Assistance to certification Programs of support to certifications lack practicality in their implementation.programsFinancial assistance to Fiscal incentives to quality-related training programs have proved useful. The financing of the one-time quality development investments required to meet foreign STRs, which often represent a large initial disbursement, is not readily
available. While the FONTAR program offers financing for new machinery and equipment, there is a mismatch between the response time demanded by foreign customers and the speed of access to credit. This is particularly critical for SMEs.
Inter-institutional Lack of agreement between INTI and Metrología Legal regarding the tests required for the approval of new coordination models of weighing machines has prevented the approval of new models since September 2003. Collective action In many industries, inter-firm heterogeneity regarding size, productivity, technological development, attitude
towards quality, and conformity to regulations prevents a collective action leading to privately-funded provision of SCA services.
Table 7.8 Evolution of certification activity 1994–2004
1994 1999 2001 2004
ISO 9001 certification1 23 1 388 2 324 3 100ISO 14001 certification2 0 84 175 400Conformity marks 750 3 002 10 981 16 691Estimated unit cost
(US$/certificate)3 2 174 1 262 1 045 910
Source: UNIDO/IRAM.Notes: 1 and 2: Total number of certificates issued in Argentina by all the
certification bodies operating in the country;3: Includes ISO 9001 and 14001 certification costs only.
100 UNIDO Industrial Development Report 2005
about investing in capability-building and in creating theincentives and institutions for the development of a respon-sive standard and conformity assessment infrastructure toassist enhancing firm’s quality management and internationalcompetitiveness. Only in very few cases are potential catch-
ing-up countries beginning to play a role in standard settingin emerging technology fields. This experience may show theway for the countries that follow and for that reason warrantsclose monitoring.
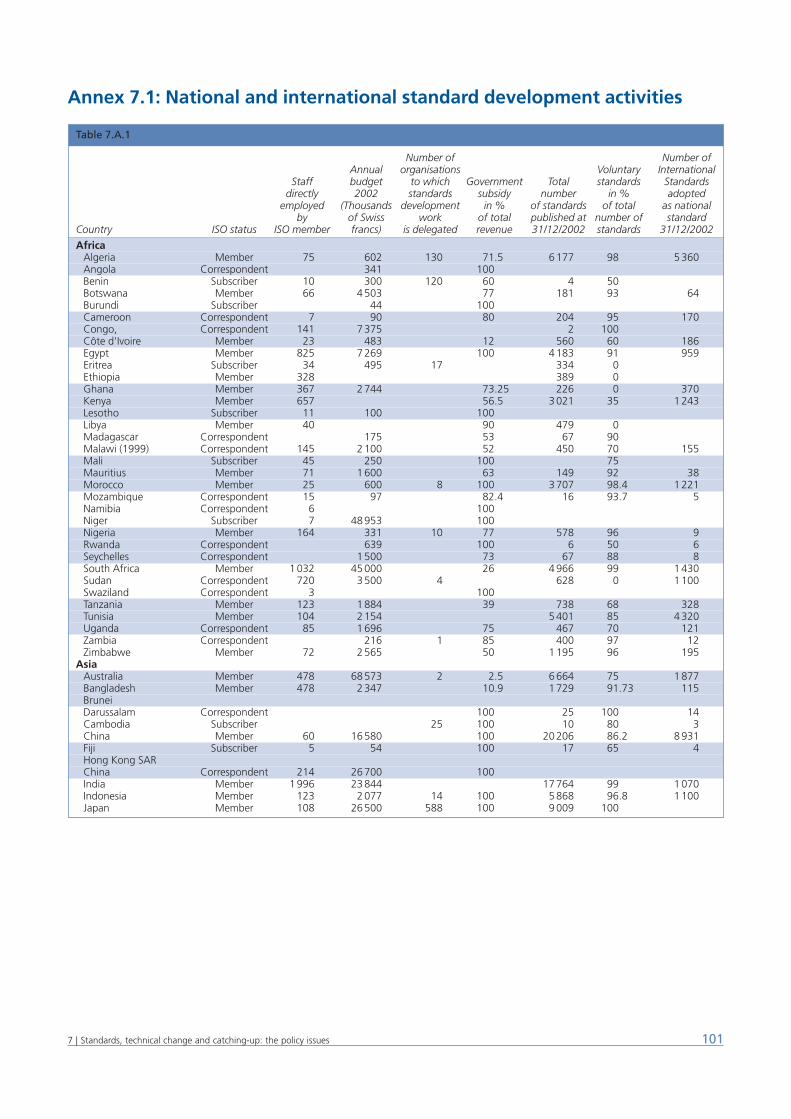
1017 | Standards, technical change and catching-up: the policy issues
Table 7.A.1
Number of Number ofAnnual organisations Voluntary International
Staff budget to which Government Total standards Standardsdirectly 2002 standards subsidy number in % adopted
employed (Thousands development in % of standards of total as nationalby of Swiss work of total published at number of standard
Country ISO status ISO member francs) is delegated revenue 31/12/2002 standards 31/12/2002
AfricaAlgeria Member 75 602 130 71.5 6177 98 5360Angola Correspondent 341 100Benin Subscriber 10 300 120 60 4 50Botswana Member 66 4503 77 181 93 64Burundi Subscriber 44 100Cameroon Correspondent 7 90 80 204 95 170Congo, Correspondent 141 7375 2 100Côte d'Ivoire Member 23 483 12 560 60 186Egypt Member 825 7269 100 4183 91 959Eritrea Subscriber 34 495 17 334 0Ethiopia Member 328 389 0Ghana Member 367 2744 73.25 226 0 370Kenya Member 657 56.5 3021 35 1243Lesotho Subscriber 11 100 100Libya Member 40 90 479 0Madagascar Correspondent 175 53 67 90Malawi (1999) Correspondent 145 2100 52 450 70 155Mali Subscriber 45 250 100 75Mauritius Member 71 1600 63 149 92 38Morocco Member 25 600 8 100 3707 98.4 1221Mozambique Correspondent 15 97 82.4 16 93.7 5Namibia Correspondent 6 100Niger Subscriber 7 48953 100Nigeria Member 164 331 10 77 578 96 9Rwanda Correspondent 639 100 6 50 6Seychelles Correspondent 1500 73 67 88 8South Africa Member 1032 45000 26 4966 99 1430Sudan Correspondent 720 3500 4 628 0 1100Swaziland Correspondent 3 100Tanzania Member 123 1884 39 738 68 328Tunisia Member 104 2154 5401 85 4320Uganda Correspondent 85 1696 75 467 70 121Zambia Correspondent 216 1 85 400 97 12Zimbabwe Member 72 2565 50 1195 96 195
AsiaAustralia Member 478 68573 2 2.5 6664 75 1877Bangladesh Member 478 2347 10.9 1729 91.73 115BruneiDarussalam Correspondent 100 25 100 14Cambodia Subscriber 25 100 10 80 3China Member 60 16580 100 20206 86.2 8931Fiji Subscriber 5 54 100 17 65 4Hong Kong SARChina Correspondent 214 26700 100India Member 1996 23844 17764 99 1070Indonesia Member 123 2077 14 100 5868 96.8 1100Japan Member 108 26500 588 100 9009 100
Annex 7.1: National and international standard development activities
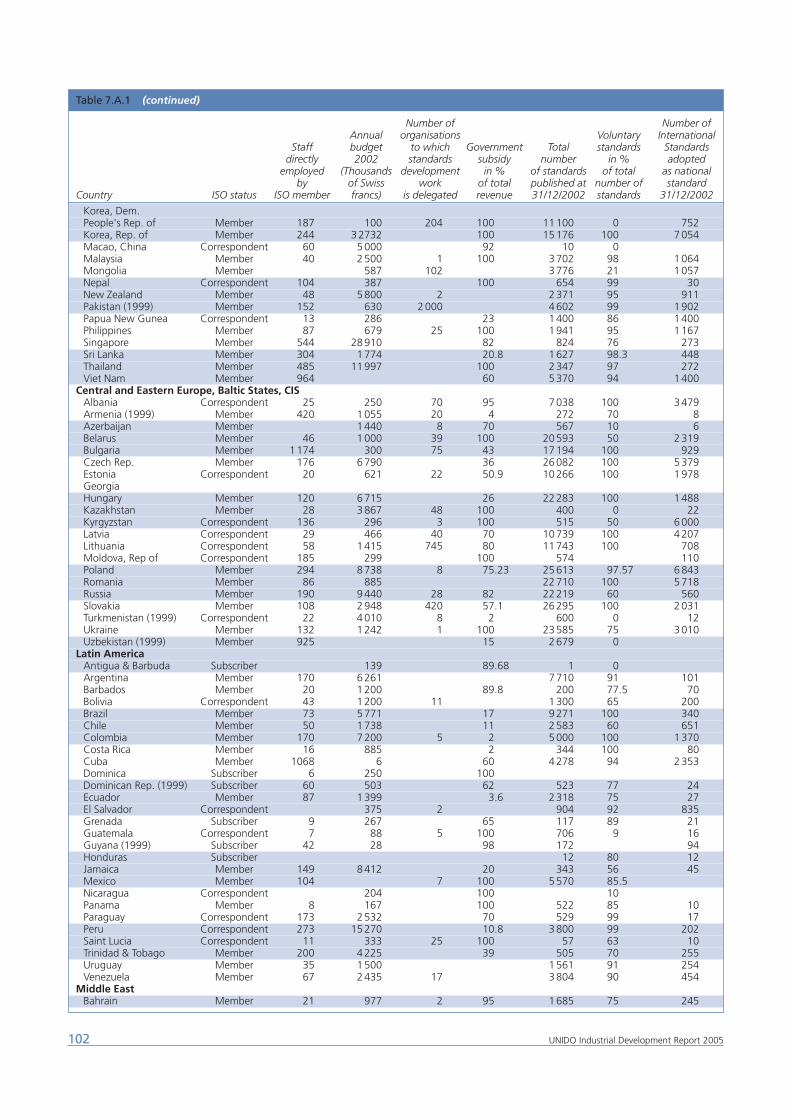
102 UNIDO Industrial Development Report 2005
Table 7.A.1 (continued)
Number of Number ofAnnual organisations Voluntary International
Staff budget to which Government Total standards Standardsdirectly 2002 standards subsidy number in % adopted
employed (Thousands development in % of standards of total as nationalby of Swiss work of total published at number of standard
Country ISO status ISO member francs) is delegated revenue 31/12/2002 standards 31/12/2002
Korea, Dem.People's Rep. of Member 187 100 204 100 11100 0 752Korea, Rep. of Member 244 32732 100 15176 100 7054Macao, China Correspondent 60 5000 92 10 0Malaysia Member 40 2500 1 100 3702 98 1064Mongolia Member 587 102 3776 21 1057Nepal Correspondent 104 387 100 654 99 30New Zealand Member 48 5800 2 2371 95 911Pakistan (1999) Member 152 630 2000 4602 99 1902Papua New Gunea Correspondent 13 286 23 1400 86 1400Philippines Member 87 679 25 100 1941 95 1167Singapore Member 544 28910 82 824 76 273Sri Lanka Member 304 1774 20.8 1627 98.3 448Thailand Member 485 11997 100 2347 97 272Viet Nam Member 964 60 5370 94 1400
Central and Eastern Europe, Baltic States, CISAlbania Correspondent 25 250 70 95 7038 100 3479Armenia (1999) Member 420 1055 20 4 272 70 8Azerbaijan Member 1440 8 70 567 10 6Belarus Member 46 1000 39 100 20593 50 2319Bulgaria Member 1174 300 75 43 17194 100 929Czech Rep. Member 176 6790 36 26082 100 5379Estonia Correspondent 20 621 22 50.9 10266 100 1978Georgia Hungary Member 120 6715 26 22283 100 1488Kazakhstan Member 28 3867 48 100 400 0 22Kyrgyzstan Correspondent 136 296 3 100 515 50 6000Latvia Correspondent 29 466 40 70 10739 100 4207Lithuania Correspondent 58 1415 745 80 11743 100 708Moldova, Rep of Correspondent 185 299 100 574 110Poland Member 294 8738 8 75.23 25613 97.57 6843Romania Member 86 885 22710 100 5718Russia Member 190 9440 28 82 22219 60 560Slovakia Member 108 2948 420 57.1 26295 100 2031Turkmenistan (1999) Correspondent 22 4010 8 2 600 0 12Ukraine Member 132 1242 1 100 23585 75 3010Uzbekistan (1999) Member 925 15 2679 0
Latin AmericaAntigua & Barbuda Subscriber 139 89.68 1 0Argentina Member 170 6261 7710 91 101Barbados Member 20 1200 89.8 200 77.5 70Bolivia Correspondent 43 1200 11 1300 65 200Brazil Member 73 5771 17 9271 100 340Chile Member 50 1738 11 2583 60 651Colombia Member 170 7200 5 2 5000 100 1370Costa Rica Member 16 885 2 344 100 80Cuba Member 1068 6 60 4278 94 2353Dominica Subscriber 6 250 100Dominican Rep. (1999) Subscriber 60 503 62 523 77 24Ecuador Member 87 1399 3.6 2318 75 27El Salvador Correspondent 375 2 904 92 835Grenada Subscriber 9 267 65 117 89 21Guatemala Correspondent 7 88 5 100 706 9 16Guyana (1999) Subscriber 42 28 98 172 94Honduras Subscriber 12 80 12Jamaica Member 149 8412 20 343 56 45Mexico Member 104 7 100 5570 85.5Nicaragua Correspondent 204 100 10Panama Member 8 167 100 522 85 10Paraguay Correspondent 173 2532 70 529 99 17Peru Correspondent 273 15270 10.8 3800 99 202Saint Lucia Correspondent 11 333 25 100 57 63 10Trinidad & Tobago Member 200 4225 39 505 70 255Uruguay Member 35 1500 1561 91 254Venezuela Member 67 2435 17 3804 90 454
Middle EastBahrain Member 21 977 2 95 1685 75 245
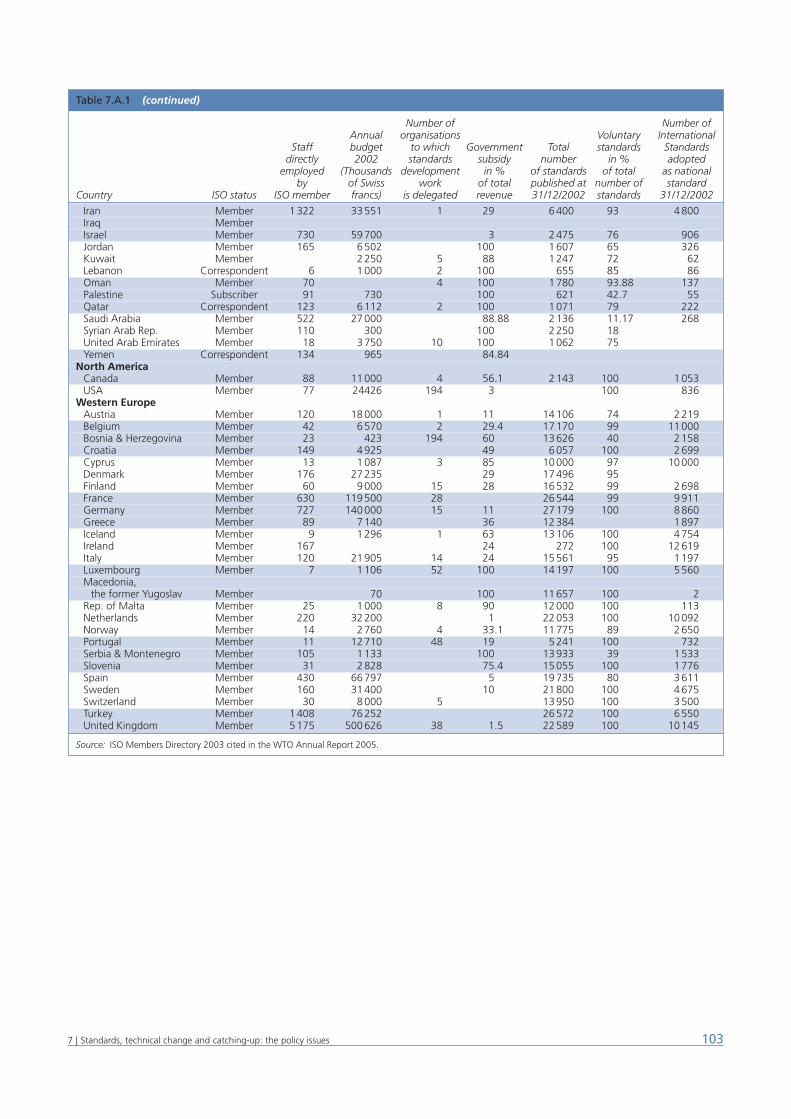
1037 | Standards, technical change and catching-up: the policy issues
Table 7.A.1 (continued)
Number of Number ofAnnual organisations Voluntary International
Staff budget to which Government Total standards Standardsdirectly 2002 standards subsidy number in % adopted
employed (Thousands development in % of standards of total as nationalby of Swiss work of total published at number of standard
Country ISO status ISO member francs) is delegated revenue 31/12/2002 standards 31/12/2002
Iran Member 1322 33551 1 29 6400 93 4800Iraq Member Israel Member 730 59700 3 2475 76 906Jordan Member 165 6502 100 1607 65 326Kuwait Member 2250 5 88 1247 72 62Lebanon Correspondent 6 1000 2 100 655 85 86Oman Member 70 4 100 1780 93.88 137Palestine Subscriber 91 730 100 621 42.7 55Qatar Correspondent 123 6112 2 100 1071 79 222Saudi Arabia Member 522 27000 88.88 2136 11.17 268Syrian Arab Rep. Member 110 300 100 2250 18United Arab Emirates Member 18 3750 10 100 1062 75Yemen Correspondent 134 965 84.84
North AmericaCanada Member 88 11000 4 56.1 2143 100 1053USA Member 77 24426 194 3 100 836
Western Europe Austria Member 120 18000 1 11 14106 74 2219Belgium Member 42 6570 2 29.4 17170 99 11000Bosnia & Herzegovina Member 23 423 194 60 13626 40 2158Croatia Member 149 4925 49 6057 100 2699Cyprus Member 13 1087 3 85 10000 97 10000Denmark Member 176 27235 29 17496 95Finland Member 60 9000 15 28 16532 99 2698France Member 630 119500 28 26544 99 9911Germany Member 727 140000 15 11 27179 100 8860Greece Member 89 7140 36 12384 1897Iceland Member 9 1296 1 63 13106 100 4754Ireland Member 167 24 272 100 12619Italy Member 120 21905 14 24 15561 95 1197Luxembourg Member 7 1106 52 100 14197 100 5560Macedonia,
the former Yugoslav Member 70 100 11657 100 2Rep. of Malta Member 25 1000 8 90 12000 100 113Netherlands Member 220 32200 1 22053 100 10092Norway Member 14 2760 4 33.1 11775 89 2650Portugal Member 11 12710 48 19 5241 100 732Serbia & Montenegro Member 105 1133 100 13933 39 1533Slovenia Member 31 2828 75.4 15055 100 1776Spain Member 430 66797 5 19735 80 3611Sweden Member 160 31400 10 21800 100 4675Switzerland Member 30 8000 5 13950 100 3500Turkey Member 1408 76252 26572 100 6550United Kingdom Member 5175 500626 38 1.5 22589 100 10145
Source: ISO Members Directory 2003 cited in the WTO Annual Report 2005.
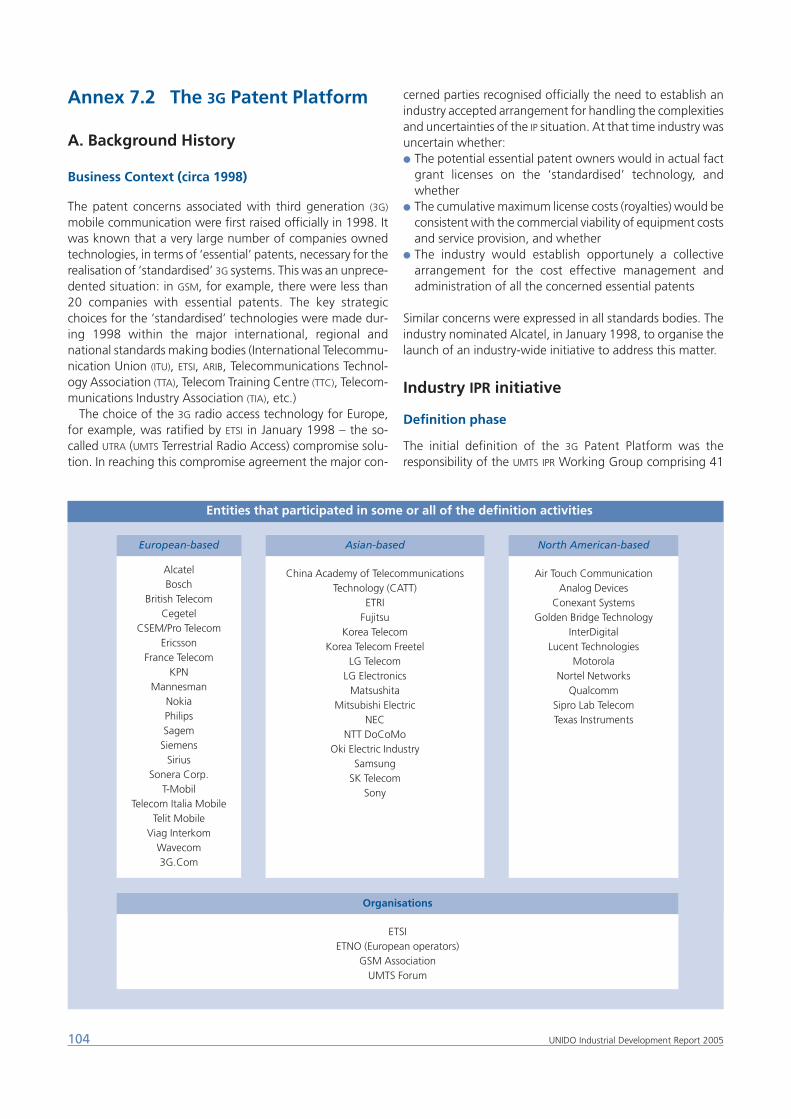
Annex 7.2 The 3G Patent Platform
A. Background History
Business Context (circa 1998)
The patent concerns associated with third generation (3G)
mobile communication were first raised officially in 1998. Itwas known that a very large number of companies ownedtechnologies, in terms of ‘essential’ patents, necessary for therealisation of ‘standardised’ 3G systems. This was an unprece-dented situation: in GSM, for example, there were less than20 companies with essential patents. The key strategicchoices for the ‘standardised’ technologies were made dur-ing 1998 within the major international, regional andnational standards making bodies (International Telecommu-nication Union (ITU), ETSI, ARIB, Telecommunications Technol-ogy Association (TTA), Telecom Training Centre (TTC), Telecom-munications Industry Association (TIA), etc.)
The choice of the 3G radio access technology for Europe,for example, was ratified by ETSI in January 1998 – the so-called UTRA (UMTS Terrestrial Radio Access) compromise solu-tion. In reaching this compromise agreement the major con-
cerned parties recognised officially the need to establish anindustry accepted arrangement for handling the complexitiesand uncertainties of the IP situation. At that time industry wasuncertain whether:● The potential essential patent owners would in actual fact
grant licenses on the ‘standardised’ technology, andwhether
● The cumulative maximum license costs (royalties) would beconsistent with the commercial viability of equipment costsand service provision, and whether
● The industry would establish opportunely a collectivearrangement for the cost effective management andadministration of all the concerned essential patents
Similar concerns were expressed in all standards bodies. Theindustry nominated Alcatel, in January 1998, to organise thelaunch of an industry-wide initiative to address this matter.
Industry IPR initiative
Definition phase
The initial definition of the 3G Patent Platform was theresponsibility of the UMTS IPR Working Group comprising 41
104 UNIDO Industrial Development Report 2005
Entities that participated in some or all of the definition activities
European-based
AlcatelBosch
British TelecomCegetel
CSEM/Pro TelecomEricsson
France TelecomKPN
MannesmanNokiaPhilipsSagem
SiemensSirius
Sonera Corp.T-Mobil
Telecom Italia MobileTelit Mobile
Viag InterkomWavecom3G.Com
Organisations
ETSIETNO (European operators)
GSM AssociationUMTS Forum
Asian-based
China Academy of TelecommunicationsTechnology (CATT)
ETRIFujitsu
Korea TelecomKorea Telecom Freetel
LG TelecomLG Electronics
MatsushitaMitsubishi Electric
NECNTT DoCoMo
Oki Electric IndustrySamsung
SK TelecomSony
North American-based
Air Touch CommunicationAnalog Devices
Conexant SystemsGolden Bridge Technology
InterDigitalLucent Technologies
MotorolaNortel Networks
QualcommSipro Lab TelecomTexas Instruments
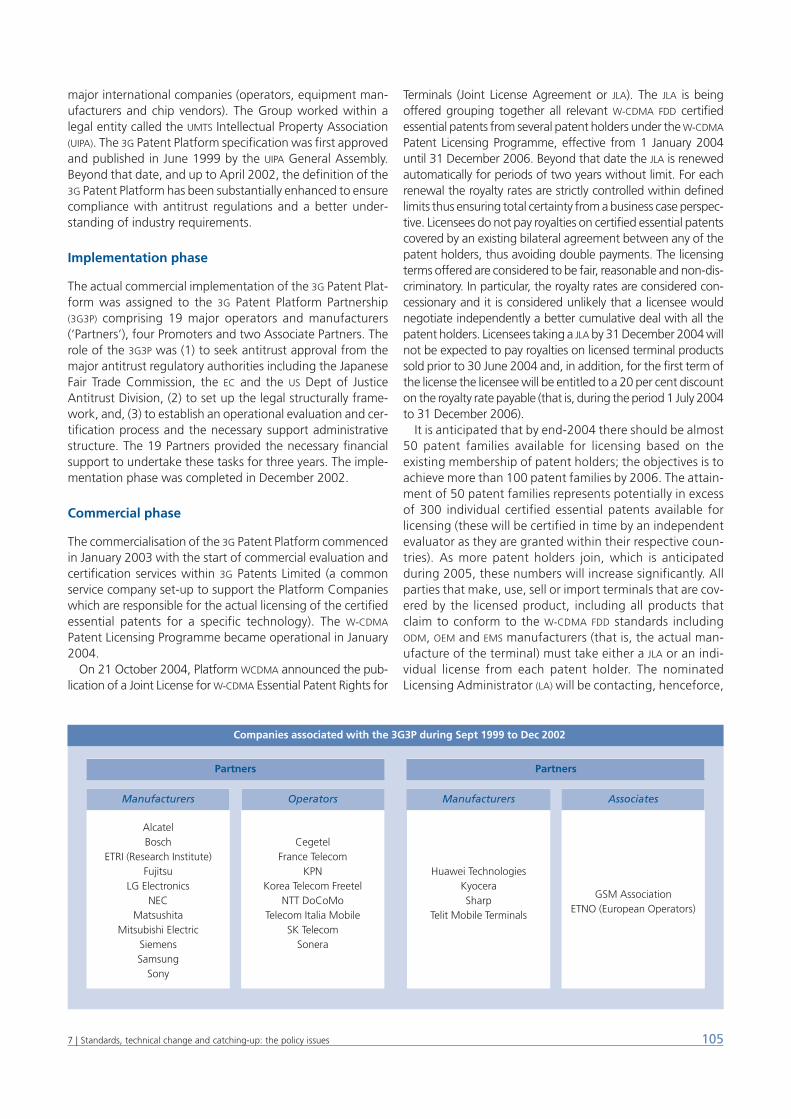
major international companies (operators, equipment man-ufacturers and chip vendors). The Group worked within alegal entity called the UMTS Intellectual Property Association(UIPA). The 3G Patent Platform specification was first approvedand published in June 1999 by the UIPA General Assembly.Beyond that date, and up to April 2002, the definition of the3G Patent Platform has been substantially enhanced to ensurecompliance with antitrust regulations and a better under-standing of industry requirements.
Implementation phase
The actual commercial implementation of the 3G Patent Plat-form was assigned to the 3G Patent Platform Partnership(3G3P) comprising 19 major operators and manufacturers(‘Partners’), four Promoters and two Associate Partners. Therole of the 3G3P was (1) to seek antitrust approval from themajor antitrust regulatory authorities including the JapaneseFair Trade Commission, the EC and the US Dept of JusticeAntitrust Division, (2) to set up the legal structurally frame-work, and, (3) to establish an operational evaluation and cer-tification process and the necessary support administrativestructure. The 19 Partners provided the necessary financialsupport to undertake these tasks for three years. The imple-mentation phase was completed in December 2002.
Commercial phase
The commercialisation of the 3G Patent Platform commencedin January 2003 with the start of commercial evaluation andcertification services within 3G Patents Limited (a commonservice company set-up to support the Platform Companieswhich are responsible for the actual licensing of the certifiedessential patents for a specific technology). The W-CDMA
Patent Licensing Programme became operational in January2004.
On 21 October 2004, Platform WCDMA announced the pub-lication of a Joint License for W-CDMA Essential Patent Rights for
Terminals (Joint License Agreement or JLA). The JLA is beingoffered grouping together all relevant W-CDMA FDD certifiedessential patents from several patent holders under the W-CDMA
Patent Licensing Programme, effective from 1 January 2004until 31 December 2006. Beyond that date the JLA is renewedautomatically for periods of two years without limit. For eachrenewal the royalty rates are strictly controlled within definedlimits thus ensuring total certainty from a business case perspec-tive. Licensees do not pay royalties on certified essential patentscovered by an existing bilateral agreement between any of thepatent holders, thus avoiding double payments. The licensingterms offered are considered to be fair, reasonable and non-dis-criminatory. In particular, the royalty rates are considered con-cessionary and it is considered unlikely that a licensee wouldnegotiate independently a better cumulative deal with all thepatent holders. Licensees taking a JLA by 31 December 2004 willnot be expected to pay royalties on licensed terminal productssold prior to 30 June 2004 and, in addition, for the first term ofthe license the licensee will be entitled to a 20 per cent discounton the royalty rate payable (that is, during the period 1 July 2004to 31 December 2006).
It is anticipated that by end-2004 there should be almost50 patent families available for licensing based on theexisting membership of patent holders; the objectives is toachieve more than 100 patent families by 2006. The attain-ment of 50 patent families represents potentially in excessof 300 individual certified essential patents available forlicensing (these will be certified in time by an independentevaluator as they are granted within their respective coun-tries). As more patent holders join, which is anticipatedduring 2005, these numbers will increase significantly. Allparties that make, use, sell or import terminals that are cov-ered by the licensed product, including all products thatclaim to conform to the W-CDMA FDD standards includingODM, OEM and EMS manufacturers (that is, the actual man-ufacture of the terminal) must take either a JLA or an indi-vidual license from each patent holder. The nominatedLicensing Administrator (LA) will be contacting, henceforce,
1057 | Standards, technical change and catching-up: the policy issues
Companies associated with the 3G3P during Sept 1999 to Dec 2002
Manufacturers
AlcatelBosch
ETRI (Research Institute)Fujitsu
LG ElectronicsNEC
MatsushitaMitsubishi Electric
SiemensSamsung
Sony
Partners Partners
Operators
CegetelFrance Telecom
KPNKorea Telecom Freetel
NTT DoCoMoTelecom Italia Mobile
SK TelecomSonera
Manufacturers
Huawei TechnologiesKyoceraSharp
Telit Mobile Terminals
Associates
GSM AssociationETNO (European Operators)
potential licensees inviting them to take the JLA or to startindependent negotiations with each patent holder. The LA
has been given some discretionary powers to offer morefavourable terms for those licensees taking a JLA in theshort term.
B. Platform specification
The 3G Patent Platform means the rules of operation of ageneric scheme designed to deliver licenses of ‘essentialpatents’ as defined in the Platform specification, “3G PatentPlatform for Third Generation Mobile Communication Sys-tems: Definition, Functions, Structure, Operation, Govern-ance”. The 3G Patent Platform is not a corporate entity. Allfunctions are performed within a defined structure givenbelow.
Functional features
The scope of the services cover the 3G systems standardisedfamily of technologies defined in the ITU within the frame-work of IMT 2000, plus any regional adaptation defined by3GPP and 3GPP2, approved and published by the recognisedstandards bodies (e.g. ARIB, ETSI, TIA, TTA, TTC, CCSA, etc.).
The three functional services are:● An evaluation of patents submitted voluntarily by patent
holders (or third parties) and certified by the EvaluationProcess to be essential to the pertinent published standardsor to parts thereof:
● An arrangement for licensing the certified ‘essentialpatents’ under a flexible and cost effective regime,
● An identification of ‘essential patents’ necessary to realise3G systems.
The submitted patents will be evaluated and certified inaccordance with an Evaluation Process demanding the high-est quality performance. In the absence of a credible indus-try recognised evaluation and certification process ‘essentialpatents’ cannot be licensed meaningfully worldwide. Licens-ing under the 3G Patent Platform is straightforward and, bydesign, very flexible. The following licensing options exist:● Standard License Agreement (SLA): a ‘default license’ avail-
able immediately to licensees● Interim License Agreement (ILA): a ‘time-limited’ SLA permit-
ting bilateral negotiations between licensors and licensees● Independent bilateral licensing arrangements between
Members and non-Members
Flexibility in the licensing arrangements permits companies tomaintain the freedom to tailor their licensing arrangementsto suit their business interests. The Platform specification cur-rently defines the generic terms and conditions of a SLA/ILA
(annex B and C of Platform Specification). The actual ‘pric-ing’ elements, such as the Standard Royalty Rate (SRR), Maxi-mum Cumulative Royalty Rate (MCR) and the Reference Mar-ket Value (RMV), are established by a Platform Company (tech-nology-specific). The rationale for this approach is explainedbelow under Antitrust Clearance.
Structure and Governance
The 3G Patent Platform has been structured within a legal andorganisational framework to preserve and stimulate compe-tition among the various radio interface technologies definedin the 3G standards. Completely independent Platforms shallbe established, one for each radio interface technology, oper-ating within a legal structure (a Platform Company). EachPlatform Company will be incorporated under English lawand the Board of Directors will comprise the essential patentholders of that technology i.e. governance limited to thelicensors. The administrative aspects of licensing will be out-sourced to a Licensing Administrator with specialist skills.Today, a Platform Company for the W-CDMA technology hasbeen created.
Antitrust Clearance
The 3G Patent Platform has been approved by the majorantitrust regulatory authorities (Japanese Fair Trade Commis-sion, June 28, 2002; European Commission, November 11,2002 and US Dept of Justice, November 12, 2002), giving the3G mobile industry better access to patents.
The overall Platform structure, as now defined, provides fora more flexible arrangement enabling the concerned licens-ors to adjust the ‘pricing’ element of the royalty rate regimefor different technologies as they think appropriate to meetthe requirements of competitive pressures. The patent-costelement, in the establishment of a product sales price, is animportant factor in producing cost-effective competitiveequipment. The ready availability of cost-effective equipmentshould assist mobile operators in reducing their capital invest-ment in the 3G infrastructure roll-out and make new gener-ation terminal devices more affordable for the individual end-users. These factors should accelerate the introduction ofnew 3G mobile services. Obtaining antitrust clearance for thebusiness conduct proposed was a significant milestone. Noother antitrust approved collective industry patent arrange-ment exist for the 3G mobile business. The US DoJ gives anoverview of the pro-competitive nature of the 3G Patent Plat-form.
Benefits for all the players
If industry commits to the 3G Patent Platform, there is a win-win situation for all players in the 3G business chain (particu-larly manufacturers and operators), as it:● Secures knowledge of which patents are essential and their
holders (only about 30 per cent of claimed patents appearto be essential: those declared to the standards bodies)
● Achieves substantial cost and time savings in identifyingessential patents
● Reduces hold-up problems that can occur in negotiations● Reduces substantially the internal licensing negotiation
costs for a more global licensing programme i.e. increaseslicensing revenue with a lower operational cost
● Reduces exposure to patent infringement litigationthrough a more global license coverage and, by virtue of
106 UNIDO Industrial Development Report 2005
1077 | Standards, technical change and catching-up: the policy issues
the fact, that royalties are payable by the last manufacturerin the chain
● Intrinsically limits the cumulative royalty rate thus reducingthe IPR cost-element of a product i.e. creates an industrybench-marking effect for more reasonable royalty rates
● Ability to control IPR cost-element of a product for a giventechnology i.e. a strategic commercial tool for licensors topromote technology in a competitive market
● Patent holders retain control over their essential patentsproviding flexibility to license outside the Platform (a realfreedom to license to suit best business self-interest oflicensor)
● Ensures a non-discriminatory approach for licensors andlicensees
● Ensures a minimal unlicensed usage of patents due to amore expansive licensing arrangement globally i.e. aware-ness of the existence of certified essential patents facilitatesaccess for licensees.
● Eliminates documented patent licensing deficiencies preva-
lent at the start of GSM e.g. unfair, discriminatory, compli-cated, time consuming, expensive (some observers claimalso anti-competitive)
● Catalyses market growth through easier access to thepatents and through equipment cost reductions to opera-tors and end-users
● Reduction in the capital expenditure by operators due to alimiting and more competitive royalty regime for each ofthe radio access technologies
● Service provision may take place in a more certain IPR envi-ronment i.e. the fear of infringement litigation recede pro-viding a greater ‘comfort’ level to operators
● No antitrust or competition concerns associated withpatent licensing: any other collective industry arrangementfor 3G essential patents would need antitrust approval
● IPR certainty, in all respects, creates a more favourable stockmarket view (stock markets sensitive to IPR uncertainty).
Source: Third Generation Partnership Project (3GPP)(http://www.3gpatents.com/).
Annex 7.3
Disclosure rules, licensing policy and patent pools
Disclosure Rules
Disclosure rules enable the SDOs to obtain information aboutwhether technologies under consideration for inclusion in thestandard are proprietary and subject to licensing. Theythereby reduce the potential for a technology to be includedin a standard without the knowledge that a technologyowner, with IP that impinges on the standard, may try toextract royalties for the use of the technology.● Because of differences across industries in the reward
afforded by patent protection and in the needs for compat-ibility and standardisation, no rule can be optimal for all sit-uations. Because of this heterogeneity across industries,the best policy choice may be that which leaves the disclo-sure rule and the rigor of enforcement up to the respectivetechnical committees themselves. They may be the bestsuited to optimise the trade-off between the benefits andcosts of disclosure that these rules entail.
● Consequently, the shifting of responsibilities for the iden-tification of relevant IPR from the members of the standard-isation committee to the IPR holders is not assessed as beingan adequate solution. However, the current attribution ofresponsibilities seems to rely too much on the standardisa-tion committees. Therefore, the identification and disclo-sure problem has to be tackled, since erroneous decisionsat a very early stage of the standardisation process whichhave later to be withdrawn may cause massive misalloca-tion of resources.
● In order to increase the transparency of IPR relevant forstandards, the SDOs following ETSI ’s example, should buildup publicly available databases with IPR that are potentially‘essential’ for their standards.
Licensing Policy
Having learned through disclosure which elements of thestandardised technology may be proprietary and subject toroyalties, the SDOs are still left with the problem of settingguidelines for the determination of licensing fees the tech-nology owner should charge after the standard is agreed.Mandating that a royalty be ‘fair, reasonable and non-dis-criminatory’ gives little guidance for royalty determinationbecause ‘reasonable’ can be appraised differently by a tech-nology owner and a technology buyer.● The extent to which a royalty is ‘reasonable’ may be
assessed in terms of the division of gains from licensingbetween licensor and licensees. While there is no singleright answer, royalties that leave the patent owner worsethan he would have been had he not joined the standard-isation process and royalties that absorb all of the gainsfrom standardisation can be ruled out as unreasonableextremes. The threshold for what is reasonable will depend
on the nature of the invention that is chosen as the stan-dard. In order to avoid excessively high licensing fees, ‘rea-sonable’ should mean the royalties that the IPR holder couldobtain in open, up-front competition with rivals, ratherthan the royalties he can extract once other participants areeffectively locked in the technology covered by the patent.
● Databases containing the relevant details of exemplarycases should be made available. This increased trans-parency provides guidelines for the negotiations betweenthe IPR holders and potential licensees, making the negoti-ation process faster and more effective.
● If alternatives between technologies are available, the IPR
holders ’ pre-selection negotiation and conclusion oflicenses with individual licensees should be a positive fac-tor of some weight in the standard selection process.
● Since the empirical evidence has made obvious that con-flicts often cannot be solved because of large discrepanciesbetween license fees demanded by the licensor and thewillingness to pay of the licensees, SDOs might set up somemeans of dispute resolution within the organisation to helpresolve royalty disagreements. Resolving reasonable royaltydisputes within the organisation will almost certainly bequicker and cheaper than resorting to the courts.
Patent Pools
Since usually a number of patents have to be considered forintegration into a standard, patent pools may represent asolution for some conflicts of IPR in standardisation processes.Patent pools can serve several key functions, like the identi-fication of essential patents, both inside and outside thestandardisation group, and the differentiation betweenpatents essential to the core standard those that are periph-eral. In addition, they are an organisational model to savetransaction costs regarding both disclosure and IPR licensing.They may also help to resolve conflicts both among IPR hold-ers and between IPR holders and standards users. In general,patent pools may support the diffusion the standards asbroadly as possible, while promoting third party licenses onfair, reasonable non-discriminatory basis. On the other hand,if completely unregulated, they may also induce cartelisticbehaviour.
Nevertheless, to establish and run patent pools efficientlyand to make them work for the public good, some potentialconflicts and disadvantages, like their misuse as of price fix-ing mechanism, have to be taken into account. The follow-ing recommendations should be considered:● The pooling of patents should not take place too late so as
to avoid them being driven by interests that may eventu-ally enter into conflict with hybrid standards development.
● Public non-profit research institutions may act as key grav-itational force for creating patent pools, since they canmore easily balance the often controversial interest of thecompanies involved.
● Despite the attractiveness of a pool solution, standardisa-tion based on a pool of patents does not automaticallymean that a technologically or economically superior solu-tion will prevail. Because of the strong common interests
108 UNIDO Industrial Development Report 2005
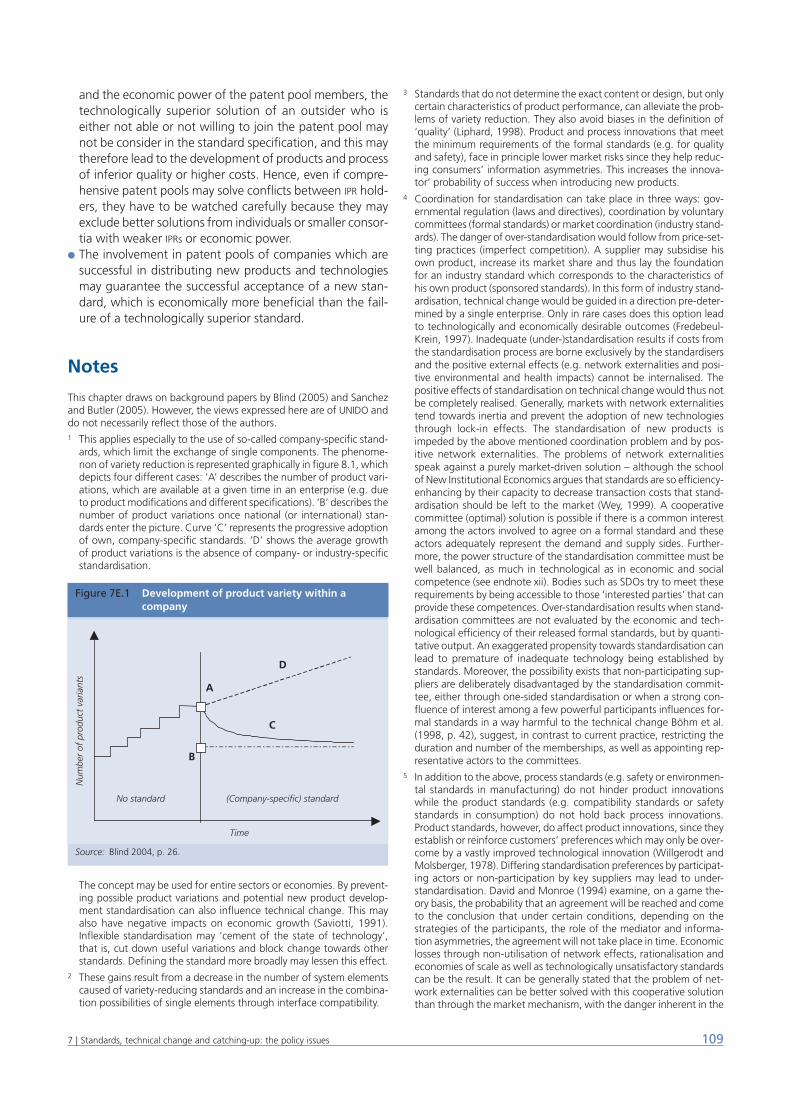
and the economic power of the patent pool members, thetechnologically superior solution of an outsider who iseither not able or not willing to join the patent pool maynot be consider in the standard specification, and this maytherefore lead to the development of products and processof inferior quality or higher costs. Hence, even if compre-hensive patent pools may solve conflicts between IPR hold-ers, they have to be watched carefully because they mayexclude better solutions from individuals or smaller consor-tia with weaker IPRs or economic power.
● The involvement in patent pools of companies which aresuccessful in distributing new products and technologiesmay guarantee the successful acceptance of a new stan-dard, which is economically more beneficial than the fail-ure of a technologically superior standard.
Notes
This chapter draws on background papers by Blind (2005) and Sanchezand Butler (2005). However, the views expressed here are of UNIDO anddo not necessarily reflect those of the authors.1 This applies especially to the use of so-called company-specific stand-
ards, which limit the exchange of single components. The phenome-non of variety reduction is represented graphically in figure 8.1, whichdepicts four different cases: ‘A’ describes the number of product vari-ations, which are available at a given time in an enterprise (e.g. dueto product modifications and different specifications). ‘B’ describes thenumber of product variations once national (or international) stan-dards enter the picture. Curve ‘C’ represents the progressive adoptionof own, company-specific standards. ‘D’ shows the average growthof product variations is the absence of company- or industry-specificstandardisation.
The concept may be used for entire sectors or economies. By prevent-ing possible product variations and potential new product develop-ment standardisation can also influence technical change. This mayalso have negative impacts on economic growth (Saviotti, 1991).Inflexible standardisation may ‘cement of the state of technology’,that is, cut down useful variations and block change towards otherstandards. Defining the standard more broadly may lessen this effect.
2 These gains result from a decrease in the number of system elementscaused of variety-reducing standards and an increase in the combina-tion possibilities of single elements through interface compatibility.
3 Standards that do not determine the exact content or design, but onlycertain characteristics of product performance, can alleviate the prob-lems of variety reduction. They also avoid biases in the definition of‘quality’ (Liphard, 1998). Product and process innovations that meetthe minimum requirements of the formal standards (e.g. for qualityand safety), face in principle lower market risks since they help reduc-ing consumers’ information asymmetries. This increases the innova-tor’ probability of success when introducing new products.
4 Coordination for standardisation can take place in three ways: gov-ernmental regulation (laws and directives), coordination by voluntarycommittees (formal standards) or market coordination (industry stand-ards). The danger of over-standardisation would follow from price-set-ting practices (imperfect competition). A supplier may subsidise hisown product, increase its market share and thus lay the foundationfor an industry standard which corresponds to the characteristics ofhis own product (sponsored standards). In this form of industry stand-ardisation, technical change would be guided in a direction pre-deter-mined by a single enterprise. Only in rare cases does this option leadto technologically and economically desirable outcomes (Fredebeul-Krein, 1997). Inadequate (under-)standardisation results if costs fromthe standardisation process are borne exclusively by the standardisersand the positive external effects (e.g. network externalities and posi-tive environmental and health impacts) cannot be internalised. Thepositive effects of standardisation on technical change would thus notbe completely realised. Generally, markets with network externalitiestend towards inertia and prevent the adoption of new technologiesthrough lock-in effects. The standardisation of new products isimpeded by the above mentioned coordination problem and by pos-itive network externalities. The problems of network externalitiesspeak against a purely market-driven solution – although the schoolof New Institutional Economics argues that standards are so efficiency-enhancing by their capacity to decrease transaction costs that stand-ardisation should be left to the market (Wey, 1999). A cooperativecommittee (optimal) solution is possible if there is a common interestamong the actors involved to agree on a formal standard and theseactors adequately represent the demand and supply sides. Further-more, the power structure of the standardisation committee must bewell balanced, as much in technological as in economic and socialcompetence (see endnote xii). Bodies such as SDOs try to meet theserequirements by being accessible to those ‘interested parties’ that canprovide these competences. Over-standardisation results when stand-ardisation committees are not evaluated by the economic and tech-nological efficiency of their released formal standards, but by quanti-tative output. An exaggerated propensity towards standardisation canlead to premature of inadequate technology being established bystandards. Moreover, the possibility exists that non-participating sup-pliers are deliberately disadvantaged by the standardisation commit-tee, either through one-sided standardisation or when a strong con-fluence of interest among a few powerful participants influences for-mal standards in a way harmful to the technical change Böhm et al.(1998, p. 42), suggest, in contrast to current practice, restricting theduration and number of the memberships, as well as appointing rep-resentative actors to the committees.
5 In addition to the above, process standards (e.g. safety or environmen-tal standards in manufacturing) do not hinder product innovationswhile the product standards (e.g. compatibility standards or safetystandards in consumption) do not hold back process innovations.Product standards, however, do affect product innovations, since theyestablish or reinforce customers’ preferences which may only be over-come by a vastly improved technological innovation (Willgerodt andMolsberger, 1978). Differing standardisation preferences by participat-ing actors or non-participation by key suppliers may lead to under-standardisation. David and Monroe (1994) examine, on a game the-ory basis, the probability that an agreement will be reached and cometo the conclusion that under certain conditions, depending on thestrategies of the participants, the role of the mediator and informa-tion asymmetries, the agreement will not take place in time. Economiclosses through non-utilisation of network effects, rationalisation andeconomies of scale as well as technologically unsatisfactory standardscan be the result. It can be generally stated that the problem of net-work externalities can be better solved with this cooperative solutionthan through the market mechanism, with the danger inherent in the
1097 | Standards, technical change and catching-up: the policy issues
Figure 7E.1 Development of product variety within a Figure 7E.1 company
Source: Blind 2004, p. 26.
Num
ber
of p
rodu
ct v
aria
nts
B
D
C
Time
A
(Company-specific) standardNo standard
strategic behavior of the participating actors and thus the tendencytowards a technical change strongly influenced by interest groups. Onthis subject see. also Steffensen (1997), and Böhm et al. (1998). Lim(2002) describes in an abstract manner pre-standardisation in ICT asa negotiation process, whereas Chiesa et al. (2002) highlight theimportant role of standard development organisation in the mediationprocess between different interests illustrated by two case studies.Regulation by governmental institutions results in an optimal solution,if the standardisation succeeds in internalising external effects. Thistarget can only be aspired to: government bodies should represent theinterests of all the members of an economy and possesses the neces-sary authority to issue binding regulations and instigate punitive meas-ures in the case of non-observance. A sub-optimal standardisationtakes place when the state cannot adequately foresee the technolog-ical development and a technical regulation is introduced too early ortoo late.
6 The ‘blind giant’ quandary is referred to in the literature as consistingof a situation where the agencies entrusted with developing standardsare most powerful when they know the least about the technology(see David, 1986).
7 Cf. Helbig and Volkert (1998, p. 5).8 In the absence of a strong business innovation subsystem with sophis-
ticated self-regulatory mechanisms in developing countries, publicregulation on standards may be expected to be relatively stronger bydefault. The extent to which this is so, however, is affected by spilloversfrom the standardisation activities in by the industrialised countries(see below).
9 With increasing income levels, the demand for product variety alsoexpands (see Chapter 6).
10 Relatively simpler products with little prior market exposure can thusgain, in a very short time, a reputation as high quality and less risk (oras low quality and high risk) products, in contrast to the case of morecomplex products introduced in advanced country markets, whichmay need longer while users detect their real performance. Depend-ing on the kind of quality and safety standards, they may foster a lock-in of the technology status quo, if they are defined as design standardsrequiring a narrowly defined product specification. The lock-in effectis less crucial in the case of performance standards, which just specifysome minimum requirements.
11 The WTO reports results from studies showing that the key reason whydeveloping countries have a very poor participation in internationalstandard-setting activities is the lack of analytical and technical capac-ity, concluding that simply increasing funding for participation wouldnot suffice (WTO, 2005a).
12 Developing countries, while accounting for the overwhelming major-ity of ISO membership, account for just three out of the 12 membersof the Technical Management board (ISO/TMB) and are responsible forbarely five per cent of its Technical Subcommittees, which set policies,actions and standards. In contrast, the US, Germany, the UK, Franceand Japan hold among them 65 per cent. The remaining 30 per centis held by other developed nations.
13 For example, China is currently moving into a leadership position instandardising nano-technological dimensions. It is not clear yet, how-ever, whether this strategic move will generate a position of techno-logical leadership in this area since China still lags behind in output ofresearch activities with respect to the US and Europe.
14 This problem is being addressed at the institutional, policy and multi-lateral levels (see annex 7.2). So far, however, this issue has beentreated rather narrowly. The literature has been focused on the patent-based conflicts that have emerged in the area of ITCs either in gen-eral theoretical (legal or economic) or in empirical terms, mostly casu-istically. The issues are however not necessarily limited to ICTs,although the drive towards patenting and standardisation is particu-larly strong in this area. Nor is it necessarily confined to patents,although this is the most obvious front for conflict. Nor does it involveonly the areas of standardisation, IPR, and competition policy only, butmay extend to research policy more generally.
15 In what follows the attention will be focused on patents and tradesecrets. Copyright has also become a large issue in standardisation dueto its uneasy association with software (see Besen and Raskind, 1991,
pp. 11–14). The question how software should best be protectedagainst imitation by copyright or by patent protection has recentlyarisen again in the European context. This question suggests oneaspect of the changing environment that increasingly brings IPR intoconflict with SDOs in new ways (for example Blind et al., 2004). In gen-eral, IPRs have a role to play in organising knowledge production, pro-moting new R&D, promoting further utilisation of and coordinatingthe use of new knowledge, while avoiding underutilisation losses (fora short presentation of the role of IPRs in the innovation process, seee.g. Iversen, 2002 on which this section draws). For the economy asa whole, the way IPRs do this implies both costs and benefits. IPR-pro-tection brings with it social costs in the form of higher prices (monop-oly pricing). But it also provides the economy with an incentive to inno-vate (based precisely on the innovator’ expectation of monopoly pric-ing). The monopoly profits provided by IPRs may benefit the economyas a whole if they are ploughed back into production and innovation.David (1993) emphasises the following dimensions: (a) full disclosureof information in patent applications. This allows dissemination, veri-fication, and application by others engaged in intellectual pursuits; (b)allocative efficiency; an efficient focusing of research effort entails,among other things, avoiding excessive concentration on the sameresearch and the ‘deadweight burden’ of monopoly (the case whererights become too strong, barring close substitutes and raising royal-ties while lowering the benefit to consumers). It also helps coordina-tion of R&D activities. thus facilitating common standardisation activ-ities; (c). Avoiding unproductive competition for monopoly profit(Kitch, 1977; Beck, 1983), including, wastage of resources on prema-ture invention, duplicative R&D, substitute inventions, and excessivelyrapid spending on research. The non-disclosure of patents in standard-isation activities provides a poignant example in which patenting con-tributes to unproductive competition for monopoly profits. The 1988Stambler v Diebold case, on ATM cards is an early conflict in which apatent holder attempted to assert his patent for what manufacturersbelieved to be an open and available standard.
16 For a review of the issues and their genealogy see Saviotti (1991).17 In market economies the market is the ultimate selection mechanism,
whereby the fitness of an individual technology comes down to thechoice of consumers. In an ideal situation, a technological design mayfit differentiated niches of heterogeneous users (see, for exampleFrenken and Nuvolari, 2003 for an evolutionary explanation of suchprocesses). However, many other factors may affect choices in theselection environment; e.g. network externalities will shape prefer-ences and affect the diffusion of new technologies. The case oflaunching large technological systems, like cellular telecoms, providesa special challenge in successfully navigating the selection environ-ment. Coordination in developing and selection is especially neededhere to concurrently design and select the large set of design dimen-sions involved, which interact in complex ways.
18 Examples of this situation are Betamax (Liebowitz and Margolis, 1999)or, more recently, the CT-2/Telepoint system (Grindley and Toker,1993).
19 The semantic web standards are one example.20 The OECD report on ICT standardisation in the new global context dis-
cusses some of the relevant changes standardisation is facing, includ-ing the IPR concern (OECD, 1996).
21 See Miselbach and Nicholson, 1994 for a description of essential IPRs.22 IPRs that definitely block the process are called ‘blocking IPRs’. This can
result mainly from two situations. First, the IPR holder may refuse tolicense at all or to license on a basis considered as fair, reasonable andnon-discriminatory. The threat to withhold IPR in this situation may beused as a bargaining chip. A flat refusal would be regarded withextreme suspicion. The existence of essential IPRs among individualrights-holders outside the standardisation work is much less pre-dictable. Absent the necessary search processes, such rights mayappear at any time during the life of the standard. The willingness ofthe rights-holder to license at agreeable terms is not a bygone conclu-sion, especially if added to already agreed royalty-schemes. Second,there may be a plurality of rights and rights-holders. This case is testi-mony to the fact that IPRs and the work of SDOs have become muchmore intertwined. A variety of rights-holders complicates the licens-ing process, which is supposed to be fair both for the licensee and
110 UNIDO Industrial Development Report 2005
licensor. If the cumulative royalty costs, while fair to the individualrights-holder, become too high for potential licensee, the standard islikely to die.
23 This is the worst-case scenario (Blind, 2002).24 The need may not be evident at the beginning of the project and
hence the implications regarding standards should be reviewed atregular project meetings and seriously considered by the funding insti-tutions. After the completion of research project, the research consor-tia should be ready to undertake additional work related to the devel-opment of standards.
25 Interesting cases from this perspective are those of the MP3 technol-ogy and the European GSM mobile communication standards.
26 Patents clearly dominate the relationship between IPR and standardi-sation. In addition, patents claim the broadest protection of a techni-cal invention, whereas trademarks matter more for market visibilityand copyrights can be more easily circumvented. The US Federal TradeCommission conducted a public hearing on Competition and IP Lawand Policy in the Knowledge-Based Economy in 2001 and 2002,where the role of IPR in standardisation activities was also explicitlyaddressed. (http://www.ftc.gov/opp/intellect/index.htm; (3-07-2002)).
27 R&D intensive companies at the leading edge are not very keen onbringing their knowledge into standardisation processes. For evidenceconcerning Germany Blind, 2006-forthcoming.
28 The existing ISO/IEC directives related to patents, which are imple-mented by most SDOs have proven be effective and efficient in mostcircumstances. Nevertheless, the proposals in the text are mostlydirected to general strategic standardisation policies, including licens-ing and disclosure rules (see Rapp and Stiroh, 2002).
29 In the very early pre-competitive stage of technology lifecycles char-acterised by high risks, the main actors are aware that they need toform alliances with their customers and suppliers, but also with theircompetitors. This constellation already causes some pressure on theactors to converge their interests. With progress in the technology life-cycle, this pressure on the companies will decrease and the likelihoodof single actions will increase.
30 This aspect is especially relevant for the development of measurementand testing standards.
31 The case of the GSM mobile communication shows that extendingthese dimensions increases the likelihood and gravity of IPR conflicts.
32 Standard processes allow all interested parties influence both the spec-ifications and implementation of a standard, thus favouring a levelplaying field.
33 The relationships between standardisation and IPRs, as well as theirimplications for competition policy, also affect technological choicesand the direction of capability development even in the less developedregions such as SSA. For example, in the field of cellular communica-tions, while the European GSM standard has enjoyed greater diffu-sion, efforts are being made to promote the US CDMA 450 wirelessloop technology, used in Eastern Europe and India. Since GSM hasenjoyed an early led and most African operators have locked into inter-national roaming agreements using GSM, it appears unlikely thatCDMA will succeed to be as widely diffused in Africa as in Latin Amer-ica (Momo, 2005 and Financial Gazette, 2004).
34 For a conceptual and empirical assessment of systemic competitive-ness in development countries, see F. Sercovich (1999).
35 STR-related requirements cover the areas of product safety, metrology,product and process standardisation, conformity assessment and doc-umentation. Compliance with public standards is not legally compul-sory, but it is usually demanded by consumers in order to reduce prob-lems of asymmetric information, credibility and reputation. Typicalpublic standards are the certifications of quality management systems(ISO 9001), of environmental management systems (ISO 14001), offood innocuity (HACCP), of good manufacturing practices (GMPs), ofgood agricultural practices (GAPs), and many other general and prod-uct- and process-specific norms. Public standards affecting publichealth, safety and the environment that become sufficiently wide-spread and scientifically founded are often turned into legally compul-sory technical regulations. There are of course many technical regula-tions that were not previously public standards. Typical examples of
technical regulations include the electrical safety regulations set by theCE policy of the EU (these technical regulations usually previouslywere public standards set by the International Electrotechnical Com-mission), the sulphur content of refined fuels (set by national govern-ments), the ban on the manufacture and use of freon, and most ofthe sanitary and phytosanitary barriers to food imports, to name a few.Proprietary standards on processes and products are set by a specificclient in a foreign market, and need not extend to other sales in thisforeign market.
36 This section is based on a survey on the Argentine industry experiencecommissioned for this Report. The survey comprised 17 enterprisesacross 16 activities at the five digits level of the International StandardsIndustrial Classification (ISIC), Rev. 3. The enterprises surveyed arebased in 7 provinces. Their size distribution is: 47 per cent, large, 35per cent medium-sized and 17 per cent, small. As to export orienta-tion, 82 per cent are established exporters, 12 per cent have recentlystarted exporting to OECD countries and 6 per cent are about to startexporting to the EU. With regard to activity, 41 per cent are in foodand beverages, six per cent in refined fuels, 12 per cent in basic fab-ricated metals, 17 per cent in automobiles and parts and 24 per centin other manufactures.
37 The 1947 the General Agreement on Tariffs and Trade (GATT) accordallowed the use of minimum standards to protect human, animal andplant health, as well as bring order to the market. The WTO estab-lished that standards can differ from internationally accepted levelsonly when there is scientific evidence supporting the decision.
38 Sometimes protection is the only goal. Standards usually apply to bothdomestic and foreign production thus matching the classical form ofprotectionism, which openly discriminates against imports. In practice,STRs may be used strategically to enhance the competitive position ofcountries or individual firms and can potentially impede internationaltrade, for example, by imposing unnecessary costly and time consum-ing tests or by laying out unjustified different requirements in differ-ent markets.
39 Many of the firms provided only aggregate information on this kindof expenses. Some only gave information on the costs of certifying ISO9001 and 14001 norms. Interestingly, two comparable firms within asame industry (dairy products) had different views regarding whichtype of expenditures qualify.
40 Experts consider that some 70 to 80 per cent of all the ISO 9001 devel-opments in Argentina are poor in nature, while 30 to 40 per cent aredownright bad If this appreciation is right, it would signal that mostof these developments obey a (shortsighted) marketing strategy ratherthan a genuine intention of improving the management of quality sys-tems, with little if any significance in terms of improving competitive-ness via enhanced credibility and reputation.
41 This of course depends on how effective the application of the qual-ity management system is. If the firm’s effort consists of just obtain-ing the certification, the compliance effort becomes a purely sunkcost.
42 A firm that has been manufacturing high-tech weighing machines forcommercial use for 40 years, is one of the leaders in the domestic mar-ket and has been exporting to Latin America for a number of years,the decision to certify compliance with the ISO 9001 and 14001 stand-ards came after deciding to start developing a new model to be mar-keted in the EU. In the case of a manufacturer of fitness equipments,which has been exporting to various destinations in the extended EUand to the US, the decision came not as a requirement from importers,but rather as a strategy to improve their own managerial procedures.
43 For instance, the Instituto Nacional de Tecnología Industrial (INTI) andthe Legal Metrology body began requiring manufacturers of weigh-ing machines to have auditable quality systems. However, the lack ofenforcement of this rule means that only ten per cent of the firms inthis sector comply with the regulation. This results in a cost advantagefor the firms that do not comply, which diminishes the overall incen-tive to invest in compliance. The negative impact would be avoided ifconsumers were willing (and able) to pay more to the compliant firms.
44 For instance, a new Electrical Safety law, equivalent to the Interna-tional Electrotechnical Commission (IEC) standards, was enacted in2000, but there were not enough accredited laboratories to test com-
1117 | Standards, technical change and catching-up: the policy issues
pliance with the new regulation. As a result, the deadline for compli-ance had to be significantly extended. In the meantime showing theapplication forms for the tests sufficed for firms to be allowed to con-tinue producing and selling. The problem was compounded by theshortage of technical assistance services, either from private or publiclaboratories. The situation was normalised only when more privatelaboratories were accredited. On a more positive note, manufacturersof car parts report that the tax-credits on training expenditures werevery helpful. However, these firms also asserted that the programs ofsupport to certifications lacked practicality and were unsuccessful.
45 Programs of this type include PROCAL (Program of Norms and Qual-ity Accreditation), which seeks to support the development of thedemand for accreditation services; FONTAR provides financing and fis-cal incentives for technological modernisation, product and processupgrading, personnel training, and quality certification; and the Pro-gram of Argentine Food Quality supports the diffusion and intensiveimplementation of systems of quality management and assurance inthe food sector with the goal of ensuring compliance with food safetystandards.
46 In contrast, the correlation between these certifications and overalleconomic activity, measured by GDP, is close to zero. At the same time,the correlation between industrial production and ISO 9001 certifica-tions in the manufacturing sector is also very low, which suggests thatcertification of these norms is associated more to increased exportsthan with the expansion of the domestic market. Moreover, a Granger(temporal) causality test suggests that the expansion of total exportsdrives QRC investment of all kinds, including non-tradables.
47 The relatively high certification intensity of these activities may alsoarise from technical characteristics of production or the need to cer-tify relatively more goods/processes.
48 The low certification intensity of the food industry appears due to thefact that ISO certifications are not strictly required by the market (asopposed to HACCP, Eurep-GAP, GMP), although this will change soonwith the introduction of the ISO 22000 certification (see Chapter 8).However, some experts consider that ISO 9001 certifications are acomplement of all the other industry-specific certifications, and thatthe low certification intensity in this sector simply reflects poor levelsof compliance with standards, coupled with exports to destinationswith relatively weaker standards. The correlations between certifica-tion intensities and export propensities are 0.36 for the whole group,but rise to 0.60 when food is excluded and to 0.84 when rubber prod-ucts are excluded as well.
49 Product-wise, the greatest incidence is that of PFI (Integrated Fruit Pro-duction) certifications, required for exporting fruit to Europe. However,the need to invest in SCA is spreading to non-fruit products, particu-larly relating to HACCP, GAP, and GMP.
50 For instance, in the dairy products industry, two comparable firmsreported compliance costs of 0.66 per cent and 9.5 per cent of totalsales, respectively.
51 Most firms regard ISO 9001 and 14001 certifications as part of SCAregardless of whether they export or not, although in practice theyusually certify compliance with these norms mostly when they export(or plan to do so). The monetary costs of ISO 9001 and 14001 andproduct specific STRs certifications (including the respective adapta-tions) are usually relatively low, making up a very small share of theoverall STR related compliance costs.
52 An example of the costs of inadequate provision of TechnologicalPublic Goods (TPGs) is given by the differences in the cost of locallycertifying different standards. Certifying an ISO 14001 or an OSHA19800 (occupational safety) standard costs 50 per cent more than cer-tifying an ISO 9001 standard. This cost differential is due to the short-age of local certifiers for the more expensive standards. This circum-stance is more evident in the case of standards such as the SA8000(Social Accountability, for which there are no local certifiers. The costof certifying this standard abroad is in the US$10000–30000 range,about two and a half times what it costs to locally certify an ISO 9001norm.
53 This does not include other (non-quantifiable costs), such as theopportunity cost (losses of sales and diversion of managerial time
from other activities) involved in adapting with foreign norms, deal-ing with the required paperwork, and so on.
54 The incremental costs for Argentine industry reported here can becompared to those obtained by the World Bank Technical Barriers toTrade Survey (WBTBTS) for the average developing country and theaverage Latin American country. Bearing in mind that the interviewedfirms may be considering different items as being part of the incre-mental costs in both surveys and that the firms included in each indus-trial classification may differ across surveys, it is possible to observethat the costs of compliance in Argentina are relatively bigger in theelectrical machinery and dairy products industries (highly intensive incertifications), and in the shoe sector (labour intensive, low economiesof scale). On the other hand, costs of compliance appear as relativelylower in Argentina in industries such as basic metals and refined fuel(industries with low certification intensities where production is highlyconcentrated and done on a large scale, and where there is evidenceof significant provision of industry-specific SCA servicess by industrialassociations and in processed food (that has a low certification inten-sity). The Argentine Institute for the Steel Industry (IAS), financed bysteel producers, has an accredited testing laboratory located in SanNicolás, province of Buenos Aires, where most steel production takesplace. The laboratories of the main oil refiner, Repsol-YPF, are used forinterlaboratory comparisons by INTI.
55 The World Bank Technical Barriers to Trade Survey (WBTBTS) suggeststhat the average costs of compliance in developing countries rangebetween 0.26 per cent of sales for Photographic and Optical Instru-ments to 11.21 per cent of sales for Fabricated Metals. The mediancosts are 4.44 per cent and 3.17 per cent respectively. The reportedcosts include one-time fixed costs (like machine re-tooling, new equip-ment, etc.), recurrent fixed costs (like the operation of improved qual-ity control systems, periodical certifications, etc.) and variable costs(like using more expensive raw material and inputs, or more expen-sive labelling and packaging). Higher fixed costs raise the probabilitythat exporters may be unable to enter (or be forced to leave) certainmarkets, while higher variable costs reduce export shares (and the netprice to exporters). Both types of expenditures will cause trade costsin the form of fully foregone producer surplus (when exporters haveto leave or cannot enter a given market) or partial losses (when mar-ginal exporters are forced to leave, and infra-marginal exportersendure partial reductions in their producer surpluses. Chen et al.(2004) perform an econometric analysis using the WBTBTS data, find-ing that technical regulations in developed countries adversely affecta firm’s propensity to export in developing countries. Their results indi-cate that testing procedures and lengthy inspections processes reduceexport shares by 9 per cent and 4 per cent respectively. They also findempirical evidence that standards and testing procedures impedeexporter’ market entry, reducing the likelihood of exporting to multi-ple countries by 13 per cent and nine per cent. Maskus, Otsuki andWilson (2004) use the same data to estimate translogarithmic costfunctions and find that fixed set-up costs of compliance also raise thevariable costs of production. According to their estimates, strict stand-ards raise variable costs of production at least as much as set-up costs.
56 For countries with small domestic markets regional (inter-country)capability-building may be called for.
57 There are however, different shades in their publicness. Some of theseservices must be provided by the government (e.g. an internationallyaccredited and technologically updated food safety agency); othersare industry-specific and can be provided by the private sector (e.g.facilities for testing the compliance with electrical safety standards) butface a coordination (free-riding) problem that may undermine coop-eration in their provision. This coordination failure can be overcomeeither by government intervention (offering, for instance, tax deduc-tions to those that contribute to funding the facilities) or by having aprivate association offer club goods.
58 This can be illustrated with an example related to electrical safety. Atypical technical regulation faced by exports of electrical machinery tothe EU deals with parameters of electromagnetic interference (EMI).In order to test compliance, complex and costly lab facilities arerequired. But these regulations change frequently with the emergenceof new technologies, like cellular telephony, that alter the previouslydefined EMI parameters, rendering the facilities obsolete. Under these
112 UNIDO Industrial Development Report 2005
1137 | Standards, technical change and catching-up: the policy issues
circumstances, private laboratories are unlikely to set up these testingfacilities, and if these exports are to be promoted, the public sectorwould have to intervene in two ways. First by being willing to fundupdated testing laboratories. Second by being a member and partic-ipating actively in technical committees of IEC, which would allow itto anticipate the upcoming changes in standards and regulations andhelp the private sector build trade competence ahead of the changesin technical requirements. This same example can be easily extendedto other areas like food safety.
59 The national standards, quality and certification system set in 1994(decree No. 1474/94) formalised a system made up of componentsthat had been operating since 1935 (standardisation) and a new con-formity assessment component, thus lying the foundations for the cre-ation of the accreditation body. 1999 witness the start of mandatorycertification resolutions by the national government. Aimed at settingminimum safety and quality standards, these resolutions so far com-prise electric products, toys, personal protection elements, automo-bile parts, bicycles, gas lighters, steel product safety and agriculturalmachinery. The mandatory resolutions factor in the existence ofmutual recognition agreements with foreign certification bodies. Theactivity of international certification bodies in the country encouraged
the national body to seek international alliances. In 2002 the accred-itation body initiated actions aimed atits integration with the multilat-eral agreements of the relevant international organisations: Interna-tional Accreditation Forum (IAF) and International Laboratory Accred-itation (ILAC).
60 Argentina has 62 accredited testing and calibration bodies. They canbe referents for product certification both in both the mandatory andvoluntary arenas and for validation in the industrial sector. Thirteen ofthem do calibration and forty nine testing, (36 of which are private).
61 During the period 1990–2004, the number of standards issued annu-ally by the Argentine SDO, IRAM, experienced steady growth, from4,137 in 1990 to 7,103 in 2004, with a compound rate of growth of4 per cent per year. The key industrial activities involved were indus-trial chemicals, stone, clay and glass, instruments, basic metal indus-tries, and food drinks and tobacco. Between them they account forover half of the total number of standards issued. The industrial activ-ities with the quickest pace of growth over the period are other man-ufacturing (7.1 per cent); stone, clay and glass (6.9 per cent), instru-ments (6.9 per cent) and paper and printing (5.3 per cent).

Introduction
The ability to compete in agricultural and food products isincreasingly about meeting safety, quality, and environmen-tal requirements (above and beyond price and basic condi-tions).1 Furthermore, the forces shaping the rules of the gamefavour more stringent requirements. Not only is there greaterscrutiny of production and processing techniques, but thereare also stricter traceability and labelling requisites across thefood supply chain. This poses a complex problem as itinvolves raising capabilities across multiple sectors and mul-tiple agents and the technologies involved span from themost traditional to the most R&D intensive. The managementof risks in the farm-to-table continuum requires policy syner-gies with the control of plant protection, animal health andwelfare, feedstuffs, veterinary medicine and other non-foodproducts. Therefore food safety and agricultural health riskmanagement are becoming core competences in the com-petitiveness of developing countries.
World trade in agricultural products amounted to US$583billion in 2002, 40 per cent of which came from developingregions (WTO, 2004). While the international debate largelyfocused on the controversy over agricultural subsidies in tradenegotiations, apart from the ‘special and differential treat-ment’ and technical assistance provisions of the Sanitary andPhytosanitary (SPS) Agreement, much less attention was beingpaid to the capability building needs of developing countriesin the face of increasingly stringent requirements to trade inagricultural products.
In particular, developing countries compliance with SPS meas-ures provides a very good illustration of the need to raise thresh-old capabilities across a wide range of activities and actors in thepre-emergence state of the Innovation System (IS). Even in semi-industrialised developing economies with developing IS, growthof capabilities in the food safety area can be uneven. Since SPS
compliance is also a ‘moving target’, the three subsystems ofthe IS – the knowledge, the business innovation and thepolicy/governance subsystems – need to co-evolve to keep upwith the demands of the international ‘rules of the game’.
While many in developing countries perceive the increasingrequirements as a potential and significant barrier to trade, theability to raise capabilities in this field also presents itself as amajor opportunity for upgrading and catching-up with otherhigh-value food exporting developing countries. Costs of com-
pliance largely depend on the prevailing level of administrative,managerial and scientific capabilities, private sector structureand conditions, the strength of existing technical extensionservices and the supply of ‘public goods’ through the effectivepartnership of public and private sector. As a result, while thelevel of overall development seems to be a good indicator ofoutstanding needs, even more industrially developed coun-tries need to make adjustments to their food safety and agri-cultural management system to comply with the most strin-gent standards. Unfortunately, while costs are much moreimmediate and easier to account for, the benefits from com-pliance tend to be much more difficult to ascertain. This islargely because of the existence of feedback mechanisms andsystem-wide spill-overs: for example a well-functioning trace-ability system creates network externalities so that, as moreagents participate, benefits increase for all.2
In order to continue to trade, developing countries have lit-tle choice but to enhance private firms’ compliance with theserequirements as well as strengthen the institutional infrastruc-ture, that helps demonstrate that compliance is beingachieved3. However, responding to such challenges requiresmore than adopting good practices and new technologies –it involves raising domestic capacity to interact with the inter-national system, enhancing the knowledge base, buildinglegitimacy and trust in the domestic institutions and guidingthe direction of search, experimentation and market buildingfor a growing business innovation system. These institutionalaspects of capability building and the interaction between thevarious actors are the focus of what follows.
1158 | Building Capabilities for Food Safety
CHAPTER 8 Building Capabilitiesfor Food Safety
In order to continue to trade,developing countries have little
choice but to enhance private firmscompliance with the new
requirements as well as strengthenthe institutional infrastructure,
that helps demonstrate thatcompliance is being achieved.
The driving forcesIn the last decade, changes in how the risks involved in thefood chain are understood and approached have resultedinto increasingly stringent standards and regulations. Foodscares such as BSE (bovine spongiform encephalopathy, com-monly known as mad-cow disease) and the increasing con-sumer awareness of health, environmental and safety con-cerns in industrialised countries – and especially in Europe –have influenced the way in which risk management and reg-ulation-setting activities are performed.4
More stringent and over-arching regulations have alsoarisen from improvements in the scientific understanding offood-borne diseases and the development of more precisetesting methods for potential contaminants, toxins and addi-tives. In fact, probably more than in any other sector, we wit-ness the role of science permeating the entire food supplychain, from most low tech to the highest value added. Thedevelopment of more rigorous scientific methods and codifi-cation of this scientific knowledge through public standardscan help improve market performance of producers, retailersand exporters everywhere through better information flows.At the same time, the new approaches to food safety regu-lation requires a certain degree of technical competence on
the part of the private sector to introduce new productionmethods to comply with SPS measures since there are alsomany tacit elements affecting scientific uncertainty and riskassessment.
The growing use of risk analysis, the farm-to-fork meas-ures, which include higher degrees of traceability5, and theincreasing demand for the use of HACCP, are importantaspects of the emerging food safety system (Roberts andUnnevehr, 2003). For example, the new EU rules on foodhygiene require all food businesses after the primary produc-tion stage to put in place, implement and sustain HACCP-based procedures (box 8.1).
While most SPS measures, such as those relating to humanhealth and safety, are embodied in technical regulations,there is also a discernible upward trend in the developmentof private standards, as retailers in developed economies,motivated by commercial strategies of mitigation and differ-entiation, impose conditions along the supply chain (for abroader conceptual discussion on standards refer to Chapter7). Although from an international policymaking point ofview there is a clear separation between mandatory regula-tions and private standards, this distinction is not felt soclearly by the producers and exporters. Furthermore, with thedawn of the new ISO 22000 standard on food safety, the
116 UNIDO Industrial Development Report 2005
Box 8.1 European Commission’s new rules on hygiene of foodstuffs and official controls
Source: European Commission, 2004b and 2005.
The new rules on food hygiene and official food controls establishedby the European Commission, including the General Food Law of 2002which established the European Food Safety Authority (together withRegulations (EC) No 852/2004, 853/2004, and 854/2004) and Regu-lation (EC) No 882/2004 (which will come into force 1 January 2006),are some of the most comprehensive and stringent rules that impactimporting countries. Although these regulations leave considerablescope as to how effective systems of traceability and official control areto be established, they require ‘food and feed imported into the Com-munity for placing on the market within the Community to complywith the relevant requirements of food law or conditions recognisedby the community to be at least equivalent thereto or, where a specificagreement exists between the Community and the exporting country,with requirements contained therein’.
The Regulation contains general provisions for traceability (applicablefrom 1 January 2005), which cover all food and feed business operators,without prejudice to existing legislation on specific sectors such as beef,fish, GMOs etc. For example, the food law does not specify what typesof information are to be kept by food-and-feed businesses in order tofacilitate traceability. However, the guidance note prepared by the Com-mission state that the following information should be kept: (i) name,address of supplier, nature of products that were supplied; (ii) name,address of customer, nature of products that were delivered; (iii) date oftransaction/delivery. It further recommends that the following informa-tion should also be kept: (i) volume or quantity; (ii) batch number, if any;(iii) more detailed description of the product (pre-packed or bulk prod-uct, variety of fruit/vegetable, raw or processed product). The guidelinesnote that ‘the traceability provisions of the General Food Law’ do nothave an extra territorial effect outside of the EU. It does however coverthe stage from ‘the importer up to the retail level’ and importers arerequired to identify by whom the product was exported in the countryof origin. Unless specific provisions for further traceability exist, therequirement for traceability is limited to ensuring that businesses are atleast able to identify the immediate supplier of the product in questionand the immediate subsequent recipient, with the exemption of retail-ers to final consumers (one-step back, one-step forward).
However, ‘it is common practice among some EU food-businessoperators to request trading partners to meet the traceability require-ments and even go beyond the ‘one-step back, one-step forward’ prin-ciple, although it should be noted that such requests form part of food-business contractual arrangements and not requirements establishedby the regulation’. From a developing country perspective it is impor-tant to note that the primary liability for traceability under EU regula-tions falls on the importer. This ultimately affects the relationshipbetween the suppliers and the EU importers leading to the prolifera-tion of a small number of ‘preferred supplier’ contracts. Thus disrup-tion of exports on traceability/food-safety grounds are likely to arisevia the cancellation of ‘contractual arrangements’ or their non-renewal, rather than as a result of any formal closure of the EU mar-ket. Hence developing country exporters need to comply with theseinternal requirements if contractual arrangements with EU importersare to continue or be developed.
More significantly, from the perspective of development of domes-tic knowledge infrastructure and food safety institutions, the new reg-ulation on official controls authorises the European Commission torequest third countries to provide accurate and up-to-date informationon their SPS regulations, control and risk assessment procedures,which supplements the existing system whereby information isrequested by the Commission’s Food and Veterinary Office duringinspection visits to the third countries. Furthermore, the new rulesseem to usher in a new trend in pre-approval requirements to export.Accordingly, international suppliers of live animals, plants and certainfood products need to be pre-approved. The Commission has plans todevelop guidelines on how such information shall be presented toassist importing countries, however under the regulation there is norequirement for third countries to submit a control plan before 1 Jan-uary 2006. Similarly, although the new regulation does not requirethird countries to have reference laboratories, it requires laboratoriesengaged in verifying compliance with EU standards to be accreditedand provides for a transition period of four years for third countries toadapt to the new situation.
boundaries between private and public aspects of standard set-ting in this field are becoming even more blurred (see box 8.2).In food safety, private standards and protocols are compara-tively more stringent and more effectively enforced.6 On theother hand, technical regulations continue to exercise moreinfluence over market access in relation to plant and animalhealth matters (Jaffee et al., 2005). The distinction betweentechnical regulations and private standards is fundamental asregards the obligations of WTO members to notify their techni-cal regulations under the SPS agreement7 (box 8.3). Further-more, despite the framework set by the SPS agreement thatfavours ‘equivalence’ of measures, exporters often observe amultiplicity of requirements for different markets.8
Beyond SPS, there are other compliance issues faced bydeveloping country food and agricultural product exporters– such as IPR protection in agricultural technology andlabelling requirements for GM crops in the EU or for trans-fatcontent in the US to name a few. These health and environ-ment related concerns are expected to increasingly translateinto specific requirements to enter not only high-income buteventually also other developing country markets.9 For exam-ple, public perception of the safety of biotechnology productsin European countries is much less favourable than in otherdeveloped regions, which affects the traceability and labellingrequirements for genetically modified organisms (GMO) prod-
ucts, and hence has significant consequences for theexporters from countries where these crops are being har-vested on a large scale.10
In light of these emerging trends, it is clear that develop-ing country food and feed exporters need to improve theircontrol systems to remain competitive. SPS-related risks areoften not limited to one stage of production or processing.As a result, interventions are required not only at the finalproduct testing level but also upstream of the supply chainfor effective quality and food safety control. This involves:● Building policymaking capabilities, including the updating
of legislation to enable food safety control agencies torespond to current challenges that go beyond basic controlof hygiene and supporting participation in internationalstandard setting and planning activities;
● Setting and fine tuning of public-private cooperation forthe effective functioning of the food safety system;
● Reinforcing the technological capabilities within the insti-tutions of the domestic knowledge subsystem, particularlythose of the food standards and quality control agencies,through investments to upgrade their testing and measure-ment, risk analysis and certification capacity, R&D efforts, ICT
resources, training and organisational changes forenhanced performance;
● Helping to build capabilities in the private sector to dealwith increasingly stringent standards and to gain compet-itive advantages through experimentation and new marketformation by promoting investments in HACCP, good agri-cultural practices (GAP) and good management practices(GMP), information systems for traceability and labelling,and uptake of environmental technologies.
Although most developing countries have widespread weak-nesses in food safety and agricultural health management,which augment other weaknesses in competitiveness such aslack of infrastructure and high transaction costs, there is evi-dence that even low-income countries can overcome prob-lems gradually by selectively adopting different technologies
1178 | Building Capabilities for Food Safety
There is a discernable trendtowards the development of privatestandards, as retailers in developedeconomies, motivated by commer-
cial strategies of mitigation and dif-ferentiation, impose conditions
along the supply chain.
Box 8.2 ISO 22000 standard for safe food supply chains
Source: ISO, 2005.
ISO 22000 is the new standard for food safety management systemsdeveloped by an ISO Working Group with representatives from 14countries and from organisations such as the Codex Alimentarius,the Global Food Safety Initiative (GFSI) and the European foodindustry organisation (CIAA) to be published in September 2005.ISO 22000 specifies the requirements for a food safety managementsystem in the food chain where an organisation needs to demon-strate its ability to control food safety hazards in order to provideconsistently safe end products that meet both the requirementsagreed with the customer and those of applicable food safety reg-ulations.
The new standard can be applied to organisations ranging fromfeed producers, primary producers through food manufacturers, trans-port and storage operators and subcontractors to retail and food serv-ice outlets – together with inter-related organisations such as produc-ers of equipment, packaging material, cleaning agents, additives andingredients.
The standard identified three kinds of requirement:
● For good manufacturing practices or pre-requisite programmes● For HACCP according to the HACCP principles of the Codex Alimen-
tarius● For a management systemThe requirements for GMPs are not listed in the standard but thestandard makes reference to ‘existing practices’. The new standardrequires the establishment of a ‘one-step back, one-step forward’traceability system and has specific measures for validation, verifica-tion and improvement of the food safety management.
The standard can be applied on its own, or in combination withother management system standards such as ISO 9001:2000, with orwithout independent (third party) certification of conformity. The pub-lication of ISO 22000 will be complemented by an ISO Technical Spec-ification (ISO/TS 22004) giving guidance on the implementation of thestandard, with a particular emphasis on small and medium-sized enter-prises. In the following months, another Technical Specification (ISO/TS22003) will be published explaining certification requirements appli-cable when third-party certification is used.
or streamlining management systems in certain sectors andgovernment functions (Jaffee and Hensen, 2004).11 Beyondimproved competitiveness, there are many other spill-overssuch as the increase in demand for technically skilled workers,local sourcing of infrastructure and technological services.
However, as mentioned in Chapter 6, there are importantobstacles to the emergence of IS in developing countries.Since the requirements for a well-functioning SPS system arerelatively complex, it is unrealistic to expect all the actors andsub-sectors in developing economies (and especially the leastdeveloped ones) to evolve concurrently in a smooth fashionand to achieve sufficient capabilities to undertake a decisiveapproach to food safety in a short period of time12. Both pol-icy makers and the private sector need to build capabilities tobroaden the strategic options available to producers andexporters – first by meeting threshold requirements torespond to current challenges and then developing the
capacity in the three IS subsystems to adopt a pre-emptivestrategy where the agents involved can foresee coming chal-lenges and convert them into strategic opportunities for mar-ket development.
Upgrading capabilities of the actorsand institutions in food safety
Interactions between the subsystems
The responsibility for safe food supply is shared by thoseintervening in production, processing, and trade along theentire food chain. The official control and food safety legis-lation-enforcing agencies play an important role in buildingconsumer trust. Modern food control systems have shiftedfrom removing unsafe food and punishing responsible par-ties after the problem has occurred, to a preventive approach,which relies heavily on risk assessment and risk management,and hence on the development of a knowledge base.13
Largely due to the demands of the international system, foodsafety control agencies in developing countries have becomea core part of the emerging knowledge systems through theirupstream (policy framing, training and R&D) and downstreamactivities (monitoring, surveillance and inspection), thusrequiring sufficient credibility. At the same time, business sec-tor associations, marketing boards and producers’ coopera-tives play an increasingly important role in the transfer anddiffusion of technologies and organizational innovations that
118 UNIDO Industrial Development Report 2005
There is evidence that even low-income countries can overcome
problems gradually by selectively adopting different technologies or streamlining
management in certain sectors and government functions.
Box 8.3 The International Governance of SPS measures
Source: WTO, 2005b.
Currently, the international infrastructure governing the SPS and tech-nical requirements in the food and agricultural products sector is multi-layered and relatively complex. World Trade Organization’s SPS Agree-ment has been in force for 10 years for developed country members,7 years for developing country members and 5 years for least-devel-oped country members as of 2005. The SPS Agreement identifies threeorganisations to promote the adoption of international standards:Codex Alimentarius Commission for food safety, International PlantProtection Convention (IPPC) for plant health and OIE for animalhealth. WTO members are encouraged (but not required) to base theirdomestic legislation on standards developed by these internationalorganisations, though the SPS agreement protects the right of a coun-try to choose its own ‘appropriate level of protection’ while taking intoaccount ‘the objective of minimising negative trade effects’. As aresult, there is a multiplicity of standards and requirements in differentcountries and food groups largely due to significant differences intastes, diets, income levels and risk perceptions. Standards also oftenreflect the feasibility of implementation depending on the initial levelof technical, scientific, administrative capabilities.
The SPS Agreement has provided a multilateral framework toguide the development, adoption and enforcement of SPS measuresin a harmonised way to minimise the negative effects on trade,including a mechanism for notifications, exchange of informationand dispute settlement. As of May 2005, 139 (94 per cent) of WTOmembers had identified a national notification authority, 130 (87 percent) had established a SPS enquiry point, and 87 (59 per cent) hadnotified at least one new or revised SPS measure. Between 1995 and
2004, over 300 disputes were formally raised under the WTO’s dis-pute settlement system, of which 30 alleged violation of the SPSagreement. Although developing countries seem to be actively par-ticipating in the notification and counter-notification procedures andraising trade concerns, the same cannot be said of least developedeconomies and certain regions particularly Africa and the MiddleEast. For example, compared with the 101 issues raised by develop-ing countries and 143 by developed countries, least developed mem-ber states only raised two SPS related trade concerns in the SPSCommittee. Furthermore, no LDC has been a member of a group ofcountries to support a concern or brought a measure to the disputesettlement body.
Similarly, participation of least developed countries in the interna-tional standard setting bodies such as CODEX has been very limited,becoming a major concern in the SPS Committee. Partly in responseto these concerns, FAO/WHO (for CODEX) and IPPC have establishedtrust funds and OIE is in the process of establishing a fund to enhancethe participation of developing countries in standard-setting meetingsand activities, training programmes and regional consultations.
Beyond the provisions of the SPS Agreement to help harmonise SPSrequirements on as wide a basis as possible, equivalence of specifiedmeasures, conformity of control, inspection and approval proceduresand recognition of pest- and disease-free areas are also important toolsmentioned in the Agreement. For example, Codex’s “Draft Guidelineson the Judgment of Equivalence of Sanitary Measures Associated withFood Inspection and Certification Systems” addresses the equivalenceof conformity assessment procedures.
are required for compliance, which also affects policy mak-ing. Therefore, the relationship between food safety agenciesand sectoral associations is one of the keys to building thenecessary information flows and transfer of technologies.
Central to the effectiveness of policies related to foodsafety is the concept of risk assessment and management. Inparticular, public policy concerning human health and foodsafety requires a process by which different control optionsare evaluated and compared to bring hazards to an ‘accept-able level of protection’ (ALOP). However, risk assessment andmanagement are strongly influenced by social and politicalfactors such as values, assumptions and vested interests. In asense it is a political process in which risk managers decidehow much of the scientifically determined risk should individ-uals be exposed to or society accept. These factors oftencomplicate the decision-making process. For example, theoften cited precautionary principle states that if there are rea-sonable scientific grounds for believing that a new process orproduct may not be safe, it should not be introduced untilthere is convincing evidence that the risks are small and out-weighed by the benefits. Dealing with such uncertaintiesrequires significant scientific and managerial capabilities, aswell as credibility in the eyes of the consumers and produc-ers.
Food safety legislation can help (or hamper) the experimen-tation, resource mobilization and market formation functionsof the IS. The way in which risk management is handled byfood safety institutions and reflected in relevant legislationcan drastically enhance or diminish the potential for techno-logical and entrepreneurial innovation in the private sector.Ideally, policymakers would base their ALOP on public healthgoals; for example, by determining the level of disease con-trol that is expected and then translating that to a measura-ble parameter that can be controlled by food producers,rather than selecting (or often mandating) an ‘optimal’ riskmanagement option. This provides the greatest flexibility inthat the industry is given clear goals to achieve, but the spe-cific manner of achieving them is left to the discretion of themanufacturer. This allows firms to be innovative in terms oftheir direction of search and enable experimentation inachieving food safety. For example, legislation mandatingthat milk must be heat pasteurised for a certain length of timeat a certain temperature, instead of stating the performancecriterion that should be achieved, virtually assures that new
technologies such as high pressure processing would not beused, though it may actually result in a product that is equallysafe and even superior in other respects (Buchanan, 2002).14
Building capabilities in the knowledge andpolicy/governance subsystems
Strengthening national food safety institutions is vital incountries where existing institutions cannot keep up withemerging requirements. Consumer trust (or mistrust) in offi-cial control functions can greatly affect the performance ofwhole sectors and countries, especially as food scares spreadmore swiftly. For example, the reduction in the consumptionof beef products was much less drastic in the US following thediscovery of BSE in the domestic herd than in Germany, par-tially due to the American public’s higher level of trust in theFDA.15
Modern food safety systems require the traditional inspec-tion/monitoring institutions to take on a more active role inthe development of the knowledge system. The multiplicityof demands for the services of national food safety and qual-ity institutions can be met by means of different organiza-tional structures depending on the size of the economy, polit-ical considerations and the weight and structure of the foodindustry. In some countries, several agencies are responsiblefor food control – often along sectoral and regional lines –but more often there is a single, unified agency with wide-ranging powers. In view of the emerging challenges, an inte-grated approach can be expected to become a good practiceoption; with normative activities (such as formulation of pol-icy, development of standards and regulations and coordina-tion) entrusted to an autonomous national food controlagency, and other agencies in charge of inspection andenforcement as well as communication and education/train-ing aspects (FAO and WHO, 2004).
A particular problem facing the formulation of policies inthis area is the lack of metrics and heuristics in defining theneeds of domestic institutions (see Chapter 6). A needsassessment exercise of the Argentinean food control agency(Servicio Nacional de Sanidad y Calidad Agroalimentaria,SENASA), reviewed below provides an example of how needsassessment can be applied in response to this apparent defi-ciency.16
Assessing the upgrading needs of food control agencies
Created in 1904 as an animal sanitary inspection agency,SENASA became the National Sanitary and Food Quality Servicein 1996.17 SENASA’s traditional practice has been to approve theinspections, satisfy claims and prevent sanitary outbreaks. In2003, the Agency was responsible for the certification ofUS$14.2 billion of food exports and US$600 million of foodimports, as well as controlling US$15 billion of food for domes-tic use.18 The budget of SENASA was approximately US$100 mil-lion up to 2001, but since then it has shrunk to approximatelyUS$30 million as a result of the January 2002 devaluation.19
Funding, far too low to accomplish the mission, comes mainly
1198 | Building Capabilities for Food Safety
The way in which risk managementis handled by food safety institu-
tions and reflected in relevantlegislation can drastically enhanceor diminish the potential for tech-
nological and entrepreneurialinnovation in the private sector.
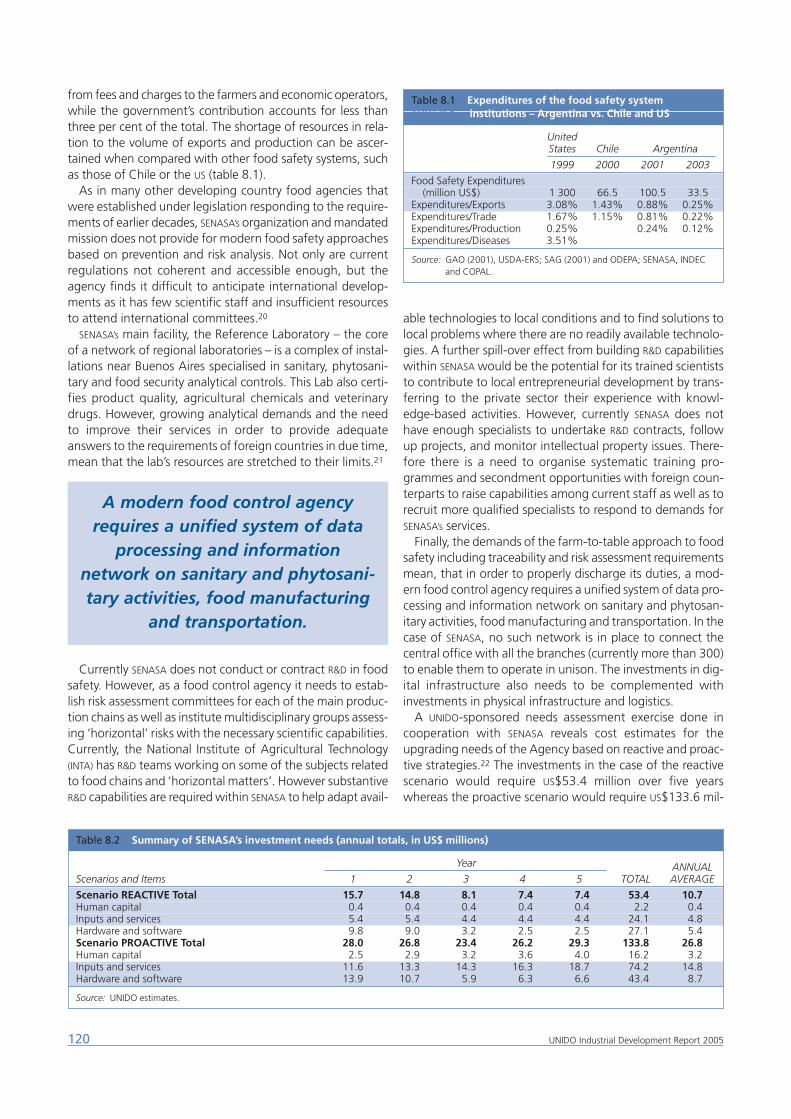
from fees and charges to the farmers and economic operators,while the government’s contribution accounts for less thanthree per cent of the total. The shortage of resources in rela-tion to the volume of exports and production can be ascer-tained when compared with other food safety systems, suchas those of Chile or the US (table 8.1).
As in many other developing country food agencies thatwere established under legislation responding to the require-ments of earlier decades, SENASA’s organization and mandatedmission does not provide for modern food safety approachesbased on prevention and risk analysis. Not only are currentregulations not coherent and accessible enough, but theagency finds it difficult to anticipate international develop-ments as it has few scientific staff and insufficient resourcesto attend international committees.20
SENASA’s main facility, the Reference Laboratory – the coreof a network of regional laboratories – is a complex of instal-lations near Buenos Aires specialised in sanitary, phytosani-tary and food security analytical controls. This Lab also certi-fies product quality, agricultural chemicals and veterinarydrugs. However, growing analytical demands and the needto improve their services in order to provide adequateanswers to the requirements of foreign countries in due time,mean that the lab’s resources are stretched to their limits.21
Currently SENASA does not conduct or contract R&D in foodsafety. However, as a food control agency it needs to estab-lish risk assessment committees for each of the main produc-tion chains as well as institute multidisciplinary groups assess-ing ‘horizontal’ risks with the necessary scientific capabilities.Currently, the National Institute of Agricultural Technology(INTA) has R&D teams working on some of the subjects relatedto food chains and ‘horizontal matters’. However substantiveR&D capabilities are required within SENASA to help adapt avail-
able technologies to local conditions and to find solutions tolocal problems where there are no readily available technolo-gies. A further spill-over effect from building R&D capabilitieswithin SENASA would be the potential for its trained scientiststo contribute to local entrepreneurial development by trans-ferring to the private sector their experience with knowl-edge-based activities. However, currently SENASA does nothave enough specialists to undertake R&D contracts, followup projects, and monitor intellectual property issues. There-fore there is a need to organise systematic training pro-grammes and secondment opportunities with foreign coun-terparts to raise capabilities among current staff as well as torecruit more qualified specialists to respond to demands forSENASA’s services.
Finally, the demands of the farm-to-table approach to foodsafety including traceability and risk assessment requirementsmean, that in order to properly discharge its duties, a mod-ern food control agency requires a unified system of data pro-cessing and information network on sanitary and phytosan-itary activities, food manufacturing and transportation. In thecase of SENASA, no such network is in place to connect thecentral office with all the branches (currently more than 300)to enable them to operate in unison. The investments in dig-ital infrastructure also needs to be complemented withinvestments in physical infrastructure and logistics.
A UNIDO-sponsored needs assessment exercise done incooperation with SENASA reveals cost estimates for theupgrading needs of the Agency based on reactive and proac-tive strategies.22 The investments in the case of the reactivescenario would require US$53.4 million over five yearswhereas the proactive scenario would require US$133.6 mil-
120 UNIDO Industrial Development Report 2005
Table 8.2 Summary of SENASA’s investment needs (annual totals, in US$ millions)
Year ANNUALScenarios and Items 1 2 3 4 5 TOTAL AVERAGE
Scenario REACTIVE Total 15.7 14.8 8.1 7.4 7.4 53.4 10.7Human capital 0.4 0.4 0.4 0.4 0.4 2.2 0.4Inputs and services 5.4 5.4 4.4 4.4 4.4 24.1 4.8Hardware and software 9.8 9.0 3.2 2.5 2.5 27.1 5.4Scenario PROACTIVE Total 28.0 26.8 23.4 26.2 29.3 133.8 26.8Human capital 2.5 2.9 3.2 3.6 4.0 16.2 3.2Inputs and services 11.6 13.3 14.3 16.3 18.7 74.2 14.8Hardware and software 13.9 10.7 5.9 6.3 6.6 43.4 8.7
Source: UNIDO estimates.
Table 8.1 Expenditures of the food safety systemTable 8.1 institutions – Argentina vs. Chile and US
UnitedStates Chile Argentina
1999 2000 2001 2003
Food Safety Expenditures (million US$) 1 300 66.5 100.5 33.5
Expenditures/Exports 3.08% 1.43% 0.88% 0.25%Expenditures/Trade 1.67% 1.15% 0.81% 0.22%Expenditures/Production 0.25% 0.24% 0.12%Expenditures/Diseases 3.51%
Source: GAO (2001), USDA-ERS; SAG (2001) and ODEPA; SENASA, INDECand COPAL.
A modern food control agencyrequires a unified system of data
processing and informationnetwork on sanitary and phytosani-tary activities, food manufacturing
and transportation.
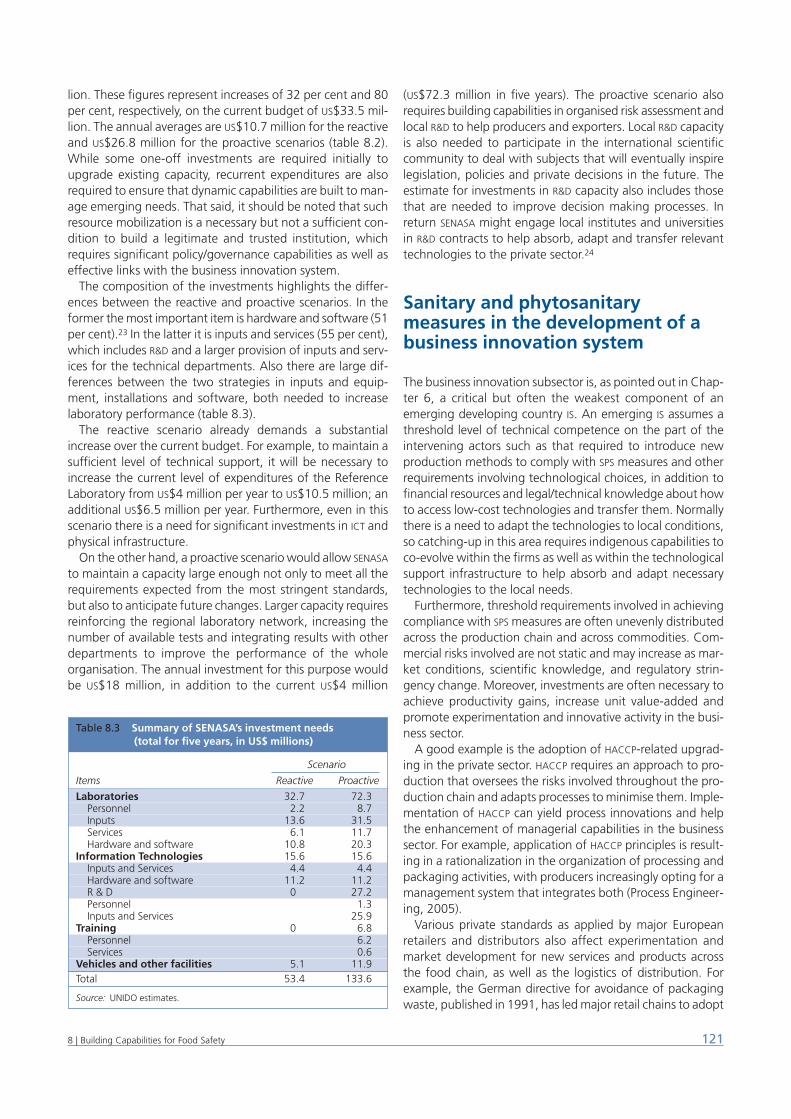
lion. These figures represent increases of 32 per cent and 80per cent, respectively, on the current budget of US$33.5 mil-lion. The annual averages are US$10.7 million for the reactiveand US$26.8 million for the proactive scenarios (table 8.2).While some one-off investments are required initially toupgrade existing capacity, recurrent expenditures are alsorequired to ensure that dynamic capabilities are built to man-age emerging needs. That said, it should be noted that suchresource mobilization is a necessary but not a sufficient con-dition to build a legitimate and trusted institution, whichrequires significant policy/governance capabilities as well aseffective links with the business innovation system.
The composition of the investments highlights the differ-ences between the reactive and proactive scenarios. In theformer the most important item is hardware and software (51per cent).23 In the latter it is inputs and services (55 per cent),which includes R&D and a larger provision of inputs and serv-ices for the technical departments. Also there are large dif-ferences between the two strategies in inputs and equip-ment, installations and software, both needed to increaselaboratory performance (table 8.3).
The reactive scenario already demands a substantialincrease over the current budget. For example, to maintain asufficient level of technical support, it will be necessary toincrease the current level of expenditures of the ReferenceLaboratory from US$4 million per year to US$10.5 million; anadditional US$6.5 million per year. Furthermore, even in thisscenario there is a need for significant investments in ICT andphysical infrastructure.
On the other hand, a proactive scenario would allow SENASA
to maintain a capacity large enough not only to meet all therequirements expected from the most stringent standards,but also to anticipate future changes. Larger capacity requiresreinforcing the regional laboratory network, increasing thenumber of available tests and integrating results with otherdepartments to improve the performance of the wholeorganisation. The annual investment for this purpose wouldbe US$18 million, in addition to the current US$4 million
(US$72.3 million in five years). The proactive scenario alsorequires building capabilities in organised risk assessment andlocal R&D to help producers and exporters. Local R&D capacityis also needed to participate in the international scientificcommunity to deal with subjects that will eventually inspirelegislation, policies and private decisions in the future. Theestimate for investments in R&D capacity also includes thosethat are needed to improve decision making processes. Inreturn SENASA might engage local institutes and universitiesin R&D contracts to help absorb, adapt and transfer relevanttechnologies to the private sector.24
Sanitary and phytosanitarymeasures in the development of abusiness innovation system
The business innovation subsector is, as pointed out in Chap-ter 6, a critical but often the weakest component of anemerging developing country IS. An emerging IS assumes athreshold level of technical competence on the part of theintervening actors such as that required to introduce newproduction methods to comply with SPS measures and otherrequirements involving technological choices, in addition tofinancial resources and legal/technical knowledge about howto access low-cost technologies and transfer them. Normallythere is a need to adapt the technologies to local conditions,so catching-up in this area requires indigenous capabilities toco-evolve within the firms as well as within the technologicalsupport infrastructure to help absorb and adapt necessarytechnologies to the local needs.
Furthermore, threshold requirements involved in achievingcompliance with SPS measures are often unevenly distributedacross the production chain and across commodities. Com-mercial risks involved are not static and may increase as mar-ket conditions, scientific knowledge, and regulatory strin-gency change. Moreover, investments are often necessary toachieve productivity gains, increase unit value-added andpromote experimentation and innovative activity in the busi-ness sector.
A good example is the adoption of HACCP-related upgrad-ing in the private sector. HACCP requires an approach to pro-duction that oversees the risks involved throughout the pro-duction chain and adapts processes to minimise them. Imple-mentation of HACCP can yield process innovations and helpthe enhancement of managerial capabilities in the businesssector. For example, application of HACCP principles is result-ing in a rationalization in the organization of processing andpackaging activities, with producers increasingly opting for amanagement system that integrates both (Process Engineer-ing, 2005).
Various private standards as applied by major Europeanretailers and distributors also affect experimentation andmarket development for new services and products acrossthe food chain, as well as the logistics of distribution. Forexample, the German directive for avoidance of packagingwaste, published in 1991, has led major retail chains to adopt
1218 | Building Capabilities for Food Safety
Table 8.3 Summary of SENASA’s investment needsTable 8.1 (total for five years, in US$ millions)
Scenario
Items Reactive Proactive
Laboratories 32.7 72.3Personnel 2.2 8.7Inputs 13.6 31.5Services 6.1 11.7Hardware and software 10.8 20.3
Information Technologies 15.6 15.6Inputs and Services 4.4 4.4Hardware and software 11.2 11.2R & D 0.2 27.2Personnel 1.3Inputs and Services 25.9
Training 0.2 6.8Personnel 6.2Services 0.6
Vehicles and other facilities 5.1 11.9Total 53.4 133.6
Source: UNIDO estimates.
a returnable transport packaging system even though the useof reusable packaging was not itself mandatory. The Interna-tional Fruit Container Organization (IFCO), a private Germancompany, took the lead to market and manage the produc-tion and distribution of foldable fruit and vegetable crates,which gave them a considerable advantage as more retailersacross Europe were persuaded to adopt these recyclablepackages instead of the local packaging made from woodand fibre from exporting countries. This measure posed majorproblems for some exporting developing countries becauseof the cost, time and logistic difficulties involved in returningpackaging.25 While, this example illustrates the challengesinvolved with keeping up with private standards (partiallypromoted by regulatory bodies), it also provides an exampleof how food safety and quality requirements can be turnedinto competitive advantage and create new markets.
Another area where consumer expectations and privatecertification schemes are shaping the high-value food tradeis organic farming. Beyond having implications for a wholerange of technologies used in production, certification pro-cedures established by private organizations require smallfarmers and cooperatives to adjust their processes in impor-tant ways that require considerable capability building. Forexample, the need to segregate organic from non-organicproduce along the production and distribution chain maymean that if small-scale farmers choose to market theirorganic products, they may no longer be able to benefit fromthe scale economies provided by cooperatives and marketingboards, unless these organizations make process changes toensure that goods can be segregated (Rotherham, 2003).
Similarly, adoption of international agreements such as theCartagena Protocol on Biosafety or Montreal Protocol onSubstances that Deplete the Ozone Layer, can have importantimplications for the development of business innovationcapabilities in the food industry. An example is the phasingout of methyl bromide in developing countries – a pesticideused in soil fumigation, post harvest protection and quaran-tine treatments – which requires capabilities to research andadapt suitable alternatives but can also help developingcountries to comply with stricter quality and environmentalrequirements through investments that improve pest man-agement and risk control (UNIDO, 2003).
Future challenges and technicalassistance needsThe ability to comply with requirements in the food safetyand quality area are clearly becoming a core prerequisite fordeveloping countries to stay competitive in the internationalfood trade and to catch-up with other high-value food prod-uct exporters. As prerequisites are proliferating, all the actorswithin the emerging innovation systems of developing coun-tries are being challenged to raise their capabilities to respondto emerging demands (box 8.3).
As argued thus far, capability building needs have notreceived the attention they warrant – partially due to thescarcity of metrics and needs assessment methodologies.Along these lines, the strategic partnership between WTO andUNIDO, to help developing and transition economies to removesupply-side constraints and prove conformity to standards andregulations, to complement the Integrated Framework andJITAP initiatives, have resulted in diagnostic studies to establishthe needs for nine pilot countries26 (UNIDO/WTO, 2004).
Recently, increasing attention has also been paid to thetechnical assistance needs in the field of compliance with SPS
and technical requirements. The SPS agreement calls forincreased technical assistance to strengthen food safety andagricultural health management capabilities in developingcountries. In September 2002, the Standards and TradeDevelopment Facility (STDF) was established through agree-ment between WHO, FAO, WTO, Office International des Epi-zooties (OIE) and the World Bank at the Doha Ministerial Con-ference to explore new technical and financial mechanismsto promote the efficient use of resources in SPS-related activ-ities and enhance the capacity of developing countries in thestandards area (WTO, 2005).27
Jaffee and Henson estimate that between US$65 and US$75million has been spent by bilateral and multilateral agencies inrecent years to build trade-related capacities which sounds likea drop in the ocean (2004). The EU has established an onlinehelp desk that will provide a tool for developing countryexporters to access the EU market more easily, including infor-mation on product-specific import requirements such as SPS
rules.28 There are also private sector initiatives to improve thecompliance capacity of their developing country suppliers. How-ever, considering the rate at which stricter SPS and technicalrequirements proliferate, there is a strong rationale for extend-ing and improving the technical assistance delivery for specificsupply-side constraints and conformity with requirements.
122 UNIDO Industrial Development Report 2005
Between US$65 and US$75 millionhas been spent by bilateral and
multilateral agencies in recent yearsto build trade-related capacities,
which sounds like a drop in the ocean.
Another area where consumerexpectations and private certi-fication schemes are shaping the high-value food trade is
organic farming. It requires smallfarmers and cooperatives to
adjust their processes in importantways that require considerable
capability-building.
Notes
The case study presented in this chapter draws on a background paperby Gargiulo(2005). However, the views expressed here are of UNIDO anddo not necessarily reflect those of the authors.1 Sanitary and phytosanitary measures are laws, regulations, require-
ments, and procedures instituted to protect human, animal and planthealth including end product criteria; processes and production meth-ods, testing, inspection, certification and approval procedures; quar-antine treatments and requirements for the transport of plants andanimals; provisions on the relevant statistical methods, sampling pro-cedures and methods of risk assessment; and packaging and labellingrequirements directly related to food safety (WTO, SPS Agreement).Safety of food, as a public policy concern, is understood within thecontext of specific risks to human health stemming from chemical andmicrobial contamination, natural toxins, mislabelling of allergens,additives and preservatives which are present throughout the foodchain. Food quality, on the other hand, while being closely related tofood safety relates to a number of other aspects, such as nutritionalvalue, additives, granting of organic status, marks of quality and pro-tected geographical indication.
2 On the contrary, the existence of double standards – where a differ-ent set of requirements exists for trading in the domestic versus theexport markets – reduces such externalities although it might also cutprivate costs in the short run.
3 As an example, outbreaks of foot-and-mouth disease in 2000/2001have cost Argentina around US$1.2 billion in forgone exports due tothe slow reaction both from producers and the control agency.According to private experts, Argentina loses up to US$1 billion everyyear due to sanitary problems that forces the exporters to acceptlower prices for their products. While over half of these losses accruedue to Argentina being not certified as a foot-and-mouth free coun-try, there are other ongoing problems with mycotoxins in nuts andsunflowers, citrus canker and nitrofurans – a microbial substance – inhoney, just to name a few.
4 For example, in Japan, recent food safety crises, including discoveryof BSE in domestic cattle herd and a series of labelling scandals, haveresulted in the implementation of new regulations including legisla-tion requiring traceability of beef muscle meats from the farm to retailoutlet as of 1 December 2004 and the creation of the new FoodSafety Commission. Many of these new regulations and assuranceprograms are based at least in part on traceability systems. Althoughattempts to require traceability for imported meats have failed, it iscertain that traceability requirements will play an increasing role in theupcoming years (Clemens, 2003).
5 The EC argues that the new system is more flexible than the old one,as the HACCP-based procedures can be adapted to all situations andas member states were already required to ensure that foodstuffsimported into the Community were submitted to the official controlsto check that HACCP-based procedures had been observed.
6 For example, in the EU countries the EUREPGAP, a consortium of majorretailers, sets standards for fruits, vegetables, beef and fish productsthat require private certification, which in almost all instances arestricter than the technical regulations.
7 For example, in a recent meeting of the SPS Committee in June 2005,St Vincent and the Grenadines, supported by Jamaica, Peru, Ecuadorand Argentina, filed a complaint about the private sector require-ments for exporting bananas and other products to European super-markets, which are tougher than the governments’ requirements. The‘EurepGap’ requirements are ‘good agricultural practices’ (GAP) set bythe Euro-Retailer Produce Working Group. The EU said in reply that itis not in a position to intervene because the private sector organiza-tions say they are reflecting consumer demands, and that if any ofthese organizations claim that their standards are EU standards, theWTO members should take this up with Brussels. Otherwise the con-cerns should be raised with the non-governmental organizationsinvolved (WTO, 2005c).
8 For example, out of a total of 67 different tests applicable to compli-ance for different fish and shellfish products, FDA, EU and Japan allrequire different combinations and total number of tests.
9 In May of 2004 the Assembly of WHO approved a Strategy on Diet,Fitness and Health, directed to prevent obesity and the consequencesof unbalanced diets or lack of exercise The initial draft of the Strategyincluded a list of unhealthy foods, and a proposal for extra-economicduties for them as well as incentives for the healthy foods. The pro-posal did not include those concepts in the final presentation.
10 The 2003 Eurobarometer study has uncovered that on average justover 50 per cent of European citizens support genetically modified(GM) foods, with highest approval rate being approximately 70 percent in countries such as Spain, Ireland and Finland. However, whenasked about their intentions with regards to purchasing and eating ofGM foods, more Europeans say that they would not buy or eat GMfoods than those saying they would.
11 Jaffee and Henson (2004) give the example of relatively large numberof low and low-middle income countries that have been consideredby the EU as having standards of hygiene at least equivalent to thoseof EU in the capture, processing, transportation and storage of fishand fishery products. Over the period 1997–2003, the number ofcountries achieving this status as outlined in Commission Decision2001/111/EC went up from 27 to 83, more than half being low andlow-middle income countries. However, such progress is not observedsimultaneously in all other sectors. For example, China, which is oneof the 83 countries found to have EU-equivalent hygiene standards infish products, is reported to waste more than 20 per cent of its esti-mated annual food production worth US$300 billion due to deficien-cies in its cold chain technology (this includes US$8.63 billions just infruit and vegetables). Cold-chain refers to comprehensive refrigerationtreatments to keep food frozen and fresh from fields all the way tothe dinner tables. While for domestic markets these problems increasethe risk of food-borne illnesses, for international markets they can pre-clude access altogether (Industry Updates, 2005).
12 For example, developing countries like Brazil, India and Mozambique(and more recently Viet Nam) are trying to develop local capacity intechnical rules for unfragmented and unscorched cashew nuts. How-ever they use substantially different machinery and have varied man-agerial and organizational skills at different stages of the business sys-tem. The array of institutional responses has differed across countriesin the same sectors, underlying that the evolution of both regulatoryand production systems is context-specific even when meeting thesame technical standards and regulations (Srinivas, 2005).
13 Subsequently, producers and exporters are expected to develop andimplement in-house control systems based on HACCP while foodsafety organizations are expected to be responsible for fosteringimplementation of HACCP, transfer of relevant technologies and con-ducting risk-based audits.
14 This principle is also reflected in the SPS Agreement and CODEX,which aim for an international framework based on the concept of‘equivalence’ of food control approaches even when the actualprocesses are dissimilar rather than one based on optimality. Whatconstitutes an optimal process is often related to other concerns suchas resource and capability endowments. For example, to achieve areduction of pathogens on the surface of citrus fruit one might followdifferent methods in a developed country than in a developing coun-try. In an industrialised country where labour costs are high, the useof advanced, high-speed steam surface pasteurization technologiesmay be the optimal system for achieving the desired reduction. How-ever, in a developing country where labour costs are low but capitalcosts are high, it may be more effective to hand wash the fruit in anappropriate sanitising solution. Thus, if the criterion for what consti-tutes optimal is minimal labour cost and speed then the former is opti-mal whereas if the criterion were minimization of capital expendituresand full employment, then the latter would be the desired approach(Buchanan, 2002).
15 Following the discovery of a BSE case among domestic herd in US in2003, 77 per cent surveyed still responded that they did not reducetheir consumption of beef products. In fact, in the first quarter of 2004domestic consumption of beef was growing. (Coffey et. al., 2005). Incontrast, a survey conducted by GfK in Germany in 2001, following acase of BSE in November 2000, concluded that more than 50 per centof respondents did not trust the food safety in the country and wouldbe reducing their consumption of meat. Beef consumption had plum-
1238 | Building Capabilities for Food Safety
124 UNIDO Industrial Development Report 2005
meted, with households buying 41 per cent less beef in November2000 than in the same month the previous year (GfK, 2001).
16 This exercise was prepared as an input for this Report, with a view toexemplify how needs assessment methodology can be used in variouscontexts.
17 It is part of the National Food Commission, which includes provincialhealth ministries and a national agency (INAL), devoted to control offood for domestic consumption.
18 In 2004 the number of lab tests grew 15 per cent in relation to theprevious year, to 200000. During the same period, 24 analytical meth-ods were already certified and 24 more were being certified.
19 According to the draft National Budget, SENASA’s budget was to beincreased to approximately US$53 million in 2005, but this figureincludes the income from fees and charges.
20 For example, a lack of resources prevented SENASA staff from attend-ing the Codex Committee on Fats and Oils, and as a result the fat andoils sector – which is the main food exporter in Argentina – could notbe helped to foresee some of the emerging requirements.
21 In 2004 it received 15 inspections of foreign countries that auditedseveral sanitary and safety risks, paying attention to the equipment,personnel, procedures, performance and relevant management skills.
22 The cost estimates for the proactive approach below are on the con-servative side. Argentina with its developing sectoral IS, will need a sig-nificant evolution in capabilities in the three subsystems that drive anIS to achieve a proactive stance in all sectors involved (see Chapter 6).The pace of development might be different in different food prod-ucts as well as plant and animal health depending on a large numberof conditioning factors.
23 The reactive strategy means that the organisational strengths barelysuffice to avoid the detention and rejection of exported food. Afterreceiving the claims, controls are increased and food chain operatorsare instructed on the practices needed to avoid commercial problems.
24 The estimate for the costs involved with the establishment of R&Dteams assumes that each team would require a team leader, a seniorscientist, three junior scientists, and a lump sum for inputs, services(training was not included), hardware and software. Three selection
criteria are used to select which food chain groups would require theset up of a research team: importance of current and future exports,risks identified by the food chain and impact or relevance of the risks.Using those criteria the food chains were grouped in: beef, poultry,other meat, dairy, honey, fish products, vegetables, fruits, cereals,oilseeds and derived products, other foods, forestry and woods. Tak-ing into account that some activities would require several teams, thetotal R&D units estimated are 16. Biotechnology, organic productionand veterinary products and chemicals used in agriculture wereincluded as ‘horizontal’ groups. The resource needs for the threeteams was estimated lower than for the previous category because ofthe availability of the equipment needed. The last category includesinternational legislation, international negotiations, harmonisation ofthe local food security regulations and technological surveillance ofrisks and appropriate technologies. These R&D teams relate to capac-ities to be built inside SENASA.
25 For example, the EU and the FAO aid helped Guinea regain competi-tiveness due to packaging requirements imposed on their fish andpineapple juice exports (UNCTAD, 2002).
26 Cambodia, Cuba, Bolivia, Egypt, Mauritania, Kenya, Jordan, Armeniaand Ghana were selected as the initial pilot countries. For each coun-try, a quick industrial and trade competitiveness analysis and assess-ment of barriers to trade and conformity requirements was under-taken, resulting in detailed action plans for each country. For exam-ple, in Bolivia, the diagnostic analysis focused on the SPS problemsfaced by the Bolivian Amazon (Brazil) nuts exporters to comply withthe maximum level of aflatoxin allowed by the EU, leading to thedesign of a targeted technical assistance project for which Switzerlandexpressed interest in funding (UNIDO/WTO, 2004).
27 A proposal has been put forward to develop an inter-agency businessplan to redress the under-provision of international public goods foreconomic development, including those relating to standards andsanitary and phytosanitary measures (see Magariños, 2005).
28 In addition, starting from 2006 the European Commission is planningto spend more than €2 million for training programs in EU food stand-ards, HACCP and Avian flu in third countries (European Commission,2005b).

Section IIA review
of world industry

The two chapters of this section present a comparativeassessment of patterns and trends in the manufacturing
industry.1 The geographic scope of the assessment is global,its range comprehensive – covering all branches of the man-ufacturing sector as well as both domestic and internationaldevelopments – and its basis quantitative, formed by a set ofempirical measures, the ‘indicators’. Within this framework,the notion of ‘industrial performance’ is used to cover andconnect the various parts of the review. Industrial perform-ance is seen from two angles. From one of them, it is associ-ated with the performance of a whole economy: develop-ments in and around industry are compared and pictured asclosely linked with the aggregate economy, in particular withits level of overall development. From the other, performanceis taken to be that of the industrial sector itself, its levels ofdomestic and international activity and its changing struc-ture. This duality of performance informs the measurement,analysis and interpretation of developments in world indus-try presented in this section.
The review is divided into two chapters. Chapter 9 isdevoted to a description and analysis of the level of manu-facturing around the globe. First, ‘industrial inequality’ acrosscountries is measured in a comprehensive way and presentedgraphically. Next, differences in output levels among broadlydefined country groups are assessed and the rankings of indi-vidual countries by industrial output discussed. Also exam-
ined is the relationship between activity levels and industrialgrowth rates. Finally, measurement and analysis are extendedto the international scene, leading to an investigation of tradelevels, complementary to the one of production levels.
Chapter 10 outlines a set of six performance indicators,their conceptual background and relationships, and somebroader aspects reflected in this ‘set-of-six’. The remainder ofthe chapter deals with the features of industry which emergefrom the four structural indicators within the set-of-six. Here,use is made of the various aspects of symmetry inherent inthe indicators system, and structural traits are visualised in theform of a ‘structural diamond’. In analogy to the combina-tion of arithmetic and geometric tools in the analysis of indus-trial inequality, this structural diamond is associated with anindex of ‘industrial-cum-technological advance’ (ITA). Usingthese assessment tools, structural features are identified,global patterns as well as changes over time discussed andthe relationships between indicators and the overall level ofdevelopment analysed.
On the whole, this review is intended to present an accountof global industrial performance, built around an applicationof quantitative indicators. Its main goal is to achieve clarityand simplicity without sacrificing soundness and accuracy.Another objective is to exploit, in measurement, analysis andinterpretation, the concepts, distinctions and relationshipsunderlying indicator construction.
127Second Part | A review of world industry
Introduction to this section

The immediate goal of this chapter is to measure the levelof industrial activity in economies around the globe and
– on the basis of that measurement – assess differences inactivity between groups of countries as well as between indi-vidual countries. Within industrial activity, the production sideis emphasised for two reasons: first, for the conceptual rea-son that per capita output is the pre-eminent indicator ofindustrial performance and second, for the practical reasonthat an analysis of trade performance would yield results sim-ilar to those obtained on the production side.
Measuring ‘manufacturing income’
If relief, reduction and ultimately eradication of poverty arethe prime objectives of international development, economicgrowth is indispensable for achieving them. This basic rela-tionship renews and enhances the significance of industry toany economy striving for vigorous and sustained growth.From the viewpoint of sustainability it is important that out-put expansion feed not only on factor accumulation but alsoon a continuous rise in productivity, which is tantamount totechnological progress. It is at this point where industryalmost by necessity enters the growth picture, since in theindustrial sector technological advance, created domesticallyor sourced from outside, is at work to bring about growththrough productivity increase. Industry is at the core of mod-ern-style productivity-based growth, which in turn is thesource of a sustained rise of welfare throughout a societyand, consequently, of a lasting reduction of poverty.
An obvious effect of industry on growth is its direct contri-bution to total output. There are also indirect effects, dis-persed through various channels and enhanced throughspillovers into other sectors. While the latter defy comprehen-sive empirical assessment, the former is captured by a simplemeasure, that of value added originating in manufacturingindustry (MVA). Just as the relationship between total incomeand population size, expressed as income per capita, meas-ures observable average income, the relationship between‘industry income’ and population size, expressed as MVA percapita, defines average level of industrial income. This aver-age reflects the hypothesis that all income in an economywould have to be drawn from an industry sector of the sizeactually observed. In addition – and other things being equal
– MVA per capita can be expected to indicate the order ofmagnitude of indirect effects from industry on averageincome.
MVA per capita plays a dual role as an empirical measure. Inthe same way as GDP per capita is the measure of averageincome and an indicator of the overall level of development,MVA per capita measures average ‘industry income’ and indi-cates the overall level of industrial development of a country.This duality will be noted frequently in what follows. At thesame time, MVA per capita will be emphasised as the ‘correct’measure in comparisons – with a view to industrial produc-tion, income and welfare – between the overall productivepotential of industry on the one hand and the number ofpeople who can expect to benefit from it, directly or indi-rectly, on the other.
The disparate geography of industry
Industrialised countries still claim nearly three-quarters ofworld industrial production, in spite of a drop of their shareby almost five percentage points between 1990 and 2002.By contrast, industrial production of all developing countriestogether still falls somewhat short of the one-quarter ofworld production that was once postulated as the target tobe reached by the beginning of the new millennium2 –despite the fact that the expansion of industry in the Southover the 1990s was remarkable by any standard, raising thedeveloping country’s share by almost eight percentage pointsover the period. Finally, the third group, the transitioneconomies, saw a halving of their contribution to worldindustrial output, which left the group aggregate at slightlyover three per cent by 2002 (a rough impression of howindustrial production is distributed among different parts ofthe world can be gleaned from table 9.1 and figure 9.1,where the 156 countries for which comparable data wereavailable are grouped by ‘type of economy’ – industrialised,transition and developing).
Among the developing countries regional differences arewide. The leading role of East and Southeast Asia is under-lined by the fact that it accounts for more than 60 per centof the developing world’s share in global industrial produc-tion. Even if China, which contributed more than 45 per centof region’s output, is excluded from the aggregate, East and
1299 | Monitoring global industrial activity
CHAPTER 9 Monitoring globalindustrial activity
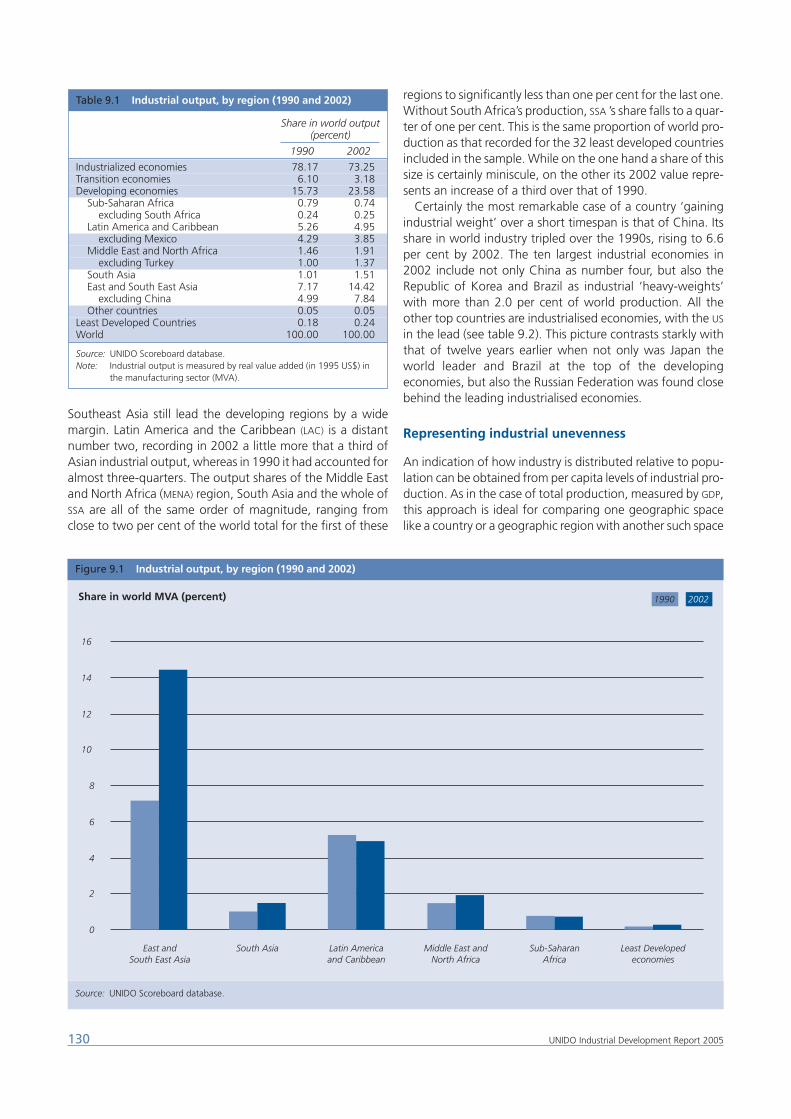
Southeast Asia still lead the developing regions by a widemargin. Latin America and the Caribbean (LAC) is a distantnumber two, recording in 2002 a little more that a third ofAsian industrial output, whereas in 1990 it had accounted foralmost three-quarters. The output shares of the Middle Eastand North Africa (MENA) region, South Asia and the whole ofSSA are all of the same order of magnitude, ranging fromclose to two per cent of the world total for the first of these
regions to significantly less than one per cent for the last one.Without South Africa’s production, SSA ’s share falls to a quar-ter of one per cent. This is the same proportion of world pro-duction as that recorded for the 32 least developed countriesincluded in the sample. While on the one hand a share of thissize is certainly miniscule, on the other its 2002 value repre-sents an increase of a third over that of 1990.
Certainly the most remarkable case of a country ‘gainingindustrial weight’ over a short timespan is that of China. Itsshare in world industry tripled over the 1990s, rising to 6.6per cent by 2002. The ten largest industrial economies in2002 include not only China as number four, but also theRepublic of Korea and Brazil as industrial ‘heavy-weights’with more than 2.0 per cent of world production. All theother top countries are industrialised economies, with the US
in the lead (see table 9.2). This picture contrasts starkly withthat of twelve years earlier when not only was Japan theworld leader and Brazil at the top of the developingeconomies, but also the Russian Federation was found closebehind the leading industrialised economies.
Representing industrial unevenness
An indication of how industry is distributed relative to popu-lation can be obtained from per capita levels of industrial pro-duction. As in the case of total production, measured by GDP,this approach is ideal for comparing one geographic spacelike a country or a geographic region with another such space
130 UNIDO Industrial Development Report 2005
Figure 9.1 Industrial output, by region (1990 and 2002)
Source: UNIDO Scoreboard database.
0
2
4
6
8
10
12
14
16
East andSouth East Asia
South Asia Latin Americaand Caribbean
Middle East andNorth Africa
Sub-SaharanAfrica
Least Developedeconomies
Share in world MVA (percent) 1990 2002
Table 9.1 Industrial output, by region (1990 and 2002)
Share in world output(percent)
1990 2002
Industrialized economies 78.17 73.25Transition economies 6.10 3.18Developing economies 15.73 23.58
Sub-Saharan Africa 0.79 0.74excluding South Africa 0.24 0.25
Latin America and Caribbean 5.26 4.95excluding Mexico 4.29 3.85
Middle East and North Africa 1.46 1.91excluding Turkey 1.00 1.37
South Asia 1.01 1.51East and South East Asia 7.17 14.42
excluding China 4.99 7.84Other countries 0.05 0.05
Least Developed Countries 0.18 0.24World 100.00 100.00
Source: UNIDO Scoreboard database.Note: Industrial output is measured by real value added (in 1995 US$) in
the manufacturing sector (MVA).
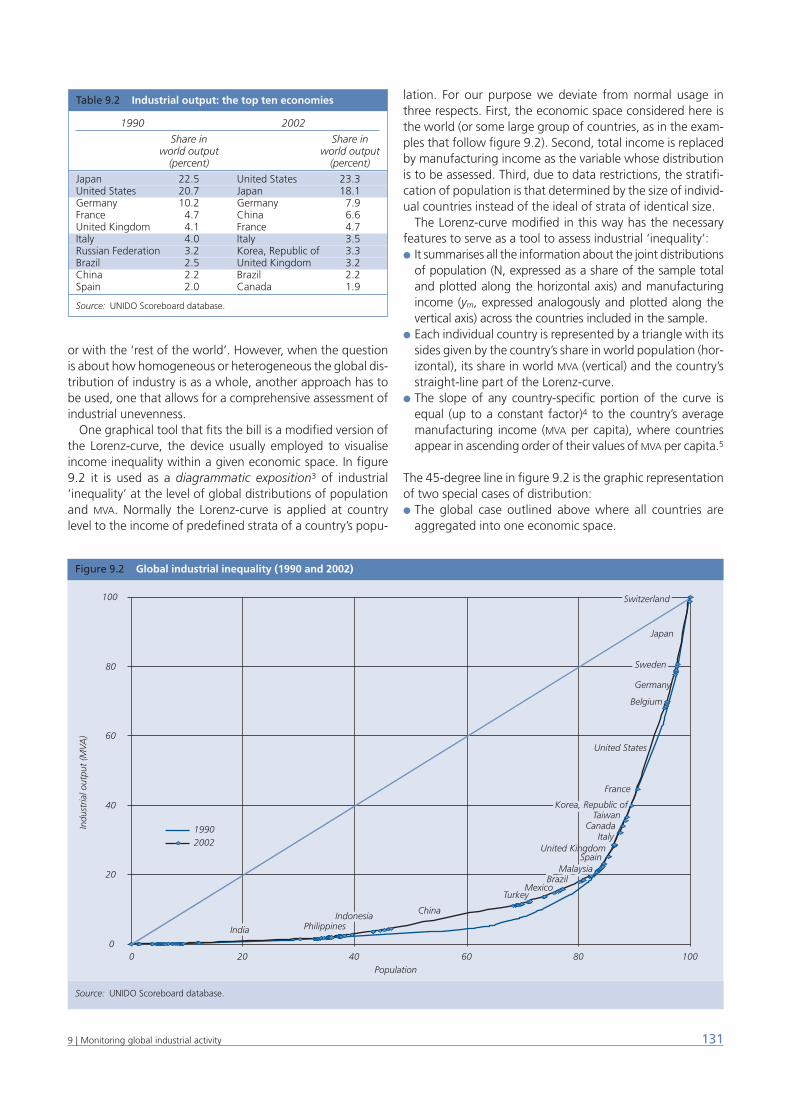
or with the ‘rest of the world’. However, when the questionis about how homogeneous or heterogeneous the global dis-tribution of industry is as a whole, another approach has tobe used, one that allows for a comprehensive assessment ofindustrial unevenness.
One graphical tool that fits the bill is a modified version ofthe Lorenz-curve, the device usually employed to visualiseincome inequality within a given economic space. In figure9.2 it is used as a diagrammatic exposition3 of industrial‘inequality’ at the level of global distributions of populationand MVA. Normally the Lorenz-curve is applied at countrylevel to the income of predefined strata of a country’s popu-
lation. For our purpose we deviate from normal usage inthree respects. First, the economic space considered here isthe world (or some large group of countries, as in the exam-ples that follow figure 9.2). Second, total income is replacedby manufacturing income as the variable whose distributionis to be assessed. Third, due to data restrictions, the stratifi-cation of population is that determined by the size of individ-ual countries instead of the ideal of strata of identical size.
The Lorenz-curve modified in this way has the necessaryfeatures to serve as a tool to assess industrial ‘inequality’:● It summarises all the information about the joint distributions
of population (N, expressed as a share of the sample totaland plotted along the horizontal axis) and manufacturingincome (ym, expressed analogously and plotted along thevertical axis) across the countries included in the sample.
● Each individual country is represented by a triangle with itssides given by the country’s share in world population (hor-izontal), its share in world MVA (vertical) and the country’sstraight-line part of the Lorenz-curve.
● The slope of any country-specific portion of the curve isequal (up to a constant factor)4 to the country’s averagemanufacturing income (MVA per capita), where countriesappear in ascending order of their values of MVA per capita.5
The 45-degree line in figure 9.2 is the graphic representationof two special cases of distribution:● The global case outlined above where all countries are
aggregated into one economic space.
1319 | Monitoring global industrial activity
Table 9.2 Industrial output: the top ten economies
1990 2002
Share in Share inworld output world output
(percent) (percent)
Japan 22.5 United States 23.3United States 20.7 Japan 18.1Germany 10.2 Germany 7.9France 4.7 China 6.6United Kingdom 4.1 France 4.7Italy 4.0 Italy 3.5Russian Federation 3.2 Korea, Republic of 3.3Brazil 2.5 United Kingdom 3.2China 2.2 Brazil 2.2Spain 2.0 Canada 1.9
Source: UNIDO Scoreboard database.
Figure 9.2 Global industrial inequality (1990 and 2002)
Source: UNIDO Scoreboard database.
0
20
40
60
80
100
0 20 40 60 80 100Population
Indu
stria
l out
put
(MVA
)
19902002
United States
Belgium
Germany
Japan
Sweden
Korea, Republic of
MalaysiaBrazil
Switzerland
Indonesia
India Philippines
Sweden
France
Korea, Republic ofTaiwan
CanadaItaly
United KingdomSpain
MalaysiaBrazil
Mexico
Switzerland
Turkey
ChinaIndonesia
India Philippines
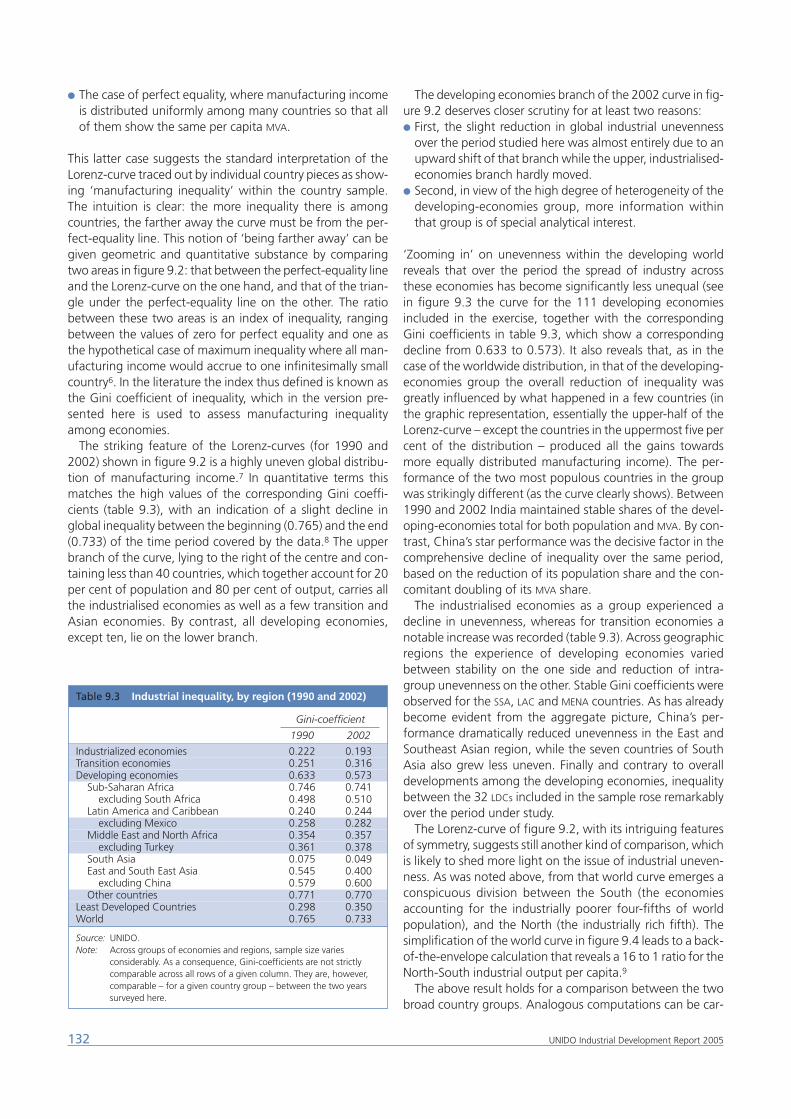
● The case of perfect equality, where manufacturing incomeis distributed uniformly among many countries so that allof them show the same per capita MVA.
This latter case suggests the standard interpretation of theLorenz-curve traced out by individual country pieces as show-ing ‘manufacturing inequality’ within the country sample.The intuition is clear: the more inequality there is amongcountries, the farther away the curve must be from the per-fect-equality line. This notion of ‘being farther away’ can begiven geometric and quantitative substance by comparingtwo areas in figure 9.2: that between the perfect-equality lineand the Lorenz-curve on the one hand, and that of the trian-gle under the perfect-equality line on the other. The ratiobetween these two areas is an index of inequality, rangingbetween the values of zero for perfect equality and one asthe hypothetical case of maximum inequality where all man-ufacturing income would accrue to one infinitesimally smallcountry6. In the literature the index thus defined is known asthe Gini coefficient of inequality, which in the version pre-sented here is used to assess manufacturing inequalityamong economies.
The striking feature of the Lorenz-curves (for 1990 and2002) shown in figure 9.2 is a highly uneven global distribu-tion of manufacturing income.7 In quantitative terms thismatches the high values of the corresponding Gini coeffi-cients (table 9.3), with an indication of a slight decline inglobal inequality between the beginning (0.765) and the end(0.733) of the time period covered by the data.8 The upperbranch of the curve, lying to the right of the centre and con-taining less than 40 countries, which together account for 20per cent of population and 80 per cent of output, carries allthe industrialised economies as well as a few transition andAsian economies. By contrast, all developing economies,except ten, lie on the lower branch.
The developing economies branch of the 2002 curve in fig-ure 9.2 deserves closer scrutiny for at least two reasons:● First, the slight reduction in global industrial unevenness
over the period studied here was almost entirely due to anupward shift of that branch while the upper, industrialised-economies branch hardly moved.
● Second, in view of the high degree of heterogeneity of thedeveloping-economies group, more information withinthat group is of special analytical interest.
‘Zooming in’ on unevenness within the developing worldreveals that over the period the spread of industry acrossthese economies has become significantly less unequal (seein figure 9.3 the curve for the 111 developing economiesincluded in the exercise, together with the correspondingGini coefficients in table 9.3, which show a correspondingdecline from 0.633 to 0.573). It also reveals that, as in thecase of the worldwide distribution, in that of the developing-economies group the overall reduction of inequality wasgreatly influenced by what happened in a few countries (inthe graphic representation, essentially the upper-half of theLorenz-curve – except the countries in the uppermost five percent of the distribution – produced all the gains towardsmore equally distributed manufacturing income). The per-formance of the two most populous countries in the groupwas strikingly different (as the curve clearly shows). Between1990 and 2002 India maintained stable shares of the devel-oping-economies total for both population and MVA. By con-trast, China’s star performance was the decisive factor in thecomprehensive decline of inequality over the same period,based on the reduction of its population share and the con-comitant doubling of its MVA share.
The industrialised economies as a group experienced adecline in unevenness, whereas for transition economies anotable increase was recorded (table 9.3). Across geographicregions the experience of developing economies variedbetween stability on the one side and reduction of intra-group unevenness on the other. Stable Gini coefficients wereobserved for the SSA, LAC and MENA countries. As has alreadybecome evident from the aggregate picture, China’s per-formance dramatically reduced unevenness in the East andSoutheast Asian region, while the seven countries of SouthAsia also grew less uneven. Finally and contrary to overalldevelopments among the developing economies, inequalitybetween the 32 LDCs included in the sample rose remarkablyover the period under study.
The Lorenz-curve of figure 9.2, with its intriguing featuresof symmetry, suggests still another kind of comparison, whichis likely to shed more light on the issue of industrial uneven-ness. As was noted above, from that world curve emerges aconspicuous division between the South (the economiesaccounting for the industrially poorer four-fifths of worldpopulation), and the North (the industrially rich fifth). Thesimplification of the world curve in figure 9.4 leads to a back-of-the-envelope calculation that reveals a 16 to 1 ratio for theNorth-South industrial output per capita.9
The above result holds for a comparison between the twobroad country groups. Analogous computations can be car-
132 UNIDO Industrial Development Report 2005
Table 9.3 Industrial inequality, by region (1990 and 2002)
Gini-coefficient
1990 2002
Industrialized economies 0.222 0.193Transition economies 0.251 0.316Developing economies 0.633 0.573
Sub-Saharan Africa 0.746 0.741excluding South Africa 0.498 0.510
Latin America and Caribbean 0.240 0.244excluding Mexico 0.258 0.282
Middle East and North Africa 0.354 0.357excluding Turkey 0.361 0.378
South Asia 0.075 0.049East and South East Asia 0.545 0.400
excluding China 0.579 0.600Other countries 0.771 0.770
Least Developed Countries 0.298 0.350World 0.765 0.733
Source: UNIDO.Note: Across groups of economies and regions, sample size varies
considerably. As a consequence, Gini-coefficients are not strictlycomparable across all rows of a given column. They are, however,comparable – for a given country group – between the two yearssurveyed here.
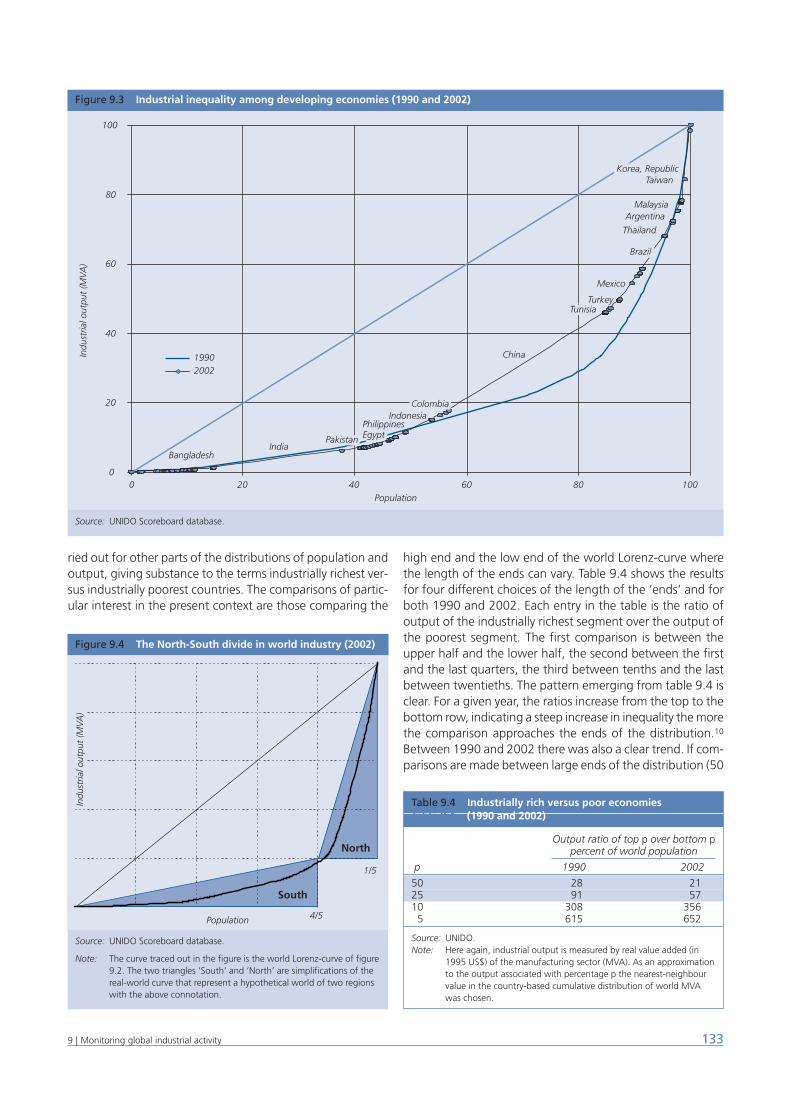
ried out for other parts of the distributions of population andoutput, giving substance to the terms industrially richest ver-sus industrially poorest countries. The comparisons of partic-ular interest in the present context are those comparing the
high end and the low end of the world Lorenz-curve wherethe length of the ends can vary. Table 9.4 shows the resultsfor four different choices of the length of the ‘ends’ and forboth 1990 and 2002. Each entry in the table is the ratio ofoutput of the industrially richest segment over the output ofthe poorest segment. The first comparison is between theupper half and the lower half, the second between the firstand the last quarters, the third between tenths and the lastbetween twentieths. The pattern emerging from table 9.4 isclear. For a given year, the ratios increase from the top to thebottom row, indicating a steep increase in inequality the morethe comparison approaches the ends of the distribution.10
Between 1990 and 2002 there was also a clear trend. If com-parisons are made between large ends of the distribution (50
1339 | Monitoring global industrial activity
Figure 9.3 Industrial inequality among developing economies (1990 and 2002)
Source: UNIDO Scoreboard database.
0
20
40
60
80
100
0 20 40 60 80 100Population
Indu
stria
l out
put
(MVA
)
19902002
India
China
Brazil
Korea, Republic
Pakistan Egypt
Tunisia
Colombia
Brazil
Korea, Republic
Turkey
Mexico
IndonesiaPhilippines
Pakistan
Thailand
ArgentinaMalaysia
Taiwan
Bangladesh
Egypt
Tunisia
Colombia
Figure 9.4 The North-South divide in world industry (2002)
Source: UNIDO Scoreboard database.
Note: The curve traced out in the figure is the world Lorenz-curve of figure9.2. The two triangles ‘South’ and ‘North’ are simplifications of thereal-world curve that represent a hypothetical world of two regionswith the above connotation.
Population
Indu
stria
l out
put
(MVA
)In
dust
rial o
utpu
t (M
VA)
4/5
1/5
South
North
Table 9.4 Industrially rich versus poor economies Table 9.4 (1990 and 2002)
Output ratio of top p over bottom ppercent of world population
p 1990 2002
50 28 2125 91 5710 308 3565 615 652
Source: UNIDO.Note: Here again, industrial output is measured by real value added (in
1995 US$) of the manufacturing sector (MVA). As an approximationto the output associated with percentage p the nearest-neighbourvalue in the country-based cumulative distribution of world MVAwas chosen.
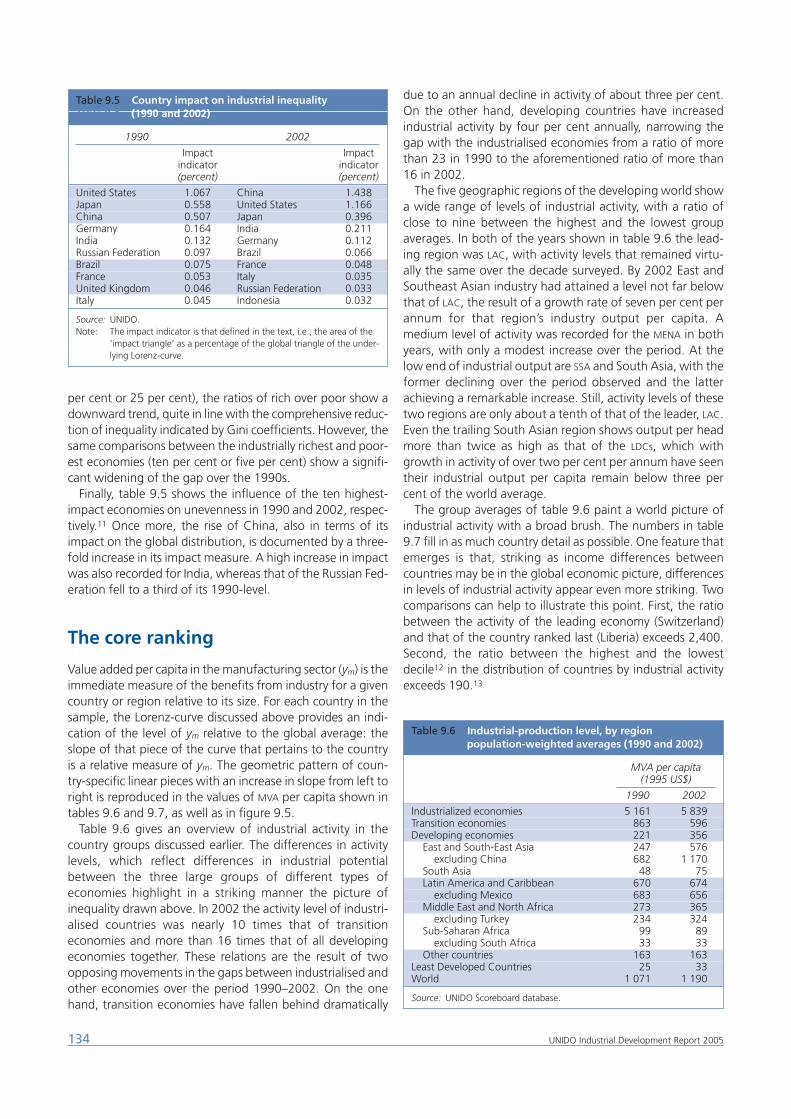
per cent or 25 per cent), the ratios of rich over poor show adownward trend, quite in line with the comprehensive reduc-tion of inequality indicated by Gini coefficients. However, thesame comparisons between the industrially richest and poor-est economies (ten per cent or five per cent) show a signifi-cant widening of the gap over the 1990s.
Finally, table 9.5 shows the influence of the ten highest-impact economies on unevenness in 1990 and 2002, respec-tively.11 Once more, the rise of China, also in terms of itsimpact on the global distribution, is documented by a three-fold increase in its impact measure. A high increase in impactwas also recorded for India, whereas that of the Russian Fed-eration fell to a third of its 1990-level.
The core ranking
Value added per capita in the manufacturing sector (ym) is theimmediate measure of the benefits from industry for a givencountry or region relative to its size. For each country in thesample, the Lorenz-curve discussed above provides an indi-cation of the level of ym relative to the global average: theslope of that piece of the curve that pertains to the countryis a relative measure of ym. The geometric pattern of coun-try-specific linear pieces with an increase in slope from left toright is reproduced in the values of MVA per capita shown intables 9.6 and 9.7, as well as in figure 9.5.
Table 9.6 gives an overview of industrial activity in thecountry groups discussed earlier. The differences in activitylevels, which reflect differences in industrial potentialbetween the three large groups of different types ofeconomies highlight in a striking manner the picture ofinequality drawn above. In 2002 the activity level of industri-alised countries was nearly 10 times that of transitioneconomies and more than 16 times that of all developingeconomies together. These relations are the result of twoopposing movements in the gaps between industrialised andother economies over the period 1990–2002. On the onehand, transition economies have fallen behind dramatically
due to an annual decline in activity of about three per cent.On the other hand, developing countries have increasedindustrial activity by four per cent annually, narrowing thegap with the industrialised economies from a ratio of morethan 23 in 1990 to the aforementioned ratio of more than16 in 2002.
The five geographic regions of the developing world showa wide range of levels of industrial activity, with a ratio ofclose to nine between the highest and the lowest groupaverages. In both of the years shown in table 9.6 the lead-ing region was LAC, with activity levels that remained virtu-ally the same over the decade surveyed. By 2002 East andSoutheast Asian industry had attained a level not far belowthat of LAC, the result of a growth rate of seven per cent perannum for that region’s industry output per capita. Amedium level of activity was recorded for the MENA in bothyears, with only a modest increase over the period. At thelow end of industrial output are SSA and South Asia, with theformer declining over the period observed and the latterachieving a remarkable increase. Still, activity levels of thesetwo regions are only about a tenth of that of the leader, LAC.Even the trailing South Asian region shows output per headmore than twice as high as that of the LDCs, which withgrowth in activity of over two per cent per annum have seentheir industrial output per capita remain below three percent of the world average.
The group averages of table 9.6 paint a world picture ofindustrial activity with a broad brush. The numbers in table9.7 fill in as much country detail as possible. One feature thatemerges is that, striking as income differences betweencountries may be in the global economic picture, differencesin levels of industrial activity appear even more striking. Twocomparisons can help to illustrate this point. First, the ratiobetween the activity of the leading economy (Switzerland)and that of the country ranked last (Liberia) exceeds 2,400.Second, the ratio between the highest and the lowestdecile12 in the distribution of countries by industrial activityexceeds 190.13
134 UNIDO Industrial Development Report 2005
Table 9.5 Country impact on industrial inequality Table 9.4 (1990 and 2002)
1990 2002
Impact Impactindicator indicator(percent) (percent)
United States 1.067 China 1.438Japan 0.558 United States 1.166China 0.507 Japan 0.396Germany 0.164 India 0.211India 0.132 Germany 0.112Russian Federation 0.097 Brazil 0.066Brazil 0.075 France 0.048France 0.053 Italy 0.035United Kingdom 0.046 Russian Federation 0.033Italy 0.045 Indonesia 0.032
Source: UNIDO.Note: The impact indicator is that defined in the text, i.e., the area of the
‘impact triangle’ as a percentage of the global triangle of the under-lying Lorenz-curve.
Table 9.6 Industrial-production level, by regionTable 9.6 population-weighted averages (1990 and 2002)
MVA per capita(1995 US$)
1990 2002
Industrialized economies 5 161 5 839Transition economies 863 596Developing economies 221 356
East and South-East Asia 247 576excluding China 682 1 170
South Asia 48 75Latin America and Caribbean 670 674
excluding Mexico 683 656Middle East and North Africa 273 365
excluding Turkey 234 324Sub-Saharan Africa 99 89
excluding South Africa 33 33Other countries 163 163
Least Developed Countries 25 33World 1 071 1 190
Source: UNIDO Scoreboard database.
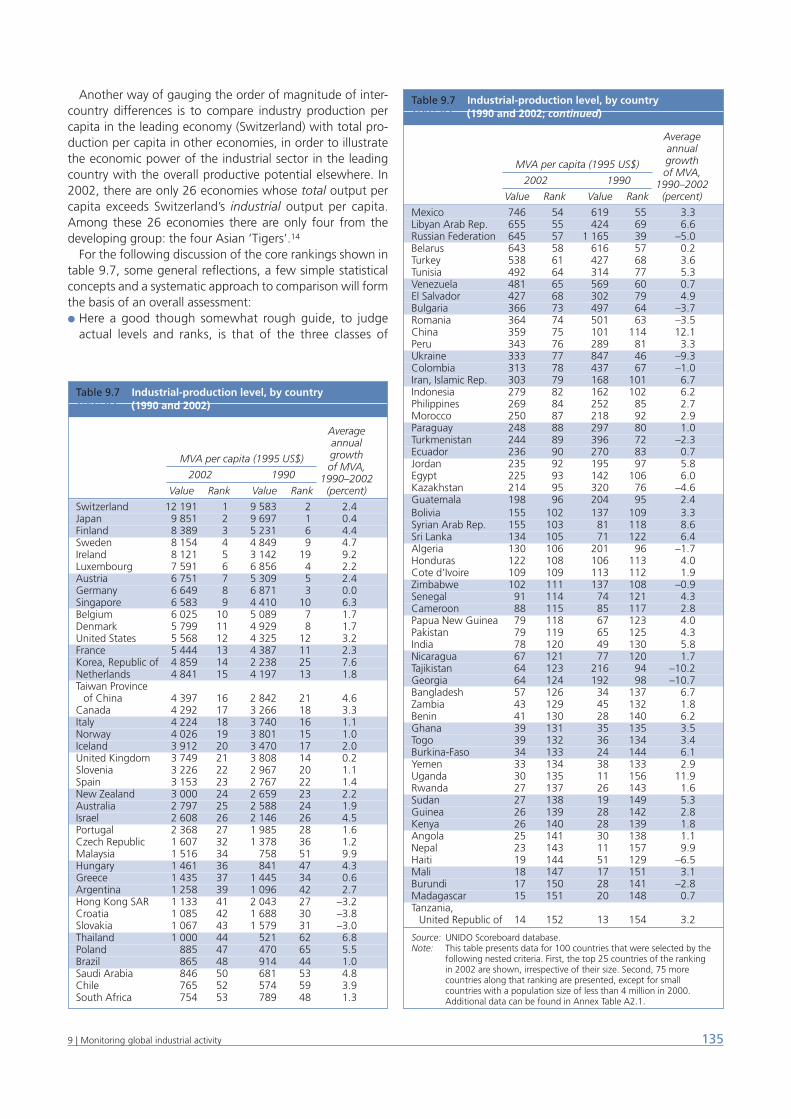
Another way of gauging the order of magnitude of inter-country differences is to compare industry production percapita in the leading economy (Switzerland) with total pro-duction per capita in other economies, in order to illustratethe economic power of the industrial sector in the leadingcountry with the overall productive potential elsewhere. In2002, there are only 26 economies whose total output percapita exceeds Switzerland’s industrial output per capita.Among these 26 economies there are only four from thedeveloping group: the four Asian ‘Tigers’.14
For the following discussion of the core rankings shown intable 9.7, some general reflections, a few simple statisticalconcepts and a systematic approach to comparison will formthe basis of an overall assessment:● Here a good though somewhat rough guide, to judge
actual levels and ranks, is that of the three classes of
1359 | Monitoring global industrial activity
Table 9.7 Industrial-production level, by countryTable 9.6 (1990 and 2002)
AverageannualgrowthMVA per capita (1995 US$)of MVA,
2002 1990 1990–2002Value Rank Value Rank (percent)
Switzerland 12 191 1 9 583 2 2.4Japan 9 851 2 9 697 1 0.4Finland 8 389 3 5 231 6 4.4Sweden 8 154 4 4 849 9 4.7Ireland 8 121 5 3 142 19 9.2Luxembourg 7 591 6 6 856 4 2.2Austria 6 751 7 5 309 5 2.4Germany 6 649 8 6 871 3 0.0Singapore 6 583 9 4 410 10 6.3Belgium 6 025 10 5 089 7 1.7Denmark 5 799 11 4 929 8 1.7United States 5 568 12 4 325 12 3.2France 5 444 13 4 387 11 2.3Korea, Republic of 4 859 14 2 238 25 7.6Netherlands 4 841 15 4 197 13 1.8Taiwan Province
of China 4 397 16 2 842 21 4.6Canada 4 292 17 3 266 18 3.3Italy 4 224 18 3 740 16 1.1Norway 4 026 19 3 801 15 1.0Iceland 3 912 20 3 470 17 2.0United Kingdom 3 749 21 3 808 14 0.2Slovenia 3 226 22 2 967 20 1.1Spain 3 153 23 2 767 22 1.4New Zealand 3 000 24 2 659 23 2.2Australia 2 797 25 2 588 24 1.9Israel 2 608 26 2 146 26 4.5Portugal 2 368 27 1 985 28 1.6Czech Republic 1 607 32 1 378 36 1.2Malaysia 1 516 34 758 51 9.9Hungary 1 461 36 841 47 4.3Greece 1 435 37 1 445 34 0.6Argentina 1 258 39 1 096 42 2.7Hong Kong SAR 1 133 41 2 043 27 –3.2Croatia 1 085 42 1 688 30 –3.8Slovakia 1 067 43 1 579 31 –3.0Thailand 1 000 44 521 62 6.8Poland 885 47 470 65 5.5Brazil 865 48 914 44 1.0Saudi Arabia 846 50 681 53 4.8Chile 765 52 574 59 3.9South Africa 754 53 789 48 1.3
Table 9.7 Industrial-production level, by countryTable 9.6 (1990 and 2002; continued)
AverageannualgrowthMVA per capita (1995 US$)of MVA,
2002 1990 1990–2002Value Rank Value Rank (percent)
Mexico 746 54 619 55 3.3Libyan Arab Rep. 655 55 424 69 6.6Russian Federation 645 57 1 165 39 –5.0Belarus 643 58 616 57 0.2Turkey 538 61 427 68 3.6Tunisia 492 64 314 77 5.3Venezuela 481 65 569 60 0.7El Salvador 427 68 302 79 4.9Bulgaria 366 73 497 64 –3.7Romania 364 74 501 63 –3.5China 359 75 101 114 12.1Peru 343 76 289 81 3.3Ukraine 333 77 847 46 –9.3Colombia 313 78 437 67 –1.0Iran, Islamic Rep. 303 79 168 101 6.7Indonesia 279 82 162 102 6.2Philippines 269 84 252 85 2.7Morocco 250 87 218 92 2.9Paraguay 248 88 297 80 1.0Turkmenistan 244 89 396 72 –2.3Ecuador 236 90 270 83 0.7Jordan 235 92 195 97 5.8Egypt 225 93 142 106 6.0Kazakhstan 214 95 320 76 –4.6Guatemala 198 96 204 95 2.4Bolivia 155 102 137 109 3.3Syrian Arab Rep. 155 103 81 118 8.6Sri Lanka 134 105 71 122 6.4Algeria 130 106 201 96 –1.7Honduras 122 108 106 113 4.0Cote d’Ivoire 109 109 113 112 1.9Zimbabwe 102 111 137 108 –0.9Senegal 91 114 74 121 4.3Cameroon 88 115 85 117 2.8Papua New Guinea 79 118 67 123 4.0Pakistan 79 119 65 125 4.3India 78 120 49 130 5.8Nicaragua 67 121 77 120 1.7Tajikistan 64 123 216 94 –10.2Georgia 64 124 192 98 –10.7Bangladesh 57 126 34 137 6.7Zambia 43 129 45 132 1.8Benin 41 130 28 140 6.2Ghana 39 131 35 135 3.5Togo 39 132 36 134 3.4Burkina-Faso 34 133 24 144 6.1Yemen 33 134 38 133 2.9Uganda 30 135 11 156 11.9Rwanda 27 137 26 143 1.6Sudan 27 138 19 149 5.3Guinea 26 139 28 142 2.8Kenya 26 140 28 139 1.8Angola 25 141 30 138 1.1Nepal 23 143 11 157 9.9Haiti 19 144 51 129 –6.5Mali 18 147 17 151 3.1Burundi 17 150 28 141 –2.8Madagascar 15 151 20 148 0.7Tanzania,
United Republic of 14 152 13 154 3.2
Source: UNIDO Scoreboard database.Note: This table presents data for 100 countries that were selected by the
following nested criteria. First, the top 25 countries of the ranking in 2002 are shown, irrespective of their size. Second, 75 morecountries along that ranking are presented, except for smallcountries with a population size of less than 4 million in 2000.Additional data can be found in Annex Table A2.1.
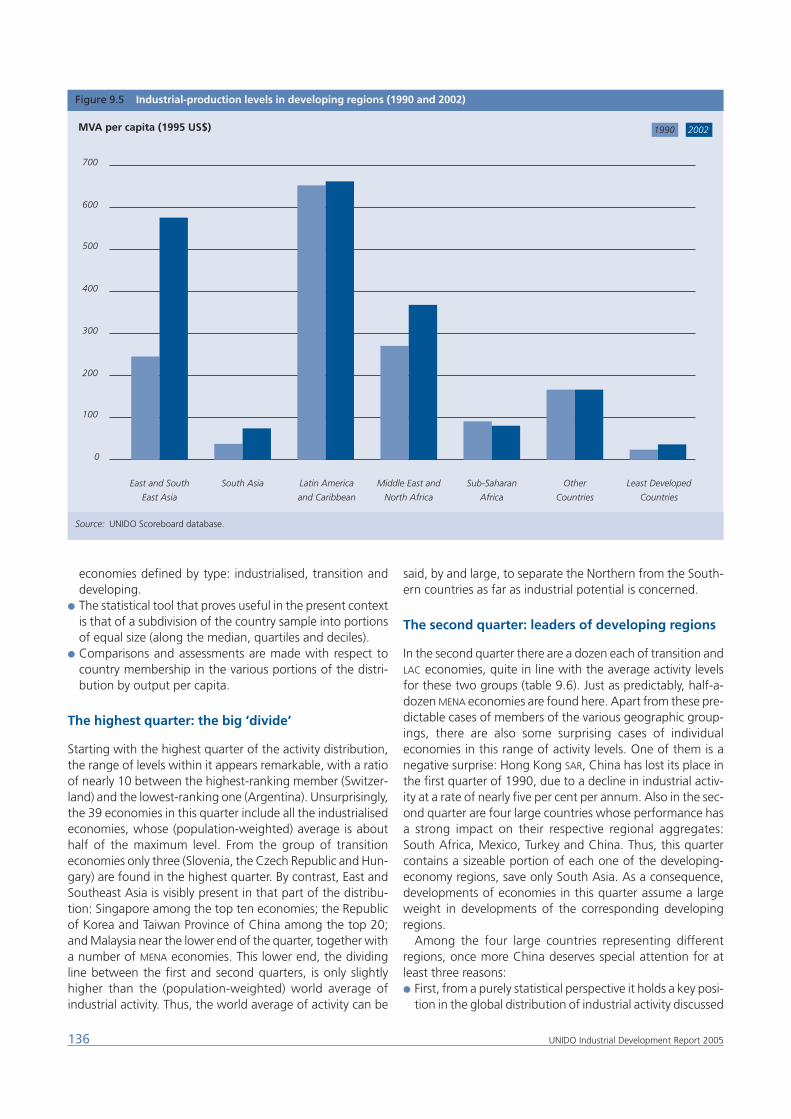
economies defined by type: industrialised, transition anddeveloping.
● The statistical tool that proves useful in the present contextis that of a subdivision of the country sample into portionsof equal size (along the median, quartiles and deciles).
● Comparisons and assessments are made with respect tocountry membership in the various portions of the distri-bution by output per capita.
The highest quarter: the big ‘divide’
Starting with the highest quarter of the activity distribution,the range of levels within it appears remarkable, with a ratioof nearly 10 between the highest-ranking member (Switzer-land) and the lowest-ranking one (Argentina). Unsurprisingly,the 39 economies in this quarter include all the industrialisedeconomies, whose (population-weighted) average is abouthalf of the maximum level. From the group of transitioneconomies only three (Slovenia, the Czech Republic and Hun-gary) are found in the highest quarter. By contrast, East andSoutheast Asia is visibly present in that part of the distribu-tion: Singapore among the top ten economies; the Republicof Korea and Taiwan Province of China among the top 20;and Malaysia near the lower end of the quarter, together witha number of MENA economies. This lower end, the dividingline between the first and second quarters, is only slightlyhigher than the (population-weighted) world average ofindustrial activity. Thus, the world average of activity can be
said, by and large, to separate the Northern from the South-ern countries as far as industrial potential is concerned.
The second quarter: leaders of developing regions
In the second quarter there are a dozen each of transition andLAC economies, quite in line with the average activity levelsfor these two groups (table 9.6). Just as predictably, half-a-dozen MENA economies are found here. Apart from these pre-dictable cases of members of the various geographic group-ings, there are also some surprising cases of individualeconomies in this range of activity levels. One of them is anegative surprise: Hong Kong SAR, China has lost its place inthe first quarter of 1990, due to a decline in industrial activ-ity at a rate of nearly five per cent per annum. Also in the sec-ond quarter are four large countries whose performance hasa strong impact on their respective regional aggregates:South Africa, Mexico, Turkey and China. Thus, this quartercontains a sizeable portion of each one of the developing-economy regions, save only South Asia. As a consequence,developments of economies in this quarter assume a largeweight in developments of the corresponding developingregions.
Among the four large countries representing differentregions, once more China deserves special attention for atleast three reasons:● First, from a purely statistical perspective it holds a key posi-
tion in the global distribution of industrial activity discussed
136 UNIDO Industrial Development Report 2005
Figure 9.5 Industrial-production levels in developing regions (1990 and 2002)
Source: UNIDO Scoreboard database.
East and South
East Asia
South Asia Latin America
and Caribbean
Middle East and
North Africa
Sub-Saharan
Africa
Least Developed
Countries
MVA per capita (1995 US$) 1990 2002
0
100
200
300
400
500
600
700
Other
Countries
here. The most populous country in the world, it is alsoclose to the global median of output per capita, implyingthat half of all economies have higher levels of industrialactivity than China, and the other half lower levels. At thesame time and largely due to population size, China’s out-put per capita is virtually identical with the average for alldeveloping countries.15
● Second, the sheer size of China’s population also makes theaverage for East and Southeast Asia wholly dependent onwhether it is included or not. In fact, excluding China fromthe regional aggregate raises the average activity level bya factor of two, reinstating the region as the industrialleader of the developing world.
● Third, China’s industrial growth performance over theperiod surveyed was unrivalled: its industrial output percapita more than tripled between 1990 and 2002.
The third quarter: between the mid-point and Sub-Saharan Africa
The third quarter – below the middle of the global activity dis-tribution, marked by China – extends to a level around theregional average of SSA.16 There are in this quarter nineAfrican countries with activity levels exceeding, for example,the average level of South Asia. Conversely, out of the lattergroup only two economies – Sri Lanka and the Maldives – arein the same quarter with activity levels similar to those of therelatively more advanced African economies. Apart from thepresence of these two geographic regions, membership ofthe third quarter runs across all the other developing-econ-omy regions as well as the less advanced transitioneconomies. Somewhat surprisingly, the two lowest rankingEast Asian economies (Indonesia and the Philippines) arefound in the lower half of the global distribution, with levelssignificantly below the developing- economy average. Andwith only a few exceptions, the remaining members of LAC
and MENA are spread across the third quarter.
The fourth quarter: the least industrialised
At the top of the lowest quarter of the global distribution byindustrial activity are two South Asian economies, Pakistanand India. The latter accounts for over 20 per cent of totaldeveloping-economy population and is therefore represen-tative of the average level of activity of the countries at thelow end of the global distribution. Moreover, India’s indus-trial output per capita is a fifth of the developing-economyaverage, a mark which separates the less industrialised ofthese economies from the least industrialised ones; the lat-ter group being, with only a few exceptions, identical withthat of the LDCs. Indeed, all but three of the economies withindustrial activity levels below a sixth of the developing-economy average are LDCs – the exceptions being three non-LDC African economies: Ghana, Kenya and Nigeria. That‘least developed’ implies – with a small number of excep-tions – ‘least industrialised’ emerges also from a simple com-parison of the statistics underlying tables 9.6 and 9.7. Theaverage activity level of LDCs (US$33 per person) is close to
the midpoint of the range (from US$5 to US$79 per person)of the lowest quarter.
This discussion of the global distribution of industrial activ-ity invites two observations which touch upon more generalfeatures in this distribution. The first observation, which israther startling, is that global industrial unevenness is theresult almost entirely of differences between, not within, thefour quarters of the world distribution of industrial activity.This can be verified by taking the sample of 156 countriesdivided into its four quarters and measuring the respectiveGini-coefficients within each of the quarters.17 The remark-able result of comparing the four coefficients is that withineach quarter the distribution is relatively even, with values ofintra-quarter Gini-coefficients between 0.21 and 0.23.
The second observation ties in with the first. It focusesonce more on the difference between the industrially mostadvanced economies in the world and the least advanced.Empirical evidence shows that differences in per capitaincome between rich and poor countries are staggering; herewe find additional evidence that such differences are exacer-bated when comparisons relate to manufacturing income or,alternatively, to levels of industrial activity. An illustration ofthis point is obtained from the subdivision of the countrysample into the quarters discussed previously: The ratiobetween the industrial activity levels of the highest and low-est quartiles18 of the global distribution exceeds 15, whereasthe corresponding ratio for GDP per capita is below 12. Thus,the gap between the industrially rich and the industrially poorquarters is larger by a third than the corresponding incomegap, which is so abundantly measured, discussed andanalysed in the growth and development literature.
So far, the discussion of the core ranking of economies hasbeen confined to the static picture of inter-country differ-ences in activity levels, with only occasional remarks onchanges over time. Below we broach the latter and attemptto relate levels of industrial activity to the growth of indus-trial production, much in the spirit of two different lines ofinvestigation in the growth literature: the one on the role ofsector development for growth and the other on conver-gence or divergence of levels of per capita income.
Levels of activity and growth rates
It seems to be common practice in the reporting on cross-country indicators, to rank countries by a given indicator indifferent time periods and then compare the rankings as awhole as well as changes in ranks for individual countries. Themain reason for this approach is that most indicators can onlybe given an ordinal interpretation, which is expressed incountry rankings. The case of the indicator of industrial activ-ity used in the present analysis is different. The constant-price value of industrial output per capita is a cardinal meas-ure of the activity level, not only an ordinal indicator. Thisimplies that comparisons can be carried out both for levelsand for ranks, and that the assessment can be comprehen-sive as well as at the level of individual countries.
A first point of interest in this connection is that of stabil-
1379 | Monitoring global industrial activity
ity over time of the activity ranking. Here the result is abun-dantly clear: a rank correlation coefficient of over 0.96 indi-cates a very high degree of stability. This is an overall resultand as such does not preclude sizeable changes in the ranksof individual countries. However, on the whole the rankingobserved in 2002 was not significantly different from that in1990. More than that, the overall relationship between coun-try values was largely preserved between the two years, wit-nessed by a highly significant standard correlation coefficient,also with a value greater than 0.96, i.e. approaching totalconcordance between the distributions in the two years.
At the level of individual countries, direct comparison ofindustrial activity in the two years produces a picture of con-siderable variation. Here country growth rates of output percapita are best gauged by the world activity growth rate of 0.9per cent per annum over the period 1990 to 2002. The onlydouble-digit rate of activity growth was recorded by Chinawith a value of 11.2 per cent per annum for output per capita,which corresponds to an expansion of total industry outputof 12.1 per cent per year. Growth of this order of magnitudecatapulted the most populous economy in the world from aposition near the end of the third quarter (rank 114) in 1990to one close above the median (rank 75) in 2002. In otherwords, China’s leap forward was of the size of exactly onequarter of the global distribution. Another case of spectacu-lar growth and change in ranks occurred among the industri-alised countries. Ireland, with growth rates of 8.2 per cent forper capita output and 9.2 per cent for total MVA moved to rankfive in the world of 2002 from the rank 19 in 1990. Outstand-ing growth performance of a similar order of magnitude wasalso observed for Malaysia and the Republic of Korea, withsimilarly large gains in ranks for both economies.
At the other end of the country distribution in terms ofindustrial growth, very high rates of industrial contractionwere observed for some small transition economies and forseveral LDCs. To give just two examples: the Ukraine saw anannual decline of industrial output of –8.9 per cent per capitaand –9.3 per cent total, which led to the country falling fromthe 46th position to the 77th over about one decade. For Haitithe rates of industrial contraction were –7.9 per cent and–6.5 per cent, respectively, resulting in a descent of this LDC
from rank 129 in 1990 to rank 144 in 2002. Many moreexamples of a notable experience of expansion or contractionof individual countries might be given for the purpose ofillustration. One may stand for all of them, also because itdocuments a remarkable break with recent history. HongKong SAR, China, previously one of the East Asian industrialstar performers, experienced a dramatic contraction of indus-try, both in per capita terms (–4.8 per cent per annum) andtotal (–3.2 per cent per annum). The consequence was a fallin the global ranking from position 27 to 41 in the course oflittle more than one decade.
A casual review of country experience as regards activitylevels at the beginning of the time period surveyed here andthe growth performance over the following decade createsthe impression of great variability across the sample. A moresystematic search, however, for a relationship between activ-ity levels and growth rates needs to invoke hypotheses as, for
example, the following two that are drawn from growthanalysis:● The first one derives from the role that industry is usually
assigned with respect to aggregate growth. Here the con-jecture is that a higher level of industrial development isconducive to higher growth, both of industry itself and ofthe aggregate economy, due to higher rates of technolog-ical progress and the ensuing increase in productivity.
● The second hypothesis has its foundation in standardgrowth theory, in particular in its prediction of long-runconvergence of income levels. It holds that higher initial lev-els of income and development (including those from andof the manufacturing sector) would entail relatively lowerrates of income growth.
Somewhat modified for the present context and cast into thesimplest possible statistical form, the first hypothesis leads toexpecting a positive correlation between the level of indus-trial activity on the one side and growth of per capita indus-trial output as well as the aggregate economy on the other;the second a negative correlation. Thus, depending on whichof the two opposing effects had a stronger presence in devel-opments over the 1990s, the sign of the respective correla-tions should be positive or negative.
In both cases – that of the effect on industry output as wellas that on aggregate output, both measured in per capitaterms – the growth-enhancing effect of industrial activityseems to prevail over the growth-dampening effect of con-vergence. Both correlation coefficients are positive and sig-nificant at the ten-per cent level. The first of the two relations,that between the initial level and the growth rate of percapita output of industry, is weaker, with a correlation coef-ficient of 0.132. The second relation, between the initial levelof per capita output of industry and per capita aggregate out-put, is considerably stronger with a coefficient of 0.178,which is significant at the five per cent level. The latter resultindicates a positive association between a country’s level ofindustrial activity and the rate of growth of aggregate pro-ductivity. This association seems to be noticeably strongerthan the conventional trends towards convergence in pro-ductivity levels.
Manufacturing trade: the international dimensionSo far only industrial output per capita (ym) has been used asan indicator for the level of industrial activity. This is only oneside of the ‘activity coin’, the domestic side, measured by thelevel of production. Another aspect of industrial activity canalso be considered, namely, the international dimension. Anobvious candidate for the latter is international comparativeadvantage in manufactured goods, for which trade theoryproposes the ratio of manufactured exports over GDP as anempirical measure. The level indicator used here is exports ofmanufactures per capita (xm), which represents the interna-tional side of the ‘activity coin’.
With per capita income as a common denominator, the
138 UNIDO Industrial Development Report 2005
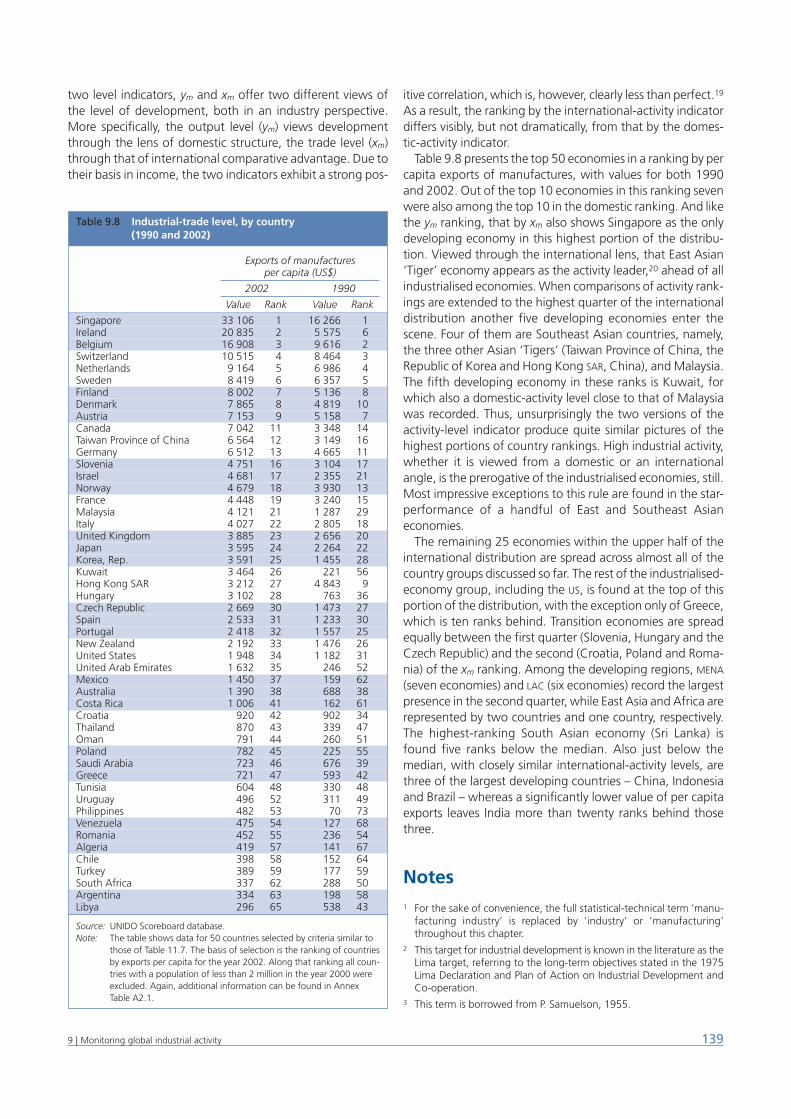
two level indicators, ym and xm offer two different views ofthe level of development, both in an industry perspective.More specifically, the output level (ym) views developmentthrough the lens of domestic structure, the trade level (xm)through that of international comparative advantage. Due totheir basis in income, the two indicators exhibit a strong pos-
itive correlation, which is, however, clearly less than perfect.19
As a result, the ranking by the international-activity indicatordiffers visibly, but not dramatically, from that by the domes-tic-activity indicator.
Table 9.8 presents the top 50 economies in a ranking by percapita exports of manufactures, with values for both 1990and 2002. Out of the top 10 economies in this ranking sevenwere also among the top 10 in the domestic ranking. And likethe ym ranking, that by xm also shows Singapore as the onlydeveloping economy in this highest portion of the distribu-tion. Viewed through the international lens, that East Asian‘Tiger’ economy appears as the activity leader,20 ahead of allindustrialised economies. When comparisons of activity rank-ings are extended to the highest quarter of the internationaldistribution another five developing economies enter thescene. Four of them are Southeast Asian countries, namely,the three other Asian ‘Tigers’ (Taiwan Province of China, theRepublic of Korea and Hong Kong SAR, China), and Malaysia.The fifth developing economy in these ranks is Kuwait, forwhich also a domestic-activity level close to that of Malaysiawas recorded. Thus, unsurprisingly the two versions of theactivity-level indicator produce quite similar pictures of thehighest portions of country rankings. High industrial activity,whether it is viewed from a domestic or an internationalangle, is the prerogative of the industrialised economies, still.Most impressive exceptions to this rule are found in the star-performance of a handful of East and Southeast Asianeconomies.
The remaining 25 economies within the upper half of theinternational distribution are spread across almost all of thecountry groups discussed so far. The rest of the industrialised-economy group, including the US, is found at the top of thisportion of the distribution, with the exception only of Greece,which is ten ranks behind. Transition economies are spreadequally between the first quarter (Slovenia, Hungary and theCzech Republic) and the second (Croatia, Poland and Roma-nia) of the xm ranking. Among the developing regions, MENA
(seven economies) and LAC (six economies) record the largestpresence in the second quarter, while East Asia and Africa arerepresented by two countries and one country, respectively.The highest-ranking South Asian economy (Sri Lanka) isfound five ranks below the median. Also just below themedian, with closely similar international-activity levels, arethree of the largest developing countries – China, Indonesiaand Brazil – whereas a significantly lower value of per capitaexports leaves India more than twenty ranks behind thosethree.
Notes1 For the sake of convenience, the full statistical-technical term ‘manu-
facturing industry’ is replaced by ‘industry’ or ‘manufacturing’throughout this chapter.
2 This target for industrial development is known in the literature as theLima target, referring to the long-term objectives stated in the 1975Lima Declaration and Plan of Action on Industrial Development andCo-operation.
3 This term is borrowed from P. Samuelson, 1955.
1399 | Monitoring global industrial activity
Table 9.8 Industrial-trade level, by countryTable 9.6 (1990 and 2002)
Exports of manufacturesper capita (US$)
2002 1990
Value Rank Value Rank
Singapore 33 106 1 16 266 1Ireland 20 835 2 5 575 6Belgium 16 908 3 9 616 2Switzerland 10 515 4 8 464 3Netherlands 9 164 5 6 986 4Sweden 8 419 6 6 357 5Finland 8 002 7 5 136 8Denmark 7 865 8 4 819 10Austria 7 153 9 5 158 7Canada 7 042 11 3 348 14Taiwan Province of China 6 564 12 3 149 16Germany 6 512 13 4 665 11Slovenia 4 751 16 3 104 17Israel 4 681 17 2 355 21Norway 4 679 18 3 930 13France 4 448 19 3 240 15Malaysia 4 121 21 1 287 29Italy 4 027 22 2 805 18United Kingdom 3 885 23 2 656 20Japan 3 595 24 2 264 22Korea, Rep. 3 591 25 1 455 28Kuwait 3 464 26 221 56Hong Kong SAR 3 212 27 4 843 9Hungary 3 102 28 763 36Czech Republic 2 669 30 1 473 27Spain 2 533 31 1 233 30Portugal 2 418 32 1 557 25New Zealand 2 192 33 1 476 26United States 1 948 34 1 182 31United Arab Emirates 1 632 35 246 52Mexico 1 450 37 159 62Australia 1 390 38 688 38Costa Rica 1 006 41 162 61Croatia 920 42 902 34Thailand 870 43 339 47Oman 791 44 260 51Poland 782 45 225 55Saudi Arabia 723 46 676 39Greece 721 47 593 42Tunisia 604 48 330 48Uruguay 496 52 311 49Philippines 482 53 70 73Venezuela 475 54 127 68Romania 452 55 236 54Algeria 419 57 141 67Chile 398 58 152 64Turkey 389 59 177 59South Africa 337 62 288 50Argentina 334 63 198 58Libya 296 65 538 43
Source: UNIDO Scoreboard database.Note: The table shows data for 50 countries selected by criteria similar to
those of Table 11.7. The basis of selection is the ranking of countriesby exports per capita for the year 2002. Along that ranking all coun-tries with a population of less than 2 million in the year 2000 wereexcluded. Again, additional information can be found in AnnexTable A2.1.
140 UNIDO Industrial Development Report 2005
4 This factor is given by the inverse of world MVA per capita.5 The result (shown in figure 9.2) is a piecewise linear, increasing and
convex curve (convexity meaning that at no point of the curve doesits slope decrease), which is composed of ‘country pieces’, startingwith the flattest and ending with the steepest of these pieces. For eachone of these pieces the 45-degree straight line drawn between the end-points of the whole curve serves as the reference regarding slope. Sincethe slope of this ‘global’ line (unity by definition) represents the worldaverage of manufacturing income, a country’s deviation from slope oneindicates a corresponding deviation from global MVA per capita.
6 Within the sample used for the present study, the real-life maximumof inequality would be achieved if all industrial production were con-centrated in a country of the size of Antigua and Barbuda.
7 For the income interpretation of industrial inequality, MVA numberswould have to be expressed in international US dollars, for example,by use of data adjusted by PPP. However, since for most of the discus-sion the output side is more important than the income side, MVA dataare expressed in constant US dollars using conventional exchange-rateconversion. A brief account of the two methods of international com-parison is provided in endnote 13, together with an estimate of differ-ences in results arising from different conversion methods.
8 Inequality of manufacturing income is certainly overestimated in thepresent calculations, but inequality of industrial output levels is not.For this reason, the terms industrial output or industrial production willbe used for MVA per capita for the remainder of this discussion.
9 The simplification of the world curve achieved by the two approximat-ing straight lines means simply to ignore inequality within the North andthe South and to treat the two parts as homogeneous economic spaces.
10 If the global distribution of industrial production were perfectly equal,all ratios in table 9.4 would have the value of one. Hence, deviationsfrom one indicate deviations from perfect equality. And in similar fash-ion, an increase of output ratios with the comparison approachingprogressively shorter ends of the distribution is indicative of risinginequality between industrially rich and poor economies.
11 There is a simple tool to assess, in relative terms, the impact that anindividual economy has on overall unevenness as illustrated by aLorenz-curve or measured by a Gini coefficient. Taking again the worldcurve of figure 9.2 as a point of departure, one form of geometric rep-resentation of a given country in relation to that curve is the triangleunder the country’s portion on the curve. The larger the area of thiscountry triangle, the stronger is its impact on the overall shape of thecurve. In line with this view, the South and the North portion of theLorenz presented in figure 9.4 have an equal impact on the shape ofthe total curve.
12 The upper (lower) quartile is the dividing line between the highest
(lowest) quarter of (country) observations in the sample and the otherobservations.
13 As was indicated earlier, the two views of MVA per capita are associ-ated with two different scales for international comparison and there-fore imply gaps of different size between economies. Output levelsmeasured in US dollars in the conventional way (as in the case of tables9.6 and 9.7) produce a larger variation across economies than doincome levels measured, for example, in international dollars using aPPP adjustment method. The most popular version of the latter is thatof the Penn World Tables, which can be applied to MVA per capita fig-ures if manufacturing income is to be compared internationally. If thecomparisons quoted above for conventional output levels are trans-lated into PPP-adjusted income comparisons, ratios between the lev-els of industrialised and developing economies are reduced by up toone order of magnitude (that is, up to a factor of 10). It should benoted in this context, however, that the approach used for construct-ing the World Penn Table is likely to underestimate income differencesbetween countries (J. P. Neary, 2004).
14 If an analogous comparison is made for manufacturing income usingPPP-adjusted numbers, the result is not dramatically different fromthat for output levels. In the case of income there are 13 developingeconomies whose GDP per capita exceeds the manufacturing incomeof Switzerland. These economies are spread across almost all regionsand include the four Asian ‘Tigers’ plus Malaysia; South Africa;Argentina, Chile, Costa Rica and Mexico; Kuwait, Oman and SaudiArabia. Together they account for less than six per cent of total devel-oping-country population.
15 Thus, in the present context the notion of China as the ‘middle king-dom’ is vindicated statistically when the level of industrial activity is thecriterion.
16 In this average South Africa is included.17 Since each quarter contains the same number of countries, these
coefficients can be compared with each other providing an indicationof which portion of the distribution accounts for more or less inequal-ity globally.
18 The upper (lower) quartile is the dividing line between the highest(lowest) quarter of (country) observations in the sample and the otherobservations.
19 The correlation coefficients are 0.73 and 0.71 for 1990 and 2002,respectively.
20 While the result for Singapore is qualitatively correct, its quantitativebasis is likely to exaggerate the leadership of this economy. The rea-son is that from the export number, on which the international-activ-ity level is based, the value of re-exports could not be deducted dueto lack of detailed information.
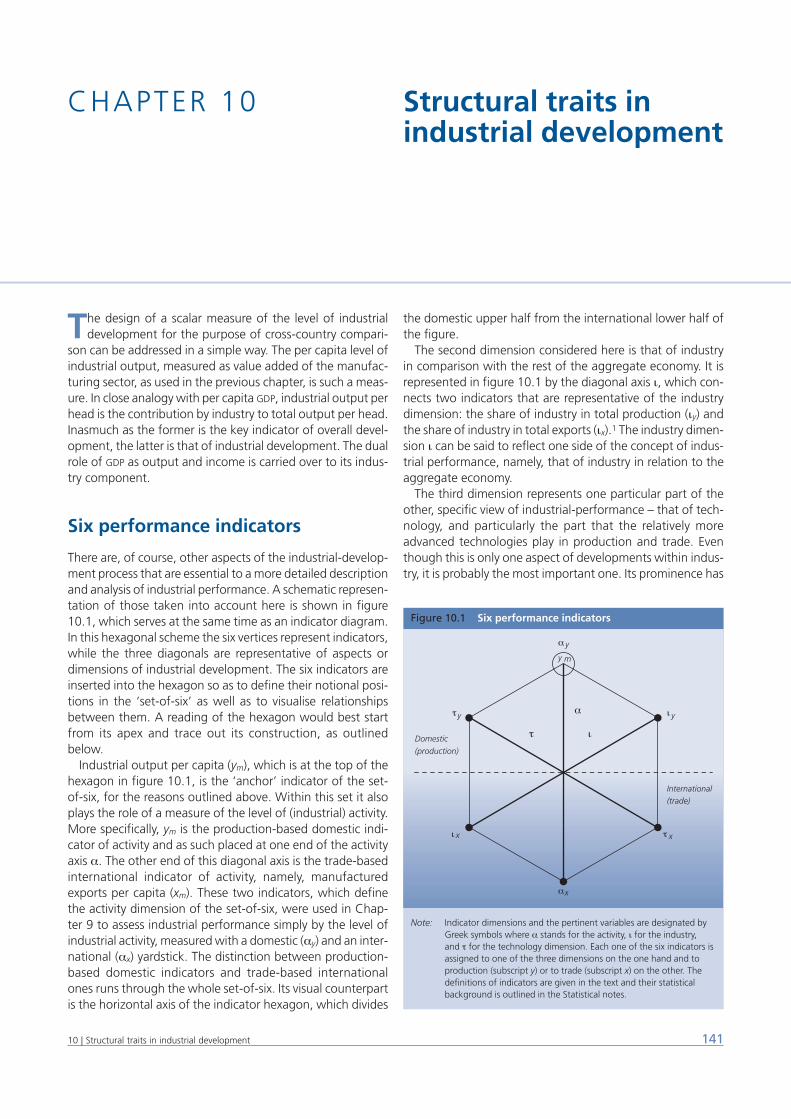
The design of a scalar measure of the level of industrialdevelopment for the purpose of cross-country compari-
son can be addressed in a simple way. The per capita level ofindustrial output, measured as value added of the manufac-turing sector, as used in the previous chapter, is such a meas-ure. In close analogy with per capita GDP, industrial output perhead is the contribution by industry to total output per head.Inasmuch as the former is the key indicator of overall devel-opment, the latter is that of industrial development. The dualrole of GDP as output and income is carried over to its indus-try component.
Six performance indicators
There are, of course, other aspects of the industrial-develop-ment process that are essential to a more detailed descriptionand analysis of industrial performance. A schematic represen-tation of those taken into account here is shown in figure10.1, which serves at the same time as an indicator diagram.In this hexagonal scheme the six vertices represent indicators,while the three diagonals are representative of aspects ordimensions of industrial development. The six indicators areinserted into the hexagon so as to define their notional posi-tions in the ‘set-of-six’ as well as to visualise relationshipsbetween them. A reading of the hexagon would best startfrom its apex and trace out its construction, as outlinedbelow.
Industrial output per capita (ym), which is at the top of thehexagon in figure 10.1, is the ‘anchor’ indicator of the set-of-six, for the reasons outlined above. Within this set it alsoplays the role of a measure of the level of (industrial) activity.More specifically, ym is the production-based domestic indi-cator of activity and as such placed at one end of the activityaxis α. The other end of this diagonal axis is the trade-basedinternational indicator of activity, namely, manufacturedexports per capita (xm). These two indicators, which definethe activity dimension of the set-of-six, were used in Chap-ter 9 to assess industrial performance simply by the level ofindustrial activity, measured with a domestic (αy) and an inter-national (αx) yardstick. The distinction between production-based domestic indicators and trade-based internationalones runs through the whole set-of-six. Its visual counterpartis the horizontal axis of the indicator hexagon, which divides
the domestic upper half from the international lower half ofthe figure.
The second dimension considered here is that of industryin comparison with the rest of the aggregate economy. It isrepresented in figure 10.1 by the diagonal axis ι, which con-nects two indicators that are representative of the industrydimension: the share of industry in total production (ιy) andthe share of industry in total exports (ιx).1 The industry dimen-sion ι can be said to reflect one side of the concept of indus-trial performance, namely, that of industry in relation to theaggregate economy.
The third dimension represents one particular part of theother, specific view of industrial-performance – that of tech-nology, and particularly the part that the relatively moreadvanced technologies play in production and trade. Eventhough this is only one aspect of developments within indus-try, it is probably the most important one. Its prominence has
14110 | Structural traits in industrial development
CHAPTER 10 Structural traits inindustrial development
Figure 10.1 Six performance indicators
Note: Indicator dimensions and the pertinent variables are designated byGreek symbols where α stands for the activity, ι for the industry, and τ for the technology dimension. Each one of the six indicators isassigned to one of the three dimensions on the one hand and toproduction (subscript y) or to trade (subscript x) on the other. Thedefinitions of indicators are given in the text and their statisticalbackground is outlined in the Statistical notes.
Domestic
(production)
International(trade)
y m
y
xx
y
y
x
α
τ ι
to do with the role of industry as the source and engine ofmodern-style productivity-enhancing growth. The technol-ogy dimension is represented by the diagonal axis τ, whichconnects the remaining two indicators: the share of medium-or-high-technology goods in industrial production (τy) andthe analogous share in manufactured exports (τx).2
Viewed as a whole, the set-of-six and its diagrammaticpresentation in figure 10.1 exhibit a number of features thatappear conceptually and analytically attractive. First, amongthe indicators there is an overall balance achieved betweendomestic and international measures, which results from bal-ance in each one of the three dimensions where a produc-tion indicator is complemented by a trade indicator. This bal-ance is represented geometrically in the various symmetriesof the indicator hexagon. Second, a number of usefuldichotomies find an expression in the set-of-six. One isbetween the level of activity (α) on the one hand and struc-tural features (ι and τ) on the other. Another one is thatbetween industry and the aggregate of all other sectors in theeconomy. A third one is the distinction between relativelytechnology-intensive activities and other manufacturing. Andfinally, geometry helps to put in relief a more general prop-erty of the indicators set: both conceptually and visually thesix indicators appear as a structured set with three pairs ofmeasures assigned to the three dimensions of activity, indus-try and technology.
ITA: an index of industrial andtechnological advancementThe illustration of the six performance indicators in figure10.1 is in terms of parallels, which are symbolic for concep-tual parallels, too. The four vertices representing structuralindicators are those that are connected by the two verticalsides of the hexagon. These ‘structural’ sides in turn are par-allel to the central activity axis. Thus, the geometry of figure10.1 is suggestive of conceptual distinctions insofar as activ-ity indicators (ym and xm) and structural indicators (ιy, ιx, τy andτx) are not combined but treated in parallel. Conceptual andgeometric parallelisms can be further carried over into anempirical discussion that parallels the one above on activitylevels.
The procedure to combine the four structural indicatorscontained in the set-of-six, first into two partial indicators andthen into a single structural index, is outlined in the follow-ing in two alternative approaches, one bottom-up and theother top-down. The idea behind both approaches is that allfour indicators in a way reflect not the level but the orienta-tion of industrial activity and that this orientation is bestdescribed by the term industrial-cum-technological advance,a notion for which the acronym ITA will be used.
Bottom-up approach
The initial step in the bottom-up approach to index construc-tion is that of defining two indicators that reflect the afore-mentioned orientation of activities. The first one is labelled
industrial advance (ι). It stands for the industry dimension ofthe indicator set and therefore combines the two share vari-ables at the two ends of the industry axis in the scheme offigure 10.1. The industrial-advance indicator is thus definedas the arithmetic mean of the share of manufacturing in GDP
(ιy) and the share of manufactures in total exports (ιx). In anal-ogy to the construction of an indicator of industrial advance,a similar one can be formed for technological advance (τ). Itis representative of the technology axis in figure 10.1 and isobtained as the arithmetic mean of the share of medium-or-high-technology activities in MVA and the correspondingshare in exports. The values of both indicators ι and τ, whichare averages of shares, lie between zero and one.
The second step in the bottom-up approach combines thenewly derived indicators of industrial advance (ι) and techno-logical advance (τ) into one index of industrial-cum-techno-logical advance, the ITA index. Here, an important point is thatthe new indicator, which is intended to have the form of anindex with values ranging between zero and one, shouldreflect the interaction between industrial and technologicaladvance, as the linking cum in the name of the index indi-cates. Consequently, the ITA index is defined as the productof indicators ι and τ.
With the above rules for deriving the ITA index it is easy toimagine the special case where the shares ιy and ιx are iden-tical and the same holds for the shares τy and τx, too. Then,indicator ι will be identical with the share ιy and indicator τwith the share τy. In this case, the ITA index – the product ofshares ιy and τy – will simply be the share of the more tech-nology-intensive activities in total (not in manufacturing) pro-duction.
Top-down approach
This points the way to the alternative, top-down approach ofderiving the ITA index. It starts with the general notion of anactivity variable A that can be applied to the entire economyor to particular sectors. The concept of the ITA index can thenbe realised by the share of the technologically more advancedindustrial activities (Aτ) in activities of the entire economy (A).The share Aτ/A can in turn be expressed as the product ofindustrial activities Aι/A and that of the technologically moreadvanced activities within manufacturing industry Aτ/Aι.Finally, the abstract notion of activities can be given sub-stance by substituting for A production or trade, or a combi-nation of the two. If the last one of these three options is cho-sen and the respective activity shares are defined as the arith-metical means of the corresponding production and tradeshares, the ITA index as defined in the bottom-up approach isthe result.
The ITA index, obtained from the four structural indicators inthe set-of-six, is intended as a proximate assessment of the partthat industry and technology have together in production andtrade. Somewhat more ambitiously, the ITA value for a giveneconomy is also expected to help gauging the impact thatindustrial-cum-technological advance is likely to have on itsdevelopment. While assessing the compound weight of indus-try and technology is of prime interest here, another goal of
142 UNIDO Industrial Development Report 2005
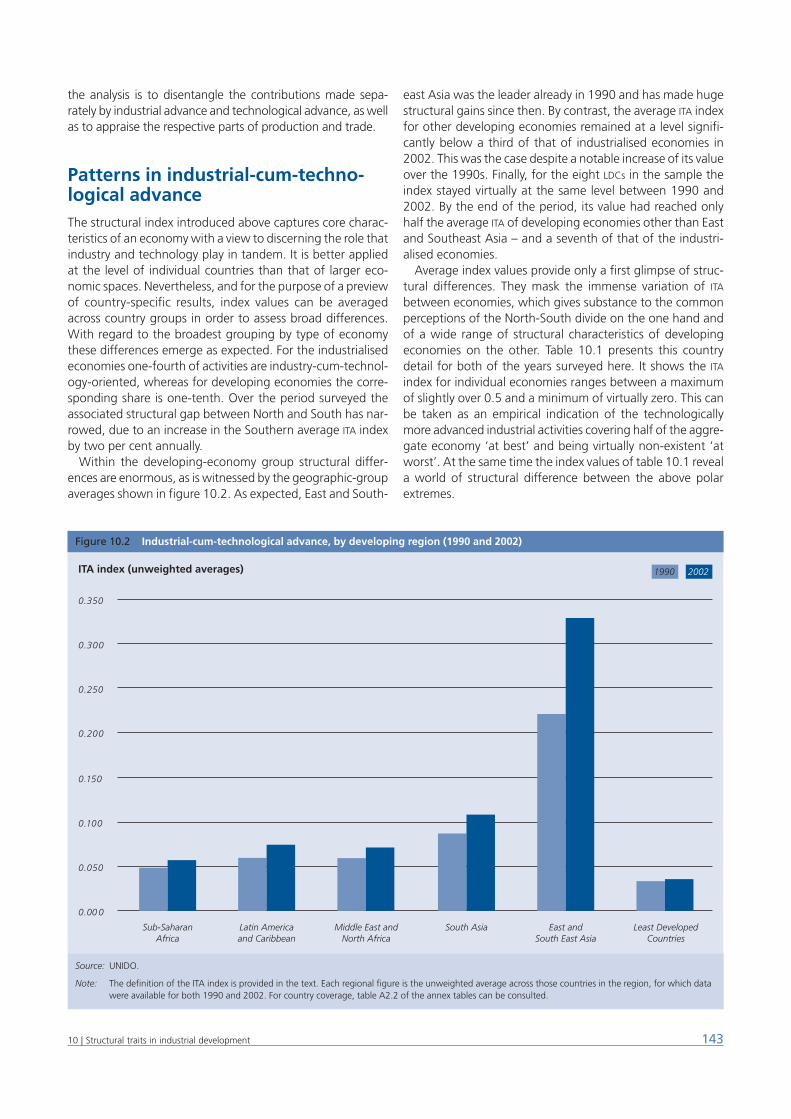
the analysis is to disentangle the contributions made sepa-rately by industrial advance and technological advance, as wellas to appraise the respective parts of production and trade.
Patterns in industrial-cum-techno-logical advanceThe structural index introduced above captures core charac-teristics of an economy with a view to discerning the role thatindustry and technology play in tandem. It is better appliedat the level of individual countries than that of larger eco-nomic spaces. Nevertheless, and for the purpose of a previewof country-specific results, index values can be averagedacross country groups in order to assess broad differences.With regard to the broadest grouping by type of economythese differences emerge as expected. For the industrialisedeconomies one-fourth of activities are industry-cum-technol-ogy-oriented, whereas for developing economies the corre-sponding share is one-tenth. Over the period surveyed theassociated structural gap between North and South has nar-rowed, due to an increase in the Southern average ITA indexby two per cent annually.
Within the developing-economy group structural differ-ences are enormous, as is witnessed by the geographic-groupaverages shown in figure 10.2. As expected, East and South-
east Asia was the leader already in 1990 and has made hugestructural gains since then. By contrast, the average ITA indexfor other developing economies remained at a level signifi-cantly below a third of that of industrialised economies in2002. This was the case despite a notable increase of its valueover the 1990s. Finally, for the eight LDCs in the sample theindex stayed virtually at the same level between 1990 and2002. By the end of the period, its value had reached onlyhalf the average ITA of developing economies other than Eastand Southeast Asia – and a seventh of that of the industri-alised economies.
Average index values provide only a first glimpse of struc-tural differences. They mask the immense variation of ITA
between economies, which gives substance to the commonperceptions of the North-South divide on the one hand andof a wide range of structural characteristics of developingeconomies on the other. Table 10.1 presents this countrydetail for both of the years surveyed here. It shows the ITA
index for individual economies ranges between a maximumof slightly over 0.5 and a minimum of virtually zero. This canbe taken as an empirical indication of the technologicallymore advanced industrial activities covering half of the aggre-gate economy ‘at best’ and being virtually non-existent ‘atworst’. At the same time the index values of table 10.1 reveala world of structural difference between the above polarextremes.
14310 | Structural traits in industrial development
Figure 10.2 Industrial-cum-technological advance, by developing region (1990 and 2002)
Source: UNIDO.
Note: The definition of the ITA index is provided in the text. Each regional figure is the unweighted average across those countries in the region, for which datawere available for both 1990 and 2002. For country coverage, table A2.2 of the annex tables can be consulted.
0.00 0
0.050
0.100
0.150
0.200
0.250
0.300
0.350
Sub-SaharanAfrica
Latin Americaand Caribbean
Middle East andNorth Africa
South Asia East andSouth East Asia
Least DevelopedCountries
ITA index (unweighted averages) 1990 2002
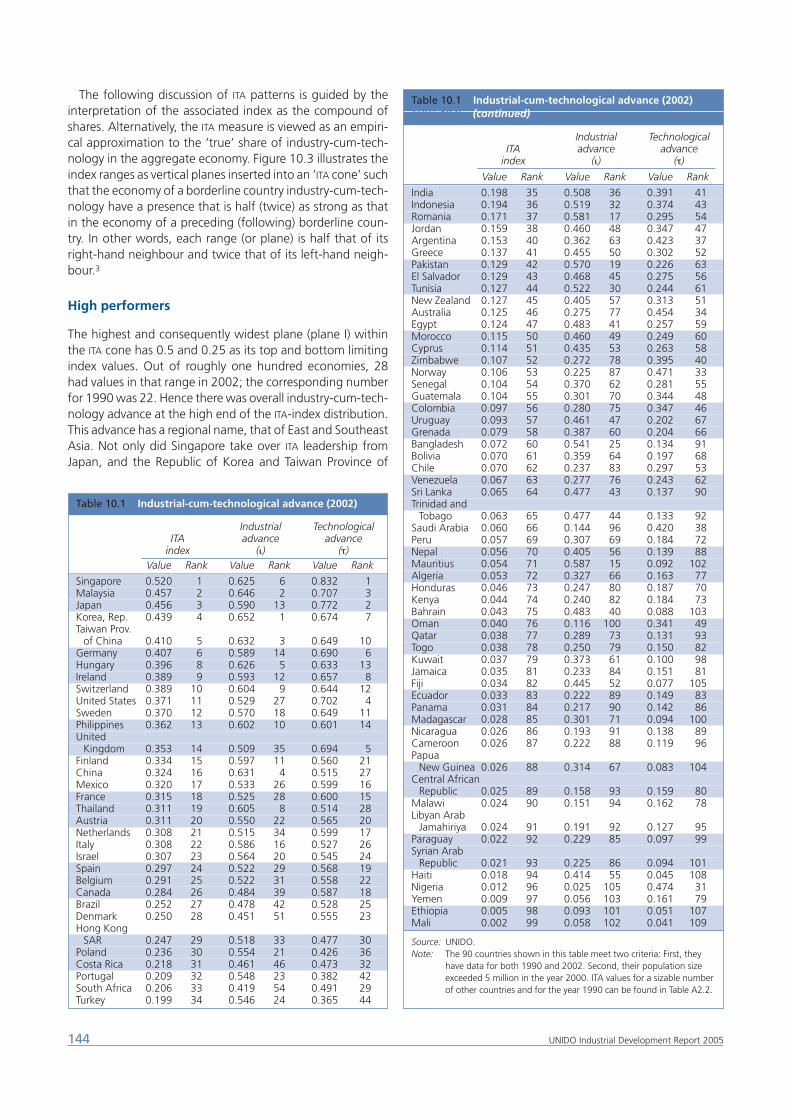
The following discussion of ITA patterns is guided by theinterpretation of the associated index as the compound ofshares. Alternatively, the ITA measure is viewed as an empiri-cal approximation to the ‘true’ share of industry-cum-tech-nology in the aggregate economy. Figure 10.3 illustrates theindex ranges as vertical planes inserted into an ‘ITA cone’ suchthat the economy of a borderline country industry-cum-tech-nology have a presence that is half (twice) as strong as thatin the economy of a preceding (following) borderline coun-try. In other words, each range (or plane) is half that of itsright-hand neighbour and twice that of its left-hand neigh-bour.3
High performers
The highest and consequently widest plane (plane I) withinthe ITA cone has 0.5 and 0.25 as its top and bottom limitingindex values. Out of roughly one hundred economies, 28had values in that range in 2002; the corresponding numberfor 1990 was 22. Hence there was overall industry-cum-tech-nology advance at the high end of the ITA-index distribution.This advance has a regional name, that of East and SoutheastAsia. Not only did Singapore take over ITA leadership fromJapan, and the Republic of Korea and Taiwan Province of
144 UNIDO Industrial Development Report 2005
Table 10.1 Industrial-cum-technological advance (2002)
Industrial TechnologicalITA advance advance
index (ι) (τ)Value Rank Value Rank Value Rank
Singapore 0.520 1 0.625 6 0.832 1Malaysia 0.457 2 0.646 2 0.707 3Japan 0.456 3 0.590 13 0.772 2Korea, Rep. 0.439 4 0.652 1 0.674 7Taiwan Prov.
of China 0.410 5 0.632 3 0.649 10Germany 0.407 6 0.589 14 0.690 6Hungary 0.396 8 0.626 5 0.633 13Ireland 0.389 9 0.593 12 0.657 8Switzerland 0.389 10 0.604 9 0.644 12United States 0.371 11 0.529 27 0.702 4Sweden 0.370 12 0.570 18 0.649 11Philippines 0.362 13 0.602 10 0.601 14United
Kingdom 0.353 14 0.509 35 0.694 5Finland 0.334 15 0.597 11 0.560 21China 0.324 16 0.631 4 0.515 27Mexico 0.320 17 0.533 26 0.599 16France 0.315 18 0.525 28 0.600 15Thailand 0.311 19 0.605 8 0.514 28Austria 0.311 20 0.550 22 0.565 20Netherlands 0.308 21 0.515 34 0.599 17Italy 0.308 22 0.586 16 0.527 26Israel 0.307 23 0.564 20 0.545 24Spain 0.297 24 0.522 29 0.568 19Belgium 0.291 25 0.522 31 0.558 22Canada 0.284 26 0.484 39 0.587 18Brazil 0.252 27 0.478 42 0.528 25Denmark 0.250 28 0.451 51 0.555 23Hong Kong
SAR 0.247 29 0.518 33 0.477 30Poland 0.236 30 0.554 21 0.426 36Costa Rica 0.218 31 0.461 46 0.473 32Portugal 0.209 32 0.548 23 0.382 42South Africa 0.206 33 0.419 54 0.491 29Turkey 0.199 34 0.546 24 0.365 44
Table 10.1 Industrial-cum-technological advance (2002)Table 10.9 (continued)
Industrial TechnologicalITA advance advance
index (ι) (τ)
Value Rank Value Rank Value Rank
India 0.198 35 0.508 36 0.391 41Indonesia 0.194 36 0.519 32 0.374 43Romania 0.171 37 0.581 17 0.295 54Jordan 0.159 38 0.460 48 0.347 47Argentina 0.153 40 0.362 63 0.423 37Greece 0.137 41 0.455 50 0.302 52Pakistan 0.129 42 0.570 19 0.226 63El Salvador 0.129 43 0.468 45 0.275 56Tunisia 0.127 44 0.522 30 0.244 61New Zealand 0.127 45 0.405 57 0.313 51Australia 0.125 46 0.275 77 0.454 34Egypt 0.124 47 0.483 41 0.257 59Morocco 0.115 50 0.460 49 0.249 60Cyprus 0.114 51 0.435 53 0.263 58Zimbabwe 0.107 52 0.272 78 0.395 40Norway 0.106 53 0.225 87 0.471 33Senegal 0.104 54 0.370 62 0.281 55Guatemala 0.104 55 0.301 70 0.344 48Colombia 0.097 56 0.280 75 0.347 46Uruguay 0.093 57 0.461 47 0.202 67Grenada 0.079 58 0.387 60 0.204 66Bangladesh 0.072 60 0.541 25 0.134 91Bolivia 0.070 61 0.359 64 0.197 68Chile 0.070 62 0.237 83 0.297 53Venezuela 0.067 63 0.277 76 0.243 62Sri Lanka 0.065 64 0.477 43 0.137 90Trinidad and
Tobago 0.063 65 0.477 44 0.133 92Saudi Arabia 0.060 66 0.144 96 0.420 38Peru 0.057 69 0.307 69 0.184 72Nepal 0.056 70 0.405 56 0.139 88Mauritius 0.054 71 0.587 15 0.092 102Algeria 0.053 72 0.327 66 0.163 77Honduras 0.046 73 0.247 80 0.187 70Kenya 0.044 74 0.240 82 0.184 73Bahrain 0.043 75 0.483 40 0.088 103Oman 0.040 76 0.116 100 0.341 49Qatar 0.038 77 0.289 73 0.131 93Togo 0.038 78 0.250 79 0.150 82Kuwait 0.037 79 0.373 61 0.100 98Jamaica 0.035 81 0.233 84 0.151 81Fiji 0.034 82 0.445 52 0.077 105Ecuador 0.033 83 0.222 89 0.149 83Panama 0.031 84 0.217 90 0.142 86Madagascar 0.028 85 0.301 71 0.094 100Nicaragua 0.026 86 0.193 91 0.138 89Cameroon 0.026 87 0.222 88 0.119 96Papua
New Guinea 0.026 88 0.314 67 0.083 104Central African
Republic 0.025 89 0.158 93 0.159 80Malawi 0.024 90 0.151 94 0.162 78Libyan Arab
Jamahiriya 0.024 91 0.191 92 0.127 95Paraguay 0.022 92 0.229 85 0.097 99Syrian Arab
Republic 0.021 93 0.225 86 0.094 101Haiti 0.018 94 0.414 55 0.045 108Nigeria 0.012 96 0.025 105 0.474 31Yemen 0.009 97 0.056 103 0.161 79Ethiopia 0.005 98 0.093 101 0.051 107Mali 0.002 99 0.058 102 0.041 109
Source: UNIDO.Note: The 90 countries shown in this table meet two criteria: First, they
have data for both 1990 and 2002. Second, their population sizeexceeded 5 million in the year 2000. ITA values for a sizable numberof other countries and for the year 1990 can be found in Table A2.2.
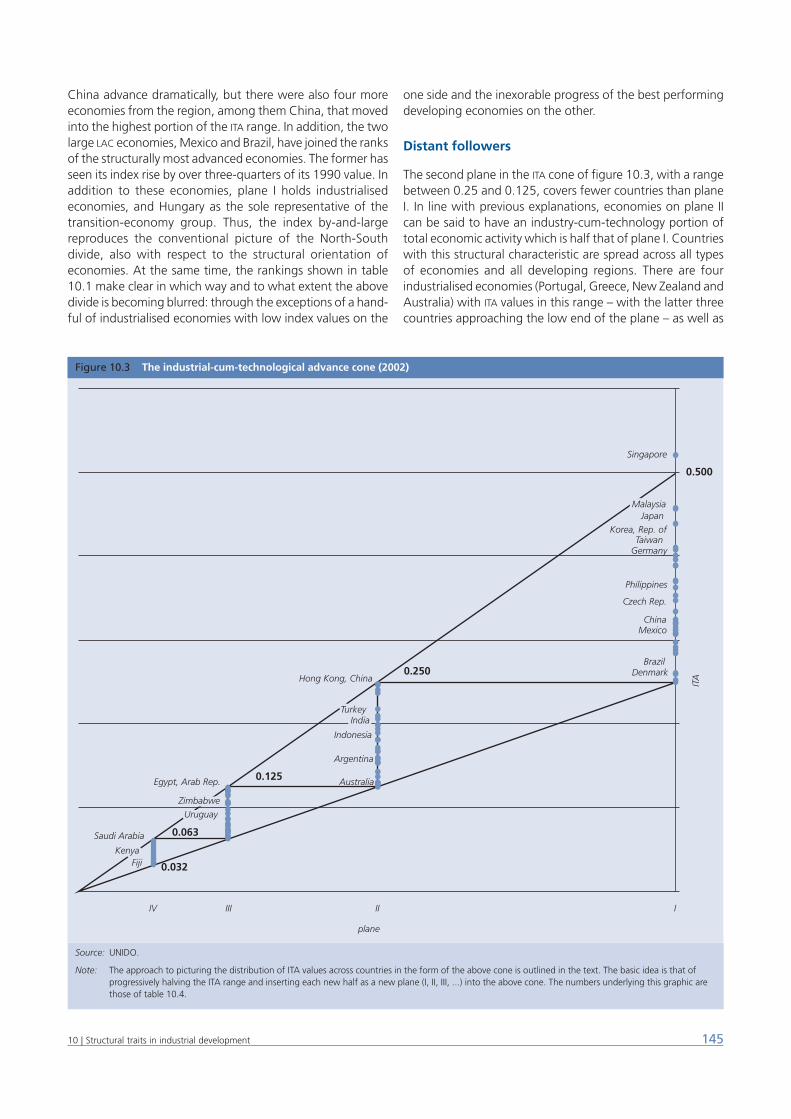
China advance dramatically, but there were also four moreeconomies from the region, among them China, that movedinto the highest portion of the ITA range. In addition, the twolarge LAC economies, Mexico and Brazil, have joined the ranksof the structurally most advanced economies. The former hasseen its index rise by over three-quarters of its 1990 value. Inaddition to these economies, plane I holds industrialisedeconomies, and Hungary as the sole representative of thetransition-economy group. Thus, the index by-and-largereproduces the conventional picture of the North-Southdivide, also with respect to the structural orientation ofeconomies. At the same time, the rankings shown in table10.1 make clear in which way and to what extent the abovedivide is becoming blurred: through the exceptions of a hand-ful of industrialised economies with low index values on the
one side and the inexorable progress of the best performingdeveloping economies on the other.
Distant followers
The second plane in the ITA cone of figure 10.3, with a rangebetween 0.25 and 0.125, covers fewer countries than planeI. In line with previous explanations, economies on plane IIcan be said to have an industry-cum-technology portion oftotal economic activity which is half that of plane I. Countrieswith this structural characteristic are spread across all typesof economies and all developing regions. There are fourindustrialised economies (Portugal, Greece, New Zealand andAustralia) with ITA values in this range – with the latter threecountries approaching the low end of the plane – as well as
14510 | Structural traits in industrial development
Figure 10.3 The industrial-cum-technological advance cone (2002)
Source: UNIDO.
Note: The approach to picturing the distribution of ITA values across countries in the form of the above cone is outlined in the text. The basic idea is that ofprogressively halving the ITA range and inserting each new half as a new plane (I, II, III, ...) into the above cone. The numbers underlying this graphic arethose of table 10.4.
Singapore
0.500
0.250
0.125
0.063
0.032
IIIIIIIV
plane
ITA
Malaysia
TurkeyIndia
Zimbabwe
Uruguay
Kenya
MalaysiaJapan
Korea, Rep. ofTaiwan
Germany
Philippines
Czech Rep.
ChinaMexico
BrazilDenmark
Hong Kong, China
TurkeyIndia
Indonesia
Argentina
AustraliaEgypt, Arab Rep.
Zimbabwe
Uruguay
Saudi Arabia
KenyaFiji
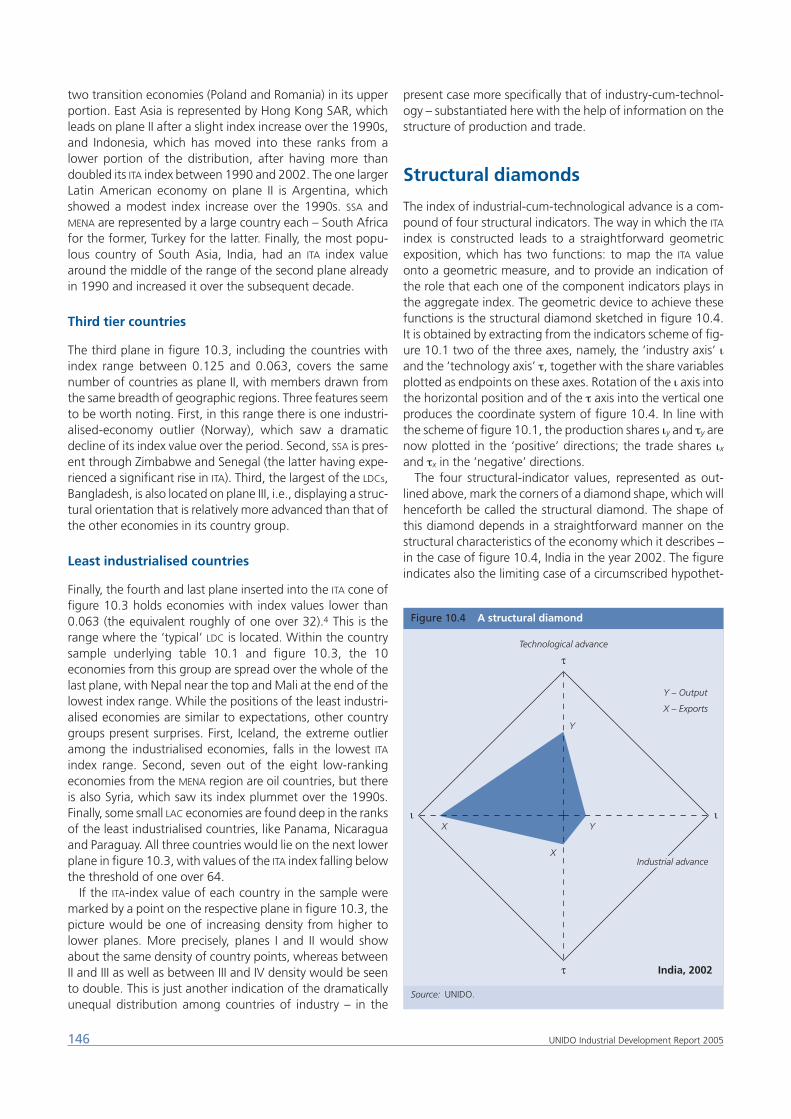
two transition economies (Poland and Romania) in its upperportion. East Asia is represented by Hong Kong SAR, whichleads on plane II after a slight index increase over the 1990s,and Indonesia, which has moved into these ranks from alower portion of the distribution, after having more thandoubled its ITA index between 1990 and 2002. The one largerLatin American economy on plane II is Argentina, whichshowed a modest index increase over the 1990s. SSA andMENA are represented by a large country each – South Africafor the former, Turkey for the latter. Finally, the most popu-lous country of South Asia, India, had an ITA index valuearound the middle of the range of the second plane alreadyin 1990 and increased it over the subsequent decade.
Third tier countries
The third plane in figure 10.3, including the countries withindex range between 0.125 and 0.063, covers the samenumber of countries as plane II, with members drawn fromthe same breadth of geographic regions. Three features seemto be worth noting. First, in this range there is one industri-alised-economy outlier (Norway), which saw a dramaticdecline of its index value over the period. Second, SSA is pres-ent through Zimbabwe and Senegal (the latter having expe-rienced a significant rise in ITA). Third, the largest of the LDCs,Bangladesh, is also located on plane III, i.e., displaying a struc-tural orientation that is relatively more advanced than that ofthe other economies in its country group.
Least industrialised countries
Finally, the fourth and last plane inserted into the ITA cone offigure 10.3 holds economies with index values lower than0.063 (the equivalent roughly of one over 32).4 This is therange where the ‘typical’ LDC is located. Within the countrysample underlying table 10.1 and figure 10.3, the 10economies from this group are spread over the whole of thelast plane, with Nepal near the top and Mali at the end of thelowest index range. While the positions of the least industri-alised economies are similar to expectations, other countrygroups present surprises. First, Iceland, the extreme outlieramong the industrialised economies, falls in the lowest ITA
index range. Second, seven out of the eight low-rankingeconomies from the MENA region are oil countries, but thereis also Syria, which saw its index plummet over the 1990s.Finally, some small LAC economies are found deep in the ranksof the least industrialised countries, like Panama, Nicaraguaand Paraguay. All three countries would lie on the next lowerplane in figure 10.3, with values of the ITA index falling belowthe threshold of one over 64.
If the ITA-index value of each country in the sample weremarked by a point on the respective plane in figure 10.3, thepicture would be one of increasing density from higher tolower planes. More precisely, planes I and II would showabout the same density of country points, whereas betweenII and III as well as between III and IV density would be seento double. This is just another indication of the dramaticallyunequal distribution among countries of industry – in the
present case more specifically that of industry-cum-technol-ogy – substantiated here with the help of information on thestructure of production and trade.
Structural diamonds
The index of industrial-cum-technological advance is a com-pound of four structural indicators. The way in which the ITA
index is constructed leads to a straightforward geometricexposition, which has two functions: to map the ITA valueonto a geometric measure, and to provide an indication ofthe role that each one of the component indicators plays inthe aggregate index. The geometric device to achieve thesefunctions is the structural diamond sketched in figure 10.4.It is obtained by extracting from the indicators scheme of fig-ure 10.1 two of the three axes, namely, the ‘industry axis’ ιand the ‘technology axis’ τ, together with the share variablesplotted as endpoints on these axes. Rotation of the ι axis intothe horizontal position and of the τ axis into the vertical oneproduces the coordinate system of figure 10.4. In line withthe scheme of figure 10.1, the production shares ιy and τy arenow plotted in the ‘positive’ directions; the trade shares ιxand τx in the ‘negative’ directions.
The four structural-indicator values, represented as out-lined above, mark the corners of a diamond shape, which willhenceforth be called the structural diamond. The shape ofthis diamond depends in a straightforward manner on thestructural characteristics of the economy which it describes –in the case of figure 10.4, India in the year 2002. The figureindicates also the limiting case of a circumscribed hypothet-
146 UNIDO Industrial Development Report 2005
Figure 10.4 A structural diamond
Source: UNIDO.
τ
ι
τ
ι
Y
Y
X
India, 2002
X
Technological advance
Industrial advanceIndustrial advance
Y – Output
X – Exports
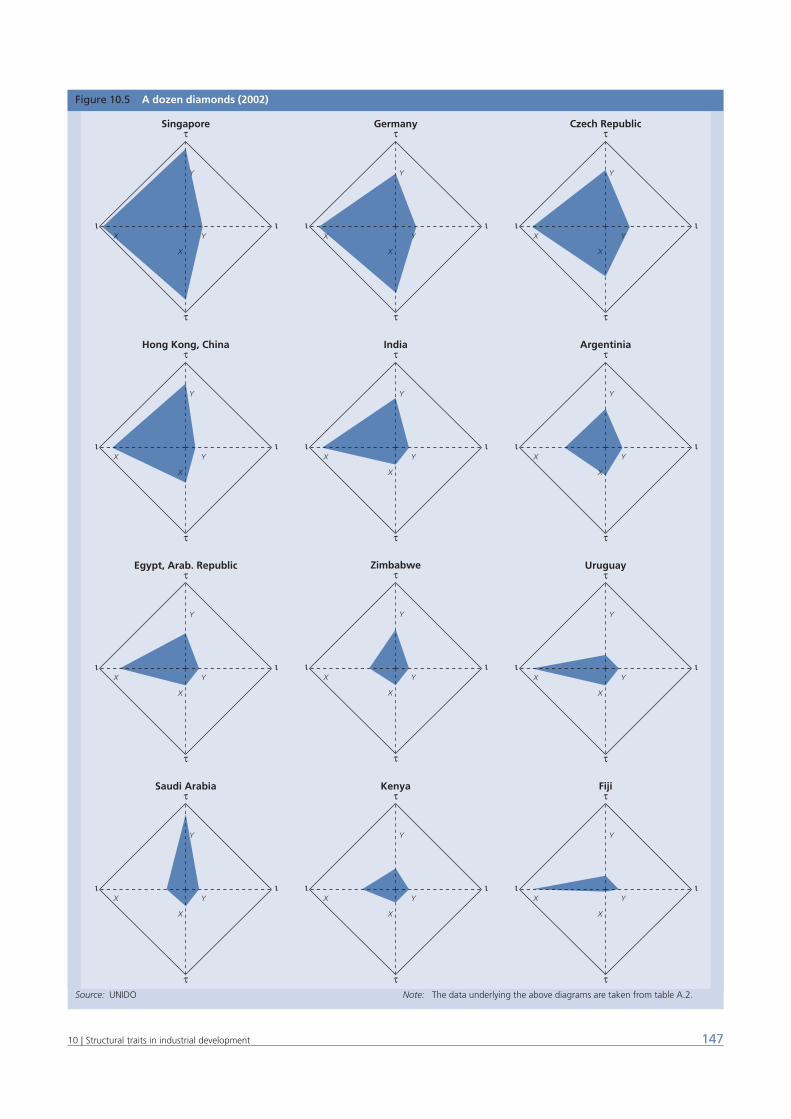
14710 | Structural traits in industrial development
Figure 10.5 A dozen diamonds (2002)
Source: UNIDO Note: The data underlying the above diagrams are taken from table A.2.
τ
ι
τ
ι
Y
Y
X
X
Zimbabwe
τ
ι
τ
ι
Y
Y
X
X
Singaporeτ
ι
τ
ι
Y
Y
X
X
Germanyτ
ι
τ
ι
Y
Y
X
X
Czech Republic
τ
ι
τ
ι
Y
Y
X
X
Hong Kong, Chinaτ
ι
τ
ι
Y
Y
X
X
Indiaτ
ι
τ
ι
Y
Y
X
X
Argentinia
τ
ι
τ
ι
Y
Y
X
X
Saudi Arabiaτ
ι
τ
ι
Y
Y
X
X
Kenyaτ
ι
τ
ι
Y
Y
X
X
Fiji
τ
ι
τ
ι
Y
Y
X
X
Egypt, Arab. Republicτ
ι
τ
ι
Y
Y
X
X
Uruguay
ical diamond, in which all shares reach their maximum valuesof one. This corresponds to the case where all production andtrade is composed of manufactures that, in addition, are rel-atively technology-intensive. An obvious interpretation of thearea of the structural diamond (expressed as a share of themaximum area of the limiting diamond) is that of a measureof industrial-cum-structural advance, too. As can be verifiedquite easily, this interpretation coincides with that of the ITA
index introduced earlier: The area of the (observed) structuraldiamond as a fraction of the area of the (hypothetical) max-imum diamond equals the value of the ITA index, calculatedfrom the values of the underlying four structural indicators.
An application of the above graphic procedure to some ofthe country data underlying ITA calculations produces shapessuch as those presented in figure 10.5. The twelve diamondshapes shown there include economies from all the countrygroups discussed in this chapter. They are arranged indescending ITA order and relate to figure 10.3 in an obviousway: From each one of the planes of the ITA cone three coun-tries are selected as examples of structural diamonds. Accord-ingly, the diamond areas (ITA index values) are seen in figure10.5 to decline from the upper-left corner to the lower-rightone. The shapes of the twelve diamonds, with all the differ-ences between them, reveal a number of features. First, theproduction share of industry makes the smallest contributionto the ITA measure, for reasons discussed earlier. Second, fortwo-thirds of the countries exhibited in the figure, the shareof manufactures in total exports marks by far the largestextension of the diamond. Third, those economies with thehighest industrial-cum-technological advance indicatorsapproach fairly closely the theoretical maximum of one in alldirections except that of ιy, while low-ITA economies show abroad variety of diamond shapes.
The industry dimension
The indicator of industrial advance (ι) can be said to cover theconventional half of the ITA index, accounting for the contri-bution of the manufacturing sector both to total productionand to total exports. Its geometric measure is the length ofthe horizontal diagonal of the structural diamond for a giveneconomic space. As can be gleaned from the examples pre-sented in figure 10.5, the diamond shapes are highly asym-metric with respect to the vertical axis. The reason for this isthe asymmetry in the composition of the industrial-advanceindicator. While the share of manufactures in domestic pro-duction, which includes a sizeable portion of non-tradablegoods, normally does not exceed a third, the correspondingshare in exports, that is, of tradable goods by definition, canapproach the value of one.
Across a wide range between a maximum of over 0.65(Republic of Korea) and a minimum of little over 0.05(Yemen), the index of industrial advance for 2002 (shown intables 10.1 and A2.2) was quite uniformly spread, where theupper half of the ι-distribution was somewhat more denselypopulated than the lower half.5 Remarkably, among the top10 economies with ι-values between 0.65 and 0.60 there
was only one industrialised economy (Switzerland) and onetransition economy (Hungary), whereas the others weredeveloping economies of the East and South-East Asianregion. The majority of industrialised economies have lowerι-values (with a lower bound of around 0.50), which spreadthem across the lower part of the first quarter of the distri-bution and the higher part of the second. However, outliersof the industrialised-economies group are found in all theother quarters, down to the lowest one.
Among the top 10 economies in 2002 there were fourSoutheast Asian countries that showed a spectacular rise intheir ι-values over the 1990s and thus entered the highestranks from positions at least ten ranks lower. China is one ofthese ‘advance’ economies, with an increase of its industrial-advance indicator of more than eight percentage points. Evenhigher were the gains, both in value and rank, recorded forMalaysia, which by the end of the period had attained thesecond position in the ι-ranking, as well as for Thailand andthe Philippines, with large gains in ranks for the ι-indicator.
Within the highest industrial-advance quarter, values ofthe trade indicator ιx – the share of manufactures in exports– are consistently high, with most of the economies exceed-ing the 90-per cent mark. In fact, with the exception of onlythree countries, all the economies of the highest ι-quarter arefound in the highest quarter of the ranking by the trade indi-cator ιx, too. Hence, it is with respect to the production partιy – the share of manufacturing in GDP – that economies dif-fer in the uppermost portion of the ranking along the indus-trial dimension. Thus, out of the top 10 economies in the ι-ranking for 2002, eight were also among the top 10 in termsof the share of manufacturing in GDP. And the relationshipbetween industrialised economies and developing economieswith regard to membership in the first quarters of the respec-tive distributions was virtually the same for ι and ιy.
The second quarter of the ranking by the industrial-advance indicator shows values roughly between 0.50 and0.45. Industrialised countries are spread across the whole ofthis range, with the US and France at the top and Greece andDenmark at the bottom. Three of the large developingeconomies – Indonesia, India and Brazil – fall in this quarter,and so does the fourth of the East Asian ‘Tiger’ economies,Hong Kong SAR, China. Apart from these remarkable casesof individual economies, membership of the second quarteris widespread, drawing on all developing regions.
The lower half of the ranking by the ι-indicator extendsfrom the median value of around 0.45 to levels as low as0.05. Somewhat surprisingly, its composition covers all threebroad groups of economies. It includes the four outliers of theindustrialised-economy group – New Zealand, Australia, Nor-way and Iceland – with ι-values ranging from 0.40 down to0.14. In the lower portion of the ι-distribution, the group oftransition economies is represented by the Russian Federa-tion, as well as several of the Central Asian republics. Devel-oping economies from three regions are found over virtuallythe whole range of lower indicator values. SSA has SouthAfrica (0.42) at the top and Mali (0.06) at the bottom of thelower half. Similarly, LAC is represented in the higher portion,for example, by Argentina (0.37), and in the lower one by
148 UNIDO Industrial Development Report 2005
Ecuador, Panama and Nicaragua (around 0.20). For the MENA
economies the range is between Kuwait (0.37) and Oman(0.12). By contrast and with the exception of Nepal (0.40),there is no Asian economy in the sample with a low value ofthe industrial-advance indicator.
The technology dimension
The indicator of technological advance (τ) is based on thosestructural features that reflect the role of the technologicallymore advanced activities in industrial production and trade.Its geometric measure is the length of the vertical diagonalof the structural diamond for the country or area considered.The examples of figure 10.5 seem to suggest that diamondsare rather more symmetrical with respect to their horizontalaxis, reflecting fewer unequal contributions from productionand trade to the τ-indicator than to the ι-indicator. Part of anexplanation of this feature is that both components of tech-nological advance refer to the manufacturing sector and aretherefore not influenced by the presence of non-tradablegoods.
The range of the technological-advance indicator is consid-erably wider than that of industrial advance, extendingbetween a maximum of 0.83 for Singapore and a minimumof 0.05 for Haiti. Across this range, differences betweeneconomies become smaller with declining levels of techno-logical advance, as is indicated by a decrease in inter-quartileranges of the indicator τ from 0.29 down to 0.11. Unlike thecase of the industrial-advance indicator, in that of technolog-ical advance membership among the top 10 economies isshared equally between industrialised and developingeconomies, with the latter, as expected, mostly from the Eastand Southeast Asian regions. The remainder of the highestτ-quarter belongs to the industrialised economies almostentirely. In fact, only five member of this group are found inthe second quarter and one outlier (Greece) below themedian-value of the present sample in 2002. In short, con-ventional wisdom – that the so-called industrialisedeconomies are the technologically advanced economies – isconspicuously supported by data on the structure of produc-tion and trade. At the same time and based on the same kindof information, the assessment of countries with respect totechnological advance shows that about a third of the upper-most portion in the ranking by the τ-indicator are developingeconomies.
The high similarity between the production and the tradesides of the τ-indicator6 implies that technological advance isreflected in largely equal measure in the corresponding pro-duction and trade shares. This feature of high concordancebetween the technological-advance indicator and each oneof its components emerges clearly from the data foreconomies in the highest quarter of the τ-distribution. Outof the top 10 economies in that distribution, eight are amongthe top 10 in terms of the corresponding production shareand seven among the top 10 in the ranking by trade share.And with a view to the full first quarter in the ranking by theτ-indicator, concordance was even more striking. Out of the24 economies in this top quarter, there were only two (the
Philippines and Mexico) that were not at the same time mem-bers of the top quarters of the rankings by both componentindicators. More specifically, the high technological-advanceindicators of these economies are the reflection of high ιx val-ues,7 whereas their structural features of industrial produc-tion place them in the second quarter of the correspondingτy component.
The second quarter has at its top a number of developingeconomies, which showed a remarkable increase in τ-valuesover the decade surveyed here. They include Brazil, China,Thailand, South Africa, and Hong Kong SAR, all with τ-valuesaround 0.50 in 2002 and increases in the indicator between0.07 (Hong Kong SAR) and 0.23 (Thailand) over the 1990s.Immediately below this group of developing economies arefour industrialised economies (Norway, Australia, Iceland andPortugal) with unusually low τ-values spread over the inter-val of the 0.40s and below. The middle portion of the secondquarter contains a number of developing economies that arenotable for their size (India), for their large increase in τ-val-ues (Argentina) or for both (Indonesia). The lower end of thisquarter approaches the median τ-value of around 0.33, withTurkey as the largest economy with this level of technologi-cal advance reflected in its manufacturing production andtrade.
In the second quarter, too, concordance between the tech-nological-advance indicator and its two components is high.Thus, all but four economies in this part of the τ-distributionare found in the same quarter of the ranking by the corre-sponding production share. And the number of exceptions isreduced to only two in a comparison of membership in thesecond quarter between the τ-indicator and its τx compo-nent.
Near the top of the lower half of the distribution by thetechnological-advance indicator there are two outliers of thegroup of industrialised economies, New Zealand and Greece,with values of around 0.30, which nevertheless representsignificant improvements over 1990. Another characteristicof the third quarter is the high number (nine) of LAC
economies, ranging from Chile near the top to Peru near thebottom of this part of the τ-distribution. In general, member-ship of the third quarter draws on virtually all groups and geo-graphic regions (except East and South-East Asia), withRomania as the one transition economy, four SSA countries,four North African economies, as well as one South Asiancountry (Pakistan).
Finally, economies with values for the technological-advance indicator of 0.15 and less form the bottom quarterof the τ-ranking. Relatively large numbers of countries in thispart of the distribution are from LAC (six) and MENA (five),while the number of SSA economies (four) is smaller thanexpected. Interestingly, within the lowest quarter LDCs arespread between the top (Togo) and the bottom (Haiti). Thefirst of these two economies recorded a significant increasein its τ-value, the second a considerable decrease over the1990s. In between these two limiting cases of indicator val-ues, Bangladesh, the one large LDC, and one other SouthAsian economy (Sri Lanka), are found in the upper range ofthis quarter.
14910 | Structural traits in industrial development
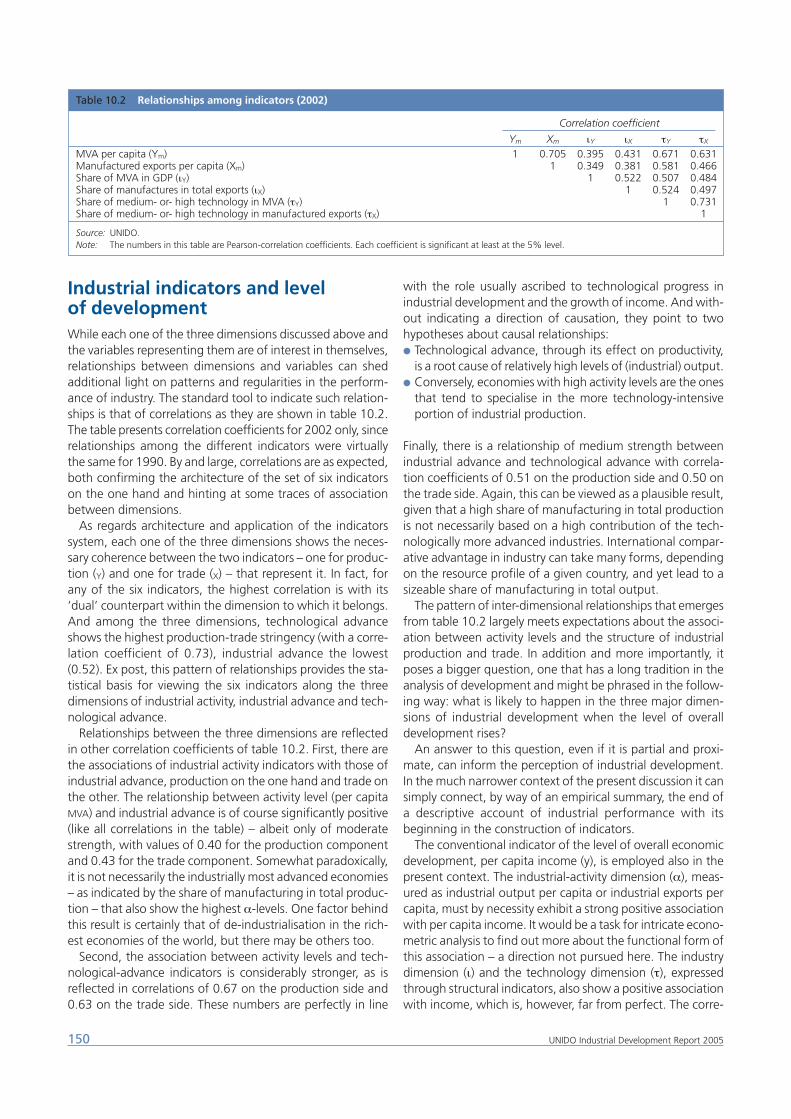
Industrial indicators and level of developmentWhile each one of the three dimensions discussed above andthe variables representing them are of interest in themselves,relationships between dimensions and variables can shedadditional light on patterns and regularities in the perform-ance of industry. The standard tool to indicate such relation-ships is that of correlations as they are shown in table 10.2.The table presents correlation coefficients for 2002 only, sincerelationships among the different indicators were virtuallythe same for 1990. By and large, correlations are as expected,both confirming the architecture of the set of six indicatorson the one hand and hinting at some traces of associationbetween dimensions.
As regards architecture and application of the indicatorssystem, each one of the three dimensions shows the neces-sary coherence between the two indicators – one for produc-tion (Y) and one for trade (X) – that represent it. In fact, forany of the six indicators, the highest correlation is with its‘dual’ counterpart within the dimension to which it belongs.And among the three dimensions, technological advanceshows the highest production-trade stringency (with a corre-lation coefficient of 0.73), industrial advance the lowest(0.52). Ex post, this pattern of relationships provides the sta-tistical basis for viewing the six indicators along the threedimensions of industrial activity, industrial advance and tech-nological advance.
Relationships between the three dimensions are reflectedin other correlation coefficients of table 10.2. First, there arethe associations of industrial activity indicators with those ofindustrial advance, production on the one hand and trade onthe other. The relationship between activity level (per capitaMVA) and industrial advance is of course significantly positive(like all correlations in the table) – albeit only of moderatestrength, with values of 0.40 for the production componentand 0.43 for the trade component. Somewhat paradoxically,it is not necessarily the industrially most advanced economies– as indicated by the share of manufacturing in total produc-tion – that also show the highest α-levels. One factor behindthis result is certainly that of de-industrialisation in the rich-est economies of the world, but there may be others too.
Second, the association between activity levels and tech-nological-advance indicators is considerably stronger, as isreflected in correlations of 0.67 on the production side and0.63 on the trade side. These numbers are perfectly in line
with the role usually ascribed to technological progress inindustrial development and the growth of income. And with-out indicating a direction of causation, they point to twohypotheses about causal relationships:● Technological advance, through its effect on productivity,
is a root cause of relatively high levels of (industrial) output.● Conversely, economies with high activity levels are the ones
that tend to specialise in the more technology-intensiveportion of industrial production.
Finally, there is a relationship of medium strength betweenindustrial advance and technological advance with correla-tion coefficients of 0.51 on the production side and 0.50 onthe trade side. Again, this can be viewed as a plausible result,given that a high share of manufacturing in total productionis not necessarily based on a high contribution of the tech-nologically more advanced industries. International compar-ative advantage in industry can take many forms, dependingon the resource profile of a given country, and yet lead to asizeable share of manufacturing in total output.
The pattern of inter-dimensional relationships that emergesfrom table 10.2 largely meets expectations about the associ-ation between activity levels and the structure of industrialproduction and trade. In addition and more importantly, itposes a bigger question, one that has a long tradition in theanalysis of development and might be phrased in the follow-ing way: what is likely to happen in the three major dimen-sions of industrial development when the level of overalldevelopment rises?
An answer to this question, even if it is partial and proxi-mate, can inform the perception of industrial development.In the much narrower context of the present discussion it cansimply connect, by way of an empirical summary, the end ofa descriptive account of industrial performance with itsbeginning in the construction of indicators.
The conventional indicator of the level of overall economicdevelopment, per capita income (y), is employed also in thepresent context. The industrial-activity dimension (α), meas-ured as industrial output per capita or industrial exports percapita, must by necessity exhibit a strong positive associationwith per capita income. It would be a task for intricate econo-metric analysis to find out more about the functional form ofthis association – a direction not pursued here. The industrydimension (ι) and the technology dimension (τ), expressedthrough structural indicators, also show a positive associationwith income, which is, however, far from perfect. The corre-
150 UNIDO Industrial Development Report 2005
Table 10.2 Relationships among indicators (2002)
Correlation coefficient
Ym Xm ιY ιX τY τX
MVA per capita (Ym) 1 0.705 0.395 0.431 0.671 0.631Manufactured exports per capita (Xm) 1 0.349 0.381 0.581 0.466Share of MVA in GDP (ιY) 1 0.522 0.507 0.484Share of manufactures in total exports (ιX) 1 0.524 0.497Share of medium- or- high technology in MVA (τY) 1 0.731Share of medium- or- high technology in manufactured exports (τX) 1
Source: UNIDO.Note: The numbers in this table are Pearson-correlation coefficients. Each coefficient is significant at least at the 5% level.
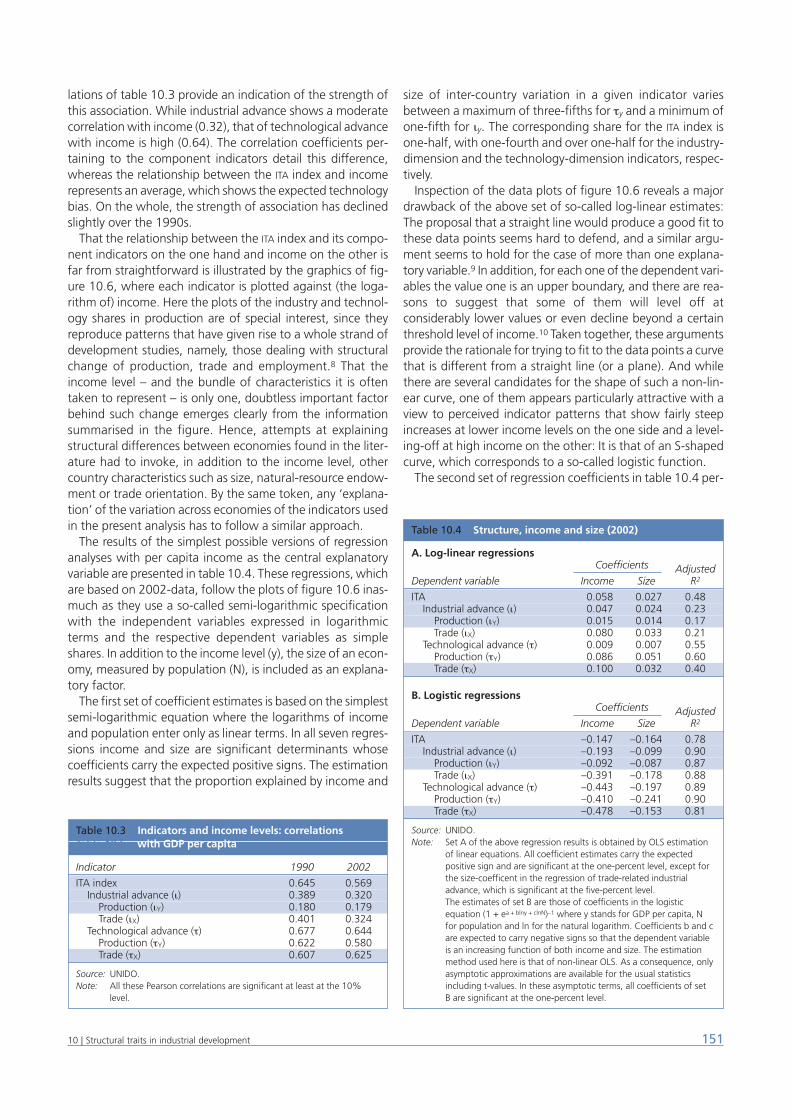
lations of table 10.3 provide an indication of the strength ofthis association. While industrial advance shows a moderatecorrelation with income (0.32), that of technological advancewith income is high (0.64). The correlation coefficients per-taining to the component indicators detail this difference,whereas the relationship between the ITA index and incomerepresents an average, which shows the expected technologybias. On the whole, the strength of association has declinedslightly over the 1990s.
That the relationship between the ITA index and its compo-nent indicators on the one hand and income on the other isfar from straightforward is illustrated by the graphics of fig-ure 10.6, where each indicator is plotted against (the loga-rithm of) income. Here the plots of the industry and technol-ogy shares in production are of special interest, since theyreproduce patterns that have given rise to a whole strand ofdevelopment studies, namely, those dealing with structuralchange of production, trade and employment.8 That theincome level – and the bundle of characteristics it is oftentaken to represent – is only one, doubtless important factorbehind such change emerges clearly from the informationsummarised in the figure. Hence, attempts at explainingstructural differences between economies found in the liter-ature had to invoke, in addition to the income level, othercountry characteristics such as size, natural-resource endow-ment or trade orientation. By the same token, any ‘explana-tion’ of the variation across economies of the indicators usedin the present analysis has to follow a similar approach.
The results of the simplest possible versions of regressionanalyses with per capita income as the central explanatoryvariable are presented in table 10.4. These regressions, whichare based on 2002-data, follow the plots of figure 10.6 inas-much as they use a so-called semi-logarithmic specificationwith the independent variables expressed in logarithmicterms and the respective dependent variables as simpleshares. In addition to the income level (y), the size of an econ-omy, measured by population (N), is included as an explana-tory factor.
The first set of coefficient estimates is based on the simplestsemi-logarithmic equation where the logarithms of incomeand population enter only as linear terms. In all seven regres-sions income and size are significant determinants whosecoefficients carry the expected positive signs. The estimationresults suggest that the proportion explained by income and
size of inter-country variation in a given indicator variesbetween a maximum of three-fifths for τy and a minimum ofone-fifth for ιy. The corresponding share for the ITA index isone-half, with one-fourth and over one-half for the industry-dimension and the technology-dimension indicators, respec-tively.
Inspection of the data plots of figure 10.6 reveals a majordrawback of the above set of so-called log-linear estimates:The proposal that a straight line would produce a good fit tothese data points seems hard to defend, and a similar argu-ment seems to hold for the case of more than one explana-tory variable.9 In addition, for each one of the dependent vari-ables the value one is an upper boundary, and there are rea-sons to suggest that some of them will level off atconsiderably lower values or even decline beyond a certainthreshold level of income.10 Taken together, these argumentsprovide the rationale for trying to fit to the data points a curvethat is different from a straight line (or a plane). And whilethere are several candidates for the shape of such a non-lin-ear curve, one of them appears particularly attractive with aview to perceived indicator patterns that show fairly steepincreases at lower income levels on the one side and a level-ing-off at high income on the other: It is that of an S-shapedcurve, which corresponds to a so-called logistic function.
The second set of regression coefficients in table 10.4 per-
15110 | Structural traits in industrial development
Table 10.3 Indicators and income levels: correlations Table 10.6 with GDP per capita
Indicator 1990 2002
ITA index 0.645 0.569Industrial advance (ι) 0.389 0.320
Production (ιY) 0.180 0.179Trade (ιX) 0.401 0.324
Technological advance (τ) 0.677 0.644Production (τY) 0.622 0.580Trade (τX) 0.607 0.625
Source: UNIDO.Note: All these Pearson correlations are significant at least at the 10%
level.
Table 10.4 Structure, income and size (2002)
A. Log-linear regressionsCoefficients Adjusted
Dependent variable Income Size R2
ITA 0.058 0.027 0.48Industrial advance (ι) 0.047 0.024 0.23
Production (ιY) 0.015 0.014 0.17Trade (ιX) 0.080 0.033 0.21
Technological advance (τ) 0.009 0.007 0.55Production (τY) 0.086 0.051 0.60Trade (τX) 0.100 0.032 0.40
B. Logistic regressionsCoefficients Adjusted
Dependent variable Income Size R2
ITA –0.147 –0.164 0.78Industrial advance (ι) –0.193 –0.099 0.90
Production (ιY) –0.092 –0.087 0.87Trade (ιX) –0.391 –0.178 0.88
Technological advance (τ) –0.443 –0.197 0.89Production (τY) –0.410 –0.241 0.90Trade (τX) –0.478 –0.153 0.81
Source: UNIDO.Note: Set A of the above regression results is obtained by OLS estimation
of linear equations. All coefficient estimates carry the expectedpositive sign and are significant at the one-percent level, except forthe size-coefficent in the regression of trade-related industrialadvance, which is significant at the five-percent level.The estimates of set B are those of coefficients in the logisticequation (1 + ea + blny + clnN)–1 where y stands for GDP per capita, Nfor population and ln for the natural logarithm. Coefficients b and care expected to carry negative signs so that the dependent variableis an increasing function of both income and size. The estimationmethod used here is that of non-linear OLS. As a consequence, onlyasymptotic approximations are available for the usual statisticsincluding t-values. In these asymptotic terms, all coefficients of set B are significant at the one-percent level.
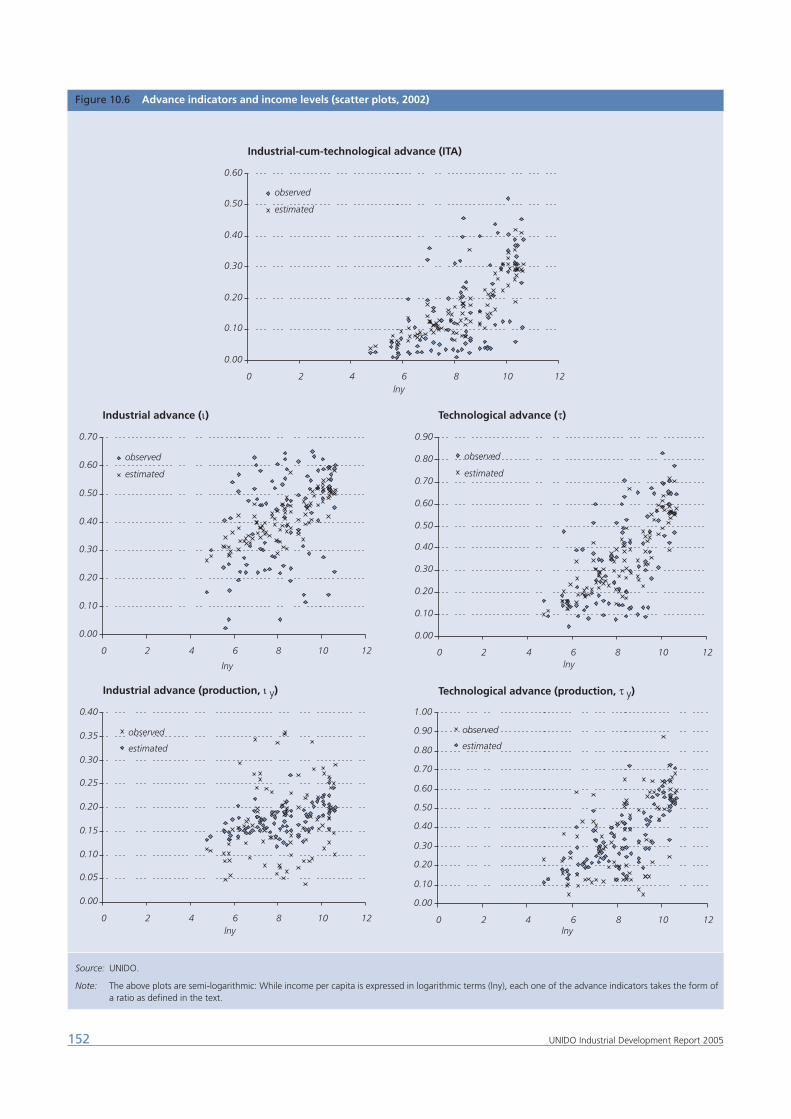
152 UNIDO Industrial Development Report 2005
Figure 10.6 Advance indicators and income levels (scatter plots, 2002)
Source: UNIDO.
Note: The above plots are semi-logarithmic: While income per capita is expressed in logarithmic terms (lny), each one of the advance indicators takes the form ofa ratio as defined in the text.
0.00
0.10
0.20
0.30
0.40
0.50
0.60
0 2 4 6 8 10 12
observed
estimated
lny
0.00
0.10
0.20
0.30
0.40
0.50
0.60
0.70
0 2 4 6 8 10 12
observed
estimated
lny
0.00
0.10
0.20
0.30
0.40
0.50
0.60
0.70
0.80
0.90
0 2 4 6 8 10 12
observed
estimated
lny
0.00
0.05
0.10
0.15
0.20
0.25
0.30
0.35
0.40
0 2 4 6 8 10 12
observed
estimated
lny
0.00
0.10
0.20
0.30
0.40
0.50
0.60
0.70
0.80
0.90
1.00
0 2 4 6 8 10 12
observed
estimated
lny
Industrial-cum-technological advance (ITA)
Industrial advance (ι) Technological advance (τ)
Technological advance (production, τ y)Industrial advance (production, ι y)
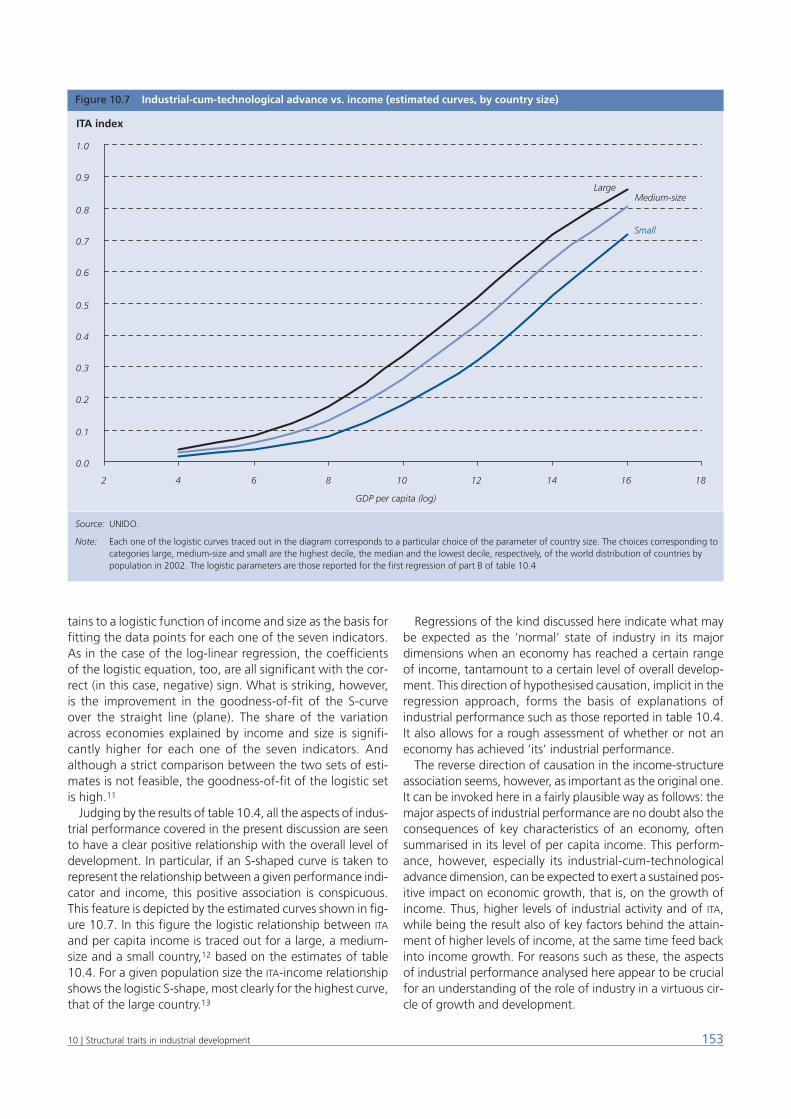
tains to a logistic function of income and size as the basis forfitting the data points for each one of the seven indicators.As in the case of the log-linear regression, the coefficientsof the logistic equation, too, are all significant with the cor-rect (in this case, negative) sign. What is striking, however,is the improvement in the goodness-of-fit of the S-curveover the straight line (plane). The share of the variationacross economies explained by income and size is signifi-cantly higher for each one of the seven indicators. Andalthough a strict comparison between the two sets of esti-mates is not feasible, the goodness-of-fit of the logistic setis high.11
Judging by the results of table 10.4, all the aspects of indus-trial performance covered in the present discussion are seento have a clear positive relationship with the overall level ofdevelopment. In particular, if an S-shaped curve is taken torepresent the relationship between a given performance indi-cator and income, this positive association is conspicuous.This feature is depicted by the estimated curves shown in fig-ure 10.7. In this figure the logistic relationship between ITA
and per capita income is traced out for a large, a medium-size and a small country,12 based on the estimates of table10.4. For a given population size the ITA-income relationshipshows the logistic S-shape, most clearly for the highest curve,that of the large country.13
Regressions of the kind discussed here indicate what maybe expected as the ‘normal’ state of industry in its majordimensions when an economy has reached a certain rangeof income, tantamount to a certain level of overall develop-ment. This direction of hypothesised causation, implicit in theregression approach, forms the basis of explanations ofindustrial performance such as those reported in table 10.4.It also allows for a rough assessment of whether or not aneconomy has achieved ‘its’ industrial performance.
The reverse direction of causation in the income-structureassociation seems, however, as important as the original one.It can be invoked here in a fairly plausible way as follows: themajor aspects of industrial performance are no doubt also theconsequences of key characteristics of an economy, oftensummarised in its level of per capita income. This perform-ance, however, especially its industrial-cum-technologicaladvance dimension, can be expected to exert a sustained pos-itive impact on economic growth, that is, on the growth ofincome. Thus, higher levels of industrial activity and of ITA,while being the result also of key factors behind the attain-ment of higher levels of income, at the same time feed backinto income growth. For reasons such as these, the aspectsof industrial performance analysed here appear to be crucialfor an understanding of the role of industry in a virtuous cir-cle of growth and development.
15310 | Structural traits in industrial development
Figure 10.7 Industrial-cum-technological advance vs. income (estimated curves, by country size)
Source: UNIDO.
Note: Each one of the logistic curves traced out in the diagram corresponds to a particular choice of the parameter of country size. The choices corresponding tocategories large, medium-size and small are the highest decile, the median and the lowest decile, respectively, of the world distribution of countries bypopulation in 2002. The logistic parameters are those reported for the first regression of part B of table 10.4
0.0
0.1
0.2
0.3
0.4
0.5
0.6
0.7
0.8
0.9
1.0
2 4 6 8 10 12 14 16 18
GDP per capita (log)
ITA index
Large Medium-size
Small
154 UNIDO Industrial Development Report 2005
Notes1 The statistical variables used to compute these two shares are MVA
and GDP for production, and manufactured exports and total mer-chandise exports for trade.
2 The statistical variables used here are value-added for production andexport value for trade. Detailed definitions of medium-to-high-tech-nology branches (for production) and products (for trade) are given inthe Statistical Notes.
3 To construct the planes, the theoretical range of index values (betweenone and zero) is divided into n portions of size 2–n, by first halving thefull interval and then progressively halving the lower half of whatremains in each step. The resulting subdivision of the full index rangeallows for straightforward comparisons of the nth sub-range with thepreceding as well as the following ones.
4 For reasons of practicality, plane IV is merged with all the planes thatwould follow to its left.
5 The observation derives from the values of inter-quartile ranges, which are0.12 and 0.09 for the upper pair and 0.17 and 0.22 for the lower pair.
6 The attendant correlation coefficient is 0.73 and significant at any cus-tomary level.
7 Here a significant upward bias of the value of medium-or-high tech-
nology exports must be allowed for, due to inclusion in the gross fig-ure of the total value of products that are only assembled in thecountry.
8 A core reference with a comprehensive bibliography is M. Syrquin,1989.
9 In this case, however, intuitive judgment would have to be based ona three-dimensional data plot, in order to see how well a plane fits theobservations.
10 The phenomenon de-industrialisation could be taken as a motivationfor modelling a decline, at least of some share variables, at highincome-levels. The levelling-off at different levels of saturation wouldbe argued for by differences among the dependent variables exam-ined here.
11 Strict comparison between the statistics of regressions A and B is pre-cluded, since for the latter only asymptotic values of the major statis-tics can be obtained.
12 The three categories of size are defined in terms of the world distri-bution of population in 2002. Large is taken to be the highest decile(about the size of Turkey or Ethiopia), medium size the median (forexample, Haiti or Bulgaria) and small the lowest decile (about the sizeof Suriname or Malta).
13 An empirical analysis similar to the one reported here can also befound in UNIDO, 1979.
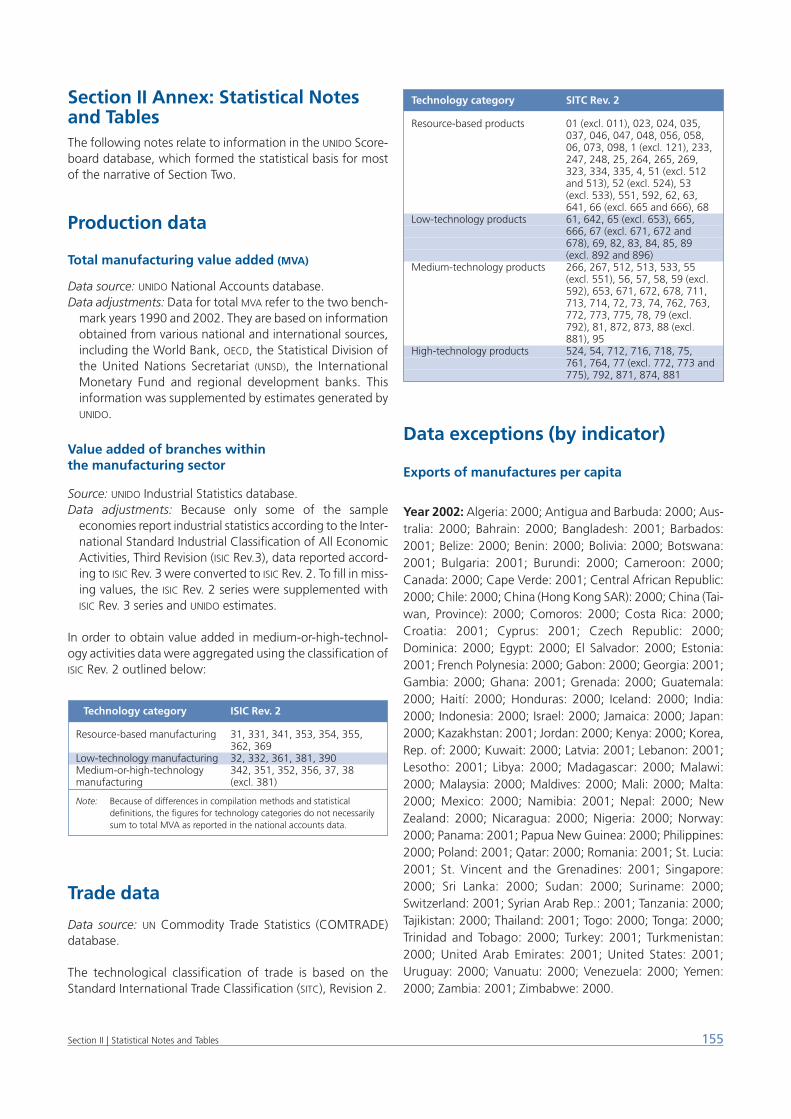
Section II Annex: Statistical Notesand TablesThe following notes relate to information in the UNIDO Score-board database, which formed the statistical basis for mostof the narrative of Section Two.
Production data
Total manufacturing value added (MVA)
Data source: UNIDO National Accounts database.Data adjustments: Data for total MVA refer to the two bench-
mark years 1990 and 2002. They are based on informationobtained from various national and international sources,including the World Bank, OECD, the Statistical Division ofthe United Nations Secretariat (UNSD), the InternationalMonetary Fund and regional development banks. Thisinformation was supplemented by estimates generated byUNIDO.
Value added of branches within the manufacturing sector
Source: UNIDO Industrial Statistics database.Data adjustments: Because only some of the sample
economies report industrial statistics according to the Inter-national Standard Industrial Classification of All EconomicActivities, Third Revision (ISIC Rev.3), data reported accord-ing to ISIC Rev. 3 were converted to ISIC Rev. 2. To fill in miss-ing values, the ISIC Rev. 2 series were supplemented withISIC Rev. 3 series and UNIDO estimates.
In order to obtain value added in medium-or-high-technol-ogy activities data were aggregated using the classification ofISIC Rev. 2 outlined below:
Trade data
Data source: UN Commodity Trade Statistics (COMTRADE)database.
The technological classification of trade is based on theStandard International Trade Classification (SITC), Revision 2.
Data exceptions (by indicator)
Exports of manufactures per capita
Year 2002: Algeria: 2000; Antigua and Barbuda: 2000; Aus-tralia: 2000; Bahrain: 2000; Bangladesh: 2001; Barbados:2001; Belize: 2000; Benin: 2000; Bolivia: 2000; Botswana:2001; Bulgaria: 2001; Burundi: 2000; Cameroon: 2000;Canada: 2000; Cape Verde: 2001; Central African Republic:2000; Chile: 2000; China (Hong Kong SAR): 2000; China (Tai-wan, Province): 2000; Comoros: 2000; Costa Rica: 2000;Croatia: 2001; Cyprus: 2001; Czech Republic: 2000;Dominica: 2000; Egypt: 2000; El Salvador: 2000; Estonia:2001; French Polynesia: 2000; Gabon: 2000; Georgia: 2001;Gambia: 2000; Ghana: 2001; Grenada: 2000; Guatemala:2000; Haití: 2000; Honduras: 2000; Iceland: 2000; India:2000; Indonesia: 2000; Israel: 2000; Jamaica: 2000; Japan:2000; Kazakhstan: 2001; Jordan: 2000; Kenya: 2000; Korea,Rep. of: 2000; Kuwait: 2000; Latvia: 2001; Lebanon: 2001;Lesotho: 2001; Libya: 2000; Madagascar: 2000; Malawi:2000; Malaysia: 2000; Maldives: 2000; Mali: 2000; Malta:2000; Mexico: 2000; Namibia: 2001; Nepal: 2000; NewZealand: 2000; Nicaragua: 2000; Nigeria: 2000; Norway:2000; Panama: 2001; Papua New Guinea: 2000; Philippines:2000; Poland: 2001; Qatar: 2000; Romania: 2001; St. Lucia:2001; St. Vincent and the Grenadines: 2001; Singapore:2000; Sri Lanka: 2000; Sudan: 2000; Suriname: 2000;Switzerland: 2001; Syrian Arab Rep.: 2001; Tanzania: 2000;Tajikistan: 2000; Thailand: 2001; Togo: 2000; Tonga: 2000;Trinidad and Tobago: 2000; Turkey: 2001; Turkmenistan:2000; United Arab Emirates: 2001; United States: 2001;Uruguay: 2000; Vanuatu: 2000; Venezuela: 2000; Yemen:2000; Zambia: 2001; Zimbabwe: 2000.
155Section II | Statistical Notes and Tables
Technology category SITC Rev. 2
Resource-based products 01 (excl. 011), 023, 024, 035, 037, 046, 047, 048, 056, 058, 06, 073, 098, 1 (excl. 121), 233, 247, 248, 25, 264, 265, 269, 323, 334, 335, 4, 51 (excl. 512 and 513), 52 (excl. 524), 53 (excl. 533), 551, 592, 62, 63, 641, 66 (excl. 665 and 666), 68
Low-technology products 61, 642, 65 (excl. 653), 665, 666, 67 (excl. 671, 672 and 678), 69, 82, 83, 84, 85, 89 (excl. 892 and 896)
Medium-technology products 266, 267, 512, 513, 533, 55 (excl. 551), 56, 57, 58, 59 (excl. 592), 653, 671, 672, 678, 711, 713, 714, 72, 73, 74, 762, 763, 772, 773, 775, 78, 79 (excl. 792), 81, 872, 873, 88 (excl. 881), 95
High-technology products 524, 54, 712, 716, 718, 75, 761, 764, 77 (excl. 772, 773 and 775), 792, 871, 874, 881
Technology category ISIC Rev. 2
Resource-based manufacturing 31, 331, 341, 353, 354, 355, 362, 369
Low-technology manufacturing 32, 332, 361, 381, 390Medium-or-high-technology 342, 351, 352, 356, 37, 38 manufacturing (excl. 381)
Note: Because of differences in compilation methods and statisticaldefinitions, the figures for technology categories do not necessarilysum to total MVA as reported in the national accounts data.
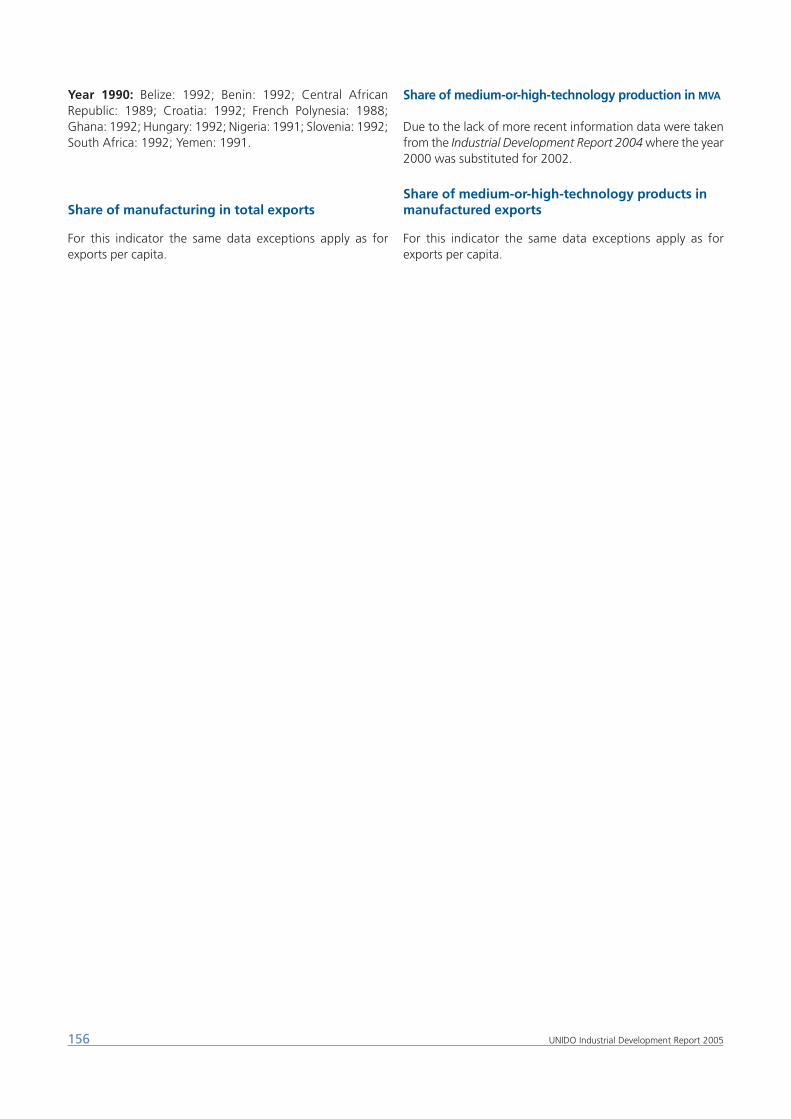
Year 1990: Belize: 1992; Benin: 1992; Central AfricanRepublic: 1989; Croatia: 1992; French Polynesia: 1988;Ghana: 1992; Hungary: 1992; Nigeria: 1991; Slovenia: 1992;South Africa: 1992; Yemen: 1991.
Share of manufacturing in total exports
For this indicator the same data exceptions apply as forexports per capita.
Share of medium-or-high-technology production in MVA
Due to the lack of more recent information data were takenfrom the Industrial Development Report 2004 where the year2000 was substituted for 2002.
Share of medium-or-high-technology products inmanufactured exports
For this indicator the same data exceptions apply as forexports per capita.
156 UNIDO Industrial Development Report 2005
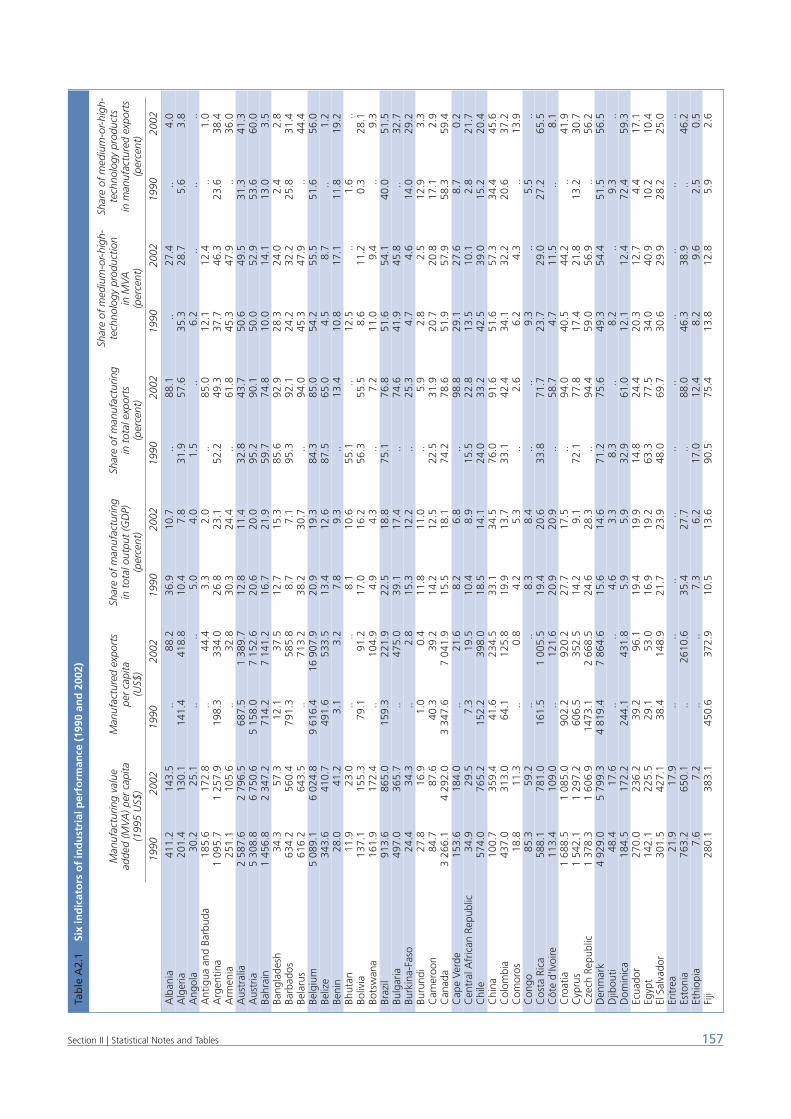
157Section II | Statistical Notes and Tables
Tab
le A
2.1
Six
ind
icat
ors
of
ind
ust
rial
per
form
ance
(19
90 a
nd
200
2)
Shar
e of
med
ium
-or-
high
-Sh
are
of m
ediu
m-o
r-hi
gh-
Man
ufac
turin
g va
lue
Man
ufac
ture
d ex
port
sSh
are
of m
anuf
actu
ring
Shar
e of
man
ufac
turin
gte
chno
logy
pro
duct
ion
tech
nolo
gy p
rodu
cts
adde
d (M
VA) p
er c
apita
per
capi
tain
tot
al o
utpu
t (G
DP)
in t
otal
exp
orts
in M
VAin
man
ufac
ture
d ex
port
s(1
995
US$
)(U
S$)
(per
cent
)(p
erce
nt)
(per
cent
)(p
erce
nt)
1990
2002
1990
2002
1990
2002
1990
2002
1990
2002
1990
2002
Alb
ania
411.
214
3.5
...88
.236
.910
.7...
88.1
...27
.4...
4.0
Alg
eria
201.
413
0.1
141.
441
8.8
10.4
7.8
31.9
57.6
35.3
28.7
5.6
3.8
Ang
ola
30.2
25.1
......
5.0
4.0
1.5
...6.
2...
.....
Ant
igua
and
Bar
buda
185.
617
2.8
...44
.43.
32.
0...
85.0
12.1
12.4
..1.
0A
rgen
tina
1 09
5.7
1 25
7.9
198.
333
4.0
26.8
23.1
52.2
49.3
37.7
46.3
23.6
38.4
Arm
enia
251.
110
5.6
...32
.830
.324
.4...
61.8
45.3
47.9
..36
.0A
ustr
alia
2 58
7.6
2 79
6.5
687.
51
389.
712
.811
.432
.843
.750
.649
.531
.341
.3A
ustr
ia5
308.
86
750.
65
158.
07
152.
620
.620
.095
.290
.150
.052
.953
.660
.0Ba
hrai
n1
456.
82
347.
271
4.2
7 14
1.2
16.7
21.9
59.7
74.8
10.0
14.1
13.0
3.5
Bang
lade
sh34
.357
.312
.137
.512
.715
.385
.692
.928
.324
.02.
42.
8Ba
rbad
os63
4.2
560.
479
1.3
585.
88.
77.
195
.392
.124
.232
.225
.831
.4Be
laru
s61
6.2
643.
5...
713.
238
.230
.7...
94.0
45.3
47.9
..44
.4Be
lgiu
m5
089.
16
024.
89
616.
416
907
.920
.919
.384
.385
.054
.255
.551
.656
.0Be
lize
343.
641
0.7
491.
653
3.5
13.4
12.6
87.5
65.0
4.5
8.7
...1.
2Be
nin
28.0
41.2
3.1
3.2
7.8
9.3
...13
.410
.817
.111
.819
.2Bh
utan
11.9
23.0
......
8.1
10.6
55.1
...12
.5..
1.6
..Bo
livia
137.
115
5.3
79.1
91.2
17.0
16.2
56.3
55.5
8.6
11.2
0.3
28.1
Bots
wan
a16
1.9
172.
4...
104.
94.
94.
3...
7.2
11.0
9.4
..9.
3Br
azil
913.
686
5.0
159.
322
1.9
22.5
18.8
75.1
76.8
51.6
54.1
40.0
51.5
Bulg
aria
497.
036
5.7
...47
5.0
39.1
17.4
...74
.641
.945
.8...
32.7
Burk
ina-
Faso
24.4
34.3
...2.
815
.312
.2...
25.3
4.7
4.6
14.0
29.2
Buru
ndi
27.8
16.9
1.0
0.4
11.8
11.0
...5.
92.
82.
512
.93.
3C
amer
oon
84.7
87.6
40.3
39.2
14.2
12.5
22.5
31.9
20.7
20.8
17.1
2.9
Can
ada
3 26
6.1
4 29
2.0
3 34
7.6
7 04
1.9
15.5
18.1
74.2
78.6
51.9
57.9
58.3
59.4
Cap
e Ve
rde
153.
618
4.0
...21
.68.
26.
8...
98.8
29.1
27.6
8.7
0.2
Cen
tral
Afr
ican
Rep
ublic
34.9
29.5
7.3
19.5
10.4
8.9
15.5
22.8
13.5
10.1
2.8
21.7
Chi
le57
4.0
765.
215
2.2
398.
018
.514
.124
.033
.242
.539
.015
.220
.4C
hina
100.
735
9.4
41.6
234.
533
.134
.576
.091
.651
.657
.334
.445
.6C
olom
bia
437.
031
3.0
64.1
125.
819
.913
.733
.142
.434
.132
.220
.637
.2C
omor
os18
.811
.3...
0.8
4.2
5.3
...2.
66.
24.
3..
13.9
Con
go85
.359
.2...
...8.
38.
4...
...9.
3..
5.5
..C
osta
Ric
a58
8.1
781.
016
1.5
1 00
5.5
19.4
20.6
33.8
71.7
23.7
29.0
27.2
65.5
Côt
e d'
Ivoi
re11
3.4
109.
0...
121.
620
.920
.9...
58.7
4.7
11.5
...8.
1C
roat
ia1
688.
51
085.
090
2.2
920.
227
.717
.5...
94.0
40.5
44.2
..41
.9C
ypru
s1
542.
11
297.
260
6.5
352.
514
.29.
172
.177
.817
.421
.813
.230
.7C
zech
Rep
ublic
1 37
8.3
1 60
6.9
1473
.12
668.
524
.628
.3...
94.4
59.0
56.9
..56
.2D
enm
ark
4 92
9.0
5 79
9.3
4 81
9.4
7 86
4.6
15.6
14.6
71.2
75.6
49.3
54.4
51.5
56.5
Djib
outi
48.4
17.6
......
4.6
3.3
8.3
...8.
2..
9.3
..D
omin
ica
184.
517
2.2
244.
143
1.8
5.9
5.9
32.9
61.0
12.1
12.4
72.4
59.3
Ecua
dor
270.
023
6.2
39.2
96.1
19.4
19.9
14.8
24.4
20.3
12.7
4.4
17.1
Egyp
t14
2.1
225.
529
.153
.016
.919
.263
.377
.534
.040
.910
.210
.4El
Sal
vado
r30
1.5
427.
138
.414
8.9
21.7
23.9
48.0
69.7
30.6
29.9
28.2
25.0
Eritr
ea21
.917
.9...
......
......
......
......
..Es
toni
a76
3.2
650.
1...
2610
.635
.427
.7...
88.0
46.3
38.9
...46
.2Et
hiop
ia7.
67.
2...
...7.
36.
217
.012
.48.
29.
62.
50.
5Fi
ji28
0.1
383.
145
0.6
372.
910
.513
.690
.575
.413
.812
.85.
92.
6
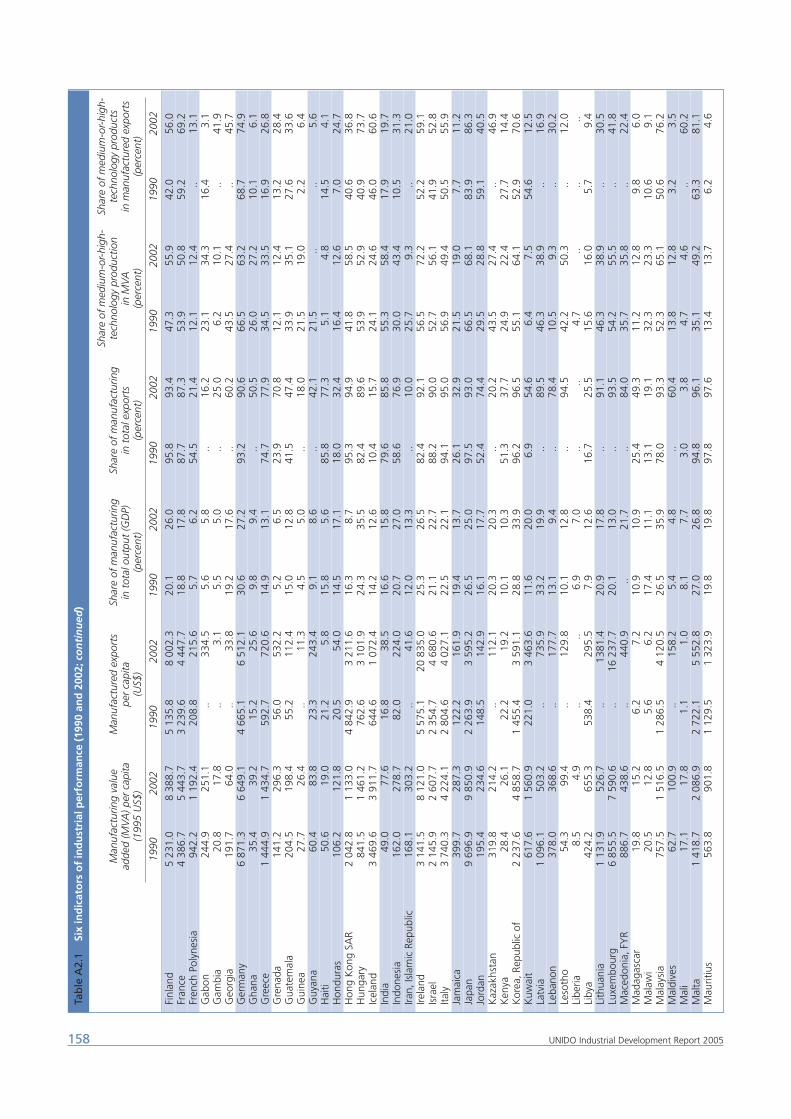
158 UNIDO Industrial Development Report 2005
Tab
le A
2.1
Six
ind
icat
ors
of
ind
ust
rial
per
form
ance
(19
90 a
nd
200
2; c
on
tin
ued
)
Shar
e of
med
ium
-or-
high
-Sh
are
of m
ediu
m-o
r-hi
gh-
Man
ufac
turin
g va
lue
Man
ufac
ture
d ex
port
sSh
are
of m
anuf
actu
ring
Shar
e of
man
ufac
turin
gte
chno
logy
pro
duct
ion
tech
nolo
gy p
rodu
cts
adde
d (M
VA) p
er c
apita
per
capi
tain
tot
al o
utpu
t (G
DP)
in t
otal
exp
orts
in M
VAin
man
ufac
ture
d ex
port
s(1
995
US$
)(U
S$)
(per
cent
)(p
erce
nt)
(per
cent
)(p
erce
nt)
1990
2002
1990
2002
1990
2002
1990
2002
1990
2002
1990
2002
Finl
and
5 23
1.0
8 38
8.7
5 13
5.8
8 00
2.3
20.1
26.0
95.8
93.4
47.3
55.9
42.0
56.0
Fran
ce4
386.
75
443.
73
239.
64
447.
718
.817
.887
.787
.353
.950
.859
.269
.2Fr
ench
Pol
ynes
ia94
2.2
1 19
2.4
208.
821
5.6
5.7
6.2
54.5
21.4
12.1
12.4
...13
.1G
abon
244.
925
1.1
...33
4.5
5.6
5.8
...16
.223
.134
.316
.43.
1G
ambi
a20
.817
.8...
3.1
5.5
5.0
...25
.06.
210
.1...
41.9
Geo
rgia
191.
764
.0...
33.8
19.2
17.6
...60
.243
.527
.4...
45.7
Ger
man
y6
871.
36
649.
14
665.
16
512.
130
.627
.293
.290
.666
.563
.268
.774
.9G
hana
35.4
39.2
15.2
25.6
9.8
9.4
...50
.526
.027
.210
.16.
1G
reec
e1
444.
91
434.
759
2.7
720.
614
.913
.174
.777
.934
.533
.516
.926
.8G
rena
da14
1.2
296.
356
.053
2.2
5.2
6.5
23.9
70.8
12.1
12.4
13.2
28.4
Gua
tem
ala
204.
519
8.4
55.2
112.
415
.012
.841
.547
.433
.935
.127
.633
.6G
uine
a27
.726
.4...
11.3
4.5
5.0
...18
.021
.519
.02.
26.
4G
uyan
a60
.483
.823
.324
3.4
9.1
8.6
...42
.121
.5...
...5.
6H
aiti
50.6
19.0
21.2
5.8
15.8
5.6
85.8
77.3
5.1
4.8
14.5
4.1
Hon
dura
s10
6.2
121.
820
.554
.014
.517
.118
.032
.416
.412
.67.
024
.7H
ong
Kon
g SA
R2
042.
81
133.
04
842.
93
211.
616
.38.
795
.394
.941
.858
.540
.636
.8H
unga
ry84
1.5
1 46
1.2
762.
63
101.
924
.335
.582
.489
.653
.952
.940
.973
.7Ic
elan
d3
469.
63
911.
764
4.6
1 07
2.4
14.2
12.6
10.4
15.7
24.1
24.6
46.0
60.6
Indi
a49
.077
.616
.838
.516
.615
.879
.685
.855
.358
.417
.919
.7In
done
sia
162.
027
8.7
82.0
224.
020
.727
.058
.676
.930
.043
.410
.531
.3Ira
n, Is
lam
ic R
epub
lic16
8.1
303.
2...
41.6
12.0
13.3
...10
.025
.79.
3...
21.0
Irela
nd3
141.
58
121.
05
575.
120
835
.025
.326
.582
.492
.156
.572
.252
.259
.1Is
rael
2 14
5.9
2 60
7.7
2 35
4.7
4 68
0.6
21.1
22.7
88.2
90.0
52.7
56.1
41.9
52.8
Italy
3 74
0.3
4 22
4.1
2 80
4.6
4 02
7.1
22.5
22.1
94.1
95.0
56.9
49.4
50.5
55.9
Jam
aica
399.
728
7.3
122.
216
1.9
19.4
13.7
26.1
32.9
21.5
19.0
7.7
11.2
Japa
n9
696.
99
850.
92
263.
93
595.
226
.525
.097
.593
.066
.568
.183
.986
.3Jo
rdan
195.
423
4.6
148.
514
2.9
16.1
17.7
52.4
74.4
29.5
28.8
59.1
40.5
Kaz
akhs
tan
319.
821
4.2
...11
2.1
20.3
20.3
...20
.243
.527
.4...
46.9
Ken
ya28
.426
.122
.219
.210
.110
.351
.337
.724
.922
.427
.714
.4K
orea
, Rep
ublic
of
2 23
7.6
4 85
8.7
1 45
5.4
3 59
1.1
28.8
33.9
96.2
96.5
55.1
64.1
52.9
70.6
Kuw
ait
617.
61
560.
922
1.0
3 46
3.6
11.6
20.0
6.9
54.6
6.4
7.5
54.6
12.5
Latv
ia1
096.
150
3.2
...73
5.9
33.2
19.9
...89
.546
.338
.9...
16.9
Leba
non
378.
036
8.6
...17
7.7
13.1
9.4
...78
.410
.59.
3...
30.2
Leso
tho
54.3
99.4
...12
9.8
10.1
12.8
...94
.542
.250
.3...
12.0
Libe
ria8.
54.
9...
...6.
97.
0...
...4.
7...
......
Liby
a42
4.2
655.
353
8.4
295.
57.
912
.616
.725
.515
.616
.05.
79.
4Li
thua
nia
1 13
1.9
526.
7...
1381
.420
.917
.8...
91.1
46.3
38.9
...30
.5Lu
xem
bour
g6
855.
57
590.
6...
16 2
37.7
20.1
13.0
...93
.554
.255
.5...
41.8
Mac
edon
ia, F
YR
886.
743
8.6
...44
0.9
...21
.7...
84.0
35.7
35.8
...22
.4M
adag
asca
r19
.815
.26.
27.
210
.910
.925
.449
.311
.212
.89.
86.
0M
alaw
i20
.512
.85.
66.
217
.411
.113
.119
.132
.323
.310
.69.
1M
alay
sia
757.
51
516.
51
286.
54
120.
526
.535
.978
.093
.352
.365
.150
.676
.2M
aldi
ves
62.7
100.
9...
158.
25.
44.
8...
60.4
13.8
12.8
3.2
3.5
Mal
i17
.117
.81.
11.
08.
17.
73.
03.
84.
74.
6...
60.2
Mal
ta1
418.
72
086.
92
722.
15
552.
827
.026
.894
.896
.135
.149
.263
.381
.1M
aurit
ius
563.
890
1.8
1 12
9.5
1 32
3.9
19.8
19.8
97.8
97.6
13.4
13.7
6.2
4.6
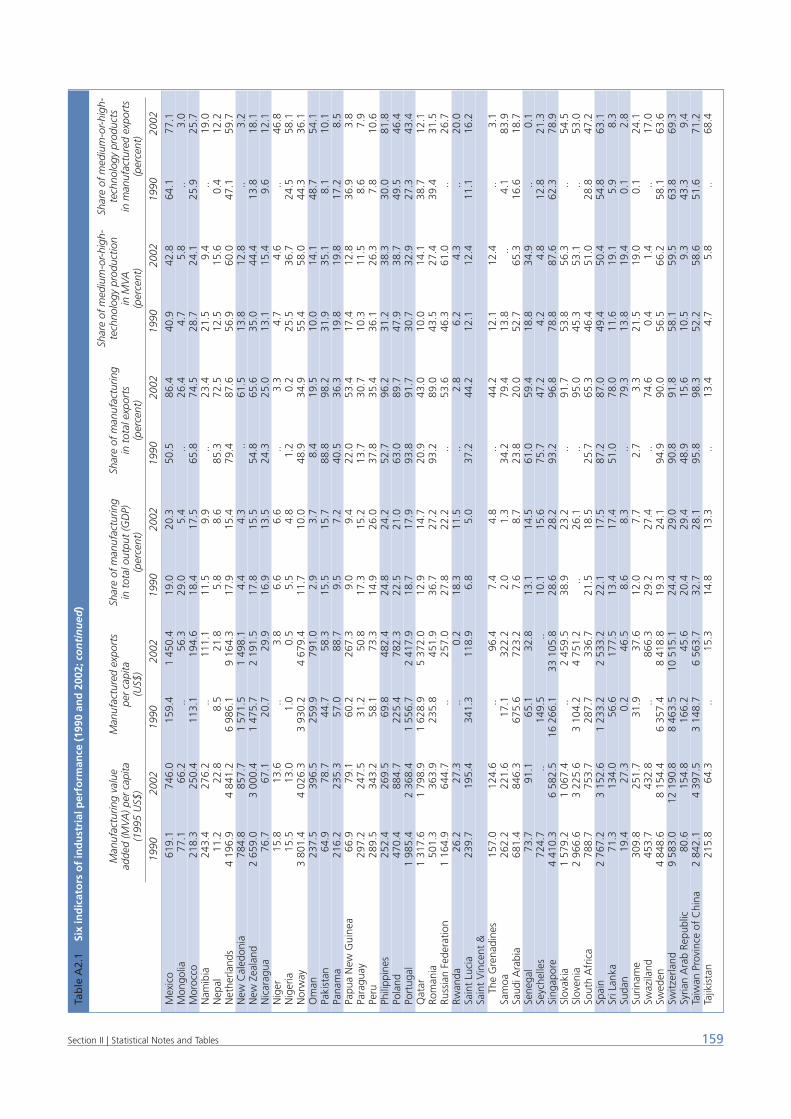
159Section II | Statistical Notes and Tables
Tab
le A
2.1
Six
ind
icat
ors
of
ind
ust
rial
per
form
ance
(19
90 a
nd
200
2; c
on
tin
ued
)
Shar
e of
med
ium
-or-
high
-Sh
are
of m
ediu
m-o
r-hi
gh-
Man
ufac
turin
g va
lue
Man
ufac
ture
d ex
port
sSh
are
of m
anuf
actu
ring
Shar
e of
man
ufac
turin
gte
chno
logy
pro
duct
ion
tech
nolo
gy p
rodu
cts
adde
d (M
VA) p
er c
apita
per
capi
tain
tot
al o
utpu
t (G
DP)
in t
otal
exp
orts
in M
VAin
man
ufac
ture
d ex
port
s(1
995
US$
)(U
S$)
(per
cent
)(p
erce
nt)
(per
cent
)(p
erce
nt)
1990
2002
1990
2002
1990
2002
1990
2002
1990
2002
1990
2002
Mex
ico
619.
174
6.0
159.
41
450.
419
.020
.350
.586
.440
.942
.864
.177
.1M
ongo
lia77
.166
.2...
56.3
29.0
5.4
...26
.44.
75.
8...
3.0
Mor
occo
218.
325
0.4
113.
119
4.6
18.4
17.5
65.8
74.5
28.7
24.1
25.9
25.7
Nam
ibia
243.
427
6.2
...11
1.1
11.5
9.9
...23
.421
.59.
4...
19.0
Nep
al11
.222
.88.
521
.85.
88.
685
.372
.512
.515
.60.
412
.2N
ethe
rland
s4
196.
94
841.
26
986.
19
164.
317
.915
.479
.487
.656
.960
.047
.159
.7N
ew C
aled
onia
784.
885
7.7
1 57
1.5
1 49
8.1
4.4
4.3
..61
.513
.812
.8...
3.2
New
Zea
land
2 65
9.0
3 00
0.4
1 47
5.7
2 19
1.5
17.8
15.5
54.8
65.6
35.0
44.4
13.8
18.1
Nic
arag
ua76
.767
.120
.729
.916
.913
.524
.325
.013
.115
.49.
612
.1N
iger
15.8
13.6
...3.
86.
66.
6...
3.3
4.7
4.6
...46
.8N
iger
ia15
.513
.01.
00.
55.
54.
81.
20.
225
.536
.724
.558
.1N
orw
ay3
801.
44
026.
33
930.
24
679.
411
.710
.048
.934
.955
.458
.044
.336
.1O
man
237.
539
6.5
259.
979
1.0
2.9
3.7
8.4
19.5
10.0
14.1
48.7
54.1
Paki
stan
64.9
78.7
44.7
58.3
15.5
15.7
88.8
98.2
31.9
35.1
8.1
10.1
Pana
ma
216.
223
5.3
57.0
88.7
9.5
7.2
40.5
36.3
19.8
19.8
17.2
8.5
Papu
a N
ew G
uine
a66
.979
.160
.226
7.3
9.0
9.4
22.0
53.4
17.4
12.8
36.9
3.8
Para
guay
297.
224
7.5
31.2
50.8
17.3
15.2
13.7
30.7
10.3
11.5
8.6
7.9
Peru
289.
534
3.2
58.1
73.3
14.9
26.0
37.8
35.4
36.1
26.3
7.8
10.6
Phili
ppin
es25
2.4
269.
569
.848
2.4
24.8
24.2
52.7
96.2
31.2
38.3
30.0
81.8
Pola
nd47
0.4
884.
722
5.4
782.
322
.521
.063
.089
.747
.938
.749
.546
.4Po
rtug
al1
985.
42
368.
41
556.
72
417.
918
.717
.993
.891
.730
.732
.927
.343
.4Q
atar
1 31
7.6
1 79
8.9
1 62
8.9
5 37
2.0
12.9
14.7
20.9
43.0
10.0
14.1
38.7
12.1
Rom
ania
501.
336
3.9
235.
845
1.9
36.7
27.2
93.2
89.0
43.5
27.4
39.4
31.5
Russ
ian
Fede
ratio
n1
164.
964
4.7
...25
7.0
27.8
22.2
...53
.646
.361
.0...
26.7
Rwan
da26
.227
.3...
0.2
18.3
11.5
...2.
86.
24.
3...
20.0
Sain
t Lu
cia
239.
719
5.4
341.
311
8.9
6.8
5.0
37.2
44.2
12.1
12.4
11.1
16.2
Sain
t V
ince
nt &
Th
e G
rena
dine
s15
7.0
124.
6...
96.4
7.4
4.8
...44
.212
.112
.4...
3.1
Sam
oa26
2.2
221.
617
.132
2.2
2.0
1.3
34.2
79.4
13.8
...4.
183
.9Sa
udi A
rabi
a68
1.4
846.
367
5.6
723.
27.
68.
723
.820
.052
.765
.316
.618
.7Se
nega
l73
.791
.165
.132
.813
.114
.561
.059
.418
.834
.9...
0.1
Seyc
helle
s72
4.7
...14
9.5
...10
.115
.675
.747
.24.
24.
812
.821
.3Si
ngap
ore
4 41
0.3
6 58
2.5
16 2
66.1
33 1
05.8
28.6
28.2
93.2
96.8
78.8
87.6
62.3
78.9
Slov
akia
1 57
9.2
1 06
7.4
...2
459.
538
.923
.2...
91.7
53.8
56.3
...54
.5Sl
oven
ia2
966.
63
225.
63
104.
24
751.
2...
26.1
...95
.045
.353
.1...
53.0
Sout
h A
fric
a78
8.7
753.
728
7.7
336.
721
.518
.525
.765
.346
.451
.028
.847
.2Sp
ain
2 76
7.2
3 15
2.6
1 23
3.2
2 53
3.2
22.1
17.5
87.2
87.0
49.4
50.4
54.8
63.1
Sri L
anka
71.3
134.
056
.617
7.5
13.4
17.4
51.0
78.0
11.6
19.1
5.9
8.3
Suda
n19
.427
.30.
246
.58.
68.
3...
79.3
13.8
19.4
0.1
2.8
Surin
ame
309.
825
1.7
31.9
37.6
12.0
7.7
2.7
3.3
21.5
19.0
0.1
24.1
Swaz
iland
453.
743
2.8
...86
6.3
29.2
27.4
...74
.60.
41.
4...
17.0
Swed
en4
848.
68
154.
46
357.
48
418.
819
.324
.194
.990
.056
.566
.258
.163
.6Sw
itzer
land
9 58
3.0
12 1
90.8
8 46
3.5
10 5
15.1
24.4
29.0
90.8
91.8
58.1
59.5
63.8
69.3
Syria
n A
rab
Repu
blic
80.6
154.
816
6.2
45.6
20.4
29.4
48.9
15.6
10.5
9.3
43.3
9.4
Taiw
an P
rovi
nce
of C
hina
2 84
2.1
4 39
7.5
3 14
8.7
6 56
3.7
32.7
28.1
95.8
98.3
52.2
58.6
51.6
71.2
Tajik
ista
n21
5.8
64.3
...15
.314
.813
.3...
13.4
4.7
5.8
...68
.4
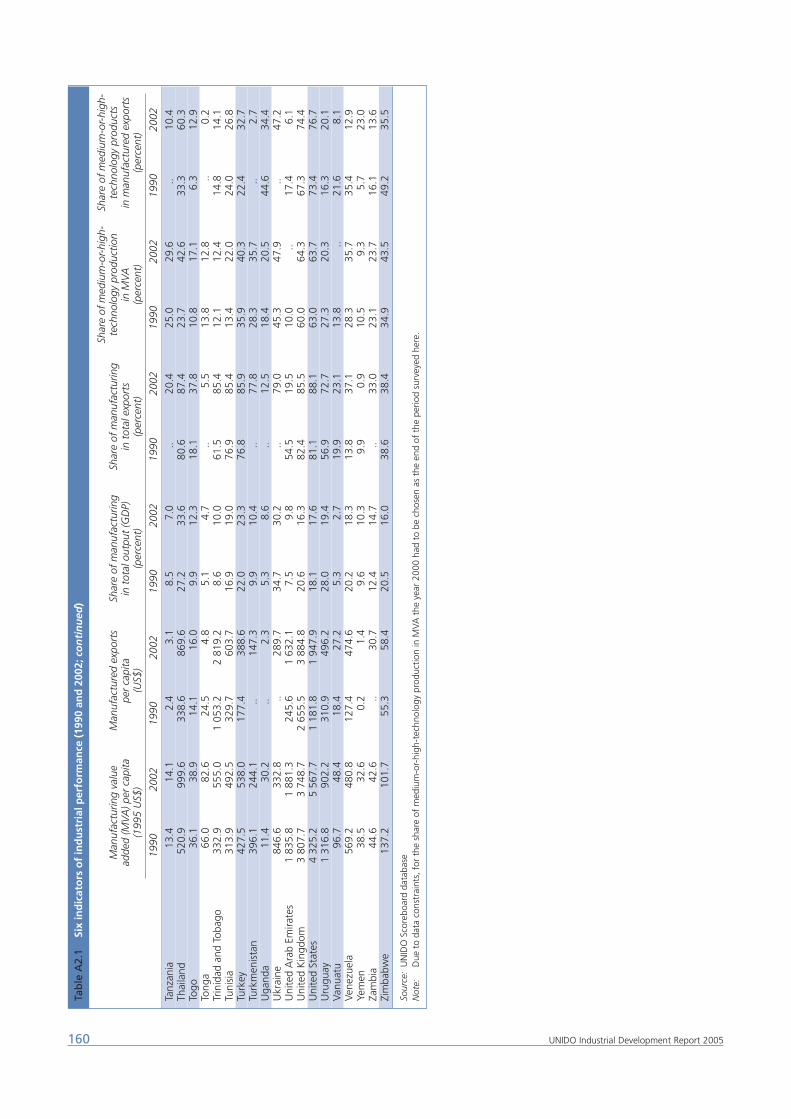
160 UNIDO Industrial Development Report 2005
Tab
le A
2.1
Six
ind
icat
ors
of
ind
ust
rial
per
form
ance
(19
90 a
nd
200
2; c
on
tin
ued
)
Shar
e of
med
ium
-or-
high
-Sh
are
of m
ediu
m-o
r-hi
gh-
Man
ufac
turin
g va
lue
Man
ufac
ture
d ex
port
sSh
are
of m
anuf
actu
ring
Shar
e of
man
ufac
turin
gte
chno
logy
pro
duct
ion
tech
nolo
gy p
rodu
cts
adde
d (M
VA) p
er c
apita
per
capi
tain
tot
al o
utpu
t (G
DP)
in t
otal
exp
orts
in M
VAin
man
ufac
ture
d ex
port
s(1
995
US$
)(U
S$)
(per
cent
)(p
erce
nt)
(per
cent
)(p
erce
nt)
1990
2002
1990
2002
1990
2002
1990
2002
1990
2002
1990
2002
Tanz
ania
13.4
14.1
2.4
3.1
8.5
7.0
...20
.425
.029
.6...
10.4
Thai
land
520.
999
9.6
338.
686
9.6
27.2
33.6
80.6
87.4
23.7
42.6
33.3
60.3
Togo
36.1
38.9
14.1
16.0
9.9
12.3
18.1
37.8
10.8
17.1
6.3
12.9
Tong
a66
.082
.624
.54.
85.
14.
7...
5.5
13.8
12.8
..0.
2Tr
inid
ad a
nd T
obag
o33
2.9
555.
01
053.
22
819.
28.
610
.061
.585
.412
.112
.414
.814
.1Tu
nisi
a31
3.9
492.
532
9.7
603.
716
.919
.076
.985
.413
.422
.024
.026
.8Tu
rkey
427.
553
8.0
177.
438
8.6
22.0
23.3
76.8
85.9
35.9
40.3
22.4
32.7
Turk
men
ista
n39
6.1
244.
1...
147.
39.
910
.4...
77.8
28.3
35.7
...2.
7U
gand
a11
.430
.2...
2.3
5.3
8.6
...12
.518
.420
.544
.634
.4U
krai
ne84
6.6
332.
8..
289.
734
.730
.2...
79.0
45.3
47.9
...47
.2U
nite
d A
rab
Emira
tes
1 83
5.8
1 88
1.3
245.
61
632.
17.
59.
854
.519
.510
.0...
17.4
6.1
Uni
ted
Kin
gdom
3 80
7.7
3 74
8.7
2 65
5.5
3 88
4.8
20.6
16.3
82.4
85.5
60.0
64.3
67.3
74.4
Uni
ted
Stat
es4
325.
25
567.
71
181.
81
947.
918
.117
.681
.188
.163
.063
.773
.476
.7U
rugu
ay1
316.
890
2.2
310.
949
6.2
28.0
19.4
56.9
72.7
27.3
20.3
16.3
20.1
Vanu
atu
96.7
48.4
18.4
27.2
5.3
2.7
19.9
23.1
13.8
..21
.68.
1Ve
nezu
ela
569.
248
0.8
127.
447
4.6
20.2
18.3
13.8
37.1
28.3
35.7
35.4
12.9
Yem
en38
.532
.60.
21.
49.
610
.39.
90.
910
.59.
35.
723
.0Za
mbi
a44
.642
.6..
30.7
12.4
14.7
...33
.023
.123
.716
.113
.6Zi
mba
bwe
137.
210
1.7
55.3
58.4
20.5
16.0
38.6
38.4
34.9
43.5
49.2
35.5
Sour
ce:
UN
IDO
Sco
rebo
ard
data
base
Not
e:D
ue t
o da
ta c
onst
rain
ts, f
or t
he s
hare
of
med
ium
-or-
high
-tec
hnol
ogy
prod
uctio
n in
MVA
the
yea
r 20
00 h
ad t
o be
cho
sen
as t
he e
nd o
f th
e pe
riod
surv
eyed
her
e.
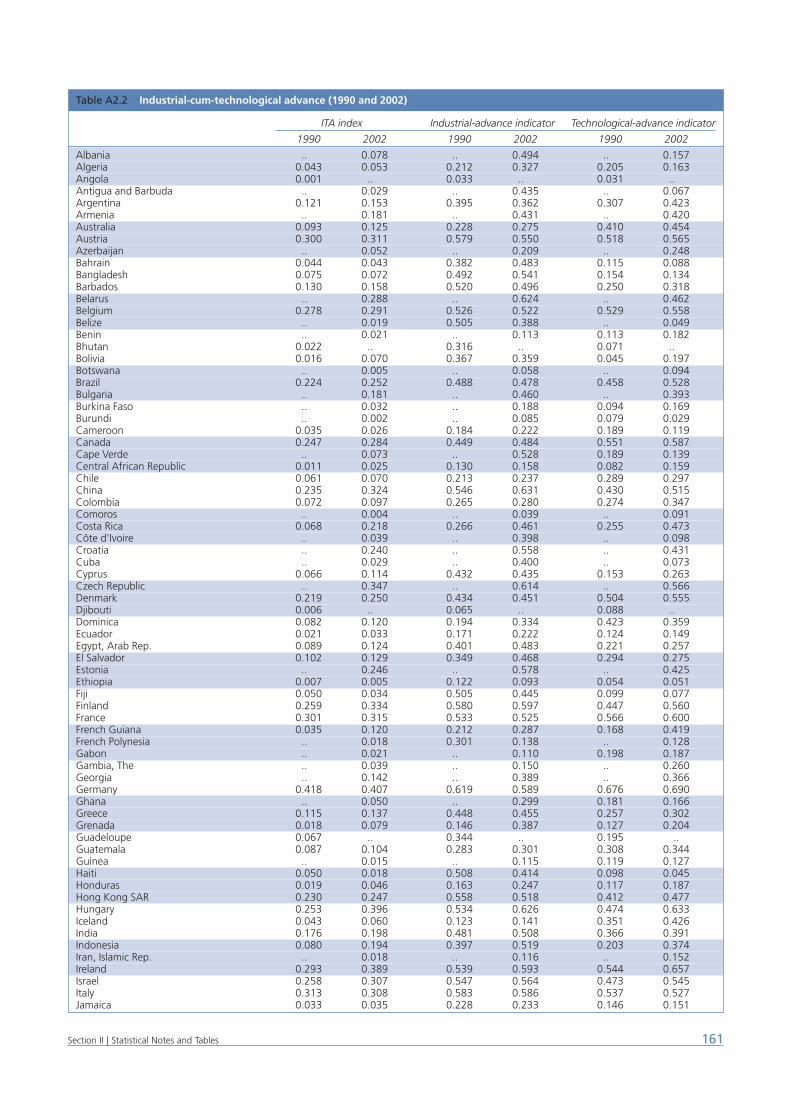
161Section II | Statistical Notes and Tables
Table A2.2 Industrial-cum-technological advance (1990 and 2002)
ITA index Industrial-advance indicator Technological-advance indicator
1990 2002 1990 2002 1990 2002
Albania ...0 0.078 ...0 0.494 ...0 0.157Algeria 0.043 0.053 0.212 0.327 0.205 0.163Angola 0.001 ...0 0.033 ...0 0.031 ...0Antigua and Barbuda ...0 0.029 ...0 0.435 ...0 0.067Argentina 0.121 0.153 0.395 0.362 0.307 0.423Armenia ...0 0.181 ...0 0.431 ...0 0.420Australia 0.093 0.125 0.228 0.275 0.410 0.454Austria 0.300 0.311 0.579 0.550 0.518 0.565Azerbaijan ...0 0.052 ...0 0.209 ...0 0.248Bahrain 0.044 0.043 0.382 0.483 0.115 0.088Bangladesh 0.075 0.072 0.492 0.541 0.154 0.134Barbados 0.130 0.158 0.520 0.496 0.250 0.318Belarus ...0 0.288 ...0 0.624 ...0 0.462Belgium 0.278 0.291 0.526 0.522 0.529 0.558Belize ...0 0.019 0.505 0.388 ...0 0.049Benin ...0 0.021 ...0 0.113 0.113 0.182Bhutan 0.022 ...0 0.316 ...0 0.071 ...0Bolivia 0.016 0.070 0.367 0.359 0.045 0.197Botswana ...0 0.005 ...0 0.058 ...0 0.094Brazil 0.224 0.252 0.488 0.478 0.458 0.528Bulgaria ...0 0.181 ...0 0.460 ...0 0.393Burkina Faso ...0 0.032 ...0 0.188 0.094 0.169Burundi ...0 0.002 ...0 0.085 0.079 0.029Cameroon 0.035 0.026 0.184 0.222 0.189 0.119Canada 0.247 0.284 0.449 0.484 0.551 0.587Cape Verde ...0 0.073 ...0 0.528 0.189 0.139Central African Republic 0.011 0.025 0.130 0.158 0.082 0.159Chile 0.061 0.070 0.213 0.237 0.289 0.297China 0.235 0.324 0.546 0.631 0.430 0.515Colombia 0.072 0.097 0.265 0.280 0.274 0.347Comoros ...0 0.004 ...0 0.039 ...0 0.091Costa Rica 0.068 0.218 0.266 0.461 0.255 0.473Côte d'Ivoire ...0 0.039 ...0 0.398 ...0 0.098Croatia ...0 0.240 ...0 0.558 ...0 0.431Cuba ...0 0.029 ...0 0.400 ...0 0.073Cyprus 0.066 0.114 0.432 0.435 0.153 0.263Czech Republic ...0 0.347 ...0 0.614 ...0 0.566Denmark 0.219 0.250 0.434 0.451 0.504 0.555Djibouti 0.006 ...0 0.065 ...0 0.088 ...0Dominica 0.082 0.120 0.194 0.334 0.423 0.359Ecuador 0.021 0.033 0.171 0.222 0.124 0.149Egypt, Arab Rep. 0.089 0.124 0.401 0.483 0.221 0.257El Salvador 0.102 0.129 0.349 0.468 0.294 0.275Estonia ...0 0.246 ...0 0.578 ...0 0.425Ethiopia 0.007 0.005 0.122 0.093 0.054 0.051Fiji 0.050 0.034 0.505 0.445 0.099 0.077Finland 0.259 0.334 0.580 0.597 0.447 0.560France 0.301 0.315 0.533 0.525 0.566 0.600French Guiana 0.035 0.120 0.212 0.287 0.168 0.419French Polynesia ...0 0.018 0.301 0.138 ...0 0.128Gabon ...0 0.021 ...0 0.110 0.198 0.187Gambia, The ...0 0.039 ...0 0.150 ...0 0.260Georgia ...0 0.142 ...0 0.389 ...0 0.366Germany 0.418 0.407 0.619 0.589 0.676 0.690Ghana ...0 0.050 ...0 0.299 0.181 0.166Greece 0.115 0.137 0.448 0.455 0.257 0.302Grenada 0.018 0.079 0.146 0.387 0.127 0.204Guadeloupe 0.067 ...0 0.344 ...0 0.195 ..Guatemala 0.087 0.104 0.283 0.301 0.308 0.344Guinea ...0 0.015 ...0 0.115 0.119 0.127Haiti 0.050 0.018 0.508 0.414 0.098 0.045Honduras 0.019 0.046 0.163 0.247 0.117 0.187Hong Kong SAR 0.230 0.247 0.558 0.518 0.412 0.477Hungary 0.253 0.396 0.534 0.626 0.474 0.633Iceland 0.043 0.060 0.123 0.141 0.351 0.426India 0.176 0.198 0.481 0.508 0.366 0.391Indonesia 0.080 0.194 0.397 0.519 0.203 0.374Iran, Islamic Rep. ...0 0.018 ...0 0.116 ...0 0.152Ireland 0.293 0.389 0.539 0.593 0.544 0.657Israel 0.258 0.307 0.547 0.564 0.473 0.545Italy 0.313 0.308 0.583 0.586 0.537 0.527Jamaica 0.033 0.035 0.228 0.233 0.146 0.151
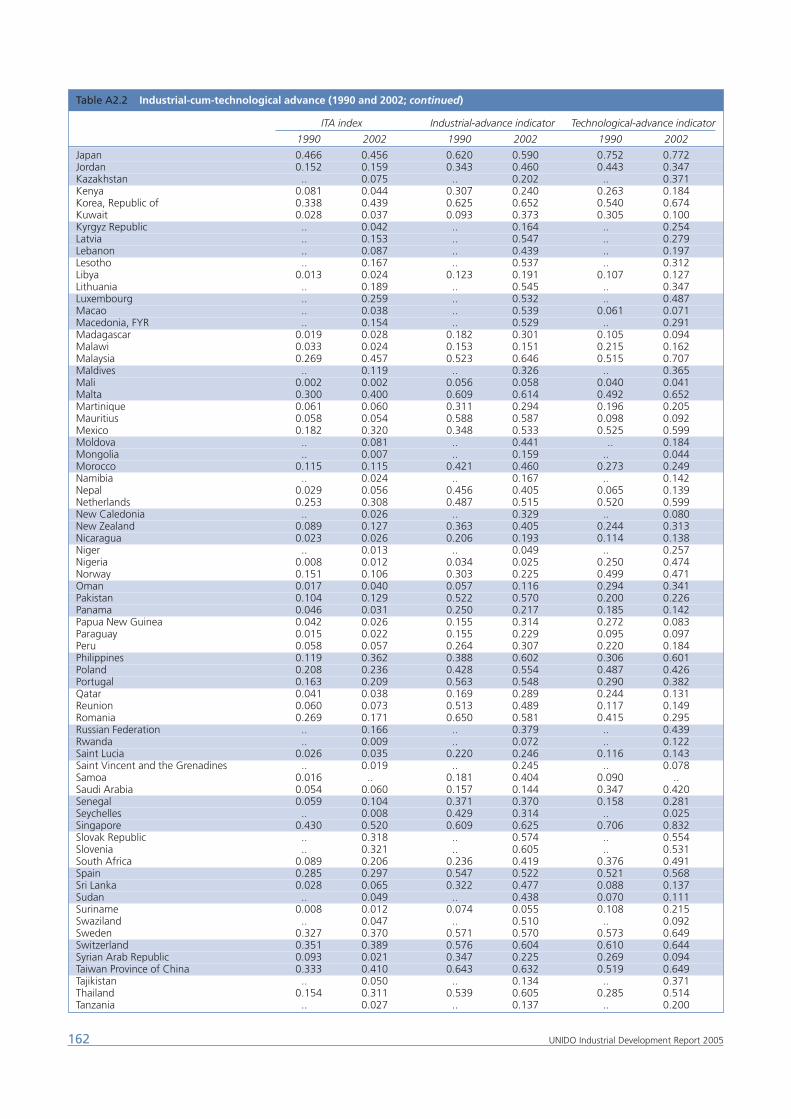
162 UNIDO Industrial Development Report 2005
Table A2.2 Industrial-cum-technological advance (1990 and 2002; continued)
ITA index Industrial-advance indicator Technological-advance indicator
1990 2002 1990 2002 1990 2002
Japan 0.466 0.456 0.620 0.590 0.752 0.772Jordan 0.152 0.159 0.343 0.460 0.443 0.347Kazakhstan ...0 0.075 ...0 0.202 ...0 0.371Kenya 0.081 0.044 0.307 0.240 0.263 0.184Korea, Republic of 0.338 0.439 0.625 0.652 0.540 0.674Kuwait 0.028 0.037 0.093 0.373 0.305 0.100Kyrgyz Republic ...0 0.042 ...0 0.164 ...0 0.254Latvia ...0 0.153 ...0 0.547 ...0 0.279Lebanon ...0 0.087 ...0 0.439 ...0 0.197Lesotho ...0 0.167 ...0 0.537 ...0 0.312Libya 0.013 0.024 0.123 0.191 0.107 0.127Lithuania ...0 0.189 ...0 0.545 ...0 0.347Luxembourg ...0 0.259 ...0 0.532 ...0 0.487Macao ...0 0.038 ...0 0.539 0.061 0.071Macedonia, FYR ...0 0.154 ...0 0.529 ...0 0.291Madagascar 0.019 0.028 0.182 0.301 0.105 0.094Malawi 0.033 0.024 0.153 0.151 0.215 0.162Malaysia 0.269 0.457 0.523 0.646 0.515 0.707Maldives ...0 0.119 ...0 0.326 ...0 0.365Mali 0.002 0.002 0.056 0.058 0.040 0.041Malta 0.300 0.400 0.609 0.614 0.492 0.652Martinique 0.061 0.060 0.311 0.294 0.196 0.205Mauritius 0.058 0.054 0.588 0.587 0.098 0.092Mexico 0.182 0.320 0.348 0.533 0.525 0.599Moldova ...0 0.081 ...0 0.441 .. 0.184Mongolia ...0 0.007 ...0 0.159 ...0 0.044Morocco 0.115 0.115 0.421 0.460 0.273 0.249Namibia ...0 0.024 ...0 0.167 ...0 0.142Nepal 0.029 0.056 0.456 0.405 0.065 0.139Netherlands 0.253 0.308 0.487 0.515 0.520 0.599New Caledonia ...0 0.026 ...0 0.329 ...0 0.080New Zealand 0.089 0.127 0.363 0.405 0.244 0.313Nicaragua 0.023 0.026 0.206 0.193 0.114 0.138Niger ...0 0.013 ...0 0.049 ...0 0.257Nigeria 0.008 0.012 0.034 0.025 0.250 0.474Norway 0.151 0.106 0.303 0.225 0.499 0.471Oman 0.017 0.040 0.057 0.116 0.294 0.341Pakistan 0.104 0.129 0.522 0.570 0.200 0.226Panama 0.046 0.031 0.250 0.217 0.185 0.142Papua New Guinea 0.042 0.026 0.155 0.314 0.272 0.083Paraguay 0.015 0.022 0.155 0.229 0.095 0.097Peru 0.058 0.057 0.264 0.307 0.220 0.184Philippines 0.119 0.362 0.388 0.602 0.306 0.601Poland 0.208 0.236 0.428 0.554 0.487 0.426Portugal 0.163 0.209 0.563 0.548 0.290 0.382Qatar 0.041 0.038 0.169 0.289 0.244 0.131Reunion 0.060 0.073 0.513 0.489 0.117 0.149Romania 0.269 0.171 0.650 0.581 0.415 0.295Russian Federation ...0 0.166 ...0 0.379 ...0 0.439Rwanda ...0 0.009 ...0 0.072 ...0 0.122Saint Lucia 0.026 0.035 0.220 0.246 0.116 0.143Saint Vincent and the Grenadines ...0 0.019 ...0 0.245 ...0 0.078Samoa 0.016 ...0 0.181 0.404 0.090 ..Saudi Arabia 0.054 0.060 0.157 0.144 0.347 0.420Senegal 0.059 0.104 0.371 0.370 0.158 0.281Seychelles ...0 0.008 0.429 0.314 ...0 0.025Singapore 0.430 0.520 0.609 0.625 0.706 0.832Slovak Republic ...0 0.318 ...0 0.574 ...0 0.554Slovenia ...0 0.321 ...0 0.605 ...0 0.531South Africa 0.089 0.206 0.236 0.419 0.376 0.491Spain 0.285 0.297 0.547 0.522 0.521 0.568Sri Lanka 0.028 0.065 0.322 0.477 0.088 0.137Sudan ...0 0.049 ...0 0.438 0.070 0.111Suriname 0.008 0.012 0.074 0.055 0.108 0.215Swaziland ...0 0.047 ...0 0.510 ...0 0.092Sweden 0.327 0.370 0.571 0.570 0.573 0.649Switzerland 0.351 0.389 0.576 0.604 0.610 0.644Syrian Arab Republic 0.093 0.021 0.347 0.225 0.269 0.094Taiwan Province of China 0.333 0.410 0.643 0.632 0.519 0.649Tajikistan ...0 0.050 ...0 0.134 ...0 0.371Thailand 0.154 0.311 0.539 0.605 0.285 0.514Tanzania ...0 0.027 ...0 0.137 ...0 0.200
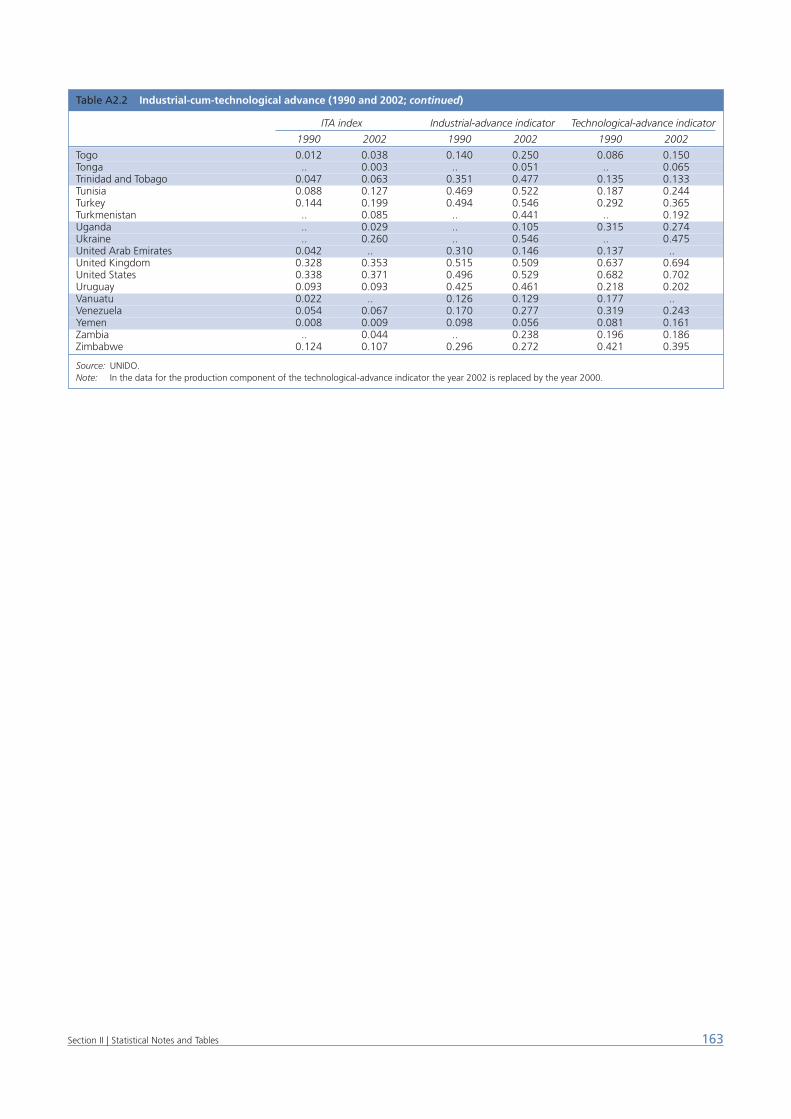
163Section II | Statistical Notes and Tables
Table A2.2 Industrial-cum-technological advance (1990 and 2002; continued)
ITA index Industrial-advance indicator Technological-advance indicator
1990 2002 1990 2002 1990 2002
Togo 0.012 0.038 0.140 0.250 0.086 0.150Tonga ...0 0.003 ...0 0.051 ...0 0.065Trinidad and Tobago 0.047 0.063 0.351 0.477 0.135 0.133Tunisia 0.088 0.127 0.469 0.522 0.187 0.244Turkey 0.144 0.199 0.494 0.546 0.292 0.365Turkmenistan ...0 0.085 ...0 0.441 ...0 0.192Uganda ...0 0.029 ...0 0.105 0.315 0.274Ukraine ...0 0.260 ...0 0.546 ...0 0.475United Arab Emirates 0.042 ...0 0.310 0.146 0.137 ...0United Kingdom 0.328 0.353 0.515 0.509 0.637 0.694United States 0.338 0.371 0.496 0.529 0.682 0.702Uruguay 0.093 0.093 0.425 0.461 0.218 0.202Vanuatu 0.022 ...0 0.126 0.129 0.177 ...0Venezuela 0.054 0.067 0.170 0.277 0.319 0.243Yemen 0.008 0.009 0.098 0.056 0.081 0.161Zambia ...0 0.044 ...0 0.238 0.196 0.186Zimbabwe 0.124 0.107 0.296 0.272 0.421 0.395
Source: UNIDO.Note: In the data for the production component of the technological-advance indicator the year 2002 is replaced by the year 2000.

165References
Abramovitz, M. (1956) “Resource and Output Trends in the United StatesSince 1870,” American Economic Review, Vol. 46 (2), pp. 5–23.
_____ (1986) “Catching Up, Forging Ahead and Falling Behind,” Jour-nal of Economic History, Vol. 46, pp. 385–406.
_____ (1994a) “The Origins of the Post-war Catch-Up and ConvergenceBoom,” in J. Fagerberg, B. Verspagen. and N. von Tunzelman (eds.)The Dynamics of Technology, Trade and Growth, Aldershot: EdwardElgar.
_____ (1994b) “Catch-up and Convergence in the Postwar GrowthBoom and After,” in W.J. Baumol, R.R. Nelson and E.N. Wolf (eds.)Convergence of Productivity – Cross-National Studies and HistoricalEvidence, Oxford: Oxford University Press.
Acemoglu, D., S. Johnson and A. Robinson (2001) “The Colonial Originsof Comparative Development: An Empirical Investigation,” AmericanEconomic Review, Vol. 91, pp. 1369–1401.
Addison-Smyth, D. (2005) “Ireland’s Revealed Comparative Advantage,”Central Bank of Ireland Quarterly Bulletin, Vol. Spring, pp. 101–114.
Adelman, I. and C. T. Morris (1965) “A Factor Analysis of the Interrela-tionship Between Social and Political Variables and Per Capita GrossNational Product,” Quarterly Journal of Economics, Vol. 79 (4), pp.555–578.
_____ (1967) Society, Politics and Economic Development, Baltimore,MD: The Johns Hopkins Press.
Adler, J. H. (1965) Absorptive Capacity, the Concepts and its Determi-nants, Washington, DC: Brookings Institution.
Aghion, P. and P. Howitt (1998) Endogenous Growth Theory, Cambridge,MA: MIT Press.
Alesina, A., A. Devleeschauwer, W. Easterly, S. Kurlat and R. Wacziarg(2003) “Fractionalization,” Journal of Economic Growth, Vol. 8, pp.155–194.
Amsden, A. H. (1984) “Taiwan in Exports of technology by Newly-Indus-trializing Countries,” World Development, Vol. 12 (5/6).
_____ and W. Chu (2003) Beyond Late Development: Taiwan’s Upgrad-ing Policies, Cambridge, MA: MIT Press.
Angel, D. P. and M. T. Rock (2003) “Engaging Economic DevelopmentAgencies in Environmental Protection: The Case for Embedded Auton-omy,” Local Environment, Vol. 8 (1), pp. 45–59.
Archibugi, D. and A. Coco (2004) “A new indicator of technologicalcapabilities for developed and developing countries (ArCo),” WorldDevelopment, Vol. 32, pp. 629–654.
Arora, A. and A. Gambardella (1994) “The changing technology of tech-nological change: general and abstract knowledge and the division ofinnovative labour,” Research Policy, Vol. 23 (5), pp. 523–532.
Asheim, B. T. and M. S. Gertler (2005) “The Geography of Innovation:Regional Innovation Systems,” in J. Fagerberg, D. C. Mowery and R.R. Nelson (eds.) The Oxford Handbook of Innovation, New York, NY:Oxford University Press.
Avnimelech, G. and M. Teubal (2005) “Evolutionary Innovation andHigh-Tech Policy: What can we Learn from Israel’s Targeting of Ven-ture Capital?” Samuel Neaman Institute for Advanced Studies in
Science and Technology Working Papers STE-WP-25, Haifa: NeamanInstitute.
Barro, R. J. (1991) “Economic Growth in a Cross Section of Countries,”Quarterly Journal of Economics, Vol. 106 (2), pp. 407–443.
_____ and J.-W. Lee (2000) “International Data on Educational Attain-ment: Updates and Implications,” Centre for International Develop-ment Working Paper No. 42, Cambridge, MA: Harvard University.
_____ and X. Sala-i-Martin (1992) “Convergence,” Journal of PoliticalEconomy, Vol. 100, pp. 223–251.
Barry, F. (2004) “Export-Platform Foreign Direct Investment: the IrishExperience,” EIB Papers, Vol. 9 (2), pp. 9–37.
_____ and A. Hannan (2001) “FDI and the Predictive Powers of RevealedComparative Advantage Indicators,” Dublin: University College.
_____, J. Bradley and A. Hannan (2001) “The Single Market, the Struc-tural Funds and Ireland’s Recent Economic Growth,” Journal of Com-mon Market Studies, Vol. 39, pp. 537–552.
_____ and D. Curran (2004) “Enlargement and the European Geogra-phy of the IT Sector,” The World Economy, Vol. 27, pp. 901–922.
_____, H. Gorg and E. Strobl (2003) “Foreign Direct Investment, Agglom-eration and Demonstration Effects: an Empirical Investigation,”Weltwirtschaftliches Archiv, Vol. 139, pp. 583–600.
Bartholomew, J. R. (1989) The Formation of Science in Japan, NewHaven, CT: Yale University Press.
Beck, R. L. (1983) “The prospect theory of the patent system and unpro-ductive competition,” Research in law and Economics, Vol. 5, pp.193–209.
Beck, T., G. Clarke, A. Groff, P. Keefer and P. Walsh (2001) “New Toolsin Comparative Political Economy: The Database of Political Institu-tions,” The World Bank Economic Review, Vol. 15 (1), pp. 165–176.
Beintema, N. M. and G.-J. Stads (2004) “Investing in Sub-SaharanAfrican agricultural research,” Issue Briefs 8, International Food PolicyResearch Institute, Washington, DC: IFPRI.
Bergin, A. and I. Kearney (2004) “Human Capital, the Labour Market andProductivity Growth in Ireland,” ESRI Working Paper No. 158, Dublin:ESRI.
Besen, S. M. and L. J. Raskind (1991) “An introduction to the law andeconomics of intellectual property,” Journal of Economic Perspectives,Vol. 5 (1), pp. 3–27.
Blind, K. (2002) “Driving Forces for Standardisation at StandardisationDevelopment Organisations,” Applied Economics, Vol. 34 (16), pp.1985–1998.
_____ (ed.) (2004) The Economics of Standards: Theory, Evidence, Pol-icy, Cheltenham: Edward Elgar.
_____ (2005) “Standards, Technical Change and IPRs: Lessons fromIndustrialized Countries for Developing Countries,” Background Paperfor this Report, Vienna: UNIDO.
_____ (2006-forthcoming) “Explanatory Factors for Participation in For-mal Standardisation Processes: Empirical Evidence at Firm Level,” Eco-nomics of Innovation and New Technology, Vol. 15.
References
166 UNIDO Industrial Development Report 2005
_____, N. Thumm, E. Iversen, K. Hossain, R. v. Reekum, B. Rixius, R. Bier-hals, J. Sillwood (eds.) (2004) “Interaction between Standardisationand Intellectual Property Rights, Joint Research Centre (EuropeanCommission); Institute for Prospective Technological Studies,” Techni-cal Report Series IPTS, Seville, Brussels: European Commission.
Bloom, D. E. and D. Canning (2003) “Geography and Poverty Traps,”Journal of Economic Growth, Vol. 8., pp. 355–378.
Böhm, E., H. Conrad, H. Hiessl, T. Hillenbrand, V. Kühn, K. Lützner andR. Walz (1998) Effektivität und Effizienz technischer Normen undStandards für kommunale Umweltschutzaufgaben am Beispiel derkommunalen Abwasserentsorgung. Studie im Auftrag des Umwelt-bundesamtes, Bonn: UBA.
Boisot, M. (1995) Information Space, London: Routledge.
Broad, E., B. Choi, D. Drum and D. Lagunes (2005) “Embraer’s Creationof Value for Shareholders and the Brazilian Economy,” Chazen WebJournal of International Business, Vol. Winter.
Buchanan, R. (2002) “The Role of Quantitative Microbiological RiskAssessment in Risk Management Options Assessment,” Backgroundpaper for the Joint FAO/WHO Consultation held in Kiel, Germany onMarch 18–22, Online http://www.foodrisk.org/Doc/qmra.pdf.
Burnside C. and D. Dollar (1997) “Aid, Policies and Growth,” PolicyResearch Working Paper, No. 1777, Washington, DC: World Bank.
_____ (2000) “Aid, Policies and Growth,” American Economic Review,Vol. 90, pp. 847–868.
Carlsson, B. and R. Stankiewicz (1999) “On the Nature, Function andComposition of Technological Systems,” in H. Hanusch (ed.) TheLegacy of Joseph A. Schumpeter Intellectual Legacies in Modern Eco-nomics, Cheltenham, U.K. and Northampton, MA: Elgar.
_____ S. Jacobsson and A. Bergek (2004) “Dynamics of Innovation Sys-tems: Policy-Making in a Complex and Non-Deterministic World,”Paper presented at the International Workshop on Functions of Inno-vation Systems, University of Utrecht, 23–24 June.
Carvalho, J. M. de (2002) A escola de Minas de Ouro Preto: o peso dagloria, 2nd edition, Belo Horizonte: Editora UFMG.
Cerf, V. et al. (2000) “A Brief History of the Internet,” Onlinehttp://www.isoc.org/internet/history/.
Chandler, A.D., Jr. (1990) Scale and Scope. The Dynamics of IndustrialCapitalism, Cambridge, MA: The Belknap Press.
Chang, H.-J. (2002) Kicking Away the Ladder, Development Strategy inHistorical Perspective, London: Anthem Press.
Chen, M. X., T. Otsuki and J. S. Wilson (2004), Standards and TechnicalRegulations: Do they matter to export success in Developing Coun-tries, Washington, DC: World Bank.
Chenery H. B. and A. M. Strout (1966) “Foreign Assistance and EconomicDevelopment,” American Economic Review, Vol. 56 (4), pp. 679–733.
Chiesa, V., R. Manzini and G. Toletti (2002) “Standard-setting processes:evidence from two case studies,” R&D Management, Vol. 32, pp.431–449.
Cincera, M., B. van Pottelsberghe de la Potterie (2001) “InternationalR&D Spillovers: A Survey,” Cahiers Economiques de Bruxelles, Vol.169, pp. 3–32.
Cingranelli, D. L. and D. L. Richards, (2004) “The Cingranelli-Richards(CIRI) Human Rights Dataset,” Dataset Version 1.0.
Clague, C., P. Keefer, S. Knack and M. Olson (1999) “Contract IntensiveMoney: Contract Enforcement, Property Rights and Economic Perfor-mance,” Journal of Economic Growth, Vol. 4, pp. 185–211.
Clemens, R. (2003) “Meat Tracibility in Japan,” Review Paper (IAR9:4:4–5) Center for Agricultural and Rural Development, Ames: IowaState University.
CNET News (2005) “Ericsson sues Sendo over cell patents,” 23 March2005, Online http://news.com.com/Ericsson+sues+Sendo+over+cell+patents/2100-1039_3-5632010.html.
Coe, D. and E. Helpman (1995) “International R&D Spillovers,” EuropeanEconomic Review, Vol. 39, pp. 859–887.
Coffey, B., J. Mintert, S. Fox, T. Schroeder and L. Valentin (2005) “TheEconomic Impact of BSE on the US Beef Industry: Product Value Losses,Regulatory Costs and Consumer Reactions,” Agricultural ExperimentStation and Cooperative Extension Service, Manhattan, KS: KansasState University.
Cohen, W. M. and D. A. Levinthal (1990) “Absorptive Capacity: A NewPerspective on Learning and Innovation,” Administrative ScienceQuarterly, Vol. 35 (1), pp. 128–152.
Consortium of University Research Libraries (2003) “Evidence submittedjointly by CURL (Consortium of University Research Libraries) andSCONUL (Society of College, National and University Libraries) toHouse of Commons: Science and Technology Committee Inquiry intoScientific Publications,” Online http://www.sconul.ac.uk/topical/doc-uments/STC_evidence.doc.
Conway, P., V. Janod and G. Nicoletti (2005) “Product Market Regula-tion in OECD Countries: 1998 to 2003,” OECD Economics Depart-ment Working Papers No. 419, Paris: OECD.
Coordinadora de Industria de la Alimentación (COPAL) (2004) “Modern-ización del Sistema de Control de Alimentos y de SENASA. Necesi-dades y propuestas de COPAL,” Documento preliminar (restringido),Buenos Aires, 13 December
Cornwall, J. (1976) “Diffusion, Convergence and Kaldor’s Law,” Eco-nomic Journal, Vol. 85, pp. 307–314.
Council for Scientific and Industrial Research (CSIR) (2005) “SatelliteApplications Centre,” Online http://www.csir.co.za/.
Cowan, R., P. A. David and D. Foray (2000) “The explicit economics ofknowledge codification and tacitness,” Industrial and CorporateChange, Vol. 9 (2).
Crafts, N. (2005) “Interpreting Ireland’s Economic Growth,” BackgroundPaper for this Report, Vienna: UNIDO.
Cyranoski, D. (2005) “An irresistible force,” Nature, Vol. 436, pp.767–768.
Dahlman, C. J. (1984) “Foreign Technology and Indigenous Technologi-cal Capability in Brazil,” in M. Fransman and K. King (eds.) Technolog-ical Capability in the Third World, New York, NY: St.Martin’s Press.
_____ and F. Fonseca (1993) “From Technological Dependence to Tech-nological Development: The case of the USIMAS Steel Plant in Brazil,”in R. R. Nelson (ed.) National Innovation Systems, New York, NY:Oxford University Press.
_____ and O. Sananikone (1990) “Technology Strategy in TaiwanProvince of China: exploiting foreign linkages and investing in localcapability,” Washington, DC: World Bank.
David, P. A. (1986) “Narrow Windows, Blind Giants and Angry Orphans:The Dynamics of Systems Rivalries and Dilemmas of Technology Pol-icy,” CEPR Technological Innovation Project Working Paper No. 10,Stanford, CA: Stanford University.
_____ (1993) “Intellectual Property Institutions and the Panda’s Thumb,”in M. B. Wallerstein, M. E. Mogee, R. A. Schoen (eds.) Global Dimen-sions of Intellectual Property Rights in Science and Technology, Wash-ington, DC: National Academy Press.
_____ and D. Foray (1994) “Dynamics of competitive technology diffu-sion through local network structures,” in L. Leydesdorff and P. Vanden Besselaar (eds.) Evolutionary Economics and Chaos Theory, Lon-don: Pinter.
_____ and H. K. Monroe (1994) “Standards Development StrategiesUnder Incomplete Information – Isn’t the ‘Battle of the Sexes’ Really aRevelation Game?” Paper presented at the Telecommunications Pol-icy Research Conference, Solomon’s Island, MD: TPRC.
Dhungana, B. P. (2003) Foreign direct investment and technologicalcapability-building in least developed countries: A case study of Nepal,Bangkok: Social Commission for Asia and the Pacific.
Easterly, W. (2003) “National Policies and Economic Growth: A Reap-praisal,” Development Research Institute Working Paper No. 1, March2003, New York, NY: New York University.
_____ and R. Levine (2001) “It’s Not Factor Accumulation: Stylized Factsand Growth Models,” World Bank Economic Review, Vo. 15 (2), pp.177–219.
_____ and M. Sewadeh (2002) Global Development Network GrowthDatabase, New York, NY: World Bank.
Economist Intelligence Unit (EIU) (2004) “Scattering the seeds of inven-tion: The globalisation of R&D,” Online http://graphics.eiu.com/files/ad_pdfs/RnD_GLOBILISATION_WHITEPAPER.pdf.
Edquist, C. (ed.) (1997) Systems of innovation; technologies, institutionsand organizations. Science, technology and the international politicaleconomy series, London: Pinter.
_____ (2004) “Systems of Innovation: Perspectives and Challenges,” inJ. Fagerberg, D. C. Mowery and R. R. Nelson (eds.) The Oxford Hand-book of Innovation, Oxford: Oxford University Press.
Eichengreen, B. and M. Uzan (1992) “The Marshall Plan: EconomicEffects and Implications for Eastern Europe and the Former USSR,”Economic Policy, Vol.14, pp. 13–76.
Einhorn, B., Carey, J. and N. Gross, (2005) “China and India – The LeapAhead: Research, A New Lab Partner For The U.S.?” Business Week,Vol. 3948, Online.
European Commission (EC) (2003) “Green Paper on Entrepreneurship inEurope,” COM(2003) 27 final, Brussels: EC.
_____ (2004a) Statistics on Science and Technology in Europe. Brussels:EC.
_____ (2004b) “Guidance On The Implementation Of Articles 11, 12, 16,17, 18, 19 and 20 Of Regulation (Ec) N 178/2002 On General FoodLaw, Conclusions Of The Standing Committee On The Food ChainAnd Animal Health,” Brussels: EC, Online http://europa.eu.int/comm/food/food/foodlaw/guidance/guidance_rev_7_en.pdf.
_____ (2005a) “Guidance Document: Key questions related to importrequirements and the new rules on food hygiene and official food con-trols,” Brussels: EC, Online http://europa.eu.int/comm/food/interna-tional/trade/interpretation_imports.pdf.
_____ (2005b) “Better Training for Safer Food Initiative,” Brussels: EC,Online http://europa.eu.int/comm/food/animal/welfare/index_en.html.
Fagerberg, J. (1987) “A Technology Gap Approach to Why Growth RatesDiffer,” Research Policy, Vol. 16, pp. 87–99.
_____ (1988) “International Competitiveness,” Economic Journal, Vol.98, pp. 355–374.
_____ (1994) “Technology and International Differences in GrowthRates,” Journal of Economic Literature, Vol. 32 (3), pp. 1147–1175.
_____ and M. M. Godinho (2004) “Innovation and Catching-up,” in J.Fagerberg, D. C. Mowery and R. R. Nelson (eds.) The Oxford Hand-book of Innovation, Oxford: Oxford University Press.
_____, P. Guerrieri and B. Verspagen (eds.) (1999) The Economic Chal-lenge for Europe. Adapting to Innovation Based Growth, Cheltenham:Edward Elgar.
_____ and M. Srholec (2005) “Catching-up: What are the Critical Fac-tors for Success?” Background Paper for this Report, Vienna: UNIDO.
_____ and B. Verspagen (1999) “Modern Capitalism in the 1970s and1980s,” in M. Setterfield (ed.) Growth, Employment and Inflation,London: Macmillan.
Fearon, J. D. (2003) “Ethnic and Cultural Diversity by Country,” Journalof Economic Growth, Vol. 8, pp. 195–222.
_____ and D. D. Laitin (2003) “Ethnicity, Insurgency, and Civil War,”American Political Science Review, Vol. 97(1), pp. 75–90.
Financial Gazette (2004) “African countries consider US wireless stand-ard,” Onlinehttp://www.fingaz.co.zw/fingaz/2004/June/June10/5704.shtml.
Fitzgerald, J. (2002) “Has Ireland Outgrown Its Clothes? Infrastructuraland Environmental Constraints in Ireland,” in V. G. Munley, R. J. Thorn-ton and J. R. Aronson (eds.) The Irish Economy in Transition, Oxford:Elsevier Science.
Food and Agriculture Organisation (FAO) and World Health Organisation(WHO) (2004) “Strengthening Official Food Safety Control Services,”Agenda Item 4 in Second FAO/WHO Global Forum of Food Safety Reg-ulators, Bangkok, Thailand, 12–14 October.
Forfas (1999) Annual Survey of Irish Economy Expenditures, Dublin:Forfas.
_____ (2004a) Building Ireland”s Knowledge Economy, Dublin: Forfas.
_____ (2004b) Enterprise Strategy Group Report, Dublin: Forfas.
Fredebeul-Krein, M. (1997) “Veränderte Anforderungen an eineeuropäische Standardisierungspolitik in der Telekommunikation,”Zeitschrift für Wirtschaftspolitik, Vol. 46, pp. 140–166.
Freeman, Ch. (2002) “The Learning Economy and International Inequal-ity”, in D. Archibugi and B.A. Lundvall (eds.) The Globalizing LearningEconomy, Oxford, UK: Oxford Univ. Press.
Frenken, K. and A. Nuvolari (2003) “The Early Development of the SteamEngine: An evolutionary interpretation using complexity theory,”Working Paper 03.15, The Netherlands: Eindhoven Centre for Inno-vation Studies.
Frischtak, C. (1994) “Learning and technical progress in the commuteraircraft industry: an analysis of the Embraer’s experience,” ResearchPolicy, Vol. 23, pp. 601–612.
FX Asia (2005) “EU confirm investigation into telecom standards body,”14 June 2005.
Gallup, J. L., J. D. Sachs and A. Mellinger (1999) “Geography and Eco-nomic Development,” Centre for International Development WorkingPaper No. 1/1999, Cambridge, MA: Harvard University.
Gandal, N. and O. Shy (2001) “Standardization Policy and Internationaltrade,” Journal of International Economics, Vol. 53, pp. 363–383.
Gargiulo, G. (2005) “Food Safety Capacity-Building Needs: The Argen-tine Food Activity,” Background Paper for this Report, Vienna: UNIDO.
General Accounting Office (GAO) (2001) “Overview of Federal and StateExpenditures. US General Accounting Office,” Report GAO-01-177,Washington, DC: GAO.
Gerschenkron, A. (1962) Economic Backwardness in Historical Perspec-tive, Cambridge, MA: Harvard University Press.
Girma, S., H. Gorg and M. Pisu (2004) “The role of exporting and link-ages for productivity spillovers from FDI,” World Bank Research Paper,Washington, DC: World Bank.
Glaeser, E. L., R. La Porta, F. Lopez-de-Silanes and A. Schleifer (2004) “DoInstitutions Cause Growth?” Journal of Economic Growth, Vol. 9, pp.271–303.
Global Entrepreneurship Monitor (GEM) (2002) “Global Entrepreneur-ship Monitor 2002 Summary Report,” Online http://www.gemconsor-tium.org/download.asp?fid=239.
Godin, B. (2005) Measurement and Statistics on Science and Technol-ogy: 1920 to the Present, London: Routledge.
Gomes, F. M. (1983) História da Siderurgia Brasileira, Belo Horizonte: Ita-tiaia and São Paulo: Editora da Universidade de São Paulo.
Gompers, P. and J. Lerner (2001) “The Venture Capital Revolution,”Journal of Economic Perspectives, Vol. 15 (2), pp. 145–168.
Gorg, H. and F. Ruane (2001) “Multinational Companies and Linkages:Panel-Data Evidence for the Irish Electronics Sector,” InternationalJournal of the Economics of Business, Vol. 8, pp. 1–18.
_____ and D. Greenaway (2004) “Much ado about nothing? Do domes-tic firms really benefit from foreign direct investment?” World BankResearch Observer, Vol. 19, pp. 171–197.
_____ and E. Strobl (2004) “Foreign Direct Investment and Local Eco-nomic Development: Beyond Productivity Spillovers,” mimeo, Not-tingham: University of Nottingham.
Gostkowski, Z. (1986) Integrated Approach to Indicators for Science andTechnology, Paris: UNESCO.
Grindley, P. and S. Toker (1993) “Regulators, Markets and StandardsCoordination: Policy Lessons from Telepoint,” Economics of Innova-tion and New Technology, Vol. 2, pp. 319–342.
Groningen Growth and Development Centre (GGDC) (2005) “TotalEconomy Database,” Groningen Growth and Development Centreand The Conference Board, Online http://www.ggdc.net.
Gropp, R. and K. Kostial (2000) “The Disappearing Tax Base: Is FDI Erod-ing Corporate Income Taxes,” International Monetary Fund WorkingPaper No. 00/173, Washington, DC:IMF.
167References
Grossman, G. M. and E. Helpman (1991) Innovation and Growth in theGlobal Economy, Cambridge, MA: MIT Press.
Gesellschaft für Konsumforschung (GfK) (2001) “BSE crisis dramaticallyreduces meat consumption of German households,” 17 January2001, Press info, Online http://www.gfk.com/english/presse/pressemeldung/contentdetail.php?id=205 =en
Guillaumont, P. (1971) L’Absorption du Capital, Paris: Ed. Cujas.
_____ and L. Chauvet (1999) “Aid and Performance: A Reassessment,”Communication ABCDE Workshop on Aid, Selectivity and Condition-ality, Washington, DC: World Bank.
Gwartney, J. and R. Lawson (2004) Economic Freedom of the World:2004 Annual Report, Vancouver: The Fraser Institute.
Haber L. F. (1971) The Chemical Industry, 1900–1930, Oxford: Claren-don Press.
Hausmann, R. and D. Rodrik (2003) “Discovering El Salvador’s Produc-tion Potential,” in In Search of The Road Ahead: Identifying a Devel-opment Strategy for El Salvador, Cambridge, MA: Harvard University.
_____, A. Rodriguez-Clare and D. Rodrik (2005) “Towards a strategy foreconomic growth in Uruguay,” Inter-American Development Bank,Economic and Social Study Series, February 2005, Washington, DC:IADB.
Helbig, J. and J. Volkert (1998) “Potentiale und Grenzen freiwilligerStandards im Umweltschutz,” IAW-Mitteilungen, Vol. 4, pp. 4–15.
Henisz, W. J. (2002) “The Institutional Environment for InfrastructureInvestment,” Industrial and Corporate Change, Vol. 11 (2) pp.355–389.
Heston, A., R. Summers and B. Aten (2002) Penn World Table Version6.1, Center for International Comparisons, Philadelphia, PA: Univer-sity of Pennsylvania.
Hinloopen, J. (2003) “Innovation Performance Across Europe,” Econom-ics of Innovation and New Technology, Vol. 12, pp. 145–161.
Hotelling, H. (1933) “Analysis of a complex of statistical variables intoprincipal components,” Journal of Educational Psychology, Vol. 24,pp. 417–441.
Hsieh, S. H. (1989) “University Education and Research in Taiwan,” inP.G. Altbach, et al., Scientific Development and Higher Education. TheCase of Newly Industrializing Nations, Westport, CT: Praeger Publish-ers.
Huang, Y. and T. Khanna (2003) “Can India Overtake China?,” ForeignPolicy, Vol. July/August, pp. 74–81.
Huffman, W. E. and R. E. Evenson (1993) Science for Agriculture: ALong-Term Perspective, Ames, IOWA State Press.
Imbs, J. and R. Wacziarg (2003) “Stages of Diversification,” AmericanEconomic Review, Vol. 93 (1), pp. 63–86.
Industrial Policy Review Group (IPRG) (1992) A Time for Change: Indus-trial Policy for the 1990s, Dublin: IPRG Stationary Office.
Industrial Technology Research Institute (ITRI) (2004) “Testing/CertificationServices,” Online http://www.itri.org.tw/eng/business/certification.jsp.
Industry News (2004) “Taiwan Province of China is exporting an increas-ing volume of electric bikes, to the tune of $700m in 2004,” Issue pub-lished on 12/02/2004, Online.
Industry Updates (2005) “Food industry calls for ‘cold-chain’ technol-ogy,” Issue published on 23 August 2005, Online.
Institute for Management Development (IMD) (2004) World Competi-tiveness Yearbook, Lausanne: IMD.
Instituto Argentino de Normalización y Certificación (IRAM) (2005)“Capacity-building, standarisation and conformity assessment,” Back-ground Paper for this Report, Vienna: UNIDO.
International Standardisation Organisation (ISO) (2005) “ISO/FDIS22000: Food Safety Management Systems – Requirements for anyOrganization in the Food Chain (Final Draft),” Geneva: ISO.
Iversen, E. J. (2000) “Standardisation and Intellectual Property Rights:Conflicts Between Innovation and Diffusion in New Telecommunica-tion Systems,” in J. Kai (ed.) Information Technology Standardisation:A Global Perspective, Hershey, London: Idea Group Publishing.
_____ (2002) “Case Study: TETRA” in Blind et al. (ed.) Study on the Inter-action between Standardisation and Intellectual Property Rights, Karls-ruhe: Fraunhofer Institute of for Systems and Innovation Research.
_____, E. Øversjøen and H. Thue Lie (2004) “Standardization, Innovationand IPRs,” Telektronikk Vol. 100 (2), pp. 65–79.
Jacobsson, S. (1986) Electronics and Industrial Policy: The Case of Com-puter-Controlled Lathes, London: Allen and Unwin.
_____ (1993) “The length of the infant industry period: evidence fromthe engineering industry in South Korea,” World Development, Vol.21, pp. 407–419.
_____ (2005) “Formation and growth of sectoral innovation systems –‘functional analysis’ as a tool for policy makers in identifying policyissues,” Background Paper for this Report, Vienna: UNIDO.
_____ and G. Alam (1994) Liberalisation and Industrial Development inthe Third World. A Comparison of the Indian and South Korean Engi-neering Industries, New Delhi: Sage Publications.
Jaffee, S. and S. Henson (2004) “Standards and Agro-Food Exports fromDeveloping Countries: Rebalancing the Debate,” World Bank PolicyResearch Working Paper 3348, June 2004, Washington, DC: WorldBank.
_____, K. van der Meer, S. Henson, C. de Haan, M. Sewadeh, L. Ignacio,J. Lamb and M. Bergovoy Lisazo (2005) “Food Safety and AgriculturalHealth Standards: Challenges and Opportunities for DevelopingCountry Exports Report No. 31027,” Poverty Reduction and EconomicManagement Trade Unit and Agricultural and Rural DevelopmentDepartment, Washington, DC: World Bank.
Johnson, C. A. (1982) MITI and the Japanese miracle: the growth ofindustrial policy, 1925–1975, Stanford, CA: Stanford University Press.
Johnson, T. (2005) “China, a low-tech powerhouse, struggles to becomea major high-tech industry player,” The Miami Herald, August 21,2005, Online http://www.broward.com/mld/miamiherald/business/12430228.htm.
Jones, L. P. and I. S. Sakong (1980) Government, Business and Entrepre-neurship in Economic Development: The Korean Case Studies in theModernization of the Republic of Korea: 1945–1975, Cambridge,MA: Harvard University Press.
Katz, J. (2004) “Economic, institutional and technological forces induc-ing the successful inception of salmon farming in Chile,” mimeo,Argentina: University of Chile and Conicet.
Kavanagh, C. (1997) “Public Capital and Private Sector Productivity in Ire-land, 1958–1990,” Journal of Economic Studies, Vol. 24, pp. 72–94.
Kim, L. (1993) “National System of Industrial Innovation: Dynamics ofCapability Building in Korea,” in R. R. Nelson (ed.) National InnovationSystems. A Comparative Analysis, Oxford: Oxford University Press, pp.357–383.
Kirkpatrick, D. (2005) “IBM Shares Its Secrets Crunched by low-costcompetition: Big Blue is betting that giveaways of precious technol-ogy will expand the market and boost its own prospects,” Fortune 05,August 2005, Online.
Kiszewksi, A., A. Mellinger, A. Spielman and P. Malaney (2004) “A GlobalIndex of the Stability of Malaria Transmission,” American Journal ofTropical Medicine and Hygiene, Vol. 70 (5), pp. 486–498.
Kitch, E. W. (1977) “The nature and function of the patent system,” Jour-nal of Law and Economics, Vol. 20, pp. 265–290.
Kline, P. (1994) An easy guide to factor analysis, London: Routledge.
Kranakis, E. (1989) “Social Determinants of Engineering Practice: AComparative View of France and America in the Nineteenth Cen-tury,” Social Studies of Science, Vol. 19 (1), pp. 5–70.
Lall, S. (2003) “Indicators of the Relative Importance of IPRs in Develop-ing Countries,” Research Policy, Vol. 32 (9), pp. 1657–1680.
Landes, D. (1998) The Wealth and Powerty of Nations, London: Abacus.
Langlois, R. N. (2000) “Knowledge, Consumption and EndogenousGrowth,” Department of Economics Working Paper 2000–2002,Hartford, CT: University of Connecticut.
_____ and D. C. Mowery (1996) “The federal government role in thedevelopment of the U.S. software industry,” in D. C. Mowery (ed.) The
168 UNIDO Industrial Development Report 2005
International Computer Software Industry: A Comparative Study ofIndustry Evolution and Structure, New York: Oxford University Press.
Lee, S. (1989) “Higher Education and Research Environments in Korea,”in P. G. Altbach et al., Scientific Development and Higher Education.The Case of Newly Industrializing Nations, Westport, CT: Praeger Pub-lishers.
Lerner, J. and J. Tirole (2000) “The Simple Economics of Open Source,”National Bureau of Economic Research Working Paper Series 7600,Cambridge, MA: NBER.
Levin, R., A. Klevorick, R. R. Nelson and S. Winter (1987) “Appropriat-ing the Returns from Industrial Research and Development,” Brook-ings Papers on Economic Activity, Special Issue on Microeconomics,Vol. 3, pp. 783–831.
Liebowitz, S. J. and S. E. Margolis (1999) Winners, Losers and Microsoft.Competition and Antitrust in High Technology, Oakland, CA: The Inde-pendent Institute.
Lim, A. (2002) “Standard Setting Processes in ICT: The NegotiationsApproach,” Working Paper 2.19, Faculty of Technology Management(ed.), Eindhoven: Technische Universiteit Eindhoven.
Lim, C. (1997) “Sectoral Systems of Innovation – the case of the Koreanmachine tool industry,” D.Phil Thesis, SPRU, UK: University of Sussex.
Liphard, K. G. (1998) “Brennstoffnormen als Bausteine der Qualitäts-politik,” Glückauf, Vol. 134, pp. 23–28.
Lucas, R. E.(2002) Lectures on Economic Growth, Cambridge, MA: Har-vard University Press.
Lundvall, B.-A. (1988) “Innovation as an Interactive Process: From User-Producer Interaction to the National System of Innovation,” in G. Dosi,C. Freeman, R. R. Nelson, G. Silverberg and L. Soete (eds.) TechnicalChange and Economic Theory, London: Pinter Publishers.
Lyman, P. and H. R. Varian (2003) “How Much Information,” Onlinehttp://www.sims.berkeley.edu/how-much-info-2003.
Machlup, F. (1962) The Production and Distribution of Knowledge in theUnited States, Princeton, NJ: Princeton University Press.
MacSharry, R. and P. A. White (2000) The Making of the Celtic Tiger,Cork: Mercier Press.
Maddison, A. (1982) Phases of Capitalist Development, Oxford: OxfordUniversity Press.
_____ (1991) Dynamic Forces in Capitalist Development, New York, NY:Oxford University Press.
_____ (2001) The World Economy: A Millennial Perspective, Paris: OECD.
_____ (2003) The World Economy: Historical Statistics, Paris: OECD.
Magariños, C. A. (2005) Economic Development and UN Reform –Towards a Common Agenda for Action, Vienna: UNIDO.
Magariños, C. and F. Sercovich (eds.) (2003) Updating and Fleshing Outthe Development Agenda, Vienna: UNIDO.
Malerba, F. (2004) “Sectoral Systems: How and Why Innovation DiffersAcross Sectors” in J. Fagerberg, D. C. Mowery and R. R. Nelson (eds.)The Oxford Handbook of Innovation, Oxford: Oxford University Press.
Markusen, J. and A. J. Venables (1999) “Foreign Direct Investment as aCatalyst for Industrial Development,” European Economic Review,Vol. 43, pp. 35–356.
Marshall, M. G. and K. Jaggers (2002) “Polity IV Dataset (Computer file;version p4v2002),” College Park, Center for International Develop-ment and Conflict Management, MD: University of Maryland.
Marson, I. (2005) “Telecom standards face patent ambush threat,”ZDNet UK, 15 June 2005, Online http://news.zdnet.co.uk/business/legal/0,39020651,39203931,00.htm.
Maskus, K. E., T. Otsuki and J. S. Wilson (2004) The Costs of Complyingwith Foreign Product Standards for Firms in Developing Countries: AnEconometric Study, Bolder, CD: University of Colorado.
Masters, W. A. and M. S. McMillan (2001) “Climate and Scale in Eco-nomic Growth,” Journal of Economic Growth, Vol. 6, pp. 167–186.
Mazzoleni, R. (2003) “The Role of Universities and public research Insti-tutes in the Catching-up Process,” presented at the Globelics confer-ence, Rio de Janeiro, Brazil.
_____ (2005) “The contribution of the Escola de Minas to the Develop-ment of Brazil’s Iron Industry (1876–1930),” Paper presented at the2005 EBHS Conference, High Point, NC, USA.
_____ (2005) “Historical Patterns in the Coevolution of Higher Educa-tion,” Public Research, and National Industrial Capabilities,” Back-ground Paper for this Report, Vienna: UNIDO.
McGinn, N. F., et al. (1980) Education and Development in Korea, Cam-bridge, MA: Harvard University Press.
McKinsey Global Institute (2003) “Offshoring: Is It a Win-Win Game?”San Francisco, CA: McKinsey.
Midelfart-Knarvik, K. H., H. G. Overman, S. J. Redding and A. J. Venables(2000) “The Location of European Industry,” Economic Papers No.142, EC DG for Economic and Financial Affairs.
Millikan, M. and W. W. Rostow (1957) A Proposal. Key to an EffectiveForeign Policy, Cambridge, MA: MIT Press.
Miselbach, R. and R. Nicholson (1994) Intellectual Property Rights andStandardization Sec. Update, France: Sophia Antipolis.
Mitchell, B. R. (1995) International historical statistics: Africa, Asia andOceania, 1750–1988 (2d rev.ed.), Basingstoke: Stockton Press.
_____ (2003a) International historical statistics: the Americas,1750–2000 (5th rev.ed.), Basingstoke: Palgrave Macmillan.
_____ (2003b) International historical statistics: Europe, 1750–2000 (5threv.ed.), Basingstoke: Palgrave Macmillan.
Mokyr, J. (2003) “Long-term Economic Growth and the History of Tech-nology,” Draft chapter for P. Aghion and S. Durlauf (eds.) Handbookof Economic Growth, USA: Elsevier.
Momo, C. (2005) “Wireless in Africa: Insights into Mobile Market,” ITPro, IEE Computer Society, May–June 2005, Online.
Morgan Stanley Equity Research (2002) Online http://www.econ.ucsb.edu/tedb/Journals/morganstanley.pdf.
Mowery, D. C. (2003) “Intellectual Property, Competition Policy and Pub-lic Goods: Evidence from Policy Reform in the United States,” in C.Magariños and F. Sercovich (eds.) Updating and Fleshing Out theDevelopment Agenda,” Vienna: UNIDO.
_____ (2005) “The role of knowledge-based ‘public goods’ in economic‘catch-up’: Lessons from history,” Background Paper for this Report,Vienna: UNIDO.
_____ and N. Rosenberg (1993) “The U.S. National Innovation System”in R. Nelson (ed.) National Innovation Systems: A Comparative Analy-sis, New York, NY: Oxford University Press.
Murmann, J. P. (1998) “Knowledge and Competitive Advantage in theSynthetic Dye Industry, 1850–1914,” unpublished Ph.D. dissertation,Columbia University, New York, NY, US.
_____ (2003a) Knowledge and Competitive Advantage, New York, NY:Cambridge University Press.
_____ (2003b) “The Coevolution of Industries and Academic Institu-tions: Theory and Evidence,” presented at the Harvard Business SchoolBusiness History seminar, September 24.
National Research Council (1999) Funding a Revolution: GovernmentSupport for Computing Research, Washingtin, DC: National AcademyPress.
National Science Council (NSC) (1997) “White Paper on Science andTechnology,” Executive Yuan, Republic of China, Taiwan, Onlinehttp://www.stic.gov.tw/stic/policy/scimeeting/ E-whitepaper/index_e.htm.
National Science Foundation (NSF) (2004) “Science and Engineering Indi-cators 2004,” National Science Board Division of Science ResourcesStatistics, Online http://www.nsf.gov/statistics/seind04/
Neary, J. P. (2004) “Rationalizing the Penn World Table: True MultilateralIndices for International Comparisons of Real Income,” American Eco-nomic Review, Vol. 94 (2), pp. 1411–1428.
Nelson, R. R. (1984) High-Technology Policies: A Five-Nation Compari-son, Washington, DC: American Enterprise Institute.
_____ (1990) “Capitalism as an Engine of Progress,” Research Policy, Vol.19, pp. 61–87.
169References
_____ (1992) “What is ‘Commercial’ and What is ‘Public’ About Tech-nology and What Should Be?” in N. Rosenberg, R. Landau and D. C.Mowery (eds.) Technology and the Wealth of Nations, Stanford, CA:Stanford University Press.
_____ (1994) “The co-evolution of technology, industrial structure andsupporting structure,” Industrial and Corporate Change, Vol. 3 (1), pp.47–63.
_____ (2003a) “The Changing Institutional Requirements for Technolog-ical and Economic Catch Up,” unpublished mimeo.
_____ (2003b) “Physical and Social Technologies and Their Evolution,”Économie Appliquée, Vol. 56 (3), pp. 13–29.
_____ and E. Phelps (1966) “Investment in humans, technology diffusionand economic growth,” American Economic Review, Papers and Pro-ceedings, Vol. 56, pp. 69–75.
_____ and P. Romer (1996) “Science, Economic Growth and Public Pol-icy,” in B. Smith and C. Barfield (eds.) Technology, R&D and the Econ-omy, Washington, DC: Brookings.
_____ and N. Rosenberg (1994) “American Universities and TechnicalAdvance in Industry,” Research Policy, Vol.23, pp. 323–348.
_____ and B. Sampat (2001) “Making sense of institutions as a factorshaping economic performance,” Journal of Economic Behavior &Organization, Vol. 44 (1), pp. 31–54.
_____ and S. G. Winter (1982) An Evolutionary Theory of EconomicChange, Cambridge, MA: Harvard University Press.
_____ and G. Wright (1992) “The rise and fall of American technologi-cal leadership: The postwar era in historical perspective,” Journal ofEconomic Literature, Vol. 30, pp. 1931–1964.
Nicoletti, G., S. Scarpetta and O. Boylaud (2000) “Summary Indicatorsof Product Market Regulation with an Extension to Employment Pro-tection Regulation,” OECD Economics, Department Working PaperNo. 226, Paris: OECD.
Nightingale, P. (2003) “If Nelson and Winter are only half right about tacitknowledge, which half?” Industrial and Corporate Change, Vol. 12(2), pp.149–183.
_____ (2004) “Technological capabilities, invisible infrastructure and theun-social construction of predictability: the overlooked fixed costs ofuseful research,” Research Policy, Vol. 33, pp. 1259–1284.
Niman, N. B. (2002) “Platform Externalities and Antirust Case AgainstMicrosoft” Antitrust Bulletin, Vol. Winter, pp. 641–660.
_____ and B. Kench (2004) “Open Source and the Future of Pharmaceu-tical Industry,” Paper presented at the DRUID Summer Conference2004 on Industrial Dynamics, Innovation and Development, Elsinore,Denmark, 14–16 June.
North, D. (1981) Structure and Change in Economic History, London: W.W. Norton and Company.
O’Grada, C. and K. H. O’Rourke (1996) “Irish Economic Growth,1945–88,” in N. Crafts and G. Toniolo (eds.) Economic Growth inEurope since 1945, Cambridge, MA: Cambridge University Press.
O’Mahony, M. (2002) Productivity in the EU, 1979–1999, London: HMTreasury.
O’Malley, E. (1995) “An Analysis of Secondary Employment Associatedwith Manufacturing Industry,” ESRI General Research Paper No. 167,Dublin: ESRI.
Odagiri, H. and A. Goto (1993) “The Japanese System of Innovation:Past, Present and Future,” in R. R. Nelson (ed.) National Innovation Sys-tems. A Comparative Analysis, Oxford University Press.
Ohkawa, K. and H. Rostovsky (1973) Japanese Economic Growth, Stan-ford, CA: Stanford University Press.
Olson, M. (1965) The Logic of Collective Action: Public Goods and theTheory of Groups, Cambridge, MA: Harvard University Press.
_____ (1996) “Big Bills Left on the Sidewalk: Why Some Nations are Richand Others Poor,” Journal of Economic Perspectives, Vol. 10 (2), pp.3–24.
Organisation for Economic Co-operation and Development (OECD)(1996) “ICT Standardization in the New Global Context,” OCDE/GD(96) 86, Paris.
_____ (2000) Literacy in the Information Age, Paris: OECD.
_____ (2004) “Compendium of Patent Statistics,” Onlinehttp://www.oecd.org/dataoecd/60/24/8208325.pdf.
_____ (2004a) “Performance Indicators of Student Achievement, 2003,”Paris: OECD.
_____ (2004b) “Revenue Statistics, 1965–2001,” Paris: OECD.
Ouédraogo, L.-D. (2005) “Policies of United Nations System Organiza-tions toward the Use of Open Source Software (OSS) – Part I: Use ofOSS in the Secretariats,” Joint Inspection Unit, JIU/REP/2005/XXX,Geneva: UN.
Overseas Development Institute (ODI) (2005) “Scaling up versus absorp-tive capacity: challenges and opportunities for reaching the MDGs inAfrica,” Briefing Paper, London: ODI.
Paula, J. A. de (1983) “A Siderurgia em Minas Gerais – 1809–1888,” inHaydn Coutinho Pimenta (ed) II Seminario Sobre a Economia Mineira,Belo Horizonte: CEDEPLAR, pp. 24–31.
Polanyi, M. (1958) Personal Knowledge: Towards a Post-Critical Philoso-phy, Chicago, IL: University of Chicago Press.
Pollard, S. (1981) Peaceful conquest. The industrialization of Europe,1760–1970. Oxford: Oxford University Press.
Pritchett, L. (2001) “Where Has All the Education Gone?” World BankEconomic Review, December 2001.
Process Engineering (2005) “All part of the process” 18 August 2005,Online http://www.processengineering.co.uk/Articles/291791/All+part+of+the+process.htm.
RAND (2002) “Can Science and Technology Capacity Capacity Be Meas-ured?” Santa Monica, CA and Leiden, NL: RAND Corporation.
Rapp, R. T. and L. J. Stiroh (2002) “Standard Setting and Market Power,contribution to the public hearing on Competition and IntellectualProperty Law and Policy in the Knowledge-Based Economy in 2001and 2002,” Online http://www.ftc.gov/opp/intellect/index.htm (3-07-2002).
Rasiah, R. (2004) Foreign firms, Technological Capabilities and EconomicPerformance: Evidence from Africa, Asia and Latin America, Chel-tenham: Edward Elgar.
Redding, S. J. and A. J. Venables (2004) “Economic Geography andInternational Inequality,” Journal of International Economics, Vol. 62,pp. 53–82.
Roberts, D. and L. Unnevehr (2003) “Resolving Trade Disputes Arisingfrom Trends in Food Safety Regulation” in International Trade andFood Safety: Economic Theory and Case Studies, USDA/ERS AER 828,Washington, DC: USDA.
Rodríguez-Clare, A. (2003) “Innovation and Technology Adoption inCentral America,” mimeo Inter-American Development Bank, Onlinehttp://www.rodriguezclare.com/Papers/Innovation%20and%20Tech-nology%20Adoption% 20in%20Central%20America.pdf.
Rodrik, D. (1999) “Institutions for High-Quality Growth: What They Areand How to Acquire Them,” Paper presented at the IMF conferenceon Second Generation Reforms, Washington, DC, November 8–9,1999.
_____ (2004) “Industrial policy for the twenty-first century,” mimeo,John F. Kennedy School of Government, Cambridge, MA: Harvard Uni-versity.
Romer, P. M. (1990) “Endogenous Technological Change,” Journal ofPolitical Economy, Vol. 98 (5), pp. 71–102.
Rosenstein-Rodan, P. (1961) “Notes on the theory of the big push” in H.S. Ellis and H. C. Wallich (eds.) Economic Development for Latin Amer-ica, New York, NY: St. Martin’s.
Rotherham, T. (2003) “Implementing Environmental, Health and Safety(EH&S) Standards and Technical Regulations: The Developing CountryExperience,” Trade Knowledge Network Thematic Paper, InternationalInstitute for Sustainable Development and International Centre forTrade and Sustainable Development, Online http://www.tradeknowl-edgenetwork.net/publication.aspx?id=531.
Ruane, F. and A. Uour (2002) “Foreign Direct Investment and Productiv-ity Spillovers in Irish Manufacturing Industry: Evidence from Firm-Level
170 UNIDO Industrial Development Report 2005
Panel Data,” Trinity College Dublin Economics Paper 02/06, Dublin:Trinity College.
Sachs, J. D., J. W. McArthur, G. Schmidt-Traub, M. Kruk, C. Bahadur, M.Faye and G. McCord (2004) “Ending Africa’s Poverty Trap,” BrookingsPapers on Economic Activity, No. 117–240, Washington, DC: Brook-ings.
Servicio Agrícola y Ganadero (SAG) (2001) Cuenta Pública 2000. Gob-ierno de Chile, Servicio Agrícola y Ganadero, Santiago de Chile.
Samuelson, P. (1955) “Diagrammatic Exposition of a Theory of PublicExpenditure,” Review of Economics and Statistics, Vol. 36, pp.350–356.
San, G. (1990) “Enterprise training in Taiwan: results from the vocationaltraining needs survey,” Economics of Education Review, Vol. 9 (4), pp.411–418.
Sánchez, G. and I. Butler (2005) “Measuring the Demand of Trade-Related Technological Public Goods in Argentina,” Background Paperfor this Report, Vienna: UNIDO.
Saperstein, J. and D. Rouach (eds.) (2002) Creating Regional Wealth inThe Innovation Economy, Toronto: Financial Times and Prendice-Hall.
Saviotti, P. P. (1998) “On the dynamics of appropriability of tacit and cod-ified knowledge,” Research Policy, Vol. 26, pp. 834–856.
_____ (1991) “The role of variety in economic and technological devel-opment,” in P. P. Saviotti and J. S. Metcalfe (eds.) Evolutionary Theo-ries of Economic and Technological Change, Chur: Harwood AcademyPublishers.
Schoonwinkel A. and G. W. Milne (1997) “University research and devel-opment of a microsatellite,” R&D Management, Vol. 27 (1), pp.37–44.
Schumpeter, J. A. (1942) Capitalism, Socialism and Democracy, (HarperColophon edition, 1976), New York, NY: Harper and Brothers.
Seely, B. E. (1993) “Research, Engineering and Science in American Engi-neering Colleges, 1900–1960,” Technology and Culture, Vol. 34, pp.344–386.
Sercovich, F. C. et al. (1999) Competition and the World Economy – Com-paring Industrial Development Policies in the Developing and Transi-tion Economies, UNIDO, Cheltenham: Edward Elgar.
_____ and M. Dolun (2005) “The Nuances of Publicness: Implications forCatching-Up,” unpublished manuscript, Vienna: UNIDO.
Servicio Nacional de Sanidad y Calidad Agroalimentaria (SENASA)(2004a) Plan estratégico para el cambio y fortalecimiento de SENASA.Síntesis del informe de un Grupo de Expertos, Buenos Aires, Onlinehttp://www.senasa.gov.ar.
_____ (2004b) Cambio y fortalecimiento del SENASA. Lineamientosestratégicos, Buenos Aires, Online http://www.senasa.gov.ar.
Sidgurdson, J. (1986) “Industry and State Partnership: The historical roleof the engineering research associations in Japan,” Industry and Inno-vation, Vol. 5 (2), pp. 209–241.
Slaughter, M. J. (2003) “Host Country Determinants of US Foreign DirectInvestment into Europe,” in H. Herrmann and R. Lipsey (eds.) ForeignDirect Investment in the Real and Financial Sector of Industrial Coun-tries, Berlin: Springer.
Solow, R. M. (1956) “A Contribution to the Theory of EconomicGrowth,” Quarterly Journal of Economics, Vol. 70 (1), pp. 65–94.
_____ (1957) “Technical Change and the Aggregate Productio n Func-tion,” Review of Economics and Statistics, Vol. 39, pp. 312–330.
Spearman, C. (1904) “General intelligence: objective determined andmeasured,” American Journal of Psychology, Vol. 15, pp. 201–292.
Spengel, C. and W. Wiegard (2004) “Dual Income Tax: a Pragmatic TaxReform Alternative for Germany,” CESifo DICE Report No. 3, Munich:IFO Institute.
Srinivas, S. (2005) “Technical standards and economic development:Meeting the most common denominator,” Paper prepared for UNIDO,Vienna: UNIDO.
Steffensen, B. (1997) New Technologies and Standardization: A Usefulbut Problematic Combination, Paper for the Interdisciplinary Work-
shop on Standardization Research at the University of the FederalArmed Forces, Hamburg: Univ. der Bundeswehr.
Sutz, J. and R. Arocena (2005) “Science, technology and innovation indeveloping countries: some elements for defining policies and assign-ing resources,” Background Paper for this Report, Vienna: UNIDO.
Syrquin, M. (1989) “Patterns of Structural Change,” Chapter 7 in H.Chenery and T.N. Srinivasan (eds.) Handbook of Development Eco-nomics, Vol.1, Amsterdam: North Holland.
Tan H. W. and G. Batra (1996) “Enterprise training in developing coun-tries. Overview of Incidence, determinants and productivity outcome,”Private Sector Development Department Occasional Paper No. 9,Washington, DC: The World Bank.
Teece, D. (1986) “Profiting from technological innovation: Implication forintegration, collaboration, licensing and public policy,” Research Pol-icy, Vol. 15, pp. 285–305.
Temple, J. and P. A. Johnson (1998) “Social Capability and EconomicGrowth,” Quarterly Journal of Economics, Vol. 113 (3), pp. 965–990.
Teubal, M. (2000) “Enterprise Restructuring and Embeddedness: A Pol-icy and Systems Perspective,” Industrial and Corporate Change, Vol.9(1), pp. 87–111.
_____ (2002) “What is the systems perspective to Innovation and Tech-nology Policy (ITP) and how can we apply it to developing and newlyindustrialized economies?” Journal of Evolutionary Economics, Vol. 12(1), pp. 233–257.
Thelen, K. (2004) How institutions evolve: The political economy of skillsin Germany, Britain, the United States and Japan, New York, NY: Cam-bridge University Press.
Third Generation Partnership Project (3G), Online http://www.3gpatents.com/.
Tocqueville, A. de. (1876) Democracy in America, Boston, MA: JohnAllyn Publisher.
Uchida, H., (1980) “Western Big Business and the Adoption of New Tech-nology in Japan: The Electrical Equipment and Chemical Industries1890–1920,” in A. Okochi and H. Uchida (eds.) Development and Dif-fusion of Technology: Electrical and Chemical Industries, 6th Interna-tional Conference on Business History, Tokyo: University of Tokyo Press.
United Nations Conference on Trade and Development (UNCTAD) (2002)“Expert meeting on environment requirements and internationaltrade,” paper by Mr. Ansoumane Berete, Head of the Trade Policy andAgreement Division of the Ministry of Trade of Guinea Expert Meet-ing on Environmental Requirements and International Trade Geneva,2–4 October 2002, Online http://r0.unctad.org/trade_env/test1/meet-ings/envreq.htm.
_____ (2004) World Investment Report, Geneva: UNCTAD.
United Nations Development Programme (UNDP) (2003) Human Devel-opment Index, Human Development Report 2003, New York, NY:UNDP.
United Nations Educational, Scientific and Cultural Organisation(UNESCO) (1972) Statistics of Students Abroad 1962–1968, Paris:UNESCO.
_____ Institute for Statistics (2005) “Research and Development Statis-tics and Indicators,” Online http://www.uis.unesco.org/ev.php?ID=5182_201&ID2=DO_TOPIC.
United Nations Industrial Development Organisation (UNIDO) (1979)“The Changing Pattern of Industrial Production,” Chapter II in WorldIndustry Since 1960: Progress and Prospects, New York, NY: UnitedNations.
_____ (2003) UNIDO in the Montreal Protocol: Impacts and lessonslearned – fumigants, Vienna: UNIDO.
_____ and World Trade Organisation (2004) “Second Joint ProgressReport: Implementation of the WTO – UNIDO Memorandum ofUnderstanding: Technical Cooperation Programme responding to theDoha Development Agenda,” 8 November 2004, Vienna/Geneva:UNIDO/WTO.
van Ark, B., J. Melka, N. Mulder, M. Timmer and G. Ypma (2003) “ICTInvestments and Growth Accounts in the European Union,” Gronin-
171References
172 UNIDO Industrial Development Report 2005
gen Growth and Development Centre Research Memorandum No. GD56, Groningen: GGDC.
Veblen, T. (1915) Imperial Germany and the Industrial Revolution, NewYork, NY: Macmillan.
Verspagen, B. (1991) “A New Empirical Approach to Catching up orFalling Behind,” Structural Change and Economic Dynamics, Vol. 2,pp. 359–380.
von Hippel, E. (2001) “Innovation by User Communities: Learning fromOpen Source Software” Sloan Management Review, Vol. 42 (4), pp.82–86.
von Tunzelmann, G. N. (1995) Technology and Industrial Progress. TheFoundations of Economic Growth, Aldershot: Edward Elgar.
Wade, R. (1990) Governing the Market, Princeton, NJ: Princeton Univer-sity Press.
Wagner, C. (2005) “The Pillars of Progress: Metrics for Science and Tech-nology Infrastructure,” Background Paper for this Report, Vienna:UNIDO.
Walsh, B. (2004) “The Transformation of the Irish Labour Market,1980–2003,” Journal of the Statistical and Social Inquiry Society of Ire-land, Vol. 33 (forthcoming).
Walsh, V. (1988) “Technology and the Competitiveness of Small Coun-tries,” in Ch. Freeman and B.A. Lundvall (eds.) Small countries facingtechnological revolution, London: Pinter.
Wey, C. (1999) Marktorganisation durch Standardisierung. Ein Beitragzur neuen Institutionenökonomik des Marktes, Wissenschaftszentrumfür Sozialforschung (ed.), Berlin: Edition Sigma.
Wickham, J. and G. W. Boucher (2004) “Training Cubs for the CelticTiger: the Volume Production of Technical Graduates in the Irish Edu-cational System,” Journal of Education and Work, Vol. 17, pp.377–395.
Willgerodt, H. and J. Molsberger (1978) “Der volkswirtschaftliche Nutzender Normung,” Gutachten im Auftrage des Bundesministerium fürWirtschaft, Bonn: BMWi.
Williams, G., (2002) “The Assessment of the Economic Role of Measure-ments and Testing in Modern Society,” Final Report, Oxford, Pem-brooke College: European Commission.
Wooldridge, J. M. (2002) Econometric Analysis of Cross Section andPanel Data, Cambridge, MA: The MIT Press.
World Bank (1993) The East Asian miracle: Economic growth and pub-lic policy. New York: Oxford University Press.
_____ (1999) Knowledge for Development, New York, NY: Oxford Uni-versity Press.
_____ (2002a) Building Institutions for Markets, New York, NY: OxfordUniversity Press.
_____ (2002b) Constructing Knowledge Societies: New Challenges forTertiary Education, Washington, DC: World Bank.
_____ (2004) World Development Indicators 2004, Washington DC:World Bank.
_____ (2005) India and the Knowledge Economy: Leveraging Strengthsand Opportunities, Washington, DC: World Bank.
World Economic Forum (2004) “Technology Index” in the Global Com-petitiveness Report 2003–2004, Geneva: WEF.
World Trade Organisation (2004) International Trade Statistics 2004online database, http://www.wto.org/english/res_e/statis_e/statis_e.htm.
_____ (2005a) Annual Report 2005, Geneva: World Trade Organization.
_____ (2005b) “Review of the Operation and Implementation of theAgreement on the Application of Sanitary and Phytosanitary Meas-ures,” G/SPS/36, Report adopted by the Committee on Sanitary andPhytosanitary Measures, 11 July 2005.
_____ (2005c) “Sanitary, Phytosanitary Measures Committee: PrivateStandards discussed as SPS Committee adopts two reports” NewsItems, 29–30 June 2005, Online http://www.wto.org/english/news_e/news05_e/sps_june05_e.htm.
Yonekura, S. (1994) The Japanese iron and steel industry, 1850–1990 :continuity and discontinuity, New York,NY: St Martin’s Press.
Zahra, S. and G. George (2002) “Absorptive capacity: a review, recon-ceptualization and extension,” Academy of Management Review, Vol.27, pp. 185–203.
Zimmerman, M. A. and G. J. f. Zeitz (2002) “Beyond survival: Achievingnew venture growth by building legitimacy,” Academy of Manage-ment Review, Vol. 27 (3), pp. 414–431.
AAbramovitz, M. 9, 10, 35, 77, 165Acemoglu, D. 10, 165Addison-Smyth, D. 79, 165Adelman, I. 13, 34, 165Adler, J. H. 11, 165Aghion, P. 34, 165, 169Alam, G. 74, 168Alesina, A. 10, 12, 25, 165Angel, D. P. 52, 56, 165Archibugi, D. 21, 34, 165, 167Arora, A. 6, 165Asheim, B. 82, 165Aten, B. 33, 40, 41, 168Avnimelech, G. 82, 83, 165
BBahadur, C. 171Barro, R. J. 22, 34, 41, 165Barry, F. 78, 79, 80, 81, 165Bartholomew, J. R. 49, 165Batra, G. 54, 171Beck, R. L. 110, 165Beck, T. 24, 165Beintema, N. M. 63, 165Bergek, A. 166Bergin, A. 77, 79, 165Bergovoy Lisazo, M. 168Besen, S. M. 110, 165Bierhals, R. 166Blind, K. iii, viii, 8, 85, 86, 90, 109, 110, 111,
165, 166, 168Bloom, D. E. 10, 166Böhm, E. 109, 110, 166Boisot, M. 12, 166Boucher, G. W. 78, 172Boylaud, O. 170Bradley, J. 165Broad, E. xiv, xvii, xx, 12, 13, 14, 19, 33, 34,
38, 48, 51, 70, 74, 76, 132, 134, 143, 148,166
Buchanan, R. 119, 123, 166Burnside C. 11, 166Butler, I. 109, 171
CCanning, D. 166Carey, J. 167Carlsson, B. 82, 89, 166Carvalho, J. M. de 54, 166Cerf, V. 51, 166Chandler, A. D. 35, 166Chang, Ha-Joon 41, 166Chauvet, L. 11, 168
Chen, M. X. 112, 166Chenery, H. B. 11, 166, 171Chiesa, V. 110, 166Choi, B. 166Cincera, M. 13, 166Cingranelli, D. L. 23, 166Clague, C. 33, 166Clarke, G. 165Clemens, R. 123, 166Coco, A. 21, 34, 165Coe, D. 13, 166Coffey, B. 123, 166Cohen, W. M. 10, 166Conrad, H. 166Conway, P. 78, 166Cornwall, J. 34, 166Cowan, R. 6, 166Curran, D. 80, 165Cyranoski, D. 70, 166
DDahlman, C. 54, 56, 74, 166David, P. A. viii, 6, 109, 110, 166Devleeschauwer, A. 165Dhungana, B. P. 75, 166Dollar, D. 11, 16, 36, 48, 70, 166Dolun, M. viii, 57, 171Drum, D. 166
EEasterly, W. 12, 25, 165, 166Edquist, C. 12, 82, 167Eichengreen, B. 78, 167Einhorn, B. 70, 167Evenson, R. E. 48, 168
FFagerberg, J. viii, 9, 12, 33, 34, 37, 41, 43,
165, 167, 169Faye, M. 171Fearon, J. D. 25, 167Fitzgerald, J. 78, 167Fonseca, F. 74, 166Foray, D. 6, 54, 166Fox, S. 166Fredebeul-Krein, M. 109, 167Freeman, Ch. 52, 167, 169, 172Frenken, K. 110, 167Frischtak, C. 74, 167
GGallup, J. L. 25, 167Gambardella, A. 6, 165Gandal, N. 87, 167
Gargiulo, G. viii, 123, 167George, G. 12, 172Gerschenkron, A. 5, 10, 167Gertler, M. S. 82, 165Girma, S. 75, 167Glaeser, E. L. 9, 12, 167Godin, B. 76, 167Godinho, M. 12, 167Gomes, F. M. 54, 167Gompers, P. 83, 167Gorg, H. 75, 81, 165, 167Gostkowski, Z. 76, 167Goto, A. 49, 170Greenaway, D. 75, 167Grindley, P. 110, 167Groff, A. 165Gropp, R. 80, 167Gross, N. x, 9, 22, 27, 36, 154, 165, 167Grossman, G. M. 13, 168Guerrieri, P. 167Guillaumont, P. 11, 168Gwartney, J. 23, 168
HHaan, C. de 168Haber, L. F. 57, 168Hannan, A. 79, 165Hausmann, R. 74, 168Helbig, J. 110, 168Helpman, E. 13, 166, 168Henisz, W. J. 24, 168Henson, S. 122, 123, 168Heston, A. 33, 40, 41, 168Hiessl, H. 166Hillenbrand, T. 166Hinloopen, J. 78, 168Hossain, K. 166Hotelling, H. 34, 168Howitt, P. 34, 165Hsieh, S. H. 44, 57, 168Huang, Y. 58, 168Huffman, W. E. 48, 168
IIgnacio, L. 168Imbs, J. 70, 82, 168Iversen, E. viii, 88, 90, 92, 110, 166, 168
JJacobsson, S. viii, 74, 82, 166, 168Jaggers, K. 24, 169Janod, V. 166Johnson, C. A. 35, 168Johnson, P. A. 13, 171
173index
Author Index
Johnson, S. 10, 165Johnson, T. 70, 168Jones, L. P. 74, 168
KKatz, J. 73, 168Kavanagh, C. 78, 168Kearney, I. 77, 79, 165Keefer, P. 165, 166Kench, B. 89, 170Khanna, T. 58, 168Kim, L. 47, 168Kirkpatrick, D. 89, 168Kiszewksi, A. 25, 168Kitch, E. W. 110, 168Klevorick, A. 169Kline, P. 34, 168Knack, S. 166Kostial, K. 80, 167Kranakis, E. 57, 168Kruk, M. 171Kühn, V. 166Kurlat, S. 165
LLa Porta, R. 167Lagunes, D. 166Lall, S. viii, 93, 168Lamb, J. 168Landau, R. 170Landes, D. 35, 168Langlois, R. N. 6, 51, 168Lawson, R. 23, 168Lee, J.-W. 22, 165Lee, S. 44, 169Lerner, J. 83, 89, 167, 169Levin, R. 89, 169Levine, R. 12, 166Levinthal, D. A. 10, 166Liebowitz, S. J. 110, 169Lim, A. 110, 169Lim, C. 74, 169Liphard, K. G. 109, 169Lopez-de-Silanes, F. 167Lucas, R. 9, 169Lundvall, B.-A. 12, 167, 169, 172Lützner, K. 166Lyman, P. 59, 169
MMachlup, F. 7, 12, 169MacSharry, R. 78, 80, 82, 169Maddison, A. 35, 36, 37, 38, 39, 40, 77, 169Magariños, C. vii, viii, 64, 124, 169Malaney, P. 168Malerba, F. 82, 169Manzini, R. 166Margolis, S. E. 110, 169Markusen, J. 81, 169Marshall 24, 78, 167, 169Marson, I. 88, 89, 169Maskus, K. E. 112, 169Masters, W. A. 10, 52, 169Mazzoleni, R. viii, 41, 46, 47, 54, 57, 74, 169McArthur, J. W. 171McCord, G. 171McGinn, N. F. 44, 169McMillan, M. S. 169Melka, J. 171Mellinger, A. 25, 167, 168Midelfart-Knarvik, K. H. 80, 169Millikan, M. 11, 169
Milne, G. W. 52, 171Mintert, J. 166Miselbach, R. 110, 169Mitchell, B. R. 44, 169Mokyr, J. 7, 169Molsberger, J. 109, 172Momo, C. 111, 169Monroe, H. K. 109, 166Morris viii, 13, 34, 165Mowery, D. C. viii, 12, 37, 51, 57, 64, 165,
167, 168, 169, 170Mulder, N. 171Murmann, J. P. 53, 57, 169
NNeary, J. P. 140, 169Nelson viii, 5, 6, 7, 8, 12, 35, 37, 46, 51, 89,
165, 166, 167, 168, 169, 170Nicholson, R. 110, 169Nicoletti, G. 78, 166, 170Nightingale, P. 6, 61, 170Niman, N. 89, 170North v, xi, xx, xxi, 9, 25, 28, 82, 103, 104,
130, 132, 133, 134, 140, 143, 145, 149,170, 171
Nuvolari, A. 110, 167
OO’Grada, C. 77, 170O’Mahony, M. 79, 170O’Malley, E. 81, 170O’Rourke, K. H. 77, 170Odagiri, H. 49, 170Ohkawa, K. 12, 170Olson, M. 12, 166, 170Otsuki, T. 112, 166, 169Ouédraogo, L.-D. 89, 170Overman, H. G. 169Øversjøen, E. 168
PPaula, J. A. de 54, 170Phelps, E. 12, 170Pisu, M. 75, 167Polanyi, M. 6, 170Pollard, S. 47, 170Pritchett, L. 57, 170
RRapp 111, 170Rasiah 75, 170Rasiah, R. 170Raskind, L. J. 110, 165Redding, S. J. 80, 169, 170Reekum, R. v. 166Richards, D. L. 23, 166Rixius, B. 166Roberts, D. 116, 170Robinson, A. 10, 165Rock, M. T. 52, 56, 165Rodriguez-Clare, A. 168Rodrik, D. viii, 68, 69, 70, 74, 82, 168, 170Romer, P. 12, 34, 170Rosenberg, N. 37, 46, 169, 170Rosenstein-Rodan, P. 11, 170Rostovsky, H. 170Rostow, W. W. 11, 169Rotherham, T. 122, 170Rouach, D. 77, 171Ruane, F. 81, 167, 170
SSachs, J. D. 10, 25, 167, 171Sakong, I. S. 74, 168Sala-i-Martin, X. 41, 165Sampat, B. 12, 170Samuelson, P. 139, 171San, G. 54, 112, 169, 171Sananikone, O. 56, 166Sánchez, G. viii, 171Saperstein, J. 77, 171Saviotti, P. P. 12, 109, 110, 171Scarpetta, S. 170Schleifer, A. 167Schmidt-Traub, G. 171Schoonwinkel, A. 52, 171Schroeder, T. 166Schumpeter, J. A. 6, 34, 55, 166, 171Seely, B. E. 57, 171Sercovich, F. viii, 57, 64, 109, 111, 169, 171Sewadeh, M. 25, 167, 168Shy, O. 87, 167Sidgurdson, J. 58, 171Sillwood, J. 166Solow, R. M. 9, 171Spearman, C. 34, 171Spengel, C. 78, 171Spielman, A. 168Srholec, M. viii, 12, 33, 41, 167Stads, G.-J. 63, 165Stankiewicz, R. 166Steffensen, B. 110, 171Stiroh, L. J. 111, 170Strobl, E. 81, 165, 167Strout, A. M. 11, 166Summers, R. 33, 40, 41, 168Sutz, J. viii, 171Syrquin, M. 154, 171
TTan, H. W. 54, 171Teece, D. 6, 171Temple, J. 13, 171Teubal, M. viii, 69, 82, 83, 165, 171Thelen, K. 54, 171Thue Lie, H. 168Thumm, N. 166Timmer, M. 171Tirole, J. 89, 169Tocqueville, A. de 46, 171Toker, S. 110, 167Toletti, G. 166
UUchida, H. 49, 171Unnevehr, L. 116, 170Uour, A. 81, 170Uzan, M. 78, 167
VValentin, L. 166van Ark, B. 79, 83, 171van der Meer, K. 168van Pottelsberghe de la Potterie, B. 13, 166Varian, H. R. 59, 169Veblen, T. 12, 172Venables, A. J. 80, 81, 169, 170Verspagen, B. 34, 165, 167, 172Volkert, J. 110, 168von Hippel, E. 89, 172von Tunzelmann, G. N. 35, 172
174 Industrial Development Report 2005

WWacziarg, R. 70, 82, 165, 168Wade, R. 35, 50, 52, 58, 172Wagner, C. viii, 172Walsh, B. 79, 172Walsh, V. 63, 172Walz, R. 166Wey, C. 109, 172White, P. A. 78, 80, 82, 169
Wickham, J. 78, 172
Wiegard, W. 78, 171
Willgerodt, H. 109, 172
Williams, G. 76, 172
Wilson, J. S. 112, 166, 169
Winter, S. 6, 25, 166, 169, 170
Wooldridge, J. M. 31, 172
Wright, G. 35, 37, 170
YYonekura, S. 54, 172Ypma, G. 171
ZZahra, S. 12, 172Zeitz, G. J. f. 69, 172Zimmerman, M. A. 69, 172
175index

Aagriculture x, xii, 12, 13, 47, 48, 49, 56, 58,
71, 73, 124, 167, 168Argentina xx, 28, 36, 38, 41, 94, 98, 99,
102, 111, 112, 113, 120, 123, 124, 135,136, 139, 140, 144, 146, 148, 149, 157,161, 168, 171
Bbiotechnology 64, 70, 73, 117, 124Brazil vi, 28, 36, 54, 63, 74, 89, 102, 123,
124, 130, 131, 134, 135, 139, 144, 145,148, 149, 157, 161, 166, 169
business vii, xiii, xiv, xvii, xix, xx, 7, 8, 10, 23,37, 43, 49, 50, 51, 52, 55, 58, 60, 67, 68,69, 70, 71, 72, 73, 74, 75, 77, 78, 79, 80,81, 82, 83, 87, 89, 92, 94, 98, 104, 105,106, 107, 110, 115, 116, 118, 121, 122,123, 124, 166, 167, 168, 169, 171
– associations xv, xvi, 43, 49, 55, 56, 57, 58,69, 112, 118, 119, 150, 171
– innovation vii, xiii, xvii, xix, xx, 58, 67, 68,69, 70, 71, 72, 73, 74, 75, 77, 79, 81, 82,83, 87, 98, 110, 115, 121, 122
Ccertification xvi, xix, 8, 13, 22, 53, 56, 76, 83,
94, 95, 96, 97, 98, 99, 105, 106, 111, 112,113, 117, 118, 119, 122, 123, 168
Chile vi, x, 28, 36, 38, 41, 63, 72, 73, 74, 83,102, 120, 135, 139, 140, 144, 149, 155,157, 161, 168, 171
China xv, xvi, xx, xxi, 5, 8, 10, 12, 16, 21, 28,29, 36, 37, 38, 43, 44, 45, 47, 49, 50, 54,55, 56, 57, 58, 63, 70, 72, 74, 82, 83, 89,101, 102, 104, 110, 123, 129, 130, 131,132, 134, 135, 136, 137, 138, 139, 140,144, 145, 148, 149, 155, 157, 159, 161,162, 166, 167, 168, 169
codified knowledge xvi, xvii, xviii, 6, 7, 12,59, 60, 61, 62, 63, 64, 171
competence vii, xiii, xiv, xv, xvi, xvii, xix, 6, 7,8, 43, 49, 50, 57, 67, 72, 78, 82, 87, 94,109, 113, 116, 121
competitiveness x, xi, xviii, xix, 14, 24, 27, 55,73, 77, 79, 81, 87, 89, 97, 98, 99, 100,111, 115, 117, 118, 124, 167, 168, 172
Costa Rica 28, 49, 55, 58, 63, 102, 139, 140,144, 155, 157, 161
Eeconomic growth xx, 5, 7, 9, 12, 14, 16, 17,
32, 34, 43, 57, 76, 77, 78, 109, 129, 153,165, 166, 167, 168, 169, 170, 171, 172
entrepreneurial development 55, 58, 73, 120environment vii, xiii, xiv, xv, 5, 6, 7, 8, 9, 12,
15, 19, 20, 35, 49, 51, 52, 61, 69, 73, 75,82, 85, 88, 91, 94, 96, 97, 98, 107, 110,111, 117, 165, 168, 171
European Commission x, 78, 89, 106, 116,124, 166, 167, 172
FFAO x, 73, 118, 119, 122, 124, 166, 167
GGermany xv, xviii, 5, 8, 9, 10, 28, 35, 36, 41,
43, 44, 45, 46, 47, 48, 49, 53, 54, 57, 72,76, 78, 99, 103, 110, 111, 119, 123, 131,134, 135, 139, 144, 158, 161, 166, 171,172
governance vii, xiii, xiv, xv, xvii, xviii, xix, xx,14, 15, 16, 17, 20, 21, 28, 29, 30, 31, 32,33, 34, 69, 70, 71, 73, 75, 77, 83, 86, 106,115, 118, 119, 121
HHACCP x, xix, 73, 96, 97, 111, 112, 116,
117, 121, 123, 124higher education xiii, xv, xvi, 13, 37, 43, 44,
46, 47, 57, 69, 82, 168, 169
IICTs 6, 7, 13, 37, 89, 90, 99, 110infrastructure xiv, xvi, xvii, xviii, xix, 6, 8, 9,
10, 13, 15, 18, 43, 44, 47, 48, 49, 51, 52,54, 56, 58, 59, 61, 62, 64, 69, 71, 73, 75,76, 77, 78, 80, 92, 96, 97, 98, 99, 100,106, 115, 116, 117, 118, 120, 121, 168,170, 172
innovation vii, xi, xiii, xiv, xv, xvi, xvii, xviii, xix,xx, 5, 7, 8, 11, 12, 13, 14, 34, 49, 50, 51,52, 53, 56, 57, 58, 62, 67, 68, 69, 70, 71,72, 73, 74, 75, 76, 77, 78, 79, 81, 82, 83,85, 86, 87, 88, 89, 98, 109, 110, 115, 119,121, 122, 165, 166, 167, 168, 169, 170,171, 172
innovation system xi, xvii, xix, 12, 52, 58, 62,115, 121, 169
– components xv, 14, 27, 43, 50, 51, 54, 55,62, 68, 69, 71, 74, 81, 82, 86, 92, 98, 109,113, 149, 168
– functions xvii, 6, 68, 69, 71, 72, 74, 82,83, 89, 106, 108, 112, 118, 119, 146, 166
– phases xvii, 54, 68, 71, 73, 74, 75, 88, 94,169
– subsystems vii, xiii, xvii, xix, xx, 12, 58,68–75, 82, 83, 87, 92, 98, 110, 115,117–119, 124
institutions vii, x, xi, xiii, xiv, xv, xvi, xvii, xix, 5,7, 8, 9, 12–15, 19, 23, 24, 33, 43, 44, 46,47, 48, 49, 50, 51, 52, 53, 54, 55, 56, 57,60, 62, 68, 69, 71, 73, 75, 76, 81, 82, 86,88, 91, 93, 98, 99, 100, 108, 110, 111,115, 116, 117, 118, 119, 120, 165, 166,167, 169, 170, 171, 172
investment vii, x, xvi, xvii, 7, 8, 9, 13, 15, 23,37, 44, 48, 51, 52, 53, 54, 58, 60, 63, 69,70, 71, 72, 74, 76, 77, 78, 79, 80, 93, 94,95, 96, 106, 112, 120, 121, 165, 166, 167,168, 169, 170, 171
IPRs xiii, xvi, xvii, xviii, 5, 8, 60, 62, 64, 67,75, 82, 88, 89, 90, 91, 92, 93, 98, 109,110, 111, 165, 168
– patents 13, 21, 22, 27, 33, 58, 60, 62, 64,69, 70, 78, 83, 88, 89, 90, 91, 92, 93, 104,105, 106, 107, 108, 110, 111, 166
– standards conflict 89– TRIPs xii, xvi, 8, 60IRAM xi, 97, 98, 99, 113, 168ISO xi, xviii, 13, 15, 21, 22, 27, 57, 93, 95,
96, 97, 99, 101, 102, 103, 110, 111, 112,116, 117, 168
– ISO 9000 13, 15, 22, 27, 97– ISO 14000 97– ISO 22000 112, 116, 117ITRI xi, xvi, 50, 52, 55, 56, 57, 58, 74, 168
JJapan x, xi, xv, xvi, xviii, 8, 28, 35, 36, 37, 43,
44, 45, 47, 49, 53, 54, 55, 56, 57, 58, 60,83, 93, 101, 110, 123, 130, 131, 134, 135,139, 144, 155, 158, 162, 165, 166, 171
KKnowledge– institutions 12– know-how 6, 7, 73, 75, 85, 87, 93– know-what 6– subsystem vii, xiii, xvii, xix, xx, 12, 58, 68,
69, 70–73, 82, 83, 87, 92, 98, 110,115,117, 118, 119, 124
LLeast Developed Countries (LDCs) ix, xiv, xx,
xxi, 19, 20, 21, 72, 82, 118, 130, 132, 134,137, 138, 143, 146, 149, 166
177index
Subject Index
Mmanufacturing x, xi, xii, xviii, xx, 49, 50, 54,
55, 73, 75, 80, 81, 83, 89, 90, 94, 95, 96,99, 109, 111, 112, 113, 117, 120, 127,129, 130, 131, 132, 133, 134, 137, 138,139, 140, 141, 142, 148, 149, 150, 155,156, 157, 158, 159, 160, 170
MDGs 170
OOECD xi, 21, 22, 59, 60, 64, 78, 110, 111,
155, 166, 169, 170Open Source (OS) xi, 89, 169, 170, 172– systems (OSS) xi, 89, 170
Pproductivity xi, xiv, xv, xvii, 5, 9, 11, 35, 37,
48, 52, 58, 67, 73, 74, 75, 77, 78, 79, 81,82, 83, 94, 99, 121, 129, 138, 142, 150,165, 167, 168, 170, 171
public goods vii, xi, xiii, xviii, 11, 57, 60, 68,69, 75, 83, 112, 115, 124, 169, 170, 171
public vii, x, xi, xiii, xiv, xv, xvi, xviii, xix, 5, 6,7, 8, 10, 11, 13, 22, 23, 24, 33, 37, 43, 46,47, 48, 49, 50, 51, 52, 53, 54, 55, 57, 59,60, 61, 62, 63, 68, 69, 71, 72, 73, 74, 75,76, 77, 78, 81, 83, 88, 89, 90, 91, 94, 95,97, 98, 99, 108, 110, 111, 112, 113, 115,116, 117, 119, 123, 124, 168, 169, 170,171, 172
public private cooperation 75
RR&D x, xi, xiv, xv, xvii, xviii, xix, 7, 10, 11, 13,
14, 18, 21, 22, 35, 37, 43, 47, 48, 49, 51,52, 53, 54, 55, 58, 60, 63, 67, 70, 71, 73,74, 75, 76, 78, 81, 82, 83, 85, 90, 91, 92,93, 94, 97, 99, 110, 111, 115, 117, 118,120, 121, 124, 166, 167, 170, 171
Republic of Korea xv, xvi, 5, 8, 12, 16, 28, 36,37, 43, 44, 47, 49, 51, 54, 56, 57, 58, 63,72, 74, 82, 83, 130, 136, 138, 139, 144,148, 168
SScience and Engineering xiii, xv, 8, 43, 45,
47, 49, 57, 78, 169– education ix, xiii, xiv, xv, xvi, 8, 10, 12, 13,
15, 18, 22, 27, 33, 37, 43, 44, 46, 47, 49,52, 53, 55, 57, 58, 62, 69, 71, 77, 78, 82,87, 99, 119, 168, 169, 170, 171, 172
– enrolment xv, 13, 22, 27, 33, 43, 44, 47,57, 78
services x, xi, xiii, xiv, xviii, 7, 8, 47, 49, 50,51, 52, 56, 57, 58, 62, 69, 70, 71, 73, 74,75, 76, 80, 81, 82, 83, 86, 87, 88, 89, 92,94, 96, 98, 99, 105, 106, 112, 115, 118,119, 120, 121, 124, 167, 168
Singapore xxi, 16, 28, 36, 37, 54, 58, 70, 75,102, 135, 136, 139, 140, 144, 149, 155,159, 162
skills vii, xiv, xv, xvii, 6, 7, 12, 47, 52, 53, 54,56, 57, 61, 62, 64, 67, 68, 69, 71, 73, 75,78, 81, 82, 93, 98, 106, 123, 124, 171
SMEs xi, xvii, 6, 49, 54, 55, 69, 71, 72, 73,75, 82, 83, 90, 96, 99
South Africa 29, 36, 41, 52, 63, 101, 130,132, 134, 135, 136, 139, 140, 144, 146,148, 149, 156, 159, 162
SPS xi, xix, 115, 116, 117, 118, 121, 122,123, 124, 172
– food safety agency 112– technical requirements 99, 113, 118, 122standards – conflict with IPRs 89– mandatory 90, 92, 113, 116, 122– Measurement x, xi, xix, xx, xxi, 9, 12, 14,
21, 56, 76, 91, 111, 117, 127, 129, 167– Quality Institutions 56, 57, 119– private xi, xiii, xiv, xvi, xvii–xix, 5, 6, 8, 10,
11, 12, 13, 22, 23, 24, 27, 46, 47, 48, 49,50, 51, 52, 53, 54, 56, 58, 60, 61, 63, 67,68, 70, 71, 72, 73, 74, 75, 78, 82, 83, 86,90, 91, 92, 95, 98, 99, 112, 113, 115–123,168, 171, 172
– public vii, x, xi, xiii, xiv, xv, xvi, xviii, xix, 5,6, 7, 8, 10, 11, 13, 22, 23, 24, 33, 37, 43,46, 47, 48, 49, 50, 51, 52, 53, 54, 55, 59,60, 63, 68, 69, 71, 72, 73, 74, 75, 76, 77,78, 81, 83, 88, 89, 90, 91, 94, 95, 98, 99,108, 110, 112, 113, 115, 117, 119, 123,124, 168, 169, 170, 171, 172
– voluntary 101, 102, 103, 109, 113
Ttacit knowledge xvii, xviii, 6, 11, 61, 62, 87,
170Taiwan xii, xv, xvi, 5, 8, 12, 16, 21, 28, 36,
37, 43, 44, 47, 49, 50, 52, 54, 55, 56, 57,58, 63, 72, 74, 82, 83, 135, 136, 139, 144,155, 159, 162, 165, 166, 168, 169, 171
Traceability xix, 76, 115, 116, 117, 120, 123
trade vii, x, xi, xii, xiii, xiv, xvii, xviii, xix, xx, 5,8, 13, 21, 23, 33, 35, 46, 51, 53, 54, 55,74, 75, 76, 77, 82, 89, 94, 97, 98, 99, 105,106, 108, 110, 111, 112, 113, 115, 118,120, 122, 124, 127, 129, 138, 139, 141,142, 143, 146, 148, 149, 150, 151, 154,155, 165, 167, 168, 170, 171, 172
training xii, xiv, xv, xvi, xvii, xix, 5, 7, 8, 12,43, 46, 50, 51, 52, 53, 54, 55, 57, 58, 69,71, 73, 74, 75, 83, 87, 89, 91, 96, 97, 98,99, 104, 112, 117, 118, 119, 120, 121,124, 167, 171, 172
UUNCTAD xii, 21, 23, 79, 80, 124, 171UNDP xii, 34, 171UNESCO xii, 22, 44, 47, 59, 63, 76, 167, 171UNIDO vii, viii, x, xii, xix, 6, 8, 10, 12, 14, 15,
16, 17, 18, 19, 20, 22, 24, 26, 28, 30, 32,33, 34, 36, 38, 40, 41, 44, 46, 48, 50, 52,54, 56, 57, 58, 60, 61, 62, 64, 68, 69, 70,72, 74, 76, 78, 80, 82, 86, 88, 90, 92, 94,95, 96, 97, 98, 99, 100, 102, 104, 106,108, 109, 110, 112, 116, 118, 120, 121,122, 123, 124, 130, 131, 132, 133, 134,135, 136, 138, 139, 140, 142, 143, 144,145, 146, 147, 148, 150, 151, 152, 153,154, 155, 156, 158, 160, 162, 163, 165,166, 167, 168, 169, 170, 171, 172
United Kingdom xii, 28, 35, 36, 78, 103,131, 134, 135, 139, 160, 163
United States xii, 5, 21, 28, 36, 48, 79, 131,134, 135, 139, 144, 155, 160, 163, 165,169, 171
USAID xii, 22
Vventure capital xvi, xvii, 6, 55, 58, 69, 71, 73,
74, 83, 165, 167
WWEF xii, 23, 33, 34, 172World Bank xii, 11, 12, 21, 22, 23, 25, 33,
34, 57, 58, 112, 122, 155, 165, 166, 167,168, 170, 171, 172
WTO vii, xii, xiii, xix, 8, 73, 83, 103, 110,111, 115, 117, 118, 122, 123, 124, 171,172
– Doha Round xiv, 5
178 Industrial Development Report 2005