Embed Size (px)
Citation preview

Can financial inflows help foster growth and reduce poverty in
Central America?
The impact of Foreign Direct Investments, net Official Development Aid, and personal remittances
received on Panama, Honduras and Costa Rica's GDP per capita and poverty headcount.
Robin Huguenot-Noël - Graduate Diploma in Economics - ASE Project 2016
(Word count: 3133; Program used: MS Excel)
Abstract
I examine the relationship between financial inflows and poverty reduction in developing
economies, focusing on Panama, Costa Rica and Honduras between 1981 and 2013. This research
uses Foreign Direct Investments, net Official Development Aid (ODA), and personal remittances
received as independent variables, and the poverty headcount and the GDP per capita as dependant
variables. Our correlation analysis indicates a significant positive relationship between the level of
FDI, growth and poverty reduction as well as between remittances and economic development.
However, our findings suggests that no significant relationship can be drawn between the level of
ODA and these indicators.

2
Official Development Aid (ODA) has traditionally been viewed as a way to fill out the
“savings” and “foreign exchange” gaps. Recent debates on aid effectiveness have however focused
on the redefinition of this “two-gaps” approach, attempting to better integrate the lessons from
contemporary theories of economic growth. Recent research tends indeed to draw more attention to
the contribution of technology change, labour force skills, and the policy environment1 - with
Foreign Direct Investments (FDI) acting as the main vehicle of economic restructuring and
technology diffusion. In the context of an important increase of migration directed to developed
countries,2 in which immigrants generally send a portion of their earning home in the form of
remittances, one may also wonder about the role of remittances in promoting and supporting
development. These three indicators – ODA, FDI and remittances – clearly have distinguishable
features, but their common characteristic as financial inflows directed to economic development
makes for an interesting comparison of their impact on growth and poverty reduction. Due to its
limited size and its geographical situation, Central America tends to be the neglected in the debate
on aid effectiveness and economic development strategies. This situation appears unjustified
considering that this region offers several features that make it a very interesting case study for this
type of research. This study therefore attempts to investigate whether the evolution of the GDP per
capita and poverty headcount in Panama, Costa Rica and Honduras between 1981 and 2013 may be
correlated to changes in the level of the above-mentioned financial inflows. After discussing the
literature related to the impact of FDI, ODA, and remittances on poverty and growth, I will
introduce the selected data and chosen indicators. I will then use descriptive statistics to highlight
relevant trends in each country, and conduct a correlation analysis between independent variables
(FDI, ODA, and remittances) and dependant variables (GDP per capita, poverty headcount), before
drawing general concluding remarks.
1 Mike Tribe, “ODA, Economic Growth and Poverty Reduction,” Ideas4development, 1 December 2010. Available at:
http://ideas4develop.blogspot.fr/2010/12/oda-economic-growth-and-poverty.html (last consulted on 12/05/16).
2 “International Migration and the Millennium Development Goals,” in Selected Papers of the UNFPA Expert Group
Meeting, Marrakech, 11-12 May 2005. Available at: https://www.unfpa.org/sites/default/files/resource-
pdf/migration_report_2005.pdf (last consulted on 12/05/16).

3
BACKGROUND AND LITTERATURE
Existing literature on the impact of official aid on economic development and poverty
reduction focuses on two questions in particular. The first question relates to the nature of the
relationship between aid and growth, as some scholars found little robust evidence of a positive
or negative relationship between aid inflows and growth.3 This is explained by the fact that setting
out the direction of causation can be a real challenge in this area: if aid may foster growth, slow
growth may in turn also trigger aid. The other question relates to the link between aid effectiveness
and environment conditions, with some scholars arguing that this impact depends on the quality of
domestic policies, whilst others state that aid tends to work best in difficult environments.4 Our
analysis will attempt to establish (1) whether or not a clear relationship can be established
between aid, growth and poverty reduction; (2) to what extent aid may be linked to a more or
less favourable environment.
The positive contribution of Foreign Direct Investment to growth and poverty
reduction is more widely accepted with existing research indicating strong empiric evidence
for this relationship.5 FDIs have notably been proven to reduce poverty by funding the delivery of
social services to the poor and to have a positive impact on employment and exports. However, as
Calvo and Hernandez rightly pointed out, the poverty impact of FDI varies across countries, and
research with an empirical focus on Latin America is missing to establish a clear relationship
in these countries.6 We shall investigate in this paper (1) whether this relationship is
confirmed for Central American economies; (2) from when a relationship between FDI and
poverty reduction can be established.
The impact of remittances on poverty and economic development has recently received
considerable attention from international institutions, with recent studies finding very
encouraging results, though again too often only focusing on African countries. Evidence
3 Rajan Raghuram and Arvind Subramanian, “Aid and Growth: What Does the Cross-Country Evidence Really
Show?” Working Paper 05/127, IMF, Washington D.C, 2005.
4 Patrick Guillaumont and Lisa Chauvet, ‘Aid and Performance: A Reassessment,’ Journal of Development Studies,
2001, 37(6): 66-92.
5 Kevin Honglin Zhang, “Does International Investment Help Poverty Reduction in China?,” The Chinese Economy,
Volume 39, Issue 3, 2006. Available at: http://www.tandfonline.com/doi/abs/10.2753/CES1097-
1475390306?journalCode=mces20 (last consulted on 08/05/16).
6 Cesar C. Calvo and Marco A. Hernandez, “Foreign Direct Investment and Poverty in Latin America,” Paper prepared
to be delivered at the Globalisation and Economic Policy, Leverhulme Centre for Research on Globalisation and
Economic Policy, University of Nottingham, 21-22 April 2006. Available at:
https://www.nottingham.ac.uk/gep/documents/conferences/2006/postgradconf2006/hernandez-postgradconf2006.pdf
(last consulted on 10/05/16).

4
notably suggests that a 10 % increase international remittances can produce a 3.5% decline in the
share of people living in poverty in African countries. The relationship would notably be explained
by their tendency to a) be disproportionately spent on human capital-building areas; b) be
countercyclical in nature; c) increase the level of income for the poor rather than the growth of the
economy as a whole.7 In fact, the primary gap in evidence regarding remittances' development
impact is the lack of research supporting their positive impact on economic growth. This is
notably due to the fact that it is often difficult to separate the cause from the effect, if remittances
react counter-cyclically to growth.8 We shall therefore investigate further in this paper (1)
whether the positive impact of remittances on poverty reduction can be confirmed for Central
American economies; (2) whether there is a causation relationship between remittances and
economic growth.
DATA
I selected out Panama, Costa Rica and Honduras as the sample representing Central America.
These three countries were relatively similar in size in 1981, have a similar geographical situation
and would be expected to have similar migration levels. These three selected countries have
however pursued different economic development strategies in recent years, which have been more
or less successful. This combination may allow us to draw more practical conclusions on the
effectiveness of these strategies.
For the purpose of this research, I used the following data, available on the World Bank's website:9
Independent variables
Foreign direct investment, net inflows (BoP, current US$). According to the World Bank
definition, FDI refers to “a category of cross-border investment associated with a resident in
one economy having control or a significant degree of influence on the management of an
enterprise that is resident in another economy.” The matadata points out that FDI represents
“the sum of equity capital, reinvestment of earnings, and other capital.” This means that
investment in non-productive assets, such as assets being transferred to shale companies (as
7 Dilip Ratha “The impact of Remittances on Economic Growth and Poverty Reduction,” MPI paper, September
2013. Available at: http://www.migrationpolicy.org/research/impact-remittances-economic-growth-and-poverty-
reduction (16/05/16).
8 Paolo Giuliano and Marta Ruiz Arranz, “Remittances, Financial Development and Growth,” Working paper 05/234,
International Monetary Fund, 2005. Available at: http://www.imf.org/external/pubs/cat/longres.aspx?sk=18607.
9 Indicators, The World Bank. Available at: http://data.worldbank.org/indicator (last consulted on 15/05/16).

5
one could reasonably assume in the case of Panama) will also be included. We should hence
be aware of a possible type 2 error in the relationship between FDI and GDP per capita, as
this wide definition of FDI may artificially increase this relationship.
Net ODA received per capita (current US$). This indicator is notably based on
disbursements of loans made on concessional terms and grants by individual countries
and by multilateral institutions. The caveat here is that it may be difficult to understand
which factor causes the relationship as negative relationship between ODA received and
GDP per capita may reflect either a negative impact of ODA on growth, or, perhaps more
likely, the reimbursement of a loan in a context of positive economic development.
Personal remittances, received (current US$). Personal remittances as defined by the World
Bank rest upon personal transfers (transfers in cash or in kind from migrants) and
compensation of employees. It is worth noting that the personal remittances received
will directly be linked to the level of migration out of the country.
Dependent variables
Poverty headcount ratio at $1.90 a day (2011 PPP) (% of population) indicates the
percentage of the population living on less than $1.90 a day at 2011 international prices.
This data is limited between 1981 and 1988. The fact that the poverty headcount ratio is
used as a dependant variable of our analysis mitigates the impact. However, the
relationship between independent variables and the poverty headcount will be more
significant for the years starting from 1988.
GDP per capita (current US$): GDP is the sum of gross value added by all resident
producers in the economy plus any product taxes and minus any subsidies not included in
the value of the products. It is worth noting that this indicator does not include the
contribution of the informal economy, which may relevant for the study of an economy like
Panama whose culture and practice of secrecy is set to attract such kind of investment.
I also look at the evolution of the total population in each country, in order to transform all
indicators on a per capita basis, and to make the comparison more insightful. All these data are from
the World Bank website and are the data being used in the graphs realised in this paper.

6
ANALYSIS
DESCRIPTIVE STATISTICS
Looking at the mean, the standard deviation, and the coefficient of skewness for GDP per capita
and poverty we note that:
Panama and Costa Rica have had similar development levels between 1981 and 2013, with
an average GDP per capita (about $4 000 per capita for both countries) and an average
poverty headcount ratio (averaging 7% for Costa Rica and 11% for Panama) reaching
similar results. On the other hand, we can see that Honduras was at a lower development
level between 1981 and 2013, with an average GDP per capita reaching only 1159 $ and a
poverty headcount ratio averaging 25% of its population over the period studied.
Standard deviation
344.37
49.92
181.06
16.46
20.11
32.48
28.30
150.04
50.05
6.02
7.89
5.06
2474.26
563.92
2466.66
MEAN
FDI, net inflows par capita (BoP, current US $) 1981-2013
Panama 319.97
Honduras 46.21
Costa Rica 174.77
Net ODA received per capita (current US$) 1981-2013
Panama 16.49
Honduras 70.00
Costa Rica 29.38
Personal remittances received per capita (current US$) 1981-2013
Panama 47.41
Honduras 123.24
Costa Rica 48.66
Poverty headcount ratio at $1.90 a day (2011 PPP) (% population) 1981-2013
Panama 11.24
Honduras 24.97
Costa Rica 6.90
GDP per capita 1981-2013
Panama 4215.77
Honduras 1159.03
Costa Rica 4061.58
TABLE 1: Mean and standard deviation for all indicators

7
FIGURE 1 (Source: World Bank)
The above graph highlights differences in the evolution of the GDP per capita in the three
countries, indicating an inability for Honduras’s economy to follow similar development as
its neighboring countries from the 1990's. This also reflects a more general feature of our
data, which indicates inconsistent development levels of most indicators (including FDI for
example) across the period studied. Looking at the standard deviations, as well as at the
confidence level, we can note that evolution of the indicators do not follow normal
distributions. For instance, the above graph indicates that the distribution is in fact
negatively skewed for the GDP per capita in Panama and Costa Rica, which can account for
the catching-up phase that these economies currently undergo.
Evolution of the independent variables over the period studied
Looking at the evolution of our independent variables on a country-by-country basis (see
graphs below), we can note that both Panama and Costa Rica have received a higher proportion of
FDI inflows than of development aid and personal remittances. By opposition, it is interesting to see
that Honduras mostly benefits from personal remittances and net ODA, reflecting a different level
of development.

8
FIGURE 2 (Source: World Bank)
FIGURE 3 (Source: World Bank)

9
FIGURE 3 (Source: World Bank)
Cross-country comparison of the evolution of each indicator
Comparing the evolution of each indicator across the countries studies also enables us to draw the
following conclusions:
The fact that the FDI curve is negatively skewed with FDI net inflows per capita showing a
rising trend since the 1990's reflect evidence highlighted by the existing literature on the
impact of globalisation. This trend indeed exacerbates from 2003 onwards, exclusion being
made from the 2008 to 2010 years. The shock observed in these years reflects the recession
of the last financial crisis. The capital flight observed in 1998 in Panama may also be related
to the 1997-1998 Asian financial crisis, to which Panama would have been more exposed
than its counterparts.10
10Juan Luis Moreno-Villalaz, “Lessons from the monetary experience of Panama: a dollar economy with financial
integration,” Cato Journal, Vol. 18, No. 3, Winter 1999. Available at:
http://object.cato.org/sites/cato.org/files/serials/files/cato-journal/1999/1/cj18n3-12.pdf ((last consulted on
15/05/16).

10
FIGURE 4 (Source: World Bank)
The evolution of the ODA received also offers interesting insight. We can first note an
important decrease in Costa Rica's reliance on development aid from 1990 to 1996. This
raises the question of the extent to which this drop may be due to positive economic
development, a question which will be further analysed in the correlation analysis. Two
shocks also deserve specific attention: the 1998 peak in Honduras is likely corresponds to
the rise in international solidarity following the 1998 Mitch Hurricane; the sudden drop in
ODA received in Panama in 2007 is expected to reflect the impact of the crisis. It is
interesting to note, however, that no such evolution can be assessed in Honduras and Costa
Rica over the same period.
FIGURE 5 (Source: World Bank)

11
Finally, the evolution of the personal remittances data indicates a general increasing trend
for all countries from 2000 to 2007, but above all, a very important growth for Honduras
from the end of the 1990's until 2007. The increase in immigration from Honduras to the
United States in these years is certainly an important factor in this evolution.11
FIGURE 6 (Source: World Bank)
CORRELATION ANALYSIS
Having looked at the drivers behind the evolution of these indicators, we now look at
whether a correlation can be observed between our independent and our dependent variables.
We use Excel's formula to determine the R score of the Pearson's coefficient. Calculating the
P value and conducting a P test is necessary to find out the significance level of our correlation
coefficient. As Excel does not provide the appropriate function, we use the function provided by the
Social Science Statistics website to find these two indicators, and add them to our Excel table.12
We find that most of our correlation coefficient are both strong and significant, with the
exception of:
the relationship between net ODA received and poverty headcount;
11Elizabeth Ellen Cramer ‘Honduran immigrants,’ Immigration to United States. Available at:
http://immigrationtounitedstates.org/555-honduran-immigrants.html (last consulted on 14/05/16).
12‘P Value from Pearson (R) Calculator,’ Social Science Statistics. Available at:
http://www.socscistatistics.com/pvalues/pearsondistribution.aspx (last consulted on 02/05/16).
12
the relationship between net ODA received and GDP per capita;
for Panama and Honduras.
The following graphs provide better visual representation of these findings:
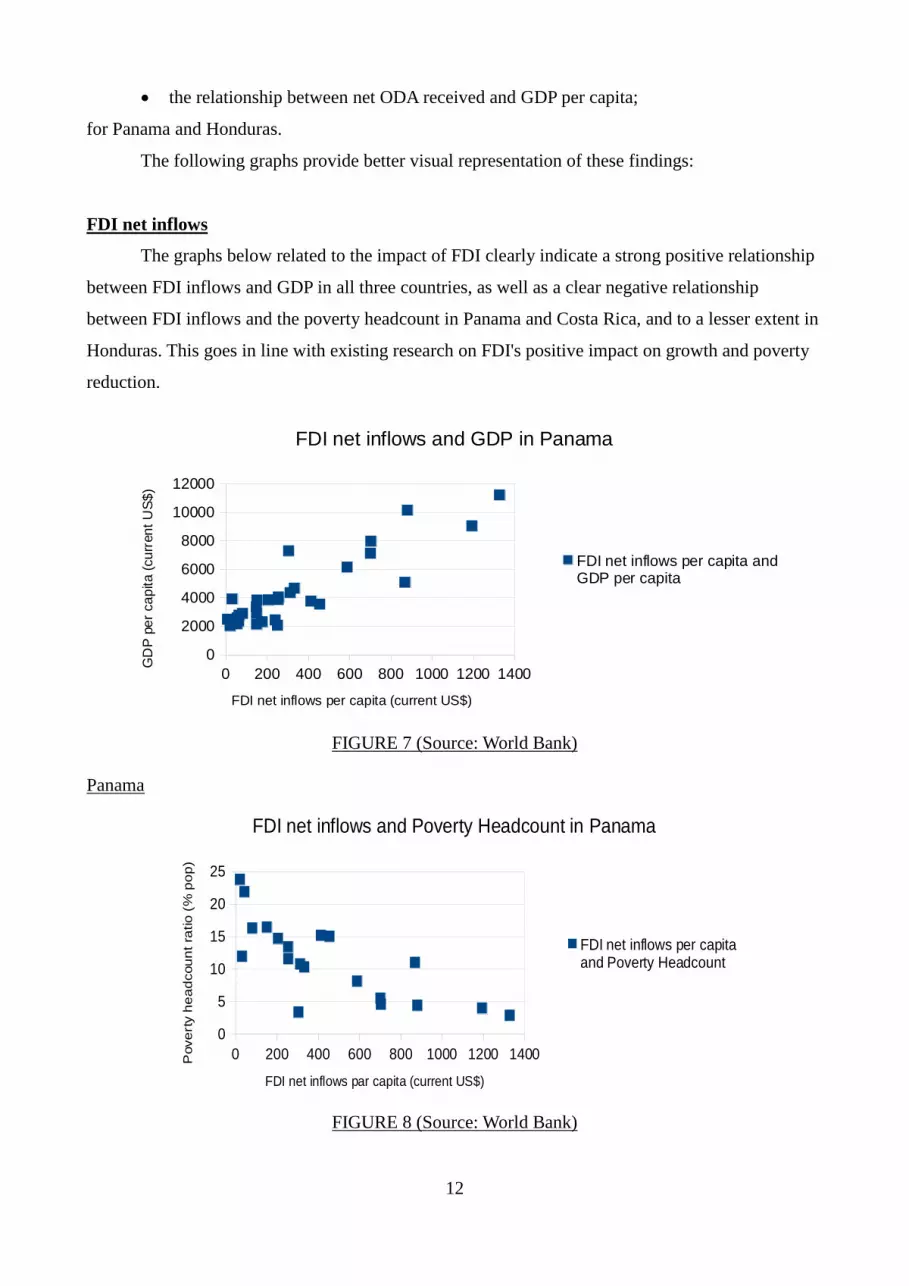
FDI net inflows
The graphs below related to the impact of FDI clearly indicate a strong positive relationship
between FDI inflows and GDP in all three countries, as well as a clear negative relationship
between FDI inflows and the poverty headcount in Panama and Costa Rica, and to a lesser extent in
Honduras. This goes in line with existing research on FDI's positive impact on growth and poverty
reduction.
FIGURE 7 (Source: World Bank)
Panama
0 200 400 600 800 1000 1200 1400
0
5
10
15
20
25
FDI net inflows and Poverty Headcount in Panama
FDI net inflows per capita and Poverty Headcount
FDI net inflows par capita (current US$)
Pove
rty h
ea
dcou
nt
ratio
(%
po
p)
FIGURE 8 (Source: World Bank)
0 200 400 600 800 1000 1200 1400
0
2000
4000
6000
8000
10000
12000
FDI net inflows and GDP in Panama
FDI net inflows per capita and GDP per capita
FDI net inflows per capita (current US$)
GD
P p
er
ca
pita (
cu
rren
t U
S$
)

13
Honduras
0 20 40 60 80 100 120 140 160 180
0
5
10
15
20
25
30
35
40
45
50
FDI net inflows and Poverty Headcount in Honduras
FDI net inflows per capita and Poverty Headcount
FDI net inflows per capita (current US$)
Pove
rty H
ead
co
un
t ra
tio
(%
po
pu
lation
)
FIGURE 9 (Source: World Bank)
0 20 40 60 80 100 120 140 160 180
0
500
1000
1500
2000
2500
3000
FDI net inflows and GDP in Honduras
FDI net inflows per capita and GDP per capita
FDI net inflows per capita (current US$)
GD
P p
er
ca
pita (
cu
rren
t U
S$
)
FIGURE 10 (Source: World Bank)
Costa Rica
0 100 200 300 400 500 600 700 800
0
5
10
15
20
25
30
FDI net inflows and Poverty headcount in Costa Rica
FDI net inflows and Poverty Headcount
FDi, net inflows per capita (BoP, current US$)
Pove
rty h
ea
dcou
nt
ratio
(%
po
pu
latio
n)
FIGURE 11 (Source: World Bank)

14
0 100 200 300 400 500 600 700 800
0
2000
4000
6000
8000
10000
12000
FDI net inflows and GDP in Costa Rica
FDI net inflows per capita and GDP per capita
FDI net inflows per capita (current US$)
GD
P p
er
ca
pita (
cu
rren
t U
S$
)
FIGURE 12 (Source: World Bank)
Official Development Aid (ODA)
The below figures indicate that it is more difficult to find any correlation between official
development aid and growth, as well as between development aid and the poverty headcount for
Panama and Honduras. Costa Rica's example indicates a negative relationship between ODA and
GDP, and a positive one between ODA and the poverty headcount ratio.
Panama
FIGURE 13 (Source: World Bank)
-60 -40 -20 0 20 40 60 80
0
5
10
15
20
25
Net ODA received and Poverty Headcount in Panama
Net ODA received and Poverty Headcount
Net ODA received per capita (current US$)
Pove
rty H
ead
co
un
t ra
tio
(%
po
pu
lation
)

15
FIGURE 14 (Source: World Bank)
Honduras
20 40 60 80 100 120 140
0
5
10
15
20
25
30
35
40
45
50
Net ODA received and Poverty Headcount in Honduras
Net ODA received and Poverty Headcount
Net ODA received per capita (current US$)
Pove
rty H
ead
co
un
t ra
tio
(%
po
pu
lation
)
FIGURE 15 (Source: World Bank)
20 40 60 80 100 120 140
0
500
1000
1500
2000
2500
3000
Net ODA received and GDP in Honduras
Net ODA received par capita and GDP per capita
Net ODA received per capita (current US$)
GD
P p
er
ca
pita (
cu
rren
t U
S$
)
FIGURE 16 (Source: World Bank)
-60 -40 -20 0 20 40 60 80
0
2000
4000
6000
8000
10000
12000
Net ODA received per capita and GDP per capita in Panama
Net ODA received par capita and GDP per capita
Net ODA received per capita (current US$)
GD
P p
er
ca
pita (
cu
rren
t U
S$
)

16
Costa Rica
-20 0 20 40 60 80 100 120
0
5
10
15
20
25
30
Net ODA received and Poverty Headcount in Costa Rica
Net ODA received and Poverty Headcount
Net ODA received per capita (current US$)
Pove
rty H
ead
co
un
t ra
tio
(%
po
pu
lation
)
FIGURE 17 (Source: World Bank)
-20 0 20 40 60 80 100 120
0
2000
4000
6000
8000
10000
12000
Net ODA received and GDP in Costa Rica
Net ODA received par capita and GDP per capita
Net ODA received per capita (current US$)
GD
P p
er
ca
pita (
cu
rren
t U
S$
)
FIGURE 18 (Source: World Bank)
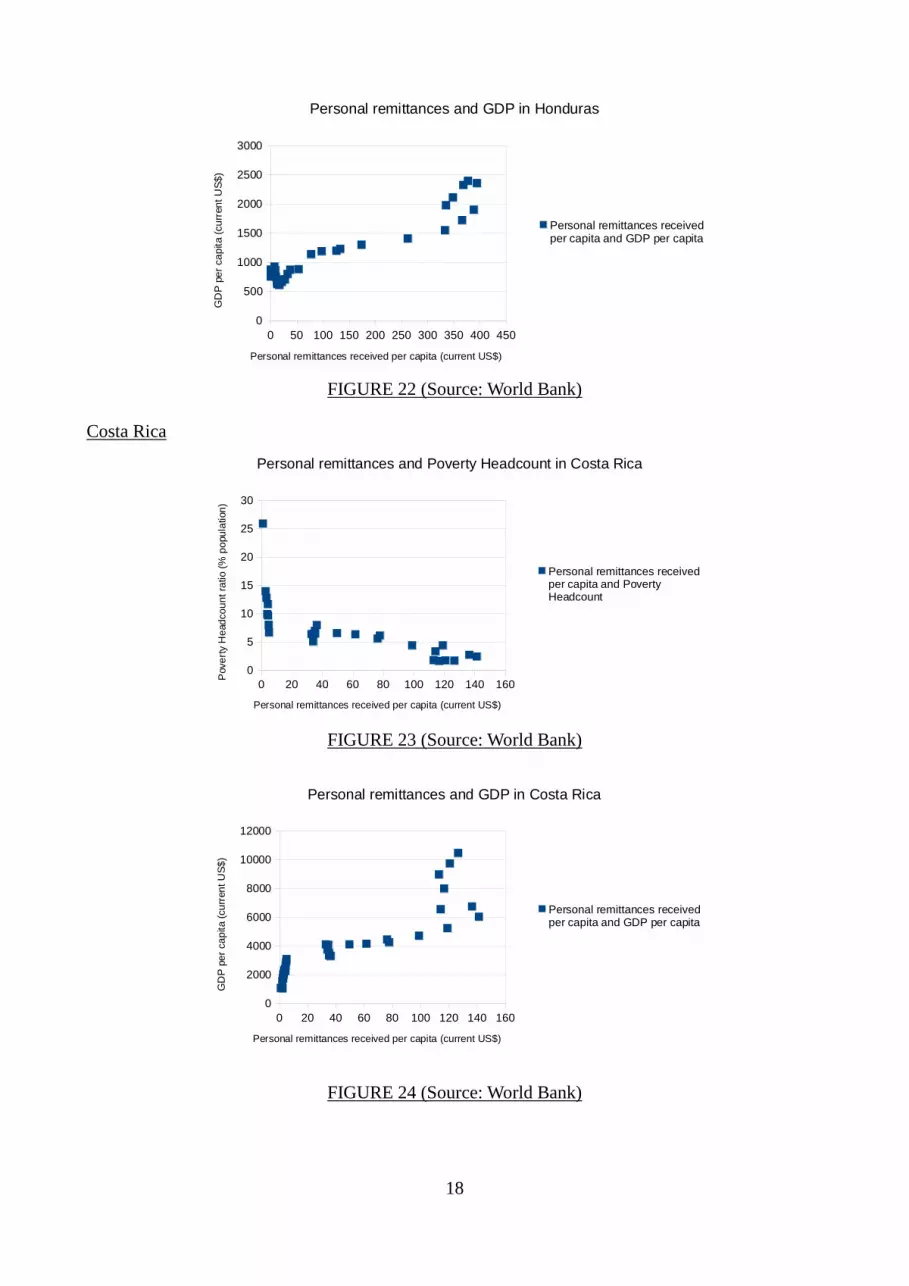
Personal remittances
The below graphs clearly indicate a strong positive relationship between personal
remittances and GDP, as well as a strong negative relationship between personal remittances and
poverty reduction in all countries.

17
Panama
0 20 40 60 80 100 120 140
0
5
10
15
20
25
Personal remittances and Poverty Headcount in Panama
Personal remittances and Poverty Headcount
Personal remittances received per capita (current US$)
Pove
rty H
ead
co
un
t ra
tio
(%
po
pu
lation
)
FIGURE 19 (Source: World Bank)
0 20 40 60 80 100 120 140
0
2000
4000
6000
8000
10000
12000
Personal remittances and GDP in Panama
Personal remittances received per capita and GDP per capita
Personal remittances received per capita (current US$)
GD
P p
er
ca
pita (
cu
rren
t U
S$
)
FIGURE 20 (Source: World Bank)
Honduras
0 50 100 150 200 250 300 350 400 450
0
5
10
15
20
25
30
35
40
45
50
Personal remittances and Poverty Headcount in Honduras
Personal remittances and Poverty Headcount
Personal remittances received per capita (current US$)
Pove
rty H
ead
co
un
t ra
tio
(%
po
pu
lation
)
FIGURE 21 (Source: World Bank)
18
0 50 100 150 200 250 300 350 400 450
0
500
1000
1500
2000
2500
3000
Personal remittances and GDP in Honduras
Personal remittances received per capita and GDP per capita
Personal remittances received per capita (current US$)
GD
P p
er
ca
pita (
cu
rren
t U
S$
)
FIGURE 22 (Source: World Bank)
Costa Rica
0 20 40 60 80 100 120 140 160
0
5
10
15
20
25
30
Personal remittances and Poverty Headcount in Costa Rica
Personal remittances received per capita and Poverty Headcount
Personal remittances received per capita (current US$)
Pove
rty H
ead
co
un
t ra
tio
(%
po
pu
lation
)
FIGURE 23 (Source: World Bank)
0 20 40 60 80 100 120 140 160
0
2000
4000
6000
8000
10000
12000
Personal remittances and GDP in Costa Rica
Personal remittances received per capita and GDP per capita
Personal remittances received per capita (current US$)
GD
P p
er
ca
pita (
cu
rren
t U
S$
)
FIGURE 24 (Source: World Bank)

19
***
This study attempted to investigate whether the evolution of the GDP per capita and Poverty
headcount ratio indicators in Panama, Costa Rica and Honduras between 1981 and 2013 may be
correlated to changes in the level of (1) Foreign Direct Investments; (2) Personal remittances; (3)
Official Development Aid. Though these findings should be considered carefully for the period
between 1981 and 1988 due to the limitation of the data on poverty headcount, the following
conclusions have emerged from this research:
There is a strong relationship between the evolution of FDI, growth and poverty reduction
over the period studied, which confirms that existing evidence on the topic can also apply to
this sample of Central American countries. The increase of FDI in these countries seems to
really take off from the 2000's only, i.e. slightly later than expected. Though this clearly
represents evidence for a relationship on longer-term trends, it is worth noting that sudden
drops in FDIs, such as those seen in crises, are not necessarily reflected in growth rates (see
Panama in 1998 and in 2007). One should also note that the inclusion of non-financial assets
in the definition of FDI may also artificially increase this relationship, notably in the case of
Panama.
Establishing a clear relationship between ODA, growth and poverty reduction is difficult.
Our study shows that this relationship is neither strong in one direction in another nor
significant for Panama and Honduras. The case of Costa Rica suggests a negative
relationship between the aid and economic development, which tends to confirm the idea
that aid may increase in less favourable environments. The peak in ODA received by
Honduras after the country was severely impacted by the Mitch hurricane represents
anecdotal evidence confirming this relationship.
The positive relationship between remittances, growth and poverty reduction can clearly be
identified in our research. We warned of the risk of a possible inverse relationship between
the two due to the traditional counter-cyclical nature of remittances. However, considering
the strength and significance of the relationships found in this research, this study rather
brings further evidence for a causal relationship between remittances and economic growth.
20
An important finding of this research is linked to the absence of a positive and significant
relationship between ODA and poverty reduction, as this finding may go against popular belief that
ODA should lead to poverty reduction. This may be explained by exogenous factors such as the
historical focus of aid on geopolitical considerations (with only a recent shift towards poverty
reduction objectives), or endogenous ones, such as the question of the direction of the causation. As
these findings may have policy consequences (as we have seen during the crisis with important
drops in ODA-spending), further research on the nature of this correlation is expected to be more
and more relevant.

21
BIBLIOGRAPHY
Calvo, Cesar C., Hernandez Marco A. “Foreign Direct Investment and Poverty in Latin America.”
Paper prepared to be delivered at the Globalisation and Economic Policy, Centre for Research on
Globalisation and Economic Policy, University of Nottingham, 21-22 April 2006. Available at:
https://www.nottingham.ac.uk/gep/documents/conferences/2006/postgradconf2006/hernandez-
postgradconf2006.pdf.
Ellen Cramer, Elizabeth. ‘Honduran immigrants.’ Immigration to United States. Available at:
http://immigrationtounitedstates.org/555-honduran-immigrants.html.
“International Migration and the Millennium Development Goals.” in Selected Papers of the
UNFPA Expert Group Meeting, Marrakech, 11-12 May 2005. Available at:
https://www.unfpa.org/sites/default/files/resource-pdf/migration_report_2005.pdf.
Giuliano, Paolo, Ruiz Arranz, Marta. “Remittances, Financial Development and Growth,” Working
paper 05/234, International Monetary Fund, 2005. Available at:
http://www.imf.org/external/pubs/cat/longres.aspx?sk=18607.
Guillaumont, Patrick, Chauvet, Lisa. ‘Aid and Performance: A Reassessment.’ Journal of
Development Studies, 2001.
Indicators, The World Bank. Available at: http://data.worldbank.org/indicator.
“International Migration and the Millennium Development Goals.” in Selected Papers of the
UNFPA Expert Group Meeting, Marrakech, 11-12 May 2005. Available at:
https://www.unfpa.org/sites/default/files/resource-pdf/migration_report_2005.pdf.
Moreno-Villalaz, Juan Luis. “Lessons from the monetary experience of Panama: a dollar economy
with financial integration.” Cato Journal, Vol. 18, No. 3, Winter 1999. Available at:
http://object.cato.org/sites/cato.org/files/serials/files/cato-journal/1999/1/cj18n3-12.pdf.
‘P Value from Pearson (R) Calculator,’ Social Science Statistics. Available at:
http://www.socscistatistics.com/pvalues/pearsondistribution.aspx.
Raghuram, Rajan, Subramanian, Arvind. “Aid and Growth: What Does the Cross-Country
Evidence Really Show?” Working Paper 05/127, IMF, Washington D.C, 2005.
Ratha, Dilip “The impact of Remittances on Economic Growth and Poverty Reduction,” MPI
paper, September 2013. Available at: http://www.migrationpolicy.org/research/impact-remittances-
economic-growth-and-poverty-reduction.
Tribe, Mike. “ODA, Economic Growth and Poverty Reduction.” Ideas4development, 1 December
2010. Available at: http://ideas4develop.blogspot.fr/2010/12/oda-economic-growth-and-
poverty.html.
Zhang, Kevin Honglin. “Does International Investment Help Poverty Reduction in China?.” The
Chinese Economy,Volume 39, Issue 3, 2006. Available at:
http://www.tandfonline.com/doi/abs/10.2753/CES1097-1475390306?journalCode=mces20.

22
APPENDIX: Definition of World Bank indicators
Net ODA received per capita (current US$)
Net official development assistance (ODA) per capita consists of disbursements of loans made on
concessional terms (net of repayments of principal) and grants by official agencies of the members
of the Development Assistance Committee (DAC), by multilateral institutions, and by non-DAC
countries to promote economic development and welfare in countries and territories in the DAC list
of ODA recipients; and is calculated by dividing net ODA received by the midyear population
estimate. It includes loans with a grant element of at least 25 percent (calculated at a rate of
discount of 10 percent).
Development Assistance Committee of the Organisation for Economic Co-operation and
Development, Geographical Distribution of Financial Flows to Developing Countries,
Development Co-operation Report, and International Development Statistics database. Data are
available online at: www.oecd.org/dac/stats/idsonline. World Bank population estimates are used
for the denominator.
Personal remittances, received (current US$)
Personal remittances comprise personal transfers and compensation of employees. Personal
transfers consist of all current transfers in cash or in kind made or received by resident households
to or from nonresident households. Personal transfers thus include all current transfers between
resident and nonresident individuals. Compensation of employees refers to the income of border,
seasonal, and other short-term workers who are employed in an economy where they are not
resident and of residents employed by nonresident entities. Data are the sum of two items defined in
the sixth edition of the IMF's Balance of Payments Manual: personal transfers and compensation of
employees. Data are in current U.S. dollars.
World Bank staff estimates based on IMF balance of payments data.
Foreign direct investment, net inflows (BoP, current US$)
Foreign direct investment refers to direct investment equity flows in the reporting economy. It is the
sum of equity capital, reinvestment of earnings, and other capital. Direct investment is a category of
cross-border investment associated with a resident in one economy having control or a significant
degree of influence on the management of an enterprise that is resident in another economy.
Ownership of 10 percent or more of the ordinary shares of voting stock is the criterion for
determining the existence of a direct investment relationship. Data are in current U.S. dollars.
International Monetary Fund, Balance of Payments database, supplemented by data from the
United Nations Conference on Trade and Development and official national sources.
GDP per capita (current US$)
GDP per capita is gross domestic product divided by midyear population. GDP is the sum of gross
value added by all resident producers in the economy plus any product taxes and minus any
subsidies not included in the value of the products. It is calculated without making deductions for
depreciation of fabricated assets or for depletion and degradation of natural resources. Data are in
current U.S. dollars.
World Bank national accounts data, and OECD National Accounts data files.
Poverty headcount ratio at $1.90 a day (2011 PPP) (% of population)
Poverty headcount ratio at $1.90 a day is the percentage of the population living on less than $1.90
a day at 2011 international prices. As a result of revisions in PPP exchange rates, poverty rates for
individual countries cannot be compared with poverty rates reported in earlier editions. Note: five

23
countries -- Bangladesh, Cabo Verde, Cambodia, Jordan, and Lao PDR -- use the 2005 PPP
conversion factors and corresponding $1.25 a day and $2 a day poverty lines. This is due to the
large deviations in the rate of change in PPP factors relative to the rate of change in domestic
consumer price indexes. See Box 1.1 in the Global Monitoring Report 2015/2016
(http://www.worldbank.org/en/publication/global-monitoring-report) for a detailed explanation.
World Bank, Development Research Group. Data are based on primary household survey data
obtained from government statistical agencies and World Bank country departments. Data for high-
income economies are from the Luxembourg Income Study database. For more information and
methodology, please see PovcalNet (http://iresearch.worldbank.org/PovcalNet/index.htm).
Population, total
Total population is based on the de facto definition of population, which counts all residents
regardless of legal status or citizenship--except for refugees not permanently settled in the country
of asylum, who are generally considered part of the population of their country of origin. The values
shown are midyear estimates.
(1) United Nations Population Division. World Population Prospects, (2) United Nations Statistical
Division. Population and Vital Statistics Report (various years), (3) Census reports and other
statistical publications from national statistical offices, (4) Eurostat: Demographic Statistics, (5)
Secretariat of the Pacific Community: Statistics and Demography Programme, and (6) U.S. Census
Bureau: International Database.


