Embed Size (px)
Citation preview
The Power of
Business ProcessImprovement

This page intentionally left blank
American Management AssociationNew York • Atlanta • Brussels • Chicago • Mexico CitySan Francisco • Shanghai • Tokyo • Toronto • Washington, D.C.
10 Simple Steps to Increase Effectiveness, Efficiency, and Adaptability
Susan Page
The Power of
Business ProcessImprovement
Bulk discounts available. For details visit:www.amacombooks.org/go/specialsalesOr contact special sales:Phone: 800-250-5308Email: [email protected] all the AMACOM titles at: www.amacombooks.org
This publication is designed to provide accurate and authoritativeinformation in regard to the subject matter covered. It is sold with theunderstanding that the publisher is not engaged in rendering legal,accounting, or other professional service. If legal advice or other expertassistance is required, the services of a competent professional personshould be sought.
The following are registered trademarks:Adobe Acrobat Reader�Adobe PDFAcrobat�Microsoft Office Access�Microsoft Office Excel�Microsoft Office Outlook�Microsoft Office PowerPoint�Microsoft Office Project�Microsoft Office SharePoint� orMicrosoft Office Visio�Microsoft Office Word�Open Text Hummingbird Connectivity�
Library of Congress Cataloging-in-Publication Data
Page, Susan (Susan Ann)The power of business process improvement : 10 simple steps to increase effectiveness,
efficiency, and adaptability / Susan Page.p. cm.
Includes bibliographical references and index.ISBN-13: 978-0-8144-1478-1ISBN-10: 0-8144-1478-81. Workflow—Management. 2. Organizational effectiveness. 3. Management. I. Title.
HD62.17.P34 2010658.5�1—dc22 2009023530
� 2010 Susan Page.All rights reserved.Printed in the United States of America.
This publication may not be reproduced, stored in a retrievalsystem, or transmitted in whole or in part, in any form or byany means, electronic, mechanical, photocopying, recording,or otherwise, without the prior written permission of AMACOM,a division of American Management Association, 1601 Broadway,New York, NY 10019
About AMAAmerican Management Association (www.amanet.org) is a world leader in talentdevelopment, advancing the skills of individuals to drive business success. Our mission is tosupport the goals of individuals and organizations through a complete range of products andservices, including classroom and virtual seminars, webcasts, webinars, podcasts,conferences, corporate and government solutions, business books and research. AMA’sapproach to improving performance combines experiential learning—learning throughdoing—withopportunities forongoing professional growthat every stepofone’s career journey.
Printing number
10 9 8 7 6 5 4 3 2 1

To Greg . . .
without his encouragement and ongoing support,
this book would never have happened

This page intentionally left blank
Contents
CHAPTER 1 :The Roadmap: Learning How to Navigate 1
Can You Do It? 5
The Journey 6
The Ten Simple Steps to Business Process Improvement 8
Step 1: Develop the Process Inventory 8
Step 2: Establish the Foundation 9
Step 3: Draw the Process Map 10
Step 4: Estimate Time and Cost 11
Step 5: Verify the Process Map 11
Step 6: Apply Improvement Techniques 12
Step 7: Create Internal Controls, Tools, and Metrics 12
Step 8: Test and Rework 13
Step 9: Implement the Change 14
Step 10: Drive Continuous Improvement 15
The Executive Summary 15
Case Study 16
Chapter Summary 16
CHAPTER 2 :Step 1: Develop the Process Inventory: Identifying and Prioritizing
the Process List 18
The Process Inventory 19
Process Prioritization 23
Developing Criteria 23
Scale 29
Applying Weighting 43
Chapter Summary: Step 1 47
Time Estimate 48
Build the Business Process Inventory 48
vii
viii CONTENTS
Sponsor Meeting 49
Establish Categories, Criteria, Scale, Weighting 49
Complete the Process Prioritization Table 49
A Second Sponsor Meeting 49
What You Have Achieved 50
CHAPTER 3 :Step 2: Establish the Foundation: Avoiding Scope Creep 51
The Eight Sections of the Scope Definition Document 54
Section 1: Process Name 54
Section 2: Process Owner 56
Section 3: Description: 56
Section 4: Scope 64
Section 5: Process Responsibilities 66
Section 6: Client and Client Needs 68
Section 7: Key Stakeholders and Interests 69
Section 8: Measurements of Success 71
Chapter Summary: Step 2 72
Time Estimate 74
First Project Team Meeting 74
Sponsor Meeting 76
What You Have Achieved 76
CHAPTER 4 :Step 3: Draw the Process Map: Flowcharting and Documenting 77
Process Map Overview 78
Drawing the Process Map 82
Box 1 84
Box 2 88
Box 3 91
Boxes 4–7 93
The Cross-Functional Process Map 96
Continuing the Work from Meeting to Meeting 97
Documenting the Process 102
Chapter Summary: Step 3 106
Time Estimate 106
Second Project Team Meeting 108
Postmeeting Work 108
Follow-on Project Team Meetings 108
What You Have Achieved 109
CONTENTS ix
CHAPTER 5 :Steps 4–5: Estimate Time and Cost and Verify the Process Map:Introducing the Process and Cycle Time and Gaining Buy-In 110
Business Process Timing 110
Process Time 111
Cycle Time 115
Process Cost 119
People Costs 120
Tool Costs 126
Overhead Costs 128
Putting It All Together 128
Alternative Cuts of the Data 129
Analyzing the Cost Estimate Columns 131
Verify the Process Map 135
Process Workers 135
Stakeholders 136
Sponsor 136
Chapter Summary: Steps 4–5 137
Time Estimate 138
Project Team Meeting 138
Postmeeting Work 138
Sponsor Meeting 139
Verify the Process Map 139
Postvalidation Work 139
What You Have Achieved 140
CHAPTER 6 :Step 6: Apply Improvement Techniques: Challenging Everything 141
Eliminate Bureaucracy 143
Value Added 147
Eliminate Duplication 151
Simplification 154
Reduce Cycle Time 156
Automation 160
Chapter Summary: Step 6 164
Time Estimate 165
Project Team Meeting 165
Postmeeting Work 166
What You Have Achieved 166
x CONTENTS
CHAPTER 7 :Step 7: Create Internal Controls, Tools, and Metrics: Making It Real 167
Internal Controls 167
Tools 173
Job Aids 174
Custom Email Forms 174
Excel Tools 180
Metrics 181
Chapter Summary: Step 7 186
Time Estimate 187
Project Team Meeting 187
Postmeeting Work 188
Project Team Meeting 188
What You Have Achieved 188
CHAPTER 8 :Step 8: Test and Rework: Making Sure It Works 189
The Five Steps to Testing the Business Process 192
Step 1: Create the Test Plan 193
Step 2: Develop the Scenarios 197
Step 3: Implement the Test Plan 202
Step 4: Summarize Feedback and Rework 203
Step 5: Retest 203
Chapter Summary: Step 8 204
Time Estimate 204
Create the Test Plan 205
Write Test Scenarios 205
Implement the Test Plan and Rework 205
What You Have Achieved 205
CHAPTER 9 :Step 9: Implement the Change: Preparing the Organization 207
The Implementation Plan 208
Overview of the Three Phases of the Implementation Plan 211
The Design Phase 211
The Development Phase 212
The Implementation Phase 213
The Four Tracks in the Implementation Phase 213
Change Management Track (Impact Analysis) 213
Testing Track 215
CONTENTS xi
Communications Track (Communication Plan) 215
Training Track (Training Plan) 218
Chapter Summary: Step 9 223
Time Estimate 224
Develop the Implementation Plan 224
Develop the Impact Analysis 225
Develop the Communication Plan 225
Develop the Training Plan 225
Gain Sponsor Buy-in 226
What You Have Achieved 226
CHAPTER 10 :Step 10: Drive Continuous Improvement: Embracing the New
Mindset 227
The Continuous Improvement Cycle 229
Evaluate 230
Test 235
Assess 236
Execute 238
Continuous Improvement Plan 239
Chapter Summary: Step 10 242
Time Estimate 243
Develop the Continuous Improvement Plan and Schedule 243
Gain Sponsor Buy-in 244
Test, Assess, Execute 244
What You Have Achieved 244
CHAPTER 11 :Create the Executive Summary: Getting the Recognition 245
The Six Sections of the Executive Summary 246
Section 1: Project Focus 247
Section 2: Goals 249
Section 3: Summary 250
Section 4: Key Findings 257
Section 5: Deliverables 258
Section 6: Appendix 259
Chapter Summary 259
Time Estimate 260
Create Analytical Tables 260
Write the Executive Summary 261
What You Have Achieved 261
xii CONTENTS
CHAPTER 12 :Case Study: Sharing a Real-World Example 262
Background 262
Step 1: Develop the Process Inventory 263
Step 2: Establish the Foundation 268
Step 3: Draw the Process Map 271
Step 4: Estimate Time and Cost 283
Process Activities and Process Time 284
Annual Volume 290
FTE Formula 293
Employee Costs 295
Step 5: Verify the Process Map 295
Step 6: Apply Improvement Techniques 296
Benchmarking 296
A New Approach 302
Step 7: Create Internal Controls, Tools, and Metrics 310
Internal Controls 310
Tools 313
Metrics 316
Step 8: Test and Rework 318
Step 9: Implement Change 321
Communication Track 322
Training Track 323
Change Management Track 323
Step 10: Drive Continuous Improvement 323
Chapter Summary 328
What You Have Achieved 328
INDEX 331

The Power of
Business ProcessImprovement

This page intentionally left blank
C H A P T E R 1
The Roadmap
Learning How to Navigate
Have you ever had a problem that you know little or nothingabout land on your desk at work? Does the problem make youfeel overwhelmed and uncertain as to where to begin? Chal-lenges like this usually occur when you already have a full work-load, unrealistic deadlines, and limited resources. What can youdo when you feel lost, like Hansel or Gretel trying to find yourway out of the forest?
Learning to navigate through unfamiliar territory goes along way toward easing the burden and can help you feel com-fortable dealing with the unknown. Business process improve-ment (BPI) work, the systematic examination and improvementof administrative processes, can seem scary and overwhelmingbecause no one teaches this navigation skill in school. But onceyou give it some thought, everything is a process, from makingbreakfast for yourself in the morning to building the space shut-tle. In both cases, you follow a series of actions or steps to bringabout a result. Making breakfast, no matter how informal, is stilla process. You brew the coffee, cook the eggs, and toast thebread. If Vince Lombardi had run a business instead of a foot-ball team, we might remember him today for saying that processisn’t everything, it’s the only thing.
The techniques covered in this book help smooth thepath to successful BPI by clearing away the unknowns and deliv-ering the power of process improvement directly into your
1
2 THE POWER OF BUS INE S S P ROCES S IMPROVEMENT
hands. Whether you consider yourself an expert on the subjector do not see yourself as a process person, you will appreciatelearning how to tackle process improvement work in a bottom-line, straightforward approach. For the inexperienced, ThePower of Business Process Improvement guides you along aproven, step-by-step approach to a successful result; for the ex-pert, it becomes a handy A-to-Z reference guide to help you en-gage an organization in a process improvement effort.
This guide cuts through the long, confusing, and diffi-cult-to-comprehend explanations regarding BPI and takes youdirectly to the core of what you, the business professional, wantto understand. It describes a pragmatic approach to businessprocess improvement that I developed over the years and thatanyone can use in real time to solve real problems. The ten sim-ple steps to increasing the effectiveness, efficiency, and adapt-ability of your business processes start with the creation of aprocess inventory and end with how to keep a business processcontinually delivering value to the business.
If you want to evaluate how your company hires employ-ees, secures sales, or manufactures a product, examining the un-derlying processes helps you better understand how thebusiness works. Every day we experience challenges with inef-ficient or ineffective processes and, after you start thinking ofbusiness processes as the foundation to the business, you beginto see the power of having a process focus and wonder why youwaited so long to change your perspective.
Bill Gates wrote in his book Business @ the Speed ofThought: Succeeding in the Digital Economy (Business Plus,2000) that ‘‘A rule of thumb is that a lousy process will consumeten times as many hours as the work itself requires.’’ We have allseen bureaucracy and red tape continually added to a businessprocess. Bureaucracy happens not all at once, but incrementallyover time. A business process can easily become bloated, leadingto an ineffective, inefficient, and inflexible process.
Improving business processes enables you to stay com-petitive and to increase your responsiveness to your customers,the productivity of your employees doing the work, and yourcompany’s return on investment. The expertise to examine and
THE ROADMAP: LEARNING HOW TO NAVIGATE 3
understand how business processes work sets you apart fromthe rest because you have the power to demonstrate the valuethat the process delivers, its importance to your company, andthe effect that a single change can produce.
People become interested in process improvement forany number of reasons. Do any of these scenarios sound fa-miliar?
? Your customers, clients, or suppliers complain about thebusiness process.
? You find that your department makes numerous errors and/or makes the same one again and again.
? You want to understand how your department can improveits efficiency so that your employees can spend their limitedtime on more valuable work.
? You have accepted responsibility for a new business ordepartment, and you want to understand the work.
? You discovered challenges with the handoffs betweendepartments.
? You want to increase your department’s productivity.
? You noticed duplication of data or tasks in multiple depart-ments.
? You started a new job and want to understand how thedepartment works.
If you encountered one or more of these experiences,then BPI can help. It improves your ability to meet your custom-er’s needs, helps you eliminate errors, identifies opportunities toyield a more effective and efficient process, assists you in learn-ing the end-to-end process for a new part of the business, makesclear the relationship between departments and the roles andresponsibilities of each, improves your department’s productiv-ity, and eliminates redundancy.
Working on business processes helps demystify the proc-ess and makes a seemingly complex process less intimidating.Process improvement work also gives you the chance to engagea cross-functional team in the work so that everyone can learnthe end-to-end business process, instead of simply focusing on
4 THE POWER OF BUS INE S S P ROCES S IMPROVEMENT
his or her own piece of the process. You will find that, as youdo the work, few employees understand the end-to-end process.Employees may understand their own piece, but not how theentire process works from beginning to end. When a team workstogether on improving business processes, the work itself pro-vides a means for colleagues to talk about common topics, andthe team effort promotes an understanding of the interconnec-tivity of their work.
When you focus on a business process, it appears lessthreatening to colleagues than focusing on the employees whodo the work. The process of finding challenges and linking thosechallenges to the process instead of to a particular employeeleads to easier, less threatening solutions. No one employee orgroup of employees has to worry about repercussions.
On the other hand, BPI does affect the entire businesssystem, including the employees who do the work; the informa-tion technology systems that support the process; the measure-ments established to assess the effectiveness, efficiency, andadaptability of the process; and reward and recognition pro-grams that exist in a company.
If you still find yourself wondering whether you shouldundertake a process improvement effort on one of your proc-esses, ask yourself four questions. If you answer no to any ofthese questions, you should start examining your business proc-esses:
1. Does your process include a high level of customer/clientinteraction?
2. Does every step in your process add value for the customer/client?
3. Have you established customer- or client-focused metricsfor the business process?
4. Are your employees evaluated on their contribution to thebusiness process?
Throughout this book, the term customer refers to some-one external to a company who pays money for a product orservice. The term client denotes an internal customer within acompany.
THE ROADMAP: LEARNING HOW TO NAVIGATE 5
If you work as an internal consultant in your company,then you probably work with clients. The client’s business proc-esses should support the company’s business goals, which inturn should support the paying customer. Remember, in busi-ness process work, the customer is king, and you should alwaysfocus on the customer.
Can You Do It?
Many of the process improvement books on the marketsupport the myth that business process improvement must betime-consuming and complex. The Power of Business ProcessImprovement shows that nothing is further from the truth. Itpresents you with numerous tools and examples that you canuse to make the work simple and yet maintain high standards.
Perhaps you have shied away from process improvementbecause it looks like something that only an expert can do. Inreality, you can do this work without having to learn the ins andouts of quality management or reengineering. This book sharesmy own unique approach to BPI, an approach influenced byboth quality and reengineering, that works for me every time. Ihave successfully used the approach outlined with every em-ployee level in different and complex situations. It works. Itworks even with people who start out as skeptics.
As you apply the ten simple steps introduced in this chap-ter and covered in depth in the chapters that follow, you willfind yourself adopting several of the quality and reengineeringphilosophies because the focus on the customer is at their core,but you use them in a seamless way that makes the work palat-able to the business.
I geared each step toward ease of use. This book answersbasic questions and elaborates on how to perform each step bydemonstrating its application. It explains topics that no one everbothers to tell you about, either because book authors, consul-tants, or colleagues assume that you already know about themor because they do not want you to know the full story, believingthat knowledge is power and wanting to hold onto that power.
6 THE POWER OF BUS INE S S P ROCES S IMPROVEMENT
The various BPI books on the market remind me of getting afavorite recipe from a restaurant, but with some key ingredientmissing. This book tells you the whole story and gives you thepower of knowledge.
You will feel comfortable with the formulas that I usethroughout the book because they are the ones commonly usedin business. You do not have to understand complicated statisti-cal measurements of process capability or know how to use SixSigma, Lean, Kaizen, or other quality methods. You have every-thing you need right now, so let us begin the journey.
The Journey
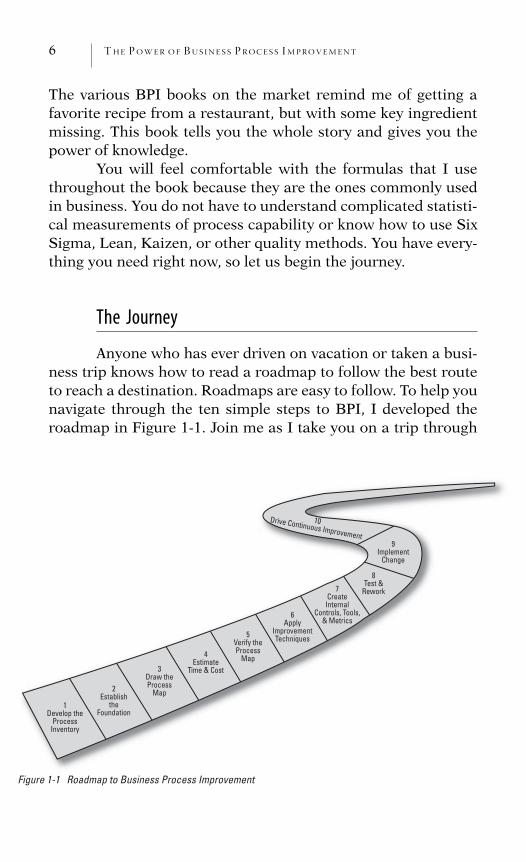
Anyone who has ever driven on vacation or taken a busi-ness trip knows how to read a roadmap to follow the best routeto reach a destination. Roadmaps are easy to follow. To help younavigate through the ten simple steps to BPI, I developed theroadmap in Figure 1-1. Join me as I take you on a trip through
Figure 1-1 Roadmap to Business Process Improvement
1Develop the
ProcessInventory
2Establish
theFoundation
3Draw theProcess
Map
4Estimate
Time & Cost
5Verify theProcess
Map
6Apply
ImprovementTechniques
7Create
InternalControls, Tools,
& Metrics
8Test &
Rework
9Implement
Change
10Drive Continuous Improvement
THE ROADMAP: LEARNING HOW TO NAVIGATE 7
process improvement, using the roadmap as a mental model ofthe ten steps.
The roadmap becomes a meaningful tool for you to usewith your colleagues when engaging them in the work. Businessprofessionals like to know what the voyage looks like and howlong it will take; the roadmap describes the journey.
The objectives of BPI are:
? Effectiveness: Does the process produce the desired resultsand meet the customer’s/client’s needs?
? Efficiency: Does the process minimize the use of resourcesand eliminate bureaucracy?
? Adaptability: Is the process flexible in the face of changingneeds?
These three terms appear frequently throughout thisbook:
? Effectiveness focuses on the customers/clients andwhether the process delivers what they want.
? Efficiency focuses on the employees responsible for theoverall process, the workers in a department or depart-ments, and how easily they can use the business process.
? Adaptability evaluates how easily you can modify the busi-ness process on the basis of changing business require-ments.
Chapters 2 through 10 focus on the ten steps in the road-map, describing each step and explaining how it works. Eachchapter includes tools that I created to help with the step, sum-marizes the key points in the chapter, and ends with a time esti-mate, so that you can see how long each step takes to finish.Chapter 11 then helps you to gain recognition for your work,and Chapter 12 discusses one of my process improvement proj-ects from beginning to end. This last chapter also demonstrateshow you can adapt the ten steps to changing circumstances be-cause, just as you may encounter detours while driving a car,course changes also pop up during process work. As a result,
8 THE POWER OF BUS INE S S P ROCES S IMPROVEMENT
you may find it necessary to alter your approach from time totime.
As you read this book, notice that the steps follow a spe-cific order because the result of one step assists in defining thenext step. In process terminology, you hear this progression de-scribed in terms of inputs and outputs. The output of step 1 inthe roadmap leads to the input for step 2.
Now meet the people you will read about on our journeythrough BPI:
? The regional sales manager who did not feel that his salesteam brought in a sufficient number of new customers
? The buyer who could not get her orders filled in a timelymanner
? The marketing director who took too long to bring herproduct to market
? The training and development manager who wanted toreduce her team’s course development time
? The human resource bank vice president who could notdecide which business process to focus on first
? The human resource information system manager whoneeded to understand how system funding worked and howsystem costs hit his budget
? The compensation director who wanted to learn the headcount requirements for his business processes
? The workforce analysis manager who wanted to understandwhy multiple groups in her company produced similarreports
The Ten Simple Steps to Business Process Improvement
Although each chapter focuses on a step in the roadmap,I will briefly explain each of them so that you have a snapshot ofwhat is ahead.
Step 1: Develop the Process InventoryEvery department has numerous business processes to
manage, but how do you decide which process to examine first?
THE ROADMAP: LEARNING HOW TO NAVIGATE 9
Take the simple process involved in joining a health club: Firstyou identify the available clubs in your neighborhood, and thenyou list your key selection criteria. Do you care more about thedistance from your home, the age of the facility, the type ofequipment, or the qualifications of the staff? You choose thehealth club to join based on what is most important to you.
Step 1 in the roadmap introduces the process inventoryto help you decide where to start. The inventory lists the entirecomplement of business processes in a department or businessarea. The chapter describes how to:
? Identify the business processes.
? Create prioritization criteria.
? Apply the criteria to each business process in the inventory.
? Create a process prioritization table so that you can con-trast a group of business processes to determine whichbusiness process you should address first.
At the end of this step, you have a list of the businessprocesses and you understand the order of priority, so that youknow where to start.
Step 2: Establish the FoundationOnce you create the process inventory in step 1 and select
the business process to focus on first, step 2 introduces the scopedefinition document, your blueprint or foundation that guidesyou through the rest of your process improvement work.
Before starting a home improvement project, you shoulddevelop a plan so that you know the tools and materials youneed. Whether building a deck on your house or simply paintinga room, you always do prework to avoid those time-consumingtrips back to the home center to pick up what you forgot. Like-wise, in BPI you need to establish the boundaries associatedwith a process before you begin the in-depth process work, sothat you avoid future time-consuming discussions about the be-ginning and end of the business process.
This is the role of the scope definition document, whichincludes the process boundaries, provides the baseline informa-
10 THE POWER OF BUS INE S S P ROCES S IMPROVEMENT
tion about the business process you selected, and thus keeps youon track. The document works like a contract, but it does notseem as formal or as threatening to the business. It helps youavoid scope creep, whereby you veer away from the original pur-pose of the work without an increase in time, resources, ormoney.
At the end of this step, you have the basic informationrequired to start the process improvement work, as well as spe-cific boundaries to help you stay on track.
Step 3: Draw the Process MapDrawing the process map enables everyone involved to
understand how the business process works and where handoffsoccur between departments.
The hardest part of many projects is getting started—taking that first step. You will find it no different when it comesto drawing the process map. Whether you work alone or with aproject team, you may find yourself questioning where to start,how to handle conflicts that arise with a project team, and howto keep everyone interested and involved in work that can seemtedious at times. The scope definition document that you cre-ated in step 2 helps you get started with this step because itidentifies where the process starts and ends.
In most cases, unless you own the process and workalone, you need other colleagues to help you build the processmap. It helps to have a project team work with you throughoutthe ten steps or at least to have resources that you can go to withquestions.
The process map you create in this step provides the in-formation you require for step 6, when you apply the improve-ment techniques, and it assists in setting improvement targets.This step gives everyone involved in the work a better under-standing of how the process works from beginning to end byeducating the project team on the end-to-end process.
At the end of this step, you and the project team under-stand how the process works.
THE ROADMAP: LEARNING HOW TO NAVIGATE 11
Step 4: Estimate Time and CostTo measure an accomplishment, you need to know where
you started. Whether you want to lose weight or run a mara-thon, you need to establish a baseline to know how much youhave improved. How much do you weigh today, or how quicklydo you run a marathon today? In process work, to establish animprovement target, you need to know how long a process takesand what it costs.
After drawing the process map in step 3, you understandthe activities involved in a business process; step 4 aids in identi-fying what the process costs today. In the chapter on step 4, youlearn about process time and cycle time. Process time helps yousummarize the labor required to deliver a business process, andcycle time identifies how long the process takes from beginningto end, a key metric that customers/clients usually list as a topconcern. Identifying the employee, overhead, and tool expensesassociated with a business process brings a financial dimensionto your work.
This step helps you define the process cost and cycletime, parameters you can use to set improvement targets.
Step 5: Verify the Process MapBefore adding a deck to your house, you would talk with
your town’s or county’s code enforcement office and seek opin-ions from family members to ensure that you meet the town’ssetback requirements and keep family members happy. Simi-larly, you want to review the process map with the appropriatecolleagues to validate that the map accurately reflects the exist-ing process. Performing this review validates the baseline foryour improvement targets and eliminates the possibility of anyfuture challenges. It provides you with a solid foundation tostart the next step, improving the business process.
By completing this step, you gain sponsor and stake-holder support, and you build a solid foundation on which tostart the improvement work.
12 THE POWER OF BUS INE S S P ROCES S IMPROVEMENT
Step 6: Apply Improvement TechniquesIf you weigh 200 pounds and want to lose 20 pounds in
three months, you know that you need to make changes in yourdaily routine. You may change your eating habits and eliminatedessert, add an exercise like jogging, or partner with a friend formotivation. The same type of evaluation has to occur to improvea business process.
The improvement technique wheel provides an organizedapproach to improving a business process by introducing keymethods to use, including:
? Eliminating bureaucracy.
? Evaluating value-added activities.
? Eliminating duplication and redundancy.
? Simplifying the process, reports, and forms.
? Reducing cycle time.
? Applying automation tools.
You learn how important it is to apply the techniques ina specific order and how applying the six improvement tech-niques, one at a time, aids in evaluating the business process ina planned and thoughtful approach.
By the end of this step, you have changed the businessprocess so that it delivers business value.
Step 7: Create Internal Controls, Tools, andMetricsOnce you establish your plan to lose the extra pounds,
how do you keep track of your progress so that you keep movingtoward your goal? You probably weigh yourself at regular inter-vals and perhaps use an online tracking tool to view your prog-ress. Without frequent measurement, you might easily gain theweight back. The same is true of a business process: Withoutregular measurement, it gets outdated, and without internalcontrols, human errors occur.
THE ROADMAP: LEARNING HOW TO NAVIGATE 13
To bring the process to life—to move it beyond just creat-ing a process map—you establish internal controls, you createtools to increase the effectiveness, efficiency, and adaptability ofthe business process, and you create metrics. Specifically:
? Internal controls identify points in the business processwhere mistakes can occur and explains how to preventthem.
? Creating tools to support the business process streamlinesthe process and assists in avoiding errors and training newemployees on how to perform their jobs.
? Developing metrics shows you whether the process worksas planned.
This book sticks to simple tools that anyone can use; itdoes not discuss large system implementations that you have nocontrol over. In Chapter 7, I focus on getting the maximum outof everyday applications, using only the tools that you no doubtalready have on your desktop computer.
This step helps you to minimize potential errors, createtools to automate the business process, and identify processmetrics.
Step 8: Test and ReworkBefore you purchase new software or join a health club
for a year, you might want to accept a 30-day trial offer andtest it out to make sure it meets your needs. Likewise, beforeintroducing a new, improved process to an organization, youshould test it and work out any bugs before implementing thechange on a wide scale.
In this step you learn how to create a plan to test the newbusiness process. The details included in the plan help to con-firm that the new process and tools work as planned, and resolveany bugs before fully implementing the change. In creating atest plan, you answer questions like whom to involve in the test-ing, what items to test, what steps are involved, where you
14 THE POWER OF BUS INE S S P ROCES S IMPROVEMENT
should conduct the testing, and when the best time is to conductthe test.
Testing the business process evaluates how well the busi-ness process performs, so that you satisfy such project goals asincreased productivity or minimizing errors.
At the end of this step, you should feel comfortable thatthe business process, tools, and metrics work as planned.
Step 9: Implement the ChangeWhen companies introduce a new product, they create a
marketing plan that identifies the product price, customer base,distribution channels, and promotion strategies. Likewise, whenyou change a business process, you need to identify who has toknow about the change, what they need to know, and how tocommunicate the right information to the right people.
Now that you have validated that the business processand tools work, this step explains how to introduce the changeto the organization. Chapter 9 introduces a sample implementa-tion plan that helps you successfully introduce the changes tothe business process. The implementation plan includes phaseslike design, development, and implementation and further orga-nizes each phase into tracks. For example, the implementationphase can have these four tracks:
1. Change management track: This track includes creating animpact analysis to ensure that you include the right col-leagues in making the appropriate changes to the businessprocess. In step 6, as you work with the project team toimprove the business process, you identify changes thatmust occur in the organization to obtain the degree of im-provement you expect. The impact analysis is a tool used tocapture the changes that have to occur to ensure the successof the new business process.
2. Testing track: The steps in this track confirm that the proc-ess and tools work as expected.
3. Communication track: This track identifies whom to notifyof the change, what they need to know, when they need to
THE ROADMAP: LEARNING HOW TO NAVIGATE 15
know it, and the audience’s preferred communication vehi-cle(s).
4. Training track: This identifies who requires training onwhat, when the training should occur, who delivers thetraining, and the preferred training method.
At the end of this step, you have introduced the newprocess.
Step 10: Drive Continuous ImprovementNow that you have lost weight, can you relax and allow
old habits to creep back into your life? Not if you intend to keepthe weight off for good. The maintenance phase of a weight lossprogram should lead to lifestyle changes that become part ofyour everyday life. Likewise, once you improve a business proc-ess, you cannot simply relax. Just as you need to keep weighingyourself to maintain your weight loss, you have to continuallymeasure the business process to retain the strategic gains.
Continuous improvement means achieving a new mind-set by which ongoing improvement is the natural course of busi-ness instead of an event. The continuous improvement cyclewheel introduces four phases—evaluate, test, assess, and exe-cute—to help you attain the new mindset. Each phase in thewheel provides you with a degree of structure to help you thinkthrough how to keep the business process up to date on an ongo-ing basis. Continuous improvement validates that the businessprocess continually delivers effectiveness, efficiency, and adapt-ability to the organization.
You now have a plan in place to evaluate the businessprocess on an ongoing basis, so that it stays relevant to yourcustomer’s/client’s needs.
After steps 1–10 are covered, there are two additionalchapters: the executive summary and a case study.
The Executive Summary
Chapter 11 assists you in gaining recognition for yourefforts. After all your work, this chapter shows you how to gain
16 THE POWER OF BUS INE S S P ROCES S IMPROVEMENT
the credit you deserve. An executive summary is a tool thatallows you to present your work to senior management in thenatural course of business. In this chapter, you learn how towrite an executive summary and present statistical informationin a thought-provoking manner. By the end of this chapter, youhave a concise summary of your work, appropriate for seniormanagement to read.
Case Study
Chapter 12 then presents a case study from beginningto end. You see the ten simple steps applied to a training anddevelopment case that I worked on for a financial institution.You can follow my journey, past the detours I had to take andall the way through to implementation.
When you reach the end of this chapter, you know howadaptable you can make the ten steps.
Chapter Summary
The journey to improving business processes should notappear threatening. I assure you that you can do the work. Justas Hansel and Gretel found their way out of the forest, you willquickly find that you are a business process person just by fol-lowing the ten simple steps to business process improvement.
You can use the ten steps whether you work with a proj-ect team or on your own. If you work with a project team, theroadmap helps the team members understand what to expect,keeps them interested, and makes them feel part of the journey.If you work alone, the roadmap helps you keep track of yourprogress.
You can adjust the time spent on each step, spending asmuch or as little time as you see fit, depending on your goal.Always keep in mind the return on investment of your time. Ex-pend as much effort as required to achieve your goal. That maymean delving deep into a business process or simply skimmingthe surface. Let your goal drive the amount of effort you invest.
THE ROADMAP: LEARNING HOW TO NAVIGATE 17
This book puts the power of business process improve-ment in your hands. You can make your business processesmore effective in delivering what your customers/clients want,more efficient for the employees who perform the processes, andmore flexible so that the processes can be adapted to changingbusiness needs.
C H A P T E R 2
Step 1: Develop the
Process Inventory
Identifying and Prioritizing the Process List
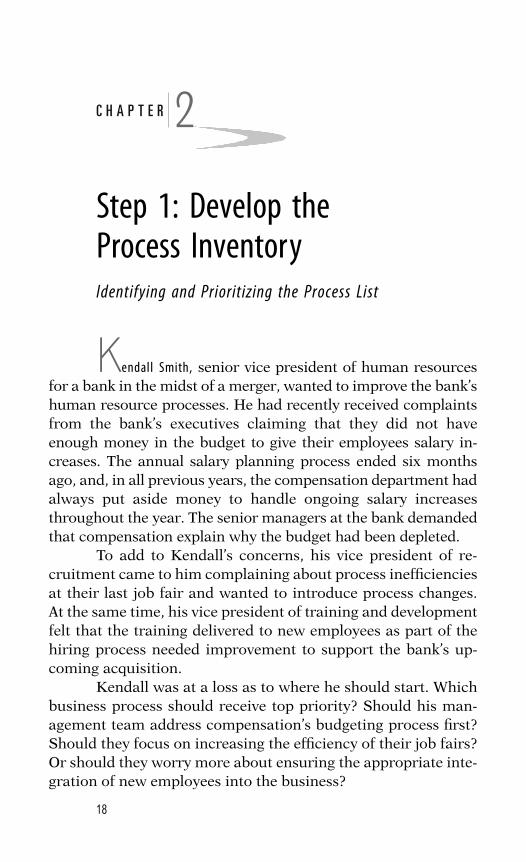
Kendall Smith, senior vice president of human resourcesfor a bank in the midst of a merger, wanted to improve the bank’shuman resource processes. He had recently received complaintsfrom the bank’s executives claiming that they did not haveenough money in the budget to give their employees salary in-creases. The annual salary planning process ended six monthsago, and, in all previous years, the compensation department hadalways put aside money to handle ongoing salary increasesthroughout the year. The senior managers at the bank demandedthat compensation explain why the budget had been depleted.
To add to Kendall’s concerns, his vice president of re-cruitment came to him complaining about process inefficienciesat their last job fair and wanted to introduce process changes.At the same time, his vice president of training and developmentfelt that the training delivered to new employees as part of thehiring process needed improvement to support the bank’s up-coming acquisition.
Kendall was at a loss as to where he should start. Whichbusiness process should receive top priority? Should his man-agement team address compensation’s budgeting process first?Should they focus on increasing the efficiency of their job fairs?Or should they worry more about ensuring the appropriate inte-gration of new employees into the business?
18
STEP 1: DEVELOP THE PROCESS INVENTORY 19
The process inventory and the process prioritizationtable introduced in this chapter helped Kendall to prioritize thework, and these same tools will help you rank your company’sbusiness processes so that you know where to start your im-provement efforts. In this chapter, I describe three main steps:
1. Build the process inventory.2. Develop prioritization criteria and scale.3. Build a table that merges the inventory and criteria so that
you know which business process to improve first.
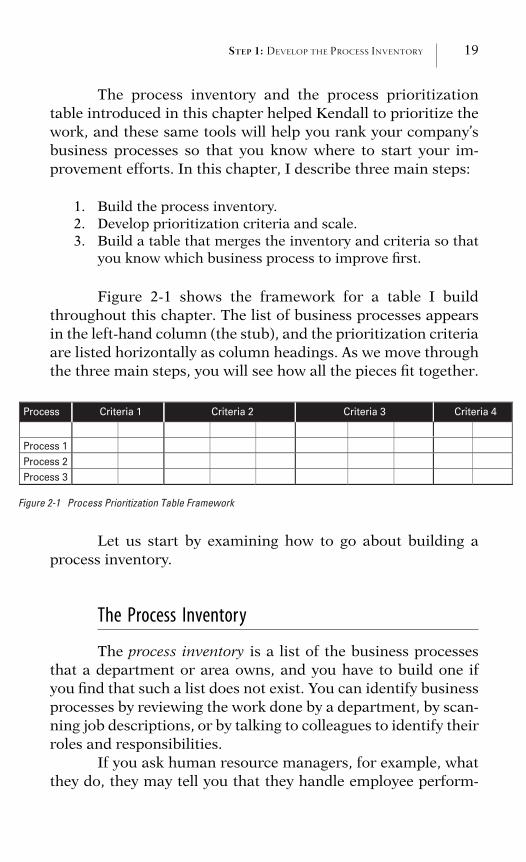
Figure 2-1 shows the framework for a table I buildthroughout this chapter. The list of business processes appearsin the left-hand column (the stub), and the prioritization criteriaare listed horizontally as column headings. As we move throughthe three main steps, you will see how all the pieces fit together.
Process Criteria 1 Criteria 2 Criteria 3 Criteria 4
Process 1Process 2Process 3
Figure 2-1 Process Prioritization Table Framework
Let us start by examining how to go about building aprocess inventory.
The Process Inventory
The process inventory is a list of the business processesthat a department or area owns, and you have to build one ifyou find that such a list does not exist. You can identify businessprocesses by reviewing the work done by a department, by scan-ning job descriptions, or by talking to colleagues to identify theirroles and responsibilities.
If you ask human resource managers, for example, whatthey do, they may tell you that they handle employee perform-
20 THE POWER OF BUS INE S S P ROCES S IMPROVEMENT
ance problems, help with change management, write or inter-pret policy, manage the recruiting strategy, or perform similartasks. You can then translate those responsibilities into businessprocesses. In this example, you may define the following busi-ness processes that come from talking to a human resourcemanager:
? Performance Management Process: Defines how tohandle employee performance problems.
? Change Management Process: Defines how the organiza-tion deals with change from both the employee and organi-zational perspectives.
? Policy Development Process: Defines the steps required towrite and gain approval on employee-related policies.
? Recruitment Process: Defines how to move from sourcingcandidates to hiring the right employees.
These four processes become part of the process inven-tory. Now, let us use another example: talking to sales represen-tatives. You may discover that they spend a great deal of timegenerating leads, cold calling, or managing existing accounts.You can then translate these responsibilities into the followingbusiness processes:
? Lead Generation Process: Defines how the sales groupgenerates, assigns, and evaluates leads.
? Sales Process: Defines the steps involved in calling onpotential customers and closing sales.
? Account Management Process: Defines how to manage astrategic customer account on a day-to-day basis.
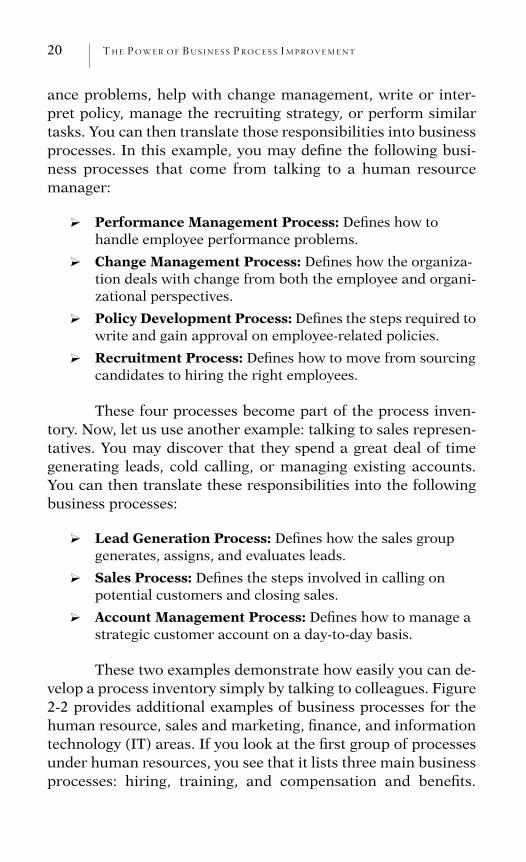
These two examples demonstrate how easily you can de-velop a process inventory simply by talking to colleagues. Figure2-2 provides additional examples of business processes for thehuman resource, sales and marketing, finance, and informationtechnology (IT) areas. If you look at the first group of processesunder human resources, you see that it lists three main businessprocesses: hiring, training, and compensation and benefits.
STEP 1: DEVELOP THE PROCESS INVENTORY 21
Process Business Process Owner
Human resource processes: ■
■
■
■
■
■
■
■
■
■
■
■
■
■
■
■
■
■
■
■
■
■
Hiring Requisition process Sourcing process Job fair process Orientation process
Training Need identification process Course development process Evaluation process
Compensation and benefits Salary planning process Budget process Job-leveling process New hire pay process
Ephron Levy
Fernando Ruiz
Susan Gail
Sales and marketing processes: Portfolio management Market planning/segmentation Advertising Distribution Lead development Account management Sales and marketing administration Revenue generation
Bob Johns Samantha Smith Steven Parker Hussein Riyad Abigail Adams Lavali Chopras John Smith Jennifer Harding
Finance processes: Budgeting and forecasting Payroll Tax planning Risk management Cash management
Alejandro Izquierdo Darpak Gupta Cybil Johnson Tim Seinfeld Susan Case
Information technology processes: Application development Change order Client relationship Portfolio management Program management Incident management
Ajit Ganeshes Isabel Munoz Brigitte Dupree Bill Stein Tom Williams Paul Reines
Figure 2-2 Sample Business Process Inventory
22 THE POWER OF BUS INE S S P ROCES S IMPROVEMENT
Since a single business process can have multiple subprocesses,you can further break down each main process into sub-processes. In this example, I broke the hiring process into foursubprocesses: requisition, sourcing, job fair, and orientation.
As you build the process inventory, break major proc-esses into subprocesses to make sure you do not overlook anybusiness process and to identify the business process owner,that is, the person responsible for each process. Figure 2-2shows the names of the process owners.
Another way to organize the process inventory is togroup all business processes under general category names. Ifyou work with an information technology department, youcould group their business processes under fairly general cate-gories that should work in most cases. For example:
1. People/organizational processes:� Performance management� Succession planning� Communication� Recognition
2. Financial processes:� Capital budgeting� Five-year plan� Annual operating plan
3. Client-facing IT processes:� Client relationship management� Change order� Issue resolution
4. Internal-facing IT processes:� Network administration� Security administration� Software development
The technique of grouping business processes under afew major headings works well when you have a long processlist because grouping the processes helps manage the inventoryand makes it easier to decide where to start. For example, youmay decide to start with the collection of client-facing processes
STEP 1: DEVELOP THE PROCESS INVENTORY 23
because they will improve the effectiveness of the department’sbusiness processes.
So, now that you know how to build the process inven-tory, let us move to step 2 and discuss how to develop the appro-priate criteria so that you can prioritize the process inventoryand pinpoint where to start.
Process Prioritization
Whether you have a list of specific business processes orjust general categories, develop criteria and apply them to theitems in the process inventory.
Remember Kendall Smith at the beginning of this chap-ter? He had to decide whether to focus on compensation’s bud-geting process, the job fair process, or their training process tobetter integrate new employees into the company. I had to finda way to help him prioritize his business processes so that heand his management team could easily decide where to start.The next section explains how to develop criteria to prioritize aprocess inventory.
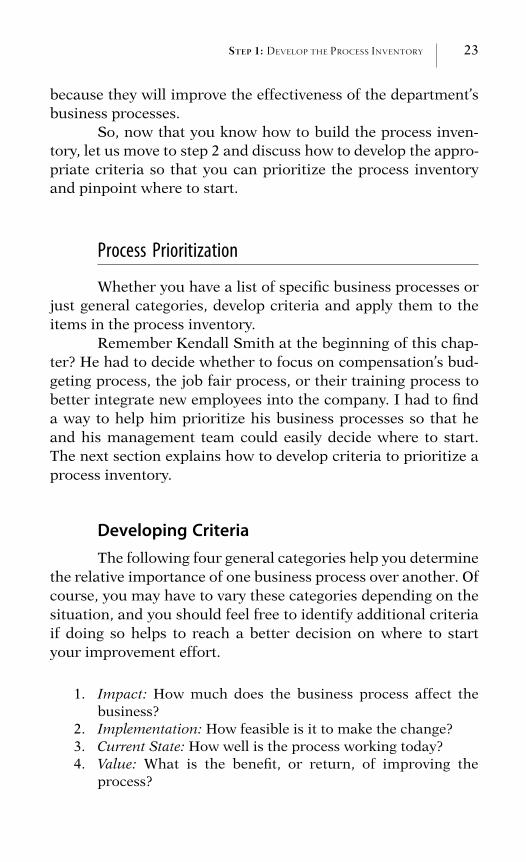
Developing CriteriaThe following four general categories help you determine
the relative importance of one business process over another. Ofcourse, you may have to vary these categories depending on thesituation, and you should feel free to identify additional criteriaif doing so helps to reach a better decision on where to startyour improvement effort.
1. Impact: How much does the business process affect thebusiness?
2. Implementation: How feasible is it to make the change?3. Current State: How well is the process working today?4. Value: What is the benefit, or return, of improving the
process?
24 THE POWER OF BUS INE S S P ROCES S IMPROVEMENT
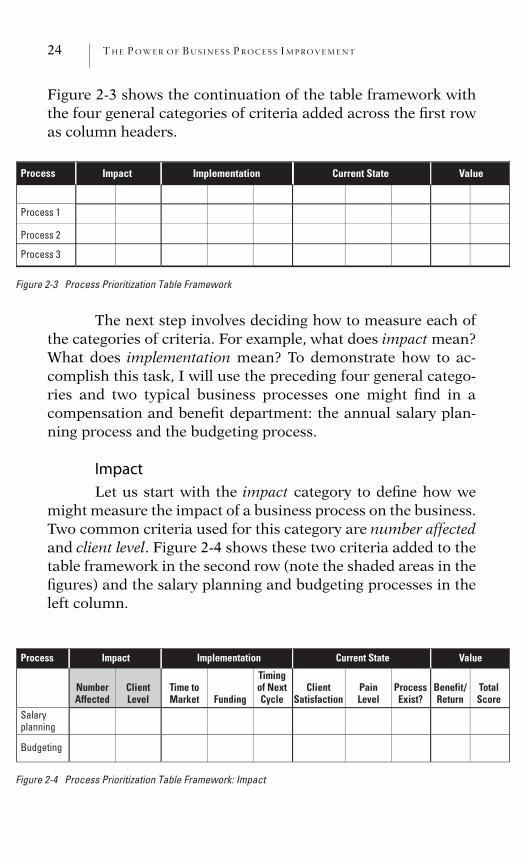
Figure 2-3 shows the continuation of the table framework withthe four general categories of criteria added across the first rowas column headers.
Process Impact Implementation Current State Value
Process 1
Process 2
Process 3
Figure 2-3 Process Prioritization Table Framework
The next step involves deciding how to measure each ofthe categories of criteria. For example, what does impact mean?What does implementation mean? To demonstrate how to ac-complish this task, I will use the preceding four general catego-ries and two typical business processes one might find in acompensation and benefit department: the annual salary plan-ning process and the budgeting process.
Impact
Let us start with the impact category to define how wemight measure the impact of a business process on the business.Two common criteria used for this category are number affectedand client level. Figure 2-4 shows these two criteria added to thetable framework in the second row (note the shaded areas in thefigures) and the salary planning and budgeting processes in theleft column.
Process Impact Implementation Current State Value
Timingof NextCycle
ClientSatisfaction
PainLevelFunding
Time toMarket
ClientLevel
NumberAffected
ProcessExist?
Benefit/Return
TotalScore
Salaryplanning
Budgeting
Figure 2-4 Process Prioritization Table Framework: Impact
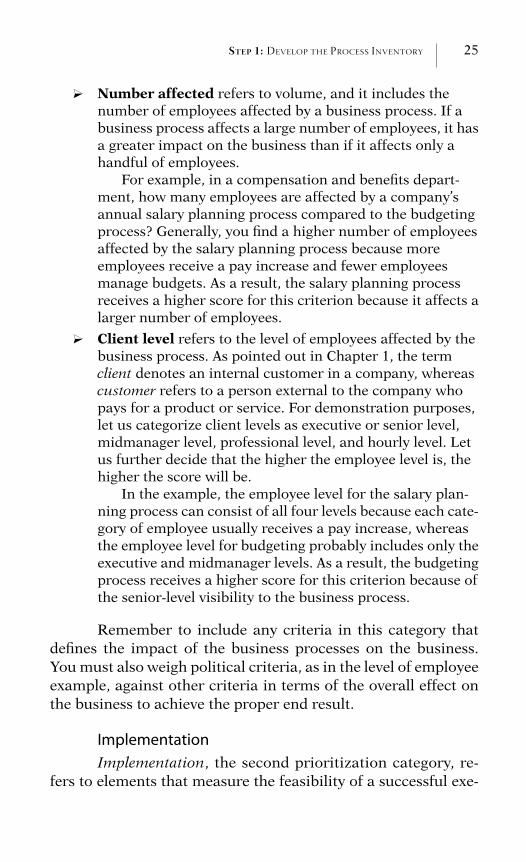
STEP 1: DEVELOP THE PROCESS INVENTORY 25
? Number affected refers to volume, and it includes thenumber of employees affected by a business process. If abusiness process affects a large number of employees, it hasa greater impact on the business than if it affects only ahandful of employees.
For example, in a compensation and benefits depart-ment, how many employees are affected by a company’sannual salary planning process compared to the budgetingprocess? Generally, you find a higher number of employeesaffected by the salary planning process because moreemployees receive a pay increase and fewer employeesmanage budgets. As a result, the salary planning processreceives a higher score for this criterion because it affects alarger number of employees.
? Client level refers to the level of employees affected by thebusiness process. As pointed out in Chapter 1, the termclient denotes an internal customer in a company, whereascustomer refers to a person external to the company whopays for a product or service. For demonstration purposes,let us categorize client levels as executive or senior level,midmanager level, professional level, and hourly level. Letus further decide that the higher the employee level is, thehigher the score will be.
In the example, the employee level for the salary plan-ning process can consist of all four levels because each cate-gory of employee usually receives a pay increase, whereasthe employee level for budgeting probably includes only theexecutive and midmanager levels. As a result, the budgetingprocess receives a higher score for this criterion because ofthe senior-level visibility to the business process.
Remember to include any criteria in this category thatdefines the impact of the business processes on the business.You must also weigh political criteria, as in the level of employeeexample, against other criteria in terms of the overall effect onthe business to achieve the proper end result.
Implementation
Implementation, the second prioritization category, re-fers to elements that measure the feasibility of a successful exe-
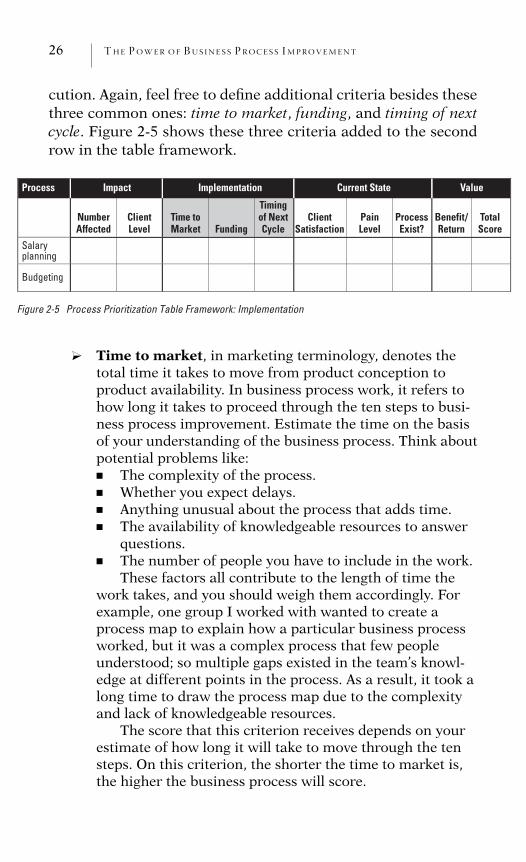
26 THE POWER OF BUS INE S S P ROCES S IMPROVEMENT
cution. Again, feel free to define additional criteria besides thesethree common ones: time to market, funding, and timing of nextcycle. Figure 2-5 shows these three criteria added to the secondrow in the table framework.
Process Impact Implementation Current State Value
Timingof NextCycle
ClientSatisfaction
PainLevelFunding
Time toMarket
ClientLevel
NumberAffected
ProcessExist?
Benefit/Return
TotalScore
Salaryplanning
Budgeting
Figure 2-5 Process Prioritization Table Framework: Implementation
? Time to market, in marketing terminology, denotes thetotal time it takes to move from product conception toproduct availability. In business process work, it refers tohow long it takes to proceed through the ten steps to busi-ness process improvement. Estimate the time on the basisof your understanding of the business process. Think aboutpotential problems like:� The complexity of the process.� Whether you expect delays.� Anything unusual about the process that adds time.� The availability of knowledgeable resources to answer
questions.� The number of people you have to include in the work.
These factors all contribute to the length of time thework takes, and you should weigh them accordingly. Forexample, one group I worked with wanted to create aprocess map to explain how a particular business processworked, but it was a complex process that few peopleunderstood; so multiple gaps existed in the team’s knowl-edge at different points in the process. As a result, it took along time to draw the process map due to the complexityand lack of knowledgeable resources.
The score that this criterion receives depends on yourestimate of how long it will take to move through the tensteps. On this criterion, the shorter the time to market is,the higher the business process will score.
STEP 1: DEVELOP THE PROCESS INVENTORY 27
? Funding refers to whether you require a budget and its size.Although you may not know the exact cost associated withany technology investment, in most cases you do have anidea of the size of the investment (small, medium, large)and know whether you have to pay for additional servicesor resources. If you expect to require funding, this criterionreceives a negative, low score because of the time-consuming nature of gaining budget approval.
? Timing of next cycle refers to the time lapse before theorganization plans to use the business process again, thatis, ongoing, almost daily, or cyclically (quarterly, semian-nual, or annual). In the annual salary planning processexample, this process receives a low score on this criterionif the annual process just occurred because it will nothappen again for another year. On the other hand, anongoing process receives a high score because any improve-ments immediately affect the business.
Current State
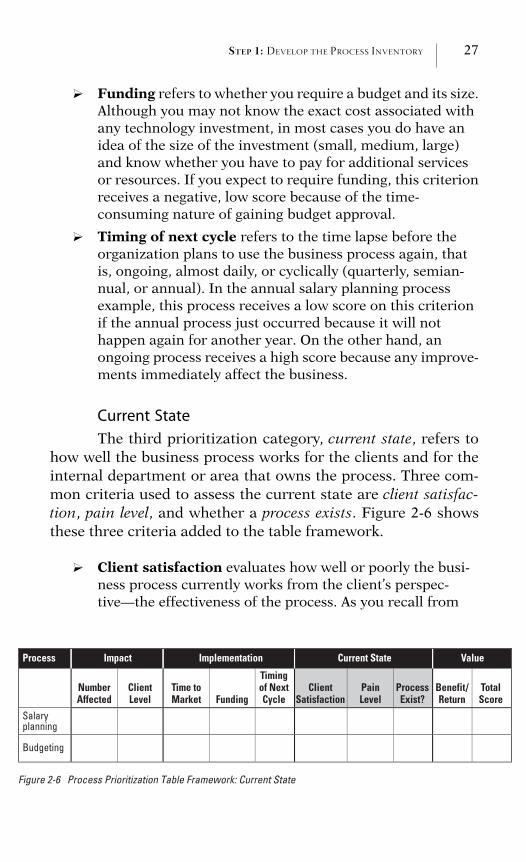
The third prioritization category, current state, refers tohow well the business process works for the clients and for theinternal department or area that owns the process. Three com-mon criteria used to assess the current state are client satisfac-tion, pain level, and whether a process exists. Figure 2-6 showsthese three criteria added to the table framework.
? Client satisfaction evaluates how well or poorly the busi-ness process currently works from the client’s perspec-tive—the effectiveness of the process. As you recall from
Process Impact Implementation Current State Value
Timingof NextCycle
ClientSatisfaction
PainLevelFunding
Time toMarket
ClientLevel
NumberAffected
ProcessExist?
Benefit/Return
TotalScore
Salaryplanning
Budgeting
Figure 2-6 Process Prioritization Table Framework: Current State
28 THE POWER OF BUS INE S S P ROCES S IMPROVEMENT
Chapter 1, we define effectiveness from the customer’s/cli-ent’s perspective. Answer the question, ‘‘How delighted areyour clients with the current process?’’ If you score clientsatisfaction as low, this criterion receives a high score.
? Pain level refers to how well or poorly the business processcurrently works for the department responsible for deliv-ering the process results. This criterion evaluates the effi-ciency of the existing process, and we define efficiency fromthe process owner’s perspective. Answer the question, ‘‘Howeasily can the department manage the existing process?’’ Ifyou score the process as an extremely manual one and feelthat it requires too much work, this criterion receives a highscore.
? Process exist? simply refers to whether a process exists ornot. Even when no formal process exists and employees justdo whatever it takes to get the job done, a process does infact exist, albeit an informal one. If no formal processexists, this criterion receives a high score because theprocess should be documented.
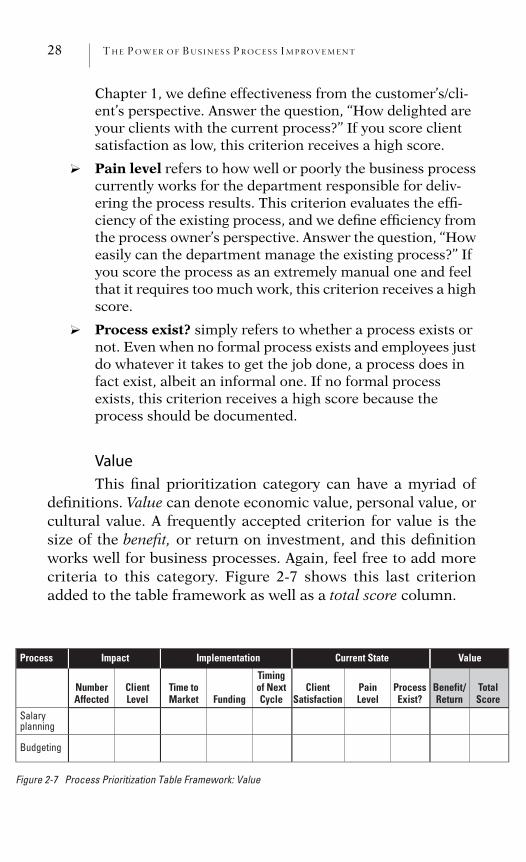
Value
This final prioritization category can have a myriad ofdefinitions. Value can denote economic value, personal value, orcultural value. A frequently accepted criterion for value is thesize of the benefit, or return on investment, and this definitionworks well for business processes. Again, feel free to add morecriteria to this category. Figure 2-7 shows this last criterionadded to the table framework as well as a total score column.
Process Impact Implementation Current State Value
Timingof NextCycle
ClientSatisfaction
PainLevelFunding
Time toMarket
ClientLevel
NumberAffected
ProcessExist?
Benefit/Return
TotalScore
Salaryplanning
Budgeting
Figure 2-7 Process Prioritization Table Framework: Value
STEP 1: DEVELOP THE PROCESS INVENTORY 29
? Benefit/return refers to either a quantitative or qualitativemeasure of the value of improving the process:� Quantitative signifies a number or quantity, usually a
measurement represented in numerical terms (liketurnover rate or error rate).
� Qualitative denotes quality, usually a measurementrepresented in softer terms (like responsiveness or theability to make decisions).Quantitative value often speaks louder to the business
because it is associated with a number. However, in busi-ness process work, qualitative value becomes increasinglyimportant because of the positive results that an effectivebusiness process can have on clients/customers.
This criterion requires further discussion to come to acommon understanding and agreement about how to eval-uate the benefit or return of a business process. Think aboutvalue relative to the status quo, which means leaving a busi-ness process in the existing condition. What merit do youassociate with taking action versus doing nothing?� Total score, at the far right in Figure 2-7, shows the
overall score for each business process once we popu-late the table with numbers.
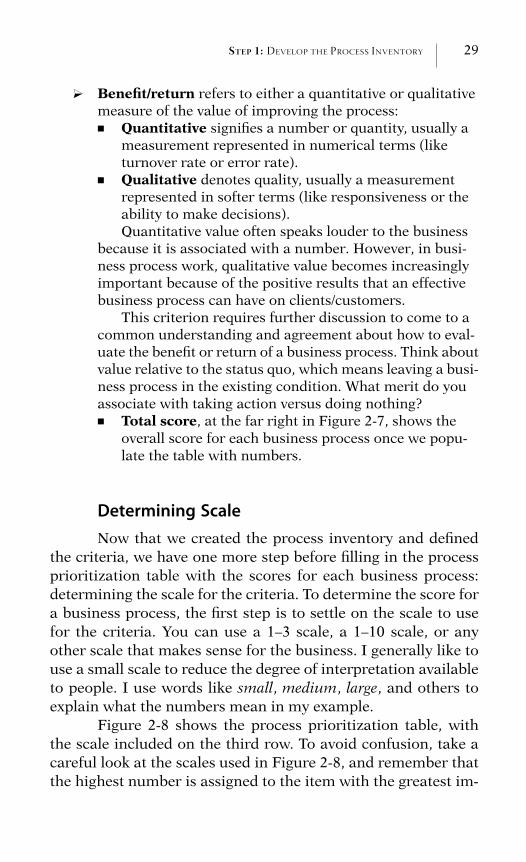
Determining ScaleNow that we created the process inventory and defined
the criteria, we have one more step before filling in the processprioritization table with the scores for each business process:determining the scale for the criteria. To determine the score fora business process, the first step is to settle on the scale to usefor the criteria. You can use a 1–3 scale, a 1–10 scale, or anyother scale that makes sense for the business. I generally like touse a small scale to reduce the degree of interpretation availableto people. I use words like small, medium, large, and others toexplain what the numbers mean in my example.
Figure 2-8 shows the process prioritization table, withthe scale included on the third row. To avoid confusion, take acareful look at the scales used in Figure 2-8, and remember thatthe highest number is assigned to the item with the greatest im-
Figure 2-8 Process Prioritization Table: Framework
Row 3 = Scale
Row 2 = Criteria
Row 1 = Category
Timing ofNext Cycle
ClientSatisfaction
PainLevelFunding
Time toMarket
ClientLevel
NumberAffected
ProcessExist?
Benefit/Return
TotalScore
Salaryplanning
Budgeting
3 = large number2 = average number1 = small number
3 = senior2 = management1 = other
3 = short2 = average1 = long
3 = small2 = medium1 = large
3 = close/ongoing2 = intermediate1 = far
3 = low2 = medium1 = high
3 = high2 = medium1 = low
1 = no0 = yes
3 = high2 = average1 = low
Process Impact Implementation Current State Value
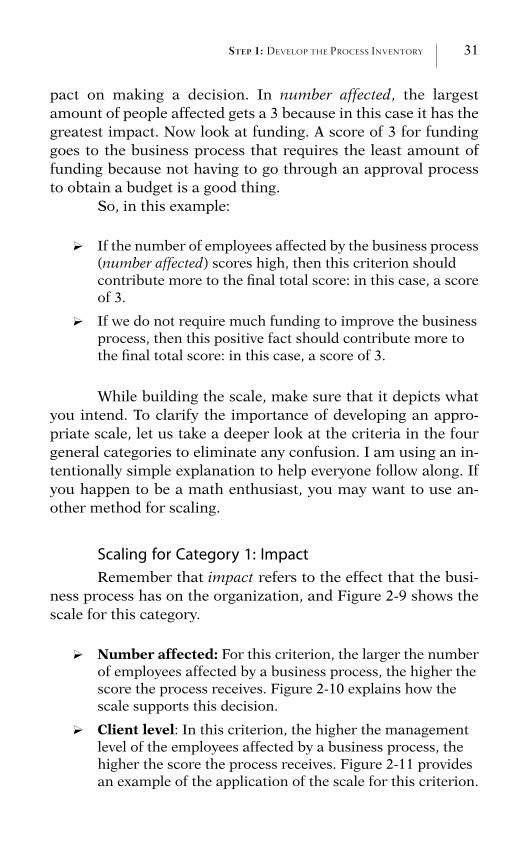
STEP 1: DEVELOP THE PROCESS INVENTORY 31
pact on making a decision. In number affected, the largestamount of people affected gets a 3 because in this case it has thegreatest impact. Now look at funding. A score of 3 for fundinggoes to the business process that requires the least amount offunding because not having to go through an approval processto obtain a budget is a good thing.
So, in this example:
? If the number of employees affected by the business process(number affected) scores high, then this criterion shouldcontribute more to the final total score: in this case, a scoreof 3.
? If we do not require much funding to improve the businessprocess, then this positive fact should contribute more tothe final total score: in this case, a score of 3.
While building the scale, make sure that it depicts whatyou intend. To clarify the importance of developing an appro-priate scale, let us take a deeper look at the criteria in the fourgeneral categories to eliminate any confusion. I am using an in-tentionally simple explanation to help everyone follow along. Ifyou happen to be a math enthusiast, you may want to use an-other method for scaling.
Scaling for Category 1: Impact
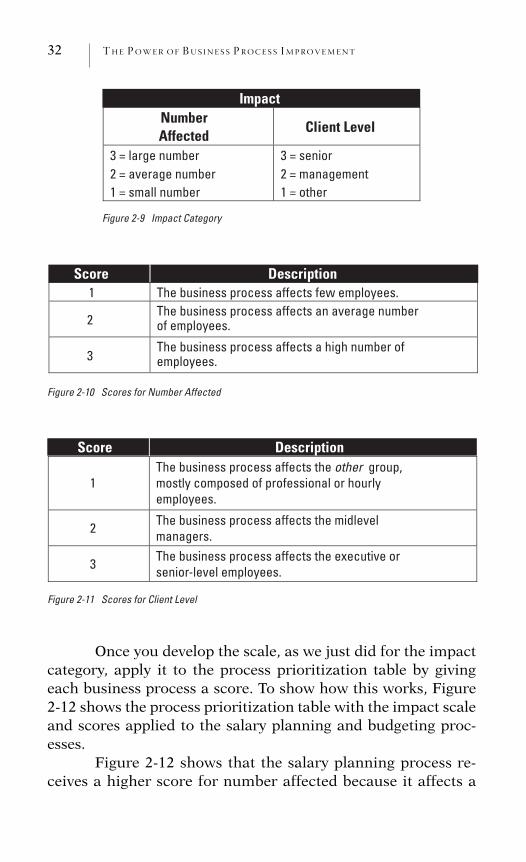
Remember that impact refers to the effect that the busi-ness process has on the organization, and Figure 2-9 shows thescale for this category.
? Number affected: For this criterion, the larger the numberof employees affected by a business process, the higher thescore the process receives. Figure 2-10 explains how thescale supports this decision.
? Client level: In this criterion, the higher the managementlevel of the employees affected by a business process, thehigher the score the process receives. Figure 2-11 providesan example of the application of the scale for this criterion.
32 THE POWER OF BUS INE S S P ROCES S IMPROVEMENT
ImpactNumberAffected
Client Level
3 = large number 2 = average number 1 = small number
3 = senior 2 = management 1 = other
Figure 2-9 Impact Category
Score Description1 The business process affects few employees.
2The business process affects an average numberof employees.
3The business process affects a high number of employees.
Figure 2-10 Scores for Number Affected
Score Description
1The business process affects the other group,mostly composed of professional or hourlyemployees.
2 The business process affects the midlevelmanagers.
3 The business process affects the executive orsenior-level employees.
Figure 2-11 Scores for Client Level
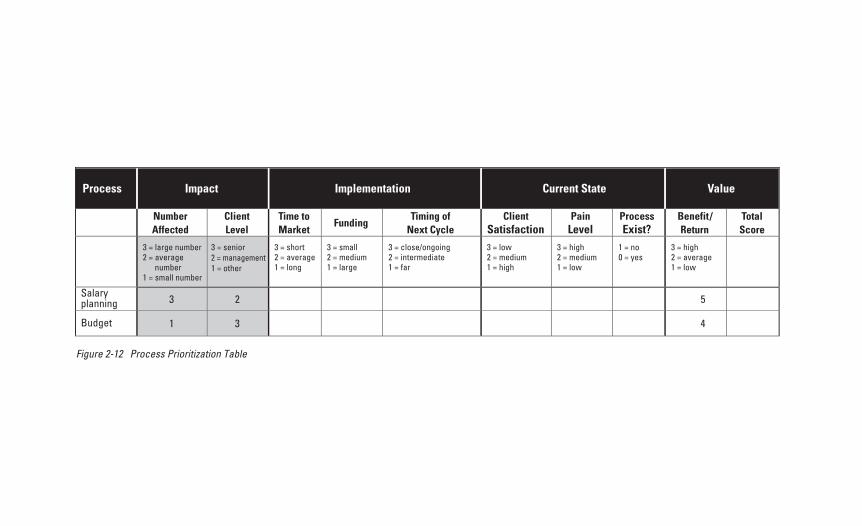
Once you develop the scale, as we just did for the impactcategory, apply it to the process prioritization table by givingeach business process a score. To show how this works, Figure2-12 shows the process prioritization table with the impact scaleand scores applied to the salary planning and budgeting proc-esses.
Figure 2-12 shows that the salary planning process re-ceives a higher score for number affected because it affects a
Process Impact Implementation Current State Value
NumberAffected
ClientLevel
Time to Market
FundingTiming of
Next CycleClient
SatisfactionPain
LevelProcessExist?
Benefit/ Return
Total Score
Salaryplanning 3 2 5
Budget 1 3 4
Figure 2-12 Process Prioritization Table
3 = short 2 = average 1 = long
3 = small 2 = medium 1 = large
3 = close/ongoing 2 = intermediate 1 = far
3 = low 2 = medium 1 = high
3 = high 2 = medium 1 = low
1 = no0 = yes
3 = high 2 = average 1 = low
3 = large number 2 = average
number1 = small number
3 = senior 2 = management1 = other
34 THE POWER OF BUS INE S S P ROCES S IMPROVEMENT
larger number of employees than the budgeting process, whichapplies only to managers and above. The budgeting process re-ceives a higher client level score than the salary planning proc-ess because of its visibility to the most senior-level employeesin the organization, even though it pertains to fewer employees.After applying the scores for the impact category, the salaryplanning process seems to take precedence, relative to whereto start an improvement effort, over the budgeting process be-cause it has a total score of 5.
But we have three more categories to add to the tablebefore making a final decision! The next three sections followthe same method used for the impact category to bring in theimplementation, current state, and value categories.
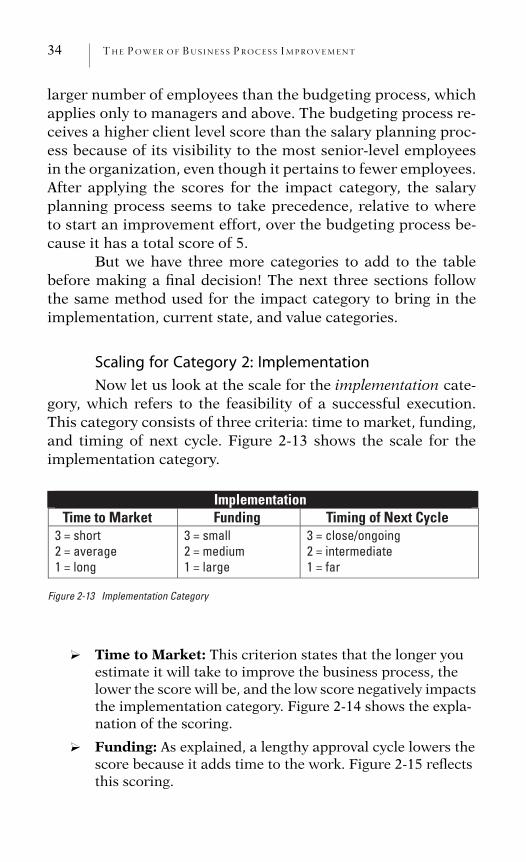
Scaling for Category 2: Implementation
Now let us look at the scale for the implementation cate-gory, which refers to the feasibility of a successful execution.This category consists of three criteria: time to market, funding,and timing of next cycle. Figure 2-13 shows the scale for theimplementation category.
ImplementationTime to Market Funding Timing of Next Cycle
3 = short 2 = average 1 = long
3 = small 2 = medium 1 = large
3 = close/ongoing 2 = intermediate 1 = far
Figure 2-13 Implementation Category
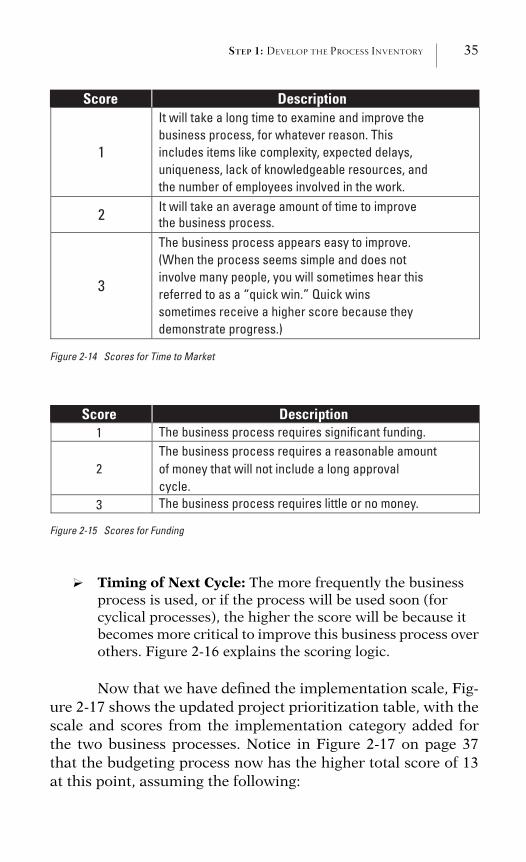
? Time to Market: This criterion states that the longer youestimate it will take to improve the business process, thelower the score will be, and the low score negatively impactsthe implementation category. Figure 2-14 shows the expla-nation of the scoring.
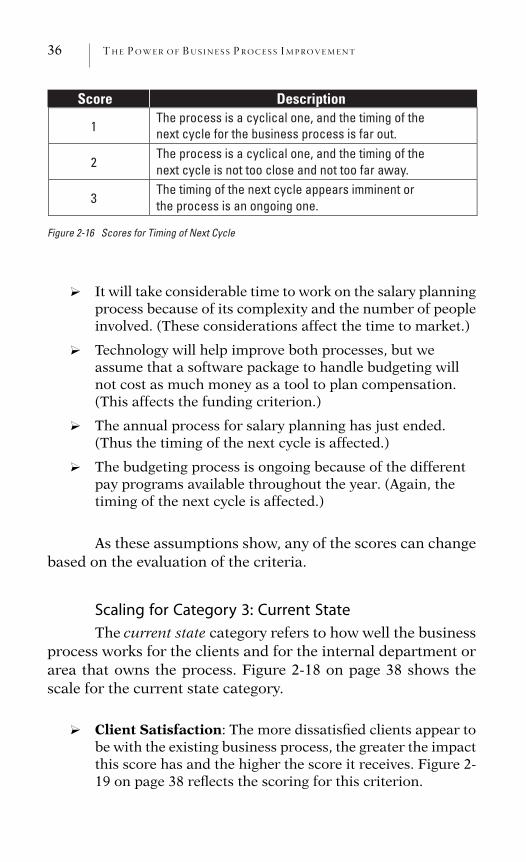
? Funding: As explained, a lengthy approval cycle lowers thescore because it adds time to the work. Figure 2-15 reflectsthis scoring.
STEP 1: DEVELOP THE PROCESS INVENTORY 35
Score Description
1
It will take a long time to examine and improve the business process, for whatever reason. This includes items like complexity, expected delays, uniqueness, lack of knowledgeable resources, and the number of employees involved in the work.
2 It will take an average amount of time to improve the business process.
3
The business process appears easy to improve. (When the process seems simple and does not involve many people, you will sometimes hear this referred to as a “quick win.” Quick wins sometimes receive a higher score because they demonstrate progress.)
Figure 2-14 Scores for Time to Market
Score Description1
2The business process requires a reasonable amount
The business process requires little or no money.
The business process requires significant funding.
of money that will not include a long approval cycle.
3
Figure 2-15 Scores for Funding
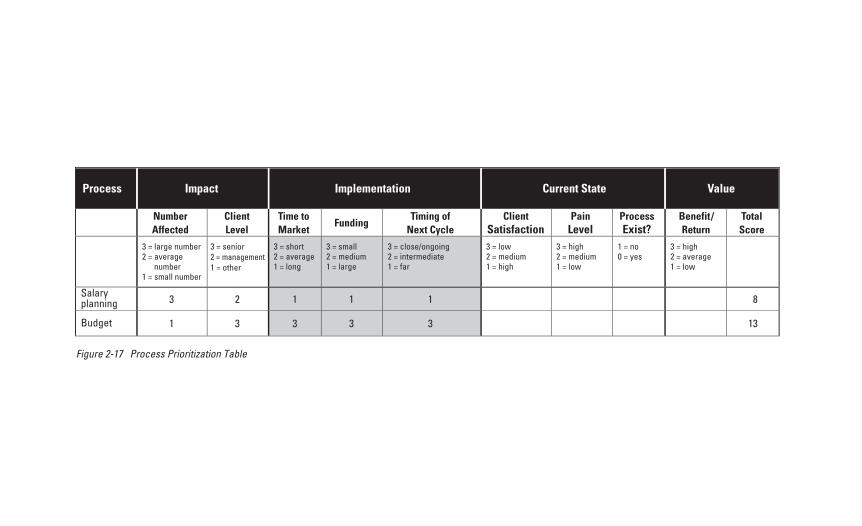
? Timing of Next Cycle: The more frequently the businessprocess is used, or if the process will be used soon (forcyclical processes), the higher the score will be because itbecomes more critical to improve this business process overothers. Figure 2-16 explains the scoring logic.
Now that we have defined the implementation scale, Fig-ure 2-17 shows the updated project prioritization table, with thescale and scores from the implementation category added forthe two business processes. Notice in Figure 2-17 on page 37that the budgeting process now has the higher total score of 13at this point, assuming the following:
36 THE POWER OF BUS INE S S P ROCES S IMPROVEMENT
Score Description
1The process is a cyclical one, and the timing of the next cycle for the business process is far out.
2The process is a cyclical one, and the timing of the next cycle is not too close and not too far away.
3The timing of the next cycle appears imminent or the process is an ongoing one.
Figure 2-16 Scores for Timing of Next Cycle
? It will take considerable time to work on the salary planningprocess because of its complexity and the number of peopleinvolved. (These considerations affect the time to market.)
? Technology will help improve both processes, but weassume that a software package to handle budgeting willnot cost as much money as a tool to plan compensation.(This affects the funding criterion.)
? The annual process for salary planning has just ended.(Thus the timing of the next cycle is affected.)
? The budgeting process is ongoing because of the differentpay programs available throughout the year. (Again, thetiming of the next cycle is affected.)
As these assumptions show, any of the scores can changebased on the evaluation of the criteria.
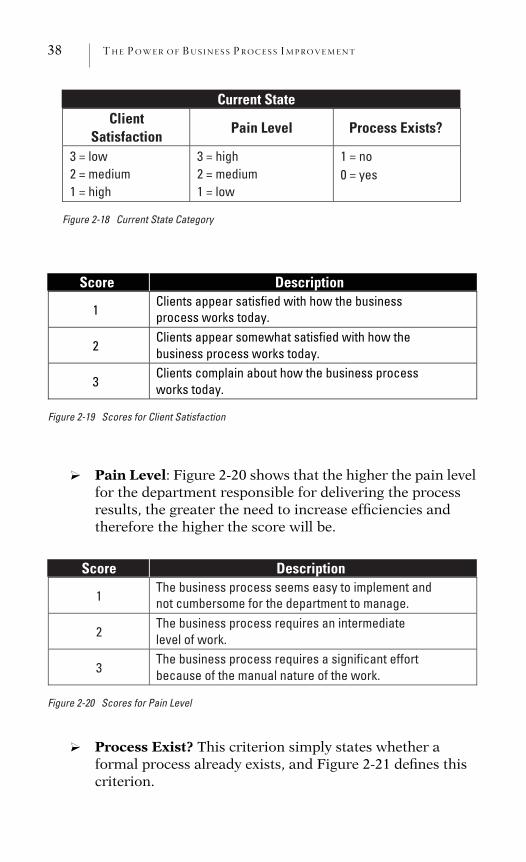
Scaling for Category 3: Current State
The current state category refers to how well the businessprocess works for the clients and for the internal department orarea that owns the process. Figure 2-18 on page 38 shows thescale for the current state category.
? Client Satisfaction: The more dissatisfied clients appear tobe with the existing business process, the greater the impactthis score has and the higher the score it receives. Figure 2-19 on page 38 reflects the scoring for this criterion.
Process Impact Implementation Current State Value
NumberAffected
ClientLevel
Time toMarket
FundingTiming of
Next CycleClient
SatisfactionPain
LevelProcessExist?
Benefit/Return
Total Score
3 = short 2 = average 1 = long
3 = small 2 = medium 1 = large
3 = close/ongoing 2 = intermediate 1 = far
3 = low 2 = medium 1 = high
3 = high 2 = medium 1 = low
1 = no0 = yes
3 = high 2 = average 1 = low
Salaryplanning 3 2
Budget 1 3
1
3
1
3
1
3
8
13
Figure 2-17 Process Prioritization Table
3 = large number 2 = average
number1 = small number
3 = senior 2 = management1 = other
38 THE POWER OF BUS INE S S P ROCES S IMPROVEMENT
Current State Client
SatisfactionPain Level Process Exists?
3 = low 2 = medium 1 = high
3 = high 2 = medium 1 = low
1 = no0 = yes
Figure 2-18 Current State Category
Score Description
1Clients appear satisfied with how the business process works today.
2Clients appear somewhat satisfied with how the business process works today.
3Clients complain about how the business process works today.
Figure 2-19 Scores for Client Satisfaction
? Pain Level: Figure 2-20 shows that the higher the pain levelfor the department responsible for delivering the processresults, the greater the need to increase efficiencies andtherefore the higher the score will be.
Score Description
1The business process seems easy to implement and not cumbersome for the department to manage.
2The business process requires an intermediate level of work.
3The business process requires a significant effort because of the manual nature of the work.
Figure 2-20 Scores for Pain Level
? Process Exist? This criterion simply states whether aformal process already exists, and Figure 2-21 defines thiscriterion.
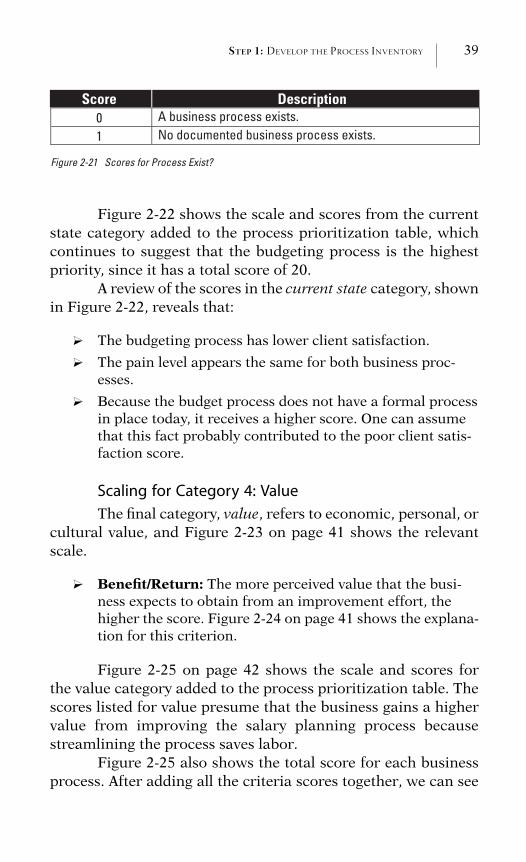
STEP 1: DEVELOP THE PROCESS INVENTORY 39
Score DescriptionA business process exists. No documented business process exists.
01
Figure 2-21 Scores for Process Exist?
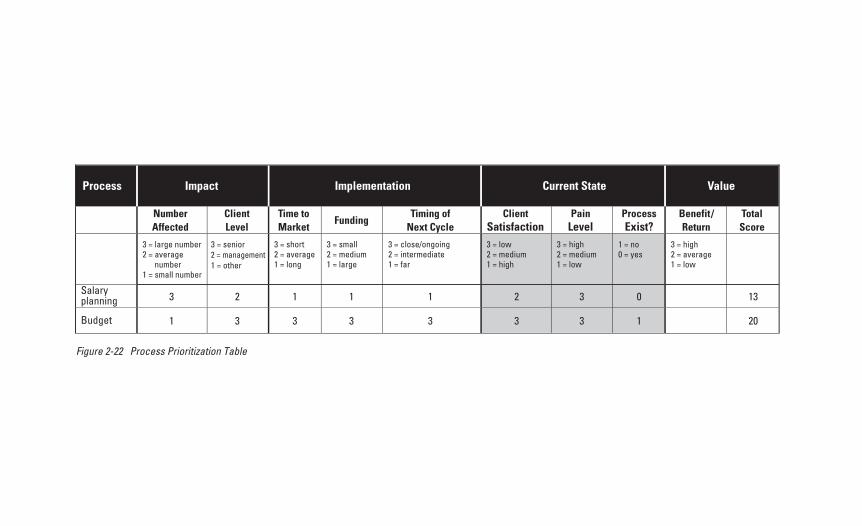
Figure 2-22 shows the scale and scores from the currentstate category added to the process prioritization table, whichcontinues to suggest that the budgeting process is the highestpriority, since it has a total score of 20.
A review of the scores in the current state category, shownin Figure 2-22, reveals that:
? The budgeting process has lower client satisfaction.
? The pain level appears the same for both business proc-esses.
? Because the budget process does not have a formal processin place today, it receives a higher score. One can assumethat this fact probably contributed to the poor client satis-faction score.
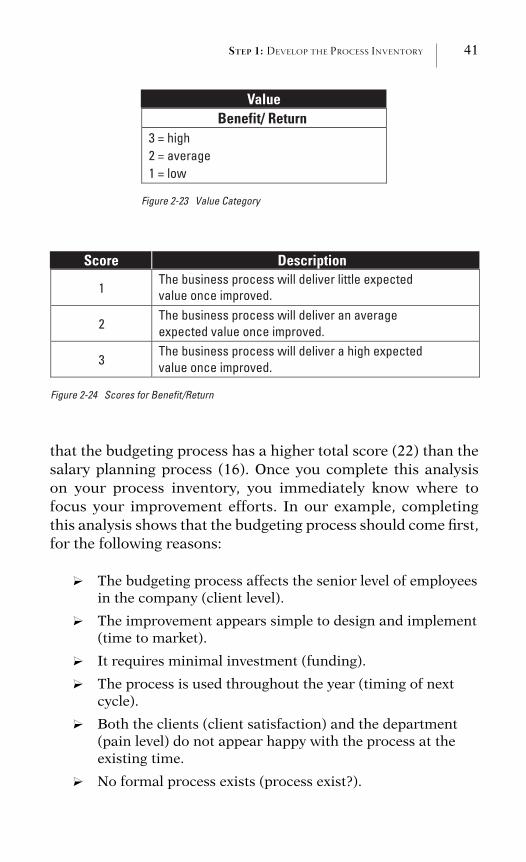
Scaling for Category 4: Value
The final category, value, refers to economic, personal, orcultural value, and Figure 2-23 on page 41 shows the relevantscale.
? Benefit/Return: The more perceived value that the busi-ness expects to obtain from an improvement effort, thehigher the score. Figure 2-24 on page 41 shows the explana-tion for this criterion.
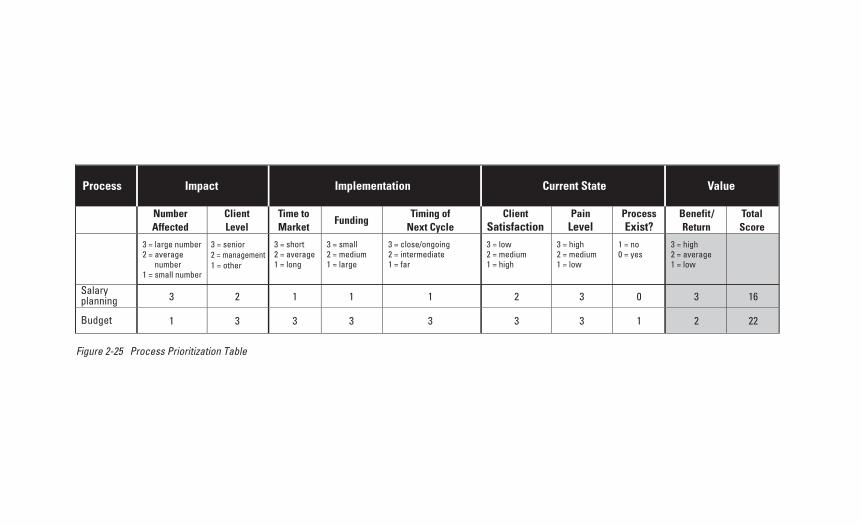
Figure 2-25 on page 42 shows the scale and scores forthe value category added to the process prioritization table. Thescores listed for value presume that the business gains a highervalue from improving the salary planning process becausestreamlining the process saves labor.
Figure 2-25 also shows the total score for each businessprocess. After adding all the criteria scores together, we can see
Process Impact Implementation Current State Value
NumberAffected
ClientLevel
Time toMarket
FundingTiming of
Next CycleClient
SatisfactionPain
LevelProcessExist?
Benefit/Return
Total Score
Salaryplanning 3 2
Budget 1 3
1
3
1
3
1
3
2
3
0
1
3
3
13
20
Figure 2-22 Process Prioritization Table
3 = short 2 = average 1 = long
3 = small 2 = medium 1 = large
3 = close/ongoing 2 = intermediate 1 = far
3 = low 2 = medium 1 = high
3 = high 2 = medium 1 = low
1 = no0 = yes
3 = high 2 = average 1 = low
3 = large number 2 = average
number1 = small number
3 = senior 2 = management1 = other
STEP 1: DEVELOP THE PROCESS INVENTORY 41
ValueBenefit/ Return
3 = high 2 = average 1 = low
Figure 2-23 Value Category
Score Description
1The business process will deliver little expected value once improved.
2The business process will deliver an average expected value once improved.
3The business process will deliver a high expected value once improved.
Figure 2-24 Scores for Benefit/Return
that the budgeting process has a higher total score (22) than thesalary planning process (16). Once you complete this analysison your process inventory, you immediately know where tofocus your improvement efforts. In our example, completingthis analysis shows that the budgeting process should come first,for the following reasons:
? The budgeting process affects the senior level of employeesin the company (client level).
? The improvement appears simple to design and implement(time to market).
? It requires minimal investment (funding).
? The process is used throughout the year (timing of nextcycle).
? Both the clients (client satisfaction) and the department(pain level) do not appear happy with the process at theexisting time.
? No formal process exists (process exist?).
Process Impact Implementation Current State Value
NumberAffected
ClientLevel
Time toMarket
FundingTiming of
Next CycleClient
SatisfactionPain
LevelProcessExist?
Benefit/Return
Total Score
Salaryplanning 3 2
Budget 1 3
1
3
1
3
1
3
2
3
0
1
3
2
3
3
16
22
Figure 2-25 Process Prioritization Table
3 = short 2 = average 1 = long
3 = small 2 = medium 1 = large
3 = close/ongoing 2 = intermediate 1 = far
3 = low 2 = medium 1 = high
3 = high 2 = medium 1 = low
1 = no0 = yes
3 = high 2 = average 1 = low
3 = large number 2 = average
number1 = small number
3 = senior 2 = management1 = other
STEP 1: DEVELOP THE PROCESS INVENTORY 43
Notice that much of the differentiation between the twoprocesses comes from the implementation category, suggestingthat the budgeting process is more feasible to begin with thanthe salary planning process. The salary planning process re-ceived more significant scores than the budgeting process ononly two criteria: number affected and benefit/return.
At this point, we have created the process inventory, de-veloped prioritization categories, and defined how to measurethe categories by introducing criteria and a scale. What happensnow if your colleagues or sponsors criticize your approach be-cause they feel that the return on investment should receive ahigher weight than some of the other categories? In such a case,simply apply weighting to the prioritization categories. The nextsection explains how to do that.
Applying WeightingTo apply a weight to a category in the process prioritiza-
tion table, start by deciding the importance of the category to thefinal result. Apply more weight to a category that you feel has agreater impact than another category. For example, make thescore for the impact category contribute more to the total scoreby giving it a higher weight than one of the other categories.
If you decide to apply weighting, assign a weight to eachcategory on a scale of 1 to 100. Decide which is the most valu-able category, then decide where each of the other categories fallwith respect to that most valuable one: half as valuable, a third,and so forth. Assign weights so that the total of all categoriesequal 100. For example, if we decided to apply a weight to thefour general categories, we might use the following weights:
? 35 percent for the impact category
? 30 percent for the implementation category
? 20 percent for the current state category
? 15 percent for the value category
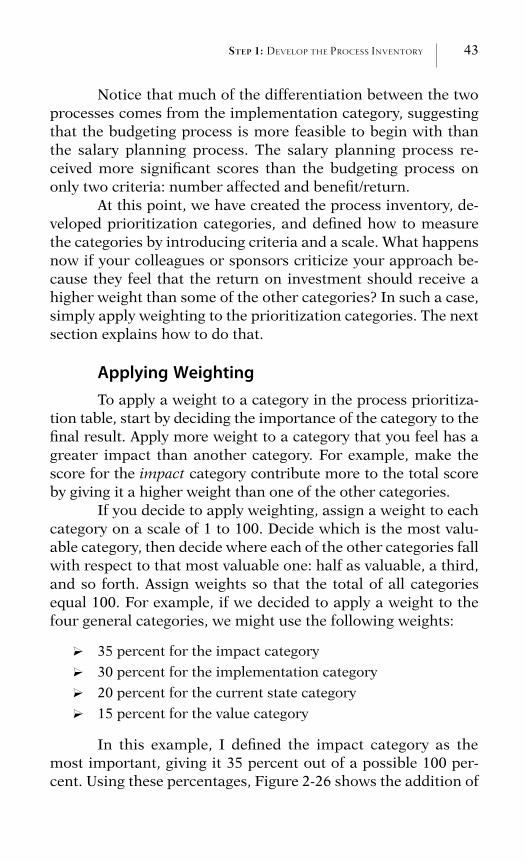
In this example, I defined the impact category as themost important, giving it 35 percent out of a possible 100 per-cent. Using these percentages, Figure 2-26 shows the addition of
44 THE POWER OF BUS INE S S P ROCES S IMPROVEMENT
Figure 2-26 Process Prioritization Table (with weights)
Process Implementation (30%)
3 2 5 1 1 1 3
1 3 4 3 3 3 9
Subtotal
NumberAffected
ClientLevel
Time toMarket Funding SubtotalSubtotal
Timing ofNext Cycle
Salaryplanning
Budget
3 = short 2 = average 1 = long
3 = small 2 = medium 1 = large
3 = close/ongoing 2 = intermediate 1 = far
3 = large number 2 = average
number1 = small number
3 = senior 2 = management1 = other
Subtotal
Weight Weight
Impact (35%)
a subtotal column for each category in the process prioritizationtable and a new total weighted score column at the far right. (Youwill find it easier to calculate the weights if you use a spread-sheet application like Microsoft Excel.) To modify Figure 2-26, Icreated a formula in the total weighted scores cell that appliedthe appropriate weights for each subtotal column and thatadded all the subtotals together to determine the total weightedscore for each business process. Figure 2-27 shows the calcula-tion for the salary planning process.
You can choose to show the weighted score for each cate-gory in the table by adding another column after each subtotalcolumn or just include the formula as part of the spreadsheetcell, as I did in this example. Figure 2-28 on page 46 shows thecalculation if you use Microsoft Excel. Cell O5 in this figureshows the formula as:
�(D5*(35%))�(H5*(30%))�(L5*(20%))�(N5*(15%))
Notice that, even after applying weighting, the budgetingprocess still surfaces as the most important business process toaddress first.
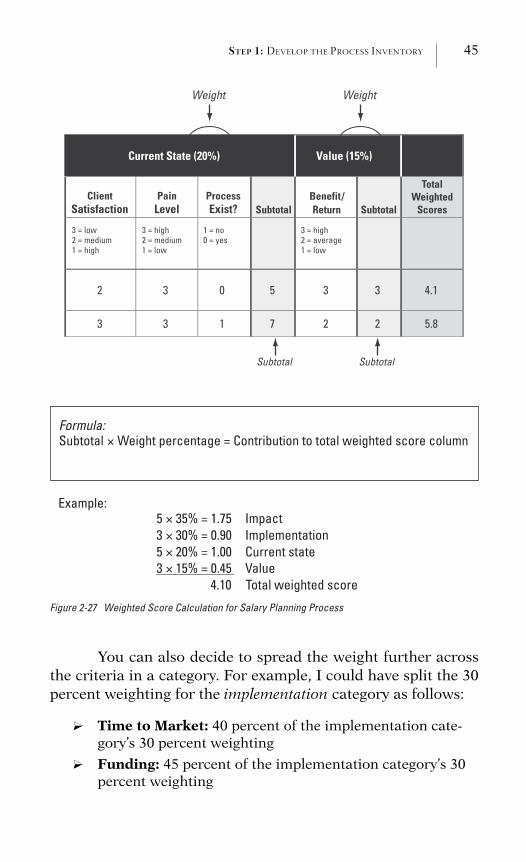
STEP 1: DEVELOP THE PROCESS INVENTORY 45
Current State (20%) Value (15%)
2 3 0 5 3 3 4.1
3 3 1 7 2 2 5.8
Weight
Subtotal SubtotalClient
SatisfactionPain
LevelProcessExist?
Benefit/Return
TotalWeighted
Scores
3 = low 2 = medium 1 = high
3 = high 2 = medium 1 = low
1 = no 0 = yes
3 = high 2 = average 1 = low
Subtotal Subtotal
Weight
Formula:Subtotal Weight percentage = Contribution to total weighted score column
Example: 5 35% = 1.75 Impact 3 30% = 0.90 Implementation 5 20% = 1.00 Current state 3 15% = 0.45 Value
4.10 Total weighted score
Figure 2-27 Weighted Score Calculation for Salary Planning Process
You can also decide to spread the weight further acrossthe criteria in a category. For example, I could have split the 30percent weighting for the implementation category as follows:
? Time to Market: 40 percent of the implementation cate-gory’s 30 percent weighting
? Funding: 45 percent of the implementation category’s 30percent weighting
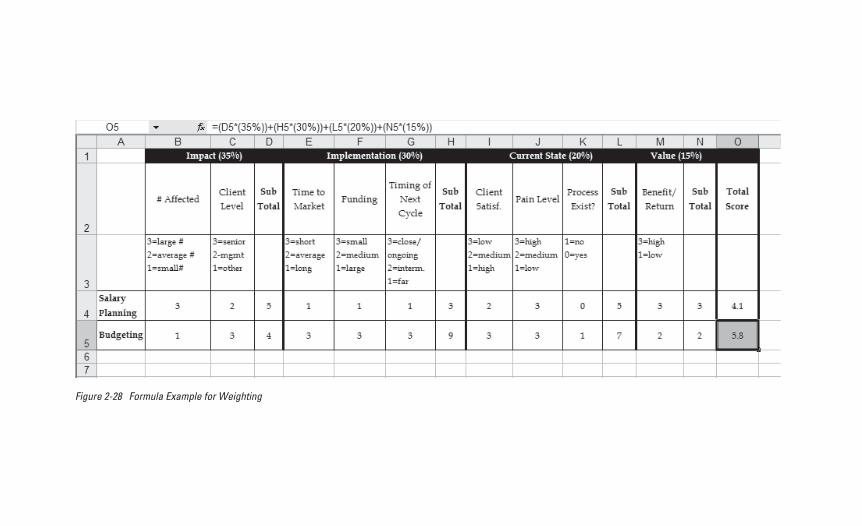
Figure 2-28 Formula Example for Weighting
STEP 1: DEVELOP THE PROCESS INVENTORY 47
? Timing of Next Cycle: 15 percent of the implementationcategory’s 30 percent weighting
After completing the process prioritization table, reviewit with your sponsor to see if he or she agrees with the results.As a result of the discussion, you may have to make some adjust-ments to either the criteria or weight, but you have a good start.
When I used this approach with Kendall Smith to helphim decide which business process to start with, the resultspointed to starting with the training process because of the ac-quisition that the bank just negotiated. As a result of the merger,bringing new employees on board fast hit several of the criteriathat he and his management team had established.
You have to do some ongoing maintenance of the processprioritization table and rescore it regularly because the scoreswill vary depending on the time of year. For example, a businessprocess may receive a low score for timing of next cycle in Febru-ary, but it may receive a higher score six months later becausethe cycle is coming due.
Chapter Summary: Step 1
Building the process inventory organizes the businessprocess work and demonstrates to your sponsor that you under-stand the business. It assists you in assessing how big a job youhave on your hands, and it provides a tool to discuss the overallbreadth of business processes. Your sponsor will probably addor subtract from the process inventory; so think of the inventoryas a vehicle to encourage discussion between you and yoursponsor.
After developing the business process inventory, identify-ing the prioritization categories, establishing criteria, develop-ing a scale, and applying these items to each business process,you now have clear direction on where to start your improve-ment efforts. You can add more prioritization criteria to the fourgeneral categories of impact, implementation, current state, andvalue to meet your needs.
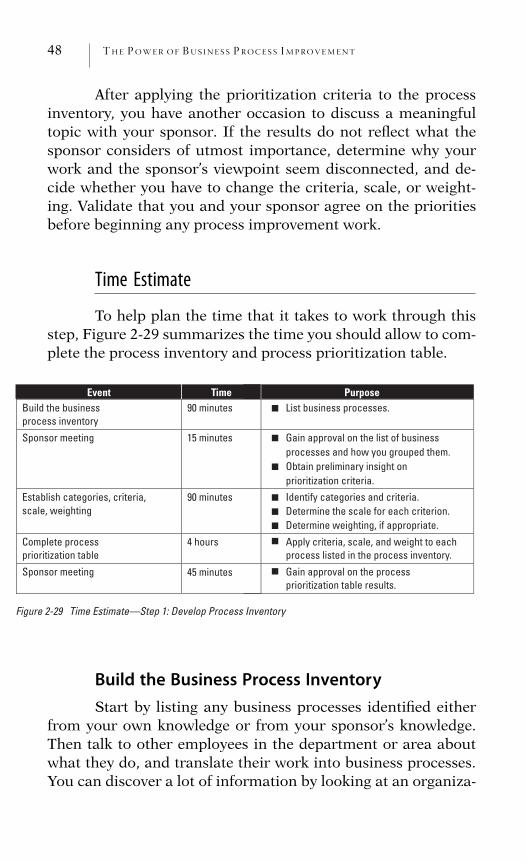
48 THE POWER OF BUS INE S S P ROCES S IMPROVEMENT
After applying the prioritization criteria to the processinventory, you have another occasion to discuss a meaningfultopic with your sponsor. If the results do not reflect what thesponsor considers of utmost importance, determine why yourwork and the sponsor’s viewpoint seem disconnected, and de-cide whether you have to change the criteria, scale, or weight-ing. Validate that you and your sponsor agree on the prioritiesbefore beginning any process improvement work.
Time Estimate
To help plan the time that it takes to work through thisstep, Figure 2-29 summarizes the time you should allow to com-plete the process inventory and process prioritization table.
Event Time PurposeBuild the business process inventory
90 minutes List business processes. ■
■
■
■
■
■
■
■
Sponsor meeting 15 minutes Gain approval on the list of business processes and how you grouped them. Obtain preliminary insight on prioritization criteria.
Establish categories, criteria, scale, weighting
90 minutes Identify categories and criteria. Determine the scale for each criterion. Determine weighting, if appropriate.
Complete process prioritization table
4 hours
45 minutes
Apply criteria, scale, and weight to each process listed in the process inventory.
Sponsor meeting Gain approval on the process prioritization table results.
Figure 2-29 Time Estimate—Step 1: Develop Process Inventory
Build the Business Process InventoryStart by listing any business processes identified either
from your own knowledge or from your sponsor’s knowledge.Then talk to other employees in the department or area aboutwhat they do, and translate their work into business processes.You can discover a lot of information by looking at an organiza-
STEP 1: DEVELOP THE PROCESS INVENTORY 49
tion chart. If you work as an internal consultant in a company,talk to your colleagues instead of asking for job descriptions.Job descriptions can make the work seem more formal to peo-ple, and, at this point, all you want to do is build the processinventory.
Sponsor MeetingMeet briefly with the sponsor to verify that he or she
agrees with the business processes listed. If you grouped theprocesses around themes, validate that the sponsor agrees withthe themes. You should also gain a sense at this point as towhether the sponsor has any ideas about the prioritization crite-ria. Share the criteria you plan to include, and get a sense as towhether the sponsor feels you are on track. This helps with thenext step and shows the sponsor what to expect next.
Establish Categories, Criteria, Scale,WeightingThink about the impact, implementation, current state,
and value categories. Then, after your discussion with the spon-sor, decide whether you want to add categories or change exist-ing categories. Adjust the criteria under each category, add newcriteria, or delete some. Decide how your scale should work andwhat weights to assign if you choose to use weighting.
Complete the Process Prioritization TableDuring this time, build the table and score each business
process listed in the left-hand column of the table.
A Second Sponsor MeetingReview the results of the prioritization with the sponsor
and ask whether he or she expected the results shown. Have athorough discussion to ensure that you both agree on the priori-ties of the work.
50 THE POWER OF BUS INE S S P ROCES S IMPROVEMENT
What You Have Achieved
In this chapter, you have achieved the following:
? An understanding of the business because you see the busi-ness processes that a department or an area is responsiblefor delivering
? A grasp of what the business deems important because youidentified and applied criteria to determine priorities
? Buy-in from the sponsor on the business processes to workon first, second, third
? And most important, the power to know where to focus yourtime
C H A P T E R 3
Step 2: Establish the
Foundation
Avoiding Scope Creep
Pete Hodges, regional sales manager for a computer partsdistributor, expressed concern that his company’s sales processdid not generate enough new customers and that the overallprocess took too long. When I spoke with Pete and his salesteam, each defined the problem a little differently. Pete identi-fied the problem as closing the sale, one district sales managercited identifying the customer needs as the issue, and the salesrepresentatives said that they did not have enough leads.
How do you decide whom to believe? Pete asked me tolook at their sales process from beginning to end, but how wouldan outsider begin to determine where their sales process startsand ends? Because the sales process varies with every company,I knew that I needed to start by identifying the boundaries. Ialso felt that I needed to understand how they measure success,or, put another way, how they know when their sales process issuccessful? They could define success as the number of new cli-ents, as achieving a certain sales volume, or as something elseentirely. I needed to establish a foundation that Pete and I couldagree on so that we would be starting out on the same page.
As an analogy, think about building a house. What doyou do first? Most people either hire an architect to help withdesign or find an existing house plan that they like. By startingwith the design, you know the size of the house and have some
51
52 THE POWER OF BUS INE S S P ROCES S IMPROVEMENT
idea of how much it will cost to build. A blueprint provides yourcontractor with step-by-step specifications to be followedthroughout the building process.
The scope definition document guides you through the ex-ercise of establishing the foundation for a business process. Itbecomes your blueprint. Once you develop the process inven-tory described in Chapter 2, and once you decide on the businessprocess to focus on first, this document provides the baselineinformation you need about that particular business process. Itguides you throughout your business process improvement ef-fort.
In an ideal world, you would start out by creating a con-tract to establish a clear definition of what is and is not includedin a BPI effort. Because we do not live in an ideal world, thescope definition document provides you with the next best wayto keep the work on track. It serves the same purpose as a con-tract because it establishes boundaries, but it does so in a man-ner that appears far less intimidating to your colleagues, animportant point when working as an internal consultant in yourcompany. When you work with an external customer, as I didwith Pete Hodges, it clarifies the scope of work similar to a state-ment of work, a common tool used by customers and vendorsalike.
Taking the time to set the foundation helps to preventscope creep, a risk in many projects. Scope creep is the veeringaway from the original purpose of the work without an increasein time, resources, or money. If you have ever built a house, thenyou have probably experienced scope creep. It occurs when youmake changes after the contractor has started construction. Anychange, such as adding an additional light fixture or changingthe location of the stove, increases the cost of the house beyondwhat you originally agreed to pay.
Scope creep appears as a common problem in manyareas of business. A software development company that I didwork for shared a concern that their product development proc-ess took too long. It quickly became obvious that the continualaddition of new functionality being added throughout the de-sign and development process was the root cause of the prob-
STEP 2: ESTABLISH THE FOUNDATION: AVOIDING SCOPE CREEP 53
lem. Although the new, additional functionality added to thevalue of the software product, it also increased the time and re-sources required to develop the product, thereby adding to thecost of the end product and increasing the time to market.
In business process work, scope creep weaves its way inbecause new ideas, demands, and needs surface as you get intothe work, and the temptation is to continually expand the scopeof a business process. Let me share an example.
At one company where I worked and acted as an internalconsultant, a simple human error led to an embarrassing predic-ament at the company’s executive level. After senior manage-ment chastised and embarrassed the department responsible forthe error, I came in to work with them over the next six weeks toexamine their business processes in order to ensure that internalcontrols existed. Internal controls, as we will see in Chapter 7,help minimize human errors.
I started by compiling the process inventory, described inChapter 2, and discovered that the department had 22 businessprocesses, far too many to evaluate in a six-week period. Afterconvincing senior management that we should concentrate onone business process per week, we agreed that we would focusour attention on six key business processes. I started by workingwith the project team to develop the scope definition documentfor the union negotiation process, one of the business processeswe would examine over the ensuing six weeks. After completingthe document, I reviewed it with the sponsor and gained theiragreement on the content.
Partway through the work, a project team member iden-tified a missing subprocess and wanted to go back and includeit in the scope definition. My evaluation showed that doing sowould introduce a major increase in scope and add at least an-other 40 hours of work, placing my commitment to the six-weekschedule at risk. My evaluation convinced me that the sub-process did not represent an important element and did not war-rant further expense or delay—but now I had to persuade mysponsor of my assessment.
I asked the sponsor if she felt the subprocess was impor-tant enough to:
54 THE POWER OF BUS INE S S P ROCES S IMPROVEMENT
1. Eliminate one of the remaining business processes that Ihad committed to complete in the six-week timeframe.
2. Note the omission but remain on track to complete the re-maining business processes on time.
3. Or extend the six-week timeframe to seven weeks.
The sponsor made the decision to stay on schedule be-cause she agreed with my assessment that the subprocess’s im-pact did not add significant risk and that the importantconsideration was to complete the remaining business proc-esses.
As you can see, the sponsor owned making the decision,not me. I easily moved the responsibility for the decision to thesponsor for several reasons: We had clearly defined the processboundaries when we developed the foundation; the scope didnot include the subprocess; and we had just determined that thesubprocess did not introduce major risk. If the sponsor had notapproved a scope definition document, we could have had a dif-ferent situation, with scope creep rearing its ugly head.
The Eight Sections of the Scope Definition Document
Now let us take a look at a completed scope definitiondocument for the human resource processes of a computer com-pany I worked with, a company I will call Alistar Corporation(because of the proprietary nature of the work). Figure 3-1shows the completed scope definition for their compensationdepartment’s budget process. I will discuss each of the eight sec-tions of the scope definition document in detail.
Section 1: Process NameThis is the name of the business process, such as the hir-
ing process, the sales process, the budget process, the softwaredevelopment process. For the Alistar Corporation it is the budgetprocess, shown in Figure 3-2 on page 56.
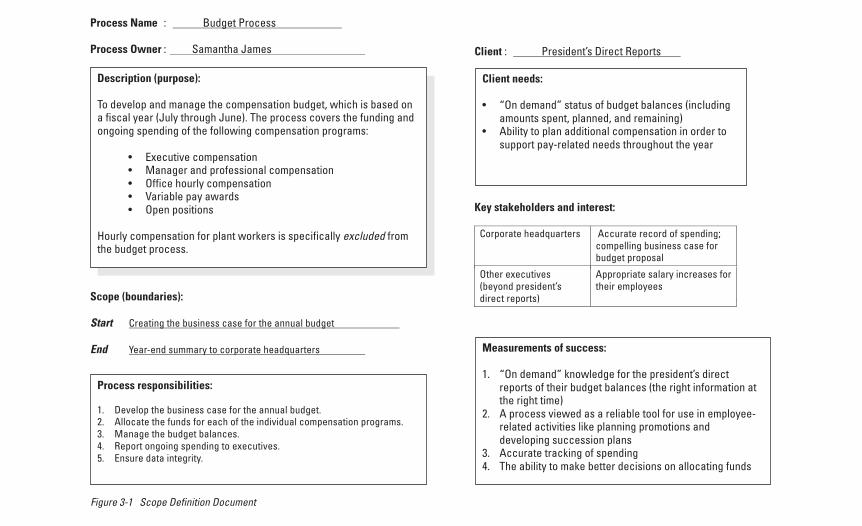
Process Name : Budget Process
Process responsibilities:
1. Develop the business case for the annual budget. 2. Allocate the funds for each of the individual compensation programs. 3. Manage the budget balances. 4. Report ongoing spending to executives. 5. Ensure data integrity.
Description (purpose):
To develop and manage the compensation budget, which is based on a fiscal year (July through June). The process covers the funding and ongoing spending of the following compensation programs:
• Executive compensation • Manager and professional compensation • Office hourly compensation • Variable pay awards • Open positions
Hourly compensation for plant workers is specifically excluded from the budget process.
Process Owner : Samantha James
Scope (boundaries):
Start Creating the business case for the annual budget
End Year-end summary to corporate headquarters Measurements of success:
1. “On demand” knowledge for the president’s direct reports of their budget balances (the right information at the right time)
2. A process viewed as a reliable tool for use in employee-related activities like planning promotions and developing succession plans
3. Accurate tracking of spending 4. The ability to make better decisions on allocating funds
Client needs:
• “On demand” status of budget balances (including amounts spent, planned, and remaining)
• Ability to plan additional compensation in order to support pay-related needs throughout the year
Client : President’s Direct Reports
Key stakeholders and interest:
Corporate headquarters Accurate record of spending; compelling business case for budget proposal
Other executives (beyond president’s direct reports)
Appropriate salary increases for their employees
Figure 3-1 Scope Definition Document
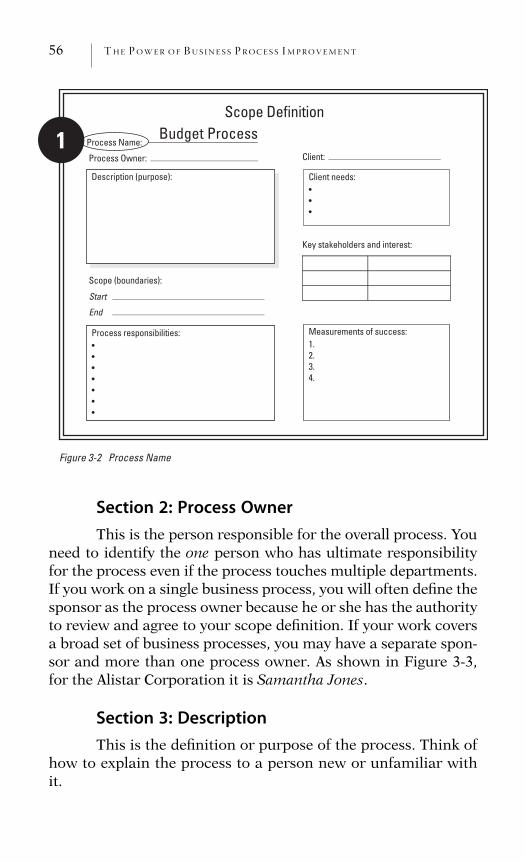
56 THE POWER OF BUS INE S S P ROCES S IMPROVEMENT
1 Budget Process Process Owner: Client:
Key stakeholders and interest:
Start
End
Scope (boundaries):
Scope Definition
Process responsibilities:•••••••
Client needs:•••
Measurements of success:1.2.3.4.
Figure 3-2 Process Name
Process Name:
Description (purpose):
Section 2: Process OwnerThis is the person responsible for the overall process. You
need to identify the one person who has ultimate responsibilityfor the process even if the process touches multiple departments.If you work on a single business process, you will often define thesponsor as the process owner because he or she has the authorityto review and agree to your scope definition. If your work coversa broad set of business processes, you may have a separate spon-sor and more than one process owner. As shown in Figure 3-3,for the Alistar Corporation it is Samantha Jones.
Section 3: DescriptionThis is the definition or purpose of the process. Think of
how to explain the process to a person new or unfamiliar withit.
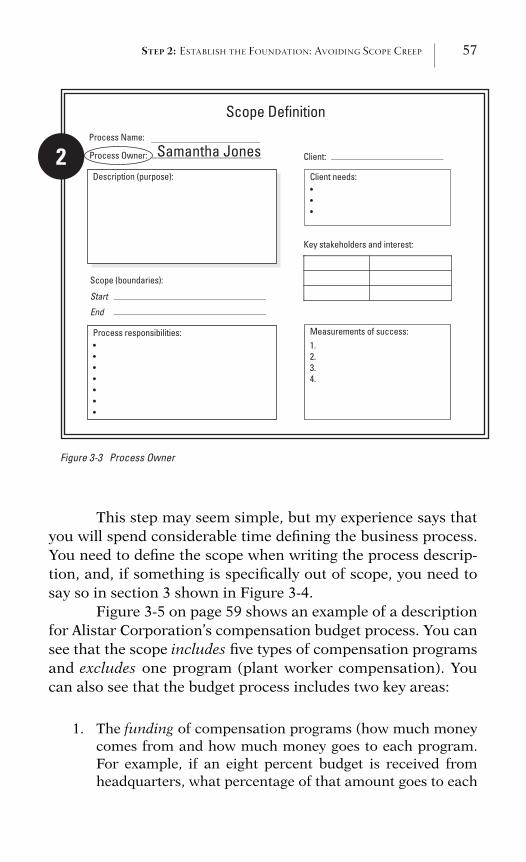
STEP 2: ESTABLISH THE FOUNDATION: AVOIDING SCOPE CREEP 57
2 Samantha JonesProcess Name:
Process Owner: Client:
Key stakeholders and interest:
Start
End
Scope (boundaries):
Scope Definition
Process responsibilities:•••••••
Client needs:•••
Measurements of success:1.2.3.4.
Figure 3-3 Process Owner
Description (purpose):
This step may seem simple, but my experience says thatyou will spend considerable time defining the business process.You need to define the scope when writing the process descrip-tion, and, if something is specifically out of scope, you need tosay so in section 3 shown in Figure 3-4.
Figure 3-5 on page 59 shows an example of a descriptionfor Alistar Corporation’s compensation budget process. You cansee that the scope includes five types of compensation programsand excludes one program (plant worker compensation). Youcan also see that the budget process includes two key areas:
1. The funding of compensation programs (how much moneycomes from and how much money goes to each program.For example, if an eight percent budget is received fromheadquarters, what percentage of that amount goes to each
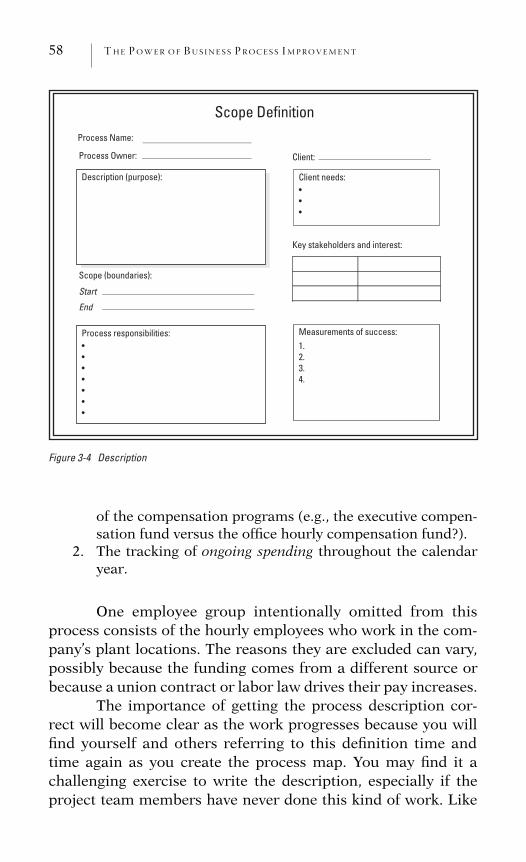
58 THE POWER OF BUS INE S S P ROCES S IMPROVEMENT
3
Process Name:
Process Owner: Client:
Key stakeholders and interest:
Start
End
Scope (boundaries):
Scope Definition
Process responsibilities:•••••••
Client needs:•••
Measurements of success:1.2.3.4.
Figure 3-4 Description
Description (purpose):
of the compensation programs (e.g., the executive compen-sation fund versus the office hourly compensation fund?).
2. The tracking of ongoing spending throughout the calendaryear.
One employee group intentionally omitted from thisprocess consists of the hourly employees who work in the com-pany’s plant locations. The reasons they are excluded can vary,possibly because the funding comes from a different source orbecause a union contract or labor law drives their pay increases.
The importance of getting the process description cor-rect will become clear as the work progresses because you willfind yourself and others referring to this definition time andtime again as you create the process map. You may find it achallenging exercise to write the description, especially if theproject team members have never done this kind of work. Like
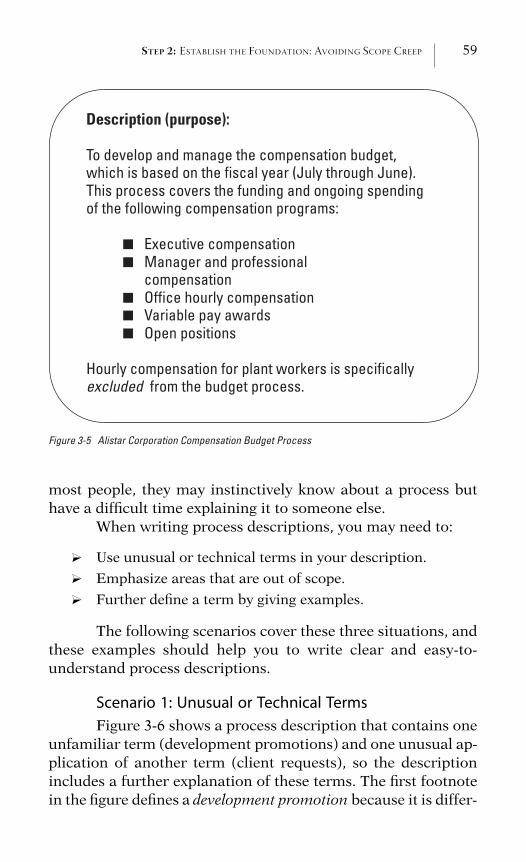
STEP 2: ESTABLISH THE FOUNDATION: AVOIDING SCOPE CREEP 59
Description (purpose):
To develop and manage the compensation budget, which is based on the fiscal year (July through June). This process covers the funding and ongoing spending of the following compensation programs:
Executive compensation ■
Manager and professional ■
compensation Office hourly compensation ■
Variable pay awards ■
Open positions ■
Hourly compensation for plant workers is specifically excluded from the budget process.
Figure 3-5 Alistar Corporation Compensation Budget Process
most people, they may instinctively know about a process buthave a difficult time explaining it to someone else.
When writing process descriptions, you may need to:
? Use unusual or technical terms in your description.
? Emphasize areas that are out of scope.
? Further define a term by giving examples.
The following scenarios cover these three situations, andthese examples should help you to write clear and easy-to-understand process descriptions.
Scenario 1: Unusual or Technical Terms
Figure 3-6 shows a process description that contains oneunfamiliar term (development promotions) and one unusual ap-plication of another term (client requests), so the descriptionincludes a further explanation of these terms. The first footnotein the figure defines a development promotion because it is differ-
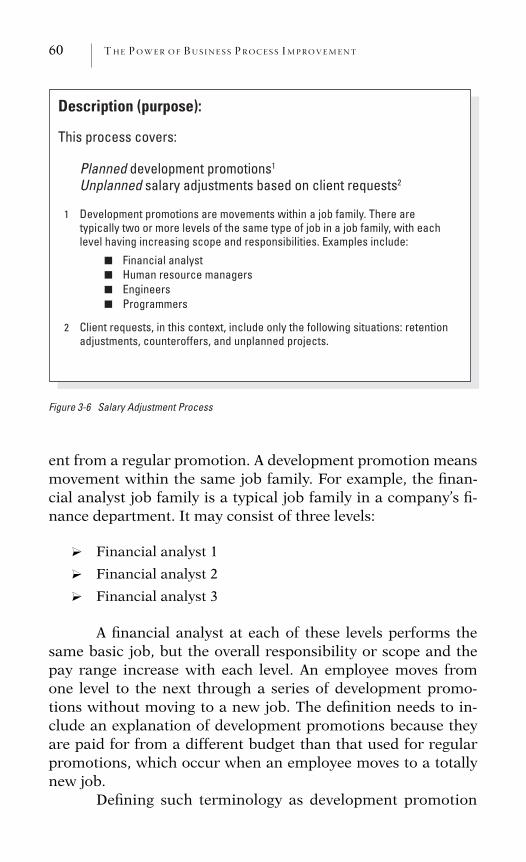
60 THE POWER OF BUS INE S S P ROCES S IMPROVEMENT
Description (purpose):
This process covers:
Planned development promotions1
Unplanned salary adjustments based on client requests2
1 Development promotions are movements within a job family. There aretypically two or more levels of the same type of job in a job family, with eachlevel having increasing scope and responsibilities. Examples include:
Financial analyst Human resource managers EngineersProgrammers
■
■
■
■
2 Client requests, in this context, include only the following situations: retentionadjustments, counteroffers, and unplanned projects.
Figure 3-6 Salary Adjustment Process
ent from a regular promotion. A development promotion meansmovement within the same job family. For example, the finan-cial analyst job family is a typical job family in a company’s fi-nance department. It may consist of three levels:
? Financial analyst 1
? Financial analyst 2
? Financial analyst 3
A financial analyst at each of these levels performs thesame basic job, but the overall responsibility or scope and thepay range increase with each level. An employee moves fromone level to the next through a series of development promo-tions without moving to a new job. The definition needs to in-clude an explanation of development promotions because theyare paid for from a different budget than that used for regularpromotions, which occur when an employee moves to a totallynew job.
Defining such terminology as development promotion
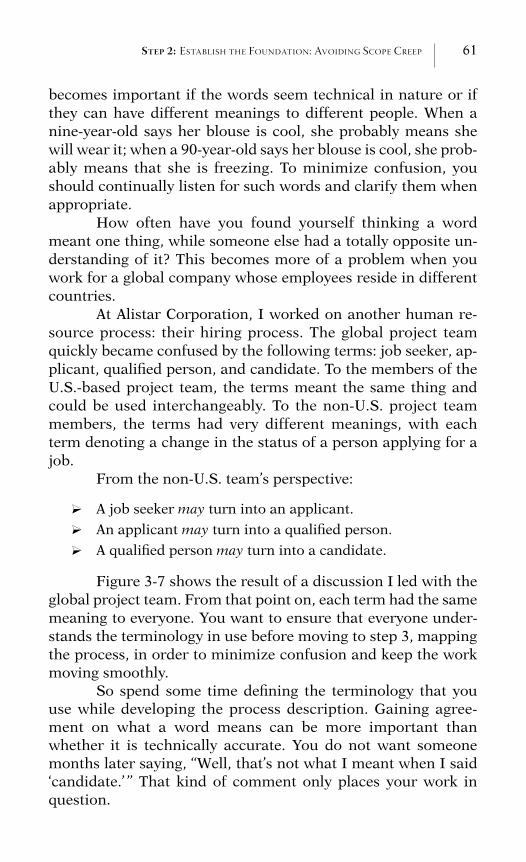
STEP 2: ESTABLISH THE FOUNDATION: AVOIDING SCOPE CREEP 61
becomes important if the words seem technical in nature or ifthey can have different meanings to different people. When anine-year-old says her blouse is cool, she probably means shewill wear it; when a 90-year-old says her blouse is cool, she prob-ably means that she is freezing. To minimize confusion, youshould continually listen for such words and clarify them whenappropriate.
How often have you found yourself thinking a wordmeant one thing, while someone else had a totally opposite un-derstanding of it? This becomes more of a problem when youwork for a global company whose employees reside in differentcountries.
At Alistar Corporation, I worked on another human re-source process: their hiring process. The global project teamquickly became confused by the following terms: job seeker, ap-plicant, qualified person, and candidate. To the members of theU.S.-based project team, the terms meant the same thing andcould be used interchangeably. To the non-U.S. project teammembers, the terms had very different meanings, with eachterm denoting a change in the status of a person applying for ajob.
From the non-U.S. team’s perspective:
? A job seeker may turn into an applicant.
? An applicant may turn into a qualified person.
? A qualified person may turn into a candidate.
Figure 3-7 shows the result of a discussion I led with theglobal project team. From that point on, each term had the samemeaning to everyone. You want to ensure that everyone under-stands the terminology in use before moving to step 3, mappingthe process, in order to minimize confusion and keep the workmoving smoothly.
So spend some time defining the terminology that youuse while developing the process description. Gaining agree-ment on what a word means can be more important thanwhether it is technically accurate. You do not want someonemonths later saying, ‘‘Well, that’s not what I meant when I said‘candidate.’ ’’ That kind of comment only places your work inquestion.
62 THE POWER OF BUS INE S S P ROCES S IMPROVEMENT
Job Seeker (e.g., 100)
Applicant(25)
Qualified Person(8)
Candidate(3)
25 people actually apply.
8 people are qualified to move on.
3 people are selected to be interviewed.
An individual interested in employment who has not yet completed a company application/resume
An individual who has completed an application/resume but who has not been prescreened
An individual who has been prescreened andwho meets the minimum requirements
An individual who will be invited to interview with the company
Figure 3-7 Recruitment Terminology
Scenario 2: Areas Out of ScopeIf you feel that people need to understand that certain
aspects of a process are out of scope, you should explicitly sayso in the description. Figure 3-8 shows an example of a processdescription that intentionally excludes four types of employees.In this example, everyone may not understand the term down-grade, and you may need to further define it, as we did in sce-nario 1 for the term development promotion.
Scenario 3: Providing ExamplesIf confusion occurs around a term, Figure 3-9 shows an-
other option to clarify what you mean by providing examples.In this figure, you can see that I clarified the employees eligiblefor a recognition bonus.

STEP 2: ESTABLISH THE FOUNDATION: AVOIDING SCOPE CREEP 63
Description (purpose):
This process determines the rate of pay for an individual to fill aU.S.-based vacant position.
This process covers the following types of employees:
Managerial and professional ■
Office hourly ■
This process does not cover the following types of employees:
Executives ■
International local hires ■
Downgrades ■
Employees on an employment contract ■
Figure 3-8 New Hire Pay Process
Description (purpose):
This process is an ongoing cash reward program to recognize outstanding contributions beyond an eligible* employee’s regularresponsibilities.
*Eligible employees include:
All managerial and professional employees not eligible for any other bonus program. All office hourly employees.
■
■
Figure 3-9 Recognition Bonus Award Process
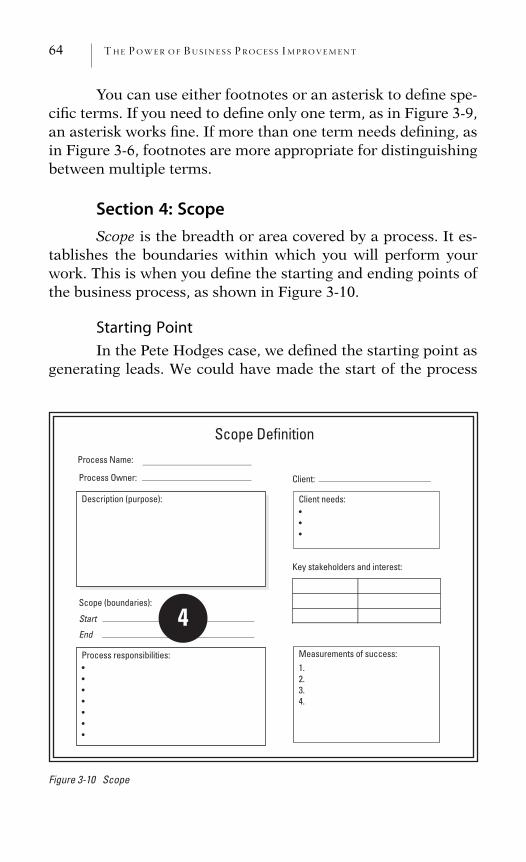
64 THE POWER OF BUS INE S S P ROCES S IMPROVEMENT
You can use either footnotes or an asterisk to define spe-cific terms. If you need to define only one term, as in Figure 3-9,an asterisk works fine. If more than one term needs defining, asin Figure 3-6, footnotes are more appropriate for distinguishingbetween multiple terms.
Section 4: ScopeScope is the breadth or area covered by a process. It es-
tablishes the boundaries within which you will perform yourwork. This is when you define the starting and ending points ofthe business process, as shown in Figure 3-10.
Starting Point
In the Pete Hodges case, we defined the starting point asgenerating leads. We could have made the start of the process
4
Process Name:
Process Owner: Client:
Key stakeholders and interest:
Start
End
Scope (boundaries):
Scope Definition
Process responsibilities:•••••••
Client needs:•••
Measurements of success:1.2.3.4.
Figure 3-10 Scope
Description (purpose):
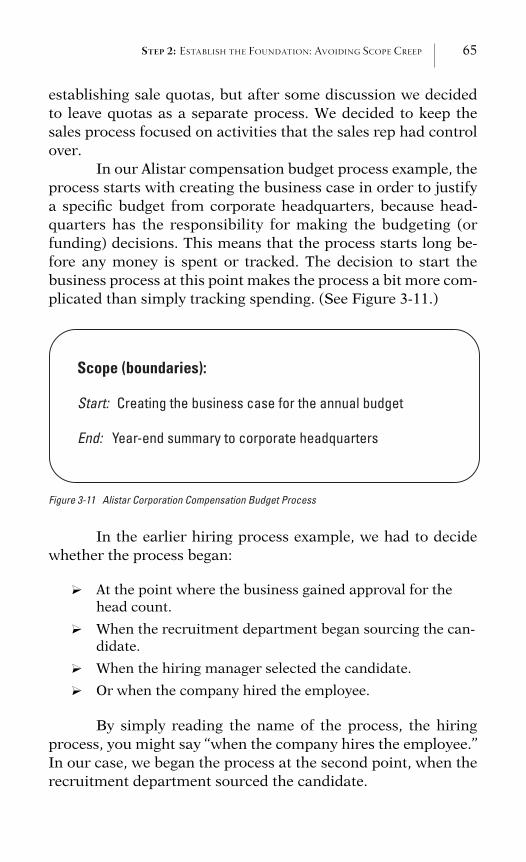
STEP 2: ESTABLISH THE FOUNDATION: AVOIDING SCOPE CREEP 65
establishing sale quotas, but after some discussion we decidedto leave quotas as a separate process. We decided to keep thesales process focused on activities that the sales rep had controlover.
In our Alistar compensation budget process example, theprocess starts with creating the business case in order to justifya specific budget from corporate headquarters, because head-quarters has the responsibility for making the budgeting (orfunding) decisions. This means that the process starts long be-fore any money is spent or tracked. The decision to start thebusiness process at this point makes the process a bit more com-plicated than simply tracking spending. (See Figure 3-11.)
Scope (boundaries):
Start: Creating the business case for the annual budget
End: Year-end summary to corporate headquarters
Figure 3-11 Alistar Corporation Compensation Budget Process
In the earlier hiring process example, we had to decidewhether the process began:
? At the point where the business gained approval for thehead count.
? When the recruitment department began sourcing the can-didate.
? When the hiring manager selected the candidate.
? Or when the company hired the employee.
By simply reading the name of the process, the hiringprocess, you might say ‘‘when the company hires the employee.’’In our case, we began the process at the second point, when therecruitment department sourced the candidate.
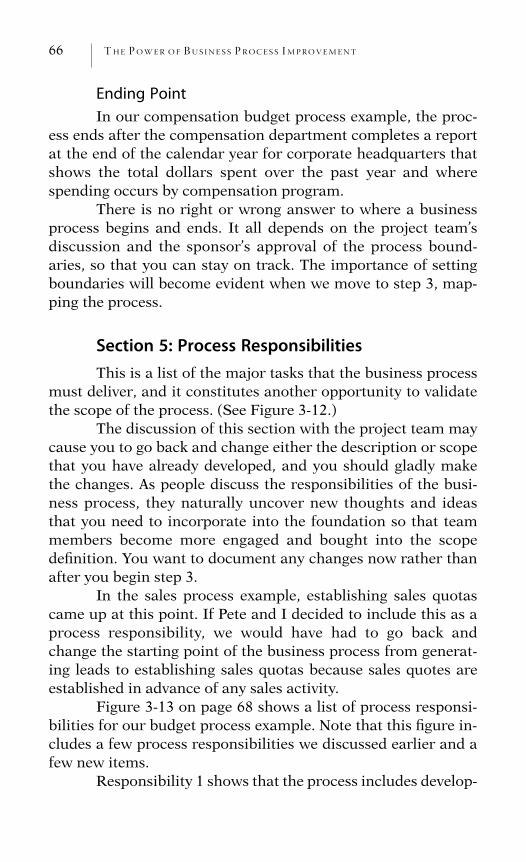
66 THE POWER OF BUS INE S S P ROCES S IMPROVEMENT
Ending Point
In our compensation budget process example, the proc-ess ends after the compensation department completes a reportat the end of the calendar year for corporate headquarters thatshows the total dollars spent over the past year and wherespending occurs by compensation program.
There is no right or wrong answer to where a businessprocess begins and ends. It all depends on the project team’sdiscussion and the sponsor’s approval of the process bound-aries, so that you can stay on track. The importance of settingboundaries will become evident when we move to step 3, map-ping the process.
Section 5: Process ResponsibilitiesThis is a list of the major tasks that the business process
must deliver, and it constitutes another opportunity to validatethe scope of the process. (See Figure 3-12.)
The discussion of this section with the project team maycause you to go back and change either the description or scopethat you have already developed, and you should gladly makethe changes. As people discuss the responsibilities of the busi-ness process, they naturally uncover new thoughts and ideasthat you need to incorporate into the foundation so that teammembers become more engaged and bought into the scopedefinition. You want to document any changes now rather thanafter you begin step 3.
In the sales process example, establishing sales quotascame up at this point. If Pete and I decided to include this as aprocess responsibility, we would have had to go back andchange the starting point of the business process from generat-ing leads to establishing sales quotas because sales quotes areestablished in advance of any sales activity.
Figure 3-13 on page 68 shows a list of process responsi-bilities for our budget process example. Note that this figure in-cludes a few process responsibilities we discussed earlier and afew new items.
Responsibility 1 shows that the process includes develop-
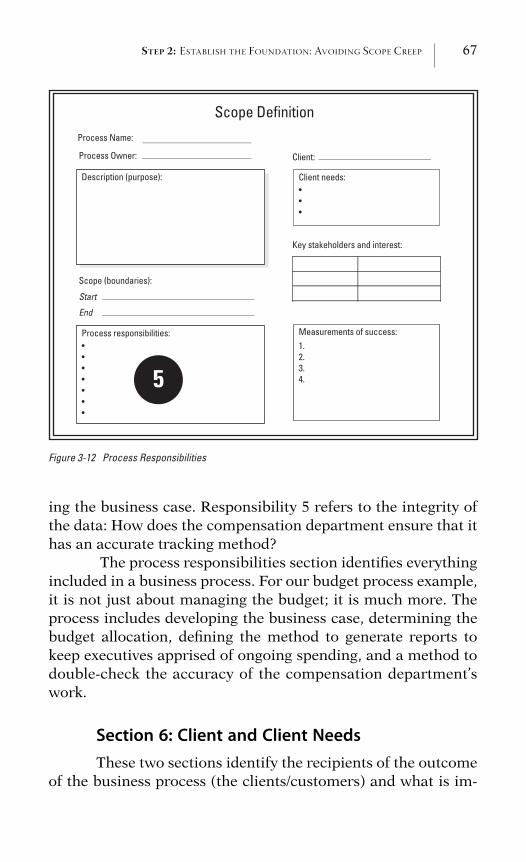
STEP 2: ESTABLISH THE FOUNDATION: AVOIDING SCOPE CREEP 67
5
Process Name:
Process Owner: Client:
Key stakeholders and interest:
Start
End
Scope (boundaries):
Scope Definition
Process responsibilities:•••••••
Client needs:•••
Measurements of success:1.2.3.4.
Figure 3-12 Process Responsibilities
Description (purpose):
ing the business case. Responsibility 5 refers to the integrity ofthe data: How does the compensation department ensure that ithas an accurate tracking method?
The process responsibilities section identifies everythingincluded in a business process. For our budget process example,it is not just about managing the budget; it is much more. Theprocess includes developing the business case, determining thebudget allocation, defining the method to generate reports tokeep executives apprised of ongoing spending, and a method todouble-check the accuracy of the compensation department’swork.
Section 6: Client and Client NeedsThese two sections identify the recipients of the outcome
of the business process (the clients/customers) and what is im-
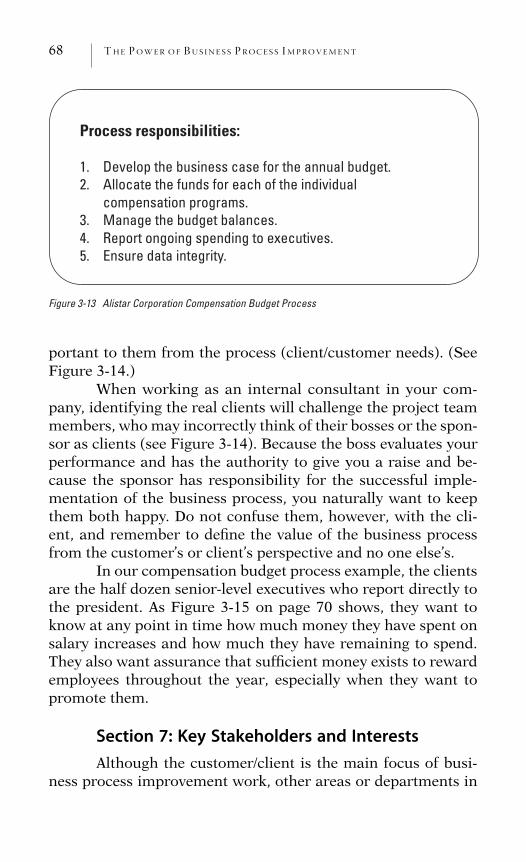
68 THE POWER OF BUS INE S S P ROCES S IMPROVEMENT
Process responsibilities:
1. Develop the business case for the annual budget. 2. Allocate the funds for each of the individual
compensation programs. 3. Manage the budget balances. 4. Report ongoing spending to executives. 5. Ensure data integrity.
Figure 3-13 Alistar Corporation Compensation Budget Process
portant to them from the process (client/customer needs). (SeeFigure 3-14.)
When working as an internal consultant in your com-pany, identifying the real clients will challenge the project teammembers, who may incorrectly think of their bosses or the spon-sor as clients (see Figure 3-14). Because the boss evaluates yourperformance and has the authority to give you a raise and be-cause the sponsor has responsibility for the successful imple-mentation of the business process, you naturally want to keepthem both happy. Do not confuse them, however, with the cli-ent, and remember to define the value of the business processfrom the customer’s or client’s perspective and no one else’s.
In our compensation budget process example, the clientsare the half dozen senior-level executives who report directly tothe president. As Figure 3-15 on page 70 shows, they want toknow at any point in time how much money they have spent onsalary increases and how much they have remaining to spend.They also want assurance that sufficient money exists to rewardemployees throughout the year, especially when they want topromote them.
Section 7: Key Stakeholders and InterestsAlthough the customer/client is the main focus of busi-
ness process improvement work, other areas or departments in
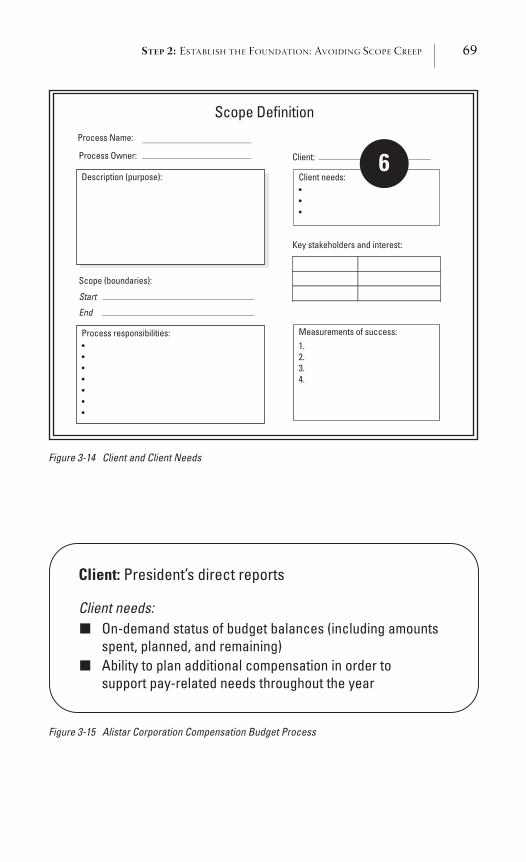
STEP 2: ESTABLISH THE FOUNDATION: AVOIDING SCOPE CREEP 69
Process Name:
Process Owner: Client:
Key stakeholders and interest:
Start
End
Scope (boundaries):
Scope Definition
Process responsibilities:•••••••
Client needs:•••
Measurements of success:1.2.3.4.
Figure 3-14 Client and Client Needs
Description (purpose):6
Client: President’s direct reports
Client needs: On-demand status of budget balances (including amounts spent, planned, and remaining) Ability to plan additional compensation in order to
■
■
support pay-related needs throughout the year
Figure 3-15 Alistar Corporation Compensation Budget Process
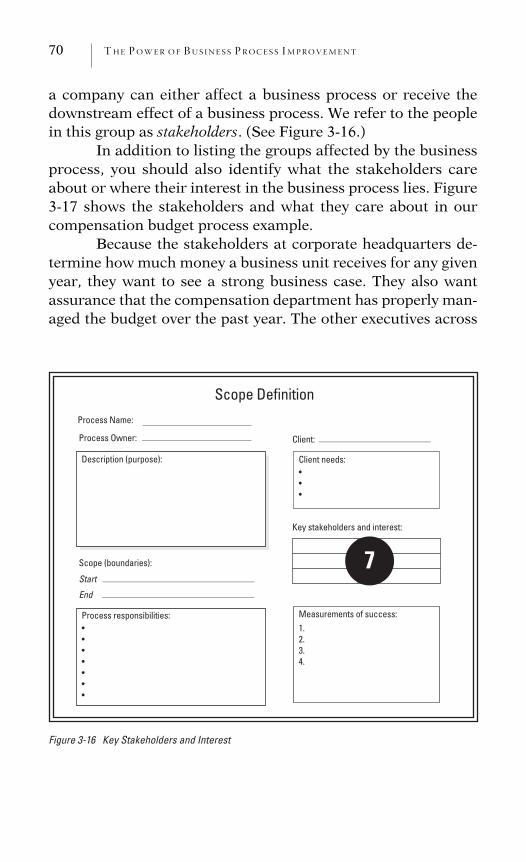
70 THE POWER OF BUS INE S S P ROCES S IMPROVEMENT
a company can either affect a business process or receive thedownstream effect of a business process. We refer to the peoplein this group as stakeholders. (See Figure 3-16.)
In addition to listing the groups affected by the businessprocess, you should also identify what the stakeholders careabout or where their interest in the business process lies. Figure3-17 shows the stakeholders and what they care about in ourcompensation budget process example.
Because the stakeholders at corporate headquarters de-termine how much money a business unit receives for any givenyear, they want to see a strong business case. They also wantassurance that the compensation department has properly man-aged the budget over the past year. The other executives across
Process Name:
Process Owner: Client:
Key stakeholders and interest:
Start
End
Scope (boundaries):
Scope Definition
Process responsibilities:•••••••
Client needs:•••
Measurements of success:1.2.3.4.
Figure 3-16 Key Stakeholders and Interest
Description (purpose):
7
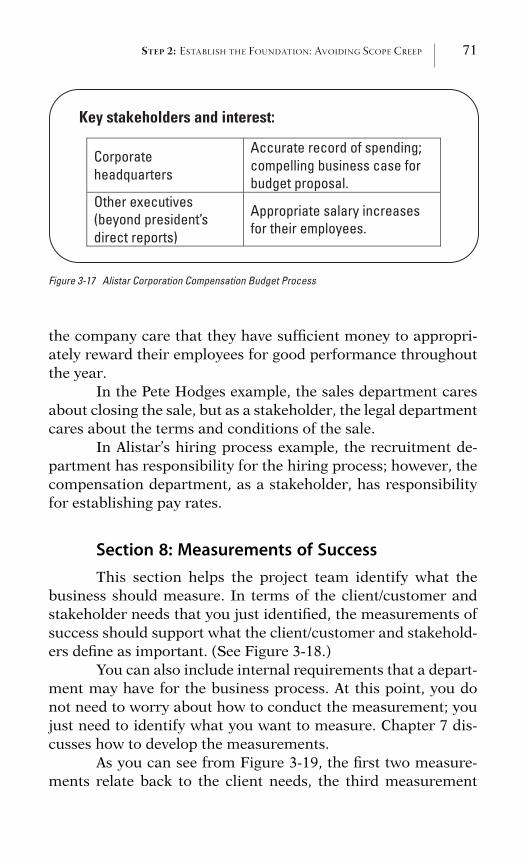
STEP 2: ESTABLISH THE FOUNDATION: AVOIDING SCOPE CREEP 71
Key stakeholders and interest:
Corporateheadquarters
Accurate record of spending; compelling business case for budget proposal.
Other executives(beyond president’s direct reports)
Appropriate salary increases for their employees.
Figure 3-17 Alistar Corporation Compensation Budget Process
the company care that they have sufficient money to appropri-ately reward their employees for good performance throughoutthe year.
In the Pete Hodges example, the sales department caresabout closing the sale, but as a stakeholder, the legal departmentcares about the terms and conditions of the sale.
In Alistar’s hiring process example, the recruitment de-partment has responsibility for the hiring process; however, thecompensation department, as a stakeholder, has responsibilityfor establishing pay rates.
Section 8: Measurements of SuccessThis section helps the project team identify what the
business should measure. In terms of the client/customer andstakeholder needs that you just identified, the measurements ofsuccess should support what the client/customer and stakehold-ers define as important. (See Figure 3-18.)
You can also include internal requirements that a depart-ment may have for the business process. At this point, you donot need to worry about how to conduct the measurement; youjust need to identify what you want to measure. Chapter 7 dis-cusses how to develop the measurements.
As you can see from Figure 3-19, the first two measure-ments relate back to the client needs, the third measurement
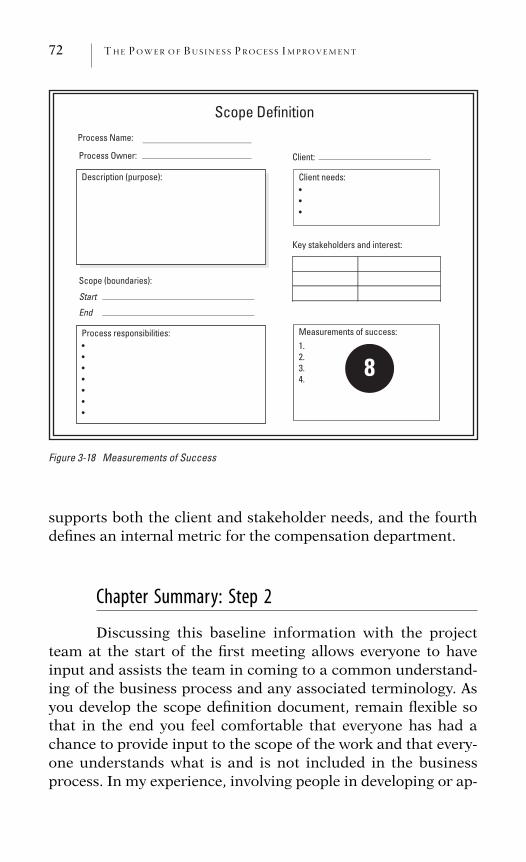
72 THE POWER OF BUS INE S S P ROCES S IMPROVEMENT
Process Name:
Process Owner: Client:
Key stakeholders and interest:
Start
End
Scope (boundaries):
Scope Definition
Process responsibilities:•••••••
Client needs:•••
Measurements of success:1.2.3.4.
Figure 3-18 Measurements of Success
Description (purpose):
8
supports both the client and stakeholder needs, and the fourthdefines an internal metric for the compensation department.
Chapter Summary: Step 2
Discussing this baseline information with the projectteam at the start of the first meeting allows everyone to haveinput and assists the team in coming to a common understand-ing of the business process and any associated terminology. Asyou develop the scope definition document, remain flexible sothat in the end you feel comfortable that everyone has had achance to provide input to the scope of the work and that every-one understands what is and is not included in the businessprocess. In my experience, involving people in developing or ap-
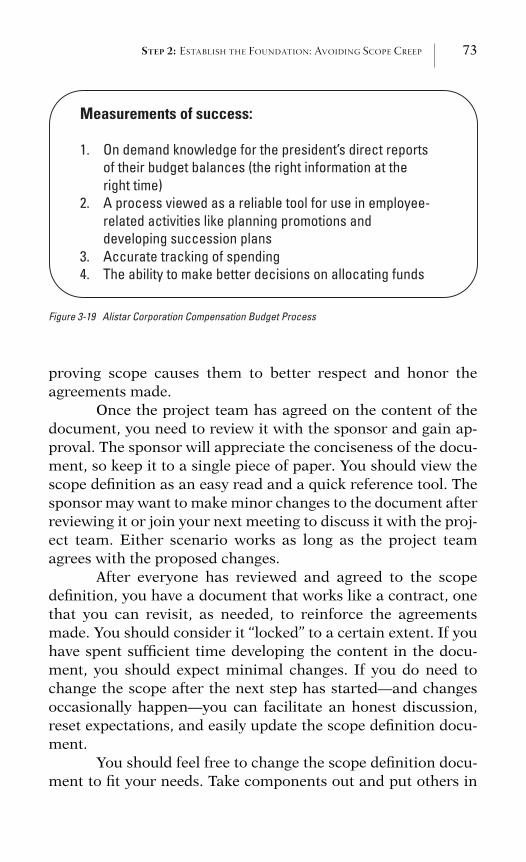
STEP 2: ESTABLISH THE FOUNDATION: AVOIDING SCOPE CREEP 73
Measurements of success:
1. On demand knowledge for the president’s direct reports of their budget balances (the right information at the right time)
2. A process viewed as a reliable tool for use in employee-related activities like planning promotions and developing succession plans
3. Accurate tracking of spending 4. The ability to make better decisions on allocating funds
Figure 3-19 Alistar Corporation Compensation Budget Process
proving scope causes them to better respect and honor theagreements made.
Once the project team has agreed on the content of thedocument, you need to review it with the sponsor and gain ap-proval. The sponsor will appreciate the conciseness of the docu-ment, so keep it to a single piece of paper. You should view thescope definition as an easy read and a quick reference tool. Thesponsor may want to make minor changes to the document afterreviewing it or join your next meeting to discuss it with the proj-ect team. Either scenario works as long as the project teamagrees with the proposed changes.
After everyone has reviewed and agreed to the scopedefinition, you have a document that works like a contract, onethat you can revisit, as needed, to reinforce the agreementsmade. You should consider it ‘‘locked’’ to a certain extent. If youhave spent sufficient time developing the content in the docu-ment, you should expect minimal changes. If you do need tochange the scope after the next step has started—and changesoccasionally happen—you can facilitate an honest discussion,reset expectations, and easily update the scope definition docu-ment.
You should feel free to change the scope definition docu-ment to fit your needs. Take components out and put others in
74 THE POWER OF BUS INE S S P ROCES S IMPROVEMENT
to address any specific situations you may encounter. The docu-ment is meant to be flexible. The model I have used throughoutthis chapter should work 80 percent of the time.
Figure 3-20 shows an alternative that I used when Iexamined the processing of various employee transactions inAlistar’s employee system of record. As this figure shows, I elimi-nated many sections of the scope definition document that didnot apply and added other sections. Since the transactions didnot belong to a single business process, I deleted the processname, process owner, process responsibilities, and the measure-ments of success sections of the template and adapted it for thisspecific case.
Time Estimate
To help plan the time that it takes to work through thisstep, Figure 3-21 on page 76 summarizes the amount of timeyou should allow to complete the scope definition document.
First Project Team MeetingThe first project team meeting should allow sufficient
time to walk through the roadmap, introduced in Chapter 1, sothat the team can see how the journey will unfold. At this meet-ing you also lead the team through a thorough discussion of allthe sections of the scope definition document.
Give the project team a blank copy of the scope definitiondocument at the first meeting and facilitate a discussion to com-plete the document together as a team. You should keep trackof the discussion during the meeting on an electronic board, ifavailable, so that everyone can see the document coming to-gether.
An electronic board is a type of dry-erase board that hasthe capability to print a hardcopy of what you write on theboard. You will find this helpful as the facilitator because itallows you to print a picture of the board contents simply byhitting a button or sending the board contents to a printer so
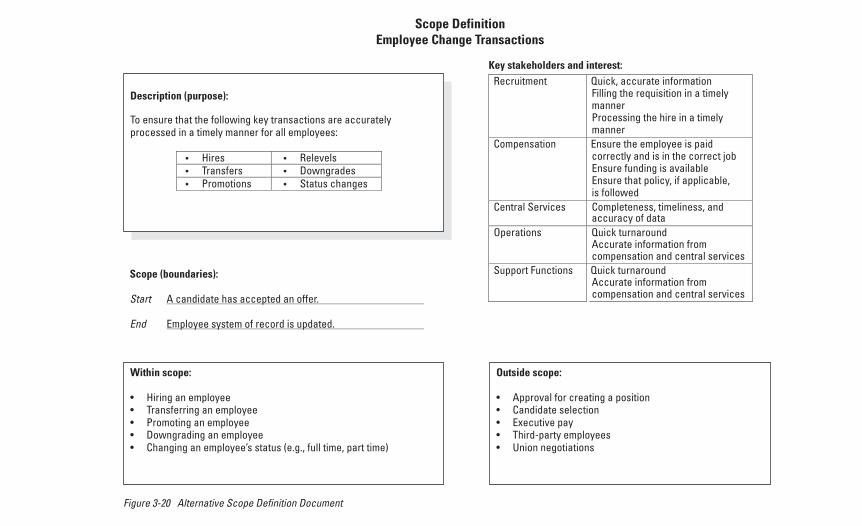
Within scope:
• Hiring an employee • Transferring an employee • Promoting an employee • Downgrading an employee • Changing an employee’s status (e.g., full time, part time)
Scope (boundaries):
Start A candidate has accepted an offer.
End Employee system of record is updated.
Outside scope:
• Approval for creating a position • Candidate selection • Executive pay • Third-party employees • Union negotiations
Key stakeholders and interest: Recruitment Quick, accurate information
Filling the requisition in a timely mannerProcessing the hire in a timely manner
Compensation Ensure the employee is paid correctly and is in the correct job Ensure funding is available Ensure that policy, if applicable, is followed
Central Services Completeness, timeliness, and accuracy of data
Operations Quick turnaround Accurate information from compensation and central services
Support Functions Quick turnaround Accurate information from compensation and central services
Description (purpose):
Scope DefinitionEmployee Change Transactions
To ensure that the following key transactions are accuratelyprocessed in a timely manner for all employees:
• Hires • Relevels• Transfers • Downgrades• Promotions • Status changes
Figure 3-20 Alternative Scope Definition Document
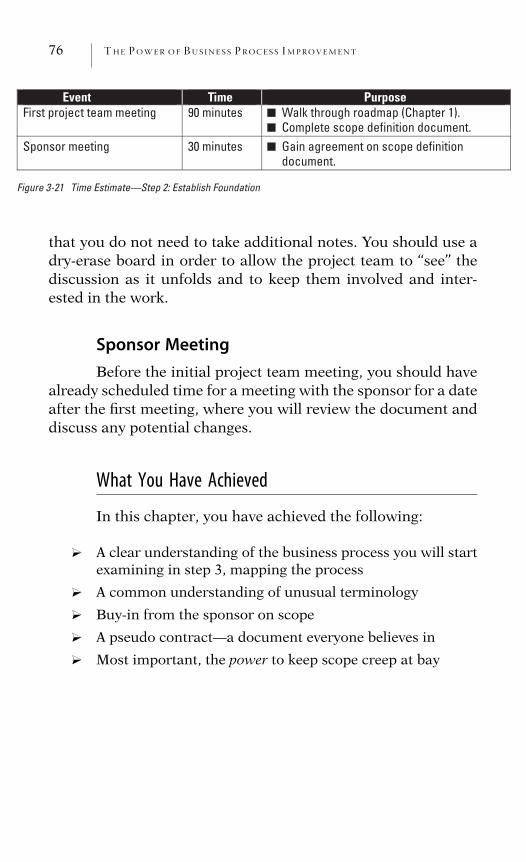
76 THE POWER OF BUS INE S S P ROCES S IMPROVEMENT
Event Time PurposeFirst project team meeting 90 minutes Walk through roadmap (Chapter 1).
Complete scope definition document. Sponsor meeting 30 minutes Gain agreement on scope definition
■
■
■
document.
Figure 3-21 Time Estimate—Step 2: Establish Foundation
that you do not need to take additional notes. You should use adry-erase board in order to allow the project team to ‘‘see’’ thediscussion as it unfolds and to keep them involved and inter-ested in the work.
Sponsor MeetingBefore the initial project team meeting, you should have
already scheduled time for a meeting with the sponsor for a dateafter the first meeting, where you will review the document anddiscuss any potential changes.
What You Have Achieved
In this chapter, you have achieved the following:
? A clear understanding of the business process you will startexamining in step 3, mapping the process
? A common understanding of unusual terminology
? Buy-in from the sponsor on scope
? A pseudo contract—a document everyone believes in
? Most important, the power to keep scope creep at bay
C H A P T E R 4
Step 3: Draw the Process Map
Flowchar ting and Documenting
Ed Seinfeld, the manager of HRIS (human resource infor-mation systems) for Alistar Corporation, wanted to understandhow technology projects secured funding and how system ex-penses hit Alistar’s financial planning processes like the five-yearcapital plan, annual operations plan, and monthly forecasts.
While trying to collect the system costs charged to thehuman resources and information technology departments, Eddiscovered that no clear process existed, causing him to ask formy help in understanding what he called the ‘‘technology fund-ing process.’’ When someone comes to me with this type of prob-lem, I like to start by defining the process as we did in Chapter3 and then draw a process map.
Drawing a process map is one of the best ways to helppeople understand any business process. It helps everyone in-volved in creating the process map learn how the process works,what activities constitute most of the work, where the handoffsoccur between departments, and where the opportunities forimprovement exist.
There are two schools of thought on how to approachthis step depending on the technique that someone subscribesto: quality or reengineering. Both techniques are well-knownprocess improvement methods:
? Reengineering focuses on the future state, driven by cus-tomer needs, and does not focus on the current process.
77
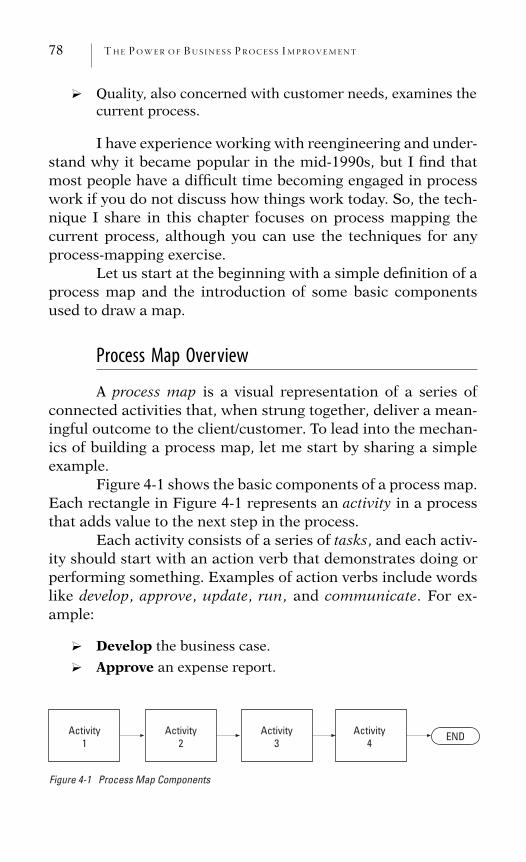
78 THE POWER OF BUS INE S S P ROCES S IMPROVEMENT
? Quality, also concerned with customer needs, examines thecurrent process.
I have experience working with reengineering and under-stand why it became popular in the mid-1990s, but I find thatmost people have a difficult time becoming engaged in processwork if you do not discuss how things work today. So, the tech-nique I share in this chapter focuses on process mapping thecurrent process, although you can use the techniques for anyprocess-mapping exercise.
Let us start at the beginning with a simple definition of aprocess map and the introduction of some basic componentsused to draw a map.
Process Map Overview
A process map is a visual representation of a series ofconnected activities that, when strung together, deliver a mean-ingful outcome to the client/customer. To lead into the mechan-ics of building a process map, let me start by sharing a simpleexample.
Figure 4-1 shows the basic components of a process map.Each rectangle in Figure 4-1 represents an activity in a processthat adds value to the next step in the process.
Each activity consists of a series of tasks, and each activ-ity should start with an action verb that demonstrates doing orperforming something. Examples of action verbs include wordslike develop, approve, update, run, and communicate. For ex-ample:
? Develop the business case.
? Approve an expense report.
Activity1
Activity2
Activity3
Activity4
END
Figure 4-1 Process Map Components
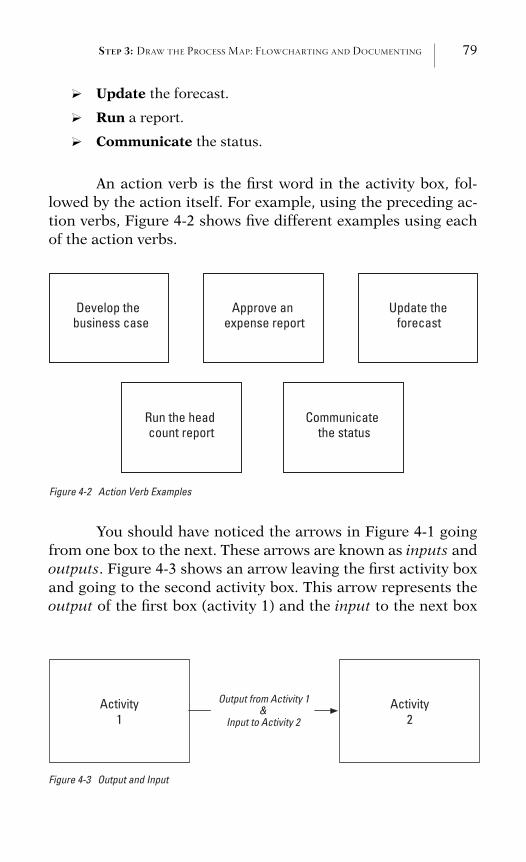
STEP 3: DRAW THE PROCESS MAP: FLOWCHARTING AND DOCUMENTING 79
? Update the forecast.
? Run a report.
? Communicate the status.
An action verb is the first word in the activity box, fol-lowed by the action itself. For example, using the preceding ac-tion verbs, Figure 4-2 shows five different examples using eachof the action verbs.
Develop the business case
Approve an expense report
Update the forecast
Run the head count report
Communicatethe status
Figure 4-2 Action Verb Examples
You should have noticed the arrows in Figure 4-1 goingfrom one box to the next. These arrows are known as inputs andoutputs. Figure 4-3 shows an arrow leaving the first activity boxand going to the second activity box. This arrow represents theoutput of the first box (activity 1) and the input to the next box
Activity1
Activity2
Output from Activity 1&
Input to Activity 2
Figure 4-3 Output and Input
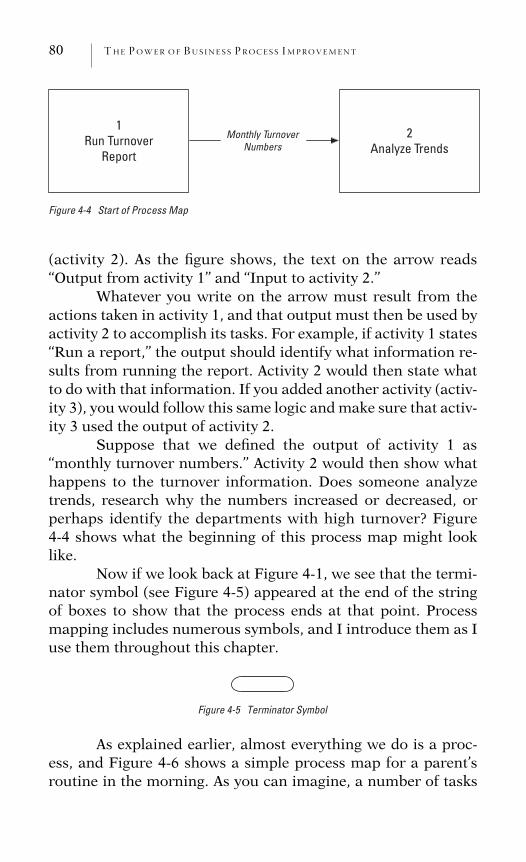
80 THE POWER OF BUS INE S S P ROCES S IMPROVEMENT
1Run Turnover
Report
2Analyze Trends
Monthly TurnoverNumbers
Figure 4-4 Start of Process Map
(activity 2). As the figure shows, the text on the arrow reads‘‘Output from activity 1’’ and ‘‘Input to activity 2.’’
Whatever you write on the arrow must result from theactions taken in activity 1, and that output must then be used byactivity 2 to accomplish its tasks. For example, if activity 1 states‘‘Run a report,’’ the output should identify what information re-sults from running the report. Activity 2 would then state whatto do with that information. If you added another activity (activ-ity 3), you would follow this same logic and make sure that activ-ity 3 used the output of activity 2.
Suppose that we defined the output of activity 1 as‘‘monthly turnover numbers.’’ Activity 2 would then show whathappens to the turnover information. Does someone analyzetrends, research why the numbers increased or decreased, orperhaps identify the departments with high turnover? Figure4-4 shows what the beginning of this process map might looklike.
Now if we look back at Figure 4-1, we see that the termi-nator symbol (see Figure 4-5) appeared at the end of the stringof boxes to show that the process ends at that point. Processmapping includes numerous symbols, and I introduce them as Iuse them throughout this chapter.
Figure 4-5 Terminator Symbol
As explained earlier, almost everything we do is a proc-ess, and Figure 4-6 shows a simple process map for a parent’sroutine in the morning. As you can imagine, a number of tasks
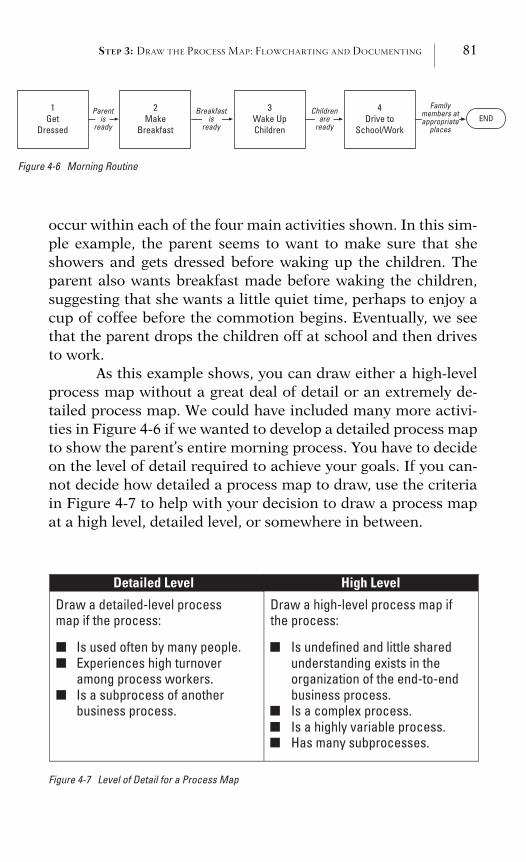
STEP 3: DRAW THE PROCESS MAP: FLOWCHARTING AND DOCUMENTING 81
1Get
Dressed
4Drive to
School/Work
2Make
Breakfast
Familymembers atappropriate
places
Childrenare
ready
Breakfastis
ready
Parentis
ready
3Wake UpChildren
END
Figure 4-6 Morning Routine
occur within each of the four main activities shown. In this sim-ple example, the parent seems to want to make sure that sheshowers and gets dressed before waking up the children. Theparent also wants breakfast made before waking the children,suggesting that she wants a little quiet time, perhaps to enjoy acup of coffee before the commotion begins. Eventually, we seethat the parent drops the children off at school and then drivesto work.
As this example shows, you can draw either a high-levelprocess map without a great deal of detail or an extremely de-tailed process map. We could have included many more activi-ties in Figure 4-6 if we wanted to develop a detailed process mapto show the parent’s entire morning process. You have to decideon the level of detail required to achieve your goals. If you can-not decide how detailed a process map to draw, use the criteriain Figure 4-7 to help with your decision to draw a process mapat a high level, detailed level, or somewhere in between.
Detailed Level High Level
Draw a detailed-level process map if the process:
Is used often by many people. Experiences high turnover among process workers. Is a subprocess of another
■■
■business process.
Draw a high-level process map if the process:
Is undefined and little shared understanding exists in the organization of the end-to-end business process. Is a complex process. Is a highly variable process. Has many subprocesses.
■
■■■
Figure 4-7 Level of Detail for a Process Map
82 THE POWER OF BUS INE S S P ROCES S IMPROVEMENT
Even if you start at a high level, you can always add addi-tional details if the need surfaces. The amount of time you spenddrawing a process map varies depending on the goals. Thinkabout what level of detail you need to accomplish your goals,and do not go any deeper.
Drawing the Process Map
In step 2 of the roadmap you laid the foundation for thebusiness process; now you can move to step 3, drawing and doc-umenting the process map. But where do you begin? The firstbox always seems to be the most difficult one to fill in becauseyou have to decide where to start.
To get started, use the scope definition document createdin step 2, and reference the boundaries defined at that time.Look at where you said the process begins and ends, and usethat information as the starting point.
Let us use Alistar Corporation’s simple recognitionbonus award process from Chapter 3 to demonstrate the build-ing of a process map. Figure 4-8 contains a description of thisbusiness process. Since this process is about rewarding employ-
Description (purpose):
This process is an ongoing cash reward program to recognize outstanding contributions beyond an eligible* employee’s regular responsibilities.
*Eligible employees include:
All managerial and professional employees not eligible for anyother incentive program. All office hourly employees.
■
■
Figure 4-8 Recognition Bonus Award Process
STEP 3: DRAW THE PROCESS MAP: FLOWCHARTING AND DOCUMENTING 83
ees for good performance, our scope definition document liststhe boundaries, as shown in Figure 4-9.
Start:■ Recommend employee for an award.
End:■ System of record is updated.
Figure 4-9 Boundaries
The entry point into the business process becomes thefirst data point to draw on the process map. In our example, wealready identified the initial entry point when we established theboundaries in Figure 4-9. So we would write ‘‘Recommend em-ployee for an award’’ on the process map and place an arrowgoing from this phrase to the first box. Figure 4-10 shows whatthe process map looks like at this point.
The next step is to decide what to write inside the firstbox on the process map.
Recognition Bonus Award Process Page 1 of 1
Activity 1
Recommend Employee for an Award
Figure 4-10 Recognition Bonus Award Process Map
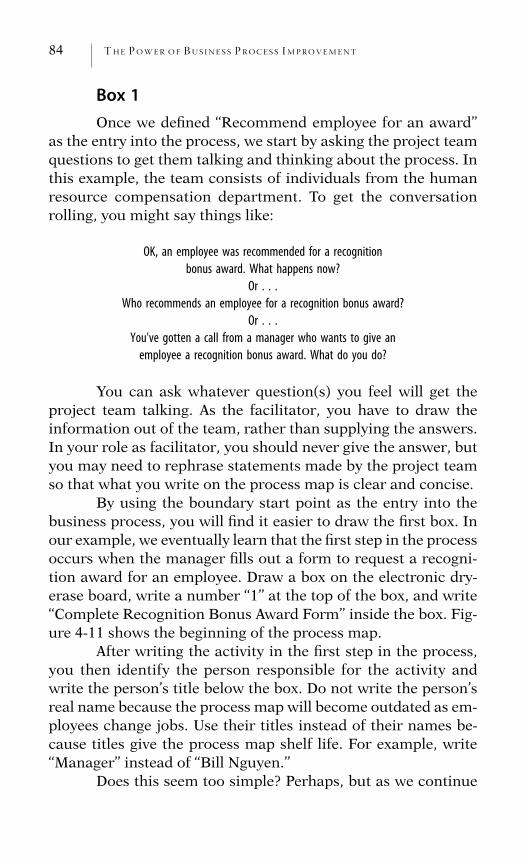
84 THE POWER OF BUS INE S S P ROCES S IMPROVEMENT
Box 1Once we defined ‘‘Recommend employee for an award’’
as the entry into the process, we start by asking the project teamquestions to get them talking and thinking about the process. Inthis example, the team consists of individuals from the humanresource compensation department. To get the conversationrolling, you might say things like:
OK, an employee was recommended for a recognition
bonus award. What happens now?
Or . . .
Who recommends an employee for a recognition bonus award?
Or . . .
You've gotten a call from a manager who wants to give an
employee a recognition bonus award. What do you do?
You can ask whatever question(s) you feel will get theproject team talking. As the facilitator, you have to draw theinformation out of the team, rather than supplying the answers.In your role as facilitator, you should never give the answer, butyou may need to rephrase statements made by the project teamso that what you write on the process map is clear and concise.
By using the boundary start point as the entry into thebusiness process, you will find it easier to draw the first box. Inour example, we eventually learn that the first step in the processoccurs when the manager fills out a form to request a recogni-tion award for an employee. Draw a box on the electronic dry-erase board, write a number ‘‘1’’ at the top of the box, and write‘‘Complete Recognition Bonus Award Form’’ inside the box. Fig-ure 4-11 shows the beginning of the process map.
After writing the activity in the first step in the process,you then identify the person responsible for the activity andwrite the person’s title below the box. Do not write the person’sreal name because the process map will become outdated as em-ployees change jobs. Use their titles instead of their names be-cause titles give the process map shelf life. For example, write‘‘Manager’’ instead of ‘‘Bill Nguyen.’’
Does this seem too simple? Perhaps, but as we continue
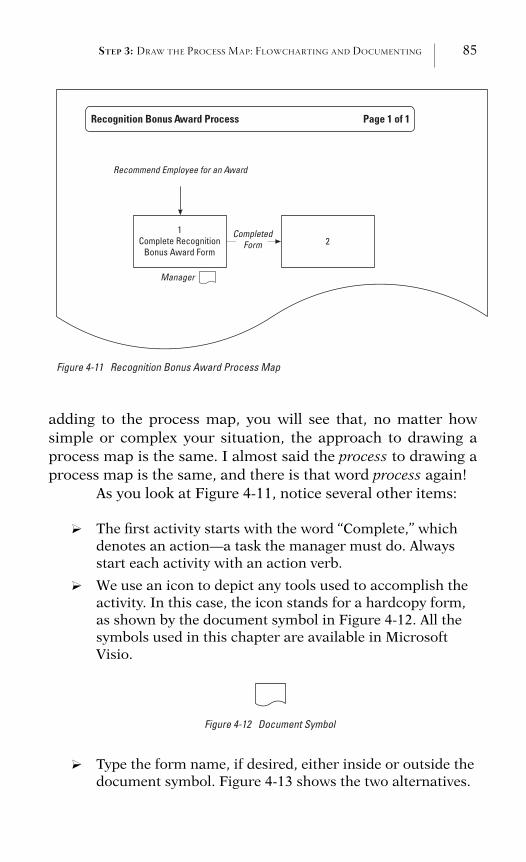
STEP 3: DRAW THE PROCESS MAP: FLOWCHARTING AND DOCUMENTING 85
Recognition Bonus Award Process Page 1 of 1
1Complete Recognition
Bonus Award Form
Recommend Employee for an Award
2Completed
Form
Manager
Figure 4-11 Recognition Bonus Award Process Map
adding to the process map, you will see that, no matter howsimple or complex your situation, the approach to drawing aprocess map is the same. I almost said the process to drawing aprocess map is the same, and there is that word process again!
As you look at Figure 4-11, notice several other items:
? The first activity starts with the word ‘‘Complete,’’ whichdenotes an action—a task the manager must do. Alwaysstart each activity with an action verb.
? We use an icon to depict any tools used to accomplish theactivity. In this case, the icon stands for a hardcopy form,as shown by the document symbol in Figure 4-12. All thesymbols used in this chapter are available in MicrosoftVisio.
Figure 4-12 Document Symbol
? Type the form name, if desired, either inside or outside thedocument symbol. Figure 4-13 shows the two alternatives.
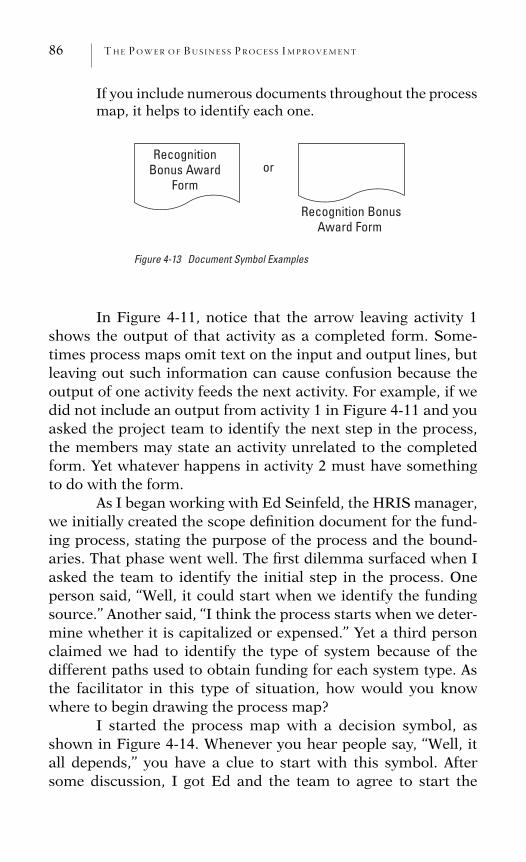
86 THE POWER OF BUS INE S S P ROCES S IMPROVEMENT
If you include numerous documents throughout the processmap, it helps to identify each one.
RecognitionBonus Award
Form
Recognition Bonus Award Form
or
Figure 4-13 Document Symbol Examples
In Figure 4-11, notice that the arrow leaving activity 1shows the output of that activity as a completed form. Some-times process maps omit text on the input and output lines, butleaving out such information can cause confusion because theoutput of one activity feeds the next activity. For example, if wedid not include an output from activity 1 in Figure 4-11 and youasked the project team to identify the next step in the process,the members may state an activity unrelated to the completedform. Yet whatever happens in activity 2 must have somethingto do with the form.
As I began working with Ed Seinfeld, the HRIS manager,we initially created the scope definition document for the fund-ing process, stating the purpose of the process and the bound-aries. That phase went well. The first dilemma surfaced when Iasked the team to identify the initial step in the process. Oneperson said, ‘‘Well, it could start when we identify the fundingsource.’’ Another said, ‘‘I think the process starts when we deter-mine whether it is capitalized or expensed.’’ Yet a third personclaimed we had to identify the type of system because of thedifferent paths used to obtain funding for each system type. Asthe facilitator in this type of situation, how would you knowwhere to begin drawing the process map?
I started the process map with a decision symbol, asshown in Figure 4-14. Whenever you hear people say, ‘‘Well, itall depends,’’ you have a clue to start with this symbol. Aftersome discussion, I got Ed and the team to agree to start the
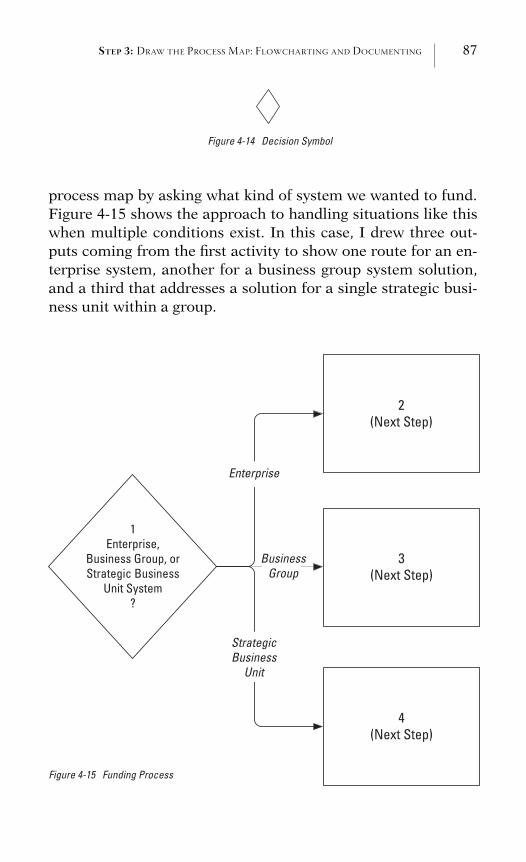
STEP 3: DRAW THE PROCESS MAP: FLOWCHARTING AND DOCUMENTING 87
Figure 4-14 Decision Symbol
process map by asking what kind of system we wanted to fund.Figure 4-15 shows the approach to handling situations like thiswhen multiple conditions exist. In this case, I drew three out-puts coming from the first activity to show one route for an en-terprise system, another for a business group system solution,and a third that addresses a solution for a single strategic busi-ness unit within a group.
StrategicBusiness
Unit
1Enterprise,
Business Group, orStrategic Business
Unit System?
3(Next Step)
4(Next Step)
2(Next Step)
BusinessGroup
Enterprise
Figure 4-15 Funding Process
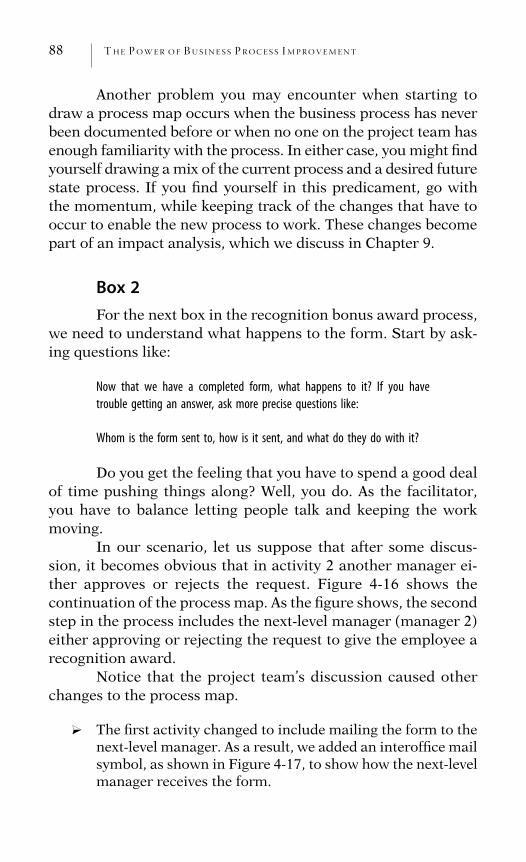
88 THE POWER OF BUS INE S S P ROCES S IMPROVEMENT
Another problem you may encounter when starting todraw a process map occurs when the business process has neverbeen documented before or when no one on the project team hasenough familiarity with the process. In either case, you might findyourself drawing a mix of the current process and a desired futurestate process. If you find yourself in this predicament, go withthe momentum, while keeping track of the changes that have tooccur to enable the new process to work. These changes becomepart of an impact analysis, which we discuss in Chapter 9.
Box 2For the next box in the recognition bonus award process,
we need to understand what happens to the form. Start by ask-ing questions like:
Now that we have a completed form, what happens to it? If you have
trouble getting an answer, ask more precise questions like:
Whom is the form sent to, how is it sent, and what do they do with it?
Do you get the feeling that you have to spend a good dealof time pushing things along? Well, you do. As the facilitator,you have to balance letting people talk and keeping the workmoving.
In our scenario, let us suppose that after some discus-sion, it becomes obvious that in activity 2 another manager ei-ther approves or rejects the request. Figure 4-16 shows thecontinuation of the process map. As the figure shows, the secondstep in the process includes the next-level manager (manager 2)either approving or rejecting the request to give the employee arecognition award.
Notice that the project team’s discussion caused otherchanges to the process map.
? The first activity changed to include mailing the form to thenext-level manager. As a result, we added an interoffice mailsymbol, as shown in Figure 4-17, to show how the next-levelmanager receives the form.
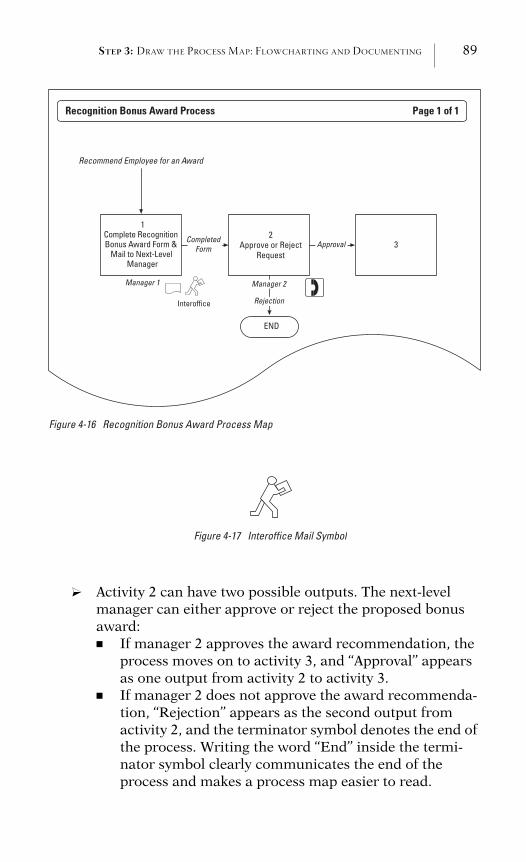
STEP 3: DRAW THE PROCESS MAP: FLOWCHARTING AND DOCUMENTING 89
Page 1 of 1Recognition Bonus Award Process
1Complete Recognition Bonus Award Form &
Mail to Next-Level Manager
Recommend Employee for an Award
2 Approve or Reject
Request3Completed
Form
Manager 1
END
Rejection
Manager 2
Approval
Interoffice
Figure 4-16 Recognition Bonus Award Process Map
Figure 4-17 Interoffice Mail Symbol
? Activity 2 can have two possible outputs. The next-levelmanager can either approve or reject the proposed bonusaward:� If manager 2 approves the award recommendation, the
process moves on to activity 3, and ‘‘Approval’’ appearsas one output from activity 2 to activity 3.
� If manager 2 does not approve the award recommenda-tion, ‘‘Rejection’’ appears as the second output fromactivity 2, and the terminator symbol denotes the end ofthe process. Writing the word ‘‘End’’ inside the termi-nator symbol clearly communicates the end of theprocess and makes a process map easier to read.
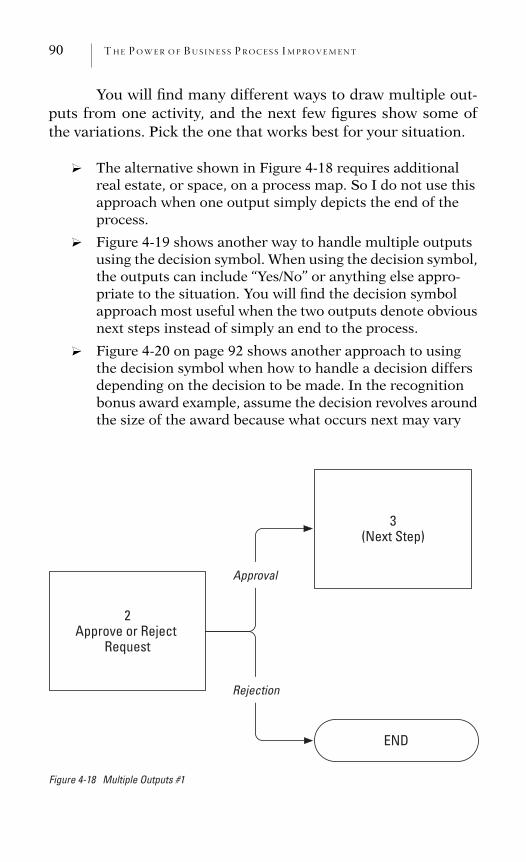
90 THE POWER OF BUS INE S S P ROCES S IMPROVEMENT
You will find many different ways to draw multiple out-puts from one activity, and the next few figures show some ofthe variations. Pick the one that works best for your situation.
? The alternative shown in Figure 4-18 requires additionalreal estate, or space, on a process map. So I do not use thisapproach when one output simply depicts the end of theprocess.
? Figure 4-19 shows another way to handle multiple outputsusing the decision symbol. When using the decision symbol,the outputs can include ‘‘Yes/No’’ or anything else appro-priate to the situation. You will find the decision symbolapproach most useful when the two outputs denote obviousnext steps instead of simply an end to the process.
? Figure 4-20 on page 92 shows another approach to usingthe decision symbol when how to handle a decision differsdepending on the decision to be made. In the recognitionbonus award example, assume the decision revolves aroundthe size of the award because what occurs next may vary
3(Next Step)
Approval
Rejection
2Approve or Reject
Request
END
Figure 4-18 Multiple Outputs #1
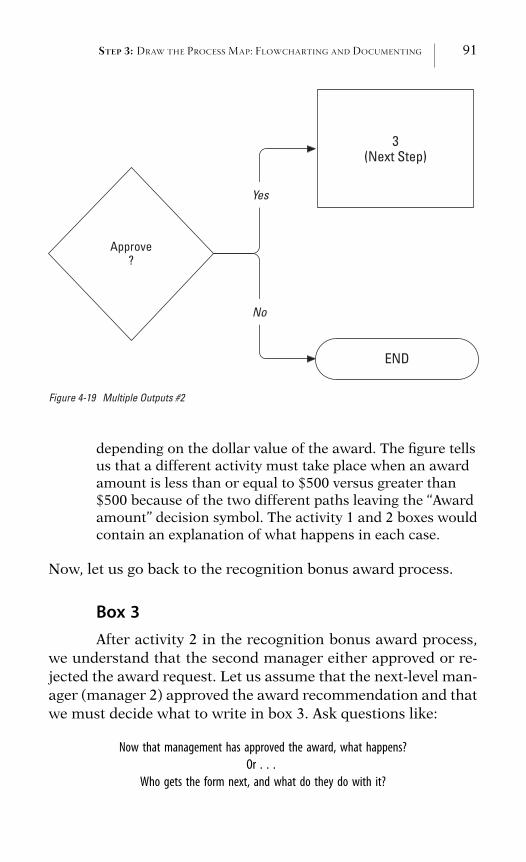
STEP 3: DRAW THE PROCESS MAP: FLOWCHARTING AND DOCUMENTING 91
3(Next Step)
Yes
No
Approve?
END
Figure 4-19 Multiple Outputs #2
depending on the dollar value of the award. The figure tellsus that a different activity must take place when an awardamount is less than or equal to $500 versus greater than$500 because of the two different paths leaving the ‘‘Awardamount’’ decision symbol. The activity 1 and 2 boxes wouldcontain an explanation of what happens in each case.
Now, let us go back to the recognition bonus award process.
Box 3After activity 2 in the recognition bonus award process,
we understand that the second manager either approved or re-jected the award request. Let us assume that the next-level man-ager (manager 2) approved the award recommendation and thatwe must decide what to write in box 3. Ask questions like:
Now that management has approved the award, what happens?
Or . . .
Who gets the form next, and what do they do with it?
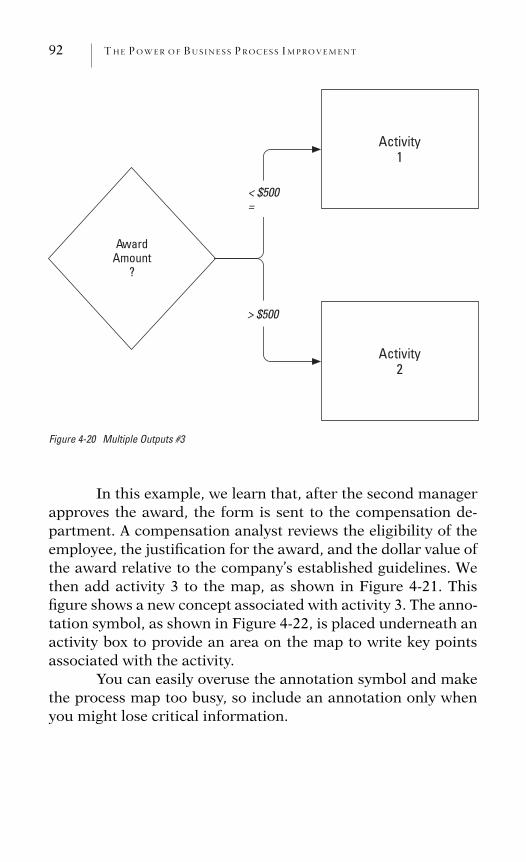
92 THE POWER OF BUS INE S S P ROCES S IMPROVEMENT
Activity1
Activity2
< $500=
> $500
AwardAmount
?
Figure 4-20 Multiple Outputs #3
In this example, we learn that, after the second managerapproves the award, the form is sent to the compensation de-partment. A compensation analyst reviews the eligibility of theemployee, the justification for the award, and the dollar value ofthe award relative to the company’s established guidelines. Wethen add activity 3 to the map, as shown in Figure 4-21. Thisfigure shows a new concept associated with activity 3. The anno-tation symbol, as shown in Figure 4-22, is placed underneath anactivity box to provide an area on the map to write key pointsassociated with the activity.
You can easily overuse the annotation symbol and makethe process map too busy, so include an annotation only whenyou might lose critical information.
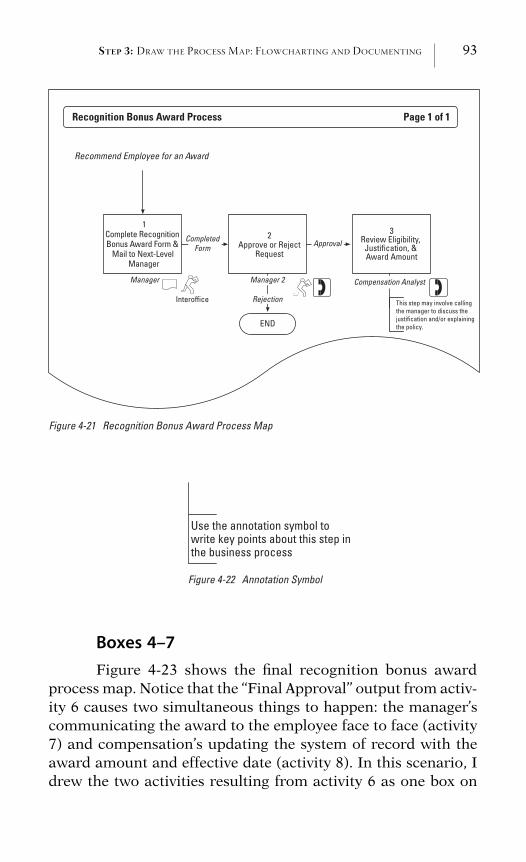
STEP 3: DRAW THE PROCESS MAP: FLOWCHARTING AND DOCUMENTING 93
Recommend Employee for an Award
2 Approve or Reject
Request
3Review Eligibility, Justification, & Award Amount
CompletedForm
This step may involve calling the manager to discuss the justification and/or explainingthe policy.
Manager Compensation Analyst
END
Rejection
Manager 2
Approval
Interoffice
Page 1 of 1Recognition Bonus Award Process
1Complete Recognition Bonus Award Form &
Mail to Next-Level Manager
Figure 4-21 Recognition Bonus Award Process Map
Use the annotation symbol to write key points about this step in the business process
Figure 4-22 Annotation Symbol
Boxes 4–7Figure 4-23 shows the final recognition bonus award
process map. Notice that the ‘‘Final Approval’’ output from activ-ity 6 causes two simultaneous things to happen: the manager’scommunicating the award to the employee face to face (activity7) and compensation’s updating the system of record with theaward amount and effective date (activity 8). In this scenario, Idrew the two activities resulting from activity 6 as one box on
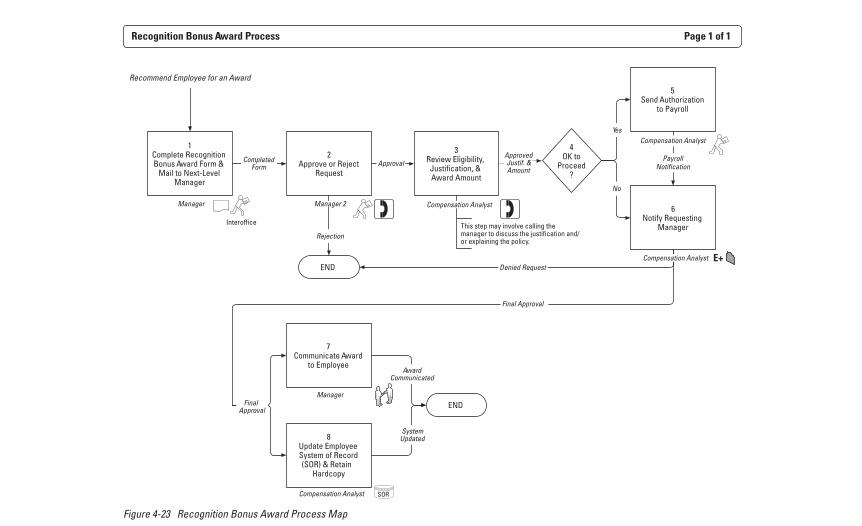
Recognition Bonus Award Process Page 1 of 1
1Complete Recognition Bonus Award Form &
Mail to Next-Level Manager
Recommend Employee for an Award
2 Approve or Reject
Request
3Review Eligibility, Justification, & Award Amount
CompletedForm
This step may involve calling the manager to discuss the justification and/or explaining the policy.
Manager Compensation Analyst
END
Rejection
Manager 2
Approval
5Send Authorization
to Payroll
7Communicate Award
to Employee
ApprovedJustif. &Amount
Final Approval
8Update Employee System of Record (SOR) & Retain
Hardcopy
Compensation Analyst
ManagerFinal
ApprovalEND
AwardCommunicated
SystemUpdated
4OK to
Proceed?
Yes
6Notify Requesting
Manager
No
Denied RequestCompensation Analyst
Interoffice
E+
SOR
PayrollNotification
Compensation Analyst
Figure 4-23 Recognition Bonus Award Process Map
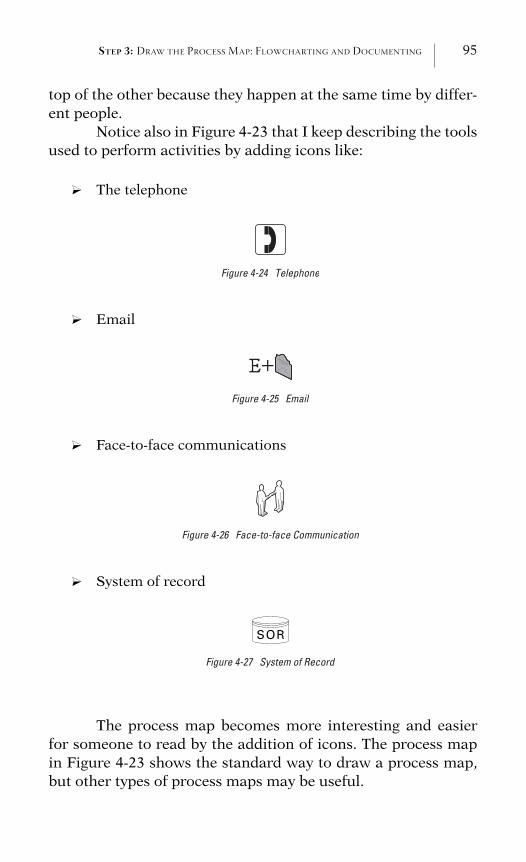
STEP 3: DRAW THE PROCESS MAP: FLOWCHARTING AND DOCUMENTING 95
top of the other because they happen at the same time by differ-ent people.
Notice also in Figure 4-23 that I keep describing the toolsused to perform activities by adding icons like:
? The telephone
Figure 4-24 Telephone
Figure 4-25 Email
? Face-to-face communications
Figure 4-26 Face-to-face Communication
? System of record
SOR
Figure 4-27 System of Record
The process map becomes more interesting and easierfor someone to read by the addition of icons. The process mapin Figure 4-23 shows the standard way to draw a process map,but other types of process maps may be useful.
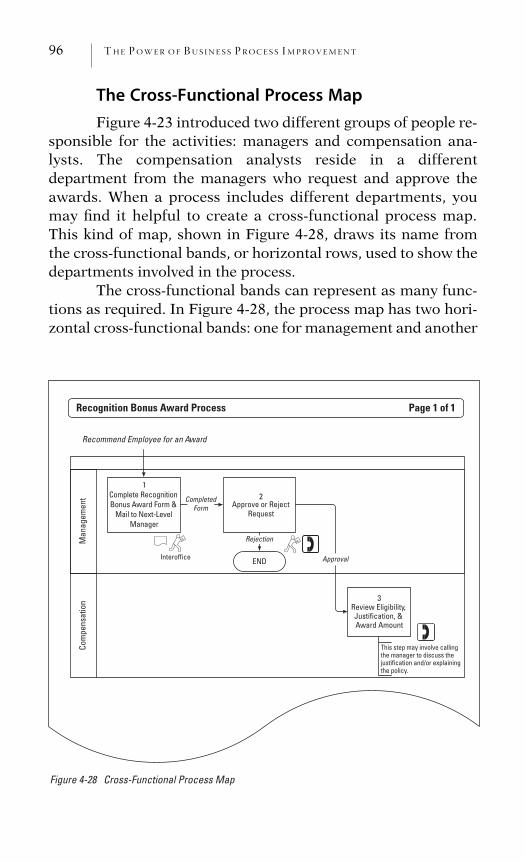
96 THE POWER OF BUS INE S S P ROCES S IMPROVEMENT
The Cross-Functional Process MapFigure 4-23 introduced two different groups of people re-
sponsible for the activities: managers and compensation ana-lysts. The compensation analysts reside in a differentdepartment from the managers who request and approve theawards. When a process includes different departments, youmay find it helpful to create a cross-functional process map.This kind of map, shown in Figure 4-28, draws its name fromthe cross-functional bands, or horizontal rows, used to show thedepartments involved in the process.
The cross-functional bands can represent as many func-tions as required. In Figure 4-28, the process map has two hori-zontal cross-functional bands: one for management and another
Com
pens
atio
nM
anag
emen
t
Recommend Employee for an Award
CompletedForm
Rejection
Approval
2 Approve or Reject
Request
3Review Eligibility, Justification, & Award Amount
ENDInteroffice
Page 1 of 1Recognition Bonus Award Process
1Complete Recognition Bonus Award Form &
Mail to Next-Level Manager
This step may involve callingthe manager to discuss the justification and/or explaining the policy.
Figure 4-28 Cross-Functional Process Map
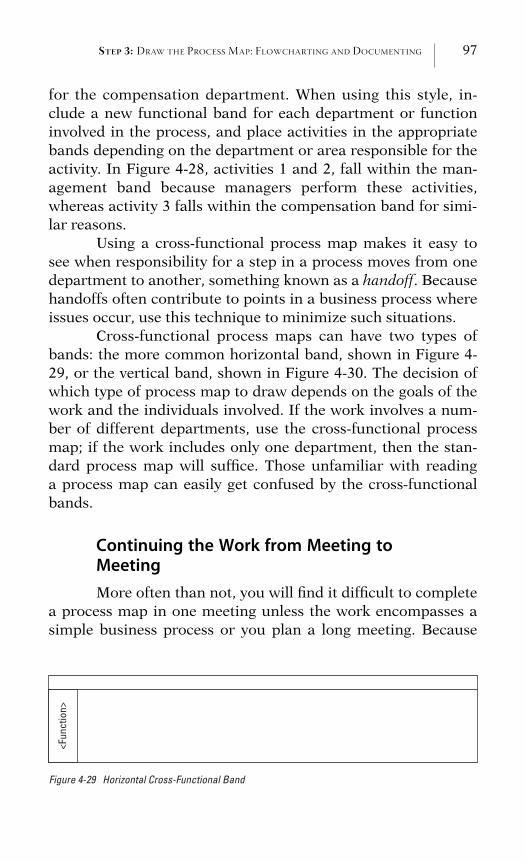
STEP 3: DRAW THE PROCESS MAP: FLOWCHARTING AND DOCUMENTING 97
for the compensation department. When using this style, in-clude a new functional band for each department or functioninvolved in the process, and place activities in the appropriatebands depending on the department or area responsible for theactivity. In Figure 4-28, activities 1 and 2, fall within the man-agement band because managers perform these activities,whereas activity 3 falls within the compensation band for simi-lar reasons.
Using a cross-functional process map makes it easy tosee when responsibility for a step in a process moves from onedepartment to another, something known as a handoff. Becausehandoffs often contribute to points in a business process whereissues occur, use this technique to minimize such situations.
Cross-functional process maps can have two types ofbands: the more common horizontal band, shown in Figure 4-29, or the vertical band, shown in Figure 4-30. The decision ofwhich type of process map to draw depends on the goals of thework and the individuals involved. If the work involves a num-ber of different departments, use the cross-functional processmap; if the work includes only one department, then the stan-dard process map will suffice. Those unfamiliar with readinga process map can easily get confused by the cross-functionalbands.
Continuing the Work from Meeting toMeetingMore often than not, you will find it difficult to complete
a process map in one meeting unless the work encompasses asimple business process or you plan a long meeting. Because
<Fun
ctio
n>
Figure 4-29 Horizontal Cross-Functional Band
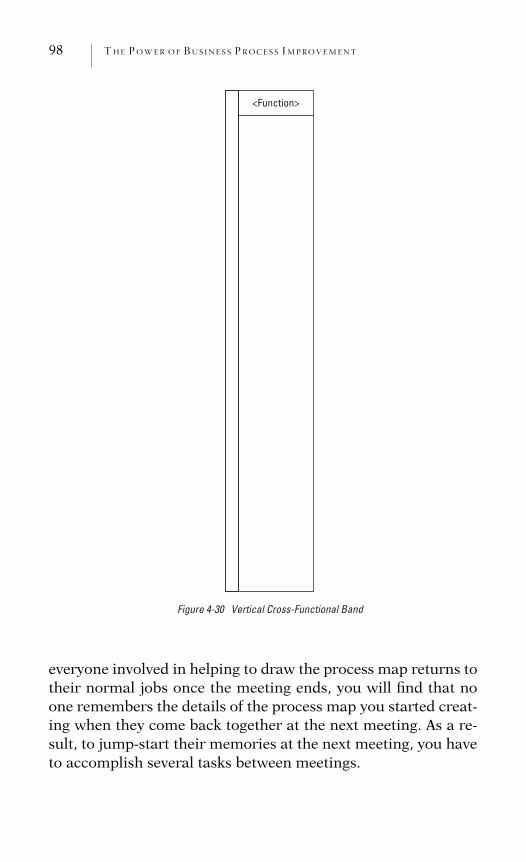
98 THE POWER OF BUS INE S S P ROCES S IMPROVEMENT
<Function>
Figure 4-30 Vertical Cross-Functional Band
everyone involved in helping to draw the process map returns totheir normal jobs once the meeting ends, you will find that noone remembers the details of the process map you started creat-ing when they come back together at the next meeting. As a re-sult, to jump-start their memories at the next meeting, you haveto accomplish several tasks between meetings.
STEP 3: DRAW THE PROCESS MAP: FLOWCHARTING AND DOCUMENTING 99
? First, after each process mapping meeting, convert yourhand drawing into a formal document using a softwareapplication like Microsoft Visio. If the project team does notfinish drawing the process map in one meeting, documentthe work done to date so that the team members start thenext meeting with a precise picture of where they left off. Ithelps to use an electronic dry-erase board so that you end ameeting with a copy of the project team’s work. If not, copythe drawing on paper before leaving the meeting room.Another alternative that works well, if you have the avail-able resources, is to have someone assist you who can drawthe process map during the meeting using a laptop com-puter and the appropriate software application. I use Micro-soft Visio because the software includes the normalflowchart shapes required.
? Second, once you completed drawing the process map fromthe first meeting, enlarge it to a poster size. If an enlargingmachine is not available, locate a copy center, like FedEx/Kinko, who charges a moderate fee for black-and-whiteenlargements.
? Third, bring copies of the process map to the next meetingfor the project team.
At the next meeting, hang the enlarged process map onthe wall and begin the meeting by walking the team membersthrough the partially completed process map to remind them allof what they accomplished at the first meeting. You should walkthem through the process map box by box, highlighting whatoccurs at each step, naming the responsible party, identifyingthe tools used, and explaining annotations. Physically point todifferent sections on the process map, explain the output of eachbox, and describe how the output is used in the next step of theprocess.
Let us step through this process using the recognitionbonus award process map from Figure 4-23.
Figure 4-31 shows sample dialog we might use to startthe second meeting. Continue this type of dialogue until youreach the point where the project team left off at the last meet-
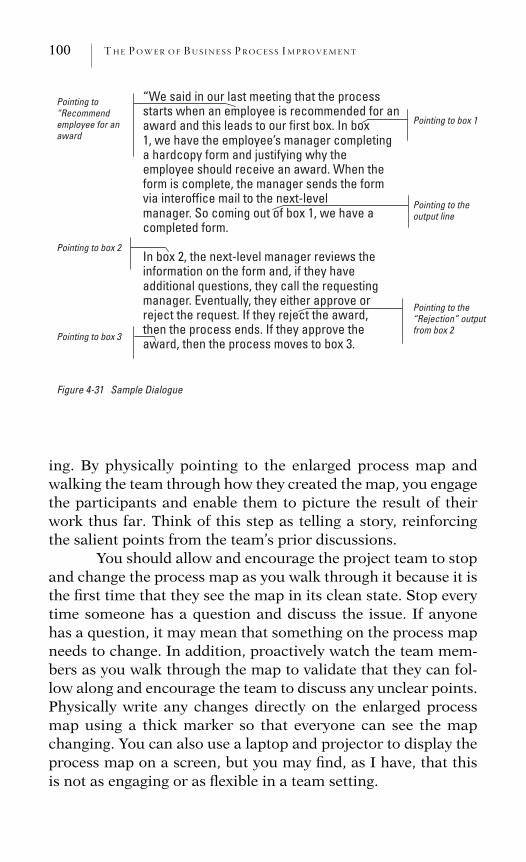
100 THE POWER OF BUS INE S S P ROCES S IMPROVEMENT
Pointing to box 1
Pointing to the “Rejection” output from box 2
Pointing to the output line
Pointing to box 2
Pointing to box 3
“We said in our last meeting that the process starts when an employee is recommended for an award and this leads to our first box. In box 1, we have the employee’s manager completing a hardcopy form and justifying why the employee should receive an award. When the form is complete, the manager sends the form via interoffice mail to the next-level manager. So coming out of box 1, we have a completed form.
In box 2, the next-level manager reviews the information on the form and, if they have additional questions, they call the requesting manager. Eventually, they either approve or reject the request. If they reject the award, then the process ends. If they approve the award, then the process moves to box 3.
Pointing to “Recommendemployee for an award
Figure 4-31 Sample Dialogue
ing. By physically pointing to the enlarged process map andwalking the team through how they created the map, you engagethe participants and enable them to picture the result of theirwork thus far. Think of this step as telling a story, reinforcingthe salient points from the team’s prior discussions.
You should allow and encourage the project team to stopand change the process map as you walk through it because it isthe first time that they see the map in its clean state. Stop everytime someone has a question and discuss the issue. If anyonehas a question, it may mean that something on the process mapneeds to change. In addition, proactively watch the team mem-bers as you walk through the map to validate that they can fol-low along and encourage the team to discuss any unclear points.Physically write any changes directly on the enlarged processmap using a thick marker so that everyone can see the mapchanging. You can also use a laptop and projector to display theprocess map on a screen, but you may find, as I have, that thisis not as engaging or as flexible in a team setting.
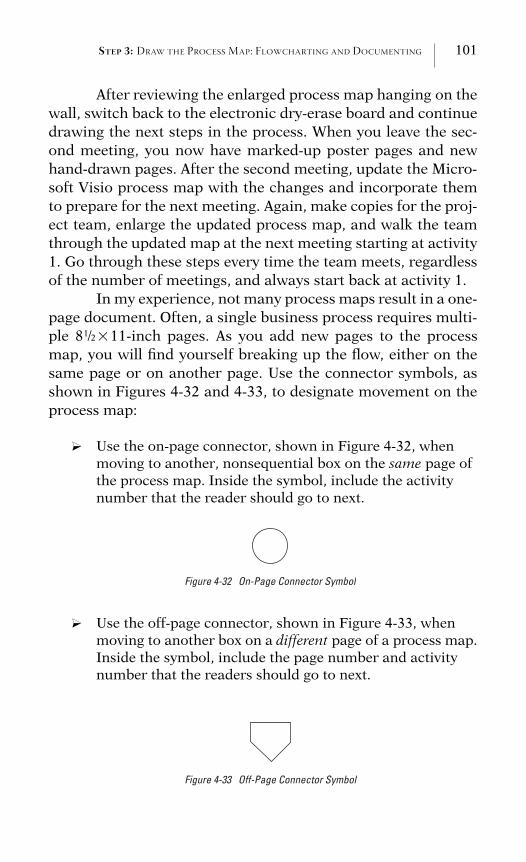
STEP 3: DRAW THE PROCESS MAP: FLOWCHARTING AND DOCUMENTING 101
After reviewing the enlarged process map hanging on thewall, switch back to the electronic dry-erase board and continuedrawing the next steps in the process. When you leave the sec-ond meeting, you now have marked-up poster pages and newhand-drawn pages. After the second meeting, update the Micro-soft Visio process map with the changes and incorporate themto prepare for the next meeting. Again, make copies for the proj-ect team, enlarge the updated process map, and walk the teamthrough the updated map at the next meeting starting at activity1. Go through these steps every time the team meets, regardlessof the number of meetings, and always start back at activity 1.
In my experience, not many process maps result in a one-page document. Often, a single business process requires multi-ple 81/2�11-inch pages. As you add new pages to the processmap, you will find yourself breaking up the flow, either on thesame page or on another page. Use the connector symbols, asshown in Figures 4-32 and 4-33, to designate movement on theprocess map:
? Use the on-page connector, shown in Figure 4-32, whenmoving to another, nonsequential box on the same page ofthe process map. Inside the symbol, include the activitynumber that the reader should go to next.
Figure 4-32 On-Page Connector Symbol
? Use the off-page connector, shown in Figure 4-33, whenmoving to another box on a different page of a process map.Inside the symbol, include the page number and activitynumber that the readers should go to next.
Figure 4-33 Off-Page Connector Symbol
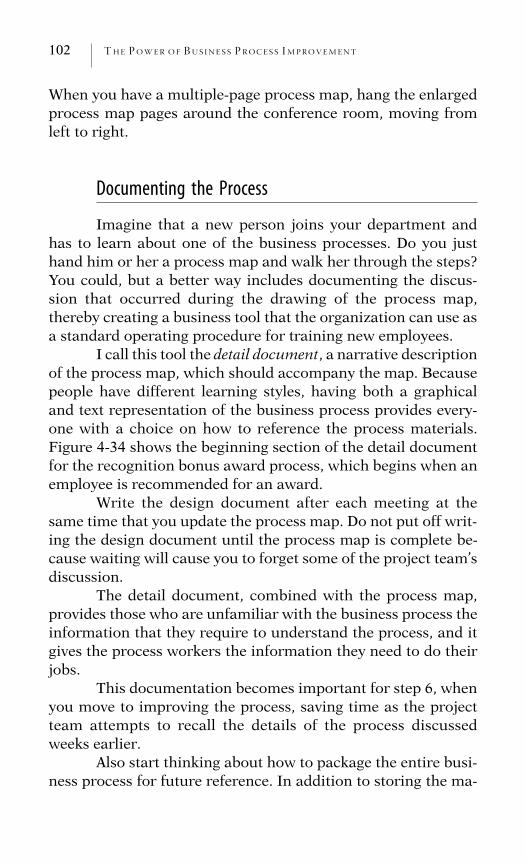
102 THE POWER OF BUS INE S S P ROCES S IMPROVEMENT
When you have a multiple-page process map, hang the enlargedprocess map pages around the conference room, moving fromleft to right.
Documenting the Process
Imagine that a new person joins your department andhas to learn about one of the business processes. Do you justhand him or her a process map and walk her through the steps?You could, but a better way includes documenting the discus-sion that occurred during the drawing of the process map,thereby creating a business tool that the organization can use asa standard operating procedure for training new employees.
I call this tool the detail document, a narrative descriptionof the process map, which should accompany the map. Becausepeople have different learning styles, having both a graphicaland text representation of the business process provides every-one with a choice on how to reference the process materials.Figure 4-34 shows the beginning section of the detail documentfor the recognition bonus award process, which begins when anemployee is recommended for an award.
Write the design document after each meeting at thesame time that you update the process map. Do not put off writ-ing the design document until the process map is complete be-cause waiting will cause you to forget some of the project team’sdiscussion.
The detail document, combined with the process map,provides those who are unfamiliar with the business process theinformation that they require to understand the process, and itgives the process workers the information they need to do theirjobs.
This documentation becomes important for step 6, whenyou move to improving the process, saving time as the projectteam attempts to recall the details of the process discussedweeks earlier.
Also start thinking about how to package the entire busi-ness process for future reference. In addition to storing the ma-
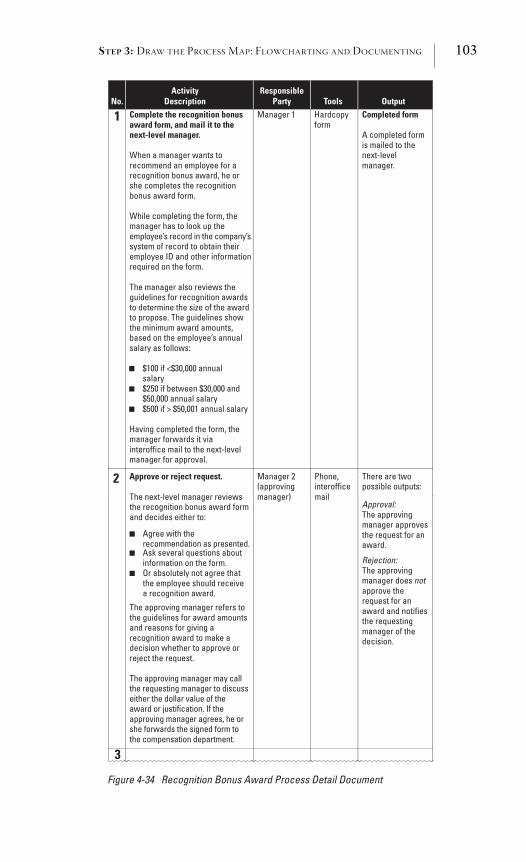
STEP 3: DRAW THE PROCESS MAP: FLOWCHARTING AND DOCUMENTING 103
No.Responsible
PartyActivity
Description Tools Output
1 Complete the recognition bonus award form, and mail it to the next-level manager.
When a manager wants to recommend an employee for a recognition bonus award, he or she completes the recognition bonus award form.
While completing the form, the manager has to look up the employee’s record in the company’s system of record to obtain theiremployee ID and other informationrequired on the form.
The manager also reviews the guidelines for recognition awards to determine the size of the award to propose. The guidelines show the minimum award amounts, based on the employee’s annual salary as follows:
$100 if <$30,000 annual salary$250 if between $30,000 and $50,000 annual salary $500 if > $50,001 annual salary
■
■
■
Having completed the form, the manager forwards it via interoffice mail to the next-level manager for approval.
Manager 1 Hardcopy form
Completed form
A completed form is mailed to the next-levelmanager.
2 Approve or reject request. Manager 2 (approving
Phone,interoffice
There are two possible outputs:
The next-level manager reviews the recognition bonus award form and decides either to:
Agree with the recommendation as presented. Ask several questions about information on the form. Or absolutely not agree that
■
■
■
the employee should receive a recognition award.
The approving manager refers to the guidelines for award amounts and reasons for giving a recognition award to make a decision whether to approve or reject the request.
The approving manager may call the requesting manager to discuss either the dollar value of the award or justification. If the approving manager agrees, he or she forwards the signed form to the compensation department.
manager) mail Approval:The approving manager approves the request for an award.
Rejection:The approving manager does notapprove the request for an award and notifies the requesting manager of the decision.
3
Figure 4-34 Recognition Bonus Award Process Detail Document
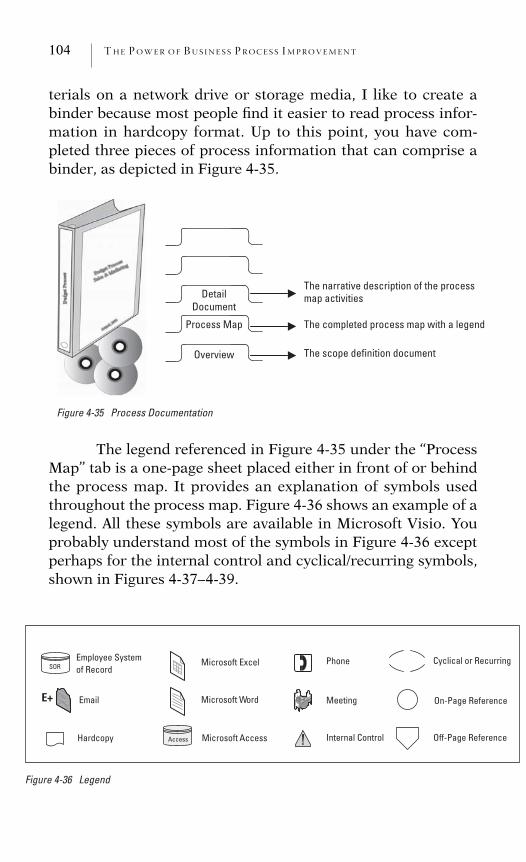
104 THE POWER OF BUS INE S S P ROCES S IMPROVEMENT
terials on a network drive or storage media, I like to create abinder because most people find it easier to read process infor-mation in hardcopy format. Up to this point, you have com-pleted three pieces of process information that can comprise abinder, as depicted in Figure 4-35.
The scope definition document
The completed process map with a legend
The narrative description of the process map activities
Process Map
Overview
DetailDocument
Figure 4-35 Process Documentation
The legend referenced in Figure 4-35 under the ‘‘ProcessMap’’ tab is a one-page sheet placed either in front of or behindthe process map. It provides an explanation of symbols usedthroughout the process map. Figure 4-36 shows an example of alegend. All these symbols are available in Microsoft Visio. Youprobably understand most of the symbols in Figure 4-36 exceptperhaps for the internal control and cyclical/recurring symbols,shown in Figures 4-37–4-39.
Microsoft AccessHardcopy
On-Page Reference
Off-Page Reference
Microsoft Word
Microsoft Excel
Access
EmailE+ Meeting
Cyclical or RecurringEmployee Systemof RecordSOR
Phone
Internal Control
Figure 4-36 Legend
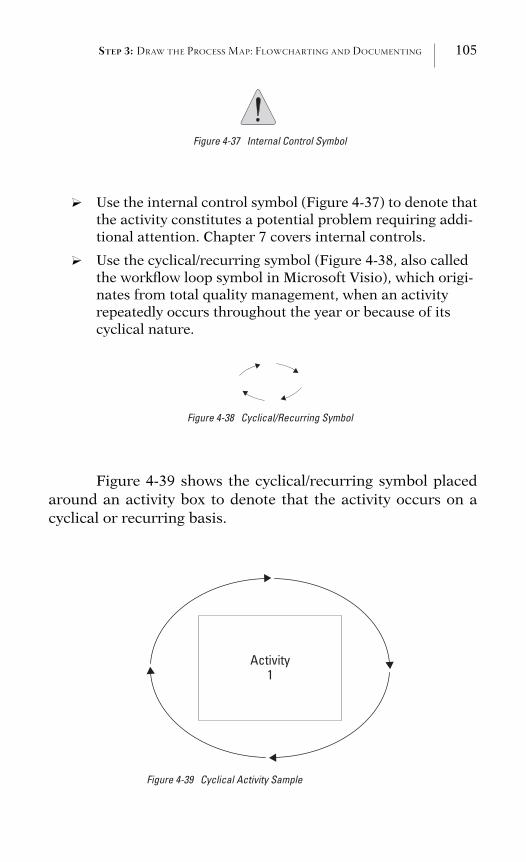
STEP 3: DRAW THE PROCESS MAP: FLOWCHARTING AND DOCUMENTING 105
Figure 4-37 Internal Control Symbol
? Use the internal control symbol (Figure 4-37) to denote thatthe activity constitutes a potential problem requiring addi-tional attention. Chapter 7 covers internal controls.
? Use the cyclical/recurring symbol (Figure 4-38, also calledthe workflow loop symbol in Microsoft Visio), which origi-nates from total quality management, when an activityrepeatedly occurs throughout the year or because of itscyclical nature.
Figure 4-38 Cyclical/Recurring Symbol
Figure 4-39 shows the cyclical/recurring symbol placedaround an activity box to denote that the activity occurs on acyclical or recurring basis.
Activity1
Figure 4-39 Cyclical Activity Sample
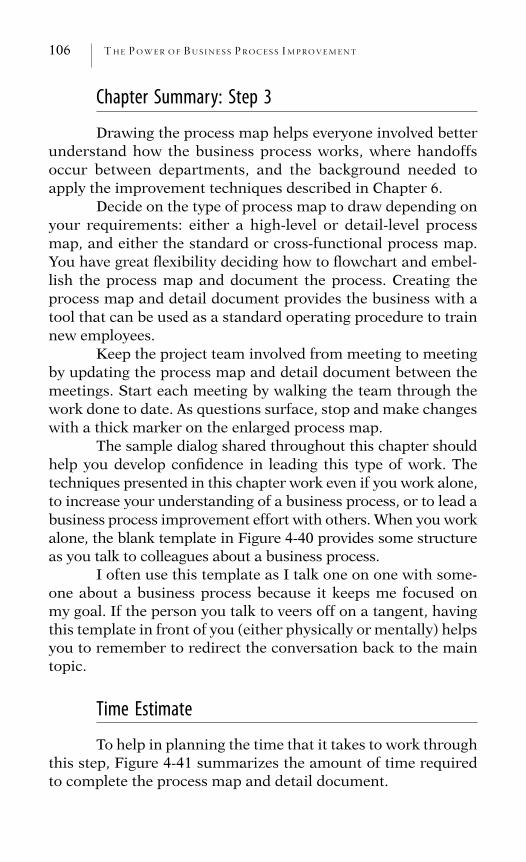
106 THE POWER OF BUS INE S S P ROCES S IMPROVEMENT
Chapter Summary: Step 3
Drawing the process map helps everyone involved betterunderstand how the business process works, where handoffsoccur between departments, and the background needed toapply the improvement techniques described in Chapter 6.
Decide on the type of process map to draw depending onyour requirements: either a high-level or detail-level processmap, and either the standard or cross-functional process map.You have great flexibility deciding how to flowchart and embel-lish the process map and document the process. Creating theprocess map and detail document provides the business with atool that can be used as a standard operating procedure to trainnew employees.
Keep the project team involved from meeting to meetingby updating the process map and detail document between themeetings. Start each meeting by walking the team through thework done to date. As questions surface, stop and make changeswith a thick marker on the enlarged process map.
The sample dialog shared throughout this chapter shouldhelp you develop confidence in leading this type of work. Thetechniques presented in this chapter work even if you work alone,to increase your understanding of a business process, or to lead abusiness process improvement effort with others. When you workalone, the blank template in Figure 4-40 provides some structureas you talk to colleagues about a business process.
I often use this template as I talk one on one with some-one about a business process because it keeps me focused onmy goal. If the person you talk to veers off on a tangent, havingthis template in front of you (either physically or mentally) helpsyou to remember to redirect the conversation back to the maintopic.
Time Estimate
To help in planning the time that it takes to work throughthis step, Figure 4-41 summarizes the amount of time requiredto complete the process map and detail document.
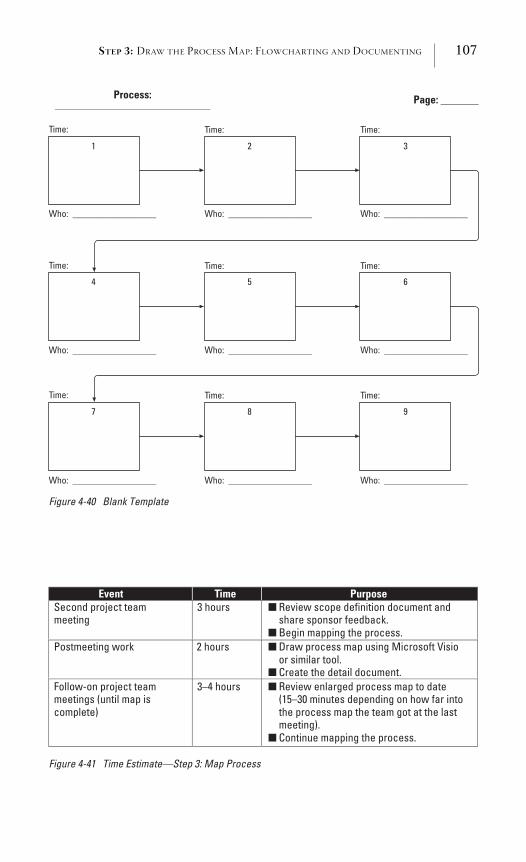
STEP 3: DRAW THE PROCESS MAP: FLOWCHARTING AND DOCUMENTING 107
Process:____________________________________
Who: __________________Who: __________________Who: __________________
1 2 3
4 5 6
7 8 9
Time:Time:Time:
Time:Time:Time:
Time:Time:Time:
Who: __________________Who: __________________Who: __________________
Who: __________________Who: __________________Who: __________________
Page: _______
Figure 4-40 Blank Template
Event Time PurposeSecond project team meeting
3 hours Review scope definition document and share sponsor feedback. Begin mapping the process.
Postmeeting work 2 hours Draw process map using Microsoft Visio or similar tool. Create the detail document.
Follow-on project team meetings (until map is complete)
3–4 hours Review enlarged process map to date(15–30 minutes depending on how far intothe process map the team got at the last meeting).Continue mapping the process.
■
■
■
■
■
■
Figure 4-41 Time Estimate—Step 3: Map Process
108 THE POWER OF BUS INE S S P ROCES S IMPROVEMENT
Second Project Team MeetingThis is the second time that the project team meets and
the first time that you review the final scope definition docu-ment. Spend the first 20 minutes reviewing the scope definitiondocument to help all members recall what they said the last timethey met and to share the sponsor’s feedback on the document.Because the project team will not have seen the scope definitiondocument typed up before, it will appear more formal and themembers may want to make adjustments. Once everyone agreeswith the final version of the scope definition, move to buildingthe process map, following the techniques outlined in thischapter.
Postmeeting WorkDuring this personal time, draw the process map using
drawing software, such as Microsoft Visio, and document thediscussion about each activity in the detail document. Write thedetail document as you progress through the work instead ofputting it off until the end because you may well forget portionsof the rich discussion.
Follow-on Project Team MeetingsThe first part of each future meeting should begin with a
walkthrough of the enlarged version of the process map, movingactivity by activity through the entire map. The greater the num-ber of meetings you have, the longer this exercise takes. Al-though it may seem repetitive, this exercise is critical because itkeeps the project team engaged, and it enables you to pick upwhere the team left off the last time they met. Remember that,even though you have worked on the process map and know itby heart, everyone else went back to their normal jobs and prob-ably have not even thought about the business process.
As you walk through the process map, remain flexibleand ready to make changes. Your flexibility ensures the ongoingimprovement of the process map and keeps the team involved.
STEP 3: DRAW THE PROCESS MAP: FLOWCHARTING AND DOCUMENTING 109
Remember to draw the changes directly on the enlarged copy ofthe process map using a marker so that everyone can see them.
Once you finish walking through the enlarged processmap, switch to the electronic, dry-erase board and use it to con-tinue drawing the process map from the point where the teamleft off the last time you met. You will find yourself referring tothe wall hangings throughout the process mapping session asthe project team discusses new topics, so leave the enlarged cop-ies hanging up throughout the meeting.
You may find yourself in a predicament where the spon-sor wants to do the work fast and suggests all-day work sessions.Unless you have a pressing reason, I recommend that the meet-ings on process work do not last longer than three or four hours.It gets harder to sustain the level of involvement required whenmeetings extend beyond this timeframe because of the mentalstrain of the work. In general, I find two hours too short andlonger than four hours too tiring for everyone involved.
What You Have Achieved
In this chapter, you have achieved the following:
? Agreement by the project team on the scope definition
? An understanding of when to draw a high-level or detail-level process map
? The importance of inputs and outputs
? A grasp of how to create a standard and cross-functionalprocess map
? Knowledge of many of the standard flowcharting shapes
? Insight into how to lead a team through the work and keepthem interested
? Most important, the power to uncover the opportunities forimprovements
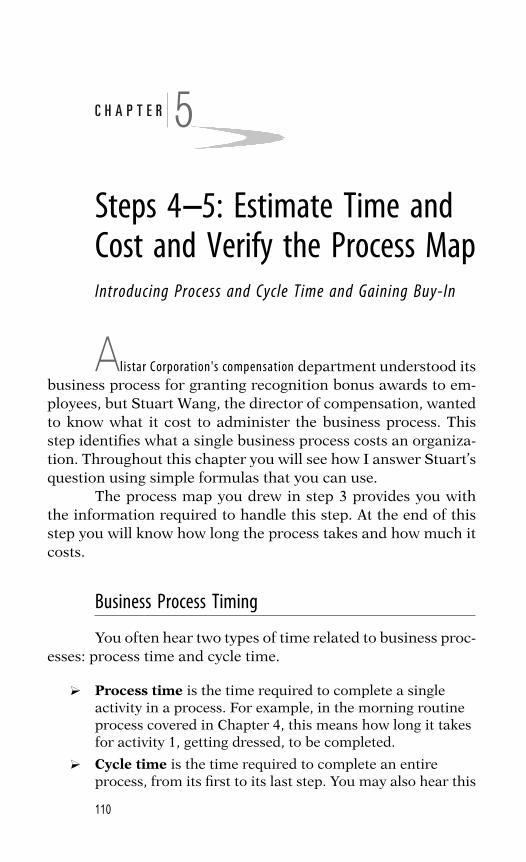
C H A P T E R 5
Steps 4–5: Estimate Time andCost and Verify the Process Map
Introducing Process and Cycle Time and Gaining Buy-In
Alistar Corporation's compensation department understood itsbusiness process for granting recognition bonus awards to em-ployees, but Stuart Wang, the director of compensation, wantedto know what it cost to administer the business process. Thisstep identifies what a single business process costs an organiza-tion. Throughout this chapter you will see how I answer Stuart’squestion using simple formulas that you can use.
The process map you drew in step 3 provides you withthe information required to handle this step. At the end of thisstep you will know how long the process takes and how much itcosts.
Business Process Timing
You often hear two types of time related to business proc-esses: process time and cycle time.
? Process time is the time required to complete a singleactivity in a process. For example, in the morning routineprocess covered in Chapter 4, this means how long it takesfor activity 1, getting dressed, to be completed.
? Cycle time is the time required to complete an entireprocess, from its first to its last step. You may also hear this
110
STEPS 4–5: ESTIMATE TIME AND COST AND VERIFY THE PROCESS MAP 111
referred to as elapsed time. In the morning routine example,it is the measure of time from when the parent began get-ting dressed in activity 1 until everyone arrived at work orschool. You cannot calculate the cycle time by just addingup the process times for each activity because cycle timeincludes waiting time, which adds considerably more timeto the total.
So let us start our discussion by focusing on processtime.
Process TimeTo establish an improvement target, you first need to de-
fine how long the process takes today. You do this by goingthrough the process map and identifying how long each activitytakes. This is your baseline time. Without a baseline, you cannotestablish an improvement target.
Project team members may feel uncomfortable startingoff with this step because they do not like estimating and preferusing a more formal technique to measure process time. Youcan use one of the formal quality control methods, like a timestudy, where you observe and measure the time it takes an em-ployee to complete each activity in a process. Although this tech-nique and others provide a definitive analysis of time, you willfind that most formal techniques are extremely structured andtime-consuming and that they often require a skilled person toeffectively apply them. Sometimes you require this level of de-tail, but it is often not necessary with the more administrativeprocesses. You can also look at historical data or test a samplein lieu of a full-blown analysis.
An effective alternative to the formal methods is simplyto ask the project team how long each activity takes. Generally,estimating works well for the administrative type of processesused as examples throughout this book. This timing providesuseful directional information, and you can always supplementit with a formal technique if you find the need for more statisti-cal data at a later date. I experimented with both approaches for
112 THE POWER OF BUS INE S S P ROCES S IMPROVEMENT
a business process I worked on to see whether any significantdifference in the numbers would surface. First, I estimated theprocess timing with the project team and then conducted a timestudy of my own. I found the results so close that it suggestedthe time study was not worth the extra time required. Whenworking with a manufacturing process, however, you may findthat you have to use one of the more formal quality controltools.
Most people have a fairly good idea of how long it takesto complete the tasks that comprise a business activity. Althoughsome may have trouble initially with this exercise, it gets easierwith time, and participants will become more comfortable withestimating. To identify the process time estimates, proceed boxby box on the completed process map, adding the informationto the process map above each activity box in the upper left-hand corner.
To demonstrate how to complete this step, let us use Stu-art Wang’s recognition bonus award process map from Chapter4, Figure 4-23. To get started, I said:
In activity 1, we said that the manager completes the recognition bonus
award form and mails it to the next-level manager. How long do you think
it typically takes a manager to complete the form?
Of course, the project team felt uncomfortable giving anestimate because they said the managers perform this step, notthem. So I rephrased the question:
How long do you think it would take you to complete the form?
If I still had trouble getting a time estimate, I would haveasked one of the team members to fill out the form. Your maingoal at this point is to keep the work progressing.
If the project team members want to confirm the timeestimates after the meeting, let them do that. I generally findvery little change between the estimates a team gives me and thelater confirmation. If the team simply cannot give you an esti-mate because the first step in the process does not involve them,
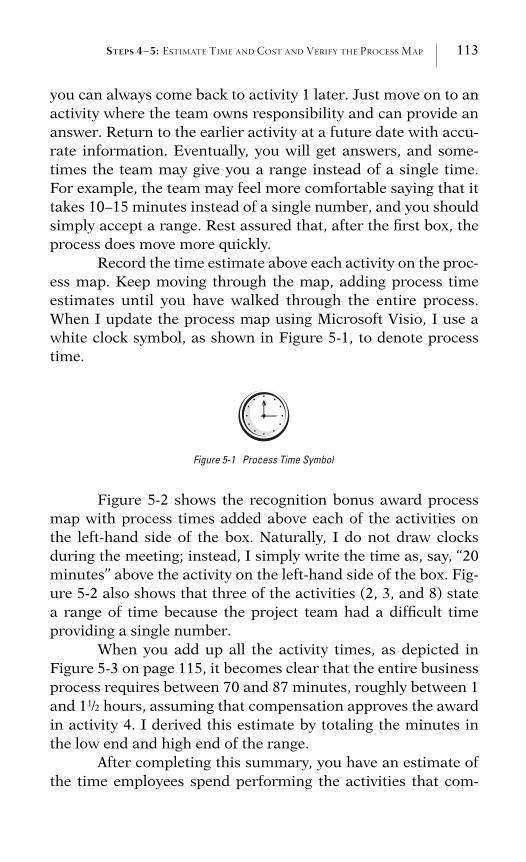
STEPS 4–5: ESTIMATE TIME AND COST AND VERIFY THE PROCESS MAP 113
you can always come back to activity 1 later. Just move on to anactivity where the team owns responsibility and can provide ananswer. Return to the earlier activity at a future date with accu-rate information. Eventually, you will get answers, and some-times the team may give you a range instead of a single time.For example, the team may feel more comfortable saying that ittakes 10–15 minutes instead of a single number, and you shouldsimply accept a range. Rest assured that, after the first box, theprocess does move more quickly.
Record the time estimate above each activity on the proc-ess map. Keep moving through the map, adding process timeestimates until you have walked through the entire process.When I update the process map using Microsoft Visio, I use awhite clock symbol, as shown in Figure 5-1, to denote processtime.
Figure 5-1 Process Time Symbol
Figure 5-2 shows the recognition bonus award processmap with process times added above each of the activities onthe left-hand side of the box. Naturally, I do not draw clocksduring the meeting; instead, I simply write the time as, say, ‘‘20minutes’’ above the activity on the left-hand side of the box. Fig-ure 5-2 also shows that three of the activities (2, 3, and 8) statea range of time because the project team had a difficult timeproviding a single number.
When you add up all the activity times, as depicted inFigure 5-3 on page 115, it becomes clear that the entire businessprocess requires between 70 and 87 minutes, roughly between 1and 11/2 hours, assuming that compensation approves the awardin activity 4. I derived this estimate by totaling the minutes inthe low end and high end of the range.
After completing this summary, you have an estimate ofthe time employees spend performing the activities that com-
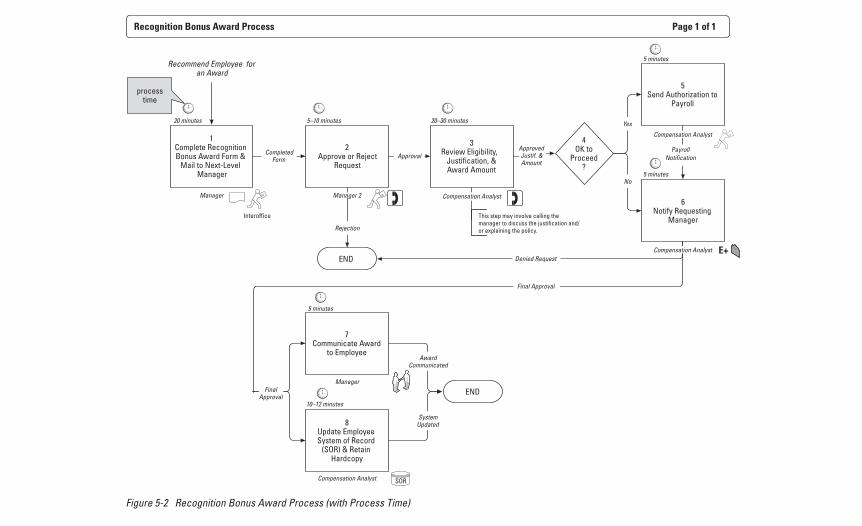
Recognition Bonus Award Process Page 1 of 1
1Complete Recognition Bonus Award Form &
Mail to Next-Level Manager
Recommend Employee for an Award
2 Approve or Reject
Request
3Review Eligibility,
Justification, & Award Amount
CompletedForm
This step may involve calling the manager to discuss the justification and/or explaining the policy.
Manager Compensation Analyst
END
Rejection
Manager 2
Approval
5Send Authorization to
Payroll
7Communicate Award
to Employee
ApprovedJustif. &Amount
Final Approval
8Update Employee System of Record
(SOR) & Retain Hardcopy
Compensation Analyst
ManagerFinal
ApprovalEND
AwardCommunicated
SystemUpdated
20 minutes
5 minutes
5 minutes
20–30 minutes5–10 minutes
10–12 minutes
4OK to
Proceed?
Yes
6Notify Requesting
Manager
5 minutesNo
Denied RequestCompensation Analyst
Interoffice
E+
SOR
PayrollNotification
Compensation Analyst
processtime
Figure 5-2 Recognition Bonus Award Process (with Process Time)
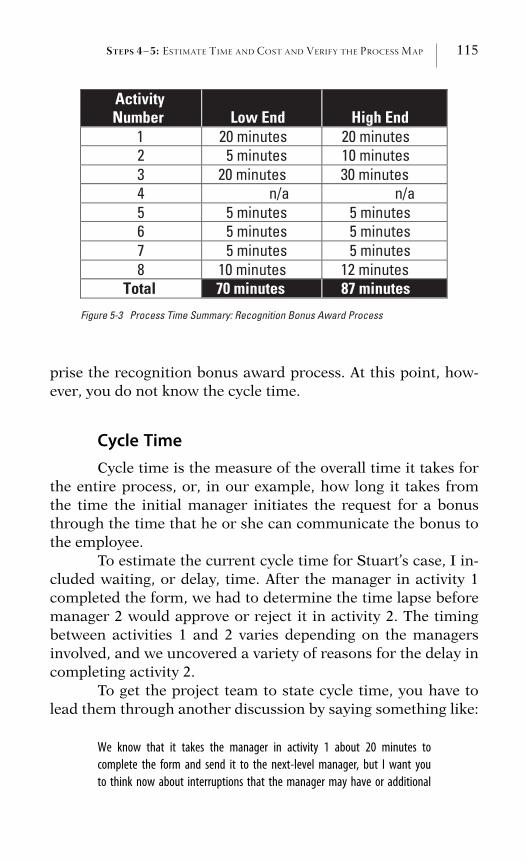
STEPS 4–5: ESTIMATE TIME AND COST AND VERIFY THE PROCESS MAP 115
ActivityNumber Low End High End
1 20 minutes 20 minutes 2 5 minutes 10 minutes 3 20 minutes 30 minutes 4 n/a n/a 5 5 minutes 5 minutes 6 5 minutes 5 minutes 7 5 minutes 5 minutes 8 10 minutes 12 minutes
Total 70 minutes 87 minutes
Figure 5-3 Process Time Summary: Recognition Bonus Award Process
prise the recognition bonus award process. At this point, how-ever, you do not know the cycle time.
Cycle TimeCycle time is the measure of the overall time it takes for
the entire process, or, in our example, how long it takes fromthe time the initial manager initiates the request for a bonusthrough the time that he or she can communicate the bonus tothe employee.
To estimate the current cycle time for Stuart’s case, I in-cluded waiting, or delay, time. After the manager in activity 1completed the form, we had to determine the time lapse beforemanager 2 would approve or reject it in activity 2. The timingbetween activities 1 and 2 varies depending on the managersinvolved, and we uncovered a variety of reasons for the delay incompleting activity 2.
To get the project team to state cycle time, you have tolead them through another discussion by saying something like:
We know that it takes the manager in activity 1 about 20 minutes to
complete the form and send it to the next-level manager, but I want you
to think now about interruptions that the manager may have or additional
116 THE POWER OF BUS INE S S P ROCES S IMPROVEMENT
tasks, unrelated to completing the form, that the manager may have to
handle before finishing the form. The phone may ring, a colleague may
walk into the office, or their boss may request something unexpectedly.
With all these interruptions, how long do you estimate it takes to finish
the form and send it on its way?
In Stuart’s case, we estimated a one-hour cycle time foractivity 1, so I recorded the cycle time estimate on the processmap above activity 1 on the right-hand side of the box. I used adark clock symbol, as shown in Figure 5-4, to denote cycle timewhen I updated the process map.
Figure 5-4 Cycle Time Symbol
Figure 5-5 shows the recognition bonus award processmap with a cycle time added above each of the activities on themap. The figure shows that the team suggested a modest onehour for activity 1, but look at activity 2, where the process mapsuggests that approving or rejecting the award may take fivedays. Include notes around the cycle time in the detail documentso that you have that information available when you move tothe improvement step.
Figure 5-6 on page 118 shows the overall cycle time esti-mate for this business process at 11 days (or 92 hours), assum-ing that compensation approved the award in activity 4. Since Iwanted to work with days when discussing cycle time, I trans-lated the project team’s hours into number of days in Figure 5-6by dividing the hours by eight, the normal number of workinghours in one day.
Figure 5-7 on page 118 shows the formula used to trans-late hours to days for activity 1.
When you compare the process and cycle times for thisbusiness process, you can see a significant variance between thenumbers. Although the physical work involved in this businessprocess requires only 1 to 11/2 hours, the time it takes to com-
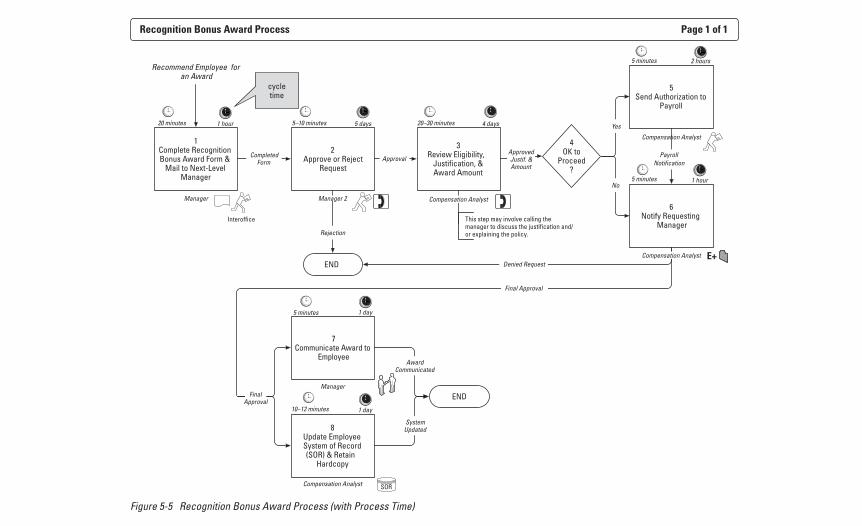
Figure 5-5 Recognition Bonus Award Process (with Process Time)
Recognition Bonus Award Process Page 1 of 1
1Complete Recognition Bonus Award Form &
Mail to Next-Level Manager
Recommend Employee for an Award
2 Approve or Reject
Request
3Review Eligibility,
Justification, & Award Amount
CompletedForm
This step may involve calling the manager to discuss the justification and/or explaining the policy.
Manager Compensation Analyst
END
Rejection
Manager 2
Approval
5Send Authorization to
Payroll
7Communicate Award to
Employee
ApprovedJustif. &Amount
Final Approval
8Update Employee System of Record (SOR) & Retain
Hardcopy
Compensation Analyst
ManagerFinal
ApprovalEND
AwardCommunicated
SystemUpdated
20 minutes
5 minutes
5 minutes
20–30 minutes5–10 minutes
10–12 minutes
4OK to
Proceed?
Yes
6Notify Requesting
Manager
5 minutesNo
Denied RequestCompensation Analyst
1 day
1 day
2 hours
4 days5 days1 hour
1 hour
Interoffice
E+
SOR
PayrollNotification
Compensation Analyst
cycletime
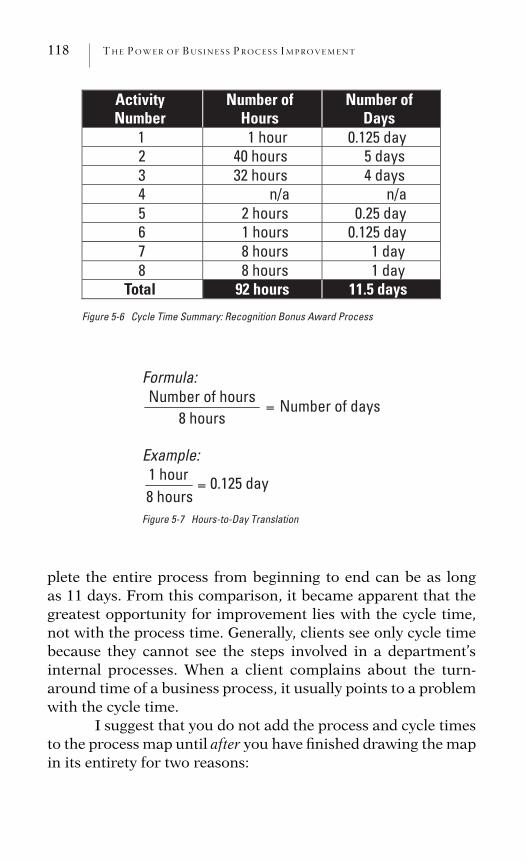
118 THE POWER OF BUS INE S S P ROCES S IMPROVEMENT
ActivityNumber
Number ofHours
Number ofDays
1 1 hour 0.125 day2 40 hours 5 days 3 32 hours 4 days 4 n/a n/a 5 2 hours 0.25 day 6 1 hours 0.125 day 7 8 hours 1 day 8 8 hours 1 day
Total 92 hours 11.5 days
Figure 5-6 Cycle Time Summary: Recognition Bonus Award Process
Formula:Number of hours
1 hour
Number of days
0.125 day
8 hours
8 hours
Example:
Figure 5-7 Hours-to-Day Translation
plete the entire process from beginning to end can be as longas 11 days. From this comparison, it became apparent that thegreatest opportunity for improvement lies with the cycle time,not with the process time. Generally, clients see only cycle timebecause they cannot see the steps involved in a department’sinternal processes. When a client complains about the turn-around time of a business process, it usually points to a problemwith the cycle time.
I suggest that you do not add the process and cycle timesto the process map until after you have finished drawing the mapin its entirety for two reasons:
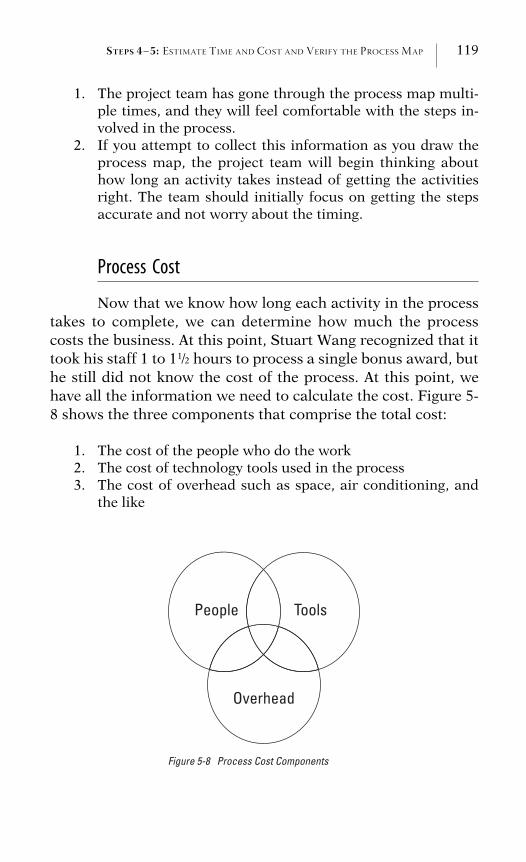
STEPS 4–5: ESTIMATE TIME AND COST AND VERIFY THE PROCESS MAP 119
1. The project team has gone through the process map multi-ple times, and they will feel comfortable with the steps in-volved in the process.
2. If you attempt to collect this information as you draw theprocess map, the project team will begin thinking abouthow long an activity takes instead of getting the activitiesright. The team should initially focus on getting the stepsaccurate and not worry about the timing.
Process Cost
Now that we know how long each activity in the processtakes to complete, we can determine how much the processcosts the business. At this point, Stuart Wang recognized that ittook his staff 1 to 11/2 hours to process a single bonus award, buthe still did not know the cost of the process. At this point, wehave all the information we need to calculate the cost. Figure 5-8 shows the three components that comprise the total cost:
1. The cost of the people who do the work2. The cost of technology tools used in the process3. The cost of overhead such as space, air conditioning, and
the like
People Tools
Overhead
Figure 5-8 Process Cost Components
120 THE POWER OF BUS INE S S P ROCES S IMPROVEMENT
People CostsThe first component consists of employee costs. Any im-
provement in process time generates an employee-related costsavings because the employees spend less time on the process.You can define cost savings as either hard cost savings or softcost savings:
? Hard cost savings equate to a reduction in head count, orthe number of employees that support the business process,thus lowering the labor cost. This quantitative measuremeans that, for example, you reduce your employees froma number like 20 to perhaps 18 in a department. The reduc-tion may result from a layoff or attrition, but the overallnumber of employees supporting the business processdeclines and thereby lowers costs.
? Soft cost savings signify a reduction in the number ofemployees who support the business process, but in thiscase the affected employees do not leave their currentdepartment. Instead of laying them off or moving theemployees to different jobs, these employees shift theirworkload to more value-added work. The cost leaves theprocess, but not the department.
In working with administrative business processes, Ihave found that sponsors often look for improved efficiency intheir business processes so that they can take on additionalwork with the same number of employees. Particularly duringeconomic downturns, it is hard to gain approval for additionalhead count, yet the work never seems to stop; so you need youremployees to accomplish more work in the same amount oftime.
Determining the People Costs
Estimating the labor cost of a business process takes foursteps:
1. List process activities and times in a spreadsheet.2. Identify the annual volume.
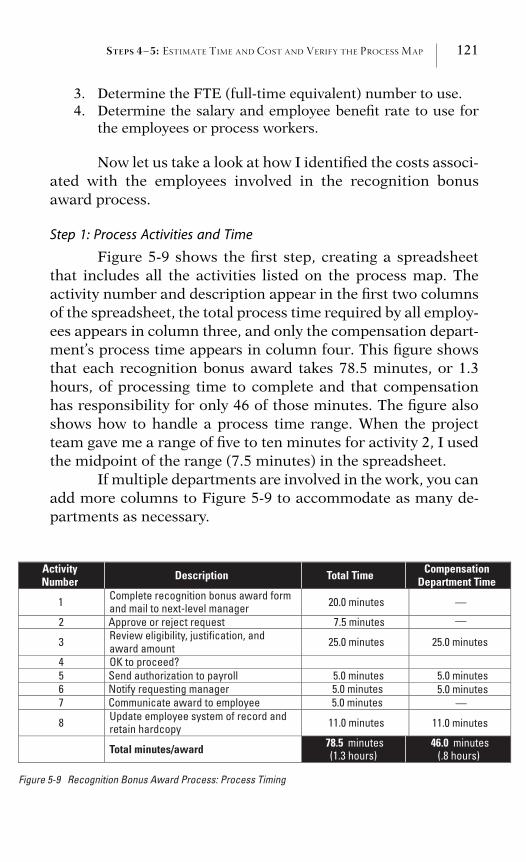
STEPS 4–5: ESTIMATE TIME AND COST AND VERIFY THE PROCESS MAP 121
3. Determine the FTE (full-time equivalent) number to use.4. Determine the salary and employee benefit rate to use for
the employees or process workers.
Now let us take a look at how I identified the costs associ-ated with the employees involved in the recognition bonusaward process.
Step 1: Process Activities and Time
Figure 5-9 shows the first step, creating a spreadsheetthat includes all the activities listed on the process map. Theactivity number and description appear in the first two columnsof the spreadsheet, the total process time required by all employ-ees appears in column three, and only the compensation depart-ment’s process time appears in column four. This figure showsthat each recognition bonus award takes 78.5 minutes, or 1.3hours, of processing time to complete and that compensationhas responsibility for only 46 of those minutes. The figure alsoshows how to handle a process time range. When the projectteam gave me a range of five to ten minutes for activity 2, I usedthe midpoint of the range (7.5 minutes) in the spreadsheet.
If multiple departments are involved in the work, you canadd more columns to Figure 5-9 to accommodate as many de-partments as necessary.
ActivityNumber Description Total Time Compensation
Department Time
1 Complete recognition bonus award form and mail to next-level manager 20.0 minutes —
—
25.0 minutes
5.0 minutes5.0 minutes
—
11.0 minutes
2 Approve or reject request 7.5 minutes
3 Review eligibility, justification, and award amount 25.0 minutes
OK to proceed?45 Send authorization to payroll 5.0 minutes6 Notify requesting manager 5.0 minutes7 Communicate award to employee 5.0 minutes
8 Update employee system of record and retain hardcopy 11.0 minutes
Total minutes/award 78.5 minutes(1.3 hours)
Figure 5-9 Recognition Bonus Award Process: Process Timing
46.0 minutes(.8 hours)
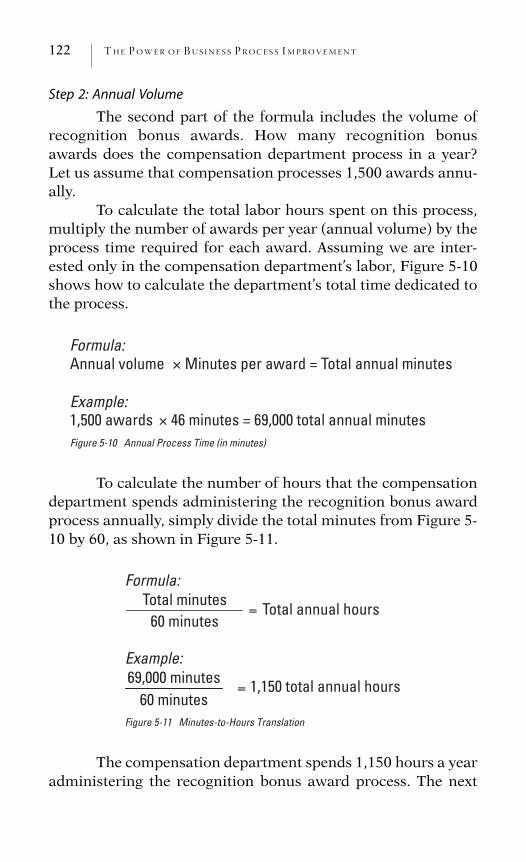
122 THE POWER OF BUS INE S S P ROCES S IMPROVEMENT
Step 2: Annual Volume
The second part of the formula includes the volume ofrecognition bonus awards. How many recognition bonusawards does the compensation department process in a year?Let us assume that compensation processes 1,500 awards annu-ally.
To calculate the total labor hours spent on this process,multiply the number of awards per year (annual volume) by theprocess time required for each award. Assuming we are inter-ested only in the compensation department’s labor, Figure 5-10shows how to calculate the department’s total time dedicated tothe process.
Formula:Annual volume Minutes per award = Total annual minutes
Example:1,500 awards 46 minutes = 69,000 total annual minutes Figure 5-10 Annual Process Time (in minutes)
To calculate the number of hours that the compensationdepartment spends administering the recognition bonus awardprocess annually, simply divide the total minutes from Figure 5-10 by 60, as shown in Figure 5-11.
Formula:Total minutes
69,000 minutes
Total annual hours
1,150 total annual hours
60 minutes
60 minutes
Example:
Figure 5-11 Minutes-to-Hours Translation
The compensation department spends 1,150 hours a yearadministering the recognition bonus award process. The next
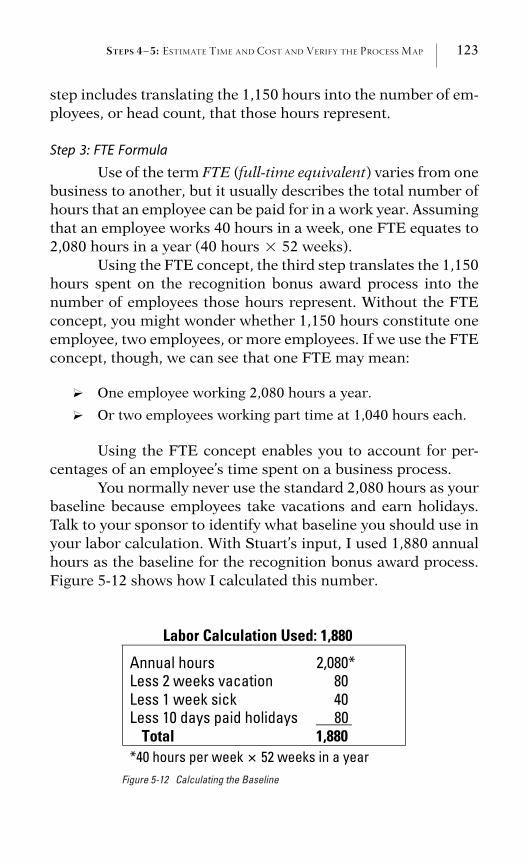
STEPS 4–5: ESTIMATE TIME AND COST AND VERIFY THE PROCESS MAP 123
step includes translating the 1,150 hours into the number of em-ployees, or head count, that those hours represent.
Step 3: FTE Formula
Use of the term FTE (full-time equivalent) varies from onebusiness to another, but it usually describes the total number ofhours that an employee can be paid for in a work year. Assumingthat an employee works 40 hours in a week, one FTE equates to2,080 hours in a year (40 hours � 52 weeks).
Using the FTE concept, the third step translates the 1,150hours spent on the recognition bonus award process into thenumber of employees those hours represent. Without the FTEconcept, you might wonder whether 1,150 hours constitute oneemployee, two employees, or more employees. If we use the FTEconcept, though, we can see that one FTE may mean:
? One employee working 2,080 hours a year.
? Or two employees working part time at 1,040 hours each.
Using the FTE concept enables you to account for per-centages of an employee’s time spent on a business process.
You normally never use the standard 2,080 hours as yourbaseline because employees take vacations and earn holidays.Talk to your sponsor to identify what baseline you should use inyour labor calculation. With Stuart’s input, I used 1,880 annualhours as the baseline for the recognition bonus award process.Figure 5-12 shows how I calculated this number.
Labor Calculation Used: 1,880
Annual hours 2,080* Less 2 weeks vacation 80Less 1 week sick 40Less 10 days paid holidays 80
Total 1,880*40 hours per week 52 weeks in a year
Figure 5-12 Calculating the Baseline
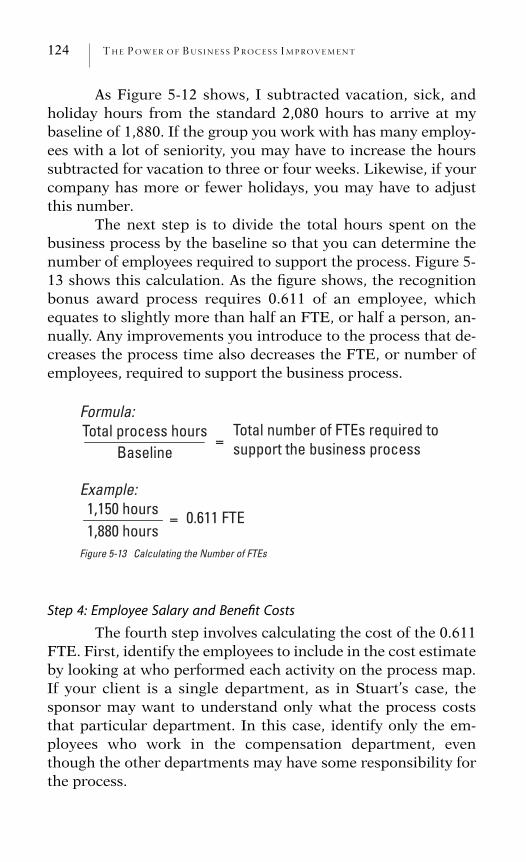
124 THE POWER OF BUS INE S S P ROCES S IMPROVEMENT
As Figure 5-12 shows, I subtracted vacation, sick, andholiday hours from the standard 2,080 hours to arrive at mybaseline of 1,880. If the group you work with has many employ-ees with a lot of seniority, you may have to increase the hourssubtracted for vacation to three or four weeks. Likewise, if yourcompany has more or fewer holidays, you may have to adjustthis number.
The next step is to divide the total hours spent on thebusiness process by the baseline so that you can determine thenumber of employees required to support the process. Figure 5-13 shows this calculation. As the figure shows, the recognitionbonus award process requires 0.611 of an employee, whichequates to slightly more than half an FTE, or half a person, an-nually. Any improvements you introduce to the process that de-creases the process time also decreases the FTE, or number ofemployees, required to support the business process.
Formula:Total process hours
1,150 hours
Total number of FTEs required to support the business process
0.611 FTE
Baseline
1,880 hours
Example:
Figure 5-13 Calculating the Number of FTEs
Step 4: Employee Salary and Benefit Costs
The fourth step involves calculating the cost of the 0.611FTE. First, identify the employees to include in the cost estimateby looking at who performed each activity on the process map.If your client is a single department, as in Stuart’s case, thesponsor may want to understand only what the process coststhat particular department. In this case, identify only the em-ployees who work in the compensation department, eventhough the other departments may have some responsibility forthe process.
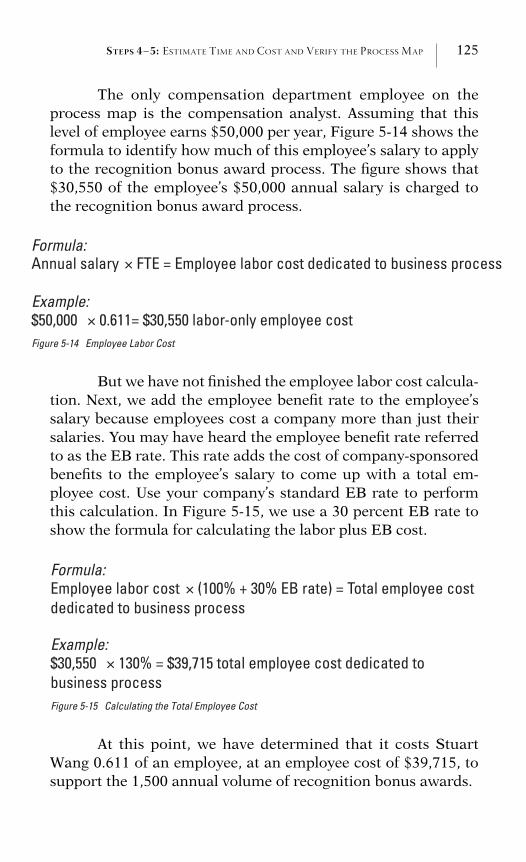
STEPS 4–5: ESTIMATE TIME AND COST AND VERIFY THE PROCESS MAP 125
The only compensation department employee on theprocess map is the compensation analyst. Assuming that thislevel of employee earns $50,000 per year, Figure 5-14 shows theformula to identify how much of this employee’s salary to applyto the recognition bonus award process. The figure shows that$30,550 of the employee’s $50,000 annual salary is charged tothe recognition bonus award process.
Formula:Annual salary FTE = Employee labor cost dedicated to business process
Example:$50,000 0.611= $30,550 labor-only employee cost Figure 5-14 Employee Labor Cost
But we have not finished the employee labor cost calcula-tion. Next, we add the employee benefit rate to the employee’ssalary because employees cost a company more than just theirsalaries. You may have heard the employee benefit rate referredto as the EB rate. This rate adds the cost of company-sponsoredbenefits to the employee’s salary to come up with a total em-ployee cost. Use your company’s standard EB rate to performthis calculation. In Figure 5-15, we use a 30 percent EB rate toshow the formula for calculating the labor plus EB cost.
Formula:Employee labor cost (100% + 30% EB rate) = Total employee cost dedicated to business process
Example:$30,550 130% = $39,715 total employee cost dedicated to business process Figure 5-15 Calculating the Total Employee Cost
At this point, we have determined that it costs StuartWang 0.611 of an employee, at an employee cost of $39,715, tosupport the 1,500 annual volume of recognition bonus awards.
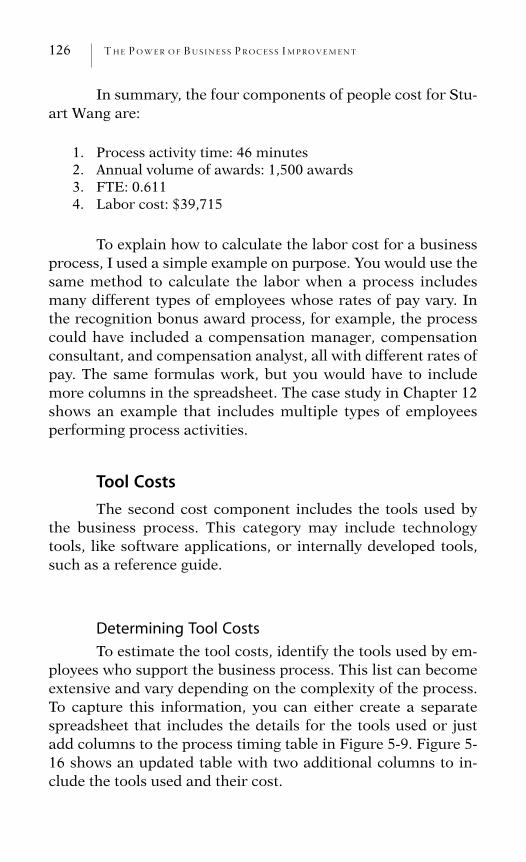
126 THE POWER OF BUS INE S S P ROCES S IMPROVEMENT
In summary, the four components of people cost for Stu-art Wang are:
1. Process activity time: 46 minutes2. Annual volume of awards: 1,500 awards3. FTE: 0.6114. Labor cost: $39,715
To explain how to calculate the labor cost for a businessprocess, I used a simple example on purpose. You would use thesame method to calculate the labor when a process includesmany different types of employees whose rates of pay vary. Inthe recognition bonus award process, for example, the processcould have included a compensation manager, compensationconsultant, and compensation analyst, all with different rates ofpay. The same formulas work, but you would have to includemore columns in the spreadsheet. The case study in Chapter 12shows an example that includes multiple types of employeesperforming process activities.
Tool CostsThe second cost component includes the tools used by
the business process. This category may include technologytools, like software applications, or internally developed tools,such as a reference guide.
Determining Tool Costs
To estimate the tool costs, identify the tools used by em-ployees who support the business process. This list can becomeextensive and vary depending on the complexity of the process.To capture this information, you can either create a separatespreadsheet that includes the details for the tools used or justadd columns to the process timing table in Figure 5-9. Figure 5-16 shows an updated table with two additional columns to in-clude the tools used and their cost.
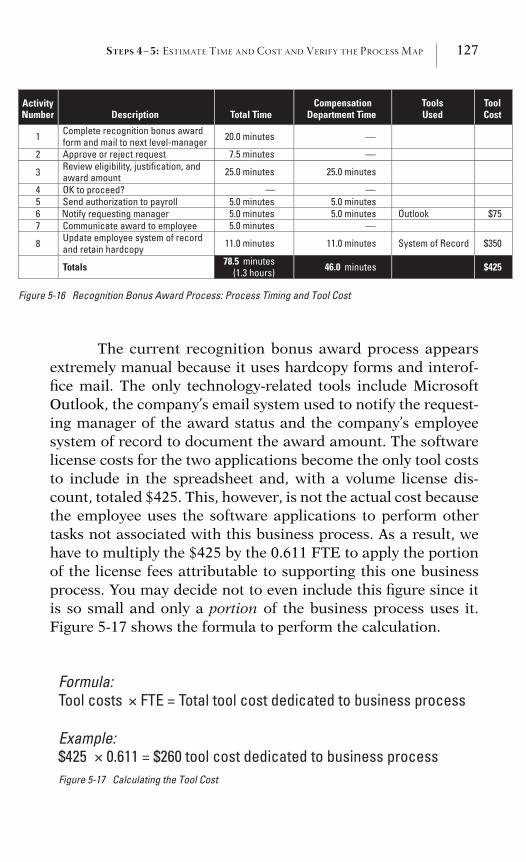
STEPS 4–5: ESTIMATE TIME AND COST AND VERIFY THE PROCESS MAP 127
ActivityNumber Description Total Time Department Time
Tools CompensationUsed
Tool Cost
1 Complete recognition bonus award form and mail to next level-manager —20.0 minutes
7.5 minutes
25.0 minutes
5.0 minutes5.0 minutes5.0 minutes
11.0 minutes
25.0 minutes
5.0 minutes5.0 minutes Outlook
11.0 minutes System of Record
$75
$350
—
——
Approve or reject request2
3 Review eligibility, justification, and award amount OK to proceed?4Send authorization to payroll5
6 Notify requesting manager—Communicate award to employee7
8 Update employee system of record and retain hardcopy
Totals 78.5 minutes(1.3 hours) 46.0 minutes $425
Figure 5-16 Recognition Bonus Award Process: Process Timing and Tool Cost
The current recognition bonus award process appearsextremely manual because it uses hardcopy forms and interof-fice mail. The only technology-related tools include MicrosoftOutlook, the company’s email system used to notify the request-ing manager of the award status and the company’s employeesystem of record to document the award amount. The softwarelicense costs for the two applications become the only tool coststo include in the spreadsheet and, with a volume license dis-count, totaled $425. This, however, is not the actual cost becausethe employee uses the software applications to perform othertasks not associated with this business process. As a result, wehave to multiply the $425 by the 0.611 FTE to apply the portionof the license fees attributable to supporting this one businessprocess. You may decide not to even include this figure since itis so small and only a portion of the business process uses it.Figure 5-17 shows the formula to perform the calculation.
Formula:Tool costs FTE = Total tool cost dedicated to business process
Example:$425 0.611 = $260 tool cost dedicated to business process Figure 5-17 Calculating the Tool Cost
128 THE POWER OF BUS INE S S P ROCES S IMPROVEMENT
Once you improve a business process, you will probablyuse additional technology, and this component of cost often in-creases. So far, though, we have identified the following costsfor the recognition bonus award program:
1. Labor (salary � EB): $39,7152. Tools: 260
Total: $39,975
Overhead CostsThe third component of cost includes overhead, which
refers to the ongoing expenses associated with running a busi-ness. It includes things like the physical office space an em-ployee occupies, utilities, supplies, taxes, insurance, andcomputer equipment.
Calculating overhead varies by company. You may findthat your company considers all administrative business proc-esses as overhead costs because they do not deliver a productsold to external customers.
Determining Overhead Costs
Companies generally use a standard overhead rate, souse that number for your calculation. For example, a 150 per-cent overhead rate means that for each $1.00 of direct labor, anadditional $1.50 is added for overhead costs. To calculate over-head rates, divide overhead costs by direct (e.g., labor) costs.You should not have to calculate the rate if you use your com-pany’s standard overhead percentage.
Figure 5-18 applies Stuart Wang’s standard overheadrate of 110 percent to the process-related employee cost.
Putting It All TogetherThe administration of the recognition bonus award proc-
ess costs Stuart Wang $123,542 a year, calculated by adding thethree cost components together:
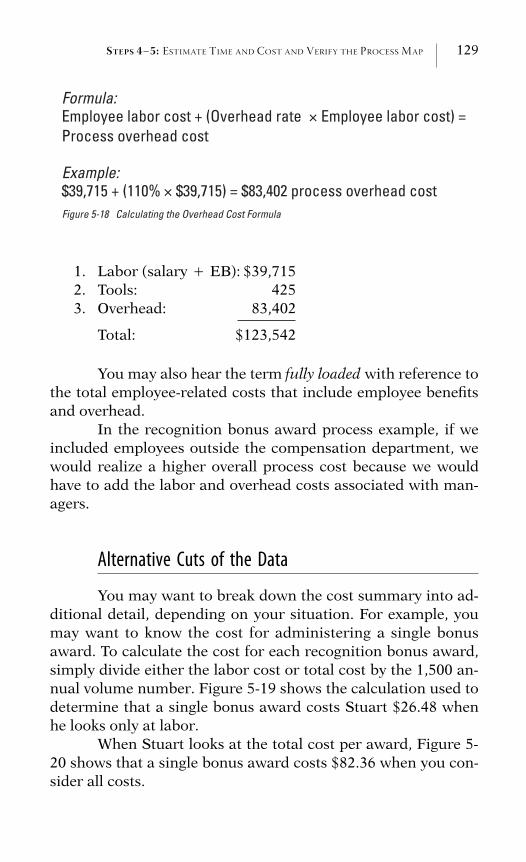
STEPS 4–5: ESTIMATE TIME AND COST AND VERIFY THE PROCESS MAP 129
Formula:Employee labor cost + (Overhead rate Employee labor cost) =Process overhead cost
Example:$39,715 + (110% $39,715) = $83,402 process overhead cost Figure 5-18 Calculating the Overhead Cost Formula
1. Labor (salary � EB): $39,7152. Tools: 4253. Overhead: 83,402
Total: $123,542
You may also hear the term fully loaded with reference tothe total employee-related costs that include employee benefitsand overhead.
In the recognition bonus award process example, if weincluded employees outside the compensation department, wewould realize a higher overall process cost because we wouldhave to add the labor and overhead costs associated with man-agers.
Alternative Cuts of the Data
You may want to break down the cost summary into ad-ditional detail, depending on your situation. For example, youmay want to know the cost for administering a single bonusaward. To calculate the cost for each recognition bonus award,simply divide either the labor cost or total cost by the 1,500 an-nual volume number. Figure 5-19 shows the calculation used todetermine that a single bonus award costs Stuart $26.48 whenhe looks only at labor.
When Stuart looks at the total cost per award, Figure 5-20 shows that a single bonus award costs $82.36 when you con-sider all costs.
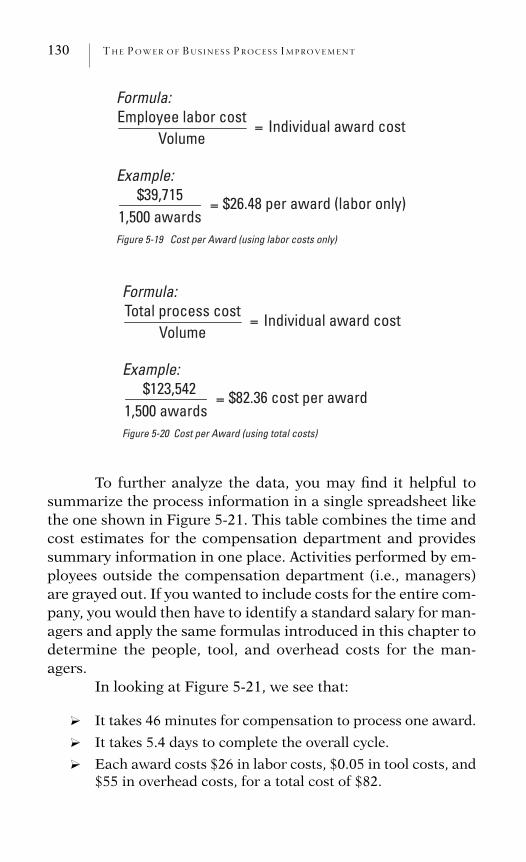
130 THE POWER OF BUS INE S S P ROCES S IMPROVEMENT
Formula:Employee labor cost
$39,715
Individual award cost
$26.48 per award (labor only)
Volume
1,500 awards
Example:
Figure 5-19 Cost per Award (using labor costs only)
Formula:Total process cost
$123,542
Individual award cost
$82.36 cost per award
Volume
1,500 awards
Example:
Figure 5-20 Cost per Award (using total costs)
To further analyze the data, you may find it helpful tosummarize the process information in a single spreadsheet likethe one shown in Figure 5-21. This table combines the time andcost estimates for the compensation department and providessummary information in one place. Activities performed by em-ployees outside the compensation department (i.e., managers)are grayed out. If you wanted to include costs for the entire com-pany, you would then have to identify a standard salary for man-agers and apply the same formulas introduced in this chapter todetermine the people, tool, and overhead costs for the man-agers.
In looking at Figure 5-21, we see that:
? It takes 46 minutes for compensation to process one award.
? It takes 5.4 days to complete the overall cycle.
? Each award costs $26 in labor costs, $0.05 in tool costs, and$55 in overhead costs, for a total cost of $82.
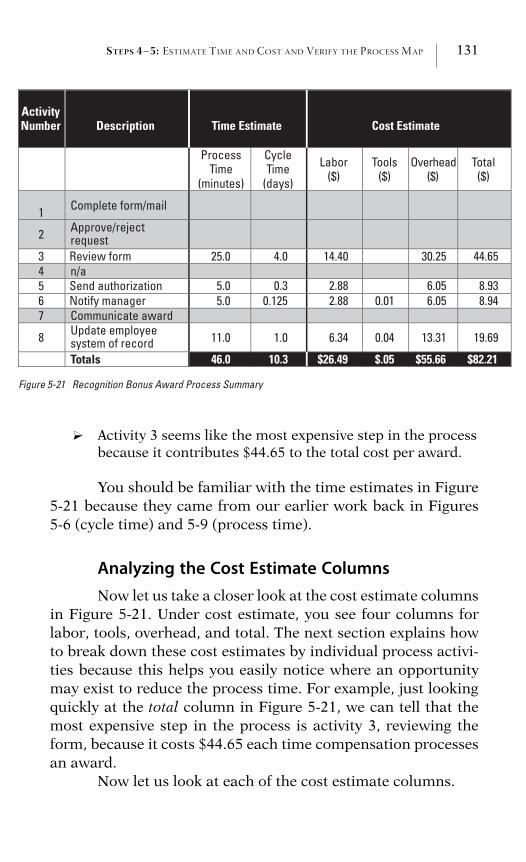
STEPS 4–5: ESTIMATE TIME AND COST AND VERIFY THE PROCESS MAP 131
ActivityNumber Description Time Estimate Cost Estimate
ProcessTime
(minutes)
CycleTime
(days)
Labor($)
Tools ($)
Overhead ($)
Total ($)
1 Complete form/mail
2 Approve/rejectrequest
3 Review form 25.0
5.05.0
11.0
4.0
0.30.125
1.0
14.40
2.882.88
6.34
0.01
0.04
30.25
6.056.05
13.31
44.65
8.938.94
19.69
4 n/a5 Send authorization6 Notify manager7 Communicate award
8 Update employee system of record Totals 46.0 10.3 $26.49 $.05 $55.66 $82.21
Figure 5-21 Recognition Bonus Award Process Summary
? Activity 3 seems like the most expensive step in the processbecause it contributes $44.65 to the total cost per award.
You should be familiar with the time estimates in Figure5-21 because they came from our earlier work back in Figures5-6 (cycle time) and 5-9 (process time).
Analyzing the Cost Estimate ColumnsNow let us take a closer look at the cost estimate columns
in Figure 5-21. Under cost estimate, you see four columns forlabor, tools, overhead, and total. The next section explains howto break down these cost estimates by individual process activi-ties because this helps you easily notice where an opportunitymay exist to reduce the process time. For example, just lookingquickly at the total column in Figure 5-21, we can tell that themost expensive step in the process is activity 3, reviewing theform, because it costs $44.65 each time compensation processesan award.
Now let us look at each of the cost estimate columns.
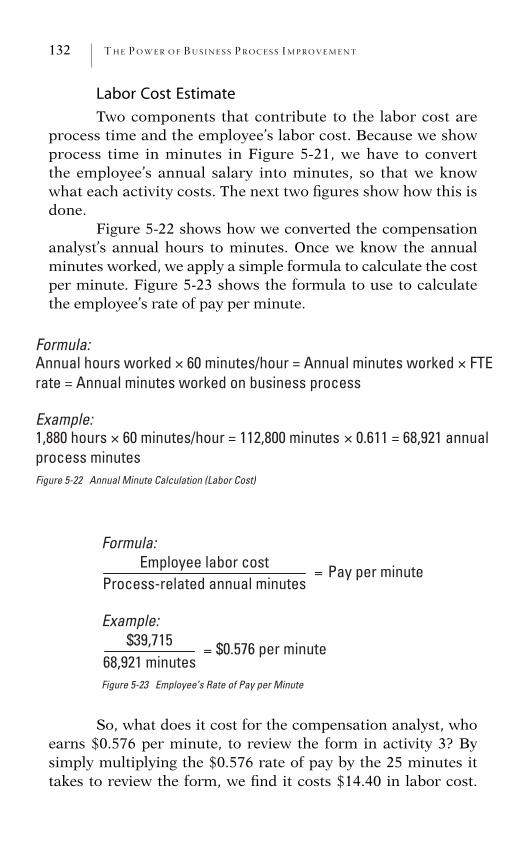
132 THE POWER OF BUS INE S S P ROCES S IMPROVEMENT
Labor Cost Estimate
Two components that contribute to the labor cost areprocess time and the employee’s labor cost. Because we showprocess time in minutes in Figure 5-21, we have to convertthe employee’s annual salary into minutes, so that we knowwhat each activity costs. The next two figures show how this isdone.
Figure 5-22 shows how we converted the compensationanalyst’s annual hours to minutes. Once we know the annualminutes worked, we apply a simple formula to calculate the costper minute. Figure 5-23 shows the formula to use to calculatethe employee’s rate of pay per minute.
Formula:Annual hours worked 60 minutes/hour = Annual minutes worked FTErate = Annual minutes worked on business process
Example:1,880 hours 60 minutes/hour = 112,800 minutes 0.611 = 68,921 annual process minutes Figure 5-22 Annual Minute Calculation (Labor Cost)
Formula:Employee labor cost
$39,715
Pay per minute
$0.576 per minute
Process-related annual minutes
68,921 minutes
Example:
Figure 5-23 Employee’s Rate of Pay per Minute
So, what does it cost for the compensation analyst, whoearns $0.576 per minute, to review the form in activity 3? Bysimply multiplying the $0.576 rate of pay by the 25 minutes ittakes to review the form, we find it costs $14.40 in labor cost.
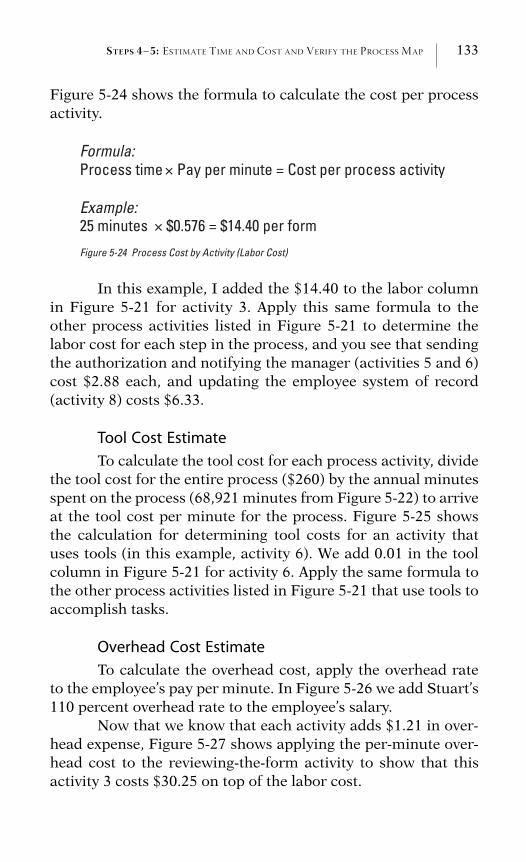
STEPS 4–5: ESTIMATE TIME AND COST AND VERIFY THE PROCESS MAP 133
Figure 5-24 shows the formula to calculate the cost per processactivity.
Formula:Process time Pay per minute = Cost per process activity
Example:25 minutes $0.576 = $14.40 per form
Figure 5-24 Process Cost by Activity (Labor Cost)
In this example, I added the $14.40 to the labor columnin Figure 5-21 for activity 3. Apply this same formula to theother process activities listed in Figure 5-21 to determine thelabor cost for each step in the process, and you see that sendingthe authorization and notifying the manager (activities 5 and 6)cost $2.88 each, and updating the employee system of record(activity 8) costs $6.33.
Tool Cost Estimate
To calculate the tool cost for each process activity, dividethe tool cost for the entire process ($260) by the annual minutesspent on the process (68,921 minutes from Figure 5-22) to arriveat the tool cost per minute for the process. Figure 5-25 showsthe calculation for determining tool costs for an activity thatuses tools (in this example, activity 6). We add 0.01 in the toolcolumn in Figure 5-21 for activity 6. Apply the same formula tothe other process activities listed in Figure 5-21 that use tools toaccomplish tasks.
Overhead Cost Estimate
To calculate the overhead cost, apply the overhead rateto the employee’s pay per minute. In Figure 5-26 we add Stuart’s110 percent overhead rate to the employee’s salary.
Now that we know that each activity adds $1.21 in over-head expense, Figure 5-27 shows applying the per-minute over-head cost to the reviewing-the-form activity to show that thisactivity 3 costs $30.25 on top of the labor cost.
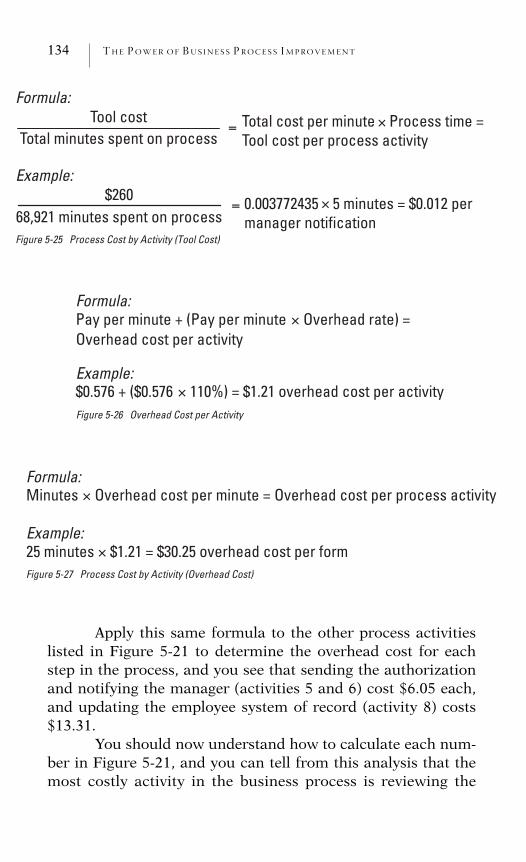
134 THE POWER OF BUS INE S S P ROCES S IMPROVEMENT
Formula:Tool cost
$260 0.003772435 5 minutes = $0.012 permanager notification
Total minutes spent on process
68,921 minutes spent on process
Example:
Figure 5-25 Process Cost by Activity (Tool Cost)
Total cost per minute Process time = Tool cost per process activity
Formula:Pay per minute + (Pay per minute Overhead cost per activity
Overhead rate) =
Example:$0.576 + ($0.576 110%) = $1.21 overhead cost per activity Figure 5-26 Overhead Cost per Activity
Formula:Minutes Overhead cost per minute = Overhead cost per process activity
Example:25 minutes $1.21 = $30.25 overhead cost per form Figure 5-27 Process Cost by Activity (Overhead Cost)
Apply this same formula to the other process activitieslisted in Figure 5-21 to determine the overhead cost for eachstep in the process, and you see that sending the authorizationand notifying the manager (activities 5 and 6) cost $6.05 each,and updating the employee system of record (activity 8) costs$13.31.
You should now understand how to calculate each num-ber in Figure 5-21, and you can tell from this analysis that themost costly activity in the business process is reviewing the
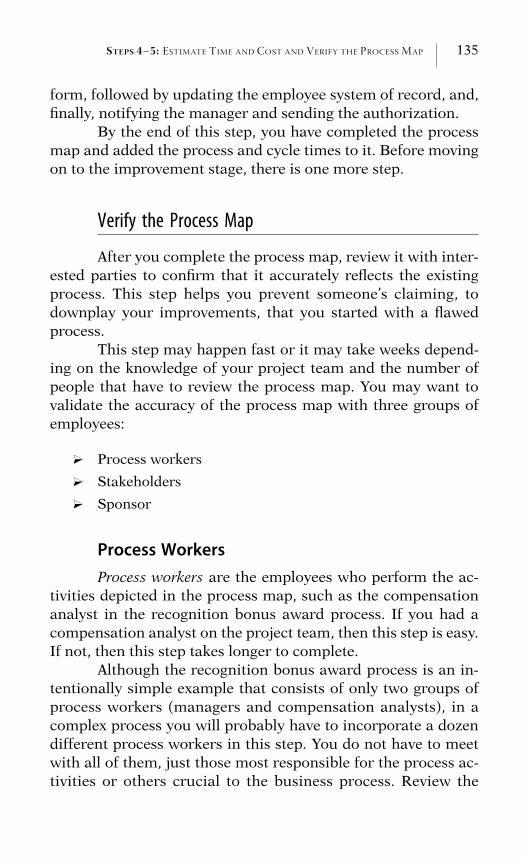
STEPS 4–5: ESTIMATE TIME AND COST AND VERIFY THE PROCESS MAP 135
form, followed by updating the employee system of record, and,finally, notifying the manager and sending the authorization.
By the end of this step, you have completed the processmap and added the process and cycle times to it. Before movingon to the improvement stage, there is one more step.
Verify the Process Map
After you complete the process map, review it with inter-ested parties to confirm that it accurately reflects the existingprocess. This step helps you prevent someone’s claiming, todownplay your improvements, that you started with a flawedprocess.
This step may happen fast or it may take weeks depend-ing on the knowledge of your project team and the number ofpeople that have to review the process map. You may want tovalidate the accuracy of the process map with three groups ofemployees:
? Process workers
? Stakeholders
? Sponsor
Process WorkersProcess workers are the employees who perform the ac-
tivities depicted in the process map, such as the compensationanalyst in the recognition bonus award process. If you had acompensation analyst on the project team, then this step is easy.If not, then this step takes longer to complete.
Although the recognition bonus award process is an in-tentionally simple example that consists of only two groups ofprocess workers (managers and compensation analysts), in acomplex process you will probably have to incorporate a dozendifferent process workers in this step. You do not have to meetwith all of them, just those most responsible for the process ac-tivities or others crucial to the business process. Review the
136 THE POWER OF BUS INE S S P ROCES S IMPROVEMENT
scope definition document created in step 2 to help decide onwhom to include. If an employee has ownership for deliveringone of the process responsibilities you identified, include thatindividual in the process verification.
If you have a large number of process workers to inter-view, allow your project team to help. Delegation not only off-loads a portion of the work from you, it also engages the teamand strengthens the members’ sense of ownership. Everyone in-volved in the validation should focus on the:
? Accuracy of the process map
? Points requiring clarification
? Accuracy of the time estimates
After finishing the verification, the project team shouldreconvene and decide whether to make changes to the processmap.
StakeholdersDepending on the foundation you established in step 2,
you may or may not choose to walk your stakeholders throughthe completed process map. Take a look at what you said thestakeholders care about, and decide whether you sense that astakeholder may not agree with something in the process map.
If you decide to meet with a stakeholder, schedule themeeting after completing the validation with the process work-ers and after incorporating any changes to the process map sothat you share an accurate, up-to-date version. You should per-form the validation with the stakeholders yourself and not dele-gate the responsibility to another project team member becauseyou have the best overall knowledge to correctly position thework. Meeting with the stakeholders also provides you with agood networking opportunity.
SponsorThe sponsor should also validate the process map before
you move to the next step. The sponsor may have a point of view
STEPS 4–5: ESTIMATE TIME AND COST AND VERIFY THE PROCESS MAP 137
that you have not considered. Before jumping in and walkingthe sponsor through the process map, go back and review thescope definition document you created in step 2 with him or her.Even though the sponsor approved the scope definition docu-ment, the review refreshes the memory and provides a transitiontool. Highlight the boundaries from that document as a transi-tion to the entry point into the process map.
Once you have completed the reviews and you have madethe changes to the process map, you can move to step 6, apply-ing improvement techniques.
Chapter Summary: Steps 4–5
In step 4, you learned the difference between process andcycle times. Whereas process time helps you to summarize thelabor required to deliver a business process, cycle time identifieshow long the process takes from beginning to end, a key metricthat clients/customers often list as a top concern.
Identifying the people, tool, and overhead costs associ-ated with a business process brings a financial component toyour work and positions you as a businessperson who under-stands how processes and costs relate to each other. The full-time equivalent (FTE) formula identifies the percentage of em-ployee time spent supporting a business process. Learning toapply the overhead rate gives you a total employee cost perspec-tive. Sometimes the sponsor cares only about a subset of num-bers, such as the labor costs associated with a business process,in which case your job gets easier.
After completing the calculations described in this chap-ter, you can cut the data numerous ways to meet your needs,stating the cost for each step in the process, the cost per transac-tion, the time from beginning to end, where to focus your timein the improvement stage, or any other statistic that you wantto share.
In step 5, you verified the accuracy of the process mapwith the process workers, stakeholders, and sponsor so that youcan move to step 6, improving the process, and feel comfortable
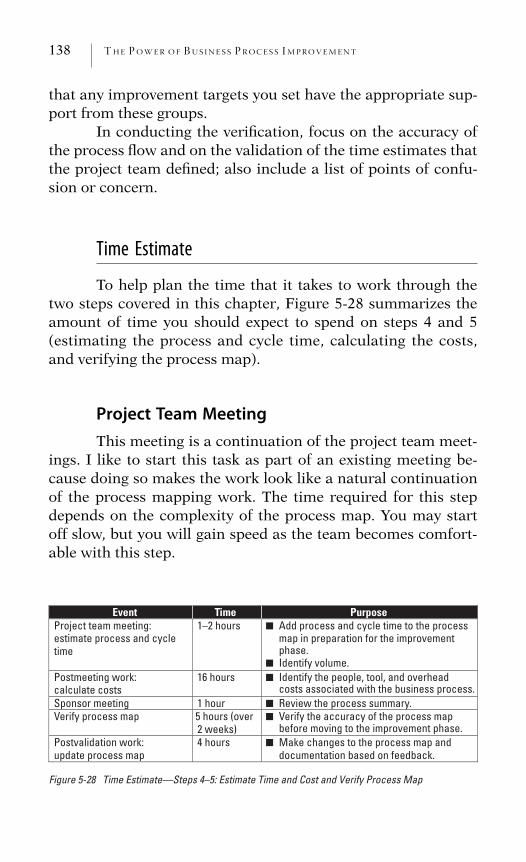
138 THE POWER OF BUS INE S S P ROCES S IMPROVEMENT
that any improvement targets you set have the appropriate sup-port from these groups.
In conducting the verification, focus on the accuracy ofthe process flow and on the validation of the time estimates thatthe project team defined; also include a list of points of confu-sion or concern.
Time Estimate
To help plan the time that it takes to work through thetwo steps covered in this chapter, Figure 5-28 summarizes theamount of time you should expect to spend on steps 4 and 5(estimating the process and cycle time, calculating the costs,and verifying the process map).
Project Team MeetingThis meeting is a continuation of the project team meet-
ings. I like to start this task as part of an existing meeting be-cause doing so makes the work look like a natural continuationof the process mapping work. The time required for this stepdepends on the complexity of the process map. You may startoff slow, but you will gain speed as the team becomes comfort-able with this step.
Event Time PurposeProject team meeting: estimate process and cycle time
1–2 hours Add process and cycle time to the process map in preparation for the improvement phase.Identify volume.
Postmeeting work: calculate costs
16 hours Identify the people, tool, and overhead costs associated with the business process.
Sponsor meeting 1 hour Review the process summary. Verify process map 5 hours (over
2 weeks) Verify the accuracy of the process map before moving to the improvement phase.
Postvalidation work: update process map
4 hours Make changes to the process map and
■
■
■
■
■
■
documentation based on feedback.
Figure 5-28 Time Estimate—Steps 4–5: Estimate Time and Cost and Verify Process Map
STEPS 4–5: ESTIMATE TIME AND COST AND VERIFY THE PROCESS MAP 139
Postmeeting WorkThis time provides you with personal time to perform the
calculations covered in this chapter and includes:
? Identifying the FTE number to use
? Calculating the FTEs required to support the businessprocess
? Calculating the people costs, including the employee benefitrate
? Calculating the tool costs
? Calculating the overhead costs, using the overhead rate
? Determining the cost per transaction (in our example, peraward)
? Summarizing the process times and costs
Verify the Process MapThis time provides you with the occasion to meet with
process workers, stakeholders, and the sponsor to verify the ac-curacy of the process map you have drawn. For my example, Iestimated five hours over a two-week period.
Postvalidation WorkThis time includes a meeting with the project team to
discuss the results of the verification with the process workers,stakeholders, and sponsor. This work provides you with per-sonal time to make the appropriate changes to the process mapand documentation.
Sponsor MeetingWhen you find yourself close to completing the analysis,
schedule time with the sponsor to review the summary informa-tion you compiled. The sponsor will have a keen interest in yoursummary, and this meeting provides you with the chance forincreased visibility.
140 THE POWER OF BUS INE S S P ROCES S IMPROVEMENT
What You Have Achieved
In this chapter, you have achieved the following:
? An estimate of how long the process takes to deliver theresults
? An understanding of the labor required by the process
? Knowledge of the total cost for the business process
? An understanding of the cost of a single transaction
? Agreement on the validity of the process map
? Buy-in from the sponsor on the process map
? Recognition from your sponsor on your financial evaluation
? Most important, the power to know where to focus yourefforts in the improvement stage
C H A P T E R 6
Step 6: Apply Improvement
Techniques
Challenging Everything
On the basis of his prioritization results, Kendall Smith,the banking vice president from Chapter 2, picked the processhe wanted to start with. First, I helped him develop the scopedefinition document on the training process for newly hired em-ployees; then we created the process map, including the timeestimates. We validated the process map and set our improve-ment target as a 50 percent reduction in cycle time for thecourse development process.
As a result of drawing the process map for your currentbusiness process in step 3, you saw how the process works; thenin step 4, you identified how long the process takes and howmuch it costs. Now we look at how to make the process moreeffective, efficient, and adaptable.
While listening to the project team talk about your proc-ess throughout the previous steps in the roadmap, you probablyalready have thoughts on how to improve the process. Thisknowledge, combined with the information in the scope defini-tion document, prepares you for this step. If you think about thevery manual recognition bonus award process we used as anexample over the last several chapters, you undoubtedly haveideas on how to improve that process. Clearly, we can find waysto reduce the 11 days of cycle time.
The improvement technique wheel in Figure 6-1 shows
141
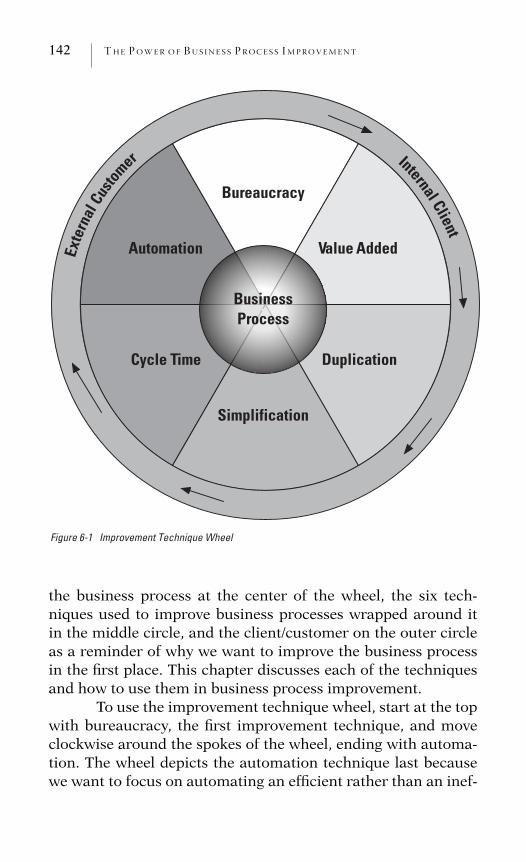
142 THE POWER OF BUS INE S S P ROCES S IMPROVEMENT
Exte
rnal
Custo
mer Internal Client
BusinessProcess
Automation
Cycle Time
Bureaucracy
Value Added
Simplification
Duplication
Figure 6-1 Improvement Technique Wheel
the business process at the center of the wheel, the six tech-niques used to improve business processes wrapped around itin the middle circle, and the client/customer on the outer circleas a reminder of why we want to improve the business processin the first place. This chapter discusses each of the techniquesand how to use them in business process improvement.
To use the improvement technique wheel, start at the topwith bureaucracy, the first improvement technique, and moveclockwise around the spokes of the wheel, ending with automa-tion. The wheel depicts the automation technique last becausewe want to focus on automating an efficient rather than an inef-
STEP 6: APPLY IMPROVEMENT TECHNIQUES: CHALLENGING EVERYTHING 143
ficient business process. Applying the other five techniques firstensures that we remove the process inefficiencies before movingto automation.
Use each of the techniques one at a time during a projectteam meeting. I like to start this exercise at a new meeting, whenthe team has a fresh perspective, rather than at the middle orend of another team meeting. This work is difficult and it helpsto have an alert group.
The project team members should feel a bit uncomfort-able during this step in the roadmap because your role is to chal-lenge the status quo and push them to think strategically.Strategic thinking sounds complex, and some people feel thatonly a few people possess this skill, but it simply means an abil-ity to conceptualize and see the big picture. Like anything else,you can improve the skill with practice.
To get started, introduce the improvement techniquewheel, define each of the techniques, and explain how you willaccomplish the work. Then walk through the process map thatyou created and focus on a single technique, applying it as thor-oughly as possible before moving to the next technique. Focus-ing on one technique at a time ensures that you thoroughlyapply each in its turn. As you move along the improvement tech-nique wheel, you will start to see the relationship of one tech-nique to another. For example, in most cases, simplifying anactivity or eliminating bureaucracy also reduces cycle time.
During this phase of the work, enlarge the completedprocess map to a poster size, as you did in step 3, so that every-one stays interested and can follow along as the team movesthrough the activities on the process map.
Eliminate Bureaucracy
Tamara Chase, a buyer who specializes in purchasingmerchandise for the home and garden line of a nationwide re-tailer, became frustrated when time after time her orders werenot filled in a timely manner. Tamara works under pressure be-cause of the competitive nature of her market, and she did not
144 THE POWER OF BUS INE S S P ROCES S IMPROVEMENT
like having to wrestle with an internal process that negativelyaffected her ability to bring product into her stores.
The order processing cycle time, overburdened with mul-tiple layers of approvals, seemed to be getting longer and longer.Tamara needed approval before she submitted an order to hercentral purchasing group, and then purchasing had to obtainadditional approvals. The bureaucracy made it difficult for herto buy and distribute products to her retail stores in time to beatthe competition, and Tamara increasingly heard complaintsfrom the store managers.
In a business process, bureaucracy requires following acomplex series of activities that hinders an effective and efficientprocess. The process gets bogged down in red tape, sometimesfor no apparent reason. Everyone knows bureaucracy when theysee it. Red tape and inflexibility go hand in hand with bureau-cracy.
You can normally trace the cause of bureaucracy to ei-ther the need for excess control, the fear of making a mistake,the desire to cover our backs in case something goes wrong, orsimply something that grew over time. You might wonder, be-cause bureaucracy seems so counterproductive, how it can haveany advocates. Even though no one outwardly admits to sup-porting bureaucracy, you will run into resistance as you work toeliminate it because of the fear of the unknown and the inclina-tion of human nature to just carry on doing things in the sameold way. In Tamara’s case, I started by asking what would hap-pen if the company eliminated some levels of approval. Wouldthe world fall apart? Was Tamara incompetent? Would the nextapproval level not catch any possible errors?
Jack Welch, former CEO of General Electric, is well-known for his dislike of bureaucracy. He calls it ‘‘productivity’senemy.’’ Think about bureaucracy from this perspective: as theenemy!
Even the federal government, as bureaucratic as manyconcede it is, has a strategic vision to be ‘‘citizen-centered, notbureaucracy-centered.’’ Although it may never change the way itdoes business, by thinking of the people as their customers, atleast the government seems to have the right perspective.
STEP 6: APPLY IMPROVEMENT TECHNIQUES: CHALLENGING EVERYTHING 145
It takes extra work to search for bureaucracy because ithas become so commonplace, but the project team memberswill find countless steps in a business process that introduce bu-reaucracy—and they should strive to eliminate them. To accom-plish this task, begin by walking through the process map boxby box and challenge the project team to identify bureaucracy.Mark the activities identified as bureaucratic with a coloredhighlighter on the enlarged process map posted in the room. Usedifferent-colored highlighters for the six improvement tech-niques. For example, use a green highlighter for bureaucracy, apink highlighter for value added, and so forth.
In Alistar’s recognition bonus award process, recall thatactivity 1 involved completing a form and sending it to the next-level manager. Do you see any potential bureaucracy in thisstep? You might ask:
Why is the form sent to the next-level manager?
This question helps the project team determine whetherthe requirement to gain another manager’s signature adds valueto the process or just adds a bureaucratic step. Who owns thebudget? If manager 1 owns the budget, why does manager 2have to approve an award? You may uncover other problemswith the business process that do not relate to bureaucracy, buthold off on those issues and stay focused on bureaucracy to keepthe team moving and on track.
Typically, you see a relationship between multiple ap-provals and bureaucracy, as in Tamara’s case. If the reason for asecond or third approval adds no value, eliminate the multipleapprovals. The scope definition document you created in step 2guides you through the exercise of eliminating bureaucracy. Ifan activity does not support the statements made in the scopedefinition, get rid of it.
In Tamara’s case, the process required four approvals be-fore purchasing sent the order to the vendor. After some discus-sion, we reduced the bureaucracy by keeping only two levels ofapprovals: central purchasing and finance. Although we focusedon eliminating bureaucracy and reduced the number of approv-
146 THE POWER OF BUS INE S S P ROCES S IMPROVEMENT
als required, we also reduced the cycle time as a result. You canstart to see the connection among the six techniques becausereducing bureaucracy also reduces cycle time.
Another filter that you can use to eliminate bureaucracyis evaluating whether an activity supports a SALT requirementof a business process. SALT stands for:
StatutoryAuditLegalTax
? Statutory denotes that the activity supports legislation or agovernment statute, such as imposing statutes of limita-tions, whether enacted by a national or state legislative gov-erning body.
? Audit means examining records or transactions to checkfor accuracy or compliance with preestablished guidelinesor rules.
? Legal signifies that the activity supports a law, like the laborlaws that control minimum wage levels and overtime pay.
? Tax denotes a financial charge or fee paid to a governmentbody, like a sales tax or income tax.
If an activity supports SALT, it probably should remain,except perhaps for audits because we often audit too frequently.Validate the reason for an audit to determine whether it shouldcontinue. If an audit does remain, ask whether a spot audit canreplace a normal audit to reduce the time required to conductit. You run a spot audit on a subset of data or transactions. Spotaudits do not cost as much as normal audits because they do nottake as long to complete, yet they generally find the errors.
A recent study by Tom Terez (www.betterworkplacenow.com) stated that the number one complaint employees hadabout their jobs was ‘‘too much workplace bureaucracy.’’ Theirsurvey also found that employees spend about ten hours everyweek tangled in corporate red tape and cumbersome workplacerules.
STEP 6: APPLY IMPROVEMENT TECHNIQUES: CHALLENGING EVERYTHING 147
Here are some questions you can ask the project team asyou work to eliminate bureaucracy:
? How many approvals do we have in place? Why?
? Can we reduce the number required?
? Do we make decisions at the right place?
? Do we generate unnecessary paperwork?
? How many copies of each document do we make?
? Why do we keep hardcopies?
? Do people receive information that they do not need?
? Do we understand what people do with the information orreports that we send them?
? Does one person check the work of another? Why?
? How do we use the information requested on a form inmaking decisions?
? Can we eliminate any forms? Do we absolutely need them?
? Do we have unnecessary rules?
? Does a policy or procedure get in the way?
? What will happen if an employee makes a mistake? Doesthe added scrutiny seem worth the expense?
Help the project team conceptualize the business processwithout bureaucracy. Ask them to show how an activity contri-butes to addressing the client’s/customer’s needs. If an activitydoes not contribute to client/customer satisfaction, if it nega-tively affects cycle time, or if it increases cost, then eliminate it.
Value Added
Tina Hernandez, marketing director for the consumerproduct division of a global company, felt that her company ex-perienced an unusually long time to market. As Tina describedthe situation, time to market includes everything from idea con-ception through customer availability.
148 THE POWER OF BUS INE S S P ROCES S IMPROVEMENT
After I completed a value-added analysis, it became ap-parent that the problem lay with the distribution component oftheir marketing strategy. We identified activities in the distribu-tion process that did not add value for the customer. Becauseevery activity in a business process adds to the cost of the endproduct or service and because every step adds labor, overhead,or other expenses, you should spend time evaluating each activ-ity to determine whether it adds value. Would customers will-ingly pay for a step in the business process if they were aware ofthe step?
The value-added analysis examines how each activity ina business process contributes value to the client/customer. Be-cause clients/customers define value, review the scope definitiondocument from step 2 to review what they consider valuable,and ask whether each activity in the process contributes to deliv-ering what you listed as client/customer needs. Then askwhether the clients/customers would agree that an activity addsvalue and whether they would pay for that step if you based yourcharges on a cost-per-activity fee.
In Alistar’s recognition bonus award process, activity 3had the compensation analyst reviewing the eligibility of theemployee for a bonus award, ensuring that the manager pro-vided appropriate justification, and validating that the awardamount falls within the guidelines. Do you think that manager1 would agree that these tasks add value to the process? Youmight ask questions like:
Whose decision is it to determine when an employee deserves recognition?
Why can't the manager be trusted to know whether
an employee is eligible for an award?
What happens if a manager exceeds the award guidelines?
Do managers have a budget that they control?
These questions help determine whether the processshould include the compensation department in this step. Whydoes the compensation analyst perform these tasks? Is the rea-son to check on the managers? Are the managers incompetent?If you look at the time that this step requires, you can see that it
STEP 6: APPLY IMPROVEMENT TECHNIQUES: CHALLENGING EVERYTHING 149
takes 20 to 30 minutes of process time and four days of cycletime. If the activity does not provide added value to the client/customer, you should try to eliminate it.
Notice again the close relationship between the improve-ment techniques—in this case, between the bureaucracy andvalue-added techniques. If we eliminate activity 3 from the rec-ognition bonus award process because it does not add value forthe client/customer, we also remove a degree of bureaucracyfrom the business process. However, we would have encoun-tered resistance from the business if we tried to eliminate thisactivity when we discussed bureaucracy because the businesswould defend the need for the step. Once the project team mem-bers discuss the same activity from the client’s/customer’s per-spective as part of the value-added technique, they might have aharder time making the case that the step adds value to the cli-ent/customer.
With that said, what about the business or the operation?Should you always delete a step in the process just because itdoes not add value to the client/customer? The answer is yes,but now office politics come into play. While activity 3 in therecognition bonus award process does not add value from theclient’s/customer’s perspective, does it add value from the busi-ness’s perspective—in this case, the compensation department?Even if a process step does not contribute to the client’s/custom-er’s value perspective, the step may still appear crucial to thebusiness. How would the compensation department feel abouteliminating this step? It will probably claim that the step addsvalue; how else can they guarantee compliance or consistencyacross the company?
This may seem like a genuine concern because Alistar’scompensation department owns responsibility for the consis-tent application of the company’s pay programs. However, if youattribute the value of an activity to the business and not to theclient, then you should challenge the thinking and push for acandid answer to the question, ‘‘Why?’’ If you cannot eliminatethe step, you can probably minimize it.
Just as we saw when we examined bureaucracy, numer-ous steps in a business process do not add any value to the final
150 THE POWER OF BUS INE S S P ROCES S IMPROVEMENT
output; so you should eliminate these activities as well. Walkthrough the process map again box by box, this time challengingthe value-added contribution of each activity. Mark the activitiesthat have value to the client/customer in one color, those withvalue to the business in another, and those with no value in athird color. Your process map should start looking like an art-ist’s palette!
You can use the value-added analysis table shown in Fig-ure 6-1 as an alternative to color coding the process map forvalue-added activities. If you choose to use the table, simply listthe business process activities in the left column and add threeadditional columns for client/customer value added, businessvalue added, and non–value added. Put an ‘‘X’’ in the appropriatecolumn for each activity. Figure 6-2 shows what the analysismight look like for Alistar’s recognition bonus award process.
Although color coding brings more visual clarity to thework and allows everyone to stay involved, the value-added anal-ysis shows the same information and may work better for com-plex processes. Even if you color-code the map, use the value-added analysis as a way to summarize the project team’s finaldecisions.
In my experience, the hardest activities to eliminate arethose that the business considers valuable for their own reasonsbecause the temptation to say an activity adds business value,instead of being a bureaucratic step, is far too easy. You have toshow courage when talking about business-value-added activi-ties. Remember to think strategically and keep the big picture inmind. Make the project team uncomfortable by challenging thestatus quo. The main question to ask when applying the value-added technique is, ‘‘Would the client/customer pay for this ac-tivity?’’
Eliminate Duplication
Wendy Chan, manager of the workforce analysis groupfor a software company, has responsibility for running the com-
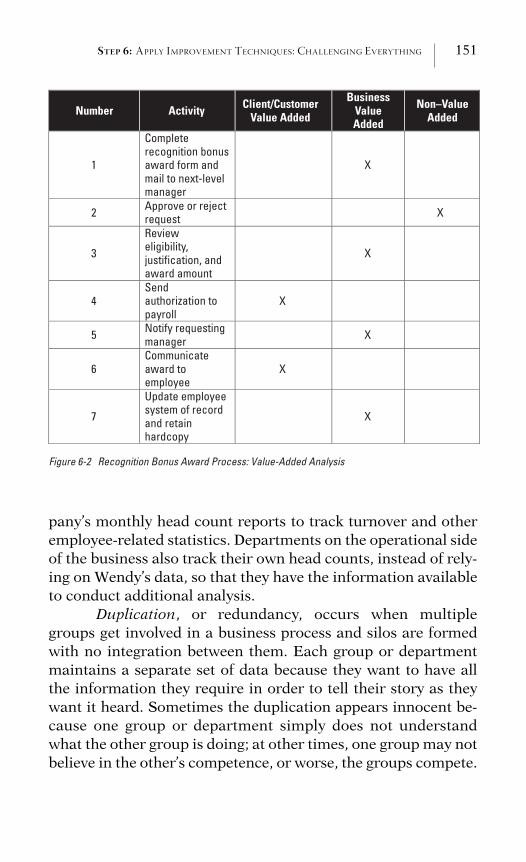
STEP 6: APPLY IMPROVEMENT TECHNIQUES: CHALLENGING EVERYTHING 151
Number Activity Client/CustomerValue Added
BusinessValue Added
Non–Value Added
1
Completerecognition bonus award form and mail to next-level manager
X
2 Approve or reject request X
3
Revieweligibility, justification, and award amount
X
4Sendauthorization to payroll
X
5 Notify requesting manager X
6Communicateaward to employee
X
7
Update employee system of record and retain hardcopy
X
Figure 6-2 Recognition Bonus Award Process: Value-Added Analysis
pany’s monthly head count reports to track turnover and otheremployee-related statistics. Departments on the operational sideof the business also track their own head counts, instead of rely-ing on Wendy’s data, so that they have the information availableto conduct additional analysis.
Duplication, or redundancy, occurs when multiplegroups get involved in a business process and silos are formedwith no integration between them. Each group or departmentmaintains a separate set of data because they want to have allthe information they require in order to tell their story as theywant it heard. Sometimes the duplication appears innocent be-cause one group or department simply does not understandwhat the other group is doing; at other times, one group may notbelieve in the other’s competence, or worse, the groups compete.
152 THE POWER OF BUS INE S S P ROCES S IMPROVEMENT
In Wendy’s case, the workforce analysis group did notprovide the level of detail that the operational groups wanted,and so operations duplicated the work instead of asking theworkforce analysis group to change their report to meet the op-eration’s business need. The workforce analysis group wouldhave gladly changed the report if told about the operation’s dis-satisfaction. This example both demonstrates a lack of aware-ness of client/customer needs by the workforce analysis groupand shows how easy it is for duplication to occur.
Each time a step in the business process moves from onedepartment to another, a handoff occurs. Handoffs can easilylead to duplication of efforts, errors, and redundancy of infor-mation, so you should pay attention to any activity on the proc-ess map where a handoff occurs. The federal governmentrecognizes ‘‘that redundant and overlapping agency activitieshave been major impediments to creating a citizen-centeredelectronic government.’’
You can spot the duplication of efforts when you findmultiple employees keeping copies of the same documents.Think of your own company, and you can probably identifycases where more than one person files a copy of a documentfor some reason. Look at Alistar Corporation’s recognitionbonus award process:
? Manager 1 retains a hardcopy of the completed form whenthe bonus award is requested.
? Manager 2 keeps a hardcopy of the signed form whenapproving the bonus award.
? Compensation files a hardcopy in its recognition bonusaward file.
? Personnel retains a hardcopy in the employee’s personnelfile.
Does everyone need a copy of the document? When mul-tiple employees maintain the same data, they increase the costto the company. It takes time for an employee to copy and file adocument, and a cost is associated with the employee’s labor.
STEP 6: APPLY IMPROVEMENT TECHNIQUES: CHALLENGING EVERYTHING 153
Copies take up storage space, and a cost is associated with theincreased storage requirements. Although the space requiredmay seem small, think about it on a company-wide scale andimagine the cost multiplied across your entire company. Alsoconsider the legal implications of maintaining documentation,and answer the question, ‘‘Where should the company’s officialdocumentation be stored?’’
A big challenge exists when a company does not define asingle source of data. In Wendy’s case, which head count reportis correct? Do the operations and the workforce analysis groupcount head counts differently? Do the groups use differentsources of data? Data errors can easily occur when differentgroups use different sources. As a result, you begin to doubt theintegrity of the data. Data integrity means consistent, correct,and accessible data. Problems with data quality, or data integ-rity, costs companies billions of dollars a year. Working to con-firm that you have a single source of data helps to reduce costsand errors.
When you completed step 5 and verified your processmap with the process workers, stakeholders, and the processowner, the project team made the appropriate changes so thatthe map accurately reflected how the process works. During thevalidation meetings, confirm where handoffs and possible dupli-cations occur. In addition to the steps in the process, look forduplication in data and reports generated from the process be-cause employees often duplicate data or reports.
You may have to talk to other departments to uncoverredundancy if your process map focuses only on one depart-ment. Find out what happens at the other end of an activity afteryou hand something off to another department. Look for occa-sions where you can:
? Establish a single source of data.
? Eliminate two employees doing the same work, like gener-ating similar reports.
? Eliminate two people maintaining the same data.
? Eliminate the dual entry of information.
154 THE POWER OF BUS INE S S P ROCES S IMPROVEMENT
? Minimize document storage.
Simplification
The inefficient warehouse process uncovered by TinaHernandez caused her marketing team to reevaluate their distri-bution strategy. Tina admitted that her marketing team spentmore time developing the product, price, and promotion com-ponents of their overall strategy than they did the fourth ‘‘P’’(placement). They did not think too long about distribution de-cisions and instead continued with business as usual. With herconcern about time to market, Tina’s team reconsidered andagreed that they needed to make a change. Tina now felt thather team could identify more streamlined distribution optionsto further improve their product’s time to market.
Simplification, or streamlining the process, means reduc-ing or eliminating the complexity of an activity in a businessprocess so that the process becomes easier to understand andmore efficient. When you keep a process simple, it gets easier tosustain and more flexible in responding to client/customerneeds. Keep one of the Dalai Lama’s quotations in mind as youwork to simplify a business process: ‘‘Simplicity is the key tohappiness in the modern world.’’ Albert Einstein came up withhis own observation: ‘‘Simplicity means the achievement ofmaximum effect with minimum means.’’
Over time, our business processes become increasinglyburdensome as we accommodate changes in the business. Wecause our processes to become bloated by continually addingcomplexity. Looking at your process map, identifying wherecomplexity exists, and simplifying the related activities becomeyour main focus with this technique.
In the recognition bonus award process, we started bylooking at the form used in activity 1. Since we decided we couldnot eliminate the form, we simplified and redesigned it to keepthe information required to a minimum, while ensuring thatmanagers could easily obtain the required data without havingto go to a myriad of sources to obtain it. To simplify the form, Iasked the project team questions like:
STEP 6: APPLY IMPROVEMENT TECHNIQUES: CHALLENGING EVERYTHING 155
Is any unnecessary information requested on the form?
Where does the manager obtain the information requested on the form?
Is the information readily available?
How often do managers call compensation with questions on how to complete the
form, and what kind of questions do they ask?
When you start looking at your company’s forms, youwill find most of them more complex than necessary and, as aresult, take longer to complete. Streamline all your forms so thatthey include only the information essential to making a deci-sion. Look for chances to simplify all reports and documenta-tion.
You can find countless examples of unnecessary com-plexity in business processes, so keep the old KISS engineeringphilosophy in mind: Keep it simple, stupid. (If you find stupidoffensive, you can say, ‘‘Keep it simple, silly’’ or ‘‘Keep it shortand sweet’’ or ‘‘Keep it sweet and simple.’’ You get the idea.)
In activity 3 in the recognition bonus award process, howoften does compensation have to call the manager, or vice versa,in completing the tasks associated with this step? Think aboutthe number of times a phone call is made to ask a process ques-tion. Eliminate unnecessary calls by simplifying the language onforms and providing any required information directly on them.
Here are other questions you can ask the project team asyou work to simplify the process:
? Can we streamline any step in the process?
? Can we streamline or simplify any of the forms?
? How many emails are sent at any point in the process? Asubstantial number of them should signal that unnecessarycomplexity exists.
? Where do employees go to obtain information to completeany step in the process?
? Do you see any roadblocks?
? Do you see unnecessary handoffs?
? Can we standardize a step, a report, or a form to make iteasier to understand?
156 THE POWER OF BUS INE S S P ROCES S IMPROVEMENT
? Do we know the number of errors we make and why?
? Can we eliminate or combine any steps in the process?
? Must process workers call other people to complete any stepin the process?
? Does everyone understand the process?
? How do we use data and reports throughout the process?
You should also consider redesigning the process tomake it simple for the client/customer. Even if you do not useevery one of the ideas to improve your business process, theclues help you simplify the process.
As you apply the improvement techniques, you will startuncovering cultural changes that have to occur in the organiza-tion, and these types of changes are often difficult to implement.Nevertheless, keep track of them, even though they may take along time to accomplish. In Chapter 9, I discuss the impact anal-ysis as a tool to capture changes that need to occur to implementa new, improved business process. Do not exclude a changefrom your plans just because it appears challenging. Sometimeswe exact the biggest gains from difficult changes.
You should continue to notice the similarity between sev-eral of the improvement techniques. When you simplify a busi-ness process, you also have the opportunity to eliminatebureaucracy. When you eliminate redundancy, you simplify theprocess. When you look at value-added activities, it leads youto examine bureaucracy. Although the distinctions among thetechniques may seem blurry, I encourage you to work throughthem one at a time because you use slightly different mentalfilters for each technique. It does not matter what you call some-thing, as long as you reach every nook and cranny in a businessprocess.
Reduce Cycle Time
Kendall Smith wanted to reduce the cycle time requiredto develop new training by 50 percent. It normally took his train-
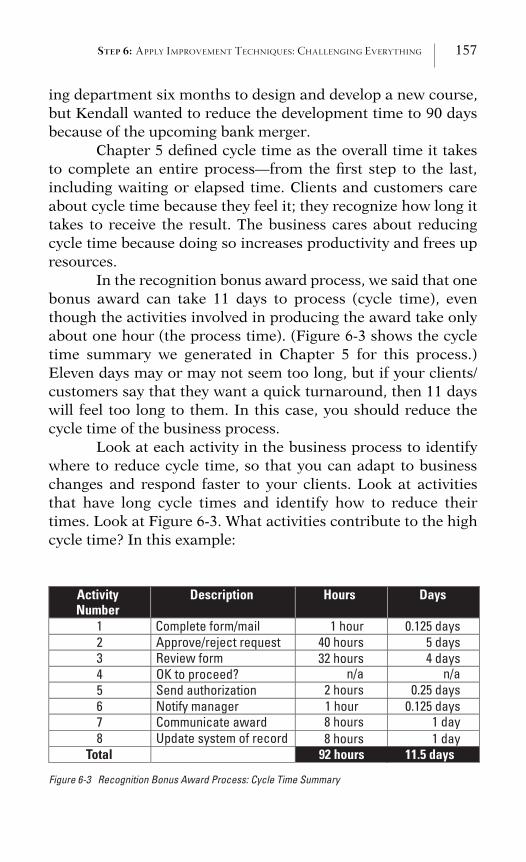
STEP 6: APPLY IMPROVEMENT TECHNIQUES: CHALLENGING EVERYTHING 157
ing department six months to design and develop a new course,but Kendall wanted to reduce the development time to 90 daysbecause of the upcoming bank merger.
Chapter 5 defined cycle time as the overall time it takesto complete an entire process—from the first step to the last,including waiting or elapsed time. Clients and customers careabout cycle time because they feel it; they recognize how long ittakes to receive the result. The business cares about reducingcycle time because doing so increases productivity and frees upresources.
In the recognition bonus award process, we said that onebonus award can take 11 days to process (cycle time), eventhough the activities involved in producing the award take onlyabout one hour (the process time). (Figure 6-3 shows the cycletime summary we generated in Chapter 5 for this process.)Eleven days may or may not seem too long, but if your clients/customers say that they want a quick turnaround, then 11 dayswill feel too long to them. In this case, you should reduce thecycle time of the business process.
Look at each activity in the business process to identifywhere to reduce cycle time, so that you can adapt to businesschanges and respond faster to your clients. Look at activitiesthat have long cycle times and identify how to reduce theirtimes. Look at Figure 6-3. What activities contribute to the highcycle time? In this example:
ActivityNumber
Description Hours Days
1 Complete form/mail 1 hour40 hours32 hours
n/a2 hours1 hour8 hours8 hours
0.125 days5 days4 days
n/a0.25 days
0.125 days1 day1 day
2 Approve/reject request 3 Review form4 OK to proceed?5 Send authorization6 Notify manager7 Communicate award8 Update system of record
Total 92 hours 11.5 days
Figure 6-3 Recognition Bonus Award Process: Cycle Time Summary
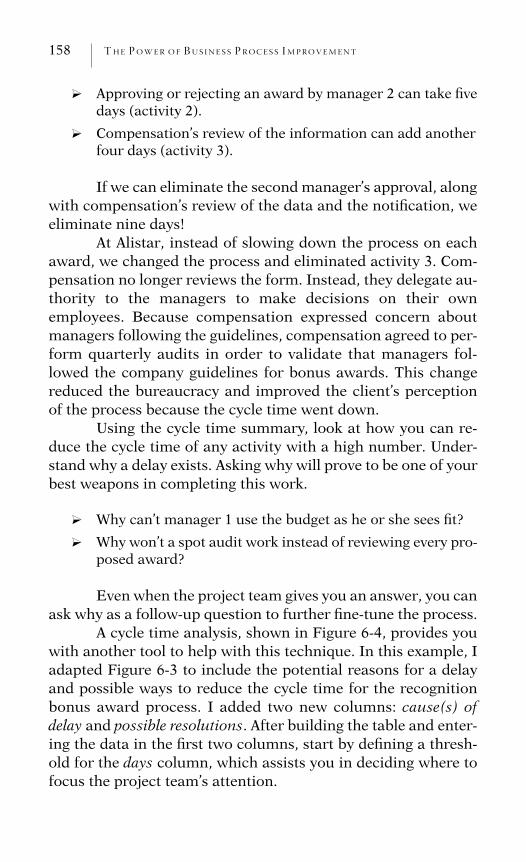
158 THE POWER OF BUS INE S S P ROCES S IMPROVEMENT
? Approving or rejecting an award by manager 2 can take fivedays (activity 2).
? Compensation’s review of the information can add anotherfour days (activity 3).
If we can eliminate the second manager’s approval, alongwith compensation’s review of the data and the notification, weeliminate nine days!
At Alistar, instead of slowing down the process on eachaward, we changed the process and eliminated activity 3. Com-pensation no longer reviews the form. Instead, they delegate au-thority to the managers to make decisions on their ownemployees. Because compensation expressed concern aboutmanagers following the guidelines, compensation agreed to per-form quarterly audits in order to validate that managers fol-lowed the company guidelines for bonus awards. This changereduced the bureaucracy and improved the client’s perceptionof the process because the cycle time went down.
Using the cycle time summary, look at how you can re-duce the cycle time of any activity with a high number. Under-stand why a delay exists. Asking why will prove to be one of yourbest weapons in completing this work.
? Why can’t manager 1 use the budget as he or she sees fit?
? Why won’t a spot audit work instead of reviewing every pro-posed award?
Even when the project team gives you an answer, you canask why as a follow-up question to further fine-tune the process.
A cycle time analysis, shown in Figure 6-4, provides youwith another tool to help with this technique. In this example, Iadapted Figure 6-3 to include the potential reasons for a delayand possible ways to reduce the cycle time for the recognitionbonus award process. I added two new columns: cause(s) ofdelay and possible resolutions. After building the table and enter-ing the data in the first two columns, start by defining a thresh-old for the days column, which assists you in deciding where tofocus the project team’s attention.
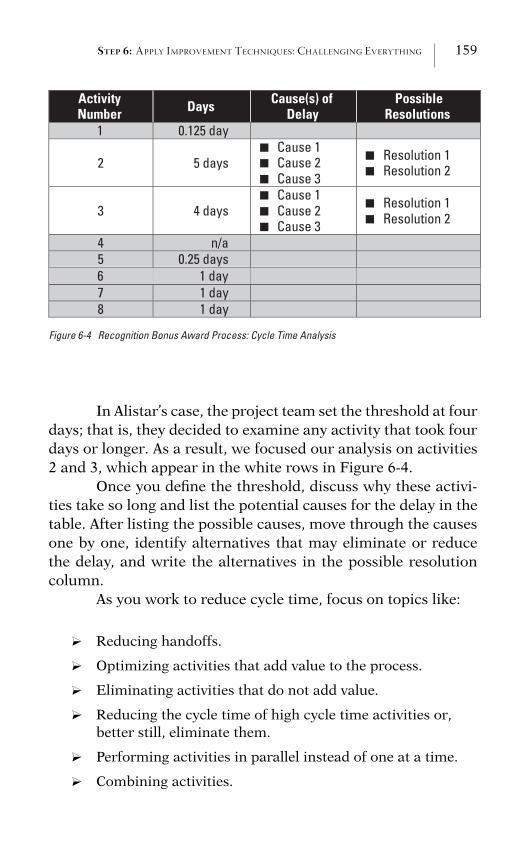
STEP 6: APPLY IMPROVEMENT TECHNIQUES: CHALLENGING EVERYTHING 159
ActivityNumber Days Cause(s) of
DelayPossible
Resolutions1 0.125 day
2 5 daysCause 1 ■
Cause 2 Cause 3
Resolution 1 Resolution 2
3 4 daysCause 1 Cause 2 Cause 3
Resolution 1 Resolution 2
4 n/a5 0.25 days
■
■
■
■
■
■
■
■
■
7 1 day8 1 day
Figure 6-4 Recognition Bonus Award Process: Cycle Time Analysis
6 1 day
In Alistar’s case, the project team set the threshold at fourdays; that is, they decided to examine any activity that took fourdays or longer. As a result, we focused our analysis on activities2 and 3, which appear in the white rows in Figure 6-4.
Once you define the threshold, discuss why these activi-ties take so long and list the potential causes for the delay in thetable. After listing the possible causes, move through the causesone by one, identify alternatives that may eliminate or reducethe delay, and write the alternatives in the possible resolutioncolumn.
As you work to reduce cycle time, focus on topics like:
? Reducing handoffs.
? Optimizing activities that add value to the process.
? Eliminating activities that do not add value.
? Reducing the cycle time of high cycle time activities or,better still, eliminate them.
? Performing activities in parallel instead of one at a time.
? Combining activities.
160 THE POWER OF BUS INE S S P ROCES S IMPROVEMENT
? Benchmarking the industry standard (benchmarking is dis-cussed in Chapter 12).
In addition to making the business process effective foryour client/customer, reducing cycle time also leads to an effi-cient process for the business, thus increasing productivity andfreeing up resources to do more valuable work.
Automation
Now that you have squeezed every last bit of efficiencyfrom the process using your analytical and mental skills, youcan look at how technology can help the process become evenmore effective and efficient.
In this discussion of the use of technology to automatethe process, I focus on technology that you probably have avail-able to you or that you can purchase inexpensively. I do not talkabout major system implementations because one employee try-ing to improve an everyday business process does not have theauthority to spend a few million dollars on a new computer sys-tem. Even if you can purchase a new application, you probablyhave to suffer through a long procurement process. If you haveimplemented company-wide systems, you should still follow thetechniques presented in this chapter to ensure that you have anefficient process that maximizes your technology investment.
You may hear different schools of thought about whetherautomation belongs at the beginning or the end of businessprocess improvement. You may have heard this basic question:
Does the technology drive the process?
Or . . .
Does the process drive the technology?
If your background includes large system implementa-tions, you have probably seen the technology drive the business
STEP 6: APPLY IMPROVEMENT TECHNIQUES: CHALLENGING EVERYTHING 161
process. A company buys a new enterprise resource planningsystem, and everyone gets busy defining new business processeson the basis of the system’s available functionality.
You find technology at the end of the improvement tech-nique wheel because I lean toward the second scenario; I like tosee an efficient process drive the technology. We want to focuson automating an efficient, not an inefficient process.
If you think of technology right away during the im-provement phase, you can too easily start thinking about build-ing a spreadsheet or a database, when in reality you shouldprobably eliminate the activity altogether because it provides noadded value to the client/customer. Therefore, I like to apply theother five techniques first, then look at the new business processfor points in the process where technology can increase effi-ciency.
Bill Gates is credited with saying, ‘‘The first principle forany technology you contemplate introducing into a business isthat automation applied to an efficient operation will magnifythe efficiency. The second is that automation applied to an inef-ficient operation will just entrench the inefficiency.’’ I could notagree more!
Alistar Corporation’s recruiting process provides an ex-ample of how automation can help improve a business process.The company has a volume-driven hiring process, which re-quires them to fill an unusually large number of hourly jobs thatpay little more than the minimum wage. Recruitment depart-ments, like Alistar’s, often measure their success by a series ofstatistics such as time to fill, number of open requisitions, ornumber of hires. Alistar had cumbersome reporting techniques,so we redesigned a couple of their reports to take advantage ofthe data sitting in their recruiting system and combined thatdata with additional data in a Microsoft Access database to de-liver reports that provided the appropriate statistics to seniormanagers.
Alistar’s recognition bonus award process offered manyopportunities to apply improvement techniques. Figure 6-5shows an updated version of the process map after we applied
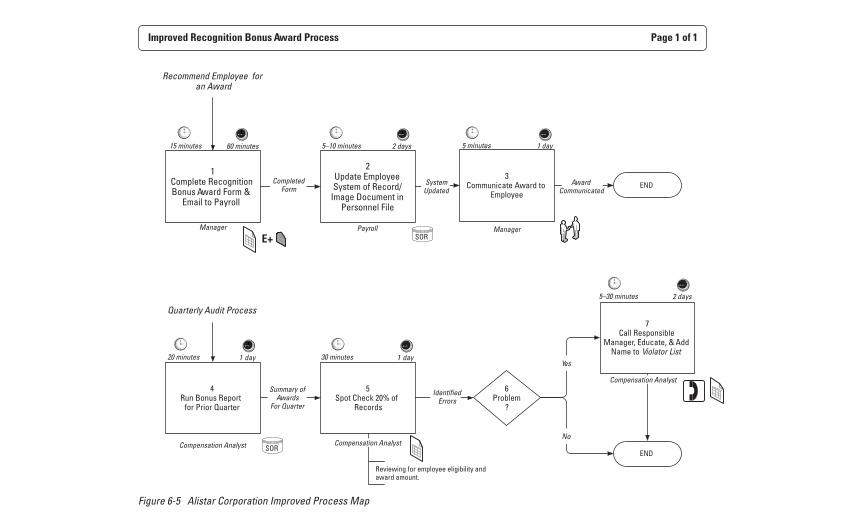
Improved Recognition Bonus Award Process Page 1 of 1
1Complete Recognition Bonus Award Form &
Email to Payroll
Recommend Employee for an Award
2Update Employee System of Record/
Image Document in Personnel File
7Call Responsible
Manager, Educate, & Add Name to Violator List
CompletedForm
Reviewing for employee eligibility and award amount.
Manager
END
Payroll
SystemUpdated
4Run Bonus Report
for Prior Quarter
3Communicate Award to
Employee
5Spot Check 20% of
Records
Summary ofAwards
For Quarter
Compensation Analyst Compensation Analyst
Manager
IdentifiedErrors
15 minutes
20 minutes
5 minutes5–10 minutes
5–30 minutes
30 minutes yad1yad1
1 day
2 days
2 days60 minutes
6Problem
?
Yes
No
Award Communicated
Quarterly Audit Process
END
Compensation Analyst
E+
SOR
SOR
Figure 6-5 Alistar Corporation Improved Process Map
STEP 6: APPLY IMPROVEMENT TECHNIQUES: CHALLENGING EVERYTHING 163
all the techniques. The figure shows that we made the followingchanges to the recognition bonus award process:
? We gained agreement on eliminating the second manager’sapproval and allowing the original manager to manage hisor her own budget.
? Although we could not gain agreement to eliminate theform entirely, we simplified it and introduced technology inactivity 1 by creating the form in Microsoft Excel so thatthe manager can email the form to payroll instead of usingthe slower interoffice mail to send the hardcopy.
? We eliminated the requirement for compensation to reviewevery form. Instead, we instituted a new quarterly auditprocess, depicted at the bottom section of Figure 6-5. Com-pensation now audits 20 percent of awards submitted forthe prior quarter by running a standard report from itssystem of record.
? Compensation agreed to permit the managers to determinethe appropriate justification for an award, so the only itemsleft to audit include the award amounts and the employee’seligibility.
? Compensation still felt the need to keep track of managerswho did not follow the guidelines so that repeat offenderscould receive constructive feedback through the perform-ance management process.
As this walkthrough shows, we reduced the cycle timefrom 11 days to three, a meaningful improvement to the busi-ness process. Managers like the authority they now have, andcompensation feels that it can still hold managers accountablefor following the guidelines.
Spend time learning about the existing technologies inyour company so that you are aware of the tools you can use inthe automation phase. Get familiar with the existing systemsthat support your company’s business processes. In addition toexisting systems, some of the common, inexpensive tools youprobably have available are:
164 THE POWER OF BUS INE S S P ROCES S IMPROVEMENT
? Microsoft Office tools like Word, Excel, PowerPoint, andAccess
? File-sharing and collaboration software like MicrosoftSharePoint or Open Text’s Hummingbird Connectivity
? Network drives where you can store shared documents
? Email and the capability to design forms
? Text messaging
? Workflow
? Portals or intranets
All these simple, everyday tools can help automate yourbusiness processes.
Chapter Summary: Step 6
Applying the six improvement techniques one at a timeassists you in evaluating your business processes in a thought-ful, planned approach. The improvement technique wheelguides you through eliminating bureaucracy, evaluating value-added activities, eliminating duplication and redundancy, sim-plifying the process/reports/forms, reducing cycle time, andapplying automation tools.
Although the differentiation among the techniques mayappear blurry at times, you should use the techniques one at atime because the project team will use slightly different mentalfilters for each. Applying the techniques one at a time ensuresthat you squeeze every last drop out of each one.
Remember that:
? Bureaucracy is ‘‘productivity’s enemy.’’
? Use SALT as a filter to eliminate bureaucracy.
? Keep it simple, silly.
? ‘‘Simplicity is the key to happiness in the modern world.’’
? ‘‘Automation applied to an efficient operation will magnifythe efficiency.’’
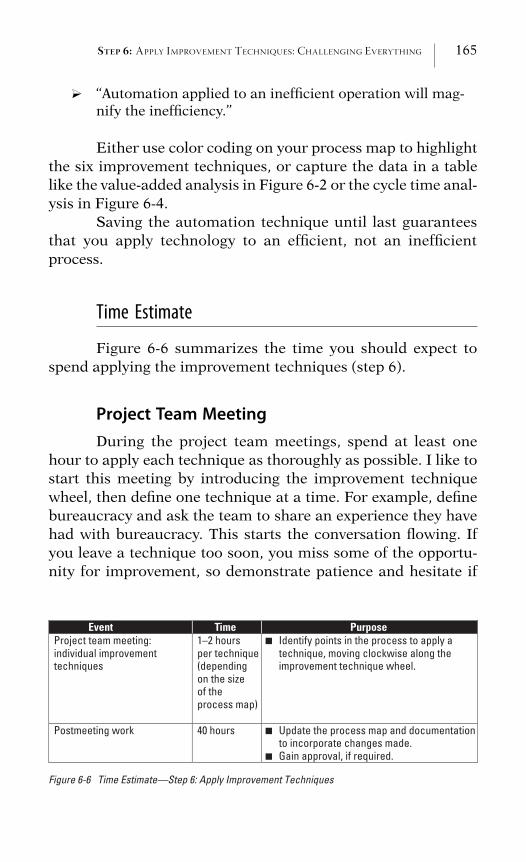
STEP 6: APPLY IMPROVEMENT TECHNIQUES: CHALLENGING EVERYTHING 165
? ‘‘Automation applied to an inefficient operation will mag-nify the inefficiency.’’
Either use color coding on your process map to highlightthe six improvement techniques, or capture the data in a tablelike the value-added analysis in Figure 6-2 or the cycle time anal-ysis in Figure 6-4.
Saving the automation technique until last guaranteesthat you apply technology to an efficient, not an inefficientprocess.
Time Estimate
Figure 6-6 summarizes the time you should expect tospend applying the improvement techniques (step 6).
Project Team MeetingDuring the project team meetings, spend at least one
hour to apply each technique as thoroughly as possible. I like tostart this meeting by introducing the improvement techniquewheel, then define one technique at a time. For example, definebureaucracy and ask the team to share an experience they havehad with bureaucracy. This starts the conversation flowing. Ifyou leave a technique too soon, you miss some of the opportu-nity for improvement, so demonstrate patience and hesitate if
Event Time PurposeProject team meeting: individual improvement techniques
1–2 hours per technique (dependingon the sizeof the process map)
Identify points in the process to apply a technique, moving clockwise along the improvement technique wheel.
Postmeeting work 40 hours Update the process map and documentation to incorporate changes made. Gain approval, if required.
■
■
■
Figure 6-6 Time Estimate—Step 6: Apply Improvement Techniques
166 THE POWER OF BUS INE S S P ROCES S IMPROVEMENT
the project team seems ready to move to the next technique. Leteveryone feel somewhat uncomfortable and squirm a bit beforemoving to the next technique.
Postmeeting WorkThis time provides you with the chance to update the
process map and the corresponding documentation on the basisof the changes the project team made. You may also have togain approval for some of the changes that the process team hassuggested, with either the sponsor or a stakeholder.
What You Have Achieved
In this chapter, you have achieved the following:
? An awareness of six improvement techniques
? An understanding of how to create a value-added analysis
? A grasp of how to use SALT as a filter for bureaucracy
? An awareness of how to eliminate nonvalue-added work
? An insight into how to eliminate duplication or redundancy
? An understanding of how to simplify, or streamline, a busi-ness process
? A grasp of how to reduce cycle time
? An awareness of how to develop a cycle time analysis
? An insight into how to automate a business process
? Most important, the power to understand how to look sys-tematically for ways to improve a business process
C H A P T E R 7
Step 7: Create Internal Controls,
Tools, and Metrics
Making It Real
Establishing internal controls, developing tools to increasethe effectiveness, efficiency, and adaptability of a business proc-ess, and developing metrics bring the process to life beyond justcreating a process map:
? Internal controls help prevent errors.
? Tools help employees perform their job more easily.
? Metrics show whether the process works as planned.
Internal Controls
Imagine the level of embarrassment when an employeereceived congratulations from a colleague on her promotion toan executive-level position before her vice president had achance to share the good news directly with her. This happenedat a bank that brought me in after this occurrence to help themput internal controls in place for their key business processes. Itseemed that the colleague had viewed the employee’s new titlewhen they right-clicked on the colleague’s name in their emailsystem even though no update had occurred in the human re-source information system.
Senior management had chastised and embarrassed the
167
168 THE POWER OF BUS INE S S P ROCES S IMPROVEMENT
department responsible for the error before I came in to workwith the firm over the next six weeks. In this case, it was a simplehuman error that caused all the commotion. Yet the departmentended up spending an unanticipated $150,000 in labor andtravel costs to create appropriate internal controls for their busi-ness processes to prevent future mistakes.
Human errors or employee misunderstandings occurevery day in business, costing billions of dollars nationally.Think about the current economic situation and the debacleswe face with banking, insurance, and auto companies becauseproper processes, procedures, or controls simply did not exist.Human error in health care alone claims the lives of close to100,000 Americans a year, making human error in health carethe eighth leading cause of death in the United States. Balbir S.Dhillon, in Human Reliability and Error in Medical Systems(World Scientific Publishing Company, 2004) estimates the an-nual national cost between $17 billion and $37.6 billion.
Internal controls ensure accuracy and reliability at cru-cial points in a business process and can help reduce the num-ber of errors introduced in the process. When you start lookingat a business process to identify internal controls, you may besurprised that none exist. In my experience, this happens fre-quently. Employees more often than not try to do a good job,but mistakes happen and a systematic approach to preventingthe same error from recurring is not always in place. To estab-lish internal controls, identify the points in the business processwhere something can go wrong. At this point, you might askhow you should begin.
Start by walking through the improved process map youcreated in step 6 and move through it box by box, asking theproject team what can go wrong with each activity. If a mistakecan happen, signify this likelihood with an icon to denote thatan error might occur. I like to use a warning symbol, as shownin Figure 7-1, to denote that an internal control should exist be-cause everyone recognizes what this cautionary sign means.
Move through the entire process map, and put warningsymbols next to each activity that may cause an error. Do notdiscuss the details about the mistakes or how you can avoid the
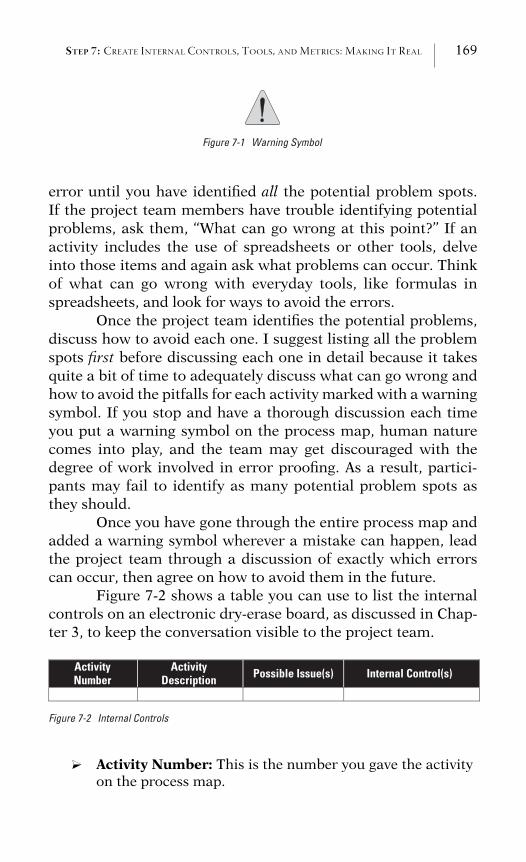
STEP 7: CREATE INTERNAL CONTROLS, TOOLS, AND METRICS: MAKING IT REAL 169
Figure 7-1 Warning Symbol
error until you have identified all the potential problem spots.If the project team members have trouble identifying potentialproblems, ask them, ‘‘What can go wrong at this point?’’ If anactivity includes the use of spreadsheets or other tools, delveinto those items and again ask what problems can occur. Thinkof what can go wrong with everyday tools, like formulas inspreadsheets, and look for ways to avoid the errors.
Once the project team identifies the potential problems,discuss how to avoid each one. I suggest listing all the problemspots first before discussing each one in detail because it takesquite a bit of time to adequately discuss what can go wrong andhow to avoid the pitfalls for each activity marked with a warningsymbol. If you stop and have a thorough discussion each timeyou put a warning symbol on the process map, human naturecomes into play, and the team may get discouraged with thedegree of work involved in error proofing. As a result, partici-pants may fail to identify as many potential problem spots asthey should.
Once you have gone through the entire process map andadded a warning symbol wherever a mistake can happen, leadthe project team through a discussion of exactly which errorscan occur, then agree on how to avoid them in the future.
Figure 7-2 shows a table you can use to list the internalcontrols on an electronic dry-erase board, as discussed in Chap-ter 3, to keep the conversation visible to the project team.
ActivityNumber
ActivityDescription Possible Issue(s) Internal Control(s)
Figure 7-2 Internal Controls
? Activity Number: This is the number you gave the activityon the process map.
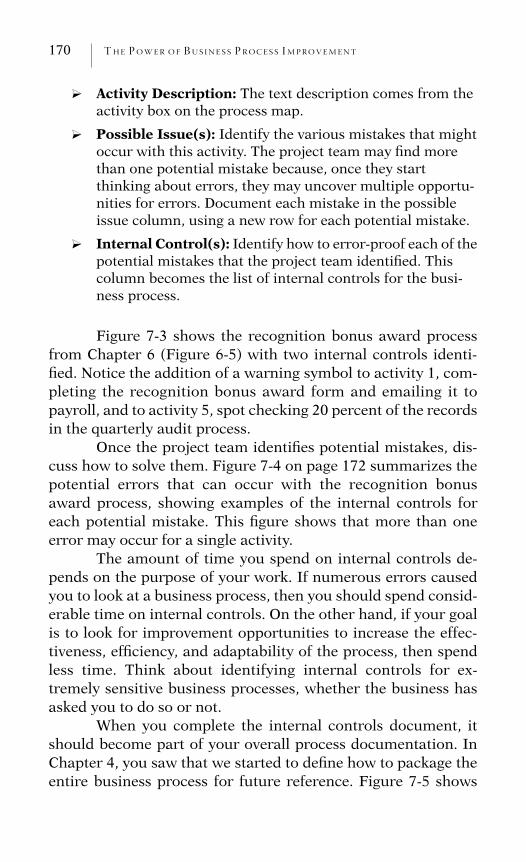
170 THE POWER OF BUS INE S S P ROCES S IMPROVEMENT
? Activity Description: The text description comes from theactivity box on the process map.
? Possible Issue(s): Identify the various mistakes that mightoccur with this activity. The project team may find morethan one potential mistake because, once they startthinking about errors, they may uncover multiple opportu-nities for errors. Document each mistake in the possibleissue column, using a new row for each potential mistake.
? Internal Control(s): Identify how to error-proof each of thepotential mistakes that the project team identified. Thiscolumn becomes the list of internal controls for the busi-ness process.
Figure 7-3 shows the recognition bonus award processfrom Chapter 6 (Figure 6-5) with two internal controls identi-fied. Notice the addition of a warning symbol to activity 1, com-pleting the recognition bonus award form and emailing it topayroll, and to activity 5, spot checking 20 percent of the recordsin the quarterly audit process.
Once the project team identifies potential mistakes, dis-cuss how to solve them. Figure 7-4 on page 172 summarizes thepotential errors that can occur with the recognition bonusaward process, showing examples of the internal controls foreach potential mistake. This figure shows that more than oneerror may occur for a single activity.
The amount of time you spend on internal controls de-pends on the purpose of your work. If numerous errors causedyou to look at a business process, then you should spend consid-erable time on internal controls. On the other hand, if your goalis to look for improvement opportunities to increase the effec-tiveness, efficiency, and adaptability of the process, then spendless time. Think about identifying internal controls for ex-tremely sensitive business processes, whether the business hasasked you to do so or not.
When you complete the internal controls document, itshould become part of your overall process documentation. InChapter 4, you saw that we started to define how to package theentire business process for future reference. Figure 7-5 shows
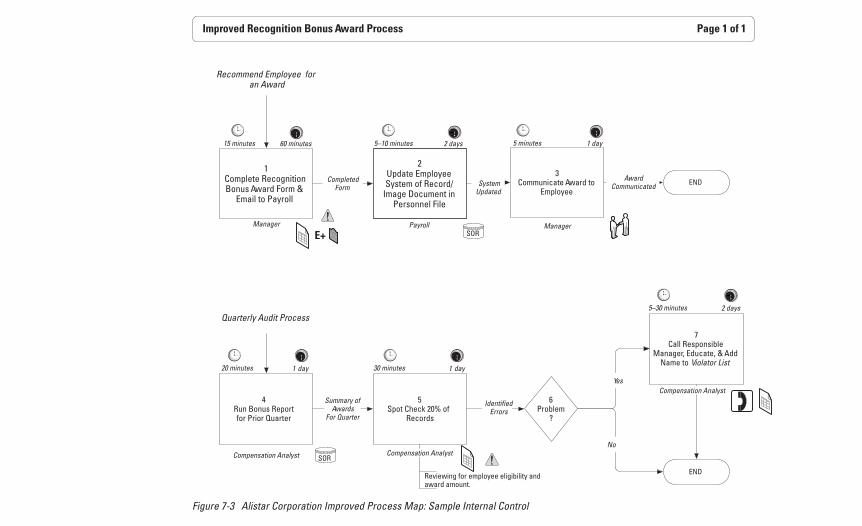
Improved Recognition Bonus Award Process Page 1 of 1
1Complete Recognition Bonus Award Form &
Email to Payroll
Recommend Employee for an Award
2Update Employee System of Record/
Image Document in Personnel File
7Call Responsible
Manager, Educate, & Add Name to Violator List
CompletedForm
Reviewing for employee eligibility and award amount.
Manager
END
Payroll
SystemUpdated
4Run Bonus Reportfor Prior Quarter
3Communicate Award to
Employee
5Spot Check 20% of
Records
Summary ofAwards
For Quarter
Compensation Analyst Compensation Analyst
Manager
IdentifiedErrors
15 minutes
20 minutes
5 minutes5–10 minutes
5–30 minutes
30 minutes yad1yad1
1 day
2 days
2 days60 minutes
6Problem
?
Yes
No
Award Communicated
Quarterly Audit Process
END
Compensation Analyst
E+
SOR
SOR
Figure 7-3 Alistar Corporation Improved Process Map: Sample Internal Control
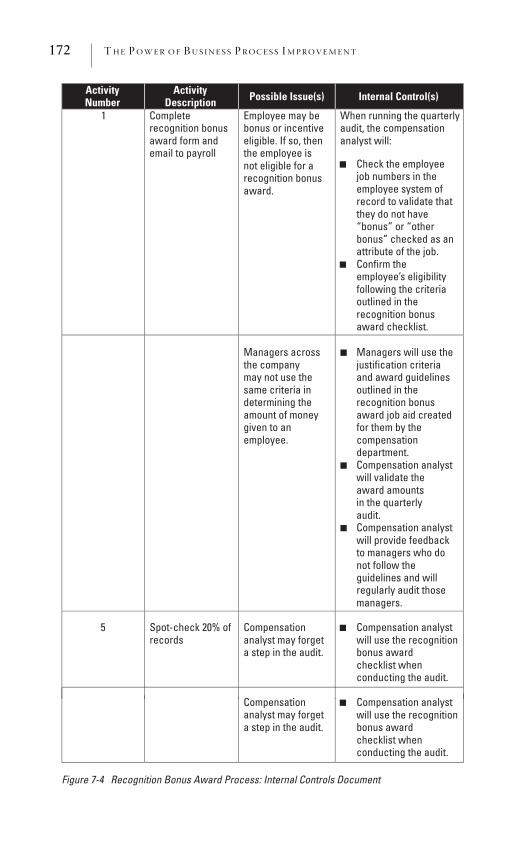
172 THE POWER OF BUS INE S S P ROCES S IMPROVEMENT
ActivityNumber
ActivityDescription Possible Issue(s) Internal Control(s)
1 Completerecognition bonus award form and email to payroll
Employee may be bonus or incentive eligible. If so, then the employee isnot eligible for a recognition bonus award.
When running the quarterlyaudit, the compensation analyst will:
Check the employee job numbers in the employee system of record to validate that they do not have “bonus” or “other bonus” checked as an attribute of the job. Confirm the
■
■
employee’s eligibility following the criteria outlined in the recognition bonus award checklist.
Managers across the company may not use thesame criteria indetermining the amount of money given to an employee.
Managers will use the justification criteria and award guidelines outlined in the recognition bonus award job aid created for them by the compensationdepartment.Compensation analyst will validate the award amountsin the quarterly audit.Compensation analyst
■
■
■
will provide feedback to managers who do not follow the guidelines and will regularly audit those managers.
5 Spot-check 20% ofrecords
Compensationanalyst may forgeta step in the audit.
Compensation analyst ■
will use the recognition bonus awardchecklist whenconducting the audit.
Compensation analyst ■
will use the recognition bonus awardchecklist whenconducting the audit.
Compensationanalyst may forget a step in the audit.
Figure 7-4 Recognition Bonus Award Process: Internal Controls Document
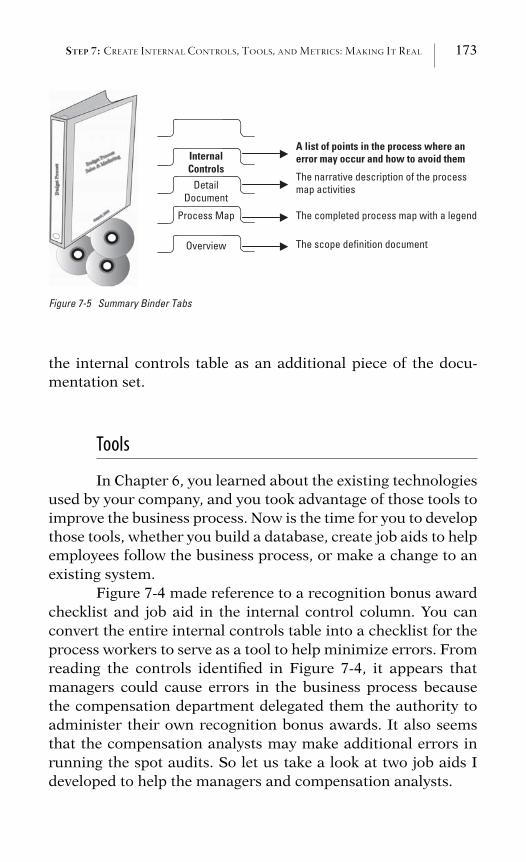
STEP 7: CREATE INTERNAL CONTROLS, TOOLS, AND METRICS: MAKING IT REAL 173
The scope definition document
The completed process map with a legend
The narrative description of the process map activities
A list of points in the process where anerror may occur and how to avoid them
Process Map
Overview
DetailDocument
InternalControls
Figure 7-5 Summary Binder Tabs
the internal controls table as an additional piece of the docu-mentation set.
Tools
In Chapter 6, you learned about the existing technologiesused by your company, and you took advantage of those tools toimprove the business process. Now is the time for you to developthose tools, whether you build a database, create job aids to helpemployees follow the business process, or make a change to anexisting system.
Figure 7-4 made reference to a recognition bonus awardchecklist and job aid in the internal control column. You canconvert the entire internal controls table into a checklist for theprocess workers to serve as a tool to help minimize errors. Fromreading the controls identified in Figure 7-4, it appears thatmanagers could cause errors in the business process becausethe compensation department delegated them the authority toadminister their own recognition bonus awards. It also seemsthat the compensation analysts may make additional errors inrunning the spot audits. So let us take a look at two job aids Ideveloped to help the managers and compensation analysts.
174 THE POWER OF BUS INE S S P ROCES S IMPROVEMENT
Job AidsSimple, quick job aids can provide easy step-by-step di-
rections or guidelines to help drive consistency in a businessprocess. They can help with complex tasks and provide refer-ence information at employees’ fingertips that they otherwisehave to repeatedly look up. Try to keep job aids to a one-sheetdocument that is either single or double-sided for ease ofuse. Figure 7-6 shows an example of a job aid that you can createfor managers so that they have the necessary information attheir fingertips.
Figure 7-7 on page 176 shows an example of a checklistyou can create.
As these two examples demonstrate, you can createcountless tools, depending on the complexity of your businessprocess. You can create a tool to simplify a step in the process,to drive consistency across multiple departments, or to explainhow to use a particular item like a Microsoft Access database.Job aids can help process workers and stakeholders more easilyunderstand a complex business process.
Custom Email Forms
Figure 7-8 on page 177 and Figure 7-9 on page 178 showthat you can create custom forms in Microsoft Outlook by usingthe forms feature of the software. You can then use the normalcapabilities of the email system to send the form to other em-ployees. These two figures resulted from working with a clientin the compensation department who expressed concern thathis recruiters did not always provide the necessary informationfor the department to provide a pay quotation on a new em-ployee; the client had to make multiple phone calls to collect therequired information. The tool I created improved the workflowand eliminated the missing information because the recruitercould not send the form without filling in all the fields.
Use tools like this when you need to ensure that a re-quester supplies the required information for either making a
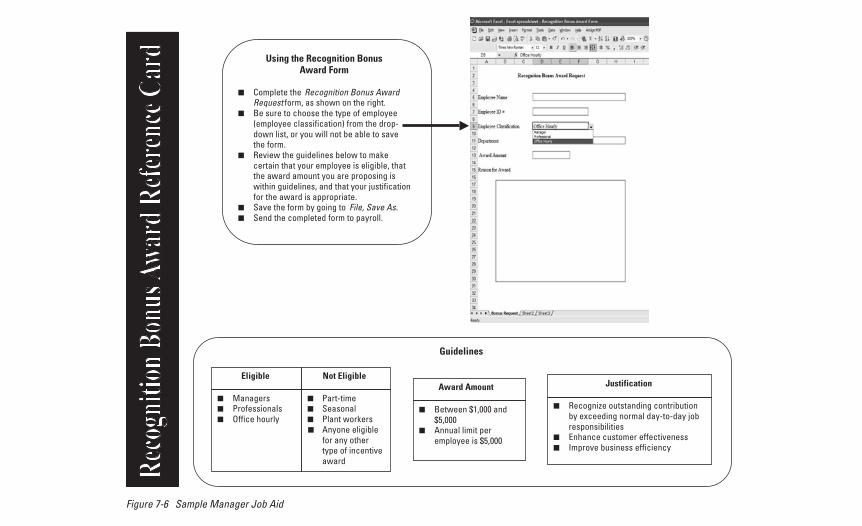
Using the Recognition Bonus Award Form
Complete the Recognition Bonus Award Request form, as shown on the right. Be sure to choose the type of employee (employee classification) from the drop-down list, or you will not be able to save the form. Review the guidelines below to make certain that your employee is eligible, that the award amount you are proposing is within guidelines, and that your justificationfor the award is appropriate. Save the form by going to File, Save As.Send the completed form to payroll.
■
■
■
■
■
Guidelines
Managers ProfessionalsOffice hourly
■
■
■
■
■
■
Part-time SeasonalPlant workers Anyone eligible ■
for any other type of incentiveaward
Eligible Not Eligible
Between $1,000 and $5,000Annual limit per
■
■
employee is $5,000
Award Amount
Recognize outstanding contribution by exceeding normal day-to-day job responsibilitiesEnhance customer effectiveness Improve business efficiency
■
■
■
Justification
Figure 7-6 Sample Manager Job Aid
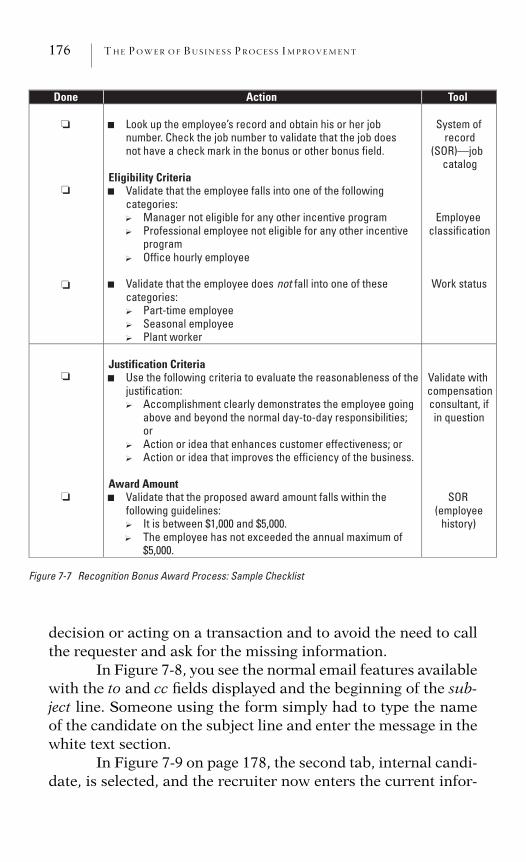
176 THE POWER OF BUS INE S S P ROCES S IMPROVEMENT
Done Action Tool
Look up the employee’s record and obtain his or her job number. Check the job number to validate that the job does not have a check mark in the bonus or other bonus field.
Eligibility CriteriaValidate that the employee falls into one of the following categories:
Manager not eligible for any other incentive program Professional employee not eligible for any other incentive programOffice hourly employee
?
?
?
Validate that the employee does not fall into one of these categories:
Part-time employee Seasonal employee Plant worker
?
?
?
System of record
(SOR)—jobcatalog
Employeeclassification
Work status
Justification Criteria Use the following criteria to evaluate the reasonableness of the justification:
Accomplishment clearly demonstrates the employee going above and beyond the normal day-to-day responsibilities; orAction or idea that enhances customer effectiveness; or Action or idea that improves the efficiency of the business.
?
?
?
Award Amount Validate that the proposed award amount falls within the
■
■
■
■
■
following guidelines: It is between $1,000 and $5,000. The employee has not exceeded the annual maximum of ?
?
$5,000.
Validate with compensationconsultant, if in question
SOR(employee
history)
Figure 7-7 Recognition Bonus Award Process: Sample Checklist
decision or acting on a transaction and to avoid the need to callthe requester and ask for the missing information.
In Figure 7-8, you see the normal email features availablewith the to and cc fields displayed and the beginning of the sub-ject line. Someone using the form simply had to type the nameof the candidate on the subject line and enter the message in thewhite text section.
In Figure 7-9 on page 178, the second tab, internal candi-date, is selected, and the recruiter now enters the current infor-
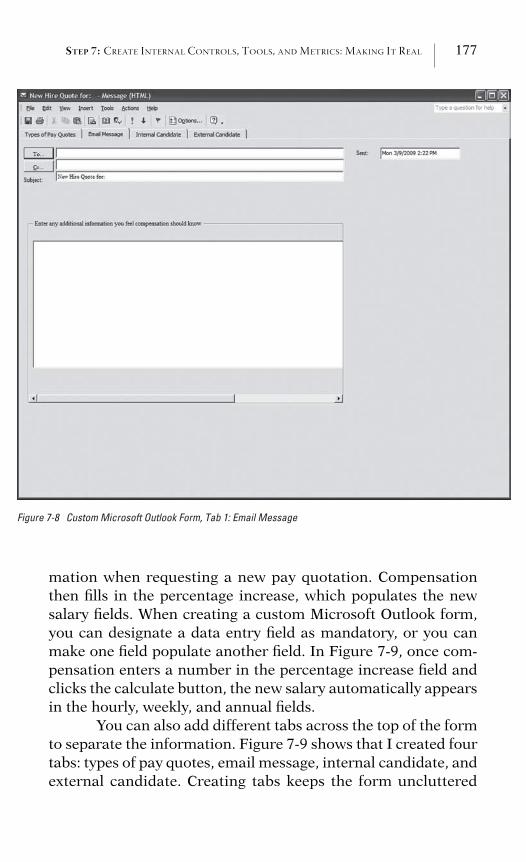
STEP 7: CREATE INTERNAL CONTROLS, TOOLS, AND METRICS: MAKING IT REAL 177
Figure 7-8 Custom Microsoft Outlook Form, Tab 1: Email Message
mation when requesting a new pay quotation. Compensationthen fills in the percentage increase, which populates the newsalary fields. When creating a custom Microsoft Outlook form,you can designate a data entry field as mandatory, or you canmake one field populate another field. In Figure 7-9, once com-pensation enters a number in the percentage increase field andclicks the calculate button, the new salary automatically appearsin the hourly, weekly, and annual fields.
You can also add different tabs across the top of the formto separate the information. Figure 7-9 shows that I created fourtabs: types of pay quotes, email message, internal candidate, andexternal candidate. Creating tabs keeps the form uncluttered
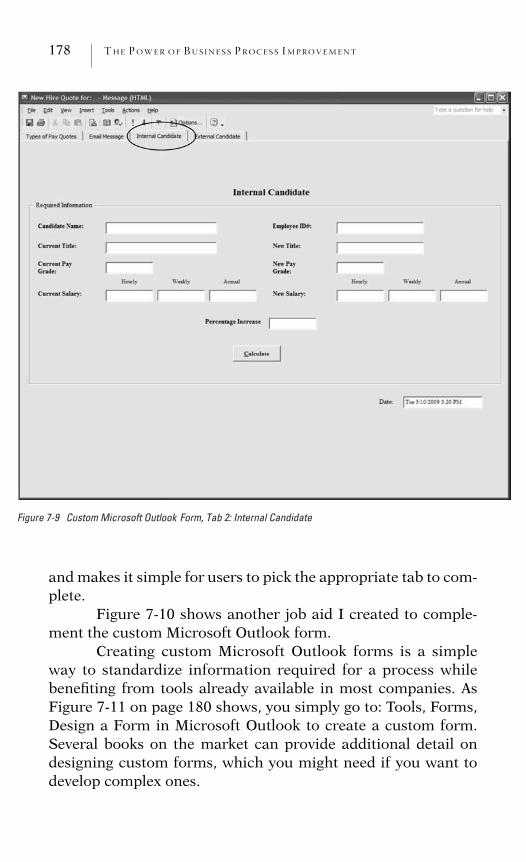
178 THE POWER OF BUS INE S S P ROCES S IMPROVEMENT
Figure 7-9 Custom Microsoft Outlook Form, Tab 2: Internal Candidate
and makes it simple for users to pick the appropriate tab to com-plete.
Figure 7-10 shows another job aid I created to comple-ment the custom Microsoft Outlook form.
Creating custom Microsoft Outlook forms is a simpleway to standardize information required for a process whilebenefiting from tools already available in most companies. AsFigure 7-11 on page 180 shows, you simply go to: Tools, Forms,Design a Form in Microsoft Outlook to create a custom form.Several books on the market can provide additional detail ondesigning custom forms, which you might need if you want todevelop complex ones.
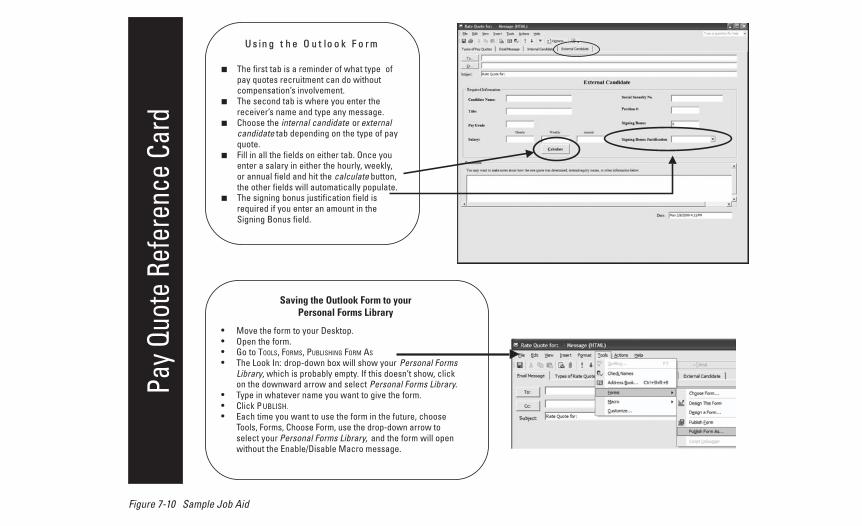
U s in g t h e O u t lo o k F o r m
The first tab is a reminder of what type ofpay quotes recruitment can do without compensation’s involvement. The second tab is where you enter the receiver’s name and type any message. Choose the internal candidate or externalcandidate tab depending on the type of pay quote.Fill in all the fields on either tab. Once you enter a salary in either the hourly, weekly, or annual field and hit the calculate button, the other fields will automatically populate. The signing bonus justification field is
■
■
■
■
■
required if you enter an amount in the Signing Bonus field.
Saving the Outlook Form to yourPersonal Forms Library
• Move the form to your Desktop. • Open the form. • Go to TOOLS, FORMS, PUBLISHING FORM AS
• The Look In: drop-down box will show your Personal Forms Library, which is probably empty. If this doesn’t show, click on the downward arrow and select Personal Forms Library.
• Type in whatever name you want to give the form. • Click PUBLISH.• Each time you want to use the form in the future, choose
Tools, Forms, Choose Form, use the drop-down arrow toselect your Personal Forms Library, and the form will open without the Enable/Disable Macro message.
Pay Q
uote
Ref
eren
ce C
ard
Figure 7-10 Sample Job Aid
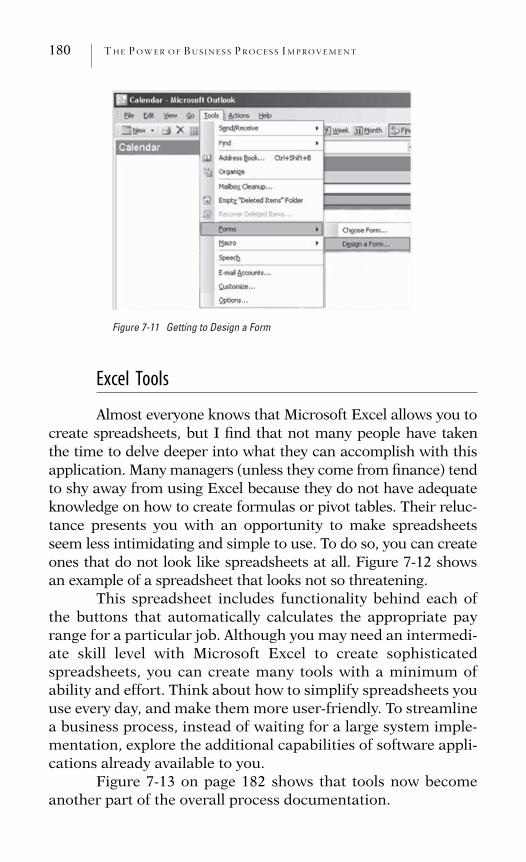
180 THE POWER OF BUS INE S S P ROCES S IMPROVEMENT
Figure 7-11 Getting to Design a Form
Excel Tools
Almost everyone knows that Microsoft Excel allows you tocreate spreadsheets, but I find that not many people have takenthe time to delve deeper into what they can accomplish with thisapplication. Many managers (unless they come from finance) tendto shy away from using Excel because they do not have adequateknowledge on how to create formulas or pivot tables. Their reluc-tance presents you with an opportunity to make spreadsheetsseem less intimidating and simple to use. To do so, you can createones that do not look like spreadsheets at all. Figure 7-12 showsan example of a spreadsheet that looks not so threatening.
This spreadsheet includes functionality behind each ofthe buttons that automatically calculates the appropriate payrange for a particular job. Although you may need an intermedi-ate skill level with Microsoft Excel to create sophisticatedspreadsheets, you can create many tools with a minimum ofability and effort. Think about how to simplify spreadsheets youuse every day, and make them more user-friendly. To streamlinea business process, instead of waiting for a large system imple-mentation, explore the additional capabilities of software appli-cations already available to you.
Figure 7-13 on page 182 shows that tools now becomeanother part of the overall process documentation.
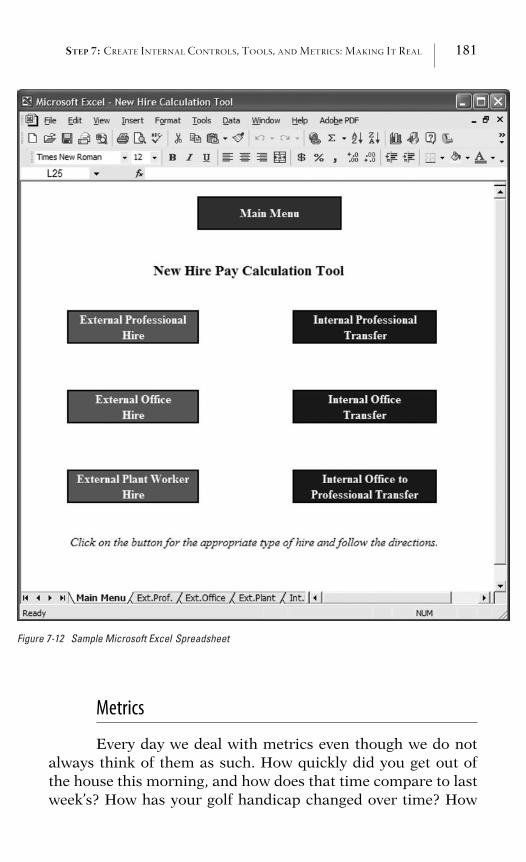
STEP 7: CREATE INTERNAL CONTROLS, TOOLS, AND METRICS: MAKING IT REAL 181
Figure 7-12 Sample Microsoft Excel Spreadsheet
Metrics
Every day we deal with metrics even though we do notalways think of them as such. How quickly did you get out ofthe house this morning, and how does that time compare to lastweek’s? How has your golf handicap changed over time? How
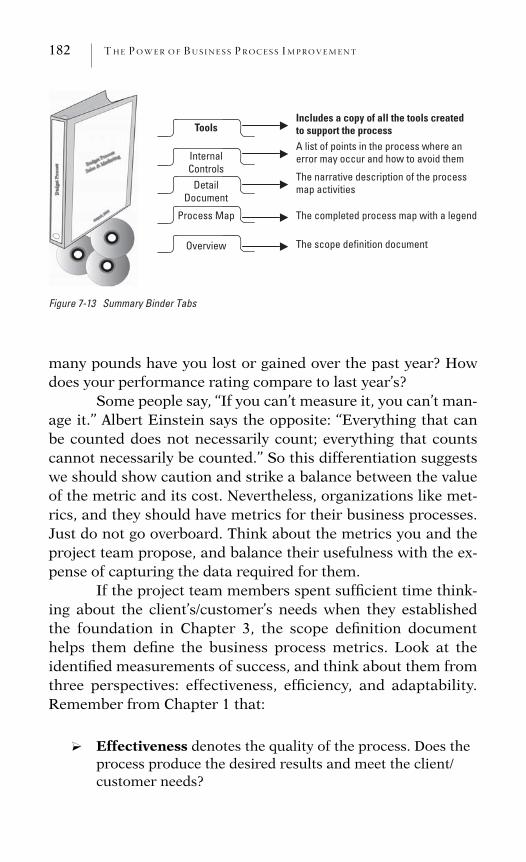
182 THE POWER OF BUS INE S S P ROCES S IMPROVEMENT
The scope definition document
The completed process map with a legend
The narrative description of the process map activities
A list of points in the process where anerror may occur and how to avoid them
Process Map
Overview
DetailDocument
InternalControls
Includes a copy of all the tools createdto support the processTools
Figure 7-13 Summary Binder Tabs
many pounds have you lost or gained over the past year? Howdoes your performance rating compare to last year’s?
Some people say, ‘‘If you can’t measure it, you can’t man-age it.’’ Albert Einstein says the opposite: ‘‘Everything that canbe counted does not necessarily count; everything that countscannot necessarily be counted.’’ So this differentiation suggestswe should show caution and strike a balance between the valueof the metric and its cost. Nevertheless, organizations like met-rics, and they should have metrics for their business processes.Just do not go overboard. Think about the metrics you and theproject team propose, and balance their usefulness with the ex-pense of capturing the data required for them.
If the project team members spent sufficient time think-ing about the client’s/customer’s needs when they establishedthe foundation in Chapter 3, the scope definition documenthelps them define the business process metrics. Look at theidentified measurements of success, and think about them fromthree perspectives: effectiveness, efficiency, and adaptability.Remember from Chapter 1 that:
? Effectiveness denotes the quality of the process. Does theprocess produce the desired results and meet the client/customer needs?
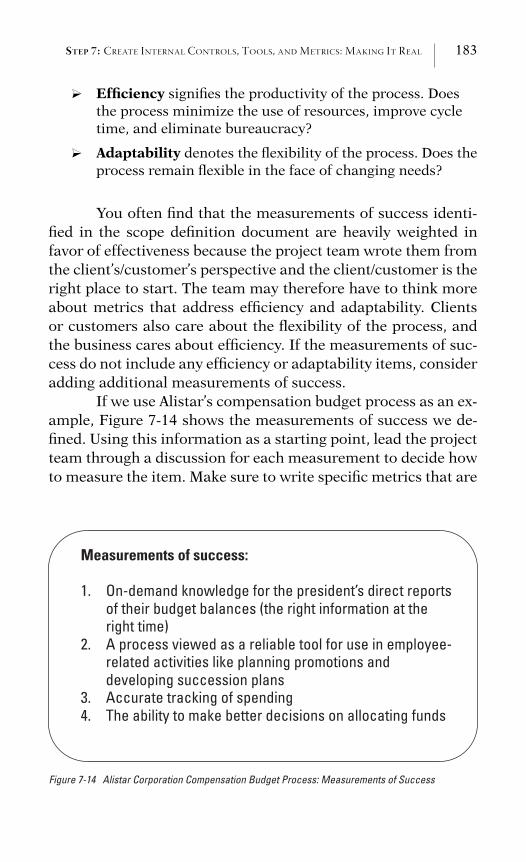
STEP 7: CREATE INTERNAL CONTROLS, TOOLS, AND METRICS: MAKING IT REAL 183
? Efficiency signifies the productivity of the process. Doesthe process minimize the use of resources, improve cycletime, and eliminate bureaucracy?
? Adaptability denotes the flexibility of the process. Does theprocess remain flexible in the face of changing needs?
You often find that the measurements of success identi-fied in the scope definition document are heavily weighted infavor of effectiveness because the project team wrote them fromthe client’s/customer’s perspective and the client/customer is theright place to start. The team may therefore have to think moreabout metrics that address efficiency and adaptability. Clientsor customers also care about the flexibility of the process, andthe business cares about efficiency. If the measurements of suc-cess do not include any efficiency or adaptability items, consideradding additional measurements of success.
If we use Alistar’s compensation budget process as an ex-ample, Figure 7-14 shows the measurements of success we de-fined. Using this information as a starting point, lead the projectteam through a discussion for each measurement to decide howto measure the item. Make sure to write specific metrics that are
Measurements of success:
1. On-demand knowledge for the president’s direct reports of their budget balances (the right information at the right time)
2. A process viewed as a reliable tool for use in employee-related activities like planning promotions and developing succession plans
3. Accurate tracking of spending 4. The ability to make better decisions on allocating funds
Figure 7-14 Alistar Corporation Compensation Budget Process: Measurements of Success
184 THE POWER OF BUS INE S S P ROCES S IMPROVEMENT
actionable and that have a time component. Everyone shouldunderstand what each metric means.
In the compensation budget process, we defined ‘‘on-demand knowledge of the budget balances’’ as the first measure-ment of success for Alistar. In other words, the half dozen sen-ior-level executives want assurance that they can identify howmuch money remains in their salary budget to spend at any timethroughout the year. The executives care about the timeliness ofthe information, which relates to our discussion of cycle time inChapter 6. In this case, the executives did not want to wait forthe normal monthly report; they wanted the information at theirfingertips. So how do you meet their need?
Start by defining what on-demand means in this case.You may find that a weekly update adequately meets the require-ment, or they may want daily updates. When the executives said‘‘on-demand,’’ they may have simply meant something more fre-quent than the monthly report that they now receive. After de-fining what on-demand means, think about the work involvedin delivering against the need and the value of achieving thismeasurement. In other words, how much labor does it take toprovide on-demand knowledge, and how much is it worth?
The project team discussed this measurement of successfor some time and considered things like what on-demandmeant, where the department stored the budget information,whether the executives already had access to the information,and whether the executives knew how to run the reports. Wefound that the company’s human resource system of record heldthe budget information and that the executives had access tothe information any time they wanted it, but they never ran thereports. The project team evaluated several options:
? Redesign the report if it did not provide the executives withthe information they wanted.
? Create a variant (a predefined report format) and teach theexecutives how to run the report easily using the variant.
? Have compensation run the report for the executives anddownload the information into a spreadsheet.
STEP 7: CREATE INTERNAL CONTROLS, TOOLS, AND METRICS: MAKING IT REAL 185
It turned out that weekly updates would provide seniorexecutives with the information they wanted in the appropriatetime frame. Although the budget information resided in the sys-tem of record and the executives could retrieve the informationat any time, even daily if they preferred, they did not want totake the time to learn how to run the report. Sound familiar? Asa result, the compensation department decided to run the reportand download the information into a spreadsheet for the execu-tives. Because this needed to be done for only a half dozen exec-utives, meeting this requirement added an additional 15minutes per week to the overall business process, a labor invest-ment deemed worth the cost.
Pete Hodges, our sales executive from Chapter 3, definedsuccess in multiple ways, but the number of new customers be-came a key metric that directly led to the lead-generation proc-ess. One of his measurements of success read, ‘‘Increasednumber of new customers.’’ Initially, this may seem like an effi-ciency metric because the statement seems to focus on volume.However, once we discussed how to measure an increase in thevolume of new customers, it became obvious that Pete caredabout more than the volume; he was also concerned about thequality of new customers. So remember not to assume what aword means. Clarify the terminology for each measurement ofsuccess before defining a metric. As a result of our discussion,Pete defined the metric as ‘‘30 percent increase in the number ofqualified new customers over the next six months.’’
Look at the second Alistar measurement of success inFigure 7-14, and you find the term reliable used. Again, whatdoes that term mean?
In the third measurement, it sounds like the compensa-tion department had trouble accurately tracking past spending.The first job is to uncover what occurred in the past so that youunderstand what this measurement means, and the next step isto establish controls so that the same problem does not happenagain.
The fourth identified measurement is an internal metricfor the compensation department. When you have internal mea-surements, spend time discussing how the department knows
186 THE POWER OF BUS INE S S P ROCES S IMPROVEMENT
when it achieves this success. Because it gets easier to create ametric once the project team can share what success looks like,simply ask, ‘‘What does success look like?’’ ‘‘How will you knowwhen you achieve success?’’ For Alistar, this measurement ofsuccess really meant how much money remained at the end ofthe year for each of their compensation funds. Because they for-feit any money remaining at the end of a year, similar to a healthflexible spending account, they wanted to make sure that theyspent every last dollar. We defined the metric for this last itemas ‘‘Less than 1 percent of budget will remain at year end.’’
Once you understand what to measure, establish a base-line measurement to help the business recognize whether thenew business process moves the organization in the right direc-tion. In the previous internal metric example, compensation hadabout 10 percent of the budget left at the end of the prior year.With their new goal of less than 1 percent, they can tell whenthey are moving in the right direction.
A department that has responsibility for system supportprovides another example. If reducing the number of reportedproblems in a specific area like security is important, then theyhave to start by identifying the number of problems reportedtoday, which becomes the baseline. We could then state the met-ric as ‘‘20 percent reduction in security issues over the nextyear.’’
Chapter Summary: Step 7
Identifying points in the business process where a mis-take can occur provides the opportunity to introduce internalcontrols. Using a warning symbol to mark those spots makesthe problem areas visible and obvious. Developing an internalcontrol document, which contains the details about how toavoid common errors, provides an effective training tool for newprocess workers.
Developing tools to support the business process helpstrain new process workers to avoid errors. Create job aids tosimplify or standardize a step in the process, use software appli-
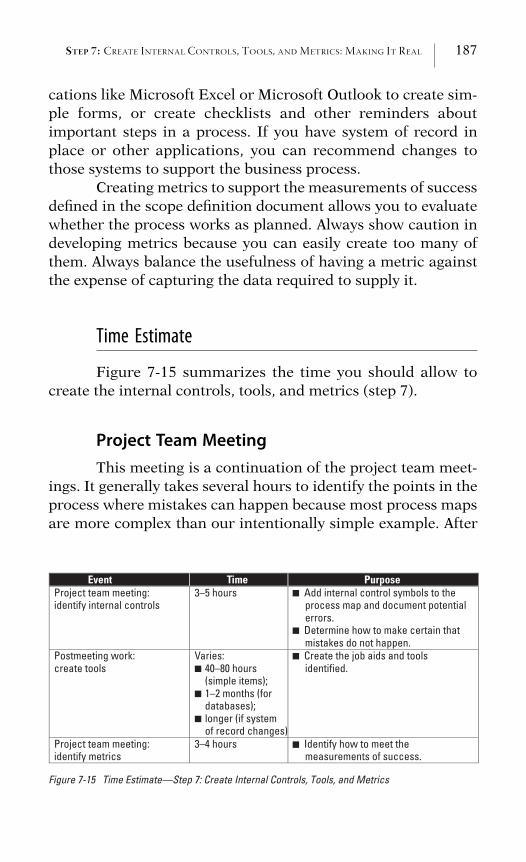
STEP 7: CREATE INTERNAL CONTROLS, TOOLS, AND METRICS: MAKING IT REAL 187
cations like Microsoft Excel or Microsoft Outlook to create sim-ple forms, or create checklists and other reminders aboutimportant steps in a process. If you have system of record inplace or other applications, you can recommend changes tothose systems to support the business process.
Creating metrics to support the measurements of successdefined in the scope definition document allows you to evaluatewhether the process works as planned. Always show caution indeveloping metrics because you can easily create too many ofthem. Always balance the usefulness of having a metric againstthe expense of capturing the data required to supply it.
Time Estimate
Figure 7-15 summarizes the time you should allow tocreate the internal controls, tools, and metrics (step 7).
Project Team MeetingThis meeting is a continuation of the project team meet-
ings. It generally takes several hours to identify the points in theprocess where mistakes can happen because most process mapsare more complex than our intentionally simple example. After
Event Time PurposeProject team meeting: identify internal controls
3–5 hours Add internal control symbols to the process map and document potential errors.Determine how to make certain that mistakes do not happen.
Postmeeting work: create tools
Varies: 40–80 hours (simple items); 1–2 months (for databases);longer (if system
■
■
■
of record changes)
Create the job aids and tools
■
■
■
■
identified.
Project team meeting: identify metrics
3–4 hours Identify how to meet the measurements of success.
Figure 7-15 Time Estimate—Step 7: Create Internal Controls, Tools, and Metrics
188 THE POWER OF BUS INE S S P ROCES S IMPROVEMENT
identifying the potential problem areas, spend the remainder ofthe meeting identifying how to avoid the potential mistakes. Igenerally dedicate an entire meeting to this topic because ittakes some time to identify solutions to potential errors. Identi-fying the possible errors is easy; determining how to avoid theproblems is the hard part.
Postmeeting WorkDuring this time, the project team creates the tools iden-
tified during the process improvement phase. Depending on thenumber of internal controls and tools you have to create, thistime takes from one to two weeks for simple job aids, a monthor more to create databases, and significantly longer if you planto make changes to your company’s system of record.
Project Team MeetingDuring this meeting, your entire focus is on reviewing
what you identified as the measurements of success on the scopedefinition document and talking about how you can deliveragainst those goals.
What You Have Achieved
In this chapter, you have achieved the following:
? The ability to identify internal controls to avoid potentialproblem points in a business process
? The knowledge of how to create a variety of tools to simplifythe process
? The wisdom of when to include a metric and how to use themeasurements of success as a starting point
? Most important, the power to bring the business process tolife by including internal controls, tools, and metrics thatemployees can use
C H A P T E R 8
Step 8: Test and Rework
Making Sure It Works
Joanne Wu, training and development manager for a mid-size computer manufacturer, redesigned a half dozen of her de-partment’s business processes to increase her department’sresponsiveness to its clients. She often received complaints thatit took too long to design and develop courses to address unex-pected training needs that surfaced throughout the year.
Joanne and I worked together for several weeks tochange a myriad of steps in her business processes, reduce theapproval cycle, and realign resources. Now we had to make cer-tain that the changes worked before introducing the new proc-esses on a wide scale. Joanne identified the area trainingmanagers as the test group because she considered them a cru-cial client group who routinely brought unplanned regionaltraining requirements to her attention. The area training man-agers had geographically dispersed employees, so using them asthe test group would also enable us to assess how the processworked in multiple locations. If the new process worked for thearea training managers, it would work for Joanne’s remainingclients. We decided to conduct the test during December, a tra-ditionally slow time for the manufacturer to deliver training.
At this point in the roadmap, you have completed theformidable work. You redesigned the business process so thatthe client/customer sees the process as effective and so that itruns efficiently for the business. You have also documented theprocess and created new tools and metrics to support the proc-
189
190 THE POWER OF BUS INE S S P ROCES S IMPROVEMENT
ess. Now you want to validate that the process, documentation,and tools work as you expect.
As an example of what you might find out, the customMicrosoft Outlook form I created to support pay quotations(Chapter 7) worked fine when entering information and calcu-lating formulas. However, we found in testing that, once the re-cruiter received an email from compensation with the new payquote amounts, the recruiters could not forward the quotationto the hiring manager because we had not enabled the forward-ing capability when we designed the form.
Before introducing a new, improved process to the orga-nization, test it and work out any bugs before communicatingthe change on a wide scale. Testing the business process helpsto determine how well the business process will perform in theorganization so that you meet your goals, whether they are in-creased productivity, minimizing errors, or something else. Test-ing helps in identifying bottlenecks and provides the chance tofix or rework the problems, thus ensuring that the implementa-tion proceeds as smoothly as possible.
In this phase of the work, think about the who, what,where, when, and how of testing:
? Whom do you involve in the testing? Consider who will usethe process and tools created. If the business processinvolves only a single department, you may have a small listof people to include in the testing. On the other hand, mul-tiple departments often share responsibility for a businessprocess. In this case, the list of people to include may con-sist of employees who work with the process daily becausethey will act as subject matter experts, managers who havea role in the process, and stakeholders who have an interestin the process.
If you suspect dissimilarity between local and globalsites, include both sites in the testing phase. Ideally, youshould include local and global site team members early inthe overall process work itself, instead of just during thetesting phase. This saves rework time in the end.
? What do you have to test? Test the business process itself,the associated documentation, and the tools created to sup-
STEP 8: TEST AND REWORK: MAKING SURE IT WORKS 191
port the process. This includes any job aids created, anynew technologies introduced, and any metrics designed.
Even though you may not have any actual data yet forthe measurements, create a mock-up of what the measure-ment will look like and validate that the information meetsthe requirements of the data recipients. If you plan to createa report, include a mock-up of the report during testing tovalidate that it works.
? Where should the testing occur? Define the different loca-tions where testing must happen.� If employees use the process in multiple locations, you
may have to test the tools at various business sitesbecause each location may use a different technology orhave unusual technical challenges. You may encounterfirewall or server challenges at different sites dependingon their functions.
� If you have local sites and global sites, include key loca-tions in the testing to validate that the process and toolswork at both types of sites. You may find a step in theprocess that does not work because of a country’s legalrequirements. If you work in the United States and havelocations in Europe, for example, think about chal-lenges that can arise because of the Safe Harbor frame-work developed between the United States and theEuropean Union. The following excerpt, taken from theU.S. Department of Commerce Web site, provides anoverview of Safe Harbor’s concern with protecting a cit-izen’s privacy. You can read additional information athttp://www.export.gov/safeharbor/eu/doc_eg_safeharbor_eu.asp:
While the United States and the European Union share the goal
of enhancing privacy protection for their citizens, the United
States takes a different approach to privacy from that taken by
the European Union.
In order to bridge these different privacy approaches and
provide a streamlined means for U.S. organizations to comply
with the Directive, the U.S. Department of Commerce in consul-
tation with the European Commission developed a `̀ Safe Harbor''
framework.
192 THE POWER OF BUS INE S S P ROCES S IMPROVEMENT
� Another decision revolves around whether to test thetools from the work location and from home. Do man-agers frequently work from home? Do managers usehandheld devices?
Think about who will use the business process, where theusers work, and how they do their work to identify theparameters to include in the testing.
? When should the testing occur? Identify the time frame forthe testing period. Think about the best time to conduct thetesting, and avoid any peak periods for the business. Forexample, if you work with finance, avoid month- and year-end time periods. If you work with a company that has aseasonal business, avoid those busy times.
In Joanne Wu’s case, she wanted to conduct the testingin December, a customarily slow period for the computermanufacturer. However, other businesses may considerDecember a busy holiday season.
? How will the testing happen? Define your testing approach,which you can think of as the series of steps involved intesting. If you participated in a system implementation inthe past, you will see similarity with the steps involved inthe user acceptance testing phase of those implementationsbecause this testing focuses on subject matter experts whotest, through trial and error, that the new or modifiedprocess and tools work.
In systems testing, three key types of testing occur: useracceptance testing, integration testing, and regressiontesting. Of course, an implementation includes other varie-ties of testing (like unit, performance, or stress testing), butthe three I mention generally involve business partnersversus the technical staff. User acceptance testing has themost applicability to business process work, because of thesimilarity of the steps.
The Five Steps in Testing the Business Process
Figure 8-1 shows the five steps to follow in testing thebusiness process.
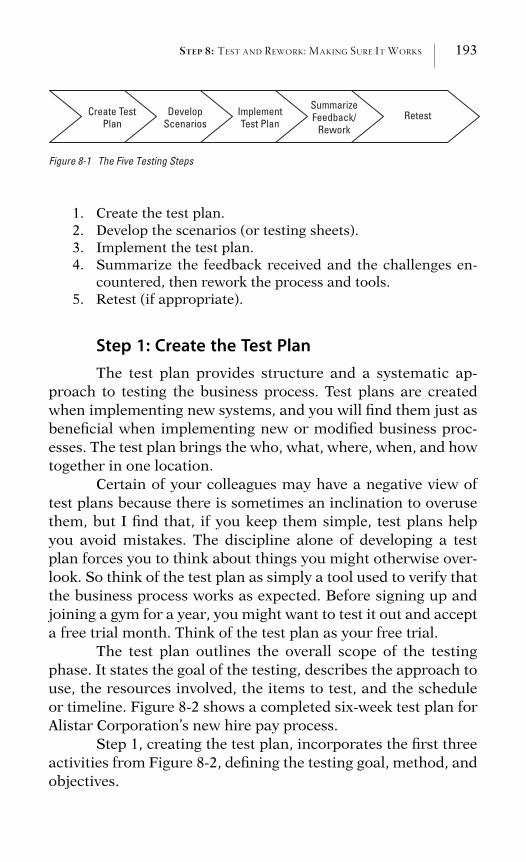
STEP 8: TEST AND REWORK: MAKING SURE IT WORKS 193
Create Test Plan
DevelopScenarios
ImplementTest Plan
SummarizeFeedback/
ReworkRetest
Figure 8-1 The Five Testing Steps
1. Create the test plan.2. Develop the scenarios (or testing sheets).3. Implement the test plan.4. Summarize the feedback received and the challenges en-
countered, then rework the process and tools.5. Retest (if appropriate).
Step 1: Create the Test PlanThe test plan provides structure and a systematic ap-
proach to testing the business process. Test plans are createdwhen implementing new systems, and you will find them just asbeneficial when implementing new or modified business proc-esses. The test plan brings the who, what, where, when, and howtogether in one location.
Certain of your colleagues may have a negative view oftest plans because there is sometimes an inclination to overusethem, but I find that, if you keep them simple, test plans helpyou avoid mistakes. The discipline alone of developing a testplan forces you to think about things you might otherwise over-look. So think of the test plan as simply a tool used to verify thatthe business process works as expected. Before signing up andjoining a gym for a year, you might want to test it out and accepta free trial month. Think of the test plan as your free trial.
The test plan outlines the overall scope of the testingphase. It states the goal of the testing, describes the approach touse, the resources involved, the items to test, and the scheduleor timeline. Figure 8-2 shows a completed six-week test plan forAlistar Corporation’s new hire pay process.
Step 1, creating the test plan, incorporates the first threeactivities from Figure 8-2, defining the testing goal, method, andobjectives.
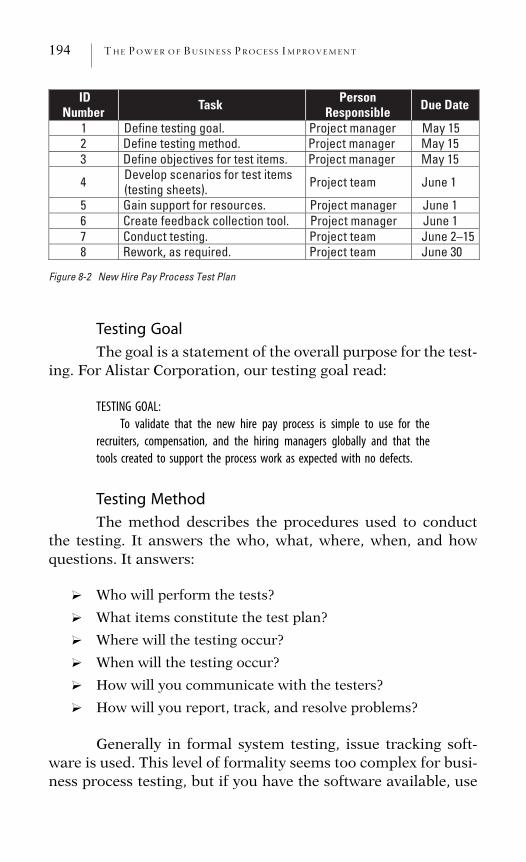
194 THE POWER OF BUS INE S S P ROCES S IMPROVEMENT
IDNumber Task Person
Responsible Due Date
1 Define testing goal. Project manager May 15 2 Define testing method. Project manager May 15 3 Define objectives for test items. Project manager May 15
4 Develop scenarios for test items (testing sheets). Project team June 1
5 Gain support for resources. Project manager June 1 6 Create feedback collection tool. Project manager June 1 7 Conduct testing. Project team June 2–158 Rework, as required. Project team June 30
Figure 8-2 New Hire Pay Process Test Plan
Testing Goal
The goal is a statement of the overall purpose for the test-ing. For Alistar Corporation, our testing goal read:
TESTING GOAL:
To validate that the new hire pay process is simple to use for the
recruiters, compensation, and the hiring managers globally and that the
tools created to support the process work as expected with no defects.
Testing Method
The method describes the procedures used to conductthe testing. It answers the who, what, where, when, and howquestions. It answers:
? Who will perform the tests?
? What items constitute the test plan?
? Where will the testing occur?
? When will the testing occur?
? How will you communicate with the testers?
? How will you report, track, and resolve problems?
Generally in formal system testing, issue tracking soft-ware is used. This level of formality seems too complex for busi-ness process testing, but if you have the software available, use
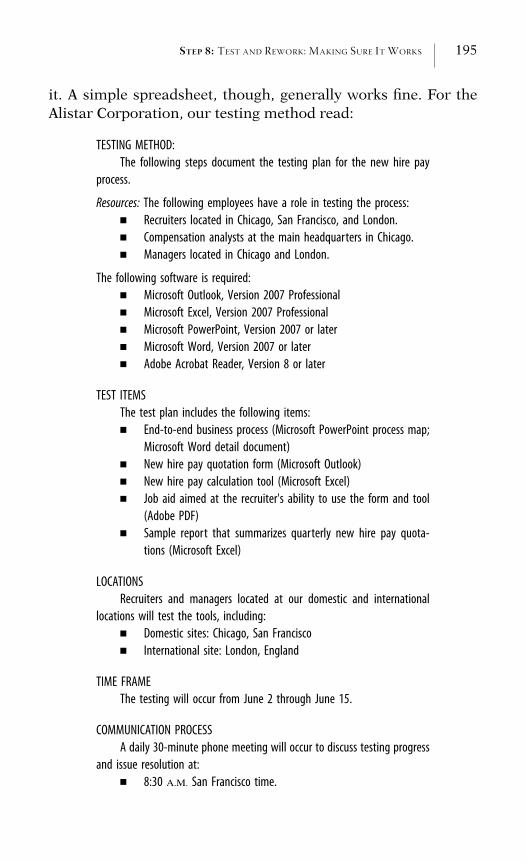
STEP 8: TEST AND REWORK: MAKING SURE IT WORKS 195
it. A simple spreadsheet, though, generally works fine. For theAlistar Corporation, our testing method read:
TESTING METHOD:
The following steps document the testing plan for the new hire pay
process.
Resources: The following employees have a role in testing the process:
� Recruiters located in Chicago, San Francisco, and London.
� Compensation analysts at the main headquarters in Chicago.
� Managers located in Chicago and London.
The following software is required:
� Microsoft Outlook, Version 2007 Professional
� Microsoft Excel, Version 2007 Professional
� Microsoft PowerPoint, Version 2007 or later
� Microsoft Word, Version 2007 or later
� Adobe Acrobat Reader, Version 8 or later
TEST ITEMS
The test plan includes the following items:
� End-to-end business process (Microsoft PowerPoint process map;
Microsoft Word detail document)
� New hire pay quotation form (Microsoft Outlook)
� New hire pay calculation tool (Microsoft Excel)
� Job aid aimed at the recruiter's ability to use the form and tool
(Adobe PDF)
� Sample report that summarizes quarterly new hire pay quota-
tions (Microsoft Excel)
LOCATIONS
Recruiters and managers located at our domestic and international
locations will test the tools, including:
� Domestic sites: Chicago, San Francisco
� International site: London, England
TIME FRAME
The testing will occur from June 2 through June 15.
COMMUNICATION PROCESS
A daily 30-minute phone meeting will occur to discuss testing progress
and issue resolution at:
� 8:30 A.M. San Francisco time.
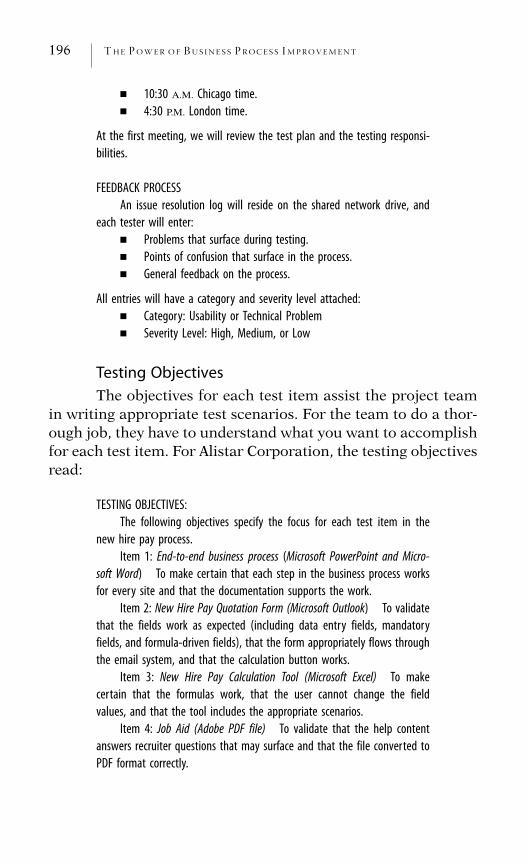
196 THE POWER OF BUS INE S S P ROCES S IMPROVEMENT
� 10:30 A.M. Chicago time.
� 4:30 P.M. London time.
At the first meeting, we will review the test plan and the testing responsi-
bilities.
FEEDBACK PROCESS
An issue resolution log will reside on the shared network drive, and
each tester will enter:
� Problems that surface during testing.
� Points of confusion that surface in the process.
� General feedback on the process.
All entries will have a category and severity level attached:
� Category: Usability or Technical Problem
� Severity Level: High, Medium, or Low
Testing Objectives
The objectives for each test item assist the project teamin writing appropriate test scenarios. For the team to do a thor-ough job, they have to understand what you want to accomplishfor each test item. For Alistar Corporation, the testing objectivesread:
TESTING OBJECTIVES:
The following objectives specify the focus for each test item in the
new hire pay process.
Item 1: End-to-end business process (Microsoft PowerPoint and Micro-
soft Word) To make certain that each step in the business process works
for every site and that the documentation supports the work.
Item 2: New Hire Pay Quotation Form (Microsoft Outlook) To validate
that the fields work as expected (including data entry fields, mandatory
fields, and formula-driven fields), that the form appropriately flows through
the email system, and that the calculation button works.
Item 3: New Hire Pay Calculation Tool (Microsoft Excel) To make
certain that the formulas work, that the user cannot change the field
values, and that the tool includes the appropriate scenarios.
Item 4: Job Aid (Adobe PDF file) To validate that the help content
answers recruiter questions that may surface and that the file converted to
PDF format correctly.
STEP 8: TEST AND REWORK: MAKING SURE IT WORKS 197
Item 5: Report (Microsoft Excel) To validate that the report includes
information required to help senior management understand the cost of
hire.
Step 2: Develop the ScenariosWhen the resources you identified for testing are ready
to start, what do they do? Where do they begin? You do not wantthem sitting around making up their own scenarios because thiswastes time and they might not test the items that you wantthem to test. The test scenarios, or testing sheets, provide theresources with step-by-step guidelines so that they understandhow to test the process and tools.
Figure 8-3 shows the overall workflow for the MicrosoftOutlook new hire pay quotation form for Alistar Corporation.The six steps involved in the process are repeated under eachprocess worker with their responsibility for the form high-lighted. This figure shows that:
? The recruiter requests the quotation from compensation.
? Compensation determines the pay rate and sends the quota-tion back to the recruiter.
? The recruiter then opens the quotation and forwards thequotation to the hiring manager.
? The hiring manager opens the quotation on their desktop,home computer, or handheld device.
Test Scripts and Data Sheets
The information in Figure 8-3 assists in creating appro-priate scenarios because each highlighted task under test scriptsin the figure must be accompanied by a testing sheet. For exam-ple, look at the first test script under the recruiter’s list, requestquote. Figure 8-4 on page 199 shows the steps involved in testingthat step. The text above Figure 8-4 provides the following gen-eral information:
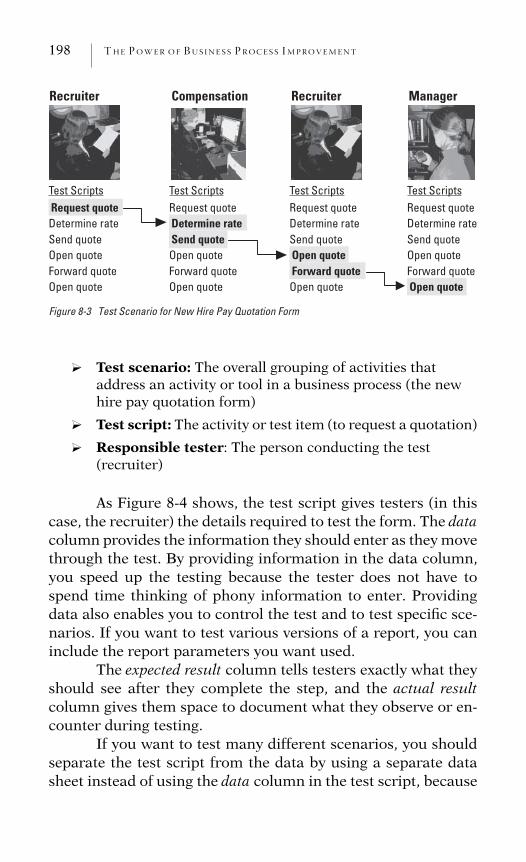
198 THE POWER OF BUS INE S S P ROCES S IMPROVEMENT
Recruiter Compensation Recruiter Manager
Test ScriptsRequest quoteDetermine rate Send quote Open quote Forward quote Open quote
Test ScriptsRequest quote Determine rateSend quoteOpen quote Forward quote Open quote
Test ScriptsRequest quote Determine rate Send quote Open quote Forward quote Open quote
Test ScriptsRequest quote Determine rate Send quote Open quoteForward quoteOpen quote
Figure 8-3 Test Scenario for New Hire Pay Quotation Form
? Test scenario: The overall grouping of activities thataddress an activity or tool in a business process (the newhire pay quotation form)
? Test script: The activity or test item (to request a quotation)
? Responsible tester: The person conducting the test(recruiter)
As Figure 8-4 shows, the test script gives testers (in thiscase, the recruiter) the details required to test the form. The datacolumn provides the information they should enter as they movethrough the test. By providing information in the data column,you speed up the testing because the tester does not have tospend time thinking of phony information to enter. Providingdata also enables you to control the test and to test specific sce-narios. If you want to test various versions of a report, you caninclude the report parameters you want used.
The expected result column tells testers exactly what theyshould see after they complete the step, and the actual resultcolumn gives them space to document what they observe or en-counter during testing.
If you want to test many different scenarios, you shouldseparate the test script from the data by using a separate datasheet instead of using the data column in the test script, because
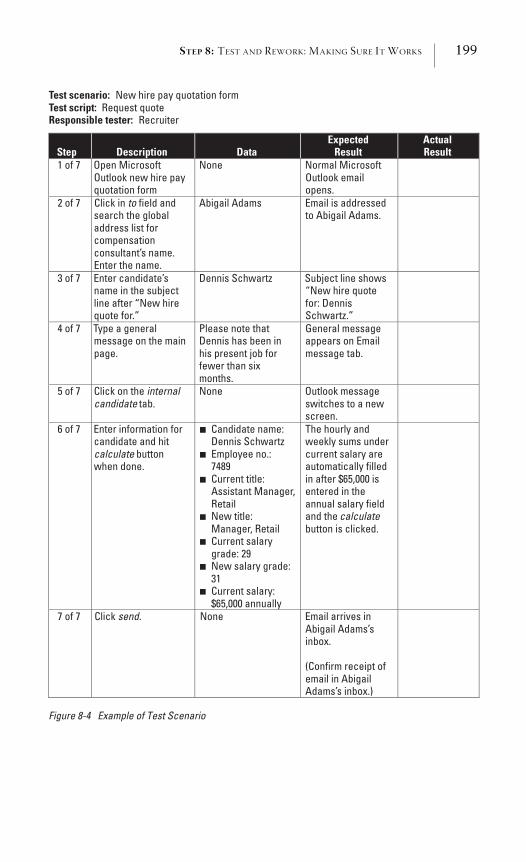
STEP 8: TEST AND REWORK: MAKING SURE IT WORKS 199
Test scenario: New hire pay quotation form Test script: Request quote Responsible tester: Recruiter
Step Description DataExpected
ResultActualResult
1 of 7 Open Microsoft Outlook new hire pay quotation form
None Normal Microsoft Outlook email opens.
2 of 7 Click in to field andsearch the global address list for compensationconsultant’s name. Enter the name.
Abigail Adams Email is addressed to Abigail Adams.
3 of 7 Enter candidate’s name in the subject line after “New hire quote for.”
Dennis Schwartz Subject line shows “New hire quote for: Dennis Schwartz.”
4 of 7 Type a general message on the main page.
Please note that Dennis has been in his present job for fewer than six months.
General message appears on Email message tab.
5 of 7 Click on the internalcandidate tab.
None Outlook message switches to a new screen.
6 of 7 Enter information for candidate and hit calculate buttonwhen done.
Candidate name: Dennis Schwartz Employee no.: 7489Current title: Assistant Manager, RetailNew title: Manager, Retail Current salary grade: 29 New salary grade: 31Current salary:
■
■
■
■
■
■
■
$65,000 annually
The hourly and weekly sums under current salary are automatically filled in after $65,000 is entered in the annual salary field and the calculatebutton is clicked.
7 of 7 Click send. None Email arrives in Abigail Adams’s inbox.
(Confirm receipt of email in Abigail Adams’s inbox.)
Figure 8-4 Example of Test Scenario
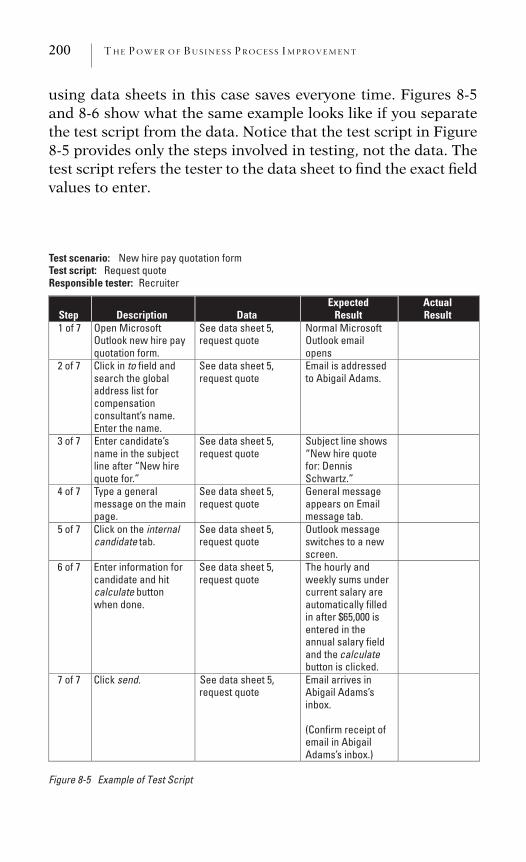
200 THE POWER OF BUS INE S S P ROCES S IMPROVEMENT
using data sheets in this case saves everyone time. Figures 8-5and 8-6 show what the same example looks like if you separatethe test script from the data. Notice that the test script in Figure8-5 provides only the steps involved in testing, not the data. Thetest script refers the tester to the data sheet to find the exact fieldvalues to enter.
Test scenario: New hire pay quotation form Test script: Request quote Responsible tester: Recruiter
Step Description DataExpected
ResultActualResult
1 of 7 Open Microsoft Outlook new hire pay quotation form.
See data sheet 5, request quote
Normal Microsoft Outlook email opens
2 of 7 Click in to field andsearch the global address list for compensationconsultant’s name. Enter the name.
See data sheet 5, request quote
Email is addressed to Abigail Adams.
3 of 7 Enter candidate’s name in the subject line after “New hire quote for.”
See data sheet 5, request quote
Subject line shows “New hire quote for: Dennis Schwartz.”
4 of 7 Type a general message on the main page.
See data sheet 5, request quote
General message appears on Email message tab.
5 of 7 Click on the internalcandidate tab.
See data sheet 5, request quote
Outlook message switches to a new screen.
6 of 7 Enter information for candidate and hit calculate buttonwhen done.
See data sheet 5, request quote
The hourly and weekly sums under current salary are automatically filled in after $65,000 is entered in the annual salary field and the calculatebutton is clicked.
7 of 7 Click send. See data sheet 5, request quote
Email arrives in Abigail Adams’s inbox.
(Confirm receipt of email in Abigail Adams’s inbox.)
Figure 8-5 Example of Test Script
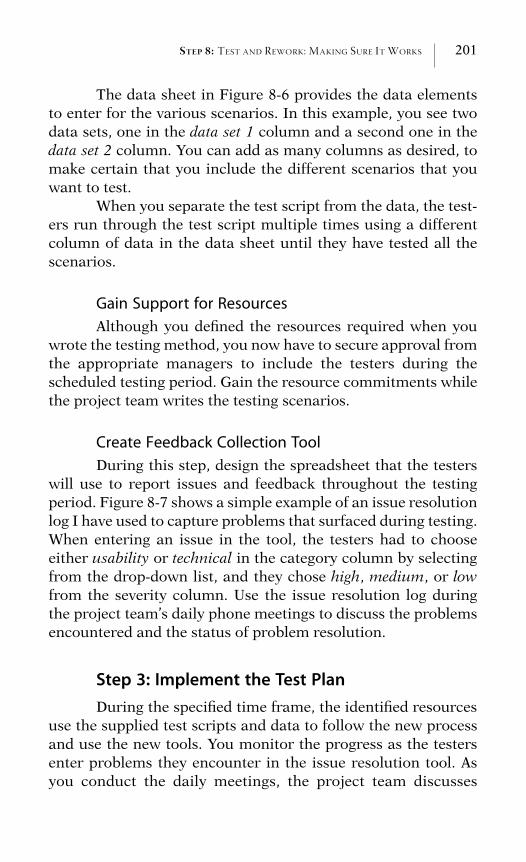
STEP 8: TEST AND REWORK: MAKING SURE IT WORKS 201
The data sheet in Figure 8-6 provides the data elementsto enter for the various scenarios. In this example, you see twodata sets, one in the data set 1 column and a second one in thedata set 2 column. You can add as many columns as desired, tomake certain that you include the different scenarios that youwant to test.
When you separate the test script from the data, the test-ers run through the test script multiple times using a differentcolumn of data in the data sheet until they have tested all thescenarios.
Gain Support for Resources
Although you defined the resources required when youwrote the testing method, you now have to secure approval fromthe appropriate managers to include the testers during thescheduled testing period. Gain the resource commitments whilethe project team writes the testing scenarios.
Create Feedback Collection Tool
During this step, design the spreadsheet that the testerswill use to report issues and feedback throughout the testingperiod. Figure 8-7 shows a simple example of an issue resolutionlog I have used to capture problems that surfaced during testing.When entering an issue in the tool, the testers had to chooseeither usability or technical in the category column by selectingfrom the drop-down list, and they chose high, medium, or lowfrom the severity column. Use the issue resolution log duringthe project team’s daily phone meetings to discuss the problemsencountered and the status of problem resolution.
Step 3: Implement the Test PlanDuring the specified time frame, the identified resources
use the supplied test scripts and data to follow the new processand use the new tools. You monitor the progress as the testersenter problems they encounter in the issue resolution tool. Asyou conduct the daily meetings, the project team discusses
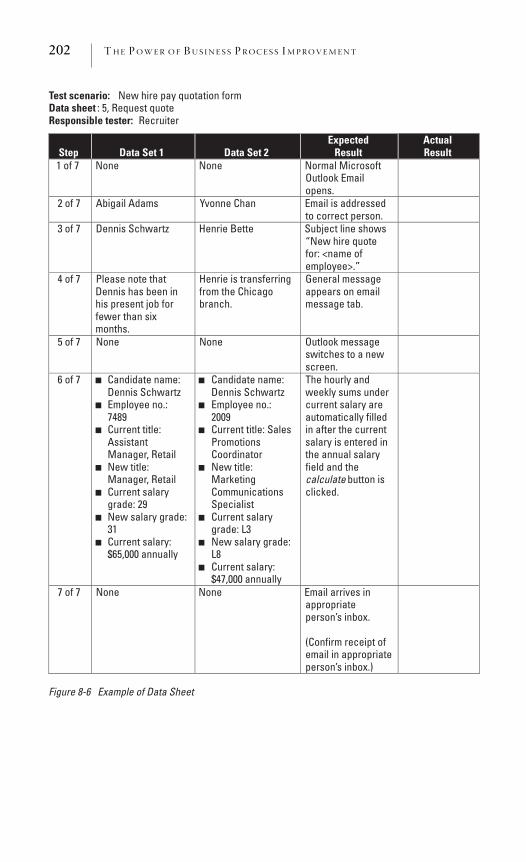
202 THE POWER OF BUS INE S S P ROCES S IMPROVEMENT
Test scenario: New hire pay quotation form Data sheet : 5, Request quote Responsible tester: Recruiter
Step Data Set 1 Data Set 2 Expected
ResultActualResult
1 of 7 None None Normal Microsoft Outlook Email opens.
2 of 7 Abigail Adams Yvonne Chan Email is addressed to correct person.
3 of 7 Dennis Schwartz Henrie Bette Subject line shows “New hire quote for: <name of employee>.”
4 of 7 Please note that Dennis has been in his present job for fewer than six months.
Henrie is transferring from the Chicago branch.
General message appears on email message tab.
5 of 7 None None Outlook message switches to a new screen.
6 of 7 Candidate name: Dennis Schwartz
Employee no.: 7489
Current title: AssistantManager, Retail
New title: Manager, Retail
Current salary grade: 29
New salary grade: 31
Current salary:
■
■
■
■
■
■
■
$65,000 annually
Candidate name: Dennis Schwartz
Employee no.: 2009
Current title: Sales PromotionsCoordinator
New title: MarketingCommunicationsSpecialist
Current salary grade: L3
New salary grade: L8
Current salary:
■
■
■
■
■
■
■
$47,000 annually
The hourly and weekly sums under current salary are automatically filled in after the current salary is entered in the annual salary field and the calculate button is clicked.
7 of 7 None None Email arrives in appropriateperson’s inbox.
(Confirm receipt of email in appropriate person’s inbox.)
Figure 8-6 Example of Data Sheet
STEP 8: TEST AND REWORK: MAKING SURE IT WORKS 203
ID Number Test Item Date Description Category Severity Detected By Assigned To1 Calculation
tool6/4 No scenario
for an external hire with greater than 10 years’experience
Usability High Sarah Jones
JesusCarrabba
2 Job aid 6/5 Missing step: what to do after you enter the desiredpercentage
Usability Low May Chang
Sue Sams
3 Quote form 6/5 Cannot forwardform to hiringmanager
Technical High Liz Fleet Jesus Carrabba
4 5
Figure 8-7 New Hire Pay Quotation Process: Issue Resolution Tool
known problems and possible resolutions. If the project teamresolves a problem, remove the item from the list by movingthe problem to a new worksheet called closed. Continue workingthrough the issue resolution log until the team fixes the majorproblems.
Step 4: Summarize Feedback and ReworkOnce the test period ends, summarize the findings and
determine the next steps. If you do not obtain the results ex-pected, identify the steps required to attain them. You may haveto adjust the business process itself, fix errors in spreadsheets,or rectify other problems that surfaced during the testing phase.
Step 5: RetestBased on the number and severity of problems that sur-
faced, you may or may not have to retest a portion of the proc-ess. View testing as an iterative process when you test an item.
204 THE POWER OF BUS INE S S P ROCES S IMPROVEMENT
If the item does not work, you fix it, but then you have to test itagain.
Chapter Summary: Step 8
Creating a plan to test the new business process helpsto make certain that it works as expected and that you do notexperience too many surprises during implementation. Con-sider it your test drive.
The discipline of creating a test plan forces you to an-swer questions such as who should be involved in the testing,what items to test, where to conduct the testing, when is thebest time to conduct the test, and the steps involved in thetesting.
Test scripts provide structure for the resources by givingthem step-by-step instructions for conducting the test. Gather-ing information in an issue resolution log or a similar tool givesyou the information to understand what may have to change inthe business process or tools. Include as many different scenar-ios in the testing phase that may occur in real life. If you havemultiple scenarios, separate the data from the test script byusing data sheets.
Once the testing is done, summarize the feedback andmake adjustments. If you make a substantial number of changes,retest either the entire business process or the impacted tools.
If you suspect deviation between local and global loca-tions, include participants from both locations in the overallprocess work itself because including them early in the processsaves rework time in the end.
Time Estimate
To plan the time that it takes to work through this step,Figure 8-8 summarizes the time you should allow to test theprocess (step 8).
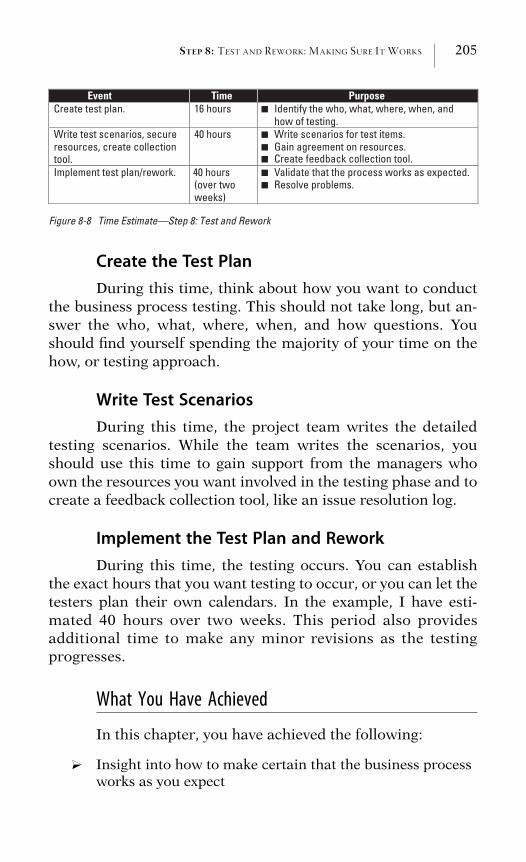
STEP 8: TEST AND REWORK: MAKING SURE IT WORKS 205
Event Time PurposeCreate test plan. 16 hours Identify the who, what, where, when, and
how of testing. Write test scenarios, secure resources, create collection tool.
40 hours Write scenarios for test items. Gain agreement on resources.
Implement test plan/rework. 40 hours (over two weeks)
Validate that the process works as expected. Resolve problems.
■
■
■
Create feedback collection tool. ■
■
■
Figure 8-8 Time Estimate—Step 8: Test and Rework
Create the Test PlanDuring this time, think about how you want to conduct
the business process testing. This should not take long, but an-swer the who, what, where, when, and how questions. Youshould find yourself spending the majority of your time on thehow, or testing approach.
Write Test ScenariosDuring this time, the project team writes the detailed
testing scenarios. While the team writes the scenarios, youshould use this time to gain support from the managers whoown the resources you want involved in the testing phase and tocreate a feedback collection tool, like an issue resolution log.
Implement the Test Plan and ReworkDuring this time, the testing occurs. You can establish
the exact hours that you want testing to occur, or you can let thetesters plan their own calendars. In the example, I have esti-mated 40 hours over two weeks. This period also providesadditional time to make any minor revisions as the testingprogresses.
What You Have Achieved
In this chapter, you have achieved the following:
? Insight into how to make certain that the business processworks as you expect
206 THE POWER OF BUS INE S S P ROCES S IMPROVEMENT
? The awareness to include both local and global locations inthe business process improvement work, or at least intesting the process
? The importance of identifying whom to include in testing,what to test, where to test, when to test, and the method fortesting
? The steps involved in the entire testing cycle
? Knowledge of how to create a test script and data sheets
? Most important, the power to make certain that you intro-duce a workable business process into your company
C H A P T E R 9
Step 9: Implement the Change
Preparing the Organization
Now that you know your business process and tools willwork, think about how to introduce the change to the organiza-tion. Who needs to know? What do they need to know? Whenshould you inform them? How should you communicate thechange?
The term change management simply means taking peo-ple in an organization from the current state to a future state.This chapter focuses on managing change because, as we knowfrom our own experiences, change is a constant and ‘‘nothingendures but change,’’ as the Greek philosopher Heraclitus wrote.
When the banking industry went through a cycle of rapidacquisitions and mergers in the 1990s, I was asked by an indus-try giant to help them merge two separate business processes.At the beginning of the work, I developed an implementationplan that included all the roadmap steps, which kept the workorganized while ensuring that we did not miss anyone or any-thing along the way.
The implementation plan acts as your guide to ensuresuccessful implementation of a new or improved business proc-ess. Think of it as a project plan that focuses on either an indi-vidual business process or a group of processes. It includeseverything from start to finish:
? Developing the process inventory
? Establishing the foundation and creating the scope defini-tion document
207
208 THE POWER OF BUS INE S S P ROCES S IMPROVEMENT
? Drawing the process map and developing the documenta-tion
? Estimating the time and cost
? Verifying the process map
? Applying the improvement techniques
? Creating internal controls, tools, and metrics
? Testing and reworking the business process
? Implementing the change
? Developing a continuous improvement plan
In this chapter, I cover three new topics to include in animplementation plan that will help you identify the who, what,where, when, and how. The implementation plan acts as the or-ganizing umbrella that pulls the following three components to-gether in one location:
1. The impact analysis outlines the changes that must happenin the organization to ensure a successful implementationof the business process.
2. The communication plan provides clarity about who needsto know about the change, what they need to know, whenthey need to know and the best method of communicationfor each of the defined audiences.
3. The training plan covers who requires training on what, whoowns the responsibility to conduct the training, where thetraining will occur, and when and how to deliver thetraining.
The sponsor, as the champion for the change, has in-creased responsibility in the implementation phase, and that re-sponsibility includes advocating the change, aligning thebusiness process changes with the organizational strategy, andhelping to resolve any resistance or remove roadblocks.
The Implementation Plan
The best implementation plans include phases that breakthe work down into reasonable chunks that function as a guide
STEP 9: IMPLEMENT THE CHANGE: PREPARING THE ORGANIZATION 209
to keep the work on track. Figure 9-1 shows an example of animplementation plan with three phases identified:
? The design phase identifies the work involved in definingand improving the business process.
? The development phase includes creating the toolsrequired to make the improved business process workbefore moving to step 8, where you test the process.
? The implementation phase includes testing the process,determining how to roll out the new business process, howto communicate and train the affected people, and how tocontinually improve the business process so that it remainsrelevant over time.
For a complex business process, it helps to use projectmanagement software. For a simple business process, on theother hand, a table or a spreadsheet may work fine. If you use atable or spreadsheet, though, you must manually calculate howlong a task takes (the duration), which can be a disadvantagebecause manual calculations increase the time required to cre-ate the original timeline and then to make adjustments to thedates as the work progresses. Figure 9-1 shows an implementa-tion plan created with Microsoft Office Project. That figureshows the following standard Microsoft Office Project columns:
? Task Name: Create the phases in this column and includespecific tasks associated with each major phase. Figure 9-1shows three phases (design, development, and implementa-tion). The implementation phase then includes four sepa-rate tracks (change management, testing, communication,and training). Using tracks within a phase helps to furtherorganize the work. Although this layout works well for gen-eral business process implementations, feel free to cus-tomize the list of tasks to fit your situation.
? Duration: This column states how long a task will take tocomplete. After entering the number of days for each task,Microsoft Office Project automatically rolls up the subtasksand shows the total duration for a phase in bold text. Forexample, Figure 9-1 shows a duration of:
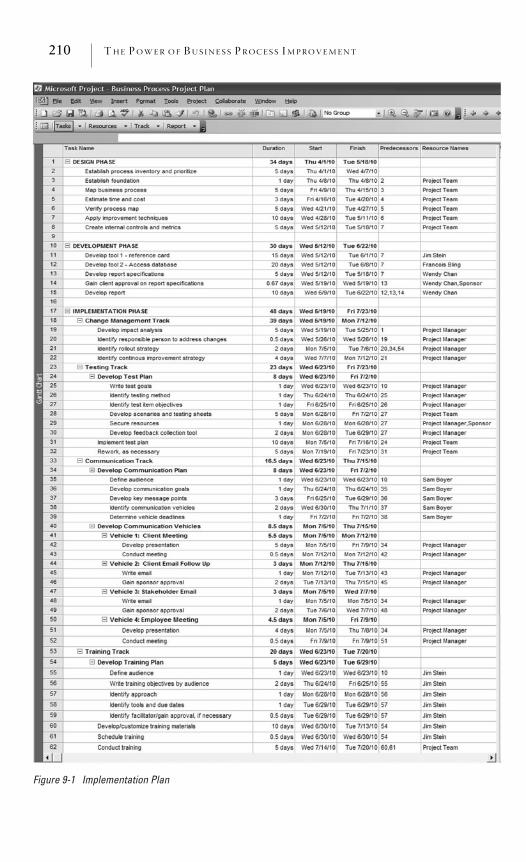
210 THE POWER OF BUS INE S S P ROCES S IMPROVEMENT
Figure 9-1 Implementation Plan
STEP 9: IMPLEMENT THE CHANGE: PREPARING THE ORGANIZATION 211
� 34 days for the design phase (row 1).� 30 days for the development phase (row 10).� 48 days for the implementation phase (row 17).
? Start/Finish: Microsoft Office Project automatically calcu-lates the start and finish dates once you enter the beginningdate of the project and the duration for each task.
? Predecessors: This column shows the dependency of onetask on another and allows you to identify whether one taskhas to occur before another can start. If you make one taska predecessor to another, Microsoft Office Project appropri-ately schedules the start and finish dates to ensure that thefirst task is completed before scheduling the second task. InFigure 9-1, row 4 has the number 3 listed in the predecessorscolumn, indicating that you cannot begin mapping the busi-ness process (task 4) until you have established the founda-tion (task 3). In this example, Microsoft Office Projectautomatically set the task 4 start date after the completionof task 3, just as soon as I entered the number 3 in the pre-decessor’s column in row 4.
? Resource Names: Identify the people responsible for atask.
As an alternative to using project software for the imple-mentation plan, Figure 9-2 shows a portion of Figure 9-1 createdusing Microsoft Office Word. In this case think through the taskdependencies and schedule the tasks using the predecessor con-cept.
Overview of the Three Phases of the
Implementation Plan
The next few sections help you to develop an implemen-tation plan by explaining the three phases in greater detail.
The Design PhaseThe design phase tasks in Figure 9-1 or 9-2 should seem
familiar because these include the roadmap steps 2–7 coveredin previous chapters:
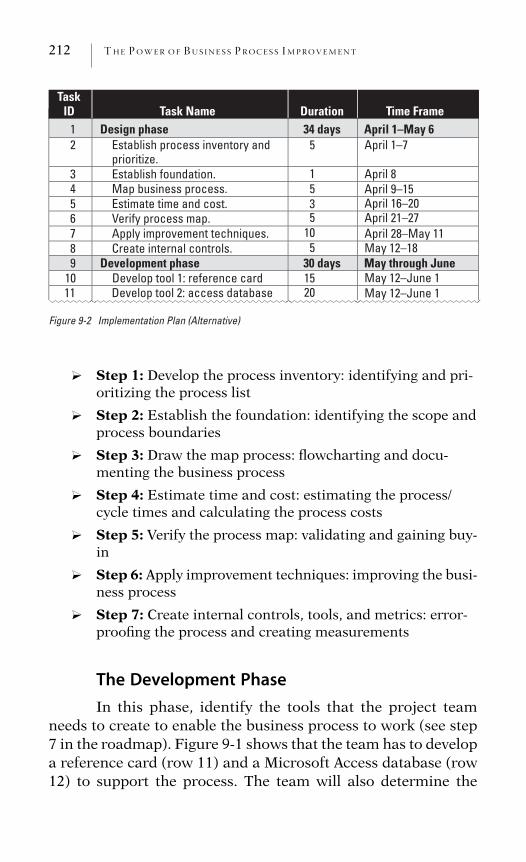
212 THE POWER OF BUS INE S S P ROCES S IMPROVEMENT
Figure 9-2 Implementation Plan (Alternative)
Task Name Duration Time Frame 1 Design phase 34 days April 1–May 6 2 Establish process inventory and
prioritize.April 1–7
April 8April 9–15April 16–20April 21–27April 28–May 11May 12–18
May 12–June 1May 12–June 1
5
1535
105
1520
3 Establish foundation. 4 Map business process. 5 Estimate time and cost. 6 Verify process map. 7 Apply improvement techniques. 8 Create internal controls. 9 Development phase 30 days May through June
10 Develop tool 1: reference card11 Develop tool 2: access database
Task ID
? Step 1: Develop the process inventory: identifying and pri-oritizing the process list
? Step 2: Establish the foundation: identifying the scope andprocess boundaries
? Step 3: Draw the map process: flowcharting and docu-menting the business process
? Step 4: Estimate time and cost: estimating the process/cycle times and calculating the process costs
? Step 5: Verify the process map: validating and gaining buy-in
? Step 6: Apply improvement techniques: improving the busi-ness process
? Step 7: Create internal controls, tools, and metrics: error-proofing the process and creating measurements
The Development PhaseIn this phase, identify the tools that the project team
needs to create to enable the business process to work (see step7 in the roadmap). Figure 9-1 shows that the team has to developa reference card (row 11) and a Microsoft Access database (row12) to support the process. The team will also determine the
STEP 9: IMPLEMENT THE CHANGE: PREPARING THE ORGANIZATION 213
data elements required for the report (row 13), gains agreementfrom clients to verify that the report meets their needs (row 14),and then develops the report (row 15).
The predecessors column on row 15 tells us that the re-port development cannot begin until after the project team cre-ates the database (task 12), develops the report specifications(task 13), and gains client approval (task 14).
The Implementation PhaseThis phase, which covers roadmap steps 8–10, includes
several different components that require further explanation.
? The change management track includes developing animpact analysis, identifying who has responsibility for eachproposed change, determining the overall rollout strategy,and developing the continuous improvement plan. I discusscontinuous improvement as a separate topic in Chapter 10.
? The testing track focuses on step 8 of the roadmap andincludes the tasks that must happen to make sure theprocess works.
? The communication track includes developing the com-munication plan and associated communication vehicles.
? The training track includes developing the training plan,course materials, scheduling the training, securing facilita-tors for the training, and conducting the training.
The Four Tracks in the Implementation Phase
Now that you have an overview of the four tracks in theimplementation phase, let me explain each of them in more de-tail.
Change Management Track (Impact Analysis)As the project team worked to improve the business proc-
ess, they undoubtedly identified changes that need to occur inthe organization to obtain the expected degree of improvement.
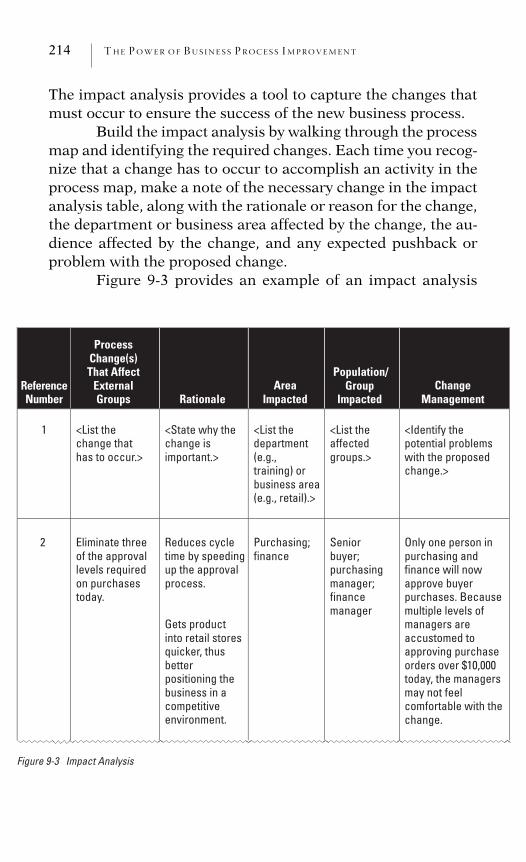
214 THE POWER OF BUS INE S S P ROCES S IMPROVEMENT
The impact analysis provides a tool to capture the changes thatmust occur to ensure the success of the new business process.
Build the impact analysis by walking through the processmap and identifying the required changes. Each time you recog-nize that a change has to occur to accomplish an activity in theprocess map, make a note of the necessary change in the impactanalysis table, along with the rationale or reason for the change,the department or business area affected by the change, the au-dience affected by the change, and any expected pushback orproblem with the proposed change.
Figure 9-3 provides an example of an impact analysis
ReferenceNumber
ProcessChange(s)That Affect
ExternalGroups Rationale
AreaImpacted
Population/Group
ImpactedChange
Management
1 <List the change that has to occur.>
<State why the change is important.>
<List the department(e.g.,training) or business area (e.g., retail).>
<List the affectedgroups.>
<Identify the potential problems with the proposed change.>
2 Eliminate three of the approval levels required on purchases today.
Reduces cycle time by speeding up the approval process.
Gets product into retail stores quicker, thus betterpositioning the business in a competitiveenvironment.
Purchasing;finance
Seniorbuyer;purchasingmanager;financemanager
Only one person in purchasing and finance will now approve buyer purchases. Because multiple levels of managers are accustomed to approving purchase orders over $10,000 today, the managers may not feel comfortable with the change.
Figure 9-3 Impact Analysis
STEP 9: IMPLEMENT THE CHANGE: PREPARING THE ORGANIZATION 215
table. In this example, the impact analysis captures only changesthat affect external groups, as shown by the title of the secondcolumn, because the sponsor’s concern revolved around depart-ments outside of his or her control. You can capture all changesin an impact analysis or just those that impact external groups.
As seen in this example, the new process eliminates threeapproval levels, which improves the cycle time, thus gettingproduct into stores quicker. However, purchasing and financemay not support the change because they may fear that an un-warranted purchase could be made without their approval. Thechange management column lists any potential pushback thatyou or the sponsor should address.
Sponsors appreciate the impact analysis because theyoften own a fair portion of the responsibility for gaining agree-ment on the required changes to the business process, and theimpact analysis provides them with the information they needto make the changes happen.
Testing TrackI do not cover the testing track here because it is dis-
cussed in depth in Chapter 8, and you can refer to that chapterfor the list of items to include in this track.
Communications Track (CommunicationPlan)The third track in the implementation phase involves the
communication plan. In developing this plan, think about whatcommunication has to occur to make sure that all parties re-ceive the appropriate information to prepare them for thechange. Introducing a new business process is like introducingany other change to an organization. After defining the audience(the who), determine the following for each audience:
? The key message points (the what): What each audiencegroup has to know about the change
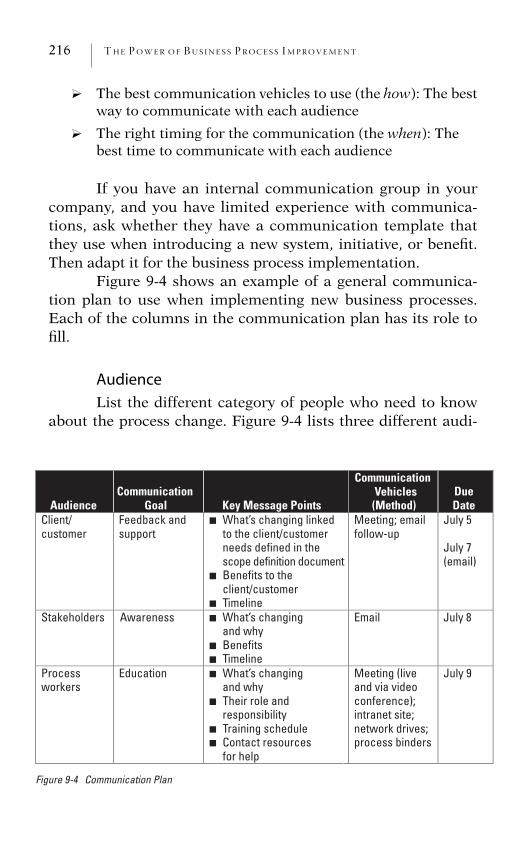
216 THE POWER OF BUS INE S S P ROCES S IMPROVEMENT
? The best communication vehicles to use (the how): The bestway to communicate with each audience
? The right timing for the communication (the when): Thebest time to communicate with each audience
If you have an internal communication group in yourcompany, and you have limited experience with communica-tions, ask whether they have a communication template thatthey use when introducing a new system, initiative, or benefit.Then adapt it for the business process implementation.
Figure 9-4 shows an example of a general communica-tion plan to use when implementing new business processes.Each of the columns in the communication plan has its role tofill.
Audience
List the different category of people who need to knowabout the process change. Figure 9-4 lists three different audi-
AudienceCommunication
Goal Key Message Points
CommunicationVehicles
(Method)DueDate
Client/customer
Feedback and support
What’s changing linked to the client/customerneeds defined in the scope definition document
Benefits to the client/customer
Timeline
Meeting; email follow-up
July 5
July 7 (email)
Stakeholders Awareness What’s changing and why
Benefits Timeline
Email July 8
Processworkers
Education What’s changingand why
Their role and responsibility
Training schedule Contact resources
■
■
■
■
■
■
■
■
■
■
for help
Meeting (live and via video conference);intranet site; network drives; process binders
July 9
Figure 9-4 Communication Plan
STEP 9: IMPLEMENT THE CHANGE: PREPARING THE ORGANIZATION 217
ences: the client/customer, the stakeholders, and the processworkers.
Communication Goal
State what you hope to accomplish with each audience.Typical examples include providing awareness, gaining ap-proval, obtaining feedback, gaining support, or educating.
In the example, the goal for the clients/customers is togain their feedback and support for the changes, whereas thestakeholders simply need awareness of the changes, and theprocess workers require education on the changes so that theycan support the new process.
Key Message Points
List the key points to cover for each audience. Thinkabout different cultures that you may have to communicate withbecause you may need to design different messages to work forthose audiences.
Notice in the example that for the clients/customers, akey message point is to connect the process changes back towhat the project team defined as important to the clients/customers in the scope definition document created in step 2.Getting the key message points correct is critical to a success-ful implementation, so do not rush through this step. The keymessage points make writing the presentation or emails easierbecause they guide you through the creation of the communi-cations.
Communication Vehicles
Identify the methods to use to communicate with eachaudience. Consider the different vehicles available, includingface-to-face meetings, email, brochures, flyers, newsletters, andvideo conferencing. The method(s) chosen may differ becauseof local cultures; for example, some cultures prefer face-to-facecommunications.
For clients/customers, our example shows that we planto conduct face-to-face meetings with them, along with a follow-
218 THE POWER OF BUS INE S S P ROCES S IMPROVEMENT
up email to reinforce the key message points. A simple emailmessage suffices for the stakeholders, and a video conferencemeeting will occur for the process workers in order to engagethe geographically dispersed employees. The project team alsoplans to replace content that resides on the company’s intranet,on network drives, and in the current process binders.
Due Date
Identify the timeline for the each communication piece.Think about who needs to know the information first, second,and third.
In our example, we wanted to communicate with the cli-ents/customers first to gain their support before letting thestakeholders and process workers know about the new process.In this way, any changes that have to occur to the business proc-ess can happen before introducing the new process on a widescale.
As part of the communication plan, develop responsesto any anticipated concerns, in the form of a frequently askedquestions list. This may seem similar to the change managementcolumn in the impact analysis, but in this case the list is muchbroader and has to include questions or concerns that could sur-face from anywhere, both within and outside the departmentmaking the changes. If the new process significantly changes thecurrent work of any of the process workers, you should includethis fact in the impact analysis so that the sponsor can assumeresponsibility for presenting the change to the affected em-ployees.
The keys for successful communication include usingsimple language and terminology that the audience under-stands, as well as putting the message in the appropriate contextso that the recipients of the message can relate to the key points.
Training Track (Training Plan)The fourth track in the implementation phase entails the
training plan. In developing this plan, think about what training
STEP 9: IMPLEMENT THE CHANGE: PREPARING THE ORGANIZATION 219
has to occur to make sure that all parties understand and canperform their process responsibilities. Consider:
? Who needs training
? Who owns the responsibility to conduct the training
? What they need training on
? Where to conduct the training
? When to train
? What methods to use to conduct the training
Although some people use the terms training and com-munication interchangeably, they are two different streams ofwork, and anyone in the training field probably has experiencewith a client trying to make a communication problem a train-ing problem. I differentiate the two terms this way:
? Communication transmits or exchanges information andmessages.
? Training provides a person with the knowledge and skillsto perform a task.
If you have an internal training group in your company,and you have limited experience with training, ask for its helpon this part of the implementation. Tools may exist that you canuse when analyzing audience needs, deciding how to deliver thetraining, and developing the training.
Figure 9-5 shows a general example of a training planthat you can use as a starting point for implementing any newbusiness process. Let us look more closely at each of the col-umns in the training plan.
Audience
Here you list the different categories of people who re-quire training on the process change.
You may notice that we omitted the stakeholders fromthe training plan in Figure 9-5, although we included them in
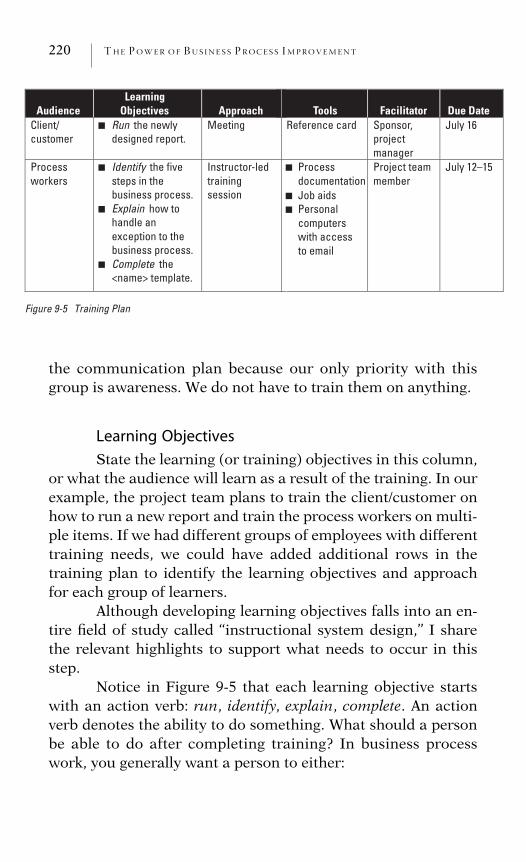
220 THE POWER OF BUS INE S S P ROCES S IMPROVEMENT
AudienceLearning
Objectives Approach Tools Due Date FacilitatorClient/customer
Run■ the newly designed report.
Meeting Reference card Sponsor, projectmanager
July 16
Processworkers
Identify the five steps in the business process. Explain how to handle an exception to the business process. Complete the
■
■
■
<name> template.
Instructor-led trainingsession
ProcessdocumentationJob aids Personal
■
■
■
computerswith access to email
Project team member
July 12–15
Figure 9-5 Training Plan
the communication plan because our only priority with thisgroup is awareness. We do not have to train them on anything.
Learning Objectives
State the learning (or training) objectives in this column,or what the audience will learn as a result of the training. In ourexample, the project team plans to train the client/customer onhow to run a new report and train the process workers on multi-ple items. If we had different groups of employees with differenttraining needs, we could have added additional rows in thetraining plan to identify the learning objectives and approachfor each group of learners.
Although developing learning objectives falls into an en-tire field of study called ‘‘instructional system design,’’ I sharethe relevant highlights to support what needs to occur in thisstep.
Notice in Figure 9-5 that each learning objective startswith an action verb: run, identify, explain, complete. An actionverb denotes the ability to do something. What should a personbe able to do after completing training? In business processwork, you generally want a person to either:
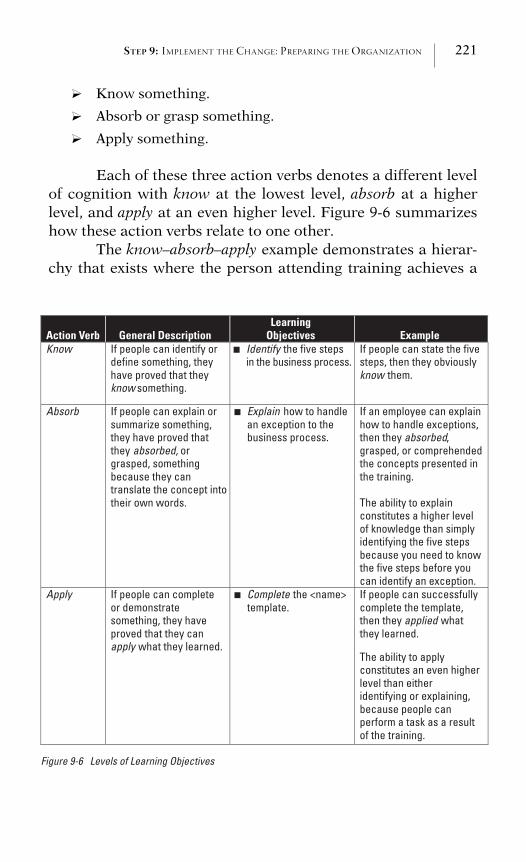
STEP 9: IMPLEMENT THE CHANGE: PREPARING THE ORGANIZATION 221
? Know something.
? Absorb or grasp something.
? Apply something.
Each of these three action verbs denotes a different levelof cognition with know at the lowest level, absorb at a higherlevel, and apply at an even higher level. Figure 9-6 summarizeshow these action verbs relate to one other.
The know–absorb–apply example demonstrates a hierar-chy that exists where the person attending training achieves a
Action Verb General Description Learning
Objectives ExampleKnow If people can identify or
define something, they have proved that they know something.
Identify the five steps in the business process.
If people can state the fivesteps, then they obviously know them.
Absorb If people can explain or summarize something, they have proved that they absorbed, or grasped, something because they can translate the concept into their own words.
Explain how to handle an exception to the business process.
If an employee can explain how to handle exceptions, then they absorbed,grasped, or comprehended the concepts presented in the training.
The ability to explain constitutes a higher level of knowledge than simply identifying the five steps because you need to know the five steps before you can identify an exception.
Apply If people can complete or demonstratesomething, they have proved that they can apply what they learned.
Complete
■
■
■ the <name> template.
If people can successfully complete the template, then they applied what they learned.
The ability to apply constitutes an even higher level than either identifying or explaining, because people can perform a task as a result of the training.
Figure 9-6 Levels of Learning Objectives
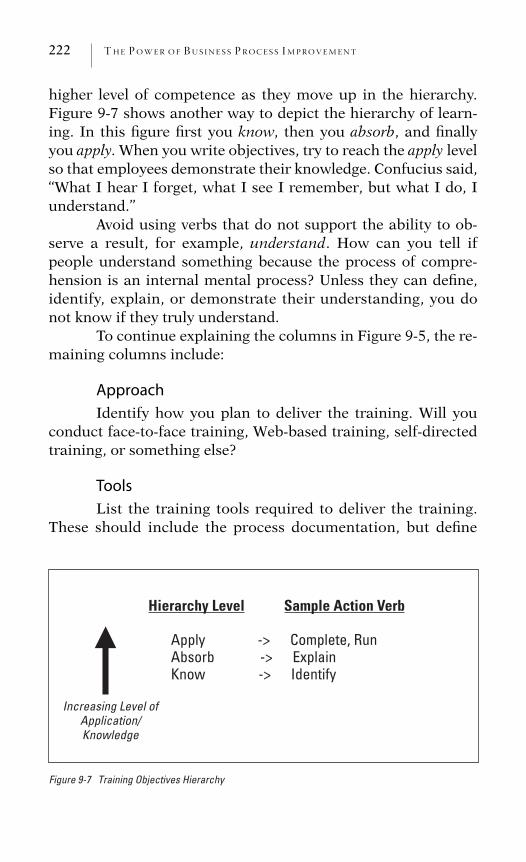
222 THE POWER OF BUS INE S S P ROCES S IMPROVEMENT
higher level of competence as they move up in the hierarchy.Figure 9-7 shows another way to depict the hierarchy of learn-ing. In this figure first you know, then you absorb, and finallyyou apply. When you write objectives, try to reach the apply levelso that employees demonstrate their knowledge. Confucius said,‘‘What I hear I forget, what I see I remember, but what I do, Iunderstand.’’
Avoid using verbs that do not support the ability to ob-serve a result, for example, understand. How can you tell ifpeople understand something because the process of compre-hension is an internal mental process? Unless they can define,identify, explain, or demonstrate their understanding, you donot know if they truly understand.
To continue explaining the columns in Figure 9-5, the re-maining columns include:
Approach
Identify how you plan to deliver the training. Will youconduct face-to-face training, Web-based training, self-directedtraining, or something else?
Tools
List the training tools required to deliver the training.These should include the process documentation, but define
Hierarchy Level Sample Action Verb
Apply -> Complete, Run Absorb -> Explain Know -> Identify
Increasing Level of Application/Knowledge
Figure 9-7 Training Objectives Hierarchy
STEP 9: IMPLEMENT THE CHANGE: PREPARING THE ORGANIZATION 223
what other tools you require. For example, do you need personalcomputers so that the people attending the training can accessyour company’s intranet and email system, or do you require awireless connection?
Facilitator
Identify who will deliver the training to each audience.You, a project team member, or your sponsor may own a por-tion of this responsibility.
Due Date
Identify the timeline for the training and think aboutwho needs the training first, second, and third, similar to theway we thought about the order in the communication plan. Inour example, we trained the employees first so that they couldsupport the clients/customers when they had questions runningthe report.
The keys for successful training include developing goodlearning objectives that articulate what the participants shouldknow at the end of training, matching delivery styles withlearner preferences, and delivering the training at the right time.
Chapter Summary: Step 9
Planning the entire business process improvement en-deavor up front, by creating the implementation plan, will giveyou confidence that you have the right steps and the right peoplein place to improve the business process and implement thechanges required to bring it to fruition. The implementationplan is the framework that brings the separate components to-gether, and Figure 9-8 shows a summary of the implementationplan components.
The new topics introduced in this chapter include the:
? Impact analysis that identifies the changes that have tooccur, the rationale for the changes, the area and popula-tion impacted, and potential pushback.
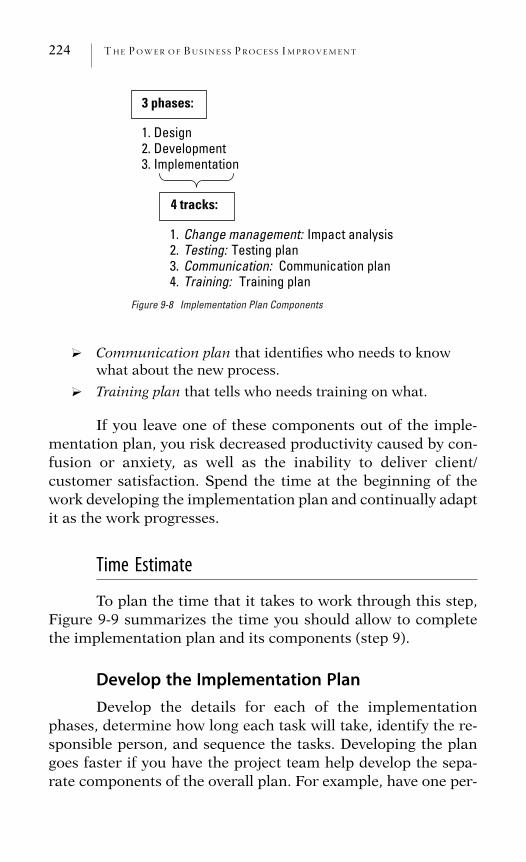
224 THE POWER OF BUS INE S S P ROCES S IMPROVEMENT
3 phases:
1. Design 2. Development 3. Implementation
4 tracks:
1. Change management: Impact analysis2. Testing: Testing plan 3. Communication: Communication plan 4. Training: Training plan
Figure 9-8 Implementation Plan Components
? Communication plan that identifies who needs to knowwhat about the new process.
? Training plan that tells who needs training on what.
If you leave one of these components out of the imple-mentation plan, you risk decreased productivity caused by con-fusion or anxiety, as well as the inability to deliver client/customer satisfaction. Spend the time at the beginning of thework developing the implementation plan and continually adaptit as the work progresses.
Time Estimate
To plan the time that it takes to work through this step,Figure 9-9 summarizes the time you should allow to completethe implementation plan and its components (step 9).
Develop the Implementation PlanDevelop the details for each of the implementation
phases, determine how long each task will take, identify the re-sponsible person, and sequence the tasks. Developing the plangoes faster if you have the project team help develop the sepa-rate components of the overall plan. For example, have one per-
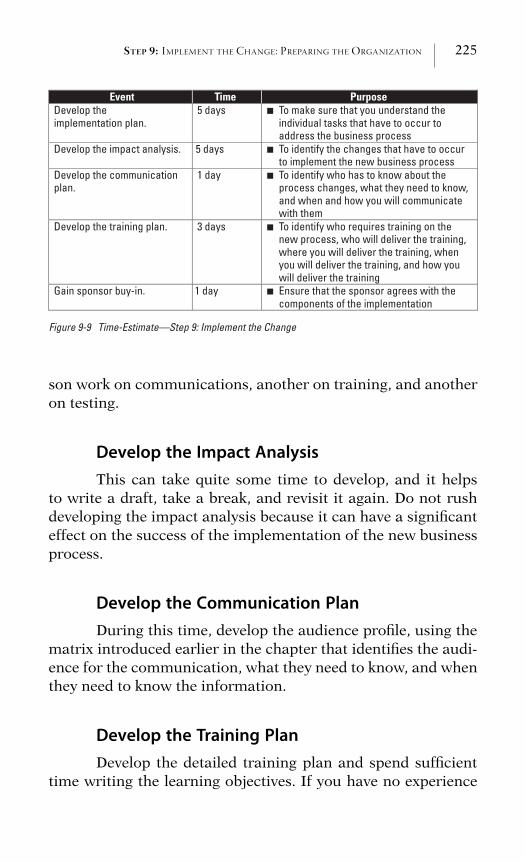
STEP 9: IMPLEMENT THE CHANGE: PREPARING THE ORGANIZATION 225
Event Time PurposeDevelop the implementation plan.
5 days To make sure that you understand the individual tasks that have to occur to address the business process
Develop the impact analysis. 5 days To identify the changes that have to occur to implement the new business process
Develop the communication plan.
1 day To identify who has to know about the process changes, what they need to know, and when and how you will communicate with them
Develop the training plan. 3 days To identify who requires training on the new process, who will deliver the training, where you will deliver the training, when you will deliver the training, and how you will deliver the training
Gain sponsor buy-in. 1 day Ensure that the sponsor agrees with the
■
■
■
■
■
components of the implementation
Figure 9-9 Time-Estimate—Step 9: Implement the Change
son work on communications, another on training, and anotheron testing.
Develop the Impact AnalysisThis can take quite some time to develop, and it helps
to write a draft, take a break, and revisit it again. Do not rushdeveloping the impact analysis because it can have a significanteffect on the success of the implementation of the new businessprocess.
Develop the Communication PlanDuring this time, develop the audience profile, using the
matrix introduced earlier in the chapter that identifies the audi-ence for the communication, what they need to know, and whenthey need to know the information.
Develop the Training PlanDevelop the detailed training plan and spend sufficient
time writing the learning objectives. If you have no experience
226 THE POWER OF BUS INE S S P ROCES S IMPROVEMENT
writing learning objectives, try to find someone, if possible, witha training background to validate them.
Gain Sponsor Buy-inOnce you have completed the implementation plan, re-
view it with the sponsor and make adjustments to either the con-tent or the timeline. In my experience, the timeline generallyneeds adjustments because the sponsor wants to have the workdone sooner than you estimate.
What You Have Achieved
In this chapter you have achieved the following:
? An understanding of the tasks required to implement thenew business process
? Insight into how to use phases and tracks to organize imple-mentation tasks
? An analysis of the changes that need to occur
? A grasp of how to develop a communication plan that pro-vides details surrounding who needs to know about thechanges and what they need to know
? A plan to train those affected by the change
? A tool to help you stay on track
? Most important, the power to have a successful implemen-tation
C H A P T E R 10
Step 10: Drive Continuous
Improvement
Embracing the New Mindset
Joanne Wu, the training and development manager fromChapter 8, led the effort each year to create the annual budgetfor the training department, which required her to gather thetraining requirements for the next year from client groups, de-termine priorities, and allocate the department’s resources toaddress the forecasted training needs. Joanne found the timerequired to conduct this annual process excessive, just as inevery prior year. Only about 40 percent of the projects specifiedin the plan ever happened. Joanne felt her clients requested un-necessary projects, which did not allow her to plan her depart-ment’s resources or budget as tightly as she would like.
My first observation was that Joanne viewed the annualplan as an end in itself, not as an ongoing process. AlthoughJoanne’s team had streamlined the process of collecting input,she still did not like the result; so she asked me to evaluate theprocess and help make additional changes to improve the proc-ess. An analysis of the situation showed me that Joanne’s staffspent most of their time focusing on the process efficiency,streamlining it so that their clients would find it simple. Al-though they did make the process easier for the clients, theyoverlooked the effectiveness aspect because the process couldnot adapt to changing business needs. Because the clients couldnot always foresee issues that might surface during the year, like
227
228 THE POWER OF BUS INE S S P ROCES S IMPROVEMENT
new competitive products or a changing economy, the businessprocess had to include flexibility so that it could address newneeds as they surfaced throughout the year.
Continuous improvement, a term derived from the totalquality movement, means monitoring a business process andmaking adjustments to it so that it continually improves overtime. Developing a continuous improvement mindset ensuresthat the process continues to deliver the gains achieved. Thismeans continually measuring the business process, regularly re-evaluating client/customer needs and expectations, engaging theprocess workers on a regular basis, and not allowing the docu-mentation to sit on the shelf.
Although you may consider skipping over this chapterbecause it sounds like more theory than practicality, I urge youto reconsider because this step enables you to sustain the effec-tiveness, efficiency, and adaptability introduced into the busi-ness process. If you decide to skip this step, you will find that thebusiness process works fine for a while. Then it starts slippingbackward a little, then a little more, until eventually it becomesoutdated, and you have to start the improvement effort all overagain. Think about losing weight. If you successfully lose 20pounds but never weigh yourself, you will probably start regain-ing the pounds—perhaps not overnight, but gradually until youfind yourself back at your original weight or higher.
The same scenario applies to business processes for a va-riety of reasons. You have to stay on top of your business proc-esses in order to stay competitive, to continue meeting thechanging client/customer needs, or to keep pace with changingtechnology. Change and external factors demand that you con-tinuously improve business processes.
Even business processes that went through reengineer-ing in the 1990s required a focus on continuous improvement toretain the strategic gains made. During the reengineering rage,though, continuous improvement did not enter many people’sminds, probably because it stems from the total quality manage-ment field. Proponents of reengineering dismissed total qualitymanagement as too slow because total quality techniques deliv-ered incremental, not dramatic change. Some people incorrectly
STEP 10: DRIVE CONTINUOUS IMPROVEMENT: EMBRACING THE NEW MINDSET 229
theorized that when you reengineered a business process, itwould remain competitive.
Continuous improvement requires the mindset that im-provement never ends and that you may never achieve perfec-tion. Practitioners of yoga or followers of Buddhism strive toreach nirvana with the full knowledge that, at best, they mayonly become more serene and self-disciplined. Just as you setgoals to fulfill your personal vision, set goals also to sustain theimprovements made to a business process.
As you follow the 10 steps to business process improve-ment, you acquire a unique level of understanding about thebusiness process, which positions you to act in the role of inno-vator, influencer, and communicator. You can then:
? Demonstrate innovation by continually identifying newways to improve the business process.
? Influence others to continuously think about their workfrom a process perspective.
? Continue to talk and communicate with the clients/cus-tomers, stakeholders, and process workers to make sure theprocess continues to deliver what they require.
So let me share a model that will help you think aboutcontinuous improvement and some tools that can help. Becausecontinuous improvement can seem like an obscure concept, themodel and tools assist in keeping this step at the forefront andin perspective.
The Continuous Improvement Cycle
The continuous improvement cycle wheel in Figure 10-1shows four phases that can help you achieve the new mindset.Each phase in the wheel provides a degree of structure to keepyou thinking about how to continually improve a business proc-ess. You can move through the four phases quickly, but do sooften. The four phases are:
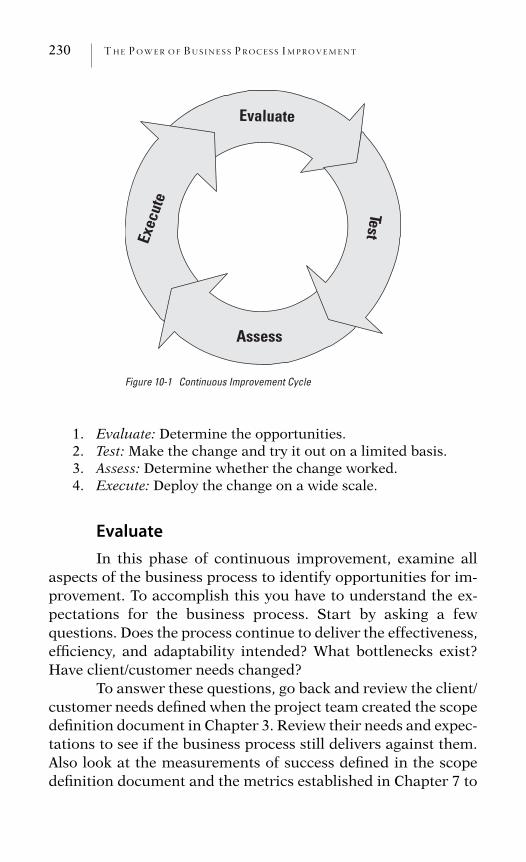
230 THE POWER OF BUS INE S S P ROCES S IMPROVEMENT
Evaluate
Exec
ute
Assess
Test
Figure 10-1 Continuous Improvement Cycle
1. Evaluate: Determine the opportunities.2. Test: Make the change and try it out on a limited basis.3. Assess: Determine whether the change worked.4. Execute: Deploy the change on a wide scale.
EvaluateIn this phase of continuous improvement, examine all
aspects of the business process to identify opportunities for im-provement. To accomplish this you have to understand the ex-pectations for the business process. Start by asking a fewquestions. Does the process continue to deliver the effectiveness,efficiency, and adaptability intended? What bottlenecks exist?Have client/customer needs changed?
To answer these questions, go back and review the client/customer needs defined when the project team created the scopedefinition document in Chapter 3. Review their needs and expec-tations to see if the business process still delivers against them.Also look at the measurements of success defined in the scopedefinition document and the metrics established in Chapter 7 to
STEP 10: DRIVE CONTINUOUS IMPROVEMENT: EMBRACING THE NEW MINDSET 231
see how the process has performed over time against the base-line and goals.
You should spend the majority of your time in the evalu-ate phase of the continuous improvement cycle. How frequentlyyou revisit this phase depends on how often the business usesthe process. If it is an ongoing process used daily, go throughthis phase more frequently, but if it is a cyclical process usedannually or semiannually, go through this phase less often. Thecontinuous improvement schedule (discussed later in this chap-ter) provides a tool to set a timeline for how often to go throughthis phase for each business process.
This first phase of the continuous improvement cycle re-quires you to ask yourself several questions:
? Does the process deliver what the project team identified asclient/customer needs? Clients have a way of raising the barover time because, as the process meets their expectations,they tend to expect a new level of service. They may not beexplicit about their expectations, so stay focused on how theclients/customers feel about the business process. To stayon top of their expectations, revisit the client/customerneeds and measurements of success over and over again.Make sure that you do the right things well, and stay freshand connected to any new expectations. As Joanne Wulearned, client needs do not stay static but change as thebusiness changes. Joanne needed increased flexibility in herbudget to accommodate changing business needs.
? Do the process workers follow the documented process?Keep the documentation up-to-date, make sure thatemployees use the documentation and tools created, andsee that new employees receive training on the businessprocess. Problems can easily occur simply because no onethoroughly trains new employees.
? Do the stakeholders receive what they require from thebusiness process? Although the client/customer is our pri-mary focus, do not ignore the stakeholders. Review thescope definition document, and validate that the processcontinues to meet their requirements.
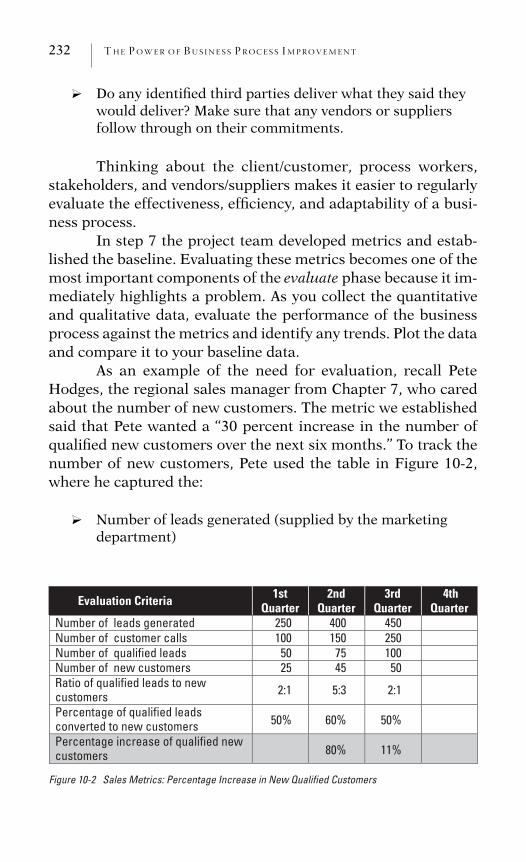
232 THE POWER OF BUS INE S S P ROCES S IMPROVEMENT
? Do any identified third parties deliver what they said theywould deliver? Make sure that any vendors or suppliersfollow through on their commitments.
Thinking about the client/customer, process workers,stakeholders, and vendors/suppliers makes it easier to regularlyevaluate the effectiveness, efficiency, and adaptability of a busi-ness process.
In step 7 the project team developed metrics and estab-lished the baseline. Evaluating these metrics becomes one of themost important components of the evaluate phase because it im-mediately highlights a problem. As you collect the quantitativeand qualitative data, evaluate the performance of the businessprocess against the metrics and identify any trends. Plot the dataand compare it to your baseline data.
As an example of the need for evaluation, recall PeteHodges, the regional sales manager from Chapter 7, who caredabout the number of new customers. The metric we establishedsaid that Pete wanted a ‘‘30 percent increase in the number ofqualified new customers over the next six months.’’ To track thenumber of new customers, Pete used the table in Figure 10-2,where he captured the:
? Number of leads generated (supplied by the marketingdepartment)
Evaluation Criteria 1stQuarter
2ndQuarter
3rdQuarter
4thQuarter
Number of leads generated 250 400 450Number of customer callsNumber of qualified leadsNumber of new customers
1005025
1507545
25010050
2:1 5:3 2:1
50% 60% 50%
Ratio of qualified leads to new customersPercentage of qualified leads converted to new customers Percentage increase of qualified new customers 80% 11%
Figure 10-2 Sales Metrics: Percentage Increase in New Qualified Customers
STEP 10: DRIVE CONTINUOUS IMPROVEMENT: EMBRACING THE NEW MINDSET 233
? Number of customer calls (the number of leads that salesrepresentatives followed up)
? Number of qualified leads (the number of leads that fellwithin the sales department’s definition of ‘‘qualified,’’ onesthat the sales representatives would call on)
? Number of new customers (the number of new accountsclosed)
? Ratio of qualified leads to new customers
? Percentage of qualified leads converted to new customers
? Percentage increase of qualified new customers
According to Figure 10-2, something seems to have hap-pened between the second and third quarters because the per-centage of qualified leads converted to new customers dropped by10 percent (from 60 percent to 50 percent), although the totalincrease of qualified new customers increased by 11 percent.Pete was happy with the second quarter results, which exceededhis expectations, but not with the third quarter results becausethey fell below his 30 percent criteria.
At this point, Pete came to me wanting to dig deeper intothe decrease in the ratio between the second and third quarters.I tried to determine the cause for the drop, and we set new goalsfor the next measurement period. Pete had to reach a numberequal to or greater than the second quarter to get at least backup to the 60 percent conversion rate. This would put him backon track to achieve his overall target of a 30 percent increase inthe number of qualified new customers over a six-month period.With two months behind him, he was averaging a 45.5 percentincrease, which looked good, but he knew that he had to focuson the monthly statistics to ensure meeting his 30 percenttarget.
After assessing how the sales representatives performedtheir day-to-day responsibilities, it appeared the problem restedwith a dozen new sales representatives who did not follow theguidelines established for qualifying leads. As a result, Pete didnot have to introduce any new steps in the process; he simplyhad to make certain that the new sales representatives received
234 THE POWER OF BUS INE S S P ROCES S IMPROVEMENT
the appropriate training on how to qualify sales leads. Peteadded this training to the onboarding process to help new salesrepresentatives in the future.
In Joanne Wu’s case, we designed flexibility into herannual budgeting process to accommodate new client expecta-tions, technology improvements, or changing business priorit-ies. We changed the process so that Joanne’s staff captured onlya handful of initiatives for the next year, ones that clearly sup-ported the company’s stated priorities and that would notchange. We introduced changes to allow Joanne and her staff toregularly evaluate incoming requests. Having a half dozen iden-tified projects gave Joanne at least some sense of control and yetgave her clients the flexibility they wanted.
During the evaluation phase, look at the process itselfand confirm that everyone follows the process, uses the tools asplanned, and gathers the metrics as defined. This includes itemslike:
? Determining the effectiveness of the internal controls put inplace: Do they help in eliminating errors?
? Talking to the clients/customers and stakeholders to assesshow they feel about the effectiveness of the process: Thisprovides qualitative feedback instead of numbers, and bothqualitative and quantitative data aid in determining theeffectiveness of the process.
? Evaluating the roles and responsibilities and makingchanges if appropriate.
? Making sure that the organization trains new employees.
? Evaluating the effectiveness of any communication proc-esses.
? Making sure employees share information and knowledge.
? Making sure that vendors or suppliers deliver what theprocess expects.
After conducting some analysis and talking to the appro-priate people, propose any needed changes, either to thebusiness process itself, to client/customer needs, to the measure-ments of success, or to the process metrics.
STEP 10: DRIVE CONTINUOUS IMPROVEMENT: EMBRACING THE NEW MINDSET 235
By the end of this phase, you have identified the pointsin the process that present improvement opportunities and havecreated a plan of action to focus on them.
TestOnce you have identified a problem or opportunity, made
the process changes, and established an improvement goal, im-plement the change on a small scale to validate that thechange(s) work. In this phase of continuous improvement, youwant to make certain that any changes work before introducingthem on a wide scale.
This task should seem familiar since Chapter 8 coveredtesting in detail. You can use many of the same techniques fromthat chapter here, just on a smaller scale. Remember to thinkabout the who, what, where, when, and how of testing thechange:
? Whom to involve in the test
? What items to test
? Where the test should occur
? When the test should occur
? How to measure the success of the change
During the second phase of the continuous improvementcycle, plan how to test the change. Identify who will participate,what part of the business process to test, what location or areato include in the test, how long the test will run, how to collectand analyze the data, and how to define success. Include theprocess owner or sponsor to make sure that you have the appro-priate support.
Testing in the continuous improvement phase should beon a smaller scale than what we covered in Chapter 8, so involvea smaller number of participants and test items in the testing. Agood example of the extent of testing is the follow-up on thebank merger from Chapter 9, where we merged the businessprocesses from two banks into one after an acquisition. In this
236 THE POWER OF BUS INE S S P ROCES S IMPROVEMENT
example, the merger of two highly visible areas, private bankingand investment banking, worked fine because the merger teamplaced significant effort on making their transition seamless.However, after evaluating the new process three months later aspart of our continuous improvement plan, problems surfaced atthe retail banking sector with their level of customer service andincreased operating expenses. This sector had not received asmuch attention during the merger, and so the retail team madeadjustments to their business processes. In deciding where totest the changes, the project team decided to test them with onebranch before implementing the changes at all branches.
Depending on what you uncover in the evaluate phase ofcontinuous improvement, you may not always have to test be-cause in some cases employees simply require training, as in thePete Hodges case, or the project team may simply make adjust-ments to the measurement data. At other times, though, as inthe retail banking example, the project team makes significantchanges and you have to test those changes before implement-ing them on a wide scale. If you find yourself making majorchanges, revisit Chapter 8 and create a test plan.
It often helps to look first at the process workers if aproblem in the measurement data surfaces because you will findit easier to retrain employees on the process or tools than tochange the process. Understand why employees perform theway they do, and make sure to differentiate between an em-ployee and a process issue.
At the end of this phase, you have data that tells whetherthe proposed changes to the business process work.
AssessIn this phase of continuous improvement, keep track of
how the changes work as you implement the change on a smallscale to understand what has to occur to introduce the changeon a wider scale. Did the change deliver the value expected?What other criteria should you consider?
In this phase, review the data collected during the testingphase, make any adjustments deemed appropriate, and decide
STEP 10: DRIVE CONTINUOUS IMPROVEMENT: EMBRACING THE NEW MINDSET 237
whether to proceed with the changes. You may also want tobring in benchmark data to help you form an opinion on whatchanges to introduce.
Benchmarking consists of measuring a business processagainst a standard of excellence, either an internal group in yourcompany or an external company well-known as being of world-class or best-in-class caliber. For example, Disney is known fordelivering outstanding guest service, Toyota for its high-qualitycars, and Apple for its innovative designs. Benchmark data canhelp introduce greater effectiveness, efficiency, and flexibilityinto your business processes so that they can be adapted tochanging needs. Chapter 12 includes a real-life example of abenchmarking study.
Gathering external benchmark data can present a prob-lem because some companies do not like to share informationabout their business processes. Not all external companies pres-ent a problem, though, particularly if they belong to a differentindustry and do not compete in the same market as your com-pany. Internal benchmarking can be just as effective as externalbenchmarking, and it may seem easier because you do not haveto worry about confidentiality.
If you choose to proceed with benchmarking, work witha colleague who has designed a benchmark study in the pastbecause conducting an effective benchmark study requires expe-rience. Spend enough time planning the benchmark study, andhave a solid understanding of your own business process beforetalking to other people about their processes.
To conduct a benchmark, start with the client/customerneeds identified in the scope definition document and prioritizethem so that your benchmarking study focuses on the most im-portant client/customer needs. Joanne Wu, the training and de-velopment manager introduced earlier in this chapter, identified‘‘quality training experience’’ as one of her client’s top needs.
Start a benchmark study by conducting internal inter-views because these assist in defining terminology and in devel-oping a list of external companies and internal groups tobenchmark. As you conduct the internal interviews, ask the in-terviewee to define terms. In Joanne’s case, for example, I had to
238 THE POWER OF BUS INE S S P ROCES S IMPROVEMENT
find out what a quality training experience meant. By talking toJoanne’s clients, I found that they wanted their employees whoattended training to apply what they learned on the job upontheir return, and they wanted their employees to have referencematerials that they could use on the job. The clients also wantedonly experienced instructors teaching classes. Once you under-stand what a term means, ask the interviewee to identify best-in-class companies or internal groups who demonstrate excel-lence in the type of client/customer need being discussed. Forexample, I asked Joanne’s clients if they knew of any companiesor internal groups that delivered a quality training experience.
As this example shows, the internal clients interviewedcan help you develop a clear list of client/customer needs andbuild the list of companies to benchmark because they knowtheir field and they know the best-in-class companies. Once youidentify the benchmark list, comprised of both internal and ex-ternal contacts, develop a set of questions that focus on the busi-ness processes’ critical success factors. The questions shoulddelve into how the benchmark companies or internal groupsachieve the critical success factors.
The project team can also use benchmarking during theevaluate phase of the continuous improvement cycle and duringstep 6 (when looking at improving the business process) to helpdetermine how the business process compares to best-in-classcompanies, which in turn can help establish improvement goals.
At the end of this phase, you have all the informationnecessary to make a decision on how to proceed.
ExecuteAfter assessing the success of the changes to the business
process and perhaps comparing the process to other internalgroups or external companies, in this phase of continuous im-provement you deploy the updated business process across theorganization.
This phase should seem similar to the implementationstep discussed in Chapter 9, but on a smaller scale. In this phase,communicate the change and train the process workers on the
STEP 10: DRIVE CONTINUOUS IMPROVEMENT: EMBRACING THE NEW MINDSET 239
change. Although you do not have to recreate a communicationplan or a training plan, you should create a new impact analysis.
The same audience defined in the original communica-tion plan has to know about the process changes if the changesaffect them. You can probably use the same goal, key messagepoints, and preferred communication vehicles defined in theplan.
The training plan will have a reduced number of learningobjectives and perhaps a different, simpler approach, but theaudience probably remains the same.
Create a new impact analysis any time a change occursbecause it ensures that nothing falls through the cracks. Alwaysengage the sponsor in introducing the proposed changes.
At the end of this phase, you have introduced the busi-ness process change(s) to the organization.
Continuous Improvement Plan
Although continuous improvement introduces manynew points to remember, the continuous improvement plan as-sists you in developing a continuous improvement mindset. Theplan summarizes the activities necessary to maintain a focus onthe business process and outlines how frequently to performeach activity, any sources of data used, the technique or methodused, and who performs the activity.
Before leaving the business process you just worked onand moving to the next one, create a continuous improvementplan for the existing process so that everyone can see the tasksrequired to keep the process alive and adaptable to the changingbusiness climate. Figure 10-3 shows a sample plan for JoanneWu’s training department. Use this template as a starting pointto create a plan for your own business process. The activitieslisted in Figure 10-3 remain fairly consistent for any businessprocess because they represent the components of the founda-tion established in Chapter 3 or the process map created inChapter 4. Make sure to include these activities in your continu-ous improvement plan:
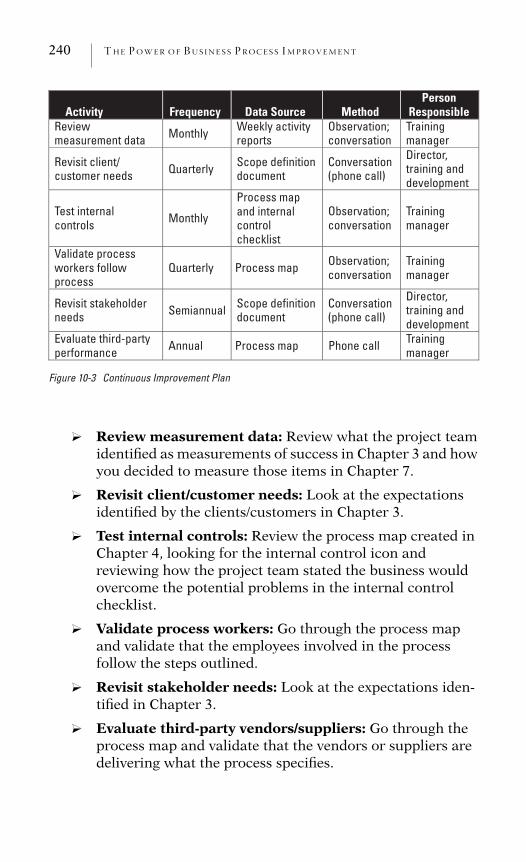
240 THE POWER OF BUS INE S S P ROCES S IMPROVEMENT
Activity Frequency Data Source MethodPerson
ResponsibleReviewmeasurement data Monthly Weekly activity
reportsObservation;conversation
Training manager
Revisit client/ customer needs Quarterly Scope definition
documentConversation(phone call)
Director, training and development
Test internal controls Monthly
Process map and internal controlchecklist
Observation;conversation
Training manager
Validate process workers follow process
Quarterly Process map Observation;conversation
Training manager
Revisit stakeholder needs Semiannual Scope definition
documentConversation(phone call)
Director, training and development
Evaluate third-party performance Annual Process map Phone call Training
manager
Figure 10-3 Continuous Improvement Plan
? Review measurement data: Review what the project teamidentified as measurements of success in Chapter 3 and howyou decided to measure those items in Chapter 7.
? Revisit client/customer needs: Look at the expectationsidentified by the clients/customers in Chapter 3.
? Test internal controls: Review the process map created inChapter 4, looking for the internal control icon andreviewing how the project team stated the business wouldovercome the potential problems in the internal controlchecklist.
? Validate process workers: Go through the process mapand validate that the employees involved in the processfollow the steps outlined.
? Revisit stakeholder needs: Look at the expectations iden-tified in Chapter 3.
? Evaluate third-party vendors/suppliers: Go through theprocess map and validate that the vendors or suppliers aredelivering what the process specifies.
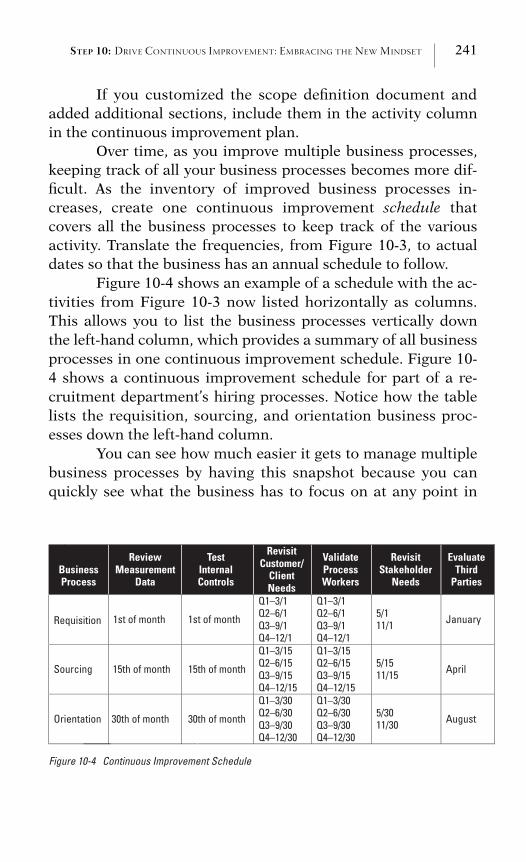
STEP 10: DRIVE CONTINUOUS IMPROVEMENT: EMBRACING THE NEW MINDSET 241
If you customized the scope definition document andadded additional sections, include them in the activity columnin the continuous improvement plan.
Over time, as you improve multiple business processes,keeping track of all your business processes becomes more dif-ficult. As the inventory of improved business processes in-creases, create one continuous improvement schedule thatcovers all the business processes to keep track of the variousactivity. Translate the frequencies, from Figure 10-3, to actualdates so that the business has an annual schedule to follow.
Figure 10-4 shows an example of a schedule with the ac-tivities from Figure 10-3 now listed horizontally as columns.This allows you to list the business processes vertically downthe left-hand column, which provides a summary of all businessprocesses in one continuous improvement schedule. Figure 10-4 shows a continuous improvement schedule for part of a re-cruitment department’s hiring processes. Notice how the tablelists the requisition, sourcing, and orientation business proc-esses down the left-hand column.
You can see how much easier it gets to manage multiplebusiness processes by having this snapshot because you canquickly see what the business has to focus on at any point in
BusinessProcess
ReviewMeasurement
Data
Test InternalControls
RevisitCustomer/
ClientNeeds
Validate ProcessWorkers
RevisitStakeholder
Needs
EvaluateThird
Parties
Requisition 1st of month
Q1–3/1Q2–6/1Q3–9/1Q4–12/1
Q1–3/1Q2–6/1Q3–9/1Q4–12/1
5/111/1 January
Sourcing 15th of month
Q1–3/15Q2–6/15Q3–9/15Q4–12/15
Q1–3/15Q2–6/15Q3–9/15Q4–12/15
5/1511/15 April
Orientation 30th of month
1st of month
15th of month
30th of month
Q1–3/30Q2–6/30Q3–9/30Q4–12/30
Q1–3/30Q2–6/30Q3–9/30Q4–12/30
5/3011/30 August
Figure 10-4 Continuous Improvement Schedule
242 THE POWER OF BUS INE S S P ROCES S IMPROVEMENT
time. In this example, the business decided to look at the metricsfor the requisition process on the first of each month, sourcingon the fifteenth, and orientation on the thirtieth. Figure 10-4also demonstrates that the business wants to review the mea-surement data and test internal controls the most frequently(monthly) and the third-party performance the least frequently(annually).
In developing the continuous improvement plan, theproject team identified how often to evaluate each activity, but,after creating the combined schedule, you may decide to reducesome of the frequencies because it may seem overwhelming.Continue to develop the continuous improvement plan for eachbusiness process even if you create a continuous improvementschedule because the plan provides additional data that thebusiness requires to conduct the appropriate evaluations.
Chapter Summary: Step 10
The continuous improvement cycle confirms that thebusiness process continually delivers effectiveness, efficiency,and flexibility to the organization. The four phases (evaluate,test, assess, and execute) provide the necessary structure. Youcan move through the four phases quickly, but do so often. Letthe frequency of how often the business uses a business processdrive the continuous improvement schedule. During continuousimprovement, spend the majority of your time in the evaluatephase because improvement opportunities surface in this phase.
Throughout continuous improvement, you will findyourself using some of the tools created during previous steps,like the scope definition document from step 2 or the communi-cation, training, and impact analysis plans from step 9. Continu-ally evaluate the information defined in the scope definitiondocument because it helps to keep the business process alignedwith the changing business needs.
Benchmarking can influence how to approach a businessprocess and assist you in thinking about different goals. Focusany benchmarking effort on the most important client/customer
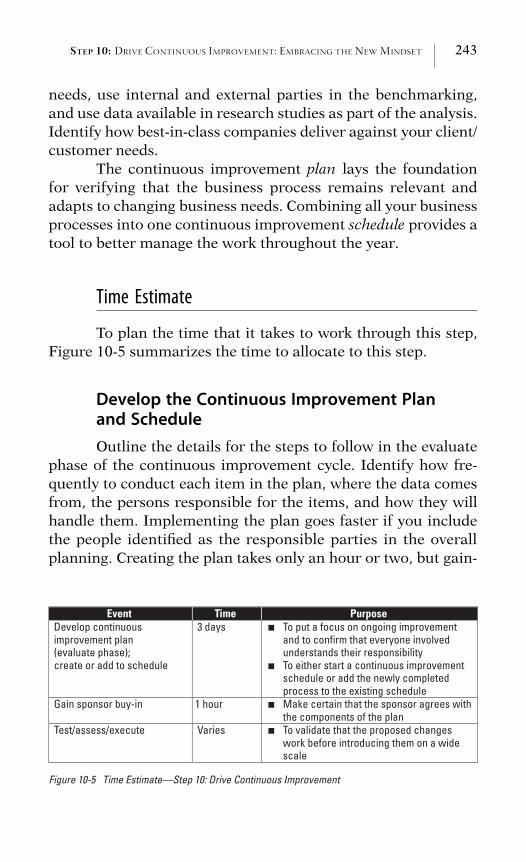
STEP 10: DRIVE CONTINUOUS IMPROVEMENT: EMBRACING THE NEW MINDSET 243
needs, use internal and external parties in the benchmarking,and use data available in research studies as part of the analysis.Identify how best-in-class companies deliver against your client/customer needs.
The continuous improvement plan lays the foundationfor verifying that the business process remains relevant andadapts to changing business needs. Combining all your businessprocesses into one continuous improvement schedule provides atool to better manage the work throughout the year.
Time Estimate
To plan the time that it takes to work through this step,Figure 10-5 summarizes the time to allocate to this step.
Develop the Continuous Improvement Planand ScheduleOutline the details for the steps to follow in the evaluate
phase of the continuous improvement cycle. Identify how fre-quently to conduct each item in the plan, where the data comesfrom, the persons responsible for the items, and how they willhandle them. Implementing the plan goes faster if you includethe people identified as the responsible parties in the overallplanning. Creating the plan takes only an hour or two, but gain-
Event Time PurposeDevelop continuous improvement plan(evaluate phase); create or add to schedule
3 days To put a focus on ongoing improvement and to confirm that everyone involved understands their responsibility To either start a continuous improvement schedule or add the newly completed process to the existing schedule
Gain sponsor buy-in 1 hour Make certain that the sponsor agrees with the components of the plan
Test/assess/execute Varies To validate that the proposed changes
■
■
■
■
work before introducing them on a wide scale
Figure 10-5 Time Estimate—Step 10: Drive Continuous Improvement
244 THE POWER OF BUS INE S S P ROCES S IMPROVEMENT
ing other people’s support adds to the time it takes to completethis step. Also develop the continuous improvement scheduleduring this time, or add the newly improved business process tothe existing schedule and make any adjustments.
Gain Sponsor Buy-inOnce you complete the continuous improvement plan,
review it with the sponsor and adjust the tasks as necessary. Ifyou created a continuous improvement schedule, show thesponsor how the newest business process fits into the overallschedule. You may need the sponsor to gain the agreement fromexecutive-level persons if you list them as responsible for anyaction items in the plan.
Test, Assess, ExecuteDuring these phases, you or a project team member
makes the decision on how to test the changes on a small scale,evaluate the effectiveness of the proposed changes, and then im-plement them on a full scale.
What You Have Achieved
In this chapter you have achieved the following:
? An understanding of what continuous improvement meansand why you should care
? Details about how to keep adapting the business process tochanging business needs
? A plan that includes the appropriate steps to regularlyreview the business process
? A schedule that provides a snapshot of when to evaluatemultiple business processes so that you can manage a groupof business processes
? Most important, the power to sustain the improvements
C H A P T E R 11
Create the Executive Summary
Getting the Recognition
After all the work you have gone through with each step ofthe roadmap, now is your time to get some well-deserved recog-nition. Do not relax yet, but rather help management recognizewhat you have accomplished. Recognition for improving a busi-ness process does not come as easy as getting a compliment ona new haircut or a new suit because the new process may notimmediately stand out. You have to let management know, in anacceptable way, the work you have done, and that becomes thechallenge. This chapter shows how you gain recognition in a pro-fessional way by summarizing your business process work in anexecutive summary, a package that management will find useful.
Executive summaries always seem to differ and I do notrecall any two that looked exactly alike. Every executive sum-mary I completed for the scenarios presented throughout thisbook has a different look because each has its own unique cir-cumstances. My executive summaries have ranged from two toten pages, but there is no standard, so feel free to create whatseems right for your particular situation.
The most important point when writing an executivesummary is to make certain that it addresses what the sponsorcares about, so tailor the summary to address those known con-cerns. For example, let me summarize the chief concerns of thepeople discussed so far:
? Stuart Wang, the compensation director, wanted to under-stand the labor requirements to support the business proc-
245
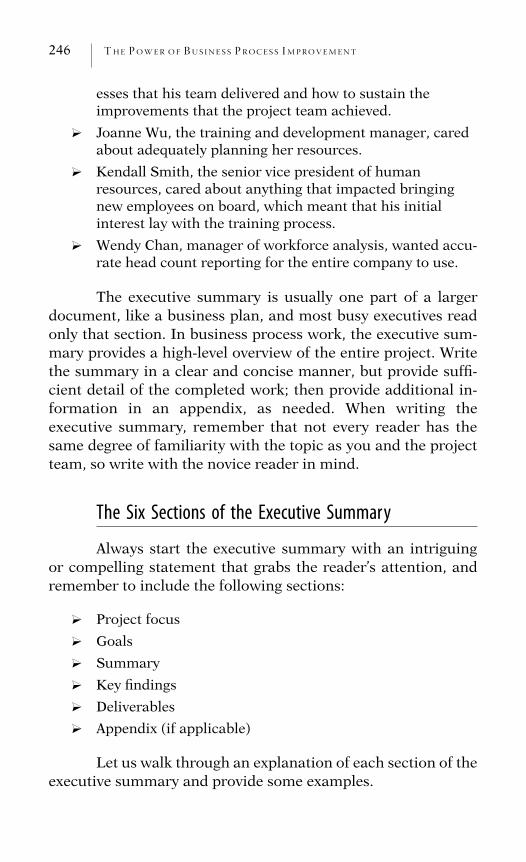
246 THE POWER OF BUS INE S S P ROCES S IMPROVEMENT
esses that his team delivered and how to sustain theimprovements that the project team achieved.
? Joanne Wu, the training and development manager, caredabout adequately planning her resources.
? Kendall Smith, the senior vice president of humanresources, cared about anything that impacted bringingnew employees on board, which meant that his initialinterest lay with the training process.
? Wendy Chan, manager of workforce analysis, wanted accu-rate head count reporting for the entire company to use.
The executive summary is usually one part of a largerdocument, like a business plan, and most busy executives readonly that section. In business process work, the executive sum-mary provides a high-level overview of the entire project. Writethe summary in a clear and concise manner, but provide suffi-cient detail of the completed work; then provide additional in-formation in an appendix, as needed. When writing theexecutive summary, remember that not every reader has thesame degree of familiarity with the topic as you and the projectteam, so write with the novice reader in mind.
The Six Sections of the Executive Summary
Always start the executive summary with an intriguingor compelling statement that grabs the reader’s attention, andremember to include the following sections:
? Project focus
? Goals
? Summary
? Key findings
? Deliverables
? Appendix (if applicable)
Let us walk through an explanation of each section of theexecutive summary and provide some examples.
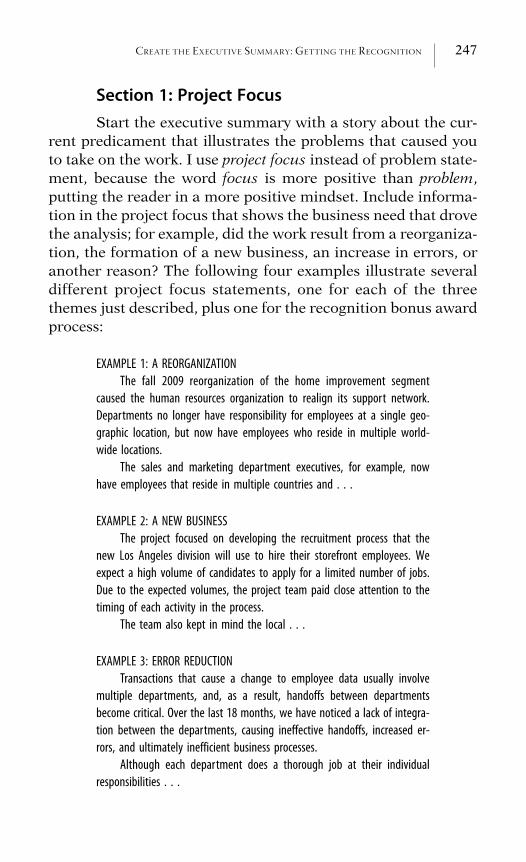
CREATE THE EXECUTIVE SUMMARY: GETTING THE RECOGNITION 247
Section 1: Project FocusStart the executive summary with a story about the cur-
rent predicament that illustrates the problems that caused youto take on the work. I use project focus instead of problem state-ment, because the word focus is more positive than problem,putting the reader in a more positive mindset. Include informa-tion in the project focus that shows the business need that drovethe analysis; for example, did the work result from a reorganiza-tion, the formation of a new business, an increase in errors, oranother reason? The following four examples illustrate severaldifferent project focus statements, one for each of the threethemes just described, plus one for the recognition bonus awardprocess:
EXAMPLE 1: A REORGANIZATION
The fall 2009 reorganization of the home improvement segment
caused the human resources organization to realign its support network.
Departments no longer have responsibility for employees at a single geo-
graphic location, but now have employees who reside in multiple world-
wide locations.
The sales and marketing department executives, for example, now
have employees that reside in multiple countries and . . .
EXAMPLE 2: A NEW BUSINESS
The project focused on developing the recruitment process that the
new Los Angeles division will use to hire their storefront employees. We
expect a high volume of candidates to apply for a limited number of jobs.
Due to the expected volumes, the project team paid close attention to the
timing of each activity in the process.
The team also kept in mind the local . . .
EXAMPLE 3: ERROR REDUCTION
Transactions that cause a change to employee data usually involve
multiple departments, and, as a result, handoffs between departments
become critical. Over the last 18 months, we have noticed a lack of integra-
tion between the departments, causing ineffective handoffs, increased er-
rors, and ultimately inefficient business processes.
Although each department does a thorough job at their individual
responsibilities . . .
248 THE POWER OF BUS INE S S P ROCES S IMPROVEMENT
EXAMPLE 4: RECOGNITION BONUS AWARD PROCESS
Managers have increasingly complained about the turnaround time
associated with providing their employees with recognition bonus awards.
As the company faces increasing competition in the labor market, the
compensation department wanted to streamline the business process and
make it easier for managers to give employees a bonus award as part of
the company's retention strategy.
The project team focused its work on reducing the overall time re-
quired to process a bonus award, which now averages 11 days. The . . .
The intent of these opening paragraphs is to enable thereader to instantly understand why the project team focused onthese specific business processes. Provide enough detail so thatyou paint the picture of the current situation from the reader’sperspective rather than from your own. Often when we writeemails or memos, it is natural to include everything we knowabout a subject, believing that everything is important and los-ing sight that most readers care only about a quarter of the in-formation provided. Make an effort to keep the project focussimple, and give readers only what they want to know. Theyshould grasp the issue and want to read further.
In the previous four examples, the reader cares that:
? The human resources organization is proactively sup-porting the company’s reorganization.
? The recruitment department is concerned with staffing anew location.
? Management is focusing on integration among departmentsto make sure that the process runs smoothly.
? Compensation is concerned with retaining employees incompetitive times.
From reading the project focus alone, the reader eithercontinues reading the remainder of the executive summary orloses interest and decides to stop. The more engaging this sec-tion, the more likely it is that the reader will continue reading.
CREATE THE EXECUTIVE SUMMARY: GETTING THE RECOGNITION 249
Section 2: GoalsThe project goals become the second part of the execu-
tive summary. Think of a goal as an objective or the purpose ofyour work. When listing the goals of the project, revisit the scopedefinition document you created and review what the client/cus-tomer and stakeholders told you they wanted from the process.Then look at the measurements of success that you defined. Thisinformation assists you in articulating the goals to include inthis section. Simply state the goals in bulleted fashion and keepthem short. For example:
? Provide executives with up-to-date budget balances.
? Develop a common understanding of the end-to-end busi-ness process.
? Balance client/customer needs of the learning environmentwith prevailing technologies.
If you feel that you have to provide additional detail,write the information as a subset of the main point. For the firstexample, it might read:
PROVIDE EXECUTIVES WITH UP-TO-DATE BUDGET BALANCES:
Make certain that executives can see the dollar amounts that they
have already spent on a compensation program, the amount of money they
have planned for the next quarter, and the remaining balance that they
have to spend.
If you worked on multiple business processes, you mightidentify general goals, not specific ones targeted at a businessprocess. In this case, the goal section of the executive summarymay start with a statement like:
The goals of the process work are to ensure that the business processes:
� Provide our clients/customers with an effective process.
� Deliver efficiency to the operation.
� Integrate with our key stakeholders.
� Drive consistency across the business groups.
250 THE POWER OF BUS INE S S P ROCES S IMPROVEMENT
� Have the appropriate internal controls.
� Reflect the future direction.
Section 3: SummaryThe summary should tell the story of your journey. You
can think of this third section of the executive summary as anexecutive summary within the executive summary. I find thatexecutives generally spend their time reading the project focusand the summary sections, skimming over goals and delivera-bles. As a result, devote sufficient time to this section.
If your work included a cross-functional group of em-ployees, identify the project team members to show the integra-tion between departments, a point that management willappreciate. Link what you write in this section to the goals iden-tified in the prior section, and include various analytical resultsto give the reader a few concrete statistics to identify with, likea labor summary or information from the impact analysis orimplementation. A few examples of different ways to includestatistical information in an executive summary might help youbetter understand what I mean.
Example 1
An executive I worked with at a consumer products com-pany accepted responsibility for a new department and he didnot have familiarity with the new group’s work. While the newdepartment was located in California, Jim resided in New Jer-sey, so he rarely had occasion to interact with them face-to-face.He wanted to understand the details of their work, if the depart-ment had the right number of employees, and if he shouldchange any reporting relationships.
With Jim’s goals defined, I worked with the employees inthe personnel administrative services group over six weeks tobetter understand what they did. I started by identifying thebusiness processes that the department owned, and then identi-fied the process activities and timing involved. I used the simpleprocess map template that I presented in Chapter 4, repeated
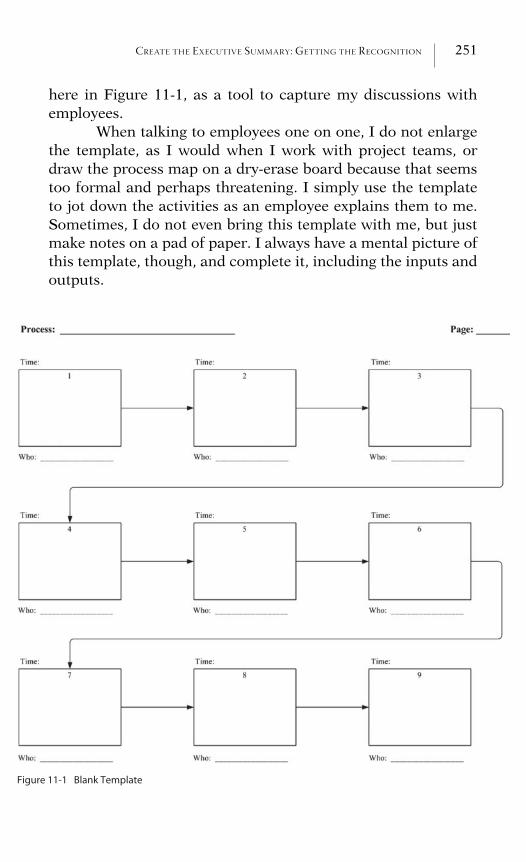
CREATE THE EXECUTIVE SUMMARY: GETTING THE RECOGNITION 251
here in Figure 11-1, as a tool to capture my discussions withemployees.
When talking to employees one on one, I do not enlargethe template, as I would when I work with project teams, ordraw the process map on a dry-erase board because that seemstoo formal and perhaps threatening. I simply use the templateto jot down the activities as an employee explains them to me.Sometimes, I do not even bring this template with me, but justmake notes on a pad of paper. I always have a mental picture ofthis template, though, and complete it, including the inputs andoutputs.
Figure 11-1 Blank Template
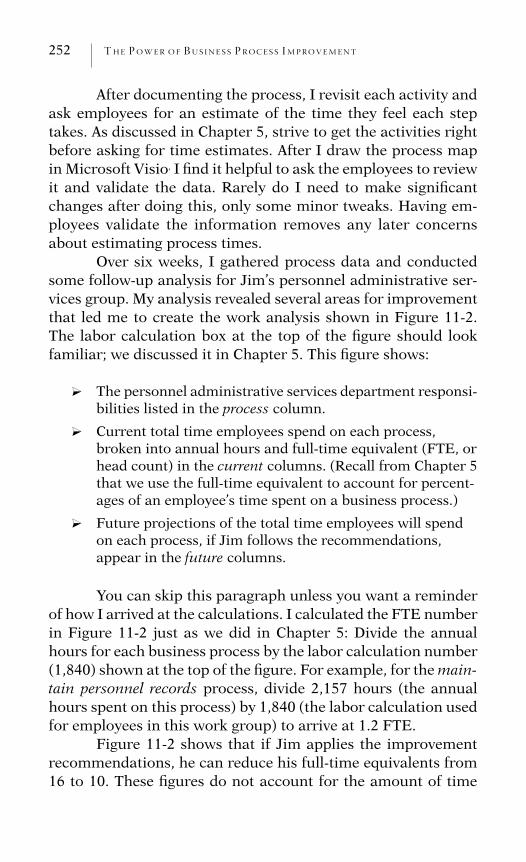
252 THE POWER OF BUS INE S S P ROCES S IMPROVEMENT
After documenting the process, I revisit each activity andask employees for an estimate of the time they feel each steptakes. As discussed in Chapter 5, strive to get the activities rightbefore asking for time estimates. After I draw the process mapin Microsoft Visio, I find it helpful to ask the employees to reviewit and validate the data. Rarely do I need to make significantchanges after doing this, only some minor tweaks. Having em-ployees validate the information removes any later concernsabout estimating process times.
Over six weeks, I gathered process data and conductedsome follow-up analysis for Jim’s personnel administrative ser-vices group. My analysis revealed several areas for improvementthat led me to create the work analysis shown in Figure 11-2.The labor calculation box at the top of the figure should lookfamiliar; we discussed it in Chapter 5. This figure shows:
? The personnel administrative services department responsi-bilities listed in the process column.
? Current total time employees spend on each process,broken into annual hours and full-time equivalent (FTE, orhead count) in the current columns. (Recall from Chapter 5that we use the full-time equivalent to account for percent-ages of an employee’s time spent on a business process.)
? Future projections of the total time employees will spendon each process, if Jim follows the recommendations,appear in the future columns.
You can skip this paragraph unless you want a reminderof how I arrived at the calculations. I calculated the FTE numberin Figure 11-2 just as we did in Chapter 5: Divide the annualhours for each business process by the labor calculation number(1,840) shown at the top of the figure. For example, for the main-tain personnel records process, divide 2,157 hours (the annualhours spent on this process) by 1,840 (the labor calculation usedfor employees in this work group) to arrive at 1.2 FTE.
Figure 11-2 shows that if Jim applies the improvementrecommendations, he can reduce his full-time equivalents from16 to 10. These figures do not account for the amount of time
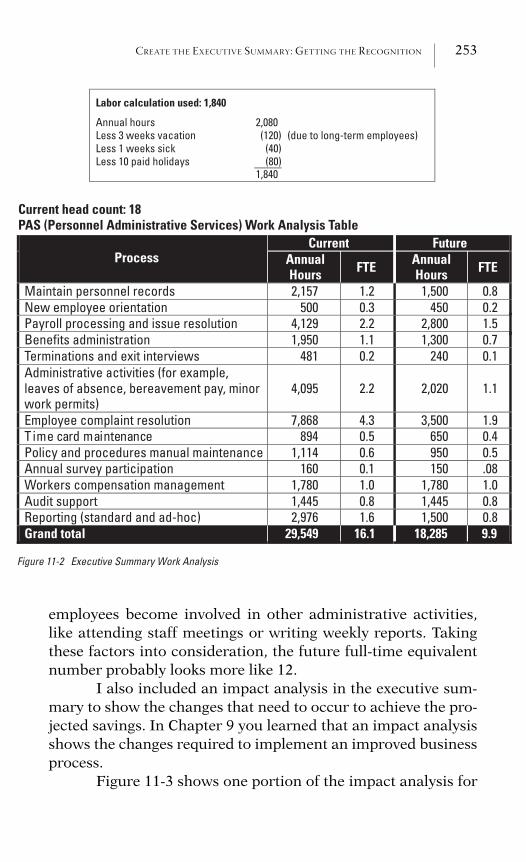
CREATE THE EXECUTIVE SUMMARY: GETTING THE RECOGNITION 253
Current head count: 18 PAS (Personnel Administrative Services) Work Analysis Table
Current FutureProcess Annual
Hours FTE AnnualHours FTE
Maintain personnel recordsNew employee orientationPayroll processing and issue resolutionBenefits administrationTerminations and exit interviewsAdministrative activities (for example, leaves of absence, bereavement pay, minorwork permits)
4,095
Employee complaint resolution894ecnanetniamdracemiT
Policy and procedures manual maintenanceAnnual survey participationWorkers compensation management
1,445Audit supportReporting (standard and ad-hoc)
2,157500
4,1291,950
481
7,868
1,114160
1,780
2,976
2.2
0.5
0.8
1.20.32.21.10.2
4.3
0.60.11.0
1.6
2,020
650
1,445
1,500450
2,8001,300
240
3,500
950150
1,780
1,500
1.1
0.4
0.8
0.80.21.50.70.1
1.9
0.5.081.0
0.8Grand total 29,549 16.1 18,285 9.9
Labor calculation used: 1,840
Annual hours 2,080Less 3 weeks vacation (120) (due to long-term employees) Less 1 weeks sickLess 10 paid holidays
(40)(80)
1,840
Figure 11-2 Executive Summary Work Analysis
employees become involved in other administrative activities,like attending staff meetings or writing weekly reports. Takingthese factors into consideration, the future full-time equivalentnumber probably looks more like 12.
I also included an impact analysis in the executive sum-mary to show the changes that need to occur to achieve the pro-jected savings. In Chapter 9 you learned that an impact analysisshows the changes required to implement an improved businessprocess.
Figure 11-3 shows one portion of the impact analysis for
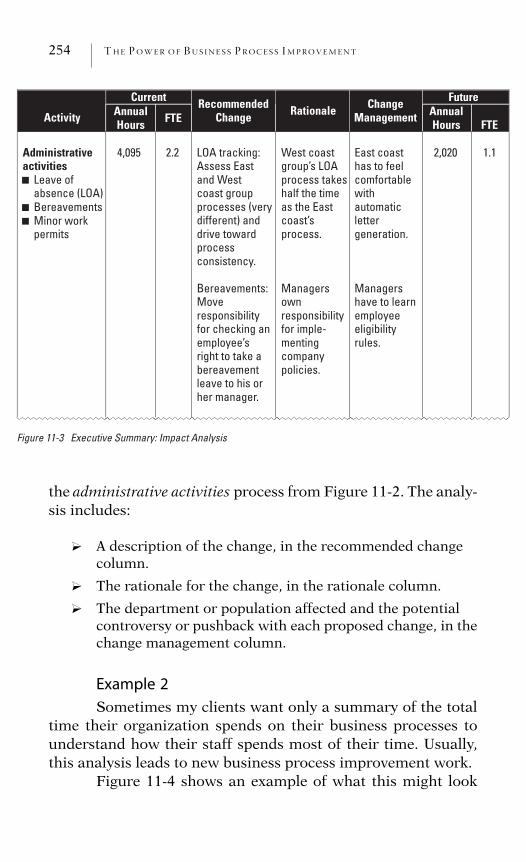
254 THE POWER OF BUS INE S S P ROCES S IMPROVEMENT
Current Future
Activity AnnualHours FTE
RecommendedChange Rationale Change
Management AnnualHours FTE
Administrativeactivities
Leave of absence (LOA) BereavementsMinor work
■
■
■
permits
4,095 2.2 LOA tracking: Assess Eastand Westcoast group processes (very different) and drive toward processconsistency.
Bereavements:Moveresponsibilityfor checking an employee’s right to take a bereavementleave to his or her manager.
West coast group’s LOA process takes half the time as the East coast’s process.
Managersownresponsibilityfor imple-mentingcompanypolicies.
East coast has to feel comfortablewithautomaticlettergeneration.
Managershave to learn employeeeligibilityrules.
2,020 1.1
Figure 11-3 Executive Summary: Impact Analysis
the administrative activities process from Figure 11-2. The analy-sis includes:
? A description of the change, in the recommended changecolumn.
? The rationale for the change, in the rationale column.
? The department or population affected and the potentialcontroversy or pushback with each proposed change, in thechange management column.
Example 2
Sometimes my clients want only a summary of the totaltime their organization spends on their business processes tounderstand how their staff spends most of their time. Usually,this analysis leads to new business process improvement work.
Figure 11-4 shows an example of what this might look
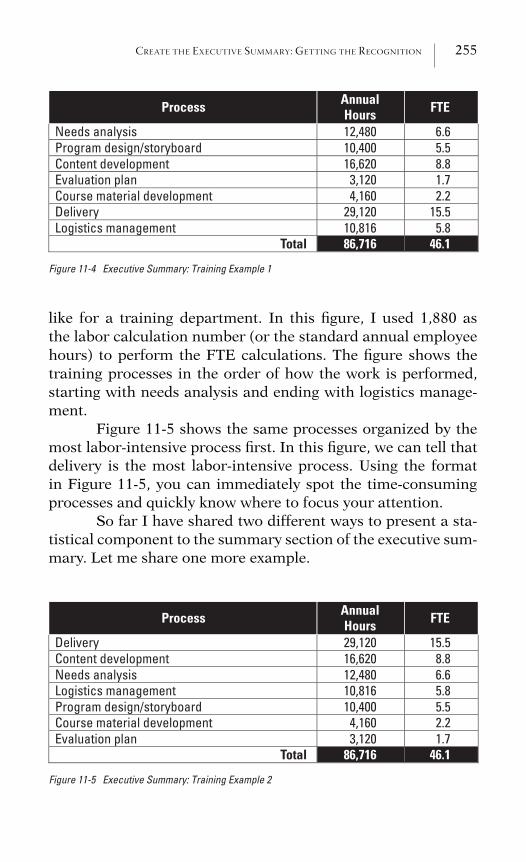
CREATE THE EXECUTIVE SUMMARY: GETTING THE RECOGNITION 255
Process AnnualHours FTE
Needs analysisProgram design/storyboardContent developmentEvaluation planCourse material developmentDeliveryLogistics management
Total
12,48010,40016,620
3,1204,160
29,12010,81686,716
6.65.58.81.72.2
15.55.8
46.1
Figure 11-4 Executive Summary: Training Example 1
like for a training department. In this figure, I used 1,880 asthe labor calculation number (or the standard annual employeehours) to perform the FTE calculations. The figure shows thetraining processes in the order of how the work is performed,starting with needs analysis and ending with logistics manage-ment.
Figure 11-5 shows the same processes organized by themost labor-intensive process first. In this figure, we can tell thatdelivery is the most labor-intensive process. Using the formatin Figure 11-5, you can immediately spot the time-consumingprocesses and quickly know where to focus your attention.
So far I have shared two different ways to present a sta-tistical component to the summary section of the executive sum-mary. Let me share one more example.
Process AnnualHours FTE
DeliveryContent developmentNeeds analysisLogistics managementProgram design/storyboardCourse material developmentEvaluation plan
Total
29,12016,62012,48010,81610,400
4,1603,120
86,716
15.58.86.65.85.52.21.7
46.1
Figure 11-5 Executive Summary: Training Example 2
256 THE POWER OF BUS INE S S P ROCES S IMPROVEMENT
Example 3
A program management group asked me to help themmove responsibility for some business processes from humanresources to the operations department. In this case, the goaldid not include reducing head count but instead required me toexamine the business and make sure that the business processesresided closest to where the work originated, thus reducinghandoffs, cycle time, and errors.
Figure 11-6 shows the final summary analysis in thiscase. You can see that I listed the business processes, currentlabor requirements, and future labor requirements on the leftthree-quarters of the figure and summary information on theright quarter of the figure. It took eight weeks to obtain the in-formation necessary to put together this analysis, but having allthis information in one table provided the sponsor with a snap-shot of the business.
Figure 11-6 shows:
? What work the program management group will keep(‘‘PMG Retain . . .’’ columns).
? What work my process evaluation recommends eliminating(processes in the new responsible party column marked n/ato denote they are not applicable).
? Work that should move to other departments (also reflectedin the new responsible party column).
In addition, this figure shows two summaries on theright-hand side: the total labor moving to each of the new de-partments in the labor shifts section and a total summary of allmovements in the grand summary section. As it turned out, theprogram management group retained 5.4 head count, shifted7.4 head count to the operations, and reduced head count by 0.7(the not applicable items).
Figures 11-2 through 11-6 show examples of includingimportant analytical information in the executive summary.They also show different ways to provide this type of analyticaldata. Base this section on whatever drove you to do the work in
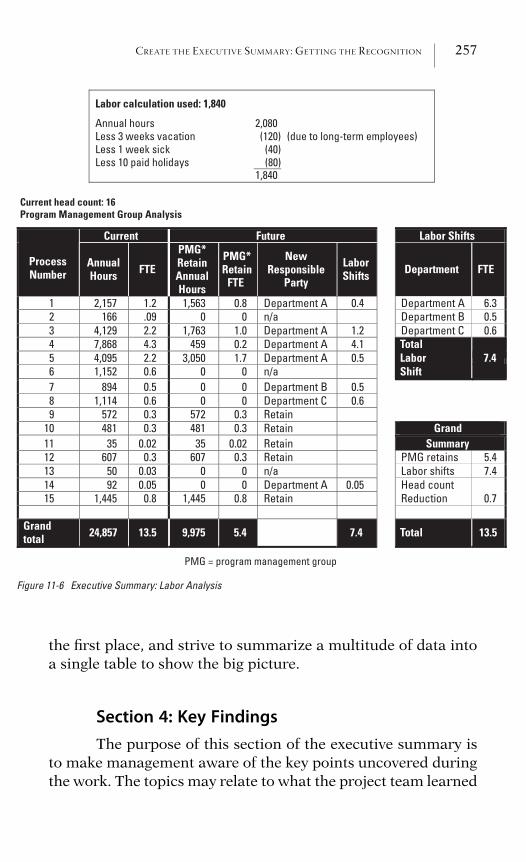
CREATE THE EXECUTIVE SUMMARY: GETTING THE RECOGNITION 257
Current head count: 16 Program Management Group Analysis
Current Future Labor Shifts
ProcessNumber
AnnualHours FTE
PMG*RetainAnnualHours
PMG*Retain
FTE
NewResponsible
Party
LaborShifts Department FTE
TotalLabor 7.4Shift
GrandSummary
123456789
101112131415
6.30.50.6
5.47.4
0.7
Department ADepartment BDepartment C
PMG retainsLabor shiftsHead countReduction
0.4
1.24.10.5
0.50.6
0.05
Department An/aDepartment ADepartment ADepartment An/aDepartment BDepartment CRetainRetainRetainRetainn/aDepartment ARetain
0.80
1.00.21.7
000
0.30.3
0.020.3
00
0.8
1,5630
1,763459
3,050000
57248135
60700
1,445
1.2.092.24.32.20.60.50.60.30.3
0.020.3
0.030.050.8
2,157166
4,1297,8684,0951,152
8941,114
57248135
6075092
1,445
Grandtotal 24,857 13.5 9,975 5.4 7.4 Total 13.5
PMG = program management group
Labor calculation used: 1,840
Annual hours 2,080Less 3 weeks vacation (120) (due to long-term employees) Less 1 week sickLess 10 paid holidays
(40)(80)
1,840
Figure 11-6 Executive Summary: Labor Analysis
the first place, and strive to summarize a multitude of data intoa single table to show the big picture.
Section 4: Key FindingsThe purpose of this section of the executive summary is
to make management aware of the key points uncovered duringthe work. The topics may relate to what the project team learned
258 THE POWER OF BUS INE S S P ROCES S IMPROVEMENT
or to cautions about crucial points in the process. Here are someexamples:
? The project team developed a shared knowledge of theeffect that the actions of one person has on the other. Priorto the business process improvement work, each depart-ment completed their actions without understanding theend-to-end process and was thus unaware of the effect onother departments.
? We created internal controls to address crucial points in thebusiness process where the highest likelihood of errorexisted.
? Human errors will persist if the department does not followthe processes put in place and bypass the internal controls.Although internal controls add time to the overall process,they offset the increased time by mitigating human error.
? The department should review the business process at leastannually.
The information included in this section should focus onthe few points important for the reader to remember.
Section 5: DeliverablesIn this section, identify the materials created as a result
of the business process work. List the title and description ofeach deliverable. The recap helps readers understand what in-formation to ask for if they need additional details. Deliverablescan include documents like:
? Process Overview: A narrative description explaining thepurpose of the process, boundaries or scope, clients/cus-tomers and their needs, key stakeholders and their needs,measurements of success, and other relevant information.
? Process Maps: A visual representation of the businessprocess outlining key activities.
? Detail Document: A narrative description of the processmap to assist in understanding and to provide a frameworkfor additional training.
CREATE THE EXECUTIVE SUMMARY: GETTING THE RECOGNITION 259
? Internal Controls Document: The crucial points in theprocess where an error can occur, the potential reasons forthe errors, and the proposed solution.
? Checklists: Tools that document the internal controls orother important information.
? Impact Analysis: A summary of the changes that have tooccur to ensure the success of the new business process.
? Implementation Plan: A project plan that identifies the keyphases of the work and their associated timelines.
? Training Plan: An outline of who requires training on thenew business process, what they require training on, whoowns the responsibility for the training, and how to conductthe training.
? Communication Plan: An audience profile of who has toreceive communication on the new business process, thekey message points, the best vehicles to use, and when thecommunications should happen.
Section 6: AppendixInclude any additional content in the appendix. If you
want to include numerous pieces of information, break the ap-pendix down into separate ones and number them. The appen-dix may include feedback you received from the project team,how the team completed the work, a customized version of theroadmap, the scope definition document, process definitions ifyou addressed multiple business processes, and perhaps theprocess map(s). Include whatever material you feel supportsyour conclusions.
Chapter Summary
Creating an executive summary gives you the opportu-nity to summarize your work for management and gain recogni-tion, while appearing like a normal part of any project closure.
Keep the readers in mind when writing the executivesummary, and include the information you know they care
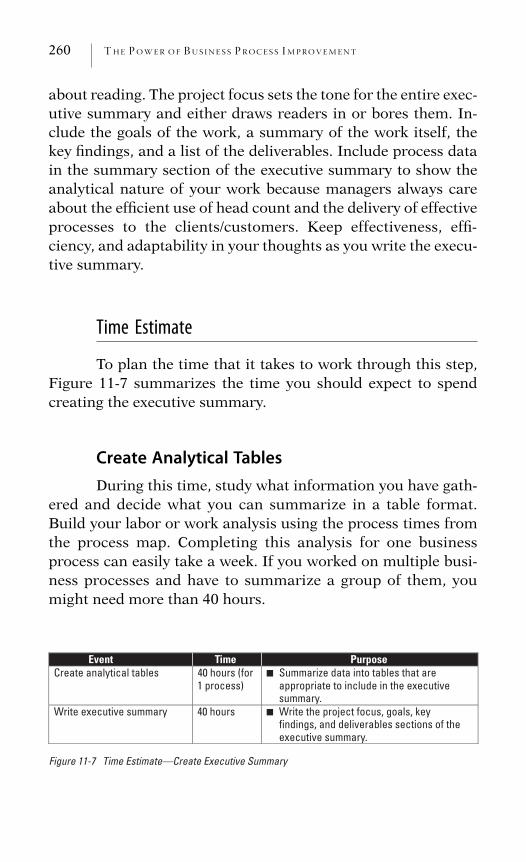
260 THE POWER OF BUS INE S S P ROCES S IMPROVEMENT
about reading. The project focus sets the tone for the entire exec-utive summary and either draws readers in or bores them. In-clude the goals of the work, a summary of the work itself, thekey findings, and a list of the deliverables. Include process datain the summary section of the executive summary to show theanalytical nature of your work because managers always careabout the efficient use of head count and the delivery of effectiveprocesses to the clients/customers. Keep effectiveness, effi-ciency, and adaptability in your thoughts as you write the execu-tive summary.
Time Estimate
To plan the time that it takes to work through this step,Figure 11-7 summarizes the time you should expect to spendcreating the executive summary.
Create Analytical TablesDuring this time, study what information you have gath-
ered and decide what you can summarize in a table format.Build your labor or work analysis using the process times fromthe process map. Completing this analysis for one businessprocess can easily take a week. If you worked on multiple busi-ness processes and have to summarize a group of them, youmight need more than 40 hours.
Event Time PurposeCreate analytical tables 40 hours (for
1 process) Summarize data into tables that areappropriate to include in the executive summary.
Write executive summary 40 hours Write the project focus, goals, key
■
■
findings, and deliverables sections of the executive summary.
Figure 11-7 Time Estimate—Create Executive Summary
CREATE THE EXECUTIVE SUMMARY: GETTING THE RECOGNITION 261
Write the Executive SummaryAt this time, take a step back and reflect on what you
have accomplished. Write each of the sections and have a col-league—who is not familiar with the work—review what youwrote. Keep streamlining the executive summary until you feelthat it tells the story of your journey in a tight, compressed way.
What You Have Achieved
In this chapter, you have achieved the following:
? The opportunity to summarize your work
? The knowledge of how to write an executive summary
? An understanding of how to create analytical summaries ofthe work
? What senior managers care about reading
? Most important, the power to gain the recognition for yourwork
C H A P T E R 12
Case Study
Sharing a Real-World Example
Now let us put all the pieces together by stepping througha complete BPI project that I completed for a major bank that Icall BB&Z. We all read stories about how someone lost weight,climbed a difficult mountain, or ran a marathon. If you are likeme, you find them inspiring because reading what others wentthrough helps me realize that I can do things I might previouslyhave thought were impossible. I chose this particular case be-cause it introduces several new bends in the road and demon-strates how you can adapt the 10 steps to any situation. As wemove through the study, you can reference the previous chaptersin this book for clarification or for additional details. Hopefully,this case study motivates you and jump-starts you on your ownroad to improving business processes. I selected a training anddevelopment business process.
Background
Pam Borzak, senior vice president of human resourcesfor BB&Z, called me for help with improving the business proc-esses in her organization. As a result of that call, I spent the nextyear tackling each business process within her departments.Because Pam had responsibility for all the human resourcefunctions, we decided to start her process inventory at the de-partment level to decide which of the human resource depart-ments we should start with first.
262
CASE STUDY: SHARING A REAL-WORLD EXAMPLE 263
In previous chapters we looked at individual businessprocesses. This time we raise the bar a notch and start at thedepartment level. Using this approach, I created a process inven-tory and process prioritization table by listing the departmentsin BB&Z’s human resource function, and then I applied the pri-oritization criteria at the department level to determine whichdepartment’s processes to focus on first.
Step 1: Develop the Process Inventory
In Chapter 2, we built the business process inventory,created prioritization criteria, applied the criteria to each proc-ess, and created a process prioritization table that summarizedthe business processes. We did all that in one table to enablea process-by-process comparison, which then helped us decidewhere to start our improvement efforts.
I proceeded the same way in Pam’s case, only this time Ibuilt the process inventory at her department level and appliedthe prioritization criteria used in Chapter 2 to the list of humanresource departments. As you recall, the four main categories ofcriteria we used in Chapter 2 are:
? Impact: How much the business process affects Pam’s busi-ness, including the number of employees impacted by thebusiness process and the client level of the impactedemployees.
? Implementation: How the complexity of the businessprocess, the cost to improve the process, and the timing ofthe next cycle (or how long before the organization uses theprocess again) affect Pam’s ability to drive any processchanges through the organization.
? Current State: How well the business process works todayfor Pam’s clients and her internal organization.
? Value: How well the business process delivers worth to theorganization, or the quantitative and qualitative benefitsthat the process delivers.
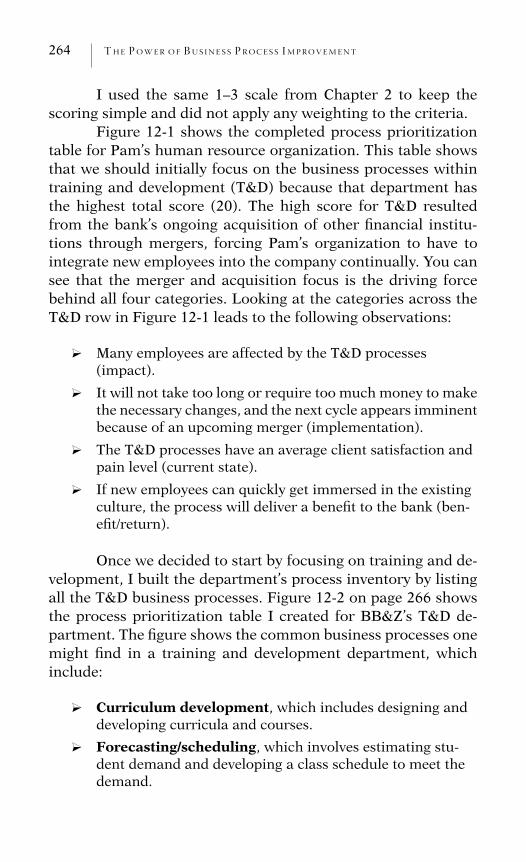
264 THE POWER OF BUS INE S S P ROCES S IMPROVEMENT
I used the same 1–3 scale from Chapter 2 to keep thescoring simple and did not apply any weighting to the criteria.
Figure 12-1 shows the completed process prioritizationtable for Pam’s human resource organization. This table showsthat we should initially focus on the business processes withintraining and development (T&D) because that department hasthe highest total score (20). The high score for T&D resultedfrom the bank’s ongoing acquisition of other financial institu-tions through mergers, forcing Pam’s organization to have tointegrate new employees into the company continually. You cansee that the merger and acquisition focus is the driving forcebehind all four categories. Looking at the categories across theT&D row in Figure 12-1 leads to the following observations:
? Many employees are affected by the T&D processes(impact).
? It will not take too long or require too much money to makethe necessary changes, and the next cycle appears imminentbecause of an upcoming merger (implementation).
? The T&D processes have an average client satisfaction andpain level (current state).
? If new employees can quickly get immersed in the existingculture, the process will deliver a benefit to the bank (ben-efit/return).
Once we decided to start by focusing on training and de-velopment, I built the department’s process inventory by listingall the T&D business processes. Figure 12-2 on page 266 showsthe process prioritization table I created for BB&Z’s T&D de-partment. The figure shows the common business processes onemight find in a training and development department, whichinclude:
? Curriculum development, which includes designing anddeveloping curricula and courses.
? Forecasting/scheduling, which involves estimating stu-dent demand and developing a class schedule to meet thedemand.
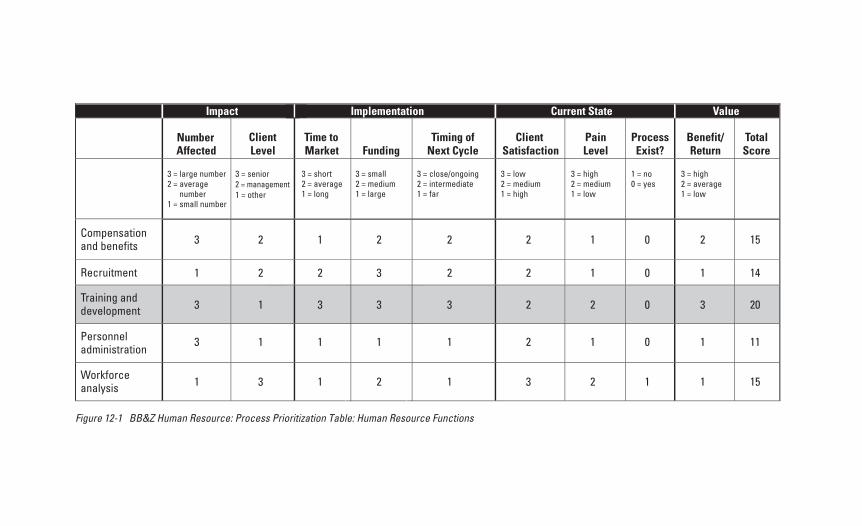
Impact Implementation Current State Value
NumberAffected
ClientLevel
Time to Market Funding
Timing ofNext Cycle
ClientSatisfaction
PainLevel
ProcessExist?
Benefit/Return
TotalScore
Compensationand benefits
Recruitment
Training and development
Personneladministration
Workforce analysis
3 = short 2 = average 1 = long
3 = small 2 = medium 1 = large
3 = close/ongoing 2 = intermediate 1 = far
3 = low 2 = medium 1 = high
3 = high 2 = medium 1 = low
1 = no0 = yes
3 = high 2 = average 1 = low
3 = large number 2 = average
number1 = small number
3 = senior 2 = management1 = other
3 2 1 2 2 2 1 0 2 15
1 2 2 3 2 2 1 0 1 14
3 1 3 3 3 2 2 0 3 20
3 1 1 1 1 2 1 0 1 11
1 3 1 2 1 3 2 1 1 15
Figure 12-1 BB&Z Human Resource: Process Prioritization Table: Human Resource Functions
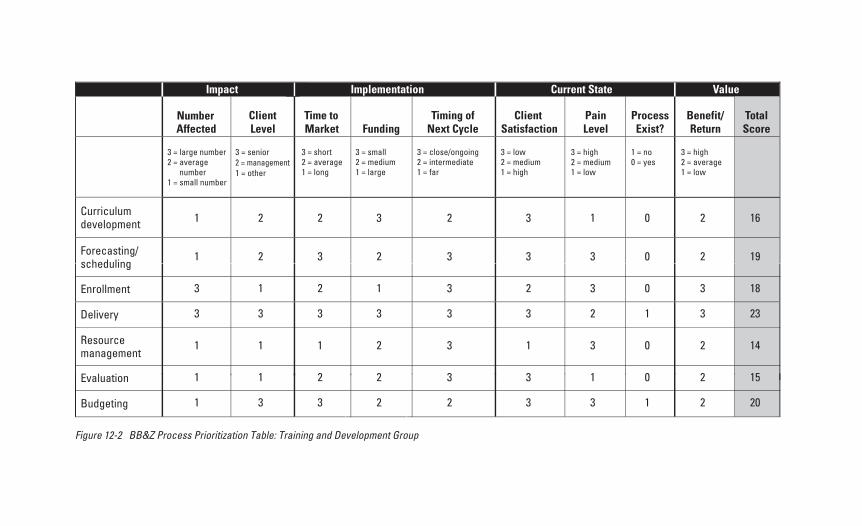
Figure 12-2 BB&Z Process Prioritization Table: Training and Development Group
Impact Implementation Current State Value
NumberAffected
ClientLevel
Time to Market Funding
Timing ofNext Cycle
ClientSatisfaction
PainLevel
ProcessExist?
Benefit/Return
Curriculumdevelopment
Forecasting/scheduling
management
3 = short 2 = average 1 = long
3 = small 2 = medium 1 = large
3 = close/ongoing 2 = intermediate 1 = far
3 = low 2 = medium 1 = high
3 = high 2 = medium 1 = low
1 = no0 = yes
3 = high 2 = average 1 = low
3 = large number 2 = average
number1 = small number
3 = senior 2 = management1 = other
1 2 2 3 2 3 1 0 2 16
1 2 3 2 3 3 3 0 2 19
3 1 2 1 3 2 3 0 3 18
3 3 3 3 3 3 2 1 3 23
1 1 1 2 3 1 3 0 2 14
1 1 2 2 3 3 1 0 2 15
1 3 3 2 2 3 3 1 2 20
TotalScore
Enrollment
Evaluation
Budgeting
Delivery
Resource
CASE STUDY: SHARING A REAL-WORLD EXAMPLE 267
? Enrollment, which allows students to enroll in a learningevent.
? Delivery, which includes the facilitation of a class, either byan instructor or by alternative methods.
? Resource management, which involves securing all mate-rials, equipment, and facilitators required to delivertraining.
? Evaluation, which assesses the impact of training.
? Budgeting, which tracks all spending.
Based on the results of the process prioritization table inFigure 12-2, I normally would start with the delivery processbecause it has the highest score (23), but before moving to thenext step, I reviewed the results of this exercise with Pam. I ex-pressed concern that the score given to delivery may be becauseit is one of the only business processes, besides enrollment, thather clients experience. All others reflect the internal workings inthe department, which are not visible to clients.
At this point, a bend in the road occurred in my workwith Pam. I encouraged her to think about the lack of clientinteraction throughout the process, and she agreed not to rushin and start with the delivery process just yet, but rather to takea fresh look at how her organization functioned and interfacedwith the client. Pam agreed that her key goal was making surethat her organization delivered training that supported the com-pany’s business objectives. As a result of our discussion, we de-cided to take a high-level look at the training and developmentprocess before getting into the details of any single businessprocess.
The change in direction meant that I had to adjust howwe approached step 2, building the foundation. Any change youmake along the way subsequently causes other changes downthe line as you move through the roadmap, and these changesare perfectly acceptable. In Pam’s case, instead of developing ascope definition document on the delivery process, we createdone for the entire training and development process.
268 THE POWER OF BUS INE S S P ROCES S IMPROVEMENT
The roadmap is a flexible and dynamic tool that providesoverall direction on how to perform business process improve-ment work, but remember to adapt it to changing circum-stances.
Step 2: Establish the Foundation
In Chapter 3 we learned that in this step we create thescope definition document to establish the boundaries for thebusiness process, so that we can stay on track and avoid scopecreep. At this point, you also form the project team, if one isnecessary. Because we chose to look at the end-to-end trainingand development process, Pam elected to include on the teamher training and development director, a delivery manager, aninstructor, two instructional designers, one of her training spe-cialists who helped with resource scheduling, and her businessmanager.
During the initial project team meeting, I walked thegroup through the roadmap in Figure 12-3 so that they couldsee the steps we would go through and provide them with anopportunity to ask questions. Pam joined us for the first 15 min-utes of the initial team meeting.
After reviewing the objectives of business process im-provement and answering the project team’s questions, wemoved on to setting the foundation for our work. All team mem-bers had a copy of the blank scope definition document so thatthey could see the information we would discuss. I kept track ofthe team’s conversation on an electronic dry-erase board so thateveryone could see the results of our conversation. Figure 12-4on page 270 shows the completed scope definition documentthat the team created for the training and development process.
A look at the scope definition document tells us a greatdeal. We can see where the project team decided to start andend the process by reading the scope (boundaries) section. Itstarts when Pam’s organization works with the finance depart-
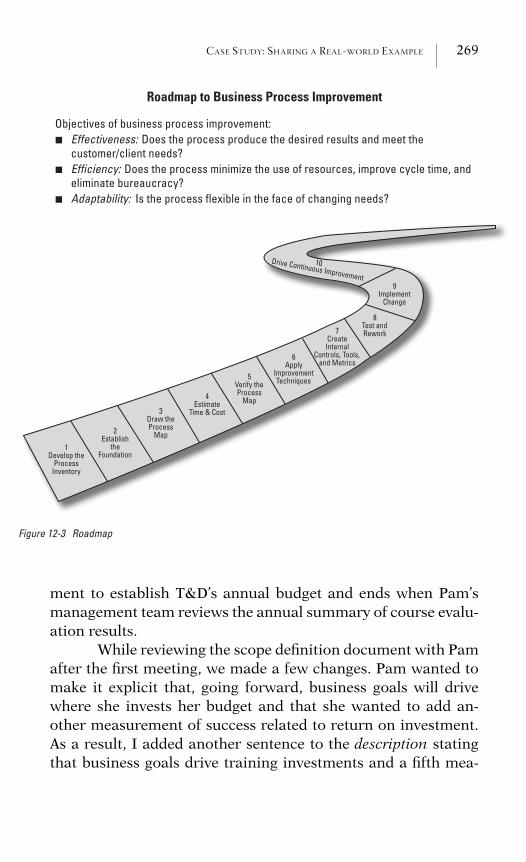
CASE STUDY: SHARING A REAL-WORLD EXAMPLE 269
Roadmap to Business Process Improvement
Objectives of business process improvement: Effectiveness: Does the process produce the desired results and meet the customer/client needs? Efficiency: Does the process minimize the use of resources, improve cycle time, and eliminate bureaucracy? Adaptability:
■
■
■ Is the process flexible in the face of changing needs?
1Develop the
ProcessInventory
2Establish
theFoundation
3Draw theProcess
Map
4Estimate
Time & Cost
5Verify theProcess
Map
6Apply
ImprovementTechniques
7Create
InternalControls, Tools,
and Metrics
8Test andRework
9Implement
Change
10Drive Continuous Improvement
Figure 12-3 Roadmap
ment to establish T&D’s annual budget and ends when Pam’smanagement team reviews the annual summary of course evalu-ation results.
While reviewing the scope definition document with Pamafter the first meeting, we made a few changes. Pam wanted tomake it explicit that, going forward, business goals will drivewhere she invests her budget and that she wanted to add an-other measurement of success related to return on investment.As a result, I added another sentence to the description statingthat business goals drive training investments and a fifth mea-
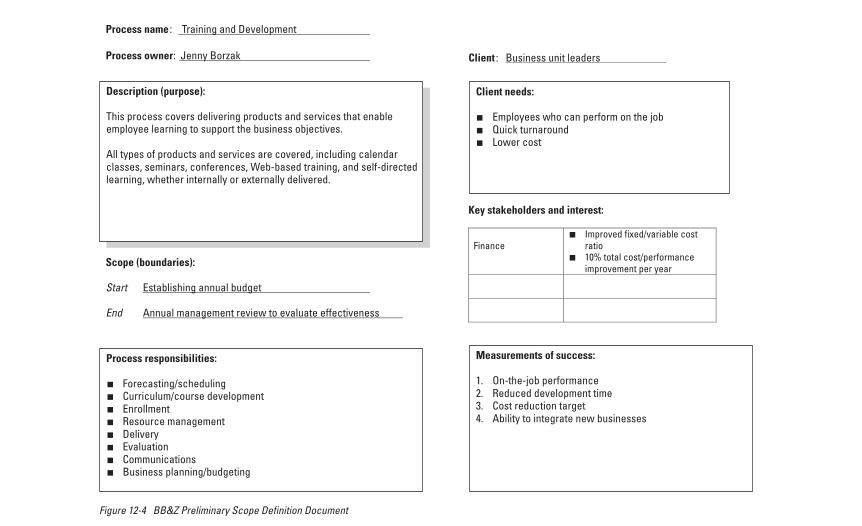
Process name : Training and Development
Process responsibilities:
Forecasting/schedulingCurriculum/course development EnrollmentResource management Delivery
Evaluation Communications Business planning/budgeting
■
■
■
■
■
■
■
■
Process owner: Jenny Borzak
Scope (boundaries):
Start Establishing annual budget
End Annual management review to evaluate effectiveness
Measurements of success:
1. On-the-job performance 2. Reduced development time 3. Cost reduction target 4. Ability to integrate new businesses
Client needs:
Employees who can perform on the job Quick turnaround Lower cost
■
■
■
Client : Business unit leaders
Key stakeholders and interest:
FinanceImproved fixed/variable cost ratio10% total cost/performance
■
■
improvement per year
Description (purpose):
This process covers delivering products and services that enable employee learning to support the business objectives.
All types of products and services are covered, including calendar classes, seminars, conferences, Web-based training, and self-directedlearning, whether internally or externally delivered.
Figure 12-4 BB&Z Preliminary Scope Definition Document
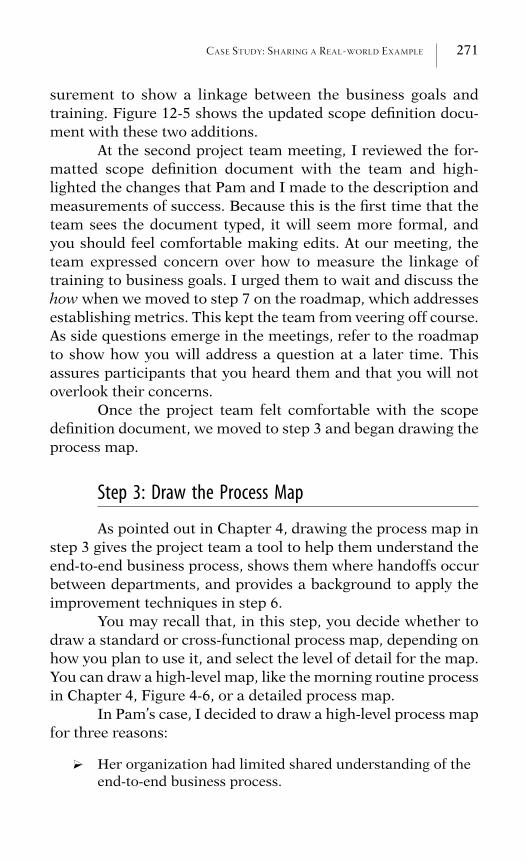
CASE STUDY: SHARING A REAL-WORLD EXAMPLE 271
surement to show a linkage between the business goals andtraining. Figure 12-5 shows the updated scope definition docu-ment with these two additions.
At the second project team meeting, I reviewed the for-matted scope definition document with the team and high-lighted the changes that Pam and I made to the description andmeasurements of success. Because this is the first time that theteam sees the document typed, it will seem more formal, andyou should feel comfortable making edits. At our meeting, theteam expressed concern over how to measure the linkage oftraining to business goals. I urged them to wait and discuss thehow when we moved to step 7 on the roadmap, which addressesestablishing metrics. This kept the team from veering off course.As side questions emerge in the meetings, refer to the roadmapto show how you will address a question at a later time. Thisassures participants that you heard them and that you will notoverlook their concerns.
Once the project team felt comfortable with the scopedefinition document, we moved to step 3 and began drawing theprocess map.
Step 3: Draw the Process Map
As pointed out in Chapter 4, drawing the process map instep 3 gives the project team a tool to help them understand theend-to-end business process, shows them where handoffs occurbetween departments, and provides a background to apply theimprovement techniques in step 6.
You may recall that, in this step, you decide whether todraw a standard or cross-functional process map, depending onhow you plan to use it, and select the level of detail for the map.You can draw a high-level map, like the morning routine processin Chapter 4, Figure 4-6, or a detailed process map.
In Pam’s case, I decided to draw a high-level process mapfor three reasons:
? Her organization had limited shared understanding of theend-to-end business process.
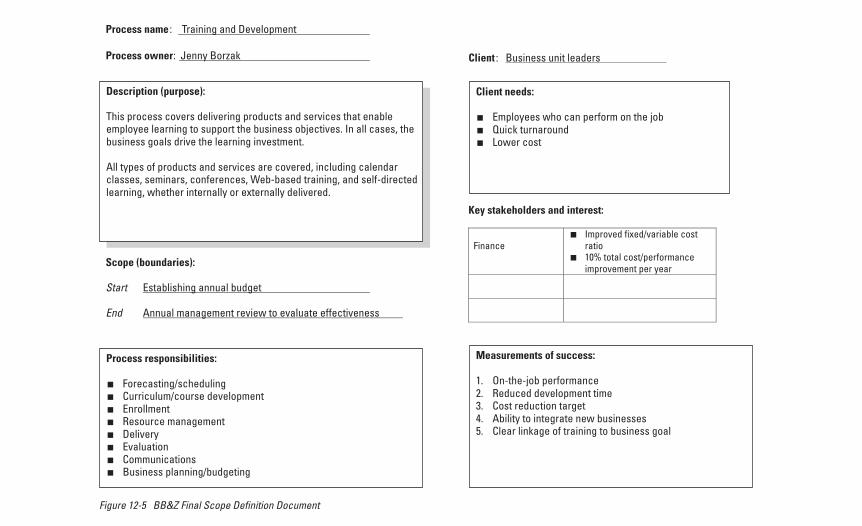
Process name : Training and Development
Process responsibilities:
Forecasting/schedulingCurriculum/course development EnrollmentResource management DeliveryEvaluationCommunicationsBusiness planning/budgeting
■
■
■
■
■
■
■
■
Process owner: Jenny Borzak
Scope (boundaries):
Start Establishing annual budget
End Annual management review to evaluate effectiveness
Measurements of success:
1. On-the-job performance 2. Reduced development time 3. Cost reduction target 4. Ability to integrate new businesses 5. Clear linkage of training to business goal
Client needs:
Employees who can perform on the job Quick turnaround Lower cost
■
■
■
Client : Business unit leaders
Key stakeholders and interest:
FinanceImproved fixed/variable cost ratio10% total cost/performance
■
■
improvement per year
Description (purpose):
This process covers delivering products and services that enable employee learning to support the business objectives. In all cases, thebusiness goals drive the learning investment.
All types of products and services are covered, including calendar classes, seminars, conferences, Web-based training, and self-directedlearning, whether internally or externally delivered.
Figure 12-5 BB&Z Final Scope Definition Document
CASE STUDY: SHARING A REAL-WORLD EXAMPLE 273
? The process had numerous subprocesses, making it com-plex.
? This level of detail would provide Pam with an overall viewof the entire process.
We agreed to delve into a single business process as re-quired, to answer questions or to address problems.
Deciding to start at a high level of detail leads to bothpositive and negative repercussions for the facilitator. On theone hand, this decision makes it easier to draw the process mapbecause you do not need a detailed level of understanding andyou can do so quickly. On the other hand, managing the projectteam becomes more difficult because part of the team almostalways likes to delve into detail. Although you will hear various,reasonable-sounding explanations for the need to go deeper,recognize that the root of team members’ anxiety usually re-volves around not seeing their own job reflected in the processmap. Your challenge, as the facilitator, becomes keeping every-one grounded and feeling secure.
To draw Pam’s high-level process map, the team met forthree hours every week for four weeks to create the two-page,high-level process map shown in Figures 12-6 and 12-7. Betweeneach meeting, I created and updated the process map using Mi-crosoft Visio.
Notice that in these two figures that the process mapspans two pages because it did not fit onto a single page; noticehow I used the two types of connectors discussed in Chapter 4(Figures 12-8 and 12-9 on page 276). The connector symbolshelp readers understand how to follow the process map by tell-ing them where to move next. I used the off-page connector inFigure 12-6 to tell the reader to move to page two, activity 8,after estimating the annual budget in activity 7. Also notice theoff-page connector in Figure 12-7 entering activity 8, which letsthe reader know that this activity comes from a prior page inthe process map. After moving to activity 8 on the second pageof the process map, the on-page connector in Figure 12-7 tellsreaders that, after activities 10 and 11, they move to delivery of
(text continues on page 276)
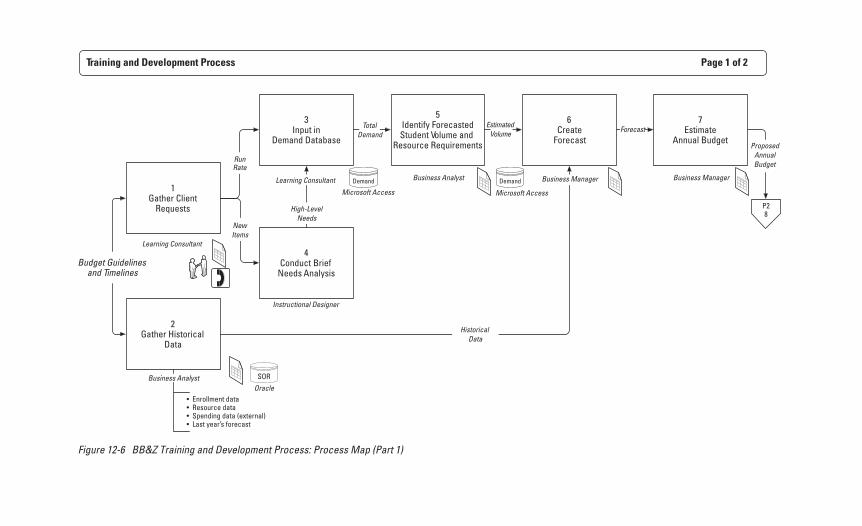
Training and Development Process Page 1 of 2
1Gather Client
Requests
Budget Guidelines and Timelines
3Input in
Demand Database
4Conduct Brief
Needs Analysis
RunRate
• Enrollment data• Resource data• Spending data (external)• Last year’s forecast
2Gather Historical
Data
NewItems
High-LevelNeeds
5Identify ForecastedStudent Volume and
Resource Requirements
6Create
Forecast
7Estimate
Annual Budget
HistoricalData
TotalDemand
EstimatedVolume
Forecast
Business Analyst Business Manager
Learning Consultant
Instructional Designer
Business Analyst
Learning Consultant
P28
ProposedAnnualBudget
Demand
SOR
Demand
Oracle
Microsoft Access Microsoft Access
Business Manager
Figure 12-6 BB&Z Training and Development Process: Process Map (Part 1)
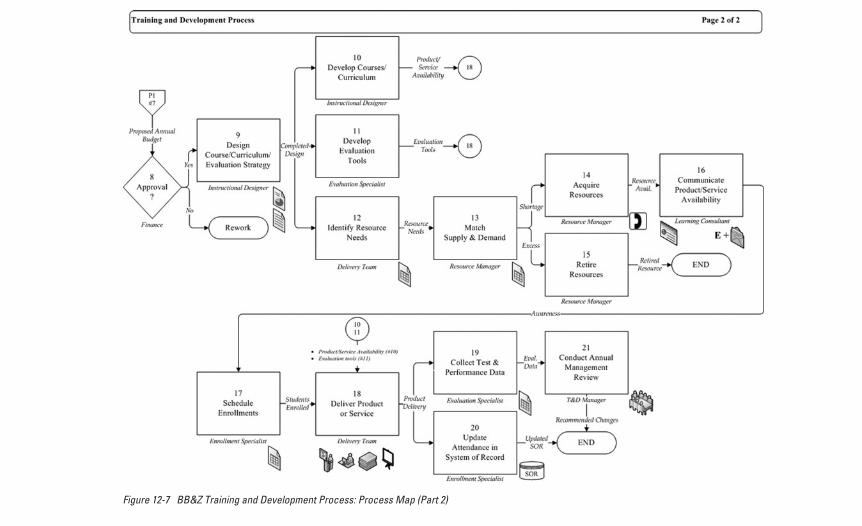
Figure 12-7 BB&Z Training and Development Process: Process Map (Part 2)
276 THE POWER OF BUS INE S S P ROCES S IMPROVEMENT
the products and services in activity 18 on the same page of themap.
Figure 12-8 Off-Page Connector Symbol
Figure 12-9 On-Page Connector Symbol
In reviewing Figures 12-6 and 12-7, we see that Pam’sprocess starts after she receives the budget guidelines andtimeline from the finance department. Figure 12-6 shows oneway to draw a business process that starts with two activitiesoccurring at the same time after an event enters the process.In Pam’s case, as soon as her team receives the budget guide-lines and timeline from finance, the learning consultants col-lect input from their clients to cover their needs for the nextyear. Simultaneously, the business analyst gathers historicaldata from the prior year. In looking at the process map, it be-comes apparent, by the addition of the Microsoft Excel icon,that Pam’s team uses a spreadsheet for many of the activitiesidentified as well as two databases: the demand database (aMicrosoft Access database) and their system of record (an Ora-cle database).
Once finance approves the annual budget in activity 8,the instructional designers begin design work on courses, cur-riculum, and evaluation strategies. As the instructional design-ers design and develop the training products throughout theyear, the evaluation specialists get involved and create the evalu-ation tools and the delivery team identifies the resources re-quired to facilitate the planned training.
Once the delivery team identifies the resources, the re-source management team starts evaluating the available re-sources and secures any additional resources required. Once the
CASE STUDY: SHARING A REAL-WORLD EXAMPLE 277
resource management team secures the resources, communica-tions can begin to tell employees of the upcoming trainingschedule. As students enroll and attend training, the evaluationspecialists gather the performance data in preparation for theannual review meeting that occurs at the end of every year.Meanwhile, the enrollment specialist updates the system of re-cord to reflect the employee’s completion of training.
Figures 12-6 and 12-7 include many symbols to denotethe various tools used to accomplish each activity, and Figure12-10 shows the legend page of the process map that explainsthe meanings of the symbols used. The legend page can go atthe beginning or end of the map.
In addition to updating the process map between meet-ings, I spent time documenting the conversation in the detaildocument, shown in Figure 12-11. Remember to document theconversation as you proceed so that you do not lose track of therich dialogue, and include examples when possible. The projectteam usually accepts a higher level process map as long as youcapture sufficient information in the detail document that ac-companies the map.
After drawing the high-level process map and capturingthe narrative to accompany the map, the team moved to step 4.We added the process timing to the process map and identifiedthe cost of the business process.
(text continues on page 283)
Microsoft PowerPoint
Meeting
On-page reference
Off-page reference
Phone
Database
Microsoft Word
Microsoft Excel
Process time
Cycle time
E +
Face-to-facecommunications
Instructor-led training
Web-based training
Self-paced study
Audio/visual
Figure 12-10 Legend
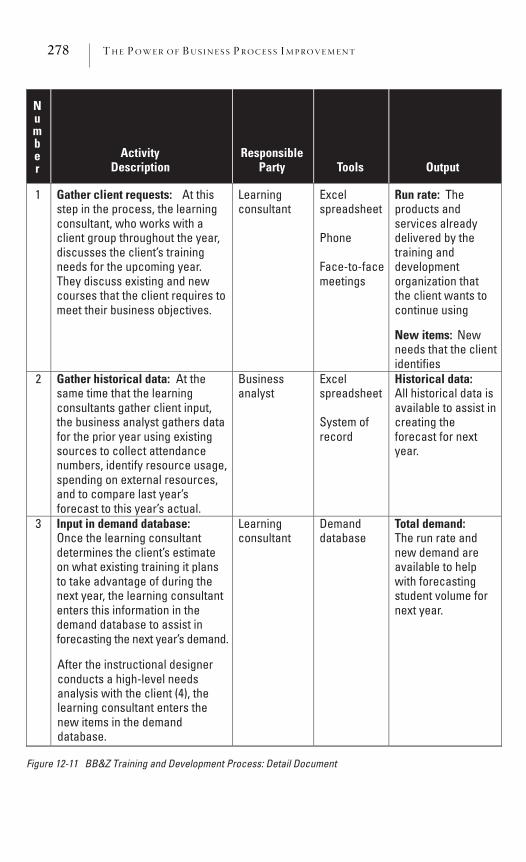
278 THE POWER OF BUS INE S S P ROCES S IMPROVEMENT
Number
ActivityDescription
ResponsibleParty Tools Output
1 Gather client requests: At this step in the process, the learning consultant, who works with a client group throughout the year, discusses the client’s training needs for the upcoming year. They discuss existing and new courses that the client requires to meet their business objectives.
Learningconsultant
Excelspreadsheet
Phone
Face-to-facemeetings
Run rate: Theproducts and services already delivered by the training and developmentorganization that the client wants to continue using
New items: Newneeds that the client identifies
2 Gather historical data: At the same time that the learning consultants gather client input, the business analyst gathers data for the prior year using existing sources to collect attendance numbers, identify resource usage, spending on external resources, and to compare last year’s forecast to this year’s actual.
Businessanalyst
Excelspreadsheet
System of record
Historical data: All historical data is available to assist in creating the forecast for next year.
3 Input in demand database: Once the learning consultant determines the client’s estimate on what existing training it plans to take advantage of during the next year, the learning consultant enters this information in the demand database to assist in forecasting the next year’s demand.
Learningconsultant
Demanddatabase
Total demand: The run rate and new demand are available to help with forecasting student volume for next year.
After the instructional designer conducts a high-level needs analysis with the client (4), the learning consultant enters the new items in the demand database.
Figure 12-11 BB&Z Training and Development Process: Detail Document
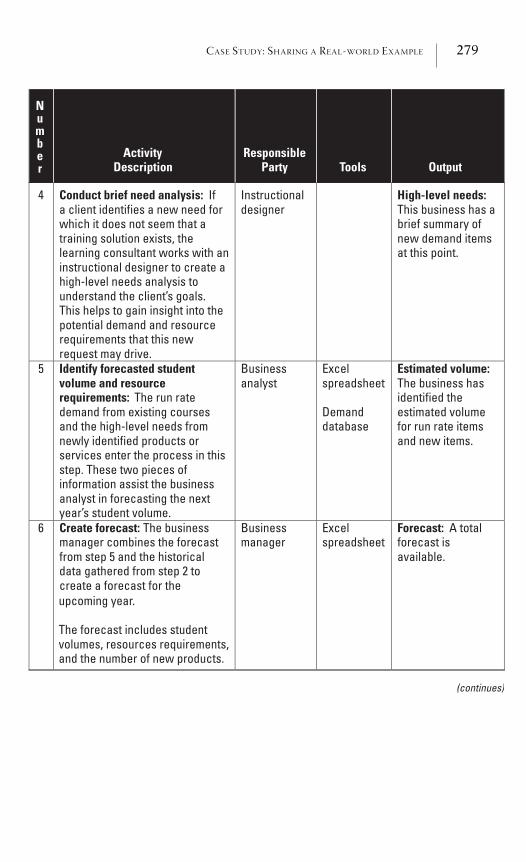
CASE STUDY: SHARING A REAL-WORLD EXAMPLE 279
4 Conduct brief need analysis: Ifa client identifies a new need for which it does not seem that a training solution exists, the learning consultant works with an instructional designer to create a high-level needs analysis to understand the client’s goals. This helps to gain insight into the potential demand and resource requirements that this new request may drive.
Instructionaldesigner
High-level needs:This business has a brief summary of new demand items at this point.
5 Identify forecasted student volume and resource requirements: The run rate demand from existing courses and the high-level needs from newly identified products or services enter the process in this step. These two pieces of information assist the business analyst in forecasting the next year’s student volume.
Businessanalyst
Excelspreadsheet
Demanddatabase
Estimated volume: The business has identified the estimated volume for run rate items and new items.
6 Create forecast: The business manager combines the forecast from step 5 and the historical data gathered from step 2 to create a forecast for the
Businessmanager
Excelspreadsheet
Forecast: A total forecast is available.
Number
ActivityDescription
ResponsibleParty Tools Output
upcoming year.
The forecast includes student volumes, resources requirements, and the number of new products.
(continues)
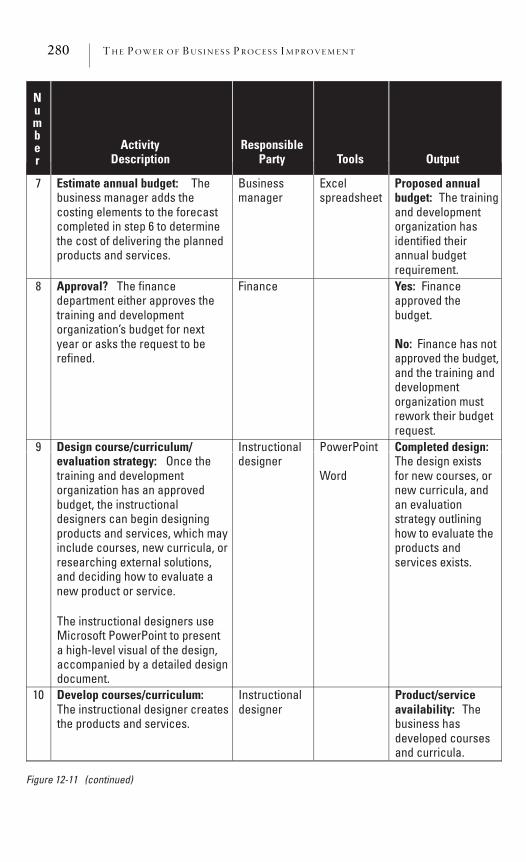
280 THE POWER OF BUS INE S S P ROCES S IMPROVEMENT
7 Estimate annual budget: Thebusiness manager adds the costing elements to the forecast completed in step 6 to determine the cost of delivering the planned products and services.
Businessmanager
Excelspreadsheet
Proposed annual budget: The trainingand developmentorganization hasidentified their annual budgetrequirement.
8 Approval? The finance department either approves the training and development organization’s budget for next year or asks the request to be refined.
Finance Yes: Financeapproved the budget.
No: Finance has not approved the budget,and the training anddevelopmentorganization mustrework their budgetrequest.
9 Design course/curriculum/ evaluation strategy: Once the training and development organization has an approved budget, the instructional designers can begin designing products and services, which may include courses, new curricula, or researching external solutions, and deciding how to evaluate a new product or service.
Instructionaldesigner
PowerPoint
Word
Completed design: The design exists for new courses, or new curricula, and an evaluation strategy outlining how to evaluate the products and services exists.
The instructional designers use Microsoft PowerPoint to present a high-level visual of the design, accompanied by a detailed design document.
10 Develop courses/curriculum: The instructional designer creates the products and services.
Instructionaldesigner
Product/serviceavailability: Thebusiness has developed courses and curricula.
Number
ActivityDescription
ResponsibleParty Tools Output
Figure 12-11 (continued)
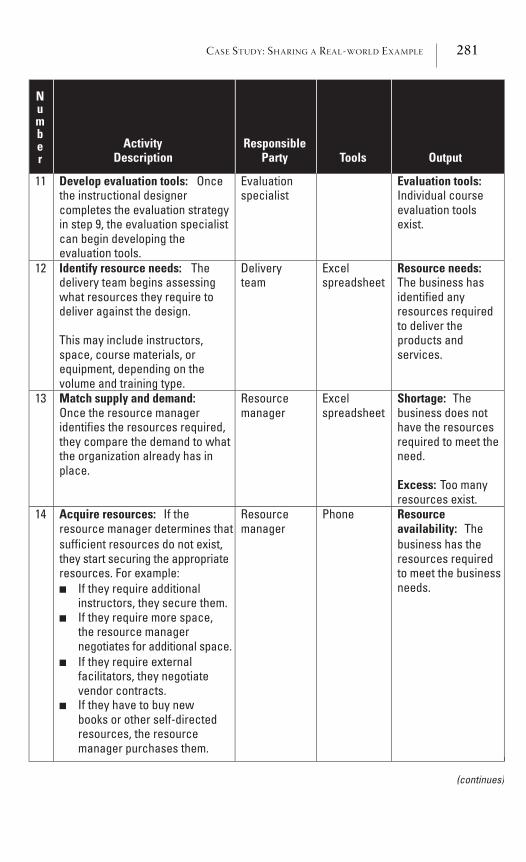
CASE STUDY: SHARING A REAL-WORLD EXAMPLE 281
11 Develop evaluation tools: Oncethe instructional designer completes the evaluation strategy in step 9, the evaluation specialist can begin developing the evaluation tools.
Evaluationspecialist
Evaluation tools: Individual course evaluation tools exist.
12 Identify resource needs: Thedelivery team begins assessing what resources they require to deliver against the design.
This may include instructors, space, course materials, or equipment, depending on the volume and training type.
Deliveryteam
Excelspreadsheet
Resource needs: The business has identified any resources required to deliver the products and services.
13 Match supply and demand: Once the resource manager identifies the resources required, they compare the demand to what the organization already has in place.
Resourcemanager
Excelspreadsheet
Shortage: Thebusiness does not have the resources required to meet the need.
Excess: Too many resources exist.
14 Acquire resources: If the resource manager determines that
Resourcemanager
Phone Resourceavailability: The
Number
ActivityDescription
ResponsibleParty Tools Output
sufficient resources do not exist, they start securing the appropriateresources. For example:
If they require additional instructors, they secure them.If they require more space, the resource manager negotiates for additional space.If they require external facilitators, they negotiate vendor contracts. If they have to buy new
■
■
■
■
books or other self-directed resources, the resource manager purchases them.
business has the resources required to meet the business needs.
(continues)
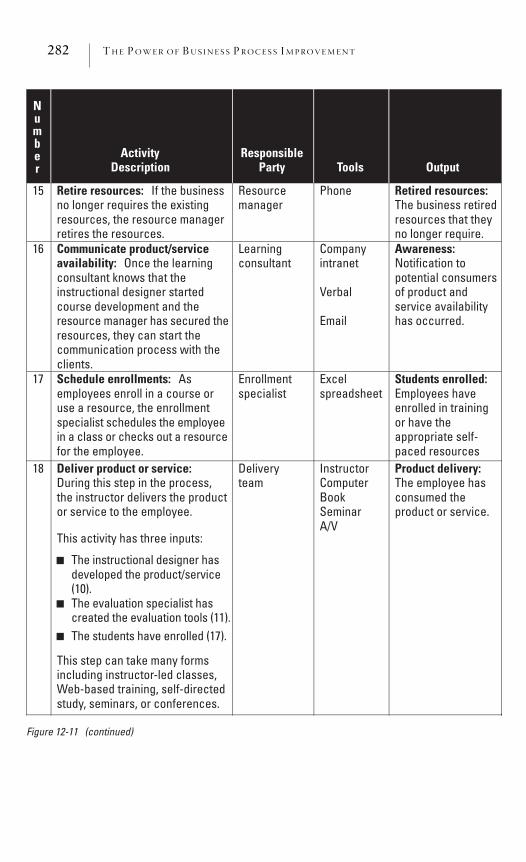
282 THE POWER OF BUS INE S S P ROCES S IMPROVEMENT
15 Retire resources: If the business no longer requires the existing resources, the resource manager retires the resources.
Resourcemanager
Phone Retired resources: The business retired resources that they no longer require.
16 Communicate product/service availability: Once the learning consultant knows that the instructional designer started course development and the resource manager has secured the resources, they can start the communication process with the clients.
Learningconsultant
Companyintranet
Verbal
Awareness: Notification to potential consumers of product and service availability has occurred.
17 Schedule enrollments: Asemployees enroll in a course or use a resource, the enrollment specialist schedules the employee in a class or checks out a resource for the employee.
Enrollmentspecialist
Excelspreadsheet
Students enrolled: Employees have enrolled in training or have the appropriate self-paced resources
18 Deliver product or service: During this step in the process, the instructor delivers the product or service to the employee.
This activity has three inputs:
The instructional designer has developed the product/service (10).The evaluation specialist has created the evaluation tools (11). The students have enrolled (17).
■
■
■
This step can take many forms including instructor-led classes, Web-based training, self-directed study, seminars, or conferences.
Deliveryteam
InstructorComputerBookSeminarA/V
Product delivery: The employee has consumed the product or service.
Number
ActivityDescription
ResponsibleParty Tools Output
Figure 12-11 (continued)
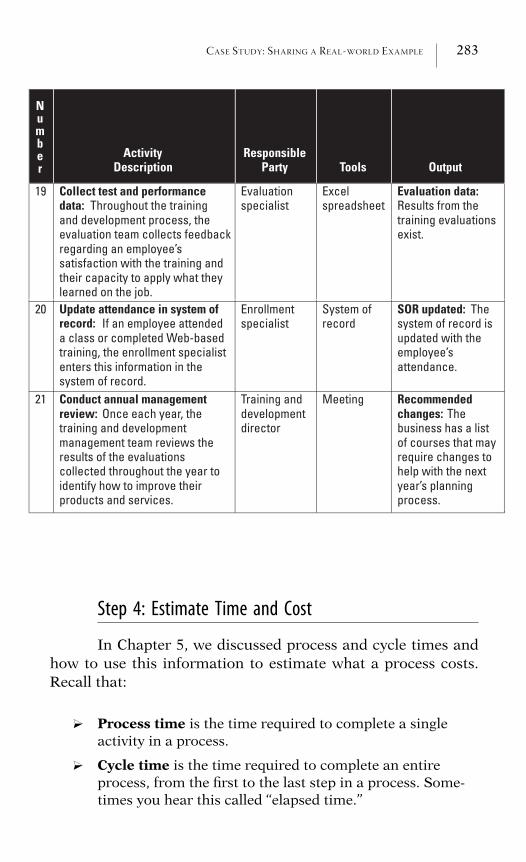
CASE STUDY: SHARING A REAL-WORLD EXAMPLE 283
19 Collect test and performance data: Throughout the training and development process, the evaluation team collects feedback regarding an employee’s satisfaction with the training and their capacity to apply what they learned on the job.
Evaluationspecialist
Excelspreadsheet
Evaluation data: Results from the training evaluations exist.
20 Update attendance in system of record: If an employee attended a class or completed Web-based training, the enrollment specialist enters this information in the system of record.
Enrollmentspecialist
System of record
SOR updated: Thesystem of record is updated with the employee’s attendance.
21 Conduct annual management review: Once each year, the training and development management team reviews the results of the evaluations collected throughout the year to identify how to improve their products and services.
Training and developmentdirector
Meeting Recommendedchanges: Thebusiness has a list of courses that may require changes to help with the next year’s planning process.
Number
ActivityDescription
ResponsibleParty Tools Output
Step 4: Estimate Time and Cost
In Chapter 5, we discussed process and cycle times andhow to use this information to estimate what a process costs.Recall that:
? Process time is the time required to complete a singleactivity in a process.
? Cycle time is the time required to complete an entireprocess, from the first to the last step in a process. Some-times you hear this called ‘‘elapsed time.’’
284 THE POWER OF BUS INE S S P ROCES S IMPROVEMENT
In Chapter 5, I discussed how well estimating works forthis step instead of using a formal data-gathering technique.However, when you work with such a high-level process map, aswe did in Pam’s case, you will not find the estimate as accuratebecause you do not have enough detail on all the subprocesses.You should still perform this task, though, because it providesdirectional information. When you draw a high-level processmap, go back and revisit the timing estimates when you move toindividual business processes.
During this step, I added process and cycle times to theprocess map for Pam’s high-level T&D process. Figures 12-12and 12-13 show the process and cycle times added to the train-ing and development process map. As in Chapter 4, the whiteclock denotes process time, and the dark clock denotes cycletime.
After adding the process time to Pam’s training and de-velopment process map and asking the project team to identifyannual volumes, I had the data necessary to complete a high-level estimate of the labor cost for the T&D process. In Chapter5, you learned that calculating the labor cost of a business proc-ess entails these four steps:
1. List the process activities and process times in a spread-sheet.
2. Identify the annual volume.3. Determine the full-time equivalent (FTE) formula to use.4. Determine the salary and employee benefit rate to use for
the employees or process workers.
Process Activities and Process TimeAfter the project team completed the estimates for proc-
ess and cycle time, I transferred the times shown on the processmap to the next two tables. I completed this task after the proj-ect meeting, during which we identified process time, cycletime, and annual volume. Figure 12-14 on page 287 shows theprocess time estimates for the training and development proc-ess, and Figure 12-15 on page 288 shows the cycle time esti-
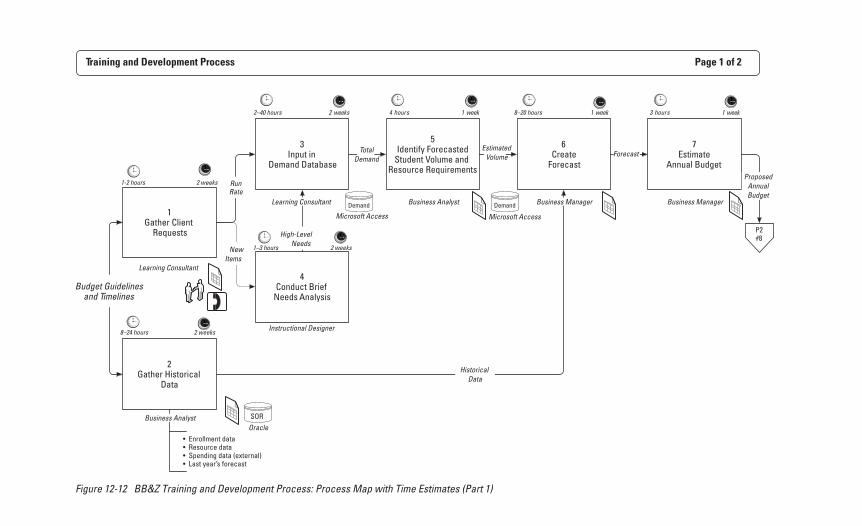
Training and Development Process Page 1 of 2
1Gather Client
Requests
Budget Guidelines and Timelines
3Input in
Demand Database
4Conduct Brief
Needs Analysis
RunRate
• Enrollment data• Resource data• Spending data (external)• Last year’s forecast
2Gather Historical
Data
NewItems
High-LevelNeeds
5Identify Forecasted
Student Volume and Resource Requirements
6Create
Forecast
7Estimate
Annual Budget
HistoricalData
TotalDemand
EstimatedVolume Forecast
Business Analyst Business Manager Business Manager
Learning Consultant
Instructional Designer
Business Analyst
Learning Consultant
P2#8
ProposedAnnualBudget
Demand
SOR
Demand
1-2 hours
sruoh38–20 hourssruoh42–40 hours
1–3 hours
8–24 hours
keew1keew1keew1skeew2
2 weeks
2 weeks
2 weeks
Oracle
Microsoft Access Microsoft Access
Figure 12-12 BB&Z Training and Development Process: Process Map with Time Estimates (Part 1)
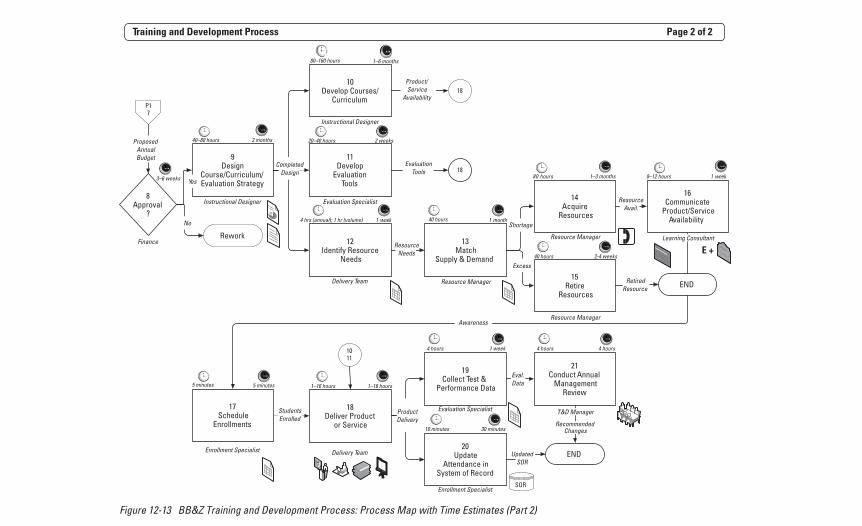
9Design
Course/Curriculum/Evaluation Strategy
8Approval
?
Yes
No
12Identify Resource
Needs
Training and Development Process Page 2 of 2
Rework
P17
ProposedAnnualBudget
18Deliver Product
or Service
11Develop
EvaluationTools
13Match
Supply & Demand
14Acquire
Resources
15Retire
Resources
16Communicate
Product/ServiceAvailability
17Schedule
Enrollments
19Collect Test &
Performance Data
21Conduct Annual
ManagementReview
20Update
Attendance inSystem of Record
18
18Evaluation
Tools
ResourceNeeds
Shortage
Excess
ResourceAvail.
Awareness
Eval.Data
ENDUpdatedSOR
RecommendedChanges
Instructional Designer Evaluation Specialist
Delivery Team Resource Manager
Resource Manager Learning Consultant
Enrollment Specialist
Resource Manager
T&D ManagerEvaluation Specialist
Enrollment Specialist
Delivery Team
SOR
Finance
ENDRetiredResource
ProductDelivery
10Develop Courses/
Curriculum
Instructional Designer
CompletedDesign
Product/Service
Availability
StudentsEnrolled
8–12 hourssruoh08
5 minutes
20–40 hours 2 weeks
80–160 hours
40–80 hours
4 hrs (annual); 1 hr (volume)
keew11–3 months
5 minutes
1–6 months
40 hours
3–6 weeks
40 hours 2-4 weeks
2 months
htnom1keew1
4 hours 4 hours4 hours 1 week
10 minutes 30 minutes
1–16 hours 1–16 hours
E +
1011
Figure 12-13 BB&Z Training and Development Process: Process Map with Time Estimates (Part 2)
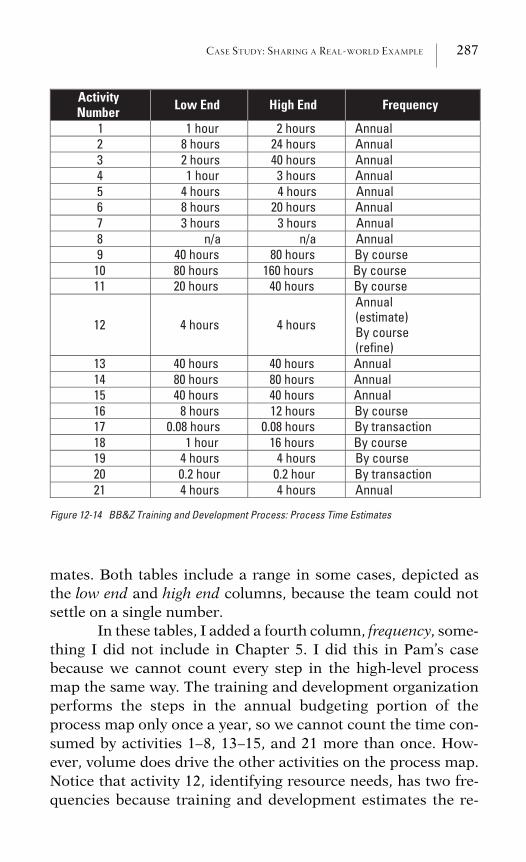
CASE STUDY: SHARING A REAL-WORLD EXAMPLE 287
ActivityNumber Low End High End Frequency
1 1 hour 2 hours Annual 2 8 hours 24 hours Annual 3 2 hours 40 hours Annual 4 1 hour 3 hours Annual 5 4 hours 4 hours Annual 6 8 hours 20 hours Annual 7 3 hours 3 hours Annual 8 n/a n/a Annual 9 40 hours 80 hours By course
10 80 hours 160 hours By course 11 20 hours 40 hours By course
12 4 hours 4 hours
Annual(estimate)By course (refine)
13 40 hours 40 hours Annual 14 80 hours 80 hours Annual 15 40 hours 40 hours Annual 16 8 hours 12 hours By course 17 0.08 hours 0.08 hours By transaction 18 1 hour 16 hours By course 19 4 hours 4 hours By course 20 0.2 hour 0.2 hour By transaction 21 4 hours 4 hours Annual
Figure 12-14 BB&Z Training and Development Process: Process Time Estimates
mates. Both tables include a range in some cases, depicted asthe low end and high end columns, because the team could notsettle on a single number.
In these tables, I added a fourth column, frequency, some-thing I did not include in Chapter 5. I did this in Pam’s casebecause we cannot count every step in the high-level processmap the same way. The training and development organizationperforms the steps in the annual budgeting portion of theprocess map only once a year, so we cannot count the time con-sumed by activities 1–8, 13–15, and 21 more than once. How-ever, volume does drive the other activities on the process map.Notice that activity 12, identifying resource needs, has two fre-quencies because training and development estimates the re-
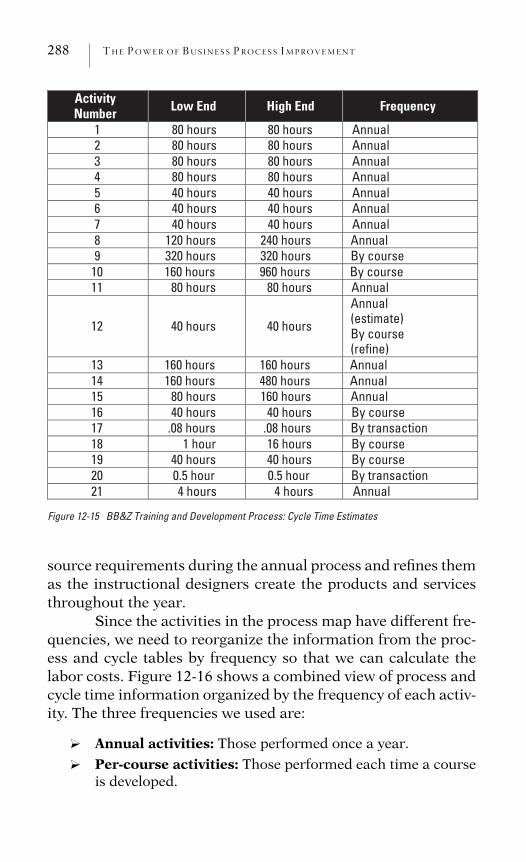
288 THE POWER OF BUS INE S S P ROCES S IMPROVEMENT
ActivityNumber Low End High End Frequency
1 80 hours 80 hours Annual 2 80 hours 80 hours Annual 3 80 hours 80 hours Annual 4 80 hours 80 hours Annual 5 40 hours 40 hours Annual 6 40 hours 40 hours Annual 7 40 hours 40 hours Annual 8 120 hours 240 hours Annual 9 320 hours 320 hours By course
10 160 hours 960 hours By course 11 80 hours 80 hours Annual
12 40 hours 40 hours
Annual(estimate)By course (refine)
13 160 hours 160 hours Annual 14 160 hours 480 hours Annual 15 80 hours 160 hours Annual 16 40 hours 40 hours By course 17 .08 hours .08 hours By transaction 18 1 hour 16 hours By course 19 40 hours 40 hours By course 20 0.5 hour 0.5 hour By transaction 21 4 hours 4 hours Annual
Figure 12-15 BB&Z Training and Development Process: Cycle Time Estimates
source requirements during the annual process and refines themas the instructional designers create the products and servicesthroughout the year.
Since the activities in the process map have different fre-quencies, we need to reorganize the information from the proc-ess and cycle tables by frequency so that we can calculate thelabor costs. Figure 12-16 shows a combined view of process andcycle time information organized by the frequency of each activ-ity. The three frequencies we used are:
? Annual activities: Those performed once a year.
? Per-course activities: Those performed each time a courseis developed.
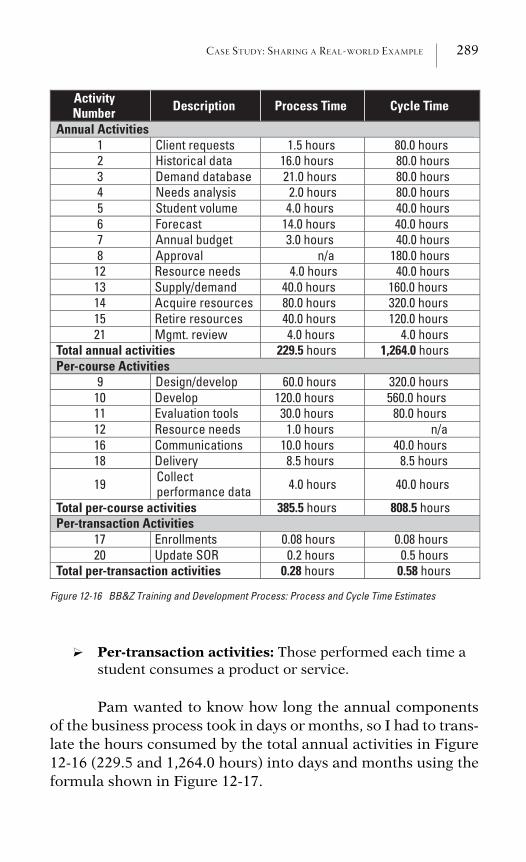
CASE STUDY: SHARING A REAL-WORLD EXAMPLE 289
ActivityNumber Description Process Time Cycle Time
Annual Activities 1 Client requests 1.5 hours 80.0 hours 2 Historical data 16.0 hours 80.0 hours 3 Demand database 21.0 hours 80.0 hours 4 Needs analysis 2.0 hours 80.0 hours 5 Student volume 4.0 hours 40.0 hours 6 Forecast 14.0 hours 40.0 hours 7 Annual budget 3.0 hours 40.0 hours 8 Approval n/a 180.0 hours
12 Resource needs 4.0 hours 40.0 hours 13 Supply/demand 40.0 hours 160.0 hours 14 Acquire resources 80.0 hours 320.0 hours 15 Retire resources 40.0 hours 120.0 hours 21 Mgmt. review 4.0 hours 4.0 hours
Total annual activities 229.5 hours 1,264.0 hoursPer-course Activities
9 Design/develop 60.0 hours 320.0 hours 10 Develop 120.0 hours 560.0 hours 11 Evaluation tools 30.0 hours 80.0 hours 12 Resource needs 1.0 hours n/a 16 Communications 10.0 hours 40.0 hours 18 Delivery 8.5 hours 8.5 hours
19 Collectperformance data 4.0 hours 40.0 hours
Total per-course activities 385.5 hours 808.5 hoursPer-transaction Activities
17 Enrollments 0.08 hours 0.08 hours 20 Update SOR 0.2 hours 0.5 hours
Total per-transaction activities 0.28 hours 0.58 hours
Figure 12-16 BB&Z Training and Development Process: Process and Cycle Time Estimates
? Per-transaction activities: Those performed each time astudent consumes a product or service.
Pam wanted to know how long the annual componentsof the business process took in days or months, so I had to trans-late the hours consumed by the total annual activities in Figure12-16 (229.5 and 1,264.0 hours) into days and months using theformula shown in Figure 12-17.
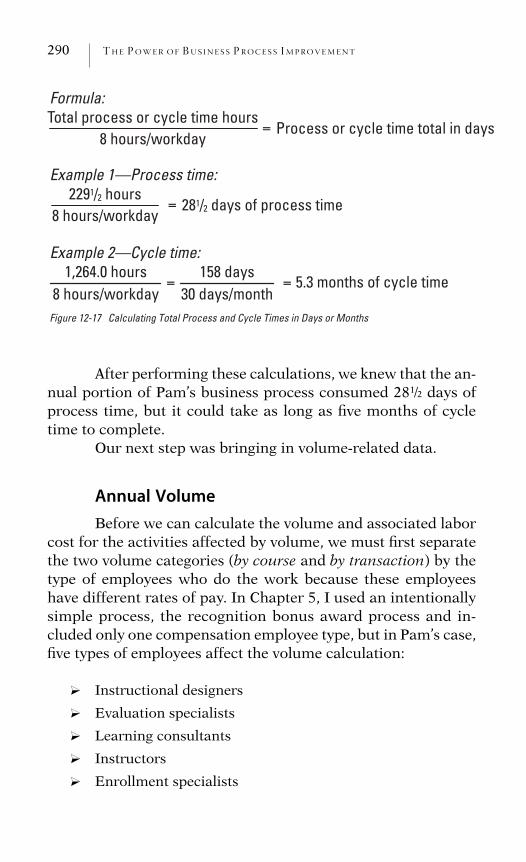
290 THE POWER OF BUS INE S S P ROCES S IMPROVEMENT
Example 1—Process time:2291/2 hours
1,264.0 hours5.3 months of cycle time
8 hours/workday
8 hours/workday
Example 2—Cycle time: 158 days
30 days/monthFigure 12-17 Calculating Total Process and Cycle Times in Days or Months
281/2 days of process time
Formula:Total process or cycle time hours
8 hours/workdayProcess or cycle time total in days
After performing these calculations, we knew that the an-nual portion of Pam’s business process consumed 281/2 days ofprocess time, but it could take as long as five months of cycletime to complete.
Our next step was bringing in volume-related data.
Annual VolumeBefore we can calculate the volume and associated labor
cost for the activities affected by volume, we must first separatethe two volume categories (by course and by transaction) by thetype of employees who do the work because these employeeshave different rates of pay. In Chapter 5, I used an intentionallysimple process, the recognition bonus award process and in-cluded only one compensation employee type, but in Pam’s case,five types of employees affect the volume calculation:
? Instructional designers
? Evaluation specialists
? Learning consultants
? Instructors
? Enrollment specialists
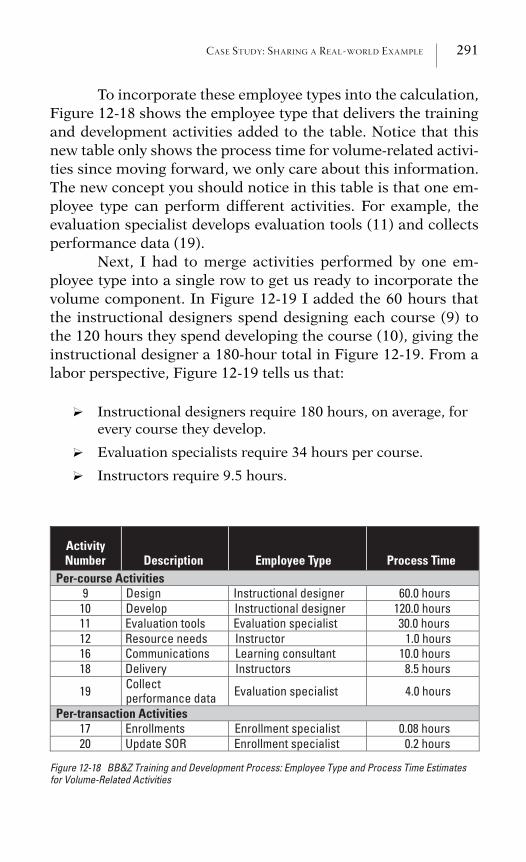
CASE STUDY: SHARING A REAL-WORLD EXAMPLE 291
To incorporate these employee types into the calculation,Figure 12-18 shows the employee type that delivers the trainingand development activities added to the table. Notice that thisnew table only shows the process time for volume-related activi-ties since moving forward, we only care about this information.The new concept you should notice in this table is that one em-ployee type can perform different activities. For example, theevaluation specialist develops evaluation tools (11) and collectsperformance data (19).
Next, I had to merge activities performed by one em-ployee type into a single row to get us ready to incorporate thevolume component. In Figure 12-19 I added the 60 hours thatthe instructional designers spend designing each course (9) tothe 120 hours they spend developing the course (10), giving theinstructional designer a 180-hour total in Figure 12-19. From alabor perspective, Figure 12-19 tells us that:
? Instructional designers require 180 hours, on average, forevery course they develop.
? Evaluation specialists require 34 hours per course.
? Instructors require 9.5 hours.
ActivityNumber Description Employee Type Process Time
Per-course Activities 9 Design Instructional designer 60.0 hours
10 Develop Instructional designer 120.0 hours 11 Evaluation tools Evaluation specialist 30.0 hours 12 Resource needs Instructor 1.0 hours 16 Communications Learning consultant 10.0 hours 18 Delivery Instructors 8.5 hours
19 Collectperformance data Evaluation specialist 4.0 hours
Per-transaction Activities 17 Enrollments Enrollment specialist 0.08 hours 20 Update SOR Enrollment specialist 0.2 hours
Figure 12-18 BB&Z Training and Development Process: Employee Type and Process Time Estimates for Volume-Related Activities
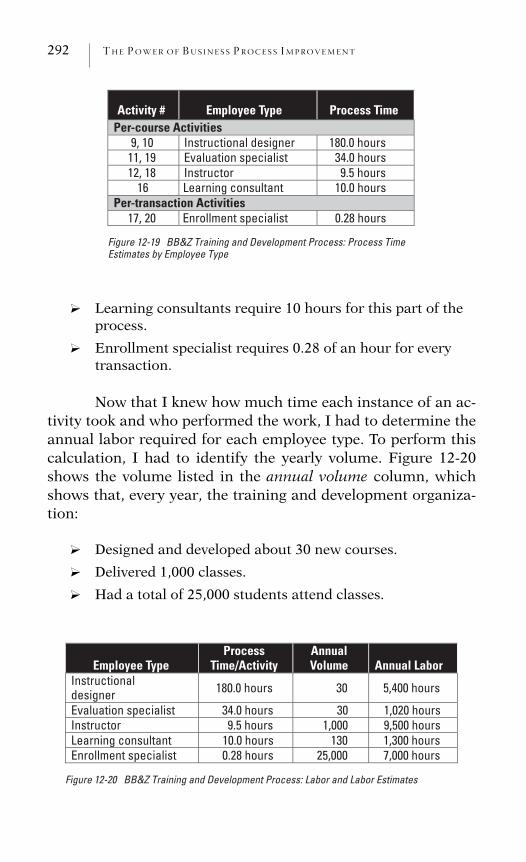
292 THE POWER OF BUS INE S S P ROCES S IMPROVEMENT
Activity # Employee Type Process Time Per-course Activities
9, 10 Instructional designer 180.0 hours 11, 19 Evaluation specialist 34.0 hours 12, 18 Instructor 9.5 hours
16 Learning consultant 10.0 hours Per-transaction Activities
17, 20 Enrollment specialist 0.28 hours
Figure 12-19 BB&Z Training and Development Process: Process Time Estimates by Employee Type
? Learning consultants require 10 hours for this part of theprocess.
? Enrollment specialist requires 0.28 of an hour for everytransaction.
Now that I knew how much time each instance of an ac-tivity took and who performed the work, I had to determine theannual labor required for each employee type. To perform thiscalculation, I had to identify the yearly volume. Figure 12-20shows the volume listed in the annual volume column, whichshows that, every year, the training and development organiza-tion:
? Designed and developed about 30 new courses.
? Delivered 1,000 classes.
? Had a total of 25,000 students attend classes.
Employee Type Process
Time/Activity AnnualVolume Annual Labor
Instructionaldesigner 180.0 hours 30 5,400 hours
Evaluation specialist 34.0 hours 30 1,020 hours Instructor 9.5 hours 1,000 9,500 hours Learning consultant 10.0 hours 130 1,300 hours Enrollment specialist 0.28 hours 25,000 7,000 hours
Figure 12-20 BB&Z Training and Development Process: Labor and Labor Estimates
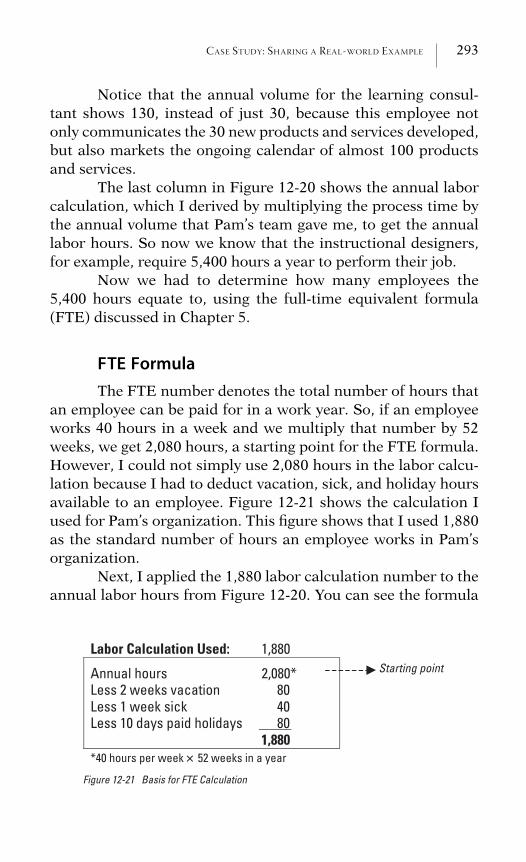
CASE STUDY: SHARING A REAL-WORLD EXAMPLE 293
Notice that the annual volume for the learning consul-tant shows 130, instead of just 30, because this employee notonly communicates the 30 new products and services developed,but also markets the ongoing calendar of almost 100 productsand services.
The last column in Figure 12-20 shows the annual laborcalculation, which I derived by multiplying the process time bythe annual volume that Pam’s team gave me, to get the annuallabor hours. So now we know that the instructional designers,for example, require 5,400 hours a year to perform their job.
Now we had to determine how many employees the5,400 hours equate to, using the full-time equivalent formula(FTE) discussed in Chapter 5.
FTE FormulaThe FTE number denotes the total number of hours that
an employee can be paid for in a work year. So, if an employeeworks 40 hours in a week and we multiply that number by 52weeks, we get 2,080 hours, a starting point for the FTE formula.However, I could not simply use 2,080 hours in the labor calcu-lation because I had to deduct vacation, sick, and holiday hoursavailable to an employee. Figure 12-21 shows the calculation Iused for Pam’s organization. This figure shows that I used 1,880as the standard number of hours an employee works in Pam’sorganization.
Next, I applied the 1,880 labor calculation number to theannual labor hours from Figure 12-20. You can see the formula
Labor Calculation Used: 1,880
Annual hours 2,080*Less 2 weeks vacation 80Less 1 week sick 40Less 10 days paid holidays 80
1,880*40 hours per week 52 weeks in a year
Starting point
Figure 12-21 Basis for FTE Calculation
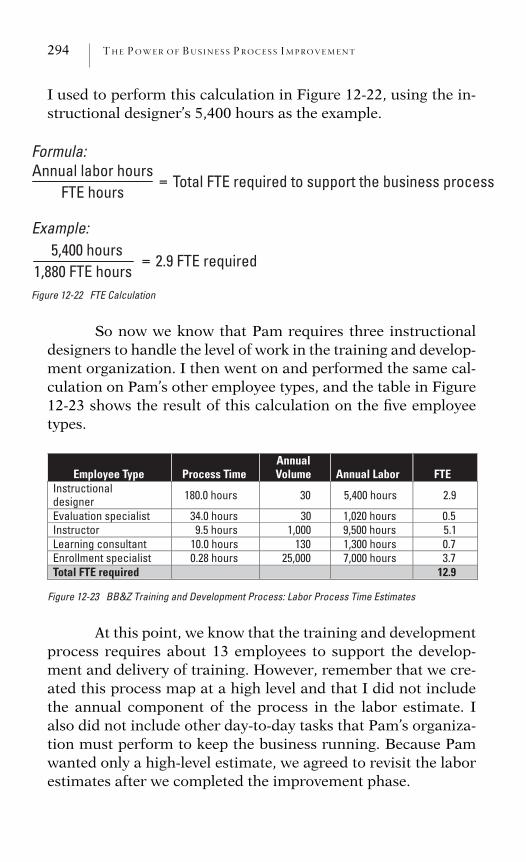
294 THE POWER OF BUS INE S S P ROCES S IMPROVEMENT
I used to perform this calculation in Figure 12-22, using the in-structional designer’s 5,400 hours as the example.
Figure 12-22 FTE Calculation
Example:5,400 hours
1,880 FTE hours2.9 FTE required
Formula:Annual labor hours
FTE hoursTotal FTE required to support the business process
So now we know that Pam requires three instructionaldesigners to handle the level of work in the training and develop-ment organization. I then went on and performed the same cal-culation on Pam’s other employee types, and the table in Figure12-23 shows the result of this calculation on the five employeetypes.
Employee Type Process Time AnnualVolume Annual Labor FTE
Instructionaldesigner 180.0 hours 30 5,400 hours 2.9
Evaluation specialist 34.0 hours 30 1,020 hours 0.5 Instructor 9.5 hours 1,000 9,500 hours 5.1 Learning consultant 10.0 hours 130 1,300 hours 0.7 Enrollment specialist 0.28 hours 25,000 7,000 hours 3.7 Total FTE required 12.9
Figure 12-23 BB&Z Training and Development Process: Labor Process Time Estimates
At this point, we know that the training and developmentprocess requires about 13 employees to support the develop-ment and delivery of training. However, remember that we cre-ated this process map at a high level and that I did not includethe annual component of the process in the labor estimate. Ialso did not include other day-to-day tasks that Pam’s organiza-tion must perform to keep the business running. Because Pamwanted only a high-level estimate, we agreed to revisit the laborestimates after we completed the improvement phase.
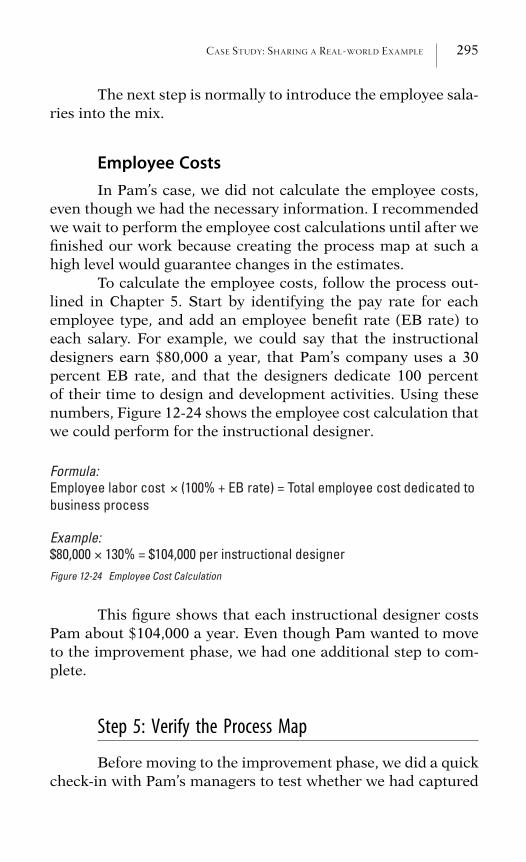
CASE STUDY: SHARING A REAL-WORLD EXAMPLE 295
The next step is normally to introduce the employee sala-ries into the mix.
Employee CostsIn Pam’s case, we did not calculate the employee costs,
even though we had the necessary information. I recommendedwe wait to perform the employee cost calculations until after wefinished our work because creating the process map at such ahigh level would guarantee changes in the estimates.
To calculate the employee costs, follow the process out-lined in Chapter 5. Start by identifying the pay rate for eachemployee type, and add an employee benefit rate (EB rate) toeach salary. For example, we could say that the instructionaldesigners earn $80,000 a year, that Pam’s company uses a 30percent EB rate, and that the designers dedicate 100 percentof their time to design and development activities. Using thesenumbers, Figure 12-24 shows the employee cost calculation thatwe could perform for the instructional designer.
Formula:Employee labor cost (100% + EB rate) = Total employee cost dedicated to business process
Example:$80,000 130% = $104,000 per instructional designer Figure 12-24 Employee Cost Calculation
This figure shows that each instructional designer costsPam about $104,000 a year. Even though Pam wanted to moveto the improvement phase, we had one additional step to com-plete.
Step 5: Verify the Process Map
Before moving to the improvement phase, we did a quickcheck-in with Pam’s managers to test whether we had captured
296 THE POWER OF BUS INE S S P ROCES S IMPROVEMENT
the big pieces of work and used the right volume numbers. Wecompleted this task at her weekly staff meeting and made minorchanges to the volume numbers.
Step 6: Apply Improvement Techniques
Chapter 6 covered how to use six techniques to improve abusiness process, including eliminating bureaucracy, evaluatingvalue-added activities, eliminating duplication and redundancy,simplifying the process/reports/forms used, reducing cycle time,and applying automation tools.
I began this step by discussing what happens in activity1 with the project team, to find places where we could reducebureaucracy. As the conversation progressed to the value-addedtechnique, we found few value-added activities. I asked whygathering client requests occurred only once a year. The morethe team talked, the more they came to realize that activity 1appeared to be the only activity in the entire business processwhere the client interacted with the process. The team becamemore and more concerned about the limited interaction theirclients had with the business process.
As we talked about their clients and what their clientswanted from the process, the project team began doubtingwhether they truly understood their client needs. Going back tothe scope definition document the team completed earlier, theythought their clients cared about their employee’s ability to per-form on the job, quick turnaround on training requests, andlower cost. But now the team questioned the validity of thoseneeds and did not even agree on what a particular need meant.Failing to reach any satisfactory conclusions, we chose to stopand conduct a benchmark study to determine how best-in-classcompanies meet certain client/customer needs.
BenchmarkingIn Chapters 6 and 10 we touched on benchmarking,
which consists of measuring a business process against a stan-
CASE STUDY: SHARING A REAL-WORLD EXAMPLE 297
dard of excellence (either of an internal group in your companyor of an external company well-known as best in class). Beforeyou can benchmark a process against best-in-class companies,you first have to understand the crucial points in your own busi-ness process. Figure 12-25 shows a visual depiction of how toapproach a benchmarking exercise, with three distinct phases.
Now let us look at how I led Pam’s training and develop-ment organization in conducting a benchmark study and howto apply each of the three phases.
Phase 1: Client/Customer Interviews
In the first phase, the project team had to understand:
? What Pam’s internal clients deemed important, to seewhether they matched what the project team identified asclient needs
? How the clients recognize when their need is met
? Who the clients would identify as best in class for each oftheir needs
So I directed the project team to begin the benchmarkingexercise by conducting 55 client interviews over a four-week pe-riod. We then validated the interview results by using a surveythat we sent to 700 end users of training and their managers.We received 519 surveys back. As a result of gathering and ana-lyzing the data, we determined that Pam’s clients wanted thefollowing from their training investment:
? Quality instructors
? Training alternatives
? The ability to customize courses
? Employees applying the training on the job
During the interviews, we asked interviewees how theywould know when a need was met. For example, how wouldthey know if they had a quality instructor? What does qualitymean? In asking how clients would measure a quality instructor,
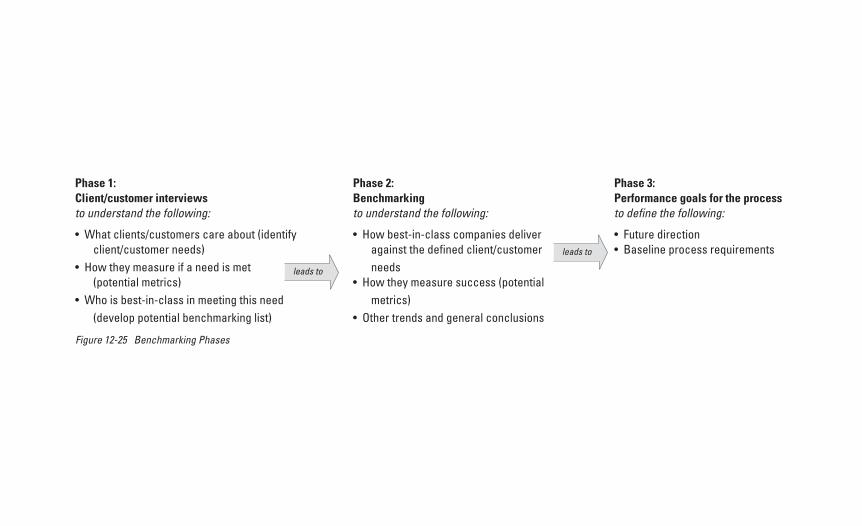
Phase 1:Client/customer interviewsto understand the following:
• What clients/customers care about (identify client/customer needs)
• How they measure if a need is met (potential metrics)
• Who is best-in-class in meeting this need (develop potential benchmarking list)
Phase 2:Benchmarkingto understand the following:
• How best-in-class companies deliver against the defined client/customer needs
• How they measure success (potential metrics)
• Other trends and general conclusions
Phase 3:Performance goals for the processto define the following:
• Future direction• Baseline process requirements
leads to
leads to
Figure 12-25 Benchmarking Phases
CASE STUDY: SHARING A REAL-WORLD EXAMPLE 299
I found out that quality, in their eyes, meant they wanted in-structors with real-life experience. In other words, they wantedinstructors who had industry experience teaching classes. I nowhad a new gauge by which Pam could evaluate her instructorpool: How many of Pam’s instructors taught courses in whichthey possessed real-world experience? As it turned out, notmany.
The final question in the interview asked clients to iden-tify any companies they felt did an outstanding job at meeting aparticular need. Could they identify a company that did a goodjob at having quality instructors, instructors who bring theirreal-life experience to their teaching? Their answers to this ques-tion helped me build a list of companies that we could bench-mark against.
At the end of the first phase, we had a validated list ofclient needs for the training and development business process,we knew how Pam’s clients measured success, and we had alist of companies and internal groups that we could benchmarkagainst to find out how they delivered against client needs.
Phase 2: Benchmarking
Now that we understood what Pam’s clients cared about,how they would measure success, and who they thought werebest-in-class companies, it was time to move the project team tophase two. Next, I asked the team members to focus on:
? Writing the interview questions and creating a tool to col-lect the data
? Working with Pam’s internal productivity group to identifycontacts at the companies that we wanted to benchmarkand then scheduling appointments
? Reviewing benchmarking studies available in the market oneducation and training
We created two sets of questions. One set focused on gen-eral information to ask every benchmark company, and the sec-ond addressed the list of client needs. We did not ask every
300 THE POWER OF BUS INE S S P ROCES S IMPROVEMENT
benchmark company about all four client needs, but rather fo-cused each interview on the single client need for which thecompany was identified as best in class. We asked certain com-panies about quality instructors, another group about trainingalternatives, others about course customization, and finally afourth group about how they evaluated an employee’s perform-ance on the job.
The first list of general questions, which we asked allcompanies, included items like:
? How many employees do you have in your company?
? How many employees do you have in your training anddevelopment organization?
? How do you organize your training and development group(centralized, decentralized, or other)?
? How do you organize your resources to support your clientbase (by business, geography, or other)?
? How do you fund the training and development group(tuition, fully budgeted, other)?
? What do you consider the top-priority goals for the trainingand development organization?
? What do you consider the training and development group’scritical success factors (the key goals your organizationmust attain to compete in your market)?
? What do you feel differentiates you from other companiesin the training and development business (your primarystrengths)?
For the second set of questions, we started the interviewby providing each best-in-class company with a definition of theclient need we wanted to discuss with them. For example, westarted an interview on quality instructors by defining what wethought quality instructors should possess: industry expertise,technical competence, exceptional platform skills, and credi-bility.
We then asked five main questions to understand howthe particular benchmark company met the client need, for ex-ample:
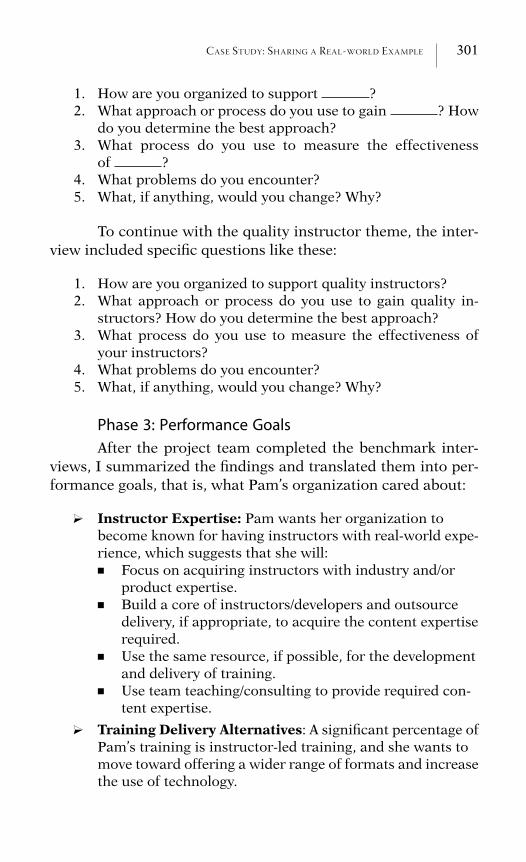
CASE STUDY: SHARING A REAL-WORLD EXAMPLE 301
1. How are you organized to support ?2. What approach or process do you use to gain ? How
do you determine the best approach?3. What process do you use to measure the effectiveness
of ?4. What problems do you encounter?5. What, if anything, would you change? Why?
To continue with the quality instructor theme, the inter-view included specific questions like these:
1. How are you organized to support quality instructors?2. What approach or process do you use to gain quality in-
structors? How do you determine the best approach?3. What process do you use to measure the effectiveness of
your instructors?4. What problems do you encounter?5. What, if anything, would you change? Why?
Phase 3: Performance Goals
After the project team completed the benchmark inter-views, I summarized the findings and translated them into per-formance goals, that is, what Pam’s organization cared about:
? Instructor Expertise: Pam wants her organization tobecome known for having instructors with real-world expe-rience, which suggests that she will:� Focus on acquiring instructors with industry and/or
product expertise.� Build a core of instructors/developers and outsource
delivery, if appropriate, to acquire the content expertiserequired.
� Use the same resource, if possible, for the developmentand delivery of training.
� Use team teaching/consulting to provide required con-tent expertise.
? Training Delivery Alternatives: A significant percentage ofPam’s training is instructor-led training, and she wants tomove toward offering a wider range of formats and increasethe use of technology.
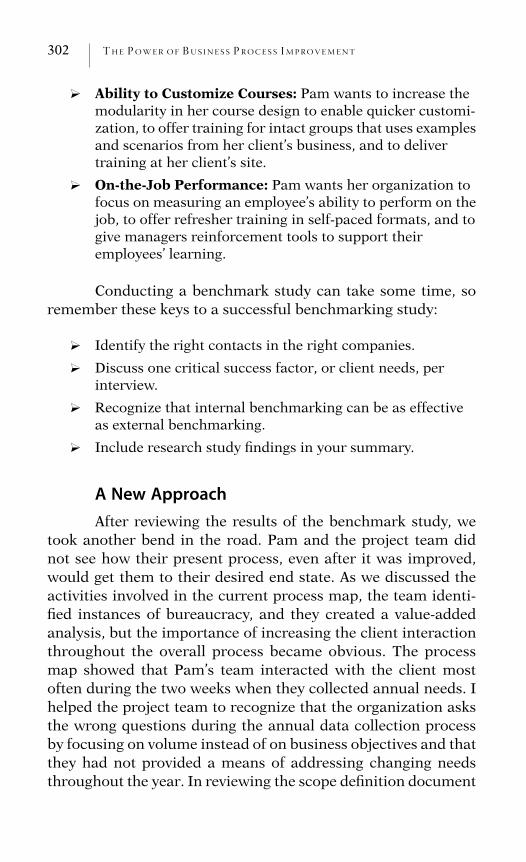
302 THE POWER OF BUS INE S S P ROCES S IMPROVEMENT
? Ability to Customize Courses: Pam wants to increase themodularity in her course design to enable quicker customi-zation, to offer training for intact groups that uses examplesand scenarios from her client’s business, and to delivertraining at her client’s site.
? On-the-Job Performance: Pam wants her organization tofocus on measuring an employee’s ability to perform on thejob, to offer refresher training in self-paced formats, and togive managers reinforcement tools to support theiremployees’ learning.
Conducting a benchmark study can take some time, soremember these keys to a successful benchmarking study:
? Identify the right contacts in the right companies.
? Discuss one critical success factor, or client needs, perinterview.
? Recognize that internal benchmarking can be as effectiveas external benchmarking.
? Include research study findings in your summary.
A New ApproachAfter reviewing the results of the benchmark study, we
took another bend in the road. Pam and the project team didnot see how their present process, even after it was improved,would get them to their desired end state. As we discussed theactivities involved in the current process map, the team identi-fied instances of bureaucracy, and they created a value-addedanalysis, but the importance of increasing the client interactionthroughout the overall process became obvious. The processmap showed that Pam’s team interacted with the client mostoften during the two weeks when they collected annual needs. Ihelped the project team to recognize that the organization asksthe wrong questions during the annual data collection processby focusing on volume instead of on business objectives and thatthey had not provided a means of addressing changing needsthroughout the year. In reviewing the scope definition document
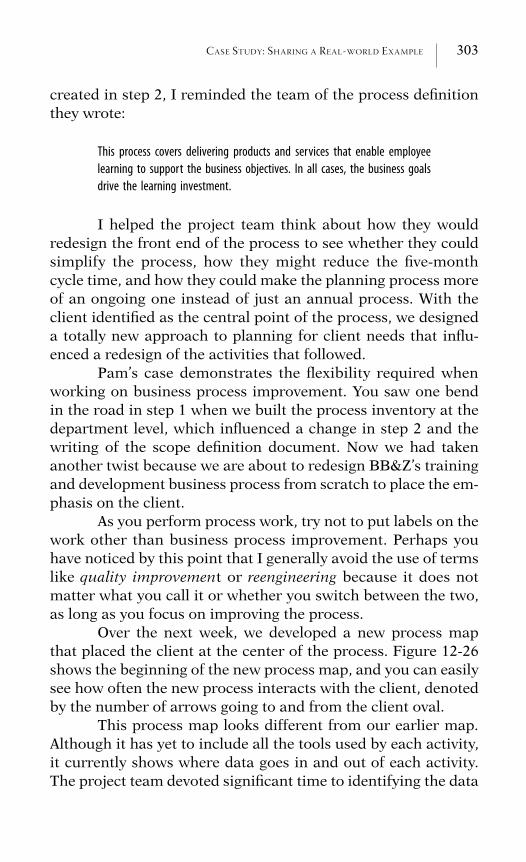
CASE STUDY: SHARING A REAL-WORLD EXAMPLE 303
created in step 2, I reminded the team of the process definitionthey wrote:
This process covers delivering products and services that enable employee
learning to support the business objectives. In all cases, the business goals
drive the learning investment.
I helped the project team think about how they wouldredesign the front end of the process to see whether they couldsimplify the process, how they might reduce the five-monthcycle time, and how they could make the planning process moreof an ongoing one instead of just an annual process. With theclient identified as the central point of the process, we designeda totally new approach to planning for client needs that influ-enced a redesign of the activities that followed.
Pam’s case demonstrates the flexibility required whenworking on business process improvement. You saw one bendin the road in step 1 when we built the process inventory at thedepartment level, which influenced a change in step 2 and thewriting of the scope definition document. Now we had takenanother twist because we are about to redesign BB&Z’s trainingand development business process from scratch to place the em-phasis on the client.
As you perform process work, try not to put labels on thework other than business process improvement. Perhaps youhave noticed by this point that I generally avoid the use of termslike quality improvement or reengineering because it does notmatter what you call it or whether you switch between the two,as long as you focus on improving the process.
Over the next week, we developed a new process mapthat placed the client at the center of the process. Figure 12-26shows the beginning of the new process map, and you can easilysee how often the new process interacts with the client, denotedby the number of arrows going to and from the client oval.
This process map looks different from our earlier map.Although it has yet to include all the tools used by each activity,it currently shows where data goes in and out of each activity.The project team devoted significant time to identifying the data

2Analyze Plans
and Define Needs
4Refer Need and Validate 6
Translate Objectives
5Characterize
Need with Client
3Validate,
Evaluate, and Balance
7Match
PotentialSolutions
13Consolidate
CommonNeeds
8Assess
DeliveryAbility
11Client
ProposesAlternatives
14Develop
Business Plans
10Develop
Recommenda-tions and
Alternatives
9Create
PreliminaryDesign
ClientNeeds
Rejection/Referral
ValidatedNeed
RefinedClientNeed
CharacterizedNeed
PotentialSolutions
ConsolidatedNeeds
KnownSolution
Description
UnmatchedPotentialSolutions
PossibleSolutions
Proactive Request for Plans/Needs/Clarification
Problems, Goals, Plans
Rework
Questions
Rejection and Referral
SolutionSpecifications
BusinessPlans
Recommendations
Alternatives
Modification Request
12Client Accepts
Proposal
AcceptanceClient
Databases(A) Client profile(B) Offering profile(C) Process performance profile
Feed to or from databases
A
BAB
B
B
A B CB
B
A B
AA
1
Consolidated Needs
ConsolidatedNeeds
UnmatchedSolution
Requirements
p2
p2
Refined ClientNeed
p2
NeedNotification
p2p2
p2 p2
p2
Plans,Core
Competencies
Acceptance,Need
Commitment
NeedReservation
Marketing research,Refined needs,
Rejections
B
p2
Marketing research,Charter,
Benchmarks
Figure 12-26 BB&Z New Learning Process
CASE STUDY: SHARING A REAL-WORLD EXAMPLE 305
flow throughout the process (i.e., having the right data at theright time) because of its importance in supporting a more inte-grated process in the future. Figure 12-26 shows three new data-bases that support the process:
? Client Profile: Holds information about training and devel-opment clients, their needs and preferences, and howtraining and development handled their needs, rejections,and acceptance
? Offering Profile: Holds solutions, performance goals,designs, learning objectives, and delivery requirements
? Process Performance Profile: Holds evaluation data andother general data on how the learning process performs
Figures 12-27 and 12-28 illustrate the symbols used todenote the flow of data.
Figure 12-27 Data Flowing to an Activity
Figure 12-28 Data Flowing from an Activity
At this point in the work, two major business processesbegan to surface:
? Need/Solution Identification: This business processbecomes the focal point for the client partnership andincludes the identification of needs and solutions, proposalcreation, return on investment, and client acceptance.
? Business Direction and Measurement: This businessprocess sets the foundation for the business of the trainingand development organization and includes the rules forrunning the business, measuring the overall performance of
306 THE POWER OF BUS INE S S P ROCES S IMPROVEMENT
the learning process, and the development/coaching/rewardof employees who work throughout the learning process.
Most of the activities depicted in the process map so farfall into the needs/solution identification process, except for ac-tivity 14 (develop business plans), which falls into the businessdirection/measurement process. Both business processes jointlyown activity 13.
To help you to understand the steps in the new trainingand development business process, Figure 12-29 shows the be-ginning of the design document for the new learning processmap from Figure 12-26.
The remainder of the learning process map (not de-picted) focused on two additional business processes:
? Resource Development and Delivery: This processsecures and develops resources (internal and external) toenable development and delivery of solutions. The processincludes managing vendor relationships, assembling themultiple components, and overall applied research andtechnology.
? Promotion and Communication: This process creates thepromotional and/or communication strategy, and it reviewsthe results of the strategy. It includes managing the creationof the materials and the distribution of those materials.
In summary, the new learning process demonstrates thefollowing improvements to the business process:
? The new business process has ongoing client interaction,increasing the value-added activities of the process.
? Performing data collection throughout the year minimizesthe time required during the annual planning process, thusreducing cycle time.
? The learning process expresses client needs as performancegoals, which the training and development employeestranslate into measurable, observable learning objectives,increasing the value-added activities of the process.
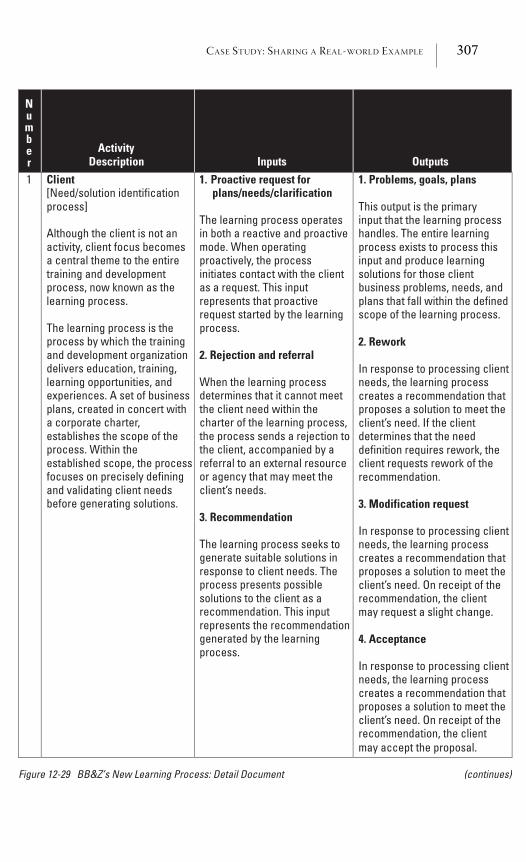
CASE STUDY: SHARING A REAL-WORLD EXAMPLE 307
1 Client[Need/solution identification process]
Although the client is not an activity, client focus becomes a central theme to the entire training and development process, now known as the learning process.
The learning process is the process by which the training and development organization delivers education, training, learning opportunities, and experiences. A set of business plans, created in concert with a corporate charter, establishes the scope of the process. Within the established scope, the process focuses on precisely defining and validating client needs before generating solutions.
1. Proactive request for plans/needs/clarification
The learning process operates in both a reactive and proactive mode. When operating proactively, the process initiates contact with the client as a request. This input represents that proactive request started by the learning process.
2. Rejection and referral
When the learning process determines that it cannot meet the client need within the charter of the learning process, the process sends a rejection to the client, accompanied by a referral to an external resource or agency that may meet the client’s needs.
3. Recommendation
The learning process seeks to generate suitable solutions in response to client needs. The process presents possible solutions to the client as a recommendation. This input represents the recommendation generated by the learning process.
1. Problems, goals, plans
This output is the primary input that the learning process handles. The entire learning process exists to process this input and produce learning solutions for those client business problems, needs, and plans that fall within the defined scope of the learning process.
2. Rework
In response to processing client needs, the learning process creates a recommendation that proposes a solution to meet the client’s need. If the client determines that the need definition requires rework, the client requests rework of the recommendation.
3. Modification request
In response to processing client needs, the learning process creates a recommendation that proposes a solution to meet the client’s need. On receipt of the recommendation, the client may request a slight change.
4. Acceptance
In response to processing client needs, the learning process creates a recommendation that proposes a solution to meet the client’s need. On receipt of the recommendation, the clientmay accept the proposal.
ActivityDescription Inputs Outputs
Number
Figure 12-29 BB&Z’s New Learning Process: Detail Document (continues)
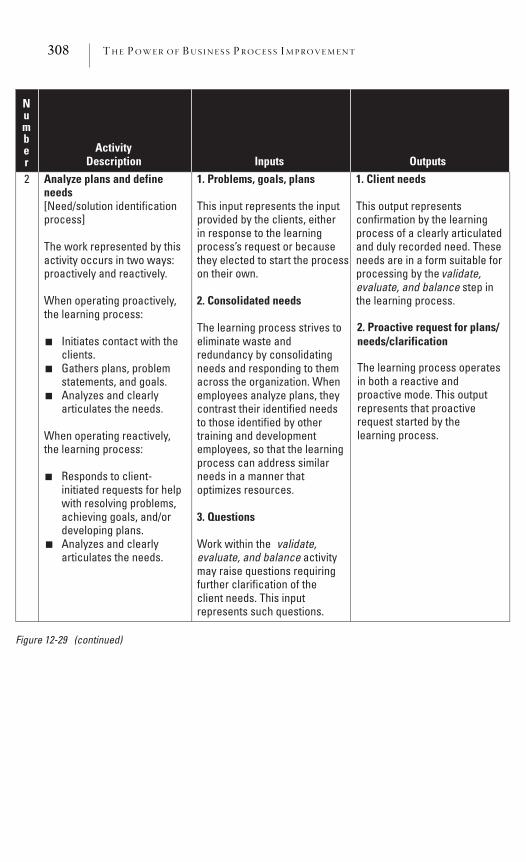
308 THE POWER OF BUS INE S S P ROCES S IMPROVEMENT
2 Analyze plans and define needs[Need/solution identification process]
The work represented by this activity occurs in two ways: proactively and reactively.
When operating proactively, the learning process:
Initiates contact with the clients.
Gathers plans, problem statements, and goals.
Analyzes and clearly
■
■
■
articulates the needs.
When operating reactively, the learning process:
Responds to client- ■
initiated requests for help with resolving problems, achieving goals, and/or developing plans.
Analyzes and clearly ■
articulates the needs.
1. Problems, goals, plans
This input represents the input provided by the clients, either in response to the learning process’s request or because they elected to start the process on their own.
2. Consolidated needs
The learning process strives to eliminate waste and redundancy by consolidating needs and responding to them across the organization. When employees analyze plans, they contrast their identified needs to those identified by other training and development
2. Proactive request for plans/needs/clarification
The learning process operatesin both a reactive and proactive mode. This outputrepresents that proactive request started by the learning process.
employees, so that the learning process can address similar needs in a manner thatoptimizes resources.
3. Questions
Work within the validate,evaluate, and balance activitymay raise questions requiring further clarification of the client needs. This input represents such questions.
1. Client needs
This output represents confirmation by the learning process of a clearly articulated and duly recorded need. These needs are in a form suitable for processing by the validate,evaluate, and balance step inthe learning process.
ActivityDescription Inputs Outputs
Number
Figure 12-29 (continued)
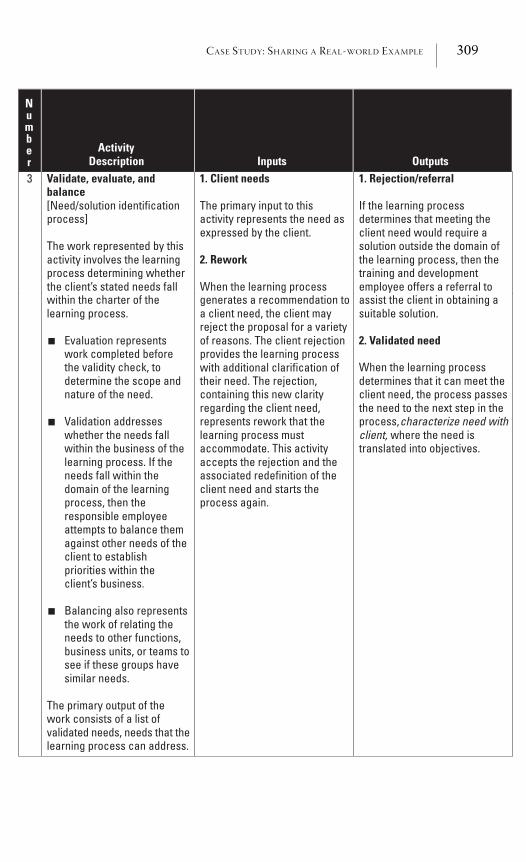
CASE STUDY: SHARING A REAL-WORLD EXAMPLE 309
within the charter of the learning process.
Evaluation represents work completed before the validity check, to determine the scope and nature of the need.
Validation addresses whether the needs fall within the business of the learning process. If the needs fall within the domain of the learning process, then the responsible employee attempts to balance them against other needs of the client to establish priorities within the client’s business.
Balancing also represents
■
■
■
the work of relating the needs to other functions, business units, or teams to see if these groups have similar needs.
The primary output of the work consists of a list of validated needs, needs that thelearning process can address.
generates a recommendation to a client need, the client may reject the proposal for a variety of reasons. The client rejection provides the learning process with additional clarification of their need. The rejection, containing this new clarity regarding the client need, represents rework that the learning process must accommodate. This activity accepts the rejection and the associated redefinition of the client need and starts the process again.
assist the client in obtaining a suitable solution.
2. Validated need
When the learning process determines that it can meet the client need, the process passes the need to the next step in the process,characterize need with client, where the need is translated into objectives.
3 Validate, evaluate, and balance[Need/solution identification process]
The work represented by this activity involves the learning process determining whether the client’s stated needs fall
1. Client needs
The primary input to this activity represents the need as expressed by the client.
2. Rework
When the learning process
1. Rejection/referral
If the learning process determines that meeting the client need would require a solution outside the domain of the learning process, then the training and development employee offers a referral to
ActivityDescription Inputs Outputs
Number
310 THE POWER OF BUS INE S S P ROCES S IMPROVEMENT
? The offering profile database provides a searchable tool thatassists in eliminating duplication. Once the training anddevelopment employee translates a client’s performanceneeds into learning objectives, the objectives become thebasis for reconciling common needs.
? The creation of three databases helps to streamline theinformation and organize the data around clients, offerings,and performance results.
? Streamlining the business process delivers a more adapt-able process that can react more quickly to changing busi-ness needs.
Pam and the project team liked the new process and re-viewed it with a few clients to gain their support. Once the teamfelt comfortable with the design, we moved to the next step onthe roadmap, identifying internal controls, creating tools, anddeveloping metrics.
Step 7: Create Internal Controls, Tools, and Metrics
In Chapter 7, we discussed how internal controls help toidentify points in the business process where a mistake canoccur and to explain how to prevent those errors; how tools cansupport and streamline the process, avoid errors, and assist withtraining new employees to perform their job easier; and howmetrics show whether the process works as planned.
Internal Controls
I started this step by asking the project team to identifywhere something could go wrong in the new process. We thencreated internal controls to address each of those areas. Figure12-30 shows the new learning process map with two internalcontrols added, as depicted by the warning symbol on activities3 and 13.
The internal control document in Figure 12-31 on page312 identifies what the project team determined could go wrongwith these two activities and describes how they plan to reduce
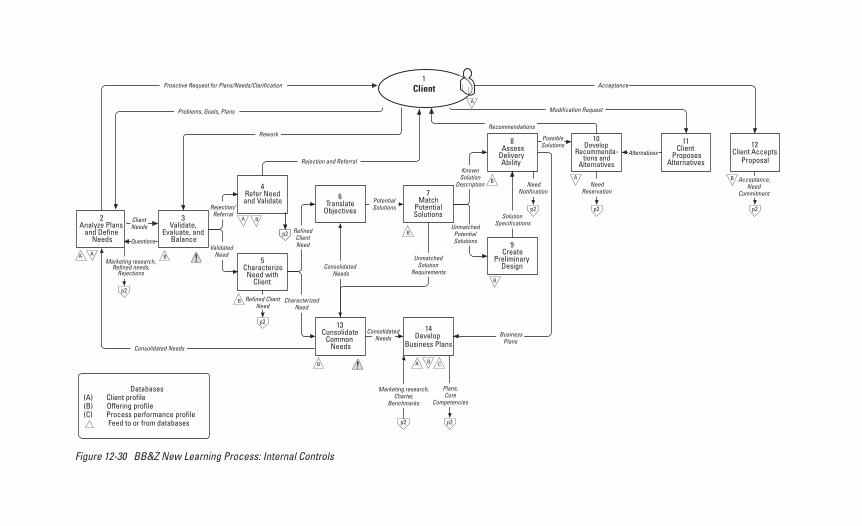
2Analyze Plans
and Define Needs
4Refer Need and Validate 6
Translate Objectives
5Characterize
Need with Client
3Validate,
Evaluate, and Balance
7Match
PotentialSolutions
13Consolidate
CommonNeeds
8Assess
DeliveryAbility
11Client
ProposesAlternatives
14Develop
Business Plans
10Develop
Recommenda-tions and
Alternatives
9Create
PreliminaryDesign
ClientNeeds
Rejection/Referral
ValidatedNeed
RefinedClientNeed
CharacterizedNeed
PotentialSolutions
ConsolidatedNeeds
KnownSolution
Description
UnmatchedPotentialSolutions
PossibleSolutions
Proactive Request for Plans/Needs/Clarification
Problems, Goals, Plans
Rework
Questions
Rejection and Referral
SolutionSpecifications
BusinessPlans
Recommendations
Alternatives
Modification Request
12Client Accepts
Proposal
AcceptanceClient
Databases(A) Client profile(B) Offering profile(C) Process performance profile
Feed to or from databases
A
BAB
B
B
A B CB
B
A B
AA
1
Consolidated Needs
ConsolidatedNeeds
UnmatchedSolution
Requirements
p2
p2
Refined ClientNeed
p2
NeedNotification
p2p2
p2 p2
p2
Plans,Core
Competencies
Acceptance,Need
CommitmentNeed
Reservation
Marketing research,Refined needs,
Rejections
B
p2
Marketing research,Charter,
Benchmarks
Figure 12-30 BB&Z New Learning Process: Internal Controls
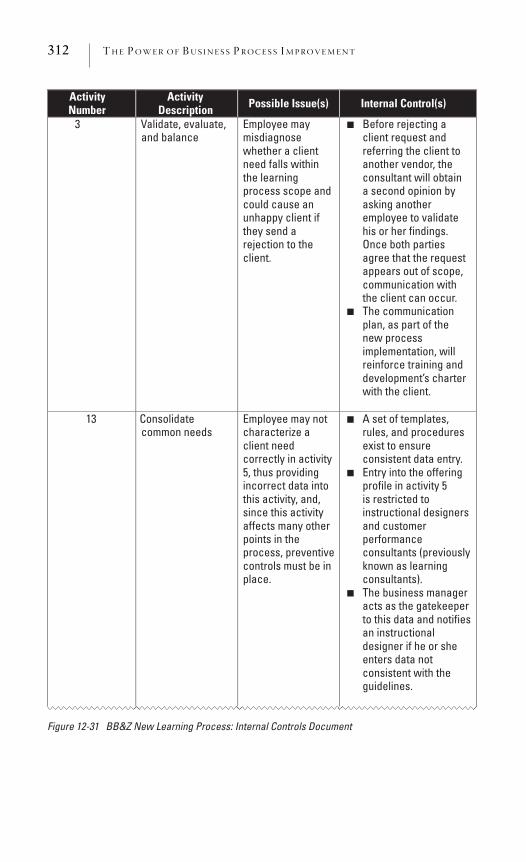
312 THE POWER OF BUS INE S S P ROCES S IMPROVEMENT
ActivityNumber
ActivityDescription Possible Issue(s) Internal Control(s)
3 Validate, evaluate, and balance
Employee may misdiagnosewhether a client need falls within the learning process scope and could cause an unhappy client if they send a rejection to the client.
Before rejecting a client request and referring the client to another vendor, the consultant will obtain a second opinion by asking another employee to validate his or her findings. Once both parties agree that the request appears out of scope, communication with the client can occur.
The communication plan, as part of the new process implementation, will reinforce training and development’s charter with the client.
13 Consolidate common needs
Employee may not characterize a client need correctly in activity 5, thus providing incorrect data into this activity, and, since this activity affects many other points in the process, preventive controls must be in place.
A set of templates, rules, and procedures exist to ensure consistent data entry.
Entry into the offering profile in activity 5is restricted to instructional designers and customer performanceconsultants (previously known as learning consultants).
The business manager
■
■
■
■
■
acts as the gatekeeper to this data and notifies an instructional designer if he or she enters data not consistent with the guidelines.
Figure 12-31 BB&Z New Learning Process: Internal Controls Document
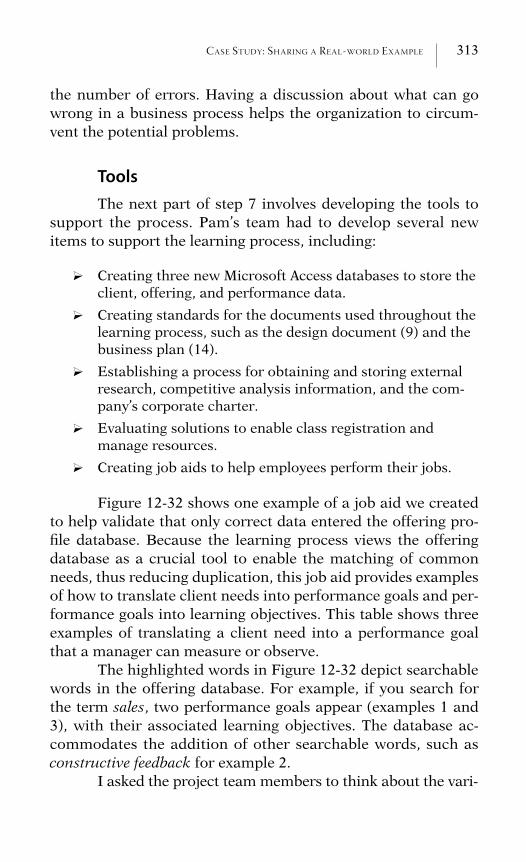
CASE STUDY: SHARING A REAL-WORLD EXAMPLE 313
the number of errors. Having a discussion about what can gowrong in a business process helps the organization to circum-vent the potential problems.
ToolsThe next part of step 7 involves developing the tools to
support the process. Pam’s team had to develop several newitems to support the learning process, including:
? Creating three new Microsoft Access databases to store theclient, offering, and performance data.
? Creating standards for the documents used throughout thelearning process, such as the design document (9) and thebusiness plan (14).
? Establishing a process for obtaining and storing externalresearch, competitive analysis information, and the com-pany’s corporate charter.
? Evaluating solutions to enable class registration andmanage resources.
? Creating job aids to help employees perform their jobs.
Figure 12-32 shows one example of a job aid we createdto help validate that only correct data entered the offering pro-file database. Because the learning process views the offeringdatabase as a crucial tool to enable the matching of commonneeds, thus reducing duplication, this job aid provides examplesof how to translate client needs into performance goals and per-formance goals into learning objectives. This table shows threeexamples of translating a client need into a performance goalthat a manager can measure or observe.
The highlighted words in Figure 12-32 depict searchablewords in the offering database. For example, if you search forthe term sales, two performance goals appear (examples 1 and3), with their associated learning objectives. The database ac-commodates the addition of other searchable words, such asconstructive feedback for example 2.
I asked the project team members to think about the vari-
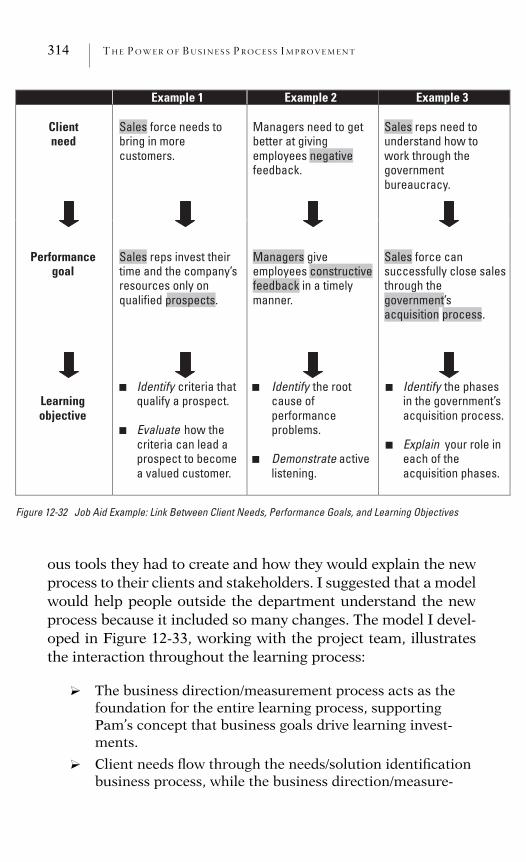
314 THE POWER OF BUS INE S S P ROCES S IMPROVEMENT
Example 1 Example 2 Example 3
Clientneed
Sales force needs to bring in more customers.
Managers need to get better at giving employees negative feedback.
Sales reps need to understand how to work through the governmentbureaucracy.
Performancegoal
Sales reps invest their time and the company’s resources only on qualified prospects.
Managers give employees constructive feedback in a timely manner.
Sales force can successfully close sales through the government’s acquisition process.
Learningobjective
Identify criteria that qualify a prospect.
Evaluate
■
■ how the criteria can lead a prospect to become a valued customer.
Identify the root cause of performanceproblems.
Demonstrate
■
■ active listening.
Identify the phases in the government’s acquisition process.
Explain
■
■ your role in each of the acquisition phases.
Figure 12-32 Job Aid Example: Link Between Client Needs, Performance Goals, and Learning Objectives
ous tools they had to create and how they would explain the newprocess to their clients and stakeholders. I suggested that a modelwould help people outside the department understand the newprocess because it included so many changes. The model I devel-oped in Figure 12-33, working with the project team, illustratesthe interaction throughout the learning process:
? The business direction/measurement process acts as thefoundation for the entire learning process, supportingPam’s concept that business goals drive learning invest-ments.
? Client needs flow through the needs/solution identificationbusiness process, while the business direction/measure-
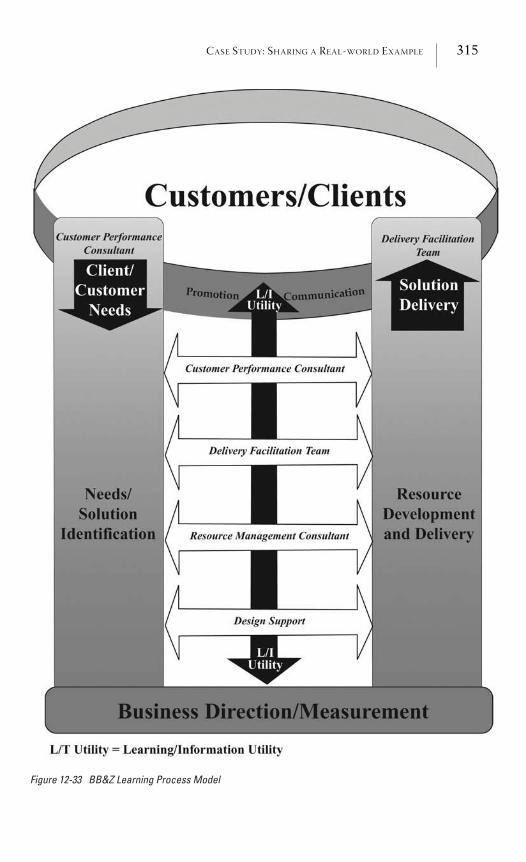
CASE STUDY: SHARING A REAL-WORLD EXAMPLE 315
Figure 12-33 BB&Z Learning Process Model
316 THE POWER OF BUS INE S S P ROCES S IMPROVEMENT
ment process and the resource development and deliveryprocesses support those client needs.
? Ultimately, the promotion/communication process inter-acts with the customers/clients to share details about theavailable products and services.
? The horizontal arrows depict the employees in the learningprocess and show the interaction between client needs andthe delivery of products and services.
? The learning/information utility reflects the databases thathold information to make the entire process functional, andthe model shows that all employees use the utility.
Notice that the learning consultant’s job name changedin the new model to customer performance consultant to stressthe importance of focusing on the clients’ businesses and help-ing them to achieve their goals.
I highly recommend that you spend time creating a vi-sual representation of how your business process works becauseusing a model helps explain a complex business process to peo-ple outside the day-to-day business better than a process map,which can seem overwhelming.
MetricsIn the scope definition document we created in step 2,
Pam’s clients seemed to care about performance on the job andtwo efficiency-oriented metrics (quick turnaround and lowercost). With this information, we listed five measurements of suc-cess in the document:
? On-the-job performance
? Reduced development time
? Cost reduction target
? The ability to integrate new businesses
? The linkage between training and business goals
After completing the benchmarking study, we learnedthat training and development’s clients also cared about quality
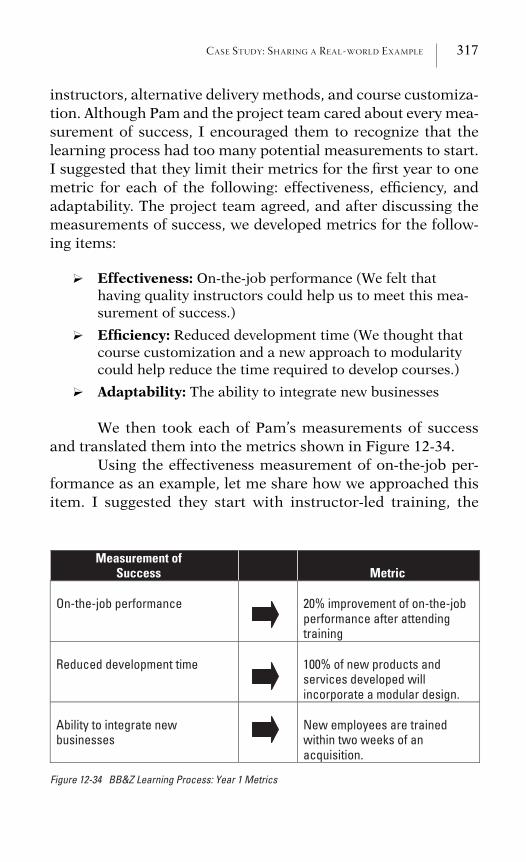
CASE STUDY: SHARING A REAL-WORLD EXAMPLE 317
instructors, alternative delivery methods, and course customiza-tion. Although Pam and the project team cared about every mea-surement of success, I encouraged them to recognize that thelearning process had too many potential measurements to start.I suggested that they limit their metrics for the first year to onemetric for each of the following: effectiveness, efficiency, andadaptability. The project team agreed, and after discussing themeasurements of success, we developed metrics for the follow-ing items:
? Effectiveness: On-the-job performance (We felt thathaving quality instructors could help us to meet this mea-surement of success.)
? Efficiency: Reduced development time (We thought thatcourse customization and a new approach to modularitycould help reduce the time required to develop courses.)
? Adaptability: The ability to integrate new businesses
We then took each of Pam’s measurements of successand translated them into the metrics shown in Figure 12-34.
Using the effectiveness measurement of on-the-job per-formance as an example, let me share how we approached thisitem. I suggested they start with instructor-led training, the
Measurement of Success Metric
On-the-job performance 20% improvement of on-the-job performance after attending training
Reduced development time 100% of new products and services developed will incorporate a modular design.
Ability to integrate new businesses
New employees are trained within two weeks of an acquisition.
Figure 12-34 BB&Z Learning Process: Year 1 Metrics
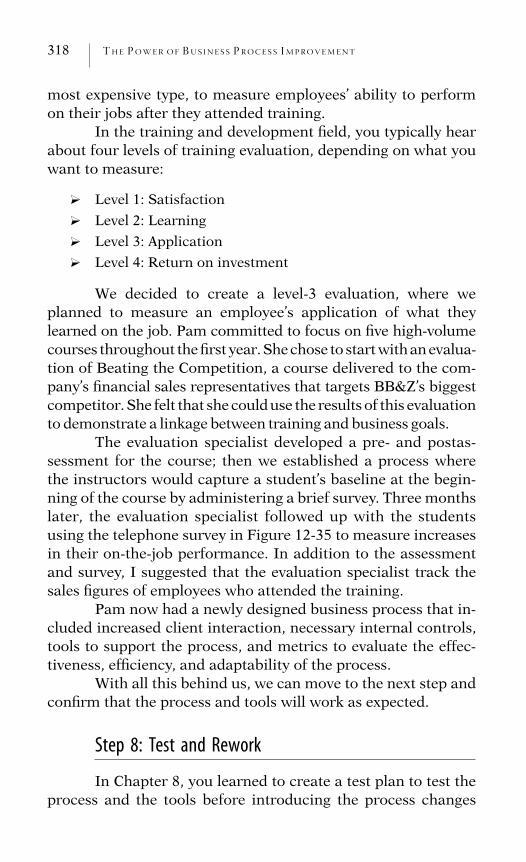
318 THE POWER OF BUS INE S S P ROCES S IMPROVEMENT
most expensive type, to measure employees’ ability to performon their jobs after they attended training.
In the training and development field, you typically hearabout four levels of training evaluation, depending on what youwant to measure:
? Level 1: Satisfaction
? Level 2: Learning
? Level 3: Application
? Level 4: Return on investment
We decided to create a level-3 evaluation, where weplanned to measure an employee’s application of what theylearned on the job. Pam committed to focus on five high-volumecourses throughout the first year. She chose to start with an evalua-tion of Beating the Competition, a course delivered to the com-pany’s financial sales representatives that targets BB&Z’s biggestcompetitor. She felt that she could use the results of this evaluationto demonstrate a linkage between training and business goals.
The evaluation specialist developed a pre- and postas-sessment for the course; then we established a process wherethe instructors would capture a student’s baseline at the begin-ning of the course by administering a brief survey. Three monthslater, the evaluation specialist followed up with the studentsusing the telephone survey in Figure 12-35 to measure increasesin their on-the-job performance. In addition to the assessmentand survey, I suggested that the evaluation specialist track thesales figures of employees who attended the training.
Pam now had a newly designed business process that in-cluded increased client interaction, necessary internal controls,tools to support the process, and metrics to evaluate the effec-tiveness, efficiency, and adaptability of the process.
With all this behind us, we can move to the next step andconfirm that the process and tools will work as expected.
Step 8: Test and Rework
In Chapter 8, you learned to create a test plan to test theprocess and the tools before introducing the process changes
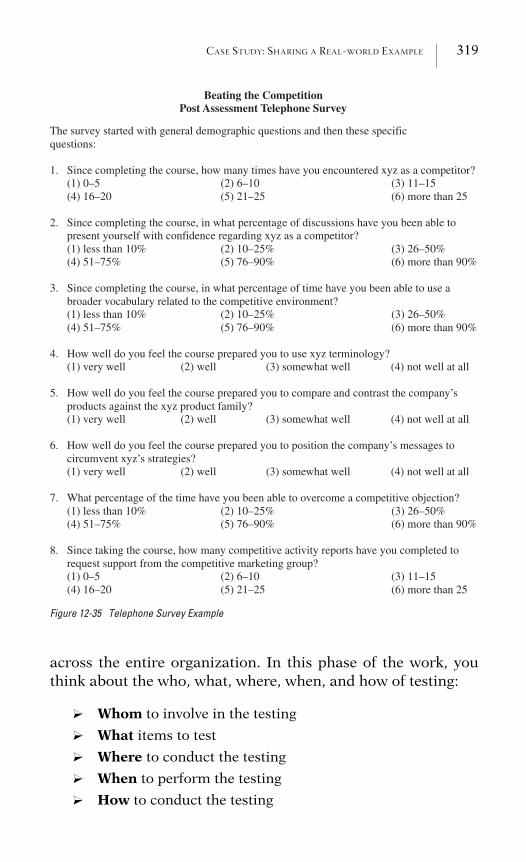
CASE STUDY: SHARING A REAL-WORLD EXAMPLE 319
Beating the Competition Post Assessment Telephone Survey
The survey started with general demographic questions and then these specific questions:
1. Since completing the course, how many times have you encountered xyz as a competitor? 51–11)3(01–6)2(5–0)1(
52nahterom)6(52–12)5(02–61)4(
2. Since completing the course, in what percentage of discussions have you been able to present yourself with confidence regarding xyz as a competitor? (1) less than 10% (2) 10–25% (3) 26–50% (4) 51–75% (5) 76–90% (6) more than 90%
3. Since completing the course, in what percentage of time have you been able to use a broader vocabulary related to the competitive environment? (1) less than 10% (2) 10–25% (3) 26–50% (4) 51–75% (5) 76–90% (6) more than 90%
4. How well do you feel the course prepared you to use xyz terminology? (1) very well (2) well (3) somewhat well (4) not well at all
5. How well do you feel the course prepared you to compare and contrast the company’s products against the xyz product family? (1) very well (2) well (3) somewhat well (4) not well at all
6. How well do you feel the course prepared you to position the company’s messages to circumvent xyz’s strategies? (1) very well (2) well (3) somewhat well (4) not well at all
7. What percentage of the time have you been able to overcome a competitive objection? (1) less than 10% (2) 10–25% (3) 26–50% (4) 51–75% (5) 76–90% (6) more than 90%
8. Since taking the course, how many competitive activity reports have you completed to request support from the competitive marketing group?
51–11)3(01–6)2(5–0)1(52nahterom)6(52–12)5(02–61)4(
Figure 12-35 Telephone Survey Example
across the entire organization. In this phase of the work, youthink about the who, what, where, when, and how of testing:
? Whom to involve in the testing
? What items to test
? Where to conduct the testing
? When to perform the testing
? How to conduct the testing
320 THE POWER OF BUS INE S S P ROCES S IMPROVEMENT
You can see that I use the same general test plan fromChapter 8 for Pam’s process, as shown in Figure 12-36. Thesesteps remain consistent for most process improvement work,and so we use this as a boilerplate test plan. The only items thatchange all the time are the test items. For Pam’s learning proc-ess, examples of our test items included:
? End-to-end business process (Microsoft PowerPointprocess map; Microsoft Word detail document)
? Customer profile database (Microsoft Access)
? Offering profile database (Microsoft Access)
? Process performance profile database (Microsoft Access)
? Job aid covering the guidelines for entering data into theoffering profile database (Adobe PDF file)
? Sample report that summarizes annual performance resultsof the learning process (Microsoft Excel)
? Class registration tool
? Resource management tool
By testing the learning process, I discovered the need tomake the following changes:
? We had to do additional work on what constituted a matchin activity 7 because it seemed too easy to credit a solutionwith addressing a performance goal.
IDNumber Task Person
Responsible Due Date
1 Define testing goal. Project manager May 15 2 Define testing method. Project manager May 15 3 Define objectives for test items. Project manager May 15
4 Develop scenarios for test items (testing sheets). Project team June 1
5 Gain support for resources. Project manager June 1 6 Create feedback collection tool. Project manager June 1
7 Conduct testing. Project team June 15–30
8 Rework, as required. Project team July 15
Figure 12-36 Learning Process: Test Plan
CASE STUDY: SHARING A REAL-WORLD EXAMPLE 321
? We had to train the customer performance consultants onhow to use the offering database.
? We redefined the activity called ‘‘synthesize/evaluaterefinements’’ because the process workers did not under-stand what this activity entailed.
? How we set up the resource management application hadto be modified.
? We adapted the fields in the customer profile database toaccommodate the customer performance consultants.
? We modified the process performance database to meetwhat Pam hoped to gain from this data.
? We changed the sample report that summarized thelearning process’s performance.
At the end of the testing phase, the project team made allthe necessary changes. The training and development employ-ees that were involved in the testing noticed that we had madesubstantial changes to the process. They understood the reasonswhy and expressed excitement about the upcoming implemen-tation.
Step 9: Implement Change
When I first started working with Pam, I created a projectplan for the training and development business process im-provement effort and continually adjusted the plan throughoutthe work, especially after deciding to redesign the process.
In Chapter 9, you learned that the implementation planincluded phases and that a phase could include tracks. Threekey tracks in the implementation phase include the:
1. Communication track: Developing a communication planstating who has to know what when
2. Training track: Developing a training plan that tells who re-quires training on what
3. Change management track: The impact analysis that identi-fies whom to engage in the changes you want to introduce
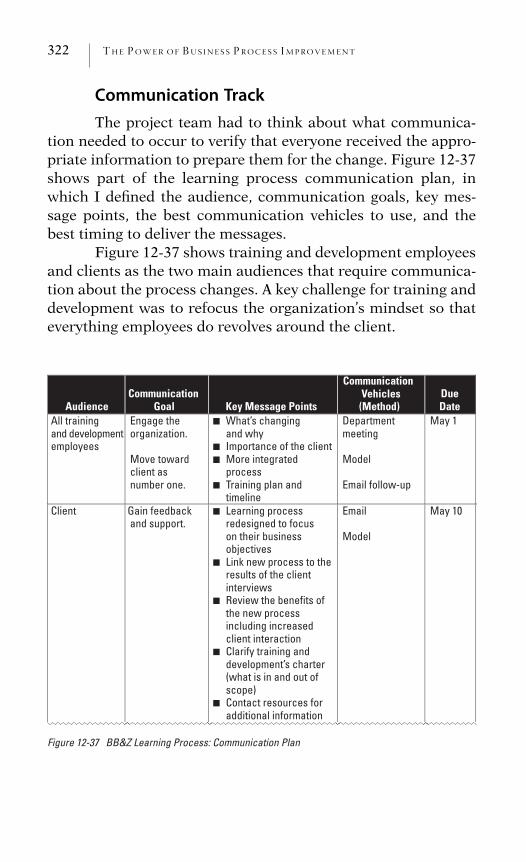
322 THE POWER OF BUS INE S S P ROCES S IMPROVEMENT
Communication TrackThe project team had to think about what communica-
tion needed to occur to verify that everyone received the appro-priate information to prepare them for the change. Figure 12-37shows part of the learning process communication plan, inwhich I defined the audience, communication goals, key mes-sage points, the best communication vehicles to use, and thebest timing to deliver the messages.
Figure 12-37 shows training and development employeesand clients as the two main audiences that require communica-tion about the process changes. A key challenge for training anddevelopment was to refocus the organization’s mindset so thateverything employees do revolves around the client.
AudienceCommunication
Goal Key Message Points
CommunicationVehicles
(Method)DueDate
All trainingand development employees
Engage the organization.
Move toward client as number one.
What’s changing and why
Importance of the client More integrated process
Training plan andtimeline
Departmentmeeting
Model
Email follow-up
May 1
Client Gain feedback and support.
Learning process redesigned to focuson their business objectives
Link new process to the results of the client interviews
Review the benefits of the new process including increased client interaction
Clarify training and development’s charter (what is in and out of scope)
Contact resources for
■
■
■
■
■
■
■
■
■
additional information
Model
May 10
Figure 12-37 BB&Z Learning Process: Communication Plan
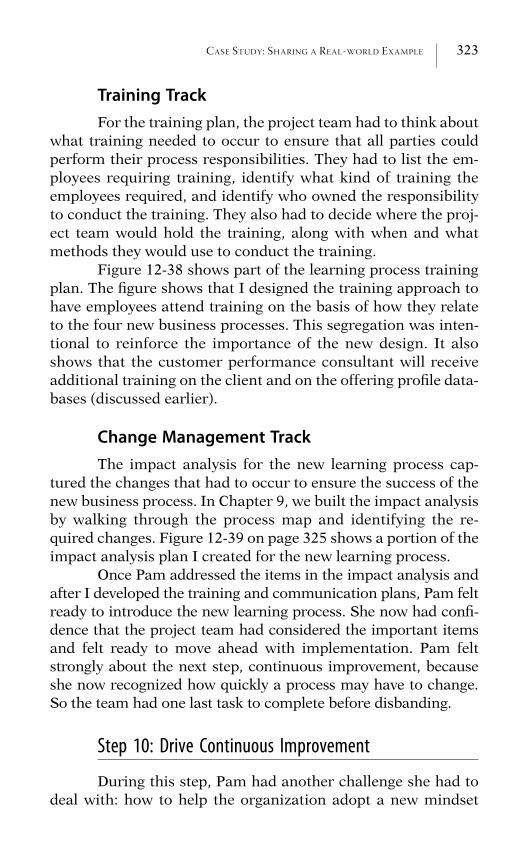
CASE STUDY: SHARING A REAL-WORLD EXAMPLE 323
Training TrackFor the training plan, the project team had to think about
what training needed to occur to ensure that all parties couldperform their process responsibilities. They had to list the em-ployees requiring training, identify what kind of training theemployees required, and identify who owned the responsibilityto conduct the training. They also had to decide where the proj-ect team would hold the training, along with when and whatmethods they would use to conduct the training.
Figure 12-38 shows part of the learning process trainingplan. The figure shows that I designed the training approach tohave employees attend training on the basis of how they relateto the four new business processes. This segregation was inten-tional to reinforce the importance of the new design. It alsoshows that the customer performance consultant will receiveadditional training on the client and on the offering profile data-bases (discussed earlier).
Change Management TrackThe impact analysis for the new learning process cap-
tured the changes that had to occur to ensure the success of thenew business process. In Chapter 9, we built the impact analysisby walking through the process map and identifying the re-quired changes. Figure 12-39 on page 325 shows a portion of theimpact analysis plan I created for the new learning process.
Once Pam addressed the items in the impact analysis andafter I developed the training and communication plans, Pam feltready to introduce the new learning process. She now had confi-dence that the project team had considered the important itemsand felt ready to move ahead with implementation. Pam feltstrongly about the next step, continuous improvement, becauseshe now recognized how quickly a process may have to change.So the team had one last task to complete before disbanding.
Step 10: Drive Continuous Improvement
During this step, Pam had another challenge she had todeal with: how to help the organization adopt a new mindset
324 THE POWER OF BUS INE S S P ROCES S IMPROVEMENT
AudienceTraining
Objectives Approach Tools FacilitatorDueDate
All training anddevelopmentemployees
Define how the learning process meets client needs.Describe each step in the learningprocess.Explain your role in the learningprocess.Illustrate
■
■
■
■ howthe learning process model supports the businessprocess.
Separate group meetings by the four new business processes:
Need/solution identification
Business direction/measurement
Resource developmentand delivery
Promotion/
■
■
■
■
communication
Process documentationModelJob aids
■
■
■
Managers May 30
Customerperformanceconsultants
Summarize howto move to a proactive client relationship.Explain thecharter of the learning process and demonstratethe validationof a clientneed.Create
■
■
■
performancegoals from a client need and categorize thoseneeds.
Instructor-led training
Process documentationModelJob aids Databases:client profile and offering profileExternal data
■
■
■
■
■
sources
Instructionaldesigner
June 15
Figure 12-38 BB&Z Learning Process: Training Plan
where they would always look for ways to improve the learningprocess. The continuous improvement cycle wheel in Chapter10 introduced some structure to this phase, and I led the projectteam in creating a plan to regularly evaluate, test, assess, andexecute against improvements. As you recall, the four steps are:
1. Evaluate: Determine the opportunities that exist.2. Test: Institute the change and try it out on a small scale.
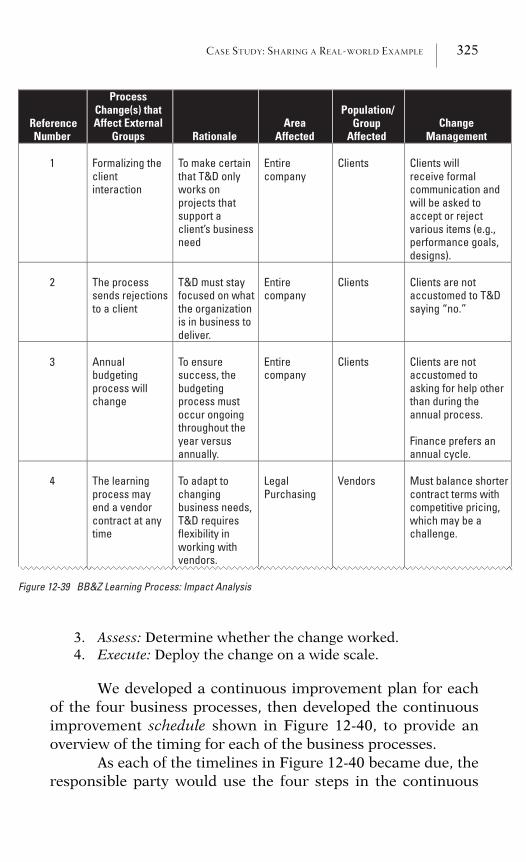
CASE STUDY: SHARING A REAL-WORLD EXAMPLE 325
ReferenceNumber
ProcessChange(s) that Affect External
Groups RationaleArea
Affected
Population/Group
AffectedChange
Management
1 Formalizing theclientinteraction
To make certainthat T&D only works on projects that support a client’s businessneed
Entirecompany
Clients Clients will receive formal communication and will be asked to accept or reject various items (e.g., performance goals, designs).
2 The process sends rejectionsto a client
T&D must stay focused on whatthe organizationis in business todeliver.
Entirecompany
Clients Clients are not accustomed to T&Dsaying “no.”
3 Annualbudgetingprocess will change
To ensure success, the budgetingprocess must occur ongoing throughout the year versus annually.
Entirecompany
Clients Clients are not accustomed to asking for help otherthan during the annual process.
Finance prefers an annual cycle.
4 The learning process may end a vendor contract at any time
To adapt to changingbusiness needs, T&D requires flexibility in working with vendors.
LegalPurchasing
Vendors Must balance shortercontract terms with competitive pricing, which may be a challenge.
Figure 12-39 BB&Z Learning Process: Impact Analysis
3. Assess: Determine whether the change worked.4. Execute: Deploy the change on a wide scale.
We developed a continuous improvement plan for eachof the four business processes, then developed the continuousimprovement schedule shown in Figure 12-40, to provide anoverview of the timing for each of the business processes.
As each of the timelines in Figure 12-40 became due, theresponsible party would use the four steps in the continuous
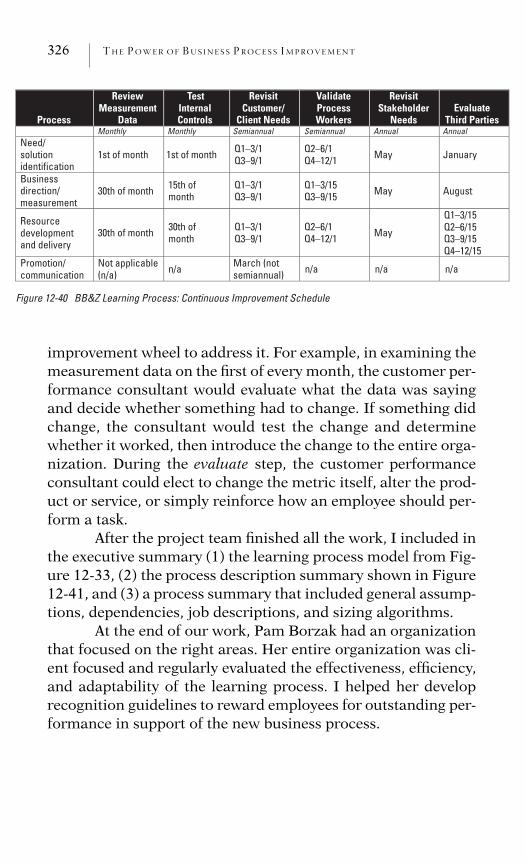
326 THE POWER OF BUS INE S S P ROCES S IMPROVEMENT
Process
ReviewMeasurement
Data
Test InternalControls
RevisitCustomer/
Client Needs
Validate ProcessWorkers
RevisitStakeholder
NeedsEvaluate
Third Parties Monthly Monthly Semiannual Semiannual Annual Annual Need/solutionidentification
1st of month 1st of month Q1–3/1Q3–9/1
Q2–6/1Q4–12/1 May January
Businessdirection/measurement
30th of month 15th of month
Q1–3/1Q3–9/1
Q1–3/15Q3–9/15 May August
Resourcedevelopmentand delivery
30th of month 30th of month
Q1–3/1Q3–9/1
Q2–6/1Q4–12/1 May
Q1–3/15Q2–6/15Q3–9/15Q4–12/15
Promotion/communication
Not applicable (n/a) semiannual)n/a March n/a n/a n/a
Figure 12-40 BB&Z Learning Process: Continuous Improvement Schedule
March (not
improvement wheel to address it. For example, in examining themeasurement data on the first of every month, the customer per-formance consultant would evaluate what the data was sayingand decide whether something had to change. If something didchange, the consultant would test the change and determinewhether it worked, then introduce the change to the entire orga-nization. During the evaluate step, the customer performanceconsultant could elect to change the metric itself, alter the prod-uct or service, or simply reinforce how an employee should per-form a task.
After the project team finished all the work, I included inthe executive summary (1) the learning process model from Fig-ure 12-33, (2) the process description summary shown in Figure12-41, and (3) a process summary that included general assump-tions, dependencies, job descriptions, and sizing algorithms.
At the end of our work, Pam Borzak had an organizationthat focused on the right areas. Her entire organization was cli-ent focused and regularly evaluated the effectiveness, efficiency,and adaptability of the learning process. I helped her developrecognition guidelines to reward employees for outstanding per-formance in support of the new business process.
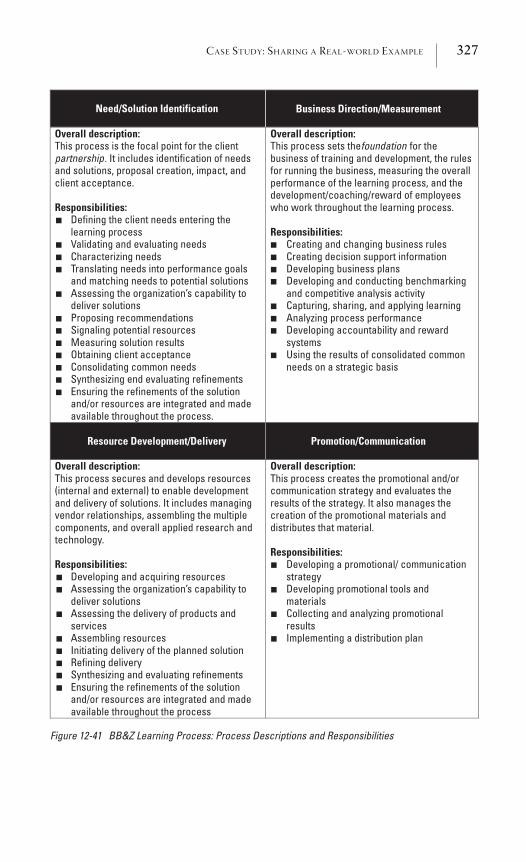
CASE STUDY: SHARING A REAL-WORLD EXAMPLE 327
Need/Solution Identification Business Direction/Measurement
Overall description:This process is the focal point for the client partnership. It includes identification of needs and solutions, proposal creation, impact, and client acceptance.
Responsibilities: Defining the client needs entering the
learning process Validating and evaluating needs Characterizing needs Translating needs into performance goals
and matching needs to potential solutions Assessing the organization’s capability to
deliver solutions Proposing recommendations Signaling potential resources Measuring solution results Obtaining client acceptance Consolidating common needs Synthesizing end evaluating refinements Ensuring the refinements of the solution
■
■
■
■
■
■
■
■
■
■
■
■
and/or resources are integrated and made available throughout the process.
Overall description:This process sets the foundation for the business of training and development, the rules for running the business, measuring the overall performance of the learning process, and the development/coaching/reward of employees who work throughout the learning process.
Responsibilities:Creating and changing business rules Creating decision support information Developing business plans Developing and conducting benchmarking and competitive analysis activity Capturing, sharing, and applying learning Analyzing process performance Developing accountability and reward systemsUsing the results of consolidated common
■
■
■
■
■
■
■
■
needs on a strategic basis
Resource Development/Delivery Promotion/Communication
Overall description:This process secures and develops resources (internal and external) to enable development and delivery of solutions. It includes managing vendor relationships, assembling the multiple components, and overall applied research and technology.
Responsibilities:Developing and acquiring resources Assessing the organization’s capability to deliver solutions Assessing the delivery of products and servicesAssembling resources Initiating delivery of the planned solution Refining delivery Synthesizing and evaluating refinements Ensuring the refinements of the solution
■
■
■
■
■
■
■
■
and/or resources are integrated and made available throughout the process
Overall description:This process creates the promotional and/or communication strategy and evaluates the results of the strategy. It also manages the creation of the promotional materials and distributes that material.
Responsibilities:Developing a promotional/ communication strategyDeveloping promotional tools and materialsCollecting and analyzing promotional resultsImplementing a distribution plan
■
■
■
■
Figure 12-41 BB&Z Learning Process: Process Descriptions and Responsibilities
328 THE POWER OF BUS INE S S P ROCES S IMPROVEMENT
Chapter Summary
Pam Borzak’s story at BB&Z demonstrates how to applythe 10 steps to business process improvement and how to adjustthe steps as you encounter obstacles or bends in the road. The10 steps are:
1. Develop the process inventory: How to build a process inven-tory and process prioritization table for either an entire de-partment or the business processes within a department
2. Establish the foundation: How to develop the scope defini-tion document for a business process
3. Draw the process map: How to decide the level of detail forbuilding the process map and how to create a map thatspans multiple pages
4. Estimate time and cost: How to calculate process and cycletime, how to incorporate frequency into the calculations,and how to include different types of employees
5. Verify the process map: Ways to validate the accuracy of theprocess map
6. Apply improvement techniques: How to incorporate bench-marking into the improvement phase and how to knowwhen to design an entirely new process
7. Create internal controls, tools, and metrics: How to developinternal controls, sample tools, and metrics. A reminder ofthe importance of building a model to explain a compli-cated process
8. Test and rework: How to test all the components of a busi-ness process
9. Implement change: How to develop the communication,training, and impact analysis plans
10. Drive continuous improvement: How to create a schedule tokeep track of all the different business processes
What You Have Achieved
In this chapter, you have achieved the following:
? A grasp of how to adjust to bends in the road and adapt the10 steps
CASE STUDY: SHARING A REAL-WORLD EXAMPLE 329
? An understanding of how to build a model to furtherexplain a complex business process
? The ability to calculate employee costs when different typesof employees are involved in the process work
? The knowledge that you can build the process inventory andprioritization table at either the department or the processlevel
? An understanding of how to incorporate multiple frequen-cies in the cost analysis
? Insight into how to conduct a benchmark study
? Most important, the power to know that you can do it

This page intentionally left blank
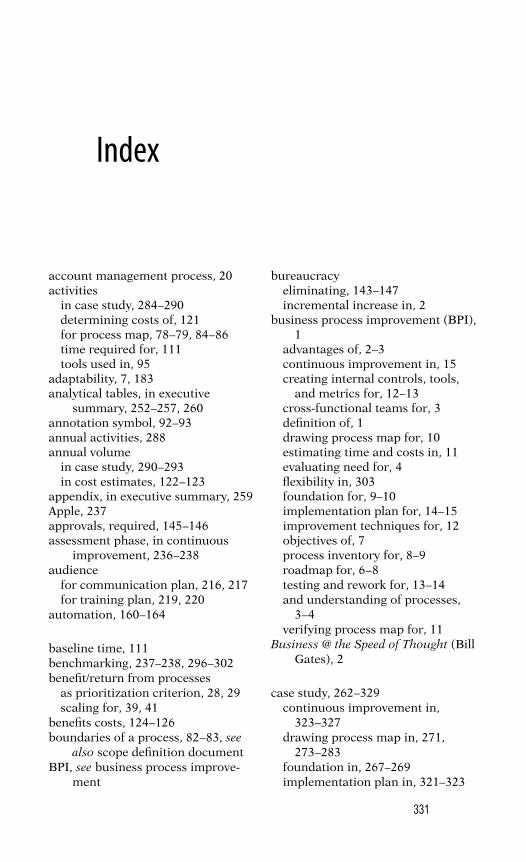
Index
account management process, 20activities
in case study, 284–290determining costs of, 121for process map, 78–79, 84–86time required for, 111tools used in, 95
adaptability, 7, 183analytical tables, in executive
summary, 252–257, 260annotation symbol, 92–93annual activities, 288annual volume
in case study, 290–293in cost estimates, 122–123
appendix, in executive summary, 259Apple, 237approvals, required, 145–146assessment phase, in continuous
improvement, 236–238audience
for communication plan, 216, 217for training plan, 219, 220
automation, 160–164
baseline time, 111benchmarking, 237–238, 296–302benefit/return from processes
as prioritization criterion, 28, 29scaling for, 39, 41
benefits costs, 124–126boundaries of a process, 82–83, see
also scope definition documentBPI, see business process improve-
ment
331
bureaucracyeliminating, 143–147incremental increase in, 2
business process improvement (BPI),1
advantages of, 2–3continuous improvement in, 15creating internal controls, tools,
and metrics for, 12–13cross-functional teams for, 3definition of, 1drawing process map for, 10estimating time and costs in, 11evaluating need for, 4flexibility in, 303foundation for, 9–10implementation plan for, 14–15improvement techniques for, 12objectives of, 7process inventory for, 8–9roadmap for, 6–8testing and rework for, 13–14and understanding of processes,
3–4verifying process map for, 11
Business @ the Speed of Thought (BillGates), 2
case study, 262–329continuous improvement in,
323–327drawing process map in, 271,
273–283foundation in, 267–269implementation plan in, 321–323
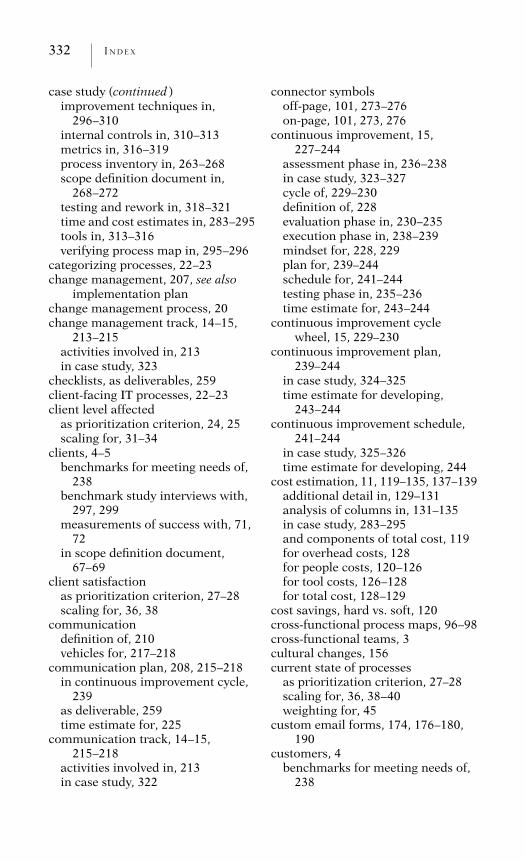
332 I NDEX
case study (continued )improvement techniques in,
296–310internal controls in, 310–313metrics in, 316–319process inventory in, 263–268scope definition document in,
268–272testing and rework in, 318–321time and cost estimates in, 283–295tools in, 313–316verifying process map in, 295–296
categorizing processes, 22–23change management, 207, see also
implementation planchange management process, 20change management track, 14–15,
213–215activities involved in, 213in case study, 323
checklists, as deliverables, 259client-facing IT processes, 22–23client level affected
as prioritization criterion, 24, 25scaling for, 31–34
clients, 4–5benchmarks for meeting needs of,
238benchmark study interviews with,
297, 299measurements of success with, 71,
72in scope definition document,
67–69client satisfaction
as prioritization criterion, 27–28scaling for, 36, 38
communicationdefinition of, 210vehicles for, 217–218
communication plan, 208, 215–218in continuous improvement cycle,
239as deliverable, 259time estimate for, 225
communication track, 14–15,215–218
activities involved in, 213in case study, 322
connector symbolsoff-page, 101, 273–276on-page, 101, 273, 276
continuous improvement, 15,227–244
assessment phase in, 236–238in case study, 323–327cycle of, 229–230definition of, 228evaluation phase in, 230–235execution phase in, 238–239mindset for, 228, 229plan for, 239–244schedule for, 241–244testing phase in, 235–236time estimate for, 243–244
continuous improvement cyclewheel, 15, 229–230
continuous improvement plan,239–244
in case study, 324–325time estimate for developing,
243–244continuous improvement schedule,
241–244in case study, 325–326time estimate for developing, 244
cost estimation, 11, 119–135, 137–139additional detail in, 129–131analysis of columns in, 131–135in case study, 283–295and components of total cost, 119for overhead costs, 128for people costs, 120–126for tool costs, 126–128for total cost, 128–129
cost savings, hard vs. soft, 120cross-functional process maps, 96–98cross-functional teams, 3cultural changes, 156current state of processes
as prioritization criterion, 27–28scaling for, 36, 38–40weighting for, 45
custom email forms, 174, 176–180,190
customers, 4benchmarks for meeting needs of,
238
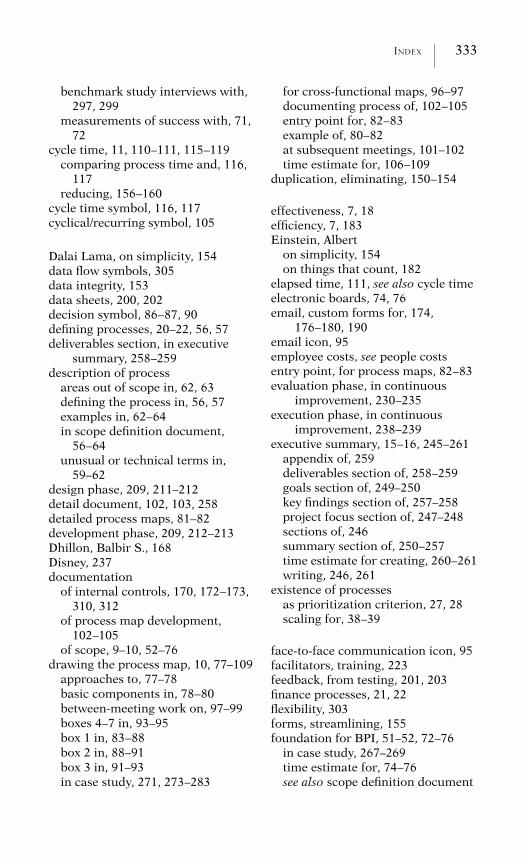
INDEX 333
benchmark study interviews with,297, 299
measurements of success with, 71,72
cycle time, 11, 110–111, 115–119comparing process time and, 116,
117reducing, 156–160
cycle time symbol, 116, 117cyclical/recurring symbol, 105
Dalai Lama, on simplicity, 154data flow symbols, 305data integrity, 153data sheets, 200, 202decision symbol, 86–87, 90defining processes, 20–22, 56, 57deliverables section, in executive
summary, 258–259description of process
areas out of scope in, 62, 63defining the process in, 56, 57examples in, 62–64in scope definition document,
56–64unusual or technical terms in,
59–62design phase, 209, 211–212detail document, 102, 103, 258detailed process maps, 81–82development phase, 209, 212–213Dhillon, Balbir S., 168Disney, 237documentation
of internal controls, 170, 172–173,310, 312
of process map development,102–105
of scope, 9–10, 52–76drawing the process map, 10, 77–109
approaches to, 77–78basic components in, 78–80between-meeting work on, 97–99boxes 4–7 in, 93–95box 1 in, 83–88box 2 in, 88–91box 3 in, 91–93in case study, 271, 273–283
for cross-functional maps, 96–97documenting process of, 102–105entry point for, 82–83example of, 80–82at subsequent meetings, 101–102time estimate for, 106–109
duplication, eliminating, 150–154
effectiveness, 7, 18efficiency, 7, 183Einstein, Albert
on simplicity, 154on things that count, 182
elapsed time, 111, see also cycle timeelectronic boards, 74, 76email, custom forms for, 174,
176–180, 190email icon, 95employee costs, see people costsentry point, for process maps, 82–83evaluation phase, in continuous
improvement, 230–235execution phase, in continuous
improvement, 238–239executive summary, 15–16, 245–261
appendix of, 259deliverables section of, 258–259goals section of, 249–250key findings section of, 257–258project focus section of, 247–248sections of, 246summary section of, 250–257time estimate for creating, 260–261writing, 246, 261
existence of processesas prioritization criterion, 27, 28scaling for, 38–39
face-to-face communication icon, 95facilitators, training, 223feedback, from testing, 201, 203finance processes, 21, 22flexibility, 303forms, streamlining, 155foundation for BPI, 51–52, 72–76
in case study, 267–269time estimate for, 74–76see also scope definition document
334 I NDEX
full-time equivalent (FTE) formula,123–124, 293–295
fully-loaded costs, 129functional bands, on process maps,
96–98funding
as prioritization criterion, 26, 27scaling for, 34, 35
future state processes, on processmap, 88
Gates, Billon lousy processes, 2on technology, 161
goalscommunication, 217performance, 301–302project, 249–250testing, 194see also objectives
handoffs, 97hard cost savings, 120health care, human error in, 168Heraclitus, on change, 207high-level process maps
in case study, 271, 273–277detailed maps vs., 81–82
horizontal functional bands, onprocess maps, 97
Human Reliability and Error inMedical Systems (Balbir S.Dhillon), 168
human resources processes, 20–22
icons, for process maps, 95, see alsosymbols, for process maps
impact analysis, 156, 208, 213–215in continuous improvement cycle,
239as deliverable, 259in executive summary, 253–254time estimate for, 225
impact of business processesas prioritization criterion, 24–25scaling for, 31–34weighting for, 43–44
implementation of processesas prioritization criterion, 25–27scaling for, 34–37weighting for, 44–46
implementation phase, 209, 213–223in case study, 318–323change management track in,
213–215communications track in, 215–218testing track in, 215training track in, 218–223see also specific tracks
implementation plan, 14–15, 207–226in case study, 321–323components of, 208as deliverable, 259design phase of, 211–212development phase of, 212–213implementation phase of, 213–223phases in, 208–211time estimate for, 224–226
improvement technique(s), 141–166automation as, 160–164in case study, 296–310eliminating bureaucracy as,
143–147eliminating duplication as,
150–154reducing cycle time as, 156–160simplification as, 154–156time estimated for, 165–166value added as, 147–150
improvement techniques wheel, 12,141–143
information technology processes,21–23
inputs, for process map, 79–80, 86internal control document, 170,
172–173in case study, 310, 312as deliverable, 259
internal controls, 13, 167–173in case study, 310–313costs of, 168documenting, 170, 172–173, 310,
312identifying points of need for,
168–172time spent on, 170
INDEX 335
internal control symbol, 105internal-facing IT processes, 22interoffice mail symbol, 88, 89
job aids, 174–176
key findings section, in executivesummary, 257–258
key stakeholders and interests, inscope definition document, 68,70–71
KISS philosophy, 155
labor costs, see people costslead generation process, 20
measurementbenchmark data for, 237–238of process time, 111see also metrics
measurements of success, 182–186in case study, 316–319in executive summary, 249in scope definition document,
71–73message points, 217method, testing, 194–196metrics, 13, 181–186
for adaptability, 183in case study, 316–319defining, 184–186for effectiveness, 182for efficiency, 183evaluating, 232–233for measuring success, 71–73, see
also measurements of successvalue vs. cost of, 182
Microsoft Access databases, 212–213,313
Microsoft Excel, 180–181Microsoft Office Project, 209–211Microsoft Outlook, 174, 176–180, 190Microsoft Visio, 99, 105
name of process, in scope definitiondocument, 54, 56
number affected by a processas prioritization criterion, 24, 25scaling for, 31–34
objectivesof BPI, 7of testing, 196–197of training, 220–222see also goals
off-page connector symbols, 101,273–276
on-page connector symbols, 101, 273,276
outputs, for process map, 79–80, 86,90
overhead costsanalyzing, 133–134estimating, 128
owner of process, in scope definitiondocument, 56, 57
pain levelas prioritization criterion, 27, 28scaling for, 38
people (employee) costsanalyzing, 132–133annual volume in, 122–123in case study, 295estimating, 120–126FTE formula for, 123–124and hard vs. soft cost savings, 120process activities and time in, 121salary and benefits costs in,
124–126people/organizational processes, 22per-course activities, 288performance goals, 301–302performance management process,
20per-transaction activities, 289policy development process, 20prioritizing a process inventory,
23–47applying weighting in, 43–47current state criterion for, 27–28determining scale in, 29–43developing criteria for, 23–24impact criterion for, 24–25implementation criterion for,
25–27time estimate for, 48, 49value criterion for, 28–29
336 I NDEX
problem statement, 247processes
categories of, 22–23defining, 20–22
process inventory, 8–9, 18–23in case study, 263–268categories of processes in, 22–23defining processes for, 20–22definition of, 19prioritization of, see prioritizing a
process inventorysteps in, 19subprocesses in, 22time estimate for, 48–49
process mapsin case study, 271, 273–283changes to, 88–89color coding of, 150components of, 78–80cost estimates for, 119–135cross-functional, 96–98definition of, 78as deliverables, 258detail documents for, 102, 103detailed, 81–82drawing, see drawing the process
mapexample of, 80–82high-level, 81–82, 271, 273–277review of, 99–101revising, 100symbols for, see symbols, for
process mapstime estimates for, 110–119verifying, see verifying the process
mapprocess name, in scope definition
document, 54, 56process overview, as deliverable, 258process owner, in scope definition
document, 56, 57process prioritization table, 19
in case study, 264–266criteria on, 24–29scaling on, 29–43time estimate for completing, 49weighting in, 43–47
process responsibilities, in scopedefinition document, 66–68
process time, 11, 110, 111–115in case study, 277, 284–290comparing cycle time and, 116, 117determining costs of, 121
process time symbol, 113, 114process workers, verifying process
map with, 135–136project focus section, in executive
summary, 247–248project team meetings
for drawing the process map,108–109
for improvement techniques,165–166
for internal controls, tools, andmetrics, 187–188
for scope definition, 74, 76for time and cost estimates, 138for verifying process map, 139
qualitative value of processes, as prio-ritization criterion, 29
quality approach to processes, 77, 78quantitative value of processes, as
prioritization criterion, 29
recruitment process, 20recurring symbol, 105redundancy, see duplication, elimi-
natingreengineering approach to processes,
77, 78, 228–229resources, approval for, 201responsibilities for processes
on process map, 84in scope definition document,
66–68retesting, 203–204return from process, see benefit/
return from processreviewing process maps, 99–101revising process maps, 100rework, 13–14, 203
in case study, 320–321implementing, 205
roadmap to BPI, 6–8, 268, 269
Safe Harbor framework, 191salary costs, in people costs, 124–126
INDEX 337
sales and marketing processes, 20, 21SALT requirement, 146scaling, on process prioritization
table, 29–43for current state, 36, 38–40for impact, 31–34for implementation, 34–37for value, 39, 41–42
scenarios, for testing, 197–201, 205scope, 64scope creep, 52–54scope definition, in scope definition
document, 64–66scope definition document, 9–10,
52–76in case study, 268–272client and client needs in, 67–69description of process in, 56–64key stakeholders and interests in,
68, 70–71measurements of success in, 71–73process name in, 54, 56process owner in, 56, 57process responsibilities in, 66–68scope definition in, 64–66sections of, 54time estimate for, 74–76
simplification, 154–156soft cost savings, 120sponsor meetings
for process inventory development,49
for scope definition, 76for time and cost estimates, 139
sponsorsexecutive summaries for, 245–246gaining buy-in of, 226, 244verifying process map with,
136–137spreadsheets, 180–181stakeholders
measurements of success with, 71,72
in scope definition document, 68,70–71
verifying process map with, 126strategic thinking, 143streamlining, see simplification
subprocesses, 22success
in communication, 218measurements of, see measure-
ments of successsummary section, in executive
summary, 250–257to familiarize a new department
head, 250–254to identify changed responsibil-
ities, 256–257to report how staff spends time,
254–255symbols, for process maps, 80, 95,
104, 277annotation, 92–93connector, 101, 273–276cycle time, 116, 117cyclical/recurring, 105for data flow, 305decision, 86–87, 90email, 95face-to-face communication, 95internal control, 105interoffice mail, 88, 89off-page connector, 101, 273–276on-page connector, 101, 273, 276process time, 113, 114system of record, 95telephone, 95terminator, 80for warnings, 169
system of record icon, 95systems testing, 192
tasks, for process map, 78teams
cross-functional, 3project, see project team meetings
technology, 161telephone icon, 95Terez, Tom, 146terminator symbol, 80terminology, in description of proc-
esses, 59–62testing, 13–14, 189–206
in case study, 318–321
338 I NDEX
testing (continued)in continuous improvement cycle,
235–236creating test plan for, 193–197developing scenarios for, 197–201implementing test plan in, 201–203and retesting, 203–204and rework, 203steps in, 192–193summarizing feedback from, 203time estimate for, 204–205who, what, where, when, and how
of, 190–192testing sheets, see scenarios, for
testingtesting track, 14, 213, 215test plan
creating, 193–197, 205implementing, 201–203, 205
test scripts, 197–201time estimation, 11, 110–119,
137–139in case study, 283–295for cycle time, 115–119for process time, 111–115and types of time, 110–111
timelines, training, 223time studies, 111, 112time to market
as prioritization criterion, 26scaling for, 34, 35
timing of next cycleas prioritization criterion, 26, 27scaling for, 35, 36
tool costsanalyzing, 133estimating, 126–128
tools, 13, 173–181in case study, 313–316custom email forms as, 174,
176–180
job aids as, 174–176spreadsheets as, 180–181for training, 222, 223
total costscomponents of, 119estimating, 128–129overhead costs in, 128people costs in, 120–126tool costs in, 126–128
total quality techniques, 228Toyota, 237training, 210training plan, 208, 218–223
in continuous improvement cycle,239
as deliverable, 259time estimate for, 225–226
training track, 15, 218–223activities involved in, 213in case study, 323
value-added techniques, 147–150value of processes
as prioritization criterion, 28–29scaling for, 39, 41–42weighting for, 45
verifying the process map, 11,135–139
in case study, 295–296with process workers, 135–136with sponsors, 136–137with stakeholders, 126time estimate for, 139
vertical functional bands, on processmaps, 97, 98
waiting time, in cycle time, 111warning symbols, 169weighting, in prioritizing a process
inventory, 43–47Welch, Jack, 144workflow loop symbol, 105


