Embed Size (px)
Citation preview
Building�a�New�Home:Migration�in�the�UK�construction�sectorby�Laura�Chappell,�Dhananjayan�Sriskandarajah�and�Tracy�K�Swinburn
Economics�of�Migration�project,�Working�Paper�2
December�2008
©�ippr�2008
Institute�for�Public�Policy�Research�Challenging�ideas�– Changing�policy
WWW.IPPR.ORG
ippr�|�Building�a�New�Home:�Migration�in�the�UK�construction�sector2
About�ippr ............................................................................................................................................ 3
About�the�authors................................................................................................................................ 3
Acknowledgements.............................................................................................................................. 3
Foreword:�The�Economics�of�Migration�project................................................................................... 4
Abbreviations ....................................................................................................................................... 5
Executive�summary .............................................................................................................................. 6
1.�Introduction..................................................................................................................................... 72.�Migration�in�context ..................................................................................................................... 10
Migration�trends�in�the�UK............................................................................................................ 10Socioeconomic�characteristics�of�recent�immigrants..................................................................... 13Economic�impacts�of�labour�migration.......................................................................................... 15Employers’�use�of�migrant�labour.................................................................................................. 16
3.�UK�construction�and�labour�markets........................................................................................... 18Understanding�the�UK�construction�sector ................................................................................... 18Case�study:�An�Olympic�labour�legacy?......................................................................................... 23
4.�Empirical�findings ......................................................................................................................... 28Quantitative�analyses..................................................................................................................... 28Qualitative�findings........................................................................................................................ 36
5.�Conclusions ................................................................................................................................... 43Trends�in�construction�labour�markets........................................................................................... 43Migration�into�the�construction�sector .......................................................................................... 43Migration�trends ............................................................................................................................ 44Impact�of�migration ....................................................................................................................... 45Protecting�all�workers .................................................................................................................... 45Helping�UK�workers�into�construction........................................................................................... 45Migrants�in�Olympics�construction ................................................................................................ 47Olympic�opportunities�for�UK�workers .......................................................................................... 47Summary ........................................................................................................................................ 48
Appendix�1.�Data�sources,�methodologies�and�definitions� .............................................................. 49
Appendix�2.�Construction�skills�network�forecasts ............................................................................ 53
References.......................................................................................................................................... 55�
Contents
ippr�|�Building�a�New�Home:�Migration�in�the�UK�construction�sector3
The�Institute�for�Public�Policy�Research�(ippr)�is�the�UK’s�leading�progressive�think�tank,�producingcutting-edge�research�and�innovative�policy�ideas�for�a�just,�democratic�and�sustainable�world.
Since�1988,�we�have�been�at�the�forefront�of�progressive�debate�and�policymaking�in�the�UK.�Throughour�independent�research�and�analysis�we�define�new�agendas�for�change�and�provide�practicalsolutions�to�challenges�across�the�full�range�of�public�policy�issues.
With�offices�in�both�London�and�Newcastle,�we�ensure�our�outlook�is�as�broad-based�as�possible,while�our�international�and�migration�teams�and�climate�change�programme�extend�our�partnershipsand�influence�beyond�the�UK,�giving�us�a�truly�world-class�reputation�for�high�quality�research.
ippr,�30-32�Southampton�Street,�London�WC2E�7RA.�Tel:�+44�(0)20�7470�6100��E:�[email protected].�Registered�Charity�No.�800065
This�paper�was�first�published�in�December�2008.�©�ippr�2008
About�ippr
About�the�authorsLaura�Chappell�is�a�Research�Fellow�in�the�Migration,�Equalities�and�Citizenship�team�at�ippr,�whereher�work�focuses�on�the�economic�and�social�impacts�of�both�immigration�and�emigration.�She�holds�aBA�from�the�University�of�Oxford,�and�an�MSc�with�distinction�from�the�School�of�Oriental�and�AfricanStudies,�University�of�London.
Tracy�K�Swinburn was�an�Economist�at�ippr.�Her�research�focused�on�urban�and�regional�economicdevelopment.�She�holds�degrees�from�Rhodes�College�in�the�US�and�the�London�School�ofEconomics.�Tracy�now�works�for�Colin�Buchanan�and�Partners�Ltd.
Dhananjayan�Sriskandarajah was�until�December�2008�the�head�of�the�Migration,�Equalities�andCitizenship�team�at�ippr,�as�well�as�Acting�Deputy�Director.�He�has�written�extensively�on�topics�suchas�migration,�identity�and�multiculturalism�and�the�political�economy�of�ethnic�conflict.�He�is�anestablished�commentator�on�migration�issues.�He�holds�an�undergraduate�degree�from�the�Universityof�Sydney,�and�an�MPhil�and�DPhil�from�the�University�of�Oxford,�where�he�was�a�Rhodes�Scholar.
AcknowledgementsThe�authors�are�grateful�for�the�support�from�a�number�of�ippr�staff.�Laurence�Cooley�contributedhugely�to�the�data�sections�of�the�report,�Andrew�Stephen�provided�invaluable�research�assistance,and�Howard�Reed�contributed�innovative�ideas�and�guidance.�Thanks�are�also�due�to�Maria�Latorre,Kayte�Lawton,�Kate�Stanley�and�Jill�Rutter�for�their�reviews�of�the�drafts,�and�to�Fancy�Sinantha�forher�highly�efficient�administrative�support�to�the�project.�The�authors�are�also�grateful�to�Alex�Balchfrom�the�University�of�Liverpool�for�reviewing�the�document�and�providing�useful�comments,�LeeBryer�and�Guy�Hazlehurst�at�ConstructionSkills�for�their�support�and�feedback,�and�to�Noble�Francisand�James�Hastings�of�Experian�for�their�helpful�assistance�regarding�the�Construction�Skills�NetworkModel.�Lastly,�we�would�like�to�thank�all�those�people�who�generously�gave�up�their�time�to�beinterviewed�or�participate�in�focus�groups.
ippr�|�Building�a�New�Home:�Migration�in�the�UK�construction�sector4
Foreword:�The�Economics�of�Migration�projectThis�working�paper�forms�part�of�ippr’s�Economics�of�Migration�project.�The�project�aims�to�shapethinking�around�how�we�conceptualise�the�economic�impacts�of�migration,�provide�new�evidenceabout�the�extent�and�nature�of�those�impacts�in�the�UK,�and�provide�new�insights�as�to�how�policymight�best�address�migration�to�maximise�economic�benefit.�We�hope�that�the�project�will�contributeto�a�better-informed�public�debate�and�a�more�prepared�policy�community,�better�able�to�evaluatemigration’s�economic�contributions,�and�manage�them�to�the�benefit�of�all.
We�are�grateful�to�the�funders�of�the�project:�Business�for�New�Europe,�Commission�for�RuralCommunities,�Trades�Union�Congress�and�the�UK�Border�Agency�(Home�Office),�as�well�asConstructionSkills,�who�supported�the�research�that�underpins�this�particular�report.�The�viewsexpressed�here�are�those�of�the�authors�and�do�not�necessarily�represent�those�of�the�project�funders.
Sarah�Mulley Tim�FinchProject�Co-ordinator Head�of�Migration,�Equalities�and�Citizenship�Team
ippr�|�Building�a�New�Home:�Migration�in�the�UK�construction�sector5
A8 The�eight�Central�and�Eastern�European�countries�that�joined�the�European�Union�in�May2004�(Czech�Republic,�Estonia,�Hungary,�Latvia,�Lithuania,�Poland,�Slovakia�and�Slovenia)
ASHE Annual�Survey�of�Hours�and�Earnings
BOSS Building�One�Stop�Shop
CORGI Council�for�Registered�Gas�Installers
DTI Department�of�Trade�and�Industry
EEA European�Economic�Area�(the�27�members�of�the�EU�plus�Iceland,�Lichtenstein�and�Norway)�
EFTA European�Free�Trade�Association�(the�EEA�plus�Switzerland�–�Swiss�nationals�enjoy�similarrights�of�residence�in�the�UK�to�EEA�nationals)
EU European�Union
EU15 The�15�member�states�of�the�European�Union�prior�to�enlargement�in�May�2004
HSMP Highly�Skilled�Migrant�Programme
IPS International�Passenger�Survey
LDA London�Development�Agency
LFS Labour�Force�Survey
NSAfC National�Skills�Academy�for�Construction
NVQ National�Vocational�Qualification
SAWS Seasonal�Agricultural�Workers�Scheme
SBS Sectors�Based�Scheme
SSC Sector�Skills�Council
WRS Worker�Registration�Scheme
Abbreviations
ippr�|�Building�a�New�Home:�Migration�in�the�UK�construction�sector6
The�impact�of�migration�on�the�UK�economy�continues�to�attract�intense�debate�and�attention�withinpolicy,�research�and�media�circles,�as�well�as�among�the�UK�public�more�widely.�This�is�no�moreapparent�than�in�discussions�of�the�scale�of�migration�into�the�construction�industry,�and�the�impactthat�these�migratory�flows�may�be�having�on�the�performance�of�this�key�sector,�as�well�as�the�well-being�of�the�workers�within�it.�However,�at�present,�the�real�role�of�migration�in�construction�is�poorlyunderstood.�There�is�a�pressing�need�to�move�beyond�guesswork�in�order�to�evaluate�systematicallythe�evidence�on�the�role�and�impact�of�migrant�workers�in�UK�construction.�
This�report�investigates�the�role�of�migrant�workers�in�UK�construction,�and�the�impact�that�theirmigration�into�this�industry�is�having�on�its�existing�construction�workforce,�on�the�development�ofthe�next�generation�of�UK�construction�workers,�and�on�the�performance�of�the�industry�as�a�whole.�Itanalyses�the�situation�at�the�national�level,�using�a�variety�of�qualitative�and�quantitative�analyses,and�by�focusing�on�one�case�study:�the�role�of�migrant�workers�in�the�construction�of�the�2012Olympic�facilities�in�London.�It�also�seeks�to�predict�the�extent�to�which�the�industry�will�need�migrantworkers�in�the�future,�and�considers�how�these�workers�might�be�recruited.�
ConclusionsThe�report�highlights�the�following�seven�key�conclusions:
1.�Migrant�workers�play�an�important�role�in�the�UK�construction�industry.
Our�research�suggests�that�migrant�workers�are�playing�a�significant�role�in�UK�construction�labourmarkets.�There�are�employment�gaps�in�the�industry�–�predominantly�as�a�result�of�strong,�sustainedoutput�growth�over�a�period�when�vocational�training�was�limited�–�which�migrant�workers�are�playinga�vital�role�in�filling.�Latest�predictions�from�September�2008�suggest�that�even�during�the�currenteconomic�downturn,�the�industry�will�require�more�than�40,000�additional�people�per�year�to�meetexpected�demand.�Given�that�migrants�have�been�mainly�filling�‘empty’�jobs,�migration�has�notresulted�in�unemployment�for�UK�workers�or�even,�on�the�whole,�on�downward�pressure�on�wages.�
2.�The�role�of�migrant�workers�in�UK�construction�is�not�a�new�one.
Our�research�highlights�the�long-standing�role�of�migrant�workers�in�construction.�Construction�is�anaturally�itinerant�industry.�As�one�of�our�interviewees�put�it,�‘Workers�have�always�moved�to�wherethe�work�is,�because�the�work�moves�around.’�It�is�clear�that�this�aspect�of�the�industry�has�notchanged�in�recent�years.�However,�whereas�previously�the�jobs�were�filled�by�migrants�from�within�theUK�or�from�countries�close�to�home�(particularly�Ireland),�as�the�European�Union�has�grown�we�nowsee�migration�from�further�afield.�
3.�Migrant�workers�should�be�viewed�as�an�opportunity,�not�a�threat.
Our�research�indicates�that�Europe’s�increasingly�integrated�labour�markets�should�not�be�viewed�as�athreat.�Indeed,�increased�mobility�can�be�viewed�as�an�opportunity,�resulting�in�greater�economicdynamism�for�the�industry�and�the�consumer�alike.�This�depends�on�two�conditions:�appropriatetraining�structures�within�UK�construction�(and�our�research�suggests�that�these�are�moving�in�theright�direction),�and�the�Government�ensuring�fair�competition�within�labour�markets�by�tacklingexploitative�employers.
A�flourishing�UK�construction�industry�also�presents�opportunities�for�UK�construction�workers.�So�domore�open�regional�–�and�indeed�global�–�labour�markets,�which�not�only�allow�foreign�workers�toseize�opportunities�in�UK�construction,�but�also�offer�the�UK�workforce�greater�opportunities�toparticipate�in�construction�projects�across�the�world.
4.�Migrant�workers�are�not�as�common�within�UK�construction�as�is�widely�believed.
There�are�fewer�migrant�workers�in�the�sector�than�many�people�appear�to�believe.�Our�findingssuggest�that,�on�the�basis�of�the�best�evidence�available�(though�this�may�undercount�migrantworkers�to�some�degree),�migrant�workers�make�up�only�around�4�per�cent�of�the�total�constructionworkforce,�and�foreign�nationals�as�a�whole�only�6�per�cent,�with�Irish�workers�still�constituting�the
Executive�summary
ippr�|�Building�a�New�Home:�Migration�in�the�UK�construction�sector7
largest�single�group.�Therefore�the�vast�majority�of�new�jobs�in�this�growing�industry�are�still�going�toBritish�nationals.�
5.�Policymakers�must�ensure�that�the�points-based�system�enables�sufficient�movement�tomeet�industry�demands.
Given�the�important�role�that�migrant�workers�play�in�the�sector,�the�UK’s�migration�system�must�becapable�of�allowing�inward�and�outward�movement�of�workers�in�line�with�construction�demand.�Thepoints�within�the�new�points-based�system�are�awarded�in�line�with�labour�market�need.�This�meansthat�the�process�of�assessing�that�need�(both�in�construction�and,�more�widely,�throughout�theeconomy)�must�draw�on�the�best�available�sources�of�information,�and�make�assessments�quickly,�inorder�to�facilitate�a�flexible�and�rapid�response�through�the�managed�migration�system.�The�MigrationAdvisory�Committee�has�just�released�its�first�shortage�occupation�list,�but�it�remains�to�be�seen�howwell�this�list�meets�labour�market�need,�and�how�flexible�the�system�will�be�to�adjusting�to�changingcircumstances.�The�Government�must�keep�this�under�close�review.�
6.�The�Government�must�protect�the�rights�of�UK�and�migrant�workers�alike.
The�Government�needs�to�protect�all�workers�in�the�sector,�migrant�and�UK�workers,�by�safeguardingthe�minimum�wage�–�primarily�though�tackling�exploitative�employers.�Protecting�the�minimum�wagealso�ensures�fair�competition�for�those�employers�who�do�play�by�the�rules.�The�unions�have�a�crucialrole�to�play,�too.�They�must�continue�to�act�as�watchdogs�of�employment�standards�and�workers’rights,�making�a�special�effort�to�reach�out�to�migrant�workers�within�the�sector.�
7.�Policymakers�must�focus�on�ensuring�adequate�workforce�skills�rather�than�altering�theflows�of�migrant�workers.
In�attempting�to�promote�the�development�of�the�UK�construction�workforce,�policymakers�shouldnot�try�to�alter�the�flows�of�migrant�workers�into�the�sector,�as�this�appears�to�be�a�peripheral�issue.Instead,�they�need�to�focus�on�ensuring�that�the�UK’s�training�systems�are�able�to�deliver�theworkforce�that�the�sector�requires.�This�means�that�training�providers�must�continue�their�work�todevelop�training�systems�that�meet�the�current�and�potential�interests�of�the�construction�workforcewhile�at�the�same�time�providing�the�industry�with�the�skills�it�requires.�The�National�Skills�Academyfor�Construction,�which�is�currently�being�rolled�out�across�the�UK,�appears�to�meet�these�criteria,�andwe�recommend�that�future�training�systems�are�built�on�this�flexible�model.�
ippr�|�Building�a�New�Home:�Migration�in�the�UK�construction�sector8
This�report�explores�the�effect�of�immigration�on�UK�employment�and�wages�–�an�issue�that�iscurrently�at�the�top�of�the�UK�policy�agenda,�even�being�addressed�by�the�House�of�Lords�(House�ofLords�Select�Committee�on�Economic�Affairs�2008).�This�exploration�takes�place�within�the�context�ofwidely�held�pessimistic�views�about�‘the�influx�[of�immigrants]…hitting�British�workers�by�keepinglow-skilled�wages�at�rock�bottom,�and�pushing�up�unemployment’�(Hickley�2006).
The�report�focuses�on�construction�for�two�reasons:�first,�because�construction�is�a�key�sector�in�theeconomy�that�has�grown�rapidly�in�recent�years�and�employs�millions�of�UK�workers,�and�second,because�of�the�widespread�belief�that�today,�many�people�working�in�the�construction�sector�aremigrants.�The�‘Polish�plumber’�has�become�an�iconic�figure�that�represents�migrants�from�the�new�EUmember�states.�It�investigates�whether�today�large�numbers�of�plumbers�and�other�tradespeople�inthe�UK�are�indeed�Polish�and,�more�generally,�the�extent�of�migration�into�the�sector.�It�also�looks�atthe�role�that�those�migrants�play,�and�the�impacts�that�that�migration�is�having�on�UK�constructionworkers,�migrant�construction�workers,�and�the�construction�industry�as�a�whole.
Examining�how�one�sector�manages�these�issues�should�shed�some�light�on�the�wider�debate�aboutrole�and�impact�of�migrant�workers�in�the�UK�economy.�While�the�construction�industry�has�its�uniquecharacteristics,�many�of�the�issues�and�impacts�highlighted�within�this�report�are�likely�to�be�relevantbeyond�construction.
This�report�is�unique�in�that�rather�than�examining�labour�market�impacts�at�the�national�or�local�level,as�other�research�tends�to�do�(Nathan�2008,�Reed�and�Latorre�forthcoming),�it�takes�a�sectoralperspective,�focusing�on�construction.�This�approach�was�used�in�order�to�provide�a�better�sense�ofthe�process�through�which�migration�impacts�UK�labour�markets.�Examining�how�an�industry�worksand�the�changing�role�of�migration�within�it�allows�us�to�see�more�clearly�how�effects�unfold.�Forexample,�it�should�help�us�develop�a�better�understanding�of�whether�the�availability�of�migrantworkers�is�preventing�UK�workers�from�entering�the�sector,�or�accessing�training.�This�would�bedifficult�to�analyse�using�a�static�national�or�local-level�‘snapshot’.
This�sectoral�perspective�was�also�selected�to�allow�us�to�examine�wider�effects�of�migration�on�theindustry,�rather�than�focusing�only�on�labour-market�effects.�Therefore,�as�well�as�discussing�theeffects�of�migration�on�UK�construction�workers’�jobs�and�wages,�we�also�discuss�its�effects�on�thehealth�of�the�industry�as�a�whole,�and�discuss�migrant�workers’�own�experiences�of�working�inconstruction.�
Finally,�we�have�focused�on�construction�because�construction�is�an�important,�highly�visible�sectorwithin�the�UK�economy�in�which�the�impact�of�migrants�is�much�contested.�For�example,�JohnDenham,�MP�for�Southampton�Itchen�and�Secretary�of�State�for�Innovation,�Universities�and�Skills,claimed�that�wage�rates�for�bricklayers�in�his�constituency�have�dropped�by�50�per�cent�because�ofrecent�waves�of�immigration�(Economist�2006).�
This�report�presents�an�analysis�of�what�is�happening�within�construction�labour�markets�at�present,and�what�is�likely�to�happen�in�future�–�particularly�in�relation�to�the�demand�for,�and�supply�of,workers.�It�asks�what�labour�demand�is�expected�to�result�from�current�and�future�constructionoutput,�and�to�what�extent�migrant�workers�will�meet�this�demand.�The�report�performs�a�macro�levelanalysis,�complemented�by�a�focus�on�the�particularly�pertinent�case�study�of�the�construction�offacilities�for�the�2012�Olympic�Games.
The�report�seeks�to�paint�an�objective�picture�of�migrant�labour�in�the�UK’s�construction�sector�today.Its�conclusions�are�intended�to�help�manage�the�interplay�between�three�key�objectives:
•Ensuring�the�construction�industry�has�enough�workers�with�the�right�skills�in�order�to�expandand�develop
•Ensuring�local�people�have�opportunities�to�enter�the�industry�and�earn�a�fair�wage
•Ensuring�that�migration�into�the�sector�is�managed�effectively�–�especially�in�order�to�prevent�theexploitation�of�migrant�workers.
1.�Introduction
ippr�|�Building�a�New�Home:�Migration�in�the�UK�construction�sector9
Balancing�these�three�objectives�will�be�critical�in�the�run-up�to�the�Olympics,�as�well�as�for�thelonger-term�health�and�dynamism�of�the�construction�sector.�
Our�findings�may�surprise�some.�They�provide�a�cautionary�lesson�about�the�dangers�of�extrapolatingfrom�anecdote�and�from�the�experiences�of�just�a�few�local�areas�when�drawing�conclusions�aboutwhat�is�happening�in�the�UK�at�large.�
Structure�of�the�reportThis�report�is�structured�around�the�key�findings�from�each�of�the�different�kinds�of�quantitative�andqualitative�research�conducted�during�the�course�of�the�project.�
• Section�2�outlines�recent�trends�in�UK�migration�and�the�impacts�of�migration�on�the�UKeconomy.�
• Section�3�offers�an�analysis�of�UK�construction�labour�markets�and�a�discussion�of�Olympics-related�issues�–�particularly�the�challenges�involved�in�delivering�an�Olympics�employment�legacy.�
• Section�4�sets�out�the�substantive�findings�of�research�in�two�parts�–�first,�the�conclusions�of�ourquantitative�research,�followed�by�the�key�findings�from�our�qualitative�research.�
•The�report’s�conclusions�are�presented�in�Section�5.
ippr�|�Building�a�New�Home:�Migration�in�the�UK�construction�sector10
This�section�provides�some�context�to�the�debate�by�examining�current�and�historical�migration�trendsin�the�UK�and�the�socio-economic�characteristics�of�recent�immigrants.�This�is�followed�by�a�look�atthe�economic�impacts�of�labour�migration.�
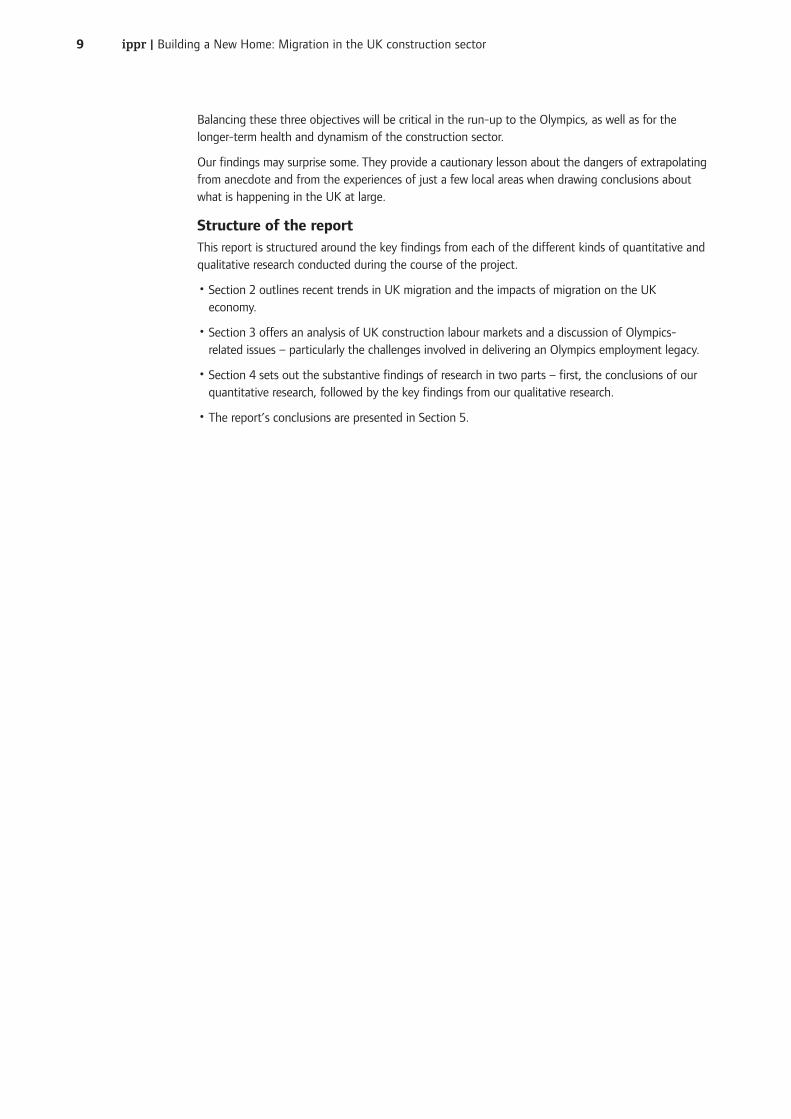
Migration�trends�in�the�UKMigration�in�the�UK�is�a�highly�complex�phenomenon�with�a�long�and�varied�history.�While�thecountry�is�presently�experiencing�atypically�high�levels�of�immigration,�historically�the�UK�has�been�acountry�of�both�immigration�and�emigration.�Until�the�1980s,�the�UK�was�a�country�of�net�emigration.However,�with�‘the�emergence�of�a�global�migration�market,�mainly�for�the�highly�skilled’�(Dobson�etal 2001:�3),�there�has�been�a�significant�increase�in�labour�migration�right�across�the�world.�This�hasresulted�in�an�increase�in�the�levels�of�both�immigration�to�and�emigration�from�Britain,�with�therecent�particular�rise�in�immigration�observed�against�the�backdrop�(until�recently)�of�a�strong�UKeconomy.�These�trends�are�shown�in�Figure�2.1.
Of�the�immigration�routes�devoted�specifically�to�labour�migration,�two�are�of�particular�significance:the�work�permit�scheme�and�freedom�of�movement�within�the�European�Union.�These�two�routes�aredescribed�below.
The�work�permit�scheme
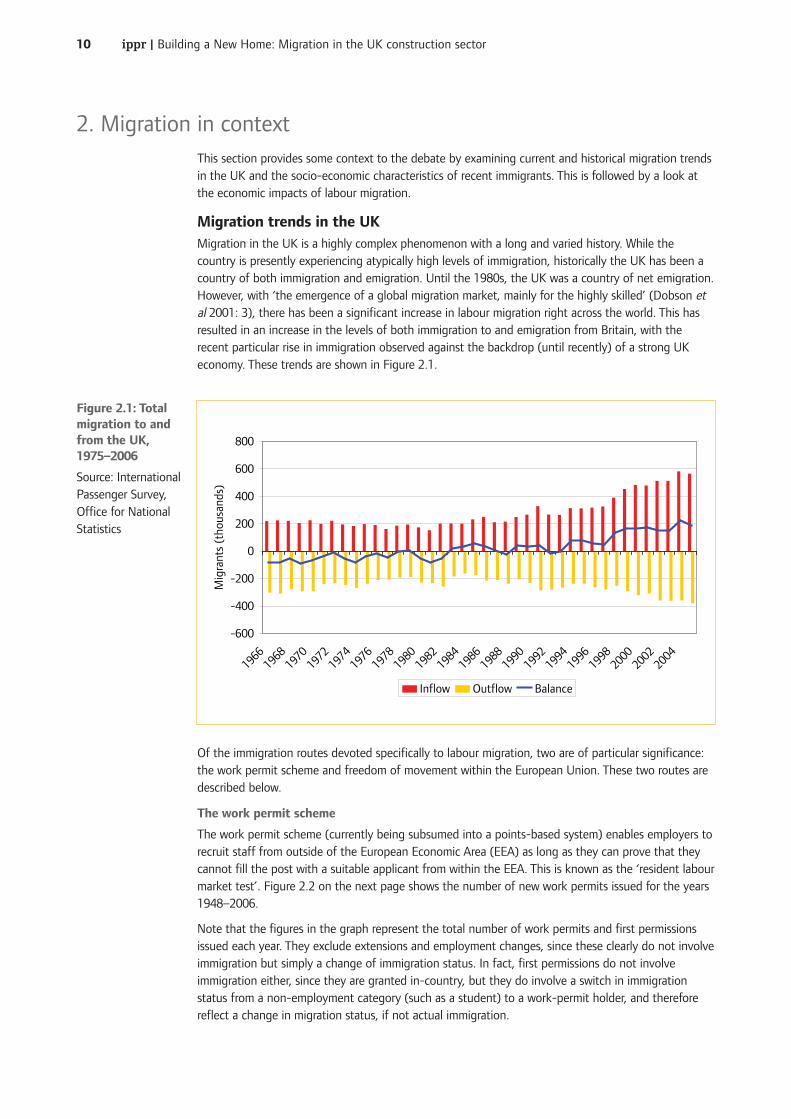
The�work�permit�scheme�(currently�being�subsumed�into�a�points-based�system)�enables�employers�torecruit�staff�from�outside�of�the�European�Economic�Area�(EEA)�as�long�as�they�can�prove�that�theycannot�fill�the�post�with�a�suitable�applicant�from�within�the�EEA.�This�is�known�as�the�‘resident�labourmarket�test’.�Figure�2.2�on�the�next�page�shows�the�number�of�new�work�permits�issued�for�the�years1948–2006.
Note�that�the�figures�in�the�graph�represent�the�total�number�of�work�permits�and�first�permissionsissued�each�year.�They�exclude�extensions�and�employment�changes,�since�these�clearly�do�not�involveimmigration�but�simply�a�change�of�immigration�status.�In�fact,�first�permissions�do�not�involveimmigration�either,�since�they�are�granted�in-country,�but�they�do�involve�a�switch�in�immigrationstatus�from�a�non-employment�category�(such�as�a�student)�to�a�work-permit�holder,�and�thereforereflect�a�change�in�migration�status,�if�not�actual�immigration.
2.�Migration�in�context
-600
-400
-200
0
200
400
600
800
1966
1968
1970
1972
1974
1976
1978
1980
1982
1984
1986
1988
1990
1992
1994
1996
1998
2000
2002
2004
Mig
rant
s (t
hous
ands
)
Inflow Outflow Balance
Figure�2.1:�Totalmigration�to�andfrom�the�UK,1975–2006
Source:�InternationalPassenger�Survey,Office�for�NationalStatistics
ippr�|�Building�a�New�Home:�Migration�in�the�UK�construction�sector11
Following�several�decades�of�growth,�the�number�of�work�permits�issued�fell�dramatically�from�1971,as�the�global�economy�entered�a�period�of�low�growth�and�high�inflation.�Issuance�began�to�pick�upagain�in�the�late�1980s,�and�rose�rapidly�in�the�late�1990s�and�early�2000s.�In�2006,�approximately96,740�work�permits�and�first�permissions�were�issued�–�the�highest�number�since�the�scheme�began(Salt�2007).
Freedom�of�movement�within�the�European�Union
The�second�major�avenue�for�labour�migration�is�the�provision�of�free�movement�of�people�within�theEU.�Nationals�of�EU�member�states�have�long�been�able�to�take�up�employment�anywhere�across�theEU.�With�the�enlargement�of�the�Union�in�May�2004�to�include�ten�new�countries,�including�eightCentral�and�Eastern�European�states�known�as�the�‘A8’,�labour�migration�through�this�route�hasincreased�substantially.�The�new�Central�and�Eastern�European�member�states�are�the�Czech�Republic,Estonia,�Hungary,�Latvia,�Lithuania,�Poland,�Slovakia�and�Slovenia.�Citizens�of�the�other�two�accedingcountries,�Cyprus�and�Malta,�are�not�required�to�register�in�order�to�be�able�to�work�in�the�UK.Romanians�and�Bulgarians�(whose�countries�joined�the�EU�on�1�January�2007)�do�not�currently�enjoyfree�access�to�the�UK�labour�market,�and�at�present�are�only�allowed�to�work�in�the�UK�under�anumber�of�sector-based�schemes,�if�they�qualify�for�a�work�permit,�or�if�they�are�self-employed.
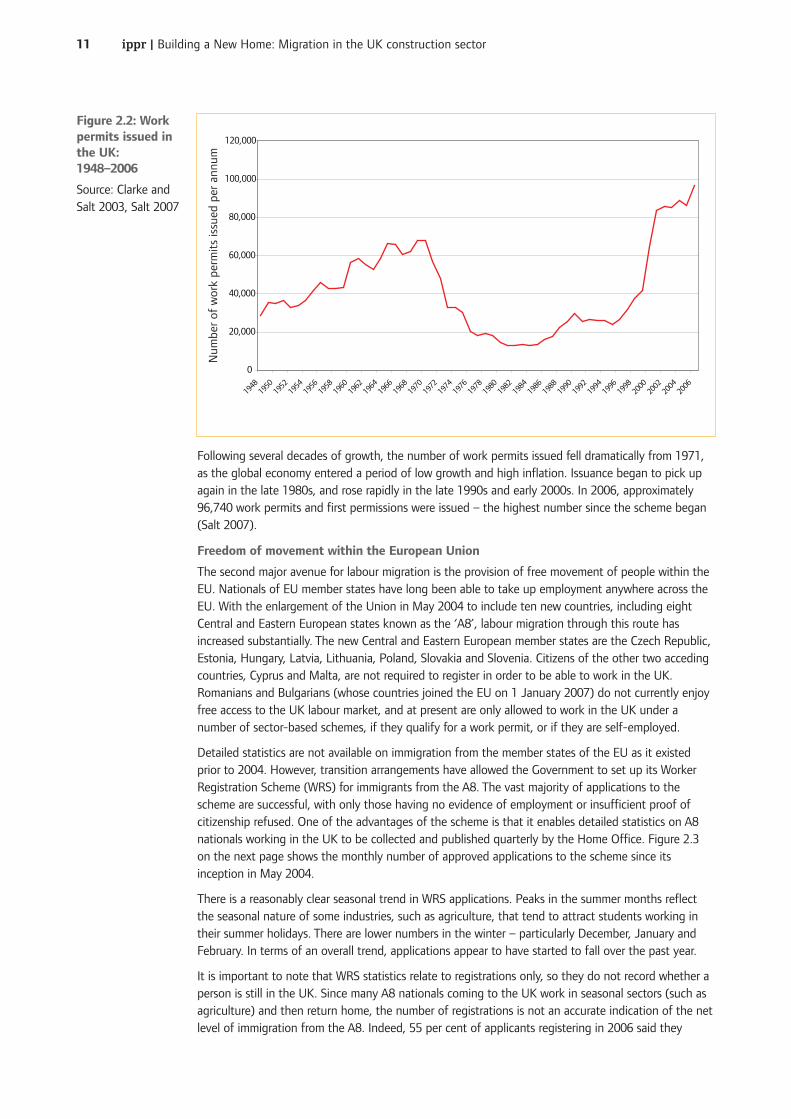
Detailed�statistics�are�not�available�on�immigration�from�the�member�states�of�the�EU�as�it�existedprior�to�2004.�However,�transition�arrangements�have�allowed�the�Government�to�set�up�its�WorkerRegistration�Scheme�(WRS)�for�immigrants�from�the�A8.�The�vast�majority�of�applications�to�thescheme�are�successful,�with�only�those�having�no�evidence�of�employment�or�insufficient�proof�ofcitizenship�refused.�One�of�the�advantages�of�the�scheme�is�that�it�enables�detailed�statistics�on�A8nationals�working�in�the�UK�to�be�collected�and�published�quarterly�by�the�Home�Office.�Figure�2.3on�the�next�page�shows�the�monthly�number�of�approved�applications�to�the�scheme�since�itsinception�in�May�2004.
There�is�a�reasonably�clear�seasonal�trend�in�WRS�applications.�Peaks�in�the�summer�months�reflectthe�seasonal�nature�of�some�industries,�such�as�agriculture,�that�tend�to�attract�students�working�intheir�summer�holidays.�There�are�lower�numbers�in�the�winter�–�particularly�December,�January�andFebruary.�In�terms�of�an�overall�trend,�applications�appear�to�have�started�to�fall�over�the�past�year.�
It�is�important�to�note�that�WRS�statistics�relate�to�registrations�only,�so�they�do�not�record�whether�aperson�is�still�in�the�UK.�Since�many�A8�nationals�coming�to�the�UK�work�in�seasonal�sectors�(such�asagriculture)�and�then�return�home,�the�number�of�registrations�is�not�an�accurate�indication�of�the�netlevel�of�immigration�from�the�A8.�Indeed,�55�per�cent�of�applicants�registering�in�2006�said�they
0
20,000
40,000
60,000
80,000
100,000
120,000
1948
1950
1952
1954
1956
1958
1960
1962
1964
1966
1968
1970
1972
1974
1976
1978
1980
1982
1984
1986
1988
1990
1992
1994
1996
1998
2000
2002
2004
2006
Num
ber
of w
ork
perm
its
issu
ed p
er a
nnum
Figure�2.2:�Workpermits�issued�inthe�UK:1948–2006
Source:�Clarke�andSalt�2003,�Salt�2007
ippr�|�Building�a�New�Home:�Migration�in�the�UK�construction�sector12
intended�to�stay�in�the�UK�for�less�than�three�months�(Home�Office�et�al 2007).�In�the�case�of�Poles,it�has�been�argued�that�while�in-migration�has�increased,�‘the�flow�is�predominantly�open�ended,short�term�and�circular’�(Eade�et�al 2006:�16).
Recent�analysis�from�ippr�has�confirmed�this,�estimating�that�around�half�of�the�migrants�who�havearrived�from�the�A8�countries�since�2004�have�now�returned�(Pollard�et�al 2008).�On�the�other�hand,self-employed�workers�are�not�required�to�register�on�the�WRS,�and�so�the�number�of�registrations�isnecessarily�lower�than�the�total�number�of�arrivals�from�the�A8.�
Other�migration�routes
Work�permits�and�the�WRS�account�for�a�high�proportion�of�overall�labour�migration�to�the�UK,�butthere�are�a�number�of�smaller�schemes�that�should�be�taken�into�account.�The�most�significant�ofthese�is�the�Highly�Skilled�Migrant�Programme�(HSMP),�which�allows�highly�skilled�people�to�move�tothe�UK�without�a�job�offer�in�place.�Until�recently,�the�HSMP�has�been�viewed�as�a�relatively�minorscheme,�which�has�had�‘little�quantitative�impact�on�the�UK�labour�market’�(Clarke�and�Salt�2003:573).�However,�in�2006�there�was�a�sharp�rise�in�the�number�of�HSMP�approvals,�to�21,939�(Salt2007).
Some�migration�routes�are�available�only�to�people�from�certain�countries:
•The�Working�Holiday�Makers�Scheme allows�young�people�from�the�Commonwealth�to�move�tothe�UK�for�a�period�of�up�to�two�years,�during�which�time�they�may�undertake�a�limited�amountof�work,�which�is�usually�in�unskilled�or�low-skilled�occupations.�Similar�opportunities�exist�foryoung�British�people�to�work�in�countries�such�as�Australia,�under�reciprocal�agreements,�thusreducing�the�overall�impact�of�this�migration�(Salt�and�Millar�2006).
•The�Seasonal�Agricultural�Workers�Scheme�(SAWS) allows�a�quota�of�migrants�to�work�in�theagricultural�sector.�The�SAWS�quota�has�been�cut�in�recent�years�as�a�result�of�EU�enlargement,and�is�now�limited�to�nationals�from�Romania�and�Bulgaria.
•The�Sectors�Based�Scheme�(SBS)�was�a�scheme�that�allowed�a�certain�amount�of�low-skilledmigration�into�the�food�processing�and�hospitality�sectors,�but�has�now�been�phased�out�as�aresult�of�EU�enlargement.
0
5,000
10,000
15,000
20,000
25,000
30,000
May
-04
Jun-
04
Jul-0
4
Aug-0
4
Sep-
04
Oct-04
Nov-0
4
Dec-0
4
Jan-
05
Feb-
05
Mar-
05
Apr-0
5
May
-05
Jun-
05
Jul-0
5
Aug-0
5
Sep-
05
Oct-05
Nov-0
5
Dec-0
5
Jan-
06
Feb-
06
Mar-
06
Apr-0
6
May
-06
Jun-
06
Jul-0
6
Aug-0
6
Sep-
06
Oct-06
Nov-0
6
Dec-0
6
Jan-
07
Feb-
07
Mar-
07
Apr-0
7
May
-07
Jun-
07
Jul-0
7
Aug-0
7
Sep-
07
Oct-07
Nov-0
7
Dec-0
7
Jan-
08
Feb-
08
Mar-
08
Apr-0
8
May
-08
Jun-
08
Num
ber
of
app
licat
ions
ap
pro
ved
Figure�2.3:Successfulapplications�tothe�WorkerRegistrationScheme�inconstruction�andland�occupations,by�month,�May2004�to�June�2008�
Source:�Home�Officeet�al 2008�
ippr�|�Building�a�New�Home:�Migration�in�the�UK�construction�sector13
Overall�foreign�labour�migration
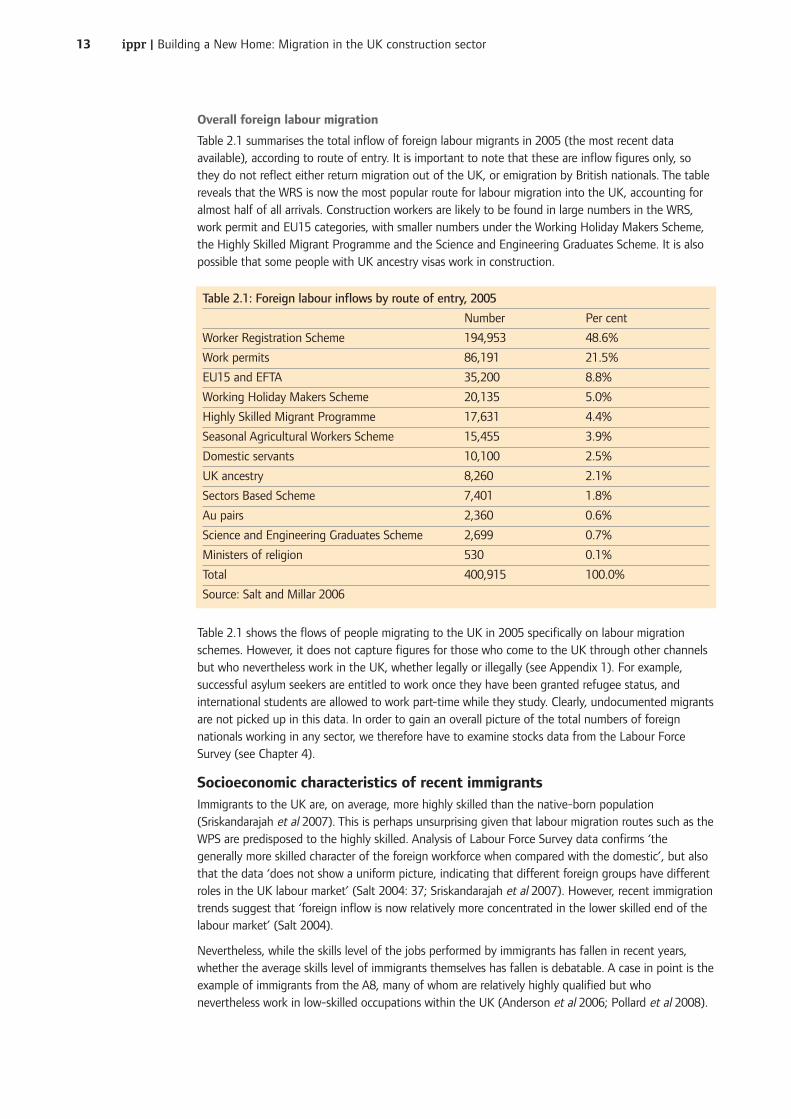
Table�2.1�summarises�the�total�inflow�of�foreign�labour�migrants�in�2005�(the�most�recent�dataavailable),�according�to�route�of�entry.�It�is�important�to�note�that�these�are�inflow�figures�only,�sothey�do�not�reflect�either�return�migration�out�of�the�UK,�or�emigration�by�British�nationals.�The�tablereveals�that�the�WRS�is�now�the�most�popular�route�for�labour�migration�into�the�UK,�accounting�foralmost�half�of�all�arrivals.�Construction�workers�are�likely�to�be�found�in�large�numbers�in�the�WRS,work�permit�and�EU15�categories,�with�smaller�numbers�under�the�Working�Holiday�Makers�Scheme,the�Highly�Skilled�Migrant�Programme�and�the�Science�and�Engineering�Graduates�Scheme.�It�is�alsopossible�that�some�people�with�UK�ancestry�visas�work�in�construction.
Table�2.1�shows�the�flows�of�people�migrating�to�the�UK�in�2005�specifically�on�labour�migrationschemes.�However,�it�does�not�capture�figures�for�those�who�come�to�the�UK�through�other�channelsbut�who�nevertheless�work�in�the�UK,�whether�legally�or�illegally�(see�Appendix�1).�For�example,successful�asylum�seekers�are�entitled�to�work�once�they�have�been�granted�refugee�status,�andinternational�students�are�allowed�to�work�part-time�while�they�study.�Clearly,�undocumented�migrantsare�not�picked�up�in�this�data.�In�order�to�gain�an�overall�picture�of�the�total�numbers�of�foreignnationals�working�in�any�sector,�we�therefore�have�to�examine�stocks�data�from�the�Labour�ForceSurvey�(see�Chapter�4).
Socioeconomic�characteristics�of�recent�immigrantsImmigrants�to�the�UK�are,�on�average,�more�highly�skilled�than�the�native-born�population(Sriskandarajah�et�al 2007).�This�is�perhaps�unsurprising�given�that�labour�migration�routes�such�as�theWPS�are�predisposed�to�the�highly�skilled.�Analysis�of�Labour�Force�Survey�data�confirms�‘thegenerally�more�skilled�character�of�the�foreign�workforce�when�compared�with�the�domestic’,�but�alsothat�the�data�‘does�not�show�a�uniform�picture,�indicating�that�different�foreign�groups�have�differentroles�in�the�UK�labour�market’�(Salt�2004:�37;�Sriskandarajah�et�al 2007).�However,�recent�immigrationtrends�suggest�that�‘foreign�inflow�is�now�relatively�more�concentrated�in�the�lower�skilled�end�of�thelabour�market’�(Salt�2004).
Nevertheless,�while�the�skills�level�of�the�jobs�performed�by�immigrants�has�fallen�in�recent�years,whether�the�average�skills�level�of�immigrants�themselves�has�fallen�is�debatable.�A�case�in�point�is�theexample�of�immigrants�from�the�A8,�many�of�whom�are�relatively�highly�qualified�but�whonevertheless�work�in�low-skilled�occupations�within�the�UK�(Anderson�et�al 2006;�Pollard�et�al 2008).
Table�2.1:�Foreign�labour�inflows�by�route�of�entry,�2005
Number Per�cent
Worker�Registration�Scheme 194,953 48.6%
Work�permits 86,191 21.5%
EU15�and�EFTA 35,200 8.8%
Working�Holiday�Makers�Scheme 20,135 5.0%
Highly�Skilled�Migrant�Programme 17,631 4.4%
Seasonal�Agricultural�Workers�Scheme 15,455 3.9%
Domestic�servants 10,100 2.5%
UK�ancestry 8,260 2.1%
Sectors�Based�Scheme 7,401 1.8%
Au�pairs 2,360 0.6%
Science�and�Engineering�Graduates�Scheme 2,699 0.7%
Ministers�of�religion 530 0.1%
Total 400,915 100.0%
Source:�Salt�and�Millar�2006
ippr�|�Building�a�New�Home:�Migration�in�the�UK�construction�sector14
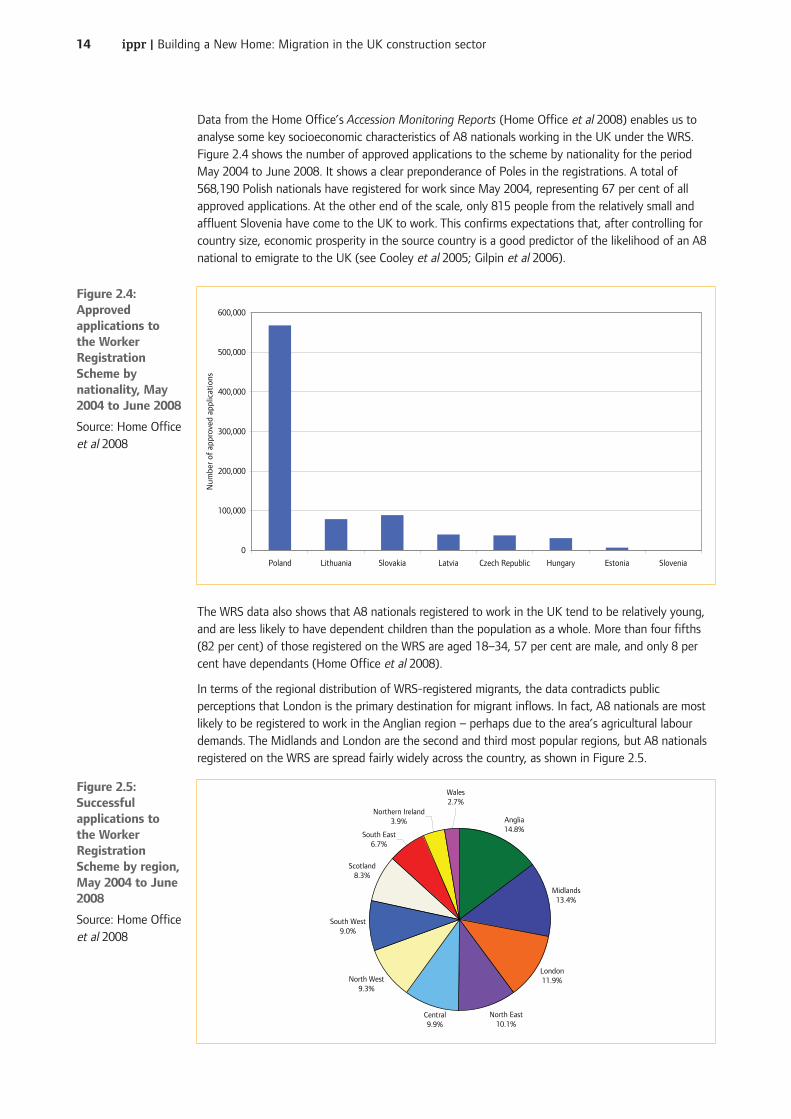
Data�from�the�Home�Office’s�Accession�Monitoring�Reports�(Home�Office�et�al 2008)�enables�us�toanalyse�some�key�socioeconomic�characteristics�of�A8�nationals�working�in�the�UK�under�the�WRS.Figure�2.4�shows�the�number�of�approved�applications�to�the�scheme�by�nationality�for�the�periodMay�2004�to�June�2008.�It�shows�a�clear�preponderance�of�Poles�in�the�registrations.�A�total�of568,190�Polish�nationals�have�registered�for�work�since�May�2004,�representing�67�per�cent�of�allapproved�applications.�At�the�other�end�of�the�scale,�only�815�people�from�the�relatively�small�andaffluent�Slovenia�have�come�to�the�UK�to�work.�This�confirms�expectations�that,�after�controlling�forcountry�size,�economic�prosperity�in�the�source�country�is�a�good�predictor�of�the�likelihood�of�an�A8national�to�emigrate�to�the�UK�(see�Cooley�et�al 2005;�Gilpin�et�al 2006).
The�WRS�data�also�shows�that�A8�nationals�registered�to�work�in�the�UK�tend�to�be�relatively�young,and�are�less�likely�to�have�dependent�children�than�the�population�as�a�whole.�More�than�four�fifths(82�per�cent)�of�those�registered�on�the�WRS�are�aged�18–34,�57�per�cent�are�male,�and�only�8�percent�have�dependants�(Home�Office�et�al 2008).
In�terms�of�the�regional�distribution�of�WRS-registered�migrants,�the�data�contradicts�publicperceptions�that�London�is�the�primary�destination�for�migrant�inflows.�In�fact,�A8�nationals�are�mostlikely�to�be�registered�to�work�in�the�Anglian�region�–�perhaps�due�to�the�area’s�agricultural�labourdemands.�The�Midlands�and�London�are�the�second�and�third�most�popular�regions,�but�A8�nationalsregistered�on�the�WRS�are�spread�fairly�widely�across�the�country,�as�shown�in�Figure�2.5.
0
100,000
200,000
300,000
400,000
500,000
600,000
Poland Lithuania Slovakia Latvia Czech Republic Hungary Estonia Slovenia
Num
ber
of a
ppro
ved
appl
icat
ions
Figure�2.4:Approvedapplications�tothe�WorkerRegistrationScheme�bynationality,�May2004�to�June�2008�
Source:�Home�Officeet�al 2008�
Midlands13.4%
London11.9%
North East10.1%
North West9.3%
South West9.0%
Scotland8.3%
South East6.7%
Northern Ireland3.9%
Central9.9%
Anglia14.8%
Wales2.7%
Figure�2.5:Successfulapplications�tothe�WorkerRegistrationScheme�by�region,May�2004�to�June2008�
Source:�Home�Officeet�al 2008�
ippr�|�Building�a�New�Home:�Migration�in�the�UK�construction�sector15
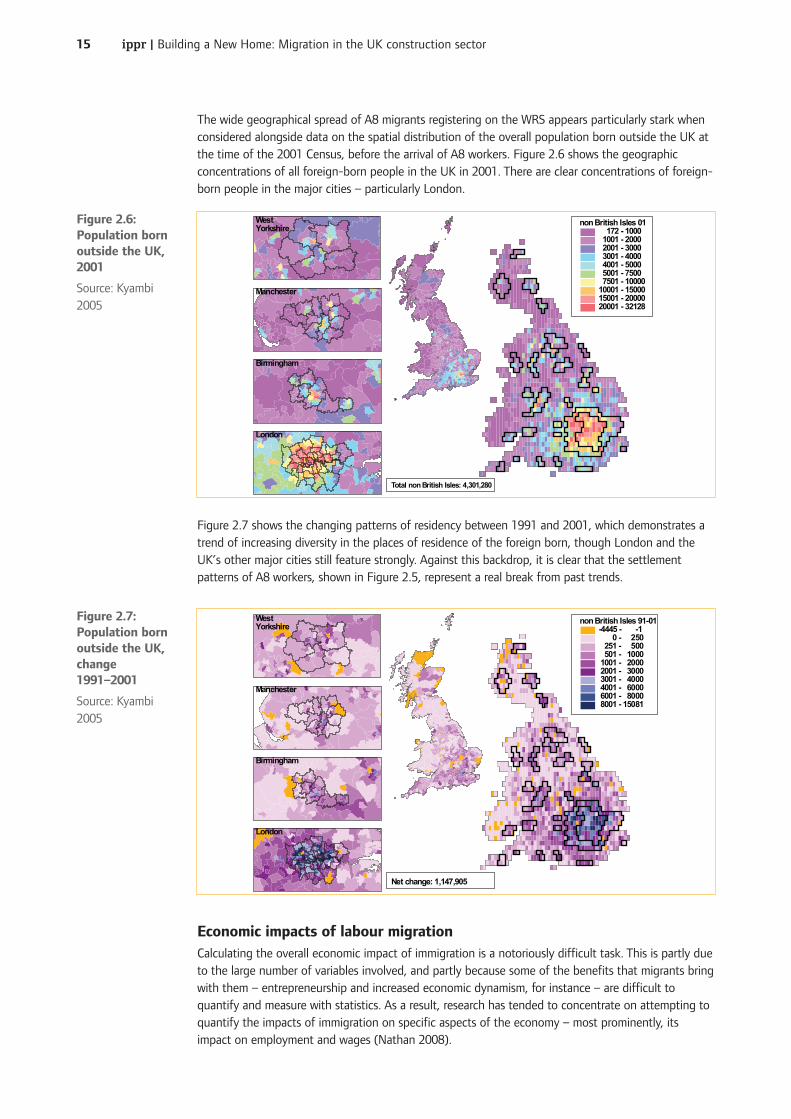
The�wide�geographical�spread�of�A8�migrants�registering�on�the�WRS�appears�particularly�stark�whenconsidered�alongside�data�on�the�spatial�distribution�of�the�overall�population�born�outside�the�UK�atthe�time�of�the�2001�Census,�before�the�arrival�of�A8�workers.�Figure�2.6�shows�the�geographicconcentrations�of�all�foreign-born�people�in�the�UK�in�2001.�There�are�clear�concentrations�of�foreign-born�people�in�the�major�cities�–�particularly�London.�
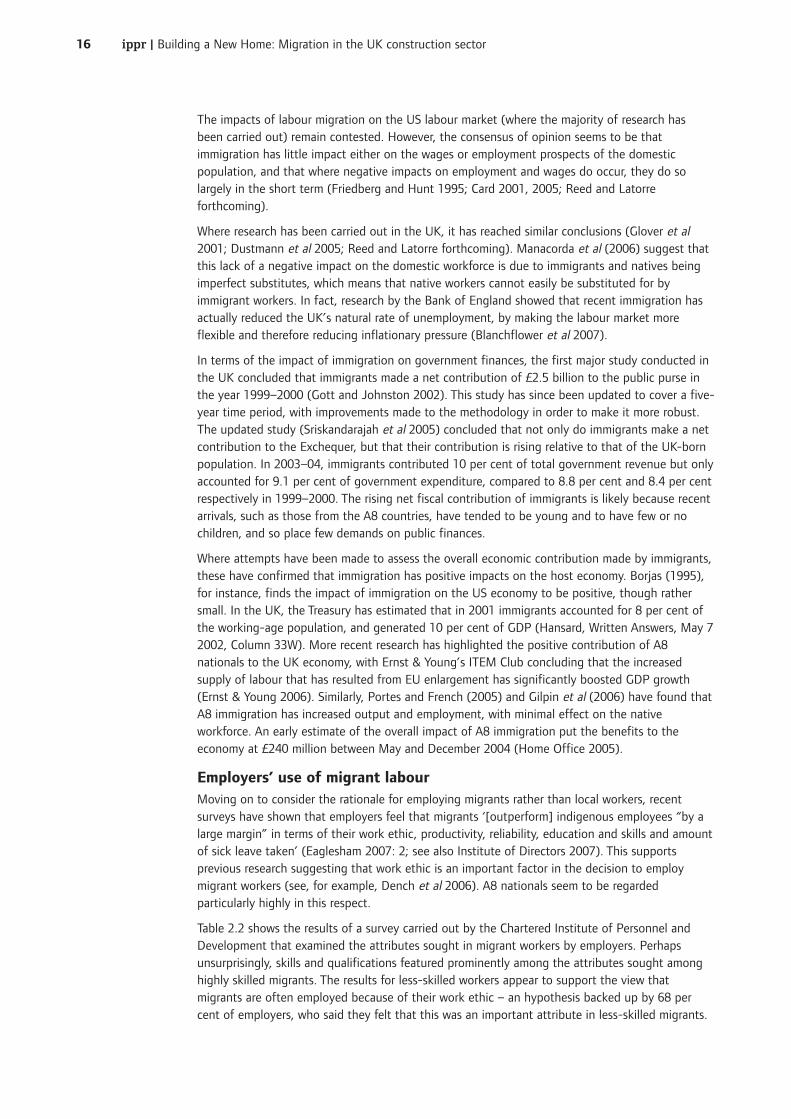
Figure�2.7�shows�the�changing�patterns�of�residency�between�1991�and�2001,�which�demonstrates�atrend�of�increasing�diversity�in�the�places�of�residence�of�the�foreign�born,�though�London�and�theUK’s�other�major�cities�still�feature�strongly.�Against�this�backdrop,�it�is�clear�that�the�settlementpatterns�of�A8�workers,�shown�in�Figure�2.5,�represent�a�real�break�from�past�trends.
Economic�impacts�of�labour�migrationCalculating�the�overall�economic�impact�of�immigration�is�a�notoriously�difficult�task.�This�is�partly�dueto�the�large�number�of�variables�involved,�and�partly�because�some�of�the�benefits�that�migrants�bringwith�them�–�entrepreneurship�and�increased�economic�dynamism,�for�instance�–�are�difficult�toquantify�and�measure�with�statistics.�As�a�result,�research�has�tended�to�concentrate�on�attempting�toquantify�the�impacts�of�immigration�on�specific�aspects�of�the�economy�–�most�prominently,�itsimpact�on�employment�and�wages�(Nathan�2008).�
non British Isles 01 172 - 1000 1001 - 2000 2001 - 3000 3001 - 4000 4001 - 5000 5001 - 7500 7501 - 1000010001 - 1500015001 - 2000020001 - 32128
WestYorkshire
Manchester
Birmingham
London
Total non British Isles: 4,301,280
Figure�2.6:Population�bornoutside�the�UK,2001
Source:�Kyambi2005
non British Isles 91-01-4445 - -1 0 - 250 251 - 500 501 - 1000 1001 - 2000 2001 - 3000 3001 - 4000 4001 - 6000 6001 - 8000 8001 - 15081
WestYorkshire
Manchester
Birmingham
London
Net change: 1,147,905
Figure�2.7:Population�bornoutside�the�UK,change1991–2001
Source:�Kyambi2005
ippr�|�Building�a�New�Home:�Migration�in�the�UK�construction�sector16
The�impacts�of�labour�migration�on�the�US�labour�market�(where�the�majority�of�research�hasbeen�carried�out)�remain�contested.�However,�the�consensus�of�opinion�seems�to�be�thatimmigration�has�little�impact�either�on�the�wages�or�employment�prospects�of�the�domesticpopulation,�and�that�where�negative�impacts�on�employment�and�wages�do�occur,�they�do�solargely�in�the�short�term�(Friedberg�and�Hunt�1995;�Card�2001,�2005;�Reed�and�Latorreforthcoming).
Where�research�has�been�carried�out�in�the�UK,�it�has�reached�similar�conclusions�(Glover�et�al2001;�Dustmann�et�al 2005;�Reed�and�Latorre�forthcoming).�Manacorda�et�al (2006)�suggest�thatthis�lack�of�a�negative�impact�on�the�domestic�workforce�is�due�to�immigrants�and�natives�beingimperfect�substitutes,�which�means�that�native�workers�cannot�easily�be�substituted�for�byimmigrant�workers.�In�fact,�research�by�the�Bank�of�England�showed�that�recent�immigration�hasactually�reduced�the�UK’s�natural�rate�of�unemployment,�by�making�the�labour�market�moreflexible�and�therefore�reducing�inflationary�pressure�(Blanchflower�et�al 2007).
In�terms�of�the�impact�of�immigration�on�government�finances,�the�first�major�study�conducted�inthe�UK�concluded�that�immigrants�made�a�net�contribution�of�£2.5�billion�to�the�public�purse�inthe�year�1999–2000�(Gott�and�Johnston�2002).�This�study�has�since�been�updated�to�cover�a�five-year�time�period,�with�improvements�made�to�the�methodology�in�order�to�make�it�more�robust.The�updated�study�(Sriskandarajah�et�al 2005)�concluded�that�not�only�do�immigrants�make�a�netcontribution�to�the�Exchequer,�but�that�their�contribution�is�rising�relative�to�that�of�the�UK-bornpopulation.�In�2003–04,�immigrants�contributed�10�per�cent�of�total�government�revenue�but�onlyaccounted�for�9.1�per�cent�of�government�expenditure,�compared�to�8.8�per�cent�and�8.4�per�centrespectively�in�1999–2000.�The�rising�net�fiscal�contribution�of�immigrants�is�likely�because�recentarrivals,�such�as�those�from�the�A8�countries,�have�tended�to�be�young�and�to�have�few�or�nochildren,�and�so�place�few�demands�on�public�finances.
Where�attempts�have�been�made�to�assess�the�overall�economic�contribution�made�by�immigrants,these�have�confirmed�that�immigration�has�positive�impacts�on�the�host�economy.�Borjas�(1995),for�instance,�finds�the�impact�of�immigration�on�the�US�economy�to�be�positive,�though�rathersmall.�In�the�UK,�the�Treasury�has�estimated�that�in�2001�immigrants�accounted�for�8�per�cent�ofthe�working-age�population,�and�generated�10�per�cent�of�GDP�(Hansard,�Written�Answers,�May�72002,�Column�33W).�More�recent�research�has�highlighted�the�positive�contribution�of�A8nationals�to�the�UK�economy,�with�Ernst�&�Young’s�ITEM�Club�concluding�that�the�increasedsupply�of�labour�that�has�resulted�from�EU�enlargement�has�significantly�boosted�GDP�growth(Ernst�&�Young�2006).�Similarly,�Portes�and�French�(2005)�and�Gilpin�et�al (2006)�have�found�thatA8�immigration�has�increased�output�and�employment,�with�minimal�effect�on�the�nativeworkforce.�An�early�estimate�of�the�overall�impact�of�A8�immigration�put�the�benefits�to�theeconomy�at�£240�million�between�May�and�December�2004�(Home�Office�2005).�
Employers’�use�of�migrant�labourMoving�on�to�consider�the�rationale�for�employing�migrants�rather�than�local�workers,�recentsurveys�have�shown�that�employers�feel�that�migrants�‘[outperform]�indigenous�employees�“by�alarge�margin”�in�terms�of�their�work�ethic,�productivity,�reliability,�education�and�skills�and�amountof�sick�leave�taken’�(Eaglesham�2007:�2;�see�also�Institute�of�Directors�2007).�This�supportsprevious�research�suggesting�that�work�ethic�is�an�important�factor�in�the�decision�to�employmigrant�workers�(see,�for�example,�Dench�et�al 2006).�A8�nationals�seem�to�be�regardedparticularly�highly�in�this�respect.
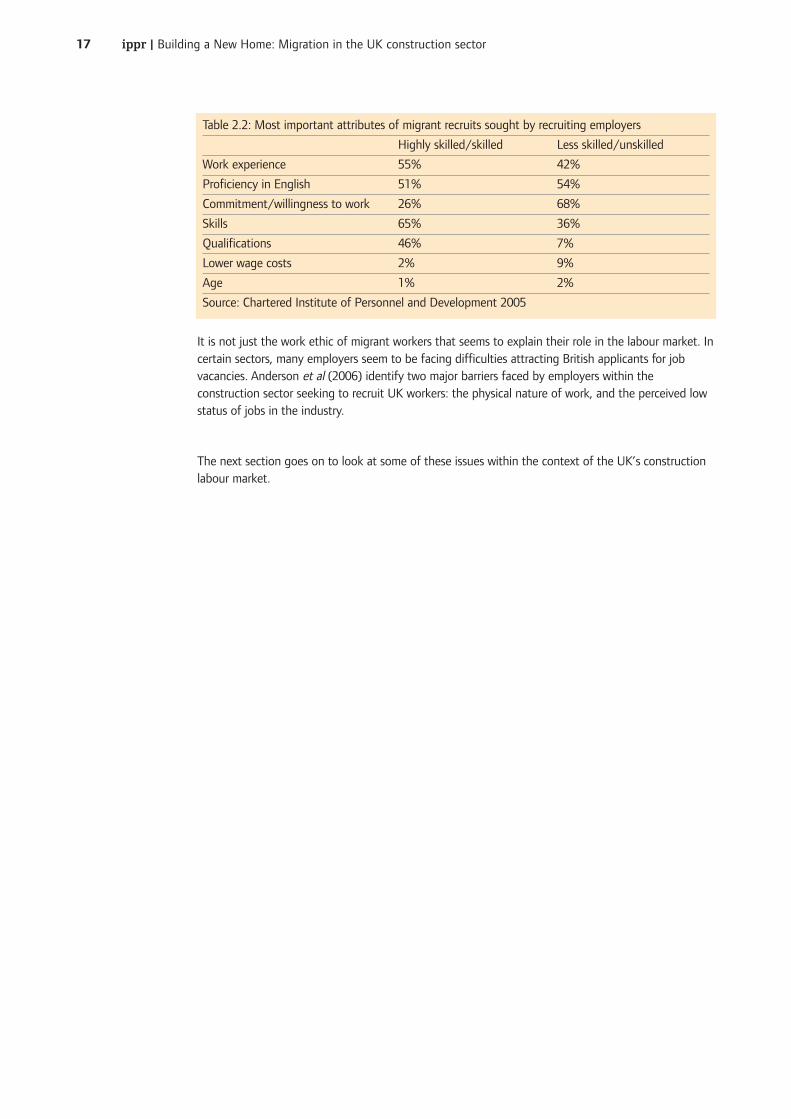
Table�2.2�shows�the�results�of�a�survey�carried�out�by�the�Chartered�Institute�of�Personnel�andDevelopment�that�examined�the�attributes�sought�in�migrant�workers�by�employers.�Perhapsunsurprisingly,�skills�and�qualifications�featured�prominently�among�the�attributes�sought�amonghighly�skilled�migrants.�The�results�for�less-skilled�workers�appear�to�support�the�view�thatmigrants�are�often�employed�because�of�their�work�ethic�–�an�hypothesis�backed�up�by�68�percent�of�employers,�who�said�they�felt�that�this�was�an�important�attribute�in�less-skilled�migrants.
ippr�|�Building�a�New�Home:�Migration�in�the�UK�construction�sector17
It�is�not�just�the�work�ethic�of�migrant�workers�that�seems�to�explain�their�role�in�the�labour�market.�Incertain�sectors,�many�employers�seem�to�be�facing�difficulties�attracting�British�applicants�for�jobvacancies.�Anderson�et�al (2006)�identify�two�major�barriers�faced�by�employers�within�theconstruction�sector�seeking�to�recruit�UK�workers:�the�physical�nature�of�work,�and�the�perceived�lowstatus�of�jobs�in�the�industry.�
The�next�section�goes�on�to�look�at�some�of�these�issues�within�the�context�of�the�UK’s�constructionlabour�market.
Table�2.2:�Most�important�attributes�of�migrant�recruits�sought�by�recruiting�employers
Highly�skilled/skilled Less�skilled/unskilled
Work�experience 55% 42%
Proficiency�in�English 51% 54%
Commitment/willingness�to�work 26% 68%
Skills 65% 36%
Qualifications 46% 7%
Lower�wage�costs 2% 9%
Age 1% 2%
Source:�Chartered�Institute�of�Personnel�and�Development�2005
ippr�|�Building�a�New�Home:�Migration�in�the�UK�construction�sector18
This�section�examines�the�UK’s�construction�labour�market,�looking�at�how�it�is�structured�and�therole�of�migrants�within�it.�In�particular,�it�examines�a�case�study�of�the�construction�of�the�forthcomingLondon�Olympic�facilities.�We�investigate�the�job�creation�potential�of�the�Olympics,�including�howmany�‘Olympic�jobs’�might�be�expected�to�go�to�local�workers�and�how�many�to�migrants.�
Understanding�the�UK�construction�sectorBefore�beginning�our�analysis�of�the�sector’s�labour�markets,�we�set�out�some�of�the�key�factorsthat�have�shaped�the�industry�and�have�an�important�influence�on�how�it�functions.�Theconstruction�sector�–�both�in�the�UK�and�internationally�–�is�heavily�influenced�by�conditions�inthe�wider�economy.�This�is�because�construction�output�tends�to�rely�on�the�success�of�sectorsfurther�upstream.�As�these�other�industries�expand,�they�generate�demand�for�downstreamservices�–�one�of�which�is�construction.�Similarly,�as�they�contract,�construction�demand�may�fall.This�is�one�reason�why�the�construction�sector�is�often�seen�as�a�good�barometer�for�theperformance�of�the�economy�as�a�whole.
The�decade�of�solid�economic�growth�that�the�UK�has�recently�enjoyed�–�in�particular,�the�rise�inpublic�investment�programmes�–�has�had�important�positive�repercussions�for�the�industry.�UKconstruction�has�enjoyed�a�fairly�unprecedented�period�of�continuing�strong�performance�andgrowth�(ConstructionSkills�2007),�with�output�and�employment�rising�rapidly.�However,�the�strongunderlying�relationship�between�the�success�of�other�sectors�and�construction�demand�means�thatthe�construction�sector�is�sensitive�to�the�potential�for�peaks�and�troughs�in�demand�for�itsservices.�As�a�result,�the�current�downturn�in�economic�growth�had�already�begun�to�affect�UKconstruction�output.�
While�wider�economic�conditions�go�some�way�towards�explaining�the�sector’s�performance,�policyalso�plays�a�role.�In�particular,�careful�strategic�planning�can�help�avoid�‘boom�and�bust’�scenarios.Historically,�however,�very�little�strategic�planning�has�been�in�place.�In�the�1980s�especially,�keypolicy�decisions�exacerbated�rather�than�neutered�the�industry’s�tendency�towards�volatility.�Inparticular,�the�decision�to�downgrade�the�importance�of�vocational�training�throughout�the�1980shad�serious�impacts�on�the�industry.
Such�policies�helped�to�generate�a�situation�where�the�industry�was�described�by�the�NationalAudit�Office�as�being�characterised�by�a�culture�of�‘short-termism’,�with�‘a�lack�of�serious�andsustained�commitment�to�education,�training,�safety,�and�research,�and�in�particular�the�low�levelsof�commitment�to�serious�skills�development’�(Comptroller�and�Auditor�General�2001:�58).�Thisshort-term�approach�–�particularly�regarding�training�and�skills�development�–�has�posed�seriouschallenges�for�the�industry�in�recent�decades.
However,�in�the�past�ten�years�significant�efforts�have�been�made�to�manage�the�industry’svolatility�and�to�tackle�short-termism,�particularly�in�relation�to�training.�At�a�policy�level,significant�progress�was�made�with�the�commissioning�of�a�Construction�Task�Force,�which�in�1998produced�the�Egan�Report.�This�report�in�turn�helped�lead�to�the�establishment�of�a�high-levelgroup�called�Rethinking�Construction,�which�was�mandated�with�tackling�under-investment�in�theindustry�–�particularly�in�people.�Wider�efforts�by�the�Government�to�reverse�the�neglect�ofvocational�skills�development�–�most�recently�the�Leitch�Review (Leitch�2006)�–�havecomplemented�these�sector-specific�efforts.�
The�industry�has�also�become�more�self-aware�over�time,�and�has�been�improving�its�long-termplanning�and�strategy.�This�has�involved,�for�example,�attempts�to�make�training�provision�moredemand�led,�and�efforts�to�forecast�future�labour�demand�and�supply,�in�order�to�plan�moreeffectively�for�the�industry’s�likely�future�labour�requirements.�This�has�been�most�recentlymanifest�through�the�industry’s�engagement�with�its�Sector�Skills�Council,�ConstructionSkills.�
3.�The�UK�construction�labour�market
ippr�|�Building�a�New�Home:�Migration�in�the�UK�construction�sector19
Key�trends�in�the�sector’s�labour�markets
To�develop�an�understanding�of�the�current�labour�market�situation,�we�now�trace�some�key�trendswithin�the�sector’s�labour�markets,�and�consider�how�these�have�shaped,�and�continue�to�shape,�thelabour�situation�we�see�today.�In�this�section,�we�explore�five�key�trends:�labour�shortages,�highdemand�for�labour,�high�levels�of�self-employment�and�subcontracting,�and�rapid�change�in�skillsrequired.
Labour�shortagesAccording�to�a�number�of�sources,�until�recently�there�have�been�significant�shortages�of�labourwithin�the�construction�industry,�with�particular�deficits�in�a�number�of�occupations.�The�Learning�andSkills�Council’s�National�Employers�Skills�Survey suggests�that�overall�vacancies�in�the�sector�areroughly�average�for�all�sectors,�but�that�construction�suffers�from�more�hard-to-fill�vacancies�and�skill-shortage�vacancies�than�almost�any�other�sector.�Sector-specific�evidence�suggests�that�whilebusinesses�do�not�rate�‘obtaining�suitably�skilled�staff’�as�their�top�challenge,�they�do�rate�it�as�aconsistent�second-tier�concern�(ConstructionSkills,�Employer�Consultation�Panel).�
Two�key�trends�must�be�highlighted�in�relation�to�these�findings.�First,�it�appears�that�in�the�last�fewyears�there�has�been�a�small�reduction�in�levels�of�concern�about�skills�and�labour�shortages.�Forexample,�data�from�the�Federation�of�Master�Builders�demonstrates�a�decrease�in�employers�citing‘skills�shortages’�as�a�constraint�on�activity�(falling�from�70�per�cent�to�35�per�cent�in�the�period�2005to�2007).�This�fall�is�due,�in�part,�to�the�industry�growing�its�workforce�by�over�30�per�cent�in�the�lastten�years.�This�may�be�related�to�increasing�migration�(an�issue�we�shall�explore�in�some�detail�infollowing�sections),�as�well�as�the�rising�numbers�of�trainees�who�have�entered�the�industry�in�recentyears.�
Nevertheless,�the�second�trend�is�that�even�the�most�recent�data�for�the�current�period�of�recessionsuggests�that�shortages�still�remain�in�the�sector�(Bryer�2008;�data�for�autumn�2008).�TheConstruction�Skills�Network�model�is�the�best�model�available�for�projecting�expected�constructionoutput,�associated�labour�demand,�and�the�‘average�annual�requirement’�–�additional�labour�requiredby�the�sector�beyond�that�expected�to�be�supplied.�Although�not�without�its�flaws,�we�believe�thatthe�process�used�to�generate�the�figures�is�sound,�and�the�national�employment�and�‘employmentgap’�predictions�it�generates�are�respected�as�the�best�available.�This�model�suggests�that,�despite�thedownturn,�significant�numbers�of�new�entrants�will�be�needed�to�meet�labour�demand�–�and�that�atpresent,�training�schemes�are�not�producing�the�workforce�required�to�meet�that�demand.�What�is
Box�3.1:�Sector�Skills�CouncilsSector�Skills�Councils�were�created�in�2003,�when�the�Government�acknowledged�that�the�UKcould�only�compete�in�the�global�economy�if�it�had�a�highly�skilled�and�productive�workforce.�
Sector�Skills�Councils�are�independent,�employer-led�organisations�responsible�for�tackling�theskills�and�productivity�needs�of�their�industry�sectors�across�the�UK.�They�were�set�up�to�decidehow�training�is�delivered�and�funded�in�the�UK.�Each�Sector�Skills�Council�is�the�voice�of�theindustry�that�it�represents,�rather�than�of�the�Government.�But�they�are�answerable�to�theGovernment�for�meeting�their�targets�through�their�Sector�Skills�Agreement�(SSA)�and�the�SectorSkills�Development�Agency�(SSDA).�Each�SSC�is�responsible�for�dealing�with�the�skills�needs�withintheir�sector�UK-wide,�and�all�SSCs�have�the�same�four�key�goals:
1.�Reduce�skills�gaps�and�shortages�
2.�Improve�productivity�
3.�Increase�opportunities�for�all�individuals�in�the�workforce�
4.�Improve�learning�supply.
ConstructionSkills,�as�the�Sector�Skills�Council�for�construction,�represents�every�part�of�theconstruction�industry�in�every�part�of�the�UK.
ippr�|�Building�a�New�Home:�Migration�in�the�UK�construction�sector20
more,�many�training�schemes�are�already�operating�at�full�capacity,�meaning�that�very�rapid�expansionof�numbers�of�trainees�would�not�be�easy�to�achieve.�As�a�result,�it�is�likely�that�the�sector�willcontinue�to�experience�shortages�of�labour�across�many�occupations.�
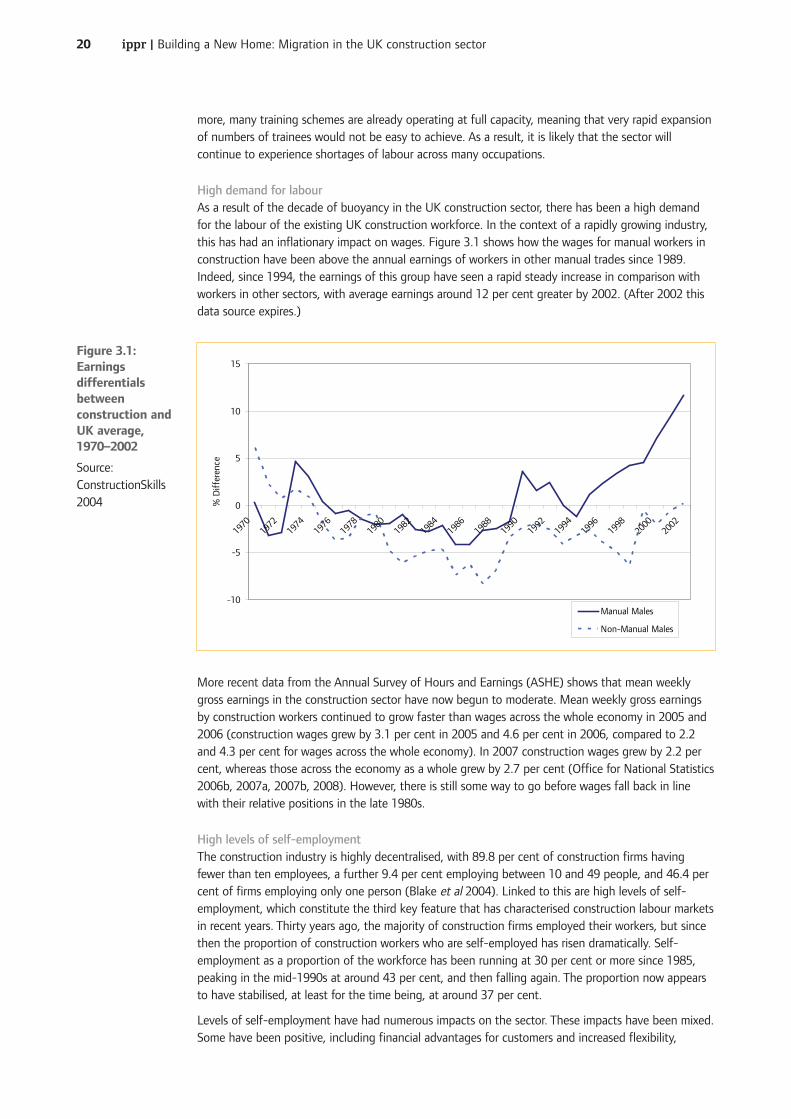
High�demand�for�labourAs�a�result�of�the�decade�of�buoyancy�in�the�UK�construction�sector,�there�has�been�a�high�demandfor�the�labour�of�the�existing�UK�construction�workforce.�In�the�context�of�a�rapidly�growing�industry,this�has�had�an�inflationary�impact�on�wages.�Figure�3.1�shows�how�the�wages�for�manual�workers�inconstruction�have�been�above�the�annual�earnings�of�workers�in�other�manual�trades�since�1989.Indeed,�since�1994,�the�earnings�of�this�group�have�seen�a�rapid�steady�increase�in�comparison�withworkers�in�other�sectors,�with�average�earnings�around�12�per�cent�greater�by�2002.�(After�2002�thisdata�source�expires.)�
More�recent�data�from�the�Annual�Survey�of�Hours�and�Earnings�(ASHE)�shows�that�mean�weeklygross�earnings�in�the�construction�sector�have�now�begun�to�moderate.�Mean�weekly�gross�earningsby�construction�workers�continued�to�grow�faster�than�wages�across�the�whole�economy�in�2005�and2006�(construction�wages�grew�by�3.1�per�cent�in�2005�and�4.6�per�cent�in�2006,�compared�to�2.2and�4.3�per�cent�for�wages�across�the�whole�economy).�In�2007�construction�wages�grew�by�2.2�percent,�whereas�those�across�the�economy�as�a�whole�grew�by�2.7�per�cent�(Office�for�National�Statistics2006b,�2007a,�2007b,�2008).�However,�there�is�still�some�way�to�go�before�wages�fall�back�in�linewith�their�relative�positions�in�the�late�1980s.�
High�levels�of�self-employmentThe�construction�industry�is�highly�decentralised,�with�89.8�per�cent�of�construction�firms�havingfewer�than�ten�employees,�a�further�9.4�per�cent�employing�between�10�and�49�people,�and�46.4�percent�of�firms�employing�only�one�person�(Blake�et�al 2004).�Linked�to�this�are�high�levels�of�self-employment,�which�constitute�the�third�key�feature�that�has�characterised�construction�labour�marketsin�recent�years.�Thirty�years�ago,�the�majority�of�construction�firms�employed�their�workers,�but�sincethen�the�proportion�of�construction�workers�who�are�self-employed�has�risen�dramatically.�Self-employment�as�a�proportion�of�the�workforce�has�been�running�at�30�per�cent�or�more�since�1985,peaking�in�the�mid-1990s�at�around�43�per�cent,�and�then�falling�again.�The�proportion�now�appearsto�have�stabilised,�at�least�for�the�time�being,�at�around�37�per�cent.�
Levels�of�self-employment�have�had�numerous�impacts�on�the�sector.�These�impacts�have�been�mixed.Some�have�been�positive,�including�financial�advantages�for�customers�and�increased�flexibility,
-10
-5
0
5
10
15
1970
1972
1974
1976
1978
1980
1982
1984
1986
1988
1990
1992
1994
1996
1998
2000
2002
% D
iffe
renc
e
Manual Males
Non-Manual Males
Figure�3.1:Earningsdifferentialsbetweenconstruction�andUK�average,1970–2002
Source:ConstructionSkills2004
ippr�|�Building�a�New�Home:�Migration�in�the�UK�construction�sector21
benefiting�employers�and�some�workers.�However,�other�effects�of�self-employment�have�beenproblematic.�For�example,�there�are�concerns�about�‘false�self-employment’,�where�workers�havemany�of�the�characteristics�of�an�employee�(for�example,�working�for�the�same�employer�for�years)and�would�prefer�to�have�employed�status,�but�are�nonetheless�unable�to�access�work�as�an�employee.
Also,�self-employment�has�drawbacks�specifically�in�relation�to�training.�Very�small�firms�can�find�ithighly�risky�to�take�on�an�apprentice,�or�even�a�fully�work-ready�but�inexperienced�new�worker�(Clarke2006).�The�training�opportunities�and�access�to�qualifications�for�workers�already�in�the�workforce�arealso�affected,�as�it�is�less�likely�that�self-employed�workers�will�take�the�risk�of�investing�in�theseopportunities.�
High�levels�of�subcontractingRelated�to�the�rise�in�self-employment�is�the�proliferation�of�subcontracting�witnessed�across�thesector,�with�many�construction�projects�characterised�by�a�number�of�tiers�of�sub-contracted�firms.One�investigation�concluded�that�in�construction�‘there�are�now�no�large�employers;�the�industry�issupplied�by�labour�contractors’�(RSA�Migration�Commission�2005:�9).�This�in�turn�often�means�thatthe�majority�of�small�firms�lack�the�information�or�incentives�required�to�carry�out�strategic�planningwith�regard�to�labour�recruitment�and�training.�Subcontracting�therefore�shapes�how�traininginitiatives�at�the�industry�level�should�be�designed�and�delivered.
Rapid�changes�in�skills�requiredThe�sector’s�labour�profile�is�also�being�affected�by�the�rapid�change�taking�place�in�technologies,materials�and�practices�within�the�sector,�and�this�has�had�an�effect�on�the�kinds�and�levels�of�skillsrequired.�Geddes�and�Balch�suggest�that�the�effect�of�this�technological�change�has�been�to�steadilypush�up�skill�requirements,�as�workers�require�specific�skills�to�use�these�technologies,�combined�withthe�flexibility�to�adapt�to�a�quickly�changing�environment�(Geddes�and�Balch�2002).�
Current�sector�performance�and�impact�on�labour�demand
Having�described�the�trends�that�have�shaped�the�industry�over�the�past�decades,�we�now�considerhow�the�industry�is�performing�today.�The�construction�sector�in�the�UK�is�large.�Estimates�suggestthat�it�presently�employs�over�2.3�million�workers,�or�2.6�million�including�those�working�inprofessional�practice�(Bryer�2008)�across�a�wide�range�of�activities�and�sub-sectors,�from�manuallabourers�to�highly�skilled�engineers�and�professionals.
Total�output�is�expected�to�continue�to�grow�in�the�medium�term,�driven�by�planned�expansions�in�anumber�of�sub-sectors�–�particularly�infrastructure�(Bryer�2008).�However,�in�2008�and�2009contractions�in�demand�are�expected,�with�fewer�projects�in�the�pipeline�–�especially�in�privatehousing�(Bryer�2008).�Nonetheless,�between�2009�and�2013�employment�is�expected�to�expand,�byaround�2�per�cent�overall.�Appendix�2�gives�an�idea�of�the�number�of�employees�working�in�eachoccupation�at�present,�as�well�as�the�projected�annual�employment�requirement�for�each�occupationover�the�period�up�to�2013.
The�projected�average�annual�employment�requirement�is�expected�to�reach�42,000�each�year�for�theperiod�spanning�2009�to�2013.�This�figure,�an�interim�forecast�generated�by�the�Construction�SkillsNetwork�Model,�represents�the�number�of�extra�employees�that�the�industry�is�expected�to�requireeach�year�in�order�for�labour�supply�to�meet�predicted�labour�demand.�It�must�be�emphasised�thatthese�are�relatively�recent�figures,�from�September�2008.�They�may�seem�overly�optimistic,�but�itshould�be�emphasised�that�the�expected�requirement�of�42,000�workers�represents�a�significantreduction�on�earlier�estimates�–�for�example,�previously�the�model�has�suggested�that�the‘employment�gap’�would�be�88,390�workers�annually�(ConstructionSkills�2008).�It�therefore�seemsthat,�at�least�for�the�moment,�while�the�recession�has�reduced�the�labour�and�skills�gaps�affecting�thesector,�it�has�not�eliminated�them�entirely.�
Key�characteristics�of�the�construction�workforce
It�is�important�not�only�to�examine�the�gaps�in�labour�for�particular�occupations,�but�also�to�considerthe�skills�and�qualifications�of�those�in�the�sector.�Analysis�of�the�Labour�Force�Survey�allows�us�to
ippr�|�Building�a�New�Home:�Migration�in�the�UK�construction�sector22
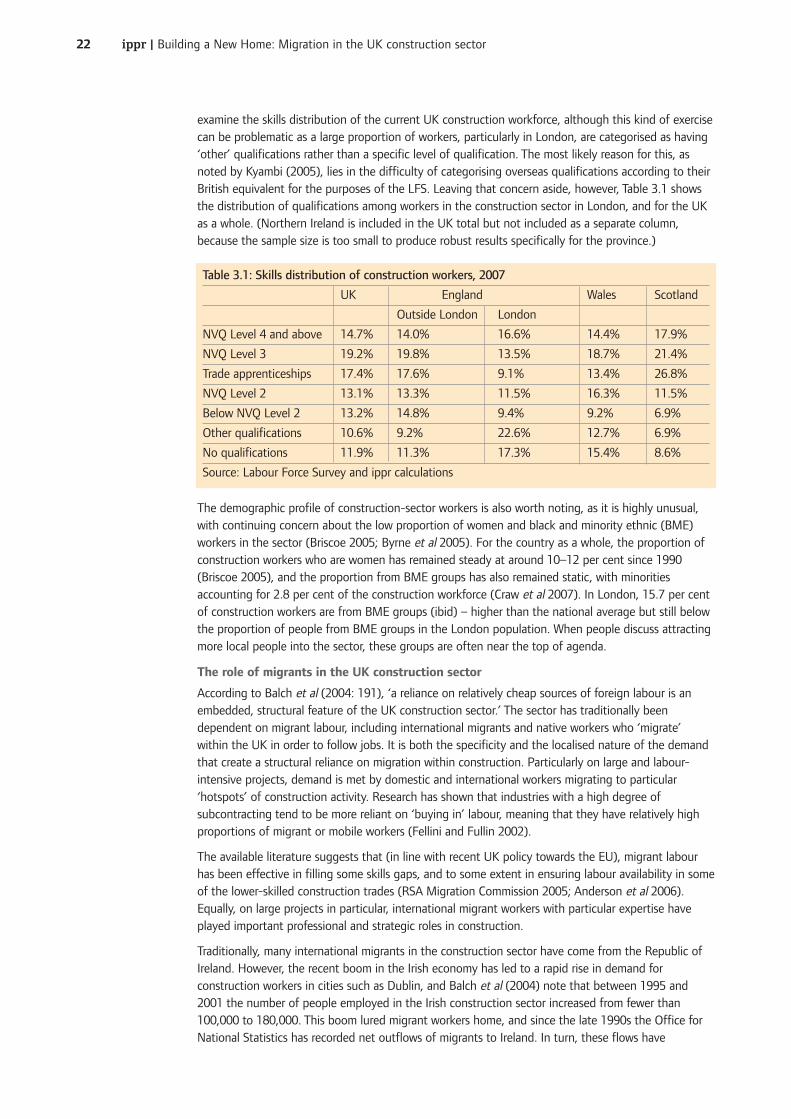
examine�the�skills�distribution�of�the�current�UK�construction�workforce,�although�this�kind�of�exercisecan�be�problematic�as�a�large�proportion�of�workers,�particularly�in�London,�are�categorised�as�having‘other’�qualifications�rather�than�a�specific�level�of�qualification.�The�most�likely�reason�for�this,�asnoted�by�Kyambi�(2005),�lies�in�the�difficulty�of�categorising�overseas�qualifications�according�to�theirBritish�equivalent�for�the�purposes�of�the�LFS.�Leaving�that�concern�aside,�however,�Table�3.1�showsthe�distribution�of�qualifications�among�workers�in�the�construction�sector�in�London,�and�for�the�UKas�a�whole.�(Northern�Ireland�is�included�in�the�UK�total�but�not�included�as�a�separate�column,because�the�sample�size�is�too�small�to�produce�robust�results�specifically�for�the�province.)
The�demographic�profile�of�construction-sector�workers�is�also�worth�noting,�as�it�is�highly�unusual,with�continuing�concern�about�the�low�proportion�of�women�and�black�and�minority�ethnic�(BME)workers�in�the�sector�(Briscoe�2005;�Byrne�et�al 2005).�For�the�country�as�a�whole,�the�proportion�ofconstruction�workers�who�are�women�has�remained�steady�at�around�10–12�per�cent�since�1990(Briscoe�2005),�and�the�proportion�from�BME�groups�has�also�remained�static,�with�minoritiesaccounting�for�2.8�per�cent�of�the�construction�workforce�(Craw�et�al 2007).�In�London,�15.7�per�centof�construction�workers�are�from�BME�groups�(ibid)�–�higher�than�the�national�average�but�still�belowthe�proportion�of�people�from�BME�groups�in�the�London�population.�When�people�discuss�attractingmore�local�people�into�the�sector,�these�groups�are�often�near�the�top�of�agenda.
The�role�of�migrants�in�the�UK�construction�sector
According�to�Balch�et�al (2004:�191),�‘a�reliance�on�relatively�cheap�sources�of�foreign�labour�is�anembedded,�structural�feature�of�the�UK�construction�sector.’�The�sector�has�traditionally�beendependent�on�migrant�labour,�including�international�migrants�and�native�workers�who�‘migrate’within�the�UK�in�order�to�follow�jobs.�It�is�both�the�specificity�and�the�localised�nature�of�the�demandthat�create�a�structural�reliance�on�migration�within�construction.�Particularly�on�large�and�labour-intensive�projects,�demand�is�met�by�domestic�and�international�workers�migrating�to�particular‘hotspots’�of�construction�activity.�Research�has�shown�that�industries�with�a�high�degree�ofsubcontracting�tend�to�be�more�reliant�on�‘buying�in’�labour,�meaning�that�they�have�relatively�highproportions�of�migrant�or�mobile�workers�(Fellini�and�Fullin�2002).
The�available�literature�suggests�that�(in�line�with�recent�UK�policy�towards�the�EU),�migrant�labourhas�been�effective�in�filling�some�skills�gaps,�and�to�some�extent�in�ensuring�labour�availability�in�someof�the�lower-skilled�construction�trades�(RSA�Migration�Commission�2005;�Anderson�et�al 2006).Equally,�on�large�projects�in�particular,�international�migrant�workers�with�particular�expertise�haveplayed�important�professional�and�strategic�roles�in�construction.�
Traditionally,�many�international�migrants�in�the�construction�sector�have�come�from�the�Republic�ofIreland.�However,�the�recent�boom�in�the�Irish�economy�has�led�to�a�rapid�rise�in�demand�forconstruction�workers�in�cities�such�as�Dublin,�and�Balch�et�al (2004)�note�that�between�1995�and2001�the�number�of�people�employed�in�the�Irish�construction�sector�increased�from�fewer�than100,000�to�180,000.�This�boom�lured�migrant�workers�home,�and�since�the�late�1990s�the�Office�forNational�Statistics�has�recorded�net�outflows�of�migrants�to�Ireland.�In�turn,�these�flows�have
Table�3.1:�Skills�distribution�of�construction�workers,�2007
UK England Wales Scotland
Outside�London London
NVQ�Level�4�and�above 14.7% 14.0% 16.6% 14.4% 17.9%
NVQ�Level�3 19.2% 19.8% 13.5% 18.7% 21.4%
Trade�apprenticeships 17.4% 17.6% 9.1% 13.4% 26.8%
NVQ�Level�2 13.1% 13.3% 11.5% 16.3% 11.5%
Below�NVQ�Level�2 13.2% 14.8% 9.4% 9.2% 6.9%
Other�qualifications 10.6% 9.2% 22.6% 12.7% 6.9%
No�qualifications 11.9% 11.3% 17.3% 15.4% 8.6%
Source:�Labour�Force�Survey�and�ippr�calculations
ippr�|�Building�a�New�Home:�Migration�in�the�UK�construction�sector23
contributed�to�pockets�of�labour�shortage�in�the�UK�construction�sector.�The�result�has�been�thatconstruction�firms�have�sought�to�recruit�substitutes�for�Irish�migrant�labour�–�and�have�found�them,in�workers�from�Asia�and�Central�and�Eastern�Europe�(Balch�et�al 2004).
The�construction�industry�has�been�identified�as�one�of�a�number�of�sectors�in�which�illegal�working�isa�particular�problem,�along�with�sectors�such�as�agriculture,�catering,�cleaning�and�hospitality�(HomeOffice�2002;�Anderson�and�Rogaly�2005;�Serious�Organised�Crime�Agency�2006).�However,�much�ofthe�illegal�working�that�takes�place�in�the�construction�industry�probably�occurs�in�the�domestic�repairand�maintenance�sector,�which�is�subject�to�little�regulation.�Balch�et�al (2004)�argue�that�it�has�beenthe�inability�of�the�industry�to�replace�returning�Irish�migrant�workers�and�the�political�difficulties�ofcreating�new�routes�for�immigration�of�construction�workers�that�accounts�for�the�relatively�highnumber�of�undocumented�workers�in�the�sector.�However,�with�the�enlargement�of�the�EU�and�thesubsequent�legal�migration�of�A8�nationals�to�the�UK,�it�is�possible�that�employing�irregular�migrantshas�become�a�less�attractive�(and,�indeed,�less�necessary)�option�in�recent�years.
Case�study:�an�Olympic�labour�legacy?The�construction�of�the�facilities�for�the�2012�Olympic�Games�is�perhaps�the�best-known�constructionproject�currently�being�undertaken�in�the�UK.�Moreover,�given�the�iconic�nature�of�the�Olympics,�theconstruction�of�the�facilities�is�often�seen�as�a�unique�challenge.�However,�while�this�development�isdifferent�in�many�ways�from�the�usual�construction�project,�it�does�have�some�precedents.�First,�weknow�what�other�cities�have�been�able�to�achieve�for�their�own�Olympic�facilities.�And,�while�a�numberof�factors�set�the�2012�Olympics�project�apart�from�most�UK�construction�projects�(including�theattention�it�attracts,�the�‘legacy�benefits’�it�is�meant�to�deliver,�and�the�absolute�immovability�ofdeadlines),�in�other�ways�it�faces�many�of�the�same�challenges�as�other�large�projects.�So�ourdiscussion�of�an�Olympic�labour�legacy�can�draw�on�these�experiences.�
It�is�worth�noting�a�word�of�caution,�however:�it�is�very�difficult�to�isolate�the�impacts�of�the�OlympicGames�on�a�host�city.�There�are�often�multiple�activities�and�investments�that�are�brought�forward�tocoincide�with�Olympics�preparations,�including�projects�that�were�scheduled�to�happen�in�any�case,and�whose�impact�is�therefore�not�really�a�result�of�the�Games.�It�is�also�difficult�to�assess�what�wouldhave�happened�in�a�host�city�without�the�Olympics.�How�else�would�public�funds�be�spent,�and�whatwould�the�costs�and�benefits�have�been?�To�what�extent�did�Olympics�investment�crowd�out�otherinvestment�that�would�have�occurred,�and�to�what�degree�did�Olympics�jobs�displace�other�jobs�–�socould�these�therefore�be�considered�a�net�gain?�These�factors�need�to�be�borne�in�mind�by�thoseplanning�for�or�assessing�Olympic�legacies.�
Impacts�of�the�Olympics�on�the�economy�and�on�construction�labour�markets
Different�host�cities�have�had�different�aims�for�their�Olympic�Games.�The�Games�are�commonly�seenas�an�economic�development�tool,�and�many�host�cities�bid�for�the�Olympics�for�economicdevelopment�reasons.�However,�not�all�Olympics�have�brought�economic�gain.�For�example,�Montrealstruggled�for�three�decades�to�pay�off�its�Olympic�debt.�By�the�late�1970s,�there�were�no�bidders�forthe�1984�Olympics,�in�fear�that�the�Games�were�too�risky�and�expensive.�Los�Angeles�finally�decidedto�be�the�host�and,�with�a�favourable�deal�from�the�International�Olympic�Committee,�turned�a�recordprofit�of�US$200�million,�thereby�encouraging�bids�for�future�Games.
Just�as�Los�Angeles�gave�the�Olympics�a�profit-generating�reputation,�Barcelona�branded�them�as�aregeneration�tool.�The�1992�Barcelona�Olympics�brought�forward�large-scale�public�infrastructureprojects,�including�waterfront�redevelopment,�a�new�ring�road,�substantial�airport�improvements,housing�(later�converted�from�the�original�Olympic�Village),�and�renewed�public�spaces.�These�Gameswere�a�catalyst�for�broader�economic�development,�and�led�the�regeneration�in�severalneighbourhoods,�so�there�are�clear�parallels�here�with�the�aspirations�of�London�2012.
Sydney�won�the�bid�for�the�2000�Games,�and�included�in�its�plans�the�later�development�of�the�Olympicsite�at�Homebush�Bay.�Athens�in�2004�brought�forward�large-scale�transportation�infrastructure�for�itsGames,�and�its�famed�race�to�finish�the�stadium�roof�serves�as�a�reminder�of�the�intensity�of�Olympicconstruction�efforts.�Beijing’s�Olympics�construction�is�thought�to�be�the�biggest�yet.�
ippr�|�Building�a�New�Home:�Migration�in�the�UK�construction�sector24
It�should�be�clear,�then,�that�generalising�about�the�impact�of�the�Games�is�difficult.�Indeed,�assessingimpacts�is�further�complicated�by�relatively�weak�information.�Nonetheless,�we�believe�that�directimpacts�accrue�in�a�broad�range�of�categories:
•Economic�stimulus�(for�example,�investment�and�employment)
• Infrastructure
•Political�impacts
•Social�impacts
• Image�impacts.
The�Games�also�trigger�secondary�impacts,�which�(because�of�the�scale�of�the�project)�could�besubstantial.�These�include�wider�economic�growth�or�recession,�and�other�infrastructure�or�investmentin�non-Olympics�structures.
For�the�purposes�of�this�report,�we�shall�focus�mainly�on�two�direct�impact�areas:�economic�stimulus,and�infrastructure.�These�two�factors�help�determine�the�labour�market�impacts�of�the�Games,because�they�are�inherently�linked�–�most�of�the�short-term�employment�stimulus�occurs�as�a�result�ofthe�construction�of�the�Games�infrastructure.
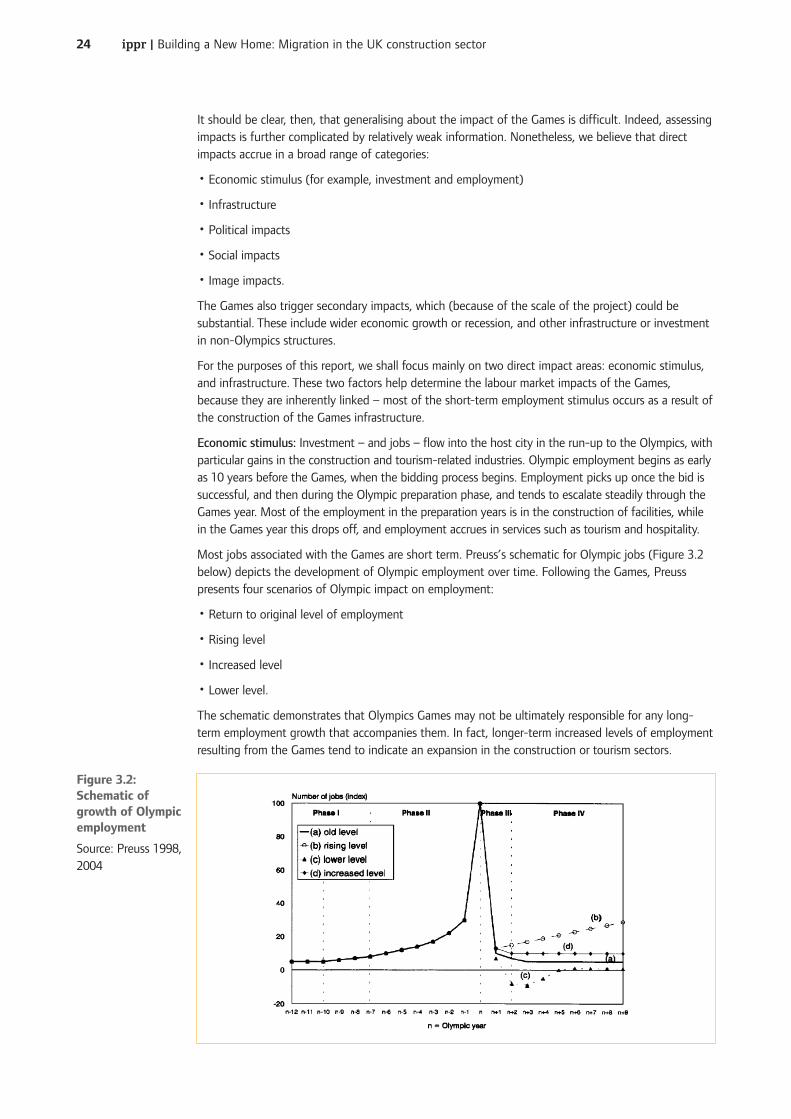
Economic�stimulus: Investment�–�and�jobs�–�flow�into�the�host�city�in�the�run-up�to�the�Olympics,�withparticular�gains�in�the�construction�and�tourism-related�industries.�Olympic�employment�begins�as�earlyas�10�years�before�the�Games,�when�the�bidding�process�begins.�Employment�picks�up�once�the�bid�issuccessful,�and�then�during�the�Olympic�preparation�phase,�and�tends�to�escalate�steadily�through�theGames�year.�Most�of�the�employment�in�the�preparation�years�is�in�the�construction�of�facilities,�whilein�the�Games�year�this�drops�off,�and�employment�accrues�in�services�such�as�tourism�and�hospitality.
Most�jobs�associated�with�the�Games�are�short�term.�Preuss’s�schematic�for�Olympic�jobs�(Figure�3.2below)�depicts�the�development�of�Olympic�employment�over�time.�Following�the�Games,�Preusspresents�four�scenarios�of�Olympic�impact�on�employment:�
•Return�to�original�level�of�employment
•Rising�level
• Increased�level
• Lower�level.
The�schematic�demonstrates�that�Olympics�Games�may�not�be�ultimately�responsible�for�any�long-term�employment�growth�that�accompanies�them.�In�fact,�longer-term�increased�levels�of�employmentresulting�from�the�Games�tend�to�indicate�an�expansion�in�the�construction�or�tourism�sectors.�
Figure�3.2:Schematic�ofgrowth�of�Olympicemployment
Source:�Preuss�1998,2004�
ippr�|�Building�a�New�Home:�Migration�in�the�UK�construction�sector25
Total�employment�figures�vary�from�one�host�country�to�another,�as�different�Games�make�verydifferent�levels�of�investment.�Barcelona�is�thought�to�have�employed�the�most,�with�281,213�person-years�of�employment�–�equivalent�to�7,030�jobs.�At�the�other�extreme,�Atlanta�made�87,510�person-years�of�employment�–�equivalent�to�2,188�jobs�(Preuss�2004).
It�is�worth�noting�that�estimates�on�employment�figures�vary�widely�–�partly�because�most�‘official’estimates�come�from�host�cities�and�organising�committees,�and�are�sometimes�thought�to�be�overlyoptimistic.�The�calculations�here�were�made�by�Holger�Preuss,�an�independent�academic.�It�is�alsoworth�noting�that�although�these�figures�describe�the�employment�impact�of�the�Games,�others�havesuggested�that�had�the�Games�not�occurred,�public�expenditure�would�employ�workers�elsewhere,�sothe�net�impact�may�be�much�lower�(Baade�and�Matheson�2002).
Infrastructure�impact:�The�Games�seem�to�have�the�most�significant�economic�benefit�when�theinfrastructure�and�other�Olympic�investments�are�made�in�line�with�the�host�city’s�future�needs.Barcelona�used�the�Olympics�to�bring�forward�infrastructure�builds�they�were�already�planning,�so�thenew�builds�had�lasting,�long-term�uses.�The�Olympics�is�a�brief�event,�and�bringing�forwardinfrastructure�that�is�needed�in�any�case�can�help�ensure�that�the�Games�offer�lasting�economicbenefits.�
What�labour�legacy�is�expected�from�the�2012�Games?�
Estimates�vary�regarding�the�likely�employment�legacy�and�impacts�of�the�2012�Games.�However,prior�to�the�current�budget�figures,�analysts�Experian�estimated�that�the�Olympics�will�employ�49,000person-years�of�construction�employment�and�36,700�additional�jobs�in�staging�and�showcasing�theGames�(Experian�2006).�(These�figures�refer�to�direct�impacts,�over�a�time�period�extending�beyondthe�Games�and�including�direct�legacy�employment.�Not�including�legacy�employment�–�to�convertGames�structures�for�post-Games�use�–�Experian�estimates�that�the�Games�will�employ�35,500�person-years�of�construction�employment.)�In�this�distinction�between�person-years�and�jobs,�person-yearsare�more�precise,�and�jobs�may�be�very�long�or�very�short�in�time�span.�Experian�states�the�‘jobs’�ithas�calculated�will�mostly�be�very�short-term�in�nature.�
There�will�also�be�other�indirect�employment�impacts�–�both�positive�and�negative.�In�terms�of�impacton�the�construction�sector,�job�shifting�and�displacement�will�make�the�net�impact�of�London�2012less�clear.�To�some�degree,�other�publicly�funded�infrastructure�projects�may�be�shifted�or�delayed,and�public�infrastructure�spending�in�the�post-Games�years�may�drop�to�compensate�for�the�extraOlympics-related�spending.
It�is�important�to�note�that�there�is�not�just�one�‘legacy�plan’�but�many,�with�different�areas�andorganisations�all�trying�to�harness�the�Olympics�to�meet�some�of�their�objectives.�Key�among�theseactors�are�the�five�‘Olympic�boroughs’�–�the�areas�of�London�in�which�the�Olympic�facilities�will�bebuilt,�and�where�activities�will�take�place.�The�employment�legacy�has�become�a�particular�focus�forthese�five�boroughs,�along�with�the�London�Development�Agency�(LDA),�the�London�Employmentand�Skills�Taskforce�for�2012�and�other�local�interest�groups.�However,�there�is�confusion�about�howmany�Olympics�jobs�will�be�local,�and�indeed�how�to�define�‘local’–�a�complex�concept�given�EastLondon’s�distinct�international�communities.�In�the�case�of�construction,�it�is�unclear�how�manyconstruction�jobs�will�go�to�‘local’�residents�–�particularly�because�there�are�relatively�few�skilledconstruction�workers�living�in�the�five�Olympic�boroughs.�
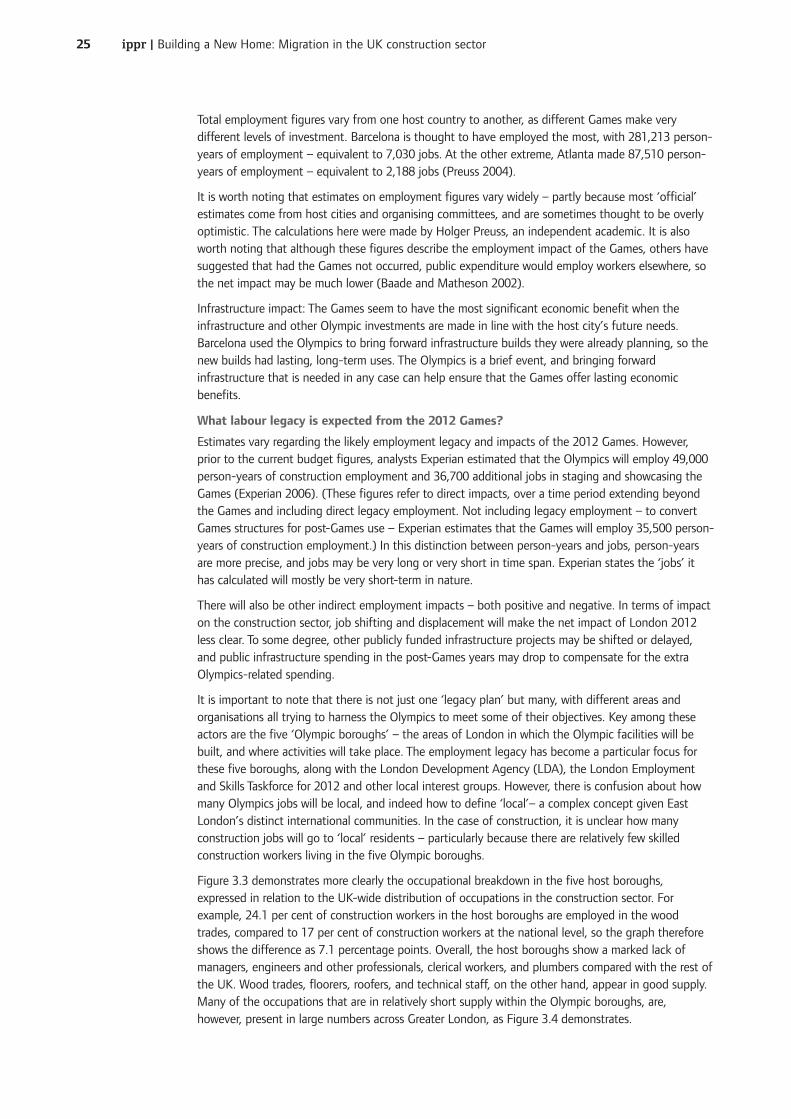
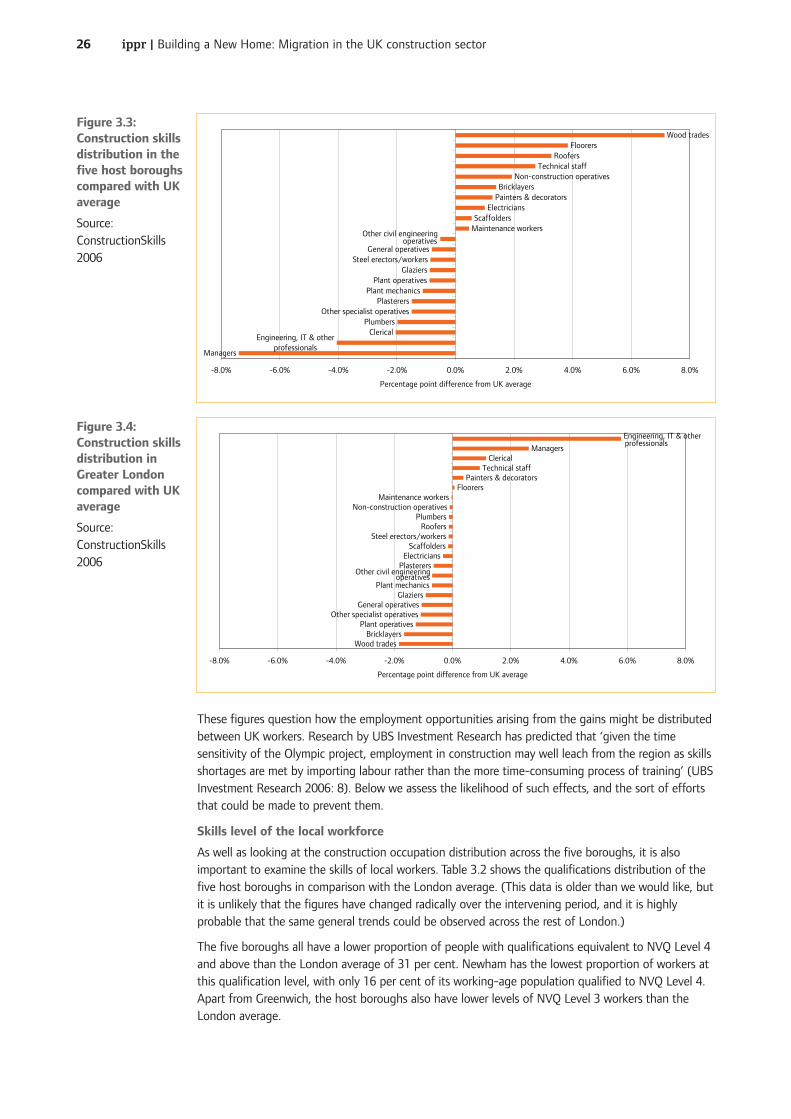
Figure�3.3�demonstrates�more�clearly�the�occupational�breakdown�in�the�five�host�boroughs,expressed�in�relation�to�the�UK-wide�distribution�of�occupations�in�the�construction�sector.�Forexample,�24.1�per�cent�of�construction�workers�in�the�host�boroughs�are�employed�in�the�woodtrades,�compared�to�17�per�cent�of�construction�workers�at�the�national�level,�so�the�graph�thereforeshows�the�difference�as�7.1�percentage�points.�Overall,�the�host�boroughs�show�a�marked�lack�ofmanagers,�engineers�and�other�professionals,�clerical�workers,�and�plumbers�compared�with�the�rest�ofthe�UK.�Wood�trades,�floorers,�roofers,�and�technical�staff,�on�the�other�hand,�appear�in�good�supply.Many�of�the�occupations�that�are�in�relatively�short�supply�within�the�Olympic�boroughs,�are,however,�present�in�large�numbers�across�Greater�London,�as�Figure�3.4�demonstrates.
ippr�|�Building�a�New�Home:�Migration�in�the�UK�construction�sector26
These�figures�question�how�the�employment�opportunities�arising�from�the�gains�might�be�distributedbetween�UK�workers.�Research�by�UBS�Investment�Research�has�predicted�that�‘given�the�timesensitivity�of�the�Olympic�project,�employment�in�construction�may�well�leach�from�the�region�as�skillsshortages�are�met�by�importing�labour�rather�than�the�more�time-consuming�process�of�training’�(UBSInvestment�Research�2006:�8).�Below�we�assess�the�likelihood�of�such�effects,�and�the�sort�of�effortsthat�could�be�made�to�prevent�them.�
Skills�level�of�the�local�workforce
As�well�as�looking�at�the�construction�occupation�distribution�across�the�five�boroughs,�it�is�alsoimportant�to�examine�the�skills�of�local�workers.�Table�3.2�shows�the�qualifications�distribution�of�thefive�host�boroughs�in�comparison�with�the�London�average.�(This�data�is�older�than�we�would�like,�butit�is�unlikely�that�the�figures�have�changed�radically�over�the�intervening�period,�and�it�is�highlyprobable�that�the�same�general�trends�could�be�observed�across�the�rest�of�London.)
The�five�boroughs�all�have�a�lower�proportion�of�people�with�qualifications�equivalent�to�NVQ�Level�4and�above�than�the�London�average�of�31�per�cent.�Newham�has�the�lowest�proportion�of�workers�atthis�qualification�level,�with�only�16�per�cent�of�its�working-age�population�qualified�to�NVQ�Level�4.Apart�from�Greenwich,�the�host�boroughs�also�have�lower�levels�of�NVQ�Level�3�workers�than�theLondon�average.
Managers
Engineering, IT & other professionals
ClericalPlumbers
PlasterersPlant mechanics
Plant operativesGlaziers
Steel erectors/workersGeneral operatives
Other civil engineering operatives
Maintenance workersScaffolders
ElectriciansPainters & decoratorsBricklayers
Non-construction operativesTechnical staff
RoofersFloorers
Wood trades
Other specialist operatives
-8.0% -6.0% -4.0% -2.0% 0.0% 2.0% 4.0% 6.0% 8.0%
Percentage point difference from UK average
Figure�3.3:Construction�skillsdistribution�in�thefive�host�boroughscompared�with�UKaverage
Source:ConstructionSkills2006
Wood tradesBricklayers
Plant operatives
General operativesGlaziers
Plant mechanics
Other civil engineering operativesPlasterers
ElectriciansScaffolders
Steel erectors/workersRoofers
PlumbersNon-construction operatives
Maintenance workersFloorers
Painters & decoratorsTechnical staff
ClericalManagers
Engineering, IT & other professionals
Other specialist operatives
-8.0% -6.0% -4.0% -2.0% 0.0% 2.0% 4.0% 6.0% 8.0%
Percentage point difference from UK average
Figure�3.4:Construction�skillsdistribution�inGreater�Londoncompared�with�UKaverage
Source:ConstructionSkills2006
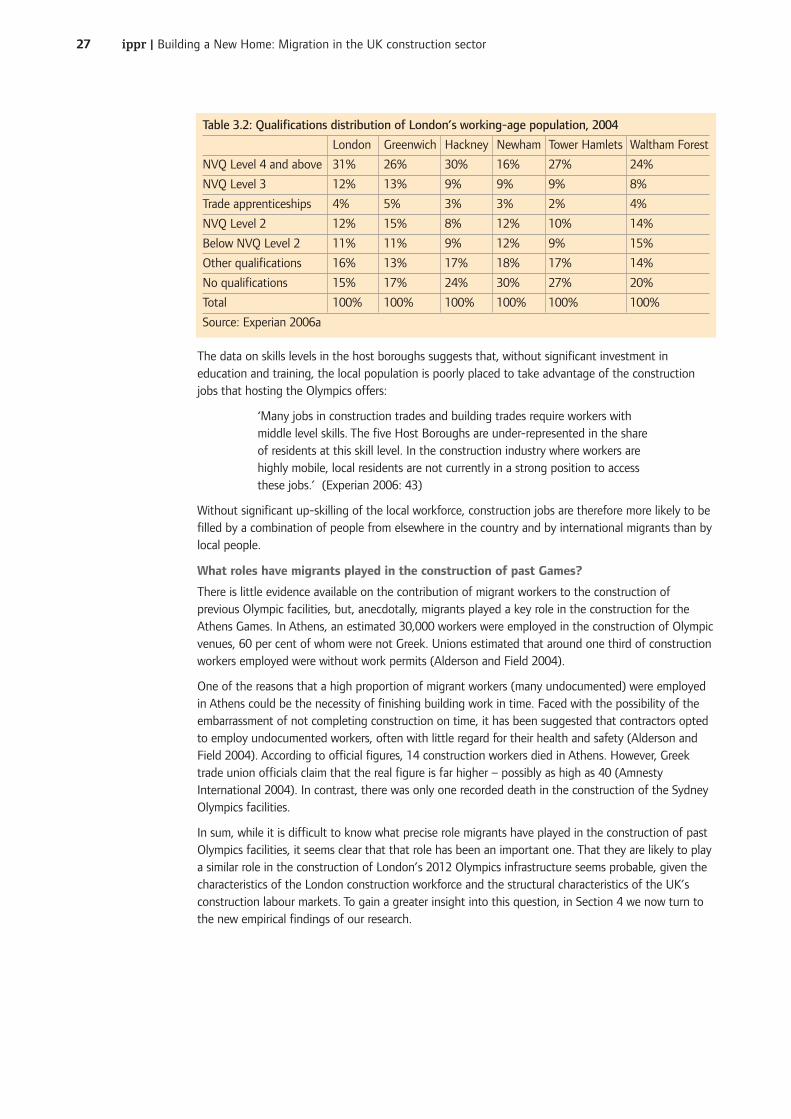
ippr�|�Building�a�New�Home:�Migration�in�the�UK�construction�sector27
The�data�on�skills�levels�in�the�host�boroughs�suggests�that,�without�significant�investment�ineducation�and�training,�the�local�population�is�poorly�placed�to�take�advantage�of�the�constructionjobs�that�hosting�the�Olympics�offers:
‘Many�jobs�in�construction�trades�and�building�trades�require�workers�withmiddle�level�skills.�The�five�Host�Boroughs�are�under-represented�in�the�shareof�residents�at�this�skill�level.�In�the�construction�industry�where�workers�arehighly�mobile,�local�residents�are�not�currently�in�a�strong�position�to�accessthese�jobs.’��(Experian�2006:�43)
Without�significant�up-skilling�of�the�local�workforce,�construction�jobs�are�therefore�more�likely�to�befilled�by�a�combination�of�people�from�elsewhere�in�the�country�and�by�international�migrants�than�bylocal�people.
What�roles�have�migrants�played�in�the�construction�of�past�Games?
There�is�little�evidence�available�on�the�contribution�of�migrant�workers�to�the�construction�ofprevious�Olympic�facilities,�but,�anecdotally,�migrants�played�a�key�role�in�the�construction�for�theAthens�Games.�In�Athens,�an�estimated�30,000�workers�were�employed�in�the�construction�of�Olympicvenues,�60�per�cent�of�whom�were�not�Greek.�Unions�estimated�that�around�one�third�of�constructionworkers�employed�were�without�work�permits�(Alderson�and�Field�2004).�
One�of�the�reasons�that�a�high�proportion�of�migrant�workers�(many�undocumented)�were�employedin�Athens�could�be�the�necessity�of�finishing�building�work�in�time.�Faced�with�the�possibility�of�theembarrassment�of�not�completing�construction�on�time,�it�has�been�suggested�that�contractors�optedto�employ�undocumented�workers,�often�with�little�regard�for�their�health�and�safety�(Alderson�andField�2004).�According�to�official�figures,�14�construction�workers�died�in�Athens.�However,�Greektrade�union�officials�claim�that�the�real�figure�is�far�higher�–�possibly�as�high�as�40�(AmnestyInternational�2004).�In�contrast,�there�was�only�one�recorded�death�in�the�construction�of�the�SydneyOlympics�facilities.
In�sum,�while�it�is�difficult�to�know�what�precise�role�migrants�have�played�in�the�construction�of�pastOlympics�facilities,�it�seems�clear�that�that�role�has�been�an�important�one.�That�they�are�likely�to�playa�similar�role�in�the�construction�of�London’s�2012�Olympics�infrastructure�seems�probable,�given�thecharacteristics�of�the�London�construction�workforce�and�the�structural�characteristics�of�the�UK’sconstruction�labour�markets.�To�gain�a�greater�insight�into�this�question,�in�Section�4�we�now�turn�tothe�new�empirical�findings�of�our�research.�
Table�3.2:�Qualifications�distribution�of�London’s�working-age�population,�2004
London Greenwich Hackney Newham Tower�Hamlets Waltham�Forest
NVQ�Level�4�and�above 31% 26% 30% 16% 27% 24%
NVQ�Level�3 12% 13% 9% 9% 9% 8%
Trade�apprenticeships 4% 5% 3% 3% 2% 4%
NVQ�Level�2 12% 15% 8% 12% 10% 14%
Below�NVQ�Level�2 11% 11% 9% 12% 9% 15%
Other�qualifications 16% 13% 17% 18% 17% 14%
No�qualifications 15% 17% 24% 30% 27% 20%
Total 100% 100% 100% 100% 100% 100%
Source:�Experian�2006a
ippr�|�Building�a�New�Home:�Migration�in�the�UK�construction�sector28
The�previous�sections�have�summarised�the�findings�from�the�existing�literature,�in�order�to�provide�anoverview�of�the�relationship�between�migration�and�construction,�including�in�particular�migrants’�rolein�the�construction�of�past�Olympic�facilities.�In�this�section�we�provide�the�results�of�our�originalanalysis.�We�hope�this�will�provide�insight�into�the�role�migrants�are�currently�playing�in�UKconstruction,�and�in�particular�the�construction�of�the�2012�Olympic�facilities.�We�have�undertakenboth�quantitative�and�qualitative�work,�and�the�findings�from�each�are�presented�in�turn.�
Quantitative�analysesThe�main�quantitative�methodology�employed�in�this�report�was�analysis�of�the�Labour�Force�Survey.This�was�undertaken�to�estimate�stocks�of�migrants�in�the�construction�sector�and�to�understand�thecharacteristics�of�those�migrants�and�their�local�colleagues.�We�also�used�data�that�draws�on�existingsources�such�as�the�Accession�Monitoring�Reports,�data�from�Work�Permits�UK�and�the�InternationalPassenger�Survey.�More�details�are�provided�in�Appendix�1.
The�results�of�our�quantitative�analyses�yield�questions�as�well�as�answers.�This�is�partly�becausenationally�available�data�on�migration�is�limited�and�generally�of�poor�quality,�as�described�in�Section2.�What�is�more,�the�focus�of�this�report�raises�a�particular�challenge�that�other�analyses�of�migrationmay�not�have�faced,�in�that�it�seeks�to�establish�the�trends�and�characteristics�of�particular�populationsubgroups�of�interest.�However,�in�some�cases�the�samples�of�these�subgroups�are�so�small�that�anyresults�we�could�draw�from�the�available�data�would�be�invalid.�(For�a�fuller�summary�of�the�keychallenges�with�the�migration�data�in�relation�to�this�report,�see�Box�4.1�on�the�next�page).
We�were�well�aware�that�these�challenges�would�arise;�to�help�us�address�them�we�organised�aroundtable�of�migration�statistical�experts,�who�advised�us�of�the�best�way�to�proceed.�The�resultsbelow�draw�upon�their�recommendations,�and�seek�to�undertake�the�best�analysis�possible�given�thedata�available.�
In�this�section�we�have�used�the�definition�of�a�migrant�construction�worker�given�in�Appendix�1�–�‘aforeign�national�currently�working�in�construction�who�arrived�within�the�last�10�years’.�However,sometimes�analysis�only�proved�possible�when�using�a�‘foreign�national�regardless�of�date�of�arrival’definition,�and�so�in�places�this�has�been�adopted.
Flows�of�migrants�into�the�construction�sector
Estimating�the�total�inflow�of�migrants�into�the�construction�sector�is�complicated�by�the�variety�ofmigration�channels�open�to�different�types�of�migrant.�It�is�therefore�necessary�to�build�up�a�channel-by-channel�picture�of�inflows�into�the�sector.
The�construction�and�land�services�industry�accounts�for�a�relatively�small�proportion�of�work-permitholders�–�comprising�3.5�per�cent�of�those�work�permits�and�first�permissions�granted�in�2006�–although�this�figure�rose�from�just�0.8�per�cent�the�previous�year.�It�is�important�to�note,�however,that�people�who�hold�work�permits�in�the�administration,�business�and�management�services�sectormay�be�also�be�employed�within�the�construction�sector.�Figure�4.1�(next�page)�shows�the�number�ofwork�permits�issued�in�the�construction�sector�in�1995�and�for�the�period�2000–06.�These�permitholders�can�be�classified�under�the�‘non-EEA�nationals�with�work�visa’�category,�within�the�typologyof�migrant�construction�workers�set�out�in�Appendix�1.
Figure�4.2�shows�the�distribution�of�A8�nationals�registering�to�work�in�the�UK,�by�occupation�group.These�workers�are�categorised�under�‘employed�EEA�nationals’�within�the�typology�in�Appendix�1.�Atfirst�glance,�relatively�few�A8�workers�register�to�work�in�construction�–�perhaps�a�surprisingly�lowproportion.�However,�the�data�needs�to�be�treated�with�some�degree�of�caution�since,�as�theAccession�Monitoring�Report confirms,�‘the�majority�of�workers�in�the�Administration,�Business�&Management�occupation�group�work�for�recruitment�agencies�and�could�be�employed�in�a�variety�ofoccupations’�(Home�Office�et�al 2007:�13).�Therefore,�this�sector�is�overrepresented�in�the�data.�
4.�Empirical�findings
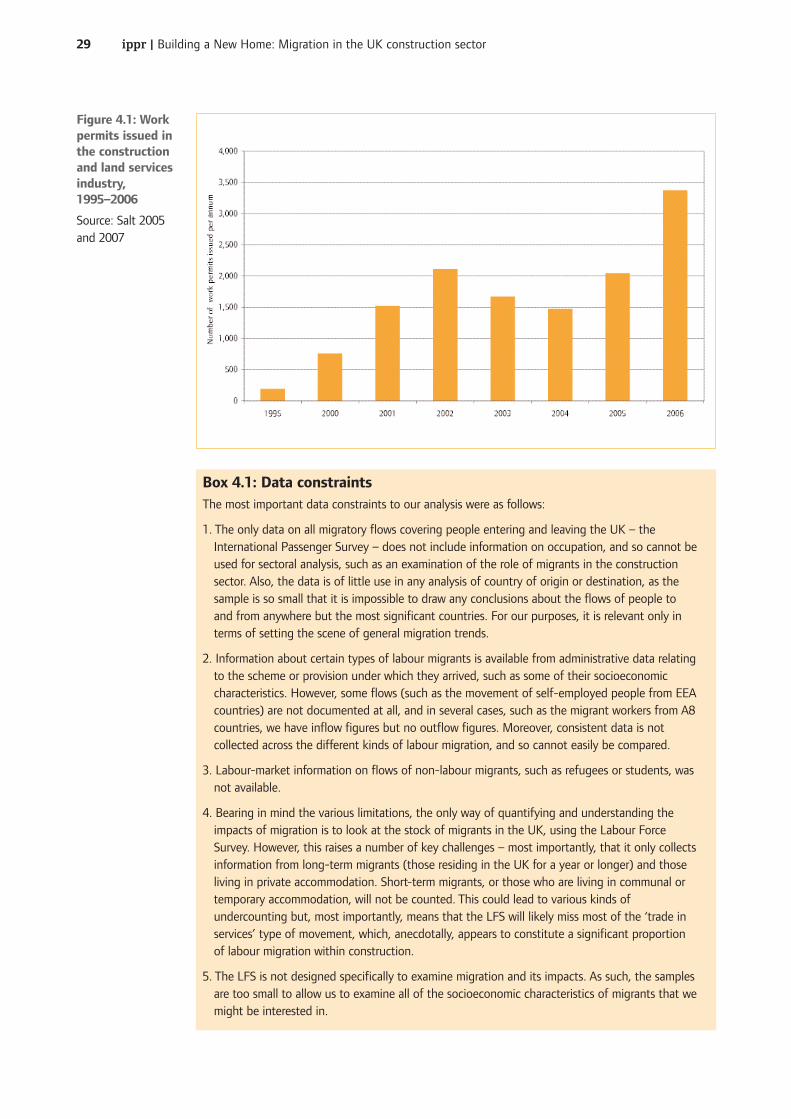
ippr�|�Building�a�New�Home:�Migration�in�the�UK�construction�sector29
Box�4.1:�Data�constraintsThe�most�important�data�constraints�to�our�analysis�were�as�follows:
1.�The�only�data�on�all�migratory�flows�covering�people�entering�and�leaving�the�UK�– theInternational�Passenger�Survey�– does�not�include�information�on�occupation,�and�so�cannot�beused�for�sectoral�analysis,�such�as�an�examination�of�the�role�of�migrants�in�the�constructionsector.�Also,�the�data�is�of�little�use�in�any�analysis�of�country�of�origin�or�destination,�as�thesample�is�so�small�that�it�is�impossible�to�draw�any�conclusions�about�the�flows�of�people�toand�from�anywhere�but�the�most�significant�countries.�For�our�purposes,�it�is�relevant�only�interms�of�setting�the�scene�of�general�migration�trends.
2.�Information�about�certain�types�of�labour�migrants�is�available�from�administrative�data�relatingto�the�scheme�or�provision�under�which�they�arrived,�such�as�some�of�their�socioeconomiccharacteristics.�However,�some�flows�(such�as�the�movement�of�self-employed�people�from�EEAcountries)�are�not�documented�at�all,�and�in�several�cases,�such�as�the�migrant�workers�from�A8countries,�we�have�inflow�figures�but�no�outflow�figures.�Moreover,�consistent�data�is�notcollected�across�the�different�kinds�of�labour�migration,�and�so�cannot�easily�be�compared.
3.�Labour-market�information�on�flows�of�non-labour�migrants,�such�as�refugees�or�students,�wasnot�available.�
4.�Bearing�in�mind�the�various�limitations,�the�only�way�of�quantifying�and�understanding�theimpacts�of�migration�is�to�look�at�the�stock�of�migrants�in�the�UK,�using�the�Labour�ForceSurvey.�However,�this�raises�a�number�of�key�challenges�–�most�importantly,�that�it�only�collectsinformation�from�long-term�migrants�(those�residing�in�the�UK�for�a�year�or�longer)�and�thoseliving�in�private�accommodation.�Short-term�migrants,�or�those�who�are�living�in�communal�ortemporary�accommodation,�will�not�be�counted.�This�could�lead�to�various�kinds�ofundercounting�but,�most�importantly,�means�that�the�LFS�will�likely�miss�most�of�the�‘trade�inservices’�type�of�movement,�which,�anecdotally,�appears�to�constitute�a�significant�proportionof�labour�migration�within�construction.
5.�The�LFS�is�not�designed�specifically�to�examine�migration�and�its�impacts.�As�such,�the�samplesare�too�small�to�allow�us�to�examine�all�of�the�socioeconomic�characteristics�of�migrants�that�wemight�be�interested�in.
Figure�4.1:�Workpermits�issued�inthe�constructionand�land�servicesindustry,1995–2006
Source:�Salt�2005and�2007
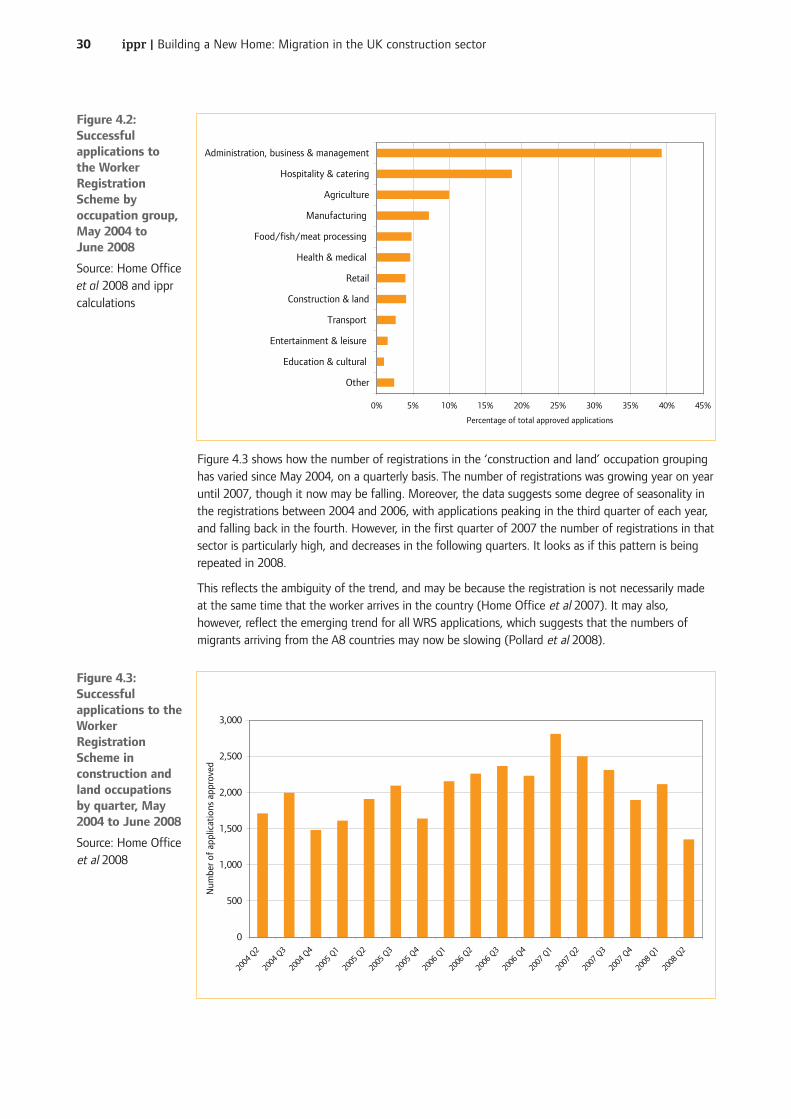
ippr�|�Building�a�New�Home:�Migration�in�the�UK�construction�sector30
Figure�4.3�shows�how�the�number�of�registrations�in�the�‘construction�and�land’�occupation�groupinghas�varied�since�May�2004,�on�a�quarterly�basis.�The�number�of�registrations�was�growing�year�on�yearuntil�2007,�though�it�now�may�be�falling.�Moreover,�the�data�suggests�some�degree�of�seasonality�inthe�registrations�between�2004�and�2006,�with�applications�peaking�in�the�third�quarter�of�each�year,and�falling�back�in�the�fourth.�However,�in�the�first�quarter�of�2007�the�number�of�registrations�in�thatsector�is�particularly�high,�and�decreases�in�the�following�quarters.�It�looks�as�if�this�pattern�is�beingrepeated�in�2008.
This�reflects�the�ambiguity�of�the�trend,�and�may�be�because�the�registration�is�not�necessarily�madeat�the�same�time�that�the�worker�arrives�in�the�country�(Home�Office�et�al 2007).�It�may�also,however,�reflect�the�emerging�trend�for�all�WRS�applications,�which�suggests�that�the�numbers�ofmigrants�arriving�from�the�A8�countries�may�now�be�slowing�(Pollard�et�al 2008).�
0% 5% 10% 15% 20% 25% 30% 35% 40% 45%
Administration, business & management
Hospitality & catering
Agriculture
Manufacturing
Food/fish/meat processing
Health & medical
Retail
Construction & land
Transport
Entertainment & leisure
Education & cultural
Other
Percentage of total approved applications
Figure�4.2:Successfulapplications�to�the�WorkerRegistrationScheme�byoccupation�group,May�2004�to�June�2008
Source:�Home�Officeet�al�2008�and�ipprcalculations
0
500
1,000
1,500
2,000
2,500
3,000
2004
Q2
2004
Q3
2004
Q4
2005
Q1
2005
Q2
2005
Q3
2005
Q4
2006
Q1
2006
Q2
2006
Q3
2006
Q4
2007
Q1
2007
Q2
2007
Q3
2007
Q4
2008
Q1
2008
Q2
Num
ber
of a
pplic
atio
ns a
ppro
ved
Figure�4.3:Successfulapplications�to�theWorkerRegistrationScheme�inconstruction�andland�occupationsby�quarter,�May2004�to�June�2008�
Source:�Home�Officeet�al 2008
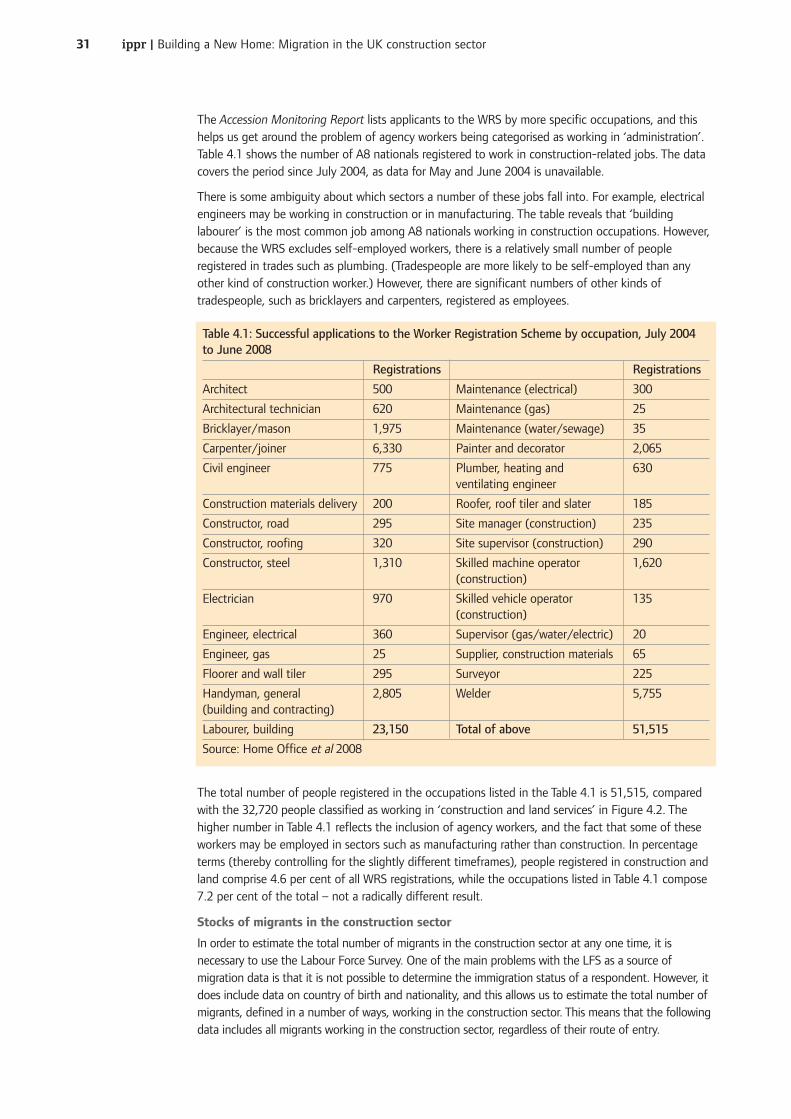
ippr�|�Building�a�New�Home:�Migration�in�the�UK�construction�sector31
The�Accession�Monitoring�Report lists�applicants�to�the�WRS�by�more�specific�occupations,�and�thishelps�us�get�around�the�problem�of�agency�workers�being�categorised�as�working�in�‘administration’.Table�4.1�shows�the�number�of�A8�nationals�registered�to�work�in�construction-related�jobs.�The�datacovers�the�period�since�July�2004,�as�data�for�May�and�June�2004�is�unavailable.�
There�is�some�ambiguity�about�which�sectors�a�number�of�these�jobs�fall�into.�For�example,�electricalengineers�may�be�working�in�construction�or�in�manufacturing.�The�table�reveals�that�‘buildinglabourer’�is�the�most�common�job�among�A8�nationals�working�in�construction�occupations.�However,because�the�WRS�excludes�self-employed�workers,�there�is�a�relatively�small�number�of�peopleregistered�in�trades�such�as�plumbing.�(Tradespeople�are�more�likely�to�be�self-employed�than�anyother�kind�of�construction�worker.)�However,�there�are�significant�numbers�of�other�kinds�oftradespeople,�such�as�bricklayers�and�carpenters,�registered�as�employees.
The�total�number�of�people�registered�in�the�occupations�listed�in�the�Table�4.1�is�51,515,�comparedwith�the�32,720�people�classified�as�working�in�‘construction�and�land�services’�in�Figure�4.2.�Thehigher�number�in�Table�4.1�reflects�the�inclusion�of�agency�workers,�and�the�fact�that�some�of�theseworkers�may�be�employed�in�sectors�such�as�manufacturing�rather�than�construction.�In�percentageterms�(thereby�controlling�for�the�slightly�different�timeframes),�people�registered�in�construction�andland�comprise�4.6�per�cent�of�all�WRS�registrations,�while�the�occupations�listed�in�Table�4.1�compose7.2�per�cent�of�the�total�–�not�a�radically�different�result.�
Stocks�of�migrants�in�the�construction�sector
In�order�to�estimate�the�total�number�of�migrants�in�the�construction�sector�at�any�one�time,�it�isnecessary�to�use�the�Labour�Force�Survey.�One�of�the�main�problems�with�the�LFS�as�a�source�ofmigration�data�is�that�it�is�not�possible�to�determine�the�immigration�status�of�a�respondent.�However,�itdoes�include�data�on�country�of�birth�and�nationality,�and�this�allows�us�to�estimate�the�total�number�ofmigrants,�defined�in�a�number�of�ways,�working�in�the�construction�sector.�This�means�that�the�followingdata�includes�all�migrants�working�in�the�construction�sector,�regardless�of�their�route�of�entry.
Table�4.1:�Successful�applications�to�the�Worker�Registration�Scheme�by�occupation,�July�2004to�June�2008
Registrations Registrations
Architect 500 Maintenance�(electrical) 300
Architectural�technician 620 Maintenance�(gas) 25
Bricklayer/mason 1,975 Maintenance�(water/sewage) 35
Carpenter/joiner 6,330 Painter�and�decorator 2,065
Civil�engineer 775 Plumber,�heating�and� 630ventilating�engineer
Construction�materials�delivery 200 Roofer,�roof�tiler�and�slater 185
Constructor,�road 295 Site�manager�(construction) 235
Constructor,�roofing 320 Site�supervisor�(construction) 290
Constructor,�steel 1,310 Skilled�machine�operator� 1,620(construction)
Electrician 970 Skilled�vehicle�operator� 135(construction)
Engineer,�electrical 360 Supervisor�(gas/water/electric) 20
Engineer,�gas 25 Supplier,�construction�materials 65
Floorer�and�wall�tiler 295 Surveyor 225
Handyman,�general� 2,805 Welder 5,755(building�and�contracting)
Labourer,�building 23,150 Total�of�above 51,515
Source:�Home�Office�et�al 2008
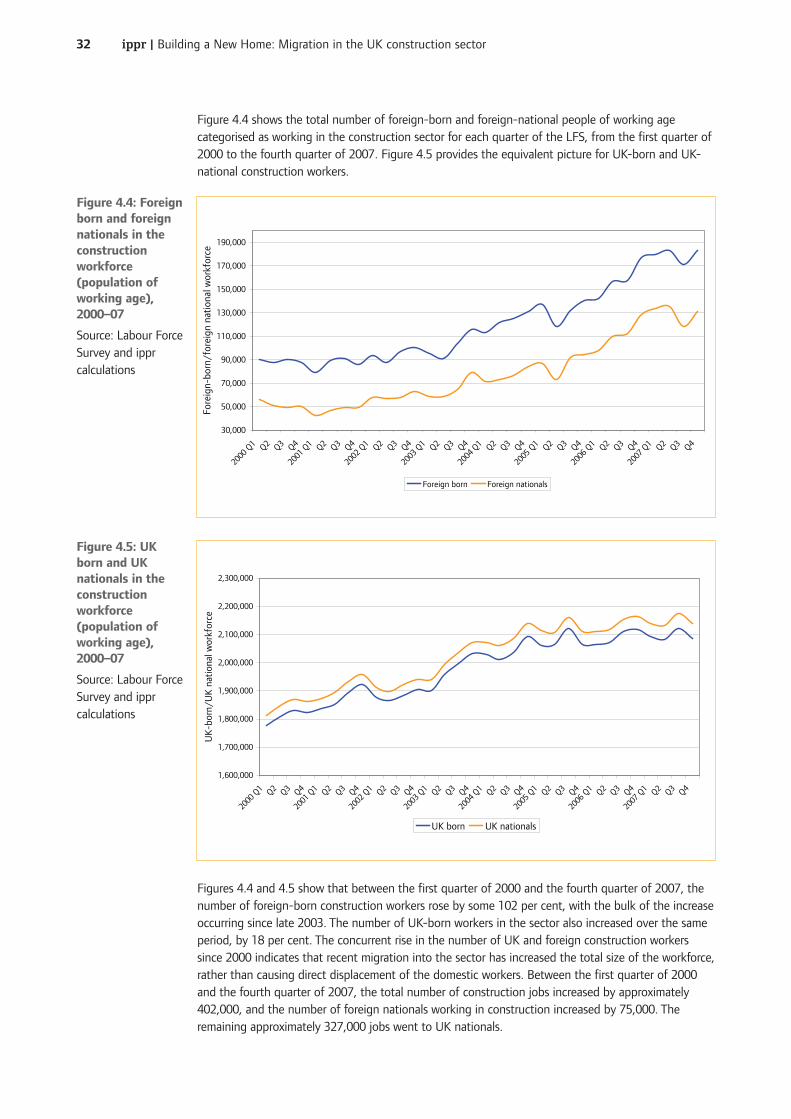
ippr�|�Building�a�New�Home:�Migration�in�the�UK�construction�sector32
Figure�4.4�shows�the�total�number�of�foreign-born�and�foreign-national�people�of�working�agecategorised�as�working�in�the�construction�sector�for�each�quarter�of�the�LFS,�from�the�first�quarter�of2000�to�the�fourth�quarter�of�2007.�Figure�4.5�provides�the�equivalent�picture�for�UK-born�and�UK-national�construction�workers.
Figures�4.4�and�4.5�show�that�between�the�first�quarter�of�2000�and�the�fourth�quarter�of�2007,�thenumber�of�foreign-born�construction�workers�rose�by�some�102�per�cent,�with�the�bulk�of�the�increaseoccurring�since�late�2003.�The�number�of�UK-born�workers�in�the�sector�also�increased�over�the�sameperiod,�by�18�per�cent.�The�concurrent�rise�in�the�number�of�UK�and�foreign�construction�workerssince�2000�indicates�that�recent�migration�into�the�sector�has�increased�the�total�size�of�the�workforce,rather�than�causing�direct�displacement�of�the�domestic�workers.�Between�the�first�quarter�of�2000and�the�fourth�quarter�of�2007,�the�total�number�of�construction�jobs�increased�by�approximately402,000,�and�the�number�of�foreign�nationals�working�in�construction�increased�by�75,000.�Theremaining�approximately�327,000�jobs�went�to�UK�nationals.
30,000
50,000
70,000
90,000
110,000
130,000
150,000
170,000
190,000
2000
Q1 Q2 Q3 Q4
2001
Q1 Q2 Q3 Q4
2002
Q1 Q2 Q3 Q4
2003
Q1 Q2 Q3 Q4
2004
Q1 Q2 Q3 Q4
2005
Q1 Q2 Q3 Q4
2006
Q1 Q2 Q3 Q4
2007
Q1 Q2 Q3 Q4
Fore
ign-
born
/for
eign
nat
iona
l wor
kfor
ce
Foreign born Foreign nationals
Figure�4.4:�Foreignborn�and�foreignnationals�in�theconstructionworkforce(population�ofworking�age),2000–07
Source:�Labour�ForceSurvey�and�ipprcalculations
1,600,000
1,700,000
1,800,000
1,900,000
2,000,000
2,100,000
2,200,000
2,300,000
2000
Q1 Q2 Q3 Q4
2001
Q1 Q2 Q3 Q4
2002
Q1 Q2 Q3 Q4
2003
Q1 Q2 Q3 Q4
2004
Q1 Q2 Q3 Q4
2005
Q1 Q2 Q3 Q4
2006
Q1 Q2 Q3 Q4
2007
Q1 Q2 Q3 Q4
UK
-bor
n/U
K n
atio
nal w
orkf
orce
UK born UK nationals
Figure�4.5:�UKborn�and�UKnationals�in�theconstructionworkforce(population�ofworking�age),2000–07
Source:�Labour�ForceSurvey�and�ipprcalculations
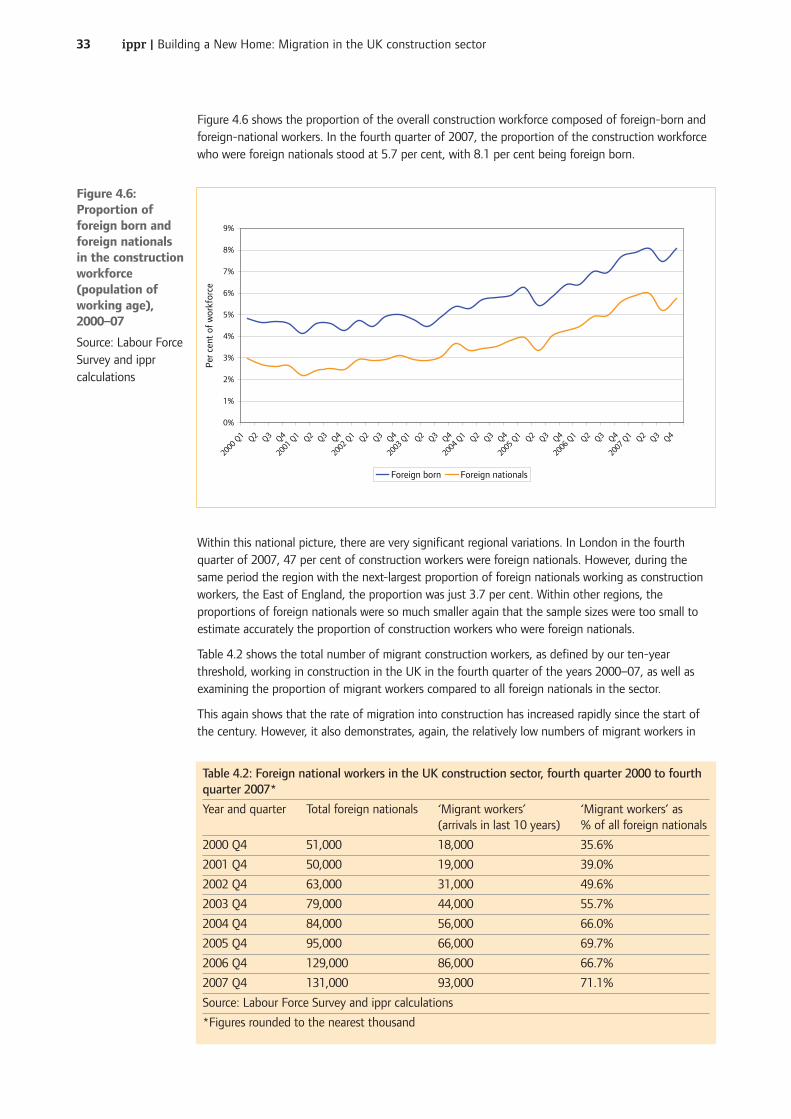
ippr�|�Building�a�New�Home:�Migration�in�the�UK�construction�sector33
Figure�4.6�shows�the�proportion�of�the�overall�construction�workforce�composed�of�foreign-born�andforeign-national�workers.�In�the�fourth�quarter�of�2007,�the�proportion�of�the�construction�workforcewho�were�foreign�nationals�stood�at�5.7�per�cent,�with�8.1�per�cent�being�foreign�born.�
Within�this�national�picture,�there�are�very�significant�regional�variations.�In�London�in�the�fourthquarter�of�2007,�47�per�cent�of�construction�workers�were�foreign�nationals.�However,�during�thesame�period�the�region�with�the�next-largest�proportion�of�foreign�nationals�working�as�constructionworkers,�the�East�of�England,�the�proportion�was�just�3.7�per�cent.�Within�other�regions,�theproportions�of�foreign�nationals�were�so�much�smaller�again�that�the�sample�sizes�were�too�small�toestimate�accurately�the�proportion�of�construction�workers�who�were�foreign�nationals.�
Table�4.2�shows�the�total�number�of�migrant�construction�workers,�as�defined�by�our�ten-yearthreshold,�working�in�construction�in�the�UK�in�the�fourth�quarter�of�the�years�2000–07,�as�well�asexamining�the�proportion�of�migrant�workers�compared�to�all�foreign�nationals�in�the�sector.�
This�again�shows�that�the�rate�of�migration�into�construction�has�increased�rapidly�since�the�start�ofthe�century.�However,�it�also�demonstrates,�again,�the�relatively�low�numbers�of�migrant�workers�in
0%
1%
2%
3%
4%
5%
6%
7%
8%
9%
2000
Q1 Q2 Q3 Q4
2001
Q1 Q2 Q3 Q4
2002
Q1 Q2 Q3 Q4
2003
Q1 Q2 Q3 Q4
2004
Q1 Q2 Q3 Q4
2005
Q1 Q2 Q3 Q4
2006
Q1 Q2 Q3 Q4
2007
Q1 Q2 Q3 Q4
Per c
ent
of w
orkf
orce
Foreign born Foreign nationals
Figure�4.6:Proportion�offoreign�born�andforeign�nationalsin�the�constructionworkforce(population�ofworking�age),2000–07
Source:�Labour�ForceSurvey�and�ipprcalculations
Table�4.2:�Foreign�national�workers�in�the�UK�construction�sector,�fourth�quarter�2000�to�fourthquarter�2007*
Year�and�quarter Total�foreign�nationals ‘Migrant�workers’� ‘Migrant�workers’�as(arrivals�in�last�10�years) %�of�all�foreign�nationals
2000�Q4 51,000 18,000 35.6%
2001�Q4 50,000 19,000 39.0%
2002�Q4 63,000 31,000 49.6%
2003�Q4 79,000 44,000 55.7%
2004�Q4 84,000 56,000 66.0%
2005�Q4 95,000 66,000 69.7%
2006�Q4 129,000 86,000 66.7%
2007�Q4 131,000 93,000 71.1%
Source:�Labour�Force�Survey�and�ippr�calculations
*Figures�rounded�to�the�nearest�thousand
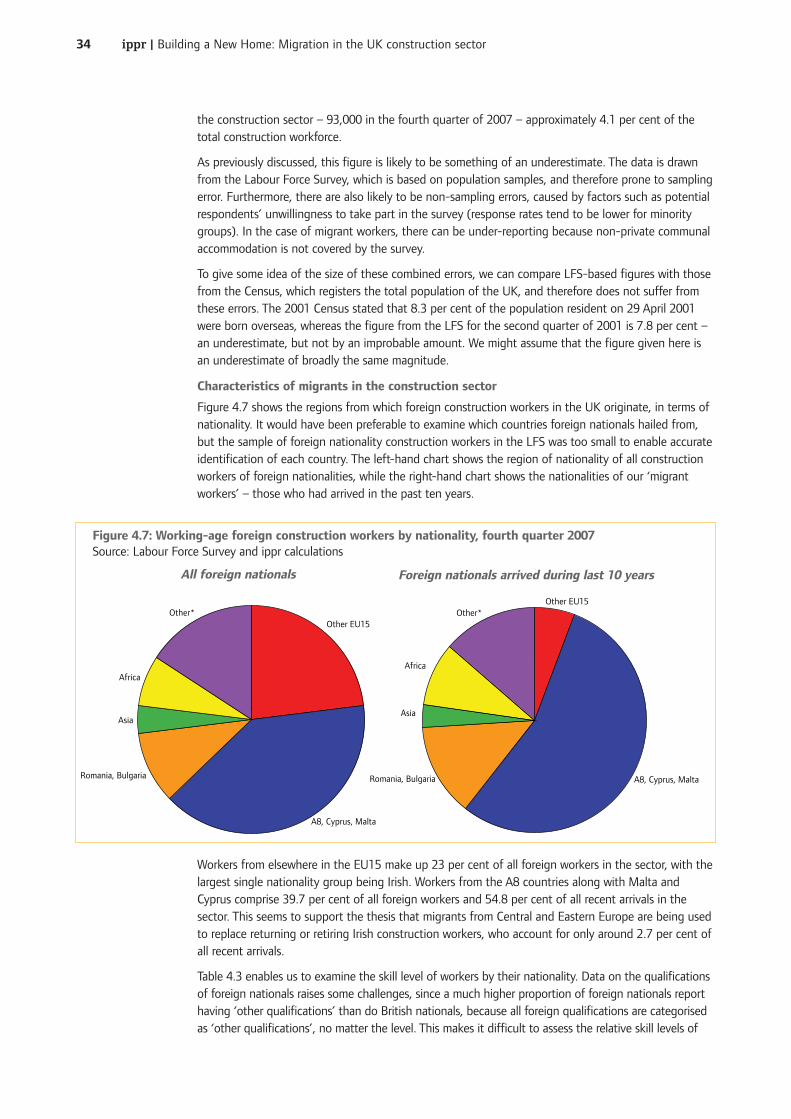
ippr�|�Building�a�New�Home:�Migration�in�the�UK�construction�sector34
the�construction�sector�–�93,000�in�the�fourth�quarter�of�2007�–�approximately�4.1�per�cent�of�thetotal�construction�workforce.�
As�previously�discussed,�this�figure�is�likely�to�be�something�of�an�underestimate.�The�data�is�drawnfrom�the�Labour�Force�Survey,�which�is�based�on�population�samples,�and�therefore�prone�to�samplingerror.�Furthermore,�there�are�also�likely�to�be�non-sampling�errors,�caused�by�factors�such�as�potentialrespondents’�unwillingness�to�take�part�in�the�survey�(response�rates�tend�to�be�lower�for�minoritygroups).�In�the�case�of�migrant�workers,�there�can�be�under-reporting�because�non-private�communalaccommodation�is�not�covered�by�the�survey.
To�give�some�idea�of�the�size�of�these�combined�errors,�we�can�compare�LFS-based�figures�with�thosefrom�the�Census,�which�registers�the�total�population�of�the�UK,�and�therefore�does�not�suffer�fromthese�errors.�The�2001�Census�stated�that�8.3�per�cent�of�the�population�resident�on�29�April�2001were�born�overseas,�whereas�the�figure�from�the�LFS�for�the�second�quarter�of�2001�is�7.8�per�cent�–an�underestimate,�but�not�by�an�improbable�amount.�We�might�assume�that�the�figure�given�here�isan�underestimate�of�broadly�the�same�magnitude.
Characteristics�of�migrants�in�the�construction�sector
Figure�4.7�shows�the�regions�from�which�foreign�construction�workers�in�the�UK�originate,�in�terms�ofnationality.�It�would�have�been�preferable�to�examine�which�countries�foreign�nationals�hailed�from,but�the�sample�of�foreign�nationality�construction�workers�in�the�LFS�was�too�small�to�enable�accurateidentification�of�each�country.�The�left-hand�chart�shows�the�region�of�nationality�of�all�constructionworkers�of�foreign�nationalities,�while�the�right-hand�chart�shows�the�nationalities�of�our�‘migrantworkers’�–�those�who�had�arrived�in�the�past�ten�years.�
Workers�from�elsewhere�in�the�EU15�make�up�23�per�cent�of�all�foreign�workers�in�the�sector,�with�thelargest�single�nationality�group�being�Irish.�Workers�from�the�A8�countries�along�with�Malta�andCyprus�comprise�39.7�per�cent�of�all�foreign�workers�and�54.8�per�cent�of�all�recent�arrivals�in�thesector.�This�seems�to�support�the�thesis�that�migrants�from�Central�and�Eastern�Europe�are�being�usedto�replace�returning�or�retiring�Irish�construction�workers,�who�account�for�only�around�2.7�per�cent�ofall�recent�arrivals.
Table�4.3�enables�us�to�examine�the�skill�level�of�workers�by�their�nationality.�Data�on�the�qualificationsof�foreign�nationals�raises�some�challenges,�since�a�much�higher�proportion�of�foreign�nationals�reporthaving�‘other�qualifications’�than�do�British�nationals,�because�all�foreign�qualifications�are�categorisedas�‘other�qualifications’,�no�matter�the�level.�This�makes�it�difficult�to�assess�the�relative�skill�levels�of
Other EU15
A8, Cyprus, Malta
Romania, Bulgaria
Asia
Africa
Other*Other EU15
A8, Cyprus, MaltaRomania, Bulgaria
Asia
Africa
Other*
Figure�4.7:�Working-age�foreign�construction�workers�by�nationality,�fourth�quarter�2007Source:�Labour�Force�Survey�and�ippr�calculations
All�foreign�nationals Foreign�nationals�arrived�during�last�10�years
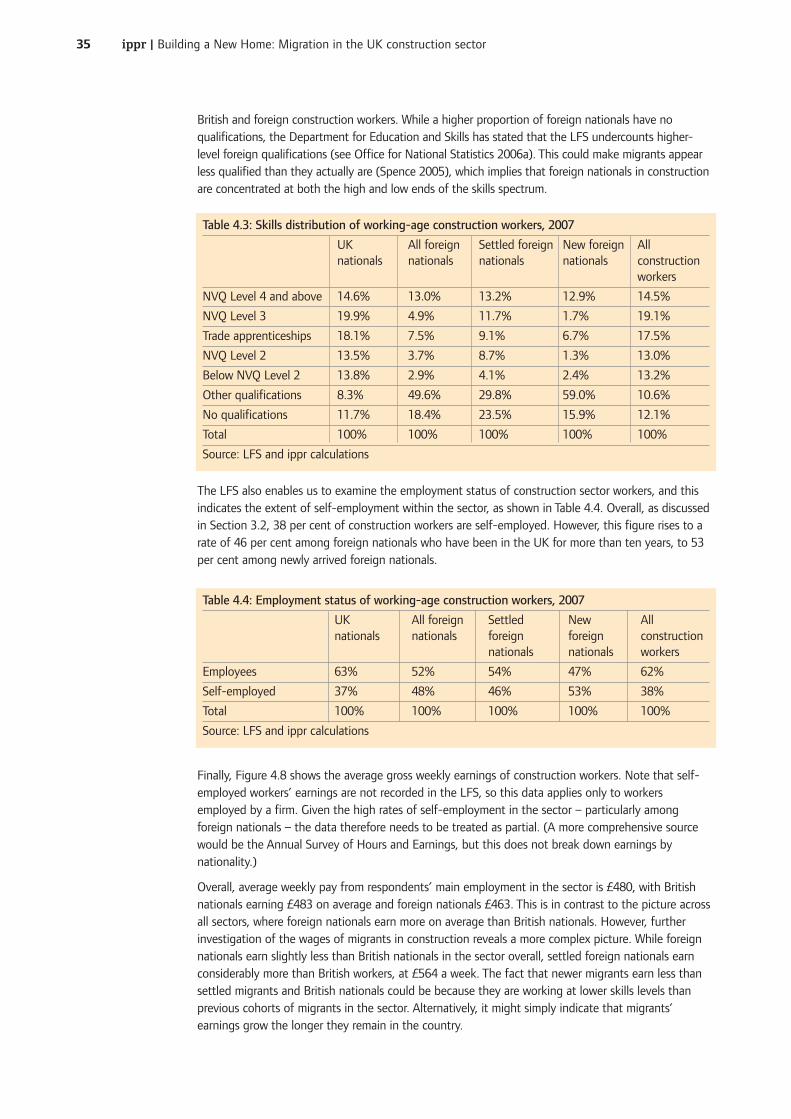
ippr�|�Building�a�New�Home:�Migration�in�the�UK�construction�sector35
British�and�foreign�construction�workers.�While�a�higher�proportion�of�foreign�nationals�have�noqualifications,�the�Department�for�Education�and�Skills�has�stated�that�the�LFS�undercounts�higher-level�foreign�qualifications�(see�Office�for�National�Statistics�2006a).�This�could�make�migrants�appearless�qualified�than�they�actually�are�(Spence�2005),�which�implies�that�foreign�nationals�in�constructionare�concentrated�at�both�the�high�and�low�ends�of�the�skills�spectrum.
The�LFS�also�enables�us�to�examine�the�employment�status�of�construction�sector�workers,�and�thisindicates�the�extent�of�self-employment�within�the�sector,�as�shown�in�Table�4.4.�Overall,�as�discussedin�Section�3.2,�38�per�cent�of�construction�workers�are�self-employed.�However,�this�figure�rises�to�arate�of�46�per�cent�among�foreign�nationals�who�have�been�in�the�UK�for�more�than�ten�years,�to�53per�cent�among�newly�arrived�foreign�nationals.
Finally,�Figure�4.8�shows�the�average�gross�weekly�earnings�of�construction�workers.�Note�that�self-employed�workers’�earnings�are�not�recorded�in�the�LFS,�so�this�data�applies�only�to�workersemployed�by�a�firm.�Given�the�high�rates�of�self-employment�in�the�sector�–�particularly�amongforeign�nationals�–�the�data�therefore�needs�to�be�treated�as�partial.�(A�more�comprehensive�sourcewould�be�the�Annual�Survey�of�Hours�and�Earnings,�but�this�does�not�break�down�earnings�bynationality.)�
Overall,�average�weekly�pay�from�respondents’�main�employment�in�the�sector�is�£480,�with�Britishnationals�earning�£483�on�average�and�foreign�nationals�£463.�This�is�in�contrast�to�the�picture�acrossall�sectors,�where�foreign�nationals�earn�more�on�average�than�British�nationals.�However,�furtherinvestigation�of�the�wages�of�migrants�in�construction�reveals�a�more�complex�picture.�While�foreignnationals�earn�slightly�less�than�British�nationals�in�the�sector�overall,�settled�foreign�nationals�earnconsiderably�more�than�British�workers,�at�£564�a�week.�The�fact�that�newer�migrants�earn�less�thansettled�migrants�and�British�nationals�could�be�because�they�are�working�at�lower�skills�levels�thanprevious�cohorts�of�migrants�in�the�sector.�Alternatively,�it�might�simply�indicate�that�migrants’earnings�grow�the�longer�they�remain�in�the�country.�
Table�4.3:�Skills�distribution�of�working-age�construction�workers,�2007
UK� All�foreign� Settled�foreign New�foreign All�nationals nationals nationals nationals construction�
workers
NVQ�Level�4�and�above 14.6% 13.0% 13.2% 12.9% 14.5%
NVQ�Level�3 19.9% 4.9% 11.7% 1.7% 19.1%
Trade�apprenticeships 18.1% 7.5% 9.1% 6.7% 17.5%
NVQ�Level�2 13.5% 3.7% 8.7% 1.3% 13.0%
Below�NVQ�Level�2 13.8% 2.9% 4.1% 2.4% 13.2%
Other�qualifications 8.3% 49.6% 29.8% 59.0% 10.6%
No�qualifications 11.7% 18.4% 23.5% 15.9% 12.1%
Total 100% 100% 100% 100% 100%
Source:�LFS�and�ippr�calculations
Table�4.4:�Employment�status�of�working-age�construction�workers,�2007
UK� All�foreign� Settled New Allnationals nationals foreign� foreign construction
nationals nationals workers
Employees 63% 52% 54% 47% 62%
Self-employed 37% 48% 46% 53% 38%
Total 100% 100% 100% 100% 100%
Source:�LFS�and�ippr�calculations
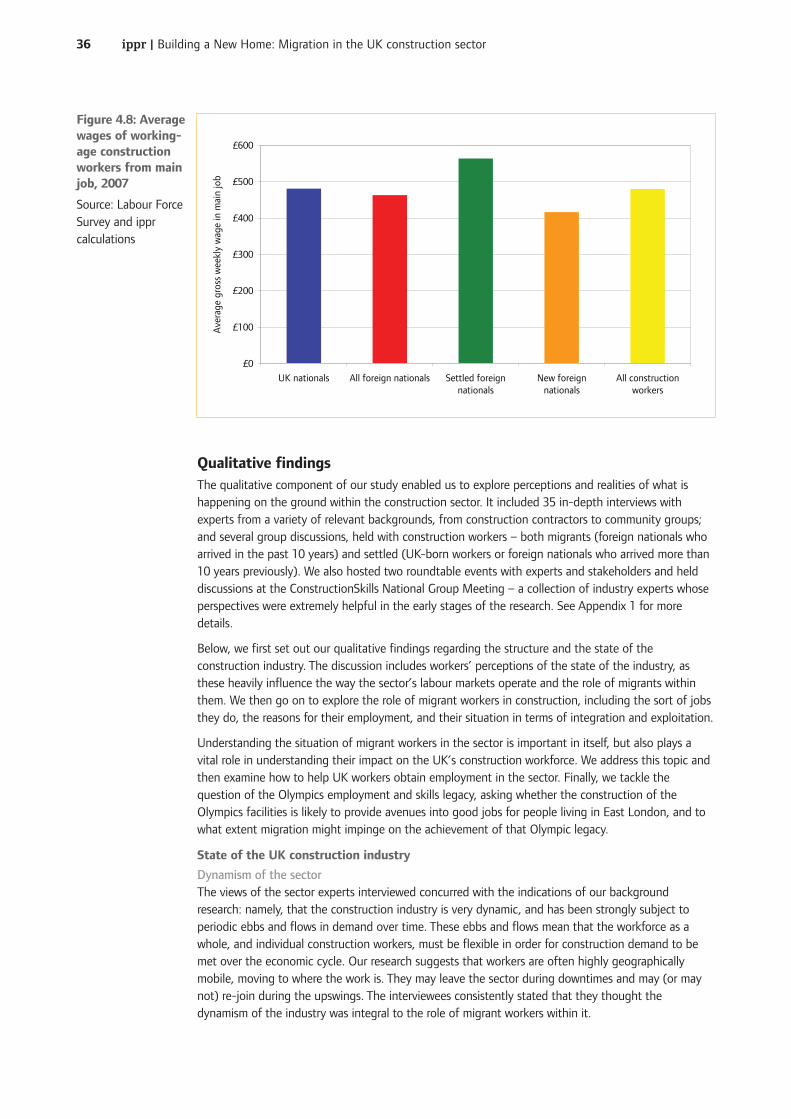
ippr�|�Building�a�New�Home:�Migration�in�the�UK�construction�sector36
Qualitative�findingsThe�qualitative�component�of�our�study�enabled�us�to�explore�perceptions�and�realities�of�what�ishappening�on�the�ground�within�the�construction�sector.�It�included�35�in-depth�interviews�withexperts�from�a�variety�of�relevant�backgrounds,�from�construction�contractors�to�community�groups;and�several�group�discussions,�held�with�construction�workers�–�both�migrants�(foreign�nationals�whoarrived�in�the�past�10�years)�and�settled�(UK-born�workers�or�foreign�nationals�who�arrived�more�than10�years�previously).�We�also�hosted�two�roundtable�events�with�experts�and�stakeholders�and�helddiscussions�at�the�ConstructionSkills�National�Group�Meeting�–�a�collection�of�industry�experts�whoseperspectives�were�extremely�helpful�in�the�early�stages�of�the�research.�See�Appendix�1�for�moredetails.�
Below,�we�first�set�out�our�qualitative�findings�regarding�the�structure�and�the�state�of�theconstruction�industry.�The�discussion�includes�workers’�perceptions�of�the�state�of�the�industry,�asthese�heavily�influence�the�way�the�sector’s�labour�markets�operate�and�the�role�of�migrants�withinthem.�We�then�go�on�to�explore�the�role�of�migrant�workers�in�construction,�including�the�sort�of�jobsthey�do,�the�reasons�for�their�employment,�and�their�situation�in�terms�of�integration�and�exploitation.�
Understanding�the�situation�of�migrant�workers�in�the�sector�is�important�in�itself,�but�also�plays�avital�role�in�understanding�their�impact�on�the�UK’s�construction�workforce.�We�address�this�topic�andthen�examine�how�to�help�UK�workers�obtain�employment�in�the�sector.�Finally,�we�tackle�thequestion�of�the�Olympics�employment�and�skills�legacy,�asking�whether�the�construction�of�theOlympics�facilities�is�likely�to�provide�avenues�into�good�jobs�for�people�living�in�East�London,�and�towhat�extent�migration�might�impinge�on�the�achievement�of�that�Olympic�legacy.�
State�of�the�UK�construction�industry
Dynamism�of�the�sectorThe�views�of�the�sector�experts�interviewed�concurred�with�the�indications�of�our�backgroundresearch:�namely,�that�the�construction�industry�is�very�dynamic,�and�has�been�strongly�subject�toperiodic�ebbs�and�flows�in�demand�over�time.�These�ebbs�and�flows�mean�that�the�workforce�as�awhole,�and�individual�construction�workers,�must�be�flexible�in�order�for�construction�demand�to�bemet�over�the�economic�cycle.�Our�research�suggests�that�workers�are�often�highly�geographicallymobile,�moving�to�where�the�work�is.�They�may�leave�the�sector�during�downtimes�and�may�(or�maynot)�re-join�during�the�upswings.�The�interviewees�consistently�stated�that�they�thought�thedynamism�of�the�industry�was�integral�to�the�role�of�migrant�workers�within�it.�
£0
£100
£200
£300
£400
£500
£600
UK nationals All foreign nationals Settled foreignnationals
New foreignnationals
All constructionworkers
Ave
rage
gro
ss w
eekl
y w
age
in m
ain
job
Figure�4.8:�Averagewages�of�working-age�constructionworkers�from�mainjob,�2007
Source:�Labour�ForceSurvey�and�ipprcalculations
ippr�|�Building�a�New�Home:�Migration�in�the�UK�construction�sector37
Changing�employment�structuresOur�discussions�with�stakeholders�also�confirmed�the�significance�of�the�trend�towards�self-employment�that�is�detailed�in�the�literature.�Several�interviewees�pointed�out�advantages�to�self-employment:�
‘[Self-employment]�allowed�the�industry�to�become�more�mobile�andefficient.�There�is�no�more�builder�leaning�on�a�spade�for�a�fortnight�waitingfor�the�carpenter�to�finish.’�(Construction�firm�manager,�interview)�
However,�all�were�agreed�that�the�rise�in�self-employment�had�caused�problems�for�training�and,�inparticular,�apprenticeships,�because�smaller�employers�tended�not�to�expose�themselves�to�the�risk�ofhaving�a�less�experienced�person�on�their�team.�
Labour�and�skills�shortagesStakeholders’�opinions�varied�on�the�extent�of�skills�and�labour�shortages�in�the�construction�sector.Most�diagnosed�or�cited�labour�shortages�of�one�kind�or�another,�and�some�also�perceived�a�shortageof�skilled�labour.�A�minority�(predominantly�union�officials)�perceived�no�labour�shortages�of�any�kind–�just�a�need�to�facilitate�better�movement�of�labour�from�places�where�jobs�are�scarce�to�placeswhere�there�was�more�demand:
‘There�is�no�skills�shortage.�There�are�hotspots,�yes,�but�not�skillsshortages…Skills�shortages�are�more�regional�–�there�are�hotspots�forconstruction,�and�workers�shift�around�to�appropriate�places.’�(Union�official,interview)
On�the�whole,�those�who�believed�there�are�labour�shortages�did�not�think�this�was�an�unusualsituation.�However,�these�people�were�split�between�a�minority�who�saw�the�shortages�as�part�of�thenatural�culture�of�the�industry�–�and�therefore�not�particularly�problematic�–�and�the�majority,�whofelt�that�shortages�do�require�greater�attention.�
The�role�of�migrant�workers�in�construction
The�available�literature�tends�to�consider�migration�as�a�natural�feature�of�construction,�emphasisingthat�migrants�have�long�played�a�key�role�in�the�industry.�This�view�was�echoed�by�our�interviewees:
‘The�construction�industry�has�been�traditionally�built�on�migrant�labour,�sothere’s�nothing�new�here.’�(Public�sector�official,�interview)
Many�pointed�in�particular�to�the�long-standing�role�of�Irish�migrant�workers�in�the�sector,�and�to�thefact�that�many�Irish�workers�have�returned�home�in�recent�years�because�of�the�boom�in�the�Irishconstruction�sector.�
Our�interviewees�also�considered�migrant�workers�to�be�a�‘natural’�feature�of�the�industry.�This�wasbecause�of�the�vital�role�they�play�in�helping�the�industry�to�meet�labour�demand�when�constructionhotspots�develop�that�cannot�be�satisfied�by�a�standing�pool�of�local�labour.�Intermittent�boosts�andfalls�in�demand�require�a�flexible�workforce,�and�our�stakeholders�suggested�that�migrants�play�animportant�role�in�providing�this�flexibility:
‘Migration�is�used�to�get�around�periods�of�boom,�as�a�bolster�to�domesticworkforce�capacity.’�(Sector�academic,�interview)
Internal�migrants�–�people�moving�within�the�UK�–�also�help�to�provide�this�flexibility.�Internalmigrants�are�very�common�in�the�UK�construction�industry.�Indeed,�one�interviewee�suggested�that�itis�rare�for�any�construction�worker�not�to�undertake�some�form�of�inter-regional�or�internationalmigration�during�his�or�her�career�in�order�to�find�work:
‘If�you�only�want�to�work�down�the�road,�then�construction�isn’t�the�industryfor�you…There�isn’t�a�job�in�construction�that�is�going�to�keep�you�in�oneplace�for�the�rest�of�your�career.’�(Industry�training�provider,�interview)
The�‘ebb�and�flow’�nature�of�industry�demand�is�vital�in�understanding�the�prominence�of�migrants�–both�international�and�internal�–�within�the�sector.�
ippr�|�Building�a�New�Home:�Migration�in�the�UK�construction�sector38
Reasons�for�employing�migrantsWe�also�probed�interviewees�for�reflections�on�why�projects�employ�migrants�rather�than�localworkers.�We�heard�again�and�again�that�migrants�are�often�employed�to�fill�gaps�because�there�issimply�no�UK�worker�available�to�do�the�job.�In�particular,�we�heard�of�migrant�workers�beingemployed�for�work�that�UK�workers�perceive�as�undesirable�–�work�that�is�dirty,�dangerous,�or�in�anisolated�location�(such�as�offshore).�
Beyond�‘filling�gaps’,�interviewees�also�mentioned�skill,�wage,�and�productivity�as�factors�involved�inthe�reason�for�employing�migrants.�In�particular,�they�stressed�the�latter,�although�there�was�somedisagreement�over�whether�migrant�workers�are�actually�more�productive�or�are�simply�viewed�as�such.The�majority�felt�that�there�was�some�productivity�gain�to�employing�migrant�workers,�and�cited�anumber�of�reasons�for�this,�including�migrants�having�fewer�distractions�(such�as�established�networksof�family�and�friends),�greater�loyalty�to�an�employer�and�access�to�fewer�job�networks,�greaterdedication�to�doing�a�good�job,�a�greater�level�of�experience,�and�a�higher�level�of�skills:�
‘Polish�workers�won’t�be�cheaper,�they’ll�be�more�productive.�You’ll�get�a�costsaving,�but�not�through�salary�reduction.�It’s�about�productivity,�work�ethic,and�commitment.’�(Construction�recruiter,�interview)
Union�officials�and�migrant�workers�themselves�raised�some�concerns�that�they�were�often�paid�lessthan�UK�workers�doing�similar�jobs�(an�issue�of�particular�concern�for�undocumented�migrants).However,�there�was�consensus�that�migration�flows�in�construction�were�perhaps�less�determined�bysimple�wage�factors�than�flows�in�other�industries.�A�labour-market�specialist�described�his�findingsfrom�a�study�of�the�experiences�of�migrants�employed�in�four�low-wage�sectors:�
‘Most�of�them�were�employed�close�to�the�minimum�wage�or�even�below,�butthe�construction�sector�was�a�bit�of�an�exception.�Migrants�were�getting�paidmuch�more�than�respondents�in�other�sectors,�such�as�agriculture…theanswer�is�probably�sector-specific.’�(Labour�market�specialist,�interview)
Reasons�for�coming�to�the�UKThe�flipside�to�the�question�of�why�UK�construction�firms�employ�migrant�workers�is�why�migrantsshould�choose�to�seek�work�in�the�industry�themselves,�and�whether�they�intend�to�stay.�It�was�clearfrom�our�interviews�that�there�is�an�enormous�diversity,�both�in�motivations�and�intentions.�Some�ofthe�migrant�construction�workers�we�spoke�to�came�with�the�intention�of�staying�long�term,�andbuilding�a�life�in�the�UK,�others�came�to�acquire�skills�and�experience�that�would�be�highly�valuedback�home,�while�others�still�emphasised�that�getting�work�and�earning�good�wages�was�the�mostimportant�thing,�and�that�they�would�consider�moving�elsewhere�for�better�opportunities.�
This�diversity�is�perhaps�unsurprising,�given�what�we�know�about�the�diverse�kinds�of�migrants�whofind�work�in�construction�in�the�UK�(see�Appendix�1).�So�too,�perhaps,�is�their�frequent�tendencytowards�future�movement,�given�the�frequency�with�which�construction�workers�from�all�backgroundsmove�around.�However,�these�findings�are�worth�highlighting,�given�that�they�differ�quite�widely�fromthe�common�perception�of�all�migration�as�permanent�immigration,�rather�than�as�flows�of�peoplewith�diverse�interests�and�motivations.�
Exploitation�of�migrant�workersWe�explored�a�number�of�aspects�of�the�working�life�of�migrant�construction�workers.�One�positivefinding�was�that,�where�English�was�not�a�barrier,�both�migrant�and�UK�workers�cited�generally�goodrelationships�between�workers�on�site:�
‘There’s�no�animosity�whatsoever.’�(Settled�UK�construction�worker,�interview)
However,�concerns�were�raised�about�tensions�between�workers�and�management.�In�fact,�ourinterviews�yielded�quite�a�number�of�anecdotes�of�exploitative�behaviour,�but�workers�in�differentsituations�reported�quite�different�experiences.�The�migrant�workers�we�spoke�to�emphasised�that�ifthey�were�working�legally,�the�factors�of�greatest�concern�were�finding�a�job�commensurate�to�their
ippr�|�Building�a�New�Home:�Migration�in�the�UK�construction�sector39
skills�and�qualifications,�and�the�(often�severe)�docking�of�their�wages�due�to�agency�fees.�Bothcircumstances�were�felt�to�be�frustrating�and�unjust�aspects�of�being�a�migrant�worker,�but�perhapsnot�exactly�exploitation.�Episodes�such�as�these�indicate�that,�labour�migration�to�the�UK�often�seemsto�be:�
‘…not�exactly�a�story�of�exploitation,�but�rather�of�tough�choices.’�(Labourmarket�specialist,�interview)
However,�other�instances�of�exploitation�were�more�severe.�Migrant�workers�themselves�emphasisedthe�precarious�position�of�undocumented�workers.�As�mentioned�earlier,�it�was�undocumentedmigrants�who�seemed�to�be�employed�because�they�could�be�paid�significantly�lower�wages�thanother�workers.�The�migrants�we�spoke�to�emphasised�how�vulnerable�these�workers�are�to�wageexploitation,�as�well�as�to�other�kinds�of�exploitation�–�such�as�being�forced�to�work�long�hours.However,�notably,�they�reported�that�illegal�working�and�related�problems�of�wage�exploitation�weremore�common�in�other�sectors,�such�as�retail�and�catering,�than�in�construction.�
The�role�of�organisationSome�union�officials�were�keen�to�emphasise�that�with�union�involvement,�workers�had�managed�tojoin�forces�in�order�to�confront�exploitative�employers,�taking�the�approach�that:�
‘It�isn’t�migrant�workers�who�drive�down�wages�but�exploitative�employers.’(Union�official,�interview)
They�reported�that�this�approach�has�helped�to�transform�potentially�negative�relations�into�positiveones.�One�case�involved�an�employer�that�had�slowly�been�replacing�its�workforce�with�cheaperagency�staff.�By�encouraging�cooperation�between�locals�and�migrants,�the�union�ensured�that�thepay�rates�of�agency�matched�those�of�permanent�staff,�thus�reducing�friction�and�exploitation.�
More�broadly,�some�evidence�suggests�that�organisation�is�starting�to�take�place�more�broadly�amongA8�nationals�in�the�UK,�with�trade�unions�recently�setting�up�branches�specifically�for�Polish�speakersin�Southampton�and�Glasgow�(Campbell�2006).�In�the�North�East,�the�Union�of�Construction,�AlliedTrades�and�Technicians�(UCATT)�has�been�cooperating�with�the�Polish�trade�union�Solidarnosc�in�orderto�establish�trust�between�Polish�construction�workers�and�unions�(Fitzgerald�2006).�The�GMB�unionhas�also�started�a�joint�campaign�with�Solidarnosc�aimed�at�making�sure�Poles�arriving�in�the�UK�areaware�of�their�legal�rights�(Buckley�2007).�However,�while�most�of�the�union�representatives�we�spoketo�were�willing�to�support�migrant�workers,�one�stated�that�although�they�might�reach�out�to�anyindividual�working�on�a�site,�they�do�not�want�to�be�seen�to�do�anything�that�implicitly�encouragesmigrants.�
Impacts�on�domestic�workers
Job�and�wage�impactsRather�than�hearing�fears�that�migrant�workers�were�taking�jobs�away�from�UK�workers,�the�almostunanimous�sentiment�was�that�there�is�enough�work�for�UK�workers�and�migrant�workers�alike.�Evenunion�officials�expressed�little�concern�about�the�effect�of�migration�on�UK�workers’�employment:�
‘There�is�sufficient�demand�to�facilitate�migrant�workers�and�to�ensure�thatour�workers�would�not�be�out�of�work�at�this�time.’�(Union�official,�interview)
The�impact�of�migrant�labour�on�wages�was�a�bigger�issue,�although�there�was�widespread�scepticismtowards�sensationalist�media�reports�of�migrants�undercutting�local�construction�workers:�
‘Some�tabloid�coverage�of�the�role�of�migrant�workers�and�their�effect�onwages�is�just�totally�off�the�wall.’�(Union�official,�interview)
However,�the�picture�became�more�complex�when�one�moved�from�discussing�the�overall�picture�tomore�specific�cases�and�occupations.�Stakeholders�were�keen�to�emphasise�the�distinction�betweenthe�so-called�‘biblical’�trades,�such�as�plastering,�tiling,�bricklaying,�and�the�more�technical�trades�suchas�electrical�engineering.�The�labour�markets�of�the�biblical�and�technical�trades�differ,�as�technicaltrades�tend�to�be�more�regulated,�with�requirements�for�certification�(such�as�CORGI�registration�for
ippr�|�Building�a�New�Home:�Migration�in�the�UK�construction�sector40
gas�installers),�whereas�biblical�trades�are�more�open�to�competition�since�there�are�fewer�barriers�toentry�into�the�market.�This�appears�to�influence�the�extent�to�which�migration�has�an�impact.
In�particular,�a�number�of�interviewees�emphasised�that�migrant�workers�who�were�employed�in�thetechnical�trades�were�unlikely�to�have�negative�impacts�on�wages.�This�probably�goes�some�way�toexplaining�why,�four�years�after�EU�enlargement,�we�see�continued�shortages�in�these�occupationsand�the�subsequent�high�hourly�rates�of�pay.�The�extent�to�which�migrant�labour�could�be�seen�tothreaten�the�wages�of�workers�in�the�technical�trades�seemed�confined�to�their�possible�impact�on�aparticular�group�of�UK�workers�–�the�travelling�workforce�(predominantly�workers�from�the�generallycooler�construction�markets�of�the�North,�who�are�paid�a�travel�and�housing�subsidy,�making�themmore�expensive�than�local�workers).�If�migrant�workers�are�willing�to�move�to�the�site�–�essentiallybecoming�local�residents�–�then�they�are�likely�to�become�cheaper�than�this�travelling�workforce.
There�were�greater�concerns�that�the�deregulated�nature�of�the�biblical�trades�opened�thepossibility�that�migrants�might�be�employed�at�below�prevailing�wages�in�that�part�of�the�labourmarket,�hence�undercutting�local�workers.�However,�again,�it�seems�that�even�within�this�sub-groupexperiences�are�not�homogenous.�We�saw�considerable�differentiation�between�the�impacts�ondifferent�kinds�of�workers�in�different�areas.�Settled�workers�told�us,�for�example,�that�perhapsthose�at�the�lower�skilled�end�of�the�biblical�trades�–�such�as�labourers�–�were�suffering�wagedeflation,�whereas�other�jobs�were�not:
‘There�aren’t�many�migrant�bricklayers,�but�those�there�are�will�work�for�thesame�rate�as�me,�which�is�no�problem.’�(Settled�UK�construction�worker,interview)
Helping�local�people�into�the�sector�
The�effectiveness�of�the�training�and�skills�systemThere�was�a�sense�among�our�respondents�that�the�current�training�system�is�not�always�keeping�pacewith�the�industry’s�needs.�However,�we�heard�some�very�different�views�about�what�the�industry’sneeds�are,�why�the�system�might�fail�to�meet�them,�and�what�kind�of�a�remedy�is�required.�Someargued�that�NVQ�level�4�training�is�what�the�industry�is�‘really’�demanding,�others�that�theapprenticeship�system�needs�to�be�revived�to�deliver�the�industry�with�the�‘right’�skills,�while�otherssuggested�that�the�focus�has�been�too�strongly�on�long-term�training�of�one�kind�or�another�whenoften�the�industry�needs�basic�operatives�with�three�weeks�of�training.�
This�variety�of�diagnoses�made�it�clear�to�us�that�in�order�to�be�successful,�training�provision�needs�tobe�flexible�–�as,�for�example,�in�the�case�of�the�National�Skills�Academy�for�Construction�(NSAfC).�TheNSAfC�is�the�latest�innovation�in�training,�and�was�positively�received�by�our�interviewees.�Theinterviewees�were�particularly�pleased�to�see�Building�One�Stop�Shop�(BOSS)�at�the�heart�of�theNSAfC�model.�BOSS�is�a�job�brokerage�system�that�uses�training�to�help�individuals�into�the�industry:
‘The�training�is�very�much�beneficiary�led…BOSS�source�the�training…�Theyidentify�with�the�clients�what�would�benefit�them�and�go�out�and�broker�thattraining�for�them�–�so�if�they�have�a�guy�come�in�who�aspires�to�drive�somemachinery�on�site,�they�would�encourage�him�to�talk�to�employers,�check�howviable�it�is,�and�then�if�it�seemed�that�it�would�be�reasonable�to�expect�him�togo�into�employment�after�training�in�that�area,�then�BOSS�would�source�thenearest�provider�to�an�industry-recognised�standard,�and�then�work�with�himto�go�back�to�those�employers.’�(Job�broker,�interview)
Such�flexibility�and�direct�engagement�should�allow�training�to�meet�the�needs�both�of�local�industryand�the�trainees,�and�it�is�heartening�to�see�it�at�the�centre�of�the�NSAfC.�
What�will�the�Olympic�labour�legacy�be?Much�has�been�made�of�the�role�that�the�Olympics�will�play�in�bringing�job�opportunities�to�localresidents�in�East�London.�In�our�interviews,�stakeholders�highlighted�the�public�expectation�that�jobswill�be�created�for�local�people,�and�that�many�of�these�jobs�would�be�found�in�the�construction�ofthe�Olympic�facilities.�However�stakeholders�also�revealed�varying�assessments�as�to�how�realistic
ippr�|�Building�a�New�Home:�Migration�in�the�UK�construction�sector41
these�expectations�are.�We�also�heard�just�how�sensitive�the�question�of�Olympic�employment�is�likelyto�be,�with�some�stakeholders�emphasising�the�common�perception�of�migrant�workers�as�a�majorpotential�threat�to�the�jobs�and�skills�legacy�for�East�London.
Labour�shortages�for�the�London�2012�OlympicsA�majority�of�the�stakeholders�we�spoke�to�expressed�little�or�no�concern�about�labour�shortages�forthe�London�Olympics.�They�cited�the�UK�workforce’s�interest�in�working�on�the�project�–�a�result�of�acombination�of�the�project’s�prestige�and�the�wage�premium�that�such�large�projects�tend�to�pay.Many�also�pointed�out�that�the�London�Olympics�will�represent�only�a�small�share�of�construction�inGreater�London:
‘For�all�its�sexiness,�the�Olympics�will�only�be�7�per�cent�of�constructionactivity�in�London�[in�terms�of�value]…and�3–4�per�cent�in�terms�of�labour.’(Industry�training�provider,�interview)
This�low�labour�figure�in�comparison�to�output�is�a�result�of�the�fact�that�the�work�is�likely�to�be�moremachine�intensive�than�labour�intensive,�given�its�high-technology�nature.
Many�stakeholders�mentioned�this�3–4�per�cent�employment�statistic,�which�seemed�a�key�factor�inexplaining�the�relaxed�attitudes�that�we�frequently�encountered�towards�the�question�of�attracting�the2012�construction�workforce.�However,�as�stressed�by�an�official�close�to�the�Games,�this�figure�hadbeen�calculated�on�the�basis�of�the�level�of�expenditure�predicted�(originally�£2.6�billion).�Since�thisoriginal�budget�has�now�more�than�tripled,�this�may�mean�that�the�predicted�3–4�per�cent�figuremoves�to�9–12�per�cent,�depending�on�the�labour�intensity�of�the�construction).�If�training�providersand�other�stakeholders�are�working�to�an�assumption�of�3–4�per�cent�employment,�they�may�beunderestimating�the�needs�of�the�Games.�It�became�apparent�through�our�interviews�that�someindividuals�who�were�close�to�the�planning�of�the�Games�are�concerned.
Moreover,�the�fact�that�the�Olympics�will�only�make�up�a�minor�proportion�of�the�capital’sconstruction�output�does�not�necessarily�mean�that�we�should�have�no�concerns�about�labouravailability.�The�relative�lack�of�construction�workers�within�the�region�to�meet�labour�demand�couldgenerate�tight�labour�markets,�and�might�make�recruitment�for�the�project�problematic.�Moreover,getting�workers�from�outside�the�area�to�these�sites�and�housing�them�will�also�create�logisticaldifficulties.�Rental�accommodation�will�be�stretched�thin,�and�workers�will�be�required�to�use�publictransportation�to�get�to�the�sites.�Such�micro-economic�factors�may�further�hinder�the�Olympicscontractors�from�obtaining�all�the�labour�they�require.�
Ensuring�an�employment�legacyA�number�of�suggestions�have�been�put�forward�as�to�how�to�ensure�that�local�people�do�gain�fromthe�construction�activity�occurring�on�their�doorsteps.�One�suggestion�is�to�compel�contractors�–�andthrough�them,�the�chains�of�subcontractors�that�they�employ�–�to�hire�locally.�Our�interviewees�notedthat�if�a�contractor�is�very�committed�to�encouraging�local�labour,�substantial�pressure�from�the�topcan�work.�However,�this�is�unlikely�in�the�case�of�the�Olympics.�Where�projects�have�a�definitedeadline�–�as�the�Olympics�clearly�does�–�our�interviewees�suggested�that�there�could�be�problemsenforcing�such�agreements.�This�is�because�Olympic�officials�and�contractors�alike�know�that�in�theend,�while�factors�such�as�employment�legacy�and�keeping�to�budget�may�be�important,�getting�thefacilities�finished�on�time�will�always�be�the�ultimate�priority.�
However,�this�is�not�the�only�approach�to�encouraging�an�employment�and�skills�legacy.�In�London,there�have�been�attempts�to�boost�training�in�order�to�provide�local�people�with�some�of�thenecessary�skills�for�on-site�employment.�There�have�also�been�improvements�in�job�brokerage�facilities,in�order�to�help�local�people�with�existing�necessary�skills�into�employment�on�the�site.�In�oneexample�of�such�an�initiative,�the�LDA�has�provided�the�five�host�boroughs�with�funds�–�the�LocalEmployment�and�Training�Framework�–�to�allow�them�to�fund�Olympics-related�training�for�theirresidents,�in�order�to�help�them�into�employment.�There�also�appears�to�have�been�significantcoordination�among�London�and�Olympic�officials�and�ConstructionSkills�in�creating�bespoke�trainingcourses�for�the�needs�of�the�London�Olympics.�

ippr�|�Building�a�New�Home:�Migration�in�the�UK�construction�sector42
This�work�is�vital,�and�should�help�to�deliver�an�employment�and�skills�legacy.�It�is�important,�however,that�policymakers�and�the�general�public�realise�that�local�employment�in�Olympics�construction�willbe�limited.�This�is�not�because�a�migrant�workforce�will�arrive�in�East�London�and�‘take’�the�jobs:�it�isbecause,�even�four�years�away�from�completion,�it�is�already�too�late�to�train�unemployed�people�orother�potential�local�workers�for�the�vast�majority�of�Olympic�construction�jobs.�Indeed,�work�isalready�underway�on�site�preparation,�and�much�of�the�construction�activity�will�peak�in�2010,�bywhich�time�those�who�have�entered�training�in�2008�will�only�just�be�ready�for�work.
In�our�interviews,�those�closest�to�the�Games�suggested�that�a�few�thousand�or�so�local�workers�willbe�trained�up�for�basic�work,�while�local�construction�workers�with�existing�skills�should�be�able�to�findwork�on�the�site�through�brokerage�agencies.
The�rest�of�the�employment�and�skills�legacy�will�come�from�secondary�economic�stimulus.�Forexample,�as�local�construction�workers�move�on�to�the�Olympic�site,�other�local�residents�may�train�tofill�the�gaps�left�locally�in�construction�work,�so�the�opportunities�may�filter�down.�Beyond�these�sortsof�effects,�it�is�also�hoped�that�London�2012�will�improve�the�image�of�construction�as�a�career�in�theUK,�and�that�more�people�will�enter�the�sector�for�employment�in�the�future�at�other�sites.
ippr�|�Building�a�New�Home:�Migration�in�the�UK�construction�sector43
Based�on�the�analysis�of�the�previous�sections,�here�we�draw�out�some�key�conclusions�about�trendsin�construction�and�migration,�and�their�likely�impacts�on�the�supply�of�workers�in�the�run-up�to�the2012�Olympics�and�beyond.
Trends�in�construction�labour�marketsAt�the�national�level,�the�most�recent�estimates�of�labour�demand�suggest�a�variable�trend�for�theperiod�of�Olympics�construction�up�to�2011.�It�is�worth�emphasising�that�the�model�used�to�producethese�figures�–�the�ConstructionSkills�Network�model�–�appears�fairly�impressive.�While�not�without�itsflaws,�the�process�used�to�generate�the�figures�is�comprehensive,�and�the�predictions�it�generatesseem�respected.�It�is�also�worth�emphasising�that�these�figures�are�relatively�recent�–�from�September2008.
Nationally,�output�and�labour�demand�are�expected�to�decline�in�2009�but�to�rise�again�in�2010�and2011,�driven�by�demand�from�infrastructure,�and�from�public�housing�and�non-housing�projects.Within�London,�demand�for�labour�is�expected�to�slow�quite�considerably�over�the�next�few�years,which�might�be�expected�to�translate�into�an�over-supply�of�construction�workers�in�the�region.However,�despite�this�slowing�in�output�growth,�London’s�construction�sector�is�lacking�labour�to�suchan�extent�that�it�is�still�expected�to�require�greater�numbers�of�new�recruits�than�any�other�region�ofthe�UK�–�an�average�annual�requirement�of�between�7,000�and�8,000�additional�people.�
It�is�difficult,�of�course,�to�know�how�accurate�these�figures�are.�However,�if�there�is�an�element�oferror�within�them,�the�stakeholders�we�spoke�to�suggested�that�they�would�be�more�likely�tounderestimate,�rather�than�overestimate,�labour�demand.�
Migration�into�the�construction�sectorOne�of�our�main�conclusions�is�that�construction�is,�and�always�has�been,�a�migratory�industry.�Thereis�an�expectation�that�people�will�go�where�the�work�is.�In�the�past,�these�migratory�movements�haveoften�been�confined�within�the�British�Isles�–�although�the�well-known�tradition�of�UK�workers�findingemployment�in�Germany�reminds�us�that�international�travel�has�been�common�for�some�time.However,�in�today’s�increasingly�globalised�world,�itinerant�construction�workers�come�from�all�overEurope�and�beyond.
It�is�extremely�difficult�to�obtain�a�complete�picture�of�the�extent�of�these�migratory�flows,�andestimates�are�likely�to�be�undercounted�to�an�extent.�However,�we�can�draw�some�tentativeconclusions�about�the�numbers�of�migrant�workers�in�construction,�their�countries�of�origin,�and�thekinds�of�skills�they�are�bringing�with�them.�
In�terms�of�scale,�the�evidence�suggests�that�the�numbers�of�foreign�nationals�in�constructionincreased�from�around�51,000�at�the�end�of�2000�to�around�131,000�at�the�end�of�2007.�There�hasbeen�a�corresponding�increase�in�the�number�of�individuals�defined�as�‘migrant�workers’�(foreignnationals�who�have�arrived�in�the�past�ten�years)�within�the�industry�from�around�18,000�at�the�endof�2000�to�around�93,000�at�the�end�of�2007.�It�appears�that�the�scale�of�migratory�flows�into�theindustry�is�increasing�rapidly.
So�it�is�perhaps�unsurprising�that�the�proportion�of�migrant�workers�as�a�percentage�of�all�workers�hasrisen�over�the�same�period.�However,�this�is�a�rise�from�a�very�low�level.�In�2000,�around�1�per�cent�ofthe�total�construction�workforce�comprised�recently�arrived�foreign�nationals.�By�the�end�of�2007,�thisfigure�had�grown�to�the�still�very�modest�percentage�of�around�4.1�per�cent�(all�foreign�nationalscorrespondingly�making�up�3�per�cent�of�the�construction�workforce�in�2000�and�5.8�per�cent�by�thethird�quarter�of�2007).�
It�is�important�to�note�that�this�rise�in�the�employment�of�migrant�workers�does�not�seem�to�havebeen�at�the�direct�expense�of�UK�workers.�In�fact,�we�have�seen�a�very�substantial�rise�(of�18�percent)�in�the�number�of�UK�workers�employed�in�the�sector�over�the�same�period,�with�the�number�ofUK�nationals�employed�in�construction�rising�from�just�over�1,810,000�at�the�start�of�2000�to�just
5.�Conclusions
ippr�|�Building�a�New�Home:�Migration�in�the�UK�construction�sector44
over�2,138,000�at�the�end�of�2007.�As�a�proportion�of�all�work,�migrant�workers�are�now�holdingmore�jobs�than�they�used�to,�but�in�absolute�terms,�the�vast�majority�of�new�jobs�are�still�going�to�UKworkers.
The�data�suggests�that�the�entry�of�the�A8�countries�into�the�EU,�and�the�opening�of�UK�labourmarkets�to�citizens�of�those�countries,�has�had�an�impact�on�the�flows�of�migrants�to�the�sector.�Wehave�observed�a�slowly�rising�trend�of�migrants�as�a�percentage�of�the�total�UK�workforce�from�thestart�of�this�century,�but�this�appears�to�have�picked�up�around�the�time�of�the�entry�of�the�A8countries�into�the�European�market,�suggesting�that�workers�from�these�countries�may�havecomprised�a�good�proportion�of�arrivals�in�the�past�few�years.�This�is�corroborated�by�an�analysis�ofthe�countries�of�origin�of�those�people�arriving�in�the�past�ten�years,�almost�half�of�whom�were�fromthe�A8,�Cyprus�and�Malta.�This�is�quite�striking�given�that�most�of�those�workers�have�probably�arrivedonly�since�May�2004,�when�the�terms�of�entry�changed.�
In�terms�of�the�occupation�profile�of�migrant�workers�in�construction,�there�is�evidence�that�migrantworkers�are�also�found�right�across�the�industry,�filling�the�skills�and�labour�gaps�at�both�ends�of�theskills�spectrum.�For�example,�data�from�the�WRS�suggests�that�between�a�third�and�a�half�of�A8workers�registered�as�labourers.�This�may�suggest�that�migrant�workers�often�undertake�relativelyunattractive�jobs�on�construction�sites,�the�so-called�dirty,�difficult�and�dangerous�jobs�that�UKworkers�are�increasingly�unwilling�to�do.
Importantly,�migrant�workers�can�also�be�found�at�the�other�points�in�the�skills�spectrum.�WRS�datashows�that�sizeable�proportions�of�A8�workers�are�tradesmen,�with�for�example�around�8�per�centregistering�as�carpenter/joiners�and�7�per�cent�registering�as�welders.�As�noted�above,�this�excludesthe�self-employed,�who�make�up�over�half�of�all�migrant�construction�workers.�Statistics�for�allworkers�currently�in�the�UK�suggest�that�the�self-employed�are�much�more�likely�to�hold�a�tradequalification�than�employed�workers,�possibly�implying�that�self-employed�A8�migrants�may�beconcentrated�in�the�trades�to�a�greater�degree�than�those�registering�as�employed.�
However,�it�is�important�to�recognise�that�just�because�A8�migrants�register�in�these�industries,�thisdoes�not�mean�that�they�necessarily�stay�in�them.�As�noted�previously,�construction�is�a�dynamicindustry,�with�workers�moving�between�jobs�and,�to�some�degree,�occupations,�relatively�easily.�Inparticular,�over�time,�migrant�construction�workers�may�move�up�the�skills�ladder,�and�acrossindustries,�as�many�migrants�tend�to�do�once�they�have�been�in�the�UK�for�a�number�of�years.�
Migration�trendsIt�is�extremely�difficult�to�foresee�the�future�flows�of�migrant�workers,�as�there�are�simply�so�manyinfluencing�factors.�A�case�in�point�was�one�prediction�that�the�UK�opening�its�borders�to�A8�workerswould�result�in�a�net�annual�flow�of�about�13,000�workers�at�most�(Dustmann�et�al 2003).�We�do�notknow�the�exact�numbers�remaining�in�the�UK,�because�we�do�not�know�how�many�of�those�whoregistered�have�now�left�the�country,�but�this�was�clearly�a�massive�underestimate�(Pollard�et�al 2008).This�appears�to�be�at�least�partly�due�to�one�unanticipated�circumstance�–�the�fact�that�very�few�othercountries�in�the�EU�opened�their�borders�alongside�the�UK.�This�highlights�the�extent�to�which�achange�in�one�key�variable�determining�migration�decisions�may�result�in�very�different�flows.�
It�would�be�reasonable�to�anticipate,�however,�that�A8�nationals�will�continue�to�dominate�migratoryflows�into�construction�in�the�near�future,�joined�by�lower�numbers�of�Romanians�and�Bulgarianswhen�the�UK�opens�its�borders�to�workers�from�those�nations.�This�is�because�access�for�EU�workers�is(and�looks�likely�to�remain)�much�easier�than�access�for�workers�from�other�nations.
Meanwhile,�for�migrants,�the�various�financial,�social�and�emotional�‘costs’�of�migrating�are�likely�to�bereduced�because�of�the�networks�created�by�earlier�A8�migrants.�Analysis�of�migration�has�shown�thatin�general,�while�the�costs�of�the�first�member�of�a�community�migrating�to�a�certain�destination�canbe�high�(given�uncertainty�around�how�to�obtain�work�or�find�a�home),�the�more�people�who�migratefrom�a�given�community�leave,�the�easier�it�is�for�others�to�follow.�Especially�given�the�importance�ofword-of-mouth�recruitment�in�construction,�these�established�networks�would�be�expected�tofacilitate�a�relatively�easy�flow�of�movement�of�A8�workers�to�UK�construction�jobs.�
ippr�|�Building�a�New�Home:�Migration�in�the�UK�construction�sector45
It�seems�likely�that�some�flows�will�continue.�Despite�their�impressive�growth�rates�in�recent�years,�theA8�countries�are�likely�to�remain�poorer�than�the�majority�of�the�other�countries�in�Europe�for�sometime,�thus�providing�incentives�for�people�to�leave.�Moreover,�our�interviewees�suggested�that�the�UKis�also�likely�to�continue�to�have�attractive�aspects�compared�to�other�destinations�in�Europe,including�the�reputation�as�being�an�easier�place�to�‘get�ahead’�and�be�successful�if�you�work�hard.However,�with�economic�growth�in�the�UK�faltering,�and�the�construction�sector�already�facing�adownturn,�we�anticipate�fewer�new�arrivals�in�future,�and�some�existing�workers�returning�home,�inline�with�the�trends�observed�in�other�sectors�(Pollard�et�al 2008).�
The�crucial�factor�in�terms�of�future�workforce�supply�is�to�ensure�that�the�points-based�system�issufficiently�flexible�to�allow�workers�to�move�in�and�out�of�the�UK�as�labour�demand�rises�and�falls.�Acritical�factor�will�be�how�Tier�2�of�the�system�(under�which�skilled�workers�enter�the�UK)�operates.�Forexample,�the�process�for�deciding�on�shortage�occupations�needs�to�be�swift�and�accurate.�It�shouldemerge�over�the�coming�months�and�years�whether�this�will�be�the�case,�as�the�process�beds�in.
The�Government�will�also�need�to�monitor�whether�the�EU�provides�enough�low-skilled�workers�tomeet�demand.�If�not,�it�needs�to�be�willing�to�open�up�Tier�3�–�the�tier�that�allows�low-skilled�workersinto�the�UK,�and�which�is�currently�considered�closed.�If�the�Government�gets�these�measures�right,�itis�likely�that�construction�workers�will�tend�to�do�what�they�have�always�done,�and�follow�the�work�asit�moves�around�the�globe.�
Impact�of�migrationThe�impact�of�migrant�workers�on�the�sector�appears�broadly�benign.�We�found�no�evidence�ofmigrants�posing�a�threat�to�the�job�opportunities�of�workers�in�the�sector.�We�also�found�surprisinglylittle�evidence�of�migration�causing�adverse�wage�impacts.�While�there�may�well�be�localised�wageeffects,�the�barriers�to�entry�in�the�technical�trades�seem�to�prevent�many�migrant�workers�fromaccessing�these�jobs.�Even�where�the�barriers�to�entry�are�lower,�such�as�in�the�biblical�trades,�theimpact�of�migration�on�wages�appears�limited.�Again,�this�should�not�be�surprising�given�the�limitedrole�that�migrant�workers�currently�play�in�the�sector.�At�4�per�cent�of�the�total�workforce�(theestimate�using�the�best�currently�available�data)�one�would�not�expect�migrant�workers�to�have�a�verywidespread�impact.�
Nevertheless�if�wages�do�fall,�this�is�not�necessarily�always�a�bad�thing.�If�labour�demand�really�wereoutstripping�supply,�workers�could�be�enjoying�an�unfair�wage�premium.�Uncompetitively�high�wageswould�not�only�mean�higher�prices�for�consumers,�but�could�constrain�the�industry’s�ability�to�operate,in�turn�restricting�the�sector’s�total�output.�In�such�a�situation,�should�the�entry�of�more�workers�intothe�labour�market�cause�wages�to�drop,�this�would�mean�a�return�to�free�and�fair�competition�in�thelabour�market,�with�important�broader�benefits.�We�do�not�believe�that�this�trend�has�in�fact�occurred–�which�should�not�be�a�surprising�conclusion,�given�the�relatively�limited�number�of�migrant�workersin�the�sector.�However,�it�is�worth�noting�that�if�wages�were�to�fall�as�a�result�of�migrant�worker�entry,the�broader�effects�could�potentially�be�positive,�rather�than�negative.
Protecting�all�workersOur�research�revealed�that�migration�is�widely�accepted�and�welcomed�as�an�integral�part�of�theconstruction�industry,�as�long�as�it�does�not�lead�to�an�undermining�of�minimum�standards.�In�ourview,�the�key�to�ensuring�fair�and�efficient�competitive�construction�labour�markets�(in�which�migrantworkers�and�domestic�workers�are�protected,�and�law-abiding�employers�are�protected�fromcompetitors�with�artificially�low�costs)�is�for�the�Government�to�target�the�employers�of�illegal�workers.�
The�Government’s�new�approach�to�combating�illegal�working�appears�to�take�these�considerations�onboard.�These�measures�establish�a�set�of�fines�that�will�be�levied�on�firms�that�employ�irregularmigrants,�with�harsher�fines�and/or�prison�sentences�for�those�who�do�so�knowingly�(UK�BorderAgency�2007).
There�are�two�important�aspects�to�these�proposals.�First,�it�appears�that�significant�effort�is�beingdedicated�to�enforcement,�alongside�legislation.�Second,�it�seems�that�the�measures�will�be�imposedsystematically,�rather�than�in�the�rather�haphazard�fashion�of�the�past.�For�example,�the�approach�to
ippr�|�Building�a�New�Home:�Migration�in�the�UK�construction�sector46
preventing�the�illegal�working�of�Romanians�and�Bulgarians�is�based�ostensibly�on�significant�fines�forthe�employers�of�illegal�workers,�and�smaller�fines�for�the�illegal�workers�themselves.�However,�inpractice�there�seems�to�have�been�more�emphasis�on�pursuing�illegal�workers�than�their�employers.For�example,�a�case�of�illegal�working�at�the�Wembley�site�resulted�in�fines�for�the�workers�concernedbut�not�for�the�contractor�(Bentham�and�Simons�2007).�
In�our�view�this�is�neither�fair�nor�likely�to�be�effective.�Punishing�the�undocumented�workersthemselves�will�probably�remove�some�of�those�workers�from�the�labour�market,�but�if�the�demand�fortheir�labour�remains�then�undocumented�workers�will�continue�to�arrive.�If,�on�the�other�hand,�thefocus�is�on�employers,�then�appropriate�penalties�could�reduce�the�demand�for�undocumented�labour,with�a�more�long-lasting�impact�on�its�supply.
Unions�have�a�vital�role�to�play�in�this�area.�There�appear�to�be�a�number�of�useful�initiatives�in�whichunions�are�playing�a�key�watchdog�role�in�ensuring�that�migrant�workers�are�not�exploited.�Positiveinitiatives�within�unions�include�projects�looking�actively�to�recruit�migrant�workers,�by�seeking�themout�and�endeavouring�to�respond�to�their�grievances,�and�alliances�formed�with�unions�from�currentsource�countries,�such�as�Poland.�These�individual�initiatives�also�appear�to�be�increasingly�joined�up,and�in�2007�the�Trades�Union�Congress�agreed�to�share�best�practice.�
These�efforts�are�obviously�of�value�in�themselves,�but�they�also�help�maintain�fair�competitionbetween�migrant�workers�and�local�workers.�The�unions’�task�may�be�made�easier�by�the�fact�thatmany�of�the�A8�countries�have�a�strong�history�of�unionisation.�Such�efforts�to�assist�migrant�workers,in�order�to�protect�all�workers,�should�be�expanded.�
Helping�UK�workers�into�construction�Tailored�support�is�needed�to�help�UK�citizens�into�work�–�whether�in�construction�or�in�other�sectors.For�some,�this�will�mean�help�with�basic�skills,�childcare�or�managing�a�health�condition,�while�otherswill�need�help�with�their�confidence�and�motivation.�Some�people�will�also�benefit�from�support�thatcontinues�after�they�start�work,�to�help�them�remain�in�employment�and�progress.�A�personalisedapproach�to�‘welfare�to�work’,�as�well�as�a�greater�emphasis�on�retention�and�progression,�is�thereforecentral�to�boosting�employment�across�all�sectors�of�the�labour�market.�This�approach�is�reflected�inthe�Government’s�plans�for�welfare�reform.
Training�will�often�play�an�important�role�in�supporting�people�into�work.�To�maximise�its�potential,however,�training�must�be�accessible.�The�Government’s�current�drive�to�integrate�welfare�and�skillsservices�should�help�with�this�–�for�example,�the�availability�of�‘skills�screenings’�(as�well�as�a�full�‘skillshealth�check’�if�significant�skills�problems�are�identified)�should�provide�routes�into�training�for�thosewho�are�out�of�work.
As�well�as�being�more�accessible,�training�also�needs�to�be�carefully�designed�to�provide�people�withthe�right�skills�to�help�them�into�employment.�The�Government’s�new�Adult�Advancement�and�CareersService�(currently�being�piloted,�and�due�to�be�rolled�out�across�England�by�2010�or�2011)�shouldhelp,�by�offering�advice�and�guidance�both�to�jobseekers�and�to�people�currently�in�work�(Departmentfor�Work�and�Pensions�and�Department�for�Innovation,�Universities�and�Skills�2008).�Among�otherthings,�this�service�will�lead�the�development�of�a�sophisticated�system�of�labour-market�information,to�help�jobseekers�and�workers�understand�the�employment,�training�and�progression�opportunitiesavailable�in�their�local�labour�market�(Cooke�and�Lawton�2008).�In�order�to�be�successful,�trainingmust�meet�jobseekers’�and�workers’�own�interests�while�also�being�based�on�an�understanding�of�theindustry’s�likely�future�labour�requirements.�The�focus�must�be�on�helping�people�into�work,�ratherthan�simply�providing�them�with�qualifications.�
Within�the�construction�sector�itself,�the�National�Skills�Academy�in�Construction�seems�to�be�a�goodexample�of�such�an�approach.�We�therefore�recommend�that�the�construction�industry�and�theGovernment�support�the�Skills�Academy�approach,�and�ensure�that�it�achieves�the�desired�flexibilityand�focus�on�industry�needs.�This�will�involve�exploring�what�employers,�those�wishing�to�join�theindustry,�and�workers�already�within�the�sector�who�wish�to�access�training,�think�of�the�Academy.�Inour�view,�efforts�to�improve�the�way�that�training�is�used�in�construction�are�the�most�crucial�way�inwhich�the�industry�can�help�boost�UK�worker�involvement�within�it.
ippr�|�Building�a�New�Home:�Migration�in�the�UK�construction�sector47
Migrants�in�Olympics�constructionWe�expect�that�migrant�workers�will�play�an�important�role�in�the�construction�and�success�of�theconstruction�of�facilities�for�London’s�2012�Olympic�Games.�Apart�from�the�ongoing�role�of�migrantworkers�in�the�UK�construction�sector,�which�is�likely�to�extend�to�the�construction�of�any�new�large-scale�project�such�as�the�Olympics,�Olympics�construction�is�likely�to�require�migrant�workers�for�thefollowing�specific�reasons.
First,�as�with�other�mega-projects,�the�Olympics�will�require�some�specialist�construction�skills,�in�thiscase�related�to�stadium�and�sporting�infrastructure,�which�will�almost�certainly�involve�the�recruitmentof�foreign�specialists.�Even�if�it�were�possible�within�the�Olympic�timeframe�to�train�local�people�to�dothese�jobs,�it�would�not�make�much�sense�to�do�so,�as�the�future�demand�for�such�highly�specialisedworkers�(such�as�stadium�roof�constructors)�is�likely�to�be�very�limited�in�East�London,�Greater�Londonand�even�the�UK�as�a�whole.�
Second,�the�Games�will�be�an�extremely�intense�construction�project�–�the�facilities�must�becompleted�to�an�immovable�deadline,�at�a�quality�that�London�will�be�proud�to�showcase�to�the�world,and�to�a�budget�that�will�be�scrutinised�by�the�UK�government�and�the�wider�public.�These�pressuresmean�that�appropriate�labour�is�required�quickly�and�flexibly.�
Finally,�the�Olympics�will�not�be�the�only�major�source�of�labour�demand.�Other�projects�within�thegeographical�area�–�notably�the�Lower�Lea�Valley�and�the�wider�South�East�–�will�also�requireconstruction�labour.�Moreover,�as�the�immediate�local�neighbourhood�is�not�teeming�with�skilledconstruction�workers,�and�as�difficulties�are�anticipated�relating�to�commuting�into�this�busy�area,�it�islikely�that�employers�and�contractors�will�look�to�migrant�labour,�located�on�site�or�in�the�immediatearea,�to�fill�some�of�this�demand.�For�all�of�these�reasons,�we�expect�that�migrant�workers�will�play�avital�role�in�the�construction�of�London�2012.
Olympics�opportunities�for�UK�workersThe�potential�to�recruit�migrant�workers�does�not�mean�that�local�residents�will�not�be�able�to�findconstruction�jobs�for�the�London�Olympics.�Indeed,�skilled�local�residents�will�have�extremelypromising�prospects.�Meanwhile,�some�training�schemes�will�be�able�to�give�untrained�residentsbasic�skills�that�will�help�them�be�able�to�compete�for�employment�in�some�lesser-skilledconstruction�roles�as�general�operatives�on�the�site.�But�the�numbers�envisaged�here�are�modest,and�local�residents�and�legacy�planners�must�be�prepared�for�this.�However,�it�is�not�theavailability�of�migrant�workers�that�will�prevent�more�local�workers�getting�jobs�on�site.�Mostimportant�will�be�the�fact�that�it�is�simply�too�late�to�train�for�the�more�skilled�occupationsassociated�with�the�Games.�
Nevertheless,�London�2012�may�help�build�up�the�image�of�the�industry,�attracting�more�peopleinto�construction.�In�this�way,�the�Olympics�may�help�raise�aspirations�of�local�–�and�national�–residents,�and�help�them�develop�their�longer-term�job�prospects.�Perhaps�this�will�lead�to�morelocal�residents�joining�skilled�training�programmes.�Although�they�may�not�be�ready�for�theGames,�they�could�be�employed�on�other�projects�afterwards.�Local�residents�should�be�madeaware�of�the�full�array�of�employment�opportunities,�so�that�they�are�not�disappointed�that�manywill�not�end�up�in�construction�jobs�on�the�Olympics�site.�The�most�important�element�of�effortsto�help�local�residents�access�2012�employment�opportunities�will�be�coordination�andcommunication.�Training�efforts�need�to�avoid�duplication�and�remain�focused�on�the�project’stight�timelines.�
Summary�Perhaps�the�most�important�finding�from�our�research�is�the�natural,�long-standing�role�of�migrationin�construction.�Construction�is�a�migratory�industry.�As�one�of�our�interviewees�put�it,�‘Workers�havealways�moved�to�where�the�work�is,�because�the�work�moves�around.’�It�is�clear�that�this�characteristicof�the�industry�has�not�changed�in�recent�years.�In�the�past,�migrants�from�places�closer�to�home,such�as�Ireland,�might�have�filled�the�jobs.�Today,�in�the�context�of�a�globalising�world,�with�ever�more

ippr�|�Building�a�New�Home:�Migration�in�the�UK�construction�sector48
global�labour�markets,�we�now�see�more�movement�from�countries�across�Europe,�such�as�Poland�andthe�other�A8�nations.�
We�should�not�be�concerned�about�this,�any�more�than�any�other�aspect�of�globalisation.�The�UK�hasa�long�tradition�of�benefiting�from�free�trade,�and�there�is�no�reason�for�the�construction�industry�tobe�any�different.�As�long�as�we�get�our�training�structures�right�(and�efforts�at�reforming�them�appearto�be�going�in�the�right�direction)�and�place�plenty�of�importance�on�ensuring�fair�competition�bycracking�down�on�exploitative�employers,�then�UK�workers�will�be�well�placed�to�compete�and�succeedin�our�own�labour�markets�and,�should�they�choose�to�migrate,�those�abroad.�
Moreover,�migrant�workers�are�playing�an�important�role�in�construction�labour�markets.�There�areemployment�gaps�in�the�industry�–�predominantly�as�a�result�of�strong,�sustained�output�growth�overa�period�when�vocational�training�was�limited.�Migrant�workers�are�playing�a�vital�role�in�filling�thesegaps.�Given�that�on�the�whole�they�seem�to�be�filling�‘empty’�jobs,�we�are�not�seeing�migration�resultin�unemployment�for�UK�workers,�or�even,�on�the�whole,�in�downward�pressure�on�wages.�
The�other�key�finding�which�must�be�reiterated�is�that�there�are�simply�not�as�many�migrant�workersin�the�sector�as�many�people�seem�to�believe.�Our�findings�suggest�that,�on�the�basis�of�the�bestevidence�available,�migrant�workers�only�make�up�around�4�per�cent�of�the�total�workforce.Meanwhile,�foreign�nationals�in�total�make�up�only�6�per�cent�–�with�Irish�workers�still�constituting�thelargest�single�group�within�that�figure.�Therfore,�the�vast�majority�of�new�jobs�in�this�growing�industryare�still�going�to�UK�nationals.�
As�a�result,�migrant�workers�are�unlikely�to�be�a�significant�barrier�to�local�people�securing�Olympicsconstruction�jobs.�In�our�view,�the�most�important�thing�that�will�assist�local�people�in�doing�so�iseffective�targeted�training�and�job�brokerage.�
ippr�|�Building�a�New�Home:�Migration�in�the�UK�construction�sector49
Data�sourcesThe�empirical�data�used�in�this�report�draws�on�a�range�of�sources,�reflecting�the�need�to�incorporatedata�on�a�number�of�different�topics�–�from�migration�trends�to�construction�employment�and�skillslevels.�Furthermore,�there�are�several�key�sources�of�migration�statistics�that�are�available�in�the�UK,and�so�we�have�made�use�of�these�to�build�up�an�overall�picture�of�migration�trends�as�they�pertain�tothe�construction�sector.
Our�main�sources�of�data�on�migration�are�statistics�from�Work�Permits�UK,�the�Home�Office’sAccession�Monitoring�Reports�(Home�Office�et�al 2008),�and�the�total�international�migrationestimates�that�are�calculated�by�the�Office�for�National�Statistics�from�International�Passenger�Surveydata.�The�International�Passenger�Survey�provides�an�overall�picture�of�trends�in�migration�to�the�UK.The�Work�Permits�UK�data�provides�us�with�statistics�on�total�work-permit�issuance,�the�nationality�ofwork-permit�holders�and�on�the�sectors�they�are�working�in.�The�Accession�Monitoring�Reportsprovide�detailed�sectoral�and�socioeconomic�data�on�migrants�from�the�eight�Central�and�EasternEuropean�countries�that�joined�the�EU�in�2004.
In�order�to�gain�an�understanding�of�the�stock�of�migrants�working�in�the�construction�industry�andtheir�socioeconomic�characteristics,�we�used�the�Labour�Force�Survey�(LFS),�which�is�a�comprehensivequarterly�survey�of�households�with�the�aim�of�providing�information�on�the�labour�market.�The�LFSalso�enabled�us�to�analyse�the�skills�levels�of�the�domestic�construction�workforce.
The�LFS�is�based�on�a�random�sample�of�households,�which�are�selected�from�the�Postcode�AddressFile�–�a�list�of�all�addresses�to�which�mail�is�delivered.�Of�the�addresses�in�the�list,�only�those�definedas�‘small�users’�–�those�receiving�fewer�than�50�items�of�mail�per�day�–�were�included�in�the�sample.�
The�LFS�provides�a�consistent�set�of�data�over�long�timeframes,�and�is�highly�regarded�because�it�usesinternationally�agreed�concepts�and�definitions,�but�it�is�important�to�bear�in�mind�that�since�it�is�notspecifically�designed�to�be�a�source�of�data�on�migrants,�it�does�not�capture�the�immigration�status�ofrespondents.�Instead,�it�states�the�country�of�birth�and�nationality�of�participants.�This�means�that�it�isnot�possible�to�differentiate�easily�between,�for�example,�a�highly�skilled�work-permit�holder�and�arefugee.�Nonetheless,�it�does�include�a�question�on�year�of�arrival�in�the�UK,�which�makes�it�possibleto�differentiate�between�recently�arrived�foreign�nationals�and�those�who�are�longer�settled.
We�also�need�to�bear�in�mind�that�LFS�response�rates�tend�to�be�lower�for�black�and�minority�ethnicgroups,�and�in�the�case�of�migrant�workers�there�can�be�under-reporting�because�non-privatecommunal�accommodation�is�not�covered�by�the�survey�(Office�for�National�Statistics�2003).�Theremay�also�be�specific�issues�with�the�inclusion�of�construction�workers�in�the�survey�due�to�their�hoursof�work.�Nonetheless,�we�believe�that�the�LFS�presents�the�best�official�data�available�on�thesocioeconomic�characteristics�of�migrants�working�in�the�construction�sector.
Quantitative�methodsThe�main�quantitative�methodology�employed�in�this�report�is�analysis�of�the�Labour�Force�Surveyusing�the�statistical�package�Stata.�We�have�used�the�LFS�for�two�primary�purposes:�first,�to�estimatestocks�of�migrants�in�the�construction�sector�and�second,�to�understand�the�characteristics�of�thosemigrants�and�their�local�colleagues.�In�order�to�calculate�the�stock�of�migrants�in�construction,�wehave�used�individual�quarterly�LFS�datasets,�enabling�us�to�track�changes�over�time.
In�order�to�analyse�the�characteristics�both�of�migrants�and�local�workers,�we�have�appended�fourquarters�of�data�together.�This�increases�the�total�sample�size,�and�therefore�allows�for�more�detailedanalysis�of�socioeconomic�characteristics�than�is�possible�using�a�single�quarter�of�data.�Thesocioeconomic�data�in�this�report�is�therefore�from�the�first�to�the�fourth�quarter�of�2007.�These�fourquarters�are�the�latest�available�from�the�UK�Data�Archive.�Because�each�household�in�the�LFS�issurveyed�in�five�successive�quarters,�we�used�the�thiswv variable�to�exclude�all�households�apart�fromthose�on�their�first�or�last�interview.�This�ensures�that�each�respondent�is�represented�only�once�in�theappended�dataset,�while�maximising�the�number�of�observations.
Appendix�1.�Data�sources,�methodologies�and�definitions
ippr�|�Building�a�New�Home:�Migration�in�the�UK�construction�sector50
In�order�to�analyse�data�according�to�country�of�birth�and�nationality,�we�used�the�cryox and�natoxvariables,�and�to�differentiate�between�settled�and�new�migrants�we�used�the�cameyr�variable�todefine�foreign�nationals�arriving�within�the�ten�years�leading�up�to�the�survey�date�as�‘new’�migrants(as�discussed�below,�under�‘Key�definitions’).�Using�these�definitions,�we�calculated�the�stock�of�UKnationals,�and�of�settled�and�new�migrants,�of�working�age�in�the�construction�sector�(defined�usingthe�age�and�indsect�variables).�In�order�to�analyse�socioeconomic�characteristics,�we�used�statr(employment�status),�grsswk (gross�weekly�pay�in�main�job)�and�levqual6 (level�of�highestqualification�held)�variables.�The�data�was�weighted�using�the�pwt03 and�piwt03 weights.�
The�other�quantitative�data�in�this�report�draws�on�existing�sources�such�as�the�Accession�MonitoringReports,�data�from�Work�Permits�UK�and�the�International�Passenger�Survey,�as�well�as�survey�data�onskills�and�projections�of�labour�market�demands�surrounding�the�Olympics.
Qualitative�methodsThe�data�analysis�was�supplemented�with�a�comprehensive�qualitative�component�that�enabled�us�toexplore�perceptions�and�realities�of�what�is�happening�on�the�ground�within�the�construction�sector.The�project�included�35�in-depth�interviews�with�experts�from�a�variety�of�relevant�backgrounds.Speaking�anonymously,�these�interviewees�gave�us�a�diverse�range�of�honest�and�often�frank�views.�
These�one-to-one�interviews�were�supplemented�by�several�group�discussions�of�the�questions�raisedby�this�project.�To�gain�insight�into�the�workers’�perspective,�we�held�focused�discussions�withconstruction�workers�in�East�London�–�both�with�migrants�and�with�members�of�settled�communities.We�also�hosted�two�roundtable�events�under�the�Chatham�House�Rule,�to�discuss�the�design�anddirection�of�our�research.�The�first�gathered�a�broad�range�of�experts�and�stakeholders�to�help�guideour�research�design.�The�second�was�focused�on�data�collection�and�presentation�related�to�migrants�–particularly�in�construction.�Finally,�we�held�discussions�at�the�ConstructionSkills�National�GroupMeeting�–�a�collection�of�industry�experts�whose�perspectives�were�extremely�helpful�in�the�earlystages�of�the�research.�
These�qualitative�methods�gave�us�the�opportunity�to�hear�the�views�of�a�range�of�key�stakeholdersrelevant�to�our�research,�including:�
•Academics�
•Business�representatives
•Central�and�local�government�officials
•Community-group�representatives
•Construction�firms�and�contractors
• Industry�training�providers
• Job�brokers
•Labour-market�specialists
•Olympic�officials
•Recruiters
•Union�officials.
The�findings�from�these�interviews�and�discussions�are�presented�in�the�qualitative�section�of�thereport.�
DefinitionsIn�this�report�we�define�a�‘migrant’�as�‘a�foreign�national�who�has�arrived�in�the�UK�within�the�last�10years’.�It�is�important�to�note�that�this�definition�is�very�different�from�commonly�used�or�commonlyunderstood�definitions�of�a�migrant.�
ippr�|�Building�a�New�Home:�Migration�in�the�UK�construction�sector51
The�most�commonly�understood�conception�is�someone�who�is�residing,�either�temporarily�orpermanently,�in�any�country�other�than�that�of�their�birth.�One�key�aspect�of�this�project,�however,�isto�look�at�the�role�of�‘migrants’�versus�that�of�‘locals’�in�construction�–�particularly�in�the�Olympicsboroughs�of�East�London.�It�is�clear�that�a�typical�‘foreign-born’�definition�of�migrant�will�not�allow�usto�get�to�the�heart�of�our�research�questions,�because�many�people,�especially�in�East�London,�maywell�be�born�abroad�but�are�also�settled,�local�residents�of�the�UK.
For�example,�according�to�the�2001�Census,�some�38�per�cent�of�residents�in�Newham�and�35�percent�of�residents�in�Hackney�and�Tower�Hamlets�were�foreign�born�(Travers�et�al 2007).�Yet�many�ofthese�people�will�have�been�living�in�the�UK�(and�indeed,�in�these�boroughs)�for�decades,�and�willtherefore�be�considered�‘local’�for�the�purposes�of�Olympics�planning.�Similarly,�the�constructionindustry�employs�many�permanent�residents�who�were�born�in�Ireland�but�have�been�working�in�theUK�for�decades.�These�foreign-born�residents�are�not�generally�what�we,�or�the�broader�public,�tendto�have�in�mind�when�discussing�‘migrant’�workers.�
In�this�report,�we�use�an�alternative�approach�to�distinguish�between�‘migrant�workers’�and�‘localworkers’,�based�on�nationality�rather�than�country�of�birth.�This�has�the�advantage�of�designatingthose�who�may�have�been�born�abroad�but�now�have�British�nationality�as�‘local’.�Some�‘foreignnationals’�however�will�have�been�living�in�London�for�decades�but�will�not�have�taken�Britishnationality,�or�may�be�dual�nationals.�These�people�may�be�categorised�as�‘migrants’�when�in�fact�theyfeel�like�Londoners�and�are�seen�as�such�by�others�(including�official�agencies).�This�is�why�we�havetried�to�use�a�cut-off�point�of�having�arrived�in�the�UK�within�the�past�10�years.�In�other�words,�in�ouranalysis,�a�foreign�national�who�has�been�living�in�the�UK�for�20�years�will�not�be�counted�as�amigrant�unless�specified.�
It�is�also�important�to�note�that�migrants�in�the�construction�industry�are�an�extremely�heterogeneousgroup.�They�come�from�many�different�countries,�have�arrived�for�all�kinds�of�reasons,�possess�a�rangeof�employment�and�skills�backgrounds,�and�are�in�the�UK�for�durations�ranging�from�a�few�weeks�topermanently.�In�the�course�of�our�research,�we�found�it�useful�to�distinguish�between�the�followingdifferent�types�of�migrants�within�the�construction�sector.�We�hope�that�this�typology,�though�by�nomeans�perfect,�will�help�readers�make�sense�of�the�heterogeneity�in�the�sector:
1.�Short-term�contract�workers This�group�includes�very�highly�skilled�specialists�contracted�orsubcontracted�to�provide�a�key�service,�or�teams�of�‘posted�workers’�working�on�a�particular�project.The�defining�feature�of�these�workers�is�that�they�do�not�reside�in�the�UK�–�they�come�to�work�solelyon�a�particular�contract,�and�then�leave�again.�This�is�‘trade�in�services’�rather�than�migration�as�it�isstrictly�understood,�but�nonetheless�it�does�constitute�international�labour�mobility,�with�an�impact�onUK�labour�markets,�and�must�be�included�in�any�study�such�as�this.�However,�as�it�is�not�considered‘migration’,�these�workers�are�not�captured�in�the�migration�datasets,�and�as�such�it�is�not�possible�tosay�much�about�them�in�any�detail.�Most�of�the�report’s�conclusions�therefore�exclude�this�group.
2.�Employed�EEA�nationals�With�the�exception�of�Romanians�and�Bulgarians,�most�nationals�of�theEuropean�Economic�Area�(EEA)�have�the�right�to�work�in�the�UK.�Many�EEA�nationals�in�theconstruction�sector,�particularly�from�the�eight�states�that�joined�the�EU�in�2004�(A8�countries),�wererecruited�in�their�home�country�by�an�agency,�and�work�in�the�UK�for�the�same�agency.�However,some�came�on�their�own�to�the�UK�and�found�work,�either�directly�with�an�employer�or�through�alocal�recruitment�agency.�It�is�helpful�to�make�this�distinction,�as�this�may�affect�the�worker’s�labourmarket�flexibility.�
3.�Self-employed�EEA�nationals All�EEA�nationals,�including�Romanians�and�Bulgarians,�have�theright�to�be�self-employed�in�the�UK.�There�is�considerable�evidence�to�suggest�that�many�EEAnationals�(particularly�from�the�A8�countries)�contract�their�services�in�the�construction�sector�aslabour-only�subcontractors�or�self-employed�businesses.
4.�Non-EEA�nationals�with�work�visas Nationals�of�non-EEA�nationals�generally�require�specialpermission�to�be�employed�or�self-employed�in�the�UK.�Routes�of�permission�include�the�HighlySkilled�Migrant�Programme�and�the�work�permit�scheme.�These�are�currently�being�merged�into�Tiers1�and�2�of�the�points-based�system.�
ippr�|�Building�a�New�Home:�Migration�in�the�UK�construction�sector52
5.�Non-EEA�nationals�with�permission�to�work Some�non-EEA�nationals�in�the�constructionsector�may�not�possess�a�special�work�visa�but�may�have�the�right�to�work�in�the�UK�through�theirresidence�status.�This�may�arise�because�they�are�family�members�of�UK�or�EEA�nationals,�familymembers�of�migrants�with�the�right�to�work,�international�students�with�permission�to�work�limitedhours,�or�refugees�and�their�family�members.
6.�Undocumented�migrants This�group,�sometimes�called�‘irregular�migrants’,�includes�non-EEAnationals�who�do�not�have�the�right�to�be�in�the�UK,�who�do�not�have�a�work�visa�or�permission�towork�in�the�UK,�or�who�may�be�working�in�breach�of�the�terms�of�their�visa.�Until�they�are�given�fullfree-movement�rights,�A8�nationals�who�do�not�register�with�the�Worker�Registration�Scheme,�andRomanians�and�Bulgarians�in�employment�(rather�than�self-employment),�could�also�be�classed�withinthis�group.
As�discussed�earlier,�in�this�report�we�do�not�classify�those�who�have�taken�UK�nationality�as‘migrants’,�though�most�of�them�will�have�once�belonged�to�one�of�the�above�categories.
In�most�parts�of�the�report�we�focus�on�the�effect�of�all�migration�into�the�sector,�and�do�notdifferentiate�between�types�of�migrants.�However,�in�places�we�discuss�‘labour�migration’�–�that�is,members�of�groups�2,�3�and�4�above�–�where�migrants�come�to�the�UK�with�the�intention�of�working.However,�only�migrants�described�in�group�4�(plus�Romanians�and�Bulgarians)�will�be�affected�bylabour�migration�policy�per�se,�as�intra-EEA�migration�is�not�subject�to�regulation�at�the�national�level(except�for�transitional�arrangements�for�Romanians�and�Bulgarians).�It�is�actually�only�this�smallsubset�of�workers�whose�entry�to�the�UK�is�determined�on�the�basis�of�economic�considerations,�andthus�it�is�this�limited�category�of�workers�that�will�be�affected�by�the�conclusions�drawn�about�theeconomic�impacts�of�migration�as�a�whole.
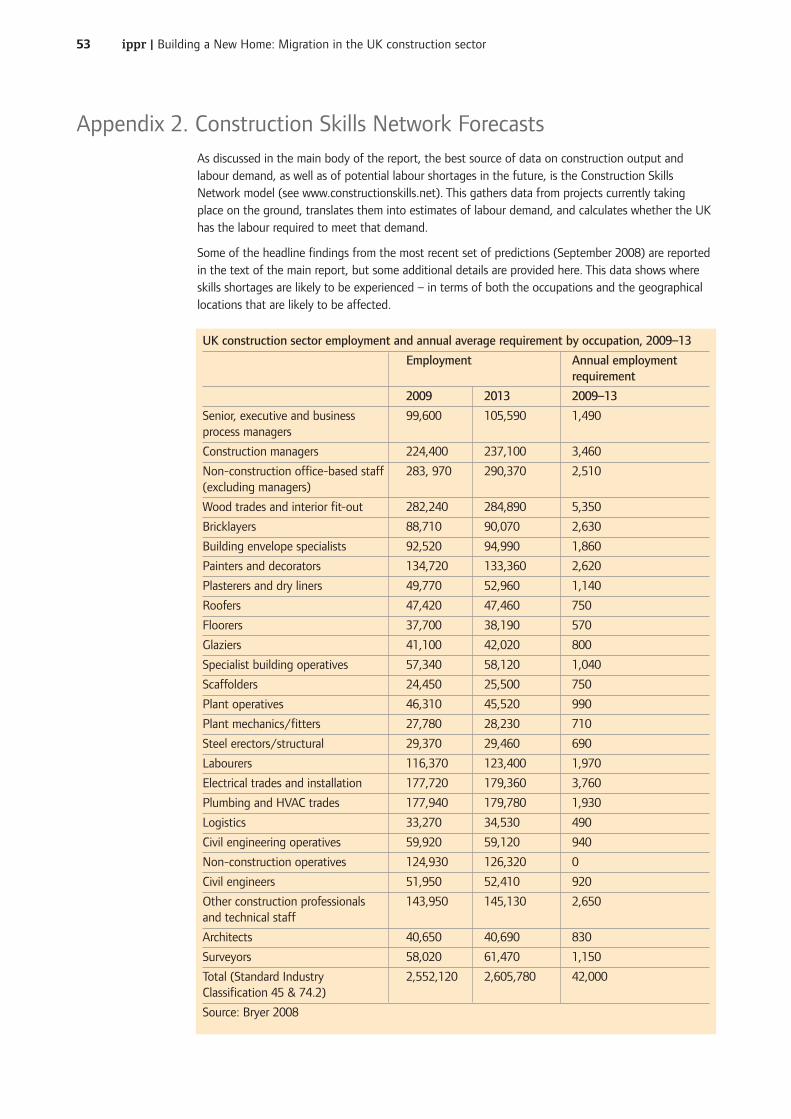
ippr�|�Building�a�New�Home:�Migration�in�the�UK�construction�sector53
As�discussed�in�the�main�body�of�the�report,�the�best�source�of�data�on�construction�output�andlabour�demand,�as�well�as�of�potential�labour�shortages�in�the�future,�is�the�Construction�SkillsNetwork�model�(see�www.constructionskills.net).�This�gathers�data�from�projects�currently�takingplace�on�the�ground,�translates�them�into�estimates�of�labour�demand,�and�calculates�whether�the�UKhas�the�labour�required�to�meet�that�demand.�
Some�of�the�headline�findings�from�the�most�recent�set�of�predictions�(September�2008)�are�reportedin�the�text�of�the�main�report,�but�some�additional�details�are�provided�here.�This�data�shows�whereskills�shortages�are�likely�to�be�experienced�–�in�terms�of�both�the�occupations�and�the�geographicallocations�that�are�likely�to�be�affected.�
Appendix�2.�Construction�Skills�Network�Forecasts
UK�construction�sector�employment�and�annual�average�requirement�by�occupation,�2009–13
Employment Annual�employment�requirement
2009 2013 2009–13
Senior,�executive�and�business� 99,600 105,590 1,490process�managers
Construction�managers 224,400 237,100 3,460
Non-construction�office-based�staff� 283,�970 290,370 2,510(excluding�managers)
Wood�trades�and�interior�fit-out 282,240 284,890 5,350
Bricklayers 88,710 90,070 2,630
Building�envelope�specialists 92,520 94,990 1,860
Painters�and�decorators� 134,720 133,360 2,620
Plasterers�and�dry�liners 49,770 52,960 1,140
Roofers 47,420 47,460 750
Floorers 37,700 38,190 570
Glaziers 41,100 42,020 800
Specialist�building�operatives 57,340 58,120 1,040
Scaffolders 24,450 25,500 750
Plant�operatives 46,310 45,520 990
Plant�mechanics/fitters� 27,780 28,230 710
Steel�erectors/structural 29,370 29,460 690
Labourers� 116,370 123,400 1,970
Electrical�trades�and�installation 177,720 179,360 3,760
Plumbing�and�HVAC�trades 177,940 179,780 1,930
Logistics 33,270 34,530 490
Civil�engineering�operatives� 59,920 59,120 940
Non-construction�operatives 124,930 126,320 0
Civil�engineers 51,950 52,410 920
Other�construction�professionals� 143,950 145,130 2,650and�technical�staff
Architects 40,650 40,690 830
Surveyors 58,020 61,470 1,150
Total�(Standard�Industry� 2,552,120 2,605,780 42,000Classification�45�&�74.2)
Source:�Bryer�2008
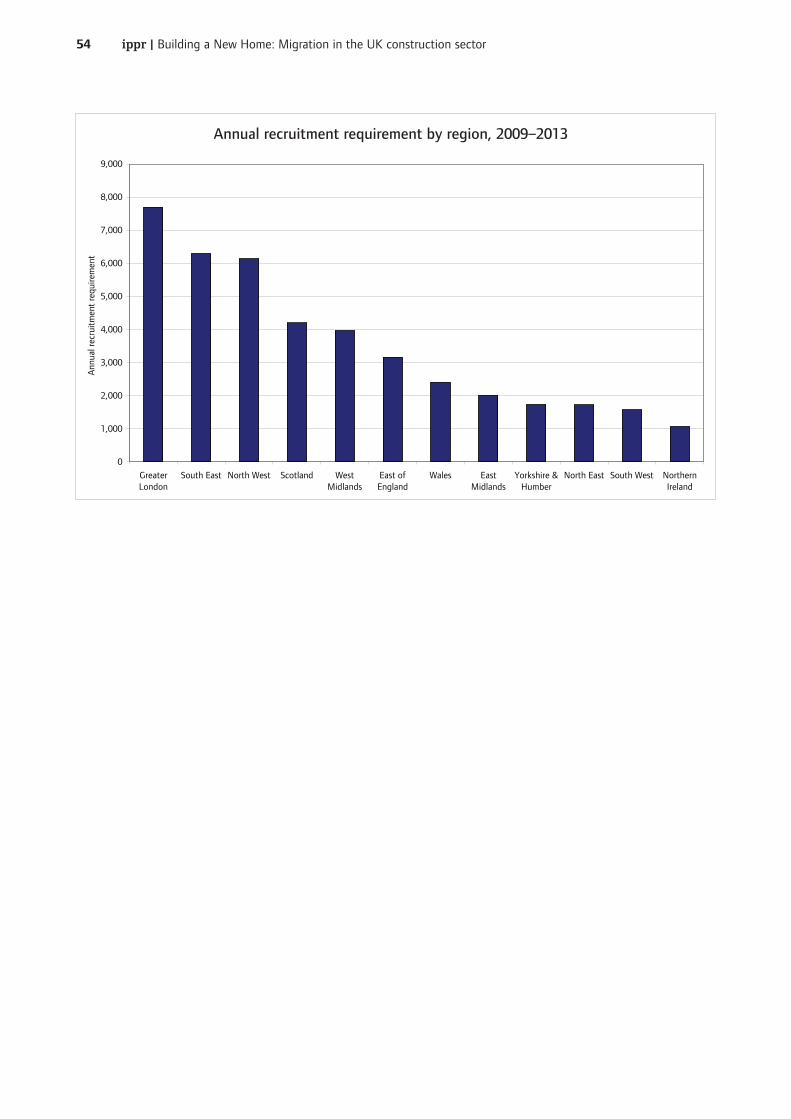
ippr�|�Building�a�New�Home:�Migration�in�the�UK�construction�sector54
Annual recruitment requirement by region 2009-2013
0
1,000
2,000
3,000
4,000
5,000
6,000
7,000
8,000
9,000
GreaterLondon
South East North West Scotland WestMidlands
East ofEngland
Wales EastMidlands
Yorkshire &Humber
North East South West NorthernIreland
Ann
ual r
ecru
itmen
t re
quire
men
t
Annual�recruitment�requirement�by�region,�2009–2013
ippr�|�Building�a�New�Home:�Migration�in�the�UK�construction�sector55
Alderson�A�and�Field�J�(2004)�‘Greece�calls�up�army�of�illegal�workers�to�get�Olympic�venuescompleted�on�time’�Daily�Telegraph 1�August:�9,�available�atwww.telegraph.co.uk/news/main.jhtml?xml=/news/2004/08/01/woly01.xml&sSheet=/portal/2004/08/01/ixportal.html
Amnesty�International�(2004)�‘Greece:�Olympics�‘clean-up’�hits�city’s�most�vulnerable�inhabitants’press�release,�6�August,�available�at�http://news.amnesty.org/index/ENGEUR256082004
Anderson�B�and�Rogaly�B�(2005) Forced�Labour�and�Migration�to�the�UK Oxford:�COMPAS�with�theTrades�Union�Congress,�available�at�www.tuc.org.uk/international/tuc-9317-f0.pdf
Anderson�B,�Ruhs�M,�Rogaly�B�and�Spencer�S�(2006)�Fair�Enough?�Central�and�East�Europeanmigrants�in�low-wage�employment�in�the�UK York:�Joseph�Rowntree�Foundation,�available�atwww.jrf.org.uk/bookshop/eBooks/1617-migrants-low-wage-employment.pdf
Baade�R�and�Matheson�V�(2002)�‘Bidding�for�the�Olympics:�Fool’s�gold?’�in�Barros�C,�Ibrahim�M�andSzymanski�S�(eds)�Transatlantic�Sport:�The�comparative�cconomics�of�North�American�andEuropean�sports�London:�Edward�Elgar:�127-51
Balch�A,�Fellini�I,�Ferro�A,�Fullin�G�and�Hunger�U�(2004)�‘The�political�economy�of�labour�migration�inthe�European�construction�sector’ IMIS-Beiträge 25:�179-99
Bentham�M�and�Simons�R�(2007)�‘Illegal�workers�held�after�raid�on�Wembley’ Evening�Standard 13February:�4
Blake�N,�Croot�J�and�Hastings�J�(2004)�Measuring�the�Competitiveness�of�the�UK�ConstructionIndustry:�Volume�2 London:�Department�of�Trade�and�Industry,�available�atwww.dti.gov.uk/files/file19029.pdf
Blanchflower�D,�Saleheen�J�and�Shadforth�C�(2007)�The�Impact�of�the�Recent�Migration�from�EasternEurope�on�the�UK�Economy�London:�Bank�of�England,�available�atwww.bankofengland.co.uk/publications/speeches/2007/speech297.pdf
Borjas�G�(1995)�‘The�economic�benefits�from�immigration’�Journal�of�Economic�Perspectives 9(2):�3-22
Briscoe�G�(2005)�‘Women�and�minority�groups�in�UK�construction:�Recent�trends’�ConstructionManagement�and�Economics�23(10):�1001-05
Bryer�L�(2008)�Personal�communication�to�the�authors,�2/10/08
Buckley�C�(2007)�‘GMB�targets�Polish�migrant�workers�in�spirit�of�solidarity’�The�Times 15�January:41,�available�at�http://business.timesonline.co.uk/tol/business/markets/europe/article1292912.ece
Byrne�J,�Clarke�L�and�van�der�Meer�M�(2005)�‘Gender�and�ethnic�minority�exclusion�from�skilledoccupations�in�construction:�A�Western�European�comparison’�Construction�Management�andEconomics�23(10):�1025-34
Campbell�D�(2006)�‘Poles�are�bringing�solidarity�back�into�fashion�in�Britain’�The�Guardian, 6December:�32,�available�at�www.guardian.co.uk/commentisfree/story/0,,1965023,00.html
Card�D�(2001)�‘Immigrant�inflows,�native�outflows,�and�the�local�market�impacts�of�higherimmigration’�Journal�of�Labor�Economics 19(1):�22-64
Card�D�(2005)�‘Is�the�new�immigration�really�so�bad?’�The�Economic�Journal 115(507):�F300–23
Chartered�Institute�of�Personnel�and�Development�(2005) Labour�Market�Outlook, autumn,�availableat�www.cipd.co.uk/NR/rdonlyres/149C9564-1AB6-4AED-8F17-A6E71DE60254/0/labmktout1105.pdf
References
ippr�|�Building�a�New�Home:�Migration�in�the�UK�construction�sector56
CITB-ConstructionSkills�(2006)�Olympics�Research:�Phase�two�–�Construction�skills�in�Greater�LondonKing’s�Lynn:�CITB-ConstructionSkills
Clarke�J�and�Salt�J�(2003)�‘Work�permits�and�foreign�labour�in�the�UK:�A�statistical�review’ LabourMarket�Trends�111(11):�563-74,�available�atwww.statistics.gov.uk/articles/labour_market_trends/Workpermits_nov03.pdf
Clarke�L�(2006)�‘Valuing�labour’ Building�Research�&�Information�34(3):�246-56
Comptroller�and�Auditor�General�(2001)�Modernising�Construction:�Report�by�the�Comptroller�andAuditor�General�London:�National�Audit�Office,�available�atwww.nao.org.uk/publications/nao_reports/00-01/000187.pdf
ConstructionSkills�(2004)�Skills�needs�analysis�for�the�construction�industry King’s�Lynn:ConstructionSkills,�available�at�www.ssda.org.uk/ssda/pdf/050708%20D%20ConstructionSkills%20Stage%201%20final%20document.pdf
ConstructionSkills�(2007)�Blueprint�for�UK�Construction�Skills�2007-2011 King’s�Lynn:ConstructionSkills,�available�at�www.constructionskills.net/pdf/research/outputs/UK_LMI.pdf
ConstructionSkills�(2008)�Blueprint�for�UK�Construction�Skills�2008�-�2012:�ConstructionSkills,�availableat�www.constructionskills.net/pdf/research/outputs/2008/UK_LMI.pdf
Cooley�L,�Farrant�M�and�Sriskandarajah�D�(2005)�Selecting�Wisely:�Making�managed�migration�workfor�Britain London:�Institute�for�Public�Policy�Research,�available�atwww.ippr.org/members/download.asp?f=%2Fecomm%2Ffiles%2Fselecting%5Fwisely%2Epdf
Craw�M,�Clarke�L,�Jeffreys�S,�Beutel�M,�Roy�K�and�Gribling�M�(2007)�The�Construction�Industry�inLondon�and�Diversity�Performance�London:�Greater�London�Authority
Dench�S,�Hurstfield�J,�Hill�D�and�Akroyd�K�(2006)�Employers’�use�of�Migrant�Labour:�Main�report,Home�Office�Online�Report�04/06 London:�Home�Office,�available�atwww.homeoffice.gov.uk/rds/pdfs06/rdsolr0406.pdf
Department�for�Work�and�Pensions�and�Department�for�Innovation�Universities�and�Skills�(2008)Ready�for�Work,�Skilled�for�Work:�Unlocking�Britain’s�talent�London:�The�Stationary�Office
Dobson�J,�Koser�K,�Mclaughlan�G�and�Salt�J�(2001)�International�Migration�and�the�United�Kingdom:Recent�patterns�and�trends�RDS�Occasional�Paper�75,�London:�Home�Office,�available�atwww.homeoffice.gov.uk/rds/pdfs/occ75.pdf
Dustmann�C,�Casanova�M,�Fertig�M,�Preston�I�and�Schmidt�C�(2003)�The�Impact�of�EU�Enlargementon�Migration�Flows�Home�Office�Online�Report�25/03�London:�Home�Office,�available�atwww.homeoffice.gov.uk/rds/pdfs2/rdsolr2503.pdf
Dustmann�C,�Fabbri�F�and�Preston�I�(2005)�‘The�impact�of�immigration�on�the�British�labour�market’The�Economic�Journal�115(507):�F324-41
Eade�J,�Drinkwater�S�and�Garapich�M�(2006)�Class�and�Ethnicity:�Polish�migrants�in�London�Guildford:University�of�Surrey�Centre�for�Research�on�Nationalism,�Ethnicity�and�Multiculturalism,�availableat�www.surrey.ac.uk/Arts/CRONEM/polish/POLISH_FINAL_RESEARCH_REPORT_WEB.pdf
Eaglesham�J�(2007)�‘Migrants�‘better�skilled�than�Britons’’�Financial�Times�30�January:�2,�available�atwww.ft.com/cms/s/0de4f24a-b007-11db-94ab-0000779e2340.html
Economist�(2006)�‘Second�thoughts:�Why�the�door�will�not�open�for�workers�from�Romania�andBulgaria’�The�Economist�26�August:�26,�available�atwww.economist.com/displayStory.cfm?story_id=7843391
Ernst�&�Young�(2006)�ITEM�Club�Special�Report:�Finding�our�potential�London:�Ernst�&�Young,available�at�www.ey.com/Global/download.nsf/UK/Economic_Outlook_for_Business_-_report_09_06_-_Finding_our_potential/$file/EY_ITEM_Finding_Potential_Report_Sept_2006.pdf
ippr�|�Building�a�New�Home:�Migration�in�the�UK�construction�sector57
Experian�(2006)�Employment�and�Skills�for�the�2012�Games:�Research�and�evidence�–�final�report�forthe�Learning�and�Skills�Council�and�London�Development�Agency London:�Learning�and�SkillsCouncil�and�London�Development�Agency,�available�athttp://readingroom.lsc.gov.uk/lsc/2006/research/commissioned/nat-employment-and-skills-for-the-2012-games-research-and-evidence-jun-2006-main-report.pdf
Fellini�I�and�Fullin�G�(2002)�Firms�as�Actors�in�Subcontracting�and�Recruitment�of�Foreign�Labour:�Thechallenge�of�cross-sectoral�comparison�Political�Economy�of�Migration�in�an�Integrating�Europe(PEMINT)�Working�Paper�3/2002,�Coimbra:�Centro�de�Estudos�Sociais,�available�athttp://pemint.ces.uc.pt/Working%20Paper-3.pdf
Fitzgerald�I�(2006)�Organising�Migrant�Workers�in�Construction:�Experience�from�the�North�East�ofEngland�Newcastle�upon�Tyne:�Northern�Trades�Union�Congress,�available�atwww.tuc.org.uk/extras/northernmigrant.pdf
Friedberg�R�and�Hunt�J�(1995)�‘The�impact�of�immigrants�on�host�country�wages,�employment�andgrowth’�Journal�of�Economic�Perspectives 9(2):�23-44
Geddes�A�and�Balch�A�(2002)�The�Political�Economy�of�Migration�in�an�Integrating�Europe:�Patterns,trends,�lacunae�and�their�implications�Political�Economy�of�Migration�in�an�Integrating�Europe(PEMINT)�Working�Paper�6/2002�,Coimbra:�Centro�de�Estudos�Sociais,�available�athttp://pemint.ces.uc.pt/Working%20Paper-6.pdf
Gilpin�N,�Henty�M,�Lemos�S,�Portes�J�and�Bullen�C�(2006)�The�Impact�of�Free�Movement�of�Workersfrom�Central�and�Eastern�Europe�on�the�UK�Labour�Market�Department�for�Work�and�PensionsWorking�Paper�29,�London:�Department�for�Work�and�Pensions,�available�atwww.dwp.gov.uk/asd/asd5/wp29.pdf
Glover�S,�Gott�C,�Loizillon�A,�Portes�J,�Price�R,�Spencer�S,�Srinivasan�V�and�Willis�C�(2001)�Migration:An�economic�and�social�analysis�RDS�Occasional�Paper�67,�London:�Home�Office,�available�atwww.homeoffice.gov.uk/rds/pdfs/occ67-migration.pdf
Gott�C�and�Johnston�K�(2002)�The�Migrant�Population�in�the�UK:�Fiscal�effects RDS�Occasional�Paper77,�London:�Home�Office�www.homeoffice.gov.uk/rds/pdfs/occ77migrant.pdf
Hickley�M�(2006)�‘Britain’s�biggest�wave�of�migrants�in�history’�Daily�Mail�21�July�2006,�available�atwww.dailymail.co.uk/pages/live/articles/news/news.html?in_article_id=396825&in_page_id=1770&ico=Homepage&icl=TabModule&icc=NEWS&ct=5
Home�Office�(2002)�Secure�Borders,�Safe�Haven:�Integration�with�diversity�in�modern�Britain London:The�Stationery�Office,�available�at�www.archive2.official-documents.co.uk/document/cm53/5387/cm5387.pdf
Home�Office�(2005)�‘Worker�Registration�Scheme�and�Work�Permit�figures�published’,�press�release22�February,�available�at�www.workingintheuk.gov.uk/working_in_the_uk/en/homepage/news/press/worker_registration.html
Home�Office,�Department�for�Work�and�Pensions,�HM�Revenue�&�Customs�and�Communities�andLocal�Government�(2007)�Accession�Monitoring�Report:�May�2004-June 2007�London:�HomeOffice
Home�Office,�Department�for�Work�and�Pensions,�HM�Revenue�&�Customs�and�Department�forCommunities�and�Local�Government�(2008)�Accession�Monitoring�Report:�May�2004-June�2008London:�Home�Office,�available�athttp://ukba.homeoffice.gov.uk/sitecontent/documents/aboutus/reports/accession_monitoring_report/report16/may04jun08.pdf?view=Binary
House�of�Lords�Select�Committee�on�Economic�Affairs�(2008)�The�Economic�Impact�of�ImmigrationLondon:�House�of�Lords,�available�at�www.parliament.the-stationery-office.co.uk/pa/ld200708/ldselect/ldeconaf/82/82.pdf
ippr�|�Building�a�New�Home:�Migration�in�the�UK�construction�sector58
Institute�of�Directors�(2007)�‘Business�leader’s�survey�on�migrant�workers’�press�release�30�January,available�at�http://press.iod.com/newsdetails.aspx?ref=263&m=2&mi=62&ms=
Kyambi�S�(2005)�Beyond�Black�and�White:�Mapping�new�immigrant�communities�London:�Institute�forPublic�Policy�Research
Leitch�S�(2006)�Prosperity�for�All�in�the�Global�Economy�–�World�class�skills London:�The�StationeryOffice,�available�at�www.hm-treasury.gov.uk/d/leitch_finalreport051206.pdf
Manacorda�M,�Manning�A�and�Wadsworth�J�(2006)�The�Impact�of�Immigration�on�the�Structure�ofMale�Wages:�Theory�and�evidence�from�Britain�IZA�Discussion�Paper�2352,�Bonn:�Institute�for�theStudy�of�Labor,�available�at�http://ftp.iza.org/dp2352.pdf
Nathan�M�(2008)�Your�Place�or�Mine?�The�Local�Economics�of�Migration�The�Economics�of�Migration1,�London:�Institute�for�Public�Policy�Research
Office�for�National�Statistics�(2003)�Labour�Force�Survey�User�Guide�–�Volume�1:�Background�&methodology London:�Office�for�National�Statistics,�available�atwww.statistics.gov.uk/downloads/theme_labour/LFSUG_Vol1_2003.pdf
Office�for�National�Statistics�(2006a)�The�2011�Census:�Assessment�of�initial�user�requirements�oncontent�for�England�and�Wales�–�Qualifications London:�Office�for�National�Statistics,�available�atwww.statistics.gov.uk/about/consultations/downloads/2011Census_assessment_qualifications.pdf
Office�for�National�Statistics�(2006b)�Annual�Survey�of�Hours�and�Earnings�(ASHE):�2005�resultsLondon:�Office�for�National�Statistics,�available�atwww.statistics.gov.uk/StatBase/Product.asp?vlnk=14203&Pos=&ColRank=1&Rank=272
Office�for�National�Statistics�(2007a)�Annual�Survey�of�Hours�and�Earnings�(ASHE):�2006�resultsLondon:�Office�for�National�Statistics,�available�atwww.statistics.gov.uk/StatBase/Product.asp?vlnk=14630
Office�for�National�Statistics�(2008)�Annual�Survey�of�Hours�and�Earnings�(ASHE):�2007�results,available�at�www.statistics.gov.uk/StatBase/Product.asp?vlnk=15050
Pollard�N,�Latorre�M�and�Sriskandarajah�D�(2008)�Floodgates�or�turnstiles?�Post-EU�enlargementmigration�flows�to�(and�from)�the�UK London:�Institute�for�Public�Policy�Research,�available�atwww.ippr.org.uk/publicationsandreports/publication.asp?id=603
Portes�J�and�French�S�(2005)�The�Impact�of�Free�Movement�of�Workers�from�Central�and�EasternEurope�on�the�UK�Labour�Market:�Early�evidence Department�for�Work�and�Pensions�WorkingPaper�18,�London:�Department�for�Work�and�Pensions,�available�atwww.dwp.gov.uk/asd/asd5/WP18.pdf
Preuss�H�(1998)�‘Problematizing�arguments�of�the�opponents�of�Olympic�Games’,�in�Barney�R,Wamsley�K,�Martyn�S�and�MacDonald�G�(eds)�Global�and�Cultural�Critique:�Problematizing�theOlympic�Games London,�Ontario:�Fourth�International�Symposium�for�Olympic�Research:�197-218,available�at�www.aafla.org/SportsLibrary/ISOR/ISOR1998w.pdf
Preuss�H�(2004)�The�Economics�of�Staging�the�Olympics Cheltenham:�Edward�Elgar
Reed�H�and�Latorre�M�(forthcoming)�The�Economic�Impacts�of�Migration�on�the�UK�Labour�MarketLondon:�Institute�for�Public�Policy�Research
RSA�Migration�Commission�(2005)�Migration:�A�welcome�opportunity London:�RSA,�available�atwww.migrationcommission.org/pdf/RSA_migration_report_awo.pdf
Salt�J�(2004)�International�Migration�and�the�United�Kingdom:�Report�of�the�United�Kingdom�SOPEMIcorrespondent�to�the�OECD, 2004�London:�University�College�London,�available�atwww.geog.ucl.ac.uk/mru/docs/uk_sopemi_04.pdf
Salt�J�(2007)�International�migration�and�the�United�Kingdom:�Report�of�the�United�Kingdom�SOPEMIcorrespondent�to�the�OECD,�available�at�www.geog.ucl.ac.uk/research/mobility-identity-and-security/migration-research-unit/pdfs/Sop07_20080131.pdf
ippr�|�Building�a�New�Home:�Migration�in�the�UK�construction�sector59
Salt�J�and�Millar�J�(2006)�‘Foreign�labour�in�the�United�Kingdom:�Current�patterns�and�trends’ LabourMarket�Trends�114(10):�335-55,�available�atwww.statistics.gov.uk/articles/labour_market_trends/foreign_labour.pdf
Serious�Organised�Crime�Agency�(2006)�The�United�Kingdom�Threat�Assessment�of�Serious�OrganisedCrime London:�Serious�Organised�Crime�Agency,�available�atwww.soca.gov.uk/assessPublications/downloads/threat_assess_unclass_250706.pdf
Spence�L�(2005)�Country�of�Birth�and�Labour�Market�Outcomes�in�London:�An�analysis�of�LabourForce�Survey�and�Census�data DMAG�Briefing�2005/1,�London:�Greater�London�Authority,available�at�www.london.gov.uk/gla/publications/factsandfigures/DMAG-Briefing-2005-1.pdf
Sriskandarajah�D,�Cooley�L�and�Kornblatt�T�(2007)�Britain’s�immigrants:�An�economic�profile,�availableat�www.ippr.org.uk/publicationsandreports/publication.asp?id=563
Sriskandarajah�D,�Cooley�L�and�Reed�H�(2005)�Paying�Their�Way:�The�fiscal�contribution�of�immigrantsin�the�UK London:�Institute�for�Public�Policy�Research,�available�atwww.ippr.org/members/download.asp?f=%2Fecomm%2Ffiles%2FPaying+Their+Way%2Epdf
Travers�T,�Tunstall�R,�Whitehead�C�and�Pruvot�S�(2007)�Population�Mobility�and�Service�Provision:�Areport�for�London�Councils London:�London�School�of�Economics,�available�atwww.londoncouncils.gov.uk/upload/public/attachments/997/LSE%20Population%20Mobility%20report%20-%20Feb%202007.pdf
UBS�Investment�Research�(2006)�Winning�by�Taking�Part:�East�London’s�economy�and�the�OlympicsLondon:�UBS�Limited
UK�Border�Agency�(2007)�‘Employers�Face�New�Fines�for�Illegal�Working’�Retrieved�27/08/08,available�at�www.bia.homeoffice.gov.uk/sitecontent/newsarticles/2007/employersfacenewfines


