Embed Size (px)
Citation preview

BSES Rajdhani Power Limited
Document No. BRPL/MYT/2007-11 BSES Rajdhani Power Limited
Rev: 00 Page 1 of 26
BSES Rajdhani Power Limited
Capital Investment Plan
For FY 2007-2011
BSES Rajdhani Power Limited
Document No. BRPL/MYT/2007-11 BSES Rajdhani Power Limited
Rev: 00 Page 2 of 26
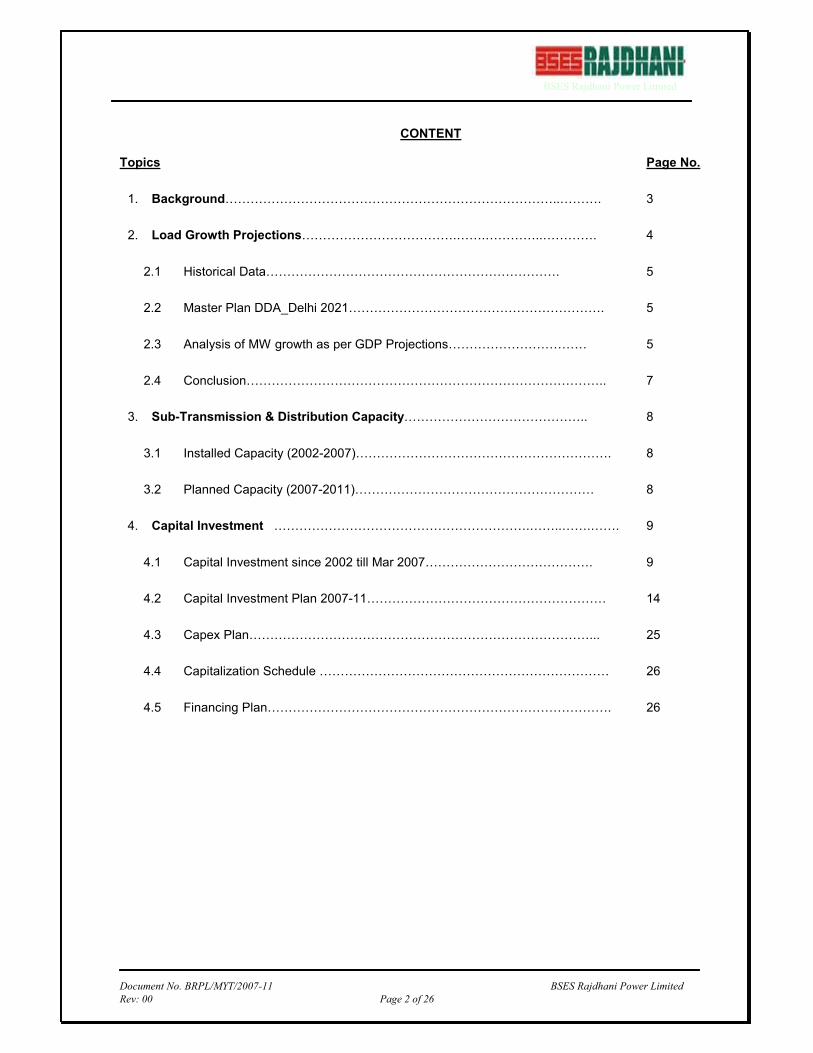
CONTENT
Topics Page No.
1. Background……………………………………………………………………..………. 3
2. Load Growth Projections……………………………….…….…………..…………. 4
2.1 Historical Data……………………………………………………………. 5
2.2 Master Plan DDA_Delhi 2021……………………………………………………. 5
2.3 Analysis of MW growth as per GDP Projections…………………………… 5
2.4 Conclusion………………………………………………………………………….. 7
3. Sub-Transmission & Distribution Capacity…………………………………….. 8
3.1 Installed Capacity (2002-2007)……………………………………………………. 8
3.2 Planned Capacity (2007-2011)………………………………………………… 8
4. Capital Investment …………………………………………………….……..…….……. 9
4.1 Capital Investment since 2002 till Mar 2007…………………………………. 9
4.2 Capital Investment Plan 2007-11………………………………………………… 14
4.3 Capex Plan………………………………………………………………………... 25
4.4 Capitalization Schedule …………………………………………………………… 26
4.5 Financing Plan………………………………………………………………………. 26

BSES Rajdhani Power Limited
Document No. BRPL/MYT/2007-11 BSES Rajdhani Power Limited
Rev: 00 Page 3 of 26
1. Background BSES Rajdhani Power Limited (BRPL), a joint venture between BSES Limited and the government of NCT
of Delhi had taken over the distribution of electric power in the area of South & West Delhi from Delhi
Vidyut Board (DVB) on July 2002.
For administrative purpose, BRPL is split into 19 business units on the basis of number of consumers. The
various consumer touch points include Consumer Care Centers, Complaint Centers, Consumer Call
Centers to facilitate commercial process such as new connection, billing related queries, solving the
complaints etc,.
BRPL distributes electricity in South and West Delhi with a registered consumer base of around 10 lacs, a
peak load of 1684 MW and operation span across an area of 700 Sq. km.
Delhi Electricity Regulatory Commission (DERC) has proposed to implement the ‘Multi Year Tariff’ (MYT)
framework, applicable from 1st April ’07 for the control period 2007-2011. Accordingly, yearly capital
investment plan for the control period is required for determination of Tariff for the control period.
In view of above a Capital investment plan has been developed, structured and phased out taking into
consideration the key issues such as the upcoming Load Growth, Commonwealth Games - 2010, DDA
Master Plan, Governments commitment to make Delhi a world class City etc. While developing the
investment plan due weight-age has been given to facets such as reduction of AT&C loss, strengthening of
existing system, automation, and routine up-gradation for development of distribution network with the aim
to maintain a reliable and quality power supply to its consumer.
BSES Rajdhani Power Limited
Document No. BRPL/MYT/2007-11 BSES Rajdhani Power Limited
Rev: 00 Page 4 of 26
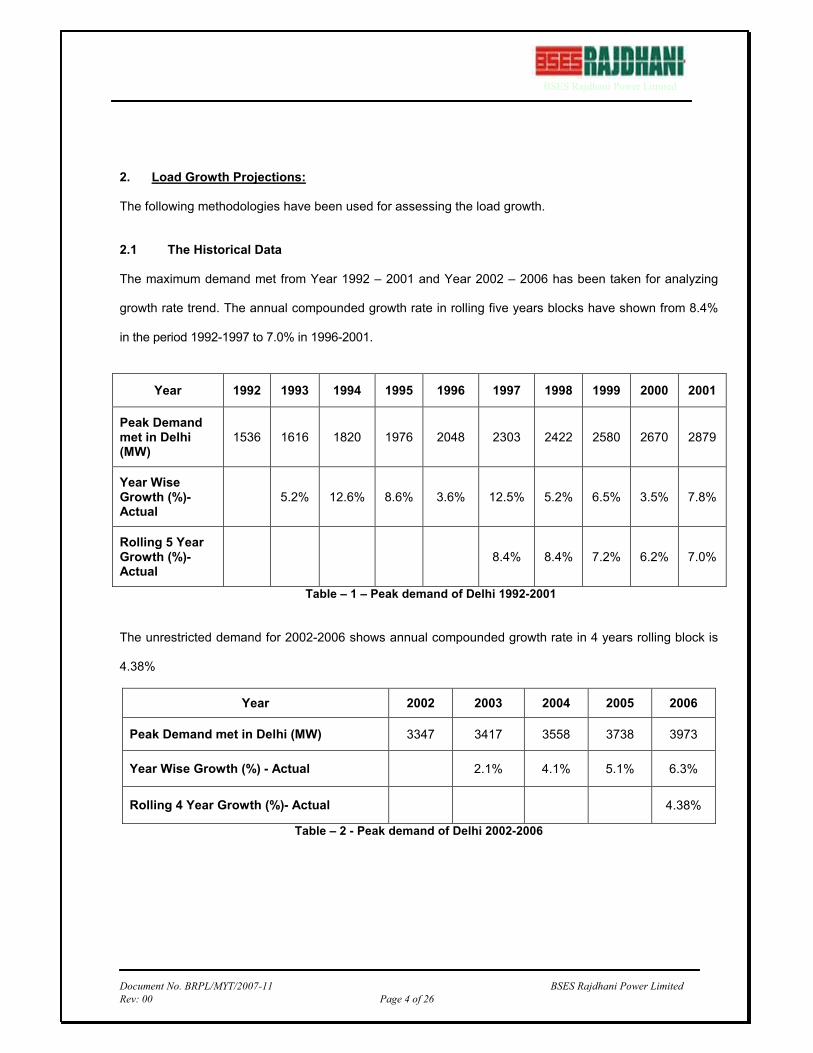
2. Load Growth Projections: The following methodologies have been used for assessing the load growth. 2.1 The Historical Data The maximum demand met from Year 1992 – 2001 and Year 2002 – 2006 has been taken for analyzing
growth rate trend. The annual compounded growth rate in rolling five years blocks have shown from 8.4%
in the period 1992-1997 to 7.0% in 1996-2001.
Year 1992 1993 1994 1995 1996 1997 1998 1999 2000 2001
Peak Demand met in Delhi (MW)
1536 1616 1820 1976 2048 2303 2422 2580 2670 2879
Year Wise Growth (%)- Actual
5.2% 12.6% 8.6% 3.6% 12.5% 5.2% 6.5% 3.5% 7.8%
Rolling 5 Year Growth (%)- Actual
8.4% 8.4% 7.2% 6.2% 7.0%
Table – 1 – Peak demand of Delhi 1992-2001
The unrestricted demand for 2002-2006 shows annual compounded growth rate in 4 years rolling block is
4.38%
Year 2002 2003 2004 2005 2006
Peak Demand met in Delhi (MW) 3347 3417 3558 3738 3973
Year Wise Growth (%) - Actual 2.1% 4.1% 5.1% 6.3%
Rolling 4 Year Growth (%)- Actual 4.38%
Table – 2 - Peak demand of Delhi 2002-2006
BSES Rajdhani Power Limited
Document No. BRPL/MYT/2007-11 BSES Rajdhani Power Limited
Rev: 00 Page 5 of 26
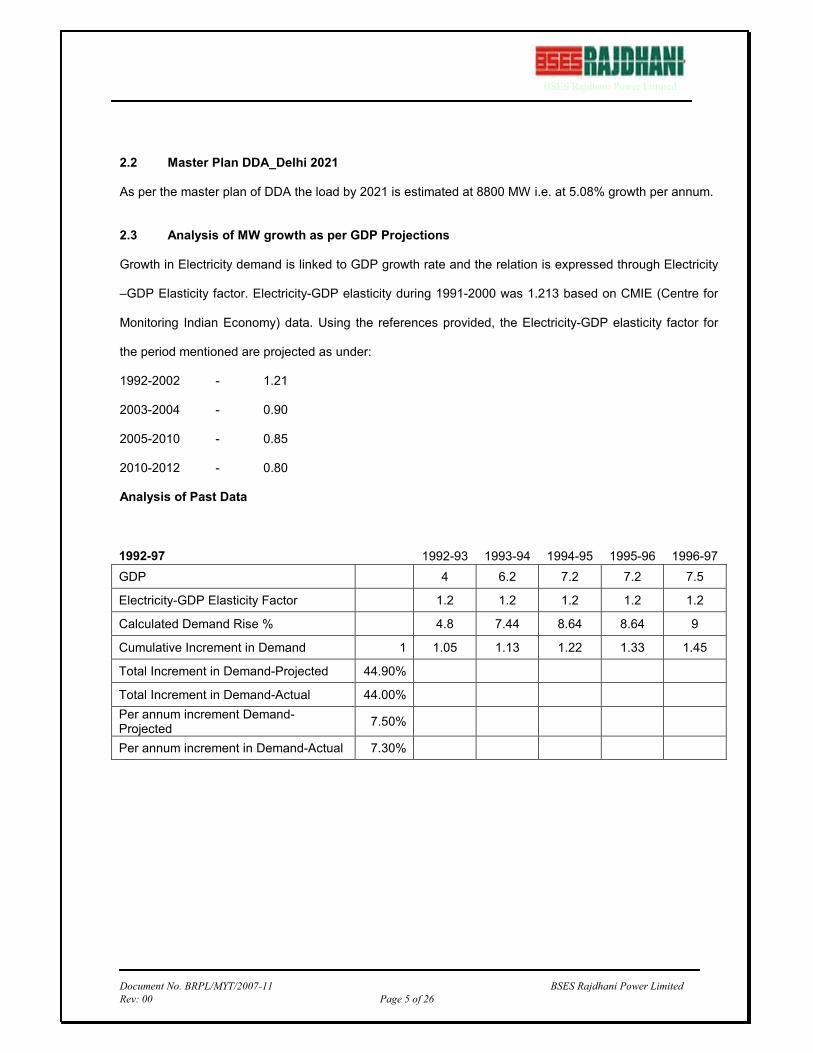
2.2 Master Plan DDA_Delhi 2021 As per the master plan of DDA the load by 2021 is estimated at 8800 MW i.e. at 5.08% growth per annum.
2.3 Analysis of MW growth as per GDP Projections Growth in Electricity demand is linked to GDP growth rate and the relation is expressed through Electricity
–GDP Elasticity factor. Electricity-GDP elasticity during 1991-2000 was 1.213 based on CMIE (Centre for
Monitoring Indian Economy) data. Using the references provided, the Electricity-GDP elasticity factor for
the period mentioned are projected as under:
1992-2002 - 1.21
2003-2004 - 0.90
2005-2010 - 0.85
2010-2012 - 0.80
Analysis of Past Data
1992-97 1992-93 1993-94 1994-95 1995-96 1996-97
GDP 4 6.2 7.2 7.2 7.5
Electricity-GDP Elasticity Factor 1.2 1.2 1.2 1.2 1.2
Calculated Demand Rise % 4.8 7.44 8.64 8.64 9
Cumulative Increment in Demand 1 1.05 1.13 1.22 1.33 1.45
Total Increment in Demand-Projected 44.90%
Total Increment in Demand-Actual 44.00%
Per annum increment Demand-Projected
7.50%
Per annum increment in Demand-Actual 7.30%
BSES Rajdhani Power Limited
Document No. BRPL/MYT/2007-11 BSES Rajdhani Power Limited
Rev: 00 Page 6 of 26
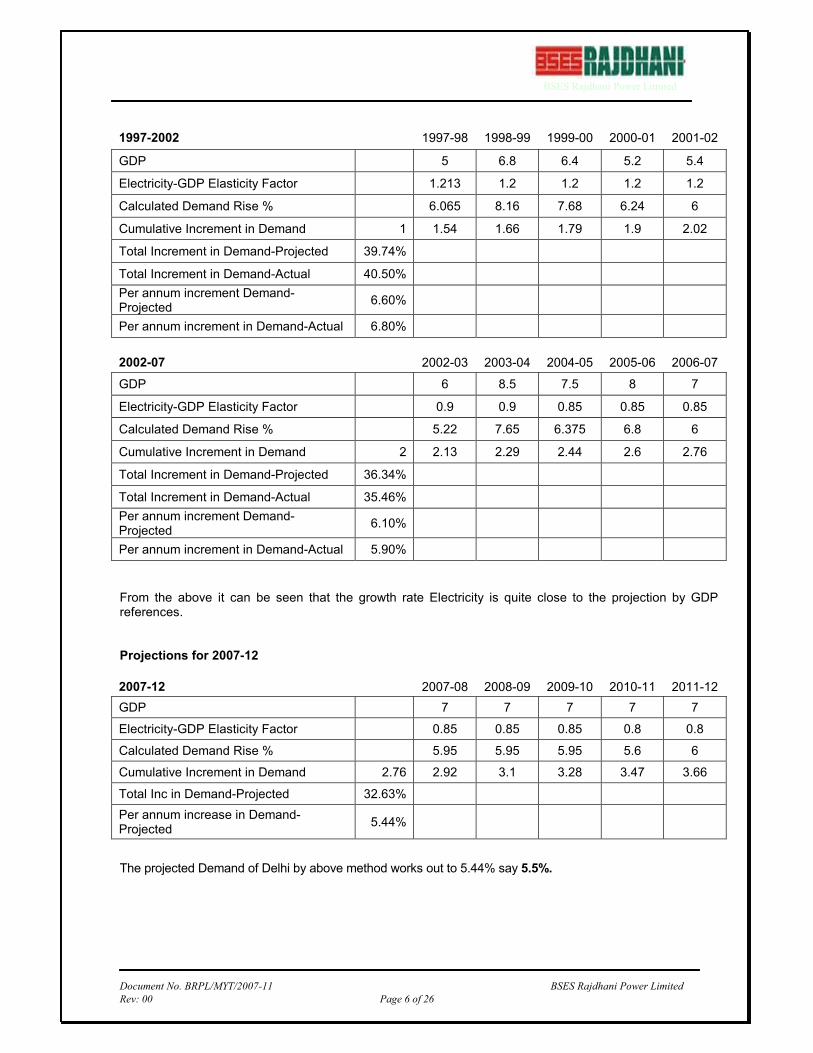
1997-2002 1997-98 1998-99 1999-00 2000-01 2001-02
GDP 5 6.8 6.4 5.2 5.4
Electricity-GDP Elasticity Factor 1.213 1.2 1.2 1.2 1.2
Calculated Demand Rise % 6.065 8.16 7.68 6.24 6
Cumulative Increment in Demand 1 1.54 1.66 1.79 1.9 2.02
Total Increment in Demand-Projected 39.74%
Total Increment in Demand-Actual 40.50%
Per annum increment Demand-Projected
6.60%
Per annum increment in Demand-Actual 6.80%
2002-07 2002-03 2003-04 2004-05 2005-06 2006-07
GDP 6 8.5 7.5 8 7
Electricity-GDP Elasticity Factor 0.9 0.9 0.85 0.85 0.85
Calculated Demand Rise % 5.22 7.65 6.375 6.8 6
Cumulative Increment in Demand 2 2.13 2.29 2.44 2.6 2.76
Total Increment in Demand-Projected 36.34%
Total Increment in Demand-Actual 35.46%
Per annum increment Demand-Projected
6.10%
Per annum increment in Demand-Actual 5.90%
From the above it can be seen that the growth rate Electricity is quite close to the projection by GDP references. Projections for 2007-12
2007-12 2007-08 2008-09 2009-10 2010-11 2011-12
GDP 7 7 7 7 7
Electricity-GDP Elasticity Factor 0.85 0.85 0.85 0.8 0.8
Calculated Demand Rise % 5.95 5.95 5.95 5.6 6
Cumulative Increment in Demand 2.76 2.92 3.1 3.28 3.47 3.66
Total Inc in Demand-Projected 32.63%
Per annum increase in Demand-Projected
5.44%
The projected Demand of Delhi by above method works out to 5.44% say 5.5%.
BSES Rajdhani Power Limited
Document No. BRPL/MYT/2007-11 BSES Rajdhani Power Limited
Rev: 00 Page 7 of 26
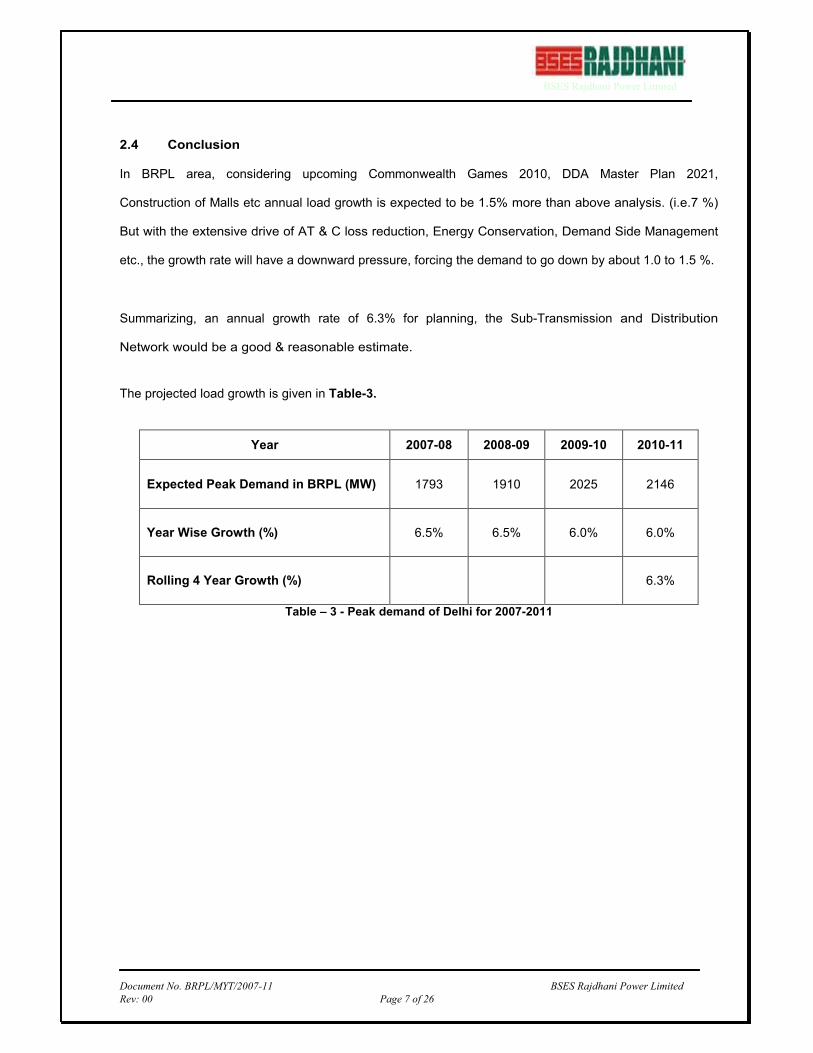
2.4 Conclusion
In BRPL area, considering upcoming Commonwealth Games 2010, DDA Master Plan 2021,
Construction of Malls etc annual load growth is expected to be 1.5% more than above analysis. (i.e.7 %)
But with the extensive drive of AT & C loss reduction, Energy Conservation, Demand Side Management
etc., the growth rate will have a downward pressure, forcing the demand to go down by about 1.0 to 1.5 %.
Summarizing, an annual growth rate of 6.3% for planning, the Sub-Transmission and Distribution
Network would be a good & reasonable estimate.
The projected load growth is given in Table-3.
Year 2007-08 2008-09 2009-10 2010-11
Expected Peak Demand in BRPL (MW) 1793 1910 2025 2146
Year Wise Growth (%) 6.5% 6.5% 6.0% 6.0%
Rolling 4 Year Growth (%) 6.3%
Table – 3 - Peak demand of Delhi for 2007-2011
BSES Rajdhani Power Limited
Document No. BRPL/MYT/2007-11 BSES Rajdhani Power Limited
Rev: 00 Page 8 of 26
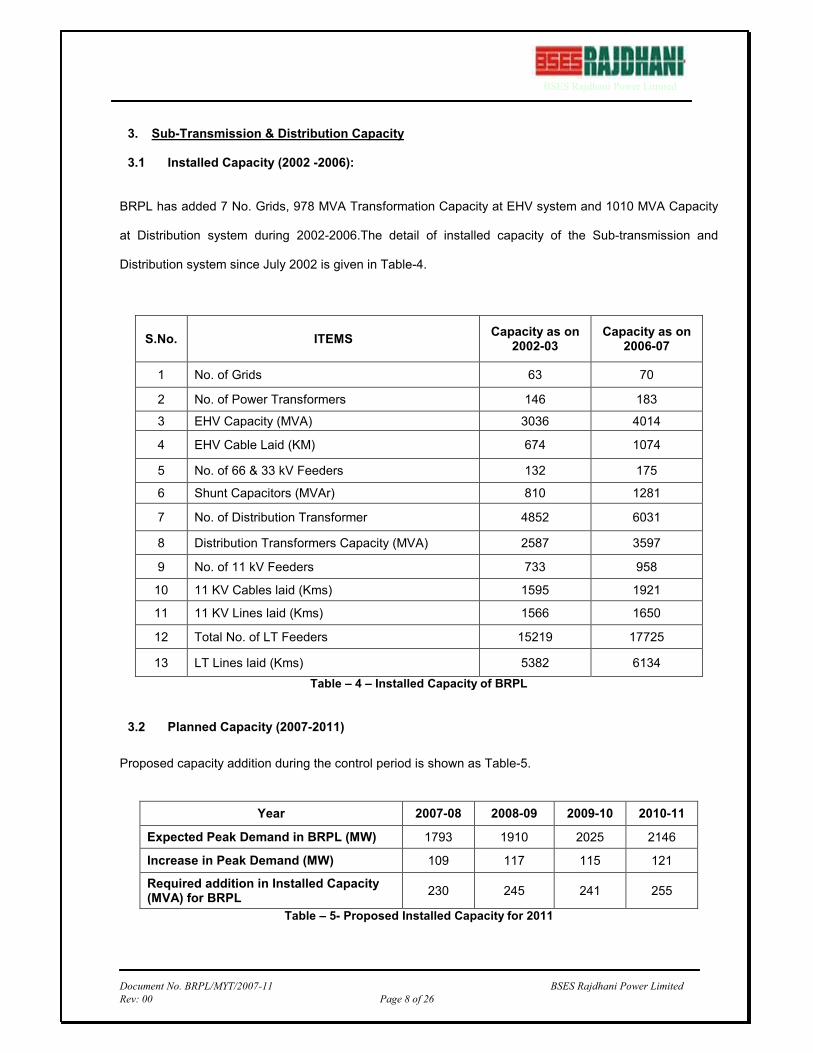
3. Sub-Transmission & Distribution Capacity 3.1 Installed Capacity (2002 -2006):
BRPL has added 7 No. Grids, 978 MVA Transformation Capacity at EHV system and 1010 MVA Capacity
at Distribution system during 2002-2006.The detail of installed capacity of the Sub-transmission and
Distribution system since July 2002 is given in Table-4.
S.No. ITEMS Capacity as on
2002-03 Capacity as on
2006-07
1 No. of Grids 63 70
2 No. of Power Transformers 146 183
3 EHV Capacity (MVA) 3036 4014
4 EHV Cable Laid (KM) 674 1074
5 No. of 66 & 33 kV Feeders 132 175
6 Shunt Capacitors (MVAr) 810 1281
7 No. of Distribution Transformer 4852 6031
8 Distribution Transformers Capacity (MVA) 2587 3597
9 No. of 11 kV Feeders 733 958
10 11 KV Cables laid (Kms) 1595 1921
11 11 KV Lines laid (Kms) 1566 1650
12 Total No. of LT Feeders 15219 17725
13 LT Lines laid (Kms) 5382 6134
Table – 4 – Installed Capacity of BRPL
3.2 Planned Capacity (2007-2011)
Proposed capacity addition during the control period is shown as Table-5.
Table – 5- Proposed Installed Capacity for 2011
Year 2007-08 2008-09 2009-10 2010-11
Expected Peak Demand in BRPL (MW) 1793 1910 2025 2146
Increase in Peak Demand (MW) 109 117 115 121
Required addition in Installed Capacity (MVA) for BRPL
230 245 241 255
BSES Rajdhani Power Limited
Document No. BRPL/MYT/2007-11 BSES Rajdhani Power Limited
Rev: 00 Page 9 of 26
4. Capital Investment : 4.1 Capital Investment made since July 2002 till Mar 2007 BRPL has invested 1865 Crs for strengthening of its existing system, automation, Reduction of AT&C loss
and routine up-gradation for development of distribution network with the aim to maintain a reliable and
quality power supply to its consumer, after taking over DVB on July 2002. The same is delineated below.
4.1.1 AT&C Loss reduction
4.1.1.1 Electrification of Colonies
Un-electrified colonies have been located where high theft causes higher AT&C losses in Delhi electricity
supply system. In the view to curb the electricity theft, BRPL has taken the following initiative.
(a) High Voltage Distribution System
BRPL has started to electrify 323 no of colonies (JJ/UC/LOP) out of which 300 no of colonies are
physically completed and around 82000 thousand consumers are added in billing net.
(b) Low Voltage System using LT ABC
By using LT AB Cable, BRPL has electrified approx. 100 no of colonies (JJ/UC/LOP) where 22
thousand consumers added into billing net.
.

BSES Rajdhani Power Limited
Document No. BRPL/MYT/2007-11 BSES Rajdhani Power Limited
Rev: 00 Page 10 of 26
4.1.1.2 Replacement of meters
Electromechanical meters, which are more prone to tampering and have the tendency to slow down due to
aging and contribute to high loss, are being replaced with static meters. These meters are tamper proof,
highly accurate and have the features to record reactive power, power factor, demand etc.
4.1.1.3 Installation of Capacitor Bank
The BRPL system has an average of power factor of 0.82. To improve its average power factor, BRPL has
installed 2 no capacitor banks at 33 KV level, 33 nos. capacitor banks at 11 KV level and 350 nos. LT
APFC panels at distribution transformers.
4.1.2 System Reliability Improvement
BRPL has primarily focused in Reliability and Quality of supply in the last five years. The network
optimization study (Reliability Analysis Study) has been conducted on district wise network drawings
modeled in CYME and using Reliability module of CYMEDIST. The concept of N-1 reliability was being
implemented at 66 KV, 33 KV and 11 KV level, which shall be achieved fully in near future. Many types of
non–repairable equipment have been replaced by new state of art equipments. The old existing
equipments which were obsolete and used to break down frequently resulting in long outage durations
have been replaced by new equipments with SCADA compatibility for remote operations for future
requirements
Major initiatives taken by BRPL for improving reliability are mentioned below
4.1.2.1 SCADA and DMS
A Supervisory Control and Data Acquisition (SCADA) system for the Delhi Distribution network has been
envisioned for centralized control and monitoring of the network for optimum and synergized usage of
resources.

BSES Rajdhani Power Limited
Document No. BRPL/MYT/2007-11 BSES Rajdhani Power Limited
Rev: 00 Page 11 of 26
SCADA & Distribution Management System will be used as enterprise-wide management of the BRPL
networks. It will provide for efficient operations, enhance operational outputs and translate into economic
benefits. Installing SCADA System is seen to be a major initiative to improve quality and reliability of Power
Supply to the consumer. There are many applications in SCADA & DMS as delineated below.
• Supervisory Control: This function normally includes remote device control and local device
tagging. Activities normally start with device selection and complete with feedback of status.
• Improved Visibility: All the Indications like Fault Condition, Breaker Status, etc. and measured
Values like Load Current, Voltage, Active and Reactive Power etc. are available on the same
screen providing all the required information to carry out remote operation.
• Data Acquisition: SCADA accumulates data from the chain of field devices (IEDS, substation data
and protective devices, via RTUs or substation controllers). Operators get the data in scan groups,
so that polling and updating can be used for maximum efficiency
• SCADA Events: Event in SCADA is any spontaneous change in system. All the events are logged
and historically preserved.
• SCADA Alarms: Using different knowledge-based parameters, alarms are generated or
suppressed on a need-to-know basis, confident that all events (alarms being a subset of events)
will be logged and historically preserved
• SCADA Tagging: SCADA allows tagging of Isolators and Switches. A comment line is assigned to
each tag, which shows the date & time and also provides space to assign comments.
4.1.2.2 GIS
The GIS which will contain details of all assets of the Distribution Network and shall be used for asset
management and with integration of GIS with other enterprise systems like ERP, SCADA, AMR, and
Trouble Call Management will provide a strong base as well as user friendly tool for management of
assets, outages, crew management, etc.

BSES Rajdhani Power Limited
Document No. BRPL/MYT/2007-11 BSES Rajdhani Power Limited
Rev: 00 Page 12 of 26
Applications in GIS are as delineated below.
• Provides common Spatial Data Format
• Promotes Data Sharing
• Enhances Communication
• Facilitates Decision Making
• Getting Geographical locations and other details of various Facilities of the organization
• Equipment Failure Analysis
• Load Forecasting
• Optimal Substation load allocation and transformer Sizing
• Power Flow route tracing
• Outage Management in conjunction with IVR System
• Determination of Location wise Load Density
• Automatic reconfiguration of the Network and updating the inventory in the database when
equipment is added or removed
4.1.2.3 AMR & DT Metering
BRPL has been also establishing the first of its kind Automatic Meter Reading (AMR) system for all its Grid
Feeders, Distribution Transformers and KCC & MLCC consumers. The following benefits are achieved
through this project.
• Full-fledged energy audit at Grid/feeder level.
• Division wise Energy audit.
• Computation of load profile and Energy demand by studying the pattern.
• Pin pointing the theft prone areas, whereby concerted efforts can be made in thwarting thefts on
specific feeders, which shall enable reduction of commercial losses.
• Human errors involved in the reading shall be eliminated, which will result in accurate
measurement of energy requirement:
BSES Rajdhani Power Limited
Document No. BRPL/MYT/2007-11 BSES Rajdhani Power Limited
Rev: 00 Page 13 of 26
• Reactive Energy management shall be possible by measurement of Reactive Energy at each
feeder and at each Grid station.
4.1.2.4 Replacement of Old Cables/ Switchgear
(a) Replacement of old HT panels by RMU
BRPL has done a survey for all the grid and distribution sub-stations. Based on the results of Survey, it
was decided to replace the old oil type 11 KV switchgear with SF6 type RMU/ HT Panels with SCADA
compatible.
(b) Replacement of sick Cables
Old 11KV underground cables (PILCA) having so many joints and frequent faults have been replaced
to ensure reliable and uninterrupted power supply.
(c) Other LT Works
Other works such as installation or replacement of LT Cables, LT ACB, and old 11KV switchgear have
been carried out to improve system reliability.
4.1.3 Load growth
BRPL has added 7 No New Grid Sub Stations in its EHV system to cater load growth. Further addition and
augmentation of Power transformers, Distribution Transformers, OH/UG Lines (66KV, 33KV & 11KV) have
also been carried out.
4.1.4 Infrastructure development
To give better service for consumers, BRPL has renovated many Customer Care Centers with digital
communication facility, comfortable sitting arrangements. Better tools, tackles and safety equipments are
being used which will also lead to systematic and proper execution of maintenance of main equipments. As
the possibility of accidents reduces with the use of proper equipment, the safety and life of equipment will
also increase. Further the safety of manpower also increases which cannot be put in terms of monitory
benefits.
BSES Rajdhani Power Limited
Document No. BRPL/MYT/2007-11 BSES Rajdhani Power Limited
Rev: 00 Page 14 of 26
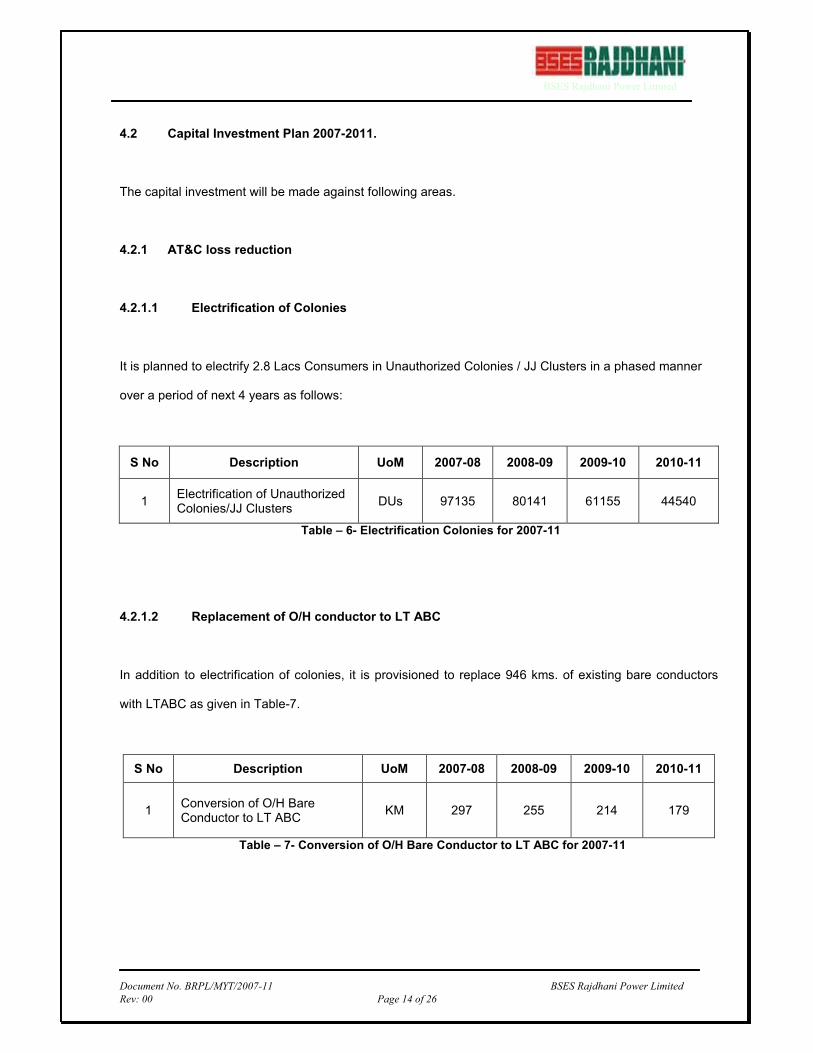
4.2 Capital Investment Plan 2007-2011.
The capital investment will be made against following areas.
4.2.1 AT&C loss reduction
4.2.1.1 Electrification of Colonies
It is planned to electrify 2.8 Lacs Consumers in Unauthorized Colonies / JJ Clusters in a phased manner
over a period of next 4 years as follows:
S No Description UoM 2007-08 2008-09 2009-10 2010-11
1 Electrification of Unauthorized Colonies/JJ Clusters
DUs 97135 80141 61155 44540
Table – 6- Electrification Colonies for 2007-11
4.2.1.2 Replacement of O/H conductor to LT ABC
In addition to electrification of colonies, it is provisioned to replace 946 kms. of existing bare conductors
with LTABC as given in Table-7.
S No Description UoM 2007-08 2008-09 2009-10 2010-11
1 Conversion of O/H Bare Conductor to LT ABC
KM 297 255 214 179
Table – 7- Conversion of O/H Bare Conductor to LT ABC for 2007-11

BSES Rajdhani Power Limited
Document No. BRPL/MYT/2007-11 BSES Rajdhani Power Limited
Rev: 00 Page 15 of 26
4.2.1.3 Replacement/Installation of Meters
BRPL has been replacing electro-mechanical meters with electronic meters further it is proposed to
implement Pre-paid system, Group metering system and Remote control metering system for reducing
AT&C losses. The proposed systems are delineated below:
4.2.1.3.1 Electronic Meters
Energy meter is a device to measure the consumption of Electrical energy. There are two categories for
Energy meters, electro-mechanical or electronic. Electro-mechanical meters offer a level of comfort,
familiarity and simplicity, but are limited in functionality. However, due to following parameters it is
observed that mechanical meters record less consumption:
• High Starting current
• Friction Losses
• Aging process
Electronic meters are more accurate & reliable and can perform more functions than electro-mechanical
meters. The best electro-mechanical meter can have an accuracy of 0.5% whereas electronic meters are
available up to accuracy of 0.005%. Electronic meters compared to traditional electro-mechanical meters
offer several additional advantages. The advantages are:
• Wide range
• Low starting current
• Better reliability
• Better accuracy
• Ease of calibration
• Anti-tampering protection
• Automated meter reading
• Security
• Advanced billing

BSES Rajdhani Power Limited
Document No. BRPL/MYT/2007-11 BSES Rajdhani Power Limited
Rev: 00 Page 16 of 26
4.2.3.1.2 Pre-paid Metering
The pre paid metering system will have following advantages over conventional metering system:
• Improved operational efficiencies: The prepaid meters are likely to cut the cost of meter
reading, as no meter readers are required. In addition, they eliminate administrative hassles
associated with disconnection and reconnection. Prepaid meters could help control appropriation
of electricity in a better way than conventional meters.
• Reduced financial risks: Since the payment is up-front, it reduces the financial risk by improving
the cash flows and necessitates an improved revenue management system.
• Better customer service: The system eliminates billing delay, removes cost involved in
disconnection/reconnection, enables controlled use of energy, and helps customers to save
money through better energy management.
• Controlling non-technical losses: Metering errors, tampering with meters leading to low
registration and calibration related frauds are some of the key components of non-technical
losses. It has been reported that prepaid meters control non-technical losses better than
conventional ones.
4.2.3.1.2 Group Metering System
This is not exactly a meter but a concept. 8~12 Metering units are packed in a box with common
communication system. Since lot of feature e.g. AMR etc are common so this help in reduction of
accessories cost. Mostly these units are installed at Pole/ Feeder level and thus further make tampering
difficult.
• Group metering system are available with various add on feature like split display unit, GSM based
communication, remote disconnection etc.
• Meter reading is much easier in this metering system.
BSES Rajdhani Power Limited
Document No. BRPL/MYT/2007-11 BSES Rajdhani Power Limited
Rev: 00 Page 17 of 26
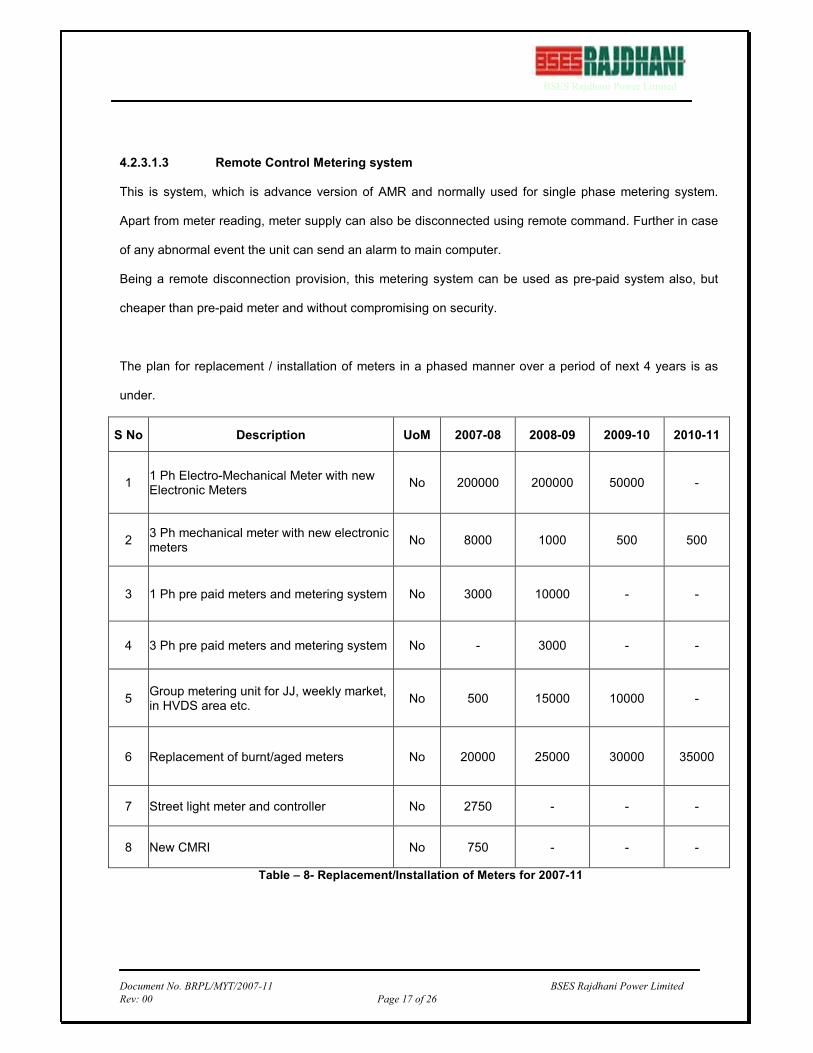
4.2.3.1.3 Remote Control Metering system
This is system, which is advance version of AMR and normally used for single phase metering system.
Apart from meter reading, meter supply can also be disconnected using remote command. Further in case
of any abnormal event the unit can send an alarm to main computer.
Being a remote disconnection provision, this metering system can be used as pre-paid system also, but
cheaper than pre-paid meter and without compromising on security.
The plan for replacement / installation of meters in a phased manner over a period of next 4 years is as
under.
S No Description UoM 2007-08 2008-09 2009-10 2010-11
1 1 Ph Electro-Mechanical Meter with new Electronic Meters
No 200000 200000 50000 -
2 3 Ph mechanical meter with new electronic meters
No 8000 1000 500 500
3 1 Ph pre paid meters and metering system No 3000 10000 - -
4 3 Ph pre paid meters and metering system No - 3000 - -
5 Group metering unit for JJ, weekly market, in HVDS area etc.
No 500 15000 10000 -
6 Replacement of burnt/aged meters No 20000 25000 30000 35000
7 Street light meter and controller No 2750 - - -
8 New CMRI No 750 - - -
Table – 8- Replacement/Installation of Meters for 2007-11
BSES Rajdhani Power Limited
Document No. BRPL/MYT/2007-11 BSES Rajdhani Power Limited
Rev: 00 Page 18 of 26
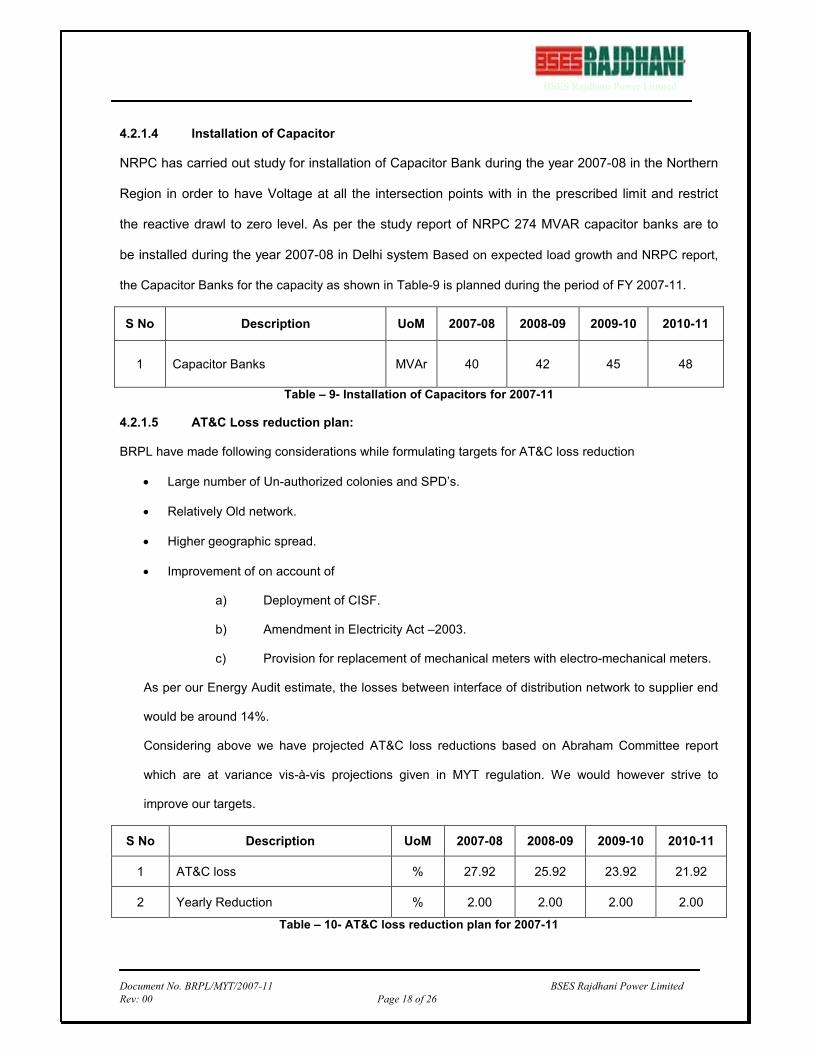
4.2.1.4 Installation of Capacitor
NRPC has carried out study for installation of Capacitor Bank during the year 2007-08 in the Northern
Region in order to have Voltage at all the intersection points with in the prescribed limit and restrict
the reactive drawl to zero level. As per the study report of NRPC 274 MVAR capacitor banks are to
be installed during the year 2007-08 in Delhi system Based on expected load growth and NRPC report,
the Capacitor Banks for the capacity as shown in Table-9 is planned during the period of FY 2007-11.
S No Description UoM 2007-08 2008-09 2009-10 2010-11
1 Capacitor Banks MVAr 40 42 45 48
Table – 9- Installation of Capacitors for 2007-11
4.2.1.5 AT&C Loss reduction plan:
BRPL have made following considerations while formulating targets for AT&C loss reduction
• Large number of Un-authorized colonies and SPD’s.
• Relatively Old network.
• Higher geographic spread.
• Improvement of on account of
a) Deployment of CISF.
b) Amendment in Electricity Act –2003.
c) Provision for replacement of mechanical meters with electro-mechanical meters.
As per our Energy Audit estimate, the losses between interface of distribution network to supplier end
would be around 14%.
Considering above we have projected AT&C loss reductions based on Abraham Committee report
which are at variance vis-à-vis projections given in MYT regulation. We would however strive to
improve our targets.
S No Description UoM 2007-08 2008-09 2009-10 2010-11
1 AT&C loss % 27.92 25.92 23.92 21.92
2 Yearly Reduction % 2.00 2.00 2.00 2.00
Table – 10- AT&C loss reduction plan for 2007-11
BSES Rajdhani Power Limited
Document No. BRPL/MYT/2007-11 BSES Rajdhani Power Limited
Rev: 00 Page 19 of 26
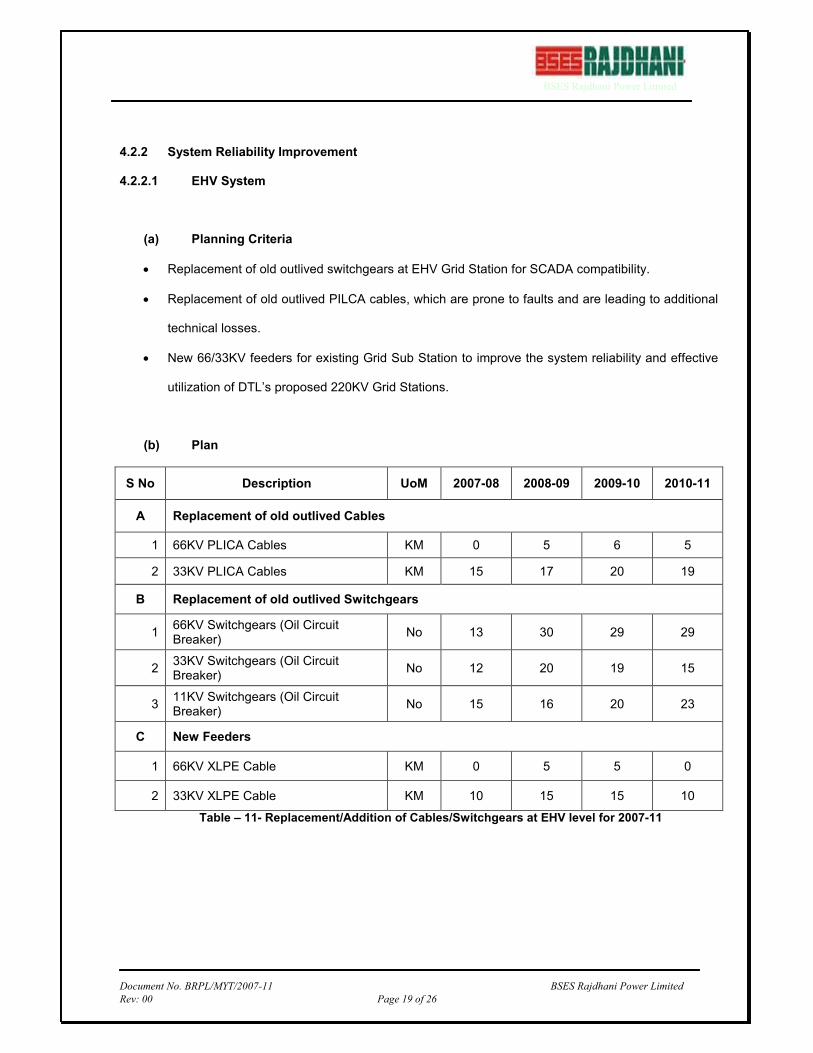
4.2.2 System Reliability Improvement
4.2.2.1 EHV System
(a) Planning Criteria
• Replacement of old outlived switchgears at EHV Grid Station for SCADA compatibility.
• Replacement of old outlived PILCA cables, which are prone to faults and are leading to additional
technical losses.
• New 66/33KV feeders for existing Grid Sub Station to improve the system reliability and effective
utilization of DTL’s proposed 220KV Grid Stations.
(b) Plan
S No Description UoM 2007-08 2008-09 2009-10 2010-11
A Replacement of old outlived Cables
1 66KV PLICA Cables KM 0 5 6 5
2 33KV PLICA Cables KM 15 17 20 19
B Replacement of old outlived Switchgears
1 66KV Switchgears (Oil Circuit Breaker)
No 13 30 29 29
2 33KV Switchgears (Oil Circuit Breaker)
No 12 20 19 15
3 11KV Switchgears (Oil Circuit Breaker)
No 15 16 20 23
C New Feeders
1 66KV XLPE Cable KM 0 5 5 0
2 33KV XLPE Cable KM 10 15 15 10
Table – 11- Replacement/Addition of Cables/Switchgears at EHV level for 2007-11
BSES Rajdhani Power Limited
Document No. BRPL/MYT/2007-11 BSES Rajdhani Power Limited
Rev: 00 Page 20 of 26
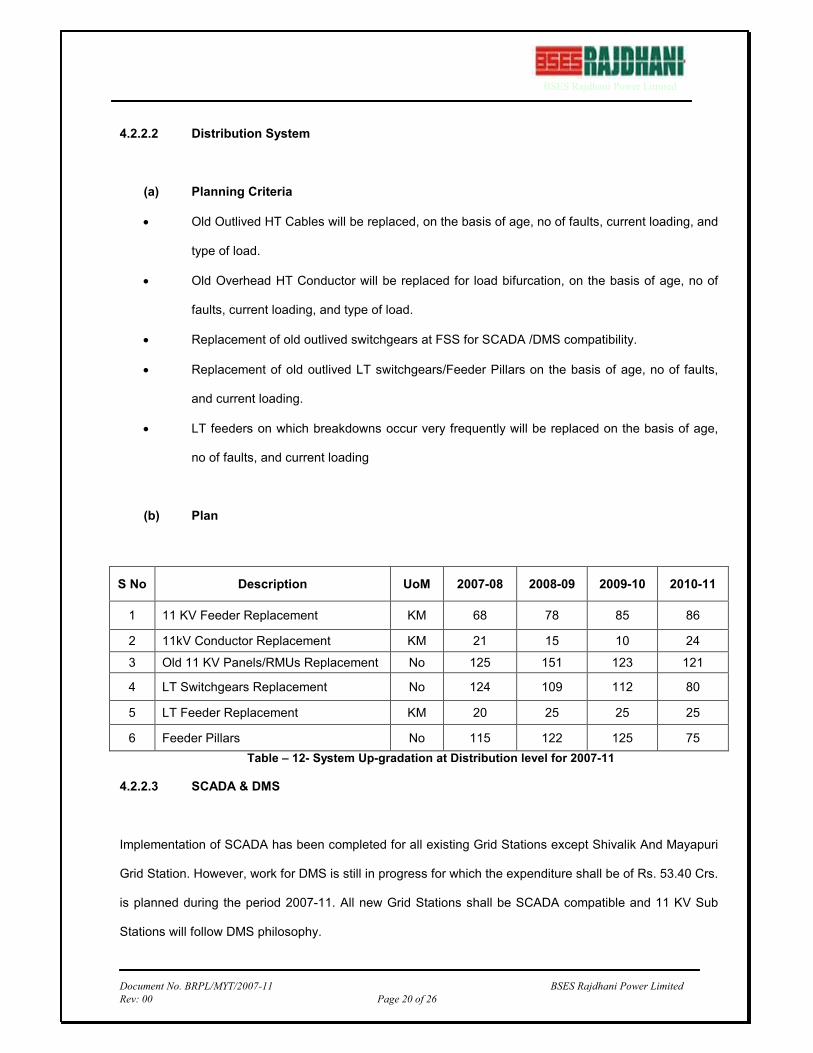
4.2.2.2 Distribution System
(a) Planning Criteria
• Old Outlived HT Cables will be replaced, on the basis of age, no of faults, current loading, and
type of load.
• Old Overhead HT Conductor will be replaced for load bifurcation, on the basis of age, no of
faults, current loading, and type of load.
• Replacement of old outlived switchgears at FSS for SCADA /DMS compatibility.
• Replacement of old outlived LT switchgears/Feeder Pillars on the basis of age, no of faults,
and current loading.
• LT feeders on which breakdowns occur very frequently will be replaced on the basis of age,
no of faults, and current loading
(b) Plan
S No Description UoM 2007-08 2008-09 2009-10 2010-11
1 11 KV Feeder Replacement KM 68 78 85 86
2 11kV Conductor Replacement KM 21 15 10 24
3 Old 11 KV Panels/RMUs Replacement No 125 151 123 121
4 LT Switchgears Replacement No 124 109 112 80
5 LT Feeder Replacement KM 20 25 25 25
6 Feeder Pillars No 115 122 125 75
Table – 12- System Up-gradation at Distribution level for 2007-11
4.2.2.3 SCADA & DMS
Implementation of SCADA has been completed for all existing Grid Stations except Shivalik And Mayapuri
Grid Station. However, work for DMS is still in progress for which the expenditure shall be of Rs. 53.40 Crs.
is planned during the period 2007-11. All new Grid Stations shall be SCADA compatible and 11 KV Sub
Stations will follow DMS philosophy.
BSES Rajdhani Power Limited
Document No. BRPL/MYT/2007-11 BSES Rajdhani Power Limited
Rev: 00 Page 21 of 26
4.2.2.4 GIS
About 42% of total project has been completed. The remaining project will be completed by 2010 for which
the expenditure shall be incurred around Rs. 7.67 Crs
4.2.2.5 AMR & DT Metering
Approx. 1000 Feeder meters, 170 Grid meters and 5500 KCC meters have been facilitated with automatic
meter reading (AMR) and 1100 meters have been installed at 11KV Sub Stations with AMR facility.
Further, BRPL is proposing to implement the AMR for KCC, MLCC, domestic consumers and DT metering.
4.2.3 Load growth
4.2.3.1 EHV System
(a) Planning Criteria
• The required Installed Power Transformation Capacity has been taken as 2.1 times the expected
peak demand.
• Redundancy of (n-1) has been taken for planning any EHV GSS.
• The average in-feed length has been considered as 5 kms.
• Capacity of the Grid Stations has been decided based on the Load Centers requirement. The Grid
Stations shall be located near/close to the Load Centers.
• Each Grid-Station will have preferably dual in-feeds from independent sources.
• The Voltage Level of the Grid-Stations shall be based on the operating Voltage level in the
surrounding network. Dual Transmission Ratio shall be minimized to reduce the Transformation
Losses.
• 66/11 kV Transformers shall be 20/25 MVA ONAN/ONAF type.
• 33/11 kV Transformers shall be 20 MVA ONAN type.
• In-feed shall be through U/G Cables of 1C x 630 / 1000 sq.mm for 66 kV level and 3C x 400
sq.mm for 33 kV level.
BSES Rajdhani Power Limited
Document No. BRPL/MYT/2007-11 BSES Rajdhani Power Limited
Rev: 00 Page 22 of 26
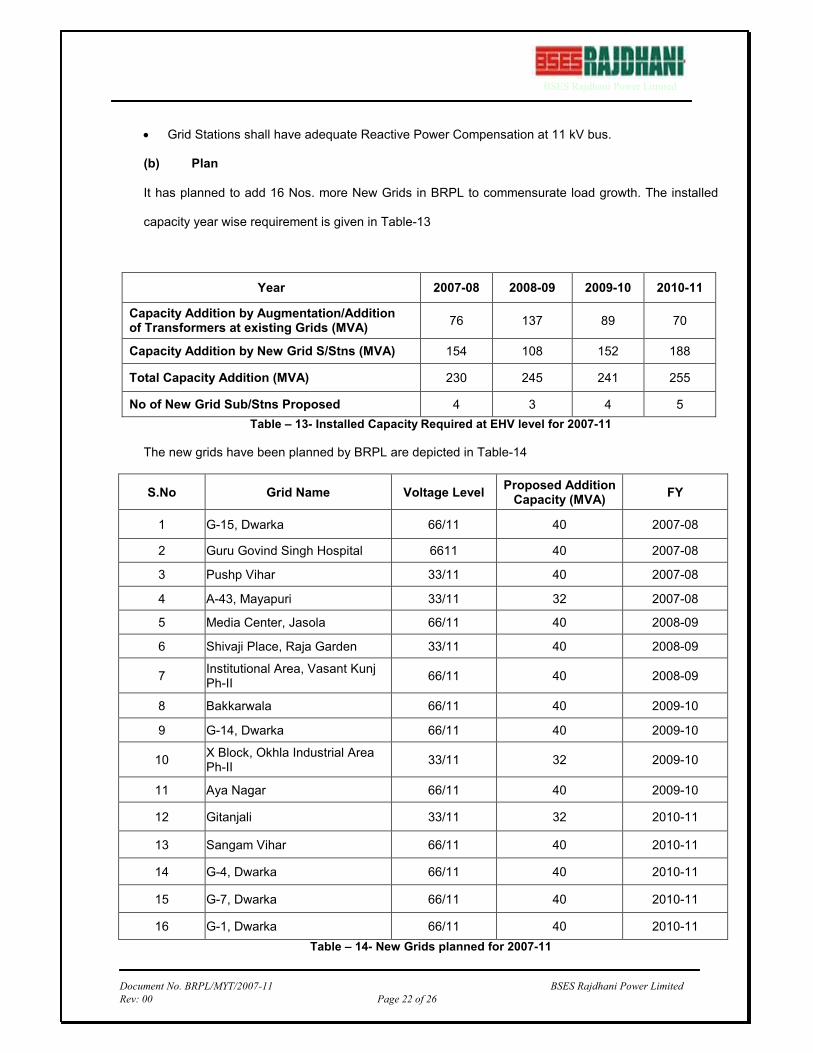
• Grid Stations shall have adequate Reactive Power Compensation at 11 kV bus.
(b) Plan
It has planned to add 16 Nos. more New Grids in BRPL to commensurate load growth. The installed
capacity year wise requirement is given in Table-13
Year 2007-08 2008-09 2009-10 2010-11
Capacity Addition by Augmentation/Addition of Transformers at existing Grids (MVA)
76 137 89 70
Capacity Addition by New Grid S/Stns (MVA) 154 108 152 188
Total Capacity Addition (MVA) 230 245 241 255
No of New Grid Sub/Stns Proposed 4 3 4 5
Table – 13- Installed Capacity Required at EHV level for 2007-11
The new grids have been planned by BRPL are depicted in Table-14
S.No Grid Name Voltage Level Proposed Addition Capacity (MVA)
FY
1 G-15, Dwarka 66/11 40 2007-08
2 Guru Govind Singh Hospital 6611 40 2007-08
3 Pushp Vihar 33/11 40 2007-08
4 A-43, Mayapuri 33/11 32 2007-08
5 Media Center, Jasola 66/11 40 2008-09
6 Shivaji Place, Raja Garden 33/11 40 2008-09
7 Institutional Area, Vasant Kunj Ph-II
66/11 40 2008-09
8 Bakkarwala 66/11 40 2009-10
9 G-14, Dwarka 66/11 40 2009-10
10 X Block, Okhla Industrial Area Ph-II
33/11 32 2009-10
11 Aya Nagar 66/11 40 2009-10
12 Gitanjali 33/11 32 2010-11
13 Sangam Vihar 66/11 40 2010-11
14 G-4, Dwarka 66/11 40 2010-11
15 G-7, Dwarka 66/11 40 2010-11
16 G-1, Dwarka 66/11 40 2010-11
Table – 14- New Grids planned for 2007-11
BSES Rajdhani Power Limited
Document No. BRPL/MYT/2007-11 BSES Rajdhani Power Limited
Rev: 00 Page 23 of 26
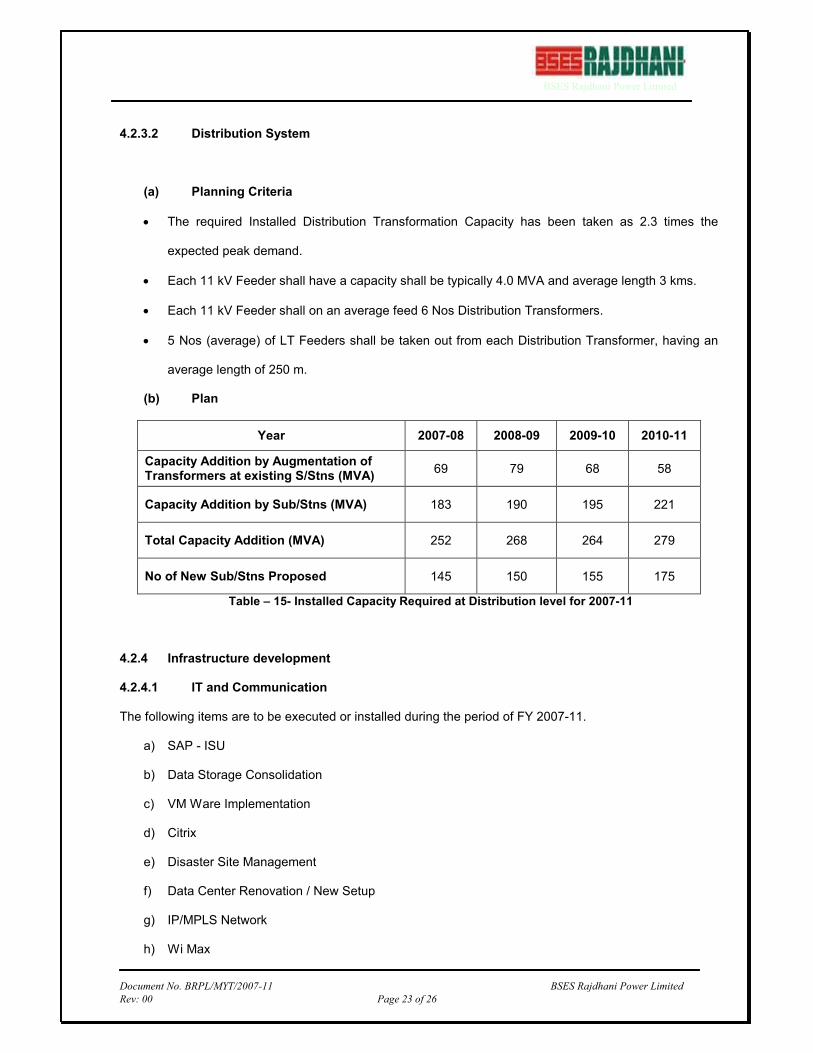
4.2.3.2 Distribution System
(a) Planning Criteria
• The required Installed Distribution Transformation Capacity has been taken as 2.3 times the
expected peak demand.
• Each 11 kV Feeder shall have a capacity shall be typically 4.0 MVA and average length 3 kms.
• Each 11 kV Feeder shall on an average feed 6 Nos Distribution Transformers.
• 5 Nos (average) of LT Feeders shall be taken out from each Distribution Transformer, having an
average length of 250 m.
(b) Plan
Year 2007-08 2008-09 2009-10 2010-11
Capacity Addition by Augmentation of Transformers at existing S/Stns (MVA)
69 79 68 58
Capacity Addition by Sub/Stns (MVA) 183 190 195 221
Total Capacity Addition (MVA) 252 268 264 279
No of New Sub/Stns Proposed 145 150 155 175
Table – 15- Installed Capacity Required at Distribution level for 2007-11
4.2.4 Infrastructure development
4.2.4.1 IT and Communication
The following items are to be executed or installed during the period of FY 2007-11.
a) SAP - ISU
b) Data Storage Consolidation
c) VM Ware Implementation
d) Citrix
e) Disaster Site Management
f) Data Center Renovation / New Setup
g) IP/MPLS Network
h) Wi Max

BSES Rajdhani Power Limited
Document No. BRPL/MYT/2007-11 BSES Rajdhani Power Limited
Rev: 00 Page 24 of 26
i) IPS / Internet Caching
j) Telecom Up-gradation / IP Phones / Web or Video Conferencing / IP Soft Phone
k) Mobile Computing
l) Voice and Video Surveillance for CCC
m) Training Infrastructure -- VC/ Recording
n) Learning Management System
o) Computers/Printers/Laptop/UPS
4.2.4.2 Land / Building and Renovation of offices
BRPL plans to carry out up-gradation of Customer Care Centers, offices and other infrastructure during the
Control period for which an amount of about 2 Crs per annum will be spent. In addition residential colony of
Janakpuri, which was established in mid 70’s and has outlived its life cycle shall be demolished and re-
constructed. For this an amount of Rs.57.5 Crs. will be spending from 2008 to 2010.
4.2.4.3 Vehicle
BRPL intents to replace old vehicles for which the life cycle is completed based on mileage and condition
of the vehicle, This includes FLC, Tower Wagons, Cash Vans, HT& LT breakdown vehicles etc. for which
an amount of Rs. 6.81 Crs will be spent over entire Control period..
BSES Rajdhani Power Limited
Document No. BRPL/MYT/2007-11 BSES Rajdhani Power Limited
Rev: 00 Page 25 of 26
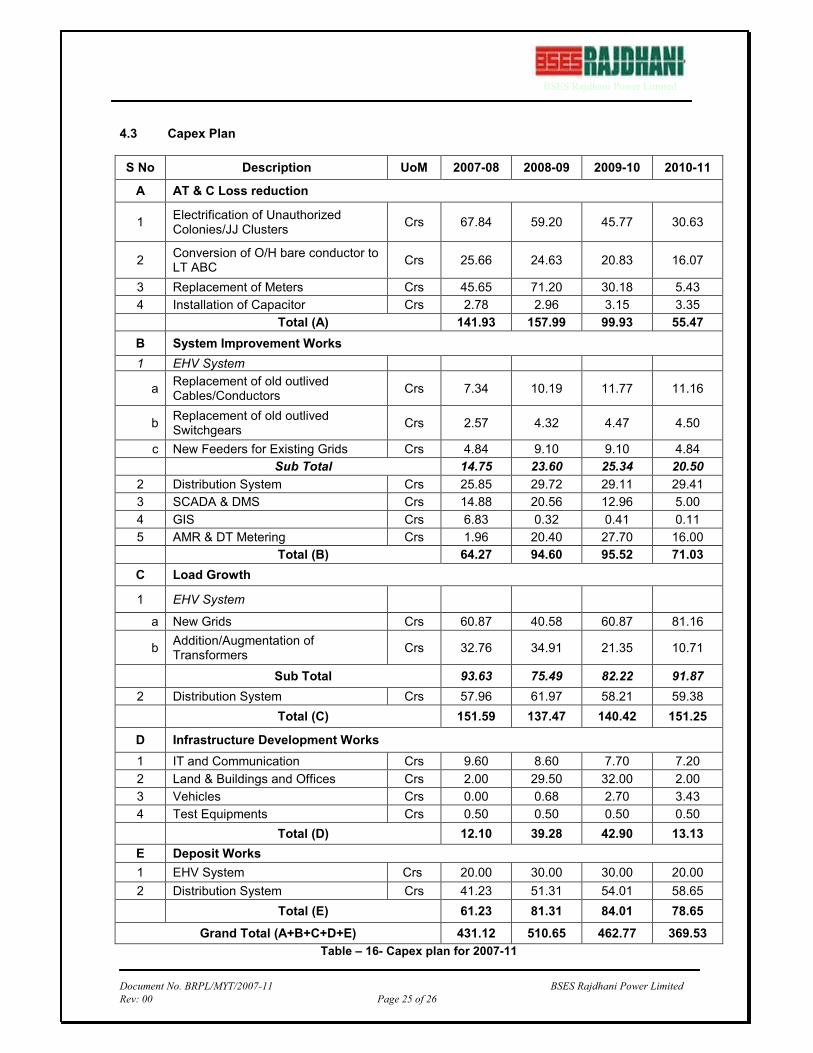
4.3 Capex Plan
S No Description UoM 2007-08 2008-09 2009-10 2010-11
A AT & C Loss reduction
1 Electrification of Unauthorized Colonies/JJ Clusters
Crs 67.84 59.20 45.77 30.63
2 Conversion of O/H bare conductor to LT ABC
Crs 25.66 24.63 20.83 16.07
3 Replacement of Meters Crs 45.65 71.20 30.18 5.43
4 Installation of Capacitor Crs 2.78 2.96 3.15 3.35
Total (A) 141.93 157.99 99.93 55.47
B System Improvement Works
1 EHV System
a Replacement of old outlived Cables/Conductors
Crs 7.34 10.19 11.77 11.16
b Replacement of old outlived Switchgears
Crs 2.57 4.32 4.47 4.50
c New Feeders for Existing Grids Crs 4.84 9.10 9.10 4.84
Sub Total 14.75 23.60 25.34 20.50
2 Distribution System Crs 25.85 29.72 29.11 29.41
3 SCADA & DMS Crs 14.88 20.56 12.96 5.00
4 GIS Crs 6.83 0.32 0.41 0.11
5 AMR & DT Metering Crs 1.96 20.40 27.70 16.00
Total (B) 64.27 94.60 95.52 71.03
C Load Growth
1 EHV System
a New Grids Crs 60.87 40.58 60.87 81.16
b Addition/Augmentation of Transformers
Crs 32.76 34.91 21.35 10.71
Sub Total 93.63 75.49 82.22 91.87
2 Distribution System Crs 57.96 61.97 58.21 59.38
Total (C) 151.59 137.47 140.42 151.25
D Infrastructure Development Works
1 IT and Communication Crs 9.60 8.60 7.70 7.20
2 Land & Buildings and Offices Crs 2.00 29.50 32.00 2.00
3 Vehicles Crs 0.00 0.68 2.70 3.43
4 Test Equipments Crs 0.50 0.50 0.50 0.50
Total (D) 12.10 39.28 42.90 13.13
E Deposit Works
1 EHV System Crs 20.00 30.00 30.00 20.00
2 Distribution System Crs 41.23 51.31 54.01 58.65
Total (E) 61.23 81.31 84.01 78.65
Grand Total (A+B+C+D+E) 431.12 510.65 462.77 369.53
Table – 16- Capex plan for 2007-11
BSES Rajdhani Power Limited
Document No. BRPL/MYT/2007-11 BSES Rajdhani Power Limited
Rev: 00 Page 26 of 26
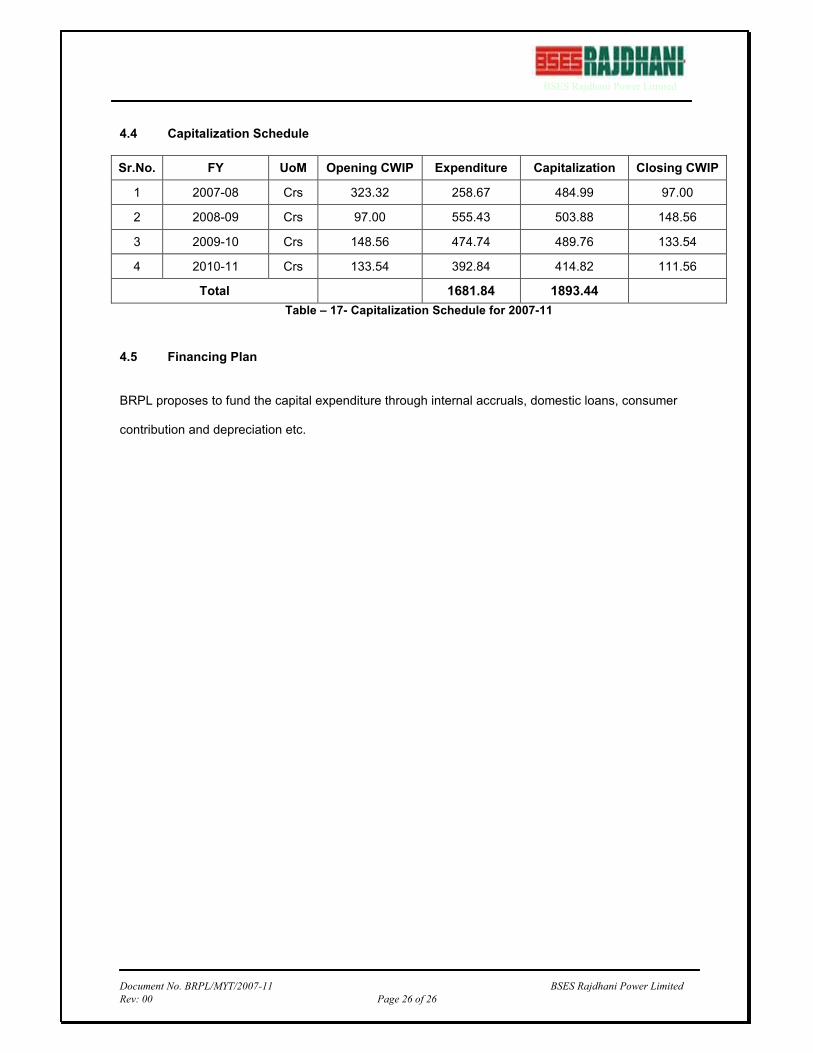
4.4 Capitalization Schedule
Sr.No. FY UoM Opening CWIP Expenditure Capitalization Closing CWIP
1 2007-08 Crs 323.32 258.67 484.99 97.00
2 2008-09 Crs 97.00 555.43 503.88 148.56
3 2009-10 Crs 148.56 474.74 489.76 133.54
4 2010-11 Crs 133.54 392.84 414.82 111.56
Total 1681.84 1893.44
Table – 17- Capitalization Schedule for 2007-11
4.5 Financing Plan BRPL proposes to fund the capital expenditure through internal accruals, domestic loans, consumer
contribution and depreciation etc.


![Kku ds fy, izos'k] fodkl ds fy, izLFkku - MGIMT](https://img.dokumen.tips/doc/110x75/634c9c98ae9997954c039497/kku-ds-fy-izosk-fodkl-ds-fy-izlfkku-mgimt.jpg)


