Embed Size (px)
Citation preview
Provided by the author(s) and University College Dublin Library in accordance with publisher policies. Please
cite the published version when available.
Downloaded 2014-01-13T10:55:29Z
Some rights reserved. For more information, please see the item record link above.
Title Browsing onwards : Irish public spending in perspective
Author(s) McCarthy, Colm; Lawlor, John
PublicationDate 2003
Publicationinformation Irish Banking Review, (Autumn 2003): 2-17
Publisher Irish Bankers' Federation
Link topublisher's
versionhttp://www.ucd.ie/economics/staff/cmccarthy/browson.pdf
This item'srecord/moreinformation
http://hdl.handle.net/10197/562
C O N T E N T S
BROWSING ONWARDS: IRISH PUBLIC SPENDING INPERSPECTIVEJohn Lawlor and Colm McCarthy
DKM Economic Consultants
2
FINANCIAL MARKETS INTEGRATION: A REVIEW AFTER FIVE YEARS OF EMUPat McArdle
Chief Economist
Ulster Bank Ireland Limited
THE IRISH BANKING SECTOR: A COMPARATIVE OVERVIEW Trevor Fitzpatrick and David Doran,
Monetary Policy & Financial Stability Department,
Central Bank & Financial Services Authority of Ireland
29
CORPORATE SOCIAL RESPONSIBILITY AND THE FINANCIALSERVICES SECTOR: A EUROPEAN PERSPECTIVENiall Gallagher, Regulatory Compliance and Business Ethics,
Allied Irish Banks plc
48
18
1
A U T U M N 2 0 0 3
The opinions expressed in the Review
by our contributors do not necessarily
coincide with those of the banks.
BROWSING ONWARDS: IRISH PUBLIC SPENDING INPERSPECTIVE
John Lawlor and Colm McCarthy, DKM Economic Consultants
In the context of the current debate over standards of public services in Ireland and
the appropriate level of public spending this paper reviews historical trends in Irish
public expenditure, its relationship to GDP/GNP and comparisons with other EU
states. The growth in Irish public spending has accelerated sharply in recent years.
Since 1996 real public current expenditure (net of inflation) has grown by almost
70% and the figure for health is 136%. This rapid growth means that, on a per
capita basis, public expenditure will be above the projected EU average for 2003
and health expenditure in particular will be amongst the highest per capita in the EU.
Education expenditure will also be above the EU average. Assertions to the
contrary would have been more accurate some years ago, but have been overtaken
by the Irish spending explosion.
INTRODUCTION
'It is really intolerable the way these civil departments browse onwards like a horde of
injurious locusts......'
Winston Churchill, as Chancellor of the Exchequer, 1927.
With the demise of the Celtic Tiger, the brief period during which Ireland enjoyed large
budget surpluses has come to an end. The stagnation in tax revenues since 2001
has been accompanied by a sharp increase in public spending and budget deficits
have been avoided only through some once-off accounting measures, facilitated by
Ireland’s less-than-transparent public finance accounting conventions.[1]
Substantial spending commitments emerged from all of the political parties during the
2002 election campaign, predicated on a return to faster economic growth and
accompanying tax buoyancy. Public spending has indeed been increased in 2003.
But there is no sign of a return to sustained rapid economic growth; membership of
the euro zone imposes constraints on future borrowing; and tax revenues for 2003 to
2
[1] McCarthy, C., “Generally Unacceptable Accounting Principles: The Irish Public Finance Accounts”, Economic and SocialResearch Institute Quarterly Economic Commentary, Summer 2002.
date are again running below expectations. Tax burdens have begun to rise again
and further tax impositions are likely if spending growth continues.
Some commentators have urged that tax burdens should indeed be increased, on the
grounds that they are unusually low in Ireland by comparison with other EU countries.
It has also been argued that public spending in Ireland is lower than in comparable
countries and that extra tax burdens would be justified in order to finance further
spending increases. In view of this debate, it is useful to review historical trends in
Irish public expenditure, its relationship to GDP/GNP and comparisons with other EU
member states.
THE PUBLIC EXPENDITURE RECORD
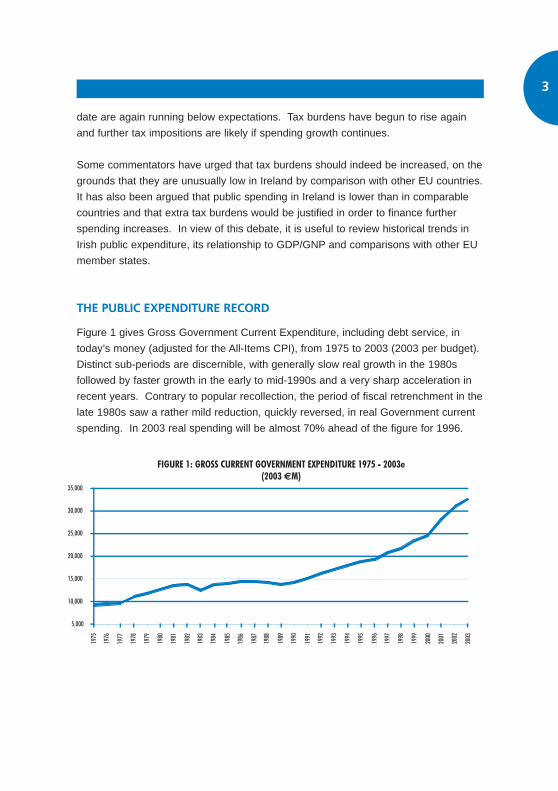
Figure 1 gives Gross Government Current Expenditure, including debt service, in
today’s money (adjusted for the All-Items CPI), from 1975 to 2003 (2003 per budget).
Distinct sub-periods are discernible, with generally slow real growth in the 1980s
followed by faster growth in the early to mid-1990s and a very sharp acceleration in
recent years. Contrary to popular recollection, the period of fiscal retrenchment in the
late 1980s saw a rather mild reduction, quickly reversed, in real Government current
spending. In 2003 real spending will be almost 70% ahead of the figure for 1996.
3
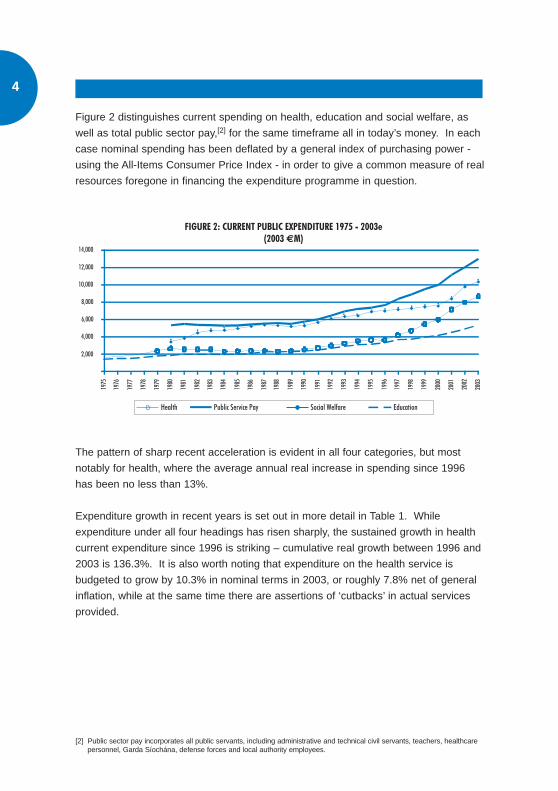
Figure 2 distinguishes current spending on health, education and social welfare, as
well as total public sector pay,[2] for the same timeframe all in today’s money. In each
case nominal spending has been deflated by a general index of purchasing power -
using the All-Items Consumer Price Index - in order to give a common measure of real
resources foregone in financing the expenditure programme in question.
The pattern of sharp recent acceleration is evident in all four categories, but most
notably for health, where the average annual real increase in spending since 1996
has been no less than 13%.
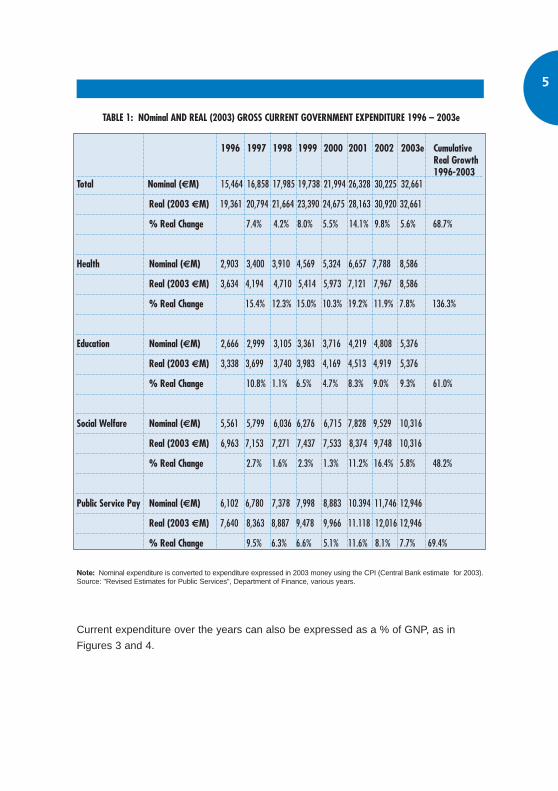
Expenditure growth in recent years is set out in more detail in Table 1. While
expenditure under all four headings has risen sharply, the sustained growth in health
current expenditure since 1996 is striking – cumulative real growth between 1996 and
2003 is 136.3%. It is also worth noting that expenditure on the health service is
budgeted to grow by 10.3% in nominal terms in 2003, or roughly 7.8% net of general
inflation, while at the same time there are assertions of ‘cutbacks’ in actual services
provided.
4
[2] Public sector pay incorporates all public servants, including administrative and technical civil servants, teachers, healthcarepersonnel, Garda Síochána, defense forces and local authority employees.
5
TABLE 1: NOminal AND REAL (2003) GROSS CURRENT GOVERNMENT EXPENDITURE 1996 – 2003e
1996 1997 1998 1999 2000 2001 2002 2003e CumulativeReal Growth1996-2003
Total Nominal (€M) 15,464 16,858 17,985 19,738 21,994 26,328 30,225 32,661
Real (2003 €M) 19,361 20,794 21,664 23,390 24,675 28,163 30,920 32,661
% Real Change 7.4% 4.2% 8.0% 5.5% 14.1% 9.8% 5.6% 68.7%
Health Nominal (€M) 2,903 3,400 3,910 4,569 5,324 6,657 7,788 8,586
Real (2003 €M) 3,634 4,194 4,710 5,414 5,973 7,121 7,967 8,586
% Real Change 15.4% 12.3% 15.0% 10.3% 19.2% 11.9% 7.8% 136.3%
Education Nominal (€M) 2,666 2,999 3,105 3,361 3,716 4,219 4,808 5,376
Real (2003 €M) 3,338 3,699 3,740 3,983 4,169 4,513 4,919 5,376
% Real Change 10.8% 1.1% 6.5% 4.7% 8.3% 9.0% 9.3% 61.0%
Social Welfare Nominal (€M) 5,561 5,799 6,036 6,276 6,715 7,828 9,529 10,316
Real (2003 €M) 6,963 7,153 7,271 7,437 7,533 8,374 9,748 10,316
% Real Change 2.7% 1.6% 2.3% 1.3% 11.2% 16.4% 5.8% 48.2%
Public Service Pay Nominal (€M) 6,102 6,780 7,378 7,998 8,883 10.394 11,746 12,946
Real (2003 €M) 7,640 8,363 8,887 9,478 9,966 11.118 12,016 12,946
% Real Change 9.5% 6.3% 6.6% 5.1% 11.6% 8.1% 7.7% 69.4%
Note: Nominal expenditure is converted to expenditure expressed in 2003 money using the CPI (Central Bank estimate for 2003).Source: "Revised Estimates for Public Services", Department of Finance, various years.
Current expenditure over the years can also be expressed as a % of GNP, as in
Figures 3 and 4.
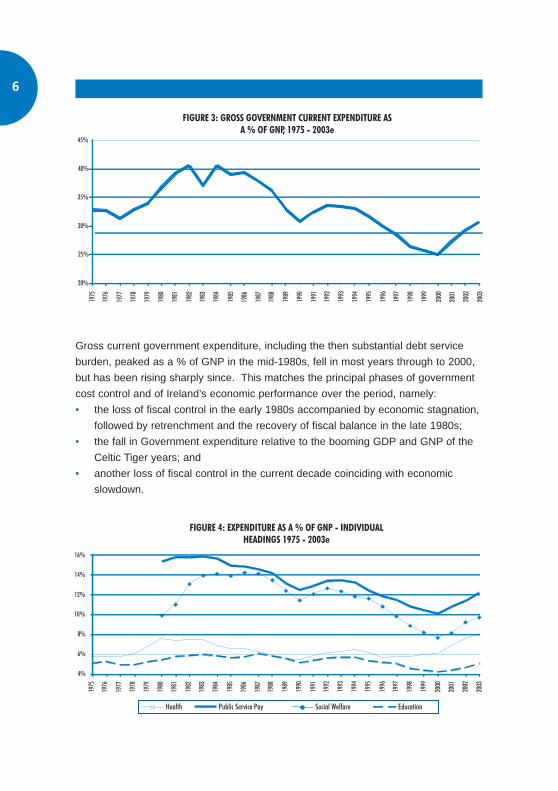
Gross current government expenditure, including the then substantial debt service
burden, peaked as a % of GNP in the mid-1980s, fell in most years through to 2000,
but has been rising sharply since. This matches the principal phases of government
cost control and of Ireland’s economic performance over the period, namely:
• the loss of fiscal control in the early 1980s accompanied by economic stagnation,
followed by retrenchment and the recovery of fiscal balance in the late 1980s;
• the fall in Government expenditure relative to the booming GDP and GNP of the
Celtic Tiger years; and
• another loss of fiscal control in the current decade coinciding with economic
slowdown.
6
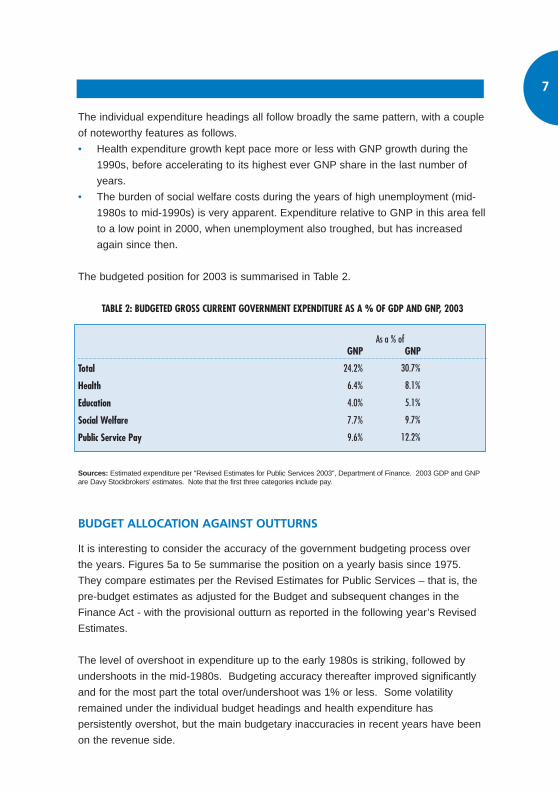
The individual expenditure headings all follow broadly the same pattern, with a couple
of noteworthy features as follows.
• Health expenditure growth kept pace more or less with GNP growth during the
1990s, before accelerating to its highest ever GNP share in the last number of
years.
• The burden of social welfare costs during the years of high unemployment (mid-
1980s to mid-1990s) is very apparent. Expenditure relative to GNP in this area fell
to a low point in 2000, when unemployment also troughed, but has increased
again since then.
The budgeted position for 2003 is summarised in Table 2.
TABLE 2: BUDGETED GROSS CURRENT GOVERNMENT EXPENDITURE AS A % OF GDP AND GNP, 2003
As a % ofGNP GNP
Total
Health
Education
Social Welfare
Public Service Pay
Sources: Estimated expenditure per "Revised Estimates for Public Services 2003", Department of Finance. 2003 GDP and GNPare Davy Stockbrokers’ estimates. Note that the first three categories include pay.
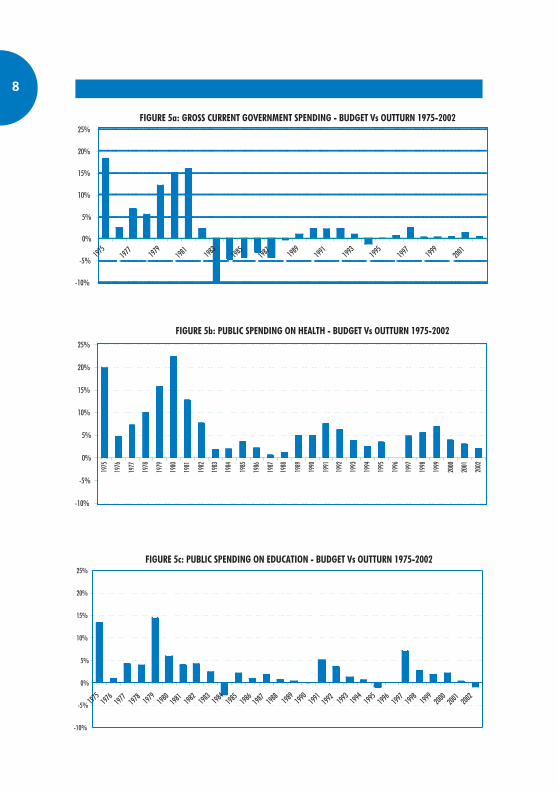
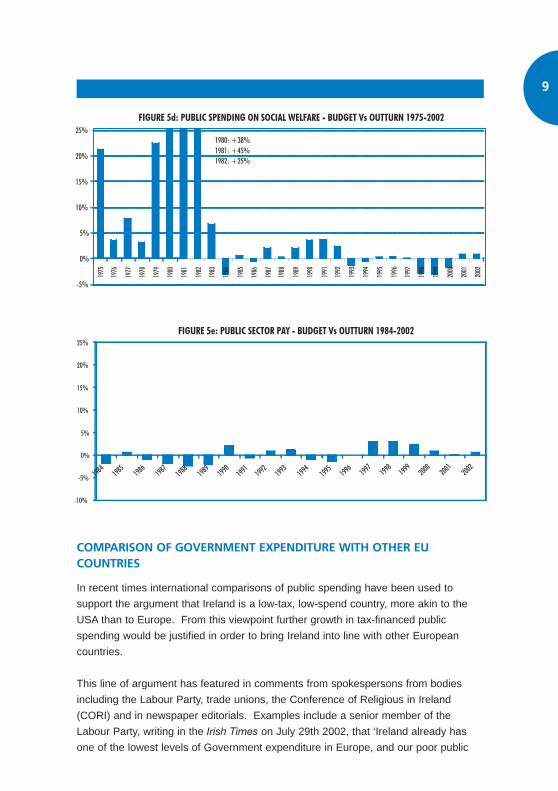
BUDGET ALLOCATION AGAINST OUTTURNS
It is interesting to consider the accuracy of the government budgeting process over
the years. Figures 5a to 5e summarise the position on a yearly basis since 1975.
They compare estimates per the Revised Estimates for Public Services – that is, the
pre-budget estimates as adjusted for the Budget and subsequent changes in the
Finance Act - with the provisional outturn as reported in the following year’s Revised
Estimates.
The level of overshoot in expenditure up to the early 1980s is striking, followed by
undershoots in the mid-1980s. Budgeting accuracy thereafter improved significantly
and for the most part the total over/undershoot was 1% or less. Some volatility
remained under the individual budget headings and health expenditure has
persistently overshot, but the main budgetary inaccuracies in recent years have been
on the revenue side.
7
24.2%
6.4%
4.0%
7.7%
9.6%
30.7%
8.1%
5.1%
9.7%
12.2%
8
COMPARISON OF GOVERNMENT EXPENDITURE WITH OTHER EUCOUNTRIES
In recent times international comparisons of public spending have been used to
support the argument that Ireland is a low-tax, low-spend country, more akin to the
USA than to Europe. From this viewpoint further growth in tax-financed public
spending would be justified in order to bring Ireland into line with other European
countries.
This line of argument has featured in comments from spokespersons from bodies
including the Labour Party, trade unions, the Conference of Religious in Ireland
(CORI) and in newspaper editorials. Examples include a senior member of the
Labour Party, writing in the Irish Times on July 29th 2002, that ‘Ireland already has
one of the lowest levels of Government expenditure in Europe, and our poor public
9
services reflect that’, or a senior SIPTU official, who described Ireland in the same
newspaper on July 17th 2003 as ‘… an economy with one of the lowest levels of
public expenditure in Europe’.
These statements seem to rely mainly on straight ratios of government spending or
revenue to GDP. However, there are numerous traps for the unwary in international
fiscal comparisons, including the following in particular.
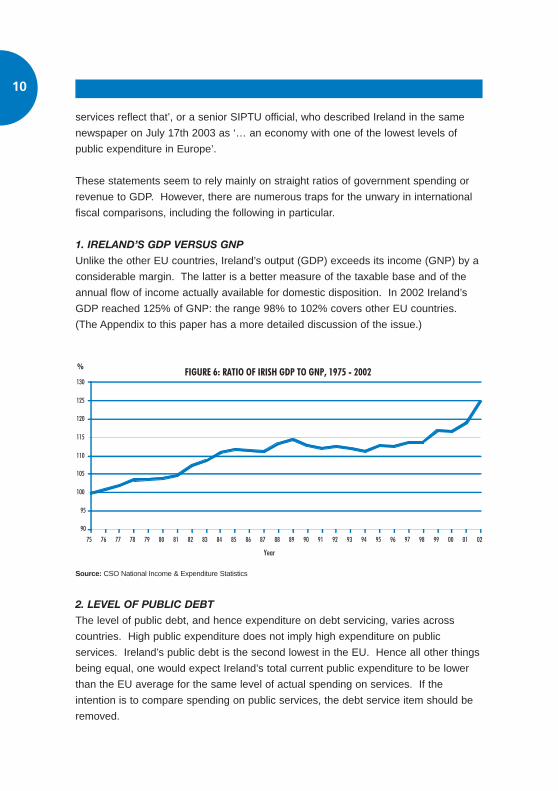
1. IRELAND’S GDP VERSUS GNP
Unlike the other EU countries, Ireland’s output (GDP) exceeds its income (GNP) by a
considerable margin. The latter is a better measure of the taxable base and of the
annual flow of income actually available for domestic disposition. In 2002 Ireland’s
GDP reached 125% of GNP: the range 98% to 102% covers other EU countries.
(The Appendix to this paper has a more detailed discussion of the issue.)
Source: CSO National Income & Expenditure Statistics
2. LEVEL OF PUBLIC DEBT
The level of public debt, and hence expenditure on debt servicing, varies across
countries. High public expenditure does not imply high expenditure on public
services. Ireland’s public debt is the second lowest in the EU. Hence all other things
being equal, one would expect Ireland’s total current public expenditure to be lower
than the EU average for the same level of actual spending on services. If the
intention is to compare spending on public services, the debt service item should be
removed.
10
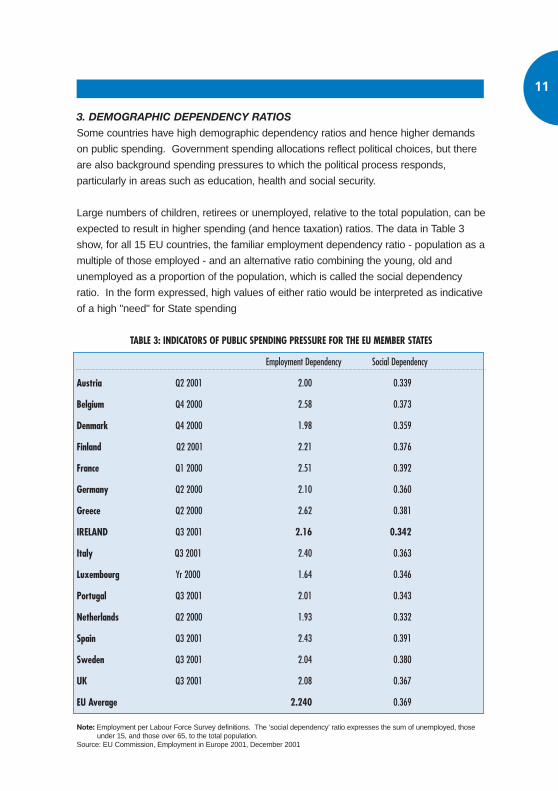
3. DEMOGRAPHIC DEPENDENCY RATIOS
Some countries have high demographic dependency ratios and hence higher demands
on public spending. Government spending allocations reflect political choices, but there
are also background spending pressures to which the political process responds,
particularly in areas such as education, health and social security.
Large numbers of children, retirees or unemployed, relative to the total population, can be
expected to result in higher spending (and hence taxation) ratios. The data in Table 3
show, for all 15 EU countries, the familiar employment dependency ratio - population as a
multiple of those employed - and an alternative ratio combining the young, old and
unemployed as a proportion of the population, which is called the social dependency
ratio. In the form expressed, high values of either ratio would be interpreted as indicative
of a high "need" for State spending
TABLE 3: INDICATORS OF PUBLIC SPENDING PRESSURE FOR THE EU MEMBER STATES
Employment Dependency Social Dependency
Austria Q2 2001
Belgium Q4 2000
Denmark Q4 2000
Finland Q2 2001
France Q1 2000
Germany Q2 2000
Greece Q2 2000
IRELAND Q3 2001
Italy Q3 2001
Luxembourg Yr 2000
Portugal Q3 2001
Netherlands Q2 2000
Spain Q3 2001
Sweden Q3 2001
UK Q3 2001
EU Average
Note: Employment per Labour Force Survey definitions. The ‘social dependency’ ratio expresses the sum of unemployed, those under 15, and those over 65, to the total population.
Source: EU Commission, Employment in Europe 2001, December 2001
2.00
2.58
1.98
2.21
2.51
2.10
2.62
2.16
2.40
1.64
2.01
1.93
2.43
2.04
2.08
2.240
0.339
0.373
0.359
0.376
0.392
0.360
0.381
0.342
0.363
0.346
0.343
0.332
0.391
0.380
0.367
0.369
11
There is a wide range in employment dependency ratios, with only 1.64 persons per
employed worker in Luxembourg, ranging up to 2.62 in Greece. At 2.16, Ireland is below
the EU average of 2.24. The alternative ratio, which shows the proportion of the
population in the child, elderly and unemployed categories, ranges from a low of 0.332 in
the Netherlands to a high of 0.392 in France. The Irish figure of 0.342 is one of the
lowest and compares to an EU average of 0.369.
Thus on neither measure could one construct a case for the view that there is an above-
average public spending “need” in Ireland, deriving either from demographic structure or
the level of unemployment. The political or ideological case for higher ratios of taxation
or spending in Ireland is of course another matter and logically independent of
international comparisons. There is no reason why Ireland could not choose the highest
(or indeed the lowest) of such ratios as an expression of political preference. The
foregoing calculations are offered merely to draw attention to the limitations of a line of
argument based on some notion that Ireland’s ratios should be ‘increased to the average
EU level’. As will be shown, Irish expenditure ratios are not in fact materially out of line
with the EU average, contrary to assertions whose constant repetition appears to have
exalted them to the status of fact.
4. PENSION FUNDING ARRANGEMENTS
Provision for retirement income is funnelled largely through the state system in some
countries, but more through private sector provision in others. In Ireland employee social
insurance taxes have recently been about 6% of income, with employers contributing
about double that proportion. The figures are similar in the UK. In most European
countries the corresponding contributions are much higher, but they ‘purchase’ greater
entitlements, particularly in relation to retirement income.
Most European countries run unfunded (pay-as-you-go) income-related pension schemes
and, as a result, few employers or employees have arranged pre-funded private
schemes. Employees can expect the state to provide retirement benefits related to their
earnings, rather akin to the benefit package of the traditional pre-funded defined benefit
pension schemes familiar in private sector employments in the UK and Ireland.
There is a recent trend towards pre-funding in continental Europe, since the unfunded
state schemes will require ever-increasing social security taxes if existing pension
promises are to be met; and there is a growing reluctance to believe that state pension
promises will be fully honoured. Retirement ages, for example, are being raised and
some European governments have already partially reneged on their pension promises.
12
OECD figures for 1998 show that social security and other payroll taxes yielded 14% of
total tax revenue in Ireland as against 29% for the EU as a whole. The UK also had a low
proportion (18%), as had Denmark, where social expenditures are funded through general
taxation rather than through earmarked payroll taxes. But the corresponding figures for
France and Germany were no less than 40%. Thus, the relatively low (by EU standards)
state revenue from social insurance taxes in Ireland, which pulls down the overall revenue
(and also expenditure) to GNP ratio, ignores the sizeable annual contributions which
employers and employees in the private sector make to pre-funded pension schemes. In
effect, the private sector pensions business goes through the state budget in most
continental European countries and high social insurance taxes (and hence high current
spending to GNP ratios) are a reflection of this. The definition of the public and private
sectors in this aspect reflects statistical conventions rather than the reality of the
underlying transactions in retirement income provision which are taking place.
In order to achieve better comparability in the spending to GNP ratios, it would be
interesting to add to the level of social security spending in countries such as Ireland and
the UK the amounts being subscribed to pre-funded pension schemes (or the amounts
being disbursed) in the different countries. However consistent data do not appear to be
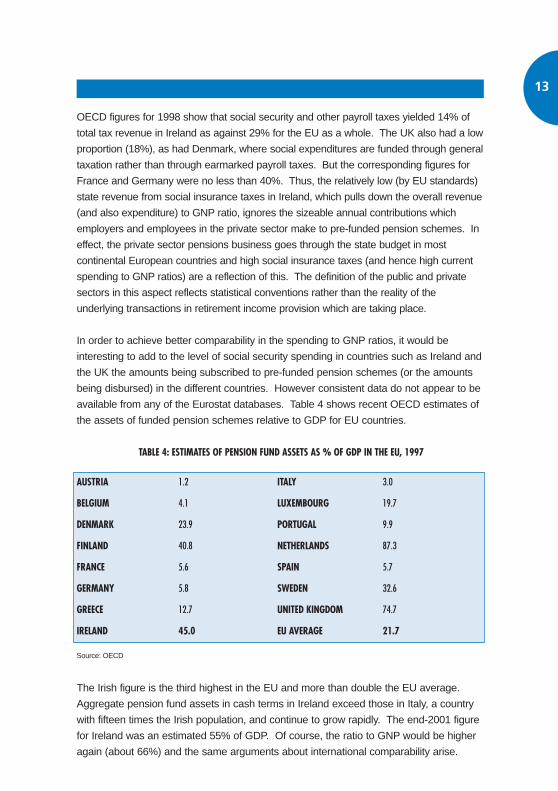
available from any of the Eurostat databases. Table 4 shows recent OECD estimates of
the assets of funded pension schemes relative to GDP for EU countries.
TABLE 4: ESTIMATES OF PENSION FUND ASSETS AS % OF GDP IN THE EU, 1997
AUSTRIA 1.2 ITALY 3.0
BELGIUM 4.1 LUXEMBOURG 19.7
DENMARK 23.9 PORTUGAL 9.9
FINLAND 40.8 NETHERLANDS 87.3
FRANCE 5.6 SPAIN 5.7
GERMANY 5.8 SWEDEN 32.6
GREECE 12.7 UNITED KINGDOM 74.7
IRELAND 45.0 EU AVERAGE 21.7
Source: OECD
The Irish figure is the third highest in the EU and more than double the EU average.
Aggregate pension fund assets in cash terms in Ireland exceed those in Italy, a country
with fifteen times the Irish population, and continue to grow rapidly. The end-2001 figure
for Ireland was an estimated 55% of GDP. Of course, the ratio to GNP would be higher
again (about 66%) and the same arguments about international comparability arise.
13
Being the income concept, GNP is a more logical base for ratios of this type. Both the
Netherlands and the UK have pre-funded pension schemes along lines similar to those in
Ireland and they are more “mature” (average age of contributing members is higher);
hence the large ratios to GDP or GNP. The annual gross flow of cash income into pre-
funded schemes in Ireland, including self-employed arrangements, is currently in the
range 3% to 4% of GNP, but is under 1% in most other member states. Allowance for
this factor narrows further the gap between the Irish ratios of revenue and expenditure to
GNP and the EU averages.
Table 5 sets out the level of total Government expenditure - expenditure net of national
debt interest - and expenditure on health and education, as a percentage of GDP, of
GNP and expressed per capita for the EU countries in 2003.[3] All of these figures are for
current and capital expenditure combined on the Eurostat ‘General Government’ basis.
In order to capture the recent fast pace of growth in Irish public spending relative to other
EU countries, it is desirable to use 2003 estimates, even though outturns may of course
differ from the numbers shown.[4] Sources are described beneath the table.
The Table shows that, as a simple percentage of GDP, total public expenditure in Ireland
is indeed the lowest in the EU: 35.9% versus an EU average of 47.4%, a sizeable gap of
11.5%. But as a percentage of GNP, the Irish figure is 45.5%, just 2.1% under the EU
average and is higher than Spain and the UK. When expressed on a per capita basis,
Ireland’s public expenditure is higher than the estimated 2003 EU average and is ahead
of Spain, Portugal, Greece, Italy and the UK.
The figures net of national debt interest give a more accurate indicator of actual
expenditure on public services. Relative to GDP, Ireland’s public expenditure net of
interest remains the lowest in the EU; but as a percentage of GNP it is just 0.6% lower
than the average and is higher than Belgium, Greece, Italy, Spain and the UK. On a per
capita basis, it is 9.5% ahead of the average EU spend. These figures make no
adjustment to the Irish, British and Dutch data to allow for the pre-funding of pension
schemes in those three countries. Ratios as shown would be higher for all three with
such an adjustment.
Ireland’s public expenditure on health has been buoyed by the very strong growth in
recent years. Expressed as a percentage of GDP, it remains below average, but as a
percentage of GNP it is now the highest in the EU and in per capita terms it is the third
highest. Only Denmark and Luxembourg will spend more per capita on the public health
system in 2003. Finally, public expenditure on education in Ireland as a percentage of
GDP is lower than the EU average. However, as a percentage of GNP and per capita
the figure rises above the average, and ranks seventh among the EU countries.
14
[3] Comparable data for social welfare expenditure and public service pay are difficult to obtain.[4] For the first seven months of 2003, actual health expenditure has been 3% below the 2003 Estimate, while education expenditure
has been 1.4% above the Estimate.
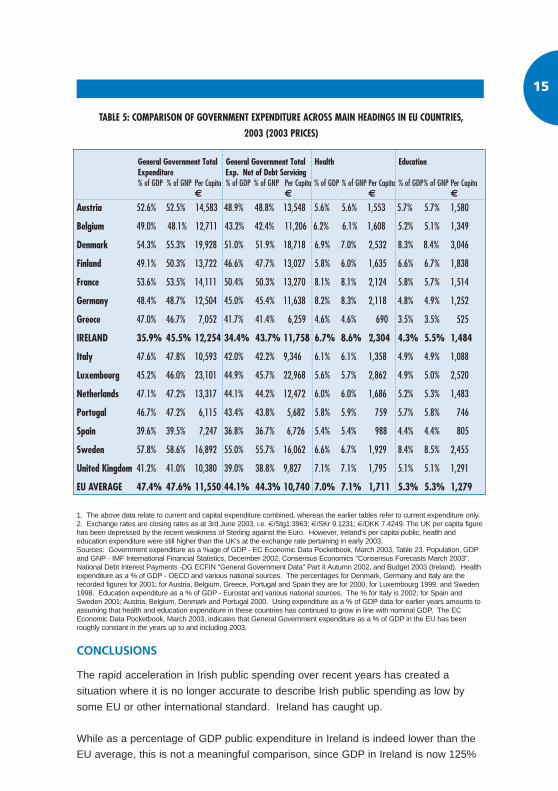
TABLE 5: COMPARISON OF GOVERNMENT EXPENDITURE ACROSS MAIN HEADINGS IN EU COUNTRIES,
2003 (2003 PRICES)
General Government Total General Government Total Health EducationExpenditure Exp. Net of Debt Servicing% of GDP % of GNP Per Capita % of GDP % of GNP Per Capita % of GDP % of GNP Per Capita % of GDP% of GNP Per Capita
€ € € €
Austria 52.6% 52.5% 14,583 48.9% 48.8% 13,548 5.6% 5.6% 1,553 5.7% 5.7% 1,580
Belgium 49.0% 48.1% 12,711 43.2% 42.4% 11,206 6.2% 6.1% 1,608 5.2% 5.1% 1,349
Denmark 54.3% 55.3% 19,928 51.0% 51.9% 18,718 6.9% 7.0% 2,532 8.3% 8.4% 3,046
Finland 49.1% 50.3% 13,722 46.6% 47.7% 13,027 5.8% 6.0% 1,635 6.6% 6.7% 1,838
France 53.6% 53.5% 14,111 50.4% 50.3% 13,270 8.1% 8.1% 2,124 5.8% 5.7% 1,514
Germany 48.4% 48.7% 12,504 45.0% 45.4% 11,638 8.2% 8.3% 2,118 4.8% 4.9% 1,252
Greece 47.0% 46.7% 7,052 41.7% 41.4% 6,259 4.6% 4.6% 690 3.5% 3.5% 525
IRELAND 35.9% 45.5% 12,254 34.4% 43.7% 11,758 6.7% 8.6% 2,304 4.3% 5.5% 1,484
Italy 47.6% 47.8% 10,593 42.0% 42.2% 9,346 6.1% 6.1% 1,358 4.9% 4.9% 1,088
Luxembourg 45.2% 46.0% 23,101 44.9% 45.7% 22,968 5.6% 5.7% 2,862 4.9% 5.0% 2,520
Netherlands 47.1% 47.2% 13,317 44.1% 44.2% 12,472 6.0% 6.0% 1,686 5.2% 5.3% 1,483
Portugal 46.7% 47.2% 6,115 43.4% 43.8% 5,682 5.8% 5.9% 759 5.7% 5.8% 746
Spain 39.6% 39.5% 7,247 36.8% 36.7% 6,726 5.4% 5.4% 988 4.4% 4.4% 805
Sweden 57.8% 58.6% 16,892 55.0% 55.7% 16,062 6.6% 6.7% 1,929 8.4% 8.5% 2,455
United Kingdom 41.2% 41.0% 10,380 39.0% 38.8% 9,827 7.1% 7.1% 1,795 5.1% 5.1% 1,291
EU AVERAGE 47.4% 47.6% 11,550 44.1% 44.3% 10,740 7.0% 7.1% 1,711 5.3% 5.3% 1,279
1. The above data relate to current and capital expenditure combined, whereas the earlier tables refer to current expenditure only.2. Exchange rates are closing rates as at 3rd June 2003, i.e. €/Stg1.3963; €/SKr 9.1231; €/DKK 7.4249. The UK per capita figurehas been depressed by the recent weakness of Sterling against the Euro. However, Ireland's per capita public, health andeducation expenditure were still higher than the UK's at the exchange rate pertaining in early 2003.Sources: Government expenditure as a %age of GDP - EC Economic Data Pocketbook, March 2003, Table 23. Population, GDPand GNP - IMF International Financial Statistics, December 2002, Consensus Economics "Consensus Forecasts March 2003".National Debt Interest Payments -DG ECFIN "General Government Data" Part II Autumn 2002, and Budget 2003 (Ireland). Healthexpenditure as a % of GDP - OECD and various national sources. The percentages for Denmark, Germany and Italy are therecorded figures for 2001; for Austria, Belgium, Greece, Portugal and Spain they are for 2000; for Luxembourg 1999, and Sweden1998. Education expenditure as a % of GDP - Eurostat and various national sources. The % for Italy is 2002; for Spain andSweden 2001; Austria, Belgium, Denmark and Portugal 2000. Using expenditure as a % of GDP data for earlier years amounts toassuming that health and education expenditure in these countries has continued to grow in line with nominal GDP. The ECEconomic Data Pocketbook, March 2003, indicates that General Government expenditure as a % of GDP in the EU has beenroughly constant in the years up to and including 2003.
CONCLUSIONS
The rapid acceleration in Irish public spending over recent years has created a
situation where it is no longer accurate to describe Irish public spending as low by
some EU or other international standard. Ireland has caught up.
While as a percentage of GDP public expenditure in Ireland is indeed lower than the
EU average, this is not a meaningful comparison, since GDP in Ireland is now 125%
15
of national income, as measured by GNP. For other European countries, whose
national accounts are free of the measurement problems created for Ireland by
multinational transfer pricing, the GDP and GNP figures almost coincide. On a per
capita basis Ireland’s total public expenditure is now higher than the EU average.
Based on 2003 estimates, Ireland’s public expenditure on health as a percentage of
GNP is the highest in the EU and in per capita terms it is the third highest, behind
Denmark and Luxembourg. Public expenditure on education as a percentage of GNP
(and per capita) is likewise above the EU average.
Whether further increases in public spending should be undertaken is of course an
important policy question, which requires consideration of taxation consequences,
value for money and a host of other essentially political aspects. However,
proponents of higher spending should not be encouraged to continue ducking these
issues through reliance on inappropriate (or simply out-of-date) international
comparisons of Ireland’s current position.
APPENDIX: THE OUTCOME/INCOME GAP
There are several alternative definitions of overall economic activity, of which GDP and GNP are
the most commonly encountered. GDP, or Gross Domestic Product, measures the volume of
output in the economy. It is a measure of the valuation placed on the total annual or quarterly
flow of economic value added in the various sectors of economic activity. But some of this value
added will arise, in an open economy, through the use of factors of production which belong to
others (foreigners). The portion of the value of output which flows abroad must be deducted.
Equally, domestic agents may be entitled to a portion of the value of output produced elsewhere
and a net sum must be arrived at. This sum is called net factor flows and can be positive or
negative. Output (GDP) plus or minus Net Factor Flows equals Gross National Product or
GNP. This concept is closer to a notion of income accruing to the domestic economy.
Taxes are levied on domestic economic aggregates such as personal income, payroll,
and consumer spending and go to finance the State’s spending programmes and
commitments. The base on which taxes are levied is more accurately proxied by income
(GNP) than by output (GDP), and the spending of the State best seen as a use of
national income rather than of national output. These two magnitudes, GDP and GNP, do
not differ much for most economically advanced countries, but one of the exceptions is
the Republic of Ireland. A further refinement adjusts GNP for international transfers,
unrequited flows such as foreign aid, to produce a concept called Gross National
Disposable Income or GNDI. In the early 1990s this exceeded GNP in Ireland by a
significant margin, due to large transfers from the European Union. This gap has
narrowed to less than 1% of GNP and is expected to disappear altogether in the next few
years. But GNDI is a key operational concept of income for many developing countries,
where it can substantially exceed the GNP measure because of foreign aid inflows.
16

17


