Embed Size (px)
Citation preview
A W O R L D B A N K P O L I C Y R E S E A R C H R E P O R T
Civil War and Development Policy
Breaking the ConflictTrap
Breaking the ConflictTrap
Pub
lic D
iscl
osur
e A
utho
rized
Pub
lic D
iscl
osur
e A
utho
rized
Pub
lic D
iscl
osur
e A
utho
rized
Pub
lic D
iscl
osur
e A
utho
rized

Breaking the Conflict TrapCivil War and Development Policy
A World BankPolicy Research Report

Breaking the Conflict TrapCivil War and Development Policy
Paul CollierV. L. ElliottHåvard HegreAnke HoefflerMarta Reynal-QuerolNicholas Sambanis
A copublication of the World Bankand Oxford University Press
© 2003 The International Bank for Reconstruction and Development / The World Bank1818 H Street, NWWashington, DC 20433Telephone 202-473-1000Internet www.worldbank.orgE-mail [email protected]
All rights reserved.
1 2 3 4 06 05 04 03
A copublication of the World Bank and Oxford University Press.
This volume is a product of the staff of the World Bank. The findings, interpretations,and conclusions expressed herein do not necessarily reflect the views of the Board ofExecutive Directors of the World Bank or the governments they represent.
The World Bank does not guarantee the accuracy of the data included in this work.The boundaries, colors, denominations, and other information shown on any map inthis work do not imply any judgment on the part of the World Bank concerning thelegal status of any territory or the endorsement or acceptance of such boundaries.
Rights and PermissionsThe material in this work is copyrighted. Copying and/or transmitting portions or allof this work without permission may be a violation of applicable law. The World Bankencourages dissemination of its work and will normally grant permission promptly.
For permission to photocopy or reprint any part of this work, please send a requestwith complete information to the Copyright Clearance Center, Inc., 222 RosewoodDrive, Danvers, MA 01923, USA, telephone 978-750-8400, fax 978-750-4470, www.copyright.com.
All other queries on rights and licenses, including subsidiary rights, should be ad-dressed to the Office of the Publisher, World Bank, 1818 H Street NW, Washington,DC 20433, fax 202-522-2422, e-mail [email protected].
Library of Congress Cataloging-in-Publication Data has been applied for.
ISBN 0-8213-5481-7
Cover photo: © Peter Turnley/CORBIS
v
Contents
Foreword ix
The Report Team xiii
Acronyms and Abbreviations xv
Overview 1Let Them Fight It Out among Themselves? 1What Can We Do about Ancestral Hatreds? 3The Conflict Trap 4The Rising Global Incidence of Conflict 5Nothing Can Be Done 6
PART I. CRY HAVOC:WHY CIVIL WAR MATTERS 11
1. Civil War as Development in Reverse 13Costs during Conflict 13Legacy Effects of Civil War 19Conclusion 31
2. Let Them Fight It Out among Themselves? 33Neighborhood Effects of Civil War 33Global Effects of Civil War 41Conclusion 48
PART II. WHAT FUELS CIVIL WAR? 51
3. What Makes a Country Prone to Civil War? 53Understanding Rebellion 55The Conflict Trap 79Conclusion 88
C O N T E N T S
vi
4. Why Is Civil War So Common? 93Changes in the Global Pattern of Civil War 93Changes in the Incidence of Civil War 98Unpacking the Global Incidence of Civil War 100Conclusion: Poverty and the Conflict Trap 117
PART III. POLICIES FOR PEACE 119
5. What Works Where? 121Conflict Prevention in the Successful Developers 122Marginalized Countries at Peace 125Ending Conflicts 140Reducing Postconflict Risks 150Conclusion 171
6. An Agenda for International Action 173Precedents for International Action 174International Policies for Peace 175Conclusion: A New Goal for 2015? 186
Appendix 1. Methods and Data 189Data Set and Model 189Data Sources 193
Appendix 2. A Selected Bibliography of Studies of Civil War and Rebellion 197
Economic Factors 197Role of Ethnicity and Nationalism 198Anatomy of Rebellion 199Role of the State 199Negotiation and Implementation of Peace 200Bibliography 200
References 211
Boxes1.1 Violent conflict and the transformation of social capital 161.2 Refugees and IDPs in Liberia and Sudan 201.3 Angola 281.4 Psychological trauma 291.5 Landmines: A bitter legacy for Cambodians 31
2.1 Regional arms races 342.2 Eritrea 40
3.1 Modeling the risk of civil war 583.2 Oil and demands for secession in Nigeria 613.3 Inefficient counterinsurgency measures in Indonesia 733.4 Financing the Chechen rebellion 78
vii
C O N T E N T S
3.5 Modeling the duration of civil war 80
4.1 Recurrent conflicts example 1: Afghanistan 1044.2 Recurrent conflicts example 2: Angola 105
5.1 A comparison of Botswana and Sierra Leone 1275.2 Transparency of oil revenues in Chad 1315.3 The rough diamond trade and the Kimberley process 1435.4 The Khmer Rouge and the logs of war 145
Figures1.1 GDP per capita before and after civil war 141.2 Total number of refugees, 1962–2002 181.3 Increase in mortality rates due to civil war 24
2.1 The flow and stock of refugees, 1951–2002 362.2 The stock of refugees and civil wars, 1951–2001 372.3 Refugees and cases of malaria, 1962–97 382.4 Opium production, 1986–2001 432.5 Cocaine production, 1986–2001 432.6 Opium production in Afghanistan and heroin seizures in Europe,
1980–2001 452.7 Estimates of annual opiate and cocaine use in the late 1990s 45
3.1 Ethnic fractionalization and the risk of civil war 593.2 Risk of civil war for the typical low-income country with and
without ethnic dominance during a five-year period 593.3 Risk of civil wars from natural resources endowment 613.4 The risk of civil war in democracies and nondemocracies
at different levels of income 653.5 Improved economic performance and the risk of civil war 673.6 Military expenditures and the risk of civil war 723.7 Natural resources and the risk of civil war for low-income
countries 763.8 How chances of peace evolve worldwide 813.9 Duration of civil wars over time 823.10 The risk of civil war for a typical civil war country, just before
and just after war 833.11 Diasporas and postconflict risk 853.12 Military spending and the risk of renewed conflict in postconflict
countries 86
4.1 The global incidence of civil warfare, 1950–2001 944.2 Simulating the effects of the waves of decolonization,
1950–2020 954.3 Proportion of civil wars that end each year 964.4 The global self-sustaining incidence of civil war, by decades 974.5 Factors changing the global risk of conflict 994.6 The changing rates of conflict termination 1004.7 Divergent risks: marginalized countries relative to
successful developers 102
C O N T E N T S
viii
4.8 Development of risk of civil war for the marginalized and successfuldevelopers, 2000–2020 103
4.9 The conflict trap: risk of civil war relative to a country withno recent war 106
4.10 The conflict trap by type of country 1074.11 Risk components for marginalized countries in the conflict trap,
relative to the same countries preconflict 1074.12 The conflict trap in 2000: annual flows into and out
of conflict 1094.13a The conflict trap in 2020: annual flows into and out
of conflict 1114.13b The conflict trap in 2050: annual flows into and out
of conflict 1114.14 The incidence of civil war in South and East Asia and in Oceania,
1950–2001 1124.15 The incidence of civil war in Latin America and the Caribbean,
1950–2001 1134.16 The incidence of civil war in Eastern Europe and Central Asia,
1950–2001 1134.17 The incidence of civil war in the Middle East and North Africa,
1950–2001 1144.18 The incidence of civil war in Sub-Saharan Africa,
1950–2001 1144.19 The incidence of civil war in Africa and other developing countries,
1950–2001 115
5.1 The contribution to peace of faster growth in the successfuldevelopers 124
5.2 The contribution to peace of faster growth in the marginalizedcountries 135
5.3 The contribution to peace of shortening conflicts 1415.4 The contribution to peace of successful postconflict policies 151
6.1 The contribution of the policy package to peace 187
Tables1.1 Major refugee and IDP populations, 2001 191.2 Mortality rates among children under five in refugee
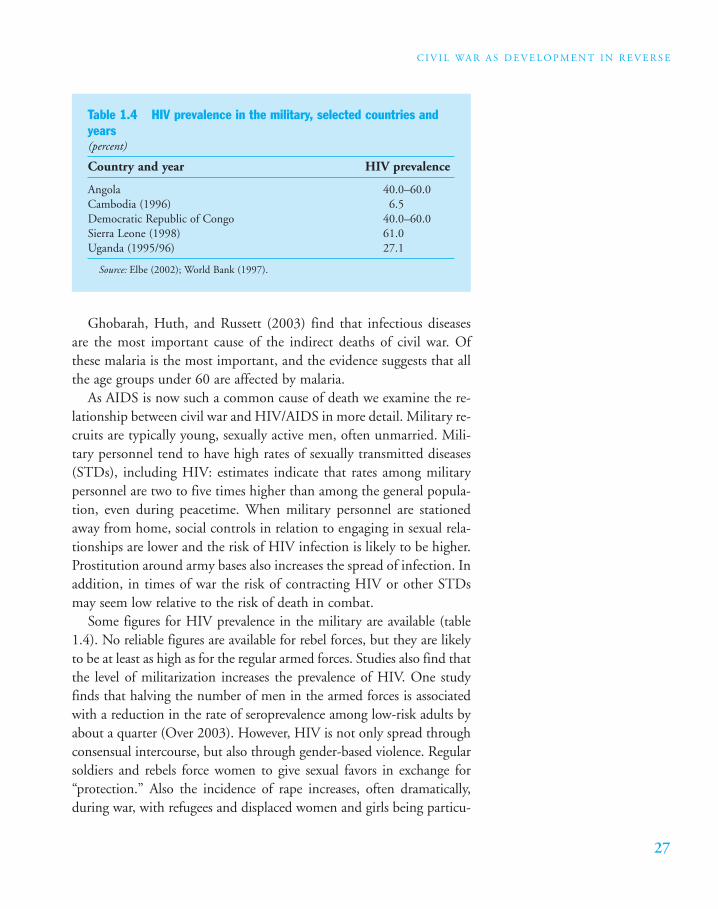
and IDP camps, selected conflicts 251.3 Effects of civil war on public health 261.4 HIV prevalence in the military, selected countries and years 27
2.1 Production of opium and coca, selected countriesand years, 1990–2001 42
2.2 Prevalence estimates of opiate and cocaine use, selected industrialcountries and years 46
3.1 Size of rebel organizations, selected countries and years 55
WHY SHOULD THE WORLD BANK FOCUS ON CIVIL WAR?
Basically, there are two reasons. First, civil war usually hasdevastating consequences: it is development in reverse. As
civil wars have accumulated and persisted, they have generated or in-tensified a significant part of the global poverty problem that is theWorld Bank’s core mission to confront. Part of the purpose of thisreport is to alert the international community to the adverse conse-quences of civil war for development. These consequences are sufferedmostly by civilians, often by children and by those in neighboringcountries. Those who make the decisions to start or to sustain wars areoften relatively immune to their adverse effects. The international com-munity therefore has a legitimate role as an advocate for those who arevictims. The second reason why the World Bank should focus on civilwar is that development can be an effective instrument for conflict pre-vention. The risk of civil war is much higher in low-income countriesthan in middle-income countries. Civil war thus reflects not just aproblem for development, but a failure of development. The core of this report sets out the evidence on the efficacy of development for con-flict prevention and proposes a practical agenda for action. The WorldBank and its partner development agencies can undertake parts of thisagenda, but other parts depend on international collective action by thegovernments of industrial countries. One important forum for such ac-tion is the Group of Eight.
Our research yields three main findings. First, civil wars have highlyadverse ripple effects that those who determine whether they start orend obviously do not take into account. The first ripple is within thecountry: most of the victims are children and other noncombatants.The second ripple is the region: neighboring countries suffer reduced
ix
Foreword
F O R E W O R D
x
incomes and increased disease. The third ripple is global: civil war gen-erates territory outside the control of any recognized government, andsuch territories have become the epicenters of crime and disease. Manyof these adverse consequences persist long after the civil war has ended,so that much of the costs of a war occur after it is over.
The second finding is that the risks of civil war differ massively ac-cording to a country’s characteristics, including its economic character-istics. As a result, civil war is becoming increasingly concentrated in rel-atively few developing countries. Two groups of countries are at thehighest risk. One we refer to as the marginalized developing countries,that is, those low-income countries that have to date failed to sustain thepolicies, governance, and institutions that might give them a chance ofachieving reasonable growth and diversifying out of dependence on pri-mary commodities. On average, during the 1990s these countries actu-ally had declining per capita incomes. Such countries are facing a Rus-sian roulette of conflict risk. Even countries that have had long periodsof peace do not seem to be safe, as shown by recent conflicts in Côted’Ivoire and Nepal. It is imperative that such countries are brought intothe mainstream of development. The other high-risk group is countriescaught in the conflict trap. Once a country has had a conflict it is in fargreater danger of further conflict: commonly, the chief legacy of a civilwar is another war. For this group of countries the core developmentchallenge is to design international interventions that are effective instabilizing the society during the first postconflict decade.
The third finding is that feasible international actions could sub-stantially reduce the global incidence of civil war. Although our pro-posals are wide-ranging, including aid and policy reform, we place par-ticular emphasis on improving the international governance of naturalresources. Diamonds were critical to the tremendous economic successof Botswana, but also to the social catastrophe that engulfed SierraLeone. The Kimberley process of tracking diamonds is intended to cur-tail rebel organizations’ access to diamond revenues. The “publish whatyou pay” initiative, launched by the nongovernmental organizationGlobal Witness, is intended to increase the transparency of natural re-source revenues to governments. Transparency is, in turn, an input intoenhanced domestic scrutiny of how such revenues are used. If rebel fi-nances can be curbed and citizens come to believe that resources arebeing well used, civil war will be less likely. A third element in a pack-age of improved international governance of natural resources is to
F O R E W O R D
xi
cushion the price shocks that exporters commonly face. Price crasheshave been associated with severe recessions that directly increase therisk of civil war and have sometimes destabilized economic manage-ment for long periods. At present the international community has noeffective instrument to compensate for these shocks.
International collective action has seldom looked so difficult, but thecost of failure will be measured in violence and poverty.
Nicholas SternSenior Vice-President
and Chief EconomistThe World BankApril 2003

THIS REPORT WAS PREPARED UNDER THE SUPERVISION OF
Nicholas Stern, chief economist and senior vice-president. Itwas written by a team led by Paul Collier (director, Develop-
ment Research Group) and consisting of V. L. Elliott, Håvard Hegre,Anke Hoeffler, Marta Reynal-Querol, and Nicholas Sambanis.
The report builds on research by the Economics of Civil War,Crime, and Violence project in the World Bank Development ResearchGroup. The project was initiated and directed by Paul Collier and hasbeen ongoing since 1999. Ibrahim Elbadawi, Håvard Hegre, MartaReynal-Querol, and Nicholas Sambanis were the project’s core staff. Inaddition, the project has commissioned a large number of studies fromresearchers outside the World Bank. The project received funding fromthe Norwegian, Swiss, and Greek governments; the World Bank Post-Conflict Fund; and the World Bank Research Committee.
The project has been collaborating with United Nations Studies atYale, the International Peace Research Institute in Oslo, the Agencefrançaise de développement, the Economic Commission for Africa,and the African Economic Research Consortium. Conferences havebeen held in Addis Ababa, Irvine, Kampala, New Haven, Oslo, Paris,Princeton, and Washington, D.C.
Many of the project papers are referred to in the text of the report,and most of them are posted on the project’s web site: http://econ.worldbank.org/programs/conflict. Selections of the papers have alsobeen published as special issues of the Journal of Conflict Resolution,Defence and Peace Economics, the Journal of Peace Research, and theJournal of African Economies. A set of country studies is being preparedfor publication under the supervision of Nicholas Sambanis.
xiii
The Report Team
T H E R E P O RT T E A M
xiv
We thank for their excellent work Polly Means, who did the graph-ics; Audrey Kitson-Walters, who processed the report; Alice Faintich,who edited it; and Susan Graham, who was in charge of production.
The judgments in this policy research report do not necessarily re-flect the views of the World Bank’s Board of Directors or the govern-ments they represent.
CPIA country policy and institutional assessmentDALY disability-adjusted life yearDDR disarmament, demobilization, and reintegrationELN Ejército popular de liberación (Colombia)ETA Euskadi ta azkatasuna (Spain)EU European UnionFARC Fuerzas armadas revolucionarias colombianas
(Colombia)GAM Gerakan Aceh Merdeka (Indonesia)GDP gross domestic productIDP internally displaced personIMF International Monetary FundIRA Irish Republican ArmyLICUS low-income countries under stressMIGA Multilateral Investment Guarantee AgencyMNC multinational corporation NATO North Atlantic Treaty OrganizationNGO nongovernmental organizationOECD Organisation for Economic Co-operation
and DevelopmentRENAMO Resistência nacional Moçambicana (Mozambique) RUF Revolutionary United Front (Sierra Leone)STD sexually transmitted diseaseUN United NationsUNHCR United Nations High Commission for RefugeesUNITA União Nacional para a Independência Total
de Angola (Angola)UXO unexploded ordinanceWHO World Health Organization
xv
Acronyms and Abbreviations

1
Overview
MOST WARS ARE NOW CIVIL WARS. EVEN
though international wars attract enormousglobal attention, they have become infrequentand brief. Civil wars usually attract less atten-tion, but they have become increasingly com-mon and typically go on for years. This report
argues that civil war is now an important issue for development. Warretards development, but conversely, development retards war. Thisdouble causation gives rise to virtuous and vicious circles. Where de-velopment succeeds, countries become progressively safer from violentconflict, making subsequent development easier. Where developmentfails, countries are at high risk of becoming caught in a conflict trap inwhich war wrecks the economy and increases the risk of further war.
The global incidence of civil war is high because the internationalcommunity has done little to avert it. Inertia is rooted in two beliefs:that we can safely “let them fight it out among themselves” and that“nothing can be done” because civil war is driven by ancestral ethnicand religious hatreds. The purpose of this report is to challenge thesebeliefs.
Let Them Fight It Out among Themselves?
PART I INVESTIGATES THE ECONOMIC AND SOCIAL COSTS OF
civil war. The costs the active participants in combat bear ac-count for only a trivial part of the overall suffering. The damage
from a war ripples out in three rings. The inner ring is the displace-
B R E A K I N G T H E C O N F L I C T T R A P : C I V I L WA R A N D D E V E L O P M E N T P O L I C Y
2
ment, mortality, and poverty inflicted on noncombatants within thecountry, and this is the subject of chapter 1. The United Nations HighCommission for Refugees is currently assisting more than 5 million in-ternally displaced persons as a result of civil war. Many of these dis-placed people are forced to move to areas where the partial immunitythey have acquired to malaria is no longer effective, and so their mor-tality rate rises. By the end of the typical civil war incomes are around15 percent lower than they would otherwise have been, implying thatabout 30 percent more people are living in absolute poverty. However,the end of a civil war does not end the costs arising from it. Many ofthe economic costs, such as high military expenditure and capital flight,persist for years after the conflict. So too do heightened mortality andmorbidity rates. Approximately half of the loss of disability-adjustedyears of life expectancy due to a conflict arise after it is over. These eco-nomic and health costs of conflict are not usually compensated by anypostconflict improvements in economic policy, democratic institutions,or political freedom. On the contrary, all three usually deteriorate. Thetypical civil war starts a prolonged process of development in reverse.
Chapter 2 focuses on civil wars’ spillover effects beyond the country.The second ring of suffering affects neighboring countries. Refugeesstream across borders carrying and spreading the infections to whichthey have been exposed; for example, for every 1,000 internationalrefugees the host country sees around 1,400 additional cases of malaria.Neighboring economies also suffer in other ways: growth rates are sig-nificantly reduced and neighbors increase their military expenditure ina chain reaction of local arms races. Often the costs of a civil war to thecombined neighboring countries are of the same order of magnitude asthe costs to the country itself. Through all these routes civil war is a re-gional public bad.
The outer ring of suffering is global. Civil war creates territory out-side the control of any recognized government. One major use for thisterritory is to produce and transport drugs: 95 percent of the globalproduction of hard drugs occurs in countries with civil wars and themajor supply routes run through conflict territories. A more speculativepossible global cost of civil war is the current AIDS pandemic. Someevidence suggests that this was triggered by the rapid spread of a highlylocalized infection caused by mass rape during a civil war. A furtherglobal shock to which civil war has contributed is Al Qaeda. When in-ternational terrorism is conducted on a large scale, the organization
3
O V E RV I E W
needs a safe haven that can probably only be provided in territory out-side the control of any recognized government. Al Qaeda chose to lo-cate in Taliban-held territory in Afghanistan, even though most of itsrecruits were not Afghans. It also used the war in Sierra Leone to gen-erate profits from the trade in conflict diamonds and to store its wealth.The global mortality caused by hard drugs and international terrorismis a significant toll, but the wider social costs are immense. The WorldBank estimates that the September 11 attacks alone may have increasedglobal poverty by 10 million people.
We have no reason to think that those who decide to embark on civilwar—the active participants, especially a few leaders—take all this suf-fering of others into account. Furthermore, many of these adverse ef-fects are highly persistent. The typical civil war lasts long enough,around seven years, but the damage persists well beyond the end of theconflict. Once disease has set in, a country may need many years ofpeace to revert to its preconflict morbidity and mortality rates. Simi-larly, once an economy has experienced a wave of capital flight and em-igration, this tends to continue even when the conflict is over. In addi-tion, the regional escalation in military expenditure can persist becauseof insufficient coordination to reduce it. In many cases most of thecosts of a civil war occur only once it is over. Again, those who have thepower of decision are unlikely to take these consequences into account.Thus, in practice, the attitude let them fight it out among themselvesgives license to a few thousand combatants and a few dozen of theirleaders to inflict widespread misery on millions of others.
What Can We Do about Ancestral Hatreds?
C AN THE INTERNATIONAL COMMUNITY DO ANYTHING TO
reduce the global incidence of civil war? If violence is simplydetermined by ancestral ethnic and religious hatreds, outsiders
can probably do little. Part II turns to the underlying factors that de-termine the global incidence of civil war.
Chapter 3 discusses what makes some countries prone to civil war. Ofcourse, each civil war is different and has its own distinctive, idiosyn-cratic triggers, be they a charismatic rebel leader or a provocative gov-ernment action, but beneath these chance circumstances patterns areapparent. Some social, political, and economic characteristics systemat-
B R E A K I N G T H E C O N F L I C T T R A P : C I V I L WA R A N D D E V E L O P M E N T P O L I C Y
4
ically increase the incidence of civil war, and we show that ethnicity andreligion are much less important than is commonly believed. Indeed, so-cieties that are highly diverse mixtures of many ethnic and religiousgroups are usually safer than more homogenous societies. By contrast,economic characteristics matter more than has usually been recognized.If a country is in economic decline, is dependent on primary commod-ity exports, and has a low per capita income and that income is un-equally distributed, it is at high risk of civil war. This cocktail is so lethalfor several reasons. Low and declining incomes, badly distributed, cre-ate a pool of impoverished and disaffected young men who can becheaply recruited by “entrepreneurs of violence.” In such conditions thestate is also likely to be weak, nondemocratic, and incompetent, offer-ing little impediment to the escalation of rebel violence, and maybe eveninadvertently provoking it. Natural resource wealth provides a source offinance for the rebel organization and encourages the local populationto support political demands for secession. It is also commonly associ-ated with poor governance. Disputes often fall along ethnic and reli-gious divisions, but they are much more likely to turn violent in coun-tries with low and declining incomes.
The Conflict Trap
ONCE SUCH A COUNTRY STUMBLES INTO CIVIL WAR, ITS RISK
of further conflict soars. Conflict weakens the economy andleaves a legacy of atrocities. It also creates leaders and organi-
zations that have invested in skills and equipment that are only usefulfor violence. Disturbingly, while the overwhelming majority of thepopulation in a country affected by civil war suffers from it, the lead-ers of military organizations that are actually perpetrating the violenceoften do well out of it. The prospect of financial gain is seldom the pri-mary motivation for rebellion, but for some it can become a satisfac-tory way of life. This is a further reason why the participants in a civilwar should not be left to fight it out among themselves. Some evidencesuggests that decade by decade, civil wars have been getting longer.While this may be due to circumstances in individual countries, it morelikely reflects global changes that have made civil wars easier to sustainby allowing rebel groups to raise finance and acquire armaments moreeasily.
5
O V E RV I E W
The Rising Global Incidence of Conflict
THE INCIDENCE OF CIVIL WAR HAS INCREASED SUBSTANTIALLY
over the past 40 years. As this has been a period of unprece-dented global economic development, it might appear evident
that development has not been an effective remedy for violent civil con-flict, but to make sense of the patterns we need to distinguish betweendifferent groups of countries. This is the subject of chapter 4.
Many developing countries have either already reached middle-income status or have policy and institutional environments that shouldput them on track to do so. Around 4 billion people live in such coun-tries. Currently, as a group, they face a risk of civil war four times ashigh as the negligible risk societies in countries of the Organisation forEconomic Co-operation and Development (OECD) face; however, 30years ago their risk was five times as high, so they are converging withthe group of countries already in secure peace.
Nevertheless, more than a billion people live in low-income coun-tries that have been unable to adopt and sustain policies and institu-tions conducive to development. On average, these countries have beenin economic decline and have remained dependent on natural resourcesor other primary commodities. This group of countries face far higherrisks: typically around 15 times as high as OECD societies. Indeed,these risks have been rising as economies have deteriorated. Forty yearsago there were many fewer independent, low-income countries. Mostlow-income countries were under the imposed peace of colonialism orwere fighting liberation wars. As countries gained independence theystarted, in effect, to play Russian roulette with civil war risk. Many ofthem stumbled into conflict, and where this happened the conflict trapimplied an even higher risk of further conflict. This is the group thatincreasingly accounts for the global incidence of conflict.
Thus the overall trend in the global incidence of conflict is made upof two radically divergent components. For most of the world’s popu-lation development has been significantly reducing risks, but a signifi-cant minority of people live in low-income countries that have notshared in development. For them the risks have been increasing.
If these two opposing forces persist, the global incidence of conflictwill not continue to rise indefinitely, but neither will development se-cure global peace. The world will find itself stuck with a self-sustainingincidence of civil war, determined predominantly by the large and per-
B R E A K I N G T H E C O N F L I C T T R A P : C I V I L WA R A N D D E V E L O P M E N T P O L I C Y
6
sistent pool of nondeveloping, low-income countries. These countrieswill account for a small and diminishing share of global income, butthey will be responsible for a high share of the regional and globalspillovers from civil war.
Nothing Can Be Done
PART III TURNS TO THE POLICIES THAT MIGHT BE EFFECTIVE IN
reducing the global incidence of conflict. Some of these requireaction at the national level and others at the global level. Until
recently, superpower rivalries made an international policy toward civilwar unrealistic. Developing country governments lined up on one sideor the other, and many rebel movements could count on some degreeof cover from the opposing superpower. Therefore the question of whatinternational responses were appropriate has only been worth posing inthe past decade. Because asking the question had made little sense, theanalysis to guide post–Cold War responses was not in place. Relative tomany other questions the analysis is still seriously incomplete, but weare no longer completely in the dark. We now know enough for a rea-sonable basis for action.
Economic development is central to reducing the global incidence ofconflict; however, this does not mean that the standard elements of de-velopment strategy—market access, policy reform, and aid—are suffi-cient, or even appropriate, to address the problem. At the most basiclevel, development has to reach countries that it has so far missed. Be-yond this, development strategies should look different in countriesfacing a high risk of conflict, where the problems and priorities are dis-tinctive. In addition, some policies that are not normally part of devel-opment strategy affect the risk of conflict, such as the presence of externalpeacekeeping forces, the tendency toward domestic military expendi-tures, and the design of political institutions. In designing a strategy forrisk reduction a useful approach is to view all the interventions that sig-nificantly affect risk in an integrated way. For example, different inter-ventions are most effective at different phases, and so may best be se-quenced. Because different actors who are not used to working togetherdetermine the interventions, to date this has not been common practice.
The global incidence of conflict is made up of four very differentcomponents, each of which needs a distinctive approach. This is thesubject of chapter 5. The first is the relatively low risk of conflict that is
7
O V E RV I E W
faced by a large group of middle-income countries and by some low-income countries that are on track to becoming middle-income becauseof good policies and rapid growth. For this class of countries the main riskprobably comes from sudden economic crashes, such as that Indonesiaexperienced in the late 1990s. These crashes are in any case disastrous,and the heightened risk of conflict simply adds a further reason why bothnational and international action needs to be taken to avoid such shocksand to cushion them when they happen. This is the group of countriesthat has already participated in global growth. Accelerating their growthwould make a modest, but significant, contribution to global peace.
The second component of the global incidence of conflict is themuch higher risk stagnant or declining low-income countries face. Thisgroup has basically been missed by development to date, and is in ef-fect locked in a game of Russian roulette in which the probability ofwar is dangerously high. Igniting development in this group wouldmake a far more substantial contribution to global peace, but is diffi-cult because it has not been achieved to date. A particularly helpful as-pect of development for these countries would be to help them diver-sify out of dependence on primary commodity exports.
The third component of the global incidence of conflict is the coun-tries currently in conflict. If the typical conflict could be shortened,then the global incidence of conflict would decrease significantly. Pastinternational interventions to shorten conflict have not been systemat-ically effective; however, some evidence suggests that conflicts can beshortened by squeezing rebel organizations of their sources of externalfinance. Yet in the absence of other interventions shortening conflictsis not particularly effective: countries in the conflict trap simply pass inand out of war more frequently.
The final component of the global incidence of conflict is thosecountries that are in the first decade of postconflict peace. For thisgroup the risks of further conflict are exceptionally high: approximatelyhalf will fall back into conflict within the decade. This is the area thatprobably has the most scope for effective international interventions toreduce the incidence of conflict. What is most likely required is a coor-dination of external military peacekeeping for the first few years with abuildup of large aid programs during the middle of the decade. Bothmilitary peacekeeping and aid could be made conditional on the rapidreform of government policies and institutions, so that by the end ofthe decade the society is reasonably safe from further conflict. We showthat an integrated approach involving external military support, aid,
B R E A K I N G T H E C O N F L I C T T R A P : C I V I L WA R A N D D E V E L O P M E N T P O L I C Y
8
and policy reform could, over the course of two decades, take postcon-flict countries well out of the zone of high risk and reduce their risk ofconflict to only a quarter of its initial level.
No single intervention is decisive in reducing the global incidence ofconflict; however, different measures complement each other and cu-mulate. Our simulation of a package of development measures suggestshow the global incidence of conflict could be reduced to less than halfof its present level. Some of the actions needed for such an improve-ment come from the governments of developing countries, and somerequire action at an international level.
Chapter 6 sets out a specific agenda for international action. Becausethose who decide whether to initiate civil wars and whether to accept asettlement ignore the large and adverse spillovers from civil war, thisgives the international community both the moral right and the prac-tical duty to intervene to prevent and shorten conflicts.
International interventions have recently had some important suc-cesses, such as the launch of the Kimberley process to regulate trade indiamonds and the international ban on antipersonnel mines. We con-sider three further sets of interventions: aid, the governance of naturalresources, and military peacekeeping.
Aid has substantial potential for conflict prevention, particularly inpostconflict settings, and in the past donors have probably not got theiraid policies right. Aid has usually flooded in during the immediatepostconflict period, when the country is prominent in the internationalmedia, and then rapidly tapered out. Based on our analysis, overall aidshould have been larger during the first postconflict decade, but itshould have gradually tapered in during the decade. There is also con-siderable scope to retarget aid toward low-income countries: the inter-national community has provided much aid to middle-income coun-tries where conflict risks are usually quite low.
Natural resource endowments have the potential for poverty reduc-tion, but historically have often been associated with conflict, poor gov-ernance, and economic decline. Because the adverse effects of naturalresources work through a number of routes, several distinct interven-tions could be helpful.
One global objective might be to make securing finance more diffi-cult for rebel organizations. The Kimberley process has this objective,and it needs to be monitored. If it is successful, it could be replicatedfor some other commodities. If it is unsuccessful, the present voluntaryagreement may need to be strengthened by legislation. There is also
9
O V E RV I E W
scope to supplement the tracking of commodities with the tracking ofthe financial flows that are their counterparts, and the internationalbanking system is now rightly coming under pressure to provide moreeffective scrutiny of the transactions it administers. A further source ofrebel finance is from ransoms and extortion. Obviously such activitiesare already illegal, but the scale of payments can probably be reduced bygovernment action in the OECD countries in which targeted compa-nies are based. For example, the recent emergence of a market for ran-som insurance is probably undesirable in that it escalates payments. Afinal source of rebel finance is from illicit primary commodities, notablycoca and opium. The current OECD regulatory environment makesterritory outside the control of a recognized government extremely valu-able, and this clearly facilitates conflict. Many options for redesigningdrug policy are available that would moderate this dangerous effect.
A distinct reason why countries dependent on natural resources faceproblems is their exposure to price shocks. OECD governments, andindeed charities, have been good at responding to such photogenicshocks as earthquakes and hurricanes, but have utterly failed to respondto the much more severe shocks caused by price crashes. There is con-siderable scope for both the international financial institutions and bi-lateral donors to provide better cushioning of these shocks and to con-duct their commercial policies in such a way as to reduce price shocksin the first place.
A final reason why countries dependent on natural resources faceproblems is that their revenues are often used inefficiently or corruptly.The Monterrey consensus emphasized that both industrial and devel-oping country governments have responsibilities in this context. Thereis a case for a template of governance of natural resource revenues towhich governments could choose to adhere. Such a template would in-clude transparency and effective scrutiny. It could potentially be usedas a signal of reduced exposure to political risk, and so help to attractmore reputable resource extraction companies to low-income environ-ments. The international financial institutions have a potential rolehere in aggregating revenues from the individual accounts of resourceextraction companies and publishing the resulting estimates of revenuein a way that integrates the information with budgetary data.
Especially in postconflict situations, government military spendingtends to be excessive. High spending tends to increase risks rather thanto contain them. Through powerful regional arms races, this highspending becomes a regional public bad. There is scope for regional po-
B R E A K I N G T H E C O N F L I C T T R A P : C I V I L WA R A N D D E V E L O P M E N T P O L I C Y
10
litical organizations to negotiate mutual reductions in spending. Theinternational financial institutions may have a role here as honest bro-kers monitoring that countries actually implement agreed reductions inspending.
Finally, and more speculatively, we consider the coordination of ex-ternal military interventions with aid and policy reform. We suggestthat in many postconflict environments neither aid, nor policy reform,nor even new democratic political institutions can realistically securepeace during the first few years. External military intervention may bethe only practical guarantor of peace. An effective sequence might bethat large aid inflows are phased in during the middle of the postcon-flict decade, generating a growth spurt that may enable a substantial re-duction of the military presence. As the conflict-related aid program ta-pers out at the end of the decade, if the government has used the decadewell to accelerate reforms, it should be in a position to sustain the rapidgrowth that can make the society safer.
In securing a safer world, no single intervention is likely to be deci-sive. Conflict risk works through multiple channels, and so calls for apackage of complementary solutions. Furthermore, most interventionstake time to work. However, our simulations suggest that if action istaken now, by 2015—the timetable for the attainment of the Millen-nium Development Goals—more than halving the global incidence ofcivil war would be feasible.
At present, reducing the global incidence of civil war is not includedas a Millennium Development Goal. Yet both because war is so power-fully development in reverse and because peace is a fundamental goodin its own right, it is surely appropriate as a core development objec-tive. It is also much more readily monitorable than any of the othergoals and, indeed, is already monitored by the authoritative SwedishInternational Peace Research Institute. The case for treating the halvingof the incidence of civil war as a Millennium Development Goal is thesame as that for the current goals: explicit commitments help the in-ternational community to sustain collective action. Because the risk ofwar is so heavily concentrated in the minority of developing countrieswe have referred to as “marginalized,” attaining the overarching goal ofhalving world poverty without having much impact on the incidenceof conflict would unfortunately be entirely possible. The goal of halv-ing the incidence of civil war would help to focus efforts on those coun-tries and people who are at the bottom of the heap.
P A R T I
CRY HAVOC: WHY CIVILWAR MATTERSCry havoc and let slip the dogs of war.
Shakespeare, Henry IV
CIVIL WAR DIFFERS RADICALLY FROM BOTH IN-
ternational war and communal violence. Unlikeinternational war, it is fought outside any struc-ture of rules and entirely within the territory ofthe society. Unlike communal violence, it im-plies a rebel organization equipped with arma-ments and staffed with full-time recruits. Suchrebel armies usually have little option but to liveoff the land. These features typically escalate thesocial costs of civil war above the costs of eitherinternational war or communal violence. Forexample, the same conflict between Eritrea andEthiopia generated both a civil war and, follow-ing Eritrean independence, an international war.As a civil war the conflict lasted for 30 years andwas ended only by military victory. As an inter-national war the conflict was subject to the fullpanoply of international mediation and endedswiftly in a negotiated settlement. To analyzecivil war we need to know what we mean by it.We adopt a precise but conventional definition:civil war occurs when an identifiable rebel or-ganization challenges the government militarilyand the resulting violence results in more than
1,000 combat-related deaths, with at least 5 per-cent on each side. There are many other formsof group violence, such as protests, riots, andpogroms, but we do not consider them here.
The perpetrators of civil war usually adoptthe rhetoric that the war is a necessary catalystfor social progress. Occasionally this is right, butmore typically war is an economic and socialdisaster for the affected country. Therefore, forthose who care about development, civil war isa major problem. This is the focus of chapter 1:a theme of the chapter is that civilians, not theactive combatants, suffer the main adverse con-sequences of civil war, and that many of theseconsequences accrue long after the war is over.Hence the people who determine whether waroccurs are likely to ignore much of its adverseconsequences. Furthermore, civil war has severeconsequences that spill over regionally and glob-ally, and civil war is not just a problem for thecountries directly affected. Thus the attitude“let them fight it out among themselves” is notjust heartless, it is foolish. This is the subject ofchapter 2.
During a civil war a society diverts some of itsresources from productive activities to violence.As a result, the society loses twice over. The di-verted resources are lost to productive activity,analogous to the loss from what economists callrent-seeking. Because much of the increase inmilitary spending is on government forces paidfor out of the government budget, resources aredisproportionately diverted from government pro-vision of useful public goods, such as health careand policing. However, whereas rent-seeking ac-tivities are simply unproductive, the increase inviolence is harmful. One part of society is pro-ducing while another part is destroying.
Most of the costs of civil war accrue from thesedestructive activities. The power of the gun dis-places civil rights. Men with guns, from bothrebel and government forces, can steal, rape, andmurder with impunity. Behind this veil of havoc,the localized collapse of order extends impunityto criminal and other antisocial behavior. Theprimary response to the fear of theft, rape, andmurder is flight. People try to shift their assets to safety, and they themselves flee. This flight in turn creates massive problems, especially forhealth, as people are pushed into areas where theylack immunity to disease. They then carry thesediseases with them, infecting host populations.
13
C H A P T E R O N E
Civil War as Development in Reverse
THIS CHAPTER FOCUSES ONLY ON THE EFFECTS OF
civil war within the country that is directly affected.War has economic and social costs. Some of theseaccrue to the combatants, but many affect peoplewho have no part in the decisions that create andsustain the conflict. Furthermore, many of the ad-
verse consequences of a conflict occur only once it is over and are prob-ably ignored in combatants’ decisions. We begin with the costs thatarise during conflict and then turn to the legacy effects.
Costs during Conflict
THIS SECTION DISTINGUISHES BETWEEN THE ECONOMIC
and social costs of conflict.
Economic Costs
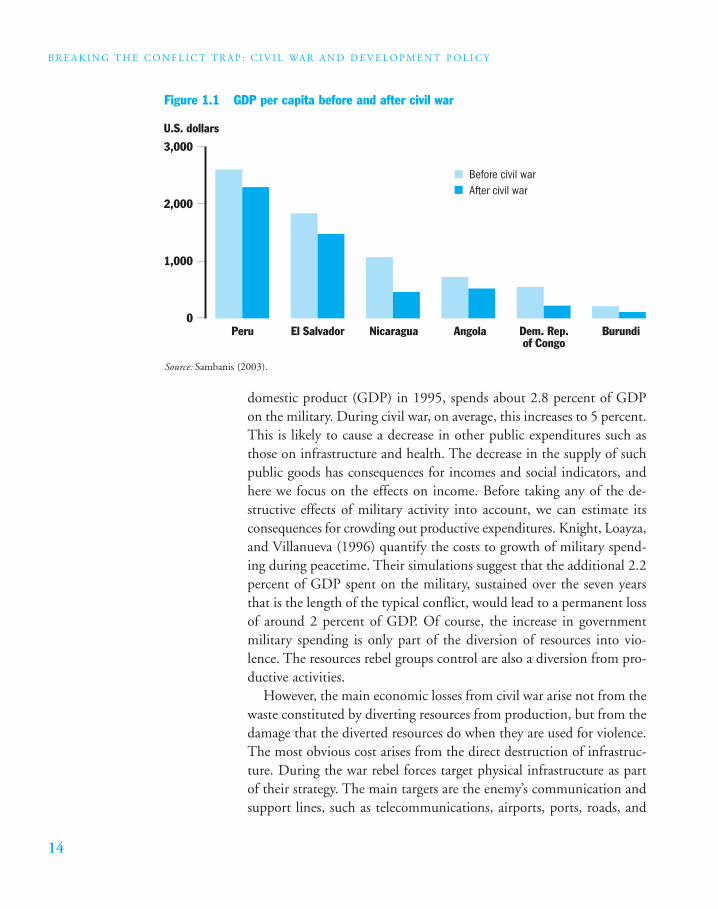
During a civil war a society diverts some of its resources from produc-tive activities to destruction. This causes a double loss: the loss fromwhat the resources were previously contributing and the loss from thedamage that they now inflict (figure 1.1).
The first loss can to some extent be quantified, as governments in-crease their military expenditure during civil war, and this directly re-duces economic growth. During peacetime the average developingcountry, defined as a country with less than US$3,000 per capita gross
B R E A K I N G T H E C O N F L I C T T R A P : C I V I L WA R A N D D E V E L O P M E N T P O L I C Y
14
domestic product (GDP) in 1995, spends about 2.8 percent of GDPon the military. During civil war, on average, this increases to 5 percent.This is likely to cause a decrease in other public expenditures such asthose on infrastructure and health. The decrease in the supply of suchpublic goods has consequences for incomes and social indicators, andhere we focus on the effects on income. Before taking any of the de-structive effects of military activity into account, we can estimate itsconsequences for crowding out productive expenditures. Knight, Loayza,and Villanueva (1996) quantify the costs to growth of military spend-ing during peacetime. Their simulations suggest that the additional 2.2percent of GDP spent on the military, sustained over the seven yearsthat is the length of the typical conflict, would lead to a permanent lossof around 2 percent of GDP. Of course, the increase in governmentmilitary spending is only part of the diversion of resources into vio-lence. The resources rebel groups control are also a diversion from pro-ductive activities.
However, the main economic losses from civil war arise not from thewaste constituted by diverting resources from production, but from thedamage that the diverted resources do when they are used for violence.The most obvious cost arises from the direct destruction of infrastruc-ture. During the war rebel forces target physical infrastructure as partof their strategy. The main targets are the enemy’s communication andsupport lines, such as telecommunications, airports, ports, roads, and
Figure 1.1 GDP per capita before and after civil war
U.S. dollars
0
1,000
2,000
3,000
Peru El Salvador
Before civil warAfter civil war
Nicaragua Angola Dem. Rep.of Congo
Burundi
Source: Sambanis (2003).
15
C I V I L WA R A S D E V E L O P M E N T I N R E V E R S E
bridges. In addition to this strategic destruction of key infrastructure,rebels and government soldiers loot and destroy housing, schools, andhealth facilities. An example is Mozambique (Brück 2001), whereabout 40 percent of immobile capital in the agriculture, communica-tions, and administrative sectors was destroyed. The prewar transportsystem had been a large foreign income earner, as goods were trans-ported from and to the neighboring states of Malawi, South Africa,Swaziland, and Zimbabwe, but 208 out of 222 units of rolling stockwere lost or badly damaged between 1982 and 1989. Similarly, duringthe war in Liberia in the mid-1990s all major infrastructures were dam-aged and looted. Monrovia, the largest port, suffered major damageduring the first few months of the war, most of the electricity generat-ing capacity of the Liberian Electricity Corporation was destroyed, andlooting removed much of the distribution and transmission systems.Infrastructure is an important determinant of economic growth (Can-ning 1998), and so destruction of infrastructure on such a scale isbound to reduce incomes.
Probably a more substantial cost arises from the fear that violence in-evitably generates. Frightened people flee from their homes. They alsotend to lose the few assets they possess. For example, in a survey ofhouseholds in Uganda, Matovu and Stewart (2001) found that two-thirds of respondents had lost all their assets. Their houses were bombedor unroofed; their household belongings, such as bicycles and furniture,were looted; and their cattle were stolen by soldiers. In Mozambique lessthan a fifth of the recorded 1980 cattle stock remained by 1992. Cattlewere lost because of direct rebel activity, that is, rebels stole them to feedtheir troops and killed them to spread terror, and because of indirect ef-fects of warfare, namely, a lack of feed and veterinary attention duringthe war. Faced with the prospect of such losses, people try to protecttheir assets by shifting wealth abroad (Collier, Hoeffler, and Pattillo2002). Prior to conflict the typical civil war country held 9 percent ofits private wealth abroad. By the end of the civil war this had risen toan astonishing 20 percent, so that more than a 10th of the private cap-ital stock had been shifted abroad. Even this probably underestimatesthe extent of overall capital flight, for example, cattle may be moved toneighboring countries and sold.
The disruption of civil war shortens time horizons and the displace-ment severs family and community links. Both weaken the constraintson opportunistic and criminal behavior. For example, during the Rus-
B R E A K I N G T H E C O N F L I C T T R A P : C I V I L WA R A N D D E V E L O P M E N T P O L I C Y
16
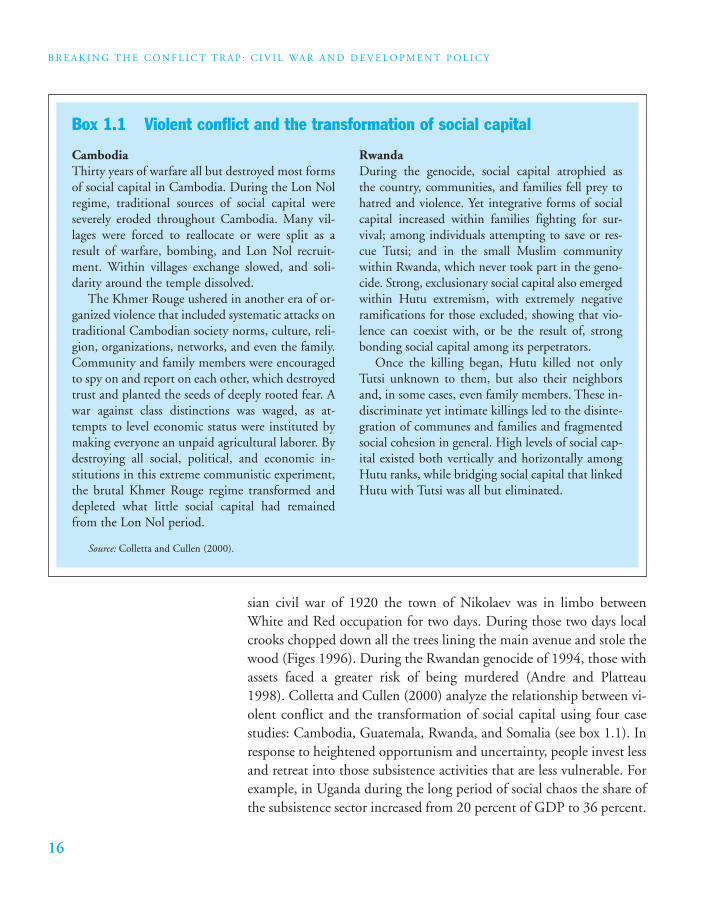
sian civil war of 1920 the town of Nikolaev was in limbo betweenWhite and Red occupation for two days. During those two days localcrooks chopped down all the trees lining the main avenue and stole thewood (Figes 1996). During the Rwandan genocide of 1994, those withassets faced a greater risk of being murdered (Andre and Platteau1998). Colletta and Cullen (2000) analyze the relationship between vi-olent conflict and the transformation of social capital using four casestudies: Cambodia, Guatemala, Rwanda, and Somalia (see box 1.1). Inresponse to heightened opportunism and uncertainty, people invest lessand retreat into those subsistence activities that are less vulnerable. Forexample, in Uganda during the long period of social chaos the share ofthe subsistence sector increased from 20 percent of GDP to 36 percent.
CambodiaThirty years of warfare all but destroyed most formsof social capital in Cambodia. During the Lon Nolregime, traditional sources of social capital wereseverely eroded throughout Cambodia. Many vil-lages were forced to reallocate or were split as aresult of warfare, bombing, and Lon Nol recruit-ment. Within villages exchange slowed, and soli-darity around the temple dissolved.
The Khmer Rouge ushered in another era of or-ganized violence that included systematic attacks ontraditional Cambodian society norms, culture, reli-gion, organizations, networks, and even the family.Community and family members were encouragedto spy on and report on each other, which destroyedtrust and planted the seeds of deeply rooted fear. Awar against class distinctions was waged, as at-tempts to level economic status were instituted bymaking everyone an unpaid agricultural laborer. Bydestroying all social, political, and economic in-stitutions in this extreme communistic experiment,the brutal Khmer Rouge regime transformed anddepleted what little social capital had remainedfrom the Lon Nol period.
RwandaDuring the genocide, social capital atrophied as the country, communities, and families fell prey tohatred and violence. Yet integrative forms of socialcapital increased within families fighting for sur-vival; among individuals attempting to save or res-cue Tutsi; and in the small Muslim communitywithin Rwanda, which never took part in the geno-cide. Strong, exclusionary social capital also emergedwithin Hutu extremism, with extremely negativeramifications for those excluded, showing that vio-lence can coexist with, or be the result of, strongbonding social capital among its perpetrators.
Once the killing began, Hutu killed not onlyTutsi unknown to them, but also their neighborsand, in some cases, even family members. These in-discriminate yet intimate killings led to the disinte-gration of communes and families and fragmentedsocial cohesion in general. High levels of social cap-ital existed both vertically and horizontally amongHutu ranks, while bridging social capital that linkedHutu with Tutsi was all but eliminated.
Box 1.1 Violent conflict and the transformation of social capital
Source: Colletta and Cullen (2000).
17
C I V I L WA R A S D E V E L O P M E N T I N R E V E R S E
Investigators have used both econometrics and case studies to esti-mate the overall effect of civil war on the economy. An econometricstudy finds that during civil war countries tend to grow around 2.2 per-centage points more slowly than during peace (Collier 1999). Henceafter a typical civil war of seven years duration, incomes would bearound 15 percent lower than had the war not happened, implying anapproximately 30 percent increase in the incidence of absolute poverty.The cumulative loss of income during the war would be equal to around60 percent of a year’s GDP. Note that this is much larger than the lossdirectly caused by the resources wasted on extra government militaryspending, which suggests that most of the costs of war are due to the ad-verse effects of violence rather than simply to the waste of resources.Stewart, Huang, and Wang (2001) survey data from about 18 countriesaffected by civil war. For the 14 countries whose average growth rates ofgross national product per capita could be calculated, the average annualgrowth rate was negative, at –3.3 percent. Furthermore, they found thata wide range of macroeconomic indicators worsened during the conflict:in 15 countries per capita income fell, in 13 countries food productiondropped, in all 18 economies their external debt increased as a percent-age of GDP, and in 12 countries export growth declined.
Social Costs
The most direct human effects of civil war are fatalities and populationdisplacements. In the modern civil war the composition of victims dif-fers radically from the wars of the early 20th century, in that the impacthas shifted from military personnel to civilians. At the beginning of the20th century about 90 percent of the victims were soldiers, but by the1990s nearly 90 percent of the casualties resulting from armed conflictwere civilian (Cairns 1997).
To some extent the rise in civilian casualties is a consequence of newmilitary practices. Rebel recruitment strategies are now commonly co-ercive, so people flee to avoid recruitment. For example, in response toa recent rebel attack in rural Nepal, “About 35,000 people (out of apopulation of 75,000) have left the district, mainly young men mov-ing to India to avoid being forcibly recruited by the Maoists” (Holt2003, p. 23). Furthermore, the military sometimes deliberately targetscivilians to create forced migration. Azam and Hoeffler (2002) analyze
B R E A K I N G T H E C O N F L I C T T R A P : C I V I L WA R A N D D E V E L O P M E N T P O L I C Y
18
the different motives for targeting civilians in internal wars. On the onehand, soldiers may terrorize civilians because they need loot to augmenttheir resources. An alternative hypothesis suggests that terrorizing thecivilian population plays a direct military role. Using cross-countrydata from Sub-Saharan Africa they find support for the latter hypothe-sis. Civilians are targeted mainly because the displacement of large frac-tions of the civilian population reduces the fighting efficiency of theenemy, as they cannot hide and obtain support as easily.
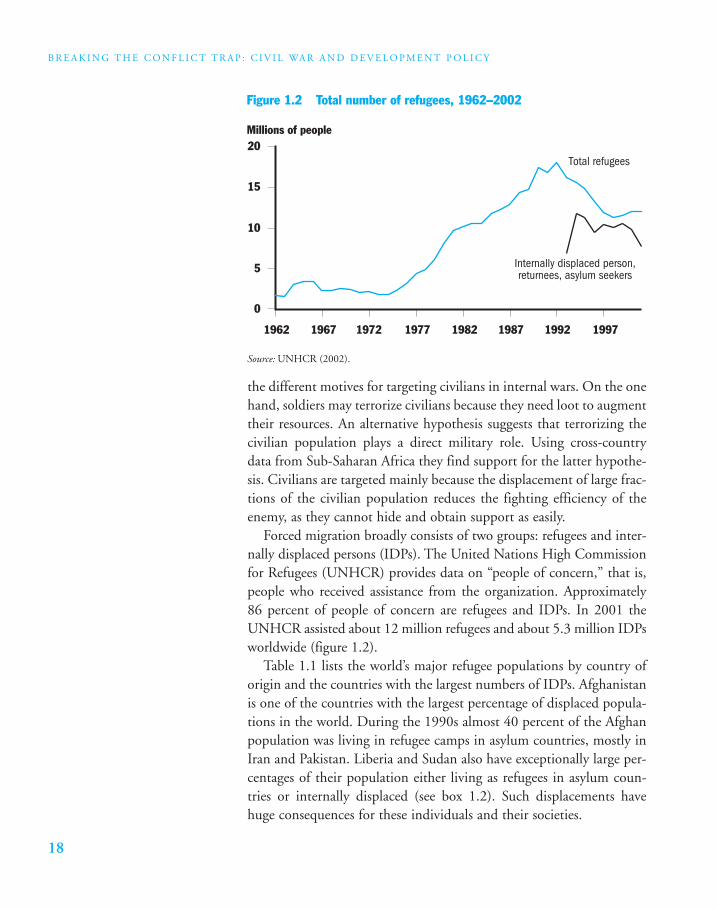
Forced migration broadly consists of two groups: refugees and inter-nally displaced persons (IDPs). The United Nations High Commissionfor Refugees (UNHCR) provides data on “people of concern,” that is,people who received assistance from the organization. Approximately86 percent of people of concern are refugees and IDPs. In 2001 theUNHCR assisted about 12 million refugees and about 5.3 million IDPsworldwide (figure 1.2).
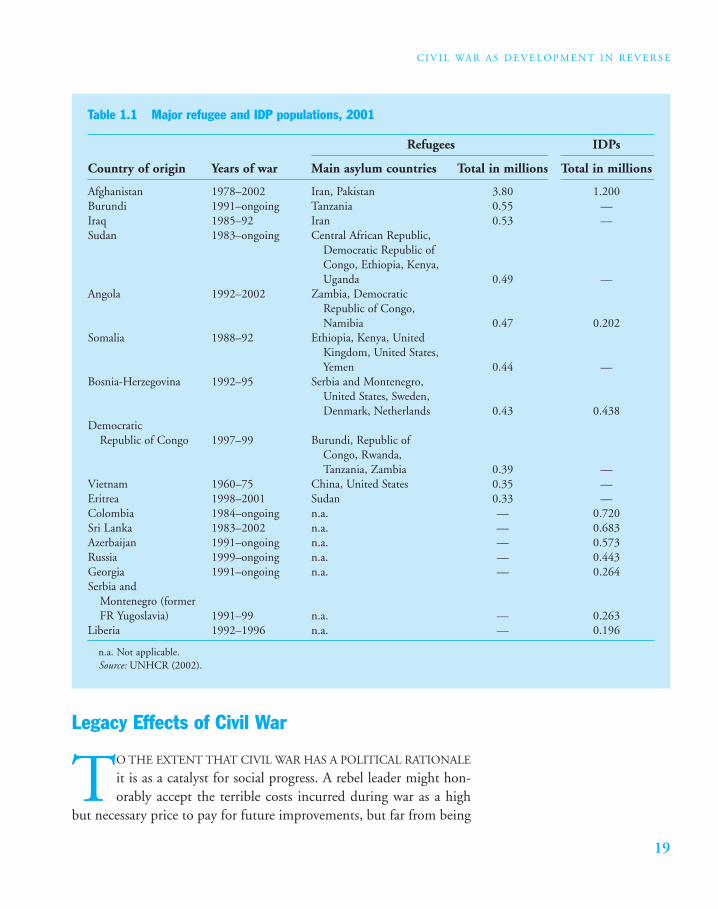
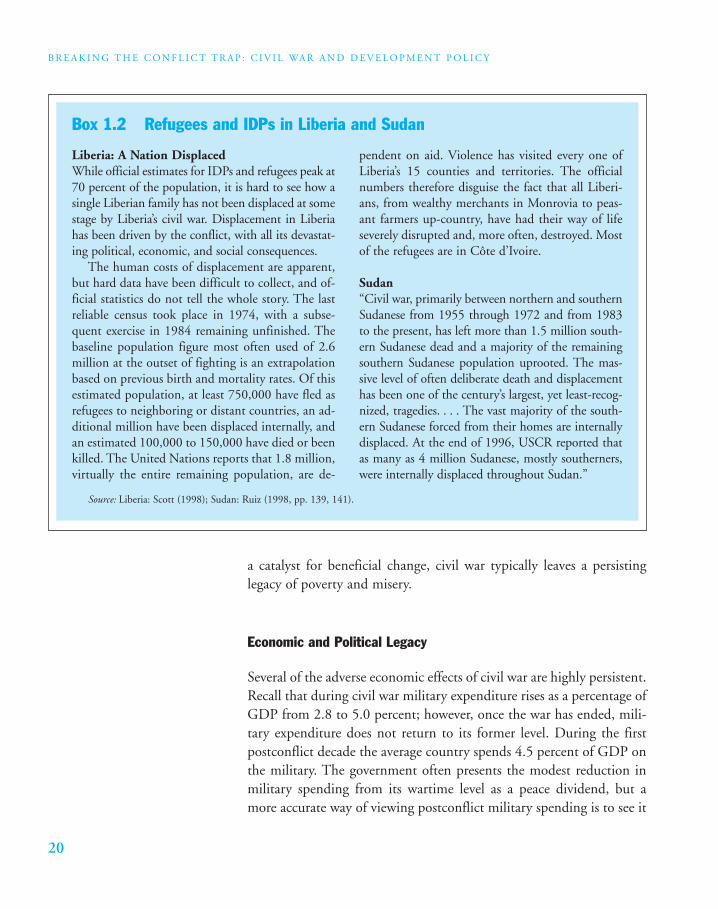
Table 1.1 lists the world’s major refugee populations by country oforigin and the countries with the largest numbers of IDPs. Afghanistanis one of the countries with the largest percentage of displaced popula-tions in the world. During the 1990s almost 40 percent of the Afghanpopulation was living in refugee camps in asylum countries, mostly inIran and Pakistan. Liberia and Sudan also have exceptionally large per-centages of their population either living as refugees in asylum coun-tries or internally displaced (see box 1.2). Such displacements havehuge consequences for these individuals and their societies.
Figure 1.2 Total number of refugees, 1962–2002
0
1962 1967
Millions of people
1972 1977 1982 1987 1992 1997
Total refugees
Internally displaced person,returnees, asylum seekers5
10
15
20
Source: UNHCR (2002).
19
C I V I L WA R A S D E V E L O P M E N T I N R E V E R S E
Legacy Effects of Civil War
TO THE EXTENT THAT CIVIL WAR HAS A POLITICAL RATIONALE
it is as a catalyst for social progress. A rebel leader might hon-orably accept the terrible costs incurred during war as a high
but necessary price to pay for future improvements, but far from being
Table 1.1 Major refugee and IDP populations, 2001
Refugees IDPs
Country of origin Years of war Main asylum countries Total in millions Total in millions
Afghanistan 1978–2002 Iran, Pakistan 3.80 1.200Burundi 1991–ongoing Tanzania 0.55 —Iraq 1985–92 Iran 0.53 —Sudan 1983–ongoing Central African Republic,
Democratic Republic of Congo, Ethiopia, Kenya, Uganda 0.49 —
Angola 1992–2002 Zambia, Democratic Republic of Congo, Namibia 0.47 0.202
Somalia 1988–92 Ethiopia, Kenya, United Kingdom, United States, Yemen 0.44 —
Bosnia-Herzegovina 1992–95 Serbia and Montenegro, United States, Sweden, Denmark, Netherlands 0.43 0.438
Democratic Republic of Congo 1997–99 Burundi, Republic of
Congo, Rwanda, Tanzania, Zambia 0.39 —
Vietnam 1960–75 China, United States 0.35 —Eritrea 1998–2001 Sudan 0.33 —Colombia 1984–ongoing n.a. — 0.720Sri Lanka 1983–2002 n.a. — 0.683Azerbaijan 1991–ongoing n.a. — 0.573Russia 1999–ongoing n.a. — 0.443Georgia 1991–ongoing n.a. — 0.264Serbia and
Montenegro (former FR Yugoslavia) 1991–99 n.a. — 0.263
Liberia 1992–1996 n.a. — 0.196
n.a. Not applicable. Source: UNHCR (2002).
B R E A K I N G T H E C O N F L I C T T R A P : C I V I L WA R A N D D E V E L O P M E N T P O L I C Y
20
a catalyst for beneficial change, civil war typically leaves a persistinglegacy of poverty and misery.
Economic and Political Legacy
Several of the adverse economic effects of civil war are highly persistent.Recall that during civil war military expenditure rises as a percentage ofGDP from 2.8 to 5.0 percent; however, once the war has ended, mili-tary expenditure does not return to its former level. During the firstpostconflict decade the average country spends 4.5 percent of GDP onthe military. The government often presents the modest reduction inmilitary spending from its wartime level as a peace dividend, but amore accurate way of viewing postconflict military spending is to see it
Liberia: A Nation DisplacedWhile official estimates for IDPs and refugees peak at70 percent of the population, it is hard to see how asingle Liberian family has not been displaced at somestage by Liberia’s civil war. Displacement in Liberiahas been driven by the conflict, with all its devastat-ing political, economic, and social consequences.
The human costs of displacement are apparent,but hard data have been difficult to collect, and of-ficial statistics do not tell the whole story. The lastreliable census took place in 1974, with a subse-quent exercise in 1984 remaining unfinished. Thebaseline population figure most often used of 2.6million at the outset of fighting is an extrapolationbased on previous birth and mortality rates. Of thisestimated population, at least 750,000 have fled asrefugees to neighboring or distant countries, an ad-ditional million have been displaced internally, andan estimated 100,000 to 150,000 have died or beenkilled. The United Nations reports that 1.8 million,virtually the entire remaining population, are de-
pendent on aid. Violence has visited every one ofLiberia’s 15 counties and territories. The officialnumbers therefore disguise the fact that all Liberi-ans, from wealthy merchants in Monrovia to peas-ant farmers up-country, have had their way of lifeseverely disrupted and, more often, destroyed. Mostof the refugees are in Côte d’Ivoire.
Sudan“Civil war, primarily between northern and southernSudanese from 1955 through 1972 and from 1983to the present, has left more than 1.5 million south-ern Sudanese dead and a majority of the remainingsouthern Sudanese population uprooted. The mas-sive level of often deliberate death and displacementhas been one of the century’s largest, yet least-recog-nized, tragedies. . . . The vast majority of the south-ern Sudanese forced from their homes are internallydisplaced. At the end of 1996, USCR reported thatas many as 4 million Sudanese, mostly southerners,were internally displaced throughout Sudan.”
Box 1.2 Refugees and IDPs in Liberia and Sudan
Source: Liberia: Scott (1998); Sudan: Ruiz (1998, pp. 139, 141).
21
C I V I L WA R A S D E V E L O P M E N T I N R E V E R S E
as a major hidden cost of conflict, hidden because abnormally inflatedmilitary spending persists long after the conflict is over. Cumulativelyover the first decade of peace some 17 percent of a year’s GDP is lost inincreased military spending. This is far from being the only postconflictcost of war, but alone it is substantial: during the typical conflict thetotal income loss cumulates to around 60 percent of a year’s GDP.
A second cost during conflict is capital flight. Recall that during warcapital flight increases from 9 percent of private wealth to 20 percent.By the end of the first decade of postconflict peace capital flight hasrisen further to 26.1 percent. Far from realizing a peace dividend here,the country experiences a war overhang effect. A possible reason for thisis that asset portfolios can only be adjusted gradually, so that even bythe end of a war the typical portfolio may not have fully adjusted to thepolitical uncertainty created by the war. Once a country has experi-enced a civil war it is much more likely to see further conflict, so thateven though peace is an improvement, risk levels do not return to theirpreconflict level. Thus even once peace has returned, people may stillwish to move more of their assets abroad. Capital repatriation requiresmore than just peace. The same is true, only much more powerfully, forhuman flight. Civil war gives a big impetus to emigration, but some ofthese emigrants, especially those in industrial countries, then provide apostconflict channel for further emigration.
A third persistent adverse legacy is the loss of social capital. Civil warcan have the effect of switching behavior from an equilibrium in whichthere is an expectation of honesty to one in which there is an expecta-tion of corruption. Once a reputation for honesty has been lost, the in-centive for honest behavior in the future is greatly weakened. Clearlycivil war is not the only way in which a society can become corrupted,but the point is that the costs inflicted by corruption are likely to per-sist long after the conflict is over.
For civil war to have some redeeming features, the most hopefulareas would be policies, political institutions, and human rights. Theimpact of civil war on each of these can, to an extent, be measured.With respect to policy we use a measure adopted by the World Bank,the country policy and institutional assessment (CPIA). The CPIA is anassessment on a 5-point scale of economic policy in four areas—macro-economic, structural, social, and public sector management—with ahigher score indicating better policies. While what constitutes “good”policies can be controversial, consensus on the recognition of bad poli-
B R E A K I N G T H E C O N F L I C T T R A P : C I V I L WA R A N D D E V E L O P M E N T P O L I C Y
22
cies is wider, and, unfortunately, civil war countries tend to be at thisend of the spectrum. Those low-income countries that are neither atwar nor in the first decade of postwar peace have, on average, a CPIAscore of 2.75. For those countries that have had a civil war and re-established peace, we can track whether the war served as a catalyst forimprovement. On average, during the last five years prior to war theCPIA for these countries was 2.56. During the first postconflict decadeit averaged only 2.29. Although the numbers are close together, theyactually reflect a substantial deterioration in policies. All four policyareas are worse in postconflict societies: their macroeconomies are lessstable, their structural policies such as trade and infrastructure are lessconducive to growth, their social policies are less inclusive, and theirpublic sectors are less well managed. Civil war is thus not normally acatalyst for policy improvement, but rather for policy deterioration.
With respect to the extent to which political institutions are demo-cratic, we use the standard political science index, polity IV. This is a 10-point scale, and as with the CPIA the bottom end of the range is proba-bly more clear-cut than the top. The typical low-income country that isneither at war nor in postwar peace has a score of 2.11, while countriesin the first decade of postwar peace average a score of only 1.49. Thusagain, on average, civil war leads to a deterioration rather than an im-provement in political institutions. A related measure is an index of po-litical freedoms compiled by Freedom House. This is a 7-point scale inwhich, unlike the other indexes, a low score is better than a high score.The comparable numbers are 4.79 prior to conflict and 5.66 postcon-flict. Hence civil war again leaves a legacy of reduced freedom rather thanincreased freedom. A further new measure combines a democracy scoreand an autocracy score and ranges from 0 to 20. Countries are typicallydemocratic if they score 15 or above. Five years after the end of the civilwar the average score on this index is only 8.1 (Doyle and Sambanis2003). Some evidence suggests that postconflict, countries tend to revertapproximately to their preconflict political conditions (Sambanis 2000).
As chapter 3 shows, in reality the political legacy of civil war is farworse than these indicators imply. Once a country has had a civil warit is far more at risk of further war. This is partly because war leaves thesociety divided and embittered, and partly because war creates intereststhat favor continued violence and criminality. As a result, people’s fearsof a relapse into further conflict may dominate the postconflict eco-nomic landscape.
23
C I V I L WA R A S D E V E L O P M E N T I N R E V E R S E
The overall economic and political legacy from civil war is thus suf-ficiently adverse that rapid recovery is unlikely. Collier (1999) findssome evidence for a war overhang effect, whereby after short wars theeconomy continues to have exceptionally low growth. This is consistentwith the capital flight story, in that a short war may not give peopleenough time to shift their assets abroad, so they continue with capitalflight even after the war is over. Chapter 5 discusses the postconflicteconomic recovery in detail with a focus on national and global poli-cies. The pace of postconflict recovery is highly dependent on nationalpolicy choices and the scale and nature of international support. Re-covery is not an automatic process of bouncing back. Even in success-ful recoveries the process is slow. Consider, for example, Uganda, whererecovery was unusually rapid, yet even by the late 1990s, 10 years afterthe end of the civil war, per capita income had barely regained its levelof the early 1970s and the retreat into subsistence had barely been re-versed. At the household level, even though most respondents had beenable to replace some of their assets, when interviewed 60 percent indi-cated that they were still worse off than before the war (Matovu andStewart 2001).
Social Legacy
Civil War Increases Mortality Rates. Mortality rates only captureone dimension of the human consequences of conflict; however, theyare a useful summary measure of the crisis and its impact. Mortality es-timates can be highly inaccurate, but they are often better and moreeasily captured than other health indicators, which may be subject todifferent definitions and cultural interpretations (Keely, Reed, andWaldman 2000). Other human damage as a consequence of conflict in-cludes morbidity and psychological effects, but mortality rates havebeen one of the most easily and accurately measured indicators in emer-gency settings.
The long-term effect of civil war on mortality can be investigatedusing both econometrics and case studies. A new econometric study in-vestigates the effect on infant mortality (Hoeffler and Reynal-Querol2003). Unsurprisingly, the mortality effect depends on the duration ofthe conflict. Considering a typical five-year war, the study finds that in-fant mortality increases by 13 percent during such a war; however, this
B R E A K I N G T H E C O N F L I C T T R A P : C I V I L WA R A N D D E V E L O P M E N T P O L I C Y
24
effect is persistent, and in the first five years of postconflict peace theinfant mortality rate remains 11 percent higher than the baseline.
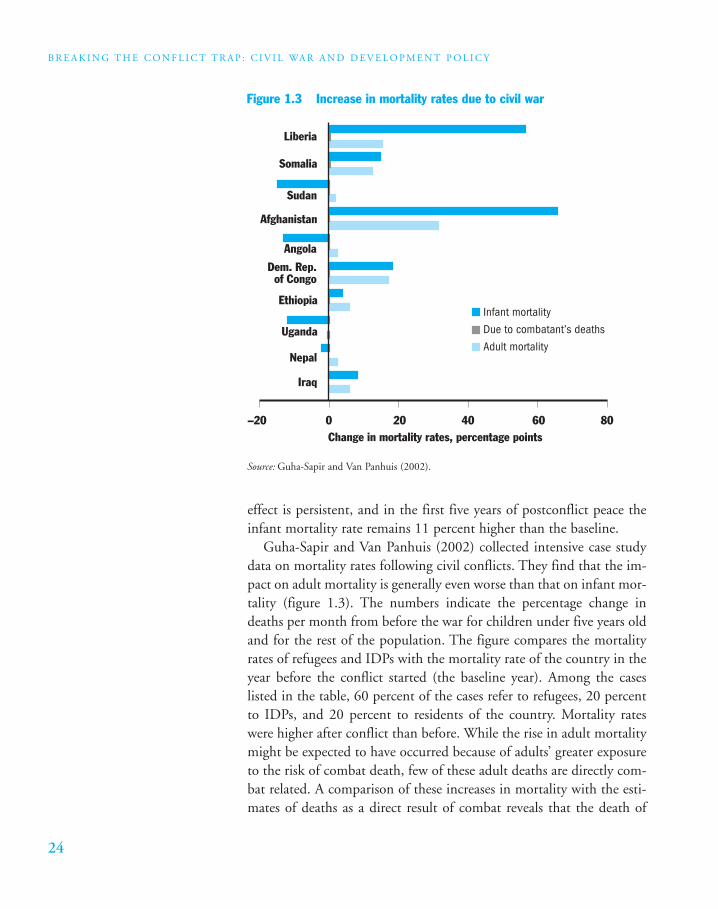
Guha-Sapir and Van Panhuis (2002) collected intensive case studydata on mortality rates following civil conflicts. They find that the im-pact on adult mortality is generally even worse than that on infant mor-tality (figure 1.3). The numbers indicate the percentage change indeaths per month from before the war for children under five years oldand for the rest of the population. The figure compares the mortalityrates of refugees and IDPs with the mortality rate of the country in theyear before the conflict started (the baseline year). Among the caseslisted in the table, 60 percent of the cases refer to refugees, 20 percentto IDPs, and 20 percent to residents of the country. Mortality rateswere higher after conflict than before. While the rise in adult mortalitymight be expected to have occurred because of adults’ greater exposureto the risk of combat death, few of these adult deaths are directly com-bat related. A comparison of these increases in mortality with the esti-mates of deaths as a direct result of combat reveals that the death of
Figure 1.3 Increase in mortality rates due to civil war
Liberia
Somalia
Sudan
Afghanistan
Angola
Dem. Rep.of Congo
Ethiopia
Uganda
Nepal
Iraq
–20 0 20 40Change in mortality rates, percentage points
60 80
Infant mortality
Due to combatant’s deaths
Adult mortality
Source: Guha-Sapir and Van Panhuis (2002).
25
C I V I L WA R A S D E V E L O P M E N T I N R E V E R S E
combatants is only a minor component of the overall rise in mortality.These numbers suggest that civil wars kill far more civilians even afterthe conflict is over than they kill combatants during the conflict.
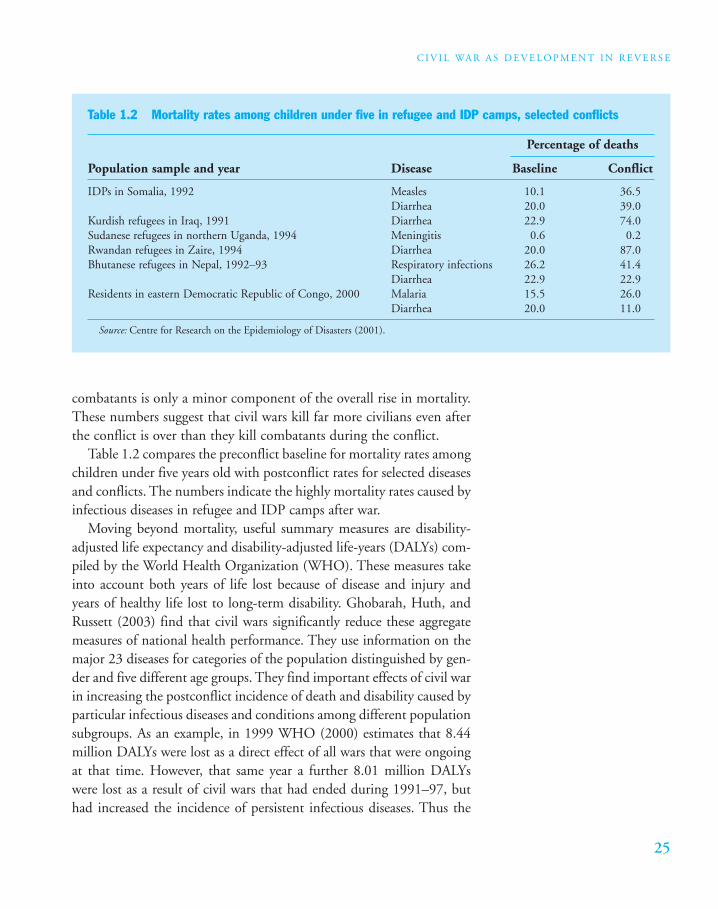
Table 1.2 compares the preconflict baseline for mortality rates amongchildren under five years old with postconflict rates for selected diseasesand conflicts. The numbers indicate the highly mortality rates caused byinfectious diseases in refugee and IDP camps after war.
Moving beyond mortality, useful summary measures are disability-adjusted life expectancy and disability-adjusted life-years (DALYs) com-piled by the World Health Organization (WHO). These measures takeinto account both years of life lost because of disease and injury andyears of healthy life lost to long-term disability. Ghobarah, Huth, andRussett (2003) find that civil wars significantly reduce these aggregatemeasures of national health performance. They use information on themajor 23 diseases for categories of the population distinguished by gen-der and five different age groups. They find important effects of civil warin increasing the postconflict incidence of death and disability caused byparticular infectious diseases and conditions among different populationsubgroups. As an example, in 1999 WHO (2000) estimates that 8.44million DALYs were lost as a direct effect of all wars that were ongoingat that time. However, that same year a further 8.01 million DALYswere lost as a result of civil wars that had ended during 1991–97, buthad increased the incidence of persistent infectious diseases. Thus the
Table 1.2 Mortality rates among children under five in refugee and IDP camps, selected conflicts
Percentage of deaths
Population sample and year Disease Baseline Conflict
IDPs in Somalia, 1992 Measles 10.1 36.5Diarrhea 20.0 39.0
Kurdish refugees in Iraq, 1991 Diarrhea 22.9 74.0Sudanese refugees in northern Uganda, 1994 Meningitis 0.6 0.2Rwandan refugees in Zaire, 1994 Diarrhea 20.0 87.0Bhutanese refugees in Nepal, 1992–93 Respiratory infections 26.2 41.4
Diarrhea 22.9 22.9Residents in eastern Democratic Republic of Congo, 2000 Malaria 15.5 26.0
Diarrhea 20.0 11.0
Source: Centre for Research on the Epidemiology of Disasters (2001).
B R E A K I N G T H E C O N F L I C T T R A P : C I V I L WA R A N D D E V E L O P M E N T P O L I C Y
26
legacy effect of civil wars on DALYs was approximately as large as the ef-fect during conflict (Ghobarah, Huth, and Russett 2003).
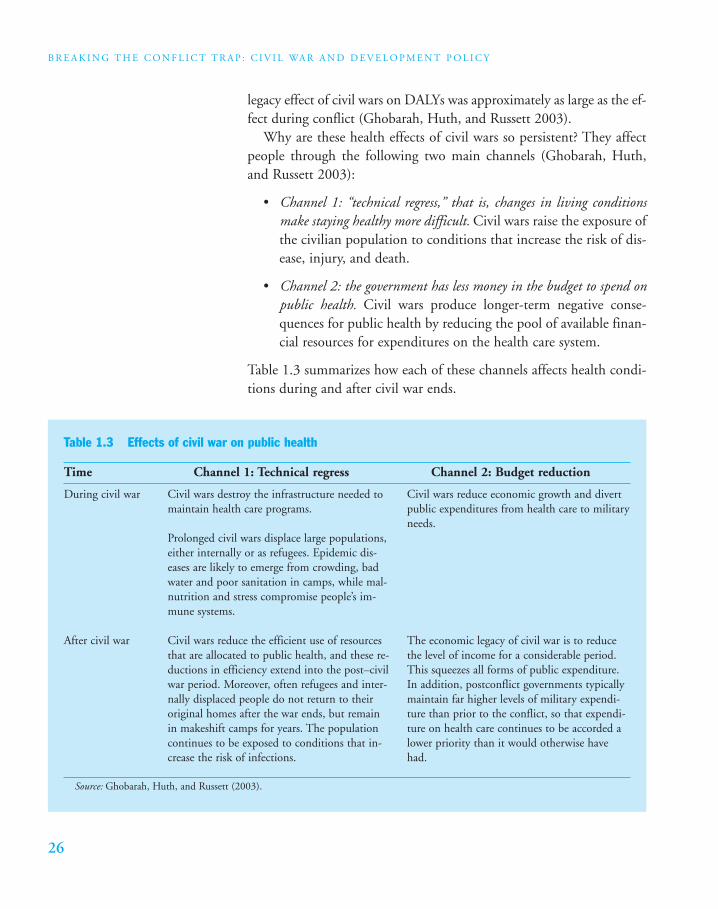
Why are these health effects of civil wars so persistent? They affectpeople through the following two main channels (Ghobarah, Huth,and Russett 2003):
• Channel 1: “technical regress,” that is, changes in living conditionsmake staying healthy more difficult. Civil wars raise the exposure ofthe civilian population to conditions that increase the risk of dis-ease, injury, and death.
• Channel 2: the government has less money in the budget to spend onpublic health. Civil wars produce longer-term negative conse-quences for public health by reducing the pool of available finan-cial resources for expenditures on the health care system.
Table 1.3 summarizes how each of these channels affects health condi-tions during and after civil war ends.
During civil war
After civil war
Table 1.3 Effects of civil war on public health
Time Channel 1: Technical regress Channel 2: Budget reduction
Civil wars destroy the infrastructure needed tomaintain health care programs.
Prolonged civil wars displace large populations,either internally or as refugees. Epidemic dis-eases are likely to emerge from crowding, badwater and poor sanitation in camps, while mal-nutrition and stress compromise people’s im-mune systems.
Civil wars reduce the efficient use of resourcesthat are allocated to public health, and these re-ductions in efficiency extend into the post–civilwar period. Moreover, often refugees and inter-nally displaced people do not return to theiroriginal homes after the war ends, but remainin makeshift camps for years. The populationcontinues to be exposed to conditions that in-crease the risk of infections.
Source: Ghobarah, Huth, and Russett (2003).
Civil wars reduce economic growth and divertpublic expenditures from health care to militaryneeds.
The economic legacy of civil war is to reducethe level of income for a considerable period.This squeezes all forms of public expenditure.In addition, postconflict governments typicallymaintain far higher levels of military expendi-ture than prior to the conflict, so that expendi-ture on health care continues to be accorded alower priority than it would otherwise havehad.
27
C I V I L WA R A S D E V E L O P M E N T I N R E V E R S E
Ghobarah, Huth, and Russett (2003) find that infectious diseasesare the most important cause of the indirect deaths of civil war. Ofthese malaria is the most important, and the evidence suggests that allthe age groups under 60 are affected by malaria.
As AIDS is now such a common cause of death we examine the re-lationship between civil war and HIV/AIDS in more detail. Military re-cruits are typically young, sexually active men, often unmarried. Mili-tary personnel tend to have high rates of sexually transmitted diseases(STDs), including HIV: estimates indicate that rates among militarypersonnel are two to five times higher than among the general popula-tion, even during peacetime. When military personnel are stationedaway from home, social controls in relation to engaging in sexual rela-tionships are lower and the risk of HIV infection is likely to be higher.Prostitution around army bases also increases the spread of infection. Inaddition, in times of war the risk of contracting HIV or other STDsmay seem low relative to the risk of death in combat.
Some figures for HIV prevalence in the military are available (table1.4). No reliable figures are available for rebel forces, but they are likelyto be at least as high as for the regular armed forces. Studies also find thatthe level of militarization increases the prevalence of HIV. One studyfinds that halving the number of men in the armed forces is associatedwith a reduction in the rate of seroprevalence among low-risk adults byabout a quarter (Over 2003). However, HIV is not only spread throughconsensual intercourse, but also through gender-based violence. Regularsoldiers and rebels force women to give sexual favors in exchange for“protection.” Also the incidence of rape increases, often dramatically,during war, with refugees and displaced women and girls being particu-
Table 1.4 HIV prevalence in the military, selected countries andyears(percent)
Country and year HIV prevalence
Angola 40.0–60.0Cambodia (1996) 6.5Democratic Republic of Congo 40.0–60.0Sierra Leone (1998) 61.0Uganda (1995/96) 27.1
Source: Elbe (2002); World Bank (1997).
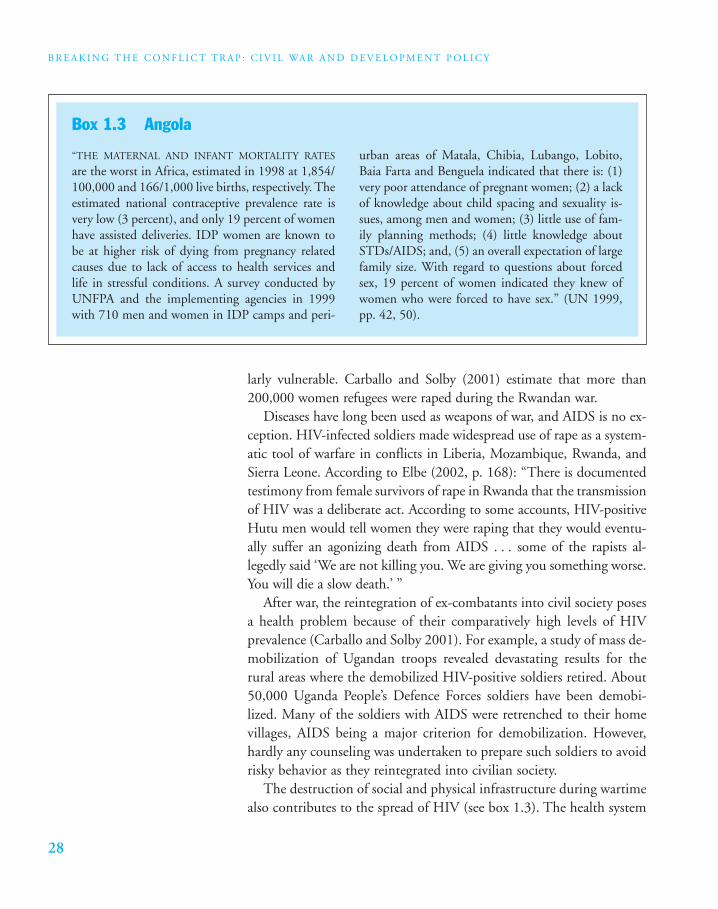
B R E A K I N G T H E C O N F L I C T T R A P : C I V I L WA R A N D D E V E L O P M E N T P O L I C Y
28
larly vulnerable. Carballo and Solby (2001) estimate that more than200,000 women refugees were raped during the Rwandan war.
Diseases have long been used as weapons of war, and AIDS is no ex-ception. HIV-infected soldiers made widespread use of rape as a system-atic tool of warfare in conflicts in Liberia, Mozambique, Rwanda, andSierra Leone. According to Elbe (2002, p. 168): “There is documentedtestimony from female survivors of rape in Rwanda that the transmissionof HIV was a deliberate act. According to some accounts, HIV-positiveHutu men would tell women they were raping that they would eventu-ally suffer an agonizing death from AIDS . . . some of the rapists al-legedly said ‘We are not killing you. We are giving you something worse.You will die a slow death.’ ”
After war, the reintegration of ex-combatants into civil society posesa health problem because of their comparatively high levels of HIVprevalence (Carballo and Solby 2001). For example, a study of mass de-mobilization of Ugandan troops revealed devastating results for therural areas where the demobilized HIV-positive soldiers retired. About50,000 Uganda People’s Defence Forces soldiers have been demobi-lized. Many of the soldiers with AIDS were retrenched to their homevillages, AIDS being a major criterion for demobilization. However,hardly any counseling was undertaken to prepare such soldiers to avoidrisky behavior as they reintegrated into civilian society.
The destruction of social and physical infrastructure during wartimealso contributes to the spread of HIV (see box 1.3). The health system
“THE MATERNAL AND INFANT MORTALITY RATES
are the worst in Africa, estimated in 1998 at 1,854/100,000 and 166/1,000 live births, respectively. Theestimated national contraceptive prevalence rate isvery low (3 percent), and only 19 percent of womenhave assisted deliveries. IDP women are known tobe at higher risk of dying from pregnancy relatedcauses due to lack of access to health services and life in stressful conditions. A survey conducted byUNFPA and the implementing agencies in 1999with 710 men and women in IDP camps and peri-
urban areas of Matala, Chibia, Lubango, Lobito,Baia Farta and Benguela indicated that there is: (1)very poor attendance of pregnant women; (2) a lackof knowledge about child spacing and sexuality is-sues, among men and women; (3) little use of fam-ily planning methods; (4) little knowledge aboutSTDs/AIDS; and, (5) an overall expectation of largefamily size. With regard to questions about forcedsex, 19 percent of women indicated they knew ofwomen who were forced to have sex.” (UN 1999,pp. 42, 50).
Box 1.3 Angola
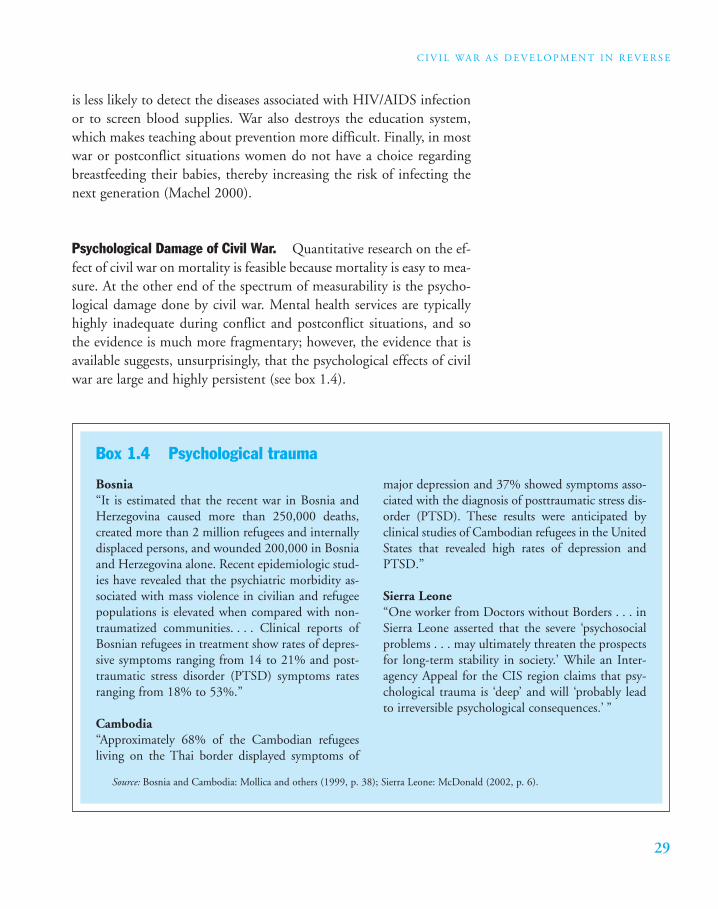
29
C I V I L WA R A S D E V E L O P M E N T I N R E V E R S E
is less likely to detect the diseases associated with HIV/AIDS infectionor to screen blood supplies. War also destroys the education system,which makes teaching about prevention more difficult. Finally, in mostwar or postconflict situations women do not have a choice regardingbreastfeeding their babies, thereby increasing the risk of infecting thenext generation (Machel 2000).
Psychological Damage of Civil War. Quantitative research on the ef-fect of civil war on mortality is feasible because mortality is easy to mea-sure. At the other end of the spectrum of measurability is the psycho-logical damage done by civil war. Mental health services are typicallyhighly inadequate during conflict and postconflict situations, and sothe evidence is much more fragmentary; however, the evidence that isavailable suggests, unsurprisingly, that the psychological effects of civilwar are large and highly persistent (see box 1.4).
Bosnia “It is estimated that the recent war in Bosnia andHerzegovina caused more than 250,000 deaths,created more than 2 million refugees and internallydisplaced persons, and wounded 200,000 in Bosniaand Herzegovina alone. Recent epidemiologic stud-ies have revealed that the psychiatric morbidity as-sociated with mass violence in civilian and refugeepopulations is elevated when compared with non-traumatized communities. . . . Clinical reports ofBosnian refugees in treatment show rates of depres-sive symptoms ranging from 14 to 21% and post-traumatic stress disorder (PTSD) symptoms ratesranging from 18% to 53%.”
Cambodia“Approximately 68% of the Cambodian refugeesliving on the Thai border displayed symptoms of
major depression and 37% showed symptoms asso-ciated with the diagnosis of posttraumatic stress dis-order (PTSD). These results were anticipated byclinical studies of Cambodian refugees in the UnitedStates that revealed high rates of depression andPTSD.”
Sierra Leone“One worker from Doctors without Borders . . . inSierra Leone asserted that the severe ‘psychosocialproblems . . . may ultimately threaten the prospectsfor long-term stability in society.’ While an Inter-agency Appeal for the CIS region claims that psy-chological trauma is ‘deep’ and will ‘probably leadto irreversible psychological consequences.’ ”
Box 1.4 Psychological trauma
Source: Bosnia and Cambodia: Mollica and others (1999, p. 38); Sierra Leone: McDonald (2002, p. 6).
B R E A K I N G T H E C O N F L I C T T R A P : C I V I L WA R A N D D E V E L O P M E N T P O L I C Y
30
Civil war survivors have lost family members, friends, livelihoods,and identity. Many of them are living in refugee camps. This experienceof trauma suffered on a wide scale has psychological consequences: “In-timate exposure to brutality and subsequent displacement and civil dis-order leave individuals psychologically scarred and the intricate net-work of social interaction deeply torn” (McDonald 2002, p. 4). Theexperience of trauma continues after war. Moreover, living in a refugeecamp or transitory settlement can constitute a “secondary wound.”Most individuals will experience low-grade but long-lasting mentalhealth problems (McDonald 2002).
During the period following displacement the threat of violence ishigh, as are mortality and morbidity rates. These features, together withhaving to live in camps, contribute to the development of a prevailingsense of hopelessness that increases the traumatic experience. Traumasare of two types, single event traumas and ongoing traumas. Life in arefugee camp is an ongoing trauma (McDonald 2002). Clinical condi-tions such as depression and schizophrenia are linked to prematuredeath in refugee populations.
Ghobarah, Huth, and Russett (2003) find an indirect effect of civilwars on suicides of women of childbearing age. This probably reflectsthe trauma of rape. Longitudinal studies of survivors of terror, such asHolocaust survivors and survivors of the Pol Pot regime in Cambodia,show the existence of an intergenerational transmission of trauma.“The effects of massive trauma, tragically . . . do not end with deaths ofsurvivors and may continue into the lives of their children” (box 1.4).
Landmines. A final legacy of civil war, landmines, affects both eco-nomic activity and health (this section is based on ICBL 2002). Land-mines are, in effect, a negative capital stock that the society accumulatesduring conflict. They continue to kill and maim people long after theactual fighting has stopped. For 2001 the International Campaign toBan Landmines recorded 7,987 landmine casualties in 70 countries, ofwhich about 70 percent were civilians; however, as reporting is incom-plete, the campaign estimates that the total number is more likely to bebetween 15,000 and 20,000. In comparison with previous years, whenthe number of casualties was estimated at around 26,000 per year, thisis a considerable improvement. The decrease in the number of landminevictims is due to the international ban of antipersonnel mines in 1997,
31
C I V I L WA R A S D E V E L O P M E N T I N R E V E R S E
which resulted in the destruction of stockpiles as well as a drastic de-crease in the production and trade of landmines. In addition, mine-sweeping operations have been extremely successful in detecting and de-stroying mines in many countries. Yet as the example of Cambodiashows (see box 1.5), landmines continue to severely disrupt normaldaily activities and therefore constitute a serious obstacle to economicand social recovery.
Conclusion
THIS CHAPTER HAS FOCUSED ONLY ON THE EFFECTS OF CIVIL
war within the affected country and has clearly shown thatmost of the suffering inflicted by civil war accrues to noncom-
batants who typically have no say in either whether the conflict is ini-tiated or whether it is settled.
During the war income losses are severe and mortality and morbid-ity exhibit large increases. Even if a war is viewed as a costly investment
CAMBODIA IS ONE OF THE MOST HEAVILY LAND-
mine and unexploded ordnance (UXO) contami-nated countries in the world. Although the actualfighting stopped more than a decade ago in 1991,on average more than two people are injured orkilled by landmines in Cambodia every day. Eventhough 166 million square meters of land werecleared from 1992 through 2001 and a total of313,586 antipersonnel mines were found and de-stroyed, all 24 provinces still have areas contami-nated by mines and UXO. In 2001, 6,422 villages,or 46 percent of Cambodian villages, had areascontaminated with mines and/or UXO. Mine andUXO contamination restricts access to homes, agri-cultural land, pastures, water sources, forests,schools, dams, canals, markets, business activities,health centers, pagodas, bridges, and neighboring
villages. Thus the threat of UXO and mines impedesmobility, security, economic activity, and develop-ment in several provinces, particularly in the northand northwest. With more than 80 percent of thecountry’s population residing in rural areas, andwith 40 percent of these estimated to be living belowthe poverty line, mine action programs continue tobe of the highest priority in Cambodia’s poverty re-duction policy. Official reports show that 173 peo-ple were killed and 640 were injured in mine orUXO incidents during 2001. The proportion ofcivilian casualties was about 95 percent, with chil-dren particularly at risk (232, or 28 percent, of thecasualties were children). Clearing mines, caring forthe injured and disabled, and providing mine edu-cation programs place a severe strain on Cambodianpublic expenditure.
Box 1.5 Landmines: A bitter legacy for Cambodians
Source: ICBL (2002).
B R E A K I N G T H E C O N F L I C T T R A P : C I V I L WA R A N D D E V E L O P M E N T P O L I C Y
32
for subsequent social progress, the costs during the conflict are typicallyso high that postconflict progress would need to be dramatic for subse-quent benefits to outweigh these costs. Yet the legacy effects of civil warare usually so adverse that they cannot reasonably be viewed as socialprogress. Many of the costs of the war continue to accrue long after it isover. For example, the country tends to get locked into persistently highlevels of military expenditure, sees capital continuing to flow out of thecountry at an unusually high rate, and faces a much higher incidence ofinfectious disease. Even economic policies, political institutions, and po-litical freedom appear to deteriorate. Hence most modern civil wars arenot remotely like the 19th century American civil war that ended slav-ery. Of course, finding some modern civil wars that can reasonably beseen as ushering in social progress is always possible, but these are surelythe exceptions. On average, modern civil war has not been a useful forcefor social change, but has been development in reverse.
33
C H A P T E R T W O
Let Them Fight It OutAmong Themselves?
CHAPTER 1 SHOWED THAT FOR THE COUNTRIES
directly affected, civil war is development in reverse,therefore preventing civil war is important for thoseconcerned about the development of low-incomecountries. However, the constituency for action toprevent war is potentially much larger than this, be-
cause civil war has spillover effects for both neighboring countries andthe entire international community. This chapter first considers theneighborhood effects and then turns to the global effects.
Neighborhood Effects of Civil War
PEACEFUL COUNTRIES THAT ARE ADJACENT TO COUNTRIES EN-
gaged in civil war suffer from direct and long-term effects causedby the civil wars of their neighbors.
Economic Spillovers
Civil wars are not only costly for the countries in which they arefought, but for the entire region. Neighboring countries must usuallyaccommodate large numbers of refugees, because the victims of war donot usually have the means to travel to countries further away fromtheir home country, and, in any case, arrive on foot. For example, Pak-istan’s burden of accommodating more than 2 million refugees fromAfghanistan is considerable. However, this direct burden is probably
B R E A K I N G T H E C O N F L I C T T R A P : C I V I L WA R A N D D E V E L O P M E N T P O L I C Y
34
not the most important regional economic spillover. Other effects areon the military budget, the costs of transport, and the reputation of theregion in relation to investors.
An important route by which civil war affects neighbors is throughregional arms races (see box 2.1). Both in response to the risk of a civilwar, and especially once it has started, a government tends to increaseits military expenditure sharply, typically by around two percentagepoints of GDP. Unfortunately, one of the strongest influences on thelevel of military expenditure a government chooses is the level its neigh-bors have chosen (Collier and Hoeffler 2002d). This may be partly be-cause of a perceived threat, and partly because of norm setting and theemulation and rivalries of military leaderships. On average, if civil warleads a government with two neighbors to increase its military expen-diture by 2.0 percentage points of GDP, by the time the arms race isback to equilibrium, the neighboring countries will each have increasedtheir spending by around 0.7 percentage points.
In some situations war in one country directly increases the risk ofwar in neighboring countries. Chapter 3 discusses how the supply ofarmaments has sometimes spilled across borders and how rival govern-ments can find themselves financing each other’s rebel movements.Such regional increases in conflict risk are compounded by their effects
A RECENT STUDY ATTEMPTS TO MODEL WHAT
level of military spending governments choose as ashare of GDP. On average, governments spend 3.4percentage points of GDP on the military, but thisaverage varies widely and predictably. The largest in-crease is if a country is engaged in international war-fare, when spending rises by 2.5 percentage points.Civil war raises spending almost as much, by 1.8percentage points, that is, the military budget in-creases by 50 percent. The risk of war also matters.Each 10.0 percentage points on the risk of civil warraises military spending by 0.4 percentage points.
Both a past history of international war and themilitary expenditure of neighboring countries arehighly significant. Because of these neighborhoodeffects military spending is, in effect, a regionalpublic bad. Controlling for all these risks, militarygovernments still spend more on the military, pre-sumably because they are more susceptible to themilitary lobby. A wave of democratization, such asoccurred in the early 1990s, is thus a regional pub-lic good. Finally, the end of the Cold War gradually,but substantially, yielded a peace dividend, as mili-tary spending fell by around 0.7 percentage points.
Box 2.1 Regional arms races
Source: Collier and Hoeffler (2002d).
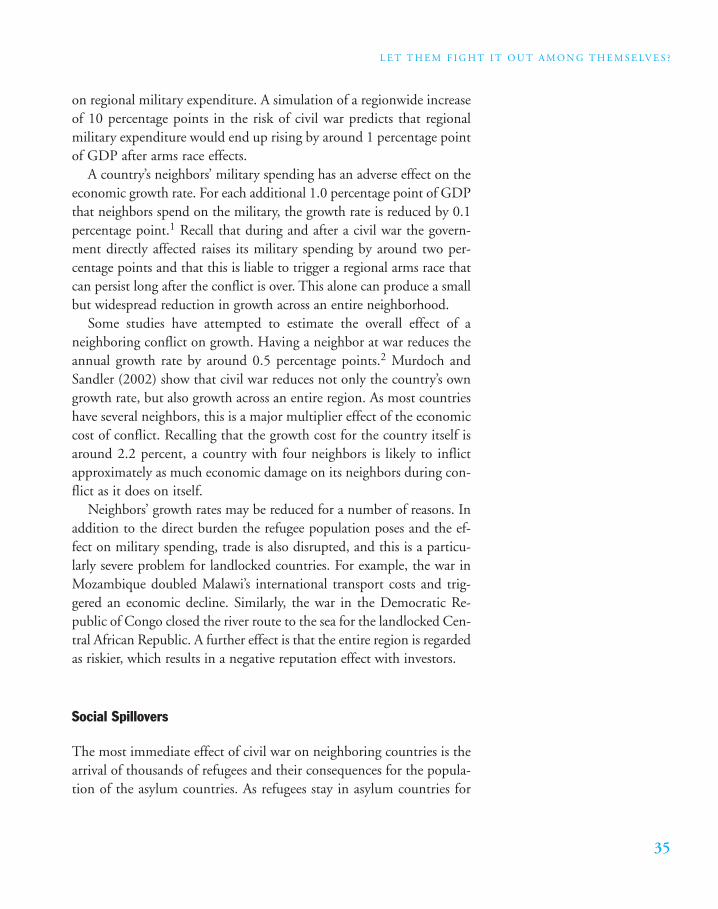
35
L E T T H E M F I G H T I T O U T A M O N G T H E M S E LV E S ?
on regional military expenditure. A simulation of a regionwide increaseof 10 percentage points in the risk of civil war predicts that regionalmilitary expenditure would end up rising by around 1 percentage pointof GDP after arms race effects.
A country’s neighbors’ military spending has an adverse effect on theeconomic growth rate. For each additional 1.0 percentage point of GDPthat neighbors spend on the military, the growth rate is reduced by 0.1percentage point.1 Recall that during and after a civil war the govern-ment directly affected raises its military spending by around two per-centage points and that this is liable to trigger a regional arms race thatcan persist long after the conflict is over. This alone can produce a smallbut widespread reduction in growth across an entire neighborhood.
Some studies have attempted to estimate the overall effect of aneighboring conflict on growth. Having a neighbor at war reduces theannual growth rate by around 0.5 percentage points.2 Murdoch andSandler (2002) show that civil war reduces not only the country’s owngrowth rate, but also growth across an entire region. As most countrieshave several neighbors, this is a major multiplier effect of the economiccost of conflict. Recalling that the growth cost for the country itself isaround 2.2 percent, a country with four neighbors is likely to inflictapproximately as much economic damage on its neighbors during con-flict as it does on itself.
Neighbors’ growth rates may be reduced for a number of reasons. Inaddition to the direct burden the refugee population poses and the ef-fect on military spending, trade is also disrupted, and this is a particu-larly severe problem for landlocked countries. For example, the war inMozambique doubled Malawi’s international transport costs and trig-gered an economic decline. Similarly, the war in the Democratic Re-public of Congo closed the river route to the sea for the landlocked Cen-tral African Republic. A further effect is that the entire region is regardedas riskier, which results in a negative reputation effect with investors.
Social Spillovers
The most immediate effect of civil war on neighboring countries is thearrival of thousands of refugees and their consequences for the popula-tion of the asylum countries. As refugees stay in asylum countries for
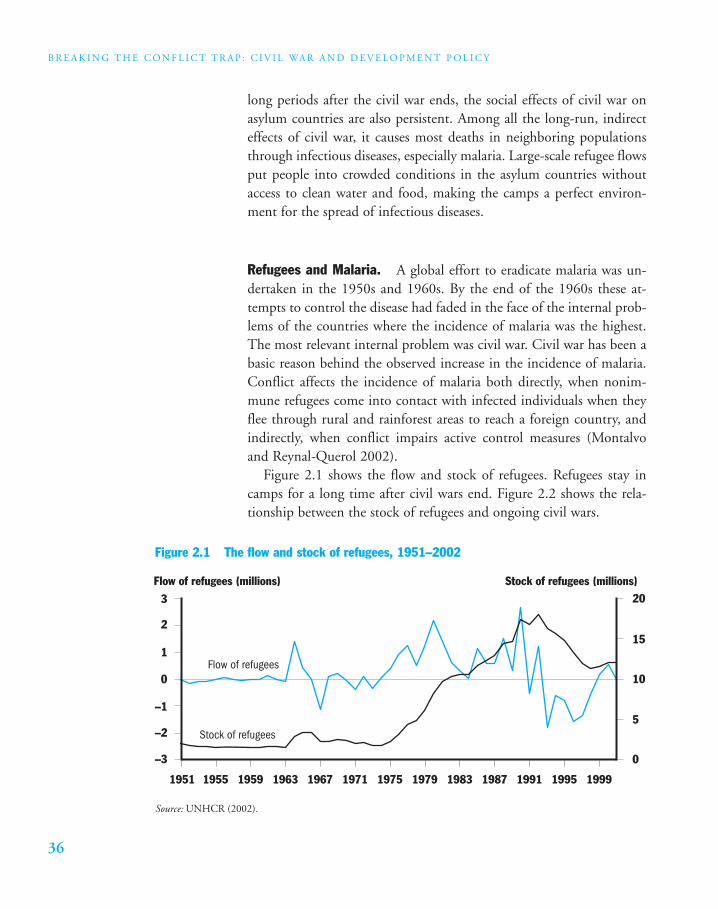
B R E A K I N G T H E C O N F L I C T T R A P : C I V I L WA R A N D D E V E L O P M E N T P O L I C Y
36
long periods after the civil war ends, the social effects of civil war onasylum countries are also persistent. Among all the long-run, indirecteffects of civil war, it causes most deaths in neighboring populationsthrough infectious diseases, especially malaria. Large-scale refugee flowsput people into crowded conditions in the asylum countries withoutaccess to clean water and food, making the camps a perfect environ-ment for the spread of infectious diseases.
Refugees and Malaria. A global effort to eradicate malaria was un-dertaken in the 1950s and 1960s. By the end of the 1960s these at-tempts to control the disease had faded in the face of the internal prob-lems of the countries where the incidence of malaria was the highest.The most relevant internal problem was civil war. Civil war has been abasic reason behind the observed increase in the incidence of malaria.Conflict affects the incidence of malaria both directly, when nonim-mune refugees come into contact with infected individuals when theyflee through rural and rainforest areas to reach a foreign country, andindirectly, when conflict impairs active control measures (Montalvoand Reynal-Querol 2002).
Figure 2.1 shows the flow and stock of refugees. Refugees stay incamps for a long time after civil wars end. Figure 2.2 shows the rela-tionship between the stock of refugees and ongoing civil wars.
Figure 2.1 The flow and stock of refugees, 1951–2002
Stock of refugees (millions)Flow of refugees (millions)
Flow of refugees
Stock of refugees
1951 1955 1959 1963 1967 1971 1975 1979 1983 1987 1991 1995 1999
–3
–2
–1
0
1
2
3
0
5
10
15
20
Source: UNHCR (2002).
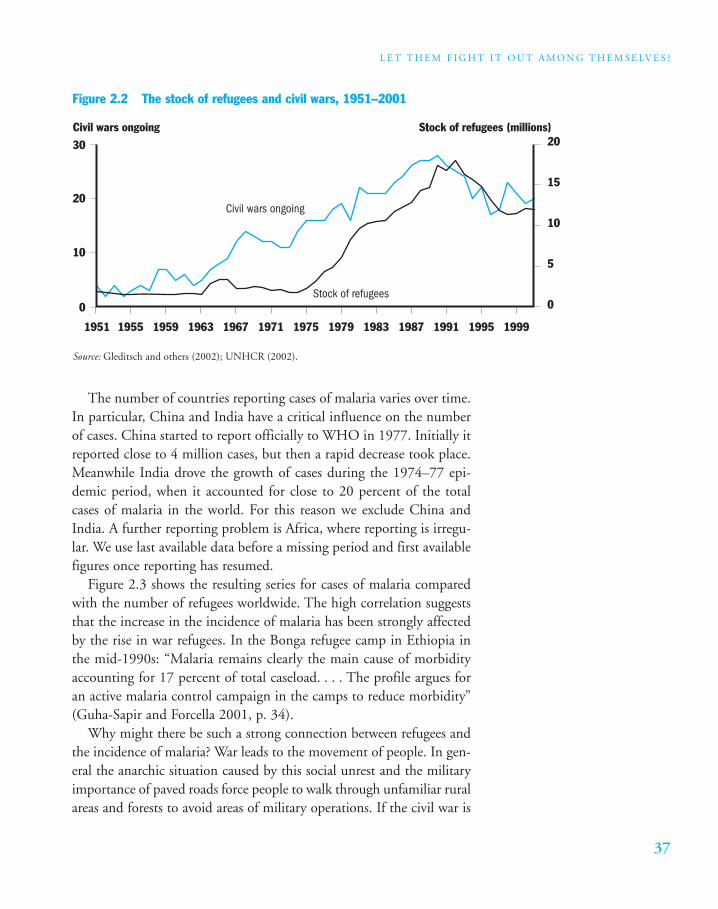
37
L E T T H E M F I G H T I T O U T A M O N G T H E M S E LV E S ?
The number of countries reporting cases of malaria varies over time.In particular, China and India have a critical influence on the numberof cases. China started to report officially to WHO in 1977. Initially itreported close to 4 million cases, but then a rapid decrease took place.Meanwhile India drove the growth of cases during the 1974–77 epi-demic period, when it accounted for close to 20 percent of the totalcases of malaria in the world. For this reason we exclude China andIndia. A further reporting problem is Africa, where reporting is irregu-lar. We use last available data before a missing period and first availablefigures once reporting has resumed.
Figure 2.3 shows the resulting series for cases of malaria comparedwith the number of refugees worldwide. The high correlation suggeststhat the increase in the incidence of malaria has been strongly affectedby the rise in war refugees. In the Bonga refugee camp in Ethiopia inthe mid-1990s: “Malaria remains clearly the main cause of morbidityaccounting for 17 percent of total caseload. . . . The profile argues foran active malaria control campaign in the camps to reduce morbidity”(Guha-Sapir and Forcella 2001, p. 34).
Why might there be such a strong connection between refugees andthe incidence of malaria? War leads to the movement of people. In gen-eral the anarchic situation caused by this social unrest and the militaryimportance of paved roads force people to walk through unfamiliar ruralareas and forests to avoid areas of military operations. If the civil war is
Figure 2.2 The stock of refugees and civil wars, 1951–2001
Civil wars ongoing Stock of refugees (millions)
Stock of refugees
Civil wars ongoing
0
10
20
30
1951 1955 1959 1963 1967 1971 1975 1979 1983 1987 1991 1995 1999
0
5
10
15
20
Source: Gleditsch and others (2002); UNHCR (2002).
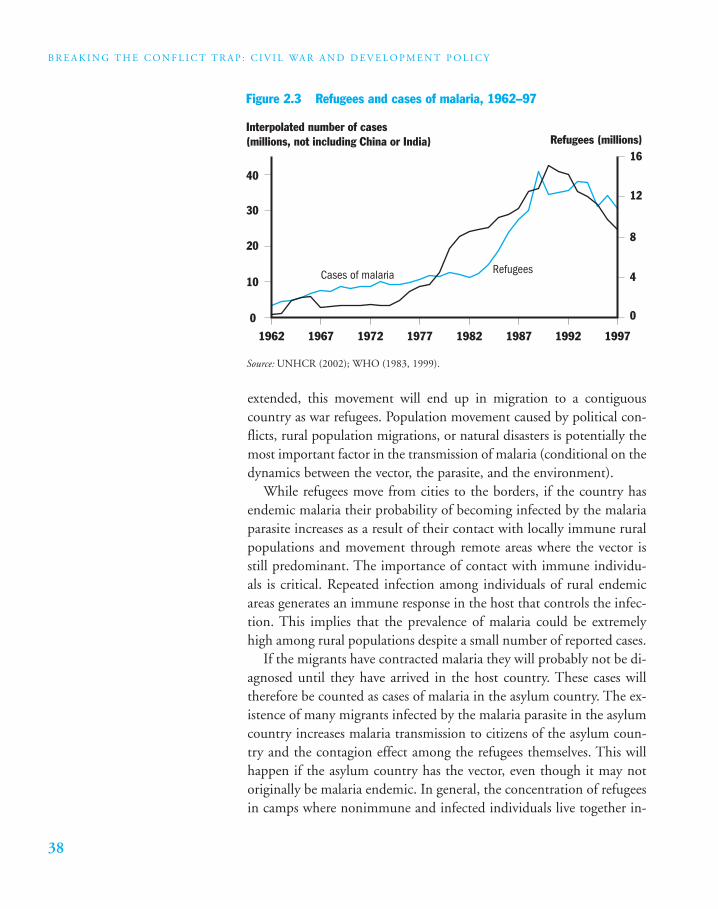
B R E A K I N G T H E C O N F L I C T T R A P : C I V I L WA R A N D D E V E L O P M E N T P O L I C Y
38
extended, this movement will end up in migration to a contiguouscountry as war refugees. Population movement caused by political con-flicts, rural population migrations, or natural disasters is potentially themost important factor in the transmission of malaria (conditional on thedynamics between the vector, the parasite, and the environment).
While refugees move from cities to the borders, if the country hasendemic malaria their probability of becoming infected by the malariaparasite increases as a result of their contact with locally immune ruralpopulations and movement through remote areas where the vector isstill predominant. The importance of contact with immune individu-als is critical. Repeated infection among individuals of rural endemicareas generates an immune response in the host that controls the infec-tion. This implies that the prevalence of malaria could be extremelyhigh among rural populations despite a small number of reported cases.
If the migrants have contracted malaria they will probably not be di-agnosed until they have arrived in the host country. These cases willtherefore be counted as cases of malaria in the asylum country. The ex-istence of many migrants infected by the malaria parasite in the asylumcountry increases malaria transmission to citizens of the asylum coun-try and the contagion effect among the refugees themselves. This willhappen if the asylum country has the vector, even though it may notoriginally be malaria endemic. In general, the concentration of refugeesin camps where nonimmune and infected individuals live together in-
Source: UNHCR (2002); WHO (1983, 1999).
Figure 2.3 Refugees and cases of malaria, 1962–97
Refugees (millions)Interpolated number of cases(millions, not including China or India)
Cases of malaria Refugees
0
10
20
30
40
1962 1967 1972 1977 1982 1987 1992 1997
0
4
8
12
16
39
L E T T H E M F I G H T I T O U T A M O N G T H E M S E LV E S ?
creases the risk of transmission conditional on the existence of theAnopheles mosquito.
Research using annual data for 135 countries between 1960 and1999 studies the effects of refugee flows from tropical countries withcivil war to neighboring tropical countries (Montalvo and Reynal-Querol 2002). It finds that for each 1,000 refugees the asylum countriessee 1,406 new cases of malaria. The size of the refugee population com-ing from tropical countries with a civil war thus has an important im-pact on malaria in the asylum countries. Preventing civil wars, especiallyin tropical countries, is therefore important for controlling malaria.
The effect of war-driven refugees on malaria is qualitatively similarto that of other refugees, an effect that is better known but is quanti-tatively more important. Refugees fleeing from droughts and faminesdo not have such a significant effect on the incidence of malaria for tworeasons. First, the mechanism whereby refugees escaping from war be-come infected is because civil wars force people to walk through unfa-miliar rural areas and forests to avoid areas of military operations, butpeople displaced by famines and droughts do not have to avoid pavedroads, so they are less likely to be exposed to the mosquito. Second,refugees from war stay in asylum camps for long periods after the warends, whereas once droughts and famines end refugees can quickly re-turn home. Montalvo and Reynal-Querol (2002) find that refugeesfrom drought who come to tropical asylum countries have no signifi-cant effect on the incidence of malaria in the asylum country.
Refugees and the Spread of HIV/AIDS. Refugees and other displacedpopulations are at increased risk of contracting HIV/AIDS during andafter displacement because of poverty; disruption of family and socialstructures and of health services; increased sexual violence; and in-creased socioeconomic vulnerability, particularly among women andyouth. Data on HIV prevalence in refugee camps are scarce; however,some examples described in box 2.2 suggest the extent of HIV infec-tion in refugee camps in asylum countries. Ghobarah, Huth and Rus-sett (2003) find that the most important effect of civil war on neigh-boring countries is caused by HIV/AIDS, with the groups that are mostaffected being young children (who are infected by their mothers) andyoung and middle-aged adults. The average loss of healthy life for thesegroups ranges from roughly 2 to 10 years.
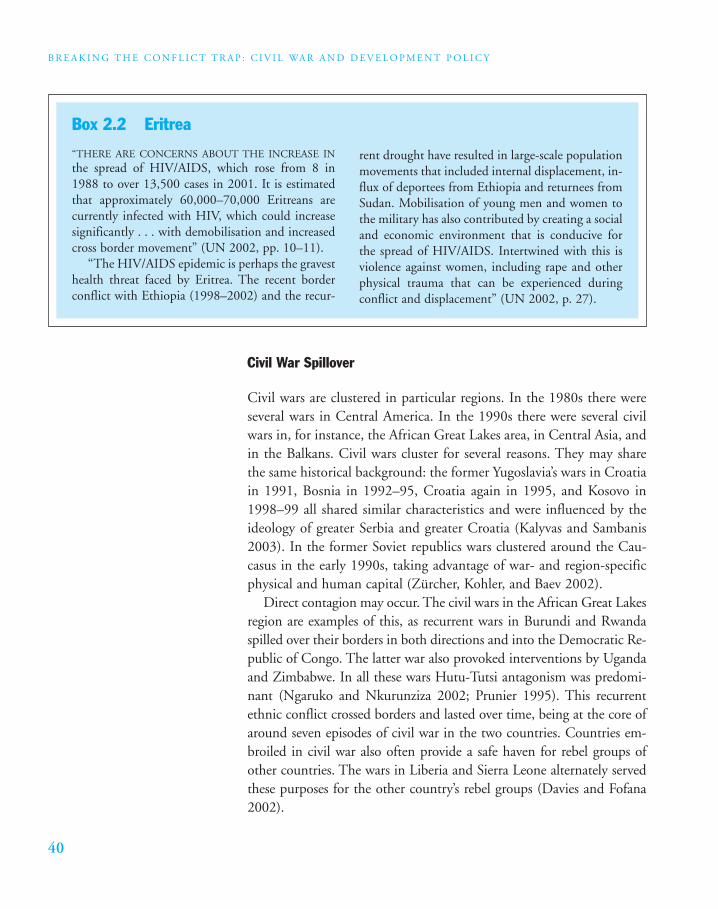
B R E A K I N G T H E C O N F L I C T T R A P : C I V I L WA R A N D D E V E L O P M E N T P O L I C Y
40
Civil War Spillover
Civil wars are clustered in particular regions. In the 1980s there wereseveral wars in Central America. In the 1990s there were several civilwars in, for instance, the African Great Lakes area, in Central Asia, andin the Balkans. Civil wars cluster for several reasons. They may sharethe same historical background: the former Yugoslavia’s wars in Croatiain 1991, Bosnia in 1992–95, Croatia again in 1995, and Kosovo in1998–99 all shared similar characteristics and were influenced by theideology of greater Serbia and greater Croatia (Kalyvas and Sambanis2003). In the former Soviet republics wars clustered around the Cau-casus in the early 1990s, taking advantage of war- and region-specificphysical and human capital (Zürcher, Kohler, and Baev 2002).
Direct contagion may occur. The civil wars in the African Great Lakesregion are examples of this, as recurrent wars in Burundi and Rwandaspilled over their borders in both directions and into the Democratic Re-public of Congo. The latter war also provoked interventions by Ugandaand Zimbabwe. In all these wars Hutu-Tutsi antagonism was predomi-nant (Ngaruko and Nkurunziza 2002; Prunier 1995). This recurrentethnic conflict crossed borders and lasted over time, being at the core ofaround seven episodes of civil war in the two countries. Countries em-broiled in civil war also often provide a safe haven for rebel groups ofother countries. The wars in Liberia and Sierra Leone alternately servedthese purposes for the other country’s rebel groups (Davies and Fofana2002).
“THERE ARE CONCERNS ABOUT THE INCREASE INthe spread of HIV/AIDS, which rose from 8 in1988 to over 13,500 cases in 2001. It is estimatedthat approximately 60,000–70,000 Eritreans arecurrently infected with HIV, which could increasesignificantly . . . with demobilisation and increasedcross border movement” (UN 2002, pp. 10–11).
“The HIV/AIDS epidemic is perhaps the gravesthealth threat faced by Eritrea. The recent borderconflict with Ethiopia (1998–2002) and the recur-
rent drought have resulted in large-scale populationmovements that included internal displacement, in-flux of deportees from Ethiopia and returnees fromSudan. Mobilisation of young men and women tothe military has also contributed by creating a socialand economic environment that is conducive forthe spread of HIV/AIDS. Intertwined with this isviolence against women, including rape and otherphysical trauma that can be experienced duringconflict and displacement” (UN 2002, p. 27).
Box 2.2 Eritrea
41
L E T T H E M F I G H T I T O U T A M O N G T H E M S E LV E S ?
Refugee flows caused by civil wars may also be destabilizing to thehost country. During the war in the 1990s, Burundian rebels soughtrefuge in neighboring Tanzania and the Democratic Republic of Congoand recruited among the Burundi refugee population in Tanzania. Theprovinces in the Democratic Republic of Congo neighboring those two countries had the highest incidence of fighting and displacementsof people (Ngaruko and Nkurunziza 2002).
The economic spillover also increases the risk of civil war in neigh-boring countries (see chapters 3 and 4).
Global Effects of Civil War
CIVIL WAR IS NOT JUST BAD FOR THE NEIGHBORHOOD. DUR-
ing the past 30 years three major global social evils can reason-ably be ascribed in substantial part to side effects of civil war.
The global cost of these social evils has already been astronomical, andthey are proving highly persistent. They are hard drugs, AIDS, and in-ternational terrorism.
The link from civil war to hard drugs is through both productionand distribution. The cultivation of hard drugs, coca and opium, nowa-days predominantly requires territory that is outside the control of anyrecognized government. Where territory is under the control of an in-ternationally recognized government it can generally be prevailed uponto enforce anticultivation policies reasonably effectively. A by-productof civil war is that large rural areas cease to be under government con-trol. Currently some 95 percent of the global production of opium isin civil war countries. Not only is production concentrated in civil warterritory, but distribution and storage channels rely on the lawlessnesscivil war generates.
The link between civil war and the spread of AIDS within a nationand a region has already been discussed; however, the most far-reachingclaim is that the origin of the global pandemic is a consequence of a par-ticular civil war. The hypothesis, for which credible evidence exists, butwhich is far from proven, is that the conditions of war enabled whatwould otherwise have been a routine, localized outbreak to spiral out ofcontrol. Even if we attach only a small likelihood to this explanationbeing correct—say 10 percent—then one-tenth of the global cost of theAIDS pandemic should be added to the estimated global cost of civil war.
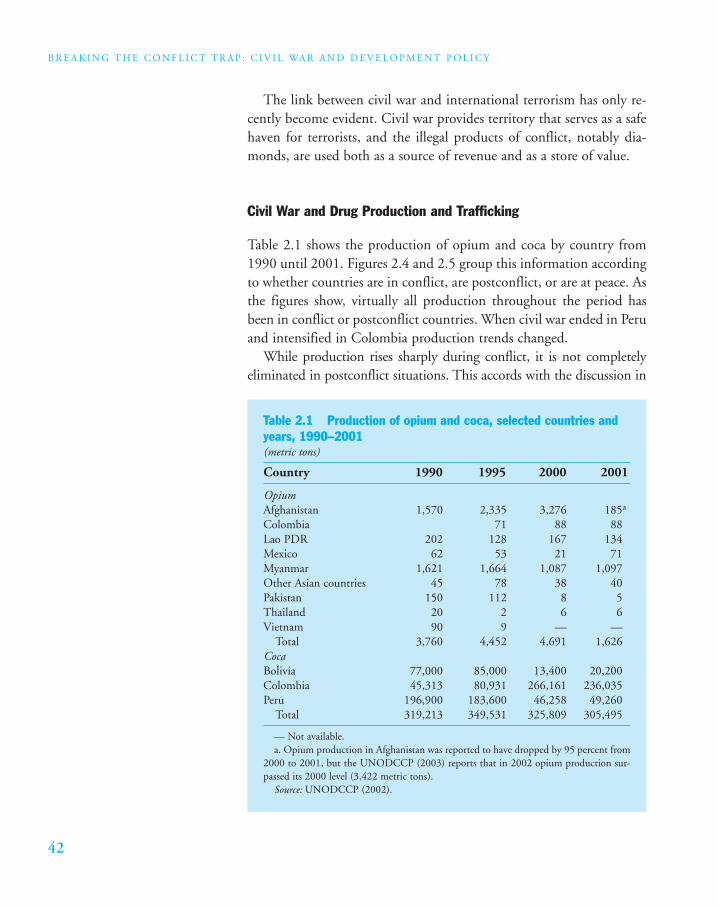
B R E A K I N G T H E C O N F L I C T T R A P : C I V I L WA R A N D D E V E L O P M E N T P O L I C Y
42
The link between civil war and international terrorism has only re-cently become evident. Civil war provides territory that serves as a safehaven for terrorists, and the illegal products of conflict, notably dia-monds, are used both as a source of revenue and as a store of value.
Civil War and Drug Production and Trafficking
Table 2.1 shows the production of opium and coca by country from1990 until 2001. Figures 2.4 and 2.5 group this information accordingto whether countries are in conflict, are postconflict, or are at peace. Asthe figures show, virtually all production throughout the period hasbeen in conflict or postconflict countries. When civil war ended in Peruand intensified in Colombia production trends changed.
While production rises sharply during conflict, it is not completelyeliminated in postconflict situations. This accords with the discussion in
Table 2.1 Production of opium and coca, selected countries andyears, 1990–2001(metric tons)
Country 1990 1995 2000 2001
OpiumAfghanistan 1,570 2,335 3,276 185a
Colombia 71 88 88Lao PDR 202 128 167 134Mexico 62 53 21 71Myanmar 1,621 1,664 1,087 1,097Other Asian countries 45 78 38 40Pakistan 150 112 8 5Thailand 20 2 6 6Vietnam 90 9 — —
Total 3,760 4,452 4,691 1,626CocaBolivia 77,000 85,000 13,400 20,200Colombia 45,313 80,931 266,161 236,035Peru 196,900 183,600 46,258 49,260
Total 319,213 349,531 325,809 305,495
— Not available.a. Opium production in Afghanistan was reported to have dropped by 95 percent from
2000 to 2001, but the UNODCCP (2003) reports that in 2002 opium production sur-passed its 2000 level (3,422 metric tons).
Source: UNODCCP (2002).
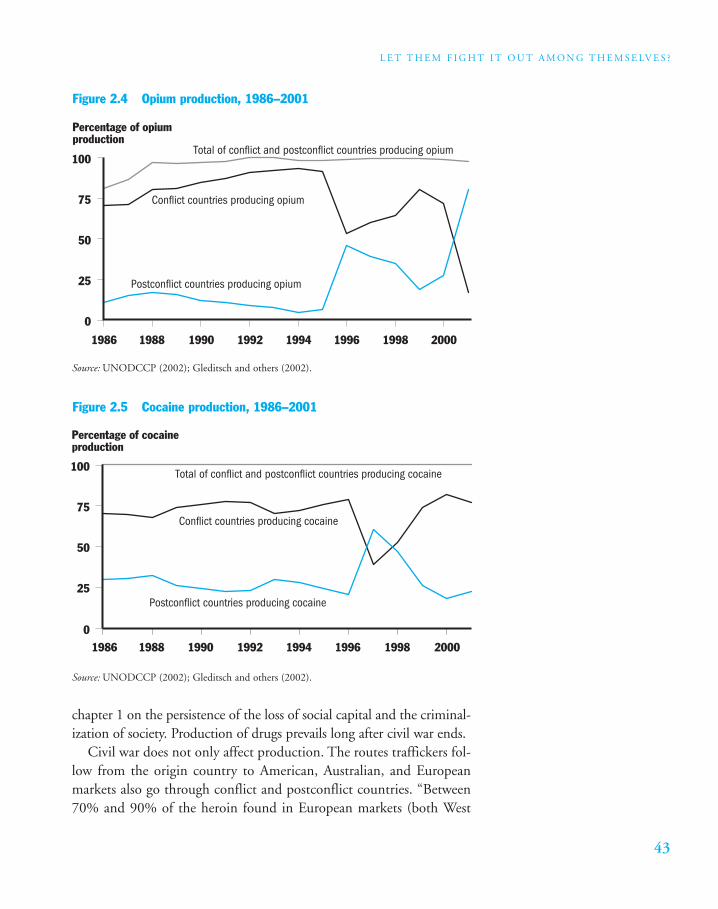
43
L E T T H E M F I G H T I T O U T A M O N G T H E M S E LV E S ?
chapter 1 on the persistence of the loss of social capital and the criminal-ization of society. Production of drugs prevails long after civil war ends.
Civil war does not only affect production. The routes traffickers fol-low from the origin country to American, Australian, and Europeanmarkets also go through conflict and postconflict countries. “Between70% and 90% of the heroin found in European markets (both West
Figure 2.5 Cocaine production, 1986–2001
Percentage of cocaineproduction
1986 1988 1990 1992 1994 1996 1998 2000
Postconflict countries producing cocaine
Total of conflict and postconflict countries producing cocaine
Conflict countries producing cocaine
0
25
50
75
100
Figure 2.4 Opium production, 1986–2001
Percentage of opiumproduction
1986 1988 1990 1992 1994 1996 1998 2000
0
25
50
75
100
Postconflict countries producing opium
Total of conflict and postconflict countries producing opium
Conflict countries producing opium
Source: UNODCCP (2002); Gleditsch and others (2002).
Source: UNODCCP (2002); Gleditsch and others (2002).
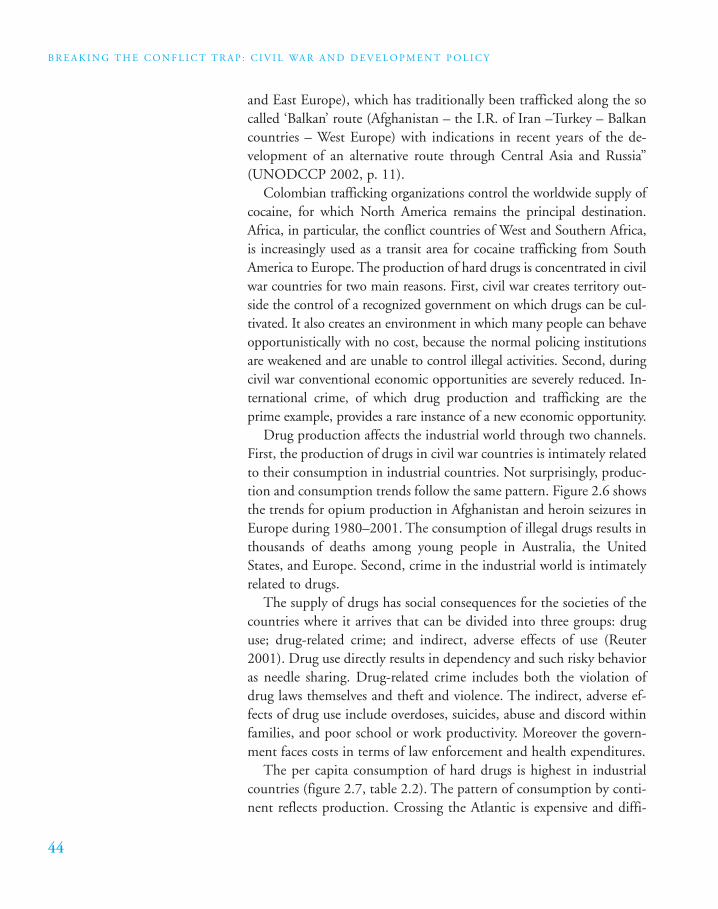
B R E A K I N G T H E C O N F L I C T T R A P : C I V I L WA R A N D D E V E L O P M E N T P O L I C Y
44
and East Europe), which has traditionally been trafficked along the socalled ‘Balkan’ route (Afghanistan – the I.R. of Iran –Turkey – Balkancountries – West Europe) with indications in recent years of the de-velopment of an alternative route through Central Asia and Russia”(UNODCCP 2002, p. 11).
Colombian trafficking organizations control the worldwide supply ofcocaine, for which North America remains the principal destination.Africa, in particular, the conflict countries of West and Southern Africa,is increasingly used as a transit area for cocaine trafficking from SouthAmerica to Europe. The production of hard drugs is concentrated in civilwar countries for two main reasons. First, civil war creates territory out-side the control of a recognized government on which drugs can be cul-tivated. It also creates an environment in which many people can behaveopportunistically with no cost, because the normal policing institutionsare weakened and are unable to control illegal activities. Second, duringcivil war conventional economic opportunities are severely reduced. In-ternational crime, of which drug production and trafficking are theprime example, provides a rare instance of a new economic opportunity.
Drug production affects the industrial world through two channels.First, the production of drugs in civil war countries is intimately relatedto their consumption in industrial countries. Not surprisingly, produc-tion and consumption trends follow the same pattern. Figure 2.6 showsthe trends for opium production in Afghanistan and heroin seizures inEurope during 1980–2001. The consumption of illegal drugs results inthousands of deaths among young people in Australia, the UnitedStates, and Europe. Second, crime in the industrial world is intimatelyrelated to drugs.
The supply of drugs has social consequences for the societies of thecountries where it arrives that can be divided into three groups: druguse; drug-related crime; and indirect, adverse effects of use (Reuter2001). Drug use directly results in dependency and such risky behavioras needle sharing. Drug-related crime includes both the violation ofdrug laws themselves and theft and violence. The indirect, adverse ef-fects of drug use include overdoses, suicides, abuse and discord withinfamilies, and poor school or work productivity. Moreover the govern-ment faces costs in terms of law enforcement and health expenditures.
The per capita consumption of hard drugs is highest in industrialcountries (figure 2.7, table 2.2). The pattern of consumption by conti-nent reflects production. Crossing the Atlantic is expensive and diffi-
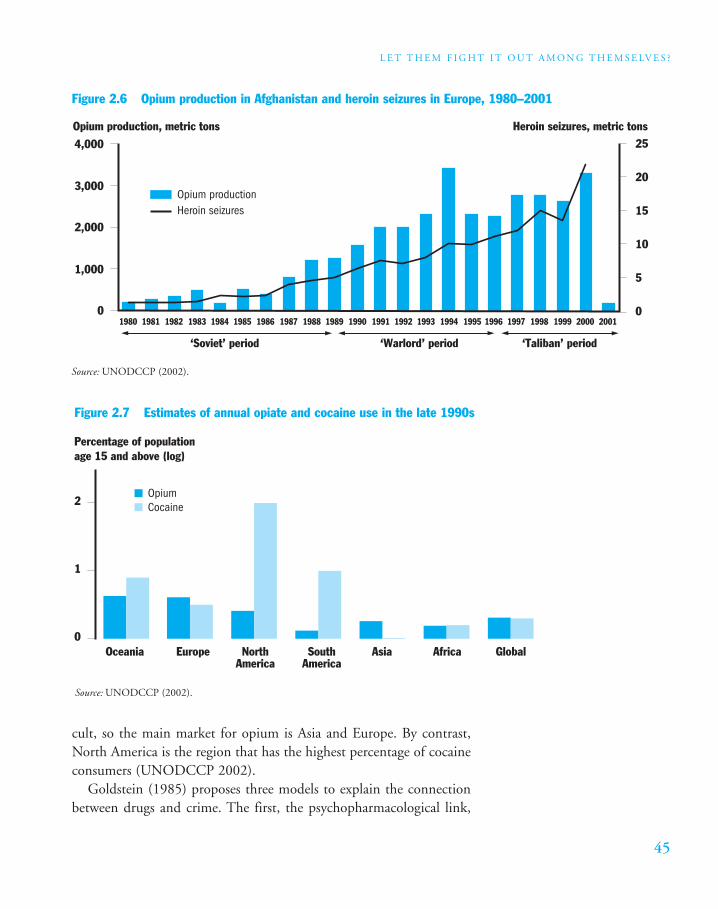
45
L E T T H E M F I G H T I T O U T A M O N G T H E M S E LV E S ?
cult, so the main market for opium is Asia and Europe. By contrast,North America is the region that has the highest percentage of cocaineconsumers (UNODCCP 2002).
Goldstein (1985) proposes three models to explain the connectionbetween drugs and crime. The first, the psychopharmacological link,
Figure 2.6 Opium production in Afghanistan and heroin seizures in Europe, 1980–2001
Opium production, metric tons Heroin seizures, metric tons
Opium productionHeroin seizures
0
‘Soviet’ period ‘Warlord’ period ‘Taliban’ period
19811980 19831982 19851984 19871986 19891988 19911990 19931992 19951994 19971996 19991998 20012000
1,000
2,000
3,000
4,000
0
5
10
15
20
25
Source: UNODCCP (2002).
Figure 2.7 Estimates of annual opiate and cocaine use in the late 1990s
Source: UNODCCP (2002).
Percentage of populationage 15 and above (log)
0Oceania Europe North
AmericaSouth
AmericaAsia Africa Global
1
2OpiumCocaine
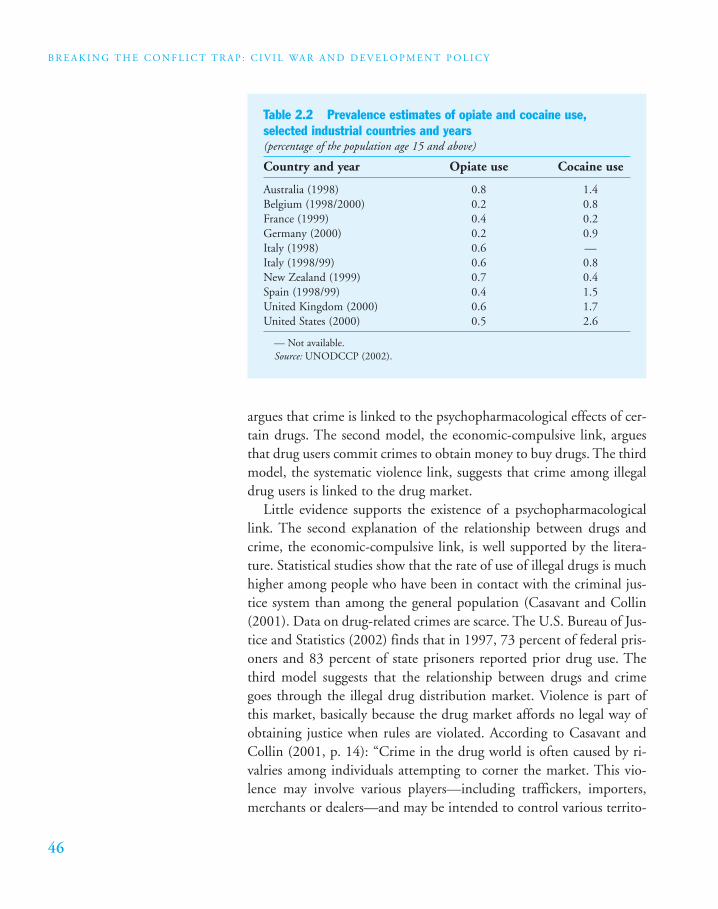
B R E A K I N G T H E C O N F L I C T T R A P : C I V I L WA R A N D D E V E L O P M E N T P O L I C Y
46
argues that crime is linked to the psychopharmacological effects of cer-tain drugs. The second model, the economic-compulsive link, arguesthat drug users commit crimes to obtain money to buy drugs. The thirdmodel, the systematic violence link, suggests that crime among illegaldrug users is linked to the drug market.
Little evidence supports the existence of a psychopharmacologicallink. The second explanation of the relationship between drugs andcrime, the economic-compulsive link, is well supported by the litera-ture. Statistical studies show that the rate of use of illegal drugs is muchhigher among people who have been in contact with the criminal jus-tice system than among the general population (Casavant and Collin(2001). Data on drug-related crimes are scarce. The U.S. Bureau of Jus-tice and Statistics (2002) finds that in 1997, 73 percent of federal pris-oners and 83 percent of state prisoners reported prior drug use. Thethird model suggests that the relationship between drugs and crimegoes through the illegal drug distribution market. Violence is part ofthis market, basically because the drug market affords no legal way ofobtaining justice when rules are violated. According to Casavant andCollin (2001, p. 14): “Crime in the drug world is often caused by ri-valries among individuals attempting to corner the market. This vio-lence may involve various players—including traffickers, importers,merchants or dealers—and may be intended to control various territo-
Table 2.2 Prevalence estimates of opiate and cocaine use,selected industrial countries and years (percentage of the population age 15 and above)
Country and year Opiate use Cocaine use
Australia (1998) 0.8 1.4Belgium (1998/2000) 0.2 0.8France (1999) 0.4 0.2Germany (2000) 0.2 0.9Italy (1998) 0.6 —Italy (1998/99) 0.6 0.8New Zealand (1999) 0.7 0.4Spain (1998/99) 0.4 1.5United Kingdom (2000) 0.6 1.7United States (2000) 0.5 2.6
— Not available.Source: UNODCCP (2002).
47
L E T T H E M F I G H T I T O U T A M O N G T H E M S E LV E S ?
ries, such as a neighbourhood, streets or school. Violence is then usedas an organizational management strategy.”
This evidence gives an idea of the impact of drugs on crime. Thehigh proportion of convicts who are drug users indicates the potentialfor crime reduction in the industrial world if illegal drugs were less eas-ily available.
Civil War as an Explanation of the Origins of the AIDS Pandemic
Epidemiological research on the spread of HIV/AIDS points out thatthe initial spread of HIV is closely associated with the war in Ugandain 1979. Smallman-Raynor and Cliff (1991, p. 78), geographers atCambridge University, conclude that “the apparent geographical pat-tern of clinical AIDS in Uganda partially reflects the diffusion of HIVassociated with civil war during the first six years of the post-Amin pe-riod.” Using regression analysis they find a significant and positive cor-relation between the spread of HIV infections in the 1980s and 1990sand the ethnic patterns of recruitment into the Ugandan National Lib-eration Army. Their research supports the following hypothesis. Manyrapes occurred along the borders of Tanzania and Uganda in 1979.HIV was in this region, but before 1979 contagion was sporadic andthere was still no epidemic. However, because of the continuous rape,promiscuity, and dislocation during and after the war, HIV started tobecome an epidemic infection. The spread of AIDS from the south tothe north of Uganda exhibited the same route as the one Idi Amin’s sol-diers followed after the war in 1979.
Civil War and International Terrorism
The link between civil war and Al Qaeda is well established. The mainactivists in the organization were not Afghani, yet they chose to locatein Afghanistan because it provided territory outside the control of a rec-ognized government and under the control of the Taliban, a recentlysuccessful rebel organization. Small-scale international terrorism canhide and survive in most societies. What was distinctive about AlQaeda when compared with other terrorist organizations was its scale.The large scale of Al Qaeda operations, such as training camps for
B R E A K I N G T H E C O N F L I C T T R A P : C I V I L WA R A N D D E V E L O P M E N T P O L I C Y
48
thousands of recruits, would have been infeasible except in territoryoutside the control of a recognized government. Hence the safe havensproduced by civil war are not just convenient for large-scale global ter-rorism, they are likely to be essential. Widespread civil war offers suchorganizations a choice of location and relocation. For example, therehas been speculation that Al Qaeda might relocate in Somalia, anothercivil war territory with no recognized government.
Evidence indicates that Al Qaeda acquired substantial revenues fromtrafficking in West African conflict diamonds (Farah 2002). Recent ev-idence also suggests that in response to greater scrutiny in the interna-tional banking system it has shifted its assets into conflict diamonds.
As with AIDS, claiming that without civil war large-scale interna-tional terrorism would have been impossible is unnecessary. There issufficient evidence for a reasonable inference that civil war facilitatessuch terrorism. If we attribute to civil war only 10 percent of the con-tributing factors to the September 11 attack, the cost remains enor-mous. The World Bank has estimated that as a result of September 11global GDP is currently around 0.8 percent lower than it would havebeen (World Bank 2002a) and that about 10 more million peopleworldwide live in poverty than would otherwise have been the case.
Conclusion
SOMETIMES THE INTERNATIONAL COMMUNITY EXHIBITS AN
understandable impatience with civil war, taking an it’s-not-our-problem attitude and remarking that the participants should be
left to fight it out among themselves. This chapter has tried to showwhy such an attitude is mistaken. Many of the costs of civil war, indeed,probably most of them, accrue outside the affected country. The activeparticipants in conflict can be presumed to ignore these costs, as theyneither bear them nor are even aware of them.
The costs of civil war can be though of as forming three ripples be-yond the direct effects on combatants. The inner ripple, discussed inchapter 1, is the effect on the civilian population: the loss of incomeand the severe deterioration in health. Many of these losses accrue afterthe conflict is over, so that even if the active participants care about theeffects on civilians, they are likely to be unaware of them. The secondripple, discussed in the first part of this chapter, is across the neighbor-
49
L E T T H E M F I G H T I T O U T A M O N G T H E M S E LV E S ?
hood. The economic costs of conflict suffered elsewhere in the regionmay be approximately as large as those suffered within the country, andsevere health spillovers also occur, predominantly through refugees.The outer ripple is the global costs. In the past 30 years three devastat-ing social shocks have been facilitated by civil war. We have not at-tempted to quantify the costs of these shocks, but they are clearly huge.
Our point is not to emphasize or inflate the importance of civil waramong the world’s problems. Rather, we wish to make the simplerpoint that decisions about these conflicts should not just be left to theparticipants. The participants bear such a small share of the costs oftheir actions that they will systematically indulge in civil war far beyondits likely social value.
Notes
1. Results are available on request.
2. Results are available on request.

P A R T I I
WHAT FUELS CIVIL WAR?
PART I SHOWED THAT CIVIL WAR IS A MAJOR
impediment to development and has spilloversthat make it a problem of global concern. Wenow turn to what fuels civil war. An under-standing of the factors that make civil war moreor less likely is a helpful input into the formula-tion of policy responses, which is the subject ofpart III.
Chapter 3 analyzes what makes a countrymore or less prone to civil war and considersboth the risk that a war will ignite and the fac-tors that tend to sustain it once it has started.Although civil war is intensely political, some of
the most important factors affecting pronenessto conflict turn out to be closely associated witheconomic development: risks are much higherfor the poorest countries. Furthermore, far fromwar resolving political struggle, countries are atrisk of falling into a conflict trap whereby onecivil war tends to lead to another. Chapter 4scales this analysis up to the global level, tryingto understand what has determined the globalincidence of conflict and how it might change.The main statistical techniques that we use anda selective bibliography of the broader literatureare set out in appendixes 1 and 2, respectively.

53
C H A P T E R T H R E E
What Makes a Country Prone to Civil War?
CIVIL WAR IS FUELED PARTLY BY THE CIRCUM-
stances that account for the initial resort to large-scale organized violence, and partly by forces gen-erated once violence has started and that tend toperpetuate it. We refer to the initial circumstances as the root causes and to the perpetuating forces as the
conflict trap.Most people think that they already know the root causes of civil
war. Those on the political right tend to assume that it is due to long-standing ethnic and religious hatreds, those in the political center tendto assume that it is due to a lack of democracy and that violence occurswhere opportunities for the peaceful resolution of political disputes arelacking, and those on the political left tend to assume that it is due toeconomic inequalities or to a deep-rooted legacy of colonialism. Noneof these explanations sits comfortably with the statistical evidence. Em-pirically, the most striking pattern is that civil war is heavily concen-trated in the poorest countries. War causes poverty, but the more im-portant reason for the concentration is that poverty increases thelikelihood of civil war. Thus our central argument can be stated briefly:the key root cause of conflict is the failure of economic development.Countries with low, stagnant, and unequally distributed per capita in-comes that have remained dependent on primary commodities fortheir exports face dangerously high risks of prolonged conflict. In theabsence of economic development neither good political institutions,nor ethnic and religious homogeneity, nor high military spending pro-vide significant defenses against large-scale violence. Once a country
B R E A K I N G T H E C O N F L I C T T R A P : C I V I L WA R A N D D E V E L O P M E N T P O L I C Y
54
has stumbled into conflict powerful forces—the conflict trap—tend tolock it into a syndrome of further conflict.
Each war is distinctive, with its own particular personalities, events,and antecedents. Any all-embracing, general theory of civil war wouldtherefore be patently ridiculous, and sensibly enough most analyses are country-specific, historical accounts. However, when we pan backfrom the particular patterns emerge, some of them surprisingly strong,which suggests that some characteristics tend to make a country moreor less prone to civil war. This chapter summarizes the evidence onthese statistical patterns based on global experience since the 1960s.We abstract from triggering events: the day by day political and mili-tary changes that usher in war. Our focus is on a country’s longer-termsocial, economic, and institutional features. Recall that we are using a precise definition of civil war that excludes several other forms ofviolence: civil war occurs when an identifiable rebel organization chal-lenges the government militarily and the resulting violence results inmore than 1,000 combat-related deaths, with at least 5 percent oneach side.
Statistical patterns are useful in that they can suggest policies thatmight typically work in particular situations. They can also defend usfrom the temptation to overgeneralize from particular conflicts andfrom the tendency to pick out from the multiplicity of possible causesthat which conforms with the beliefs of the researcher. We will see thatthe large differences in proneness to conflict reflect the conjunction ofseveral risk factors. In this sense, a conflict will usually have multiplecauses.
Patterns, however, are only a supplement to analysis, not a substitutefor it. Patterns come about because of behavior. Civil war occurs if agroup of people forms a private military organization that attacks gov-ernment forces and ordinary civilians on a large scale and with a degreeof persistence. The typical such organization has between 500 and5,000 members, although a few, such as the Sudanese People’s Libera-tion Army, range up to 150,000 (table 3.1). Globally, such organiza-tions are rare, but they are relatively common in extremely poor coun-tries. To understand the root causes of civil war we need to understandthe formation of these private military organizations. Why are suchgroups formed, that is, what are their motives? How are they formed,that is, what are their opportunities?
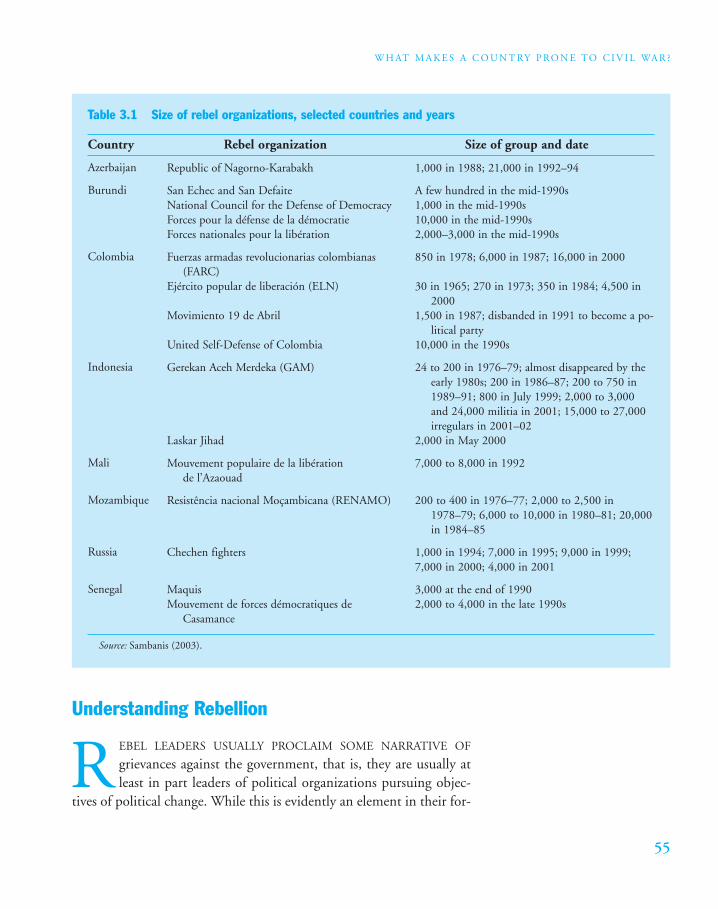
55
W H AT M A K E S A C O U N T RY P RO N E T O C I V I L WA R ?
Understanding Rebellion
R EBEL LEADERS USUALLY PROCLAIM SOME NARRATIVE OF
grievances against the government, that is, they are usually atleast in part leaders of political organizations pursuing objec-
tives of political change. While this is evidently an element in their for-
Table 3.1 Size of rebel organizations, selected countries and years
Country Rebel organization Size of group and date
Azerbaijan
Burundi
Colombia
Indonesia
Mali
Mozambique
Russia
Senegal
Source: Sambanis (2003).
1,000 in 1988; 21,000 in 1992–94
A few hundred in the mid-1990s1,000 in the mid-1990s 10,000 in the mid-1990s2,000–3,000 in the mid-1990s
850 in 1978; 6,000 in 1987; 16,000 in 2000
30 in 1965; 270 in 1973; 350 in 1984; 4,500 in2000
1,500 in 1987; disbanded in 1991 to become a po-litical party
10,000 in the 1990s
24 to 200 in 1976–79; almost disappeared by theearly 1980s; 200 in 1986–87; 200 to 750 in1989–91; 800 in July 1999; 2,000 to 3,000and 24,000 militia in 2001; 15,000 to 27,000irregulars in 2001–02
2,000 in May 2000
7,000 to 8,000 in 1992
200 to 400 in 1976–77; 2,000 to 2,500 in1978–79; 6,000 to 10,000 in 1980–81; 20,000in 1984–85
1,000 in 1994; 7,000 in 1995; 9,000 in 1999;7,000 in 2000; 4,000 in 2001
3,000 at the end of 19902,000 to 4,000 in the late 1990s
Republic of Nagorno-Karabakh
San Echec and San DefaiteNational Council for the Defense of Democracy Forces pour la défense de la démocratie Forces nationales pour la libération
Fuerzas armadas revolucionarias colombianas(FARC)
Ejército popular de liberación (ELN)
Movimiento 19 de Abril
United Self-Defense of Colombia
Gerekan Aceh Merdeka (GAM)
Laskar Jihad
Mouvement populaire de la libérationde l’Azaouad
Resistência nacional Moçambicana (RENAMO)
Chechen fighters
Maquis Mouvement de forces démocratiques de
Casamance
B R E A K I N G T H E C O N F L I C T T R A P : C I V I L WA R A N D D E V E L O P M E N T P O L I C Y
56
mation, political opposition to governments is not usually conductedthrough military organizations. The normal vehicles for political oppo-sition are political parties and protest movements. These are quite dif-ferently structured from a private military organization.
Most political opposition is somewhat democratic and participatory,whether structured political parties, such as the African National Con-gress during the apartheid era in South Africa and the Movement forDemocratic Change in present-day Zimbabwe, or unstructured, non-hierarchical protest movements, such as the revolutions that overthrewthe communist dictatorships in Eastern Europe. By contrast, a privatemilitary organization is typically small and highly hierarchical, withpower concentrated at the top of the organization, often in a singlecharismatic leader, with a high degree of discipline and severe punish-ment for dissent.
Furthermore, most political opposition does not require substantialfinance for the organization to be effective. Most participation is vol-untary and part-time, and activities do not require a lot of expensive in-puts. By contrast, a private military organization is a costly operation.It must meet a payroll, because most members are full-time and there-fore dependent on the organization for their material needs, and itmust be able to purchase a good deal of imported military equipment.
Thus as well as being a political organization, a private military or-ganization is an army and a business. Those analyzing rebel groupsmust always keep this triple feature—political organization, militaryorganization, and business organization—in mind. Rebellions occurpredominantly in countries where circumstances are conducive to allthree features. So what are the features conducive to each aspect of asuccessful rebel organization?
Rebel Groups as Political Organizations
Like all political organizations, a rebellion thrives on group grievances;however, political organizations opposing the government are found invirtually all societies. Even in societies where group grievances are rela-tively modest, as in the high-income societies where income is equallydistributed, vigorous mass opposition parties exist. Political grievancesand the political conflict they generate are universal. If the main impe-tus for rebel groups is the representation of political grievances, then
57
W H AT M A K E S A C O U N T RY P RO N E T O C I V I L WA R ?
the obvious question is why does political organization take the un-usual form of small, hierarchical, violent rebellion rather than the moreconventional forms of mass parties or mass protest?
Why Are so Many Rebellions Ethnic? Many rebellions have an ethnicor religious dimension. This accords with an explanation of conflictcommon on the political right that ethnic and religious hatreds are theroot cause of many wars. However, the statistical patterns are quite sur-prising. Here we use Collier and Hoeffler’s (2002c) analysis (see box 3.1).
Substantial ethnic and religious diversity significantly reduces therisk of civil war. Controlling for other characteristics, a society is saferif is composed of many such groups than if everyone has the same eth-nicity and religion. Obviously such diverse societies are likely to be lessharmonious than homogenous societies, in that people identify morewith their own ethnic or religious group and less with the society as awhole, and they frequently dislike other groups, but evidently a majorgulf exists between such disharmony and the resort to rebellion. Anunresolved dispute in political science concerns whether such societiesare better suited to proportional representation electoral systems, witheach group represented by its own party, or by winner take all systems,which encourage the formation of two large, multi-ethnic parties.Overall, however, the basic circumstances of diversity may be much lessdangerous than has popularly been thought (figure 3.1). Although eth-nically diverse societies are commonly seen as fragmented, ethnicityprovides an effective basis for social networks. Such societies mighttherefore be less atomistic than homogenous societies. Some evidenceindicates that ethnically diverse societies find nationwide collective ac-tion more difficult, but have an offsetting advantage in private sectoractivity that can benefit from ethnic networks (Collier 2001).
More limited ethnic differentiation can, however, be a problem. Ifthe largest ethnic group in a multi-ethnic society forms an absolute ma-jority, the risk of rebellion is increased by approximately 50 percent(figure 3.2). Around half of developing societies have this characteristicof ethnic dominance. Presumably, in such societies minorities may rea-sonably fear that even a democratic political process will lead to theirpermanent exclusion from influence regardless of the electoral system.Ethiopia and Sri Lanka are examples of ethnically dominant societieswith civil wars.
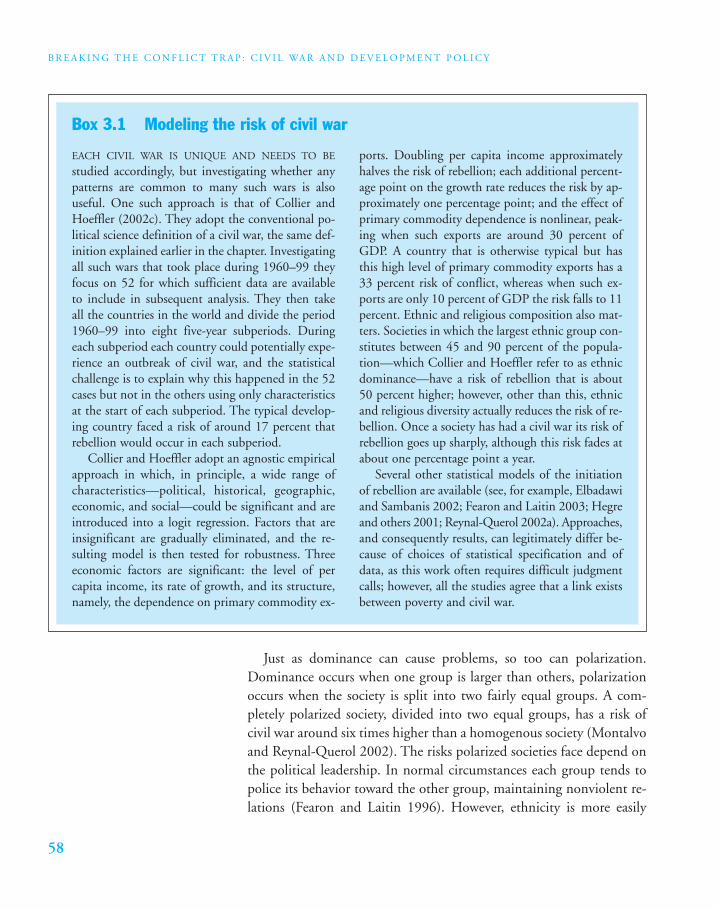
B R E A K I N G T H E C O N F L I C T T R A P : C I V I L WA R A N D D E V E L O P M E N T P O L I C Y
58
Just as dominance can cause problems, so too can polarization.Dominance occurs when one group is larger than others, polarizationoccurs when the society is split into two fairly equal groups. A com-pletely polarized society, divided into two equal groups, has a risk ofcivil war around six times higher than a homogenous society (Montalvoand Reynal-Querol 2002). The risks polarized societies face depend onthe political leadership. In normal circumstances each group tends topolice its behavior toward the other group, maintaining nonviolent re-lations (Fearon and Laitin 1996). However, ethnicity is more easily
EACH CIVIL WAR IS UNIQUE AND NEEDS TO BE
studied accordingly, but investigating whether anypatterns are common to many such wars is alsouseful. One such approach is that of Collier andHoeffler (2002c). They adopt the conventional po-litical science definition of a civil war, the same def-inition explained earlier in the chapter. Investigatingall such wars that took place during 1960–99 theyfocus on 52 for which sufficient data are available to include in subsequent analysis. They then take all the countries in the world and divide the period1960–99 into eight five-year subperiods. Duringeach subperiod each country could potentially expe-rience an outbreak of civil war, and the statisticalchallenge is to explain why this happened in the 52cases but not in the others using only characteristicsat the start of each subperiod. The typical develop-ing country faced a risk of around 17 percent thatrebellion would occur in each subperiod.
Collier and Hoeffler adopt an agnostic empiricalapproach in which, in principle, a wide range ofcharacteristics—political, historical, geographic,economic, and social—could be significant and areintroduced into a logit regression. Factors that areinsignificant are gradually eliminated, and the re-sulting model is then tested for robustness. Threeeconomic factors are significant: the level of percapita income, its rate of growth, and its structure,namely, the dependence on primary commodity ex-
ports. Doubling per capita income approximatelyhalves the risk of rebellion; each additional percent-age point on the growth rate reduces the risk by ap-proximately one percentage point; and the effect ofprimary commodity dependence is nonlinear, peak-ing when such exports are around 30 percent ofGDP. A country that is otherwise typical but hasthis high level of primary commodity exports has a33 percent risk of conflict, whereas when such ex-ports are only 10 percent of GDP the risk falls to 11percent. Ethnic and religious composition also mat-ters. Societies in which the largest ethnic group con-stitutes between 45 and 90 percent of the popula-tion—which Collier and Hoeffler refer to as ethnicdominance—have a risk of rebellion that is about50 percent higher; however, other than this, ethnicand religious diversity actually reduces the risk of re-bellion. Once a society has had a civil war its risk ofrebellion goes up sharply, although this risk fades atabout one percentage point a year.
Several other statistical models of the initiationof rebellion are available (see, for example, Elbadawiand Sambanis 2002; Fearon and Laitin 2003; Hegreand others 2001; Reynal-Querol 2002a). Approaches,and consequently results, can legitimately differ be-cause of choices of statistical specification and ofdata, as this work often requires difficult judgmentcalls; however, all the studies agree that a link existsbetween poverty and civil war.
Box 3.1 Modeling the risk of civil war
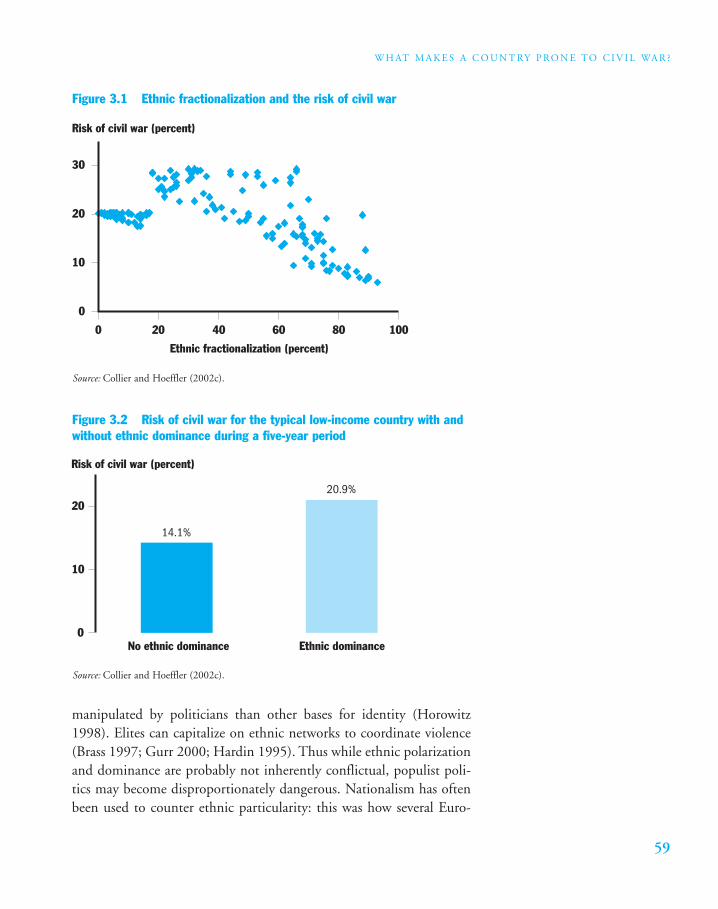
59
W H AT M A K E S A C O U N T RY P RO N E T O C I V I L WA R ?
manipulated by politicians than other bases for identity (Horowitz1998). Elites can capitalize on ethnic networks to coordinate violence(Brass 1997; Gurr 2000; Hardin 1995). Thus while ethnic polarizationand dominance are probably not inherently conflictual, populist poli-tics may become disproportionately dangerous. Nationalism has oftenbeen used to counter ethnic particularity: this was how several Euro-
Figure 3.1 Ethnic fractionalization and the risk of civil war
Risk of civil war (percent)
0
0 20 40 60
Ethnic fractionalization (percent)
80 100
10
20
30
Figure 3.2 Risk of civil war for the typical low-income country with andwithout ethnic dominance during a five-year period
14.1%
20.9%
0No ethnic dominance Ethnic dominance
10
20
Risk of civil war (percent)
Source: Collier and Hoeffler (2002c).
Source: Collier and Hoeffler (2002c).
B R E A K I N G T H E C O N F L I C T T R A P : C I V I L WA R A N D D E V E L O P M E N T P O L I C Y
60
pean states were build in the 19th century (Hechter 2001). However,even nationalism can be manipulated for internal division. Irredentistnationalism attempts to extend the boundaries of a state by incorpo-rating adjacent territory occupied by those of the same ethnicity.
An important circumstance in which ethnic differentiation can ap-pear to be the cause of rebellion is if a country discovers a valuable nat-ural resource such as oil. Natural resources are seldom found uniformlydistributed over the entire country, but are usually concentrated in aparticular part of it. The issue then arises as to who owns the resources,the whole nation or the lucky locality. The inhabitants of the lucky lo-cality have an obvious interest in seceding from the rest of the nationand keeping the wealth for themselves. In all societies locality is one as-pect of people’s identity, and in ethnically differentiated societies eth-nicity can be used to reinforce this sense of local identity. In most soci-eties, wherever valuable resources are discovered some particular ethnicgroup is likely to be living on top of them that then has an incentive toassert its rights to secede. All ethnically differentiated societies have a fewethnic romantics who dream of creating an ethnically “pure” politicalentity, but resource discoveries have the potential to shift such move-ments from the margin of romanticism to the core agenda of economicself-interest. Take, for example, the politics of oil in the United King-dom. Oil was discovered off the shores of Scotland during the 1960s,but it first became really valuable in 1973 when its price quadrupled.The following year the tiny Scottish Nationalist Party, which had onlyone seat in parliament, launched the “it’s Scotland’s oil” campaign, andgained 30 percent of the Scottish vote (Collier and Hoeffler 2003).
Statistically, secessionist rebellions are considerably more likely if thecountry has valuable natural resources, with oil being particularly po-tent (figure 3.3). Examples of this sort of secessionist movement areCabinda in Angola, Katanga in the then Congo, Aceh and West Papuain Indonesia, and Biafra in Nigeria (see box 3.2). Some evidence sug-gests that rebel leaders massively exaggerate the likely gains from cap-turing ownership of the resources. Partly this exaggeration is strategic:the leaders of secessionist movements are often ethnic romantics whosimply use the resource issue opportunistically to reinforce their sup-port. Party leaders may themselves succumb to the glamour of naturalresources and overestimate the likely gains. For example, leaders of theGerekan Aceh Merdeka (the Aceh Freedom Movement or GAM) re-bellion in Aceh told the local population that secession would raise
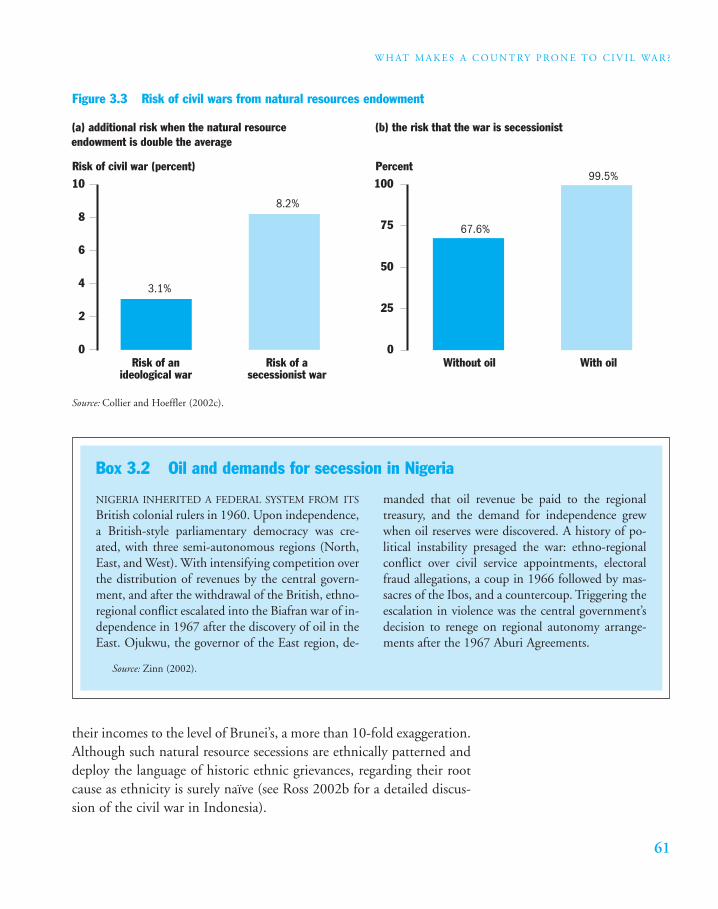
61
W H AT M A K E S A C O U N T RY P RO N E T O C I V I L WA R ?
their incomes to the level of Brunei’s, a more than 10-fold exaggeration.Although such natural resource secessions are ethnically patterned anddeploy the language of historic ethnic grievances, regarding their rootcause as ethnicity is surely naïve (see Ross 2002b for a detailed discus-sion of the civil war in Indonesia).
Figure 3.3 Risk of civil wars from natural resources endowment
Risk of civil war (percent)
(a) additional risk when the natural resourceendowment is double the average
Percent
(b) the risk that the war is secessionist
8.2%
3.1%
0Risk of an
ideological warRisk of a
secessionist warWithout oil With oil
2
4
6
8
1099.5%
67.6%
0
25
50
75
100
Source: Collier and Hoeffler (2002c).
NIGERIA INHERITED A FEDERAL SYSTEM FROM ITS
British colonial rulers in 1960. Upon independence,a British-style parliamentary democracy was cre-ated, with three semi-autonomous regions (North,East, and West). With intensifying competition overthe distribution of revenues by the central govern-ment, and after the withdrawal of the British, ethno-regional conflict escalated into the Biafran war of in-dependence in 1967 after the discovery of oil in theEast. Ojukwu, the governor of the East region, de-
manded that oil revenue be paid to the regionaltreasury, and the demand for independence grewwhen oil reserves were discovered. A history of po-litical instability presaged the war: ethno-regionalconflict over civil service appointments, electoralfraud allegations, a coup in 1966 followed by mas-sacres of the Ibos, and a countercoup. Triggering theescalation in violence was the central government’sdecision to renege on regional autonomy arrange-ments after the 1967 Aburi Agreements.
Box 3.2 Oil and demands for secession in Nigeria
Source: Zinn (2002).
B R E A K I N G T H E C O N F L I C T T R A P : C I V I L WA R A N D D E V E L O P M E N T P O L I C Y
62
In many developing countries the government is unwilling to meetsuch demands for secession, even if a majority of the locality supportsit. Indeed, strong ethical arguments can be made against secession. Forexample, the influential theory of justice proposed by Rawls (1971)asks us to imagine making our choices behind a veil of ignorance:would the secession still be as well supported if the local population didnot know in what region of the country the resources were located? Thegovernment has a legitimate interest in retaining these resources for useby the poorer majority rather than permitting them to be expropriatedto create a small, rich group. The local demand may well be rational,but were such demands met, the world would become more unequal.A more legitimate demand would be that the resources should indeedbe used for the poor majority rather than for a small elite. In manycountries natural resources have been associated with elite corruption.For example, the International Monetary Fund (IMF) has recently re-ported that more than US$1 billion per year of Angolan oil revenueshave been misappropriated, with large sums being paid directly intooffshore bank accounts. Where a region sees a corrupt national elitestealing “its” resources, secessionist pressures are surely more likely.
Another reason why rebel leaders promote ethnic grievances soprominently is that they are a plausible and legitimate smokescreen forless reputable agendas. The discourse of grievances articulated by rebelgroups cannot necessarily be trusted. As with all political movements,the rebel organization needs to emphasize grievances, and if necessary itwill attempt to exaggerate them or to disguise its true interests in termsof more populist ones. For example, a violent attempted coup d’état inFiji appeared at first sight to be motivated by the interests of the in-digenous ethnic group. It turned out, however, that the leader of thecoup attempt was a businessman who had been seeking a timber con-cession for the private American company he was representing. Whenthe government awarded the contract to a public agency instead, helaunched the coup. The coup’s rallying cry of “power to indigenous peo-ple” was undoubtedly more appealing, but perhaps less accurate, thanhad it been “give the timber contract to the Americans.” Similarly, thelitany of grievances proclaimed by the Revolutionary United Front(RUF) in Sierra Leone eventually led to the offer of a settlement by thegovernment in which the rebel leader, Foday Sankoh, would becomevice president of the country. Sankoh refused this offer and instead de-manded political control of the diamond trade. When he was offered
63
W H AT M A K E S A C O U N T RY P RO N E T O C I V I L WA R ?
this he accepted the peace settlement. As with most conflicts, that inSierra Leone had multiple causes, including a history of clientalist pol-itics. Natural resources are seldom the entire story behind a conflict, butthey have the potential to compound other problems and make themunmanageable.
Rebel leaders often use some of the military force at their commandto weaken the normal political movements whose objective is to ad-vance the cause that the rebel group ostensibly supports. A commonstrategy is for a rebel organization to assassinate the moderate politicalleaders of the interests it purports to represent. If some of these politi-cal organizations are provoked into a military capability as a survivalstrategy, then one dimension of violent political conflict might beamong rebel organizations with apparently similar political objectives.Civil war between rebel groups ostensibly representing the same causeor group is indeed common, for example, in Sudan (see Elbadawi, Ali,and Al Battahani 2002). Thus while the leadership may rely on a dis-course of ethnic grievance and ethnic solidarity, its main energies maybe devoted to a power struggle within the ethnic group.
Is the Motive Usually Greed? While political scientists and anthro-pologists have tended to focus on political and ethnic agendas, respec-tively, as the motive for civil wars, economic theorists writing on con-flict have treated the motivation quite differently. Grossman’s (1991,1999) model does not distinguish between rebels or revolutionaries andbandits or pirates. Hirshleifer (2001), probably the leading economictheorist of conflict, analyzes rebellion as the use of resources to exploitothers for an economic gain. The natural resource secessions discussedearlier broadly fit this economic model: political and ethnic agendaspiggyback onto what is basically an attempt to expropriate resources. Isthis the norm for rebellion?
Sometimes lucrative resources cannot be captured by secession, butrequire the capture of the state. The most obvious case of this is wherethe resource is foreign aid: the aid accrues to the recognized governmentand a rebel group can only acquire it if it overthrows and replaces thatgovernment. Grossman (1992) applies his model to aid and predictsthat it will increase the risk of rebellion. For many low-income coun-tries aid is certainly a substantial part of the government budget, and soindirectly finances many public sector jobs and contracts that are keenly
B R E A K I N G T H E C O N F L I C T T R A P : C I V I L WA R A N D D E V E L O P M E N T P O L I C Y
64
contested politically. Hence a large aid inflow makes a state more at-tractive to capture. An empirical test of whether aid increases the risk ofrebellion is thus, to an extent, a test of whether greed is an importantunderlying motivation for conflict. Contrary to the assumption econo-mists commonly make, aid does not appear to increase the risk of re-bellion (Collier and Hoeffler 2002b). Indirectly, as discussed later, aidaffects the risk of conflict through its effects on growth, but controllingfor this it has no direct effect. While the prevalence of natural resourcesecessions suggests that greed cannot be entirely discounted, it does notappear to be the powerful force behind rebellion that economic theo-rists have assumed.
Are Rebellions Responses to Political Repression? While the politi-cal right tends to focus on ethnic and religious differences as explana-tions for rebellion, the political center tends to focus on the absence ofpolitical rights, maintaining that rebellion occurs where other forms ofpolitical organization are not permitted, so the big driver must be polit-ical repression or the lack of political opportunities. Surprisingly, this isnot supported empirically. The evidence is muddled, but autocracies areapproximately as safe as full democracies, with partial democracies hav-ing a somewhat higher risk than either (Esty and others 1998; Fearonand Laitin 2003; Hegre and others 2001). This is partly because partialdemocracies allow some political opposition, but do not give the oppo-sition real influence. However, the association between partial democ-racy and civil war may be spurious, because partial democracies haveother characteristics such as low income that increase the risk of conflict.
A much clearer empirical association is apparent between a changein political institutions and subsequent civil war: stability increasessafety (Hegre and others 2001). So how does democracy affect thechances that political institutions will be stable? Unfortunately, this ap-pears to be critically dependent on the level of economic development(Hegre 2003; figure 3.4). At low levels of per capita income, politicalinstitutions tend to be less stable in democracies than in autocracies.The average duration of a democratic political system in a low-incomecountry is only nine years. The first four or five years are the most crit-ical: only half survive beyond the first election (figures are calculatedusing the dataset developed by Gates and others 2003). As per capitaincome rises, democracies gradually become more stable, whereas the
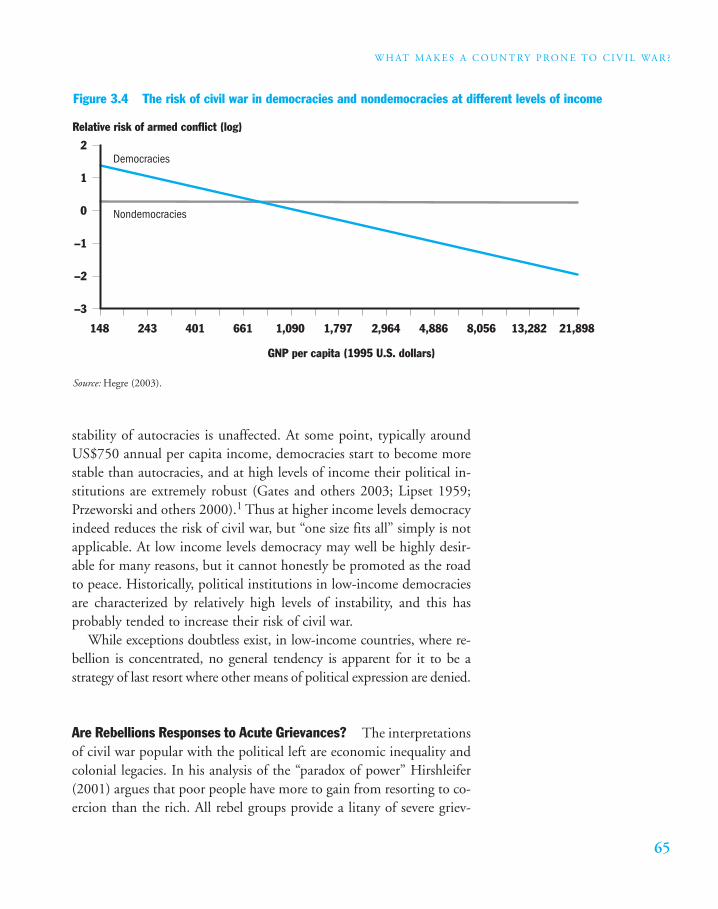
65
W H AT M A K E S A C O U N T RY P RO N E T O C I V I L WA R ?
stability of autocracies is unaffected. At some point, typically aroundUS$750 annual per capita income, democracies start to become morestable than autocracies, and at high levels of income their political in-stitutions are extremely robust (Gates and others 2003; Lipset 1959;Przeworski and others 2000).1 Thus at higher income levels democracyindeed reduces the risk of civil war, but “one size fits all” simply is notapplicable. At low income levels democracy may well be highly desir-able for many reasons, but it cannot honestly be promoted as the roadto peace. Historically, political institutions in low-income democraciesare characterized by relatively high levels of instability, and this hasprobably tended to increase their risk of civil war.
While exceptions doubtless exist, in low-income countries, where re-bellion is concentrated, no general tendency is apparent for it to be astrategy of last resort where other means of political expression are denied.
Are Rebellions Responses to Acute Grievances? The interpretationsof civil war popular with the political left are economic inequality andcolonial legacies. In his analysis of the “paradox of power” Hirshleifer(2001) argues that poor people have more to gain from resorting to co-ercion than the rich. All rebel groups provide a litany of severe griev-
Figure 3.4 The risk of civil war in democracies and nondemocracies at different levels of income
Relative risk of armed conflict (log)
–3
–2
–1
0
1
2
148 243
Democracies
Nondemocracies
401 661 1,090 1,797
GNP per capita (1995 U.S. dollars)
2,964 4,886 8,056 13,282 21,898
Source: Hegre (2003).
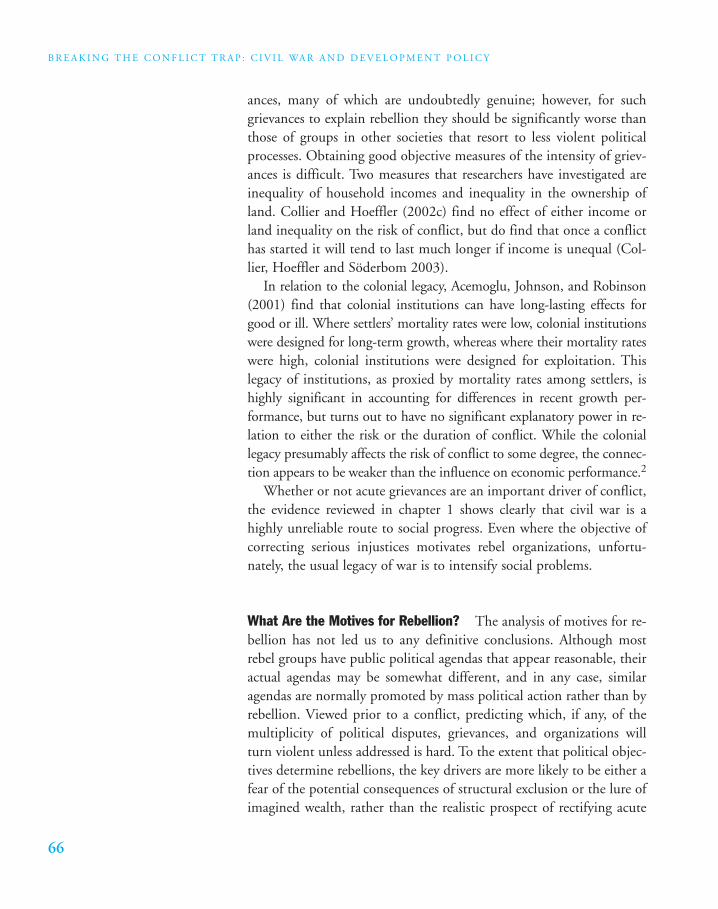
B R E A K I N G T H E C O N F L I C T T R A P : C I V I L WA R A N D D E V E L O P M E N T P O L I C Y
66
ances, many of which are undoubtedly genuine; however, for suchgrievances to explain rebellion they should be significantly worse thanthose of groups in other societies that resort to less violent politicalprocesses. Obtaining good objective measures of the intensity of griev-ances is difficult. Two measures that researchers have investigated areinequality of household incomes and inequality in the ownership ofland. Collier and Hoeffler (2002c) find no effect of either income orland inequality on the risk of conflict, but do find that once a conflicthas started it will tend to last much longer if income is unequal (Col-lier, Hoeffler and Söderbom 2003).
In relation to the colonial legacy, Acemoglu, Johnson, and Robinson(2001) find that colonial institutions can have long-lasting effects forgood or ill. Where settlers’ mortality rates were low, colonial institutionswere designed for long-term growth, whereas where their mortality rateswere high, colonial institutions were designed for exploitation. Thislegacy of institutions, as proxied by mortality rates among settlers, ishighly significant in accounting for differences in recent growth per-formance, but turns out to have no significant explanatory power in re-lation to either the risk or the duration of conflict. While the coloniallegacy presumably affects the risk of conflict to some degree, the connec-tion appears to be weaker than the influence on economic performance.2
Whether or not acute grievances are an important driver of conflict,the evidence reviewed in chapter 1 shows clearly that civil war is ahighly unreliable route to social progress. Even where the objective ofcorrecting serious injustices motivates rebel organizations, unfortu-nately, the usual legacy of war is to intensify social problems.
What Are the Motives for Rebellion? The analysis of motives for re-bellion has not led us to any definitive conclusions. Although mostrebel groups have public political agendas that appear reasonable, theiractual agendas may be somewhat different, and in any case, similaragendas are normally promoted by mass political action rather than byrebellion. Viewed prior to a conflict, predicting which, if any, of themultiplicity of political disputes, grievances, and organizations willturn violent unless addressed is hard. To the extent that political objec-tives determine rebellions, the key drivers are more likely to be either afear of the potential consequences of structural exclusion or the lure ofimagined wealth, rather than the realistic prospect of rectifying acute
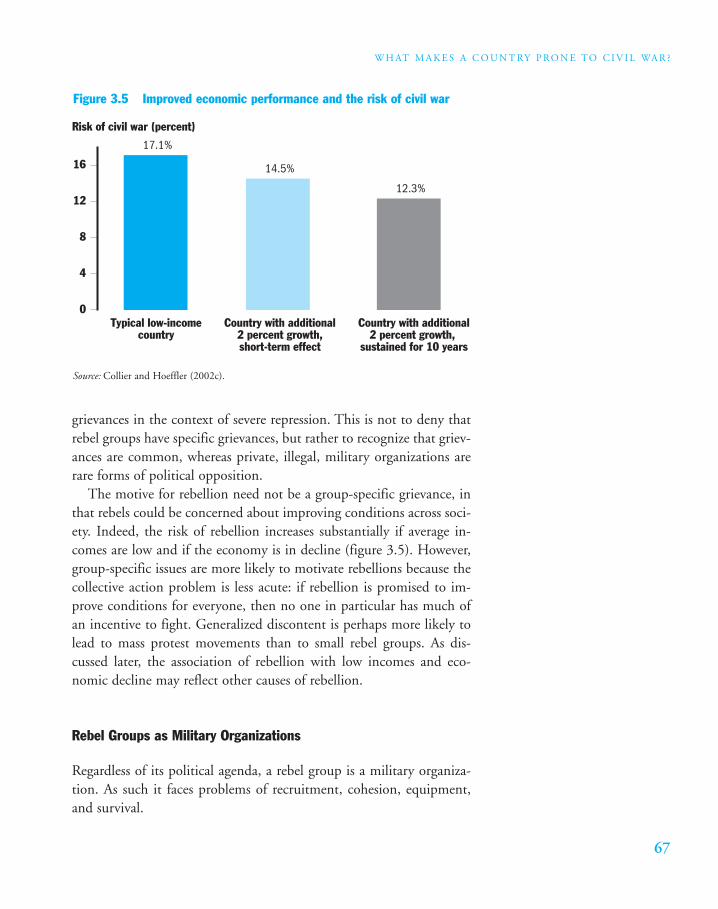
67
W H AT M A K E S A C O U N T RY P RO N E T O C I V I L WA R ?
grievances in the context of severe repression. This is not to deny thatrebel groups have specific grievances, but rather to recognize that griev-ances are common, whereas private, illegal, military organizations arerare forms of political opposition.
The motive for rebellion need not be a group-specific grievance, inthat rebels could be concerned about improving conditions across soci-ety. Indeed, the risk of rebellion increases substantially if average in-comes are low and if the economy is in decline (figure 3.5). However,group-specific issues are more likely to motivate rebellions because thecollective action problem is less acute: if rebellion is promised to im-prove conditions for everyone, then no one in particular has much ofan incentive to fight. Generalized discontent is perhaps more likely tolead to mass protest movements than to small rebel groups. As dis-cussed later, the association of rebellion with low incomes and eco-nomic decline may reflect other causes of rebellion.
Rebel Groups as Military Organizations
Regardless of its political agenda, a rebel group is a military organiza-tion. As such it faces problems of recruitment, cohesion, equipment,and survival.
Figure 3.5 Improved economic performance and the risk of civil war
Risk of civil war (percent)
0
17.1%
Typical low-incomecountry
14.5%
Country with additional2 percent growth,short-term effect
12.3%
Country with additional2 percent growth,
sustained for 10 years
4
8
12
16
Source: Collier and Hoeffler (2002c).
B R E A K I N G T H E C O N F L I C T T R A P : C I V I L WA R A N D D E V E L O P M E N T P O L I C Y
68
Recruiting a Private Army In terms of recruitment rebel groups usu-ally look much more like an army than a political movement. First, theactual numbers of people involved in rebel activities are usually only atiny proportion of the society. “Given the right environmental condi-tions, insurgencies can thrive on the basis of small numbers of rebelswithout strong, widespread, freely-granted, popular support rooted ingrievances and, hence, even in democracies” (Fearon and Laitin 2003,p. 81). Even a relatively large rebel group such as the Fuerzas armadasrevolucionarias colombianas (the People’s Army or FARC) in Colom-bia is recruiting less than 1 Colombian in 2,000.
Second, the people who join rebel groups are overwhelmingly young,uneducated males. For this group objectively observed grievancesmight count for relatively little. Rather, they may be disproportionatelydrawn from those easily manipulated by propaganda and who find thepower that comes from the possession and use of a gun alluring. Socialpsychologists find that around 3 percent of the population has psycho-pathic tendencies and actually enjoys violence against others (Pinker2002), and this is more than is needed to equip a rebel group with re-cruits.3 In Nigeria’s Maitatsine region, a rebel movement was created in the 1980s by a “prophetic” leader, Marwa, who recruited 8,000 to12,000 members. Ideological indoctrination and religious teaching weretargeted on the homeless and refugees. Their insurgency caused around5,000 deaths (Zinn 2002).
Third, as chapter 1 noted, a seemingly paradoxical, yet common,motivation for recruitment is safety. Compared with the starvation anddisease facing the thousands of people displaced from their homes, theorganized facilities of a rebel group provide a haven.
Fourth, many rebel movement “recruits” do not volunteer; forexample, around 80 percent of Resistência Nacional Moçambicana(RENAMO) recruits were coerced. One standard technique is to kid-nap recruits and then force them to commit atrocities in their homeareas, thereby reducing their incentive to escape. Another technique,which the RUF in Sierra Leone adopted, was to target drug addicts onthe grounds that such recruits would be easier to control. A furtherwidespread technique is to recruit children. Children are attractive torebel groups because they are cheap and have little regard for their ownsafety. For example, in Burundi rebel groups recruited children byforce, purchasing Kenyan street children at the price of US$500 for
69
W H AT M A K E S A C O U N T RY P RO N E T O C I V I L WA R ?
150 boys (Ngaruko and Nkurunziza 2002). Obviously children do notjoin rebellions because of objective social grievances.
Even where rebel groups do rely upon grievances for recruitment,they sometimes exploit them. A technique common to several groupsis to target people whose parents were victims of previous governmentatrocities. The recruiter pretends to know who on the government sidecommitted the atrocity and offers the opportunity for revenge (Ross,2002b).
Recruits frequently desert. In the largest civil war of the 20th cen-tury, Russia in 1919–21, around 4 million men deserted from the Redand White Armies. The desertion rate was 10 times greater in summerthan in winter, because most recruits were peasants whose time wasmuch more valuable during the harvest season (Figes 1996).
Using Ethnicity for Cohesion Rebel military organizations face severedifficulties of maintaining cohesion. As they operate outside the lawthey do not have recourse to normal contract enforcement techniques.Governments can divide a rebel movement by buying off local com-manders, a technique used against the Khmer Rouge. One techniquefor maintaining cohesion is to have a hierarchical, dictatorial decisionstructure, with most power vested in a charismatic leader. A measure of this is that if such leaders are removed the rebel organization tendsto collapse rapidly, examples being the eclipse of the Shining Path inPeru once Abimael Guzman had been imprisoned and the surrender of the massive União Nacional para a Independência Total de Angola(UNITA) forces in Angola following the death of Jonas Savimbi. An-other common technique rebel organizations use to increase cohesionis to confine recruitment to a single ethnic group with leaders drawnfrom the same clan (Gates 2002). The rebellion thus uses existing eth-nic “social capital.” In this they resemble the solutions successful dicta-tors favor, a spectacular example being Saddam Hussein’s reliance onthe Tikriti clan. In the Democratic Republic of Congo all the rebellionsdrew their support predominantly from particular ethnic groups, evenif the conflict was resource driven. For example, the Katanga secessionand the Shaba wars were led by the Lunda, Ndembu, and Yeke ethnicgroups. Similarly, the Kwilu rebellion involved the Mbunda and Pendeethnic groups, while the 1996–97 rebellion led by Laurent Kabila drew
B R E A K I N G T H E C O N F L I C T T R A P : C I V I L WA R A N D D E V E L O P M E N T P O L I C Y
70
its initial combatant force from among the Banyamulenge (Ndikumanaand Emizet 2002).
Where the society is divided into a few large ethnic groups civil warstend to last much longer. This is probably an indication that ethnicityis being used to maintain rebel cohesion. Recall that where societies arehighly fragmented in ethnic and religious terms the risk of rebellion isactually lower than in homogenous societies, and when conflicts dooccur they tend to be brief. A possible explanation for this is that insuch societies large rebel groups will usually need to be multi-ethnic,but multi-ethnic groups cannot maintain cohesion. An example of asociety with high ethnic fragmentation and correspondingly limitedlarge-scale violence is Papua New Guinea. At the other end of the spec-trum, Somalia is one of the most ethnically homogenous societies inAfrica. Because rebel leaders actively use ethnicity to encourage cohe-sion, this is another reason why ethnicity is so prominent in the rebeldiscourse and appears to be an important root cause of conflict.
Equipping a Private Army A private military organization needs toacquire armaments and ammunition. This is normally extremely diffi-cult: even criminals seldom have access to armaments more powerfulthan handguns. Access to armaments varies enormously between coun-tries and over time. Where rebels face large but poorly run governmentforces, they have occasionally been able to equip themselves by captur-ing government equipment, a classic case being the Eritrean People’sLiberation Front versus the Derg government of Ethiopia. Similarly, inAlbania and Somalia brief episodes of social disorder enabled localgangs to raid government arsenals. In Albania the looted armamentswere taken across the border and became the basis for arming rebellionin the Balkans. In Somalia this set off a chain of gang militarization, de-stroying the possibility of central government on a long-term basis.
The breakup of the former Soviet Union established some new gov-ernments that faced acute shortages of revenue, but had huge stockpilesof armaments for which they had no use. Major illegal businesses de-veloped, often run by former soldiers such as the Russian Victor Bout,in which stocks were air freighted to conflict zones in return for natu-ral resource wealth. Thus the availability of military equipment forrebel groups expanded enormously during the 1990s, and its cost col-lapsed. AK-47s now sell for as little as US$6 in some African countries
71
W H AT M A K E S A C O U N T RY P RO N E T O C I V I L WA R ?
(Graduate Institute of International Studies 2001; U.S. Department ofState 1999).
Surviving and Military Viability The sheer military viability of rebel-lion will differ greatly between societies, and so will influence the risk ofconflict. One simple factor influencing military viability is the terrain.It is easier for large rebel groups to conceal themselves in rural areas witha low population density than in urban areas. Countries in which thepopulation is concentrated in urban areas, but with large, scarcely pop-ulated hinterlands, are statistically more at risk of rebellion. Some evi-dence also suggests that rebellions are more likely to be launched incountries with extensive mountainous terrain. For example, the EritreanPeople’s Liberation Front was able to rely on safe havens in mountainretreats, and Nepal, one of the most mountainous countries in theworld, has seen a substantial war. Countries such as Colombia, withboth mountains and forests, may be geographically more prone to re-bellion than countries such as Saudi Arabia (see Buhaug and Gates 2002for an empirical study of geography and war).
A second factor influencing military viability is the capability of thegovernment. Both good policing and military counterinsurgency oper-ations are organizationally demanding and are much more difficult, forexample, than providing basic social services.
Deterring rebellion in its early stages requires an effective local pres-ence of government and a willingness to share information on the partof the population. Typically rebel groups kill people they suspect ofbeing informers, and so for people to give the government informationthey must trust it to be effective. Local populations many neither ap-preciate nor trust weak states, which therefore lack the information tocontain rebellion. Even highly effective governments find containingrebellion to be an arduous and complex process, although France, Ger-many, Spain, and the United Kingdom were eventually fairly successfulin containing violent actions by, respectively, the Front de LibérationNationale de la Corse, Baader-Meinhof and its later manifestationssuch as the Red Army Faction, Euskadi ta azkatasuna (ETA), and theIrish Republican Army (IRA).
Less effective governments commonly attempt to prevent rebellionby substantially raising conventional military expenditure. For exam-ple, when the objective risk of rebellion is proxied by the risk estimated
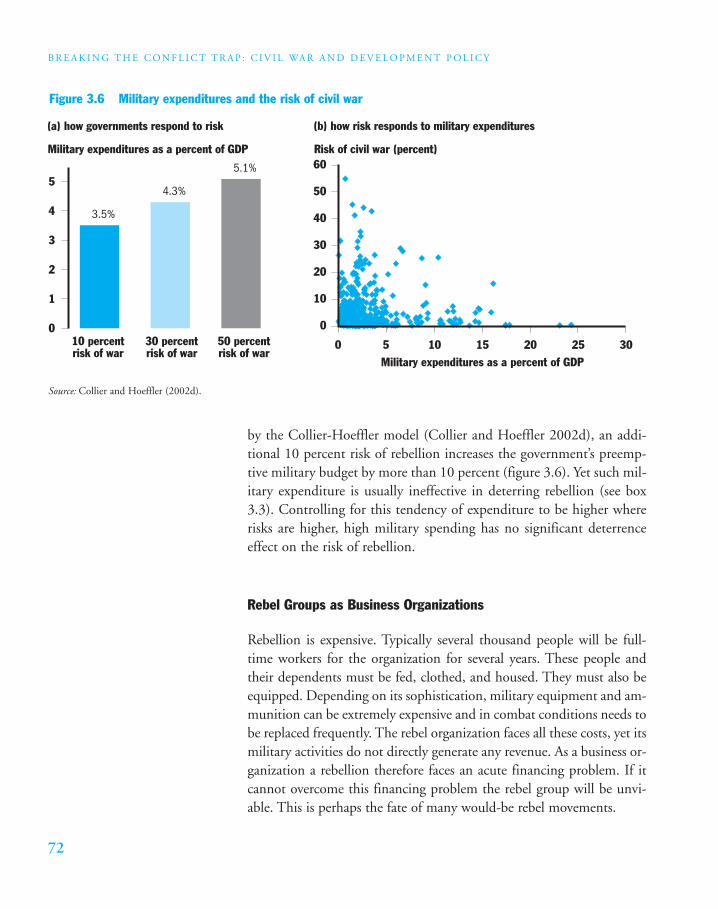
B R E A K I N G T H E C O N F L I C T T R A P : C I V I L WA R A N D D E V E L O P M E N T P O L I C Y
72
by the Collier-Hoeffler model (Collier and Hoeffler 2002d), an addi-tional 10 percent risk of rebellion increases the government’s preemp-tive military budget by more than 10 percent (figure 3.6). Yet such mil-itary expenditure is usually ineffective in deterring rebellion (see box3.3). Controlling for this tendency of expenditure to be higher whererisks are higher, high military spending has no significant deterrenceeffect on the risk of rebellion.
Rebel Groups as Business Organizations
Rebellion is expensive. Typically several thousand people will be full-time workers for the organization for several years. These people andtheir dependents must be fed, clothed, and housed. They must also beequipped. Depending on its sophistication, military equipment and am-munition can be extremely expensive and in combat conditions needs tobe replaced frequently. The rebel organization faces all these costs, yet itsmilitary activities do not directly generate any revenue. As a business or-ganization a rebellion therefore faces an acute financing problem. If itcannot overcome this financing problem the rebel group will be unvi-able. This is perhaps the fate of many would-be rebel movements.
Figure 3.6 Military expenditures and the risk of civil war
Military expenditures as a percent of GDP
(a) how governments respond to risk
Risk of civil war (percent)
(b) how risk responds to military expenditures
5.1%
4.3%
3.5%
010 percentrisk of war
30 percentrisk of war
50 percentrisk of war
1
2
3
4
5
0
10
20
30
40
50
60
0 5 10 15Military expenditures as a percent of GDP
20 25 30
Source: Collier and Hoeffler (2002d).
73
W H AT M A K E S A C O U N T RY P RO N E T O C I V I L WA R ?
All the rebel groups that succeed in escalating violence to the scale ofcivil war must therefore in part be business organizations. This does notimply that personal wealth, or indeed any other economic ambition, isthe motivation for the rebellion. Rebel organizations have to be busi-nesses because they have to cover their costs, but most are probably notrun for profit. Much of the economics literature on rebellion assumesthat the rebel group has economic objectives, whereas much of the po-litical literature neglects to consider finance as a constraint, yet financecan be critical in explaining rebellion, even though it is not motivating.
Rebel groups have three broad options in raising finance: they canbe initiated by someone who is already wealthy, they can seek dona-tions, and they can operate commercial businesses. The super-rich oc-casionally launch their own political parties, for instance, James Gold-smith in France and the United Kingdom and Ross Perot in the UnitedStates, and occasionally they also launch rebellions. Osama Bin Ladenis a spectacular current example, and when Jonas Savimbi relaunchedthe war in Angola in 1994 he was among the richest people in theworld. As the numbers of super-rich increase, this may become morecommon, but historically rebel groups have usually been funded bydonations or by their own commercial enterprises.
INDONESIA HAS KNOWN MUCH POLITICAL VIO-
lence in its history, including civil wars, self-determination movements, ethnic clashes, coups,and state-sponsored massacres. A civil war tookplace in the resource-rich province of Aceh in theearly 1990s and again in 1999–2002. The war wasfought between the government and GAM, an or-ganization that had pursued autonomy since theearly 1970s. For more than two decades GAM waspoorly funded, had little military equipment, andfew recruits. Part of the reason for GAM’s growth inthe 1990s was the demonstration effect in neighbor-ing East Timor, which encouraged the Acehnese todemand independence as well. Also relevant were
expectations of revenue windfalls that could resultfrom ruling a resource-rich independent state ofAceh. But what gave GAM greater legitimacy andaccess to a larger pool of potential recruits than inprevious years was a negative reaction by the publicto the government’s counterinsurgency measures of the 1980s. These actions intensified after GAM’sreappearance in 1990–91. Following a period ofdormancy, GAM emerged stronger in 1999 at leastin part because of increased support by Acehnesepublic opinion, possibly resulting from the publicoutrage against alleged human rights abuses com-mitted by Indonesian security forces between 1990and 1998.
Box 3.3 Inefficient counterinsurgency measures in Indonesia
Source: Ross (2002b).
B R E A K I N G T H E C O N F L I C T T R A P : C I V I L WA R A N D D E V E L O P M E N T P O L I C Y
74
Who Donates Death? In seeking donations, rebel groups typically donot rely heavily on voluntary contributions from the local group whoseinterests they promote. In this they differ markedly from normal polit-ical movements. Their main sources of donations are from foreign gov-ernments hostile to the government they oppose and from diasporasliving in rich countries.
Hostile governments see several advantages in this type of militaryintervention. It is covert, and so avoids the normal pressures of inter-national dispute settlement. It is containable, and does not result indomestic casualties. Until the end of the Cold War the chief sources ofgovernment finance for rebel movements were probably the two super-powers. Since the end of the Cold War regional conflicts have becomemore feasible, and so neighboring governments may have increasedtheir funding of rebel groups. Obviously, obtaining clear evidence ofthe importance of government funding for rebel groups is difficult.One such case was the role of the government of Southern Rhodesia infunding and training RENAMO during the 1970s. Once this govern-ment collapsed, RENAMO collapsed. It was then restarted in the early1980s by the government of South Africa. The United Nations (UN)has documented how several African governments supported UNITA.Similarly, clear evidence points to the involvement of the governmentsof Rwanda, Uganda, and Zimbabwe in the Democratic Republic ofCongo and of the government of Liberia in Sierra Leone. Sometimesinvolvement is reciprocal, so that the conflict is, in effect, an interna-tional war. For example, at one stage the government of Sudan was sup-porting the Lord’s Resistance Army fighting in northern Uganda andthe government of Uganda was supporting the Sudan People’s Libera-tion Movement fighting in southern Sudan. The rebel group probablygets significant support from a foreign government in most civil wars.
The other major source of donations for rebel groups is from dias-poras in rich countries. Diasporas do not suffer the consequences ofviolence, nor are they in day-to-day contact and accommodation with“the enemy.” Case studies suggest that diasporas tend to be more ex-treme than the population remaining in the country of origin: sup-porting extremism is a simple way of asserting continued identity withthe place that has been left. A spectacular example of such financingwas for the Eritrean People’s Liberation Front, which levied an informalincome tax on its huge diaspora. Other examples are support from the
75
W H AT M A K E S A C O U N T RY P RO N E T O C I V I L WA R ?
Tamil diaspora in North America for the Tamil Tigers and supportfrom the Albanian diaspora in Europe for the Kosovo Liberation Army.
Unlike the other sources of finance for rebellion, diaspora contribu-tions are sensitive to the media image of the rebel group. Hence ashrewd rebel group will attempt to manage its image, playing on theconcerns and memories of the relevant diaspora. After September 11the American population became more aware of the true consequencesof financing political violence, and donations to rebel groups have re-putedly declined sharply. Following September 11 two rebel organiza-tions highly dependent on diaspora contributions from North America,the IRA and the Tamil Tigers, both took unprecedented steps towardpeace, with the IRA accepting “decommissioning” of its weapons andthe Tamil Tigers withdrawing their demand for independence.
What Sorts of Commercial Enterprises Do Rebel Groups Engage in?Most successful rebel organizations now rely substantially on generat-ing finance by running businesses alongside their military and politicalactivities. The question then becomes in what types of business activi-ties are rebel organizations likely to be competitive? Unfortunately, theobvious answer is that rebel groups have only one competitive advan-tage, namely, their possession of an usually large capacity for violence.Thus the business activities to which they are well suited are variousforms of extortion rackets or activities that only require military con-trol over a limited territory. These business activities are most com-monly associated with the extraction of natural resources, and civil warsoccur disproportionally in countries with extensive dependence on nat-ural resources (figure 3.7).
Recall that for military reasons rebel groups will tend to locate inrural areas. Most rural areas are poor. Obviously extortion rackets onlywork if there is something to extort, and this constitutes a major limi-tation on rebel activity: extremely poor areas are not well suited to ex-tortion, and so tend to be unsuited for rebellion.4 However, a minorityof rural areas are well suited to extortion, namely, if they are producingprimary commodities with high economic rents. Such commodities aregenerally for export, and the largest rents are usually from the extrac-tion of natural resource wealth. Where such activities are under way, forrebel groups to run an extortion racket that involves charging produc-
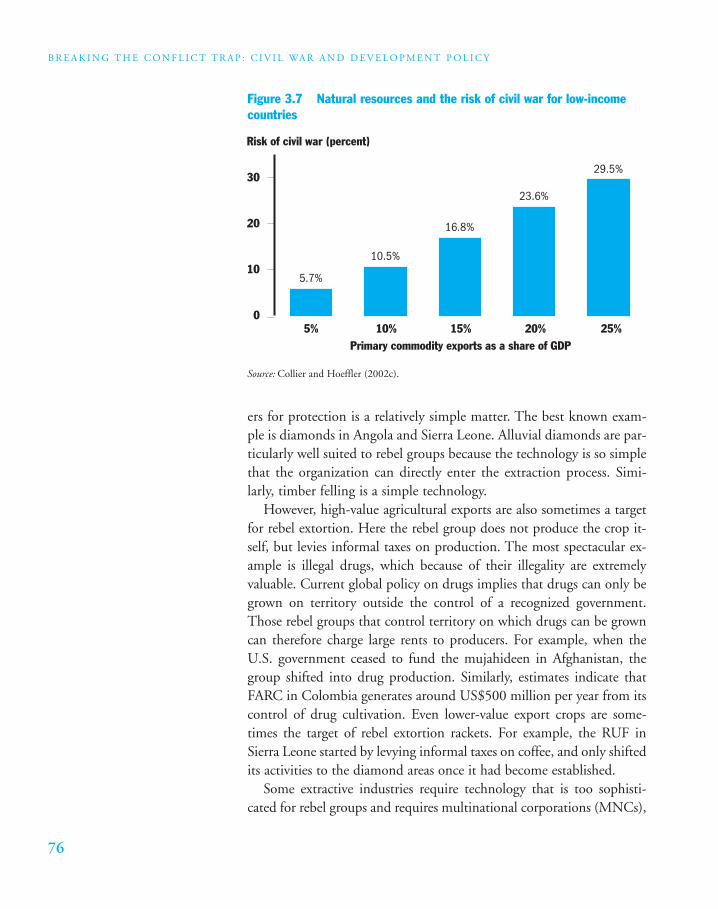
B R E A K I N G T H E C O N F L I C T T R A P : C I V I L WA R A N D D E V E L O P M E N T P O L I C Y
76
ers for protection is a relatively simple matter. The best known exam-ple is diamonds in Angola and Sierra Leone. Alluvial diamonds are par-ticularly well suited to rebel groups because the technology is so simplethat the organization can directly enter the extraction process. Simi-larly, timber felling is a simple technology.
However, high-value agricultural exports are also sometimes a targetfor rebel extortion. Here the rebel group does not produce the crop it-self, but levies informal taxes on production. The most spectacular ex-ample is illegal drugs, which because of their illegality are extremelyvaluable. Current global policy on drugs implies that drugs can only begrown on territory outside the control of a recognized government.Those rebel groups that control territory on which drugs can be growncan therefore charge large rents to producers. For example, when theU.S. government ceased to fund the mujahideen in Afghanistan, thegroup shifted into drug production. Similarly, estimates indicate thatFARC in Colombia generates around US$500 million per year from itscontrol of drug cultivation. Even lower-value export crops are some-times the target of rebel extortion rackets. For example, the RUF inSierra Leone started by levying informal taxes on coffee, and only shiftedits activities to the diamond areas once it had become established.
Some extractive industries require technology that is too sophisti-cated for rebel groups and requires multinational corporations (MNCs),
Figure 3.7 Natural resources and the risk of civil war for low-incomecountries
Risk of civil war (percent)
29.5%
23.6%
16.8%
10.5%
5.7%
05% 10% 15%
Primary commodity exports as a share of GDP20% 25%
10
20
30
Source: Collier and Hoeffler (2002c).
77
W H AT M A K E S A C O U N T RY P RO N E T O C I V I L WA R ?
but this does not prevent extortion. Rebel groups can target MNCs bythreatening expensive infrastructure. The classic infrastructure target isa pipeline: typically oil companies pay protection money to “violenceentrepreneurs” in local communities. Such entrepreneurs sometimesfight among themselves for the right to extort. For example, in the deltaregion of Nigeria violence entrepreneurs from rival villages on either sideof a new Shell pumping station recently fought it out for the extortionrights, resulting in 75 deaths. Violence in the Nigerian delta began inthe mid-1990s at a modest level. It was essentially political, being di-rected against a military government. Despite democratization, the vio-lence has escalated sharply, but has been transformed into somethingmore akin to American gangland fights for control of the drug trade.
A particularly remarkable recent development is for rebel groups toraise finance by selling the advance rights to the extraction of mineralsthat they currently do not control, but which they propose to control bypurchasing armaments financed through the sale of the extractionrights. Kabila, subsequently president of the Democratic Republic ofCongo, reportedly raised several million dollars from Zimbabwean com-mercial interests in return for extraction contracts before launching hissuccessful assault on Kinshasa (Graduate Institute of International Stud-ies 2001). Similarly Denis Sassou-Nguesso, subsequently president ofthe Republic of Congo, reportedly sold extraction rights to help financehis military bid for power.
An alternative technique for extortion against MNCs is kidnappingfollowed by ransom demands. FARC generates around US$200 millionannually from ransoms, disproportionately from kidnapping the em-ployees of MNCs. Oil companies are common targets for kidnapping,and in some regions companies now suffer kidnaps as a daily occurrence.Pax Christi Netherlands (2001) estimates that during the 1990s Euro-pean companies’ ransoms to rebel movements amounted to US$1.2 bil-lion, a sum that far exceeds official European aid flows to the affectedgovernments. The Colombian rebel group Ejército de Liberación Na-cional (ELN) reputedly got US$20 million in ransom from the Germancompany Mannesmann, money that was critical for the group’s purchaseof sophisticated military equipment and its subsequent expansion. Rebelgroups also target foreign tourists for kidnap. For example, a small rebelgroup in the Philippines recently ransomed a party of European touristsvia Libya for US$1 million per person. Following each successful kid-napping rebel recruitment soars, presumably as young men anticipate
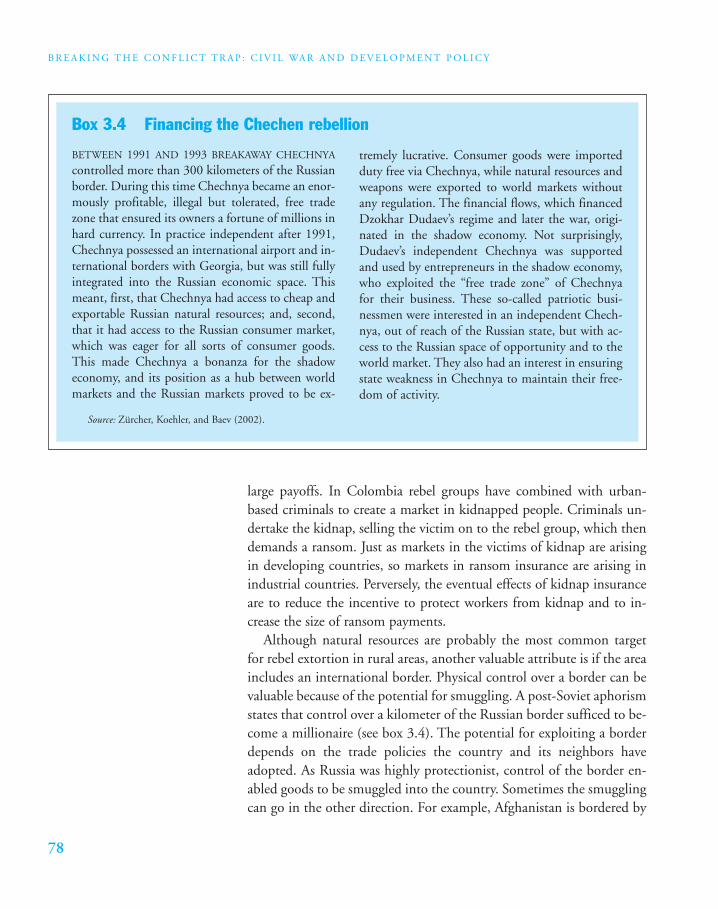
B R E A K I N G T H E C O N F L I C T T R A P : C I V I L WA R A N D D E V E L O P M E N T P O L I C Y
78
large payoffs. In Colombia rebel groups have combined with urban-based criminals to create a market in kidnapped people. Criminals un-dertake the kidnap, selling the victim on to the rebel group, which thendemands a ransom. Just as markets in the victims of kidnap are arisingin developing countries, so markets in ransom insurance are arising inindustrial countries. Perversely, the eventual effects of kidnap insuranceare to reduce the incentive to protect workers from kidnap and to in-crease the size of ransom payments.
Although natural resources are probably the most common targetfor rebel extortion in rural areas, another valuable attribute is if the areaincludes an international border. Physical control over a border can bevaluable because of the potential for smuggling. A post-Soviet aphorismstates that control over a kilometer of the Russian border sufficed to be-come a millionaire (see box 3.4). The potential for exploiting a borderdepends on the trade policies the country and its neighbors haveadopted. As Russia was highly protectionist, control of the border en-abled goods to be smuggled into the country. Sometimes the smugglingcan go in the other direction. For example, Afghanistan is bordered by
BETWEEN 1991 AND 1993 BREAKAWAY CHECHNYA
controlled more than 300 kilometers of the Russianborder. During this time Chechnya became an enor-mously profitable, illegal but tolerated, free tradezone that ensured its owners a fortune of millions inhard currency. In practice independent after 1991,Chechnya possessed an international airport and in-ternational borders with Georgia, but was still fullyintegrated into the Russian economic space. Thismeant, first, that Chechnya had access to cheap andexportable Russian natural resources; and, second,that it had access to the Russian consumer market,which was eager for all sorts of consumer goods.This made Chechnya a bonanza for the shadoweconomy, and its position as a hub between worldmarkets and the Russian markets proved to be ex-
tremely lucrative. Consumer goods were importedduty free via Chechnya, while natural resources andweapons were exported to world markets withoutany regulation. The financial flows, which financedDzokhar Dudaev’s regime and later the war, origi-nated in the shadow economy. Not surprisingly,Dudaev’s independent Chechnya was supportedand used by entrepreneurs in the shadow economy,who exploited the “free trade zone” of Chechnya for their business. These so-called patriotic busi-nessmen were interested in an independent Chech-nya, out of reach of the Russian state, but with ac-cess to the Russian space of opportunity and to theworld market. They also had an interest in ensuringstate weakness in Chechnya to maintain their free-dom of activity.
Box 3.4 Financing the Chechen rebellion
Source: Zürcher, Koehler, and Baev (2002).
79
W H AT M A K E S A C O U N T RY P RO N E T O C I V I L WA R ?
countries that have usually been highly protectionist; thus control offrontier areas in Afghanistan has enabled goods to be flown in at worldprices and smuggled into these neighboring countries where they are farmore valuable.
Finally, some rebel groups have used their comparative advantage inviolence to capture some niche markets in extortion in industrial coun-tries. For example, the Albanian mafia associated with the Kosovo Lib-eration Army reputedly now controls around 80 percent of the prosti-tution trade in central London (The Observer 2002).
So Is the Root the Loot? We have already argued against a greed-basedinterpretation of rebellion. Most entrepreneurs of violence have essen-tially political objectives, and presumably initially undertake criminal ac-tivities only as a grim necessity to raise finance. However, over time thedaily tasks involved in running a criminal business may tend inadver-tently to develop a momentum of their own. The organization starts toattract more criminal types and fewer idealists, so that it may graduallychange its character. Some rebel leaderships tend to do well out of warand may be quite reluctant to see it end. In some cases, such as RUF’smovement from Sierra Leone to Guinea, a rebel group that finds itscriminal activities thwarted in one country relocates in another country.At this point any political agenda has withered away, leaving a “rovingbandit” that classic analysis tells us is the most destructive form of power(Olson 1993). Loot is not usually the root motivation for conflict, but itmay become critical to its perpetuation, giving rise to the conflict trap.
The Conflict Trap
ONCE A REBELLION HAS STARTED IT APPEARS TO DEVELOP A
momentum of its own. Getting back to peace is hard, andeven when peace is re-established, it is often fragile.
Getting Back to Peace
The best predictor of whether a country will be in civil war next year iswhether it is at civil war now (see box 3.5). Wars are highly persistent:
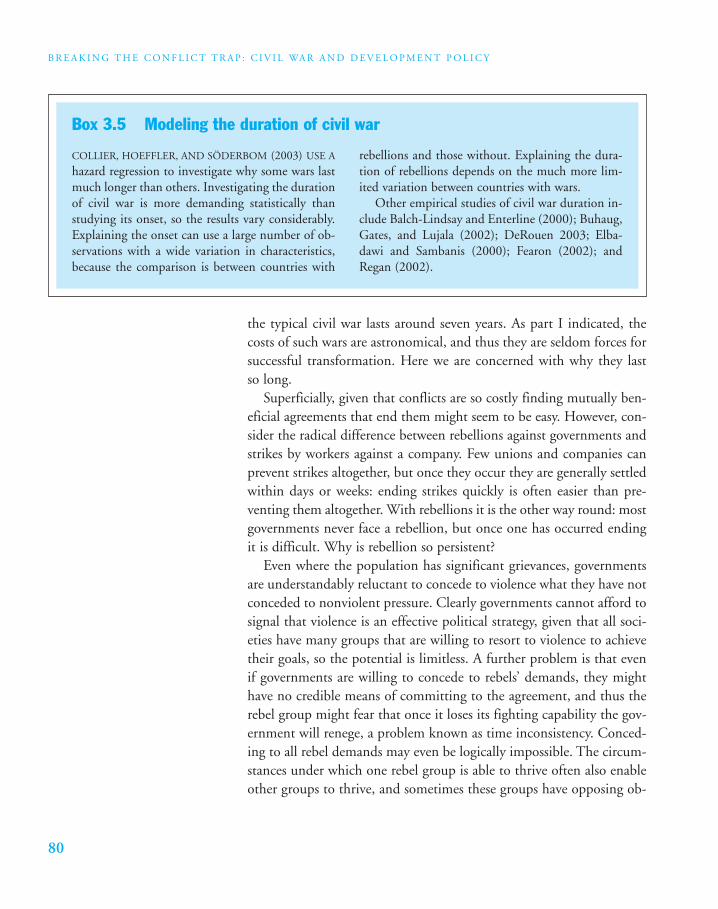
B R E A K I N G T H E C O N F L I C T T R A P : C I V I L WA R A N D D E V E L O P M E N T P O L I C Y
80
the typical civil war lasts around seven years. As part I indicated, thecosts of such wars are astronomical, and thus they are seldom forces forsuccessful transformation. Here we are concerned with why they last so long.
Superficially, given that conflicts are so costly finding mutually ben-eficial agreements that end them might seem to be easy. However, con-sider the radical difference between rebellions against governments andstrikes by workers against a company. Few unions and companies canprevent strikes altogether, but once they occur they are generally settledwithin days or weeks: ending strikes quickly is often easier than pre-venting them altogether. With rebellions it is the other way round: mostgovernments never face a rebellion, but once one has occurred endingit is difficult. Why is rebellion so persistent?
Even where the population has significant grievances, governmentsare understandably reluctant to concede to violence what they have notconceded to nonviolent pressure. Clearly governments cannot afford tosignal that violence is an effective political strategy, given that all soci-eties have many groups that are willing to resort to violence to achievetheir goals, so the potential is limitless. A further problem is that evenif governments are willing to concede to rebels’ demands, they mighthave no credible means of committing to the agreement, and thus therebel group might fear that once it loses its fighting capability the gov-ernment will renege, a problem known as time inconsistency. Conced-ing to all rebel demands may even be logically impossible. The circum-stances under which one rebel group is able to thrive often also enableother groups to thrive, and sometimes these groups have opposing ob-
COLLIER, HOEFFLER, AND SÖDERBOM (2003) USE A
hazard regression to investigate why some wars lastmuch longer than others. Investigating the durationof civil war is more demanding statistically thanstudying its onset, so the results vary considerably.Explaining the onset can use a large number of ob-servations with a wide variation in characteristics,because the comparison is between countries with
rebellions and those without. Explaining the dura-tion of rebellions depends on the much more lim-ited variation between countries with wars.
Other empirical studies of civil war duration in-clude Balch-Lindsay and Enterline (2000); Buhaug,Gates, and Lujala (2002); DeRouen 2003; Elba-dawi and Sambanis (2000); Fearon (2002); andRegan (2002).
Box 3.5 Modeling the duration of civil war
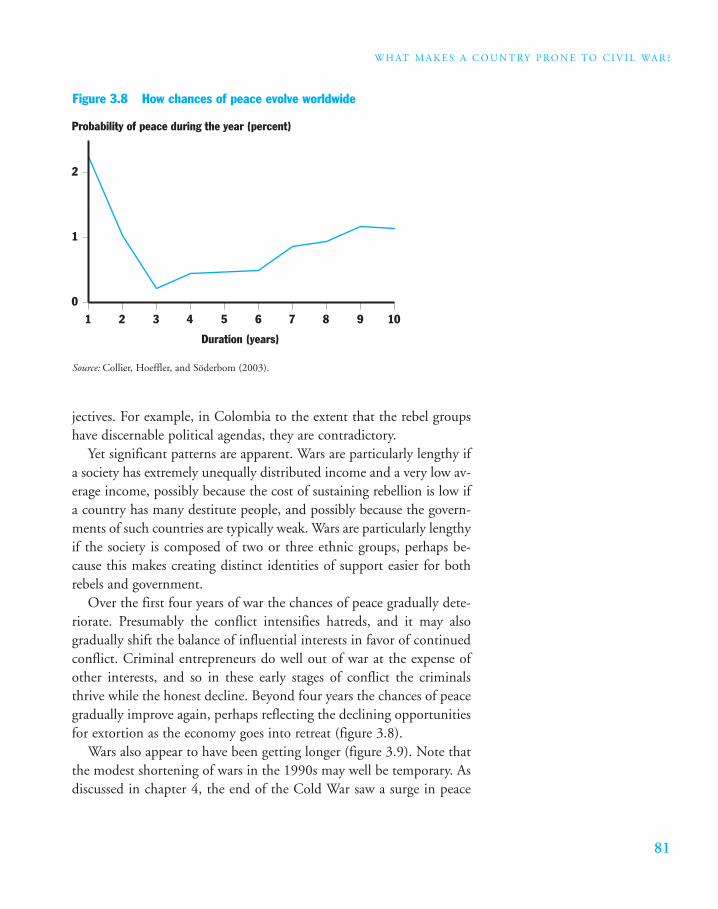
81
W H AT M A K E S A C O U N T RY P RO N E T O C I V I L WA R ?
jectives. For example, in Colombia to the extent that the rebel groupshave discernable political agendas, they are contradictory.
Yet significant patterns are apparent. Wars are particularly lengthy ifa society has extremely unequally distributed income and a very low av-erage income, possibly because the cost of sustaining rebellion is low ifa country has many destitute people, and possibly because the govern-ments of such countries are typically weak. Wars are particularly lengthyif the society is composed of two or three ethnic groups, perhaps be-cause this makes creating distinct identities of support easier for bothrebels and government.
Over the first four years of war the chances of peace gradually dete-riorate. Presumably the conflict intensifies hatreds, and it may alsogradually shift the balance of influential interests in favor of continuedconflict. Criminal entrepreneurs do well out of war at the expense ofother interests, and so in these early stages of conflict the criminalsthrive while the honest decline. Beyond four years the chances of peacegradually improve again, perhaps reflecting the declining opportunitiesfor extortion as the economy goes into retreat (figure 3.8).
Wars also appear to have been getting longer (figure 3.9). Note thatthe modest shortening of wars in the 1990s may well be temporary. Asdiscussed in chapter 4, the end of the Cold War saw a surge in peace
Figure 3.8 How chances of peace evolve worldwide
01 2 3 4 5 6
Duration (years)
7 8 9 10
1
2
Probability of peace during the year (percent)
Source: Collier, Hoeffler, and Söderbom (2003).
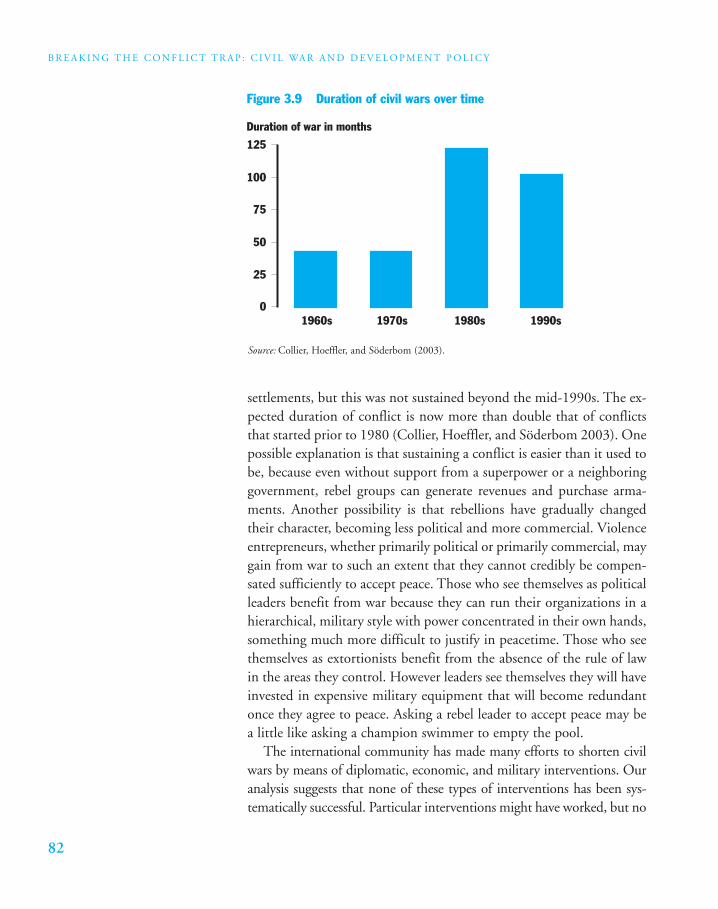
B R E A K I N G T H E C O N F L I C T T R A P : C I V I L WA R A N D D E V E L O P M E N T P O L I C Y
82
settlements, but this was not sustained beyond the mid-1990s. The ex-pected duration of conflict is now more than double that of conflictsthat started prior to 1980 (Collier, Hoeffler, and Söderbom 2003). Onepossible explanation is that sustaining a conflict is easier than it used tobe, because even without support from a superpower or a neighboringgovernment, rebel groups can generate revenues and purchase arma-ments. Another possibility is that rebellions have gradually changedtheir character, becoming less political and more commercial. Violenceentrepreneurs, whether primarily political or primarily commercial, maygain from war to such an extent that they cannot credibly be compen-sated sufficiently to accept peace. Those who see themselves as politicalleaders benefit from war because they can run their organizations in ahierarchical, military style with power concentrated in their own hands,something much more difficult to justify in peacetime. Those who seethemselves as extortionists benefit from the absence of the rule of lawin the areas they control. However leaders see themselves they will haveinvested in expensive military equipment that will become redundantonce they agree to peace. Asking a rebel leader to accept peace may bea little like asking a champion swimmer to empty the pool.
The international community has made many efforts to shorten civilwars by means of diplomatic, economic, and military interventions. Ouranalysis suggests that none of these types of interventions has been sys-tematically successful. Particular interventions might have worked, but no
Figure 3.9 Duration of civil wars over time
Duration of war in months
0
25
50
75
100
125
1960s 1970s 1980s 1990s
Source: Collier, Hoeffler, and Söderbom (2003).
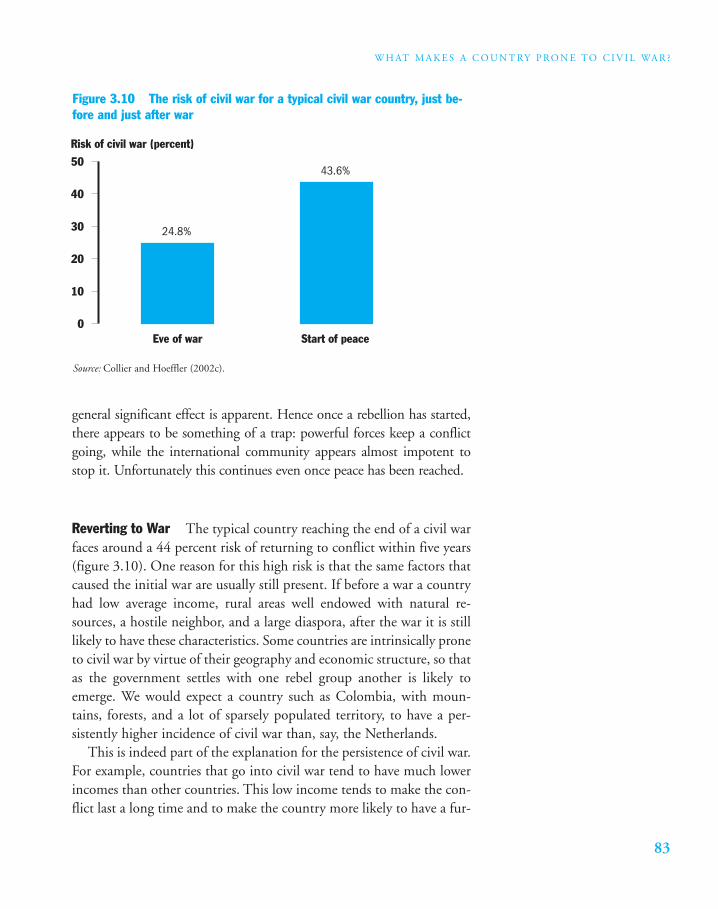
83
W H AT M A K E S A C O U N T RY P RO N E T O C I V I L WA R ?
general significant effect is apparent. Hence once a rebellion has started,there appears to be something of a trap: powerful forces keep a conflictgoing, while the international community appears almost impotent tostop it. Unfortunately this continues even once peace has been reached.
Reverting to War The typical country reaching the end of a civil warfaces around a 44 percent risk of returning to conflict within five years(figure 3.10). One reason for this high risk is that the same factors thatcaused the initial war are usually still present. If before a war a countryhad low average income, rural areas well endowed with natural re-sources, a hostile neighbor, and a large diaspora, after the war it is stilllikely to have these characteristics. Some countries are intrinsically proneto civil war by virtue of their geography and economic structure, so thatas the government settles with one rebel group another is likely toemerge. We would expect a country such as Colombia, with moun-tains, forests, and a lot of sparsely populated territory, to have a per-sistently higher incidence of civil war than, say, the Netherlands.
This is indeed part of the explanation for the persistence of civil war.For example, countries that go into civil war tend to have much lowerincomes than other countries. This low income tends to make the con-flict last a long time and to make the country more likely to have a fur-
Figure 3.10 The risk of civil war for a typical civil war country, just be-fore and just after war
Eve of war Start of peace
Risk of civil war (percent)
43.6%
24.8%
0
10
20
30
40
50
Source: Collier and Hoeffler (2002c).
B R E A K I N G T H E C O N F L I C T T R A P : C I V I L WA R A N D D E V E L O P M E N T P O L I C Y
84
ther conflict once it has reached peace. However, another possibility isthat a high degree of conflict persistence arises because of a vicious cir-cle of civil war. We now explore various ways in which conflict in oneperiod may increase the risks of subsequent conflict.
War Reverses Development The most obvious way in which conflicthas a feedback loop is that civil war interrupts, and indeed reverses, eco-nomic development. As chapter 1 showed, during a civil war a countryloses, on average, around 2.2 percentage points off its normal annualgrowth rate. Because the average civil war lasts around seven years, bythe end of the war per capita income is around 15 percent lower thanit would otherwise have been. Our previous analysis indicates that thiswill raise the long-term incidence of conflict for the country both byincreasing its risk of further rebellion and by increasing the duration ofrebellion should one occur. For the typical country experiencing a civilwar, this effect of the war would increase the risk by 13.5 percent andthe duration by 5.9 percent, so that the long-term incidence would riseby 16.9 percent.5
A related feedback loop works through the effect of conflict on thestructure of the economy. Natural resource exports are relatively robustin the face of conflict, because of the high rents normally involved intheir production and their relative independence of inputs from the restof the economy. By contrast, more sophisticated exports are typicallylow-margin and dependent on a fragile network of business interdepen-dencies, and these tend to get severely disrupted by the war. Further-more, economic policy and institutions deteriorate significantly duringcivil war, and this takes time to put right. Studies show that diversifica-tion out of primary commodity dependence is influenced both by thelevel of income and by policies and institutions (Collier and Hoeffler2002b). Thus as policies, institutions, and income all deteriorate duringwar and take a long time to rectify, for a much longer period than thewar itself the country will find itself trapped into dependence on pri-mary commodities. This in turn will increase the risk of further conflict.
War Triggers Emigration and Diasporas A further feedback loop isthrough emigration of the work force. Civil war triggers an exodus ofpeople: some are refugees to neighboring countries, others are asylum
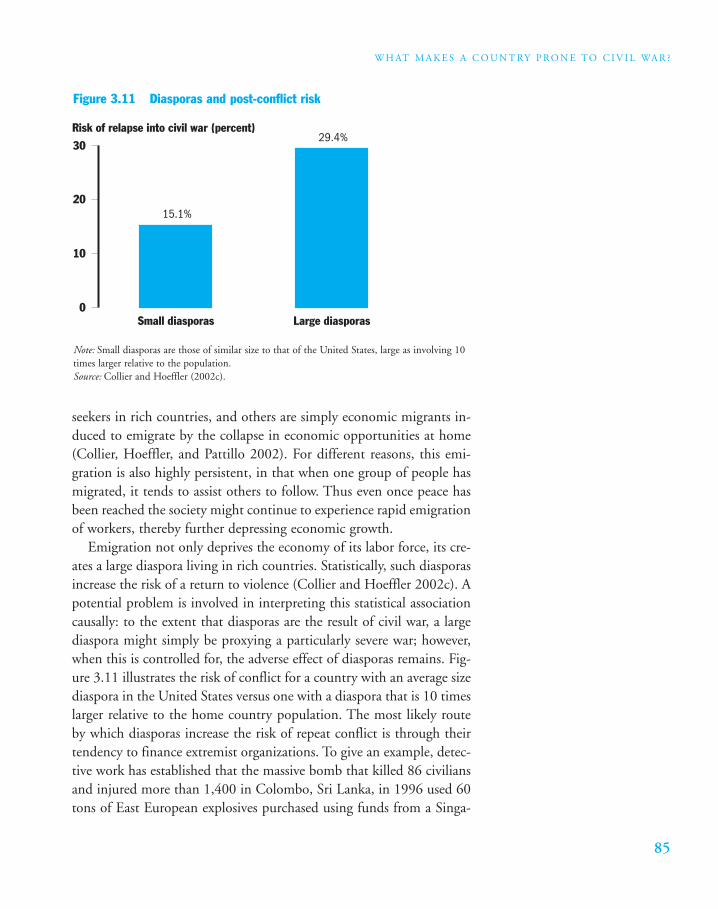
85
W H AT M A K E S A C O U N T RY P RO N E T O C I V I L WA R ?
seekers in rich countries, and others are simply economic migrants in-duced to emigrate by the collapse in economic opportunities at home(Collier, Hoeffler, and Pattillo 2002). For different reasons, this emi-gration is also highly persistent, in that when one group of people hasmigrated, it tends to assist others to follow. Thus even once peace hasbeen reached the society might continue to experience rapid emigrationof workers, thereby further depressing economic growth.
Emigration not only deprives the economy of its labor force, its cre-ates a large diaspora living in rich countries. Statistically, such diasporasincrease the risk of a return to violence (Collier and Hoeffler 2002c). Apotential problem is involved in interpreting this statistical associationcausally: to the extent that diasporas are the result of civil war, a largediaspora might simply be proxying a particularly severe war; however,when this is controlled for, the adverse effect of diasporas remains. Fig-ure 3.11 illustrates the risk of conflict for a country with an average sizediaspora in the United States versus one with a diaspora that is 10 timeslarger relative to the home country population. The most likely routeby which diasporas increase the risk of repeat conflict is through theirtendency to finance extremist organizations. To give an example, detec-tive work has established that the massive bomb that killed 86 civiliansand injured more than 1,400 in Colombo, Sri Lanka, in 1996 used 60tons of East European explosives purchased using funds from a Singa-
Figure 3.11 Diasporas and post-conflict risk
Small diasporas Large diasporas
Risk of relapse into civil war (percent)
15.1%
29.4%
0
10
20
30
Note: Small diasporas are those of similar size to that of the United States, large as involving 10times larger relative to the population.Source: Collier and Hoeffler (2002c).
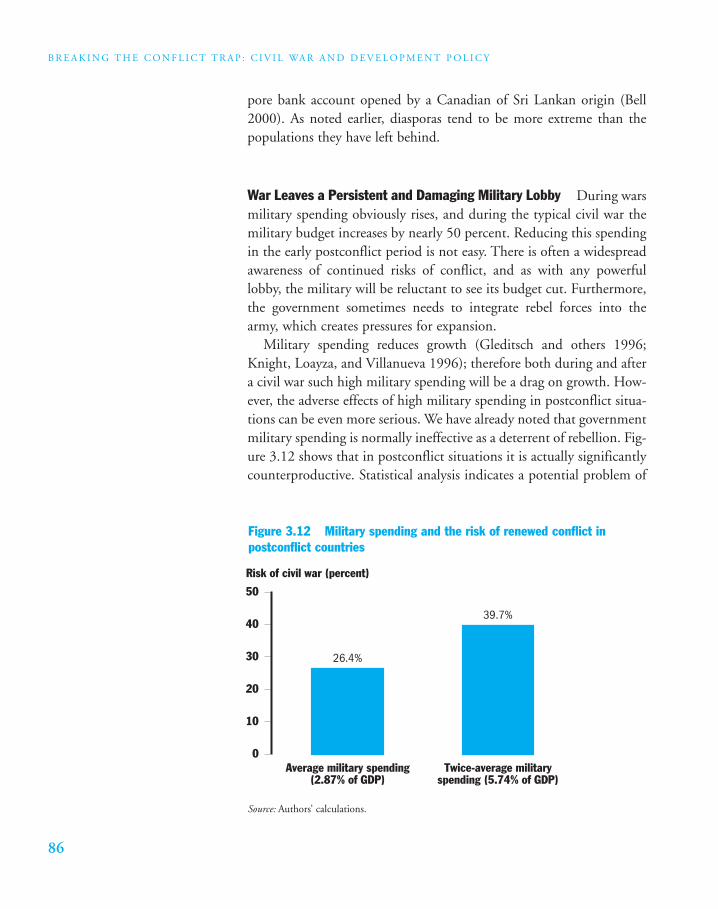
B R E A K I N G T H E C O N F L I C T T R A P : C I V I L WA R A N D D E V E L O P M E N T P O L I C Y
86
pore bank account opened by a Canadian of Sri Lankan origin (Bell2000). As noted earlier, diasporas tend to be more extreme than thepopulations they have left behind.
War Leaves a Persistent and Damaging Military Lobby During warsmilitary spending obviously rises, and during the typical civil war themilitary budget increases by nearly 50 percent. Reducing this spendingin the early postconflict period is not easy. There is often a widespreadawareness of continued risks of conflict, and as with any powerfullobby, the military will be reluctant to see its budget cut. Furthermore,the government sometimes needs to integrate rebel forces into thearmy, which creates pressures for expansion.
Military spending reduces growth (Gleditsch and others 1996;Knight, Loayza, and Villanueva 1996); therefore both during and aftera civil war such high military spending will be a drag on growth. How-ever, the adverse effects of high military spending in postconflict situa-tions can be even more serious. We have already noted that governmentmilitary spending is normally ineffective as a deterrent of rebellion. Fig-ure 3.12 shows that in postconflict situations it is actually significantlycounterproductive. Statistical analysis indicates a potential problem of
Figure 3.12 Military spending and the risk of renewed conflict in postconflict countries
Risk of civil war (percent)
39.7%
26.4%
0Average military spending
(2.87% of GDP)Twice-average military
spending (5.74% of GDP)
10
20
30
40
50
Source: Authors’ calculations.
87
W H AT M A K E S A C O U N T RY P RO N E T O C I V I L WA R ?
bogus causality: high spending will sometimes reflect a correct percep-tion of an unusually high risk of further conflict, and so will simply beproxying the risk, but when this is controlled for the effect remains.
Why should high military spending in postconflict situations be sodysfunctional? A possible reason is that military spending may inadver-tently be a signal of government ill-intent. Recall that one obstacle to asettlement is the low credibility of an agreement, that is, the govern-ment has more interest in promising generous peace terms than in ac-tually delivering on them. High military spending might thus be seenas an indication that the government is likely to renege. Some indirectsupport for this interpretation comes from an analysis of which policiesare most conducive to growth in postconflict situations. On average,countries emerge from conflict with poor policies across the board:macroeconomic, structural, and social.
Collier and Hoeffler (2002a) investigate how policy priorities shoulddiffer in such a country from one that has the same poor policies but isnot postconflict. They find that simply on the criterion of maximizingshort-run growth, if the country is postconflict it should give greaterpriority to such inclusive social policies as widening access to educationand health care. Although education and health care eventually con-tribute to growth, they do so with long lags, so that the unusually strongeffect of social policies is unlikely to be due to their direct contributionto growth. An alternative route may be that prioritizing inclusive socialpolicies signals to the population that the government is committed toa peace settlement. On this interpretation, postconflict governmentsthat prioritize military spending are inadvertently signaling that theywill renege on the peace settlement and those that prioritize socialspending are signaling that they will adhere to it. The former signal in-creases the risk of conflict, while the latter builds private sector confi-dence and thereby accelerates growth. If this interpretation is right itsuggests that governments are not impotent: their policy choices canalter the risks they face. We return to this in more detail in chapter 5.
War Changes the Balance of Interests and Intensifies Hatreds Allthe foregoing feedback loops work through factors that investigatorshave incorporated into models of conflict risk: the level, growth, andstructure of income; military spending; and diasporas. However, therisk of a reversion to conflict is much higher than is accounted for by
B R E A K I N G T H E C O N F L I C T T R A P : C I V I L WA R A N D D E V E L O P M E N T P O L I C Y
88
these effects. On average, only about half of the 44 percent risk of re-peat conflict is due to characteristics either present before the conflictstarted or explicitly modeled as deteriorating as a result of conflict. Theother half of the risk is due to things that happen during the conflictbut are not included in the analysis. By definition, as these factors areomitted from the modeling analysis, it cannot guide us as to what theyare, but we can speculate on some likely ways in which conflict in-creases the risk of further conflict.
One likely feedback mechanism is that violent conflict changes thebalance of assets in the society, reducing the value of those that are use-ful during peacetime and increasing the value of those that are usefulonly for violence. The violence-specific assets are partly physical, such asarmaments; partly human, such as the skills to use weapons and the re-duced regard for human life and dignity; and partly organizational, suchas the hierarchical rebel management structure and established com-mercial ties with arms suppliers and natural resource traders. The own-ers of these assets are unlikely to sit on the sidelines while their value col-lapses. They do well out of war and would like to get back to it.
Another likely feedback mechanism is that violent conflict leaves alegacy of atrocities. As a result, hatreds build up during periods of vio-lence, leaving the society polarized. People of both sides want vengeancefor atrocities committed during the conflict and these may supplant anyprior grievances. We have already noted how rebel recruitment some-times capitalizes on such grievances.
Conclusion
THE INTERPRETATIONS OF CIVIL WAR THAT HAVE BEEN MOST
common in industrial countries either treat them as wholly anoutcome of primordial ethnic and religious hatreds or force
them into the familiar framework of Western politics. Rebel leadershave learnt to play up to these images of their organizations, raisingmoney from ethnic diasporas while styling themselves as heroic politi-cal leaders. Another tempting framework, favored by economists, is to see rebel leaders as being at the apex of organized crime, enrichingthemselves from massive protection rackets at the expense of the widersociety. The recent prominence of so-called “conflict diamonds” has in-
89
W H AT M A K E S A C O U N T RY P RO N E T O C I V I L WA R ?
creased popular awareness of this darker side of rebellion. Both theseinterpretations miss the reality of many rebellions; that is, even thoughrebel leaders are indeed violence entrepreneurs heading private militaryorganizations that run protection rackets, they usually have some po-litical agenda. However, they are not conventional political leaders inthat they have chosen not to lead normal political movements.
Motivations—grievances and greed—are obviously part of the expla-nation for rebellion, but if we focus exclusively on motivation we rapidlyencounter a paradox. In many situations of the most grievous injustice,both currently and historically, rebellion does not occur. Highly repres-sive societies often fail to trigger civil war, such as Iraq and the Dem-ocratic People’s Republic of Korea. Highly unequal societies often fail totrigger civil war, such as Chile and Kenya. Extreme cases of ethnic abusesof power have often failed to trigger civil war, such as white dominationin South Africa, and, delving back into history, Norman domination inEngland, although some forms of ethnic political exclusion do appear toincrease the risk of war. Greed perhaps fares a little better as an explana-tion, as secessionist rebellions seem to be linked to the desire to appro-priate valuable resources and some rebel leaders appear more committedto a personal than to a social agenda; however, even greed does not seemto get us very far, because states with large aid inflows are much more at-tractive to capture, but they do not face any greater risk of rebellion.
While the literature that tries to explain civil war has focused over-whelmingly on motivation, we also need to note that the circumstancesin which rebel groups are militarily and financially viable are relativelyrare. Hirshleifer (2001) has put forward a depressing proposition, theMachiavelli theorem, whereby no advantageous opportunity to exploitsomeone will be missed. Even though many rebellions are not moti-vated by the desire to exploit someone, a closely analogous propositionmay be fairly accurate: no militarily and financially viable opportunityto promote a political agenda by rebellion will be missed. If a neigh-boring government is sufficiently hostile and the circumstances are pro-pitious, it will seek out and promote a local violence entrepreneur. Ifresource-extracting MNCs offer sufficiently easy pickings in unpro-tected rural areas, local violence entrepreneurs will set up rudimentaryprotection rackets loosely linked to political demands. In such circum-stances the ostensible grievance might be any of a wide range of things:grievances are not in short supply.
B R E A K I N G T H E C O N F L I C T T R A P : C I V I L WA R A N D D E V E L O P M E N T P O L I C Y
90
Globally, one of the largest mass political protests of recent years,which brought more than 400,000 people onto the streets of London,was to defend the right to hunt foxes. The typical rebel group does notneed a cause that attracts anything like this level of support: a few hun-dred or a few thousand people will suffice to reach the level of violencethat constitutes civil war. Thus most societies probably have severalissues on which it is possible to find a small core of people who feelpassionate and who are not averse to violence. Identifiable politicalgroups have perpetrated violence in France (Breton separatists), theUnited Kingdom (animal rights activists), and the United States (anti-abortion activists), and political assassinations have occurred in Italy,the Netherlands, and Sweden. Hence most societies have the politicalpotential for violence. Whether such violence remains peripheral, as inthe foregoing examples, or becomes large enough to generate wide-spread death and destruction, may depend as much upon whether anillegal, private, military organization is militarily and financially viableas upon the political issue itself.
Obviously governments should address justified grievances, whetheror not they are likely to lead to large-scale violence. A government thatis considerate and inclusive is surely less likely to face rebellion, and, in any case, it will be a better government. However, we should be wary of vilifying those governments of low-income, natural resource–dependent countries that face rebellion. Rebellion need not be a symp-tom that they are markedly worse than other governments. Instead,they may be in an economic and geographic environment where rebel-lion is particularly easy, and perhaps even particularly attractive. A jour-nalist interviewed Kabila when he was marching on Kinshasa. He re-portedly explained that in Zaire rebellion was easy—all that was neededwas ten thousand dollars and a satellite phone. The dollars were to re-cruit a small army, cheap because the population of Zaire was amongthe poorest in the world. Recall that even in Zaire the quote was an ex-aggeration. Kabila had received several million dollars and the supportof foreign armies to launch his assault. The satellite phone was to makedeals with foreign businesses in extractive industries.
Although occasionally rebellion leads to an improvement in govern-ment, more often it leads to spectacular deterioration, and therefore thepresumption that rebellion should be avoided is reasonable. Partly thisis a matter for governments to make greater efforts to redress reasonable
91
W H AT M A K E S A C O U N T RY P RO N E T O C I V I L WA R ?
grievances, but it is also a matter of making rebellion less easy. Many ofthe things that would make rebellion more difficult require action atthe regional or global level, and the international community can ac-tively discourage rebellion without taking sides in political disputes.This is the subject of part III.
Although political conflict is common to all societies, civil war is con-centrated in the lowest-income countries. In a sense this is hopeful. It isan indication that peace does not depend on resolving all political con-flict and that such conflict is normal. Rather, economic development isthe critical instrument in preventing rebellion and in building the con-ditions in which groups engage in their conflicts through normal polit-ical means. Economic development in the lowest-income countries isnot easy, but neither is it unprecedented, incredibly complex, or wildlyexpensive.
Once a rebellion has started, a society risks being caught in a con-flict trap. Ending the conflict is difficult, and even if it ends, the riskthat it will start again is high. Strong global actions can be targeted to-ward conflict prevention in these high-risk environments. Building apeaceful world is not just a matter of encouraging tolerance and con-sensus. It involves a practical agenda for economic development andthe effective regulation of those markets that have come to facilitate re-bellion and corrupt governance.
Notes
1. Heavy dependence on natural resources also tendsto make autocracies stable and democracies unstable(Ross 2000).
2. Results available on request.
3. Mueller (2000) analyzes the wars in Bosnia andRwanda and concludes that the number of rebels com-mitting the atrocities was relatively small. He estimatesthat the genocide in Rwanda was carried out by approx-imately 2 percent of the male adult population.
4. A possible exception is where resources are valu-able because they are locally scarce, such as water and
fertile land in arid areas. Homer-Dixon (1991) has em-phasized this category of conflict, but see the discussionby Gleditsch (1998).
5. The change in the long-term or self-sustaining in-cidence is calculated using the method explained in ap-pendix 1. We assumed the initial probability of war ini-tiation is 0.016 and that of termination is 0.123. Wemultiply the initial w probability with 1.135 (corre-sponding to a 13.5 percent increase) and the initial vprobability with 0.9405 and recalculate the self-sustain-ing incidence.

93
C H A P T E R F O U R
Why Is Civil WarSo Common?
THIS CHAPTER TURNS FROM A MICRO-LEVEL ANALY-
sis of what circumstances are conducive to rebellionto a macro-level analysis of what determines theglobal incidence of civil war. It looks at how the in-cidence of civil war has changed over time and spaceand attempts to account for these changes in terms
of the underlying causes of civil war identified in chapter 3. Civil waris increasingly concentrated in relatively few conflict-prone countries,many of them in Africa. We use the macro-level analysis to investigatehow economic development is changing the overall incidence of civilwar. Development has not been reaching those countries most proneto civil war. As a result, if past trends continue, the world will evolveinto a two-class system, with the majority virtually conflict free and aminority trapped in a cycle of long internal wars interspersed withbrief, unstable periods of peace. The minority of countries caught inthe conflict trap will increasingly dominate the global incidence.
Changes in the Global Pattern of Civil War
A CTIVE WARFARE HAS CHANGED ITS CHARACTER OVER THE
past 50 years in that international wars have become rare,whereas civil wars have become more common. In 2001 all
but one of the world’s wars were civil wars. Furthermore, when inter-national wars do occur, they tend to be short: most last less than sixmonths (Bennett and Stam 1996). By contrast, civil wars last a longtime, on average about seven years, and their duration has tended toincrease.
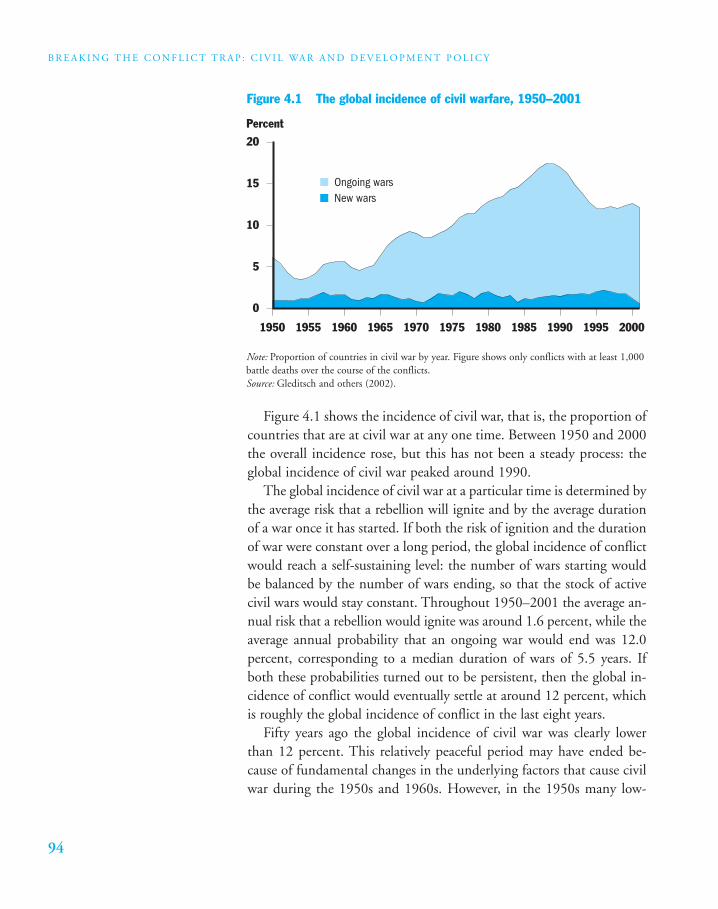
B R E A K I N G T H E C O N F L I C T T R A P : C I V I L WA R A N D D E V E L O P M E N T P O L I C Y
94
Figure 4.1 shows the incidence of civil war, that is, the proportion ofcountries that are at civil war at any one time. Between 1950 and 2000the overall incidence rose, but this has not been a steady process: theglobal incidence of civil war peaked around 1990.
The global incidence of civil war at a particular time is determined bythe average risk that a rebellion will ignite and by the average durationof a war once it has started. If both the risk of ignition and the durationof war were constant over a long period, the global incidence of conflictwould reach a self-sustaining level: the number of wars starting wouldbe balanced by the number of wars ending, so that the stock of activecivil wars would stay constant. Throughout 1950–2001 the average an-nual risk that a rebellion would ignite was around 1.6 percent, while theaverage annual probability that an ongoing war would end was 12.0percent, corresponding to a median duration of wars of 5.5 years. Ifboth these probabilities turned out to be persistent, then the global in-cidence of conflict would eventually settle at around 12 percent, whichis roughly the global incidence of conflict in the last eight years.
Fifty years ago the global incidence of civil war was clearly lowerthan 12 percent. This relatively peaceful period may have ended be-cause of fundamental changes in the underlying factors that cause civilwar during the 1950s and 1960s. However, in the 1950s many low-
Figure 4.1 The global incidence of civil warfare, 1950–2001
Percent
0
5
10
15
20
1950 1955 1960 1965 1970 1975 1980 1985 1990 1995 2000
Ongoing warsNew wars
Note: Proportion of countries in civil war by year. Figure shows only conflicts with at least 1,000battle deaths over the course of the conflicts.Source: Gleditsch and others (2002).
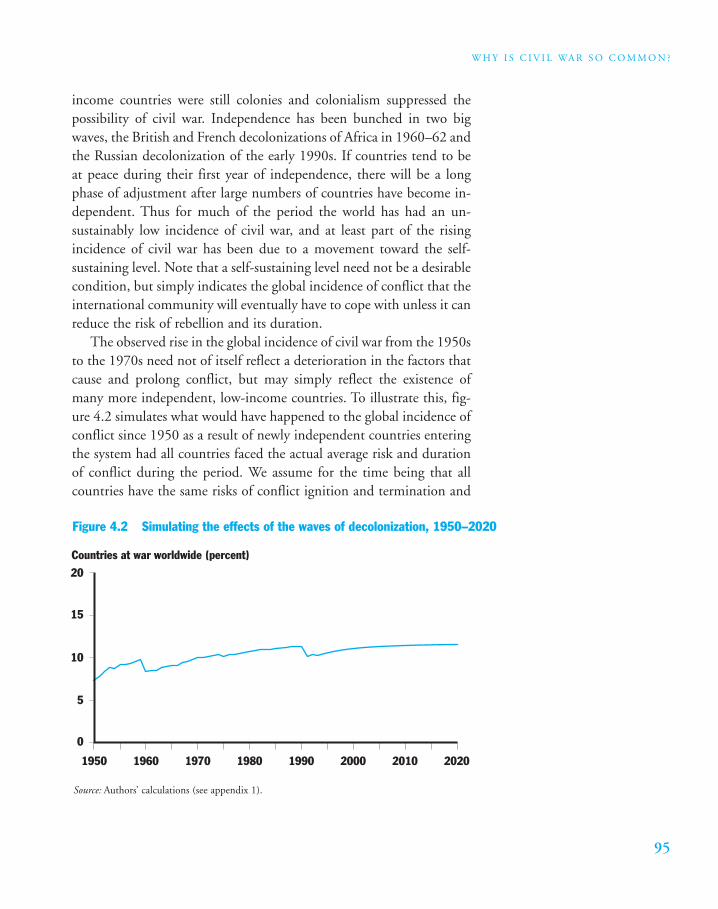
95
W H Y I S C I V I L WA R S O C O M M O N ?
income countries were still colonies and colonialism suppressed thepossibility of civil war. Independence has been bunched in two bigwaves, the British and French decolonizations of Africa in 1960–62 andthe Russian decolonization of the early 1990s. If countries tend to beat peace during their first year of independence, there will be a longphase of adjustment after large numbers of countries have become in-dependent. Thus for much of the period the world has had an un-sustainably low incidence of civil war, and at least part of the risingincidence of civil war has been due to a movement toward the self-sustaining level. Note that a self-sustaining level need not be a desirablecondition, but simply indicates the global incidence of conflict that theinternational community will eventually have to cope with unless it canreduce the risk of rebellion and its duration.
The observed rise in the global incidence of civil war from the 1950sto the 1970s need not of itself reflect a deterioration in the factors thatcause and prolong conflict, but may simply reflect the existence ofmany more independent, low-income countries. To illustrate this, fig-ure 4.2 simulates what would have happened to the global incidence ofconflict since 1950 as a result of newly independent countries enteringthe system had all countries faced the actual average risk and durationof conflict during the period. We assume for the time being that allcountries have the same risks of conflict ignition and termination and
Figure 4.2 Simulating the effects of the waves of decolonization, 1950–2020
Countries at war worldwide (percent)
0
5
10
15
20
1950 1960 1970 1980 1990 2000 2010 2020
Source: Authors’ calculations (see appendix 1).
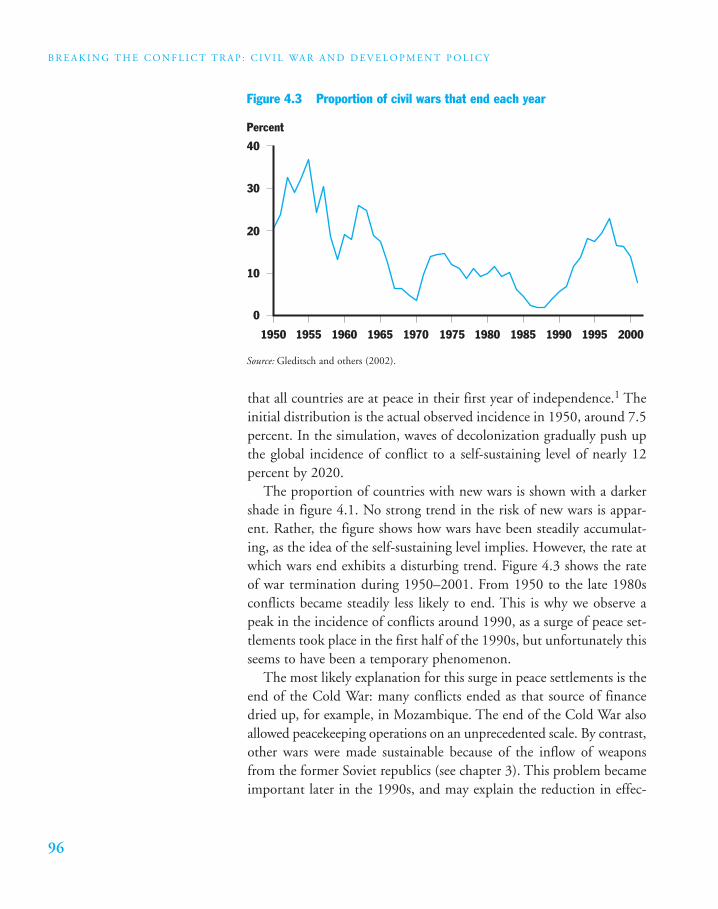
B R E A K I N G T H E C O N F L I C T T R A P : C I V I L WA R A N D D E V E L O P M E N T P O L I C Y
96
that all countries are at peace in their first year of independence.1 Theinitial distribution is the actual observed incidence in 1950, around 7.5percent. In the simulation, waves of decolonization gradually push upthe global incidence of conflict to a self-sustaining level of nearly 12percent by 2020.
The proportion of countries with new wars is shown with a darkershade in figure 4.1. No strong trend in the risk of new wars is appar-ent. Rather, the figure shows how wars have been steadily accumulat-ing, as the idea of the self-sustaining level implies. However, the rate atwhich wars end exhibits a disturbing trend. Figure 4.3 shows the rateof war termination during 1950–2001. From 1950 to the late 1980sconflicts became steadily less likely to end. This is why we observe apeak in the incidence of conflicts around 1990, as a surge of peace set-tlements took place in the first half of the 1990s, but unfortunately thisseems to have been a temporary phenomenon.
The most likely explanation for this surge in peace settlements is theend of the Cold War: many conflicts ended as that source of financedried up, for example, in Mozambique. The end of the Cold War alsoallowed peacekeeping operations on an unprecedented scale. By contrast,other wars were made sustainable because of the inflow of weaponsfrom the former Soviet republics (see chapter 3). This problem becameimportant later in the 1990s, and may explain the reduction in effec-
Figure 4.3 Proportion of civil wars that end each year
Percent
0
10
20
30
40
1950 1955 1960 1965 1970 1975 1980 1985 1990 1995 2000
Source: Gleditsch and others (2002).
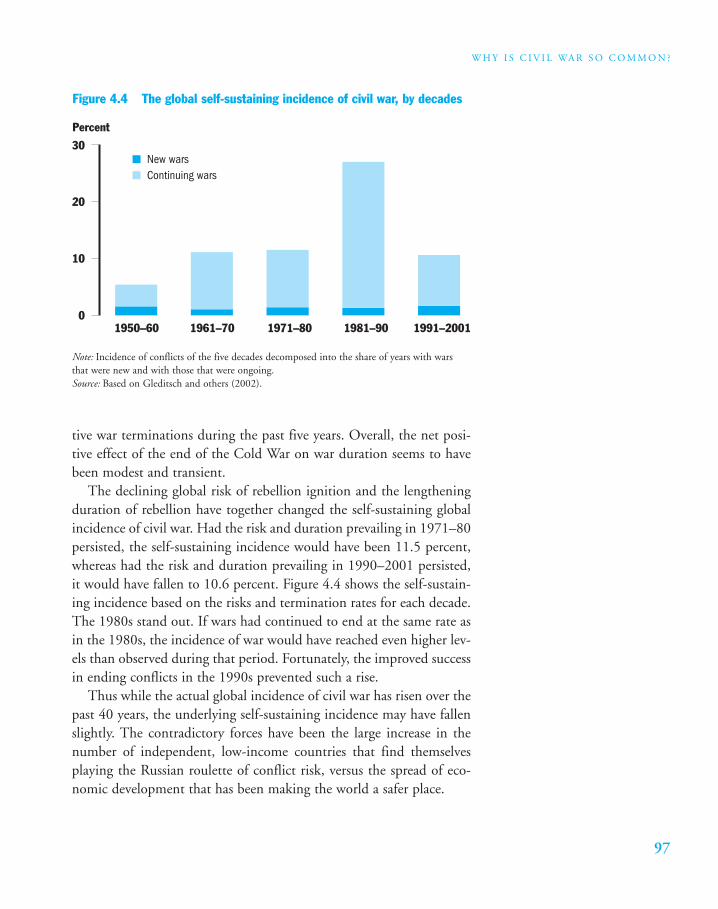
97
W H Y I S C I V I L WA R S O C O M M O N ?
tive war terminations during the past five years. Overall, the net posi-tive effect of the end of the Cold War on war duration seems to havebeen modest and transient.
The declining global risk of rebellion ignition and the lengtheningduration of rebellion have together changed the self-sustaining globalincidence of civil war. Had the risk and duration prevailing in 1971–80persisted, the self-sustaining incidence would have been 11.5 percent,whereas had the risk and duration prevailing in 1990–2001 persisted,it would have fallen to 10.6 percent. Figure 4.4 shows the self-sustain-ing incidence based on the risks and termination rates for each decade.The 1980s stand out. If wars had continued to end at the same rate asin the 1980s, the incidence of war would have reached even higher lev-els than observed during that period. Fortunately, the improved successin ending conflicts in the 1990s prevented such a rise.
Thus while the actual global incidence of civil war has risen over thepast 40 years, the underlying self-sustaining incidence may have fallenslightly. The contradictory forces have been the large increase in thenumber of independent, low-income countries that find themselvesplaying the Russian roulette of conflict risk, versus the spread of eco-nomic development that has been making the world a safer place.
Figure 4.4 The global self-sustaining incidence of civil war, by decades
Percent
0
10
20
30
1950–60
New warsContinuing wars
1961–70 1971–80 1981–90 1991–2001
Note: Incidence of conflicts of the five decades decomposed into the share of years with warsthat were new and with those that were ongoing.Source: Based on Gleditsch and others (2002).
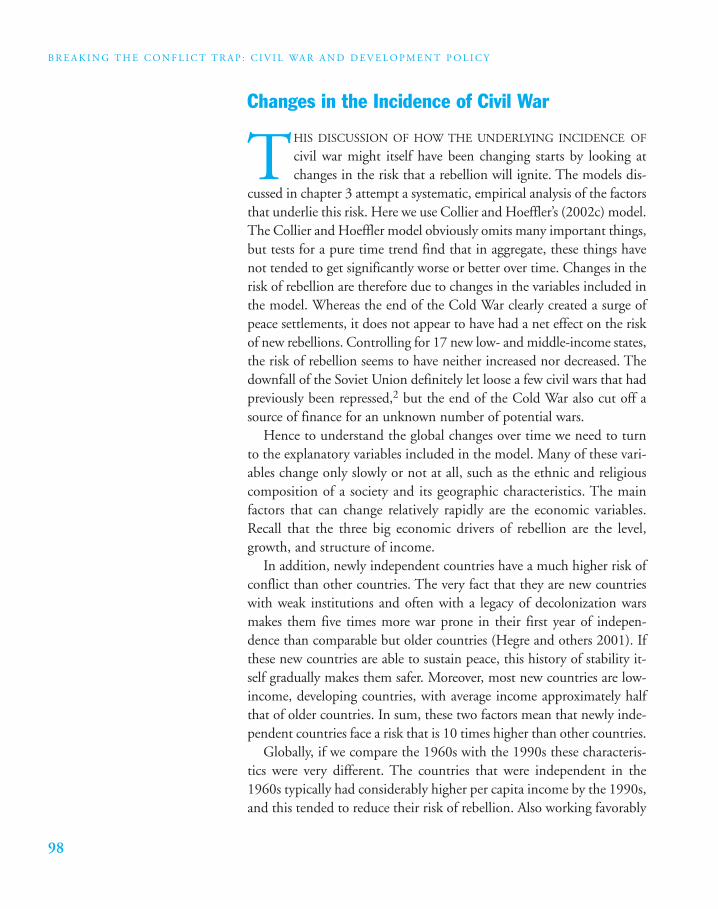
B R E A K I N G T H E C O N F L I C T T R A P : C I V I L WA R A N D D E V E L O P M E N T P O L I C Y
98
Changes in the Incidence of Civil War
THIS DISCUSSION OF HOW THE UNDERLYING INCIDENCE OF
civil war might itself have been changing starts by looking atchanges in the risk that a rebellion will ignite. The models dis-
cussed in chapter 3 attempt a systematic, empirical analysis of the factorsthat underlie this risk. Here we use Collier and Hoeffler’s (2002c) model.The Collier and Hoeffler model obviously omits many important things,but tests for a pure time trend find that in aggregate, these things havenot tended to get significantly worse or better over time. Changes in therisk of rebellion are therefore due to changes in the variables included inthe model. Whereas the end of the Cold War clearly created a surge ofpeace settlements, it does not appear to have had a net effect on the riskof new rebellions. Controlling for 17 new low- and middle-income states,the risk of rebellion seems to have neither increased nor decreased. Thedownfall of the Soviet Union definitely let loose a few civil wars that hadpreviously been repressed,2 but the end of the Cold War also cut off asource of finance for an unknown number of potential wars.
Hence to understand the global changes over time we need to turnto the explanatory variables included in the model. Many of these vari-ables change only slowly or not at all, such as the ethnic and religiouscomposition of a society and its geographic characteristics. The mainfactors that can change relatively rapidly are the economic variables.Recall that the three big economic drivers of rebellion are the level,growth, and structure of income.
In addition, newly independent countries have a much higher risk ofconflict than other countries. The very fact that they are new countrieswith weak institutions and often with a legacy of decolonization warsmakes them five times more war prone in their first year of indepen-dence than comparable but older countries (Hegre and others 2001). Ifthese new countries are able to sustain peace, this history of stability it-self gradually makes them safer. Moreover, most new countries are low-income, developing countries, with average income approximately halfthat of older countries. In sum, these two factors mean that newly inde-pendent countries face a risk that is 10 times higher than other countries.
Globally, if we compare the 1960s with the 1990s these characteris-tics were very different. The countries that were independent in the1960s typically had considerably higher per capita income by the 1990s,and this tended to reduce their risk of rebellion. Also working favorably
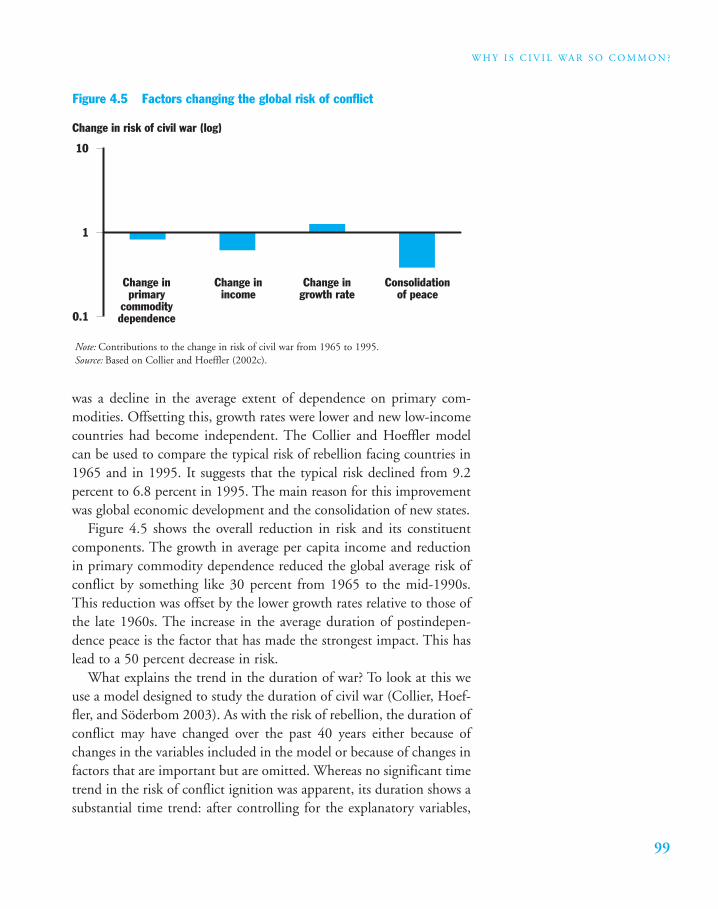
99
W H Y I S C I V I L WA R S O C O M M O N ?
was a decline in the average extent of dependence on primary com-modities. Offsetting this, growth rates were lower and new low-incomecountries had become independent. The Collier and Hoeffler modelcan be used to compare the typical risk of rebellion facing countries in1965 and in 1995. It suggests that the typical risk declined from 9.2percent to 6.8 percent in 1995. The main reason for this improvementwas global economic development and the consolidation of new states.
Figure 4.5 shows the overall reduction in risk and its constituentcomponents. The growth in average per capita income and reductionin primary commodity dependence reduced the global average risk ofconflict by something like 30 percent from 1965 to the mid-1990s.This reduction was offset by the lower growth rates relative to those ofthe late 1960s. The increase in the average duration of postindepen-dence peace is the factor that has made the strongest impact. This haslead to a 50 percent decrease in risk.
What explains the trend in the duration of war? To look at this weuse a model designed to study the duration of civil war (Collier, Hoef-fler, and Söderbom 2003). As with the risk of rebellion, the duration ofconflict may have changed over the past 40 years either because ofchanges in the variables included in the model or because of changes infactors that are important but are omitted. Whereas no significant timetrend in the risk of conflict ignition was apparent, its duration shows asubstantial time trend: after controlling for the explanatory variables,
Figure 4.5 Factors changing the global risk of conflict
Change in risk of civil war (log)
Consolidationof peace
Change ingrowth rate
Change inincome
Change inprimary
commoditydependence0.1
1
10
Note: Contributions to the change in risk of civil war from 1965 to 1995.Source: Based on Collier and Hoeffler (2002c).
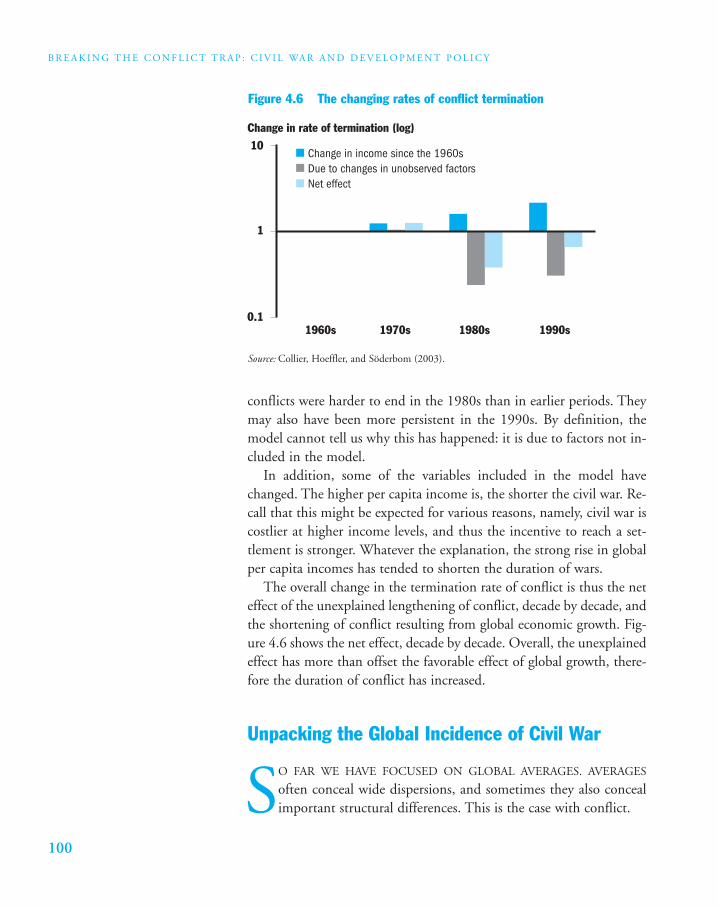
B R E A K I N G T H E C O N F L I C T T R A P : C I V I L WA R A N D D E V E L O P M E N T P O L I C Y
100
conflicts were harder to end in the 1980s than in earlier periods. Theymay also have been more persistent in the 1990s. By definition, themodel cannot tell us why this has happened: it is due to factors not in-cluded in the model.
In addition, some of the variables included in the model havechanged. The higher per capita income is, the shorter the civil war. Re-call that this might be expected for various reasons, namely, civil war iscostlier at higher income levels, and thus the incentive to reach a set-tlement is stronger. Whatever the explanation, the strong rise in globalper capita incomes has tended to shorten the duration of wars.
The overall change in the termination rate of conflict is thus the neteffect of the unexplained lengthening of conflict, decade by decade, andthe shortening of conflict resulting from global economic growth. Fig-ure 4.6 shows the net effect, decade by decade. Overall, the unexplainedeffect has more than offset the favorable effect of global growth, there-fore the duration of conflict has increased.
Unpacking the Global Incidence of Civil War
SO FAR WE HAVE FOCUSED ON GLOBAL AVERAGES. AVERAGES
often conceal wide dispersions, and sometimes they also concealimportant structural differences. This is the case with conflict.
Figure 4.6 The changing rates of conflict termination
Change in rate of termination (log)
0.1
1
10
1960s 1970s 1980s
Change in income since the 1960sDue to changes in unobserved factorsNet effect
1990s
Source: Collier, Hoeffler, and Söderbom (2003).
101
W H Y I S C I V I L WA R S O C O M M O N ?
Divergent Development Trends
For the past 20 years global growth has been raising incomes in much ofthe developing world and reducing the incidence of poverty. Much ofthe world’s population now lives in middle-income countries, defined asthose with per capita annual income above US$745. The structure ofdeveloping countries’ exports has also changed dramatically. Whereas in1980 primary commodities still accounted for three-quarters of exports,they now account for only 20 percent. Some low-income countries, in-cluding the largest, have succeeded in implementing and sustaining pol-icy reforms conducive to rapid growth and integration into global mar-kets. While currently they are still low-income countries, they are ontrack to joining China in becoming middle-income countries. Recallfrom chapter 3 that fast growth is not just a route to the eventual lowrisk that goes along with higher income levels, but also contributes di-rectly to risk reduction. We therefore aggregate those low-income coun-tries that have sustained reasonably good economic policies with themiddle-income countries and term the combined group “successful de-velopers.” Specifically, we include all those low-income countries thatover the 1990s averaged CPIA scores of 3.5 or better.3 Some of the suc-cessful developers are still at high risk of conflict, but as a group they arealready much safer than other developing countries and are on coursefor continuing reductions in risk.
Many developing countries have not, however, participated in thesefavorable trends. They have either been unable to implement reform ortheir reforms have not been sustained and they remain stuck in undi-versified primary commodity exports. We refer to this group as the“marginalized” low-income countries. The growth rates of per capita in-come in the two groups of countries were dramatically different in the1990s, negative at –1.0 percent for the marginalized countries and pos-itive at 2.0 percent for the successful developers. The average level of in-come in the marginalized countries was less than a third that of the suc-cessful developers when measured on a purchasing power parity basis.
Thus in aggregate, the marginalized countries are the one group thathas all three of the economic characteristics that appear to increaseproneness to conflict: low income, economic decline, and dependenceon primary commodities. The following section compares the risks andincidence of a civil war for a typical marginalized country with that forthe typical successful developer. Figure 4.7 shows the predicted risk for
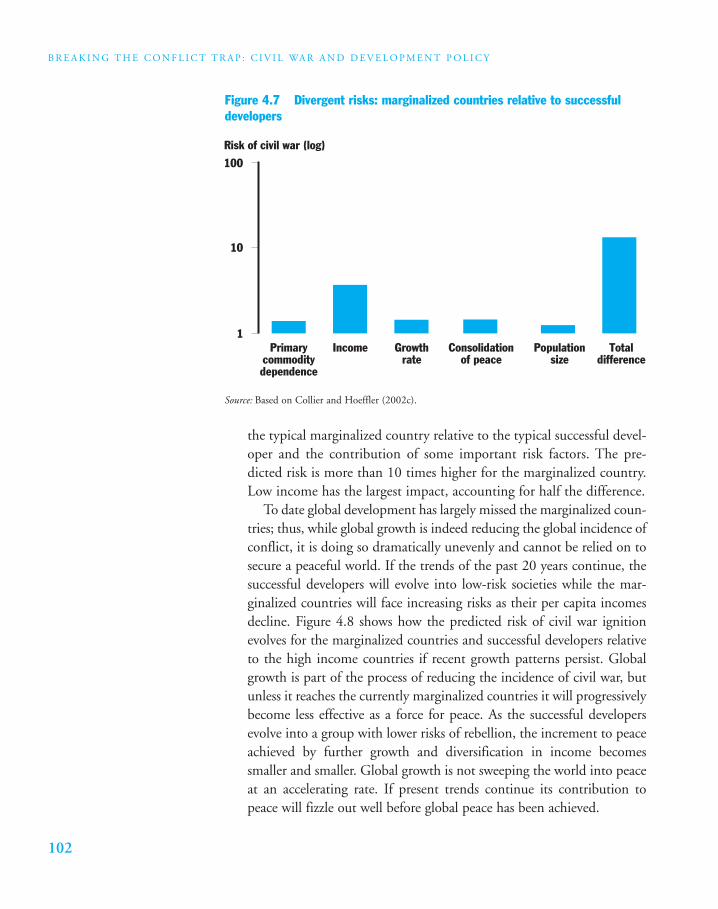
B R E A K I N G T H E C O N F L I C T T R A P : C I V I L WA R A N D D E V E L O P M E N T P O L I C Y
102
the typical marginalized country relative to the typical successful devel-oper and the contribution of some important risk factors. The pre-dicted risk is more than 10 times higher for the marginalized country.Low income has the largest impact, accounting for half the difference.
To date global development has largely missed the marginalized coun-tries; thus, while global growth is indeed reducing the global incidence ofconflict, it is doing so dramatically unevenly and cannot be relied on tosecure a peaceful world. If the trends of the past 20 years continue, thesuccessful developers will evolve into low-risk societies while the mar-ginalized countries will face increasing risks as their per capita incomesdecline. Figure 4.8 shows how the predicted risk of civil war ignitionevolves for the marginalized countries and successful developers relativeto the high income countries if recent growth patterns persist. Globalgrowth is part of the process of reducing the incidence of civil war, butunless it reaches the currently marginalized countries it will progressivelybecome less effective as a force for peace. As the successful developersevolve into a group with lower risks of rebellion, the increment to peaceachieved by further growth and diversification in income becomessmaller and smaller. Global growth is not sweeping the world into peaceat an accelerating rate. If present trends continue its contribution topeace will fizzle out well before global peace has been achieved.
Figure 4.7 Divergent risks: marginalized countries relative to successfuldevelopers
Risk of civil war (log)
1Primary
commoditydependence
Income Growthrate
Consolidationof peace
Populationsize
Totaldifference
10
100
Source: Based on Collier and Hoeffler (2002c).
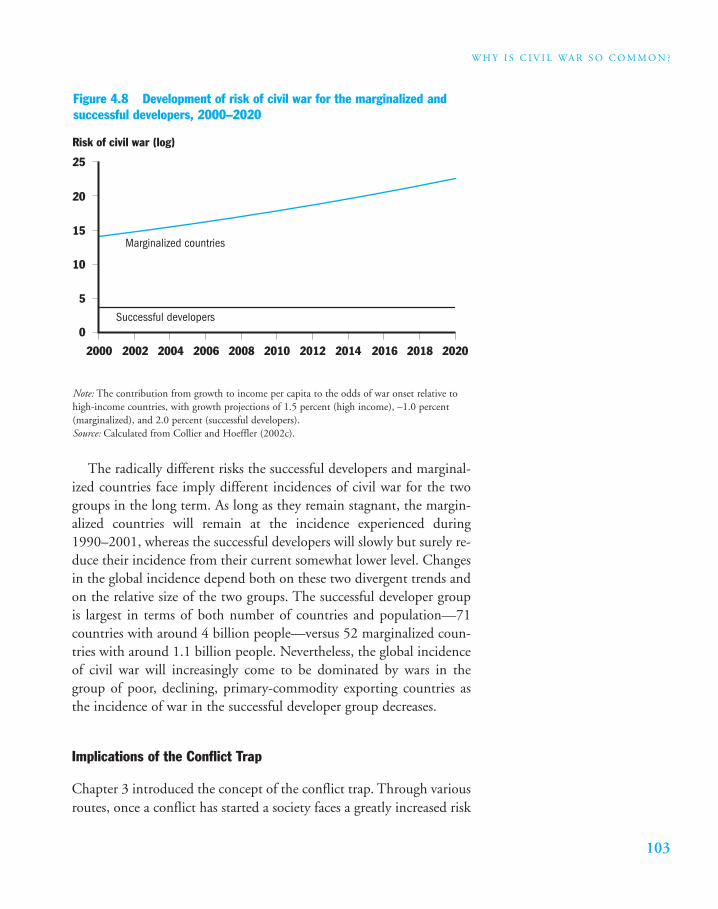
103
W H Y I S C I V I L WA R S O C O M M O N ?
The radically different risks the successful developers and marginal-ized countries face imply different incidences of civil war for the twogroups in the long term. As long as they remain stagnant, the margin-alized countries will remain at the incidence experienced during1990–2001, whereas the successful developers will slowly but surely re-duce their incidence from their current somewhat lower level. Changesin the global incidence depend both on these two divergent trends andon the relative size of the two groups. The successful developer groupis largest in terms of both number of countries and population—71countries with around 4 billion people—versus 52 marginalized coun-tries with around 1.1 billion people. Nevertheless, the global incidenceof civil war will increasingly come to be dominated by wars in thegroup of poor, declining, primary-commodity exporting countries asthe incidence of war in the successful developer group decreases.
Implications of the Conflict Trap
Chapter 3 introduced the concept of the conflict trap. Through variousroutes, once a conflict has started a society faces a greatly increased risk
Figure 4.8 Development of risk of civil war for the marginalized andsuccessful developers, 2000–2020
0
5
10
15
20
25
2000 2002 2004
Marginalized countries
Successful developers
Risk of civil war (log)
2006 2008 2010 2012 2014 2016 2018 2020
Note: The contribution from growth to income per capita to the odds of war onset relative tohigh-income countries, with growth projections of 1.5 percent (high income), –1.0 percent(marginalized), and 2.0 percent (successful developers).Source: Calculated from Collier and Hoeffler (2002c).
B R E A K I N G T H E C O N F L I C T T R A P : C I V I L WA R A N D D E V E L O P M E N T P O L I C Y
104
of further wars. Conflicts are hard to stop, and what happens duringconflict increases both the risk and duration of subsequent conflict.Countries that have had a war have a two to four times higher risk of asubsequent war, even when controlling for the factors we identified ear-lier. Boxes 4.1 and 4.2 describe two recurrent conflicts.
Figure 4.9 indicates how the risk of war ignition is altered after acivil war compared with before a war. The risk depends on how longthe country has been independent and at peace. In the first month ofpostindependence peace the risk of war is more than four times as highas after a decade of peace. After the first decade of consolidation, therisk does not change much as time goes by; however, if a civil warbreaks out the gain from this consolidation is lost. After the war, therisk of war re-igniting is two to four times higher than the risk facingnew states. This is the conflict trap: a country that first falls into thetrap may have a risk of new war that is 10 times higher just after thatwar has ended than before the war started. If the country succeeds inmaintaining postconflict peace for 10 years or so, the risk is consider-ably reduced, but remains at a higher level than before the conflict.This legacy of war seems to take a long time—a generation or two—before withering away (Hegre and others 2001).
THE WAR IN AFGHANISTAN STARTED IN 1978 WHEN
members of the Marxist-Leninist People’s Democra-tic Party of Afghanistan captured the state; assassi-nated political, ethnic, and religious elites; and in-cited uprisings (Asia Watch 1991). After the Sovietinvasion of December 1979 and the assassination ofAfghan president Hafizullah Amin, the war contin-ued with mujahideen fighting against the Soviet-installed Afghan government of Mohammad Na-jibullah. In 1992 the mujahideen captured powerand the state changed hands, but peace negotiationsamong Afghanistan’s many resistance factions ex-cluded key parties. One such group was GulbuddinHikmatyar’s Hizb-i Islami, which rejected the result-ing agreement and began a series of rocket attacks onKabul that continued into 1995 (Hiltermann 2002).
From 1992 until 1996 the war was waged by thePashtun-dominated Taliban seeking to overthrowBurhanuddin Rabbani and his Tajik-dominatedJam’iyat-i-Islam party. After a Taliban victory in1996 a new war started in which the Tajiks, Uzbeks,and others became the insurgents against the new“government” (Gurr, Marshall, and Khosla 2001).In 1997 the Taliban proclaimed the Islamic Emirateof Afghanistan, which was recognized by Pakistan,Saudi Arabia, and the United Arab Emirates. TheTaliban never controlled all the territory of Af-ghanistan, and about 5 to 10 percent of that terri-tory was controlled by the alliance known as theUnited Front, formed in 1996 by non-Pashtungroups opposed to the Taliban and led by Rabbani’sformer defense minister, Ahmad Shah Massoud.
Box 4.1 Recurrent conflicts example 1: Afghanistan
105
W H Y I S C I V I L WA R S O C O M M O N ?
This increase in risk is before we account for the changes in the ob-servable risk factors caused by the war itself. In particular, the impact ofthe civil war on the economy is extremely damaging (see chapter 1).Growth of GDP per capita is reduced by around 2.2 percentage pointsper year during war. Moreover, the effects of the war linger on after theconflict, so that the country’s economic performance is hampered for several years after the conflict has ended. Only after extremely longconflicts, for example, in Mozambique, where disruption is so completethat the mere fact that large numbers of people return to work showsup as a significant improvement, will a peace agreement mean an im-mediate improvement in growth performance. Hence the typical con-flict reduces income by some 10 to 15 percent. Such losses in incomeare also often associated with an increase in primary commodity de-pendence of roughly two percentage points (Collier and Hoeffler2002b). These two changes imply an increase in the risk of war onset ofan additional 5 percent.
A PATTERN OF FAILED PEACE AGREEMENTS IN
Angola has checkered a history of civil war that hasbeen ongoing since the country’s independence in1975. The war against UNITA over control of thecentral government from 1975 until 1994 causedapproximately 345,000 deaths and ended in a stale-mate that led to the Lusaka Accord and the deploy-ment of a UN peacekeeping force. Failure to imple-ment the agreement led to a renewal of war in late1997. The U.S. State Department noted more than100 ceasefire violations in a three-month period in1996. Despite that instability, the period 1996–97was one in which UNITA officials were becomingincreasingly integrated into the government, andthe annual death toll during this time was probably“only” in the low hundreds. Fighting resumed inMarch 1998 despite an agreement reached on Jan-uary 9, 1998, for resolution of the remaining issuesunder the Lusaka Accord. UNITA leader JonasSavimbi refused to move to the capital and join thegovernment. UNITA forces quickly retook more
than 300 areas previously returned to the gov-ernment, but by the end of 1999 the government,with the support of Namibian government forces,had overrun UNITA’s former headquarters (Parker,Heindel, and Branch 2000). Thereafter, UNITA’smilitary position continued to deteriorate becauseof a double squeeze. The government used theopportunity of high oil prices to increase militaryspending. At the same time the Fowler Report ofthe UN exposed the routes by which UNITA hadbeen financed and supplied, as a result of which it was closed off. In February 2002 Savimbi wascornered and killed and UNITA accepted a peacesettlement. The Angolan government was able tonegotiate from strength. More than 10,000 peoplewere killed in the new round of fighting, and ac-cording to the United Nations Children’s Fund,nearly 75,000 people died of starvation in 1999 andat least 1.5 million people were displaced as of Jan-uary 2000 because of the war (Parker, Heindel, andBranch 2000).
Box 4.2 Recurrent conflicts example 2: Angola
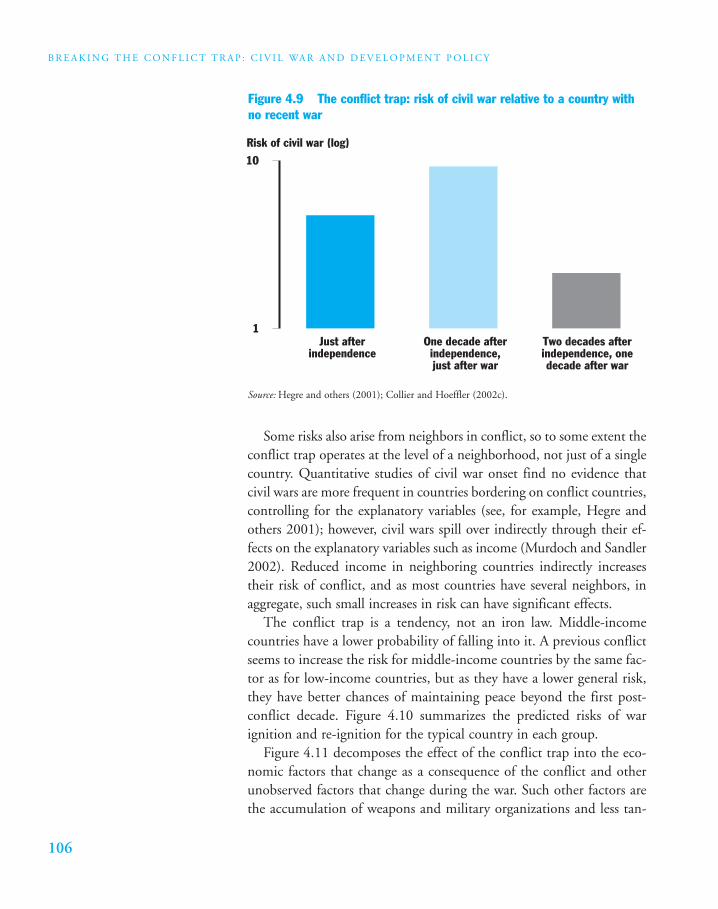
B R E A K I N G T H E C O N F L I C T T R A P : C I V I L WA R A N D D E V E L O P M E N T P O L I C Y
106
Some risks also arise from neighbors in conflict, so to some extent theconflict trap operates at the level of a neighborhood, not just of a singlecountry. Quantitative studies of civil war onset find no evidence thatcivil wars are more frequent in countries bordering on conflict countries,controlling for the explanatory variables (see, for example, Hegre andothers 2001); however, civil wars spill over indirectly through their ef-fects on the explanatory variables such as income (Murdoch and Sandler2002). Reduced income in neighboring countries indirectly increasestheir risk of conflict, and as most countries have several neighbors, inaggregate, such small increases in risk can have significant effects.
The conflict trap is a tendency, not an iron law. Middle-incomecountries have a lower probability of falling into it. A previous conflictseems to increase the risk for middle-income countries by the same fac-tor as for low-income countries, but as they have a lower general risk,they have better chances of maintaining peace beyond the first post-conflict decade. Figure 4.10 summarizes the predicted risks of warignition and re-ignition for the typical country in each group.
Figure 4.11 decomposes the effect of the conflict trap into the eco-nomic factors that change as a consequence of the conflict and otherunobserved factors that change during the war. Such other factors arethe accumulation of weapons and military organizations and less tan-
Figure 4.9 The conflict trap: risk of civil war relative to a country withno recent war
Two decades afterindependence, onedecade after war
One decade afterindependence,just after war
Just afterindependence
Risk of civil war (log)
1
10
Source: Hegre and others (2001); Collier and Hoeffler (2002c).
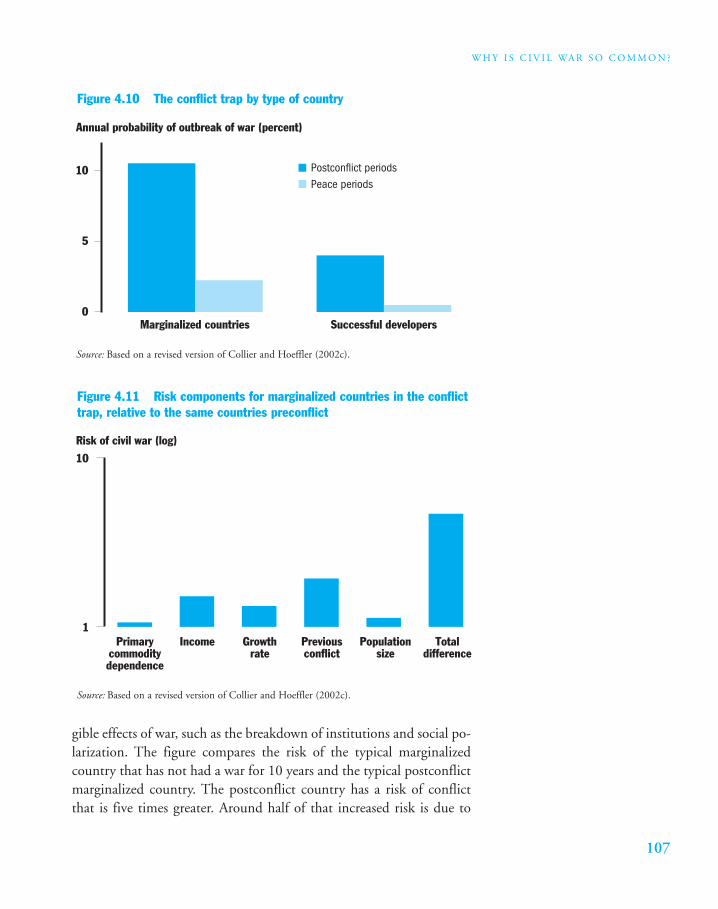
107
W H Y I S C I V I L WA R S O C O M M O N ?
gible effects of war, such as the breakdown of institutions and social po-larization. The figure compares the risk of the typical marginalizedcountry that has not had a war for 10 years and the typical postconflictmarginalized country. The postconflict country has a risk of conflictthat is five times greater. Around half of that increased risk is due to
Figure 4.11 Risk components for marginalized countries in the conflicttrap, relative to the same countries preconflict
Risk of civil war (log)
Primarycommoditydependence
Income Growthrate
Previousconflict
Populationsize
Totaldifference
1
10
Source: Based on a revised version of Collier and Hoeffler (2002c).
Figure 4.10 The conflict trap by type of country
Marginalized countries Successful developers
Postconflict periodsPeace periods
5
0
10
Annual probability of outbreak of war (percent)
Source: Based on a revised version of Collier and Hoeffler (2002c).
B R E A K I N G T H E C O N F L I C T T R A P : C I V I L WA R A N D D E V E L O P M E N T P O L I C Y
108
negative changes in primary commodity dependence and reduced in-come and growth. The other half of the increased risk is unexplainedand will in part be due to the selection problem: conflict countries al-ready had unobserved characteristics that increase the risk of conflict.
The conflict trap has implications for the global incidence of con-flict. The countries most prone to the trap are the marginalized low-income countries. Although poor, peaceful, stagnant economies look asif they are stuck in an equilibrium, they are, in effect, playing Russianroulette. A low-income, stagnant country that starts its independenceat peace does not have a very long expected duration of that peace, al-though some countries, even though economically stagnant, have todate preserved peace, whether through prudent policies or good for-tune, for example, Malawi, Tanzania, and Zambia. However, even longperiods of peace are no guarantee of safety. Côte d’Ivoire and Nepal arerecent instances of moderately democratic low-income countries withlong histories of peace collapsing into civil war.
The marginalized stagnant but peaceful countries are thus livingdangerously. Not only are they prone to civil war, more important,once a war has started they also face a permanently changed risk of con-flict, that is, they are stuck in the conflict trap. The poor but peacefulcategory of countries, although currently numerous, is thus not likelyto be so numerous in a global self-sustaining level. We would expectthese countries either to develop, joining the successful developers, orat some stage succumb to civil war, with many then becoming trappedin conflict. In the long run poor but peaceful is not an option. Theworld is therefore evolving into a state in which most countries are per-manently conflict free while a minority are trapped in a cycle of lengthywar, uneasy peace, and reversion to lengthy war.
This leads to a different view of the self-sustaining incidence of con-flict, with radically different risks for different groups. The high-incomecountries have a negligible risk of civil war. A second group of coun-tries, a majority, will be in a virtuous circle of peace, with income ris-ing strongly and diversifying out of dependence on primary commodi-ties. These countries will face a low and declining risk of conflict. Thefew civil wars that occur in this group may be long, but they will tendnot to trap countries into a cycle of conflict. A third smaller group ofcountries will be stuck in a conflict trap. Although they may periodi-cally reach peace, the legacy of the conflict is such that peace is not sus-tained. Occasionally countries will switch between these groups. Once
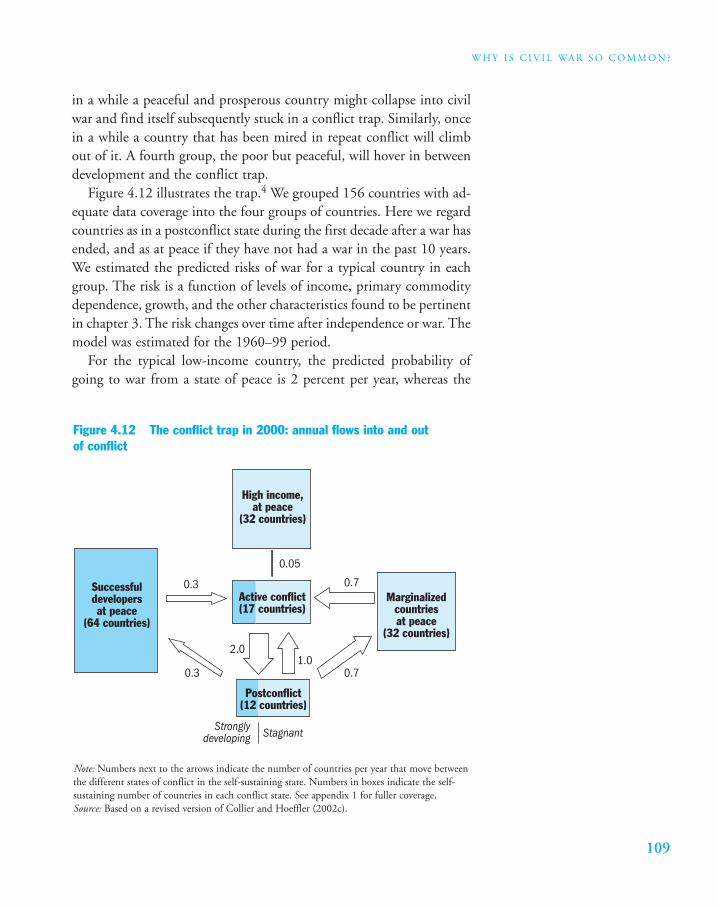
109
W H Y I S C I V I L WA R S O C O M M O N ?
in a while a peaceful and prosperous country might collapse into civilwar and find itself subsequently stuck in a conflict trap. Similarly, oncein a while a country that has been mired in repeat conflict will climbout of it. A fourth group, the poor but peaceful, will hover in betweendevelopment and the conflict trap.
Figure 4.12 illustrates the trap.4 We grouped 156 countries with ad-equate data coverage into the four groups of countries. Here we regardcountries as in a postconflict state during the first decade after a war hasended, and as at peace if they have not had a war in the past 10 years.We estimated the predicted risks of war for a typical country in eachgroup. The risk is a function of levels of income, primary commoditydependence, growth, and the other characteristics found to be pertinentin chapter 3. The risk changes over time after independence or war. Themodel was estimated for the 1960–99 period.
For the typical low-income country, the predicted probability ofgoing to war from a state of peace is 2 percent per year, whereas the
Figure 4.12 The conflict trap in 2000: annual flows into and outof conflict
Note: Numbers next to the arrows indicate the number of countries per year that move betweenthe different states of conflict in the self-sustaining state. Numbers in boxes indicate the self-sustaining number of countries in each conflict state. See appendix 1 for fuller coverage.Source: Based on a revised version of Collier and Hoeffler (2002c).
High income,at peace
(32 countries)
Active conflict(17 countries)
Postconflict(12 countries)
Successfuldevelopersat peace
(64 countries)
0.3
0.05
0.7
0.70.3
Stronglydeveloping Stagnant
1.02.0
Marginalizedcountriesat peace
(32 countries)
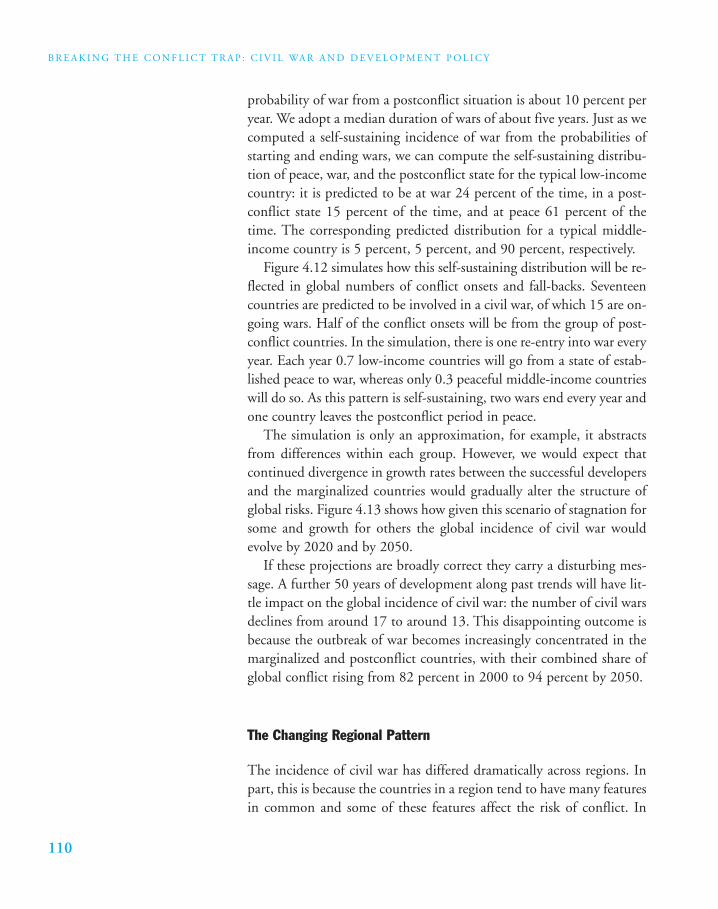
B R E A K I N G T H E C O N F L I C T T R A P : C I V I L WA R A N D D E V E L O P M E N T P O L I C Y
110
probability of war from a postconflict situation is about 10 percent peryear. We adopt a median duration of wars of about five years. Just as wecomputed a self-sustaining incidence of war from the probabilities ofstarting and ending wars, we can compute the self-sustaining distribu-tion of peace, war, and the postconflict state for the typical low-incomecountry: it is predicted to be at war 24 percent of the time, in a post-conflict state 15 percent of the time, and at peace 61 percent of thetime. The corresponding predicted distribution for a typical middle-income country is 5 percent, 5 percent, and 90 percent, respectively.
Figure 4.12 simulates how this self-sustaining distribution will be re-flected in global numbers of conflict onsets and fall-backs. Seventeencountries are predicted to be involved in a civil war, of which 15 are on-going wars. Half of the conflict onsets will be from the group of post-conflict countries. In the simulation, there is one re-entry into war everyyear. Each year 0.7 low-income countries will go from a state of estab-lished peace to war, whereas only 0.3 peaceful middle-income countrieswill do so. As this pattern is self-sustaining, two wars end every year andone country leaves the postconflict period in peace.
The simulation is only an approximation, for example, it abstractsfrom differences within each group. However, we would expect thatcontinued divergence in growth rates between the successful developersand the marginalized countries would gradually alter the structure ofglobal risks. Figure 4.13 shows how given this scenario of stagnation forsome and growth for others the global incidence of civil war wouldevolve by 2020 and by 2050.
If these projections are broadly correct they carry a disturbing mes-sage. A further 50 years of development along past trends will have lit-tle impact on the global incidence of civil war: the number of civil warsdeclines from around 17 to around 13. This disappointing outcome isbecause the outbreak of war becomes increasingly concentrated in themarginalized and postconflict countries, with their combined share ofglobal conflict rising from 82 percent in 2000 to 94 percent by 2050.
The Changing Regional Pattern
The incidence of civil war has differed dramatically across regions. Inpart, this is because the countries in a region tend to have many featuresin common and some of these features affect the risk of conflict. In
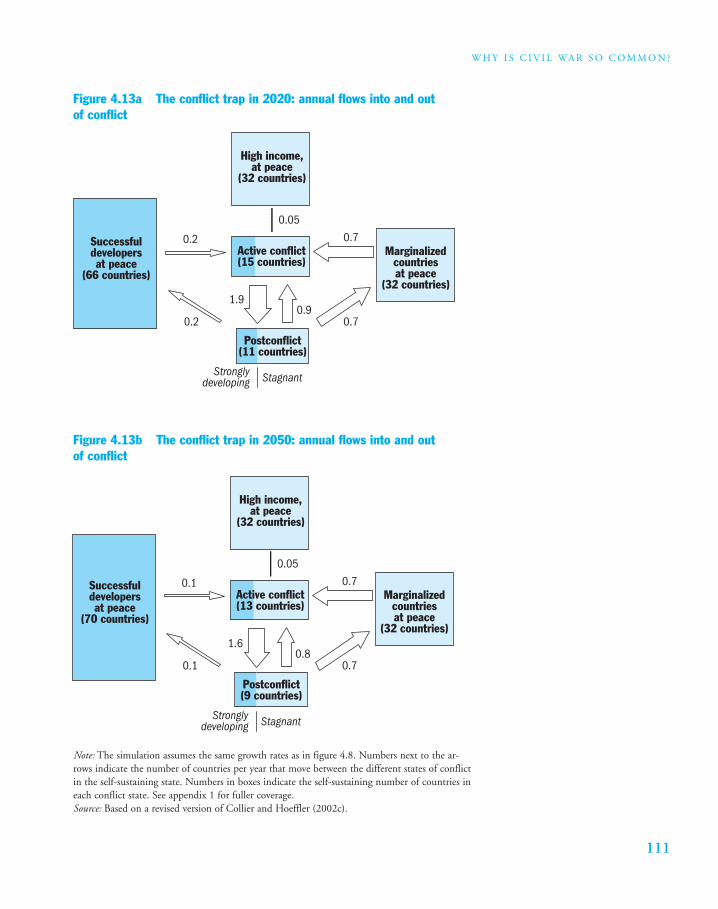
111
W H Y I S C I V I L WA R S O C O M M O N ?
Figure 4.13a The conflict trap in 2020: annual flows into and outof conflict
High income,at peace
(32 countries)
Active conflict(15 countries)
Postconflict(11 countries)
Successfuldevelopersat peace
(66 countries)
0.2
0.05
0.7
0.70.2
Stronglydeveloping Stagnant
0.91.9
Marginalizedcountriesat peace
(32 countries)
Figure 4.13b The conflict trap in 2050: annual flows into and outof conflict
Note: The simulation assumes the same growth rates as in figure 4.8. Numbers next to the ar-rows indicate the number of countries per year that move between the different states of conflictin the self-sustaining state. Numbers in boxes indicate the self-sustaining number of countries ineach conflict state. See appendix 1 for fuller coverage.Source: Based on a revised version of Collier and Hoeffler (2002c).
High income,at peace
(32 countries)
Active conflict(13 countries)
Postconflict(9 countries)
Successfuldevelopersat peace
(70 countries)
0.1
0.05
0.7
0.70.1
Stronglydeveloping Stagnant
0.81.6
Marginalizedcountriesat peace
(32 countries)
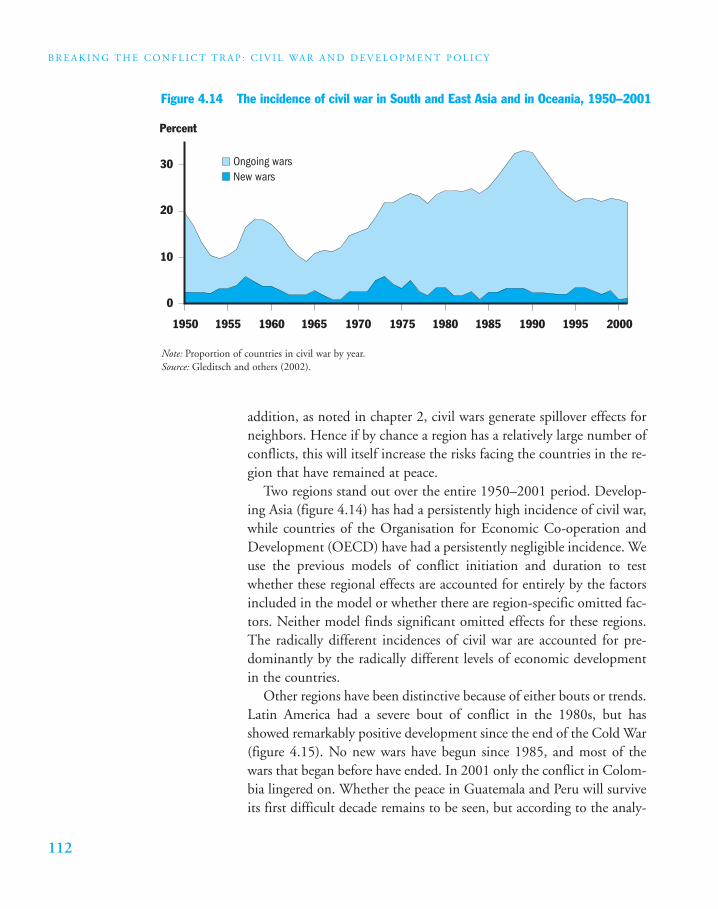
B R E A K I N G T H E C O N F L I C T T R A P : C I V I L WA R A N D D E V E L O P M E N T P O L I C Y
112
addition, as noted in chapter 2, civil wars generate spillover effects forneighbors. Hence if by chance a region has a relatively large number ofconflicts, this will itself increase the risks facing the countries in the re-gion that have remained at peace.
Two regions stand out over the entire 1950–2001 period. Develop-ing Asia (figure 4.14) has had a persistently high incidence of civil war,while countries of the Organisation for Economic Co-operation andDevelopment (OECD) have had a persistently negligible incidence. Weuse the previous models of conflict initiation and duration to testwhether these regional effects are accounted for entirely by the factorsincluded in the model or whether there are region-specific omitted fac-tors. Neither model finds significant omitted effects for these regions.The radically different incidences of civil war are accounted for pre-dominantly by the radically different levels of economic developmentin the countries.
Other regions have been distinctive because of either bouts or trends.Latin America had a severe bout of conflict in the 1980s, but hasshowed remarkably positive development since the end of the Cold War(figure 4.15). No new wars have begun since 1985, and most of thewars that began before have ended. In 2001 only the conflict in Colom-bia lingered on. Whether the peace in Guatemala and Peru will surviveits first difficult decade remains to be seen, but according to the analy-
Figure 4.14 The incidence of civil war in South and East Asia and in Oceania, 1950–2001
Note: Proportion of countries in civil war by year.Source: Gleditsch and others (2002).
Percent
Ongoing warsNew wars
0
10
20
30
1950 1955 1960 1965 1970 1975 1980 1985 1990 1995 2000
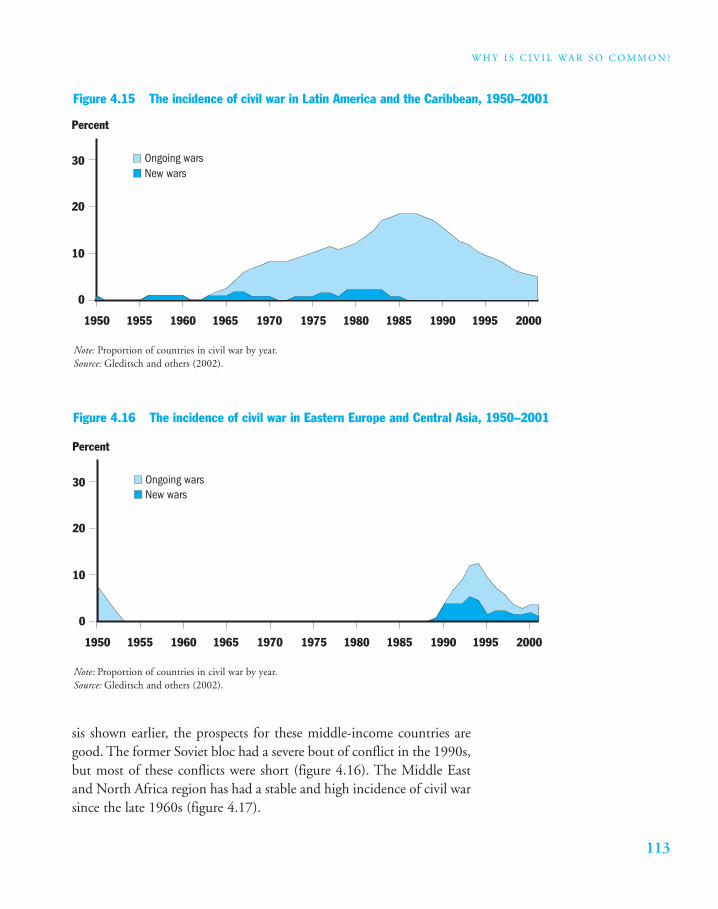
113
W H Y I S C I V I L WA R S O C O M M O N ?
sis shown earlier, the prospects for these middle-income countries aregood. The former Soviet bloc had a severe bout of conflict in the 1990s,but most of these conflicts were short (figure 4.16). The Middle Eastand North Africa region has had a stable and high incidence of civil warsince the late 1960s (figure 4.17).
Figure 4.15 The incidence of civil war in Latin America and the Caribbean, 1950–2001
Note: Proportion of countries in civil war by year.Source: Gleditsch and others (2002).
Percent
Ongoing warsNew wars
0
10
20
30
1950 1955 1960 1965 1970 1975 1980 1985 1990 1995 2000
Figure 4.16 The incidence of civil war in Eastern Europe and Central Asia, 1950–2001
Note: Proportion of countries in civil war by year.Source: Gleditsch and others (2002).
Percent
Ongoing warsNew wars
0
10
20
30
1950 1955 1960 1965 1970 1975 1980 1985 1990 1995 2000
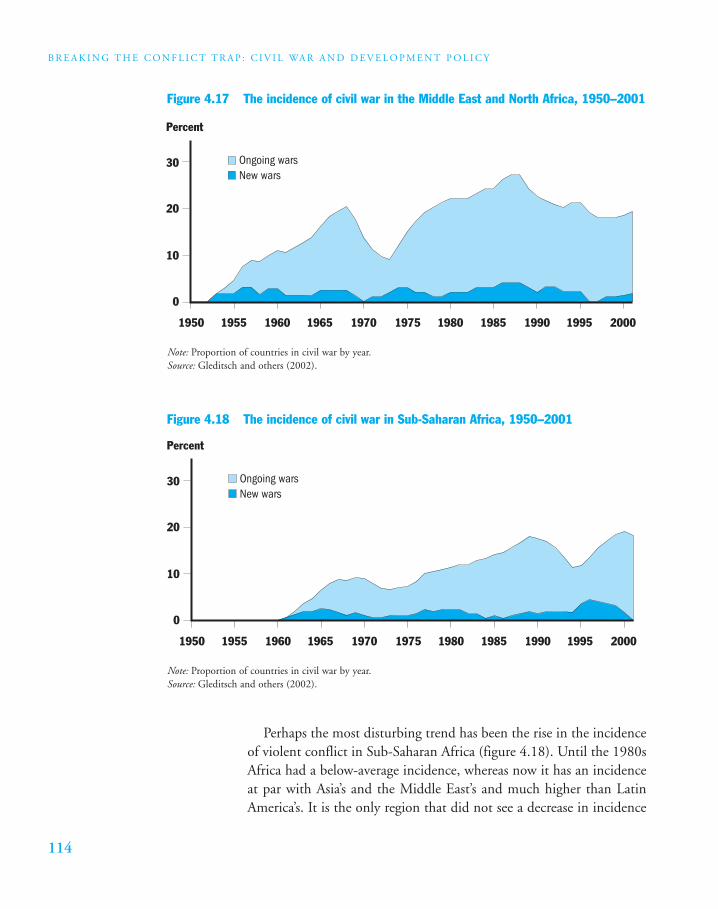
B R E A K I N G T H E C O N F L I C T T R A P : C I V I L WA R A N D D E V E L O P M E N T P O L I C Y
114
Perhaps the most disturbing trend has been the rise in the incidenceof violent conflict in Sub-Saharan Africa (figure 4.18). Until the 1980sAfrica had a below-average incidence, whereas now it has an incidenceat par with Asia’s and the Middle East’s and much higher than LatinAmerica’s. It is the only region that did not see a decrease in incidence
Figure 4.18 The incidence of civil war in Sub-Saharan Africa, 1950–2001
Note: Proportion of countries in civil war by year.Source: Gleditsch and others (2002).
Percent
Ongoing warsNew wars
0
10
20
30
1950 1955 1960 1965 1970 1975 1980 1985 1990 1995 2000
Figure 4.17 The incidence of civil war in the Middle East and North Africa, 1950–2001
Note: Proportion of countries in civil war by year.Source: Gleditsch and others (2002).
Percent
Ongoing warsNew wars
0
10
20
30
1950 1955 1960 1965 1970 1975 1980 1985 1990 1995 2000
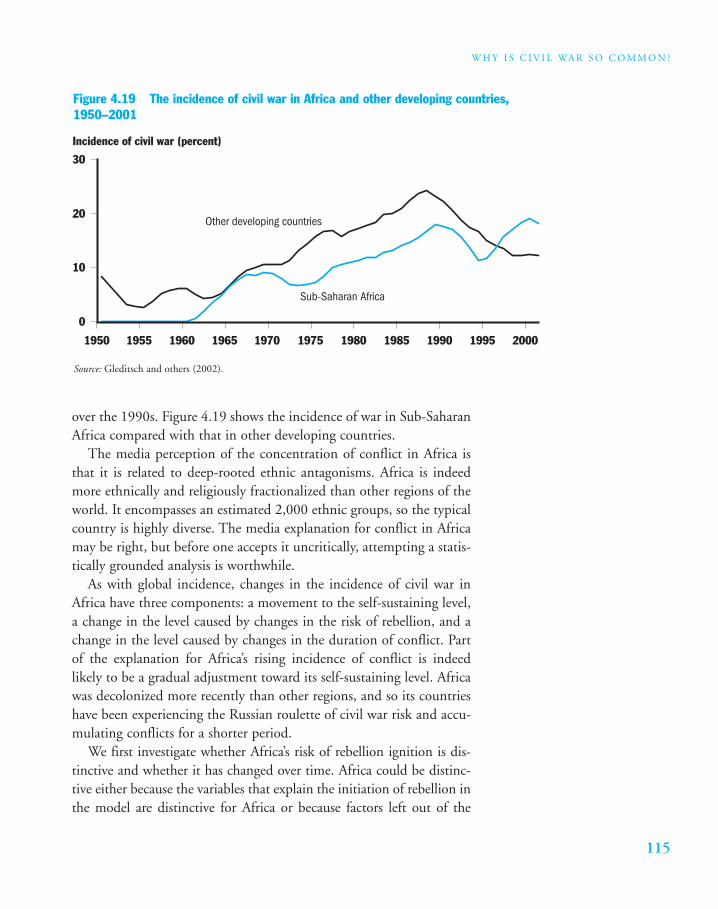
115
W H Y I S C I V I L WA R S O C O M M O N ?
over the 1990s. Figure 4.19 shows the incidence of war in Sub-SaharanAfrica compared with that in other developing countries.
The media perception of the concentration of conflict in Africa isthat it is related to deep-rooted ethnic antagonisms. Africa is indeedmore ethnically and religiously fractionalized than other regions of theworld. It encompasses an estimated 2,000 ethnic groups, so the typicalcountry is highly diverse. The media explanation for conflict in Africamay be right, but before one accepts it uncritically, attempting a statis-tically grounded analysis is worthwhile.
As with global incidence, changes in the incidence of civil war inAfrica have three components: a movement to the self-sustaining level,a change in the level caused by changes in the risk of rebellion, and achange in the level caused by changes in the duration of conflict. Partof the explanation for Africa’s rising incidence of conflict is indeedlikely to be a gradual adjustment toward its self-sustaining level. Africawas decolonized more recently than other regions, and so its countrieshave been experiencing the Russian roulette of civil war risk and accu-mulating conflicts for a shorter period.
We first investigate whether Africa’s risk of rebellion ignition is dis-tinctive and whether it has changed over time. Africa could be distinc-tive either because the variables that explain the initiation of rebellion inthe model are distinctive for Africa or because factors left out of the
Figure 4.19 The incidence of civil war in Africa and other developing countries,1950–2001
Source: Gleditsch and others (2002).
Incidence of civil war (percent)
0
10
20
30
1950 1955 1960 1965
Other developing countries
Sub-Saharan Africa
1970 1975 1980 1985 1990 1995 2000
B R E A K I N G T H E C O N F L I C T T R A P : C I V I L WA R A N D D E V E L O P M E N T P O L I C Y
116
model are distinctive for Africa. The latter possibility can be investigatedby including a dummy variable for Africa. When this is included—bothfor the whole of the region and for the francophone part separately—itis insignificant; thus the distinctive behavior of the variables includedwithin the model account for Africa’s distinctive experience.
If we compare economic variables for 1970 with those for 1995,Africa appears to have changed relatively little. Per capita income hadbarely risen over the quarter century, and by the early 1990s growthrates had actually turned negative, whereas in the late 1960s they hadbeen quite high. Dependence on primary commodity exports had in-creased slightly over the period. In combination, the Collier and Hoef-fler model estimates that the risk of the initiation of rebellion in Africaincreased from around 8 percent for the five-year period 1970–74 toaround 12.6 percent for 1995–99. By contrast, other developing re-gions had, on average, experienced a substantial increase in per capitaincome, and even though growth rates were lower in the early 1990sthan in the late 1960s, they remained positive. Furthermore, theseother developing regions had sharply reduced their dependence on pri-mary commodity exports from levels above those of Africa in 1970 tolevels well below those of Africa by 1995. In combination the model es-timates that these changes substantially reduced the risk that a rebellionwould be initiated, from nearly 15 percent in 1970–74, a level farhigher than that of Africa, to around 5 percent by 1995–99.
If the model is broadly correct it implies that the distinctively risingincidence of civil war in Africa was at least partly due to the contributionof Africa’s distinctively poor economic performance to its risk of rebel-lion ignition. Other regions had sufficiently good economic perfor-mance to radically drive down the rate at which rebellions were initiated.
As concerns the duration of conflict, the Collier, Hoeffler, and Söder-bom model does not find any distinctive Africa effect. To the extent thatAfrican conflicts last a long time it is because of factors included withinthe model. Here again, Africa’s distinctive economic performance mat-ters. Recall that the lower per capita income is, the longer conflicts tendto last. The divergence between Africa and other developing regions inper capita income has tended to shorten non-African conflicts relativeto African conflicts. Africa has thus had no favorable offsetting effect tothe unexplained global trend for conflicts to lengthen.
Africa has experienced quite different trends from other developingregions, both in the risk of conflict ignition and in its expected dura-
117
W H Y I S C I V I L WA R S O C O M M O N ?
tion. Both of these divergences are due to its worse economic perfor-mance. As these are the two components determining the self-sustain-ing incidence of civil war, the implication is that the incidence rose inAfrica whereas it declined substantially elsewhere.
How does this account compare with the popular media explanationof African conflict in terms of deep-rooted ethnic hatreds? Recall thatthe statistical analysis reported in chapter 3 agrees that ethnic and reli-gious composition affect both the risk of conflict and its duration. Eth-nic dominance is a substantial risk factor, although ethnic and religiousdiversity is otherwise a safety factor. Compared with other developingregions, the model considers Africa’s social composition to be con-ducive to a low risk of conflict ignition. Its high level of diversity im-plies that fewer African countries (40 percent) are characterized by eth-nic dominance compared with other developing regions (54 percent);however, once a conflict starts, Africa’s ethnic composition is likely tolead to longer conflicts. Africa’s index of ethno-linguistic fractionaliza-tion is higher than in other regions, and for the typical country this im-plies that conflict would be longer. The lower risk of conflict ignitionand longer conflicts on the incidence of conflict offset each other, sothat the effect of social composition on the incidence of conflict is am-biguous. In essence, however, the models suggest that far from Africa’sconflict problem being deep-rooted in its social structure, it is a conse-quence of the disastrous deviation of African economic performancefrom that of other developing countries that set it apart during the1970s and has proved persistent. Of course, Africa’s distinctive socialcomposition may have contributed to its poor economic performance,but this is a different issue.
Conclusion: Poverty and the Conflict Trap
INDIVIDUAL CIVIL WARS HAVE THEIR OWN IDIOSYNCRATIC
causes, such as the appearance of a charismatic rebel leader coinci-dent with government abuses of power; however, long-term
changes in the global incidence of civil war are unlikely to be deter-mined by any overall pattern in such idiosyncratic events. The behav-ior of two groups of countries will increasingly come to dominate theglobal prevalence of civil war: the marginalized countries and those inthe conflict trap.
B R E A K I N G T H E C O N F L I C T T R A P : C I V I L WA R A N D D E V E L O P M E N T P O L I C Y
118
The contribution of the marginalized countries to the global inci-dence of conflict will depend on the size of the group and its economicperformance. Thus stimulating development in the slow-growing, low-income countries is one of the two critical interventions to reduce theglobal incidence of conflict. The other critical intervention is to weakenthe conflict trap, thereby increasing the chances of sustained peace inpostconflict situations. These are not the only intervention points forenhancing global peace, but they will increasingly become the most im-portant ones. Part III focuses on these.
Notes
1. Later in the chapter we show that newly inde-pendent countries have a particularly high risk of war.This is not accounted for in figure 4.2. A simulation in-cluding this in the specification would have had aquicker convergence to the self-sustaining incidence.
2. See Mearsheimer (1990) for an extremely pes-simistic prediction just after the Cold War ended.
3. These were Armenia, Bhutan, Ghana, India, In-donesia, and Uganda.
4. The methods used to produce this figure are de-scribed in detail in appendix 1.
P A R T I I I
POLICIESFOR PEACE
PART I SHOWED THAT CIVIL WAR IS DEVELOP-
ment in reverse for the countries directly affectedand that it generates huge costs both for neigh-bors and internationally. Those who are not thecombatants bear most of the costs of war. Mod-ern civil war is not usually an investment in thefuture: it is not a catalyst for progress. On thecontrary, even after the war ends its costs—social,political, and economic—continue to mount. Ifthe international incidence of civil war could bereduced, the world would be a better place. Thequestion is not whether curtailing civil war is de-sirable, but whether doing so is feasible. Part IIinvestigated the background to effective policyformulation: what fuels war, both at the level ofan individual country and at the level of the in-ternational system. At the country level we saw
that various dimensions of economic develop-ment strongly influence the risk of war. At the in-ternational level we saw that two components ofrisk dominate the overall incidence of conflict:the risks coming from low-income, stagnant coun-tries and the risks coming from countries in theconflict trap.
Chapter 5 organizes the discussion of policyinterventions around each of the problems thatcontribute to the international incidence of con-flict. Some policies are the responsibility of thegovernments of countries at risk of conflict,while others can only be achieved by interna-tional action. Chapter 6 brings together themost important of the policies that require aninternational response, and so presents an agendafor international action.

121
C H A P T E R F I V E
What Works Where?
PART I DEMONSTRATED THAT THE BULK OF THE COSTS
of civil war, both social and economic, do not accrue tothe active participants. A distinct possibility is that theparticipants will do well out of war while inflicting mas-sive damage. Nor are the victims of civil war confined tothose living in the combat-affected country. Civil war is
a regional public bad: it reduces incomes and raises mortality elsewherein the region. It is also a global public bad: through hard drugs, disease,and terrorism it inflicts death, misery, and economic loss among peo-ple who know nothing of the conflict. Many of these costs are highlypersistent and outlast the civil war by many years. Because of the radi-cal divergence between the incentives facing participants and the inter-ests of others, conflict cannot just be left to the participants to sort outamong themselves. If it is, civil wars will be too frequent and last toolong. A problem with the attitude “a plague on both your houses” isthat other people’s houses are also affected. But what can be done?
Some of the causes of civil war are idiosyncratic and beyond the con-trol of policy; however, as chapter 3 suggested, some combinations of characteristics make countries radically more or less prone to vio-lent conflict. Many of these characteristics are amenable to policy: well-chosen policies can reduce the risk of civil war. Chapter 4 demonstratedthat four radically different risk groups affect the global incidence of civil war. The rich countries are virtually risk free. Those that are alreadymiddle-income countries or on track to becoming middle-income coun-tries have low and declining risks. By contrast, those countries that arepoor and in economic decline and those that are stuck in the conflicttrap both have much higher risks and constitute the core of the futureglobal risk of civil war. Between them these two groups of countries have
B R E A K I N G T H E C O N F L I C T T R A P : C I V I L WA R A N D D E V E L O P M E N T P O L I C Y
122
a population of around 1.1 billion people. Well-chosen policies can re-duce the global incidence of civil war, but the policies that are appropriateare quite different for each group and need to take many country-specificcharacteristics into account. Nevertheless, focusing on the different groupsfacing significant risks is useful. Commonly, however, policy discussionstend either to be country specific or not to differentiate between coun-tries based on their economic characteristics.
This chapter discusses policies that could reduce the global inci-dence of civil war. Some of these policies can be implemented by thegovernment of the country at risk, some by neighbors in the region,and some by the international community. The chapter follows thecountry grouping developed in chapter 4.
Conflict Prevention in the Successful Developers
STATISTICALLY, THE SUCCESSFUL DEVELOPERS ARE NOT AT
high risk of conflict, but neither have they reached a level of riskso low as to be able to forget about the problem. Such countries
do sometimes collapse into conflict. When such conflicts do happenthey are hugely costly: the country risks falling off its growth path intothe conflict trap. Furthermore, in aggregate this is by far the largestgroup of countries, accounting for around 4 billion people. The ques-tion is not, therefore, whether to pay some attention to policies that re-duce the risk of conflict for this group of countries, but rather whatpolicies might be particularly appropriate for them.
Cushioning Adverse Shocks
Once a country is either middle-income or low-income but growingrapidly, it has relatively little scope for reducing risk by accelerating itseconomic performance. The exception is its greater exposure to shocksbrought about by financial crashes, and so the priority is to avoid suchshocks. The reduction in the risk of conflict is merely one further rea-son why a government should pay attention to the financial sector’shealth; however, to the extent that the international community is ofteninvolved in mitigating such crises, given its concern to prevent civil warbecause of its spillover effects, there is an enhanced reason to provide afinancial cushion.
123
W H AT W O R K S W H E R E ?
Undertaking Political Reform
The limited scope for enhancing economic performance suggests that asensible approach would be to place greater emphasis on the reform ofpolitical institutions as a means of risk reduction. Evidence that demo-cratic political institutions are differentially effective once a country has reached middle-income levels strengthens support for this option.Hence, as the level of income rises, economic policy becomes absolutelyless important in conflict reduction, while political institutions becomeabsolutely more important; however, as even moderate change in polit-ical institutions is a risk factor in itself, political institutions must bestable (Fearon and Laitin 2003; Hegre and others 2001).
Institutions that are internally consistent have the lowest risk of abreakdown because such institutions are self-reinforcing (Gates andothers 2003; Gurr 1974). For democracies, this means a wide distribu-tion of power and no permanent exclusions of actors from the politicalsystem. The powers of the elected executive branch of the governmentare balanced by a strong house of representatives, elections are open tothe entire population, and multiparty competition is genuine. If onebranch of government becomes too powerful, other branches will at-tempt to rein it in. In a consistent democracy they will succeed. In aninconsistent democracy such a contest may turn violent.
Related to this, democracy functions best as a conflict preventionmechanism when the stakes of the political contest are low (Przeworski1991; Weingast 1997). Many of the economic policy recommenda-tions suggested later in this chapter help to reduce the stakes by reduc-ing the gains to narrow interests from obtaining or retaining politicaloffice. Legal and economic institutions that help achieve these aims areindispensable for a well-functioning democracy.
Most new democracies have adopted majoritarian or presidential po-litical systems. These institutions have the advantage that they performbetter in terms of accountability: placing responsibility for failed poli-cies on a single-party government typical of these institutions is easierthan placing responsibility on the minority or coalition governmentsthat are typical of proportional systems. Moreover, governments in ma-joritarian or presidential political systems tend to have moderate poli-cies, because two-party systems have a powerful incentive to adhere tothe median voter’s preferences and extreme parties will rarely be repre-sented in the country’s parliament. In divisive societies, however, such
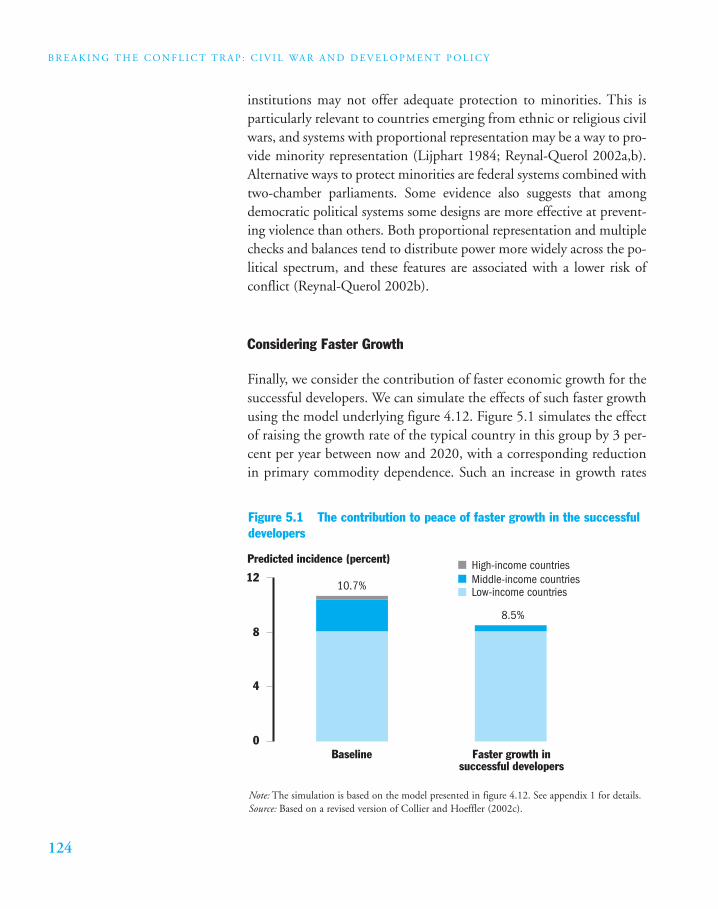
B R E A K I N G T H E C O N F L I C T T R A P : C I V I L WA R A N D D E V E L O P M E N T P O L I C Y
124
institutions may not offer adequate protection to minorities. This isparticularly relevant to countries emerging from ethnic or religious civilwars, and systems with proportional representation may be a way to pro-vide minority representation (Lijphart 1984; Reynal-Querol 2002a,b).Alternative ways to protect minorities are federal systems combined withtwo-chamber parliaments. Some evidence also suggests that amongdemocratic political systems some designs are more effective at prevent-ing violence than others. Both proportional representation and multiplechecks and balances tend to distribute power more widely across the po-litical spectrum, and these features are associated with a lower risk ofconflict (Reynal-Querol 2002b).
Considering Faster Growth
Finally, we consider the contribution of faster economic growth for thesuccessful developers. We can simulate the effects of such faster growthusing the model underlying figure 4.12. Figure 5.1 simulates the effectof raising the growth rate of the typical country in this group by 3 per-cent per year between now and 2020, with a corresponding reductionin primary commodity dependence. Such an increase in growth rates
Figure 5.1 The contribution to peace of faster growth in the successfuldevelopers
Predicted incidence (percent)
0Baseline
10.7%
8.5%
Faster growth insuccessful developers
4
8
12High-income countriesMiddle-income countriesLow-income countries
Note: The simulation is based on the model presented in figure 4.12. See appendix 1 for details.Source: Based on a revised version of Collier and Hoeffler (2002c).
125
W H AT W O R K S W H E R E ?
would be a massive improvement in development performance, and sois at the outer bound of what is possible. In effect, this amounts to thelimits of implementing the current development strategy more success-fully. As the figure shows, it offers only a modest contribution to globalpeace: the global incidence of civil war declines by around two per-centage points. This is a relatively modest gain for a truly dramatic im-provement in development.
Marginalized Countries at Peace
WE HAVE LIKENED THOSE MARGINALIZED COUNTRIES
that have to date maintained peace to a group of Russianroulette players who have so far been lucky. To an extent
this is unfair: poor countries that have managed to maintain peace haveprobably been making choices that have contributed to that peace.Nevertheless, as a class such countries are at much higher risk than thesuccessful developers, and as chapter 4 pointed out, the risks for thetwo groups are not only widely different, they are also diverging: risksfor the poor but peaceful have actually been rising. What can the in-ternational community do to reverse this disturbing trend?
Believing False Friends: The Military Lobby for Deterrence
Governments of poor but peaceful countries typically attempt to reducethe risk of rebellion by raising their military spending. Recall from chap-ter 3 that during peacetime, each additional 10 percentage points on therisk of rebellion raises military spending by around 1 percentage pointof GDP. This might seem like a prudent action, and we can be sure thatthe military lobby will urge the government to take such action. Just likeother groups, the military favors spending on itself. When the militaryis in political control of a country, military spending increases by twopercentage points of GDP, controlling for all other influences on themilitary budget, such as risks and the ability to afford the expenditure.
We have also seen that military expenditure is ineffective in reduc-ing the risk of conflict. Allowing for the potentially confusing effect ofrisk on spending, spending has no deterrence effect on rebellion. Henceeven though governments have listened to the siren voices of their own
B R E A K I N G T H E C O N F L I C T T R A P : C I V I L WA R A N D D E V E L O P M E N T P O L I C Y
126
militaries, this is not an effective way for poor but peaceful countries toreduce the risk of rebellion. Of course, governments also spend on themilitary to reduce the risk of international conflict. Across a neighbor-hood, this is obviously futile: a region is no safer if all countries havehigh levels of military spending. The evidence on regional arms racesgiven in chapter 2 suggests that there is scope for regionally coordinatedreductions in military spending, brokered by regional political organi-zations, possibly with expenditure monitored by the international fi-nancial institutions.
If military spending is not an effective instrument for peace, whatelse can governments do that might work better?
Reducing the Risks from Primary Commodities
Many low-income countries depend on primary commodities for theirexport revenue. On average, such dependence is associated with an in-creased risk of rebellion, poor governance, and poor economic per-formance; however, the average conceals extremely wide variation. In1970 Botswana and Sierra Leone were both low-income countries withsubstantial diamond resources. Over the next 30 years diamonds werecentral to the economic and social collapse of Sierra Leone: its percapita income is now much lower than in 1970 and it has sunk to bot-tom place on the Human Development Index. By contrast, diamondresources were critical to Botswana’s success in becoming the fastest-growing economy in the world, and it is now a middle-income coun-try (see box 5.1). Thus even though, on average, primary commoditieshave been detrimental to development, they clearly have the potentialto be enormously useful. The challenge, at both the national and inter-national levels, is to adopt policies that better harness this potential.
As discussed earlier, primary commodity exports can increase therisk of conflict by four routes: financing rebels, worsening corruptionin governance, increasing the incentive for secession, and increasing ex-posure to shocks. Each of these is amenable to policies that can makeliving with natural resource endowments easier.
Curbing Finance for New Rebellions Building a rebel army is a costlyundertaking; thus most small rebel groups are unable to escalate vio-
127
W H AT W O R K S W H E R E ?
lence to the level of a civil war, but the presence of primary commodi-ties can make financing this stage of escalation easier for rebel groups.Expropriation of the commodity itself often requires a scale of violencethat is beyond the capability of a rebel group in its early stages. We dis-cuss this source of finance when we turn to policies that can shorten
IN 1961 DIAMOND-RICH BOTSWANA AND SIERRA
Leone had approximately the same per capita in-come of about US$1,070; however, the countriesexperienced extremely different paths of economicdevelopment. Why did diamonds cause an eco-nomic miracle in Botswana and lead to a total statecollapse in Sierra Leone?
In Botswana the extraction and export of dia-monds came to be an engine of rapid economicgrowth. The country maintained a stable and well-functioning democracy since independence and en-joyed the steady leadership of three democraticallyelected presidents. A national development plan isthe key to managing the economy, setting targetsfor public expenditures that are consistent with ex-pected government revenues and the capacity of theeconomy.
Diamond extraction is concentrated in three largemines (kimberlite deposits). The government alsoencourages other industries besides diamond mining.This has allowed Botswana’s economy to prosper:per capita income is currently about US$8,800 andincome distribution is relatively equal. Botswana’shuman development record is also impressive; how-ever, like many of its southern African neighbors,Botswana also suffers from a high HIV infectionrate.
By contrast, Sierra Leone’s recent history is atragedy. Diamond wealth in combination with poor
governance led to the state’s collapse and created theincentive, as well as the opportunity, for a rebellionthroughout the 1990s. Sierra Leone is now rankedamong the poorest countries in the world, with a per capita income of about US$480. In contrast toBotswana, most diamond deposits in Sierra Leoneare alluvial, that is, are found in riverbeds. Govern-ment control of extraction is difficult, because allu-vial deposits are dispersed over more than one-thirdof the country and, unlike kimberlite deposits, can be mined using simple technology. Prospectors digholes with shovels and sift through the dirt.
However, Sierra Leone’s misfortune has been po-litical as well as geological. Starting out as a multi-party state after independence in 1961, the countryturned into a one-party state with a succession ofautocratic leaders. Corruption and poor fiscal man-agement destabilized the economy, and, from 1967on, the government granted mining rights to indi-viduals in return for their political support. Gradu-ally, the government lost control over its assets,enabling private entrepreneurs and organized crim-inals to take charge of the diamond mining. Youthswere marginalized in the economic and politicalcollapse of the 1980s and turned increasingly tocrime and drugs. For rebel leader Foday Sankoh torecruit young men for his civil war and to financethe warfare through diamond extraction was there-fore relatively easy.
Box 5.1 A comparison of Botswana and Sierra Leone
Sources: 1961 income figures: Heston, Summers, and Aten (2002); purchasing power parity adjusted GDI income figures for 2001:World Bank (2002a); mining information on Botswana: http://www.mbendi.co.za/indy/ming/dmnd/af/bo/p0005.htm; Davies andFofana (2002); Harvey (1992); Hirsch (2001); Leith (2002).
B R E A K I N G T H E C O N F L I C T T R A P : C I V I L WA R A N D D E V E L O P M E N T P O L I C Y
128
wars. Here we focus on two ways in which small rebel groups use pri-mary commodities to finance their military escalation.
Some small rebel groups have been able to raise substantial finance byselling the future rights to war booty (Ross 2002a). In the 1997 civil warin the Republic of Congo the private militia of the former president,Denis Sassou-Nguesso, was funded in part by the sale of future exploita-tion rights to oil reserves. On the eve of the conflict Sassou-Nguesso re-ceived substantial assistance from an oil company, Elf-Aquitaine, report-edly of the order of US$150 million, and these funds were critical inenabling the defeat of the incumbent president, Pascal Lissouba. Similaruses of war booty futures occurred in Angola, the Democratic Republicof Congo, Liberia, and Sierra Leone. The phenomenon is not entirelynew. In 1960 a Belgian company, Union Minière du Haut Katanga,bankrolled the Katanga rebellion in the Congo in exchange for futuremineral rights. Similarly, during the Algerian war of independence, theItalian oil company Ente Nazionale Idrocarburi reportedly suppliedmoney and arms to the National Liberation Front in exchange for future“consideration.” While not new, the approach seems to have becomemore common in Africa during the past decade. As the supply of financein these cases is coming from OECD-based companies it is, in principle,controllable. Such financing of political organizations in conflict withrecognized governments could be made a criminal offence, analogous tothe new OECD-wide legislation banning companies from bribing gov-ernment officials.
Another way in which small rebel groups finance their military es-calation using natural resources is by extortion of natural resource com-panies. Both kidnapping and sabotage of infrastructure require onlymodest capabilities for violence, yet the ransom payments and protec-tion money they currently yield can be substantial. The ELN receivedUS$20 million in ransom payments from a German company at a timewhen it was a weak organization, and used these funds to equip itselfmilitarily well beyond the standard of the government forces it opposes.Currently a major oil company in West Africa is reputedly payingaround US$250 million to small-scale violence entrepreneurs. The pol-icy issue here is to discourage such payments, both by legal means andby exposure. A possible point for legal intervention is to make kidnapinsurance illegal and to make all extortion payments nondeductible fortax purposes. Group of Eight governments could usefully agree thatthey will not provide public money to pay ransoms to rebel movements
129
W H AT W O R K S W H E R E ?
for their citizens. Currently practices differ markedly among Group ofEight governments, as revealed by their different reactions to the kid-napping of tourists and the demands for US$1 million per tourist by asmall rebel group in the Philippines in 2000.
Reducing Corruption Rebel movements, particularly those seeking to secede that part of a country endowed with natural resources, aregreatly aided if the revenues from resources are embezzled by a narrowelite rather than used in a transparent manner for the common good.Governments of natural resource–abundant countries therefore have astrong interest in demonstrating that revenues deriving from natural re-sources are well used.
The first step here is providing trustworthy information about whatthe revenues actually amount to. As potential rebel groups do not trustgovernments, the MNCs that undertake resource extraction could pro-vide independent information about payments. British Petroleum re-cently took such action in its payments to the government of Angola,but none of the other 34 oil companies active in Angola have adoptedthis policy. This demonstrated that the oil industry is not sufficientlyconcentrated for the self-regulation model to work as it did in the caseof diamonds. There is therefore a case for public action to facilitate co-ordination in the oil industry and other extractive industries. Variousapproaches have been suggested. One is to make all such payments alegal reporting requirement. An alternative, proposed by Global Wit-ness and George Soros, is to make such reporting a requirement for list-ing on major stock exchanges. A further alternative is for the compa-nies to report on a confidential basis to the international financialinstitutions, which would then collate the information and publish ag-gregate revenue figures. This has the advantage of preserving the confi-dentiality of firm-specific information while providing a global certifi-cation system for information.
All these approaches have the advantage that by making reporting anobligation, they clearly signal that the information provided is inde-pendent of the recipient government, and thus it is more likely to betrusted. To the extent that this reduces the risk of rebellion, the chief ben-eficiary of this is, of course, the government itself. The principle of legallyindependent reporting of revenues is somewhat analogous to the in-creasingly accepted principle of independent central banks. In addition,
B R E A K I N G T H E C O N F L I C T T R A P : C I V I L WA R A N D D E V E L O P M E N T P O L I C Y
130
obligatory revenue reporting by MNCs could be supplemented by com-plementary reporting on the part of recipient governments and nationalresource extraction companies to make the use of revenues transparent.
Finally, transparency in reporting is itself an input into scrutiny. Theappropriate level for such scrutiny is within the society. Once numbersare properly provided, parliaments and the press provide the natural in-stitutions for scrutiny, but a useful approach, especially where such in-stitutions are recent, is to supplement this with purpose-designedscrutiny by civil society representatives. A useful model here is theChad-Cameroon pipeline project, for which local civil society organi-zations, MNCs, the World Bank, and the government of Chad forgedan alliance (see box 5.2). This could become a template for managingnatural resources in other developing countries, a template that isneeded both by the governments of low-income countries and byMNCs in the extractive sector. Many low-income developing countriesare in the process of discovering natural resources and their govern-ments keenly feel the lack of a template. For example, in 2002 the gov-ernments of both East Timor and São Tomé and Príncipe realized thatthey needed to learn how to manage prospective oil revenues. In the ab-sence of a template, both chose to send a delegation to Angola, butwhile Angola has the advantage that communication can be in Por-tuguese, it is clearly not the best model for the governance of revenues.A template is also increasingly needed to encourage reputable MNCs towork in difficult environments. MNCs rate the risk that misgovernancewill damage their reputations as the most important impediment totheir involvement in low-income countries.
Reducing Secession Chapter 3 showed that natural resources, espe-cially oil, increase the risk of violent secession. How can policy reducethese risks? Transparency about the magnitude of the revenues will helpto reduce the risk, because it makes exaggeration of the gains more dif-ficult. Recall that exaggeration occurs partly because of the sheer glam-our of natural resource revenues—the local population is likely to con-jure up images of Bahrain and Brunei—and partly because it is adeliberate strategy of secessionist politicians. Again, only informationprovided independent of the government can hope to be convincing.Thus scrutiny of the effective use of revenues is an important step indefusing pressures for secession.
131
W H AT W O R K S W H E R E ?
CHAD IS ONE OF THE POOREST COUNTRIES IN THE
world. Oil was found in the early 1950s, but it couldnot be exported without a pipeline. Furthermore,civil wars from the 1960s until 1990 made it impos-sible to undertake the necessary investments. WhenExxon tried to mobilize private financing in the1990s, it was told that the risks would be too highunless the World Bank participated. One of theBank’s conditions was that Chad must commit itselfto completely transparent management of oil rev-enues and that the revenues must be used for povertyreduction. The project started in October 2000. Oilrevenues are projected to be around US$150 millionto US$300 million per year, compared with tax rev-enues of less than US$200 million in 2002.
A stringent supervision mechanism was put inplace: the External Compliance Monitoring Groupwas charged with supervising the implementation of all legal covenants regarding environmental andsocioeconomic management through quarterly visits.The International Advisory Group, which visitsChad every six months, was created to advise thepresidents of Chad and the Bank about maximizingthe development impact of the project. Its reports arepublicly available on the web. A unique feature of theChadian model is the Petroleum Revenue Manage-ment Law of 1999. This law stipulates that all directoil revenues have to go first to an offshore escrowaccount. From there, 10 percent is transferred intoan account for the Future Generations Fund and theremainder is transferred to a special oil revenue ac-count in Chad. The law specifies that 80 percent ofthe oil revenues must be used for additional expendi-tures in the four priority sectors for poverty reduc-tion: health and social affairs, education, infrastruc-ture, and rural development. Five percent of theroyalties are to benefit the local communities in theoil producing region. The remainder can be used forgeneral expenditures of the administration. A power-ful local watchdog institution, the College de Con-trole et Surveillance des Ressources Petroliers, was
also created that has to authorize all commitmentsand disbursements from the special oil revenue ac-count and to certify that the budget presented to par-liament conforms with the Petroleum Revenue Man-agement Law. It has nine members as follows: fourfrom civil society, two members of parliament, onemember of the Supreme Court, the national directorof the central bank, and the director of the treasury.
The first oil will be pumped around July 2003,but there have already been some interesting expe-riences. The oil consortium was constituted in early2000 and paid a signature bonus of US$25 million.The government treated this as off-budget incomeand used it without following the spirit of the Pe-troleum Revenue Management Law and withoutfollowing its own procedures. According to themedia, a large share was used to purchase weapons,because the Mouvement pour la démocratie et lajustice au Tchad rebellion in the north of the coun-try was creating many security problems. TheWorld Bank protested, given the agreement that alloil income should be used for poverty reduction.The government agreed to freeze the remainingUS$10 million and use it strictly according to thelaw and to have the Auditor General’s Office un-dertake a complete audit of the money alreadyspent. The latter was only created in 1999, and thiswas the first big audit it had to undertake. The fullaudit was published on its web site. As a result ofthe bonus debacle, the members of the College deControle et Surveillance des Ressources Petrolierswere nominated ahead of schedule in 2001.
There is another interesting feature about Chad:military and political power is currently held largelyby people from the north of the country, while theoil fields and most agricultural land are in the south.Even though the current government is being con-tested, there is little talk about secession. Transpar-ent management of oil revenues benefiting the poormajority of the population will be a key ingredientof maintaining national unity in Chad.
Box 5.2 Transparency of oil revenues in Chad
Source: prepared by Gregor Binkert, World Bank country manager for Chad.
B R E A K I N G T H E C O N F L I C T T R A P : C I V I L WA R A N D D E V E L O P M E N T P O L I C Y
132
A further possible strategy is to include political leaders from the lo-cality of the discovery prominently in the government. This, fortu-itously, happened in Botswana. At present, a common response is togive the locality a disproportionate share of the revenues. If this is theonly strategy followed, it may even exacerbate the problem, because itappears to concede the principle that the resources belong to the local-ity. The government of Indonesia faced continued demands for seces-sion from the province of Aceh even after it had conceded that 75 per-cent of revenues would accrue to the locality. Indeed, such generousoffers may not be seen as credible in the long term. There is a good casefor decentralizing some of the revenues from natural resources, but theprinciple of equitable division, combined with transparency, may be amore effective way of preventing secession.
Cushioning Adverse Shocks The prices of primary commodities arehighly volatile, so that countries dependent on a narrow range of com-modities for their exports periodically face severe negative shocks. Re-cent research finds that when these shocks are large, they severely dam-age medium-run growth: each dollar lost in export income generates afurther two dollars of output contraction (Collier and Dehn 2001).Some evidence also suggests that much of this lost growth is never re-covered. Hence episodes of price crashes may induce the growth col-lapses that increase the risk of rebellion, and over the longer term maylead to lower levels of income. For example, in Indonesia, the East Asianfinancial crisis of 1998 caused income to fall by around 10 percent inAceh. This was shortly followed by the escalation of violent conflict.
Even the governments of industrial countries with sophisticatedteams of experts at their disposal would find managing such largeshocks extremely difficult, but the industrial countries have not experi-enced such large-scale shocks since the 1930s. The governments of de-veloping countries usually lack the expertise, and often lack the politi-cal goodwill, to implement contractionary policies effectively. There istherefore a case for international action to cushion such shocks. Donorresponses to severe shocks in developing countries are currently deter-mined by the nature of the shock. Generally, if the shock is photogenic,such as an earthquake, hurricane, or drought, aid increases rapidly andsubstantially, sometimes more than covering the losses incurred. Un-fortunately, even though natural resource price shocks are often much
133
W H AT W O R K S W H E R E ?
larger than these calamities, they are not photogenic, and, historically,aid has shown no tendency to increase in response to such shocks: gov-ernments have been on their own.
The international community might consider three types of arrange-ments: risk pooling, credit facilities, and aid. The scope for risk poolingis considerable. For example, the World Bank lends to both oil exportersand oil importers. The former have an interest in repayments being lowduring periods of low oil prices, while the latter have an interest in re-payments being low during periods of high oil prices. By structuring re-payments contingent upon the oil price, the World Bank could effec-tively match these complementary risks and in the process reduce itsown default risk. The use of derivatives markets also provides scope forrisk pooling. Because these are highly technical, for developing countrygovernments to enter directly into these markets is not usually appro-priate, but the World Bank could enter into risk-bearing contracts withdeveloping countries and then lay off these risks in derivatives markets.The Bank already manages foreign exchange positions for some devel-oping countries, and no issue of principle would seem to be involved inthe provision of such a service. The IMF has had credit facilities in theform of the Compensatory Financing Facility, but these were seldomused. In addition, for a developing country to borrow at commercialrates at the onset of a severe negative shock of uncertain duration is usu-ally unwise. There may, however, be scope for concessional finance.Probably more important than loan finance is grant aid. Aid responsesto shocks need to be set in a more rational framework, transferringresources at the margin from high-glamour natural disasters to low-profile, but more devastating, economic shocks.
Beyond cushioning price shocks, reducing them where possible alsomakes sense. Attempts to control commodity prices have been unsuc-cessful, and no basis for repeating them appears to exist; however, tradepolicies on the part of OECD economies can inadvertently have asharp effect on world prices. For example, if OECD governments in-crease their subsidy to domestic producers when the world price of anagricultural commodity is low, then the effect will be to systematicallyamplify price shocks. The cushioning that such subsidies achieve fordomestic producers comes at the cost of increasing the shock to pro-ducers in low-income countries. For example, the recent increase in thesubsidy to American cotton producers has had the effect of further re-ducing the incomes of cotton farmers in the Central African Republic.
B R E A K I N G T H E C O N F L I C T T R A P : C I V I L WA R A N D D E V E L O P M E N T P O L I C Y
134
Diversifying On average, developing country exports are no longerpredominantly primary commodities, but this average is made up ofcontinued dependence on the part of the marginalized countries andastonishingly rapid diversification by the successful developers. Thesuccess of the latter group shows that for the marginalized countries todo the same is possible, but the emergence of China and India as majorexporters of labor-intensive goods makes it more difficult. In addition,diversification is not always possible; for instance, Botswana is a land-locked desert with few options other than diamonds. For such coun-tries the priority should be to make natural resource endowments workeffectively, as Botswana has indeed done, but for many countries diver-sification is surely feasible. For example, a country such as Ghana thathas a favorable coastal location near global markets seems to have no in-trinsic reason why it cannot succeed in manufacturing.
A study of the determinants of primary commodity dependencefinds three factors that significantly reduce it: growth, aid, and policy(Collier and Hoeffler 2002b). On average, growth diversifies an econ-omy, and this reduces the risk of conflict in addition to the direct con-tribution of growth to risk reduction. This does not imply that anypolicies that promote growth promote diversification, but the induce-ment of growth will normally assist diversification. Aid significantly re-duces primary commodity dependence. This may in part be a “Dutchdisease” effect, whereby the provision of foreign exchange through aidreduces the incentive to export; however, aid may also improve the in-frastructure for activities that do not rely upon high, location-specificrents for their profitability. Good economic policy also significantlypromotes diversification. We measure the effectiveness of policy usingthe World Bank’s CPIAs. On average, an improvement of one point inthe CPIA—roughly equivalent to the difference between African andSouth Asian policies—would reduce dependence on primary commod-ities from 15.2 percent of GDP to 13.8 percent.
Raising Economic Growth
The poor but peaceful economies are characterized, on average, by slowgrowth. Faster growth would reduce the risk of conflict both directly inthe short term and cumulatively in the longer term by raising the levelof income, and indirectly by assisting diversification. We can simulate
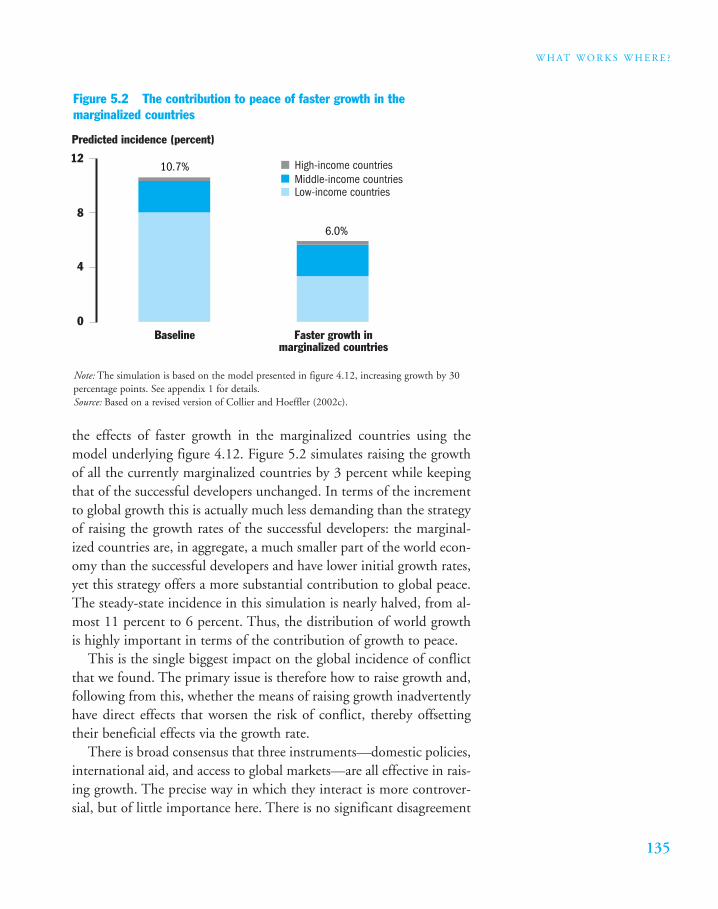
135
W H AT W O R K S W H E R E ?
the effects of faster growth in the marginalized countries using themodel underlying figure 4.12. Figure 5.2 simulates raising the growthof all the currently marginalized countries by 3 percent while keepingthat of the successful developers unchanged. In terms of the incrementto global growth this is actually much less demanding than the strategyof raising the growth rates of the successful developers: the marginal-ized countries are, in aggregate, a much smaller part of the world econ-omy than the successful developers and have lower initial growth rates,yet this strategy offers a more substantial contribution to global peace.The steady-state incidence in this simulation is nearly halved, from al-most 11 percent to 6 percent. Thus, the distribution of world growthis highly important in terms of the contribution of growth to peace.
This is the single biggest impact on the global incidence of conflictthat we found. The primary issue is therefore how to raise growth and,following from this, whether the means of raising growth inadvertentlyhave direct effects that worsen the risk of conflict, thereby offsettingtheir beneficial effects via the growth rate.
There is broad consensus that three instruments—domestic policies,international aid, and access to global markets—are all effective in rais-ing growth. The precise way in which they interact is more controver-sial, but of little importance here. There is no significant disagreement
Figure 5.2 The contribution to peace of faster growth in themarginalized countries
Predicted incidence (percent)
0
4
8
12
Baseline Faster growth inmarginalized countries
High-income countriesMiddle-income countriesLow-income countries
10.7%
6.0%
Note: The simulation is based on the model presented in figure 4.12, increasing growth by 30percentage points. See appendix 1 for details.Source: Based on a revised version of Collier and Hoeffler (2002c).
B R E A K I N G T H E C O N F L I C T T R A P : C I V I L WA R A N D D E V E L O P M E N T P O L I C Y
136
about the merits of market access. Some analysts argue that aid andpolicies complement each other, with aid becoming more effective aspolicies improve, and, conversely, with policy reform being more effec-tive with larger aid inflows. Other analysts argue that the beneficial ef-fects of aid and policy are independent. The common ground is thatwhere policies are reasonable, aid is effective, and that where policiesare unreasonable, policy improvement will enhance growth.
Economic Policy Controversy as to what constitutes “good” policy isconsiderable; for example, electorates have chosen significantly differ-ent policies in different OECD economies and periodically changetheir views as to what policies they want, yet all these policy environ-ments sustain high incomes. What constitutes really bad policy is muchless controversial. No reputable economist advocates high and variableinflation, high trade barriers, widespread public ownership of marketedactivities other than “network industries,” or use of public employmentfor patronage rather than for equitable service delivery. Yet this is thecurrent reality in many of the poor but peaceful societies. A useful wayof quantifying this is through the CPIA, the World Bank’s policy ratingsystem, which rates macroeconomic, structural, social, and public sec-tor policies on a scale of 1 to 5, with a higher rating indicating more ef-fective policy. The average rating for the marginalized countries is only2.95, whereas that for the successful developers is 3.75. The reformsneeded to effect such a change are thus considerably less controversialthan policy reform in good environments. The broad technical consen-sus on these basic reforms reflects accumulated evidence on the conse-quences of bad policies. One illustrative measure is the relationship be-tween the CPIA and growth: for the typical low-income, poor policycountry, a one-point improvement in the CPIA is associated with ahigher growth rate of 1.6 percentage points (Collier and Dollar 2002).
Although basic reforms are not technically particularly controversial,they can still arouse considerable opposition from within a society. Typ-ically, bad policies are not in place by mistake, but because even thoughthey are damaging to ordinary citizens, they favor some powerfulgroup. Potentially, powerful groups will violently resist policy reform,therefore reform could increase the risk of conflict. In this case the fa-vorable effects engendered by growth would be offset by this direct risk.One study investigates the effect of policy on conflict risk using the
137
W H AT W O R K S W H E R E ?
CPIA as a measure (Collier and Hoeffler 2002b). While the CPIA hasmany limitations, a major advantage is that as it is constructed byWorld Bank operational economists working on each country, becauseit reflects their judgment it also proxies their advice. Thus if a countryis judged to have improved its CPIA score, this is probably becausechanges have been broadly consistent with the advice that Bank staffhave been giving. If, for example, we were to find that policy improve-ment increased the risk of conflict, this would indicate that Bank pol-icy advice was exacerbating the risk of conflict.
Obviously policy deteriorates rapidly during a war; therefore to de-termine whether policy affects the risk of war we need to look at poli-cies that are already in place prior to the risk period being considered.The study therefore looks at policy during the five years prior to thefive-year period for which the risk of conflict is estimated. It finds nosignificant association between the level of economic policy, as mea-sured by the CPIA, and the risk of subsequent conflict—that is, badpolicies neither reduce the risk of conflict nor increase it, other thanthrough their adverse effects on growth. Changes in policy do, however,have a significant effect. Improvements in the CPIA appear to reducethe risk of conflict in the subsequent period. This benign effect maywell be spurious, however, reflecting nothing more than policy startingto deteriorate in the run-up to violent conflict. For example, as alreadynoted, a higher risk of conflict induces governments to increase mili-tary expenditure.
The important point is, however, that no evidence suggests that pol-icy improvement directly increases the risk of conflict. As long as it doesnot directly increase the risk of conflict, it will tend to reduce the riskindirectly through its effects on the growth rate. This does not meanthat all growth-inducing policies reduce risk: there is no substitute forlooking policy by policy, country by country, to see whether the po-tential for adverse effects exists. It simply means that there is no generalpresumption that where countries have implemented policy reforms asadvocated by the World Bank they have systematically directly in-creased the risk of conflict (Collier and Hoeffler 2002b).
Aid Measuring aid entails less controversy than measuring policy.Here we use a conventional measure of aid as concessional developmentassistance, which excludes humanitarian assistance and military aid,
B R E A K I N G T H E C O N F L I C T T R A P : C I V I L WA R A N D D E V E L O P M E N T P O L I C Y
138
neither of which is intended to raise growth. Actually quantifying theeffect of aid on growth is more controversial. Applying the results of arecent study, an additional percentage point of aid as a share of GDPfor the marginalized countries would raise the average growth rate ofthese countries by only 0.1 percentage point (Collier and Dollar 2002).Some analysts argue that aid would become more effective if combinedwith policy reform, but the matter that concerns us here is whether aidinadvertently increases the risk of conflict. Some economists, notablyGrossman (1992), have argued this on the grounds that aid increasesthe honey pot to be contested.
Researchers have also investigated the effect of aid on conflict riskfollowing the same approach as for the effect of policy. Controlling forthe effect on growth, aid has no significant direct effect on the risk ofconflict. Again, this does not absolve donors from the need to scruti-nize their aid programs carefully to see whether particular componentsmight increase the risks of conflict. Several case studies argue preciselythis: that particular types of aid have increased the risk of conflict (see,for example, Esman and Herring 2001). Learning from such bad expe-riences is important: projects need to be designed with proper aware-ness of their potential for creating division. However, we should also bewary of generalizations from such horror stories that imply that aid isnormally part of the problem. Its effects on growth imply that it is nor-mally part of the solution.
Access to Global Markets The poor but peaceful group of countrieshas largely not broken into global markets for nontraditional exports.There is a case for accelerating improvements in market access for thesecountries ahead of more general improvements negotiated under thedevelopment round of the World Trade Organization. Both the UnitedStates and the European Union (EU) have recently introduced suchdifferentially favorable market access for some countries within thepoor but peaceful group. The United States has introduced the AfricaGrowth and Opportunity Act, and early signs indicate that this is sig-nificantly facilitating African countries’ entry into manufactured exportmarkets. Similarly, for the least developed countries the EU has intro-duced the Anything but Arms initiative.
As with policies and aid, any favorable effects of improved marketaccess on growth could, in principle, be offset by a direct effect on con-
139
W H AT W O R K S W H E R E ?
flict risk. Indeed, we have found that exports can have a direct, adverseimpact on the risk of conflict, namely, through the rents on primarycommodities; however, major trade reforms are likely to diversify tradeas well as to increase it.
Economic Revival: A Simulation Each conflict has its own peculiari-ties; thus country knowledge always needs to supplement the group-level analysis discussed here. Models of conflict risk are not well suitedfor country-specific questions and are more appropriate for the sort of policy simulations of global incidence conducted in chapter 4.However, changes in global incidence are outcomes of changes in real,country-specific situations, and for illustrative purposes we take an ac-tual conflict in a typical marginalized country and ask whether any fea-sible economic recovery could have helped to avert it.
The conflict episode we consider is Zaire, as it was then known, inthe late 1990s. Our simulation model predicts that as of 1995 Zairewas at severe risk of a conflict. Indeed, the model estimates an 80 per-cent risk of a conflict during the ensuing five years. The point of usinga model is not, however, to predict such risks, but rather to simulate theeffect of changing a few factors that were potentially within the controlof the government and the international community. The challenge setto the model was to see whether any feasible change in characteristicscould have reduced the risk of conflict from 80 percent to the arbitrarytarget of 30 percent. The model predicts that had a package of strongeconomic reforms and greatly expanded aid been implemented duringthe first half of the 1990s, then the risk of conflict would have fallen tothis level. The scale of the required policy reform is an improvement inthe CPIA of 1.2 points, approximately equal to what Uganda achievedbetween 1986 and 1988. In conjunction with this strong reform effort,aid would have had to be tripled. While these specific results are merelyillustrative, had the government and the donor community actuallyknown and believed these figures at the time, the reforms would havebeen implemented and the aid would have been found.
Reducing the Risks of Ethnic Dominance
Ethnic dominance characterizes approximately half of the poor butpeaceful countries; that is, the largest ethnic group accounts for a ma-
B R E A K I N G T H E C O N F L I C T T R A P : C I V I L WA R A N D D E V E L O P M E N T P O L I C Y
140
jority of the population, but the countries also have significant num-bers of ethnic minorities. Recall that this increases the risk of civil war.Managing the risks of ethnic dominance calls for political solutions.
One approach is to guarantee rights to individuals so that they canchallenge individual cases of ethnic discrimination. This is the approachpredominantly followed in the industrial countries. A possible supple-ment to individual rights is to guarantee group rights to minorities. Anobvious way of guaranteeing group rights is through quotas, notably onpublic employment. While this may sound like a radical and costly idea,the few industrial countries that are characterized by ethnic dominancehave adopted it. For example, Switzerland is a classic example of ethnicdominance, with 75 percent of the population being German speakingand the rest consisting of French and Italian minorities. Switzerlandguarantees minority rights by means of three devices: radical decentral-ization, multilingual education, and ethnic quotas. Public hiring is re-quired to designate a certain proportion of jobs to the ethnic groups inaccordance with their size. Acknowledging popular concerns about eth-nic rights in this explicit fashion is often better than wishing them away.
Conversely, when the majority is significantly poorer than the mi-nority, group rights may need to focus on the majority, but in a waythat does not alarm the minority. A useful approach is to have an ex-plicit long-term strategy for intergroup redistribution. An advantage ofan explicit policy is that it contains the fears of the minority while re-assuring the majority that its concerns are being addressed. The maxi-mum pace of redistribution depends on the growth of the economy:the faster the growth, then the more that can be redistributed withoutthreatening the absolute living standards of the minority. A good ex-ample is Malaysia, where over the course of 30 years a policy of grad-ual asset redistribution has helped the majority Malays to increase theirshare of GDP by about 15 percentage points. At the same time, GDPhas grown so rapidly over the period that the redistribution has notprevented the incomes of the minority groups from rising.
Ending Conflicts
WE NOW TURN FROM THE MARGINALIZED COUNTRIES
that are at peace to countries that have fallen into conflictand are stuck in it. Recall that decade-by-decade, such con-
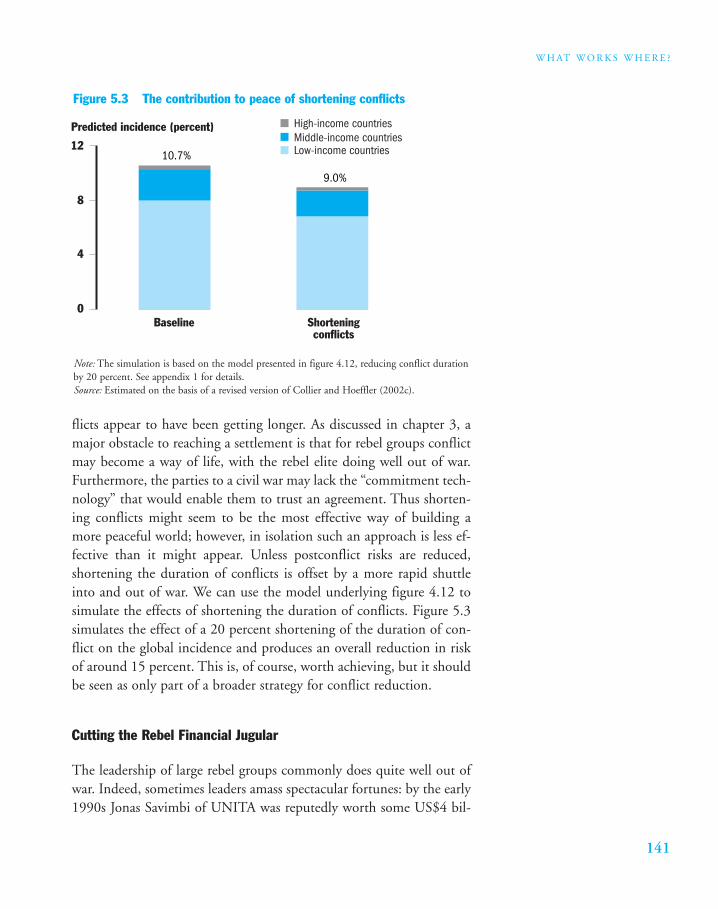
141
W H AT W O R K S W H E R E ?
flicts appear to have been getting longer. As discussed in chapter 3, amajor obstacle to reaching a settlement is that for rebel groups conflictmay become a way of life, with the rebel elite doing well out of war.Furthermore, the parties to a civil war may lack the “commitment tech-nology” that would enable them to trust an agreement. Thus shorten-ing conflicts might seem to be the most effective way of building amore peaceful world; however, in isolation such an approach is less ef-fective than it might appear. Unless postconflict risks are reduced,shortening the duration of conflicts is offset by a more rapid shuttleinto and out of war. We can use the model underlying figure 4.12 tosimulate the effects of shortening the duration of conflicts. Figure 5.3simulates the effect of a 20 percent shortening of the duration of con-flict on the global incidence and produces an overall reduction in riskof around 15 percent. This is, of course, worth achieving, but it shouldbe seen as only part of a broader strategy for conflict reduction.
Cutting the Rebel Financial Jugular
The leadership of large rebel groups commonly does quite well out ofwar. Indeed, sometimes leaders amass spectacular fortunes: by the early1990s Jonas Savimbi of UNITA was reputedly worth some US$4 bil-
Figure 5.3 The contribution to peace of shortening conflicts
Predicted incidence (percent)
0
4
8
12
Baseline Shorteningconflicts
High-income countriesMiddle-income countriesLow-income countries10.7%
9.0%
Note: The simulation is based on the model presented in figure 4.12, reducing conflict durationby 20 percent. See appendix 1 for details.Source: Estimated on the basis of a revised version of Collier and Hoeffler (2002c).
B R E A K I N G T H E C O N F L I C T T R A P : C I V I L WA R A N D D E V E L O P M E N T P O L I C Y
142
lion, making him one of the world’s wealthiest individuals. While fight-ing is so lucrative, rebels have little incentive to reach a settlement; forexample, four years of negotiations with the FARC proved fruitless forthe government of Colombia. Hence measures that reduce the flow offunds to rebel movements are likely to encourage them to come to thenegotiating table.
Curbing Rebel Access to Commodity Markets In the case of somecommodities, rebel groups are raising substantial finance by controllingthe production of the commodity in their territory and selling the out-put. To date the Kimberley process is the most important example ofinternational action to reduce rebel organizations’ access to commoditymarkets (see box 5.3). It was triggered by the Fowler Report of the UN,which drew world attention to the way in which some rebel organiza-tions were financing their activities through the sale of diamonds andprovided explicit detail about the routes involved. The Kimberleyprocess is a private sector initiative. It was able to overcome the usualcollective action problems with private sector self-regulation becausethe industry is unusually highly concentrated, with de Beers in a dom-inant position. Although the agreement itself is recent, its antecedentsincluded de Beers’ decision to cease purchasing diamonds in the openmarket and intensive action by the Diamonds High Council, based inAntwerp, to reduce rebel access to the market. An analysis of the ini-tiative by Klare (2000) speculated that it might well lead to the termi-nation of some West African conflicts. This proved percipient: over thenext two years both UNITA and the RUF were defeated militarily, al-though both had previously been highly durable organizations. Notethat in both cases other important factors were also at work: in Angolathe government used the opportunity of high oil prices to massively in-crease its military expenditure, and in Sierra Leone the British govern-ment sent in substantial military forces. The tightening of the financialjugular complemented these changes, and probably no single compo-nent was decisive.
Establishing whether the Kimberley process is going to be effective isimportant, and for this a monitoring and evaluation process is needed.If the Kimberley process is ineffective, public action will probably benecessary to strengthen self-regulation. Indeed, the very existence of the
143
W H AT W O R K S W H E R E ?
Kimberley process is an acknowledgment of the need to regulate accessto the diamonds market. If the Kimberley process is effective, the ques-tion arises whether it should be replicated in a few other commoditymarkets, such as timber and Columbite-tantalite (usually known ascoltan). Although the timber industry is much less concentrated thanthe diamond industry, the commodity itself is inherently easier to trackwhile in transit.
As noted, timber is at the opposite end of the concentration spec-trum from diamonds and involves many small companies. Here themost successful action to date has been at the regional level. For exam-
DIAMONDS HAVE LONG BEEN RECOGNIZED AS A
source of conflict finance. To restrict this channel of financing, the major diamond trading countriesand companies took part in the Kimberley process,which formally began in November 2002. Its pri-mary purpose is to establish an international certifi-cation scheme for rough diamonds based mainly oninternationally agreed minimum standards for cer-tificates of origin and national certification schemes.
The participants agreed to establish internal con-trols to eliminate the presence of conflict diamondsfrom shipments of rough diamonds imported and ex-ported from their territories. This includes designat-ing monitoring authorities to diamond shipmentsand ensuring that all diamonds are imported and ex-ported in tamper-resistant containers accompaniedby Kimberley process certificates. The participants areobliged to amend or enact appropriate laws or regu-lations to implement and enforce the certificationscheme and to maintain penalties for transgressions.They are also to collect and maintain relevant officialproduction, import, and export data and to collateand exchange this information when necessary.
Each participating country is to ensure that aduly validated certificate accompanies each ship-
ment of rough diamonds on export and import. Im-porting authorities must also confirm receipt of ashipment expeditiously to the relevant exporting au-thority, specifying the details of the shipment. To fa-cilitate the tracking of diamond flows, the originalcertificate must be readily accessible for a period ofno less than three years. To further filter out conflictdiamonds, the participants agreed to ensure that noshipment of rough diamonds is imported from orexported to a nonparticipant and that each ship-ment leaves its territory unopened and not tamperedwith. A degree of transparency and monitoring wasintegrated into the process as a result of oppositionby nongovernmental organizations to proposals thatthe system be self-regulating.
In Ottawa in March 2002, Kimberley partici-pants announced confidence in meeting their endof year deadline for implementing the regime, al-though several significant technical and operationalissues remained. Success depends on whether theseproblems are properly resolved. One day after a res-olution passed the UN Security Council in supportof the Kimberley process, EU member states an-nounced that they could not meet their obligationsby the deadline of February 1, 2003.
Box 5.3 The rough diamond trade and the Kimberley process
Source: Crossin, Hayman, and Taylor (2003).
B R E A K I N G T H E C O N F L I C T T R A P : C I V I L WA R A N D D E V E L O P M E N T P O L I C Y
144
ple, the government of Thailand increased scrutiny of the border tradein illegal timber with Cambodia that was financing the Khmer Rouge.This was so successful that it substantially accounted for the collapse ofthe Khmer Rouge (see box 5.4).
Realistically, the effect of better regulation of commodity markets isnot literally to shut rebel organizations out of markets, but to maketheir activities so difficult that they can only sell their illegal booty at adeep price discount. A recent study of the duration of conflict providessome insight into the possible effects of deepening such a discount(Collier, Hoeffler, and Söderbom 2003). The study controls for all theother factors that influence the duration of a conflict and investigatesthe effect of world commodity prices. It finds that for countries that areheavily dependent on commodity exports, the world price of thesecommodities significantly affects the duration of the conflict: whenprices are high the conflict is less likely to end than when prices are low.For example, for a country for which primary commodity exports ac-count for 30 percent of GDP, a 10 percent decline in the price of its ex-port commodities tends to shorten the expected duration of conflict byaround 12 percent. The effect of targeted policies should be consider-ably greater than this, because they detach the price rebels receive fromthe world price. Potentially, creating deep price discounts and moni-toring them should be feasible. An analogy is the deep discounts thatare already routine for counterfeit goods.
Another activity of enormous importance to rebel groups is the pro-duction of illegal drugs for sale in rich countries. Current OECD pol-icy toward these drugs varies, but its main thrust is to encourage thegovernments of developing countries to discourage production. Theproblem with this production-focused approach is that it makes terri-tory outside the control of a recognized government enormously valu-able, and so inadvertently helps to sustain rebellion. An alternative ap-proach that would radically reduce the funding for rebellion would beto focus penalties on illegal consumption so as to bring down the priceof illegal drugs. For example, for many years the United Kingdom hada policy that while it severely penalized trade in heroin, once heroinusers were registered as addicts they were provided with supplies fromofficial sources. This radically reduced the commercial incentive topush heroin, and under this policy regime the United Kingdom hadfewer than 1,000 registered addicts. It also enabled addicts to be sup-plied from legal sources of production.
145
W H AT W O R K S W H E R E ?
Curbing Diaspora Finance of Rebel Groups Another importantsource of rebel finance is from diasporas in rich countries. This phe-nomenon is long-standing, but as the number of migrants from low-income developing countries has increased, so has the potential for dias-
IN 1979 THE KHMER ROUGE WERE DRIVEN INTO
the jungle and waged war against the Vietnamese-installed regime led by former Khmer Rouge com-mander Hun Sen. The war was funded by the tim-ber trade. The timber logged during the civil warhelped create more demand for Cambodian forestproducts, and the exploitation of timber quickly be-came a sustaining factor of the war and a cause ofarmed conflict in its own right.
In 1992 the Security Council asked the UNTransitional Authority in Cambodia to impose a logexport ban to dampen the Khmer Rouge’s efforts to undermine the peace process. The TransitionalAuthority sent military observers to monitor Cam-bodia’s border, but without power of arrest. TheKhmer Rouge refused such monitoring in its terri-tories, and the Thai government denied access toUN observers on its side of the border. AlthoughThailand eventually prohibited log exports, theCambodian government’s lifting of the ban afternine months undermined its overall impact. In theend, Thai timber imports in 1993 were only 20percent lower than in 1992, while the gems trade,which also benefited the Khmer Rouge, continuedlargely unabated. The sanctions were also weakenedby a 10-week delay in implementation, which led toa logging frenzy, as well as an export quota on sawntimber, which led to the proliferation of sawmillswithin Cambodia but did not significantly affectcommercial timber harvesting rates.
After elections in 1993, the destruction of Cam-bodia’s forests continued. Numerous logging com-panies dealt directly with the Khmer Rouge in amonthly cross-border timber trade worth an esti-
mated US$10 million to US$20 million. The KhmerRouge’s military decline did not end the misuse, andno revenue reached the Cambodian government. Inresponse, the IMF froze the next US$20 milliontranche of its Enhanced Structural Adjustment Facil-ity and threatened to let its support lapse entirely ifthe Cambodian government failed to implementforestry reforms. In November 1996 the EnhancedStructural Adjustment Facility lapsed, and forestrywent to the top of Cambodia’s international agenda.
At least 1.3 million cubic meters of logs weretaken between 1996 and 1997 to fuel a conflict that,in addition to lost revenues, placed additional de-mands on the revenues the treasury was able to raisefrom other sources. It effectively halted the growthof the Cambodian economy. In July 1997 a coupd’état was primarily funded by logging revenue. Topay for military backing and to reward military lead-ers, Hun Sen personally authorized various militaryregions to export logs, in contravention of Cambo-dian law.
The timber trade and the Khmer Rouge benefitedfrom the support of Thai officials who used loggingrevenues to finance their electoral campaigning.Donors used aid conditionality on the Thai govern-ment to end the trade and stop assistance to theKhmer Rouge. The U.S. Congress threatened to endmilitary assistance in 1996 and then all assistance in1997. The IMF pressured Cambodia to end its ac-quiescence to unauthorized exports by canceling partof its Enhanced Structural Adjustment Fund loan in late 1996. The outcome was an effective ban byThailand on Cambodian timber. These pressurescontributed significantly to the demise of the KhmerRouge.
Box 5.4 The Khmer Rouge and the logs of war
Source: Global Witness (2002).
B R E A K I N G T H E C O N F L I C T T R A P : C I V I L WA R A N D D E V E L O P M E N T P O L I C Y
146
pora finance. For instance, more Tamils live in OECD countries thanlive in the Jaffna peninsula of Sri Lanka, and estimates indicate thatTamil diaspora organizations raised around US$450 million per yearduring the 1990s, much of it used by the Tamil Tigers to buy arms. Forexample, a bank account opened by a Canadian of Sri Lankan origin wasused to purchase the 60 tons of Eastern European explosive that killedand injured some 1,500 people in Sri Lanka in 1996. Similarly, theKurdish Workers Party stated that it had raised around US$50 millionfrom the Kurdish diaspora in 1992. One method of collecting moneywas to control the wholesale trade for Kurdish retailers and charge theminflated prices. This “tax” was then transferred to Kurdish rebels.
Only recently have the governments of industrial countries startedto face up to their responsibilities to curtail the organized provision offinance from their territories. For example, the United Kingdom re-cently banned the activities of the Tamil Tigers. Even prior to Septem-ber 11, diaspora funding for the Tamil Tigers was reportedly drying up,but the terrorist attacks brought home to North American diasporasthat donating death was unacceptable (The Economist 2001). In 2002the Tamil Tigers abandoned their long-standing demand for indepen-dence and entered into serious peace negotiations. At the same time theIRA, another violent organization that relied heavily on North Ameri-can diaspora finance, abandoned its previous refusal to “decommission”any of its stock of armaments.
Employing International Interventions
In recent decades the international community has tried many inter-ventions in particular civil wars with the intention of ending them. Theinterventions were sometimes on the side of governments and some-times on the side of rebel organizations. Some interventions were mil-itary, and others were economic or diplomatic (see Regan (2002) for acomprehensive dataset on these interventions).
Recent studies use this dataset to investigate whether any of thesetypes of interventions systematically shortened the duration of conflict(Collier, Hoeffler, and Söderbom 2003; Regan 2002). The results aredisappointing, although such an analysis is intrinsically difficult andmay have missed favorable effects. For example, one possibility is thatthe interventions were targeted on the most difficult conflicts, and thus
147
W H AT W O R K S W H E R E ?
the mere fact that those conflicts with interventions did not last longerthan average would be evidence of modest success. The nonmilitary in-terventions had no significant effect. The only military interventionthat was systematically effective was support for rebels: apparently ex-ternal military support can defeat a government more readily than arebel organization. This may reflect the different styles of governmentand rebel campaigns. Rebel forces typically withdraw into forests ormountains, whereas government forces typically withdraw into majorcities where they can be subject to total defeat, such as the forces of theDerg government of Ethiopia that holed up in Asmara in 1992. Notethat the findings do not imply that no international interventions havebeen effective, but only that no one type of intervention appears tohave been systematically effective.
Negotiating Peace
Prior to a rebellion, predicting which issues and which groups have thepotential to turn opposition into large-scale violence may be hard. Oncea rebellion has started, who the parties to a negotiation should be be-comes clearer. Nevertheless, negotiating peace is difficult. Both partieslack the means to lock into an agreement. A rebel group cannot guar-antee that if it accepts peace, its more extreme members will not estab-lish a new violent organization; for example, once the IRA had accepteda peace settlement a new group calling itself the Real IRA continued theviolence. A government also finds that making commitments that rebelscan trust once they disarm is difficult. In addition to this commitmentproblem is the danger of setting a precedent of conceding to violencewhat has not been conceded to normal political opposition. One of thereasons for the conflict trap may be that rebellion can appear to pay offas a strategy.
Civil wars are far less likely to end in peace agreements than inter-national wars (Licklider 1995). Between 1940 and 1990, combatantsresolved 55 percent of interstate wars at the bargaining table, whereasfewer than 30 percent of post-1945 civil wars have terminated with thesigning of a peace treaty (Doyle and Sambanis 2000; Walter 1997).Furthermore, many of the treaties that end civil wars are unstable andcollapse into renewed fighting. As noted earlier, the difficulty of nego-tiating a lasting peace is due to the parties’ inability to credibly commit
B R E A K I N G T H E C O N F L I C T T R A P : C I V I L WA R A N D D E V E L O P M E N T P O L I C Y
148
to the peace. In contrast to civil wars, international wars have been rel-atively easier to end through bargaining precisely because the partieshave internationally recognized boundaries and standing armies to de-fend those boundaries after the war ends. Walter (1997, 2002) arguesthat what reduces the probability of reaching a negotiated settlement isthe lack of credible guarantees offered by third parties committed to en-forcing the terms of a peace treaty. In a study of modern civil wars shefinds that lack of credible enforcement is the key factor explaining fail-ures to reach a negotiated settlement.
Other authors have emphasized different causes of the long durationof civil wars. For example, secessionist conflicts tend to last longer thanother civil wars because secession is perceived as a nondivisible good,and the new polity that emerges from civil war may incorporate termsof a settlement that exclude some of the parties, thereby creating in-centives for new violence (Licklider 1993). Moreover, a large numberof incoherent and unreconciled groups and coalitions makes negotia-tion harder, other things being equal, as does a rough military balanceamong the parties (Doyle and Sambanis 2003; Elbadawi and Sambanis2000; Zartman 1995). Several other explanations are also possible, suchas tunnel vision, organizational inertia, wishful thinking, and miscom-munication. A study of 16 peace implementation episodes finds thatthe presence of valuable spoils of war, such as natural resources, reducesthe likelihood of success, reinforcing the foregoing discussion of theneed to manage natural resources effectively (Stedman 2001).
Despite the relevance of these explanations to many cases of civilwar, the single most promising explanation is the lack of credible guar-antees for a settlement. In effect, this argument shifts the analyticalfocus from the underlying causes of the long duration of civil wars tothe mechanisms that explain the inability to commit to an agreement,even when the parties prefer an agreement to continued fighting.
According to Walter (1997, 2002), only parties with credible andwell-established self-interest in preserving the peace, parties with suffi-cient military resources to engage in combat, and parties that providecostly signals of their commitment by actually deploying troops canprovide credible guarantees. Without such an external commitment,the absence of a government seen as legitimate by the rebels and thehistory of war in the country will act as disincentives for the parties todisarm. As disarmament is typically a precondition for peace imple-mentation, this creates a barrier to negotiation. The presence of armed
149
W H AT W O R K S W H E R E ?
rebels further undermines the government’s legitimacy and sovereignty.Under these conditions, what is needed is either an external solutionsuch as the one Walter discusses or a solution that makes the peace self-enforcing. Integrating part of the rebel forces into the national armymight be one such solution.
Once the rebels demobilize, they lose their bargaining power in re-lation to the government. In those cases where postwar peace is basedon a self-enforcing agreement, the drastic change in the parties’ relativecapabilities makes the agreement time inconsistent, that is, the govern-ment, which retains its military, can renege on its promise after therebels have disarmed. The government has both the power and the in-centive to renegotiate the agreement or defect from it unilaterally. Thisis particularly true in cases where the war had no definitive outcome,but rather the violence ended in a cease-fire, truce, or negotiated com-promise. One way in which parties have attempted to insure themselvesagainst violations of the peace agreement has been integrating parts ofthe rebel forces into the government’s military. Similarly, in the recentsettlement in Côte d’Ivoire, a leader of the rebel organization was nom-inated to become the minister of defense. Such solutions provide em-ployment for the rebels and reduce their private incentives for contin-uing their rebellion. It also makes coordinated action by the militaryagainst rebel sympathizers more difficult.
Integration of rebels into the government army occurs only rarely. Asexpected, such integration is more common if the war ends in a negoti-ated settlement as opposed to victory; however, integrating defeatedrebel forces is possible, as demonstrated by the case of Biafra, where therebel army was integrated into the national Nigerian army after the endof the war. Where the war ends in a negotiated settlement rebel-militaryintegration occurs in about half the cases, whereas without a treaty in-tegration occurs in only about one-seventh of cases. While no statisticalanalyses of the effects of military integration on the likelihood of war re-currence are available, in several cases military integration is associatedwith a lowered rate of war recurrence. Examples are Nigeria after the1966–70 Biafran war; Chad, where successive bilateral agreements withrebel groups reduced the magnitude of the insurgency in the 1980s and1990s; the Philippines, where the government’s agreement with theMoro National Liberation Front left only a fringe group, the Moro Is-lamic Liberation Front, fighting after 1996; and Zimbabwe, where thepeace after the war of the 1970s and early 1980s has held. At the same
B R E A K I N G T H E C O N F L I C T T R A P : C I V I L WA R A N D D E V E L O P M E N T P O L I C Y
150
time, integrating rebels into the government’s military can threaten theinterests of extreme nationalists and re-ignite civil war before the inte-gration is completed. Examples are Rwanda, where the massacres of1994 followed the failed Arusha Accords, and Angola, where the failureto demobilize and to reintegrate combatants within the framework ofthe Lusaka Accords of 1994 led to a resurgence of violence in 1996.
Reducing Postconflict Risks
A T ANY ONE TIME FEW COUNTRIES ARE IN THE FIRST DECADE
of postconflict peace. For example, the global steady state de-picted in figure 4.12 shows only 12 postconflict countries ver-
sus 64 successful developers currently at peace. Yet the postconflictcountries have a highly disproportionate effect on the global incidenceof conflict: they account for three times as many new conflicts as theentire group of successful developers. Hence in focusing developmentefforts on building a more peaceful world society, clearly the few post-conflict countries warrant particular attention. We can use the modelunderlying figure 4.12 to simulate the effects of reducing postconflictrisks. A wide range of policies could make the first postconflict decadesafer. Furthermore, because these policies are highly focused on a fewcountries, they are relatively straightforward to implement. Figure 5.4simulates how halving the risk of conflict repetition would reduce theglobal incidence of conflict. As the figure indicates, this would make aclear contribution to global peace, with a reduction of around a quar-ter in the incidence of war. Translated into the number of wars, the re-duction is from 16.6 active conflicts at a time to 13, most of them inthe marginalized group of countries.
Postconflict countries face two major challenges. First, as chapter 3indicated, they have a high risk of further conflict, and so a key objec-tive of policy must be to reduce this risk as rapidly as possible. Second,as chapter 1 noted, they inherit a severe economic and social declinefrom the period of conflict, and so the other key objective is to restoreeconomic and social conditions.
The high risks of further conflict inherent to many postconflict sit-uations reflect both risks inherited from prior to the conflict and riskscaused by the conflict. The structure of the inherited risks will differ be-tween societies, and not all risks are amenable to policy; for example, a
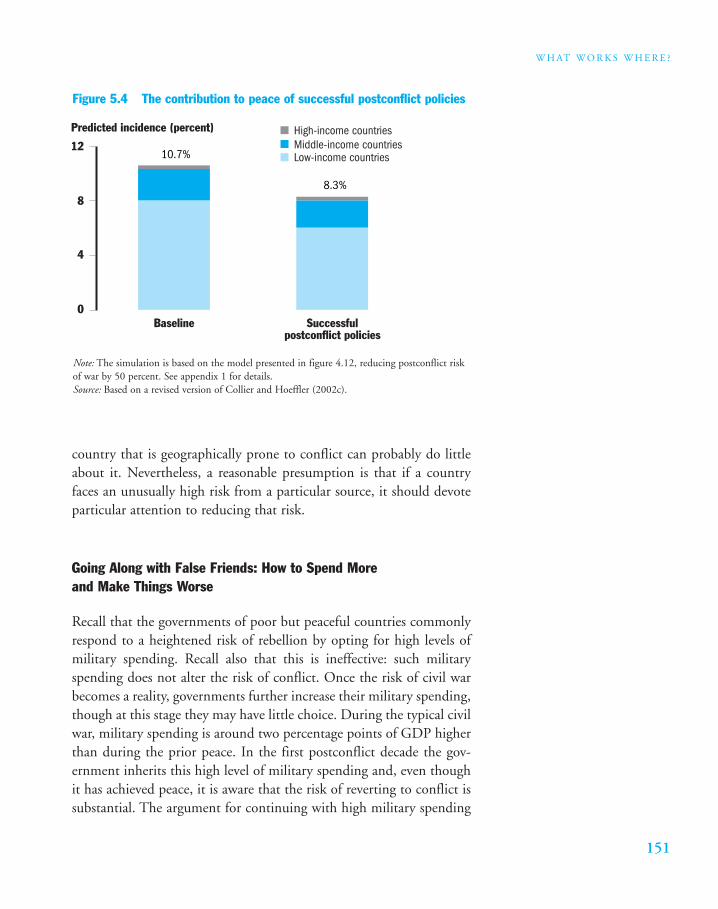
151
W H AT W O R K S W H E R E ?
country that is geographically prone to conflict can probably do littleabout it. Nevertheless, a reasonable presumption is that if a countryfaces an unusually high risk from a particular source, it should devoteparticular attention to reducing that risk.
Going Along with False Friends: How to Spend Moreand Make Things Worse
Recall that the governments of poor but peaceful countries commonlyrespond to a heightened risk of rebellion by opting for high levels ofmilitary spending. Recall also that this is ineffective: such militaryspending does not alter the risk of conflict. Once the risk of civil warbecomes a reality, governments further increase their military spending,though at this stage they may have little choice. During the typical civilwar, military spending is around two percentage points of GDP higherthan during the prior peace. In the first postconflict decade the gov-ernment inherits this high level of military spending and, even thoughit has achieved peace, it is aware that the risk of reverting to conflict issubstantial. The argument for continuing with high military spending
Figure 5.4 The contribution to peace of successful postconflict policies
Predicted incidence (percent)
0
4
8
12
Baseline Successfulpostconflict policies
High-income countriesMiddle-income countriesLow-income countries10.7%
8.3%
Note: The simulation is based on the model presented in figure 4.12, reducing postconflict riskof war by 50 percent. See appendix 1 for details.Source: Based on a revised version of Collier and Hoeffler (2002c).
B R E A K I N G T H E C O N F L I C T T R A P : C I V I L WA R A N D D E V E L O P M E N T P O L I C Y
152
therefore appears to be strong. This argument for deterrence will be re-inforced by the special interest pleading of the military establishment,and quite possibly by rebel forces that might want to be integrated intothe regular army. Thus the pressures for continued high military spend-ing are powerful.
What are the effects of high military spending in postconflict situa-tions? Are they simply the same as in preconflict situations, namely, in-effective? A recent study investigates this, using the same approach asfor the deterrence effect of military spending in preconflict situations(Collier and Hoeffler 2003). It finds that the effect of military spendingis indeed significantly different in postconflict situations. High levels ofmilitary spending postconflict significantly increase the risk of reversionto war. As with the more general study of the effect of military spend-ing, the approach controls for the problem that a high level of militaryspending reflects an enhanced level of risk. Chapter 3 suggested that apossible reason why high military spending might increase the risk ofreversion to conflict is that it inadvertently signals that the governmentlacks confidence in the persistence of peace. An important postconflictproblem is that neither side trusts the other, thus the more the govern-ment spends on the military, the more the rebel organization may thinkthat it too has to prepare for the renewal of conflict. Such mutual mil-itary escalation can easily trigger incidents that re-ignite the conflict.
Each postconflict situation is distinctive, and so any general principlesare merely broad guidelines; however, one policy lesson for postconflictsituations is that governments should be wary of the strong lobbyingpressures for maintaining high military spending. In addition to theproblems resulting from such spending, the government could foregothe opportunity to realize a peace dividend from reduced spending.
Reviving Economic Growth
The level and growth of per capita income are important risk factors forconflict. Faster growth tends to reduce the risk of further conflict di-rectly, and also cumulatively by raising the level of income. Are theeffects of growth different in postconflict situations? A study that ex-amines this finds that a given rate of growth is significantly more effec-tive in reducing risk in postconflict situations (Bigombe, Collier, and
153
W H AT W O R K S W H E R E ?
Sambanis 2000). Hence a sensible approach is for governments to payconsiderable attention to reviving the economy.
Fortunately, on average, the first postconflict decade is a good periodfor growth: countries do tend to bounce back. Taking the first decadeas a whole, annual per capita growth is around 1.1 percent faster thannormal. This growth boom is not uniformly spread over the decade:growth is not more rapid than normal during the first two or threeyears, and by the end of the decade the growth spurt is fading. Thegrowth spurt is concentrated into the middle four or five years of thedecade. Some evidence suggests that the recovery is faster after longerwars, but our main concern is to understand what countries can do toaccelerate the recovery (this discussion is based mainly on Collier andHoeffler 2002a).
As with the poor but peaceful economies, the likely cocktail of in-terventions that might raise the growth rate combines policy reform,aid, and improved access to global markets. The issue is whether any ofthese should be tailored differently for a postconflict country than foran equally poor country that is not just emerging from conflict.
Economic Policy Priorities for Growth As noted earlier, policy mat-ters in the poor but peaceful countries. A useful broad measure of eco-nomic policy, the CPIA, helps explain variations in the growth rateamong developing countries. Is the relationship between policy andgrowth any different for postconflict situations than in peacetime? A re-cent study finds that it is (Collier and Hoeffler 2002a). As measured bythe CPIA, growth is more sensitive to policy during the first decadepostconflict than in normal situations. For the typical postconflictcountry, a one-point improvement in the CPIA would raise growth by2.5 percentage points, whereas normally its contribution to growthwould be around 1.6 percentage points. Thus not only is growth moreeffective in risk reduction in postconflict countries, but policy reformis more effective in raising growth. But which policies matter most?
That economic policies should be distinctive in postconflict situa-tions is indeed likely. Policies at the start of peace are usually muchworse than in equally poor countries without a recent history of con-flict. Hence one difference is simply that postconflict countries are atan earlier stage of reform. Related to this, the politics of reform are
B R E A K I N G T H E C O N F L I C T T R A P : C I V I L WA R A N D D E V E L O P M E N T P O L I C Y
154
likely to be different: the balance between interest groups is distinc-tively different in postconflict situations.
Postconflict countries start with an average CPIA score of only 2.41,compared with a developing country average of 3.00, therefore muchmore is wrong with their policy. This is the case across the entire rangeof macroeconomic, structural, and social policies. The World Bank hasrecently developed a strategy for addressing the needs and problems ofsuch environments known as the low-income countries under stress(LICUS) approach. The essence of the LICUS approach is that eventhough many policies are wrong, the capacity and appetite for reformare limited, and thus attempting reform across a broad front is not sen-sible. Rather, reform efforts should focus on two or three policies thatare politically as easy as possible and yield rapid payoffs. The rationalefor this approach is to build a constituency for reform in contexts inwhich the demand for reform is largely latent. Postconflict situationsresemble other LICUS contexts in starting with poor policies and in-stitutions; however, they differ in that reform may be more constrainedby limited capacity than by limited appetite. The early postconflict pe-riod may politically be a relatively easy time for reform, because peopleexpect change and old vested interests may have been weakened. Thisis borne out empirically by the rapid pace of reform during the firstpostconflict decade. By the end of the decade postconflict countries, onaverage, have a CPIA score of 3.05, slightly above the developing coun-try average. Thus the greater political scope for reform may be con-strained by the limited technical capacity to design and implementpolicies, but this is amenable to donor assistance.
In the normal LICUS environment, given that the agenda for re-form has to be highly prioritized, the conventional sequence is that thetop priority is to correct macroeconomic imbalances. Is there any rea-son to adopt a distinctive prioritization in postconflict environments?Two factors suggest that priorities should be broader in postconflictcontexts than in other LICUS environments. First, the scope for rapidpolicy reform suggests less need to limit reform to two or three policieswith rapid payoffs. Second, some evidence suggests that the relativeimportance of macroeconomic, social, and structural policies is dis-tinctive in postconflict settings.
A recent study focuses on the determinants of growth in all the post-conflict episodes of the 1990s (Collier and Hoeffler 2002a). For this pe-
155
W H AT W O R K S W H E R E ?
riod the CPIA can be disaggregated into three broad areas of policy—macroeconomic, social, and structural—that encompass such matters astrade and privatization. The results suggest that social policy is relativelymore important and macroeconomic policy is relatively less importantin postconflict situations than in normal situations. The effect seems tobe quite large: if opportunities exist for modest trade-offs that improvesocial policies at the expense of a small deterioration in macroeconomicbalances, growth is, on average, significantly augmented. The results donot in any sense imply that macroeconomic balance is unimportant, nordo they imply that it is less important than social policies. They simplysuggest that relative to the strategies normally adopted, social policyshould be given somewhat more weight. As the correction of macro-economic imbalances has been accorded top priority in the normal poorpolicy environments, it may well be that in an absolute sense it shouldalso be the top priority even in postconflict situations. Nevertheless, theresults are important, because both governments and the teams fromthe international financial institutions that advise them have lacked anysystematic tendency to adopt such priorities.
Why should social policies—specifically policies for social inclu-sion—be differentially important for the growth process in postconflictcountries? As the direct effects of education and health care on growthare likely to be long term, the relatively short-term growth effects thatare detected are unlikely to be due to the direct impact of these services.A more likely route by which a government priority for social inclusionmight enhance growth is through its effects as a signal of governmentintent. We have already come across a likely signaling effect: high lev-els of military expenditure increase the risk of renewed conflict, perhapsbecause the rebel organization interprets this as a lack of governmentcommitment to the peace settlement. Conversely, if the government at-taches a high priority to inclusive social policies, this may be inter-preted, not just by the rebel organization but by the wider population,as the government actively honoring the spirit of the settlement. Be-cause the risk of conflict renewal is so high in postconflict situations,the private sector has to take this risk into account in its economic be-havior, and it will obviously influence the decision of whether to investdomestically in irreversible assets or to send wealth abroad, and this de-cision matters for growth. Thus, by prioritizing social inclusion, thegovernment may indirectly reassure investors. This may account for the
B R E A K I N G T H E C O N F L I C T T R A P : C I V I L WA R A N D D E V E L O P M E N T P O L I C Y
156
differential contribution of socially inclusive policies to growth in post-conflict settings.
So far we have suggested that economic policy priorities should dif-fer in postconflict situations, because both the starting point of poorpolicies and the politics of reform are likely to be distinctive. We nowturn to a second reason: the economic inheritance is distinctive, in thatcivil war leaves a legacy that determines priorities for action.
As discussed in chapter 1, civil war has various economic effectsbeyond the overall decline in income. The most obvious is the de-struction of physical assets such as the transport system. Beyond this,economic activity is disrupted. Normal business often becomes moreuncertain, and so time horizons shorten. An important consequence of this uncertainty is that economic behavior tends to become moreopportunistic: people have fewer incentives to build a reputation forhonest dealing. In addition to destruction and disruption, assets andskilled people are diverted abroad. Finally, a retreat into subsistence ac-tivities occurs as other activities decline in response to uncertainty andpredation.
These distinctive effects of conflict determine some of the postcon-flict policy priorities. The returns to early rehabilitation of key infra-structure destroyed during the conflict can be extremely high. For ex-ample, estimates indicate that World Bank road projects in the earlypostconflict phase in Uganda had a rate of return of around 40 percent.The restoration of transport connections is also important for reinte-grating the rural subsistence economy into the market.
The disruption and the high level of opportunism create both pri-orities and constraints. For example, property rights have become con-fused in some postconflict situations: owners have fled and peoplewithout good title have seized or occupied their property. In these cir-cumstances opportunistic claims flourish. Until property rights havebeen clarified reviving investment is difficult, and without deliberateaction, the process of settling disputed claims can take many years. Apriority is for the government to set up a fast-track process for resolv-ing claims that involves setting an early time limit by which all claimsmust be registered in order to be considered; however, high levels of op-portunism constrain what the government can realistically do.
Often the conduct of the civil service and of such professionals aslawyers and judges will have been undermined, and this limits the gov-
157
W H AT W O R K S W H E R E ?
ernment’s ability to collect taxes and deliver public services. Under suchconditions the best approach may be to keep the government sectoratypically small until reasonable practices can be reestablished.
A major potential asset of the society is wealth held abroad. A prior-ity is therefore to induce the repatriation of these funds. All capitalflight is likely to have been illegal, but it reflects two very differentprocesses. Some capital flight will be to hide the proceeds of large-scalecorruption. Other capital flight will simply reflect the prudent move-ment of honestly acquired assets into a safer environment. During civilwar both of these occur on a significant scale, but they require quite dif-ferent postconflict policies. The former should be tracked down, andwith the compliance of authorities in the industrial countries the fundsshould be forcibly repatriated. The latter, which probably accounts forthe bulk of money abroad, should be induced to return voluntarily.One way to encourage repatriation is by keeping the exchange ratecompetitive: a wide gap between the official exchange rate and that onthe parallel market is a powerful driver of capital flight. Other signifi-cant influences on the repatriation of capital are high indebtedness,poor economic policies as measured by the CPIA, and political insta-bility (Collier, Hoeffler, and Pattillo 2002).
Aid in Postconflict Situations Donors typically curtail aid flows dur-ing a civil war. Various factors determine such flows, such as the eco-nomic policy of the recipient government, its per capita income, and itspopulation. The decline in aid flows during conflict is partly a responseto deteriorating policy: on average each one-point reduction in theCPIA reduces aid by around 0.3 percent of GDP. However, the deteri-oration in policy does not by itself account for the significant reductionin aid. In addition, the longer the war lasts, the more aid declines. Bythe end of a four-year war, aid will have declined by over half a per-centage point of GDP simply due to this effect. How do donors re-spond to the restoration of peace?
In the first couple of years postconflict donors substantially increaseaid; however, this is not sustained. By the third or fourth year postcon-flict some signs suggest that aid is below normal levels, and toward theend of the first decade it is more than one percentage point below nor-mal levels. This overall pattern of aid allocation is readily intelligible. In
B R E A K I N G T H E C O N F L I C T T R A P : C I V I L WA R A N D D E V E L O P M E N T P O L I C Y
158
the immediate postconflict period international publicity and goodwillis considerable, and so donors are keen to be seen as involved. Some-times donors provide funds out of resources dedicated to postconflictuses, which, as new postconflict situations arise, are gradually divertedto these new needs. For the aid programs to be sustained bureaucrati-cally, the recipient country needs to become part of the donor’s normalallocation mechanism, but during the conflict the original aid pro-grams have eroded and the donor has allocated the funds to othercountries. Most donors do not have an automatic process whereby apostconflict country becomes part of its core aid allocation. Further-more, using aid effectively during the early postconflict years is ex-tremely difficult, and donors can easily become disillusioned with thecountry. For whatever reason, the pattern is that taking the first post-conflict decade as a whole, aid is lower than if the country were notpostconflict. Within the decade the aid profile is an initial burst fol-lowed by a gradual decline.
The pattern of donor contributions is thus distinctive in postconflictsituations. Is the contribution of aid to growth also distinctive in thesesituations? The evidence suggests that aid during the postconflict pe-riod is more effective than normal in raising growth. The effect is notuniform: during the first two or three years of the postconflict decadeaid is no more effective than in normal situations, and by the end of thedecade it is also no more effective than normal. The high-impact phaseis during the middle four or five years of the decade, when it is muchmore effective than normal. One way of expressing this is in terms ofabsorptive capacity. Aid, like most other resources, is subject to dimin-ishing returns: as more aid is put into a situation the additional contri-bution of each dollar becomes smaller, and eventually the point of sat-uration is reached beyond which further aid does not raise growth andmay even be damaging. During the middle phase of the postconflictdecade aid absorption capacity, that is, the amount of aid that a coun-try can absorb productively, is approximately double normal.
The phase of super-effective aid turns out to account fully for thegrowth spurt in postconflict economies. If a postconflict country didnot receive aid during the first decade, the growth analysis suggests thatit would completely miss out on the above normal growth phase. Notethat the original impetus for aid was postconflict recovery. The WorldBank’s original name is the Bank for Reconstruction and Development,and its first task was to help restore the European economies after
159
W H AT W O R K S W H E R E ?
World War II. Apparently this impetus was not misguided: aid has acrucial role in postconflict recovery.
Yet aid policy as it has evolved over the past half-century has evi-dently lost this original insight. Aid during the first postconflict decadeis insufficient, and it is also mistimed, coming in when the institutionalcapacity to use it well is not yet in place and tapering out just as itshould be surging in. The donor community can surely do better.
Postconflict aid also provides an opportunity for credible enforce-ment of peace agreements. Boyce (2002) argues that postconflict aidcould use conditionality to encourage governments to adopt policiesthat secure the peace.
Reducing Risk Using Political and Military Strategies
Economic recovery helps to reduce the risk of renewed conflict, butother policies are also important.
Disarmament and Demobilization The pace at which military forcesare demobilized varies widely, as does the attention paid to reintegrat-ing soldiers into society. What do we now know that can guide thesedecisions?
Disarmament, demobilization, and reintegration (DDR) involves achain of activities that normally begins with disarmament and endswith ex-combatants (both government soldiers and members of anarmed opposition group) finding new, productive roles in civilian life.The importance of this process is increasingly being recognized. The1998 report of the UN secretary-general on “The Causes of Conflictand the Promotion of Durable Peace and Sustainable Development inAfrica” cites the reintegration of ex-combatants and others into pro-ductive society as one of the priorities of postconflict peace building.DDR would help reduce conflict risk both through the direct effects ofdecreased military expenditure and manpower and through the indirecteffects on growth and poverty reduction of budget reallocation and thereturn of the labor force. A structured DDR process, which demobilizescombatants in stages and emphasizes their ability to reintegrate into so-ciety, may reduce the risk of ex-combatants turning to violent crime orrejoining rebel groups in order to survive.
B R E A K I N G T H E C O N F L I C T T R A P : C I V I L WA R A N D D E V E L O P M E N T P O L I C Y
160
The starting point for the whole process is political will among thekey parties: experience shows that no DDR will succeed if that is miss-ing. In some cases the demobilized include ex-soldiers from a nationalarmy as well as ex–rebel fighters with whom they have been at war, asin Angola and Sierra Leone, while in other cases the demobilized aresoldiers from two warring national armies, as in the case of Eritrea andEthiopia. In all cases the timing of the demobilization efforts is critical:the demobilization should start as soon as possible after the parties haveagreed to end the war; the different armies should be demobilized inparallel; and the quartering of combatants waiting for discharge shouldbe as short as possible, only allowing for registration, health checks, andso on.
While disarmament and demobilization are reasonably straightfor-ward logistical operations, reintegration is a complex and long-termprocess of coalescing groups with different backgrounds, experiences,norms, expectations, and capacities. The process also has psychosocialaspects, as most ex-combatants go through a process of adjusting theirattitudes and expectations, and many suffer from traumatic experiencesrelated to the war. Experience shows that successful reintegration de-pends to a considerable extent on the support that ex-combatants re-ceive from their families and communities. Strengthening the absorptivecapacity of the receiving communities is therefore an important part ofthe reintegration process. In some cases, however, ex-combatants havecommitted atrocities in or near their own communities and are oftenunable to return to these communities, for example, in Mozambique(Kingma 2002). Except under such circumstances, ex-combatants shouldbe allowed to freely choose the community in which they settle.
DDR is a sensitive process undertaken in an environment where thesources of conflict often remain unresolved despite peace agreements,and experience has given rise to lessons that may help avoid inadver-tently fueling tension (Kingma 2002). The ongoing provision of infor-mation about the process to the armed forces as well as to society atlarge can counter rumors and unrealistic expectations, as can the use oftransparent criteria for selecting and phasing the groups to be demobi-lized. Efficient support for reintegration requires targeted interventionsbased on socioeconomic data for the ex-combatants. Knowledge oftheir geographic origins, family situation, education, and past occupa-tion greatly helps the planning of realistic reintegration support, which
161
W H AT W O R K S W H E R E ?
normally includes access to training, employment opportunities, andproductive assistance (for instance, micro-credit).
Support levels should, however, be in line with assistance providedto other reintegrating groups, such as the internally displaced or re-turning refugees, many of whom may be more vulnerable than the ex-combatants. In some conflict situations civilians view combatants asrobbers and rapists rather than as fighters for a just cause, and the pro-vision of a higher level of reintegration support for ex-combatants thanfor other groups is likely to provoke negative reactions. DDR activitiestherefore need to be designed as an integral part of the broader postwarrecovery and peace-building process.
Maintaining a large army is expensive for the budget, denies the restof the economy part of the labor force, and, as noted earlier, appears toincrease the risks of further conflict. Nevertheless, governments are oftenhesitant to demobilize soldiers for fear that they will be disruptive. Ofparticular concern is the danger that demobilized soldiers will turn toviolent crime. This fear has some basis, because soldiers may have losttheir skills for other activities, or indeed, if they were recruited as childsoldiers they may never have had any other skills. Their time in the mil-itary may have provided them with the skills and equipment for vio-lence and desensitized them to its use. One study investigated the effectsof demobilizing soldiers in Uganda during the early 1990s, a policy thatthe Ugandan public widely feared would lead to a crime wave (Collier1994). Soldiers were returned to their home districts, but with large dif-ferences between districts in the number of soldiers returned, and so thestudy was able to determine whether any relationship existed betweenchanges in district-level crime rates and the number of soldiers demo-bilized. Overall, despite the fears, the demobilization had no effect oncrime; however, prior to the demobilization all soldiers had been sur-veyed to discover what access they had to income-earning possibilities.Around 12 percent claimed to have no access to land, and these soldierswere concentrated in a few districts. Demobilized soldiers with no ac-cess to land significantly and substantially increased local crime rates.Statistically, they were more than 100 times more likely to commit acrime than the average Ugandan. A possible implication of this is thatefforts to help demobilized soldiers return to normal economic activityneed to be highly targeted. Most soldiers probably do not need muchassistance, but identifiable categories are likely to turn to crime.
B R E A K I N G T H E C O N F L I C T T R A P : C I V I L WA R A N D D E V E L O P M E N T P O L I C Y
162
Diasporas Recall that the existence of a large diaspora living in richcountries is an important risk factor in postconflict societies. This isboth a statistical result and is supported by evidence of how particulardiasporas have tended to support and finance violent political organi-zations. How can policymakers respond to this risk?
One useful response is for donor agencies and postconflict govern-ments to recognize the diasporas’ potential to play a productive role ineconomic reconstruction. Diasporas in rich countries possess skills thatare in acutely short supply in postconflict situations. Furthermore,many members of diasporas are often running businesses that couldprovide useful trading opportunities. They are the part of the globalbusiness community that is most knowledgeable about the country andmost prepared to undertake the risks of engagement. Business peopleliving abroad often go back to visit during early postconflict situations,combining social and business opportunities. Governments are oftenineffective in harnessing this potential, and formalizing the use of thediaspora may be helpful. For example, in postconflict Afghanistan thegovernment used the Internet to create a directory of skilled Afghansliving abroad, while postconflict Eritrea had a cabinet minister dedi-cated to diaspora concerns. Diaspora organizations can be brought for-mally into business recovery strategies by organizing visits home, andcan even be formally involved in the peace process. There may also bescope for recruiting second-generation diasporas into service along thelines of the Peace Corps, as Israel has effectively done for many years.A diaspora can be a wasted asset unless its members maintain familycontacts. The new communications technology is well suited to thispurpose, yet some postconflict governments are hesitant to permit it onsecurity grounds. Any direct security benefits from curtailing commu-nications may come at a high cost in terms of slowing recovery.
The donor community may also be able to encourage diasporas toplay a constructive economic role. Bilateral donors can make businesslinks with the diasporas living in their countries part of a postconflictaid program. Multilateral agencies could arrange business forums, andeven design projects with an explicit role for diaspora organizations. Forexample, a school enrollment program could seek diaspora assistancefor books, and even for volunteer teachers.
In conjunction with these greater opportunities for diasporas to playa positive role in recovery, host governments in industrial countriesmust recognize their responsibilities to ensure that diaspora organiza-
163
W H AT W O R K S W H E R E ?
tions do not finance violence. For example, The Economist (2001) re-ported that diaspora remittances to the Tamil Tigers were substantiallycurtailed as governments tightened controls, and this may have assistedin the substantial softening of the Tamil Tigers’ demands, which hasgreatly facilitated the peace process in Sri Lanka. September 11 hasbrought home to North American diasporas what the financing of vio-lence actually means.
Political Architecture Experience shows that democratic institutionsare extremely unstable in low-income countries dependent on primarycommodities. For this reason, empirical analyses fail to find any system-atic risk-reducing effect of democracy in such countries. Democratic in-stitutions are difficult to sustain unless all important actors accept thatresorting to physical force is unacceptable. Where the underlying factorsthat predict a high risk of civil war are present, this is unlikely to be thecase. In many low-income countries reducing the risk of civil war is thusa necessary precondition for democracy rather than the other wayround. Outbreaks of violence often follow on the heels of reversals fromdemocratic institutions. The external imposition of a set of unsustain-able institutions without the commitment to defend them over the longerterm may prove to be counterproductive; however, there may be scopefor using aid conditionality to help stabilize new institutions over alonger period (Lipset 1959; Przeworski and others 2000; Ross 2000).
One attempted solution to conflict in polarized nations has beenpartition; however, multicultural nations are not inherently problem-atic. Recall from chapter 3 that highly diverse societies are much saferthan polarized societies. Horowitz (1991) has proposed that instead ofpartition, there might be scope for regional political integration, tobuild larger, more complex multiethnic states (see also Sambanis 2000).
External Military Presence In many postconflict situations the UN,a concerned neighbor, or the former colonial power provides peace-keeping troops. Given the high risks of renewed conflict in the earlypostconflict years, some form of military solution seems necessary. Asdomestic military expenditure actually appears to increase the risks,such a military presence should be external. Among external interven-tions various options are possible: regional or extraregional, bilateral or
B R E A K I N G T H E C O N F L I C T T R A P : C I V I L WA R A N D D E V E L O P M E N T P O L I C Y
164
international. Whatever forces are deployed, however, should be seen ascredible and should not be seen as a party in the conflict. Credibility de-pends, in part, upon rules of engagement and willingness to use force.For example, in Sierra Leone the RUF took a large UN force hostage,because the former correctly perceived that it would not meet resis-tance. By contrast, when a much smaller British force was deployed withclear instructions to be prepared to fight, the RUF rapidly dissolved.
In Georgia a few Russian peacekeepers have managed to bottle up thepassions that fueled secessionist violence in South Ossetia and Abkhaziafrom 1991 to 1993, and North Atlantic Treaty Organization (NATO)military support was effective in helping the UN mission in easternSlavonia to implement its transitional authority mandate. U.S. militaryintervention ended the war in Haiti, and U.S. monitors succeeded inproviding legitimacy and technical assistance during the Nicaraguanelections of 1989, ending a 10-year-long war, much as international vol-unteers did in the case of the Cambodian elections in 1993, which in-stalled the first publicly elected government in that country’s history.
Yet every regional peacekeeping success story can be counterbal-anced with a failure. Libyan intervention in Chad only exacerbated thefighting in the 1980s, Iranian intervention in Iraq only intensified Iraqiviolence against the Kurds, and a multinational peace enforcement mis-sion led by the United States in Somalia created new fault lines amongpreviously cooperating warlords and escalated the violence in that coun-try in the second half of the 1990s.
Regional, non-UN peacekeeping and peace building can be more ef-fective than multilateral intervention. An important shortcoming ofmultilateral peacekeeping by the UN is that the participants are engagedin a coordination problem, and the possible defection from agreed ac-tion by any participants creates gaps in the collective effort. The eco-nomic costs of collective security arrangements are also substantial, andinfighting occurs over the distribution of these costs and the conse-quences of intervention. By contrast, unilateral or regional interventionoccurs only if security concerns justify the economic costs of interven-tion, and parties are likely to contribute to the degree to which their in-terests are threatened. Regional organizations can provide useful instru-ments for peace maintenance, and they can do so within the frameworkof the UN Charter. Chapter VIII of the Charter discusses the regionalmanagement of conflict. The idea behind this is that regional organiza-tions are a better locus of activity because they are more familiar with the
165
W H AT W O R K S W H E R E ?
region, they may have greater leverage with the parties, and they are lesslikely to be impeded by the politics of the UN Security Council.
Security Council politics were an especially relevant consideration dur-ing the Cold War. The rule of great power unanimity that gov-erns Council voting often paralyzed the UN’s ability to intervene. Be-tween 1946 and 1990 the great powers exercised their veto rights 279times: the former Soviet Union did so 124 times, the United States 82 times, the United Kingdom 33 times, China 22 times, and France 18times. However, from 1991 to 1995 they used the veto only 3 times (Rus-sia twice and the United States once) and recorded only 20 abstentions(which need not preclude a resolution on any matter before the council).Thus in the post–Cold War period multilateral operations face fewer op-erational and political constraints. Since 1989 the Security Council hasauthorized 31 peacekeeping operations and adopted 145 resolutionsunder Chapter VII of the UN Charter (enforcement, non-consent-basedaction). By contrast, the council had authorized only 15 peacekeepingoperations and adopted 22 resolutions under Chapter VII during theCold War. In an environment of greater major power cooperation, re-gional organizations may lose some of their advantages in relation to theUN as an instrument for exercising collective security arrangements.
While regional organizations do have advantages and can help sup-port the UN by constructing a network of institutions to implementthe Charter, they also have shortcomings. Establishing which regionalorganization should intervene is often difficult because of ambiguityregarding the concept of region, that is, is geography or politics thedetermining factor (see Weiss 1998). An example is the public debateabout NATO’s involvement in the former Yugoslavia’s wars. A secondadvantage of regional organizations may be that they can possess greaterinstitutional resources and technical knowledge than the UN’s peace-keepers; however, this is not true for all regional organizations, and thefact that their resources come directly from one or more hegemonicstates may create doubts about their impartiality during peacekeepingoperations. A related concern is that regional hegemons who couldprovide the bulk of support in a regional organization may be directlyinvolved in the conflict. Furthermore, regional organizations’ interestsmay be limited to regional—not global—stability, so that both theirstrategies and goals may be different from the global interest. Thus,while the use of regional organizations for conflict resolution has ad-vantages, it also entails considerable limitations that perhaps account
B R E A K I N G T H E C O N F L I C T T R A P : C I V I L WA R A N D D E V E L O P M E N T P O L I C Y
166
for the limited success of major regional organizations in maintaininginternational peace and security.
Examining Trade-Offs between Growth and Peace
The government’s objectives in a postconflict situation need to be quitedifferent from those appropriate for a peaceful situation. In particular,in view of the high risk of repeat conflict, policies for maintaining peaceshould receive a much higher priority in postconflict situations than innormal situations. This creates the potential for trade-offs betweenpolicies that promote growth and those that promote peace.
Policies that promote economic recovery will, on the whole, reducerisk. Recall that policy improvement, as defined by the World Bank, hasno overall tendency to create risks of conflict; however, there will clearlybe exceptions: some policies may raise growth but enhance either griev-ances or opportunities for rebellion. Growth-promoting policies willtherefore need to be screened for such effects. Where a significant trade-off exists, the government may need to give priority to policies for peacebuilding.
The most probable locations for the early stages of economic recov-ery are the capital city of the country and the most developed region.The most difficult regions to revive are likely to be those that the rebelorganization controlled. Market forces will therefore probably agglom-erate activity in a way that is disadvantageous to the rebels. The returnto public economic expenditure is likely to be highest in those areaswhere private activity is reviving most rapidly, and so is most con-strained by a lack of publicly provided goods and services. Hence thereis likely to be a trade-off between the growth-maximizing geographicdistribution of public expenditure and a distribution that might be re-garded as fair.
The economy will need the foreign exchange from reviving export ac-tivities, but by far the easiest exports to encourage are likely to be thoseobtained by natural resource extraction. These activities have location-specific rents and are not as highly dependent on inputs as manufacturing.Yet an expanded resource extraction sector risks generating all the prob-lems previously discussed: financial opportunities for rebel groups, cor-ruption in government, and exposure to macroeconomic shocks. Indeed,the initial conflict may have been induced in part because the country was
167
W H AT W O R K S W H E R E ?
heavily dependent on primary commodities; thus a long-term strategy fordiversification is desirable for peace building. A trade-off between the sec-tor strategy that maximizes short-term growth and that which most re-duces the risks of renewed conflict is therefore likely. A possible way out ofthis trade-off is to give priority to transparent governance of the revenuesfrom natural resources and to establish institutions of scrutiny that are suf-ficiently inclusive to be credible with opposition groups.
Sequencing Postconflict Policies
We have considered two groups of policies for restoring postconflict so-cieties: measures to revive the economy, notably aid and policy reform;and military interventions, notably demobilization and external peace-keeping. Can we say anything about the appropriate sequencing ofthese interventions?
The typical postconflict society begins peace with high risks of fur-ther conflict and with a weak economy. Although much can be done torevive the economy, recovery will inevitably take time. Indeed, the paceof growth tends to quicken after being modest in the first three post-conflict years. Aid is not especially effective during this early period, atleast in reviving growth, and any policy improvement is from a lowbase. Hence neither aid, nor policy reform, nor any combination of the two can reasonably be expected to deliver peace with any reliabilityduring these early years. Of course, some situations will be inherentlyhopeful. Especially in middle-income countries, the risks of furtherconflict may sometimes be quite limited, but for low-income countriesthis postconflict phase will typically need a temporary intervention thatgoes beyond effective strategies for economic development. This is thephase during which external military intervention has a critical role toplay. Currently the UN typically sees postconflict interventions as two-year operations. This may well be too short, as the economy will nor-mally not have responded much by the end of two years.
The earliest that economic recovery can realistically hope to take overthe burden of maintaining the peace is by the middle of the first post-conflict decade. During this period growth rates are atypically high and,even more important, could be raised substantially more if aid were tar-geted to this phase. At present aid is inadequate and mistimed. Theglobal response to postconflict situations should therefore evolve from
B R E A K I N G T H E C O N F L I C T T R A P : C I V I L WA R A N D D E V E L O P M E N T P O L I C Y
168
military peacekeeping to aid during the first decade. Countries can andmust graduate from postconflict status.
We can simulate the effects of a well-used first decade on the risk ofconflict. Suppose that under the protection of military peacekeeping a large and well-timed aid program, combined with rapid and well-selected policy reforms, succeeds in raising the annual growth rate ofthe economy by two percentage points and that this is sustained overthe decade. Suppose also that this enables the economy to diversify bya relatively modest two percentage points of GDP out of primary com-modity dependence. By the end of the decade the risk of conflict hasbeen halved from a 44 percent risk of conflict in the ensuing five yearsto a 22 percent risk, that is, the country has more or less returned tothe level of risk faced by the group of marginalized countries that haveenjoyed sustained peace.
Beyond the first decade the challenge of risk reduction passes to thecountry’s government. An external military presence cannot be contin-ued indefinitely, nor can countries that have at some prior stage had aconflict permanently preempt aid. The risks during the second decadewill be substantially lower if the country has put reasonable policies,both economic and political, in place during the first decade.
Governments already tend to improve policies during the firstdecade. As noted earlier, policies start the decade with a CPIA rating of2.41 and end it with a rating of 3.05, slightly above the developingcountry average, but this is not enough. Policy is a continuum, so nocritical threshold exists that must be attained; however, recall that thedividing line between the marginalized countries and the successful de-velopers was a sustained rating of 3.5; thus the typical postconflictcountry is still short of reasonable policies after a decade of reform.Some low-income postconflict countries have managed to implementmuch more rapid policy reform, achieving policy scores of 4.0 by theend of the first decade. A high policy score is associated with both fastergrowth and a more diversified economy, both of which tend to reducerisks. Suppose that by the end of the first decade the country had a pol-icy score of 4.0. How would risks typically have evolved by the end ofa second decade of peace during which the country had maintained thislevel of policy? The good policy environment raises the growth rate,which results in a higher income level. Both the better policy and thehigher level of income in turn facilitate export diversification. Fastergrowth, higher income, and greater diversification all contribute to
169
W H AT W O R K S W H E R E ?
peace, reinforcing the pure effect of the passage of time, which itselflowers the risk. Twenty years after the end of the conflict the risk of re-newed conflict has fallen to 12 percent over the ensuing five years: thesociety has effectively escaped the conflict trap.
Coping with the Health Crisis
As chapter 1 showed, civil war leaves a terrible legacy of health prob-lems, and these require focused attention. The war destroys infrastruc-ture, leaving the population in conditions that increase the risk of dis-ease; squeezes the budget for the health system; and displaces people,which again increases the risk of infectious diseases. Policies to addressthis issue should take a long-term perspective, because refugees andIDPs may stay away from their homes for long periods after the warends, yet current responses to humanitarian emergencies improve healthconditions only in the very short term.
International assistance usually invests money in bringing doctors todevastated areas and refugees camps; however, the level of absenteeismof doctors in areas difficult to access is around 45 percent (Chadhuryand Hammer 2002), and doctors stay in devastated areas only for shortperiods. Therefore even though the emergency actions for devastatedareas are effective in the short term, the health problems remain in thelong term. International assistance agencies should rethink their poli-cies to achieve sustainable improvements in health.
Doctors need to be given an incentive to do their job, and their payshould reflect the difficulty of the job. The main problem of absen-teeism has to do with incentives. Another approach could be to go out-side the public sector and let nongovernmental organizations (NGOs)do this job. Doctors working for NGOs typically do not show such highlevels of absenteeism; moreover, patients are more motivated and happywith NGO doctors (Reinikka and Svensson 2002). Beyond this build-ing an infrastructure to avoid the spread of infectious diseases such asmalaria and HIV is necessary that includes safe water, sanitation, andpaved roads. This should occur before public medical personnel arebrought into the region for long periods. Infrastructure is crucial to fa-cilitate mobility and to ensure that professional staff will stay in the area.
IDPs should receive the same attention from the international com-munity as refugees in asylum countries. IDPs suffer similar problems to
B R E A K I N G T H E C O N F L I C T T R A P : C I V I L WA R A N D D E V E L O P M E N T P O L I C Y
170
refugees in asylum camps, but their situation is worse because they donot receive much humanitarian help. This increases mortality rates andthe spread of infectious diseases. The location of camps is crucial: manyhave been set up far away from hospitals and safe water, which increasesthe risk of infectious diseases. Moreover, camps are sometimes locatedin areas extremely difficult to access. Before setting up any camp itshould be recognized that people may stay there for long periods afterthe war has ended, and thus its location should be suitable for habita-tion in the long run; however, many camps already exist and relocatingthe millions of people involved is impossible. For these camps provid-ing the basic infrastructure is important.
Another general recommendation is to have the community, whetherrefugees or the internally displaced, participate in the construction ofpublic services. Services work better when the community contributesto their cost.
HIV and Other Sexually Transmitted Diseases As discussed in chapter1, civil wars create an environment for the spread of HIV/AIDS. Militarypersonnel tend to have high rates of STDs, including HIV. When sta-tioned away from home, social controls to engage in sexual relationshipsare lower and the risk of HIV infection is likely to be higher. Prostitutionaround army bases also increases the spread of infection. In addition, theincidence of rape often increases dramatically during war, with refugeesand displaced women and girls being particularly vulnerable. The de-struction of the social and physical infrastructure during wartime con-tributes to the spread of the disease. War also weakens the education sys-tem, which makes the teaching of prevention more difficult.
The basic approach used to address this problem is to combine theprovision of information and support. Refugees can be provided withappropriate education programs on transmission and prevention andon the consequences of becoming infected to change their behavior.This is the strategy the UNHCR has adopted in its plan for 2002–04,and the Centre for Research on the Epidemiology of Disasters also em-phasizes this approach. The refugee community can itself be used as asupport group, in that associations and groups in the camp can serve asthe vehicle to implement measures.
Soldiers also need targeted education programs. According to Elbe(2002, p. 176): “The armed forces themselves should be involved in
171
W H AT W O R K S W H E R E ?
combating the HIV/AIDS pandemic. In Africa these forces should beencouraged to implement education programs that discuss the illness inan open and serious manner, as well as work to reduce the stigma at-tached to the illness. . . . Military leaders should reevaluate militarypractices that expose soldiers to HIV transmission, making changeswhere possible.”
Malaria Civil wars increase the incidence of malaria. The existence ofmany migrants infected by the malaria parasite in the asylum countryalso increases malaria transmission to citizens of the asylum country andthe contagion effect among refugees themselves.
Introducing protection measures and education programs in refugeecamps is possible. “Policies to control malaria will have to include manyactivities that involve improving public awareness and modifying per-sonal behavior” (Hammer 1993, p. 15). Associations and communitygroups can be used as vehicles to implement these measures. Simplygiving bed nets directly to households is ineffective. A more effectivestrategy is to give them to community organizations and let them en-courage households to use them. In some cases camps can be located innonendemic areas. Sometimes discouraging people from crossing theborders of endemic areas to avoid the spread of malaria in the asylumcountry may also be possible.
Landmines Chapter 1 noted the legacy of landmines and how deathsand injuries from them have recently been substantially curtailed. Thisis an example of successful international public action. The decrease inthe number of landmine victims is due to the international ban of an-tipersonnel mines in 1997, which resulted in the destruction of stock-piles and a drastic decrease in the production of landmines and trade inthem. In addition, minesweeping operations have been extremely suc-cessful in detecting and destroying mines in many countries.
Conclusion
FOR 40 YEARS THE GLOBAL COMMUNITY HAS LARGELY IGNORED
civil war. Two attitudes underlie this neglect: “it’s not our prob-lem” and “nothing can be done.”
B R E A K I N G T H E C O N F L I C T T R A P : C I V I L WA R A N D D E V E L O P M E N T P O L I C Y
172
It’s Not Our Problem
Civil war does not just affect the participants. Through displacementand disruption it affects the entire society; through spillovers such asrefugees and arms races it affects the entire region; and through drugs,disease, and terrorism it affects rich countries. Behind the it’s-not-our-problem response is a sense that both parties to a war are probably to blame, and that they might as well come to their senses by fightingit out among themselves. Such a view is seriously misguided, in thatsometimes the active participants in a civil war do well out of it. Thisis one reason why civil wars last so long: the people whose decisionsdetermine events are not the ones who are hurting. Furthermore, whilein retrospect governments could always have done more to avert con-flict, in poor, stagnant, and natural resource–abundant economies evendemocratic and egalitarian governments face a high risk of rebellion.Civil war is our problem.
Nothing Can Be Done
Civil war may be our problem, but if we can’t do anything about it, sowhat? Underlying the nothing can be done view is an interpretation ofthe causes of conflict that is both patronizing and misleading, that is,that civil wars are caused by ancestral ethnic and religious hatreds. Aswe have seen, whether a country is prone to civil war is related to moremundane factors, such as the level of income, its structure, and its rateof growth. A country’s ethnic and religious composition plays a part,but its effect is ambiguous: highly diverse societies actually have a lowerrisk of conflict than homogenous societies. While no single magic bul-let policy will drastically reduce the global incidence of civil war, manyrelatively simple policies would have significant effects and togetherwould have a major impact. The instruments of economic develop-ment, properly combined and targeted, are an important part of thequest for a more peaceful world.
173
C H A P T E R S I X
An Agenda for International Action
WITHOUT PURPOSIVE INTERNATIONAL
action the incidence of civil war will re-main high. Based on past trends, globalgrowth will contribute little to a morepeaceful world. The rationale for inter-national action is that more widespread
peace would confer global benefits. Civil wars inflict immense socialcosts, but these costs are largely incidental to the combatants and lead-ers who determine whether they start and end. For the countries di-rectly affected, civil war is development in reverse. Hence a core partof the international constituency for action to reduce the incidence ofcivil war consists of those who support a reduction in global poverty;however, the potential coalition for action is far larger than this coregroup. Spillovers from civil wars adversely affect both the regions inwhich they occur and, through drugs, disease, and terrorism, high-income societies. Given these spillovers, the direct participants in aconflict do not have the moral right to exclude consideration of its ef-fects on the regional and global communities. Yet when Jonas Savimbi,leader of the UNITA rebel group in Angola, decided to go back to warin 1998, neither the adverse economic consequences for neighboringcountries, nor the role of Angolan territory as a transit point for cocatrafficking to Europe, is likely to have weighed heavily on his mind.Likewise, when President Laurent Gbagbo of Côte d’Ivoire decided toreject the peace settlement that had been agreed on between his gov-ernment and rebels in January 2003, the likely health repercussions forneighboring countries and the potential for engendering a haven forglobal crime probably did not feature prominently in his calculations.But they should in ours.
B R E A K I N G T H E C O N F L I C T T R A P : C I V I L WA R A N D D E V E L O P M E N T P O L I C Y
174
The question is thus not whether the international community hasthe right to intervene, but whether interventions are available that are likely to be effective at a reasonable cost. Inaction is also expensive.Several civil wars reached the point at which international military in-tervention became unavoidable. For example, Bosnia, Cambodia, ElSalvador, Haiti, Rwanda, and Somalia cost outside powers a total ofUS$85 billion (Brown and Rosecrance 1999). Other strategies do notneed to be cheap to be more cost-effective than this military option.Chapter 5 reviewed both national and international policies organizedaround the different categories of countries that were at risk of conflict.This chapter assembles the most salient of the interventions that re-quire some degree of international action.
Precedents for International Action
THE BACKGROUND FOR CONSIDERING INTERNATIONAL AC-
tion is the UN’s Monterrey Conference on Development Fi-nance held in 2002, which produced consensus around the
principle of shared responsibilities. To substantially reduce the globalincidence of conflict, policy changes are critical both in the OECDcountries and in the marginalized, low-income, developing countries.Monterrey is not just crying in the wind: the international communityhas recently demonstrated an unprecedented capacity for collective ac-tion. The Kimberley process, begun in 2000, has introduced regulationinto the diamonds trade, making it harder for rebel groups to obtain fi-nancing from the extortion of diamond producers, and so has helpedto bring peace in Angola and Sierra Leone. The OECD-wide criminal-ization of bribery of government officials has reduced the corrupting ef-fect of natural resource rents upon governments. At a military level, theinternational ban on antipersonnel landmines, adopted in 1997, hasalready more than halved the number of casualties.
These three international initiatives are each significant changes inthe right direction. They demonstrate that international action is pos-sible, and that it need not take an inordinate amount of time—for ex-ample, the Kimberley process took only two years. The task now is toidentify a short list of feasible international actions that would cumu-latively make a substantial difference. This chapter makes a start at suchan agenda. No single “magic bullet” policy will deliver global peace, but
175
A N A G E N D A F O R I N T E R N AT I O N A L A C T I O N
several policies are reasonably effective and mutually supporting. Forexample, policies to reduce the risk of postconflict reversals comple-ment policies to shorten conflicts. Yet even though policies make senseas a complementary package, they do not need to be promoted as apackage. Different groups are already promoting particular componentreforms, and this is a realistic process of change. The rationale for pre-senting policies as a package is that it can be helpful for each group tosee how its efforts can contribute to the bigger picture. As no one pol-icy has magical effects, each individually is open to the charge that itwill not address the core of the conflict problem. While the simulationsin chapter 5 support the view that no single policy is decisive, this chap-ter simulates a policy package and finds that it would more than halvethe global incidence of civil wars.
International Policies for Peace
WE NOW FOCUS ON THREE OPPORTUNITIES FOR INTER-
national collective action: aid, the governance of natural re-sources, and military interventions.
Aid
The World Bank is an aid agency, and so beginning our discussion ofan international agenda with the role of aid is appropriate. From theperspective of reducing the global incidence of civil war, has the inter-national community got aid right?
Providing Aid in Postconflict Situations One important respect inwhich the international community has probably not got aid right isduring the first postconflict decade. Historically, aid has come in a rushduring the first couple of years of peace and then evaporated. Taking thepostconflict decade as a whole, aid has usually been lower than in non-conflict situations. The latest evidence suggests that aid is particularlyeffective in raising growth during the postconflict decade, but that it ismore effective in the middle of the decade than at the beginning. Aid inpostconflict situations should be much larger than it has usually been,
B R E A K I N G T H E C O N F L I C T T R A P : C I V I L WA R A N D D E V E L O P M E N T P O L I C Y
176
but it should be phased in gradually. This would require significant, butnot impossible, changes in donors’ practices. The most straightforwardchange would be to lengthen the period between the political commit-ment of postconflict aid and its disbursement.
Retargeting Aid to Low-Income Countries A second respect in whichthe international community has probably got aid wrong is in its alloca-tion between countries. The risk of conflict is much higher in low-income countries than in middle-income countries, but historically theinternational community has allocated much aid to countries that arenot particularly poor. The motivations for this have been partly com-mercial and geopolitical and partly an outcome of bureaucratic inertia.As chapter 5 showed, growth is far more effective in reducing the globalincidence of civil war if it occurs in low-income countries. Here the con-cern for a more peaceful world leads to the same conclusion as a concernfor more effective poverty reduction. The World Bank has led the wayhere: its allocation of concessional development assistance (through In-ternational Development Association funds) is much better targeted onlow-income countries than most bilateral programs. Fortunately, bilat-eral programs are improving; for example, the new American Millen-nium Challenge Account promises to be far more poverty-focused thanpast U.S. Agency for International Development allocations.
Providing Aid in Environments of Poor Policies and Weak Gover-nance A third respect in which the international community hasprobably got aid wrong is in its composition. The countries most at riskof civil war are those with both extremely low incomes and poor poli-cies, institutions, and governance. In these environments conventionalaid programs have historically not been very successful. While policies,institutions, and governance must be improved, the attempt to inducereform through conditionality has largely failed to overcome the pow-erful forces of inertia.
The World Bank, the United Nations Development Programme, andthe Development Assistance Committee of the OECD are currentlypiloting an alternative approach, LICUS, which emphasizes a more
177
A N A G E N D A F O R I N T E R N AT I O N A L A C T I O N
informed approach to the political economy of reform (World Bank2002b). This approach initially targets aid for capacity building at a fewrelatively uncontentious reforms with quick payoffs, so that the latentconstituency for reform can gradually be built. Whereas in most situa-tions donor coordination means that donors should each do differentthings, in LICUS situations donors should do the same thing, that is,reinforce efforts to break out of low-level equilibrium traps.
In postconflict situations, the LICUS approach is different. Post-conflict situations are often politically ripe for rapid and extensive re-forms, but what is acutely lacking is the technical capacity to designand implement them. Hence part of the donor response should be tostrengthen technical capacity, for example, by financing the return ofskilled members of the diaspora.
Expanding Aid A fourth respect in which the international commu-nity has probably not got aid right is in its overall scale. Even acceptingthe argument that aid is relatively ineffective in environments of poorpolicies, institutions, and governance, in many low-income countriesfacing significant risks of conflict additional aid would significantlyraise growth and cumulatively make them safer societies.
Using Aid to Reinforce Existing Democratic Institutions A final re-spect in which the international community has probably not got aidright is its treatment of political change. Recall that in low-incomecountries democracy is typically quite fragile, and that the very fragilityof political institutions is an important source of conflict risk. Histori-cally, to the extent that bilateral donors have included political institu-tions in their conditions, the focus has been on encouraging politicalchange. Understandable as this is, it may also be quite dangerous, aswell as being highly intrusive. An alternative approach is to attempt toreinforce existing democratic institutions, where they exist, by condi-tioning aid upon adherence to the country’s constitution. Conditioningaid upon constitutionality is potentially stabilizing and is nonintrusive.It mirrors attempts by some regional organizations to discourage un-constitutional political change by withholding membership.
B R E A K I N G T H E C O N F L I C T T R A P : C I V I L WA R A N D D E V E L O P M E N T P O L I C Y
178
International Governance of Natural Resources
Natural resource endowments offer the potential for poverty reduction,but historically have often been associated with conflict, poor gover-nance, and economic decline. The adverse effects of natural resource en-dowments flow through several channels, and so several distinct globalinterventions could all be helpful. The options discussed here are ex-plored more fully in World Bank (2003).
Shutting Rebel Organizations Out of Markets The Kimberley processis designed to shut rebel organizations out of the global market forrough diamonds. It will have been effective even if rebels are still able tosell the diamonds they extort from local producers, as long as the pricethe rebels can get on the illicit market is driven to a deep discount. It istoo early to judge whether the Kimberley process will be a sustainablesuccess. If it proves ineffective, intergovernmental legislation will haveto reinforce the current private, voluntary agreement. Nevertheless, theexistence of such a private agreement demonstrates that all parties haverecognized the need for effective action. If, however, the Kimberleyprocess succeeds, then it could provide a model for the governance ofother commodities that inadvertently fund conflict, notably timber andcoltan. In this respect key international actions that will be needed overthe next year are to monitor and evaluate the Kimberley process. Paral-lel to this, certification and tracking procedures can be prepared for tim-ber and coltan (Crossin, Hayman and Taylor 2003; Sherman 2002).
Each commodity transaction has a financial counterpart. Just as atsome point in the chain of physical transactions a conflict diamondswitches from being illicit to licit, so at some point in the chain of fi-nancial transactions money is laundered. Monitoring and investigatingthe financial transactions may often be easier than tracking the physi-cal transactions. Requiring official scrutiny of physical transactions atsome points, notably customs, in relation to information about coun-terpart financial transactions may also be useful. Left to its own devices,the international banking system is unlikely to provide the necessarydegree of scrutiny, as the pressures of competition encourage secrecyand complicity rather than active scrutiny. By the early 1990s UNITAreputedly held some US$4 billion on the New York financial market.
179
A N A G E N D A F O R I N T E R N AT I O N A L A C T I O N
In the wake of the September 11 terrorist attacks on the UnitedStates significant moves are under way to require banks to know theirclients and to report doubtful transactions. The weakest links in this ef-fort are the offshore havens, which often lack both the will and the ca-pacity to police the banks that they register. Such havens are analogousto territory outside the control of a recognized government, but theyare easily dealt with by the withdrawal of recognition as banking au-thorities. Thus a key global action is to place an enforceable require-ment of client knowledge and reporting upon banks, coupled with ade-recognition process for banks and banking authorities that do notcomply (Winer and Roule 2003).
One practice that financed several rebel organizations during the1990s was the sale of “war booty futures,” whereby a rebel organizationreceived finance up front in return for an entitlement to natural re-source extraction in the future if the rebel organization succeeded in se-curing territory (Ross 2002a, 2003). Reputable companies rightly viewthis practice as unacceptable, but it nevertheless occurs on the fringesof the corporate world. There is a strong case for making such transac-tions criminal in the country in which the company is registered, anal-ogous to the OECD agreement criminalizing international bribery.
A further way in which rebel organizations gain access to revenuesfrom natural resources is to threaten the companies involved in extrac-tion with extortion and kidnapping. The financial flows from compa-nies to rebel movements from these activities are considerable, and bothgovernments and civil society should discourage companies from oper-ating in such conditions. The insurance industry has recently developedproducts offering ransom insurance. The overall effect will obviously beto increase the ransom payments demanded, and thus there is a goodcase for banning ransom insurance. OECD governments should alsoput their own house in order: they could undertake that they would notuse public money to pay ransoms to rebel movements, and corre-spondingly, they could mandate that companies could not treat extor-tion payments as tax deductible costs of doing business.
A final important source of rebel finance is from illicit primarycommodities, notably opium and coca. As discussed earlier, the currentregulatory environment makes territory outside the control of a recog-nized government hugely profitable to the rebel group that controls it.Just as the participants in civil wars have ignored the spillover effects on
B R E A K I N G T H E C O N F L I C T T R A P : C I V I L WA R A N D D E V E L O P M E N T P O L I C Y
180
other societies, so have national drug policies in OECD societies. An-tidrug policies could be redesigned in a number of ways that would re-duce financial flows to rebel groups. For example, a combination of in-creased penalties for illegal consumption and the creation of a legalizedsupply for registered addicts would reduce the profitability of illegalproduction.
Reducing Countries’ Exposure to Price Shocks A distinct reasonwhy countries dependent on natural resources and other primary com-modities for their exports tend to have a record of conflict and povertyis that they are exposed to shocks. The prices of primary commoditiesare highly volatile, and periodically such countries face a crash in exportprices. Such large declines in export income in turn tend to produce a contraction in aggregate output and severe pressure on the budget.Episodes of rapid economic decline increase the risk of conflict, andsome evidence indicates that the output losses are persistent.
Governments of low-income, shock-prone countries face macroeco-nomic management problems of a scale that the governments of in-dustrial countries have not seen since the 1930s, yet they have basicallybeen left to cope on their own. “Photogenic” shocks, such as earth-quakes or droughts, typically result in a massive donor response that issometimes even larger than the cost of the shock itself. Yet even thoughprice shocks are often much more devastating, they have not tended totrigger any significant donor response. Until recently, the internationalcommunity had two instruments to address the problem: the Com-pensatory Financing Facility of the IMF and the Stabex Facility of theEU. For different reasons neither of these worked well, and both arecurrently in abeyance. The Compensatory Financing Facility was anonconcessional borrowing facility, but for a country to borrow com-mercially at the onset of a severe negative shock is usually unwise.Meanwhile Stabex disbursements were so slow that they tended to ar-rive during the subsequent price upturn.
The international community might consider three approaches tocushioning shocks. First, the IMF could consider the case for a moreconcessional facility triggered at times of severe price crashes. Second,once the IMF had a system in place that signaled eligibility for such afacility, it could function as a guide to the provision of grant finance bybilateral donors, grants probably being the most appropriate cushion
181
A N A G E N D A F O R I N T E R N AT I O N A L A C T I O N
for large adverse shocks. Third, the World Bank could develop bothrisk-pooling and risk-bearing facilities. For example, pooling the risksoil exporters and oil importers face might be possible, because theirprice risk is precisely offsetting. The Bank might also be able to act asan intermediary between low-income governments and the derivativesmarkets, basically taking on the burden of staff supervision to avoid themaverick trader problem, which could otherwise be ruinous (Guillau-mont 2003).
In addition to these means of cushioning shocks, the OECD coun-tries should eliminate those features of their commercial policies thatinadvertently accentuate global price crashes. When domestic farmersreceive increased price subsidies in response to a crash in world prices—such as the recent increase in the subsidy to American cotton farmers—this depresses the price to cotton farmers in low-income countries.Nobody wants this to happen, and low-income farmers in OECD coun-tries do not wish to feel that they are profiting at the expense of theireven poorer counterparts. It is simply the consequence of a lazy and in-competently designed approach to social protection. Similarly, tariff es-calation is typical of the barriers that developing countries’ exports face.Tariffs on processed commodities are higher than on raw materials,tending to lock exports into undiversified resource extraction. PresidentJacques Chirac has recently taken up the theme of reducing exposure toprice shocks, urging the international financial institutions to deviseeffective price cushioning instruments and proposing a moratorium on commercial policies such as agricultural subsidies that increase pricevolatility.
Increasing the Transparency of Natural Resource Revenues Thegovernments of low-income, resource-abundant countries have a stronginterest in the various proposals for international action. They are oftenunder threat from rebel organizations that receive finance from naturalresources and would be helped if such financing were curtailed, and theyare periodically hit by export price crashes and would benefit from in-struments that reduced and cushioned these shocks. As in the Monter-rey consensus, however, they have counterpart responsibilities to demon-strate that their revenues from natural resources are well used. As seenearlier, one of the major threats such governments face is from the vio-lent secession of resource-rich regions, and the best defense against this
B R E A K I N G T H E C O N F L I C T T R A P : C I V I L WA R A N D D E V E L O P M E N T P O L I C Y
182
is likely to be credible scrutiny of how revenues are used. In addition, forresources to be well used is not enough in the many situations where thegovernment is not fully trusted, and so it will need to convince doubtersby establishing a credible, independent process of verification.
In essence, what is required is an international template for the ac-ceptable governance of natural resource revenues to which a govern-ment with significant revenues could chose to subscribe (Lunde andSwanson 2003). Such a template would have five elements. First, hostgovernments should require international companies in the extractiveindustries operating in the country to report payments in sufficientdetail to permit internationally comparable accounting of natural re-source revenue payments to governments. Such reporting could beeither to the general public, as envisaged in the “publish what you pay”campaign launched by Global Witness and George Soros, or to atrusted independent authority such as the international financial insti-tutions. Second, the government should require that national resourceextraction companies, whether private or government owned, shouldreport on the same basis. Third, the government should undertake toreport its receipts from all the foregoing sources. Fourth, an indepen-dent authority, such as the international financial institutions, shouldcollate the reported information, attempt to reconcile payments andreceipts, integrate the net government revenue figure with standardbudget information on revenues and expenditures, and publish the re-sults on an annual basis. A possible division of labor here would be forthe World Bank to collate, reconcile, and aggregate the data from com-panies, while the IMF would integrate the net revenue figure into thebudget data it already scrutinizes under its routine annual consultationswith governments as mandated under its Article IV. Fifth, the govern-ment should designate, and if necessary establish, credible domestic in-stitutions of scrutiny, such as parliamentary committees, or ad hoc en-tities that include civil society as in Chad, to which the internationalfinancial institutions could report the information. Such reports shouldavoid obscurantist, technocratic jargon. Prime Minister Tony Blair haslaunched an initiative along these lines.
Attracting More Reputable Resource Extraction Companies Somelow-income countries are facing severe difficulties in attracting rep-utable resource extraction companies. If the effect of greater interna-
183
A N A G E N D A F O R I N T E R N AT I O N A L A C T I O N
tional public scrutiny on resource extraction was that reputable com-panies withdrew from difficult environments to be replaced by fly-by-night operations, then global efforts would have been counterproduc-tive. Survey evidence suggests that the two main impediments deterringgood companies are the risk to their reputations and the political riskof unreasonable treatment. The template concept described earlier hasthe potential to address both these risks (Bray 2003).
One success of the Chad-Cameroon pipeline model of improvedgovernance of natural resource revenues was that it provided interna-tional companies with a degree of reputational protection. The inter-national financial institutions in effect certified the governance struc-ture as acceptable. The introduction of a more standardized templatefor appropriate governance, and its adoption by governments interestedin attracting reputable companies, would provide a much higher degreeof reputational cover. Such a template also has the potential to addresspolitical risk. At present, the insurance entities that supply cover forpolitical risks, notably the Multilateral Investment Guarantee Agency(MIGA), which is part of the World Bank Group, have to assess eachgovernance situation on an ad hoc basis. If governments subscribed tothe good governance template, this would be pertinent information forMIGA and other insurers. MIGA might be able to provide a formal un-dertaking that proposals for investment in signatory countries wouldreceive more favorable treatment in relation to risk assessment thanproposals for investment in other countries.
Tightening Scrutiny of Illicit Payments The proposed template is in-tended to provide convincing evidence that legitimate payments fromcompanies to governments are properly used. Illicit payments by natu-ral resource extraction companies to bribe people of influence are a dif-ferent problem. The OECD agreement to criminalize such payments isa start toward curbing them; however, bribes to officials can be dis-guised as “facilitation payments” to companies controlled by their rela-tives, and so complementary efforts are required. Some resource ex-traction companies have now unilaterally undertaken not to make suchfacilitation payments.
For the industry to determine the precise boundary between legiti-mate and illegitimate payments and embed this in corporate rules ofbehavior is surely desirable; however, the international banking system
B R E A K I N G T H E C O N F L I C T T R A P : C I V I L WA R A N D D E V E L O P M E N T P O L I C Y
184
also has an important role. The family of President Sani Abacha wasable to deposit sums absurdly in excess of his presidential salary, evi-dently corruptly siphoned off from Nigerian oil revenues, in reputableinternational banks. Banks now have somewhat greater responsibilityto know their clients and to report suspect receipts. Cooperation is alsobeginning to increase in repatriating corrupt money. Nevertheless,there is scope for much tighter reinforcement of antibribery legislationon the part of the international banking system.
In some cases increased scrutiny will reveal information about in-cumbent officials and politicians. In a few cases such politicians may be so elevated as to be above their own national law. Consider, for ex-ample, the limited options available to Nigerian society had the scale ofPresident Abacha’s corruption been publicly exposed while he was stillin power. In such cases the international community has some respon-sibility to impose penalties that inconvenience the guilty party withoutinflicting suffering upon the society. The UN has been developingsanctions that offer some scope for such a targeted approach towardpenalties (Cortright and Lopez 2002; Le Billon 2003).
Military Expenditures and Interventions
Coordinating Reductions in Military Spending One of the impor-tant routes by which a conflict in one country adversely affects neigh-boring countries is through neighborhood arms races. In response tothe risk of civil war, and even more in response to its actual occurrence,the concerned government sharply increases its military expenditure.Neighbors tend to copy this increase for various reasons. Postconflict,countries tend to get locked into this high level of expenditure formany years. The research underlying this report has found that highmilitary expenditure is normally ineffective in deterring rebellion, andthat in postconflict situations it is significantly counterproductive andactually increases the risk of renewed conflict. Hence all concerned par-ties have an interest in curtailing military spending; however, becauseone motive for military spending is protection from neighbors, reduc-ing spending in an uncoordinated way is difficult.
A possible solution to this coordination problem is for regional polit-ical organizations to join forces with the international financial institu-tions to offer their services as honest brokers. The regional organizations
185
A N A G E N D A F O R I N T E R N AT I O N A L A C T I O N
can facilitate the necessary political cooperation between neighbors,while the international financial institutions can provide an impartialscrutiny process to ensure that agreed spending reductions actuallyoccur. In the past the World Bank’s routine public expenditure reviewshave politely skirted round military spending, but there is a robust, non-political case for thorough scrutiny. In the absence of such coordinatedefforts, the continuing postconflict military burden can come to exceedthe costs incurred during the war itself.
Sequencing Military Interventions with Aid and Reform This reporthas placed considerable emphasis upon the conflict trap: postconflictsituations carry high risks of further conflict. In the first few years afterconflict the risks are often so high, and the scope for accelerated eco-nomic recovery so modest, that external military peacekeeping is prob-ably essential. International relations experts emphasize that such in-terventions are most credible if they are by parties that have a direct andlong-term interest in sustaining peace in the country.
The most challenging task is to sequence such military interventionwith development strategies in a way that avoids gap periods of excep-tionally high risk. Obviously each situation must be evaluated individ-ually, but as an approximate guide, even a large and well-timed aidprogram will not produce a substantial growth spurt until around thefifth postconflict year. Rapid policy and institutional reform should bestarted immediately after peace has been established, and capacity-building aid will probably be needed for this. However, given the typ-ical poor starting point, reform is unlikely to deliver an environmentthat can sustain rapid growth without aid until around the end of thepostconflict decade. In particular, evidence indicates that democraticinstitutions are fragile in low-income countries and that this fragilityincreases the risk of conflict. This suggests that the international com-munity should be wary of imposing an apparently “appropriate” con-stitutional design during a peace settlement, sending in troops and bigaid for the first two years of peace, and then withdrawing militarily andfinancially and hoping for the best. The military commitment shouldbe for longer. The aid commitment should be later and larger and con-ditioned upon the maintenance of political institutions. A critical post-conflict stage is the first election, typically in the fourth or fifth year ofpeace. This is a further reason why aid should be peaking around this
B R E A K I N G T H E C O N F L I C T T R A P : C I V I L WA R A N D D E V E L O P M E N T P O L I C Y
186
time, rather than being in steep decline as has often been the case. Theemphasis on policy reform should be continuous over the decade andgive priority to policies for social inclusion.
Conclusion: A New Goal for 2015?
THE PROPOSED AGENDA FOR INTERNATIONAL ACTION HAS
three building blocks: better use of aid, improved governance ofnatural resources, and enhanced coordination of military and de-
velopmental strategies during the postconflict period. This is by no meansan exhaustive agenda, and chapter 5 discussed several other policies; how-ever, being comprehensive and being focused involves a trade-off.
If the proposed package were implemented, how would it help to re-duce the global incidence of civil war? First, fewer of the low-income,weak policy countries that we have referred to as marginalized wouldfall into conflict. These are a minority of the developing world, and ac-count for only around 1.1 billion people, but they are an importantpart of the conflict problem. Providing a larger amount of aid, focus-ing more strongly on policy reform, cushioning large external shocks,reducing military spending, and increasing the transparency of naturalresource revenues would all raise growth. Faster growth, combined withmore credible scrutiny of how revenue is used, would reduce disaffec-tion. Other measures to improve the governance of global markets innatural resources would make acquiring finance more difficult for rebelmovements.
Second, conflicts would be shorter. Rebel organizations would beweaker because of reduced finance, and socially inclusive policies wouldhave a similar effect: more equal societies tend to have shorter conflicts.
Third, once out of a conflict, countries would be less likely to re-lapse. Better aid, better coordination with military intervention, andfaster policy reform would improve opportunities for reconstructionduring the first postconflict decade. Greater attention would be paid tothe stability of political institutions, to the transparent governance ofnatural resource revenues, and to the regional de-escalation of militaryspending.
Between them these three consequences of the proposed packagewould probably have a major impact on the global incidence of civilwar. Around 85 percent of new civil wars are either the marginalized
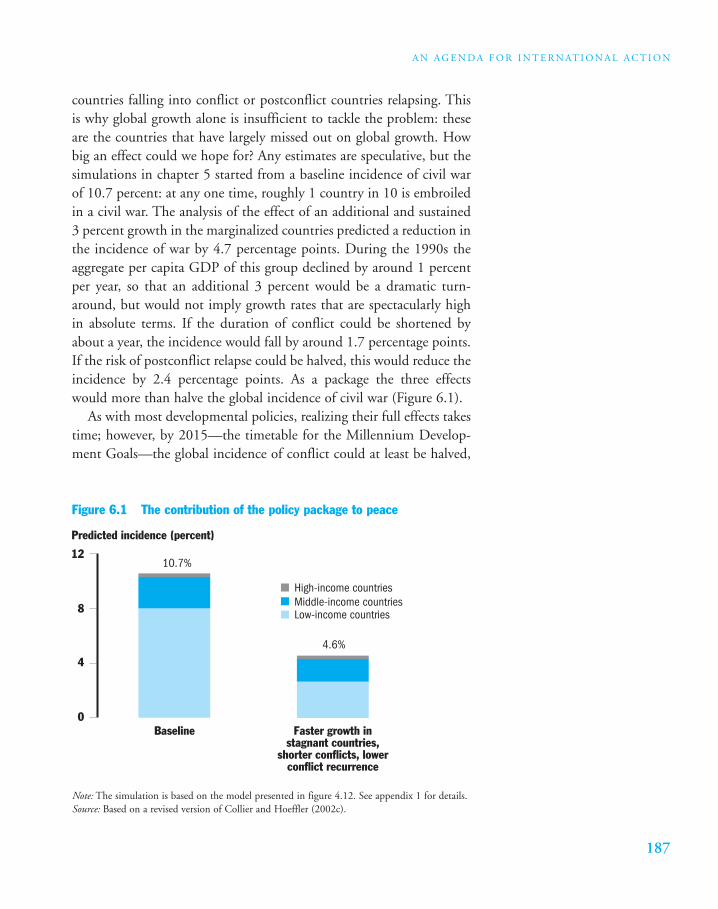
187
A N A G E N D A F O R I N T E R N AT I O N A L A C T I O N
countries falling into conflict or postconflict countries relapsing. Thisis why global growth alone is insufficient to tackle the problem: theseare the countries that have largely missed out on global growth. Howbig an effect could we hope for? Any estimates are speculative, but thesimulations in chapter 5 started from a baseline incidence of civil warof 10.7 percent: at any one time, roughly 1 country in 10 is embroiledin a civil war. The analysis of the effect of an additional and sustained3 percent growth in the marginalized countries predicted a reduction inthe incidence of war by 4.7 percentage points. During the 1990s theaggregate per capita GDP of this group declined by around 1 percentper year, so that an additional 3 percent would be a dramatic turn-around, but would not imply growth rates that are spectacularly highin absolute terms. If the duration of conflict could be shortened byabout a year, the incidence would fall by around 1.7 percentage points.If the risk of postconflict relapse could be halved, this would reduce theincidence by 2.4 percentage points. As a package the three effectswould more than halve the global incidence of civil war (Figure 6.1).
As with most developmental policies, realizing their full effects takestime; however, by 2015—the timetable for the Millennium Develop-ment Goals—the global incidence of conflict could at least be halved,
Figure 6.1 The contribution of the policy package to peace
Predicted incidence (percent)
0
4
8
12
Baseline
10.7%
4.6%
Faster growth instagnant countries,
shorter conflicts, lowerconflict recurrence
High-income countriesMiddle-income countriesLow-income countries
Note: The simulation is based on the model presented in figure 4.12. See appendix 1 for details.Source: Based on a revised version of Collier and Hoeffler (2002c).
B R E A K I N G T H E C O N F L I C T T R A P : C I V I L WA R A N D D E V E L O P M E N T P O L I C Y
188
analogous to the overarching Millennium Development Goal of halv-ing poverty. Peace is not officially included as a Millennium Develop-ment Goal, yet at the minimum it is important as an instrument for at-taining these goals. More reasonably, and in view of the spillover effectsof conflict, peace can be seen as a core objective of the internationalcommunity. Potentially, the international community could adopt thesame approach to reducing the incidence of civil war as it has to the ob-jective of reducing world poverty. It could set a target, such as halvingthe incidence of civil war by 2015; adopt a strategy; and monitor theoutcomes. Monitoring the incidence of civil war is easier than moni-toring global poverty. Feasible strategies are available that if imple-mented are likely to make the target attainable.
International cooperation is always difficult, but since the mid-1990s the international community has achieved cooperation for re-lated policies. Given the terrible global cost of civil war we may wishthat it had pursued such efforts more vigorously.
189
A P P E N D I X 1
Methods and Data
Data Set and Model
THE FIGURES AND PROBABILITY ESTIMATES PRESENTED IN
chapters 3–5 are based mainly on the logistic regression analy-sis reported in tables 3 and 5 in Collier and Hoeffler (2002c).
The data set used is global, spans the years 1960–99, and covers 161countries. We divide the data series into eight subperiods, 1960–64,1965–69, …, 1995–99.
In our regressions we estimate the probability of a war breaking outduring a five-year period, and the model can be written in the follow-ing general form:
(A1.1)
where t and i are time and country indicators. The dependent variableis a dummy variable indicating whether a war broke out during thefive-year period, so that Yit is the log odds of war. The explanatory vari-ables are either measured at the beginning of the period (the X variablesin equation (A1.1), for example, income per capita, primary commod-ity exports/gross domestic product [GDP], population), or during theprevious five-year period (the M variables, for instance, per capita in-come growth), or are time invariant or changing slowly over time (theZ variables, for example, social fractionalization).
The expected probability pit of a war breaking out can be calculatedby using the estimated coefficients obtained from equation (A1.1):
(A1.2)ˆ ˆ ˆ ˆ ˆ, –a bX cM dZ Wit i t i it+ + + =1
Y a bX cM dZ uit it i t i it= + + + +, – ,1
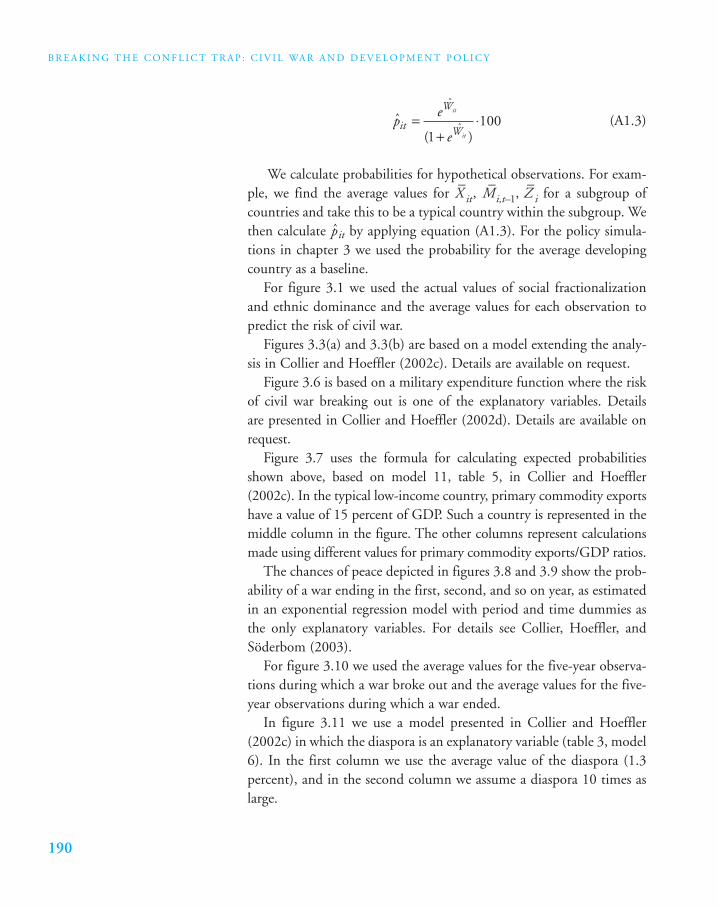
B R E A K I N G T H E C O N F L I C T T R A P : C I V I L WA R A N D D E V E L O P M E N T P O L I C Y
190
(A1.3)
We calculate probabilities for hypothetical observations. For exam-ple, we find the average values for X
–it, M
–i,t–1, Z
–i for a subgroup of
countries and take this to be a typical country within the subgroup. Wethen calculate pit by applying equation (A1.3). For the policy simula-tions in chapter 3 we used the probability for the average developingcountry as a baseline.
For figure 3.1 we used the actual values of social fractionalizationand ethnic dominance and the average values for each observation topredict the risk of civil war.
Figures 3.3(a) and 3.3(b) are based on a model extending the analy-sis in Collier and Hoeffler (2002c). Details are available on request.
Figure 3.6 is based on a military expenditure function where the riskof civil war breaking out is one of the explanatory variables. Details are presented in Collier and Hoeffler (2002d). Details are available onrequest.
Figure 3.7 uses the formula for calculating expected probabilitiesshown above, based on model 11, table 5, in Collier and Hoeffler(2002c). In the typical low-income country, primary commodity exportshave a value of 15 percent of GDP. Such a country is represented in themiddle column in the figure. The other columns represent calculationsmade using different values for primary commodity exports/GDP ratios.
The chances of peace depicted in figures 3.8 and 3.9 show the prob-ability of a war ending in the first, second, and so on year, as estimatedin an exponential regression model with period and time dummies asthe only explanatory variables. For details see Collier, Hoeffler, andSöderbom (2003).
For figure 3.10 we used the average values for the five-year observa-tions during which a war broke out and the average values for the five-year observations during which a war ended.
In figure 3.11 we use a model presented in Collier and Hoeffler(2002c) in which the diaspora is an explanatory variable (table 3, model6). In the first column we use the average value of the diaspora (1.3percent), and in the second column we assume a diaspora 10 times aslarge.
ˆ( )
ˆ
ˆpe
eit
W
W
it
it
=+
⋅1
100
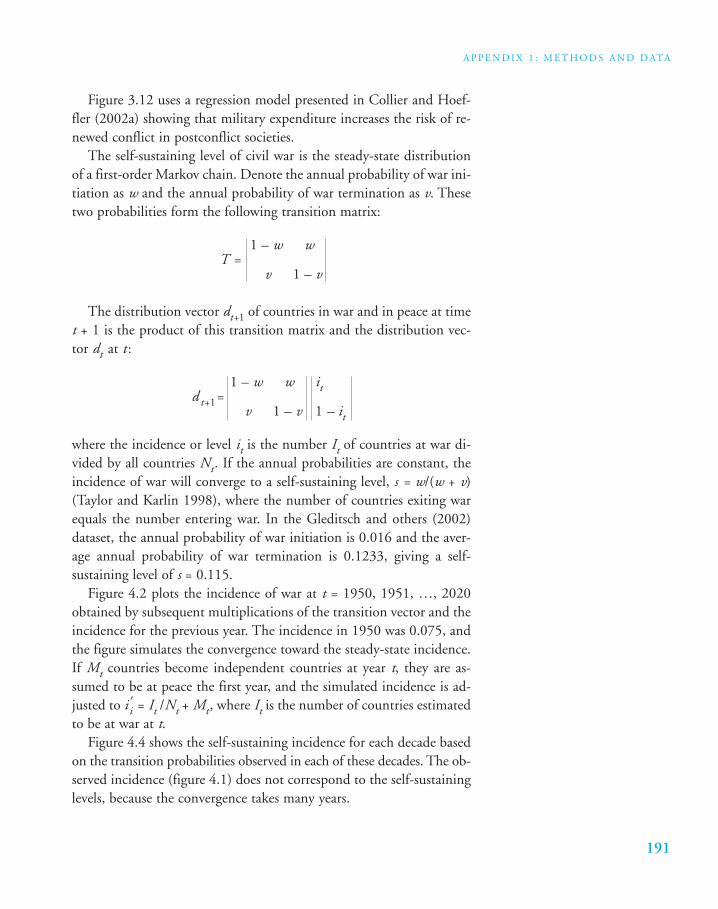
191
A P P E N D I X 1 : M E T H O D S A N D D ATA
Figure 3.12 uses a regression model presented in Collier and Hoef-fler (2002a) showing that military expenditure increases the risk of re-newed conflict in postconflict societies.
The self-sustaining level of civil war is the steady-state distributionof a first-order Markov chain. Denote the annual probability of war ini-tiation as w and the annual probability of war termination as v. Thesetwo probabilities form the following transition matrix:
1 – w wT =
v 1 – v
The distribution vector dt+1 of countries in war and in peace at timet + 1 is the product of this transition matrix and the distribution vec-tor dt at t :
1 – w w itd t+1=
v 1 – v 1 – it
where the incidence or level it is the number It of countries at war di-vided by all countries Nt. If the annual probabilities are constant, theincidence of war will converge to a self-sustaining level, s = w/(w + v)(Taylor and Karlin 1998), where the number of countries exiting warequals the number entering war. In the Gleditsch and others (2002)dataset, the annual probability of war initiation is 0.016 and the aver-age annual probability of war termination is 0.1233, giving a self-sustaining level of s = 0.115.
Figure 4.2 plots the incidence of war at t = 1950, 1951, …, 2020obtained by subsequent multiplications of the transition vector and theincidence for the previous year. The incidence in 1950 was 0.075, andthe figure simulates the convergence toward the steady-state incidence.If Mt countries become independent countries at year t, they are as-sumed to be at peace the first year, and the simulated incidence is ad-justed to i ′
i = It /Nt + Mt, where It is the number of countries estimatedto be at war at t.
Figure 4.4 shows the self-sustaining incidence for each decade basedon the transition probabilities observed in each of these decades. The ob-served incidence (figure 4.1) does not correspond to the self-sustaininglevels, because the convergence takes many years.
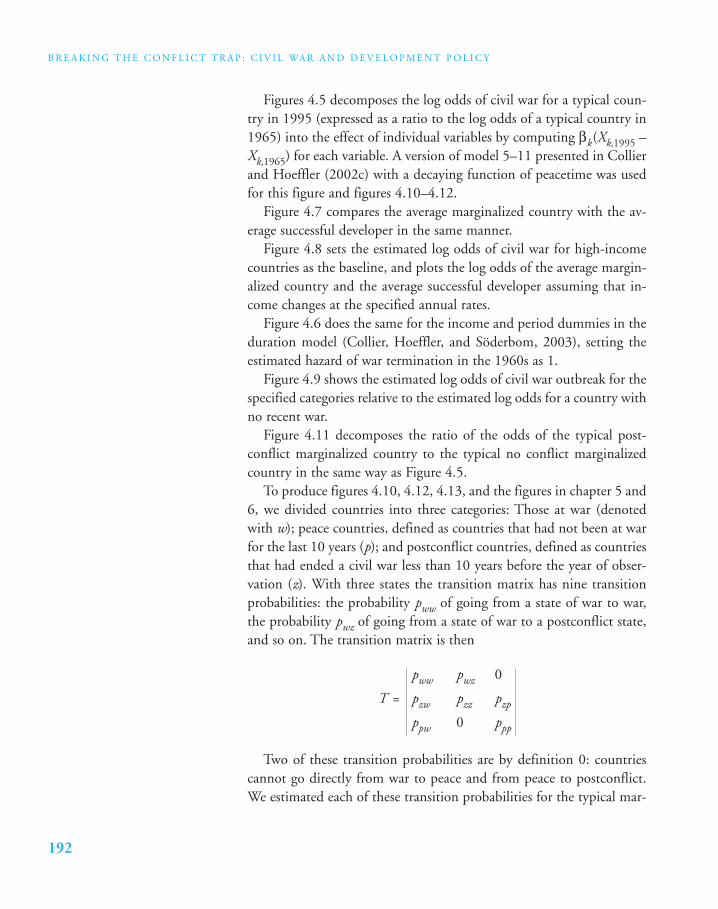
B R E A K I N G T H E C O N F L I C T T R A P : C I V I L WA R A N D D E V E L O P M E N T P O L I C Y
192
Figures 4.5 decomposes the log odds of civil war for a typical coun-try in 1995 (expressed as a ratio to the log odds of a typical country in1965) into the effect of individual variables by computing βk(Xk,1995 –Xk,1965) for each variable. A version of model 5–11 presented in Collierand Hoeffler (2002c) with a decaying function of peacetime was usedfor this figure and figures 4.10–4.12.
Figure 4.7 compares the average marginalized country with the av-erage successful developer in the same manner.
Figure 4.8 sets the estimated log odds of civil war for high-incomecountries as the baseline, and plots the log odds of the average margin-alized country and the average successful developer assuming that in-come changes at the specified annual rates.
Figure 4.6 does the same for the income and period dummies in theduration model (Collier, Hoeffler, and Söderbom, 2003), setting theestimated hazard of war termination in the 1960s as 1.
Figure 4.9 shows the estimated log odds of civil war outbreak for thespecified categories relative to the estimated log odds for a country withno recent war.
Figure 4.11 decomposes the ratio of the odds of the typical post-conflict marginalized country to the typical no conflict marginalizedcountry in the same way as Figure 4.5.
To produce figures 4.10, 4.12, 4.13, and the figures in chapter 5 and6, we divided countries into three categories: Those at war (denotedwith w); peace countries, defined as countries that had not been at warfor the last 10 years (p); and postconflict countries, defined as countriesthat had ended a civil war less than 10 years before the year of obser-vation (z). With three states the transition matrix has nine transitionprobabilities: the probability pww of going from a state of war to war,the probability pwz of going from a state of war to a postconflict state,and so on. The transition matrix is then
pww pwz 0
T = pzw pzz pzp
ppw 0 ppp
Two of these transition probabilities are by definition 0: countriescannot go directly from war to peace and from peace to postconflict.We estimated each of these transition probabilities for the typical mar-
193
A P P E N D I X 1 : M E T H O D S A N D D ATA
ginalized country, the typical successful developer, and for high-incomecountries. We assumed the probability of reversion to war from thepostconflict state to be constant over the 10 years even if model 4 as-sumes this probability to be steadily decreasing over time. We used theestimated probability for the average time since the end of the war forthe postconflict group. The probability of transition from postconflictto peace was assumed to be 0.1(1 – pzw) if a country does not revert towar. The probability that the year of observation is the last year of thepostconflict period is 0.1.
Based on these transition probabilities, we estimated the steady-statedistribution over these three states for each of these three subgroups.The box in figure 4.12 labeled “successful developers at peace” showsthe number of successful developers at peace in equilibrium (93 percentof 71 countries). The boxes labeled “active conflict” and “postconflict”show the total number of countries at war and in the postconflict statein all three country groups. The arrows show the number of countriestransiting from one state to another. These figures are computed as thetransition probability times the number of countries in the initial state.For instance, the probability for marginalized countries of going frompeace to active conflict is estimated to be 0.022. In the estimated steadystate, 32 of the 52 marginalized countries are at peace, and 0.022*32 =0.7 countries are going into conflict per year. The arrows between theactive conflict and postconflict boxes add the estimated number oftransitions of countries of all three groups.
Given the estimated steady-state distributions, we obtained the esti-mated incidence of (active) war. Figures 5.1–5.5 and 6.1 show the in-cidence for the baseline (based on predicted probabilities for the aver-age country in each group in 1990–99) compared with the incidencepredicted when the underlying variables are altered as specified.
Data Sources
Diaspora
We used data on the foreign-born population from the U.S. Bureau ofthe Census and divided these numbers by the total population in thecountry of origin (see http://www.census.gov/population/).
B R E A K I N G T H E C O N F L I C T T R A P : C I V I L WA R A N D D E V E L O P M E N T P O L I C Y
194
Ethnic Dominance
Using ethno-linguistic data from the original data source (USSR 1964)we calculated an indicator of ethnic dominance. This variable takes thevalue of 1 if a single ethno-linguistic group makes up 45 to 90 percentof the total population and 0 otherwise. We would like to thank TomilaLankina for the translation of the original data source.
GDP Per Capita
We measure income as real purchasing power parity-adjusted GDP percapita. The primary dataset is the Penn World Tables 5.6 (Summers andHeston 1991). Since the data are only available for 1960–92, we usedthe growth rates of real purchasing power parity-adjusted GDP percapita data from the World Development Indicators (World Bank 2002a)to obtain income data for the 1990s.
Geographic Dispersion of the Population
We constructed a dispersion index of the population on a country-by-country basis. Based on population data for cells of 400 square kilo-meters we generated a Gini coefficient of population dispersion foreach country. A value of 0 indicates that the population is evenly dis-tributed across the country and a value of 1 indicates that the total pop-ulation is concentrated in one area. Data are available for 1990 and1995. For years prior to 1990 we used the 1990 data. We would like tothank Uwe Deichman of the World Bank’s Geographic InformationSystem Unit for generating these data. He used data from the Centerfor International Earth Science Information Network, Columbia Uni-versity; the International Food Policy Research Institute; the World Re-sources Institute; and Gridded Population of the World.
Peace Duration
This variable measures the length of the peace period (in months) sincethe end of the previous civil war. For countries that never experienced
195
A P P E N D I X 1 : M E T H O D S A N D D ATA
a civil war we measure the peace period since the end of World War II.In chapter 4 we used a decaying function of peacetime: exp(–peaceduration/24).
Population
Population measures the total population. The data source is the WorldDevelopment Indicators (World Bank 2002a).
Primary Commodity Exports/GDP
The ratio of primary commodity exports to GDP proxies the abun-dance of natural resources. The data on primary commodity exportsand GDP were obtained from the World Bank. Export and GDP dataare measured in current U.S. dollars.
Social, Ethno-linguistic, and Religious Fractionalization
We proxy social fractionalization in a combined measure of ethnic andreligious fractionalization. Ethnic fractionalization is measured by theethno-linguistic fractionalization index. It measures the probability thattwo randomly drawn individuals from a given country do not speak thesame language. Data are only available for 1960. In the economics lit-erature this measure was first used by Mauro (1995). Using data fromBarrett (1982) on religious affiliations we constructed an analogous re-ligious fractionalization index. Following Barro (1997) we aggregatedthe various religious affiliations into nine categories: Catholic, Protes-tant, Muslim, Jew, Hindu, Buddhist, Eastern religions (other thanBuddhist), indigenous religions, and no religious affiliation.
The fractionalization indexes range from 0 to 100. A value of 0 in-dicates that the society is completely homogenous, whereas a value of100 characterizes a completely heterogeneous society.
We calculated our social fractionalization index as the product of theethno-linguistic fractionalization and the religious fractionalization in-dexes plus the ethno-linguistic or the religious fractionalization index,whichever is the greater. By adding either index we avoid classifying a
B R E A K I N G T H E C O N F L I C T T R A P : C I V I L WA R A N D D E V E L O P M E N T P O L I C Y
196
country as homogenous (a value of 0) if the country is ethnically ho-mogenous but religiously diverse or vice versa.
War Start
We use mainly the data collected by Small and Singer (1982) andSinger and Small (1994). War start is a dummy variable. It takes a valueof 1 if the country was at peace at the beginning of the period and warbroke out during the following five years. If the country remained atpeace during the entire period we record a value of 0. A missing valueis recorded if the country was at war at the beginning of the period. Werecord 78 outbreaks of civil war, but cannot use all these observationsin our regressions because of missing data for some of the explanatoryvariables.
197
A P P E N D I X 2
A Selected Bibliography of Studies of Civil War and Rebellion
THE LITERATURE ON CIVIL WAR IS EXTENSIVE AND
dates back at least to Hobbes (1660) and Hutcheson(1755). In the modern economics literature Tullock(1974) made the seminal contribution. Below is acollection of central contributions and broad litera-ture reviews grouped into core topics. Many of the
works listed are also relevant to other subjects.
Economic Factors
Economic Motives
Blomberg and Hess 2002; Brough and Elliott 1989, 1999; Collier1998, 2000; Collier and Hoeffler 2002c; Collier and Sambanis 2002;De Soto 1989; Garfinkel and Skaperdas 1996; Grossman 1991, 1995;Hirshleifer 1978, 1987, 1988, 1991a,b, 1995a,b, 2001; Kuran 1989,1995; Lichbach 1995; Mehlum, Moene, and Torvik 2002; Olson 1982;Sandler 2000; Silver 1974; Skaperdas 2002; Tullock 1971, 1974.
Economic Effects of Civil War
Blomberg and Hess 2002; Brogan 1951; Brown and Rosecrance 1999;Collier 1999; Murdoch and Sandler 2002a,b.
B R E A K I N G T H E C O N F L I C T T R A P : C I V I L WA R A N D D E V E L O P M E N T P O L I C Y
198
Foreign Aid and Conflict
Anderson 1990; Collier and Hoeffler 2002a,b; Grossman 1992; Pren-dergast 1996.
Inequality and Conflict
Hegre, Gissinger, and Gleditsch 2003; Lichbach 1989; Muller 1985;Muller and Seligson 1987.
Resource Scarcity and Abundance
Bächler and Spillmann 1996; Buhaug and Gates 2002; Collier andHoeffler 2002c; de Soysa 2002a,b; Hauge and Ellingsen 1998; Homer-Dixon 1991; Klare 2001; Le Billon 2001; Le Billon, Sherman, andHartwell 2002; Reynal-Querol 2002a; Ross 2003.
Role of Ethnicity and Nationalism
Ethnic Conflict
Bates 2001; Brass 1997; Brubaker and Laitin 1998; Elbadawi and Sam-banis 2002; Ellingsen 2000; Fearon and Laitin 1996; Gurr 1995;Horowitz 1985; Mason 1984; Newman 1991; Olzak and Nagel 1986;Vanhanen 1999; Varshney 2002.
Nationalism and Ethnicity
Anderson 1983; Connor 1994; Deutsch 1953; Gellner 1983; Hechter2001; Ignatieff 1993; Smith 1991.
Secession and Self-Determination
Alesina and Spolaore 1997; Buchanan and Faith 1987; Horowitz 1991;Kaufmann 1996; Marcouiller and Young 1995; Muller and Opp 1986;Sambanis 2000; Tullock 1985.
199
A P P E N D I X 2 : A S E L E C T E D B I B L I O G R A P H Y O F S T U D I E S O F C I V I L WA R A N D R E B E L L I O N
Anatomy of Rebellion
Strategic Logic of Rebellion and Repression
Davenport 1999; DeNardo 1995; Gates 2002; Gottschalk 1944; Gross-man 1991, 1995; Hardin 1995; Hopper 1950; Kuran 1989; Lichbach1995; Moore 1998; Muller and Weede 1990; Neumann 1949; Odom1992; Posen 1993; Skaperdas 2001; Wintrobe 1998.
Form and Magnitude of Political Violence
Brass 1985; Brito and Intriligator 1988, 1990; Cartwright, Delorme,and Wood 1985; Deutscher 1952; Kalyvas 2001; Palmer 1954.
Emotional Roots of Conflict
Ellwood 1905; Le Bon 1913; Petersen 2002; Riezler 1943.
Social Protest and Rebellion
Arendt 1965; Davies 1962; Gurr 1970; Hibbs 1973; Huntington1968; Johnson 1964; McAdam, Tarrow, and Tilly 2000; Olson 1971,1982; Tilly 1978; Tullock 1971, 1974.
Sociology of Revolution
Goldstone 2002; Goldstone, Gurr, and Moshiri 1991; Lasswell andKaplan 1955; Moore 1966; Skocpol 1987; Sorokin 1925.
Role of the State
State Weakness and Insurgency
Bates 2001; Brough and Elliott 1989, 1999; Esty and others 1995,1998; Fearon and Laitin 2003; Herbst 2000; Leites and Wolf 1970;Lichbach 1984; Odom 1992; Olson 1971, 1982; Tullock 1987.
B R E A K I N G T H E C O N F L I C T T R A P : C I V I L WA R A N D D E V E L O P M E N T P O L I C Y
200
Democracy, Democratization, and Civil War
Esty and others 1998; Fearon and Laitin 2003; Hegre and others 2001;Huntington 1968; Muller and Weede 1990; Reynal-Querol 2002b;Snyder 2000; Wood 2000.
Development and Democratization
Burkhart and Lewis-Beck 1994; Dahl 1989; Huntington 1968; Lipset1959; Muller 1995; Przeworski and others 2000; Ross 2000; Vanhanen1990.
Legitimacy
Schutz and Slater 1990; Zartman 1995.
International Dimensions of Civil War
Betts 1994; Brown 1996; Carment and James 1997; Lake and Roth-schild 1998; Midlarsky 2000; Regan 2000, 2002.
Negotiation and Implementation of Peace
Azam 1995; Doyle and Sambanis 2000; Doyle, Johnstone, and Orr1997; Fearon 2001; Licklider 1993, 1995; Mason and Fett 1996; Paris1997; Stedman, Rothschild, and Cousens 2002; Walter 2002; Zartman1985.
Bibliography
The word “processed” describes informally reproduced works that maynot be commonly available through libraries.
Alesina, A., and E. Spolaore. 1997. “On the Number and Size of Na-tions.” Quarterly Journal of Economics 112(4):1027–56.
201
A P P E N D I X 2 : A S E L E C T E D B I B L I O G R A P H Y O F S T U D I E S O F C I V I L WA R A N D R E B E L L I O N
Anderson, B. 1983. Imagined Communities: Reflections on the Originsand Spread of Nationalism. London: Verso.
Anderson, M. B. 1990. Do No Harm. How Aid Can Support Peace—OrWar. Boulder, Colo.: Lynne Rienner.
Arendt, H. 1965. On Revolution. New York: Penguin.Azam, J. P. 1995. “How to Pay for Peace.” Public Choice 83(1/2):
173–84.Bächler, G., and K. R. Spillmann, eds. 1996. Environmental Degrada-
tion as a Cause of War—Kriegsursache Umweltzerstörung. Chur,Switzerland: Ruegger.
Bates, R. H. 2001. Prosperity and Violence. The Political Economy ofDevelopment. New York and London: Norton.
Betts, R. K. 1994. “The Delusions of Partial Intervention.” ForeignAffairs 73(6): 20–33.
Blomberg, B., and G. Hess. 2002. “The Temporal Links between Con-flict and Economic Activity.” Journal of Conflict Resolution 46(1):74–90.
Brass, P. 1985. Ethnic Groups and the State. London: Croom-HelmBrown.
_____. 1997. Theft of an Idol. Princeton, N.J.: Princeton UniversityPress.
Brito, D. L., and M. D. Intriligator. 1988. “A Predator-Prey Model ofGuerrilla Warfare.” Synthese 6(2): 235–44.
_____. 1990. “An Economic Model of Guerilla Warfare.” InternationalInteractions 15(3/4): 319–29.
Brogan, D. W. 1951. The Price of Revolution. London: Hamish Hamilton.Brough, W. T., and V. L. Elliott. 1989. “The Economics of Insur-
gency.” Paper presented at the Public Choice Society AnnualMeeting, March 17–19, Agency for International Development,Washington, D.C. Processed.
_____. 1999. “The Economics of Insurgency.” In Mwangi S. Kimenyiand John Mukum Mbaku, eds., Institutions and Collective Choicein Developing Countries: Applications of the Theory of PublicChoice. Burlington, Vt.: Ashgate.
Brown, M. 1996. International Dimensional of Internal Conflict. Cam-bridge, Mass.: MIT Press.
Brown, M. E., and R. Rosecrance, eds. 1999. The Costs of Conflict.Boulder, Colo.: Rowman & Littlefield.
B R E A K I N G T H E C O N F L I C T T R A P : C I V I L WA R A N D D E V E L O P M E N T P O L I C Y
202
Brubaker, R., and D. D. Laitin. 1998. “Ethnic and Nationalist Vio-lence.” Annual Review of Sociology 24: 243–52.
Buchanan, James M., and Roger Faith. 1987. “Secession and the Lim-its of Taxation.” American Economic Review 77(5): 1023–31.
Buhaug, H., and S. Gates. 2002. “The Geography of Civil War.” Jour-nal of Peace Research 39(4): 417–33.
Burkhart, R. E., and M. S. Lewis-Beck. 1994. “Comparative Democracy:The Economic Development Thesis.” American Political ScienceReview 88(4): 903–10.
Carment, D., and P. James, eds. 1997. Wars in the Midst of Peace. Pitts-burgh, Pa.: University of Pittsburgh Press.
Cartwright, P. A., C. D. Delorme, Jr., and N. J. Wood. 1985. “The By-Product Theory of Revolution: Some Empirical Evidence.” Pub-lic Choice 46(3): 265–74.
Collier, P. 1998. “On Economic Causes of Civil War.” Oxford EconomicPapers 50(4): 563–73.
_____. 1999. “On the Economic Consequences of Civil War.” OxfordEconomic Papers 51: 168–83.
_____. 2000. “Rebellion as a Quasi-Criminal Activity.” Journal of Con-flict Resolution 44(6): 839–53.
Collier, P., and A. Hoeffler. 2002a. “Aid, Policy, and Growth in Post-Conflict Societies.” Policy Research Working Paper no. 2902.World Bank, Washington, D.C.
_____. 2002b. “Aid, Policy, and Peace: Reducing the Risks of CivilConflict.” Defence and Peace Economics 13(6): 435–50.
_____. 2002c. “Greed and Grievance in Civil Wars.” Working PaperSeries 2002–01. Centre for the Study of African Economies, Ox-ford, U.K. Available on: http://www.csae.ox.ac.uk.
Collier, P., and N. Sambanis. 2002. “Understanding Civil War: A NewAgenda.” Journal of Conflict Resolution 46(1): 3–12.
Connor, W. 1994. Ethno-nationalism: The Quest for Understanding. Prince-ton, N.J.: Princeton University Press.
Dahl, R. 1989. Democracy and Its Critics. New Haven, Conn., andLondon: Yale University Press.
Davenport, C. 1999. “Human Rights and the Democratic Proposi-tion.” Journal of Conflict Resolution 43(1): 92–116.
Davies, J. C. 1962. “Toward a Theory of Revolution.” American Soci-ological Review 27(1): 5–19.
203
A P P E N D I X 2 : A S E L E C T E D B I B L I O G R A P H Y O F S T U D I E S O F C I V I L WA R A N D R E B E L L I O N
DeNardo, J. 1985. Power in Numbers: The Political Strategy of Protestand Rebellion. Princeton, N.J.: Princeton University Press.
De Soto, H. 1989. The Other Path: The Invisible Revolution in the ThirdWorld. Translated by June Abbot. New York: Harper and Row.
de Soysa, I. 2002a. “Ecoviolence: Shrinking Pie or Honey Pot?” GlobalEnvironmental Politics 2(4): 1–27.
_____. 2002b. “Paradise Is a Bazaar? Greed, Creed, and Governance inCivil War, 1989–99.” Journal of Peace Research 39(4): 395–416.
Deutsch, K. W. 1953. Nationalism and Social Communication: An In-quiry into the Foundations of Nationality. Cambridge, Mass., andNew York: Technology Press of the Massachusetts Institute ofTechnology and Wiley.
Deutscher, I. 1952. “The French Revolution and the Russian Revolu-tion: Some Suggestive Analogies.” World Politics 4: 369–81.
Doyle, M. W., and N. Sambanis. 2000. “International Peacebuilding:A Theoretical and Quantitative Analysis.” American Political Sci-ence Review 94(4): 779–801.
Doyle M. W., I. Johnstone, and R. O. Orr, eds. 1997. Keeping thePeace: Multidimensional UN Operations in Cambodia and El Sal-vador. Cambridge, U.K.: Cambridge University Press.
Elbadawi, I., and N. Sambanis. 2002. “How Much Civil War Will WeSee? Explaining the Prevalence of Civil War.” Journal of ConflictResolution 46(3): 307–34.
Ellingsen, T. 2000. “Colorful Community or Ethnic Witches’ Brew?Multiethnicity and Domestic Conflict during and after the ColdWar.” Journal of Conflict Resolution 44(2): 228–49.
Ellwood, C. A. 1905. “A Psychological Theory of Revolutions.” Amer-ican Journal of Sociology 11: 49–59.
Esty, D. C., J. Goldstone, T. R. Gurr, P. T. Surko, and A. N. Unger.1995. “Working Papers: State Failure Task Force Report.” ScienceApplications International Corporation, McLean, Va.
Esty, D. C., J. A. Goldstone, T. R. Gurr, B. Harff, M. Levy, G. D.Dabelko, P. T. Surko, and A. N. Unger. 1998. State Failure TaskForce Report: Phase II Findings. McLean, Va.: Science ApplicationsInternational Corporation.
Fearon, J. D. 2001. “Why Do Some Civil Wars Last So Much LongerThan Others?” Paper prepared for the World Bank-University ofCalifornia at Irvine Conference on Civil War Duration and Post-conflict Peace Building, May 18–20, Irvine, Calif.
B R E A K I N G T H E C O N F L I C T T R A P : C I V I L WA R A N D D E V E L O P M E N T P O L I C Y
204
Fearon, J. D., and D. D. Laitin. 1996. “Explaining Interethnic Coop-eration.” American Political Science Review 90(4): 715–35.
_____. 2003. “Ethnicity, Insurgency, and Civil War.” American Politi-cal Science Review 97(1): 75–90.
Garfinkel, M. R., and S. Skaperdas, eds. 1996. The Political Economy ofConflict and Appropriation. New York: Cambridge University Press.
Gates, S. 2002. “Recruitment and Allegiance: The Microfoundationsof Rebellion.” Journal of Conflict Resolution 46(1): 111–30.
Gellner, E. 1983. Nations and Nationalism. Ithaca, N.Y.: Cornell Uni-versity Press.
Goldstone, J. A., ed. 2002. Revolutions: Theoretical, Comparative, andHistorical Studies, 3d ed. Fort Worth, Tex.: Harcourt Brace Col-lege Publishers.
Goldstone, J. A., T. R. Gurr, and F. Moshiri. 1991. Revolutions in theLate 20th Century. Boulder, Colo.: Westview Press.
Gottschalk, L. 1944. “Causes of Revolution.” American Journal of So-ciology 50: 1–8.
Grossman, H. I. 1991. “A General Equilibrium Model of Insurrec-tions.” American Economic Review 81(4): 912–921.
_____. 1992. “Foreign Aid and Insurrection.” Defence Economics 3(4):275–88.
_____. 1995. “Insurrections.” In K. Hartley and T. Sandler, eds., Hand-book of Defense Economics, vol. 1. Amsterdam: Elsevier ScienceBV.
Gurr, T. R. 1970. Why Men Rebel. Princeton, N.J.: Princeton Univer-sity Press.
_____. 1995. Minorities at Risk: A Global View of Ethno-political Con-flicts. Washington, D.C.: United States Institute for Peace.
Hardin, R. 1995. One for All: The Logic of Group Conflict. Princeton,N.J.: Princeton University Press.
Hauge, W., and T. Ellingsen. 1998. “Beyond Environmental Scarcity:Causal Pathways to Conflict.” Journal of Peace Research 35(3):299–317.
Hechter, M. 2001. Containing Nationalism. Oxford, U.K.: OxfordUniversity Press.
Hegre, H., R. Gissinger, and N. P. Gleditsch. 2003. “Globalization andInternal Conflic.” In G. Schneider, K. Barbieri, and N. P. Gled-itsch, eds., Globalization and Conflict. Boulder, Colo.: Rowman& Littlefield.
205
A P P E N D I X 2 : A S E L E C T E D B I B L I O G R A P H Y O F S T U D I E S O F C I V I L WA R A N D R E B E L L I O N
Hegre, H., T. Ellingsen, S. Gates, and N. P. Gleditsch. 2001. “Towarda Democratic Civil Peace? Democracy, Political Change, andCivil War, 1816–1992.” American Political Science Review 95(1):33–48.
Herbst, J. 2000. States and Power in Africa: Comparative Lessons in Au-thority and Control. Princeton, N.J.: Princeton University Press.
Hibbs, D. 1973. Mass Political Violence: A Cross-National Causal Analy-sis. New York: Wiley.
Hirshleifer, J. 1978. “Competition, Cooperation, and Conflict in Eco-nomics and Biology.” American Economic Review 68(2): 238–45.
_____. 1987. Economic Behavior in Adversity. Chicago: University ofChicago Press.
_____. 1988. “The Analytics of Continuing Conflict.” Synthese 76(2):201–33.
_____. 1991a. “The Paradox of Power.” Economics and Politics 3(3):177–200.
_____. 1991b. “The Technology of Conflict.” American Economic Re-view Papers and Proceedings 81(2): 130–134.
_____. 1995a. “Anarchy and Its Breakdown.” Journal of Political Econ-omy 103(1): 26–52.
_____. 1995b. “Theorizing about Conflict.” In K. Hartley and T. San-dler, eds., The Handbook of Defense Economics. Amsterdam: Else-vier Science BV.
_____. 2001. The Dark Side of the Force. Economic Foundations of Con-flict Theory. Cambridge, U.K.: Cambridge University Press.
Hobbes, T. 1660. Leviathan or the Matter, Forme, and Power of a Com-monwealth, Ecclesiastical and Civil. Reprint 1991. CambridgeTexts in the History of Political Thought Series. Richard Tuck,ed. Cambridge, U.K.: Cambridge University Press.
Homer-Dixon, T. F. 1991. “On the Threshold: Environmental Changesas Causes of Acute Conflict.” International Security 19(1): 5–40.
Hopper, R. D. 1950. “The Revolutionary Process.” Social Forces 28:270–79.
Horowitz, D. L. 1985. Ethnic Groups in Conflict. Berkeley, Calif.: Uni-versity of California Press.
_____. 1991. “Self-Determination: Politics, Philosophy, and Law.”NOMOS 39: 421–63.
Huntington, S. P. 1968. Political Order in Changing Societies. NewHaven, Conn.: Yale University Press.
B R E A K I N G T H E C O N F L I C T T R A P : C I V I L WA R A N D D E V E L O P M E N T P O L I C Y
206
Hutcheson, Frances. 1755. A System of Moral Philosophy. Reprint 1968.New York: Augustus M. Kelley.
Ignatieff, M. 1993. Blood and Belonging: Journeys into the New Nation-alism. New York: Farrar, Straus, and Giroux.
Johnson, C. 1964. Revolution and the Social System. Stanford, Calif.:Hoover Institution on War, Revolution, and Peace.
Kalyvas, S. 2001. “The Logic of Violence in Civil War: Theory andPreliminary Empirical Results.” University of Chicago, Chicago.Processed.
Kaufmann, C. 1996. “Possible and Impossible Solutions to EthnicCivil Wars.” International Security 20(4): 136–75.
Klare, M. 2001. Natural Resource Wars: The New Landscape of GlobalConflict. New York: Metropolitan Books.
Kuran, T. 1989. “Sparks and Prairie Fires: A Theory of UnanticipatedPolitical Revolution.” Public Choice 61(1): 41–74.
_____. 1995. Private Truths, Public Lies: The Social Consequences ofPreference Falsification. Cambridge, Mass.: Harvard UniversityPress.
Lake, D. A., and D. Rothschild, eds. 1998. The International Spread ofEthnic Conflict: Fear, Diffusion, and Escalation. Princeton, N.J.:Princeton University Press.
Lasswell, H., and A. Kaplan. 1955. Power and Society. New Haven,Conn.: Yale University Press.
Le Billon, P. 2001. “The Political Ecology of War: Natural Resourcesand Armed Conflicts.” Political Geography 20(5): 561–84.
Le Billon, P., J. Sherman, and M. Hartwell. 2002. “Controlling Re-source Flows to Civil Wars: A Review and Analysis of CurrentPolicies and Legal Instruments.” Background Paper for the Con-ference on Policies and Practices for Regulating Resource Flows to Armed Conflicts, May 20–24, Bellagio Study and ConferenceCenter, Bellagio, Italy. Available on: http://www.ipacademy.org.
Le Bon, G. 1913. The Psychology of Revolution. New York: Putnam.Leites, N., and C. Wolf, Jr. 1970. Rebellion and Authority: An Analytic
Essay on Insurgent Conflicts. Chicago: Markham.Lichbach, M. I. 1984. “An Economic Theory of Governability: Choosing
Policy and Optimizing Performance.” Public Choice 44(2): 307–37. _____. 1989. “An Evaluation of Does Economic-Inequality Breed
Political-Conflict Studies.” World Politics 41(4): 431–70.
207
A P P E N D I X 2 : A S E L E C T E D B I B L I O G R A P H Y O F S T U D I E S O F C I V I L WA R A N D R E B E L L I O N
_____. 1995. The Rebel’s Dilemma. Economics, Cognition, and SocietySeries. Ann Arbor, Mich.: University of Michigan Press.
Licklider, R. 1993. Stopping the Killing. New York: New York Univer-sity Press.
_____. 1995. “The Consequences of Negotiated Settlements in CivilWars, 1945–1993.” American Political Science Review 89(3): 681–90.
Lipset, S. M. 1959. “Some Social Requisites of Democracy: EconomicDevelopment and Political Legitimacy.” American Political Sci-ence Review 53(1): 69–106.
Marcouiller, D., and L. Young. 1995. “The Black Hole of Graft: ThePredatory State and the Informal Economy.” American EconomicReview 85(3): 630–46.
Mason, T. D., 1984. “Individual Participation in Collective Racial Vi-olence: A Rational Choice Synthesis.” American Political ScienceReview 78(4): 1040–56.
Mason, T. D., and P. J. Fett. 1996. “How Civil Wars End: A RationalChoice Approach.” Journal of Conflict Resolution 40(4): 546–68.
McAdam, D., S. Tarrow, and C. Tilly. 2000. Dynamics of Contention.Cambridge, U.K.: Cambridge University Press.
Mehlum, H., K. O. Moene, and R. Torvik. 2002. “Plunder & Protec-tion Inc.” Journal of Peace Research 39(4): 447–59.
Midlarsky, M. I. 2000. “Identity and International Conflict.” In M. I.Midlarsky, ed., Handbook of War Studies II. Ann Arbor, Mich.:University of Michigan Press.
Moore, B., Jr. 1966. Social Origins of Dictatorship and Democracy: Lordand Peasant in the Making of the Modern World. Boston: BeaconPress.
Moore, W. H. 1998. “Repression and Dissents: Substitution, Context,and Timing.” American Journal of Political Science 42(3): 851–73.
Muller, E. N. 1985. ”Income Inequality, Regime Repressiveness, andPolitical Violence.” American Sociological Review 50(1): 47–61.
_____. 1995. ”Economic Determinants of Democracy.” American So-ciological Review 60(6): 966–82.
Muller, E. N., and K.-D. Opp. 1986. “Rational Choice and RebelliousCollective Action.” American Political Science Review 80(2):471–87.
Muller, E. N., and M. A. Seligson. 1987. ”Inequality and Insurgency.”American Political Science Review 81(2): 425–51.
B R E A K I N G T H E C O N F L I C T T R A P : C I V I L WA R A N D D E V E L O P M E N T P O L I C Y
208
Muller, E. N., and E. Weede. 1990. “Cross-National Variation in Po-litical Violence: A Rational Action Approach.” Journal of ConflictResolution 34(4): 624–51.
Murdoch, J., and Sandler T. 2002a. “Civil Wars and EconomicGrowth: A Regional Comparison.” Defense and Peace Economics13(6): 451–64.
_____. 2002b. “Economic Growth, Civil Wars, and Spatial Spillovers.”Journal of Conflict Resolution 46(1): 91–110.
Neumann, S. 1949. “The Structure and Strategy of Revolutions: 1848and 1948.” Journal of Politics 11: 532–44.
Newman, S. 1991. “Does Modernization Breed Ethnic Conflict?”World Politics 43(3): 451–78.
Odom, W. E. 1992. On Internal War: American and Soviet Approachesto Third World Clients and Insurgents. Durham, N.C.: Duke Uni-versity Press.
Olson, M. 1971. Logic of Collective Action: Public Goods and the Theoryof Groups. Cambridge, Mass.: Harvard University Press.
_____. 1982. The Rise and Decline of Nations: Growth, Stagflation, andSocial Rigidities. New Haven, Conn.: Yale University Press.
Olzak, S., and J. Nagel, eds. 1986. Competitive Ethnic Relations. NewYork: Academic Press.
Palmer, R. R. 1954. “The World Revolution in the West.” Political Sci-ence Quarterly 69(1): 1–14.
Paris, R. 1997. “Peacebuilding and the Limits of Liberal International-ism.” International Security 22(Fall): 54–89.
Petersen, R. D. 2002. Understanding Ethnic Violence: Fear, Hatred, andResentment in 20th-Century Eastern Europe. Cambridge, U.K.:Cambridge University Press.
Posen, B. 1993. “The Security Dilemma and Ethnic Conflict.” InMichael Brown, ed., Ethnic Conflict and International Security.Princeton, N.J.: Princeton University Press.
Prendergast, J. 1996. Frontline Diplomacy: Humanitarian Aid and Con-flict in Africa. Boulder, Colo.: Lynne Rienner.
Przeworski, A., M. E. Alvarez, J. A. Cheibub, and F. Limongi. 2000.Democracy and Development: Political Institutions and Well-Beingin the World, 1950–1990. Cambridge, U.K.: Cambridge Univer-sity Press.
Regan, P. M. 2000. Civil Wars and Foreign Powers. Ann Arbor, Mich.:Michigan University Press.
209
A P P E N D I X 2 : A S E L E C T E D B I B L I O G R A P H Y O F S T U D I E S O F C I V I L WA R A N D R E B E L L I O N
_____. 2002. “Third-Party Intervention and the Duration of IntrastateConflicts.” Journal of Conflict Resolution 46(1): 55–73.
Reynal-Querol, M. 2002a. “Ethnicity, Political Systems, and CivilWar.” Journal of Conflict Resolution 46(1): 29–54.
_____. 2002b. “Political Systems, Stability, and Civil Wars.” Defenceand Peace Economics 13(6): 465–83.
Riezler, K. 1943. “On the Psychology of Modern Revolutions.” SocialResearch 10: 320–36.
Ross, M. L. 2000. “Does Oil Hinder Democracy?” World Politics53(April): 325–61.
_____. 2003. “The Natural Resource Curse: How Wealth Can MakeYou Poor.” In I. Bannon and P. Collier, eds., Natural Resourcesand Violent Conflict: Options and Actions. Washington, D.C.:World Bank.
Sambanis, N. 2000. “Partition as a Solution to Ethnic War.” World Pol-itics 52(4): 437–83.
Sandler, T. 2000. “Economic Analysis of Conflict.” Journal of ConflictResolution 44(6): 723–29.
Schutz, B. M., and R. O. Slater. 1990. Revolutionary Change in theThird World. Boulder, Colo.: Lynne Rienner.
Silver, M. 1974. “Political Revolutions and Repression: An EconomicApproach.” Public Choice 14(1): 63–71.
Skaperdas, S. 2001. “An Economic Approach to Analyzing Civil Wars.”Paper presented at the World Bank Conference on Civil Wars andPost-War Transitions, May 18–20, University of California atIrvine.
_____. 2002. “Warlord Competition.” Journal of Peace Research 39(4):435–46.
Skocpol, T. 1987. States and Social Revolutions: A Comparative Study ofFrance, Russia, and China. New York: Cambridge University Press.
Smith, A. D. 1991. National Identity. Reno, Nev.: University of NevadaPress.
Snyder, J. 2000. From Voting to Violence: Democratization and Nation-alist Conflict. New York: Norton.
Sorokin, P. 1925. The Sociology of Revolution. New York: Lippincott.Stedman, S. J., D. Rothschild, and E. N. Cousens, eds. 2002. Ending
Civil Wars: The Implementation of Peace Agreements. Boulder,Colo.: Lynne Rienner.
B R E A K I N G T H E C O N F L I C T T R A P : C I V I L WA R A N D D E V E L O P M E N T P O L I C Y
210
Tilly, C. 1978. From Mobilization to Revolution. New York: McGraw-Hill.
Tullock, G. 1971. “The Paradox of Revolution.” Public Choice 11:89–99.
_____. 1974. The Social Dilemma: The Economics of War and Peace.Blacksburg, Va.: Public Choice Center.
_____. 1985. “A New Proposal for Decentralizing Government Activ-ity.” In H. Milde and H. G. Monissen, eds., Rationale Wirtshafts-politik in Komplexen Gesellschaften. Stuttgart, Germany: Verlag W.Kohlhammer.
_____. 1987. Autocracy. Boston: Kluwer Academic Publishers.Vanhanen, T. 1990. The Process of Democratization. A Comparative
Study of 147 States, 1980–88. New York: Crane Russak._____. 1999. “Domestic Ethnic Conflict and Ethnic Nepotism: A
Comparative Analysis.” Journal of Peace Research 36(1): 55–73.Varshney, A. 2002. Ethnic Conflict and Civic Life: Hindus and Muslims
in India. New Haven, Conn.: Yale University Press.Walter, B. F. 2002. Committing to Peace. Princeton, N.J.: Princeton
University Press.Wintrobe, R. 1998. The Political Economy of Dictatorship. Cambridge,
U.K.: Cambridge University Press.Wood, E. J. 2000. Forging Democracy from Below: Insurgent Traditions
in South Africa and El Salvador. Cambridge, U.K.: CambridgeUniversity Press.
Zartman, W. I. 1985. Ripe for Resolution: Conflict and Intervention inAfrica. Oxford, U.K.: Oxford University Press.
_____, ed. 1995. Collapsed States: The Disintegration and Restoration ofLegitimate Authority. Boulder, Colo.: Lynne Rienner.
211
References
Acemoglu, D., S. Johnson, and J. A. Robinson.2001. “The Colonial Origins of Compara-tive Development: An Empirical Investi-gation.” American Economic Review 91(5):1369–1401.
Andre, C., and J. P. Platteau. 1998. “Land Rela-tions under Unbearable Stress: RwandaCaught in the Malthusian Trap.” Journal ofEconomic Behavior and Organization 34(1):1–47.
Asia Watch. 1991. Afghanistan: The Forgotten War.New York: Human Rights Watch.
Azam, J.-P., and A. Hoeffler. 2002. “Violenceagainst Civilians in Civil Wars: Looting orTerror?” Journal of Peace Research 39(4):461–85.
Balch-Lindsay, D., and A. J. Enterline. 2000.“Killing Time: The World Politics of CivilWar Duration, 1820–1992. InternationalStudies Quarterly 44(4): 615–42.
Barrett, D. B., ed. 1982. World Christian Encyclope-dia. Oxford, U.K.: Oxford University Press.
Barro, R. J., ed. 1997. Determinants of EconomicGrowth. Cambridge, Mass. and London:MIT Press.
Bell, Stewart. 2000. “Canadian Financed TerrorBombs, Sri Lankans Say.” National Post.
Bennett, D. S., and A. Stam. 1996. “The Durationof Interstate Wars, 1816–1985.” AmericanPolitical Science Review 90(2): 239–57.
Bigombe, B., P. Collier, and N. Sambanis. 2000.“Policies for Building Post-Conflict Peace.”Journal of African Economies 9(3): 322–47.
Boyce, J. K. 2002. Investing in Peace: Aid and Con-ditionality after Civil Wars. International In-stitute for Strategic Studies, Adelphi Paperno. 351. Oxford, U.K.: Oxford UniversityPress.
Brass, P. 1997. Theft of an Idol. Princeton, N.J.:Princeton University Press.
Bray, J. 2003. “Attracting Reputable Companies toRisky Environments: Petroleum and Min-ing Companies.” In I. Bannon and P. Col-
The word “processed” describes informally reproduced works that may not be commonly available throughlibraries.
B R E A K I N G T H E C O N F L I C T T R A P : C I V I L WA R A N D D E V E L O P M E N T P O L I C Y
212
lier, eds., Natural Resources and Violent Con-flict: Options and Actions. Washington, D.C.:World Bank.
Brown, M. E., and R. Rosecrance, eds. 1999. TheCosts of Conflict. Boulder, Colo.: Rowman& Littlefield.
Brück, T. 2001. “Mozambique: The Economic Ef-fects of the War.” In F. Stewart, V. Fitzger-ald, and associates, eds., War and Underde-velopment, vol. 2. Oxford, U.K.: OxfordUniversity Press.
Buhaug, H., and S. Gates. 2002. “The Geographyof Civil War.” Journal of Peace Research39(4): 417–33.
Buhaug, H., S. Gates, and P. Lujala. 2002.“Lootable Natural Resources and the Dura-tion of Armed Civil Conflict, 1946–2001.”Paper presented at the Annual Meeting ofthe Peace Science Society (International),November 1–3, Tucson, Ariz.
Cairns, Edmund. 1997. A Safer Future: Reducingthe Human Cost of War. Oxford, U.K.:Oxfam Publications.
Canning, D. 1998. “A Database of World Stocks ofInfrastructure, 1950–95.” World Bank Eco-nomic Review 12(3): 529–47.
Carballo, M., and S. Solby. 2001. “HIV/AIDS,Conflict and Reconstruction in Sub-Saha-ran Africa.” Paper presented at the con-ference on Preventing and Coping withHIV/AIDS in Post-Conflict Societies: Gen-der Based Lessons from Sub-Saharan Africa,March 26–28, Durban, South Africa.
Casavant L., and C. Collin. 2001. “Illegal Drugand Crime: A Complex Relationship.” Pre-pared for the U.S. Senate Special Commit-tee on Illegal Drugs.
Centre for Research on the Epidemiology of Disas-ters. 2001. Data presented to the workshopon Filling Knowledge Gaps: A ResearchAgenda on the Impact of Armed Conflicton Children, July 2–4, Florence, Italy.
Chadhury, N., and J. S. Hammer. 2002. “GhostDoctors: Absenteeism in Bangladesh HealthFacilities.” Development Research Group,World Bank, Washington, D.C. Processed.
Colletta, Nat J., and Michelle L. Cullen. 2000. Vio-lent Conflict and the Transformation of SocialCapital. Washington, D.C.: World Bank.
Collier, P. 1994. “Demobilization and Insecurity: AStudy in the Economics of the Transitionfrom War to Peace.” Journal of InternationalDevelopment 6.
_____. 1999. “On the Economic Consequences of Civil War.” Oxford Economic Papers 51:168–83.
_____. 2001. “Ethnic Diversity: An EconomicAnalysis.” Economic Policy 32(2):129–66.
Collier, P., and J. Dehn. 2001. “Aid, Shocks, andGrowth.” Policy Research Working Paperno. 2688. World Bank, Washington, D.C.
Collier, P., and D. Dollar. 2002. “Aid Allocationand Poverty Reduction.” European Eco-nomic Review 46(8):1475–1500.
213
R E F E R E N C E S
Collier, P. and A. Hoeffler. 2002a. “Aid, Policy, andGrowth in Post-Conflict Societies.” PolicyResearch Working Paper no. 2902. WorldBank, Washington, D.C.
_____. 2002b. “Aid, Policy, and Peace: Reducingthe Risks of Civil Conflict.” Defence andPeace Economics 13(6): 435–50.
_____. 2002c. “Greed and Grievance in CivilWars.” Working Paper Series 2002–01. Cen-tre for the Study of African Economies, Ox-ford, U.K. Available on: http://www.csae.ox.ac.uk.
_____. 2002d. “Military Expenditure: Threats, Aid,and Arms Races.” Policy Research WorkingPaper no. 2927. World Bank, Washington,D.C.
_____. 2002e. “On the Incidence of Civil War inAfrica.” Journal of Conflict Resolution 46(1):13–28.
_____. 2003. “The Political Economy of Seces-sion.” Centre for the Study of AfricanEconomies, Oxford, U.K. Processed. Avail-able on: http://users.ox.ac.uk/~ball0144.
Collier, P., A. Hoeffler, and C. Pattillo. 2002.“Africa’s Exodus: Capital Flight and theBrain Drain as Portfolio Decisions.” WorldBank, Washington, D.C. Processed.
Collier, P., A. Hoeffler, and M. Söderbom. 2003.“On the Duration of Civil War.” Centre forthe Study of African Economies, Oxford,U.K. Processed. Available on: http://users.ox.ac.uk/~ball0144.
Cortright, D., and G. A. Lopez 2002. Sanctionsand the Search for Security: Challenges to UNAction, a Project of the International PeaceAcademy. Boulder, Colo.: Lynne Rienner.
Crossin, C. G. Hayman and S. Taylor. 2003.“Where Did It Come From? CommodityTracking Systems.” In I. Bannon and P. Col-lier, eds., Natural Resources and Violent Con-flict: Options and Actions. Washington, D.C.:World Bank.
Davies, V. A. B., and A. Fofana. 2002. “Diamonds,Crime, and Civil War in Sierra Leone.”Paper prepared for the World Bank and YaleUniversity case study project The PoliticalEconomy of Civil Wars. Processed.
DeRouen, K., Jr. 2003. “A Competing Risks Modelof Civil War Duration and Outcome: Impli-cations for Rebel Decision Making.” Paperpresented to the Gilman/Curiel Conferenceon New Directions in International Rela-tions, February, Yale University.
Doyle, M. W., and N. Sambanis. 2000. “Interna-tional Peace Building: A Theoretical andQuantitative Analysis.” American PoliticalScience Review 94(4): 779–801.
_____. 2003. “Alternative Measures and Estimatesof Peace Building Success.” Yale University,Department of Political Science, NewHaven, Conn. Processed.
Economist, The. 2001. “Hitting the Tigers in theirPockets.” March 10.
Elbadawi, I., and N. Sambanis. 2000. “External In-terventions and the Duration of Civil Wars.”Paper presented at World Bank DECRG
B R E A K I N G T H E C O N F L I C T T R A P : C I V I L WA R A N D D E V E L O P M E N T P O L I C Y
214
conference on The Economics and Politicsof Civil Conflicts, March, Princeton Univer-sity, Princeton, N.J.
_____. 2002. “How Much Civil War Will We See?Explaining the Prevalence of Civil War.”Journal of Conflict Resolution 46(3): 307–34.
Elbadawi, I., A. A. Ali, and A. Al Battahani. 2002.“On the Causes, Consequences, and Resolu-tion of the Civil War in Sudan.” Processed.
Elbe, S. 2002. “HIV/AIDS and the ChangingLandscape of War in Africa.” InternationalSecurity 27(2): 159–77.
Esman, M. J., and R. J. Herring, eds. 2001. Car-rots, Sticks, and Ethnic Conflict: RethinkingDevelopment Assistance. Ann Arbor, Mich.:University of Michigan Press.
Esty, D. C., J. A. Goldstone, T. R. Gurr, B. Harff,M. Levy, G. D. Dabelko, P. T. Surko, and A. N. Unger. 1998. State Failure Task ForceReport: Phase II Findings. McLean, Va.: Sci-ence Applications International Corporation.
Farah, Douglas. 2002. “Al Qaeda Cash Tied toDiamond Trade.” Washington Post, No-vember 1. Available on: http://www.washingtonpost.com/wp-dyn/articles/A27281-2001Nov1.html.
Fearon, J. D. 2002. “Why Do Some Civil WarsLast So Much Longer Than Others?” Stan-ford University, Palo Alto, Calif. Processed.Available on: http://econ.worldbank.org/files/18171_Fearon Dur3. pdf.
Fearon, J. D., and D. Laitin. 1996. “Explaining In-terethnic Cooperation.” American PoliticalScience Review 90(4): 715–35.
_____. 2003. “Ethnicity, Insurgency, and CivilWar.” American Political Science Review97(1): 75–90.
Figes, O. 1996. A People’s Tragedy: The Russian Rev-olution 1891–1924. London: Pimlico.
Gates, S. 2002. “Recruitment and Allegiance: TheMicrofoundations of Rebellion.” Journal ofConflict Resolution 46(1): 111–30.
Gates, S., H. Hegre, M. P. Jones, and H. Strand.2003. “Institutional Inconsistency and Po-litical Instability: Persistence and Change in Political Systems Revisited, 1800–1998.”International Peace Research Institute, Oslo,Norway. Processed.
Ghobarah, H. A., P. Huth, and B. Russett. 2003.“Civil Wars Kill and Maim People—Longafter Shooting Stops.” American PoliticalScience Review 97(2).
Gleditsch, N. P. 1998. “Armed Conflict and theEnvironment: A Critique of the Literature.”Journal of Peace Research 35(3): 381–400.
Gleditsch, N. P., O. Bjerkholt, Å. Cappelen, R. P.Smith, and J. P. Dunne. 1996. The PeaceDividend. Amsterdam: Elsevier.
Gleditsch, N. P., P. Wallensteen, M. Eriksson, M.Sollenberg, and H. Strand. 2002. “ArmedConflict 1946–2001: A New Dataset.”Journal of Peace Research 39(5): 615–37.
Global Witness. 2002. The Logs of War. The TimberTrade and Armed Conflict. Report no. 379.Fafo Institute for Applied Social Science,Oslo, Norway. Available on: http://www.fafo.no/pub/ rapp/379/379.pdf.
215
R E F E R E N C E S
Goldstein, P. 1985. “The Drug/Violence Nexus: ATripartite Conceptual Framework.” Journalof Drug Issues 39: 143–74. Available on:http://www.lindesmith.org/library/tlcgolds.html.
Graduate Institute of International Studies. 2001.Small Arms Survey 2001. Profiling the Prob-lem. Oxford, U.K.: Oxford University Press.Available on: http://www.smallarmssurvey.org/Yearbook2001.html.
Grossman, H. I. 1991. “A General EquilibriumModel of Insurrections.” American EconomicReview 81(4): 912–21.
_____. 1992. “Foreign Aid and Insurrection.” De-fense Economics 3(4): 275–88.
_____. 1995. “Insurrections.” In K. Hartley and T. Sandler, eds., Handbook of Defense Eco-nomics, vol. 1. New York: Elsevier Science.
_____. 1999. “Kleptocracy and Revolutions.” Ox-ford Economic Papers 51(2): 267–83.
Guha-Sapir, D., and Emanuela Forcella. 2001. “TheReproductive Health Needs of Refugees:Evidence from Three Camps in Ethiopia.”Centre for Research on the Epidemiology ofDisasters, Brussels. Processed.
Guha-Sapir, D., and W. G. Van Panhuis. 2002.“Mortality Risks in Recent Civil Conflicts:A Comparative Analysis.” Centre for Re-search on the Epidemiology of Disasters,Brussels. Processed.
Guillaumont, P. and S. G. Jeanneney. 2003.“Dampening Price Shocks.” In I. Bannonand P. Collier, eds., Natural Resources and
Violent Conflict: Options and Actions. Wash-ington, D.C.: World Bank.
Gurr, T. R. 1974. “Persistence and Change in Po-litical Systems, 1800–1971.” American Po-litical Science Review 68(4): 1482–1504.
_____. 2000. Peoples Versus States: Minorities atRisk in the New Century. Washington, D.C.:United States Institute of Peace.
Gurr, Ted Robert, Monty G. Marshall, and DeepaKhosla. 2001. Peace and Conflict 2001: AGlobal Survey of Armed Conflicts, Self-Determination Movements, and Democracy.College Park, Md.: Center for InternationalDevelopment and Conflict Management.
Hammer, J. S. 1993. “The Economics of MalariaControl.” World Bank Research Observer 8(1):1–22.
Hardin, R. 1995. One for All: The Logic of GroupConflict. Princeton, N.J.: Princeton Univer-sity Press.
Harvey, C. 1992. “Botswana: Is the Economic Mir-acle Over?” Journal of African Economies1(3): 335–68.
Hechter, M. 2001. Containing Nationalism. Ox-ford, U.K.: Oxford University Press.
Hegre, H. 2003. ”Disentangling Democracy andDevelopment as Determinants of ArmedConflict.” Paper presented at the AnnualMeeting of International Studies Associa-tion, February 27, Portland, Oreg. Availableon: http://econ.worldbank.org/files/ 24637_ddcwwb.PDF.
Hegre, H., T. Ellingsen, S. Gates, and N. P. Gled-itsch. 2001. “Toward a Democratic Civil
B R E A K I N G T H E C O N F L I C T T R A P : C I V I L WA R A N D D E V E L O P M E N T P O L I C Y
216
Peace? Democracy, Political Change, andCivil War, 1816–1992.” American PoliticalScience Review 95(1): 33–48.
Heston, A., R. Summers, and B. Aten, 2002. PennWorld Table Version 6.1. Center for Interna-tional Comparisons at the University ofPennsylvania. Available on: http://pwt.econ.upenn.edu/.
Hiltermann, Joost. 2002. “Incorporating HumanRights in the Study of Civil Wars.” George-town University, Washington, D.C. Processed.
Hirsch, J. L. 2001. Sierra Leone: Diamonds and theStruggle for Democracy. International PeaceAcademy Occasional Paper Series. Boulder,Colo.: Lynne Rienner:
Hirshleifer, J. 2001. The Dark Side of the Force. Eco-nomic Foundations of Conflict Theory. Cam-bridge, U.K.: Cambridge University Press.
Hoeffler, A., and M. Reynal-Querol. 2003. “Mea-suring the Cost of Conflict.” Oxford Uni-versity, Oxford, U.K. Processed. Availableon: http://users.ox.ac.uk/~ball0144.
Holt, K. 2003. “Once They Were Girls. Now TheyAre Slaves.” The Observer. February 2, p. 23.
Homer-Dixon, T. F. 1991. “On the Threshold: En-vironmental Changes as Causes of AcuteConflict.” International Security 19(1): 5–40.
Horowitz, D. L. 1991. “Self-Determination: Politics,Philosophy, and Law.” NOMOS 39: 421–63.
_____. 1998. “Structure and Strategy in EthnicConflict.” Paper presented at the AnnualBank Conference on Development Eco-
nomics, April 20–21, World Bank, Wash-ington, D.C.
ICBL (International Campaign to Ban Land-mines). 2002. Landmine Monitor Report2002: Toward a Mine Free World. New York:Human Rights Watch. Available on: http://www.icbl.org.
Keely, C. B., H. E. Reed, and R. J. Waldman. 2000.“Understanding Mortality Patterns in Com-plex Humanitarian Emergencies.” In H. E.Reed and C. B. Keely, eds., Forced Migrationand Mortality. Washington, D.C.: The Na-tional Academies Press. Available on: http://www.nap.edu/openbook/0309073340/html/1.html.
Kingma. K. 2002. “Improving External Support toReintegration of Ex-Combatants into Civil-ian Life.” Bonn International Center forConversion, Bonn, Germany. Processed.
Klare, M. 2001. Natural Resource Wars: The NewLandscape of Global Conflict. New York:Metropolitan Books.
Knight, M., N. Loayza, and D. Villanueva. 1996.“The Peace Dividend: Military SpendingCuts and Economic Growth.” IMF Staff Pa-pers 43(1): 1–37.
Le Billon, P. 2003. “Getting It Done: Instrumentsof Enforcement.” In I. Bannon and P. Col-lier, eds., Natural Resources and Violent Con-flict: Options and Actions. Washington, D.C.:World Bank.
Leith, C. J. 2002. “Why Botswana Prospered.” Uni-versity of Western Ontario, London, On-tario, Canada. Processed.
217
R E F E R E N C E S
Licklider, R. 1993. Stopping the Killing. New York:New York University Press.
_____. 1995. “The Consequences of NegotiatedSettlements in Civil Wars, 1945–1993.”American Political Science Review 89(3).
Lijphart, A. 1984. Democracies: Patterns of Majori-tarian and Consensus Government in Twenty-One Countries. New Haven, Conn.: YaleUniversity Press.
Lipset, S. M. 1959. “Some Social Requisites ofDemocracy: Economic Development andPolitical Legitimacy.” American Political Sci-ence Review 53(1): 69–106.
Lunde, L., and P. Swanson. 2003. “Who Gets theMoney? Reporting Resource Revenues.” InI. Bannon and P. Collier, eds., Natural Re-sources and Violent Conflict: Options and Ac-tions. Washington, D.C.: World Bank.
Machel, G. 2002. “Conflict Fuels HIV/AIDS Cri-sis.” Available on: http://www.IPsnews.net/hivaids/section1_2.shtml.
Matovu, J. M,. and F. Stewart. 2001. “Uganda:The Social and Economic Costs of Con-flict.” In F. Stewart, V. Fitzgerald, and asso-ciates. War and Underdevelopment, vol. 2.Oxford, U.K.: Oxford University Press.
Mauro, P. 1995. “Corruption and Growth.” Quar-terly Journal of Economics 110(3): 681–712.
McDonald, L. 2002. “The International Opera-tional Response to the PsychologicalWounds of War: Understanding and Im-proving Psychosocial Interventions.” Work-
ing Paper no. 7. Feinstein InternationalFamine Center, Tufts University.
Mearsheimer, J. J. 1990. “Back to the Future: In-stability in Europe after the Cold War.” In-ternational Security 15(1): 5–56.
Mollica, R. F., K. McInnes, N. Sarajlic, J. Lavelle, I.Sarajlic, and M. P. Massagli. 1999. “Disabil-ity Associated with Psychiatric Comorbidityand Health Status in Bosnian Refugees Liv-ing in Croatia.” Journal of the AmericanMedical Association 281(5): 433–39.
Montalvo, Jose G., and M. Reynal-Querol. 2002. “Fighting against Malaria: Prevent Warswhile Waiting for the Miraculous Vaccine.”Working Paper. University of PompeuFabra, Barcelona, Spain. Processed.
Mueller, J. 2000. “The Banality of ‘Ethnic War.’ ”International Security 25(1): 42–70.
Murdoch, J., and Sandler T. 2002. “EconomicGrowth, Civil Wars, and Spatial Spillovers.”Journal of Conflict Resolution 46(1): 91–110.
Ndikumana, L., and K. Emizet. 2002. “The Eco-nomics of Civil War: The Case of the Dem-ocratic Republic of Congo.” World Bankand Yale University case study project ThePolitical Economy of Civil Wars. Processed.
Ngaruko, F., and J. D. Nkurunziza. 2002. “CivilWar and Its Duration in Burundi.” Paperprepared for the World Bank and Yale Uni-versity case study project The PoliticalEconomy of Civil Wars. Processed.
Ogen, J. K., and N. Loy. 1996. “AIDS and the Mil-itary: Implications of Demobilisation.”
B R E A K I N G T H E C O N F L I C T T R A P : C I V I L WA R A N D D E V E L O P M E N T P O L I C Y
218
Paper presented at the International Confer-ence on AIDS, July 7–12.
Olson, M. 1993. “Dictatorship, Democracy, andDevelopment.” American Political Science Re-view 87(3): 567–76.
Over, M. 2003. “The Effects of Societal Variableson Urban Rates of HIV Infection in Devel-oping Countries: An Exploratory Analysis.Confronting AIDS.” In M. Ainsworth, L.Fransen, and M. Over, eds., Evidence fromthe Developing World. Washington, D.C.and Brussels, Belgium: European Commis-sion and World Bank.
Parker, K., A. Heindel, and A. Branch. 2000.“Armed Conflict in the World Today: ACountry by Country Review.” Written forthe Humanitarian Law Project/InternationalEducational Development and ParliamentaryHuman Rights Group, U.K. Available on:http://www.hri.ca/doccentre/docs/cpr/armedconflict2000. shtml#_Toc486401419.
Pax Christi Netherlands. 2001. “Peace in Colom-bia: A Matter of Civil Initiatives.” Availableon: http://www.paxchristi.net.
Pinker, S. 2002. The Blank Slate. The Modern De-nial of Human Nature. Viking Press.
Prunier, G. 1995. The Rwanda Crisis: History of aGenocide. New York: Columbia UniversityPress.
Przeworski, A. 1991. Democracy and the Market:Political and Economic Reforms in EasternEurope and Latin America. Cambridge,U.K.: Cambridge University Press.
Przeworski, A., M. E. Alvarez, J. A. Cheibub, andF. Limongi. 2000. Democracy and Develop-ment: Political Institutions and Well-Being inthe World, 1950–1990. Cambridge, U.K.:Cambridge University Press.
Rawls, J. 1971. A Theory of Justice. Cambridge,Mass.: Harvard University Press.
Regan, P. 2002. “Third-Party Intervention and theDuration of Intrastate Conflicts.” Journal ofConflict Resolution 46(1): 55–73.
Reinikka, R., and J. Svensson. 2002. “Coping withPoor Public Capital.” Journal of Develop-ment Economics 69(1): 51–69.
Reuter, P. 2001. “The Need for Dynamic Modelsof Drug Markets.” Bulletin of Narcotics LIII(1–2).
Reynal-Querol, M. 2002a. “Ethnicity, Political Sys-tems, and Civil War.” Journal of ConflictResolution 46(1): 29–54.
_____. 2002b. “Political Systems, Stability, andCivil Wars.” Defence and Peace Economics13(6): 465–83.
Ross, M. L. 2000. “Does Oil Hinder Democracy?”World Politics 53(April): 325–61.
_____. 2002a. ”Booty Futures: Africa’s Civil Warsand the Futures Market for Natural Re-sources.” Department of Political Science,University of California, Los Angeles.Processed. Available on: http://www.polisci.ucla.edu/faculty/ross/bootyfutures.pdf.
_____. 2002b. “Resources and Rebellion in Aceh,Indonesia.” Paper prepared for the World
219
R E F E R E N C E S
Bank and Yale University case study projectThe Political Economy of Civil Wars.Processed. Available on: http://www.polisci.ucla.edu/faculty/ross.
Ross, M. 2003. “The Natural Resource Curse:How Wealth Can Make You Poor.” Ch. 2 inI. Bannon and P. Collier, eds, Natural Re-sources and Violent Conflict: Options and Ac-tions. Washington, DC: The World Bank.
Ruiz, Hiram A. 1998. “The Sudan: Cradle of Dis-placement.” In R. Cohen and M. F. Deng,eds., The Forsaken People: Case Studies of theInternally Displaced. Washington, D.C.:The Brookings Institution.
Sambanis, N. 2000. “Partition as a Solution toEthnic War.” World Politics 52: 437–83.
_____. 2003. “Using Case Studies to Expand theTheory of Civil War.” Paper prepared forthe World Bank and Yale University casestudy project The Political Economy ofCivil Wars. Processed.
Scott, Colin. 1998. “Liberia: A Nation Displaced.”In R. Cohen and M. F. Deng, eds., The For-saken People: Case Studies of the InternallyDisplaced. Washington, D.C.: The Brook-ings Institution.
Sherman, J. 2002. Policies and Practices for Con-trolling Resource Flows in Armed Conflict.New York: International Peace Academy.Available on: http://www.ipacademy.org.
Singer, D. J., and Small, M. 1994. Correlates ofWar Project: International and Civil WarData, 1816–1992. Ann Arbor, Michigan:
Inter-University Consortium for Politicaland Social Research.
Small, M., and Singer, J. D. 1982. Resort to Arms:International and Civil War, 1816–1980.Beverly Hills, Calif.: Sage.
Smallman-Raynor, M. R. and A. D. Cliff. 1991.“Civil War and the Spread of AIDS in Cen-tral Africa.” Epidemiology and Infection 107(1): 69–80.
Stedman, S. J. 2001. “Implementing Peace Agree-ments in Civil Wars: Lessons and Recom-mendations for Policymakers.” Policy PaperSeries on Peace Implementation. New York:International Peace Academy.
Stewart, F., C. Huang, and M. Wang. 2001. InternalWars in Developing Countries: An EmpiricalOverview of Economic and Social Conse-quences. In F. Stewart, V. Fitzgerald, and asso-ciates, eds., War and Underdevelopment, vol.1. Oxford, U.K.: Oxford University Press.
Summers, R., and A. Heston. 1991. “The PennWorld Table (Mark 5): An Expanded Set ofInternational Comparisons, 1950–1988.”Quarterly Journal of Economics 99(2):327–68.
Taylor, H. M., and S. Karlin. 1998. An Introductionto Stochastic Modeling. 3rd. ed. San Diego,Calif.: Academic Press.
UN (United Nations). 1999. Consolidated Inter-Agency Appeal for Angola, 2000. New Yorkand Geneva: Office for the Coordination ofHumanitarian Affairs. Available on: http://www.reliefweb.int.
B R E A K I N G T H E C O N F L I C T T R A P : C I V I L WA R A N D D E V E L O P M E N T P O L I C Y
220
_____. 2000. Humanitarian Context.
_____. 2002. Consolidated Inter-Agency Appeal forEritrea, 2003. New York and Geneva: forthe Coordination of Humanitarian Affairs.Available on: http://www.reliefweb.int.
UNHCR (United Nations High Commission forRefugees). 2002. “Refugees by Numbers.”Available on: http://www.unhrc.ch/.
UNODCCP (United Nations Office for Drug Con-trol and Crime Prevention). 2002. “GlobalIllicit Drugs Trends 2002.” In ODCCP Stud-ies on Drugs and Crime. New York.
_____. 2003. The Opium Economy in Afghanistan:An International Problem. New York.
U.S. Bureau of Justice and Statistics. 2002. “Drugsand Crime Facts.” Available on: http://www.ojp.usdoj.gov/bjs/spectps.htm.
U.S. Department of State. 1999. “Arms and Con-flict in Africa.” Available on: http://www.state.gov/www/global/arms/reports/arms_conflict.html.
USSR. 1964. Atlas Narodov Mira. Moscow: De-partment of Geodesy and Cartography ofthe State Geological Committee.
Walter, B. F. 1997. “The Critical Barrier to CivilWar Settlement.” International Organiza-tion 51(3): 335–65.
_____. 2002. Committing to Peace. Princeton, N.J.:Princeton University Press.
Weingast, B. R. 1997. “The Political Foundationsof Democracy and the Rule of Law.” Amer-ican Political Science Review 91(2): 245–63.
Weiss, Thomas G. 1998. Beyond UN Subcontract-ing: Task-Sharing with Regional SecurityArrangements and Service-Providing NGOs.New York: St. Martin’s Press.
WHO (World Health Organization). 1983. WorldHealth Statistics Annual. Geneva.
_____. 1999. “Malaria 1982–1997.” Weekly Epi-demiological Record 74(32): 265–70.
_____. 2000. The World Health Report 2000: HealthSystems: Improving Performance. Geneva.
_____. 2001. Reproductive Health during Conflictand Displacement. Available on: http://www.who.int/reproductive_health/publi…/RHR_00_13_RH_conflict_and_displacemnet.
Winer, J. M. and T. J. Roule. 2003. “Follow theMoney: The Finance of Illicit Resource Ex-traction.” In I. Bannon and P. Collier, eds.,Natural Resources and Violent Conflict: Op-tions and Actions. Washington, D.C.: WorldBank.
World Bank. 1997. Confronting Aids: Public Prior-ities in a Global Epidemic. Oxford, U.K.:Oxford University Press.
_____. 2002a. World Development Indicators. Wash-ington, D.C.
_____. 2002b. World Bank Work in Low-IncomeCountries under Stress: A Task Force Report.Washington, D.C. Available on: http://www1.worldbank.org/operations/licus/documents/licus.pdf.
_____. 2003.
221
R E F E R E N C E S
Zartman, William I. 1995. “Putting Things BackTogether.” In Collapsed States: The Disinte-gration and Restoration of Legitimate Author-ity. Boulder, Colo.: Lynne Rienner.
Zinn, A. 2002. “Theory Versus Reality: Civil WarOnset and Avoidance in Nigeria, 1960–1999.” Paper prepared for the World Bank
and Yale University case study project ThePolitical Economy of Civil Wars. Processed.
Zürcher, C., J. Koehler, and P. Baev. 2002. “CivilWars in the Caucasus.” Paper prepared forthe World Bank and Yale University casestudy project The Political Economy ofCivil Wars. Processed.


Civil war conflict is a core development issue. Theexistence of civil war can dramatically slow acountry's development process, especially in low-income countries, which are more vulnerable to civilwar conflict. Conversely, development can impede
civil war. When development succeeds, countries become safer;when development fails, countries experience a greater risk ofbeing caught in a conflict trap. Ultimately, civil war is a failureof development.
Breaking the Conflict Trap identifies the dire consequences that civil war has on the development process and offers threemain findings. First, that civil war has adverse ripple effects,which are often not taken into account by those who determinewhether wars start or end. Second, some countries are morelikely than others to experience civil war conflict and thereforethe risks of civil war differ considerably according to a country'scharacteristics, including its economic stability. Finally,Breaking the Conflict Trap explores viable internationalmeasures that can be taken to reduce the global incidence ofcivil war and proposes a practical agenda for action.
This book should serve as a wake-up call to anyone in the international community who still thinks that development and conflict are distinct issues. This book will also be ofinterest to researchers, academics, and anyone interested in conflict and post-conflict resolution.
ISBN 978-0-8213-5481-0
SKU 15481


