Embed Size (px)
Citation preview
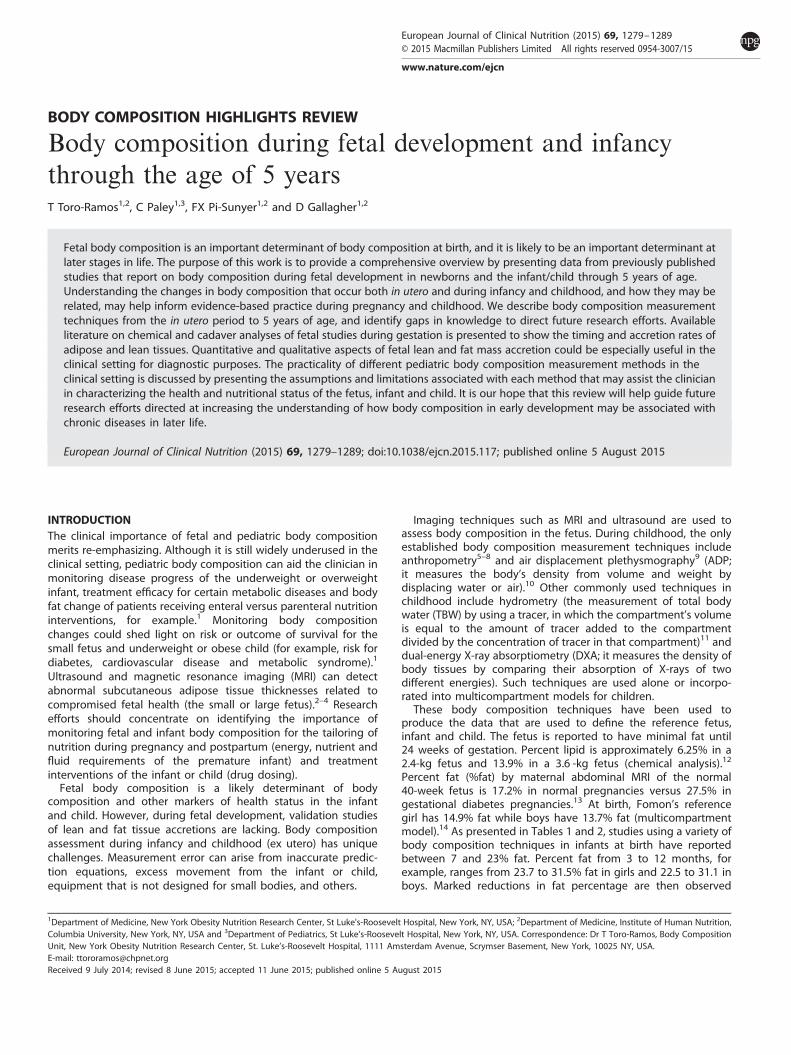
BODY COMPOSITION HIGHLIGHTS REVIEW
Body composition during fetal development and infancythrough the age of 5 yearsT Toro-Ramos1,2, C Paley1,3, FX Pi-Sunyer1,2 and D Gallagher1,2
Fetal body composition is an important determinant of body composition at birth, and it is likely to be an important determinant atlater stages in life. The purpose of this work is to provide a comprehensive overview by presenting data from previously publishedstudies that report on body composition during fetal development in newborns and the infant/child through 5 years of age.Understanding the changes in body composition that occur both in utero and during infancy and childhood, and how they may berelated, may help inform evidence-based practice during pregnancy and childhood. We describe body composition measurementtechniques from the in utero period to 5 years of age, and identify gaps in knowledge to direct future research efforts. Availableliterature on chemical and cadaver analyses of fetal studies during gestation is presented to show the timing and accretion rates ofadipose and lean tissues. Quantitative and qualitative aspects of fetal lean and fat mass accretion could be especially useful in theclinical setting for diagnostic purposes. The practicality of different pediatric body composition measurement methods in theclinical setting is discussed by presenting the assumptions and limitations associated with each method that may assist the clinicianin characterizing the health and nutritional status of the fetus, infant and child. It is our hope that this review will help guide futureresearch efforts directed at increasing the understanding of how body composition in early development may be associated withchronic diseases in later life.
European Journal of Clinical Nutrition (2015) 69, 1279–1289; doi:10.1038/ejcn.2015.117; published online 5 August 2015
INTRODUCTIONThe clinical importance of fetal and pediatric body compositionmerits re-emphasizing. Although it is still widely underused in theclinical setting, pediatric body composition can aid the clinician inmonitoring disease progress of the underweight or overweightinfant, treatment efficacy for certain metabolic diseases and bodyfat change of patients receiving enteral versus parenteral nutritioninterventions, for example.1 Monitoring body compositionchanges could shed light on risk or outcome of survival for thesmall fetus and underweight or obese child (for example, risk fordiabetes, cardiovascular disease and metabolic syndrome).1
Ultrasound and magnetic resonance imaging (MRI) can detectabnormal subcutaneous adipose tissue thicknesses related tocompromised fetal health (the small or large fetus).2–4 Researchefforts should concentrate on identifying the importance ofmonitoring fetal and infant body composition for the tailoring ofnutrition during pregnancy and postpartum (energy, nutrient andfluid requirements of the premature infant) and treatmentinterventions of the infant or child (drug dosing).Fetal body composition is a likely determinant of body
composition and other markers of health status in the infantand child. However, during fetal development, validation studiesof lean and fat tissue accretions are lacking. Body compositionassessment during infancy and childhood (ex utero) has uniquechallenges. Measurement error can arise from inaccurate predic-tion equations, excess movement from the infant or child,equipment that is not designed for small bodies, and others.
Imaging techniques such as MRI and ultrasound are used toassess body composition in the fetus. During childhood, the onlyestablished body composition measurement techniques includeanthropometry5–8 and air displacement plethysmography9 (ADP;it measures the body’s density from volume and weight bydisplacing water or air).10 Other commonly used techniques inchildhood include hydrometry (the measurement of total bodywater (TBW) by using a tracer, in which the compartment’s volumeis equal to the amount of tracer added to the compartmentdivided by the concentration of tracer in that compartment)11 anddual-energy X-ray absorptiometry (DXA; it measures the density ofbody tissues by comparing their absorption of X-rays of twodifferent energies). Such techniques are used alone or incorpo-rated into multicompartment models for children.These body composition techniques have been used to
produce the data that are used to define the reference fetus,infant and child. The fetus is reported to have minimal fat until24 weeks of gestation. Percent lipid is approximately 6.25% in a2.4-kg fetus and 13.9% in a 3.6 -kg fetus (chemical analysis).12
Percent fat (%fat) by maternal abdominal MRI of the normal40-week fetus is 17.2% in normal pregnancies versus 27.5% ingestational diabetes pregnancies.13 At birth, Fomon’s referencegirl has 14.9% fat while boys have 13.7% fat (multicompartmentmodel).14 As presented in Tables 1 and 2, studies using a variety ofbody composition techniques in infants at birth have reportedbetween 7 and 23% fat. Percent fat from 3 to 12 months, forexample, ranges from 23.7 to 31.5% fat in girls and 22.5 to 31.1 inboys. Marked reductions in fat percentage are then observed
1Department of Medicine, New York Obesity Nutrition Research Center, St Luke's-Roosevelt Hospital, New York, NY, USA; 2Department of Medicine, Institute of Human Nutrition,Columbia University, New York, NY, USA and 3Department of Pediatrics, St Luke’s-Roosevelt Hospital, New York, NY, USA. Correspondence: Dr T Toro-Ramos, Body CompositionUnit, New York Obesity Nutrition Research Center, St. Luke’s-Roosevelt Hospital, 1111 Amsterdam Avenue, Scrymser Basement, New York, 10025 NY, USA.E-mail: [email protected] 9 July 2014; revised 8 June 2015; accepted 11 June 2015; published online 5 August 2015
European Journal of Clinical Nutrition (2015) 69, 1279–1289© 2015 Macmillan Publishers Limited All rights reserved 0954-3007/15
www.nature.com/ejcn
between 2 and 5 years, where girls have approximately 21.7% fatand boys have 17.2% fat (Table 3).15 Noting that certain ethnic/racial and gender body composition characteristic differ at birth,accurate assessment of body composition during and across keyphases of development is important for intervention studies andchronic disease prevention strategies.This review presents data from previously published studies
that report on body composition during fetal development andwhat is known on body composition in newborns and the infant/child through 5 years. We also examine existing pediatric bodycomposition measurement techniques beginning during fetaldevelopment, an understudied area of body composition, to 5years of age and highlight new methods that are being developedto measure body composition. Gaps in knowledge are identifiedwith respect to where information is needed so as to direct futureresearch efforts.
SEARCH STRATEGYSeveral text books were consulted to determine the appropriateterminology to use as search keywords to ensure that theappropriate and full array of relevant studies were discovered.16–20
PubMed searches up to June 2014 using the terms ‘fetal adiposity’,‘fetal body composition’, ‘newborn adiposity’, ‘newborn bodycomposition’, ‘infant adiposity’ and ‘infant total body water’ wereconducted with limits of healthy human studies and Englishlanguage, identifying 755 articles, excluding duplicates. AdditionalPubMed searches were conducted by adding key terms forcadaver body composition, imaging (ultrasound and MRI),anthropometry, air displacement plethysmography, hydrometry,dual-energy X-ray absorptiometry, 4-compartment model and
quantitative magnetic resonance (EchoMRI Infants), with age limitsfrom the fetus to 5 years. Predictors and outcomes of bodycomposition changes of the fetus in utero and the infant/child exutero were also identified. Papers were reviewed when theyreported on changes in body composition during fetal develop-ment and after birth up to 5 years with reliable methods (highprecision or low coefficient of variation based on repeatedmeasures). Seminal papers related to the development andvalidation of assessment methods were also reviewed. The searchprocess resulted in 121 sources that were incorporated in thisreview.
BODY COMPOSITION IN THE FETUS, NEWBORN AND INFANTFetal body compositionDuring the early fetal period, TBW or the hydration of fat-free mass(FFM) is relatively high, and it decreases slowly until term. Body fatand protein accretion of the fetus are slow during the first half ofgestation (approximately weeks 1–20) and accelerate thereafteruntil term. Several published works (1923–1983) have summarizedbody composition data based on fetal cadaver analyses.12,20–23
Over the past 10 years, the first in vivo studies involving MRI-derived measures of tissue and organ masses were published.24–26
With the advent of this new technology, the characterization offetal body composition in the clinical setting with high accuracy todiagnose the lean, overfat (mid-thigh or mid arm fat mass (FM)495th percentile),27 small or large fetus and other bodycomposition-related diseases is possible. Historical body composi-tion studies of the fetus are described below.Moulton coined the term chemical maturity to explain the age
at which water, nitrogen and minerals (ash) reach constant levels
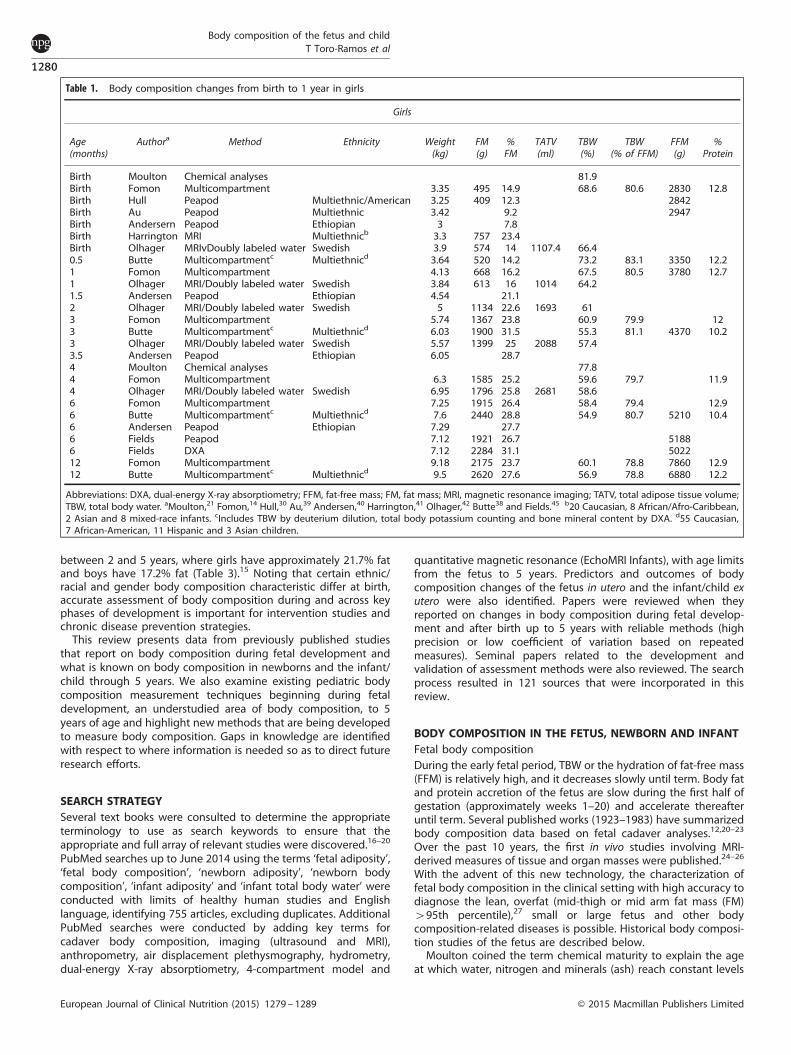
Table 1. Body composition changes from birth to 1 year in girls
Girls
Age(months)
Authora Method Ethnicity Weight(kg)
FM(g)
%FM
TATV(ml)
TBW(%)
TBW(% of FFM)
FFM(g)
%Protein
Birth Moulton Chemical analyses 81.9Birth Fomon Multicompartment 3.35 495 14.9 68.6 80.6 2830 12.8Birth Hull Peapod Multiethnic/American 3.25 409 12.3 2842Birth Au Peapod Multiethnic 3.42 9.2 2947Birth Andersern Peapod Ethiopian 3 7.8Birth Harrington MRI Multiethnicb 3.3 757 23.4Birth Olhager MRIvDoubly labeled water Swedish 3.9 574 14 1107.4 66.40.5 Butte Multicompartmentc Multiethnicd 3.64 520 14.2 73.2 83.1 3350 12.21 Fomon Multicompartment 4.13 668 16.2 67.5 80.5 3780 12.71 Olhager MRI/Doubly labeled water Swedish 3.84 613 16 1014 64.21.5 Andersen Peapod Ethiopian 4.54 21.12 Olhager MRI/Doubly labeled water Swedish 5 1134 22.6 1693 613 Fomon Multicompartment 5.74 1367 23.8 60.9 79.9 123 Butte Multicompartmentc Multiethnicd 6.03 1900 31.5 55.3 81.1 4370 10.23 Olhager MRI/Doubly labeled water Swedish 5.57 1399 25 2088 57.43.5 Andersen Peapod Ethiopian 6.05 28.74 Moulton Chemical analyses 77.84 Fomon Multicompartment 6.3 1585 25.2 59.6 79.7 11.94 Olhager MRI/Doubly labeled water Swedish 6.95 1796 25.8 2681 58.66 Fomon Multicompartment 7.25 1915 26.4 58.4 79.4 12.96 Butte Multicompartmentc Multiethnicd 7.6 2440 28.8 54.9 80.7 5210 10.46 Andersen Peapod Ethiopian 7.29 27.76 Fields Peapod 7.12 1921 26.7 51886 Fields DXA 7.12 2284 31.1 502212 Fomon Multicompartment 9.18 2175 23.7 60.1 78.8 7860 12.912 Butte Multicompartmentc Multiethnicd 9.5 2620 27.6 56.9 78.8 6880 12.2
Abbreviations: DXA, dual-energy X-ray absorptiometry; FFM, fat-free mass; FM, fat mass; MRI, magnetic resonance imaging; TATV, total adipose tissue volume;TBW, total body water. aMoulton,21 Fomon,14 Hull,30 Au,39 Andersen,40 Harrington,41 Olhager,42 Butte38 and Fields.45 b20 Caucasian, 8 African/Afro-Caribbean,2 Asian and 8 mixed-race infants. cIncludes TBW by deuterium dilution, total body potassium counting and bone mineral content by DXA. d55 Caucasian,7 African-American, 11 Hispanic and 3 Asian children.
Body composition of the fetus and childT Toro-Ramos et al
1280
European Journal of Clinical Nutrition (2015) 1279 – 1289 © 2015 Macmillan Publishers Limited

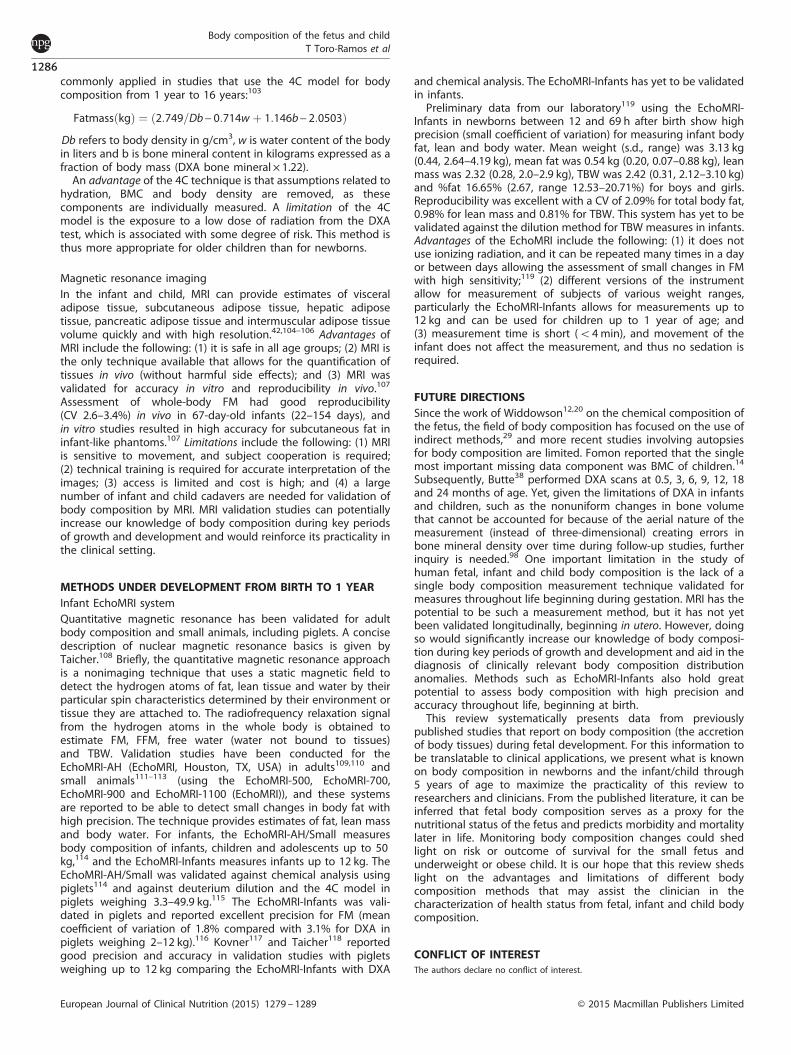
in the body, which Moulton estimated to be between 500 and1000 days of life.21 Moulton used data from chemical analyses byFehling and Michel to study the composition of the human fromgestation to adulthood, and noted that hydration of FFM rapidlydecreased after conception (from 97.34% at 35 days in utero to81.52% at term).21 Body nitrogen (0.30% nitrogen at 35 days inutero to 2.08% at term) and ash content (from 0.001 at 35 days inutero to 2.81 at term) increased21 (Figure 1). In humans, chemicaland anatomical analysis of cadavers is the only direct method tomeasure body composition and the most reliable method forvalidation of new body composition instrumentation.17 However,because of the destructive nature of the technique, chemicalanalyses are either used in vitro with tissue samples or with theanalysis of cadavers.Friis-Hansen22 reported that the hydration in early fetal life was
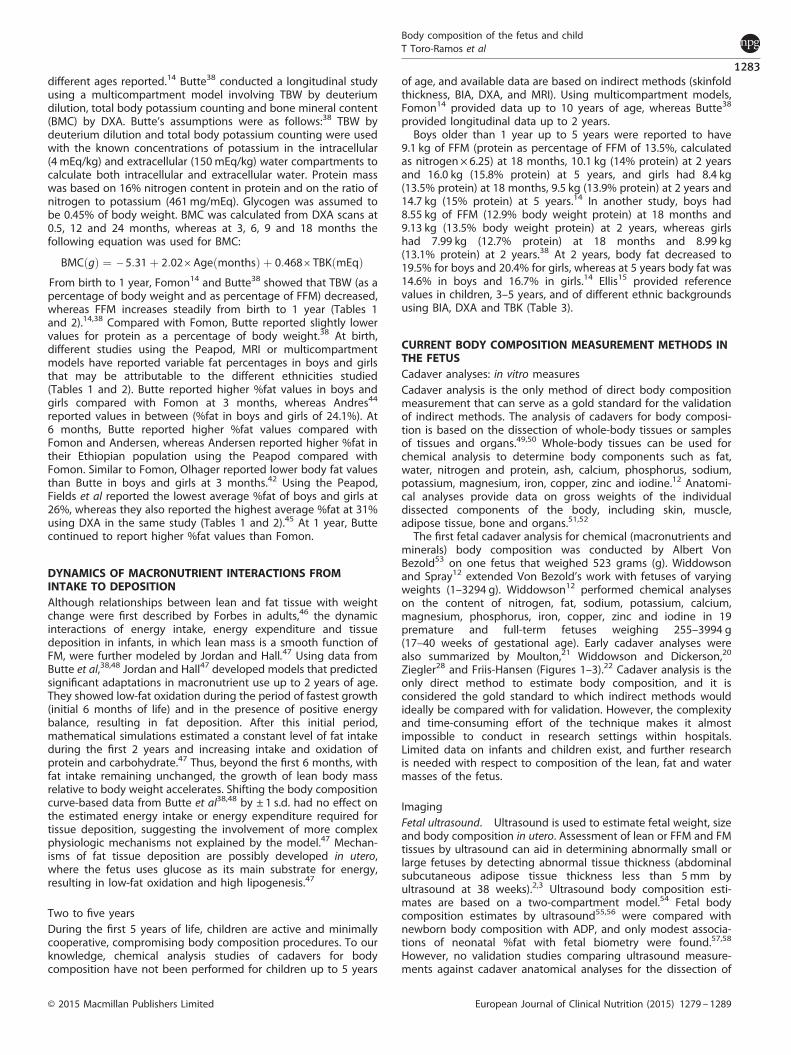
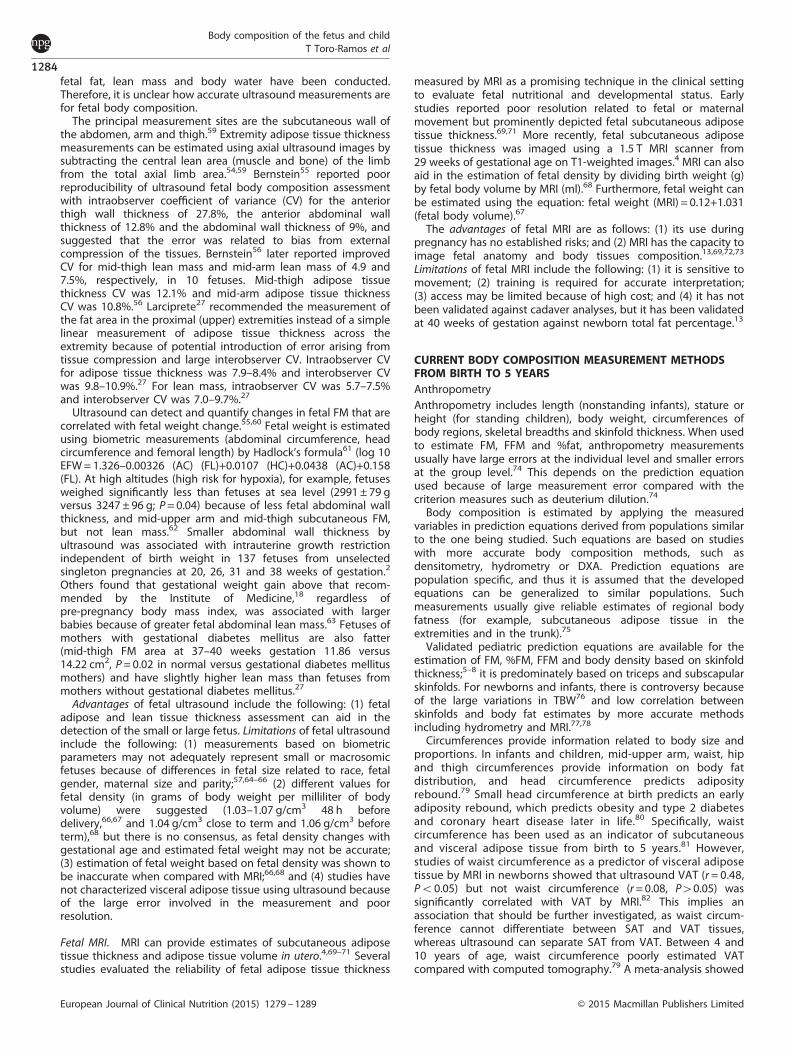
~ 92%, and Widdowson and Dickerson20 showed that it remainedabove 80% at term (shown as a function of body weight, Figure 2).Ziegler et al28 (Figure 3) reported similar values for hydration ofFFM between 93 and 83%. Deposition of body fat in the fetusbegins at around 25 weeks of gestation and continues until term.Ziegler et al28 showed the composition of gain of the referencefetus in 1-week intervals from 24 to 40 weeks. Water decreasedfrom 82.1 to 51.7%, protein increased from 10.9 g at 24 weeks to14.6 g at 40 weeks per week per 100 g gained and lipid increasedfrom 4.7 to 28.9 g per week per 100 g gained, where protein andfat have similar accretion rates (Figure 3). Ziegler et al28 furtherdescribed the composition of weight gain of the reference fetusat 4-week intervals, where protein increased at a rate of 10.8 g/dayat 24–28 weeks, 12.2 g/day at 28–32 weeks, 13.3 g/day at32–36 weeks and 13.9 g/day at 36–40 weeks. Lipid increased
at a similar rate with 7.8 g/day at 24–28 weeks, 11.4 g/day at28–32 weeks, 13.9 g/day at 32–36 weeks and 19.8 g/day at36–40 weeks.Fetal adipose tissue thickness by MRI at the trunk, lower and
upper back and above the umbilical cord ranged from 2mm at29 weeks to 4.5 mm at 39–40 weeks of gestational age.4 Adiposetissue thickness of the extremities ranged from 2mm at 29 weeksto 6 mm at 39–40 weeks of gestational age.4 Therefore, the ratio ofextremity to trunk adipose tissue thickness was close to 1:1 at29 weeks and 1.5:1 at 39–40 weeks of gestational age.4 Adiposetissue thickness between 18 and 26 weeks was visible butunquantifiable.4 These data are in agreement with fetal FMaccretion and fast rate of increase, especially after 25 weeks ofgestation.28 Adipose tissue thickness smaller than 5mm, indicativeof a small fetus by ultrasound, may be because of higherresolution by MRI.4 Using MRI at 40 weeks of gestation, Deans13
estimated that fetal %fat was 17.15 ± 3.83% (range 11.8–25%) foran average birth weight of 3.48 kg (range 2.94–4.30 kg).
The newbornRapid changes in body composition occur soon after birth.29
During the initial 24-h period, a newborn loses weight. Hull30
reported that the mean weights at 25–48 h and at 48–72 h afterbirth did not differ but were significantly less than the meanweight at o24 h (Po0.0001). Others have reported a weight lossof 5–10% in the neonate during the first week after birth.16 Thisweight loss is attributed to a loss in body water but not FM.The loss of water during the first days of life is an adaptation to
the extrauterine environment in which the newborn’s skin is stillmaturing (keratinizing),19 and there is contraction of the
Table 2. Body composition changes from birth to 1 year in boys
Boys
Age(months)
Authora Method Ethnicity Weight(kg)
FM(g)
%FM
TATV(ml)
TBW(%)
TBW (% ofFFM)
FFM(g)
%Protein
Birth Moulton Chemical analyses 81.9Birth Fomon Multicompartment 3.5 468 13.7 69.6 80.6 3059 12.9Birth Hull Peapod Multiethnic/American 3.25 409 12.3 2842Birth Au Peapod Multiethnic 3.42 9.2 2947Birth Andersern Peapod Ethiopian 3.11 7.3Birth Harrington MRI Multiethnicb 3.3 757 23.4Birth Olhager MRI/Doubly labeled water Swedish 3.8 495 12.8 961 69.90.5 Butte Multicompartmentc Multiethnicd 3.76 440 11.4 73.9 82.7 3350 12.51 Fomon Multicompartment 4.45 671 15.1 68.4 80.5 3780 12.91 Olhager MRI/Doubly labeled water Swedish 4.16 718 17 1114 66.61.5 Andersen Peapod Ethiopian 4.78 21.61.5 Olhager MRI/Doubly labeled water Swedish 5.2 1122 21.5 1675 62.62 Olhager MRI//Doubly labeled water Swedish 5.54 1320 23.8 1971 61.13 Fomon Multicompartment 6.44 1495 23.2 61.4 80 123 Butte Multicompartmentc Multiethnicd 6.33 1910 30.2 56.5 81 4370 10.63 Olhager MRI/Doubly labeled water Swedish 6.45 1582 24.3 2362 593.5 Andersen Peapod Ethiopian 6.3 26.74 Moulton Chemical analyses 77.84 Fomon Multicompartment 7.06 1743 24.7 60.1 79.9 11.94 Olhager MRI/Doubly labeled water Swedish 6.74 1659 24 2476 57.26 Fomon Multicompartment 8.03 2037 25.4 59.4 79.6 126 Butte Multicompartmentc Multiethnicd 8.04 2320 29.1 57.2 80.7 5630 10.96 Andersen Peapod Ethiopian 7.52 266 Fields Peapod 7.12 1921 26.7 51886 Fields DXA 7.12 2284 31.1 502212 Fomon Multicompartment 10.15 2287 22.5 61.2 79 7860 12.912 Butte Multicompartmentc Multiethnicd 10.03 2560 25.6 59 79.3 7400 12.3
Abbreviations: DXA, dual-energy X-ray absorptiometry; FFM, fat-free mass; FM, fat mass; MRI, magnetic resonance imaging; TATV, total adipose tissue volume; TBW,total body water. aMoulton,21 Fomon,14 Hull,30 Au,39 Andersen,40 Harrington,41 Olhager,42 Butte38 and Fields.45 b20 Caucasian, 8 African/Afro-Caribbean, 2 Asian and 8mixed-race infants. cIncludes TBW by deuterium dilution, total body potassium counting and bone mineral content by DXA. d55 Caucasian, 7 African-American, 11Hispanic and 3 Asian children.
Body composition of the fetus and childT Toro-Ramos et al
1281
© 2015 Macmillan Publishers Limited European Journal of Clinical Nutrition (2015) 1279 – 1289
extracellular water compartment soon after birth controlled byatrial natriuretic peptide and antidiuretic hormone.31,32 Suchmechanisms of water equilibrium in the body have beendescribed elsewhere.16 From over 100 years of cadaver studies,it is known that the newborn has higher TBW relative to bodyweight, which equates to a higher hydration of FFM than an olderchild at 1 year. Moulton21 noted that hydration of FFM rapidlydecreased after birth (Tables 1 and 2). Comparisons of TBW andhydration of FFM can be found in Tables 1 and 2 for girls and boys,respectively.Fomon14 described the body composition of the reference
newborn using data and assumptions based on previous studies,specifically Widdowson33 (calcium, fat and protein (nitrogen×6.25)), Brozek34 (osseous minerals as Ca/0.34), McGowan35
(assumed that the ratio of fat to body weight was the same astruncal skinfold thickness to body weight), Yssing and Friis-Hansen36 (TBW by deuterium dilution) and Burmeister37 (extra-cellular water). Carbohydrate was assumed to be 0.6% of FFM toestimate body composition of boys and girls during the newbornperiod and infancy. At birth, Fomon14 assumed that boys weighedon average 3.5 kg, whereas girls weighed 3.35 kg. Interpolationbased on three ages (birth, 6 months and 9 years for boys and 10years for girls) was done to obtain values for other ages.14
Tables 1 and 2 also summarize FM and FFM values fromFomon,14 Butte,38 Hull30 (PeaPod, multiethnic), Au39 (Peapod,
multiethnic), Andersen40 (Peapod, Ethiopian), Harrington41 (MRI)and Olhager (MRI).42 Harrington41 showed that newborns havelittle intra-abdominal adipose tissue (10 g, s.d. 0.11 g), with mostbody fat being subcutaneous (693 (295) g or 21.44 (3.81) %))(Supplementary Figure 1). Using MRI, others43 showed thatsubcutaneous body fat is predominant at birth and intra-abdominal adipose tissue is scarce. However, significant ethnicdifferences were apparent in adipose tissue distribution, indicatingthat abdominal obesity propensity may be detectable at birth(Supplementary Figure 2).43 At 2 weeks, Butte reported values of440 g or 11.4% for FM in boys and 520 g or 14.2% body fat forgirls.38 Recently, Andres44 reported %fat values, estimated usingthe Peapod, of 11.9 (4.6) % for White and African-Americanhealthy breastfed boys and girls at 2 weeks after birth in theUnited States. Early-life reference body composition data areimportant in the diagnosis of the underfat or overfat infant andthe effectiveness of obesity prevention efforts.
The first-year periodThe most comprehensive works describing the body compositionof the reference infant have been by Fomon14 and Butte.38
A limitation of Fomon’s reference infant is that his results werebased on data from different published reports and made manyassumptions and extrapolations (as described above) for the
Figure 1. *Moulton:21 Effect of age on the composition of man.♢ ( ) Hydration of fat-free mass (%)=− 0.05 ×Age (days) + 96.31,R2= 0.91 (SEE= 1.63%); ● ( ), Ash (%)= 0.009 ×Age (days) + 0.55,R2= 0.81 (SEE= 0.443%); ( ), Nitrogen (%)= 0.007 ×Age(days)+0.25, R2= 0.97 (SEE= 1.123%).
Figure 2. *Widdowson and Dickerson:20 Chemical composition ofhuman fetuses and full-term babies. --- Hydration of fat free mass(g per kg of body weight); ▬ Hydration of body weight (g/kg ofbody weight); ◻Fat mass (g/kg of body weight); …Nitrogen (g/kg ofbody weight), an index of protein.
0
2
4
6
8
10
12
14
70
80
90
0 5 10 15 20 25 30 35 40
Prot
ein
and
lipid
con
tent
of w
eigh
t, %
Hyd
ratio
n of
bod
y w
eigh
t, %
Gestational age (weeks)
83
84
85
86
87
88
89
0 1000 2000 3000 4000
Hyd
ratio
n of
fat f
ree
mas
s, %
Weight (g)
Figure 3. *Ziegler:28 Body composition of the reference fetus, ◾,Hydration of fat-free mass (%, g/100 g FFM); ♦, Hydration of bodyweight (%, g/100 g of body weight); ▴, Protein content ofbody weight (%, g/100 g of body weight); ○, Lipid (%, g/100 g ofbody weight).
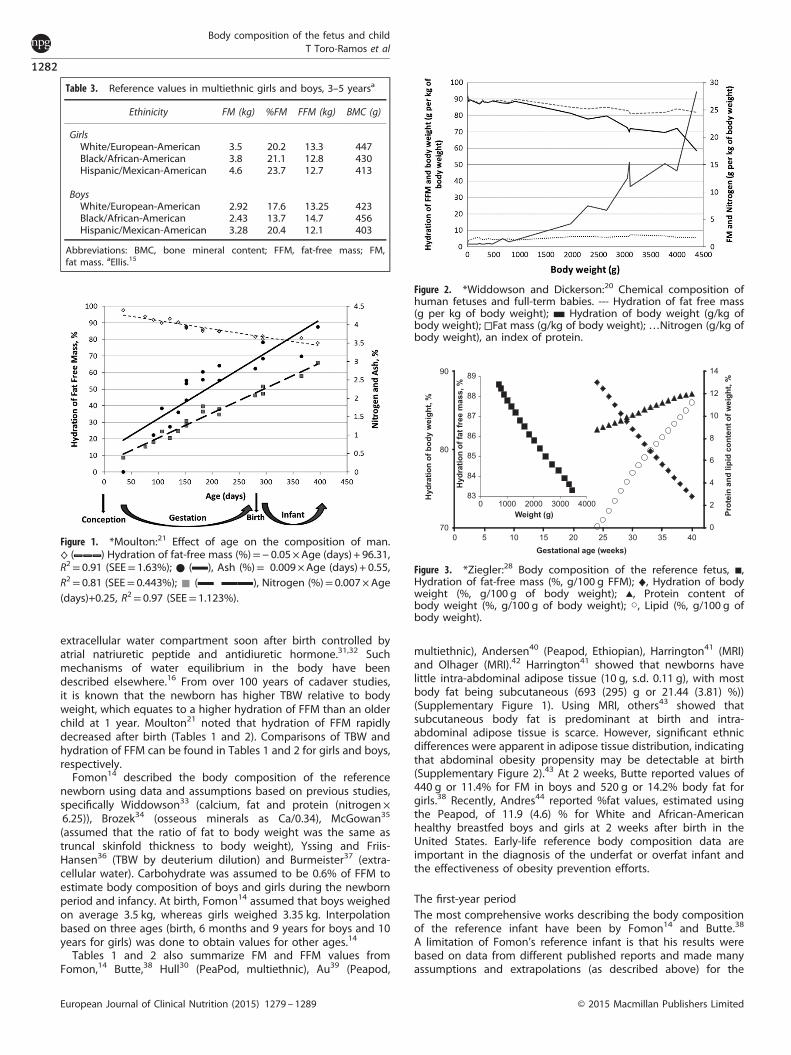
Table 3. Reference values in multiethnic girls and boys, 3–5 yearsa
Ethinicity FM (kg) %FM FFM (kg) BMC (g)
GirlsWhite/European-American 3.5 20.2 13.3 447Black/African-American 3.8 21.1 12.8 430Hispanic/Mexican-American 4.6 23.7 12.7 413
BoysWhite/European-American 2.92 17.6 13.25 423Black/African-American 2.43 13.7 14.7 456Hispanic/Mexican-American 3.28 20.4 12.1 403
Abbreviations: BMC, bone mineral content; FFM, fat-free mass; FM,fat mass. aEllis.15
Body composition of the fetus and childT Toro-Ramos et al
1282
European Journal of Clinical Nutrition (2015) 1279 – 1289 © 2015 Macmillan Publishers Limited
different ages reported.14 Butte38 conducted a longitudinal studyusing a multicompartment model involving TBW by deuteriumdilution, total body potassium counting and bone mineral content(BMC) by DXA. Butte’s assumptions were as follows:38 TBW bydeuterium dilution and total body potassium counting were usedwith the known concentrations of potassium in the intracellular(4 mEq/kg) and extracellular (150 mEq/kg) water compartments tocalculate both intracellular and extracellular water. Protein masswas based on 16% nitrogen content in protein and on the ratio ofnitrogen to potassium (461mg/mEq). Glycogen was assumed tobe 0.45% of body weight. BMC was calculated from DXA scans at0.5, 12 and 24 months, whereas at 3, 6, 9 and 18 months thefollowing equation was used for BMC:
BMCðgÞ ¼ - 5:31þ 2:02 ´AgeðmonthsÞ þ 0:468 ´ TBKðmEqÞFrom birth to 1 year, Fomon14 and Butte38 showed that TBW (as apercentage of body weight and as percentage of FFM) decreased,whereas FFM increases steadily from birth to 1 year (Tables 1and 2).14,38 Compared with Fomon, Butte reported slightly lowervalues for protein as a percentage of body weight.38 At birth,different studies using the Peapod, MRI or multicompartmentmodels have reported variable fat percentages in boys and girlsthat may be attributable to the different ethnicities studied(Tables 1 and 2). Butte reported higher %fat values in boys andgirls compared with Fomon at 3 months, whereas Andres44
reported values in between (%fat in boys and girls of 24.1%). At6 months, Butte reported higher %fat values compared withFomon and Andersen, whereas Andersen reported higher %fat intheir Ethiopian population using the Peapod compared withFomon. Similar to Fomon, Olhager reported lower body fat valuesthan Butte in boys and girls at 3 months.42 Using the Peapod,Fields et al reported the lowest average %fat of boys and girls at26%, whereas they also reported the highest average %fat at 31%using DXA in the same study (Tables 1 and 2).45 At 1 year, Buttecontinued to report higher %fat values than Fomon.
DYNAMICS OF MACRONUTRIENT INTERACTIONS FROMINTAKE TO DEPOSITIONAlthough relationships between lean and fat tissue with weightchange were first described by Forbes in adults,46 the dynamicinteractions of energy intake, energy expenditure and tissuedeposition in infants, in which lean mass is a smooth function ofFM, were further modeled by Jordan and Hall.47 Using data fromButte et al,38,48 Jordan and Hall47 developed models that predictedsignificant adaptations in macronutrient use up to 2 years of age.They showed low-fat oxidation during the period of fastest growth(initial 6 months of life) and in the presence of positive energybalance, resulting in fat deposition. After this initial period,mathematical simulations estimated a constant level of fat intakeduring the first 2 years and increasing intake and oxidation ofprotein and carbohydrate.47 Thus, beyond the first 6 months, withfat intake remaining unchanged, the growth of lean body massrelative to body weight accelerates. Shifting the body compositioncurve-based data from Butte et al38,48 by ± 1 s.d. had no effect onthe estimated energy intake or energy expenditure required fortissue deposition, suggesting the involvement of more complexphysiologic mechanisms not explained by the model.47 Mechan-isms of fat tissue deposition are possibly developed in utero,where the fetus uses glucose as its main substrate for energy,resulting in low-fat oxidation and high lipogenesis.47
Two to five yearsDuring the first 5 years of life, children are active and minimallycooperative, compromising body composition procedures. To ourknowledge, chemical analysis studies of cadavers for bodycomposition have not been performed for children up to 5 years
of age, and available data are based on indirect methods (skinfoldthickness, BIA, DXA, and MRI). Using multicompartment models,Fomon14 provided data up to 10 years of age, whereas Butte38
provided longitudinal data up to 2 years.Boys older than 1 year up to 5 years were reported to have
9.1 kg of FFM (protein as percentage of FFM of 13.5%, calculatedas nitrogen× 6.25) at 18 months, 10.1 kg (14% protein) at 2 yearsand 16.0 kg (15.8% protein) at 5 years, and girls had 8.4 kg(13.5% protein) at 18 months, 9.5 kg (13.9% protein) at 2 years and14.7 kg (15% protein) at 5 years.14 In another study, boys had8.55 kg of FFM (12.9% body weight protein) at 18 months and9.13 kg (13.5% body weight protein) at 2 years, whereas girlshad 7.99 kg (12.7% protein) at 18 months and 8.99 kg(13.1% protein) at 2 years.38 At 2 years, body fat decreased to19.5% for boys and 20.4% for girls, whereas at 5 years body fat was14.6% in boys and 16.7% in girls.14 Ellis15 provided referencevalues in children, 3–5 years, and of different ethnic backgroundsusing BIA, DXA and TBK (Table 3).
CURRENT BODY COMPOSITION MEASUREMENT METHODS INTHE FETUSCadaver analyses: in vitro measuresCadaver analysis is the only method of direct body compositionmeasurement that can serve as a gold standard for the validationof indirect methods. The analysis of cadavers for body composi-tion is based on the dissection of whole-body tissues or samplesof tissues and organs.49,50 Whole-body tissues can be used forchemical analysis to determine body components such as fat,water, nitrogen and protein, ash, calcium, phosphorus, sodium,potassium, magnesium, iron, copper, zinc and iodine.12 Anatomi-cal analyses provide data on gross weights of the individualdissected components of the body, including skin, muscle,adipose tissue, bone and organs.51,52
The first fetal cadaver analysis for chemical (macronutrients andminerals) body composition was conducted by Albert VonBezold53 on one fetus that weighed 523 grams (g). Widdowsonand Spray12 extended Von Bezold’s work with fetuses of varyingweights (1–3294 g). Widdowson12 performed chemical analyseson the content of nitrogen, fat, sodium, potassium, calcium,magnesium, phosphorus, iron, copper, zinc and iodine in 19premature and full-term fetuses weighing 255–3994 g(17–40 weeks of gestational age). Early cadaver analyses werealso summarized by Moulton,21 Widdowson and Dickerson,20
Ziegler28 and Friis-Hansen (Figures 1–3).22 Cadaver analysis is theonly direct method to estimate body composition, and it isconsidered the gold standard to which indirect methods wouldideally be compared with for validation. However, the complexityand time-consuming effort of the technique makes it almostimpossible to conduct in research settings within hospitals.Limited data on infants and children exist, and further researchis needed with respect to composition of the lean, fat and watermasses of the fetus.
ImagingFetal ultrasound. Ultrasound is used to estimate fetal weight, sizeand body composition in utero. Assessment of lean or FFM and FMtissues by ultrasound can aid in determining abnormally small orlarge fetuses by detecting abnormal tissue thickness (abdominalsubcutaneous adipose tissue thickness less than 5mm byultrasound at 38 weeks).2,3 Ultrasound body composition esti-mates are based on a two-compartment model.54 Fetal bodycomposition estimates by ultrasound55,56 were compared withnewborn body composition with ADP, and only modest associa-tions of neonatal %fat with fetal biometry were found.57,58
However, no validation studies comparing ultrasound measure-ments against cadaver anatomical analyses for the dissection of
Body composition of the fetus and childT Toro-Ramos et al
1283
© 2015 Macmillan Publishers Limited European Journal of Clinical Nutrition (2015) 1279 – 1289
fetal fat, lean mass and body water have been conducted.Therefore, it is unclear how accurate ultrasound measurements arefor fetal body composition.The principal measurement sites are the subcutaneous wall of
the abdomen, arm and thigh.59 Extremity adipose tissue thicknessmeasurements can be estimated using axial ultrasound images bysubtracting the central lean area (muscle and bone) of the limbfrom the total axial limb area.54,59 Bernstein55 reported poorreproducibility of ultrasound fetal body composition assessmentwith intraobserver coefficient of variance (CV) for the anteriorthigh wall thickness of 27.8%, the anterior abdominal wallthickness of 12.8% and the abdominal wall thickness of 9%, andsuggested that the error was related to bias from externalcompression of the tissues. Bernstein56 later reported improvedCV for mid-thigh lean mass and mid-arm lean mass of 4.9 and7.5%, respectively, in 10 fetuses. Mid-thigh adipose tissuethickness CV was 12.1% and mid-arm adipose tissue thicknessCV was 10.8%.56 Larciprete27 recommended the measurement ofthe fat area in the proximal (upper) extremities instead of a simplelinear measurement of adipose tissue thickness across theextremity because of potential introduction of error arising fromtissue compression and large interobserver CV. Intraobserver CVfor adipose tissue thickness was 7.9–8.4% and interobserver CVwas 9.8–10.9%.27 For lean mass, intraobserver CV was 5.7–7.5%and interobserver CV was 7.0–9.7%.27
Ultrasound can detect and quantify changes in fetal FM that arecorrelated with fetal weight change.55,60 Fetal weight is estimatedusing biometric measurements (abdominal circumference, headcircumference and femoral length) by Hadlock’s formula61 (log 10EFW=1.326–0.00326 (AC) (FL)+0.0107 (HC)+0.0438 (AC)+0.158(FL). At high altitudes (high risk for hypoxia), for example, fetusesweighed significantly less than fetuses at sea level (2991 ± 79 gversus 3247 ± 96 g; P= 0.04) because of less fetal abdominal wallthickness, and mid-upper arm and mid-thigh subcutaneous FM,but not lean mass.62 Smaller abdominal wall thickness byultrasound was associated with intrauterine growth restrictionindependent of birth weight in 137 fetuses from unselectedsingleton pregnancies at 20, 26, 31 and 38 weeks of gestation.2
Others found that gestational weight gain above that recom-mended by the Institute of Medicine,18 regardless ofpre-pregnancy body mass index, was associated with largerbabies because of greater fetal abdominal lean mass.63 Fetuses ofmothers with gestational diabetes mellitus are also fatter(mid-thigh FM area at 37–40 weeks gestation 11.86 versus14.22 cm2, P= 0.02 in normal versus gestational diabetes mellitusmothers) and have slightly higher lean mass than fetuses frommothers without gestational diabetes mellitus.27
Advantages of fetal ultrasound include the following: (1) fetaladipose and lean tissue thickness assessment can aid in thedetection of the small or large fetus. Limitations of fetal ultrasoundinclude the following: (1) measurements based on biometricparameters may not adequately represent small or macrosomicfetuses because of differences in fetal size related to race, fetalgender, maternal size and parity;57,64–66 (2) different values forfetal density (in grams of body weight per milliliter of bodyvolume) were suggested (1.03–1.07 g/cm3 48 h beforedelivery,66,67 and 1.04 g/cm3 close to term and 1.06 g/cm3 beforeterm),68 but there is no consensus, as fetal density changes withgestational age and estimated fetal weight may not be accurate;(3) estimation of fetal weight based on fetal density was shown tobe inaccurate when compared with MRI;66,68 and (4) studies havenot characterized visceral adipose tissue using ultrasound becauseof the large error involved in the measurement and poorresolution.
Fetal MRI. MRI can provide estimates of subcutaneous adiposetissue thickness and adipose tissue volume in utero.4,69–71 Severalstudies evaluated the reliability of fetal adipose tissue thickness
measured by MRI as a promising technique in the clinical settingto evaluate fetal nutritional and developmental status. Earlystudies reported poor resolution related to fetal or maternalmovement but prominently depicted fetal subcutaneous adiposetissue thickness.69,71 More recently, fetal subcutaneous adiposetissue thickness was imaged using a 1.5 T MRI scanner from29 weeks of gestational age on T1-weighted images.4 MRI can alsoaid in the estimation of fetal density by dividing birth weight (g)by fetal body volume by MRI (ml).68 Furthermore, fetal weight canbe estimated using the equation: fetal weight (MRI) = 0.12+1.031(fetal body volume).67
The advantages of fetal MRI are as follows: (1) its use duringpregnancy has no established risks; and (2) MRI has the capacity toimage fetal anatomy and body tissues composition.13,69,72,73
Limitations of fetal MRI include the following: (1) it is sensitive tomovement; (2) training is required for accurate interpretation;(3) access may be limited because of high cost; and (4) it has notbeen validated against cadaver analyses, but it has been validatedat 40 weeks of gestation against newborn total fat percentage.13
CURRENT BODY COMPOSITION MEASUREMENT METHODSFROM BIRTH TO 5 YEARSAnthropometryAnthropometry includes length (nonstanding infants), stature orheight (for standing children), body weight, circumferences ofbody regions, skeletal breadths and skinfold thickness. When usedto estimate FM, FFM and %fat, anthropometry measurementsusually have large errors at the individual level and smaller errorsat the group level.74 This depends on the prediction equationused because of large measurement error compared with thecriterion measures such as deuterium dilution.74
Body composition is estimated by applying the measuredvariables in prediction equations derived from populations similarto the one being studied. Such equations are based on studieswith more accurate body composition methods, such asdensitometry, hydrometry or DXA. Prediction equations arepopulation specific, and thus it is assumed that the developedequations can be generalized to similar populations. Suchmeasurements usually give reliable estimates of regional bodyfatness (for example, subcutaneous adipose tissue in theextremities and in the trunk).75
Validated pediatric prediction equations are available for theestimation of FM, %FM, FFM and body density based on skinfoldthickness;5–8 it is predominately based on triceps and subscapularskinfolds. For newborns and infants, there is controversy becauseof the large variations in TBW76 and low correlation betweenskinfolds and body fat estimates by more accurate methodsincluding hydrometry and MRI.77,78
Circumferences provide information related to body size andproportions. In infants and children, mid-upper arm, waist, hipand thigh circumferences provide information on body fatdistribution, and head circumference predicts adiposityrebound.79 Small head circumference at birth predicts an earlyadiposity rebound, which predicts obesity and type 2 diabetesand coronary heart disease later in life.80 Specifically, waistcircumference has been used as an indicator of subcutaneousand visceral adipose tissue from birth to 5 years.81 However,studies of waist circumference as a predictor of visceral adiposetissue by MRI in newborns showed that ultrasound VAT (r = 0.48,Po0.05) but not waist circumference (r= 0.08, P40.05) wassignificantly correlated with VAT by MRI.82 This implies anassociation that should be further investigated, as waist circum-ference cannot differentiate between SAT and VAT tissues,whereas ultrasound can separate SAT from VAT. Between 4 and10 years of age, waist circumference poorly estimated VATcompared with computed tomography.79 A meta-analysis showed
Body composition of the fetus and childT Toro-Ramos et al
1284
European Journal of Clinical Nutrition (2015) 1279 – 1289 © 2015 Macmillan Publishers Limited

that waist circumference accounted for 64.8% of the variance invisceral adipose tissue in children.83 Circumference measurementsalone have a low sensitivity at early ages.82
Advantages of anthropometry include the following: (1) it canbe applied in settings requiring little and inexpensive equipment.Limitations of anthropometry include the following: (1) trainingmust be conducted by a trained technician to achieve highprecision (low intraobserver variability);84,85 and (2) one challengeof the technique for use in pediatric populations is that newborns(0–1 month), infants (aged 1–12 months) and children arerequired to be calm and cooperative—otherwise, error may resultfrom movement of a hungry, thirsty or fussy child.
Air displacement plethysmographyADP is a densitometric technique that relies on the use of Boyle’sand Poison’s gas laws to estimate body volume by displacing airinside an enclosed chamber. It is considered an accurate methodfor body composition assessment based on a two-compartmentmodel.17,34 The PeaPod (Cosmed) uses the ADP approach forinfants up to 8 kg, which calculates %FM using age- and sex-specific density constants.9,38 It was recently validated againstdeuterium dilution in preterm infants, showing a nonsignificantmean difference of 0.32% fat between the two methods.86 Unlikethe BodPod, in which thoracic gas volume is estimated by puffingair through a tube tightly inserted in the mouth, in infants residualthoracic volume is estimated, as a direct measurement would beinvasive.9
A pediatric adapter (a type of seat) for children aged 2–6 yearsand weighing larger than 8 kg inserted into the BodPod (adultversion of the PeaPod, Cosmed) was developed in an attempt toallow for longitudinal measures from childhood by the sametechnology.87 Compared with the 4C model (3.5% CV for %fat),87
with or without the adapter, the BodPod was shown to beinaccurate for use in infants and children less than 7 years becauseof compliance issues that include movements, talking and cryingduring the test.87 At this time, infants weighing48 kg (~6 months)and less than 2 years of age cannot be measured by ADP.87
Advantages of the PeaPod include the following: (1) It is a non-invasive quick and safe method, and it does not require sedation.Limitations of the PeaPod include the following: (1) an upperweight limit of 8 kg (approximately 6 months of age), and theassumptions underlying estimates;17 and (2) age- and sex-specificdensity of FFM constants applied may not be appropriate for allinfants because of the rapid changes in body water in the earlyweeks of life and in some disease states with abnormalbody water.
HydrometryHydrometry, as the name suggests, estimates TBW. Naturallyoccurring isotopes (2H or 18O) in the body are measured bysampling blood, saliva or urine samples before dosing, andthen an oral dose of labeled water 2H2O or H2
18O is administered,and a final blood, urine or saliva sample is acquired to measurethe amount distributed in body fluids. Hydrometry functionsunder the assumption that 'the volume of the compartmentis equal to the amount of tracer added to the compartmentdivided by the concentration of the tracer in that compartment'.11,88 The dilution space (N in g) is calculated as N = (WA/a)(Sa − St)f/(Ss–Sp); W is the mass of water used to dilute the dose, A is thedose given to the subject, a is the mass of dose in the prepareddilute dose, f is the fractionation factor for the physiologicalsample relative to body water, Sa is the measured value forthe diluted dose, St the value for tap water in the dilution, Ss thevalue for the post-dose sample and Sp is the value for thepredose sample. 88 This approach assumes the following: (1) thatthe tracer distributes only in the body’s water pool and that thedistribution is equal throughout the body’s water pool, (2) rapid
equilibration and (3) that the tracer is not metabolized duringequilibration.88
The main advantage of this technique is its high accuracy andprecision (1–2% CV).89,90 Limitations of this technique for infantmeasurement include the following: (1) attention to detail isnecessary to avoid estimation errors due to spillage whenadministering the dose and the difficulties obtaining sufficientinfant saliva or urine samples; (2) the assumptions may not bevalid for infants who need to be fed during the equilibrationperiod, where TBW is constantly changing; (3) because of ongoingand rapid changes in the hydration of FFM in the newborn period,the use of hydration constants to estimate body composition in a2-compartment model may introduce error at the individuallevel.88,91
Dual-energy X-ray absorptiometryDXA uses an X-ray tube with a filter that divides an X-ray beaminto peaks of low and high densities.92 The tissues can bedifferentiated by the attenuation capacity according to theirradiographic density.92
Attempts to validate DXA for pediatric populations have beenmade using piglet carcass analysis. Moderate CV values for BMC(mean 2.3%, range 0.6–4.3 for small piglets, and mean 1.5%, range0.1–3.4% for large piglets) and FM (small piglets mean 6.3%, range2.8–12.2%, large piglets mean 3.3%, range 0.9–5.7%) werefound.93 Others found that, compared with carcass analysis,DXA significantly overestimated bone mineral density andlean mass and underestimated FM (CV 13.5%) in 12-week-oldpiglets, and these differences were attributed to an increasedhydration of FFM.94 However, Testolin95 reported that, basedon theoretical calculations, by modeling reference bodycomposition values from birth to 10 years, small clinicallyirrelevant %fat errors of up to 0.8% would arise when adultconstants for lean soft tissue were used for pediatric popula-tions. Koo96 found significant deficiencies in the DXA measure-ment of bone mineral mass and lean and fat tissues usingthe piglet model and the manufacturer’s software for infantsand children. Compared with ADP, %fat and FM were over-estimated by DXA, whereas FFM was underestimated.45
Fields and Goran97 found significant discrepancies betweenDXA and the 4C model in children (mean age 11.4 ± 1.4 years)and reported that the assessment of FM can be improvedif a correction factor is used (Fat mass = (0.78 × DXA lean)+(0.16 × body wt)+0.34 kg).Some advantages of this technique are as follows: (1) DXA is
fast and precise; (2) DXA separates bone from the remainingFFM tissues, therefore providing estimates for three compo-nents: fat, bone and bone-free lean mass; (3) DXA providescomponent estimates for the whole body and regions (arms,legs and trunk). Some limitations of DXA are as follows:(1) subjects are exposed to radiation (1–5 μSv)98 where withoutpediatric programing, the effective dose can be up to threetimes higher than for adults;99 (2) in pediatric populations, thechanges in bone structure (cartilage, ossification and formationof articular cartilage) due to growth can introduce error in theinterpretation of DXA results;100 and (3) the increased andchanging hydration of FFM in infants may lead to inaccurate fatand lean mass estimates.95
Four-compartment modelThe most commonly used four components of a 4C model includeTBW by a dilution method, total body BMC by DXA, body weightand body volume (converted to body density) by ADP orhydrostatic weighing. The 4C model is considered as close to agold standard for body composition assessment as is possibletoday,75 and it has been used in studies of infants/children asyoung as 8 years.101 The following equation by Lohman102 is
Body composition of the fetus and childT Toro-Ramos et al
1285
© 2015 Macmillan Publishers Limited European Journal of Clinical Nutrition (2015) 1279 – 1289
commonly applied in studies that use the 4C model for bodycomposition from 1 year to 16 years:103
Fatmass kgð Þ ¼ 2:749=Db - 0:714w þ 1:146b - 2:0503ð ÞDb refers to body density in g/cm3, w is water content of the bodyin liters and b is bone mineral content in kilograms expressed as afraction of body mass (DXA bone mineral × 1.22).An advantage of the 4C technique is that assumptions related to
hydration, BMC and body density are removed, as thesecomponents are individually measured. A limitation of the 4Cmodel is the exposure to a low dose of radiation from the DXAtest, which is associated with some degree of risk. This method isthus more appropriate for older children than for newborns.
Magnetic resonance imagingIn the infant and child, MRI can provide estimates of visceraladipose tissue, subcutaneous adipose tissue, hepatic adiposetissue, pancreatic adipose tissue and intermuscular adipose tissuevolume quickly and with high resolution.42,104–106 Advantages ofMRI include the following: (1) it is safe in all age groups; (2) MRI isthe only technique available that allows for the quantification oftissues in vivo (without harmful side effects); and (3) MRI wasvalidated for accuracy in vitro and reproducibility in vivo.107
Assessment of whole-body FM had good reproducibility(CV 2.6–3.4%) in vivo in 67-day-old infants (22–154 days), andin vitro studies resulted in high accuracy for subcutaneous fat ininfant-like phantoms.107 Limitations include the following: (1) MRIis sensitive to movement, and subject cooperation is required;(2) technical training is required for accurate interpretation of theimages; (3) access is limited and cost is high; and (4) a largenumber of infant and child cadavers are needed for validation ofbody composition by MRI. MRI validation studies can potentiallyincrease our knowledge of body composition during key periodsof growth and development and would reinforce its practicality inthe clinical setting.
METHODS UNDER DEVELOPMENT FROM BIRTH TO 1 YEARInfant EchoMRI systemQuantitative magnetic resonance has been validated for adultbody composition and small animals, including piglets. A concisedescription of nuclear magnetic resonance basics is given byTaicher.108 Briefly, the quantitative magnetic resonance approachis a nonimaging technique that uses a static magnetic field todetect the hydrogen atoms of fat, lean tissue and water by theirparticular spin characteristics determined by their environment ortissue they are attached to. The radiofrequency relaxation signalfrom the hydrogen atoms in the whole body is obtained toestimate FM, FFM, free water (water not bound to tissues)and TBW. Validation studies have been conducted for theEchoMRI-AH (EchoMRI, Houston, TX, USA) in adults109,110 andsmall animals111–113 (using the EchoMRI-500, EchoMRI-700,EchoMRI-900 and EchoMRI-1100 (EchoMRI)), and these systemsare reported to be able to detect small changes in body fat withhigh precision. The technique provides estimates of fat, lean massand body water. For infants, the EchoMRI-AH/Small measuresbody composition of infants, children and adolescents up to 50kg,114 and the EchoMRI-Infants measures infants up to 12 kg. TheEchoMRI-AH/Small was validated against chemical analysis usingpiglets114 and against deuterium dilution and the 4C model inpiglets weighing 3.3–49.9 kg.115 The EchoMRI-Infants was vali-dated in piglets and reported excellent precision for FM (meancoefficient of variation of 1.8% compared with 3.1% for DXA inpiglets weighing 2–12 kg).116 Kovner117 and Taicher118 reportedgood precision and accuracy in validation studies with pigletsweighing up to 12 kg comparing the EchoMRI-Infants with DXA
and chemical analysis. The EchoMRI-Infants has yet to be validatedin infants.Preliminary data from our laboratory119 using the EchoMRI-
Infants in newborns between 12 and 69 h after birth show highprecision (small coefficient of variation) for measuring infant bodyfat, lean and body water. Mean weight (s.d., range) was 3.13 kg(0.44, 2.64–4.19 kg), mean fat was 0.54 kg (0.20, 0.07–0.88 kg), leanmass was 2.32 (0.28, 2.0–2.9 kg), TBW was 2.42 (0.31, 2.12–3.10 kg)and %fat 16.65% (2.67, range 12.53–20.71%) for boys and girls.Reproducibility was excellent with a CV of 2.09% for total body fat,0.98% for lean mass and 0.81% for TBW. This system has yet to bevalidated against the dilution method for TBW measures in infants.Advantages of the EchoMRI include the following: (1) it does notuse ionizing radiation, and it can be repeated many times in a dayor between days allowing the assessment of small changes in FMwith high sensitivity;119 (2) different versions of the instrumentallow for measurement of subjects of various weight ranges,particularly the EchoMRI-Infants allows for measurements up to12 kg and can be used for children up to 1 year of age; and(3) measurement time is short (o4min), and movement of theinfant does not affect the measurement, and thus no sedation isrequired.
FUTURE DIRECTIONSSince the work of Widdowson12,20 on the chemical composition ofthe fetus, the field of body composition has focused on the use ofindirect methods,29 and more recent studies involving autopsiesfor body composition are limited. Fomon reported that the singlemost important missing data component was BMC of children.14
Subsequently, Butte38 performed DXA scans at 0.5, 3, 6, 9, 12, 18and 24 months of age. Yet, given the limitations of DXA in infantsand children, such as the nonuniform changes in bone volumethat cannot be accounted for because of the aerial nature of themeasurement (instead of three-dimensional) creating errors inbone mineral density over time during follow-up studies, furtherinquiry is needed.98 One important limitation in the study ofhuman fetal, infant and child body composition is the lack of asingle body composition measurement technique validated formeasures throughout life beginning during gestation. MRI has thepotential to be such a measurement method, but it has not yetbeen validated longitudinally, beginning in utero. However, doingso would significantly increase our knowledge of body composi-tion during key periods of growth and development and aid in thediagnosis of clinically relevant body composition distributionanomalies. Methods such as EchoMRI-Infants also hold greatpotential to assess body composition with high precision andaccuracy throughout life, beginning at birth.This review systematically presents data from previously
published studies that report on body composition (the accretionof body tissues) during fetal development. For this information tobe translatable to clinical applications, we present what is knownon body composition in newborns and the infant/child through5 years of age to maximize the practicality of this review toresearchers and clinicians. From the published literature, it can beinferred that fetal body composition serves as a proxy for thenutritional status of the fetus and predicts morbidity and mortalitylater in life. Monitoring body composition changes could shedlight on risk or outcome of survival for the small fetus andunderweight or obese child. It is our hope that this review shedslight on the advantages and limitations of different bodycomposition methods that may assist the clinician in thecharacterization of health status from fetal, infant and child bodycomposition.
CONFLICT OF INTERESTThe authors declare no conflict of interest.
Body composition of the fetus and childT Toro-Ramos et al
1286
European Journal of Clinical Nutrition (2015) 1279 – 1289 © 2015 Macmillan Publishers Limited
ACKNOWLEDGEMENTSWe gratefully acknowledge Martica Heaner, PhD for her editorial assistance. Thisstudy was supported by National Institutes of Health Grants UO1-DK-094463(Diversityfellowship); P30-DK-26687; UL1-TR000040.
REFERENCES1 Wells JC, Fewtrell MS. Is body composition important for paediatricians? Arch Dis
Child 2008; 93: 168–172.2 Gardeil F, Greene R, Stuart B, Turner MJ. Subcutaneous fat in the fetal abdomen
as a predictor of growth restriction. Obstet Gynecol 1999; 94: 209–212.3 Skinner J, O'Donoghue K, Gardeil F, Greene R, Turner MJ. Is fetal abdominal
subcutaneous fat comparable with established indices of growth restriction?J Obst Gynaecol 2001; 21: 439–442.
4 Berger-Kulemann V, Brugger PC, Reisegger M, Klein K, Hachemian N, KoelblingerC et al. Quantification of the subcutaneous fat layer with MRI in fetuses ofhealthy mothers with no underlying metabolic disease vs. fetuses of diabeticand obese mothers. J Perinat Med 2012; 40: 179–184.
5 Slaughter MH, Lohman TG, Boileau RA, Horswill CA, Stillman RJ, Van Loan MDet al. Skinfold equations for estimation of body fatness in children and youth.Human Biol 1988; 60: 709–723.
6 Janz KF, Nielsen DH, Cassady SL, Cook JS, Wu YT, Hansen JR. Cross-validation ofthe Slaughter skinfold equations for children and adolescents. Med Sci SportsExerc 1993; 25: 1070–1076.
7 Sen B, Bose K, Shaikh S, Mahalanabis D. Prediction equations for body-fat per-centage in Indian infants and young children using skinfold thickness and mid-arm circumference. J Health Popul Nutr 2010; 28: 221–229.
8 Hoffman DJ, Toro-Ramos T, Sawaya AL, Roberts SB, Rondo P. Estimating totalbody fat using a skinfold prediction equation in Brazilian children. Ann HumanBiol 2012; 39: 156–160.
9 Urlando A, Dempster P, Aitkens S. A new air displacement plethysmographfor the measurement of body composition in infants. Pediatr Res 2003; 53:486–492.
10 Dempster P, Aitkens S. A new air displacement method for the determination ofhuman body composition. Med Sci Sports Exerc 1995; 27: 1692–1697.
11 Cardozo RH, Edelman IS. The volume of distribution of sodium thiosulfate as ameasure of the extracellular fluid space. J Clin Invest 1952; 31: 280–290.
12 Widdowson EM, Spray CM. Chemical development in utero. Arch Dis Child 1951;26: 205–214.
13 Deans HE, Smith FW, Lloyd DJ, Law AN, Sutherland HW. Fetal fat measurementby magnetic resonance imaging. Br J Radiol 1989; 62: 603–607.
14 Fomon SJ, Haschke F, Ziegler EE, Nelson SE. Body composition of referencechildren from birth to age 10 years. Am J Clin Nutr 1982; 35: 1169–1175.
15 Ellis KJ. Human body composition: in vivo methods. Physiol Rev 2000; 80:649–680.
16 Barbosa Baker Meio MD, Lopes Moreira ME. Total body water in newborns. In:Preedy VR(ed.). Handbook of Anthropometry: Physical Measures of Human Form inHealth and Disease 2. Springer Science+Business Media LLC: New York, 2012, p. 1121.
17 Heymsfield S, Lohman T, Wang Z-M, Going S. In: Going SB (ed.). Human BodyComposition, 2nd ed. Human Kinetics Publishers: Champaign, IL, USA, 2005.
18 Institute of Medicine (IOM). Weight Gain During Pregnancy: Reexamining theGuidelines. National Academic Press: Washington, DC, 2009.
19 Sridhar S, Baumgart S. Water and electrolyte balance in newborn infants. In:Thrureen PJ, Hay WW (eds). Neonatal Nutrition and Metabolism. CambridgeUniversity Press: Cambridge, 2006, pp 104–114.
20 Widdowson EM, Dickerson JWT. Chemical composition of the body. In: ComarCL, Bronner F (eds). Mineral Metabolism, An Advanced Treatise II, Part A. Aca-demic: New York, 1964, pp 1–247.
21 Moulton CR. Age and chemical development in mammals. J Biol Chem 1923; 57:79–97.
22 Friis-Hansen B. Water distribution in the foetus and newborn infant. Acta Pae-diatr Scand Suppl 1983; 305: 7–11.
23 Ziegler EE. Body composition of the reference fetus. Growth 1976; 40:329–341.
24 Votino C, Verhoye M, Segers V, Cannie M, Bessieres B, Cos T et al. Fetal organweight estimation by postmortem high-field magnetic resonance imagingbefore 20 weeks' gestation. Ultrasound Obstet Gynecol 2012; 39: 673–678.
25 Thayyil S, Schievano S, Robertson NJ, Jones R, Chitty LS, Sebire NJ et al.A semi-automated method for non-invasive internal organ weight estimation bypost-mortem magnetic resonance imaging in fetuses, newborns and children.Eur J Radiol 2009; 72: 321–326.
26 Thayyil S, Cleary JO, Sebire NJ, Scott RJ, Chong K, Gunny R et al.Post-mortem examination of human fetuses: a comparison of whole-body high-
field MRI at 9.4 T with conventional MRI and invasive autopsy. Lancet 2009; 374:467–475.
27 Larciprete G, Valensise H, Vasapollo B, Novelli GP, Parretti E, Altomare F et al.Fetal subcutaneous tissue thickness (SCTT) in healthy and gestational diabeticpregnancies. Ultrasound Obstet Gynecol 2003; 22: 591–597.
28 Ziegler EE, O'Donnell AM, Nelson SE, Fomon SJ. Body composition of thereference fetus. Growth 1976; 40: 329–341.
29 Demerath EW, Fields DA. Body composition assessment in the infant. Am J HumBiol 2014; 26: 291–304.
30 Hull HR, Thornton JC, Ji Y, Paley C, Rosenn B, Mathews P et al. Higher infant bodyfat with excessive gestational weight gain in overweight women. Am J ObstetGynecol 2011; 205: e1–e7.
31 Modi N, Bétrémieux P, Midgley J, Hartnoll G. Postnatal weight loss and con-traction of the extracellular compartment is triggered by atrial natriuretic pep-tide. Early Hum Dev 2000; 59: 201–208.
32 Modi N. Clinical implications of postnatal alterations in body water distribution.Semin Neonatol 2003; 8: 301–306.
33 Widdowson EM. Nutrition from conception to extreme old age. Food Nutr(Roma) 1982; 8: 32–40.
34 Brozek J, Grande F, Anderson JT, Keys A. Densitometric analysis of body com-position: revision of some quantitative assumptions. Ann NY Acad Sci 1963; 110:113–140.
35 McGowan A, Jordan M, MacGregor J. Skinfold thickness in neonates. Biol Neonate1974; 25: 66–84.
36 Yssing M, Friis-Hansen B. Body composition of newborn infants. Acta Paediatr1965; 54: 117–118.
37 Burmeister W. The extracellular (thiosulfate) space in the human body duringgrowth. Ann Univ Sarav Med 1961; 9: 167–219.
38 Butte NF, Hopkinson JM, Wong WW, Smith EO, Ellis KJ. Body composition duringthe first 2 years of life: an updated reference. Pediatr Res 2000; 47: 578–585.
39 Au CP, Raynes-Greenow CH, Turner RM, Carberry AE, Jeffery H. Fetal andmaternal factors associated with neonatal adiposity as measured by air dis-placement plethysmography: a large cross-sectional study. Early Hum Dev 2013;89: 839–843.
40 Andersen GS, Girma T, Wells JC, Kaestel P, Leventi M, Hother AL et al. Bodycomposition from birth to 6 mo of age in Ethiopian infants: reference dataobtained by air-displacement plethysmography. Am J Clin Nutr 2013; 98:885–894.
41 Harrington TA, Thomas EL, Frost G, Modi N, Bell JD. Distribution of adipose tissuein the newborn. Pediatr Res 2004; 55: 437–441.
42 Olhager E, Flinke E, Hannerstad U, Forsum E. Studies on human body compo-sition during the first 4 months of life using magnetic resonance imaging andisotope dilution. Pediatr Res 2003; 54: 906–912.
43 Modi N, Thomas EL, Uthaya SN, Umranikar S, Bell JD, Yajnik C. Whole bodymagnetic resonance imaging of healthy newborn infants demonstratesincreased central adiposity in Asian Indians. Pediatr Res 2009; 65: 584–587.
44 Andres A, Shankar K, Badger TM. Body fat mass of exclusively breastfed infantsborn to overweight mothers. J Acad Nutr Diet 2012; 112: 991–995.
45 Fields DA, Demerath EW, Pietrobelli A, Chandler-Laney PC. Body composition at6 months of life: comparison of air displacement plethysmography and dual-energy X-ray absorptiometry. Obesity 2012; 20: 2302–2306.
46 Forbes GB. Lean body mass-body fat interrelationships in humans. Nutr Rev1987; 45: 225–231.
47 Jordan PN, Hall KD. Dynamic coordination of macronutrient balance duringinfant growth: insights from a mathematical model. Am J Clin Nutr 2008; 87:692–703.
48 Butte NF, Wong WW, Hopkinson JM, Heinz CJ, Mehta NR, Smith EO. Energyrequirements derived from total energy expenditure and energy depositionduring the first 2 y of life. Am J Clin Nutr 2000; 72: 1558–1569.
49 Forbes RM, Cooper AR, Mitchell HH. The composition of the adult human bodyas determined by chemical analysis. J Biol Chem 1953; 203: 359–366.
50 Spray CM, Widdowson EM. The effect of growth and development on thecomposition of mammals. Br J Nutr 1950; 4: 332–353.
51 Clarys JP, Provyn S, Marfell-Jones MJ. Cadaver studies and their impact on theunderstanding of human adiposity. Ergonomics 2005; 48: 1445–1461.
52 Clarys JP, Martin AD, Drinkwater DT. Gross tissue weights in the human body bycadaver dissection. Hum Biol 1984; 56: 459–473.
53 von Bezold A. Das shemische Skelett der Wirbelthiere. Ztschr Wissensch Zool1858; 9: 240.
54 Bernstein I. Fetal body composition. Curr Opin Clin Nutr Metab Care 2005; 8:613–617.
55 Bernstein IM, Catalano PM. Ultrasonographic estimation of fetal bodycomposition for children of diabetic mothers. Investig Radiol 1991; 26:722–726.
Body composition of the fetus and childT Toro-Ramos et al
1287
© 2015 Macmillan Publishers Limited European Journal of Clinical Nutrition (2015) 1279 – 1289
56 Bernstein IM, Goran MI, Amini SB, Catalano PM. Differential growth of fetaltissues during the second half of pregnancy. Am J Obstet Gynecol 1997; 176:28–32.
57 Law TL, Korte JE, Katikaneni LD, Wagner CL, Ebeling MD, Newman RB. Ultrasoundassessment of intrauterine growth restriction: relationship to neonatal bodycomposition. Am J Obstet Gynecol 2011; 205: e1–e6.
58 Moyer-Mileur LJ, Slater H, Thomson JA, Mihalopoulos N, Byrne J, Varner MW.Newborn adiposity measured by plethysmography is not predicted by lategestation two-dimensional ultrasound measures of fetal growth. J Nutr 2009;139: 1772–1778.
59 Valensise H, Larciprete G, Arduini D, De Lorenzo A. The fetal body compartmentsand their detection during pregnancy. A review. Acta Diabetol 2003; 40:S79–S82.
60 Winn HN, Holcomb WL. Fetal nonmuscular soft tissue: a prenatal assessment.J Ultrasound Med 1993; 12: 197–199.
61 Hadlock FP, Harrist RB, Sharman RS, Deter RL, Park SK. Estimation of fetal weightwith the use of head, body, and femur measurements--a prospective study.Am J Obstet Gynecol 1985; 151: 333–337.
62 Galan HL, Rigano S, Radaelli T, Cetin I, Bozzo M, Chyu J et al. Reduction ofsubcutaneous mass, but not lean mass, in normal fetuses in Denver, Colorado.Am J Obstet Gynecol 2001; 185: 839–844.
63 Hure AJ, Collins CE, Giles WB, Paul JW, Smith R. Greater maternal weight gainduring pregnancy predicts a large but lean fetal phenotype: a prospectivecohort study. Matern Child Health J 2011; 16: 1374–1384.
64 Platz E, Newman R. Diagnosis of IUGR: traditional biometry. Semin Perinatol 2008;32: 140–147.
65 Gardosi J, Francis A. A customized standard to assess fetal growth in a USpopulation. Am J Obstet Gynecol 2009; 201: 25 e1–e7.
66 Uotila J, Dastidar P, Heinonen T, Ryymin P, Punnonen R, Laasonen E. Magneticresonance imaging compared to ultrasonography in fetal weight and volumeestimation in diabetic and normal pregnancy. Acta Obstet Gynecol Scand 2000;79: 255–259.
67 Baker PN, Johnson IR, Gowland PA, Hykin J, Harvey PR, Freeman A et al. Fetalweight estimation by echo-planar magnetic resonance imaging. Lancet 1994;343: 644–645.
68 Kacem Y, Cannie MM, Kadji C, Dobrescu O, Lo Zito L, Ziane S et al. Fetal weightestimation: comparison of two-dimensional US and MR imaging assessments.Radiology 2013; 267: 902–910.
69 Smith FW. The potential use of nuclear magnetic resonance imaging in preg-nancy. J Perinat Med 1985; 13: 265–276.
70 Anblagan D, Deshpande R, Jones NW, Costigan C, Bugg G, Raine-Fenning Net al. Measurement of fetal fat in utero in normal and diabetic pregnanciesusing magnetic resonance imaging. Ultrasound Obstet Gynecol 2013; 42:335–340.
71 Lowe TW, Weinreb J, Santos-Ramos R, Cunningham FG. Magnetic resonanceimaging in human pregnancy. Obstet Gynecol 1985; 66: 629–633.
72 Smith FW, Adam AH, Phillips WD. NMR imaging in pregnancy. Lancet 1983; 1:61–62.
73 Smith FW, Kent C, Abramovich DR, Sutherland HW. Nuclear magneticresonance imaging--a new look at the fetus. Br J Obstet Gynaecol 1985; 92:1024–1033.
74 Piers LS, Soares MJ, Frandsen SL, O'Dea K. Indirect estimates of body composi-tion are useful for groups but unreliable in individuals. Int J Obes Relat MetabDisord 2000; 24: 1145–1152.
75 Wells JC, Fewtrell MS. Measuring body composition. Arch Dis Child 2006; 91:612–617.
76 Farr V. Skinfold thickness as an indication of maturity of the newborn. Arch DisChild 1966; 41: 301–308.
77 Tennefors C, Forsum E. Assessment of body fatness in young children using theskinfold technique and BMI vs body water dilution. Eur J Clin Nutr 2004; 58:541–547.
78 Kabir N, Forsum E. Estimation of total body fat and subcutaneous adiposetissue in full-term infants less than 3 months old. Pediatr Res 1993; 34:448–454.
79 Goran MI, Gower BA, Treuth M, Nagy TR. Prediction of intra-abdominal andsubcutaneous abdominal adipose tissue in healthy pre-pubertal children. Int JObes Relat Metab Disord 1998; 22: 549–558.
80 Eriksson JG, Kajantie E, Lampl M, Osmond C, Barker DJ. Small headcircumference at birth and early age at adiposity rebound. Acta Physiol 2014;210: 154–160.
81 Evelein AM, Visseren FL, van der Ent CK, Grobbee DE, Uiterwaal CS. Excess earlypostnatal weight gain leads to increased abdominal fat in young children. Int JPediatr 2012; 2012: 141656.
82 De Lucia Rolfe E, Modi N, Uthaya S, Hughes IA, Dunger DB, Acerini C et al.Ultrasound estimates of visceral and subcutaneous-abdominal adipose tissues ininfancy. J Obes 2013; 2013: 951954.
83 Brambilla P, Bedogni G, Moreno LA, Goran MI, Gutin B, Fox KR et al. Cross-validation of anthropometry against magnetic resonance imaging for theassessment of visceral and subcutaneous adipose tissue in children. Int J Obes(Lond) 2006; 30: 23–30.
84 Stomfai S, Ahrens W, Bammann K, Kovacs E, Marild S, Michels N et al. Intra- andinter-observer reliability in anthropometric measurements in children. Int J Obes(Lond) 2011; 35: S45–S51.
85 West J, Manchester B, Wright J, Lawlor DA, Waiblinger D. Reliability of routineclinical measurements of neonatal circumferences and research measurementsof neonatal skinfold thicknesses: findings from the Born in Bradford study.Paediatr Perinat Epidemiol 2011; 25: 164–171.
86 Roggero P, Gianni ML, Amato O, Piemontese P, Morniroli D, Wong WW et al.Evaluation of air-displacement plethysmography for body composition assess-ment in preterm infants. Pediatr Res 2012; 72: 316–320.
87 Fields DA, Allison DB. Air-displacement plethysmography pediatric option in 2-6years old using the four-compartment model as a criterion method. Obesity2012; 20: 1732–1737.
88 Schoeller DA. Hydrometry. In: Heymsfield S, Lohman T, Wang Z-M, Going S (eds).Human Body Composition 918, 2nd edn. Human Kinetics: Champaign, IL, USA,2005, p 536.
89 Speakman JR, Nair KS, Goran MI. Revised equations for calculating CO2 productionfrom doubly labeled water in humans. Am J Physiol 1993; 264: E912–E917.
90 Wang Z, Deurenberg P, Wang W, Pietrobelli A, Baumgartner RN, Heymsfield SB.Hydration of fat-free body mass: new physiological modeling approach. Am JPhysiol 1999; 276: E995–E1003.
91 Hashimoto K, Wong WW, Thomas AJ, Uvena-Celebrezze J, Huston-Pressley L,Amini SB et al. Estimation of neonatal body composition: isotope dilution versustotal-body electrical conductivity. Biol Neonate 2002; 81: 170–175.
92 Laskey MA. Dual-energy X-ray absorptiometry and body composition. Nutrition1996; 12: 45–51.
93 Brunton JA, Bayley HS, Atkinson SA. Validation and application of dual-energyx-ray absorptiometry to measure bone mass and body composition in smallinfants. Am J Clin Nutr 1993; 58: 839–845.
94 Elowsson P, Forslund AH, Mallmin H, Feuk U, Hansson I, Carlsten J. An evaluationof dual-energy X-Ray absorptiometry and underwater weighing to estimatebody composition by means of carcass analysis in piglets. J Nutr 1998; 128:1543–1549.
95 Testolin CG, Gore R, Rivkin T, Horlick M, Arbo J, Wang Z et al. Dual-energy X-rayabsorptiometry: analysis of pediatric fat estimate errors due to tissue hydrationeffects. J Appl Physiol 2000; 89: 2365–2372.
96 Koo WW, Hammami M, Shypailo RJ, Ellis KJ. Bone and body composition mea-surements of small subjects: discrepancies from software for fan-beam dualenergy X-ray absorptiometry. J Am Coll Nutr 2004; 23: 647–650.
97 Fields DA, Goran MI. Body composition techniques and the four-compartmentmodel in children. J Appl Physiol 2000; 89: 613–620.
98 Binkovitz LA, Henwood MJ. Pediatric DXA: technique and interpretation. PediatrRadiol 2007; 37: 21–31.
99 Task Force on Bone Densitometry (H-30) CRCPD. Technical White Paper: BoneDensitometry. Frankfort, KY, 2006.
100 Agur A. Grant's Atlas of Anatomy. Lippincott, Williams, and Wilkins: Philadelphia,2009; 484–485.
101 Wells JC, Fuller NJ, Dewit O, Fewtrell MS, Elia M, Cole TJ. Four-component modelof body composition in children: density and hydration of fat-free mass andcomparison with simpler models. Am J Clin Nutr 1999; 69: 904–912.
102 Lohman TG, Going SB. Multicomponent models in body composition research:opportunities and pitfalls. Basic Life Sci 1993; 60: 53–58.
103 Lohman TG. Assessment of body composition in children. Pediatr Exerc Sci 1989;1: 19–30.
104 Shen W, Liu H, Punyanitya M, Chen J, Heymsfield SB. Pediatric obesity phenotypingby magnetic resonance methods. Curr Opin Clin Nutr Metab Care 2005; 8: 595–601.
105 Samara A, Ventura EE, Alfadda AA, Goran MI. Use of MRI and CT for fat imagingin children and youth: what have we learned about obesity, fat distribution andmetabolic disease risk? Obes Rev 2012; 13: 723–732.
106 Kullberg J, Karlsson AK, Stokland E, Svensson PA, Dahlgren J. Adipose tissuedistribution in children: automated quantification using water and fat MRI. JMagn Reson Imaging 2010; 32: 204–210.
107 Bauer JS, Noel PB, Vollhardt C, Much D, Degirmenci S, Brunner S et al. Accuracyand reproducibility of adipose tissue measurements in young infants by wholebody magnetic resonance imaging. PLoS One 2015; 10: e0117127.
108 Taicher GZ, Tinsley FC, Reiderman A, Heiman ML. Quantitative magnetic reso-nance (QMR) method for bone and whole-body-composition analysis. AnalBioanal Chem2003; 377: 990–1002.
Body composition of the fetus and childT Toro-Ramos et al
1288
European Journal of Clinical Nutrition (2015) 1279 – 1289 © 2015 Macmillan Publishers Limited
109 Napolitano A, Miller SR, Murgatroyd PR, Coward WA, Wright A, Finer N et al.Validation of a quantitative magnetic resonance method for measuring humanbody composition. Obesity (Silver Spring) 2008; 16: 191–198.
110 Gallagher D, Thornton JC, He Q, Wang J, Yu W, Bradstreet TE et al. Quantitativemagnetic resonance fat measurements in humans correlate with establishedmethods but are biased. Obesity (Silver Spring) 2010; 18: 2047–2054.
111 Zanghi BM, Cupp CJ, Pan Y, Tissot-Favre DG, Milgram NW, Nagy TR et al. Non-invasive measurements of body composition and body water via quantitativemagnetic resonance, deuterium water, and dual-energy x-ray absorptiometryin cats. Am J Vet Res 2013; 74: 721–732.
112 Zanghi BM, Cupp CJ, Pan Y, Tissot-Favre DG, Milgram NW, Nagy TR et al. Non-invasive measurements of body composition and body water via quantitativemagnetic resonance, deuterium water, and dual-energy x-ray absorptiometry inawake and sedated dogs. Am J Vet Res 2013; 74: 733–743.
113 Mitchell AD, Rosebrough RW, Taicher GZ, Kovner I. In vivo measurement of bodycomposition of chickens using quantitative magnetic resonance. Poult Sci 2011;90: 1712–1719.
114 Andres A, Gomez-Acevedo H, Badger TM. Quantitative nuclear magnetic reso-nance to measure fat mass in infants and children. Obesity 2011; 19: 2089–2095.
115 Andres A, Mitchell AD, Badger TM. QMR: validation of an infant and childrenbody composition instrument using piglets against chemical analysis. Int J Obes2010; 34: 775–780.
116 Mitchell A. Validation of QMR body composition analysis for infants usingPiglet Model. Pediatr Res 2010; 9: 9.
117 Kovner I, Taicher GZ, Mitchell AD. Calibration and validation of EchoMRI™ wholebody composition analysis based on chemical analysis of piglets, in comparisonwith the same for DXA. Int J Body Compos Res 2010; 8: 17–29.
118 Taicher G, Kovner I, Mitchell AD. Accuracy and precision for EchoMRI-Infants™body composition analysis in piglets. 17th European Congress on Obesity.Poster ECO: PS 5-1. Amsterdam, The Netherlands.
119 Toro-Ramos T, Paley CW, Lin S, Yu W, Pi-Sunyer X, Gallagher D (eds). Reliability ofthe EchoMRI-Infant System for Water and Fat Measurements in Newborns.Obesity 2013, The 31st Annual Scientific Meeting of The Obesity Society; 2013;Atlanta, Georgia.
Supplementary Information accompanies this paper on European Journal of Clinical Nutrition website (http://www.nature.com/ejcn)
Body composition of the fetus and childT Toro-Ramos et al
1289
© 2015 Macmillan Publishers Limited European Journal of Clinical Nutrition (2015) 1279 – 1289