Embed Size (px)
Citation preview
nutrients
Article
Blueberry Counteracts Prediabetes in a HypercaloricDiet-Induced Rat Model and Rescues HepaticMitochondrial Bioenergetics
Sara Nunes 1,2,3 , Sofia D. Viana 1,2,3,4, Inês Preguiça 1,2,3 , André Alves 1,2,3 , Rosa Fernandes 1,2,3 ,João S. Teodoro 5,6 , Patrícia Matos 7,8,9 , Artur Figueirinha 7,8 , Lígia Salgueiro 7,9, Alexandra André 4,Sara Silva 10, Ivana Jarak 11, Rui A. Carvalho 5,12, Cláudia Cavadas 2,3,6,7, Anabela P. Rolo 5,6,Carlos M. Palmeira 5,6 , Maria M. Pintado 10 and Flávio Reis 1,2,3,*
�����������������
Citation: Nunes, S.; Viana, S.D.;
Preguiça, I.; Alves, A.; Fernandes, R.;
Teodoro, J.S.; Matos, P.; Figueirinha,
A.; Salgueiro, L.; André, A.; et al.
Blueberry Counteracts Prediabetes in
a Hypercaloric Diet-Induced Rat
Model and Rescues Hepatic
Mitochondrial Bioenergetics.
Nutrients 2021, 13, 4192. https://
doi.org/10.3390/nu13124192
Academic Editors:
María-Teresa García Conesa,
Regina Menezes and Paulo Matafome
Received: 21 September 2021
Accepted: 20 November 2021
Published: 23 November 2021
Publisher’s Note: MDPI stays neutral
with regard to jurisdictional claims in
published maps and institutional affil-
iations.
Copyright: © 2021 by the authors.
Licensee MDPI, Basel, Switzerland.
This article is an open access article
distributed under the terms and
conditions of the Creative Commons
Attribution (CC BY) license (https://
creativecommons.org/licenses/by/
4.0/).
1 Institute of Pharmacology & Experimental Therapeutics & Coimbra Institute for Clinical and BiomedicalResearch (iCBR), Faculty of Medicine, University of Coimbra, 3000-548 Coimbra, Portugal;[email protected] (S.N.); [email protected] (S.D.V.); [email protected] (I.P.);[email protected] (A.A.); [email protected] (R.F.)
2 Center for Innovative Biomedicine and Biotechnology (CIBB), University of Coimbra,3004-504 Coimbra, Portugal; [email protected]
3 Clinical Academic Center of Coimbra (CACC), 3004-504 Coimbra, Portugal4 Polytechnic Institute of Coimbra, ESTESC-Coimbra Health School, Pharmacy/Biomedical Laboratory
Sciences, 3046-854 Coimbra, Portugal; [email protected] Department of Life Sciences, Faculty of Science and Technology (FCTUC), University of Coimbra,
3000-456 Coimbra, Portugal; [email protected] (J.S.T.); [email protected] (R.A.C.); [email protected] (A.P.R.);[email protected] (C.M.P.)
6 Center for Neurosciences and Cell Biology of Coimbra (CNC), University of Coimbra,3004-504 Coimbra, Portugal
7 Faculty of Pharmacy, University of Coimbra, 3000-548 Coimbra, Portugal;[email protected] (P.M.); [email protected] (A.F.); [email protected] (L.S.)
8 LAQV, REQUIMTE, Faculty of Pharmacy, University of Coimbra, 3000-456 Coimbra, Portugal9 CIEPQPF, Chemical Process Engineering and Forest Products Research Centre Research Center,
University of Coimbra, 3000-456 Coimbra, Portugal10 CBQF—Centro de Biotecnologia e Química Fina—Laboratório Associado, Escola Superior de Biotecnologia,
Universidade Católica Portuguesa, Rua Diogo Botelho 1327, 4169-005 Porto, Portugal;[email protected] (S.S.); [email protected] (M.M.P.)
11 Department of Microscopy, Laboratory of Cell Biology and Unit for Multidisciplinary Research inBiomedicine (UMIB), Institute of Biomedical Sciences Abel Salazar (ICBAS), University of Porto,4050-313 Porto, Portugal; [email protected]
12 Associated Laboratory for Green Chemistry-Clean Technologies and Processes, REQUIMTE, Faculty ofSciences and Technology, University of Porto, 4050-313 Porto, Portugal
* Correspondence: [email protected]; Tel.: +351-239-480-053
Abstract: The paramount importance of a healthy diet in the prevention of type 2 diabetes isnow well recognized. Blueberries (BBs) have been described as attractive functional fruits forthis purpose. This study aimed to elucidate the cellular and molecular mechanisms pertainingto the protective impact of blueberry juice (BJ) on prediabetes. Using a hypercaloric diet-inducedprediabetic rat model, we evaluated the effects of BJ on glucose, insulin, and lipid profiles; gutmicrobiota composition; intestinal barrier integrity; and metabolic endotoxemia, as well as on hepaticmetabolic surrogates, including several related to mitochondria bioenergetics. BJ supplementationfor 14 weeks counteracted diet-evoked metabolic deregulation, improving glucose tolerance, insulinsensitivity, and hypertriglyceridemia, along with systemic and hepatic antioxidant properties, withouta significant impact on the gut microbiota composition and related mechanisms. In addition, BJtreatment effectively alleviated hepatic steatosis and mitochondrial dysfunction observed in theprediabetic animals, as suggested by the amelioration of bioenergetics parameters and key targets ofinflammation, insulin signaling, ketogenesis, and fatty acids oxidation. In conclusion, the beneficialmetabolic impact of BJ in prediabetes may be mainly explained by the rescue of hepatic mitochondrialbioenergetics. These findings pave the way to support the use of BJ in prediabetes to prevent diabetesand its complications.
Nutrients 2021, 13, 4192. https://doi.org/10.3390/nu13124192 https://www.mdpi.com/journal/nutrients
Nutrients 2021, 13, 4192 2 of 32
Keywords: blueberries; hypercaloric diet-induced prediabetes; gut microbiota; hepatic energymetabolism; mitochondria function; hepatoprotection
1. Introduction
Prediabetes, characterized by impaired glucose tolerance (IGT) and/or impairedfasting glucose (IFG) [1,2], represents a high-risk state for type 2 diabetes mellitus (T2DM)development. Annually, around 5–10% of prediabetic patients progress to T2DM, andestimates indicate that up to 70% of patients with prediabetes will eventually develop overtdiabetes within their lifetime [3,4].
During the last decades, new studies have suggested a chief role for gut microbiota(GM) in the development of metabolic diseases, including T2DM. Although incongruentdata subsist, emerging evidence underlines a dysbiotic GM community characterized bychanges in bacterial abundance/diversity along with decreased short-chain fatty acids(SCFAs) levels (e.g., butyrate) early in the period of human prediabetes [5–7]. Moreover,the liver plays a predominant role in the development of insulin resistance since it is akey organ involved in glucose, lipid, and amino acid metabolism and crucial for main-tain energy homeostasis [8]. Notably, both insulin resistance and hepatic glucose/lipiddysmetabolism start years before T2DM diagnosis, underpinning prediabetes’ subclinicalevolution [4,9–11]. Likewise, hepatic energy dysmetabolism has been traced to mitochon-dria as early as prediabetes in both rodents [12] and humans [13]. However, a direct causalrelationship between insulin resistance and mitochondrial dysfunction still lacks furtherelucidation [14–16]. Collectively, the aforesaid pathophysiological mechanisms often cul-minate in a state of chronic low-grade inflammation and oxidative stress that follows theprogression of prediabetes to overt T2DM [17,18]. In the view of the T2DM health burden,which has reached epidemic proportions [19,20], it is crucial to establish interventionstargeted to early pathophysiological mechanisms in the asymptomatic prediabetic phase,an opportunity window to prevent or attenuate disease progression and to reduce the riskof subsequent complications [21].
Lifestyle changes focused on improved diet quality can slow down or even halt(pre)diabetes progression [22–24]. For instance, an inverse association between plant-based diets (e.g., fresh vegetables, fruits) and T2DM evolution has been consistentlyhighlighted [25–29]. Blueberries (BBs), one of the most popular berries due to theirpalatableness and nutritional/phytochemical composition, display a panoply of health-related properties in several metabolic diseases, including T2DM, as comprehensivelyreviewed elsewhere [30–32]. Briefly, their low caloric value pairs with an enriched contentof dietary fibers and an array of polyphenolic secondary metabolites (e.g., flavonols, an-thocyanins, phenolic acids) that greatly dictate BBs’ antioxidant and anti-inflammatoryprofiles [31,33–35]. Moreover, a wealth of experimental evidence openly points out theBBs-derived hypoglycemic and insulin-sensitizing effects [30,32,36,37]. However, the pre-cise pathophysiologic mechanisms counteracted by BBs in early prediabetes progressionare far from being disclosed. They are also consistently narrowed by the discrepancy inthe experimental designs (e.g., disease stage, BBs doses and presentation forms, treatmentduration) in both preclinical studies and clinical settings.
Recently, our group underscored that long-term BBs supplementation in a healthycondition triggered an expressive polyphenol-derived remodeling of hepatic mitochondrialbioenergetics [38]. Given the well-recognized hepatic mitochondrial impairments in overtT2DM, we hypothesized that BBs’ ability to counteract prediabetes would follow similartraits. This study aimed to shed light on cellular and molecular mechanisms parallelingthe protective effects of BBs on glucose tolerance, insulin resistance, and lipid profileas early as prediabetes. To this end, we carried out an integrative preclinical approachencompassing functional and molecular readouts of gut health, hepatic metabolomics, and
Nutrients 2021, 13, 4192 3 of 32
oxidative/inflammatory status, focusing on mitochondria, upon a clinically relevant BBsdose supplementation, in diet-induced prediabetes.
2. Materials and Methods2.1. Blueberry Juice Preparation
Blueberries (Vaccinium corymbosum L., cultivar “Liberty”) were supplied from the samevariety and in the same maturation stage by COAPE (Farming Cooperative of Mangualde,Mangualde, Portugal) and stored at −80 ◦C until use.
BBs juice (BJ) was obtained as described in a previous study [38]. Briefly, BBs wereweighed, blended with sucrose solution (35%), and converted into juice to assure consump-tion of whole fruit parts (peel, pulp, and seeds). The volume of sucrose solution added wascorrected every day to guarantee that 25 g/kg of BW of BBs were daily consumed by theanimals. This BBs dose was selected based on a previous study of our group [38].
2.2. Phytochemical Screening of Blueberry Juice
The characterization of the phenolic compounds present in BJ was performed throughHPLC-PAD-ESI/MSn analysis, as previously described [38,39].
2.3. Animals and Experimental Design
Eight-week-old male Wistar rats (Charles River Laboratories, Barcelona, Spain) werepair-housed in ventilated cages, under controlled environmental conditions of temperature(22 ± 1 ◦C), humidity (50–60%), and light (12 h light-dark cycle) and ad libitum access totap water and standard rodent chow. All animal procedures performed in this study wereapproved by the local (iCBR) Animal Welfare Body (ORBEA, #9/2018) and complied withthe Animal Care National and European Directives and with the ARRIVE guidelines [40].
Following a one-week period of acclimatization, rats were arbitrarily assigned into3 groups, in a 23-week protocol: control group, received standard chow and tap wa-ter (CTRL, n = 8); prediabetic group, received 35% sucrose (Hsu-84100; Sigma-Aldrich,St. Louis, MO, USA) in the drinking water plus standard chow until week 9, further supple-mented by high-fat (HF) diet (58Y1, TestDiet, St. Louis, MO, USA) until week 23 (HSuHF,n = 10); and prediabetic group supplemented with BJ (HSuHF + BJ; n = 10), submitted tothe same dietary regimen as the prediabetic group but received 25 g/kg BW/day of BJ (in35% sucrose solution) between weeks 9 and 23. The development of prediabetes in rats,including the protocol of the dietary regimen and the duration, was performed based onour previous study [41].
Briefly, the high-fat diet contained 61.6% of energy as fat, 20.3% as carbohydrates(CH), and 18.1% as protein, with a total of 5.10 kcal/g (58Y1, TestDiet, St. Louis, MO, USA),whereas standard rat chow contained 8.6% of energy as fat and 67.9% as CH, 23.5% asprotein, with a total of 3.15 kcal/g (4RF21 Mucedola, Milan, Italy).
Feed and beverage were provided ad libitum during the entire experimental protocol,except for the fasting periods. BW was weekly monitored; food and beverage consumptionwere recorded daily per cage throughout the protocol and used to calculate energy intake.The estimated values (calculated by dividing the total intake by two rats per cage) arepresented per week.
2.4. Glucose Tolerance Test (GTT) and Insulin Tolerance Test (ITT)
At the first day of week 22, GTT was performed to assess the rats’ glucose tolerance.Rats submitted to a fasting period of 6 h were intraperitoneally (i.p.) injected with asolution of glucose (2 g/kg BW) and the blood glucose levels from the tail vein wererecorded in samples taken immediately before (0 min) the injection and 30, 60, 90, and120 min after, using an ACCU-CHEK® Aviva portable glucometer (Roche Diagnostics,Mannheim, Germany). In addition, blood samples (≈30 µL) were collected before glucosechallenge to assess fasting insulin levels.
Nutrients 2021, 13, 4192 4 of 32
At the first day of week 23, the in vivo peripheral insulin sensitivity was evaluated byITT performed through the i.p. injection of insulin solution (0.75 units/kg BW; ActrapidNovo Nordisk, Bagsvaerd, Denmark) in 6-h fasted rats. Blood glucose levels were measuredin the tail vein blood collected immediately before (0 min) the injection and 15, 30, 45, 60,and 120 min after, using the same glucometer, as previously described [41]. The area underthe curve (AUC) of GTT (AUCGTT) and the rate constant for glucose clearance (KITT) werecalculated as previously reported elsewhere [42,43].
2.5. In Vivo Hepatic Ultrasonographic Analysis
Rat liver ultrasound examination was performed using e General Electrics LOGIQe(GE Healthcare, Milwaukee, WI, USA), with a linear-array transducer with multifrequency(7.5–12 MHz). Before US examination, the rats were anesthetized by inhalation of 1.5%isoflurane by using an inhalation anesthesia system, kept under mild anesthesia during thedata acquisition, and the abdomen was shaved by an electric shaver to reduce artifacts inthe ultrasonography images. The liver and portal vein were analyzed in animals positionedin the supine position and the spleen in the right posterior oblique position, throughmultiple transversal and longitudinal scanning. A sound-conducting gel was applied, andthe liver was assessed by placing the transducer just distal to the last right costal ribs andangling its beam cranially and obliquely, obtaining multiple transversal and longitudinalscans. A fundamental brightness mode (B-mode) was applied to all imaging. The acousticfocus was placed in the center of the liver and in the largest transverse cross-section of thespleen.
The ultrasound examination was performed by one blinded expert and the criteriafor ultrasound diagnosis, including changes in the liver parenchymal echogenicity, focalsteatosis, and diameter of the portal vein, were analyzed as previously described [44].
2.6. Biological Sample Collection
Serum samples were obtained by centrifugation (2300× g/15 min/4 ◦C) of wholeblood samples (immediately collected after animal sacrifice by venipuncture from thejugular vein) and stored at−20 ◦C until assay. Liver and gastrointestinal tissues (duodenumand colon) were immediately excised, dissected into small pieces, and stored in conditionsaccording to the assay’s requirements. The liver was firstly weighed and then dividedinto distinct pieces: one was immediately used for functional mitochondria assays; onewas stored for NMR analysis; one was directly frozen in liquid nitrogen and stored at−80 ◦C until analysis for further protein and RNA extraction; one was kept in neutralbuffered formalin solution (10%) to be used for histological analysis; and the remainingliver pieces were frozen by liquid nitrogen and stored at −80 ◦C. The liver weight relativeto BW was calculated. During the last week of the experimental protocol, animals were putin metabolic cages to collect fecal samples, which were weighed and stored at −80 ◦C untilprocessing.
2.7. Determination of Serum Metabolic Parameters
Serum samples were used to determine the postprandial glucose and triglycerides(TGs) by using automatic validated methods and equipment (Hitachi 717 analyzer, RocheDiagnostics GMBH, Mannheim, Germany), as previously described [10]. Serum insulincontents were quantified by using commercially available ELISA kits for rat samples(10-1250-01, Mercodia, Uppsala, Sweden).
2.8. Evaluation of Serum Redox Status
Total antioxidant status (TAS) in serum samples was estimated through the ferricreducing antioxidant potential (FRAP) assay, as previously described [45], with slightmodifications. This method is based on the ability of the antioxidants contained in a sampleto reduce ferric-tripyridyltriazine (Fe3+ -TPTZ) to a ferrous form (Fe2+) that develops anintense blue color, with maximum absorbance at 593 nm. In brief, the FRAP reagent was
Nutrients 2021, 13, 4192 5 of 32
prepared freshly by the addition of acetate buffer (300 mM, pH 3.6), 10 mM of TPTZ (2.4.6-tripyridyl-s-triazine, T1253, Sigma-Aldrich, St. Louis, MO, USA) solution in 40 mM HCl andferric chloride (FeCl3·6H2O, 236489, Sigma-Aldrich, St. Louis, MO, USA) solution (20 mM),at the ratio of 10:1:1 (v/v/v), respectively. In total, 10 µL of serum sample were added to30 µL of distilled water and 300 µL of FRAP reagent in a 96-well microplate and incubatedat 37 ◦C for 15 min; then, the absorbance was measured spectrophotometrically at 593 nmusing a microplate reader (Synergy™ HT Multi-Detection Microplate Reader, BioTek®,Burlington, VT, USA). The antioxidant capacity of the samples was quantified from thecalibration curve plotted using Trolox solution as the standard reference. Malondialdehyde(MDA) levels were performed through the thiobarbituric acid (TBA) reactive substances(TBARs) test. In total, 100 µL of serum were incubated (for 1 h) in a TBA solution, at roomtemperature (RT) and in dark conditions. The samples were then incubated at 90 ◦C for60 min. Afterwards, the tubes were placed on ice for reaction cessation. In this assay,one MDA molecule chemically reacts with two TBA molecules, the final product being amolecule that can be spectrophotometrically quantified at 532 nm (pink pigment). The MDAconcentration was calculated against a calibration curve using 1,1,3,3-tetramethoxypropane(108383, Sigma-Aldrich, St. Louis, MO, USA) as the external standard (range: 0.1–83.5 µM).The results were expressed as MDA/TAS ratio, a marker of oxidative stress [46].
2.9. 1H Nuclear Magnetic Resonance (NMR) Spectroscopy
Serum samples were prepared for the NMR analysis as described previously [41].Liver metabolites were extracted from liquid N2 ground samples using a Folch extrac-tion [47]. Polar extracts were lyophilized and dissolved in D2O phosphate buffer (0.2 M,pH = 7) supplemented with sodium fumarate (2 mM) used as internal standard. Samplesfor high-resolution 1H NMR analysis were loaded into 3 mm NMR-grade tubes.
1D-1H cpmg (Carr-Purcell-Meiboom-Gill spin-echo pulse sequence) NMR spectrawere recorded by a 600 MHz (14.1 T) spectrometer (Agilent, Santa Clara, CA, USA) using a3 mm indirect detection probe with a z-gradient. The spectra acquisition and processingwere performed as previously described [38].
Recorded spectra were compared to the reference data from public databases, suchas the Human Metabolome Database (HMDM), for spectral assignment [48]. In order tohelp spectral assignment, 2D homonuclear total correlation spectroscopy (TOCSY) spectrawere also recorded [49]. Metabolites were identified according to Metabolomics StandardsInitiative (MSI) guidelines for metabolite identification [50] and the identification levels areindicated in Supplementary Materials Tables S2 and S3.
Processed 1D cpmg spectra were bucketed using one-point bucket (0.6–9.0 ppm,with signal-free, water, and fumarate regions excluded) using Amix Viewer (version3.9.15, Bruker Biospin GmbH, Rheinstetten, Germany) and aligned using the icoshiftalgorithm [51]. The resulting matrix was normalized by the total spectral area and alsoanalyzed. Multivariate statistical analysis was applied on unit variance scaled matrix(SIMCA 14, Umetrics, Sartorius Stedim Biotech, Gottingen, Germany). Information on theglobal data structure was obtained from principal component analysis (PCA); in addition,partial least square discriminant analysis (PLS-DA) was used to evaluate class separationand identify the main metabolites involved in the discrimination of class. The qualitativemeasure of the predictive power (Q2) and the degree of fit to the data (R2) were givenby a 7-fold internal cross-validation of the PLS-DA models, which were validated by thepermutation test (n = 100) [52]. The corresponding PLS-DA loadings plots were obtainedby multiplying the loading weight factors (w) by the standard deviation of the respectivevariables and were color-coded according to the variable importance in the projection (VIP).For quantitative assessment of metabolite variations between the groups, metabolite signals(VIP > 1) were integrated and normalized by the total spectral area. Outliers were excludedon the basis of the quality of the recorded NMR spectra according to the recommendationsof MSI [50].
Nutrients 2021, 13, 4192 6 of 32
2.10. Extraction and Quantification of Gut Microbiota in Feces2.10.1. DNA Extraction from Stool
An NZY Tissue gDNA Isolation Kit (NZYtech, Lisbon, Portugal) was used to extractand purify genomic DNA from fecal samples, as previously reported [53]. DNA purityand quantification were evaluated with a NanoDrop spectrophotometer (Thermo FisherScientific, Wilmington, DE, USA).
2.10.2. Real-Time PCR for Fecal Microbiota Analysis
Real-time PCR was performed by using a LightCycler FastStart DNA Master SYBRGreen kit and a LightCycler instrument (Hoffman-La Roche Ltd., Basel, Switzerland) andthe assay’s conditions were performed as previously described [53]. Primer sequences(Sigma-Aldrich, St. Louis, MO, USA) used to target the 16S rRNA gene of the bacteriaand the conditions for PCR amplification reactions were previously described [38] and arelisted in Table 1. Data are presented as the mean values of duplicate PCR analysis.
Table 1. Primer sequences and real-time PCR conditions used for gut microbiota analysis.
Bacterial Group Primer Sequence (5′-3′) PCR Product Size (bp) AT (◦C)
FirmicutesATG TGG TTT AAT TCG AAG CA
126 45AGC TGA CGA CAA CCA TGC AC
BacteroidetesCAT GTG GTT TAA TTC GAT GAT
126 45AGC TGA CGA CAA CCA TGC AG
ClostridiumGCA CAA GCA GTG GAG T
239 45CTT CCT CCG TTT TGT CAA
UniversalAAA CTC AAA KGA ATT GAC GG
180 45CTC ACR RCA CGA GCT GAC
EnterococcusCCC TTA TTG TTA GTT GCC GCC ATC ATT
144 50ACTCGT TGT ACT TCC CT TGT
PrevotellaCAC RGT AAA CGA TGG ATG CC
513 50GGT CGG GTT GCA GAC C
Bifidobacterium CGC GTC YGG TGT GAA AG244 50CCC CAC ATC CAG CAT CCA
RoseburiaTAC TGC ATT GGA AAC TGT CG
230 50CGG CAC CGA AGA GCA AT
LactobacillusGAG GCA GCA GTA GGG AAT CTT C
126 55GGC CAG TTA CTA CCT CTA TCC TTC TTC
AkkermansiaCAG CAC GTG AAG GTG GGG AC
327 55CCT TGC GGT TGG CTT CAG AT
AT, annealing temperature; bp, base pairs; PCR, polymerase chain reaction.
2.10.3. Quantification of Fecal Short-Chain Fatty Acids (SCFAs) and Organic Acids
SCFAs and organic acids (lactic and succinic acid) were evaluated using an Agilent1200 series HPLC system with a refractive index—RI detector and with a UV detector, aspreviously described [53]. Quantification of fecal SCFAs was achieved by using calibrationcurves, and concentrations were expressed as mean micromoles/g of wet weight.
2.11. Evaluation of Intestinal Permeability Using FITC-Dextran
Intestinal integrity was determined by measuring the permeability of FITC-dextran.Rats from each group were fasted for 6 h and then gavaged with FICT-dextran solution(600 mg/kg, 4 kDa, Sigma-Aldrich), as previously described [54]. After a 4-h dosage,animals were anesthetized, and blood collected from the jugular vein. Blood samples werethen centrifuged (2300× g, 10 min, 4 ◦C) to obtain serum. Aliquots of serum were dilutedin PBS (1:1 v/v) and then added in a black 96-well microplate (Costar 96 back opaque).
Nutrients 2021, 13, 4192 7 of 32
Subsequently, FITC-dextran was measured using a fluorescence spectrophotometer (BioTekSynergy HT, Winooski, VT, USA,) at an excitation and emission wavelength of 485 and535 nm, respectively. Each sample was quantified in triplicate and the standard curvewas obtained by diluting the serial concentrations of FTTC-dextran in non-treated serumdiluted in PBS (1:1 v/v). The results are expressed as µg/mL.
2.12. Quantification of Serum Lipopolysaccharide (LPS) Concentration
Endotoxin LPS contents in serum samples were measured by using a PyrochromeLisate Mix, a quantitative chromogenic reagent, diluted in Glucashield® buffer, as previ-ously reported by our group [38].
2.13. Colon and Duodenum Analysis by Transmission Electron Microscopy (TEM)
Duodenum and colon samples collected after the sacrifice were immediately sectionedin small fragments of about 1 mm3 and fixed in 2.5% glutaraldehyde solution in 0.1 Mphosphate buffer (pH = 7.2) for 2 h. Successive post-fixation was done in 1% osmiumtetroxide (1.5 h) and in 1% aqueous uranyl acetate (1 h in the dark). After washing withdistilled water, samples were dehydrated in a graded acetone series (30–100%) and embed-ded in an Epoxy resine (Fluka Analytical, Sigma-Aldrich, Darmstadt, Germany). Ultrathinsections obtained with a Leica EM UC6 (Leica Co, Vienna, Austria) ultramicrotome werethen mounted on copper grids and stained with lead citrate 0.2% for 10 min. Observationswere carried out on a TEM Tecnai G2 Spirit Bio Twin at 100 kV (FEI, Hillsboro, OR, USA),and images were processed using AnalySIS 3.2.
2.14. Immunohistochemical Staining
Cross-sections of rat colon (10 µm) were cut with a cryostat (Leica CM3050S, Nussloch,Germany) and fixed with an acetone:methanol mixture (1:1) at 20 ◦C for 2 min and thenrehydrated in phosphate-buffered saline (PBS) (3 × 5 min). After rinsing, sections were per-meabilized with 0.5% Triton X-100 in PBS for 15 min and blocked for 40 min with 4% non-fatmilk in 20 mM Tris, pH 7.2, and 150 mM NaCl. Then, samples were incubated with primaryantibodies: rabbit polyclonal anti-ZO-1 (ab96587, Abcam, Cambridge, MA, USA) andmouse monoclonal anti-occludin (OC-3F10, 33-1500, Life Tecnologies, Carlsbad, CA, USA)in PBS containing 1% BSA (4 ◦C overnight). After washing with PBS (3 × 5 min), the sec-tions were incubated with the secondary fluorescent antibody Alexa Fluor 488-conjugatedgoat anti-rabbit IgG or Alexa Fluor 568-conjugated donkey anti-mouse IgG (1:200; Molec-ular Probes, Life Technologies, Paisley, UK) and 4′,6-diamidino-2-phenylindole (DAPI,nuclei dye, D1306, Invitrogen, Carlsbad, CA, USA), for 1 h at room temperature. Sampleswere then washed with PBS (3× 5 min), and the slides mounted using the Glycergel mount-ing medium (Dako, C0563, Agilent, Santa Clara, CA, USA). Anti-ZO-1 and anti-occludinimmunostaining samples were imaged using a confocal fluorescence microscope (LSM 710,Carl Zeiss, Gottingen, Germany).
2.15. Hepatic Histological Analysis
Hematoxylin-eosin (H&E) and Oil Red O staining were performed as previouslydescribed [41,55]. Sections were visualized with a Zeiss microscope Mod. Axioplan 2(Zeiss, Jena, Germany).
2.16. Hepatic Triglycerides Quantification
Triglycerides contents in the liver samples were quantified by using a TriglyceridesColorimetric Assay kit (1155010, Cromatest®, Linear Chemicals, Barcelona, Spain), asdescribed previously [56].
2.17. Hepatic SEM Analysis
Frozen liver sections were defrosted and mounted on an SEM stub using a double-sided carbon sticker. The specimens were analyzed using a compact variable-pressure
Nutrients 2021, 13, 4192 8 of 32
scanning electron microscope (Hitachi, FlexSEM 1000, Tokyo, Japan) equipped with acryostage at 15KV.
2.18. Hepatic Mitochondria Bioenergetics
Liver mitochondria were isolated in homogenization medium composed of 250 mMsucrose, 10 mM HEPES (pH 7.4), 0.5 mM EGTA, and 0.1% fat-free bovine serum albumin(BSA), as previously described [57,58]. EGTA and BSA were omitted from the final washingmedium, adjusted at pH 7.4. After homogenization of the minced blood-free hepatic tissue,homogenates were centrifuged at 800× g for 10 min at 4 ◦C. Supernatant was collected andcentrifuged at 10,000× g for 10 min at 4 ◦C to pellet mitochondria, which were resuspendedin washing medium (250 mM sucrose and 10 mM HEPES, pH 7.4) and centrifuged again at10,000× g for 10 min at 4 ◦C. Final pellet were resuspended in a final washing medium andimmediately used. The integrity of mitochondrial (93 ± 2.5%) was assessed by quantifyingcitrate synthase (CS) activity, in the absence and presence of detergentof. The proteinconcentration was measured by using the biuret method calibrated with BSA [59].
2.18.1. Mitochondrial Membrane Potential (∆Ψ)
The mitochondrial membrane potential (∆Ψ) was assessed using an ion-selectiveelectrode to quantify the distribution of tetraphenylphosphonium (TPP+) as previouslydescribed [58,60] using an Ag/AgCl2 electrode as the reference. The parameters evaluatedwere the membrane potential (-mV), lag phase (seconds), repolarization (-mV), respiratoryrates, and ∆Ψ.
2.18.2. Mitochondrial Respiration (Oxygen Consumption) and PermeabilityTransition (MPT)
Mitochondria oxygen consumption was polarographically monitored with a Clarkoxygen electrode (Oxygraph, Hansatech Instruments Ltd., Cambridge, UK) as previouslydescribed [57]. Mitochondrial swelling was followed by changes in light scattering, asmonitored spectrophotometrically at 540 nm, and the reaction conditions were performedas previously described [60]. All the experiments were performed in triplicate.
2.19. Gene Expression by Quantitative Real-Time PCR Analysis
Total RNA samples from liver and colon tissue were extracted using a PureLink RNAMini Kit (12183018A, Ambion, Thermo Fisher Scientific, Carlsbad, CA, USA) as well as aTrizol protocol (93289, Sigma Aldrich; St. Louis, MO, USA), following the manufacturer’sinstructions and as previously described [60].
2.20. Statistical Analysis
The distribution of continuous variables was analyzed using the Kolmogorov–Smirnovtest to assess significant deviations from normality. Differences between experimentalgroups were compared using the nonparametric test Kruskal–Wallis test (followed by theDunn’s test for multiple comparisons) for non-normally distributed data or the parametrictest one-way ANOVA, followed by Bonferroni’s test for multiple comparisons) for normallydistributed data. Repeated measures ANOVA, followed by the Bonferroni post-hoc test,was used to compare glucose levels throughout the GTT and ITT assays. The effect sizewas determined using Cohen’s d (dCohen), which was calculated by dividing the meandifference between the groups by the pooled standard deviation [61]. The effect size wasconsidered as small, medium, or large when dCohen was close to 0.2, 0.5, or 0.8, respectively.A large dCohen without a statistically significant p value means a higher variability and/ora small sample size. The G*Power software (version 1.3.9.4) was used to calculate thestatistical power concerning fasting insulin levels. p-values < 0.05 indicated statisticalsignificance. Results are depicted as the mean ± standard error of the mean (SEM) anddata analyses were performed using GraphPad Prism 6.0 software for Windows.
Nutrients 2021, 13, 4192 9 of 32
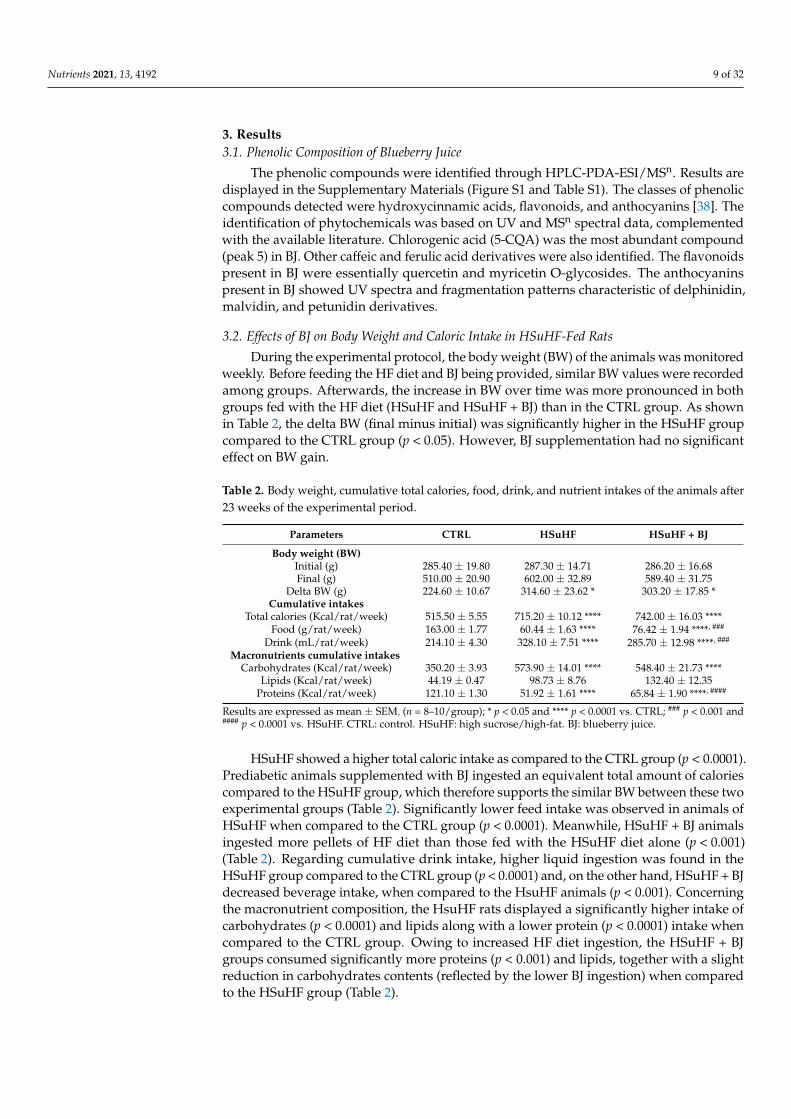
3. Results3.1. Phenolic Composition of Blueberry Juice
The phenolic compounds were identified through HPLC-PDA-ESI/MSn. Results aredisplayed in the Supplementary Materials (Figure S1 and Table S1). The classes of phenoliccompounds detected were hydroxycinnamic acids, flavonoids, and anthocyanins [38]. Theidentification of phytochemicals was based on UV and MSn spectral data, complementedwith the available literature. Chlorogenic acid (5-CQA) was the most abundant compound(peak 5) in BJ. Other caffeic and ferulic acid derivatives were also identified. The flavonoidspresent in BJ were essentially quercetin and myricetin O-glycosides. The anthocyaninspresent in BJ showed UV spectra and fragmentation patterns characteristic of delphinidin,malvidin, and petunidin derivatives.
3.2. Effects of BJ on Body Weight and Caloric Intake in HSuHF-Fed Rats
During the experimental protocol, the body weight (BW) of the animals was monitoredweekly. Before feeding the HF diet and BJ being provided, similar BW values were recordedamong groups. Afterwards, the increase in BW over time was more pronounced in bothgroups fed with the HF diet (HSuHF and HSuHF + BJ) than in the CTRL group. As shownin Table 2, the delta BW (final minus initial) was significantly higher in the HSuHF groupcompared to the CTRL group (p < 0.05). However, BJ supplementation had no significanteffect on BW gain.
Table 2. Body weight, cumulative total calories, food, drink, and nutrient intakes of the animals after23 weeks of the experimental period.
Parameters CTRL HSuHF HSuHF + BJ
Body weight (BW)Initial (g) 285.40 ± 19.80 287.30 ± 14.71 286.20 ± 16.68Final (g) 510.00 ± 20.90 602.00 ± 32.89 589.40 ± 31.75
Delta BW (g) 224.60 ± 10.67 314.60 ± 23.62 * 303.20 ± 17.85 *Cumulative intakes
Total calories (Kcal/rat/week) 515.50 ± 5.55 715.20 ± 10.12 **** 742.00 ± 16.03 ****Food (g/rat/week) 163.00 ± 1.77 60.44 ± 1.63 **** 76.42 ± 1.94 ****, ###
Drink (mL/rat/week) 214.10 ± 4.30 328.10 ± 7.51 **** 285.70 ± 12.98 ****, ###
Macronutrients cumulative intakesCarbohydrates (Kcal/rat/week) 350.20 ± 3.93 573.90 ± 14.01 **** 548.40 ± 21.73 ****
Lipids (Kcal/rat/week) 44.19 ± 0.47 98.73 ± 8.76 132.40 ± 12.35Proteins (Kcal/rat/week) 121.10 ± 1.30 51.92 ± 1.61 **** 65.84 ± 1.90 ****, ####
Results are expressed as mean ± SEM. (n = 8–10/group); * p < 0.05 and **** p < 0.0001 vs. CTRL; ### p < 0.001 and#### p < 0.0001 vs. HSuHF. CTRL: control. HSuHF: high sucrose/high-fat. BJ: blueberry juice.
HSuHF showed a higher total caloric intake as compared to the CTRL group (p < 0.0001).Prediabetic animals supplemented with BJ ingested an equivalent total amount of caloriescompared to the HSuHF group, which therefore supports the similar BW between these twoexperimental groups (Table 2). Significantly lower feed intake was observed in animals ofHSuHF when compared to the CTRL group (p < 0.0001). Meanwhile, HSuHF + BJ animalsingested more pellets of HF diet than those fed with the HSuHF diet alone (p < 0.001)(Table 2). Regarding cumulative drink intake, higher liquid ingestion was found in theHSuHF group compared to the CTRL group (p < 0.0001) and, on the other hand, HSuHF + BJdecreased beverage intake, when compared to the HsuHF animals (p < 0.001). Concerningthe macronutrient composition, the HsuHF rats displayed a significantly higher intake ofcarbohydrates (p < 0.0001) and lipids along with a lower protein (p < 0.0001) intake whencompared to the CTRL group. Owing to increased HF diet ingestion, the HSuHF + BJgroups consumed significantly more proteins (p < 0.001) and lipids, together with a slightreduction in carbohydrates contents (reflected by the lower BJ ingestion) when comparedto the HSuHF group (Table 2).
Nutrients 2021, 13, 4192 10 of 32
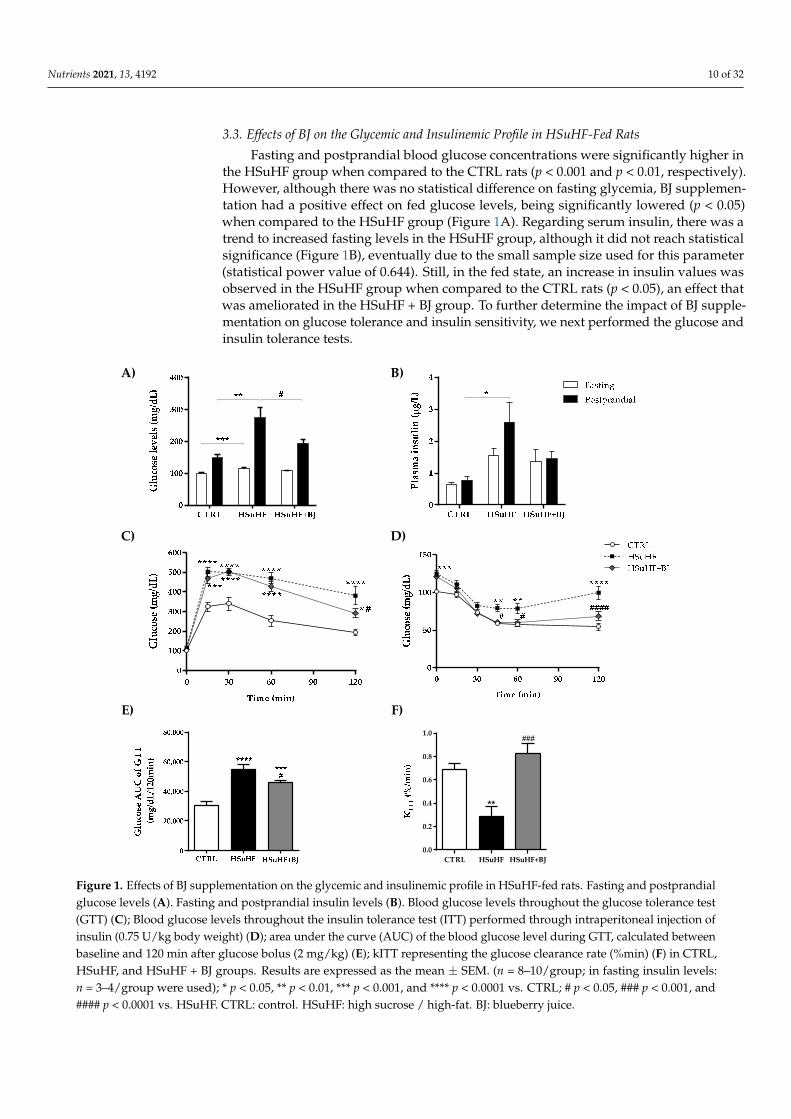
3.3. Effects of BJ on the Glycemic and Insulinemic Profile in HSuHF-Fed Rats
Fasting and postprandial blood glucose concentrations were significantly higher inthe HSuHF group when compared to the CTRL rats (p < 0.001 and p < 0.01, respectively).However, although there was no statistical difference on fasting glycemia, BJ supplemen-tation had a positive effect on fed glucose levels, being significantly lowered (p < 0.05)when compared to the HSuHF group (Figure 1A). Regarding serum insulin, there was atrend to increased fasting levels in the HSuHF group, although it did not reach statisticalsignificance (Figure 1B), eventually due to the small sample size used for this parameter(statistical power value of 0.644). Still, in the fed state, an increase in insulin values wasobserved in the HSuHF group when compared to the CTRL rats (p < 0.05), an effect thatwas ameliorated in the HSuHF + BJ group. To further determine the impact of BJ supple-mentation on glucose tolerance and insulin sensitivity, we next performed the glucose andinsulin tolerance tests.
Nutrients 2021, 13, x FOR PEER REVIEW 11 of 33
Figure 1. Effects of BJ supplementation on the glycemic and insulinemic profile in HSuHF-fed rats. Fasting and postpran-dial glucose levels (A). Fasting and postprandial insulin levels (B). Blood glucose levels throughout the glucose tolerance test (GTT) (C); Blood glucose levels throughout the insulin tolerance test (ITT) performed through intraperitoneal injection of insulin (0.75 U/kg body weight) (D); area under the curve (AUC) of the blood glucose level during GTT, calculated between baseline and 120 min after glucose bolus (2 mg/kg) (E); kITT representing the glucose clearance rate (%min) (F) in CTRL, HSuHF, and HSuHF + BJ groups. Results are expressed as the mean ± SEM. (n = 8–10/group; in fasting insulin levels: n = 3–4/group were used); * p < 0.05, ** p < 0.01, *** p < 0.001, and **** p < 0.0001 vs. CTRL; # p < 0.05, ### p < 0.001, and #### p < 0.0001 vs. HSuHF. CTRL: control. HSuHF: high sucrose / high-fat. BJ: blueberry juice.
As expected, HSuHF displayed glucose intolerance and insulin resistance as revealed by the higher glucose concentrations throughout the 2 h of GTT and ITT (Figure 1C,D, respectively) and further supported by both the significantly higher area under the curve (AUC) of GTT (p < 0.001 vs. CTRL group) (Figure 1E) and lower glucose disappearance rate (kiTT), a measure of insulin sensitivity (p < 0.01 vs. CTRL group) (Figure 1F). Other-wise, no statistical changes were found in the fasting glucose and insulin levels between the two experimental groups. However, in the HSuHF + BJ-treated rats, glucose intoler-ance and insulin sensitivity were alleviated when compared to the HSuHF group, as re-flected by both the lower AUC of GTT (p < 0.05) and significantly higher kITT values (p < 0.001) (Figure 1C–F). Collectively, these findings indicate that BJ supplementation had significant protection against glucose intolerance and insulin resistance in the prediabetic rats.
CTRL HSuHF HSuHF+BJ0.0
0.2
0.4
0.6
0.8
1.0
**
###
A)
C)
B)
D)
E) F)
Figure 1. Effects of BJ supplementation on the glycemic and insulinemic profile in HSuHF-fed rats. Fasting and postprandialglucose levels (A). Fasting and postprandial insulin levels (B). Blood glucose levels throughout the glucose tolerance test(GTT) (C); Blood glucose levels throughout the insulin tolerance test (ITT) performed through intraperitoneal injection ofinsulin (0.75 U/kg body weight) (D); area under the curve (AUC) of the blood glucose level during GTT, calculated betweenbaseline and 120 min after glucose bolus (2 mg/kg) (E); kITT representing the glucose clearance rate (%min) (F) in CTRL,HSuHF, and HSuHF + BJ groups. Results are expressed as the mean ± SEM. (n = 8–10/group; in fasting insulin levels:n = 3–4/group were used); * p < 0.05, ** p < 0.01, *** p < 0.001, and **** p < 0.0001 vs. CTRL; # p < 0.05, ### p < 0.001, and#### p < 0.0001 vs. HSuHF. CTRL: control. HSuHF: high sucrose / high-fat. BJ: blueberry juice.
Nutrients 2021, 13, 4192 11 of 32
As expected, HSuHF displayed glucose intolerance and insulin resistance as revealedby the higher glucose concentrations throughout the 2 h of GTT and ITT (Figure 1C,D,respectively) and further supported by both the significantly higher area under the curve(AUC) of GTT (p < 0.001 vs. CTRL group) (Figure 1E) and lower glucose disappearance rate(kiTT), a measure of insulin sensitivity (p < 0.01 vs. CTRL group) (Figure 1F). Otherwise,no statistical changes were found in the fasting glucose and insulin levels between thetwo experimental groups. However, in the HSuHF + BJ-treated rats, glucose intoleranceand insulin sensitivity were alleviated when compared to the HSuHF group, as reflectedby both the lower AUC of GTT (p < 0.05) and significantly higher kITT values (p < 0.001)(Figure 1C–F). Collectively, these findings indicate that BJ supplementation had significantprotection against glucose intolerance and insulin resistance in the prediabetic rats.
3.4. Effects of BJ on the Serum Lipid Profile and Redox Status Markers in HSuHF-Fed Rats
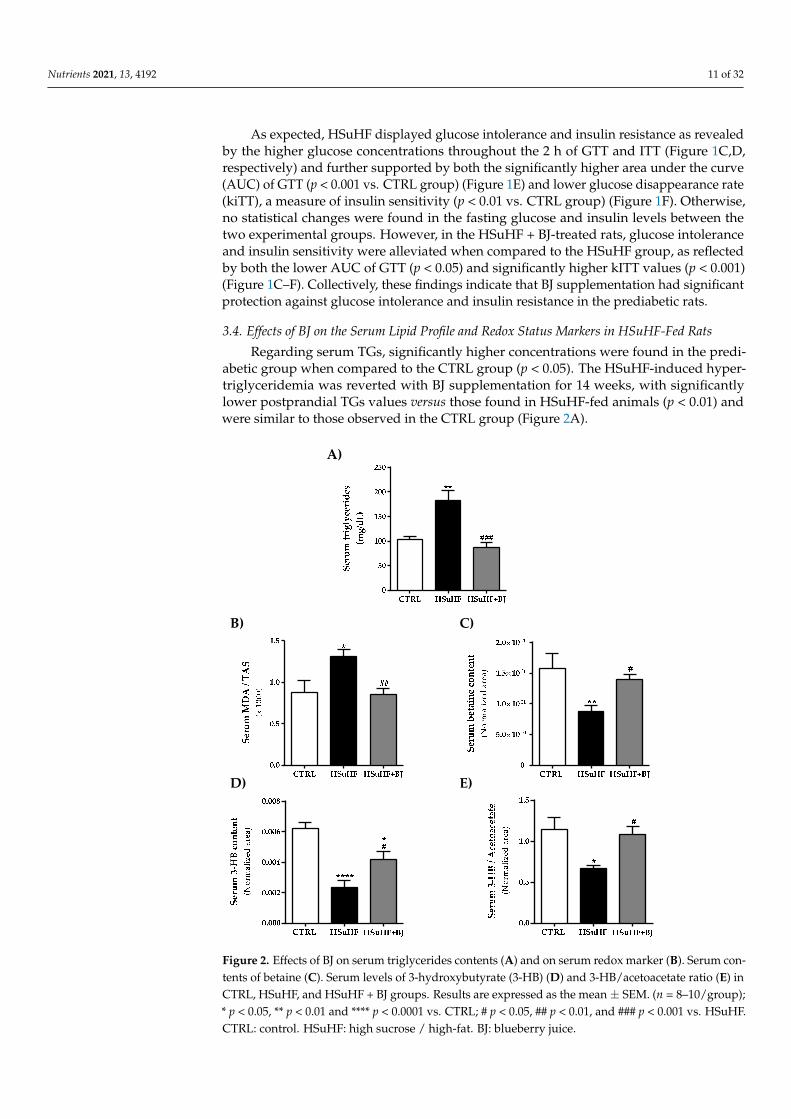
Regarding serum TGs, significantly higher concentrations were found in the predi-abetic group when compared to the CTRL group (p < 0.05). The HSuHF-induced hyper-triglyceridemia was reverted with BJ supplementation for 14 weeks, with significantlylower postprandial TGs values versus those found in HSuHF-fed animals (p < 0.01) andwere similar to those observed in the CTRL group (Figure 2A).
Nutrients 2021, 13, x FOR PEER REVIEW 12 of 33
3.4. Effects of BJ on the Serum Lipid Profile and Redox Status Markers in HSuHF-Fed Rats Regarding serum TGs, significantly higher concentrations were found in the predia-
betic group when compared to the CTRL group (p < 0.05). The HSuHF-induced hypertri-glyceridemia was reverted with BJ supplementation for 14 weeks, with significantly lower postprandial TGs values versus those found in HSuHF-fed animals (p < 0.01) and were similar to those observed in the CTRL group (Figure 2A).
Serum total antioxidant status (TAS) and MDA levels were used to assess the total antioxidant capacity and lipid peroxidation. We determined the serum MDA/TAS ratio as a redox status marker. The HsuHF group presented significantly higher values of the se-rum MDA/TAS ratio (p < 0.05 vs. CTRL group). This effect was restored by BJ supplemen-tation in the HSuHF + BJ-treated group, which showed a significantly lower MDA/TAS ratio (p < 0.01) compared to the HSuHF-fed animals, suggesting a restored antioxidant profile (Figure 2B).
Figure 2. Effects of BJ on serum triglycerides contents (A) and on serum redox marker (B). Serum contents of betaine (C). Serum levels of 3-hydroxybutyrate (3-HB) (D) and 3-HB/acetoacetate ratio (E) in CTRL, HSuHF, and HSuHF + BJ groups. Results are expressed as the mean ± SEM. (n = 8–10/group); * p < 0.05, ** p < 0.01 and **** p < 0.0001 vs. CTRL; # p < 0.05, ## p < 0.01, and ### p < 0.001 vs. HSuHF. CTRL: control. HSuHF: high sucrose / high-fat. BJ: blueberry juice.
Moreover, we further performed a nontargeted proton nuclear magnetic resonance spectroscopy (1H NMR)-based metabolomic approach in serum samples to identify pos-sible endogenous metabolite alterations and to define putative molecular mechanisms un-derpinning BJ protection. The identified serum metabolites as well as their chemical shifts are listed in the Supplementary Materials (Table S2). To identify the key metabolite changes between the groups, a partial least squares-discriminate analysis (PLS-DA) was performed. Accordingly with the multivariate data analysis, the most pronounced find-ings were related to betaine and ketone bodies levels. There was a significant reduction in
B)
D)
C)
E)
A)
Figure 2. Effects of BJ on serum triglycerides contents (A) and on serum redox marker (B). Serum con-tents of betaine (C). Serum levels of 3-hydroxybutyrate (3-HB) (D) and 3-HB/acetoacetate ratio (E) inCTRL, HSuHF, and HSuHF + BJ groups. Results are expressed as the mean± SEM. (n = 8–10/group);* p < 0.05, ** p < 0.01 and **** p < 0.0001 vs. CTRL; # p < 0.05, ## p < 0.01, and ### p < 0.001 vs. HSuHF.CTRL: control. HSuHF: high sucrose / high-fat. BJ: blueberry juice.
Nutrients 2021, 13, 4192 12 of 32
Serum total antioxidant status (TAS) and MDA levels were used to assess the totalantioxidant capacity and lipid peroxidation. We determined the serum MDA/TAS ratio asa redox status marker. The HsuHF group presented significantly higher values of the serumMDA/TAS ratio (p < 0.05 vs. CTRL group). This effect was restored by BJ supplementationin the HSuHF + BJ-treated group, which showed a significantly lower MDA/TAS ratio(p < 0.01) compared to the HSuHF-fed animals, suggesting a restored antioxidant profile(Figure 2B).
Moreover, we further performed a nontargeted proton nuclear magnetic resonancespectroscopy (1H NMR)-based metabolomic approach in serum samples to identify pos-sible endogenous metabolite alterations and to define putative molecular mechanismsunderpinning BJ protection. The identified serum metabolites as well as their chemicalshifts are listed in the Supplementary Materials (Table S2). To identify the key metabo-lite changes between the groups, a partial least squares-discriminate analysis (PLS-DA)was performed. Accordingly with the multivariate data analysis, the most pronouncedfindings were related to betaine and ketone bodies levels. There was a significant re-duction in betaine levels in serum samples from HSuHF-fed animals compared to theCTRL group (p < 0.05), which was slightly recovered in serum from HSuHF + BJ-treatedanimals (p < 0.05 vs. HSuHF group). The levels of 3-hydroxybutyrate (3-HB) and the3-HB/acetoacetate ratio were significantly lowered in the serum of the HSuHF-fed groupcompared to the CTRL group. Conversely, a remarkable recovery in the contents of thesemetabolites was found in the serum of HSuHF + BJ -treated animals when compared to theprediabetic group (p < 0.05 vs. HSuHF group), reaching similar values from those found inthe control group. Moreover, the relative concentrations of valine, histidine, lactate, andN-acetylglycoproteins were significantly lower in the HSuHF group, when compared withcontrol animals; however, BJ supplementation had no significant impact on their contentsin serum, as can be seen in the Supplementary Materials Table S2.
3.5. Effects of BJ on Gut Microbiota Composition and Intestinal Integrity in HSuHF-Fed Rats
We assessed the composition of the bacterial community by real-time PCR and theSCFAs and organic acids by HPLC in fecal samples that were collected at the end of theexperimental protocol. As shown in Table 3, the GM composition of HSuHF-fed ratswas modestly altered compared to the control´s GM. The hypercaloric diet-fed animalspresented a trend of a decreased relative abundance of Firmicutes and Bacteroidetes phylumindependently of the supplementation with BJ, albeit no significant differences were foundwhen compared to the CTRL group. Moreover, a trend was observed towards an increase inthe Firmicutes/Bacteroidetes ratio and Enterococcus in HSuHF-fed rats but without statisticalsignificance when compared to the control animals (p > 0.05).
The abundance of Akkermansia was significantly lower in HSuHF-fed animals (p < 0.05)compared to the control animals. Nonetheless, in spite of the BJ addition showing atrend to counteract the loss of the proportions of Akkermansia induced by hypercaloricfeeding, a modest antimicrobial effect of BJ was encountered in the fecal GM compositionfrom BJ-treated animals. Interestingly, the gut microbiota of the HSuHF + BJ group wasless abundant in Bifidobacterium and Prevotella when compared to the gut microbiota ofuntreated prediabetic animals (Table 3).
Despite these subtle changes observed in the bacterial community from HSuHFgroups, the SCFA profile revealed a lowered fecal content of butyric and propionic acidswhen compared to the CTRL group (p < 0.01 and p < 0.05, respectively). Moreover, the BJsupplementation was unable to alter the fecal SCFAs contents compared to the HSuHF-untreated rats (Table 3); however, the addition of BJ resulted in a significant decrease inthe fecal contents of succinic acid when compared to the gut microbiota of the untreatedHSuHF group (p < 0.05), likely due to the loss of the succinate-producing Prevotella ssp.
Nutrients 2021, 13, 4192 13 of 32
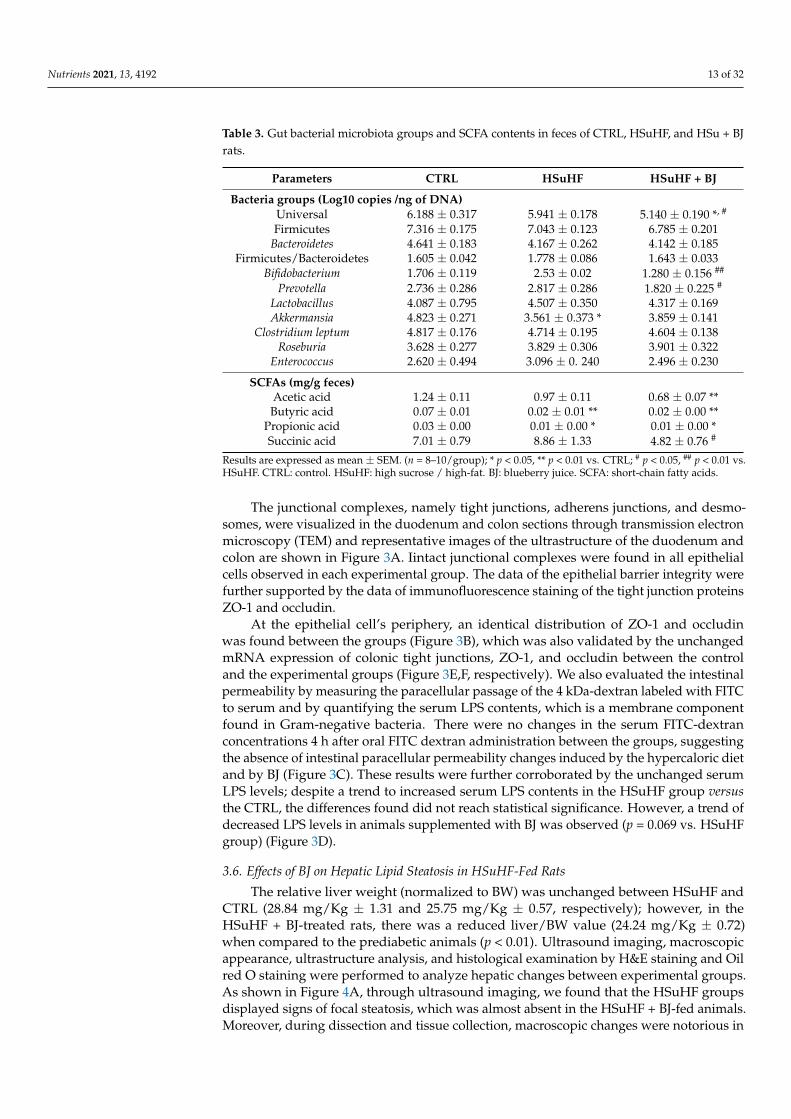
Table 3. Gut bacterial microbiota groups and SCFA contents in feces of CTRL, HSuHF, and HSu + BJrats.
Parameters CTRL HSuHF HSuHF + BJ
Bacteria groups (Log10 copies /ng of DNA)Universal 6.188 ± 0.317 5.941 ± 0.178 5.140 ± 0.190 *, #
Firmicutes 7.316 ± 0.175 7.043 ± 0.123 6.785 ± 0.201Bacteroidetes 4.641 ± 0.183 4.167 ± 0.262 4.142 ± 0.185
Firmicutes/Bacteroidetes 1.605 ± 0.042 1.778 ± 0.086 1.643 ± 0.033Bifidobacterium 1.706 ± 0.119 2.53 ± 0.02 1.280 ± 0.156 ##
Prevotella 2.736 ± 0.286 2.817 ± 0.286 1.820 ± 0.225 #
Lactobacillus 4.087 ± 0.795 4.507 ± 0.350 4.317 ± 0.169Akkermansia 4.823 ± 0.271 3.561 ± 0.373 * 3.859 ± 0.141
Clostridium leptum 4.817 ± 0.176 4.714 ± 0.195 4.604 ± 0.138Roseburia 3.628 ± 0.277 3.829 ± 0.306 3.901 ± 0.322
Enterococcus 2.620 ± 0.494 3.096 ± 0. 240 2.496 ± 0.230
SCFAs (mg/g feces)Acetic acid 1.24 ± 0.11 0.97 ± 0.11 0.68 ± 0.07 **Butyric acid 0.07 ± 0.01 0.02 ± 0.01 ** 0.02 ± 0.00 **
Propionic acid 0.03 ± 0.00 0.01 ± 0.00 * 0.01 ± 0.00 *Succinic acid 7.01 ± 0.79 8.86 ± 1.33 4.82 ± 0.76 #
Results are expressed as mean ± SEM. (n = 8–10/group); * p < 0.05, ** p < 0.01 vs. CTRL; # p < 0.05, ## p < 0.01 vs.HSuHF. CTRL: control. HSuHF: high sucrose / high-fat. BJ: blueberry juice. SCFA: short-chain fatty acids.
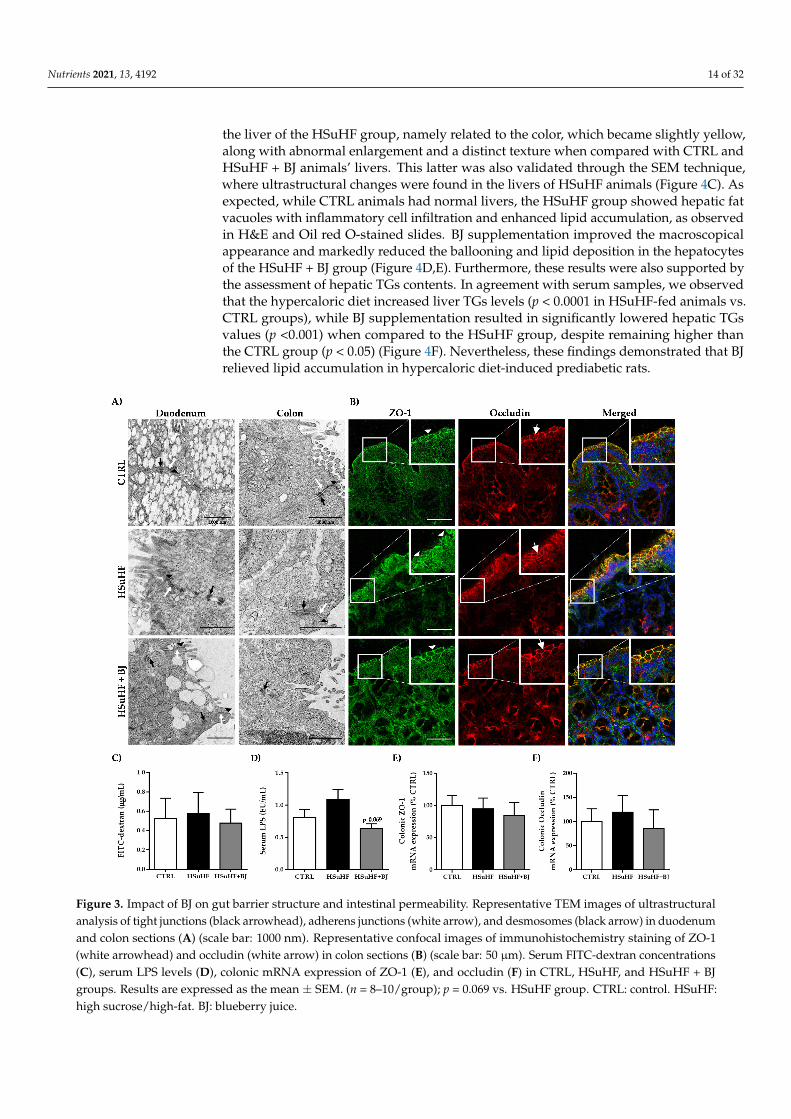
The junctional complexes, namely tight junctions, adherens junctions, and desmo-somes, were visualized in the duodenum and colon sections through transmission electronmicroscopy (TEM) and representative images of the ultrastructure of the duodenum andcolon are shown in Figure 3A. Iintact junctional complexes were found in all epithelialcells observed in each experimental group. The data of the epithelial barrier integrity werefurther supported by the data of immunofluorescence staining of the tight junction proteinsZO-1 and occludin.
At the epithelial cell’s periphery, an identical distribution of ZO-1 and occludinwas found between the groups (Figure 3B), which was also validated by the unchangedmRNA expression of colonic tight junctions, ZO-1, and occludin between the controland the experimental groups (Figure 3E,F, respectively). We also evaluated the intestinalpermeability by measuring the paracellular passage of the 4 kDa-dextran labeled with FITCto serum and by quantifying the serum LPS contents, which is a membrane componentfound in Gram-negative bacteria. There were no changes in the serum FITC-dextranconcentrations 4 h after oral FITC dextran administration between the groups, suggestingthe absence of intestinal paracellular permeability changes induced by the hypercaloric dietand by BJ (Figure 3C). These results were further corroborated by the unchanged serumLPS levels; despite a trend to increased serum LPS contents in the HSuHF group versusthe CTRL, the differences found did not reach statistical significance. However, a trend ofdecreased LPS levels in animals supplemented with BJ was observed (p = 0.069 vs. HSuHFgroup) (Figure 3D).
3.6. Effects of BJ on Hepatic Lipid Steatosis in HSuHF-Fed Rats
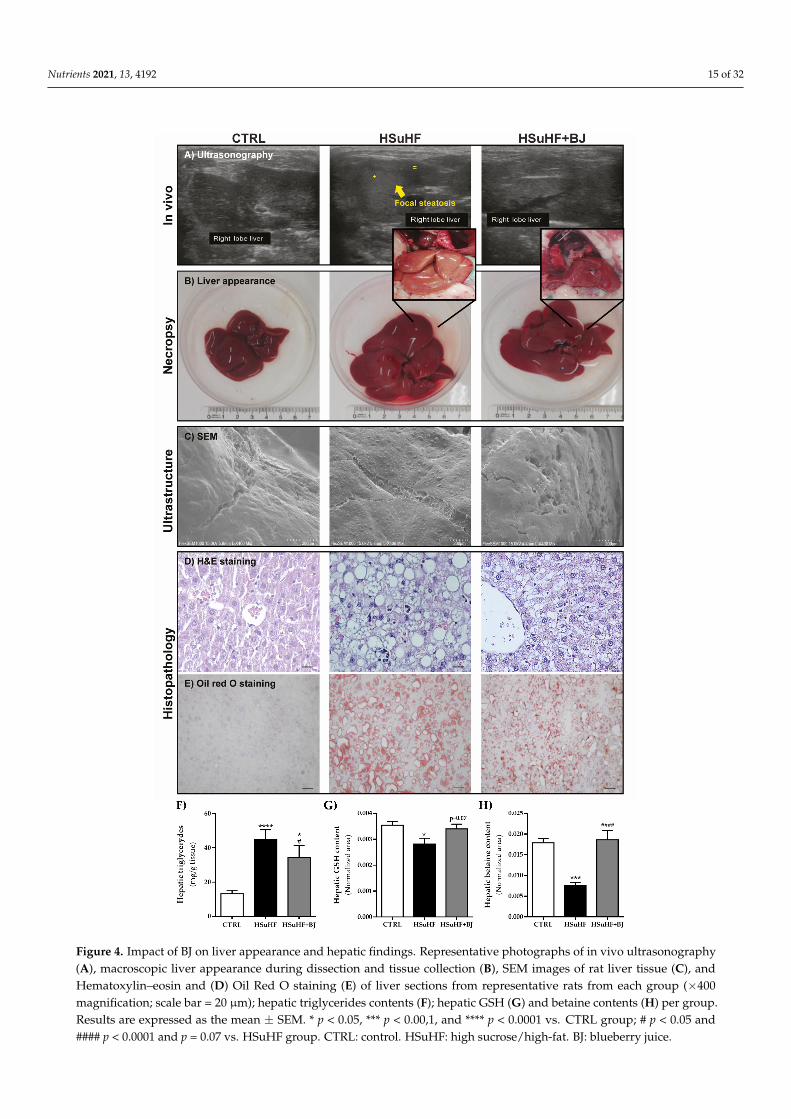
The relative liver weight (normalized to BW) was unchanged between HSuHF andCTRL (28.84 mg/Kg ± 1.31 and 25.75 mg/Kg ± 0.57, respectively); however, in theHSuHF + BJ-treated rats, there was a reduced liver/BW value (24.24 mg/Kg ± 0.72)when compared to the prediabetic animals (p < 0.01). Ultrasound imaging, macroscopicappearance, ultrastructure analysis, and histological examination by H&E staining and Oilred O staining were performed to analyze hepatic changes between experimental groups.As shown in Figure 4A, through ultrasound imaging, we found that the HSuHF groupsdisplayed signs of focal steatosis, which was almost absent in the HSuHF + BJ-fed animals.Moreover, during dissection and tissue collection, macroscopic changes were notorious in
Nutrients 2021, 13, 4192 14 of 32
the liver of the HSuHF group, namely related to the color, which became slightly yellow,along with abnormal enlargement and a distinct texture when compared with CTRL andHSuHF + BJ animals’ livers. This latter was also validated through the SEM technique,where ultrastructural changes were found in the livers of HSuHF animals (Figure 4C). Asexpected, while CTRL animals had normal livers, the HSuHF group showed hepatic fatvacuoles with inflammatory cell infiltration and enhanced lipid accumulation, as observedin H&E and Oil red O-stained slides. BJ supplementation improved the macroscopicalappearance and markedly reduced the ballooning and lipid deposition in the hepatocytesof the HSuHF + BJ group (Figure 4D,E). Furthermore, these results were also supported bythe assessment of hepatic TGs contents. In agreement with serum samples, we observedthat the hypercaloric diet increased liver TGs levels (p < 0.0001 in HSuHF-fed animals vs.CTRL groups), while BJ supplementation resulted in significantly lowered hepatic TGsvalues (p <0.001) when compared to the HSuHF group, despite remaining higher thanthe CTRL group (p < 0.05) (Figure 4F). Nevertheless, these findings demonstrated that BJrelieved lipid accumulation in hypercaloric diet-induced prediabetic rats.
Nutrients 2021, 13, x FOR PEER REVIEW 14 of 33
Despite these subtle changes observed in the bacterial community from HSuHF groups, the SCFA profile revealed a lowered fecal content of butyric and propionic acids when compared to the CTRL group (p < 0.01 and p < 0.05, respectively). Moreover, the BJ supplementation was unable to alter the fecal SCFAs contents compared to the HSuHF-untreated rats (Table 3); however, the addition of BJ resulted in a significant decrease in the fecal contents of succinic acid when compared to the gut microbiota of the untreated HSuHF group (p < 0.05), likely due to the loss of the succinate-producing Prevotella ssp.
The junctional complexes, namely tight junctions, adherens junctions, and desmo-somes, were visualized in the duodenum and colon sections through transmission elec-tron microscopy (TEM) and representative images of the ultrastructure of the duodenum and colon are shown in Figure 3A. Iintact junctional complexes were found in all epithelial cells observed in each experimental group. The data of the epithelial barrier integrity were further supported by the data of immunofluorescence staining of the tight junction pro-teins ZO-1 and occludin.
Figure 3. Impact of BJ on gut barrier structure and intestinal permeability. Representative TEM images of ultrastructural analysis of tight junctions (black arrowhead), adherens junctions (white arrow), and desmosomes (black arrow) in duode-num and colon sections (A) (scale bar: 1000 nm). Representative confocal images of immunohistochemistry staining of ZO-1 (white arrowhead) and occludin (white arrow) in colon sections (B) (scale bar: 50 μm). Serum FITC-dextran concen-trations (C), serum LPS levels (D), colonic mRNA expression of ZO-1 (E), and occludin (F) in CTRL, HSuHF, and HSuHF + BJ groups. Results are expressed as the mean ± SEM. (n = 8–10/group); p = 0.069 vs. HSuHF group. CTRL: control. HSuHF: high sucrose / high-fat. BJ: blueberry juice.
At the epithelial cell’s periphery, an identical distribution of ZO-1 and occludin was found between the groups (Figure 3B), which was also validated by the unchanged mRNA
Figure 3. Impact of BJ on gut barrier structure and intestinal permeability. Representative TEM images of ultrastructuralanalysis of tight junctions (black arrowhead), adherens junctions (white arrow), and desmosomes (black arrow) in duodenumand colon sections (A) (scale bar: 1000 nm). Representative confocal images of immunohistochemistry staining of ZO-1(white arrowhead) and occludin (white arrow) in colon sections (B) (scale bar: 50 µm). Serum FITC-dextran concentrations(C), serum LPS levels (D), colonic mRNA expression of ZO-1 (E), and occludin (F) in CTRL, HSuHF, and HSuHF + BJgroups. Results are expressed as the mean ± SEM. (n = 8–10/group); p = 0.069 vs. HSuHF group. CTRL: control. HSuHF:high sucrose/high-fat. BJ: blueberry juice.
Nutrients 2021, 13, 4192 15 of 32Nutrients 2021, 13, x FOR PEER REVIEW 16 of 33
Figure 4. Impact of BJ on liver appearance and hepatic findings. Representative photographs of in vivo ultrasonography (A), macroscopic liver appearance during dissection and tissue collection (B), SEM images of rat liver tissue (C), and He-matoxylin–eosin and (D) Oil Red O staining (E) of liver sections from representative rats from each group (×400 magnifi-cation; scale bar = 20 μm); hepatic triglycerides contents (F); hepatic GSH (G) and betaine contents (H) per group. Results
Figure 4. Impact of BJ on liver appearance and hepatic findings. Representative photographs of in vivo ultrasonography(A), macroscopic liver appearance during dissection and tissue collection (B), SEM images of rat liver tissue (C), andHematoxylin–eosin and (D) Oil Red O staining (E) of liver sections from representative rats from each group (×400magnification; scale bar = 20 µm); hepatic triglycerides contents (F); hepatic GSH (G) and betaine contents (H) per group.Results are expressed as the mean ± SEM. * p < 0.05, *** p < 0.00,1, and **** p < 0.0001 vs. CTRL group; # p < 0.05 and#### p < 0.0001 and p = 0.07 vs. HSuHF group. CTRL: control. HSuHF: high sucrose/high-fat. BJ: blueberry juice.
Nutrients 2021, 13, 4192 16 of 32
Multivariate analysis was performed on 1H NMR data for hepatic metabolic profilecomparison between the CTRL and experimental groups. Metabolomic analysis of the liversamples demonstrated a reduced hepatic glutathione level in HSuHF rats compared to theCTRL group. Although missing statistical significance, there was a clear trend of increasedhepatic GSH levels in the HSuHF + BJ rats (p = 0.07 vs. HSuHF-fed rats) (Figure 4G). Inaddition, the relative levels of betaine were significantly decreased in the liver of prediabeticanimals, which were totally recovered in HSuHF + BJ-treated rats (Figure 4H).
3.7. Impact of BJ on Hepatic Mitochondrial Function in HSuHF Rats
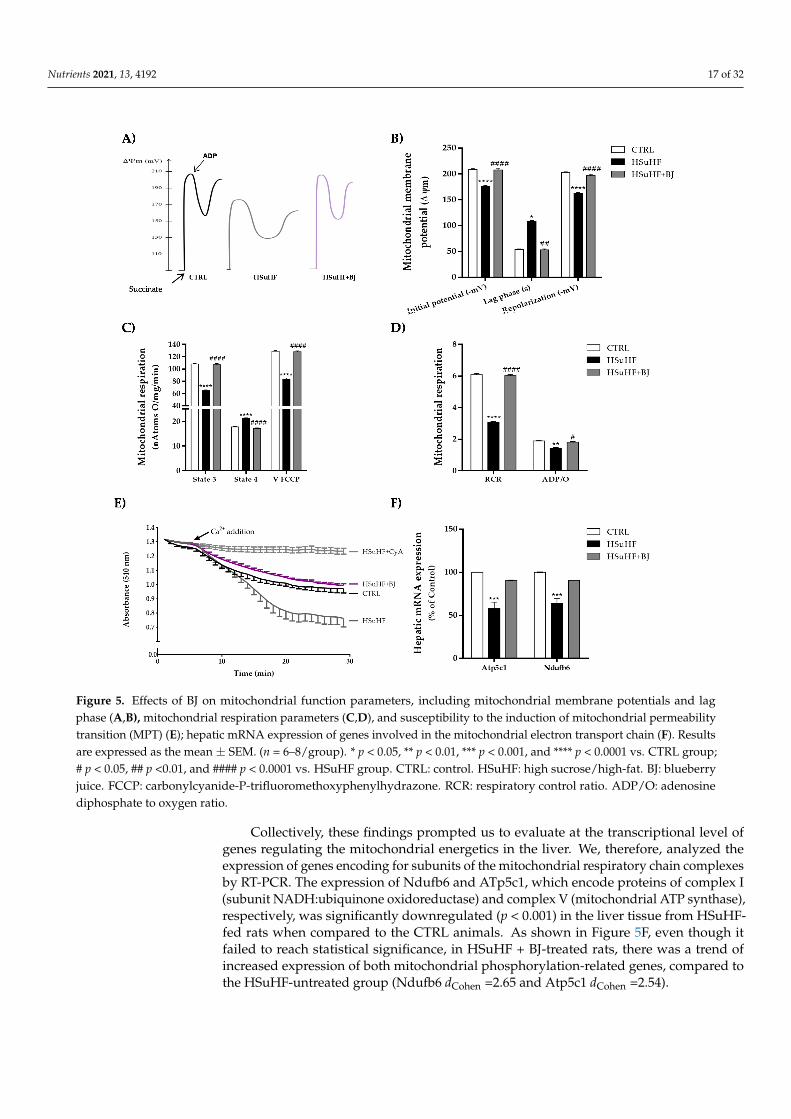
To elucidate whether BJ consumption induced protective effects on hepatic mito-chondrial function, we assessed several bioenergetic parameters in isolated hepatic mi-tochondria. Oxidative phosphorylation relies on the generation of a transmembraneelectrochemical potential (∆Ψ, in the form of a proton gradient), associated with molecularoxygen consumption. Compared to the control group, the hepatic mitochondria fromHSuHF groups showed a significant reduction in mitochondrial initial ∆Ψ (after substrateaddition) and ∆Ψ after repolarization (mitochondrial capacity to establish ∆Ψ after ADPphosphorylation). These parameters were clearly reverted by BJ supplementation in theHSuHF + BJ-treated rats. In addition, a significant increase in the lag phase time (which rep-resents the time required for ADP phosphorylation) was noticed in hepatic mitochondriafrom HSuHF-fed animals compared to the CTRL groups (p < 0.05), suggesting a compro-mised hepatic mitochondrial function in HSuHF-fed animals. In contrast, mitochondriafrom HSuHF + BJ-treated animals showed a shorter lag-phase, which indicated fasterphosphorylation activity (Figure 5A,B).
The putative alterations in the respiratory chains and oxidative phosphorylative sys-tem of mitochondria isolated from the control and both experimental groups were alsodetermined by following the oxygen consumption in the presence of succinate. Mito-chondria isolated from HSuHF-fed rats displayed a significant decline in respiratory state3 (ADP-stimulated respiration) and FCCP-uncoupled respiratory rates together with anincrease in respiratory state 4 (in the ADP absence, corresponding to the resting state)(p < 0.0001), when compared to mitochondria from the control group (Figure 5C). Con-sequently, the respiratory control ratio (RCR) was significantly lowered (p < 0.0001) inmitochondria isolated from the livers of HSuHF-fed animals (Figure 5D). Additionally,the oxidative phosphorylation efficiency estimated by the ADP/O ratio was significantlydecreased in mitochondria from HSuHF-fed rats as compared to control animals (p < 0.01)(Figure 5D), reflecting an uncoupling between respiration and ADP phosphorylation. BJsupplementation effectively reversed the effects of the HSuHF diet on mitochondrial res-piration parameters. When compared to rats fed simply with a hypercaloric diet, theresults showed that mitochondria from HSuHF + BJ-treated rats had a significant rise inrespiratory state 3, FCCP-uncoupled respiration, RCR, and the ADP/O ratio, as well asreduced state 4 respiration (Figure 5C,D).
Figure 5E illustrates the induction of mitochondrial swelling as a marker for perme-ability transition pore induction. The isolated hepatic mitochondria from HSuHF in thepresence of 20 nmol Ca2+ and 5 mM succinate underwent a pronounced decrease in lightscattering, reflecting the ability to further induce the opening of the mitochondrial mem-brane permeability transition pore. The hypercaloric diet-induced mitochondrial swellingwas completely prevented by BJ supplementation, as detected by an increase in lightscattering. Furthermore, hypercaloric diet-induced swelling was sensitive to cyclosporin A(Figure 5E), reflecting calcium-dependent MPT induction.
Nutrients 2021, 13, 4192 17 of 32Nutrients 2021, 13, x FOR PEER REVIEW 18 of 33
Figure 5. Effects of BJ on mitochondrial function parameters, including mitochondrial membrane potentials and lag phase (A,B), mitochondrial respiration parameters (C,D), and susceptibility to the induction of mitochondrial permeability tran-sition (MPT) (E); hepatic mRNA expression of genes involved in the mitochondrial electron transport chain (F). Results are expressed as the mean ± SEM. (n = 6–8/group). * p < 0.05, ** p < 0.01, *** p < 0.001, and **** p < 0.0001 vs. CTRL group; # p < 0.05, ## p <0.01, and #### p < 0.0001 vs. HSuHF group. CTRL: control. HSuHF: high sucrose / high-fat. BJ: blueberry juice. FCCP: carbonylcyanide-P-trifluoromethoxyphenylhydrazone. RCR: respiratory control ratio. ADP/O: adenosine di-phosphate to oxygen ratio.
Collectively, these findings prompted us to evaluate at the transcriptional level of genes regulating the mitochondrial energetics in the liver. We, therefore, analyzed the ex-pression of genes encoding for subunits of the mitochondrial respiratory chain complexes by RT-PCR. The expression of Ndufb6 and ATp5c1, which encode proteins of complex I (subunit NADH:ubiquinone oxidoreductase) and complex V (mitochondrial ATP syn-thase), respectively, was significantly downregulated (p < 0.001) in the liver tissue from HSuHF-fed rats when compared to the CTRL animals. As shown in Figure 5F, even though it failed to reach statistical significance, in HSuHF + BJ-treated rats, there was a trend of increased expression of both mitochondrial phosphorylation-related genes, com-pared to the HSuHF-untreated group (Ndufb6 dCohen =2.65 and Atp5c1 dCohen =2.54).
3.8. Effects of BJ on Hepatic mRNA Expression of Inflammation-Related Genes
Figure 5. Effects of BJ on mitochondrial function parameters, including mitochondrial membrane potentials and lagphase (A,B), mitochondrial respiration parameters (C,D), and susceptibility to the induction of mitochondrial permeabilitytransition (MPT) (E); hepatic mRNA expression of genes involved in the mitochondrial electron transport chain (F). Resultsare expressed as the mean ± SEM. (n = 6–8/group). * p < 0.05, ** p < 0.01, *** p < 0.001, and **** p < 0.0001 vs. CTRL group;# p < 0.05, ## p <0.01, and #### p < 0.0001 vs. HSuHF group. CTRL: control. HSuHF: high sucrose/high-fat. BJ: blueberryjuice. FCCP: carbonylcyanide-P-trifluoromethoxyphenylhydrazone. RCR: respiratory control ratio. ADP/O: adenosinediphosphate to oxygen ratio.
Collectively, these findings prompted us to evaluate at the transcriptional level ofgenes regulating the mitochondrial energetics in the liver. We, therefore, analyzed theexpression of genes encoding for subunits of the mitochondrial respiratory chain complexesby RT-PCR. The expression of Ndufb6 and ATp5c1, which encode proteins of complex I(subunit NADH:ubiquinone oxidoreductase) and complex V (mitochondrial ATP synthase),respectively, was significantly downregulated (p < 0.001) in the liver tissue from HSuHF-fed rats when compared to the CTRL animals. As shown in Figure 5F, even though itfailed to reach statistical significance, in HSuHF + BJ-treated rats, there was a trend ofincreased expression of both mitochondrial phosphorylation-related genes, compared tothe HSuHF-untreated group (Ndufb6 dCohen =2.65 and Atp5c1 dCohen =2.54).
Nutrients 2021, 13, 4192 18 of 32
3.8. Effects of BJ on Hepatic mRNA Expression of Inflammation-Related Genes
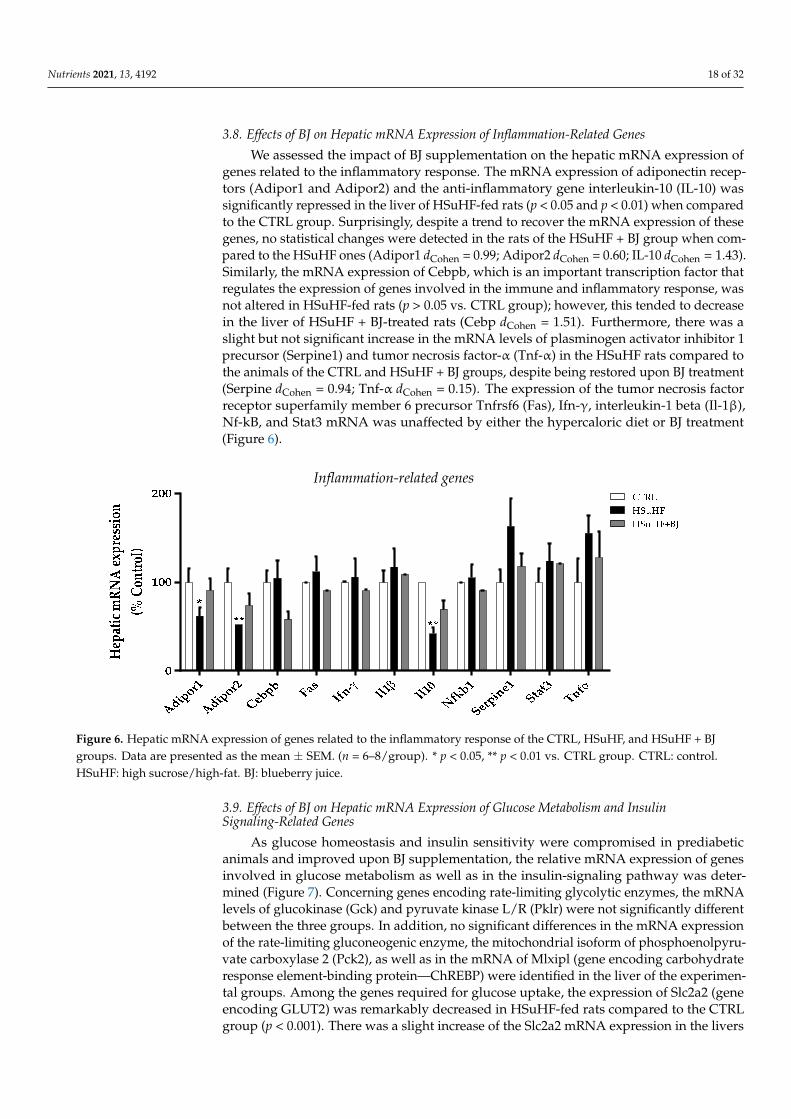
We assessed the impact of BJ supplementation on the hepatic mRNA expression ofgenes related to the inflammatory response. The mRNA expression of adiponectin recep-tors (Adipor1 and Adipor2) and the anti-inflammatory gene interleukin-10 (IL-10) wassignificantly repressed in the liver of HSuHF-fed rats (p < 0.05 and p < 0.01) when comparedto the CTRL group. Surprisingly, despite a trend to recover the mRNA expression of thesegenes, no statistical changes were detected in the rats of the HSuHF + BJ group when com-pared to the HSuHF ones (Adipor1 dCohen = 0.99; Adipor2 dCohen = 0.60; IL-10 dCohen = 1.43).Similarly, the mRNA expression of Cebpb, which is an important transcription factor thatregulates the expression of genes involved in the immune and inflammatory response, wasnot altered in HSuHF-fed rats (p > 0.05 vs. CTRL group); however, this tended to decreasein the liver of HSuHF + BJ-treated rats (Cebp dCohen = 1.51). Furthermore, there was aslight but not significant increase in the mRNA levels of plasminogen activator inhibitor 1precursor (Serpine1) and tumor necrosis factor-α (Tnf-α) in the HSuHF rats compared tothe animals of the CTRL and HSuHF + BJ groups, despite being restored upon BJ treatment(Serpine dCohen = 0.94; Tnf-α dCohen = 0.15). The expression of the tumor necrosis factorreceptor superfamily member 6 precursor Tnfrsf6 (Fas), Ifn-γ, interleukin-1 beta (Il-1β),Nf-kB, and Stat3 mRNA was unaffected by either the hypercaloric diet or BJ treatment(Figure 6).
Nutrients 2021, 13, x FOR PEER REVIEW 19 of 33
We assessed the impact of BJ supplementation on the hepatic mRNA expression of genes related to the inflammatory response. The mRNA expression of adiponectin recep-tors (Adipor1 and Adipor2) and the anti-inflammatory gene interleukin-10 (IL-10) was significantly repressed in the liver of HSuHF-fed rats (p < 0.05 and p < 0.01) when com-pared to the CTRL group. Surprisingly, despite a trend to recover the mRNA expression of these genes, no statistical changes were detected in the rats of the HSuHF + BJ group when compared to the HSuHF ones (Adipor1 dCohen = 0.99; Adipor2 dCohen = 0.60; IL-10 dCohen = 1.43). Similarly, the mRNA expression of Cebpb, which is an important transcription factor that regulates the expression of genes involved in the immune and inflammatory response, was not altered in HSuHF-fed rats (p > 0.05 vs. CTRL group); however, this tended to decrease in the liver of HSuHF + BJ-treated rats (Cebp dCohen = 1.51). Furthermore, there was a slight but not significant increase in the mRNA levels of plasminogen activator inhibitor 1 precursor (Serpine1) and tumor necrosis factor-α (Tnf-α) in the HSuHF rats compared to the animals of the CTRL and HSuHF + BJ groups, despite being restored upon BJ treatment (Serpine dCohen = 0.94; Tnf-α dCohen = 0.15). The expression of the tumor necrosis factor receptor superfamily member 6 precursor Tnfrsf6 (Fas), Ifn-γ, interleukin-1 beta (Il-1β), Nf-kB, and Stat3 mRNA was unaffected by either the hypercaloric diet or BJ treatment (Figure 6).
Figure 6. Hepatic mRNA expression of genes related to the inflammatory response of the CTRL, HSuHF, and HSuHF + BJ groups. Data are presented as the mean ± SEM. (n = 6–8/group). * p < 0.05, ** p < 0.01 vs. CTRL group. CTRL: control. HSuHF: high sucrose/high-fat. BJ: blueberry juice.
3.9. Effects of BJ on Hepatic mRNA Expression of Glucose Metabolism and Insulin Signaling-Related Genes
As glucose homeostasis and insulin sensitivity were compromised in prediabetic an-imals and improved upon BJ supplementation, the relative mRNA expression of genes involved in glucose metabolism as well as in the insulin-signaling pathway was deter-mined (Figure 7). Concerning genes encoding rate-limiting glycolytic enzymes, the mRNA levels of glucokinase (Gck) and pyruvate kinase L/R (Pklr) were not significantly different between the three groups. In addition, no significant differences in the mRNA expression of the rate-limiting gluconeogenic enzyme, the mitochondrial isoform of phos-phoenolpyruvate carboxylase 2 (Pck2), as well as in the mRNA of Mlxipl (gene encoding carbohydrate response element-binding protein—ChREBP) were identified in the liver of the experimental groups. Among the genes required for glucose uptake, the expression of Slc2a2 (gene encoding GLUT2) was remarkably decreased in HSuHF-fed rats compared to the CTRL group (p < 0.001). There was a slight increase of the Slc2a2 mRNA expression in the livers of HSuHF + BJ-treated animals compared to the HSuHF-fed rats (Slc2a2 dCohen = 84.48), although this was still lowered when compared to the CTRL group. Conversely,
Inflammation-related genes
Figure 6. Hepatic mRNA expression of genes related to the inflammatory response of the CTRL, HSuHF, and HSuHF + BJgroups. Data are presented as the mean ± SEM. (n = 6–8/group). * p < 0.05, ** p < 0.01 vs. CTRL group. CTRL: control.HSuHF: high sucrose/high-fat. BJ: blueberry juice.
3.9. Effects of BJ on Hepatic mRNA Expression of Glucose Metabolism and InsulinSignaling-Related Genes
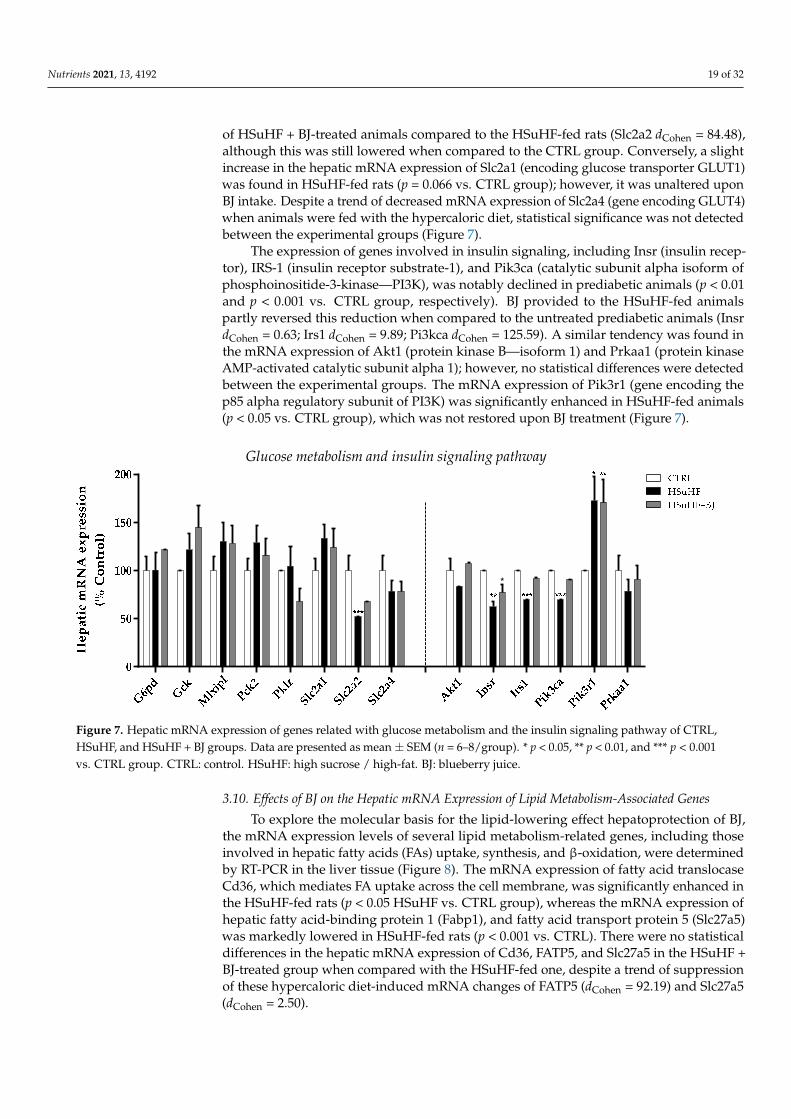
As glucose homeostasis and insulin sensitivity were compromised in prediabeticanimals and improved upon BJ supplementation, the relative mRNA expression of genesinvolved in glucose metabolism as well as in the insulin-signaling pathway was deter-mined (Figure 7). Concerning genes encoding rate-limiting glycolytic enzymes, the mRNAlevels of glucokinase (Gck) and pyruvate kinase L/R (Pklr) were not significantly differentbetween the three groups. In addition, no significant differences in the mRNA expressionof the rate-limiting gluconeogenic enzyme, the mitochondrial isoform of phosphoenolpyru-vate carboxylase 2 (Pck2), as well as in the mRNA of Mlxipl (gene encoding carbohydrateresponse element-binding protein—ChREBP) were identified in the liver of the experimen-tal groups. Among the genes required for glucose uptake, the expression of Slc2a2 (geneencoding GLUT2) was remarkably decreased in HSuHF-fed rats compared to the CTRLgroup (p < 0.001). There was a slight increase of the Slc2a2 mRNA expression in the livers
Nutrients 2021, 13, 4192 19 of 32
of HSuHF + BJ-treated animals compared to the HSuHF-fed rats (Slc2a2 dCohen = 84.48),although this was still lowered when compared to the CTRL group. Conversely, a slightincrease in the hepatic mRNA expression of Slc2a1 (encoding glucose transporter GLUT1)was found in HSuHF-fed rats (p = 0.066 vs. CTRL group); however, it was unaltered uponBJ intake. Despite a trend of decreased mRNA expression of Slc2a4 (gene encoding GLUT4)when animals were fed with the hypercaloric diet, statistical significance was not detectedbetween the experimental groups (Figure 7).
The expression of genes involved in insulin signaling, including Insr (insulin recep-tor), IRS-1 (insulin receptor substrate-1), and Pik3ca (catalytic subunit alpha isoform ofphosphoinositide-3-kinase—PI3K), was notably declined in prediabetic animals (p < 0.01and p < 0.001 vs. CTRL group, respectively). BJ provided to the HSuHF-fed animalspartly reversed this reduction when compared to the untreated prediabetic animals (InsrdCohen = 0.63; Irs1 dCohen = 9.89; Pi3kca dCohen = 125.59). A similar tendency was found inthe mRNA expression of Akt1 (protein kinase B—isoform 1) and Prkaa1 (protein kinaseAMP-activated catalytic subunit alpha 1); however, no statistical differences were detectedbetween the experimental groups. The mRNA expression of Pik3r1 (gene encoding thep85 alpha regulatory subunit of PI3K) was significantly enhanced in HSuHF-fed animals(p < 0.05 vs. CTRL group), which was not restored upon BJ treatment (Figure 7).
Nutrients 2021, 13, x FOR PEER REVIEW 20 of 33
a slight increase in the hepatic mRNA expression of Slc2a1 (encoding glucose transporter GLUT1) was found in HSuHF-fed rats (p = 0.066 vs. CTRL group); however, it was unal-tered upon BJ intake. Despite a trend of decreased mRNA expression of Slc2a4 (gene en-coding GLUT4) when animals were fed with the hypercaloric diet, statistical significance was not detected between the experimental groups (Figure 7).
The expression of genes involved in insulin signaling, including Insr (insulin recep-tor), IRS-1 (insulin receptor substrate-1), and Pik3ca (catalytic subunit alpha isoform of phosphoinositide-3-kinase—PI3K), was notably declined in prediabetic animals (p < 0.01 and p < 0.001 vs. CTRL group, respectively). BJ provided to the HSuHF-fed animals partly reversed this reduction when compared to the untreated prediabetic animals (Insr dCohen = 0.63; Irs1 dCohen = 9.89; Pi3kca dCohen = 125.59). A similar tendency was found in the mRNA expression of Akt1 (protein kinase B—isoform 1) and Prkaa1 (protein kinase AMP-acti-vated catalytic subunit alpha 1); however, no statistical differences were detected between the experimental groups. The mRNA expression of Pik3r1 (gene encoding the p85 alpha regulatory subunit of PI3K) was significantly enhanced in HSuHF-fed animals (p < 0.05 vs. CTRL group), which was not restored upon BJ treatment (Figure 7).
Figure 7. Hepatic mRNA expression of genes related with glucose metabolism and the insulin signaling pathway of CTRL, HSuHF, and HSuHF + BJ groups. Data are presented as mean ± SEM (n = 6–8/group). * p < 0.05, ** p < 0.01, and *** p < 0.001 vs. CTRL group. CTRL: control. HSuHF: high sucrose / high-fat. BJ: blueberry juice.
3.10. Effects of BJ on the Hepatic mRNA Expression of Lipid Metabolism-Associated Genes To explore the molecular basis for the lipid-lowering effect hepatoprotection of BJ,
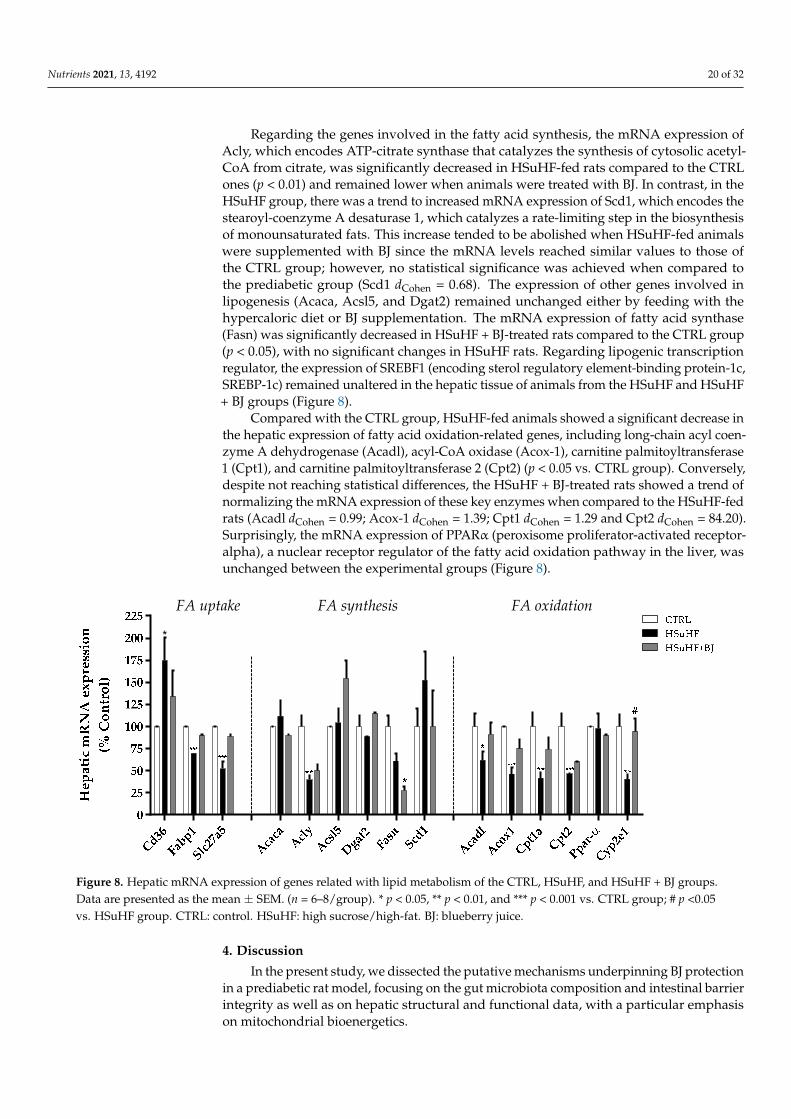
the mRNA expression levels of several lipid metabolism-related genes, including those involved in hepatic fatty acids (FAs) uptake, synthesis, and β-oxidation, were determined by RT-PCR in the liver tissue (Figure 8). The mRNA expression of fatty acid translocase Cd36, which mediates FA uptake across the cell membrane, was significantly enhanced in the HSuHF-fed rats (p < 0.05 HSuHF vs. CTRL group), whereas the mRNA expression of hepatic fatty acid-binding protein 1 (Fabp1), and fatty acid transport protein 5 (Slc27a5) was markedly lowered in HSuHF-fed rats (p < 0.001 vs. CTRL). There were no statistical differences in the hepatic mRNA expression of Cd36, FATP5, and Slc27a5 in the HSuHF + BJ-treated group when compared with the HSuHF-fed one, despite a trend of suppression of these hypercaloric diet-induced mRNA changes of FATP5 (dCohen = 92.19) and Slc27a5 (dCohen = 2.50).
Regarding the genes involved in the fatty acid synthesis, the mRNA expression of Acly, which encodes ATP-citrate synthase that catalyzes the synthesis of cytosolic acetyl-CoA from citrate, was significantly decreased in HSuHF-fed rats compared to the CTRL ones (p < 0.01) and remained lower when animals were treated with BJ. In contrast, in the
*
Glucose metabolism and insulin signaling pathway
Figure 7. Hepatic mRNA expression of genes related with glucose metabolism and the insulin signaling pathway of CTRL,HSuHF, and HSuHF + BJ groups. Data are presented as mean± SEM (n = 6–8/group). * p < 0.05, ** p < 0.01, and *** p < 0.001vs. CTRL group. CTRL: control. HSuHF: high sucrose / high-fat. BJ: blueberry juice.
3.10. Effects of BJ on the Hepatic mRNA Expression of Lipid Metabolism-Associated Genes
To explore the molecular basis for the lipid-lowering effect hepatoprotection of BJ,the mRNA expression levels of several lipid metabolism-related genes, including thoseinvolved in hepatic fatty acids (FAs) uptake, synthesis, and β-oxidation, were determinedby RT-PCR in the liver tissue (Figure 8). The mRNA expression of fatty acid translocaseCd36, which mediates FA uptake across the cell membrane, was significantly enhanced inthe HSuHF-fed rats (p < 0.05 HSuHF vs. CTRL group), whereas the mRNA expression ofhepatic fatty acid-binding protein 1 (Fabp1), and fatty acid transport protein 5 (Slc27a5)was markedly lowered in HSuHF-fed rats (p < 0.001 vs. CTRL). There were no statisticaldifferences in the hepatic mRNA expression of Cd36, FATP5, and Slc27a5 in the HSuHF +BJ-treated group when compared with the HSuHF-fed one, despite a trend of suppressionof these hypercaloric diet-induced mRNA changes of FATP5 (dCohen = 92.19) and Slc27a5(dCohen = 2.50).
Nutrients 2021, 13, 4192 20 of 32
Regarding the genes involved in the fatty acid synthesis, the mRNA expression ofAcly, which encodes ATP-citrate synthase that catalyzes the synthesis of cytosolic acetyl-CoA from citrate, was significantly decreased in HSuHF-fed rats compared to the CTRLones (p < 0.01) and remained lower when animals were treated with BJ. In contrast, in theHSuHF group, there was a trend to increased mRNA expression of Scd1, which encodes thestearoyl-coenzyme A desaturase 1, which catalyzes a rate-limiting step in the biosynthesisof monounsaturated fats. This increase tended to be abolished when HSuHF-fed animalswere supplemented with BJ since the mRNA levels reached similar values to those ofthe CTRL group; however, no statistical significance was achieved when compared tothe prediabetic group (Scd1 dCohen = 0.68). The expression of other genes involved inlipogenesis (Acaca, Acsl5, and Dgat2) remained unchanged either by feeding with thehypercaloric diet or BJ supplementation. The mRNA expression of fatty acid synthase(Fasn) was significantly decreased in HSuHF + BJ-treated rats compared to the CTRL group(p < 0.05), with no significant changes in HSuHF rats. Regarding lipogenic transcriptionregulator, the expression of SREBF1 (encoding sterol regulatory element-binding protein-1c,SREBP-1c) remained unaltered in the hepatic tissue of animals from the HSuHF and HSuHF+ BJ groups (Figure 8).
Compared with the CTRL group, HSuHF-fed animals showed a significant decrease inthe hepatic expression of fatty acid oxidation-related genes, including long-chain acyl coen-zyme A dehydrogenase (Acadl), acyl-CoA oxidase (Acox-1), carnitine palmitoyltransferase1 (Cpt1), and carnitine palmitoyltransferase 2 (Cpt2) (p < 0.05 vs. CTRL group). Conversely,despite not reaching statistical differences, the HSuHF + BJ-treated rats showed a trend ofnormalizing the mRNA expression of these key enzymes when compared to the HSuHF-fedrats (Acadl dCohen = 0.99; Acox-1 dCohen = 1.39; Cpt1 dCohen = 1.29 and Cpt2 dCohen = 84.20).Surprisingly, the mRNA expression of PPARα (peroxisome proliferator-activated receptor-alpha), a nuclear receptor regulator of the fatty acid oxidation pathway in the liver, wasunchanged between the experimental groups (Figure 8).
Nutrients 2021, 13, x FOR PEER REVIEW 21 of 33
HSuHF group, there was a trend to increased mRNA expression of Scd1, which encodes the stearoyl-coenzyme A desaturase 1, which catalyzes a rate-limiting step in the biosyn-thesis of monounsaturated fats. This increase tended to be abolished when HSuHF-fed animals were supplemented with BJ since the mRNA levels reached similar values to those of the CTRL group; however, no statistical significance was achieved when com-pared to the prediabetic group (Scd1 dCohen = 0.68). The expression of other genes involved in lipogenesis (Acaca, Acsl5, and Dgat2) remained unchanged either by feeding with the hypercaloric diet or BJ supplementation. The mRNA expression of fatty acid synthase (Fasn) was significantly decreased in HSuHF + BJ-treated rats compared to the CTRL group (p < 0.05), with no significant changes in HSuHF rats. Regarding lipogenic tran-scription regulator, the expression of SREBF1 (encoding sterol regulatory element-binding protein-1c, SREBP-1c) remained unaltered in the hepatic tissue of animals from the HSuHF and HSuHF + BJ groups (Figure 8).
Compared with the CTRL group, HSuHF-fed animals showed a significant decrease in the hepatic expression of fatty acid oxidation-related genes, including long-chain acyl coenzyme A dehydrogenase (Acadl), acyl-CoA oxidase (Acox-1), carnitine palmito-yltransferase 1 (Cpt1), and carnitine palmitoyltransferase 2 (Cpt2) (p < 0.05 vs. CTRL group). Conversely, despite not reaching statistical differences, the HSuHF + BJ-treated rats showed a trend of normalizing the mRNA expression of these key enzymes when compared to the HSuHF-fed rats (Acadl dCohen = 0.99; Acox-1 dCohen = 1.39; Cpt1 dCohen = 1.29 and Cpt2 dCohen = 84.20). Surprisingly, the mRNA expression of PPARα (peroxisome pro-liferator-activated receptor-alpha), a nuclear receptor regulator of the fatty acid oxidation pathway in the liver, was unchanged between the experimental groups (Figure 8).
Figure 8. Hepatic mRNA expression of genes related with lipid metabolism of the CTRL, HSuHF, and HSuHF + BJ groups. Data are presented as the mean ± SEM. (n = 6–8/group). * p < 0.05, ** p < 0.01, and *** p < 0.001 vs. CTRL group; # p <0.05 vs. HSuHF group. CTRL: control. HSuHF: high sucrose / high-fat. BJ: blueberry juice.
4. Discussion In the present study, we dissected the putative mechanisms underpinning BJ protec-
tion in a prediabetic rat model, focusing on the gut microbiota composition and intestinal barrier integrity as well as on hepatic structural and functional data, with a particular emphasis on mitochondrial bioenergetics.
As expected, the hypercaloric diet induced an increase in BW gain in the prediabetic rats, as a result of a higher intake of calories, especially carbohydrates and lipids, when compared with the control animals. These changes were not prevented in the HSuHF rats under BJ supplementation, which presented unchanged BW and calorie consumption.
*
FA uptake FA synthesis FA oxidation
Figure 8. Hepatic mRNA expression of genes related with lipid metabolism of the CTRL, HSuHF, and HSuHF + BJ groups.Data are presented as the mean ± SEM. (n = 6–8/group). * p < 0.05, ** p < 0.01, and *** p < 0.001 vs. CTRL group; # p <0.05vs. HSuHF group. CTRL: control. HSuHF: high sucrose/high-fat. BJ: blueberry juice.
4. Discussion
In the present study, we dissected the putative mechanisms underpinning BJ protectionin a prediabetic rat model, focusing on the gut microbiota composition and intestinal barrierintegrity as well as on hepatic structural and functional data, with a particular emphasison mitochondrial bioenergetics.
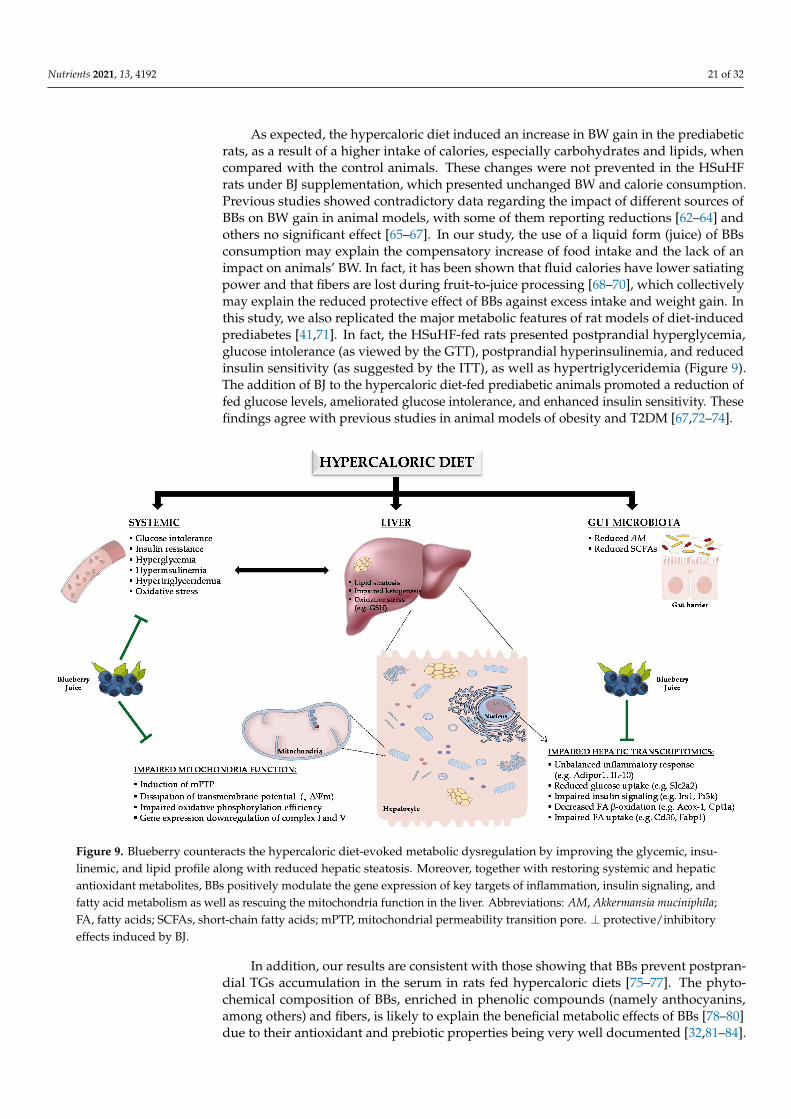
Nutrients 2021, 13, 4192 21 of 32
As expected, the hypercaloric diet induced an increase in BW gain in the prediabeticrats, as a result of a higher intake of calories, especially carbohydrates and lipids, whencompared with the control animals. These changes were not prevented in the HSuHFrats under BJ supplementation, which presented unchanged BW and calorie consumption.Previous studies showed contradictory data regarding the impact of different sources ofBBs on BW gain in animal models, with some of them reporting reductions [62–64] andothers no significant effect [65–67]. In our study, the use of a liquid form (juice) of BBsconsumption may explain the compensatory increase of food intake and the lack of animpact on animals’ BW. In fact, it has been shown that fluid calories have lower satiatingpower and that fibers are lost during fruit-to-juice processing [68–70], which collectivelymay explain the reduced protective effect of BBs against excess intake and weight gain. Inthis study, we also replicated the major metabolic features of rat models of diet-inducedprediabetes [41,71]. In fact, the HSuHF-fed rats presented postprandial hyperglycemia,glucose intolerance (as viewed by the GTT), postprandial hyperinsulinemia, and reducedinsulin sensitivity (as suggested by the ITT), as well as hypertriglyceridemia (Figure 9).The addition of BJ to the hypercaloric diet-fed prediabetic animals promoted a reduction offed glucose levels, ameliorated glucose intolerance, and enhanced insulin sensitivity. Thesefindings agree with previous studies in animal models of obesity and T2DM [67,72–74].
Nutrients 2021, 13, x FOR PEER REVIEW 22 of 33
Previous studies showed contradictory data regarding the impact of different sources of BBs on BW gain in animal models, with some of them reporting reductions [62–64] and others no significant effect [65–67]. In our study, the use of a liquid form (juice) of BBs consumption may explain the compensatory increase of food intake and the lack of an impact on animals’ BW. In fact, it has been shown that fluid calories have lower satiating power and that fibers are lost during fruit-to-juice processing [68–70], which collectively may explain the reduced protective effect of BBs against excess intake and weight gain. In this study, we also replicated the major metabolic features of rat models of diet-induced prediabetes [41,71]. In fact, the HSuHF-fed rats presented postprandial hyperglycemia, glucose intolerance (as viewed by the GTT), postprandial hyperinsulinemia, and reduced insulin sensitivity (as suggested by the ITT), as well as hypertriglyceridemia (Figure 9). The addition of BJ to the hypercaloric diet-fed prediabetic animals promoted a reduction of fed glucose levels, ameliorated glucose intolerance, and enhanced insulin sensitivity. These findings agree with previous studies in animal models of obesity and T2DM [67,72–74].
Figure 9. Blueberry counteracts the hypercaloric diet-evoked metabolic dysregulation by improving the glycemic, insu-linemic, and lipid profile along with reduced hepatic steatosis. Moreover, together with restoring systemic and hepatic antioxidant metabolites, BBs positively modulate the gene expression of key targets of inflammation, insulin signaling, and fatty acid metabolism as well as rescuing the mitochondria function in the liver. Abbreviations: AM, Akkermansia muciniphila; FA, fatty acids; SCFAs, short-chain fatty acids; mPTP, mitochondrial permeability transition pore. ┴ protec-tive/inhibitory effects induced by BJ.
In addition, our results are consistent with those showing that BBs prevent postpran-dial TGs accumulation in the serum in rats fed hypercaloric diets [75–77]. The phytochem-ical composition of BBs, enriched in phenolic compounds (namely anthocyanins, among others) and fibers, is likely to explain the beneficial metabolic effects of BBs [78–80] due to their antioxidant and prebiotic properties being very well documented [32,81–84]. How-ever, the precise mechanisms underlying the protection of BBs against deregulation of glucose, insulin, and lipids, especially in the prediabetic state, remain to be elucidated. In
Figure 9. Blueberry counteracts the hypercaloric diet-evoked metabolic dysregulation by improving the glycemic, insu-linemic, and lipid profile along with reduced hepatic steatosis. Moreover, together with restoring systemic and hepaticantioxidant metabolites, BBs positively modulate the gene expression of key targets of inflammation, insulin signaling, andfatty acid metabolism as well as rescuing the mitochondria function in the liver. Abbreviations: AM, Akkermansia muciniphila;FA, fatty acids; SCFAs, short-chain fatty acids; mPTP, mitochondrial permeability transition pore. ⊥ protective/inhibitoryeffects induced by BJ.
In addition, our results are consistent with those showing that BBs prevent postpran-dial TGs accumulation in the serum in rats fed hypercaloric diets [75–77]. The phyto-chemical composition of BBs, enriched in phenolic compounds (namely anthocyanins,among others) and fibers, is likely to explain the beneficial metabolic effects of BBs [78–80]due to their antioxidant and prebiotic properties being very well documented [32,81–84].
Nutrients 2021, 13, 4192 22 of 32
However, the precise mechanisms underlying the protection of BBs against deregulation ofglucose, insulin, and lipids, especially in the prediabetic state, remain to be elucidated. Inthe present study, we chose to deepen some of the most promising hypotheses, startingfrom the potential to modulate the gut microbiota and related mechanisms.
Changes in the composition or diversity/richness of gut microbiota (called dysbiosis)have been associated with several extraintestinal disorders, including metabolic diseases,such as obesity and diabetes [85]. Diet is a major modulator of GM, and hypercaloric dietsevoke dysbiosis [86,87]; on the contrary, fiber and polyphenols—which are abundant inblueberry—are promoters of symbiosis [88,89].
Regarding the prediabetic rats, we did not obtain all the typical markers of dysbiosisdescribed in other studies using both animal models and human samples [5–7,90]. Forexample, the HSuHF-treated rats presented an unchanged relative abundance of Firmi-cutes to Bacteroidetes. Notwithstanding, consistent with our data, a similar unchangedFirmicutes:Bacteroidetes ratio was observed in Wistar rats fed with HF or HSuHF diets for10 weeks [91]. In addition, ultrastructural analysis of the gut by TEM revealed maintenanceof the epithelial barrier integrity. The intestinal barrier’s function is based on an intactepithelial lining, which is comprised of epithelial cells that are joined at different levelsof the intercellular junction by cell-to-cell structural adhesions, such as tight junctions,adherens junctions, and desmosomes [92]. TJs are dynamic and highly organized com-plexes, consisting of various proteins, including ZO-1 and occludin, which allow selectivetransport across the intestinal barrier. Moreover, the mRNA expression levels of ZO-1 andoccludin and their distribution at the periphery of epithelial cells were unchanged. In linewith these results, the measure of endotoxemia and the FITC-dextran permeability assayshowed that the intestinal barrier was functionally still intact. These results could be even-tually explained by the early disease stage, although some studies have already describeddysbiosis in prediabetic states [5,90,93]. Even though, there was a reduced abundance ofAkkermansia muciniphila (AM) in the HSuHF-treated animals, a bacterial species that hasbeen negatively correlated with glucose tolerance, insulin resistance, and obesity [94–96].Furthermore, there was a reduced fecal content of SCFAs (Figure 9), which is in line withwhat has been described in states of prediabetes and diabetes [6,90,97,98]. Regarding theHSuHF animals treated with BJ, the prebiotic properties previously described in otherconditions [62,99–102] were not replicated in our study. In fact, the reduced abundanceof AM found in the HSuHF-treated animals was not prevented, which was accompaniedby a significant reduction of Prevotella spp. and Bifidobacterium. These distinct bacterialcommunities are typically associated with SCFAs production, which were not recoveredby BJ supplementation in the HSuHF rats. In addition, fecal succinate was reduced inthe BJ-fed animals; since Prevotella spp. belongs to a group of succinate-producing bacte-ria [103], the reduction in fecal succinate in BJ-treated prediabetic animals can be eventuallyderived from the suppressed Prevotella abundance. In addition, there was a reduced overallcount of bacteria (universal), which might be eventually explained by the antimicrobialproperties described for some polyphenols that are abundant in BBs, such as quercetinand hesperidin [104–106]. Although it is important in the future to study models withother characteristics, the results of our study, using this early disease model, show that gutmicrobiota modulation cannot explain the metabolic improvement observed in prediabeticanimals when treated with BJ. In this sense, we moved forward to check the expected an-tioxidant properties of BJ and find possible crosslinks with other mechanisms that regulatethe metabolism of glucose and lipids.
Hyperglycemia and hypertriglyceridemia are key drivers of glucotoxicity and lipo-toxicity, which are among the main causes of oxidative stress and inflammation, twomechanisms closely linked with the (pre)diabetic state [107,108]. In our model, the serumMDA/TAS ratio was higher in HSuHF rats and ameliorated in BJ-treated animals (Figure 9).In addition, we found a depletion of hepatic GSH levels in prediabetic rats, an effect thatwas prevented by BJ supplementation (HSuHF + BJ group). Another important findingof this study from NMR analysis was the increment of taurine in the hepatic tissue of
Nutrients 2021, 13, 4192 23 of 32
BJ-treated animals. This endogenous metabolite has diverse cytoprotective actions, suchas antioxidant activity linked to improved mitochondrial function (e.g., decreases the su-peroxide generation by mitochondria) [109–111]. Furthermore, we also found a decreasedbetaine content in the serum and liver of HSuHF rats, an effect that was prevented in BJ-treated animals. Betaine is a methyl donor that can be obtained directly from the diet or bycholine oxidation [112,113]. This metabolite plays a role in the hepatic remethylation of themethionine-homocysteine cycle by betaine-homocysteine methyltransferase (BHMT), pro-ducing carnitine, a key factor in fatty acid metabolism related to the transfer of long-chainfatty acids into mitochondria for subsequent β-oxidation [114]. In line with our results,lower levels of hepatic betaine were observed in Zucker rats [115] and in HFD-inducedobese mice [116,117]. Indeed, it has been shown that betaine supplementation improveshepatic steatosis and insulin resistance both in in vivo [117–120] and in vitro studies [117].Betaine levels were restored in BJ-treated animals, which could also be explained by theenriched amount of betaine present in BBs [113]. In addition, 3-hydroxibutyric acid (3-HB),a ketone body that represents the main alternative energy substrate to glucose and is aby-product of hepatic FA oxidation, was recovered in the rats of the HSuHF + BJ group. Inagreement with previous studies [121,122], the reduced serum levels of 3-HB in HSuHF ratsmight suggest impaired FA metabolism and a degree of hepatic mitochondrial dysfunctionsince ketone bodies are produced from acetyl-Coa via ketogenesis, which mainly occurs inthe hepatic mitochondria [8]. The recovery of 3-HB levels and the 3-HB/acetoacetate ratioin the rats of the HSuHF group when supplemented with BJ suggests an improvementin FA oxidation and mitochondrial function. Thus, our findings agree with the expectedantioxidant properties of BBs and further points to hepatic mechanisms regulating themetabolism, including at the mitochondrial level.
Several studies have indicated a close relationship between mitochondrial dysfunc-tion or defects in mitochondrial biogenesis and the pathogenesis of insulin resistanceand associated metabolic disorders [16,123]. It has been consistently considered that thehealth-promoting effects of some polyphenols extend to mitochondria and may representa valuable and attractive nutritional strategy to prevent or hinder the metabolic impair-ments underpinning mitochondrial dysfunction [124,125]. Indeed, some polyphenols canmodulate several mitochondrial processes, including mitochondrial biogenesis, oxidativephosphorylation, mitochondrial membrane potential (∆Ψ), and ATP synthesis, amongothers [126–128]. Our group previously showed that a long-term intake of BBs phytochem-icals triggered a hepatic mitochondrial-related metabolic transcriptomic reprogrammingin healthy rats [38]. In light of these considerations, we then focused our attention onthe BJ effects on the hepatic tissue towards functional and molecular readouts from amitochondria perspective in a prediabetic setting.
Our results revealed that the prediabetic animals displayed hepatic steatosis, viewedmainly by an increased hepatic content of TGs, which was paralleled by an impairedmitochondrial function and insulin resistance (Figure 9). Noticeably, BJ supplementationfor 14 weeks alleviated hepatic steatosis, which is in accordance with other studies [75,76].The hepatic lipid overload represents a key driver for lipotoxicity, which together withglucotoxicity are closely associated with mitochondrial dysfunction [129]. Furthermore,hypercaloric diet-induced prediabetic animals display an impairment in hepatic mito-chondrial bioenergetics machinery, which contributes to a redox imbalance and fostersectopic lipid storage [123,130]. Accordingly, we showed that the hypercaloric diet elicitedconsiderable impairments in mitochondrial functional activity comprising disturbancesin mitochondrial electric potentials and respiration, associated with decreased state 3 andVFCCP, which may result from dysfunction in the electron transport chain complexesor due to an uncoupling of oxidative phosphorylation, as suggested by the decreasedRCR and ADP/O. Moreover, the hypercaloric diet-induced changes in respiratory parame-ters rendered mitochondria more susceptible to Ca2+-induced mitochondrial permeabilitytransition. mPTP opening, resulting from unbalanced cytoplasmic ion levels, mainlyCa2+, potentiates membrane potential dissipation and uncoupled oxidative phosphory-
Nutrients 2021, 13, 4192 24 of 32
lation, resulting in ATP depletion. Although discrepancies have been reported in otherstudies [131–134], several pieces of evidence are in line with our data showing impairedHF-induced bioenergetics [123,135,136].
BJ supplementation restored these detrimental effects observed in the prediabetic ani-mals, as viewed by: (i) recovery of the transmembrane electrochemical potential, indicatingprotection of passive permeability to protons (proton leakage); (ii) increased oxidative phos-phorylation efficiency (restored state 4 and increased RCR and ADP/O; and (iii) restoredactivity of the electron transport chain (increase state 3 and VFCCP). The protection ofmitochondrial function exerted by BJ is also sustained by the reduced mPTP opening, pro-tecting mitochondrial from hypercaloric diet-induced swelling. This effect can be mediatedby antioxidant protection against oxidative damage in the mitochondria membrane [127].Consistent with the mitochondrial dysfunction, prediabetic animals showed significantlydecreased mRNA levels of NDufb6 (a subunit of complex I) and ATP5C1 (a subunit ofcomplex V), which were recovered upon BJ supplementation, indicating that BJ improvedhepatic mitochondrial integrity and function (Figure 9).
To gain further insight into the metabolic protection prompted by BJ, we also evaluatedthe expression of genes involved in glucose metabolism and insulin signaling. Significantlyreduced hepatic expression of genes involved in insulin signaling (e.g., Ins, Irs1, Pi3ca) wasobserved in the HSuHF group, an effect that was partly restored in the liver of BJ-treatedanimals. Similar results were found in the liver, pancreas, and white adipose tissue ofHF diet-fed mice after blueberry-leaf extract intake [137]. Furthermore, we showed thatBJ was able to normalize the hepatic mRNA expression levels of Glut2, the main glucosetransporter in the liver that was downregulated in prediabetic rats. This effect may accountfor the normalization of hepatic glucose levels by promoting insulin-stimulated glucoseuptake and by restoring insulin sensitivity.
Besides being the cell’s powerhouse, mitochondria are also pivotal for oxidativecatabolism of amino acids, ketone bodies synthesis, and FA breakdown through β-oxidation [8,129,138]. With more efficient mitochondria, hepatocytes can handle morenutrients (namely lipids) and consequently avoid their accumulation. The reduced de-position of hepatic TGs along with high levels of ketone bodies in BJ-treated prediabeticanimals pave the way to an efficient shift towards fatty acid β-oxidation and ketone syn-thesis (Figure 9). These effects are in line with the recovery of serum 3-HB levels and the3-HB/acetoacetate ratio in the rats of the HSuHF + BJ group. To complement these obser-vations, we analyzed the liver expression of a panel of genes related to lipid metabolism,including FA uptake, synthesis, and oxidation. Previous studies have shown that fattyacid translocase/CD36 overexpression increases hepatic TGs storage by increasing FAuptake [139], which is in line with our results showing increased mRNA CD36 expressionin prediabetic animals. In the livers of BJ-treated animals, a trend toward normal valueswas obtained, which was probably due to decreased systemic FA. Conversely, the nor-malization of the mRNA expression of fatty acid-binding protein-1 (Fabp1) and fatty acidtransporter 5 (FATP5/Slc27a5) in BJ-treated animals suggests a compensatory hepatocyteFA uptake, preventing cytotoxicity promoted by binding of long-chain fatty acids. Whilemost evidence shows the BBs phytochemicals can protect from steatosis by suppressingthe expression of genes involved in lipogenesis [137,140–143], in this study, we foundunchanged mRNA expression of key genes involved in lipogenesis, such as Fasn, Acaca,ACSL5, and SREBP-1C, together with unaltered mRNA expression of Dgat2 and Scd1.Thus, considering the above data of FA uptake and synthesis, our results suggested thatthe lipid-lowering activity of BJ cannot be explained by the ability to suppress fatty acidsynthesis, contrasting with the effects of BJ on FA β-oxidation. In fact, the HSuHF ratspresented decreased mRNA expression of peroxisomal Acox1, as well as mitochondrialACADL, CPT-1, and CPT-2, reflecting an imbalance from the substrate influx exceedingfat burning, thus favoring the ectopic lipid accumulation and storage in hepatocytes. BJsupplementation was able to rescue the mRNA expression of some of these genes, whichcollectively may contribute to the improvement of hepatic FA β-oxidation in prediabetic
Nutrients 2021, 13, 4192 25 of 32
rats (Figure 9). These results are consistent with other studies showing beneficial lipidhomeostasis of BBs polyphenols or anthocyanins extracts in mice models of metabolicdiseases [62,76,140–142,144]. Moreover, the prevention of serum and hepatic lipid accumu-lation in the BJ-treated animals of our study was accompanied by changes in some genestowards the improvement of the liver inflammatory profile, suggesting a protective effectof BJ against lipotoxicity. Indeed, the reduced lipid loading in the BJ-treated group couldeventually explain the improved performance of hepatocytes, namely the slight changes ingene expression data.
Future studies are warranted to elucidate the open questions and to overcome the spe-cific limitations of this study. Microbial analysis should be performed using metagenomicsequencing technology to provide stronger information about the functional diversity ofthe bacterial community. In addition, further work should dissect the possibility that thedecreased consumption of 35% sucrose in the BJ group might be partially responsible forthe improved metabolic phenotype. In addition, alternative players possibly involved inthe impact of the consumption of sugar-sweetened beverages should be explored. Forinstance, it would be interesting to assess the effects of BJ on the activity of ChREBP and theexpression of other key regulators of hepatic carbohydrates metabolism, such as PEPCK1and G6PC.
5. Conclusions
In the current study, using a hypercaloric diet-induced rat model, we found thatlong-term BJ supplementation at 25 g/day for 14 weeks afforded protective effects againstprediabetes by: (i) improving glucose homeostasis and insulin sensitivity, (ii) preventinghypertriglyceridemia and liver lipid deposition, and (iii) promoting strong antioxidanteffects on serum and hepatic levels. The beneficial metabolic effects of BJ in this earlydisease stage could not be attributed to a correction of gut dysbiosis or prevention ofleaky gut. Instead, the improved hepatic mitochondrial function, accompanied by restoredFA oxidation and ketogenesis, may contribute to explaining the reduction of hepaticsteatosis and hyperlipidemia, as well as the amelioration of insulin resistance and glucosemetabolism. Our data provide evidence that amelioration of hepatic mitochondrial functioncould be a crucial mechanism by which BJ exerts antidiabetic properties in early stages(prediabetes). The present work paves the way to support the use of BBs to counteractprediabetes progression.
Supplementary Materials: The following are available online at https://www.mdpi.com/article/10.3390/nu13124192/s1, Figure S1: Chromatographic profile of phenolic compounds in BJ, obtainedwith HPLC-PDA-ESI/MSn (UV, 320 nm); Table S1: Polyphenol compounds identified in Blueberryjuice by HPLC-PDA-ESI/MSn; Table S2: Metabolites detected in serum samples by 1H-NMR analysis;Table S3. Metabolites detected in liver samples by 1H-NMR analysis. References [145–149] are citedin the supplementary materials.
Author Contributions: Conceptualization, S.N., S.D.V. and F.R.; investigation, S.N., I.P., A.A. (AndréAlves), R.F., J.S.T., P.M., A.F., L.S., A.A. (Alexandra André) and S.S.; resources, A.F., L.S., R.A.C.,C.M.P., M.M.P. and F.R.; data curation, S.N., J.S.T., A.F., A.A. (Alexandra André), I.J. and A.P.R.;writing—original draft preparation, S.N., S.D.V. and F.R.; writing—review and editing, S.N., S.D.V.,R.F., J.S.T., A.F., L.S., A.A. (Alexandra André), I.J. and F.R.; supervision, F.R., M.M.P. and C.C.; projectadministration, F.R.; funding acquisition, F.R. All authors have read and agreed to the publishedversion of the manuscript.
Funding: This research was funded by the European Regional Development Fund (FEDER), throughPrograma Operacional Factores de Competitividade COMPETE2020 (CENTRO-01-0145-FEDER-000012-HealthyAging2020) and by National funds via Portuguese Science and Technology Founda-tion (FCT): Strategic Projects UID/NEU/04539/2013, UID/NEU/04539/2019, UIDB/04539/2020,UIDB/50006/2020 and UIDP/04539/2020 (CIBB), SFRH/BD/109017/2015 (PhD Fellowship) andPTDC/SAU-NUT/31712/2017, as well as by COMPETE-FEDER funds (POCI-01-0145-FEDER-007440 and POCI-01-0145-FEDER-031712). J.S.T. is a recipient of a CEEC researcher contract(CEECIND/04400/2017). NMR data was collected at the UC-NMR facility which is supported
Nutrients 2021, 13, 4192 26 of 32
in part by FEDER—European Regional Development Fund through the COMPETE Programme(Operational Programme for Competitiveness) and by National Funds through FCT—Fundaçãopara a Ciência e a Tecnologia (Portuguese Foundation for Science and Technology) through grantsREEQ/481/QUI/2006, RECI/QEQ-QFI/0168/2012, CENTRO-07-CT62-FEDER-002012, and RedeNacional de Ressonância Magnética Nuclear (RNRMN).
Institutional Review Board Statement: All animal experiments were conducted according to theNational and European Communities Council Directives of Animal Care and with the ARRIVEguidelines for reporting animal experimentation. The animal’s protocol was approved by the local(iCBR) Animal Welfare Body (ORBEA), with the approval number #9/2018 (30 October 2018).
Informed Consent Statement: Not applicable.
Data Availability Statement: The data present in this current study are available from the corre-sponding author upon reasonable request.
Acknowledgments: We are grateful to Monica Zuzarte for TEM and SEM analyses and to Laboratoryof Mass Spectrometry (LEM) of UC Node integrated in the National Mass Spectrometry Network(RNEM) of Portugal, for MS analyses.
Conflicts of Interest: The authors declare no conflict of interest.
References1. Abdul-Ghani, M.A.; DeFronzo, R.A. Pathophysiology of prediabetes. Curr. Diabetes Rep. 2009, 9, 193–199. [CrossRef] [PubMed]2. Edwards, C.M.; Cusi, K. Prediabetes. Endocrinol. Metab. Clin. N. Am. 2016, 45, 751–764. [CrossRef]3. Hostalek, U. Global epidemiology of prediabetes—Present and future perspectives. Clin. Diabetes Endocrinol. 2019, 5, 1–5.
[CrossRef] [PubMed]4. Tabák, A.G.; Herder, C.; Rathmann, W.; Brunner, E.; Kivimaki, M. Prediabetes: A high-risk state for diabetes development. Lancet
2012, 379, 2279–2290. [CrossRef]5. Zhang, X.; Shen, D.; Fang, Z.; Jie, Z.; Qiu, X.; Zhang, C.; Chen, Y.; Ji, L. Human Gut Microbiota Changes Reveal the Progression of
Glucose Intolerance. PLoS ONE 2013, 8, e71108. [CrossRef]6. Wu, H.; Tremaroli, V.; Schmidt, C.; Lundqvist, A.; Olsson, L.M.; Krämer, M.; Gummesson, A.; Perkins, R.; Bergström, G.; Bäckhed,
F. The Gut Microbiota in Prediabetes and Diabetes: A Population-Based Cross-Sectional Study. Cell Metab. 2020, 32, 379–390.e3.[CrossRef]
7. Allin, K.H.; The IMI-DIRECT Consortium; Tremaroli, V.; Caesar, R.; Jensen, B.; Damgaard, M.T.F.; Bahl, M.I.; Licht, T.R.; Hansen,T.; Nielsen, T.; et al. Aberrant intestinal microbiota in individuals with prediabetes. Diabetologia 2018, 61, 810–820. [CrossRef]
8. Rui, L. Energy Metabolism in the Liver. Compr. Physiol. 2014, 4, 177–197. [CrossRef]9. Ferrannini, E.; Gastaldelli, A.; Iozzo, P. Pathophysiology of Prediabetes. Med. Clin. N. Am. 2011, 95, 327–339. [CrossRef]10. Burgeiro, A.; Cerqueira, M.; Varela-Rodríguez, B.M.; Nunes, S.; Neto, P.; Pereira, F.C.; Reis, F.; Carvalho, E. Glucose and Lipid
Dysmetabolism in a Rat Model of Prediabetes Induced by a High-Sucrose Diet. Nutrients 2017, 9, 638. [CrossRef]11. DeFronzo, R.A.; Tripathy, D. Skeletal Muscle Insulin Resistance Is the Primary Defect in Type 2 Diabetes. Diabetes Care 2009, 32,
S157–S163. [CrossRef] [PubMed]12. Alimujiang, M.; Yu, X.; Yu, M.; Hou, W.; Yan, Z.; Yang, Y.; Bao, Y.; Yin, J. Enhanced liver but not muscle OXPHOS in diabetes and
reduced glucose output by complex I inhibition. J. Cell. Mol. Med. 2020, 24, 5758–5771. [CrossRef]13. Zheng, L.D.; Linarelli, L.E.; Brooke, J.; Smith, C.; Wall, S.S.; Greenawald, M.H.; Seidel, R.W.; Estabrooks, P.A.; Almeida, F.A.;
Cheng, Z. Mitochondrial Epigenetic Changes Link to Increased Diabetes Risk and Early-Stage Prediabetes Indicator. OxidativeMed. Cell. Longev. 2016, 2016, 5290638. [CrossRef] [PubMed]
14. Rabøl, R.; Boushel, R.; Dela, F. Mitochondrial oxidative function and type 2 diabetes. Appl. Physiol. Nutr. Metab. 2006, 31, 675–683.[CrossRef]
15. Rector, R.S.; Thyfault, J.; Uptergrove, G.M.; Morris, E.M.; Naples, S.P.; Borengasser, S.J.; Mikus, C.R.; Laye, M.; Laughlin, M.H.;Booth, F.W.; et al. Mitochondrial dysfunction precedes insulin resistance and hepatic steatosis and contributes to the naturalhistory of non-alcoholic fatty liver disease in an obese rodent model. J. Hepatol. 2010, 52, 727–736. [CrossRef]
16. Sergi, D.; Naumovski, N.N.; Heilbronn, L.H.K.; Abeywardena, M.; O’Callaghan, N.; Lionetti, L.; Luscombe-Marsh, N.L.-M.Mitochondrial (Dys)function and Insulin Resistance: From Pathophysiological Molecular Mechanisms to the Impact of Diet.Front. Physiol. 2019, 10, 532. [CrossRef]
17. Saltevo, J.; Kautiainen, H.; Vanhala, M. Gender differences in adiponectin and low-grade inflammation among individuals withnormal glucose tolerance, prediabetes, and type 2 diabetes. Gend. Med. 2009, 6, 463–470. [CrossRef]
18. Luc, K.; Schramm-Luc, A.; Guzik, T.J.; Mikolajczyk, T.P. Oxidative stress and inflammatory markers in prediabetes and dia-betes.J. Physiol. Pharmacol. 2019, 70, 70. [CrossRef]
19. Lin, X.; Xu, Y.; Pan, X.; Xu, J.; Ding, Y.; Sun, X.; Song, X.; Ren, Y.; Shan, P.F. Global, regional, and national burden and trend ofdiabetes in 195 countries and territories: An analysis from 1990 to 2025. Sci. Rep. 2020, 10, 14790. [CrossRef]
Nutrients 2021, 13, 4192 27 of 32
20. Lam, D.W.; LeRoith, D. The worldwide diabetes epidemic. Curr. Opin. Endocrinol. Diabetes Obes. 2012, 19, 93–96. [CrossRef]21. Wilson, M.L. Prediabetes. Nurs. Clin. N. Am. 2017, 52, 665–677. [CrossRef]22. Glechner, A.; Keuchel, L.; Affengruber, L.; Titscher, V.; Sommer, I.; Matyas, N.; Wagner, G.; Kien, C.; Klerings, I.; Gartlehner,
G. Effects of lifestyle changes on adults with prediabetes: A systematic review and meta-analysis. Prim. Care Diabetes 2018, 12,393–408. [CrossRef]
23. Basiak-Rasała, A.; Rózanska, D.; Zatonska, K. Food groups in dietary prevention of type 2 diabetes. Rocz. Panstwowego ZakładuHig. 2019, 70, 347–357. [CrossRef]
24. Asif, M. The prevention and control the type-2 diabetes by changing lifestyle and dietary pattern. J. Educ. Healh Promot. 2014, 3, 1.[CrossRef] [PubMed]
25. Wang, P.-Y.; Fang, J.-C.; Gao, Z.-H.; Zhang, C.; Xie, S.-Y. Higher intake of fruits, vegetables or their fiber reduces the risk of type 2diabetes: A meta-analysis. J. Diabetes Investig. 2016, 7, 56–69. [CrossRef]
26. McMacken, M.; Shah, S. A plant-based diet for the prevention and treatment of type 2 diabetes. J. Geriatr. Cardiol. 2017, 14,342–354. [CrossRef]
27. Yingli, F.; Fan, Y.; Zhang, X.; Hou, W.; Tang, Z. Fruit and vegetable intake and risk of type 2 diabetes mellitus: Meta-analysis ofprospective cohort studies. BMJ Open 2014, 4, e005497. [CrossRef]
28. Jiang, Z.; Sun, T.-Y.; He, Y.; Gou, W.; Zuo, L.-S.; Fu, Y.; Miao, Z.; Shuai, M.; Xu, F.; Xiao, C.; et al. Dietary fruit and vegetable intake,gut microbiota, and type 2 diabetes: Results from two large human cohort studies. BMC Med. 2020, 18, 371. [CrossRef]
29. Cooper, A.J.; Sharp, S.J.; Lentjes, M.A.; Luben, R.N.; Khaw, K.-T.; Wareham, N.J.; Forouhi, N.G. A Prospective Study of theAssociation Between Quantity and Variety of Fruit and Vegetable Intake and Incident Type 2 Diabetes. Diabetes Care 2012, 35,1293–1300. [CrossRef] [PubMed]
30. Stull, A.J. Blueberries’ Impact on Insulin Resistance and Glucose Intolerance. Antioxidants 2016, 5, 44. [CrossRef] [PubMed]31. Silva, S.; Costa, E.M.; Veiga, M.; Morais, R.M.; Calhau, C.; Pintado, M. Health promoting properties of blueberries: A review. Crit.
Rev. Food Sci. Nutr. 2018, 60, 181–200. [CrossRef]32. Nunes, S.; Vieira, P.; Gomes, P.; Viana, S.; Reis, F. Blueberry as an Attractive Functional Fruit to Prevent (Pre)Diabetes Progression.
Antioxidants 2021, 10, 1162. [CrossRef]33. Durazzo, A.; Lucarini, M.; Souto, E.B.; Cicala, C.; Caiazzo, E.; Izzo, A.A.; Novellino, E.; Santini, A. Polyphenols: A concise
overview on the chemistry, occurrence, and human health. Phytother. Res. 2019, 33, 2221–2243. [CrossRef]34. Skrovankova, S.; Sumczynski, D.; Mlcek, J.; Jurikova, T.; Sochor, J. Bioactive Compounds and Antioxidant Activity in Different
Types of Berries. Int. J. Mol. Sci. 2015, 16, 24673–24706. [CrossRef] [PubMed]35. Bujor, O.-C.; Le Bourvellec, C.; Volf, I.; Popa, V.I.; Dufour, C. Seasonal variations of the phenolic constituents in bilberry (Vaccinium
myrtillus L.) leaves, stems and fruits, and their antioxidant activity. Food Chem. 2016, 213, 58–68. [CrossRef] [PubMed]36. Shi, M.; Loftus, H.; McAinch, A.; Su, X.Q. Blueberry as a source of bioactive compounds for the treatment of obesity, type 2
diabetes and chronic inflammation. J. Funct. Foods 2017, 30, 16–29. [CrossRef]37. Basu, A.; Lyons, T.J. Strawberries, Blueberries, and Cranberries in the Metabolic Syndrome: Clinical Perspectives. J. Agric. Food
Chem. 2011, 60, 5687–5692. [CrossRef]38. Nunes, S.; Viana, S.D.; Preguiça, I.; Alves, A.; Fernandes, R.; Teodoro, J.S.; Figueirinha, A.; Salgueiro, L.; Silva, S.; Jarak, I.; et al.
Blueberry Consumption Challenges Hepatic Mitochondrial Bioenergetics and Elicits Transcriptomics Reprogramming in HealthyWistar Rats. Pharmaceutics 2020, 12, 1094. [CrossRef] [PubMed]
39. Couto, J.; Figueirinha, A.; Batista, M.T.; Paranhos, A.; Nunes, C.; Gonçalves, L.M.; Marto, J.; Fitas, M.; Pinto, P.; Ribeiro, H.M.; et al.Fragaria vesca L. Extract: A Promising Cosmetic Ingredient with Antioxidant Properties. Antioxidants 2020, 9, 154. [CrossRef]
40. du Sert, N.P.; Hurst, V.; Ahluwalia, A.; Alam, S.; Avey, M.T.; Baker, M.; Browne, W.J.; Clark, A.; Cuthill, I.C.; Dirnagl, U.; et al. TheARRIVE guidelines 2.0: Updated guidelines for reporting animal research. PLoS Biol. 2020, 18, e3000410. [CrossRef]
41. Nunes, S.; Alves, A.; Preguiça, I.; Barbosa, A.; Vieira, P.; Mendes, F.; Martins, D.; Viana, S.D.; Reis, F. Crescent-Like Lesions as anEarly Signature of Nephropathy in a Rat Model of Prediabetes Induced by a Hypercaloric Diet. Nutrients 2020, 12, 881. [CrossRef]
42. Conde, S.V.; Da Silva, T.N.; Gonzalez, C.; Carmo, M.M.; Monteiro, E.C.; Guarino, M.P. Chronic caffeine intake decreases circulatingcatecholamines and prevents diet-induced insulin resistance and hypertension in rats. Br. J. Nutr. 2011, 107, 86–95. [CrossRef][PubMed]
43. Ghezzi, A.C.; Cambri, L.; Botezelli, J.D.; Ribeiro, C.; Dalia, R.A.; De Mello, M.A.R. Metabolic syndrome markers in wistar rats ofdifferent ages. Diabetol. Metab. Syndr. 2012, 4, 16. [CrossRef] [PubMed]
44. Lessa, A.S.; Paredes, B.D.; Dias, J.V.; Carvalho, A.B.; Quintanilha, L.F.; Takiya, C.M.; Tura, B.R.; Rezende, G.F.; de Carvalho,A.C.C.; MC Resende, C.; et al. Ultrasound imaging in an experimental model of fatty liver disease and cirrhosis in rats. BMCVeter- Res. 2010, 6, 6. [CrossRef]
45. Benzie, I.F.F.; Strain, J.J. The ferric reducing ability of plasma (FRAP) as a measure of “antioxidant power”: The FRAP assay. Anal.Biochem. 1996, 239, 70–76. [CrossRef]
46. Sánchez-Rodríguez, M.A.; Mendoza-Núñez, V.M. Oxidative Stress Indexes for Diagnosis of Health or Disease in Humans.Oxidative Med. Cell. Longev. 2019, 2019, 4128152. [CrossRef]
47. Jarak, I.; Almeida, S.; Carvalho, R.; Sousa, M.; Barros, A.; Alves, M.G.; Oliveira, P.F. Senescence and declining reproductivepotential: Insight into molecular mechanisms through testicular metabolomics. Biochim. Biophys. Acta (BBA)-Mol. Basis Dis. 2018,1864, 3388–3396. [CrossRef] [PubMed]
Nutrients 2021, 13, 4192 28 of 32
48. Wishart, D.S.; Tzur, D.; Knox, C.; Eisner, R.; Guo, A.C.; Young, N.; Cheng, D.; Jewell, K.; Arndt, D.; Sawhney, S.; et al. HMDB: TheHuman Metabolome Database. Nucleic Acids Res. 2007, 35, D521–D526. [CrossRef]
49. Cloarec, O.; Dumas, M.-E.; Craig, A.; Barton, R.H.; Trygg, J.; Hudson, J.; Blancher, C.; Gauguier, D.; Lindon, J.C.; Holmes, A.E.;et al. Statistical Total Correlation Spectroscopy: An Exploratory Approach for Latent Biomarker Identification from Metabolic 1HNMR Data Sets. Anal. Chem. 2005, 77, 1282–1289. [CrossRef]
50. Sumner, L.W.; Amberg, A.; Barrett, D.; Beale, M.H.; Beger, R.; Daykin, C.A.; Fan, T.W.-M.; Fiehn, O.; Goodacre, R.; Griffin, J.L.;et al. Proposed minimum reporting standards for chemical analysis. Metabolomics 2007, 3, 211–221. [CrossRef]
51. Savorani, F.; Tomasi, G.; Engelsen, S.B. icoshift: A versatile tool for the rapid alignment of 1D NMR spectra. J. Magn. Reson. 2010,202, 190–202. [CrossRef]
52. Triba, M.N.; Le Moyec, L.; Amathieu, R.; Goossens, C.; Bouchemal, N.; Nahon, P.; Rutledge, D.N.; Savarin, P. PLS/OPLS modelsin metabolomics: The impact of permutation of dataset rows on the K-fold cross-validation quality parameters. Mol. BioSyst.2014, 11, 13–19. [CrossRef]
53. Reis, F.; Madureira, A.R.; Nunes, S.; Campos, D.A.; Fernandes, J.C.; Marques, C.; Zuzarte, M.; Gullón, B.; Rodríguez-Alcalá,L.M.; Calhau, C.; et al. Safety profile of solid lipid nanoparticles loaded with rosmarinic acid for oral use: In vitro and animalapproaches. Int. J. Nanomed. 2016, 11, 3621–3640. [CrossRef]
54. Zhao, H.-B.; Jia, L.; Yan, Q.-Q.; Deng, Q.; Wei, B. Effect of Clostridium butyricum and Butyrate on Intestinal Barrier Functions:Study of a Rat Model of Severe Acute Pancreatitis With Intra-Abdominal Hypertension. Front. Physiol. 2020, 11, 561061. [CrossRef]
55. Kumar, A.; Lawrence, J.C.; Jung, D.Y.; Ko, H.J.; Keller, S.R.; Kim, J.K.; Magnuson, M.A.; Harris, T.E. Fat Cell-Specific Ablation ofRictor in Mice Impairs Insulin-Regulated Fat Cell and Whole-Body Glucose and Lipid Metabolism. Diabetes 2010, 59, 1397–1406.[CrossRef] [PubMed]
56. Weber, M.; Mera, P.; Casas, J.; Salvador, J.; Rodríguez, A.; Alonso, S.; Sebastián, D.; Soler-Vázquez, M.C.; Montironi, C.; Recalde,S.; et al. Liver CPT1A gene therapy reduces diet-induced hepatic steatosis in mice and highlights potential lipid biomarkers forhuman NAFLD. FASEB J. 2020, 34, 11816–11837. [CrossRef] [PubMed]
57. Rolo, A.P.; Oliveira, P.J.; Moreno, A.J.M.; Palmeira, C.M. Bile acids affect liver mitochondrial bioenergetics: Possible relevance forcholestasis therapy. Toxicol. Sci. 2000, 57, 177–185. [CrossRef]
58. Varela, A.T.; Simões, A.M.; Teodoro, J.S.; Duarte, F.V.; Gomes, A.P.; Palmeira, C.M.; Rolo, A.P. Indirubin-3′-oxime prevents hepaticI/R damage by inhibiting GSK-3β and mitochondrial permeability transition. Mitochondrion 2010, 10, 456–463. [CrossRef]
59. Gornall, A.G.; Bardawill, C.J.; David, M.M. Determination of serum proteins by means of the biuret reaction. J. Biol. Chem. 1949,177, 751–766. [CrossRef]
60. Teodoro, J.; Duarte, F.V.; Gomes, A.P.; Varela, A.; Peixoto, F.; Rolo, A.; Palmeira, C. Berberine reverts hepatic mitochondrialdysfunction in high-fat fed rats: A possible role for SirT3 activation. Mitochondrion 2013, 13, 637–646. [CrossRef] [PubMed]
61. Cohen, J. A power primer. Psychol. Bull. 1992, 112, 155–159. [CrossRef]62. Jiao, X.; Wang, Y.; Lin, Y.; Lang, Y.; Li, E.; Zhang, X.; Zhang, Q.; Feng, Y.; Meng, X.; Li, B. Blueberry polyphenols extract as a
potential prebiotic with anti-obesity effects on C57BL/6 J mice by modulating the gut microbiota. J. Nutr. Biochem. 2018, 64,88–100. [CrossRef]
63. Prior, R.L.; Wilkes, S.E.; Rogers, T.R.; Khanal, R.C.; Wu, X.; Howard, L.R. Purified Blueberry Anthocyanins and Blueberry JuiceAlter Development of Obesity in Mice Fed an Obesogenic High-Fat Diet. J. Agric. Food Chem. 2010, 58, 3970–3976. [CrossRef]
64. Song, Y.; Park, H.J.; Kang, S.N.; Jang, S.-H.; Lee, S.-J.; Ko, Y.-G.; Kim, G.-S.; Cho, J.-H. Blueberry Peel Extracts Inhibit Adipogenesisin 3T3-L1 Cells and Reduce High-Fat Diet-Induced Obesity. PLoS ONE 2013, 8, e69925. [CrossRef]
65. Lee, S.; Keirsey, K.I.; Kirkland, R.; Grunewald, Z.I.; Fischer, J.G.; De La Serre, C.B. Blueberry Supplementation Influences the GutMicrobiota, Inflammation, and Insulin Resistance in High-Fat-Diet–Fed Rats. J. Nutr. 2018, 148, 209–219. [CrossRef] [PubMed]
66. Rodríguez-Daza, M.C.; Daoust, L.; Boutkrabt, L.; Pilon, G.; Varin, T.; Dudonné, S.; Levy, É.; Marette, A.; Roy, D.; Desjardins,Y. Wild blueberry proanthocyanidins shape distinct gut microbiota profile and influence glucose homeostasis and intestinalphenotypes in high-fat high-sucrose fed mice. Sci. Rep. 2020, 10, 2217. [CrossRef] [PubMed]
67. Seymour, E.M.; Tanone, I.I.; Urcuyo-Llanes, D.E.; Lewis, S.K.; Kirakosyan, A.; Kondoleon, M.G.; Kaufman, P.B.; Bolling, S.F.Blueberry Intake Alters Skeletal Muscle and Adipose Tissue Peroxisome Proliferator-Activated Receptor Activity and ReducesInsulin Resistance in Obese Rats. J. Med. Food 2011, 14, 1511–1518. [CrossRef] [PubMed]
68. Benton, D.; Young, H.A. Role of fruit juice in achieving the 5-a-day recommendation for fruit and vegetable intake. Nutr. Rev.2019, 77, 829–843. [CrossRef] [PubMed]
69. Ho, K.K.H.Y.; Ferruzzi, M.G.; Wightman, J.D. Potential health benefits of (poly)phenols derived from fruit and 100% fruit juice.Nutr. Rev. 2019, 78, 145–174. [CrossRef] [PubMed]
70. Stribitcaia, E.; Evans, C.E.L.; Gibbons, C.; Blundell, J.; Sarkar, A. Food texture influences on satiety: Systematic review andmeta-analysis. Sci. Rep. 2020, 10, 12929. [CrossRef]
71. Preguiça, I.; Alves, A.; Nunes, S.; Fernandes, R.; Gomes, P.; Viana, S.D.; Reis, F. Diet-induced rodent models of obesity-relatedmetabolic disorders—A guide to a translational perspective. Obes. Rev. 2020, 21, e13081. [CrossRef]
72. DeFuria, J.; Bennett, G.; Strissel, K.J.; Perfield, J.W.; Milbury, P.E.; Greenberg, A.S.; Obin, M.S. Dietary Blueberry AttenuatesWhole-Body Insulin Resistance in High Fat-Fed Mice by Reducing Adipocyte Death and Its Inflammatory Sequelae. J. Nutr. 2009,139, 1510–1516. [CrossRef] [PubMed]
Nutrients 2021, 13, 4192 29 of 32
73. Mykkänen, O.T.; Huotari, A.; Herzig, K.-H.; Dunlop, T.W.; Mykkänen, H.; Kirjavainen, P.V. Wild Blueberries (Vaccinium myrtillus)Alleviate Inflammation and Hypertension Associated with Developing Obesity in Mice Fed with a High-Fat Diet. PLoS ONE2014, 9, e114790. [CrossRef]
74. Roopchand, D.E.; Kuhn, P.; Rojo, L.E.; Lila, M.A.; Raskin, I. Blueberry polyphenol-enriched soybean flour reduces hyperglycemia,body weight gain and serum cholesterol in mice. Pharmacol. Res. 2012, 68, 59–67. [CrossRef] [PubMed]
75. Elks, C.M.; Terrebonne, J.D.; Ingram, D.K.; Stephens, J.M. Blueberries improve glucose tolerance without altering body composi-tion in obese postmenopausal mice. Obesity 2015, 23, 573–580. [CrossRef]
76. Ren, T.; Huang, C.; Cheng, M. Dietary Blueberry and Bifidobacteria Attenuate Nonalcoholic Fatty Liver Disease in Rats byAffecting SIRT1-Mediated Signaling Pathway. Oxidative Med. Cell. Longev. 2014, 2014, 469059. [CrossRef]
77. Si, X.; Tian, J.; Shu, C.; Wang, Y.; Gong, E.; Zhang, Y.; Zhang, W.; Cui, H.; Li, B. Serum Ceramide Reduction by BlueberryAnthocyanin-Rich Extract Alleviates Insulin Resistance in Hyperlipidemia Mice. J. Agric. Food Chem. 2020, 68, 8185–8194.[CrossRef] [PubMed]
78. Grace, M.; Ribnicky, D.M.; Kuhn, P.; Poulev, A.; Logendra, S.; Yousef, G.G.; Raskin, I.; Lila, M.A. Hypoglycemic activity of anovel anthocyanin-rich formulation from lowbush blueberry, Vaccinium angustifolium Aiton. Phytomedicine 2009, 16, 406–415.[CrossRef]
79. Norberto, S.; Silva, S.; Meireles, M.; Faria, A.; Pintado, M.M.; Calhau, C. Blueberry anthocyanins in health promotion: A metabolicoverview. J. Funct. Foods 2013, 5, 1518–1528. [CrossRef]
80. Vuong, T.; Benhaddou-Andaloussi, A.; Brault, A.; Harbilas, D.; Martineau, L.C.; Vallerand, D.; Ramassamy, C.; Matar, C.; Haddad,P.S. Antiobesity and antidiabetic effects of biotransformed blueberry juice in KKAy mice. Int. J. Obes. 2009, 33, 1166–1173.[CrossRef]
81. Brown, J.E.; Kelly, M.F. Inhibition of lipid peroxidation by anthocyanins, anthocyanidins and their phenolic degradation products.Eur. J. Lipid Sci. Technol. 2007, 109, 66–71. [CrossRef]
82. Li, D.; Zhang, Y.; Liu, Y.; Sun, R.; Xia, M. Purified Anthocyanin Supplementation Reduces Dyslipidemia, Enhances AntioxidantCapacity, and Prevents Insulin Resistance in Diabetic Patients. J. Nutr. 2015, 145, 742–748. [CrossRef]
83. Pranprawit, A.; Heyes, J.A.; Molan, A.L.; Kruger, M.C. Antioxidant Activity and Inhibitory Potential of Blueberry Extracts AgainstKey Enzymes Relevant for Hyperglycemia. J. Food Biochem. 2015, 39, 109–118. [CrossRef]
84. Wu, T.; Gao, Y.; Guo, X.; Zhang, M.; Gong, L. Blackberry and Blueberry Anthocyanin Supplementation Counteract High-Fat-Diet-Induced Obesity by Alleviating Oxidative Stress and Inflammation and Accelerating Energy Expenditure. Oxidative Med. Cell.Longev. 2018, 2018, 4051232. [CrossRef] [PubMed]
85. Fernandes, R.; Viana, S.; Nunes, S.R.R.P.; Reis, F. Diabetic gut microbiota dysbiosis as an inflammaging and immunosenescencecondition that fosters progression of retinopathy and nephropathy. Biochim. Biophys. Acta (BBA)-Mol. Basis Dis. 2018, 1865,1876–1897. [CrossRef] [PubMed]
86. Guirro, M.; Costa, A.; Gual-Grau, A.; Herrero, P.; Torrell, H.; Canela, N.; Arola, L. Effects from diet-induced gut microbiotadysbiosis and obesity can be ameliorated by fecal microbiota transplantation: A multiomics approach. PLoS ONE 2019, 14,e0218143. [CrossRef]
87. Zhang, C.; Zhang, M.; Wang, S.; Han, R.; Cao, Y.; Hua, W.; Mao, Y.; Zhang, X.; Pang, X.; Wei, C.; et al. Interactions between gutmicrobiota, host genetics and diet relevant to development of metabolic syndromes in mice. ISME J. 2009, 4, 232–241. [CrossRef]
88. Singh, A.K.; Cabral, C.; Kumar, R.; Ganguly, R.; Rana, H.K.; Gupta, A.; Lauro, M.R.; Carbone, C.; Reis, F.; Pandey, A.K. BeneficialEffects of Dietary Polyphenols on Gut Microbiota and Strategies to Improve Delivery Efficiency. Nutrients 2019, 11, 2216.[CrossRef]
89. Rodríguez-Daza, M.-C.; Roquim, M.; Dudonné, S.; Pilon, G.; Levy, E.; Marette, A.; Roy, D.; Desjardins, Y. Berry Polyphenols andFibers Modulate Distinct Microbial Metabolic Functions and Gut Microbiota Enterotype-Like Clustering in Obese Mice. Front.Microbiol. 2020, 11, 2032. [CrossRef]
90. Hereu, M.; Ramos-Romero, S.; Busquets, C.; Atienza, L.; Amézqueta, S.; Miralles-Pérez, B.; Nogués, M.R.; Méndez, L.; Medina, I.;Torres, J.L. Effects of combined D-fagomine and omega-3 PUFAs on gut microbiota subpopulations and diabetes risk factors inrats fed a high-fat diet. Sci. Rep. 2019, 9, 16628. [CrossRef]
91. Gual-Grau, A.; Guirro, M.; Mayneris-Perxachs, J.; Arola, L.; Boqué, N. Impact of different hypercaloric diets on obesity features inrats: A metagenomics and metabolomics integrative approach. J. Nutr. Biochem. 2019, 71, 122–131. [CrossRef]
92. Groschwitz, K.R.; Hogan, S.P. Intestinal barrier function: Molecular regulation and disease pathogenesis. J. Allergy Clin. Immunol.2009, 124, 3–20. [CrossRef]
93. Shah, V.O.; Lambeth, S.M.; Carson, T.; Lowe, J.; Ramaraj, T.; Leff, J.W.; Luo, L.; Bell, C.J. Composition Diversity and Abundance ofGut Microbiome in Prediabetes and Type 2 Diabetes. J. Diabetes Obes. 2015, 2, 108–114. [CrossRef]
94. Depommier, C.; Everard, A.; Druart, C.; Plovier, H.; Van Hul, M.; Vieira-Silva, S.; Falony, G.; Raes, J.; Maiter, D.; Delzenne,N.M.; et al. Supplementation with Akkermansia muciniphila in overweight and obese human volunteers: A proof-of-conceptexploratory study. Nat. Med. 2019, 25, 1096–1103. [CrossRef] [PubMed]
95. Zhao, S.; Liu, W.; Wang, J.; Shi, J.; Sun, Y.; Wang, W.; Ning, G.; Liu, R.-X.; Hong, J. Akkermansia muciniphila improves metabolicprofiles by reducing inflammation in chow diet-fed mice. J. Mol. Endocrinol. 2017, 58, 1–14. [CrossRef] [PubMed]
Nutrients 2021, 13, 4192 30 of 32
96. Zhang, J.; Ni, Y.; Qian, L.; Fang, Q.; Zheng, T.; Zhang, M.; Gao, Q.; Ni, J.; Hou, X.; Bao, Y.; et al. Decreased Abundance ofAkkermansia muciniphila Leads to the Impairment of Insulin Secretion and Glucose Homeostasis in Lean Type 2 Diabetes. Adv.Sci. 2021, 8, 2100536. [CrossRef]
97. Qin, J.; Li, Y.; Cai, Z.; Li, S.; Zhu, J.; Zhang, F.; Liang, S.; Zhang, W.; Guan, Y.; Shen, D.; et al. A metagenome-wide associationstudy of gut microbiota in type 2 diabetes. Nature 2012, 490, 55–60. [CrossRef]
98. Wang, Y.; Dilidaxi, D.; Wu, Y.; Sailike, J.; Sun, X.; Nabi, X.-H.; Wang, Y.; Dilidaxi, D.; Wu, Y.; Sailike, J.; et al. Composite probioticsalleviate type 2 diabetes by regulating intestinal microbiota and inducing GLP-1 secretion in db/db mice. Biomed. Pharmacother.2020, 125, 109914. [CrossRef] [PubMed]
99. Guo, J.; Han, X.; Tan, H.; Huang, W.; You, Y.; Zhan, J. Blueberry Extract Improves Obesity through Regulation of the GutMicrobiota and Bile Acids via Pathways Involving FXR and TGR5. iScience 2019, 19, 676–690. [CrossRef] [PubMed]
100. Ntemiri, A.; Ghosh, T.; Gheller, M.; Tran, T.; Blum, J.; Pellanda, P.; Vlckova, K.; Neto, M.; Howell, A.; Thalacker-Mercer, A.; et al.Whole Blueberry and Isolated Polyphenol-Rich Fractions Modulate Specific Gut Microbes in an In Vitro Colon Model and in aPilot Study in Human Consumers. Nutrients 2020, 12, 2800. [CrossRef]
101. Si, X.; Bi, J.; Chen, Q.; Cui, H.; Bao, Y.; Tian, J.; Shu, C.; Wang, Y.; Tan, H.; Zhang, W.; et al. Effect of Blueberry Anthocyanin-RichExtracts on Peripheral and Hippocampal Antioxidant Defensiveness: The Analysis of the Serum Fatty Acid Species and GutMicrobiota Profile. J. Agric. Food Chem. 2021, 69, 3658–3666. [CrossRef]
102. Yan, Z.; Yang, F.; Hong, Z.; Wang, S.; Jinjuan, Z.; Han, B.; Xie, R.; Leng, F.; Yang, Q. Blueberry Attenuates Liver Fibrosis, ProtectsIntestinal Epithelial Barrier, and Maintains Gut Microbiota Homeostasis. Can. J. Gastroenterol. Hepatol. 2019, 2019, 5236149.[CrossRef]
103. De Vadder, F.; Kovatcheva-Datchary, P.; Zitoun, C.; Duchampt, A.; Bäckhed, F.; Mithieux, G. Microbiota-Produced SuccinateImproves Glucose Homeostasis via Intestinal Gluconeogenesis. Cell Metab. 2016, 24, 151–157. [CrossRef] [PubMed]
104. Cladis, D.P.; Simpson, A.M.R.; Cooper, K.J.; Nakatsu, C.H.; Ferruzzi, M.G.; Weaver, C.M. Blueberry polyphenols alter gutmicrobiota & phenolic metabolism in rats. Food Funct. 2021, 12, 2442–2456. [CrossRef]
105. Gwiazdowska, D.; Jus, K.; Jasnowska-Małecka, J.; Kluczynska, K. The impact of polyphenols on Bifidobacterium growth. ActaBiochim. Pol. 2015, 62, 895–901. [CrossRef]
106. Marín, L.; Miguélez, E.M.; Villar, C.J.; Lombó, F. Bioavailability of Dietary Polyphenols and Gut Microbiota Metabolism:Antimicrobial Properties. BioMed Res. Int. 2015, 2015, 905215. [CrossRef]
107. Agarwal, A.; Hegde, A.; Yadav, C.; Ahmad, A.; Manjrekar, P.A.; Srikantiah, R.M. Assessment of oxidative stress and inflammationin prediabetes—A hospital based cross-sectional study. Diabetes Metab. Syndr. Clin. Res. Rev. 2016, 10, S123–S126. [CrossRef]
108. Fiorentino, T.; Prioletta, A.; Zuo, P.; Folli, F. Hyperglycemia-induced Oxidative Stress and its Role in Diabetes Mellitus RelatedCardiovascular Diseases. Curr. Pharm. Des. 2013, 19, 5695–5703. [CrossRef] [PubMed]
109. Jong, C.J.; Azuma, J.; Schaffer, S. Mechanism underlying the antioxidant activity of taurine: Prevention of mitochondrial oxidantproduction. Amino Acids 2011, 42, 2223–2232. [CrossRef] [PubMed]
110. Schaffer, S.; Kim, H.W. Effects and Mechanisms of Taurine as a Therapeutic Agent. Biomol. Ther. 2018, 26, 225–241. [CrossRef]111. Schaffer, S.W.; Azuma, J.; Mozaffari, M. Role of antioxidant activity of taurine in diabetesThis article is one of a selection of papers
from the NATO Advanced Research Workshop on Translational Knowledge for Heart Health (published in part 1 of a 2-partSpecial Issue). Can. J. Physiol. Pharmacol. 2009, 87, 91–99. [CrossRef]
112. Day, C.; Kempson, S.A. Betaine chemistry, roles, and potential use in liver disease. Biochim. Biophys. Acta (BBA)-Gen. Subj. 2016,1860, 1098–1106. [CrossRef] [PubMed]
113. Zeisel, S.H.; Mar, M.-H.; Howe, J.C.; Holden, J.M. Concentrations of Choline-Containing Compounds and Betaine in CommonFoods. J. Nutr. 2003, 133, 1302–1307. [CrossRef] [PubMed]
114. Longo, N.; Frigeni, M.; Pasquali, M. Carnitine transport and fatty acid oxidation. Biochim. Biophys. Acta (BBA)-Bioenerg. 2016,1863, 2422–2435. [CrossRef]
115. Serkova, N.J.; Jackman, M.; Brown, J.L.; Liu, T.; Hirose, R.; Roberts, J.P.; Maher, J.J.; Niemann, C.U. Metabolic profiling of liversand blood from obese Zucker rats. J. Hepatol. 2006, 44, 956–962. [CrossRef]
116. Kim, H.-J.; Kim, J.H.; Noh, S.; Hur, H.J.; Sung, M.J.; Hwang, J.-T.; Park, J.H.; Yang, H.J.; Kim, M.-S.; Kwon, D.Y.; et al. MetabolomicAnalysis of Livers and Serum from High-Fat Diet Induced Obese Mice. J. Proteome Res. 2010, 10, 722–731. [CrossRef] [PubMed]
117. Kathirvel, E.; Morgan, K.; Nandgiri, G.; Sandoval, B.C.; Caudill, M.A.; Bottiglieri, T.; French, S.W.; Morgan, T.R. Betaine improvesnonalcoholic fatty liver and associated hepatic insulin resistance: A potential mechanism for hepatoprotection by betaine. Am. J.Physiol. Liver Physiol. 2010, 299, G1068–G1077. [CrossRef]
118. Wang, L.-J.; Zhang, H.-W.; Zhou, J.-Y.; Liu, Y.; Yang, Y.; Chen, X.-L.; Zhu, C.-H.; Zheng, R.-D.; Ling, W.-H.; Zhu, H.-L. Betaineattenuates hepatic steatosis by reducing methylation of the MTTP promoter and elevating genomic methylation in mice fed ahigh-fat diet. J. Nutr. Biochem. 2014, 25, 329–336. [CrossRef]
119. Zhang, W.; Wang, L.-W.; Wang, L.-K.; Li, X.; Zhang, H.; Luo, L.-P.; Song, J.-C.; Gong, Z.-J. Betaine Protects Against High-Fat-Diet-Induced Liver Injury by Inhibition of High-Mobility Group Box 1 and Toll-Like Receptor 4 Expression in Rats. Dig. Dis. Sci. 2013,58, 3198–3206. [CrossRef]
120. Wang, Z.; Yao, T.; Pini, M.; Zhou, Z.; Fantuzzi, G.; Song, Z. Betaine improved adipose tissue function in mice fed a high-fat diet:A mechanism for hepatoprotective effect of betaine in nonalcoholic fatty liver disease. Am. J. Physiol. Liver Physiol. 2010, 298,G634–G642. [CrossRef]
Nutrients 2021, 13, 4192 31 of 32
121. Niu, Y.; Li, S.; Na, L.; Feng, R.; Liu, L.; Li, Y.; Sun, C. Mangiferin Decreases Plasma Free Fatty Acids through Promoting ItsCatabolism in Liver by Activation of AMPK. PLoS ONE 2012, 7, e30782. [CrossRef]
122. Tranchida, F.; Rakotoniaina, Z.; Shintu, L.; Tchiakpe, L.; Deyris, V.; Yemloul, M.; Stocker, P.; Vidal, N.; Rimet, O.; Hiol, A.; et al.Hepatic metabolic effects of Curcuma longa extract supplement in high-fructose and saturated fat fed rats. Sci. Rep. 2017, 7, 5880.[CrossRef]
123. Crescenzo, R.; Bianco, F.; Mazzoli, A.; Giacco, A.; Liverini, G.; Iossa, S. A possible link between hepatic mitochondrial dysfunctionand diet-induced insulin resistance. Eur. J. Nutr. 2015, 55, 1–6. [CrossRef] [PubMed]
124. Lai, C.-S.; Wu, J.-C.; Ho, C.-T.; Pan, M.-H. Chemoprevention of obesity by dietary natural compounds targeting mitochondrialregulation. Mol. Nutr. Food Res. 2016, 61, 1600721. [CrossRef] [PubMed]
125. Serrano, J.C.E.; Cassanyé, A.; Martín-Gari, M.; Granado-Serrano, A.B.; Portero-Otín, M. Effect of Dietary Bioactive Compoundson Mitochondrial and Metabolic Flexibility. Diseases 2016, 4, 14. [CrossRef]
126. Lahouel, M.; Amedah, S.; Zellagui, A.; Touil, A.; Rhouati, S.; Benyache, F.; Leghouchi, E.; Bousseboua, H. The Interaction of NewPlant Flavonoids with Rat Liver Mitochondria: Relation between the Anti- and Pro-oxydant Effect and Flavonoids Concentration.Therapies 2006, 61, 347–355. [CrossRef]
127. Sandoval-Acuña, C.; Ferreira, J.; Speisky, H. Polyphenols and mitochondria: An update on their increasingly emerging ROS-scavenging independent actions. Arch. Biochem. Biophys. 2014, 559, 75–90. [CrossRef]
128. Dos Santos, T.W.; Pereira, Q.C.; Teixeira, L.; Gambero, A.; Villena, J.A.; Ribeiro, M.L. Effects of Polyphenols on Thermogenesisand Mitochondrial Biogenesis. Int. J. Mol. Sci. 2018, 19, 2757. [CrossRef]
129. Schrauwen, P.; Schrauwen-Hinderling, V.; Hoeks, J.; Hesselink, M.K. Mitochondrial dysfunction and lipotoxicity. Biochim. Biophys.Acta (BBA)-Mol. Cell Biol. Lipids 2010, 1801, 266–271. [CrossRef]
130. Diao, L.; Auger, C.; Konoeda, H.; Sadri, A.-R.; Amini-Nik, S.; Jeschke, M.G. Hepatic steatosis associated with decreased β-oxidation and mitochondrial function contributes to cell damage in obese mice after thermal injury. Cell Death Dis. 2018, 9, 530.[CrossRef]
131. Cardoso, A.R.; Cabral-Costa, J.V.; Kowaltowski, A.J. Effects of a high fat diet on liver mitochondria: Increased ATP-sensitive K+channel activity and reactive oxygen species generation. J. Bioenerg. Biomembr. 2010, 42, 245–253. [CrossRef]
132. Ciapaite, J.; Bakker, S.J.; Van Eikenhorst, G.; Wagner, M.J.; Teerlink, T.; Schalkwijk, C.G.; Fodor, M.; Ouwens, D.M.; Diamant, M.;Heine, R.J.; et al. Functioning of oxidative phosphorylation in liver mitochondria of high-fat diet fed rats. Biochim. Biophys. Acta(BBA)-Mol. Basis Dis. 2007, 1772, 307–316. [CrossRef] [PubMed]
133. Franko, A.; von Kleist-Retzow, J.-C.; Neschen, S.; Wu, M.; Schommers, P.; Böse, M.; Kunze, A.; Hartmann, U.; Sanchez-Lasheras,C.; Stoehr, O.; et al. Liver adapts mitochondrial function to insulin resistant and diabetic states in mice. J. Hepatol. 2014, 60,816–823. [CrossRef]
134. Holloway, G.P.; Thrush, A.B.; Heigenhauser, G.J.F.; Tandon, N.N.; Dyck, D.J.; Bonen, A.; Spriet, L.L. Skeletal muscle mitochondrialFAT/CD36 content and palmitate oxidation are not decreased in obese women. Am. J. Physiol. Metab. 2007, 292, E1782–E1789.[CrossRef] [PubMed]
135. Moon, S.H.; Dilthey, B.G.; Liu, X.; Guan, S.; Sims, H.F.; Gross, R.W. High-fat diet activates liver iPLA2γ generating eicosanoidsthat mediate metabolic stress. J. Lipid Res. 2021, 62, 100052. [CrossRef] [PubMed]
136. Yu, L.; Fink, B.D.; Herlein, J.A.; Oltman, C.L.; Lamping, K.G.; Sivitz, W.I. Dietary fat, fatty acid saturation and mitochondrialbioenergetics. J. Bioenerg. Biomembr. 2013, 46, 33–44. [CrossRef]
137. Li, H.; Park, H.-M.; Ji, H.-S.; Han, J.; Kim, S.-K.; Park, H.-Y.; Jeong, T.-S. Phenolic-enriched blueberry-leaf extract attenuatesglucose homeostasis, pancreatic β-cell function, and insulin sensitivity in high-fat diet–induced diabetic mice. Nutr. Res. 2019, 73,83–96. [CrossRef] [PubMed]
138. Spinelli, J.B.; Haigis, M.C. The multifaceted contributions of mitochondria to cellular metabolism. Nature 2018, 20, 745–754.[CrossRef]
139. Koonen, D.P.; Jacobs, R.L.; Febbraio, M.; Young, M.E.; Soltys, C.-L.M.; Ong, H.; Vance, D.E.; Dyck, J.R. Increased Hepatic CD36Expression Contributes to Dyslipidemia Associated With Diet-Induced Obesity. Diabetes 2007, 56, 2863–2871. [CrossRef]
140. Aranaz, P.; Romo-Hualde, A.; Zabala, M.; Navarro-Herrera, D.; de Galarreta, M.R.; Gil, A.G.; Martinez, J.A.; Milagro, F.I.;González-Navarro, C.J. Freeze-dried strawberry and blueberry attenuates diet-induced obesity and insulin resistance in rats byinhibiting adipogenesis and lipogenesis. Food Funct. 2017, 8, 3999–4013. [CrossRef]
141. Nagao, K.; Higa, K.; Shirouchi, B.; Nomura, S.; Inoue, N.; Inafuku, M.; Yanagita, T. Effect ofVaccinium ashei readeLeaves on LipidMetabolism in Otsuka Long-Evans Tokushima Fatty Rats. Biosci. Biotechnol. Biochem. 2008, 72, 1619–1622. [CrossRef] [PubMed]
142. Zhao, W.-J.; Bian, Y.-P.; Wang, Q.-H.; Yin, F.; Yin, L.; Zhang, Y.-L.; Liu, J.-H. Blueberry-derived exosomes-like nanoparticlesameliorate nonalcoholic fatty liver disease by attenuating mitochondrial oxidative stress. Acta Pharmacol. Sin. 2021, 1–14.[CrossRef] [PubMed]
143. Zhuge, Q.; Zhang, Y.; Liu, B.; Wu, M. Blueberry polyphenols play a preventive effect on alcoholic fatty liver disease C57BL/6 Jmice by promoting autophagy to accelerate lipolysis to eliminate excessive TG accumulation in hepatocytes. Ann. Palliat. Med.2020, 9, 1045–1054. [CrossRef]
144. Takikawa, M.; Inoue, S.; Horio, F.; Tsuda, T. Dietary Anthocyanin-Rich Bilberry Extract Ameliorates Hyperglycemia and InsulinSensitivity via Activation of AMP-Activated Protein Kinase in Diabetic Mice. J. Nutr. 2010, 140, 527–533. [CrossRef] [PubMed]

Nutrients 2021, 13, 4192 32 of 32
145. Liu, S.; Marsol-Vall, A.; Laaksonen, O.; Kortesniemi, M.; Yang, B. Characterization and Quantification of NonanthocyaninPhenolic Compounds in White and Blue Bilberry (Vaccinium myrtillus) Juices and Wines Using UHPLC-DAD−ESI-QTOF-MS andUHPLC-DAD. J. Agric. Food Chem. 2020, 68, 7734–7744. [CrossRef]
146. Ek, S.; Kartimo, H.; Mattila, S.; Tolonen, A. Characterization of Phenolic Compounds from Lingonberry (Vaccinium vitis-idaea). J.Agric. Food Chem. 2006, 54, 9834–9842. [CrossRef]
147. Mikulic-Petkovsek, M.; Schmitzer, V.; Slatnar, A.; Stampar, F.; Veberic, R. A comparison of fruit quality parameters of wild bilberry(Vaccinium myrtillus L.) growing at different locations. J. Sci. Food Agric. 2014, 95, 776–785. [CrossRef]
148. Stanoeva, J.P.; Stefova, M.; Andonovska, K.B.; Vankova, A.; Stafilov, T. Phenolics and mineral content in bilberry and bog bilberryfrom Macedonia. Int. J. Food Prop. 2017, 20, S863–S883. [CrossRef]
149. Howard, L.R.; Brownmiller, C.; Mauromoustakos, A.; Prior, R.L. Improved stability of blueberry juice anthocyanins by acidificationand refrigeration. J. Berry Res. 2016, 6, 189–201. [CrossRef]


