Embed Size (px)
Citation preview
Page 1/15
Changes in hyperglycaemia-related testing forprediabetes and type 2 diabetes mellitusmanagement: a prospective, cross-sectional surveyof 16 years of general practice data from AustraliaAndrew Leigh
The University of Sydney, Sydney, Faculty of Medicine and Health, Sydney School of Medicine, AndersonStuart Building, The University of Sydney, NSW, 2006Jennifer Hunter
Western Sydney University, NICM Health Research Institute, Locked Bag 1797, Penrith, NSW, 2751Christopher Harrison
The University of Sydney, Faculty of Medicine and Health, Sydney School of Public Health, MenziesCentre for Health Policy and Economics, Charles Perkins Centre (D17), NSW, 2006Helena Britt
The University of Sydney, Faculty of Medicine and Health, Sydney School of Public Health, Edward FordBuilding, A27 Fisher Rd, University of Sydney NSW 2006Eugen Molodysky ( [email protected] )
The University of Sydney, Sydney, Faculty of Medicine and Health, Sydney School of Medicine, AndersonStuart Building, The University of Sydney, NSW, 2006
Research Article
Keywords: General Practice, Primary Care, Diabetes Mellitus Type 2, Prediabetes, Insulin Resistance,Health Care Survey
Posted Date: October 7th, 2021
DOI: https://doi.org/10.21203/rs.3.rs-874376/v1
License: This work is licensed under a Creative Commons Attribution 4.0 International License. Read Full License
Page 2/15
AbstractBackground
The rising prevalence of prediabetes increases the population risk of type 2 diabetes mellitus (T2DM),metabolic syndrome and cardiovascular disease. Early identi�cation by General Practitioners (GPs)provides opportunities for lifestyle modi�cations that can lower these risks.
Methods
This study examined 16 years of annual trends (2000/01-20015/16) in hyperglycaemia-related testing forpatients in Australia aged 13 years or older with, or at risk of a diagnosis of T2DM. The Bettering theEvaluation and Care of Health (BEACH) study is a national cross-sectional survey, with a single-stage,cluster sampling design. Approximately 1,000 GPs were randomly selected annually (2000/01-20015/16)from across Australia, who each recorded details of 100 consecutive clinical encounters with consentingpatients. Means and 95% con�dence intervals were adjusted for intracluster correlation and GPcharacteristics.
Results
15,679 GPs recorded details of 1,387,190 clinical encounters with patients aged 13+ years. Prediabetesand T2DM were managed at 0.25% (95% CI: 0.24-0.27%) and 3.68% (95% CI: 3.62-3.73%) of encountersrespectively. By the end of the study, annual management rates were 2.3 times higher for prediabetes and1.5 times for T2DM management. The likelihood of ordering at least one hyperglycaemia-related testduring prediabetes management occasion was twice the likelihood in management of T2DM. Forprediabetes, glucose tolerance tests were most common but from 2014/15, requests for HbA1c testsbegan to increase. For T2DM, HbA1c tests were most common, and requests for one or more glucosetests gradually declined.
Conclusion
The observed 16-year annual trends align with the rising incidence of prediabetes and T2DM. GPsappeared to be strongly in�uenced by changes to the national insurance scheme and clinical guidelinesfor hyperglycaemia-related pathology testing. However, some GPs may have been pre-empting policychanges as there was also evidence of ‘unendorsed’ testing, notably for prediabetes that warrants furtherinvestigation. The increasing management rates for prediabetes, coupled with higher rates of pathologyrequesting have substantial resource implication. Calls to lower the risk threshold for prediabetesscreening therefore warrant an economic analysis. Ongoing, reliable, up-to-date data is needed to informclinical practice guidelines and policy in Australia.
Introduction
Page 3/15
The prevalence of Type 2 Diabetes Mellitus (T2DM) continues to rise globally. Current estimates are thataround half a billion people worldwide have T2DM and this is projected to increase by at least 50% overthe next 30 years [1]. In Australia, well over 1.2 million (4.9%) of the population have a diagnosis ofdiabetes, mostly T2DM [2, 3]. Another 1 in 6 Australians older than 25 years are likely to have prediabetes[4]. Primary medical care is the cornerstone of T2DM management in Australia. In 2015/16, around 4.0%of general practitioners’ (GP) clinical encounters involved T2DM management [5].
The Royal Australian College of General Practitioners (RACGP) in collaboration with Diabetes Australia,provides patient-centered recommendations aimed at optimizing diabetes diagnosis and management[6]. In 2016, glycated haemoglobin (HbA1c) was introduced as an alternative screening pathway to thestandard fasting blood glucose (FBG) test that is followed by an oral glucose tolerance test (OGTT) ifindicated [6]. In discussion with patients, GPs decide which screening pathway, FBG or HbA1c they willuse.
Prediabetes – a state of glucose dysregulation that does not meet the diagnostic criteria of T2DM – isconsidered part of the continuum of glucose dysregulation culminating in T2DM. However, it is also arecognised clinical entity and is independently associated with an increased risk of the metabolicsyndrome and cardiovascular disease [7, 8]. Studies have demonstrated that early identi�cation ofprediabetes when accompanied with lifestyle interventions, may reduce the risk of developing T2DM [9].
While T2DM is well de�ned, there is no agreed, universally recognised screening and diagnostic criteriafor prediabetes [10–12]. Notably, the term ‘prediabetes’ is only used in the RACGP diabetes guidelines inthe context of gestational diabetes, and instead ‘impaired fasting glucose’, ‘impaired glucose tolerance’,and ‘high risk HbA1c’ are used when referring to elevated results that do not meet the diagnostic criteriafor T2DM [6]. In contrast, leading Australian non-medical primary care professional bodies havecontinued to use the term ‘prediabetes’ in their updated 2020 joint position statement on the screeningand management of prediabetes in adults in primary care [12]. Along with FBG, HbA1c is nowrecommended as a �rst line screening test and a lower risk threshold is applied than that used forscreening for T2DM. The addition of HbA1c and their use of the term prediabetes aligns with theAmerican Diabetes Association guidelines [10].
Insulin, either fasting or with an OGTT, is another pathology test that GPs and medical specialists mightuse when screening and diagnosing prediabetes. Whilst these tests are not widely endorsed, since at least2010 there have been calls to consider the role of insulin tests [13–15].
Given the current, and potential uses of these hyperglycaemia-related tests (FBG, HbA1c, OGTT andinsulin) and their cost implications, it is important to document pathology referral activity by GPs inAustralia within the broader picture of T2DM and prediabetes. A secondary analysis of publicly availableMedicare Bene�ts Schedule (MBS) data found that between 2010 and 2019 pathology screening rates forT2DM doubled [16]. Limitations of the data included the MBS item numbers that bundle tests together, noinformation about who ordered the test, and little, if any information about the clinical circumstances.
Page 4/15
Consequently, there remains a need to determine which hyperglycaemia-related pathology tests GPs inAustralia use for managing prediabetes and T2DM, and how this may have changed over time relative tochanges to Australian diabetes guidelines and MBS funding policies. The aim of this study was toinvestigate 16 years of GP encounters with patients aged 13 years and over (adolescents and adults) forthe management of prediabetes and T2DM, and the rates of requests for hyperglycaemia-relatedpathology tests.
Methods
Study designAnalyses of data from the Bettering the Evaluation and Care of Health (BEACH) study, a national cross-sectional survey of GP clinical activity, with single-stage, cluster sampling of GPs, conducted from April1998 to March 2016. [5].
Setting, participants, data source & classi�cationThe BEACH methods are described in detail elsewhere [5]. In brief, each year from April 1998 through toMarch 2016, the BEACH study involved ever-changing, random samples of approximately 1,000 GPs fromacross Australia, each of whom recorded details of 100 consecutive clinical encounters with consentingpatients. At each encounter, participating GPs recorded, deidenti�ed clinical details including: patientcharacteristics; up to four problems actively managed at the encounter (free text) and any managementactions taken by the GP (directly linked to the problem being managed), including up to 5 pathologytests/batteries of test ordered(free text). The data were then coded by trained clinical coders using theAustralian interface terminology ICPC-2 PLUS [17], which is classi�ed according to the InternationalClassi�cation of Primary Care (ICPC-2) [18].
Data analysisData collected in the last 16 years (April 2000 to March 2016) of the BEACH study were selected for theanalysis. Only encounters with patients aged 13 years and over (adolescents and adults) were included.The ICPC-2 PLUS terms and codes rubric used to de�ne prediabetes, T2DM, and the hyperglycaemia-related tests is outlined in Box 1. All point estimates were calculated as proportions, if an event couldhappen more than once (e.g. any glucose test) they were calculated as ‘at least one’ (e.g. at least oneglucose test). The types of patients seen, the problems managed, and treatments provided by the GP canbe in�uenced by the characteristics of the GP. We accounted for the clustering of 100 encounters aroundeach GP in the sample, by using the survey means procedure in SAS v9.4 to calculate the intraclustercorrelation and adjusting the 95% con�dence intervals accordingly. Post-strati�cation weighting ofencounter data was used to adjust for GP activity according to the number of MBS encounters claimed inthe previous 12 months and for any minor differences in the age-sex distribution of participating GPs.Statistically signi�cant differences between point estimates were determined by non-overlapping 95%con�dence intervals, which is a more conservative approach than the traditional alpha of 0.05 [19].
Page 5/15
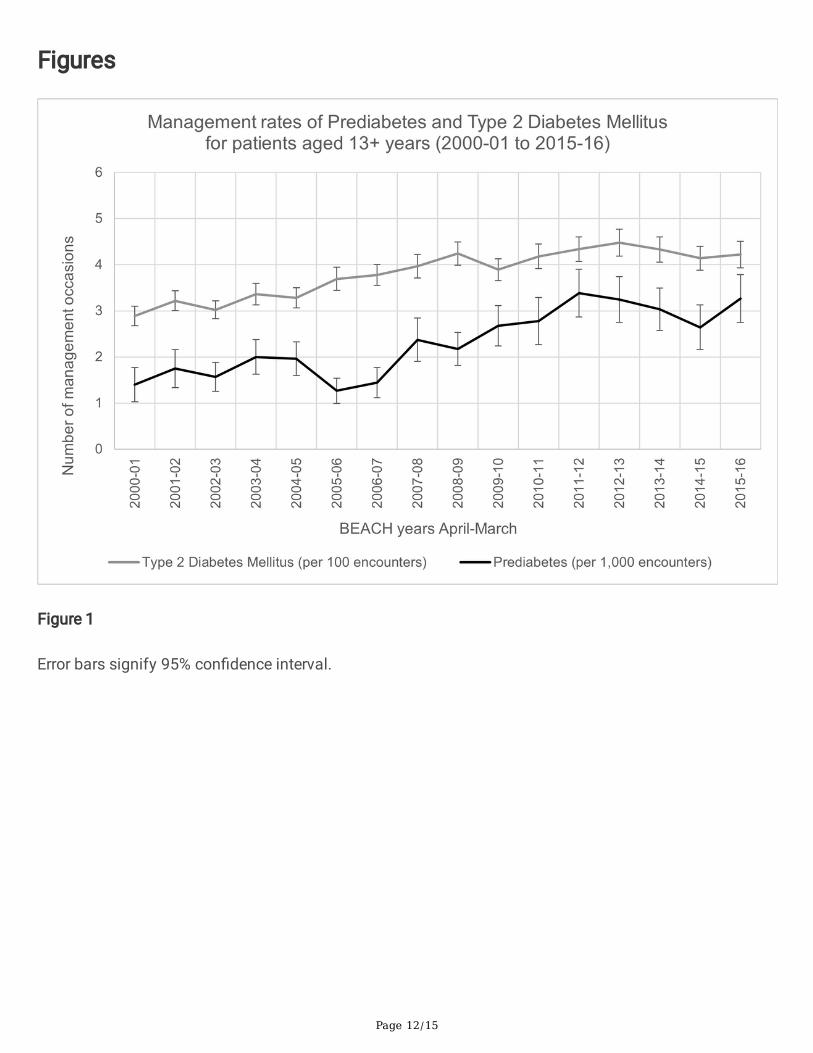
ResultsOver the 16-year study period (April 2000 to March 2016), 15,679 GPs participated in the BEACH project,recording details of 1,387,190 encounters with patients aged 13 years or older. Substantially moreencounters with patients involved T2DM management than prediabetes management (Fig. 1). GPsmanaged T2DM in 50,979 (3.68%, 95% CI: 3.62-3.73%) of these encounters and prediabetes at 3,530(0.25%, 95% CI: 0.24-0.27%) encounters. Statistically signi�cant increases in the management rates forboth conditions were observed. Compared to 2000-01 (2.89% of encounter (95% CIs 2.67-3.10)), theannual T2DM management rate was 1.46 times higher in 2015-16 (4.22%, 95% CI: 3.93-4.50%). Over thesame period, prediabetes management increased 2.33 times (0.14% of encounters (95% CI: 0.10-0.18%)to 0.33% (95% CI: 0.28-0.38%)).
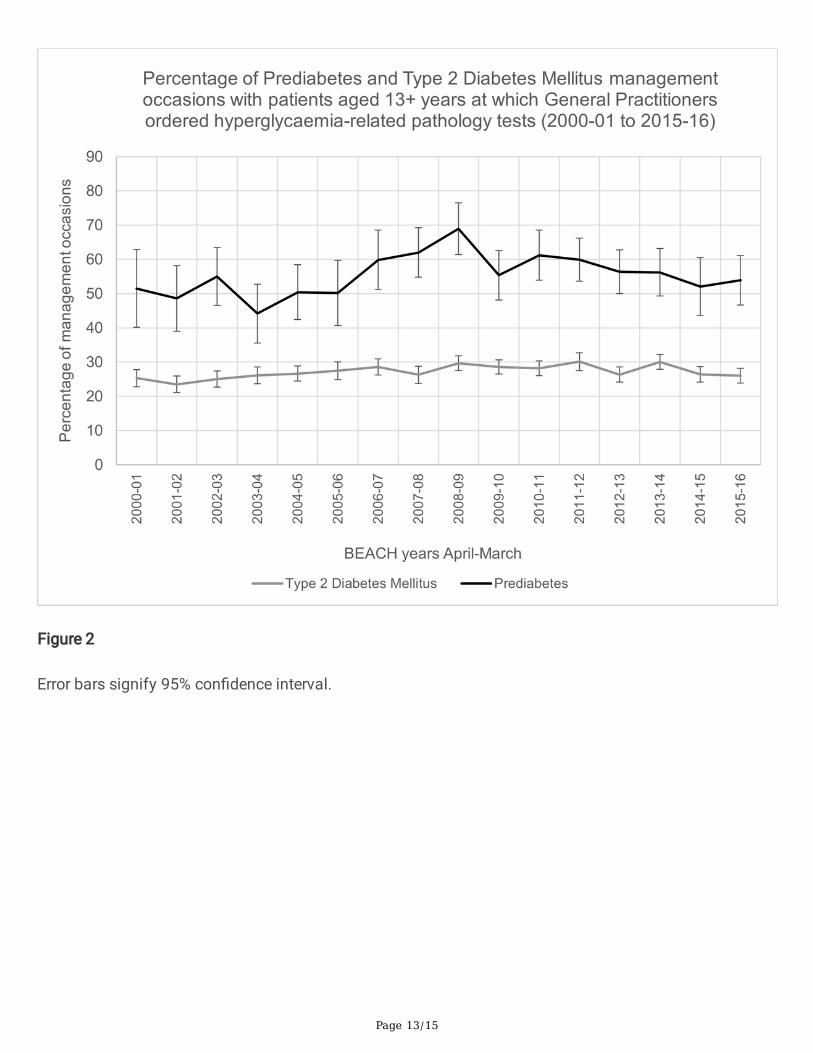
Over the 16-year study period, the proportion of prediabetes and T2DM management occasions whereone or more hyperglycaemia-related test(s) were requested was relatively stable (Fig. 2). However, thelikelihood of a GP ordering at least one hyperglycaemia-related test in management of prediabetes(55.9%, 95% CI 53.9-57.8%) was signi�cantly higher than when T2DM was managed (27.3%, 95% CI: 26.7-27.9%).
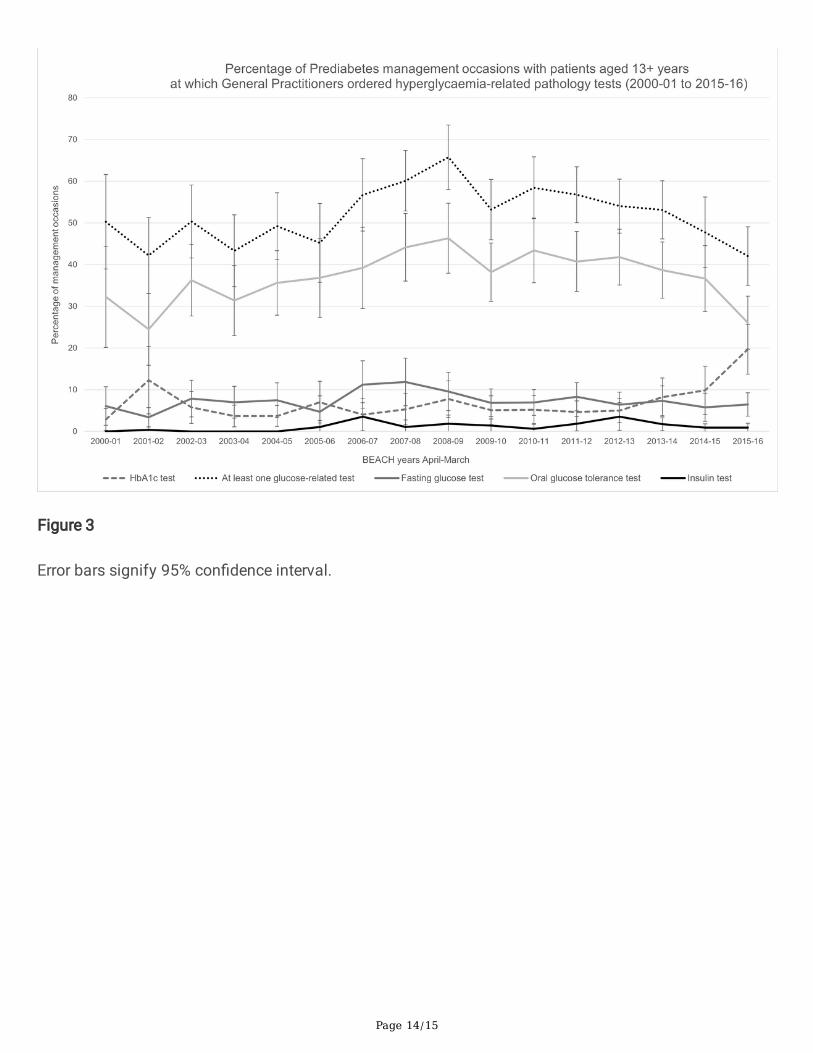
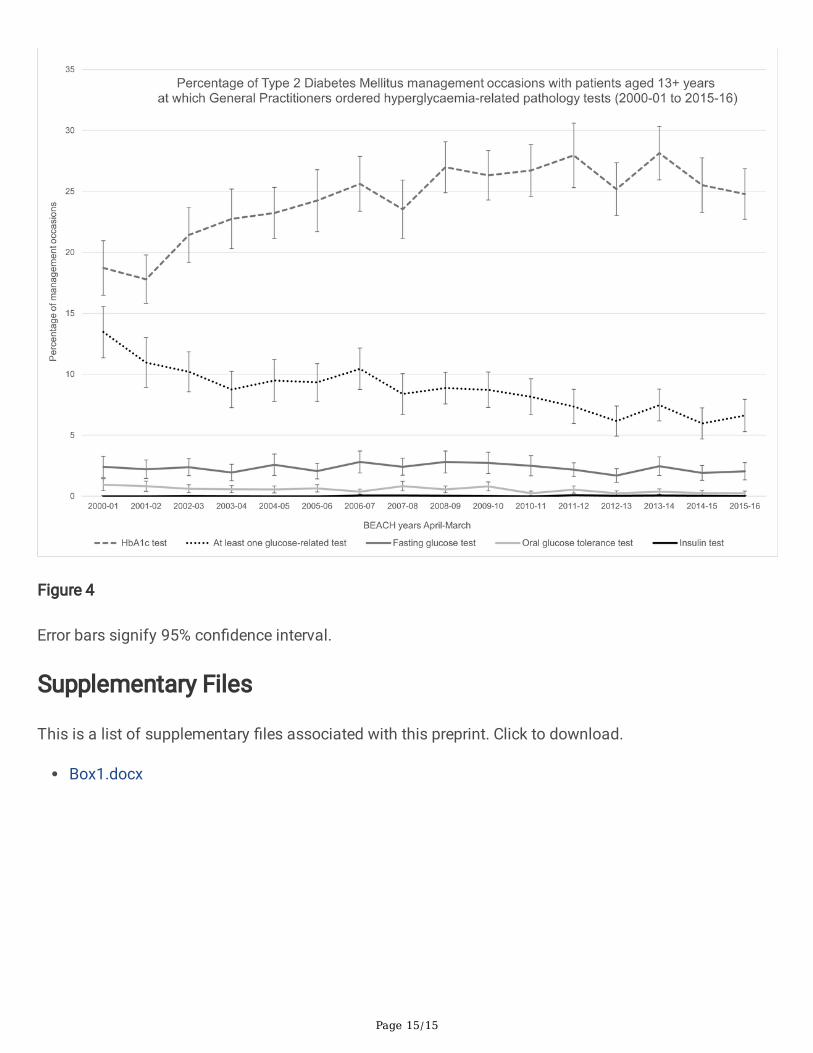
When hyperglycaemia-related tests were considered separately for the management of prediabetes(Fig. 3) and T2DM (Fig. 4), differences were observed in both the annual rates of the different pathologytests that were requested per encounter and the annual trends.
For prediabetes management, requests for any one or more of the glucose-related tests were by far themost common. Requests ranged from 42.2% (95% CI: 35.1-51.3%) of prediabetes management occasionsin 2001/02, to a peak of 65.8% (95% CI: 58.0-73.5%) in 2008/09. This trend was attributable to OGTTsthat represented the bulk of the glucose-related tests. OGTTs were requested at 24.5% (95% CI: 15.9-33.1%) of prediabetes management occasions in 2001/02, peaking at 46.3% (95% CI: 54.7%-38.0%) in2008/09. Requests for FBG tests were signi�cantly lower each year, ranging from 3.4% (95%CI: 1.1-5.7%)in 2001/02 to 11.9% (95% CI: 6.1-17.7%) in 2007/08. Requests for HbA1c tests ranged between 2.6%(95% CI: 0.3-5.4%) in 2001/02 and 19.7% (95% CI: 13.7-25.7%) in 2015/16. Requests for insulin tests werethe lowest. No insulin tests were requested for four of the 16 years of the study, and their highest use wasin 2012/13 (3.6%, 95% CI: 2.5-6.9%) (Fig. 3).
For T2DM management, annual requests for HbA1c were signi�cantly more likely than for any of theother hyperglycaemia-related tests. There was a steady, signi�cant increase in HbA1c requests, starting at18.7% (95% CI: 16.5-21.0%) of T2DM management occasions in 2000/01, increasing to 24.8% (95% CI:22.7-26.9%) by 2015/16. Over the same timeframe, requests for any glucose-related test fell signi�cantlyfrom 13.5% (95% CI: 11.4-15.6%) to 6.6% (95% CI: 5.3-7.9%). Requests for both FBG (95% CI ranges 1.4–3.7%) and OGTT (95% CI ranges 0.1–1.4%) were substantially lower than in prediabetes management,and the OGTT was the least common glucose test. Pathology requests for insulin were also negligible,with annual rates including the upper limit of the 95% CI remaining below 0.2% (Fig. 4).
Page 6/15
DiscussionThis study reports 16 years of hyperglycaemia-related pathology test ordering for the management ofprediabetes and T2DM by GPs in Australia. During this time, 3.68% of GP encounters were for themanagement of T2DM and 0.25% were for prediabetes and the management rates increased by 1.5 and2.3 times, respectively. For both conditions, the annual requests for hyperglycaemic-related tests permanagement occasion remained relatively stable. However, signi�cant changes were observed in thetypes of tests requested for the two conditions and the annual rates. For prediabetes management,glucose tests that mostly re�ected high request rates for OGTTs, were most common but from 2014/15,requests for HbA1c tests started to dramatically increase. For T2DM management, HbA1c tests weremost often requested, and the annual rate steadily increased as the rates of glucose testing declined. Theproportion of prediabetes management occasions where glycaemia-related test were requested wasdouble that of T2DM. Combined, these �ndings suggest that GP activity was in�uenced by nationallyendorsed clinical practice guidelines for the use of pathology tests [6, 11, 20] and by national healthinsurance (MBS) funding [21]. However, ‘unendorsed’ and unfunded pathology tests were also requested.
The appropriate use of pathology tests is important for optimizing patient outcomes and there aresubstantial cost implications for both insurers and patients. It is reassuring then, that within the BEACHdataset used for this study, hyperglycaemia-related pathology testing for T2DM diagnosis andmanagement generally aligned with the nationally endorsed recommendations [6, 11, 20]. Like otherstudies, there was also evidence that MBS funding of tests probably in�uenced GP clinical practice [16].As such, both appear to be effective policy tools for promoting evidence-based medicine.
Notwithstanding, not all requests for pathology aligned with nationally endorsed guidelines. GPs wererequesting HbA1c tests in the context of prediabetes management well before 2009, when some of the�rst calls were being made in Australia to add HbA1c tests for screening patients with an increased riskof developing T2DM [20], and also before the introduction of MBS funding near the end of 2014 [21].Similarly, despite no national or international recommendations, insulin tests were requested by GPs,albeit infrequently and mostly for prediabetes management.
It is well recognised that clinical practice guidelines are often not followed for a wide range of reasons,including limited evidence [22–26]. Indeed, only the evidence for HbA1c monitoring of long-term glucosecontrol was graded by the RACGP as high (A), and all other recommendations for pathology testing weregraded as moderate (B) or low (C) [6]. Emerging evidence [13–15, 20], along with clinicalacumen/wisdom and tailoring pathology screening to the individual patient [22, 24], are also likely tohave in�uenced clinical decisions. Further research is warranted, both in the context of prediabetes andT2DM, and more broadly, to understand the factors that in�uence clinical decisions.
The �ndings also raise questions about potential resource implications of the 2020 Australian jointposition statement for screening prediabetes in adults in primary care, as a lower risk threshold is appliedand HbA1c is included [12]. During the 16-year study period, the management rate of prediabetes morethan doubled and hyperglycaemia-related pathology tests were consistently more likely to be ordered
Page 7/15
than for T2DM management. Since the end of the BEACH study in 2016, due to the changingdemographics of the Australian population and rising rates of obesity the prevalence of prediabetes andT2DM have continued to rise [2, 12]. Additional longitudinal data about the primary care activities and theclinical outcomes of patients at risk of prediabetes and T2DM, would help inform economic modelling ofthe potential costs and bene�ts of the proposed policy changes and whether additional MBS funding isindicated.
Strengths and limitations of this studyThe BEACH study is unique in the Australian setting. The very large data set, consistently collected over16 years, coupled with the cluster analysis and weighted strati�cation approach has generated reliable,representative data to inform Australian healthcare planning and policies. The BEACH dataset allowedexploration of temporal changes in encounter rates and hyperglycaemia-related testing.
Limitations of the BEACH study include its cross-sectional study design which did not allow us todetermine how often individual patients consulted the GP or were being tested., nor to explore the reasonsGPs ordered tests not endorsed by national guidelines or funded by the MBS. Data were only available upto March 2016. This was the same year that substantial changes to the RACGP diabetes guidelines weremade, so the full impact of RACGP endorsement of HbA1c for diagnosing T2DM could not be assessed.A maximum of �ve pathology tests, or suites of tests (e.g. liver function tests or lipid studies), could berecorded per encounter. Yet, it is common for GPs to order more tests, particularly when there ismultimorbidity as is often the case with prediabetes and T2DM [3, 7]. Therefore, when selecting up to �vetests, participating GPs might be inclined to �rst list tests that they perceived as most important and lesscontentious. As such, it is possible that insulin, and perhaps some prediabetes HbA1c testing, wasunderreported.
Limitations of this analysis included not investigating the number of tests requested for an individualpatient encounter and whether there were any differences in the patient characteristics (e.g. age, gender,ethnicity, multimorbidity) for whom the different hyperglycaemia-related tests were requested. Anotherlimitation was not investigating when hyperglycaemia-related tests were ordered for reasons other thanT2DM and prediabetes, such as for metabolic syndrome, polycystic ovarian syndrome, other endocrinedisorders, and routine health checks. Such tests for other morbidities were therefore not enumerated inthis study.
ConclusionAnnual trends in pathology request rates for hyperglycaemia-related tests suggest that the clinicalpractice of GPs in Australia is strongly in�uenced by national guidelines and funding. Changes inAustralian diabetes guidelines during the 16-year study corresponded with a signi�cant increase in use ofHbA1c and decline in glucose tests for the management of T2DM, and rising rates of HbA1c testing forpatients with prediabetes near the end of the study. While it is likely that glucose-related testing will
Page 8/15
remain the major mode of testing for prediabetes management, the impact of the recent 2020 jointposition statement is uncertain. The BEACH study was completed in 2016, it has proved to be anessential information source for research, health system planning, and policy development. Similarprojects are now urgently needed in Australia to ensure there is reliable, up-to-date, primary care data thatcan be used to inform government, industry, and not-for-pro�t organisations.
At the end of the manuscript, before the references you need to insert:
AbbreviationsT2DM type 2 diabetes mellitus
GP General Practitioner
RACGP Royal Australian College of General Practitioners
HbA1c glycated haemoglobin
FBG fasting blood glucose
OGTT oral glucose tolerance test
IFG impaired fasting glucose
MBS Medicare Bene�ts Schedule
BEACH Bettering the Evaluation and Care of Health
ICPC-2 International Classi�cation of Primary Care
ICPC-2 PLUS Australian interface terminology of the International Classi�cation of Primary Care
DeclarationsEthics approval and consent to participate
The BEACH program has ethics approval from the Human Research Ethics Committee of the University ofSydney (Reference number 2012/130) for all years of this study and the Australian Institute of Health andWelfare for the years they collaborated on the project (April 1998– March 2011 inclusive). All patientparticipants gave informed consent to participate in the BEACH study.
Methods
All methods were performed in accordance to the relevant guidelines.
Page 9/15
Consent for publication (not applicable)
Availability of data and materials
The dataset analysed during the current study is not publicly available as it contains health data withethical and privacy restrictions placed on it. However, researchers with reasonable research questionsmay request analyses of these data if their questions are within the ethical guidelines set for the use ofBEACH data. Data for the BEACH dataset can be requested from Dr Chris Harrison([email protected]).
Competing interests
The authors declare no competing interests.
Funding
Between 2011 and 2016 BEACH was �nancially supported by a consortium of Government, Industry andnon-Government organisations, namely: Abbott Australasia Pty. Ltd.; AbbVie Pty Ltd.; AstraZeneca PtyLtd. (Australia); Australian Government Department of Health and Ageing; Australian GovernmentDepartment of Veterans’ Affairs; Aventis Pharma Pty. Ltd.; Bayer Australia Ltd.; GlaxoSmithKlineAustralia Pty Ltd.; Janssen-Cilag Pty. Ltd.; Merck, Sharpe and Dohme (Australia) Pty Ltd.; NationalPrescribing Service; Novartis Pharmaceuticals Australia Pty Ltd.; P�zer Australia; Roche Products Pty.Ltd.; Sano�-Aventis Australia Pty Ltd.; CSL/Seqirus (Australia) Pty Ltd. Wyeth Australia Pty. Ltd.; Fundingwas provided through a research agreement with the University of Sydney which afforded completeresearch autonomy for the team conducting the BEACH program. Final decisions regarding researchdesign, data collection and analysis, and reporting of �ndings remain with the principal investigatorsunder the ethical supervision of the University of Sydney. The funders had no role in study design, datacollection and analysis, decision to publish, or preparation of the manuscript.
Authors' contributions
EM conceptualised the research question. CH conducted the data analysis. AL drafted the manuscriptand created the �gures. JH revised the manuscript. All authors interpreted the data, edited the manuscript,and approved the �nal manuscript.
Acknowledgements Not applicable
Authors' information Not applicable
References1. Saeedi P, Petersohn I, Salpea P, Malanda B, Karuranga S, Unwin N, Colagiuri S, Guariguata L,Motala AA, Ogurtsova K et al: Global and regional diabetes prevalence estimates for 2019 and projections
Page 10/15
for 2030 and 2045: Results from the International Diabetes Federation Diabetes Atlas, 9(th) edition.Diabetes Res Clin Pract 2019, 157:107843.
2. Diabetes. Cat. No. CVD82. [https://www.aihw.gov.au/reports/diabetes/diabetes/contents/hospital-care-for-diabetes/type-2-diabetes]
3. Harrison C, Henderson J, Miller G, Britt H: The prevalence of diagnosed chronic conditions andmultimorbidity in Australia: A method for estimating population prevalence from general practice patientencounter data. PLoS One 2017, 12(3):e0172935.
4. Shaw J, Tanamas S: Diabetes: the silent pandemic and its impact on Australia. . Melbourne: BakerIDI Heart and Diabetes Institute.; 2012.
5. Britt H, Miller GC, Bayram C, Henderson J, Valenti L, Harrison C, Pan Y, Charles J, Pollack AJ,Chambers T et al: A decade of Australian general practice activity 2006–07 to 2015–16. General practiceseries no. 41. In. Sydney: Sydney University Press; 2016.
6. RACGP: Management of type 2 diabetes: A handbook for general practice. East Melbourne, Vic.:The Royal Australian College of General Practitioners; 2020.
7. Huang Y, Cai X, Mai W, Li M, Hu Y: Association between prediabetes and risk of cardiovasculardisease and all cause mortality: systematic review and meta-analysis. BMJ 2016, 355:i5953.
8. Richter B, Hemmingsen B, Metzendorf MI, Takwoingi Y: Development of type 2 diabetes mellitus inpeople with intermediate hyperglycaemia. Cochrane Database Syst Rev 2018, 10(10):Cd012661.
9. Glechner A, Keuchel L, Affengruber L, Titscher V, Sommer I, Matyas N, Wagner G, Kien C, Klerings I,Gartlehner G: Effects of lifestyle changes on adults with prediabetes: A systematic review and meta-analysis. Prim Care Diabetes 2018, 12(5):393-408.
10. Standards of Medical Care in Diabetes-2021. Diabetes Care 2021, 44(Suppl 1).
11. Twigg SM, Kamp MC, Davis TM, Neylon EK, Flack JR: Prediabetes: a position statement from theAustralian Diabetes Society and Australian Diabetes Educators Association. Med J Aust 2007,186(9):461-465.
12. Bell K, Shaw JE, Maple-Brown L, Ferris W, Gray S, Murfet G, Flavel R, Maynard B, Ryrie H, PritchardB et al: A position statement on screening and management of prediabetes in adults in primary care inAustralia. Diabetes Res Clin Pract 2020, 164:108188.
13. Johnson JL, Duick DS, Chui MA, Aldasouqi SA: Identifying prediabetes using fasting insulin levels.Endocr Pract 2010, 16(1):47-52.
Page 11/15
14. Switzer WB, Stewart F, Paauwe-Weust J: Fasting Insulin vs Hemoglobin A1c: Are We Getting ItRight? . Clinical Advisor 2018, September 01.
15. Nolan CJ, Prentki M: Insulin resistance and insulin hypersecretion in the metabolic syndrome andtype 2 diabetes: Time for a conceptual framework shift. Diab Vasc Dis Res 2019, 16(2):118-127.
16. Tijs L, Hunter J, Molodysky E: Annual trends in diabetes screening in Australia: a secondaryanalysis of MBS data. Accepted January 14, 2021. AJGP-11-20-5718. The Australian Journal of GeneralPractice 2021.
17. Britt H: A new coding tool for computerised clinical systems in primary care--ICPC plus. Aust FamPhysician 1997, 26 Suppl 2:S79-82.
18. ICPC-2 : international classi�cation of primary care / prepared by the Classi�cation Committee ofthe World Organization of National Colleges, Academies, and Academic Associations of GeneralPractitioners/Family Physicians (WONCA), known more brie�y as the World Organization of FamilyDoctors, 2nd ed. edn. Oxford, New York: Oxford University Press; 1998.
19. Austin PC, Hux JE: A brief note on overlapping con�dence intervals. J Vasc Surg 2002, 36(1):194-195.
20. Colagiuri S, Davies D, Girgis S, Colagiuri R: National evidence based guideline for case detectionand diagnosis of type 2 diabetes. Canberra: Diabetes Australia and National Health and MedicalResearch Council; 2009.
21. Medicare bene�ts schedule book. Canberra, ACT: Australian Government Department of Health;2021.
22. Alexander PE, Li SA, Tonelli M, Guyatt G: Canadian Primary Care Physicians' Attitudes TowardUnderstanding Clinical Practice Guidelines for Diabetes Screening. Can J Diabetes 2016, 40(6):580-585.
23. Barth JH, Misra S, Aakre KM, Langlois MR, Watine J, Twomey PJ, Oosterhuis WP: Why are clinicalpractice guidelines not followed? Clin Chem Lab Med 2016, 54(7):1133-1139.
24. Gabbay J, le May A: Mindlines: making sense of evidence in practice. Br J Gen Pract 2016,66(649):402-403.
25. Hafez D, Nelson DB, Martin EG, Cohen AJ, Northway R, Kullgren JT: Understanding type 2 diabetesmellitus screening practices among primary care physicians: a qualitative chart-stimulated recall study.BMC Fam Pract 2017, 18(1):50.
26. Lugtenberg M, Burgers JS, Besters CF, Han D, Westert GP: Perceived barriers to guidelineadherence: a survey among general practitioners. BMC Fam Pract 2011, 12:98.
Page 12/15
Figures
Figure 1
Error bars signify 95% con�dence interval.
Page 13/15
Figure 2
Error bars signify 95% con�dence interval.
Page 14/15
Figure 3
Error bars signify 95% con�dence interval.
Page 15/15
Figure 4
Error bars signify 95% con�dence interval.
Supplementary Files
This is a list of supplementary �les associated with this preprint. Click to download.
Box1.docx


