Embed Size (px)
Citation preview
Black Oystercatcher Reproductive Success
California Central Coast, Monterey Bay Region 2019
Northern Monterey County
(Point Lobos State Natural Reserve to City of Monterey) and
Northern Santa Cruz County to Southern San Mateo County (Natural Bridges State Beach to Pescadero State Beach)
Prepared by
Jennifer L. Parkin, Judith S. Romero and Herrick E. Hanks
Prepared for Pacific Grove Museum of Natural History

Table of Contents
Introduction . . . . . . . . . . . . . . . . . . . . . . . . . . . 1 Figure 1. Map of Study Area . . . . . . . . . . . . . . . . . . . . 1 Methods . . . . . . . . . . . . . . . . . . . . . . . . . . . . 2 Number of Monitors, Monitoring Hours and Observations . . . . . . . . . . 3 Table 1. 2019 Monitoring Hours and Observations . . . . . . . . . . . . 4 Results . . . . . . . . . . . . . . . . . . . . . . . . . . . . . 4 Distribution . . . . . . . . . . . . . . . . . . . . . . . . . . 4 Timing of Breeding . . . . . . . . . . . . . . . . . . . . . . . 5 Figure 2. Egg Laying Dates . . . . . . . . . . . . . . . . . . . . 6
Reproductive Success . . . . . . . . . . . . . . . . . . . . . . . 6 Table 2. Reproductive Success . . . . . . . . . . . . . . . . . . . 7 Table 3. Reproductive Success 2016 – 2019 . . . . . . . . . . . . . . . 8 Table 4. Monterey Peninsula Monitoring Section Productivity Results . . . . . . 8 Table 5. Pebble Beach Monitoring Section Productivity Results . . . . . . . . 9 Table 6. Point Lobos Monitoring Section Productivity Results . . . . . . . . . 9 Table 7. Santa Cruz Monitoring Section Productivity Results . . . . . . . . . 10 Table 8. San Mateo Monitoring Section Productivity Results . . . . . . . . . 11 Nesting Location . . . . . . . . . . . . . . . . . . . . . . . . 11 Image 1. Map of Monterey Peninsula . . . . . . . . . . . . . . . . . 12 Image 2. Map of Pebble Beach . . . . . . . . . . . . . . . . . . . 12 Image 3. Map of Point Lobos . . . . . . . . . . . . . . . . . . . 13 Image 4. Map of Santa Cruz County . . . . . . . . . . . . . . . . . 13 Image 5. Map of Natural Bridges to 3-Mile Beach . . . . . . . . . . . . 14 Image 6. Map of Davenport to Greyhound Rock . . . . . . . . . . . . . 14 Image 7. Map of San Mateo County . . . . . . . . . . . . . . . . . 15 Image 8. Map of Prisoner Rock and Pigeon Point . . . . . . . . . . . . . 15 Image 9. Map of Pescadero State Beach . . . . . . . . . . . . . . . . 16 Disturbance . . . . . . . . . . . . . . . . . . . . . . . . . . 16 Protective Measures . . . . . . . . . . . . . . . . . . . . . . . . 17 Ropes and Signs . . . . . . . . . . . . . . . . . . . . . . . . 17 Table 9. Nesting Site Protection Measures . . . . . . . . . . . . . . . 18 Outreach . . . . . . . . . . . . . . . . . . . . . . . . . . . 19 Related Monitoring Items . . . . . . . . . . . . . . . . . . . . . . 19 Banded Female Black Oystercatcher Capture . . . . . . . . . . . . . . 19 Mortality of Sub-Adult Black Oystercatcher . . . . . . . . . . . . . . . 21 One-Eyed Male Black Oystercatcher . . . . . . . . . . . . . . . . . 21 Cooperation with Professional Drone Operator . . . . . . . . . . . . . . 21 UCSC & Stanford Kelp Canopy Drone Surveys . . . . . . . . . . . . . 22 Table 10. Observations from Monitoring Drone Surveys . . . . . . . . . . . 23 References . . . . . . . . . . . . . . . . . . . . . . . . . . . 24 Acknowledgements . . . . . . . . . . . . . . . . . . . . . . . . 25

1
Black Oystercatcher (Haematopus bachmani) Reproductive Success California Central Coast, Monterey Bay Region
2019
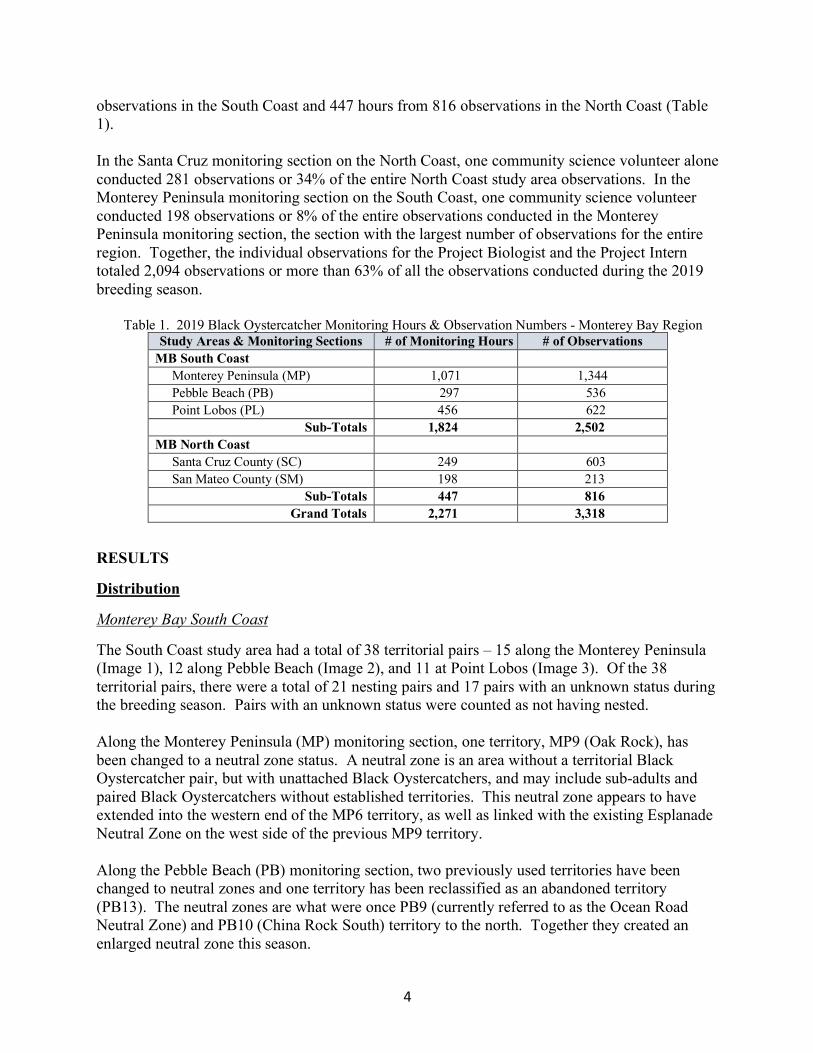
Jennifer L. Parkin, Judith S. Romero and Herrick E. Hanks INTRODUCTION – STUDY AREAS In 2019, the California Central Coast Black Oystercatcher (Haematopus bachmani) Project monitored nesting activity for a total of 65 Black Oystercatcher territorial pairs in the Monterey Bay region, from Point Lobos State Natural Reserve to Pescadero State Beach. This covered coastal sections in three counties and approximately 160 kilometers (100 miles) of coastline. The Monterey Bay region is separated into two study areas: (1) Monterey Bay South Coast (northern Monterey County) and (2) Monterey Bay North Coast (northern Santa Cruz County and southern San Mateo County) (Figure 1).
Figure 1. Map showing Monterey Bay South Coast and North Coast Study Areas.
2
The separation of the Monterey Bay region into two study areas was done for the following reasons: (1) there is a large stretch of sandy shoreline of about 55 kilometers (34 miles) that separates the two study areas; (2) one side of the coast had more monitoring history; and (3) the separation allows for a clear comparison of the productivity between the two study areas. The Monterey Bay South Coast study area (South Coast) is located along the northern portion of the Monterey County coast extending north from the south end of Point Lobos State Natural Reserve to the Coast Guard Pier in the City of Monterey and is broken into three monitoring sections: (1) Point Lobos (PL) (Point Lobos State Natural Reserve), (2) Pebble Beach (PB) (Stillwater Cove to Point Joe), and (3) Monterey Peninsula (MP) (Asilomar State Beach to Monterey). Both the Monterey Peninsula monitoring section and the Point Lobos monitoring section are completely covered, while the Pebble Beach monitoring section has a number of small breaks due to private property access restrictions. The Monterey Bay North Coast study area (North Coast) extends north from the south end of Natural Bridges State Beach to the north end of Pescadero State Beach and consists of two monitoring sections: (1) northern Santa Cruz County coast (SC) and (2) southern San Mateo County coast (SM) It needs to be noted that each of the monitoring sections in the North Coast does not include the entire area of each section of coastline. The Santa Cruz monitoring section includes Natural Bridges State Beach, then a break until Wilder Ranch State Park’s Wilder Beach to Three-Mile Beach, then a break until Yellow Bank Cove to Davenport, and finally a break until Pelican Rock to Greyhound Rock. The San Mateo monitoring section includes only the area around Pigeon Point Light Station State Historic Park and the coastline of Pescadero State Beach, this does not include Año Nuevo State Park (See Images 4 & 7). METHODS The monitoring methodology used is based on the Black Oystercatcher standardized protocols for monitoring population size and reproductive success developed by the US Geological Survey (Elliott-Smith and Haig 2011), with slight modifications adapted by Audubon California. The primary monitoring was conducted during the breeding season from mid-April through the end of September. Although the project is overseen by professional biologists from Audubon California and the US Department of the Interior-Bureau of Land Management’s California Coastal National Monument, it is currently operated as a community science effort using primarily volunteers and docents from the Pacific Grove Museum of Natural History and Point Lobos State Natural Reserve. All of the Monterey Bay region’s Black Oystercatcher monitors are also California Coastal National Monument volunteers. More than 40 community science volunteers were involved in the breeding season monitoring. For 2019, with key funding from an anonymous donor and additional funding from the Point Lobos Foundation and other small donations from entities such as Sustainable Pacific Grove and various individuals, the California Central Coast Black Oystercatcher Project was able to hire a Project Biologist and a Project Intern. The Project Biologist covered all of the North Coast Black Oystercatcher territories once a week and all of the South Coast Black Oystercatcher territories once a month, while the Project Intern covered all of the South Coast Black

3
Oystercatcher territories once a week. This provided a consistent monitoring base for each of the 65 Black Oystercatcher territories throughout the Monterey Bay region. The Black Oystercatcher territory size was determined based on observations made of the individual Black Oystercatcher pair’s foraging distance, encounters with neighboring pairs, and distance covered during territorial chases of interloping oystercatchers, as well as areas traveled with young to forage post fledging. Google Earth Pro was used to obtain GPS coordinates, map nest locations, and delineate territory size. Observations were made using binoculars and spotting scopes from land at each Black Oystercatcher territory for a minimum of 30 to 60 minutes at least once a week during the initial portion of the breeding season. At nesting sites with incubation, the minimal observation time may have reduced to about 15 to 20 minutes, while for those nesting sites with chicks, the observations may have increased to 60 minutes or more while chicks were present or if other Black Oystercatcher activity warranted much longer observations. In some cases, volunteer monitors with assigned territories made observations almost daily, but at a minimum once a week. In the South Coast, nests with known hatching dates, chicks, or near areas with high human disturbance were monitored more frequently than the minimum in order to document nesting success, predation, human interaction, and inform people about wildlife disturbance and Black Oystercatchers. In the North Coast, part of the Wilder Ranch State Park portion in the Santa Cruz monitoring section includes approximately 6.5 kilometer (4 miles) of a coastline trail with only one main access point. This required the use of a bicycle in order to efficiently monitor, within a reasonable timeframe, 8 territorial pairs. NUMBER OF MONITORS, MONITORING HOURS & OBSERVATIONS For the 2019 breeding season, the California Central Coast Black Oystercatcher Project used a total of 41 community science monitors, along with the Project Biologist and the Project Intern, creating a cadre of 43 monitors. Most of the community science monitors were distributed throughout the South Coast with 38 monitors. The Project Biologist and the Regional Coordinator monitored in both the North Coast and South Coast study areas, while the Project Intern monitored all territories on the South Coast study area. In addition, a few of the community science monitors, monitored in more than one of the five monitoring sections. Therefore, with some duplication, 26 monitors were used on the Monterey Peninsula (MP), nine monitors at Pebble Beach (PB), 17 monitors at Point Lobos (PL), four at the Santa Cruz (SC), and two at the San Mateo (SM) monitoring sections. The number of monitors, monitoring hours, and observations were determined based on data entries on the Google Sheets set-up for each of the five monitoring sections monitored (MP, PB, PL, SC & SM). The number of monitoring hours and the number of observations were counted for each individual monitor. For example, a single Google Sheets entry with two monitors listed for 30 minutes of monitoring was counted as two individual observations with 30 minutes of observation for each monitor (two observations for a total of one hour). For the 65 Black Oystercatcher territories monitored in the Monterey Bay region, there were a total of 2,271 hours of monitoring from 3,318 observations – 1,824 hours from 2,502
4
observations in the South Coast and 447 hours from 816 observations in the North Coast (Table 1). In the Santa Cruz monitoring section on the North Coast, one community science volunteer alone conducted 281 observations or 34% of the entire North Coast study area observations. In the Monterey Peninsula monitoring section on the South Coast, one community science volunteer conducted 198 observations or 8% of the entire observations conducted in the Monterey Peninsula monitoring section, the section with the largest number of observations for the entire region. Together, the individual observations for the Project Biologist and the Project Intern totaled 2,094 observations or more than 63% of all the observations conducted during the 2019 breeding season.
Table 1. 2019 Black Oystercatcher Monitoring Hours & Observation Numbers - Monterey Bay Region Study Areas & Monitoring Sections # of Monitoring Hours # of Observations
MB South Coast Monterey Peninsula (MP) 1,071 1,344 Pebble Beach (PB) 297 536 Point Lobos (PL) 456 622
Sub-Totals 1,824 2,502 MB North Coast Santa Cruz County (SC) 249 603 San Mateo County (SM) 198 213
Sub-Totals 447 816 Grand Totals 2,271 3,318
RESULTS Distribution Monterey Bay South Coast The South Coast study area had a total of 38 territorial pairs – 15 along the Monterey Peninsula (Image 1), 12 along Pebble Beach (Image 2), and 11 at Point Lobos (Image 3). Of the 38 territorial pairs, there were a total of 21 nesting pairs and 17 pairs with an unknown status during the breeding season. Pairs with an unknown status were counted as not having nested. Along the Monterey Peninsula (MP) monitoring section, one territory, MP9 (Oak Rock), has been changed to a neutral zone status. A neutral zone is an area without a territorial Black Oystercatcher pair, but with unattached Black Oystercatchers, and may include sub-adults and paired Black Oystercatchers without established territories. This neutral zone appears to have extended into the western end of the MP6 territory, as well as linked with the existing Esplanade Neutral Zone on the west side of the previous MP9 territory. Along the Pebble Beach (PB) monitoring section, two previously used territories have been changed to neutral zones and one territory has been reclassified as an abandoned territory (PB13). The neutral zones are what were once PB9 (currently referred to as the Ocean Road Neutral Zone) and PB10 (China Rock South) territory to the north. Together they created an enlarged neutral zone this season.
5
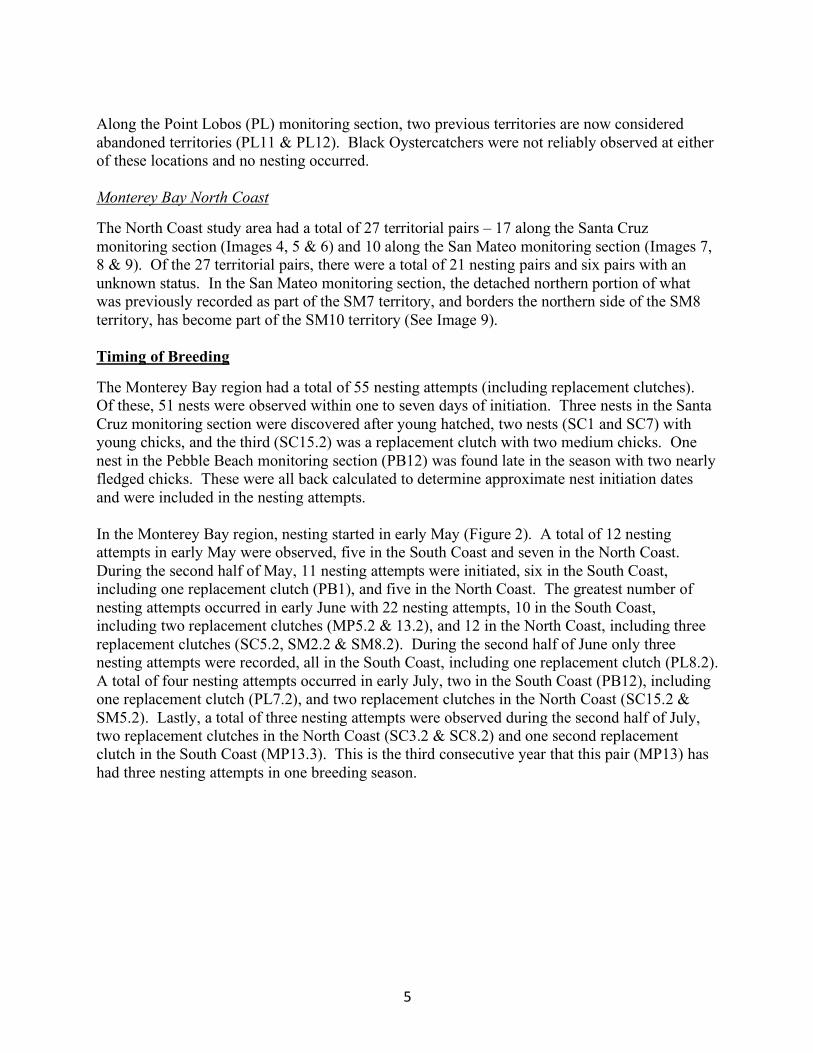
Along the Point Lobos (PL) monitoring section, two previous territories are now considered abandoned territories (PL11 & PL12). Black Oystercatchers were not reliably observed at either of these locations and no nesting occurred. Monterey Bay North Coast The North Coast study area had a total of 27 territorial pairs – 17 along the Santa Cruz monitoring section (Images 4, 5 & 6) and 10 along the San Mateo monitoring section (Images 7, 8 & 9). Of the 27 territorial pairs, there were a total of 21 nesting pairs and six pairs with an unknown status. In the San Mateo monitoring section, the detached northern portion of what was previously recorded as part of the SM7 territory, and borders the northern side of the SM8 territory, has become part of the SM10 territory (See Image 9). Timing of Breeding The Monterey Bay region had a total of 55 nesting attempts (including replacement clutches). Of these, 51 nests were observed within one to seven days of initiation. Three nests in the Santa Cruz monitoring section were discovered after young hatched, two nests (SC1 and SC7) with young chicks, and the third (SC15.2) was a replacement clutch with two medium chicks. One nest in the Pebble Beach monitoring section (PB12) was found late in the season with two nearly fledged chicks. These were all back calculated to determine approximate nest initiation dates and were included in the nesting attempts. In the Monterey Bay region, nesting started in early May (Figure 2). A total of 12 nesting attempts in early May were observed, five in the South Coast and seven in the North Coast. During the second half of May, 11 nesting attempts were initiated, six in the South Coast, including one replacement clutch (PB1), and five in the North Coast. The greatest number of nesting attempts occurred in early June with 22 nesting attempts, 10 in the South Coast, including two replacement clutches (MP5.2 & 13.2), and 12 in the North Coast, including three replacement clutches (SC5.2, SM2.2 & SM8.2). During the second half of June only three nesting attempts were recorded, all in the South Coast, including one replacement clutch (PL8.2). A total of four nesting attempts occurred in early July, two in the South Coast (PB12), including one replacement clutch (PL7.2), and two replacement clutches in the North Coast (SC15.2 & SM5.2). Lastly, a total of three nesting attempts were observed during the second half of July, two replacement clutches in the North Coast (SC3.2 & SC8.2) and one second replacement clutch in the South Coast (MP13.3). This is the third consecutive year that this pair (MP13) has had three nesting attempts in one breeding season.

6
Figure 2. 2019 Monterey Bay Region Black Oystercatcher egg laying dates. The 2019 breeding season had a later start than previous years. In part, this could be due to the late and heavy rains the Monterey Bay region had in mid-May. Several early nests, such as MP5 and SM2, are known to have been washed out during these storms, while others were not yet regularly monitored, but also may have been affected. In many areas throughout the entire region, Western Gulls began nesting earlier than the Black Oystercatchers and may have taken the prime nesting sites in some locations, especially along the bases of the cliffs in the Wilder Ranch stretch in the Santa Cruz County. At Point Lobos State Natural Reserve and along the North Coast, including Pescadero Rock in San Mateo County and Pelican Rock in Santa Cruz County, several offshore rocks were heavily used by Brown Pelicans and Brandt’s Cormorants. This occurred early in the breeding season and continued intermittently until the end of the breeding season. The sheer number of birds may have altered the timing of nesting for the Black Oystercatchers, as well as impacting clutches where incubation had already begun. Reproductive Success During the 2019 breeding season, a total of 65 territorial pairs were identified but only 42 pairs were observed nesting. Due to the diverse coastal topography throughout the Monterey Bay region, exact clutch size for all nesting attempts was not attainable. Many nests were viewed with spotting scopes from distant observation points on land. Therefore, many nesting attempts had an estimated clutch size of two eggs when confirmation was not possible. A total of 21 nesting pairs and six re-nesting attempts occurred along the South Coast. A minimum of 58 eggs were produced and resulted in 41% nesting success (# of clutches that produced young / # of clutches) (Table 2). The total number of chicks hatched was 19 with 26% surviving to fledging (# of chicks fledged / # of chicks). The South Coast had a total of five fledglings from three pairs and a reproductive success of 0.24 per pair (# of fledglings / # of
5 5
8
2
1
7
5
9
1
2
1 1
3
2 2
1
0123456789
10
May 1-15 May 16-31 June 1-15 June 16-30 July 1-15 July 16-31
Num
ber
of N
ests
Egg Laying Date
1st Attempt South Coast 1st Attempt North Coast
2nd Attempt South Coast 2nd Attempt North Coast
3rd Attempt South Coast 3rd Attempt North Coast

7
breeding pairs). One pair from Point Lobos (PL2) produced one fledgling and two pairs from Pebble Beach (PB1 & PB12) produced two fledglings each. Since the fledglings from PB12 were not discovered until early September, it is possible that this nest was a replacement clutch; However, in this data set, it is considered an initial clutch. This particular nest area is located on the ocean side of on an offshore rock in Stillwater Cove and is difficult to view. Table 2. 2019 Black Oystercatcher Reproductive Success – Monterey Bay Region
This was an exceptionally poor reproductive season for the Monterey Peninsula monitoring section. For the first time in seven years of monitoring, the nesting attempts produced zero fledglings. There were only five recorded chicks hatched in the Monterey Peninsula monitoring section during the 2019 breeding season and each of these chicks survived only a few days. A total of 21 nesting pairs and seven re-nesting attempts occurred along the North Coast. A minimum of 63 eggs were produced and resulted in 71% nesting success (Table 2). The total number of recorded chicks hatched was 33, substantially greater than the South Coast, with 46% surviving to fledging. A total of 15 fledglings from 10 pairs were recorded and resulted in a reproductive success of 0.71 per pair (Table 2). Six pairs (SC4, SC7, SC12, SM4, SM9 & SM10) produced one fledgling each. Three pairs (SC1, SC5.2 & SM8.2) produced two fledglings each; However, one of the two newly fledged chicks from SC1 was lost shortly after fledging. The other two pairs (SC5.2 & SM8.2) were successful with replacement clutches. Finally, one pair (SM2.2) successfully fledged three chicks at Pigeon Point Lighthouse from a second clutch. Overall, the reproductive success of the Monterey Bay region was 0.48 per pair (Table 2). A minimum of 121 eggs were produced and resulted in 56% nesting success. At least 52 chicks hatched and 39% survived to fledging. The 2019 breeding season produced a total of 20 fledglings from 13 of the 42 breeding pairs that attempted nesting. In comparison to previous years, the Monterey Bay region’s 2019 breeding season, although a poor year for the Monterey Peninsula monitoring section, had similar reproductive success (0.48 per pair) to the 2017 breeding season (0.46 per pair) and 2018 (0.50 per pair) (Table 3). This was mainly due to the similar percent per pair in the South Coast and greater reproductive success in the North Coast. Tables 4 through 8 show detailed 2019 productivity results for each territory within each section.
Study Areas# of
Breeding Pairs
# of Eggs
# of Chicks
# of Fledglings
# of Nest Attempts
Nesting Success
(%)
Hatching Success
(%)
Per Pair
Per Nest
Survival to Fledging
(%)
Monterey Peninsula (MP) 9 27 5 0 12 25.0 18.5 0.00 0.00 0.0Pebble Beach (PB) 6 14 7 4 7 57.1 50.0 0.67 0.57 57.1Point Lobos (PL) 6 17 7 1 8 50.0 41.2 0.17 0.13 14.3Monterey Bay South Coast 21 58 19 5 27 40.7 32.8 0.24 0.19 26.3
Santa Cruz County (SC) 12 38 20 7 16 68.8 52.6 0.58 0.44 35.0San Mateo County (SM) 9 25 13 8 12 75.0 52.0 0.89 0.67 61.5Monterey Bay North Coast 21 63 33 15 28 71.4 52.4 0.71 0.54 45.5
Monterey Bay South + North Coast 42 121 52 20 55 56.4 43.0 0.48 0.36 38.5
8
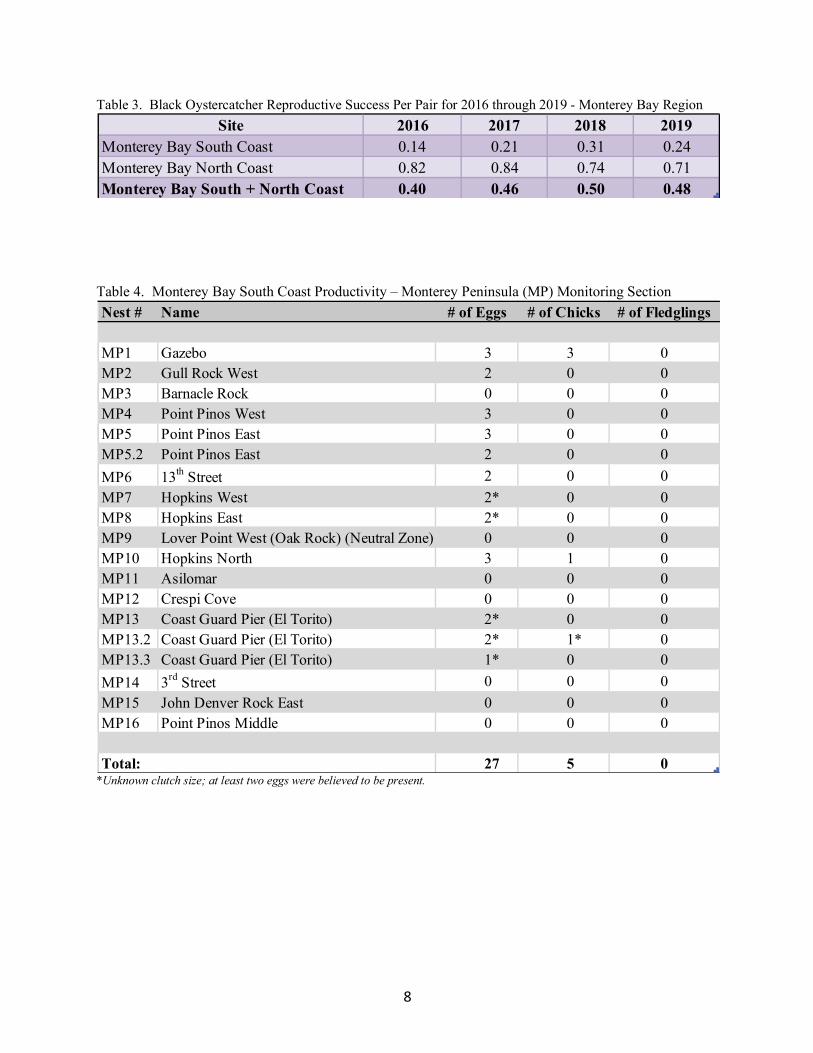
Table 3. Black Oystercatcher Reproductive Success Per Pair for 2016 through 2019 - Monterey Bay Region
Table 4. Monterey Bay South Coast Productivity – Monterey Peninsula (MP) Monitoring Section
*Unknown clutch size; at least two eggs were believed to be present.
Site 2016 2017 2018 2019Monterey Bay South Coast 0.14 0.21 0.31 0.24Monterey Bay North Coast 0.82 0.84 0.74 0.71Monterey Bay South + North Coast 0.40 0.46 0.50 0.48
Nest # Name # of Eggs # of Chicks # of Fledglings
MP1 Gazebo 3 3 0
MP2 Gull Rock West 2 0 0
MP3 Barnacle Rock 0 0 0
MP4 Point Pinos West 3 0 0
MP5 Point Pinos East 3 0 0
MP5.2 Point Pinos East 2 0 0
MP6 13th
Street 2 0 0
MP7 Hopkins West 2* 0 0
MP8 Hopkins East 2* 0 0
MP9 Lover Point West (Oak Rock) (Neutral Zone) 0 0 0
MP10 Hopkins North 3 1 0
MP11 Asilomar 0 0 0
MP12 Crespi Cove 0 0 0
MP13 Coast Guard Pier (El Torito) 2* 0 0
MP13.2 Coast Guard Pier (El Torito) 2* 1* 0
MP13.3 Coast Guard Pier (El Torito) 1* 0 0
MP14 3rd
Street 0 0 0
MP15 John Denver Rock East 0 0 0
MP16 Point Pinos Middle 0 0 0
Total: 27 5 0

9
Table 5. Monterey Bay South Coast Productivity – Pebble Beach (PB) Monitoring Section
*Unknown clutch size; at least two eggs were believed to be present.
Table 6. Monterey Bay South Coast Productivity – Point Lobos (PL) Monitoring Section
*Unknown clutch size; at least two eggs were believed to be present.
Nest # Name # of Eggs # of Chicks # of Fledglings
PB1 Stillwater Cove East 2* 0 0PB1.2 Stillwater Cove East 2* 2 2PB2 Stillwater Cove South 2* 0 0PB3 Stillwater Cove West 0 0 0PB4 Ghost Tree (Stillwater Point) 0 0 0PB5 Lone Cypress 0 0 0PB6 Cypress Point Lookout 2* 2 0PB7 Bird Rock South 0 0 0PB8 Bird Rock North 2 1 0PB9 Ocean Road Neutral Zone (ORNZ) 0 0 0PB10 China Rock South (Neutral Zone) 0 0 0PB11 Point Joe 2* 0 0PB12 Stillwater Cove North 2* 2 2PB13 Stillwater Cove South [Abandoned] 0 0 0PB14 Bird Rock West 0 0 0PB15 Cypress Point North 0 0 0
Total: 14 7 4
Nest # Name # of Eggs # of Chicks # of Fledglings
PL1 Bird Island SE 2* 0 0PL2 Bird Island NE 2* 1 1PL3 China Cove (Weston South) 0 0 0PL4 Sand Hill Cove (Weston North) 0 0 0PL5 Sea Lion Cove 0 0 0PL6 Headland Cove South 0 0 0PL7 Whalers Cove 3 3 0PL7.2 Whalers Cove 2* 1 0PL8 Moss Cove 2* 0 0PL8.2 Moss Cove 2* 2 0PL9 Middle Rock North 0 0 0PL10 Cypress Cove 2* 0 0PL11 Headland Cove North [Abandoned] 0 0 0PL12 Bird Island Rocks [Abandoned] 0 0 0PL13 Guillemot Rock 2* 0 0
Total: 17 7 1

10
Table 7. Monterey Bay North Coast Productivity – Santa Cruz (SC) Monitoring Section
*Unknown clutch size; at least two eggs were believed to be present.
Nest # Name # of Eggs # of Chicks # of Fledglings
SC1 Natural Bridges 2* 2 2SC2 Wilder Beach 0 0 0SC3 Fern Grotto Beach South 3 3 0SC3.2 Fern Grotto Beach South 2* 0 0SC4 Fern Grotto Beach North 3 2 1SC5 Sand Plant Beach North 2 0 0SC5.2 Sand Plant Beach North 3 2 2SC6 Strawberry Beach South 3 2 0SC7 Strawberry Beach North 2* 1 1SC8 3 Mile Beach South 2* 0 0SC8.2 3 Mile Beach South 2* 0 0SC9 3 Mile Beach North 0 0 0SC10 Shark’s Tooth Rock 3 1 0SC11 Shark’s Tooth Cove South 0 0 0SC12 Davenport South 3* 2 1SC13 Davenport North 2* 1* 0SC14 Pelican Rock 2* 0 0SC15 Greyhound Rock 2* 2 0SC15.2 Greyhound Rock 2* 2 0SC16 Davenport Bluff Middle 0 0 0SC17 Ohlone Bluff 0 0 0
Total: 38 20 7
11
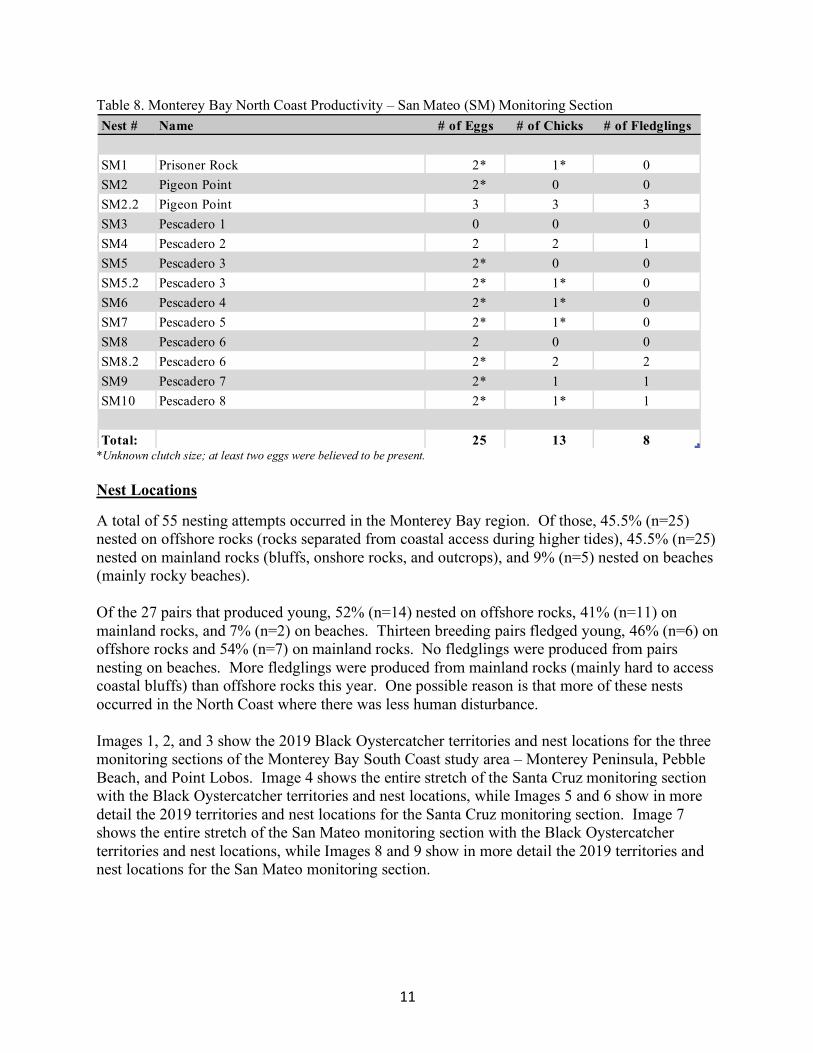
Table 8. Monterey Bay North Coast Productivity – San Mateo (SM) Monitoring Section
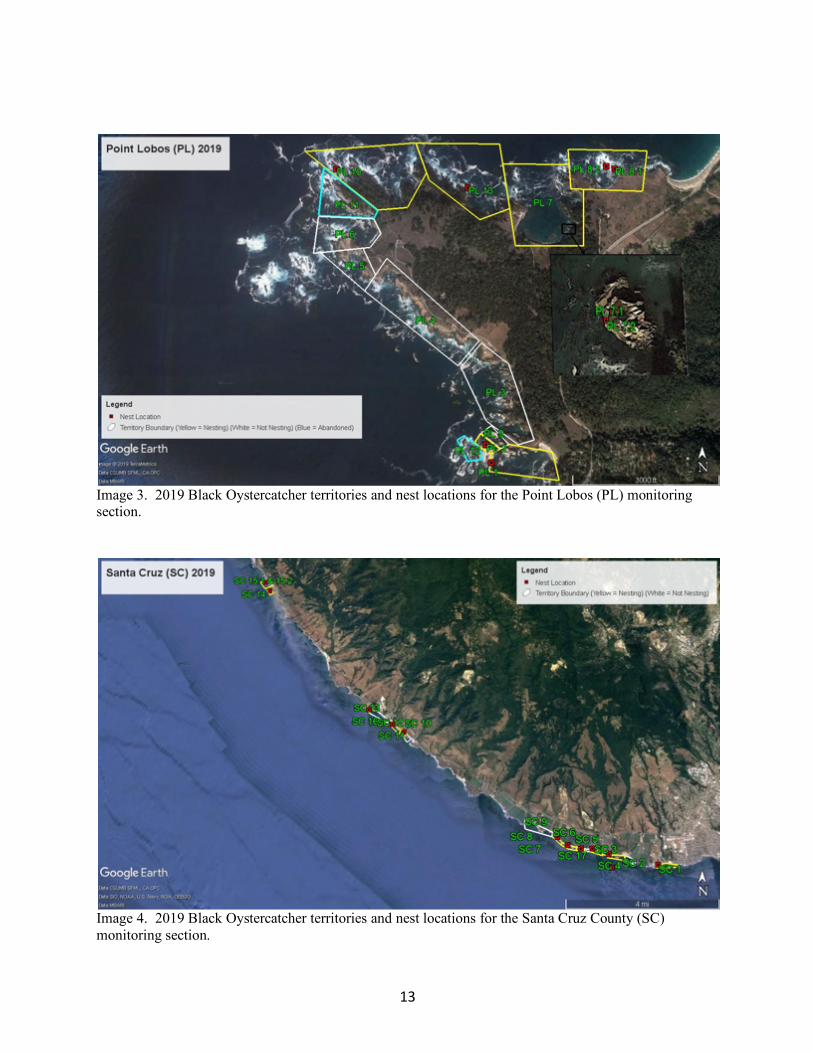
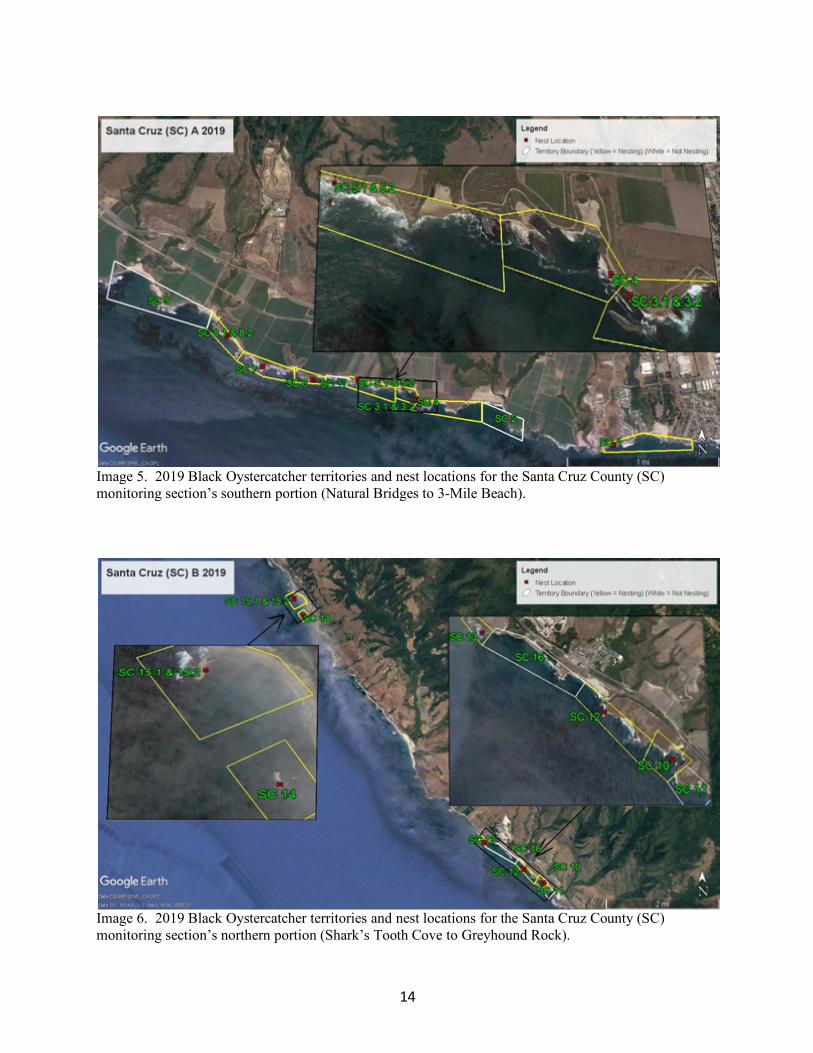
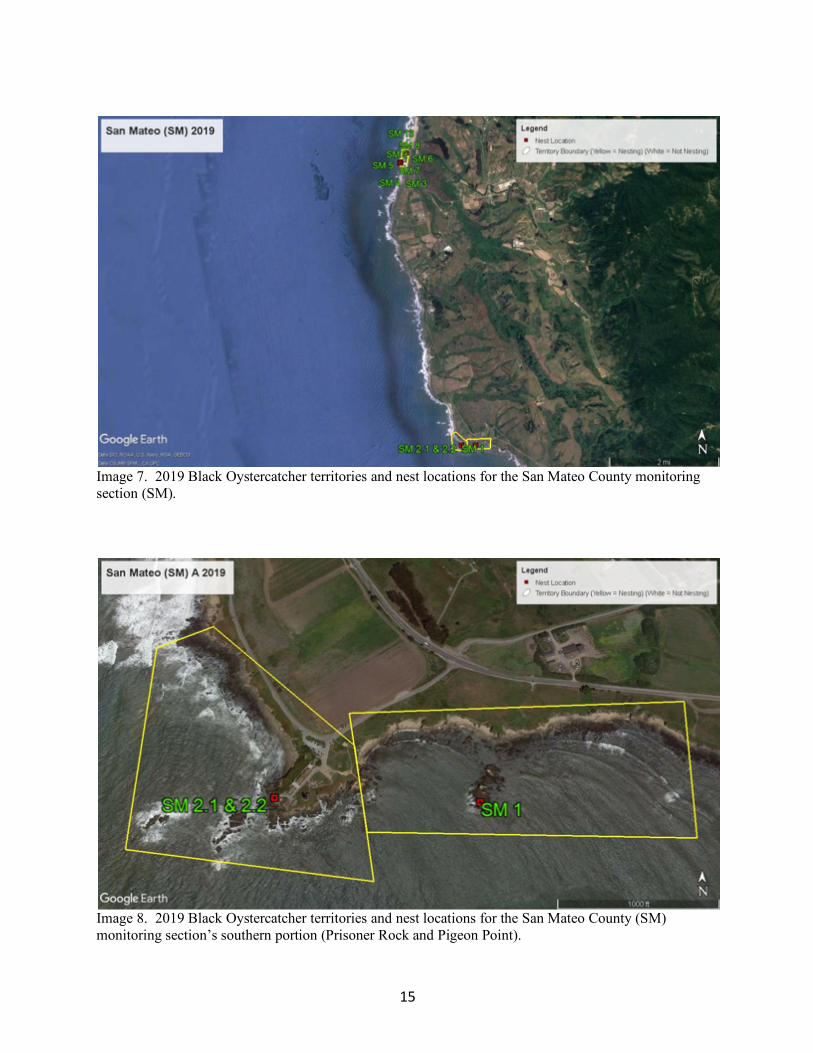
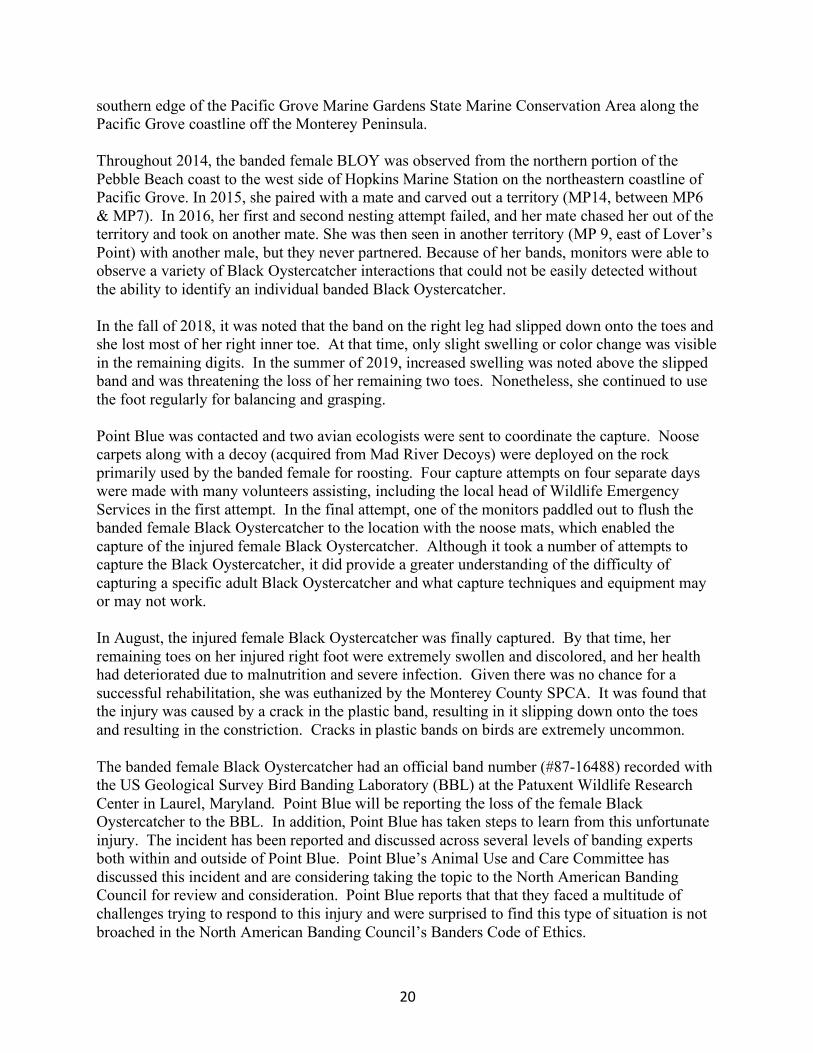
*Unknown clutch size; at least two eggs were believed to be present. Nest Locations A total of 55 nesting attempts occurred in the Monterey Bay region. Of those, 45.5% (n=25) nested on offshore rocks (rocks separated from coastal access during higher tides), 45.5% (n=25) nested on mainland rocks (bluffs, onshore rocks, and outcrops), and 9% (n=5) nested on beaches (mainly rocky beaches). Of the 27 pairs that produced young, 52% (n=14) nested on offshore rocks, 41% (n=11) on mainland rocks, and 7% (n=2) on beaches. Thirteen breeding pairs fledged young, 46% (n=6) on offshore rocks and 54% (n=7) on mainland rocks. No fledglings were produced from pairs nesting on beaches. More fledglings were produced from mainland rocks (mainly hard to access coastal bluffs) than offshore rocks this year. One possible reason is that more of these nests occurred in the North Coast where there was less human disturbance. Images 1, 2, and 3 show the 2019 Black Oystercatcher territories and nest locations for the three monitoring sections of the Monterey Bay South Coast study area – Monterey Peninsula, Pebble Beach, and Point Lobos. Image 4 shows the entire stretch of the Santa Cruz monitoring section with the Black Oystercatcher territories and nest locations, while Images 5 and 6 show in more detail the 2019 territories and nest locations for the Santa Cruz monitoring section. Image 7 shows the entire stretch of the San Mateo monitoring section with the Black Oystercatcher territories and nest locations, while Images 8 and 9 show in more detail the 2019 territories and nest locations for the San Mateo monitoring section.
Nest # Name # of Eggs # of Chicks # of Fledglings
SM1 Prisoner Rock 2* 1* 0SM2 Pigeon Point 2* 0 0SM2.2 Pigeon Point 3 3 3SM3 Pescadero 1 0 0 0SM4 Pescadero 2 2 2 1SM5 Pescadero 3 2* 0 0SM5.2 Pescadero 3 2* 1* 0SM6 Pescadero 4 2* 1* 0SM7 Pescadero 5 2* 1* 0SM8 Pescadero 6 2 0 0SM8.2 Pescadero 6 2* 2 2SM9 Pescadero 7 2* 1 1SM10 Pescadero 8 2* 1* 1
Total: 25 13 8

12
Image 1. 2019 Black Oystercatcher territories and nest locations for the Monterey Peninsula (MP) monitoring section.
Image 2. 2019 Black Oystercatcher territories and nest locations for the Pebble Beach (PB) monitoring section.
13
Image 3. 2019 Black Oystercatcher territories and nest locations for the Point Lobos (PL) monitoring section.
Image 4. 2019 Black Oystercatcher territories and nest locations for the Santa Cruz County (SC) monitoring section.
14
Image 5. 2019 Black Oystercatcher territories and nest locations for the Santa Cruz County (SC) monitoring section’s southern portion (Natural Bridges to 3-Mile Beach).
Image 6. 2019 Black Oystercatcher territories and nest locations for the Santa Cruz County (SC) monitoring section’s northern portion (Shark’s Tooth Cove to Greyhound Rock).
15
Image 7. 2019 Black Oystercatcher territories and nest locations for the San Mateo County monitoring section (SM).
Image 8. 2019 Black Oystercatcher territories and nest locations for the San Mateo County (SM) monitoring section’s southern portion (Prisoner Rock and Pigeon Point).

16
Image 9. 2019 Black Oystercatcher territories and nest locations for the San Mateo County (SM) monitoring section’s northern portion (Pescadero State Beach). Disturbance The five monitoring sections of the Monterey Bay region differ greatly in topography, accessibility, land use, and regulations; thus, making each area distinctively different in its vulnerability. Along the South Coast, Point Lobos State Natural Reserve has strict regulations, limited and difficult access to some areas, and the presence of docents discouraging people from accessing some of the rocky areas. However, some Black Oystercatcher territories are still impacted by humans walking out on rocky outcroppings. Pebble Beach has even fewer access points, due to private homes, fencing, and natural barriers. Many of the Black Oystercatchers nesting there are more prone to special events and increased tourism. The Monterey Peninsula is the most vulnerable to disturbance because it has the most accessible areas of the entire Monterey Bay region. Along the coastline, it has recreational trails, substantial nearshore development, parking areas, and numerous rocky outcroppings that are easily accessed, especially at low tide. It is extremely important to use protective measures at many of the Monterey Peninsula nesting spots to prevent human related access. The North Coast has a mixture of rugged topography and accessible coastline. The Santa Cruz monitoring section consists mainly of coastal bluffs and farmland, making human access difficult. These areas are less vulnerable to human disturbance. The stretch along Wilder Ranch State Park to Davenport contained nine of the 12 nesting pairs for this monitoring section. Natural Bridges and Greyhound Rock nesting areas are more accessible to humans via beaches and can suffer reproductive losses due to both human and natural disturbances. The San Mateo monitoring section is the most vulnerable of the North Coast. Most of the coast and offshore rocks can be accessed during low tide from a number of parking areas along Highway 1 that are

17
a short walking distance from the intertidal zone. Pescadero Rock is particularly vulnerable at negative low tides when access by humans is less impeded. Given that seven Black Oystercatcher pairs have territories on Pescadero Rock (six of which nested during the 2019 season), one major incident could have detrimental effects on all of these pairs; thus, it is important to use protective measures in this area. Black Oystercatchers nesting in all five sections of the Monterey Bay region experienced varying degrees of natural and human caused disturbances. Due to the number of community science volunteers, the greatest number of recorded disturbance reports were from the South Coast monitoring sections, mainly Monterey Peninsula. A disturbance was recorded when a pair (or one individual of a pair) was seen chasing or flying away, making alert calls, or territorial calls toward any threats. The most frequently observed natural disturbance for the entire Monterey Bay region was from Black Oystercatcher interlopers (192 observations). The second was from other avian species (Brandt’s Cormorant, Brown Pelican, Heermann’s Gull, Western Gull, American Crow, Common Raven, Red-shouldered Hawk, Turkey Vulture, Peregrine Falcon, Great Blue Heron, and Great Egret) roosting, nesting, or flying near nesting sites (67 observations). Throughout the breeding season, an exceptionally high number of Brandt’s Cormorants and Brown Pelicans were observed roosting on both offshore and mainland rocks, possibly pushing out the Black Oystercatchers from traditional nesting and roosting spots. This was most frequently observed in the San Mateo, Santa Cruz (Greyhound Rock), and Point Lobos monitoring sections. Various human disturbances throughout the region included: researchers and people walking out onto rocky outcroppings and offshore rocks at low tides (40 observations); drones (ten recorded observations, not including collaboration with graduate student drone flights for two kelp canopy studies; See UCSC & Stanford Kelp Canopy Drone Surveys section below); and fishing, both from land and on boats (four observations). Other major disturbances included the US Open Golf Championship at Pebble Beach, whereby excessive noise, people, and drones disturbed Black Oystercatchers primarily at the Stillwater Cove area; the Pebble Beach Concours d’Elegance Car Week; and the Pacific Grove Feast of the Lanterns, which included a fireworks display from Berwick Park on the Monterey Peninsula (near several Black Oystercatcher territories). We do not have enough information to support any losses due to these events; However, they clearly impacted the normal routines of the Black Oystercatchers. For example, constant Black Oystercatcher alert calls could be clearly heard on the televised broadcast of the US Open. Also monitors were not allowed access to Pebble Beach for about a 3-week period in June before, during, or after the US Open and, therefore, monitoring could not be conducted on any Pebble Beach nesting sites during the height of the nesting season. PROTECTIVE MEASURES Ropes & Signs In an attempt to try to minimize human disturbance to nesting pairs, protective measures using ropes with signs or stakes with signs were put in place at nesting locations known to have high human activity. The protective measure used depended on what was feasible for the particular nesting area. The seasonal protective measures are implemented from April through September.

18
In total, physical protective measures were used on 16 territories with 19 nesting attempts in three of the Monterey Bay region’s monitoring sections – Monterey Peninsula, Pebble Beach, and San Mateo. As seen in Table 9 below, these seasonal measures attempted to provide protection for a total of 16 nesting pairs (MP1, MP2, MP4, MP5, MP6, MP16, PB7, PB8, PB11, SM4, SM5, SM6, SM7, SM8, SM9 & SM10). The seasonal protective measures were put in place on 14 offshore rocks that fall within the jurisdiction of the California Coastal National Monument – six on the Monterey Peninsula (MP1, MP2, MP4, MP5, MP6 & MP16), one at Pebble Beach (PB7), and seven in the San Mateo County section (SM4, SM5, SM6, SM7, SM8, SM9 & SM10). For the third year in a row, State Parks closed off one site along Asilomar State Beach (MP1). The Pebble Beach protection measures on the mainland across from Bird Rock (PB7 & PB8) and south of Point Joe (PB11) were implemented earlier this season and gave protection to the nesting attempts just before the activities associated with the US Open Golf Championship began. Table 9. 2019 Monterey Bay Region Black Oystercatcher Nesting Site Protection Measures
Region & Section Nest # Nest Location Protection Method
# of Chicks
# of Fledglings
MB South Coast Monterey Peninsula MP1 Arena Street Rock Ropes & Signs 3 0 MP2 Gull Rock East Ropes & Signs 0 0
MP4 Point Pinos West Ropes & Signs 0 0 MP5 Point Pinos East Ropes & Signs 0 0 MP5.2 Point Pinos East Ropes & Signs 0 0 MP6 13th Street Rock Ropes & Signs 0 0 MP16 Point Pinos Middle Ropes & Signs 0 0 Pebble Beach PB7 Bird Rock South Ropes & Signs 0 0 PB8 Bird Rock North Stakes & Signs 1 0 PB11 Point Joe Stakes & Signs 0 0 MB North Coast San Mateo SM4 Pescadero Rock 2 Ropes & Signs 2 1 SM5 Pescadero Rock 3 Ropes & Signs 0 0 SM5.2 Pescadero Rock 3 Ropes & Signs 1* 0 SM6 Pescadero Rock 4 Ropes & Signs 1* 0
SM7 Pescadero Rock 5 Ropes & Signs 1* 0 SM8 Pescadero Rock 6 Rope & Sign 0 0 SM8.2 Pescadero Rock 6 Rope & Sign 2 2 SM9 Pescadero Rock 7 Ropes & Signs 1 1
SM10 Pescadero Rock 8 Ropes & Signs 1* 1 TOTAL: 13 5
Although the ropes and signs or stakes and signs were successful in keeping the vast majority of people off of the nesting sites, a total of only five fledglings were produced within the roped off areas, all within the San Mateo section and all on or next to Pescadero Rock situated off Pescadero State Beach. The five fledglings accounted for 25% of the fledglings produced in the Monterey Bay region. That was down 17% from the previous breeding season.

19
Outreach Outreach continued in the form of contacts between monitors and curious locals and coastal visitors, including many international tourists. These contacts allowed some of the monitors to discuss Black Oystercatchers and other coastal and marine related wildlife and ecosystem dynamics. Small stickers with the logo of the Black Oystercatcher Project were given out to kids and adults alike. On the Monterey Peninsula, the wildlife disturbance brochure, developed the previous year by a multi-agency/multi-organization working group and paid for by the Monterey Peninsula Audubon Society, was handed out to interested parties when appropriate. In Pacific Grove, the card with the City’s ordinances related to drone operation and wildlife disturbance was also given out. The printing of the card was paid for by one of the community science monitors. Also, this year most of the monitors wore “Black Oystercatcher Monitoring Project” buttons that not only helped identify them as associated with the monitoring project, but also helped expand the visibility of the Black Oystercatcher monitoring and community science effort. At low tide on a few busy weekends, some Bureau of Land Management personnel, along with Black Oystercatcher Project monitors, spent time at Point Pinos, at the end of the Monterey Peninsula, attempting to inform visitors about nesting Black Oystercatchers and to lessen the human stress on the nesting Black Oystercatchers on the Point Pinos islet. Interested visitors were able to view the MP5.2 nesting birds up close through a spotting scope and learn about Black Oystercatchers from a poster display and discussions with the monitors. At the end of the breeding season, a group of the Black Oystercatcher project monitors spent part of an afternoon at Point Pinos with a Point Blue Conservation Science hosted group of visiting Latin American shorebird biologists. The Black Oystercatcher Project was discussed and protective measures were reviewed. The group was particularly interested in the signing techniques used and samples of various signs were provided to the visiting biologists. In addition, the Black Oystercatcher Project was part of a fund-raising session at the Monterey Bay Birding Festival held in September. The Black Oystercatcher Project monitors had a display table with poster board displays, as well as brochures and other handouts (e.g., stickers and postcards drawn of Black Oystercatchers by a 12-year old artist), including a life-size paper-mache Black Oystercatcher. Also, the Black Oystercatcher Project display table was available at the festival’s Family Day. Black Oystercatcher Project monitors had the opportunity to talk one-on-one with a variety of interested individuals about Black Oystercatchers, the Black Oystercatcher Project, and monitoring opportunities. RELATED MONITORING ITEMS Banded Female Black Oystercatcher Capture In 2011, a female Black Oystercatcher chick was banded on the Farallon Islands National Wildlife Refuge (NWR) by Point Blue Conservation Science (Point Blue) with a turquoise plastic band on the right leg, and a black plastic band over a metal silver band on the left leg (See cover photo). In February of 2014, she appeared with a band of Black Oystercatchers on the
20
southern edge of the Pacific Grove Marine Gardens State Marine Conservation Area along the Pacific Grove coastline off the Monterey Peninsula. Throughout 2014, the banded female BLOY was observed from the northern portion of the Pebble Beach coast to the west side of Hopkins Marine Station on the northeastern coastline of Pacific Grove. In 2015, she paired with a mate and carved out a territory (MP14, between MP6 & MP7). In 2016, her first and second nesting attempt failed, and her mate chased her out of the territory and took on another mate. She was then seen in another territory (MP 9, east of Lover’s Point) with another male, but they never partnered. Because of her bands, monitors were able to observe a variety of Black Oystercatcher interactions that could not be easily detected without the ability to identify an individual banded Black Oystercatcher. In the fall of 2018, it was noted that the band on the right leg had slipped down onto the toes and she lost most of her right inner toe. At that time, only slight swelling or color change was visible in the remaining digits. In the summer of 2019, increased swelling was noted above the slipped band and was threatening the loss of her remaining two toes. Nonetheless, she continued to use the foot regularly for balancing and grasping. Point Blue was contacted and two avian ecologists were sent to coordinate the capture. Noose carpets along with a decoy (acquired from Mad River Decoys) were deployed on the rock primarily used by the banded female for roosting. Four capture attempts on four separate days were made with many volunteers assisting, including the local head of Wildlife Emergency Services in the first attempt. In the final attempt, one of the monitors paddled out to flush the banded female Black Oystercatcher to the location with the noose mats, which enabled the capture of the injured female Black Oystercatcher. Although it took a number of attempts to capture the Black Oystercatcher, it did provide a greater understanding of the difficulty of capturing a specific adult Black Oystercatcher and what capture techniques and equipment may or may not work. In August, the injured female Black Oystercatcher was finally captured. By that time, her remaining toes on her injured right foot were extremely swollen and discolored, and her health had deteriorated due to malnutrition and severe infection. Given there was no chance for a successful rehabilitation, she was euthanized by the Monterey County SPCA. It was found that the injury was caused by a crack in the plastic band, resulting in it slipping down onto the toes and resulting in the constriction. Cracks in plastic bands on birds are extremely uncommon.
The banded female Black Oystercatcher had an official band number (#87-16488) recorded with the US Geological Survey Bird Banding Laboratory (BBL) at the Patuxent Wildlife Research Center in Laurel, Maryland. Point Blue will be reporting the loss of the female Black Oystercatcher to the BBL. In addition, Point Blue has taken steps to learn from this unfortunate injury. The incident has been reported and discussed across several levels of banding experts both within and outside of Point Blue. Point Blue’s Animal Use and Care Committee has discussed this incident and are considering taking the topic to the North American Banding Council for review and consideration. Point Blue reports that that they faced a multitude of challenges trying to respond to this injury and were surprised to find this type of situation is not broached in the North American Banding Council’s Banders Code of Ethics.

21
Mortality of Sub-Adult Black Oystercatcher On the Monterey Peninsula, a sub-adult female Black Oystercatcher, most likely a 2018 breeding season fledgling, was first observed on March 7 off the northern coastline of Pacific Grove. She appeared to have an injury to her right leg/foot. She was observed on various occasions in the MP9 territory, the Esplanade Neutral Zone (ENZ), and Coral Street Cove in the eastern end of the MP15 territory. The Black Oystercatcher Project was considering investigating the possibility of capturing the injured sub-adult, but unfortunately on May 26 she was found dead in the ice plant just above the beach at Coral Street Cove. She presumably died, in part, due to her leg injury. One-Eyed Male Black Oystercatcher At the end of March 2019, an adult male Black Oystercatcher with a damaged left eye with a white film covering it was observed along the Monterey Peninsula. This damage would have left the male Black Oystercatcher with a blind eye. This “one-eyed” Black Oystercatcher was first observed with a female Black Oystercatcher foraging and then resting and preening on the wrack on the western end of the MP9 territory. Their actions indicated that they were a pair, or at least working on developing a partnership. Throughout April and May, the one-eyed male was usually observed foraging, resting, and roosting with his female partner, but was also seen foraging in close vicinity of the banded female Black Oystercatcher. On April 23, the one-eyed Black Oystercatcher was observed foraging with its female partner on the small sandy beach beyond the end of Marine Street within the MP9 territory, then the pair performed a quick copulation before returning to their foraging activity. The pair was observed foraging, resting, and roosting from the east side of Lovers Point west to the east side of Otter Point. The last confirmed observation of the one-eyed male Black Oystercatcher was June 15. Cooperation with Professional Drone Operator Since 2017, the Black Oystercatcher Project has worked with Paul Black, a photographer, professional drone pilot, and owner-operator of Black Sky (a photography and professional drone company). This collaboration has given the Project an opportunity to observe Black Oystercatcher reactions to drones and to aid in the development of guidelines to decrease wildlife disturbance due to flying drones on the Monterey Peninsula. Black established launch sites that avoid wildlife disturbance in the Point Pinos and Hopkins Marine Station areas as discussed as follows: Point Pinos Area In mid-August 2017, while filming for a car auction set up at the corner of Ocean View Boulevard and Asilomar Avenue, Black’s drone was launched on the coast at the John Denver Rock turnout loop (near Ocean View Boulevard) resulting in a brief disturbance to a few Western gulls. During this launch there were no Black Oystercatchers present in the area. During the mid-August 2018 car auction, Black launched his drone from the car auction site across the street from the John Denver Rock turnout and flushed a foraging pair of Black Oystercatchers (MP12) and a large mixed flock of resting gulls, including Heermann’s Gulls with their fledglings. When Black attempted a second launch about 40 meters back (south) from
22
Ocean View Boulevard, it resulted in the same flushing reaction. Black landed the drone each time a wildlife disturbance occurred. Earlier that day, Black had launched from Point Pinos Lighthouse grounds without any observed wildlife disturbance. For filming in the Point Pinos area, Black found that the Point Pinos Lighthouse was the best launch site with the least amount of wildlife disturbance. The lighthouse is on a hill that provides a good line of sight and allows Black’s drone to reach an altitude of 350+ feet, at a distance well removed from the coast. Hopkins Marine Station Area In August 2019, Black was contracted to do drone photography of the American Tin Cannery building directly across from the Hopkins Marine Station. Knowing the sensitivity of the Hopkins Marine Station area, especially for Black Oystercatchers and Harbor Seals, Black planned his flight to launch from the Pacific Grove Tourist Information Center located a block above the American Tin Cannery. He launched to a height of 385 feet before flying his drone out over the coastal waters. The six monitors distributed at or near the east, west, and north sides of Hopkins Marine Station observed no disturbance to Black Oystercatchers and Harbor Seals in the area. Another brief flight in September 2019, from the same launch site and at the same launch height, flew over the water on the west side of the Hopkins’ property with no wildlife disturbance observed by one monitor present at the Hopkin’s fence. These observations provide information indicating that: (1) the launching of a drone can be particularly disturbing to Black Oystercatchers and gulls; (2) launching away from the coastline and resting shorebirds and seabirds can greatly reduce or eliminate disturbance, and (3) the time of year is a critical factor in determining negative impacts on Black Oystercatchers and other shorebirds or seabirds (e.g., breeding season and migration periods). In addition, Paul Black continues to be willing to contact the Black Oystercatcher Project prior to any of his drone flights near the coast and allowing monitors to observe his flights. Also, Black is willing to make adjustments to his launches, landings, and flight plans to avoid wildlife disturbance. Black provides an exemplary model that other drone operators could follow. As Paul Black has alluded, we are just in the infant stage in the evolution of drones and drone use, as well as understanding their impact on wildlife and how best to deal with reducing this impact (Black 2017). UCSC & Stanford Kelp Canopy Drone Surveys In early July, the Black Oystercatcher Project started working alongside a University of California Santa Cruz (UCSC) PhD candidate who was conducting surveys to map the kelp canopy along the south side of Monterey Bay from Point Pinos in Pacific Grove to the Coast Guard Pier in Monterey. She used a large black drone (DJI Matrice 100, 25”x22”x13”, weighing approximately 6.6 lbs., with a MicaSense RedEdge-M camera) that was flying preprogrammed transects at a height of 400’ (121+ meters), as well as a hyperbolic distance of 1000’ (350+ meters) from nesting Black Oystercatchers. The Black Oystercatcher Project monitored any impacts the drone had on nesting and non-nesting Black Oystercatchers in the area, along with the reactions of other shorebirds and seabirds. Black Oystercatchers are extremely sensitive to drone activity and, depending on

23
distance, duration, and topography, will make continual alarm calls and even attack drones until the drone either lands or moves out of range. It would be beneficial to determine the best drone distances to avoid unnecessary stress to Black Oystercatchers. The drone flights were launched around 8:00 a.m. in order to reduce sun light glare and wind disturbance. Once launched, the flights could take anywhere from 30 minutes to more than two hours to complete the coverage of a programmed sector grid, especially because periodic battery changes were needed. Although eleven flights were planned, Black Oystercatcher Project personnel were able to monitor six flights since fog and/or wind caused the cancellation of five flights. To reduce disturbance, the flight plan was adjusted during one of the first monitored flights because a Black Oystercatcher pair in the MP6 territory was recorded making drone alarm calls for several minutes. During that same flight, the programmed hyperbolic 1000’ distance appears to have avoided any observable reaction from the nesting MP8 pair that was within the sector. The majority of observed reactions occurred during drone launching and landing. During one launch, several Heermann’s Gulls were flushed from the beach. Western Gulls were the most aggressive species, especially if they had chicks. Western Gulls would chase the drone or call frequently when the drone flew nearby. A few Western Gulls would even follow the drone to its 400’ height and partially out along the drone’s transects (Table 10). Table 10. Observations from Monitoring Research Drone Surveys
In late September and early October, the Black Oystercatcher Project worked with both the UCSC PhD student and a Stanford University PhD student, who was also using a drone to study kelp off of Stanford University’s Hopkins Marine Station. Both drones launched and landed from the same location and were flown at relatively the same time. The Stanford student was using a smaller white drone (DJI Phantom 3 Pro with a 13.8” diameter & weighing 2.8 lbs., with a DJI RGB camera) and flew at a lower height of 125’ (38+ meters). For the final flight in October, the FAA restricted the UCSC drone flight height to a maximum of 350’ (106+ meters) instead of the 400’ (121+ meters).
DATEHOURS
MONITORED*
NESTING OR NON-NESTING
LAUNCH LOCATION FLIGHT TRANSECT
BLOY TERRITORY
BLOY RESPONSE COMMENTS
16-Jul-19 1Nesting (MP8 pair)
Lover's PointLover's Point to NE side of Hopkins Marine Station
MP6,7,8,9,14 NoneFlight started then aborted due to wet weather
17-Jul-19 2Nesting (MP8 pair)
Lover's PointLover's Point to NE side of Hopkins Marine Station
MP6,7,8,9,14 None Other BLOY in area alarm called
29-Jul-19 2 Non-nestingPG Marine Gardens Park
Point Pinos to Otter Point MP 5, 12, 15 None
11-Sep-19 2 Non-nestingSan Carlos Beach Park
Monterey Bay Aquarium to Coast Guard Pier
MP13 None
12-Sep-19 3 Non-nesting Perkins Park PulloutEast of Otter Cove to Eaast of Lover's Point
ENZ Neutral Territory and MP9
None
Non-nestingPG Marine Gardens Park
Point Pinos to Otter Point MP 5, 12, 15 None4 BLOY flew out of area to West side of Point Pinos
1-Oct-19 3 Non-nestingHopkins Marine Station (near dive locker)
East of Cabrillo Point to west of Monterey Bay Aquarium
MP8, 10
Looked only Alert called
During parallel flights Mainly during landing; with some during launching
*The hours monitored are calculated for actual drone activity, not for total time monitors were present in area montoring BLOY activity

24
Even with the lower flight pattern the smaller Stanford drone caused less of a disturbance than the larger UCSC drone. The smaller Stanford drone, when leaving its programmed flight transects and returned in a path directly over a sitting pair of Black Oystercatchers, caused the pair to attempt to find the drone but did not cause them to stand. In contrast, the UCSC drone was quite a bit louder and was heard from further away. When the UCSC drone would come in to change batteries at least a few Black Oystercatcher alert calls could be heard, but no flushing was observed. It should be also noted that the 50’ (15+ meters) difference from flying the UCSC drone at 350’ verses 400’ made a noticeable difference. Black Oystercatchers that did not react to the 400’ height, did brief alert calls or at least sat or stood searching for the drone when it flew over or near them. These reactions were after the end of the Black Oystercatcher breeding season. It can be predicted that there would be greater reactions from the Black Oystercatchers (e.g., flushing and alarm calls) if the Black Oystercatchers had nests with eggs and/or chicks. Launching and landing of the drones appeared to be more disruptive than over flights within a consistent flight pattern. The launching and landing disturbances appear to be due to the noise level when hovering and rising to its desired height and dropping to land. Sound bouncing off cliff faces or buildings also appears to amplify and possibly extend the sound of a drone beyond its normal range. The work with both PhD students and their drones provided useful insight regarding Black Oystercatcher reaction to drones. From these initial observations, the 400’ height and 1000’ hyperbolic distance appears to avoid Black Oystercatcher reactions in some situations, but in other situations it may still cause reactions. Regardless, the goal of the California Department of Fish and Wildlife is simply avoiding wildlife disturbance rather than any specific distance requirement (Henkel 2019). It has been helpful to observe that Black Oystercatchers react differently to variables such as drone size, and flying at different altitudes, distances, and flight patterns. This has indicated that there are a number of variables that need to be determined by much more controlled observations of Black Oystercatcher reactions to drone use. REFERENCES Black, Paul. 2017. Personal communication (Pacific Grove drones & wildlife multi-agency/multi-organization working group meeting). Elliot-Smith, E. and Haig, S. 2011. Standardized protocols for monitoring population size and reproductive success in Black Oystercatcher, Haematopus bachmani. Corvallis, OR: US Geological Survey. Henkel, L. 2019. Personal communication (Group email, August 29, 2019). Santa Cruz, CA: California Department of Fish and Wildlife.

25
ACKNOWLEDGEMENTS A very special thank you to all of the volunteers from the Bureau of Land Management’s California Coastal National Monument, Pacific Grove Museum of Natural History, and Point Lobos State Natural Reserve. Without your monitoring work, dedicated effort, and passion for the protection of the Black Oystercatcher, this project would not be possible. We are particularly appreciative for the funding the California Central Coast Black Oystercatcher Project received in 2019. It covered a contract for the Project Biologist and a stipend for the Project Intern. A small amount of funding covered Black Oystercatcher Project handout stickers and a reprint of the Pacific Grove wildlife protection card. This funding would not have been possible without an extremely generous $10,000 grant from an anonymous donor to which we are tremendously grateful. We are equally appreciative for a small grant from the Point Lobos Foundation, as well as donations from Sustainable Pacific Grove (that adopted the Black Oystercatcher as its mascot) and a number of individual donors. We thank you all! A special thanks to the Pacific Grove Museum of Natural History for hosting the California Central Coast Black Oystercatcher Project as one of the museum’s community science programs and managing the project’s funding account. In addition, a grateful thanks to both the Pacific Grove Museum of Natural History and the Point Lobos Docent program at the Point Lobos State Natural Reserve for helping recruit, provide, and sustain the community science monitors. A gracious thanks to Audubon California for its continual support, data compilation and analysis, and coordination of the overall California coast-wide Black Oystercatcher program, of which the California Central Coast Black Oystercatcher Project is a part. Thanks to the BLM’s California Coastal National Monument for overseeing the California Central Coast Black Oystercatcher Project and providing technical guidance as needed. And thanks to California State Parks for permitting access to continue monitoring at their locations within the Monterey District and for closing off a section of Asilomar State Beach in order to protect a nesting site. Also, thank you to Stanford University’s Hopkins Marine Station and the Pebble Beach Company for allowing us to use their locations to conduct the study. Thanks to Environment for the Americas for including this project as a part of their shorebird internship program for Latino youths (Celebra las Aves Playeras) and providing an intern who used her GIS skills to produce a set of individual BLOY territory maps for each of the Monterey Peninsula territories. Thank you to the Point Blue Conservation Science avian ecologists who coordinated the capture attempts and ultimate capture of the injured female BLOY, and to the local Wildlife Emergency Services who helped get us started on the capture attempts and making noose mats. Finally, thanks to the UCSC and Stanford University PhD students for working with us on monitoring BLOY and other wildlife reactions to their drone flights regarding their respective kelp studies, and the Monterey Bay National Marine Sanctuary staffers and BayNet volunteers who also helped with the wildlife monitoring and interagency coordination.


