Embed Size (px)
Citation preview

IJOMEH 2007;20(1)48
International Journal of Occupational Medicine and Environmental Health 2007;20(1):48 – 65DOI 10.2478/v10001-007-0008-2
BIOMONITORING OF CYANOBACTERIAL BLOOMS IN POLISH WATER RESERVOIR AND THE CYTOTOXICITY AND GENOTOXICITY OF SELECTED CYANOBACTERIAL EXTRACTSJADWIGA PALUS1, ELŻBIETA DZIUBAŁTOWSKA1, MAŁGORZATA STAŃCZYK1, DOBROSŁAWA LEWIŃSKA1, JOANNA MANKIEWICZ-BOCZEK2, KATARZYNA IZYDORCZYK2, ANITA BONISŁAWSKA3, TOMASZ JURCZAK2, MACIEJ ZALEWSKI2, and WOJCIECH WĄSOWICZ1
1 Department of Toxicology and CarcinogenesisNofer Institute of Occupational MedicineŁódź, Poland2 International Centre of EcologyThe Polish Academy of SciencesŁódź, Poland3 Department of Environmental Health ScienceMedical University of WarsawWarszawa, Poland
AbstractObjectives: Water pollution with toxic cyanobacterial blooms is a worldwide problem. Cyanobacteria species that mainly produce microcystins predominate in Polish water reservoirs. Materials and Methods: In our study, cyanobacterial blooms were monitored during summer of 2004 in the Sulejów reservoir. The concentration of microcystins in water and cyanobacterial cells were determined using liquid chromatography and immunobiotests, while the biological activity of microcystic cyanobacterial extracts was assessed using bacterial tests (SOS Chromotest, UMU test), the comet assay and micronucleus test with human lymphocytes. Results: It was revealed that cyanobacterial bloom was most intensive in mid August and lasted until the end of September. Microcystis aeruginosa and Aphanizomenon flos-aquae dominated in the blooms. The highest concentration of microcystins in cyanobacterial cells was also observed at that time. The concentration of microcystins in water did not exceed 1 μg/l. All cyanobacterial extracts showed weak genotoxicity only for Escherichia coli PQ37. The cyanobacterial extracts prepared at the beginning of September were most toxic to human lymphocytes, the effective microcystin extracts (EC50) concentration was about two or three times lower compared to the other extracts. The level of DNA damage in lymphocytes after short exposure to microcystic extracts (3 and 6 h) was significantly higher than respective levels after longer exposure. The microcystins of cyanobacterial blooms induced a slight increase in micronuclei frequencies in human lymphocytes. Conclusion: Phytoplankton biomass and the genotoxicity of massive cyanobacterial blooms should be assessed for eucariotic cells in the Sulejów reservoir to avoid the hazard induced by cyanobacterial blooms.
Key words:Cyanobacterial extracts, Concentration of microcystins, Genotoxicity, SOS Chromotest, UMU test, Human lymphocytes, Comet assay, Micronucleus test, XTT cytotoxicity test
The study was supported by the Department of Scientific Research, Ministry of Science and Information Technology (Grant 3 PO5D 011 25).Received: November 10, 2006. Accepted: February 28, 2007.Address reprint requests: Jadwiga Palus, Department of Toxicology and Carcinogenesis, Nofer Institute of Occupational Medicine, św. Teresy 8, 91-348 Łódź, Poland; (e-mail: [email protected]).
R E V I E W P A P E R S © Nofer Institute of Occupational Medicine, Łódź, Poland
IJOMEH_1_2007.indb 48IJOMEH_1_2007.indb 48 2007-04-19 08:16:042007-04-19 08:16:04

BIOMONITORING OF CYANOBACTERIAL BLOOMS IN POLISH WATER RESERVOIR O R I G I N A L P A P E R S
IJOMEH 2007;20(1) 49
INTRODUCTION
The data from all over the world provide evidence that cyanobacterial blooms are responsible for acute poisonings and various diseases in animals, wild and domestic, and in humans [1–4]. Cyanobacteria (blue-green algae) dominate during warm days of late summer and autumn. Their high biomass can create the surface scum or froth along the shore. Dangerous toxins produced by cyanobacteria are released to water during lysis of cells [5–7]. Consumption of both cya-nobacteria and water containing released toxins may cause poisoning. The lethal dose depends on the type of cyanobac-terial toxins and species of cyanobacteria, as well as on the age, weight and gender of the exposed organism.Cyanobacterial toxins (cyanotoxins) can be classified into three main groups: hepatotoxins, which are most common, neurotoxins, and dermatotoxins. Hepatotoxins are com-pounds that damage liver cells (hepatocytes). Microcys-tins are the most common group of hepatotoxins. To date, about 65 microcystin variants have been described [1]. These substances are cyclic heptapeptides. Microcystis and Anabaena are mainly responsible for the production of mi-crocystins. Hepatotoxins are harmful to human health and cause cutaneous rash, fever, vomiting, diarrhea, and acute hepatocellular damage [1,2,8]. Toxins can penetrate the human body through gastric or dermal route, by inhala-tion or during blood dialysis. A long-term consumption of water containing even a low dose of these toxins can cause chronic liver damage, which can lead to primary hepatic carcinoma [9,10], bleeding and necrosis of hepatocytes [2]. The lethal effect of microcystins connected with the liver damage was noted mainly in animals.Over the recent years, an increase in the incidence of dis-eases and acute poisonings in humans induced by cyano-bacterial toxins has been observed. In 1996, in Caruaru, Brazil, 131 dialyzed patients were exposed to cyanotoxins via water used for dialysis (filter with active carbon and re-versed osmosis system were used). Sixty of them died, and the others showed typical hepato- and neurotoxic symp-toms [11]. As a result of this accident, the World Health Organisation (WHO) accepted the epidemic of the cya-nobacterial toxin nature. Then the maximum permissible
concentration of microcystins in the reservoir water was recommended at the level of 1.0 μg/l [12].The genotoxic activity of microcystins was found to be higher than that observed for benzene [13]. Microcystins inhibit activity of specific protein phosphatase enzymes within the cells [14–17]. This effect of decreased homeo-stasis and increased carcinogenic processes or cell death [2,10,18,19] showed that microcystins present in water could induce chromosomal aberrations (chromatid and chromosomal breakage) in human lymphocytes. Our pre-vious studies indicated the increase in chromosomal aber-rations in human lymphocytes after exposure to a few cya-nobacterial extracts from the Sulejów reservoir [20,21].The efficiency of water treatment processes in the elimi-nation of cyanotoxins using conventional methods is low, hence a high risk posed to populations supplied with drink-ing water from eutrophic reservoirs [21]. The concentra-tion of microcystin-LR in water of the Sulejów reservoir can reach even 5 μg/l. Therefore, the citizens of Łódź and Tomaszów Mazowiecki supplied with water from this res-ervoir can be exposed to cyanotoxins during the period from August to October. This situation was confirmed by the study of microcystin concentration in the drinking wa-ter that accounted for 0.8 μg/l [22].The aim of the study was to monitor cyanobacterial bloom during the summer of 2004 in the Sulejów reservoir and assess the biological activity of cyanobacterial toxins from excessive blooms in genetic material (DNA and chromo-some levels). Both bacterial models (Escherichia coli, Sal-monella typhimurium) and mammalian cells (human lym-phocytes) were used for assessing cytotoxic and genotoxic properties of cyanobacterial toxins. Moreover, the analyti-cal methods, such as liquid chromatography and immuno-biotests were applied to determine the concentration of microcystins in water and cyanobacterial cells.
MATERIALS AND METHODS
Monitoring of cyanobacterial bloom in the Sulejów lowland reservoirMonitoring of cyanobacterial bloom in the Sulejów res-ervoir was performed once a week in the summer of 2004 (from April to October). The samples of blooms and water
IJOMEH_1_2007.indb 49IJOMEH_1_2007.indb 49 2007-04-19 08:16:052007-04-19 08:16:05
O R I G I N A L P A P E R S J. PALUS ET AL.
IJOMEH 2007;20(1)50
were collected during the intensive bloom and after de-composition of blooms. The Sulejów reservoir is impor-tant to the inhabitants of Central Poland because it is their main reservoir of drinking water.
Analysis of seasonal cyanobacterial biomass changes in the reservoirWater samples for phytoplankton biomass analysis were collected from integrated water column using a Bernato-wicz sampler. One liter of phytoplankton was preserved in Lugol’s solution for analysis of species, their numeri-cal and phytoplankton biomass. Morphological analysis of collected material was performed according to Starmach [23–26]. Phytoplankton biomass counting was determined using a Fuch-Rosenthal camera. The size of cells for each species was measured during the calculation under a mi-croscope. Then, using the geometric formulas or their combinations, their mean volume was determined [24]. Biomass quantity was obtained by adding the values ob-tained after multiplying the number for each species and the mean value of cells. After adding, the density of cells in algae was 1, then the total volume of cells in the water volume unit corresponded with their biomass.
Concentrations of microcystins in cyanobacterial cells and water samples analyzed by PPIA and ELISA methodsProtein phosphatase inhibition assay (PPIA)This assay is the colorimetric method applied to deter-mine the biological activity of microcystin on the ground of inhibition of the protein phosphatase type 1 (PP1) ac-tivity from rabbit’s skeletal muscle (BioLabs). Phosphate activity was measured by the hydrolysis of p-nitrophenol phosphate (pNPP) to p-nitrophenyl (pNP) [27–29]. The quantity of pNP product after reaction of PP1 enzyme with pNPP substrate was measured at 405 nm in a mi-croplate reader (Labsystems). The pNP product quan-tity decreased with increasing concentration of the tested compound, since pNPP is not dephosphorated during inhibition of PP1 activity. This method enables the deter-mination of total microcystin concentration at the level of 0.125 μg/l in water samples. The total range of test is from
0.125 to 4 μg/l microcystin in a water sample. Two analyses were performed for each water sample.
Enzyme-linked immunosorbent assay (ELISA)The enzyme-linked immunosorbent assay is a colorimetric method used for analyzing microcystins and nodularines in water samples. ELISA test is available as a kit (Envirol-Logix, QuantiPlateTM Microcystin Kits). Microplates with monoclonal antibodies on wells were stored at +4°C. The calibration curve was always evaluated using the follow-ing concentrations of microcystin LR (MC-LR): 0.16, 0.6 and .5 μg/l during the measurement of tested samples. Af-ter conjugation of microcystin contained in samples with antibodies, the microcystin enzyme was added to bind the excess of antibodies. The concentration of conjugated enzyme was measured in a colorimetric reader at 450 nm and the concentration of all variants of microcystin in wa-ter samples was read from the calibration curve. The de-tection limit of microcystins in this assay was 0.16 μg/l. The total range of test was from 0.16 to 2.5 μg/l of microcystin in a water sample. Two analyses were performed for each water sample.
Sample preparation and microcystins detection in blooms and water by high performance liquid chromatography (HPLC)Water samples with phytoplankton (1 liter volume) were filtered through GF/C filter (Whatman) to separate cyanobacterial cells from water and to measure toxins in the water and cells using the HPLC method. The fil-trate was extracted and concentrated by passage through Bakerbound speTM octadecyl (C18) disposable extraction columns conditioned by methanol. The concentrated fil-trate was then eluted with 90% methanol and 0.1% tri-fluoracetic acid (TFA), which was subsequently removed by rotary evaporation and again dissolved in 1 ml of 75% methanol. The Whatmann GF/C filters with cyanobacte-rial cells were extracted with 75% methanol and ultrasoni-cated in an ultrasonicator XL 2020 (Misonix Inc., USA). Then the samples were centrifuged, evaporated and again dissolved in 1 ml of 75% methanol. The purified samples
IJOMEH_1_2007.indb 50IJOMEH_1_2007.indb 50 2007-04-19 08:16:052007-04-19 08:16:05

BIOMONITORING OF CYANOBACTERIAL BLOOMS IN POLISH WATER RESERVOIR O R I G I N A L P A P E R S
IJOMEH 2007;20(1) 51
were filtered through GHP Acrodisc 0.45 μm (Pall firm) and stored in the vials at –20oC before analysis.Moreover, different sampling of cyanobacterial blooms was used for preparation of extracts to assess their genotoxicity. The phytoplankton samples were collected from the surface water (0–0.5 m depth) and concentrated (5–10 l of concen-trated sample) using a 65 μm plankton net. The concentrated samples were frozen, lyophilized (Eppendorf lyophilisator) under pressure conditions at –40oC, homogenized and stored at –20°C before analysis. To obtain the purified extracts, lyophilized materials were dissolved in 80–100 ml of 75% methanol, ultrasonicated on ice for 10 min to release toxins from cyanobacterial cells, centrifuged two times for 10 min at 10 000 g at 4°C and filtered. The samples were divided into several portions and after evaporation of methanol in the pressure centrifuge SC 110A SpeedVacR Plus (Thermo-Savant) were stored in the vials at –20°C before analysis.Microcystins in cyanobacterial blooms and water ex-tracts were determined by HPLC with a diode array detection (DAD) detector (model 1100, Hewlett Pack-ard) according to Lawton et al. [30]. The extracts were dissolved in 75% methanol and the samples in the vol-ume of 20 μl were injected into chromatographic column LiChroCART™ (55 mm • 4 mm) with a Purospher™ STAR RP-18e (3 μm), stored in thermal conditions at 40oC, to separate microcystins. The mobile phase consisted of 0.05% trifluoracetic acid (A) and acetoni-trile with 0.05% trifluoracetic acid (B) in the time gradi-ent: 0 min 25% B, 5 min 70% B, 6 min 70% B, 6.10 min 25% B. The flow speed of mobile phase was 1 ml/min. The measurements were read at the wave length ranging from 200 to 300 nm. Identification of microcystin peaks was based on the comparison of retention times and UV spectra characteristic of microcystin. The quantity of identified microcystins was determined from the calibra-tion curve. The calibration curves were prepared using control microcystins from Calbiochem.
SOS ChromotestThe SOS Chromotest with Escherichia coli strain PQ 37 (Institute of Pasteur, Paris, France) was performed accord-ing to the procedure outlined by Quillared and Hoffnung
[31]. Strain PQ 37 has the genotype sfiA::Mud (Ap lac) cts, lac U169, mal+,uvrA, galE, galY, PhoC, rfa, F-, thr, leu, his, pyrD, thl, trp::Muc+, srl300::Tn10 (Medical University of Warsaw, Poland). Escherichia coli PQ 37 was grown overnight in LB medium (10 g Bacto tryptone, 5 g Yeast extract, 10 g NaCl, 100 μl ampicillin) with shaking at 37°C. Then, the culture was diluted with fresh LB medium with ampicillin and incubated for 2 h with shaking at 37°C.Five cyanobacterial extracts were tested. The concentra-tion of microcystins in cultures varied from extract to extract and depended on the intensity of cyanobacterial blooms. The standard microcystin LR (MC-LR) (Sigma, St. Louis, USA) was used as a positive control. The bacte-ria with cyanobacterial extracts or MC-LR were incubated for 2 h at 37°C. The control cells were incubated without cyanobacterial extracts or MC-LR in the same conditions. Control cells with 1% DMSO (dimethylsulfoxide) were also submitted to test DMSO toxicity.The genotoxicity of cyanobacterial extracts and MC-LR was assessed as the induction factor (IF), which was the ratio of the specific activity of β-galactosidase at a given concentration of microcystins in culture divided by its value at a zero concentration.The potency of genotoxic effects for cyanobacterial ex-tracts was possible to compare by using the SOS-inducing potency factor which was determined as the ratio of the IF difference to the difference between the successive con-centrations of microcystins in extracts.The toxicity of cyanobacterial extracts was determined as the toxicity factor (TF), which was the ratio of the activity of alkaline phosphatase for the control sample divided by its value at a given concentration of microcystins in culture.
UMU testThe umu test [32] for measuring DNA damage by means of SOS induction was performed according to Reiffer-scheid et al. [33]. Salmonella typhimurium TA 1535/pSK 1002 (The German Collection for Microorganisms and Cell Cultures, Braunschweig, Germany) was grown over-night in TGA medium (11.9 g HEPES, 10 g Bacto tryp-tone, 5 g NaCl, 2 g glucose, 0.05 g ampicillin in 1000 ml
IJOMEH_1_2007.indb 51IJOMEH_1_2007.indb 51 2007-04-19 08:16:062007-04-19 08:16:06

O R I G I N A L P A P E R S J. PALUS ET AL.
IJOMEH 2007;20(1)52
distilled water, pH 7.0) with shaking at 37°C. Then, the culture was diluted with fresh TGA medium and grown for 1.5 h at 37°C to get the optical density (OD600) at 600 nm versus TGA medium about 0.53–0.54. 300 μl of bacterial culture (± cofactor-mix and S9-fraction) was added to the 96-well plates.Five cyanobacterial extracts were tested. The concentra-tion of microcystins in cultures varied from extract to extract and depended on the intensity of cyanobacterial blooms. The standard MC-LR (Sigma, St. Louis, USA) was used as a positive control. The bacteria with cyano-bacterial extracts or MC-LR were incubated for 2 h at 37°C. The control cells were incubated without cyano-bacterial extracts or MC-LR in the same conditions. The test extracts were dissolved and diluted in 100% DMSO and added to the wells. After mixing, the plates were in-cubated for 2 h at 37°C with shaking. After incubation, each mixture was diluted tenfold with TGA medium and incubated for additional 2 h at 37°C with shaking. At the end of the incubation, the cell density was measured at 600 nm. For testing β-galactosidase activity, 120 μl B-buf-fer (20.18 g Na2HPO4 • 2 H2O, 5.5 g NaH2PO4 • H2O, 0.75 g KCl, 0.25 g MgSO4 • 7H2O, 1 g SDS and 2.7 ml β-mercaptoethanol in 1000 ml distilled water, pH 7.0), 30 μl of treated cells and 30 μl of o-nitro-phenyl-β-D-galactopyranoside (ONPG) solution (4.5 mg/ml in 0.1 M phosphate buffer, pH 7.0) were mixed per well in fresh microplate. After a 30-min incubation at 28°C, the reac-tion was stopped by adding 120 μl of 1 M Na2CO3. The absorbance was then measured at 420 nm. Enzyme activ-ity was calculated according to Miller [34] adapted to the microplate assay.The genotoxicity of cyanobacterial extracts and MC-LR were determined as the induction factor, which was the ratio of the activities of β-galactosidase to alkaline phos-phatase at a given concentration of microcystin in culture divided by its value at a zero concentration.
Isolation and lymphocyte culturesPeripheral blood from two healthy volunteer donors was collected. Lymphocytes were isolated under sterile con-ditions by centrifugation (2000 rpm/min) on Histopaque
1077 and washed twice in phosphate-buffered saline (PBS). The isolated lymphocytes were suspended in RPMI 1640 medium with antibiotics (penicillin at a concentration of 50 IU/ml, streptomycin at a concentration of 50 μg/ml and gentamycin at a concentration of 40 μg/ml) and 10% fetal calf serum. Viability of lymphocytes was determined using trypan blue and was above 97%. Thereafter, the cell suspension in RPMI 1640 with antibiotics and 10% fetal calf serum, at the density 5–6 • 106 cells/ml medium was prepared for further studies.
Cytotoxicity of cyanobacterial extracts —XTT reduction testLymphocytes (2.5 • 105 cells) were incubated for 24 h at 37oC and 5% CO2 with cyanobacterial extracts con-taining microcystins or standard MC-LR at the concen-trations ranging from 10 to 80 μg/ml in culture. The cya-nobacterial extracts were dissolved in 40% ethanol and diluted in RPMI 1640 medium. The concentration of ethanol in each culture did not exceed 1%. For each con-centration of microcystins in extracts or MC-LR, three cultures were prepared. The control cells were incubated without extract or MC-LR in the same conditions. Con-trol cells with ethanol were also submitted to test ethanol toxicity.Two hours before the end of incubation, the solution of yellow tetrazolium salt XTT at the concentration 1 mg/ml was added to each culture to reduce it to orange colored water soluble formazan by metabolic active cells. The formazan was directly quantified using microtiter plate reader (Multiscan RC, Labsystems, Finland) at the wave-length of 450 nm with the reference wavelength of 620 nm. The measurements of optical density (OD) were used to calculate the percentage of cell survival according to the formula:
Viability [%] = (absorbance in treated cells/absorbance
in control cells) • 100%
The microcystins concentration inducing 50% cellular cy-totoxicity (EC50) were calculated.
IJOMEH_1_2007.indb 52IJOMEH_1_2007.indb 52 2007-04-19 08:16:062007-04-19 08:16:06
BIOMONITORING OF CYANOBACTERIAL BLOOMS IN POLISH WATER RESERVOIR O R I G I N A L P A P E R S
IJOMEH 2007;20(1) 53
Alkaline version of comet assayLymphocyte cultures in RPMI 1640 medium with antibiot-ics (penicillin at a concentration of 50 IU/ml, streptomycin at a concentration of 50 μg/ml, gentamycin at a concentra-tion of 40 μg/ml) and 10% fetal calf serum were performed in 96-well plates. The cells were exposed to cyanobacterial extracts dissolved in 40% ethanol and diluted in RPMI 1640 medium, in which the microcystins concentrations ranged from 2.5 to 10 μg/ml for 3, 6 and 12 h. Microcystin LR was used as a positive control at the concentrations of 1, 2 and 4 μg/ml in cultures. Two cultures for each concentra-tion of microcystins and time exposure were performed.DNA damage, including single strand breaks (SSB) and alkali labile sites (ALS), were detected using the alka-line single cell gel electrophoresis (SCGE, comet assay) according to the method of Singh et al. [35] as modi-fied by Mc Kelvey-Martin et al. [36]. The lymphocyte suspension (500 000 cells) were resuspended in the low melting agarose (1:1 v/v), embedded on agarose gel and immersed in cold lysing solution (2.5 M NaCl, 0.1 M Na2EDTA, 10 mM Tris-HCl, pH 10, 1% Triton X-100) for 1 h at 4oC. Two slides for each experimental end-point were prepared. After lysis, DNA was denatured in an electrophoretic buffer (1 mM Na2EDTA, 300 mM NaOH, pH > 13) for 20 min at 4oC, electrophorezed in the same alkaline conditions (30 min, 0.9 V/cm, 25 V and 300 mA), neutralized by threefold rinsing the slides with 0.4 Tris buffer (pH 7.5), dried and stored for stain-ing with fluorescent dye (DAPI). All the steps described above were carried out under red light to avoid the in-duction of DNA damage. The slides were stained just before analysis with 50 μl of DAPI (5 μl/ml) and kept in a humidified box.At the same time, the oxidative DNA damages were identified using formamidopyrimidine glycosylase (FPG) enzyme, which converted oxidized purine bases to strand breaks according to Collin et al. [37]. A part of slides, after lysis, was washed three times with enzyme buffer (0.1 M KCl, 0.5 mM Na2EDTA, 40 mM HEPES-KOH, 0.2 mg/ml bovine serum albumin, pH 8) and incubated with FPG in the buffer (or buffer alone as a control) for 30 min at 37oC.
They were then electrophorezed, neutralized, and stained as described above.To assess the level of DNA fragmentation, 25 cells in each gel were analyzed using fluorescence microscope (Olympus BX40) and the image analysis system (LUCIA COMET ASSAY, Precoptic Co.). The tail moment, which considers both the tail length and the fraction of DNA in the comet tail was used as an indicator of DNA damage.The results were expressed as a mean of tail moment for each experimental endpoint ± SD. Statistical differences versus respective controls were calculated using t-Stu-dent’s test.
Micronucleus testBlood samples (0.4 ml) were cultured in RPMI 1640 me-dium (5 ml) supplemented with 10% fetal bovine serum, L-glutamine and antibiotics (penicillin at a concentration of 50 IU/ml, streptomycin at a concentration of 50 μg/ml, and gentamycin at a concentration of 40 μg/ml) for 72 h at 37oC in 5% CO2 atmosphere. Lymphocytes` growth was stimulated with phytohemaglutinin (PHA, 10 μg/ml). After 44 h of incubation at 37oC in an atmosphere con-taining 5% CO2, cytochalasin B (5 μg/ml) was added to each culture to inhibit cytokinesis [38]. At 48 h the lym-phocytes were treated with each of five cyanobacterial extracts. The cyanobacterial extracts were dissolved in 40% ethanol and diluted in RPMI 1640 medium to get the respective concentrations of microcystins in cultures (4–50 μg/ml). Each treatment was tested with cells from two donors, performed in duplicate separate cultures. After incubation, the cells were collected by centrifuga-tion. The cell pellets were treated with a cold hypotonic solution (0.075 M KCl) and fixed three times in metha-nol:acetic acid (3:1) mixture. Then, the cytogenetic slides were prepared from the pellets. The slides were air-dried and stained with 2% Giemsa solution (5 min). The micronuclei frequency was determined in 1000 bi-nucleated lymphocytes for each experimental endpoint, where mononucleated, binucleated, trinucleated and tetranucleated were scored. Also, for the assessment of lymphocyte proliferating rate, the nuclear division index was calculated using the formula:
IJOMEH_1_2007.indb 53IJOMEH_1_2007.indb 53 2007-04-19 08:16:072007-04-19 08:16:07

O R I G I N A L P A P E R S J. PALUS ET AL.
IJOMEH 2007;20(1)54
NDI = (1mono+2bi+3tri+4tetra)/total number of scored cells,
where: 1 mono through 4 tetra indicate the number of cells with 1–4 nuclei.The statistical analysis of MN frequency and NDI were calculated by t-Student’s test.
RESULTS
Seasonal cyanobacterial biomass changes in the Sulejów reservoirCyanobacterial bloom in the Sulejów reservoir in 2004 was typical of eutrophic reservoirs. The bloom was mainly dominated by Microcystis aeruginosa and also by Aphani-zomenon flos-aquae, Anabaena sp. and Pseudoanabaena sp.
(Table 1). The low biomass of cyanobacteria (less than 1 mg/l) was observed until mid July. The highest biomass of cyanobacteria (33 mg/l) occurred in mid September. The increased percentage of Aphanizomenon flos-aquae was noted after mid August.
Determination of the concentration of microcystins in cyanobacterial extracts and waterUsing ELISA and PPIA tests it was possible to determine the most dangerous period for recreation and the qual-ity of drinking water. The concentration of microcystins in cyanobacterial cells increased above the detection limit, i.e. > 2.5 μg/l (ELISA) and > 4 μg/l (PPIA) not before mid August and lasted to the end of September (Table 2). In the summer of 2004, the concentration of microcystins
Tab1e 1. Cyanobacteria biomass in water of the Sulejów reservoir in 2004, assessed under a microscope
Sampling dateCyanobacteria biomass including their species (mg/l)
Microcystis aeruginosa Aphanizomenon flos-aquae Anabaena sp. Pseudoanabaena sp. TotalApr 21 0.0 0.0 0.0 0.0 0.0Apr 28 0.0 0.0 0.0 0.0 0.0May 5 0.0 0.0 0.0 0.0 0.0May 12 0.0 0.0 0.0 0.0 0.0May 19 0.1 0.0 0.0 0.0 0.1May 26 0.0 0.0 0.0 0.0 0.0Jun 2 0.1 0.0 0.0 0.0 0.1Jun 9 0.2 0.0 0.0 0.0 0.2Jun 16 0.9 0.0 0.0 0.0 0.9Jun 23 0.2 0.0 0.1 0.0 0.3Jun 29 0.9 0.0 0.2 0.0 1.1Jul 7 0.9 0.1 0.1 0.0 1.1Jul 14 1.4 0.2 0.2 0.0 1.8Jul 21 3.2 0.2 0.4 0.1 3.9Jul 28 14.2 1.9 2.7 1.0 19.8Aug 4 4.2 2.9 0.6 0.0 7.7Aug 11 4.3 0.2 0.0 0.1 4.6Aug 18 27.7 3.7 0.0 1.5 32.9Aug 25 7.9 10.5 0.1 0.8 19.3Sep 1 27.9 1.6 0.0 0.3 29.8Sep 8 9.1 6.7 0.1 0.3 16.2Sep 15 18.2 0.8 0.0 0.1 19.1Sep 22 9.7 0.2 0.0 0.0 9.9Sep 29 4.6 0.4 0.0 0.0 5.0
IJOMEH_1_2007.indb 54IJOMEH_1_2007.indb 54 2007-04-19 08:16:072007-04-19 08:16:07

BIOMONITORING OF CYANOBACTERIAL BLOOMS IN POLISH WATER RESERVOIR O R I G I N A L P A P E R S
IJOMEH 2007;20(1) 55
in water was always below 1 μg/l (admissible concentration of microcystins in water) (Table 2).
Qualitative and quantitative detection of microcystins in cyanobacterial extracts and water by HPLCUsing HPLC assay with a DAD detector it was possible to qualitatively identify microcystins in cyanobacterial extracts and water. Three hepatotoxins were identified: MC-YR, MC-RR, and MC-LR mainly in cyanobacterial extracts when compared the retention time with respective
standards and after the analysis of absorption spectrum
for individual components (Table 3). On some days, the
other microcystins were detected, but having no standards
we could not identify them. During the study period, mi-
crocystin-RR was detected at the highest concentration
(Table 3). The high concentrations of microcystins (above
3 μg/l) were observed from August 18 to September 22
(Table 3). In water, the concentration of microcystins did
not exceed 1 μg/l during the summer of 2004 (Table 3).
Table 2. Concentration of microcystins in water and cyanobacteria cells in the Sulejów reservoir in 2004
Sampling date
Concentration of microcystins in water
(μg/l)
Concentration of microcystins in cyanobacterial cells
(μg/l)
Total concentration of microcystins
(μg/l)ELISA PPIA ELISA PPIA ELISA PPIA
Apr 21 < 0.16 < 0.125 < 0.16 < 0.125 < 0.16 < 0.125Apr 28 < 0.16 < 0.125 < 0.16 0.23 < 0.16 0.23May 5 < 0.16 < 0.125 < 0.16 < 0.125 < 0.16 < 0.125May 12 < 0.16 0.22 < 0.16 < 0.125 < 0.16 0.22May 19 < 0.16 < 0.125 < 0.16 < 0.125 < 0.16 < 0.125May 26 < 0.16 < 0.125 < 0.16 < 0.125 < 0.16 < 0.125Jun 2 < 0.16 < 0.125 < 0.16 < 0.125 < 0.16 < 0.125Jun 9 < 0.16 < 0.125 < 0.16 < 0.125 < 0.16 < 0.125Jun 16 < 0.16 < 0.125 < 0.16 < 0.125 < 0.16 < 0.125Jun 23 0.19 < 0.125 < 0.16 < 0.125 0.19 < 0.125Jun 29 0.17 < 0.125 < 0.16 < 0.125 0.17 < 0.125Jul 7 0.24 < 0.125 < 0.16 < 0.125 0.24 < 0.125Jul 14 0.25 < 0.125 < 0.16 0.48 0.25 0.48Jul 21 < 0.16 < 0.125 < 0.16 0.56 < 0.16 0.56Jul 28 < 0.16 0.27 > 2.50 3.69 > 2.50 3.96Aug 4 0.31 0.30 > 2.50 3.28 > 2.50 3.58Aug 11 0.31 0.39 > 2.50 3.09 > 2.50 3.48Aug 18 0.25 < 0.125 > 2.50 > 4.00 > 2.50 > 4.00Aug 25 0.33 < 0.125 2.50 2.16 > 2.50 2.16Sep 1 0.26 < 0.125 > 2.50 2.39 > 2.50 2.39Sep 8 < 0.16 < 0.125 > 2.50 > 4.00 > 2.50 > 4.00Sep 15 < 0.16 < 0.125 > 2.50 > 4.00 > 2.50 > 4.00Sep 22 < 0.16 < 0.125 > 2.50 > 4.00 > 2.50 > 4.00Sep 29 < 0.16 < 0.125 > 2.50 2.91 > 2.50 2.91Oct 7 < 0.16 0.27 < 0.16 0.67 < 0.16 0.94Oct 13 0.30 0.27 < 0.16 0.51 0.30 0.78Oct 21 0.25 0.29 < 0.16 0.34 0.25 0.63
ELISA — the enzyme-linked immunosorbent assay; the test range, 0.16–2.5 μg microcystins/l water.PPIA — the protein phosphatase inhibition assay; the test range, 0.125–4.00 μg microcystins/l water.
IJOMEH_1_2007.indb 55IJOMEH_1_2007.indb 55 2007-04-19 08:16:082007-04-19 08:16:08

O R I G I N A L P A P E R S J. PALUS ET AL.
IJOMEH 2007;20(1)56
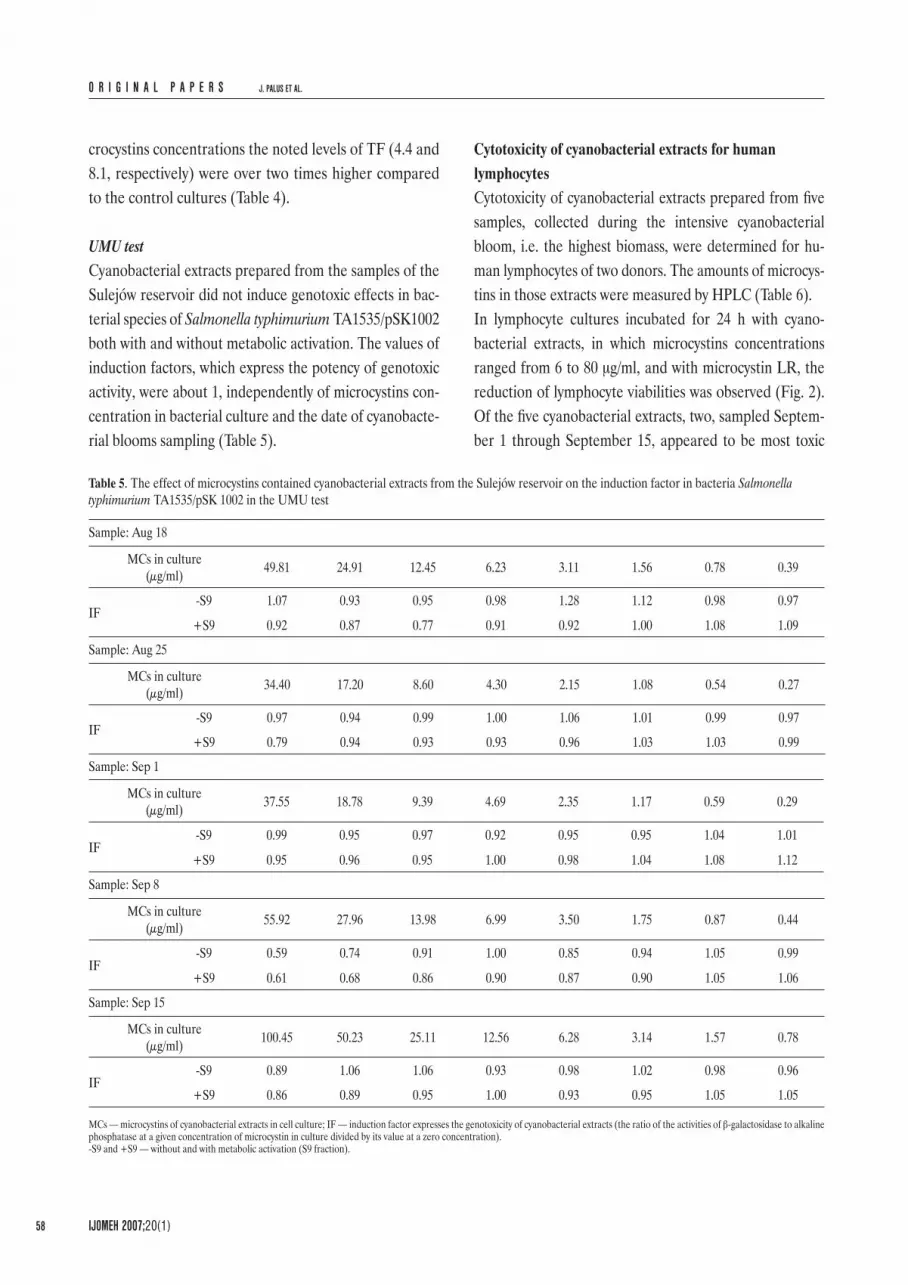
Genotoxicity of cyanobacterial extracts in bacterial testsSOS ChromotestTable 4 presents the estimation of the genotoxic and toxic effects of five cyanobacterial extracts with micro-cystins from the Sulejów reservoir. These effects were described in the SOS Chromotest by particular param-eters, such as IF, TF and SOS-inducing potency (SO-SIP). The weak genotoxic effects in bacterial species Escherichia coli PQ37 were induced by two cyanobacte-rial extracts (from August 18 with metabolic activation and from September 8 without S9). The induction fac-tors of SOS DNA rapair in the bacterial cultures with these extracts at the highest concentrations of microcys-
tins (41.5 and 46.6 μg/ml, respectively) were over two times higher than in control cultures (without extracts) (Table 4). Comparing the SOSIP factors for each extracts it appeared that the strong genotoxic effects of Esche-richia coli PQ37 were induced by cyanobacterial extracts of September 8 (-S9) and August 25 both with and with-out S9 (Fig. 1). The toxic effects of some cyanobacterial extracts without metabolic activation for Escherichia coli PQ37 were also revealed. The most toxic extracts for bacterial species appeared to be those prepared from the samples of August 25 and September 8, because in bac-terial cultures incubated with these extracts showing the highest levels (28.6 and 46.6 μg/ml, respectively) of mi-
Table 3. The concentration of microcystins in water and cyanobacterial cells in the Sulejów reservoir in 2004, assessed by HPLC assay
Samplingdate
Concentration of microcystins in water (μg/l) Concentration of microcystins in cells (μg/l)
MC-RR MC-LR MC-YR Others MC-RR MC-LR MC-YR Others
Apr 21 ND ND ND ND ND ND ND ND
Apr 28 ND ND ND ND ND ND ND ND
May 5 ND ND ND ND ND ND ND ND
May 12 ND ND ND ND ND ND ND ND
May 19 ND ND ND ND ND ND ND ND
May 26 ND ND ND ND ND ND ND ND
Jun 2 ND ND ND ND ND ND ND ND
Jun 9 ND ND ND ND ND ND ND ND
Jun 16 ND ND ND ND ND ND ND ND
Jun 23 ND ND ND ND ND ND ND ND
Jun 29 ND ND ND ND ND ND ND 0.151
Jul 7 ND ND ND ND 0.004 0.088 0.082 ND
Jul 14 ND ND ND ND 0.211 0.221 0.157 ND
Jul 21 ND ND ND ND 0.271 0.282 0.194 ND
Jul 28 0.160 ND ND ND 0.932 0.726 0.431 ND
Aug 4 0.145 ND ND ND 1.326 0.873 0.583 ND
Aug 11 0.218 ND ND ND 1.165 0.883 0.615 ND
Aug 18 ND ND ND 0.076 2.099 1.280 0.948 0.676
Aug 25 ND ND ND ND 1.224 0.781 0.443 0.351
Sep 1 ND ND ND ND 2.057 1.081 0.709 0.711
Sep 8 ND 0.127 ND ND 2.061 0.987 0.551 ND
Sep 15 ND ND ND ND 3.009 1.319 0.768 0.737
Sep 22 ND ND ND ND 2.266 1.009 0.732 0.659
Sep 29 ND 0.076 0.050 ND 0.978 0.460 0.350 0.223
MC-RR — microcystin RR; MC-LR — microcystin LR; MC-YR — microcystin YR; ND — not detected.
IJOMEH_1_2007.indb 56IJOMEH_1_2007.indb 56 2007-04-19 08:16:082007-04-19 08:16:08

BIOMONITORING OF CYANOBACTERIAL BLOOMS IN POLISH WATER RESERVOIR O R I G I N A L P A P E R S
IJOMEH 2007;20(1) 57
Table 4. The effect of microcystins contained in cyanobacterial extracts from the Sulejów reservoir on the induction factor of SOS repair system in bacteria of Escherichia coli PQ37
Sample: Aug 18
MCs in culture(μg/ml) 20.74 41.49 10.37 5.19 2.59 1.30 0.65 0.33 0
IF-S9 1.26 1.12 1.06 0.88 0.85 0.86 0.87 0.96 1.00
+S9 2.20 1.36 1.44 1.76 1.48 1.11 1.28 1.58 1.00
TF-S9 2.21 1.68 1.29 1.04 1.04 1.01 0.99 1.05 1.00
+S9 1.66 1.37 1.39 1.60 1.24 1.11 1.28 1.42 1.00
Sample: Aug 25
MCs in culture(μg/ml0 28.61 14.31 7.15 3.58 1.79 0.89 0.45 0.23 0
IF-S9 1.65 1.13 1.14 0.98 0.76 1.08 0.91 0.85 1.00
+S9 1.61 1.91 1.50 1.19 1.30 0.93 1.12 1.13 1.00
TF-S9 4.40 2.99 2.15 1.59 1.31 1.29 1.32 1.12 1.00
+S9 1.56 1.59 1.56 1.13 1.13 0.87 1.09 0.98 1.00
Sample: Sep 1
MCs in culture(μg/ml) 31.28 15.64 7.82 3.91 1.95 0.98 0.49 0.25 0
IF-S9 1.18 1.04 0.93 0.85 0.99 0.99 0.96 0.91 1.00
+S9 1.79 1.38 1.38 1.36 1.37 1.06 1.07 1.24 1.00
TF-S9 2.46 1.74 1.40 1.16 1.02 1.07 1.09 1.08 1.00
+S9 1.66 1.56 1.68 1.47 1.19 1.16 1.22 1.22 1.00
Sample: Sep 8
MCs in culture(μg/ml) 46.57 23.28 11.64 5.82 2.91 1.46 0.73 0.37 0
IF-S9 2.69 1.51 1.26 1.08 0.93 0.85 0.97 0.88 1.00
+S9 1.81 1.37 1.13 1.34 2.08 1.54 1.15 1.27 1.00
TF-S9 8.09 4.98 3.39 2.15 1.46 1.26 1.18 1.16 1.00
+S9 2.62 1.58 1.30 1.26 1.68 1.15 1.29 1.24 1.00
Sample: Sep 15
MCs in culture(μg/ml) 83.68 41.84 20.92 10.46 5.23 2.61 1.31 0.66 0
IF-S9 1.64 1.18 0.99 0.99 1.07 0.99 0.96 1.01 1.00
+S9 1.54 1.56 1.34 1.27 1.20 1.25 1.12 1.06 1.00
TF-S9 2.94 1.96 1.42 1.21 1.07 1.18 1.09 1.05 1.00
+S9 1.47 1.56 1.51 1.43 1.14 1.29 1.21 1.16 1.00
MCs — microcystins of cyanobacterial extracts in cell culture; IF — induction factor expresses the genotoxicity of cyanobacterial extracts (the ratio of the specific activity of β-galactosidase at a given concentration of microcystins in culture divided by its value at a zero concentration); TF — toxicity factor expresses the toxicity of cyanobacterial extracts (the ratio of the activity of alkaline phosphatase for the control sample divided by its value at a given concentration of microcystins in culture).-S9 and +S9 — without and with metabolic activation (S9 fraction).
IJOMEH_1_2007.indb 57IJOMEH_1_2007.indb 57 2007-04-19 08:16:092007-04-19 08:16:09
O R I G I N A L P A P E R S J. PALUS ET AL.
IJOMEH 2007;20(1)58
crocystins concentrations the noted levels of TF (4.4 and 8.1, respectively) were over two times higher compared to the control cultures (Table 4).
UMU testCyanobacterial extracts prepared from the samples of the Sulejów reservoir did not induce genotoxic effects in bac-terial species of Salmonella typhimurium TA1535/pSK1002 both with and without metabolic activation. The values of induction factors, which express the potency of genotoxic activity, were about 1, independently of microcystins con-centration in bacterial culture and the date of cyanobacte-rial blooms sampling (Table 5).
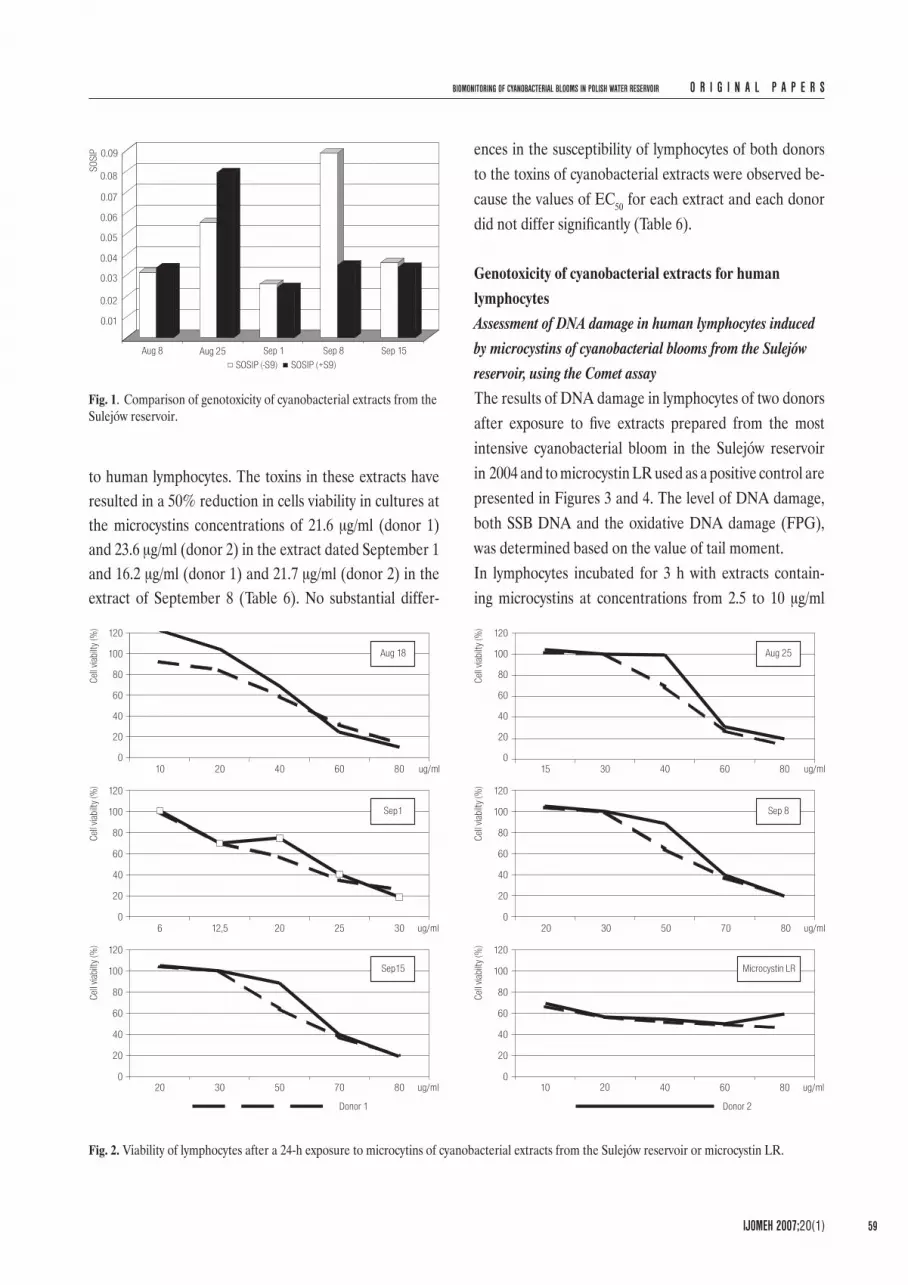
Cytotoxicity of cyanobacterial extracts for human lymphocytesCytotoxicity of cyanobacterial extracts prepared from five samples, collected during the intensive cyanobacterial bloom, i.e. the highest biomass, were determined for hu-man lymphocytes of two donors. The amounts of microcys-tins in those extracts were measured by HPLC (Table 6).In lymphocyte cultures incubated for 24 h with cyano-bacterial extracts, in which microcystins concentrations ranged from 6 to 80 μg/ml, and with microcystin LR, the reduction of lymphocyte viabilities was observed (Fig. 2). Of the five cyanobacterial extracts, two, sampled Septem-ber 1 through September 15, appeared to be most toxic
Table 5. The effect of microcystins contained cyanobacterial extracts from the Sulejów reservoir on the induction factor in bacteria Salmonella typhimurium TA1535/pSK 1002 in the UMU test
Sample: Aug 18
MCs in culture(μg/ml) 49.81 24.91 12.45 6.23 3.11 1.56 0.78 0.39
IF-S9 1.07 0.93 0.95 0.98 1.28 1.12 0.98 0.97
+S9 0.92 0.87 0.77 0.91 0.92 1.00 1.08 1.09
Sample: Aug 25
MCs in culture(μg/ml) 34.40 17.20 8.60 4.30 2.15 1.08 0.54 0.27
IF-S9 0.97 0.94 0.99 1.00 1.06 1.01 0.99 0.97
+S9 0.79 0.94 0.93 0.93 0.96 1.03 1.03 0.99
Sample: Sep 1
MCs in culture(μg/ml) 37.55 18.78 9.39 4.69 2.35 1.17 0.59 0.29
IF-S9 0.99 0.95 0.97 0.92 0.95 0.95 1.04 1.01
+S9 0.95 0.96 0.95 1.00 0.98 1.04 1.08 1.12
Sample: Sep 8
MCs in culture(μg/ml) 55.92 27.96 13.98 6.99 3.50 1.75 0.87 0.44
IF-S9 0.59 0.74 0.91 1.00 0.85 0.94 1.05 0.99
+S9 0.61 0.68 0.86 0.90 0.87 0.90 1.05 1.06
Sample: Sep 15
MCs in culture(μg/ml) 100.45 50.23 25.11 12.56 6.28 3.14 1.57 0.78
IF-S9 0.89 1.06 1.06 0.93 0.98 1.02 0.98 0.96
+S9 0.86 0.89 0.95 1.00 0.93 0.95 1.05 1.05
MCs — microcystins of cyanobacterial extracts in cell culture; IF — induction factor expresses the genotoxicity of cyanobacterial extracts (the ratio of the activities of β-galactosidase to alkaline phosphatase at a given concentration of microcystin in culture divided by its value at a zero concentration).-S9 and +S9 — without and with metabolic activation (S9 fraction).
IJOMEH_1_2007.indb 58IJOMEH_1_2007.indb 58 2007-04-19 08:16:092007-04-19 08:16:09
BIOMONITORING OF CYANOBACTERIAL BLOOMS IN POLISH WATER RESERVOIR O R I G I N A L P A P E R S
IJOMEH 2007;20(1) 59
to human lymphocytes. The toxins in these extracts have resulted in a 50% reduction in cells viability in cultures at the microcystins concentrations of 21.6 μg/ml (donor 1) and 23.6 μg/ml (donor 2) in the extract dated September 1 and 16.2 μg/ml (donor 1) and 21.7 μg/ml (donor 2) in the extract of September 8 (Table 6). No substantial differ-
ences in the susceptibility of lymphocytes of both donors to the toxins of cyanobacterial extracts were observed be-cause the values of EC50 for each extract and each donor did not differ significantly (Table 6).
Genotoxicity of cyanobacterial extracts for human lymphocytesAssessment of DNA damage in human lymphocytes induced by microcystins of cyanobacterial blooms from the Sulejów reservoir, using the Comet assayThe results of DNA damage in lymphocytes of two donors after exposure to five extracts prepared from the most intensive cyanobacterial bloom in the Sulejów reservoir in 2004 and to microcystin LR used as a positive control are presented in Figures 3 and 4. The level of DNA damage, both SSB DNA and the oxidative DNA damage (FPG), was determined based on the value of tail moment.In lymphocytes incubated for 3 h with extracts contain-ing microcystins at concentrations from 2.5 to 10 μg/ml
Fig. 1. Comparison of genotoxicity of cyanobacterial extracts from the Sulejów reservoir.
Fig. 2. Viability of lymphocytes after a 24-h exposure to microcytins of cyanobacterial extracts from the Sulejów reservoir or microcystin LR.
IJOMEH_1_2007.indb 59IJOMEH_1_2007.indb 59 2007-04-19 08:16:102007-04-19 08:16:10

O R I G I N A L P A P E R S J. PALUS ET AL.
IJOMEH 2007;20(1)60
Fig. 3. The level of DNA damage in human lymphocytes induced by microcystins of cyanobacterial extracts from the Sulejów reservoir.
IJOMEH_1_2007.indb 60IJOMEH_1_2007.indb 60 2007-04-19 08:16:102007-04-19 08:16:10

BIOMONITORING OF CYANOBACTERIAL BLOOMS IN POLISH WATER RESERVOIR O R I G I N A L P A P E R S
IJOMEH 2007;20(1) 61
Table 6. The effective concentration of cyanobacterial extracts from the Sulejów reservoir and microcystin LR for human lymphocytes after a 24-h incubation assessed by the XTT reduction test
Date and place of cyanobacteria sampling
Amount of microcystins
in extract(μg/g dry weight)
Donor 1EC50
(μg/ml)
Donor 2EC50
(μg/ml)
Standard Microcystin LR - 54.0 47.0
Sulejów reservoir
Aug 18 996 38.0 46.0Aug 25 987 54.3 49.0Sep 1 751 23.6 21.6Sep 8 1118 21.7 16.2
Sep 15 2009 65.8 60.5
EC50 — the concentration of microcystins inducing 50% cellular cytotoxicity.
in cultures, about two or three times higher levels of DNA damage in cells exposed to toxins at the highest concen-trations were revealed compared to the respective control cells (without extracts) (Fig. 3). After a 6-h incubation of lymphocytes of two donors exposed to cyanobacterial extracts, the slight reduction in the levels of DNA single strand breaks in relation to the respective levels after a 3-h exposure was observed. After a 12-h exposure of extracts to microcystins, the levels of SSB DNA in lymphocytes of two donors were comparable with respective con-trols (Fig. 3). Among 5 cyanobacterial extracts, the most genotoxic effects in human lymphocytes were induced by samples dated August 25, September 8 and September 15, because the levels of DNA SSB in lymphocyte cultures ex-posed to microcystins of these extracts were significantly higher compared to the respective control cultures (with-out extracts) (Fig. 3).After using FPG enzyme, recognizing the damaged purine bases in DNA, the increased DNA fragmentation in lym-phocytes of two donors exposed for 3 and/or 6 h to cyano-bacterial extracts prepared from blooms collected at the beginning of September (September 1, 8 and 15) in relation to the respective DNA fragmentation in lymphocytes with-out FPG enzyme was revealed. The levels of oxidative DNA damage in cells exposed to toxins of cyanobacterial extracts for 12 h were at the respective control levels (Fig. 3).Microcystin LR, used as a positive control, induced DNA damage, both DNA SSB and oxidative DNA damage, in human lymphocytes of two donors. The most evident DNA
fragmentation was observed after 3 and 6 h of incubation of cells with MCLR at concentrations 1, 2 and 4 μg/ml in cultures (Fig. 4). After a 12-h incubation of cells with MC-LR, the levels of DNA SSB were the same as those of respective control cells. The oxidative DNA damage was most visible in cells incubated with MC-LR for 3 h. The reduction of the oxidative DNA damage in lymphocytes exposed to MC-LR was revealed after incubation for 6 h and after 12 h of incubation this effect was at the control level (Fig. 4).
Assessment of micronuclei frequencies in human lymphocytes induced by microcystins of cyanobacterial blooms from the Sulejów reservoir using the micronucleus testThe frequencies of micronuclei in human lymphocytes of two donors induced by microcystins of cyanobacterial ex-tracts are presented in Table 7. The selections of concentra-tion ranges for microcystins of each extract in lymphocytes cultures depended on the values of EC50 (determined in XTT test) for cells exposed to extracts for 24 h. The highest
Fig. 4. The level of DNA damage in human lymphocytes induced by the microcystin LR (possitive control).
IJOMEH_1_2007.indb 61IJOMEH_1_2007.indb 61 2007-04-19 08:16:112007-04-19 08:16:11

O R I G I N A L P A P E R S J. PALUS ET AL.
IJOMEH 2007;20(1)62
concentration of microcystins for each extract in lympho-cyte cultures was 80% of EC50. Microcystins of cyanobacte-rial extracts from the Sulejów reservoir insignificantly in-creased the frequencies of micronuclei in the lymphocytes of donor 1 compared to the frequencies of micronuclei in control cells (Table 7). In the lymphocytes of donor 2, these effects were more visible than in donor 1. Proliferation of lymphocytes of two donors was like in control cultures be-cause NDI values in lymphocyte cultures with and without extracts were at the same level (Table 7).
DISCUSSION
It is thought that one of the reasons for cyanobacterial bloom in the summer is an excessive eutrophication of wa-ter reservoirs [22,39,40]. Eutrophication process is linked with an increased influx of nitrogen and phosphorus to reservoirs, which in turn is related to the production of industrial pollutions, communal and agricultural sewers. The weather factors, such as temperature (15–30oC), wind-less weather, and water pH (pH 6–9) also play an impor-
tant role in this process. The monitoring study performed in the Sulejów reservoir in the summer of 2004 revealed a slight phytoplankton bloom in June and its excessive growth between mid August and the end of September. Phytoplankton blooms were dominated by the cyanobac-teria species, such as Microcystis aeruginosa responsible for the production of hepatotoxins mainly microcystins and to much less extent by Aphanizomenon flos-aquae and Ana-baena sp. producing neurotoxic alkaloids. The past activi-ties in this field have indicated that in the water reservoirs of our country and in those of countries with the temper-ate climate, cyanobacterial blooms of genera Microcystis, Planktothrix and Anabaena, which produce microcystins, are in the majority [39–41]. Therefore, the studies per-formed to date in Polish scientific centers (University of Łódź, Swietokrzyska Academy in Kielce) as well as our studies have been concentrated on the hazard of microcys-tins, particularly of microcystin LR present in cyanobacte-rial blooms [41–43]. Our data indicated a low concentra-tion of microcystins in water (about 0.2 μg/l) as early as in the midsummer of 2004 in the Sulejów reservoir, which
Table 7. Frequencies of micronuclei in human lymphocytes after a 24-h exposure to cyanobacterial extracts from the Sulejów reservoir
Date of samplingMCs in culture
(μg/ml)Donor 1 Donor 2
MN/1000BN NDI MN/1000BN NDIAug 18 40 8.0 ± 2.8 1.5 ± 0.2 11.0 ± 2.8 1.6 ± 0.0
20 7.0 ± 1.4 1.5 ± 0.0 8.0 ± 4.2 1.6 ± 0.1
Aug 2510 5.5 ± 0.7 1.5 ± 0.1 5.5 ± 0.7 1.6 ± 0.140 7.0 ± 2.8 1.6 ± 0.1 11.5 ± 2.1 1.5 ± 0.120 6.0 ± 0.0 1.7 ± 0.1 9.5 ± 2.1 1.5 ± 0.0
Sep 110 7.0 ± 1.4 1.5 ± 0.1 9.5 ± 2.1 1.6 ± 0.218 5.5 ± 0.7 1.6 ± 0.3 8.0 ± 1.4 1.4 ± 0.19 7.0 ± 1.4 1.8 ± 0.0 7.0 ± 1.4 1.5 ± 0.1
Sep 85 5.0 ± 1.4 1.7 ± 0.1 5.5 ± 0.7 1.5 ± 0.0
15 9.0 ± 2.8 1.6 ± 0.1 11.0 ± 1.4 1.4 ± 0.18 7.5 ± 2.1 1.6 ± 0.1 10.0 ± 2.8 1.5 ± 0.0
Sep 154 6.5 ± 2.1 1.8 ± 0.3 10.5 ± 0.7 1.6 ± 0.1
50 7.0 ± 2.8 1.7 ± 0.2 11.0 ± 1.4 1.5 ± 0.025 6.0 ± 1.4 1.7 ± 0.0 10.5 ± 0.7 1.5 ± 0.0
Negative control 0 5.5 ± 2.1 1.5 ± 0.1 6.0 ± 1.4 1.6 ± 0.1Solvent control 0 5.5 ± 2.1 1.6 ± 0.1 5.5 ± 2.1 1.6 ± 0.0
MCs — microcystins of cyanobacterial extracts in cell culture; MN — number of micronuclei in binucleated cells; BN — binucleated cells; NDI — nuclear division index.SOSIP — SOS-inducing potency factor that represents the level of genotoxicity of cyanobacterial extracts.
IJOMEH_1_2007.indb 62IJOMEH_1_2007.indb 62 2007-04-19 08:16:112007-04-19 08:16:11

BIOMONITORING OF CYANOBACTERIAL BLOOMS IN POLISH WATER RESERVOIR O R I G I N A L P A P E R S
IJOMEH 2007;20(1) 63
was associated with the period of intensive recreation and agricultural works. Therefore, the quality of water in the Sulejów reservoir should be controlled in August and Sep-tember because then the concentration of microcystins in water can increase to > 4 μg/l.Cyanobacterial extracts prepared from samples collect-ed during the intensive bloom in the Sulejów reservoir showed weak genotoxic action for bacteria Escherichia coli PQ37. Only two of five extracts induced mutations in these bacterial cells, but merely in the cultures with the highest concentrations of microcystins. The induction factors, pre-senting the potency of genotoxicity, were two times higher in these cultures compared to controls. The dose-response effect in bacterial cultures with microcystins of each cya-nobacterial extracts was not observed. All extracts induced weak toxic effects in Escherichia coli PQ37. On the other hand, the study performed in the Sulejów reservoir by Mankiewicz et al. [41] in 1998–1999 showed the correlation between the concentration of microcystins in bacterial cul-tures and the potency of genotoxic action for Escherichia coli PQ37, probably because the amount of microcystins, including also microcystin LR, was significantly higher than in extracts assessed in our study. The genotoxic ef-fects of cyanobacterial extracts from the Sulejów reservoir in bacteria of Salmonella typhimurium TA 1535/pSK1002 were not observed. The values of induction factors repre-senting the genotoxic potency of microcystic cyanobacte-rial extracts were about 1 independently of the amount of microcystins in bacterial cultures. However, the Chinese study revealed that microcystic cyanobacteria extracts in-duced mutations in Salmonella typhimurium TA97, TA98 and TA100 assessed in the Ames test both with and with-out metabolic activation, while microcystin LR, used as a positive control, was not mutagenic for these bacterial cells [44].The cyanobacterial extracts prepared from the blooms at the beginning of September proved to be most cytotoxic for lymphocytes of two donors because their EC50 was over two times lower compared to the other extracts.The cyanobacterial extracts from the Sulejów reservoir induced slight genotoxic effects in human lymphocytes as indicated by the results of the Comet assay and micro-
nucleus test. The observed DNA damage in the cells of DNA SSB and the oxidized purine bases in DNA, after 3 and 6 h of incubation with microcystic cyanobacterial ex-tracts were significantly higher compared to the respective levels after a 12-h incubation. This was probably caused by the progressive DNA degradation, and small DNA frag-ments seemed to be lost during the alkaline electropho-resis [45]. The genotoxic effects in human lymphocytes induced by the cyanobacterial extracts from the Sulejów reservoir in 1998–1999 were also revealed in the study of Mankiewicz et al. [41], but an evident decrease in the level of DNA damage was observed after the 18- and 24-h ex-posures. The microcystins of cyanobacterial blooms from the Sulejów reservoir induced a slight increase in micro-nuclei frequencies in human lymphocytes, but only in the cultures with the highest microcystins concentration. The lymphocyte proliferation in cultures with cyanobacterial extracts was not inhibited.In our study, the massive cyanobacterial blooms, mainly the species of Microcystis aeruginosa and Aphanizomenon flos-aquae, in the Sulejów reservoir were observed in the midsummer of 2004. Therefore, the phytoplankton bio-mass and the microcystins concentration should be moni-tored in the summer time and during the massive of cya-nobacterial bloom and the genotoxicity of these extracts for eucariotic cells should be assessed. Although the con-centration of microcystin LR in water of this reservoir did not exceed the limit level (1 μg/l), the hazard of cyanobac-terial blooms could be observed at that time since a lot of people used the water of this reservoir for the recreation and for agricultural purposes.
ACKNOWLEDGEMENTS
The authors wish to thank Barbara Pawlak and Mariola Włodarek for their excellent technical assistance.
REFERENCES
1. Carmichael WW. A status report on planktonic cyanobacteria (blue-
green algae) and their toxins. Cincinnati (Ohio): Environmental Pro-
tection Agency, USA, 1992.
IJOMEH_1_2007.indb 63IJOMEH_1_2007.indb 63 2007-04-19 08:16:122007-04-19 08:16:12

O R I G I N A L P A P E R S J. PALUS ET AL.
IJOMEH 2007;20(1)64
2. Ressom R, Soong FS, Fitzgerald J, Turczynowicz L, Saadi OE, Roder D, et al. Health effects of toxic cyanobacteria (blue-green al-
gae). Australian Government Publishing Service, 1994.3. Vasconcelson VM, Evans WR, Carmichael WW, Namikoshi M.
Isolation of microcystin-LR from a Microcystis (Cyanobacteria) wa-
terbloom collected in the drinking water reservoir for Porto, Portugal.
J Environ Sci Health 1993;28(9):208–94.4. Carmichael WW. Health effects of toxin-producing Cyanobacteria:
The CyanoHABs. Hum Ecol Risk Assess 2001;7(5):1393–407.5. Kenefick SL, Hrudey SE, Peterson HG, Prepas EE. Toxin release
from Microcystis aeruginosa after chemical treatment. Wat Sci Tech 1993;27(3–4):433–40.
6. Jones GJ, Orr PT. In situ release and degradation of microcystin
following algicide treatment of a Microcystis aeruginosa bloom in a
recreational lake, as determined by HPLC and protein phosphatase
inhibition assays. Water Res 1994;28:871–76.7. Berg K, Skulberg OM. Skulberg R. Effects of decaying toxic blue-
green algae on water quality: A laboratory study. Arch Hydrobiol 1987;108:549–63.
8. Fitzgerald DJ. Cyanotoxins and human health — overview. In: Chorus I, editor. Cyanotoxins. Occurrence, Causes, Consequences. Springer, Germany, 2000;179–90.
9. Falconer IR. Detection methods for cyanobacterial toxins. In: Codd GA, Jefferies TM, Keevil CW, Potter E, editors. Cambridge, UK: Royal Chem Soc 1994.
10. Humpage AR, Falconer IR. Microcystin-LR and liver tumor promo-
tion: Effects on Cytokinesis, ploidy, and apoptosis in cultured hepato-
cytes. Environ Toxicol 1999;14(1):61–75.11. Jochimsen EM, Carmichael WW, An JS, Cardo DM, Cookson ST,
Holmes CE, et al. Liver failure and death after exposure to micro-
cystins at a hemodialysis center in Brazil. New England J Med 1998;338:873–78.
12. WHO. Guidelines for Drinking-water Quality. 2nd edition, Health
Criteria and Other Supporting Information. vol. 2. World Health Or-ganisation, Geneva, 1998.
13. Keevil CW. Toxicology and detection of cyanobacterial (blue-green al-
gal) toxins. In: Codd GA, Roberts C, editors. Public Health Aspects
of Cyanobacteria. Proceedings of a Seminar in London, PHLS Mi-crobiol, Digest 1991;8(3):91–5.
14. Eriksson JE, Brautigan DL, Vallee R, Olmsted J, Fujoki H, Gold-man RD. Cytoskeletal integrity in interphase cells require protein phos-
phatase activity. Proc Natl Acad Sci USA, 1992;89,11093–97.15. Fujiki H, Suganuma M. Tumor promotion by inhibitors of protein
phosphatase 1 and 2A: The okadaic acid class of compounds. Adv Cancer Res 1993;61:143–96.
16. Yoshida T, Makita Y, Tsutsumi T, Nagata S, Tashiro F. Immunohis-
tochemical localization of microcystin-LR in the liver of mice: A study
on the pathogenesis of microcystin-LR-induced hepatotoxicity. Toxicol Pathol 1998;26(3):411–18.
17. Toivola DM, Eriksson JE. Toxins affecting cell signalling and altera-
tion of cytoskeletal structure. Toxicol in Vitro 1999;13:521–30.18. Chorus I, Bertram J. Eds. Toxic Cyanobacteria in Water. A Guide
to Their Public Health Consequences, Monitoring and Management. E & FN Spon, London 1999.
19. Repavich WM, Sonzogni WC, Standridge JH, Wedepohl RE, Mei-sner LF. Cyanobacteria (blue-green algae) in Wisconsin waters acute
and chronic toxicity. Water Res 1990;24(2):225–31.20. Osiecka R. Mutagenic and cytotoxic action of cyanobacterial toxins.
In: Zalewski M, editor. Biological Processess in the Protection and
Renovation of Low-land Reservoirs. Bibl Protect Monitor NIEP, Noteb. Lodz 1995;111–24 [in Polish].
21. Tarczynska M, Osiecka R, Kontek R, Blaszczyk A, Zalewski M. Cases and consequences of toxic cyanobacterial blooms in lowland res-
ervoirs. Com Sci Notebook Human and Environment 1997;18:59–74 [in Polish].
22. Tarczynska M, Romanowska-Duda Z, Jurczak T, Zalewski M. Toxic
cyanobacterial blooms in a drinking water reservoir: causes, conse-
quences and management strategy. Water Sci Technol 2001;1(2): 237–46.
23. Starmach K. The fresh-water flora in Poland. Cyanophyta-Cyano-
bacteria, Glaucophyta. Vol. 2 Polish Scientific Press, Warsaw, 1966 [in Polish].
24. Starmach K. Flora Plancton of Fresh-water. Polish Scientific Press, Warsaw, 1989 [in Polish].
25. Komarek J. A review of water-bloom forming Microcystis species, with
regard to populations from Japan. Algical Stud 1991;65:115–27.26. Komarek J, Anagnostidis K. Cyanoprokaryota. Teil: Chroococcales.
In: Ettl H, Gartner J, Heyning H, Mollenhauer D, editors. Süsswas-
serflora von Mitteleuropa. 19/1. Gustav Fischer Verlag, Jena, 1999.27. An J, Carmichael WW. Use of colorymetric protein phosphatase inhi-
bition assay and enzyme linked immunosorbent assay for the study of
microcystins and nodularins. Toxicon 1994;32(12):1495–507.28. Ward CJ, Beattie KA, Lee EYC, Codd GA. Colorymetric protein
phosphatase inhibition assay of labolaratory strains and natural
blooms of cyanobacteria: comparisons with high-performance liquid
chromatographic analysis for microcystins. FEMS Microbiol Lett 1997;153:465–73.
29. Rapala J, Erkomaa K, Kukkonen J, Sivonen K, Lahti K. Detection
of microcystins with protein phosphatase inhibition assay, high per-
formance liquid chromatography-UV detection and enzyme-linked
IJOMEH_1_2007.indb 64IJOMEH_1_2007.indb 64 2007-04-19 08:16:122007-04-19 08:16:12

BIOMONITORING OF CYANOBACTERIAL BLOOMS IN POLISH WATER RESERVOIR O R I G I N A L P A P E R S
IJOMEH 2007;20(1) 65
immunosorbent assay. Comparison of methods. Anal Chim Acta 2002;466:213–31.
30. Lawton LA, Edwards C, Beattie KA, Pleasance S, Dear GJ, Codd GA. Isolation and characterization of microcystins from labora-
tory cultures and environmental samples of Microcystis aeruginosa and
from an associated animal toxicosis. Natural Toxins 1995;3:50–7.31. Quillardet P, Huisman O, D’ari R, Hofnung M. SOS chromotest,
a direct assay of induction of SOS function in Escherichia coli K-12 to
measure genotoxicity. Proc Natl Acad Sci USA 1982;79:5971–5.32. Oda Y, Nakamura S, Oki I, Kato T, Shinagawa H. Evaluation of the
new system (umu-test) for detection of environmental mutagens and
carcinogens. Mutat Res 1985;47:219–29.33. Reifferscheid G, Heil J, Oda Y, Zahn R K. A microplate version
of the SOS/umu-test for rapid detection of genotoxins and genotoxic
potentials of environmental samples. Mutat Res 1991;253:215–22.34. Miller JH. Eds. A short course in bacterial genetics: A laboratory Man-
ual and Handbook for Escherichia coli and Related Bacteria. New York: Cold Spring Harbor Laboratory Press, 1992.
35. Singh NP, Mc Koy MT, Tice RR, Schneider EL. A simple technique
for quantitation of low levels of damage in individual cells. Exp Cell Res 1988;175:184–91.
36. Mc Kelvey-Martin VJ, Green MHL, Schmezer P, Pool-Zobel BL, De Meo MP, Collins A. The single cell gel electrophoresis assay (com-
et assay): a European review. Mutat Res 1993;288:47–63.
37. Collins AR, Dobson VL, Dusinska M, Kennedy G, Stetina R. The
comet assay: what can it really tell us? Mutat Res 1997;375:183–93.38. Fenech M. The advantages and disadvantages of the cytokinesis-block
micronucleus method. Mutat Res 1997;392:11–8.39. Falconer IR, Humpage AR. Health risk assessment of cyanobacterial
(blue-green algal) toxins in drinking water. Int J Environ Res Public Health 2005;2(1):43–50.
40. Tarczynska M, Mankiewicz-Boczek J. Risk of microcystins occurrence
in water, guidelines of WHO. Ecohydrol Hydrobiol 2005;5:7–12.41. Mankiewicz J, Walter Z, Tarczynska M, Palyvoda O, Wojtysiak-
Staniaszczyk M, Zalewski M. Genotoxicity of cyanobacterial extracts
with microcystins from Polish water reservoirs as determined by the
SOS Chromotest and comet assay. Environ Toxicol 2002;17:341–50.42. Mankiewicz J, Tarczynska M, Fladmark KE, Doskeland SO, Wal-
ter Z, Zalewski M. Apoptotic effect of cyanobacterial extract on rat
hepatocytes and human lymphocytes. Environ Toxicol 2001;16(3): 225–33.
43. Lankoff A, Krzowski Ł, Glab J, Banasik A. DNA damage and repair
in human peripheral blood lymphocytes following treatment with mi-
crocystin-LR. Mutat Res 2004;559:131–42.44. Ding WX, Shen HM, Zhu HG, Lee BL, Ong CN. Genotoxicity of
microcystic cyanobacterial extract of a water source in China. Mutat Res 1999;442:69–77.
45. Olive PL, Durand RE, Banath JP, Johnston PJ. Analysis of DNA
damage in individual cells. Methods Cell Biol 2001;64:235–49.
IJOMEH_1_2007.indb 65IJOMEH_1_2007.indb 65 2007-04-19 08:16:132007-04-19 08:16:13


