Embed Size (px)
Citation preview

BIOMECHANICAL REPORT FOR THE
400 m Women’s
Dr Lysander Pollitt, Josh Walker, Dr Catherine Tucker and Dr Athanassios Bissas
Carnegie School of Sport
Stéphane Merlino IAAF Project Leader

Event Directors
Dr Lysander Pollitt Dr Athanassios Bissas
Project Director
Dr Athanassios Bissas
Project Coordinator Louise Sutton
Senior Technical Support Liam Gallagher Aaron Thomas Liam Thomas
Senior Research Officer Josh Walker
Report Editor Dr Catherine Tucker
Analysis Support Dr Lysander Pollitt
Logistics Dr Zoe Rutherford
Calibration Dr Brian Hanley
Data Management Nils Jongerius
Technical Support Ashley Grindrod
Joshua Rowe Ruth O’Faolain Lewis Lawton
Joe Sails
Data Analysts
Dr Lysander Pollitt Dr Giorgios Paradisis
(National and Kapodistrian University of Athens)
Josh Walker Dr Athanassios Bissas
Parag Parelkar Pierre-Jean Vazel
Dr Catherine Tucker
Dr Tim Bennett
Helen Gravestock
Project Team Mark Cooke
Dr Alex Dinsdale
Dr Gareth Nicholson
Masalela Gaesenngwe Emily Gregg Mike Hopkinson
Rachael Bradley
Ruan Jones Dr Ian Richards Jack Whiteside
Dr Emily Williams
Amy Brightmore Jamie French
Philip McMorris William Shaw
Jessica Wilson Dr Stephen Zwolinsky
Helen Davey Callum Guest
Maria van Mierlo James Webber
Lara Wilson
Coaching Commentary Historical Analysis and Coaching Commentary
Ralph Mouchbahani Pierre-Jean Vazel

Table of Contents
INTRODUCTION 1
METHODS 2
RESULTS – FINAL 7
Performance data 7
Positional analysis 8
Individual split times 9
Completed steps and step length 13
Kinematic characteristics 16
Angular kinematics 19
RESULTS – SEMI-FINAL 1 22
Performance data 22
Positional analysis 22
Individual split times 23
Completed steps and step length 26
RESULTS – SEMI-FINAL 2 28
Performance data 28
Positional analysis 28
Individual split times 29
Completed steps and step length 32
RESULTS – SEMI-FINAL 3 34
Performance data 34
Positional analysis 34
Individual split times 35
Completed steps and step length 38
COACH’S COMMENTARY 40
Historical analysis and coaching commentary – Pierre-Jean Vazel 40
Coaching commentary – Ralph Mouchbahani 45
CONTRIBUTORS 46

Figures
Figure 1. Camera layout within the stadium for the women’s 400 m indicated by green in-filled circles. 2
Figure 2. Set-up of the hurdle calibration system used to determine split intervals. 3
Figure 3. The calibration frame was constructed and filmed before and after the competition. 4
Figure 4. Action from the 400 m women’s final. 5
Figure 5. Positions at the end of each 100 m split. 8
Figure 6. Positions at the end of each 10 m split throughout the home straight. 8
Figure 7. Individual 0-200 m split times (minus reaction time). 9
Figure 8. Individual 200-400 m split times. 9
Figure 9. Individual consecutive 100 m split times (0-100 m minus reaction time). 10
Figure 10. Individual consecutive 10 m split times throughout the home straight. 11
Figure 11. Mean running speed during each 10 m split throughout the home straight. 12
Figure 12. Mean and relative (height) step length during each 100 m split. 13
Figure 13. Total completed steps during the race and throughout each consecutive 100 m split. 14
Figure 14. Step lengths for each of the finalists around 350 m. 16
Figure 15. Relative (height) step lengths for each of the finalists around 350 m. 17
Figure 16. Swing times for each of the finalists around 350 m. 17
Figure 17. Individual contact and flight times for each of the finalists around 350 m. For each athlete, the top column (black text) represents the left foot contact and left-to-right flight time, and the bottom column (white text) represents the right foot contact (pink shading) and right-to-left flight time (black shading). 18
Figure 18. Body schematic denoting joint angles measured at touchdown. This does not represent any athlete’s posture but is merely for illustration purposes. 19
Figure 19. Body schematic denoting joint angles measured at toe-off. This does not represent any athlete’s posture but is merely for illustration purposes. 20
Figure 20. Positions at the end of each 100 m split. 22
Figure 21. Individual 0-200 m split times (minus reaction time). 23
Figure 22. Individual 200-400 m split times. 23
Figure 23. Individual consecutive 100 m split times, and both 50 m times during the home straight. 24
Figure 24. Mean running speed during each consecutive 100 m split, and each 50 m split during the home straight. 25
Figure 25. Mean and relative (height) step length during each 100 m split. 26
Figure 26. Total completed steps during the race and throughout each consecutive 100 m split. 27

Figure 27. Positions at the end of each 100 m split. 28
Figure 28. Individual 0-200 m split times (minus reaction time). 29
Figure 29. Individual 200-400 m split times. 29
Figure 30. Individual consecutive 100 m split times, and both 50 m times during the home straight. 30
Figure 31. Mean running speed during each consecutive 100 m split, and each 50 m split during the home straight. 31
Figure 32. Mean and relative (height) step length during each 100 m split. 32
Figure 33. Total completed steps during the race and throughout each consecutive 100 m split. 33
Figure 34. Positions at the end of each 100 m split. 34
Figure 35. Individual 0-200 m split times (minus reaction time). 35
Figure 36. Individual 200-400 m split times. 35
Figure 37. Individual consecutive 100 m split times, and both 50 m times during the home straight. 36
Figure 38. Mean running speed during each consecutive 100 m split, and each 50 m split during the home straight. 37
Figure 39. Mean and relative (height) step length during each 100 m split. 38
Figure 40. Total completed steps during the race and throughout each consecutive 100 m split. 39

Tables
Table 1. Variables selected to describe the performance of the athletes. 5
Table 2. Individual season’s (SB) and personal bests (PB), and performance during the semi-final (SF). 7
Table 3. Comparison of athletes’ performance during the final compared to PB, SB and semi-finals (SF). 7
Table 4. Mean step rate, step velocity and step length for each finalist around 350 m. 16
Table 5. Horizontal distance to the centre of mass (DCM) at touchdown (TD) and toe-off (TO).18
Table 6. Joint angles at touchdown for the medallists. 19
Table 7. Joint angles at toe-off for the medallists. 20
Table 8. Joint angles at touchdown for the remaining five finalists. 21
Table 9. Joint angles at toe-off for the remaining five finalists. 21
Table 10. Athletes’ ranking based on SB and PB, and comparison to their semi-final performance. 22
Table 11. Athletes’ ranking based on SB and PB, and comparison to their semi-final performance. 28
Table 12. Athletes’ ranking based on SB and PB, and comparison to their semi-final performance. 34

1
INTRODUCTION
In the highly anticipated women’s 400 m final on the evening of Wednesday 9th August, Phyllis
Francis upset the form book and secured one of the surprise gold medals of the championships
with a lifetime best performance despite poor weather conditions. In similar circumstances to the
2016 Olympic final, Shaunae Miller-Uibo led the defending champion Allyson Felix into the home
straight. Although Felix could not produce her trademark finish and began to run out of steam, it
was Miller-Uibo who faltered 30 m from the line eventually finishing fourth in 50.49 s. Francis took
full advantage, passing Felix at 370 m and then the stricken Miller-Uibo at 380 m to secure gold
in 49.92 s. Silver went to the impressive 19-year-old Bahraini Salwa Eid Naser. The time of 50.06
s surpassed her lifetime best performance during the semi-finals (50.08 s) where she again
overtook Felix in the closing stages. Felix did however take the bronze in a time of 50.08 s, and
at the same time equalled the record of the most successful athletes at the World Championships,
alongside Usain Bolt and Merlene Ottey.

2
METHODS
Eleven vantage locations for camera placement were identified and secured. Six of these were
dedicated to the home straight and the additional five were strategically positioned around the
stadium (Figure 1). Each of the home straight locations had the capacity to accommodate up to
five cameras placed on tripods in parallel. Five locations were situated on the broadcasting
balcony along the home straight (from the 300 m line to the 390 m line) whilst the sixth location
was located within the IAAF VIP outdoor area overlooking the finish line from a semi-frontal angle.
Two separate calibration procedures were conducted before and after each competition. First, a
series of nine interlinked training hurdles were positioned every 10 m along the home straight
ensuring that the crossbar of each hurdle, covered with black and white tape, was aligned with
the track’s transverse line (Figure 2). These hurdles were also positioned across all nine lanes on
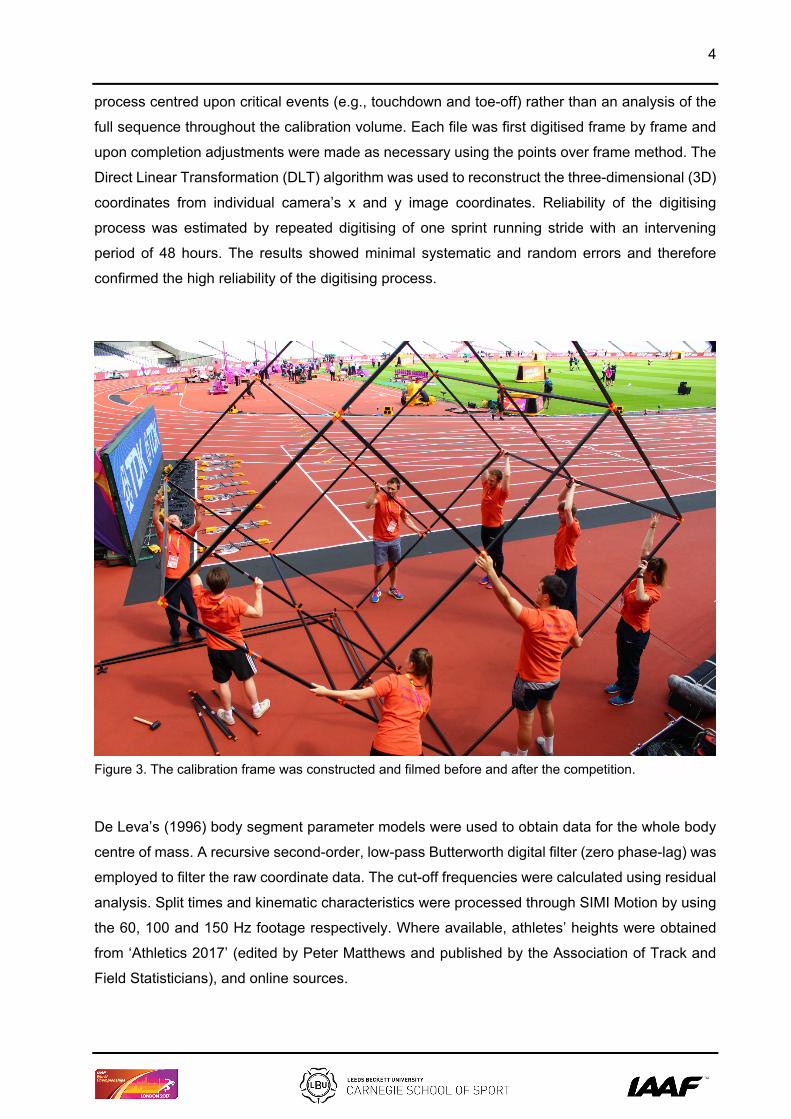
the track markings for the 100, 200 and 300 m intervals. Second, a rigid cuboid calibration frame
was positioned on the running track between the 347-metre mark and the 355.5-metre mark (from
the starting line) multiple times over discrete predefined areas along and across the track to
ensure an accurate definition of a volume within which athletes were achieving high running
speeds (Figure 3). This approach produced a large number of non-coplanar control points per
individual calibrated volume and facilitated the construction of bi-lane specific global coordinate
systems.
Figure 1. Camera layout within the stadium for the women’s 400 m indicated by green in-filled circles.

3
A total of 20 cameras were employed to record the action during the 400 m semi-finals and finals.
Five Sony RX10 M3 cameras operating at 100 Hz (shutter speed: 1/1250; ISO: 1600; FHD:
1920x1080 px) were positioned strategically along the home straight with their optical axes
perpendicular to the running direction in order to capture motion in the sagittal plane and provide
footage for the analysis of the split times. Five Sony PXW-FS7 cameras operating at 150 Hz
(shutter speed: 1/1250; ISO: 1600; FHD: 1920x1080 px) were used to capture the motion of
athletes as they were moving through the calibrated middle section. Each of the five Sony PXW-
FS7 cameras was paired with an additional Sony RX10 M3 camera operating at 100 Hz as a
precaution against the unlikely event of data capture loss. To provide footage for the analysis of
the initial 300 m, five Canon EOS 700D cameras operating at 60 Hz (shutter speed: 1/1250; ISO:
1600; SHD: 1280x720 px) were used.
Figure 2. Set-up of the hurdle calibration system used to determine split intervals.
The video files were imported into SIMI Motion (SIMI Motion version 9.2.2, Simi Reality Motion
Systems GmbH, Germany) and were manually digitised by a single experienced operator to
obtain kinematic data. An event synchronisation technique (synchronisation of four critical
instants) was applied through SIMI Motion to synchronise the two-dimensional coordinates from
each camera involved in the recording. Because of greater variability of performance across
athletes during the middle calibration volume, compared to the shorter sprints, the digitising
4
process centred upon critical events (e.g., touchdown and toe-off) rather than an analysis of the
full sequence throughout the calibration volume. Each file was first digitised frame by frame and
upon completion adjustments were made as necessary using the points over frame method. The
Direct Linear Transformation (DLT) algorithm was used to reconstruct the three-dimensional (3D)
coordinates from individual camera’s x and y image coordinates. Reliability of the digitising
process was estimated by repeated digitising of one sprint running stride with an intervening
period of 48 hours. The results showed minimal systematic and random errors and therefore
confirmed the high reliability of the digitising process.
Figure 3. The calibration frame was constructed and filmed before and after the competition.
De Leva’s (1996) body segment parameter models were used to obtain data for the whole body
centre of mass. A recursive second-order, low-pass Butterworth digital filter (zero phase-lag) was
employed to filter the raw coordinate data. The cut-off frequencies were calculated using residual
analysis. Split times and kinematic characteristics were processed through SIMI Motion by using
the 60, 100 and 150 Hz footage respectively. Where available, athletes’ heights were obtained
from ‘Athletics 2017’ (edited by Peter Matthews and published by the Association of Track and
Field Statisticians), and online sources.

5
Figure 4. Action from the 400 m women’s final.
Table 1. Variables selected to describe the performance of the athletes.
Variable Definition
Positional analysis
Position of each athlete at each 100 m interval during the race. Also, throughout the home straight, the position at each 10 m interval (final), and for each 20 m interval (semi-finals).
Individual split times
Split time for each athlete based on the positional analysis above.
Mean speed Mean speed for each athlete based on the individual split times.
Completed steps
Total recorded steps (e.g., right foot to left foot) during each 100 m interval.
Mean step length (split data) Mean absolute length of each step during each 100 m interval and the relative value, based on an athlete’s height, of each step during these intervals. The value of 1 relates to an athlete’s height.
Step length The distance covered from toe-off on one foot
to toe-off on the other foot.
Relative step length Step length as a proportion of the athlete’s
height (body height = 1.00).
Step rate The number of steps per second (Hz).
Contact time The time the foot is in contact with the ground.

6
Flight time The time from toe-off (TO) of one foot to
touchdown (TD) of the other foot.
Step time Contact time + flight time.
Step velocity Step length divided by step time.
Swing time The time that the foot is not in contact with the
ground during one full stride.
DCM TD The horizontal distance between the ground
contact point (foot tip) at TD and the CM.
DCM TO The horizontal distance between the ground
contact point (foot tip) at TO and the CM.
Trunk angle (α) The angle of the trunk relative to the horizontal
and considered to be 90° in the upright
position.
Knee angle (β) The angle between the thigh and lower leg and
considered to be 180° in the anatomical
standing position.
Contact leg hip angle (γ) The shoulder-hip-knee angle of the contact
side.
Swing leg hip angle (δ) The shoulder-hip-knee angle of the swing
side.
Note: angle taken at toe-off only.
Contact thigh angle (ε) The angle between the thigh of the contact leg
and the vertical.
Swing thigh angle (ζ) The angle between the thigh of the swing leg
and the vertical.
Thigh separation angle (η) The angle between the thighs of the contact
and swing legs. This has been calculated as
the difference between ε and ζ.
Shank angle (θ) The angle of the lower leg relative to the
running surface and considered to be 90°
when the shank is perpendicular to the running
surface.
Ankle angle (ι) The angle between the lower leg and the foot
and considered to be 90° in the anatomical
standing position.
Note: CM = Centre of mass.

7
RESULTS – Final
Performance data
The tables below display the season’s (SB) and personal best (PB) times of each athlete
competing in the final before the World Championships, and their performance during the semi-
finals (Table 2). These values are then compared to their performance in the final itself (Table 3).
Table 2. Individual season’s (SB) and personal bests (PB), and performance during the semi-final (SF).
Athlete SB rank PB rank SF rank notes
FRANCIS 49.96 s 3 49.94 s 6 50.37 s 4
NASER 50.57 s 6 50.57 s 8 50.08 s 1 NR
FELIX 49.65 s 1 49.26 s 1 50.12 s 2
MILLER-UIBO 49.77 s 2 49.44 s 2 50.36 s 3
JACKSON 50.05 s 4 49.83 s 4 50.70 s 8
McPHERSON 50.68 s 7 49.92 s 5 50.56 s 5 SB
MUPOPO 51.09 s 8 50.22 s 7 50.60 s 6 SB
WILLIAMS-MILLS 50.14 s 5 49.63 s 3 50.67 s 7
Key: SB = season’s best, PB = personal best, SF = semi-final, NR = national record.
Table 3. Comparison of athletes’ performance during the final compared to PB, SB and semi-finals (SF).
Athlete FINAL notes vs. SF vs. SB vs. PB
FRANCIS 49.92 s PB −0.45 s −0.02 s −0.04 s
NASER 50.06 s NR −0.02 s −0.51 s −0.51 s
FELIX 50.08 s −0.04 s 0.82 s 0.43 s
MILLER-UIBO 50.49 s 0.13 s 1.05 s 0.72 s
JACKSON 50.76 s 0.06 s 0.93 s 0.71 s
McPHERSON 50.86 s 0.3 s 0.94 s 0.18 s
MUPOPO 51.15 s 0.55 s 0.93 s 0.06 s
WILLIAMS-MILLS 51.48 s 0.81 s 1.85 s 1.34 s
Key: SB = season’s best, PB = personal best, SF = semi-final.

8
Positional analysis
Figure 5 shows the relative position of each athlete at each 100 m split throughout the race. A
more detailed overview of the relative positions at each 10 m split throughout the home straight
is presented in Figure 6.
Figure 5. Positions at the end of each 100 m split.
Figure 6. Positions at the end of each 10 m split throughout the home straight.
0
1
2
3
4
5
6
7
8
9100m 200m 300m 400m
FRANCIS
NASER
FELIX
MILLER UIBO
JACKSON
McPHERSON
MUPOPO
WILLIAMSMILLS
0
1
2
3
4
5
6
7
8
9310m 320m 330m 340m 350m 360m 370m 380m 390m 400m
FRANCIS
NASER
FELIX
MILLER UIBO
JACKSON
McPHERSON
MUPOPO
WILLIAMSMILLS

9
Individual split times
The following graphs display the split times of all athletes over each: 200 m split (Figures 7 and
8), consecutive 100 m splits (Figure 9; note: 0-100 m is displayed without the reaction time) and
consecutive 10 m splits throughout the home straight (Figures 9 and 10). The mean speed over
consecutive 10 m splits throughout the home straight is presented in Figure 11. Please note that
split times have been rounded mathematically to two decimal places throughout this report.
However, the official result is always rounded up in accordance with the IAAF Competition Rules
– this causes some instances where our total race times differ by 0.01 seconds. Any instances of
this are highlighted in the notes section of the performance tables by an asterisk (*).
Figure 7. Individual 0-200 m split times (minus reaction time).
Figure 8. Individual 200-400 m split times.
23.11 s
23.50 s
22.70 s
22.74 s
23.43 s
23.54 s
23.40 s
23.75 s
20.0 s 22.0 s 24.0 s 26.0 s 28.0 s
FRANCIS
NASER
FELIX
MILLER UIBO
JACKSON
McPHERSON
MUPOPO
WILLIAMS MILLS
0-200 m
26.61 s
26.36 s
27.20 s
27.59 s
27.14 s
27.16 s
27.57 s
27.46 s
20.0 s 22.0 s 24.0 s 26.0 s 28.0 s
FRANCIS
NASER
FELIX
MILLER UIBO
JACKSON
McPHERSON
MUPOPO
WILLIAMS MILLS
200-400 m

10
Figure 9. Individual consecutive 100 m split times (0-100 m minus reaction time).
11.70 s
12.01 s
11.46 s 11.46 s
11.91 s12.05 s
11.66 s
12.16 s
11.0 s
11.6 s
12.2 s
FRANCIS NASER FELIX MILLER UIBO JACKSON McPHERSON MUPOPO WILLIAMSMILLS
0-100 m
11.41 s11.49 s
11.24 s 11.28 s
11.52 s 11.49 s
11.74 s11.59 s
10.6 s
11.2 s
11.8 s
FRANCIS NASER FELIX MILLER UIBO JACKSON McPHERSON MUPOPO WILLIAMSMILLS
100-200 m
12.55 s12.43 s
12.76 s
12.46 s
12.85 s 12.79 s 12.86 s 12.79 s
11.7 s
12.3 s
12.9 s
FRANCIS NASER FELIX MILLER UIBO JACKSON McPHERSON MUPOPO WILLIAMSMILLS
200-300 m
14.06 s13.93 s
14.44 s
15.13 s
14.29 s 14.37 s
14.71 s 14.67 s
13.2 s
14.2 s
15.2 s
FRANCIS NASER FELIX MILLER UIBO JACKSON McPHERSON MUPOPO WILLIAMSMILLS
300-400 m

11
Figure 10. Individual consecutive 10 m split times throughout the home straight.
1.33 s1.31 s
1.35 s
1.27 s
1.36 s1.34 s
1.36 s 1.35 s
1.1 s
1.2 s
1.3 s
1.4 s
FRANCIS NASER FELIX MILLER UIBO JACKSON McPHERSON MUPOPO WILLIAMSMILLS
300-310 m
1.32 s1.30 s
1.33 s 1.34 s 1.33 s1.35 s 1.34 s
1.37 s
1.1 s
1.2 s
1.3 s
1.4 s
FRANCIS NASER FELIX MILLER UIBO JACKSON McPHERSON MUPOPO WILLIAMSMILLS
310-320 m
1.33 s1.31 s
1.35 s 1.34 s1.36 s 1.37 s 1.37 s
1.40 s
1.2 s
1.3 s
1.4 s
1.5 s
FRANCIS NASER FELIX MILLER UIBO JACKSON McPHERSON MUPOPO WILLIAMSMILLS
320-330 m
1.36 s 1.35 s1.38 s
1.35 s 1.36 s1.39 s 1.38 s
1.41 s
1.2 s
1.3 s
1.4 s
1.5 s
FRANCIS NASER FELIX MILLER UIBO JACKSON McPHERSON MUPOPO WILLIAMSMILLS
330-340 m
1.40 s 1.40 s1.44 s 1.43 s
1.41 s 1.42 s1.45 s 1.44 s
1.2 s
1.3 s
1.4 s
1.5 s
FRANCIS NASER FELIX MILLERUIBO
JACKSON McPHERSON MUPOPO WILLIAMSMILLS
340-350 m
1.41 s 1.40 s
1.46 s1.48 s
1.42 s1.44 s
1.50 s1.46 s
1.3 s
1.4 s
1.5 s
1.6 s
FRANCIS NASER FELIX MILLERUIBO
JACKSON McPHERSON MUPOPO WILLIAMSMILLS
350-360 m
1.42 s1.40 s
1.49 s 1.50 s
1.45 s1.48 s
1.53 s
1.48 s
1.3 s
1.4 s
1.5 s
1.6 s
FRANCIS NASER FELIX MILLERUIBO
JACKSON McPHERSON MUPOPO WILLIAMSMILLS
360-370 m
1.47 s 1.44 s1.51 s
1.68 s
1.50 s 1.49 s1.57 s
1.49 s
1.1 s
1.3 s
1.5 s
1.7 s
FRANCIS NASER FELIX MILLERUIBO
JACKSON McPHERSON MUPOPO WILLIAMSMILLS
370-380 m
1.52 s 1.49 s1.54 s
1.87 s
1.52 s 1.54 s1.62 s
1.54 s
1.0 s
1.3 s
1.6 s
1.9 s
FRANCIS NASER FELIX MILLER UIBO JACKSON McPHERSON MUPOPO WILLIAMSMILLS
380-390 m
1.50 s1.53 s
1.59 s
1.87 s
1.58 s 1.55 s1.59 s
1.73 s
1.3 s
1.5 s
1.7 s
1.9 s
FRANCIS NASER FELIX MILLER UIBO JACKSON McPHERSON MUPOPO WILLIAMSMILLS
390-400 m

12
Figure 11. Mean running speed during each 10 m split throughout the home straight.
4.0
5.0
6.0
7.0
8.0
300-310m 310-320m 320-330m 330-340m 340-350m 350-360m 360-370m 370-380m 380-390m 390-400m
Run
ning
spe
d (m
/s)
WILLIAMS MILLS
MUPOPO
McPHERSON
JACKSON
MILLER UIBO
FELIX
NASER
FRANCIS

13
Completed steps and step length
The following graphs show step information of individual athletes over progressive 100 m splits
for the mean step length and relative to each athlete’s stature (Figure 12). The total completed
steps for the race and during each 100 m split for each athlete is presented in Figure 13.
Figure 12. Mean and relative (height) step length during each 100 m split.
2.21m
2.06m2.15m 2.15m
2.02m2.11m 2.07m
1.97m
1.50m
2.00m
2.50m
FRANCIS NASER FELIX MILLER UIBO JACKSON McPHERSON MUPOPO WILLIAMSMILLS
Mean step length: 0-100 m
1.23 1.231.28
1.16 1.171.22 1.22
1.17
0.90
1.20
1.50
FRANCIS NASER FELIX MILLER UIBO JACKSON McPHERSON MUPOPO WILLIAMSMILLS
Relative mean step length: 0-100 m
2.37m2.24m
2.39m 2.37m
2.14m2.24m
2.14m 2.11m
1.50m
2.00m
2.50m
FRANCIS NASER FELIX MILLER UIBO JACKSON McPHERSON MUPOPO WILLIAMSMILLS
Mean step length: 100-200 m
1.32 1.331.42
1.281.24
1.29 1.26 1.26
0.90
1.20
1.50
FRANCIS NASER FELIX MILLER UIBO JACKSON McPHERSON MUPOPO WILLIAMSMILLS
Relative mean step length: 100-200 m
2.27m2.13m
2.23m 2.21m
2.01m2.14m
2.06m1.95m
1.50m
2.00m
2.50m
FRANCIS NASER FELIX MILLER UIBO JACKSON McPHERSON MUPOPO WILLIAMSMILLS
Mean step length: 200-300 m
1.26 1.271.33
1.19 1.161.24 1.21
1.16
0.90
1.20
1.50
FRANCIS NASER FELIX MILLER UIBO JACKSON McPHERSON MUPOPO WILLIAMSMILLS
Relative mean step length: 200-300 m
2.14m2.02m
2.08m 2.08m
1.90m2.03m
1.92m 1.89m
1.50m
2.00m
2.50m
FRANCIS NASER FELIX MILLER UIBO JACKSON McPHERSON MUPOPO WILLIAMSMILLS
Mean step length: 300-400 m
1.19 1.20 1.24
1.12 1.101.17
1.13 1.13
0.90
1.20
1.50
FRANCIS NASER FELIX MILLER UIBO JACKSON McPHERSON MUPOPO WILLIAMSMILLS
Relative mean step length: 300-400 m

14
Figure 13. Total completed steps during the race and throughout each consecutive 100 m split.
45.22
48.55
46.62
46.47
49.43
47.36
48.24
50.67
42.25
44.56
41.91
42.19
46.82
44.64
46.76
47.42
44.13
47.04
44.90
45.34
49.75
46.74
48.65
51.20
46.73
49.41
48.15
48.17
52.63
49.26
51.97
52.88
178.3
189.6
181.6
182.2
198.6
188.0
195.6
202.2
0 25 50 75 100 125 150 175 200 225
FRANCIS
NASER
FELIX
MILLER UIBO
JACKSON
McPHERSON
MUPOPO
WILLIAMS MILLS
0-100m 100-200m 200-300m 300-400m Total 400m

15
GOLD MEDALLIST: Phyllis Francis
RT 100 m 200 m 300 m RESULT Final 0.196 s 11.90 s 23.31 s 35.86 s 49.92 s Rank 6th 4th 3rd 3rd 1st vs. silver −0.007 s −0.31 s −0.39 s −0.27 s −0.14 s vs. bronze +0.012 s +0.26 s +0.43 s +0.22 s −0.16 s
Semi-Final 0.187 s 12.09 s 23.38 s 36.15 s 50.37 s Rank 8th =3rd 1st 2nd 4th 0-100 m 100-200 m 0-200 m 200-300 m 300-400 m 200-400 m Final 11.70 s 11.41 s 23.11 s 12.55 s 14.06 s 26.61 s Rank 4th 3rd 3rd 3rd 2nd 2nd vs. silver −0.30 s −0.08 s −0.38 s +0.12 s +0.13 s −0.25 s vs. bronze +0.25 s +0.17 s +0.42 s −0.21 s −0.38 s −0.59 s
Semi-Final 11.91 s 11.28 s 23.19 s 12.77 s 14.22 s 26.99 s Rank 4th 1st 1st 8th 13th 13th

16
Kinematic characteristics
This section presents the results from the digitised data within the calibration zone (i.e., around
350 m) along the home straight. All variables have been described previously (Table 1).
Table 4. Mean step rate, step velocity and step length for each finalist around 350 m.
Step velocity (m/s)
Step rate (Hz)
Step length (m)
#relative
FRANCIS 7.32 3.37 2.17 1.21
NASER 7.36 3.62 2.03 1.21
FELIX 6.90 3.33 2.07 1.23
MILLER-UIBO 7.12 3.29 2.16 1.17
JACKSON 7.02 3.80 1.85 1.07
McPHERSON 6.99 3.44 2.03 1.17
MUPOPO 6.91 3.58 1.93 1.14
WILLIAMS-MILLS 7.05 3.75 1.88 1.12
Note: Step velocity calculated from step length and step time; # relative step length based on athlete’s height.
Figure 14. Step lengths for each of the finalists around 350 m.
2.13m2.11m 2.12m 2.13m
1.81m
2.01m
1.88m 1.87m
2.20m
1.94m
2.02m
2.19m
1.88m
2.04m
1.97m
1.88m
1.5
1.7
1.9
2.1
2.3
FRANCIS NASER FELIX MILLER UIBO JACKSON MCPHERSON MUPOPO WILLIAMS-MILLS
Step
leng
th (m
)
Left-Right Right-Left

17
Figure 15. Relative (height) step lengths for each of the finalists around 350 m.
Figure 16. Swing times for each of the finalists around 350 m.
1.18
1.26 1.26
1.15
1.04
1.16
1.11 1.11
1.22
1.16
1.201.18
1.09
1.181.16
1.12
0.7
0.9
1.1
1.3
FRANCIS NASER FELIX MILLER UIBO JACKSON MCPHERSON MUPOPO WILLIAMS-MILLS
Step
leng
th (h
eigh
t)Left-Right Right-Left
0.447
0.420
0.467
0.460
0.387
0.433
0.427
0.380
0.000 0.080 0.160 0.240 0.320 0.400 0.480
FRANCIS
NASER
FELIX
MILLER UIBO
JACKSON
MCPHERSON
MUPOPO
WILLIAMS-MILLS
Swing time (s)

18
Figure 17. Individual contact and flight times for each of the finalists around 350 m. For each athlete, the top column (black text) represents the left foot contact and left-to-right flight time, and the bottom column (white text) represents the right foot contact (pink shading) and right-to-left flight time (black shading).
Table 5. Horizontal distance to the centre of mass (DCM) at touchdown (TD) and toe-off (TO).
DCM TD (m / % body height) DCM TO (m / % body height)
Left Right Left Right
FRANCIS 0.48 / 27 0.48 / 27 0.50 / 28 0.57 / 32
NASER 0.52 / 31 0.52 / 31 0.39 / 23 0.43 / 26
FELIX 0.41 / 24 0.43 / 25 0.50 / 30 0.45 / 27
MILLER UIBO 0.45 / 25 0.51 / 28 0.58 / 31 0.56 / 30
JACKSON 0.48 / 28 0.43 / 25 0.30 / 17 0.49 / 28
MCPHERSON 0.44 / 25 0.42 / 24 0.52 / 30 0.51 / 30
MUPOPO 0.43 / 25 0.46 / 27 0.44 / 26 0.39 / 23
WILLIAMS-MILLS 0.45 / 27 0.43 / 26 0.55 / 33 0.59 / 35
Note: Data displayed as an absolute distance and as a percentage of the athletes’ heights. Percentage values have been rounded to the nearest integer.
0.140
0.147
0.133
0.133
0.133
0.133
0.147
0.160
0.140
0.127
0.147
0.140
0.133
0.133
0.147
0.153
0.153
0.153
0.153
0.133
0.167
0.167
0.140
0.160
0.140
0.120
0.147
0.147
0.133
0.160
0.120
0.113
0.000 0.070 0.140 0.210 0.280 0.350
FRANCIS
NASER
FELIX
MILLER UIBO
JACKSON
MCPHERSON
MUPOPO
WILLIAMS-MILLS
Step time (s)

19
Angular kinematics
Figure 18. Body schematic denoting joint angles measured at touchdown. This does not represent any athlete’s posture but is merely for illustration purposes.
Table 6. Joint angles at touchdown for the medallists.
FRANCIS NASER FELIX
Left (°) Right (°) Left (°) Right (°) Left (°) Right (°)
α 84.0 86.1 87.1 88.5 83.2 84.0
β 158.0 148.9 149.0 154.5 157.7 151.3
γ 149.2 153.1 149.8 158.2 153.5 154.3
ε 30.5 31.0 33.7 30.6 24.8 28.2
ζ −7.5 −5.9 1.2 1.0 −0.4 −8.5
η −38.0 −36.9 −32.5 −29.6 −25.2 −36.7
θ 101.9 97.5 94.2 95.8 101.0 99.1
ι 125.8 109.6 116.0 118.9 117.7 106.0
Note: For angles ε and ζ, a positive value indicates that the thigh segment was in front of the vertical axis. For angle η, a negative value indicates that the swing leg is behind the touchdown leg at the point of contact, whereas a positive value indicates the swing thigh is in front of the contralateral thigh segment. The 2-D schematic should not be used as a model to combine angles as different landmarks have been used for defining certain angles.

20
Figure 19. Body schematic denoting joint angles measured at toe-off. This does not represent any athlete’s posture but is merely for illustration purposes.
Table 7. Joint angles at toe-off for the medallists.
FRANCIS NASER FELIX
Left (°) Right (°) Left (°) Right (°) Left (°) Right (°)
α 87.4 87.3 84.9 86.3 83.4 88.2
β 169.2 162.8 167.0 163.3 166.8 167.7
γ 202.3 202.8 196.3 207.2 196.3 203.9
δ 129.0 134.5 119.3 133.2 117.9 130.2
ε −27.9 −28.3 −30.0 −28.5 −28.5 −29.1
ζ 54.6 55.8 65.6 57.1 61.1 54.8
η 82.5 84.1 95.6 85.6 89.6 83.9
θ 51.1 45.1 47.1 45.3 48.5 49.5
ι 140.9 147.9 142.7 141.2 139.3 122.0
Note: For angles ε and ζ, a positive value indicates that the thigh segment was in front of the vertical axis. For angle η, a negative value indicates that the swing leg is behind the touchdown leg at the point of contact, whereas a positive value indicates the s wing thigh is in front of the contralateral thigh segment. The 2-D schematic should not be used as a model to combine angles as different landmarks have been used for defining certain angles.

21
Table 8. Joint angles at touchdown for the remaining five finalists.
MILLER-UIBO JACKSON McPHERSON MUPOPO WILLIAMS-MILLS
Left (°) Right (°) Left (°) Right (°) Left (°) Right (°) Left (°) Right (°) Left (°) Right (°)
α 81.7 84.7 88.7 83.9 85.9 83.4 85.7 87.5 88.3 83.9
β 158.5 144.8 169.1 164.9 153.6 144.0 155.3 147.3 166.7 158.8
γ 151.4 145.7 165.5 156.1 151.0 151.1 161.3 157.0 162.4 150.5
ε 26.4 34.3 22.3 28.0 32.0 32.6 24.6 31.0 20.8 26.6
ζ 2.6 −6.9 −4.0 3.3 −12.7 −4.9 −1.9 −10.4 −8.6 −7.0
η −23.8 −41.2 −26.3 −24.7 −44.7 −37.5 −26.5 −41.4 −29.4 −33.6
θ 97.9 94.7 103.7 93.3 99.3 94.5 101.9 98.0 104.5 98.2
ι 109.3 100.9 117.4 108.7 114.1 99.8 110.8 101.8 116.9 111.1
Note: For angles ε and ζ, a positive value indicates that the thigh segment was in front of the vertical axis. For angle η, a negative value indicates that the swing leg is behind the touchdown leg at the point of contact, whereas a positive value indicates the swing thigh is in front of the contralateral thigh segment. The 2-D schematic should not be used as a model to combine angles as different landmarks have been used for defining certain angles.
Table 9. Joint angles at toe-off for the remaining five finalists.
MILLER-UIBO JACKSON McPHERSON MUPOPO WILLIAMS-MILLS
Left (°) Right (°) Left (°) Right (°) Left (°) Right (°) Left (°) Right (°) Left (°) Right (°)
α 84.8 89.0 88.1 86.0 89.6 83.9 84.4 85.5 89.4 85.0
β 167.0 171.6 174.5 160.6 161.2 166.6 160.3 157.7 173.7 163.2
γ 202.7 208.0 209.8 204.7 201.3 204.2 205.0 200.9 211.5 200.6
δ 126.3 129.4 135.4 139.3 136.9 129.2 139.6 132.1 126.2 120.9
ε −30.0 −32.7 −33.7 −23.5 −28.4 −30.6 −26.0 −19.2 −36.9 −31.0
ζ 56.8 56.9 52.3 47.4 49.4 53.9 50.9 51.4 57.9 61.5
η 86.8 89.6 86.0 70.9 77.8 84.5 76.9 70.6 94.8 92.5
θ 47.8 49.3 52.2 47.4 43.0 46.1 44.3 48.5 46.6 42.7
ι 144.9 139.2 94.5 141.1 132.6 135.5 126.0 125.6 144.0 141.9
Note: For angles ε and ζ, a positive value indicates that the thigh segment was in front of the vertical axis. For angle η, a negative value indicates that the swing leg is behind the touchdown leg at the point of contact, whereas a positive value indicates the swing thigh is in front of the contralateral thigh segment. The 2-D schematic should not be used as a model to combine angles as different landmarks have been used for defining certain angles.

22
RESULTS – Semi-Final 1
Performance data
Table 10 below displays the ranking of each athlete before the World Championships across all
athletes qualifying for the semi-finals, based on their season’s (SB) and personal best (PB) times,
and a comparison to their semi-final time.
Table 10. Athletes’ ranking based on SB and PB, and comparison to their semi-final performance.
Athlete SB rank PB rank SEMI-FINAL notes vs. SB vs. PB
MILLER-UIBO 3 3 50.36 s Q 0.59 s 0.92 s
McPHERSON 10 7 50.56 s Q SB −0.12 s 0.64 s
HAYES 2 5 50.71 s 0.99 s 0.99 s
L-ČUDARE 15 18 51.57 s 0.20 s 0.20 s
GÓMEZ 17 20 52.01 s 0.55 s 0.55 s
RAZOR 19 12 52.09 s 0.47 s 1.72 s
GEORGE 11 14 52.60 s 1.54 s 1.89 s
KELLY 20 21 54.50 s 2.87 s 2.87 s
Key: Q = automatic qualifier, q = secondary qualifier, SB = season’s best, PB = personal best, NR = national record.
Positional analysis
Figure 20 shows the relative position of each athlete at each 100 m split throughout the race.
Figure 20. Positions at the end of each 100 m split.
0
1
2
3
4
5
6
7
8
9100m 200m 300m 350m 400m
MILLER UIBO
McPHERSON
HAYES
L-ČUDARE
GÓMEZ
RAZOR
GEORGE
KELLY

23
Individual split times
The following graphs display the split times of all athletes over each: 200 m split (Figures 21 and
22), consecutive 100 m splits (note: 0-100 m is displayed without the reaction time) including
consecutive 50 m splits during the home straight (Figure 23). The mean speeds over progressive
100 m (from 0-300 metres) and 50 metre (from 300-400 metres) splits are presented in Figure
24.
Figure 21. Individual 0-200 m split times (minus reaction time).
Figure 22. Individual 200-400 m split times.
23.58 s
23.73 s
24.67 s
24.50 s
24.59 s
24.58 s
23.79 s
23.83 s
20.8 s 23.3 s 25.8 s 28.3 s 30.8 s
MILLER UIBO
McPHERSON
HAYES
L-ČUDARE
GÓMEZ
RAZOR
GEORGE
KELLY
0-200 m
26.62 s
26.67 s
25.85 s
26.85 s
27.17 s
27.33 s
28.62 s
30.49 s
20.8 s 23.3 s 25.8 s 28.3 s 30.8 s
MILLER UIBO
McPHERSON
HAYES
L-ČUDARE
GÓMEZ
RAZOR
GEORGE
KELLY
200-400 m

24
Figure 23. Individual consecutive 100 m split times, and both 50 m times during the home straight.
11.93 s
12.18 s12.37 s
12.56 s 12.60 s 12.58 s
12.09 s11.89 s
11.5 s
12.1 s
12.7 s
MILLER UIBO McPHERSON HAYES L-ČUDARE GÓMEZ RAZOR GEORGE KELLY
0-100 m
11.65 s11.55 s
12.30 s
11.94 s 11.99 s 12.00 s
11.70 s
11.94 s
11.1 s
11.7 s
12.3 s
MILLER UIBO McPHERSON HAYES L-ČUDARE GÓMEZ RAZOR GEORGE KELLY
100-200 m
12.54 s12.74 s
12.35 s12.86 s 12.79 s
13.05 s
13.65 s13.92 s
11.0 s
12.5 s
14.0 s
MILLER UIBO McPHERSON HAYES L-ČUDARE GÓMEZ RAZOR GEORGE KELLY
200-300 m
6.73 s 6.69 s6.59 s
6.87 s 6.90 s 6.92 s 6.97 s 6.92 s
5.8 s
6.4 s
7.0 s
MILLER UIBO McPHERSON HAYES L-ČUDARE GÓMEZ RAZOR GEORGE KELLY
300-350 m
7.35 s 7.24 s6.91 s 7.12 s
7.48 s 7.36 s8.00 s
9.65 s
5.7 s
7.7 s
9.7 s
MILLER UIBO McPHERSON HAYES L-ČUDARE GÓMEZ RAZOR GEORGE KELLY
350-400 m

25
Figure 24. Mean running speed during each consecutive 100 m split, and each 50 m split during the home straight.
5.0
6.0
7.0
8.0
9.0
0-100m 100-200m 200-300m 300-350m 350-400m
Run
ning
spe
ed (m
/s)
KELLY
GEORGE
RAZOR
GÓMEZ
L-ČUDARE
HAYES
McPHERSON
MILLER UIBO

26
Completed steps and step length
The following graphs show step information of individual athletes over progressive 100 m splits
for the mean step length and relative to each athlete’s stature (Figure 25). The total completed
steps for the race and during each 100 m split for each athlete is presented in Figure 26.
Figure 25. Mean and relative (height) step length during each 100 m split.
2.13m 2.10m2.19m
2.02m 2.02m1.91m
1.98m 1.96m
1.50m
2.00m
2.50m
MILLER UIBO McPHERSON HAYES L-ČUDARE GÓMEZ RAZOR GEORGE KELLY
Mean step length: 0-100 m
1.151.21
1.25
1.131.20
1.131.17
1.13
0.90
1.20
1.50
MILLER UIBO McPHERSON HAYES L-ČUDARE GÓMEZ RAZOR GEORGE KELLY
Relative mean step length: 0-100 m
2.34m2.27m
2.41m
2.16m2.22m
2.09m 2.14m 2.11m
1.50m
2.00m
2.50m
MILLER UIBO McPHERSON HAYES L-ČUDARE GÓMEZ RAZOR GEORGE KELLY
Mean step length: 100-200 m
1.261.31
1.38
1.21
1.311.24 1.27
1.22
0.90
1.20
1.50
MILLER UIBO McPHERSON HAYES L-ČUDARE GÓMEZ RAZOR GEORGE KELLY
Relative mean step length: 100-200 m
2.24m2.16m
2.32m
2.06m2.12m
2.00m 2.03m1.93m
1.50m
2.00m
2.50m
MILLER UIBO McPHERSON HAYES L-ČUDARE GÓMEZ RAZOR GEORGE KELLY
Mean step length: 200-300 m
1.21 1.251.33
1.15
1.251.18 1.20
1.12
0.90
1.20
1.50
MILLER UIBO McPHERSON HAYES L-ČUDARE GÓMEZ RAZOR GEORGE KELLY
Relative mean step length: 200-300 m
2.18m
1.99m
2.21m
1.96m2.06m
1.92m 1.91m1.80m
1.50m
2.00m
2.50m
MILLER UIBO McPHERSON HAYES L-ČUDARE GÓMEZ RAZOR GEORGE KELLY
Mean step length: 300-400 m
1.18 1.15
1.26
1.09
1.221.14 1.13
1.040.90
1.20
1.50
MILLER UIBO McPHERSON HAYES L-ČUDARE GÓMEZ RAZOR GEORGE KELLY
Relative mean step length: 300-400 m

27
Figure 26. Total completed steps during the race and throughout each consecutive 100 m split.
47.00
47.59
45.57
49.48
49.49
52.36
50.57
51.00
42.70
44.14
41.57
46.26
45.13
47.94
46.80
47.31
44.57
46.27
43.17
48.66
47.20
50.05
49.24
51.69
45.90
50.31
45.29
51.01
48.45
52.03
52.39
55.65
180.2
188.3
175.6
195.4
190.3
202.4
199.0
205.7
0 25 50 75 100 125 150 175 200 225
MILLER UIBO
McPHERSON
HAYES
L-ČUDARE
GÓMEZ
RAZOR
GEORGE
KELLY
0-100m 100-200m 200-300m 300-400m Total 400m

28
RESULTS – Semi-Final 2
Performance data
Table 11 below displays the ranking of each athlete before the World Championships across all
athletes qualifying for the semi-finals, based on their season’s (SB) and personal best (PB) times,
and a comparison to their semi-final time.
Table 11. Athletes’ ranking based on SB and PB, and comparison to their semi-final performance.
Athlete SB rank PB rank SEMI-FINAL notes vs. SB vs. PB
NASER 9 13 50.08 s Q NR −0.49 s −0.49 s
FELIX 1 1 50.12 s Q 0.47 s 0.86 s
WILLIAMS-MILLS 7 4 50.67 s q 0.53 s 1.04 s
JACKSON 5 6 50.70 s q 0.65 s 0.87 s
JELE 8 11 51.57 s 1.25 s 1.25 s
AJAYI 14 17 52.10 s 0.80 s 0.80 s
SHEORAN 13 16 53.07 s 1.79 s 1.79 s
VASILÍOU 24 24 53.27 s 1.41 s 1.41 s
Key: Q = automatic qualifier, q = secondary qualifier, SB = season’s best, PB = personal best.
Positional analysis
Figure 27 shows the relative position of each athlete at each 100 m split throughout the race.
Figure 27. Positions at the end of each 100 m split.
0
1
2
3
4
5
6
7
8
9100m 200m 300m 350m 400m
NASER
FELIX
WILLIAMS MILLS
JACKSON
JELE
AJAYI
SHEORAN
VASILÍOU

29
Individual split times
The following graphs display the split times of all athletes over each: 200 m split (Figures 28 and
29), consecutive 100 m splits (note: 0-100 m is displayed without the reaction time) including
consecutive 50 m splits during the home straight (Figure 30). The mean speeds over progressive
100 m (from 0-300 metres) and 50 metre (from 300-400 metres) splits are presented in Figure
31.
Figure 28. Individual 0-200 m split times (minus reaction time).
Figure 29. Individual 200-400 m split times.
23.97 s
23.22 s
23.75 s
23.59 s
24.02 s
24.74 s
24.53 s
24.51 s
20.8 s 23.3 s 25.8 s 28.3 s 30.8 s
NASER
FELIX
WILLIAMS MILLS
JACKSON
JELE
AJAYI
SHEORAN
VASILÍOU
0-200 m
25.91 s
26.72 s
26.65 s
26.92 s
27.35 s
27.11 s
28.25 s
28.57 s
20.8 s 23.3 s 25.8 s 28.3 s 30.8 s
NASER
FELIX
WILLIAMS MILLS
JACKSON
JELE
AJAYI
SHEORAN
VASILÍOU
200-400 m

30
Figure 30. Individual consecutive 100 m split times, and both 50 m times during the home straight.
11.70 s 11.65 s
12.12 s 12.09 s12.20 s
12.56 s 12.62 s12.43 s
11.3 s
12.0 s
12.7 s
NASER FELIX WILLIAMSMILLS
JACKSON JELE AJAYI SHEORAN VASILÍOU
0-100 m
12.27 s
11.57 s 11.63 s11.50 s
11.82 s
12.18 s
11.91 s12.08 s
11.1 s
11.7 s
12.3 s
NASER FELIX WILLIAMSMILLS
JACKSON JELE AJAYI SHEORAN VASILÍOU
100-200 m
12.40 s
12.79 s 12.68 s 12.81 s13.05 s 12.97 s
13.63 s
13.05 s
11.7 s
12.7 s
13.7 s
NASER FELIX WILLIAMSMILLS
JACKSON JELE AJAYI SHEORAN VASILÍOU
200-300 m
6.61 s
6.95 s
6.68 s6.81 s
6.94 s 6.86 s
7.10 s
7.35 s
6.2 s
6.8 s
7.4 s
NASER FELIX WILLIAMS MILLS JACKSON JELE AJAYI SHEORAN VASILÍOU
300-350 m
6.90 s 6.98 s7.29 s 7.30 s 7.36 s 7.28 s
7.52 s
8.17 s
6.2 s
7.2 s
8.2 s
NASER FELIX WILLIAMS MILLS JACKSON JELE AJAYI SHEORAN VASILÍOU
350-400 m

31
Figure 31. Mean running speed during each consecutive 100 m split, and each 50 m split during the home straight.
5.0
6.0
7.0
8.0
9.0
0-100m 100-200m 200-300m 300-350m 350-400m
Run
ning
spe
ed (m
/s)
VASILÍOU
SHEORAN
AJAYI
JELE
JACKSON
WILLIAMS MILLS
FELIX
NASER

32
Completed steps and step length
The following graphs show step information of individual athletes over progressive 100 m splits
for the mean step length and relative to each athlete’s stature (Figure 31). The total completed
steps for the race and during each 100 m split for each athlete is presented in Figure 32.
Figure 32. Mean and relative (height) step length during each 100 m split.
2.04m2.13m
1.98m 2.01m 2.03m1.93m
2.17m2.06m
1.50m
2.00m
2.50m
NASER FELIX WILLIAMSMILLS
JACKSON JELE AJAYI SHEORAN VASILÍOU
Mean step length: 0-100 m
1.211.27
1.18 1.16 1.18 1.16
1.311.22
0.90
1.20
1.50
NASER FELIX WILLIAMSMILLS
JACKSON JELE AJAYI SHEORAN VASILÍOU
Relative mean step length: 0-100 m
2.22m
2.38m
2.09m 2.13m 2.17m2.11m
2.36m2.26m
1.50m
2.00m
2.50m
NASER FELIX WILLIAMSMILLS
JACKSON JELE AJAYI SHEORAN VASILÍOU
Mean step length: 100-200 m
1.321.42
1.24 1.23 1.26 1.27
1.421.34
0.90
1.20
1.50
NASER FELIX WILLIAMSMILLS
JACKSON JELE AJAYI SHEORAN VASILÍOU
Relative mean step length: 100-200 m
2.15m2.24m
1.98m 2.02m 2.04m 2.06m2.18m 2.14m
1.50m
2.00m
2.50m
NASER FELIX WILLIAMSMILLS
JACKSON JELE AJAYI SHEORAN VASILÍOU
Mean step length: 200-300 m
1.281.33
1.18 1.17 1.191.24
1.311.27
0.90
1.20
1.50
NASER FELIX WILLIAMSMILLS
JACKSON JELE AJAYI SHEORAN VASILÍOU
Relative mean step length: 200-300 m
2.05m2.12m
1.91m 1.91m 1.95m 1.99m2.07m
1.97m
1.50m
2.00m
2.50m
NASER FELIX WILLIAMSMILLS
JACKSON JELE AJAYI SHEORAN VASILÍOU
Mean step length: 300-400 m
1.221.26
1.14 1.10 1.131.20
1.251.17
0.90
1.20
1.50
NASER FELIX WILLIAMSMILLS
JACKSON JELE AJAYI SHEORAN VASILÍOU
Relative mean step length: 300-400 m

33
Figure 33. Total completed steps during the race and throughout each consecutive 100 m split.
49.00
47.00
50.44
49.73
49.21
51.92
46.00
48.47
45.00
42.00
47.82
46.92
46.10
47.50
42.44
44.28
46.45
44.74
50.40
49.60
49.00
48.59
45.86
46.81
48.79
47.26
52.34
52.27
51.19
50.20
48.34
50.88
189.2
181.0
201.0
198.5
195.5
198.2
182.6
190.4
0 25 50 75 100 125 150 175 200 225
NASER
FELIX
WILLIAMS MILLS
JACKSON
JELE
AJAYI
SHEORAN
VASILÍOU
0-100m 100-200m 200-300m 300-400m Total 400m

34
RESULTS – Semi-Final 3
Performance data
Table 12 below displays the ranking of each athlete before the World Championships across all
athletes qualifying for the semi-finals, based on their season’s (SB) and personal best (PB) times,
and a comparison to their semi-final time.
Table 12. Athletes’ ranking based on SB and PB, and comparison to their semi-final performance.
Athlete SB rank PB rank SEMI-FINAL notes vs. SB vs. PB
FRANCIS 4 8 50.37 s Q 0.41 s 0.43 s
MUPOPO 12 10 50.60 s Q SB −0.49 s 0.38 s
GORDON 6 9 50.87 s 0.74 s 0.74 s
MONTSHO 15 2 51.28 s SB −0.09 s 1.95 s
SPELMEYER 22 19 51.77 s 0.05 s 0.34 s
BAUMGART 21 22 51.81 s .801 s* 0.09 s 0.09 s
CLARK 23 23 51.81 s PB .804 s* −0.04 s −0.04 s
BAMGBOSE 18 15 DQ 0.66 s 1.12 s
Key: Q = automatic qualifier, q = secondary qualifier, SB = season’s best, PB = personal best. .
Positional analysis
Figure 34 shows the relative position of each athlete at each 100 m split throughout the race.
Figure 34. Positions at the end of each 100 m split.
0
1
2
3
4
5
6
7
8
9100m 200m 300m 350m 400m
FRANCIS
MUPOPO
GORDON
MONTSHO
SPELMEYER
BAUMGART
CLARK
BAMGBOSE

35
Individual split times
The following graphs display the split times of all athletes over each: 200 m split (Figures 35 and
36), consecutive 100 m splits (note: 0-100 m is displayed without the reaction time) including
consecutive 50 m splits during the home straight (Figure 37). The mean speeds over progressive
100 m (from 0-300 metres) and 50 metre (from 300-400 metres) splits are presented in Figure
38.
Figure 35. Individual 0-200 m split times (minus reaction time).
Figure 36. Individual 200-400 m split times.
23.19 s
23.74 s
23.83 s
23.70 s
24.76 s
24.79 s
24.38 s
23.97 s
20.8 s 23.3 s 25.8 s 28.3 s 30.8 s
FRANCIS
MUPOPO
GORDON
MONTSHO
SPELMEYER
BAUMGART
CLARK
BAMGBOSE
0-200 m
26.99 s
26.66 s
26.87 s
27.38 s
26.85 s
26.80 s
27.23 s
28.00 s
20.8 s 23.3 s 25.8 s 28.3 s 30.8 s
FRANCIS
MUPOPO
GORDON
MONTSHO
SPELMEYER
BAUMGART
CLARK
BAMGBOSE
200-400 m

36
Figure 37. Individual consecutive 100 m split times, and both 50 m times during the home straight.
11.91 s12.09 s
12.24 s12.09 s
12.74 s 12.71 s
12.41 s12.24 s
11.6 s
12.2 s
12.8 s
FRANCIS MUPOPO GORDON MONTSHO SPELMEYER BAUMGART CLARK BAMGBOSE
0-100 m
11.28 s
11.65 s 11.59 s 11.61 s
12.02 s 12.08 s11.97 s
11.73 s
10.9 s
11.5 s
12.1 s
FRANCIS MUPOPO GORDON MONTSHO SPELMEYER BAUMGART CLARK BAMGBOSE
100-200 m
12.77 s12.58 s 12.61 s
12.88 s 12.83 s 12.83 s13.00 s
13.13 s
12.0 s
12.6 s
13.2 s
FRANCIS MUPOPO GORDON MONTSHO SPELMEYER BAUMGART CLARK BAMGBOSE
200-300 m
6.87 s6.72 s
6.88 s6.97 s
6.75 s 6.73 s6.85 s
7.21 s
6.1 s
6.7 s
7.3 s
FRANCIS MUPOPO GORDON MONTSHO SPELMEYER BAUMGART CLARK BAMGBOSE
300-350 m
7.35 s 7.36 s 7.38 s7.53 s
7.27 s 7.24 s7.38 s
7.66 s
6.8 s
7.4 s
8.0 s
FRANCIS MUPOPO GORDON MONTSHO SPELMEYER BAUMGART CLARK BAMGBOSE
350-400 m

37
Figure 38. Mean running speed during each consecutive 100 m split, and each 50 m split during the home straight.
5.0
6.0
7.0
8.0
9.0
0-100m 100-200m 200-300m 300-350m 350-400m
Run
ning
spe
ed (m
/s)
BAMGBOSE
CLARK
BAUMGART
SPELMEYER
MONTSHO
GORDON
MUPOPO
FRANCIS

38
Completed steps and step length
The following graphs show step information of individual athletes over progressive 100 m splits
for the mean step length and relative to each athlete’s stature (Figure 39). The total completed
steps for the race and during each 100 m split for each athlete is presented in Figure 40.
Figure 39. Mean and relative (height) step length during each 100 m split.
2.19m
2.03m1.93m
2.08m 2.08m 2.11m
1.93m2.00m
1.50m
2.00m
2.50m
FRANCIS MUPOPO GORDON MONTSHO SPELMEYER BAUMGART CLARK BAMGBOSE
Mean step length: 0-100 m
1.18 1.171.10
1.161.23 1.25
1.14 1.16
0.90
1.20
1.50
FRANCIS MUPOPO GORDON MONTSHO SPELMEYER BAUMGART CLARK BAMGBOSE
Relative mean step length: 0-100 m
2.39m
2.18m2.07m
2.27m 2.23m2.31m
2.07m
2.24m
1.50m
2.00m
2.50m
FRANCIS MUPOPO GORDON MONTSHO SPELMEYER BAUMGART CLARK BAMGBOSE
Mean step length: 100-200 m
1.29 1.261.18
1.271.32
1.37
1.221.29
0.90
1.20
1.50
FRANCIS MUPOPO GORDON MONTSHO SPELMEYER BAUMGART CLARK BAMGBOSE
Relative mean step length: 100-200 m
2.25m
2.08m2.01m
2.14m 2.12m2.22m
1.96m
2.16m
1.50m
2.00m
2.50m
FRANCIS MUPOPO GORDON MONTSHO SPELMEYER BAUMGART CLARK BAMGBOSE
Mean step length: 200-300 m
1.22 1.201.15
1.201.25
1.31
1.161.25
0.90
1.20
1.50
FRANCIS MUPOPO GORDON MONTSHO SPELMEYER BAUMGART CLARK BAMGBOSE
Relative mean step length: 200-300 m
2.12m
1.97m 1.93m
2.07m 2.03m 2.08m
1.81m
2.12m
1.50m
2.00m
2.50m
FRANCIS MUPOPO GORDON MONTSHO SPELMEYER BAUMGART CLARK BAMGBOSE
Mean step length: 300-400 m
1.15 1.14 1.101.16
1.20 1.23
1.07
1.23
0.90
1.20
1.50
FRANCIS MUPOPO GORDON MONTSHO SPELMEYER BAUMGART CLARK BAMGBOSE
Relative mean step length: 300-400 m

39
Figure 40. Total completed steps during the race and throughout each consecutive 100 m split.
45.64
49.34
51.69
48.00
48.17
47.39
51.80
50.00
41.92
45.85
48.31
44.05
44.92
43.25
48.20
44.69
44.44
48.14
49.76
46.66
47.20
45.14
51.15
46.31
47.23
50.82
51.93
48.29
49.37
48.09
55.31
47.24
179.2
194.2
201.7
187.0
189.7
183.9
206.5
188.2
0 25 50 75 100 125 150 175 200 225
FRANCIS
MUPOPO
GORDON
MONTSHO
SPELMEYER
BAUMGART
CLARK
BAMGBOSE
0-100m 100-200m 200-300m 300-400m Total 400m

40
COACH’S COMMENTARY
Historical analysis and coaching commentary – Pierre-Jean Vazel
The women’s 400 m final was expected to be a dual between reigning world champion Allyson
Felix and Olympic champion Shaunae Miller-Uibo. It was indeed the case for 360 m (see Figures
5 and 6) before the two favourites faded to 3rd and 4th place, respectively, behind Phyllis Francis
who became one of the biggest surprises of the 2017 world championships. Junior Salwa Eid
Naser broke her personal best in all her three races in London and got 2nd. Except the gold and
silver medallists Francis and Eid Naser, who improved theirs by 0.02 s, all the finalists were far
from their personal bests, in a range of 0.80 s to 1.85 s. Interestingly in London, in all women’s
sprint events, athletes who set PB or SB placed no lower than 4th place, so being able to show
one’s best form in the final increases odds of getting a medal (see Tables 2 and 3).
Watching the race gives the impression that Felix and Miller-Uibo started too fast and were left
without resource in the home stretch. The report presents data recorded during the whole race,
so it’s now possible to have objective information about the athletes’ tactics and compare them
with their personal best, and track the consequences on their running mechanics, especially in
the last 100 m of the race where fatigue sets in.
Miller-Uibo led Felix by 0.02 s at 100 m in 11.62 s, an extremely fast time considering that it’s on
pace for a final time of 47.50 s (Vazel, 2010). During the world record of 47.60 s, Marita Koch
passed in 11.70 s (attributed times 10.9 s and 11.4 s were incorrect) and she never tried a faster
pace than her 11.60 s for a 48.22 s race in Stuttgart (1986). However, the fastest time ever
recorded is 11.46 s by Felix at the 2015 world championships (47.00 s pace), where she won in
a personal best of 49.26 s. During that race, this incredible first bend was followed by a very
cautious 2nd 100 m timed in 11.88 s where she managed to recover, much slower than in London
(11.24 s), as placed in lane 5, she chose to follow the fast pace imposed by Miller-Uibo in lane 7.
Felix and Miller-Uibo reached the 200 m in 22.88 s and 22.90 s, respectively. Considering that
both are sub-22 s runners, this leaves them with 1 sec of speed reserve (the difference between
the 200 m intermediate time during a 400 m for an athlete and their performance in a 200 m race).
This would be almost ideal if the weather in London had been conducive to sprinting performance,
but the rain and the cool temperature (15°C, page 1) contrasted with the good conditions both
athletes had when they set their lifetime bests (26°C in Beijing 2015 for Felix and 22°C in Rio
2016 for Miller-Uibo, cf. Seiko 2015 and Omega 2016 official result sheets). A split time less than
23 s sets a pace for a 48.50 s result, which seems to be within reach for both sprinters, but maybe
not while fighting with the elements.

41
Intermediate times for Allyson Felix and Shaunae Miller during the 2017 world championship final and during their personal best races (Yamamoto, 2015 & 2016).
A. Felix 100 m (s) 200 m (s) 300 m (s) 350 m (s) 400 m (s)
WC 2017 11.64 22.88 35.64 42.49 50.08
WC 2015 11.46 23.34 35.67 42.24 49.26
S. Miller Uibo
WC 2017 11.62 22.90 35.36 42.09 50.49
OG 2016 11.80 22.98 35.34 42.10 49.44
Miller-Uibo was on pace to run her personal best until she collapsed in the last metres. She gave
the explanation for this dramatic finish in her post-race interviews: “I know a lot of people thought
I hurt my hamstring or something along that line, but it was kind of weird. I had the race under
control and I looked up at the screen and misplaced my foot and completely lost balance”
(Turnbull, 2017).
The kinematic analysis of the running motion at 350 m shows that Felix was the slowest finalist
at that point of the race (6.90 m/s). Her step length (2.07 m) and step rate (3.33 Hz) were both
lower than what she had done during her fastest last straights in her career (2.20 m and 3.50 Hz
for 13 s). Looking at the pattern of the 5 fastest women ever at 400 m, this was also the case for
Marita Koch (47.60 s), Jarmila Kratochvilova (47.99 s) and Olga Bryzgina (48.27 s), whereas
Marie-José Pérec (48.25 s) speed loss was step length reliant and Tatana Kocembova’s (48.59
s) was step rate reliant. Those trends correspond to the most economical ratio between step
length and frequency for a given athlete, it lies in the region of the freely chosen one, but is also
influenced by different morphologies and coaching orientations (Högberg, 1952; Hofmann, 1986).
However, during the course of the 400 m, both step length and frequency decrease along with
velocity, with frequency suffering the most, for any group of performers from world to national
class (Schäffer, 1989). The kinematic breakdown of Felix’s step frequency shows that in London
2017, she had the shortest contact times (0.133 s), both time wise and relative to flight times
(0.167 s). While this is ideal in the maximum velocity section of short sprints, such technique is
not advisable for the end of a 400 m race because the reduction in force due to fatigue should be
balanced with a necessary longer time of contact, since impulse is the product of force and time
of application of force. Data from the finalists illustrate this theory: the three finalists that were
running at the highest velocity at 350 m (Naser, Francis,and Miller-Uibo) had an average contact
time of 0.143 s, longer than of the three slowest (McPherson, Mupopo and McPherson), at 0.136
s; however, they had a shorter flight time – 0.149 s vs. 0.153 s. Furthermore, Felix’s shorter step
length and longer flight time indicate that she was no longer able to apply force into the ground
horizontally enough. By contrast, the mechanics of world record holder Marita Koch were well

42
adapted to the 400 m race, although she was a very fast short sprinter too (personal bests of 7.04
s at 60 m, 10.83 s at 100 m and 21.71 s at 200 m). During a 48.56 s time trial in July 1984, where
Koch had a faster last 100 m than during her current world record of 47.60 s (13.26 s vs. 13.38
s), her kinematic parameters at 150 m and 350 m were compared (Müller, 1987). For running
velocities of 9.01 m/s an 8.05 m/s, respectively, her flight time decreased from 0.13 s to 0.10 s in
order to prevent an excessive loss of step rate and too much vertical oscillation of the centre of
mass, while her contact time was lengthened from 0.11 s to 0.15 s, so that there is enough impulse
to apply force in its horizontal component and prevent a high loss of step length. Similarly, taking
another example in history, during her 47.99 s race, Kratochvilova’s flight time was reduced from
53% in the mid-first straight to 49% in the mid-last straight, producing a high efficiency of forward
running motion with a vertical displacement of the centre of mass of only 6 cm during a stride
cycle (Susanka, 1983).
Olympic champion Miller-Uibo was an example of adaptation of stride pattern between 200 m and
400 m as she was a finalist at both events in London. The main differences, as expected, were a
lower knee lift at toe-off, signalling fatigue, and larger extensions of the knee and ankle at toe-off
as contact times were longer (0.113 s to 0.147 s for left foot and 0.127 s to 0.160 s for right foot).
The average angle extension range was larger during 400 m, from 152° touchdown to 169° at
toe-off, compared to what she displayed at 200 m, 156° to 164°. This is similar to Marita Koch
during her 1984 time-trial, as her knee angle was about the same at 150 m while running at
submaximal speed (155°), and a much larger range at 350 m, from 140° at touchdown to 168° at
toe-off. Yet, coaches should be warned about focusing specifically on training muscles (e.g. hip
flexors) involved in the above mechanical changes for strength endurance for two main reasons
(Martins, 2016). Firstly, as discussed before, the running mechanics under fatigue should not be
trained in order to mimic one of sprinting at maximum velocity during a 100 m, since when running
400 m, athletes will look after a more economical pattern and a way to generate enough impulse
with longer contact times in order to compensate lower force production due to fatigue. Thus the
shift goes from a more vertically orientated force application to a more horizontal one. Secondly,
fatigue should be understood from a global, neuromuscular coordination point of view and not as
a localised phenomenon on agonist muscles. Indeed, the nervous system adapts and adjusts to
local muscular fatigue (e.g. hip flexion) by decreasing the activation of non-fatigued synergist and
antagonist muscles in order to maintain an effective coordination and technique (direction of force
application) and by increasing the activation of muscles involved in other part of the running
motion (e.g. hip extension) in order to limit the decrease of total force application (Brochner
Nielsen, 2018). The observation that the knee lift drops with fatigue led coaches to prescribe
endurance runs with exaggerated high knees for long sprinters, which became popular from 1955
in Poland (Mach, 1971). However, given the complexity of the neuromuscular coordination with

43
fatigue, the pertinence of training a muscle group in isolation for strength-endurance should be
reconsidered. Resistance training using light sleds or gentle hills might be more specific to work
on the step adaptations that occur in the last straight of a 400 m race.
Maximum velocity sprinting mechanics may not be a model for 400 m runners due to running
economy considerations and necessary adaptations to fatigue. The fact several runners are
equally successful at short and long sprints is not contradictory with this statement, as the best
are the ones who manage to adapt their stride to the requirements of the distance to run.
Furthermore, the final result is more related to the ability to maintain a high velocity in the 200-
300 m section of the race, rather than being able to cover the last 100 m faster, since the slope
of velocity reduction is the same for all groups of performances from world to national class as
shown in studies that included hundreds of subjects (Schäffer, 1989; Vazel, 2010; Yamamoto
2014). However, maximum velocity during 400 m can reach 90% of the maximum velocity
recorded during a 100 m and can be achieved as soon as 5.5 s into the 400 m race in the case
of the world record holder (Schäffer, 1989), showing the paramount importance of acceleration
and top speed workouts for long sprinters.
Bibliography
Brochner Nielsen & al. Changes in motor coordination induced by local fatigue during sprint cycling task. Medicine & Science in Sport & Exercise, 2018 (in press). Högberg, P. How do stride length and stride frequency influence the energy-output during running? Arbeitsphysiologie, n. 14, p. 437-441, 1952. Hofmann, S. The Influence of the body features on the stride formation in the women’s 400m. Diploma thesis, DHfK, Leipzig, 53p, 1986. Mach G. Terminology of sprint and hurdles. Lekkoatletyka, n. 12, p. 4-6, 1971 (in Polish). Martins, F. Recognize the importance of return to play process. NSCA-Shanghai Conference, China, 26-28 October 2016. Müller H. Incidence of strength training on some aspects of the structure or the performance in sprinting, experience of training in GDR. Atleticastudi, n. 1, p 25-28, 1987 (in Italian). Omega, Official results Rio Olympic Games 2016, http://rio2016.olimpiade.lv/upload/content/rio2016-athletics-400m-final.pdf. Schäffer, W. On structure characteristics of the competitive performance and the corresponding training content in the athletics discipline 400m long sprint. Dissertation, 262p, Martin-Luther-Universität Halle-Wittenberg, 1989 (in German). Seiko, Official results Beijing IAAF World Championships 2017, https://media.aws.iaaf.org/competitiondocuments/pdf/4875/AT-400-W-f----.RS6.pdf?v=795205213. Susanka, P. Sprint and relays, Champion Style III, Helsinki 1983. 70min. Kratky Film, Prague 1983 (in Czech).

44
Turnbull, S. Report: Women’s 200m final, 2017 IAAF World Championships, https://www.iaaf.org/competitions/iaaf-world-championships/iaaf-world-championships-london-2017-5151/news/report/women/200-metres/semi-final. Vazel, PJ. Speed reserve in the 400m. Special Report. 16p, 2011, http://ucoach.com/articles/detail/speed-reserve-in-the-400m. Yamamoto & al. The relationship between race pattern & performance in the men 400m sprint. Japan Journal of Physical Education Health Sport Science n.59, p. 159-173, 2014 (in Japanese). Yamamoto & al. Analysis of the major men and women’s 400m races of 2015. Bulletin of Studies in Athletics of JAAF, Vol. 11, p.128-135, 2015 (in Japanese). Yamamoto & al. Analysis of the major men and women’s 400m races of 2016. Bulletin of Studies in Athletics of JAAF, Vol. 12, p.98-103, 2016 (in Japanese).

45
Coaching commentary – Ralph Mouchbahani
The data collected for the women’s 400 m reveal a trend that seems to underline the importance
of speed over endurance for podium performance. Alison Felix has the best 200 m personal best
amongst all finalists. It was her fast first 200 m that seemed to secure her the bronze medal (see
Figures 5, 7 and 8) as she passed the 200 m mark in first place.
Looking at the importance of the stride pattern (stride length and stride rate), it seems to play a
very important role when it comes to efficiency and speed maintenance. The knee angle at
touchdown for the non-medallists was on average larger than that of the three podium
performance (Tables 6 and 8). Further, the knee angle at toe-off was on average slightly larger
for medallists over the non-medallists (Tables 7 and 9). This indicates that the non-medallists
were having bigger problems with maintaining proper running mechanics at this stage in the race.
Looking at the individual contact and flight times for each of the finalists around 350 m in Figure
17, along with the step length and swing time data also presented shows that the medallists were
travelling faster through the air than the remaining finalists. Covering more distance in less time
expresses the efficiency of the stride. Step velocity and relative step length play a major role in
the long sprint. Alison Felix managed to secure third position through having a large relative step
length (Figure 12, Table 4).
Looking at the individual kinematic characteristics of the finalists around 350 m in Figures 14-17,
it becomes apparent that the medallists exhibit a higher relative step length than the non-
medallists, whilst they present similar values in other temporal parameters (e.g. contact time, flight
time). This allowed the gold and silver medallists to achieve considerably higher step velocities
than all the other finalists. As for Felix, her relative step length played a major role as through
that, she managed to secure a bronze medal, even though it was obvious that the pacing strategy
had a negative effect on the second 200 m performance.
Recommendations for training
1. Special endurance should be linked to proper mechanics.
2. Speed endurance is only effective when proper mechanics and speed have been
developed prior.
3. Importance of speed training for 400 m runner secured through proper time and movement
patterns of the technical model.

46
CONTRIBUTORS
Dr Lysander Pollitt is a Senior Lecturer in Sport and Exercise
Biomechanics at Leeds Beckett University. His research
interests primarily focus on neuromuscular biomechanics,
particularly the impact of surface instability on performance.
Previously, Lysander has provided applied biomechanical
support to British Weight Lifting, including preparation for the
2012 Olympics in London. He was also an integral part of the
development and implementation of the talent identification
programme, which also aimed to increase awareness and
enhance participation within the sport.
Josh Walker, MSc is currently a Senior Research Project
Officer within the Carnegie School of Sport at Leeds Beckett
University. Josh joined Leeds Beckett in 2013 where he
studied at both undergraduate and postgraduate level and
has a research interest into the biomechanics of cycling and
running, particularly within the areas of muscle-tendon
architecture, neuromuscular performance and the effects of
different modes of exercise on muscle fascicle behaviour and
neuromechanical effectiveness.
Dr Catherine Tucker is a Senior Lecturer in Sport and
Exercise Biomechanics at Leeds Beckett University.
Catherine graduated with First Class Honours in Sport and
Exercise Sciences from the University of Limerick and
subsequently completed a PhD in sports biomechanics, also
at the University of Limerick. Catherine’s main research
interests centre on the biomechanics of striking movements,
particularly golf. She is also interested in movement
variability with respect to gait and how it relates to movement
outcome / injury reduction.

47
Dr Athanassios Bissas is the Head of the Biomechanics
Department in the Carnegie School of Sport at Leeds Beckett
University. His research includes a range of topics but his
main expertise is in the areas of biomechanics of sprint
running, neuromuscular adaptations to resistance training,
and measurement and evaluation of strength and power. Dr
Bissas has supervised a vast range of research projects
whilst having a number of successful completions at PhD
level. Together with his team he has produced over 100
research outputs and he is actively involved in research
projects with institutions across Europe.
Ralph Mouchbahani is a global master in implementing sport
structures for federations within a high-performance
environment. He is an editor of the IAAF Coaches Education
and Certification System and a senior IAAF and DOSB
lecturer with exceptional athletic technical knowledge and a
passion for sport research. In his career, he has coached
many elite athletes, including sprinters, helping them to
achieve podium performances at several international
competitions. Ralph is managing partner in Athletic-
Solutions, a company that focuses on bringing Sport Science
and Practice together to help coaches maximise their efforts.
Pierre-Jean Vazel is a sprint and throws coach at Athlétisme
Metz Métropole club in France. PJ is a 5th year graduate in
Fine Arts and has covered 2 Olympics, 9 World
Championships and over 300 meetings as a coach or
chronicler for Le Monde and IAAF website. Since 2004 he
coached national champions from six countries including Olu
Fasuba to the 100 m African Record (9.85 s) and 60 m world
indoor title. PJ is co-author of the ALTIS Foundation course
and has done many lectures on the history of sprint science
and training.