Embed Size (px)
Citation preview
BIOMECHANICS ff^l ©bylAAF
14:4:37-44.1999
Mechanical energetic processes in Long Jump and their effeet on jumping Performance By Adamantios Arampatzis / Gert-Peter Brüggemann
The goal of this study was to find the optimal take-off characteristics for elite athletes with given starting conditions (initial energy). The data for this study was recorded at the 1997 Track and Field World Championships in Athens, Greece. The data was collected using three stationary video cameras (50 Hz). A total of31 jumps performed by 12 athletes were analysed from both the men's and women's competitions. It can be seen in both the men's and women's groups that athletes demonstrating different take-off parameters and different combinations of vertical and horizontal velocities attain the same jump distance. The total energy at touch down for the last approach stride determines the maximum jumping distance but most athletes fall to use this energy optimally. The take-off parameters which are determined by the loss ofthe centre ofmass(CM) energy during take-off and by the transformation of the approach energy to jump energy (transformation Index) are very important for determining the jump distance. The transformation Index shows a high correlation with both the start energy at tauch down and the energy decrease during the take-off phase. The optimum energy loss at take-off for the athletes analysed was determined to be 5.5- 6.0 J/kg far the women and 7.5-8.4 J/kg for the men.
H
<
H
<
entific co-worker at the Institute of Athletics at the German Sport University Cologne and has been involved in several athletics related scientific projects, including one that focused on the 6th World Championships in Athletics in Athens.
His major field of research is modelling of biological Systems. Prof. Dr. Peter Brüggemann is director of the Institute of Athletics at the German Sport University Cologne.
He is an international expert in the field of Biomechanics and Training Sciences. He has condueted several biomechanical research projects in the past 15 years for the International Athletic Foundation.
Introduction
Long jump Performance is determined by the so-called "official distance". This is obtained by measuring the length of an imaginary perpendicular line from the front edge of the take-off board to the nearest mark that the athlete leaves in the sand. The flight distance was found to have the greatest influence on the jump distance (Hay et al., 1986; Lees et al., 1994). This distance is determined by the centre of mass (CM) takeoff velocity, the take-off angle (the angle of projection) and the relative height of the CM from take-off to landing. The relative height of the CM depends on the CM height at the moment of both take-off and landing. The
37
Mechanical energetic processes in Long Jump and their effeet on jumping Performance
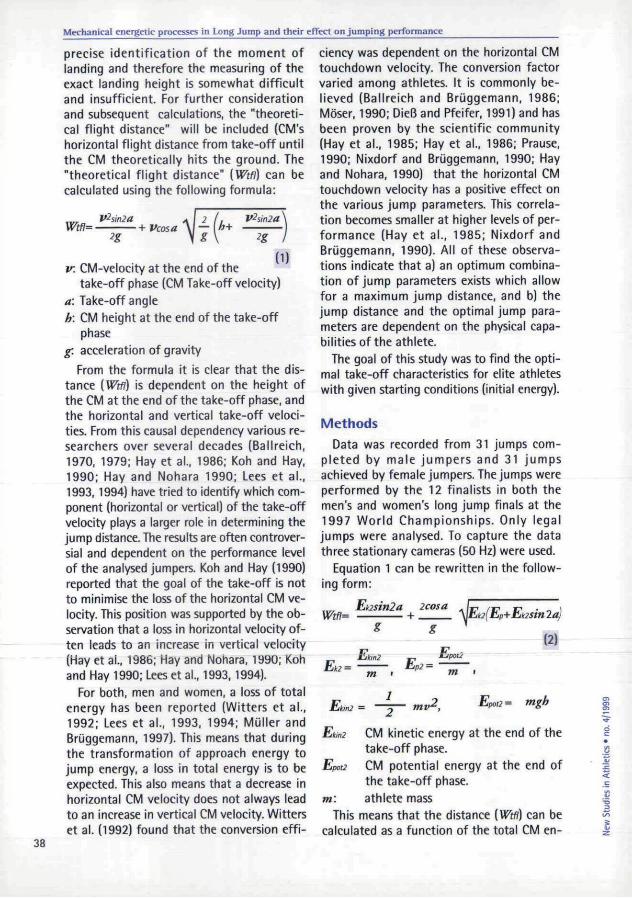
precise identification of the moment of landing and therefore the measuring of the exact landing height is somewhat difficult and insufficient. For further consideration and subsequent calculations, the "theoretical flight distance" will be included (CM's horizontal flight distance from take-off until the CM theoretically hits the ground. The "theoretical f l ight distance" [Wtfl) can be caleulated using the following formula:
Vhin2a Wtfl= + Vcosa
2g wF V^sinZa
2g (1)
v: CM-velocity at the end ofthe take-off phase (CM Take-off velocity)
a: Take-off angle h: CM height at the end of the take-off
phase g: acceleration of gravity
From the formula it is clear that the distance (Wtfl) is dependent on the height of the CM at the end of the take-off phase, and the horizontal and vertical take-off velocities. From this causal dependency various researchers over several decades (Ballreich, 1970, 1979; Hay et al., 1986; Koh and Hay, 1990; Hay and Nohara 1990; Lees et al., 1993,1994) have tried to identify which component (horizontal or vertical) of the take-off velocity plays a larger role in determining the Jump distance. The results are often controversial and dependent on the Performance level of the analysed jumpers. Koh and Hay (1990) reported that the goal of the take-off is not to minimise the loss of the horizontal CM velocity. This position was supported by the observation that a loss in horizontal velocity often leads to an increase in vertical velocity (Hay et al., 1986; Hay and Nohara, 1990; Koh and Hay 1990; Lees et al., 1993,1994).
For both, men and women, a loss of total energy has been reported (Witters et al., 1992; Lees et al., 1993. 1994; Müller and Brüggemann, 1997). This means that during the transformation of approach energy to jump energy, a loss in total energy is to be expected. This also means that a decrease in horizontal CM velocity does not always lead to an increase in vertical CM velocity. Witters et al. (1992) found that the conversion effi
ciency was dependent on the horizontal CM touchdown velocity. The conversion factor varied among athletes. It is commonly believed (Ballreich and Brüggemann, 1986; Moser, 1990; Dieß and Pfeifer, 1991) and has been proven by the scientific Community (Hay et al., 1985; Hay et al., 1986; Prause, 1990; Nixdorf and Brüggemann, 1990; Hay and Nohara, 1990) that the horizontal CM touchdown velocity has a positive effeet on the various jump parameters. This correlation becomes smaller at higher levels of Performance (Hay et al., 1985; Nixdorf and Brüggemann, 1990). All of these observations indicate that a) an optimum combination of Jump parameters exists which allow for a maximum jump distance, and b) the jump distance and the optimal jump parameters are dependent on the physical capabilities ofthe athlete.
The goal of this study was to find the optimal take-off characteristics for elite athletes with given starting conditions (initial energy).
Methods
Data was recorded from 31 jumps completed by male jumpers and 31 jumps achieved by female Jumpers. The jumps were performed by the 12 finalists in both the men's and women's long jump finals at the 1997 World Championships. Only legal jumps were analysed. To capture the data three stationary cameras (50 Hz) were used.
Equation 1 can be rewritten in the following form:
Wtfl= Ek2sin2a icosa
% t VEk2(Ep+Ek2sm2a)
Ek2 = m km2
Ep2 = m
Ekm2 = & Epot2 = frigh
E kin2
Ei ipot2
CM kinetic energy at the end of the take-off phase. CM potential energy at the end of the take-off phase.
m: athlete mass This means that the distance (Wtfl) can be
caleulated as a funetion of the total CM en-38
Mechanical energetic processes in Long Jump and their effeet on jumping Performance
s 5
ergy at take-off and the take-off angle. The distance, which can be caleulated using equation 2, shows a positive correlation with the official distance (r=0.70, p<0.001 for the men and r=0.711 p<0.001 for the women) and also with the effective distance* (r=0.80, p<0.001 for the men and r=0.75, p<0.001 for the women). During the take-off phase a decrease in the CM total energy always occurs. During the take-off phase a transformation of approach energy to jump energy also occurs. To quantify this transformation, an Index was created which shows the relationship of the directional change of the movement during the take-off phase with regard to the energy loss at take-off. The transformation Index is defined as the quotient of the take-off angle divided by the energy loss.
' Index = a Cjdecrease
(3)
Edeaease: decrease in the athlete's total energy during the take-off phase
The total CM energy at the end of the takeoff phase can be ascertained by the following equation:
ET2 = En - Ede c>
Ep2 + Ek2 = ET2 - Edeaease ^
Ek2 = ETI - Edecrease - Ep2 <=!>
(4)
ETI= Emi
ET2= Etot2
Etoti: total energy at the beginning of the take-off phase (Start Energy)
Etot2: total energy at the end of the takeoff phase (End Energy)
The differences in the athlete's potential energy at the end of the take-off phase are very small and can therefore be represented for each athlete by a constant value.
From equations (2), (3) and (4) the distance (Wtfl) can be caleulated as a funetion of the starting energy, energy loss and the transformation Index. * Effective distance: the distance between the
tip of the athlete's jump foot at take-off and the heels at landing
The starting energy represents the initial conditions for the Jump and the energy loss and the transformation Index represent the
[ETI - Edecrease - Ep2)s\n [2 Tindex Edecrease) Wtfl =
2COS;2 Tindex Edeaease) JiEk2(ETl-Edeaease-Ep2)
(+ET1 -Edecrease -Epzj? sin^( Tindex Edeaease) (5)
Jump characteristics. Using a cluster analysis, groups were cre
ated on the basis of starting energy, energy loss and the transformation Index. For both the men and the women, 3 relatively homogeneous groups could be identified. An independent group t-test was used to measure the differences among the groups.
Results and Discussion
From the results it is clear that both the men's and women's groups can be divided into two primary jumping styles which demonstrate the same starting characteristics and achieve the same effective jump distance and official jump distance. Groups 1 and 2 from the men and groups 1 and 3 from the women produeed the same starting energy (tabies 1 and 2). During the take off, the energy loss for group 1 from the men and group 3 from the women was more than for the other groups (tabies 1 and 2). The importance of this observation is that both groups showed less energy and a larger takeoff angle at the end of the take off phase in comparison to groups 2 (men) and 1 (women, tabies 1 and 2). The relationship between the horizontal and vertical velocities in groups 1 (men) and 3 (women) also varied. Group 3 from the men had the farthest jump distance and group 2 from the women had the shortest jump distance (tabies 1 and 2). Group 3 (men) had the largest energy loss and the lowest transformation Index (table 2).
With group 3 producing the highest starting energy as well as the highest energy loss, the athletes were able to achieve a higher end energy than group 1 and a higher takeoff angle than group 2 (table 2). Group 3 al-
39
Mechanical energetic processes in Long Jump and their effeet on jumping Performance
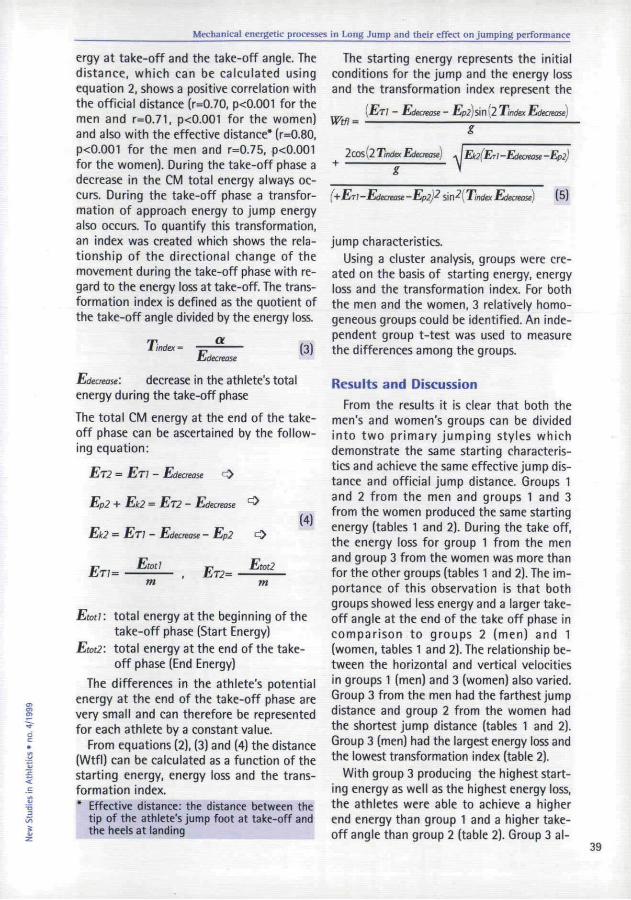
Table 1: Energy, transformation Index, distances, take-off angles, horizontal and vertical CM velocities during the take-off phase for the women's groups
Parameter
Beginning energy (Joule/kg)
Energy decrease (Joule/kg)
Transformation Index (Grad/Joule/kg)
Endenergy (Joule/kg)
Take-off angle (Grad)
Effective distance (m)
Official distance (m)
Horizontal touch down velocity
Horizontal take-off velocity
Vertical take-off velocity
Group 1 (n=9)
55.73(1.01)
5.40(1.04)
3.61 (0.69)
50.32(1.70)
18.96(1.54)
7.01 (0.17)
6.82(0.13)
9.62 (0.09)
8.29 (0.23
2.84(0.18)
Group 2 (n=11)
52.38(1.13)*
5.21 (0.92)
4.21 (0.72)
47.17(1.31)*
21.41 (1.73)*
6.76(0.15)*
6.60(0.12)*
9.53(0.11)*
7.83 (0.24)*
3.05(0.19)*
Group 3
MD 55.90(1.OB)1
7.83 (0.71p
2.70 (0.32)*i
48.07(1.10)*
20.97(1.66)*
6.98 (0.26)1
6.73(0.17)1
9.65(0.14)1
7.97(0.21)1
3.07 (0.23)*
7 Statistically significant difference between groups 1 and 2, and between groups 1 and 3 (p<0.05) Statistically significant difference between groups 2 and 3(p<0.05)
so had the highest horizontal touch down velocity and the highest vertical take off velocity (table 2). Group 2 of the women demonstrated similar attributes during the take off phase (similar energy loss and transformation Index). Due to the fact that group 2 produeed the lowest starting energy, the athletes also showed a lower end energy
than their counterparts in group 1 (table 1). It is clear at this level of competition that
the starting energy, which is determined by the horizontal velocity at touch down, plays an important role in Jump Performance. It cannot be conduded that the start energy alone determines the official jump distance. There is a significant (p<0.05) correlation be-
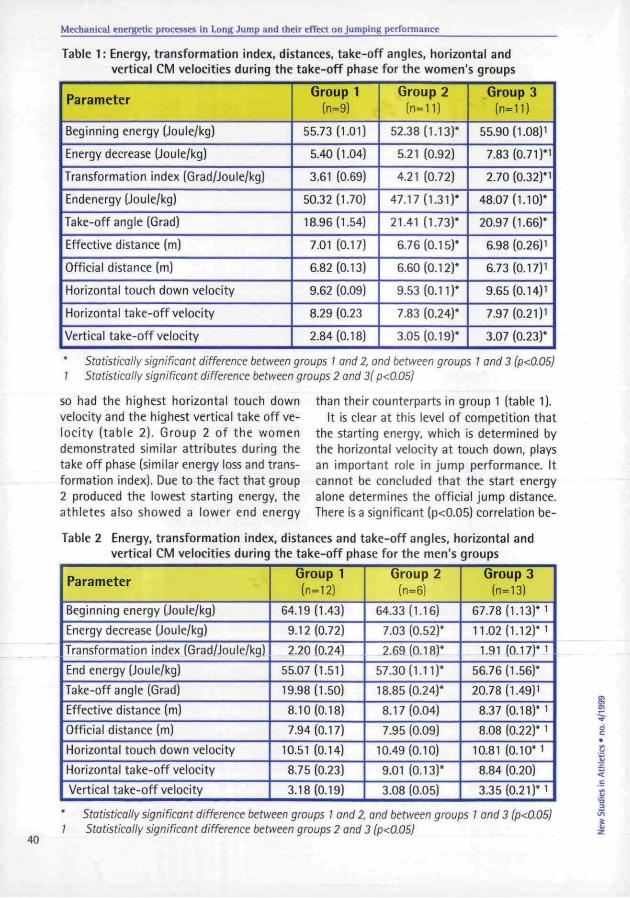
Table 2 Energy, transformation Index, distances and take-off angles, horizontal and vertical CM velocities during the take-off phase for the men's groups
Parameter
Beginning energy (Joule/kg)
Energy decrease (Joule/kg)
Transformation Index (Grad/Joule/kg)
End energy (Joule/kg)
Take-off angle (Grad)
Effective distance (m)
Official distance (m)
Horizontal touch down velocity
Horizontal take-off velocity
Vertical take-off velocity
Group 1 (n=12)
64.19(1.43)
9.12 (0.72)
2.20 (0.24)
55.07(1.51)
19.98(1.50)
8.10(0.18)
7.94(0.17)
10.51 (0.14)
8.75 (0.23)
3.18(0.19)
Group 2 (n=6)
64.33(1.16)
7.03 (0.52)*
2.69(0.18)*
57.30(1.11)*
18.85(0.24)*
8.17(0.04)
7.95 (0.09)
10.49(0.10)
9.01 (0.13)*
3.08 (0.05)
Group 3 (n=13)
67.78 (1.13)* 1
11.02 (1.12)* i
1.91 (0.17)* 1
56.76(1.56)*
20.78(1.49)1
8.37 (0.18)* i
8.08 (0.22)* 1
10.81 (0.10*1
8.84 (0.20)
3.35 (0.21)* 1
S CD
d c
8
i 1 1
40
Statistically significant difference between groups 1 and 2. and between groups 1 and 3 (p<0.05) 1 Statistically significant difference between groups 2 and 3 (p<0.05)
Mechanical energetic processes in Long Jump and their effeet on jumping Performance
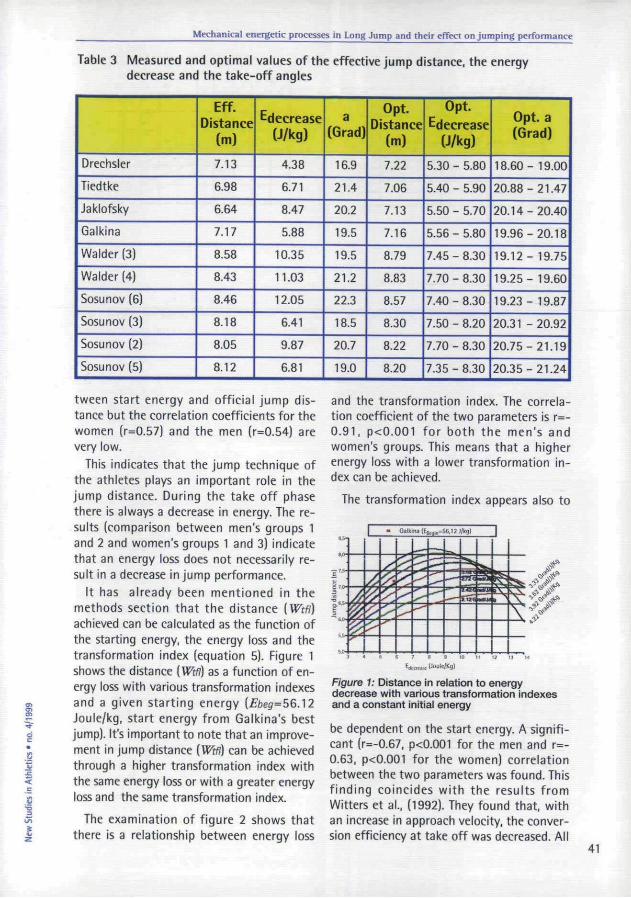
Table 3 Measured and optimal values of the effective Jump distance, the energy decrease and the take-off angles
Drechsler
Tiedtke
Jaklofsky
Galkina
Walder (3)
Walder (4)
Sosunov (6)
Sosunov (3)
Sosunov (2)
Sosunov (5)
Eff. Distance
(m)
7.13
6.98
6.64
7.17
8.58
8.43
8.46
8.18
8.05
8.12
Edecrease (J/kg)
4.38
6.71
8.47
5.88
10.35
11.03
12.05
6.41
9.87
6.81
a (Grad)
16.9
21.4
20.2
19.5
19.5
21.2
22.3
18.5
20.7
19.0
Opt. Distance
(m)
7.22
7.06
7.13
7.16
8.79
8.83
8.57
8.30
8.22
8.20
Opt.
Edecrease (J/kg)
5.30 - 5.80
5.40 - 5.90
5.50 - 5.70
5.56 - 5.80
7.45 - 8.30
7.70 - 8.30
7.40 - 8.30
7.50 - 8.20
7.70 - 8.30
7.35 - 8.30
Opt. a (Grad)
18.60- 19.00
20.88-21.47
20.14-20.40
19.96-20.18
19.12- 19.75
19.25- 19.60
19.23- 19.87
20.31 - 20.92
20.75-21.19
20.35-21.24
tween start energy and official jump distance but the correlation coefficients for the women (r=0.57) and the men (r=0.54) are very low.
This indicates that the jump technique of the athletes plays an important role in the jump distance. During the take off phase there is always a decrease in energy. The results (comparison between men's groups 1 and 2 and women's groups 1 and 3) indicate that an energy loss does not necessarily result in a decrease in jump Performance.
It has already been mentioned in the methods section that the distance (Wtfl) achieved can be caleulated as the funetion of the starting energy, the energy loss and the transformation Index (equation 5). Figure 1 shows the distance (Wtfl) as a funetion of energy loss with various transformation Indexes and a given starting energy (Ebeg=SB.]2 Joule/kg, start energy from Galkina's best jump). It's important to note that an improvement in jump distance (Wtfl) can be achieved through a higher transformation Index with the same energy loss or with a greater energy loss and the same transformation Index.
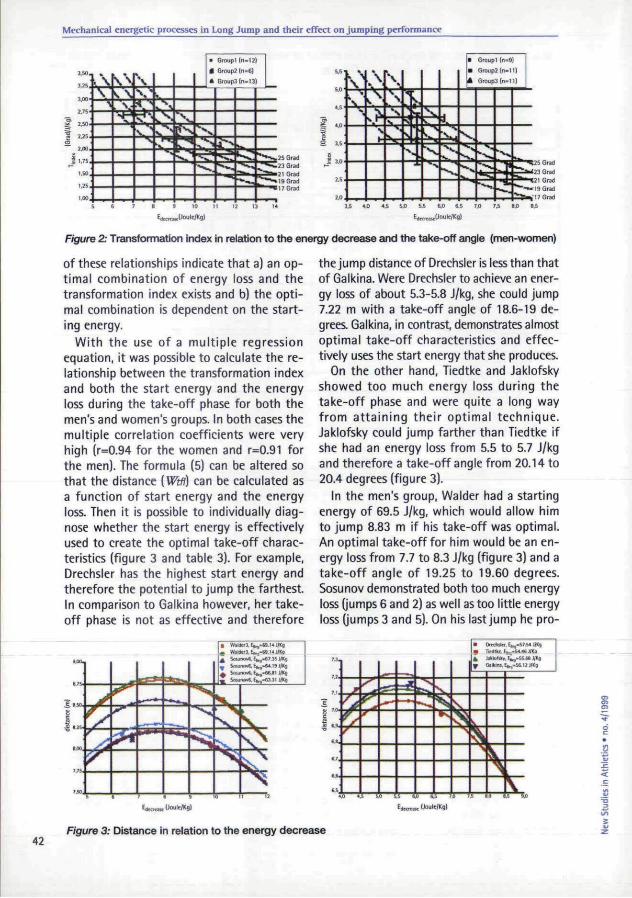
The examination of figure 2 shows that there is a relationship between energy loss
and the transformation Index. The correlation coefficient of the two parameters is r=-0.91, p<0.001 for both the men's and women's groups. This means that a higher energy loss with a lower transformation Index can be achieved.
The transformation Index appears also to
Figure 1: Distance in relation to energy decrease with various transformation Indexes and a constant initial energy
be dependent on the start energy. A significant (r=-0.67, p<0.001 for the men and r=-0.63, p<0.001 for the women) correlation between the two parameters was found. This finding eoineides with the results from Witters et al., (1992). They found that, with an increase in approach velocity, the conversion efficiency at take off was decreased. All
41
Mechanical energetic processes in Long Jump and their effeet on jumping Performance
I 3.0
E^^Poule/Kg) Itoc^VoultlKg)
Figure 2: Transformation Index in relation to the energy decrease and the take-off angle (men-women)
of these relationships indicate that a) an optimal combination of energy loss and the transformation Index exists and b) the optimal combination is dependent on the starting energy.
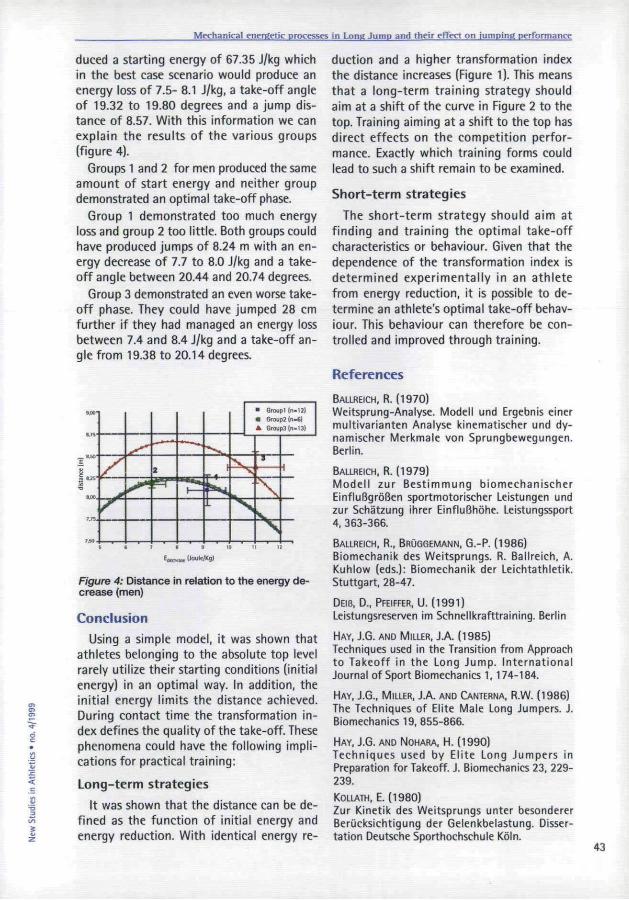
With the use of a multiple regression equation, it was possible to calculate the relationship between the transformation Index and both the start energy and the energy loss during the take-off phase for both the men's and women's groups. In both cases the multiple correlation coefficients were very high (r=0.94 for the women and r=0.91 for the men). The formula (5) can be altered so that the distance (Wtfl) can be caleulated as a funetion of start energy and the energy loss. Then it is possible to individually diagnose whether the start energy is effectively used to create the optimal take-off characteristics (figure 3 and table 3). For example, Drechsler has the highest Start energy and therefore the potential to Jump the farthest. In comparison to Galkina however, her takeoff phase is not as effective and therefore
a WlMnl. i*~.ta. U «Ho ^ Solu>«lvS,£fc,rf7 351^5
J.8.S0,
. (Joulc/Kg)
the jump distance of Drechsler is less than that of Galkina. Were Drechsler to achieve an energy loss of about 5.3-5.8 J/kg, she could jump 7.22 m with a take-off angle of 18.6-19 degrees. Galkina, in contrast, demonstrates almost optimal take-off characteristics and effectively uses the start energy that she produces.
On the other hand, Tiedtke and Jaklofsky showed too much energy loss during the take-off phase and were quite a long way from attaining their optimal technique. Jaklofsky could jump farther than Tiedtke if she had an energy loss from 5.5 to 5.7 J/kg and therefore a take-off angle from 20.14 to 20.4 degrees (figure 3).
In the men's group. Walder had a starting energy of 69.5 J/kg, which would allow him to jump 8.83 m if his take-off was optimal. An optimal take-off for him would be an energy loss from 7.7 to 8.3 J/kg (figure 3) and a take-off angle of 19.25 to 19.60 degrees. Sosunov demonstrated both too much energy loss (jumps 6 and 2) as well as too little energy loss (jumps 3 and 5). On his last jump he pro-
42 Figure 3: Distance in relation to the energy decrease
i < C
jO — s i
Mechanical energetic processes in Long Jump and their effeet on jumping Performance
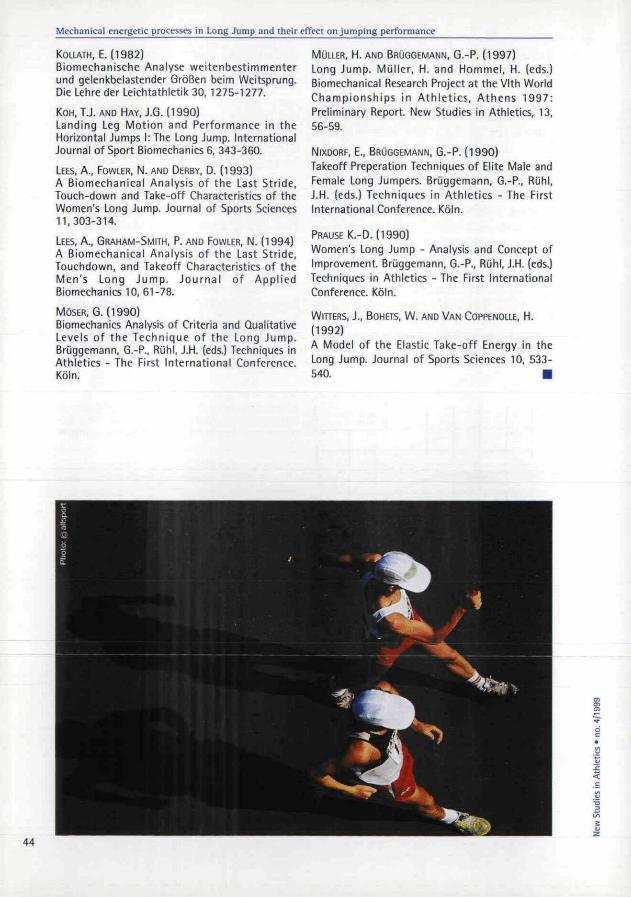
duced a starting energy of 67.35 J/kg which in the best case scenario would produce an energy loss of 7.5- 8.1 J/kg, a take-off angle of 19.32 to 19.80 degrees and a jump distance of 8.57. With this information we can explain the results of the various groups (figure 4).
Groups 1 and 2 for men produeed the same amount of start energy and neither group demonstrated an optimal take-off phase.
Group 1 demonstrated too much energy loss and group 2 too little. Both groups could have produeed Jumps of 8.24 m with an energy decrease of 7.7 to 8.0 J/kg and a takeoff angle between 20.44 and 20.74 degrees.
Group 3 demonstrated an even worse takeoff phase. They could have Jumped 28 cm further if they had managed an energy loss between 7.4 and 8.4 J/kg and a take-off angle from 19.38 to 20.14 degrees.
WO-I
E
a ts
7*0.
/
j f
r
^
s*
***
2
e r
— ,
1 —
^
1
H -
• Qraupl (nc12) • Group2(n-6) * Group3(n.13)
V , \
N ri
L \
V N
Figure 4: Distance in relation to the energy decrease (men)
Conclusion
Using a simple model, it was shown that athletes belonging to the absolute top level rarely utilize their starting conditions (initial energy) in an optimal way. In addition, the initial energy limits the distance achieved. During contact time the transformation Index defines the quality of the take-off. These phenomena could have the following implications for practical training:
Long-term strategies
It was shown that the distance can be defined as the funetion of initial energy and energy reduetion. With identical energy re
duetion and a higher transformation Index the distance increases (Figure 1). This means that a long-term training strategy should aim at a shift of the curve in Figure 2 to the top. Training aiming at a shift to the top has direct effects on the competition Performance. Exactly which training forms could lead to such a shift remain to be examined.
Short-term strategies
The short-term strategy should aim at finding and training the optimal take-off characteristics or behaviour. Given that the dependence of the transformation index is determined experimentally in an athlete from energy reduetion, it is possible to determine an athlete's optimal take-off behaviour. This behaviour can therefore be controlled and improved through training.
References
BALLREICH, R. (1970) Weitsprung-Analyse. Modell und Ergebnis einer multivarianten Analyse kinematischer und dynamischer Merkmale von Sprungbewegungen. Berlin.
BALLREICH, R. (1979)
Modell zur Bestimmung biomechanischer Einflußgrößen sportmotorischer Leistungen und zur Schätzung ihrer Einflußhöhe. Leistungssport 4,363-366.
BALLREICH, R., BRÜGGEMANN, G.-P. (1986)
Biomechanik des Weitsprungs. R. Ballreich, A. Kuhlow (eds.): Biomechanik der Leichtathletik. Stuttgart, 28-47.
DEIB, D., PFEIFFER, U. (1991)
Leistungsreserven im Schnellkrafttraining. Berlin
HAY, J.G. AND MILLER, J.A. (1985)
Techniques used in the Transition from Approach to Takeoff in the Long Jump. International Journal of Sport Biomechanics 1,174-184.
HAY, J.G., MILLER, J A AND CANTERNA, R.W. (1986)
The Techniques of Elite Male Long Jumpers. J. Biomechanics 19, 855-866.
HAY, J.G. AND NOHARA. H. (1990)
Techniques used by Elite Long Jumpers in Preparation for Takeoff. J. Biomechanics 23, 229-239.
KOLLATH, E.( 1980)
Zur Kinetik des Weitsprungs unter besonderer Berücksichtigung der Gelenkbelastung. Dissertation Deutsche Sporthochschule Köln.
43
Mechanical energetic processes in Long Jump and their effeet on jumping Performance
KOLLATH. E. (1982) Biomechanische Analyse weitenbestimmenter und gelenkbelastender Größen beim Weitsprung. Die Lehre der Leichtathletik 30. 1275-1277.
KOH.TJ . AND HAY, J.G. (1990) Landing Leg Motion and Performance in the Horizontal Jumps I: The Long Jump. International Journal of Sport Biomechanics 6. 343-360.
LEES, A., FOWLER, N. AND DERBY, D. (1993)
A Biomechanical Analysis of the Last Stride, Touch-down and Take-off Characteristics of the Women's Long Jump. Journal of Sports Sciences 11.303-314.
LEES. A., GRAHAM-SMITH, P. AND FOWLER, N. (1994)
A Biomechanical Analysis of the Last Stride, Touchdown, and Takeoff Characteristics of the Men's Long Jump. Journal of Applied Biomechanics 10,61-78.
MOSER. G.( 1990)
Biomechanics Analysis of Criteria and Qualitative Levels of the Technique of the Long Jump. Brüggemann. G.-P.. Rühl. J.H. (eds.) Techniques in Athletics - The First International Conference. Köln.
MÜLLER. H. AND BRÜGGEMANN, G.-P. (1997)
Long Jump. Müller. H. and Hommel. H. (eds.) Biomechanical Research Project at the Vlth World Championships in Athlet ics, Athens 1997: Preliminary Report. New Studies in Athletics, 13, 56-59.
NIXDORF, E., BRÜGGEMANN, G.-P. (1990)
Takeoff Preperation Techniques of Elite Male and Female Long Jumpers. Brüggemann. G.-P., Rühl. J.H. (eds.) Techniques in Athletics - The First International Conference. Köln.
PRAUSE K.-D. (1990)
Women's Long Jump - Analysis and Concept of Improvement. Brüggemann. G.-P., Rühl, J.H. (eds.) Techniques in Athletics - The First International Conference. Köln.
WITTERS. J.. BOHETS. W. AND VAN COPPENOLLE. H.
(1992) A Model of the Elastic Take-off Energy in the Long Jump. Journal of Sports Sciences 10. 533-540. •
44