Embed Size (px)
Citation preview
Biologia, Bratislava, 61/Suppl. 20: S509—S521, 2006 S509
Biomass and element pools of understory vegetationin the catchments of Čertovo Lake and Plešné Lakein the Bohemian Forest
Miroslav Svoboda1, Karel Matějka2 & Jiří Kopáček3
1Czech University of Agriculture in Prague, Faculty of Forestry and Environment, Kamýcká 129, CZ-16521 Praha 6 –Suchdol, Czech Republic; e-mail: [email protected], Na Komořsku 2175/2A, CZ-14300 Praha 4, Czech Republic; e-mail: [email protected] Centre, Academy of Sciences of the Czech Republic, Institute of Hydrobiology, Na Sádkách 7, CZ-37005 ČeskéBudějovice, Czech Republic; e-mail: [email protected]
Abstract: This paper presents data on species composition, biomass, and element pools (C, N, P, Ca, Mg, Na, K, Al, Fe,Mn) of the understory vegetation of spruce forests in the catchments of lakes Čertovo jezero (CT) and Plešné jezero (PL) inthe Bohemian Forest (Šumava, Czech Republic). Calamagrostis villosa was the most abundant species in the CT catchment,while Vaccinium myrtillus was the most abundant species in the PL catchment. The catchments weighted mean (CWM)of above-ground biomass of the understory vegetation was 288 and 723 g m−2 in the CT and PL catchments, respectively.The significant difference in the biomass between the catchments was caused by the much higher abundance of V. myrtillusin the PL catchment. The CWM of below-ground biomass of the fine roots was 491 and 483 g m−2 in the CT and PLcatchments, respectively. The respective CWM element pools of biomass in the CT and PL catchments were: C (33 and 51mol m−2), N (0.8 and 1.0 mol m−2), P (24 and 34 mmol m−2), Ca (53 and 113 mmol m−2), Mg (24 and 41mmol m−2),Na (3.7 and 6.5 mmol m−2), K (83 and 109 mmol m−2), Al (50 and 42 mmol m−2), Fe (13.3 and 7.3 mmol m−2), and Mn(4.2 and 8.8 mmol m−2).
Key words: Norway spruce forest, understory vegetation, Calamagrostis villosa, Vaccinium myrtillus.
Introduction
Forest research has always tended to focus on the trees,while much less attention has been paid to understorycomponents such as dwarf shrubs, herbs, grass, fernsand mosses (Nilsson & Wardle, 2005). However, theimportance of understory vegetation in forest ecosys-tems is probably comparable to that of the trees. Theecological importance of understory vegetation can beviewed at the vegetation and soil process scales. Un-derstory vegetation can strongly influence tree seedlingestablishment and growth (George & Bazzaz, 1999)and thus the dynamics of the whole forest stand. Soilprocesses affect belowground processes, such as decom-position and build-up of soil nutrients (Jonasson &Shaver, 1999). Understory vegetation can also serveas an important pool of nutrients in forest ecosystems.For example, the annual aboveground production of un-derstory vegetation was estimated to be between 25 and32% of total aboveground biomass for a Norway sprucestand in boreal Fennoscandia (Finer et al., 2003). Inthe same stands, the annual uptake of C and N byunderstory vegetation represented as much as 22 and
56% of the annual net uptake of C and N by trees,respectively (Finer et al., 2003). Similar values werereported for Scots pine dominated forests from borealFennoscandia (Helmisaari, 1995). According to somerecent studies, understory vegetation can also affectand modify nutrient flow in forest ecosystems (Ro-denkirchen, 1995; Huber et al., 2004). It has beenshown that grass understory vegetation can serve asan important sink of atmospheric nitrogen (Holub,1999). Sward grass vegetation can also decrease soilacidity and the loss of base cations (Fiala et al., 2005).This suggests that some species of understory vegeta-tion can partly eliminate negative processes associatedwith soil acidification and positively affect the reduc-tion of nutrient losses from the soil (Fiala et al., 2005).Contradictory results were found by Šantrůčková etal. (2006), showing that vegetation cover of Calama-grostis villosa possibly contributed to high N flux fromthe litter in the spruce forest of the Bohemian For-est. On the whole catchment scale, N flux from thelitter was similar to N input by atmospheric deposi-tion. Based on these results, there is an obvious needfor detailed studies on the role of understory vegetation
S510 M. Svoboda et al.
within the process of element cycling on the catchmentscale.The aim of this paper is to evaluate differences in
the character, biomass and element pools of the under-story vegetation in the spruce forest of two BohemianForest catchments of lakes Plešné jezero (PL) and Čer-tovo jezero (CT). Catchments of both lakes have beenexposed to high deposition of S and N compounds dur-ing the last six decades, but have been partly recoveringfrom this acid stress since the late 1980s (Majer et al.,2003). Long term ecosystem research focusing on theprocess of ecosystem acidification and biological recov-ery has been carried out in both catchments since 1990(Vrba et al., 2003). Despite similar climatic and mor-phological conditions, there are significant differencesin the N and P fluxes within the ecosystems, as well asin rates of their biological recovery (Kopáček et al.,2002c; Majer et al., 2003). The role of the differentbedrock and soils on these processes have been recentlystudied (Kaňa & Kopáček, 2006; Kopáček et al.,2006a, b). However, the important part of the catch-ment ecosystem, the vegetation layer, was neglected un-til now, because of the lack of reliable data. This studypresents the first analysis of the understory vegetationand related element pools for these ecosystems. Here weevaluate: (1) differences in the species composition andbiomass of the understory vegetation and the associ-ated pools of major nutrients (C, N, P, Ca, Mg, and K)and ecologically important metals (Al, Fe, Mn) in thecatchments of the PL and CT lakes, (2) spatial variabil-ity of the studied characteristics (biomass and elementpools) within the catchments, and (3) a comparison ofthe biomass and element pools in the catchments toother available data from Central European spruce for-est ecosystems. A comparison of element pools associ-ated with the understory vegetation to those in the soiland tree layers are given in Svoboda et al. (2006). Therole of the understory vegetation in the cycling of ter-restrial elements is evaluated by Šantrůčková et al.(2006).
Study sites
The research was carried out in the catchments of PlešnéLake (PL; 48◦46′35′′ N, 13◦52′0′′ E; elevation of 1087–1378m a.s.l.; total forested area of 59.5 ha) and Čertovo Lake(CT; 49◦9′55′′ N, 13◦11′50′′ E; elevation of 1027–1343 ma.s.l.; total forested area of 81.2 ha) in the Bohemian For-est (Šumava, Bohmerwald). The PL catchment is nearlycompletely covered with forest (∼90% of the catchment).The forest stand is on average 160 years old and dominated(99%) by Norway spruce (Picea abies), with minor con-tributions of mountain-ash (Sorbus aucuparia) and beech(Fagus sylvatica). Timber biomass ranges between 15 and720 m3 ha−1 (catchment average of 230 m3 ha−1) accord-ing to the Stožec, 1995–2004, and Plešný, 1996–2005 forestmanagement plans (I. VICENA – pers. commun.). Only fewdata are available in the literature on the history of land-use in the PL catchment, summarised by VESELÝ (1994).
Disturbances occasionally affecting the surroundings of thePL catchment (logging, pasturing, or fires) were probablynegligible within the catchment during the last ∼250 years(I. VICENA – pers. commun.). Details on forest develop-ment in the study area are given by JANKOVSKÁ (2006).The bedrock of the PL catchment is granite, soils are de-veloped from till, rich in sand (∼75%), and consist of ∼0.2m deep leptosol (38%) and ∼0.45 m deep podsol (29%) ordystric cambisol (27%). The rest of the watershed is rocky;wetlands are negligible (∼1%). Soil pH (CaCl2 extractable)is low, with minimum values of 2.5–3.1 in A-horizons andmaximum (3.2–4.4) in low mineral horizons. The mean ef-fective cation exchange capacity of the soils is dominatedby exchangeable Al (57%) and protons (28%), while basesaturation is 15% (KOPÁČEK et al., 2002a).
The Čertovo Lake catchment is covered with 90–150year-old Norway spruce forest (Picea abies) of at least sec-ondary origin, with sparse European beech (Fagus sylvat-ica). Timber biomass is (according to the Železná Ruda2003 forest management plans; I. VICENA – pers. commun.)on average 287 m3 ha−1. The land use history of the CTcatchment is summarised by VESELÝ (1994), and suggestsimportant timber harvesting and charcoal and potash pro-duction from the Middle Ages to the late 19th century. Thebedrock of the CT catchment is made up of mica-schist(muscovitic gneiss), quartzite, and small amounts of peg-matite (VESELÝ, 1994). The watershed is covered with ∼0.5m deep dystric cambisol (58%), podsol (21%), and shallow(∼0.2 m) leptosol (17%); wetlands and bare rocks represent∼3% and 1%, respectively. Fine soil is sandy (48–81%) witha low (1–4%) content of clay. Soil pH (CaCl2 extractable)is low, with minimum values of 2.5–3.3 in A-horizons andmaximum values of 3.6–4.5 in mineral horizons. The meaneffective cation exchange capacity of the soils is dominatedby exchangeable Al (62%) and protons (29%), while basesaturation is 9% (KOPÁČEK et al., 2002b).
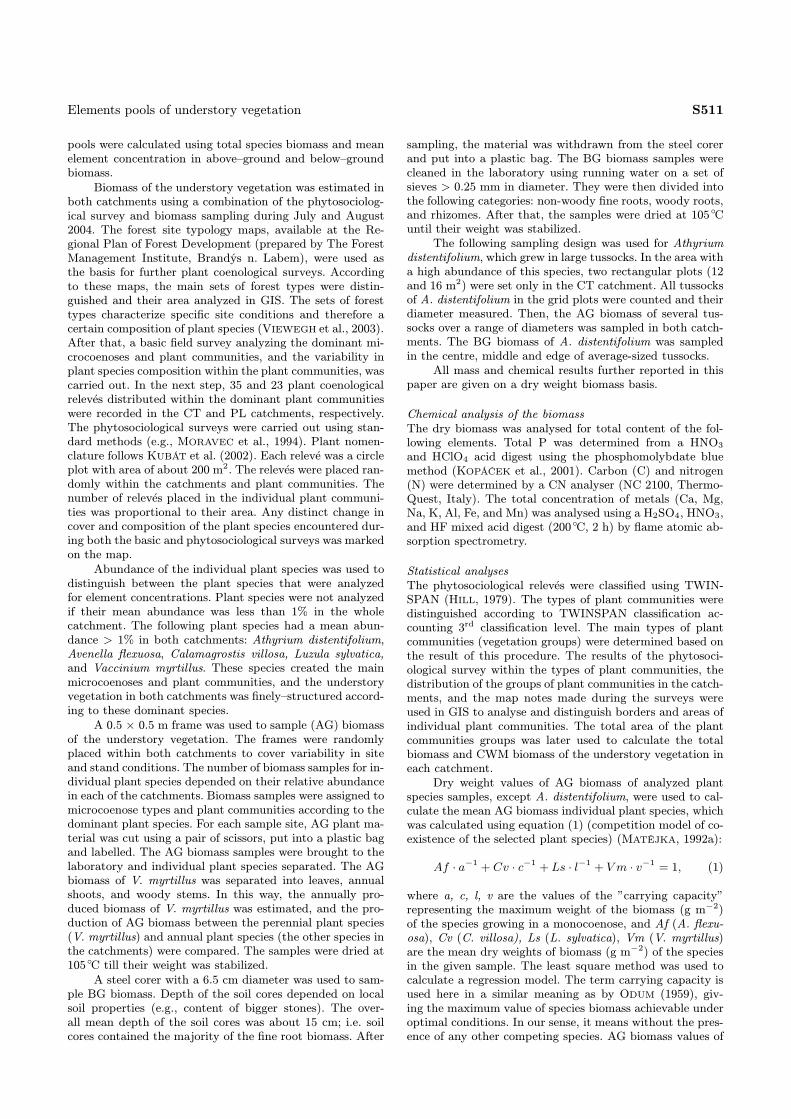
As determined from typological maps (using the Czechtypological system; VIEWEGH et al., 2003), the CT catch-ment belongs to the spruce–beech vegetation zone (81% offorested area) and spruce vegetation zone (19% of forestedarea). The PL catchment belongs to the spruce–beech veg-etation zone (12%) and spruce vegetation zone (88%). Thedistribution and fractions of the groups of the forest typespresented within the catchment are shown in Figs 1a and1b.
Material and methods
Sampling and analysis of the understory vegetationThe investigation of understory vegetation was carried outusing the following steps: (1) Plant communities (usingplant coenological relevés) were inspected and the bound-aries between the distinguished plant communities surveyed.(2) All important types of plant microcoenoses within theplant communities (sensu MATĚJKA, 1992b), based on thedominant plant species, were determined by field reconnais-sance. (3) Each type of microcoenose within each plant com-munity was sampled to determine aboveground (AG) andbelowground (BG) biomass. (4) The area of each plant com-munity was calculated (total area of plant communities gavethe total catchment area). (5) Total biomass and catchmentweighted mean (CWM) biomass were calculated. (6) Se-lected elements were analyzed in dried biomass samples (ormixed samples). (7) Total pools of these elements and CWM
Elements pools of understory vegetation S511
pools were calculated using total species biomass and meanelement concentration in above–ground and below–groundbiomass.
Biomass of the understory vegetation was estimated inboth catchments using a combination of the phytosociolog-ical survey and biomass sampling during July and August2004. The forest site typology maps, available at the Re-gional Plan of Forest Development (prepared by The ForestManagement Institute, Brandýs n. Labem), were used asthe basis for further plant coenological surveys. Accordingto these maps, the main sets of forest types were distin-guished and their area analyzed in GIS. The sets of foresttypes characterize specific site conditions and therefore acertain composition of plant species (VIEWEGH et al., 2003).After that, a basic field survey analyzing the dominant mi-crocoenoses and plant communities, and the variability inplant species composition within the plant communities, wascarried out. In the next step, 35 and 23 plant coenologicalrelevés distributed within the dominant plant communitieswere recorded in the CT and PL catchments, respectively.The phytosociological surveys were carried out using stan-dard methods (e.g., MORAVEC et al., 1994). Plant nomen-clature follows KUBÁT et al. (2002). Each relevé was a circleplot with area of about 200 m2. The relevés were placed ran-domly within the catchments and plant communities. Thenumber of relevés placed in the individual plant communi-ties was proportional to their area. Any distinct change incover and composition of the plant species encountered dur-ing both the basic and phytosociological surveys was markedon the map.
Abundance of the individual plant species was used todistinguish between the plant species that were analyzedfor element concentrations. Plant species were not analyzedif their mean abundance was less than 1% in the wholecatchment. The following plant species had a mean abun-dance > 1% in both catchments: Athyrium distentifolium,Avenella flexuosa, Calamagrostis villosa, Luzula sylvatica,and Vaccinium myrtillus. These species created the mainmicrocoenoses and plant communities, and the understoryvegetation in both catchments was finely–structured accord-ing to these dominant species.
A 0.5 × 0.5 m frame was used to sample (AG) biomassof the understory vegetation. The frames were randomlyplaced within both catchments to cover variability in siteand stand conditions. The number of biomass samples for in-dividual plant species depended on their relative abundancein each of the catchments. Biomass samples were assigned tomicrocoenose types and plant communities according to thedominant plant species. For each sample site, AG plant ma-terial was cut using a pair of scissors, put into a plastic bagand labelled. The AG biomass samples were brought to thelaboratory and individual plant species separated. The AGbiomass of V. myrtillus was separated into leaves, annualshoots, and woody stems. In this way, the annually pro-duced biomass of V. myrtillus was estimated, and the pro-duction of AG biomass between the perennial plant species(V. myrtillus) and annual plant species (the other species inthe catchments) were compared. The samples were dried at105◦C till their weight was stabilized.
A steel corer with a 6.5 cm diameter was used to sam-ple BG biomass. Depth of the soil cores depended on localsoil properties (e.g., content of bigger stones). The over-all mean depth of the soil cores was about 15 cm; i.e. soilcores contained the majority of the fine root biomass. After
sampling, the material was withdrawn from the steel corerand put into a plastic bag. The BG biomass samples werecleaned in the laboratory using running water on a set ofsieves > 0.25 mm in diameter. They were then divided intothe following categories: non-woody fine roots, woody roots,and rhizomes. After that, the samples were dried at 105◦Cuntil their weight was stabilized.
The following sampling design was used for Athyriumdistentifolium, which grew in large tussocks. In the area witha high abundance of this species, two rectangular plots (12and 16 m2) were set only in the CT catchment. All tussocksof A. distentifolium in the grid plots were counted and theirdiameter measured. Then, the AG biomass of several tus-socks over a range of diameters was sampled in both catch-ments. The BG biomass of A. distentifolium was sampledin the centre, middle and edge of average-sized tussocks.
All mass and chemical results further reported in thispaper are given on a dry weight biomass basis.
Chemical analysis of the biomassThe dry biomass was analysed for total content of the fol-lowing elements. Total P was determined from a HNO3and HClO4 acid digest using the phosphomolybdate bluemethod (KOPÁČEK et al., 2001). Carbon (C) and nitrogen(N) were determined by a CN analyser (NC 2100, Thermo-Quest, Italy). The total concentration of metals (Ca, Mg,Na, K, Al, Fe, and Mn) was analysed using a H2SO4, HNO3,and HF mixed acid digest (200◦C, 2 h) by flame atomic ab-sorption spectrometry.
Statistical analysesThe phytosociological relevés were classified using TWIN-SPAN (HILL, 1979). The types of plant communities weredistinguished according to TWINSPAN classification ac-counting 3rd classification level. The main types of plantcommunities (vegetation groups) were determined based onthe result of this procedure. The results of the phytosoci-ological survey within the types of plant communities, thedistribution of the groups of plant communities in the catch-ments, and the map notes made during the surveys wereused in GIS to analyse and distinguish borders and areas ofindividual plant communities. The total area of the plantcommunities groups was later used to calculate the totalbiomass and CWM biomass of the understory vegetation ineach catchment.
Dry weight values of AG biomass of analyzed plantspecies samples, except A. distentifolium, were used to cal-culate the mean AG biomass individual plant species, whichwas calculated using equation (1) (competition model of co-existence of the selected plant species) (MATĚJKA, 1992a):
Af · a−1 + Cv · c−1 + Ls · l−1 + V m · v−1 = 1, (1)
where a, c, l, v are the values of the ”carrying capacity”representing the maximum weight of the biomass (g m−2)of the species growing in a monocoenose, and Af (A. flexu-osa), Cv (C. villosa), Ls (L. sylvatica), Vm (V. myrtillus)are the mean dry weights of biomass (g m−2) of the speciesin the given sample. The least square method was used tocalculate a regression model. The term carrying capacity isused here in a similar meaning as by ODUM (1959), giv-ing the maximum value of species biomass achievable underoptimal conditions. In our sense, it means without the pres-ence of any other competing species. AG biomass values of
S512 M. Svoboda et al.
A. distentifolium were calculated using a regression model,where the weight of AG biomass (m; g) is expressed as afunction of tussock diameter (D; cm):
m = a × Db, (2)
where a and b represent result of the regression solution.The carrying capacity values for individual plant
species (or mean biomass of A. distentifolium), in otherwords the biomass of i-th species per unit area – Bi, coverof i-th species in the j-th plant community type – Cij , andthe area of the j-th plant community type – Aj (the sumof area of all plant communities gives the total catchmentarea), were used to calculate the CWM of AG biomass ofthe i-th species in both catchments:
CWM i = Bi ×∑
j
Cij × Aj
/∑j
Aj (3)
This catchment weighting generates a single value for eachparameter, representing a hypothetical situation when allrepresentatives of understory vegetation are uniformly dis-tributed over the whole catchment. The total CWM AGbiomass was calculated over all incorporated species.
The mean BG biomass was calculated for all types ofmicrocoenoses. The final BG biomass means have thereforelimited significance. The CWM of BG biomass was calcu-lated as a function of mean BG biomass in the i-th type ofmicrocoenose – Bi, relative representation of the i-th typeof microcoenose in the j-th plant community type – Rij , andthe area of the j-th community type – Aj (whole catchmentarea was divided into areas of plant community types):
CWM =∑i,j
Bi × Rij × Ai
/∑j
Aj (4)
Total element pools were calculated as a function ofthe CWM and mean element concentrations of AG and BGbiomass (according to individual plant species) for each ofthe catchments.
Results
Plant coenological surveysClear differences were found between the plant commu-nities in the catchments of both lakes. C. villosa wasthe most abundant species in the CT catchment, whileV. myrtillus was the most abundant species in the PLcatchment (Tab. 1). There were 5 main types of un-derstory vegetation plant communities in each of thecatchments. Groups *000, *001, and *111 were dom-inated by A. distentifolium and represented the asso-ciation Athyrio alpestris-Piceetum Hartman ex Hart-mann et Jahn, 1967 on wet sites. Other groups ofplant communities with various shares of C. villosa andV. myrtillus belonged to the broad association Cala-magrostio villosae-Piceetum Hartman in Hartmann etJahn, 1967 (compare Husová et al., 2002). Types *010and *011 surrounding CT Lake were classified as theassociation Calamagrostio villosae-Fagetum Mikyška,
Fig. 1.
A
B
A – Map of forest types in the catchments of Čertovo Lake.The share of the individual forest type group in the CT catch-ment was: 7Y – Fageto-Piceetum saxatilis – 57.4%, 7K – Fageto-Piceetum acidophilum – 4.4%, 7V – Fageto-Piceetum acerosumhumidum – 9.7%, 8Z – Sorbeto-Piceetum (humilis) – 6.8%, 7N –Fageto-Piceetum lapidosum acidophilum – 8.9%, 8N – Piceetumlapidosum acidophilum – 0.1%, 8Y – Piceetum saxatile – 1.3%,7Z – Fageto-Piceetum humilis – 1.0%, 8R – Piceetum turfosum(montanum)– 0.4%, 8K – Piceetum acidophilum – 10.1%. Theterminology of the forest type groups is according to VIEWEGHet al. (2003).B – Map of forest types in the catchments of Plešné Lake. Theshare of the individual forest type group in the PL catchment was:7K – Fageto-Piceetum acidophilum – 1.2%, 7N – Fageto-Piceetumlapidosum acidophilum – 9.3%, 7V – Fageto-Piceetum acero-sum humidum – 0.5%, 7Y – Fageto-Piceetum saxatilis – 0.9%,8N – Piceetum lapidosum acidophilum – 25.3%, 8V – Acereto-Piceetum humidum – 1.6%, 8Y – Acereto-Piceetum humidum –45.0%, 8Z – Sorbeto-Piceetum (humilis) – 16.2%. The terminol-ogy of the forest type groups is according to VIEWEGH et al.(2003).
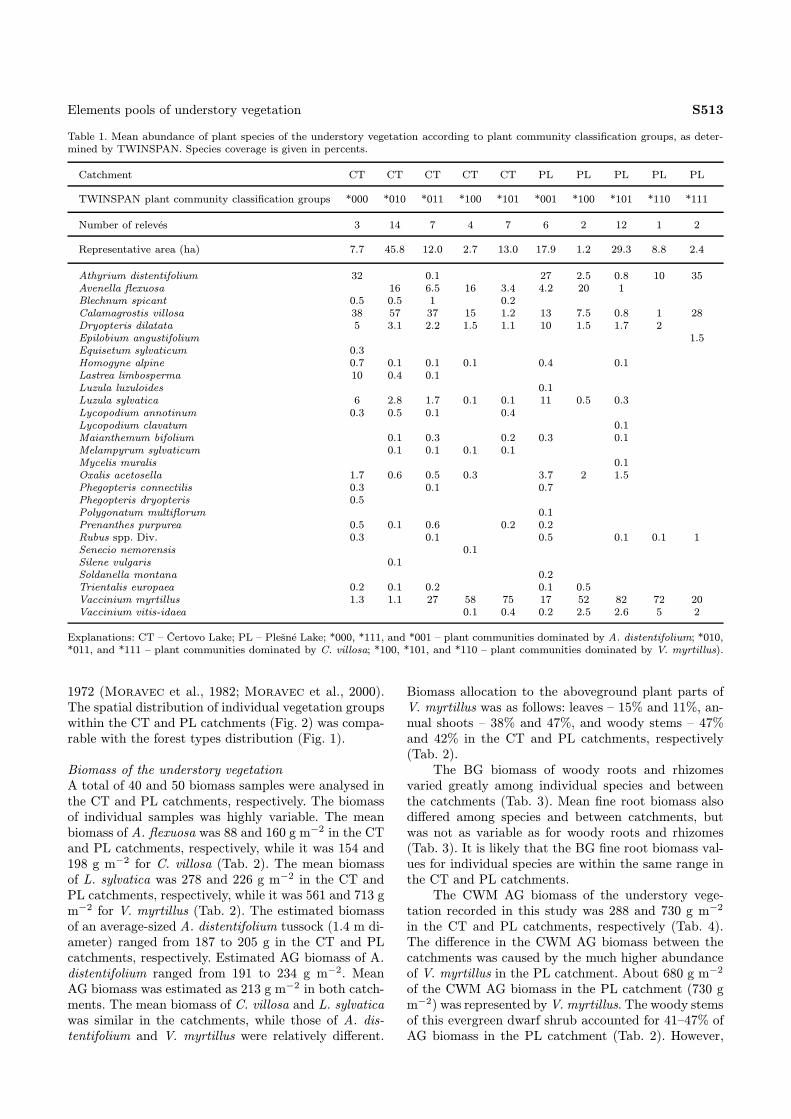
Elements pools of understory vegetation S513
Table 1. Mean abundance of plant species of the understory vegetation according to plant community classification groups, as deter-mined by TWINSPAN. Species coverage is given in percents.
Catchment CT CT CT CT CT PL PL PL PL PL
TWINSPAN plant community classification groups *000 *010 *011 *100 *101 *001 *100 *101 *110 *111
Number of relevés 3 14 7 4 7 6 2 12 1 2
Representative area (ha) 7.7 45.8 12.0 2.7 13.0 17.9 1.2 29.3 8.8 2.4
Athyrium distentifolium 32 0.1 27 2.5 0.8 10 35Avenella flexuosa 16 6.5 16 3.4 4.2 20 1Blechnum spicant 0.5 0.5 1 0.2Calamagrostis villosa 38 57 37 15 1.2 13 7.5 0.8 1 28Dryopteris dilatata 5 3.1 2.2 1.5 1.1 10 1.5 1.7 2Epilobium angustifolium 1.5Equisetum sylvaticum 0.3Homogyne alpine 0.7 0.1 0.1 0.1 0.4 0.1Lastrea limbosperma 10 0.4 0.1Luzula luzuloides 0.1Luzula sylvatica 6 2.8 1.7 0.1 0.1 11 0.5 0.3Lycopodium annotinum 0.3 0.5 0.1 0.4Lycopodium clavatum 0.1Maianthemum bifolium 0.1 0.3 0.2 0.3 0.1Melampyrum sylvaticum 0.1 0.1 0.1 0.1Mycelis muralis 0.1Oxalis acetosella 1.7 0.6 0.5 0.3 3.7 2 1.5Phegopteris connectilis 0.3 0.1 0.7Phegopteris dryopteris 0.5Polygonatum multiflorum 0.1Prenanthes purpurea 0.5 0.1 0.6 0.2 0.2Rubus spp. Div. 0.3 0.1 0.5 0.1 0.1 1Senecio nemorensis 0.1Silene vulgaris 0.1Soldanella montana 0.2Trientalis europaea 0.2 0.1 0.2 0.1 0.5Vaccinium myrtillus 1.3 1.1 27 58 75 17 52 82 72 20Vaccinium vitis-idaea 0.1 0.4 0.2 2.5 2.6 5 2
Explanations: CT – Čertovo Lake; PL – Plešné Lake; *000, *111, and *001 – plant communities dominated by A. distentifolium; *010,*011, and *111 – plant communities dominated by C. villosa; *100, *101, and *110 – plant communities dominated by V. myrtillus).
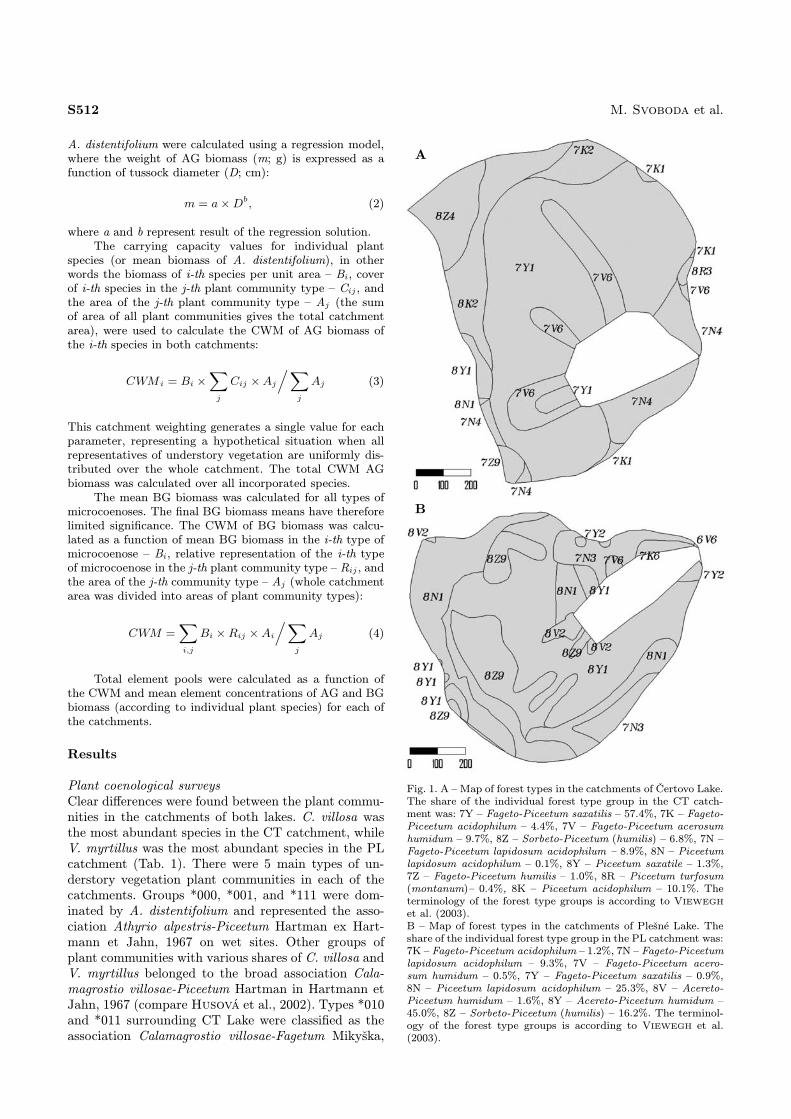
1972 (Moravec et al., 1982; Moravec et al., 2000).The spatial distribution of individual vegetation groupswithin the CT and PL catchments (Fig. 2) was compa-rable with the forest types distribution (Fig. 1).
Biomass of the understory vegetationA total of 40 and 50 biomass samples were analysed inthe CT and PL catchments, respectively. The biomassof individual samples was highly variable. The meanbiomass of A. flexuosa was 88 and 160 g m−2 in the CTand PL catchments, respectively, while it was 154 and198 g m−2 for C. villosa (Tab. 2). The mean biomassof L. sylvatica was 278 and 226 g m−2 in the CT andPL catchments, respectively, while it was 561 and 713 gm−2 for V. myrtillus (Tab. 2). The estimated biomassof an average-sized A. distentifolium tussock (1.4 m di-ameter) ranged from 187 to 205 g in the CT and PLcatchments, respectively. Estimated AG biomass of A.distentifolium ranged from 191 to 234 g m−2. MeanAG biomass was estimated as 213 g m−2 in both catch-ments. The mean biomass of C. villosa and L. sylvaticawas similar in the catchments, while those of A. dis-tentifolium and V. myrtillus were relatively different.
Biomass allocation to the aboveground plant parts ofV. myrtillus was as follows: leaves – 15% and 11%, an-nual shoots – 38% and 47%, and woody stems – 47%and 42% in the CT and PL catchments, respectively(Tab. 2).The BG biomass of woody roots and rhizomes
varied greatly among individual species and betweenthe catchments (Tab. 3). Mean fine root biomass alsodiffered among species and between catchments, butwas not as variable as for woody roots and rhizomes(Tab. 3). It is likely that the BG fine root biomass val-ues for individual species are within the same range inthe CT and PL catchments.The CWM AG biomass of the understory vege-
tation recorded in this study was 288 and 730 g m−2
in the CT and PL catchments, respectively (Tab. 4).The difference in the CWM AG biomass between thecatchments was caused by the much higher abundanceof V. myrtillus in the PL catchment. About 680 g m−2
of the CWM AG biomass in the PL catchment (730 gm−2) was represented byV. myrtillus. The woody stemsof this evergreen dwarf shrub accounted for 41–47% ofAG biomass in the PL catchment (Tab. 2). However,
S514 M. Svoboda et al.
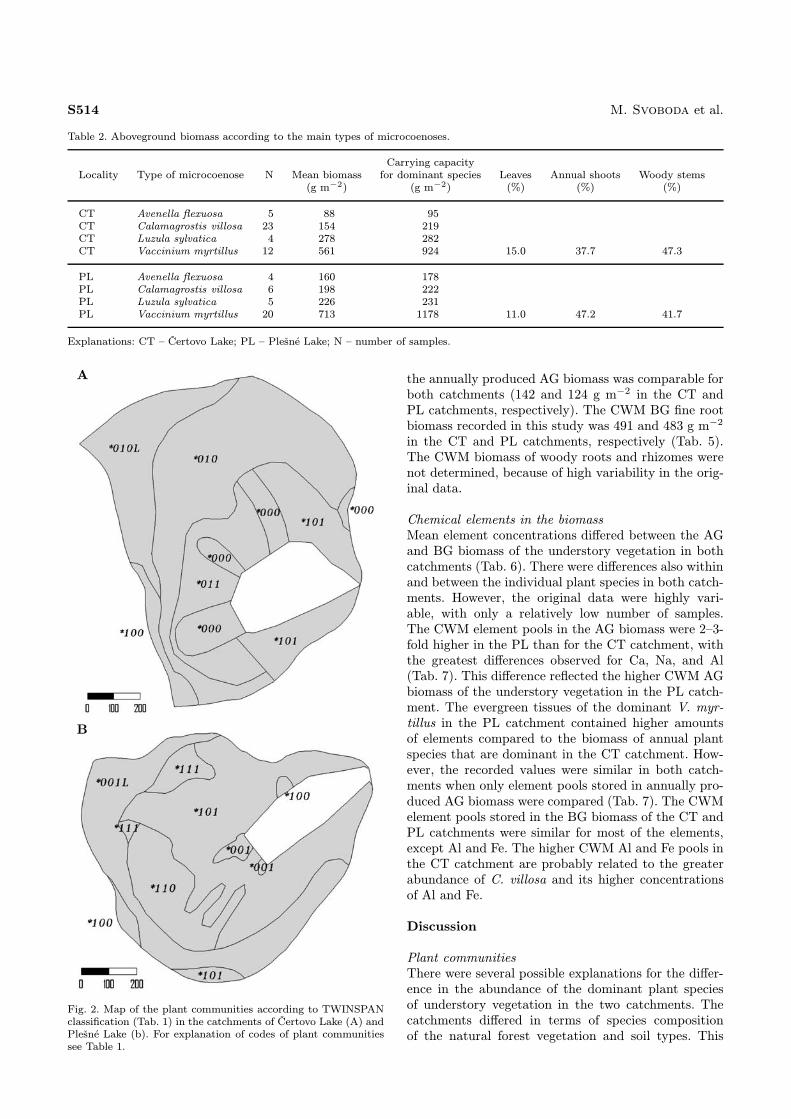
Table 2. Aboveground biomass according to the main types of microcoenoses.
Carrying capacityLocality Type of microcoenose N Mean biomass for dominant species Leaves Annual shoots Woody stems
(g m−2) (g m−2) (%) (%) (%)
CT Avenella flexuosa 5 88 95CT Calamagrostis villosa 23 154 219CT Luzula sylvatica 4 278 282CT Vaccinium myrtillus 12 561 924 15.0 37.7 47.3
PL Avenella flexuosa 4 160 178PL Calamagrostis villosa 6 198 222PL Luzula sylvatica 5 226 231PL Vaccinium myrtillus 20 713 1178 11.0 47.2 41.7
Explanations: CT – Čertovo Lake; PL – Plešné Lake; N – number of samples.
Fig. 2.
A
B
Map of the plant communities according to TWINSPANclassification (Tab. 1) in the catchments of Čertovo Lake (A) andPlešné Lake (b). For explanation of codes of plant communitiessee Table 1.
the annually produced AG biomass was comparable forboth catchments (142 and 124 g m−2 in the CT andPL catchments, respectively). The CWM BG fine rootbiomass recorded in this study was 491 and 483 g m−2
in the CT and PL catchments, respectively (Tab. 5).The CWM biomass of woody roots and rhizomes werenot determined, because of high variability in the orig-inal data.
Chemical elements in the biomassMean element concentrations differed between the AGand BG biomass of the understory vegetation in bothcatchments (Tab. 6). There were differences also withinand between the individual plant species in both catch-ments. However, the original data were highly vari-able, with only a relatively low number of samples.The CWM element pools in the AG biomass were 2–3-fold higher in the PL than for the CT catchment, withthe greatest differences observed for Ca, Na, and Al(Tab. 7). This difference reflected the higher CWM AGbiomass of the understory vegetation in the PL catch-ment. The evergreen tissues of the dominant V. myr-tillus in the PL catchment contained higher amountsof elements compared to the biomass of annual plantspecies that are dominant in the CT catchment. How-ever, the recorded values were similar in both catch-ments when only element pools stored in annually pro-duced AG biomass were compared (Tab. 7). The CWMelement pools stored in the BG biomass of the CT andPL catchments were similar for most of the elements,except Al and Fe. The higher CWM Al and Fe pools inthe CT catchment are probably related to the greaterabundance of C. villosa and its higher concentrationsof Al and Fe.
Discussion
Plant communitiesThere were several possible explanations for the differ-ence in the abundance of the dominant plant speciesof understory vegetation in the two catchments. Thecatchments differed in terms of species compositionof the natural forest vegetation and soil types. This
Elements pools of understory vegetation S515
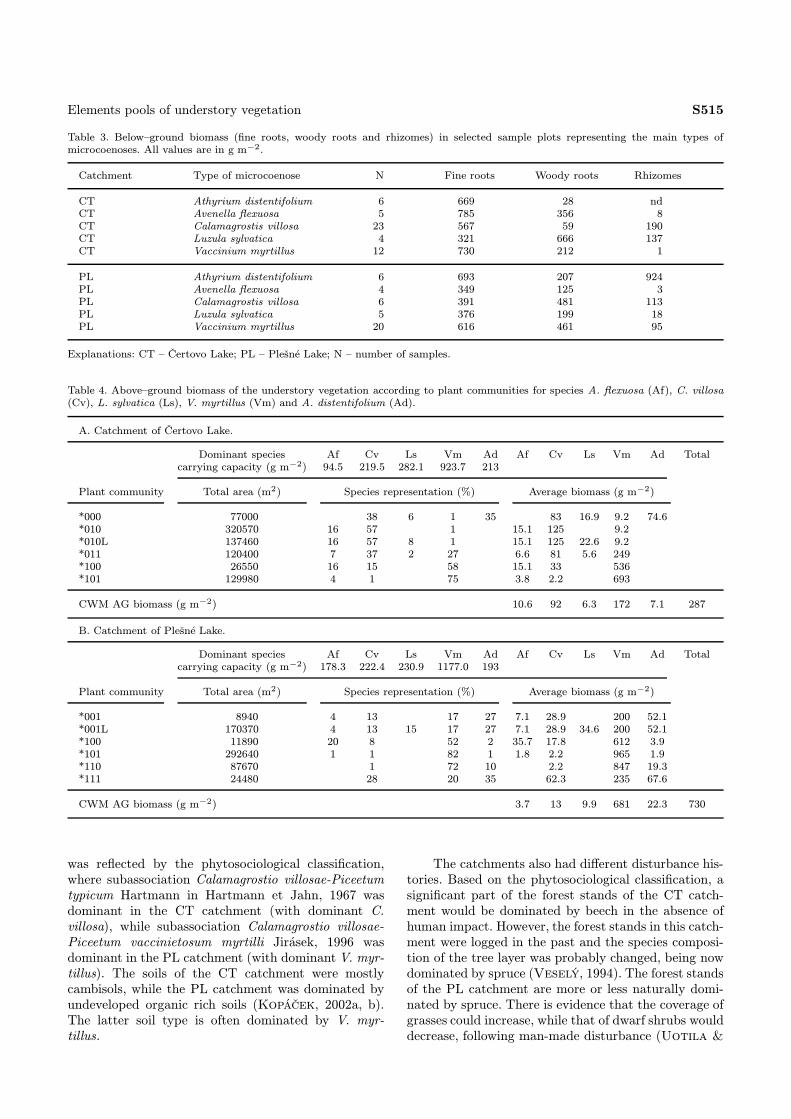
Table 3. Below–ground biomass (fine roots, woody roots and rhizomes) in selected sample plots representing the main types ofmicrocoenoses. All values are in g m−2.
Catchment Type of microcoenose N Fine roots Woody roots Rhizomes
CT Athyrium distentifolium 6 669 28 ndCT Avenella flexuosa 5 785 356 8CT Calamagrostis villosa 23 567 59 190CT Luzula sylvatica 4 321 666 137CT Vaccinium myrtillus 12 730 212 1
PL Athyrium distentifolium 6 693 207 924PL Avenella flexuosa 4 349 125 3PL Calamagrostis villosa 6 391 481 113PL Luzula sylvatica 5 376 199 18PL Vaccinium myrtillus 20 616 461 95
Explanations: CT – Čertovo Lake; PL – Plešné Lake; N – number of samples.
Table 4. Above–ground biomass of the understory vegetation according to plant communities for species A. flexuosa (Af), C. villosa(Cv), L. sylvatica (Ls), V. myrtillus (Vm) and A. distentifolium (Ad).
A. Catchment of Čertovo Lake.
Dominant species Af Cv Ls Vm Ad Af Cv Ls Vm Ad Totalcarrying capacity (g m−2) 94.5 219.5 282.1 923.7 213
Plant community Total area (m2) Species representation (%) Average biomass (g m−2)
*000 77000 38 6 1 35 83 16.9 9.2 74.6*010 320570 16 57 1 15.1 125 9.2*010L 137460 16 57 8 1 15.1 125 22.6 9.2*011 120400 7 37 2 27 6.6 81 5.6 249*100 26550 16 15 58 15.1 33 536*101 129980 4 1 75 3.8 2.2 693
CWM AG biomass (g m−2) 10.6 92 6.3 172 7.1 287
B. Catchment of Plešné Lake.
Dominant species Af Cv Ls Vm Ad Af Cv Ls Vm Ad Totalcarrying capacity (g m−2) 178.3 222.4 230.9 1177.0 193
Plant community Total area (m2) Species representation (%) Average biomass (g m−2)
*001 8940 4 13 17 27 7.1 28.9 200 52.1*001L 170370 4 13 15 17 27 7.1 28.9 34.6 200 52.1*100 11890 20 8 52 2 35.7 17.8 612 3.9*101 292640 1 1 82 1 1.8 2.2 965 1.9*110 87670 1 72 10 2.2 847 19.3*111 24480 28 20 35 62.3 235 67.6
CWM AG biomass (g m−2) 3.7 13 9.9 681 22.3 730
was reflected by the phytosociological classification,where subassociation Calamagrostio villosae-Piceetumtypicum Hartmann in Hartmann et Jahn, 1967 wasdominant in the CT catchment (with dominant C.villosa), while subassociation Calamagrostio villosae-Piceetum vaccinietosum myrtilli Jirásek, 1996 wasdominant in the PL catchment (with dominant V. myr-tillus). The soils of the CT catchment were mostlycambisols, while the PL catchment was dominated byundeveloped organic rich soils (Kopáček, 2002a, b).The latter soil type is often dominated by V. myr-tillus.
The catchments also had different disturbance his-tories. Based on the phytosociological classification, asignificant part of the forest stands of the CT catch-ment would be dominated by beech in the absence ofhuman impact. However, the forest stands in this catch-ment were logged in the past and the species composi-tion of the tree layer was probably changed, being nowdominated by spruce (Veselý, 1994). The forest standsof the PL catchment are more or less naturally domi-nated by spruce. There is evidence that the coverage ofgrasses could increase, while that of dwarf shrubs woulddecrease, following man-made disturbance (Uotila &
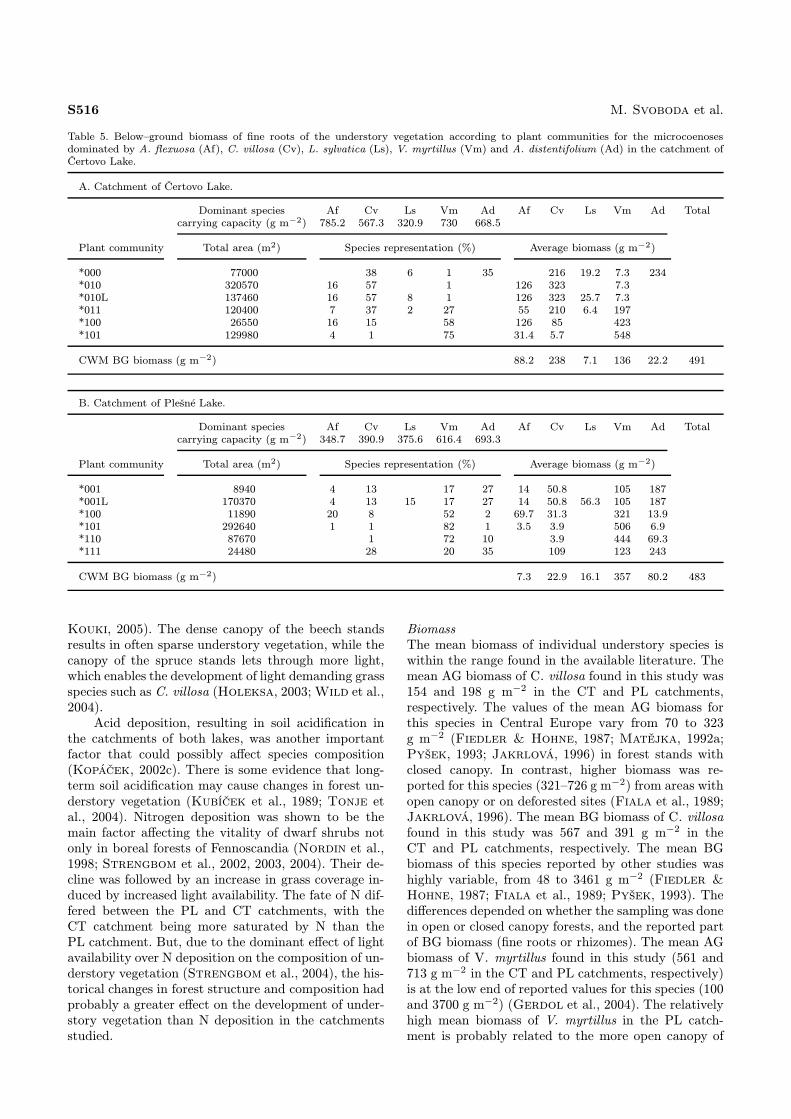
S516 M. Svoboda et al.
Table 5. Below–ground biomass of fine roots of the understory vegetation according to plant communities for the microcoenosesdominated by A. flexuosa (Af), C. villosa (Cv), L. sylvatica (Ls), V. myrtillus (Vm) and A. distentifolium (Ad) in the catchment ofČertovo Lake.
A. Catchment of Čertovo Lake.
Dominant species Af Cv Ls Vm Ad Af Cv Ls Vm Ad Totalcarrying capacity (g m−2) 785.2 567.3 320.9 730 668.5
Plant community Total area (m2) Species representation (%) Average biomass (g m−2)
*000 77000 38 6 1 35 216 19.2 7.3 234*010 320570 16 57 1 126 323 7.3*010L 137460 16 57 8 1 126 323 25.7 7.3*011 120400 7 37 2 27 55 210 6.4 197*100 26550 16 15 58 126 85 423*101 129980 4 1 75 31.4 5.7 548
CWM BG biomass (g m−2) 88.2 238 7.1 136 22.2 491
B. Catchment of Plešné Lake.
Dominant species Af Cv Ls Vm Ad Af Cv Ls Vm Ad Totalcarrying capacity (g m−2) 348.7 390.9 375.6 616.4 693.3
Plant community Total area (m2) Species representation (%) Average biomass (g m−2)
*001 8940 4 13 17 27 14 50.8 105 187*001L 170370 4 13 15 17 27 14 50.8 56.3 105 187*100 11890 20 8 52 2 69.7 31.3 321 13.9*101 292640 1 1 82 1 3.5 3.9 506 6.9*110 87670 1 72 10 3.9 444 69.3*111 24480 28 20 35 109 123 243
CWM BG biomass (g m−2) 7.3 22.9 16.1 357 80.2 483
Kouki, 2005). The dense canopy of the beech standsresults in often sparse understory vegetation, while thecanopy of the spruce stands lets through more light,which enables the development of light demanding grassspecies such as C. villosa (Holeksa, 2003;Wild et al.,2004).Acid deposition, resulting in soil acidification in
the catchments of both lakes, was another importantfactor that could possibly affect species composition(Kopáček, 2002c). There is some evidence that long-term soil acidification may cause changes in forest un-derstory vegetation (Kubíček et al., 1989; Tonje etal., 2004). Nitrogen deposition was shown to be themain factor affecting the vitality of dwarf shrubs notonly in boreal forests of Fennoscandia (Nordin et al.,1998; Strengbom et al., 2002, 2003, 2004). Their de-cline was followed by an increase in grass coverage in-duced by increased light availability. The fate of N dif-fered between the PL and CT catchments, with theCT catchment being more saturated by N than thePL catchment. But, due to the dominant effect of lightavailability over N deposition on the composition of un-derstory vegetation (Strengbom et al., 2004), the his-torical changes in forest structure and composition hadprobably a greater effect on the development of under-story vegetation than N deposition in the catchmentsstudied.
BiomassThe mean biomass of individual understory species iswithin the range found in the available literature. Themean AG biomass of C. villosa found in this study was154 and 198 g m−2 in the CT and PL catchments,respectively. The values of the mean AG biomass forthis species in Central Europe vary from 70 to 323g m−2 (Fiedler & Hohne, 1987; Matějka, 1992a;Pyšek, 1993; Jakrlová, 1996) in forest stands withclosed canopy. In contrast, higher biomass was re-ported for this species (321–726 g m−2) from areas withopen canopy or on deforested sites (Fiala et al., 1989;Jakrlová, 1996). The mean BG biomass of C. villosafound in this study was 567 and 391 g m−2 in theCT and PL catchments, respectively. The mean BGbiomass of this species reported by other studies washighly variable, from 48 to 3461 g m−2 (Fiedler &Hohne, 1987; Fiala et al., 1989; Pyšek, 1993). Thedifferences depended on whether the sampling was donein open or closed canopy forests, and the reported partof BG biomass (fine roots or rhizomes). The mean AGbiomass of V. myrtillus found in this study (561 and713 g m−2 in the CT and PL catchments, respectively)is at the low end of reported values for this species (100and 3700 g m−2) (Gerdol et al., 2004). The relativelyhigh mean biomass of V. myrtillus in the PL catch-ment is probably related to the more open canopy of
Elements pools of understory vegetation S517
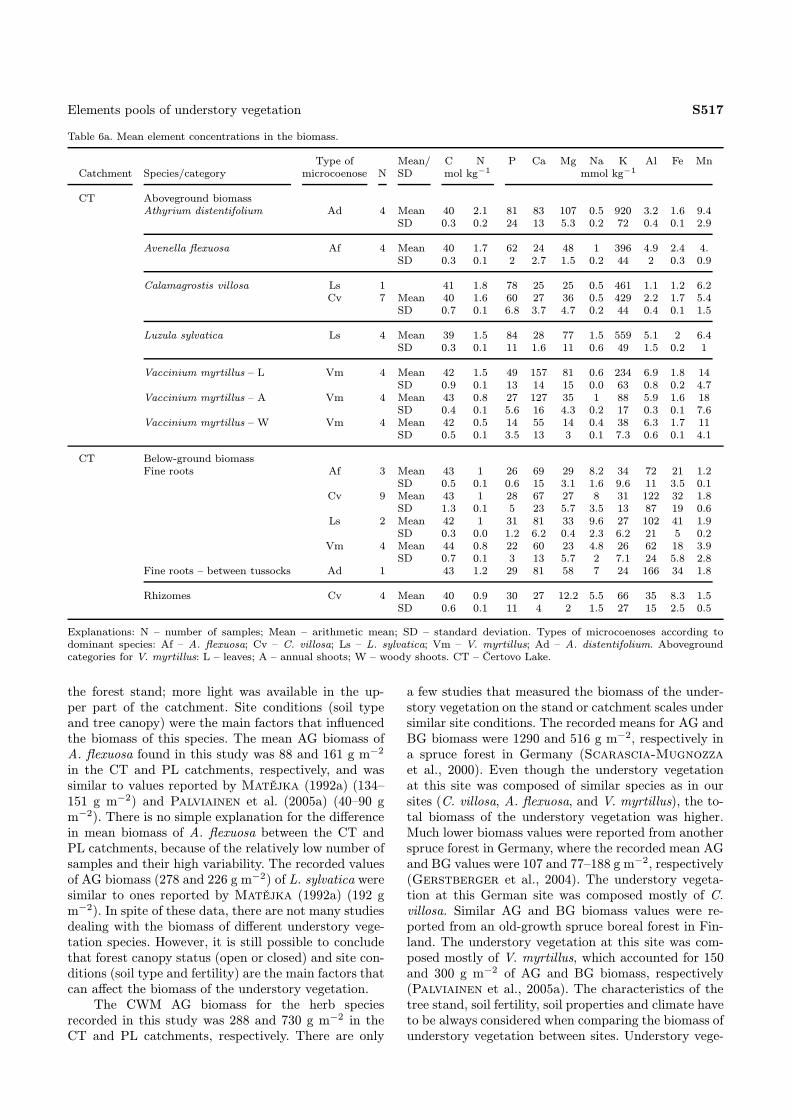
Table 6a. Mean element concentrations in the biomass.
Type of Mean/ C N P Ca Mg Na K Al Fe MnCatchment Species/category microcoenose N SD mol kg−1 mmol kg−1
CT Aboveground biomassAthyrium distentifolium Ad 4 Mean 40 2.1 81 83 107 0.5 920 3.2 1.6 9.4
SD 0.3 0.2 24 13 5.3 0.2 72 0.4 0.1 2.9
Avenella flexuosa Af 4 Mean 40 1.7 62 24 48 1 396 4.9 2.4 4.SD 0.3 0.1 2 2.7 1.5 0.2 44 2 0.3 0.9
Calamagrostis villosa Ls 1 41 1.8 78 25 25 0.5 461 1.1 1.2 6.2Cv 7 Mean 40 1.6 60 27 36 0.5 429 2.2 1.7 5.4
SD 0.7 0.1 6.8 3.7 4.7 0.2 44 0.4 0.1 1.5
Luzula sylvatica Ls 4 Mean 39 1.5 84 28 77 1.5 559 5.1 2 6.4SD 0.3 0.1 11 1.6 11 0.6 49 1.5 0.2 1
Vaccinium myrtillus – L Vm 4 Mean 42 1.5 49 157 81 0.6 234 6.9 1.8 14SD 0.9 0.1 13 14 15 0.0 63 0.8 0.2 4.7
Vaccinium myrtillus – A Vm 4 Mean 43 0.8 27 127 35 1 88 5.9 1.6 18SD 0.4 0.1 5.6 16 4.3 0.2 17 0.3 0.1 7.6
Vaccinium myrtillus – W Vm 4 Mean 42 0.5 14 55 14 0.4 38 6.3 1.7 11SD 0.5 0.1 3.5 13 3 0.1 7.3 0.6 0.1 4.1
CT Below-ground biomassFine roots Af 3 Mean 43 1 26 69 29 8.2 34 72 21 1.2
SD 0.5 0.1 0.6 15 3.1 1.6 9.6 11 3.5 0.1Cv 9 Mean 43 1 28 67 27 8 31 122 32 1.8
SD 1.3 0.1 5 23 5.7 3.5 13 87 19 0.6Ls 2 Mean 42 1 31 81 33 9.6 27 102 41 1.9
SD 0.3 0.0 1.2 6.2 0.4 2.3 6.2 21 5 0.2Vm 4 Mean 44 0.8 22 60 23 4.8 26 62 18 3.9
SD 0.7 0.1 3 13 5.7 2 7.1 24 5.8 2.8Fine roots – between tussocks Ad 1 43 1.2 29 81 58 7 24 166 34 1.8
Rhizomes Cv 4 Mean 40 0.9 30 27 12.2 5.5 66 35 8.3 1.5SD 0.6 0.1 11 4 2 1.5 27 15 2.5 0.5
Explanations: N – number of samples; Mean – arithmetic mean; SD – standard deviation. Types of microcoenoses according todominant species: Af – A. flexuosa; Cv – C. villosa; Ls – L. sylvatica; Vm – V. myrtillus; Ad – A. distentifolium. Abovegroundcategories for V. myrtillus: L – leaves; A – annual shoots; W – woody shoots. CT – Čertovo Lake.
the forest stand; more light was available in the up-per part of the catchment. Site conditions (soil typeand tree canopy) were the main factors that influencedthe biomass of this species. The mean AG biomass ofA. flexuosa found in this study was 88 and 161 g m−2
in the CT and PL catchments, respectively, and wassimilar to values reported by Matějka (1992a) (134–151 g m−2) and Palviainen et al. (2005a) (40–90 gm−2). There is no simple explanation for the differencein mean biomass of A. flexuosa between the CT andPL catchments, because of the relatively low number ofsamples and their high variability. The recorded valuesof AG biomass (278 and 226 g m−2) of L. sylvatica weresimilar to ones reported by Matějka (1992a) (192 gm−2). In spite of these data, there are not many studiesdealing with the biomass of different understory vege-tation species. However, it is still possible to concludethat forest canopy status (open or closed) and site con-ditions (soil type and fertility) are the main factors thatcan affect the biomass of the understory vegetation.The CWM AG biomass for the herb species
recorded in this study was 288 and 730 g m−2 in theCT and PL catchments, respectively. There are only
a few studies that measured the biomass of the under-story vegetation on the stand or catchment scales undersimilar site conditions. The recorded means for AG andBG biomass were 1290 and 516 g m−2, respectively ina spruce forest in Germany (Scarascia-Mugnozzaet al., 2000). Even though the understory vegetationat this site was composed of similar species as in oursites (C. villosa, A. flexuosa, and V. myrtillus), the to-tal biomass of the understory vegetation was higher.Much lower biomass values were reported from anotherspruce forest in Germany, where the recorded mean AGand BG values were 107 and 77–188 g m−2, respectively(Gerstberger et al., 2004). The understory vegeta-tion at this German site was composed mostly of C.villosa. Similar AG and BG biomass values were re-ported from an old-growth spruce boreal forest in Fin-land. The understory vegetation at this site was com-posed mostly of V. myrtillus, which accounted for 150and 300 g m−2 of AG and BG biomass, respectively(Palviainen et al., 2005a). The characteristics of thetree stand, soil fertility, soil properties and climate haveto be always considered when comparing the biomass ofunderstory vegetation between sites. Understory vege-
S518 M. Svoboda et al.
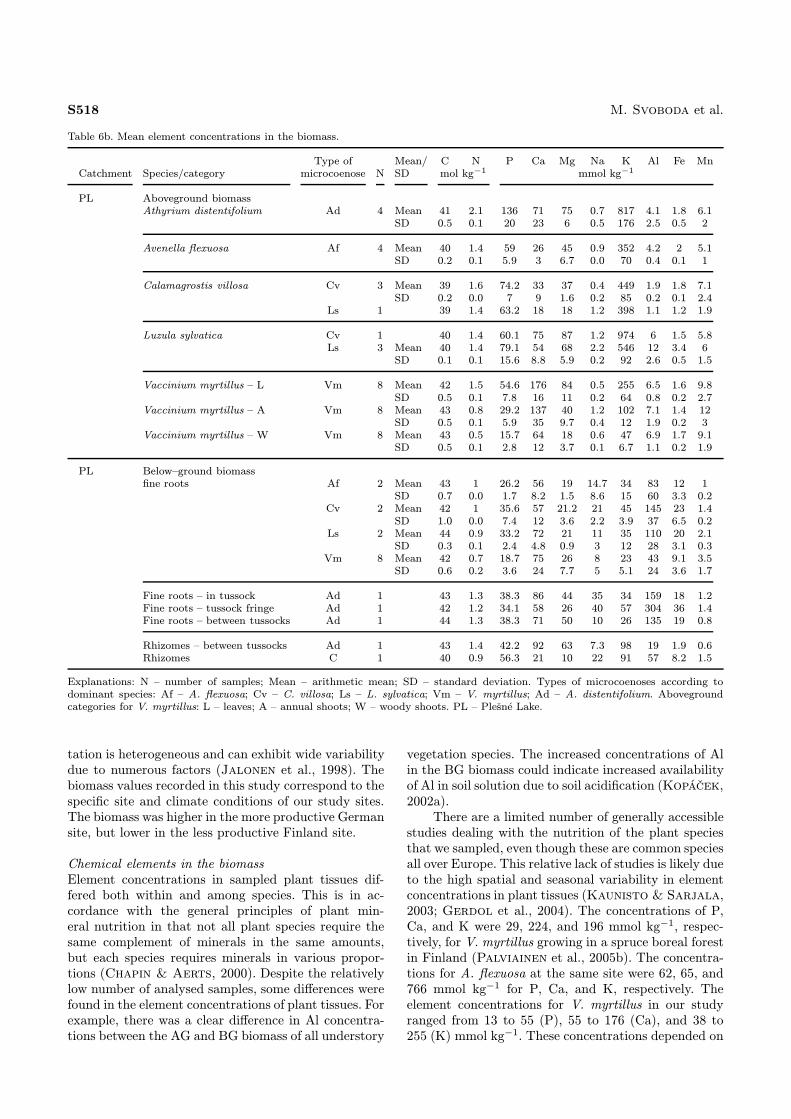
Table 6b. Mean element concentrations in the biomass.
Type of Mean/ C N P Ca Mg Na K Al Fe MnCatchment Species/category microcoenose N SD mol kg−1 mmol kg−1
PL Aboveground biomassAthyrium distentifolium Ad 4 Mean 41 2.1 136 71 75 0.7 817 4.1 1.8 6.1
SD 0.5 0.1 20 23 6 0.5 176 2.5 0.5 2
Avenella flexuosa Af 4 Mean 40 1.4 59 26 45 0.9 352 4.2 2 5.1SD 0.2 0.1 5.9 3 6.7 0.0 70 0.4 0.1 1
Calamagrostis villosa Cv 3 Mean 39 1.6 74.2 33 37 0.4 449 1.9 1.8 7.1SD 0.2 0.0 7 9 1.6 0.2 85 0.2 0.1 2.4
Ls 1 39 1.4 63.2 18 18 1.2 398 1.1 1.2 1.9
Luzula sylvatica Cv 1 40 1.4 60.1 75 87 1.2 974 6 1.5 5.8Ls 3 Mean 40 1.4 79.1 54 68 2.2 546 12 3.4 6
SD 0.1 0.1 15.6 8.8 5.9 0.2 92 2.6 0.5 1.5
Vaccinium myrtillus – L Vm 8 Mean 42 1.5 54.6 176 84 0.5 255 6.5 1.6 9.8SD 0.5 0.1 7.8 16 11 0.2 64 0.8 0.2 2.7
Vaccinium myrtillus – A Vm 8 Mean 43 0.8 29.2 137 40 1.2 102 7.1 1.4 12SD 0.5 0.1 5.9 35 9.7 0.4 12 1.9 0.2 3
Vaccinium myrtillus – W Vm 8 Mean 43 0.5 15.7 64 18 0.6 47 6.9 1.7 9.1SD 0.5 0.1 2.8 12 3.7 0.1 6.7 1.1 0.2 1.9
PL Below–ground biomassfine roots Af 2 Mean 43 1 26.2 56 19 14.7 34 83 12 1
SD 0.7 0.0 1.7 8.2 1.5 8.6 15 60 3.3 0.2Cv 2 Mean 42 1 35.6 57 21.2 21 45 145 23 1.4
SD 1.0 0.0 7.4 12 3.6 2.2 3.9 37 6.5 0.2Ls 2 Mean 44 0.9 33.2 72 21 11 35 110 20 2.1
SD 0.3 0.1 2.4 4.8 0.9 3 12 28 3.1 0.3Vm 8 Mean 42 0.7 18.7 75 26 8 23 43 9.1 3.5
SD 0.6 0.2 3.6 24 7.7 5 5.1 24 3.6 1.7
Fine roots – in tussock Ad 1 43 1.3 38.3 86 44 35 34 159 18 1.2Fine roots – tussock fringe Ad 1 42 1.2 34.1 58 26 40 57 304 36 1.4Fine roots – between tussocks Ad 1 44 1.3 38.3 71 50 10 26 135 19 0.8
Rhizomes – between tussocks Ad 1 43 1.4 42.2 92 63 7.3 98 19 1.9 0.6Rhizomes C 1 40 0.9 56.3 21 10 22 91 57 8.2 1.5
Explanations: N – number of samples; Mean – arithmetic mean; SD – standard deviation. Types of microcoenoses according todominant species: Af – A. flexuosa; Cv – C. villosa; Ls – L. sylvatica; Vm – V. myrtillus; Ad – A. distentifolium. Abovegroundcategories for V. myrtillus: L – leaves; A – annual shoots; W – woody shoots. PL – Plešné Lake.
tation is heterogeneous and can exhibit wide variabilitydue to numerous factors (Jalonen et al., 1998). Thebiomass values recorded in this study correspond to thespecific site and climate conditions of our study sites.The biomass was higher in the more productive Germansite, but lower in the less productive Finland site.
Chemical elements in the biomassElement concentrations in sampled plant tissues dif-fered both within and among species. This is in ac-cordance with the general principles of plant min-eral nutrition in that not all plant species require thesame complement of minerals in the same amounts,but each species requires minerals in various propor-tions (Chapin & Aerts, 2000). Despite the relativelylow number of analysed samples, some differences werefound in the element concentrations of plant tissues. Forexample, there was a clear difference in Al concentra-tions between the AG and BG biomass of all understory
vegetation species. The increased concentrations of Alin the BG biomass could indicate increased availabilityof Al in soil solution due to soil acidification (Kopáček,2002a).There are a limited number of generally accessible
studies dealing with the nutrition of the plant speciesthat we sampled, even though these are common speciesall over Europe. This relative lack of studies is likely dueto the high spatial and seasonal variability in elementconcentrations in plant tissues (Kaunisto & Sarjala,2003; Gerdol et al., 2004). The concentrations of P,Ca, and K were 29, 224, and 196 mmol kg−1, respec-tively, for V. myrtillus growing in a spruce boreal forestin Finland (Palviainen et al., 2005b). The concentra-tions for A. flexuosa at the same site were 62, 65, and766 mmol kg−1 for P, Ca, and K, respectively. Theelement concentrations for V. myrtillus in our studyranged from 13 to 55 (P), 55 to 176 (Ca), and 38 to255 (K) mmol kg−1. These concentrations depended on
Elements pools of understory vegetation S519
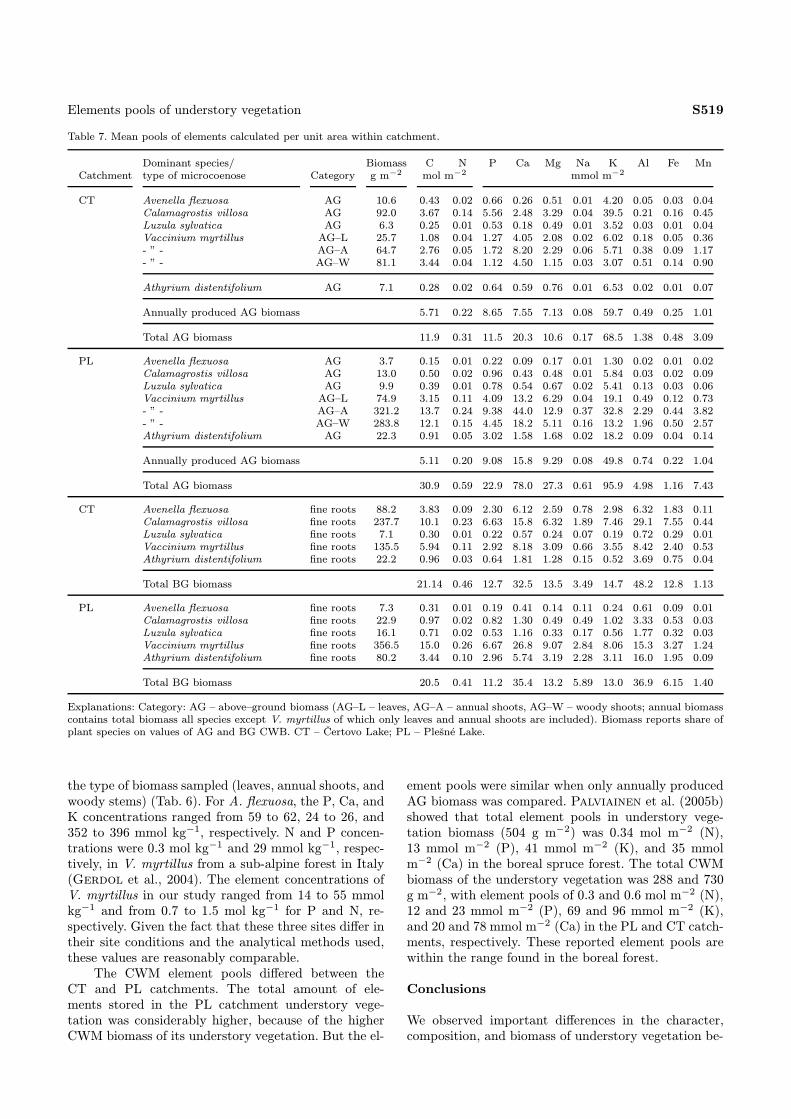
Table 7. Mean pools of elements calculated per unit area within catchment.
Dominant species/ Biomass C N P Ca Mg Na K Al Fe MnCatchment type of microcoenose Category g m−2 mol m−2 mmol m−2
CT Avenella flexuosa AG 10.6 0.43 0.02 0.66 0.26 0.51 0.01 4.20 0.05 0.03 0.04Calamagrostis villosa AG 92.0 3.67 0.14 5.56 2.48 3.29 0.04 39.5 0.21 0.16 0.45Luzula sylvatica AG 6.3 0.25 0.01 0.53 0.18 0.49 0.01 3.52 0.03 0.01 0.04Vaccinium myrtillus AG–L 25.7 1.08 0.04 1.27 4.05 2.08 0.02 6.02 0.18 0.05 0.36- ” - AG–A 64.7 2.76 0.05 1.72 8.20 2.29 0.06 5.71 0.38 0.09 1.17- ” - AG–W 81.1 3.44 0.04 1.12 4.50 1.15 0.03 3.07 0.51 0.14 0.90
Athyrium distentifolium AG 7.1 0.28 0.02 0.64 0.59 0.76 0.01 6.53 0.02 0.01 0.07
Annually produced AG biomass 5.71 0.22 8.65 7.55 7.13 0.08 59.7 0.49 0.25 1.01
Total AG biomass 11.9 0.31 11.5 20.3 10.6 0.17 68.5 1.38 0.48 3.09
PL Avenella flexuosa AG 3.7 0.15 0.01 0.22 0.09 0.17 0.01 1.30 0.02 0.01 0.02Calamagrostis villosa AG 13.0 0.50 0.02 0.96 0.43 0.48 0.01 5.84 0.03 0.02 0.09Luzula sylvatica AG 9.9 0.39 0.01 0.78 0.54 0.67 0.02 5.41 0.13 0.03 0.06Vaccinium myrtillus AG–L 74.9 3.15 0.11 4.09 13.2 6.29 0.04 19.1 0.49 0.12 0.73- ” - AG–A 321.2 13.7 0.24 9.38 44.0 12.9 0.37 32.8 2.29 0.44 3.82- ” - AG–W 283.8 12.1 0.15 4.45 18.2 5.11 0.16 13.2 1.96 0.50 2.57Athyrium distentifolium AG 22.3 0.91 0.05 3.02 1.58 1.68 0.02 18.2 0.09 0.04 0.14
Annually produced AG biomass 5.11 0.20 9.08 15.8 9.29 0.08 49.8 0.74 0.22 1.04
Total AG biomass 30.9 0.59 22.9 78.0 27.3 0.61 95.9 4.98 1.16 7.43
CT Avenella flexuosa fine roots 88.2 3.83 0.09 2.30 6.12 2.59 0.78 2.98 6.32 1.83 0.11Calamagrostis villosa fine roots 237.7 10.1 0.23 6.63 15.8 6.32 1.89 7.46 29.1 7.55 0.44Luzula sylvatica fine roots 7.1 0.30 0.01 0.22 0.57 0.24 0.07 0.19 0.72 0.29 0.01Vaccinium myrtillus fine roots 135.5 5.94 0.11 2.92 8.18 3.09 0.66 3.55 8.42 2.40 0.53Athyrium distentifolium fine roots 22.2 0.96 0.03 0.64 1.81 1.28 0.15 0.52 3.69 0.75 0.04
Total BG biomass 21.14 0.46 12.7 32.5 13.5 3.49 14.7 48.2 12.8 1.13
PL Avenella flexuosa fine roots 7.3 0.31 0.01 0.19 0.41 0.14 0.11 0.24 0.61 0.09 0.01Calamagrostis villosa fine roots 22.9 0.97 0.02 0.82 1.30 0.49 0.49 1.02 3.33 0.53 0.03Luzula sylvatica fine roots 16.1 0.71 0.02 0.53 1.16 0.33 0.17 0.56 1.77 0.32 0.03Vaccinium myrtillus fine roots 356.5 15.0 0.26 6.67 26.8 9.07 2.84 8.06 15.3 3.27 1.24Athyrium distentifolium fine roots 80.2 3.44 0.10 2.96 5.74 3.19 2.28 3.11 16.0 1.95 0.09
Total BG biomass 20.5 0.41 11.2 35.4 13.2 5.89 13.0 36.9 6.15 1.40
Explanations: Category: AG – above–ground biomass (AG–L – leaves, AG–A – annual shoots, AG–W – woody shoots; annual biomasscontains total biomass all species except V. myrtillus of which only leaves and annual shoots are included). Biomass reports share ofplant species on values of AG and BG CWB. CT – Čertovo Lake; PL – Plešné Lake.
the type of biomass sampled (leaves, annual shoots, andwoody stems) (Tab. 6). For A. flexuosa, the P, Ca, andK concentrations ranged from 59 to 62, 24 to 26, and352 to 396 mmol kg−1, respectively. N and P concen-trations were 0.3 mol kg−1 and 29 mmol kg−1, respec-tively, in V. myrtillus from a sub-alpine forest in Italy(Gerdol et al., 2004). The element concentrations ofV. myrtillus in our study ranged from 14 to 55 mmolkg−1 and from 0.7 to 1.5 mol kg−1 for P and N, re-spectively. Given the fact that these three sites differ intheir site conditions and the analytical methods used,these values are reasonably comparable.The CWM element pools differed between the
CT and PL catchments. The total amount of ele-ments stored in the PL catchment understory vege-tation was considerably higher, because of the higherCWM biomass of its understory vegetation. But the el-
ement pools were similar when only annually producedAG biomass was compared. Palviainen et al. (2005b)showed that total element pools in understory vege-tation biomass (504 g m−2) was 0.34 mol m−2 (N),13 mmol m−2 (P), 41 mmol m−2 (K), and 35 mmolm−2 (Ca) in the boreal spruce forest. The total CWMbiomass of the understory vegetation was 288 and 730g m−2, with element pools of 0.3 and 0.6 mol m−2 (N),12 and 23 mmol m−2 (P), 69 and 96 mmol m−2 (K),and 20 and 78 mmol m−2 (Ca) in the PL and CT catch-ments, respectively. These reported element pools arewithin the range found in the boreal forest.
Conclusions
We observed important differences in the character,composition, and biomass of understory vegetation be-
S520 M. Svoboda et al.
tween the PL and CT catchments in the Bohemian For-est, resulting in significant differences in the associatedpools of key elements. The CWM AG biomass of theunderstory vegetation, as well as the associated CWMelements pools, was 2–3 times higher in the PL thanCT catchment, with the greatest differences observedfor Ca, Na, and Al. The differences were predominantlycaused by higher abundance of V. myrtillus in the PLcatchment, while the understory vegetation was dom-inated by C. villosa in the CT catchment. The CWMBG biomass of the understory vegetation was similar inboth catchments.The differences in both site factors and history of
land use were probably responsible for the observed dif-ferences in the character and pools of the understoryvegetation in the CT and PL catchments. The catch-ments differ in the proportion of individual soil typesand catchments morphology. Without a more detailedknowledge of the land use history and its impact onthe vegetation in the catchments, it is, however, diffi-cult to conclude whether the difference in the characterof understory vegetation reflects the natural or anthro-pogenic factors.The major aim of this study was to evaluate dif-
ferences in the understory vegetation in the PL andCT catchments. Further evaluation of the data (Svo-boda et al., 2006; Šantrůčková et al., 2006), how-ever, suggested their following implication for wholeecosystems studies: (1) The understory vegetation ofC. villosa played an important role in N balance onthe catchment scale. The higher abundance of C. vil-losa in the CT catchment possibly caused higher Nflux from the litter to the CT soil compared to thePL catchment, where V. myrtillus was the most abun-dant species (Šantrůčková et al., 2006). (2) Com-paring the data on element pools in understory veg-etation to those in the tree layer showed that theannual uptake of nutrients by these two vegetationlayers were of the same magnitude (Svoboda etal., 2006). These results imply that adequate atten-tion should be paid to the role of understory veg-etation in element cycling at the whole ecosystemscale.
Acknowledgements
We acknowledge the field and laboratory assistance pro-vided by our colleagues from the Faculty of Environment,Czech University of Agriculture in Prague (particulary toK. GRYGAROVÁ, M. ČÍŽEK, B. PITNEROVÁ, L. HATLA-PATKOVÁ, and R. ŠOLC). We thank the Šumava NationalPark authorities for their administrative support. We thankK. EDWARDS for proof reading. This study was supportedby the Grant Agency of the Czech Republic (project No.206/03/1583) and partly by the Grant Agency of the Min-istry of Agriculture of the Czech Republic (project No.NAZV QG50105).
References
CHAPIN, F.S. & AERTS, R. 2000. The mineral nutrition of wildplants revisited: A re-evaluation of processes and patterns.Adv. Ecol. Res. 30: 1–67.
FIALA, K., JAKRLOVÁ, J. & ZELENÁ, V. 1989. Biomass partition-ing in two Calamagrostis villosa stands on deforested sites.Folia Geobot. 24: 207–210.
FIALA, K., TŮMA, I., HOLUB, P. & JANDÁK, J. 2005. The roleof Calamagrostis communities in preventing soil acifiticationand base cation losses in a deforested mountain area affectedby acid deposition. Plant Soil 268: 35–49.
FIEDLER, H.J. & HOHNE, H. 1987. Biomass production and nu-trient content of Calamagrostis villosa (Chaix) J. F. Gmelinin a spruce forest. Flora 179: 109–123.
FINER, L., MANNERKOSKI, H., PIIRAINEN, S. & STARR, M. 2003.Carbon and nitrogen pools in an old–growth, Norway sprucemixed forest in eastern Finland and changes associated withclear–cutting. For. Ecol. Manag. 174: 51–63.
GEORGE, L.O. & BAZZAZ, F.A. 1999. The fern understory as anecological filter: emergence and establishment of canopy–treeseedlings. Ecology 80: 833–845.
GERDOL, R., ANFODILLO, T., GUALMINI, M., CANNONE, N.,LUCA, B. & BRANCALEONI, L. 2004. Biomass distributionof two subalpine dwarf–shrubs in relation to soil moistureand nutrient content. J. Veg. Sci. 15: 457–464.
GERSTBERGER, P., FOKEN, T. & KALBITZ, K. 2004. TheLehstenbach and Steinkreuz catchments in NE Bavaria, Ger-many, pp. 15–41. In: MATZNER, E. (ed.) Biogeochemistry offorested catchments in a changing environment, EcologicalStudies 172, Springer-Verlag, Berlin – Heidelberg.
HELMISAARI, H.S. 1995. Nutrient cycling in Pinus sylvestrisstands in eastern Finland. Plant Soil 168–169: 327–336.
HILL, M.O. 1979. TWINSPAN – a FORTRAN program for ar-ranging multivariate data in an ordered two way table by clas-sification of individuals and attributes. Cornell Univ., Ithaca,48 pp.
HOLEKSA, J. 2003. Relationship between field–layer vegetationand canopy openings in a Carpathian subalpine spruce forest.Plant Ecol. 168: 57–67.
HOLUB, P. 1999. Hodnocení příjmu dusíku a jeho retranslokacetravami na odlesněných plochách [Assessment of nitrogen up-take and its retranslocation by gramineous plants on the de-forested land]. J. For. Sci. 45: 358–364.
HUBER, C., WEIS, W., BUAMGARTEN, M. & GOTTLEIN, A. 2004.Spatial and temporal variation of seepage water chemistry af-ter femel and small scale clear-cutting in a N-saturated Nor-way spruce stand. Plant Soil 267: 23–40.
HUSOVÁ, M., JIRÁSEK, J. & MORAVEC, J. 2002. Jehličnaté lesy[Coniferous forests]. In: MORAVEC, J. (ed.) Přehled vegetaceČeské republiky [Vegetation survey of the Czech Republic],Vol. 3, Academia, Praha, 128 pp.
JAKRLOVÁ, J. 1996. Variability of aboveground production ofCalamagrostis villosa in localities exposed to immissions inthe region of Beskydy Mts, pp. 75–82. In: FIALA, K. (ed.)Grass ecosystems of deforested areas in the Beskydy Mts,Preliminary results of ecological studies, Proceedings of theworkshop held in Brno, Institute of Landscape Ecology, Brno.
JANKOVSKÁ, V. 2006. Late Glacial and Holocene history ofPlešné Lake and its surrounding landscape based on pollenand palaeoalgological analyses. Biologia, Bratislava 61,Suppl. 20: S371–S385.
JALONEN, J., VANHA-MAJAMAA, I. & TONTERI, T. 1998. Op-timal sample and plot size for inventory of field and groundlayer vegetation in a mature Myrtillus-type boreal spruce for-est. Ann. Bot. Fenn. 35: 191–196.
JIRÁSEK, J. 1996. Přirozené smrčiny České republiky [Naturalspruce forest of the Czech republic]. Preslia 67: 225–259.
JONASSON, S. & SHAVER, G.R. 1999. Within–stand nutrient cy-cling in arctic and boreal wetlands. Ecology 80: 2139–2150.
KAŇA, J. & KOPÁČEK, J. 2006. Impact of soil sorption character-istics and bedrock composition on phosphorus concentrations
Elements pools of understory vegetation S521
in two Bohemian Forest lakes. Water Air Soil Pollut. 173:243–259.
KAUNISTO, S. & SARJALA, T. 2003. Foliar pottassium concentra-tions of Bilberry, Bog Bilberry and Downy Birch as indicatorof Potassium nutrition of Scots pine on a drained peatland.Silva Fenn. 37: 235–332.
KOPÁČEK, J., BOROVEC, J., HEJZLAR, J. & PORCAL, P.2001. Parallel spectrophotometric determinations of iron, alu-minum, and phosphorus in soil and sediment extracts. Comm.Soil Sci. Plant. 32: 1431–1443.
KOPÁČEK, J., KAŇA, J., ŠANTRŮČKOVÁ, H., PORCAL, P., HEJ-ZLAR, J., PICEK, T., ŠIMEK, M. & VESELÝ, J. 2002a. Phys-ical, chemical and biological characteristics of soils in wa-tersheds of the Bohemian Forest lakes: I. Plešné Lake. SilvaGabreta 8: 43–66.
KOPÁČEK, J., KAŇA, J., ŠANTRŮČKOVÁ, H., PORCAL, P., HEJ-ZLAR, J., PICEK, T., ŠIMEK, M. & VESELÝ, J. 2002b. Phys-ical, chemical and biological characteristics of soils in water-sheds of the Bohemian Forest lakes: II. Čertovo and ČernéLakes. Silva Gabreta 8: 97–94.
KOPÁČEK, J., STUCHLÍK, E., VESELÝ, J., SCHAUMBURG, J., AN-DERSON, I.C., FOTT, J., HEJZLAR J. & VRBA J. 2002c. Hys-teresis in reversal of Central European mountain lakes fromatmospheric acidification. Water Air Soil Pollut.: Focus 2:91–114.
KOPÁČEK, J. TUREK, J., HEJZLAR, J., KAŇA, J. & PORCAL, P.2006a. Element fluxes in watershed-lake ecosystems recover-ing from acidification: Čertovo Lake, the Bohemian Forest,2001–2005. Biologia, Bratislava 61, Suppl. 20: S413–S426.
KOPÁČEK, J., TUREK, J., HEJZLAR, J., KAŇA, J. & PORCAL,P. 2006b. Element fluxes in watershed-lake ecosystems recov-ering from acidification: Plešné Lake, the Bohemian Forest,2001–2005. Biologia, Bratislava 61, Suppl. 20: S427–S440.
KUBÁT, K., HROUDA, L., CHRTEK, J., KAPLAN, Z., KIRCHNER,J. & ŠTĚPÁNEK J. (eds) 2002. Klíč ke květeně České republiky[Key to the Flora of the Czech Republic]. Academia, Praha,928 pp.
KUBÍČEK, F., ŠIMONOVIČ, V. & SZABO, J. 1989. Biomass of theherb layer and moss layer in several forest ecosystems influ-enced by air pollution, the Beskydy mountains (part Kysuce).Ekológia (ČSSR) 8: 23–34.
MAJER, V., COSBY, B.J., KOPÁČEK, J. & VESELÝ, J. 2003. Mod-eling reversibility of Central European mountain lakes fromacidification: Part I – The Bohemian Forest. Hydrol. EarthSyst. Sci. 7: 494–509.
MATĚJKA, K. 1992a. A case study of mountain spruce forest –problems and comments, pp. 42–50. In: MATĚJKA, K. (ed.)Investigation of the mountain forest ecosystems and of forestdamage in the Czech Republic, Proceedings of the workshopheld in České Budějovice, České Budějovice.
MATĚJKA, K. 1992b. Some aspects of the theory of the ecosystemspatial structure. I. Theory. Ekológia (ČSFR) 11: 369–377.
MORAVEC, J. et al. 1994. Fytocenologie. Academia, Praha, 403pp.
MORAVEC, J., HUSOVÁ, M., CHYTRÝ, M. & NEUHÄUSLOVÁ,Z. 2000. Hygrofilní, mezofilní a xerofilní opadavé lesy [Hy-grophilous, mesophilous and xerophilous deciduous forests].In: MORAVEC, J. (ed.) Přehled vegetace České republiky[Vegetation survey of the Czech Republic], Vol. 2, Academia,Praha, 319 pp.
MORAVEC, J., HUSOVÁ, M., NEUHÄUSL, R. & NEUHÄUSLOVÁ–NOVOTNÁ, Z. 1982. Die Association mesophiler und hy-grophiler Laubwälder in der Tschechischen Sozialistischen Re-publik. Vegetace ČSSR, Ser. A, Vol. 12. Academia, Praha, 296pp.
NILSSON, M.C. & WARDLE, D.A. 2005. Understory vegetation asa forest ecosystem driver: evidence from the northern Swedishboreal forest. Front. Ecol. Environ. 8: 421–428.
NORDIN, A., NASHOLM, T. & ERICSON, L. 1998. Effects of sim-ulated N deposition on understorey vegetation of a borealconiferous forest. Funct. Ecol. 12: 691–699.
ODUM, E.P. 1959. Fundamentals of ecology. 2nd Ed. Saunders,Philadelphia, 546 pp.
PAVLIAINEN, M., FINÉR, L. & MANNERKOSKI, H. 2005a. Re-sponse of ground vegetation species to clear-cutting in a bo-real forest: aboveground biomass and nutrient contents duringthe first 7 years. Ecol. Res. 20: 652–660.
PAVLIAINEN, M., FINÉR, L., MANNERKOSKI, H., PIIRAINEN, S.& STARR., M. 2005b. Changes in the above- and below-ground biomass and nutrient pools of ground vegetation afterclear-cutting of a mixed boreal forest. Plant Soil 275: 157–167.
PYŠEK, P. 1993. What do we know about Calamagrostis villosa?A review of the species behaviour in secondary habitats. Pres-lia 65: 1–20.
RODENKIRCHEN, H. 1995. Nutrient pools and fluxes of theground vegetation in coniferous forests due to fertilizing, lim-ing and amelioration. Plant Soil 168–169: 383–390.
SCARASCIA–MUGNOZZA, G., BAUER, G.A. PERSSON, H., MAT-TEUCCI, G. & MASCI, A. 2000. Tree biomass, growth, andnutrient pools, pp. 49–61. In: SCHULZE, E.D. (ed.) Carbonand nitrogen cycling in European forest ecosystems, Ecolog-ical Studies 142, Springer–Verlag, Berlin–Heidelberg.
STRENGBOM, J., NORDIN, A., NASHOLM, T. & ERICSON, L.2002. Parasitic fungus mediates change in nitrogen–exposedboreal forest vegetation. J Ecol. 90: 61–67.
STRENGBOM, J., WALHEIM, M., NASHOLM, T. & ERICSON, L.2003. Regional differences in the occurrence of understoreyspecies reflect nitrogen deposition in Swedish forests. Ambio32: 1–97.
STRENGBOM, J., NASHOLM, T. & ERICSON, L. 2004. Light, notnitrogen, limits growth of the grass Deschampsia flexulosa inboreal forests. Can. J. Bot. 82: 430–435.
SVOBODA, M., MATĚJKA, K., KOPÁČEK, J. & ŽALOUDÍK, J.2006. Estimation of tree biomass of Norway spruce forest inthe Plešné Lake catchment, the Bohemian Forest. Biologia,Bratislava 61, Suppl. 20: S523–S532.
ŠANTRŮČKOVÁ, H., KRIŠTŮFKOVÁ, M. & VANĚK, D. 2006.Decomposition rate and nutrient release from plant litterof Norway spruce forest in the Bohemian Forest. Biologia,Bratislava 61, Suppl. 20: S499–S508.
TONJE, O., BAKKESTUEN, V., HALVORSEN, O.R. & ODD, E.2004. Changes in forest understorey vegetation in Norwayrelated to long–term soil acidification and climatic change. J.Veg. Sci. 15: 437–448.
UOTILA, A. & KOUKI, J. 2005. Understorey vegetation in spruce-dominated forests in eastern Finland and Russian Karelia:Successional patterns after anthropogenic and natural dis-turbances. For. Ecol. Manag. 215: 113–137.
VESELÝ, J. 1994. Investigation of the nature of the Šumava lakes:a review. Čas. Nár. Muz. Praha, Řada Přírodověd. 163: 103–120.
VIEWEGH, J., KUSBACH, A. & MIKESKA, M. 2003. Czech forestecosystem classification. J. For. Sci. 49: 74–82.
VRBA, J., KOPÁČEK, J., FOTT, J., KOHOUT, L., NEDBALOVÁ,L., PRAŽÁKOVÁ, M., SOLDÁN, T. & SCHAUMBURG. J. 2003.Long-term studies (1871–2000) on acidification and recoveryof lakes in the Bohemian Forest (Central Europe). Sci. TotalEnviron. 310: 73–85.
WILD, J., NEUHAUSLOVA, Z. & SOFRON, J. 2004. Changes ofplant species composition in the Sumava spruce forests, SWBohemia, since the 1970s. For. Ecol. Manag. 187: 117–132.
Received May 29, 2006Accepted November 15, 2006


