Embed Size (px)
Citation preview
Biochemical Engineering Journal 22 (2005) 151–159
Biodegradation kinetics of phenol and catechol usingPseudomonasputidaMTCC 1194
Arinjay Kumar1, Shashi Kumar, Surendra Kumar∗
Chemical Engineering Department, Indian Institute of Technology Roorkee, Roorkee 247 667, Uttaranchal, India
Received 4 April 2004; received in revised form 29 August 2004; accepted 3 September 2004
Abstract
Biological degradation of phenol and catechol by a bacterial strain ofPseudomonas putida(MTCC 1194) in basal salt medium (BSM) wasinvestigated in shake-flask experiments at 29.9± 0.3◦C and pH of approximately 7.1. The lyophilized cultures ofP. putida(MTCC 1194)were revived and exposed to increasing concentrations of phenol, and catechol in shake-flasks. This bacterial strain could be acclimatized tothe concentrations of 1000 and 500 mg/l for phenol and catechol, respectively, over a period of three months. The higher the concentrationo olc enol andc th kineticso the entirec ol,r ly. It is ourv stewaters.©
K
1
teiuisteT
U
ecos to
odies.robicctiveAC
ctorytived itsol islogi-such
d ki-teingls be-
spite
1d
f phenol or catechol, the longer was the lag period. The well-acclimatized culture ofP. putida(MTCC 1194) degraded the initial phenoncentration of 1000 mg/l and initial catechol concentration of 500 mg/l completely in 162 and 94 h, respectively. Both the phatechol were observed to be the inhibitory compounds. Monod’s and linearized-Haldane’s model could not represent the growver the studied concentration range. However, Haldane’s growth kinetics model could be fitted to the growth kinetics data well foroncentration range. Further, the decay coefficients have been found to be 0.0056 and 0.0067 h−1 for the growth on phenol and catechespectively. Besides, the yield coefficient for the growth on phenol and catechol were found to be 0.65 and 0.50 mg/mg, respectiveiew that the above information would be useful for modeling and designing the units treating phenol- and catechol-containing wa2004 Elsevier B.V. All rights reserved.
eywords:Biodegradation; Phenol; Catechol; Growth kinetics;P. putida; Substrate inhibition
. Introduction
Aqueous phenolic effluents are relatively common indus-rial wastes, being produced in several industries and op-rations such as petroleum refineries, gas and coke oven
ndustries, fiber glass units, pharmaceuticals, explosive man-facture, phenolic resin manufacture, plastic and varnish
ndustries, textiles units, making use of organic dyes, andmelting and related metallurgical operations, etc. In addi-ion to being potential carcinogens, phenol and catechol areither toxic or lethal to fish at concentrations of 5–25 mg/l.his imparts medicinal taste and odour even at much lower
∗ Corresponding author. Tel.: +91 1332 285714; fax: +91 1332 273560.E-mail address:[email protected] (S. Kumar).
1 Present address: School of Chemical Technology, GGS Indraprasthaniversity, Kashmere Gate, Delhi-110 006, India.
concentration of 2�g/l. Therefore, to save our aqueoussystems, it has been mandatory world wide for industrietreat these wastes before safe disposal to the water bVarious treatment alternatives include aerobic and anaedigestion, adsorption, ion exchange with resin, and bioaactivated carbon (BAC) treatment. The efficacy of the Bin removing total phenols has been found to be satisfa[1]. In a research program in our laboratory, this alternahas been explored for removal of phenol, catechol another derivatives. It is also mentioned that the catechconsidered more toxic than phenol. Adsorption and biocal degradation are two main mechanisms exercised inunits. The results pertaining to adsorption isotherm annetics have been discussed elsewhere[2–3]. In the presenpaper, the results related to biological degradation are bdiscussed. There is a general perception that the phenoing toxic are not amenable to biological degradation. De
369-703X/$ – see front matter © 2004 Elsevier B.V. All rights reserved.oi:10.1016/j.bej.2004.09.006
152 A. Kumar et al. / Biochemical Engineering Journal 22 (2005) 151–159
Nomenclature
kd decay coefficient (h−1)Ki Haldane’s growth kinetics inhibition coeffi-
cient (mg/l)Ks half saturation coefficient (mg/l)m maintenance coefficient (h−1)R2 correlation coefficient (−)S concentration of substrate (mg/l)t time (h)X concentration of biomass (mg/l)Y, Yx/s observed yield coefficient
(mg biomass/mg substrate)YG true yield coefficient
(mg biomass/mg substrate)
Greek symbolµg specific growth rate (h−1)µmax maximum specific growth rate (h−1)µnet �g − kd, net specific growth rate (h−1)
Subscript0 initial value
the fact that there exist in nature some phenolytic microor-ganisms[4], these microorganisms show different behaviourin terms of their ability to degrade these compounds.
In the literature, the degradation of phenol by bacterialstrainP. putidais very well documented. However, to the bestof our knowledge the degradation potential ofPseudomonasputida(MTCC 1194) for the catechol has not been exploredearlier. For phenol too, the lyophilized culture might have lostsome degradation potential and the history of the culture wasnot known. Therefore, in the present research work kinetics ofphenol and catechol degradation byP. putida(MTCC 1194)was studied. In addition, biodegradation behaviour over awide range of concentrations, yield and decay coefficients ofthe bacteria are determined for the sake of completeness.
2. Background information
The biological degradation is accomplished through ben-zene ring cleavage using the enzyme present in the microor-ganism. The bacteria express differently when exposed todifferent initial phenol concentrations and other experimen-tal conditions. Therefore, numerous studies were directed toevaluate the behaviour of these organisms in different con-centrations and under varying environmental conditions, sot n oft dgeo r theu
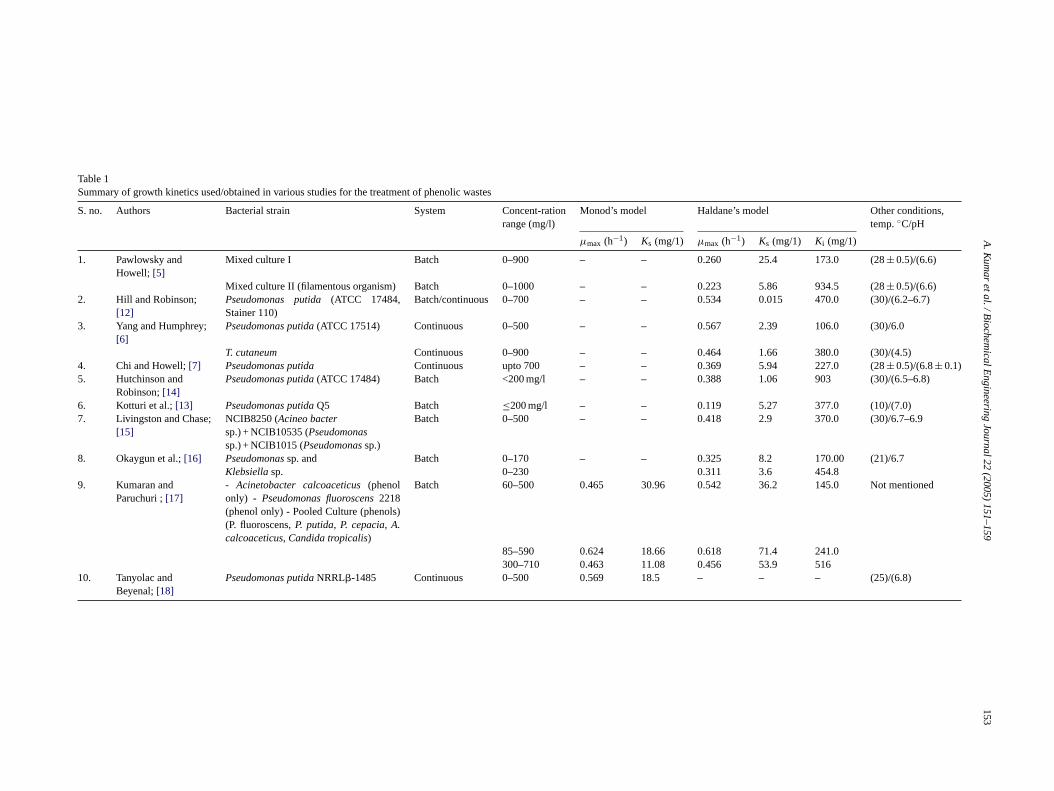
The biodegradation of phenol and its derivatives by mi-crobial cultures has been the focus of research for more thanthree decades[5–11]. These studies have been conducted withdifferent micro-flora, under varied environmental conditionsof pH, temperature, in the presence or absence of oxygen, inbatch and continuous flow reactors. Determination of growthkinetics of organisms has been one of the main issues con-sidered in these studies. As the knowledge of the growth ki-netics is essential for the understanding of the capacities ofthe microorganisms for the degradation and the operation ofthe treatment units, therefore, several degradation studies re-lated to phenol degradation were reviewed for the selectionof bacteria, and are summarized inTable 1. On this basis,P.putidawas found to be the best microorganism to degradethe phenolic compounds.
Cell Growth Kinetics in a batch reactor may be modeledby the following equation.
dX
dt= µgX − kdX = µnetX (1)
For substrate,
dS
dt= − 1
Y
(dX
dt
)(2)
µg is a function ofS. In the literature, two approaches are en-c wtho non-i od’sn
µ
W rowth-i f in-h d tot hesem er byE delw ac-c torys qua-t
µ
A -t
µ
o
T
hat the result may be useful in the design and optimizatiohe biological reactors treating phenolic wastes. Knowlef both the rate and extent of degradation is essential fonderstanding of the behaviour.
ountered for representing the kinetics of bacterial gron phenols. According to one, phenol is considered
nhibitory compound and so was represented by Monon-inhibitory kinetics equation as given below.
g = µmaxS
Ks + S(3)
hereas second approach considers the phenol to be gnhibitory compound. To represent the growth kinetics oibitory compounds, several kinetics models were fitte
he experimental data for selecting the best models. Todels have been discussed in detail in a seminal papdwards[19]. Out of the models, Haldane’s growth moas selected due to its mathematical simplicity and wideeptance for representing the growth kinetics of inhibiubstrates. The Haldane’s inhibitory growth kinetics eion is as follows:
g = µmaxS
Ks + S + (S2/Ki )(4)
t higher substrate concentrations, S�Ks, the above equaion reduces to the following.
g = µmaxS
S + (S2/Ki )(5)
r
1
µg= 1
µmax+ S
(Kiµmax)(6)
his is the linearized Haldane’s equation.
A.Kumaretal./B
iochemicalEngineeringJournal22(200
Table 1Summary of growth kinetics used/obtained in various studies for the treatment of phenolic wastes
S. no. Authors Bacterial strain System Concent-rationrange (mg/l)
Monod’s model Haldane’s model Other conditions,temp.◦C/pH
µmax (h−1) Ks (mg/1) µmax (h−1) Ks (mg/1) Ki (mg/1)
1. Pawlowsky andHowell; [5]
Mixed culture I Batch 0–900 – – 0.260 25.4 173.0 (28± 0.5)/(6.6)
Mixed culture II (filamentous organism) Batch 0–1000 – – 0.223 5.86 934.5 (28± 0.5)/(6.6)2. Hill and Robinson;
[12]Pseudomonas putida(ATCC 17484,Stainer 110)
Batch/continuous 0–700 – – 0.534 0.015 470.0 (30)/(6.2–6.7)
3. Yang and Humphrey;[6]
Pseudomonas putida(ATCC 17514) Continuous 0–500 – – 0.567 2.39 106.0 (30)/6.0
T. cutaneum Continuous 0–900 – – 0.464 1.66 380.0 (30)/(4.5)4. Chi and Howell;[7] Pseudomonas putida Continuous upto 700 – – 0.369 5.94 227.0 (28± 0.5)/(6.8± 0.1)5. Hutchinson and
Robinson;[14]Pseudomonas putida(ATCC 17484) Batch <200 mg/l – – 0.388 1.06 903 (30)/(6.5–6.8)
6. Kotturi et al.;[13] Pseudomonas putidaQ5 Batch ≤200 mg/l – – 0.119 5.27 377.0 (10)/(7.0)7. Livingston and Chase;
[15]NCIB8250 (Acineo bactersp.) + NCIB10535 (Pseudomonassp.) + NCIB1015 (Pseudomonassp.)
Batch 0–500 – – 0.418 2.9 370.0 (30)/6.7–6.9
8. Okaygun et al.;[16] Pseudomonassp. andKlebsiellasp.
Batch 0–170 – – 0.325 8.2 170.00 (21)/6.70–230 0.311 3.6 454.8
9. Kumaran andParuchuri ;[17]
- Acinetobacter calcoaceticus(phenolonly) - Pseudomonas fluoroscens2218(phenol only) - Pooled Culture (phenols(P. fluoroscens,P. putida, P. cepacia, A.calcoaceticus, Candida tropicalis)
Batch 60–500 0.465 30.96 0.542 36.2 145.0 Not mentioned
10. Tanyolac andBeyenal;[18]
Pseudomonas putidaNRRL�-1485
5)151–159
153
)
85–590 0.624 18.66 0.618 71.4 241.0300–710 0.463 11.08 0.456 53.9 516
Continuous 0–500 0.569 18.5 – – – (25)/(6.8)
154 A. Kumar et al. / Biochemical Engineering Journal 22 (2005) 151–159
For the calculation of observed yield coefficientY, Pirt[20] proposed the model.
1
Y= 1
YG+ m
µ(7)
However, Eq.(7) is not applied to batch growth data as thespecific growth rateµ does not vary appreciably fromµmaxfor most of the culture period. So, it is difficult to plotYas a function ofµ. [21]. This means thatY remains almostconstant, and can be assumed to be equal to true yield,YG.Also, by the same reasoning, endogenous coefficientkd inEq. (1) may be neglected during exponential phase. Eq.(1)therefore reduces to the following equation.
dX
dt= µgX (8)
During initial phase,Smay be taken equal toSo. Therefore,
ln
(X
Xo
)= µgt (9)
However, for continuous reactor operating at low exit concen-trations, bothkd andmshould be taken into account. There-fore, it is necessary to estimatekd.
3. Materials and methods
3
df nk,I inl garP theno .
3
ereA eref o-r he-n toa he-n basalsT ipi-t de-n ns:
P
P
pro-p Thep
3.3. Acclimatization of culture and inoculumdevelopment
The revived cultures were first grown in basal salt mediumwith glucose as sole carbon source. The cultures were accli-matized to phenol or catechol by exposing the cultures in aseries of shake flasks (250 ml), wherein the content of glucosewas decreased and that of phenolic compound increased overa period of three months. For inoculum, a further subculturingwas done, and all the inoculum transfers were done in expo-nential phase. The temperature in all the batch experimentswas maintained at 30◦C.
3.4. Analytical procedure
Measurements of phenol and catechol were done byUV–vis spectrophotometer [Model UV 210 Shimadzu,Japan] both in UV and visible range. The maximum wave-lengths were found to be 270 and 267 nm for phenol and cat-echol, respectively. The colour of the growth medium turnedto light green as the catechol was being metabolized, andthis created difficulty in measuring the catechol concentra-tion in the samples in UV range. Therefore, the measure-ment of concentration of catechol was tried using standard4-aminoantepyrene method[22], and it worked well. Phenolbeing reference compound in these studies was also some-times measured by using standard method. The calibrationcurves were prepared and were found linear upto 10 mg/l ofconcentrations withR2 value of 0.99.
For measuring biomass, the samples were centrifuged atapproximately 8000 rpm for 20 min. The supernatant wasused for phenol/catechol determination. The biomass at-tached to the walls of tubes were resuspended in distilledwater and optical density of this suspension was measuredagainst distilled water as reference at 620 nm using UV–visdouble beam spectrophotometer. The calibration curves wereobtained by plotting dry weight of biomass per litre againstoptical density of the suspension.
For each concentration, four flasks of 500 ml capacitywith 300 ml working volume were kept in incubator-cum-shaker. At the most, six samples of 5 ml were taken fromeach flask. All the transfers were made in UV chamber, andglasswares and medium properly autoclaved. The batch ex-periments were repeated and the results were found repro-ducible within acceptable range.
4. Results and discussion
4.1. Acclimatization phase
Phenol-degrading bacteria are required to be adapted to thephenol environment. During acclimatization process certainenzymes in the bacteria are induced so that they are availablefor taking part in the metabolism reaction. This is much moreimportant when dealing with toxic compounds such as phenol
.1. Organism
The bacteriumP. Pudita (MTCC 1194) was procurerom Microbial Type Culture Collection and Gene Banstitute of Microbiology (IMTECH), Chandigarh, India,yophilized form. These cultures were revived on solid aetri dish and in the liquid medium. Stock cultures werebtained by standard spread plate microbial techniques
.2. Phenolic compounds and growth medium
All the chemicals including phenol and catechol wR grade with more than 99% purity. The chemicals w
rom M/s SRL Pvt. Ltd., India, and M/s Ranbaxy Labatories Ltd., India. One percent stock solutions of pol or catechol were stored in brown glass bottlesvoid photo-oxidation. The growth medium contained pol/catechol as the sole carbon source, and includedalts at the concentrations, used by Kotturi et al.[13].he medium was sterilized in two parts to avoid prec
ation of ferrous salts during autoclaving. These wereoted as Part A and Part B with the following compositio
art A K2HPO4, KH2PO4, FeSO4·7H2O
art B (NH4)2SO4, MgCl2·6H2O, MnCl2·4H2O,
CaCl2·2H2O, Na2MoO4·2H2O
These two parts and phenol/catechol are mixed in apriate proportions at the start of any batch experiment.H of the medium thus obtained was 7.1± 0.1.
A. Kumar et al. / Biochemical Engineering Journal 22 (2005) 151–159 155
and catechol, and these too at high concentrations. In thisstudy, it was envisaged to degrade phenol and catechol usingP. putida(MTCC 1194) at concentrations upto 1000 mg/l. Toinitiate the acclimatization procedure 2% glucose as carbonsource in basal salt medium was used for the growth ofP.putida(MTCC 1194).
The acclimatization of culture was performed as describedin the Section3.3. To avoid problems due to contaminationand non-growth, the bacteria were transferred to six flasksthree for each compound. After 48 h significant bacterialgrowth was observed; the synthetic medium had turned milky.The stock solutions of phenol and catechol were added to theflasks so as to give 10 mg/l concentrations of the each phe-nolic compounds in the synthetic medium. Thereafter, thephenol and catechol were periodically added in incrementsof 10 mg/l till the cumulative concentration reached 100 mg/lfor each of them.
No sample was taken from these flasks till this time just toavoid contamination and save time. It was planned to trans-fer the inoculum from these flasks to new flasks for furtherenrichment of the culture. The degradation was found tobe complete for both the phenol and catechol. Further en-richment studies with phenol and catechol showed that thedegradation of phenol and catechol was possible only upto1000 and 500 mg/l, respectively. Before starting the kineticss e ac-c s ofp
4
erec thed terials -t mg/l( 500,6 20,3 g/l)a cat-e and5 -r . Them undsw llyc is thec o bec wereo usedi weekh ol atip lyi ocu-l e, toa sed.
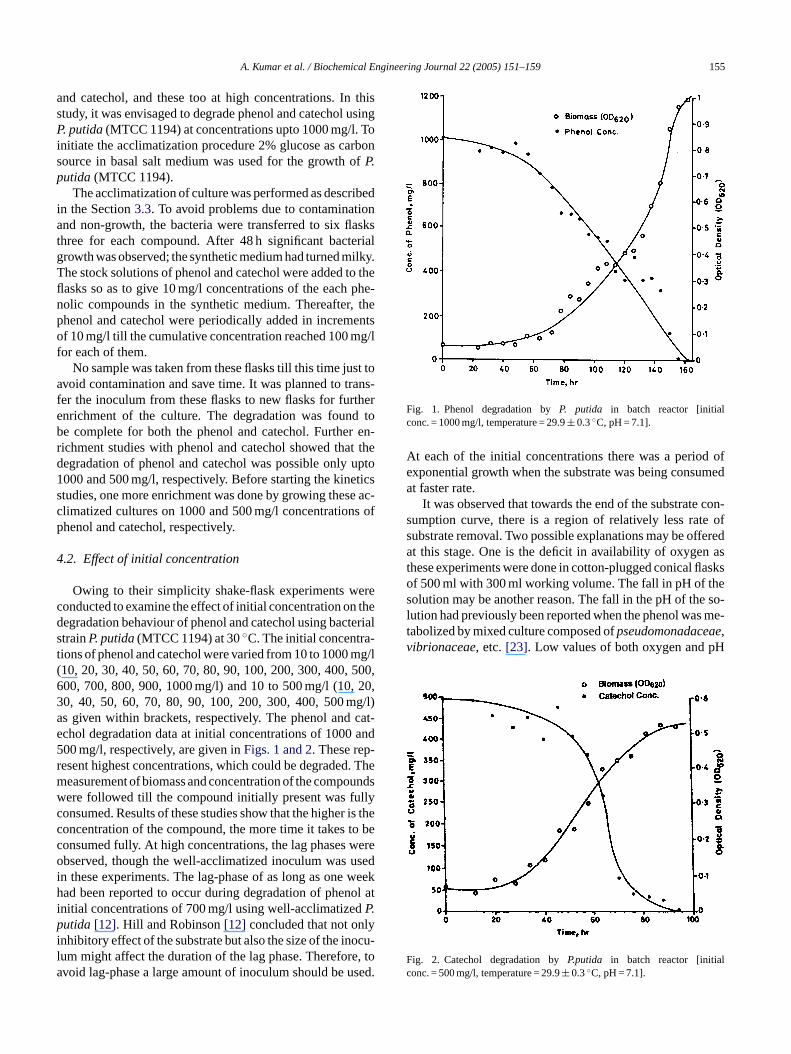
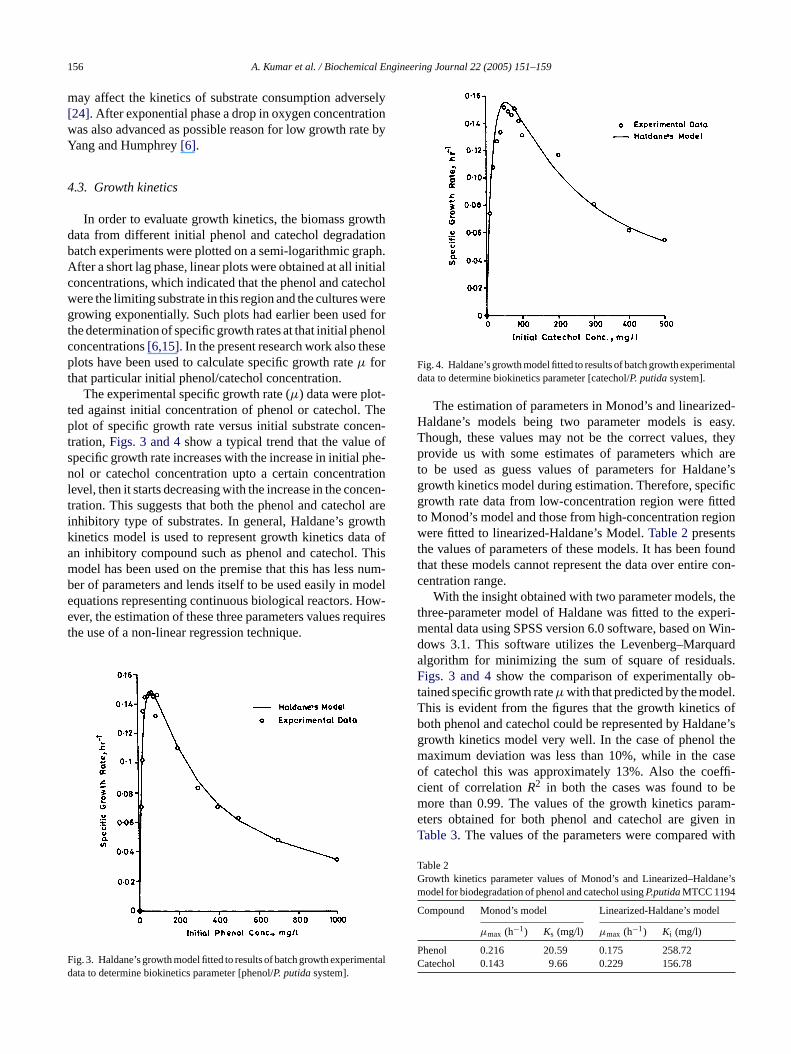
Fig. 1. Phenol degradation byP. putida in batch reactor [initialconc. = 1000 mg/l, temperature = 29.9± 0.3◦C, pH = 7.1].
At each of the initial concentrations there was a period ofexponential growth when the substrate was being consumedat faster rate.
It was observed that towards the end of the substrate con-sumption curve, there is a region of relatively less rate ofsubstrate removal. Two possible explanations may be offeredat this stage. One is the deficit in availability of oxygen asthese experiments were done in cotton-plugged conical flasksof 500 ml with 300 ml working volume. The fall in pH of thesolution may be another reason. The fall in the pH of the so-lution had previously been reported when the phenol was me-tabolized by mixed culture composed ofpseudomonadaceae,vibrionaceae, etc.[23]. Low values of both oxygen and pH
F lc
tudies, one more enrichment was done by growing theslimatized cultures on 1000 and 500 mg/l concentrationhenol and catechol, respectively.
.2. Effect of initial concentration
Owing to their simplicity shake-flask experiments wonducted to examine the effect of initial concentration onegradation behaviour of phenol and catechol using bactrainP. putida(MTCC 1194) at 30◦C. The initial concentraions of phenol and catechol were varied from 10 to 100010, 20, 30, 40, 50, 60, 70, 80, 90, 100, 200, 300, 400,00, 700, 800, 900, 1000 mg/l) and 10 to 500 mg/l (10,0, 40, 50, 60, 70, 80, 90, 100, 200, 300, 400, 500 ms given within brackets, respectively. The phenol andchol degradation data at initial concentrations of 100000 mg/l, respectively, are given inFigs. 1 and 2. These repesent highest concentrations, which could be degradedeasurement of biomass and concentration of the compoere followed till the compound initially present was fuonsumed. Results of these studies show that the higheroncentration of the compound, the more time it takes tonsumed fully. At high concentrations, the lag phasesbserved, though the well-acclimatized inoculum was
n these experiments. The lag-phase of as long as onead been reported to occur during degradation of phen
nitial concentrations of 700 mg/l using well-acclimatizedP.utida [12]. Hill and Robinson[12] concluded that not on
nhibitory effect of the substrate but also the size of the inum might affect the duration of the lag phase. Thereforvoid lag-phase a large amount of inoculum should be u
ig. 2. Catechol degradation byP.putida in batch reactor [initiaonc. = 500 mg/l, temperature = 29.9± 0.3◦C, pH = 7.1].
156 A. Kumar et al. / Biochemical Engineering Journal 22 (2005) 151–159
may affect the kinetics of substrate consumption adversely[24]. After exponential phase a drop in oxygen concentrationwas also advanced as possible reason for low growth rate byYang and Humphrey[6].
4.3. Growth kinetics
In order to evaluate growth kinetics, the biomass growthdata from different initial phenol and catechol degradationbatch experiments were plotted on a semi-logarithmic graph.After a short lag phase, linear plots were obtained at all initialconcentrations, which indicated that the phenol and catecholwere the limiting substrate in this region and the cultures weregrowing exponentially. Such plots had earlier been used forthe determination of specific growth rates at that initial phenolconcentrations[6,15]. In the present research work also theseplots have been used to calculate specific growth rateµ forthat particular initial phenol/catechol concentration.
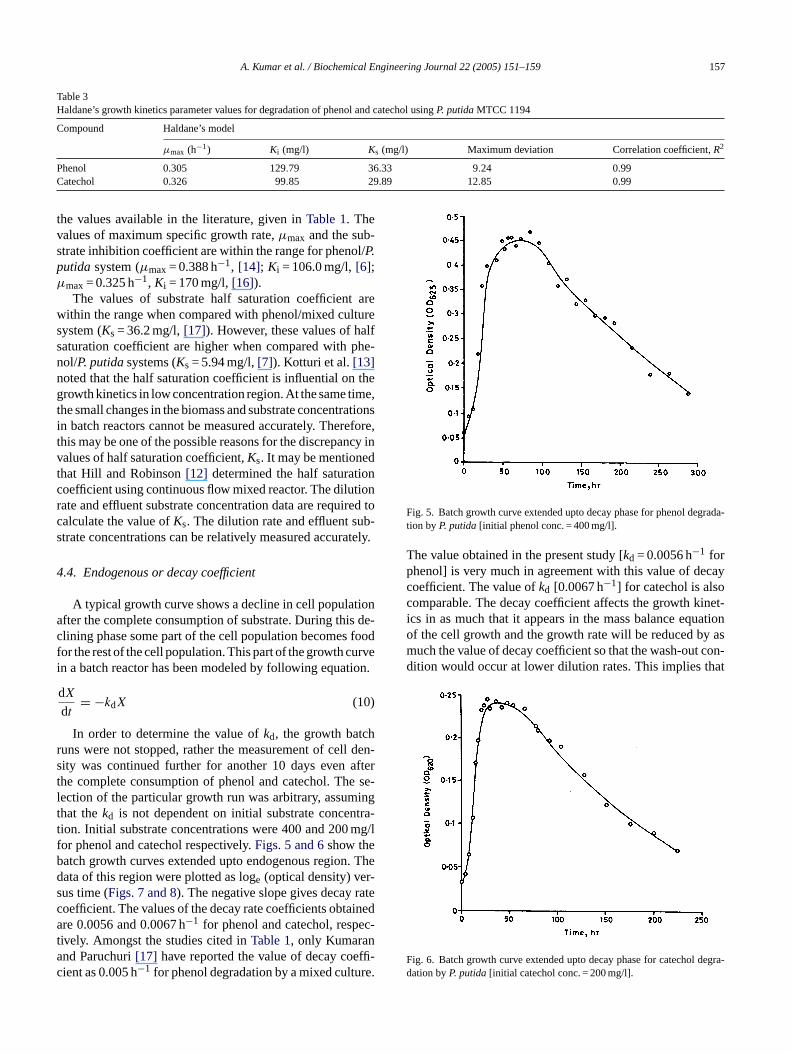
The experimental specific growth rate (µ) data were plot-ted against initial concentration of phenol or catechol. Theplot of specific growth rate versus initial substrate concen-tration,Figs. 3 and 4show a typical trend that the value ofspecific growth rate increases with the increase in initial phe-nol or catechol concentration upto a certain concentrationlevel, then it starts decreasing with the increase in the concen-t ol arei wthk ta ofa Thism num-b odele ow-e quirest
F entald
Fig. 4. Haldane’s growth model fitted to results of batch growth experimentaldata to determine biokinetics parameter [catechol/P. putidasystem].
The estimation of parameters in Monod’s and linearized-Haldane’s models being two parameter models is easy.Though, these values may not be the correct values, theyprovide us with some estimates of parameters which areto be used as guess values of parameters for Haldane’sgrowth kinetics model during estimation. Therefore, specificgrowth rate data from low-concentration region were fittedto Monod’s model and those from high-concentration regionwere fitted to linearized-Haldane’s Model.Table 2presentsthe values of parameters of these models. It has been foundthat these models cannot represent the data over entire con-centration range.
With the insight obtained with two parameter models, thethree-parameter model of Haldane was fitted to the experi-mental data using SPSS version 6.0 software, based on Win-dows 3.1. This software utilizes the Levenberg–Marquardalgorithm for minimizing the sum of square of residuals.Figs. 3 and 4show the comparison of experimentally ob-tained specific growth rateµ with that predicted by the model.This is evident from the figures that the growth kinetics ofboth phenol and catechol could be represented by Haldane’sgrowth kinetics model very well. In the case of phenol themaximum deviation was less than 10%, while in the caseof catechol this was approximately 13%. Also the coeffi-cient of correlationR2 in both the cases was found to bem ram-e n inT with
TG ane’sm
C l
PC
ration. This suggests that both the phenol and catechnhibitory type of substrates. In general, Haldane’s groinetics model is used to represent growth kinetics dan inhibitory compound such as phenol and catechol.odel has been used on the premise that this has lesser of parameters and lends itself to be used easily in mquations representing continuous biological reactors. Hver, the estimation of these three parameters values rehe use of a non-linear regression technique.
ig. 3. Haldane’s growth model fitted to results of batch growth experimata to determine biokinetics parameter [phenol/P. putidasystem].
ore than 0.99. The values of the growth kinetics paters obtained for both phenol and catechol are giveable 3. The values of the parameters were compared
able 2rowth kinetics parameter values of Monod’s and Linearized–Haldodel for biodegradation of phenol and catechol usingP.putidaMTCC 1194
ompound Monod’s model Linearized-Haldane’s mode
µmax (h−1) Ks (mg/l) µmax (h−1) Ki (mg/l)
henol 0.216 20.59 0.175 258.72atechol 0.143 9.66 0.229 156.78
A. Kumar et al. / Biochemical Engineering Journal 22 (2005) 151–159 157
Table 3Haldane’s growth kinetics parameter values for degradation of phenol and catechol usingP. putidaMTCC 1194
Compound Haldane’s model
µmax (h−1) Ki (mg/l) Ks (mg/l) Maximum deviation Correlation coefficient,R2
Phenol 0.305 129.79 36.33 9.24 0.99Catechol 0.326 99.85 29.89 12.85 0.99
the values available in the literature, given inTable 1. Thevalues of maximum specific growth rate,µmax and the sub-strate inhibition coefficient are within the range for phenol/P.putidasystem (µmax= 0.388 h−1, [14]; Ki = 106.0 mg/l,[6];µmax= 0.325 h−1, Ki = 170 mg/l,[16]).
The values of substrate half saturation coefficient arewithin the range when compared with phenol/mixed culturesystem (Ks = 36.2 mg/l,[17]). However, these values of halfsaturation coefficient are higher when compared with phe-nol/P. putidasystems (Ks = 5.94 mg/l,[7]). Kotturi et al.[13]noted that the half saturation coefficient is influential on thegrowth kinetics in low concentration region. At the same time,the small changes in the biomass and substrate concentrationsin batch reactors cannot be measured accurately. Therefore,this may be one of the possible reasons for the discrepancy invalues of half saturation coefficient,Ks. It may be mentionedthat Hill and Robinson[12] determined the half saturationcoefficient using continuous flow mixed reactor. The dilutionrate and effluent substrate concentration data are required tocalculate the value ofKs. The dilution rate and effluent sub-strate concentrations can be relatively measured accurately.
4.4. Endogenous or decay coefficient
A typical growth curve shows a decline in cell populationa de-c foodf rvei ion.
hr den-s aftert e se-l ingt tra-t mg/lfb . Thed -s atec ineda c-ta ffi-c re.
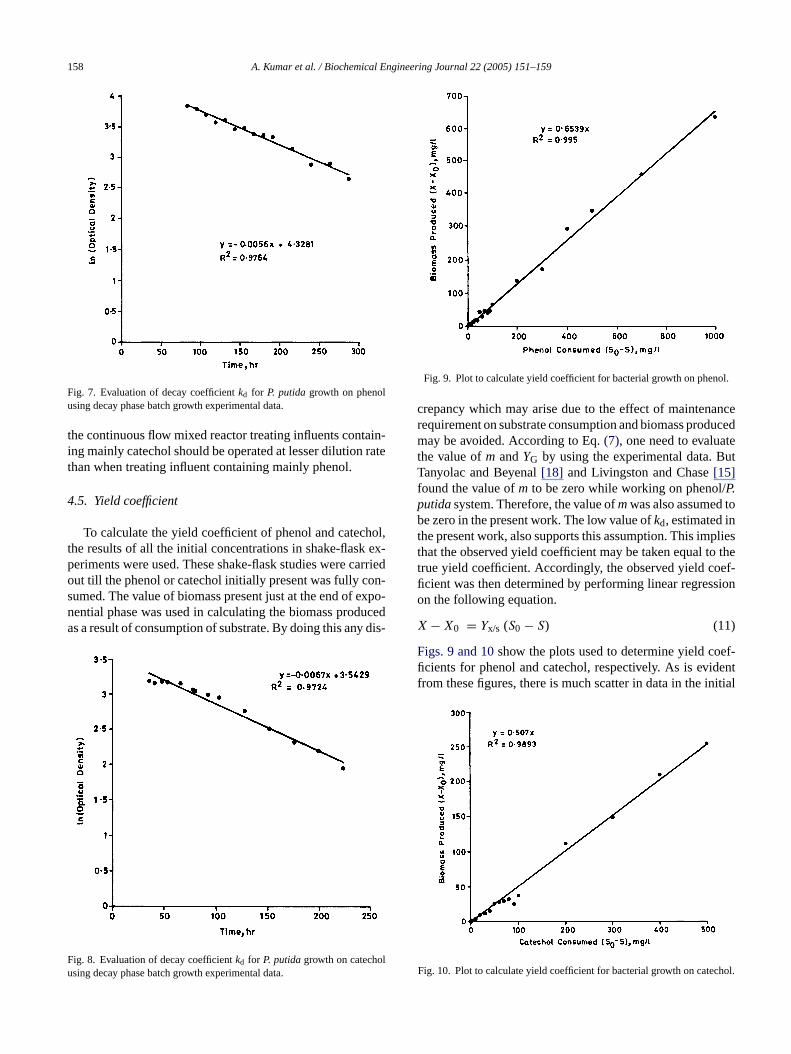
Fig. 5. Batch growth curve extended upto decay phase for phenol degrada-tion byP. putida[initial phenol conc. = 400 mg/l].
The value obtained in the present study [kd = 0.0056 h−1 forphenol] is very much in agreement with this value of decaycoefficient. The value ofkd [0.0067 h−1] for catechol is alsocomparable. The decay coefficient affects the growth kinet-ics in as much that it appears in the mass balance equationof the cell growth and the growth rate will be reduced by asmuch the value of decay coefficient so that the wash-out con-dition would occur at lower dilution rates. This implies that
F degra-d
fter the complete consumption of substrate. During thislining phase some part of the cell population becomesor the rest of the cell population. This part of the growth cun a batch reactor has been modeled by following equat
dX
dt= −kdX (10)
In order to determine the value ofkd, the growth batcuns were not stopped, rather the measurement of cellity was continued further for another 10 days evenhe complete consumption of phenol and catechol. Thection of the particular growth run was arbitrary, assumhat thekd is not dependent on initial substrate concenion. Initial substrate concentrations were 400 and 200or phenol and catechol respectively.Figs. 5 and 6show theatch growth curves extended upto endogenous regionata of this region were plotted as loge (optical density) verus time (Figs. 7 and 8). The negative slope gives decay roefficient. The values of the decay rate coefficients obtare 0.0056 and 0.0067 h−1 for phenol and catechol, respe
ively. Amongst the studies cited inTable 1, only Kumarannd Paruchuri[17] have reported the value of decay coeient as 0.005 h−1 for phenol degradation by a mixed cultu
ig. 6. Batch growth curve extended upto decay phase for catecholation byP. putida[initial catechol conc. = 200 mg/l].
158 A. Kumar et al. / Biochemical Engineering Journal 22 (2005) 151–159
Fig. 7. Evaluation of decay coefficientkd for P. putidagrowth on phenolusing decay phase batch growth experimental data.
the continuous flow mixed reactor treating influents contain-ing mainly catechol should be operated at lesser dilution ratethan when treating influent containing mainly phenol.
4.5. Yield coefficient
To calculate the yield coefficient of phenol and catechol,the results of all the initial concentrations in shake-flask ex-periments were used. These shake-flask studies were carriedout till the phenol or catechol initially present was fully con-sumed. The value of biomass present just at the end of expo-nential phase was used in calculating the biomass producedas a result of consumption of substrate. By doing this any dis-
F lu
Fig. 9. Plot to calculate yield coefficient for bacterial growth on phenol.
crepancy which may arise due to the effect of maintenancerequirement on substrate consumption and biomass producedmay be avoided. According to Eq.(7), one need to evaluatethe value ofm andYG by using the experimental data. ButTanyolac and Beyenal[18] and Livingston and Chase[15]found the value ofm to be zero while working on phenol/P.putidasystem. Therefore, the value ofmwas also assumed tobe zero in the present work. The low value ofkd, estimated inthe present work, also supports this assumption. This impliesthat the observed yield coefficient may be taken equal to thetrue yield coefficient. Accordingly, the observed yield coef-ficient was then determined by performing linear regressionon the following equation.
X − X0 = Yx/s (S0 − S) (11)
Figs. 9 and 10show the plots used to determine yield coef-ficients for phenol and catechol, respectively. As is evidentfrom these figures, there is much scatter in data in the initial
hol.
ig. 8. Evaluation of decay coefficientkd for P. putidagrowth on catechosing decay phase batch growth experimental data. Fig. 10. Plot to calculate yield coefficient for bacterial growth on catec
A. Kumar et al. / Biochemical Engineering Journal 22 (2005) 151–159 159
region of the plot. In this region, data from low concentra-tion range fall, where determination of biomass was difficult.However, in both the cases, the coefficient of correlationR2 ismore than 0.98. The value of the yield coefficient for phenol[0.65 mg/mg] falls within the range reported in the literature(Y= 0.6± 0.12 mg/mg,[15]).
The value of yield coefficient of phenol is greater thanthat of catechol. The ratio of carbon to total mass in phe-nol is higher than that for catechol. This may be one of thepossible reasons for this difference in the values of the yieldcoefficients of the two, though both are being consumed byP. putida(MTCC 1194) and under the same environmentalconditions.
5. Conclusions
The bacterial strainP. putida(MTCC 1194) could be ac-climatized to phenol and catechol upto 1000 and 500 mg/lconcentrations, respectively. At phenol concentrations of1200 mg/l, the above bacterial strain did not start degrad-ing even upto 20 days. For catechol, the bacterial strain startdying when exposed to 600 mg/l.
The results of shake-flask experiments have shown thatthe initial phenol concentration of 1000 mg/l and the initialc dedi cul-t ini-t lagp
viora im-p ueso phe-n ame-t n ofb tew-a
A
ntsC w-s ringD Au-t ables
R
at-4.
[2] A. Kumar, Studies on Adsorption and Bioregeneration Processes inGAC Systems. Ph.D. Thesis, Indian Institute of Technology Roorkee,U.A., India, 2001.
[3] A. Kumar, S. Kumar, S. Kumar, Adsorption of resorcinol and cate-chol on granular activated carbon: equilibrium and kinetics, Carbon41 (2003) 3015–3025.
[4] C.A. Sastry, Recent advances in biological treatment and environ-mental monitoring, in: C.A. Sastry, M.A. Hashim, P. Agamuthu(Eds.), Waste Treatment Plants, Narosa Publishing House, NewDelhi, 1995, p. 333.
[5] U. Pawlowsky, J.A. Howell, Mixed culture biooxidation of phenol I.Determination of kinetic parameters, Biotechnol. Bioeng. 15 (1973)889–896.
[6] R.D. Yang, A.E. Humphrey, Dynamic and steady state studies ofphenol biodegradation in pure and mixed cultures, Biotechnol. Bio-eng. 17 (1975) 1211–1235.
[7] C.T. Chi, J.A. Howell, Transient behaviour of a continuous stirredtank biological reactor utilizing phenol as an inhibitory substrate,Biotechnol. Bioeng. 18 (1976) 68–80.
[8] Z. Alexievaa, M. Gerginova, P. Zlateva, N. Peneva, Comparison ofgrowth kinetics and phenol metabolizing enzymes ofTrichosporoncutaneumR57 and mutants with modified degradation abilities, En-zyme Microbial Technol. 34 (2004) 242–247.
[9] M. Latkar, K. Swaminathan, T. Chakrabarti, Kinetics of anaerobicbiodegradation of resorcinol, catechol and hydroquinone in upflowfixed film bed reactors, Bioresource Technol. 88 (2003) 69–74.
[10] T.P. Chung, H.Y. Tseng, R.S. Juang, Mass transfer effect and in-termediate detection for phenol degradation in immobilizedPseu-domonas putidasystems, Process Biochem. 38 (2003) 1497–1507.
[11] S.M. Park, H.H. Park, W.K. Lim, H.J. Shin, A new variant activatorin of
[ nol5)
[ by
[ cesss. 24
[ n a
[ tivenvi-
[ ion,
[ rate,rical216.
[ s on
[ ell
[ ress,
[ ofocia-
[ in1338.
[ ker
atechol concentration of 500 mg/l could be fully degran 162 and 94 h, respectively. Even the well-acclimatizedure (upto 1000 mg/l) showed lag phase. The higher theial concentration of the compound, the longer was thehase.
Both phenol and catechol exhibited inhibitory behand their growth kinetics could be correlated well by the sle Haldane’s inhibitory growth kinetics model. The valf endogenous or decay and yield coefficients for bothol and catechol were also determined. The above par
ers are invariably required for the design and simulatioatch and continuous bioreactors treating phenolic wasters.
cknowledgements
The first author (A.K.) is grateful to the University Graommission, New Delhi for providing him a research fellohip for pursuing doctoral studies at Chemical Engineeepartment, Indian Institute of Technology, Roorkee.
hors are extremely grateful to the reviewer for his valuuggestions and comments.
eferences
[1] W. Lin, A.S. Weber, Aerobic biological activated carbon (BAC) trement of phenolic wastewater, Environ. Prog. 11 (1992) 145–15
involved in the degradation of phenolic compounds from a straPseudomonas putida, J. Biotechnol. 103 (2003) 227–236.
12] G.A. Hill, C.W. Robinson, Substrate inhibition kinetics: phedegradation byPseudomonas putida, Biotechnol. Bioeng. 17 (1971599–1615.
13] G. Kotturi, C.W. Robinson, W.E. Inniss, Phenol degradationa psychrotrophic strain ofPseudomonas putida, Appl. Microbiol.Biotechnol. 34 (1991) 539–543.
14] D.H. Hutchinson, C.W. Robinson, A microbial regeneration profor granular activated carbon II. Regeneration studies, Water Re(1990) 1217–1223.
15] A.G. Livingston, H.A. Chase, Modeling phenol degradation ifluidized bed bioreactor, AIChE J. 35 (1989) 1980–1992.
16] M.S. Okaygun, L.A. Green, A. Akgerman, Effects of consecupulsing of an inhibitory substrate on biodegradation kinetics, Eron. Sci. Technol. 26 (1992) 1746–1752.
17] P. Kumaran, Y.L. Paruchuri, Kinetics of phenol biotransformatWater Res. 31 (1997) 11–22.
18] A. Tanyolac, H. Beyenal, Prediction of substrate consumptionaverage biofilm density and active thickness for a thin sphebiofilm at pseudo-steady state, Biochem Eng. J. 2 (1998) 207–
19] V.H. Edwards, The influence of high substrate concentrationmicrobial kinetics, Biotechnol. Bioeng. 12 (1970) 679–712.
20] S.J. Pirt, Principles of Microbial and Cell Cultivation, BlackwScientific Publications, Oxford, 1975.
21] P.M. Doran, Bioprocess Engineering Principles, Academic PLondon, 1995.
22] APHA-AWWA-WPCF, Standard Methods for the ExaminationWater and Wastewater, 17th ed., American Public Health Asstion, Washington, DC, 1989.
23] A. Lallai, G. Mura, pH variation during phenol biodegradationmixed cultures of microorganisms, Water Res. 23 (1989) 1335–
24] H.W. Blanch, D.S. Clark, Biochemical Engineering, Marcel DekInc., New York, 1996.


