Embed Size (px)
Citation preview
Elsevier Editorial System(tm) for Biochimie Manuscript Draft Manuscript Number: BIOCHI-D-14-00489R1 Title: DECIPHERING METABOLIC ABNORMALITIES ASSOCIATED WITH ALZHEIMER'S DISEASE IN SERUM FROM THE APP/PS1 MOUSE MODEL USING INTEGRATED METABOLOMIC APPROACHES Article Type: Research Paper Section/Category: Regular issue Keywords: Metabolomics; APP/PS1 mice; Alzheimer's disease; serum Corresponding Author: Prof. JOSE LUIS GOMEZ-ARIZA, Ph.D. Corresponding Author's Institution: UNIVERSITY OF HUELVA First Author: Raul Gonzalez-Dominguez, Ms Order of Authors: Raul Gonzalez-Dominguez, Ms; Tamara Garcia-Barrera, Dr; Javier Vitorica, Dr; JOSE LUIS GOMEZ-ARIZA, Ph.D. Manuscript Region of Origin: SPAIN Abstract: The transgenic mouse APP/PS1 is widely employed by neuroscientists because reproduces well some of the neuropathological and cognitive deficits observed in human Alzheimer's disease. In this study, serum samples from APP/PS1 mice (n = 30) and wild-type controls (n = 30) were analyzed using a metabolomic multiplatform based on the combination of gas chromatography-mass spectrometry and ultra-high performance liquid chromatography-mass spectrometry, in order to obtain wide information about serum metabolome. Metabolic profiles showed significant differences between the groups of study, and numerous metabolites were identified as potential players in the development of Alzheimer-type disorders in this transgenic model. Pathway analysis revealed the involvement of multiple metabolic networks in the underlying pathology, such as deficiencies in energy metabolism, altered amino acid homeostasis, abnormal membrane lipid metabolism, and other impairments related to the integrity of the central nervous system. It is noteworthy that some of these metabolomic markers are in accordance with pathological alterations observed in human Alzheimer's disease, while others have not been previously described. Therefore, these results demonstrate the potential of metabolomics and the use of transgenic animal models to understand the pathogenesis of Alzheimer's disease. Opposed Reviewers:
Dear Editor,
Please consider the manuscript entitled “DECIPHERING METABOLIC ABNORMALITIES
ASSOCIATED WITH ALZHEIMER’S DISEASE IN THE APP/PS1 MOUSE MODEL
USING INTEGRATED METABOLOMIC APPROACHES“ by R. Gonzalez-Dominguez, T.
Garcia-Barrera, J. Vitorica and J.L.Gomez-Ariza for its publication in Biochimie.
This study considers the use of a metabolomic multiplatform based on the combination of gas
chromatography-mass spectrometry and ultra-high performance liquid chromatography-mass
spectrometry in order to obtain wide information about serum metabolome. The approach has
been used in the transgenic mouse APP/PS1 widely employed by neuroscientists because
reproduces some of the neuropathological and cognitive deficits observed in human
Alzheimer’s disease. In this study, serum samples from APP/PS1 mice (n = 30) and wild-type
controls (n = 30) were analyzed. Metabolic profiles showed significant differences between the
groups of study, and numerous metabolites were identified as potential players in the
development of Alzheimer-type disorders in this transgenic model. In this way, multiple
pathways were involved in the underlying pathology, such as deficiencies in energy
metabolism, altered amino acid homeostasis, abnormal membrane lipid metabolism, and other
impairments related to the integrity of the central nervous system. It is noteworthy that some of
these metabolomic markers are in accordance with pathological alterations observed in human
Alzheimer’s disease, while others have not been previously described. Therefore, these results
demonstrate the potential of this combined metabolomic approach and its possibilities to be
used in the study of the pathogenesis of Alzheimer’s disease.
Yours sincerely,
J.L. Gómez-Ariza
Cover Letter
Reviewers' comments:
Reviewer #1: Gonzalez-Dominguez and colleagues report on a shotgun metabolomic profiling of
serum samples from APP/PS1 mouse model compared to WT animals. The metabolomic profiling
was performed by both LC-MS and GC-MS. Reported results show an extended alteration of
several pathways involved in aminoacid, lipid and sugar metabolism. The paper is clear and well
written. The experimental outline is good, carefully described and well performed. Conclusions
appear to be fully supported by the experimental evidences. The pathways analysis is clear.
I have just a few minor comments for the authors
1) The title should mention that you investigated the serum metabolome
The title has been changed in order to mention the use of serum samples in this study.
2) Page 3, Line 40. Please use Electon Ionization, not impact
It was corrected.
3) Page 4, Line 10. The description of the data thresholding is not clear at all. Could you be more
clear here?
This part was re-written.
4) Page 4, Line 44. Is'nt 30ppm a little bit too high for metabolite identification? Standard is 5-
10ppm. Did you recalibrate your spectra somehow? You surely got tens of putative IDs per each
m/z, with this value. MS/MS spectra are available for a limited part of the metabolites. Can you
comment or explain better this point?
Although many metabolomic approaches based on ultra-high resolution systems employ mass accuracies
below 10 ppm for database searching, it is not rare to find other metabolomic studies using higher values
(e.g. Anal Chem 2014,86:9496; J Proteome Res 2010,9:4071; J Proteomics 2014,104:37). Anyway, this
database search with a pre-established mass tolerance is only a preliminary filter to create a list of
“candidate metabolites” (maybe tens, as you comment), but then confirmation is performed by means of
the characterization of MS/MS spectra. When MS/MS spectra are not available in databases, which is
very common for most lipid species, structural elucidation can be undertaken through the use of
fragmentation patterns reported in literature, as described in section 2.7.
5) Page 6-7. I think that a full metabolite list is too long. Can't you move it in the supplementary
info section and report just a limited number of metabolites in the text?
Table 1 has been replaced by another simpler one, and the original data were moved to the supplementary
info section.
6) I would emphasize Fig 2 a little bit more, and better explain its meaning. Maybe it should go
along with Fig. 3
Section 3.3 has been explained in more detail, and Fig. 2 and 3 have been come together in a single
figure.
7) I would shorten down the conclusion section a little bit, if posible.
The Conclusion section has been shortened.
Detailed Responses to Reviewers

DECIPHERING METABOLIC ABNORMALITIES ASSOCIATED WITH
ALZHEIMER’S DISEASE IN THE APP/PS1 MOUSE MODEL USING
INTEGRATED METABOLOMIC APPROACHES
Raúl González-Domínguez, Tamara García-Barrera, Javier Vitorica, José Luis Gómez-
Ariza
The authors declare no conflict of interest either financial, personal or other
*Author Agreement
1 2 3 4 5 6 7 8 9 10 11 12 13 14 15 16 17 18 19 20 21 22 23 24 25 26 27 28 29 30 31 32 33 34 35 36 37 38 39 40 41 42 43 44 45 46 47 48 49 50 51 52 53 54 55 56 57 58 59 60 61 62 63 64 65
DECIPHERING METABOLIC ABNORMALITIES ASSOCIATED WITH
ALZHEIMER’S DISEASE IN THE APP/PS1 MOUSE MODEL USING
INTEGRATED METABOLOMIC APPROACHES
Raúl González-Domínguez, Tamara García-Barrera, Javier Vitorica, José Luis Gómez-
Ariza
ABSTRACT
The transgenic mouse APP/PS1 is widely employed by neuroscientists because
reproduces well some of the neuropathological and cognitive deficits observed in
human Alzheimer’s disease. In this study, serum samples from APP/PS1 mice (n = 30)
and wild-type controls (n = 30) were analyzed using a metabolomic multiplatform based
on the combination of gas chromatography-mass spectrometry and ultra-high
performance liquid chromatography-mass spectrometry, in order to obtain wide
information about serum metabolome. Metabolic profiles showed significant differences
between the groups of study, and numerous metabolites were identified as potential
players in the development of Alzheimer-type disorders in this transgenic model.
Pathway analysis revealed the involvement of multiple metabolic networks in the
underlying pathology, such as deficiencies in energy metabolism, altered amino acid
homeostasis, abnormal membrane lipid metabolism, and other impairments related to
the integrity of the central nervous system. It is noteworthy that some of these
metabolomic markers are in accordance with pathological alterations observed in human
Alzheimer’s disease, while others have not been previously described. Therefore, these
results demonstrate the potential of metabolomics and the use of transgenic animal
models to understand the pathogenesis of Alzheimer’s disease.
*Abstract

Highlights
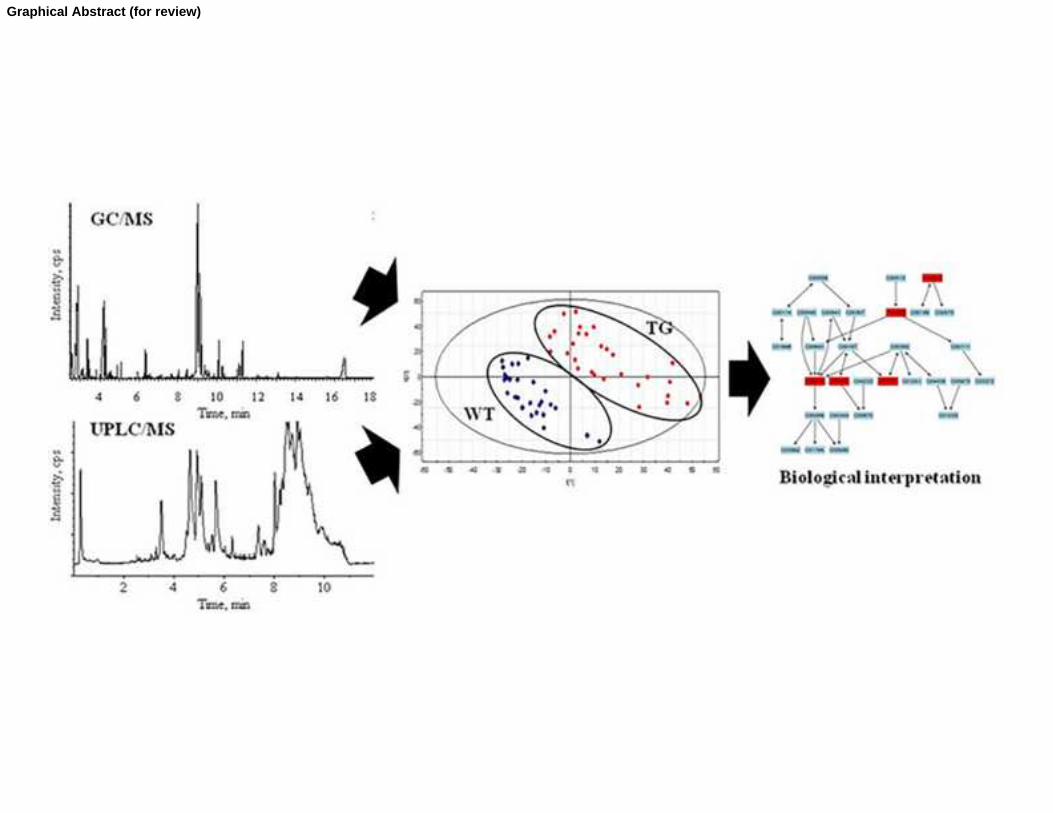
Combined GC/MS and UPLC/MS provides comprehensive metabolomic fingerprinting
APP/PS1 mice showed characteristic metabolic signatures compared to wild type mice
Metabolic pathway analysis allowed the elucidation of pathological mechanisms
Impaired energy metabolism stands out as a key factor in pathogenesis of Alzheimer
Highlights (for review)
Graphical Abstract (for review)
1 2 3 4 5 6 7 8 9 10 11 12 13 14 15 16 17 18 19 20 21 22 23 24 25 26 27 28 29 30 31 32 33 34 35 36 37 38 39 40 41 42 43 44 45 46 47 48 49 50 51 52 53 54 55 56 57 58 59 60 61 62 63 64 65
1
DECIPHERING METABOLIC ABNORMALITIES ASSOCIATED WITH ALZHEIMER’S
DISEASE IN SERUM FROM THE APP/PS1 MOUSE MODEL USING INTEGRATED
METABOLOMIC APPROACHES
Raúl González-Domíngueza,b,c
, Tamara García-Barreraa,b,c
, Javier Vitoricad,e,f
, José Luis Gómez-Arizaa,b,c
aDepartment of Chemistry and CC.MM. Faculty of Experimental Sciences. University of Huelva. Campus
de El Carmen. 21007 Huelva. Spain; bCampus of Excellence International ceiA3. University of Huelva.
Spain; cResearch Center of Health and Environment (CYSMA). University of Huelva. Campus de El
Carmen. 21007 Huelva. Spain; dDepartment Bioquímica, Bromatologia, Toxicología y Medicina Legal,
Faculty of Pharmacy, University of Seville. 41012 Seville. Spain, eCentro de Investigación Biomédica en
Red sobre Enfermedades Neurodegenerativas (CIBERNED). 41013 Seville. Spain, fInstituto de
Biomedicina de Sevilla (IBiS)–Hospital Universitario Virgen del Rocío/CSIC/University of Seville.
41013 Seville. Spain
Corresponding authors:
Prof. J.L Gómez Ariza, Department of Chemistry and CC.MM. Faculty of Experimental Sciences.
University of Huelva. Campus de El Carmen. 21007 Huelva. Spain. Tel.: +34 959 219968, fax: +34 959
219942, e-mail: [email protected]
Dr. T. Garcia-Barrera. Department of Chemistry and CC.MM. Faculty of Experimental Sciences.
University of Huelva. Campus de El Carmen. 21007 Huelva. Spain. Tel.: +34 959 219962, fax: +34 959
219942, e-mail: [email protected]
ABSTRACT
The transgenic mouse APP/PS1 is widely employed by neuroscientists because reproduces well some of
the neuropathological and cognitive deficits observed in human Alzheimer‟s disease. In this study, serum
samples from APP/PS1 mice (n = 30) and wild-type controls (n = 30) were analyzed using a metabolomic
multiplatform based on the combination of gas chromatography-mass spectrometry and ultra-high
performance liquid chromatography-mass spectrometry, in order to obtain wide information about serum
metabolome. Metabolic profiles showed significant differences between the groups of study, and
numerous metabolites were identified as potential players in the development of Alzheimer-type disorders
in this transgenic model. Pathway analysis revealed the involvement of multiple metabolic networks in
the underlying pathology, such as deficiencies in energy metabolism, altered amino acid homeostasis,
abnormal membrane lipid metabolism, and other impairments related to the integrity of the central
nervous system. It is noteworthy that some of these metabolomic markers are in accordance with
pathological alterations observed in human Alzheimer‟s disease, while others have not been previously
described. Therefore, these results demonstrate the potential of metabolomics and the use of transgenic
animal models to understand the pathogenesis of Alzheimer‟s disease.
KEYWORDS. Metabolomics, APP/PS1 mice, Alzheimer‟s disease, serum
ABBREVIATIONS. AD: Alzheimer‟s disease; GC-MS: gas chromatography mass spectrometry;
UHPLC-MS: ultra-high performance liquid chromatography mass spectrometry; TG: transgenic; WT:
wild type; QC: quality control; PCA: principal component analysis; PLS-DA: partial least squares
discriminant analysis; VIP: variable importance in the projection; HEPE: hydroxyl-eicosapentaenoic acid;
LPC: lyso-phosphocholine; LPI: lyso-phosphoinositol; LPE: lyso-phosphoethanolamine; PI:
phosphoinositol; PC: phosphocholine; PE: phosphoethanolamine; PPE: plasmenylethanolamine; PPC:
plasmenylcholine; SM: sphingomyelin.
*ManuscriptClick here to download Manuscript: Revised Manuscript.docx Click here to view linked References
1 2 3 4 5 6 7 8 9 10 11 12 13 14 15 16 17 18 19 20 21 22 23 24 25 26 27 28 29 30 31 32 33 34 35 36 37 38 39 40 41 42 43 44 45 46 47 48 49 50 51 52 53 54 55 56 57 58 59 60 61 62 63 64 65
2
1. INTRODUCTION
Alzheimer‟s disease (AD), the most common neurodegenerative disorder worldwide, is characterized by
an insidious onset and a progressive decline of cognitive functions. It is recognized that genetics plays an
important role in AD, principally due to mutations in the genes of amyloid precursor protein (APP) and
presenilin 1 and 2 (PS1 and PS2), which lead to the accumulation of A peptides [1]. However, the exact
etiology and pathogenesis of this disorder is not clear, given that its study is hindered by the complex
underlying biochemistry, the long presymptomatic period, the inability to study microscopic
morphological changes in tissues until the final stage of the disease and the variability of clinical
expression of symptoms. Thereby, nowadays AD can only be detected at advanced stages of disease by
exclusion of other pathologies based on clinical criteria defined by the NINCDS-ADRDA, and a
definitive diagnosis is only made when there is histopathological confirmation [2]. Therefore, early
preclinical detection has become a primary focus of AD research. Numerous transgenic mouse models
that mimic the main features of Alzheimer‟s disease have been developed to better understand the
pathogenic mechanism of neurodegeneration and to test potential therapies [3]. In most of these models,
the transgenic animals over-express mutated forms of human amyloid precursor protein, developing
amyloid plaques with aging predominantly in the hippocampus and cortex. However, it has been
demonstrated that co-expression of mutated human presenilin 1 or presenilin 2 in the model accelerates
amyloid deposition. In this sense, the double mutant transgenic line APP/PS1 has been widely used in
neuroscience studies given that reproduce some of the neuropathological and cognitive deficits observed
in AD, with a phenotype characterized by early amyloid deposits and behavioral deficits [4].
Metabolomics presents a high potential in health survey and biomarkers discovery, because changes in
specific groups of metabolites may be sensitive to pathogenically relevant factors. Thus, metabolomic
profiling is emerging as a powerful tool for the characterization of complex phenotypes affected by both
genetic and environmental factors [5]. Particularly, metabolomics plays a prominent role in biomarker
identification of multifunctional disorders such as Alzheimer‟s disease, in which many heterogeneous
cellular processes are involved. Numerous studies have been performed to assess the pathophysiological
status of transgenic animals by postmortem analysis of brain tissue samples [6-9]. However, the use of
peripheral biofluids has been only scarcely considered, although the discovery of a well-established
peripheral biomarker easily accessible is of primary importance when considering the prevalence of this
disease [10]. Jiang et al. found significant differences in endogenous metabolites from serum of the
senescence-accelerated mouse, suggesting perturbed glucose and lipid metabolisms, and attenuated
protective function of inosine [11]. In other studies, the metabolic profiles of both brain and plasma of
transgenic mice were characterized and compared to those of wild-type mice [12-13]. Lower levels of
metabolites were found in plasma samples, and they fluctuate more between the two groups than brain
metabolites. However, the statistical models built using plasma metabolite profiles were more accurate
than brain tissue despite the smaller number of factors. Finally, metabolomics has been also applied to
examine changes in urinary metabolites of transgenic AD mice, demonstrating the utility of a very simple
and easily available sample in clinical laboratory as is urine for the search of potential biomarkers [14-
15].
In the study presented here, serum samples from APP/PS1 transgenic mice were analyzed by a
metabolomic multiplatform combining gas chromatography-mass spectrometry (GC-MS) and ultra-high
performance liquid chromatography-mass spectrometry (UHPLC-MS). No single analytical technique
covers the entire spectrum of the metabolome, so the application of combined LC-MS and GC-MS
technologies is becoming the most relevant tool for biomarkers discovery due to their complementarity.
Gas chromatography-mass spectrometry has been traditionally employed for the profiling of low
molecular weight metabolites with high sensitivity, peak resolution and reproducibility [16]. On the other
hand, reversed-phase ultra-high performance liquid chromatography-mass spectrometry has become the
main workhorse in metabolomics due to its high resolution and sensitivity, fast analysis and good
potential for biomarker identification, which provides efficient retention and separation of relatively
nonpolar metabolites across a large molecular weight range [17]. Thus, the application of this global
metabolomic approach using two complementary platforms allowed a broad analytical coverage of serum
metabolites, from small polar metabolites to lipids. Then, multivariate statistical analysis was used to
differentiate serum metabolomic profiles of APP/PS1 mice from wild-type controls, and to identify
perturbations in biochemical pathways related to pathological processes.
2. MATERIAL AND METHODS
2.1. ANIMAL HANDLING
1 2 3 4 5 6 7 8 9 10 11 12 13 14 15 16 17 18 19 20 21 22 23 24 25 26 27 28 29 30 31 32 33 34 35 36 37 38 39 40 41 42 43 44 45 46 47 48 49 50 51 52 53 54 55 56 57 58 59 60 61 62 63 64 65
3
Transgenic APP/PS1 mice (C57BL/6 background) were generated as previously described by Jankowsky
et al., expressing the Swedish mutation of APP together with PS1 deleted in exon 9 [18]. On the other
hand, age-matched wild-type mice of the same genetic background (C57BL/6) were purchased from
Charles River Laboratory for their use as controls. In this study, male and female animals at 6 months of
age were used for experiments (TG: N=30, male/female 13/17; WT: N=30, male/female 15/15). Animals
were acclimated for 3 days after reception in rooms with a 12-h light/dark cycle at 20-25 °C, with water
and food available ad libitum. Then, mice were anesthetized by isoflurane inhalation and blood was
extracted by cardiac puncture. Blood samples were immediately cooled and protected from light for 30
minutes to allow clot retraction, and then centrifuged at 3500 rpm for 10 minutes at 4ºC. Serum was
aliquoted in Eppendorf tubes and frozen at -80°C until analysis. Animals were handled according to the
directive 2010/63/EU stipulated by the European Community, and the study was approved by the Ethical
Committee of University of Huelva.
2.2. SERUM SAMPLES PREPARATION
For the extraction of metabolites, 100 µL of serum were mixed with 400 µL of methanol/ethanol (50%
v/v) and vortexed for 5 min. Then, samples were centrifuged at 4000 rpm for 10 min at 4°C, and the
supernatant was transferred to another tube to be dried under nitrogen stream. Finally, the resulting
residue was reconstituted with methanol/water (80:20 v/v) containing 0.1% formic acid. An aliquot of this
extract (50 l) was split for derivatization before GC-MS fingerprinting, and the rest of the sample was
transferred to the injection vial for LC-MS analysis. Derivatization was carried out according to the two
step methodology proposed by Begley et al [19]. For this, 50l of extracts were dried under nitrogen
stream and redissolved in 50 μL of 20 mg mL-1
methoxyamine in pyridine for protection of carbonyl
groups by methoximation. After briefly vortexing, samples were incubated at 80°C for 15 min in a water
bath. Then silylation was performed by adding 50 μL of MSTFA (N-methyl-N-trimethylsilyl
trifluoroacetamide) and incubating at 80°C for a further 15 min. Finally, extracts were centrifuged at 4000
rpm for one minute and supernatant was collected for analysis.
2.3. METABOLOMIC PROFILING BY GC-MS
Analyses were performed in a Trace GC ULTRA gas chromatograph coupled to an ion trap mass
spectrometer detector ITQ 900 (Thermo Fisher Scientific), using a Factor Four capillary column VF-5MS
30m×0.25mm ID, with 0.25 µm of film thickness (Varian). The GC column temperature was set to 100ºC
for 0.5 minutes, and programmed to reach 320ºC at a rate of 15ºC per minute. Finally, this temperature
was maintained for other 2.8 minutes, being the total time of analysis 18 minutes. The injector
temperature was kept at 280ºC, and helium was used as carrier gas at a constant flow rate of 1 ml min-1
.
For mass spectrometry detection, ionization was carried out by electron ionization (EI) using a voltage of
70 eV, and the ion source temperature was set at 200ºC. Data were obtained acquiring full scan spectra in
the m/z range 35-650. For analysis, 1 µl of sample was injected in splitless mode.
2.4. METABOLOMIC PROFILING BY UHPLC-MS
Serum was fingerprinted by ultra-high performance liquid chromatography (Accela LC system, Thermo
Fisher Scientific) coupled to a quadrupole-time-of-flight mass spectrometry system equipped with
electrospray source (QSTAR XL Hybrid system, Applied Biosystems). Chromatographic separations
were performed in a reversed-phase column (Hypersil Gold C18, 2.1x50 mm, 1.9m) thermostated at
50ºC, with an injection volume of 5l. Solvents were delivered at a flow rate 0.5ml/min, using methanol
(solvent A) and water (solvent B), both containing 10mM ammonium formate and 0.1% formic acid. The
gradient elution program was: 0-1 min, 95% B; 2.5 min, 25% B; 8.5-10 min, 0% B; 10.1-12 min, 95% B.
MS operated in positive and negative polarities, acquiring full scan spectra in the m/z range 50-1000 with
1.005 seconds scan time. The ion spray voltage (IS) was set at 5000V and -2500V, and high-purity
nitrogen was used as curtain, nebulizer and heater gas at flow rates about 1.48 L min-1
, 1.56 L min-1
and
6.25 L min-1
, respectively. The source temperature was fixed at 400ºC, with a declustering potential (DP)
of 100V/-120V, and a focusing potential (FP) of ±350V. To acquire MS/MS spectra, nitrogen was used as
collision gas.
2.5. DATA PROCESSING
Raw data was processed following the pipeline described by Katajamaa et al., which proceeds through
multiple stages including feature detection, alignment of peaks and normalization [20]. For this purpose,
we employed the freely available software XCMS, included in the R platform (http://www.r-project.org).
UHPLC-MS files were converted into mzXML format using the msConvert tool (ProteoWizard), while
GC-MS files were converted into netCDF using the Thermo File Converter tool (Thermo Fisher
Scientific). Subsequently, data were extracted using the matchedFilter method. This algorithm slices data
1 2 3 4 5 6 7 8 9 10 11 12 13 14 15 16 17 18 19 20 21 22 23 24 25 26 27 28 29 30 31 32 33 34 35 36 37 38 39 40 41 42 43 44 45 46 47 48 49 50 51 52 53 54 55 56 57 58 59 60 61 62 63 64 65
4
into extracted ion chromatograms (XIC) on a fixed step size (default 0.1 m/z), and then each slice is
filtered with matched filtration using a second-derivative Gaussian as the model peak shape [21]. This
filtration requires the optimization of two parameters in order to extract the maximum information as
possible according to the characteristics of data sets obtained, named signal/noise threshold and full width
at half-maximum (fwhm). The S/N threshold was set at 2 for both analytical approaches, while the
optimal fwhm value was 10 for UHPLC-MS and 3 for GC-MS data, considering that lower peak widths
are usually obtained in gas chromatography. After peak extraction, grouping and retention time correction
of peaks (alignment) was accomplished in three iterative cycles with descending bandwidth (bw) from 10
to 1 seconds in UHPLC-MS, and descending bw from 5 to 1 seconds for GC-MS. Then, imputation of
missing values was performed by returning to the raw spectral data and integrating the areas of the
missing peaks which are below the applied signal-to-noise ratio threshold, using the fillPeaks algorithm.
For data normalization, the locally weighted scatter plot smoothing (LOESS) normalization method was
used, which adjusts the local median of log fold changes of peak intensities between samples in the data
set to be approximately zero across the whole peak intensity range [22]. Finally, data were submitted to
logarithmic transformation, in order to stabilize the variance of results. The preprocessed data were then
exported as a .csv file for further data analysis by multivariate procedures.
2.6. DATA ANALYSIS
Data were subjected to multivariate analysis by principal component analysis (PCA) and partial least
squares discriminant analysis (PLS-DA) in order to compare metabolomic profiles obtained, using the
SIMCA-P™ software (version 11.5, UMetrics AB, Umeå, Sweden). Before performing statistical
analysis, data are usually scaled and transformed in order to minimize the technical variability between
individual samples to extract the relevant biological information from these data sets [23]. For this, data
was submitted to Pareto scaling, for reducing the relative importance of larger values, and logarithmic
transformation, in order to approximate a normal distribution. Quality of the models was assessed by the
R2 and Q
2 values, supplied by the software, which provide information about the class separation and
predictive power of the model, respectively. These parameters are ranged between 0 and 1, and they
indicate the variance explained by the model for all the data analyzed (R2) and this variance in a test set
by cross-validation (Q2). Finally, potential biomarkers were selected according to the Variable
Importance in the Projection, or VIP (a weighted sum of squares of the PLS weight, which indicates the
importance of the variable in the model), considering only variables with VIP values higher than 1.5,
indicative of significant differences among groups. In addition, groups comparison was conducted by t-
test using the STATISTICA 8.0 software (StatSoft, Tulsa, USA). Only p values below 0.05 were regarded
as statistically significant.
2.7. IDENTIFICATION OF BIOMARKERS
Potential biomarkers detected by GC-MS were identified using the NIST Mass Spectral Library (version
08). Alternatively, identification of metabolites from UHPLC-MS profiling was made matching the
experimental accurate mass and tandem mass spectra (MS/MS) with those available in metabolomic
databases (HMDB, METLIN and LIPIDMAPS), using a mass accuracy of 30 ppm. Furthermore, the
identity of lipids was confirmed based on characteristic fragmentation patterns. Choline-containing
phospholipids were detected as protonated and sodiated ions in positive ion mode, while in negative
polarity these lipids formed demethylated ions or formate adducts. On the other hand, more abundant ions
for ethanolamine species were [M+H]+ and [M-H]
-, in positive and negative modes respectively. Finally,
phosphatidylinositols were detected in negative ion mode in form of deprotonated ions.
Phosphatidylcholines (PCs) and lysophosphatidylcholines (LPCs) presented characteristic ions in positive
ionization mode at m/z 184.07, 104.10 and 86.09, and two typical fragments due to the loss of
trimethylamine (m/z 59) and phosphocholine (m/z 183 or 205, if the counterion is proton or sodium). In
contrast, the product-ion spectra of ethanolamines were dominated by [M+H-141]+ arising from
elimination of the phosphoethanolamine moiety. Finally, in negative mode these distinctive signals were
found at 168.04, 196.07 and 241.02, for choline, ethanolamine and inositol derived lipids, respectively.
Furthermore, the fragmentation in the glycerol backbone and release of the fatty acyl substituents enabled
the identification of individual species of phospholipids, as previously described [24]. For
sphingomyelins, typical product ions appear at m/z 264 and 282 due to the fragmentation in the
sphingosine moiety, and the cleavage of phosphocholine headgroup generates characteristic fragments at
184.07 and 168.04 m/z, in positive and negative modes respectively [25]. Acylcarnitines were confirmed
based on characteristic fragments of 60.08 and 85.03 m/z [26]. Finally, fatty acid amides [27],
eicosanoids [28] and sphingoid bases [29] were also confirmed with characteristic fragments described in
the literature.
1 2 3 4 5 6 7 8 9 10 11 12 13 14 15 16 17 18 19 20 21 22 23 24 25 26 27 28 29 30 31 32 33 34 35 36 37 38 39 40 41 42 43 44 45 46 47 48 49 50 51 52 53 54 55 56 57 58 59 60 61 62 63 64 65
5
2.8. METABOLIC PATHWAY ANALYSIS
Metabolic pathway analysis was subsequently performed to identify and visualize the affected metabolic
pathways in APP/PS1 mice on the basis of potential biomarkers detected by GC-MS and UHPLC-MS
profiling. For this purpose, the MetPA web tool was employed (http://metpa.metabolomics.ca), which
conducts pathway analysis through pathway enrichment analysis and pathway topological analysis [30].
In this work, we select the Mus musculus library and use the default „Hypergeometric Test‟ and „Relative-Betweenness Centrality‟ algorithms for pathway enrichment analysis and pathway topological analysis,
respectively. In order to identify the most relevant pathways, the impact-value threshold calculated from
pathway topology analysis was set to 0.1.
3. RESULTS
3.1. MULTIVARIATE DATA ANALYSIS
The metabolomic approach based on the combination of GC-MS and UHPLC-MS profiling was applied
to serum samples from APP/PS1 and wild-type mice in order to determine changes in metabolites
associated with neurodegenerative processes. Due to the high complexity of metabolomic profiles
obtained, multivariate data analysis based on projection methods was employed for the interpretation of
results. Projection methods are based on the conversion of a multidimensional data table into a low-
dimensional model through reduction of the high number of variables to obtain new variables or
components (combinations of the originals) that are able to explain the variability of results [31]. These
models make possible to extract and display the systematic variation in the data, and allow visualizing
outliers, groupings and trends between different groups of samples, so they have become the main
workhorse in chemometrics for metabolomics. In this way, after raw data processing, Pareto scaling and
logarithmic transformation, data was submitted to multivariate statistics in order to build predictive
models for classification of samples. As a first exploratory step, principal component analysis (PCA) was
applied for a preliminary evaluation of the quality of the data before the application of any supervised
statistical analysis. This unsupervised method was not able to discriminate between groups (Fig. 1A-C),
as previously reported in other metabolomic studies with AD transgenic mice [11,14], but showed a
clustering of samples in the scores plot without significant outliers (tested by inspection of Hotelling T2-
range plots). Subsequently, partial least squares discriminant analysis (PLS-DA) was used in the same
data set to sharpen the separation between groups. PLS-DA scores plots (Fig 1D-F) displayed a clear
separation between transgenic (TG) and control (WT) mice. Furthermore, the statistics parameters
confirmed the goodness of these models (GC-MS: R2=0.991 Q
2=0.802; UHPLC-MS(+): R
2=0.985
Q2=0.938; UHPLC-MS(-): R
2=0.995 Q
2=0.944).
3.2. SELECTION OF BIOMARKERS
After PLS-DA modeling, data was further analyzed to identify the significant metabolites that contributed
to the separation of groups. For this purpose, statistically significant metabolites were selected by
inspecting loadings plots from PLS-DA, considering only metabolites with VIP values higher than 1.5, as
well as by t-test (p≤0.05). In Table 1 are listed the potential biomarkers identified by UHPLC-MS, their
experimental mass and retention time, the ionization mode used for detection, the fold change (calculated
by dividing the mean area for peaks in the APP/PS1 group by the mean area in the control group) and p
value (data for individual lipids are presented in electronic Supplementary Material, Table S1). On the
other hand, significant compounds identified by GC-MS are summarized in Table 2, including the
retention time, the fold change and p value.
As can be observed, complementary results were obtained from both analytical techniques employed in
this study. Metabolomic profiling by UHPLC-MS highlighted the importance of different classes of lipids
in the development of features of Alzheimer‟s disease displayed by the APP/PS1 mice, including
phospholipids and lysophospholipids, eicosanoids, sphingomyelins and sphingoid bases, bile acids, and
others. Alternatively, GC-MS showed that a number of low molecular weight metabolites were
significantly perturbed in this mouse model, such as amino acids, hexoses or organic acids. Therefore,
these results demonstrated that a broad number of metabolites can be detected by this metabolomic
multiplatform, which provides a comprehensive overview of serum metabolome.
3.3. METABOLIC PATHWAY ANALYSIS
Pathway analysis was then performed to identify the altered biochemical networks associated with the
metabolic perturbations presented in Tables 1-2, in order to elucidate the underlying pathological
mechanisms occurring in the APP/PS1 mice. To this end, the MetPA web tool combines pathway
enrichment analysis and pathway topology analysis to identify the most relevant metabolic pathways
involved in the conditions under study, using pathways downloaded from the KEGG database. Thereby,
1 2 3 4 5 6 7 8 9 10 11 12 13 14 15 16 17 18 19 20 21 22 23 24 25 26 27 28 29 30 31 32 33 34 35 36 37 38 39 40 41 42 43 44 45 46 47 48 49 50 51 52 53 54 55 56 57 58 59 60 61 62 63 64 65
6
the pathway impact is calculated as the sum of the importance measures of the matched metabolites
normalized by the sum of the importance measures of all metabolites in each pathway [30]. Finally,
results from this pathway analysis can be visualized as a graphical output representing the p value for
each metabolic pathway (log-transformed) vs. the calculated pathway impact, where each node represents
a metabolic pathway and its size indicates the importance of this pathway in response to Alzheimer‟s
disease (Fig. 2A). In this way, pathway analysis revealed that the most disturbed pathways were the
metabolism of amino acids such as phenylalanine (a); glycine, serine and threonine (c); tryptophan (d);
and tyrosine (h); metabolism of lipids as glycerophospholipids (b); sphingolipids (g); and ether lipids (l);
perturbed inositol phosphate metabolism (k); and alterations related to energy metabolism, including
glyoxylate and dicarboxylate metabolism (e); starch and sucrose metabolism (f); glycolysis (i); and TCA
cycle (j).
4. DISCUSSION
The APP/PS1 mouse model reproduces well some of the neuropathological and cognitive deficits
observed in human Alzheimer, with a phenotype characterized by deposition of Aβ plaques starting from
the age of four months, glial activation, and deficits in cognitive functions at the age of six months [4].
Furthermore, the study of the neurochemical profile and age-dependent metabolic changes exhibited by
this transgenic line has demonstrated that these alterations precede cognitive dysfunctions [32], being
very similar to those found in AD patients. Therefore, the use of this model may be of great help for the
investigation of pathological mechanisms associated with Alzheimer‟s disease. Serum metabolomics
based on mass spectrometry techniques, coupled to both gas chromatography and ultra-high performance
liquid chromatography, revealed significant alterations in numerous metabolites. Furthermore, the
application of metabolic pathway analysis allowed the identification of multiple abnormal processes
underlying the pathology.
It is noteworthy the presence of characteristic metabolomic signatures indicating a severe energy
impairment, with altered serum levels of metabolites such as glucose, glucose-6-phosphate, glycerol-3-
phosphate, 1,3-bisphosphoglycerate, inorganic phosphate, lactate, -hydroxybutyrate, citrate, malate,
succinate, oleyl-carnitine, stearic acid and creatinine. The reduction of the cerebral metabolic rate for
glucose and oxygen is one of the main features of Alzheimer‟s disease, demonstrated by in vivo imaging
using positron emission tomography [33]. This hypometabolic situation, occurring as a consequence of
multiple metabolic defects, is finally reflected in perturbed levels of energy-related metabolites. Lower
blood levels of glucose (Table 2) have been previously reported for different transgenic models of
Alzheimer‟s disease [11-13], which suggests a change in carbohydrate and energy metabolism. In
addition, the decrease observed in glycolytic intermediates such as glucose-6-phosphate and 1,3-
bisphosphoglycerate, and the increase of glycerol-3-phosphate, precursor of glyceraldehydede-3-
phosphate, also support an important dysfunction in glycolysis. In this sense, numerous alterations have
been found in key glycolytic enzymes in AD, including increased glucose-6-phosphate dehydrogenase
activity [34] and decreased glyceraldehyde-3-phosphate dehydrogenase activity [35], which is in
agreement with our metabolomic findings. Serum concentration of inorganic phosphate is a determining
factor in the regulation of energy metabolism and rate of oxygen consumption [36], so that reduced blood
phosphate (Table 2) could be linked to a high demand by cells to stimulate metabolism of glucose.
Mitochondrial dysfunction also plays a prominent role in energy deficiencies related to Alzheimer‟s
disease. Significant impairments have been reported in multiple enzymes from the tricarboxylic acid
cycle (TCA) [37], leading to abnormal levels of TCA intermediates and related compounds [38], in
accordance with imbalances in serum concentrations of citrate, succinate and malate listed in Tables 1-2.
In order to compensate these bioenergetic deficits caused by brain hypometabolism and impaired
mitochondrial function, alternative pathways have been found significantly over-expressed in the
APP/PS1 mice. The increase observed in serum lactate together with the reduction of glucose levels is
consistent with a shift in energy metabolism toward anaerobic glycolysis. Under hypoxic conditions,
neurons suffer adaptive processes to the reduced glucose consumption in order to maintain ATP levels,
which are mediated by the hypoxia-inducible factor 1. This transcription factor induces the transcription
of numerous genes related to hexoses metabolism including lactate dehydrogenase, but inhibits pyruvate
dehydrogenase, thus promoting lactic fermentation instead of oxidative phosphorylation [39]. Thereby, a
significant increase of lactate dehydrogenase activity has been previously found in AD brains, which
produces an accumulation of lactate in brain [8,9,13] and blood [11,13]. Moreover, ketone body-driven
energy production has been also proposed as a compensatory response when carbohydrate intake is low.
Ketone bodies, principally acetoacetate and -hydroxybutyrate, are produced from fatty acids in the liver
and can be used to produce energy via conversion into acetyl-CoA and the TCA cycle. Yao et al.
demonstrated that triple transgenic Alzheimer‟s mouse models use ketone bodies as alternative fuel to
1 2 3 4 5 6 7 8 9 10 11 12 13 14 15 16 17 18 19 20 21 22 23 24 25 26 27 28 29 30 31 32 33 34 35 36 37 38 39 40 41 42 43 44 45 46 47 48 49 50 51 52 53 54 55 56 57 58 59 60 61 62 63 64 65
7
sustain ATP generation, so that the decline in mitochondrial bioenergetics is accompanied by increased
activity of 3-oxoacid-CoA transferase 1 (SCOT, required for ketone body utilization) [40]. This enhanced
ketogenic pathway leads to decreased levels of ketone bodies such as -hydroxybutyrate [13], in
accordance with experimental data from GC-MS profiling in APP/PS1 mice (Table 2), and also supports
the aforementioned increase in succinate levels, because it is a byproduct in the metabolism of ketone
bodies by the action of SCOT. Another indicator of mitochondrial dysfunction observed in the APP/PS1
mice is the decrease of serum oleyl-carnitine and complementary increase of stearic acid levels. Lower
levels of L-carnitine have been reported in AD [41-42], suggesting a perturbed transport of fatty acids
into the mitochondria. Furthermore, different enzymes related to the -oxidation pathway have been
found over-expressed in AD, such as hydroxyacyl-coenzyme A dehydrogenase [40] or short chain 3-
hydroxyacyl-CoA dehydrogenase [43]. Therefore, this impaired metabolism of lipids could be involved in
neurodegenerative energetic failures as a supplementary pathway to those previously described. Finally,
the increase in creatinine levels (Table 2) implies an abnormal metabolism of creatine in the APP/PS1
mice. Creatine plays a fundamental role in energy buffering and overall cellular bioenergetics by means
of the creatine kinase/phosphocreatine system, being responsible for the transfer of energy from
mitochondria to cytosol. Oxidative stress have been previously related to reduced creatine kinase activity
in brain of AD patients, which finally results in reduced levels of creatine [41,42,44]. By contrast, levels
of creatinine, the non-enzymatic degradation product of creatine and phosphocreatine, are usually higher
in AD [9,42], which could indicate a dyshomeostasis of phosphocreatine system. Therefore, it could be
concluded that deficits in bioenergetic metabolism is a key factor in pathogenesis of AD-type disorders
found in the APP/PS1 mice, affecting multiple metabolic pathways such as glycolysis, TCA cycle, -
oxidation, ketogenic pathway and phosphocreatine system, as summarized in Figure 2B.
The decrease observed in adenosine monophosphate levels (Table 1) and the complementary increase of
uric acid (Table 2) suggests an impaired purine metabolism. In this sense, Lin et al. found a perturbed
catabolism of different purine derivatives toward the accumulation of uric acid in the cerebellum of
transgenic CRND8 mice [45]. Moreover, the degradation of AMP may have important consequences in
cellular energy homeostasis, since it plays a central role in glucose and lipid metabolism through the
AMP-activated protein kinase, which is known to be decreased in AD brain [46]. Furthermore, the
decrease of serum AMP levels could be related to an elevated adenosine monophosphate deaminase
activity, which has been proposed as a potential source for ammonia production in Alzheimer‟s disease
brain [47]. Hyperammonemia resulting from alterations in ammonia regulation, mainly due to urea cycle
enzyme deficiencies, has deleterious effects on the central nervous system. In Alzheimer‟s disease, the
alteration of urea cycle has been demonstrated on the basis of altered levels of expression in different
enzymes and the corresponding genes [48]. Thus, abnormal content of urea and related amino acids has
been previously reported in AD [44,49], in agreement with our metabolomic findings regarding reduced
serum levels of urea and citrulline (Tables 1-2). Besides these metabolic alterations, other metabolites
potentially involved in different pathways related to the integrity of the central nervous system were
perturbed in serum from APP/PS1 mice, such as tyrosine, tryptophan, serotonin, fatty acid amides,
monostearin and bile acids. Serotonin is a neurotransmitter derived from tryptophan involved in memory
and learning, while tyrosine is the precursor of catecholamines such as dopamine or epinephrine.
Thereby, reductions of serotonin, tryptophan and tyrosine levels denote a severe disturbance in
monoaminergic neurotransmission systems, which confirm previous studies in AD subjects [41,44,50].
Fatty acid amides are a family of lipid signaling molecules that can act as regulators of several cellular
and physiological functions, demonstrating control over a variety of biological processes such as sleep
regulation, modulation of monoaminergic systems, locomotion, inhibition of phospholipase A2 and
epoxide hydrolase, among other processes [51]. These lipids are metabolized by the fatty acid amide
hydrolase (FAAH), the principal catabolic enzyme of endocannabinoid system. The over-expression of
FAAH has been previously associated with AD [52], which might lead to decreased levels of palmitamide
and stearamide observed in serum of APP/PS1 mice (Table S1). On the other hand, the reduction of
circulating levels of monostearin could be considered as an indicator of altered expression of
monoacylglycerol lipase, also involved in endocannabinoid system and over-expressed in AD brain [53].
Therefore, reduced palmitamide, stearamide and monostearin could be considered as novel potential
biomarkers of AD-type disorders in APP/PS1 mice indirectly related to endocannabinoid dysfunction,
previously not described to our knowledge. Finally, decreased levels of deoxycholic, taurodeoxycholic
and taurocholic acids were also observed in serum samples analyzed by UHPLC-MS (Table S1). In this
context, ursodeoxycholic acid and tauroursodeoxycholic acid were demonstrated to be potent inhibitors of
apoptosis [54], and they present neuroprotective action against amyloid deposition [55]. Therefore,
although further studies have to be performed in order to confirm these results, these compounds
1 2 3 4 5 6 7 8 9 10 11 12 13 14 15 16 17 18 19 20 21 22 23 24 25 26 27 28 29 30 31 32 33 34 35 36 37 38 39 40 41 42 43 44 45 46 47 48 49 50 51 52 53 54 55 56 57 58 59 60 61 62 63 64 65
8
highlight as interesting potential markers of AD, especially considering their role as important metabolic
integrators and signaling factors [56].
Numerous lipids also contributed significantly to discrimination between APP/PS1 mice and WT-controls
considering the high impact-value calculated from pathway topology analysis (Fig. 2A), including
choline, ethanolamine and inositol derived phospholipids and lyso-phospholipids, plasmalogens,
sphingomyelins and sphingoid bases, as well as cholesterol, which may indicate an abnormal metabolism
of membrane lipids. Membrane breakdown in AD has been traditionally related to over-activation of
phospholipases, principally phospholipase A2, leading to phospholipids degradation and resulting in the
generation of second messengers involved in neurodegeneration [57]. However, this membrane
destabilization process has been also associated with imbalance in the levels of saturated/unsaturated fatty
acids contained in the structure of phospholipids [24,41]. In this study, decreased serum levels of different
phospholipid species was observed, including cholines, ethanolamines, inositols and plasmalogens, most
of them containing PUFAs in their structure, which is in accordance with previous studies in brain from
transgenic mice of AD [6,7,58]. However, this is the first time that this finding is described in a peripheral
sample as is serum. Furthermore, the release of fatty acids from the hydrolysis of these phospholipids by
PLA2 and subsequent oxidation supports the elevation of different eicosanoids in serum samples, such as
prostaglandins (PG) and hydroxy-eicosapentaenoic acid (HEPE) (Table S1), which are important lipid
mediators closely associated with neuronal pathways involved in AD neurobiology [59]. Moreover, lower
concentrations of lyso-phospholipids were found in serum from APP/PS1 mice (Table S1), in agreement
with previous studies in blood from human AD patients [24,29]. Therefore, results presented here
demonstrate that phospholipids dyshomeostasis must be developed through similar pathways in both AD
humans and transgenic mice. In addition, this altered metabolism of phospholipids in the APP/PS1 mice
was also supported by other metabolomic changes in low molecular weight metabolites:
phosphoethanolamine, myoinositol and myoinositol-1-phosphate. The decrease in phosphoethanolamine,
the precursor of phosphatidylethanolamines, has been previously reported in postmortem AD brains [60],
corroborating the evidence for a membrane defect in Alzheimer disease. On the other hand, perturbed
levels of myoinositol and myoinositol-1-phosphate may be directly related to altered phosphatidylinositol
metabolism and dysfunctions in the phosphoinositide signaling system. In this sense, previous reports
have described increased levels of several isoenzymes of phosphoinositide-specific phospholipase C [61],
as well as higher activity of myo-inositol monophosphatase in AD brains [62]. Therefore, an altered
cellular homeostasis of myoinositol and their phosphorylated forms occurs in neurons, leading to the
accumulation of free myoinositol, a conventional marker of astrogliosis and neuronal death, and decrease
of myoinositol-1 phosphate in brains from both humans and animal models of AD [33,60].
Sphingolipid metabolism also seems to play a major role in the dysfunctional management of cellular
membranes in the APP/PS1 mice, as can be observed in Table S1 considering reduced levels of different
species of sphingomyelins and sphingoid bases. In Alzheimer‟s disease, perturbed sphingomyelin
metabolism has been proposed as a pivotal event in the dysfunction and degeneration of neurons, with
increased SM levels in CSF [63] and decreased in blood [64], while results from post-mortem brain
analyses are contradictory, showing increased [58] or decreased [65] total concentrations of
sphingomyelins. On the other hand, lipidomic investigations in transgenic mouse brains showed
consistent increases of SM levels [58,66], but this is the first time that altered circulating levels of
sphingomyelins in serum samples is observed. Moreover, decreased levels of sphinganine,
hexadecasphinganine and phytosphingosine also support a disturbed sphingolipid metabolism, as
previously reported in human serum [29]. Cholesterol is also an essential constituent of lipid rafts, whose
reduction in brain can produce serious alterations of the physicochemical structure of lipid raft
microdomains [66]. However, elevated blood levels of cholesterol and other lipids have been proposed to
increase the risk of developing AD [67], as observed in our study (Table 2). Hyperlipidemia is one of the
most important vascular risk factors, which can affect to cerebrovascular system causing atrophy,
structural changes in the blood-brain barrier and inflammation. In this way, it is recognized that subjects
with vascular risk factors have an increased prevalence of both vascular dementia and Alzheimer‟s
disease [68], caused by decreased cerebral blood flow that finally involves neuronal cell loss.
Finally, decreased levels of amino acids glycine, threonine, proline and pyroglutamate were found by GC-
MS profiling of serum samples (Table 2). By contrast, previous studies reported increased concentrations
of several amino acids in brains from AD transgenic mice, including serine, threonine, valine, alanine,
lysisne and leucine [7,8,9,12], which could indicate an important deregulation of the transport of amino
acids across the blood brain barrier. Amino acids enter into the central nervous system by means of the
sodium-independent system L1, which is regulated by the γ-glutamyl cycle [69]. In this process, amino
1 2 3 4 5 6 7 8 9 10 11 12 13 14 15 16 17 18 19 20 21 22 23 24 25 26 27 28 29 30 31 32 33 34 35 36 37 38 39 40 41 42 43 44 45 46 47 48 49 50 51 52 53 54 55 56 57 58 59 60 61 62 63 64 65
9
acids react with glutathione by the action of -glutamyl transpeptidase to form -glutamyl amino acids,
which after enter cells are degraded to the corresponding amino acid, being liberated a molecule of
pyroglutamate that is essential since stimulates sodium dependent carriers for the later removal of
deleterious amino acids from brain. Changes in this cycle are known in AD brain, with a decrease of the
GSH/GSSG ratio, diminished γ-glutamylcysteine synthetase activity and increased activity of enzymes
related to the GSH use such as glutathione peroxidase, γ-glutamyl transpeptidase, and glutathione S-
transferase [70]. In addition, reduced levels of pyroglutamate have been previously reported in AD brain
[9], in accordance with our metabolomic results. Therefore, these data may suggest that disturbances in
amino acids homeostasis play a critical role in the pathogenesis of AD in APP/PS1 mice.
5. CONCLUSIONS
In the present study, the APP/PS1 transgenic mice of Alzheimer‟s disease could be clearly differentiated
from wild-type controls by metabolomic analysis of serum samples using combined GC-MS and
UHPLC-MS. Subsequent application of metabolic pathway analysis allowed the elucidation of underlying
pathological mechanisms occurring in the APP/PS1 mice, including failures in energy metabolism,
perturbed homeostasis of membrane lipids and amino acids, as well as abnormal processes related to the
integrity of the central nervous system, such as hyperammonemia, endocannabinoid dysfunction or
monoaminergic alterations. Therefore, these findings stand out the potential of the APP/PS1 transgenic
mice to study the pathogenesis and development of Alzheimer‟s disease, because many of these findings
agree with pathological alterations observed in diseased humans.
Acknowledgements. This work was supported by the projects CTM2012-38720-C03-01 from the
Ministerio de Ciencia e Innovación and P008-FQM-3554 and P009-FQM-4659 from the Consejería de
Innovación, Ciencia y Empresa (Junta de Andalucía). Raúl González Domínguez thanks the Ministerio de
Educación for a predoctoral scholarship.
REFERENCES
[1] Bettens K, Sleegers K, Van Broeckhoven C. Genetic insights in Alzheimer‟s disease. Lancet Neurol
2013;2:92-104. [2] McKahnn G, Drachman D, Folstein M, Katzman R, Price D, Stadlan EM. Clinical diagnosis of
Alzheimer´s disease: report of the NINCDS-ADRDA Work Group under the auspices of Department of
Health and Human Services Task Force on Alzheimer´s disease. Neurology 1984;34:939-44.
[3] Hall AM, Roberson ED. Mouse models of Alzheimer‟s disease. Brain Res Bull 2012;88:3-12.
[4] Malm T, Koistinaho J, Kanninen K. Utilization of APPswe/PS1dE9 transgenic mice in research of
Alzheimer's disease: Focus on gene therapy and cell-based therapy applications. Int J Alzheimers Dis
2011;2011:517160.
[5] Lindon JC, Holmes E, Nicholson JK. Metabonomics and its role in drug development and disease
diagnosis. Expert Rev Mol Diagn 2004;4:189-99.
[6] González-Domínguez R, García-Barrera T, Vitorica J, Gómez-Ariza JL. Region-specific metabolic
alterations in brain of the APP/PS1 transgenic mice of Alzheimer‟s disease. Biochim Biophys Acta Mol
Basis Dis 2014; 1842:2395-402.
[7] González-Domínguez R, García-Barrera T, Vitorica J, Gómez-Ariza JL. Metabolomic screening of
regional brain alterations in the APP/PS1transgenic model of Alzheimer‟s disease by direct infusion mass
spectrometry. J Pharm Biomed Anal 2015;102:425-35. [8] Salek RM, Xia J, Innes A, Sweatman BC, Adalbert R, Randle S, McGowan E, Emson PC, Griffin JL.
A metabolomic study of the CRND8 transgenic mouse model of Alzheimer‟s disease. Neurochem Int
2010;56:937-43. [9] Trushina E, Nemutlu E, Zhang S, ChristensenT, Camp J, Mesa J, Siddiqui A, Tamura Y, Sesaki H,
Wengenack TM, Dzeja PP, Poduslo JF. Defects in mitochondrial dynamics and metabolomic signatures
of evolving energetic stress in mouse models of familial Alzheimer‟s disease. PLoS ONE 2012;7:e32737.
[10] Patel S, Shah RJ, Coleman P, Sabbagh M. Potential peripheral biomarkers for the diagnosis of
Alzheimer‟s disease. Int. J. Alzheimers Dis 2011;2011:572495.
[11] Jiang N, Yan X, Zhou W, Zhang Q, Chen H, Zhang Y, Zhang X. NMR-based metabonomic
investigations into the metabolic profile of the senescence-accelerated mouse. J Proteome Res
2008;7:3678-86. [12] Hu ZP, Browne ER, Liu T, Angel TE, Ho PC, Chan ECY. Metabonomic profiling of TASTPM
transgenic alzheimer‟s disease mouse model. J Proteome Res 2012;11:5903-13. [13] Graham SF, Holscher C, McClean P, Elliott CT, Green BD.
1H NMR metabolomics investigation of
an Alzheimer‟s disease (AD) mouse model pinpoints important biochemical disturbances in brain and
plasma. Metabolomics 2013;9:974-83.
1 2 3 4 5 6 7 8 9 10 11 12 13 14 15 16 17 18 19 20 21 22 23 24 25 26 27 28 29 30 31 32 33 34 35 36 37 38 39 40 41 42 43 44 45 46 47 48 49 50 51 52 53 54 55 56 57 58 59 60 61 62 63 64 65
10
[14] Fukuhara K, Ohno A, Ota Y, Senoo Y, Maekawa K, Okuda H, Kurihara M, Okuno A, Niida S, Saito
Y, Takikawa O. NMR-based metabolomics of urine in a mouse model of Alzheimer‟s disease:
identification of oxidative stress biomarkers. J Clin Biochem Nutr 2013;52:133-8. [15] Gonzalez-Dominguez R, Castilla-Quintero R, Garcia-Barrera T, Gomez-Ariza JL. Development of a
metabolomic approach based on urine samples and direct infusion mass spectrometry. Anal Biochem
2014;465:20-7.
[16] Pasikanti KK, Ho PC, Chan ECY. Gas chromatography/mass spectrometry in metabolic profiling of
biological fluids. J Chromatogr B Analyt Technol Biomed Life Sci 2008;871:202-11. [17] Wilson ID, Nicholson JK,Castro-Perez J, Granger JH, Johnson KA, Smith BW, Plumb RS. High
resolution “ultra performance” liquid chromatography coupled to oa-TOF mass spectrometry as a tool for
differential metabolic pathway profiling in functional genomic studies. J Proteome Res 2005;4:591-8.
[18] Jankowsky JL, Fadale DJ, Anderson J, Xu GM, Gonzales V, Jenkins NA, Copeland NG, Lee MK,
Younkin LH, Wagner SL, Younkin SG, Borchelt DR. Mutant presenilins specifically elevate the levels of
the 42 residue beta-amyloid peptide in vivo: evidence for augmentation of a 42-specific g secretase. Hum
Mol Genet 2004;13:159-70.
[19] Begley P, Francis-McIntyre S, Dunn WB, Broadhurst DI, Halsall A, Tseng A, Knowles J,
HUSERMET Consortium, Goodacre R, Kell DB. Development and performance of a gas
chromatography-time-of-flight mass spectrometry analysis for large-scale nontargeted metabolomic
studies of human serum. Anal Chem 2009;81:7038-46. [20] Katajamaa M, Oresic M. Data processing for mass spectrometry-based metabolomics. J Chromatogr
A 2007;1158:318-28.
[21] Smith CA, Want EJ, O‟Maille G, Abagyan R, Siuzdak G. XCMS: Processing mass spectrometry
data for metabolite profiling using nonlinear peak alignment, matching, and identification. Anal Chem
2006;78:779-87.
[22] Veselkov KA, Vingara LK, Masson P, Robinette SL, Want E, Li JV, Barton RH, Boursier-Neyret C,
Walther B, Ebbels TM, Pelczer I, Holmes E, Lindon JC, Nicholson JK. Optimized preprocessing of ultra-
performance liquid chromatography/mass spectrometry urinary metabolic profiles for improved
information recovery. Anal Chem 2011;83:5864-72. [23] van den Berg RA, Hoefsloot HCJ, Westerhuis JA, Smilde AK, van der Werf MJ. Centering, scaling,
and transformations: improving the biological information content of metabolomics data. BMC Genomics
2006;7:142. [24] Gonzalez-Dominguez R, Garcia-Barrera T, Gomez-Ariza JL. Combination of metabolomic and
phospholipid-profiling approaches for the study of Alzheimer's disease. J Proteomics 2014;104:37-47.
[25] Haynes CA, Allegood JC, Park H, Sullards MC. Sphingolipidomics: Methods for the comprehensive
analysis of sphingolipids. J Chromatogr B Analyt Technol Biomed Life Sci 2009;877:2696-708. [26] Vernez L, Hopfgartner G, Wenk M, Krahenbuhl S. Determination of carnitine and acylcarnitines in
urine by high-performance liquid chromatography-electrospray ionization ion trap tandem mass
spectrometry. J Chromatogr A 2003;984:203-13.
[27] Nichols KK, Ham BM, Nichols JJ, Ziegler C, Green-Church KB. Identification of fatty acids and
fatty acid amides in human meibomian gland secretions. Invest Ophthalmol Vis Sci 2007;48:34-9. [28] Murphy RC, Barkley RM, Berry KZ, Hankin J, Harrison K, Johnson C, Krank J, McAnoy A, Uhlson
C, Zarini S. Electrospray ionization and tandem mass spectrometry of eicosanoids. Anal Biochem
2005;346:1-42.
[29] Li N, Liu W, Li W, Li S, Chen X, Bi K, He P. Plasma metabolic profiling of Alzheimer‟s disease by
liquid chromatography/mass spectrometry. Clin Biochem 2010;43:992-7.
[30] Xia J, Wishart DS. MetPA: a web-based metabolomics tool for pathway analysis and visualization.
Bioinformatics 2010;26:2342-4. [31] Trygg J, Holmes E, Lundstedt T. Chemometrics in metabonomics. J Proteome Res 2007;6:469-79.
[32] Chen SQ, Cai Q, Shen YY, Wang PJ, Teng GJ, Zhang W, Zang FC. Age-related changes in brain
metabolites and cognitive function in APP/PS1 transgenic mice. Behav Brain Res 2012;235:1-6.
[33] Ferreira IL, Resende R, Ferreiro E, Rego AC, Pereira CF. Multiple defects in energy metabolism in
Alzheimer‟s disease. Curr Drug Targets 2010;11:1193-206.
[34] Russell RL, Siedlak SL, Raina AK, Bautista JM, Smith MA, Perry G. Increased neuronal glucose-6-
phosphate dehydrogenase and sulfhydryl levels indicate reductive compensation to oxidative stress in
Alzheimer disease. Arch Biochem Biophys 1999;370:236-9.
[35] Shalova IN, Cechalova K, Rehakova Z, Dimitrova P, Ognibene E, Caprioli A, Schmalhausen EV,
Muronetz VI, Saso L. Decrease of dehydrogenase activity of cerebral glyceraldehyde-3-phosphate
dehydrogenase in different animal models of Alzheimer‟s disease. Biochim Biophys Acta
2007;1770:826-32.
1 2 3 4 5 6 7 8 9 10 11 12 13 14 15 16 17 18 19 20 21 22 23 24 25 26 27 28 29 30 31 32 33 34 35 36 37 38 39 40 41 42 43 44 45 46 47 48 49 50 51 52 53 54 55 56 57 58 59 60 61 62 63 64 65
11
[36] Bose S, French S, Evans FJ, Balaban RS. Metabolic network control of oxidative phosphorylation:
Multiple roles of inorganic phosphate. J Biol Chem 2003;278:39155-65.
[37] Bubber P, Haroutunian V, Fisch G, Blass JP, Gibson GE. Mitochondrial abnormalities in Alzheimer
brain: mechanistic implications. Ann Neurol 2005;57:695-703.
[38] Redjems-Bennani N, Jeandel C, Lefebvre E, Blain H, Vidailhet M, Guéanta JL. Abnormal substrate
levels that depend upon mitochondrial function in cerebrospinal fluid from Alzheimer patients.
Gerontology 1998;44:300-4. [39] Papandreou I, Cairns RA, Fontana L, Lim AL, Denko NC. HIF-1 mediates adaptation to hypoxia by
actively down-regulating mitochondrial oxygen consumption. Cell Metab 2006;3:187-97.
[40] Yao J, Hamilton RT, Cadenas E, Brinton RD. Decline in mitochondrial bioenergetics and shift to
ketogenic profile in brain during reproductive senescence. Biochim Biophys Acta 2010;1800:1121-6.
[41] González-Domínguez R, García-Barrera T, Gómez-Ariza JL. Using direct infusión mass
spectrometry for serum metabolomics in Alzheimer‟s disease. Anal Bioanal Chem 2014;406:7137-48. [42] González-Domínguez R, García A, García-Barrera T, Barbas C, Gómez-Ariza JL. Metabolomic
profiling of serum in the progression of Alzheimer‟s disease by capillary electrophoresis-mass
spectrometry. Electrophoresis 2014; 35:3321-30.
[43] Yang SY, He XY, Schulz H. 3-Hydroxyacyl-CoA dehydrogenase and short chain 3-hydroxyacyl-
CoA dehydrogenase in human health and disease. FEBS J 2005;272:4874-83.
[44] González-Domínguez R, Garcia-Barrera T, Gomez-Ariza JL. Application of a novel metabolomic
approach based on atmospheric pressure photoionization mass spectrometry using flow injection analysis
for the study of Alzheimer‟s disease. Talanta 2015;131:480-9.
[45] Lin S, Kanawati B, Liu L, Witting M, Li M, Huang J, Schmitt-Kopplin P, Cai Z. Ultra high
resolution mass spectrometry-based metabolic characterization reveals cerebellum as a disturbed region in
two animal models. Talanta 2014;118:45-53. [46] Cai Z, Yan LJ, Li K, Quazi SH, Zhao B. Roles of AMP-activated protein kinase in Alzheimer‟s
disease. Neuromol Med 2012;14:1-14.
[47] Sims B, Powers RE, Sabina RL, Theibert AB. Elevated adenosine monophosphate deaminase
activity in Alzheimer‟s disease brain. Neurobiol Aging 1998;19:385-91.
[48] Hansmannel F, Sillaire A, Kamboh MI, Lendon C, Pasquier F, Hannequin D, Laumet G, Mounier A,
Ayral AM, DeKosky ST, Hauw JJ, Berr C, Mann D, Amouyel P, Campion D, Lambert JC. Is the urea
cycle involved in Alzheimer‟s disease? J Alzheimers Dis 2010;21:1013-21. [49] González-Domínguez R, García-Barrera T, Gómez-Ariza JL. Metabolomic study of lipids in serum
for biomarker discovery in Alzheimer‟s disease using direct infusion mass spectrometry. J Pharm Biomed
Anal 2014;98:321-6.
[50] Storga D, Vrecko K, Birkmayer JGD, Reibnegger G. Monoaminergic neurotransmitters, their
precursors and metabolites in brains of Alzheimer patients. Neurosci Lett 1996;203:29-32.
[51] Ezzili C, Otrubova K, Boger DL. Fatty acid amide signaling molecules. Bioorg Med Chem Lett
2010;20:5959-68.
[52] Benito C, Nuñez E, Tolon RM, Carrier EJ, Rabano A, Hillard CJ, Romero J. Cannabinoid CB2
receptors and fatty acid amide hydrolase are selectively overexpressed in neuritic plaque-associated glia
in Alzheimer‟s disease brains. J Neurosci 2003;23:11136-41.
[53] Mulder J, Zilberter M, Pasquaré SJ, Alpár A, Schulte G, Ferreira SG, Köfalvi A, Martín-Moreno
AM, Keimpema E, Tanila H, Watanabe M, Mackie K, Hortobágyi T, de Ceballos ML, Harkany T.
Molecular reorganization of endocannabinoid signalling in Alzheimer‟s disease. Brain 2011;134:1041-60.
[54] Ramalho RM, Viana RJS, Low WC, Steer CJ, Rodrigues CMP. Bile acids and apoptosis modulation:
an emerging role in experimental Alzheimer‟s disease. Trends Mol Med 2008;14:54-62.
[55] Lo AC, Callaerts-Vegh Z, Nunes AF, Rodrigues CMP, D'Hooge R. Tauroursodeoxycholic acid
(TUDCA) supplementation prevents cognitive impairment and amyloid deposition in APP/PS1 mice.
Neurobiol Dis 2013;50:21-9.
[56] Thomas C, Pellicciari R, Pruzanski M, Auwerx J, Schoonjans K. Targeting bile-acid signalling for
metabolic diseases. Nat Rev Drug Discov 2008;7:678-93. [57] Farooqui AA, Ong WY, Horrocks LA. Biochemical aspects of neurodegeneration in human brain:
involvement of neural membrane phospholipids and phospholipases A2. Neurochem Res 2004;29:1961-
77.
[58] Chan RB, Oliveira TG, Cortes EP, Honig LS, Duff KE, Small SA, Wenk MR, Shui G, Di Paolo G.
Comparative lipidomic analysis of mouse and human brain with Alzheimer disease. J Biol Chem
2012;287:2678-88.
[59] Frisardi V, Panza F, Seripa D, Farooqui T, Farooqui AA. Glycerophospholipids and
glycerophospholipid-derived lipid mediators: A complex meshwork in Alzheimer‟s disease pathology.
Prog Lipid Res 2011;50:313-30.
1 2 3 4 5 6 7 8 9 10 11 12 13 14 15 16 17 18 19 20 21 22 23 24 25 26 27 28 29 30 31 32 33 34 35 36 37 38 39 40 41 42 43 44 45 46 47 48 49 50 51 52 53 54 55 56 57 58 59 60 61 62 63 64 65
12
[60] Klunk WE, Panchalingam K, McClure RJ, Stanley JA, Pettegrew JW. Quantitative 1H and
31P MRS
of PCA extracts of postmortem Alzheimer's disease brain. Neurobiol Aging 1996;17:349-57.
[61] Shimohama S, Sasaki Y, Fujimoto S, Kamiya S, Taniguchi T, Takenawa T, Kimura J. Phospholipase
C isoenzymes in the human brain and their changes in Alzheimer‟s disease. Neuroscience 1998;82:999-
1007.
[62] Shimohama S, Tanino H, Sumida Y, Tsuda J, Fujimoto S. Alteration of myo-inositol
monophosphatase in Alzheimer‟s disease brains. Neurosci Lett 1998;245:159-62.
[63] Kosicek M, Zetterberg H, Andreasen N, Peter-Katalinic J, Hecimovic S. Elevated cerebrospinal fluid
sphingomyelin levels in prodromal Alzheimer‟s disease. Neurosci Lett 2012;516:302-305.
[64] Han X, Rozen S, Boyle SH, Hellegers C, Cheng H, Burke JR, Welsh-Bohmer KA, Doraiswamy PM,
Kaddurah-Daouk R. Metabolomics in early Alzheimer‟s disease: identification of altered plasma
sphingolipidome using shotgun lipidomics. PLoS ONE 2011;6:e21643.
[65] Cutler RG, Kelly J, Storie K, Pedersen WA, Tammara A, Hatanpaa K, Troncoso JC, Mattson MP.
Involvement of oxidative stress-induced abnormalities in ceramide and cholesterol metabolism in brain
aging and Alzheimer‟s disease. Proc Natl Acad Sci 2004;101:2070-5. [66] Fabelo N, Martín V, Marín R, Santpere G, Aso E, Ferrer I, Díaz M. Evidence for premature lipid raft
aging in APP/PS1 double-transgenic mice, a model of familial Alzheimer disease. J Neuropathol Exp
Neurol 2012;71:868-81.
[67] Pappolla MA, Bryant-Thomas TK, Herbert D, Pacheco J, Fabra Garcia M, Manjon M, Girones X,
Henry TL, Matsubara E, Zambon D, Wolozin B, Sano M, Cruz-Sanchez FF, Thal LJ, Petanceska SS,
Refolo LM.Mild hypercholesterolemia is an early risk factor for the development of Alzheimer amyloid
pathology. Neurology 2003;61:199-205.
[68] Breteler MMB. Vascular risk factors for Alzheimer‟s disease: An epidemiologic perspective.
Neurobiol Aging 2000;21:153-60.
[69] Lee WJ, Hawkins RA, Peterson DR, Viña JR. Role of oxoproline in the regulation of neutral amino
acid transport across the blood-brain barrier. J Biol Chem 1996;271:19129-33.
[70] Zhu Y, Carvey PM, Ling Z. Age-related changes in glutathione and glutathione-related enzymes in
rat brain. Brain Res 2006;1090:35-44.
FIGURE LEGENDS
Fig 1. Scores plots of PCA (A-C) and PLS-DA (D-F) models for GC-MS, UHPLC-ESI(+)/MS and
UHPLC-ESI(-)/MS data
Fig 2. (A) Pathway analysis overview showing altered metabolic pathways in serum from APP/PS1 mice.
(a) phenylalanine metabolism; (b) glycerophospholipid metabolism; (c) glycine, serine and threonine
metabolism; (d) tryptophan metabolism; (e) glyoxylate and dicarboxylate metabolism; (f) starch and
sucrose metabolism; (g) sphingolipid metabolism; (h) tyrosine metabolism; (i) glycolysis; (j) TCA cycle;
(k) inositol phosphate metabolism; (l) ether lipids metabolism. (B) Overview of serum metabolomic
changes in APP/PS1 mice related to bioenergetic metabolism; (↑) increased; (↓) decreased.
Abbreviations: Glc, glucose; Glc-6-P, glucose-6-phosphate; G-3-P, glycerol-3-phosphate; 1,3-BPG, 1,3
bisphosphoglycerate; Pi, inorganic phosphate; HB, -hydroxybutyrate.
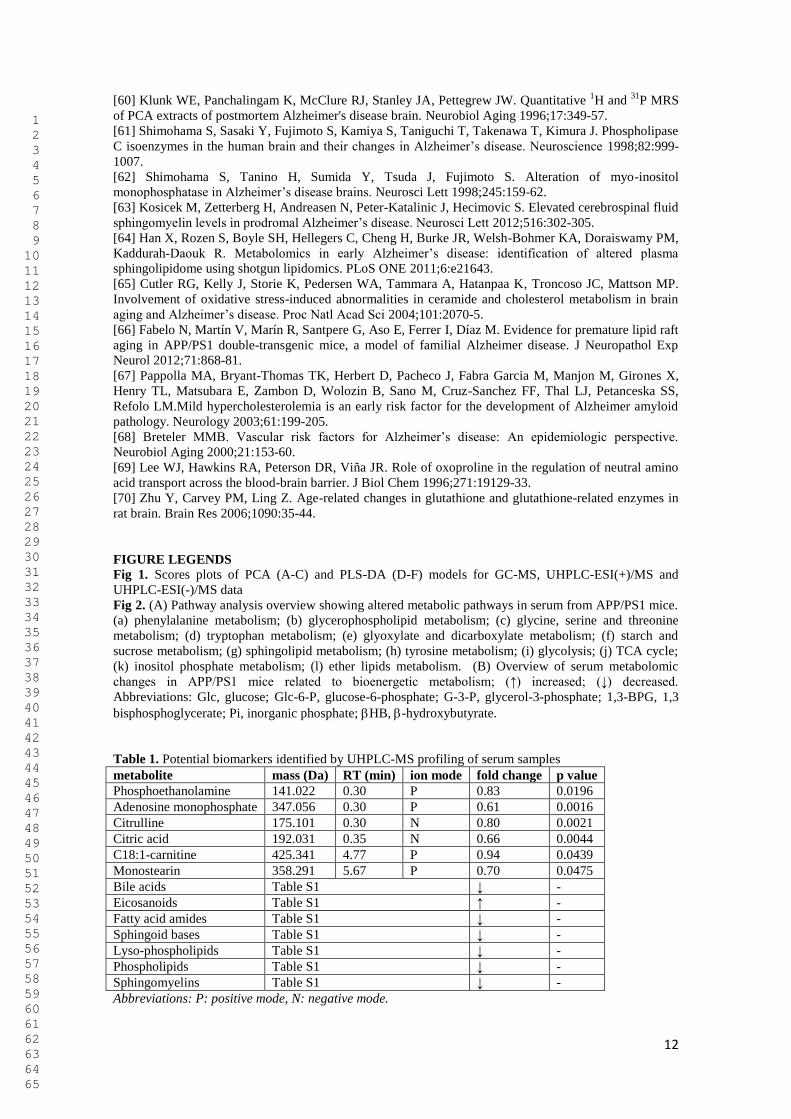
Table 1. Potential biomarkers identified by UHPLC-MS profiling of serum samples
metabolite mass (Da) RT (min) ion mode fold change p value
Phosphoethanolamine 141.022 0.30 P 0.83 0.0196
Adenosine monophosphate 347.056 0.30 P 0.61 0.0016
Citrulline 175.101 0.30 N 0.80 0.0021
Citric acid 192.031 0.35 N 0.66 0.0044
C18:1-carnitine 425.341 4.77 P 0.94 0.0439
Monostearin 358.291 5.67 P 0.70 0.0475
Bile acids Table S1 ↓ -
Eicosanoids Table S1 ↑ -
Fatty acid amides Table S1 ↓ -
Sphingoid bases Table S1 ↓ -
Lyso-phospholipids Table S1 ↓ -
Phospholipids Table S1 ↓ -
Sphingomyelins Table S1 ↓ -
Abbreviations: P: positive mode, N: negative mode.
1 2 3 4 5 6 7 8 9 10 11 12 13 14 15 16 17 18 19 20 21 22 23 24 25 26 27 28 29 30 31 32 33 34 35 36 37 38 39 40 41 42 43 44 45 46 47 48 49 50 51 52 53 54 55 56 57 58 59 60 61 62 63 64 65
13
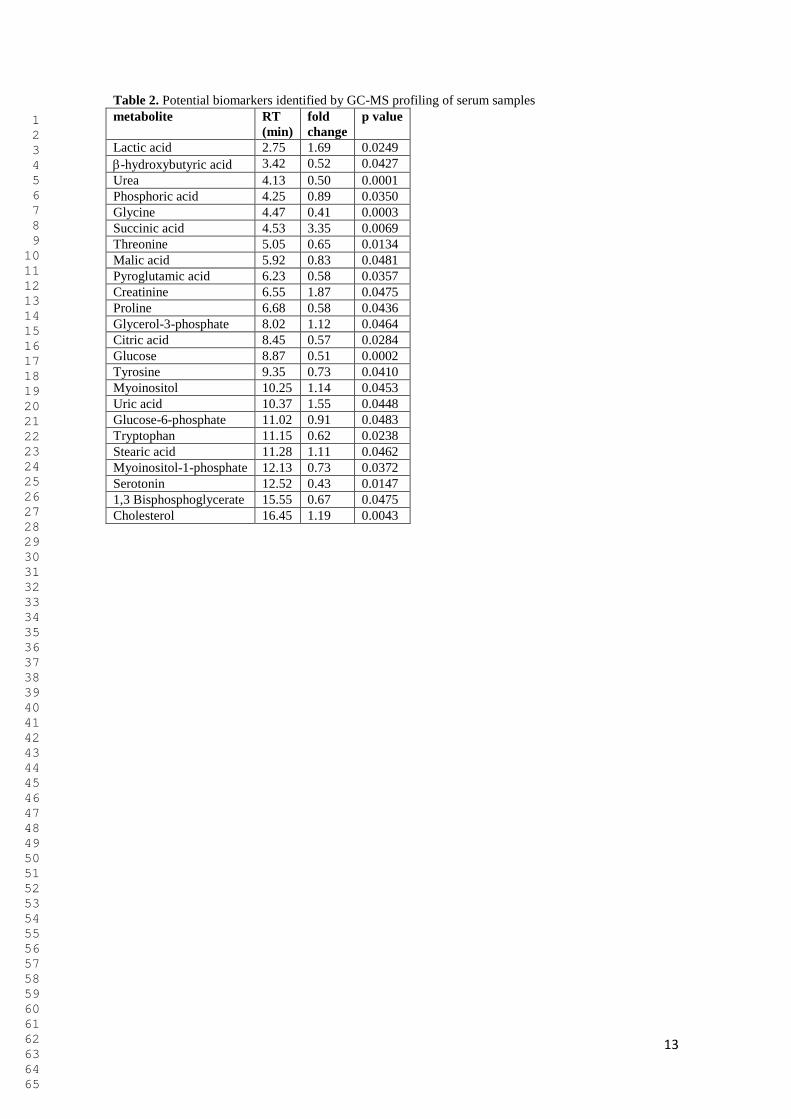
Table 2. Potential biomarkers identified by GC-MS profiling of serum samples
metabolite RT
(min)
fold
change
p value
Lactic acid 2.75 1.69 0.0249
-hydroxybutyric acid 3.42 0.52 0.0427
Urea 4.13 0.50 0.0001
Phosphoric acid 4.25 0.89 0.0350
Glycine 4.47 0.41 0.0003
Succinic acid 4.53 3.35 0.0069
Threonine 5.05 0.65 0.0134
Malic acid 5.92 0.83 0.0481
Pyroglutamic acid 6.23 0.58 0.0357
Creatinine 6.55 1.87 0.0475
Proline 6.68 0.58 0.0436
Glycerol-3-phosphate 8.02 1.12 0.0464
Citric acid 8.45 0.57 0.0284
Glucose 8.87 0.51 0.0002
Tyrosine 9.35 0.73 0.0410
Myoinositol 10.25 1.14 0.0453
Uric acid 10.37 1.55 0.0448
Glucose-6-phosphate 11.02 0.91 0.0483
Tryptophan 11.15 0.62 0.0238
Stearic acid 11.28 1.11 0.0462
Myoinositol-1-phosphate 12.13 0.73 0.0372
Serotonin 12.52 0.43 0.0147
1,3 Bisphosphoglycerate 15.55 0.67 0.0475
Cholesterol 16.45 1.19 0.0043
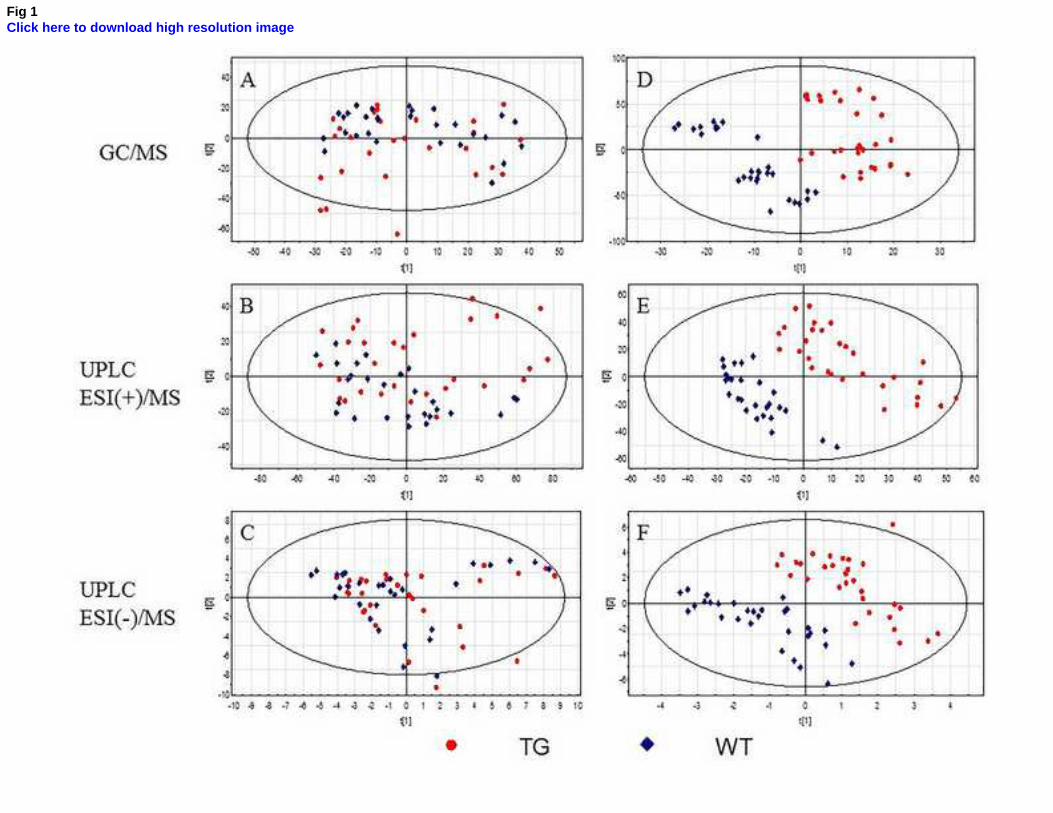
Fig 1Click here to download high resolution image
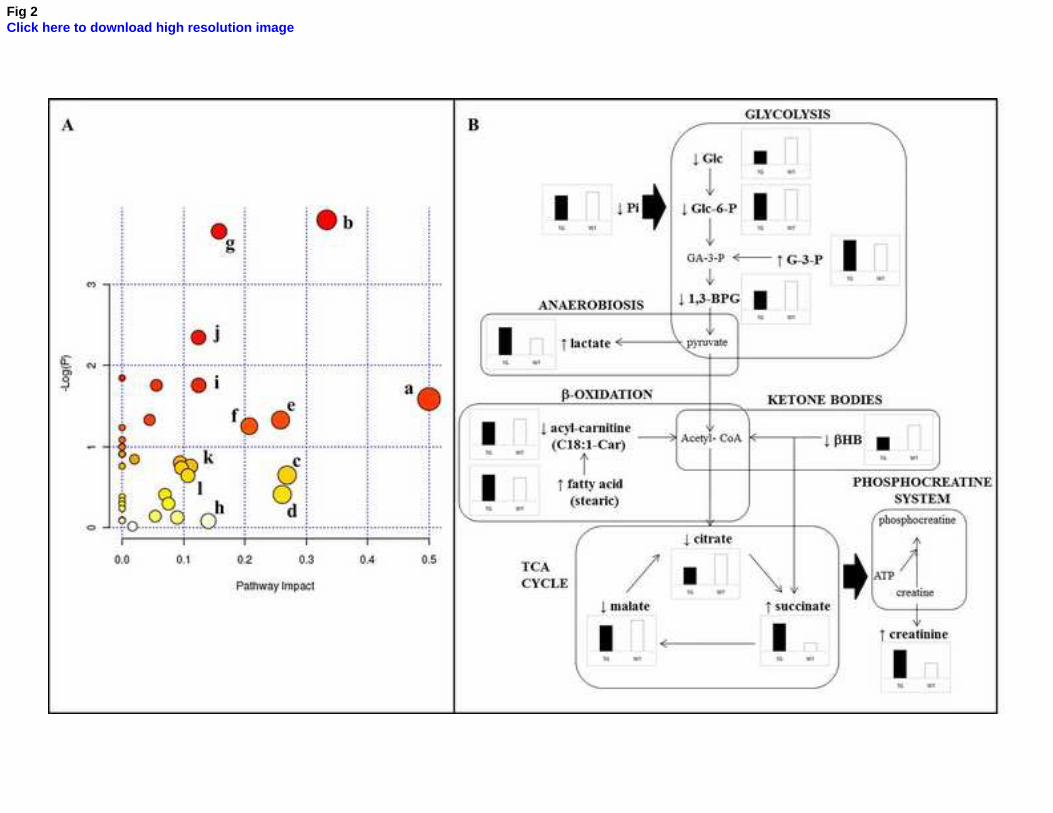
Fig 2Click here to download high resolution image

Supplementary MaterialClick here to download Supplementary Material: Supplementary material.docx


