Embed Size (px)
Citation preview

Biased Extinction and Evolutionary Trends
Richard D. Norris
Paleobiology, Vol. 17, No. 4. (Autumn, 1991), pp. 388-399.
Stable URL:
http://links.jstor.org/sici?sici=0094-8373%28199123%2917%3A4%3C388%3ABEAET%3E2.0.CO%3B2-T
Paleobiology is currently published by Paleontological Society.
Your use of the JSTOR archive indicates your acceptance of JSTOR's Terms and Conditions of Use, available athttp://www.jstor.org/about/terms.html. JSTOR's Terms and Conditions of Use provides, in part, that unless you have obtainedprior permission, you may not download an entire issue of a journal or multiple copies of articles, and you may use content inthe JSTOR archive only for your personal, non-commercial use.
Please contact the publisher regarding any further use of this work. Publisher contact information may be obtained athttp://www.jstor.org/journals/paleo.html.
Each copy of any part of a JSTOR transmission must contain the same copyright notice that appears on the screen or printedpage of such transmission.
The JSTOR Archive is a trusted digital repository providing for long-term preservation and access to leading academicjournals and scholarly literature from around the world. The Archive is supported by libraries, scholarly societies, publishers,and foundations. It is an initiative of JSTOR, a not-for-profit organization with a mission to help the scholarly community takeadvantage of advances in technology. For more information regarding JSTOR, please contact [email protected].
http://www.jstor.orgFri Feb 8 15:52:12 2008

Paleobiology, 17(4), 1991, pp. 388-399
Biased extinction and evolutionary trends
Richard D. Norris
Abstract.-The directionality of long-term trends can be strongly biased by forces intrinsic to a clade. Trends in body size and skeletal shape may be dictated more by variations in survivorship that reflect differences in ecology than by long-term directional changes in the environment. Hence, mass extinctions can help drive evolutionary trends by selectively eliminating some morphologies and permitting the survivors to found the next radiation.
Examples include repeated trends toward larger maximum body size and the evolution of keeled species from those with globose tests in planktonic foraminifera. Both the trends in size and shape develop because small species with globose tests are significantly more resistant to extinction than species that are large or have peripheral keels. Hence, the survivors of both the Cretaceous-Tertiary and Eocene-Oligocene extinction episodes are small, unkeeled taxa. Large species and species with keels evolved convergently after both mass extinctions as the founders radiated anew.
Comparison of three radiations of planktonic foraminifera suggest that the convergent evolution of similar test shapes and sizes is not due to synchronous changes in oceanography that track evolutionary trends. Instead, the reestablishment of habitat heterogeneity is needed to permit the ensuing radiation to unfold rather than to closely guide its progress. Similar evolutionary trends will develop in each radiation as long as the founders have similar morphology and the evolution of variants present in the previous radiation is not precluded by the environment.
Richard D. Norris. Woods Hole Oceanographic Institution, Woods Hole, Massachusetts 02543
Accepted: May 15, 1991
Introduction forminifera can be readily placed into 1 of 10 The causes of directional evolutionary basic body plans, and each of these designs
trends have figured prominently in evolu- is known from at least two of the three most tionary debate for over a century. To what recent radiations (Fig. 2). Such striking con- extent are trends directed by environmental servatism in test structure is also exemplified forces as opposed to constraints set by a clade's by the repetitive appearance of a similar range history? Do long-term directional changes in of body sizes (Gould 1988), species longevity the environment drive these patterns, or distributions (Levinton and Ginzberg 1984), might the way a trend is initiated bias the test shapes (Cifelli 1969; Norris 1986), and result? character evolution (see Cifelli 1969; Frerichs
Examples of cyclic or iterative evolution 1971; Vincent and Berger 1981; Cifelli and can be used to determine what forces gen- Scott 1986; Bolli 1986; Leckie 1989). erate trends. Evolutionary cycles can be com- One of the best-documented cases of iter- pared with one another to determine how ative character evolution in planktonic fora- environmental factors that change continu- minifera is the repeated development of ously contribute to the development of mac- keeled species from unkeeled ancestors (Fig. roevolutionary patterns. These comparisons 2). Keeled species appear in all four major can also reveal how slowly changing factors, radiations and evolved several times within such as a clade's genetics or ecology, influ- each diversification event. Current phyloge- ence evolutionary history. nies for Cretaceous and Cenozoic foraminif-
The fossil record of planktonic forminifera era imply that keels have evolved indepen- contains numerous examples of cyclic pat- dently at least 16 times (phylogenies of Banner terns that have developed over four radia- 1982; Kennett and Srinivasan 1983; Caron tions (Fig. l; Banner and Lowry 1985). For 1985). Reversion to unkeeled state, on the instance, species with grossly similar body other hand, is known in only four cases, three plans evolve in each radiation. All planktonic of them in Neogene lineages (e.g., Kennett O 1991 The Paleontological Society. All rights reserved. 0094-8373191 11704-0005/$1.00

389 TRENDS IN PLANKTC INIC FORAMINIFERA
and Srinivasan 1983). Hence, there is a strong directional trend to evolve from unkeeled to keeled morphologies.
These trends raise two questions. First, what causes morphologic trends such as that from unkeeled morphotypes to keeled designs? A related question is why unkeeled species con- sistently survive the episodic mass extinc- tions to found the subsequent radiations, whereas keeled taxa do not? Second, why do keeled species reappear in each radiation fol- lowing wholesale extinction of the previous keeled species group? In a broader context, why is it that foraminifera are so tightly con- strained to evolve a limited and stereotyped suite of test designs?
Methods
To analyze trends in morphology over time, we need accurate range data for a large num- ber of planktonic foraminifera, and we need to assign species objectively to morphologic categories. In this study, species' geologic ranges have been compiled from published range charts for Cretaceous through Recent species. Morphologic categories have been simplified by recognizing only two: keeled and unkeeled morphotypes. Keeled species are easily distinguished from unkeeled spe- cies by the imperforate carina that rims the test in keeled forms.
This simple dichotomy between keeled and unkeeled taxa is used to test the general re- lationship between test structure and geolog- ic longevity. The presence of keels correlates well with compressed test shape, smooth, macroperforate walls, and the absence of spines and thus serves as a proxy for these and other characters. There are also biological reasons to use the keeled-unkeeled dichoto- my. Living keeled taxa occupy deeper levels in the water column than unkeeled forms and have different trophic ecologies, population structure, and patterns of vertical migration (see Hemleben et al. 1989). These ecologic differences are known to hold true in the re- cent fossil record as well. Therefore, it is plau- sible that ecological differences could alter the macroevolutionary behavior of keeled taxa relative to unkeeled forms.
Range Data. -Species-longevity data con-
' Species FIGURE1. Spindle diagram of species diversity for planktonic foraminifera through geologic time. The width of the spindle shows standing species diversity. Diver- sities calculated as number of co-occurring species found at any time in a given foraminifera1 zone. Data from range charts in Norris (1990).
sist of geologic ranges for 392 species of planktonic foraminifera. Range charts were compiled principally from Kennett and Sri- nivasan (1983) and Bolli and Saunders (1985) for Neogene species; Berggren (1977), Blow (1979), Boersma and Premoli Silva (1983), Toumarkine and Luterbacher (1985), Boersma et al. (1987), and Premoli Silva and Boersma (1988) for Paleogene taxa, and Gorbachik (1971, 1986), Robaszynski and Caron (1979), Robaszynski et al. (1984), Stam (1986), Riegraf (1987a,b), and Banner and Desai (1988) for Cretaceous and latest Jurassic faunas. Range charts and a complete list of sources are pre- sented in Norris (1990).
I used the taxonomies of Kennett and Sri- nivasan (1983); Toumarkine and Luterbacher (1985), Robaszynski and Caron (1979) and Ro- baszynski et al. (1984) as primary sources, be- cause these sources are comprehensive and taxonomically conservative. The Neogene and Cretaceous range charts are the most inter- nally consistent because they have been con- structed largely from group-authored publi- cations and hence use consistent species

390 RICHARD D. NORRIS
NEOGENE
ABSENT Q@$@Q PALEOGENE
CRETACEOUS
FIGURE2. Representative homeomorphs from each of the three major radiations of planktonic foraminifera. Species not drawn to the same scale. Note the close correspondence in gross morphology between species in each radiation. Keeled species are the third, fourth, and fifth shapes from the left in each row. Some morphotypes are not represented in all the radiations (e.g., spiral-convex forms in the Paleogene, and spherical shapes in the Cretaceous).
concepts and nomenclature. Paleogene and Jurassic range charts have been compiled from a larger number of sources, which frequently use conflicting nomenclature. I have account- ed for synonymies by comparing published illustrations, synonymy lists, and descrip- tions for each species in these parts of the data file. My results are just as subjective as those in my sources, but at least I have re- jected the obvious synonymies and lumped the morphologically intergrading taxa to-gether. Still, ranges for species in these time periods are considered less reliable than those for Cretaceous and Neogene taxa.
Ranges were calibrated to the geologic time scales of Berggren et al. (1985, as modified by Aubry et al. [1988]) and Kent and Gradstein (1985). Species were assumed to range through any zone in which they occur and first and last appearances are keyed to the numerical ages of foraminifera1 zone boundaries.
Results
Differential survival of unkeeled species over keeled taxa could be explained by one or more factors. Possible causal factors in- clude difference~ in: (1) species' geographic range, (2) abundance of species with un-keeled and keeled test shapes, (3) turnover rate, or (4)differential turnover between times
of mass extinction and times of background extinction. If unkeeled taxa have broader geo- graphic ranges than keeled taxa, keeled spe- cies may be more susceptible to local catas- trophes than unkeeled species. Likewise, if unkeeled morphologies are more species-rich than keeled taxa, probability would dictate that the more diverse group should be more extinction-resistant than the smaller group. Species with high rates of intrinsic turn-over-high speciation and extinction rates- might also be more susceptible to mass ex- tinction than species predisposed to surviv- ing hard times. Finally, as Jablonski (1989) proposed for Cretaceous molluscs, survival across mass extinction boundaries may be regulated by features that have little or noth- ing to do with survival during times of "back- ground extinction" or clade diversification.
Geographic Range. -Despite attempts by several workers, no correlations have been found between species longevity and geo- graphic range (e.g., Stehli et al. 1972; Wei and Kennett 1983, 1986; Stanley et al. 1988). No differences in mean species duration were found between tropical and nontropical spe- cies or between species restricted to two lat- itudinal subzones and species with broader distributions (Stanley et al. 1988). These au- thors did find that species ranging into polar

TRENDS IN PLANKTONIC FORAMINIFERA
Age (my) Globose Discoidal Keeled 151 -
FIGURE3. Spindle diagrams of species diversity in un- keeled taxa (with globose and discoidal tests) and keeled taxa. Species diversities plotted as occurrence in a given foraminifera1 zone. Keeled species die out at the Creta- ceous-Tertiary and Eocene-Oligocene boundaries despite having species diversities equal to or exceeding those of unkeeled groups. Note that keeled species appear shortly after the first occurrence of unkeeled taxa in each radi- ation.
and subpolar habitats are significantly lon- ger-ranging than species restricted to warmer waters (Mann-Whitney U-test, P < 0.005). Yet, although temperature tolerance may be cor- related with species age, there is no evidence that a taxon's geographic range is associated with species longevity.
Abundance of Species in Shape Groups.-Plots of species diversity within the major shape groups show that, although keeled shape groups never survive mass extinctions, these groups are not less diverse than surviving unkeeled shape groups (Fig. 3). Over 50% of all Upper Cretaceous species were keeled, yet relatively species-poor globose and discoidal shape groups survived the Cretaceous-Terti- ary (K-T) boundary while none of the keeled
KEELED
X = 5.59 my
u,Q,.- 5
Q,
=V) 0 5 10 15 20
Species Longevity (my) FIGURE4. Histograms of species longevity for all keeled and unkeeled taxa. Open boxes indicate partial longev- ities for extant species and those that became extinct at the Cretaceous-Tertiary (K-T) boundary. Species lost at the K-T boundary are included in the partial range cat- egory to show that the catastrophic extinction cut across all age cohorts of Cretaceous taxa.
species did. The same pattern is observed at the Eocene-Oligocene boundary. Keeled taxa were more diverse than co-occurring discoi- dal species, yet the discoidal shape group sur- vives, while the keeled taxa gradually lost diversity throughout the Late Eocene and be- came extinct.
These results suggest that there is little cor- relation between species diversity and mor- photype survival. Evidently, the differential survival of keeled and unkeeled shape groups is not probabilistic. Instead, survival of shape groups probably depends on ecological dif- ferences between their constituent species.
Turnover.-Plots of mean species longevity show that unkeeled species have significantly longer taxonomic durations than keeled spe- cies (Fig. 4).Species in the keeled shape group are short-ranging with mean durations of about 5-6 m.y. Unkeeled taxa tend to have species durations in excess of 8-10 m.y. These differences in mean species longevity are highly significant (Mann-Whitney U-test; P

RICHARD D. NORRIS
l5 1 Unkeeled Keeled
Paleogene
r 50
a
5
Cretaceous
bML5:01Jhk&--O 0 10 20 30 0 10 20
Species Longevity (my) FIGURE5. Histograms of species longevity for keeled and unkeeled species in each of the three most recent radiations. Open boxes are partial ranges of extant species and species that become extinct at the Cretaceous-Tertiary boundary. Keeled taxa are consistently short-ranging (ranges <10 m.y.) whereas unkeeled shape groups include many taxa with ranges in excess of 10 m.y. Mean longevities for each group are listed in order from the Neogene to the Cretaceous as follows. Unkeeled group: 14.1 m.y., 8.8 m.y., and 11.0 m.y. Keeled group: 5.58 m.y., 5.54 m.y., and 7.18 m.y.
< 0.001). Short-ranging taxa occur in both keeled and unkeeled morphologies; thus, the difference in mean longevity must reside in the proportion of long-ranging species in both groups.
Histograms of species longevity show that the unkeeled group tends to be long-ranging by virtue of its highly skewed longevity dis- tribution (Fig. 4). Whereas the unkeeled shape group tends to include many species with du- rations of 10 m.y. or less, it also includes a disproportionate number of species with lon- gevities of over 10 m.y. The keeled shape group, on the other hand, is made up nearly exclusively of species with ranges of less than 10 m.y. This keeled group contains no long- ranging survivor taxa.
Splitting up the range data among the three radiations shows that species in each shape group show similar longevity distributions through time (Fig. 5). These differences in species longevity are statistically significant. An ANOVA on species durations grouped by morphology shows significant heterogeneity in geologic range among all species of plank- tonic foraminifera (Welch ANOVA, P < 0.01).
The unkeeled shape group includes signifi- cantly longer-ranging species than the keeled shape group according to pairwise trimmed f-tests (P < 0.05). Indeed, the longevity dis- tributions are strikingly similar, although there is no direct phylogenetic linkage be- tween keeled taxa in the various radiations.
The close convergence in longevity distri- butions among the three radiations implies that morphology is correlated with turnover rate. All keeled species have high rates of turnover in comparison with the longer-ranging, unkeeled shape group. Keeled spe- cies are particularly susceptible to extinction and therefore must have relatively high rates of origination during each of the radiations to maintain the generally high diversity for which they are known.
These results suggest that keeled species die out in each episode of mass extinction because they are inherently prone to rapid turnover. Like the Mesozoic ammonoids (see, e.g., Ward and Signor 1983), keeled plank- tonic foraminifera are blessed with rapid origination and cursed with a marked sus- ceptibility to extinction. Although relatively

393 TRENDS IN PLANKTONIC FORAMINIFERA
moderate rates of extinction can be offset by abundant speciation, catastrophic extinction can easily remove all members of a shape group. Unkeeled species also include among them many short-ranging taxa, but a rela- tively large number of species seem to be ar- mored against extinction.
For example, the Oligocene fauna is char- acterized almost entirely by very long-rang- ing unkeeled globose and discoidal species. There is virtually no speciation during the Late Eocene and Early to Middle Oligocene. Isotopic evidence suggests that marine pro- ductivity crashed near the end of the Eocene, because the surface water-to-bottom water 613 C gradient dropped to near zero during this time (Premoli Silva and Boersma 1988). The productivity drop may explain the loss of some species of foraminifera. Yet the major killer seems not to have been any single event, but a marked drop in speciation, possibly re- lated to the productivity drop, temperature changes, or reorganizaton of water masses that occurred throughout the late Paleogene (Shackleton and Kennett 1975; Kennett and Shackleton 1976; Jenkins 1986; Premoli Silva and Boersma 1988, 1989). Phytoplankton ap- pear to show the same pattern of constant rates of extinction but reduced speciation at this time (Knoll 1989). Keeled taxa with high intrinsic turnover rates may have disap-peared because conditions were inimical to the survival of populations that, under more ordinary conditions, would have replaced the species that were regularly becoming extinct. Indeed, extinction dropped off into the Oli- gocene as the extinction-prone Late Eocene species with keeled morphologies were re- moved. Only the extinction-resistant, un-keeled taxa remained to found the Neogene radiation.
The situation is somewhat different across the Cretaceous-Tertiary extinction event. There, the survivors include small, globose and discoidal taxa that appear just before the extinction episode and disappear in the Early Paleocene (see, e.g., Gerstel et al. 1986; Keller 1989). The extinction removed foraminifera of all ages, from recently evolved keeled and globose species to long-ranging biserial spe- cies as seen in range charts in Caron (1985).
The survivors do not appear to be particularly long-ranging. However, the estimated ranges of these species may be too short because their average body sizes are so small that they may be overlooked by micropaleontologists. The actual survivors did not distinguish them- selves before or after the extinction except through the fact of their survival. Yet the globose and discoidal shape of these taxa seems to be too much of a coincidence. Pos- sibly ecological traits shared by all globose and discoidal taxa helped Maastrichtian spe- cies weather the extinction crisis.
Background and Mass Extinction.-Evidence presented above suggests that there are no qualitative changes in extinction susceptibil- ity of different shape groups between periods of mass extinction and the background re-moval of taxa that occurs all the time during radiations. Keeled species that ordinarily show high turnover within radiations are also the ones removed at the major boundaries. Unkeeled globose species that have shown low rates of extinction throughout every ra- diation are the survivors of catastrophic events.
Foraminifera appear to respond differently to mass extinction than some other groups. Jablonski (1986) found that, among Creta- ceous molluscs, the longest-ranging taxa were those with planktotrophic larvae. Feeding larvae are correlated with broad geographic ranges among both living and fossil species (Jablonski and Lutz 1983). The inference is that cosmopolitan distributions should re-duce the likelihood of extinction of all pop- ulations in a species. Indeed, broadly distrib- uted Cretaceous molluscs are longer-ranging than co-occurring endemic molluscs. Yet, this advantage during the late Mesozoic was re- moved during the K-T event, and both en- demic and cosmopolitan species suffered sim- ilar levels of extinction (Jablonski 1989). For Cretaceous planktonic foraminifera, killing was also widespread across ordinarily resis- tant groups of biserial, discoidal, and globose taxa, but these groups still left the only sur- vivors of the near-total extinction.
In many respects, the macroevolutionary pattern of foraminifera is more similar to that of diatoms, brachiopods, and trilobites than
394 RICHARD D. NORRIS
it is to that of Jablonski's molluscs. Kitchell et al. (1986) described the differential survival of diatom species across the K-T boundary, pointing out that the survivors were species that formed resting cysts. They suggested that resting cysts are a means of escaping periods of nutrient starvation and dangerously high light levels that develop in high-latitude sur- face waters following the spring bloom. Be- cause species without resting cysts did not survive the boundary event, Kitchell et al. suggested that characteristics of species ecol- ogy used to escape seasonality during "nor- mal" times also come in handy during biotic crises that occur on a larger and less regular scale. Johansen (1989) noted that Cretaceous brachiopods show selective extinction at the K-T boundary. Reclining and pedically at- tached species showed the highest turnover, while most other ecological groups were less affected. Chatterton and Speyer (1989) found that trilobite taxa with benthic larvae sur- vived the Ashgillian extinction at a much higher rate than did species with planktonic larvae. Trilobites with benthic larvae also gradually increased in numbers relative to species with planktonic larvae throughout the preceding Ordovician radiation. Evidently, larval feeding mode consistently favored one group of trilobites over another during times of both background and mass extinction.
Discussion
Biasing Factors
Variations in shape longevity could be re- lated to either taxonomic biases or to factors potentially linked to test shape such as body size. If taxonomists systematically oversplit keeled species relative to unkeeled taxa, ar- tificial differences in geologic ranges could result (Schopf el al. 1975). Alternatively, if keeled species are substantially larger in test size than unkeeled species, the frequent ten- dency for large species to have higher rates of turnover relative to smaller taxa could ex- plain the apparent relationship between test shape and longevity (Stanley 1973). It is con- ceivable that phylogenetically linked traits could bias these results, especially if most spe- cies are in a relatively small number of dis- crete genera. Finally, unkeeled species could
be longer-ranging than keeled species simply because unkeeled taxa appear earlier in each radiation.
Skeletal Complexity.-Oversplitting certain-ly has affected the longevities of some species, but there is no clear evidence for a systematic bias. Each of the major morphologic groups are defined by roughly equivalent numbers of characters. These traits include aspects of coiling geometry, surface texture, wall struc- ture, aperture shape and position, chamber shape and number, suture shape, and modi- fications to the aperture in the form of teeth, lips, or portici. Therefore morphotype lon- gevity is not due to the abundance of char- acters used to describe the test. Indeed, spe- cies with relatively complex test designs like clavate skeletons with bulbose extensions of the chambers, or serially coiled tests with a great diversity of surface sculpture and pat- terns of chamber addition, are just as long-ranging as morphologically "simple" species with discoidal and globose tests.
Body Size.-To test the correlation between size and body design, I calculated body vol- umes for 338 species in the data set. Size was estimated as the volume of an ellipsoid with dimensions equal to the length and height of a foraminifer in axial section. Since most spe- cies are roughly discoidal, this measure of volume gives a reasonably good estimate of cross-sectional area, and is a proxy for body size. Volumes are overestimated for most keeled species because of compression at the chamber periphery. Hence, statistical tests of the relationship between body size, shape, and longevity should be biased toward find- ing that keeled species owe their short ranges simply to their larger body volumes. Biserial species were excluded from the analysis, be- cause their volumes cannot be accurately es- timated by this method.
The relationship between volume, shape, and species longevity was tested with a two- factor ANOVA (Fig. 6). Species longevity was log-transformed to produce equality of vari- ances and volume was broken into four size classes. Volume is a poor predictor of lon- gevity (P = 0.889) and has few interaction effects with shape (P = 0.798). Keeled species do reach larger body volumes than most un-

TRENDS IN PLANKTONIC FORAMINIFERA
keeled taxa (Mann-Whitney U-test, P < 0.0001), but keeled species are always short- ranging no matter what their size. Therefore, the correlation between shape and longevity is not biased by differences in size.
Phylogenetically Linked Traits.-If most spe- cies are in a relatively small number of gen- era, then the effective sample sizes used in this analysis might actually be smaller than they seem at first glance. Species might have long or short ranges by virtue of belonging to a particular lineage with its particular ecol- ogy, rather than because of traits found among all members of a given shape group.
That longevity might be linked to generic membership is rejected by several observa- tions. The planktonic foraminifera in this analysis belong to some 82 genera, of which 21 include keeled species. It is hard to imag- ine all these keeled lineages evolving similar longevity spectra if species duration is con- trolled by factors individualistic to each ge- nus. Furthermore, the keeled genera have no direct phylogenetic connection across the major radiations, so that calling upon chance to produce similar patterns of longevity in all three radiations strains credulity. Last, statis- tical tests of longevity differences for species from all 82 genera show significant differ- ences in longevity between the various shape groups as noted earlier.
Order of Appearance.-The order of appear- ance of unkeeled and keeled body plans does not affect their differences in species longev- ity. When the ranges of all unkeeled taxa that appeared before the first keeled species in a given radiation are removed from Fig. 6, the distributions are scarcely affected. Keeled taxa first appeared shortly after the start of both the Cretaceous and Paleogene radiations; therefore, few unkeeled species need to be removed, and most of those are short-rang- ing. In the Neogene, all unkeeled taxa with durations longer than 20 m.y. are removed, but even so, the remaining unkeeled species are significantly longer-ranging than keeled species.
Origin of Trends
Whatever the causal forces behind rates of foraminiferal turnover, the directions of cy-
Keeled 10 1 Unkeeledl
FIGURE6. Histograms of species longevity for taxa in four size classes. Keeled species in the left-hand histo- grams are short-ranging no matter what their size. Con- versely, unkeeled species in the right-hand histograms are long-ranging no matter which size class they fall in. Similar numbers of species are present in each size class.
clic trends in planktonic foraminifera are strongly biased by forces intrinsic to this clade. The repeated trend from unkeeled to keeled species could not happen any other way. Since keeled species always die out in the mass ex- tinctions, the surviving unkeeled species are left to inherit the foraminiferal world. Keeled species have high rates of turnover at all times by virtue of their ecology and thus have little chance to initiate a radiation. The direction- ality of iterative trends is imposed by the dif- ferential survivorship of species in the vari- ous shape groups.
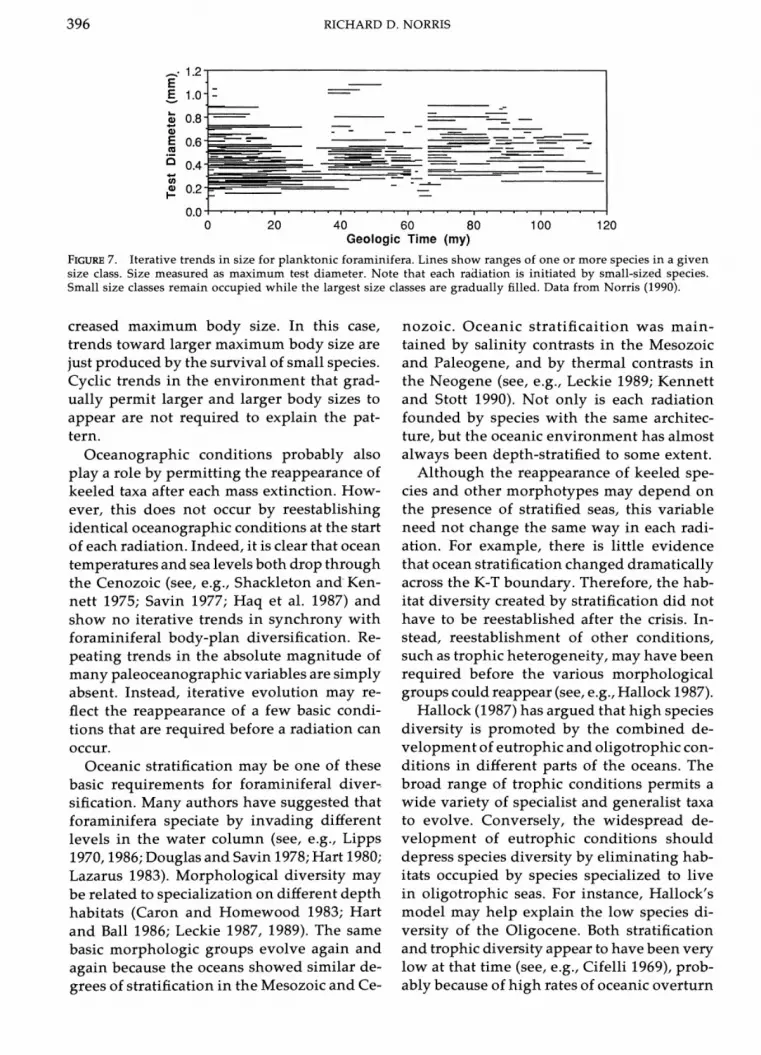
Differential extinction can also explain trends in test size within planktonic fora- minifera. Trends toward larger maximum body size have been documented in the three youngest radiations. Each diversification starts from small-sized ancestors and gradually fills out the size spectrum over time (Fig. 7). Spe-cies continuously occupy the small size class- es while the larger size classes are gradually filled in. Mass extinction selectively elimi- nates species in the larger size classes, per- mitting renewal of the trend toward in-
RICHARD D. NORRIS
0 20 40 60 80 100 120 Geologic Time (my)
FIGURE7. Iterative trends in size for planktonic foraminifera. Lines show ranges of one or more species in a given size class. Size measured as maximum test diameter. Note that each radiation is initiated by small-sized species. Small size classes remain occupied while the largest size classes are gradually filled. Data from Norris (1990).
creased maximum body size. In this case, trends toward larger maximum body size are just produced by the survival of small species. Cyclic trends in the environment that grad- ually permit larger and larger body sizes to appear are not required to explain the pat- tern.
Oceanographic conditions probably also play a role by permitting the reappearance of keeled taxa after each mass extinction. How- ever, this does not occur by reestablishing identical oceanographic conditions at the start of each radiation. Indeed, it is clear that ocean temperatures and sea levels both drop through the Cenozoic (see, e.g., Shackleton and Ken- nett 1975; Savin 1977; Haq et al. 1987) and show no iterative trends in synchrony with foraminiferal body-plan diversification. Re- peating trends in the absolute magnitude of many paleoceanographic variables are simply absent. Instead, iterative evolution may re- flect the reappearance of a few basic condi- tions that are required before a radiation can occur.
Oceanic stratification may be one of these basic requirements for foraminiferal diver- sification. Many authors have suggested that foraminifera speciate by invading different levels in the water column (see, e.g., Lipps 1970,1986; Douglas and Savin 1978; Hart 1980; Lazarus 1983). Morphological diversity may be related to specialization on different depth habitats (Caron and Homewood 1983; Hart and Ball 1986; Leckie 1987, 1989). The same basic morphologic groups evolve again and again because the oceans showed similar de- grees of stratification in the Mesozoic and Ce-
nozoic. Oceanic stratificaition was main- tained by salinity contrasts in the Mesozoic and Paleogene, and by thermal contrasts in the Neogene (see, e.g., Leckie 1989; Kennett and Stott 1990). Not only is each radiation founded by species with the same architec- ture, but the oceanic environment has almost always been depth-stratified to some extent.
Although the reappearance of keeled spe- cies and other morphotypes may depend on the presence of stratified seas, this variable need not change the same way in each radi- ation. For example, there is little evidence that ocean stratification changed dramatically across the K-T boundary. Therefore, the hab- itat diversity created by stratification did not have to be reestablished after the crisis. In- stead, reestablishment of other conditions, such as trophic heterogeneity, may have been required before the various morphological groups could reappear (see, e.g., Hallock 1987).
Hallock (1987) has argued that high species diversity is promoted by the combined de- velopment of eutrophic and oligotrophic con- ditions in different parts of the oceans. The broad range of trophic conditions permits a wide variety of specialist and generalist taxa to evolve. Conversely, the widespread de- velopment of eutrophic conditions should depress species diversity by eliminating hab- itats occupied by species specialized to live in oligotrophic seas. For instance, Hallock's model may help explain the low species di- versity of the Oligocene. Both stratification and trophic diversity appear to have been very low at that time (see, e.g., Cifelli 1969), prob- ably because of high rates of oceanic overturn

397 TRENDS IN PLANKTONIC FORAMINIFERA
and consequent mixing of nutrient-rich deep waters into the surface waters (Premoli Silva and Boersma 1988; Hallock et al. 1991). Both highly stratified conditions and a combina- tion of eutrophic and oligotrophic conditions may have had to be reestablished before the Neogene radiation could begin.
Although reappearance of foraminifera1 body plans may be dependent on the rees- tablishment of favorable habitats, the itera- tive trends, themselves, do not require iden- tical directional changes in the oceanic environment in each radiation. Cyclic evo- lution is not simply tracking recurrent changes in paleoceanography. Rather the ini- tial bias created by differences in species sur- vivorship sets up the trend, which can be replayed as long as a few basic oceanographic conditions are in place.
Still, long-term trends in oceanography can influence the diversity of species within body plans. The representation of the various body designs within these habitats has clearly changed over the course of time. Keeled spe- cies were dominant over all other groups in the Cretaceous while unkeeled, globose spe- cies were of very low species diversity. Just the opposite is true now, where globose and discoidal taxa dominate modern faunas (Fig. 3). Differences in representation of body plans are probably signals of oceanographic con- ditions since many keeled species are char- acteristic of warm waters that were wide-spread in the Cretaceous, while globose species have always diversified in temperate and polar seas that are at their acme today. Overall species diversity is also tied to ocean- ographic events such as switches in water- mass structure (Wei and Kennett 1986), tem- perature gradients, oxygen tensions Premoli Silva and Boersma 1989), and productivity levels (Lipps 1986). Clearly, oceanography profoundly influences species diversity and relative abundance of species in each body plan. Yet, the evolution of the body plans themselves may represent adaptations to more fundamental and more stable features of the oceanic realm such as stratification and nu- trient flux.
In more general terms, many cases of it- erative evolution reflect the basic ecological
and perhaps genetic conservatism of higher taxa that sets in after they first appear. Cyclic trends have been described from many groups of fossils including graptolites (Cooper and Fortey 1983; Mitchell 1987); trilobites (Mc- Namara 1982); ammonites (Haas 1942; Ken- nedy and Wright 1985); mammals (Simpson 1980); radiolarians (Riedel and Sanfilippo 1981) and many other taxa. For instance, ho- moplasy in graptolites may reflect functional limitations imposed by planktonic existence (Fortey and Bell 1987). Given the mode of colony growth, the potential array of altera- tions are limited. Landman (1989) has de- scribed the iterative appearance of small ptero- scaphitid ammonites from larger ancestors by progenetic trends. He suggests that pro- genetic species may have repeatedly evolved to take advantage of resources available only to the juveniles of the larger, ancestral spe- cies. As in planktonic foraminifera, particular traits in ammonites may appear iteratively to serve in exploitation of persistent resources.
Conclusions
Species longevity seems to be associated with shape in all three radiations analyzed here. Keeled species have mean durations about half as long as co-occurring unkeeled species. Both keeled and unkeeled morphol- ogies include short-ranging species but only the unkeeled group includes substantial numbers of long-ranging taxa. Unkeeled spe- cies always survive to found the next radia- tion because they possess a suite of ecological traits that promote extinction resistance dur- ing times of both mass extinction and radia- tion. These results for marine zooplankton are similar to examples described for diatoms, trilobites, and molluscs.
Evolutionary trends in the shape and size of planktonic foraminifera, and probably oth- er taxa as well, owe their origin to intrinsic constraints rather than repeated directional changes in oceanography. High extinction re- sistance of many species with small body sizes predisposes each diversification to be initi- ated by small-sized ancestors. Trends toward larger maximum body sizes require no special explanation aside from recognizing that small

398 RICHARD D. NORRIS
species survive catastrophes whereas large taxa generally do not. Likewise, biases in sur- vival dictate the morphological trend from unkeeled to keeled morphologies. Therefore, iterative trends in foraminifera are related to differential survivorship coupled with the maintenance or reestablishment of suitable habitat to permit renewed radiation after each mass extinction. Mass extinctions may have a profound effect on the directionality of trends in the subsequent radiation. Genetic conservatism may also explain part of the ten- dency to evolve similar body designs repeat- edly (Norris 1991). The abundance of iterative patterns throughout the history of life may reflect great ecological and genetic conser-vatism of clades once they first evolve.
Acknowledgments
I thank S. J. Gould, A. H. Knoll, and W. A. Berggren, and two anonymous reviewers for reviews of an earlier version of this paper and fruitful discussions about the significance of cyclic patterns of evolution. Early discussions with D. Jablonski and students in his course "Macroevolution" served as the initial im- petus for this study.
Literature Cited
AUBRY,M.-P., W. A. BERGGREN, D. V. KENT, J. J. FLYNN, K. D. KLITGORD, AND D. R. PROTHERO. J. D. OBRADOVITCH, 1988. Pa- leogene geochronology: an integrated approach. Paleocean- ography 3:707-742.
BANNER,F. T. 1982. A classification and introduction to the Globigerinacea. Pp. 142-239. In Banner, F. T., and A. R. Lord (eds.), Aspects of Micropaleontology. Allen and Unwin; Lon- don.
BANNER,F. T., AND D. DESAI. 1988. A review and revision of the Jurassic-Early Cretaceous Globigerinina, with special ref- erence to the Aptian assemblages of Speeton (North Yorkshire, England). Journal of Micropaleontology 7:143-185.
BANNER,F. T., AND F.M.D. LOWRY. 1985. The stratigraphical record of planktonic foraminifera and its evolutionary impli- cations. Special Papers in Palaeontology 33:117-130.
BERGGREN,W. A. 1977. Atlas of Palaeogene planktonic fora- minifera. Pp. 205-299. In Ramsay, A.T.S. (ed.), Oceanic Micro- paleontology, Volume 1. Academic Press; London.
BERGGREN,W. A., D. V. KENT, J. J. FLYNN, AND J. A. VAN COUVERING.1985. Cenozoic geochronology. Geological So- ciety of America Bulletin 96:1407-1418.
BLOW,W. H. 1979. The Cainozoic Foraminiferida, Volumes I-111. E. J. Brill; Leiden.
BOERSMA,A,, AND I. PREMOLISILVA. 1983. Paleocene planktonic foraminiferal biogeography and the paleoceanography of the Atlantic Ocean. Micropaleontology 29:355-381.
BOERSMA,A,, I. PREMOLI SILVA, AND N. J. SHACKLETON. 1987. Atlantic Eocene planktonic foraminiferal paleohydrographic indicators and stable isotope paleoceanography. Paleocean- ography 2:287-331.
BOLLI, H. M. 1986. Evolutionary trends in planktic foraminifera from early Cretaceous to Recent, with special emphasis on selected Tertiary lineages. Bulletin Centres Recherches Explo- ration-Production Elf-Aquitaine 10:565-577.
BOLLI, H. M., AND J. B. SAUNDERS. 1985. Oligocene to Holocene low latitude planktic foraminifera. Pp. 155-262. In Bolli, H. M., J. B. Saunders, and K. Perch-Nielsen (eds.), Plankton Stratig- raphy. Cambridge University Press; Cambridge.
CARON, M. 1985. Cretaceous foraminifera. Pp. 17-86. In Bolli, H. M., J. B. Saunders, and K. Perch-Nielsen (eds.), Plankton Stratigraphy. Cambridge University Press; New York.
CARON,M., AND P. HOMEWOOD. 1983. Evolution of early plank- tonic foraminifers. Marine Micropaleontology 7:453-462.
CHATTERTON, 1989. Larval ecology, life B.D.E.,AND S. E. SPEYER. history strategies, and patterns of extinction and survivorship among Ordovician trilobites. Paleobiology 15:118-132.
CIFELLI,R. 1969. Radiation of Cenozoic planktonic foraminifera. Systematic Zoology 18:154-168.
CIFELLI, R., AND G. SCOTT. 1986. Stratigraphic record of the Neogene globorotalid radiation (planktonic foraminiferida). Smithsonian Contributions to Paleobiology 58.
COOPER,R. A,, AND R. A. FORTEY. 1983. Development of the graptolite rhabdosome. Alcheringa 7:201-221.
DOUGLAS,R. G.,AND S. M. SAVIN. 1978. Oxygen isotope evidence for the depth stratification of Tertiary and Cretaceous planktic foraminifera. Marine Micropaleontology 3:175-196.
FORTEY,R. A,, AND A. BELL. 1987. Branching geometry and func- tion of multiramous graptoloids. Paleobiology 13:l-19.
FRERICHS, 1971. Evolution of planktonic foraminifera and W. E. paleotemperatures. Journal of Paleontology 45:963-968.
GERSTEL,J., R. C. THUNELL, J. C. ZACHOS, AND M. A. ARTHUR. 1986. The Cretaceous/Tertiary boundary event in the North Atlantic: planktonic foraminiferal results from the Deep Sea Drilling Project Site 577, Shatsky rise. Paleoceanography 1 :97- 117.
GORBACHIK,T. N. 1971. On early Cretaceous foraminifera of Crimea. Voprosi Micropaleontologii 14:125-139.
GORBACHIK, 1986. Jurassic and Early Cretaceous Planktonic T. N. Foraminifera of the South of the USSR. Nauka; Moscow.
GOULD,S. J. 1988. Trends as changes in variance: a new slant on progress and directionality in evolution. Journal of Pale- ontology 62:319-329.
HAAS,0. 1942. Recurrence of morphologic types and evolu- tionary cycles in Mesozoic ammonites. Journal of Paleontology 16:643-650.
HALLOCK,P. 1987. Fluctuations in the trophic resource contin- uum: a factor of global diversity cycles? Paleoceanography 2: 457-471.
HALLOCK, SILVA, 1991. Similar- P., I. PREMOLI AND A. BOERSMA. ities between planktonic and larger foraminifera evolutionary trends through Paleogene paleoceanographic changes. Palaeo- geography, Palaeoclimatology, Palaeoecology 83:49-64.
HAQ, B. U., J. HARDENBOL, AND P. R. VAIL. 1987. Chronology of fluctuating sea levels since the Triassic. Science 235:1156-1167.
HART, M. B. 1980. A water depth model for the evolution of the planktonic foraminiferida. Nature 286:252-254.
HART, M. B., AND K. C. BALL. 1986. Late Cretaceous anoxic events, sea-level changes and the evolution of planktonic fo- raminifera. Pp. 67-78. In Summerhayes, C. p., and N. J. Shack- leton (eds.), North Atlantic Paleoceanography. Geological So- ciety Special Publication 21.
HEMLEBEN, AND 0 . R. ANDERSON. C., M. SPINDLER, 1989. Modern Planktonic Foraminifera. Springer-Verlag; New York.
JABLONSKI, 1986. Larval ecology and macroevolution in ma- D. rine invertebrates. Bulletin of Marine Science 39:565-587.
JABLONSKI, 1989. The biology of mass extinction: a palaeon- D. tological view. Philosophical Transactions of the Royal Society of London, B 325:357-368.
JABLONSKI,D., AND R. A. LUTZ. 1983. Larval ecology of marine