Embed Size (px)
Citation preview

Beach Boundary Layer: A Framework for AddressingRecreational Water Quality Impairment at EnclosedBeachesS T A N L E Y B . G R A N T * , † , ‡ , § A N D B R E T T F . S A N D E R S ‡
Department of Chemical Engineering and Materials Science, Department of Civiland Environmental Engineering, Henry Samueli School of Engineering, Universityof California, Irvine, California 92697, United States, and Department of Civiland Environmental Engineering, School of Engineering, University of Melbourne,Victoria 3010, Australia
Received May 21, 2010. Revised manuscript received September 9, 2010. AcceptedSeptember 16, 2010.
Nearshore waters in bays, harbors, and estuaries arefrequently contaminated with human pathogens and fecalindicatorbacteria.Trackingdownandmitigatingthiscontaminationis complicated by the many point and nonpoint sources offecal pollution that can degrade water quality along the shore.From a survey of the published literature, we propose aconceptual and mathematical framework, the “beach boundarylayer model”, for understanding and quantifying the relativeimpact of beach-side and bay-side sources of fecal pollutionon nearshore water quality. In the model, bacterial concentrationin ankle depth water Cankle [bacteria L-3] depends on the fluxm′′ [bacteria L-2 T-1] of fecal bacteria from beach-side sources(bather shedding, bird and dog feces, tidal washing ofsediments, decaying vegetation, runoff from small drains, andshallow groundwater discharge), a cross-shore mass transfervelocity k [L T-1] that accounts for the physics of nearshoretransport and mixing, and a background concentrationCbay [bacteria L-3] attributable to bay-side sources of pollutionthat impact water quality over large regions (sewage outfalls,creeks and rivers): Cankle ) m′′/k + Cbay. We demonstrate theutility of the model for identifying risk factors and pollutionsources likely to impact shoreline water quality, and evaluatethe model’s underlying assumptions using computationalfluid dynamic simulations of flow, turbulence, and mass transportin a trapezoidal channel.
Introduction
Beaches located inside coastal embayments, or “enclosedbeaches”, are sheltered from the large waves and strongcurrents of open coastlines and, for this reason, are populardestinations for recreational bathers, particularly familieswith young children. Unfortunately, these coastal sites alsohave among the highest rates of beach closures and healthadvisories (1, 2). To our knowledge there are no literaturereviews of the physical and biological processes that controlnearshore water quality at enclosed beaches, despite theexplosion of papers recently published on the topic. This
critical review is intended to fill that gap, and provide a newconceptual framework (the “beach boundary layer model”)for predicting the impacts of beach-side and bay-sidepollution on nearshore water quality. For the purposes ofthis review, we define “nearshore” as the shallow (ankle towaist depth) water along the shoreline where water samplesare collected for routine monitoring of recreational beachwater quality. We further divide sources of microbial pollutioninto those located in, or inland, of the nearshore (“beach-side”) or offshore of the nearshore (“bay-side”). The reviewdoes not encompass predictive regression models of beachwater quality (3), although the findings of regression studiesare discussed to the extent they shed light on relevant physicaland/or biological processes. While the review focusesprimarily on fecal indicator bacteria (FIB)sthe water qualityindex used by public health officials to determine if a beachis safe for swimming and recreationsmany of the resultsand conclusions are transferable to the viruses, bacteria, andprotozoa that cause recreational waterborne illness. Thereview begins by rationalizing the division of embaymentsinto nearshore and bay regions, and the division of fecalinputs into beach-side and bay-side sources. This is followedby the derivation, testing, and application of the beachboundary layer model.
Spatiotemporal Scales: Bay versus Nearshore. Whitmanand co-workers (4) argue that water quality impairment ofshoreline waters should be evaluated from the perspectiveof a “beachshed”, that includes all nonpoint and point sourcesof FIB and pathogens that potentially affect shoreline waterquality, coupled with the biological and physical processesthat amplify or diminish their concentrations. A beachshedfor a FIB impaired coastal embayment is illustrated sche-matically in Figure 1. We conceptually divide the embaymentinto two regions: (1) bay and (2) nearshore. This division ismotivated by at least four considerations. First, most routinewater quality monitoring occurs in waters very close toshorestypically in ankle to waist depth watersbut waterquality can vary significantly over a few meters in the cross-shore direction. For example, Boehm et al. (5) report thattotal coliform concentrations in the nearshore waters atAvalon Beach, Catalina Island, decreased >100 fold from ankle(∼50 cm) to 10 m depth. Second, most humans recreate veryclose to shore, particularly young children who are amongthe most vulnerable to recreational waterborne illness(6-8). Third, some sources of fecal pollution (e.g., pointsources of treated or untreated sewage) affect water quality
* Corresponding author phone: (949) 824-8277; fax: (949) 824-2541; e-mail: [email protected].
† Department of Chemical Engineering and Materials Science.‡ Department of Civil and Environmental Engineering.§ University of Melbourne.
Environ. Sci. Technol. 2010, 44, 8804–8813
8804 9 ENVIRONMENTAL SCIENCE & TECHNOLOGY / VOL. 44, NO. 23, 2010 10.1021/es101732m 2010 American Chemical SocietyPublished on Web 10/15/2010

of the entire bay, while others (e.g., a small storm drain) havelocalized impacts on nearshore water quality. Finally, dif-ferent physical processes drive water circulation in the bayand nearshore regions, as described next.
Bay-Wide Circulation. At the bay-scale, water circulationis driven by tides, density gradients, and winds. Tidesexchange water between the bay and offshore, promotechaotic mixing, and drive a residual circulation that varieshorizontally, provides nutrients and oxygen, and transportsand dilutes pollutants (9-11). Baroclinic circulation originatesfrom the within-bay mixing of water parcels with differentdensities. When a river discharges to an ocean embayment,for example, dense ocean water is drawn into the bay, mixeswith the fresh water, and the product is returned to the ocean.In low mixing environments, the recirculation is verticallystratified and in high mixing environments the recirculationis laterally stratified (11). Winds exert a stress on the watersurface that can enhance the exchange of water between thebay and offshore, generate surface water waves, and drivewithin-bay circulation (11).
Nearshore Circulation. Mixing and circulation in thenearshore region is affected by “down-scaling” of the bay-scale processes described above (tides, density gradients,and winds) (12) and physical processes confined to theshoreline (13). Breaking waves are an example of the latter.The cascade of momentum and energy from breaking wavesgenerates along-shore and cross-shore currents that oftendominate the nearshore transport of contaminants andsediments, particularly on open (unsheltered) coastlines(13-16). In sheltered embayments, waves are typically smallerand human activities can play an important role. For example,water currents along the City of Seattle waterfront in ElliotBay are dominated by boat traffic; in particular, ferries thatcontinuously apply thrust while docked in the harbor (17).Boat wakes generate turbulence capable of resuspendingsediments, and presumably particle-associated bacteria, atthe shoreline (18). Indeed, the use of mechanical flow devicesto artificially “enhance” circulation has been marketed as away to improve beach water quality, although questionspersist about the efficacy, practicality, and ecological impactof such an approach (2). Generally speaking, nearshorepollutant transport in embayments occurs by advection andturbulent mixing (19, 20).
Sources of Microbial Pollution: Bay-Side versus Beach-Side. Sources of microbial pollution in nearshore waters canbe divided into two categories: (1) bay-side sources thatimpact water quality over large regions of the bay, and (2)beach-side sources that have localized and transient impacts.Because these two source categories operate over different
spatial and temporal scales, from a modeling perspectivetheir effect on ankle depth water quality can be treatedseparately. In particular, we assume that bay-side sourcescontribute a background concentration Cbay that varies withlocation in the bay (e.g., higher at shoreline sites closer toa point source discharge of sewage) and varies slowly overtime (e.g., higher during periods of increased point sourceloading or reduced tidal mixing). In contrast, beach-sidesources are characterized by a shoreline loading rate m′ (unitsof bacteria per time per length of beach) the magnitude ofwhich varies by beach, and over tidal and longer time scalesat any particular beach. The contribution of beach-side andbay-side pollution to the concentration Cankle of FIB in ankledepth water is assumed to be additive, viz:
where f is a functional relationship derived later. In thissection we survey bay-side pollution sources that contributeto the term Cbay, and beach-side pollution sources thatcontribute to the term m′.
Bay-Side Pollution Sources. Bay-side contributions to theterm Cbay include both point- and nonpoint sources of fecalpollution. Large point sourcesssuch as rivers and partiallytreated or untreated sewage effluentscan have bay-wideimpacts on water quality via at least two pathways: (a) directdischarge to the bay, and/or (b) discharge outside of the bay(e.g., in the coastal ocean), followed by import into the bayby tides and currents. In general, the mixing of river orwastewater effluent into receiving waters occurs in threestages, namely: (1) near-field mixing which is dominated bythe buoyancy and/or momentum flux of the effluent at thepoint of discharge; (2) far-field mixing which is dominatedby ambient turbulence; and (3) midfield mixing which istransitional between near-field and far-field (21-23). Far-field plume dispersion can be modeled using either Eulerianformulations (gradient diffusion models) or Lagrangianformulations (random walk particle tracking techniques) (21).Examples of both Eulerian and Lagrangian plume trackingtools are now available online for some regions. One exampleis the Great Lakes Forecasting System (24), which includesa gradient diffusion model for simulating impacts on beachwater quality from the Grand River plume in Lake Michigan(25). Another is the Lagrangian particle tracking tool main-tained by the Southern California Coastal Ocean ObservingSystem that predicts, based on hourly high frequency radarmeasurements of surface currents in the coastal PacificOcean, the trajectory of the Tijuana River Estuary plumenear San Diego, California (26). The latter modeling tool was
FIGURE 1. A “beachshed” for fecal indicator bacteria at an enclosed beach.
Cankle ) f(m′) + Cbay (1)
VOL. 44, NO. 23, 2010 / ENVIRONMENTAL SCIENCE & TECHNOLOGY 9 8805

recently used to determine the relative impact of both riverand wastewater outfall plumes on coastal beach water qualityalong the California/Mexico border (27).
Nonpoint sources of bay-side pollution include vesselwaste discharges (28-30) and diffusive, advective, and/orerosive release of FIB from sediments (31-35). Federal lawin the U.S. prevents the discharge of raw (untreated) sewagein no discharge zones, including the Great Lakes, all navigablewaters of the U.S., and within 3 miles of the coasts (30).However, based on random surveys of recreational boatersit appears that illegal dumping of sewage is commonplacein some areas of the U.S., due to a paucity of pump-outfacilities, a lack of appreciation of the potential environmentalimpacts, and the limited range of many recreational boats(29). In the U.S., less stringent laws and regulations apply tothe dumping of untreated gray water in coastal areas (e.g.,from galleys, baths, showers, and dishwaters) and a recentU.S. EPA assessment of wastes generated from cruise shipsreported average fecal coliform concentrations in untreatedgray water from 3 to 40 × 106 bacteria/100 mL, or “one tothree orders of magnitude greater than typical fecal coliformconcentrations in untreated domestic wastewater” (30). Inpractice, estimates of Cbay for a particular beach can bedetermined empirically, by measuring pollutant concentra-tion in deeper waters offshore, or predicted by the Lagrangianor Eulerian plume tracking models described above. At manyenclosed beaches, the background concentration will be aminor contributor to nearshore water quality, and thereforeCbay ≈ 0.
Beach-Side Pollution Sources. The contribution of beach-side pollution to the term m′ includes bather shedding, birdor animal feces, beach sediments, decaying marine vegetation(e.g., associated with wracklines), runoff from small drains,and submarine groundwater discharge (SGD):
Simple expressions for each of these loading rates areproposed in Table 1; literature sources for key parametervalues are also shown in the table. Present understanding ofbeach-side sources is summarized below.
Elmir et al (36) estimate that the average marine bathersheds 300 000 enterococci bacteria in the first 15 min ofimmersion. Less enterococci bacteria are shed with subse-quent immersions, and sand attached to the skin of bathersdoes not appear to be the source of FIB, consistent with aprevious study that concluded most FIB released by bathersis associated with fecal matter (37). The deposition of dogand bird droppings on foreshore sediments is frequentlyimplicated as a source of FIB in nearshore waters (35,38-40); however, nearshore FIB concentrations are notalways correlated with bird abundance, even in tidal pondsspecifically managed as bird habitat (41). Beach sands canharbor FIB (42), genetic markers for human fecal contami-nation (enterococci bacteria with the human esp gene andhuman specific HF183 Bacteroidales) and human pathogens(Vibrio vulnificus, and Cryptosporidium) (43, 44). Potentialsources of FIB in beach sands include human and animalfeces, runoff, spilled sewage, and/or the growth of environ-mentally adapted FIB strains (44-48). FIB present in fore-shore sediment can transfer into the water column with therising tide; that is, the tides “wash” the sand free of bacteria(42). Shoreline vegetationsincluding the macroalga Cla-dophora in freshwaters (49, 50) and seaweed in marine waters(35, 51)sis another potential source of FIB. Indeed, the tidalwashing of FIB-laden foreshore sediments and decayingseaweed in wracklines may explain why nearshore waterquality at many marine beaches in California is worse duringspring tides when the daily maximum tide range is large(52).
Dry and wet-weather runoff from small drains contributesterrestrial flux of FIB and other contaminants to nearshorewaters (53, 54). During dry weather, nonpoint source runofforiginates from activities in the watershed that generateexcess water, such as over irrigation and car washing. In arid
m′ ) m′bather + m′feces + m′seds + m′wrack + m′drains + m′SGD
(2)
TABLE 1. Parameterizations for Six Beach-Side Sources of FIBa
line source for bather shedding
m′bather ) SN′S, number of FIB shed per bather (bacteria bather-1)
S ) 300,000 ENT bacteria bather-1 ref 36N′, number of bathers wading into water every hour per
meter of beach (bathers h-1 m-1)
line source for fecal droppings
m′feces ) W′fecesCfeces/TF
W′feces, weight of feces deposited on foreshore sedimentsduring low tide per meter of beach (g m-1)
Cfeces, concentration of FIB in feces (bacteria g-1)
Cfeces ) {4 × 10⁷ENT g-1(dog)
3 × 10⁵ENT g-1(bird)ref 39
TF, time over which a single flood tide occurs (ca., 6 h)
line source for sediment washing
m′seds ) W′sedsCseds/TF
Cseds, concentration of FIB in foreshore sediment (bacteria(dry weight sediment)-1)
W′seds, weight of sand washed free of bacteria by the risingtide per meter of beach (g m-1)
W′seds ) Fbdwηr/sin (tan -1s) ≈ 350 kg m-1
Fb ≈ 1.7 g cm3, bulk density of dry beach sanddw ≈ 5 cm, depth of sediment washed by the rising tide
ηr ≈ 1 m, tide ranges ≈ 0.25, beach slope
line source for wrack washing
m′wrack ) W′wrackCwrack/TF
W′wrack, weight of wrack deposited on foreshore sedimentsper meter of beach (g m-1)
Cwrack, concentration of FIB in wrack (bacteria g-1)Cwrack ≈ 4 × 10⁴ ENT g-1 [ref 99]
line source for runoff from periodically spaced drains
m′drains ) QdrainsCdrains/Ldrains
Cdrains, concentration of FIB in runoff from drains (bacteria(volume)-1)
Qdrains, daily average volumetric flow rate from drains(volume (time)-1)
Qdrains ≈ 200 liters per day [unpublished data for smalldrains in Newport Bay]
Ldrains, spacing of drains along the shore (distance)Ldrains ≈ 10 m [unpublished data for small drain spacing in
Newport Bay]
line source for shallow groundwater discharge
m′SGD ) Q′SGDCSGD
Q′SGD, volumetric discharge of shallow groundwater permeter of shoreline (volume (time)-1 (length)-1)
CSGD, concentration of FIB in SGD (bacteria (volume)-1)Q′SGD ≈ 3 L min-1 m-1 [estimated for Avalon Bay, ref 76]a ENT, enterococci bacteria.
8806 9 ENVIRONMENTAL SCIENCE & TECHNOLOGY / VOL. 44, NO. 23, 2010

urban settings such as southern California, runoff that doesnot evaporate or infiltrate, flows through a network of gutters,curbs, and underground pipes (collectively referred to as thestorm sewer, see Figure 1) to the beach, where it typicallydischarges without treatment through small drains distrib-uted around the perimeter of the bay. Dry and wet weatherrunoff from drains is a documented source of FIB andmolecular markers of human fecal pollution at recreationalbeaches (53-56), and bather illness rates appear to increasewith proximity to drains discharging dry weather runoff(57). In general, the volume of runoff flowing out of any singlestorm drain during dry weather is small and intermittent.Nevertheless, dry weather runoff from drains can potentiallyaffect nearshore water quality because of the high concen-tration of FIB carried in runoff and the location of drainoutlets close to the waterline where water depths are shallowand dilution is minimal (15, 58, 59). The recreational waterquality impacts posed by wet and dry weather urban runoff,and modeling tools available for planning and mitigation,are reviewed elsewhere (60, 61). The coastal discharge ofshallow groundwater can also contribute to the terrestrialflux of FIB and other fecal indicators to nearshore waters,particularly if the shallow groundwater is contaminated withsewage from poorly functioning onsite disposal treatmentsystems or leaking sewage collection infrastructure (62-67).
Deriving the Beach Boundary Layer Model. In this sectionwe derive the “beach boundary layer model”, which in effectis an explicit expression for the functional relationship f thatappears in eq 1. Assuming that the bacterial removal followsfirst-order kinetics (elaborated further below), the balancebetween FIB advection, turbulent mixing, and removal inany differential element in the water column can be expressedmathematically as follows (68):
The variables in eq 3 represent the concentration of FIB inthe water column (C), time (t), spatial coordinates in thealongshore (x), cross-shore (y), and vertical (z) directions,current velocities in the alongshore (U), cross-shore (V), andvertical (W) directions, turbulent diffusion coefficients in thealongshore (εx), cross-shore (εy), and vertical (εz) directions,and a first-order removal rate constant (kr).
A number of nonconservative and ecological processescan affect nearshore FIB concentrations, including (1)sequestration and differential survival in sediment (69-73)(2) bacterial mortality by exposure to sunlight (74, 75), reactiveoxygen species (76, 77), and predacious protozoa (78-80),(3) selection and growth (46, 81-83), and (4) resuscitation/recovery of injured (viable but nonculturable) cells (84). Ineq 3, all of these nonconservative and ecological processesare lumped into a single first-order decay term (last term inthe equation)san approach that will be inadequate in manysettings. For example, if FIB mortality is dominated byprotistan grazing, as appears to be the case in both fresh andmarine waters (78-80), then the first-order rate “constant”kr may depend on the abundance and clearance rates ofdominant predators. A simple first-order decay term is alsoinadequate for modeling light-induced bacterial mortality,which varies diurnally and with depth through the watercolumn (76, 85), and the turbulent sedimentation andresuspension of particle-associated FIB (86).
Rather than attempt to address these shortcomings bysignificantly increasing the complexity of eq 3 (e.g., see ref86), here we adopt the opposite tact by setting the loss termto zero, in effect neglecting all nonconservative and ecologicalprocesses. By focusing exclusively on the transport aspect ofthe problem, we can elucidate the role that physical processes
play in regulating nearshore water quality in settings whereecological and nonconservative processes are less important.The opposite approachsassuming FIB concentrations arecontrolled only by nonconservative and ecological processessis also interesting, and no doubt real systems exhibit somemixture of transport and nonconservative/ecological control.It is also interesting to note that nonconservative andecological processes may be less important in situationswhere FIB and/or pathogens are monitored using culture-independent methods, such as quantitative polymerase chainreaction (qPCR). Measurements of genome copy number byqPCR may be insensitive to the aggregation state of cells ina sample, their association with particles, or their distributionbetween culturable and nonculturable statessall factors thatcan affect measurements of FIB by conventional culture-dependent methods (87, 88).
After dropping the bacterial removal term, eq 3 can befurther simplified by invoking a set of transport-relatedassumptions that may apply in the nearshore region of coastalembayments: (1) turbulent diffusion dominates over ad-vection in the cross-shore direction (|VC| , |εy ∂C/∂y|); (2)advection dominates over turbulent diffusion in the long-shore direction (|UC|. |εx ∂C/∂x|); and (3) FIB concentrationsquickly reach quasi-steady-state (∂C/∂t ≈ 0). Assumptions(1) and (2) imply that nearshore currents follow the shorelinetopography. Assumption (3) implies that nearshore con-centrations of FIB quickly achieve quasi-steady-state inresponse to changes in pollutant loading and transport rates.Invoking these assumptions and depth-averaging the re-maining terms in eq 3 (where depth-averaged pollutantconcentration is denoted jC) we arrive at a classic “boundarylayer” balance between alongshore advection and cross-shoreturbulent diffusion, where Z(y) represents the water depthat cross-shore distance y:
In formulating eq 4 we allow for the possibility that alongshorevelocity, water depth, and turbulent diffusivity all vary withcross-shore position y (see schematic at the top of Figure 2).The emphasis on alongshore advection and cross-shorediffusion is consistent with detailed FIB budgets carried outfor recreational beaches in both Lake Michigan (68) andHuntington Beach in southern California (15, 89).
Exact Solution of the Beach Boundary Layer Equation. Theboundary layer equation above is standard in many engi-neering and scientific textbooks (90). What is unique to thisapplication is the prismatic geometry of the boundary andan alongshore velocity and cross-shore eddy diffusivity thatvary with cross-shore position. Despite these complications,we show in the Supporting Information that eq 4 can besolved exactly given the following parametrizations for thecross-shore variation in water depth, along-shore velocity,and cross-shore turbulent diffusion:
where zo,uo,ε0 represent the water depth, along-shore velocity,and eddy diffusivity all specified at cross-shore distance y )y0. Because εy and Z have the same �y dependence, ourmodel assumes that turbulent diffusion scales linearly withwater depth, εy ∼ Z1, consistent with Kolmogorov-Prandtlturbulence closure with water depth as the turbulent lengthscale (91). After combining eqs 4 and 5, performing a similaritytransformation, and applying two boundary conditions
∂C∂t
+ U∂C∂x
+ V∂C∂y
+ W∂C∂z
) ∂
∂x[εx∂C∂x ] + ∂
∂y[εy∂C∂y ] +
∂
∂z[εz∂C∂z ] - krC (3)
U(y)Z(y)∂Cj∂x
) ∂
∂y[εy(y)Z(y)∂Cj∂y ] (4)
Z(y) ) z0√y/yo (5a)
U(y) ) u0√y/yo (5b)
εy(y) ) ε0√y/yo (5c)
VOL. 44, NO. 23, 2010 / ENVIRONMENTAL SCIENCE & TECHNOLOGY 9 8807
( jCf jCbay far offshore and a finite pollutant loading rate m′ atthe shoreline) the following exact solution to eq 4 is obtained:
where the exponential integral function is defined as follows.
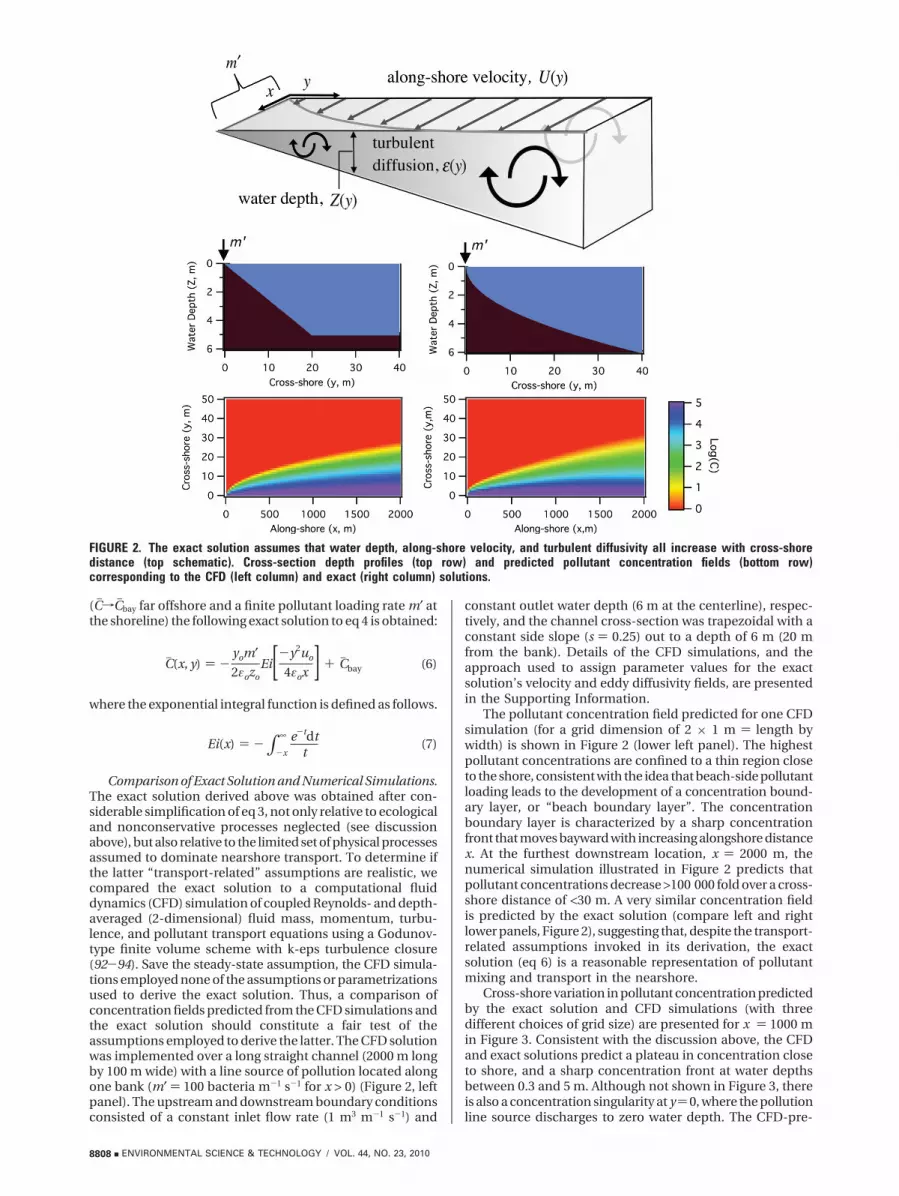
Comparison of Exact Solution and Numerical Simulations.The exact solution derived above was obtained after con-siderable simplification of eq 3, not only relative to ecologicaland nonconservative processes neglected (see discussionabove), but also relative to the limited set of physical processesassumed to dominate nearshore transport. To determine ifthe latter “transport-related” assumptions are realistic, wecompared the exact solution to a computational fluiddynamics (CFD) simulation of coupled Reynolds- and depth-averaged (2-dimensional) fluid mass, momentum, turbu-lence, and pollutant transport equations using a Godunov-type finite volume scheme with k-eps turbulence closure(92-94). Save the steady-state assumption, the CFD simula-tions employed none of the assumptions or parametrizationsused to derive the exact solution. Thus, a comparison ofconcentration fields predicted from the CFD simulations andthe exact solution should constitute a fair test of theassumptions employed to derive the latter. The CFD solutionwas implemented over a long straight channel (2000 m longby 100 m wide) with a line source of pollution located alongone bank (m′ ) 100 bacteria m-1 s-1 for x > 0) (Figure 2, leftpanel). The upstream and downstream boundary conditionsconsisted of a constant inlet flow rate (1 m3 m-1 s-1) and
constant outlet water depth (6 m at the centerline), respec-tively, and the channel cross-section was trapezoidal with aconstant side slope (s ) 0.25) out to a depth of 6 m (20 mfrom the bank). Details of the CFD simulations, and theapproach used to assign parameter values for the exactsolution’s velocity and eddy diffusivity fields, are presentedin the Supporting Information.
The pollutant concentration field predicted for one CFDsimulation (for a grid dimension of 2 × 1 m ) length bywidth) is shown in Figure 2 (lower left panel). The highestpollutant concentrations are confined to a thin region closeto the shore, consistent with the idea that beach-side pollutantloading leads to the development of a concentration bound-ary layer, or “beach boundary layer”. The concentrationboundary layer is characterized by a sharp concentrationfront that moves bayward with increasing alongshore distancex. At the furthest downstream location, x ) 2000 m, thenumerical simulation illustrated in Figure 2 predicts thatpollutant concentrations decrease >100 000 fold over a cross-shore distance of <30 m. A very similar concentration fieldis predicted by the exact solution (compare left and rightlower panels, Figure 2), suggesting that, despite the transport-related assumptions invoked in its derivation, the exactsolution (eq 6) is a reasonable representation of pollutantmixing and transport in the nearshore.
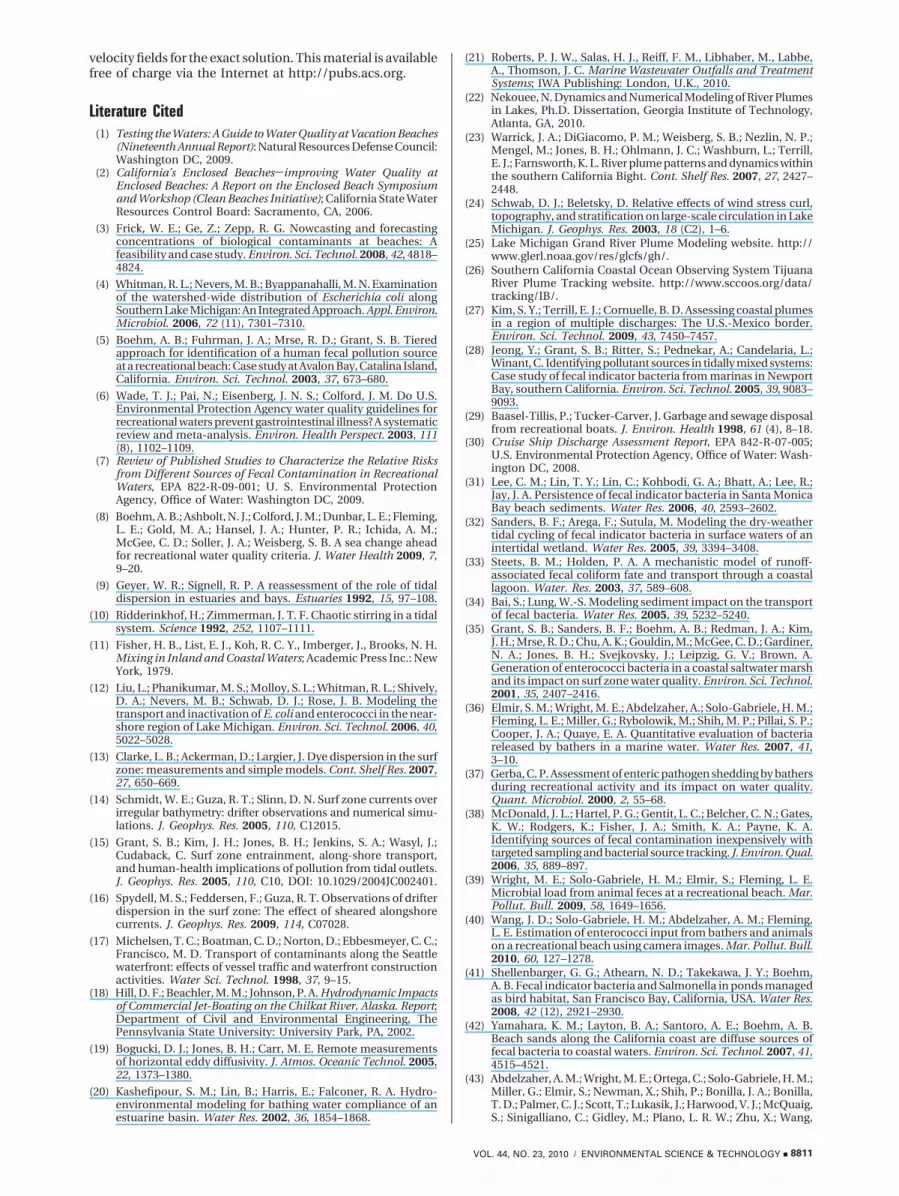
Cross-shore variation in pollutant concentration predictedby the exact solution and CFD simulations (with threedifferent choices of grid size) are presented for x ) 1000 min Figure 3. Consistent with the discussion above, the CFDand exact solutions predict a plateau in concentration closeto shore, and a sharp concentration front at water depthsbetween 0.3 and 5 m. Although not shown in Figure 3, thereis also a concentration singularity at y)0, where the pollutionline source discharges to zero water depth. The CFD-pre-
FIGURE 2. The exact solution assumes that water depth, along-shore velocity, and turbulent diffusivity all increase with cross-shoredistance (top schematic). Cross-section depth profiles (top row) and predicted pollutant concentration fields (bottom row)corresponding to the CFD (left column) and exact (right column) solutions.
Cj (x, y) ) -yom′2εozo
Ei[-y2uo
4εox ] + Cjbay (6)
Ei(x) ) -∫-x
∞ e-tdtt
(7)
8808 9 ENVIRONMENTAL SCIENCE & TECHNOLOGY / VOL. 44, NO. 23, 2010

dicted plateau concentration increases as the cross-shoreresolution of the numerical grid is refined, from 2 m to 50cm (Figure 3). This observation highlights a fundamentalchallenge associated with numerical predictions of FIBconcentrations in ankle depth water: sharp fronts in pollutantconcentration are subject to numerical diffusion that is gridresolution dependent (92, 93). The numerical predictionsconverge at the outer edge of the concentration front (depths>4 m), but do not reliably predict the ankle-depth pollutantconcentration, most likely due to numerical diffusion andthe concentration singularity at y ) 0.
Nearshore Pollutant Concentration. Estimates for theimpact of specific pollution sources on ankle depth waterquality can be obtained by setting y ) yankle in eq 6 (note theoverbar, representing depth-averaged quantities, has beendropped for notational simplicity):
Comparing eqs 1 and 8a we conclude that, in our version ofthe beach boundary layer model, the functional relationshipin eq 1 is given by f(m′) ) m′/z0k. The cross-shore masstransfer velocity k [units of L T-1] encapsulates the physicsof nearshore transport and mixing, and is proportional tothe reference eddy diffusivity ε0 and inversely proportionalto yBBL, where the latter is an estimate for the width of thebeach boundary layer. The approximate expression for yBBL
in eq 8c is valid provided that x > 10l. Solving for the flux ofFIB out of ankle depth water, m′′ ) m′/z0, eq 8a can berearranged into a form that is mathematically identical tothe film theory expression for interfacial mass transfer (90):
These results have significant implications for the influenceof beach-side pollution sources on FIB concentrations inankle depth waters, as explored in the next section.
Predicting the Impact of Beach-Side Pollution. Assumingthat FIB concentration in ankle depth water is dominated bybeach-side pollution (i.e., Cankle > >Cbay), eq 8a can be rewrittenas follows:
where Ccriterion is a water quality criterion and m′criterion is thebeach-side pollution loading rate above which an exceedenceof the criterion occurs. For the set of parameters values inTable S1 (Supporting Information), x ) 1000 m, and usingthe EPA recommended criterion for enterococci bacteria(ENT) at marine bathing beaches (104 bacteria per 100 mL),we obtain the following model parameter values: yBBL)0.7 m,k ) 3 × 10⁻⁴ m/s, and m′criterion ) 3 × 10⁵ bacteria m-1 h-1.Given this criterion loading rate, and the line sourceexpressions listed in Table 1, plots of eq 10a are presentedfor seven different beach-side pollution sources in Figure 4.While all pollution sources can trigger criterion exceedence(i.e., Cankle/Ccriterion > 1), some sources are clearly moreproblematic than others. Consistent with the findings ofWright et al. (39), dog feces are a potent contributor ofENTsas little as 1 g of dog feces deposited at low tide permeter of beach is sufficient to cause a water qualityexceedence during the following rising tide (red line, Figure4). By comparison, an average of 30 and 80 g of dry feces areproduced by small and large dogs, respectively, during a singlefecal event (39). For all other sources, the model predictsthat the concentration of ENT in ankle depth water is 10times greater than the EPA criterion whenever one or moreof the following conditions are met: (1) ENT concentrations
FIGURE 3. Cross-shore concentration profile predicted by theexact solution (eq 6) and three CFD solutions with cross-shoregrid sizes shown, all at x ) 1000 m.
Cankle ) m′zok
+ Cbay (8a)
k )2ε0
yBBL(8b)
yBBL ) -y0Ei[-l/x] ≈ y0log[0.562x/l] (8c)
l )yankle
2 u0
4ε0(8d)
m′′ ) k(Cankle - Cbay) (9)
FIGURE 4. Predictions of the contribution of beach-sidepollution to exceedences of the U.S. EPA criterion for entero-cocci bacteria (104 bacteria (100 mL)-1) at marine recreationalbeaches.
Cankle
Ccriterion) m′
m′criterion(10a)
m′criterion ) zokCcriterion (10b)
VOL. 44, NO. 23, 2010 / ENVIRONMENTAL SCIENCE & TECHNOLOGY 9 8809
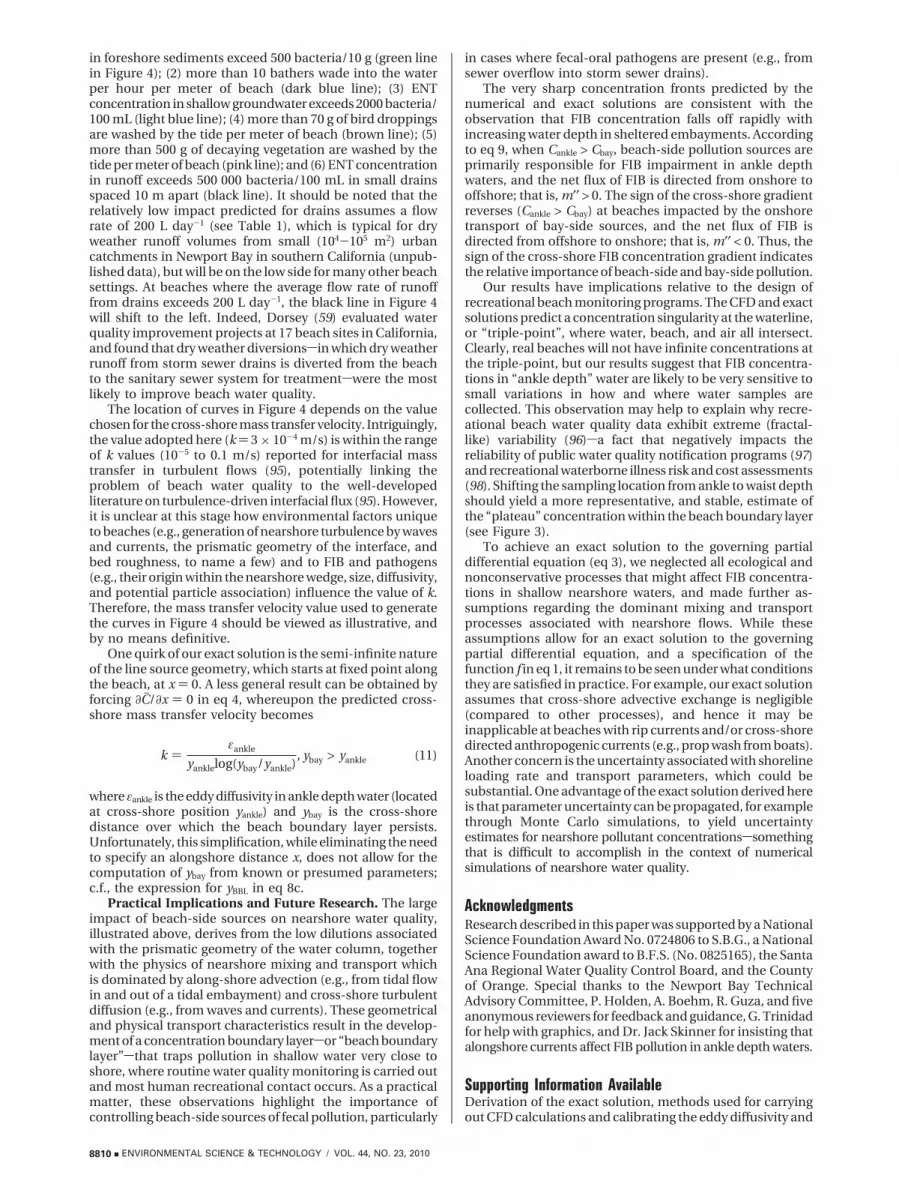
in foreshore sediments exceed 500 bacteria/10 g (green linein Figure 4); (2) more than 10 bathers wade into the waterper hour per meter of beach (dark blue line); (3) ENTconcentration in shallow groundwater exceeds 2000 bacteria/100 mL (light blue line); (4) more than 70 g of bird droppingsare washed by the tide per meter of beach (brown line); (5)more than 500 g of decaying vegetation are washed by thetide per meter of beach (pink line); and (6) ENT concentrationin runoff exceeds 500 000 bacteria/100 mL in small drainsspaced 10 m apart (black line). It should be noted that therelatively low impact predicted for drains assumes a flowrate of 200 L day-1 (see Table 1), which is typical for dryweather runoff volumes from small (104-105 m2) urbancatchments in Newport Bay in southern California (unpub-lished data), but will be on the low side for many other beachsettings. At beaches where the average flow rate of runofffrom drains exceeds 200 L day-1, the black line in Figure 4will shift to the left. Indeed, Dorsey (59) evaluated waterquality improvement projects at 17 beach sites in California,and found that dry weather diversionssin which dry weatherrunoff from storm sewer drains is diverted from the beachto the sanitary sewer system for treatmentswere the mostlikely to improve beach water quality.
The location of curves in Figure 4 depends on the valuechosen for the cross-shore mass transfer velocity. Intriguingly,the value adopted here (k ) 3 × 10⁻⁴ m/s) is within the rangeof k values (10-5 to 0.1 m/s) reported for interfacial masstransfer in turbulent flows (95), potentially linking theproblem of beach water quality to the well-developedliterature on turbulence-driven interfacial flux (95). However,it is unclear at this stage how environmental factors uniqueto beaches (e.g., generation of nearshore turbulence by wavesand currents, the prismatic geometry of the interface, andbed roughness, to name a few) and to FIB and pathogens(e.g., their origin within the nearshore wedge, size, diffusivity,and potential particle association) influence the value of k.Therefore, the mass transfer velocity value used to generatethe curves in Figure 4 should be viewed as illustrative, andby no means definitive.
One quirk of our exact solution is the semi-infinite natureof the line source geometry, which starts at fixed point alongthe beach, at x ) 0. A less general result can be obtained byforcing ∂ jC/∂x ) 0 in eq 4, whereupon the predicted cross-shore mass transfer velocity becomes
where εankle is the eddy diffusivity in ankle depth water (locatedat cross-shore position yankle) and ybay is the cross-shoredistance over which the beach boundary layer persists.Unfortunately, this simplification, while eliminating the needto specify an alongshore distance x, does not allow for thecomputation of ybay from known or presumed parameters;c.f., the expression for yBBL in eq 8c.
Practical Implications and Future Research. The largeimpact of beach-side sources on nearshore water quality,illustrated above, derives from the low dilutions associatedwith the prismatic geometry of the water column, togetherwith the physics of nearshore mixing and transport whichis dominated by along-shore advection (e.g., from tidal flowin and out of a tidal embayment) and cross-shore turbulentdiffusion (e.g., from waves and currents). These geometricaland physical transport characteristics result in the develop-ment of a concentration boundary layersor “beach boundarylayer”sthat traps pollution in shallow water very close toshore, where routine water quality monitoring is carried outand most human recreational contact occurs. As a practicalmatter, these observations highlight the importance ofcontrolling beach-side sources of fecal pollution, particularly
in cases where fecal-oral pathogens are present (e.g., fromsewer overflow into storm sewer drains).
The very sharp concentration fronts predicted by thenumerical and exact solutions are consistent with theobservation that FIB concentration falls off rapidly withincreasing water depth in sheltered embayments. Accordingto eq 9, when Cankle > Cbay, beach-side pollution sources areprimarily responsible for FIB impairment in ankle depthwaters, and the net flux of FIB is directed from onshore tooffshore; that is, m′′ > 0. The sign of the cross-shore gradientreverses (Cankle > Cbay) at beaches impacted by the onshoretransport of bay-side sources, and the net flux of FIB isdirected from offshore to onshore; that is, m′′ < 0. Thus, thesign of the cross-shore FIB concentration gradient indicatesthe relative importance of beach-side and bay-side pollution.
Our results have implications relative to the design ofrecreational beach monitoring programs. The CFD and exactsolutions predict a concentration singularity at the waterline,or “triple-point”, where water, beach, and air all intersect.Clearly, real beaches will not have infinite concentrations atthe triple-point, but our results suggest that FIB concentra-tions in “ankle depth” water are likely to be very sensitive tosmall variations in how and where water samples arecollected. This observation may help to explain why recre-ational beach water quality data exhibit extreme (fractal-like) variability (96)sa fact that negatively impacts thereliability of public water quality notification programs (97)and recreational waterborne illness risk and cost assessments(98). Shifting the sampling location from ankle to waist depthshould yield a more representative, and stable, estimate ofthe “plateau” concentration within the beach boundary layer(see Figure 3).
To achieve an exact solution to the governing partialdifferential equation (eq 3), we neglected all ecological andnonconservative processes that might affect FIB concentra-tions in shallow nearshore waters, and made further as-sumptions regarding the dominant mixing and transportprocesses associated with nearshore flows. While theseassumptions allow for an exact solution to the governingpartial differential equation, and a specification of thefunction f in eq 1, it remains to be seen under what conditionsthey are satisfied in practice. For example, our exact solutionassumes that cross-shore advective exchange is negligible(compared to other processes), and hence it may beinapplicable at beaches with rip currents and/or cross-shoredirected anthropogenic currents (e.g., prop wash from boats).Another concern is the uncertainty associated with shorelineloading rate and transport parameters, which could besubstantial. One advantage of the exact solution derived hereis that parameter uncertainty can be propagated, for examplethrough Monte Carlo simulations, to yield uncertaintyestimates for nearshore pollutant concentrationsssomethingthat is difficult to accomplish in the context of numericalsimulations of nearshore water quality.
AcknowledgmentsResearch described in this paper was supported by a NationalScience Foundation Award No. 0724806 to S.B.G., a NationalScience Foundation award to B.F.S. (No. 0825165), the SantaAna Regional Water Quality Control Board, and the Countyof Orange. Special thanks to the Newport Bay TechnicalAdvisory Committee, P. Holden, A. Boehm, R. Guza, and fiveanonymous reviewers for feedback and guidance, G. Trinidadfor help with graphics, and Dr. Jack Skinner for insisting thatalongshore currents affect FIB pollution in ankle depth waters.
Supporting Information AvailableDerivation of the exact solution, methods used for carryingout CFD calculations and calibrating the eddy diffusivity and
k )εankle
yanklelog(ybay/yankle), ybay > yankle (11)
8810 9 ENVIRONMENTAL SCIENCE & TECHNOLOGY / VOL. 44, NO. 23, 2010
velocity fields for the exact solution. This material is availablefree of charge via the Internet at http://pubs.acs.org.
Literature Cited(1) Testing the Waters: A Guide to Water Quality at Vacation Beaches
(Nineteenth Annual Report): Natural Resources Defense Council:Washington DC, 2009.
(2) California’s Enclosed Beachessimproving Water Quality atEnclosed Beaches: A Report on the Enclosed Beach Symposiumand Workshop (Clean Beaches Initiative); California State WaterResources Control Board: Sacramento, CA, 2006.
(3) Frick, W. E.; Ge, Z.; Zepp, R. G. Nowcasting and forecastingconcentrations of biological contaminants at beaches: Afeasibility and case study. Environ. Sci. Technol. 2008, 42, 4818–4824.
(4) Whitman, R. L.; Nevers, M. B.; Byappanahalli, M. N. Examinationof the watershed-wide distribution of Escherichia coli alongSouthern Lake Michigan: An Integrated Approach. Appl. Environ.Microbiol. 2006, 72 (11), 7301–7310.
(5) Boehm, A. B.; Fuhrman, J. A.; Mrse, R. D.; Grant, S. B. Tieredapproach for identification of a human fecal pollution sourceat a recreational beach: Case study at Avalon Bay, Catalina Island,California. Environ. Sci. Technol. 2003, 37, 673–680.
(6) Wade, T. J.; Pai, N.; Eisenberg, J. N. S.; Colford, J. M. Do U.S.Environmental Protection Agency water quality guidelines forrecreational waters prevent gastrointestinal illness? A systematicreview and meta-analysis. Environ. Health Perspect. 2003, 111(8), 1102–1109.
(7) Review of Published Studies to Characterize the Relative Risksfrom Different Sources of Fecal Contamination in RecreationalWaters, EPA 822-R-09-001; U. S. Environmental ProtectionAgency, Office of Water: Washington DC, 2009.
(8) Boehm, A. B.; Ashbolt, N. J.; Colford, J. M.; Dunbar, L. E.; Fleming,L. E.; Gold, M. A.; Hansel, J. A.; Hunter, P. R.; Ichida, A. M.;McGee, C. D.; Soller, J. A.; Weisberg, S. B. A sea change aheadfor recreational water quality criteria. J. Water Health 2009, 7,9–20.
(9) Geyer, W. R.; Signell, R. P. A reassessment of the role of tidaldispersion in estuaries and bays. Estuaries 1992, 15, 97–108.
(10) Ridderinkhof, H.; Zimmerman, J. T. F. Chaotic stirring in a tidalsystem. Science 1992, 252, 1107–1111.
(11) Fisher, H. B., List, E. J., Koh, R. C. Y., Imberger, J., Brooks, N. H.Mixing in Inland and Coastal Waters; Academic Press Inc.: NewYork, 1979.
(12) Liu, L.; Phanikumar, M. S.; Molloy, S. L.; Whitman, R. L.; Shively,D. A.; Nevers, M. B.; Schwab, D. J.; Rose, J. B. Modeling thetransport and inactivation of E. coli and enterococci in the near-shore region of Lake Michigan. Environ. Sci. Technol. 2006, 40,5022–5028.
(13) Clarke, L. B.; Ackerman, D.; Largier, J. Dye dispersion in the surfzone: measurements and simple models. Cont. Shelf Res. 2007,27, 650–669.
(14) Schmidt, W. E.; Guza, R. T.; Slinn, D. N. Surf zone currents overirregular bathymetry: drifter observations and numerical simu-lations. J. Geophys. Res. 2005, 110, C12015.
(15) Grant, S. B.; Kim, J. H.; Jones, B. H.; Jenkins, S. A.; Wasyl, J.;Cudaback, C. Surf zone entrainment, along-shore transport,and human-health implications of pollution from tidal outlets.J. Geophys. Res. 2005, 110, C10, DOI: 10.1029/2004JC002401.
(16) Spydell, M. S.; Feddersen, F.; Guza, R. T. Observations of drifterdispersion in the surf zone: The effect of sheared alongshorecurrents. J. Geophys. Res. 2009, 114, C07028.
(17) Michelsen, T. C.; Boatman, C. D.; Norton, D.; Ebbesmeyer, C. C.;Francisco, M. D. Transport of contaminants along the Seattlewaterfront: effects of vessel traffic and waterfront constructionactivities. Water Sci. Technol. 1998, 37, 9–15.
(18) Hill, D. F.; Beachler, M. M.; Johnson, P. A. Hydrodynamic Impactsof Commercial Jet-Boating on the Chilkat River, Alaska. Report;Department of Civil and Environmental Engineering, ThePennsylvania State University: University Park, PA, 2002.
(19) Bogucki, D. J.; Jones, B. H.; Carr, M. E. Remote measurementsof horizontal eddy diffusivity. J. Atmos. Oceanic Technol. 2005,22, 1373–1380.
(20) Kashefipour, S. M.; Lin, B.; Harris, E.; Falconer, R. A. Hydro-environmental modeling for bathing water compliance of anestuarine basin. Water Res. 2002, 36, 1854–1868.
(21) Roberts, P. J. W., Salas, H. J., Reiff, F. M., Libhaber, M., Labbe,A., Thomson, J. C. Marine Wastewater Outfalls and TreatmentSystems; IWA Publishing: London, U.K., 2010.
(22) Nekouee, N. Dynamics and Numerical Modeling of River Plumesin Lakes, Ph.D. Dissertation, Georgia Institute of Technology,Atlanta, GA, 2010.
(23) Warrick, J. A.; DiGiacomo, P. M.; Weisberg, S. B.; Nezlin, N. P.;Mengel, M.; Jones, B. H.; Ohlmann, J. C.; Washburn, L.; Terrill,E. J.; Farnsworth, K. L. River plume patterns and dynamics withinthe southern California Bight. Cont. Shelf Res. 2007, 27, 2427–2448.
(24) Schwab, D. J.; Beletsky, D. Relative effects of wind stress curl,topography, and stratification on large-scale circulation in LakeMichigan. J. Geophys. Res. 2003, 18 (C2), 1–6.
(25) Lake Michigan Grand River Plume Modeling website. http://www.glerl.noaa.gov/res/glcfs/gh/.
(26) Southern California Coastal Ocean Observing System TijuanaRiver Plume Tracking website. http://www.sccoos.org/data/tracking/IB/.
(27) Kim, S. Y.; Terrill, E. J.; Cornuelle, B. D. Assessing coastal plumesin a region of multiple discharges: The U.S.-Mexico border.Environ. Sci. Technol. 2009, 43, 7450–7457.
(28) Jeong, Y.; Grant, S. B.; Ritter, S.; Pednekar, A.; Candelaria, L.;Winant, C. Identifying pollutant sources in tidally mixed systems:Case study of fecal indicator bacteria from marinas in NewportBay, southern California. Environ. Sci. Technol. 2005, 39, 9083–9093.
(29) Baasel-Tillis, P.; Tucker-Carver, J. Garbage and sewage disposalfrom recreational boats. J. Environ. Health 1998, 61 (4), 8–18.
(30) Cruise Ship Discharge Assessment Report, EPA 842-R-07-005;U.S. Environmental Protection Agency, Office of Water: Wash-ington DC, 2008.
(31) Lee, C. M.; Lin, T. Y.; Lin, C.; Kohbodi, G. A.; Bhatt, A.; Lee, R.;Jay, J. A. Persistence of fecal indicator bacteria in Santa MonicaBay beach sediments. Water Res. 2006, 40, 2593–2602.
(32) Sanders, B. F.; Arega, F.; Sutula, M. Modeling the dry-weathertidal cycling of fecal indicator bacteria in surface waters of anintertidal wetland. Water Res. 2005, 39, 3394–3408.
(33) Steets, B. M.; Holden, P. A. A mechanistic model of runoff-associated fecal coliform fate and transport through a coastallagoon. Water. Res. 2003, 37, 589–608.
(34) Bai, S.; Lung, W.-S. Modeling sediment impact on the transportof fecal bacteria. Water Res. 2005, 39, 5232–5240.
(35) Grant, S. B.; Sanders, B. F.; Boehm, A. B.; Redman, J. A.; Kim,J. H.; Mrse, R. D.; Chu, A. K.; Gouldin, M.; McGee, C. D.; Gardiner,N. A.; Jones, B. H.; Svejkovsky, J.; Leipzig, G. V.; Brown, A.Generation of enterococci bacteria in a coastal saltwater marshand its impact on surf zone water quality. Environ. Sci. Technol.2001, 35, 2407–2416.
(36) Elmir, S. M.; Wright, M. E.; Abdelzaher, A.; Solo-Gabriele, H. M.;Fleming, L. E.; Miller, G.; Rybolowik, M.; Shih, M. P.; Pillai, S. P.;Cooper, J. A.; Quaye, E. A. Quantitative evaluation of bacteriareleased by bathers in a marine water. Water Res. 2007, 41,3–10.
(37) Gerba, C. P. Assessment of enteric pathogen shedding by bathersduring recreational activity and its impact on water quality.Quant. Microbiol. 2000, 2, 55–68.
(38) McDonald, J. L.; Hartel, P. G.; Gentit, L. C.; Belcher, C. N.; Gates,K. W.; Rodgers, K.; Fisher, J. A.; Smith, K. A.; Payne, K. A.Identifying sources of fecal contamination inexpensively withtargeted sampling and bacterial source tracking. J. Environ. Qual.2006, 35, 889–897.
(39) Wright, M. E.; Solo-Gabriele, H. M.; Elmir, S.; Fleming, L. E.Microbial load from animal feces at a recreational beach. Mar.Pollut. Bull. 2009, 58, 1649–1656.
(40) Wang, J. D.; Solo-Gabriele, H. M.; Abdelzaher, A. M.; Fleming,L. E. Estimation of enterococci input from bathers and animalson a recreational beach using camera images. Mar. Pollut. Bull.2010, 60, 127–1278.
(41) Shellenbarger, G. G.; Athearn, N. D.; Takekawa, J. Y.; Boehm,A. B. Fecal indicator bacteria and Salmonella in ponds managedas bird habitat, San Francisco Bay, California, USA. Water Res.2008, 42 (12), 2921–2930.
(42) Yamahara, K. M.; Layton, B. A.; Santoro, A. E.; Boehm, A. B.Beach sands along the California coast are diffuse sources offecal bacteria to coastal waters. Environ. Sci. Technol. 2007, 41,4515–4521.
(43) Abdelzaher, A. M.; Wright, M. E.; Ortega, C.; Solo-Gabriele, H. M.;Miller, G.; Elmir, S.; Newman, X.; Shih, P.; Bonilla, J. A.; Bonilla,T. D.; Palmer, C. J.; Scott, T.; Lukasik, J.; Harwood, V. J.; McQuaig,S.; Sinigalliano, C.; Gidley, M.; Plano, L. R. W.; Zhu, X.; Wang,
VOL. 44, NO. 23, 2010 / ENVIRONMENTAL SCIENCE & TECHNOLOGY 9 8811

J. D.; Fleming, L. E. Presence of pathogens and indicators at anon-point source subtropical recreational marine beach. Appl.Environ. Microb. 2010, 76, 724–732.
(44) Sinigalliano, C. D.; Gidley, M. L.; Shibata, T.; Whitman, D.; Dixon,T. H.; Laws, E.; Hou, A.; Bachoon, D.; Brand, L.; Amaral-Zettler,L.; Gast, R. J.; Steward, G. F.; Nigro, O. D.; Fujioka, R.; Betancourt,W. Q.; Vithanage, G.; Mathews, J.; Fleming, L. E.; Solo-Gabriele,H. M. Impacts of hurricanes Katrina and Rita on the microbiallandscape of the New Orleans area. Proc. Nat. Acad. Sci. U.S.A.2007, 104 (21), 9029–9034.
(45) Pianetti, A.; Bruscolini, F.; Sabatini, L.; Colantoni, P. Microbialcharacteristics of marine sediments in bathing area along Pesara-Gabicce coast (Italy): A preliminary study. J. Appl. Microbiol.2004, 97, 682–689.
(46) Ferguson, D. M.; Moore, D. F.; Getrich, M. A.; Zhowandai, M.Enumeration and speciation of Enterococci found in marineand intertidal sediments and coastal water in southern Cali-fornia. J. Appl. Microbiol. 2005, 99, 598–608.
(47) Mallin, M. A.; Cahoon, L. B.; Toothman, B. R.; Parsons, D. C.;McIver, M. R.; Ortwine, M. L.; Harrington, R. N. Impacts of araw sewage spill on water and sediment quality in an urbanizedestuary. Mar. Pollut. Bull. 2007, 54, 81–88.
(48) Mika, K. B.; Imamura, G.; Chang, C.; Conway, V.; Fernandez,G.; Griffith, J. F.; Kampalath, R. A.; Lee, C. M.; Lin, C.-C.;Moreno, R.; Thompson, S.; Whitman, R. L.; Jay, J. A. Pilot andbench-scale testing of faecal indicator bacteria survival inmarine beach sand near point sources. J. Appl. Microbiol. 2009,107, 72–84.
(49) Byappanahalli, M. N.; Shively, D. A.; Nevers, M. B.; Sadowsky,M. J.; Whitman, R. L. Growth and survival of Escherichia coliand Enterococci populations in the macro-alga Cladophora(Chlorophyta). FEMS Microbiol. Ecol. 2003, 46, 203–211.
(50) Verhougstraete, M. P.; Byappanahalli, M. N.; Rose, J. B.;Whitman, R. L. Cladophora in the Great Lakes: impacts onbeach water quality and human health. Water Sci. Technol.2010, 62, 68–76.
(51) Anderson, S. A.; Turner, S. J.; Lewis, G. D. Enterococci in theNew Zealand environment: implications for water qualitymonitoring. Wat. Sci. Tech. 1997, 35, 324–331.
(52) Boehm, A. B.; Weisberg, S. B. Tidal forcing of enterococci atmarine recreational beaches at fortnightly and semidiurnalfrequencies. Environ. Sci. Technol. 2005, 39, 5575–5583.
(53) Nevers, M. B.; Whitman, R. L.; Frick, W. E.; Ge, Z. Interactionand influence of two creeks on Escherichia coli concentrationsof nearby beaches: exploration of predictability and mecha-nisms. J. Environ. Qual. 2007, 36, 1338–1345.
(54) Reeves, R. L.; Grant, S. B.; Mrse, R. D.; Oancea, C. M. C.; Sanders,B. F.; Boehm, A. B. Scaling and management of fecal indicatorbacteria in runoff from a coastal urban watershed in southernCalifornia. Environ. Sci. Technol. 2004, 38, 2637–2648.
(55) Jiang, S. C.; Chu, W.; Olson, B. H.; He, J.-W.; Choi, S.; Zhang, J.;Le, J. Y.; Gedalanga, P. B. Microbial source tracking in a smallsouthern California urban watershed indicates wild animalsand growth as a source of fecal bacteria. Environ. Biotechnol.2007, 76, 927–934.
(56) Sercu, B.; Van De Werfhorst, L. C.; Murray, J.; Holden, P. A.Storm drains are sources of human fecal pollution during dryweather in three urban southern California watersheds. Environ.Sci. Technol. 2009, 43, 293–298.
(57) Haile, R. W.; Witte, J. S.; Gold, M.; Cressey, R.; McGee, C.; Millikan,R. C.; Glasser, A.; Harawa, N.; Ervin, C.; Harmon, P.; Harper, J.;Dermand, J.; Alamillo, J.; Barrett, K.; Nides, M.; Wang, G. Thehealth effects of swimming in ocean water contaminated bystorm drain runoff. Epidemiology 1999, 10 (4), 355–363.
(58) Inman, D. L.; Brush, B. M. The coastal challenge. Science 1973,181 (4094), 20–32.
(59) Dorsey, J. H. Improving water quality through California’s CleanBeach Initiative: an assessment of 17 projects. Environ. Monit.Assess. 2009, DOI: 10.1007/s10661-009-0987-5.
(60) Arnone, R. D.; Walling, J. P. Waterborne pathogens in urbanwatersheds. J. Water Health 2007, 5 (1), 149–162.
(61) Clark, S. E.; Burian, S.; Pitt, R.; Field, R. Urban wet-weatherflows. Water Environ. Res. 2007, 62, 1166–1227.
(62) Harris, P. J. Water quality impacts from on-site waste disposalsystems to coastal areas through groundwater discharge.Environ. Geol. 1995, 26, 262–268.
(63) Paul, J. H.; McLaughlin, M. R.; Griffin, D. W.; Lipp, E. K.; Stokes,R.; Rose, J. B. Rapid movement of wastewater from on-sitedisposal systems into surface waters in the Lower Florida Keys.Estuaries 2000, 23 (5), 662–668.
(64) Lipp, E. K.; Farrah, S. A.; Rose, J. B. Assessment and impactof microbial fecal pollution and human enteric pathogens
in a coastal community. Mar. Pollut. Bull. 2001, 42 (4), 286–293.
(65) Dillon, K. S.; Corbett, D. R.; Chanton, J. P.; Burnett, W. C.;Furbish, D. J. The use of sulfur hexafluoride (SF6) as a tracerof septic tank effluent in the Florida Keys. J. Hydrol. 1999, 220,129–140.
(66) Boehm, A. B.; Shellenbarger, G.; Paytan, A. Groundwaterdischarge: potential association with fecal indicator bacteria inthe surf zone. Environ. Sci. Technol. 2004, 38, 3558–3566.
(67) Meeroff, D. E.; Bloetscher, F.; Bocca, T.; Morin, F. Evaluation of waterquality impacts of on-site treatment and disposal systems on urbancoastal waters. Water, Air, Soil Pollut. 2008, 192, 11–24.
(68) Thupaki, P.; Phanikumar, M. S.; Beletsky, D.; Schwab, D. J.;Nevers, M. B.; Whitman, R. L. Budget analysis of Escherichiacoli at a southern Lake Michigan beach. Environ. Sci. Technol.2010, 44 (3)), 1010–1016.
(69) Pommepuy, M.; Guillaud, J. F.; Dupray, E.; Derrien, A.; Leguy-ader, F.; Cormier, M. Enteric bacteria survival factors. WaterSci. Technol. 1992, 25, 93–103.
(70) Anderson, K.; Whitlock, J.; Harwood, V. Persistence anddifferential survival of fecal indicator bacteria in sub-tropicalwaters and sediments. Appl. Environ. Microbiol. 2005, 71, 3041–3048.
(71) Davies, C. M.; Long, J. A. H.; Donald, M.; Ashbolt, N. J. Survivalof fecal microorganisms in marine and freshwater sediments.Appl. Environ. Microbiol. 1995, 61, 1888–1896.
(72) Desmarais, T.; Solo-Gabriele, H.; Palmer, C. Influence of soilon fecal indicator organisms in a tidally influenced sub-tropical environment. Appl. Environ. Microbiol. 2002, 68, 1165–1172.
(73) Gerba, C.; McLeod, J. Effects of sediments on the survival ofEscherichia coli in marine waters. Appl. Environ. Microbiol. 1976,32, 114–120.
(74) Sinton, L. W.; Finlay, R. K.; Lynch, P. A. Sunlight inactivationof fecal bacteriophages and bacteria in sewage polluted seawater.Appl. Environ. Microbiol. 1999, 65, 3605–3613.
(75) Sinton, L. W.; Hall, C. H.; Lynch, P. A.; Davies-Colley, R. J. Sunlightinactivation of fecal indicator bacteria and bacteriophages fromwaste stabilization pond effluent in fresh and saline waters.Appl. Environ. Microbiol. 2002, 68, 1122–1131.
(76) Boehm, A. B.; Yamahara, K. M.; Love, D. C.; Peterson, B. M.;McNeill, K.; Nelson, K. L. Covariation and photoinactivation oftraditional and novel indicator organisms and human virusesat a sewage-impacted marine beach. Environ. Sci. Technol. 2009,43, 8046–8052.
(77) Clark, C. D.; De Bruyn, W. J.; Jakubowski, S. D.; Grant, S. B.Hydrogen peroxide production in marine bathing waters:Implications for fecal indicator bacteria mortality. Mar. Pollut.Bull. 2008, 56, 397–401.
(78) Surbeck, C. Q.; Jiang, S. C.; Grant, S. B. Ecological control offecal indicator bacteria in an urban stream. Environ. Sci. Technol.2010, 44, 631–637.
(79) Pernthaler, J. Predation on prokaryotes in the water columnand its ecological implications. Nature Reviews Microbiology2005, 3, 537–546.
(80) Menon, P.; Billen, G.; Servais, P. Mortality rates of autochthonousand fecal bacteria in natural aquatic systems. Water Res. 2003,37, 4151–4158.
(81) Byappanahalli, M. N.; Fujioka, R. S. Evidence that tropical soilenvironment can support the growth of Escherichia coli. WaterSci. Technol. 1998, 38, 171–174.
(82) Toothman, B. R.; Cahoon, L. B.; Mallin, M. A. Phosphorus andcarbohydrate limitation of fecal coliform and fecal enterococcuswithin tidal creek sediments. Hydrobiologia 2009, 636 (1), 401–412.
(83) Byappanahalli, M.; Fowler, M.; Shively, D.; Whitman, R. Ubiquityand persistence of Escherichia coli in a midwestern coastalstream. Appl. Environ. Microbiol. 2003, 69, 5459–4555.
(84) Bolster, C. H.; Bromley, J. M.; Jones, S. H. Recovery of chlorine-exposed Escherichia coli in estuarine microcosms. Environ. Sci.Technol. 2005, 39, 3083–3089.
(85) Kay, D.; Stapleton, C. M.; Wyer, M. D.; McDonald, A. T.; Crowther,J.; Paul, N.; Jones, K.; Farancis, C.; Watkins, J.; Wilkinson, J.;Humphrey, N.; Lin, B.; Yang, L.; Falconer, R. A.; Gardner, S.Decay of intestinal enterococci concentrations in high-energyestuarine and coastal waters: towards real-time T90 values formodeling faecal indicators in recreational waters. Water Res.2005, 39, 655–667.
(86) Hipsey, M. R.; Antenucci, J. P.; Brookes, J. D. A generic, process-based model of microbial pollution in aquatic systems. WaterResour. Res. 2008, 44, W07408.
8812 9 ENVIRONMENTAL SCIENCE & TECHNOLOGY / VOL. 44, NO. 23, 2010

(87) Litton, R. M.; Ahn, J. H.; Sercu, B.; Holden, P. A., Sedlak, D. L.Evaluation of chemical, molecular, and traditional markers offecal contamination in an effluent dominated urban stream.Environ. Sci. Technol. 2010, 44, 7369–7375.
(88) Plancherel, Y.; Cowen, J. P. Towards measuring particle-associated fecal bacteria in tropical streams. Water Res. 2007,41, 1501–1515.
(89) Kim, J. H.; Grant, S. B.; McGee, C. D.; Sanders, B. F.; Largier, J. L.Locating sources of surf zone pollution: a mass budget analysisof fecal indicator bacteria at Huntington Beach, California.Environ. Sci. Technol. 2004, 38, 2626–2636.
(90) Incropera, F. P., Dewitt, D. P., Bergman, T. L., Lavine, A. S.Fundamentals of Heat and Mass Transfer, 6th ed.; John Wileyand Sons, Inc.: Hoboken, NJ, 2007.
(91) Wilcox, D. C. Turbulence Modeling for CFD: DCW Industries,2006.
(92) Arega, F.; Sanders, B. F. Dispersion Model for Tidal Wetlands.ASCE J. Hydraul. Eng. 2004, 130 (8), 739–754.
(93) Sanders, B. F.; Bradford, S. F. Impact of Limiters on Accuracyof High-Resolution Flow and Transport Models. ASCE J. Eng.Mech. 2006, 132 (1), 87–98.
(94) Babarutsi, S.; Chu, V. H. A two-length-scale model for quasi-two-dimensional turbulent shear flows. In Proceedings of the24th Congress of IAHR, Vol. C; International Association forHydraulic Research: Madrid, Spain, 1991; p 51-60.
(95) Lorke, A.; Peeters, F. Toward a unified scaling relation forinterfacial fluxes. J. Phys. Oceanogr. 2006, 36, 955–961.
(96) Boehm, A. B. Enterococci concentrations in diverse coastalenvironments exhibit extreme variability. Environ. Sci. Technol.2007, 41, 8227–8232.
(97) Kim, J. H.; Grant, S. B. Public mis-notification of coastal waterquality: A probabilistic evaluation of posting errors at HuntingtonBeach, California. Environ. Sci. Technol. 2004, 38, 2497–2504.
(98) Given, S.; Pendleton, L. H.; boehm, A. B. Regional public healthcost estimates of contaminated coastal waters: A case study ofgastroenteritis at southern California beaches. Environ. Sci.Technol. 2006, 40, 4851–4858.
(99) Martin, A.; Gruber, S. Amplification of indicator bacteria in organicdebris on southern California beaches. Westin Solutions Inc.Technical Report #0507; Westin Solutions, Carlsbad, CA, 2005.
ES101732M
VOL. 44, NO. 23, 2010 / ENVIRONMENTAL SCIENCE & TECHNOLOGY 9 8813


