Embed Size (px)
Citation preview
Developmental PsychologyBasic Numerical Capacities and Prevalence ofDevelopmental Dyscalculia: The Havana SurveyVivian Reigosa-Crespo, Mitchell ValdÄs-Sosa, Brian Butterworth, Nancy EstÄvez, MarisolRodrÅguez, Elsa Santos, Paul Torres, RamÇn SuÉrez, and AgustÅn LageOnline First Publication, September 12, 2011. doi: 10.1037/a0025356
CITATIONReigosa-Crespo, V., ValdÄs-Sosa, M., Butterworth, B., EstÄvez, N., RodrÅguez, M., Santos, E.,Torres, P., SuÉrez, R., & Lage, A. (2011, September 12). Basic Numerical Capacities andPrevalence of Developmental Dyscalculia: The Havana Survey. Developmental Psychology.Advance online publication. doi: 10.1037/a0025356
Basic Numerical Capacities and Prevalence of Developmental Dyscalculia:The Havana Survey
Vivian Reigosa-Crespo and Mitchell Valdes-SosaCuban Centre for Neuroscience
Brian ButterworthInstitute of Cognitive Neuroscience, University College London
Nancy Estevez, Marisol Rodrıguez, and Elsa SantosCuban Centre for Neuroscience
Paul TorresCentral Institute of Pedagogical Sciences
Ramon SuarezNational Institute of Hygiene and Epidemiology
Agustın LageCuban Centre for Neuroscience
The association of enumeration and number comparison capacities with arithmetical competence wasexamined in a large sample of children from 2nd to 9th grades. It was found that efficiency on numericalcapacities predicted separately more than 25% of the variance in the individual differences on a timedarithmetical test, and this occurred for both younger and older learners. These capacities were alsosignificant predictors of individual variations in an untimed curriculum-based math achievement test andon the teacher scores of math performance over developmental time. Based on these findings, thesenumerical capacities were used for estimating the prevalence and gender ratio of basic numerical deficitsand developmental dyscalculia (DD) over the grade range defined above (N ! 11,652 children). Theextent to which DD affects the population with poor ability on calculation was also examined. For thispurpose, the prevalence and gender ratio of arithmetical dysfluency (AD) were estimated in the samecohort. The estimated prevalence of DD was 3.4%, and the male:female ratio was 4:1. However, theprevalence of AD was almost 3 times as high (9.35%), and no gender differences were found (male:female ratio ! 1.07:1). Basic numerical deficits affect 4.54% of school-age population and affect moreboys than girls (2.4:1). The differences between the corresponding estimates were highly significant (" #.01). Based on these contrastive findings, it is concluded that DD, defined as a defective sense ofnumerosity, could be a distinctive disorder that affects only a portion of children with AD.
Keywords: arithmetic fluency, enumeration, numerical magnitude comparison, developmental dyscalcu-lia, prevalence
Current theories of typical cognitive development postulate thatknowledge acquisition is based on a restricted set of core systems,defined as domain-specific representational primitives that leadand constrain the cultural learning (Spelke & Kinzler, 2007).
According to Ansari and Karmiloff-Smith (2002) and Butterworth(2005), in the specific case of numbers, the focus of attention hasshifted from higher level, school-like arithmetic skills to an anal-ysis of lower level processes, in particular, capacities such as
Vivian Reigosa-Crespo, Department of Developmental Cognitive Neuro-science, Cuban Centre for Neuroscience; Mitchell Valdes-Sosa, Department ofCognitive Neuroscience, Cuban Centre for Neuroscience; Brian Butterworth,Numeracy and Literacy Group, Institute of Cognitive Neuroscience, Univer-sity College London; Nancy Estevez, Department of Developmental CognitiveNeuroscience, Cuban Centre for Neuroscience; Marisol Rodrıguez, Depart-ment of Developmental Cognitive Neuroscience, Cuban Centre for Neurosci-ence Elsa Santos, Department of Software Development, Cuban Centre forNeuroscience; Paul Torres, Department of Education and Quality, CentralInstitute of Pedagogical Sciences; Ramon Suarez, Department of Biostatistics,National Institute of Hygiene and Epidemiology, Agustın Lage, Department ofMathematics and Statistics, Cuban Centre for Neuroscience.
Marisol Rodrıguez is not currently affiliated with any institution.This research was carried out in the framework of the Cuban National
Study for Disabilities. It was supported by the Ministries of Health andEducation of Cuba. We thank Marcia Cobas, Vice Minister of Health,who encouraged this work. We appreciate the collaboration of the
National Group for Disabilities, the Government, Health, and Educationauthorities of Centro Habana municipality, the computing students whocreated the database, and the National Institute of Hygiene and Epide-miology, which provided the facilities for this work. Finally, we arevery grateful to the participating children and teachers, who generouslygave their time over a 9-month period.
Author contributions are as follows: Study conceived and designed byVivian Reigosa-Crespo, Mitchell Valdes-Sosa, and Brian Butterworth;study performed by Vivian Reigosa-Crespo, Nancy Estevez, MarisolRodrıguez, Elsa Santos, and Paul Torres; data analyzed by Vivian Reigosa-Crespo, Mitchell Valdes-Sosa, Ramon Suarez, and Agustın Lage; articlewritten by Vivian Reigosa-Crespo, Mitchell Valdes-Sosa, and Brian But-terworth.
Correspondence concerning this article should be addressed to VivianReigosa-Crespo, Department of Developmental Cognitive Neuroscience,Cuban Centre for Neuroscience, Ave 25, #15202esq. 158, Cubanacan.Playa, Postal code 11600. Havana, Cuba. E-mail: [email protected]
Developmental Psychology © 2011 American Psychological Association2011, Vol. !!, No. !, 000–000 0012-1649/11/$12.00 DOI: 10.1037/a0025356
1
estimating, counting, and processing numerical magnitudes. Thesecapacities may function as part of the “starter kit” for understand-ing numbers and arithmetic, and they are conceived to be executedby a domain-specific and genetically controlled module (Butter-worth, 1999, 2010). The functioning of some of these capacitiescan be observed in preverbal infants (Gelman & Meck, 1983;Wynn, 1992), and even nonhuman animals seem to be capable ofestimating numerosities and comparing the size of sets of objects(see Nieder, 2005, for a review). If the domain-specific coresystems are indeed involved in acquiring arithmetic skills, then, onone hand, measures of their proficiency should predict individualdifferences in arithmetic attainment, and on the other hand, at leasta subset of the low math achievers should be characterized bydeficits in these core capacities. We now examine these twoassumptions in more detail.
Evidence from typical development supports the idea that basicnumerical capacities predict individual differences in later mathe-matics achievement. A Finnish longitudinal study by Aunola,Leskinen, Lerkkanen, and Nurmi (2004), identified counting abil-ity at preschool age as a reliable predictor of mathematicalachievement in first grade. Similarly, in an Italian longitudinalstudy by Passolunghi, Vercelloni, and Schadee (2007), countingskills at the beginning of primary school (especially counting asfast as possible from 1 to 10) were identified as a direct precursorto early mathematics learning 6 months later. Moreover, Hollowayand Ansari (2009) found that individual differences in the timetaken to compare two digits in 6- to 8-year-olds was related tomathematics achievement but not to reading achievement. Thisrelationship was found to be specific to symbolic numerical com-parison. In a longitudinal design, De Smedt, Verschaffel, andGhesquiere (2009) found that the size of the individual’s symbolicdistance effect in Year 1, calculated based on reaction times in anumber-comparison task, was predictively related to mathematicsachievement in Year 2.
According to the second assumption, developmental dyscalculia(DD), a congenital and persistent disability in achieving normallevels of arithmetical skills (Shalev, Manor, & Gross-Tsur, 2005)could arise when the specialized capacity, or “number module”(Butterworth, 1999), fails to develop normally with correspondingdeleterious effects in the acquisition of higher level math skills.This has been called “the defective number module hypothesis”(see Butterworth, 2005, for an elaboration of this theory). Thisentails a core cognitive deficit in a sense of numerosity—a senseof the number of objects in a set—that causes poor performance onvery simple tasks, such as numerical magnitude comparison andcounting small numbers of dots (Butterworth & Reigosa-Crespo,2007).
Evidence for an association between deficits on these basicnumerical capacities and arithmetic skills has been revealed instudies of individuals with known mathematical disabilities. Se-vere low achievers (3 standard deviations worse than controls in anitem-timed arithmetic test) have been shown to perform differentlyon tasks of number comparison and counting compared withtypically developing children (Landerl, Bevan, & Butterworth,2004). Geary, Hamsom, and Hoard (2000) found small but sys-tematic group differences between first grade low achievers andcontrols in magnitude comparison tasks, whereas Koontz andBerch (1996) found that children with poor math abilities appearedto be counting to three rather than subitizing in a dot-matching
task. Moreover, Torbeyns, Verschaffel, and Ghesquiere (2004)found that low achievers also demonstrated inadequate countingstrategies when doing arithmetic. The Finnish longitudinal studyby Aunola et al. (2004) showed not only that low mathematicalschool performance was associated with low counting abilities inpreschool but also that these deficits were cumulative already atthis point in time. Atypical performance on basic numerical pro-cessing (including counting and number comparisons) has alsobeen demonstrated in individuals with Williams syndrome (Pater-son, Girelli, Butterworth, & Karmiloff-Smith, 2006), Turner syn-drome (Bruandet, Molko, Cohen, & Dehaene, 2004), and chromo-some 22q.11.2 deletion (Simon, Bearden, Mc-Ginn, & Zackai,2005), syndromes in which dyscalculia is present.
In summary, current evidence provides promising supportsfor an association between low-level numerical capacities andarithmetical skills as well as their impairment. However, thesecapacities have only been considered systematically as a schoolentry-level competence. Accordingly, the most of the studieshad been focused at an age when children are first beingintroduced to formal mathematics. As a consequence, there is alack of research that examines the nature of this relationshipalong the acquisition of more complex and increasingly sophis-ticated arithmetic skills.
Also, most of these studies only used a test of arithmeticalattainment without time controls. Under this condition, we may notdifferentiate between children who process numerical informationefficiently and those who take long time to process it. Jordan andMontani (1997) suggested that some children with specific mathdisabilities are able to compensate under untimed conditions be-cause of relatively good verbal or conceptual skills.
In the light of these limitations, the first aim of this study isto examine the relationship between individual differences inbasic numerical capacities and the development of arithmeticalcompetence over a broad developmental time (second to ninthgrades) using two item-timed capacity tests of the Basic Nu-merical Battery (BNB; dot enumeration and numerical magni-tude comparison) and three measures of arithmetical compe-tence: (a) an untimed computational test based on curriculum bygrade, (b) an item-timed test of mental arithmetic (addition,subtraction, and multiplication), and (c) a teacher report aboutmath attainment. A large body of research supports the inclu-sion of these achievement measures. As was pointed out, themost of the studies described above used untimed test of arith-metical attainment, but evidence from other studies supports therole of the speed in basic calculation for solving most mathproblems (Gersten, Jordan, & Flojo, 2005; Goldman & Pel-legrino, 1987; Hasselbring, Goin, & Bransford, 1988) and sug-gests that dysfluent calculation is a distinguishing characteristicof children with low math achievement (Barnes et al., 2006;Jordan & Montani, 1997). On the other hand, Hoge and Cola-darci (1989), in a comprehensive review, reported a moderate tostrong association between teacher judgments and studentachievement (median r ! .66). Consequently, we expect to findan association between both capacities— enumeration and num-ber comparison—and the measures of arithmetic achievement,even for older learners. We hypothesize that basic capacitieswill contribute significantly to the individual variability onperformance for all these convergent measures of arithmetical
2 REIGOSA-CRESPO ET AL.
achievement, although this contribution could be more signifi-cant for one measure than others.
We believe that this will provide empirical support for the use ofenumeration and numerical magnitude comparison tasks for iden-tifying DD children with a core cognitive deficit in the sense ofnumerosity leading to impairment along a broad age range. Ac-cordingly, the second aim of the present study is to obtain, for firsttime, a prevalence estimate of basic numerical deficits and DDbased on the entire school-age population from second to ninthgrades of a municipality of Havana, Cuba using the BNB tests. Wealso are interested in testing whether gender differences are presentin these disorders.
Here we hypothesize that children with DD exhibit very lowarithmetical attainment related to a domain-specific core deficitand that they form a subset of a more extended group of childrenwith arithmetic disabilities. We can test this assumption by com-paring prevalence estimate and gender ratio of DD with similarestimates obtained for arithmetical dysfluency (AD) from the samepopulation. We use the term AD instead of the terms mathematicalor arithmetical learning disabilities (MLD/ALD), because the ADdefinition is focused on poor fluency of calculation, a distinguish-ing characteristic of a more general deficit on mathematicalachievement, which demands, even for the early school grades, acomplex set of skills to deal with curriculum requirements (e.g.,remembering arithmetical procedures and, more generally, theprinciples and laws of arithmetic). If DD is a subset of a moreextended AD group, then the prevalence would be significantlydifferent. Moreover, differences in gender would be consideredevidence of the distinctive nature of both disorders. To our knowl-edge, convincing evidence supporting this assumption has not yetbeen reported.
Method
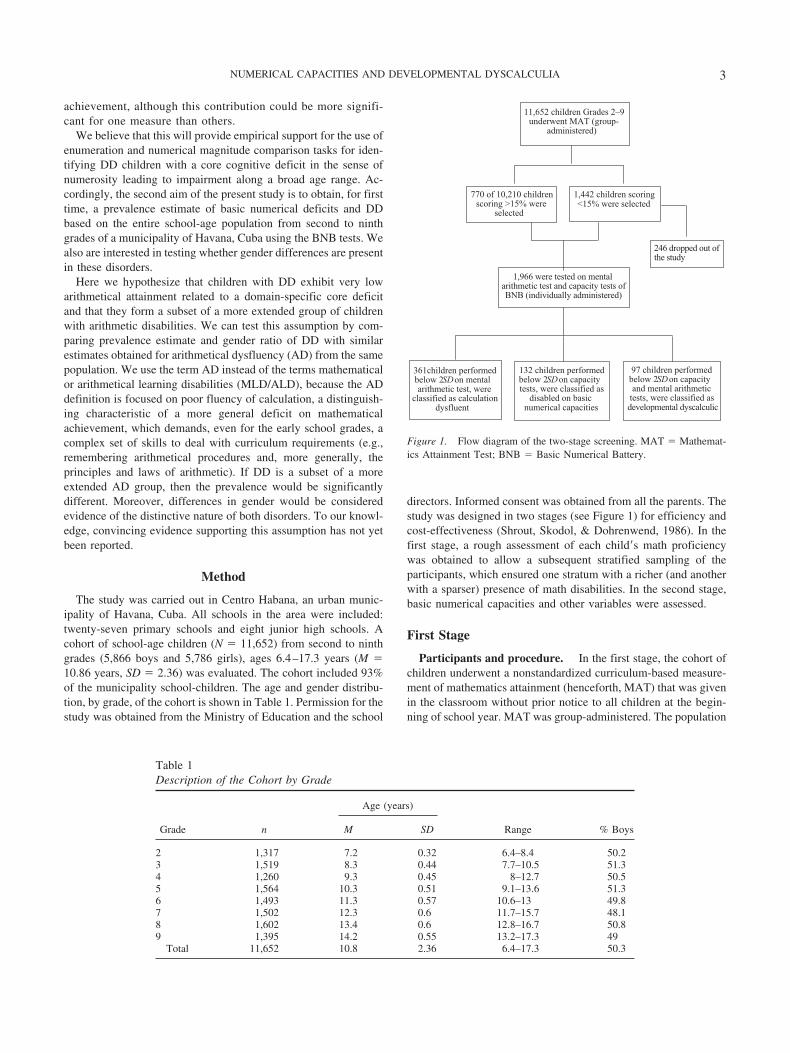
The study was carried out in Centro Habana, an urban munic-ipality of Havana, Cuba. All schools in the area were included:twenty-seven primary schools and eight junior high schools. Acohort of school-age children (N ! 11,652) from second to ninthgrades (5,866 boys and 5,786 girls), ages 6.4–17.3 years (M !10.86 years, SD ! 2.36) was evaluated. The cohort included 93%of the municipality school-children. The age and gender distribu-tion, by grade, of the cohort is shown in Table 1. Permission for thestudy was obtained from the Ministry of Education and the school
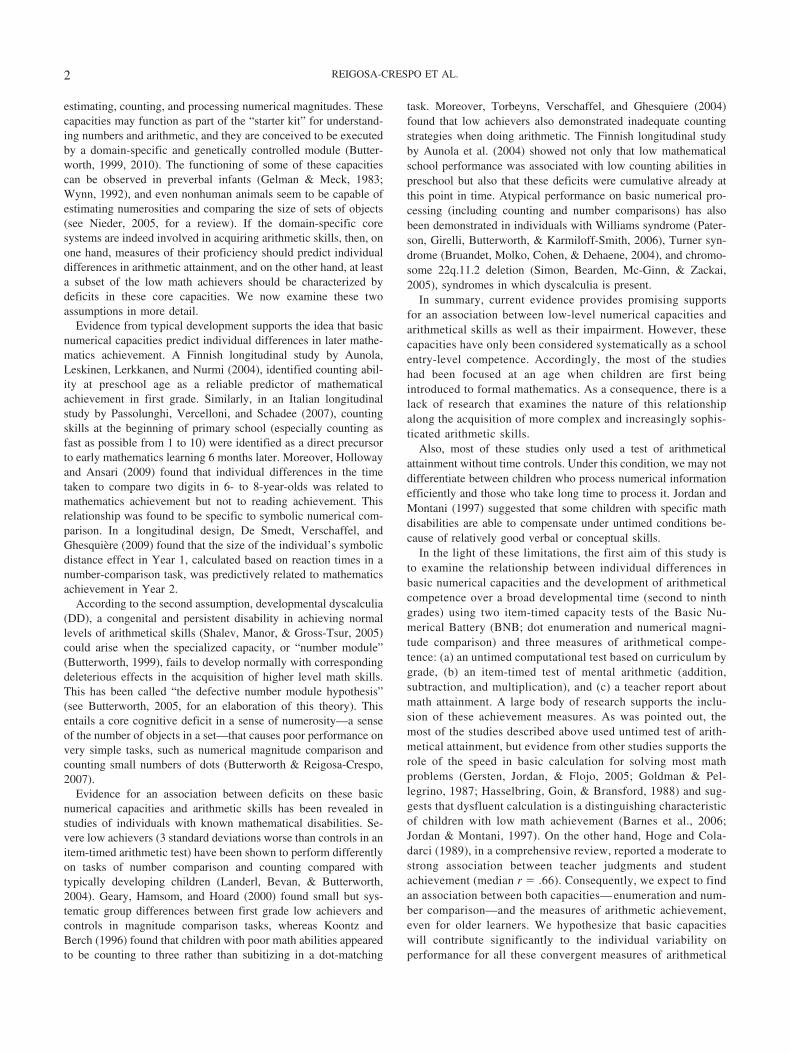
directors. Informed consent was obtained from all the parents. Thestudy was designed in two stages (see Figure 1) for efficiency andcost-effectiveness (Shrout, Skodol, & Dohrenwend, 1986). In thefirst stage, a rough assessment of each child$s math proficiencywas obtained to allow a subsequent stratified sampling of theparticipants, which ensured one stratum with a richer (and anotherwith a sparser) presence of math disabilities. In the second stage,basic numerical capacities and other variables were assessed.
First Stage
Participants and procedure. In the first stage, the cohort ofchildren underwent a nonstandardized curriculum-based measure-ment of mathematics attainment (henceforth, MAT) that was givenin the classroom without prior notice to all children at the begin-ning of school year. MAT was group-administered. The population
Table 1Description of the Cohort by Grade
Grade n
Age (years)
Range % BoysM SD
2 1,317 7.2 0.32 6.4–8.4 50.23 1,519 8.3 0.44 7.7–10.5 51.34 1,260 9.3 0.45 8–12.7 50.55 1,564 10.3 0.51 9.1–13.6 51.36 1,493 11.3 0.57 10.6–13 49.87 1,502 12.3 0.6 11.7–15.7 48.18 1,602 13.4 0.6 12.8–16.7 50.89 1,395 14.2 0.55 13.2–17.3 49
Total 11,652 10.8 2.36 6.4–17.3 50.3
11,652 children Grades 2–9 underwent MAT (group-
administered)
1,442 children scoring <15% were selected
246 dropped out of the study
132 children performed below 2 SD on capacity tests, were classified as
disabled on basic numerical capacities
1,966 were tested on mental arithmetic test and capacity tests of BNB (individually administered)
770 of 10,210 children scoring >15% were
selected
361children performed below 2 SD on mental arithmetic test, were
classified as calculation dysfluent
97 children performed below 2 SD on capacity and mental arithmetic
tests, were classified as developmental dyscalculic
Figure 1. Flow diagram of the two-stage screening. MAT ! Mathemat-ics Attainment Test; BNB ! Basic Numerical Battery.
3NUMERICAL CAPACITIES AND DEVELOPMENTAL DYSCALCULIA
was divided in two strata based on MAT score. One stratumincluded children scoring in the lowest 15% of their grade, whowere considered poor arithmetic attainers. This cutoff is restrictive,because we considered that the larger the percentage used ascutoff, the more heterogeneous and more susceptible to environ-mental factors the sample would be.
Accordingly, 1,442 children passed to second stage. Of these,246 (129 boys and 117 girls) were unavailable for further testingfor several causes (e.g., some children moved away or dropped outbecause of illness). Therefore, 1,196 children (636 boys and 560girls), aged 6.9 to 17.3 years (M ! 12.3 years, SD ! 2.17) andscoring in the lowest 15% in MAT (M score ! 1.9, SD ! 0.97,range ! 0–3) were recruited for the second stage.
The other stratum included a sample of 770 children homoge-neously distributed by grade (381 boys and 389 girls), aged 7.1 to17.3 years (M ! 11.2 years, SD ! 2.23), scoring above the lowest15% in MAT (M score ! 6.9, SD ! 1.22, range ! 4–8). Thesechildren also passed to the second stage. The inclusion of the latterallowed us to estimate true and false negatives that were includedin the analysis of the technical adequacy of MAT as screening tool.This sample was also useful for estimating the prevalence rate ofthe disorders. It was selected using a stratified random samplingstrategy (Pedhazur & Pedhazur-Schmelkin, 1991). The school-agepopulation scoring %15% in MAT (N ! 10,210) was first separateby grade and gender and was then divided into strata based onMAT score. Each stratum was initially treated independently.Thus, children within each stratum were randomly selected, andindividual estimates (proportions) were obtained. These estimateswere then weighted to arrive at an estimate for the populationparameters.
In addition, teachers were asked to provide a judgment of themath ability of all the children in both samples using the followingscale: 1 (very poor), 2 (poor), 3 (moderate), 4 (good) and 5 (verygood).
Test used in the first stage: MAT. The MAT is a nonstan-dardized curriculum-based measurement developed by researchersat the Ministry of Education (Bernabeu, M. & Leon, T., personalcommunication, 04/16/2003) and employed throughout Cubanschools. MAT comprised eight computational problems by eachrespective grade (second to ninth). The authors created the mea-sures by selecting problem types representing a proportional sam-pling of the computation skills within the national curriculum.Total score was up to 8 (one for each problem performed cor-rectly).
Second Stage
Participants and procedure. The second stage was carriedout at the end of the school year (9 months later) to identifychildren with basic numerical deficits, DD and AD. The BasicNumerical Battery (BNB; see below for details) was administeredto 1,966 children selected from the first stage (see flowchart inFigure 1). The assessment was conducted in a quiet and illumi-nated room inside the school. The physical conditions of theevaluation room were similar across participating schools. Eachchild was seen individually in a single testing session that lastedapproximately 20 min. The child sat next to the tester in front ofthe computer (PC with Pentium 3 processor). The testers were
computing teachers who previously received a certificated trainingin the BNB assessment.
Tests used in the second stage: BNB. BNB is a battery ofitem-timed computerized tests, with a structure similar to that ofthe Dyscalculia Screener (Butterworth, 2003). BNB includes twonumerical capacity tests: dot enumeration and numerical magni-tude comparison and a test of mental arithmetic fluency. Each testincluded practice trials to ensure the understanding of the instruc-tions. The children always had to give a response by pressing thecorresponding key (thus misses were not measurable). Only thekeys of the numeric pad (right side of the keyboard) were availablefor response (except the simple reaction time task).
1. Simple reaction time. Some children are relatively slowat pressing keys in response to any stimuli. The simple reactiontime test was designed to evaluate this. This measure was notanalyzed by itself. It was considered a baseline measure ofprocessing speed. Accordingly, the reaction times on the fol-lowing three computer tests described below were adjusted bysubtracting simple reaction time from reaction time on eachtest. Children were asked to press the space bar as soon as theysaw a square in the center of display. The interstimulus presen-tation time was variable (500 –1,500 ms). Twenty trials werepresented. Five practice trials were given before starting thetest. Reaction times were recorded with millisecond precision.
2. Numerical capacity tests.2.1. Dot enumeration. Randomly arranged dots ranging
from 1 to 9 were presented on the computer display. Childrenwere asked to enumerate the quantities and to respond asquickly as they could without making mistakes. Reaction timesand errors were recorded by pressing the key corresponding tonumber of dots enumerated. Eighteen trials were presentedaltogether, with each number from 1 to 9 being presented twicein a pseudorandom order, with the proviso that no item occurredtwice in succession. Five practice trials were given beforestarting the test. We assume that enumeration can involve atleast three strategies: subitizing for numerosities four or fewer;counting for four or more; and a mix of strategies, which variesby individual, depending on both the individual’s numericalcapacity, age, experience with counting, and so on. The criticalpoint is that both the speed and accuracy of enumeration willindex capacity.
2.2. Numerical magnitude comparison. Children were pre-sented with two digits (1–9) on the computer, one to the left andone to the right of the screen, and they were asked to compare themagnitude of numbers from left to right (e.g., 5 # 7, 7 % 5). Thenumerical distance between pairs was manipulated (distances1–8). The response keys were “1” for “#,” “2” for “!,” and “3”for “%.” Thirty-six trials were presented in a pseudorandom order.Five practice trials were given before starting the test. Reactiontimes and errors were recorded.
3. Mental arithmetic. Fifteen simple additions, 15 subtrac-tions, and 15 multiplications were presented in three separateblocks. All involved single-digit numbers from 2 to 9, exclud-ing 0 and 1, since number facts involving 0 and 1 can be solvedby application of a rule rather than calculation or retrieval. Noties (e.g., 3 & 3, 5 ' 5) were presented, and items were notrepeated. Items were presented on the computer screen in theform “2 & 4.” Two practices trials were given before the startof each block. Children were asked to type in the answer as
4 REIGOSA-CRESPO ET AL.
quickly as they could without making any mistake. Reactiontime (RT) was measured with the first key stroke. Errors werealso recorded. Second graders did not receive the multiplicationblock, because at the time of the assessment, they were startingto learn the multiplication tables.
The median is usually considered a trimming procedure forexcluding spuriously fast or slow reaction times from the anal-ysis. It allows one to obtain better estimation of central valuewith less variability than does the mean (Ulrich & Miller,1994). Consequently, median reaction times for correct re-sponses in dot enumeration and numerical magnitude compar-ison were calculated. The medians were adjusted, subtractingeach from the median of the simple RT for that participant(adjRTs). Then an efficiency measure (EM) for each test wascalculated by diving adjRTs by the proportion of hits (EM !adjRT/Hits). For the mental arithmetic test, the EM scores foreach operation (addition, subtraction, and multiplication) werecalculated for each child. The mean of these medians for eachchild was then used as a measure of efficiency on the mentalarithmetic test overall. As in the Landerl et al. (2004) study,these two measures (RT and proportion of hits) were usedbecause it had been noted that children with low numeracy tendto adopt strategies that produce generally accurate answers butextremely long RT latencies (see also Jordan & Montani, 1997);or they would simply guess quickly, leading to inaccurateanswers but short RT latencies. Note that higher EM scoresrepresent worse performance.
Individual Z-score for each test was calculated using the meanand standard deviation (SD) of the residuals of the regressions ofEMs as a function of age, estimated from the normative sample.Residuals are differences between the observed values and thecorresponding values that are predicted by the model and, thus,represent the variance that is not attributable to age. The opera-tional criterion for classifying children with AD was a Z-score #2 SDs in the mental arithmetic test. The operational criterion forclassifying children with basic numerical deficits was a Z-score #2 SDs in at least one of the two capacity tests (dot enumeration andnumerical magnitude comparison). Finally, DD was operationallydefined as Z-score # 2 SDs in the mental arithmetic test and in atleast one of the two capacity tests.
Results
Basic Numerical Capacities and ArithmeticalCompetence
All children assessed with both tests (MAT and BNB) wereincluded in the subsequent analysis. First, a one-way analysis ofvariance (ANOVA) was conducted, with the EMs of the enumer-ation and comparison tests as dependent variables and grade as theindependent variable. Means and standard error for each EM bygrade are shown in Table 2. The correlations in Table 2 betweenthe EMs of both tests were positive and significant across grades.
We found a significant effect of grade. Earlier grades showedlonger EMs than later grades for both enumeration, F(7, 1958) !133.11, p # .0001, and comparison tasks, F(7, 1958) ! 80.313,p # .0001. This reflects that each grade differed from other gradesin EMs, except for older grades (sixth through eighth grades forenumerating and seventh through ninth grades for comparing), asdemonstrated by post hoc Bonferroni-corrected t tests (" ! .05/28 ! .001785).
We also tested whether efficiency for enumeration and numbercomparison predicted individual variations in math performance.Because EMs did not fit a normal distribution (the data wereskewed to the right), a logarithmic transformation was performed(logEMs).
First, a correlational analysis across all grades between theoutcome measures (MAT scores and teacher scores) and the pre-dictors (logEMs of capacity tasks) was performed, including gradeas independent variable. Significant negative partial correlationswere found between teacher scores and the logEMs of enumeration(–.11, p # .01) and number comparison (–.17, p # .01) as well asbetween the logEMs of capacity tests and MAT scores (–.13 and–.09, p # .001, respectively, for enumeration and comparison).
The second analysis was performed in two ways: by grade andcollapsed across grades. In both cases, multiple regressions wereperformed. In the models, logEMs calculated for dot enumerationand number comparison were defined simultaneously as continu-ous predictor variables. MAT scores (0–8) and teachers’ opinionscores (“very poor” to “very good”) were defined separately asdependent variables. The models assumed an ordinal multinomial
Table 2Efficiency on Numerical Capacity Tests by Grade
Grade
Dot enumeration Numerical magnitude comparison
RM SE 95% CI M SE 95% CI
2 4,504 214.8 4,073.3–4,934.6 5,791.6 874.8 4,038.4–7,544.9 .38!!
3 3,484.2 84.8 3,316.2–3,652.3 2,954.9 171.0 2,616.2–3,293.6 .46!!
4 2,992.1 76.2 2,840.8–3,143.4 2,317 122.9 2,073.2–2,560.8 .22!
5 2,713.1 57.8 2,598.8–2,827.4 2,152.4 103.8 1,947.4–2,057.4 .46!!
6 2,435.5 59.6 2,317.6–2,553.5 1,755.1 80.8 1,595.2–1,915.1 .48!!
7 2,389.2 67.7 2,295.3–2,523.1 1,742.1 104.5 1,535.2–1,949.1 .41!!
8 2,236.3 23.6 2,189.8–2,282.7 1,607.6 23.8 1,560.7–1,654.4 .37!!
9 2,117.9 27.4 2,064.1–2,171.7 1,485 29.1 1,427.8–1,542.2 .32!!
Note. CI ! confidence interval; R ! Pearson product-moment correlation coefficient between efficiency on dot enumeration and numerical magnitudecomparison.! p # .05. !! p # .01.
5NUMERICAL CAPACITIES AND DEVELOPMENTAL DYSCALCULIA
distribution of dependent variables because they may be ordered ascategories.
In the analysis by grade, we found that logEMs of dot enumer-ation were significant predictors of MAT scores for all gradesexcept fourth grade, W(1, 8) between 6.63 and 53.18, p # .01.LogEMs of number comparison were also significant predictors ofMAT scores for all grades except second grade, W(1, 8) between3.98 and 36.5, p # .05. When the teacher$s judgment was ana-lyzed, the efficiency in both capacity tests was significant predictorfor all grades without exception, W(1, 4) between 3.75 and 9.11,p # .05, for dot enumeration; W(1, 4) between 3.82 and 14.1, p #.05, for number comparison.
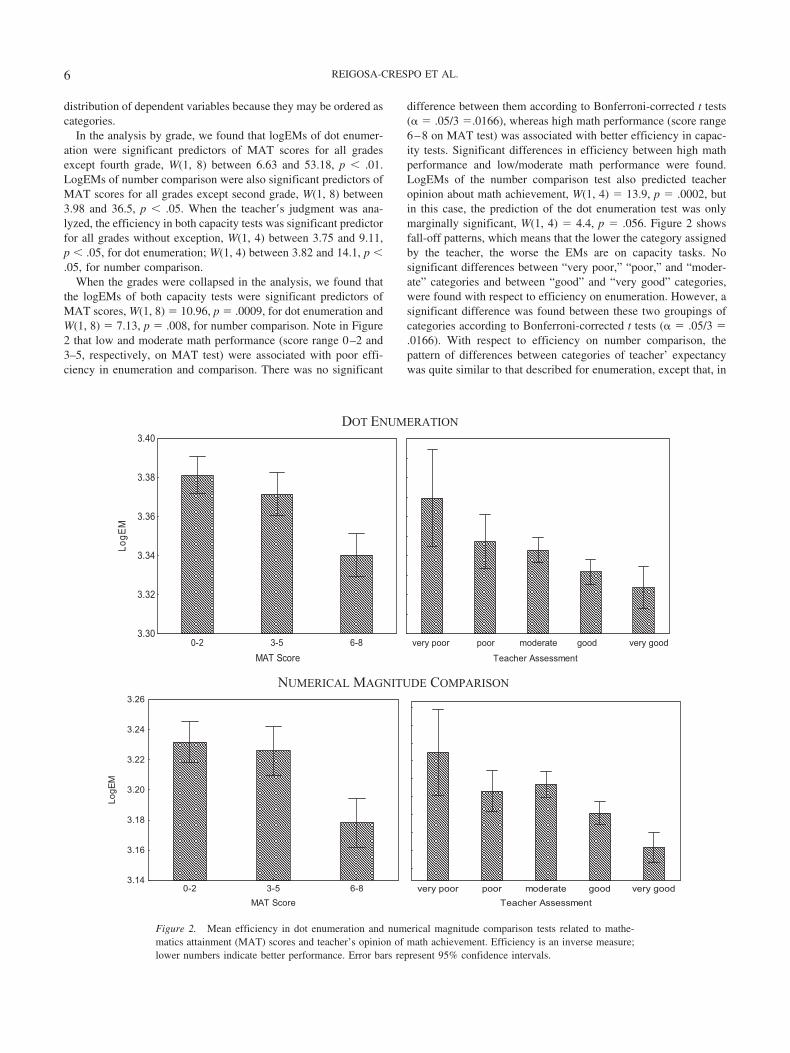
When the grades were collapsed in the analysis, we found thatthe logEMs of both capacity tests were significant predictors ofMAT scores, W(1, 8) ! 10.96, p ! .0009, for dot enumeration andW(1, 8) ! 7.13, p ! .008, for number comparison. Note in Figure2 that low and moderate math performance (score range 0–2 and3–5, respectively, on MAT test) were associated with poor effi-ciency in enumeration and comparison. There was no significant
difference between them according to Bonferroni-corrected t tests(" ! .05/3 !.0166), whereas high math performance (score range6–8 on MAT test) was associated with better efficiency in capac-ity tests. Significant differences in efficiency between high mathperformance and low/moderate math performance were found.LogEMs of the number comparison test also predicted teacheropinion about math achievement, W(1, 4) ! 13.9, p ! .0002, butin this case, the prediction of the dot enumeration test was onlymarginally significant, W(1, 4) ! 4.4, p ! .056. Figure 2 showsfall-off patterns, which means that the lower the category assignedby the teacher, the worse the EMs are on capacity tasks. Nosignificant differences between “very poor,” “poor,” and “moder-ate” categories and between “good” and “very good” categories,were found with respect to efficiency on enumeration. However, asignificant difference was found between these two groupings ofcategories according to Bonferroni-corrected t tests (" ! .05/3 !.0166). With respect to efficiency on number comparison, thepattern of differences between categories of teacher’ expectancywas quite similar to that described for enumeration, except that, in
DOT ENUMERATION
0-2 3-5 6-8MAT Score
3.30
3.32
3.34
3.36
3.38
3.40
LogE
M
very poor poor moderate good very goodTeacher Assessment
NUMERICAL MAGNITUDE COMPARISON
0-2 3-5 6-8MAT Score
3.14
3.16
3.18
3.20
3.22
3.24
3.26
LogE
M
very poor poor moderate good very goodTeacher Assessment
Figure 2. Mean efficiency in dot enumeration and numerical magnitude comparison tests related to mathe-matics attainment (MAT) scores and teacher’s opinion of math achievement. Efficiency is an inverse measure;lower numbers indicate better performance. Error bars represent 95% confidence intervals.
6 REIGOSA-CRESPO ET AL.
this case, there was a significant difference between “good” and“very good” categories.
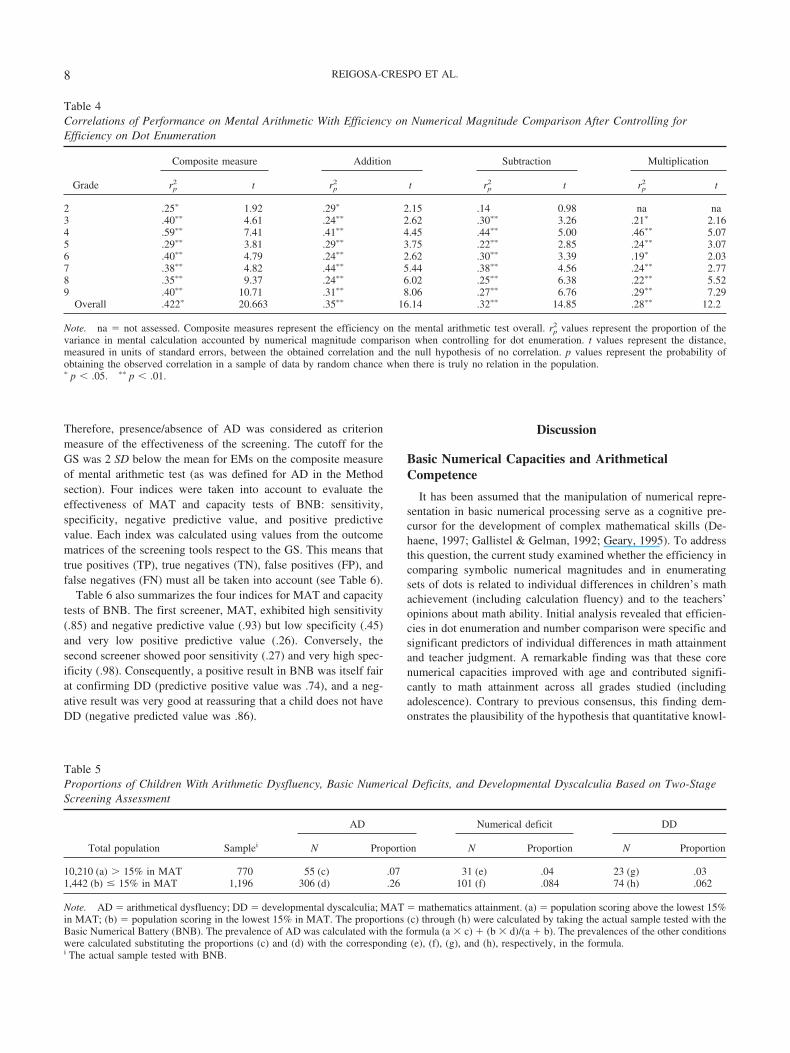
A further question to address was the unique contribution ofenumeration and comparison with the individual variability onmental arithmetic fluency during the development. That is, therelationship of one numerical capacity and the efficiency of mentalcalculation while controlling for the other numerical capacity. Toexamine this, we performed several regression analyses by grade.In the models, logEMs of mental arithmetic by operation (addition,subtraction, and multiplication) and a composite logEM on themental arithmetic overall were defined as dependent variablesseparately in each model. For each analysis, logEMs in enumera-tion and comparison were considered simultaneously as indepen-dent variables. The bivariate correlations between efficiency onmental arithmetic and efficiency on enumeration by grade werehighly significant (range ! .39–.65, p # .01) and were alsosignificant between mental arithmetic and number comparison(range ! .50–.61, p # .01).
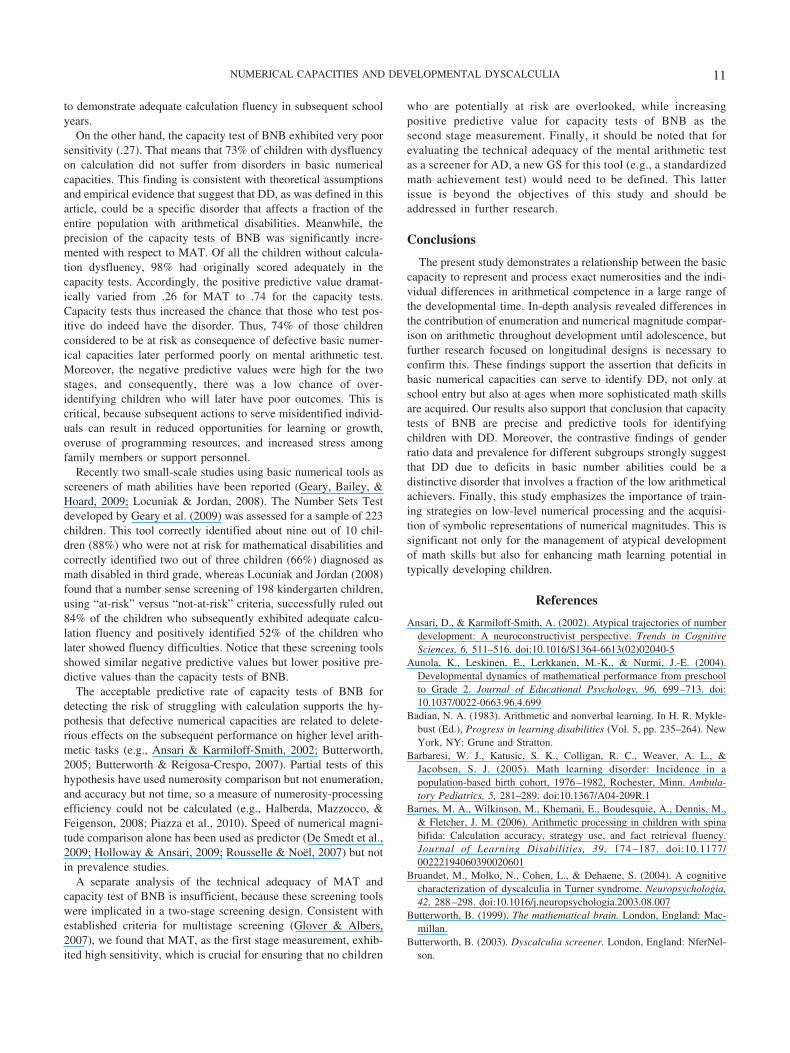
The analysis of partial correlations showed that enumerationand number comparison capacities were significantly indepen-dent predictors of the calculation efficiency (overall and byoperation) in all the grades tested (see Tables 3 and 4). As atrend, partial correlations were stronger for overall efficiencythan for efficiency by operation. In-depth analysis revealedsome interesting issues. In a similar fashion, enumeration andnumber comparison separately accounted the individual differ-ences in efficiency for addition and subtraction facts. However,the individual variance in multiplication efficiency was betterexplained by number comparison than by enumeration. In fact,there was no significant contribution of dot enumeration untilfifth grade. Focusing the attention on the younger children, wefound that enumeration showed higher partial correlations withaddition and subtraction than with comparison for second grad-ers. This pattern was inverted for third and fourth graders. Forolder children, similar contribution of enumeration and com-parison to calculation efficiency was found.
Prevalence and Gender Differences for AD,Basic Numerical Deficits, and DD
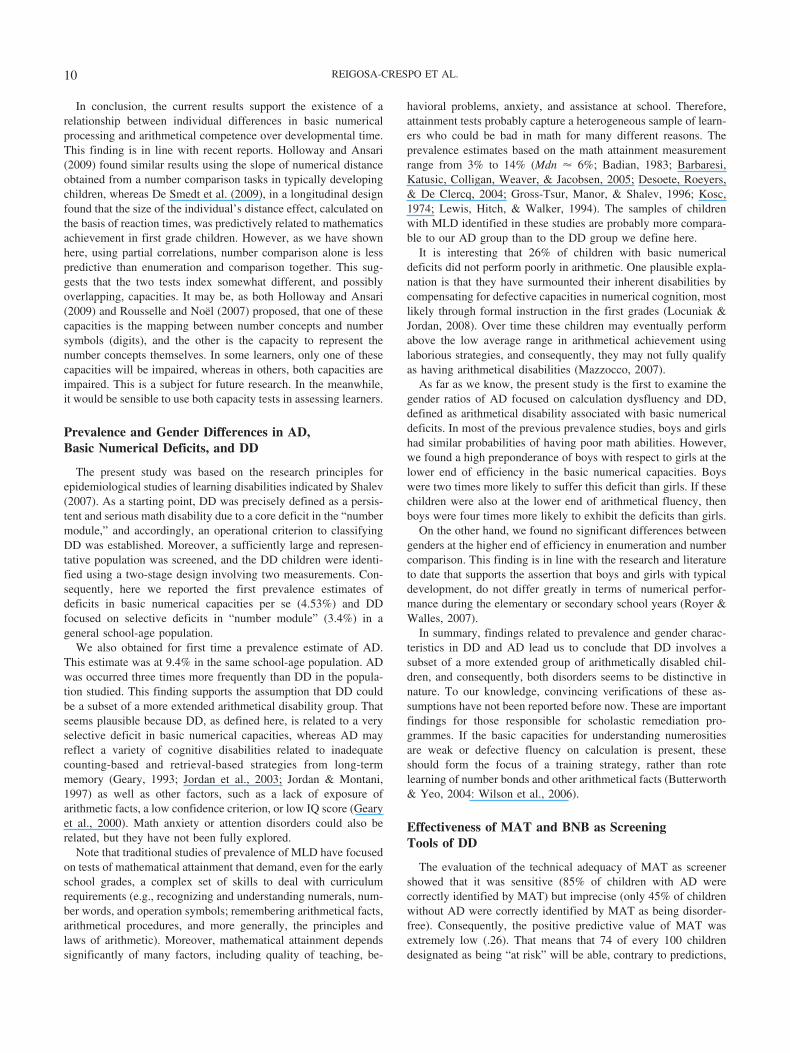
The criterion of AD was fulfilled by 361 children. Of them, 306scored below 15% and 55 scored above 15% in MAT. Using theformula shown in Table 5, we estimated the prevalence of AD inthe entire school-age population as 9.35%. The criterion of basicnumerical deficits was satisfied by 132 children: one hundred onescored below 15% and 31 scored above 15% in MAT. The esti-mated prevalence was 4.54%. Finally, 97 children fulfilled thecriterion of DD. Of them, 74 scored below 15% and 23 scoredabove 15% in MAT. We estimated that the prevalence of DD in theentire school-age population was 3.4%. Notice that 35 of 132children (26%) of those identified as poor performers on basicnumerical capacity tasks did not perform poorly in mental arith-metic. Significant differences between the estimates of the disor-ders were found (p # .0001).
On the other hand, the analysis of gender differences in childrenwith AD showed no significant preponderance of boys with re-spect to girls (m:f ratio ! 1.07:1). Conversely, the gender differ-ence was significant for children with basic numerical deficits (m:fratio ! 2.4:1), (2(1, N ! 132) ! 73.3, p # .00001. However, atthe higher end of efficiency on basic numerical capacities, genderdifferences were not found (m:f ratio ! 1:1). Interestingly, thepreponderance of boys with DD was twice that of those with onlybasic numerical deficits (m:f ratio ! 4:1), (2 (1, N ! 97) ! 103.9,p # .00001.
Effectiveness of MAT and BNB as ScreeningTools of DD
The evaluation of the technical adequacy of MAT and thecapacity tests of BNB as screening tools of DD is crucial withrespect to a criterion measure, or “gold standard” (GS). As waspreviously pointed out, there is agreement that poor fluency oncalculation is a distinguishing feature of arithmetical disorders. Forthis reason, mental arithmetic efficiency was used here as the GS.
Table 3Correlations of Performance on Mental Arithmetic With Efficiency on Dot Enumeration After Controlling for Efficiency onNumerical Magnitude Comparison
Grade
Composite measure Addition Subtraction Multiplication
rp2 t rp
2 t rp2 t rp
2 t
2 .52!! 4.45 .54!! 4.65 .43!! 3.42 na na3 .16 1.75 .19! 1.99 .19! 1.99 .09 0.954 .37!! 4.02 .16 1.6 .14 1.39 .09 0.855 .37!! 5.07 .33!! 4.4 .27!! 3.43 .21!! 2.626 .37!! 4.41 .26!! 2.87 .29!! 3.28 .25!! 2.817 .40!! 5.07 .30!! 2.98 .26!! 2.95 .18! 2.048 .38!! 10.22 .37!! 9.64 .27!! 6.92 .22!! 5.589 .41!! 11.16 .38!! 10.04 .31!! 8.2 .25!! 6.43
Overall .423! 20.684 .40!! 18.73 .34!! 15.68 .25!! 11.04
Note. na ! not assessed. Composite measures represent the efficiency on the mental arithmetic test overall. rp2 values represent the proportion of the
variance in mental calculation accounted for by dot enumeration when controlling for numerical magnitude comparison. t values represent the distance,measured in units of standard errors, between the obtained correlation and the null hypothesis of no correlation. p values represent the probability ofobtaining the observed correlation in a sample of data by random chance when there is truly no relation in the population.! p # .05. !! p # .01.
7NUMERICAL CAPACITIES AND DEVELOPMENTAL DYSCALCULIA
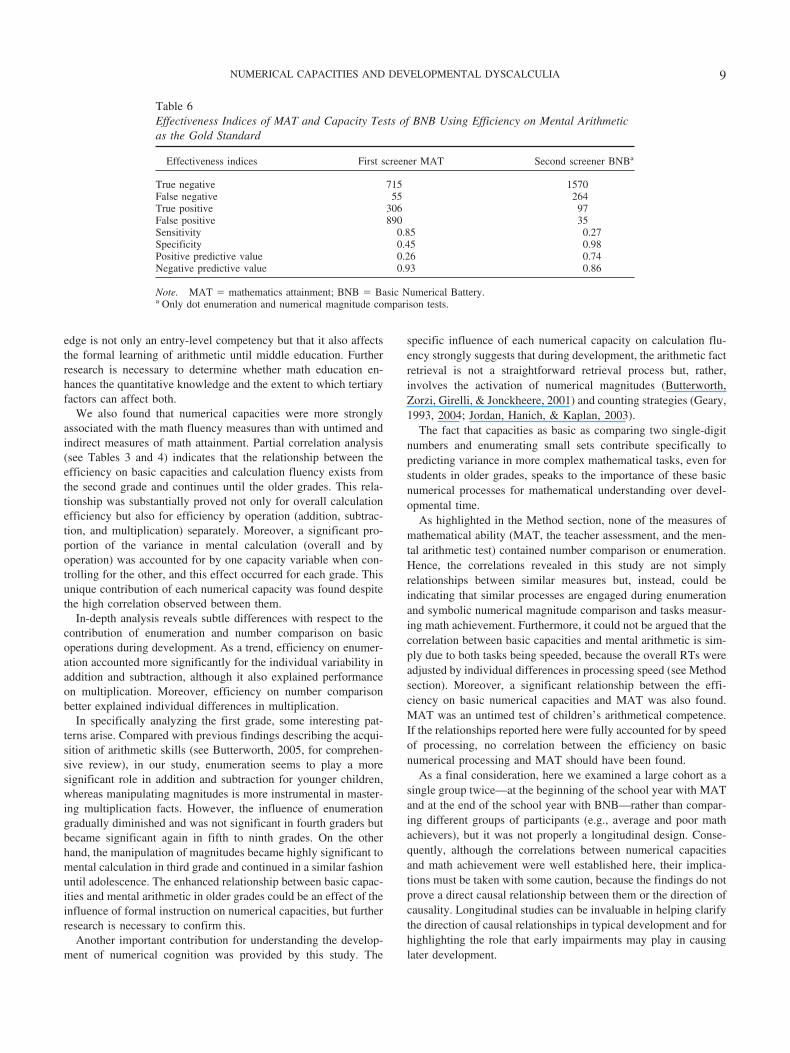
Therefore, presence/absence of AD was considered as criterionmeasure of the effectiveness of the screening. The cutoff for theGS was 2 SD below the mean for EMs on the composite measureof mental arithmetic test (as was defined for AD in the Methodsection). Four indices were taken into account to evaluate theeffectiveness of MAT and capacity tests of BNB: sensitivity,specificity, negative predictive value, and positive predictivevalue. Each index was calculated using values from the outcomematrices of the screening tools respect to the GS. This means thattrue positives (TP), true negatives (TN), false positives (FP), andfalse negatives (FN) must all be taken into account (see Table 6).
Table 6 also summarizes the four indices for MAT and capacitytests of BNB. The first screener, MAT, exhibited high sensitivity(.85) and negative predictive value (.93) but low specificity (.45)and very low positive predictive value (.26). Conversely, thesecond screener showed poor sensitivity (.27) and very high spec-ificity (.98). Consequently, a positive result in BNB was itself fairat confirming DD (predictive positive value was .74), and a neg-ative result was very good at reassuring that a child does not haveDD (negative predicted value was .86).
Discussion
Basic Numerical Capacities and ArithmeticalCompetence
It has been assumed that the manipulation of numerical repre-sentation in basic numerical processing serve as a cognitive pre-cursor for the development of complex mathematical skills (De-haene, 1997; Gallistel & Gelman, 1992; Geary, 1995). To addressthis question, the current study examined whether the efficiency incomparing symbolic numerical magnitudes and in enumeratingsets of dots is related to individual differences in children’s mathachievement (including calculation fluency) and to the teachers’opinions about math ability. Initial analysis revealed that efficien-cies in dot enumeration and number comparison were specific andsignificant predictors of individual differences in math attainmentand teacher judgment. A remarkable finding was that these corenumerical capacities improved with age and contributed signifi-cantly to math attainment across all grades studied (includingadolescence). Contrary to previous consensus, this finding dem-onstrates the plausibility of the hypothesis that quantitative knowl-
Table 4Correlations of Performance on Mental Arithmetic With Efficiency on Numerical Magnitude Comparison After Controlling forEfficiency on Dot Enumeration
Grade
Composite measure Addition Subtraction Multiplication
rp2 t rp
2 t rp2 t rp
2 t
2 .25! 1.92 .29! 2.15 .14 0.98 na na3 .40!! 4.61 .24!! 2.62 .30!! 3.26 .21! 2.164 .59!! 7.41 .41!! 4.45 .44!! 5.00 .46!! 5.075 .29!! 3.81 .29!! 3.75 .22!! 2.85 .24!! 3.076 .40!! 4.79 .24!! 2.62 .30!! 3.39 .19! 2.037 .38!! 4.82 .44!! 5.44 .38!! 4.56 .24!! 2.778 .35!! 9.37 .24!! 6.02 .25!! 6.38 .22!! 5.529 .40!! 10.71 .31!! 8.06 .27!! 6.76 .29!! 7.29
Overall .422! 20.663 .35!! 16.14 .32!! 14.85 .28!! 12.2
Note. na ! not assessed. Composite measures represent the efficiency on the mental arithmetic test overall. rp2 values represent the proportion of the
variance in mental calculation accounted by numerical magnitude comparison when controlling for dot enumeration. t values represent the distance,measured in units of standard errors, between the obtained correlation and the null hypothesis of no correlation. p values represent the probability ofobtaining the observed correlation in a sample of data by random chance when there is truly no relation in the population.! p # .05. !! p # .01.
Table 5Proportions of Children With Arithmetic Dysfluency, Basic Numerical Deficits, and Developmental Dyscalculia Based on Two-StageScreening Assessment
Total population Samplei
AD Numerical deficit DD
N Proportion N Proportion N Proportion
10,210 (a) % 15% in MAT 770 55 (c) .07 31 (e) .04 23 (g) .031,442 (b) ! 15% in MAT 1,196 306 (d) .26 101 (f) .084 74 (h) .062
Note. AD ! arithmetical dysfluency; DD ! developmental dyscalculia; MAT ! mathematics attainment. (a) ! population scoring above the lowest 15%in MAT; (b) ! population scoring in the lowest 15% in MAT. The proportions (c) through (h) were calculated by taking the actual sample tested with theBasic Numerical Battery (BNB). The prevalence of AD was calculated with the formula (a ' c) & (b ' d)/(a & b). The prevalences of the other conditionswere calculated substituting the proportions (c) and (d) with the corresponding (e), (f), (g), and (h), respectively, in the formula.i The actual sample tested with BNB.
8 REIGOSA-CRESPO ET AL.
edge is not only an entry-level competency but that it also affectsthe formal learning of arithmetic until middle education. Furtherresearch is necessary to determine whether math education en-hances the quantitative knowledge and the extent to which tertiaryfactors can affect both.
We also found that numerical capacities were more stronglyassociated with the math fluency measures than with untimed andindirect measures of math attainment. Partial correlation analysis(see Tables 3 and 4) indicates that the relationship between theefficiency on basic capacities and calculation fluency exists fromthe second grade and continues until the older grades. This rela-tionship was substantially proved not only for overall calculationefficiency but also for efficiency by operation (addition, subtrac-tion, and multiplication) separately. Moreover, a significant pro-portion of the variance in mental calculation (overall and byoperation) was accounted for by one capacity variable when con-trolling for the other, and this effect occurred for each grade. Thisunique contribution of each numerical capacity was found despitethe high correlation observed between them.
In-depth analysis reveals subtle differences with respect to thecontribution of enumeration and number comparison on basicoperations during development. As a trend, efficiency on enumer-ation accounted more significantly for the individual variability inaddition and subtraction, although it also explained performanceon multiplication. Moreover, efficiency on number comparisonbetter explained individual differences in multiplication.
In specifically analyzing the first grade, some interesting pat-terns arise. Compared with previous findings describing the acqui-sition of arithmetic skills (see Butterworth, 2005, for comprehen-sive review), in our study, enumeration seems to play a moresignificant role in addition and subtraction for younger children,whereas manipulating magnitudes is more instrumental in master-ing multiplication facts. However, the influence of enumerationgradually diminished and was not significant in fourth graders butbecame significant again in fifth to ninth grades. On the otherhand, the manipulation of magnitudes became highly significant tomental calculation in third grade and continued in a similar fashionuntil adolescence. The enhanced relationship between basic capac-ities and mental arithmetic in older grades could be an effect of theinfluence of formal instruction on numerical capacities, but furtherresearch is necessary to confirm this.
Another important contribution for understanding the develop-ment of numerical cognition was provided by this study. The
specific influence of each numerical capacity on calculation flu-ency strongly suggests that during development, the arithmetic factretrieval is not a straightforward retrieval process but, rather,involves the activation of numerical magnitudes (Butterworth,Zorzi, Girelli, & Jonckheere, 2001) and counting strategies (Geary,1993, 2004; Jordan, Hanich, & Kaplan, 2003).
The fact that capacities as basic as comparing two single-digitnumbers and enumerating small sets contribute specifically topredicting variance in more complex mathematical tasks, even forstudents in older grades, speaks to the importance of these basicnumerical processes for mathematical understanding over devel-opmental time.
As highlighted in the Method section, none of the measures ofmathematical ability (MAT, the teacher assessment, and the men-tal arithmetic test) contained number comparison or enumeration.Hence, the correlations revealed in this study are not simplyrelationships between similar measures but, instead, could beindicating that similar processes are engaged during enumerationand symbolic numerical magnitude comparison and tasks measur-ing math achievement. Furthermore, it could not be argued that thecorrelation between basic capacities and mental arithmetic is sim-ply due to both tasks being speeded, because the overall RTs wereadjusted by individual differences in processing speed (see Methodsection). Moreover, a significant relationship between the effi-ciency on basic numerical capacities and MAT was also found.MAT was an untimed test of children’s arithmetical competence.If the relationships reported here were fully accounted for by speedof processing, no correlation between the efficiency on basicnumerical processing and MAT should have been found.
As a final consideration, here we examined a large cohort as asingle group twice—at the beginning of the school year with MATand at the end of the school year with BNB—rather than compar-ing different groups of participants (e.g., average and poor mathachievers), but it was not properly a longitudinal design. Conse-quently, although the correlations between numerical capacitiesand math achievement were well established here, their implica-tions must be taken with some caution, because the findings do notprove a direct causal relationship between them or the direction ofcausality. Longitudinal studies can be invaluable in helping clarifythe direction of causal relationships in typical development and forhighlighting the role that early impairments may play in causinglater development.
Table 6Effectiveness Indices of MAT and Capacity Tests of BNB Using Efficiency on Mental Arithmeticas the Gold Standard
Effectiveness indices First screener MAT Second screener BNBa
True negative 715 1570False negative 55 264True positive 306 97False positive 890 35Sensitivity 0.85 0.27Specificity 0.45 0.98Positive predictive value 0.26 0.74Negative predictive value 0.93 0.86
Note. MAT ! mathematics attainment; BNB ! Basic Numerical Battery.a Only dot enumeration and numerical magnitude comparison tests.
9NUMERICAL CAPACITIES AND DEVELOPMENTAL DYSCALCULIA
In conclusion, the current results support the existence of arelationship between individual differences in basic numericalprocessing and arithmetical competence over developmental time.This finding is in line with recent reports. Holloway and Ansari(2009) found similar results using the slope of numerical distanceobtained from a number comparison tasks in typically developingchildren, whereas De Smedt et al. (2009), in a longitudinal designfound that the size of the individual’s distance effect, calculated onthe basis of reaction times, was predictively related to mathematicsachievement in first grade children. However, as we have shownhere, using partial correlations, number comparison alone is lesspredictive than enumeration and comparison together. This sug-gests that the two tests index somewhat different, and possiblyoverlapping, capacities. It may be, as both Holloway and Ansari(2009) and Rousselle and Noel (2007) proposed, that one of thesecapacities is the mapping between number concepts and numbersymbols (digits), and the other is the capacity to represent thenumber concepts themselves. In some learners, only one of thesecapacities will be impaired, whereas in others, both capacities areimpaired. This is a subject for future research. In the meanwhile,it would be sensible to use both capacity tests in assessing learners.
Prevalence and Gender Differences in AD,Basic Numerical Deficits, and DD
The present study was based on the research principles forepidemiological studies of learning disabilities indicated by Shalev(2007). As a starting point, DD was precisely defined as a persis-tent and serious math disability due to a core deficit in the “numbermodule,” and accordingly, an operational criterion to classifyingDD was established. Moreover, a sufficiently large and represen-tative population was screened, and the DD children were identi-fied using a two-stage design involving two measurements. Con-sequently, here we reported the first prevalence estimates ofdeficits in basic numerical capacities per se (4.53%) and DDfocused on selective deficits in “number module” (3.4%) in ageneral school-age population.
We also obtained for first time a prevalence estimate of AD.This estimate was at 9.4% in the same school-age population. ADwas occurred three times more frequently than DD in the popula-tion studied. This finding supports the assumption that DD couldbe a subset of a more extended arithmetical disability group. Thatseems plausible because DD, as defined here, is related to a veryselective deficit in basic numerical capacities, whereas AD mayreflect a variety of cognitive disabilities related to inadequatecounting-based and retrieval-based strategies from long-termmemory (Geary, 1993; Jordan et al., 2003; Jordan & Montani,1997) as well as other factors, such as a lack of exposure ofarithmetic facts, a low confidence criterion, or low IQ score (Gearyet al., 2000). Math anxiety or attention disorders could also berelated, but they have not been fully explored.
Note that traditional studies of prevalence of MLD have focusedon tests of mathematical attainment that demand, even for the earlyschool grades, a complex set of skills to deal with curriculumrequirements (e.g., recognizing and understanding numerals, num-ber words, and operation symbols; remembering arithmetical facts,arithmetical procedures, and more generally, the principles andlaws of arithmetic). Moreover, mathematical attainment dependssignificantly of many factors, including quality of teaching, be-
havioral problems, anxiety, and assistance at school. Therefore,attainment tests probably capture a heterogeneous sample of learn-ers who could be bad in math for many different reasons. Theprevalence estimates based on the math attainment measurementrange from 3% to 14% (Mdn ) 6%; Badian, 1983; Barbaresi,Katusic, Colligan, Weaver, & Jacobsen, 2005; Desoete, Roeyers,& De Clercq, 2004; Gross-Tsur, Manor, & Shalev, 1996; Kosc,1974; Lewis, Hitch, & Walker, 1994). The samples of childrenwith MLD identified in these studies are probably more compara-ble to our AD group than to the DD group we define here.
It is interesting that 26% of children with basic numericaldeficits did not perform poorly in arithmetic. One plausible expla-nation is that they have surmounted their inherent disabilities bycompensating for defective capacities in numerical cognition, mostlikely through formal instruction in the first grades (Locuniak &Jordan, 2008). Over time these children may eventually performabove the low average range in arithmetical achievement usinglaborious strategies, and consequently, they may not fully qualifyas having arithmetical disabilities (Mazzocco, 2007).
As far as we know, the present study is the first to examine thegender ratios of AD focused on calculation dysfluency and DD,defined as arithmetical disability associated with basic numericaldeficits. In most of the previous prevalence studies, boys and girlshad similar probabilities of having poor math abilities. However,we found a high preponderance of boys with respect to girls at thelower end of efficiency in the basic numerical capacities. Boyswere two times more likely to suffer this deficit than girls. If thesechildren were also at the lower end of arithmetical fluency, thenboys were four times more likely to exhibit the deficits than girls.
On the other hand, we found no significant differences betweengenders at the higher end of efficiency in enumeration and numbercomparison. This finding is in line with the research and literatureto date that supports the assertion that boys and girls with typicaldevelopment, do not differ greatly in terms of numerical perfor-mance during the elementary or secondary school years (Royer &Walles, 2007).
In summary, findings related to prevalence and gender charac-teristics in DD and AD lead us to conclude that DD involves asubset of a more extended group of arithmetically disabled chil-dren, and consequently, both disorders seems to be distinctive innature. To our knowledge, convincing verifications of these as-sumptions have not been reported before now. These are importantfindings for those responsible for scholastic remediation pro-grammes. If the basic capacities for understanding numerositiesare weak or defective fluency on calculation is present, theseshould form the focus of a training strategy, rather than rotelearning of number bonds and other arithmetical facts (Butterworth& Yeo, 2004: Wilson et al., 2006).
Effectiveness of MAT and BNB as ScreeningTools of DD
The evaluation of the technical adequacy of MAT as screenershowed that it was sensitive (85% of children with AD werecorrectly identified by MAT) but imprecise (only 45% of childrenwithout AD were correctly identified by MAT as being disorder-free). Consequently, the positive predictive value of MAT wasextremely low (.26). That means that 74 of every 100 childrendesignated as being “at risk” will be able, contrary to predictions,
10 REIGOSA-CRESPO ET AL.
to demonstrate adequate calculation fluency in subsequent schoolyears.
On the other hand, the capacity test of BNB exhibited very poorsensitivity (.27). That means that 73% of children with dysfluencyon calculation did not suffer from disorders in basic numericalcapacities. This finding is consistent with theoretical assumptionsand empirical evidence that suggest that DD, as was defined in thisarticle, could be a specific disorder that affects a fraction of theentire population with arithmetical disabilities. Meanwhile, theprecision of the capacity tests of BNB was significantly incre-mented with respect to MAT. Of all the children without calcula-tion dysfluency, 98% had originally scored adequately in thecapacity tests. Accordingly, the positive predictive value dramat-ically varied from .26 for MAT to .74 for the capacity tests.Capacity tests thus increased the chance that those who test pos-itive do indeed have the disorder. Thus, 74% of those childrenconsidered to be at risk as consequence of defective basic numer-ical capacities later performed poorly on mental arithmetic test.Moreover, the negative predictive values were high for the twostages, and consequently, there was a low chance of over-identifying children who will later have poor outcomes. This iscritical, because subsequent actions to serve misidentified individ-uals can result in reduced opportunities for learning or growth,overuse of programming resources, and increased stress amongfamily members or support personnel.
Recently two small-scale studies using basic numerical tools asscreeners of math abilities have been reported (Geary, Bailey, &Hoard, 2009; Locuniak & Jordan, 2008). The Number Sets Testdeveloped by Geary et al. (2009) was assessed for a sample of 223children. This tool correctly identified about nine out of 10 chil-dren (88%) who were not at risk for mathematical disabilities andcorrectly identified two out of three children (66%) diagnosed asmath disabled in third grade, whereas Locuniak and Jordan (2008)found that a number sense screening of 198 kindergarten children,using “at-risk” versus “not-at-risk” criteria, successfully ruled out84% of the children who subsequently exhibited adequate calcu-lation fluency and positively identified 52% of the children wholater showed fluency difficulties. Notice that these screening toolsshowed similar negative predictive values but lower positive pre-dictive values than the capacity tests of BNB.
The acceptable predictive rate of capacity tests of BNB fordetecting the risk of struggling with calculation supports the hy-pothesis that defective numerical capacities are related to delete-rious effects on the subsequent performance on higher level arith-metic tasks (e.g., Ansari & Karmiloff-Smith, 2002; Butterworth,2005; Butterworth & Reigosa-Crespo, 2007). Partial tests of thishypothesis have used numerosity comparison but not enumeration,and accuracy but not time, so a measure of numerosity-processingefficiency could not be calculated (e.g., Halberda, Mazzocco, &Feigenson, 2008; Piazza et al., 2010). Speed of numerical magni-tude comparison alone has been used as predictor (De Smedt et al.,2009; Holloway & Ansari, 2009; Rousselle & Noel, 2007) but notin prevalence studies.
A separate analysis of the technical adequacy of MAT andcapacity test of BNB is insufficient, because these screening toolswere implicated in a two-stage screening design. Consistent withestablished criteria for multistage screening (Glover & Albers,2007), we found that MAT, as the first stage measurement, exhib-ited high sensitivity, which is crucial for ensuring that no children
who are potentially at risk are overlooked, while increasingpositive predictive value for capacity tests of BNB as thesecond stage measurement. Finally, it should be noted that forevaluating the technical adequacy of the mental arithmetic testas a screener for AD, a new GS for this tool (e.g., a standardizedmath achievement test) would need to be defined. This latterissue is beyond the objectives of this study and should beaddressed in further research.
Conclusions
The present study demonstrates a relationship between the basiccapacity to represent and process exact numerosities and the indi-vidual differences in arithmetical competence in a large range ofthe developmental time. In-depth analysis revealed differences inthe contribution of enumeration and numerical magnitude compar-ison on arithmetic throughout development until adolescence, butfurther research focused on longitudinal designs is necessary toconfirm this. These findings support the assertion that deficits inbasic numerical capacities can serve to identify DD, not only atschool entry but also at ages when more sophisticated math skillsare acquired. Our results also support that conclusion that capacitytests of BNB are precise and predictive tools for identifyingchildren with DD. Moreover, the contrastive findings of genderratio data and prevalence for different subgroups strongly suggestthat DD due to deficits in basic number abilities could be adistinctive disorder that involves a fraction of the low arithmeticalachievers. Finally, this study emphasizes the importance of train-ing strategies on low-level numerical processing and the acquisi-tion of symbolic representations of numerical magnitudes. This issignificant not only for the management of atypical developmentof math skills but also for enhancing math learning potential intypically developing children.
References
Ansari, D., & Karmiloff-Smith, A. (2002). Atypical trajectories of numberdevelopment: A neuroconstructivist perspective. Trends in CognitiveSciences, 6, 511–516. doi:10.1016/S1364-6613(02)02040-5
Aunola, K., Leskinen, E., Lerkkanen, M.-K., & Nurmi, J.-E. (2004).Developmental dynamics of mathematical performance from preschoolto Grade 2. Journal of Educational Psychology, 96, 699–713. doi:10.1037/0022-0663.96.4.699
Badian, N. A. (1983). Arithmetic and nonverbal learning. In H. R. Mykle-bust (Ed.), Progress in learning disabilities (Vol. 5, pp. 235–264). NewYork, NY: Grune and Stratton.
Barbaresi, W. J., Katusic, S. K., Colligan, R. C., Weaver, A. L., &Jacobsen, S. J. (2005). Math learning disorder: Incidence in apopulation-based birth cohort, 1976–1982, Rochester, Minn. Ambula-tory Pediatrics, 5, 281–289. doi:10.1367/A04-209R.1
Barnes, M. A., Wilkinson, M., Khemani, E., Boudesquie, A., Dennis, M.,& Fletcher, J. M. (2006). Arithmetic processing in children with spinabifida: Calculation accuracy, strategy use, and fact retrieval fluency.Journal of Learning Disabilities, 39, 174 –187. doi:10.1177/00222194060390020601
Bruandet, M., Molko, N., Cohen, L., & Dehaene, S. (2004). A cognitivecharacterization of dyscalculia in Turner syndrome. Neuropsychologia,42, 288–298. doi:10.1016/j.neuropsychologia.2003.08.007
Butterworth, B. (1999). The mathematical brain. London, England: Mac-millan.
Butterworth, B. (2003). Dyscalculia screener. London, England: NferNel-son.
11NUMERICAL CAPACITIES AND DEVELOPMENTAL DYSCALCULIA
Butterworth, B. (2005). Developmental dyscalculia. In J. I. D. Campbell(Ed.), Handbook of mathematical cognition (pp. 455–467). Hove, Eng-land: Psychology Press.
Butterworth, B. (2010). Foundational numerical capacities and the originsof dyscalculia. Trends in Cognitive Sciences, 14, 534–541. doi:10.1016/j.tics.2010.09.007
Butterworth, B., & Reigosa-Crespo, V. (2007). Information processingdeficits in dyscalculia. In D. B. Berch & M. M. M. Mazzocco (Eds.),Why is math so hard for some children? The nature and origins ofmathematical learning difficulties and disabilities (pp. 65–81). Balti-more, MD: Paul H. Brookes.
Butterworth, B., & Yeo, D. (2004). Dyscalculia guidance. London, Eng-land: NferNelson.
Butterworth, B., Zorzi, M., Girelli, L., & Jonckheere, A. (2001). Storageand retrieval of addition facts: The role of number comparison. TheQuarterly Journal of Experimental Psychology A: Human ExperimentalPsychology, 54A, 1005–1029. doi:10.1080/02724980143000064
Dehaene, S. (1997). The number sense. New York, NY: Oxford UniversityPress.
De Smedt, B., Verschaffel, L., & Ghesquiere, P. (2009). The predictivevalue of numerical magnitude comparison for individual differences inmathematics achievement. Journal of Experimental Child Psychology,103, 469–479. doi:10.1016/j.jecp.2009.01.010
Desoete, A., Roeyers, H., & De Clercq, A. (2004). Children with mathe-matics learning disabilities in Belgium. Journal of Learning Disabilities,37, 50–61. doi:10.1177/00222194040370010601
Gallistel, C. R., & Gelman, R. (1992). Preverbal and verbal counting andcomputation. Cognition, 44, 43–74. doi:10.1016/0010-0277(92)90050-R
Geary, D. C. (1993). Mathematical disabilities: Cognition, neuropsycho-logical and genetic components. Psychological Bulletin, 114, 345–362.doi:10.1037/0033-2909.114.2.345
Geary, D. C. (1995). Reflections of evolution and culture in children’scognition: Implications for mathematical development and instruction.American Psychologist, 50, 24–37. doi:10.1037/0003-066X.50.1.24
Geary, D. C. (2004). Mathematics and learning disabilities. Journal ofLearning Disabilities, 37, 4–15. doi:10.1177/00222194040370010201
Geary, D. C., Bailey, D. H., & Hoard, M. K. (2009). Predicting mathe-matical achievement and mathematical learning disability with a simplescreening tool: The Number Sets Test. Journal of PsychoeducationalAssessment, 27, 265–279. doi:10.1177/0734282908330592
Geary, D. C., Hamsom, C. O., & Hoard, M. K. (2000). Numerical andarithmetical cognition: A longitudinal study of process and conceptdeficits in children with learning disability. Journal of ExperimentalChild Psychology, 77, 236–263. doi:10.1006/jecp.2000.2561
Gelman, R., & Meck, E. (1983). Preschoolers counting: Principles beforeskill. Cognition, 13, 343–359. doi:10.1016/0010-0277(83)90014-8
Gersten, R., Jordan, N. C., & Flojo, J. R. (2005). Early identification and inter-ventions for students with mathematics difficulties. Journal of Learning Dis-abilities, 38, 293–304. doi:10.1177/00222194050380040301
Glover, T. A., & Albers, C. A. (2007). Considerations for evaluatinguniversal screening assessment. Journal of School Psychology, 45, 117–135. doi:10.1016/j.jsp.2006.05.005
Goldman, S. R., & Pellegrino, J. W. (1987). Information processing andeducational microcomputer technology: Where do we go from here?Journal of Learning Disabilities, 20, 144 –154. doi:10.1177/002221948702000302
Gross-Tsur, V., Manor, O., & Shalev, R. S. (1996). Developmental dys-calculia: Prevalence and demographic features. Developmental Medicine& Child Neurology, 38, 25–33. doi:10.1111/j.1469-8749.1996.tb15029.x
Halberda, J., Mazzocco, M. M. M., & Feigenson, L. (2008). Individualdifferences in non-verbal number acuity correlate with maths achieve-ment. Nature, 455, 665–668. doi:10.1038/nature07246
Hasselbring, T. S., Goin, L. I., & Bransford, J. D. (1988). Developing math
automaticity in learning handicapped children: The role of computerizeddrill and practice. Focus on Exceptional Children, 20, 1–7.
Hoge, R. D., & Coladarci, T. (1989). Teacher-based judgments of aca-demic achievement: A review of literature. Review of Educational Re-search, 59, 297–313.
Holloway, I. D., & Ansari, D. (2009). Mapping numerical magnitudes ontosymbols: The numerical distance effect and individual differences inchildren’s mathematics achievement. Journal of Experimental ChildPsychology, 103, 17–29. doi:10.1016/j.jecp.2008.04.001
Jordan, N. C., Hanich, L. B., & Kaplan, D. (2003). A longitudinal study ofmathematical competencies in children with specific mathematics diffi-culties versus children with comorbid mathematics and reading difficul-ties. Child Development, 74, 834–850. doi:10.1111/1467-8624.00571
Jordan, N. C., & Montani, T. (1997). Cognitive arithmetic and problemsolving: A comparison of children with specific and general mathemat-ics difficulties. Journal of Learning Disabilities, 30, 624–634. doi:10.1177/002221949703000606
Koontz, K. L., & Berch, D. B. (1996). Identifying simple numericalstimuli: Processing inefficiencies exhibited by arithmetic learning dis-abled children. Mathematical Cognition, 2, 1–24. doi:10.1080/135467996387525
Kosc, L. (1974). Developmental dyscalculia. Journal of Learning Disabil-ities, 7, 164–177. doi:10.1177/002221947400700309
Landerl, K., Bevan, A., & Butterworth, B. (2004). Developmental dyscal-culia and basic numerical capacities: A study of 8–9 year old students.Cognition, 93, 99–125. doi:10.1016/j.cognition.2003.11.004
Lewis, C., Hitch, G., & Walker, P. (1994). The prevalence of specificarithmetic difficulties and specific reading difficulties in 9- and 10-yearold boys and girls. Journal of Child Psychology and Psychiatry, 35,283–292. doi:10.1111/j.1469-7610.1994.tb01162.x
Locuniak, M., & Jordan, N. (2008). Using kindergarten number sense topredict calculation fluency in second grade. Journal of Learning Dis-abilities, 41, 451–459. doi:10.1177/0022219408321126
Mazzocco, M. M. M. (2007). Defining and differentiating mathematicallearning disabilities and difficulties. In D. B. Berch & M. M. M.Mazzocco (Eds.), Why is math so hard for some children? The natureand origins of mathematical learning difficulties and disabilities (pp.29–47). Baltimore, MD: Paul H Brookes.
Nieder, A. (2005). Counting on neurons: The neurobiology of numericalcompetence. Nature Reviews Neuroscience, 6, 177–190. doi:10.1038/nrn1626
Passolunghi, M. C., Vercelloni, B., & Schadee, H. (2007). The precursorsof mathematics learning: Working memory, phonological ability andnumerical competence. Cognitive Development, 22, 165–184. doi:10.1016/j.cogdev.2006.09.001
Paterson, S. J., Girelli, L., Butterworth, B., & Karmiloff-Smith, A. (2006).Are numerical impairments syndrome specific? Evidence from Williamssyndrome and Down’s syndrome. Journal of Child Psychology andPsychiatry, 47, 190–204. doi:10.1111/j.1469-7610.2005.01460.x
Pedhazur, E. J., & Pedhazur-Schmelkin, L. (1991). Measurement, designand analysis: An integrated approach. Hillsdale, NJ: Erlbaum.
Piazza, M., Facoetti, A., Trussardi, A. N., Berteletti, I., Conte, S., Lucan-geli, D., . . . Zorzi, M. (2010). Developmental trajectories of numberacuity in normal and dyscalculic children. Cognition, 116, 33–41. doi:10.1016/j.cognition.2010.03.012
Rousselle, L., & Noel, M.-P. (2007). Basic numerical skills in children withmathematics learning disabilities: A comparison of symbolic vs. non-symbolic number magnitude processing. Cognition, 102, 361–395. doi:10.1016/j.cognition.2006.01.005
Royer, J. M., & Walles, R. (2007). Influences of gender, ethnicity, andmotivation on mathematical performance. In D. B. Berch & M. M. M.Mazzocco (Eds.), Why is math so hard for some children? The natureand origins of mathematical learning difficulties and disabilities (pp.349–367). Baltimore, MD: Paul H Brookes.
12 REIGOSA-CRESPO ET AL.
Shalev, R. S. (2007). Prevalence of developmental dyscalculia. In D. B.Berch & M. M. M. Mazzocco (Eds.), Why is math so hard for somechildren? The nature and origins of mathematical learning difficultiesand disabilities (pp. 49–60). Baltimore, MD: Paul H Brookes.
Shalev, R. S., Manor, O., & Gross-Tsur, V. (2005). Developmental dys-calculia: A prospective six-year follow up. Developmental Medicine &Child Psychology, 47, 121–125. doi:10.1017/S0012162205000216
Shrout, P. E., Skodol, A. E., & Dohrenwend, P. B. (1986). A two-stageapproach for case identification and diagnosis: First-stage instruments.In J. E. Barret & J. M. Rose (Eds.), Mental disorders in the community(pp. 286–303). New York, NY: Guilford Press.
Simon, T. J., Bearden, C. E., Mc-Ginn, D. M., & Zackai, E. (2005).Visuospatial and numerical cognitive deficits in children with chromo-some 22q11.2 deletion syndrome. Cortex, 41, 145–155. doi:10.1016/S0010-9452(08)70889-X
Spelke, E., & Kinzler, K. (2007). Core knowledge. Developmental Science,10, 89–96. doi:10.1111/j.1467-7687.2007.00569.x
Torbeyns, J., Verschaffel, L., & Ghesquiere, P. (2004). Strategic aspects ofsimple addition and subtraction: The influence of mathematical ability.Learning and Instruction, 14, 177–195. doi:10.1016/j.learninstruc.2004.01.003
Ulrich, R., & Miller, J. (1994). Effects of outlier exclusion on reaction timeanalysis. Journal of Experimental Psychology: General, 123, 34–80.doi:10.1037/0096-3445.123.1.34
Wilson, A. J., Dehaene, S., Pinel, P., Revkin, S. K., Cohen, L., & Cohen,D. (2006). Principles underlying the design of “The Number Race,” anadaptive computer game for remediation of dyscalculia. Behavioral andBrain Functions, 2, 19. doi:10.1186/1744-9081-2-19
Wynn, K. (1992). Addition and subtraction by human infants. Nature, 358,749–750. doi:10.1038/358749a0
Received June 11, 2010Revision received June 6, 2011
Accepted June 9, 2011 "
13NUMERICAL CAPACITIES AND DEVELOPMENTAL DYSCALCULIA


