Embed Size (px)
Citation preview
Int. J. Accounting and Finance, Vol. 1, No. 4, 2009 415
Copyright © 2009 Inderscience Enterprises Ltd.
Banking concentration and the price-concentration relationship: the case of Brazil
Benjamin Miranda Tabak* Central Bank of Brazil
and Universidade Catolica de Brasília, Brazil Banco Central do Brasil Ed. Sede 13 Andar, DEPEP Brasilia, DF, 70074–900, Brazil Fax: +55 61 3414–1169 E-mail: [email protected] E-mail: [email protected] *Corresponding author
Solange Maria Guerra Central Bank of Brazil, Brazil E-mail: [email protected]
Rodrigo Andrés de Souza Peñaloza Center of Research in Economics and Finance (CIEF) University of Brasília, Brazil E-mail: [email protected]
Abstract: In this paper, we present a new measure of concentration that employs duality theory and a study on the evolution of banking concentration in the Brazilian banking system. We present evidence suggesting that this new measure of concentration is more informative than the usual Hirschman-Herfindahl Index (HHI), which is commonly employed in concentration studies. Finally, we study the relation between the banking structure (level of concentration) and price using a panel data model, macroeconomic and risk variables being controlled. There is no evidence that banking concentration leads to uncompetitive practices.
Keywords: banking concentration; Hirschman-Herfindahl Index; HHI; duality theory.
Reference to this paper should be made as follows: Tabak, B.M., Guerra, S.M. and de Souza Peñaloza, R.A. (2009) ‘Banking concentration and the price-concentration relationship: the case of Brazil’, Int. J. Accounting and Finance, Vol. 1, No. 4, pp.415–435.
Biographical notes: Benjamin M. Tabak has a PhD in Economics and is currently a Professor of Finance at Universidade Catolica de Brasília, Brazil and an Advisor at the Central Bank of Brazil. He has published several papers on banking and financial stability.
416 B.M. Tabak, S.M. Guerra and R.A. de Souza Peñaloza
Solange Maria Guerra is currently enrolled at the graduate programme of Economics at Universidade de Brasília, Brazil. She works at the Research Department of the Central Bank of Brazil. She has published several papers on finance and financial stability.
Rodrigo Andrés de Souza Peñaloza has a PhD in Economics and is currently a Professor of Economics at the University of Brasilia, Brazil. He has published several papers on mathematical economics and economic theory.
1 Introduction
In recent decades, the banking industry has undergone countless transformations generated by new technologies, new financial instruments and changes in banking regulations, among other factors. During this process, several tendencies have clearly consolidated the banking systems of developed countries and emerging nations. In most countries, banking consolidation through mergers and acquisitions is a common practice. For example, in the USA, the number of banking institutions plunged from 18 711 in 1980 to 10 070 in 1999.1
One of the possible effects of this process of mergers and acquisitions is to increase banking concentration and, consequently, diminish competition. Changes in banking structures and competition may, on the one hand, produce more fragile banking systems and, on the other, result in greater market power for those banking institutions with higher spreads.2
An important question in banking literature is, How does this process affect the price-banking concentration relationship? If, on the one hand, increases in concentration may lead to gains in terms of financial stability, on the other, such increases could lead banks with significant market participation to increase their market share and adopt abusive (anticompetitive) prices, with evident adverse impacts on society as a whole.
Gelos and Roldós (2004) analysed the evolution of the market structure in the banking industry for emerging markets during the second half of the 1990s. They found that the reduction in the number of banks did not systematically result in an increase in concentration. While in Asia and Central Europe, this reduction was associated with a decline in concentration, in Latin America a reduction in the number of players resulted in higher concentration. They concluded that the process of consolidation in the banking systems of these emerging markets was not translated into a decline in competitive pressures. This was probably due to the fact that this process was in progress in some countries that were analysed. However, one could not conclude that the potential for increases in market power was absent.
Martinez-Peria and Mody (2004) studied the relationship between levels of concentration and bank spreads for some Latin American countries in the late 1990s. The results suggested that a higher degree of concentration raises spreads and is also associated with higher administrative costs. When controlling for bank-specific factors, Demirguç-Kunt et al. (2004) found evidence that concentration is positively related to bank interest margins. However, these results were not robust when controlling for regulatory restrictions and macroeconomic stability.
Banking concentration and the price-concentration relationship 417
Few studies exist with regard to the degree of banking sector competitiveness in Brazil. Rocha (2001) evaluated the evolution of banking concentration in Brazil from 1994 to 2000. The author utilised the Hirschman-Herfindahl Index (HHI) and showed that there was a general trend towards increased concentration in that period despite a high degree of data variability.
The problem with HHI is that it is compatible with different market structures. The present article seeks to introduce a new methodology to measure banking concentration that may be used to evaluate the evolution of concentration in time and to compare different countries. It analyses the evolution of the banking concentration indexes in the recent past in Brazil which may be used to study the relation between the banking structure and other important variables, such as financial stability. Moreover, using a panel data model, the price-concentration relation is studied, where the concentration is measured with the index proposed in this work.3
The goal of this article is to evaluate whether the market participation can help to explain the higher interest rates found in the Brazilian banking market as well as whether a higher degree of concentration is associated with a greater market power. The main focus of this paper is to test the relationship between bank concentration and interest rates for a variety of credit lines in the Brazilian banking industry. This is important for several reasons. First, it is not clear from the literature what this relationship should be. Second, there is a large variation in the interest rates of different credit lines, which suggests that there may be a market structure–price relationship. Third, these results have important implications to financial regulations. The recent wave of consolidation and concentration in the banking industry can have adverse effects on prices. A deeper understanding of these effects is useful to help understand the potential impacts of these recent trends.
Section 2 discusses the methodology proposed for calculating banking concentration. This methodology is an improvement of the HHI. Section 3 presents a panel data model that will be used to test the price-concentration relation for the Brazilian banking industry. Section 4 describes the data used in this study and presents some descriptive statistics. Section 5 presents the results of banking concentration in the Brazilian economy from 2001 to 2004. Section 6 discusses the empirical results of the panel data model. Finally, Section 7 gives the conclusions of this article.
2 The Hirschman-Herfindahl Index (HHI) and its dual
The HHI is a measuring tool frequently used to evaluate banking industry concentration. Gelos and Roldós (2004) utilised it to examine the evolution of the banking structure in emerging countries, including Brazil. Nissan (2004) evaluated the degree of banking concentration in developed and developing countries through the use of HHI, indicating a higher level of banking industry concentration in the developing countries than in the developed countries. Valverde et al. (2003) used this index to compare the effects on banking competition in Spain generated by mergers and the release of branches from certain restrictions.
418 B.M. Tabak, S.M. Guerra and R.A. de Souza Peñaloza
In Brazil, Rocha (2001) evaluated the evolution of banking concentration from 1994 to 2000 by analysing the HHI of the following series: total assets, total deposits, credit operations and adjusted net worth. In 2000, the HHI values of each item of the series were 0.0812, 0.1023, 0.0974 and 0.0736, respectively for banking groups. The author concluded that these values ‘are not high when compared to international standards’.
The HHI is obtained by the sum of squared shares of all banks in the market, according to the formula:
2
1
,n
i
i
xHHI
x=
⎛ ⎞= ⎜ ⎟⎝ ⎠
∑
where xi represents the absolute participation of bank i and 1
n
ii
x x .=
= ∑
By raising the participation of each bank to the square, greater weight is given to the large banks, reflecting the fact that the larger the institution, the larger will be its market power.
The HHI varies from 1/n, when there is equal participation in the banking industry,4 to its maximum value of 1, when a monopoly exists. Therefore, its minimum tends toward zero if the number of banks n is large.
Since no measurement manages to reflect all of the complexity of the behaviour of these institutions, it is only natural that, in some cases, it will not perceive what is truly happening in the market. Despite being used very frequently, the HHI analysis does not always make it clear in some situations whether there is a banking concentration, or whether banking concentration is moderate or accentuated.
Besides, the HHI can lead to erroneous conclusions when the market is composed of a reasonable number of institutions, with a small number of banks holding a significant share of the market (though less than 50%) and the vast majority of banks individually have only very small market shares.
In order to illustrate the two situations above, let us take a glance at two examples. In the first example, we will consider a market with ten banks, with the following proportionate market shares: 21%, 16%, 17%, 18%, 6%, 5%, 3%, 4%, 6% and 4%. In this case, the concentration index of this market is HHI1 equal to 0.1448. If the number of institutions were larger, we would certainly consider this a market with moderate concentration. However, when the number of banks is small, it becomes more difficult to reach this conclusion since HHI is relatively close to the minimum value of HHI, which is 0.1.
Though the next example may seem to be an anomaly, one should recall that it is possible to construct more realistic examples with these same characteristics. We opted for this example since it is quite easy to explain.
Let us presume a market with 200 institutions, where one institution accounts for 20.4% of the market and the others have equally proportionate participation of 0.4%. If we were to analyse the concentration of this market using the HHI, we would conclude that it is not a concentrated market, since its concentration index (HHI2) is equal to 0.0448.
The dual of HHI (d), which will be explained further on, provides a clearer and more objective measurement of banking concentration. Based on the analysis of the two examples above, we conclude that the market in the first example is equivalent, from the point of view of the HHI, to one that is concentrated in the hands of 70% of the banks,
Banking concentration and the price-concentration relationship 419
while the other 30% would not have market shares. In the second example, the dual analysis indicates that 11% of the institutions hold the entire market. These numbers reflect reality more effectively, principally in the second case. According to the HHI, the market is not concentrated (0,0448), but the dual indicates that this structure is concentrated. The majority of authors suggest that values below 0.10 for the HHI would represent a diversified structure, which does not necessarily correspond to the truth, as exemplified above. See Souza and Peñaloza (2005) for the different applications of the dual to concentration indices.5
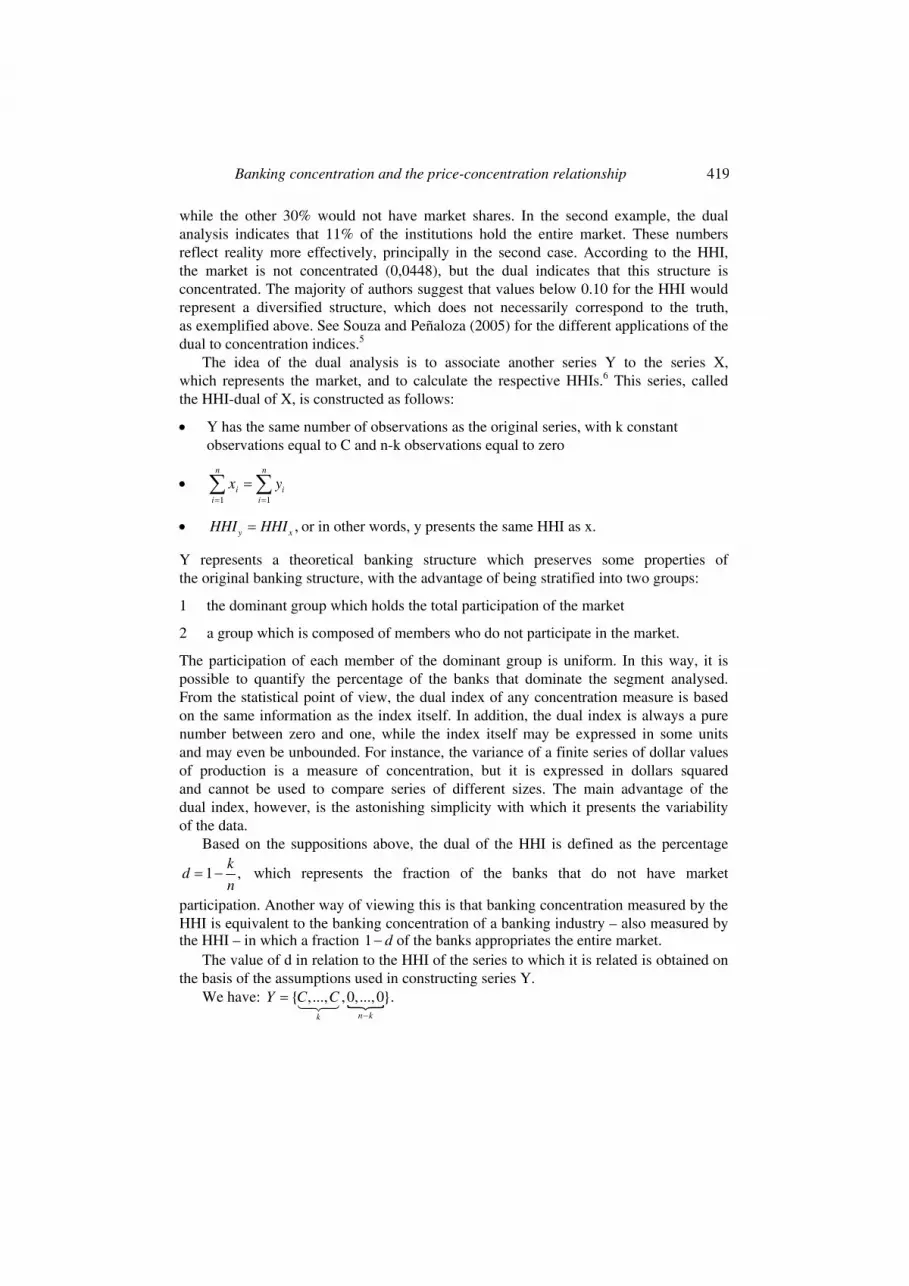
The idea of the dual analysis is to associate another series Y to the series X, which represents the market, and to calculate the respective HHIs.6 This series, called the HHI-dual of X, is constructed as follows:
• Y has the same number of observations as the original series, with k constant observations equal to C and n-k observations equal to zero
• 1 1
n n
i ii i
x y= =
=∑ ∑
• ,y xHHI HHI= or in other words, y presents the same HHI as x.
Y represents a theoretical banking structure which preserves some properties of the original banking structure, with the advantage of being stratified into two groups:
1 the dominant group which holds the total participation of the market
2 a group which is composed of members who do not participate in the market.
The participation of each member of the dominant group is uniform. In this way, it is possible to quantify the percentage of the banks that dominate the segment analysed. From the statistical point of view, the dual index of any concentration measure is based on the same information as the index itself. In addition, the dual index is always a pure number between zero and one, while the index itself may be expressed in some units and may even be unbounded. For instance, the variance of a finite series of dollar values of production is a measure of concentration, but it is expressed in dollars squared and cannot be used to compare series of different sizes. The main advantage of the dual index, however, is the astonishing simplicity with which it presents the variability of the data.
Based on the suppositions above, the dual of the HHI is defined as the percentage
1 ,k
dn
= − which represents the fraction of the banks that do not have market
participation. Another way of viewing this is that banking concentration measured by the HHI is equivalent to the banking concentration of a banking industry – also measured by the HHI – in which a fraction 1 d− of the banks appropriates the entire market.
The value of d in relation to the HHI of the series to which it is related is obtained on the basis of the assumptions used in constructing series Y.
We have: { ,..., ,0,...,0}.n kk
Y C C−
=
420 B.M. Tabak, S.M. Guerra and R.A. de Souza Peñaloza
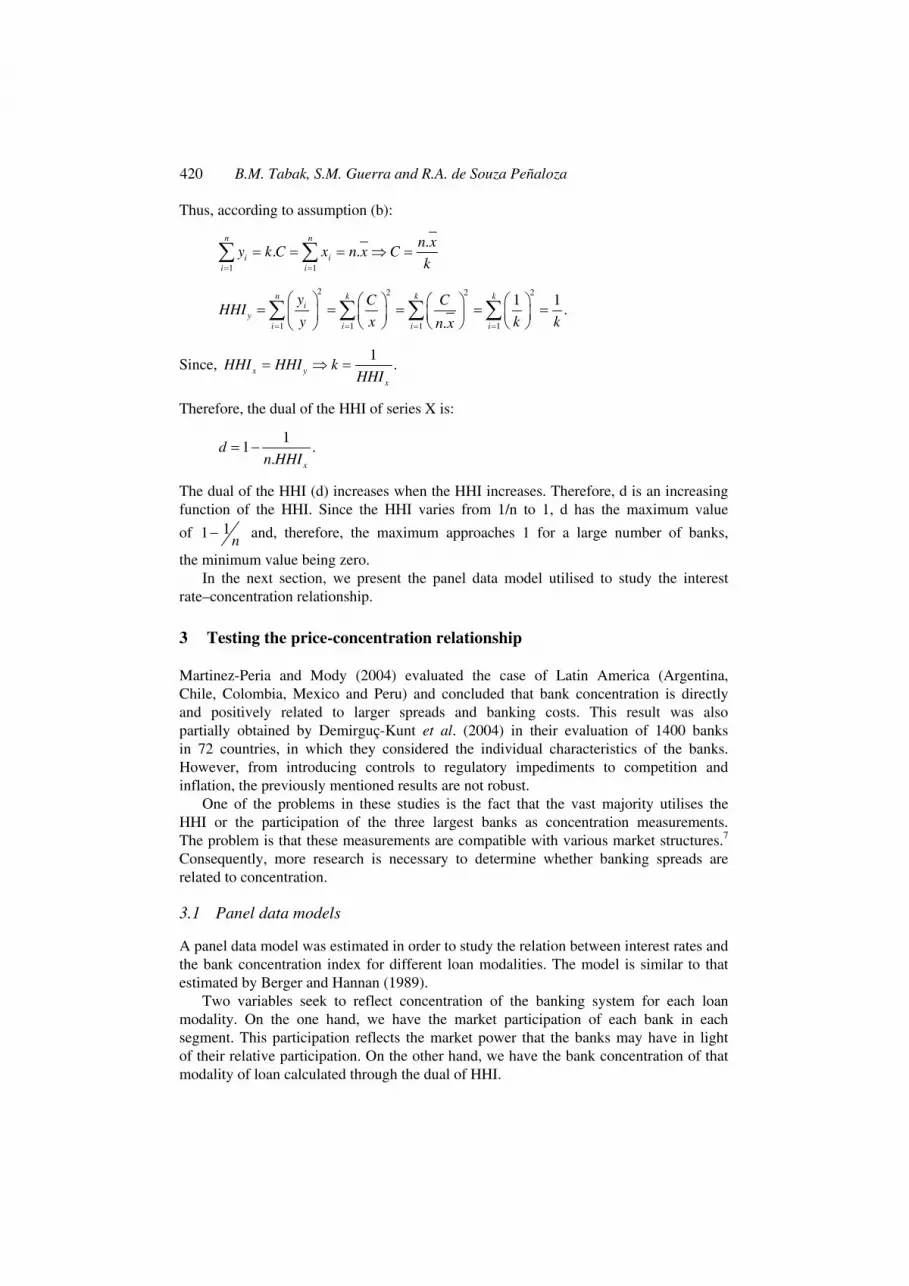
Thus, according to assumption (b):
1 1
.. .
n n
i ii i
n xy k C x n x C
k= =
= = = ⇒ =∑ ∑
2 2 2 2
1 1 1 1
1 1.
.
n k k ki
yi i i i
y C CHHI
y x k kn x= = = =
⎛ ⎞ ⎛ ⎞ ⎛ ⎞ ⎛ ⎞= = = = =⎜ ⎟ ⎜ ⎟ ⎜ ⎟ ⎜ ⎟⎝ ⎠ ⎝ ⎠ ⎝ ⎠⎝ ⎠
∑ ∑ ∑ ∑
Since, 1
.x yx
HHI HHI kHHI
= ⇒ =
Therefore, the dual of the HHI of series X is:
11 .
. x
dn HHI
= −
The dual of the HHI (d) increases when the HHI increases. Therefore, d is an increasing function of the HHI. Since the HHI varies from 1/n to 1, d has the maximum value
of 11 n− and, therefore, the maximum approaches 1 for a large number of banks,
the minimum value being zero. In the next section, we present the panel data model utilised to study the interest
rate–concentration relationship.
3 Testing the price-concentration relationship
Martinez-Peria and Mody (2004) evaluated the case of Latin America (Argentina, Chile, Colombia, Mexico and Peru) and concluded that bank concentration is directly and positively related to larger spreads and banking costs. This result was also partially obtained by Demirguç-Kunt et al. (2004) in their evaluation of 1400 banks in 72 countries, in which they considered the individual characteristics of the banks. However, from introducing controls to regulatory impediments to competition and inflation, the previously mentioned results are not robust.
One of the problems in these studies is the fact that the vast majority utilises the HHI or the participation of the three largest banks as concentration measurements. The problem is that these measurements are compatible with various market structures.7 Consequently, more research is necessary to determine whether banking spreads are related to concentration.
3.1 Panel data models
A panel data model was estimated in order to study the relation between interest rates and the bank concentration index for different loan modalities. The model is similar to that estimated by Berger and Hannan (1989).
Two variables seek to reflect concentration of the banking system for each loan modality. On the one hand, we have the market participation of each bank in each segment. This participation reflects the market power that the banks may have in light of their relative participation. On the other hand, we have the bank concentration of that modality of loan calculated through the dual of HHI.
Banking concentration and the price-concentration relationship 421
Evans et al. (1993) argued that the interest rates practised in certain markets can affect decisions as to entering and leaving such a market and, consequently, the very structure of the market. In this way, it would be necessary to control for a possible endogenous nature of the concentration and participation variables. To do this, the participation and concentration variables enter with a lag in one period in the regressions.
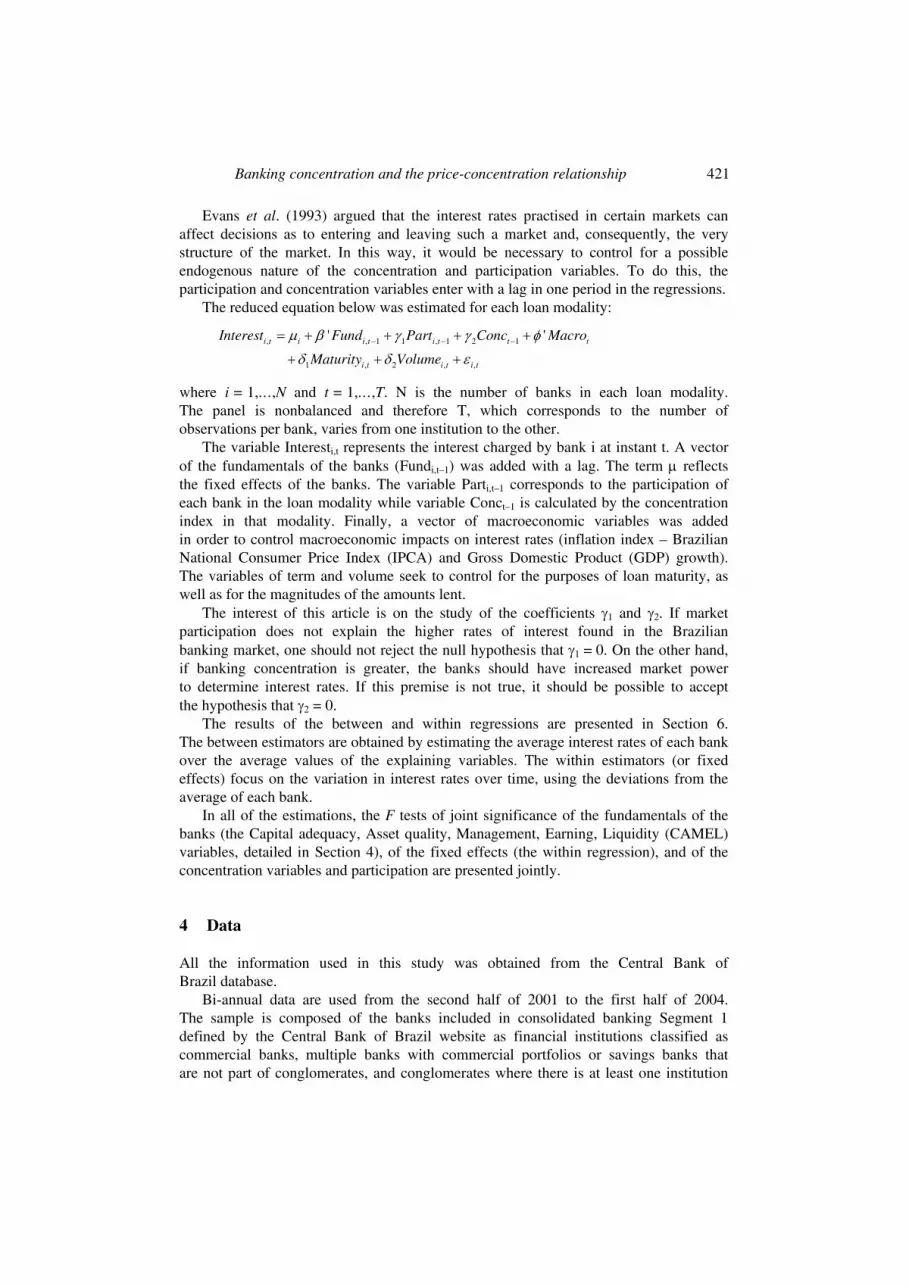
The reduced equation below was estimated for each loan modality:
, , 1 1 , 1 2 1
1 , 2 , ,
' '
i t i i t i t t t
i t i t i t
Interest Fund Part Conc Macro
Maturity Volume
µ β γ γ φ
δ δ ε− − −= + + + +
+ + +
where i = 1,…,N and t = 1,…,T. N is the number of banks in each loan modality. The panel is nonbalanced and therefore T, which corresponds to the number of observations per bank, varies from one institution to the other.
The variable Interesti,t represents the interest charged by bank i at instant t. A vector of the fundamentals of the banks (Fundi,t–1) was added with a lag. The term µ reflects the fixed effects of the banks. The variable Parti,t–1 corresponds to the participation of each bank in the loan modality while variable Conct–1 is calculated by the concentration index in that modality. Finally, a vector of macroeconomic variables was added in order to control macroeconomic impacts on interest rates (inflation index – Brazilian National Consumer Price Index (IPCA) and Gross Domestic Product (GDP) growth). The variables of term and volume seek to control for the purposes of loan maturity, as well as for the magnitudes of the amounts lent.
The interest of this article is on the study of the coefficients γ1 and γ2. If market participation does not explain the higher rates of interest found in the Brazilian banking market, one should not reject the null hypothesis that γ1 = 0. On the other hand, if banking concentration is greater, the banks should have increased market power to determine interest rates. If this premise is not true, it should be possible to accept the hypothesis that γ2 = 0.
The results of the between and within regressions are presented in Section 6. The between estimators are obtained by estimating the average interest rates of each bank over the average values of the explaining variables. The within estimators (or fixed effects) focus on the variation in interest rates over time, using the deviations from the average of each bank.
In all of the estimations, the F tests of joint significance of the fundamentals of the banks (the Capital adequacy, Asset quality, Management, Earning, Liquidity (CAMEL) variables, detailed in Section 4), of the fixed effects (the within regression), and of the concentration variables and participation are presented jointly.
4 Data
All the information used in this study was obtained from the Central Bank of Brazil database.
Bi-annual data are used from the second half of 2001 to the first half of 2004. The sample is composed of the banks included in consolidated banking Segment 1 defined by the Central Bank of Brazil website as financial institutions classified as commercial banks, multiple banks with commercial portfolios or savings banks that are not part of conglomerates, and conglomerates where there is at least one institution
422 B.M. Tabak, S.M. Guerra and R.A. de Souza Peñaloza
classified as a commercial bank or multiple banks with a commercial portfolio. Therefore, all data used in this work refer to banking conglomerates. In the first half of 2004, this sample represented 86.8% of the assets of the Brazilian banking system.
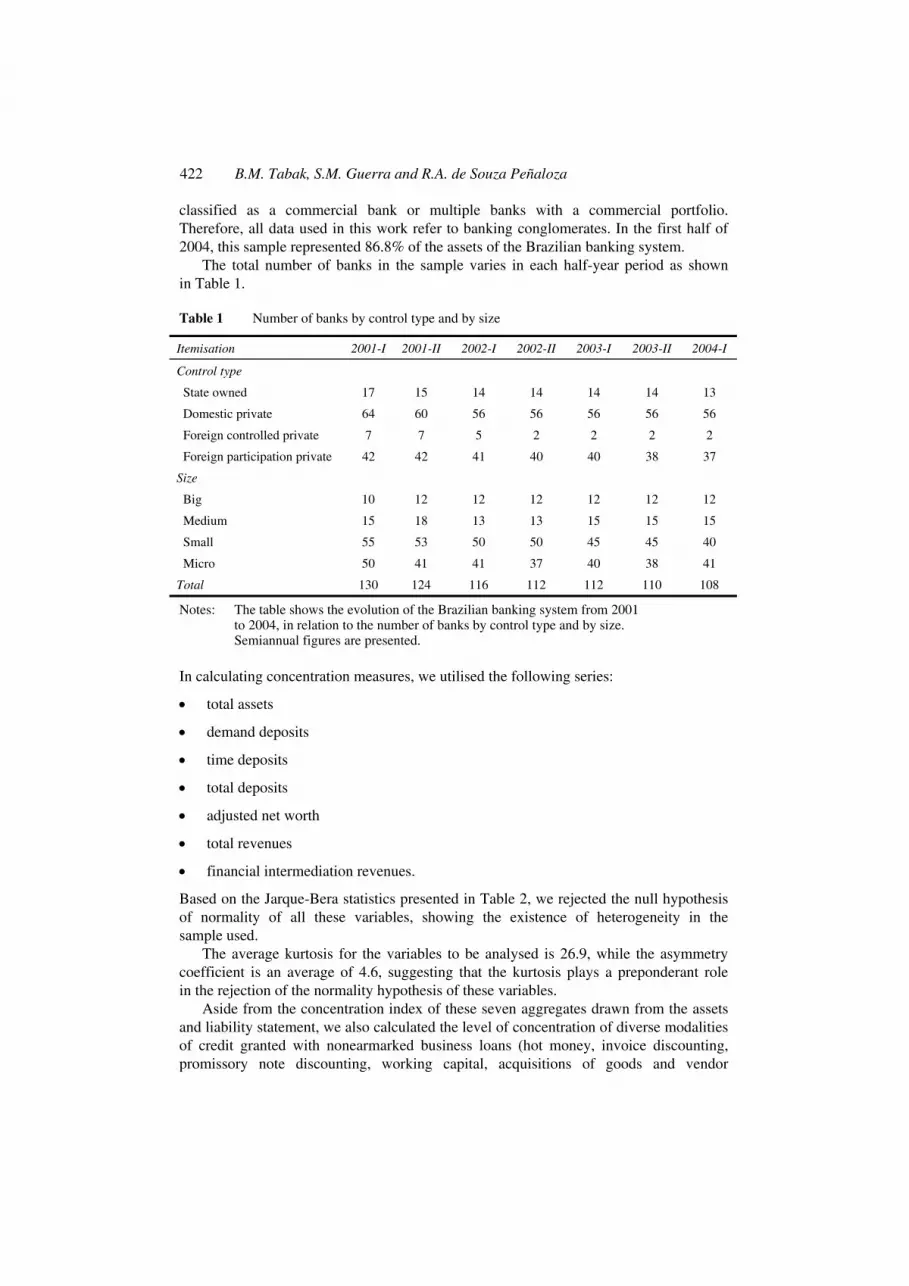
The total number of banks in the sample varies in each half-year period as shown in Table 1.
Table 1 Number of banks by control type and by size
Itemisation 2001-I 2001-II 2002-I 2002-II 2003-I 2003-II 2004-I
Control type
State owned 17 15 14 14 14 14 13
Domestic private 64 60 56 56 56 56 56
Foreign controlled private 7 7 5 2 2 2 2
Foreign participation private 42 42 41 40 40 38 37
Size
Big 10 12 12 12 12 12 12
Medium 15 18 13 13 15 15 15
Small 55 53 50 50 45 45 40
Micro 50 41 41 37 40 38 41
Total 130 124 116 112 112 110 108
Notes: The table shows the evolution of the Brazilian banking system from 2001 to 2004, in relation to the number of banks by control type and by size. Semiannual figures are presented.
In calculating concentration measures, we utilised the following series:
• total assets
• demand deposits
• time deposits
• total deposits
• adjusted net worth
• total revenues
• financial intermediation revenues.
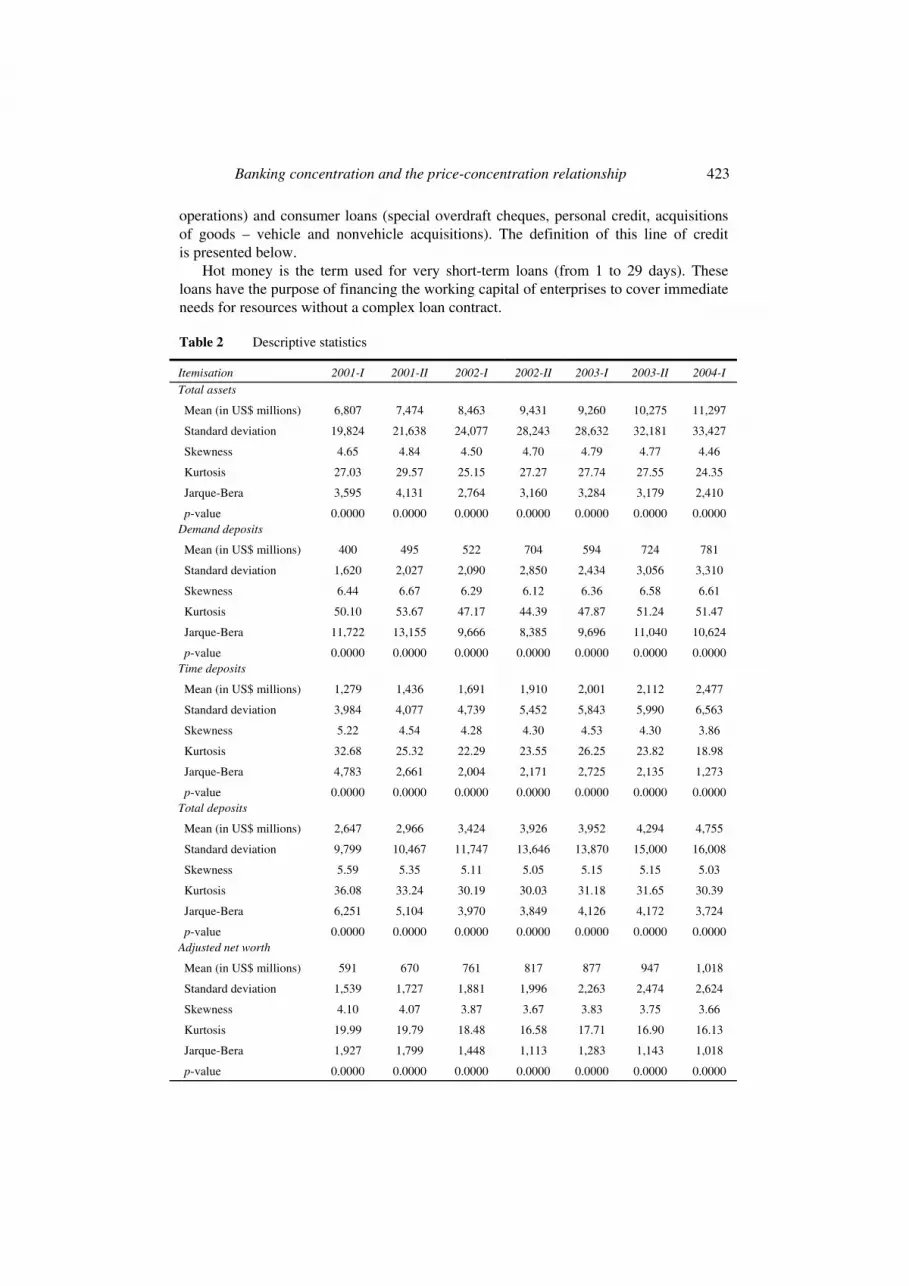
Based on the Jarque-Bera statistics presented in Table 2, we rejected the null hypothesis of normality of all these variables, showing the existence of heterogeneity in the sample used.
The average kurtosis for the variables to be analysed is 26.9, while the asymmetry coefficient is an average of 4.6, suggesting that the kurtosis plays a preponderant role in the rejection of the normality hypothesis of these variables.
Aside from the concentration index of these seven aggregates drawn from the assets and liability statement, we also calculated the level of concentration of diverse modalities of credit granted with nonearmarked business loans (hot money, invoice discounting, promissory note discounting, working capital, acquisitions of goods and vendor
Banking concentration and the price-concentration relationship 423
operations) and consumer loans (special overdraft cheques, personal credit, acquisitions of goods – vehicle and nonvehicle acquisitions). The definition of this line of credit is presented below.
Hot money is the term used for very short-term loans (from 1 to 29 days). These loans have the purpose of financing the working capital of enterprises to cover immediate needs for resources without a complex loan contract.
Table 2 Descriptive statistics
Itemisation 2001-I 2001-II 2002-I 2002-II 2003-I 2003-II 2004-I
Total assets
Mean (in US$ millions) 6,807 7,474 8,463 9,431 9,260 10,275 11,297
Standard deviation 19,824 21,638 24,077 28,243 28,632 32,181 33,427
Skewness 4.65 4.84 4.50 4.70 4.79 4.77 4.46
Kurtosis 27.03 29.57 25.15 27.27 27.74 27.55 24.35
Jarque-Bera 3,595 4,131 2,764 3,160 3,284 3,179 2,410
p-value 0.0000 0.0000 0.0000 0.0000 0.0000 0.0000 0.0000 Demand deposits
Mean (in US$ millions) 400 495 522 704 594 724 781
Standard deviation 1,620 2,027 2,090 2,850 2,434 3,056 3,310
Skewness 6.44 6.67 6.29 6.12 6.36 6.58 6.61
Kurtosis 50.10 53.67 47.17 44.39 47.87 51.24 51.47
Jarque-Bera 11,722 13,155 9,666 8,385 9,696 11,040 10,624
p-value 0.0000 0.0000 0.0000 0.0000 0.0000 0.0000 0.0000 Time deposits
Mean (in US$ millions) 1,279 1,436 1,691 1,910 2,001 2,112 2,477
Standard deviation 3,984 4,077 4,739 5,452 5,843 5,990 6,563
Skewness 5.22 4.54 4.28 4.30 4.53 4.30 3.86
Kurtosis 32.68 25.32 22.29 23.55 26.25 23.82 18.98
Jarque-Bera 4,783 2,661 2,004 2,171 2,725 2,135 1,273
p-value 0.0000 0.0000 0.0000 0.0000 0.0000 0.0000 0.0000 Total deposits
Mean (in US$ millions) 2,647 2,966 3,424 3,926 3,952 4,294 4,755
Standard deviation 9,799 10,467 11,747 13,646 13,870 15,000 16,008
Skewness 5.59 5.35 5.11 5.05 5.15 5.15 5.03
Kurtosis 36.08 33.24 30.19 30.03 31.18 31.65 30.39
Jarque-Bera 6,251 5,104 3,970 3,849 4,126 4,172 3,724
p-value 0.0000 0.0000 0.0000 0.0000 0.0000 0.0000 0.0000 Adjusted net worth
Mean (in US$ millions) 591 670 761 817 877 947 1,018
Standard deviation 1,539 1,727 1,881 1,996 2,263 2,474 2,624
Skewness 4.10 4.07 3.87 3.67 3.83 3.75 3.66
Kurtosis 19.99 19.79 18.48 16.58 17.71 16.90 16.13
Jarque-Bera 1,927 1,799 1,448 1,113 1,283 1,143 1,018
p-value 0.0000 0.0000 0.0000 0.0000 0.0000 0.0000 0.0000
424 B.M. Tabak, S.M. Guerra and R.A. de Souza Peñaloza
Table 2 Descriptive statistics (continued)
Itemisation 2001-I 2001-II 2002-I 2002-II 2003-I 2003-II 2004-I
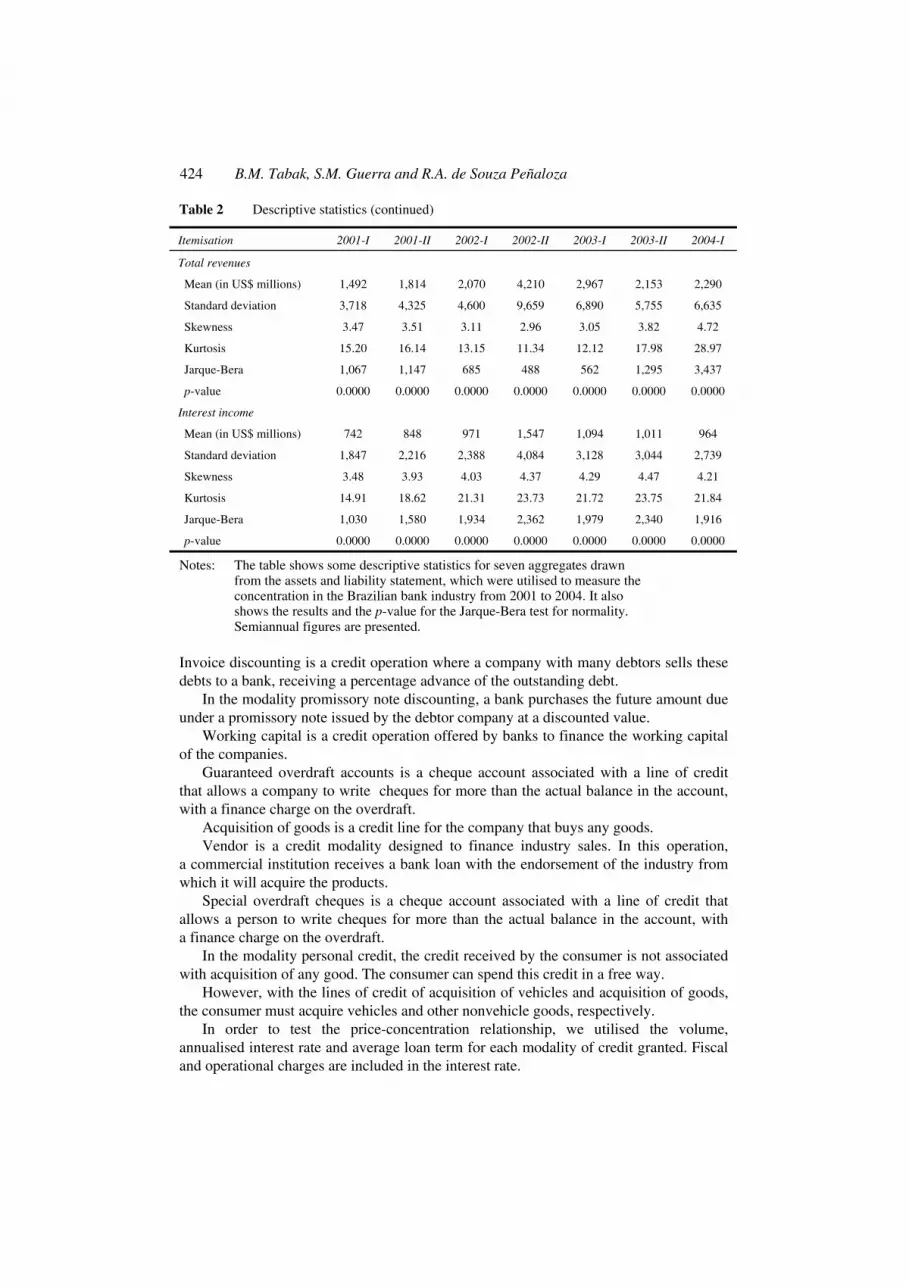
Total revenues
Mean (in US$ millions) 1,492 1,814 2,070 4,210 2,967 2,153 2,290
Standard deviation 3,718 4,325 4,600 9,659 6,890 5,755 6,635
Skewness 3.47 3.51 3.11 2.96 3.05 3.82 4.72
Kurtosis 15.20 16.14 13.15 11.34 12.12 17.98 28.97
Jarque-Bera 1,067 1,147 685 488 562 1,295 3,437
p-value 0.0000 0.0000 0.0000 0.0000 0.0000 0.0000 0.0000
Interest income
Mean (in US$ millions) 742 848 971 1,547 1,094 1,011 964
Standard deviation 1,847 2,216 2,388 4,084 3,128 3,044 2,739
Skewness 3.48 3.93 4.03 4.37 4.29 4.47 4.21
Kurtosis 14.91 18.62 21.31 23.73 21.72 23.75 21.84
Jarque-Bera 1,030 1,580 1,934 2,362 1,979 2,340 1,916
p-value 0.0000 0.0000 0.0000 0.0000 0.0000 0.0000 0.0000
Notes: The table shows some descriptive statistics for seven aggregates drawn from the assets and liability statement, which were utilised to measure the concentration in the Brazilian bank industry from 2001 to 2004. It also shows the results and the p-value for the Jarque-Bera test for normality. Semiannual figures are presented.
Invoice discounting is a credit operation where a company with many debtors sells these debts to a bank, receiving a percentage advance of the outstanding debt.
In the modality promissory note discounting, a bank purchases the future amount due under a promissory note issued by the debtor company at a discounted value.
Working capital is a credit operation offered by banks to finance the working capital of the companies.
Guaranteed overdraft accounts is a cheque account associated with a line of credit that allows a company to write cheques for more than the actual balance in the account, with a finance charge on the overdraft.
Acquisition of goods is a credit line for the company that buys any goods. Vendor is a credit modality designed to finance industry sales. In this operation,
a commercial institution receives a bank loan with the endorsement of the industry from which it will acquire the products.
Special overdraft cheques is a cheque account associated with a line of credit that allows a person to write cheques for more than the actual balance in the account, with a finance charge on the overdraft.
In the modality personal credit, the credit received by the consumer is not associated with acquisition of any good. The consumer can spend this credit in a free way.
However, with the lines of credit of acquisition of vehicles and acquisition of goods, the consumer must acquire vehicles and other nonvehicle goods, respectively.
In order to test the price-concentration relationship, we utilised the volume, annualised interest rate and average loan term for each modality of credit granted. Fiscal and operational charges are included in the interest rate.
Banking concentration and the price-concentration relationship 425
These variables are available individually for each institution and not for conglomerates. The volume for conglomerates was obtained by aggregating the individual volumes of their respective institutions. The half-year interest rate and average term for each credit modality were obtained for each conglomerate through the use of the average weighted by the volume of credits granted by each institution included in the conglomerate.
Before estimating the price-concentration relation, one must control this relation in line with the individual characteristics of the banks. The risk variables were chosen as those used in the CAMEL bank rating system. The acronym CAMEL is based on five elements used to measure the characteristics of a financial institution:
1 Capital adequacy
2 Asset quality
3 Management
4 Earnings
5 Liquidity.
In measuring capital adequacy, we used the Basel index calculated by the Central Bank of Brazil based on the definition given by the Basel committee.
Using this index, Banco Central evaluates whether an institution has sufficient equity to cover the risks to which it is exposed. Currently, in the case of banks, legislation applicable to the Brazilian financial system determines a minimum ratio of 11% between Base Capital (PR) and the Required Net Worth Limit (PLE).8 If the Basel index is greater than 11%, then PR>PLE. Therefore, the institution is in compliance with regulatory capital requirements. Should the opposite occur, the institution is noncompliant.
In measuring asset quality, we used the ratio between credits granted in default and total credits. We took the sum total of credits granted and classified into risk levels G (credits with payments past due between 151 and 180 days) and H (credits with payments past due more than 180 days) as credits granted in default. This ratio measures the percentage of loans that a bank may have to record as losses.
Bank efficiency is measured by the management variable, defined in this paper as the ratio between nonfinancial outlays and total assets. However, cases may exist where the offering of better services results in greater outlays.
In order to measure profitability, we took the ratio of Returns over Assets (ROA), utilising net profits as the measuring tool for returns.
Liquidity is measured according to the ratio between net assets and total assets. Net assets are obtained on the basis of the sum total of available resources, interbank investments and financial instruments – securities and derivatives, as included in the accounting information of the 50 largest banks in the Central Bank of Brazil website.
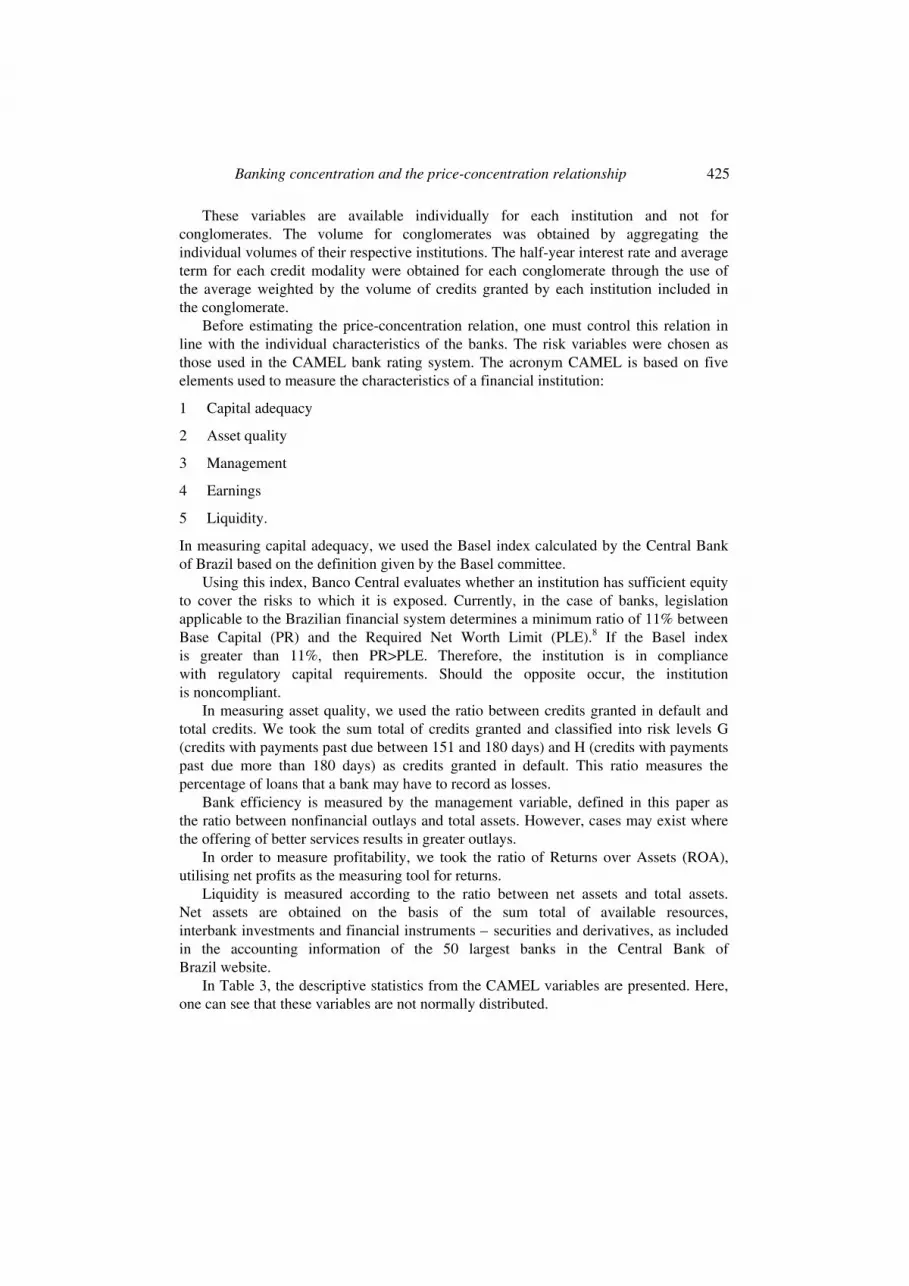
In Table 3, the descriptive statistics from the CAMEL variables are presented. Here, one can see that these variables are not normally distributed.
426 B.M. Tabak, S.M. Guerra and R.A. de Souza Peñaloza
Table 3 Descriptive statistics for CAMEL variables
Itemisation 2001-I 2001-II 2002-I 2002-II 2003-I 2003-II 2004-I
Capital adequacy
Mean 0.2870 0.2873 0.2656 0.2748 0.3268 0.4141 0.4073
Standard deviation 0.2189 0.2450 0.2356 0.2111 0.4435 0.9399 0.9152
Skewness 2.5732 3.3323 3.7992 3.0260 5.8439 8.3364 6.9122
Kurtosis 12.8950 17.4085 21.0633 14.3305 43.5830 76.9241 53.6896
Jarque-Bera 596 1,176 1,712 715 7,729 24,407 10,812
p-value 0.0000 0.0000 0.0000 0.0000 0.0000 0.0000 0.0000
Asset quality
Mean 0.0448 0.0450 0.0459 0.0450 0.0464 0.0461 0.0467
Standard deviation 0.0788 0.0793 0.0812 0.0820 0.0893 0.0902 0.0938
Skewness 5.0862 5.0488 4.9258 5.0074 5.5154 5.4753 5.3020
Kurtosis 35.4098 34.9640 33.3027 33.6787 39.7335 39.0430 36.3839
Jarque-Bera 4,712 4,541 3,892 3,819 5,394 5,085 4,039
p-value 0.0000 0.0000 0.0000 0.0000 0.0000 0.0000 0.0000
Management
Mean –0.1551 –0.2515 –0.2379 –0.4677 –0.3725 –0.1893 –0.1346
Standard deviation 0.1768 0.4233 0.4767 0.7956 0.7114 0.2291 0.1740
Skewness –2.9637 –6.0654 –6.9595 –3.1661 –4.5354 –3.6759 –5.1212
Kurtosis 12.7629 49.4798 60.1630 13.6215 28.7972 20.7516 37.3302
Jarque-Bera 625 10,768 15,432 663 3,240 1,569 5,027
p-value 0.0000 0.0000 0.0000 0.0000 0.0000 0.0000 0.0000
Earnings
Mean 0.0083 0.0064 0.0128 0.0110 0.0015 0.0037 0.0024
Standard deviation 0.0371 0.0309 0.0214 0.0584 0.0349 0.0588 0.0804
Skewness –6.1939 –5.2301 0.2225 –5.5786 –3.1565 –7.1516 –8.1702
Kurtosis 55.3067 41.0000 10.4829 51.1782 16.4842 61.9589 75.1158
Jarque-Bera 13,845 7,249 251 10,598 961 15,643 21,415
p-value 0.0000 0.0000 0.0000 0.0000 0.0000 0.0000 0.0000
Liquidity
Mean 0.4258 0.4461 0.4438 0.4657 0.4634 0.4900 0.4630
Standard deviation 0.2184 0.2133 0.2115 0.2261 0.2244 0.2373 0.2316
Skewness 0.3496 0.3069 0.2350 0.2969 0.2620 0.1156 0.1107
Kurtosis 2.3957 2.2847 2.3507 2.2517 2.2526 2.1964 2.2015
Jarque-Bera 4 4 3 4 4 3 3
p-value 0.1292 0.1258 0.2388 0.1384 0.1644 0.2263 0.2606
Notes: The table shows some descriptive statistics for the CAMEL variables for Brazilian banks, which were utilised to control the price-concentration relation for the bank risk characteristics. It also shows the results and the p-value for the Jarque-Bera test for normality. Semiannual figures are presented from 2001 to 2004.
Banking concentration and the price-concentration relationship 427
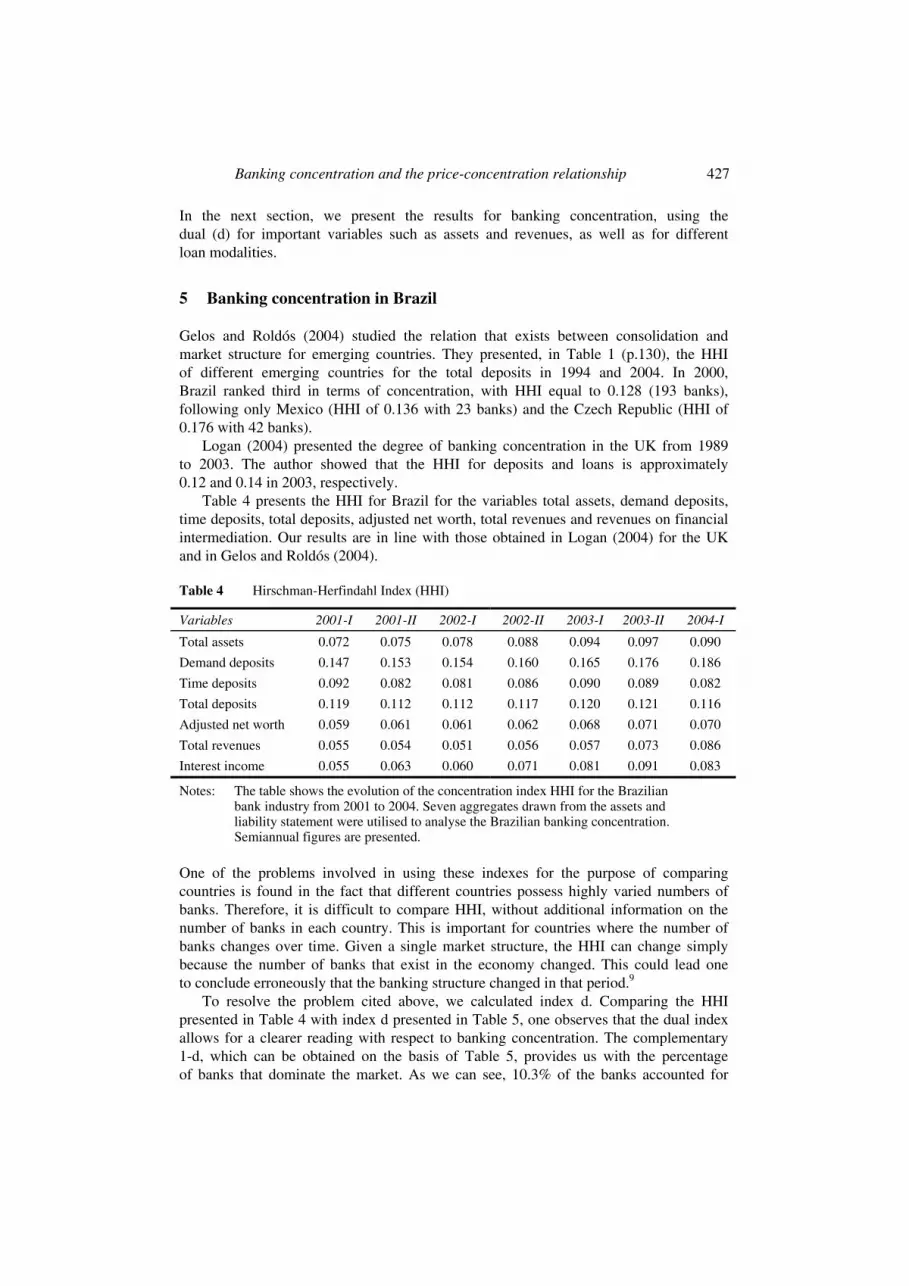
In the next section, we present the results for banking concentration, using the dual (d) for important variables such as assets and revenues, as well as for different loan modalities.
5 Banking concentration in Brazil
Gelos and Roldós (2004) studied the relation that exists between consolidation and market structure for emerging countries. They presented, in Table 1 (p.130), the HHI of different emerging countries for the total deposits in 1994 and 2004. In 2000, Brazil ranked third in terms of concentration, with HHI equal to 0.128 (193 banks), following only Mexico (HHI of 0.136 with 23 banks) and the Czech Republic (HHI of 0.176 with 42 banks).
Logan (2004) presented the degree of banking concentration in the UK from 1989 to 2003. The author showed that the HHI for deposits and loans is approximately 0.12 and 0.14 in 2003, respectively.
Table 4 presents the HHI for Brazil for the variables total assets, demand deposits, time deposits, total deposits, adjusted net worth, total revenues and revenues on financial intermediation. Our results are in line with those obtained in Logan (2004) for the UK and in Gelos and Roldós (2004).
Table 4 Hirschman-Herfindahl Index (HHI)
Variables 2001-I 2001-II 2002-I 2002-II 2003-I 2003-II 2004-I
Total assets 0.072 0.075 0.078 0.088 0.094 0.097 0.090
Demand deposits 0.147 0.153 0.154 0.160 0.165 0.176 0.186
Time deposits 0.092 0.082 0.081 0.086 0.090 0.089 0.082
Total deposits 0.119 0.112 0.112 0.117 0.120 0.121 0.116
Adjusted net worth 0.059 0.061 0.061 0.062 0.068 0.071 0.070
Total revenues 0.055 0.054 0.051 0.056 0.057 0.073 0.086
Interest income 0.055 0.063 0.060 0.071 0.081 0.091 0.083
Notes: The table shows the evolution of the concentration index HHI for the Brazilian bank industry from 2001 to 2004. Seven aggregates drawn from the assets and liability statement were utilised to analyse the Brazilian banking concentration. Semiannual figures are presented.
One of the problems involved in using these indexes for the purpose of comparing countries is found in the fact that different countries possess highly varied numbers of banks. Therefore, it is difficult to compare HHI, without additional information on the number of banks in each country. This is important for countries where the number of banks changes over time. Given a single market structure, the HHI can change simply because the number of banks that exist in the economy changed. This could lead one to conclude erroneously that the banking structure changed in that period.9
To resolve the problem cited above, we calculated index d. Comparing the HHI presented in Table 4 with index d presented in Table 5, one observes that the dual index allows for a clearer reading with respect to banking concentration. The complementary 1-d, which can be obtained on the basis of Table 5, provides us with the percentage of banks that dominate the market. As we can see, 10.3% of the banks accounted for
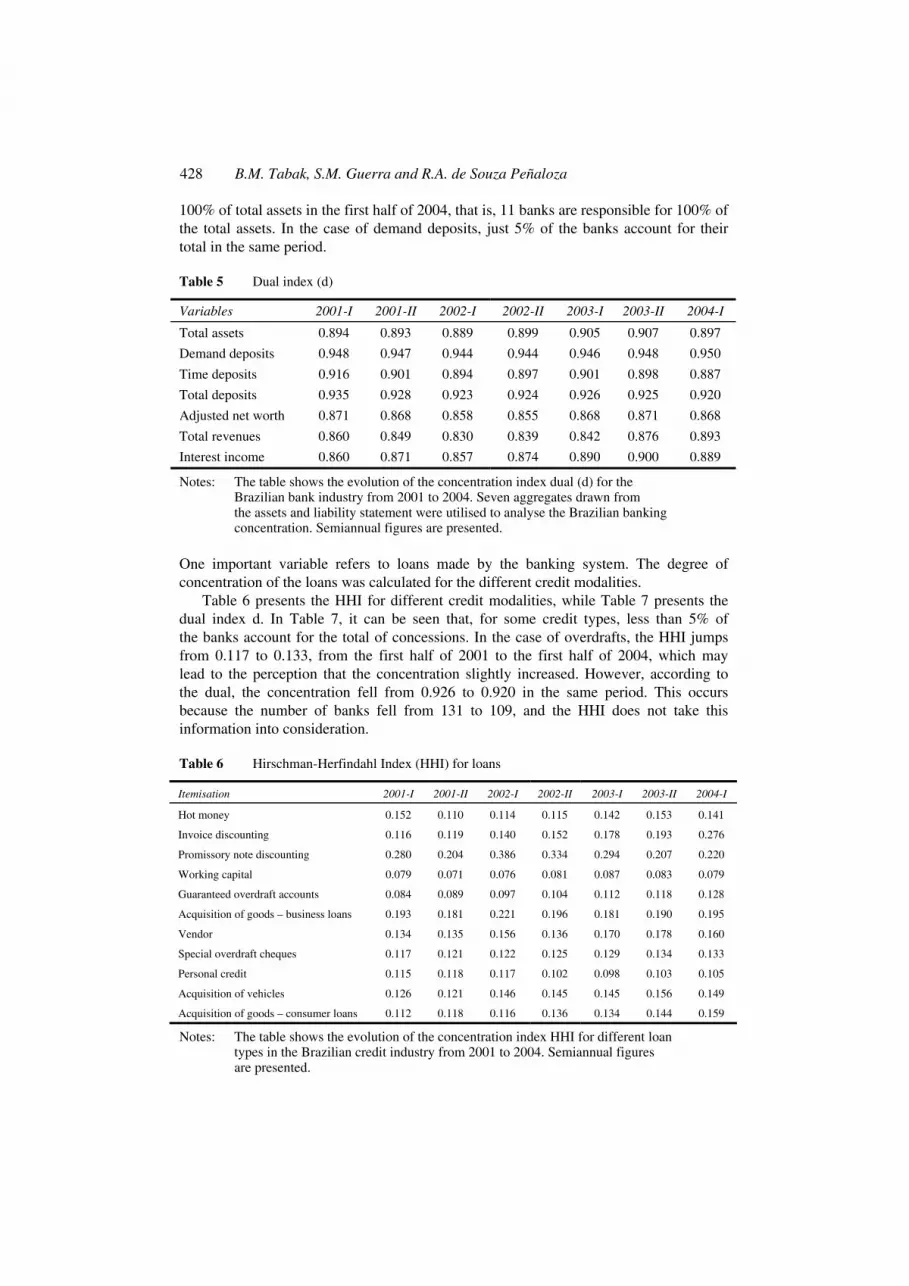
428 B.M. Tabak, S.M. Guerra and R.A. de Souza Peñaloza
100% of total assets in the first half of 2004, that is, 11 banks are responsible for 100% of the total assets. In the case of demand deposits, just 5% of the banks account for their total in the same period.
Table 5 Dual index (d)
Variables 2001-I 2001-II 2002-I 2002-II 2003-I 2003-II 2004-I
Total assets 0.894 0.893 0.889 0.899 0.905 0.907 0.897
Demand deposits 0.948 0.947 0.944 0.944 0.946 0.948 0.950
Time deposits 0.916 0.901 0.894 0.897 0.901 0.898 0.887
Total deposits 0.935 0.928 0.923 0.924 0.926 0.925 0.920
Adjusted net worth 0.871 0.868 0.858 0.855 0.868 0.871 0.868
Total revenues 0.860 0.849 0.830 0.839 0.842 0.876 0.893
Interest income 0.860 0.871 0.857 0.874 0.890 0.900 0.889
Notes: The table shows the evolution of the concentration index dual (d) for the Brazilian bank industry from 2001 to 2004. Seven aggregates drawn from the assets and liability statement were utilised to analyse the Brazilian banking concentration. Semiannual figures are presented.
One important variable refers to loans made by the banking system. The degree of concentration of the loans was calculated for the different credit modalities.
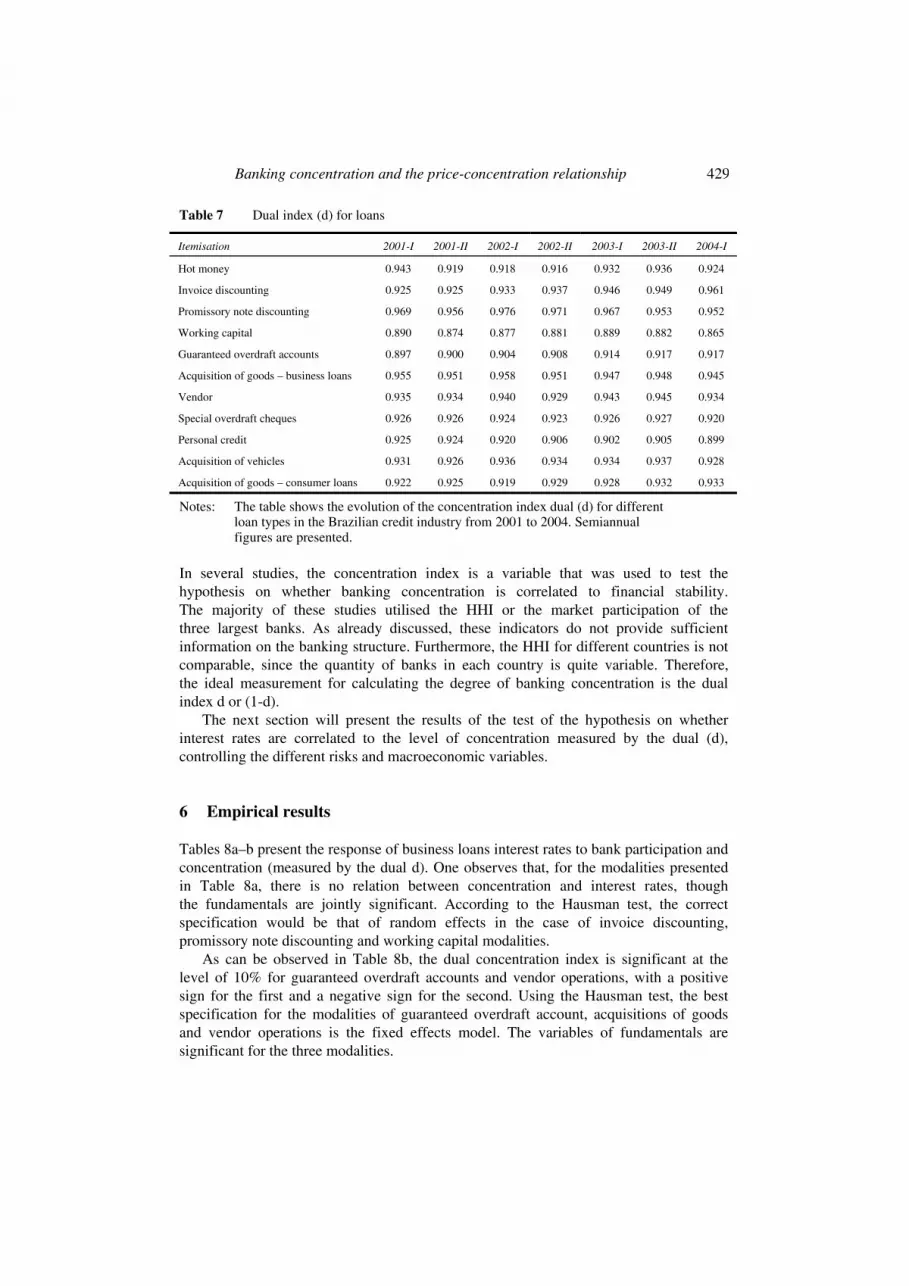
Table 6 presents the HHI for different credit modalities, while Table 7 presents the dual index d. In Table 7, it can be seen that, for some credit types, less than 5% of the banks account for the total of concessions. In the case of overdrafts, the HHI jumps from 0.117 to 0.133, from the first half of 2001 to the first half of 2004, which may lead to the perception that the concentration slightly increased. However, according to the dual, the concentration fell from 0.926 to 0.920 in the same period. This occurs because the number of banks fell from 131 to 109, and the HHI does not take this information into consideration.
Table 6 Hirschman-Herfindahl Index (HHI) for loans
Itemisation 2001-I 2001-II 2002-I 2002-II 2003-I 2003-II 2004-I
Hot money 0.152 0.110 0.114 0.115 0.142 0.153 0.141
Invoice discounting 0.116 0.119 0.140 0.152 0.178 0.193 0.276
Promissory note discounting 0.280 0.204 0.386 0.334 0.294 0.207 0.220
Working capital 0.079 0.071 0.076 0.081 0.087 0.083 0.079
Guaranteed overdraft accounts 0.084 0.089 0.097 0.104 0.112 0.118 0.128
Acquisition of goods – business loans 0.193 0.181 0.221 0.196 0.181 0.190 0.195
Vendor 0.134 0.135 0.156 0.136 0.170 0.178 0.160
Special overdraft cheques 0.117 0.121 0.122 0.125 0.129 0.134 0.133
Personal credit 0.115 0.118 0.117 0.102 0.098 0.103 0.105
Acquisition of vehicles 0.126 0.121 0.146 0.145 0.145 0.156 0.149
Acquisition of goods – consumer loans 0.112 0.118 0.116 0.136 0.134 0.144 0.159
Notes: The table shows the evolution of the concentration index HHI for different loan types in the Brazilian credit industry from 2001 to 2004. Semiannual figures are presented.
Banking concentration and the price-concentration relationship 429
Table 7 Dual index (d) for loans
Itemisation 2001-I 2001-II 2002-I 2002-II 2003-I 2003-II 2004-I
Hot money 0.943 0.919 0.918 0.916 0.932 0.936 0.924
Invoice discounting 0.925 0.925 0.933 0.937 0.946 0.949 0.961
Promissory note discounting 0.969 0.956 0.976 0.971 0.967 0.953 0.952
Working capital 0.890 0.874 0.877 0.881 0.889 0.882 0.865
Guaranteed overdraft accounts 0.897 0.900 0.904 0.908 0.914 0.917 0.917
Acquisition of goods – business loans 0.955 0.951 0.958 0.951 0.947 0.948 0.945
Vendor 0.935 0.934 0.940 0.929 0.943 0.945 0.934
Special overdraft cheques 0.926 0.926 0.924 0.923 0.926 0.927 0.920
Personal credit 0.925 0.924 0.920 0.906 0.902 0.905 0.899
Acquisition of vehicles 0.931 0.926 0.936 0.934 0.934 0.937 0.928
Acquisition of goods – consumer loans 0.922 0.925 0.919 0.929 0.928 0.932 0.933
Notes: The table shows the evolution of the concentration index dual (d) for different loan types in the Brazilian credit industry from 2001 to 2004. Semiannual figures are presented.
In several studies, the concentration index is a variable that was used to test the hypothesis on whether banking concentration is correlated to financial stability. The majority of these studies utilised the HHI or the market participation of the three largest banks. As already discussed, these indicators do not provide sufficient information on the banking structure. Furthermore, the HHI for different countries is not comparable, since the quantity of banks in each country is quite variable. Therefore, the ideal measurement for calculating the degree of banking concentration is the dual index d or (1-d).
The next section will present the results of the test of the hypothesis on whether interest rates are correlated to the level of concentration measured by the dual (d), controlling the different risks and macroeconomic variables.
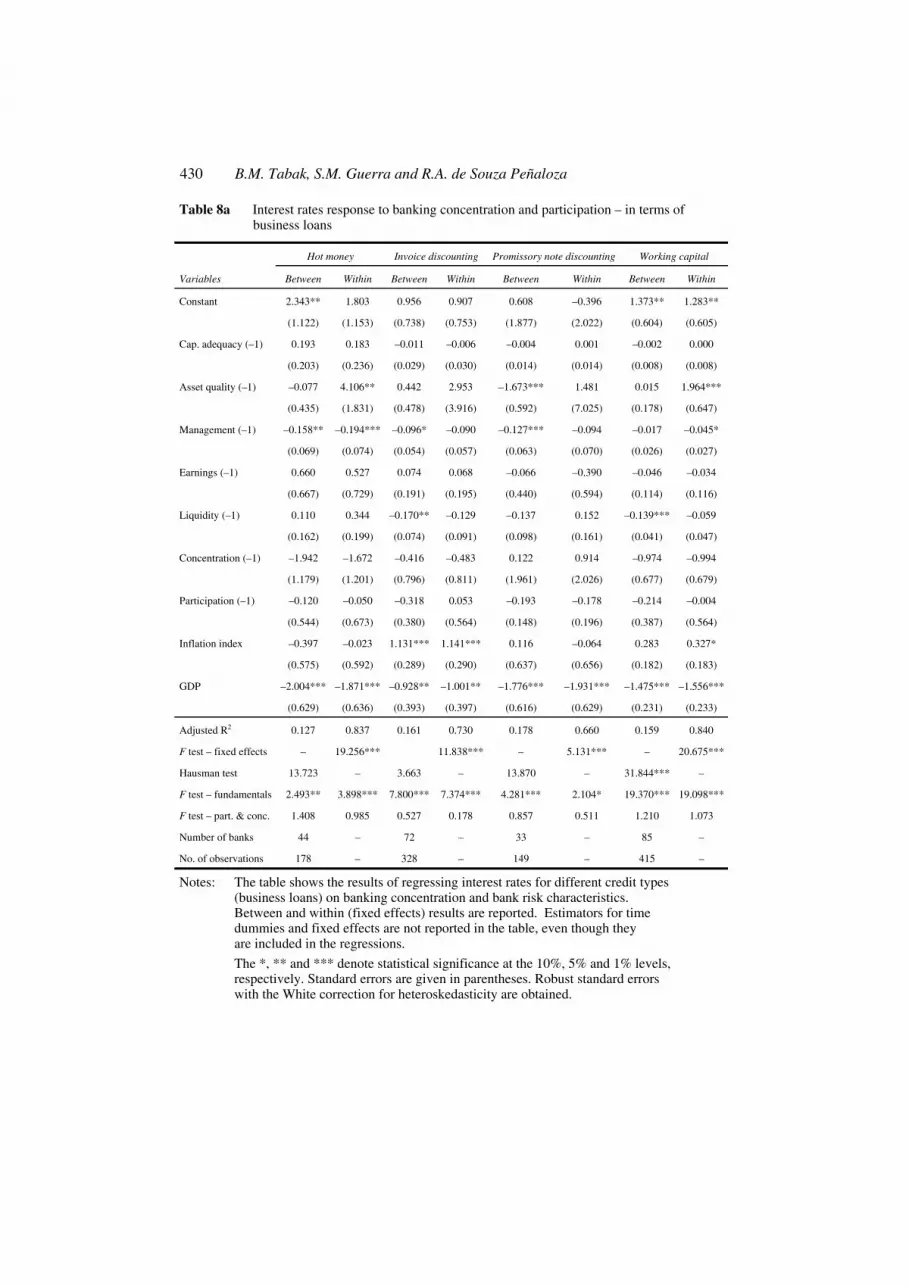
6 Empirical results
Tables 8a–b present the response of business loans interest rates to bank participation and concentration (measured by the dual d). One observes that, for the modalities presented in Table 8a, there is no relation between concentration and interest rates, though the fundamentals are jointly significant. According to the Hausman test, the correct specification would be that of random effects in the case of invoice discounting, promissory note discounting and working capital modalities.
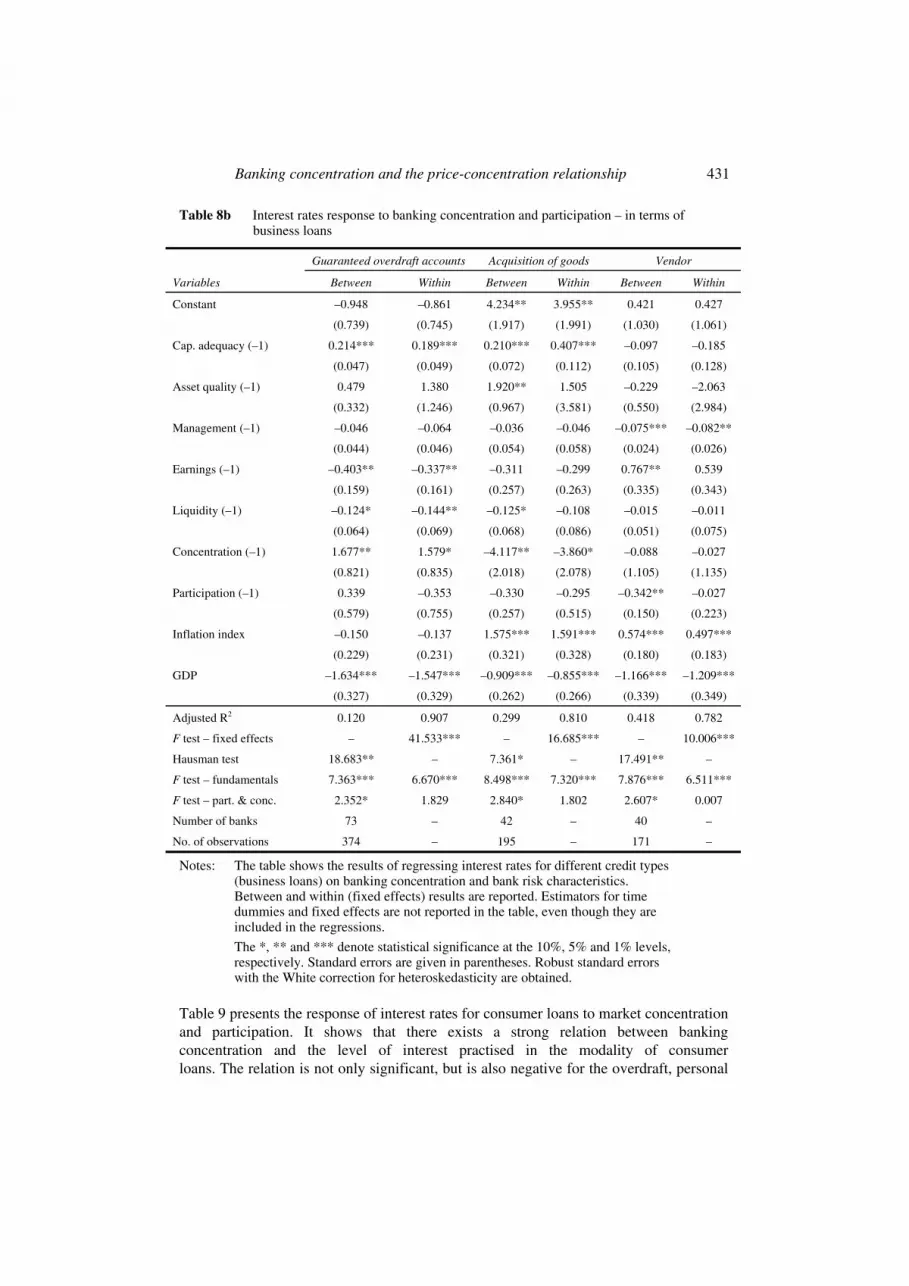
As can be observed in Table 8b, the dual concentration index is significant at the level of 10% for guaranteed overdraft accounts and vendor operations, with a positive sign for the first and a negative sign for the second. Using the Hausman test, the best specification for the modalities of guaranteed overdraft account, acquisitions of goods and vendor operations is the fixed effects model. The variables of fundamentals are significant for the three modalities.
430 B.M. Tabak, S.M. Guerra and R.A. de Souza Peñaloza
Table 8a Interest rates response to banking concentration and participation – in terms of business loans
Hot money Invoice discounting Promissory note discounting Working capital
Variables Between Within Between Within Between Within Between Within
Constant 2.343** 1.803 0.956 0.907 0.608 –0.396 1.373** 1.283**
(1.122) (1.153) (0.738) (0.753) (1.877) (2.022) (0.604) (0.605)
Cap. adequacy (–1) 0.193 0.183 –0.011 –0.006 –0.004 0.001 –0.002 0.000
(0.203) (0.236) (0.029) (0.030) (0.014) (0.014) (0.008) (0.008)
Asset quality (–1) –0.077 4.106** 0.442 2.953 –1.673*** 1.481 0.015 1.964***
(0.435) (1.831) (0.478) (3.916) (0.592) (7.025) (0.178) (0.647)
Management (–1) –0.158** –0.194*** –0.096* –0.090 –0.127*** –0.094 –0.017 –0.045*
(0.069) (0.074) (0.054) (0.057) (0.063) (0.070) (0.026) (0.027)
Earnings (–1) 0.660 0.527 0.074 0.068 –0.066 –0.390 –0.046 –0.034
(0.667) (0.729) (0.191) (0.195) (0.440) (0.594) (0.114) (0.116)
Liquidity (–1) 0.110 0.344 –0.170** –0.129 –0.137 0.152 –0.139*** –0.059
(0.162) (0.199) (0.074) (0.091) (0.098) (0.161) (0.041) (0.047)
Concentration (–1) –1.942 –1.672 –0.416 –0.483 0.122 0.914 –0.974 –0.994
(1.179) (1.201) (0.796) (0.811) (1.961) (2.026) (0.677) (0.679)
Participation (–1) –0.120 –0.050 –0.318 0.053 –0.193 –0.178 –0.214 –0.004
(0.544) (0.673) (0.380) (0.564) (0.148) (0.196) (0.387) (0.564)
Inflation index –0.397 –0.023 1.131*** 1.141*** 0.116 –0.064 0.283 0.327*
(0.575) (0.592) (0.289) (0.290) (0.637) (0.656) (0.182) (0.183)
GDP –2.004*** –1.871*** –0.928** –1.001** –1.776*** –1.931*** –1.475*** –1.556***
(0.629) (0.636) (0.393) (0.397) (0.616) (0.629) (0.231) (0.233)
Adjusted R2 0.127 0.837 0.161 0.730 0.178 0.660 0.159 0.840
F test – fixed effects – 19.256*** 11.838*** – 5.131*** – 20.675***
Hausman test 13.723 – 3.663 – 13.870 – 31.844*** –
F test – fundamentals 2.493** 3.898*** 7.800*** 7.374*** 4.281*** 2.104* 19.370*** 19.098***
F test – part. & conc. 1.408 0.985 0.527 0.178 0.857 0.511 1.210 1.073
Number of banks 44 – 72 – 33 – 85 –
No. of observations 178 – 328 – 149 – 415 –
Notes: The table shows the results of regressing interest rates for different credit types (business loans) on banking concentration and bank risk characteristics. Between and within (fixed effects) results are reported. Estimators for time dummies and fixed effects are not reported in the table, even though they are included in the regressions.
The *, ** and *** denote statistical significance at the 10%, 5% and 1% levels, respectively. Standard errors are given in parentheses. Robust standard errors with the White correction for heteroskedasticity are obtained.
Banking concentration and the price-concentration relationship 431
Table 8b Interest rates response to banking concentration and participation – in terms of business loans
Guaranteed overdraft accounts Acquisition of goods Vendor
Variables Between Within Between Within Between Within
Constant –0.948 –0.861 4.234** 3.955** 0.421 0.427
(0.739) (0.745) (1.917) (1.991) (1.030) (1.061)
Cap. adequacy (–1) 0.214*** 0.189*** 0.210*** 0.407*** –0.097 –0.185
(0.047) (0.049) (0.072) (0.112) (0.105) (0.128)
Asset quality (–1) 0.479 1.380 1.920** 1.505 –0.229 –2.063
(0.332) (1.246) (0.967) (3.581) (0.550) (2.984)
Management (–1) –0.046 –0.064 –0.036 –0.046 –0.075*** –0.082**
(0.044) (0.046) (0.054) (0.058) (0.024) (0.026)
Earnings (–1) –0.403** –0.337** –0.311 –0.299 0.767** 0.539
(0.159) (0.161) (0.257) (0.263) (0.335) (0.343)
Liquidity (–1) –0.124* –0.144** –0.125* –0.108 –0.015 –0.011
(0.064) (0.069) (0.068) (0.086) (0.051) (0.075)
Concentration (–1) 1.677** 1.579* –4.117** –3.860* –0.088 –0.027
(0.821) (0.835) (2.018) (2.078) (1.105) (1.135)
Participation (–1) 0.339 –0.353 –0.330 –0.295 –0.342** –0.027
(0.579) (0.755) (0.257) (0.515) (0.150) (0.223)
Inflation index –0.150 –0.137 1.575*** 1.591*** 0.574*** 0.497***
(0.229) (0.231) (0.321) (0.328) (0.180) (0.183)
GDP –1.634*** –1.547*** –0.909*** –0.855*** –1.166*** –1.209***
(0.327) (0.329) (0.262) (0.266) (0.339) (0.349)
Adjusted R2 0.120 0.907 0.299 0.810 0.418 0.782
F test – fixed effects – 41.533*** – 16.685*** – 10.006***
Hausman test 18.683** – 7.361* – 17.491** –
F test – fundamentals 7.363*** 6.670*** 8.498*** 7.320*** 7.876*** 6.511***
F test – part. & conc. 2.352* 1.829 2.840* 1.802 2.607* 0.007
Number of banks 73 – 42 – 40 –
No. of observations 374 – 195 – 171 –
Notes: The table shows the results of regressing interest rates for different credit types (business loans) on banking concentration and bank risk characteristics. Between and within (fixed effects) results are reported. Estimators for time dummies and fixed effects are not reported in the table, even though they are included in the regressions.
The *, ** and *** denote statistical significance at the 10%, 5% and 1% levels, respectively. Standard errors are given in parentheses. Robust standard errors with the White correction for heteroskedasticity are obtained.
Table 9 presents the response of interest rates for consumer loans to market concentration and participation. It shows that there exists a strong relation between banking concentration and the level of interest practised in the modality of consumer loans. The relation is not only significant, but is also negative for the overdraft, personal
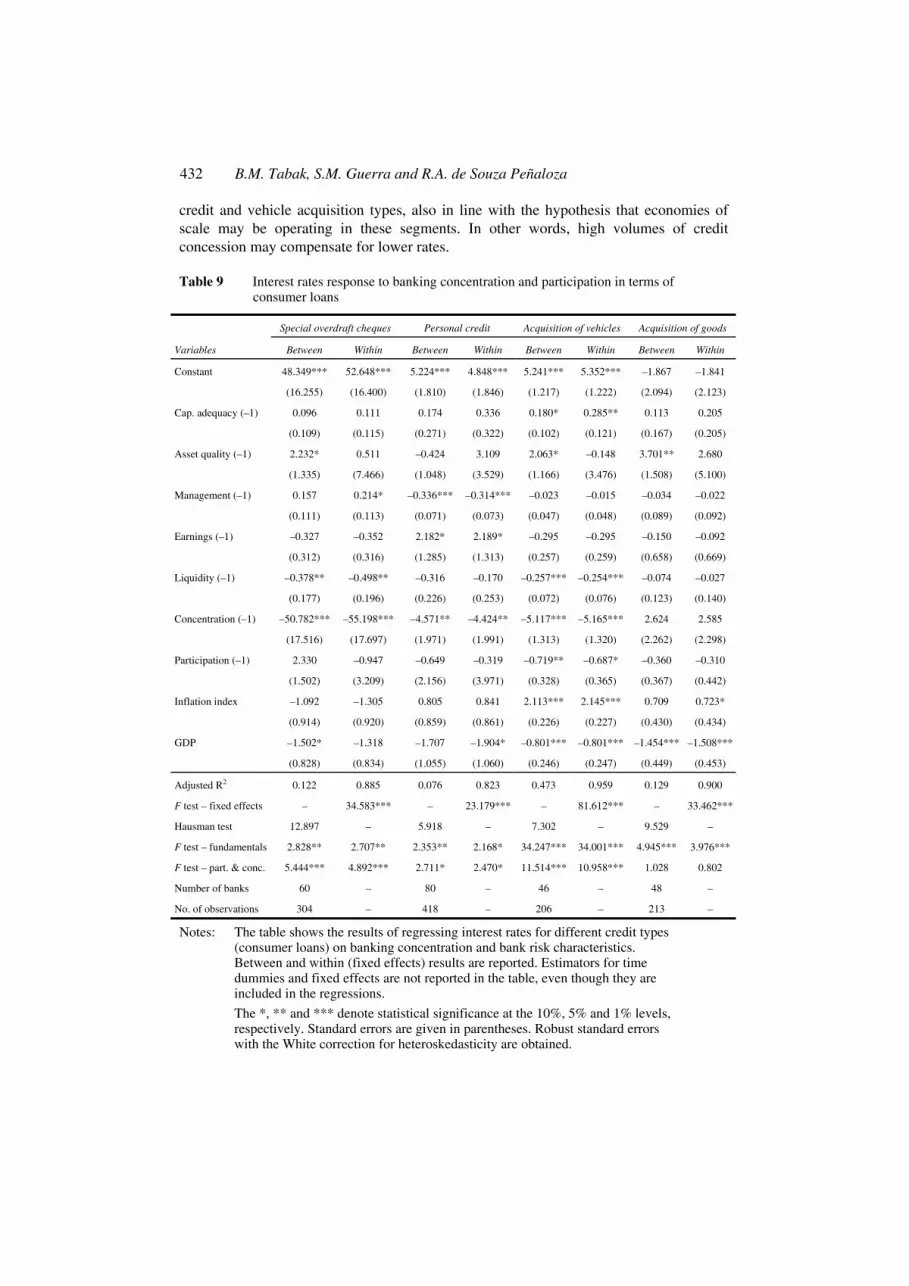
432 B.M. Tabak, S.M. Guerra and R.A. de Souza Peñaloza
credit and vehicle acquisition types, also in line with the hypothesis that economies of scale may be operating in these segments. In other words, high volumes of credit concession may compensate for lower rates.
Table 9 Interest rates response to banking concentration and participation in terms of consumer loans
Special overdraft cheques Personal credit Acquisition of vehicles Acquisition of goods
Variables Between Within Between Within Between Within Between Within
Constant 48.349*** 52.648*** 5.224*** 4.848*** 5.241*** 5.352*** –1.867 –1.841
(16.255) (16.400) (1.810) (1.846) (1.217) (1.222) (2.094) (2.123)
Cap. adequacy (–1) 0.096 0.111 0.174 0.336 0.180* 0.285** 0.113 0.205
(0.109) (0.115) (0.271) (0.322) (0.102) (0.121) (0.167) (0.205)
Asset quality (–1) 2.232* 0.511 –0.424 3.109 2.063* –0.148 3.701** 2.680
(1.335) (7.466) (1.048) (3.529) (1.166) (3.476) (1.508) (5.100)
Management (–1) 0.157 0.214* –0.336*** –0.314*** –0.023 –0.015 –0.034 –0.022
(0.111) (0.113) (0.071) (0.073) (0.047) (0.048) (0.089) (0.092)
Earnings (–1) –0.327 –0.352 2.182* 2.189* –0.295 –0.295 –0.150 –0.092
(0.312) (0.316) (1.285) (1.313) (0.257) (0.259) (0.658) (0.669)
Liquidity (–1) –0.378** –0.498** –0.316 –0.170 –0.257*** –0.254*** –0.074 –0.027
(0.177) (0.196) (0.226) (0.253) (0.072) (0.076) (0.123) (0.140)
Concentration (–1) –50.782*** –55.198*** –4.571** –4.424** –5.117*** –5.165*** 2.624 2.585
(17.516) (17.697) (1.971) (1.991) (1.313) (1.320) (2.262) (2.298)
Participation (–1) 2.330 –0.947 –0.649 –0.319 –0.719** –0.687* –0.360 –0.310
(1.502) (3.209) (2.156) (3.971) (0.328) (0.365) (0.367) (0.442)
Inflation index –1.092 –1.305 0.805 0.841 2.113*** 2.145*** 0.709 0.723*
(0.914) (0.920) (0.859) (0.861) (0.226) (0.227) (0.430) (0.434)
GDP –1.502* –1.318 –1.707 –1.904* –0.801*** –0.801*** –1.454*** –1.508***
(0.828) (0.834) (1.055) (1.060) (0.246) (0.247) (0.449) (0.453)
Adjusted R2 0.122 0.885 0.076 0.823 0.473 0.959 0.129 0.900
F test – fixed effects – 34.583*** – 23.179*** – 81.612*** – 33.462***
Hausman test 12.897 – 5.918 – 7.302 – 9.529 –
F test – fundamentals 2.828** 2.707** 2.353** 2.168* 34.247*** 34.001*** 4.945*** 3.976***
F test – part. & conc. 5.444*** 4.892*** 2.711* 2.470* 11.514*** 10.958*** 1.028 0.802
Number of banks 60 – 80 – 46 – 48 –
No. of observations 304 – 418 – 206 – 213 –
Notes: The table shows the results of regressing interest rates for different credit types (consumer loans) on banking concentration and bank risk characteristics. Between and within (fixed effects) results are reported. Estimators for time dummies and fixed effects are not reported in the table, even though they are included in the regressions.
The *, ** and *** denote statistical significance at the 10%, 5% and 1% levels, respectively. Standard errors are given in parentheses. Robust standard errors with the White correction for heteroskedasticity are obtained.
Banking concentration and the price-concentration relationship 433
7 Final considerations
This article presented a concentration measurement that is more informative than the HHI. The measurement in question has a direct interpretation and can be used to measure banking concentration, making it possible to draw direct comparisons over time and among countries. This measurement was developed on the basis of the theory of duality.
The most important contribution of this article is that it presents this new measurement of banking concentration and demonstrates its utility. Moreover, it shows that such ordinary measurements as HHI are not comparable, making it difficult to compare countries and even to evaluate the evolution of the domestic banking sector should there be significant alterations in the number of banks. The article is an original contribution that can aid research in the banking literature and can be used in a variety of applications. Studies that draw direct relations between financial stability and banking concentration should use the measurement tool proposed in this article. Furthermore, studies that make comparisons among countries should use the dual of the HHI since this measurement of banking concentration is directly comparable, which is not true for the HHI (which is commonly used in the literature).
A panel data model was estimated in order to test the price-concentration relationship. The results show that, for corporations, the loan types secured accounts and acquisition of assets maintain a statistically significant relation with banking concentration.
For consumer loans, in the loan modalities of special overdraft cheques, personal credit and vehicle acquisitions, there is a statistically significant negative relationship between banking concentration (measured by the HHI dual) and the interest rates practised.
Interest rates charged on business and consumer loans, on the average, reflect a systematic risk. Banks charge a higher premium when systemic and macroeconomic conditions are worse. However, banks may take excessive risks (fundamentals are poorer) and, in that case, they will increase interest rates on their loans. In both cases, interest rates reflect a systemic risk in the economy, although indirectly. Therefore, if concentration is significant in explaining interest rates, a relationship between financial fragility and banking concentration is established.
For some types of loans, a statistically significant relationship between concentration and interest rates charged was found. Nonetheless, the relationship is negative or positive for different types of loans. These results suggest that perhaps other variables, such as market microstructure elements, may be important in studying this relationship.
In this way, the conclusions of this paper indicate that there is no evidence that banking concentration leads to anticompetitive practices. Other variables may be included in future surveys in order to better understand this relationship.
434 B.M. Tabak, S.M. Guerra and R.A. de Souza Peñaloza
Acknowledgements
The authors thank the anonymous reviewers and the editor Mostaq Hussain for their comments, which have helped improve this paper. The opinions expressed in this paper are those of the authors and do not necessarily reflect those of the Central Bank of Brazil. Benjamin M. Tabak gratefully acknowledges the financial support from CNPQ Foundation.
References Allen, F. and Gale, D. (2001) Comparing Financial Systems, Cambridge, MA: MIT Press.
Allen, F. and Gale, D. (2004) ‘Competition and financial stability’, Journal of Money, Credit and Banking, Vol. 36, pp.453–480.
Beck, T., Demirguc-Kunt, A. and Levine, R. (2003) ‘Bank concentration and crisis’, NBER Working Paper 9921.
Berger, A.N. and Hannan, T.H. (1989) ‘The price-concentration relationship in banking’, The Review of Economics and Statistics, Vol. 71, No. 2, pp.291–299.
BIS (2001) Consolidation in the Financial Sector, Group of Ten, January.
Carletti, E. and Hartmann, P. (2002) ‘Competition and stability: what’s special about banking’, in P. Mizen (Ed.) Monetary History, Exchange Rates and Financial Markets: Essays in Honor of Charles Goodhart, Cheltenham, UK: Edward Elgar.
Das, A. and Ghosh, S. (2006) ‘Financial deregulation and efficiency: an empirical analysis of Indian banks during the post reform period’, Review of Financial Economics, Vol. 15, pp.193–221.
Demirguç-Kunt, A., Laeven, L. and Levine, R. (2004) ‘Regulations, market structure, institutions, and the cost of financial intermediation’, Journal of Money, Credit, and Banking, Vol. 36, pp.593–622.
Evans, W.N., Froeb, L.M. and Werden, G.J. (1993) ‘Endogeneity in the concentration-price relationship: causes, consequences and cures’, The Journal of Industrial Economics, Vol. XLI, No. 4, pp.431–438.
Gelos, R.G. and Roldós, J. (2004) ‘Consolidation and market structure in emerging market banking systems’, Emerging Markets Review, Vol. 5, pp.39–59.
Grochulski, B. and Kareken, J. (2004) ‘Allen and Gale on risk-taking and competition in banking’, Finance Research Letters, Vol. 1, pp.236–240.
Logan, A. (2004) ‘Banking concentration’, Financial Stability Review, Bank of England, June.
Martinez-Peria, M.S. and Mody, A. (2004) ‘How foreign participation and market concentration impact bank spreads: evidence from Latin America’, Journal of Money, Credit, and Banking, Vol. 36, pp.512–537.
Nissan, E. (2004) ‘Comparing bank concentration across developing and developed countries’, Journal of Global Business, Vol. 15, p.28.
Rocha, F.A.S. (2001) Evolução da Concentração Bancária no Brasil, Technical notes, Central Bank of Brazil.
Souza, J. (1977) Estatística Econômica e Social, Editora Campus.
Souza, J. and Peñaloza, R.S. (2005) Estatística Exploratória, mimeo, University of Brasília, Department of Economics.
Theil, H. (1967) Economics and Information Theory, North-Holland, Amsterdan.
Valverde, S.C., Humphrey, D.B. and Fernández, F.R. (2003) ‘Bank deregulation is better than mergers’, Journal of International Financial Markets, Institutions and Money, Vol. 13, pp.429–449.
Banking concentration and the price-concentration relationship 435
Notes
1 Though part of this reduction was due to bank failures, mergers and acquisitions accounted for the major share of this decline. See BIS (2001).
2 Although there is no doubt that alterations in the banking structure generate impacts on financial stability, the banking literature has not been able to come to a consensus as to whether increases in banking concentration or competition within banking systems result in increases/reductions in financial stability. On the one hand, there exists the argument known as the ‘concentration-stability’ approach. From this point of view, banking economies with a lesser number of large-scale institutions are more resistant to shock due to the fact that banks in these economies can be more profitable and diversity in their risks are more efficient and can be more effectively monitored. On the other hand, there exists another approach known as ‘concentration-fragility’ which argues that, in economies with few large-scale banks, banking institutions may take on greater risks than are desirable due to the implicit operation of the ‘too big to fail’ theory. For more details about the relationship between banking structure and financial fragility, see Allen and Gale (2001), Grochulski and Kareken (2004), Beck et al. (2003), Allen and Gale (2004) and Carletti and Hartmann (2002).
3 In a recent and interesting work, Das and Ghosh (2006) study the efficiency of Indian banks. Measures of bank concentration may be related to efficiency as well, and our methodology may be used in such studies.
4 Equal participation is a proxy for perfect competition if banks have the same technology and the number of banks is large.
5 See also Souza (1977).
6 The first formulation of a dual concentration measure was given by Theil (1967). He developed the dual of the entropy of a series. See Souza and Peñaloza (2005) for an extension of the dual theory to nominal and ordinal measures of concentration.
7 For example, two distinct economies may have the same HHI = 0.10, one with ten banks with uniform participation in the market and therefore not concentrated, and the other with a thousand banks where there is a strong concentration.
8 PR and PLE are defined in Resolution 2837, dated 30 May 2001, and Resolution 2099, dated 17 August 1994 (with later alterations), both issued by the Central Bank of Brazil.
9 Table 1 makes it clear that this influences the Brazilian case.


