Embed Size (px)
Citation preview
Asiamoney’s
2013
Best Domestic
Equity House
Sector flash
9 January 2015
Disclosure: Bahana Securities does and seeks to do business with companies covered in its research reports. Investors should consider this report as only a single factor
in making their investment decision.
Please see the important disclaimer information on the back of this report
2014
Finance Asia's
Best
Equity House
Asiamoney's
2013
Best Domestic
Equity House
Alpha
Southeast Asia
2014 Best
Research Call
FMCG Sector
Indonesia Construction
NEUTRAL (Unchanged)
Bob Setiadi E-mail: [email protected] Phone: +6221 250 5081 Ext. 3605
Creating a solid foundation
Ambitious 5-year target: To elevate Indonesia’s status to a middle-income
country, the government, through the National Planning Agency (Bappenas),
has mapped out a 5-year development target (RPJMN 2014-19 – exhibit 23).
This ambitious goal has an estimated cost of IDR5,519tn, with the
government contributing 40% of the funding with the rest split between SOE
companies (20%), local governments (10%) and the private sector (30%).
We expect President Jokowi to prioritize several vital areas such as seaports,
toll roads and irrigation due to the plan’s sheer size and budget constraints.
Extra IDR138tn for infrastructure spending: President Jokowi’s latest
move to partly dismantle the fuel subsidy scheme, effective 1 January, will
provide badly needed funds to kick-start the country’s massive infrastructure
plan. In the upcoming State Budget Revision, we expect the government will
double its 2015 infrastructure budget from IDR157tn to IDR295tn on fuel-
subsidy reallocations and tax revenue increases. The Ministry of Public Works
and Public Housing, which provide a major contribution to SOE construction
companies’ revenues, should see its original 2015 budget of IDR85tn to rise
by IDR33tn. Thus, this year, we expect the sector’s total 2015 new contracts
to increase 18.5% y-y to IDR88.3tn from IDR74.5tn in 2014.
Implementation remains an issue; retain NEUTRAL rating
Despite high hopes about the new government’s infrastructure program,
there are some lingering issues on program implementation. We are waiting
to gauge the effectiveness of the new land-clearing law (UU No.2/2012),
which is meant to address arguably the most challenging issue in developing
Indonesia’s infrastructure. Furthermore, the government needs to pass
several regulations to improve Indonesia’s investment conditions and to more
evenly distribute the budget proceeds throughout the year, unlike the current
practice of back-loading projects at the last quarter of the year. Hence, we
may see project delays in the first year of President Jokowi’s administration,
and as such maintain our NEUTRAL rating on the sector for the time being.
Nevertheless, at this stage of the cycle, we believe that the market has
currently placed high expectations on the success of President Jokowi in
accelerating these ambitious infrastructure plans.
Substantial capital requirements ahead to benefit WIKA and PTPP:
Although debt levels have increased in the past couple of years (exhibit 24),
upcoming massive infrastructure projects, combined with government
guidelines which encourage SOEs to take stakes in infrastructure projects,
should pressure SOEs to secure additional funding to support working capital.
We expect these conditions to benefit companies with solid balance sheet
such as WIKA (net cash) and PTPP (53% net gearing), as both companies
should be able to raise required funds without severely affecting their bottom
lines. In 2015, each company also plans to list its property subsidiary to raise
additional funds and improve the balance sheet. On the other hand, WSKT
and ADHI are planning to conduct rights issuances in which the government,
for the first time, plans to participate, setting aside IDR3tn for WSKT and
IDR2tn for ADHI. Nevertheless, both companies need to prepare for a long
Exhibit 1. Rating & target price summary
Code Share price +/- Ratings
CP TP (%) OLD NEW
WIKA 3,680 4,200 14.1 BUY BUY
PTPP 3,755 4,660 24.1 BUY BUY
WSKT 1,455 1,570 7.9 HOLD HOLD
ADHI 3,605 3,600 (0.1) REDUCE HOLD
TOTL 1,180 1,100 (6.8) REDUCE REDUCE
WTON 1,335 1,335 0.0 HOLD HOLD
Source: Bloomberg, Bahana estimates
(Based on closing prices on 8 January 2015)
Exhibit 2. Valuation summary Code 2015F PER EPS gwt ROAE Div.yield
Current @TP (%) (%) (%)
WIKA 29.0 33.1 28.0 16.3 1.0
PTPP 24.4 30.2 45.7 27.9 1.2
WSKT 25.9 27.9 23.8 18.8 1.1
ADHI 22.0 22.0 30.5 16.3 0.9
TOTL 23.6 22.0 18.6 19.5 2.1
WTON 29.2 29.2 24.5 18.1 1.2
Sector 26.5 29.4 30.6 19.9 1.2
Regional 22.2 n.a. 13.6 13.1 2.2
Source: Bloomberg, Bahana estimates
Exhibit 3. Company information Code Mkt. cap Free float 3m avg. Price (12m)
(USDmn) (%) (USDmn) High Low
WIKA 1,784 34.7 3.9 3,720 1,645
PTPP 1,434 42.8 2.5 3,755 1,145
WSKT 1,116 26.4 4.1 1,510 409
ADHI 512 49.0 3.7 3,605 1,470
TOTL 317 33.8 0.6 1,180 525
WTON 914 28.8 2.7 1,330 590
Source: Bloomberg, Bahana estimates
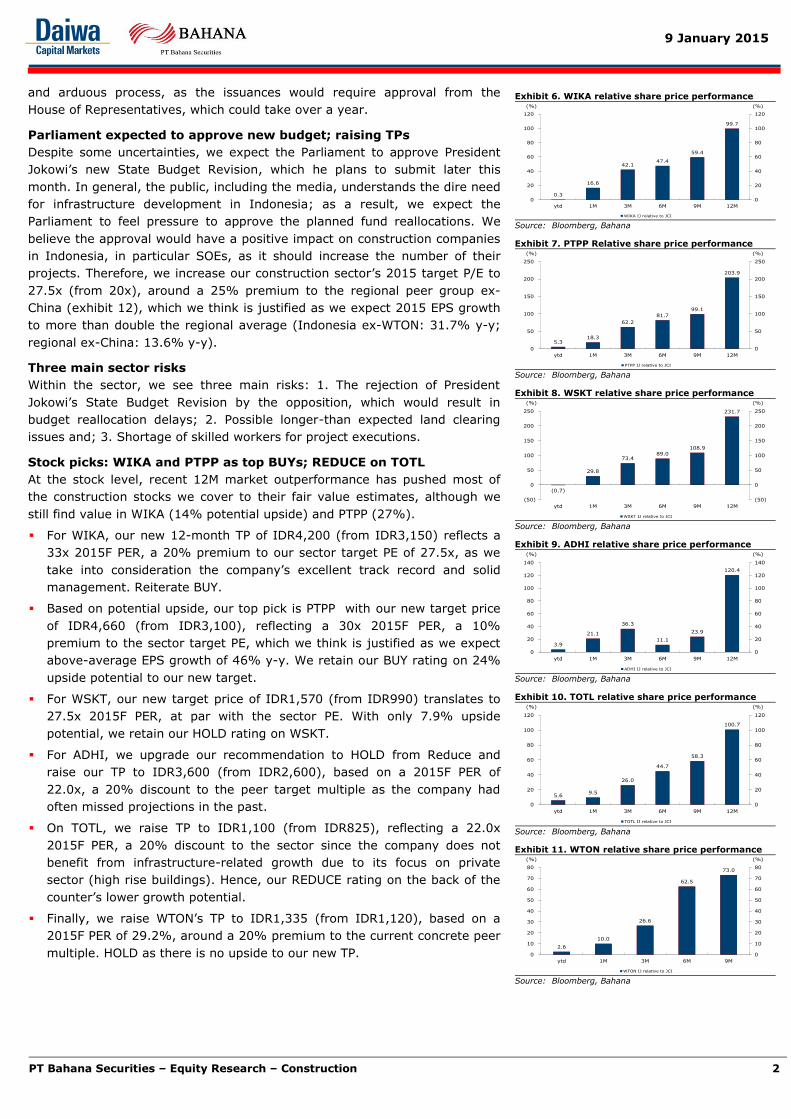
Exhibit 4. Construction sector relative to JCI
2.2
18.4
48.9
62.2
22.1
159.2
(15)
(10)
(5)
0
5
10
15
20
0
20
40
60
80
100
120
140
160
180
ytd 1M 3M 6M 9M 12M
(%) (%)
Construction sector relative to JCI
Source: Bloomberg, Bahana
Exhibit 5. Relative performance to JCI, ytd
5.6 5.3
3.9
2.2
0.3
(0.7)
(20)
0
20
40
60
80
100
(2)
(1)
0
1
2
3
4
5
6
TOTL PTPP ADHI SECTOR WIKA WSKT
(%)(%)
Source: Bloomberg, Bahana
9 January 2015
PT Bahana Securities – Equity Research – Construction 2
and arduous process, as the issuances would require approval from the
House of Representatives, which could take over a year.
Parliament expected to approve new budget; raising TPs
Despite some uncertainties, we expect the Parliament to approve President
Jokowi’s new State Budget Revision, which he plans to submit later this
month. In general, the public, including the media, understands the dire need
for infrastructure development in Indonesia; as a result, we expect the
Parliament to feel pressure to approve the planned fund reallocations. We
believe the approval would have a positive impact on construction companies
in Indonesia, in particular SOEs, as it should increase the number of their
projects. Therefore, we increase our construction sector’s 2015 target P/E to
27.5x (from 20x), around a 25% premium to the regional peer group ex-
China (exhibit 12), which we think is justified as we expect 2015 EPS growth
to more than double the regional average (Indonesia ex-WTON: 31.7% y-y;
regional ex-China: 13.6% y-y).
Three main sector risks
Within the sector, we see three main risks: 1. The rejection of President
Jokowi’s State Budget Revision by the opposition, which would result in
budget reallocation delays; 2. Possible longer-than expected land clearing
issues and; 3. Shortage of skilled workers for project executions.
Stock picks: WIKA and PTPP as top BUYs; REDUCE on TOTL
At the stock level, recent 12M market outperformance has pushed most of
the construction stocks we cover to their fair value estimates, although we
still find value in WIKA (14% potential upside) and PTPP (27%).
For WIKA, our new 12-month TP of IDR4,200 (from IDR3,150) reflects a
33x 2015F PER, a 20% premium to our sector target PE of 27.5x, as we
take into consideration the company’s excellent track record and solid
management. Reiterate BUY.
Based on potential upside, our top pick is PTPP with our new target price
of IDR4,660 (from IDR3,100), reflecting a 30x 2015F PER, a 10%
premium to the sector target PE, which we think is justified as we expect
above-average EPS growth of 46% y-y. We retain our BUY rating on 24%
upside potential to our new target.
For WSKT, our new target price of IDR1,570 (from IDR990) translates to
27.5x 2015F PER, at par with the sector PE. With only 7.9% upside
potential, we retain our HOLD rating on WSKT.
For ADHI, we upgrade our recommendation to HOLD from Reduce and
raise our TP to IDR3,600 (from IDR2,600), based on a 2015F PER of
22.0x, a 20% discount to the peer target multiple as the company had
often missed projections in the past.
On TOTL, we raise TP to IDR1,100 (from IDR825), reflecting a 22.0x
2015F PER, a 20% discount to the sector since the company does not
benefit from infrastructure-related growth due to its focus on private
sector (high rise buildings). Hence, our REDUCE rating on the back of the
counter’s lower growth potential.
Finally, we raise WTON’s TP to IDR1,335 (from IDR1,120), based on a
2015F PER of 29.2%, around a 20% premium to the current concrete peer
multiple. HOLD as there is no upside to our new TP.
Exhibit 6. WIKA relative share price performance
0.3
16.6
42.1 47.4
59.4
99.7
0
20
40
60
80
100
120
0
20
40
60
80
100
120
ytd 1M 3M 6M 9M 12M
(%) (%)
WIKA IJ relative to JCI Source: Bloomberg, Bahana
Exhibit 7. PTPP Relative share price performance
5.3 18.3
62.2
81.7
99.1
203.9
0
50
100
150
200
250
0
50
100
150
200
250
ytd 1M 3M 6M 9M 12M
(%) (%)
PTPP IJ relative to JCI Source: Bloomberg, Bahana
Exhibit 8. WSKT relative share price performance
(0.7)
29.8
73.4 89.0
108.9
231.7
(50)
0
50
100
150
200
250
(50)
0
50
100
150
200
250
ytd 1M 3M 6M 9M 12M
(%) (%)
WSKT IJ relative to JCI Source: Bloomberg, Bahana
Exhibit 9. ADHI relative share price performance
3.9
21.1
36.3
11.1
23.9
120.4
0
20
40
60
80
100
120
140
0
20
40
60
80
100
120
140
ytd 1M 3M 6M 9M 12M
(%) (%)
ADHI IJ relative to JCI Source: Bloomberg, Bahana
Exhibit 10. TOTL relative share price performance
5.6 9.5
26.0
44.7
58.3
100.7
0
20
40
60
80
100
120
0
20
40
60
80
100
120
ytd 1M 3M 6M 9M 12M
(%) (%)
TOTL IJ relative to JCI Source: Bloomberg, Bahana
Exhibit 11. WTON relative share price performance
2.6
10.0
26.6
62.5
73.0
0
10
20
30
40
50
60
70
80
0
10
20
30
40
50
60
70
80
ytd 1M 3M 6M 9M
(%) (%)
WTON IJ relative to JCI Source: Bloomberg, Bahana
9 January 2015
PT Bahana Securities – Equity Research – Construction 3
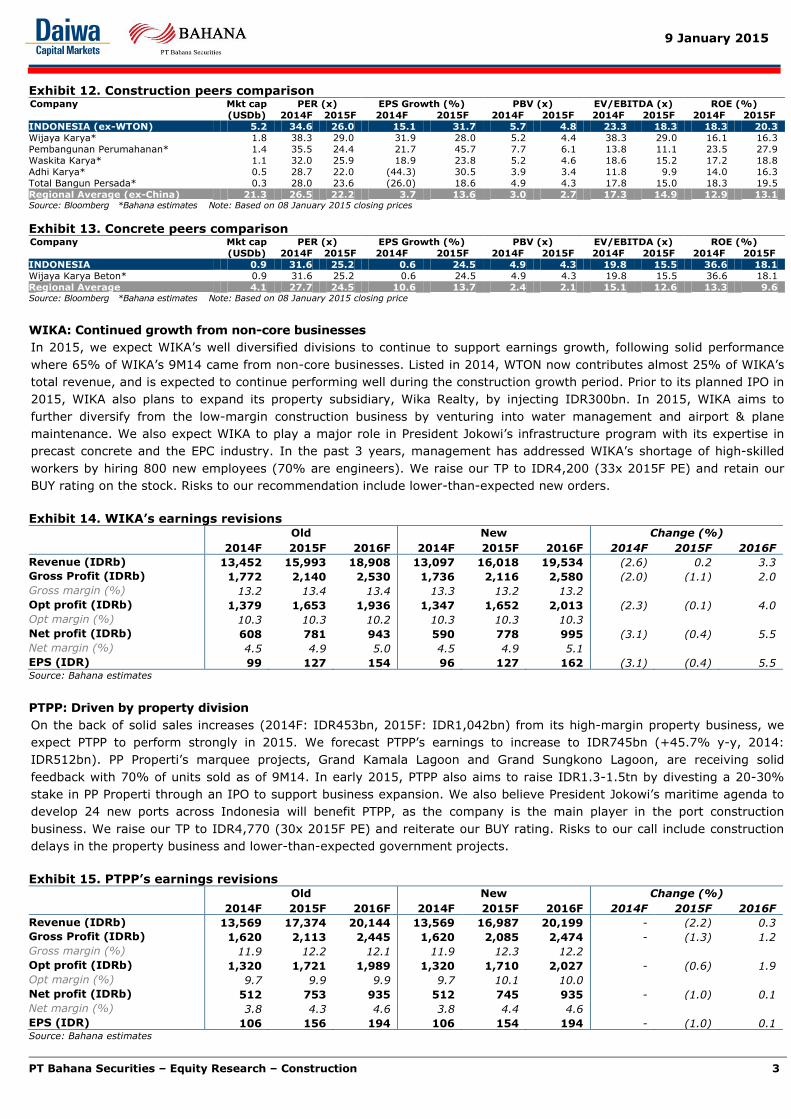
Exhibit 12. Construction peers comparison Company Mkt cap PER (x) EPS Growth (%) PBV (x) EV/EBITDA (x) ROE (%)
(USDb) 2014F 2015F 2014F 2015F 2014F 2015F 2014F 2015F 2014F 2015F
INDONESIA (ex-WTON) 5.2 34.6 26.0 15.1 31.7 5.7 4.8 23.3 18.3 18.3 20.3
Wijaya Karya* 1.8 38.3 29.0 31.9 28.0 5.2 4.4 38.3 29.0 16.1 16.3
Pembangunan Perumahanan* 1.4 35.5 24.4 21.7 45.7 7.7 6.1 13.8 11.1 23.5 27.9
Waskita Karya* 1.1 32.0 25.9 18.9 23.8 5.2 4.6 18.6 15.2 17.2 18.8
Adhi Karya* 0.5 28.7 22.0 (44.3) 30.5 3.9 3.4 11.8 9.9 14.0 16.3
Total Bangun Persada* 0.3 28.0 23.6 (26.0) 18.6 4.9 4.3 17.8 15.0 18.3 19.5
Regional Average (ex-China) 21.3 26.5 22.2 3.7 13.6 3.0 2.7 17.3 14.9 12.9 13.1 Source: Bloomberg *Bahana estimates Note: Based on 08 January 2015 closing prices
Exhibit 13. Concrete peers comparison Company Mkt cap PER (x) EPS Growth (%) PBV (x) EV/EBITDA (x) ROE (%)
(USDb) 2014F 2015F 2014F 2015F 2014F 2015F 2014F 2015F 2014F 2015F
INDONESIA 0.9 31.6 25.2 0.6 24.5 4.9 4.3 19.8 15.5 36.6 18.1
Wijaya Karya Beton* 0.9 31.6 25.2 0.6 24.5 4.9 4.3 19.8 15.5 36.6 18.1
Regional Average 4.1 27.7 24.5 10.6 13.7 2.4 2.1 15.1 12.6 13.3 9.6 Source: Bloomberg *Bahana estimates Note: Based on 08 January 2015 closing price
WIKA: Continued growth from non-core businesses
In 2015, we expect WIKA’s well diversified divisions to continue to support earnings growth, following solid performance
where 65% of WIKA’s 9M14 came from non-core businesses. Listed in 2014, WTON now contributes almost 25% of WIKA’s
total revenue, and is expected to continue performing well during the construction growth period. Prior to its planned IPO in
2015, WIKA also plans to expand its property subsidiary, Wika Realty, by injecting IDR300bn. In 2015, WIKA aims to
further diversify from the low-margin construction business by venturing into water management and airport & plane
maintenance. We also expect WIKA to play a major role in President Jokowi’s infrastructure program with its expertise in
precast concrete and the EPC industry. In the past 3 years, management has addressed WIKA’s shortage of high-skilled
workers by hiring 800 new employees (70% are engineers). We raise our TP to IDR4,200 (33x 2015F PE) and retain our
BUY rating on the stock. Risks to our recommendation include lower-than-expected new orders.
Exhibit 14. WIKA’s earnings revisions
Old New Change (%)
2014F 2015F 2016F 2014F 2015F 2016F 2014F 2015F 2016F
Revenue (IDRb) 13,452 15,993 18,908 13,097 16,018 19,534 (2.6) 0.2 3.3
Gross Profit (IDRb) 1,772 2,140 2,530 1,736 2,116 2,580 (2.0) (1.1) 2.0
Gross margin (%) 13.2 13.4 13.4 13.3 13.2 13.2
Opt profit (IDRb) 1,379 1,653 1,936 1,347 1,652 2,013 (2.3) (0.1) 4.0
Opt margin (%) 10.3 10.3 10.2 10.3 10.3 10.3
Net profit (IDRb) 608 781 943 590 778 995 (3.1) (0.4) 5.5
Net margin (%) 4.5 4.9 5.0 4.5 4.9 5.1
EPS (IDR) 99 127 154 96 127 162 (3.1) (0.4) 5.5 Source: Bahana estimates
PTPP: Driven by property division
On the back of solid sales increases (2014F: IDR453bn, 2015F: IDR1,042bn) from its high-margin property business, we
expect PTPP to perform strongly in 2015. We forecast PTPP’s earnings to increase to IDR745bn (+45.7% y-y, 2014:
IDR512bn). PP Properti’s marquee projects, Grand Kamala Lagoon and Grand Sungkono Lagoon, are receiving solid
feedback with 70% of units sold as of 9M14. In early 2015, PTPP also aims to raise IDR1.3-1.5tn by divesting a 20-30%
stake in PP Properti through an IPO to support business expansion. We also believe President Jokowi’s maritime agenda to
develop 24 new ports across Indonesia will benefit PTPP, as the company is the main player in the port construction
business. We raise our TP to IDR4,770 (30x 2015F PE) and reiterate our BUY rating. Risks to our call include construction
delays in the property business and lower-than-expected government projects.
Exhibit 15. PTPP’s earnings revisions
Old New Change (%)
2014F 2015F 2016F 2014F 2015F 2016F 2014F 2015F 2016F
Revenue (IDRb) 13,569 17,374 20,144 13,569 16,987 20,199 - (2.2) 0.3
Gross Profit (IDRb) 1,620 2,113 2,445 1,620 2,085 2,474 - (1.3) 1.2
Gross margin (%) 11.9 12.2 12.1 11.9 12.3 12.2
Opt profit (IDRb) 1,320 1,721 1,989 1,320 1,710 2,027 - (0.6) 1.9
Opt margin (%) 9.7 9.9 9.9 9.7 10.1 10.0
Net profit (IDRb) 512 753 935 512 745 935 - (1.0) 0.1
Net margin (%) 3.8 4.3 4.6 3.8 4.4 4.6
EPS (IDR) 106 156 194 106 154 194 - (1.0) 0.1 Source: Bahana estimates
9 January 2015
PT Bahana Securities – Equity Research – Construction 4
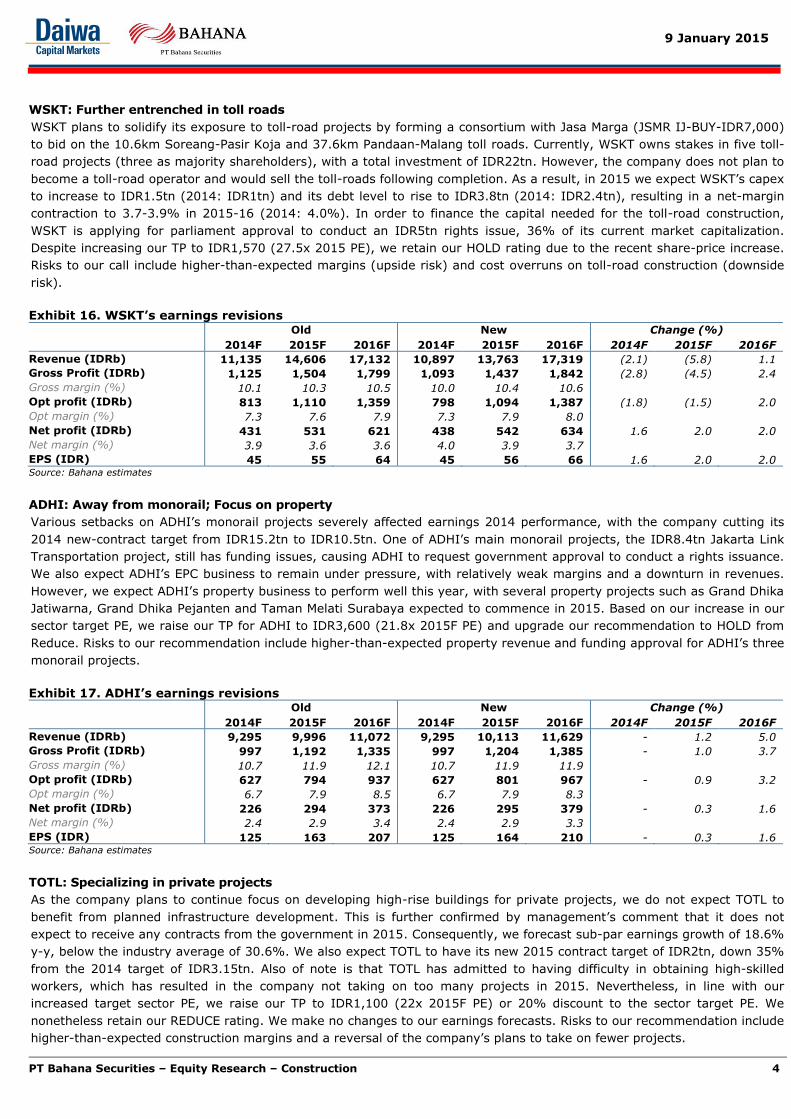
WSKT: Further entrenched in toll roads
WSKT plans to solidify its exposure to toll-road projects by forming a consortium with Jasa Marga (JSMR IJ-BUY-IDR7,000)
to bid on the 10.6km Soreang-Pasir Koja and 37.6km Pandaan-Malang toll roads. Currently, WSKT owns stakes in five toll-
road projects (three as majority shareholders), with a total investment of IDR22tn. However, the company does not plan to
become a toll-road operator and would sell the toll-roads following completion. As a result, in 2015 we expect WSKT’s capex
to increase to IDR1.5tn (2014: IDR1tn) and its debt level to rise to IDR3.8tn (2014: IDR2.4tn), resulting in a net-margin
contraction to 3.7-3.9% in 2015-16 (2014: 4.0%). In order to finance the capital needed for the toll-road construction,
WSKT is applying for parliament approval to conduct an IDR5tn rights issue, 36% of its current market capitalization.
Despite increasing our TP to IDR1,570 (27.5x 2015 PE), we retain our HOLD rating due to the recent share-price increase.
Risks to our call include higher-than-expected margins (upside risk) and cost overruns on toll-road construction (downside
risk).
Exhibit 16. WSKT’s earnings revisions
Old New Change (%)
2014F 2015F 2016F 2014F 2015F 2016F 2014F 2015F 2016F
Revenue (IDRb) 11,135 14,606 17,132 10,897 13,763 17,319 (2.1) (5.8) 1.1
Gross Profit (IDRb) 1,125 1,504 1,799 1,093 1,437 1,842 (2.8) (4.5) 2.4
Gross margin (%) 10.1 10.3 10.5 10.0 10.4 10.6
Opt profit (IDRb) 813 1,110 1,359 798 1,094 1,387 (1.8) (1.5) 2.0
Opt margin (%) 7.3 7.6 7.9 7.3 7.9 8.0
Net profit (IDRb) 431 531 621 438 542 634 1.6 2.0 2.0
Net margin (%) 3.9 3.6 3.6 4.0 3.9 3.7
EPS (IDR) 45 55 64 45 56 66 1.6 2.0 2.0 Source: Bahana estimates
ADHI: Away from monorail; Focus on property
Various setbacks on ADHI’s monorail projects severely affected earnings 2014 performance, with the company cutting its
2014 new-contract target from IDR15.2tn to IDR10.5tn. One of ADHI’s main monorail projects, the IDR8.4tn Jakarta Link
Transportation project, still has funding issues, causing ADHI to request government approval to conduct a rights issuance.
We also expect ADHI’s EPC business to remain under pressure, with relatively weak margins and a downturn in revenues.
However, we expect ADHI’s property business to perform well this year, with several property projects such as Grand Dhika
Jatiwarna, Grand Dhika Pejanten and Taman Melati Surabaya expected to commence in 2015. Based on our increase in our
sector target PE, we raise our TP for ADHI to IDR3,600 (21.8x 2015F PE) and upgrade our recommendation to HOLD from
Reduce. Risks to our recommendation include higher-than-expected property revenue and funding approval for ADHI’s three
monorail projects.
Exhibit 17. ADHI’s earnings revisions
Old New Change (%)
2014F 2015F 2016F 2014F 2015F 2016F 2014F 2015F 2016F
Revenue (IDRb) 9,295 9,996 11,072 9,295 10,113 11,629 - 1.2 5.0
Gross Profit (IDRb) 997 1,192 1,335 997 1,204 1,385 - 1.0 3.7
Gross margin (%) 10.7 11.9 12.1 10.7 11.9 11.9
Opt profit (IDRb) 627 794 937 627 801 967 - 0.9 3.2
Opt margin (%) 6.7 7.9 8.5 6.7 7.9 8.3
Net profit (IDRb) 226 294 373 226 295 379 - 0.3 1.6
Net margin (%) 2.4 2.9 3.4 2.4 2.9 3.3
EPS (IDR) 125 163 207 125 164 210 - 0.3 1.6 Source: Bahana estimates
TOTL: Specializing in private projects
As the company plans to continue focus on developing high-rise buildings for private projects, we do not expect TOTL to
benefit from planned infrastructure development. This is further confirmed by management’s comment that it does not
expect to receive any contracts from the government in 2015. Consequently, we forecast sub-par earnings growth of 18.6%
y-y, below the industry average of 30.6%. We also expect TOTL to have its new 2015 contract target of IDR2tn, down 35%
from the 2014 target of IDR3.15tn. Also of note is that TOTL has admitted to having difficulty in obtaining high-skilled
workers, which has resulted in the company not taking on too many projects in 2015. Nevertheless, in line with our
increased target sector PE, we raise our TP to IDR1,100 (22x 2015F PE) or 20% discount to the sector target PE. We
nonetheless retain our REDUCE rating. We make no changes to our earnings forecasts. Risks to our recommendation include
higher-than-expected construction margins and a reversal of the company’s plans to take on fewer projects.
9 January 2015
PT Bahana Securities – Equity Research – Construction 5
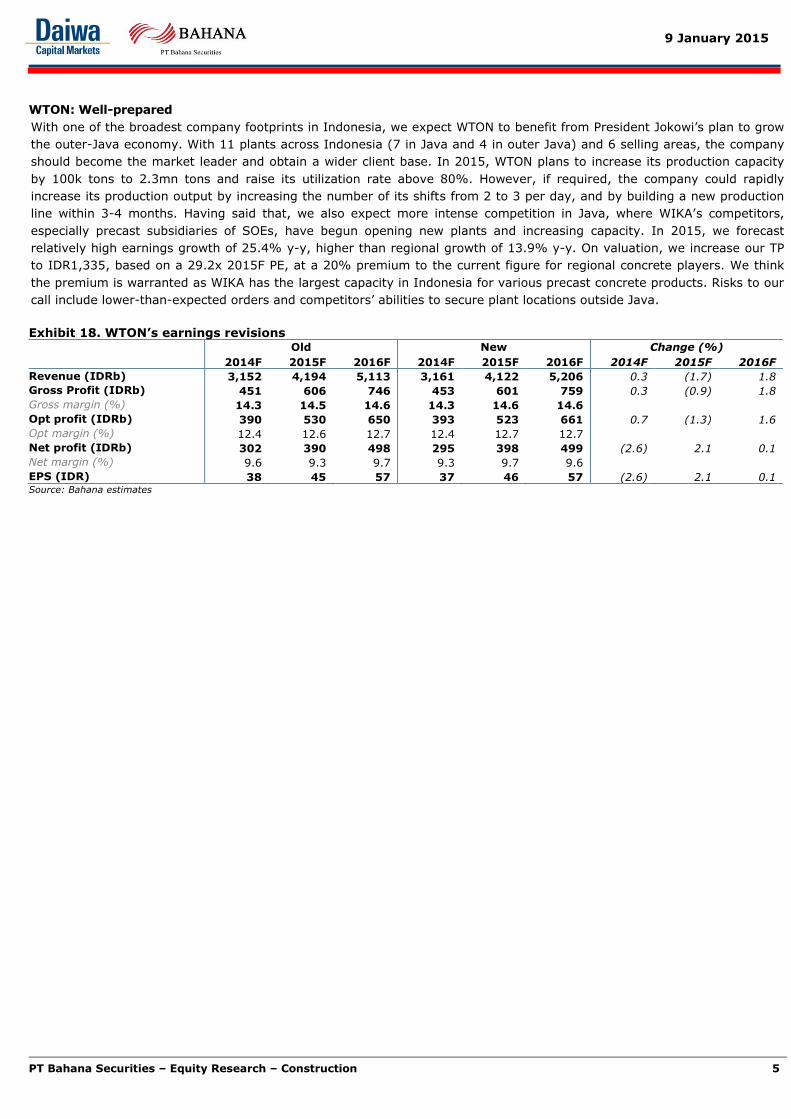
WTON: Well-prepared
With one of the broadest company footprints in Indonesia, we expect WTON to benefit from President Jokowi’s plan to grow
the outer-Java economy. With 11 plants across Indonesia (7 in Java and 4 in outer Java) and 6 selling areas, the company
should become the market leader and obtain a wider client base. In 2015, WTON plans to increase its production capacity
by 100k tons to 2.3mn tons and raise its utilization rate above 80%. However, if required, the company could rapidly
increase its production output by increasing the number of its shifts from 2 to 3 per day, and by building a new production
line within 3-4 months. Having said that, we also expect more intense competition in Java, where WIKA’s competitors,
especially precast subsidiaries of SOEs, have begun opening new plants and increasing capacity. In 2015, we forecast
relatively high earnings growth of 25.4% y-y, higher than regional growth of 13.9% y-y. On valuation, we increase our TP
to IDR1,335, based on a 29.2x 2015F PE, at a 20% premium to the current figure for regional concrete players. We think
the premium is warranted as WIKA has the largest capacity in Indonesia for various precast concrete products. Risks to our
call include lower-than-expected orders and competitors’ abilities to secure plant locations outside Java.
Exhibit 18. WTON’s earnings revisions
Old New Change (%)
2014F 2015F 2016F 2014F 2015F 2016F 2014F 2015F 2016F
Revenue (IDRb) 3,152 4,194 5,113 3,161 4,122 5,206 0.3 (1.7) 1.8
Gross Profit (IDRb) 451 606 746 453 601 759 0.3 (0.9) 1.8
Gross margin (%) 14.3 14.5 14.6 14.3 14.6 14.6
Opt profit (IDRb) 390 530 650 393 523 661 0.7 (1.3) 1.6
Opt margin (%) 12.4 12.6 12.7 12.4 12.7 12.7
Net profit (IDRb) 302 390 498 295 398 499 (2.6) 2.1 0.1
Net margin (%) 9.6 9.3 9.7 9.3 9.7 9.6
EPS (IDR) 38 45 57 37 46 57 (2.6) 2.1 0.1 Source: Bahana estimates
9 January 2015
PT Bahana Securities – Equity Research – Construction 6
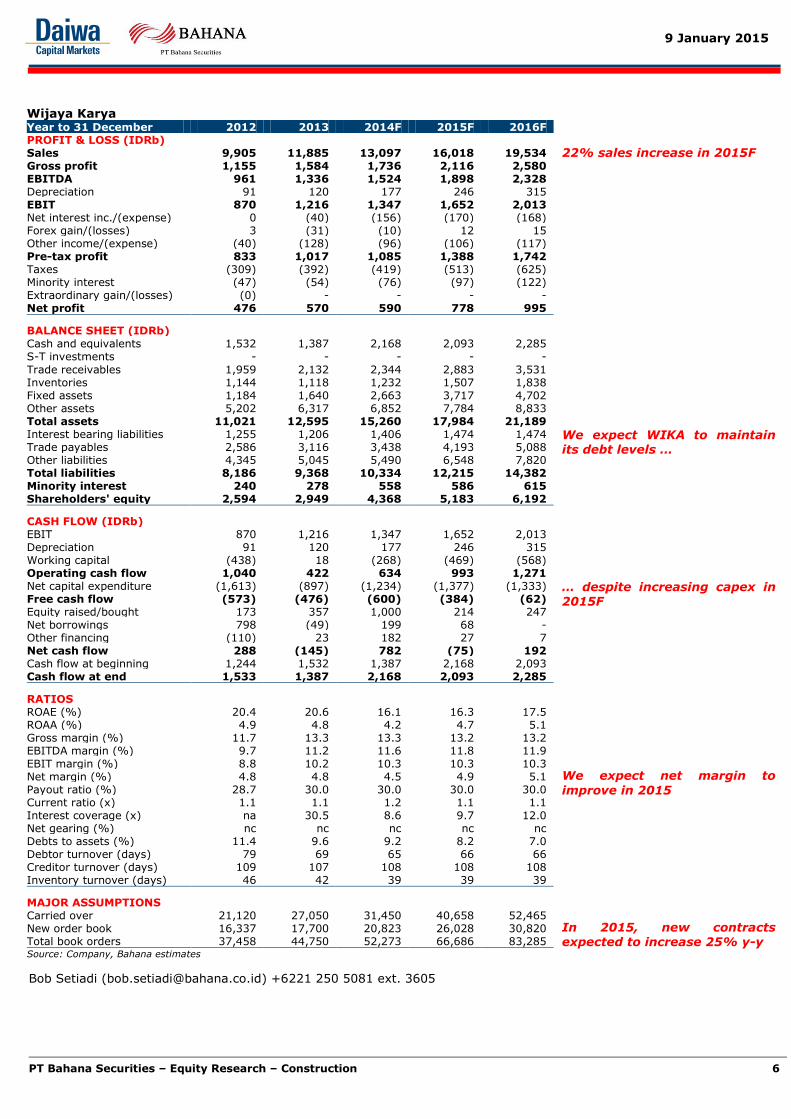
Wijaya Karya Year to 31 December 2012 2013 2014F 2015F 2016F PROFIT & LOSS (IDRb) Sales 9,905 11,885 13,097 16,018 19,534 Gross profit 1,155 1,584 1,736 2,116 2,580 EBITDA 961 1,336 1,524 1,898 2,328 Depreciation 91 120 177 246 315 EBIT 870 1,216 1,347 1,652 2,013 Net interest inc./(expense) 0 (40) (156) (170) (168) Forex gain/(losses) 3 (31) (10) 12 15 Other income/(expense) (40) (128) (96) (106) (117) Pre-tax profit 833 1,017 1,085 1,388 1,742 Taxes (309) (392) (419) (513) (625) Minority interest (47) (54) (76) (97) (122) Extraordinary gain/(losses) (0) - - - - Net profit 476 570 590 778 995
BALANCE SHEET (IDRb) Cash and equivalents 1,532 1,387 2,168 2,093 2,285 S-T investments - - - - -
Trade receivables 1,959 2,132 2,344 2,883 3,531 Inventories 1,144 1,118 1,232 1,507 1,838 Fixed assets 1,184 1,640 2,663 3,717 4,702 Other assets 5,202 6,317 6,852 7,784 8,833 Total assets 11,021 12,595 15,260 17,984 21,189 Interest bearing liabilities 1,255 1,206 1,406 1,474 1,474 Trade payables 2,586 3,116 3,438 4,193 5,088 Other liabilities 4,345 5,045 5,490 6,548 7,820 Total liabilities 8,186 9,368 10,334 12,215 14,382 Minority interest 240 278 558 586 615 Shareholders' equity 2,594 2,949 4,368 5,183 6,192
CASH FLOW (IDRb) EBIT 870 1,216 1,347 1,652 2,013 Depreciation 91 120 177 246 315 Working capital (438) 18 (268) (469) (568) Operating cash flow 1,040 422 634 993 1,271 Net capital expenditure (1,613) (897) (1,234) (1,377) (1,333) Free cash flow (573) (476) (600) (384) (62) Equity raised/bought 173 357 1,000 214 247 Net borrowings 798 (49) 199 68 - Other financing (110) 23 182 27 7 Net cash flow 288 (145) 782 (75) 192 Cash flow at beginning 1,244 1,532 1,387 2,168 2,093 Cash flow at end 1,533 1,387 2,168 2,093 2,285
RATIOS ROAE (%) 20.4 20.6 16.1 16.3 17.5 ROAA (%) 4.9 4.8 4.2 4.7 5.1 Gross margin (%) 11.7 13.3 13.3 13.2 13.2 EBITDA margin (%) 9.7 11.2 11.6 11.8 11.9 EBIT margin (%) 8.8 10.2 10.3 10.3 10.3 Net margin (%) 4.8 4.8 4.5 4.9 5.1 Payout ratio (%) 28.7 30.0 30.0 30.0 30.0 Current ratio (x) 1.1 1.1 1.2 1.1 1.1 Interest coverage (x) na 30.5 8.6 9.7 12.0 Net gearing (%) nc nc nc nc nc Debts to assets (%) 11.4 9.6 9.2 8.2 7.0 Debtor turnover (days) 79 69 65 66 66 Creditor turnover (days) 109 107 108 108 108 Inventory turnover (days) 46 42 39 39 39
MAJOR ASSUMPTIONS Carried over 21,120 27,050 31,450 40,658 52,465 New order book 16,337 17,700 20,823 26,028 30,820 Total book orders 37,458 44,750 52,273 66,686 83,285 Source: Company, Bahana estimates
22% sales increase in 2015F
We expect WIKA to maintain its debt levels …
… despite increasing capex in 2015F
We expect net margin to
improve in 2015
In 2015, new contracts expected to increase 25% y-y
Bob Setiadi ([email protected]) +6221 250 5081 ext. 3605
9 January 2015
PT Bahana Securities – Equity Research – Construction 7
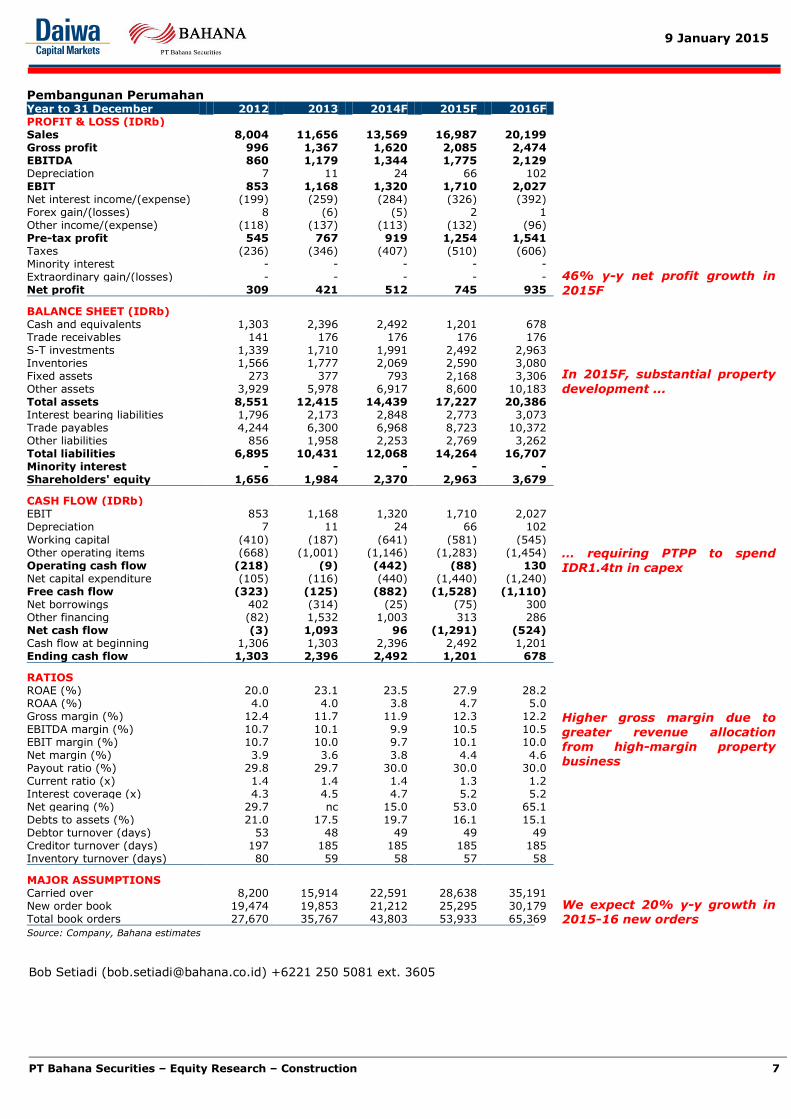
Pembangunan Perumahan Year to 31 December 2012 2013 2014F 2015F 2016F PROFIT & LOSS (IDRb) Sales 8,004 11,656 13,569 16,987 20,199 Gross profit 996 1,367 1,620 2,085 2,474 EBITDA 860 1,179 1,344 1,775 2,129 Depreciation 7 11 24 66 102 EBIT 853 1,168 1,320 1,710 2,027 Net interest income/(expense) (199) (259) (284) (326) (392) Forex gain/(losses) 8 (6) (5) 2 1 Other income/(expense) (118) (137) (113) (132) (96) Pre-tax profit 545 767 919 1,254 1,541 Taxes (236) (346) (407) (510) (606) Minority interest - - - - - Extraordinary gain/(losses) - - - - - Net profit 309 421 512 745 935
BALANCE SHEET (IDRb) Cash and equivalents 1,303 2,396 2,492 1,201 678 Trade receivables 141 176 176 176 176 S-T investments 1,339 1,710 1,991 2,492 2,963 Inventories 1,566 1,777 2,069 2,590 3,080 Fixed assets 273 377 793 2,168 3,306 Other assets 3,929 5,978 6,917 8,600 10,183 Total assets 8,551 12,415 14,439 17,227 20,386 Interest bearing liabilities 1,796 2,173 2,848 2,773 3,073 Trade payables 4,244 6,300 6,968 8,723 10,372 Other liabilities 856 1,958 2,253 2,769 3,262 Total liabilities 6,895 10,431 12,068 14,264 16,707 Minority interest - - - - - Shareholders' equity 1,656 1,984 2,370 2,963 3,679
CASH FLOW (IDRb) EBIT 853 1,168 1,320 1,710 2,027 Depreciation 7 11 24 66 102
Working capital (410) (187) (641) (581) (545) Other operating items (668) (1,001) (1,146) (1,283) (1,454) Operating cash flow (218) (9) (442) (88) 130 Net capital expenditure (105) (116) (440) (1,440) (1,240) Free cash flow (323) (125) (882) (1,528) (1,110) Net borrowings 402 (314) (25) (75) 300 Other financing (82) 1,532 1,003 313 286 Net cash flow (3) 1,093 96 (1,291) (524) Cash flow at beginning 1,306 1,303 2,396 2,492 1,201 Ending cash flow 1,303 2,396 2,492 1,201 678
RATIOS ROAE (%) 20.0 23.1 23.5 27.9 28.2 ROAA (%) 4.0 4.0 3.8 4.7 5.0 Gross margin (%) 12.4 11.7 11.9 12.3 12.2 EBITDA margin (%) 10.7 10.1 9.9 10.5 10.5 EBIT margin (%) 10.7 10.0 9.7 10.1 10.0 Net margin (%) 3.9 3.6 3.8 4.4 4.6 Payout ratio (%) 29.8 29.7 30.0 30.0 30.0 Current ratio (x) 1.4 1.4 1.4 1.3 1.2 Interest coverage (x) 4.3 4.5 4.7 5.2 5.2 Net gearing (%) 29.7 nc 15.0 53.0 65.1 Debts to assets (%) 21.0 17.5 19.7 16.1 15.1 Debtor turnover (days) 53 48 49 49 49 Creditor turnover (days) 197 185 185 185 185 Inventory turnover (days) 80 59 58 57 58
MAJOR ASSUMPTIONS Carried over 8,200 15,914 22,591 28,638 35,191 New order book 19,474 19,853 21,212 25,295 30,179 Total book orders 27,670 35,767 43,803 53,933 65,369
Source: Company, Bahana estimates
46% y-y net profit growth in
2015F
In 2015F, substantial property
development ...
… requiring PTPP to spend IDR1.4tn in capex
Higher gross margin due to greater revenue allocation from high-margin property
business
We expect 20% y-y growth in 2015-16 new orders
Bob Setiadi ([email protected]) +6221 250 5081 ext. 3605
9 January 2015
PT Bahana Securities – Equity Research – Construction 8
Source: Company, Bahana estimates
Bob Setiadi ([email protected]) +6221 250 5081 ext. 3605
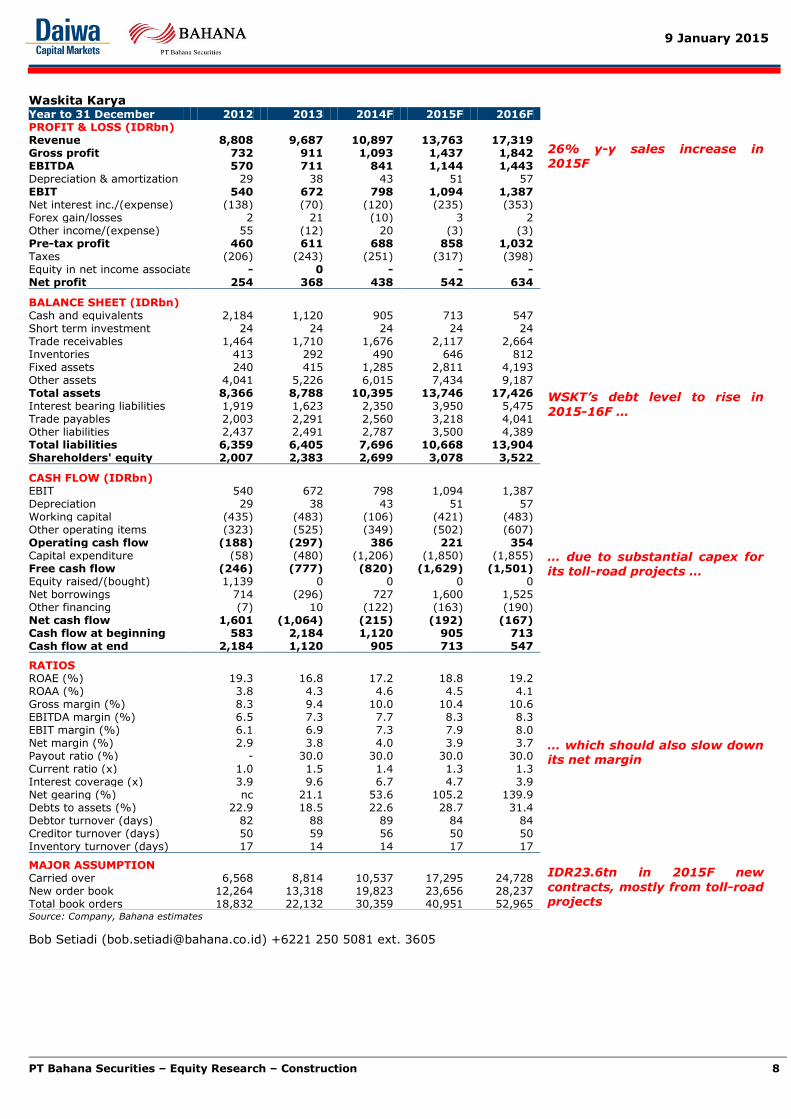
Waskita Karya
Year to 31 December 2012 2013 2014F 2015F 2016F
PROFIT & LOSS (IDRbn)
Revenue 8,808 9,687 10,897 13,763 17,319 26% y-y sales increase in 2015F
Gross profit 732 911 1,093 1,437 1,842 EBITDA 570 711 841 1,144 1,443 Depreciation & amortization 29 38 43 51 57 EBIT 540 672 798 1,094 1,387 Net interest inc./(expense) (138) (70) (120) (235) (353) Forex gain/losses 2 21 (10) 3 2 Other income/(expense) 55 (12) 20 (3) (3) Pre-tax profit 460 611 688 858 1,032 Taxes (206) (243) (251) (317) (398) Equity in net income associate - 0 - - - Net profit 254 368 438 542 634
BALANCE SHEET (IDRbn) Cash and equivalents 2,184 1,120 905 713 547
WSKT’s debt level to rise in
2015-16F …
Short term investment 24 24 24 24 24 Trade receivables 1,464 1,710 1,676 2,117 2,664 Inventories 413 292 490 646 812 Fixed assets 240 415 1,285 2,811 4,193 Other assets 4,041 5,226 6,015 7,434 9,187 Total assets 8,366 8,788 10,395 13,746 17,426 Interest bearing liabilities 1,919 1,623 2,350 3,950 5,475 Trade payables 2,003 2,291 2,560 3,218 4,041 Other liabilities 2,437 2,491 2,787 3,500 4,389 Total liabilities 6,359 6,405 7,696 10,668 13,904 Shareholders' equity 2,007 2,383 2,699 3,078 3,522
CASH FLOW (IDRbn) EBIT 540 672 798 1,094 1,387
… due to substantial capex for its toll-road projects …
Depreciation 29 38 43 51 57 Working capital (435) (483) (106) (421) (483) Other operating items (323) (525) (349) (502) (607) Operating cash flow (188) (297) 386 221 354 Capital expenditure (58) (480) (1,206) (1,850) (1,855) Free cash flow (246) (777) (820) (1,629) (1,501) Equity raised/(bought) 1,139 0 0 0 0 Net borrowings 714 (296) 727 1,600 1,525 Other financing (7) 10 (122) (163) (190) Net cash flow 1,601 (1,064) (215) (192) (167) Cash flow at beginning 583 2,184 1,120 905 713 Cash flow at end 2,184 1,120 905 713 547
RATIOS ROAE (%) 19.3 16.8 17.2 18.8 19.2
… which should also slow down its net margin
ROAA (%) 3.8 4.3 4.6 4.5 4.1 Gross margin (%) 8.3 9.4 10.0 10.4 10.6 EBITDA margin (%) 6.5 7.3 7.7 8.3 8.3 EBIT margin (%) 6.1 6.9 7.3 7.9 8.0 Net margin (%) 2.9 3.8 4.0 3.9 3.7 Payout ratio (%) - 30.0 30.0 30.0 30.0 Current ratio (x) 1.0 1.5 1.4 1.3 1.3 Interest coverage (x) 3.9 9.6 6.7 4.7 3.9 Net gearing (%) nc 21.1 53.6 105.2 139.9 Debts to assets (%) 22.9 18.5 22.6 28.7 31.4 Debtor turnover (days) 82 88 89 84 84 Creditor turnover (days) 50 59 56 50 50 Inventory turnover (days) 17 14 14 17 17
MAJOR ASSUMPTION
IDR23.6tn in 2015F new
contracts, mostly from toll-road projects
Carried over 6,568 8,814 10,537 17,295 24,728 New order book 12,264 13,318 19,823 23,656 28,237 Total book orders 18,832 22,132 30,359 40,951 52,965
9 January 2015
PT Bahana Securities – Equity Research – Construction 9
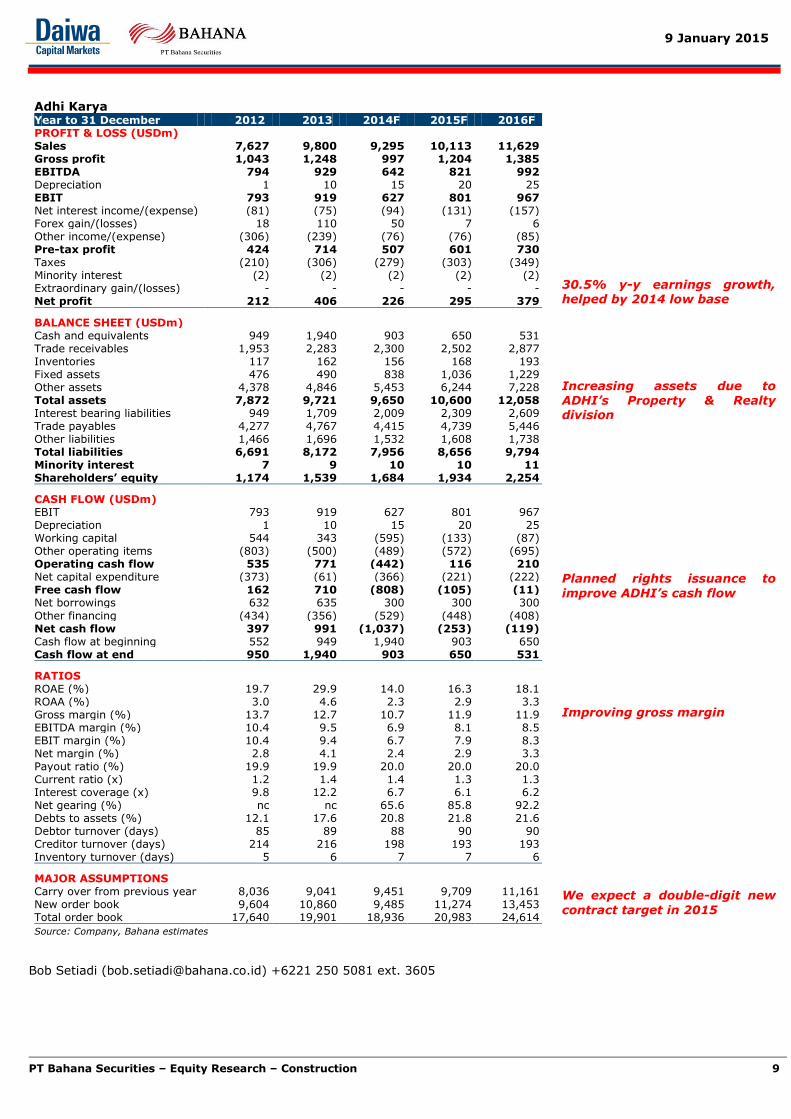
Adhi Karya Year to 31 December 2012 2013 2014F 2015F 2016F PROFIT & LOSS (USDm) Sales 7,627 9,800 9,295 10,113 11,629 Gross profit 1,043 1,248 997 1,204 1,385 EBITDA 794 929 642 821 992 Depreciation 1 10 15 20 25 EBIT 793 919 627 801 967 Net interest income/(expense) (81) (75) (94) (131) (157) Forex gain/(losses) 18 110 50 7 6 Other income/(expense) (306) (239) (76) (76) (85) Pre-tax profit 424 714 507 601 730 Taxes (210) (306) (279) (303) (349) Minority interest (2) (2) (2) (2) (2) Extraordinary gain/(losses) - - - - - Net profit 212 406 226 295 379
BALANCE SHEET (USDm) Cash and equivalents 949 1,940 903 650 531 Trade receivables 1,953 2,283 2,300 2,502 2,877 Inventories 117 162 156 168 193 Fixed assets 476 490 838 1,036 1,229 Other assets 4,378 4,846 5,453 6,244 7,228 Total assets 7,872 9,721 9,650 10,600 12,058 Interest bearing liabilities 949 1,709 2,009 2,309 2,609 Trade payables 4,277 4,767 4,415 4,739 5,446 Other liabilities 1,466 1,696 1,532 1,608 1,738 Total liabilities 6,691 8,172 7,956 8,656 9,794 Minority interest 7 9 10 10 11 Shareholders’ equity 1,174 1,539 1,684 1,934 2,254
CASH FLOW (USDm) EBIT 793 919 627 801 967 Depreciation 1 10 15 20 25 Working capital 544 343 (595) (133) (87) Other operating items (803) (500) (489) (572) (695) Operating cash flow 535 771 (442) 116 210 Net capital expenditure (373) (61) (366) (221) (222) Free cash flow 162 710 (808) (105) (11) Net borrowings 632 635 300 300 300
Other financing (434) (356) (529) (448) (408) Net cash flow 397 991 (1,037) (253) (119) Cash flow at beginning 552 949 1,940 903 650 Cash flow at end 950 1,940 903 650 531
RATIOS ROAE (%) 19.7 29.9 14.0 16.3 18.1 ROAA (%) 3.0 4.6 2.3 2.9 3.3 Gross margin (%) 13.7 12.7 10.7 11.9 11.9 EBITDA margin (%) 10.4 9.5 6.9 8.1 8.5 EBIT margin (%) 10.4 9.4 6.7 7.9 8.3 Net margin (%) 2.8 4.1 2.4 2.9 3.3 Payout ratio (%) 19.9 19.9 20.0 20.0 20.0 Current ratio (x) 1.2 1.4 1.4 1.3 1.3 Interest coverage (x) 9.8 12.2 6.7 6.1 6.2 Net gearing (%) nc nc 65.6 85.8 92.2 Debts to assets (%) 12.1 17.6 20.8 21.8 21.6 Debtor turnover (days) 85 89 88 90 90 Creditor turnover (days) 214 216 198 193 193 Inventory turnover (days) 5 6 7 7 6
MAJOR ASSUMPTIONS Carry over from previous year 8,036 9,041 9,451 9,709 11,161 New order book 9,604 10,860 9,485 11,274 13,453 Total order book 17,640 19,901 18,936 20,983 24,614
Source: Company, Bahana estimates
30.5% y-y earnings growth, helped by 2014 low base
Increasing assets due to ADHI’s Property & Realty division
Planned rights issuance to
improve ADHI’s cash flow
Improving gross margin
We expect a double-digit new
contract target in 2015
Bob Setiadi ([email protected]) +6221 250 5081 ext. 3605
9 January 2015
PT Bahana Securities – Equity Research – Construction 10
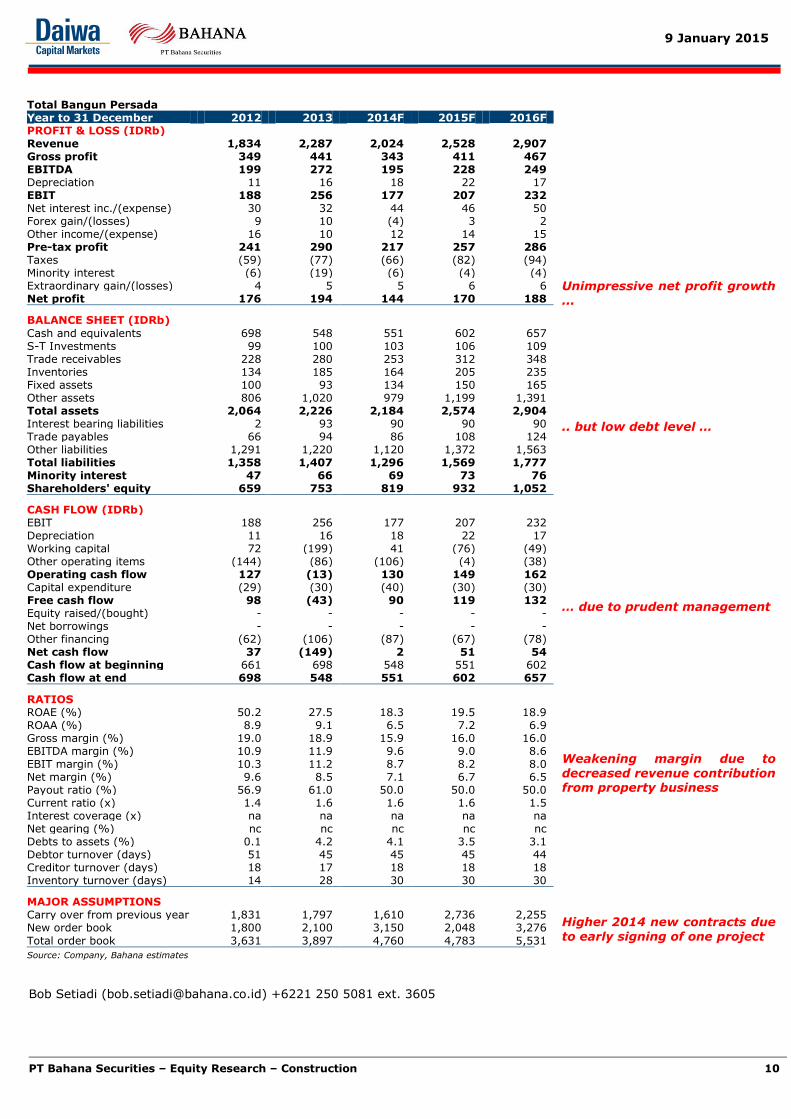
Total Bangun Persada Year to 31 December 2012 2013 2014F 2015F 2016F PROFIT & LOSS (IDRb) Revenue 1,834 2,287 2,024 2,528 2,907 Gross profit 349 441 343 411 467 EBITDA 199 272 195 228 249 Depreciation 11 16 18 22 17 EBIT 188 256 177 207 232 Net interest inc./(expense) 30 32 44 46 50 Forex gain/(losses) 9 10 (4) 3 2 Other income/(expense) 16 10 12 14 15 Pre-tax profit 241 290 217 257 286 Taxes (59) (77) (66) (82) (94) Minority interest (6) (19) (6) (4) (4) Extraordinary gain/(losses) 4 5 5 6 6 Net profit 176 194 144 170 188
BALANCE SHEET (IDRb)
Cash and equivalents 698 548 551 602 657 S-T Investments 99 100 103 106 109 Trade receivables 228 280 253 312 348 Inventories 134 185 164 205 235 Fixed assets 100 93 134 150 165 Other assets 806 1,020 979 1,199 1,391 Total assets 2,064 2,226 2,184 2,574 2,904 Interest bearing liabilities 2 93 90 90 90 Trade payables 66 94 86 108 124 Other liabilities 1,291 1,220 1,120 1,372 1,563 Total liabilities 1,358 1,407 1,296 1,569 1,777 Minority interest 47 66 69 73 76 Shareholders' equity 659 753 819 932 1,052
CASH FLOW (IDRb) EBIT 188 256 177 207 232 Depreciation 11 16 18 22 17 Working capital 72 (199) 41 (76) (49) Other operating items (144) (86) (106) (4) (38) Operating cash flow 127 (13) 130 149 162 Capital expenditure (29) (30) (40) (30) (30) Free cash flow 98 (43) 90 119 132 Equity raised/(bought) - - - - - Net borrowings - - - - - Other financing (62) (106) (87) (67) (78) Net cash flow 37 (149) 2 51 54 Cash flow at beginning 661 698 548 551 602 Cash flow at end 698 548 551 602 657
RATIOS ROAE (%) 50.2 27.5 18.3 19.5 18.9 ROAA (%) 8.9 9.1 6.5 7.2 6.9 Gross margin (%) 19.0 18.9 15.9 16.0 16.0 EBITDA margin (%) 10.9 11.9 9.6 9.0 8.6 EBIT margin (%) 10.3 11.2 8.7 8.2 8.0 Net margin (%) 9.6 8.5 7.1 6.7 6.5 Payout ratio (%) 56.9 61.0 50.0 50.0 50.0 Current ratio (x) 1.4 1.6 1.6 1.6 1.5 Interest coverage (x) na na na na na Net gearing (%) nc nc nc nc nc Debts to assets (%) 0.1 4.2 4.1 3.5 3.1 Debtor turnover (days) 51 45 45 45 44 Creditor turnover (days) 18 17 18 18 18 Inventory turnover (days) 14 28 30 30 30
MAJOR ASSUMPTIONS Carry over from previous year 1,831 1,797 1,610 2,736 2,255 New order book 1,800 2,100 3,150 2,048 3,276
Total order book 3,631 3,897 4,760 4,783 5,531
Source: Company, Bahana estimates
Unimpressive net profit growth ...
.. but low debt level …
… due to prudent management
Weakening margin due to decreased revenue contribution from property business
Higher 2014 new contracts due to early signing of one project
Bob Setiadi ([email protected]) +6221 250 5081 ext. 3605
9 January 2015
PT Bahana Securities – Equity Research – Construction 11
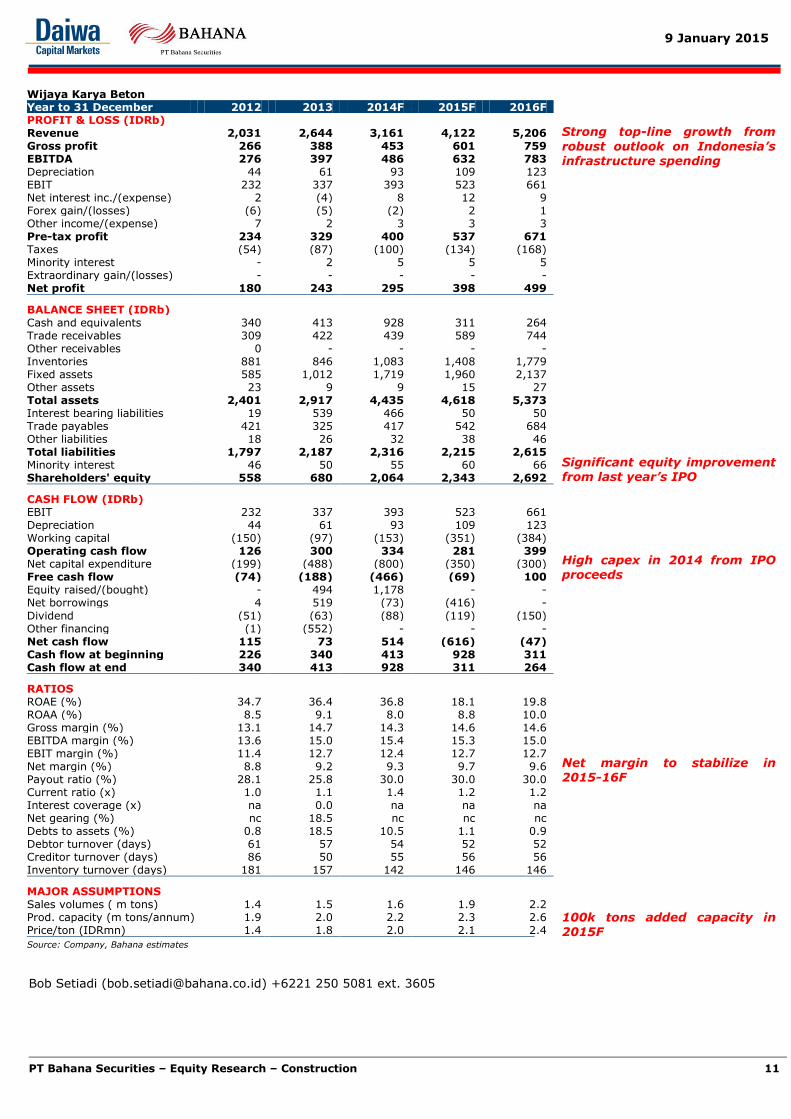
Wijaya Karya Beton Year to 31 December 2012 2013 2014F 2015F 2016F PROFIT & LOSS (IDRb) Revenue 2,031 2,644 3,161 4,122 5,206 Gross profit 266 388 453 601 759 EBITDA 276 397 486 632 783 Depreciation 44 61 93 109 123 EBIT 232 337 393 523 661 Net interest inc./(expense) 2 (4) 8 12 9 Forex gain/(losses) (6) (5) (2) 2 1 Other income/(expense) 7 2 3 3 3 Pre-tax profit 234 329 400 537 671 Taxes (54) (87) (100) (134) (168) Minority interest - 2 5 5 5 Extraordinary gain/(losses) - - - - - Net profit 180 243 295 398 499
BALANCE SHEET (IDRb) Cash and equivalents 340 413 928 311 264 Trade receivables 309 422 439 589 744 Other receivables 0 - - - - Inventories 881 846 1,083 1,408 1,779 Fixed assets 585 1,012 1,719 1,960 2,137 Other assets 23 9 9 15 27 Total assets 2,401 2,917 4,435 4,618 5,373 Interest bearing liabilities 19 539 466 50 50 Trade payables 421 325 417 542 684 Other liabilities 18 26 32 38 46 Total liabilities 1,797 2,187 2,316 2,215 2,615 Minority interest 46 50 55 60 66 Shareholders' equity 558 680 2,064 2,343 2,692
CASH FLOW (IDRb) EBIT 232 337 393 523 661 Depreciation 44 61 93 109 123 Working capital (150) (97) (153) (351) (384) Operating cash flow 126 300 334 281 399 Net capital expenditure (199) (488) (800) (350) (300) Free cash flow (74) (188) (466) (69) 100 Equity raised/(bought) - 494 1,178 - - Net borrowings 4 519 (73) (416) -
Dividend (51) (63) (88) (119) (150) Other financing (1) (552) - - - Net cash flow 115 73 514 (616) (47) Cash flow at beginning 226 340 413 928 311 Cash flow at end 340 413 928 311 264
RATIOS ROAE (%) 34.7 36.4 36.8 18.1 19.8 ROAA (%) 8.5 9.1 8.0 8.8 10.0 Gross margin (%) 13.1 14.7 14.3 14.6 14.6 EBITDA margin (%) 13.6 15.0 15.4 15.3 15.0 EBIT margin (%) 11.4 12.7 12.4 12.7 12.7 Net margin (%) 8.8 9.2 9.3 9.7 9.6 Payout ratio (%) 28.1 25.8 30.0 30.0 30.0 Current ratio (x) 1.0 1.1 1.4 1.2 1.2 Interest coverage (x) na 0.0 na na na Net gearing (%) nc 18.5 nc nc nc Debts to assets (%) 0.8 18.5 10.5 1.1 0.9 Debtor turnover (days) 61 57 54 52 52 Creditor turnover (days) 86 50 55 56 56 Inventory turnover (days) 181 157 142 146 146
MAJOR ASSUMPTIONS Sales volumes ( m tons) 1.4 1.5 1.6 1.9 2.2 Prod. capacity (m tons/annum) 1.9 2.0 2.2 2.3 2.6 Price/ton (IDRmn) 1.4 1.8 2.0 2.1 2.4
Source: Company, Bahana estimates
Strong top-line growth from
robust outlook on Indonesia’s infrastructure spending
Significant equity improvement from last year’s IPO
High capex in 2014 from IPO proceeds
Net margin to stabilize in 2015-16F
100k tons added capacity in 2015F
Bob Setiadi ([email protected]) +6221 250 5081 ext. 3605
9 January 2015
PT Bahana Securities – Equity Research – Construction 12
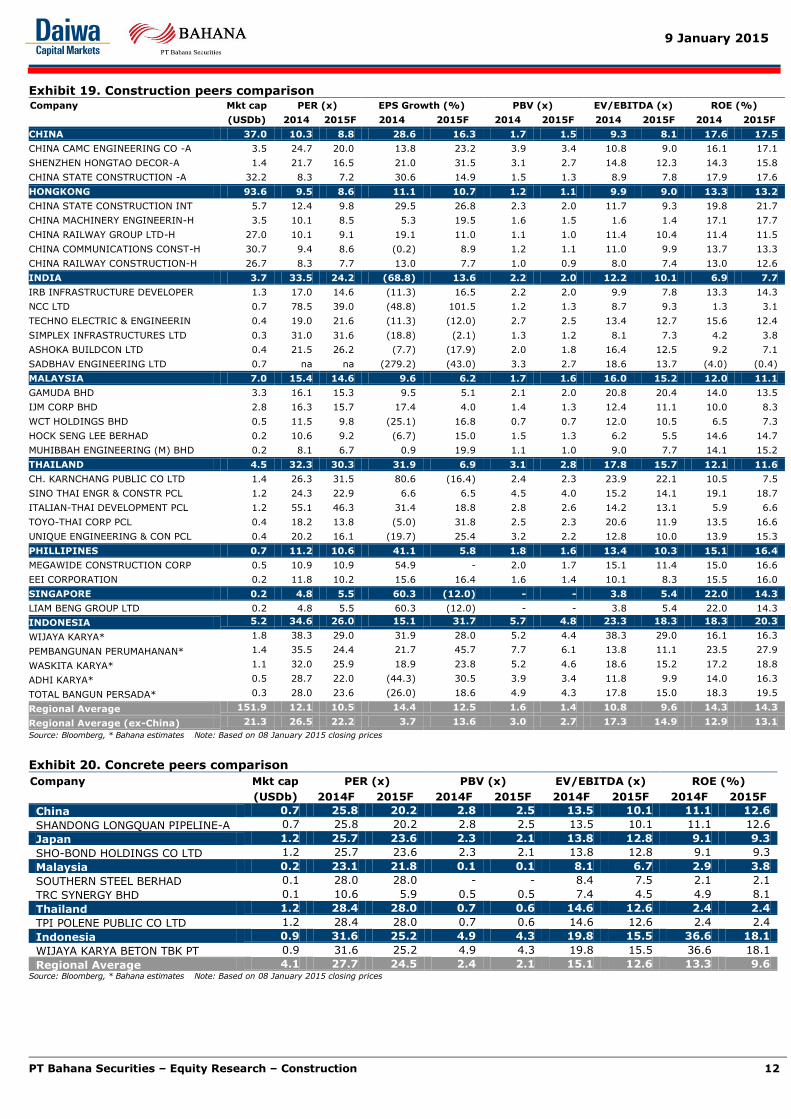
Exhibit 19. Construction peers comparison Company Mkt cap PER (x) EPS Growth (%) PBV (x) EV/EBITDA (x) ROE (%)
(USDb) 2014 2015F 2014 2015F 2014 2015F 2014 2015F 2014 2015F
CHINA 37.0 10.3 8.8 28.6 16.3 1.7 1.5 9.3 8.1 17.6 17.5
CHINA CAMC ENGINEERING CO -A 3.5 24.7 20.0 13.8 23.2 3.9 3.4 10.8 9.0 16.1 17.1
SHENZHEN HONGTAO DECOR-A 1.4 21.7 16.5 21.0 31.5 3.1 2.7 14.8 12.3 14.3 15.8
CHINA STATE CONSTRUCTION -A 32.2 8.3 7.2 30.6 14.9 1.5 1.3 8.9 7.8 17.9 17.6
HONGKONG 93.6 9.5 8.6 11.1 10.7 1.2 1.1 9.9 9.0 13.3 13.2
CHINA STATE CONSTRUCTION INT 5.7 12.4 9.8 29.5 26.8 2.3 2.0 11.7 9.3 19.8 21.7
CHINA MACHINERY ENGINEERIN-H 3.5 10.1 8.5 5.3 19.5 1.6 1.5 1.6 1.4 17.1 17.7
CHINA RAILWAY GROUP LTD-H 27.0 10.1 9.1 19.1 11.0 1.1 1.0 11.4 10.4 11.4 11.5
CHINA COMMUNICATIONS CONST-H 30.7 9.4 8.6 (0.2) 8.9 1.2 1.1 11.0 9.9 13.7 13.3
CHINA RAILWAY CONSTRUCTION-H 26.7 8.3 7.7 13.0 7.7 1.0 0.9 8.0 7.4 13.0 12.6
INDIA 3.7 33.5 24.2 (68.8) 13.6 2.2 2.0 12.2 10.1 6.9 7.7
IRB INFRASTRUCTURE DEVELOPER 1.3 17.0 14.6 (11.3) 16.5 2.2 2.0 9.9 7.8 13.3 14.3
NCC LTD 0.7 78.5 39.0 (48.8) 101.5 1.2 1.3 8.7 9.3 1.3 3.1
TECHNO ELECTRIC & ENGINEERIN 0.4 19.0 21.6 (11.3) (12.0) 2.7 2.5 13.4 12.7 15.6 12.4
SIMPLEX INFRASTRUCTURES LTD 0.3 31.0 31.6 (18.8) (2.1) 1.3 1.2 8.1 7.3 4.2 3.8
ASHOKA BUILDCON LTD 0.4 21.5 26.2 (7.7) (17.9) 2.0 1.8 16.4 12.5 9.2 7.1
SADBHAV ENGINEERING LTD 0.7 na na (279.2) (43.0) 3.3 2.7 18.6 13.7 (4.0) (0.4)
MALAYSIA 7.0 15.4 14.6 9.6 6.2 1.7 1.6 16.0 15.2 12.0 11.1
GAMUDA BHD 3.3 16.1 15.3 9.5 5.1 2.1 2.0 20.8 20.4 14.0 13.5
IJM CORP BHD 2.8 16.3 15.7 17.4 4.0 1.4 1.3 12.4 11.1 10.0 8.3
WCT HOLDINGS BHD 0.5 11.5 9.8 (25.1) 16.8 0.7 0.7 12.0 10.5 6.5 7.3
HOCK SENG LEE BERHAD 0.2 10.6 9.2 (6.7) 15.0 1.5 1.3 6.2 5.5 14.6 14.7
MUHIBBAH ENGINEERING (M) BHD 0.2 8.1 6.7 0.9 19.9 1.1 1.0 9.0 7.7 14.1 15.2
THAILAND 4.5 32.3 30.3 31.9 6.9 3.1 2.8 17.8 15.7 12.1 11.6
CH. KARNCHANG PUBLIC CO LTD 1.4 26.3 31.5 80.6 (16.4) 2.4 2.3 23.9 22.1 10.5 7.5
SINO THAI ENGR & CONSTR PCL 1.2 24.3 22.9 6.6 6.5 4.5 4.0 15.2 14.1 19.1 18.7
ITALIAN-THAI DEVELOPMENT PCL 1.2 55.1 46.3 31.4 18.8 2.8 2.6 14.2 13.1 5.9 6.6
TOYO-THAI CORP PCL 0.4 18.2 13.8 (5.0) 31.8 2.5 2.3 20.6 11.9 13.5 16.6
UNIQUE ENGINEERING & CON PCL 0.4 20.2 16.1 (19.7) 25.4 3.2 2.2 12.8 10.0 13.9 15.3
PHILLIPINES 0.7 11.2 10.6 41.1 5.8 1.8 1.6 13.4 10.3 15.1 16.4
MEGAWIDE CONSTRUCTION CORP 0.5 10.9 10.9 54.9 - 2.0 1.7 15.1 11.4 15.0 16.6
EEI CORPORATION 0.2 11.8 10.2 15.6 16.4 1.6 1.4 10.1 8.3 15.5 16.0
SINGAPORE 0.2 4.8 5.5 60.3 (12.0) - - 3.8 5.4 22.0 14.3
LIAM BENG GROUP LTD 0.2 4.8 5.5 60.3 (12.0) - - 3.8 5.4 22.0 14.3
INDONESIA 5.2 34.6 26.0 15.1 31.7 5.7 4.8 23.3 18.3 18.3 20.3
WIJAYA KARYA* 1.8 38.3 29.0 31.9 28.0 5.2 4.4 38.3 29.0 16.1 16.3
PEMBANGUNAN PERUMAHANAN* 1.4 35.5 24.4 21.7 45.7 7.7 6.1 13.8 11.1 23.5 27.9
WASKITA KARYA* 1.1 32.0 25.9 18.9 23.8 5.2 4.6 18.6 15.2 17.2 18.8
ADHI KARYA* 0.5 28.7 22.0 (44.3) 30.5 3.9 3.4 11.8 9.9 14.0 16.3
TOTAL BANGUN PERSADA* 0.3 28.0 23.6 (26.0) 18.6 4.9 4.3 17.8 15.0 18.3 19.5
Regional Average 151.9 12.1 10.5 14.4 12.5 1.6 1.4 10.8 9.6 14.3 14.3
Regional Average (ex-China) 21.3 26.5 22.2 3.7 13.6 3.0 2.7 17.3 14.9 12.9 13.1
Source: Bloomberg, * Bahana estimates Note: Based on 08 January 2015 closing prices
Exhibit 20. Concrete peers comparison
Company Mkt cap PER (x) PBV (x) EV/EBITDA (x) ROE (%)
(USDb) 2014F 2015F 2014F 2015F 2014F 2015F 2014F 2015F
China 0.7 25.8 20.2 2.8 2.5 13.5 10.1 11.1 12.6
SHANDONG LONGQUAN PIPELINE-A 0.7 25.8 20.2 2.8 2.5 13.5 10.1 11.1 12.6
Japan 1.2 25.7 23.6 2.3 2.1 13.8 12.8 9.1 9.3
SHO-BOND HOLDINGS CO LTD 1.2 25.7 23.6 2.3 2.1 13.8 12.8 9.1 9.3
Malaysia 0.2 23.1 21.8 0.1 0.1 8.1 6.7 2.9 3.8
SOUTHERN STEEL BERHAD 0.1 28.0 28.0 - - 8.4 7.5 2.1 2.1
TRC SYNERGY BHD 0.1 10.6 5.9 0.5 0.5 7.4 4.5 4.9 8.1
Thailand 1.2 28.4 28.0 0.7 0.6 14.6 12.6 2.4 2.4
TPI POLENE PUBLIC CO LTD 1.2 28.4 28.0 0.7 0.6 14.6 12.6 2.4 2.4
Indonesia 0.9 31.6 25.2 4.9 4.3 19.8 15.5 36.6 18.1
WIJAYA KARYA BETON TBK PT 0.9 31.6 25.2 4.9 4.3 19.8 15.5 36.6 18.1
Regional Average 4.1 27.7 24.5 2.4 2.1 15.1 12.6 13.3 9.6 Source: Bloomberg, * Bahana estimates Note: Based on 08 January 2015 closing prices
9 January 2015
PT Bahana Securities – Equity Research – Construction 13
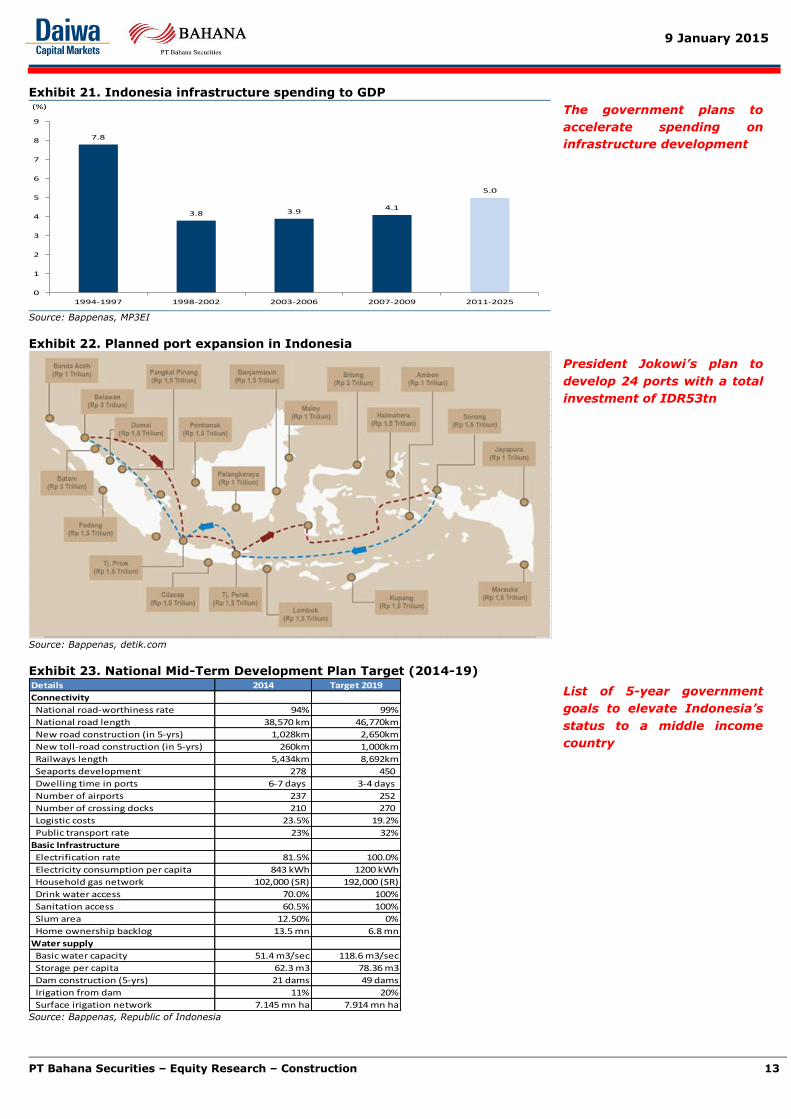
Exhibit 21. Indonesia infrastructure spending to GDP
7.8
3.8 3.94.1
5.0
0
1
2
3
4
5
6
7
8
9
1994-1997 1998-2002 2003-2006 2007-2009 2011-2025
(%)
Source: Bappenas, MP3EI
Exhibit 22. Planned port expansion in Indonesia
Source: Bappenas, detik.com
Exhibit 23. National Mid-Term Development Plan Target (2014-19) Details 2014 Target 2019
Connectivity
National road-worthiness rate 94% 99%
National road length 38,570 km 46,770km
New road construction (in 5-yrs) 1,028km 2,650km
New toll-road construction (in 5-yrs) 260km 1,000km
Railways length 5,434km 8,692km
Seaports development 278 450
Dwelling time in ports 6-7 days 3-4 days
Number of airports 237 252
Number of crossing docks 210 270
Logistic costs 23.5% 19.2%
Public transport rate 23% 32%
Basic Infrastructure
Electrification rate 81.5% 100.0%
Electricity consumption per capita 843 kWh 1200 kWh
Household gas network 102,000 (SR) 192,000 (SR)
Drink water access 70.0% 100%
Sanitation access 60.5% 100%
Slum area 12.50% 0%
Home ownership backlog 13.5 mn 6.8 mn
Water supply
Basic water capacity 51.4 m3/sec 118.6 m3/sec
Storage per capita 62.3 m3 78.36 m3
Dam construction (5-yrs) 21 dams 49 dams
Irigation from dam 11% 20%
Surface irigation network 7.145 mn ha 7.914 mn ha Source: Bappenas, Republic of Indonesia
The government plans to
accelerate spending on
infrastructure development
President Jokowi’s plan to
develop 24 ports with a total
investment of IDR53tn
List of 5-year government
goals to elevate Indonesia’s
status to a middle income
country
9 January 2015
PT Bahana Securities – Equity Research – Construction 14
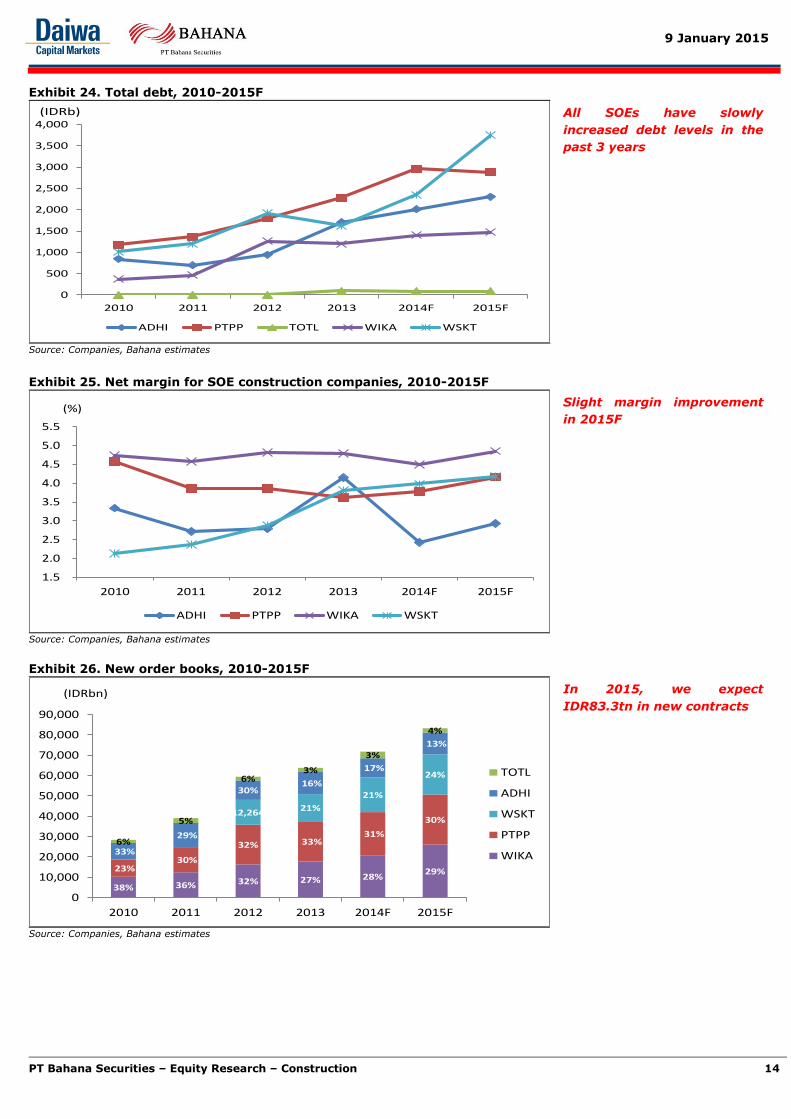
Exhibit 24. Total debt, 2010-2015F
0
500
1,000
1,500
2,000
2,500
3,000
3,500
4,000
2010 2011 2012 2013 2014F 2015F
ADHI PTPP TOTL WIKA WSKT
(IDRb)
Source: Companies, Bahana estimates
Exhibit 25. Net margin for SOE construction companies, 2010-2015F
1.5
2.0
2.5
3.0
3.5
4.0
4.5
5.0
5.5
2010 2011 2012 2013 2014F 2015F
(%)
ADHI PTPP WIKA WSKT
Source: Companies, Bahana estimates
Exhibit 26. New order books, 2010-2015F
38% 36% 32% 27% 28%29%23%
30%
32% 33%31%
30%12,264 21%
21%
24%
33%
29%
30%16%
17%
13%
6%
5%
6%3%
3%
4%
0
10,000
20,000
30,000
40,000
50,000
60,000
70,000
80,000
90,000
2010 2011 2012 2013 2014F 2015F
(IDRbn)
TOTL
ADHI
WSKT
PTPP
WIKA
Source: Companies, Bahana estimates
All SOEs have slowly
increased debt levels in the
past 3 years
Slight margin improvement
in 2015F
In 2015, we expect
IDR83.3tn in new contracts
9 January 2015
PT Bahana Securities – Equity Research – Construction 15
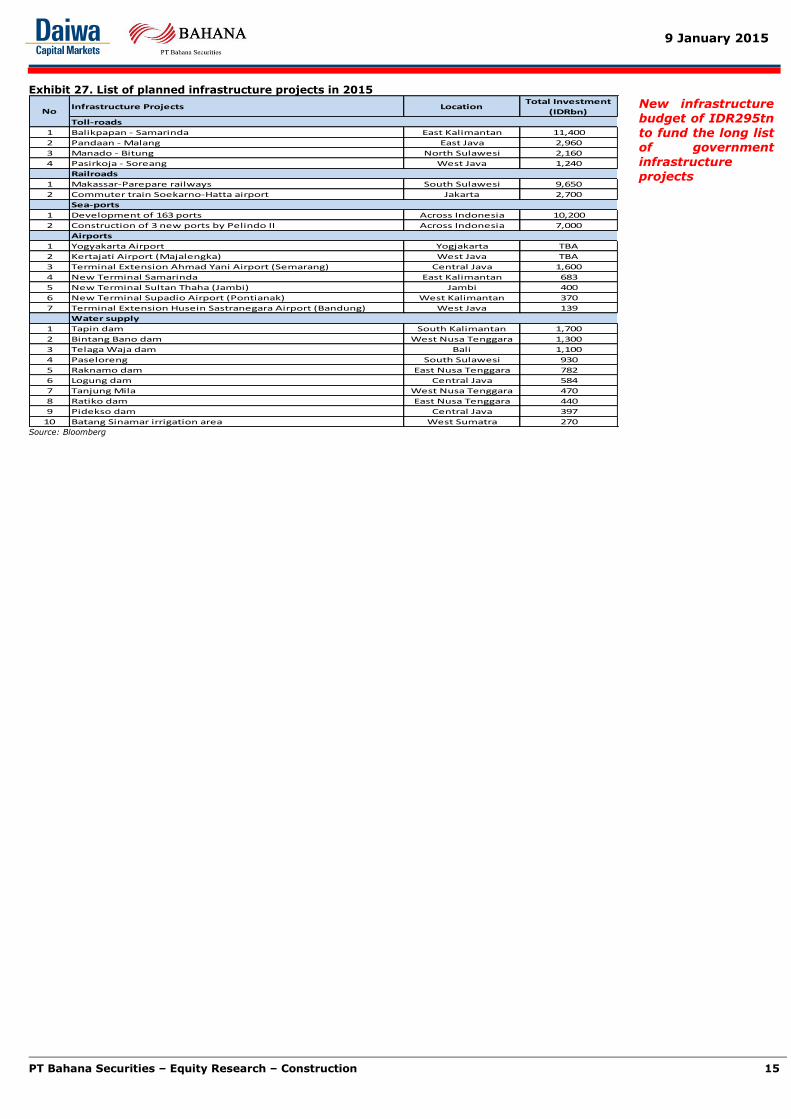
Exhibit 27. List of planned infrastructure projects in 2015
Infrastructure Projects LocationTotal Investment
(IDRbn)
Toll-roads
1 Balikpapan - Samarinda East Kalimantan 11,400
2 Pandaan - Malang East Java 2,960
3 Manado - Bitung North Sulawesi 2,160
4 Pasirkoja - Soreang West Java 1,240
Railroads
1 Makassar-Parepare railways South Sulawesi 9,650
2 Commuter train Soekarno-Hatta airport Jakarta 2,700
Sea-ports
1 Development of 163 ports Across Indonesia 10,200
2 Construction of 3 new ports by Pelindo II Across Indonesia 7,000
Airports
1 Yogyakarta Airport Yogjakarta TBA
2 Kertajati Airport (Majalengka) West Java TBA
3 Terminal Extension Ahmad Yani Airport (Semarang) Central Java 1,600
4 New Terminal Samarinda East Kalimantan 683
5 New Terminal Sultan Thaha (Jambi) Jambi 400
6 New Terminal Supadio Airport (Pontianak) West Kalimantan 370
7 Terminal Extension Husein Sastranegara Airport (Bandung) West Java 139
Water supply
1 Tapin dam South Kalimantan 1,700
2 Bintang Bano dam West Nusa Tenggara 1,300
3 Telaga Waja dam Bali 1,100
4 Paseloreng South Sulawesi 930
5 Raknamo dam East Nusa Tenggara 782
6 Logung dam Central Java 584
7 Tanjung Mila West Nusa Tenggara 470
8 Ratiko dam East Nusa Tenggara 440
9 Pidekso dam Central Java 397
10 Batang Sinamar irrigation area West Sumatra 270
No
Source: Bloomberg
New infrastructure budget of IDR295tn to fund the long list of government infrastructure projects
PT Bahana Securities – Equity Research – Construction 16
Andre Natala Susanto
[email protected] Associate
ext 3601
Chandra Widjanarka
[email protected] Analyst
ext 1252
Harry [email protected]
Senior Associate DirectorHead of Research
Strategy, Consumer
ext 3600direct: +62 21 250 5735
Dealing Room: +62 21 527 0808 (Foreign Institutional)
Teguh Hartanto
[email protected] Director
Deputy Head of Research
Banks, Cement, Aviationext 3610
Leonardo Henry Gavaza, [email protected]
Senior Research ManagerAuto, Plantations, Heavy equipment,
Telcoext 3608
Arga Samudro
[email protected] 3602
Chandra Widjanarka
[email protected] Analyst
ext 1252
+62 21 250 5508 (Domestic Institutional)
Ashish Agrawal
[email protected] President
Institutional Equity Salesext 2550 / 2553
Reynard Poernawan
[email protected] Equity Sales
ext 2528
John M. Dasaad
[email protected] Sales
ext 2549
Yohanes Adhi Handoko
[email protected], Surabaya Branch
ext 7250
Suwardi Widjaja
[email protected] Sales
ext 2548
Ricardo Silaen, CFA
[email protected] President
Institutional Equity Salesext 2524
Amelia Husada
[email protected] President
Institutional Equity Salesext 2552
Michael W Setjoadi [email protected]
Research AnalystConsumer, Poultry
ext 3613
Nurul Farida
[email protected] Sales
ext 2543
Research: +62 21 250 5081
Adrian Mahendra Putra
[email protected] AnalystIndustrial Estate
ext 3614
Hanna Marionda
[email protected] Trader
ext 2525
Adriana Kosasih
[email protected] Executive
ext 2541
Ari Santosa
[email protected] Trader
ext 2554
Adi Saputra
[email protected] Associate
ext 3693
William Tong
[email protected] Associate
ext 3604
Robin Sutanto
[email protected] Analyst
Propertyext 3620
Agustinus Reza Kirana
[email protected] AnalystTransportation
ext 3616
Wendy [email protected]
Research AnalystConsumer, Media
ext 3606
Research AnalystCement, Infratructure,Toll roads
ext 3605
Muhammad Wafi
[email protected] Analyst
ext 3609
+62 31 535 2788 (Surabaya Branch)
Arandi [email protected]
Research AnalystCoal, Metals
ext 3619
Head of Equity Sales & TradingInstitutional Equity Sales
ext 2545
Nuriah Sari
[email protected] Executive
ext 3001
Made Ayu Wijayati
[email protected] Executive
ext 3607
Sanni Satrio Dwi Utomo
[email protected] Associate
ext 3611
Andre Natala Susanto
[email protected] Associate
ext 3601
Head Office Surabaya Branch
Graha Niaga, 19th Floor Wisma BII, Ground Floor
Jl. Jend. Sudirman Kav. 58 Jl. Pemuda 60-70
Jakarta 12190 Surabaya 60271
Indonesia Indonesia
Tel. 62 21 250 5081 Tel. 62 31 535 2788 Fax. 62 21 522 6049 http://www.bahana.co.id Fax. 62 31 546 1157
PT Bahana Securities – Equity Research – Construction 17
Disclaimer This publication is prepared by PT.Bahana Securities and reviewed by Daiwa Securities Group Inc. and/or its affiliates, and distributed outside Indonesia by Daiwa Securities Group Inc. and/or its affiliates, except to the extent expressly provided herein. Certain copies of this publication may be distributed inside and outside of Indonesia by PT. Bahana Securities in accordance with relevant laws and regulations. This publication and the contents hereof are intended for information purposes only, and may be subject to change without further notice. Any use, disclosure, distribution, dissemination, copying, printing or reliance on this publication for any other purpose without our prior consent or approval is strictly prohibited. Any review does not constitute a full verification of the publication and merely provides a minimum check. Neither Daiwa Securities Group Inc. nor any of its respective parent, holding, subsidiaries or affiliates, nor any of its respective directors, officers, servants and employees, represent nor warrant the accuracy or completeness of the information contained herein or as to the existence of other facts which might be significant, and will not accept any responsibility or liability whatsoever for any use of or reliance upon this publication or any of the contents hereof. Neither this publication, nor any content hereof, constitute, or are to be construed as, an offer or solicitation of an offer to buy or sell any of the securities or investments mentioned herein in any country or jurisdiction nor, unless expressly provided, any recommendation or investment opinion or advice. Any view, recommendation, opinion or advice expressed in this publication constitutes the views of the analyst(s) named herein and does not necessarily reflect those of Daiwa Securities Group Inc. and/or its affiliates nor any of its respective directors, officers, servants and employees except where the publication states otherwise. This research report is not to be relied upon by any person in making any investment decision or otherwise advising with respect to, or dealing in, the securities mentioned, as it does not take into account the specific investment objectives, financial situation and particular needs of any person.
Neither Daiwa Securities Group Inc. nor any of its affiliates is licensed to undertake any business within the Republic of Indonesia. Any display of any trade name or logo of the Daiwa Securities Group Inc. on this publication shall not be deemed to be an undertaking of any business within the Republic of Indonesia.
Daiwa Securities Group Inc., its subsidiaries or affiliates, or its or their respective directors, officers and employees from time to time may have trades as principals, or have positions in, or have other interests in the securities of the company under research including derivatives in respect of such securities or may have also performed investment banking and other services for the issuer of such securities. The following are additional disclosures.
Japan
Daiwa Securities Co. Ltd. and Daiwa Securities Group Inc.
Daiwa Securities Co. Ltd. is a subsidiary of Daiwa Securities Group Inc.
Investment Banking Relationship
Within the preceding 12 months, The subsidiaries and/or affiliates of Daiwa Securities Group Inc. * has lead-managed public offerings and/or secondary offerings (excluding straight bonds) of the securities of the following companies: Modern Land (China) Co. Ltd (1107 HK); China Everbright Bank Company Limited (6818 HK); econtext Asia Ltd (1390 HK); Lotte Shopping Co (023530 KS); Rexlot Holdings Ltd (555 HK); Neo Solar Power Corp (3576 TT); Accordia Golf Trust (AGT SP).
*Subsidiaries of Daiwa Securities Group Inc. for the purposes of this section shall mean any one or more of:
• Daiwa Capital Markets Hong Kong Limited (大和資本市場香港有限公司)
• Daiwa Capital Markets Singapore Limited
• Daiwa Capital Markets Australia Limited
• Daiwa Capital Markets India Private Limited
• Daiwa-Cathay Capital Markets Co., Ltd.
• Daiwa Securities Capital Markets Korea Co., Ltd
Disclosure of Interest of Bahana Securities
Investment Banking Relationship
Within the preceding 12 months, Bahana Securities has lead-managed public offerings and/or secondary offerings (excluding straight bonds) of the securities of the following companies: PT Telekomunikasi Indonesia (Persero) Tbk (TLKM IJ); Garuda Indonesia (Persero) (GIAA IJ); Wijaya Karya Beton Tbk PT (WTON IJ).
Hong Kong
This research is distributed in Hong Kong by Daiwa Capital Markets Hong Kong Limited (大和資本市場香港有限公司) (“DHK”) which is regulated by the Hong Kong Securities and Futures Commission. Recipients of this research in Hong Kong may contact DHK in respect of any matter arising from or in connection with this research.
Ownership of Securities
For “Ownership of Securities” information, please visit BlueMatrix disclosure Link at https://daiwa3.bluematrix.com/sellside/Disclosures.action.
Investment Banking Relationship
For “Investment Banking Relationship”, please visit BlueMatrix disclosure Link at https://daiwa3.bluematrix.com/sellside/Disclosures.action.
Relevant Relationship (DHK)
DHK may from time to time have an individual employed by or associated with it serves as an officer of any of the companies under its research coverage.
DHK market making
DHK may from time to time make a market in the securities covered by this research.
Singapore
This research is distributed in Singapore by Daiwa Capital Markets Singapore Limited and it may only be distributed in Singapore to accredited investors, expert investors and institutional investors as defined in the Financial Advisers Regulations and the Securities and Futures Act (Chapter 289), as amended from time to time. By virtue of distribution to these category of investors, Daiwa Capital Markets Singapore Limited and its representatives are not required to comply with Section 36 of the Financial Advisers Act (Chapter 110) (Section 36 relates to disclosure of Daiwa Capital Markets Singapore Limited’s interest and/or its representative’s interest in securities). Recipients of this research in Singapore may contact Daiwa Capital Markets Singapore Limited in respect of any matter arising from or in connection with the research.
Australia
This research is distributed in Australia by Daiwa Capital Markets Stockbroking Limited and it may only be distributed in Australia to wholesale investors within the meaning of the Corporations Act. Recipients of this research in Australia may contact Daiwa Capital Markets Stockbroking Limited in respect of any matter arising from or in connection with the research.
Ownership of Securities
For “Ownership of Securities” information, please visit BlueMatrix disclosure Link at https://daiwa3.bluematrix.com/sellside/Disclosures.action.
India
This research is distributed by Daiwa Capital Markets India Private Limited (DAIWA) which is an intermediary registered with Securities & Exchange Board of India. This report is not to be considered as an offer or solicitation for any dealings in securities. While the information in this report has been compiled by DAIWA in good faith from sources believed to be reliable, no representation or warranty, express of implied, is made or given as to its accuracy, completeness or correctness. DAIWA its officers, employees, representatives and agents accept no liability whatsoever for any loss or damage whether
PT Bahana Securities – Equity Research – Construction 18
direct, indirect, consequential or otherwise howsoever arising (whether in negligence or otherwise) out of or in connection with or from any use of or reliance on the contents of and/or omissions from this document. Consequently DAIWA expressly disclaims any and all liability for, or based on or relating to any such information contained in or errors in or omissions in this report. Accordingly, you are recommended to seek your own legal, tax or other advice and should rely solely on your own judgment, review and analysis, in evaluating the information in this document. The data contained in this document is subject to change without any prior notice DAIWA reserves its right to modify this report as maybe required from time to time. DAIWA is committed to providing independent recommendations to its Clients and would be happy to provide any information in response to any query from its Clients. This report is strictly confidential and is being furnished to you solely for your information. The information contained in this document should not be reproduced (in whole or in part) or redistributed in any form to any other person. We and our group companies, affiliates, officers, directors and employees may from time to time, have long or short positions, in and buy sell the securities thereof, of company(ies) mentioned herein or be engaged in any other transactions involving such securities and earn brokerage or other compensation or act as advisor or have the potential conflict of interest with respect to any recommendation and related information or opinion. DAIWA prohibits its analyst and their family members from maintaining a financial interest in the securities or derivatives of any companies that the analyst cover. This report is not intended or directed for distribution to ,or use by any person, citizen or entity which is resident or located in any state or country or jurisdiction where such publication, distribution or use would be contrary to any statutory legislation, or regulation which would require DAIWA and its affiliates/ group companies to any registration or licensing requirements. The views expressed in the report accurately reflect the analyst’s personal views about the securities and issuers that are subject of the Report, and that no part of the analyst’s compensation was, is or will be directly or indirectly, related to the recommendations or views expressed in the Report. This report does not recommend to US recipients the use of Daiwa Capital Markets India Private Limited or any of its non – US affiliates to effect trades in any securities and is not supplied with any understanding that US recipients will direct commission business to Daiwa Capital Markets India Private Limited.
Taiwan
This research is distributed in Taiwan by Daiwa-Cathay Capital Markets Co., Ltd and it may only be distributed in Taiwan to institutional investors or specific investors who have signed recommendation contracts with Daiwa-Cathay Capital Markets Co., Ltd in accordance with the Operational Regulations Governing Securities Firms Recommending Trades in Securities to Customers. Recipients of this research in Taiwan may contact Daiwa-Cathay Capital Markets Co., Ltd in respect of any matter arising from or in connection with the research.
Philippines
This research is distributed in the Philippines by DBP-Daiwa Capital Markets Philippines, Inc. which is regulated by the Philippines Securities and Exchange
Commission and the Philippines Stock Exchange, Inc. Recipients of this research in the Philippines may contact DBP-Daiwa Capital Markets Philippines, Inc.
in respect of any matter arising from or in connection with the research. DBP-Daiwa Capital Markets Philippines, Inc. recommends that investors
independently assess, with a professional advisor, the specific financial risks as well as the legal, regulatory, tax, accounting, and other consequences of a proposed transaction. DBP-Daiwa Capital Markets Philippines, Inc. may have positions or may be materially interested in the securities in any of the markets
mentioned in the publication or may have performed other services for the issuers of such securities.
For relevant securities and trading rules please visit SEC and PSE Link at http://www.sec.gov.ph/irr/AmendedIRRfinalversion.pdf and
http://www.pse.com.ph/ respectively.
United Kingdom
This research report is produced by Daiwa Capital Markets Europe Limited and/or its affiliates and is distributed in the European Union, Iceland, Liechtenstein, Norway and Switzerland. Daiwa Capital Markets Europe Limited is authorised and regulated by The Financial Conduct Authority (“FCA”) and is a member of the London Stock Exchange, Eurex and NYSE Liffe. Daiwa Capital Markets Europe Limited and/or its affiliates may, from time to time, to the extent permitted by law, participate or invest in other financing transactions with the issuers of the securities referred to herein (the “Securities”), perform services for or solicit business from such issuers, and/or have a position or effect transactions in the Securities or options thereof and/or may have acted as an underwriter during the past twelve months for the issuer of such securities. In addition, employees of Daiwa Capital Markets Europe Limited and/or its affiliates may have positions and effect transactions in such securities or options and may serve as Directors of such issuers. Daiwa Capital Markets Europe Limited may, to the extent permitted by applicable UK law and other applicable law or regulation, effect transactions in the Securities before this material is published to recipients.
This publication is intended for investors who are not Retail Clients in the United Kingdom within the meaning of the Rules of the FCA and should not therefore be distributed to such Retail Clients in the United Kingdom. Should you enter into investment business with Daiwa Capital Markets Europe’s affiliates outside the United Kingdom, we are obliged to advise that the protection afforded by the United Kingdom regulatory system may not apply; in particular, the benefits of the Financial Services Compensation Scheme may not be available.
Daiwa Capital Markets Europe Limited has in place organisational arrangements for the prevention and avoidance of conflicts of interest. Our conflict management policy is available at http://www.uk.daiwacm.com/about-us/corporate-governance-regulatory. Regulatory disclosures of investment banking relationships are available at https://daiwa3.bluematrix.com/sellside/Disclosures.action.
Germany
This document is distributed in Germany by Daiwa Capital Markets Europe Limited, Niederlassung Frankfurt which is regulated by BaFin (Bundesanstalt fuer Finanzdienstleistungsaufsicht) for the conduct of business in Germany.
Bahrain
This research material is distributed by Daiwa Capital Markets Europe Limited, Bahrain Branch, regulated by The Central Bank of Bahrain and holds Investment Business Firm – Category 2 license and having its official place of business at the Bahrain World Trade Centre, South Tower, 7th floor, P.O. Box 30069, Manama, Kingdom of Bahrain. Tel No. +973 17534452 Fax No. +973 535113
This material is provided as a reference for making investment decisions and is not intended to be a solicitation for investment. Investment decisions should be made at your own discretion and risk. Accordingly, no representation or warranty, express or implied, is made as to and no reliance should be placed on the fairness, accuracy, completeness or correctness of the information and opinions contained in this document, Content herein is based on information available at the time the research material was prepared and may be amended or otherwise changed in the future without notice. All information is intended for the private use of the person to whom it is provided without any liability whatsoever on the part of Daiwa Capital Markets Europe Limited, Bahrain Branch, any associated company or the employees thereof. If you are in doubt about the suitability of the product or the research material itself, please consult your own financial adviser. Daiwa Capital Markets Europe Limited, Bahrain Branch retains all rights related to the content of this material, which may not be redistributed or otherwise transmitted without prior consent.
United States
This report is distributed in the U.S. by Daiwa Capital Markets America Inc. (DCMA). It may not be accurate or complete and should not be relied upon
as such. It reflects the preparer’s views at the time of its preparation, but may not reflect events occurring after its preparation; nor does it reflect
PT.Bahana Securities’ or DCMA’s views at any time. Neither PT.Bahana Securities, DCMA nor the preparer has any obligation to update this report
or to continue to prepare research on this subject. This report is not an offer to sell or the solicitation of any offer to buy securities. Unless this report says otherwise, any recommendation it makes is risky and appropriate only for sophisticated speculative investors able to incur significant losses.
Readers should consult their financial advisors to determine whether any such recommendation is consistent with their own investment objectives,
financial situation and needs. This report does not recommend to U.S. recipients the use of any of PT.Bahana Securities’ or DCMA’s non-U.S.
affiliates to effect trades in any security and is not supplied with any understanding that U.S. recipients of this report will direct commission business to
such non-U.S. entities. Unless applicable law permits otherwise, non-U.S. customers wishing to effect a transaction in any securities referenced in this
material should contact a Daiwa entity in their local jurisdiction. Most countries throughout the world have their own laws regulating the types of
securities and other investment products which may be offered to their residents, as well as a process for doing so. As a result, the securities
discussed in this report may not be eligible for sales in some jurisdictions. Customers wishing to obtain further information about this report should
contact DCMA: Daiwa Capital Markets America Inc., Financial Square, 32 Old Slip, New York, New York 10005 (telephone 212-612-7000).
PT Bahana Securities – Equity Research – Construction 19
Ownership of Securities
For “Ownership of Securities” information please visit BlueMatrix disclosure Link at https://daiwa3.bluematrix.com/sellside/Disclosures.action .
Investment Banking Relationships
For “Investment Banking Relationships” please visit BlueMatrix disclosure link at https://daiwa3.bluematrix.com/sellside/Disclosures.action .
DCMA Market Making
For “DCMA Market Making” please visit BlueMatrix disclosure link at https://daiwa3.bluematrix.com/sellside/Disclosures.action .
Research Analyst Conflicts
For updates on “Research Analyst Conflicts” please visit BlueMatrix disclosure link at https://daiwa3.bluematrix.com/sellside/Disclosures.action. The
principal research analysts who prepared this report have no financial interest in securities of the issuers covered in the report, are not (nor are any
members of their household) an officer, director or advisory board member of the issuer(s) covered in the report, and are not aware of any material
relevant conflict of interest involving the analyst or DCMA, and did not receive any compensation from the issuer during the past 12 months except as
noted: no exceptions.
Research Analyst Certification
For updates on “Research Analyst Certification” and “Rating System” please visit BlueMatrix disclosure link at https://daiwa3.bluematrix.com/sellside/Disclosures.action . The views about any and all of the subject securities and issuers expressed in this
Research Report accurately reflect the personal views of the research analyst(s) primarily responsible for this report (or the views of the firm
producing the report if no individual analysts[s] is named on the report); and no part of the compensation of such analyst(s) (or no part of the
compensation of the firm if no individual analyst[s)] is named on the report) was, is, or will be directly or indirectly related to the specific
recommendations or views contained in this Research Report.
For stocks and sectors in Indonesia covered by Bahana Securities, the following rating system is in effect:
Stock ratings are based on absolute upside or downside, which is the difference between the target price and the current market price. Unless otherwise specified, these ratings are set with a 12-month horizon. It is possible that future price volatility may cause a temporary mismatch between upside/downside for a stock based on the market price and the formal rating. "Buy": the price of the security is expected to increase by 10% or more. "Hold": the price of the security is expected to range from an increase of less than 10% to a decline of less than 5%. "Reduce": the price of the security is expected to decline by 5% or more.
Sector ratings are based on fundamentals for the sector as a whole. Hence, a sector may be rated “Overweight” even though its constituent stocks are all rated “Reduce”; and a sector may be rated “Underweight” even though its constituent stocks are all rated “Buy”. “Overweight”: positive fundamentals for the sector. “Neutral”: neither positive nor negative fundamentals for the sector. “Underweight”: negative fundamentals for the sector.
Ownership of Securities For “Ownership of Securities” information, please visit BlueMatrix disclosure Link at https://daiwa3.bluematrix.com/sellside/Disclosures.action .
Investment Banking Relationships For “Investment Banking Relationship”, please visit BlueMatrix disclosure Link at https://daiwa3.bluematrix.com/sellside/Disclosures.action . Relevant Relationships (Bahana Securities) Bahana Securities may from time to time have an individual employed by or associated with it serves as an officer of any of the companies under its research coverage.
Bahana Securities market making Bahana Securities may from time to time make a market in securities covered by this research.
Additional information may be available upon request.
Japan - additional notification items pursuant to Article 37 of the Financial Instruments and Exchange Law
(This Notification is only applicable where report is distributed by Daiwa Securities Co. Ltd.)
If you decide to enter into a business arrangement with us based on the information described in materials presented along with this document, we ask you to pay close attention to the following items.
In addition to the purchase price of a financial instrument, we will collect a trading commission* for each transaction as agreed beforehand with you. Since
commissions may be included in the purchase price or may not be charged for certain transactions, we recommend that you confirm the commission for each transaction.
In some cases, we may also charge a maximum of ¥ 2 million (including tax) per year as a standing proxy fee for our deposit of your securities, if you are
a non-resident of Japan.
For derivative and margin transactions etc., we may require collateral or margin requirements in accordance with an agreement made beforehand with
you. Ordinarily in such cases, the amount of the transaction will be in excess of the required collateral or margin requirements.
There is a risk that you will incur losses on your transactions due to changes in the market price of financial instruments based on fluctuations in interest
rates, exchange rates, stock prices, real estate prices, commodity prices, and others. In addition, depending on the content of the transaction, the loss
could exceed the amount of the collateral or margin requirements.
There may be a difference between bid price etc. and ask price etc. of OTC derivatives handled by us. Before engaging in any trading, please thoroughly confirm accounting and tax treatments regarding your trading in financial instruments with such experts
as certified public accountants.
*The amount of the trading commission cannot be stated here in advance because it will be determined between our company and you based on current market conditions and the content of each transaction etc.
When making an actual transaction, please be sure to carefully read the materials presented to you prior to the execution of agreement, and to take responsibility for your own decisions regarding the signing of the agreement with us.
Corporate Name: Daiwa Securities Co. Ltd.
Financial instruments firm: chief of Kanto Local Finance Bureau (Kin-sho) No.108
Memberships: Japan Securities Dealers Association, Financial Futures Association of Japan
Japan Securities Investment Advisers Association
Type II Financial Instruments Firms Association