Embed Size (px)
Citation preview

B2B Marketing Strategy of a Chosen Company
Bc. Olga Iogova
Master thesis 2016


ABSTRAKT
Cílem této práce je vytvoření marketingové B2B strategie pro moldavský podnik speciali-
zující se na certifikaci zboží a služeb, kontrolu kvality, inspekci a testování. I přes poměrně
úzký záběr tohoto podnikání na moldavském trhu stále existuje konkurence a proto musí
mít podnik efektivní strategii orientovanou na zákazníka. Teoretická část této práce identif-
ikuje hlavní odlišnosti mezi B2B a B2C trhy. Identifikuje také konkrétní oblasti, na které je
potřeba se při tvorbě efektivní marketingové strategie zaměřit. Druhá část obsahuje
analýzu současných aktivit podniku i situaci na trhu. Třetí část navrhuje novou marketing-
ovou strategii, která zahrnuje segmentaci, positioning a nezbytnou modifikaci marketingo-
vého mixu.
Klíčová slova: B2B strategie, marketing služeb, marketingový mix, SWOT analýza,
analýza PESTL, Porterova analýza
ABSTRACT
The aim of this project is creating B2B marketing strategy for a Moldavian company that
works in domain of certification, quality control, inspection and testing. Although the field
of activity is quite narrow and specific, competition on Moldavian market still exists and in
order to be successful company needs more effective, costumer oriented strategy.
The theoretical part describes main differences of B2B and B2C markets and particular
features, on which a B2B service company needs to focus on in order to develop an effec-
tive marketing strategy. Second part contains analysis of current company’s activities and
situation on the market. Third part suggests new marketing strategy, including segmenta-
tion, positioning and necessary modifications in marketing mix.
Keywords: b2b marketing strategy, marketing of services, marketing mix, SWOT analysis,
PESTL analysis, Porter analysis.

ACNKOWLEDGMENTS
First of all I would like to express gratitude and appreciation to my supervisor doc. Ing.
Michal Pilík, Ph.D for his guidance and support.
I wish to express thankfulness and to all my teachers and professors of FaME, Tomas Bata
University in Zlin, Czech Republic for their help, encouragement, and moral support
throughout the whole course of study.
Also I am thankful to my former colleagues and the company that provided me necessary
data and information, needed for writing this Master’s thesis.
Last but not the least I want to thank my family and friends for their moral help and kind
support.

Contents
INTRODUCTION ............................................................................................................... 9
OBJECTIVES AND METHODS OF MASTER THESIS PROCESSING .................. 10
THEORY ............................................................................................................................ 11
1 MAIN FEATURES OF B2B MARKETING ......................................................... 12
1.1 CHARACTERISTICS OF B2B MARKETS ......................................................... 12
1.1.1 DEMAND .............................................................................................................. 12
1.1.2 DECISION MAKING PROCESS ................................................................................. 13
1.1.3 RELATIONSHIPS IN B2B MARKETS ........................................................................ 15
1.1.4 MAIN TYPES OF CUSTOMERS ................................................................................. 16
1.1.5 SEGMENTATION .................................................................................................... 17
1.2 DIFFERENCES BETWEEN B2B AND B2C MARKETING ............................. 19
2 TYPES AND FEATURES OF B2B STRATEGIES .............................................. 21
2.1 CONSUMER-DRIVEN MARKETING STRATEGY .......................................... 21
2.2 RELATIONSHIP MARKETING ........................................................................... 22
2.2.1 CRM TOOLS FOR RELATIONSHIP MANAGEMENT ................................................... 23
2.3 ONE-TO-ONE MARKETING ................................................................................ 24
2.4 MULTISTRAT MODEL APPROACH FOR STRATEGY CREATION .......... 25
2.5 THE RATIONAL PLANNING APPROACH TO STRATEGY
CREATION .............................................................................................................. 25
2.6 MARKETING MIX FOR DEVELOPING STRATEGY OF A SERVICE
COMPANY ............................................................................................................... 26
2.6.1 PRODUCT .............................................................................................................. 26
2.6.2 PEOPLE ................................................................................................................. 27
2.6.3 PRICE ................................................................................................................... 27
2.6.4 PROMOTION .......................................................................................................... 28
2.6.5 PLACE .................................................................................................................. 30
2.6.6 PROCESSES ........................................................................................................... 30
2.6.7 PHYSICAL EVIDENCE ............................................................................................ 31
3 ANALYTICAL TOOLS USED FOR STRATEGY DEVELOPMENT .............. 32
3.1 BENCHMARKING .................................................................................................. 32
3.2 PORTER’S ANALYSIS........................................................................................... 33
3.3 INTERNAL AND EXTERNAL FACTORS EVALUATION .............................. 34
3.4 IFE AND EFE MATRIXES .................................................................................... 35
3.5 SPACE MATRIX ..................................................................................................... 36
3.6 SWOT MATRIX ...................................................................................................... 37
3.7 QSPM ........................................................................................................................ 37
ANALYSIS ......................................................................................................................... 38
4 COMPANY PROFILE ............................................................................................ 39
4.1 GLOBAL COMPANY CHARACTERISTICS ..................................................... 39
4.2 CHARACTERISTICS OF THE MOLDAVIAN AFFILIATE ............................ 39

4.3 COMPANY PORTFOLIO ...................................................................................... 40
4.3.1 GENERAL SERVICES PORTFOLIO ............................................................................ 40
4.3.2 DESCRIPTION OF THE SERVICES PROVIDED BY DEPARTMENTS CHOSEN FOR
THE ANALYSIS ...................................................................................................... 41
4.4 CURRENT MARKETING ACTIVITIES HELD BY MOLDAVIAN
AFFILIATE .............................................................................................................. 44
4.5 COMPETITION ANALYSIS AND BENCHMARKING .................................... 46
4.6 CURRENT CLIENTS AND SEGMENTATION .................................................. 48
4.7 SWOT ANALYSIS ................................................................................................... 48
4.7.1 IFE MATRIX .......................................................................................................... 48
4.7.2 PESTL ANALYSIS FOR EFE FACTORS DETERMINATION ........................................ 50
4.7.5 EFE FACTORS ....................................................................................................... 56
4.7.6 SPACE MATRIX ................................................................................................... 57
4.7.7 QSPM MATRIX ..................................................................................................... 60
4.7.8 PORTER’S FIVE FORCES ANALYSIS ....................................................................... 62
5 PROJECT OF B2B MARKETING STRATEGY FOR THE CHOSEN
COMPANY ......................................................................................................................... 65
5.1 OVERALL GOALS AND OBJECTIVES ............................................................. 65
5.2 TARGET MARKETS .............................................................................................. 66
5.3 DIFFERENTIATION AND POSITIONING ........................................................ 67
5.4 CRM PROGRAM .................................................................................................... 69
5.5 MARKETING MIX FOR THE CHOSEN COMPANY....................................... 70
5.5.1 PRODUCT .............................................................................................................. 70
5.5.2 PEOPLE ................................................................................................................. 72
5.5.3 PRICE ................................................................................................................... 73
5.5.4 PROMOTION .......................................................................................................... 74
5.5.5 PROCESSES ........................................................................................................... 78
5.6 TIME ANALYSIS OF PROJECT IMPLEMENTATION ................................... 79
5.7 COSTS ANALYSIS .................................................................................................. 82
5.8 RISK ANALYSIS ..................................................................................................... 83
CONCLUSION .................................................................................................................. 88
BIBLIOGRAPHY .............................................................................................................. 89
LIST OF ABBREVIATIONS ........................................................................................... 95
LIST OF FIGURES ........................................................................................................... 96
LIST OF TABLES ............................................................................................................. 97
APPENDICES .................................................................................................................... 98

TBU in Zlín, Faculty of Management and Economics 9
INTRODUCTION
For today’s competitive environment clearly defined and effective marketing strategy is
one of the most important keys to company’s success. For a B2B company it is extremely
important not only to focus on quality of their products and services but also to develop a
marketing strategy based on client’s needs, requirements and expected benefits. B2B mar-
kets differ from consumer markets in many ways that’s why B2B strategy needs to be ap-
proached differently in order to be effective and successful.
My Master’s thesis is dedicated to developing a marketing strategy for a Moldavian B2B
company, specialized in offering services of certification, quality control, inspection and
testing. The company is an affiliate of global network, which is one of the world’s leaders
in this domain. Yet, it is important to develop a separate strategy for Moldavian affiliate,
oriented to local market and its particular features.
In my project I focused on two departments chosen together with company’s management.
These departments are providing certification services according to international quality
standards and have the greatest potential of development. As Moldavian companies get
more oriented towards European markets, it is necessary for them to prove that their prod-
ucts or services are in conformity with international quality requirements. That’s why ser-
vices of chosen company become more demanded and it is important to elaborate a clearly
defined marketing strategy that will increase awareness of the company and its services
and will help to gain a bigger market share.
The project aims to analyze current situation on the market, company’s present position
and marketing activities and to suggest new target segments, differentiation, positioning
and services marketing mix modifications that will help the company to grow market share
and increase revenues of the chosen departments.

TBU in Zlín, Faculty of Management and Economics 10
OBJECTIVES AND METHODS OF MASTER THESIS PROCESSING
The main objective of this Master thesis is to prepare the project of new B2B marketing
strategy for a chosen company.
Subsequent objectives of the master thesis are as follows:
Compile the theoretical information about B2B marketing strategy building
principles
Analyze current marketing activities of the chosen company
Prepare the project of a B2B marketing strategy for the company
Submit prepared project to risk and cost analysis
During the preparation of the project were used following tools and methods: benchmark-
ing, PESTL analysis, SWOT matrix, Space matrix, QSPM matrix, and Porter’s five forces
analysis. To conduct time analysis there was used free software WinQSB, PERT-CPM
Module.

TBU in Zlín, Faculty of Management and Economics 11
I. THEORY

TBU in Zlín, Faculty of Management and Economics 12
1 MAIN FEATURES OF B2B MARKETING
For B2B companies marketing is an essential tool for identifying market’s needs, obtaining
new costumers, obtaining growth and achieving set objectives. Ericksen, Jullens, Kataria
(2009) point out, that unlike the customer markets, business markets are often underesti-
mated with marketing focusing more on achieving product-based differentiation and cus-
tomer relationships. For such kind of companies B2B marketing mostly presented a tactical
support tool, not an integral strategy.
But contemporary tendencies that include globalization, growth of competition level,
availability of information and choices have influenced the situation. Now in order to
maintain market share, generate profit and ensure continuous growth B2B companies have
to invest more in marketing and to be in line with modern technologies and tools. (Blaney,
2013)
Hutt, Speh (2012) define business markets as “markets for products and services, local to
international, bought by businesses, government bodies, and institutions (such as hospitals)
for incorporation (for example, ingredient materials or components), for consumption (for
example, process materials, office supplies, consulting services), for use (for example, in-
stallations or equipment), or for resale.”
1.1 Characteristics of B2B markets
B2B markets have some unique characteristics that should be taken into consideration
when working with them and developing a marketing strategy. When comparing to con-
sumer goods markets, B2B markets have greater sales volumes, more complex, often cus-
tomized goods and services, a longer and more complicated decision making process and a
range of other differences. Still, B2B markets directly depend on B2C ones, because in
most of the cases households and individual buyers become the final consumers of goods
thus influencing on demand at B2B markets.
1.1.1 Demand
As was told before, the demand on B2B markets strongly depends on the situation at con-
sumer goods and services markets. Lilien (2012) describes this feature as derived demand.
In most of the cases direct demand for B2B products is fairly inelastic.
TBU in Zlín, Faculty of Management and Economics 13
In order to predict demand in this case companies should perform a deeper market analysis
and show understanding of current market tendencies. This task is quite complicated be-
cause companies actually are not in direct interrogation with final consumer market.
Ferrell, Niininen, Brian (2014) point out that demand on B2B market is fluctuating. It is
also caused by the dependence of B2B markets to consumer goods and services markets.
Even small changes of demand at B2C market can become a reason for some big fluctua-
tions for a range of B2B companies that form the supply chain for these goods.
Brassington, Pettitt (2006) also mention joint demand as one of the characteristics of B2B
markets. It means that demands for different B2B products in many cases are connected to
each other and B2B companies should plan their production based on coordination with
suppliers and predict behavior of other companies that can potentially impact the demand
for company’s product
1.1.2 Decision making process
People complete 57% of the purchase decision-making process before contacting a sales
representative. (BDC, 2013) Decision making process in B2B marketing differs from the
one for consumer markets. First of all, it involves more people, has more stages, and is
generally longer and more complex.
Ray Wright (2004) points out that it is very important for the company to know who is
involved into decision making process in the costumer company. Those people form so-
called decision-making unit or buying center.
It is crucial for a B2B company not only to know who is making decisions on client’s side,
but also to understand the whole decision-making process and reasons behind it. It is also
important to work over establishing good relations between company-seller and decision
making unit representatives.
Wright (2004) describes the following characteristics of a decision-making unit:
Complex structure
Many people involved
Long time to make decisions
Buying for the organizations
Mainly rational reasons for purchase
Seller may know decision making unit members for a long period

TBU in Zlín, Faculty of Management and Economics 14
High value goods, services, projects
End user will probably not be a decision maker
Krishna, Havaldar (2005) and Brennan, Canning, McDowell (2014) describe the following
roles that buying center members can play:
Table 1: Roles of buying center members (Krishna, Havaldar, 2005, Canning,
McDowell , 2014)
Buying center roles Responsibilities
Initiators Recognize need of purchasing goods or services.
Buyers Directly involved into selection and buying process and manag-
ing purchasing process overall
Users People in the company who will actually use product or service
Influencers Influence buying decisions. They can be internal members –
technical specialists, quality control staff, etc. or external spe-
cialists – as experts or consultants
Deciders People who make actual purchase decisions.
Gatekeepers Company’s members who control the information flow about the
products to the other members of buying center
It is very important for a B2B company to identify the deciders in the company. For some
routine or small purchases the buyer and the decider roles can be combined and played by
purchase manager for example. In case of new, complex and costly purchases decisions are
usually made on a higher managerial level.
B2B decision making process is usually based on many factors and therefore is more rea-
sonable than in B2C market, where people usually make choices based on emotions and
make spontaneous decisions. Consumer market is more influenced by psychological tools
used in many main advertising campaigns. (Hague, Hague, Harrison, 2015). B2B market-
ing thus has to be based on actual product or service benefits. The decision can also be
influenced by offering integral service packs, establishing closer relationship with client,
offering advantageous long-term collaboration conditions.

TBU in Zlín, Faculty of Management and Economics 15
1.1.3 Relationships in B2B markets
Relationships in B2B markets are crucial for obtaining and maintaining costumers. Usually
B2B companies have smaller number of clients that generate larger amounts of sales. In
some cases a loss of one big client can influence significantly company’s overall revenue.
So relationship marketing is one of the main aspects that have to be considered when es-
tablishing a B2B marketing strategy.
Mudie, Pirrie (2006) give several reasons of why relationship marketing is advantageous
and beneficial for service providers, some of them are relevant in case of B2B companies
which provide services:
Relationship customers tend to increase their purchases over time, consolidating their
purchases onto a preferred supplier.
Experienced customers tend to make fewer demands on the supplier and fewer
mistakes in their operation of the service. So productivity is improved and operation
costs are reduced.
Long-term customers can help to attract new customers by positive recommendations.
There is less need to offer price promotions to the group and those customers tend to
be less price-sensitive.
Relationships in B2B and B2C markets have several essential differences. For B2B mar-
kets relationship marketing plays a much more important role, requires more efforts and
attention. Main differences in relationships between buyer and seller at B2B and B2C mar-
kets are listed in table 2.
Table 2: Relationships at B2B and B2C markets (Fill, Fill, 2005)
Factor B2C B2B
Chronology Cannot be traced
Short-term
Sudden end
Can be traced to the earlier
agreements
Long-term
Continious process
Communication Minimal, impersonal More personal, both formal
and informal types used
Attachment of buyer
to seller
No attachment in most cases,
no difference for buyer from
whom to buy the product
Hugh attachment, can occur
problems in case of
switching seller
Cooperation No cooperation Joint efforts

TBU in Zlín, Faculty of Management and Economics 16
As B2B markets usually have smaller number of clients, but one client can bring high and
long-term profit, it is very important to maintain strong, personal relations with each con-
sumer, ensure a customized approach to his needs and requests and do best for ensuring
that he will have a good experience from using your product or service.
Rauyruen, Miller, Barrett (2007) point out the importance of maintaining B2B customer
loyalty to the supplier. Knowing about the degree of client’s loyalty a supplier can perform
a more effective segmentation of customers and choose a proper strategy for each segment.
Understanding the level of clients’ loyalty can also help the marketers to find ways to in-
crease it and to build stronger connections.
In order to establish good relationships buyer and seller at B2B market they should cooper-
ate, recognize each other’s problems and provide solutions for them. Seller must help the
buyer to reduce level of uncertainty that appears while making buying decisions. (Brennan,
Canning, McDowell, 2014).
1.1.4 Main types of customers
Business-to-business marketing was previously referred to as industrial marketing, but this
phrase failed to recognize the involvement of a range of other, non-industrial enterprises.
For example, governments and the not-for-profit sector also contribute a significant
amount of commercial activity. (Fill, Fill, 2005).
According to Berkowitz, Kerin, Rudelius (2011) organizational buyers are divided into
three different markets:
Industrial - companies that purchase goods and services that they transform into
other products.
Resellers - wholesalers and retailers who buy physical products and resell them
again without any reprocessing.
Government markets - state and local agencies that buy goods and services for the
constituents they serve.
Hutt, Speh (2012) give a different classification of B2B customers, which is presented in
table 3.

TBU in Zlín, Faculty of Management and Economics 17
Table 3: Classification of B2B customers (Hutt, Speh, 2012)
Commercial customers Institutional customers Governmental customers
Manufacturers
Construction companies
Service firms
Transportation companies
Selected professional groups
Wholesalers
Retailers
Schools, colleges, universi-
ties
Health-care organizations
Libraries
Foundations
Art galleries
Clinics
Federal government:
Non-defense
Defense
State governmental
Local governmental
Counties
Townships
A company should understand perfectly, which type of customers it is working with, which
groups of customers will potentially create profit.
1.1.5 Segmentation
Segmentation is an important part of each B2B marketing strategy as it allows identifying
main groups of clients, defining their needs and developing an individual program for each
group. It is even more important in case when company has different types of goods and
services or offers individual customer packages based on the specifics of a particular client.
According to Cunningham, Cunningham, Swift (1987) companies adopt segmentation
strategies for the following reasons:
Their markets are heterogeneous; that is, why different customers have different
product or service needs.
Each segment responds differently to various market appeals.
Market segmentation is consistent with marketing concept.
It means that marketing segmentation is necessary for companies that offer different prod-
ucts and services to different customer groups. But even if the products are the same for all
clients, segmentation can help to determine main groups of customers and find the most
effective approach for persuading each group.
Chandrasekar (2010) states that customer segmentation on B2B markets can be made ac-
cording to several principles common also for consumer markets:

TBU in Zlín, Faculty of Management and Economics 18
Geographical segmentation, common for B2C markets can be also applied for business
markets, as some industries can be geographically concentrated.
Demographical segmentation on B2B can include size of companies, type of business,
buying methods and other specific features.
Behavioral segmentation can include company’s attitude towards product, experience,
desired benefits and usage.
Zimmerman, Blythe (2013) point out that such demographical factors as nationality, reli-
gion, age of B2B customers are less important than in case of B2C markets. Although in
case of international B2B companies cultural differences can become a segmentation fac-
tor. Psychographic segmentation, based on consumer’s personality, lifestyle and values is
generally not applicable for B2B markets.
Coe (2003) defines 3 types of segmentation used for B2B markets:
Macrosegmentation: a general segmentation that can be made for example by industry,
types of markets.
Microsegmentation: defined micro segments are divided to smaller clusters. It is much
easier to find a marketing and a communication approach for such a cluster.
One-to-one segmentation: means marketing and communication activities developed for
one specific client. This technique is especially useful for B2B company that has small
number of clients or several big clients who need a particular marketing and communica-
tion strategy to be applied.
In B2B marketing segmentation in most cases can be based on the flowing aspects:
Geographic segmentation
Type of company
Size of company
Goods and services that client requests/ may need
Type of buying situation (new purchase, straight re-buy or modified re-buy).
(Blaney, 2013)

TBU in Zlín, Faculty of Management and Economics 19
1.2 Differences between B2b and B2C marketing
B2B and B2C markets differ in many factors, including type of and number customers,
volumes of purchases, complexity of buying decision making, interaction of seller with the
buyer and many others. Although for B2B and B2C markets the same marketing principles
may be applied, the approaches in many cases are different.
According to Brennan, Canning, McDowell (2014) key difference is the fact that in case of
B2B market the role of costumer is played by the organization. Products for B2B and B2C
markets in many cases are the same, so it can be hard to distinguish between two types of
markets using this criterion.
Hutt, Speh (2012) point out, that besides the nature of customer the difference may be in
the way costumer uses the product. Fill, Fill, (2005) mention that marketing mix is differ-
ent for B2B and B2C markets. In the below table are gathered main differences in business
and consumer markets from the point of view of main parts of marketing mix and other
significant characteristics (Fill, Fill, 2005, Zimmerman, Blythe, 2013, Hutt, Speh, 2012,
Saha, Hossain, Islam, Rodela, 2014, Blaney, 2013).
Table 4: Differences in main characteristics of B2B and B2C markets (own source)
Characteristics Consumer markets B2B markets
Pro
du
ct
Type of products Standard range Customized packages
Size of purchase Small quantities Large in value and vol-
ume
Product complexity Lower Higher
Pri
ce Price for the same prod-
ucts
Higher Lower because of high
volumes
Price sensitivity More sensitive Less sensitive
Ch
an
nel
s Channels Long Short
Supplier switching costs Limited Large
Geographic concentration Usually dispersed Often clustered
Sel
lin
g Selling process Selling product Selling customized packs
and additional services
Personal selling Used rarely Main tool

TBU in Zlín, Faculty of Management and Economics 20
Pro
moti
on
Promotional focus Psychological benefits Economic benefits
Primary promotional tool Advertising Personal selling
Buyer-seller relationship No strong attachment Personal relationship
Promotional strategies Oriented for mass-
market
Limited, customer-
specific
Branding Extensive Limited
Web integration Limited Greater
Market research Extensive Limited
Customer segmentation Complex Unsophisticated
Information about compet-
itors
Widely available Harder reachable
Dec
isio
n m
ak
ing a
nd
bu
yin
g b
ehavio
r Number of decision mak-
ers
Small Large
Decision time length and
complexity
Short and simple Long and complex
Consequences of poor
purchase
Limited Potentially critical
Nature of decision More spontaneous More rational
Number of factors influ-
encing buying
Few Many
Purchase cycle
Usually short Often long
Cost
um
ers
Purchase orientation to
satisfy
Individual and family
needs
Organizational needs
Customers Individuals Organizations
Nature of customers Homogeneity Heterogeneity
Customer base Larger More narrow
Market size Smaller overall value Larger overall value
We can see from the table 4 that there are several significantof differences in B2B and B2C
marketing, related to marketing mix and other important aspects: types of customers, char-
acter of demand, decision making process, channels, and promotion. That’s why B2B mar-
kets require different approach and specifically adopted marketing strategy.

TBU in Zlín, Faculty of Management and Economics 21
2 TYPES AND FEATURES OF B2B STRATEGIES
According to Wright (2004) strategy plays a key role in company's development and
growth. It represents set of methods and tools needed by a company to achieve its long-
term goals, remain competitive and successful. A B2B marketing strategy should be inte-
gral and cover all areas of a company. Author defines the following features of marketing
strategies:
1. Should describe how the organization will achieve its objectives.
2. Should be clearly stated and long-term oriented.
3. Should perform a coordination function for all departments and marketing activities,
directing them towards achieving necessary goals.
Hutt, Speh (2012) define several hierarchical levels of strategy:
Corporate strategy
Business-level strategy
Functional strategy
In B2B markets strategies are usually focused on customers, unique features of products
and services as well as benefits that they can give to clients. Basically, 2 main aspects are:
Tailoring products and services for creating unique value propositions and ensure
profit for both buyer and seller.
Choosing right consumer segments and establishing close relations with them.
2.1 Consumer-driven marketing strategy
Represents a type of strategy designed according to the needs of a specifically chosen seg-
ment of customers.
According to Kotler, Armstrong (2014) contemporary companies realize that they cannot
address their messages to all of the customers in the market. Or at least the message should
be adapted to each particular segment. So the companies move from mass marketing to
target marketing. They perform segmentation, select one or more segments and adopt mar-
keting strategy and mix to each of the segments.

TBU in Zlín, Faculty of Management and Economics 22
This approach is especially relevant for small or medium B2B companies that have limited
number of clients and have to tailor their strategy not only to a specific segment, but some-
times to each potential large customer.
Kotler, Armstrong (2014) define main steps of creating costumer-driven strategy:
Market segmentation – dividing market to smaller segments according to specific
and relevant criteria.
Market targeting – choosing target segments for entry depending on each
segment’s potential.
Differentiation – company should create a unique value proposition for customers
that will differentiate it from competitors on the market.
Positioning – decision on which position compared to competitors the company
will occupy for the target customers.
2.2 Relationship marketing
Relationship marketing is not a new concept. It gained popularity in 90s and has become
one of the highly used approaches that yet caused a lot of discussions and arguing. (Egan,
2008)
Gummesson (2011) defines relationship marketing as an approach to develop long-term
loyal customers and thus gaining profitability.
Nick (2011) mentions that contemporary marketing has made a shift from transactional
marketing, which focuses on just achieving point of sale to the relationship marketing. Au-
thor describes 3 types of relationship marketing strategies:
- Database marketing – generation of personalized relations with customers using
database as a source.
- Interactive marketing – tracking the history of all communication with customer and
all transactions made in order to ensure an individual approach in future. Using
customer’s feedback for improving products and services, maintaining dialogue with
clients.
- Network marketing – involves direct selling by distributors that are encouraged to
build their own distribution networks and personal relations with clients.

TBU in Zlín, Faculty of Management and Economics 23
Relationship marketing can be successfully used by B2B companies, because as it was
mentioned before the relationships between buyer and seller for this market are crucially
important. B2B companies usually have smaller amounts of clients and several big clients
that generate major profits. In this case developing a relationship marketing strategy can
help the company to maintain clients for longer time raise their loyalty level and make col-
laboration maximally successful.
Sorce (2002) mentions factors that influence loyalty and retention of customers. These are:
Loyalty programs
Special recognition programs
Affinity programs
Community programs
Knowledge-building programs.
2.2.1 CRM tools for relationship management
Even if relationship management strategy is implemented, many companies do not succeed
because of the lack of infrastructure necessary to achieve relationship management objec-
tives. That’s why CRM software becomes more popular and used for tracking and manag-
ing relations with customers. CRM software systems aim to provide all staff that interacts
with customers, access to real-time customer information and a complete history of all cus-
tomer interactions with the selling firm. This enables staff to answer external questions
about order status and quotations as well as internal questions regarding sales forecast and
relationship potential. (Nick, 2011).
Classification of CRM systems (Torggler, 2008):
Collaborative CRM – used to manage relationships with client, establishing
contacts
Transactional CRM – used for automation of sales, customer support, complaint
management, etc.
Analytical CRM – used for market and sales analysis and prediction.
The main functions of CRM software:
sales force automation
marketing automation

TBU in Zlín, Faculty of Management and Economics 24
call center support
personalizing a web site experience
sending personalized emails
CRM software can have different interface and options but their main objective is provid-
ing customers information at the right place and time, supporting customer processes and
encourage the development of long-term relationships between clients and enterprises.
(Torggler, 2008)
CRM systems should be chosen based on ROI analysis, because their implementation can
be coasty and is needed mostly in case of big number of customers. Usually they are im-
plemented in large companies that need to automate interaction with numerous clients,
maintaining personal relations at the same time.
2.3 One-to-one marketing
The main goal of many companies is attracting more customers in order to increase market
share and sales. But in some cases it is more profitable to use one-to-one marketing which
means establishing close and personal relationship with each client and selling more prod-
ucts or services to the customer.
One-to-one marketing represents an individualized approach, when the information about
the customer and his previous interactions with the company is used to build strong, per-
sonal and long-term relationships.
There are to main goals aiming by this strategy:
Reduce advertising costs through retention of customers
Increase profits through achieving customer’s loyalty (Lamb, Hair, McDaniel,
2009).
Article on forbes.com (2014) emphasizes efficiency of one-to-one marketing for a B2B
company. This market is characterized by bigger investments and revenues from each cli-
ent, so in many cases it is much more reasonable to focus marketing efforts on smaller
amount of customers and developing meaningful relationships with them.
In the article are described main steps needed to build one-by-one marketing strategy:
Build relationships

TBU in Zlín, Faculty of Management and Economics 25
Focus on individual customer
Manage customers in-between purchases
Help customers to manage their business
2.4 Multistrat model approach for strategy creation
The Multistrat model can be used for B2B companies, especially those that are operating
internationally. It takes its name from the principle of breaking down into stages the mar-
keting strategy for a business-to-business company. The strategy should be formulated on
two levels: one for the market and second one for particular costumer. These marketing
levels also should be linked to global strategy of the company.
This approach helps to link global strategy with local strategy and approach to individual
customers, which helps to unite these 3 areas and create an integral and effective plan.
(Michel, Naudé, Salle, Valla, 2002).
Figure 1: Multistrat model. (Michel, Naudé, Salle, Valla, 2002)
2.5 The rational planning approach to strategy creation
Michel, Naudé, Salle, Valla (2002) state that for successful B2B marketing strategy crea-
tion strategic planning needs to be applied. It is generally used in order to ensure competi-
tive advantage of the company. One of the ways to evaluate the competitive advantages of
a company is applying Porter’s 5 forces.

TBU in Zlín, Faculty of Management and Economics 26
Describing rational planning approach, authors suggest the following steps for its realiza-
tion:
1. External factors evaluation (opportunities and threats)
2. Internal factors evaluation (strength and weaknesses)
3. Comparison of key company’s features with competitors (benchmarking)
4. Making a summary of findings in SWOT matrix (strengths, weaknesses,
opportunities and threats).
5. Identification of strategic alternatives – different possible strategies.
6. Evaluation of strategic alternatives – testing the different possible strategies for
their efficacy in achieving organization’s goals.
7. Implementation and control of the strategy.
2.6 Marketing mix for developing strategy of a service company
For strategy development it is very important to pay attention to all parts of marketing mix
and figure out which of them need modification and improvement. For services marketing
traditional 4 Ps are substituted with 7 Ps: product, people, price, promotion, place, process-
es, and physical evidence.
2.6.1 Product
In case of a service providing company services play the role of product. According to
American Marketing Association definition, services are 'activities, benefits or satisfac-
tions which are offered for sale or are provided in connection with the sales of goods’.
(Cunningham, Cunningham, Swift, 1987)
Specific features of services:
Services are intangible
Services cannot be inventoried
Buyers are dependent on sellers
It is difficult to specify performance standards for service industries.
Talking about service as the main product there should be also mentioned quality of ser-
vices. It is crucially important and may be considered key competitive advantage of the
company. That's why services providers pay great attention to quality management, estab-

TBU in Zlín, Faculty of Management and Economics 27
lish standards and procedures for quality control, collect and evaluate costumer’s feedback
on the quality of services provided.
2.6.2 People
People are one of the main assets in every service providing company. Every employee in
some degree plays role of a marketing person. (Rao, 2011) High level of competence and
loyalty can create main competitive advantage for the company they work for.
People can play a crucial role in case of service providing company and influence in a
great way client's perception of the service quality and overall company's performance.
Usually customers may perceive personnel involved in providing a service as a part of the
service. It is very important to pay attention to such aspects of managing human resources,
as recruitment, selection, training, performance evaluation and motivation. (Winston,
Crane, 2012).
Mudie, Pirrie (2006) when talking about service companies’ development and growth refer
to the term 'emotional capital', meaning the human resources available at the company and
treating them as a valuable asset.
2.6.3 Price
Price plays an important role in positioning products or services on the market. Positioning
on B2B markets is mostly based on rational criteria, that's why setting a reasonable price
that will be advantageous also for customer is crucial. (Wright, 2004)
Pricing in service sector is often not a very well defined measure. The cost of the same
types of services can vary significantly from one company providing them to another,
based on a wide range of factors: reputation, brand name, character of personal relation-
ship, speed, credibility, etc.
Unlike the goods production companies, which can easily calculate all direct and indirect
costs for their products and choose a pricing policy, for services it is harder to determine
the price, because they are intangible.
The major cost of providing a service is labor, so the companies that use cost-oriented pric-
ing usually base their calculations based on labor time and costs. Cunningham, Swift
(1987)

TBU in Zlín, Faculty of Management and Economics 28
Hoffman, Bateson (2015) define main factors influencing price policy of service compa-
nies:
Cost-oriented pricing is more difficult for services.
In many cases consumer may not know what price he will pay for services until it is
provided.
Services tend to be characterized by high fixed-cost to variable-cost ratio.
Price can be one of the factors that mainly influences chose of supplier.
Price discrimination is a viable practice in services.
Comparing prices to competitors tends to be more difficult for services companies.
Main approaches that can be used for price strategy of a service company:
Discount pricing – offering a commissioning or discount to intermediaries.
Guaranteed pricing – when price has to be paid only after the service is provided.
High price maintenance pricing – is applied when the price is strongly associated
with quality of service (e.g. - doctors
Value based pricing – prices based on value given to the customer's segment.
(Chowhan, 2015)
Satisfaction-based pricing – appealing to the target markets that value certainty
and want to reduce the risk. Can be also based on offering guarantees and certain
unique benefits.
Relationship pricing – pricing that helps building long-lasting relationships with
customers. For example, offering better prices or larger benefits for long-term
contracts.
Efficiency pricing – appealing to the customers who seek for the best results for
the money they pay. (Hoffman, Bateson, 2015)
2.6.4 Promotion
Promotional channels for services can be the same ones as for companies that sell tangible
goods. CIM (2009) emphasizes the importance of “promotion mix” which is defined as set
of tools a business can use to reach its customers. The following tools are considered to be
parts of promotion mix:
TBU in Zlín, Faculty of Management and Economics 29
Advertising - brining a specific product or service to the attention of target customers.
In most cases it focuses on a particular product or service. Advertising tools are:
commercials, printed materials, signs, emails or mailing and others.
Public relations – unpaid communication which can be not controlled by the company,
but can be influenced by it. (Sharp, 2013)
Sales promotion – offering advantageous conditions for the customer to motivate him
to try the product. The tools used could be: advantageous pricing, coupons, sampling in
shops, contests and competitions, trade deals, etc. (Yeshin, 2006).
Direct marketing – represents direct communication between seller and customer
without any intermediaries or additional communication channels. Helps to create direct
individual relationships between seller and buyer. (Mullin, 2002).
Personal selling – one-to-one communication between seller and potential buyer, where
seller tries to find out customer’s needs and satisfy them by selling him a particular
good or service. Salesperson in this case tries to build personal relationships, identify
client’s needs, and show him advantageous of good or service, advice solution to
client’s problem. This is a relatively expensive promotional tool, but it has such
advantages, as direct contact, building relationships with customers, receiving direct
feedback from hip for services or goods improvement. (Heerden, 2008).
Promotion mix tools can ensure an effective communication with the customer that is
extremely important in today’s competitive markets. Every company chooses their own
tools for promotion mix, depending on the specifics of activities, type of target customers
and available budgets.
Companies usually apply two types of communication strategies to ensure awareness of
their services and attract customers:
Push strategies – when the company gives the client information about the
services even if he didn't request it.
Pull strategies – when company encourages the costumer to seek for his services.
(Sharp, 2013)

TBU in Zlín, Faculty of Management and Economics 30
As in many cases client is highly involved in the process of service providing and the
quality of service in many cases strongly depends on client, companies should pay great
attention to training and educating the customer in order him to be aware of how to use the
service in the most efficient way. So promotional program should be oriented not only to
attracting new customers but also to inform clients on the way of most effective service
use, train them and help them to improve their experience. (Rao, 2011).
2.6.5 Place
Distribution policy differs from the one that is used for tangible goods. There is no storage
applicable for services, as well as retailing and wholesaling – channels widely used by tan-
gible goods producers. Though another channels can be widely used by services distribu-
tors. They include electronic channels, agents, brokers, franchisers. Intangibility of ser-
vices in this case represents their benefit. It helps companies to save money on physical
channels and also allows using direct selling widely. (Rao, 2011)
2.6.6 Processes
Processes represent actual procedure, mechanisms and flow of activities through which a
service is delivered (Zeithaml, Bitner, 2007)
Process is set of activities that ensure availability and quality of the provided service.
Process efficiency describes way in which physical setting is designed technologically and
functions that are scheduled and routed to provide the services. (Rao, 2011)
The dimensions of a process’s efficiency and effectiveness:
Length: the number of steps that participants have to follow in order to affect
service delivery.
Duration: the time that elapses from the first to the last activity of the service
delivery process.
Logistical effectiveness: the degree of smoothness in the flow of the steps of the
service delivery process.

TBU in Zlín, Faculty of Management and Economics 31
2.6.7 Physical evidence
Physical evidence is defined by Zeithaml, Bitner (2007) as the setting where the service is
delivered:
Points where the service company and the customer interact
Any tangible components that facilitate performance or communication of the
service.
Role of physical evidence for service companies:
Influences the overall service perception by the customer.
Increases desire to buy the service.
Creates differentiation of the company from competitors.
Helps to build relationships.
Physical tangibles are important for services offering. Customer in many times cannot see
the service itself, but they can see the tangibles that are related to the service and form their
opinion based on them so physical evidence plays an important role in shaping client's
perceptions of the company and influencing his expectations. (Rao, 2011).

TBU in Zlín, Faculty of Management and Economics 32
3 ANALYTICAL TOOLS USED FOR STRATEGY DEVELOPMENT
3.1 Benchmarking
Prašnikar, Debeljak, Ahčan (2010) define benchmarking as a process of creating business
knowledge by comparing and analyzing business information about other companies with
the goal of improving the quality of decision-making.
Lankford (1999) states that although from the technical point of view benchmarking is
quite an easy tool, it should be taken seriously. Subjective approach and lack of relevant
information can make this tool not efficient and cause some misleading results.
Basically benchmarking represents the practice of learning from others, using their
knowledge, best practices and experience to improve the performance of the company or
certain company’s department. Benchmarking analyses performance of the company, notes
strengths and weaknesses and assesses what areas need improvement.
Lankford (1999) also define main types of benchmarking:
Strategic benchmarking. Applied on top management level. This type of
benchmarking is used for the strategies of the competitors and analyzes what exactly
makes them successful.
Competitive benchmarking - this form of benchmarking is measuring the
performance, products, and services of an organization against its direct or indirect
competitors in its own industry.
Cooperative and collaborative benchmarking - information is shared between
groups of firms. It is a brainstorming session among organizations.
Internal benchmarking - a comparison of an organization’s internal activities and
processes. Used by the company to understand strengthes and weaknesses of it’s own
products and services.
Comparison of chosen areas of the company to competitors is a widely used practice that
helps the company to define areas where improvement is needed and achieve competitive
advantage on the market. Benchmarking, when properly used, can become a powerful tool
that helps to create a successful marketing strategy and to straighten company’s positions.

TBU in Zlín, Faculty of Management and Economics 33
3.2 Porter’s analysis
Porter’s analysis is based on the assumption that an industry is influenced by five forces. In
strategic planning this model can be used for better understanding of the industry and mar-
ket where the company operates. (quickmba.com, 2010)
Porter’s five forces determine how attractive the market is from the point of view of com-
petitive intensity. Attractiveness is defined by profitability of the industry where the com-
pany operates, assessing existing risks and opportunities. (Team FME, 2013)
Five key factors the model uses to identify and evaluate potential opportunities and risks
are:
Competitive Rivalry
Threat of New Entyrances
Threat of Substitutes
Bargaining Power of Suppliers
Bargaining Power of Customers
The desctiption of the components of each force is given in the appendix I.
Two of five forces involve the buyer-supplier relationship, one from the buyer’s side and
the other from the supplier’s.
Every company’s goals include achieving profit by creating relationships with suppliers
and buyers. The main goal of the company is developing strategy that reduces power of
suppliers by using various supply channels and reducing power of buyers by offering
unique services, diversification of portfolio, good relationship management, making
switching unprofitable and other techniques.
The same approach can be applied regarding each of five above-mentioned forces in order
to achieve advantageous position on the market, reduce risks and use the opportunities that
exist.

TBU in Zlín, Faculty of Management and Economics 34
3.3 Internal and external factors evaluation
In order to build an effective strategy internal and external factors that influence overall
organization’s performance should be analyzed. Internal factors are strengths and weak-
nesses, external factors are threats and opportunities (SWOT). Main environmental issues
are summarized in form of opportunities and threats, organization’s key characteristics are
listed as strengths and weaknesses.
Internal and external factors, presented in one frame, are interconnected. For example, in
order to use an opportunity at the market company should have an internal strength for
doing it. (Sharp, 2013).
4 types of factors are analyzed:
Strength (internal factor) – what makes company better than the others, gives it a
competitive advantage and helps to attract and retain customers.
Weakness (internal factors) – what parts of company’s activities need to be
changed/ improved. What stops the company from obtaining it goals and reaching
more customers/ getting more profit, etc.
Opportunities (external factors) – external factors, such as trends, new
technologies, etc. that can be used by the company to make its performance better,
achieve goals, expand, attract new customers, etc.
Threats – external obstacles that become a barrier for the company from achieving
its goals and may create potential problems.
Strengths and Weaknesses are internal factors that can be determined by analyzing main
company’s activities, features and characteristics. Opportunities and Threats are external
factors. In order to determine it company should perform the analysis of external envi-
ronment and to understand which factors can influence its activities. For this scope can be
used PEST analysis or one of its variants.
PEST analysis includes 5 main parts:
Political factors
Economic factors

TBU in Zlín, Faculty of Management and Economics 35
Social factors
Technological factors
There also exist some extended variants of this analysis:
PESTL (legal factors are added).
PESTLE (environmental factors are added).
SPELIT (Intercultural factors are added. (mindtools.net, 2016)
For B2B marketing it is extremely important to understand external factors, related not
only to economic issues, but also social and cultural ones. Although as direct clients com-
pany has another companies and not final users of products, B2B Company’s activity
strongly relates on consumer markets which form final demand for products of B2B cli-
ents. So if there are some issues with demand on consumer market it will strongly affect
B2B companies also. Technological external factors can play role of opportunity for B2B
companies because they can result in new business services that can be offered to B2B
customers. Technological factors can become a threat in case they offer a substitute to
company’s product or service. (Sharp, 2013)
That’s why all parts of PESTL analysis should be performed and a company should pay
great attention to its external environment.
3.4 IFE and EFE matrixes
Represent the continuation of SWOT and PESTL analysis. All internal and external factors
that were determined are placed in tables. They are assigned weights from 0 to 1 according
to the importance. Sum of ratings should be equal to one. Ratings are assigned in the fol-
lowing way:
4 – to major strength for IFE table and major opportunity for EFE table
3 – to minor strength for IFE table and minor opportunity for EFE table
2 – to minor weakness for IFE table and minor threat for EFE table
1 – to major weakness for IFE table and major threat for EFE table (Ommani, 2011)
Examples of IFE and EFE matrixes are given on the figure 2.

TBU in Zlín, Faculty of Management and Economics 36
Figure 2: IFE and EFE matrix (Slideshare.net, 2016)
3.5 SPACE matrix
The strategic position and action evaluation (SPACE) matrix is a management tool used to
analyze a company’s business. It is used to determine what type of strategy a business
should undertake. (Ommani, 2011) SPACE Matrix represents a four-quadrant Framework
which indicates whether aggressive, conservative, defensive or competitive strategies are
appropriate for a given enterprise company. The SPACE Matrix Analysis is most often
employed during professional market analysis of a firm. (Bhandari, 2013).
Figure 3: SPACE matrix (Ommani, 2011)

TBU in Zlín, Faculty of Management and Economics 37
3.6 SWOT matrix
SWOT is the first step of planning and it helps planners to focus on key subjects. SWOT
method is a key tool used in businesses to formulate strategic plans. SWOT matrix com-
prises four strategic groups:
How strengths are used to take advantage of opportunities.
How weaknesses are reduced by taking advantage of opportunities.
How strengths are used to reduce the impact of threats.
How weaknesses that will make these threats a reality are addressed. (Ommani,
2011)
From the previous step (designing SPACE matrix) we can see the type of strategy that
should be used (aggressive, defensive, competitive and conservative). Based on it we will
design our strategic goals using one key internal group of factors (strengths or weaknesses)
and one key external group of factors (opportunities or threats). Example of strategy for-
mulation process is given in Appendix II.
3.7 QSPM
QSPM is used for prioritizing factors according to their importance and relevance to key
identified internal and external factors.
The relative importance of various facts, figures, trends, and data is deciding among
feasible alternative strategies to pursue is critically important in formulating strategies that
can provide major competitive advantages to the firm. (David, David, David, 2009)
In QSPM weight of each internal and external factor (from IFE and EFE matrix) are multi-
plied to attractiveness scores of each goal related to each factor (AS). The number we get
is total attractiveness score (TAS). The summ of all TAS will give us total attractiveness
score of a goal (STAS). Based on STAS goals will be prioritized. (Ommani, 2011)

TBU in Zlín, Faculty of Management and Economics 38
II. ANALYSIS

TBU in Zlín, Faculty of Management and Economics 39
4 COMPANY PROFILE
4.1 Global company characteristics
Company represents one of the world’s leaders in the domain of certification, verification
and testing. Company operates in more than 140 countries, has over 85 000 employees
working in 1800 offices all over the world.
Company’s aim is to provide services to producers, exporters, importers and other organi-
zation through all value chain, supporting their business, insuring clients’ sustainable
growth and developing.
Global network and expertise of the company help its clients reduce risk, improve efficien-
cy and ensure compliance to contractual or regulatory requirements in all manufacturing or
sourcing
Vision: company aims to sustain one of the most competitive and productive state among
service companies in the world. Company’s core competencies in inspection, verification,
testing and certification are being continuously improved to be best-in-class. Company’s
chosen markets are and will be determined by the ability to be the most competitive and to
consistently deliver unequalled service to customers.
Values: We seek to be characterized by our passion, integrity, entrepreneurialism and our
innovative spirit, as we continually strive to fulfill our vision. These values guide us in all
that we do and are the bedrock upon which our organization is built. (Company web-site,
2016)
4.2 Characteristics of the Moldavian affiliate
Company has begun its activity in the Republic of Moldova in 1993, when, together with
the Ministry of Foreign Economic Relations has organized a symposium concerning the
assistance for export and import transactions of local economic agents.
As a result of the meeting in 1994 the Moldovan Government requested the opening of
company’s affiliate in Moldova as a nongovernmental organization. Establishment of Mol-
davian affiliate was supported by the President of the Republic of Moldova and the Gov-
ernment.
TBU in Zlín, Faculty of Management and Economics 40
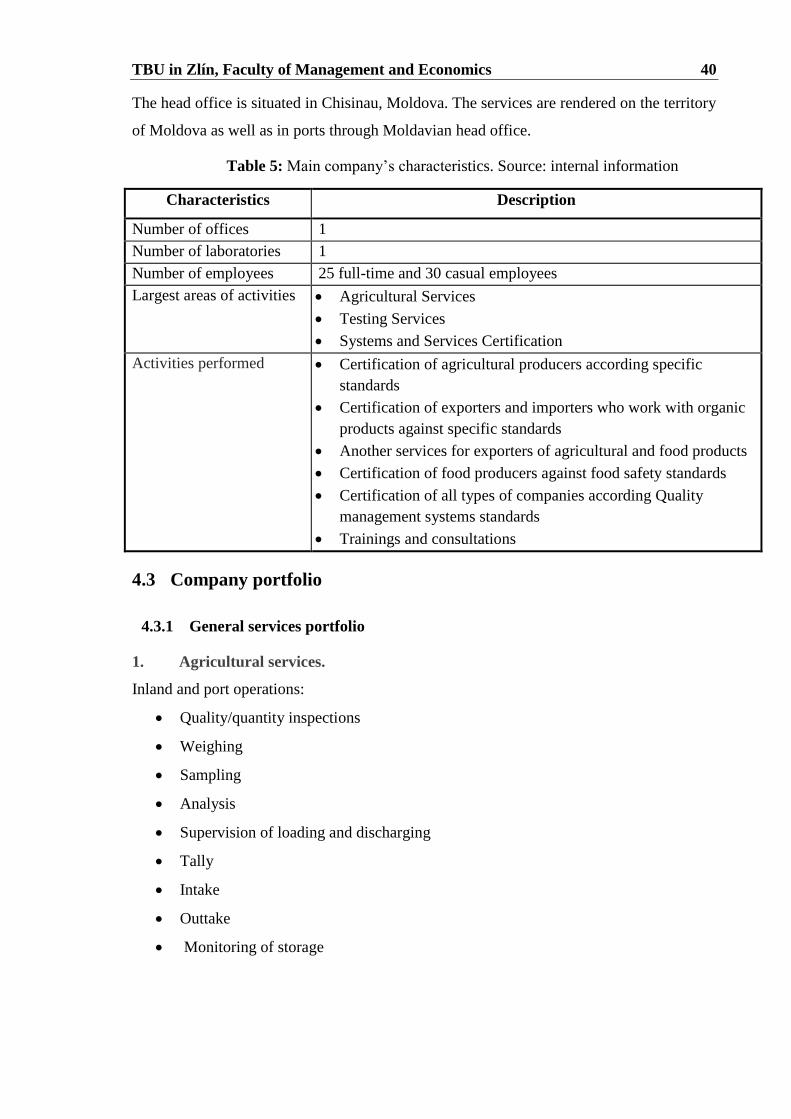
The head office is situated in Chisinau, Moldova. The services are rendered on the territory
of Moldova as well as in ports through Moldavian head office.
Table 5: Main company’s characteristics. Source: internal information
Characteristics Description
Number of offices 1
Number of laboratories 1
Number of employees 25 full-time and 30 casual employees
Largest areas of activities Agricultural Services
Testing Services
Systems and Services Certification
Activities performed
Certification of agricultural producers according specific
standards
Certification of exporters and importers who work with organic
products against specific standards
Another services for exporters of agricultural and food products
Certification of food producers against food safety standards
Certification of all types of companies according Quality
management systems standards
Trainings and consultations
4.3 Company portfolio
4.3.1 General services portfolio
1. Agricultural services.
Inland and port operations:
Quality/quantity inspections
Weighing
Sampling
Analysis
Supervision of loading and discharging
Tally
Intake
Outtake
Monitoring of storage

TBU in Zlín, Faculty of Management and Economics 41
2. Minerals services:
Certification of imported coal and exported steel raw materials.
3. Consumer testing services:
Testing
Product inspection
Process assessment
Technical assistance
ORGANIC certification
Globalgap certification
Non-GMO certification
GMP+ certification.
4. Systems & services certification.
ISO 9001
ISO 22000 certifications.
HACCP
OHSAS 18001
ISO 14001
ISO 27001
QMS Training.
5. Industrial services
GOST R certification
4.3.2 Description of the services provided by departments chosen for the analysis
For the analysis and strategy modification there were chosen 2 departments within the
company : Systems and Services Certification, Consumer Testing Services as these two
departments have the biggest potential for development and provide quite similar range of
services.
Within these two departments company provides the following types of services :
Certification of goods and services
Certification of Quality Management Systems
Trainings

TBU in Zlín, Faculty of Management and Economics 42
Consulting services
Table 6: Customer Testing Services department: range of standards (own source)
Standard Description
EU Organic
Certification of agricultural producers, processors, distribu-
tors, exporters and importers against EU standard (Organic
regulations EC 834/2007 and EC 889/2008). Standard assess-
es quality management system of the company, restricts utili-
zation of chemical and harmful substances, genetically modi-
fied organisms, hormones, antibiotics, etc. Ensures that certi-
fied products are of organic quality, don’t contain any forbid-
den harmful substances and are grown in natural conditions.
(Company’s web-site, 2016)
In Moldova such products are usually grown and certified for
export to EU countries as those products are demanded and
bought by importers for a better price.
GlobalGAP
Set of international standards for Good Agriculture Practices.
A voluntary certification that shows company’s commitment
to GlobalGAP values and rules. Standard ensures quality and
safety of agricultural products and sets up rules for production
according to principles of health and safety of workers and
environment protection. (Globalgap.org, 2016)
There are sets of standards for different types of products, but
in Moldova the most used ones are GlobalGAP for fruits and
vegetables. Farmers and exporters who get certified usually
do it with purpose to export product to European Union for a
better price.
Gmp+
GMP+ Feed Safety Assurance is a complete module for the
assurance of feed safety in all the links of the feed chain. De-
monstrable assurance of feed safety is a 'license to sell’ in
many countries and markets and participation in the GMP+
FSA module can facilitate this excellently. Based on needs in
practice, multiple components have been integrated into the
GMP+ FSA module, such as requirements for the quality
management system (ISO 9001), HACCP, product standards,
traceability, monitoring, prerequisites programs, chain ap-
proach and the Early Warning System. (Gmpplus.org, 2016)
In Moldova this standard is still gaining popularity and usual-
ly applied by producers and exporters of cereals intended to
be used as animal feed.
Non-GMO Company’s internal standard for producers that evaluates
their production methods and supply chain to ensure that the
products they produce don’t contain genetically modified

TBU in Zlín, Faculty of Management and Economics 43
Standard Description
organisms and that none of those are used during production
process. (Company’s web-site, 2016)
Product inspections and
testing.
Quality and quantity inspections of different consumer goods
according to producer’s / importer’s / exporter’s requirements
in order to assure that products are of necessary quality and
quantity and that contractual conditions during export or im-
port are respected. Include on-site inspections, weighting,
sampling, performing laboratory testing in company’s and
external laboratories, issuing reports.
Table 7: System and services certification department: range of standards (own source)
Standard Description
ISO 9001
ISO 9001:2015 sets out the criteria for a quality management
system and is the only standard in the family that can be certi-
fied to (although this is not a requirement). It can be used by
any organization, large or small, regardless of its field of ac-
tivity. In fact, there are over one million companies and or-
ganizations in over 170 countries certified to ISO 9001. This
standard is based on a number of quality management princi-
ples including a strong customer focus, the motivation and
implication of top management, the process approach and
continual improvement. (iso.org, 2016)
ISO 22000
SO 22000:2005 sets out the requirements for a food safety
management system and can be certified to. It maps out what
an organization needs to do to demonstrate its ability to con-
trol food safety hazards in order to ensure that food is safe. It
can be used by any organization regardless of its size or posi-
tion in the food chain. (iso.org, 2016)
HACCP
HACCP is a management system in which food safety is ad-
dressed through the analysis and control of biological, chemi-
cal, and physical hazards from raw material production, pro-
curement and handling, to manufacturing, distribution and
consumption of the finished product. (US FDA, 2015)
OHSAS 18001 OHSAS 18000 is an international occupational health and
safety management system specification. It comprises two
parts, 18001 and 18002 and embraces BS8800 and a number

TBU in Zlín, Faculty of Management and Economics 44
Standard Description
of other publications.
The standard helps: minimize risk to employees; improve an
existing OH&S management system; demonstrate diligence;
gain assurance; etc. (ohsas-18001-occupational-health-and-
safety.com, 2016)
ISO 14001
The ISO 14000 family of standards provides practical tools
for companies and organizations of all kinds looking to man-
age their environmental responsibilities. ISO 14001:2015 and
its supporting standards such as ISO 14006:2011 focus on
environmental systems to achieve this. The other standards in
the family focus on specific approaches such as audits, com-
munications, labeling and life cycle analysis, as well as envi-
ronmental challenges such as climate change. (iso.org, 2016)
ISO 27001
The ISO 27000 family of standards helps organizations keep
information assets secure. Using this family of standards will
help your organization manage the security of assets such as
financial information, intellectual property, employee details
or information entrusted to you by third parties. ISO/IEC
27001 is the best-known standard in the family providing
requirements for an information security management system
(ISMS). (iso.org, 2016)
4.4 Current marketing activities held by Moldavian affiliate
Marketing activities are important for the Moldavian office, because Moldavian market is
quite small and in order to meet financial objectives set it is crucial to use all possible ways
of attracting customers.
Company currently is using few types of marketing activities:
For research and identification of potential customers open databases are used.
Selected companies are added to a list and then are contacted via e-mail. After that
manager calls them and suggests company’s services. If they are interested, personal
meetings are organized. This scheme (push-tactics) is widely used, although not so
effective in this case because the company provides a range of quite specific

TBU in Zlín, Faculty of Management and Economics 45
services, so it is quite hard to convince a potential client, who initially may be not
interested, that he needs them.
Some potential clients who need this type of services contact the company by
themselves (pull-tactics). They usually find out about the company from Mass-media
or other communication channels used in marketing activities. The percentage of
conversion from potential into actual clients in this case is quite higher than in
previous one.
Main marketing communication channels and tools used:
Printed advertising (in business editions of newspapers, journals, etc.)
Database marketing
Email marketing
Telephone marketing
Occasional participation in topic related TV programs
Participation in different events (conferences, seminars, exhibitions) where
potential clients can be found
The company uses quite a wide range of channels, although not all of them are so effective.
There is also lack of modern advertising tools used: marketing via internet is done only by
email. Moldavian office doesn’t have its own locally adopted web-site and doesn’t use
social media.
Company doesn’t perform any systematic market research. There is also no research of
existing customers satisfaction level made.
There is no any CRM tools used and no clear tracking of relations with a certain costumers
is done, so in case the employee who was in contact with this client leaves, there can be
problems in recalling history of client’s relations with the company. Despite that company
showed growth in revenues and number of customers during past couple of years. It is ex-
plained by specificity of services provided, strong brand name all over the word, good
company reputation, services quality and managing relationships with existing clients.
Using a range of more relevant and efficient marketing tools and performing a market re-
search on a regular basis will help the company to obtain more clients, and proper CRM
will help to maintain them.

TBU in Zlín, Faculty of Management and Economics 46
4.5 Competition analysis and benchmarking
There are several competitors of the Company at the Moldavian market. All of them differ
by size, location and range of services so from this point of view there are no competitors
that provide exactly the same range of services as the company.
Some of the companies are situated in Moldova, other ones are located abroad in neighbor
countries (for example Romania and Ukraine) and in order to provide the services send
their auditors to the location where the company is situated.
For benchmarking analysis there were chosen 3 biggest companies who have a range of
services close to the chosen company’s and analyzed according to the selected criteria.
Table 8: Benchmarking analysis (own source)
Key factors Chosen
company
Competitor
1
Competitor
2
Competitor
3
Average
per factor
Range of services 3 4 4 3 3,5
Quality 5 4 5 4 4,5
Brand name 5 3 4 4 4
Price 3 3 3 4 3,25
Promotion:
- Web-page 3 4 0 3 2,5
- Other online
channels
3 3 3 3 3
- Offline
promotion
4 3 4 4 3,75
Speed 4 4 4 4 4
Physical place 5 4 5 3 4,25
Learning
activities
4 2 2 3 2,75

TBU in Zlín, Faculty of Management and Economics 47
Key factors Chosen
company
Competitor
1
Competitor
2
Competitor
3
Average
per factor
Consulting
activities
4 4 4 4 4
Average per
company
3,91 3,45 3,45 3,55
We can see that overall chosen company has quite strong position compared to the
competitors.
Analyzing average in categories we can see that the company is below the average
benchmark at the following factors:
- Range of services – in order to remain competitive and increase market share,
company should introduce new activities into service portfolio, after performing the
analysis of market demand.
- Web-page – it is crucially important for the company to create local affiliate’s web
page with content translated into local languages, full description of services and
affiliate’s contacts.
The following categories are very close to average so also need to be improved:
- Other online channels – recently very few marketing channels are used. This should
be improved, because online tools are necessary in modern business, may help to
attract clients and in many cases are quite cheap or can be used for free.
- Prices – are higher than those of most of the competitors. They can remain at the
same level, but stronger positioning statement is necessary, Also clearer pricing
policy and discount programs are recommended.
This should be taken into consideration when developing new marketing strategy for the
company.

TBU in Zlín, Faculty of Management and Economics 48
4.6 Current clients and segmentation
Company works with the following types of B2B customers:
- Agricultural producers
- Agricultural processing companies
- Food producers
- Exporters of agricultural and food products
- Services providing companies
- Companies of other specifics of activity
Following segmentation principles are applied:
Type of the services offered
Country where client company is situated
Currently company has around 20 permanent clients for agricultural products certification
and 30 clients for systems and services certification. Permanent clients represent 40 % of
the total number of clients served annually.
4.7 SWOT analysis
4.7.1 IFE matrix
Represent strengths and weaknesses (internal factors) of the chosen company. Summary of
internal factors evaluation is presented in table 9.

TBU in Zlín, Faculty of Management and Economics 49
Table 9: IFE factors (own source)
Internal Factors Weight Rating
Weighted
score S
tren
gth
s
Skilled human resources 0.04 4 0.16
Offering unique services on the Moldavian
market 0.06 4 0.24
Support in providing services from the offices all
over the world 0.04 4 0.16
Company’s high international reputation and
reliability 0.04 3 0.12
Quality of services provided 0.05 4 0.2
Range of services 0.03 3 0.09
Flexible timings 0.05 3 0.15
Strong position on the market 0.04 3 0.12
Permanent growth and development, high
growth rate 0.03 3 0.09
Experience in providing services 0.04 3 0.12
Distribution and sales networks 0.05 3 0.15
Brand name 0.04 4 0.16
Wide internal knowledge database 0.05 3 0.15
Total 0.56 1.91
Wea
kn
esse
s
Limited qualified workforce 0,04 2 0,08
Limited office capacity and productivity 0,04 2 0,08
Prices higher than can offer competitors 0,06 1 0,06
Weak local marketing 0,06 1 0,06
Low level of utilization of modern systems and
technologies in operating, advertising, etc. 0,06 2 0,12
Low utilization of digital marketing channels 0,05 2 0,1
Absence of company’s local web-page 0,05 1 0,05
No clearly defined pricing policy 0,05 1 0,05
No loyalty programs implemented 0,03 2 0,06
Total 0,44 0,66
Total weight score 1 2.57

TBU in Zlín, Faculty of Management and Economics 50
4.7.2 PESTL analysis for EFE factors determination
Economic factors
From the Economic point of view Moldova can be considered a developing country with
developing Economy. Recent years have rather shown stagnation, and were quite challeng-
ing for the Moldavian economy. It is based on the political situation, which highly influ-
ences country’s economic development. (imf.org, 2015)
Economic growth and the poverty reduction trend is closely correlated in Republic of Mol-
dova with the flow of remittances and consumption generated by the latter.
Total disposable income is highly influenced by the revenues of people working abroad.
Constrained by the limited capacity of domestic production, this demand was largely met
by imports of goods and services. The national public budget has benefited from this, but
the trade balance has turned into an alarming trade deficit. (worldbank.org, 2015)
Table 10: Economic indicators of Moldova in 2010-2014 (focus-economics.com, 2015)
Economic factor 2010 2011 2012 2013 2014
GDP per capita (EUR) 1,279 1,373 1,600 1,732 1,687
Econimic growth (GDP, annual
variantion in %) 7.1 6.8 -0.7 9.4 4.6
Unemployment rate 7.5 6.2 5.9 4.1 3.5
Public debt (% of GDP) 26.3 23.7 24.3 24.1 27.0
Inflacion rate (CPI, annual varia-
tion in %) 7.4 7.6 4.7 4.6 5.1
Exchange Rate (vs EUR) 16.25 15.19 16.00 17.88 18.88
Exports (USD billion) 1.5 2.2 2.2 2.4 2.3
Imports (USD billion) 3.9 5.2 5.2 5.5 5.3
Political and legal factors
Political situation in Moldova is quite unstable for the couple of recent years, which leads
to unstable situation in business markets, which strongly depend on politics. (imf.org,
2015)
Recent politics of EU integration is beneficial for the analyzed company because European
quality standards become more demanded, the trade volumes among EU and Moldova are
growing, EU is providing larger quotas for fruit and vegetable export from Moldova. All
this leads to growing number of customers for the chosen company.
TBU in Zlín, Faculty of Management and Economics 51
One more factor is legislation, especially in the domain of agricultural products and food
safety and quality. More European quality standards are adopted in Moldova and become
compulsory. More farmers and food producers are willing to implement voluntary stand-
ards to become more competitive, set higher prices for their products and find buyers
abroad.
Technological factors
Modern agricultural and food production technologies are starting to get adopted in Mol-
dova. More companies are starting to use modern equipment and technologies to achieve
higher quality of their products.
Healthy products without chemicals and harmful substances become more demanded in the
country and abroad. Organic products also gain popularity in Moldova; several Organic
shops were opened in 2014-2015. Buyer’s requirements, especially from abroad are con-
stantly growing which makes it necessary for farmers and food producers maintain higher
quality of products and implement quality management systems.
Some of the companies still prefer not to invest in development and use old equipment and
technologies, but they become not so competitive and it’s harder for them to find potential
buyers for the products. (imf.org, 2015)
One more technological change is growth of internet users which makes it easier to achieve
target auditory through digital channels.
Social factors
From social point of view we can see the migration of population. (Worldbank.org, 2015).
More people are working abroad and taking there their families. We can also see the phe-
nomena of aging of the population, because most of younger people go abroad.
Some of the people however come back to Moldova with the money earned abroad and
invest them into local business, for example agriculture. This is a positive thing because it
leads to local economy development. Often they adopt techniques seen abroad which
makes their companies competitive and ensure higher quality of their products.

TBU in Zlín, Faculty of Management and Economics 52
Table 11: PESTL analysis. Economic factors (own source)
PESTL analysis
factors Note
Potential
impact
Implication
Time
frame Type Impact
Relative
importance
Corruption Can influence overall market
situation and company`s activity
L 24+ N Decreasing Low important
Inflation rate Lowers the purchasing power of
local customers
M 24+ N Increasing Low important
Unemployment
rate
General indicator of economic
situation
L 24+ N Increasing Low important
Export Export to EU volumes are growing
which means increase of demand for
the company’s services
H 24+ P Increasing Critically Important
Import Importers are a category of
company’s potential clients
M 24+ P Increasing Low Important
Tax rates and tax
regulations
Have impact on the local business
and thus to potential number of local
clients
L 24+ N Increasing Low Important
Foreign
investments and
access to public
funding
Investing to agricultural and
production unit from local and
foreign funds have a good impact on
the number of potential exporters
M 12-24 P Increasing Low important

TBU in Zlín, Faculty of Management and Economics 53
Table 12: PESTL analysis. Political and legal factors (own source)
PESTLE
analysis factors Note
Potential
impact
Implication
Time frame Type Impact Relative importance
Unsystematic
changes
Not relevant changes during year which make
business harder. L 12-24 N Unchanged Low important
Low efficiency of
law Can affect business of company and its clients L 12-24 N Unchanged Low important
High bureaucracy Makes entrepreneurs life harder, government
needs lots of official documents. L 12-24 N Decreasing Unknown
Legislation for
agricultural and
food products
More strict legislation leads to the necessity of
providing quality control services and
implementing more strict standards
M 12-24 P Increasing Critical important
Financial support
of organic
producers
Leads to the increasing demand in organic
certification services, thus increasing number
of potential clients
M
12-24 P Increasing Critical important
Unstable political
situation
Lead to unstable financial situation and
creating undesirable conditions for the business L 12-24 N Decreasing Low important
Politics of EU
integration
Growing level of cooperation between
countries, finding new markets for Moldavian
producers, motivating them to implement
quality standards, motivating them to
implement quality standards,
M 24+ P Increasing Critical important

TBU in Zlín, Faculty of Management and Economics 54
Table 13: PESTL analysis. Technological factors (own source)
PESTLE analysis factors Note Potential
impact
Implication
Time
frame Type Impact
Relative
importance
Information and communications Placement of information in Internet and
development of effective communications
via social media and web site can increase
costumer’s loyalty and sold volumes
M 24+ P Increasing Critical im-
portant
Development of new production
technologies for healthier prod-
ucts
New technologies help to provide healthier
products to the consumer L 24+ P Increasing Low Important
Improving product quality Leads to growing number of exporters L 24+ P Increasing Low Important
Growing number of agricultural
producers willing to implement
European quality standards
Leads to higher number of potential clients
H 12-24 P Increasing Critical Im-
portant
Adopting organic production
technologies
Growing number of clients M 24+ P Increasing
Critical im-
portant
Growing quality requirements
from foreign buyers
Growing need in certification against quality
standards, performing surveys and checks H 24+ P Increasing
Critical im-
portant
Usage of old technologies and
equipment by most of the compa-
nies
Some companies don’t have enough sources
or will to improve quality of their products. L 12-24 N Decreasin
g Low important

TBU in Zlín, Faculty of Management and Economics 55
Table 14: Cultural and social factors (own source)
PESTLE analysis factors Note Potential
impact
Implication
Time
frame Type Impact
Relative
importance
Geographical area
Historically is good for growing high quality
products which creates big number of ex-
porters – our potential clients
M 24+ P Unchanged Low important
Aging of the population
Yong people have tendency to leave the
country. Older people are less flexible in
adopting new technologies and implement-
ing standards
L 24+ N Increasing Low important
Migration tendency
Less young people re willing to work and
ope business in Moldova which means that
potential market is becoming smaller
L 24+ N Increasing Low Important
People coming back from
abroad and adopting mod-
ern technologies
Influence positively potential number of
customers M 12-24 P Increasing Low important
Population size Influences potential number of customers L 24 N Increasing Important
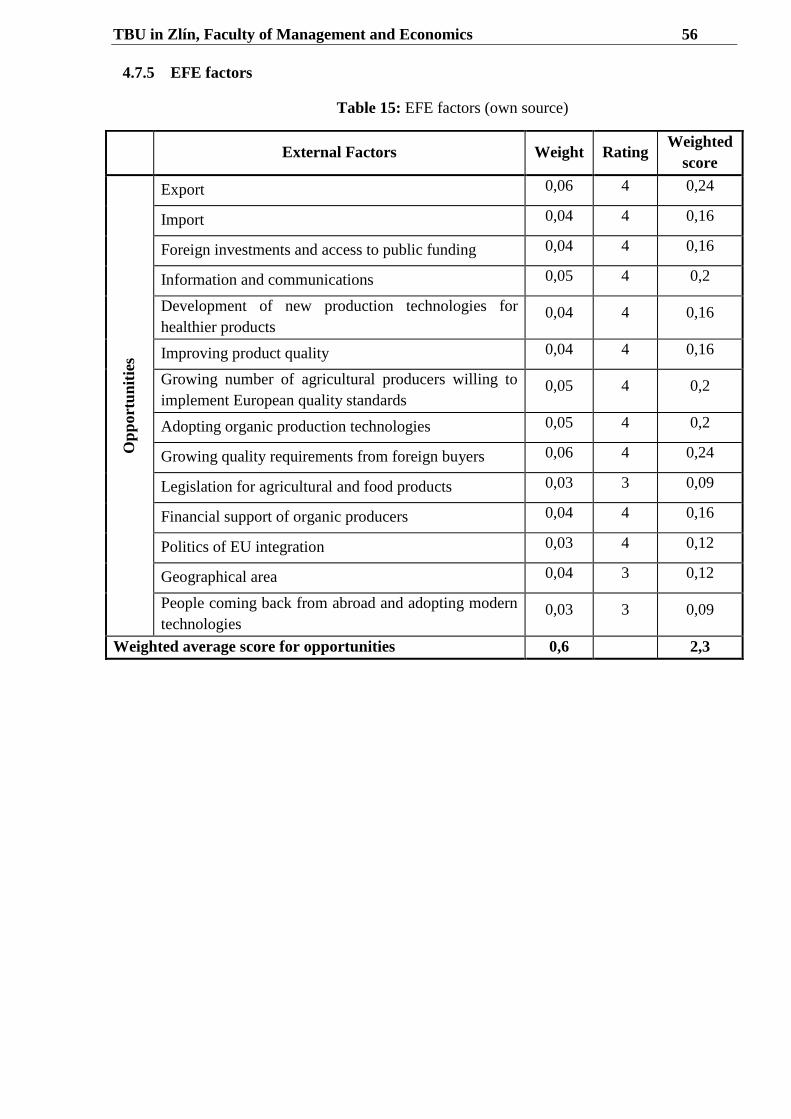
TBU in Zlín, Faculty of Management and Economics 56
4.7.5 EFE factors
Table 15: EFE factors (own source)
External Factors Weight Rating
Weighted
score
Op
port
un
itie
s
Export 0,06 4 0,24
Import 0,04 4 0,16
Foreign investments and access to public funding 0,04 4 0,16
Information and communications 0,05 4 0,2
Development of new production technologies for
healthier products 0,04 4 0,16
Improving product quality 0,04 4 0,16
Growing number of agricultural producers willing to
implement European quality standards 0,05 4 0,2
Adopting organic production technologies 0,05 4 0,2
Growing quality requirements from foreign buyers 0,06 4 0,24
Legislation for agricultural and food products 0,03 3 0,09
Financial support of organic producers 0,04 4 0,16
Politics of EU integration 0,03 4 0,12
Geographical area 0,04 3 0,12
People coming back from abroad and adopting modern
technologies 0,03 3 0,09
Weighted average score for opportunities 0,6 2,3

TBU in Zlín, Faculty of Management and Economics 57
External Factors Weight Rating
Weighted
score
Th
reats
Corruption 0,03 2 0,06
Inflation rate 0,04 2 0,08
Unemployment rate 0,03 2 0,06
Tax rates and tax regulations 0,04 1 0,04
Usage of old technologies and equipment by most of
the companies 0,03 2 0,06
Unsystematic changes 0,04 2 0,08
Low efficiency of law 0,03 2 0,06
High bureaucracy 0,03 2 0,06
Unstable political situation 0,03 2 0,06
Aging of the population 0,04 1 0,04
Migration tendency 0,03 1 0,03
Population size 0,02 1 0,02
Weighted average score for threats 0,39 0,65
Total weighted average score 0,99 2,76
4.7.6 SPACE matrix
Is composed based on IFE and EFE scores in order to determine which type of strategy is better
to use for a particular company. In case of the chosen company IFE score is 2,57 and EFE score
is 2,76. Graphical solution using SPACE matrix is presented on the figure 4.

TBU in Zlín, Faculty of Management and Economics 58
Figure 4: SPACE matrix (own source)
According to the space matrix, aggressive policy (S-O strategy) is suggested. S-O strategies es-
tablish a plan to use the company’s strengths in a way that will help it take advantage of the op-
portunities on the market.
Based on strengths and opportunities strategic goals are developed.
Development of strategic goals for the chosen company is presented in table 16.

TBU in Zlín, Faculty of Management and Economics 59
Table 16: S-O SWOT matrix (own source)
Strengths/Opportunities
O1 Export
O2 Import
O3 Foreign investments and access to public funding
O4 Information and communications
O5 Developing new production technologies for healthier products
O6 Improving product quality
O7 Growing number of agricultural producers willing to implement EU quality standards
O8 Adopting Organic production technologies
O9 Growing quality requirements from foreign buyers
O10 Legislation for agricultural and food products
O11 EU Politics of EU integration
O12 Geographical area
O13 People coming back from abroad and adopting modern technologies
S1 Skilled human resources
S2 Offering unique services on the Moldavian market
S3 Support in providing services from the offices all over the world
S4 Company’s high international reputation and reliability
S5 Quality of services provided
S6 Wide range of services
S7 Flexible timings
S8 Strong position on the market
S9 Permanent growth, high growth rate
S10 Experience in providing services
S11 Distribution and sales networks
S12 Brand name
S13 Wide internal knowledge database
Suggested strategy:
SO1 Perform segmentation, determine and attract new groups of customers
S02 Provide to the customers integral packs of services, determine and offer new services
that they need
SO3 Increase the awareness of the company using modern communication channels and
tools
SO4 Organize educational activities for current and potential clients
SO5 Develop personal customer relationships using modern tools
SO6 Monitor changes in requirements on the market, legislation and new standards in
order to widen number of services and maintain high growth rate
SO7 Develop list of activities in order to support company’s image and to straighten the
brand position on Moldavian and regional market

TBU in Zlín, Faculty of Management and Economics 60
4.7.7 QSPM matrix
QSPM K
ey f
act
or
Wei
gh
t
SO1 SO2 SO3 SO4 SO5 SO6 SO7
AS
TA
S
AS
TA
S
AS
TA
S
AS
TA
S
AS
TA
S
AS
TA
S
AS
TA
S
O1 0.06 4 0.24 4 0.24 2 0.12 2 0.12 2 0.12 3 0.18 2 0.12
O2 0.04 4 0.16 4 0.16 2 0.08 2 0.08 2 0.08 3 0.12 2 0.08
O3 0.03 3 0.09 2 0.06 2 0.06 3 0.09 1 0.03 3 0.09 1 0.03
O4 0.04 3 0.12 4 0.16 4 0.16 4 0.16 3 0.12 3 0.12 3 0.12
O5 0.03 2 0.06 2 0.06 2 0.06 3 0.09 1 0.03 3 0.09 1 0.03
O6 0.03 3 0.09 2 0.06 2 0.06 3 0.09 1 0.03 2 0.06 1 0.03
O7 0.05 4 0.20 3 0.15 4 0.20 4 0.20 2 0.10 3 0.15 1 0.05
O8 0.05 2 0.10 2 0.10 2 0.10 4 0.20 1 0.05 3 0.15 1 0.05
O9 0.06 3 0.18 4 0.24 3 0.18 4 0.24 1 0.06 4 0.24 1 0.06
O10 0.02 2 0.04 2 0.04 1 0.02 3 0.06 1 0.02 4 0.08 1 0.02
O11 0.02 3 0.06 1 0.02 2 0.04 2 0.04 1 0.02 2 0.04 1 0.02
O12 0.03 2 0.06 3 0.09 2 0.06 2 0.06 1 0.03 3 0.09 2 0.06
O13 0.04 3 0.12 2 0.08 1 0.04 2 0.08 1 0.04 1 0.04 1 0.04
O14 0.02 2 0.04 2 0.04 1 0.02 1 0.02 1 0.02 2 0.04 1 0.02
T1 0.02
5 1 0.03 1 0.03 1 0.03 1 0.03 1 0.03 1 0.03 1 0.03
T2 0.04 1 0.04 2 0.08 1 0.04 1 0.04 1 0.04 1 0.04 1 0.04
T3 0.02
5 2 0.05 2 0.05 1 0.03 1 0.03 1 0.03 1 0.03 1 0.03
T4 0.03 1 0.03 3 0.09 1 0.03 1 0.03 1 0.03 1 0.03 1 0.03
T5 0.05 3 0.15 1 0.05 2 0.10 3 0.15 1 0.05 3 0.15 1 0.05
T6 0.04 1 0.04 2 0.08 1 0.04 2 0.08 1 0.04 3 0.12 1 0.04
T7 0.03 1 0.03 2 0.06 1 0.03 1 0.03 1 0.03 1 0.03 1 0.03
T8 0.03 2 0.06 2 0.06 1 0.03 1 0.03 1 0.03 1 0.03 1 0.03
T9 0.02 3 0.06 2 0.04 1 0.02 1 0.02 1 0.02 1 0.02 1 0.02
T10 0.04 2 0.08 1 0.04 2 0.08 2 0.08 1 0.04 1 0.04 1 0.04
T11 0.04 2 0.08 1 0.04 1 0.04 1 0.04 1 0.04 1 0.04 1 0.04
T12 0.03 2 0.06 1 0.03 2 0.06 1 0.03 1 0.03 1 0.03 1 0.03

TBU in Zlín, Faculty of Management and Economics 61
Key
fact
or
Wei
gh
t
SO1 SO2 SO3 SO4 SO5 SO6 SO7
AS
TA
S
AS
TA
S
AS
TA
S
AS
TA
S
AS
TA
S
AS
TA
S
AS
TA
S
S1 0.04 2 0.08 2 0.08 1 0.04 3 0.12 1 0.04 2 0.08 1 0.04
S2 0.06 2 0.12 3 0.18 4 0.24 3 0.18 1 0.06 2 0.12 4 0.24
S3 0.05 2 0.10 3 0.15 3 0.15 1 0.05 1 0.05 3 0.15 3 0.15
S4 0.06 2 0.12 3 0.18 3 0.18 2 0.12 1 0.06 1 0.06 4 0.24
S5 0.05 2 0.10 3 0.15 3 0.15 1 0.05 2 0.10 1 0.05 3 0.15
S6 0.04 3 0.12 4 0.16 3 0.12 3 0.12 1 0.04 2 0.08 3 0.12
S7 0.05 2 0.10 3 0.15 2 0.10 1 0.05 1 0.05 1 0.05 2 0.10
S8 0.04 2 0.08 2 0.08 3 0.12 1 0.04 1 0.04 1 0.04 4 0.16
S9 0.02 2 0.04 1 0.02 3 0.06 1 0.02 3 0.06 3 0.06 4 0.08
S10 0.04 2 0.08 3 0.12 3 0.12 3 0.12 1 0.04 3 0.12 3 0.12
S11 0.04 2 0.08 3 0.12 3 0.12 1 0.04 1 0.04 1 0.04 3 0.12
S12 0.04 1 0.04 2 0.08 4 0.16 3 0.12 2 0.08 1 0.04 4 0.16
S13 0.05 2 0.10 3 0.15 1 0.05 4 0.20 2 0.10 4 0.20 1 0.05
W1 0.03 2 0.06 2 0.06 1 0.03 3 0.09 2 0.06 2 0.06 1 0.03
W2 0.03 1 0.03 2 0.06 1 0.03 1 0.03 2 0.06 2 0.06 1 0.03
W3 0.06 3 0.18 3 0.18 2 0.12 2 0.12 3 0.18 1 0.06 3 0.18
W4 0.05 3 0.15 2 0.10 4 0.20 3 0.15 2 0.10 1 0.05 3 0.15
W5 0.05 3 0.15 2 0.10 4 0.20 1 0.05 3 0.15 2 0.10 2 0.10
W6 0.04 3 0.12 2 0.08 4 0.16 1 0.04 3 0.12 1 0.04 3 0.12
W7 0.04 3 0.12 2 0.08 4 0.16 3 0.12 2 0.08 3 0.12 4 0.16
W8 0.05 1 0.05 3 0.15 1 0.05 2 0.10 2 0.10 1 0.05 2 0.10
W9 0.03 1 0.03 4 0.12 2 0.06 1 0.03 3 0.09 1 0.03 2 0.06
STAS 4.32 4.70 4.34 4.07 2.85 3.73 3.79
Priority 3 1 2 4 7 6 5
Based on the results of QSPM, the WT strategies are prioritized as follows:
1. SO2 Provide to the customers integral packs of services, determine and offer new
services that they need.
2. SO3 Increase the awareness of the company using modern communication
channels and tools.

TBU in Zlín, Faculty of Management and Economics 62
3. SO1 Focus on market research in order to determine and attract main groups of
potential customers.
4. SO4 Organize educational activities for current and potential clients.
5. SO7 Develop list of activities in order to support company’s image and to
straighten the brand position on Moldavian and regional market.
6. SO6 Monitor changes in requirements on the market, legislation and new standards
in order to widen number of services and maintain high growth rate.
7. SO5 Develop personal customer relationships using modern tools.
4.7.8 Porter’s Five Forces analysis
Threat of New Entrants
Market of certification and quality control services in Moldova is quite specific and small.
Also it can be characterized as a quite saturated one because of quite large number of com-
panies for that market. Market penetration is relatively hard because there is a necessity in
qualified specialists, qualification process is quite long and expensive, and number of qual-
ified specialists is limited.
Market has a growth potential, but at the moment number of potential clients is also limited
due to relatively high costs of services and their specific character. Quality system certifi-
cation is only starting to get demanded in Moldova, it is not compulsory according to local
legislation (as it is in some other countries) so many people still do not see its advantages
and reasons for investing in it.
Although situation may probably change in future, at the moment because of the above
mentioned factors treat of new entrants can be considered as low.
Bargaining Power of Suppliers
Bargaining power of suppliers is characterised by the number of suppliers the company
works with and the suppliers` diversification.
As suppliers in case of the analyzed company act laboratories which provide different tes-
ting services and firms who may provide specialists in case if the company doesn’t have
it’s own employees with necessary qualifications.
TBU in Zlín, Faculty of Management and Economics 63
Usually the role of specialists providers play affiliates of the same company from other
countries. So the company can choose the best option from the point of view of services
costs, travel costs for the specialist and travel time. Usually specialists of that kind can be
found in several offices. Also, taking into consideration, that suppliers are part of one glo-
bal company, they usually provide quite advantageous conditions to the affiliate they
collaborate with and in some cases are opened for negociations.
Talking about laboratories, chosen company works mostly with internal laboratories which
are part of global company structure. In this case collaboration conditions are more
attractive. In case of external laboratories there can be always a choice made between seve-
ral different suppliers, taking into consideration costs, distance and timings.
Bargaining Power of Buyers
Talking about B2B market, number of customers is quite limited and each customer is va-
lued. It reffers especially to the area of services in which chosen company operates. Num-
ber of clients who are intending to get certifications according to specific voluntary stan-
dard is limited, costs for clients are relatively high which makes the proces of attracting
new customers harder. There are several competitors at the market so the client can choose
the most attractive conditions which reffer not only to costs, but also to timings, quality of
services, personal attitude and additional services offered.
All this factors make bargaining power of buyers quite high. Company should adopt pro-
grams to gain customers’ loyalty, create advantageous conditions for maintaining clients
and attracting new ones, adopt promotion strategies, offer additional services and provide
high quality level of services.
Intensity of Competitive Rivalry
There are relatively few competitors that provide the same range of services at Moldavian
market. Yet, the market is relatively small so competition between these companies is quite
high. There is no company at the market that takes a much larger market share compard to
the other competitors, so no monopoly on the market exists. According to external data,
company’s market share is around 20 % which makes it one of the market’s leaders. Yet,
there are several competitors whose position is not much lower.

TBU in Zlín, Faculty of Management and Economics 64
Recession of recent years reduced the number of potential clients on the market which ma-
de the competition level higher.
Threat of Substitutes
There are no direct substitutes to the services that company offers on the market. As indi-
rect substitutes can be considered state certification bodies which certify goods and ser-
vices according to Moldavian standards. Yet, for potential clients who need internationally
recognized standards these services usually do not cover their needs.
Local laboratories perform limited number of tests and investigations and in case when a
more advanced or precise testing is needed clients usually address to the chosen company
or its competitors. So it can be considered that threat of substitutes is medium to low.
Table 17: Porter’s analysis. Overall conclusion (own source)
Force Level of threat
Threat of New Entrants Low
Bargaining Power of Suppliers Low
Bargaining Power of Buyers High
Intensity of Competitive Rivalry Medium to high
Threat of Substitutes Medium to low
We can see that certification services market in Moldova is quite competitive and saturat-
ed. Customers have high bargaining power due to their limited number, costs of services
and many options they have.
Competitive Rivalry is relatively high due to limited size of market, number of competitors
and specifics of services.
In order to reduce customers bargaining power company should consider widening servi-
ces portfolio, adopting strategies for entering new markets in order to achieve new custo-
mers, develop promotional strategies for attracting new customer segments, improve quali-
ty of services and strengthen the brand position on Moldavian market.
In order to remain competitive company should adopt unique for Moldavian markets servi-
ses, maintain their high quality, work on relationship management with existing clients,
adopt strategies for promotion and attracting new clients.

TBU in Zlín, Faculty of Management and Economics 65
5 PROJECT OF B2B MARKETING STRATEGY FOR THE CHOSEN
COMPANY
During the analysis it was found out that the company already has one of the leading posi-
tions on the market, is competitive and shows permanent growth. In this case it was decid-
ed to apply the aggressive strategy with strategic goals based on strengths and opportuni-
ties.
It was decided to use principles of consumer-driven marketing strategy, which consists of
segmentation, targeting, differentiation and positioning steps in order to create a unique
value proposition and to determine company’s position on the market. Also it was decided
to use elements of relationship marketing.
The company should focus on maintaining strong and competitive position on the market,
increasing market share and finding new market segments for its goods and services, im-
proving internal processes, focus more on promotional activities and adopt modern tools
for facilitation of obtaining goals.
5.1 Overall goals and objectives
New marketing strategy is aiming to achieve the following goals:
Increase market share by 10 %
Improve services marketing mix
Improve marketing and sales processes in the company
Develop new market segments for company’s services
During the analysis there were determined and prioritized the following strategic goals:
SO2 Provide to the customers integral packs of services, determine and offer new ser-
vices that they need
SO3 Increase the awareness of the company using modern communication channels
and tools
SO1 Focus on market research in order to determine and attract main groups of poten-
tial customers
SO4 Organize educational activities for current and potential clients

TBU in Zlín, Faculty of Management and Economics 66
SO7 Develop list of activities in order to support company’s image and to straighten
the brand position on Moldavian and regional market
SO6 Monitor changes in requirements on the market, legislation and new standards in
order to widen number of services and maintain high growth rate
SO5 Develop personal customer relationships using modern tools
5.2 Target markets
Segmentation for chosen company should base according to the following factors:
Geographical segmentation: Moldova-based companies and foreign companies in CIS
region (focus on Ukraine, Belarus, Georgia, Armenia).
Company type: as target segment it was decided to select agricultural, food producers and
wine producers. Agricultural companies will be sub-divided to 2 segments: fruits and vege-
tables producers and crop producers. The marketing strategy for each of sub-segments will
be the same, but the packages of services will differ.
Company size: for Moldavian market it is reasonable not to perform this segmentation due
to small number of potential clients. For foreign markets focus will be made on medium
and large companies.
Strategic priority: companies can be classified also as ones that are strategic to the busi-
ness future (bigger companies with long collaboration plans). For these companies focus
will be done on relationship marketing. Small companies that request single services and
not plan to repeat requests will be considered as more of transactional type. Good relation-
ship with clients also will be the scope, but less focus on relationships will be made.
Buying situation: companies should be divided to those that purchase services for the first
time (new task), existing clients who have some modified requests (modified re-buy) and
those who request the same services as last time (straight re-buy). Marketing messages will
differ for new and existing clients, and for those that request changes and are more flexible
and opened some additional services can be offered.

TBU in Zlín, Faculty of Management and Economics 67
Table 18: Targeting for the chosen company (own source)
Segmentation principle Target market
Geographical segmentation Moldova
CIS countries (Ukraine, Belarus, Georgia, Armenia)
Company type Agricultural producers
Fruits and vegetables
Crops and cereals
Food producers
Wine producers
Company size All sizes fir Moldavian market
Medium and big for foreign markets
Strategic priority Focus on “strategic clients”- medium to large companies
that request long-term, more complex services and plan long
collaboration.
Buying situation All buying situations
5.3 Differentiation and Positioning
Differentiation will be achieved through providing high quality of services, strong relation-
ship management, introducing new unique for this market services, issuing recognized and
reliable certificates.
Although company has prices higher than competitors, it already is one of the market lead-
ers due to quality of services, reputation and strong brand name. So suggested positioning
will maintain leader of the market in both price and quality.
The positioning map is presented on figure 5.
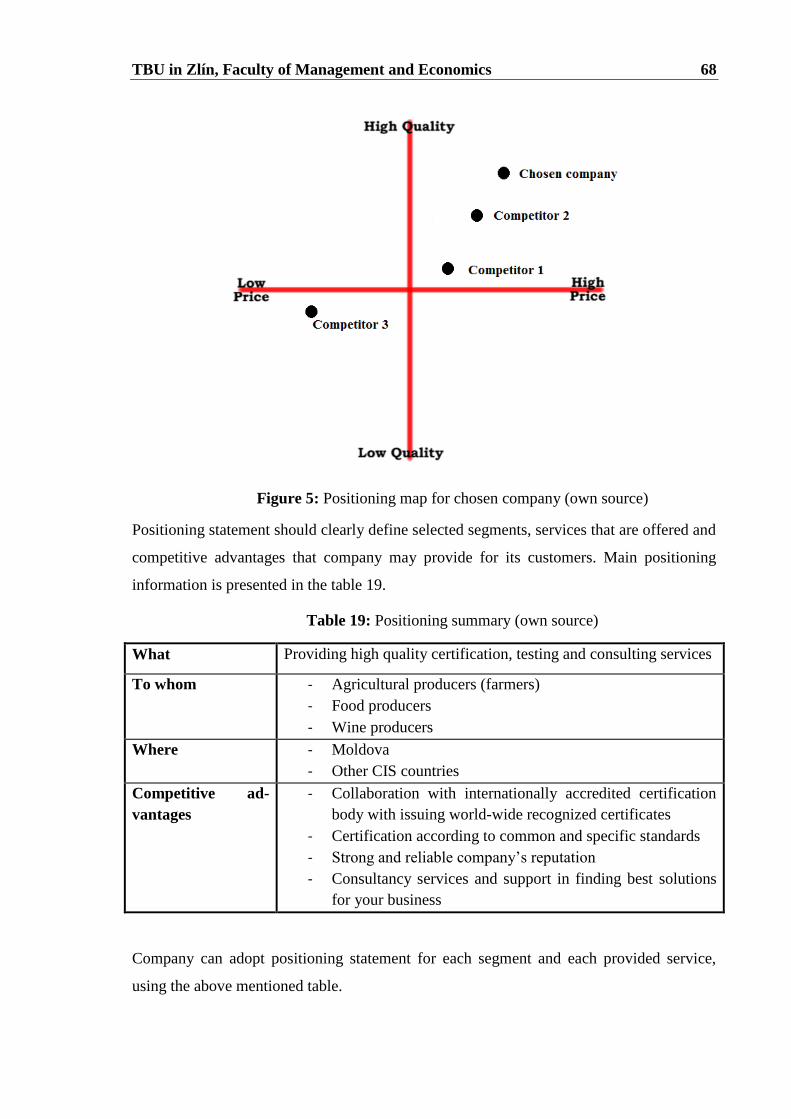
TBU in Zlín, Faculty of Management and Economics 68
Figure 5: Positioning map for chosen company (own source)
Positioning statement should clearly define selected segments, services that are offered and
competitive advantages that company may provide for its customers. Main positioning
information is presented in the table 19.
Table 19: Positioning summary (own source)
What Providing high quality certification, testing and consulting services
To whom - Agricultural producers (farmers)
- Food producers
- Wine producers
Where - Moldova
- Other CIS countries
Competitive ad-
vantages
- Collaboration with internationally accredited certification
body with issuing world-wide recognized certificates
- Certification according to common and specific standards
- Strong and reliable company’s reputation
- Consultancy services and support in finding best solutions
for your business
Company can adopt positioning statement for each segment and each provided service,
using the above mentioned table.

TBU in Zlín, Faculty of Management and Economics 69
5.4 CRM program
One of the objectives of marketing strategy is building strong personal relationships with
the customers. For that company needs to include CRM principles into the strategy.
Objectives of CRM for the company will be the following:
Increase the percentage of clients’ retention.
Increase level of loyalty of clients.
Ensure clearer tracking of relationships with current, past and potential clients.
Ensure more personalized approach to each client.
Measures Company needs to undertake for realization of CRM politics:
Establish CRM politics and develop communication standards with clients for the
employees.
Inform personnel about new CRM politics, company’s values and goals.
Organize personnel trainings on CRM principles.
Buy CRM software and organize staff trainings on its usage.
Use CRM software for data analysis and strategy improvement.
Collect feedback from the clients on their experience of collaboration with the
company.
Collect feedback from the employees in order to ensure continuous improvement of
the program.
Adopting CRM system that will help to track the history of relations with existing and po-
tential clients, sending them customized massages, maintain permanent contact and devel-
op strong, personal relationship. For this software Bpm online sales is suggested, which
will help to track customers history and relationship, analyze sales process and sale funnel,
perform customer segmentation, manage contracts and other sales documents, marketing
analytics and planning. The cost of the system is around 100 Euro per month, and although
number of clients of the company is not that big (around 150 clients annually), it will help
track relations with each potential and existing client and offer them the best solution, thus
increasing sales. (Terrasoft.ru, 2016)

TBU in Zlín, Faculty of Management and Economics 70
5.5 Marketing mix for the chosen company
5.5.1 Product
Company should work over the integrity of services and provide customers the packages
that will satisfy their needs in the best way. It means that one customer can use services
from different company’s departments.
Food producers:
ISO 9001
ISO 22000
Consultancy for export or import activities
Offering testing services
Offering inspecting services
Offering pre-certification audits
Offering social audits
Agricultural producers:
Organic certification
GlobalGAP certification
GMP+ certification in case of producing animal feed
Offering to grain and seeds producers services provided by Agricultural
department: surveys, inspections, inland and port operations, quality and quantity
inspections, etc.
Organizing conferences regarding export possibilities, inviting foreign importers
Organizing seminars on requirements for export to European Union and another
desired countries
Informational support in finding buyers and markets for products
Importers and exporters:
Offering QMS certification
Offering Organic, GlobalGAP certification in case of exporting certified products
Offering inspection services (quality / quantity inspections during export and
import)

TBU in Zlín, Faculty of Management and Economics 71
Organizing seminars and trainings on export / import requirements, new standards
that can be useful for the company and other applicable information
As additional services trainings and seminars can be offered. Seminars can be:
For potential customers in order to explain them benefits of offered services
For existing customers in order to explain them how to use the services in order to
achieve maximum success. How to collaborate with the service provider in the
most effective for both parts way.
For existing customers in order to suggest them new services and tell about their
advantages
New certification standards can be offered to customers in order to increase services port-
folio and to ensure competitive advantage of the market by providing unique services in
Moldova. After market analysis there can be suggested to start certification according to
new standards that are relevant for Moldavian market. The standards are listed in table 20.
Table 20: Services portfolio extension (own source)
Standard Application
ISCC standard
Independent, globally applicable certification systems for
sustainability and greenhouse gas emissions. ISCC can be used to
demonstrate compliance with sustainability requirements from
authorities, business customers and final consumers. ISCC can be
applied for the certification of all kinds of biomass and bioenergy as
well as for biomass-based products in the food, feed and chemical
industries.(ISCC, 2016)
ISO 26000 – social
responsibility
standard
ISO 26000 provides guidance on how businesses and organizations
can operate in a socially responsible way. This means acting in an
ethical and transparent way that contributes to the health and welfare
of society.
GlobalGAP for
Crop producers
Extend existing accreditation from fruit and vegetables also to crop
production.
There is also offered to increase value for the customers by organizing seminars and educa-
tional activities.

TBU in Zlín, Faculty of Management and Economics 72
Possible topics for trainings and seminars can be the following:
Specifics and advantages and application of a particular standard
Thematic seminars for each customer segment: importers and exporters,
agricultural producers, food producers, service products. Offered services and how
they can positively influence on the client’s business
Informational seminars on standard’s requirements, recent updates and
modification
Seminars on collaboration with the company: how to fill out documents and forms,
timings, specifics and most effective ways of collaboration, feedback.
5.5.2 People
For adopting new strategy company will need to hire additional personnel and ensure staff
trainings for guaranteeing high quality of services provided and adopting customer rela-
tionship management approach.
The following activities and changes are suggested:
1. Hire 1 marketing specialist and educate him about existing and potential services.
Background: marketing and economics, preferably knowledge about QMS or
import and export procedures.
2. Hire or promote from existing personnel 2 sales persons.
Background: sales, export and import management, quality management system
certification
3. Train more personnel for specific standards:
1 Organic and GlobalGAP auditor
1 ISO 9001 auditor
1 social auditor
Additional auditors upon necessity
Auditors can be chosen and trained among existing personnel, but additionally 2 auditors
need to be hired. As specific standards have specific requirements towards background,
studies and work experience of the auditor, those requirements should be carefully evaluat-
ed before hiring persons.
4. Ensure trainings for operational personnel growth and development:
Awareness of standards

TBU in Zlín, Faculty of Management and Economics 73
Sales – general principles
Marketing
Relationship management
Quality of processes
Operational management – for back-office stuff that are involved in main
operations.
5. Set annual KPI for personnel in dependence with their position and experience
6. Collect feedback on the personnel from clients in order to ensure high quality of
services.
5.5.3 Price
The pricing will be based on the type of services, their complexity and length and the
number of hours spent.
Pricing will include:
1. Fixed costs that are paid to the suppliers (calculated separately based on the
specifics of work)
2. Man-day rate for the auditor’s work. Depending on standard’s complexity can vary
from 300 to 500 Euro per man day. Will contain:
Number of days needed for the audit
Number of days for the preparation to the audit
Number of days needed for report writing
Table 21: Suggested prices (own source)
Type of service Man-day rate, EURO
Common standards for QMS certification 300
Specific standards 400
Standards where an external specialist needs to be invited 500
3. Hour rate for back-office personnel involved in paperwork and client contacts.
Standard costs: 20 Euro per hour.
4. Fixed costs for support personnel who is not directly involved into the process:
office manager, financial department, calculated based on overall cost of project.

TBU in Zlín, Faculty of Management and Economics 74
5. Laboratory testing services: costs paid to the laboratory and 20% margin for
office’s operational expenses and time spent on order (sending sample,
communication, processing the result, issuing the certificate).
Also elements of relationship pricing are suggested to be applied. It means that a discount
will be offered to long-term loyal clients and clients that order more than 1 service:
10 % discount of the total order amount for repeated requests
10 % discount of the total order amount for clients that use 2 or more company’s
services
20 % discount in case client makes repeated order for 2 or more company’s
services
5.5.4 Promotion
More attention is suggested to be paid to pull strategies, which means identifying key con-
sumer segments and addressing them messages that will raise their interest in company’s
services and motivate them to contact the company by themselves. This approach already
proved to be more effective for the company in the past, so focusing on pull channels will
help to make promotion more effective and attract more clients.
Advertising
Will be performed using several tools:
Printed materials with company’s logo for existing and potential clients: pens,
calendars, organizers, cups.
Printed brochures with brief information about the company and its services for
potential clients. Can be handled during initial meetings in the office, business
trips, exhibitions, conferences and other events.
Publishing information in Moldavian thematic business journals: Atlas Info ,
Business-info, Comersant, Logos-pres, Agricultura Moldovei, Lider Agro,
Omnibus, Varo Moldova, Business Class, Agrobusiness. Articles will be telling
about the company, its services and advantages that potential clients will get by
collaborating with the company.

TBU in Zlín, Faculty of Management and Economics 75
Advertising materials can also be sent to affiliates of the company in other countries,
which collaborate with the chosen company, don’t offer the same services and can promote
company’s services to their existing and potential clients.
Sales promotion
For sales promotion the following methods can be applied:
Organization of events for potential customers: conferences, free-of-charge
seminars, meetings. During these events will be provided information about
company’s services, advantages and added value offered to the potential and
existing customers, new services proposed by the company.
Offering discounts and beneficial collaboration conditions.
Discounts for existing clients that recommend the company to other potential
clients, who later become company’s costumers.
Personal selling
Represents one of the key tools for attracting new customers and promoting company’s
services. Will include:
Personal contacts with potential clients through e-mail, telephone.
Organization of one-to-one meetings at company’s office or client’s office,
presenting company’s services, listening to client’s needs and expectations and
offering him customized solutions to his problem in form of individually prepared
service pack.
Public relations
Following activities are suggested for this type of promotion mix:
Organization of conferences, promoting company’s services for potential and
current clients.
Maintaining communication with clients through e-channels.
Participating in thematic exhibitions (preparing own sand and promotional
materials). The exhibitions may include:
- Local: Food and Drinks exhibition, Annual Wine exhibition, Annual
Agricultural exhibition, organic products exhibition.

TBU in Zlín, Faculty of Management and Economics 76
- International: Biofach –annual exhibition for Organic food and Fair Trade Held
in Germany
Digital marketing
Digital marketing program will involve using several new tools and channels, as this area
was not developed at the company. It will include:
Company’s local web-site creation. Very important aspect of promotion. Local
web-site will provide information about the company and its services, contact
information, will give the clients the possibility to provide feedback on company’s
activities, will share news from Moldova and abroad referring to the fields of
activity in which the company is operating. Web-site will help to increase
awareness of the company, give to potential clients precise and clear information
regarding the services and possibilities to connect with the company in order to find
more details or order a call-back from company’s representatives.
Web-site creation will also open several more promotional options for the
company:
- Search Engines Optimization - optimizing content in a way that will help the
customers easier to find the web site through search engines (Google, Yandex) by
introducing key words.
- Exchanging links with partners and customers. Placing links to company’s
web-site on their portals and their links at company’s web-site.
- Using paid advertisings online (Pay Per Click): Google Adwards, Yandex
direct
- Analytics. After creating web-site marketing analytics can also be performed
online, using Google Analytics and Yandex Metrics. These tools will help to
monitor how much time customer spends on each page, how many of them reach
target pages (e.g. contact page or page of a certain services), which key words are
used to find web site through search engine, regions where potential customers
come from, etc. Thus new information for analysis and web-site optimization can
be gained.
- Content marketing. Promoting web-site and attracting visitors by creating
relevant and useful articles and information. The web site may include not only
information about the company and its services, but also articles about new

TBU in Zlín, Faculty of Management and Economics 77
standards and regulations, useful information for food producers, agricultural
growers, importers, exporters and other target audience. News from the world
markets, new global changes and tendencies in the area, local and global company
news which can be interesting. Web-site can be used for creation community of
current and potential clients, where they can exchange experience and useful
information.
E-mail marketing. One of the main sources used to keep contact with existing
clients and start contacts with potential customers. For this purpose CRM system
will be used, base of potential, existing and lost customers will be created and
messages with different content will be sent to each of these groups periodically.
Table 22: Example of e-mail marketing program (own source)
Type of message Message Target auditory Frequency and
time
Welcoming new
visitors
Welcome to the web-site People who visited
web-site and regis-
tered there
Once after reg-
istration
Newsletter Informational materials,
news on current markets,
legislation modifications,
new services
Current, potential
clients who regis-
tered at web-site or
left their contacts
Once a week
Motivational/
engagement e-
General information about
company’s services and
benefits
Potential customers
interested in compa-
ny’s services.
Once after reg-
istration, on
request
Feedback survey Asking to provide feedback
on company/ employees/
quality of provided service
Current clients 1 week after the
service was
provided
Brining back
emails
Reminding about the com-
pany. Information about
new services, invitation to
contact/ visit.
Past customers that
don’t use company’s
services anymore
1 in 6 month
Congratulations
e-mails
Congratulate with New
Year, Christmas, Easter, etc.
Current, potential
and past clients
Before big an-
nual holidays
Social Media Marketing. Is not so effective in case of B2B marketing, especially
in Moldova, but still some elements can be used and help to strengthen company’s

TBU in Zlín, Faculty of Management and Economics 78
overall image and raise knowledge about the brand. As social media channels can
be used: LinkedIn – very helpful for establishing business connections web-site,
Facebook. As the effect from SMM for Moldavian market isn’t expected to be
great, no professional SMM agency will be hired. Marketing will be done by
company’s internal marketing specialist and will be aimed for maintaining
communication with existing and potential customers, improving brand image,
giving general good impression about the brand.
5.5.5 Processes
Main modifications will be needed in sales process as the company will have sales manag-
er who will be in charge of initial interrogation with client.
Sales manager will contact potential clients, in dependence of their awareness of the prod-
uct and interest in it. There will be two types of potential clients: ones who expressed in-
terest in services and want to find out more and second group – potential clients that didn’t
hear about the company or its services or didn’t express any interest in them before. Focus
will be made on the first group of potential clients, who will be attracted by different pull
marketing channels. The contact process will include the following steps:
Sales manager contacts clients and finds out about their field of activity and field of
interest
Sales manager describes services that can be offered and sends requested information
via e-mail
If necessary sales manager organizes a meeting between department’s manager and
potential client
In case of big clients and potential expensive contracts signing there can be also
organized a meeting with services company’s general management
Client fills out request for quotation
Manager of the department calculates preliminary costs
Client approves or negotiates and then approves the costs
Contract is signed and invoice is issued.
Service providing phase starts
In case of potential clients who are initially not interested in company’s services technique
of cold calling will be used. Sales manager will contact potential clients and propose them
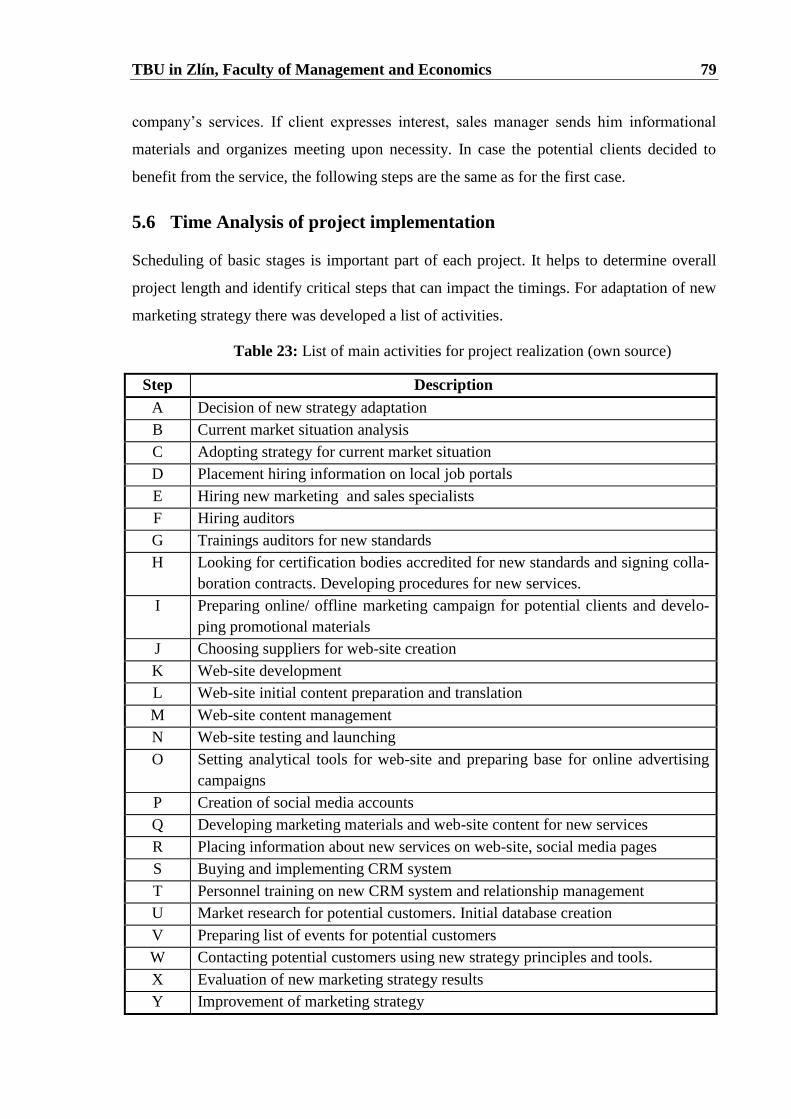
TBU in Zlín, Faculty of Management and Economics 79
company’s services. If client expresses interest, sales manager sends him informational
materials and organizes meeting upon necessity. In case the potential clients decided to
benefit from the service, the following steps are the same as for the first case.
5.6 Time Analysis of project implementation
Scheduling of basic stages is important part of each project. It helps to determine overall
project length and identify critical steps that can impact the timings. For adaptation of new
marketing strategy there was developed a list of activities.
Table 23: List of main activities for project realization (own source)
Step Description
A Decision of new strategy adaptation
B Current market situation analysis
C Adopting strategy for current market situation
D Placement hiring information on local job portals
E Hiring new marketing and sales specialists
F Hiring auditors
G Trainings auditors for new standards
H Looking for certification bodies accredited for new standards and signing colla-
boration contracts. Developing procedures for new services.
I Preparing online/ offline marketing campaign for potential clients and develo-
ping promotional materials
J Choosing suppliers for web-site creation
K Web-site development
L Web-site initial content preparation and translation
M Web-site content management
N Web-site testing and launching
O Setting analytical tools for web-site and preparing base for online advertising
campaigns
P Creation of social media accounts
Q Developing marketing materials and web-site content for new services
R Placing information about new services on web-site, social media pages
S Buying and implementing CRM system
T Personnel training on new CRM system and relationship management
U Market research for potential customers. Initial database creation
V Preparing list of events for potential customers
W Contacting potential customers using new strategy principles and tools.
X Evaluation of new marketing strategy results
Y Improvement of marketing strategy

TBU in Zlín, Faculty of Management and Economics 80
For calculation of project length WinQSB solution was used. Length of each step and its
predecessors were defined. After that the data was inserted into the software.
Figure 6: Defining length and predecessors of steps (own source, WinQSB)
According to the WinQSB program, the total time of the project realization is 45 weeks.
Critical pass, on which depends overall project length, contains the following activities: A,
B, C, D, F, G, R, W, X, Y. Critical steps are listed on the figure 7.

TBU in Zlín, Faculty of Management and Economics 81
Figure 7: Critical path for project time definition (own source, WinQSB)
Project’s graphical solution in form of network diagram is presented on the Appendix III.
Graphical solution in form of Gantt chart and detailed activity analysis of the project is
presented in the Appendix IV.
We can see that processes structure in this case is quite complicated and many processes
are interdependent. Critical pass steps, which are marked in red, are those that define over-
all project length and postponing them can impact overall timings negatively.

TBU in Zlín, Faculty of Management and Economics 82
5.7 Costs analysis
Table 24: Costs of the project (own source)
Description Price per 1
unit/ 1 month
Costs,
Euro
Current market situation analysis
Expenses related to data acquisition
-
500
Personnel costs
Additional sales and marketing personnel salary (per
year)
Sales and marketing personnel trainings
Additional auditors salary (2 people)
Auditors training
Training on CRM requirements
250
-
400
-
-
6000
600
9600
1000
500
Software costs
Accusition of CRM software
Personnel training
100
1200
200
Operational costs
Signing contracts on new cervices with certification
bodies
-
1000
Web-site
Web-site development
Content development
Content translation
-
-
-
1000
500
300
Offline promotion
Printed promotional and gifts materials design
Printed promotional and gifts materials creation
Placing promotional materials in thematic newspapers
and magazines
-
-
50
200
1000
600
Online marketing campaigns
Google Adwords campaign
Yandex direct campaign
Other online advertising
100
75
-
1200
900
1000
Events organization
Producing stands and promotional materials for
exhibitions
Organization of a conference for potential customers
-
-
500
500
Total Costs 26300

TBU in Zlín, Faculty of Management and Economics 83
5.8 Risk analysis
The aim of risk analysis is identification of the potential risks existing for the project, de-
termination of their probability of occurrence, impact that they might have and general
significance of each risk, preparing a set of measures in order to minimize or eliminate the
risk. For the marketing strategy implementation the following risks were defined:
I. Use of incorrect market data
II. Staff operational mistakes
III. Staff non-professional behavior
IV. High employee turnover
V. Internal data leak
VI. Marketing strategy turns out to be non-effective
VII. Financial risks
VIII. Aggressive competitors
IX. Political and legal risks
X. Environmental risk
XI. Economic situation on country and regional level
XII. Low interest of consumers in new services
The table below contains a list of possible risks, quantified information on their impact rate
and occurrence probability and calculated results which are used to define level of risk
(high, medium or low).
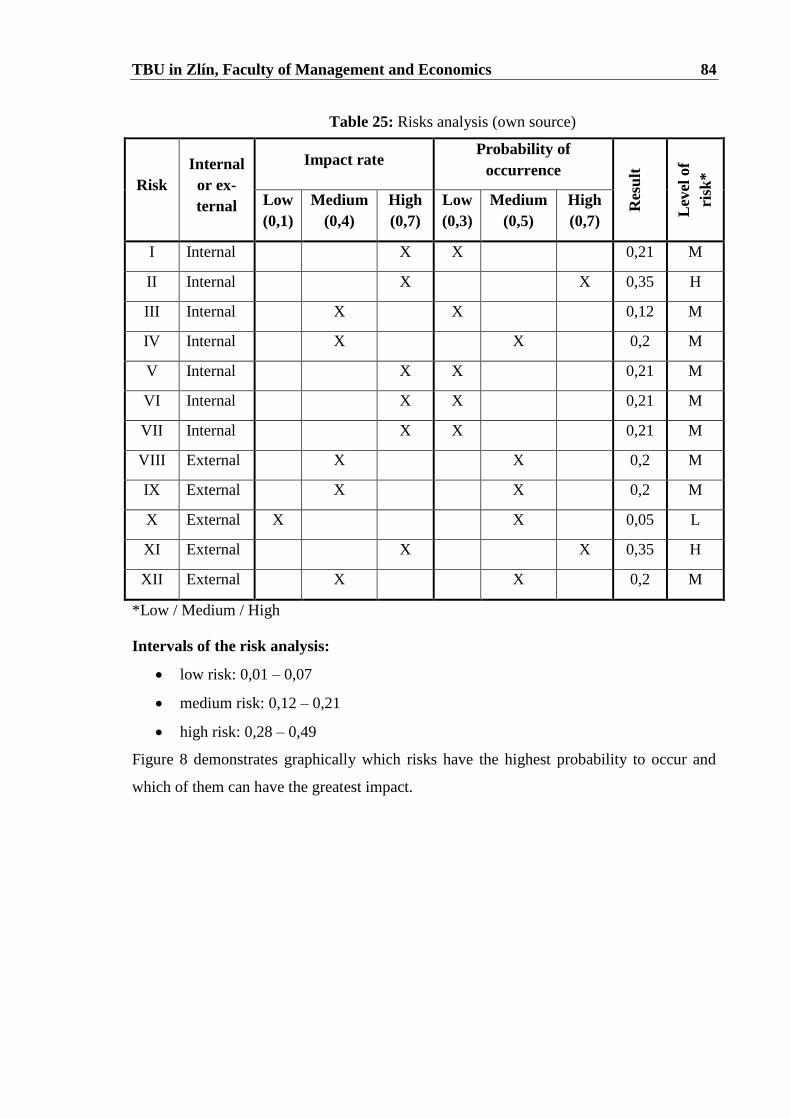
TBU in Zlín, Faculty of Management and Economics 84
Table 25: Risks analysis (own source)
Risk
Internal
or ex-
ternal
Impact rate Probability of
occurrence
Res
ult
Lev
el o
f
risk
*
Low
(0,1)
Medium
(0,4)
High
(0,7)
Low
(0,3)
Medium
(0,5)
High
(0,7)
I Internal X X 0,21 M
II Internal X X 0,35 H
III Internal X X 0,12 M
IV Internal X X 0,2 M
V Internal X X 0,21 M
VI Internal X X 0,21 M
VII Internal X X 0,21 M
VIII External X X 0,2 M
IX External X X 0,2 M
X External X X 0,05 L
XI External X X 0,35 H
XII External X X 0,2 M
*Low / Medium / High
Intervals of the risk analysis:
low risk: 0,01 – 0,07
medium risk: 0,12 – 0,21
high risk: 0,28 – 0,49
Figure 8 demonstrates graphically which risks have the highest probability to occur and
which of them can have the greatest impact.

TBU in Zlín, Faculty of Management and Economics 85
Figure 8: Risks evaluation. Graphical presentation (own source)
Figure 9 shows graphically the level of each risk.
Figure 9: Risk level. Graphical presentation (own source)
After performing the analysis 3 groups of risks were defined: low, medium and high. For
each group a relevant set of measures for risk minimization or elimination was developed.
0
0.1
0.2
0.3
0.4
0.5
0.6
0.7
0.8
I II III IV V VI VII VIII IX X XI XII
Impact
Probability

TBU in Zlín, Faculty of Management and Economics 86
Table 26: Measures for high risks prevention (own source)
Name Description Measures
Staff operational mis-
takes
Mistakes done because of
lack of knowledge, atten-
tion or professional
skills. Can cause finan-
cial losses, project delay.
Determine potential problematic
areas. Collect information on previ-
ous mistakes and their reasons. En-
sure proper trainings for operational
staff. Implement remuneration pro-
grams for good performance, work
on staff motivation.
Economic situation on
country and regional
level
Can cause decrease in
number of clients.
Focus on several market segments.
Find clients from different markets
and countries. Monitor economic
situation in the region in order to
take preventive measures.
Table 27: Measures for medium risks prevention (own source)
Name Description Measures
Use of incorrect market
data
Can cause wrong results
on market evaluation and
demand prediction,
wrong management deci-
sions.
Use only reliable sources of infor-
mation. Verify all important data
that will be used for strategy devel-
opment. Monitor changes on the
market and regularly update data.
Staff non-professional
behavior
Impolite and non-
professional attitude to
customers can influence
company’s reputation in
a negative way and cause
loss of clients.
Insure staff trainings on customer
relationship management. Collect
feedbacks from clients on staff’s
performance. Set motivational and
remuneration programs for staff.
High employee turno-
ver
Will lower company’s
capacity and increase
costs for hiring and train-
ing of new personnel
Create stable and attractive condi-
tions for staff. Elaborate system of
non-monetary benefits. Regularly
collect feedback from staff (can be
anonymous).
Internal data leak Data can get to the com-
petitors that can use it
against the company. It
can also harm company’s
reputation and its clients.
Set procedures on data protection
and control. Include non-disclosure
points into agreements with employ-
ees. Monitor and control data trans-
fer.

TBU in Zlín, Faculty of Management and Economics 87
Name Description Measures
Marketing strategy
turns out to be not ef-
fective
Will cause loss of com-
pany’s money.
Use relevant data for strategy crea-
tion. Perform deep market analysis.
Regularly evaluate results of the
campaign and improve it if neces-
sary.
Financial risks Financial problems in
company
Monitor financial situation and cash
flow in the company. Elaborate a set
of preventive measures.
Aggressive competitors Can influence negatively
on company’s number of
clients, performance, and
reputation.
Monitor situation on the market,
track new competitors activity, set
preventive measures, increase mar-
ket share and widen services range.
Political and legal risks New laws can be adopted
that will cause changes in
company’s activity.
Overall political situation
can influence negatively
number of clients in case
of crisis.
Monitor changes in legislation and
adapt to them fast. Monitor political
situation in the country. Explore
company’s activities to other coun-
tries in the region, in order not to
depend on just one sector.
Low interest of con-
sumers in new services
Will cause loss of money
and time that was neces-
sary for adding new ser-
vices into company’s
portfolio.
New services should be added after
careful market analysis and demand
prediction based on reliable data.
Table 28: Measures for low risks prevention (own source)
Name Description Measures
Environmental risk
Bad weather conditions
can cause lowering num-
ber of clients from agri-
cultural services or they
may not be able to pay
for the services.
Monitor debtors of the company.
Perform measures for debt collec-
tion. Focus on more segments be-
sides agricultural producers and
wine producers.

TBU in Zlín, Faculty of Management and Economics 88
CONCLUSION
The aim of the project was developing new marketing strategy for the chosen Moldavian
Company. The focus was made on two company’s departments: Consumer Testing Ser-
vices and Systems and Services Certification, which have the biggest growth and devel-
opment potential.
Current market analysis showed that company already has one of the leading positions on
the market and is ahead of most of the competitors in this domain. Based on internal and
external factors evaluation and SPACE matrix compiling it was determined that company
can choose aggressive strategy as one of the market’s leaders and continue to grow market
share by attracting new client segments and widening services portfolio based on current
demand on the market. As the company works in B2B sector, it has relatively low number
of clients if compared to consumer markets. That’s why new strategy needs to be focused
on client relationship management in order to attract and maintain clients by creating
strong personal relationships. For this purpose it is also important to develop loyalty pro-
grams.
Based on this new marketing strategy was elaborated for chosen departments. The strategy
suggests more clearly defined target market segments and positioning for the company. It
also contains suggested modification in product mix: growing services portfolio by adding
new services demanded on the market. People as a part of services mix need to be trained
in CRM and quality management for increasing quality of services provided. Also new
staff should be hired for marketing and sales positions, as before company didn’t have em-
ployees who focused on those areas. It is also crucial for the company to start to use more
communication channels. The biggest gap was in online communication channels that were
nearly not used. New strategy suggests creation of local affiliate’s web-site (as global
company web-site already exists but doesn’t focus on Moldavian market). It was also sug-
gested to start online campaigns in social networks, pay per click advertising and use of
other digital channels. For more effective clients’ management it is suggested to purchase
an online CRM system that will help to monitor history of relations with a particular client,
prepare personalized communication programs, gather statistical data that further can be
used for analysis and strategy improvement.
At the end there were performed: timings analysis, calculation of marketing budget needed
for strategy implementation and evaluation of existing risks.

TBU in Zlín, Faculty of Management and Economics 89
BIBLIOGRAPHY
Monographs
[1] BERKOWITZ, Eric N, Roger A KERIN a William RUDELIUS. Marketing. Chicago:
Irwin, 1989, 752 s. ISBN 0-256-07513-1.
[2] BHANDARI, Arabinda. Strategic management: A Conceptual Framework. Noida: Tata
McGraw-Hill Education, 2013, 680 s. ISBN 978-12-5902-6409 .
[3] BLANEY, Bill. B2B A to Z: marketing tools and strategies that generate leads for your
Business-to-Business company. S.l.: Denham Publishing, 2013, x, 231 s. ISBN 978-
0-98-84977-0-2.
[4] BRASSINGTON, Frances a Stephen PETTITT. Principles of Marketing. New York
City: Pearson Education, 2006, 1264 s. ISBN 978-0-27-369559-2.
[5] BRENNAN, Ross, Louise CANNING a Raymond MCDOWELL. Fundamentals of
Business-to-Business Marketing. 3rd ed. Los Angeles: SAGE, 2014, 408 s. ISBN
978-1-47-390581-8.
[6] BRENNAN, Ross, Louise CANNING a Raymond MCDOWELL. Business-to-business
marketing. 3rd ed. Los Angeles: SAGE, 2014, 408 s. ISBN 978-1-4462-7372-2.
[7] CANT, M C a C van HEERDEN. Personal Selling. Claremont: Juta and Company Ltd,
2008, 280 s. ISBN 978-0-70-216636-5.
[8] CHANDRASEKAR. Marketing Management: Text & Cases. Noida: Tata McGraw-
Hill Education, 2010, 538 s. ISBN 978-0-07-106773-7
[9] CHOWHAN, Sudhinder S. Marketing of Services. Lulu.com, 2015, 112 s. ISBN 978-
13-2905-759-3.
[10] COE, John M a John COE. The Fundamentals of Business-to-Business Sales & Mar-
keting. New York City: McGraw Hill Professional, 2003, 208 s. ISBN 978-0-07-
140879-0.
[11] CUNNINGHAM, William H, Isabella C CUNNINGHAM a Christopher M SWIFT.
Marketing, a managerial approach. 2nd ed. Cincinnati: South-Western Pub. Co. Mar-
keting, 1987, 284 s. ISBN 978-0-53-819110-4
[12] EGAN, John. Relationship Marketing: Exploring Relational Strategies in Market-

TBU in Zlín, Faculty of Management and Economics 90
ing. New York City: Pearson Education, 2008, 311 s. ISBN 978-0-2737-1319-7.
[13] ELLIS, Nick. Business to business marketing: relationships, networks and strategies.
Oxford: Oxford University Press, 2011, xxvii, 351 s. ISBN 978-0-19-955168-2.
[14] HUTT, Michael D a Thomas W SPEH. Business marketing management B2B:
Europe, Middle East and Africa edition. Hampshire: Cengage Learning, 2014, xvii,
348 s. ISBN 978-1-4080-9371-9.
[15] FERRELL, O, Outi NIININEN, Brian LUKAS, Sharon SCHEMBRI а William
M PRIDE . Marketing Principles. South Melbourne: Cengage Learning Australia,
2014, 600 s. ISBN 978-0-1702-7101-1.
[16] FILL, Chris a Karen FILL. Business-to-business Marketing: Relationships, Systems
and Communications. New York City: Pearson Education, 2005, 380 s. ISBN 978-0-
27-368279-0.
[17] GUMMESSON, Evert. Total Relationship Marketing. London: Routledge, 2011, 392
s. ISBN 978-1-13-635419-9.
[18] HAVALDAR, Krishna K.Industrial Marketing: Text and Cases. Noida: Tata
McGraw-Hill Education, 2005, 379 s. ISBN 978-0-07-058840-0.
[19] HOFFMAN, K, John E BATESON, Emma H WOOD a Alexandra J
KENYON. Services marketing: concepts, strategies and cases. 5th ed. Australia:
Cengage Learning, 2015, 480 s. ISBN 978-1-2854-2978-6.
[20] LAMB, Charles W, Joseph F HAIR a Carl D MCDANIEL. Essentials of Marketing.
Mason: South-Western Cengage Learning, 2009, 576 s. ISBN 978-11-1180-459-6.
[21] LILIEN, Gary L a Rajdeep GREWAL. Handbook of business-to-business marketing.
Cheltenham: Edward Elgar, 2012, 800 s. ISBN 978-1-78100-244-5.
[22] MICHEL, Daniel E, Pete NAUDE, Robert SALLE a Jean-Paul VALLA. Business-to-
business marketing: strategies and implementation. 2nd ed. New York City: Palgrave
Macmillan, 2002, 469 s. ISBN 978-11-3726-674-3.
[23] MUDIE, Peter a Angela PIRRIE. Services Marketing Management. London:
Routledge, 2006, 267 s. ISBN 978-0-75-066674-9.
[24] MULLIN, Roddy. Direct Marketing: A Step-by-step Guide to Effective Planning and
Targeting. 5th ed. London: Kogan Page Publishers, 2002, 180 s. ISBN 978-0-7494-
3677-3.

TBU in Zlín, Faculty of Management and Economics 91
[25] RAO, Rama M. Services Marketing. Delhi: Pearson Education India, 2011, 546 s.
ISBN 978-8-13-173225-0.
[26] SHARP, Byron. Marketing: theory, evidence, practice. 1st pub. South Melbourne:
Oxford University Press, 2013, liv, 609 s. ISBN 978-0-19-557355-8.
[27] WINSTON, William a Frederick G CRANE. Professional Services Marketing: Strate-
gy and Tactics. London: Routledge, 2012, 146 s. ISBN 156-0-24-241-8
[28] WRIGHT, Ray. Business-to-business Marketing: A Step-by-step Guide. New York
City: Pearson Education, 2004, 522 s. ISBN 978-0-27-364647-1
[29] YESHIN, Tony. Sales Promotion. Hampshire: Cengage Learning EMEA, 2006, 321 s.
ISBN 978-1-84-480161-9.
[30] ZIMMERMAN, Alan S a Jim BLYTHE. Business to business marketing manage-
ment: a global perspective. 2nd ed. London: Routledge, 2013, xxiv, 498 s. ISBN 978-
0-415-53703-2.
Journals
[31] LANKFORD, William M. Benchmarking: understanding the basics. The Coastal
Business Journal. 2002. Vol. 1, no. 1, p. 57-62.
[32] OMMANI, Ahmad Reza. Strengths, weaknesses, opportunities and threats (SWOT)
analysis for farming system businesses management: Case of wheat farmers of
Shadervan District, Shoushtar Township, Iran. African Journal of Business Manage-
ment [online]. 2011. Vol. 5(22), p. 9448-9454. ISSN: 1993-8233
[33] PRAŜNIKAR, Janez, Žiga DEBELJAK a Aleš AHČAN,. Benchmarking as a tool of
strategic management. Total Quality Management & Business Excellence. 2005.
Vol. 16, no. 2, p. 257-275. DOI 10.1080/14783360500054400.
[34] RAUYRUEN, Papassapa a Kenneth E MILLER. Relationship quality as a predictor of
B2B customer loyalty. Journal of Business Research. 2007. Vol. 60, no. 1, p. 21-31.
DOI 10.1016/j.jbusres.2005.11.006.
[35] SAHA, Swapan K, Ashraful AMAN, Shawkat HOSSAIN a Aminul ISLAM. A Com-
parative Study On B2B Vs. B2C Based On Asia Pacific Region. International Journal
of scientific & technology research. 2014. Vol. 3, no. 9, p. 294-298. ISSN 2277-8616

TBU in Zlín, Faculty of Management and Economics 92
Electronic and other sources
[36] B2B Marketing: What Makes It Special? B2B International. B2B International
[online]. 2016. [cit. 2016-02-10]. Available from:
https://www.b2binternational.com/publications/b2b-marketing/
[37] BPM online sales. Terrasoft.ru [online]. 2016. [cit. 2016-03-25]. Available from:
https://www.terrasoft.ru/sales/price
[38] Business to business marketing: BDC viewpoints study [online]. Montreal: Canada
business development bank, 2013. [cit. 2016-02-10]. Available from:
https://www.bdc.ca/en/Documents/analysis_research/business_to_business_marketin
g.pdf
[39] Company’s web-site. [online]. [cit. 2016-02-25]. Available from:
http://www.xyz.com/en/our-company/about- /-in-brief
[40] DAVID, Meredith, Forest DAVID a Fred DAVID. the Quantitative Strategic Plan-
ning Matrix (QSPM) applied to a retail computer store [online]. Carolina: The
Coastal Business Journal, 2009. [cit. 2016-03-18]. Available from:
http://strategyclub.com/CBJ%20Article.pdf
[41] ERICKSEN, Matthew, John JULLENS a Gaurav KATARIA. The New B2B Market-
ing Imperative [online]. Booz & Company, 2009. [cit. 2016-02-10]. Available from:
http://www.strategyand.pwc.com/reports/marketing-imperative
[42] FADZIL, Intan a Khalilah A. HAFIZ. Applied Business Research (MBA) Customer
Experience. [online]. 2011. [cit. 2016-02-15]. Available from:
http://www.slideshare.net/khalilah586/applied-business-research-mba-customer-
experience160511
[43] Forbes Welcome. Forbes.com [online]. 2016. [cit. 2016-03-25]. Available from:
http://www.forbes.com/sites/danielnewman/2014/10/21/b2b-marketing-must-focus-
on-11/
[44] GLOBALG.A.P. Certification. Globalgap.org [online]. 2016. [cit. 2016-03-25].
Available from: http://www.globalgap.org/uk_en/what-we-do/globalg.a.p.-
certification/
[45] GMP+ Portal. Gmpplus.org [online]. 2016. [cit. 2016-03-25]. Available from:
https://www.gmpplus.org/pagina/288/home_un.aspx
TBU in Zlín, Faculty of Management and Economics 93
[46] Hazard Analysis Critical Control Point (HACCP). Fda.gov [online]. [cit. 2016-03-25].
Available from: http://www.fda.gov/Food/GuidanceRegulation/HACCP/
[47] How to achieve the effective promotional mix [online]. Berkshire: The Chartered Insti-
tute of Marketing, 2009. [cit. 2016-03-18]. Available from:
http://www.cim.co.uk/files/promotionalmix.pdf
[48] ISO 9000 quality management - ISO. Iso.org [online]. [cit. 2016-03-25]. Available
from: http://www.iso.org/iso/home/standards/management-standards/iso_9000.htm
[49] Moldova Economy. FocusEconomics [online]. 2016. [cit. 2016-02-10]. Available
from: http://www.focus-economics.com/countries/moldova
[50] OHSAS 18001 and 18000 Occupational Health and Safety. Ohsas-18001-
occupational-health-and-safety.com [online]. 2016. [cit. 2016-03-25]. Available
from: http://www.ohsas-18001-occupational-health-and-safety.com/
[51] Organic farming. Ec.europa.eu [online]. 2016. [cit. 2016-03-25]. Available from:
http://ec.europa.eu/agriculture/organic/
[52] PEST Chart and SWOT Analysis. Edrawsoft.com [online]. 2016. [cit. 2016-02-20].
Available from: https://www.edrawsoft.com/pest-chart-swot-analysis.php
[53] Porter's Five Forces. Quickmba.com [online]. 2016. [cit. 2016-02-20]. Available from:
http://www.quickmba.com/strategy/porter.shtml
[54] Porter's Five Forces: Assessing the Balance of Power in a Business Situation.
Mindtools.com [online]. 2016. [cit. 2016-02-20]. Available from:
https://www.mindtools.com/pages/article/newTMC_08.htm
[55] Republic of Moldova. Poverty reduction strategy paper [online]. Washington: Interna-
tional Monetary Fund, 2013. [cit. 2016-02-05]. Available from:
http://www.imf.org/external/pubs/ft/scr/2013/cr13269.pdf
[56] SORCE, Patricia. Relationship Marketing Strategy [online]. Rochester: Printing In-
dustry Center at RIT, 2002. [cit. 2016-02-10]. Available from:
https://www.google.cz/url?sa=t&rct=j&q=&esrc=s&source=web&cd=7&cad=rja&ua
ct=8&ved=0ahUKEwijr4Lr1tnLAhWDOxQKHUg-
CM4QFghjMAY&url=http%3A%2F%2Fwww.edsf.org%2Ffile_download%2F998be
9c8-4138-48b0-b398-758dae309fd2&usg=AFQjCNHSeF0gzNaQecKECP-
XVH18cLIKnw

TBU in Zlín, Faculty of Management and Economics 94
[57] SORCE, Patricia. Relationship Marketing Strategy [online]. Rochester: Printing In-
dustry Center at RIT, 2002. [cit. 2016-02-11]. Available from:
http://scholarworks.rit.edu/cgi/viewcontent.cgi?article=1033&context=books
[58] SPACE Matrix Strategic Management Method. Maxi-pedia.com [online]. 2016. [cit.
2016-02-15]. Available from: http://www.maxi-
pedia.com/space+matrix+model+strategic+management+method
[59] SWOT Analysis: Discover New Opportunities, Manage and Eliminate Threats.
Mindtools.com [online]. 2016. [cit. 2015-02-20]. Available from:
https://www.mindtools.com/pages/article/newTMC_05.htm
[60] Team FME. Porters five forces. Strategy skills. [online]. Free Management Ebooks,
2013. [cit. 2016-02-15]. Available from: http://www.free-management-
ebooks.com/dldebk-pdf/fme-five-forces-framework.pdf
[61] TORGGLER, Michael. The Functionality and Usage of CRM Systems [online]. Wie-
ner Neustadt: World Academy of Science, Engineering and Technology, 2008. [cit.
2016-03-20]. Available from:
http://citeseerx.ist.psu.edu/viewdoc/download?doi=10.1.1.193.5110&rep=rep1&type
[62] World Bank Projects Recession for Moldova in 2015, Says Reforms are Necessary to
Improve Growth Prospects. World Bank [online]. 2016. [cit. 2016-02-10]. Available
from: http://www.worldbank.org/en/news/press-release/2015/04/08/world-bank-
projects-recession-for-moldova-in-2015
TBU in Zlín, Faculty of Management and Economics 95
LIST OF ABBREVIATIONS
AS Average Score
B2B Business-to-Business
B2C Business-to-Costumer
CRM Customer relationships management
CRM Customer Relationship Management
EFE External Factors Evaluation
GDP Gross Domestic Product
HACCP Hazard Analysis and Critical Control Points
IFE Internal Factors Evaluation
ISO International Organization of Standardization
KPI Key Performance Ondicators
PESTL Political, Economic, Social, Technological, Legal
QSPM Quantitative Strategic Planning Matrix
ROI Return on Investments
SPACE Strategic Position and Action Evaluation matrix
STAS Sum of Total Average Score
SWOT Strengths, Weaknesses, Opportunities, Threats
TAS Total Average Score

TBU in Zlín, Faculty of Management and Economics 96
LIST OF FIGURES
Figure 1: Multistrat model. (Michel, Naudé, Salle, Valla, 2002) ....................................... 25
Figure 2: IFE and EFE matrix (Slideshare.net, 2016) ........................................................ 36
Figure 3: SPACE matrix (Ommani, 2011) ......................................................................... 36
Figure 4: SPACE matrix (own source) ............................................................................... 58
Figure 5: Positioning map for chosen company (own source) ........................................... 68
Figure 6: Defining length and predecessors of steps (own source, WinQSB) ................... 80
Figure 7: Critical path for project time definition (own source, WinQSB) ........................ 81
Figure 8: Risks evaluation. Graphical presentation (own source) ...................................... 85
Figure 9: Risk level. Graphical presentation (own source) ................................................ 85

TBU in Zlín, Faculty of Management and Economics 97
LIST OF TABLES
Table 1: Roles of buying center members (Krishna, Havaldar, 2005, Canning,
McDowell , 2014) ....................................................................................................... 14
Table 2: Relationships at B2B and B2C markets (Fill, Fill, 2005) ..................................... 15
Table 3: Classification of B2B customers (Hutt, Speh, 2012) ............................................ 17
Table 4: Differences in main characteristics of B2B and B2C markets (own source) ....... 19
Table 5: Main company’s characteristics. Source: internal information ............................ 40
Table 6: Customer Testing Services department: range of standards (own source) ........... 42
Table 7: System and services certification department: range of standards (own
source) ........................................................................................................................ 43
Table 8: Benchmarking analysis (own source) ................................................................... 46
Table 9: IFE factors (own source) ...................................................................................... 49
Table 10: Economic indicators of Moldova in 2010-2014 (focus-economics.com,
2015) ........................................................................................................................... 50
Table 11: PESTL analysis. Economic factors (own source) ............................................... 52
Table 12: PESTL analysis. Political and legal factors (own source) .................................. 53
Table 13: PESTL analysis. Technological factors (own source) ........................................ 54
Table 14: Cultural and social factors (own source) ............................................................ 55
Table 15: EFE factors (own source) ................................................................................... 56
Table 16: S-O SWOT matrix (own source) ........................................................................ 59
Table 17: Porter’s analysis. Overall conclusion (own source) ........................................... 64
Table 18: Targeting for the chosen company (own source) ............................................... 67
Table 19: Positioning summary (own source) .................................................................... 68
Table 20: Services portfolio extension (own source) ......................................................... 71
Table 21: Suggested prices (own source) ........................................................................... 73
Table 22: Example of e-mail marketing program (own source) ......................................... 77
Table 23: List of main activities for project realization (own source) ................................ 79
Table 24: Costs of the project (own source) ....................................................................... 82
Table 25: Risks analysis (own source) ................................................................................ 84
Table 26: Measures for high risks prevention (own source)............................................... 86
Table 27: Measures for medium risks prevention (own source) ......................................... 86
Table 28: Measures for low risks prevention (own source) ................................................ 87

TBU in Zlín, Faculty of Management and Economics 98
APPENDICES
APPENDIX I: Porter’s five forces – description (Mindtools.com, 2016)
APPENDIX II: Example of SWOT matrix (Ommani, 2011)
APPENDIX III: Process network diagram (own source, WinQSB)
APPENDIX IV: Project Gantt chart (own source, WinQSB)
APPENDIX IV: Project Activities Duration (own source, WinQSB)

APPENDIX I: PORTER’S FIVE FORCES – DESCRIPTION
(MINDTOOLS.COM, 2016)

APPENDIX II: EXAMPLE OF SWOT MATRIX (OMMANI, 2011)

APPENDIX III: PROCESS NETWORK DIAGRAM (OWN SOURCE, WINQSB)

APPENDIX IV: PROJECT GANTT CHART (OWN SOURCE, WINQSB)

APPENDIX V: PROJECT ACTIVITIES DURATION (OWN SOURCE,
WINQSB)