Embed Size (px)
Citation preview
Author's personal copy
Nonlinear finite element analysis of the crush behaviour of functionallygraded foam-filled columns
M.S. Attia, S.A. Meguid n, H. Nouraei
Mechanics and Aerospace Design Laboratory, University of Toronto, 5 King’s College Road, Toronto, Ontario, Canada M5S 3G8
a r t i c l e i n f o
Article history:
Received 17 March 2012
Received in revised form
19 May 2012
Accepted 9 June 2012
Keywords:
Crashworthiness
Foam-filled structures
Cellular materials
Finite element analysis
Functionally graded materials
Progressive collapse
a b s t r a c t
The use of metallic foams as a filler in thin-walled structures can significantly enhance their
crashworthiness characteristics. It is further believed that tailoring the properties of the foam filler
would enhance the energy absorption characteristics of the foam-filled structure. It is the objective of
this study to examine the crush behaviour of density-graded foam-filled columns and evaluate the
effect of the density distribution upon both total and specific energy levels. The effect of density
grading, number of grading layers, and thickness of the interactive layer upon the resulting specific
energy absorption was investigated. To this end, nonlinear parametric finite element simulations were
developed and performed to achieve this objective. The results show relative improvement of 12% in
specific energy absorption levels of density-graded foam-filled structures over their uniform density
counterparts with the same mass.
& 2012 Elsevier B.V. All rights reserved.
1. Introduction
Innovative concepts in the design of lightweight automotivestructures are increasingly sought to meet ever increasing fuelcosts and stringent environmental regulations. The use of light-weight aluminium and magnesium alloys is gradually increasingin vehicle space frames with proven significant weight savings[1,2]. However, the concern for the crashworthiness of lightervehicles must be concurrently addressed. Progressive foldingcollapse of thin-walled structures is an effective energy absorbingmechanism in crashworthiness applications by minimising thepeak impact force and increasing the collapse distance in theplastically deformed folds. Furthermore, the energy absorptioncapacity of thin-walled sections can be further improved by fillingthem with foams [3]. In particular, metallic foams are goodcandidates for crashworthiness applications, because (i) theyenjoy excellent specific mechanical properties with respect tothe foam density, and (ii) they can undergo large plastic deforma-tion at an approximately constant stress [4,5]. The total energyabsorption of a foam-filled column can be divided as follows:
Etotal ¼ EfoamþEcolumnþEint ð1Þ
The levels of Efoam and Ecolumn are solely dictated by thematerial and geometrical properties of the column and the
foam-filler, respectively. However, the foam–column interactioncomponent (Eint) relies on the relative stiffness of the interfaceand the penetration resistance of the foam layer adjacent to theouter column. Therefore, while increasing the foam density wouldensure increasing the total energy absorption (TEA), it is notalways the case for the specific energy absorption per unit mass(SEA) [6,7]. Consequently, to further enhance the crashworthinessof foam-filled thin-walled sections, other alternatives should beconsidered. Recently, attention has been devoted to a newconcept known as functionally graded foam (FGF). In FGF, thefoam density is continuously varied in a predefined manner inorder to improve the energy absorption characteristics beyondthose offered by uniform density foam (UDF) [8,9].
In this study, a discrete form of FGF hereafter referred to asDFGF, will be constructed from existing foam layers with differentdensities in the axial or lateral directions. It is therefore theobjective of the current study to: (i) evaluate the effect of usingDFGF upon the crush behaviour of foam-filled columns, and (ii)evaluate the effect of density grading, number of grading layersNG, and thickness and density of the interactive layer upon theresulting SEA.
2. Literature review
Production of density-graded aluminium foams has beenachieved using either preformed powder compacts or precursors[10,11]. Brothers and Dunand [11,12] used investment casting
Contents lists available at SciVerse ScienceDirect
journal homepage: www.elsevier.com/locate/finel
Finite Elements in Analysis and Design
0168-874X/$ - see front matter & 2012 Elsevier B.V. All rights reserved.
http://dx.doi.org/10.1016/j.finel.2012.06.004
n Corresponding author.
E-mail address: [email protected] (S.A. Meguid).
Finite Elements in Analysis and Design 61 (2012) 50–59
Author's personal copy
techniques to produce density-graded aluminium foam frompolyurethane foam precursors. They examined the mechanicalproperties of uniform and graded aluminium alloy 6061 foams.The uniform density foam exhibited an extended, nearly constantplateau compressive response followed by densification at highstrain (0.75–0.8). In contrast, density-graded foams exhibited asmoothly rising plateau stress with an early densification (0.35–0.4). Mortensen et al. [8,13] fabricated density-graded sandwichaluminium foam structures encased in thin aluminium skins.They produced specimens containing up to five layers of porousaluminium foam. Cui et al. [9] presented polymeric FGF in whichthe size of micro-scale cells is varied continuously in a specificpattern. They showed superior SEA of polymeric FGF compared totheir UDF counterparts.
Wierzbicki and Abramowicz [14,15] developed a closed-formsolution for the mean axial crushing load of a square thin-walledcolumn based for a symmetric collapse using energy methods.Abramowicz and Jones [16,17] conducted an extensive experimentalstudy on the collapse of thin-walled circular and square columnswith various lengths and cross section dimensions. They identifiedand modelled basic collapse elements during progressive collapsemechanism; namely symmetric and anti-symmetric folding mechan-isms. Langseth and his collaborators [18,19] performed numericaland experimental investigations on the quasi-static and dynamicaxial collapse of thin-walled aluminium columns. In particular, theyidentified a marginal effect of the mass ratio between the projectileand the column upon the resulting mode of collapse.
Meguid et al. [20,21] conducted extensive experimental andnumerical simulations to investigate the quasi-static axial crushof both PVC and aluminium foam-filled aluminium circularcolumns. It was found that the relative axial stiffness of the foamand the outer column has a major role in dictating the collapsebehaviour and interaction energy component. They further iden-tified optimal geometrical configurations to maximise the SEAwithout changing the mode of collapse. Chen and Wierzbicki [22]developed theoretical solution of the axial crushing of hollow andfoam-filled multi-cell columns and found that the interactioneffect between the foam core and the column wall could mark-edly increase the total crushing resistance of the structure.
3. Problem description
3.1. Geometrical and material properties
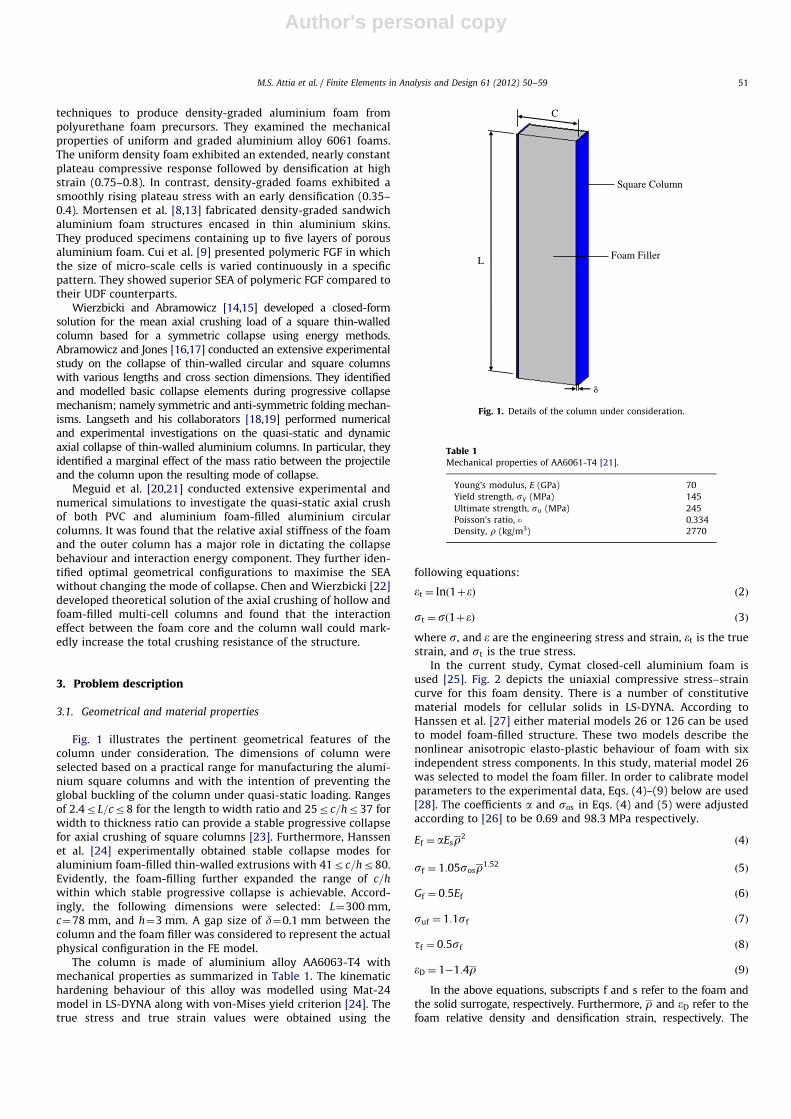
Fig. 1 illustrates the pertinent geometrical features of thecolumn under consideration. The dimensions of column wereselected based on a practical range for manufacturing the alumi-nium square columns and with the intention of preventing theglobal buckling of the column under quasi-static loading. Rangesof 2.4rL=cr8 for the length to width ratio and 25rc=hr37 forwidth to thickness ratio can provide a stable progressive collapsefor axial crushing of square columns [23]. Furthermore, Hanssenet al. [24] experimentally obtained stable collapse modes foraluminium foam-filled thin-walled extrusions with 41rc=hr80.Evidently, the foam-filling further expanded the range of c=h
within which stable progressive collapse is achievable. Accord-ingly, the following dimensions were selected: L¼300 mm,c¼78 mm, and h¼3 mm. A gap size of d¼0.1 mm between thecolumn and the foam filler was considered to represent the actualphysical configuration in the FE model.
The column is made of aluminium alloy AA6063-T4 withmechanical properties as summarized in Table 1. The kinematichardening behaviour of this alloy was modelled using Mat-24model in LS-DYNA along with von-Mises yield criterion [24]. Thetrue stress and true strain values were obtained using the
following equations:
et ¼ lnð1þeÞ ð2Þ
st ¼ sð1þeÞ ð3Þ
where s, and e are the engineering stress and strain, et is the truestrain, and st is the true stress.
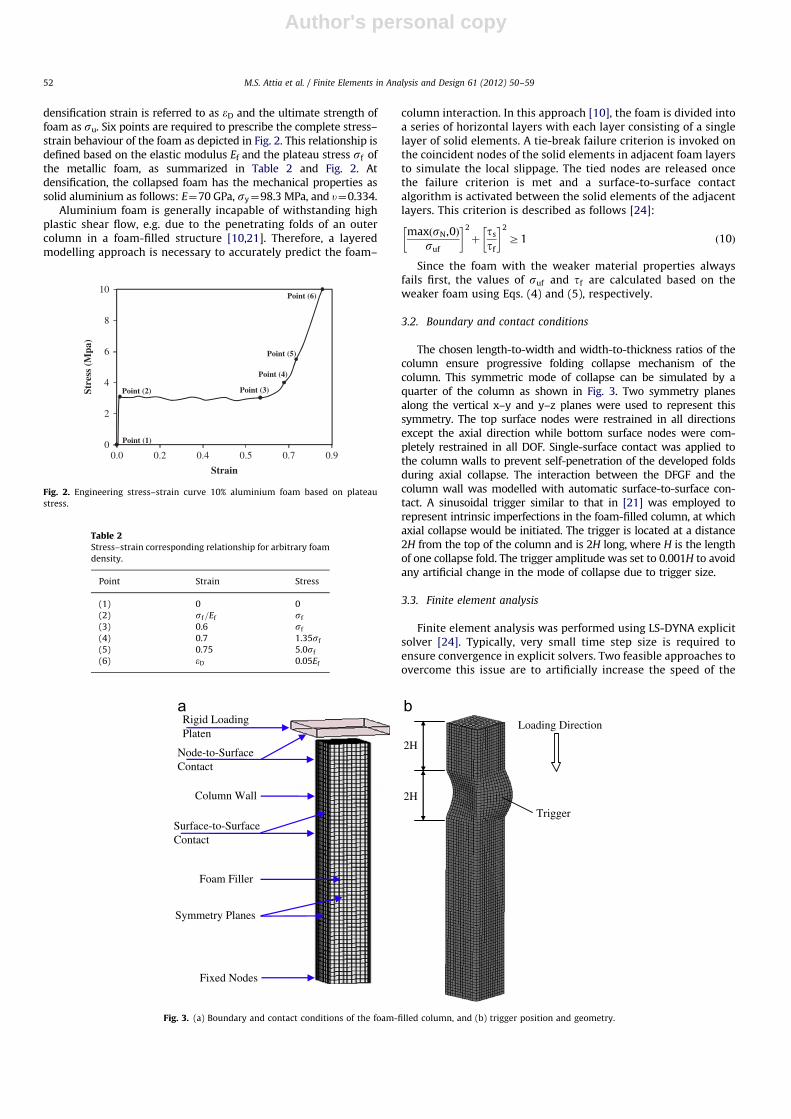
In the current study, Cymat closed-cell aluminium foam isused [25]. Fig. 2 depicts the uniaxial compressive stress–straincurve for this foam density. There is a number of constitutivematerial models for cellular solids in LS-DYNA. According toHanssen et al. [27] either material models 26 or 126 can be usedto model foam-filled structure. These two models describe thenonlinear anisotropic elasto-plastic behaviour of foam with sixindependent stress components. In this study, material model 26was selected to model the foam filler. In order to calibrate modelparameters to the experimental data, Eqs. (4)–(9) below are used[28]. The coefficients a and sos in Eqs. (4) and (5) were adjustedaccording to [26] to be 0.69 and 98.3 MPa respectively.
Ef ¼ aEsr2ð4Þ
sf ¼ 1:05sosr1:52ð5Þ
Gf ¼ 0:5Ef ð6Þ
suf ¼ 1:1sf ð7Þ
tf ¼ 0:5sf ð8Þ
eD ¼ 1�1:4r ð9Þ
In the above equations, subscripts f and s refer to the foam andthe solid surrogate, respectively. Furthermore, r and eD refer to thefoam relative density and densification strain, respectively. The
C
L Foam Filler
Square Column
δ
Fig. 1. Details of the column under consideration.
Table 1Mechanical properties of AA6061-T4 [21].
Young’s modulus, E (GPa) 70
Yield strength, sy (MPa) 145
Ultimate strength, su (MPa) 245
Poisson’s ratio, u 0.334
Density, r (kg/m3) 2770
M.S. Attia et al. / Finite Elements in Analysis and Design 61 (2012) 50–59 51
Author's personal copy
densification strain is referred to as eD and the ultimate strength offoam as su. Six points are required to prescribe the complete stress–strain behaviour of the foam as depicted in Fig. 2. This relationship isdefined based on the elastic modulus Ef and the plateau stress sf ofthe metallic foam, as summarized in Table 2 and Fig. 2. Atdensification, the collapsed foam has the mechanical properties assolid aluminium as follows: E¼70 GPa, sy¼98.3 MPa, and u¼0.334.
Aluminium foam is generally incapable of withstanding highplastic shear flow, e.g. due to the penetrating folds of an outercolumn in a foam-filled structure [10,21]. Therefore, a layeredmodelling approach is necessary to accurately predict the foam–
column interaction. In this approach [10], the foam is divided intoa series of horizontal layers with each layer consisting of a singlelayer of solid elements. A tie-break failure criterion is invoked onthe coincident nodes of the solid elements in adjacent foam layersto simulate the local slippage. The tied nodes are released oncethe failure criterion is met and a surface-to-surface contactalgorithm is activated between the solid elements of the adjacentlayers. This criterion is described as follows [24]:
maxðsN,0Þ
suf
� �2
þts
tf
� �2
Z1 ð10Þ
Since the foam with the weaker material properties alwaysfails first, the values of suf and tf are calculated based on theweaker foam using Eqs. (4) and (5), respectively.
3.2. Boundary and contact conditions
The chosen length-to-width and width-to-thickness ratios of thecolumn ensure progressive folding collapse mechanism of thecolumn. This symmetric mode of collapse can be simulated by aquarter of the column as shown in Fig. 3. Two symmetry planesalong the vertical x–y and y–z planes were used to represent thissymmetry. The top surface nodes were restrained in all directionsexcept the axial direction while bottom surface nodes were com-pletely restrained in all DOF. Single-surface contact was applied tothe column walls to prevent self-penetration of the developed foldsduring axial collapse. The interaction between the DFGF and thecolumn wall was modelled with automatic surface-to-surface con-tact. A sinusoidal trigger similar to that in [21] was employed torepresent intrinsic imperfections in the foam-filled column, at whichaxial collapse would be initiated. The trigger is located at a distance2H from the top of the column and is 2H long, where H is the lengthof one collapse fold. The trigger amplitude was set to 0.001H to avoidany artificial change in the mode of collapse due to trigger size.
3.3. Finite element analysis
Finite element analysis was performed using LS-DYNA explicitsolver [24]. Typically, very small time step size is required toensure convergence in explicit solvers. Two feasible approaches toovercome this issue are to artificially increase the speed of the
Point (1)
Point (2) Point (3)
Point (4)
Point (5)
Point (6)
0
2
4
6
8
10
0.0 0.2 0.4 0.5 0.7 0.9
Stre
ss (
Mpa
)
Strain
Fig. 2. Engineering stress–strain curve 10% aluminium foam based on plateau
stress.
Table 2Stress–strain corresponding relationship for arbitrary foam
density.
Point Strain Stress
(1) 0 0
(2) sf=Ef sf
(3) 0.6 sf
(4) 0.7 1.35sf
(5) 0.75 5.0sf
(6) eD 0.05Ef
Rigid Loading Platen
Surface-to-SurfaceContact
Fixed Nodes
Foam Filler
Column Wall
Node-to-Surface Contact
Symmetry Planes
2H
Loading Direction
2H
Trigger
Fig. 3. (a) Boundary and contact conditions of the foam-filled column, and (b) trigger position and geometry.
M.S. Attia et al. / Finite Elements in Analysis and Design 61 (2012) 50–5952
Author's personal copy
event, or to increase the material density to increase the minimumtime step according to Courant’s Condition [24]. The use of eithertechnique, or both, is conditional by the absence of significant strainrate and inertial effects. Aluminium alloys are generally lightweightand strain rate insensitive. Furthermore, the foam material inertialeffect is limited due to its low density. Therefore, it is possible toimplement both of these approaches in the current problem. Anacceptable kinetic energy to internal energy threshold ratio of 0.15%has been established to not affect the solution accuracy [29].Sensitivity studies indicated that a striker speed of 200 mm/s andmass scaling of 100 achieved marked reduction in the solution time,while not changing in the model response.
Belytschko-Lin-Tsay shell element with five through thicknessintegration points was used for modelling of the column wall. Thefoam filler was modelled with eight-node solid elements withone-point reduced integration to prevent volumetric locking.Stiffness-based hourglass control was employed to minimizethe effect of spurious zero energy deformation associated withreduced integration.
4. Discrete functionally graded foam
Cymat closed-cell foam products for structural applicationshave a relative density range of 3–20%. Practically, the use of
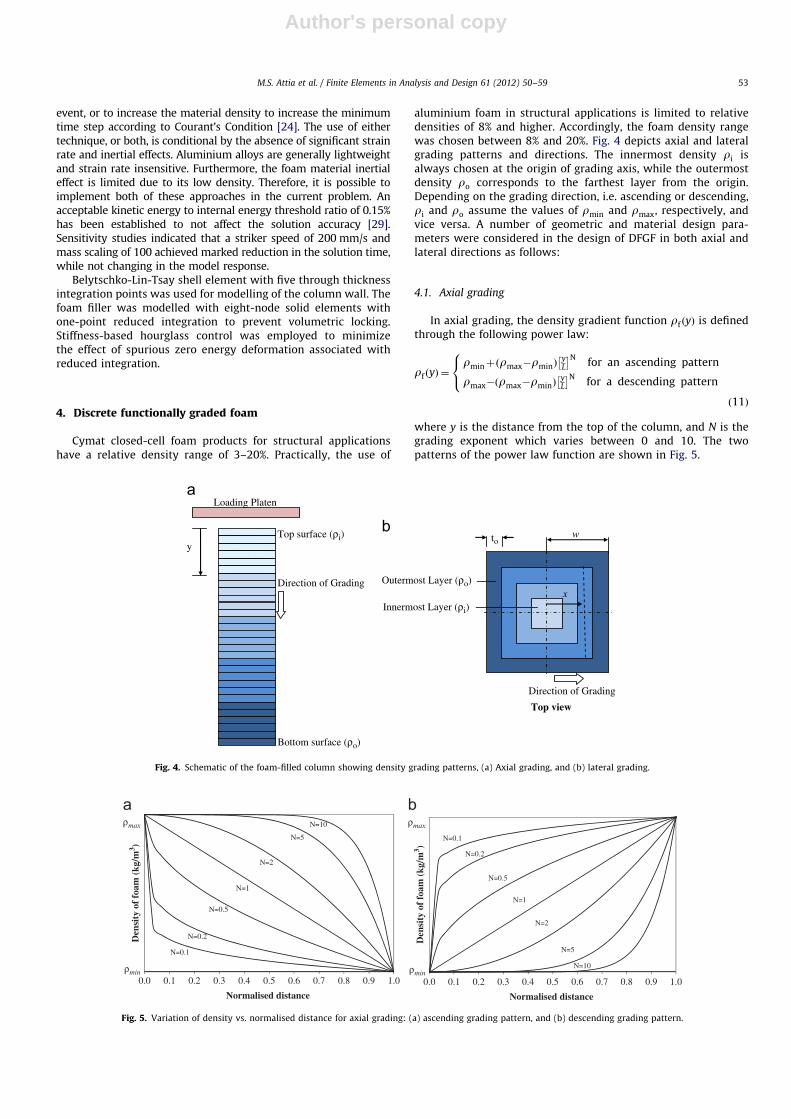
aluminium foam in structural applications is limited to relativedensities of 8% and higher. Accordingly, the foam density rangewas chosen between 8% and 20%. Fig. 4 depicts axial and lateralgrading patterns and directions. The innermost density ri isalways chosen at the origin of grading axis, while the outermostdensity ro corresponds to the farthest layer from the origin.Depending on the grading direction, i.e. ascending or descending,ri and ro assume the values of rmin and rmax, respectively, andvice versa. A number of geometric and material design para-meters were considered in the design of DFGF in both axial andlateral directions as follows:
4.1. Axial grading
In axial grading, the density gradient function rf ðyÞ is definedthrough the following power law:
rf ðyÞ ¼rminþðrmax�rminÞ
yL
� �Nfor an ascending pattern
rmax�ðrmax�rminÞyL
� �Nfor a descending pattern
8<:
ð11Þ
where y is the distance from the top of the column, and N is thegrading exponent which varies between 0 and 10. The twopatterns of the power law function are shown in Fig. 5.
Direction of Grading
y
Loading Platen
Top surface (ρi)
Bottom surface (ρo)
Top view
w
Direction of Grading
to
xInnermost Layer (ρi)
Outermost Layer (ρo)
Fig. 4. Schematic of the foam-filled column showing density grading patterns, (a) Axial grading, and (b) lateral grading.
Den
sity
of
foam
(kg
/m3 )
Normalised distance
N=0.1
N=0.2
N=0.5
N=1
N=2
N=5
N=10
ρmin
ρmax
0.0 0.1 0.2 0.3 0.4 0.5 0.6 0.7 0.8 0.9 1.0 0.0 0.1 0.2 0.3 0.4 0.5 0.6 0.7 0.8 0.9 1.0
Den
sity
of
foam
(kg
/m3 )
Normalised distance
N=0.1
N=0.2
N=0.5
N=1
N=2
N=5
N=10ρmin
ρmax
Fig. 5. Variation of density vs. normalised distance for axial grading: (a) ascending grading pattern, and (b) descending grading pattern.
M.S. Attia et al. / Finite Elements in Analysis and Design 61 (2012) 50–59 53

Author's personal copy
4.2. Lateral grading
Grading of the foam in the lateral direction is more complexthan the axial direction due to space limitations and the mini-mum feasible layer thickness. In lateral grading, Eq. (11) is usedwith y and L replaced with x and w, respectively, where x is thedistance from the inner core of the DFGF and w is the half widthof the column. These design parameters are detailed below.
4.3. Density and thickness of the outermost foam layer
The outermost layer of DFGF is in direct contact with thecolumn wall. During progressive axial collapse of a foam-filledcolumn, this layer provides the interaction energy component Eint
due to the penetration of column folds into the foam. Besides, thislayer still contributes to the energy absorbed by the foam fillerdue to axial crushing Ef. Therefore, both the density and thethickness of the outermost foam layer play an important role indictating the level of total energy absorption of the foam-filledcolumn Fig. 6.
4.4. Density of the innermost foam layer (ri)
The inner core of the DFGF contributes only to the energyabsorbed due to axial crushing of the foam filler. Hence, it isnecessary to examine the effectiveness of the inner core from SEAperspective. In particular, both the density ri and the area of theremoved core Ac of this layer were investigated upon the resultingenergy absorption levels in comparison to uniform densitystructures of the same mass. The value of ri was varied from 0%to 10%, while Ac was varied between 5% and 50%.
5. Results and discussions
5.1. Model validation
FE model validation was performed using the quasi-staticcrush test results in [21] for both empty and foam-filled squarecolumn made of aluminium alloy 6063-T4. The column was300 mm long with cross section dimensions of 76 mm�76 mm�3 mm wall thickness. The foam filler has a relative density of 10%.In the two cases, deformation was carried out to 75% of thecolumn height. Fig. 7 depicts a comparison of the deformed shapebetween FE predictions and experimental findings for empty andfoam-filled columns, respectively. The overall collapse profile ofFE model in terms of the mode of collapse and number of collapsefolds is in good agreement with experiments.
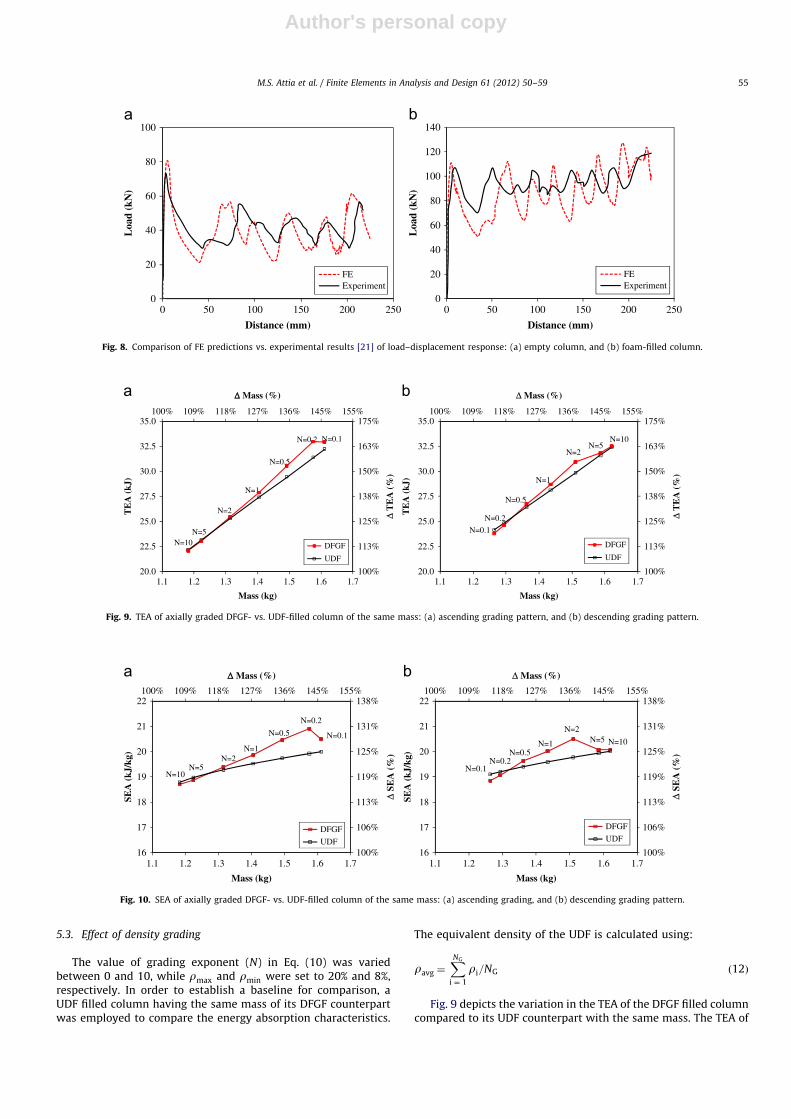
Fig. 8 illustrates a respective comparison between the FEpredictions and experimental results of the load–displacementresponse of both empty and foam-filled columns. There is goodoverall agreement between the two in predicting the peakcollapse load with a maximum discrepancy of less than 10%. Itis noted that the FE predictions show higher peak loads comparedto experiments during the formation of every subsequent fold.This can be attributed to the absence of intrinsic material defectsin the FE model; these defects act as triggers during the progres-sive collapse process in real material.
5.2. Axial grading of DFGF filled column
In this section, the effect of various design parameters on theresulting energy absorption characteristics of the axially gradedDFGF filled column is explored. Parametric studies indicated thatusing a total number of layers NG¼30 was sufficient for model-ling axially graded DFGF.
Fig. 6. Comparison of the collapse behaviour of empty column at 75% deformation, (a) FE simulations, and (b) experimental results.
Fig. 7. Comparison of the collapse behaviour of foam-filled column at 75% deformation (a) FE prediction, and (b) experimental results [21].
M.S. Attia et al. / Finite Elements in Analysis and Design 61 (2012) 50–5954
Author's personal copy
5.3. Effect of density grading
The value of grading exponent (N) in Eq. (10) was variedbetween 0 and 10, while rmax and rmin were set to 20% and 8%,respectively. In order to establish a baseline for comparison, aUDF filled column having the same mass of its DFGF counterpartwas employed to compare the energy absorption characteristics.
The equivalent density of the UDF is calculated using:
ravg ¼XNG
i ¼ 1
ri=NG ð12Þ
Fig. 9 depicts the variation in the TEA of the DFGF filled columncompared to its UDF counterpart with the same mass. The TEA of
0
20
40
60
80
100L
oad
(kN
)
Distance (mm)
FEExperiment
0
20
40
60
80
100
120
140
0 50 100 150 200 250 0 50 100 150 200 250
Loa
d (k
N)
Distance (mm)
FEExperiment
Fig. 8. Comparison of FE predictions vs. experimental results [21] of load–displacement response: (a) empty column, and (b) foam-filled column.
N=0.1N=0.2
N=0.5
N=1
N=2
N=5N=10
100%
113%
125%
138%
150%
163%
175%
20.0
22.5
25.0
27.5
30.0
32.5
35.0
ΔΔ Mass (%) Δ Mass (%)Δ
TE
A (
%)
TE
A (
kJ)
Mass (kg)
DFGF
UDF
N=0.1
N=0.2
N=0.5
N=1
N=2N=5
N=10
100% 109% 118% 127% 136% 145% 155% 100% 109% 118% 127% 136% 145% 155%
100%
113%
125%
138%
150%
163%
175%
20.0
22.5
25.0
27.5
30.0
32.5
35.0
1.1 1.2 1.3 1.4 1.5 1.6 1.7 1.1 1.2 1.3 1.4 1.5 1.6 1.7
Δ T
EA
(%
)
TE
A (
kJ)
Mass (kg)
DFGF
UDF
Fig. 9. TEA of axially graded DFGF- vs. UDF-filled column of the same mass: (a) ascending grading pattern, and (b) descending grading pattern.
N=0.1
N=0.2
N=0.5
N=1N=2
N=5N=10
100%
106%
113%
119%
125%
131%
138%
16
17
18
19
20
21
22
ΔΔ Mass (%)
Δ SE
A (
%)
SEA
(kJ
/kg)
Mass (kg)
N=0.1N=0.2
N=0.5N=1
N=2N=5 N=10
100%
106%
113%
119%
125%
131%
138%
16
17
18
19
20
21
22100% 109% 118% 127% 136% 145% 155% 100% 109% 118% 127% 136% 145% 155%
1.1 1.2 1.3 1.4 1.5 1.6 1.7 1.1 1.2 1.3 1.4 1.5 1.6 1.7
Δ SE
A (
%)
SEA
(kJ
/kg)
Mass (kg)
DFGF
UDF
Δ Mass (%)
DFGF
UDF
Fig. 10. SEA of axially graded DFGF- vs. UDF-filled column of the same mass: (a) ascending grading, and (b) descending grading pattern.
M.S. Attia et al. / Finite Elements in Analysis and Design 61 (2012) 50–59 55
Author's personal copy
the DFGF filled column with ascending grading pattern is higherthan that of the corresponding UDF filled column for Nr2.Increasing the value of N above 2 did not affect the TEA of theDFGF filled column. The TEA of the DFGF filled column withdescending grading pattern is higher than that of the correspond-ing UDF filled column for 0.5rNr5. Setting No0.5 resulted inreduction of the TEA, and negligible improvement was observedfor N45.
Fig. 10 illustrates that maximum SEA improvement of theDFGF filled column with ascending grading pattern over its UDFcounterpart is 6% at N¼0.2. In contrast, this value is 2% higherthan the SEA of the DFGF filled column with descending gradingpattern. This suggests that the effect of the density axial gradingdirection is marginal compared to the density grading exponentunder quasi-static loading conditions. Similar results were obtainedfrom a previous study [30], where 7.5% SEA improvement wasobtained for an axially graded DFGF filled column with ascendinggrading pattern at N¼0.2 under dynamic loading.
5.4. Effect of density range
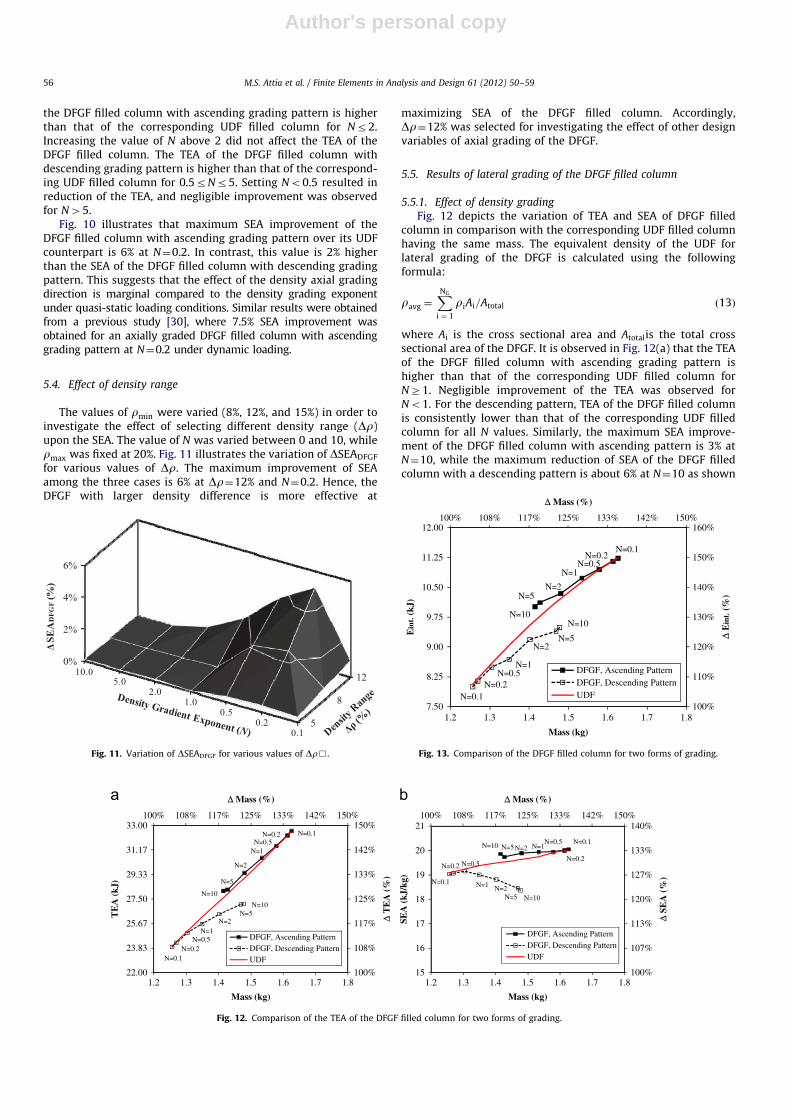
The values of rmin were varied (8%, 12%, and 15%) in order toinvestigate the effect of selecting different density range (Dr)upon the SEA. The value of N was varied between 0 and 10, whilermax was fixed at 20%. Fig. 11 illustrates the variation of DSEADFGF
for various values of Dr. The maximum improvement of SEAamong the three cases is 6% at Dr¼12% and N¼0.2. Hence, theDFGF with larger density difference is more effective at
maximizing SEA of the DFGF filled column. Accordingly,Dr¼12% was selected for investigating the effect of other designvariables of axial grading of the DFGF.
5.5. Results of lateral grading of the DFGF filled column
5.5.1. Effect of density grading
Fig. 12 depicts the variation of TEA and SEA of DFGF filledcolumn in comparison with the corresponding UDF filled columnhaving the same mass. The equivalent density of the UDF forlateral grading of the DFGF is calculated using the followingformula:
ravg ¼XNG
i ¼ 1
riAi=Atotal ð13Þ
where Ai is the cross sectional area and Atotalis the total crosssectional area of the DFGF. It is observed in Fig. 12(a) that the TEAof the DFGF filled column with ascending grading pattern ishigher than that of the corresponding UDF filled column forNZ1. Negligible improvement of the TEA was observed forNo1. For the descending pattern, TEA of the DFGF filled columnis consistently lower than that of the corresponding UDF filledcolumn for all N values. Similarly, the maximum SEA improve-ment of the DFGF filled column with ascending pattern is 3% atN¼10, while the maximum reduction of SEA of the DFGF filledcolumn with a descending pattern is about 6% at N¼10 as shown
100% 108% 117% 125% 133% 142% 150% 100% 108% 117% 125% 133% 142% 150%
100%
108%
117%
125%
133%
142%
150%
22.00
23.83
25.67
27.50
29.33
31.17
33.00
Δ Mass (%)
Δ T
EA
(%
)
TE
A (
kJ)
Mass (kg)
DFGF, Ascending PatternDFGF, Descending PatternUDF
N=2N=5
N=10
N=1
N=2
N=5
N=1
N=10
N=0.1N=0.2N=0.5
N=0.1N=0.2
N=0.5
100%
107%
113%
120%
127%
133%
140%
15
16
17
18
19
20
21
1.2 1.3 1.4 1.5 1.6 1.7 1.8 1.2 1.3 1.4 1.5 1.6 1.7 1.8
Δ Mass (%)
Δ SE
A (
%)
SEA
(kJ
/kg)
Mass (kg)
DFGF, Ascending PatternDFGF, Descending PatternUDF
N=2
N=5N=10 N=1N=2
N=5
N=1
N=10
N=0.1
N=0.2
N=0.5
N=0.1
N=0.2 N=0.5
Fig. 12. Comparison of the TEA of the DFGF filled column for two forms of grading.
Fig. 11. Variation of DSEADFGF for various values of Dr&.
100%
110%
120%
130%
140%
150%
160%
7.50
8.25
9.00
9.75
10.50
11.25
12.00100% 108% 117% 125% 133% 142% 150%
1.2 1.3 1.4 1.5 1.6 1.7 1.8
Δ Mass (%)
Δ E
int. (
%)
Ein
t. (
kJ)
Mass (kg)
DFGF, Ascending PatternDFGF, Descending PatternUDF
N=2N=5
N=10
N=1
N=2N=5
N=1
N=10
N=0.1N=0.2
N=0.5
N=0.1N=0.2
N=0.5
Fig. 13. Comparison of the DFGF filled column for two forms of grading.
M.S. Attia et al. / Finite Elements in Analysis and Design 61 (2012) 50–5956
Author's personal copy
in Fig. 12(b). This can be attributed to the variation of theinteraction energy Eint:, which is proportional to the relativestiffness of the foam and column [20] Since the interactive layerconsistently has the minimum foam density in a descendingpattern, the foam–column interaction is reduced. In contrast,the ascending grading pattern offers the maximum density foamfor the interactive layer. Fig. 13 depicts the variation of Eint: for
both patterns. It is observed that N has a significant influence onthe TEA, Eint:, and SEA of the DFGF filled column for values ofNZ1. Accordingly, it can be concluded that the ascending patternhas some advantages over the descending pattern for improvingthe crashworthiness of the DFGF.
5.5.2. Effect of density range
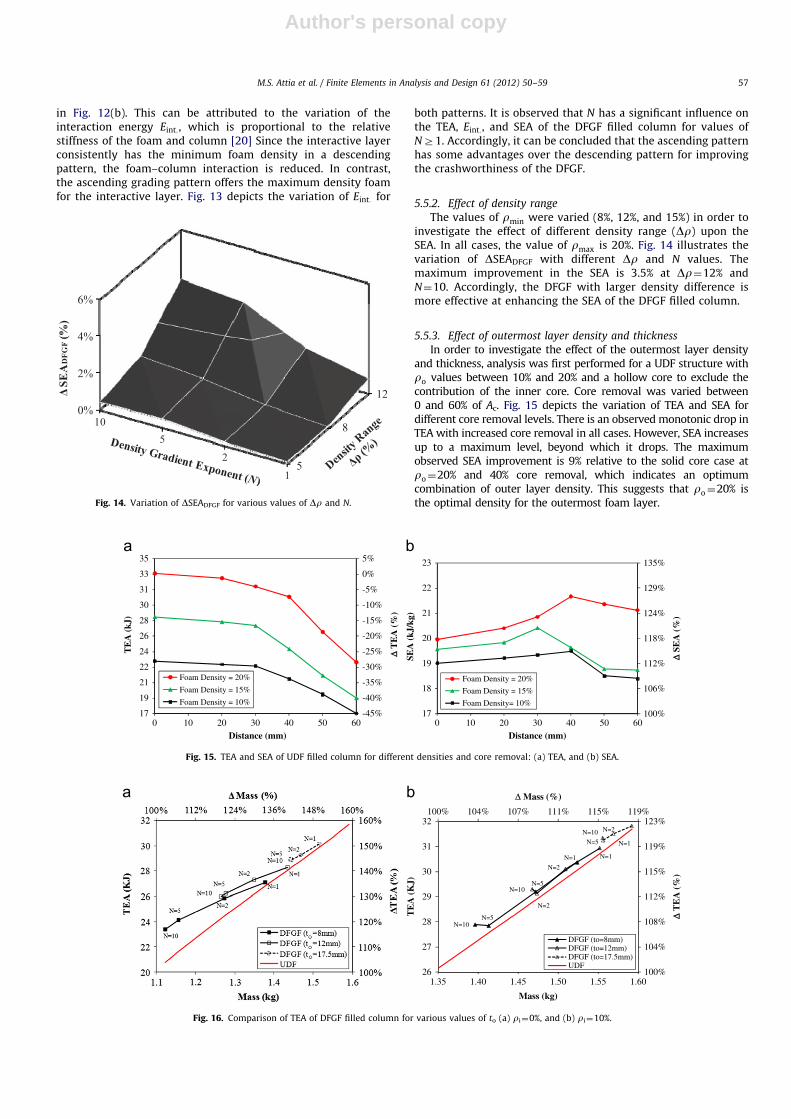
The values of rmin were varied (8%, 12%, and 15%) in order toinvestigate the effect of different density range (Dr) upon theSEA. In all cases, the value of rmax is 20%. Fig. 14 illustrates thevariation of DSEADFGF with different Dr and N values. Themaximum improvement in the SEA is 3.5% at Dr¼12% andN¼10. Accordingly, the DFGF with larger density difference ismore effective at enhancing the SEA of the DFGF filled column.
5.5.3. Effect of outermost layer density and thickness
In order to investigate the effect of the outermost layer densityand thickness, analysis was first performed for a UDF structure withro values between 10% and 20% and a hollow core to exclude thecontribution of the inner core. Core removal was varied between0 and 60% of Ac. Fig. 15 depicts the variation of TEA and SEA fordifferent core removal levels. There is an observed monotonic drop inTEA with increased core removal in all cases. However, SEA increasesup to a maximum level, beyond which it drops. The maximumobserved SEA improvement is 9% relative to the solid core case atro¼20% and 40% core removal, which indicates an optimumcombination of outer layer density. This suggests that ro¼20% isthe optimal density for the outermost foam layer.Fig. 14. Variation of DSEADFGF for various values of Dr and N.
-45%
-40%
-35%
-30%
-25%
-20%
-15%
-10%
-5%
0%
5%
17
19
21
22
24
26
28
30
31
33
35
Δ Δ T
EA
(%
)
TE
A (
kJ)
Distance (mm)
Foam Density = 20%
Foam Density = 15%
Foam Density = 10%
100%
106%
112%
118%
124%
129%
135%
17
18
19
20
21
22
23
0 10 20 30 40 50 60 0 10 20 30 40 50 60
Δ Δ SE
A (
%)
SEA
(kJ
/kg)
Distance (mm)
Foam Density = 20%
Foam Density = 15%
Foam Density= 10%
Fig. 15. TEA and SEA of UDF filled column for different densities and core removal: (a) TEA, and (b) SEA.
100%
104%
108%
112%
115%
119%
123%
26
27
28
29
30
31
32100% 104% 107% 111% 115% 119%
1.35 1.40 1.45 1.50 1.55 1.60
Δ Mass (%)
Δ Δ T
EA
(%
)
TE
A (
KJ)
Mass (kg)
DFGF (to=8mm)DFGF (to=12mm)DFGF (to=17.5mm)UDF
N=2
N=5N=10
N=1
N=1
N=2
N=5
N=10
N=1
N=2
N=5N=10
Fig. 16. Comparison of TEA of DFGF filled column for various values of to (a) ri¼0%, and (b) ri¼10%.
M.S. Attia et al. / Finite Elements in Analysis and Design 61 (2012) 50–59 57
Author's personal copy
To investigate the effect of the thickness of the outermost layerin the actual DFGF filled structure, to was simultaneously variedwith the inner core density ri such that to increased from 5 mmto 20 mm for two limiting cases where ri¼0% (hollow core) andri¼10%. In each case, the remaining area in the DFGF was equallydivided between the other grading layers. The values of N werevaried between 1 and 10 and the density profile across differentlayers was evaluated using Eq. (11).
Fig. 16 depicts the variation of TEA with to for both hollow(ri¼0%) and filled inner core with ri¼10% at different N values.In the two cases, TEA for DFGF structure is compared with thecorresponding UDF structure having the same mass. It is observedthat the DFGF structure is superior to its UDF counterpart havingthe same mass for the two density cases under consideration. Thebenefit of foam grading is more pronounced for hollow sections(ri¼0%) compared to ri¼10%. Increasing to from 8 mm to17.5 mm yielded a net TEA increase of 26% for N¼10 for ri¼0%compared to a 12% increase for the case of ri¼10%
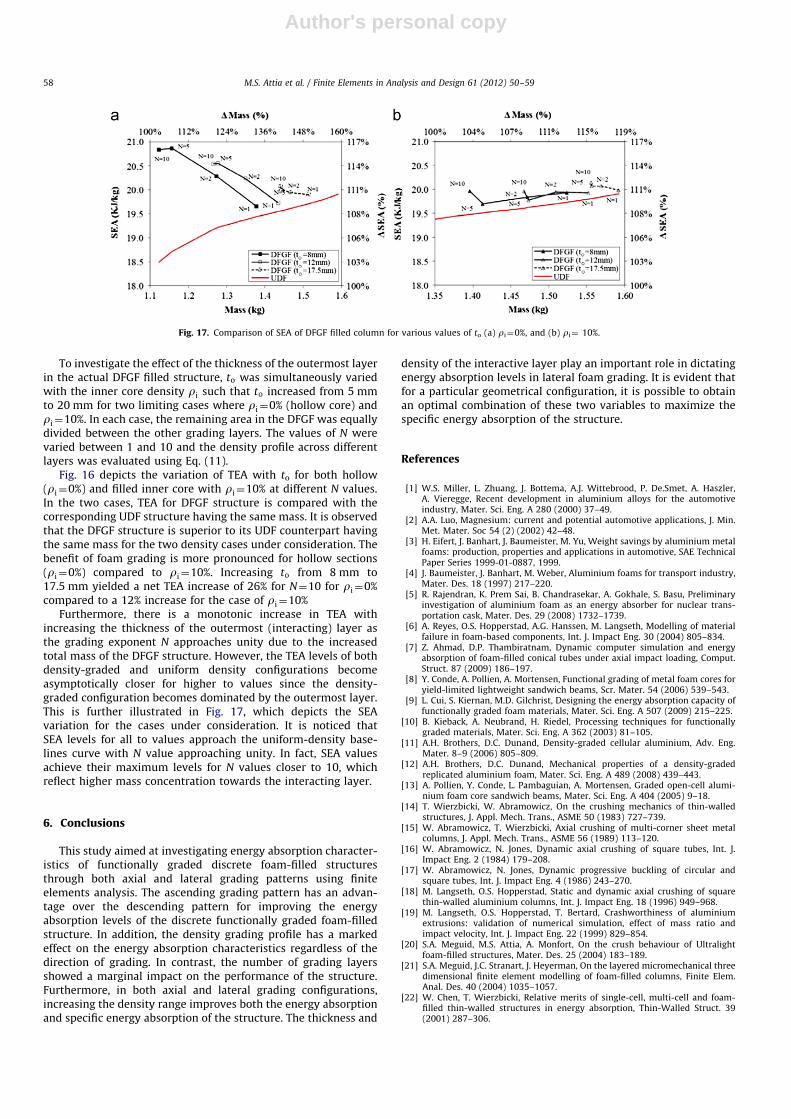
Furthermore, there is a monotonic increase in TEA withincreasing the thickness of the outermost (interacting) layer asthe grading exponent N approaches unity due to the increasedtotal mass of the DFGF structure. However, the TEA levels of bothdensity-graded and uniform density configurations becomeasymptotically closer for higher to values since the density-graded configuration becomes dominated by the outermost layer.This is further illustrated in Fig. 17, which depicts the SEAvariation for the cases under consideration. It is noticed thatSEA levels for all to values approach the uniform-density base-lines curve with N value approaching unity. In fact, SEA valuesachieve their maximum levels for N values closer to 10, whichreflect higher mass concentration towards the interacting layer.
6. Conclusions
This study aimed at investigating energy absorption character-istics of functionally graded discrete foam-filled structuresthrough both axial and lateral grading patterns using finiteelements analysis. The ascending grading pattern has an advan-tage over the descending pattern for improving the energyabsorption levels of the discrete functionally graded foam-filledstructure. In addition, the density grading profile has a markedeffect on the energy absorption characteristics regardless of thedirection of grading. In contrast, the number of grading layersshowed a marginal impact on the performance of the structure.Furthermore, in both axial and lateral grading configurations,increasing the density range improves both the energy absorptionand specific energy absorption of the structure. The thickness and
density of the interactive layer play an important role in dictatingenergy absorption levels in lateral foam grading. It is evident thatfor a particular geometrical configuration, it is possible to obtainan optimal combination of these two variables to maximize thespecific energy absorption of the structure.
References
[1] W.S. Miller, L. Zhuang, J. Bottema, A.J. Wittebrood, P. De.Smet, A. Haszler,A. Vieregge, Recent development in aluminium alloys for the automotiveindustry, Mater. Sci. Eng. A 280 (2000) 37–49.
[2] A.A. Luo, Magnesium: current and potential automotive applications, J. Min.Met. Mater. Soc 54 (2) (2002) 42–48.
[3] H. Eifert, J. Banhart, J. Baumeister, M. Yu, Weight savings by aluminium metalfoams: production, properties and applications in automotive, SAE TechnicalPaper Series 1999-01-0887, 1999.
[4] J. Baumeister, J. Banhart, M. Weber, Aluminium foams for transport industry,Mater. Des. 18 (1997) 217–220.
[5] R. Rajendran, K. Prem Sai, B. Chandrasekar, A. Gokhale, S. Basu, Preliminaryinvestigation of aluminium foam as an energy absorber for nuclear trans-portation cask, Mater. Des. 29 (2008) 1732–1739.
[6] A. Reyes, O.S. Hopperstad, A.G. Hanssen, M. Langseth, Modelling of materialfailure in foam-based components, Int. J. Impact Eng. 30 (2004) 805–834.
[7] Z. Ahmad, D.P. Thambiratnam, Dynamic computer simulation and energyabsorption of foam-filled conical tubes under axial impact loading, Comput.Struct. 87 (2009) 186–197.
[8] Y. Conde, A. Pollien, A. Mortensen, Functional grading of metal foam cores foryield-limited lightweight sandwich beams, Scr. Mater. 54 (2006) 539–543.
[9] L. Cui, S. Kiernan, M.D. Gilchrist, Designing the energy absorption capacity offunctionally graded foam materials, Mater. Sci. Eng. A 507 (2009) 215–225.
[10] B. Kieback, A. Neubrand, H. Riedel, Processing techniques for functionallygraded materials, Mater. Sci. Eng. A 362 (2003) 81–105.
[11] A.H. Brothers, D.C. Dunand, Density-graded cellular aluminium, Adv. Eng.Mater. 8–9 (2006) 805–809.
[12] A.H. Brothers, D.C. Dunand, Mechanical properties of a density-gradedreplicated aluminium foam, Mater. Sci. Eng. A 489 (2008) 439–443.
[13] A. Pollien, Y. Conde, L. Pambaguian, A. Mortensen, Graded open-cell alumi-nium foam core sandwich beams, Mater. Sci. Eng. A 404 (2005) 9–18.
[14] T. Wierzbicki, W. Abramowicz, On the crushing mechanics of thin-walledstructures, J. Appl. Mech. Trans., ASME 50 (1983) 727–739.
[15] W. Abramowicz, T. Wierzbicki, Axial crushing of multi-corner sheet metalcolumns, J. Appl. Mech. Trans., ASME 56 (1989) 113–120.
[16] W. Abramowicz, N. Jones, Dynamic axial crushing of square tubes, Int. J.Impact Eng. 2 (1984) 179–208.
[17] W. Abramowicz, N. Jones, Dynamic progressive buckling of circular andsquare tubes, Int. J. Impact Eng. 4 (1986) 243–270.
[18] M. Langseth, O.S. Hopperstad, Static and dynamic axial crushing of squarethin-walled aluminium columns, Int. J. Impact Eng. 18 (1996) 949–968.
[19] M. Langseth, O.S. Hopperstad, T. Bertard, Crashworthiness of aluminiumextrusions: validation of numerical simulation, effect of mass ratio andimpact velocity, Int. J. Impact Eng. 22 (1999) 829–854.
[20] S.A. Meguid, M.S. Attia, A. Monfort, On the crush behaviour of Ultralightfoam-filled structures, Mater. Des. 25 (2004) 183–189.
[21] S.A. Meguid, J.C. Stranart, J. Heyerman, On the layered micromechanical threedimensional finite element modelling of foam-filled columns, Finite Elem.Anal. Des. 40 (2004) 1035–1057.
[22] W. Chen, T. Wierzbicki, Relative merits of single-cell, multi-cell and foam-filled thin-walled structures in energy absorption, Thin-Walled Struct. 39(2001) 287–306.
Fig. 17. Comparison of SEA of DFGF filled column for various values of to (a) ri¼0%, and (b) ri¼ 10%.
M.S. Attia et al. / Finite Elements in Analysis and Design 61 (2012) 50–5958

Author's personal copy
[23] W. Abramowicz, N. Jones, Transition from initial global bending to progres-sive buckling of tubes loaded statically and dynamically, Int. J. Impact Eng. 19(1997) 415–437.
[24] A. Hanssen, M. Langseth, O. Hopperstad, Static crushing of square aluminiumextrusions with aluminium foam filler, Int. J. Mech. Sci. 41 (1999) 967–993.
[25] J.O. Hallquist, LS-DYNA 971: theoretical manual, California, Livermore Soft-ware Technology Corporation, 2007.
[26] Cymat Corp., Technical manual for stabilized aluminium foam, Cymat,Mississauga, Ontario, 2009.
[27] A.G. Hanssen, O.S. Hopperstad, M. Langseth, H. Ilstad, Validation of constitutivemodels applicable to aluminium foams, Int. J. Mech. Sci. 44 (2002) 359–406.
[28] L.J. Gibson, M. Ashby, Cellular Solids: Structure and Properties, CambridgeUniversity Press, Cambridge, UK, 1997.
[29] S.H. Kim, T. Wierzbicki, Crush-behaviour of thin-walled prismatic columns undercombined bending and compression, Comput. Struct. 79 (2001) 1417–1432.
[30] G. Sun, G. Li, S. Hou, S. Zhou, W. Li, Q. Li, Crashworthiness design forfunctionally graded foam-filled thin-walled structures, Mater. Sci. Eng. A 527(2010) 1911–1919.
M.S. Attia et al. / Finite Elements in Analysis and Design 61 (2012) 50–59 59


