Embed Size (px)
Citation preview

foods
Article
Authentication and Chemometric Discrimination of Six GreekPDO Table Olive Varieties through MorphologicalCharacteristics of Their Stones
Sofia Agriopoulou 1,*, Maria Tarapoulouzi 2 , Marie Ampères Bedine Boat 3, Catherine Rébufa 4,Nathalie Dupuy 4 , Charis R. Theocharis 2 , Theodoros Varzakas 1 , Sevastianos Roussos 4 and Jacques Artaud 4
�����������������
Citation: Agriopoulou, S.;
Tarapoulouzi, M.; Bedine Boat, M.A.;
Rébufa, C.; Dupuy, N.; Theocharis,
C.R.; Varzakas, T.; Roussos, S.;
Artaud, J. Authentication and
Chemometric Discrimination of Six
Greek PDO Table Olive Varieties
through Morphological
Characteristics of Their Stones. Foods
2021, 10, 1829. https://doi.org/
10.3390/foods10081829
Academic Editors: Paolo Lucci and
Simon Haughey
Received: 12 June 2021
Accepted: 4 August 2021
Published: 7 August 2021
Publisher’s Note: MDPI stays neutral
with regard to jurisdictional claims in
published maps and institutional affil-
iations.
Copyright: © 2021 by the authors.
Licensee MDPI, Basel, Switzerland.
This article is an open access article
distributed under the terms and
conditions of the Creative Commons
Attribution (CC BY) license (https://
creativecommons.org/licenses/by/
4.0/).
1 Department of Food Science and Technology, University of the Peloponnese, Antikalamos,24100 Kalamata, Greece; [email protected]
2 Department of Chemistry, University of Cyprus, P.O. Box 20537, Nicosia CY-1678, Cyprus;[email protected] (M.T.); [email protected] (C.R.T.)
3 Department of Biochemistry, University of Yaounde I, P.O. Box 812, Yaoundé, Cameroon;[email protected]
4 Aix Marseille Univ, Avignon Université, CNRS, IRD, IMBE, Campus Saint Jerome, 13007 Marseille, France;[email protected] (C.R.); [email protected] (N.D.); [email protected] (S.R.);[email protected] (J.A.)
* Correspondence: [email protected]
Abstract: Table olives, the number one consumed fermented food in Europe, are widely consumed asthey contain many valuable ingredients for health. It is also a food which may be the subject of adul-teration, as many different olive varieties with different geographical origin, exist all over the word.In the present study, the image analysis of stones of six main Greek protected designation of origin(PDO) table olive varieties was performed for the control of their authentication and discrimination,with cv. Prasines Chalkidikis, cv. Kalamata Olive, cv. Konservolia Stylidas, cv. Konservolia Amfissis,cv. Throuba Thassos and cv. Throuba Chios being the studied olive varieties. Orthogonal partial leastsquare discriminant analysis (OPLS-DA) was used for discrimination and classification of the sixGreek table olive varieties. With a 98.33% of varietal discrimination, the OPLS-DA model proved tobe an efficient tool to authentify table olive varieties from their morphological characteristics.
Keywords: Greek PDO table olive varieties; chemometric analysis; OPLS-DA; discrimination;authenticity; adulteration; geographical origin; quality; safety
1. Introduction
Olive growing is associated with the first steps of human existence, with a historyabout 5000 years [1], having acquired symbolism associated with peace and friendship asolive branches crowned the winners of the Olympics in Ancient Greece [2]. Especially inMediterranean countries where the olive tree (Olea europaea L. of the family Oleaceae) isconsidered the most emblematic tree, there exist more than 2000 varieties [3]. From thefruit of the olive trees can produce the well-known olive oil and table olives (also calledeating olives) [4,5]. According to International Olive Oil Council (IOOC), “Table olives arethe product prepared from the sound fruits of varieties of the cultivated olive tree that arechosen for their production of olives whose volume, shape, flesh-to-stone ratio, fine flesh,taste, firmness and ease of detachment from the stone make them particularly suitablefor processing; treated to remove its bitterness and preserved by natural fermentation, orby heat treatment with or without the addition of preservatives; packed with or withoutcovering liquid” [6]. The main producers of table olives in Europe are Spain, Greece, andItaly, other major producers outside the Europe are Egypt, Algeria, Turkey, and Morocco,while emerging producers are Syria, Peru and USA. The word total production exceeded2.5 million tons in the 2018/2019 season, while the precognition for the 2020/2021 seasonis to be exceeded 3.0 million tons [7].
Foods 2021, 10, 1829. https://doi.org/10.3390/foods10081829 https://www.mdpi.com/journal/foods

Foods 2021, 10, 1829 2 of 16
Table olives are an important cultural value for societies as a genetic source, displayinga multitude of nutritional characteristics [8]. The quality of table olives is associated withthe presence of valuable nutrients and functional bioactive ingredients such as phenolicacids, phenolic alcohols, flavonoids and secoiridoids, and depends on the variety [9].Consumers highly appreciate olives for their body health as the consumption of olivesis associated with many biological activities such as antioxidant, anticarcinogenic andanti-inflammatory and many others pharmaceutical and physiological benefits [5] thatallow them to be compared even to those of yogurt [8]. Moreover, olive polyphenols havebeen used for the prevention of cardiovascular diseases and are highly recommendedtogether with olive oil in the Mediterranean diet [10,11].
The World Catalogue of Olive Varieties which has been compiled under the guidance ofIOOC, includes nine Greek olive varieties, namely, Adramitini, Amigdalolia, Chalkidiki, Kalamon,Konservolia, Koroneiki, Mastoeidis, Megaritiki, and Valanolia [12]. Protected designation of origin(PDO) and the protected geographical indication (PGI) are the main designations of origin foragricultural products that are established from European Union (EU) as criteria of authenticityand quality linking these products with origin, geographical indications and traditionalspecialties [12–18]. The list in the World Catalogue of Olive Varieties, includes indicative olivevarieties from all over the world without recording all the existing olive varieties andwithout all of them being obligatorily marked with a PDO or PGI indication. In addition,these indications refer to products exclusively of the European Union. Until now, tenGreek table olive varieties have been characterized as PDO products. Among them, cv.Prasines Chalkidikis, cv. Kalamata Olives, cv. Konservolia Stylidas, cv. KonservoliaAmfissis, cv. Throuba Thassos and cv. Throuba Chios are very famous, and the presentstudy has focused on them. Since tables olives directly come from the tree are not edible,the fermentation process is mandatory, in order to remove oleuropein, which is the mainphenolic compound responsible for the bitterness of fresh olives, except from cv. ThroubaThassos and cv. Throuba Chios which have a different debittering process [5].
It is well known that better qualities of olives achieve better prices in the market. Asthere is plethora of olive varieties with a diversity of morphological and physiologicalcharacteristics, the existence of many different qualities is expected [19]. In order to avoidolive adulterations, several discriminant protocols for varietal identification, based onstone, fruit, and leaf data have been used [20].
The authentication of PDO and PGI table olives has been studied the last 15 yearsin Italy [21], Tunisia [22], Turkey [23], Portugal [24], Greece [25] and Spain [4,26,27]. Sev-eral advanced analytical techniques have been used for the study of authentication oftable olives, such as high-performance liquid chromatography (HPLC) [23,28], ultra-high-performance liquid chromatography–quadrupole time of flight tandem mass spectrometry(UHPLC-QTOF-MS) [25], gas chromatography-mass spectrometry (GC-MS) [26] and nu-clear magnetic resonance spectroscopy (NMR) [21]. Chemometrics is an important sciencewhich has been extensively used in food science and authenticity studies to facilitateinterpretation of huge load of data, and it provides an easy way to visualize the sam-ples [19,20,29–36].
Characteristics like shape, profile symmetry, front symmetry, basis, apex, mucro,position of maximum transversal width (MTW), number of fibrovascular furrow (NFF),distribution of fibrovascular furrow (DFF), are important and have been used in characteri-zation studies of olive stones [30]. Various standard process of stone processing have beenproposed in the literature. In a study by Satorres Martínez et al., three different cleaningmethods were applied: a water spray machine, an ultrasonic cleaner and a bleach solution.With the first method, the olive stone was cleaned and part of its texture was damaged.The second method did not have satisfactory results since there were residues of biologicalmaterial in the texture of the endocarp. Best results were achieved with the last method, thebleach solution. Applying a 5% bleach solution for one hour, there were a complete absenceof biological material and no damage appears in the endocarp texture [33]. Bleach solutionwas also used by Beyaz et al. for the cleaning process of olive stones [20]. Specifically, the

Foods 2021, 10, 1829 3 of 16
olive stones were kept in plastic containers, containing 10% bleach solution, for 15 h andstored at −4 ◦C to prevent them from cracking because of physiological activity.
To the best of our knowledge limited studies has been reported to investigate theauthentication of Greek olive varieties according to the morphological characteristics oftheir stones [34]. The choice of the six Greek PDO table olive varieties, for the chemometrictreatments for varietal identification of olive fruits was based on the coverage of the maincultivated with olives geographical areas of Greece. Thus the cv. Prasines Chalkidikis repre-sent Northern Greece (geographic region of Macedonia), the cv. Konservolia Stylidas, andcv. Konservolia Amfissis represent Central Greece (geographic region of Central Greece),the cv. Kalamata Olive is the most famous all over the Greece and is also characteristicof Southern Greece (geographic region of Peloponnese), and cv. Throuba Thassos andcv. Throuba Chios represent Aegean Sea. The purpose of this work is to discriminatethe six Greek PDO table olives, namely cv. Prasines Chalkidikis, cv. Kalamata Olives, cv.Konservolia Stylidas, cv. Konservolia Amfissis, cv. Throuba Thassos and cv. ThroubaChios, regarding the morphological characteristics of their stones and to produce a reliablechemometric model for the authentication of all these table olive varieties.
2. Materials and Methods2.1. Olives Sampling
Two sets of olive fruits (perimeter harvested from two olive trees from the sameorchard) for each of six Greek PDO table olive varieties, were harvested by hand in thestarting of October 2020 from various geographical areas of Greece. These areas are someof the main production areas of PDO table olives in Greece and specifically samples of cv.Prasines Chalkidikis olives were harvested from Chalkidiki (40.20◦ N, 23.03◦ E), samplesof cv. Throuba Thassos were harvested from Thassos island (40.45◦ N, 24.35◦ E), samplesof cv. Throuba Chios were harvested from Chios island (38.27◦ N, 26.07◦ E), samples ofcv. Konservolia Stylidas were harvested from Stylida (38.54◦ N, 22.37◦ E), samples of cv.Konservolia Amfissis were harvested from Amfissa (38.28◦ N, 22.26◦ E) and samples of cv.Kalamata Olives were harvested from Kalamata (37.05◦ N, 22.10◦ E). Figure 1 shows thegeographical areas of the analyzed samples of six Greek PDO table olive varieties.
Foods 2021, 10, x FOR PEER REVIEW 4 of 17
Figure 1. The map of Greece with the geographical areas of the analyzed samples of six Greek PDO
table olive varieties.
2.2. Olive Stone Processing
The olive fruits were transferred to Laboratory of Environmental Biotechnology and
Chemometrics, Aix Marseille University, IMBE, and the weight of fresh olives for 60 fruits
was measured (30 for each set). The olive fruits were stored at −20 °C for preservation,
until the beginning of the analyses. The olive stones are de-fleshed using a procedure de-
veloped by Vanloot et al. [11]. Briefly, after thawing, they were placed in hot water for ten
minutes and their flesh was removed manually. The olive fruits were brushed to remove
all traces of flesh and rinsed with water. The stones were then immersed in hydrogen
peroxide for 24 h. They were then rinsed thoroughly to remove all traces of hydrogen
peroxide, followed by drying for 48 h at room temperature to obtain a constant weight,
which was then measured. This was followed by the storage of the stones in airtight glass
bottles until their digital images were obtained. Images were taken from 60 olive stone
and for each olive stone, two images (face and profile) were obtained with a high-resolu-
tion color camera for 103 character digital processing (Baumer TXD13C) connected on a
computer for image processing (Figure 2).
Figure 2. Olive stone image acquisition with a high-resolution color camera (Baumer TXD13C) in
center and side lights.
Figure 1. The map of Greece with the geographical areas of the analyzed samples of six Greek PDOtable olive varieties.
Foods 2021, 10, 1829 4 of 16
2.2. Olive Stone Processing
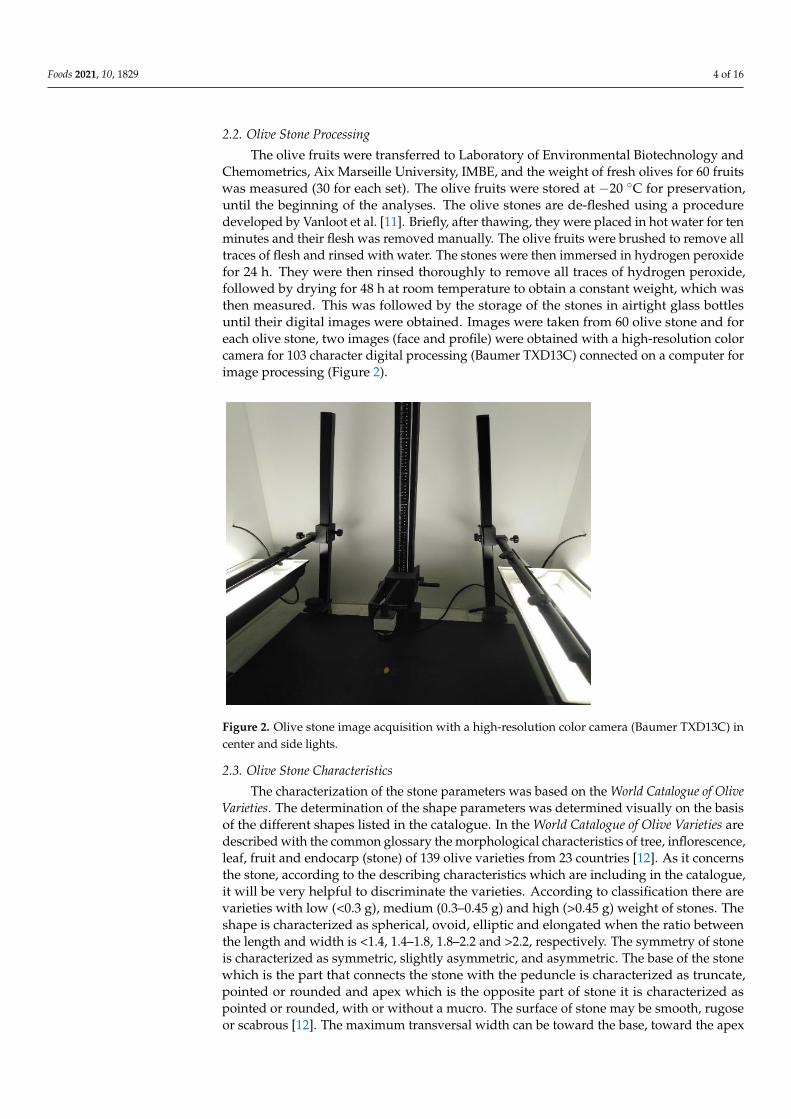
The olive fruits were transferred to Laboratory of Environmental Biotechnology andChemometrics, Aix Marseille University, IMBE, and the weight of fresh olives for 60 fruitswas measured (30 for each set). The olive fruits were stored at −20 ◦C for preservation,until the beginning of the analyses. The olive stones are de-fleshed using a proceduredeveloped by Vanloot et al. [11]. Briefly, after thawing, they were placed in hot water for tenminutes and their flesh was removed manually. The olive fruits were brushed to remove alltraces of flesh and rinsed with water. The stones were then immersed in hydrogen peroxidefor 24 h. They were then rinsed thoroughly to remove all traces of hydrogen peroxide,followed by drying for 48 h at room temperature to obtain a constant weight, which wasthen measured. This was followed by the storage of the stones in airtight glass bottlesuntil their digital images were obtained. Images were taken from 60 olive stone and foreach olive stone, two images (face and profile) were obtained with a high-resolution colorcamera for 103 character digital processing (Baumer TXD13C) connected on a computer forimage processing (Figure 2).
Foods 2021, 10, x FOR PEER REVIEW 4 of 17
Figure 1. The map of Greece with the geographical areas of the analyzed samples of six Greek PDO
table olive varieties.
2.2. Olive Stone Processing
The olive fruits were transferred to Laboratory of Environmental Biotechnology and
Chemometrics, Aix Marseille University, IMBE, and the weight of fresh olives for 60 fruits
was measured (30 for each set). The olive fruits were stored at −20 °C for preservation,
until the beginning of the analyses. The olive stones are de-fleshed using a procedure de-
veloped by Vanloot et al. [11]. Briefly, after thawing, they were placed in hot water for ten
minutes and their flesh was removed manually. The olive fruits were brushed to remove
all traces of flesh and rinsed with water. The stones were then immersed in hydrogen
peroxide for 24 h. They were then rinsed thoroughly to remove all traces of hydrogen
peroxide, followed by drying for 48 h at room temperature to obtain a constant weight,
which was then measured. This was followed by the storage of the stones in airtight glass
bottles until their digital images were obtained. Images were taken from 60 olive stone
and for each olive stone, two images (face and profile) were obtained with a high-resolu-
tion color camera for 103 character digital processing (Baumer TXD13C) connected on a
computer for image processing (Figure 2).
Figure 2. Olive stone image acquisition with a high-resolution color camera (Baumer TXD13C) in
center and side lights.
Figure 2. Olive stone image acquisition with a high-resolution color camera (Baumer TXD13C) incenter and side lights.
2.3. Olive Stone Characteristics
The characterization of the stone parameters was based on the World Catalogue of OliveVarieties. The determination of the shape parameters was determined visually on the basisof the different shapes listed in the catalogue. In the World Catalogue of Olive Varieties aredescribed with the common glossary the morphological characteristics of tree, inflorescence,leaf, fruit and endocarp (stone) of 139 olive varieties from 23 countries [12]. As it concernsthe stone, according to the describing characteristics which are including in the catalogue,it will be very helpful to discriminate the varieties. According to classification there arevarieties with low (<0.3 g), medium (0.3–0.45 g) and high (>0.45 g) weight of stones. Theshape is characterized as spherical, ovoid, elliptic and elongated when the ratio betweenthe length and width is <1.4, 1.4–1.8, 1.8–2.2 and >2.2, respectively. The symmetry of stoneis characterized as symmetric, slightly asymmetric, and asymmetric. The base of the stonewhich is the part that connects the stone with the peduncle is characterized as truncate,pointed or rounded and apex which is the opposite part of stone it is characterized aspointed or rounded, with or without a mucro. The surface of stone may be smooth, rugoseor scabrous [12]. The maximum transversal width can be toward the base, toward the apex
Foods 2021, 10, 1829 5 of 16
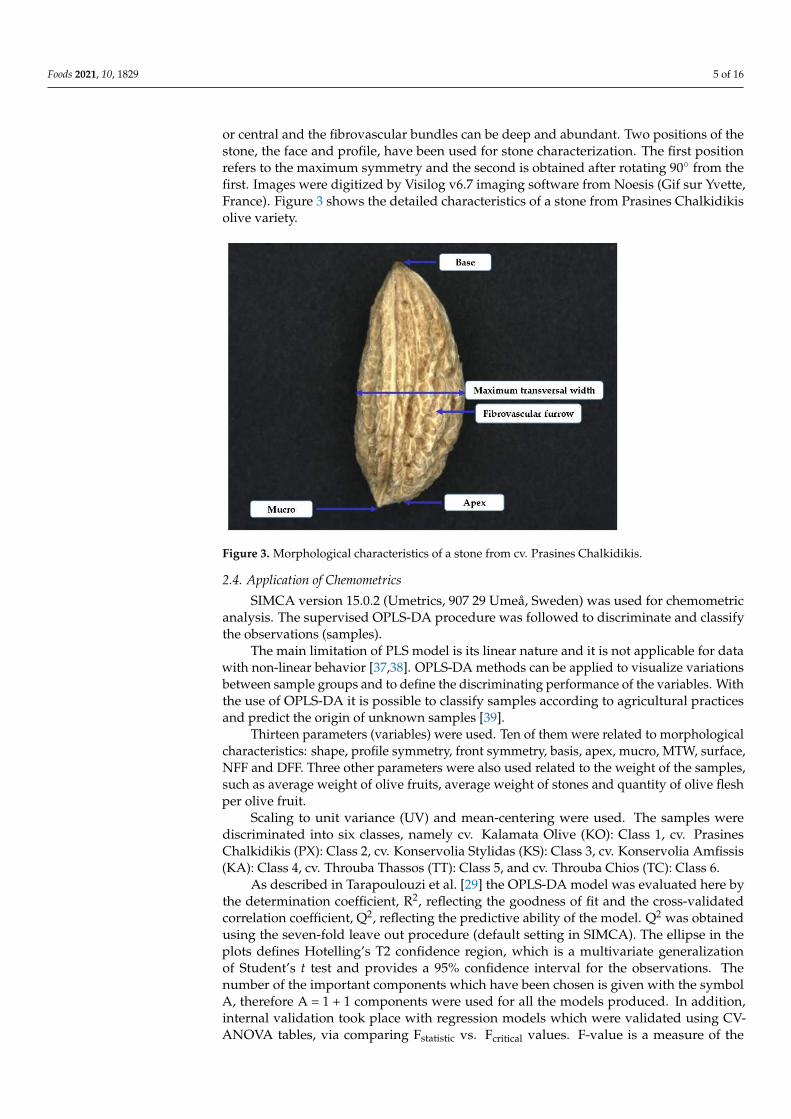
or central and the fibrovascular bundles can be deep and abundant. Two positions of thestone, the face and profile, have been used for stone characterization. The first positionrefers to the maximum symmetry and the second is obtained after rotating 90◦ from thefirst. Images were digitized by Visilog v6.7 imaging software from Noesis (Gif sur Yvette,France). Figure 3 shows the detailed characteristics of a stone from Prasines Chalkidikisolive variety.
Foods 2021, 10, x FOR PEER REVIEW 5 of 17
2.3. Olive Stone Characteristics
The characterization of the stone parameters was based on the World Catalogue of Ol-
ive Varieties. The determination of the shape parameters was determined visually on the
basis of the different shapes listed in the catalogue. In the World Catalogue of Olive Varieties
are described with the common glossary the morphological characteristics of tree, inflo-
rescence, leaf, fruit and endocarp (stone) of 139 olive varieties from 23 countries [12]. As
it concerns the stone, according to the describing characteristics which are including in
the catalogue, it will be very helpful to discriminate the varieties. According to classifica-
tion there are varieties with low (<0.3 g), medium (0.3–0.45 g) and high (>0.45 g) weight of
stones. The shape is characterized as spherical, ovoid, elliptic and elongated when the
ratio between the length and width is <1.4, 1.4–1.8, 1.8–2.2 and >2.2, respectively. The sym-
metry of stone is characterized as symmetric, slightly asymmetric, and asymmetric. The
base of the stone which is the part that connects the stone with the peduncle is character-
ized as truncate, pointed or rounded and apex which is the opposite part of stone it is
characterized as pointed or rounded, with or without a mucro. The surface of stone may
be smooth, rugose or scabrous [12]. The maximum transversal width can be toward the
base, toward the apex or central and the fibrovascular bundles can be deep and abundant.
Two positions of the stone, the face and profile, have been used for stone characterization.
The first position refers to the maximum symmetry and the second is obtained after rotat-
ing 90° from the first. Images were digitized by Visilog v6.7 imaging software from Noesis
(Gif sur Yvette, France). Figure 3 shows the detailed characteristics of a stone from
Prasines Chalkidikis olive variety.
Figure 3. Morphological characteristics of a stone from cv. Prasines Chalkidikis.
2.4. Application of Chemometrics
SIMCA version 15.0.2 (Umetrics, 907 29 Umeå, Sweden) was used for chemometric
analysis. The supervised OPLS-DA procedure was followed to discriminate and classify
the observations (samples).
The main limitation of PLS model is its linear nature and it is not applicable for data
with non-linear behavior [37,38]. OPLS-DA methods can be applied to visualize variations
between sample groups and to define the discriminating performance of the variables.
With the use of OPLS-DA it is possible to classify samples according to agricultural prac-
tices and predict the origin of unknown samples [39].
Thirteen parameters (variables) were used. Ten of them were related to morphologi-
cal characteristics: shape, profile symmetry, front symmetry, basis, apex, mucro, MTW,
surface, NFF and DFF. Three other parameters were also used related to the weight of the
Figure 3. Morphological characteristics of a stone from cv. Prasines Chalkidikis.
2.4. Application of Chemometrics
SIMCA version 15.0.2 (Umetrics, 907 29 Umeå, Sweden) was used for chemometricanalysis. The supervised OPLS-DA procedure was followed to discriminate and classifythe observations (samples).
The main limitation of PLS model is its linear nature and it is not applicable for datawith non-linear behavior [37,38]. OPLS-DA methods can be applied to visualize variationsbetween sample groups and to define the discriminating performance of the variables. Withthe use of OPLS-DA it is possible to classify samples according to agricultural practicesand predict the origin of unknown samples [39].
Thirteen parameters (variables) were used. Ten of them were related to morphologicalcharacteristics: shape, profile symmetry, front symmetry, basis, apex, mucro, MTW, surface,NFF and DFF. Three other parameters were also used related to the weight of the samples,such as average weight of olive fruits, average weight of stones and quantity of olive fleshper olive fruit.
Scaling to unit variance (UV) and mean-centering were used. The samples werediscriminated into six classes, namely cv. Kalamata Olive (KO): Class 1, cv. PrasinesChalkidikis (PX): Class 2, cv. Konservolia Stylidas (KS): Class 3, cv. Konservolia Amfissis(KA): Class 4, cv. Throuba Thassos (TT): Class 5, and cv. Throuba Chios (TC): Class 6.
As described in Tarapoulouzi et al. [29] the OPLS-DA model was evaluated here bythe determination coefficient, R2, reflecting the goodness of fit and the cross-validatedcorrelation coefficient, Q2, reflecting the predictive ability of the model. Q2 was obtainedusing the seven-fold leave out procedure (default setting in SIMCA). The ellipse in theplots defines Hotelling’s T2 confidence region, which is a multivariate generalizationof Student’s t test and provides a 95% confidence interval for the observations. Thenumber of the important components which have been chosen is given with the symbolA, therefore A = 1 + 1 components were used for all the models produced. In addition,internal validation took place with regression models which were validated using CV-ANOVA tables, via comparing Fstatistic vs. Fcritical values. F-value is a measure of the
Foods 2021, 10, 1829 6 of 16
size of the effects. The larger this value, the greater the likelihood that the differencesbetween the means are due to something other than chance alone, namely real effects. If thedifference between the means is due only to chance, that is, there are no real effects, thenthe expected value of the F-ratio would be one (1.00). A hypothesis test takes place wherethe “null hypothesis” indicates that population means of the different appraisers are equal,and “alternate hypothesis” shows that one of the means is not the same. Larger valuesof Fstatistic than the Fcritical indicate that the difference of means of the samples is largercompared to the dispersion of the observations within each sample, and therefore, thenull hypothesis should be rejected, and the alternate hypothesis is considered important.In other words, a lower Fstatistic than the Fcritical indicates that the variation within theappraisers is greater than the variation between them [40]. The misclassification tablewas considered important to evaluate the quality of the model, as well as permutationtesting was applied (100 permutations) to check the validity and the degree of overfit forthe OPLS-DA model.
Validation of the model was tested using sevenfold cross-validation. Therefore, acalibration and a validation set were set up by having 42 and 18 samples, respectively.
3. Results3.1. Weight of Olive Stones
In Table 1, the weight of stones of the six Greek PDO table olive varieties are presented.Statistical analyses were performed with SD and these gave the same score scatter plotsand classification rates as analyses which did not use them. Generally, the average weightof an olive stone is 18–22% of the olive weight [41]. The average weight of studied fresholives varied between varieties. In this study, the maximum average weight was observedin the fruits of cv. Prasines Chalkidikis whose average weight was almost ten grams andwas twice that of the cv. Kalamata Olive. The cv. Kalamata Olive had the smaller stoneand plenty of flesh with the best ratio of olive flesh (90% of the weight of fresh fruit). Thisfeature is extremely interesting to produce olive paste and other olive products from cv.Kalamata Olive. Cv. Throuba Chios had the smaller average weight of fresh olives. Asit concerns the weight of olive stones the larger the olive fruit, the larger the stone. Thehighest average weight of the stone was observed in the cv. Prasines Chalkidikis, followedby the two varieties of Konservolia and the two varieties of Throuba while the smallestaverage weight of the stone was observed in the cv. Kalamata Olive.
Table 1. Weight of 60 stones of six PDO Greek table olive varieties.
Table Olive VarietyAverage Weight of
Stones (mg)Mean ± SD
Average Weight ofOlive Fruits (mg)
Mean ± SD
Quantity of OliveFlesh per Olive
Fruit (mg)Mean ± SD
Percentage ofFlesh (%)
Mean ± SD
Percentage ofOlive Stone
Occupancy (%)Mean ± SD
Kalamata Olive (KO) 489 ± 6 4960 ± 11 4471 ± 7.5 90.2 ± 13 9.8 ± 2Prasines Chalkidikis (PX) 1050 ± 12.6 9710 ± 20.7 8660 ± 45 89.2 ± 24 10.8 ± 4Konservolia Stylidas (KS) 621 ± 5 5940 ± 9.5 5319 ± 12 89.6 ± 5.5 10.4 ± 3.5
Konservolia Amfissis (KA) 691 ± 5 5950 ± 4.9 5259 ± 9.6 88.4 ± 9 11.6 ± 1.9Throuba Thassos (TT) 629 ± 5.4 4520 ± 7.8 3891 ± 9 86.1 ± 7 13.9 ± 3Throuba Chios (TC) 614 ± 9 3030 ± 8.3 2416 ± 10 79.7 ± 10 20.3 ± 6
3.2. Artificial Visions of Olive Stones
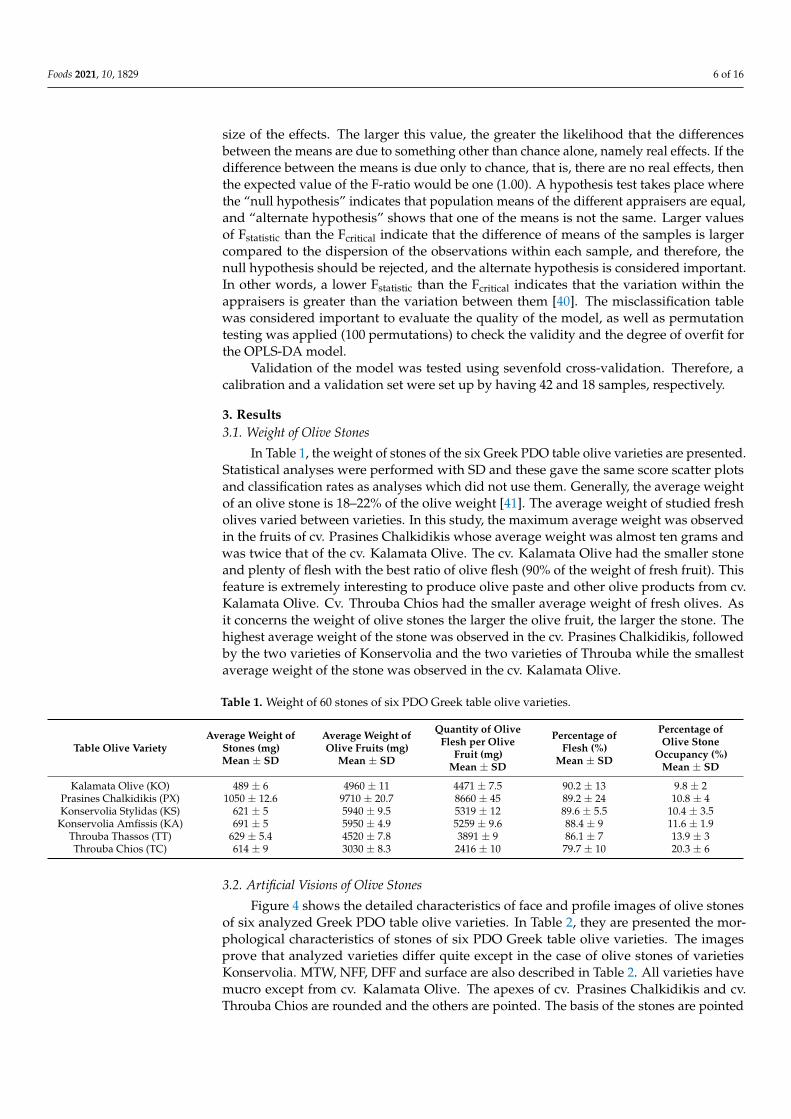
Figure 4 shows the detailed characteristics of face and profile images of olive stonesof six analyzed Greek PDO table olive varieties. In Table 2, they are presented the mor-phological characteristics of stones of six PDO Greek table olive varieties. The imagesprove that analyzed varieties differ quite except in the case of olive stones of varietiesKonservolia. MTW, NFF, DFF and surface are also described in Table 2. All varieties havemucro except from cv. Kalamata Olive. The apexes of cv. Prasines Chalkidikis and cv.Throuba Chios are rounded and the others are pointed. The basis of the stones are pointed
Foods 2021, 10, 1829 7 of 16
for cv. Konservolia Stylidas, cv. Prasines Chalkidikis, cv. Throuba Chios, cv. ThroubaThassos, and cv. Kalamata Olive and only for cv. Konservolia Amfissis is it rounded.
Foods 2021, 10, x FOR PEER REVIEW 8 of 17
Figure 4. Morphological characteristics of face and profile images of olive stones of six analyzed Greek PDO table olive
varieties.
Table 2. Morphological characteristics of 60 stones of six PDO Greek table olive varieties.
Table Olive
Variety Shape
Profile
Symmetry
Front
Symmetry Basis Apex Mucro MTW a Surface NFF b DFF c
Kalamata Olive
(KO) Elongated Asymmetrical
Slightly asym-
metrical Pointed Pointed
Without
presence Middle Rugged
Weak to
middle
Uniform or
grouped
Prasines Chal-
kidikis (PX) Elongated
Slightly asym-
metrical Symmetrical Pointed Rounded Presence Middle Rugged Middle Uniform
Konservolia Styli-
das (KS) Ovoid
Slightly asym-
metrical Symmetrical Pointed Pointed Presence Middle Rough Middle
Uniform or
grouped
Konservolia Am-
fissis (KA) Elliptic
Slightly asym-
metrical Symmetrical Rounded Pointed Presence Middle Rough Middle
Uniform or
grouped
Throuba Thassos
(TT) Elongated
Very asymmet-
rical
Symmetrical
to slightly
asymmetrical
Pointed Pointed Presence Middle Smooth to
rough Middle Uniform
Throuba Chios
(TC) Elliptic
Very asymme-
trical Symmetrical
Pointed or
rounded Rounded Presence Middle Rough Middle Uniform
a Position of maximum transversal width. b Number of fibrovascular furrow. c Distribution of fibrovascular furrow.
Figure 4. Morphological characteristics of face and profile images of olive stones of six analyzed Greek PDO tableolive varieties.
Table 2. Morphological characteristics of 60 stones of six PDO Greek table olive varieties.
Table OliveVariety Shape Profile
SymmetryFront
Symmetry Basis Apex Mucro MTW a Surface NFF b DFF c
KalamataOlive (KO) Elongated Asymmetrical Slightly
asymmetrical Pointed Pointed Withoutpresence Middle Rugged Weak to
middleUniform or
groupedPrasines
Chalkidikis(PX)
Elongated Slightlyasymmetrical Symmetrical Pointed Rounded Presence Middle Rugged Middle Uniform
KonservoliaStylidas (KS) Ovoid Slightly
asymmetrical Symmetrical Pointed Pointed Presence Middle Rough Middle Uniform orgrouped
KonservoliaAmfissis
(KA)Elliptic Slightly
asymmetrical Symmetrical Rounded Pointed Presence Middle Rough Middle Uniform orgrouped
ThroubaThassos (TT) Elongated Very
asymmetrical
Symmetricalto slightly
asymmetricalPointed Pointed Presence Middle Smooth to
rough Middle Uniform
ThroubaChios (TC) Elliptic Very
asymmetrical Symmetrical Pointed orrounded Rounded Presence Middle Rough Middle Uniform
a Position of maximum transversal width. b Number of fibrovascular furrow. c Distribution of fibrovascular furrow.
Olive stones from varieties cv. Konservolia Amfissis were morphologically verysimilar to cv. Konservolia Stylidas. Regarding the shape, cv. Prasines Chalkidikis cv.Kalamata Olive and cv. Throuba Thassos have elongated shape, cv. Konservolia Amfissis,cv. Throuba Chios have elliptic shape and cv. Konservolia Stylidas has an ovoid shape.The profiles of cv. Throuba Chios and cv. Throuba Thassos stones are very asymmetrical,slightly asymmetrical for cv. Prasines Chalkidikis, cv. Konservolia Amfissis, and cv.Konservolia Stylidas stones and asymmetrical for cv. Kalamata Olive stones.
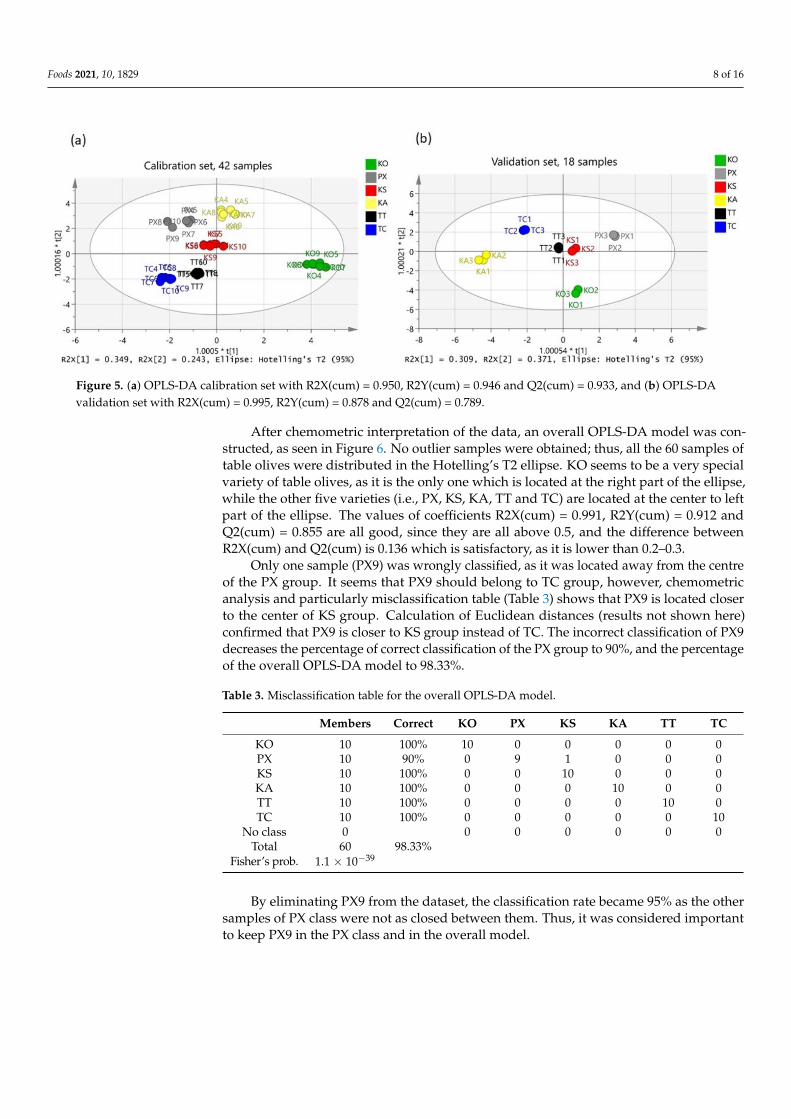
3.3. Chemometric Interpretation of the Data by Using OPLS-DA Methods
To tests the validity of the dataset, a calibration and a validation set were set up byhaving 42 and 18 samples, respectively, as shown in Figure 5. Both scatter plots (a) and(b) were successfully built with R2X(cum) = 0.950, R2Y(cum) = 0.946 and Q2(cum) = 0.933,and R2X(cum) = 0.995, R2Y(cum) = 0.878 and Q2(cum) = 0.789, respectively.
Foods 2021, 10, 1829 8 of 16
Foods 2021, 10, x FOR PEER REVIEW 9 of 17
3.3. Chemometric Interpretation of the Data by Using OPLS-DA Methods
To tests the validity of the dataset, a calibration and a validation set were set up by
having 42 and 18 samples, respectively, as shown in Figure 5. Both scatter plots (a) and
(b) were successfully built with R2X(cum) = 0.950, R2Y(cum) = 0.946 and Q2(cum) = 0.933,
and R2X(cum) = 0.995, R2Y(cum) = 0.878 and Q2(cum) = 0.789, respectively.
Figure 5. (a) OPLS-DA calibration set with R2X(cum) = 0.950, R2Y(cum) = 0.946 and Q2(cum) = 0.933, and (b) OPLS-DA
validation set with R2X(cum) = 0.995, R2Y(cum) = 0.878 and Q2(cum) = 0.789.
After chemometric interpretation of the data, an overall OPLS-DA model was con-
structed, as seen in Figure 6. No outlier samples were obtained; thus, all the 60 samples of
table olives were distributed in the Hotelling’s T2 ellipse. KO seems to be a very special
variety of table olives, as it is the only one which is located at the right part of the ellipse,
while the other five varieties (i.e., PX, KS, KA, TT and TC) are located at the center to left
part of the ellipse. The values of coefficients R2X(cum) = 0.991, R2Y(cum) = 0.912 and
Q2(cum) = 0.855 are all good, since they are all above 0.5, and the difference between
R2X(cum) and Q2(cum) is 0.136 which is satisfactory, as it is lower than 0.2–0.3.
Figure 5. (a) OPLS-DA calibration set with R2X(cum) = 0.950, R2Y(cum) = 0.946 and Q2(cum) = 0.933, and (b) OPLS-DAvalidation set with R2X(cum) = 0.995, R2Y(cum) = 0.878 and Q2(cum) = 0.789.
After chemometric interpretation of the data, an overall OPLS-DA model was con-structed, as seen in Figure 6. No outlier samples were obtained; thus, all the 60 samples oftable olives were distributed in the Hotelling’s T2 ellipse. KO seems to be a very specialvariety of table olives, as it is the only one which is located at the right part of the ellipse,while the other five varieties (i.e., PX, KS, KA, TT and TC) are located at the center to leftpart of the ellipse. The values of coefficients R2X(cum) = 0.991, R2Y(cum) = 0.912 andQ2(cum) = 0.855 are all good, since they are all above 0.5, and the difference betweenR2X(cum) and Q2(cum) is 0.136 which is satisfactory, as it is lower than 0.2–0.3.
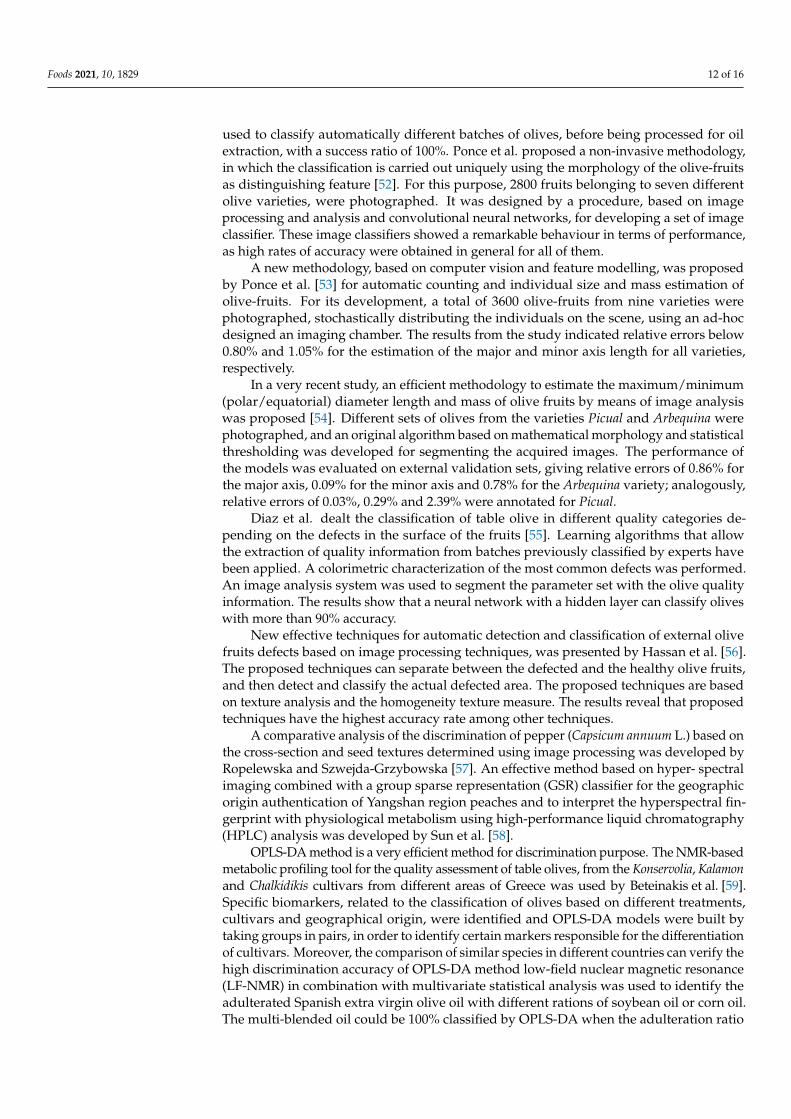
Only one sample (PX9) was wrongly classified, as it was located away from the centreof the PX group. It seems that PX9 should belong to TC group, however, chemometricanalysis and particularly misclassification table (Table 3) shows that PX9 is located closerto the center of KS group. Calculation of Euclidean distances (results not shown here)confirmed that PX9 is closer to KS group instead of TC. The incorrect classification of PX9decreases the percentage of correct classification of the PX group to 90%, and the percentageof the overall OPLS-DA model to 98.33%.
Table 3. Misclassification table for the overall OPLS-DA model.
Members Correct KO PX KS KA TT TC
KO 10 100% 10 0 0 0 0 0PX 10 90% 0 9 1 0 0 0KS 10 100% 0 0 10 0 0 0KA 10 100% 0 0 0 10 0 0TT 10 100% 0 0 0 0 10 0TC 10 100% 0 0 0 0 0 10
No class 0 0 0 0 0 0 0Total 60 98.33%
Fisher’s prob. 1.1 × 10−39
By eliminating PX9 from the dataset, the classification rate became 95% as the othersamples of PX class were not as closed between them. Thus, it was considered importantto keep PX9 in the PX class and in the overall model.

Foods 2021, 10, 1829 9 of 16Foods 2021, 10, x FOR PEER REVIEW 10 of 17
(a)
(b)
Figure 6. (a) The 2D and (b) 3D score scatter plots of the overall OPLS-DA model (R2X(cum) = 0.991, R2Y(cum) = 0.912
and Q2(cum) = 0.855.
Only one sample (PX9) was wrongly classified, as it was located away from the centre
of the PX group. It seems that PX9 should belong to TC group, however, chemometric
analysis and particularly misclassification table (Table 3) shows that PX9 is located closer
to the center of KS group. Calculation of Euclidean distances (results not shown here)
confirmed that PX9 is closer to KS group instead of TC. The incorrect classification of PX9
decreases the percentage of correct classification of the PX group to 90%, and the percent-
age of the overall OPLS-DA model to 98.33%.
Figure 6. (a) The 2D and (b) 3D score scatter plots of the overall OPLS-DA model (R2X(cum) = 0.991, R2Y(cum) = 0.912 andQ2(cum) = 0.855.
To test the significance and adequacy of the model, the CV-ANOVA, which is consid-ered as the most important test for the evaluation of significance of the developed model,was applied. The CV-ANOVA results show the value of the Fstatistic and p-value and aredepicted in Table 4. The model is highly significant, due to the p-value of zero. Based onDF = 295, the null hypothesis should be rejected, and the alternate hypothesis is consideredimportant due to that Fstatistic = 18.9 > Fcritical = 2.24 for probability level equal to 0.05.

Foods 2021, 10, 1829 10 of 16
Table 4. CV-ANOVA data obtained for the overall OPLS-DA model.
OPLS-DA SS 1 DF 2 MS 3 F 4 p 5 SD 6
Total corr. 295 295 1 1Regression 252.2 70 3.6 18.9 0 1.9Residual 42.7 225 0.19 0.4
1 SS = sum of squares, 2 DF = degree of freedom, 3 MS = mean squares, 4 F = F-test calculated value or Fstatistic,5 p = p-value of the test, 6 SD = standard deviation.
In addition, to validate further the goodness of fit and the predictability of these results,a random permutation test with 100 permutations was employed, as seen in Figure 7. BothR2 (original model) and Q2 (predictive model) located at right and permutated R2 (originalmodel) and Q2 (predictive model) located left while all blue Q2 values to the left and rightare lower than the green original R2 values. All the permuted models showed lower R2Yvalues if compared with the original model’s R2Y value (0.912) and the majority of the Q2regression lines showed negative intercepts (0.0, −0.688).
Foods 2021, 10, x FOR PEER REVIEW 12 of 17
Figure 7. Permutation test of the overall OPLS-DA model took place with 100 permutations.
4. Discussion
The determination of olive variety with this method is very different from the use of
precision instruments for material analysis. Not only does it reduce the cost of money and
time consumption, but also is more efficient. The identification of the variety of table ol-
ives and especially the ones that have been characterized as PDO table olive varieties is
required, as the PDO characterization products have higher prices. Variety is a major issue
of authenticity and the use of the term PDO can lead to significant falsifications [42]. Since
the final product of table olives is a fermented product and different types of table olives
can be produced, the methods for determining the variety of origin of fresh olives are
completely different from those of table olives, as many changes in the pulp of olives can
occur [30]. It is well known that all table olives are fermented in sodium chloride brine
[43], through a series of treatments that considerably vary depending on the region and
variety [19]. Over the last decade, several studies have been published focusing primarily
on reducing sodium chloride content. In this context, modified fermentation brines have
been used, in order to satisfy consumers’ demand for healthier table olives, with less so-
dium chloride [43–49]. Therefore, different physicochemical characteristics, and sensory
and nutritional properties, may arise from the various fermentation procedures, which
makes table olive classification difficult.
The study of morphological features of stones and weight measurements of exam-
ined Greek varieties constitutes an alternative method that permit us to determine each
variety according to their different size, aspect and weight. Besides, using a high-resolu-
tion color camera the examined stones are presented in more details, than those, that can
be measured with the human naked eye. In addition, the varietal identification achieved
with the machine vision system in combination with the chemometric analysis allows fast
classification, without the need for human observation and the subsequent errors. In
many studies, in addition to the morphological characteristics of the stones, the morpho-
logical characteristics of the leaves and fruits have also been used to identify the olive
variety. Olive stone information is the most valuable, among other morphological features
of a variety, as they are little affected by environmental conditions. Therefore, olive stone
characteristics tend to appear similar to olives belonging to the same variety and tend to
differ in the opposite case. Martínez et al. approached the problem of varietal identifica-
tion by feature extraction from the analysis of endocarp images, and then using partial
least square-discriminant classifier [33].
Figure 7. Permutation test of the overall OPLS-DA model took place with 100 permutations.
4. Discussion
The determination of olive variety with this method is very different from the useof precision instruments for material analysis. Not only does it reduce the cost of moneyand time consumption, but also is more efficient. The identification of the variety of tableolives and especially the ones that have been characterized as PDO table olive varietiesis required, as the PDO characterization products have higher prices. Variety is a majorissue of authenticity and the use of the term PDO can lead to significant falsifications [42].Since the final product of table olives is a fermented product and different types of tableolives can be produced, the methods for determining the variety of origin of fresh olivesare completely different from those of table olives, as many changes in the pulp of olivescan occur [30]. It is well known that all table olives are fermented in sodium chloridebrine [43], through a series of treatments that considerably vary depending on the regionand variety [19]. Over the last decade, several studies have been published focusingprimarily on reducing sodium chloride content. In this context, modified fermentationbrines have been used, in order to satisfy consumers’ demand for healthier table olives,with less sodium chloride [43–49]. Therefore, different physicochemical characteristics, andsensory and nutritional properties, may arise from the various fermentation procedures,which makes table olive classification difficult.

Foods 2021, 10, 1829 11 of 16
The study of morphological features of stones and weight measurements of examinedGreek varieties constitutes an alternative method that permit us to determine each varietyaccording to their different size, aspect and weight. Besides, using a high-resolutioncolor camera the examined stones are presented in more details, than those, that can bemeasured with the human naked eye. In addition, the varietal identification achievedwith the machine vision system in combination with the chemometric analysis allows fastclassification, without the need for human observation and the subsequent errors. In manystudies, in addition to the morphological characteristics of the stones, the morphologicalcharacteristics of the leaves and fruits have also been used to identify the olive variety.Olive stone information is the most valuable, among other morphological features of avariety, as they are little affected by environmental conditions. Therefore, olive stonecharacteristics tend to appear similar to olives belonging to the same variety and tend todiffer in the opposite case. Martínez et al. approached the problem of varietal identificationby feature extraction from the analysis of endocarp images, and then using partial leastsquare-discriminant classifier [33].
This is the first time that the research group studied the authenticity of Greek varietiesof table olives, although similar research has been conducted in different countries andvarieties by other authors who combined imaging and chemometrics [19,20,30–32,34,35].Esteves da Silva demonstrated the great usefulness of chemometrics in the classification ofolive varieties. The morphological characteristics of the endocarp among other character-istics (for example olive fruits, trees, branches, leaves and flowers) were used to classify22 Portuguese olive varieties. He also managed to demonstrate the similarities between thevarieties studied and to show that some characteristics have a greater power of distinctionthan others [19].
Vanloot et al. achieved the discrimination of five French varieties, namely Aglandau,Bouteillan, Lucques, Picholine, Tanche, through artificial vision and chemometric analysisof olive stones with 100% of correct classification, working with the data obtained fromfront and profile pictures [30]. Even if the front and profile parameters are differentfor the discrimination of the varieties only the picture of profile was sufficient. Imageprocessing techniques of olive fruit, olive leaves, and olive stones, were used for theidentification of Turkish olive varieties namely Sarı ulak, Gemlik, Edincik su, Memecik, Esekzeytini, Ayvalık, Kilis yaglık, Uslu, Çilli, and Domat [20], while in another study, imageprocessing techniques with data obtained from the fruits and stones were used for theclassification of Spanish olive cultivars, namely Lechin De Granada, Arbequina, Picual, VerdialDe V-M, Picudo, Hojiblanca and Empeltre [31]. Seven Greek olive varieties, namely Kalamon,Karidolia-Chalkidikis, Koroneiki, Lianomanako-Tyrou, Mastoidis, Megaron and Throumbolia, weredistinguished according to the morphological parameters of the olive fruit, olive leaves,and olive stones [34]. The study of biometric characteristics of the olive stone was alsoused to determine the relationships between wild and farmed olives [35].
The analysis regarding geographic origin of the Greek PDO table olive varieties revealsthat there is regional clustering. KS and KA were expected to be located closer than theother groups as the locations which have been harvested are nearby. In addition, it can besaid that regarding variety species, KS and KA as well as TT and TC were expected to belocated “in pairs”, meaning next to each other on the score scatter plot and this is whatwas observed. These observations show that the varieties from a particular PDO varietycan easily be discriminated using the fruit and the stones characteristics. The stones ofthe KO variety are very characteristic with their very elongated and pointed shape. Thesestones are very similar to the Lucques variety, one of the best and most popular French tableolives [50].
Moreover, other authors also stated that image processing alone or coupled withchemometrics can be the best combination in regard to rapidness and ease. Puerto et al.presented a methodology for differentiating olives collected from the ground from thoseharvested directly from the trees, as the former impoverishes quality of the subsequentlyproduced olive [51]. An automatic inspection system, based on computer vision, was
Foods 2021, 10, 1829 12 of 16
used to classify automatically different batches of olives, before being processed for oilextraction, with a success ratio of 100%. Ponce et al. proposed a non-invasive methodology,in which the classification is carried out uniquely using the morphology of the olive-fruitsas distinguishing feature [52]. For this purpose, 2800 fruits belonging to seven differentolive varieties, were photographed. It was designed by a procedure, based on imageprocessing and analysis and convolutional neural networks, for developing a set of imageclassifier. These image classifiers showed a remarkable behaviour in terms of performance,as high rates of accuracy were obtained in general for all of them.
A new methodology, based on computer vision and feature modelling, was proposedby Ponce et al. [53] for automatic counting and individual size and mass estimation ofolive-fruits. For its development, a total of 3600 olive-fruits from nine varieties werephotographed, stochastically distributing the individuals on the scene, using an ad-hocdesigned an imaging chamber. The results from the study indicated relative errors below0.80% and 1.05% for the estimation of the major and minor axis length for all varieties,respectively.
In a very recent study, an efficient methodology to estimate the maximum/minimum(polar/equatorial) diameter length and mass of olive fruits by means of image analysiswas proposed [54]. Different sets of olives from the varieties Picual and Arbequina werephotographed, and an original algorithm based on mathematical morphology and statisticalthresholding was developed for segmenting the acquired images. The performance ofthe models was evaluated on external validation sets, giving relative errors of 0.86% forthe major axis, 0.09% for the minor axis and 0.78% for the Arbequina variety; analogously,relative errors of 0.03%, 0.29% and 2.39% were annotated for Picual.
Diaz et al. dealt the classification of table olive in different quality categories de-pending on the defects in the surface of the fruits [55]. Learning algorithms that allowthe extraction of quality information from batches previously classified by experts havebeen applied. A colorimetric characterization of the most common defects was performed.An image analysis system was used to segment the parameter set with the olive qualityinformation. The results show that a neural network with a hidden layer can classify oliveswith more than 90% accuracy.
New effective techniques for automatic detection and classification of external olivefruits defects based on image processing techniques, was presented by Hassan et al. [56].The proposed techniques can separate between the defected and the healthy olive fruits,and then detect and classify the actual defected area. The proposed techniques are basedon texture analysis and the homogeneity texture measure. The results reveal that proposedtechniques have the highest accuracy rate among other techniques.
A comparative analysis of the discrimination of pepper (Capsicum annuum L.) based onthe cross-section and seed textures determined using image processing was developed byRopelewska and Szwejda-Grzybowska [57]. An effective method based on hyper- spectralimaging combined with a group sparse representation (GSR) classifier for the geographicorigin authentication of Yangshan region peaches and to interpret the hyperspectral fin-gerprint with physiological metabolism using high-performance liquid chromatography(HPLC) analysis was developed by Sun et al. [58].
OPLS-DA method is a very efficient method for discrimination purpose. The NMR-basedmetabolic profiling tool for the quality assessment of table olives, from the Konservolia, Kalamonand Chalkidikis cultivars from different areas of Greece was used by Beteinakis et al. [59].Specific biomarkers, related to the classification of olives based on different treatments,cultivars and geographical origin, were identified and OPLS-DA models were built bytaking groups in pairs, in order to identify certain markers responsible for the differentiationof cultivars. Moreover, the comparison of similar species in different countries can verify thehigh discrimination accuracy of OPLS-DA method low-field nuclear magnetic resonance(LF-NMR) in combination with multivariate statistical analysis was used to identify theadulterated Spanish extra virgin olive oil with different rations of soybean oil or corn oil.The multi-blended oil could be 100% classified by OPLS-DA when the adulteration ratio
Foods 2021, 10, 1829 13 of 16
was above 30% [60]. In a very recent study, NMR analysis to avocado oil to differentiate itfrom other oils including olive oil, was applied by Tang et al. [61]. Avocado oil and oliveoil were efficiently classified by OPLS-DA method with an R2 of 0.97, and a Q2 of 0.91,indicating a very significant model.
This method gave satisfactory results for other agricultural products proving itseffectiveness. Becerra-Martınez et al. [62] used NMR spectroscopy supported by principalcomponent analysis PCA or OPLS-DA to differentiate between two Mexican cultivars ofchili based on the difference of their metabolites. The authors were able to differentiatethe two cultivars using PCA with an R2 of 0.936; to better observe differences betweengroups, OPLS-DA was successfully applied (R2 = 0.923). Chung et al. [63] analyzed themulti-element profile of rice samples procured from six different Asian countries using ICP-MS to investigate geographical origin. Rice samples were clearly discriminated throughPCA and OPLS-DA as different countries exhibited a different proportion of micro andmacro elements.
This work is a pre-study that should be continued in order to increase the databaseon Greek table olive stones. In future, similar research studies must test more samplesper variety and focus on the harvest period. The discrimination of olive varieties can bedefinitely benefited from the current development of image analysis technology and bigdata analysis.
5. Conclusions
This research study shows that the morphological features of olives (fruit and en-docarp/stone) as well the weight of stones in combination with chemometrics can bediscriminated. OPLS-DA proved to be good method for visualizing and interpreting thedata. Morphological characteristics of olive stone have enough discrimination capacity toallow to classify the olives. Further research and assessment will take place related to theGreek PDO table olives, and more models can be developed for future predictions relatedto their quality and authenticity. Ongoing research in the particular field will enlightenthe authenticity of the Greek PDO table olives. This preliminary study shows encouragingresults and that this visual authentication analysis is easy to implement. It will be moreefficient when the image analysis is computerised as planned. This will save time andallow the Greek varieties to be compared with varieties from different geographic origins.
Author Contributions: Conceptualization, S.A., M.T., T.V., S.R. and J.A.; methodology, S.A., M.T.,T.V., S.R. and J.A.; software, M.T., C.R.T., T.V., S.R. and J.A.; validation, S.A., M.T., M.A.B.B., C.R., N.D.,C.R.T., T.V., S.R. and J.A.; formal analysis, M.T., C.R.T.; investigation, S.A., M.T., M.A.B.B., N.D., S.R.,T.V. and J.A.; resources, S.A., M.T., M.A.B.B., C.R., N.D., C.R.T., T.V., S.R. and J.A.; data curation, S.A.,M.T., M.A.B.B., C.R., N.D., C.R.T., T.V., S.R. and J.A.; writing—original draft preparation, S.A., M.T.;writing—review and editing, S.A., M.T., M.A.B.B., C.R., N.D., C.R.T., T.V., S.R. and J.A.; visualization,M.T. and C.R.T.; supervision, M.T., C.R., C.R.T., T.V., N.D., S.R. and J.A.; project administration, S.A.,T.V., S.R. and J.A. All authors have read and agreed to the published version of the manuscript.
Funding: This research received no external funding.
Institutional Review Board Statement: Not applicable.
Informed Consent Statement: Not applicable.
Data Availability Statement: Not applicable.
Acknowledgments: Agriopoulou Sofia is the beneficiary of a grant by Institute of France and IKYin the framework of “Scholarships of Greek-French Cooperation for Higher Education in France,Academic Year 2020–2021” for a post-doctoral fellowship. Moreover, the authors would also like toacknowledge Agelis Konstantinos, Stampelos Xenofontas, Kaplanis Leonidas, Dimitriou Dimitrios,Kottis Georgios and Stamatelopoulou Eugenia for their kind offer of the samples.
Conflicts of Interest: The authors declare no conflict of interest.
Foods 2021, 10, 1829 14 of 16
References1. Russo, G.; Beritognolo, I.; Bufacchi, M.; Stanzione, V.; Pisanelli, A.; Ciolfi, M.; Lauteri, M.; Brush, S.B. Advances in biocultural
geography of olive tree (Olea europaea L.) landscapes by merging biological and historical assays. Sci. Rep. 2020, 10, 7673.[CrossRef]
2. Valvez, S.; Maceiras, A.; Santos, P.; Reis, P.N.B. Olive Stones as Filler for Polymer-Based Composites: A Review. Materials 2021,14, 845. [CrossRef] [PubMed]
3. Breton, C.; Terral, J.-F.; Pinatel, C.; Médail, F.; Bonhomme, F.; Bervillé, A. The origins of the domestication of the olive tree. C. R.Biol. 2009, 332, 1059–1064. [CrossRef] [PubMed]
4. Jurado-Campos, N.; García-Nicolás, M.; Pastor-Belda, M.; Bußmann, T.; Arroyo-Manzanares, N.; Jiménez, B.; Viñas, P.; Arce, L.Exploration of the potential of different analytical techniques to authenticate organic vs. conventional olives and olive oils fromtwo varieties using untargeted fingerprinting approaches. Food Control. 2021, 124, 107828. [CrossRef]
5. Bianchi, G. Lipids and phenols in table olives. Eur. J. Lipid Sci. Technol. 2003, 105, 229–242. [CrossRef]6. International Olive Oil Council (IOC). Trade Standard Applying to Table Olives; International Olive Oil Council: Madrid, Spain, 2004.7. International Olive Oil Council. World Table Olive Figures. 2021. Available online: https://www.internationaloliveoil.org/what-
we-do/economic-affairs-promotionunit/#figures (accessed on 14 April 2021).8. Roussos, S.; Rahmani, M. Les olives de table fermentées, un aliment fonctionnel comme le yogourt. In Le Compagnon de
l’Olivier-XXVIIeme Annee-N◦ 42; Acopa: Aix-en-Provence, French, 2018; pp. 12–14.9. Ghanbari, R.; Anwar, F.; Alkharfy, K.M.; Gilani, A.-H.; Saari, N. Valuable nutrients and functional bioactives in different parts of
olive (Olea europaea L.)—A review. Int. J. Mol. Sci. 2012, 13, 1291–1340. [CrossRef]10. Zoidou, E.; Melliou, E.; Gikas, E.; Tsarbopoulos, A.; Magiatis, P.; Skaltsounis, A.L. Identification of Throuba Thassos, a Traditional
Greek Table Olive Variety, as a Nutritional Rich Source of Oleuropein. J. Agric. Food Chem. 2010, 58, 46–50. [CrossRef]11. Perpetuini, G.; Prete, R.; Garcia-Gonzalez, N.; Khairul Alam, M.; Corsetti, A. Table Olives More than a Fermented Food. Foods
2020, 9, 178. [CrossRef]12. International Olive Council. World Catalogue of Olive Varieties; International Olive Council: Madrid, Spain, 2000.13. Council Regulation (EC). No. 2081/92 of 14 July 1992 on the protection of geographical indications and designations of origin for
agricultural products and foodstuffs. Off. J. Eur. Union 1992, L208, 1–8.14. Council Regulation (EC). No. 2082/92 of 14 July 1992 on certificates of specific character for agricultural products and foodstuffs.
Off. J. Eur. Union 1992, L208, 9–14.15. Council Regulation (EC). No. 510/2006 of 20 March 2006 on the protection of geographical indications and designations of origin
for agricultural products and foodstuffs. Off. J. Eur. Union 2006, L93, 12–25.16. Council Regulation (EC). No. 1898/2006 of 14 December 2006 laying down detailed rules of implementation of Council Regulation
(EC) no. 510/2006 on the protection of geographical indications and designations of origin for agricultural products and foodstuffs.Off. J. Eur. Union 2006, L369, 1–23.
17. Council Regulation (EC). No 1151/2012 of 21 November 20122012 on quality schemes for agricultural products and foodstuffs.Off. J. Eur. Union 2012, L343, 1–29.
18. Skiada, V.; Tsarouhas, P.; Varzakas, T. Preliminary Study and Observation of “Kalamata PDO” Extra Virgin Olive Oil, in theMessinia Region, Southwest of Peloponnese (Greece). Foods 2019, 8, 610. [CrossRef] [PubMed]
19. Esteves da Silva, J.C.G. Chemometric classification of cultivars of olives: Perspectives on Portuguese olives. In Olives and OliveOil in Health and Disease Prevention; Elsevier: Amsterdam, The Netherlands, 2010; pp. 33–42.
20. Beyaz, A.; Öztürk, R. Identification of olive cultivars using image processing techniques. Turk. J. Agric. 2016, 40, 671–683.[CrossRef]
21. Consonni, R.; Cagliani, L.R. NMR Studies on Italian PDO Olive Oils and their Potential in Olive-Tree-Derived ProductsCharacterization. Eur. J. Lipid Sci. Tech. 2019, 121, 1800174. [CrossRef]
22. Ben Othman, N.; Roblain, D.; Thonart, P.; Hamdi, M. Tunisian table olive phenolic compounds and their antioxidant capacity. J.Food Sci. 2008, 73, C235–C240. [CrossRef]
23. Dagdelen, A.; Tümen, G.; Özcan, M.M.; Dündar, E. Phenolics profiles of olive fruits (Olea europaea L.) and oils from Ayvalık,Domat and Gemlik varieties at different ripening stages. Food Chem. 2013, 136, 41–45. [CrossRef]
24. Albuquerque, T.G.; Costa, H.S.; Oliveira, M.B.P.P. An overview of ortuguese olive oils and table olives with protected designationof origin. Eur. J. Lipid Sci. Tech. 2019, 121, 1800129. [CrossRef]
25. Kalogiouri, N.P.; Aalizadeh, R.; Dasenaki, M.E.; Thomaidis, N.S. Authentication of Greek PDO Kalamata Table Olives: A NovelNon-Target High Resolution Mass. Molecules 2020, 25, 2919. [CrossRef] [PubMed]
26. Sánchez, A.H.; López-López, A.; Cortés-Delgado, A.; de Castro, A.; Montaño, A. Aroma profile and volatile composition of blackripe olives (Manzanilla and Hojiblanca cultivars). Food Res. Int. 2020, 127, 108733. [CrossRef]
27. Concepción, R.; García, P.; Medina, E.; Brenes, M. The PDO and PGI Table Olives of Spain. Eur. J. Lipid Sci. Tech. 2019, 121, 1–17.[CrossRef]
28. Selli, S.; Kelebek, H.; Kesen, S.; Sonmezdag, A.S. GC-MS olfactometric and LC-DAD-ESI-MS/MS characterization of key odorantsand phenolic compounds in black dry-salted olives. J. Sci. Food. Agric. 2018, 98, 4104–4111. [CrossRef] [PubMed]
29. Tarapoulouzi, M.; Kokkinofta, R.; Theocharis, C.R. Chemometric analysis combined with FTIR spectroscopy of milk and Halloumicheese samples according to species’ origin. Food Sci. Nutr. 2020, 8, 3262–3273. [CrossRef] [PubMed]
Foods 2021, 10, 1829 15 of 16
30. Vanloot, P.; Bertrand, D.; Pinatel, C.; Artaud, J.; Dupuy, N. Artificial vision and chemometrics analyses of olive stones for varietalidentification of five French cultivars. Comput. Electron. Agric. 2014, 102, 98–105. [CrossRef]
31. Beyaz, A.; Özkaya, M.T.; Duygu, I. Identification of some spanish olive cultivars using image processing techniques. Sci. Hortic.2017, 225, 286–292. [CrossRef]
32. Tarapoulouzi, M.; Skiada, V.; Agriopoulou, S.; Psomiadis, D.; Rébufa, C.; Roussos, S.; Theocharis, C.R.; Katsaris, P.; Varzakas, T.Chemometric Discrimination of the Geographical Origin of Three Greek Cultivars of Olive Oils by Stable Isotope Ratio Analysis.Foods 2021, 10, 336. [CrossRef] [PubMed]
33. Martínez, S.S.; Gila, D.M.; Beyaz, A.; Ortega, J.G.; García, J.G. A computer vision approach based on endocarp features for theidentification of olive cultivars. Comput. Electron. Agric. 2018, 154, 341–346. [CrossRef]
34. Blazakis, K.N.; Kosma, M.; Kostelenos, G.; Baldoni, L.; Bufacchi, M.; Kalaitzis, P. Description of olive morphological parametersby using open access software. Plant Methods 2017, 13, 1–15. [CrossRef]
35. Piras, F.; Grillo, O.; Venora, G.; Lovicu, G.; Campus, M.; Bacchetta, G. Effectiveness of a computer vision technique in thecharacterization of wild and farmed olives. Comput. Electron. Agric. 2016, 122, 86–93. [CrossRef]
36. Oliveri, P.; López, M.I.; Casolino, M.C.; Ruisánchez, I.; Callao, M.P.; Medini, L.; Lanteri, S. Analytica Chimica Acta Partialleast squares density modeling (PLS-DM)—A new class-modeling strategy applied to the authentication of olives in brine bynear-infrared spectroscopy. Anal. Chim. Acta 2014, 851, 30–36. [CrossRef]
37. Brereton, R.G. Pattern recognition in chemometrics. Chemom. Intell. Lab. Syst. 2015, 149, 90–96. [CrossRef]38. de Santana, F.B.; Borges Neto, W.; Poppi, R.J. Random forest as one-class classifier and infrared spectroscopy for food adulteration
detection. Food Chem. 2019, 293, 323–332. [CrossRef] [PubMed]39. Cubero-Leon, E.; De Rudder, O.; Maquet, A. Metabolomics for organic food authentication: Results from a long-term field study
in carrots. Food Chem. 2018, 239, 760–770. [CrossRef]40. Eriksson, L.; Trygg, J.; Wold, S. CV-ANOVA for significance testing of PLS and OPLS 1 models. J. Chem. 2008, 22, 594–600.
[CrossRef]41. Rodríguez, G.; Lama, A.; Rodríguez, R.; Jiménez, A.; Guillén, R.; Fernández-Bolaños, J. Olive stone an attractive source of
bioactive and valuable compounds. Bioresour. Technol. 2008, 99, 5261–5269. [CrossRef]42. Danezis, G.P.; Tsagkaris, A.S.; Camin, F.; Brusic, V.; Georgiou, C.A. Food authentication: Techniques, trends & emerging
approaches. TrAC Trends Anal. Chem. 2016, 85, 123–132.43. Mantzouridou, F.T.; Mastralexi, A.; Filippidou, M.; Tsimidou, M.Z. Challenges in the Processing Line of Spanish Style cv.
Chalkidiki Green Table Olives Spontaneously Fermented in Reduced NaCl Content Brines. Eur. J. Lipid Sci. Technol. 2020,122, 1900453. [CrossRef]
44. Pino, A.; Vaccalluzzo, A.; Solieri, L.; Romeo, F.V.; Todaro, A.; Caggia, C.; Arroyo-López, F.N.; Bautista-Gallego, J.; Randazzo,C.L. Effect of Sequential Inoculum of Beta-Glucosidase Positive and Probiotic Strains on Brine Fermentation to Obtain Low SaltSicilian Table Olives. Front. Microbiol. 2019, 10, 174. [CrossRef] [PubMed]
45. Bautista-Gallego, J.; Arroyo-Lopez, F.N.; Gil, V.R.; Gómez, F.R.; Garcia, P.G.; Fernández, A.G. Chloride salt mixtures affect Gordalcv. green Spanish-style table olive fermentation. Food Microbiol. 2011, 28, 1316–1325. [CrossRef]
46. Moreno-Baquero, J.; Bautista-Gallego, J.; Garrido-Fernández, A.; López-López, A. Mineral and sensory profile of seasonedcracked olives packed in diverse salt mixtures. Food Chem. 2013, 138, 1–8. [CrossRef]
47. Bautista-Gallego, J.; Arroyo-Lopez, F.N.; Romero-Gil, V.; Rodríguez-Gómez, F.; García-García, P.; Garrido-Fernandez, A. Fer-mentation profile of green Spanish-style Manzanilla olives according to NaCl content in brine. Food Microbiol. 2015, 49, 56–64.[CrossRef]
48. Mateus, T.; Santo, D.; Saúde, C.; Pires-Cabral, P.; Quintas, C. The effect of NaCl reduction in the microbiological quality of crackedgreen table olives of the Maçanilha Algarvia cultivar. Int. J. Food Microbiol. 2016, 218, 57–65. [CrossRef] [PubMed]
49. Saúde, C.; Barros, T.; Mateus, T.; Quintas, C.; Pires-Cabral, P. Effect of chloride salts on the sensory and nutritional properties ofcracked table olives of the Maçanilha Algarvia cultivar. Food Biosci. 2017, 19, 73–79. [CrossRef]
50. Boskou, D.; Camposeo, S.; Clodoveo, M.L. Table Olives as Sources of Bioactive Compounds. In Olive and Olive Oil BioactiveConstituents; AOCS Press: Urbana, IL, USA, 2015; pp. 217–259.
51. Puerto, D.A.; Gila, D.M.M.; García, J.G.; Ortega, J.G. Sorting olive batches for the milling process using image processing. Sensors2015, 15, 15738–15754. [CrossRef]
52. Ponce, J.M.; Aquino, A.; Andújar, J.M. Olive-fruit variety classification by means of image processing and convolutional neuralnetworks. IEEE Access 2019, 7, 147629–147641. [CrossRef]
53. Ponce, J.M.; Aquino, A.; Millán, B.; Andújar, J.M. Automatic counting and individual size and mass estimation of olive-fruitsthrough computer vision techniques. IEEE Access 2019, 7, 59451–59465. [CrossRef]
54. Ponce, J.M.; Aquino, A.; Millán, B.; Andújar, J.M. Olive-fruit mass and size estimation using image analysis and feature modeling.Sensors 2018, 18, 2930. [CrossRef]
55. Diaz, R.; Gil, L.; Serrano, C.; Blasco, M.; Moltó, E.; Blasco, J. Comparison of three algorithms in the classification of table olives bymeans of computer vision. J. Food Eng. 2004, 61, 101–107. [CrossRef]
56. Hassan, N.M.H.; Nashat, A.A. New effective techniques for automatic detection and classification of external olive fruits defectsbased on image processing techniques. Multidim. Syst. Sign. Process. 2019, 30, 571–589. [CrossRef]

Foods 2021, 10, 1829 16 of 16
57. Ropelewska, E.; Szwejda-Grzybowska, J. A comparative analysis of the discrimination of pepper (Capsicum annuum L.) based onthe cross-section and seed textures determined using image processing. J. Food Process. Eng. 2021, 44, 13694. [CrossRef]
58. Sun, Y.; Li, Y.; Pan, L.; Abbas, A.; Jiang, Y.; Wang, X. Authentication of the geographic origin of Yangshan region peaches based onhyperspectral imaging. Postharvest Biol. Technol. 2021, 171, 111320. [CrossRef]
59. Beteinakis, S.; Papachristodoulou, A.; Gogou, G.; Katsikis, S.; Mikros, E.; Halabalaki, M. NMR-based metabolic profiling of edibleolives—Determination of quality parameters. Molecules 2020, 25, 3339. [CrossRef] [PubMed]
60. Wang, S.; Lai, G.; Lin, J.; Xia, F.; Ding, Z.; Feng, J.; Xu, J.; Shen, G. Rapid detection of adulteration in extra virgin olive oil byLow-Field Nuclear Magnetic Resonance combined with pattern recognition. Food Anal. Methods 2021, 14, 1322–1335. [CrossRef]
61. Tang, F.; Green, H.S.; Wang, S.C.; Hatzakis, E. Analysis and authentication of avocado oil using High Resolution NMR Spec-troscopy. Molecules 2021, 26, 310. [CrossRef] [PubMed]
62. Becerra-Martínez, E.; Florentino-Ramos, E.; Pérez-Hernández, N.; Zepeda-Vallejo, L.G.; Villa-Ruano, N.; Velázquez-Ponce, M.;García-Mendoza, F.; Bañuelos-Hernández, A.E. 1H NMR-based metabolomic fingerprinting to determine metabolite levels inserrano peppers (Capsicum annum L.) grown in two different regions. Food Res. Internat. 2017, 102, 163–170. [CrossRef]
63. Chung, I.M.; Kim, J.K.; Lee, K.J.; Park, S.K.; Lee, J.H.; Son, N.Y.; Jin, Y.I.; Kim, S.H. Geographic authentication of Asian rice(Oryza sativa L.) using multi-elemental and stable isotopic data combined with multivariate analysis. Food Chem. 2018, 240,840–849. [CrossRef]