Embed Size (px)
Citation preview

Working Papers | 67 |
Roman Stöllinger, Robert Stehrer and Johannes Pöschl
Austrian Exporters: A Firm-Level Analysis
July
2010

wiiw Working Papers published since 2005: No. 67 R. Stöllinger, R. Stehrer and J. Pöschl: Austrian Exporters: A Firm-Level Analysis. July 2010
No. 66 M. Holzner: Tourism and Economic Development: the Beach Disease? June 2010
No. 65 A. Bhaduri: A Contribution to the Theory of Financial Fragility and Crisis. May 2010
No. 64 L. Podkaminer: Why Are Goods Cheaper in Rich Countries? Beyond the Balassa-Samuelson Effect. April 2010
No. 63 K. Laski, J. Osiatynski and J. Zieba: The Government Expenditure Multiplier and its Estimates for Poland in 2006-2009. March 2010
No. 62 A. Bhaduri: The Implications of Financial Asset and Housing Markets on Profit- and Wage-led Growth: Some Results in Comparative Statics. February 2010
No. 61 N. Foster and R. Stehrer: Preferential Trade Agreements and the Structure of International Trade. January 2010
No. 60 J. Francois and B. Hoekman: Services Trade and Policy. December 2009
No. 59 C. Lennon: Trade in Services: Cross-Border Trade vs. Commercial Presence. Evidence of Complementarity. November 2009
No. 58 N. Foster and J. Pöschl: The Importance of Labour Mobility for Spillovers across Industries. October 2009
No. 57 J. Crespo-Cuaresma, G. Doppelhofer and M. Feldkircher: The Determinants of Economic Growth in European Regions. September 2009
No. 56 W. Koller and R. Stehrer: Trade Integration, Outsourcing and Employment in Austria: A Decomposition Approach. July 2009
No. 55 U. Schneider and M. Wagner: Catching Growth Determinants with the Adaptive Lasso. June 2009
No. 54 J. Crespo-Cuaresma, N. Foster and R. Stehrer: The Determinants of Regional Economic Growth by Quantile. May 2009
No. 53 C. Lennon: Trade in Services and Trade in Goods: Differences and Complementarities. April 2009
No. 52 J. F. Francois and C. R. Shiells: Dynamic Factor Price Equalization and International Convergence. March 2009
No. 51 P. Esposito and R. Stehrer: Effects of High-Tech Capital, FDI and Outsourcing on Demand for Skills in West and East. March 2009
No. 50 C. Fillat-Castejón, J. F. Francois and J. Wörz: Cross-Border Trade and FDI in Services. February 2009
No. 49 L. Podkaminer: Real Convergence and Inflation: Long-Term Tendency vs. Short-Term Performance. December 2008
No. 48 C. Bellak, M. Leibrecht and R. Stehrer: The Role of Public Policy in Closing Foreign Direct Investment Gaps: An Empirical Analysis. October 2008
No. 47 N. Foster and R. Stehrer: Sectoral Productivity, Density and Agglomeration in the Wider Europe. September 2008
No. 46 A. Iara: Skill Diffusion by Temporary Migration? Returns to Western European Work Experience in Central and East European Countries. July 2008
No. 45 K. Laski: Do Increased Private Saving Rates Spur Economic Growth? September 2007
No. 44 R. C. Feenstra: Globalization and Its Impact on Labour. July 2007
No. 43 P. Esposito and R. Stehrer: The Sector Bias of Skill-biased Technical Change and the Rising Skill Premium in Transition Economies. May 2007
No. 42 A. Bhaduri: On the Dynamics of Profit- and Wage-led Growth. March 2007
No. 41 M. Landesmann and R. Stehrer: Goodwin’s Structural Economic Dynamics: Modelling Schumpeterian and Keynesian Insights. October 2006
No. 40 E. Christie and M. Holzner: What Explains Tax Evasion? An Empirical Assessment based on European Data. June 2006
No. 39 R. Römisch and M. Leibrecht: An Alternative Formulation of the Devereux-Griffith Effective Average Tax Rates for International Investment. May 2006
No. 38 C. F. Castejón and J. Wörz: Good or Bad? The Influence of FDI on Output Growth. An industry-level analysis. April 2006
No. 37 J. Francois and J. Wörz: Rags in the High Rent District: The Evolution of Quota Rents in Textiles and Clothing. January 2006
No. 36 N. Foster and R. Stehrer: Modelling GDP in CEECs Using Smooth Transitions. December 2005
No. 35 R. Stehrer: The Effects of Factor- and Sector-biased Technical Change Revisited. September 2005
No. 34 V. Astrov, Sectoral Productivity, Demand, and Terms of Trade: What Drives the Real Appreciation of the East European Currencies? April 2005
Roman Stöllinger is Research Economist at the Vienna Institute for International Economic Studies (wiiw). Robert Stehrer is Deputy Director of Research at wiiw. Johannes Pöschl is Junior Researcher at wiiw.
This publication was produced in the framework of MICRO-DYN (www.micro-dyn.eu), an international economic research project focusing on the competitiveness of firms, regions and industries in the knowledge-based economy. The project is funded by the EU Sixth Framework Programme (www.cordis.lu) with socio-economic sciences and humanities (http://ec.europa.eu/research/social-sciences/index_en.html).
This publication reflects only the authors’ views, the European Community is not liable for any use that may be made of the information contained therein.
The paper also benefited strongly from work on the authors’ previous study, ‘Characteristics of exporting and non-exporting firms in Austria’, commissioned by the Austrian Federal Ministry of Economics, Family and Youth (BMWFJ) within the framework of the ‘Research Centre International Economics’ (FIW) in November 2008 and published as FIW Research Report 2009/10 N°01.
Roman Stöllinger,
Robert Stehrer and
Johannes Pöschl
Austrian Exporters:
A Firm-Level Analysis


Contents
Abstract..................................................................................................................................... i
1 Introduction....................................................................................................................1
2 Related literature ...........................................................................................................3
3 Data ...............................................................................................................................4
4 Export participation and export intensity .......................................................................6 4.1 Industry export participation ................................................................................6 4.2 Firm export intensity ............................................................................................8
5 Export concentration ...................................................................................................11
6 Export premium ...........................................................................................................12 6.1 Empirical strategy ..............................................................................................12 6.2 The export premia at the level of total manufacturing.......................................14 6.3 The export premia at the level of individual industries......................................16 6.4 The export premia – controlling for additional firm characteristics ...................21 6.5 Changing the estimation technique: a random effects model ..........................22 6.6 Changing the hypothesis: a fixed effects model ...............................................23
7 The probability of exporting.........................................................................................25
8 Conclusions .................................................................................................................27
9 Literature......................................................................................................................29
10 Appendix......................................................................................................................30

List of Tables and Figures
Table 1 Sample overview, manufacturing (NACE D), 1997-2006 ................................................ 5
Table 2 Number and relative share of exporters, 2002 and 2006 ................................................ 7
Table 3 Number of firms by export intensity and NACE industries, 2006..................................... 9
Table 4 Firm export intensities, 2006, relative shares within group of exporting firms............... 11
Table 5 Export premium for Austrian manufacturing firms, 2002-2006 (OLS) – manufacturing total .......................................................................................................... 15
Table 6 Export premium by export intensity for Austrian manufacturing firms, 2002-2006 (OLS) – manufacturing total ............................................................................................ 15
Table 7 Export premium for Austrian manufacturing firms, 2002-2006 (OLS) – individual industries.......................................................................................................................... 17
Table 8 Export premium for Austrian manufacturing firms, 2002-2006, by export intensity (OLS) – individual industries ........................................................................................... 19
Table 9 Export premium for Austrian manufacturing firms, 2002-2006, including control variables (OLS) – manufacturing total ................................................................ 21
Table 10 Export premium for Austrian manufacturing firms, 2002-2006, including firm random effects (RE) – manufacturing total.............................................................. 23
Table 11 Estimation results with firm fixed effects, simple export status (total manufacturing, 2002-2006).................................................................................... 24
Table 12 Exporting, non-exporting and switching firms (transition matrix) ................................... 25
Table 13 Results from probit estimation – marginal effects (total manufacturing, 2002-2006).... 26
Table A.1 NACE classification – divisions....................................................................................... 30
Table A.2 NACE classification – subsections and divisions used in econometric part.................. 31
Figure 1 Share of exporters in per cent, 2002 and 2006................................................................ 8
Figure 2 Change in industry export participation in percentage points, 2002-2006 ...................... 8
Figure 3 Export concentration in the Austrian manufacturing sector, 2006................................. 12
Figure 4 Export premium for Austrian manufacturing firms, 2002-2006 (pooled model) – individual industries ......................................................................................................... 17

i
Abstract
In this paper we provide detailed evidence on the importance and performance of exporters compared to non-exporters in Austrian manufacturing industries based on firm-level data. The centrepiece of the study is the issue of the export premium, i.e. the size and performance advantages of exporting firms compared to their purely domestic peers. We find evidence for the existence of large export premia for all seven size and performance premia considered. These results are largely in line with the results found for other European countries. When estimating the export premium at the level of individual industries, we find significant differences with respect to the magnitude of the export premia. Significant export premia are still found when controlling for other firm characteristics such as employment and R&D-related variables where we find lower but more plausible magnitudes for the size and performance premia of exporters. We further test the robustness of the export premium results using random and also fixed effects estimators. The random effects model delivers statistically significant export premia for all measures as well. Care has to be taken when interpreting the estimated coefficients in the firm fixed effects model as the coefficients signal differences in size and productivity for ‘export switchers’, i.e. firms changing their export status. Finally, we employ a probit model to investigate the impact of past firm characteristics on the probability to export. The major result is that while lagged firm productivity and size matter, the most important factor influencing this probability is the past export status pointing to a strong persistence of exporting. JEL classification: F14, L25 Keywords: exports, firm heterogeneity, export premium, Austrian manufacturing firms

1
Roman Stöllinger, Robert Stehrer and Johannes Pöschl
Austrian exporters: a firm-level analysis
1 Introduction
With the emergence of heterogeneous firm models (e.g. Melitz, 2003), trade theory has finally put firms, which are the major actors in the export business, in the centre of analysis, instead of countries or sectors. These models stress firm heterogeneity, which is typically modelled as (static) differences in productivity across firms. Trade models incorporating firm heterogeneity, however, do not replace the results of preceding trade models such as the new trade models developed by Krugman (1979) but rather build on them and add new elements. For example, models based on heterogeneous firms still use the established incentives for trade of existing models such as comparative advantages or product varieties. Additional elements come in as comparative advantages may be caused by additional factors and there are new sources of gains from trade, most importantly within-industry reallocations of market shares towards more efficient firms. Nevertheless, some major assumptions of existing theories are challenged. An important example in this context is the prediction of earlier models that there are only ‘export sectors’ (all firms export) and ‘import competing sectors’ (no firm exports) or, if industries both export and import, trade only takes place in differentiated goods and all firms export. In contrast, the Melitz model predicts that, depending on differences in productivities of firms and (fixed) trade costs, only a subset of firms within an industry engages in exporting. Certainly, the insight that an economy and also industries are not populated by identical firms is not exactly new and is well known from industrial economics and firm growth literature. What is relatively new, however, is the availability of firm-level data with sufficient information on international activities that allow researchers to investigate the consequences of firm heterogeneity for international trade. For example, in their seminal work Clerides, Lach and Tybout (1998) showed for Colombia, Mexico and Morocco that exporting firms indeed differ from non-exporting firms in many respects (such as in productivity, size, etc.). Bernard and Jensen (1999) analysed US firms and introduced a straightforward method to estimate the ‘export premium’, that is, the advantage of exporting over non-exporting firms in terms of size measures, productivity and other performance measures, which is also the subject of this paper. With the growing availability of firm-level data sets, including information on international activities of firms such as exports, imports or foreign direct investment, a rich empirical literature on the internationalization and the role and behaviour of international firms has developed. For Austria, however, there is still hardly any evidence on these issues. Some first results on the characteristics of Austrian exporting firms have been presented in a recent comparative country study undertaken by the International Study Group on Exports and Productivity (ISGEP, 2008) and in 2009 a first detailed study on the characteristics of exporting versus non-exporting firms was published (Pöschl et al., 2009). Here we build on

2
the results found in our earlier study and take a closer look at the export premia in Austrian manufacturing over the period 2002-2006. In particular, we extend the estimation of the export premia in several ways to check the robustness of the estimations. Finally, we touch upon the issue of causality by estimating a probit model including lagged firm characteristics as factors influencing firms’ probability of exporting. A first extension with regard to the issue of the export premium is to estimate it at the level of individual industries (in our case mainly NACE subsections) in addition to the level of entire manufacturing. This extension is motivated by the fact that the in the econometric specification of Bernard – Jensen (1999) for estimating the export premium, the inclusion of industry dummies may not sufficiently take into account industry differences. When regressing, say, labour productivity on the export status, the industry dummies capture differences in productivities across industries but the regression still forces a common coefficient on the export status, i.e. the export premia. The descriptive statistics presented at length in Pöschl et al. (2009) demonstrate, however, that the magnitude of the export premia for the different size and performance measures varies considerably across industries. We therefore make use of the large number of observations in our panel data set and estimate the export premium at the level of (broadly defined) industries. In addition to considerable variation of the export premia across industries we also find interesting differences with respect to export intensities of firms. When estimating the export premium for firms with different export intensities (export turnover as a share of total turnover), i.e. replacing the simple export status variable with dummy variables indicating the firms’ ‘export intensity group’, we find that in some industries the difference between marginal exporting firms (e.g. export shares less than five per cent) and non-exporters are striking while in other industries only the most export-intensive firms differ significantly from non-exporting firms. A more substantial extension is the inclusion of additional control variables where we opted for a size variable (employment) and some variables related to research and development (R&D). This modification seems to remedy a lot of the existent omitted variable bias in the descriptive baseline regression that only includes industry and year dummies as control variables. The estimated export premia are now of a much smaller magnitude (17% for sales, 17.5% for labour productivity and 7.7% for wages). We see this as an important confirmation of our earlier results with more plausible magnitudes. The panel structure of our data set also allow us to use a firm fixed effects and a random effects model to estimate the export premia but both approaches have drawbacks. While the latter yields statistically significant results it may suffer from inconsistency, and in the firm fixed effect model, the export status dummy in fact tests a different hypothesis which is not related to the export premium generally but to size and performance differences of switching firms, i.e. previously non-exporting firms that enter the export market. We nevertheless included these results as well because they still lend additional support to the existence of export premia. Finally, while the data do not allow to make a final judgement on

3
the issue of causality between firm performance or size on the one hand and exporting on the other, we touch upon this issue by the way of probit regressions including lagged firm characteristics. The remainder of this paper is structured as follows: Section 2 gives a brief overview of related literature. Section 3 describes the data set which is used in Sections 4 and 5 to present the facts related to export activities, including export participation and export concentration in the Austrian manufacturing sector. Section 6 reports the results of various approaches to estimate the export premia while Section 7 contains the findings from our probit regression. Section 8 concludes. 2 Related literature
The seminal paper by Melitz (2003) on heterogeneous firms and trade provides a useful theoretical background for country studies on the role and characteristics of exporting firms. It suggests a clear relationship between exporting and productivity: since exporting is assumed to entail fixed exporting costs (and variable trade costs), only the more productive firms engage in export activities while less productive firms choose to serve the domestic market only. This self-selection process of more productive firms into exporting is confirmed by studies on the causal relationship between exporting and productivity, at least for developed countries.1 The assumption of a constant price-cost mark-up in the model implies that the prices a firm charges and therefore its sales are directly related to the firm’s productivity. We therefore expect exporters to be more productive and also larger than firms selling only on the domestic market. Leaving aside the issue of causality, Bernard and Jensen (1999) propose a straightforward empirical equation to estimate the productivity and size advantages of exporting firms which became known as the ‘export premium’. The approach consists simply of regressing performance measures (such as labour productivity, total factor productivity or wages paid to employees) and size measures (such as firm sales or employment) on the export status, which is a dummy variable taking on the value one if the firm has positive export sales. This regression set-up has been used for many country studies employing firm-level data to estimate the export premium. An overview of the results on the export premium for European (and some non-European) countries can be found in Mayer and Ottaviano (2007), Altomonte and Ottaviano (2008) and ISGEP (2008). Since the direction of causality is not clear a priori, it is equally possible to treat the export status as the dependent 1 An alternative hypothesis on the self-selection of firms into export markets is that firms are learning from exporting so
that exporting makes them more productive. An overriding majority of empirical studies tackling the issue of causality between exporting and productivity came to the conclusion that, at least for developed countries, the causality runs from productivity to exporting with only limited ‘learning by exporting’ effects (e.g. Arnold and Hussinger, 2005 for Germany). It is therefore not self-evident to use productivity measures (or size measures) as the dependent variable; it allows, however, to use simple OLS estimation techniques.

4
variable and regress it on a number of firm characteristics. This approach is more in line with the suggested self-selection process of the Melitz model. As the export status is a binary variable this requires the estimation of export probabilities and a switch of the estimation procedure. In the literature this is typically tackled by employing a probit model (for example Greenaway and Kneller, 2004; Kox and Rojas-Romagosa, 2010). In this paper we estimate the export premia for Austrian manufacturing firms over the period 2002 to 2006, closely following Bernard and Jensen (1999). Our findings are fully in line with the findings of other country studies both for the existence of an export premium as well as other stylized facts, e.g. that a small number of firms account for the bulk of aggregate exports. We build on and extend our results on the export premium of our previous paper (Pöschl et al, 2009) by estimating the export premia at the individual industry level, and adding additional control variables such as research and development (R&D) indicators and more common factors such as employment (e.g. Greenaway and Kneller, 2004). A noticeable point in our fixed effects result is that the interpretation is different as outlined below. This is because the tested hypothesis with firm fixed effects included is whether export switchers differ significantly from non-exporting firms. So while our estimation approach is fully in line with previous work on export premia (e.g. Kox and Rojas-Romagosa, 2010; ISGEP, 2008), we provide an alternative interpretation. For analysing the influence of firm characteristics on the probability to export, we also opted for a probit model with our approach being similar to the one by Greenaway and Kneller (2004), who also include regional variables as controls and, most importantly, the lagged export status which reveals the persistence of exporting. 3 Data
In this paper we use Austrian firm-level data provided by Statistics Austria via ‘remote execute’.2 The basic data set is the ‘Leistungs- und Strukturerhebung’ for the period 1997-2006 and NACE categories C to F; in this paper, we only use data for the manufacturing sector (NACE D).3 There has been a methodological change in 2002 which we have to take into account. These data provide firm-level information for a number of indicators on a yearly basis of which we use the number of firms in each manufacturing NACE 2-digit industry, production value, sales, employment, total investment and wages and salaries. Unfortunately these 2 We would like to thank Mag. Wally, who was invaluable in solving the administrative and juridical hurdles and problems
in accessing the data at the first stage. We further thank ADir RR Mazanek, who provided assistance in setting up the database and the export markers in particular and a number of useful comments. Various other members of Statistics Austria have been helpful in processing the data and generating results.
3 Detailed information on definitions and methods are provided in ‘Standard-Dokumentation: Metainformationen (Definitionen, Erläuterungen, Methoden, Qualität) zur Leistungs- und Strukturstatistik, Teilprojekt Produzierender Bereich’, downloadable from www.statistik.at.

5
data do not provide information on the export behaviour of firms. For information on the export status of firms the data from the ‘Leistungs- und Strukturerhebung’ have to be combined with the ‘Konjunkturstatistik’4, which is on a monthly basis, includes a smaller number of firms sampled and provides only few indicators. The ‘Konjunkturstatistik’, however, provides information on sales in the domestic economy and export sales. Using this information it was possible to generate indicators on the export status (‘export markers’). These export markers allow to distinguish exporting firms according to their export intensity, that is, we can distinguish between firms exporting equal to or less than 5, 30, 50 and more than 50 per cent of their sales respectively. This information on the export status was merged to the indicators taken from the ‘Leistungs- und Strukturerhebung’. As the sample size in the ‘Konjunkturstatistik’ is smaller than that in the ‘Leistungs- und Strukturerhebung’ there remains a number of firms for which no information on their export status is available (see Table 1 below). Moreover, the reliance on the ‘Konjunkturstatistik’ for the export sales implies that we only have firms with 20 employees or more in our sample as this is the threshold for firms to be included in the ‘Konjunkturstatistik’. Further, due to confidentiality issues, cells with less than 4 firms are not used in the results reported below.5 Throughout the paper we will take care of the fact that there is a break in the series due to a change in the data collection method of Statistics Austria, so we split the period 1997-2006 into two sub-periods, with period 1 ranging from 1997 to 2001 and period 2 ranging from 2002 to 2006, with most of the analysis focusing on the second period. Table 1
Sample overview, manufacturing (NACE D), 1997-2006
Year Total number of firms
Firms with exports status known
Exporters Non-exporters Share of exporters in %
1997 9388 5342 2967 2375 55.54 1998 9531 5379 3045 2334 56.61 1999 9609 5106 2959 2147 57.95 2000 9421 5000 2931 2069 58.62 2001 9218 4952 2921 2031 58.99 2002 27572 5973 3218 2755 53.88 2003 28581 6054 3303 2751 54.56 2004 28609 5949 3340 2609 56.14 2005 28374 5719 3248 2471 56.79 2006 28712 6326 3537 2789 55.91
4 For details see ‘Standard-Dokumentation: Metainformationen (Definitionen, Erläuterungen, Methoden, Qualität) zur
Konjunkturstatistik im Produzierenden Bereich’, downloadable from www.statistik.at. 5 Results dealing with only the number of firms but not their characteristics are not covered by this rule.

6
As Table 1 indicates, the total number of firms for which data are available tripled from the first to the second period due to the methodological change. However, the number of firms for which the export status is known increased by a much smaller amount, rising from roughly 5000 to roughly 6000 firms. Therefore, our actual sample, i.e. the number of firms for which information on the export status is available, varies from 4952 firms in 2001 to 6326 firms in 2006, the last year for which data are available to us. For all calculations and results in this paper we chose the simplest (and also most widely used) definition of the export status. According to this definition, a firm is considered to be an exporter in any particular year if its export sales are greater than zero. This implies that individual firms can switch from being a non-exporter to being an exporter in the next year and vice versa. Hence, according to this definition firms that only export sporadically and in very low amounts also count as exporters.6 Neglecting the break in the time series, the share of exporters in our sample seems to be relatively constant over the entire period with roughly 56% both in 1997 and 2006. This, however, conceals an interim low in 2002 (53.88%) and a peak of 58.99% in the preceding year with the jump possibly caused by the break in the time series. Looking at the two time periods 1997-2001 and 2002-2006 separately, it appears that the number of exporting firms in the Austrian economy has been increasing only slightly over time. The unimpressive increase in the share of exporting firms between 2002 and 2006 was about 2 percentage points, which implies an annual increase in the share of exporters of less than 1%. In comparison, Austrian aggregate exports rose from EUR 77.4 billion to EUR 103.8 billion during the same period, an increase of more than one third or 7.6% annually, which may suggest that the expansion mostly occurred via an increased volume of exports by firms rather than an increase in the number of exporters. 4 Export participation and export intensity
4.1 Industry export participation
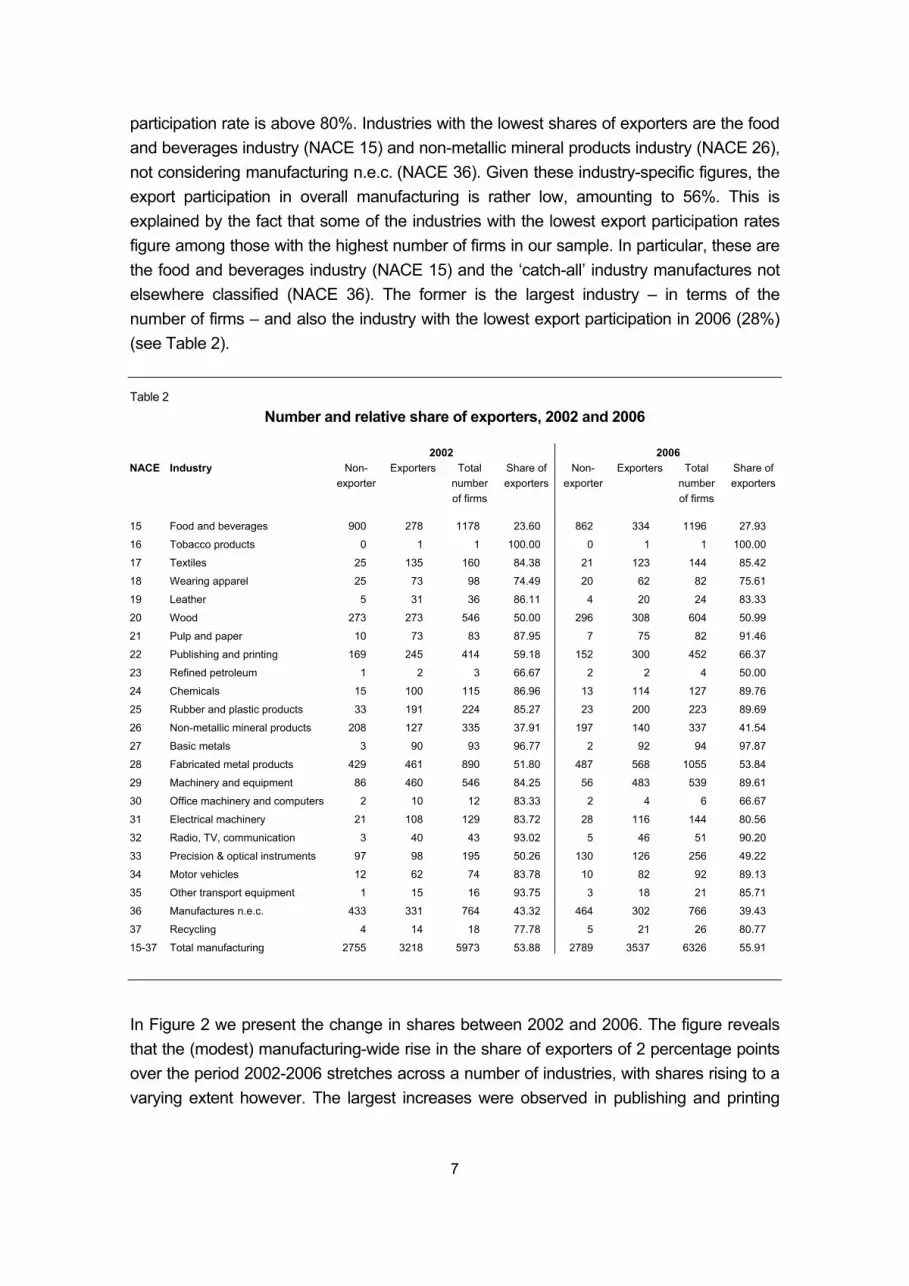
In this section we present descriptive evidence on the overall engagement of manufacturing firms in export activities and by individual industries for the period 2002-2006. Table 2 reports the number of firms and exporters together with the share of exporters in 2002 and 2006 for individual manufacturing industries (NACE 15-37) and total manufacturing. The figures suggest that the share of exporters in the total number of firms, i.e. the export participation rate, is rather high in most manufacturing industries. These shares are graphically presented in Figure 1 where we have ranked the industries by industry export participation in 2006. This shows that in 13 of the 23 industries the export
6 An alternative, narrower, definition of the export status is to consider a firm as an exporter only if it is exporting equal to
or more than 5% of its sales in two consecutive years.
7
participation rate is above 80%. Industries with the lowest shares of exporters are the food and beverages industry (NACE 15) and non-metallic mineral products industry (NACE 26), not considering manufacturing n.e.c. (NACE 36). Given these industry-specific figures, the export participation in overall manufacturing is rather low, amounting to 56%. This is explained by the fact that some of the industries with the lowest export participation rates figure among those with the highest number of firms in our sample. In particular, these are the food and beverages industry (NACE 15) and the ‘catch-all’ industry manufactures not elsewhere classified (NACE 36). The former is the largest industry – in terms of the number of firms – and also the industry with the lowest export participation in 2006 (28%) (see Table 2). Table 2
Number and relative share of exporters, 2002 and 2006
2002 2006 NACE Industry Non-
exporter Exporters Total
number of firms
Share of exporters
Non-exporter
Exporters Total number of firms
Share of exporters
15 Food and beverages 900 278 1178 23.60 862 334 1196 27.93
16 Tobacco products 0 1 1 100.00 0 1 1 100.00
17 Textiles 25 135 160 84.38 21 123 144 85.42
18 Wearing apparel 25 73 98 74.49 20 62 82 75.61
19 Leather 5 31 36 86.11 4 20 24 83.33
20 Wood 273 273 546 50.00 296 308 604 50.99
21 Pulp and paper 10 73 83 87.95 7 75 82 91.46
22 Publishing and printing 169 245 414 59.18 152 300 452 66.37
23 Refined petroleum 1 2 3 66.67 2 2 4 50.00
24 Chemicals 15 100 115 86.96 13 114 127 89.76
25 Rubber and plastic products 33 191 224 85.27 23 200 223 89.69
26 Non-metallic mineral products 208 127 335 37.91 197 140 337 41.54
27 Basic metals 3 90 93 96.77 2 92 94 97.87
28 Fabricated metal products 429 461 890 51.80 487 568 1055 53.84
29 Machinery and equipment 86 460 546 84.25 56 483 539 89.61
30 Office machinery and computers 2 10 12 83.33 2 4 6 66.67
31 Electrical machinery 21 108 129 83.72 28 116 144 80.56
32 Radio, TV, communication 3 40 43 93.02 5 46 51 90.20
33 Precision & optical instruments 97 98 195 50.26 130 126 256 49.22
34 Motor vehicles 12 62 74 83.78 10 82 92 89.13
35 Other transport equipment 1 15 16 93.75 3 18 21 85.71
36 Manufactures n.e.c. 433 331 764 43.32 464 302 766 39.43
37 Recycling 4 14 18 77.78 5 21 26 80.77
15-37 Total manufacturing 2755 3218 5973 53.88 2789 3537 6326 55.91
In Figure 2 we present the change in shares between 2002 and 2006. The figure reveals that the (modest) manufacturing-wide rise in the share of exporters of 2 percentage points over the period 2002-2006 stretches across a number of industries, with shares rising to a varying extent however. The largest increases were observed in publishing and printing
8
(NACE 22), the machinery and equipment industry (NACE 29) and the automotive industry (NACE 34). There are also a few industries with declining shares. These are in most cases industries with a relatively small number of firms, which also explains the rather large changes of the shares in percentage points. Figure 1
Share of exporters in per cent, 2002 and 2006
0
20
40
60
80
100
16 27 21 32 24 25 29 34 35 17 19 37 31 18 30 22 28 20 23 33 26 36 15
2002 2006
Note: The numbers on the horizontal axis refer to the respective NACE industry (division). Figure 2
Change in industry export participation in percentage points, 2002-2006
-20
-15
-10
-5
0
5
10
22 29 34 25 15 26 21 37 24 28 18 27 17 20 16 33 19 32 31 36 35 30 23
Note: The numbers on the horizontal axis refer to the respective NACE industry (division).
4.2 Firm export intensity
In addition to export participation at the manufacturing and industry level, we are also interested in the export intensity of firms, that is, the share of sales that a firm is earning from exporting. Unfortunately we lack detailed information on the precise export sales of firms and therefore their export intensity. But for each firm we know the range of its export sales, which allows us to distinguish between five groups. The first group consists of the

9
non-exporters, whose export intensity is obviously zero (‘none’). The second group includes exporters with exports up to 5% of their sales, and we label those as having ‘marginal’ export intensity or as ‘marginal exporters’. Exporters with exports between 5% and 30% of total sales are considered to have ‘low to medium’ export intensity and form the third firm grouping. The fourth group indicates ‘high export intensity’ and covers all firms that generate more than 30% and up to 50% of their sales in export markets. Finally, for ‘very high intensity’ exporters this share is above 50%. Table 3
Number of firms by export intensity and NACE industries, 2006
NACE Industry Non-exporters
Marginal Low to medium
High Very high Total
15 Food and beverages 862 115 122 46 51 1196 16 Tobacco products 0 0 1 0 0 1 17 Textiles 21 7 21 23 72 144 18 Wearing apparel 20 3 22 14 23 82 19 Leather 4 3 2 1 14 24 20 Wood 296 54 89 52 113 604 21 Pulp and paper 7 7 14 11 43 82 22 Publishing and printing 152 141 117 18 24 452 23 Refined petroleum 2 0 1 1 0 4 24 Chemicals 13 8 26 15 65 127 25 Rubber and plastic products 23 13 58 34 95 223 26 Non-metallic mineral products 197 33 58 14 35 337 27 Basic metals 2 3 10 11 68 94 28 Fabricated metal products 487 146 198 78 146 1055 29 Machinery and equipment 56 43 84 58 298 539 30 Office machinery and computers 2 0 0 0 4 6 31 Electrical machinery 28 9 28 12 67 144 32 Radio, TV, communication 5 2 7 8 29 51 33 Precision & optical instruments 130 20 19 16 71 256 34 Motor vehicles 10 10 14 8 50 92 35 Other transport equipment 3 1 3 3 11 21 36 Manufactures n.e.c. 464 65 110 47 80 766 37 Recycling 5 1 3 2 15 26 15-37 Total manufacturing 2789 684 1007 472 1374 6326
Note: Export intensities are defined as follows: non-exporters = ‘none’; >0% - 5% of turnover exported = ‘marginal’; >5% - 30% of turnover exported = ‘low to medium’; >30% - 50% of turnover exported = ‘high’; >50% of turnover exported = ‘very high’.
Table 3 provides an overview of the export intensities of Austrian manufacturing firms across industries. The table reveals that the pattern with respect to the export intensity is rather different across industries. In a sense, this is to be expected because the guidance provided by theory as to what pattern is likely if firms are grouped by export intensities is very limited and there is no unique pattern to be derived from analytical models.7 Rather, the distribution will depend on the size of the exporting country, comparative advantages (Bernard et al., 2007), the country’s openness, the number and openness of its trading 7 For simulation results see, for example, Bernard et al. (2003) for the US or Del Gatto et al. (2007) for France.

10
partners, industry-specific trade costs and the differences in trade costs among trading partners. All these factors may vary widely from industry to industry within one country. Therefore these differences should not come as a surprise. For manufacturing as a whole we find two major peaks at the opposite ends of the spectrum, i.e. the non-exporters (44%) and the firms with very high export intensity (22%). This is an interesting observation and shows that, given the export activity of a firm, the average Austrian firm is likely to be highly engaged in exporting with over half of its revenues generated from export operations. This is shown more clearly in Table 4 reporting the relative distribution of exporting firms only along the four firm groupings. This way of presenting the data highlights the fact that a large fraction of exporting firms has very high export intensity, standing at 39% for the entire manufacturing sector and reaching 74% in the basic metals industry (NACE 27). The picture that emerges for the entire manufacturing sector, however, is not really representative because it is heavily influenced by the food and beverages industry (NACE 15) which is dominated by non-exporters and, as already mentioned, is large in terms of the number of firms. The dominant pattern found across industries is one of a very large number of exporters with very high export intensity and a more or less evenly spread number of firms in all the other firm groupings. This pattern is discernible for a number of important industries in Austria such as machinery and equipment (NACE 29) or the motor vehicle industry (NACE 34), the chemical industry (NACE 24), the radio, TV, communication industry (NACE 32), the basic metals industry (NACE 27), the textile industry (NACE 17) and some more. How can we explain this pattern? The fact that the share of exporters is relatively high may be attributed to the fact that Austria is a small open economy. The more interesting aspect though is the concentration in the group of the very high intensity exporters. This we suppose has to do with the fact that Austria has a relatively large share of intra-EU exports (about 70%) which means that trade costs (apart from transport costs perhaps) are very similar for the different export markets. In other words, if a firm finds it profitable to export to country A, it is most likely to find it profitable to export to market B as well because of similar trade costs involved. Comparative advantages cannot fully explain the high number of exporters with very high export intensity because the industries which show this high export intensity pattern include both industries with comparative advantages as well as comparative disadvantages (as revealed by Austria’s trade statistics).8 One factor that we cannot take into account for the lack of information is the impact of foreign direct investment (FDI) and foreign ownership on firms’ export intensities. If foreign firms set up
8 The pattern would be consistent with the expected situation in comparative advantage industries in an environment with
low trading costs. Resource reallocations induced by trade towards most productive firms are strongest in comparative advantage industries which lead to a situation where the domestic cut-off productivity level and the export productivity level move closer together, resulting in a high number of exporters (Bernard et al., 2007).

11
subsidiaries in Austria, these firms are supposed to be, on average, the most productive ones (Helpman et al., 2004). Table 4
Firm export intensities, 2006, relative shares within group of exporting firms
NACE Marginal Low to medium High Very high
15 Food and beverages 34.4 36.5 13.8 15.3 16 Tobacco products 0.0 100.0 0.0 0.0 17 Textiles 5.7 17.1 18.7 58.5 18 Wearing apparel 4.8 35.5 22.6 37.1 19 Leather 15.0 10.0 5.0 70.0 20 Wood 17.5 28.9 16.9 36.7 21 Pulp and paper 9.3 18.7 14.7 57.3 22 Publishing and printing 47.0 39.0 6.0 8.0 23 Refined petroleum 0.0 50.0 50.0 0.0 24 Chemicals 7.0 22.8 13.2 57.0 25 Rubber and plastic products 6.5 29.0 17.0 47.5 26 Non-metallic mineral products 23.6 41.4 10.0 25.0 27 Basic metals 3.3 10.9 12.0 73.9 28 Fabricated metal products 25.7 34.9 13.7 25.7 29 Machinery and equipment 8.9 17.4 12.0 61.7 30 Office machinery and computers 0.0 0.0 0.0 100.0 31 Electrical machinery 7.8 24.1 10.3 57.8 32 Radio, TV, communication 4.4 15.2 17.4 63.0 33 Precision & optical instruments 15.9 15.1 12.7 56.4 34 Motor vehicles 12.2 17.1 9.8 61.0 35 Other transport equipment 5.6 16.7 16.7 61.1 36 Manufactures n.e.c. 21.5 36.4 15.6 26.5 37 Recycling 4.8 14.3 9.5 71.4 15-37 Total manufacturing 19.3 28.5 13.3 38.8
Note: Export intensities are defined as follows: non-exporters= ‘none’; >0%-5% of turnover exported = ‘marginal’; >5% - 30% of turnover exported = ‘low to medium’; >30%-50% of turnover exported = ‘high’; >50% of turnover exported = ‘very high’
5 Export concentration
Despite the high export intensity of Austrian manufacturing firms that implies a large number of firms engaged in some exporting activity, it is nevertheless a rather small number of firms that account for the bulk of total exports. Lacking precise information on actual export sales of firms, we had to make assumptions about these export sales. We used information on firms’ membership to the export intensity groups (non-exporter, marginal, low-to-medium, large and very large export intensity) and assumed that each exporter belonging to a particular group exports the average percentage of the upper and lower bound of the respective group. For example, each marginal exporter – which we know exports between 0% and 5% of its sales – is assumed to export 2.5% of its total sales and likewise for all other groups of firms.9 9 Calculations based on the upper and the lower bound of the bandwidth of the respective groups instead of averages
only yield marginal differences. A better account of the export concentration could only be achieved by using the shares of exports in total sales which is not available to us.

12
Figure 3 Export concentration in the Austrian manufacturing sector, 2006
0
10
20
30
40
50
60
70
80
90
100
0 10 20 30 40 50 60 70 80 90 100Percentage of firms (ranked by export sales)
Perc
enta
ge o
f exp
orts
42%
74%
87%
Using this assumption we derived a proxy of Austrian manufacturing firms’ export sales. We then rank firms by these export sales to arrive at the cumulative distribution function of aggregate manufacturing exports and calculate the export concentration in the manufacturing sector. The graph of the cumulative distribution function of exports (Figure 3) displays a steep increase at the beginning (exporters are ordered by export sales) and we find that the largest 1% of firms account for no less than 42% of exports in 2006. Moreover, the largest 5% and 10% make up 74% and 87% of total exports respectively.10 6 Export premium
6.1 Empirical strategy
Let us now turn to the question to which extent exporting firms differ from non-exporters. In our empirical strategy we closely follow the approach first employed by Bernard and Jensen (1999) which has since then been used intensively in empirical work on firm heterogeneity and trade. The basic idea is to regress a size or performance measure such as sales or labour productivity, in logarithmic form, on the export status represented by a dummy variable (ES) that takes the value 1 for exporting firms and 0 for non-exporters. At the level of manufacturing this regression – which we estimate by ordinary least squares (OLS) – takes the form
εδγβαι +⋅+⋅+⋅+⋅= YEARINDESY INDln (1)
where ES is a NTx1 matrix and β is the corresponding coefficient indicating the size of the export premium. The regression includes a set of dummy variables for individual industries, 10 In the calculation of the percentiles non-exporters are included.

13
IND, and time fixed-effect year dummies, YEAR, as controls. These dummies are included to control for the fact that the average firm is bigger and more productive in some sectors than in others and the business cycle respectively. YEAR is a NTxT dimensional matrix and δ the corresponding vector of coefficients for the time fixed effects with dimension Tx1. IND is a matrix with dimension NT x k where k indicates the number of industries and γ IND is the corresponding vector of coefficients with dimension kx1. Finally, ε is an NTx1 vector containing the error terms. As dependent variable we use alternatively the logarithm of different size and performance measures which are summarized by the NTx1 matrix ln Y. The variables are firm sales, employment, the wage sum, total investment as size indicators and labour productivity, wage per employee, investment intensity as performance indicators. We are interested in the coefficient of the export status dummy β which can be interpreted as the export premium. Since the self selection process into exporting suggests that exporters are larger and better performing than non-exporters we expect β to have a positive sign. In the analysis we distinguish 13 industries, so k=13, as we aggregate the 23 NACE 2-digit industries used in section 4 up to 13 NACE subsections. The reason for this is that we estimate equation (1) both at the level of manufacturing and at the level of individual industries which would be problematic for very small industries. We also drop two industries, the leather industry (NACE 19) and the refined petroleum industry (NACE 23) due to the small number of firms in these industries and uneasiness about merging them with other industries. Also, we left the medical, precision and optical instruments industry (NACE 33) separated and did not merge it with NACE industries 30, 31 and 32 to form NACE subsection DL as this industry includes a sufficient number of observations and is an important high-tech industry. The industries (or subsectors) are shown in Annex 2. The two eliminated industries are also excluded when we estimate the export premium at the manufacturing level. When estimating the export premia at the individual industry level, the regression equation is essentially the same but of course the industry dummies are absent.
εδβαι +⋅+⋅+⋅= YEARESYln
Further, in addition to the binary export status variable, we also use a similar regression specification that includes the export intensities, EXTINT, of firms introduced in the previous section. The export intensities are included as a set of dummy variables, where we use the group of non-exporters as the reference group. The expectation is that the coefficients on these export intensities are all positive and increasing, i.e. firms with higher export intensity also exhibit a larger size or performance premia. This specification takes the form
εδγβαι +⋅+⋅+⋅+⋅= YEARINDEXINTY INDln (1’)
Note that there are now four coefficients for the export premium to be estimated, one for each of the export intensity categories. These coefficients are summarized in the vector β which has dimension 4x1. Again, we estimate this regression at the total manufacturing

14
level and at the level of the 13 individual industries. In the latter case the specification takes the form
εδβαι +⋅+⋅+⋅= YEAREXINTYln
6.2 The export premia at the level of total manufacturing
The results for the export premia are provided in Table 5 for all size and performance measures. All results refer to the period 2002- 2006. The number of firm-year observations varies between 28,253 and 29,854 depending on the size or performance measure used as dependent variable. As expected we find the coefficient on the export premium being positive. The coefficients are also statistically significant at the 1% level for all size measures. Since we use a semi-log specification we have to transform our coefficient estimates in order to interpret them as a performance premium for exporters with respect to non-exporters in the estimated dependent variable11. The results suggest that exporters are larger than non-exporters by a factor of 3.89 in terms of sales and by a factor of 4.17 in terms of investment. The size premium is considerably lower for employment (factor 2.30). In general, the export premium is much larger for the size measures than for labour productivity and the other performance measures (wages and investment intensity). For example, exporters are more productive than their purely domestic peers by a factor of 1.7, or, put differently exporters are 70% more productive than non-exporters.12 The relative magnitudes of the performance premia are interesting in themselves. For example, the (labour) productivity premium by far exceeds the wage premium of exporters, which might indicate that exporters pass on smaller shares of their productivity advantage to their employees. The higher labour productivity could be the result of a more skilled workforce employed by exporter (a characteristic of which we have no information to control for) and therefore not entirely due to the export status. Indeed, if we assume investment-skill complementarities, the relatively high export premium found for investment intensity could suggest that the workforce of exporting firms is more skilled than those of non-exporters. Consequently, the wage premium would suffer from an upward bias due to omitted variables (i.e. the skill levels). The results confirm the descriptive statistics of the firm sample discussed at length in Pöschl et al. (2009) as well as the estimated export premia which include all NACE divisions (15-37) in the manufacturing sector.13 11 We do this by simply making the estimated coefficient of EXP (size premium of the exporting firm) the exponent of e.
This retrieves a variable we can interpret in the usual way. 12 Following the convention in the literature we refer to the export premium as the factor by which exporters’ sales,
productivity etc. exceed non-exporters’ corresponding values instead of the advantage of exporters in terms of the percentage of non-exporters values.
13 In fact, the export premia reported here are slightly higher than those found in Pöschl et al. (2009), mainly because of the lower number of industry dummies included. These are, however, considerably lower than in the specification without industry dummies.

15
Table 5
Export premium for Austrian manufacturing firms, 2002-2006 (OLS) – manufacturing total
(1) (2) (3) (4) (5) (6) (7) sales wage sum employment investment labour
productivity wage investment
intensity
ES1 1.358 *** 1.048 *** 0.833 *** 1.427 *** 0.533 *** 0.215 *** 0.585 *** (84.035) (74.545) (69.307) (60.316) (65.397) (53.883) (32.001) (0.000) (0.000) (0.000) (0.000) (0.000) (0.000) (0.000)
F 1046.28 982.491 698.263 508.031 766.836 1183.952 156.949R2 0.349 0.338 0.272 0.219 0.282 0.389 0.086R2-adj 0.348 0.338 0.271 0.218 0.282 0.388 0.085Obs. 29854 29844 29841 28261 29828 29833 28253
implied export premium 3.888 2.852 2.300 4.166 1.704 1.240 1.795
All regressions use a full set of industry dummies and time fixed effects. Coefficients of the constant, industry dummies and year fixed effects are not shown; t-values and p-values are shown below the respective coefficient. *** indicates significance at the 1% level, ** indicates significance at the 5% level, * indicates significance at the 10% level. The implied export premium is retrieved by making the coefficient of the export premium the exponent of e.
Table 6
Export premium by export intensity for Austrian manufacturing firms, 2002-2006 (OLS) – manufacturing total
(1) (2) (3) (4) (5) (6) (7) sales wage sum employment investment labour
productivity wage investment
intensity
EXINT1 0.699 *** 0.534 *** 0.409 *** 0.739 *** 0.299 *** 0.125 *** 0.331 *** (29.808) (25.383) (22.944) (20.763) (24.704) (20.050) (11.401) (0.000) (0.000) (0.000) (0.000) (0.000) (0.000) (0.000)
EXINT2 1.069 *** 0.823 *** 0.636 *** 1.116 *** 0.432 *** 0.187 *** 0.47 *** (50.511) (44.182) (39.695) (36.360) (41.239) (35.795) (19.566) (0.000) (0.000) (0.000) (0.000) (0.000) (0.000) (0.000)
EXINT3 1.502 *** 1.128 *** 0.889 *** 1.567 *** 0.607 *** 0.239 *** 0.666 *** (49.040) (41.839) (37.676) (35.707) (40.666) (34.640) (20.239) (0.000) (0.000) (0.000) (0.000) (0.000) (0.000) (0.000)
EXINT4 2.107 *** 1.646 *** 1.343 *** 2.218 *** 0.786 *** 0.304 *** 0.866 *** (89.463) (79.236) (73.011) (67.433) (72.047) (58.893) (36.410) (0.000) (0.000) (0.000) (0.000) (0.000) (0.000) (0.000)
F 1061.91 968.507 687.013 518.584 743.526 1076.031 157.52R2 0.415 0.393 0.329 0.263 0.32 0.405 0.097R2-adj 0.415 0.392 0.329 0.262 0.319 0.404 0.097Obs. 29854 29844 29841 28261 29828 29833 28253
implied export premium EXINT1 2.012 1.706 1.505 2.094 1.349 1.133 1.392EXINT2 2.912 2.277 1.889 3.053 1.540 1.206 1.600EXINT3 4.491 3.089 2.433 4.792 1.835 1.270 1.946EXINT4 8.224 5.186 3.831 9.189 2.195 1.355 2.377
All regressions use a full set of industry dummies and time fixed effects. Coefficients of the constant, industry dummies and year fixed effects are not shown; t-values and p-values are shown below the respective coefficient. *** indicates significance at the 1% level, ** indicates significance at the 5% level, * indicates significance at the 10% level. The implied export premium is retrieved by making the coefficient of the export premium the exponent of e.

16
The existence of the export premium is confirmed if we replace the simple export status variable by dummy variables categorizing the export intensities described above. The results for these regressions are summarized in Table 6. The resulting pattern is clear: the export premia of all size and performance measures increase with the export intensity. All coefficients remain statistically significant and there is no single deviation from the pattern of the export premium increasing with export intensity. For example, the results suggest that labour productivity of marginal exporters is 35% higher than that of non-exporters and that this labour productivity premium increases to 120% (implying a factor of 2.2) for firms with a very high export intensity. 6.3 The export premia at the level of individual industries
In a next step, we estimate the export premium separately for each of the industries described above. This is motivated by the fact that despite the industry dummies included in the pooled regression over all industries, the single estimated coefficient hides potential differences in the export premia across different industries. The OLS estimates in the overwhelming majority of cases remain statistically significant, most of them even at the 1% level. The sole exceptions are the employment premium and the premium for the wage sum in the chemical industry (NACE subsector DG) and the labour productivity premium in the transport industry (NACE subsector DM) (Table 7). However, as one can see there is a wide variation in the export premia across industries. In case of the size measures, the largest premia are found in the food, beverages and tobacco industry (NACE DA) and the electrical and the medical, precision and optical instruments industry (NACE 33), while the smallest premia are reported for the chemical industry (NACE DG) where the wage sum premium and the employment premium are not statistically significant and the rubber and plastics industry (DH). With respect to our performance measures, the food, beverages and tobacco industry (NACE DA) and the electrical and the medical, precision and optical instruments industry (NACE 33) are again those with the largest export premia while the smallest export premia are found in the mineral products industry (NACE DI). Figure 4 presents some of the export premia graphically. It confirms that also at the level of individual industries, the employment premium, the lowest among the size measures, exceeds by far the productivity and the wage premium (except for food products, beverages and tobacco, DA).14 Moreover, the productivity premium is much higher than the wage premium of exporting firms, confirming the result at the level of total manufacturing.
14 The sole exception to this is the productivity premium in the food, beverages and tobacco industry (NACE DA) and the
chemical industry (NACE DG) which is higher than the employment premium.
17
Table 7
Export premium for Austrian manufacturing firms, 2002-2006 (OLS) – individual industries
D DA DB DD DE DG DH DI DJ DK DL 30-32
DL 33
DM DN
size premium sales 3.89 8.22 3.83 3.48 2.92 1.92 2.10 2.66 3.72 2.82 3.76 4.12 3.70 3.05wage sum 2.85 4.03 2.80 2.23 2.25 1.95 2.62 3.08 2.28 3.08 3.20 3.27 2.68employment 2.30 2.70 2.14 1.95 1.99 1.72 2.38 2.55 2.00 2.71 2.20 2.97 2.19investment 4.17 8.68 3.30 3.75 3.03 2.03 2.30 3.06 4.16 2.66 5.09 6.06 5.13 2.83
productivity premium productivity 1.70 3.17 1.83 1.80 1.45 1.63 1.18 1.10 1.44 1.37 1.36 2.01 1.41wage premium 1.24 1.49 1.31 1.15 1.13 1.08 1.13 1.08 1.20 1.15 1.14 1.46 1.10 1.23investment intensity 1.79 3.23 1.57 1.91 1.52 1.74 1.40 1.26 1.59 1.32 1.85 2.77 1.77 1.28
All regressions use a full set of time fixed effects. The export premia shown are significant at least at the 5% level. Missing numbers indicate that the estimated coefficient is not statistically significant at the 10% level.
Figure 4
Export premium for Austrian manufacturing firms, 2002-2006 (OLS) – individual industries
1
1.5
2
2.5
3
3.5
total 15 17 20 22 24 25 26 27 29 30 33 34 36
employment premiumproductivity premiumwage premium
All regressions use a full set of time fixed effects. The export premia shown are significant at least at the 5% level. Missing bars indicate that the estimated coefficient is not statistically significant at the 10% level.
As for total manufacturing, we also look at the export premium for firms with different export intensities at the industry level. Table 8 shows the estimation results for two of these measures, sales and labour productivity. The picture does not change dramatically: Most export premia are statistically significant even at the industry level and the export premia are again increasing with the share of export sales in total sales, i.e. with export intensity. There are, however, some interesting aspects emerging from Table 8. While in most industries even the marginal exporters are significantly larger (in terms of sales) and more productive there are exceptions to this. For example, in the rubber and plastics industry (DH) marginal exporters are not statistically different from non-exporters in terms of size

18
and labour productivity. With regards to labour productivity even firms with low-to-medium export intensity are not statistically more productive than non-exporters. A similar situation prevails in the machinery and equipment industry (DK). This result implies that in some industries there is a clear distinction in size and performance between exporting and non-exporting firms while in other industries the dividing line is not so much between exports and non-exporters but between firms with high export intensity and other firms.
19
Table 8
Export premium for Austrian manufacturing firms, 2002-2006, by export intensity (OLS) – individual industries
Sales premium All DA DB DD DE DG DH DI DJ DK DL30-32
DL33
DM DN
EXTINT1 0.699 *** 1.54 *** 0.15 0.507 *** 0.564 *** -0.822 *** -0.171 0.505 *** 0.426 *** 0.139 0.17 0.703 *** -0.309 0.58 *** 29.808 24.310 1.086 6.417 9.604 -2.831 -1.475 4.327 9.845 1.462 1.180 5.660 -0.917 12.627 0.000 0.000 0.278 0.000 0.000 0.005 0.140 0.000 0.000 0.144 0.238 0.000 0.360 0.000
EXTINT2 1.069 *** 2.236 *** 0.778 *** 0.971 *** 0.822 *** 0.153 0.183 * 0.851 *** 0.816 *** 0.388 *** 0.762 *** 0.425 *** 0.323 0.907 *** 50.511 37.746 6.720 16.389 12.830 0.695 1.830 10.809 18.475 4.840 6.078 4.149 1.097 17.790 0.000 0.000 0.000 0.000 0.000 0.487 0.068 0.000 0.000 0.000 0.000 0.000 0.273 0.000
EXTINT3 1.502 *** 2.744 *** 1.169 *** 1.263 *** 1.514 *** 0.594 ** 0.94 *** 1.523 *** 1.304 *** 0.727 *** 0.967 *** 1.029 *** 0.716 ** 1.281 *** 49.040 30.209 9.863 15.804 12.040 2.377 6.973 9.208 19.466 8.580 5.283 6.828 2.166 13.668 0.000 0.000 0.000 0.000 0.000 0.018 0.000 0.000 0.000 0.000 0.000 0.000 0.031 0.000
EXTINT4 2.107 *** 2.62 *** 1.786 *** 1.805 *** 2.465 *** 1.09 *** 1.19 *** 1.378 *** 2.335 *** 1.455 *** 1.811 *** 2.068 *** 1.933 *** 1.752 *** 89.463 24.382 17.286 26.049 24.181 5.236 11.942 11.063 46.187 19.777 16.866 24.140 6.813 22.286 0.000 0.000 0.000 0.000 0.000 0.000 0.000 0.000 0.000 0.000 0.000 0.000 0.000 0.000
F 1061.91 399.857 46.652 125.381 89.642 13.88 35.785 33.581 308.469 89.755 43.594 75.983 23.609 124.599 R2 0.415 0.433 0.224 0.295 0.276 0.168 0.187 0.151 0.374 0.22 0.239 0.395 0.246 0.273 R2-adj 0.415 0.432 0.219 0.293 0.273 0.156 0.181 0.147 0.373 0.217 0.233 0.39 0.234 0.272 Obs. 29854 5992 1187 2760 2516 578 1081 1684 5233 2574 957 1070 503 3719
implied export premium EXTINT1 2.01 4.66 1.66 1.76 0.44 1.66 1.53 2.02 1.79 EXTINT2 2.91 9.36 2.18 2.64 2.28 1.20 2.34 2.26 1.47 2.14 1.53 2.48 EXTINT3 4.49 15.55 3.22 3.54 4.54 1.81 2.56 4.59 3.68 2.07 2.63 2.80 2.05 3.60 EXTINT4 8.22 13.74 5.97 6.08 11.76 2.97 3.29 3.97 10.33 4.28 6.12 7.91 6.91 5.77
Table 8 continued

20
Table 8 (continued)
Labour productivity premium All DA DB DD DE DG DH DI DJ DK DL
30-32 DL
33 DM DN
EXTINT1 0.299 *** 0.846 *** 0.194 ** 0.173 *** 0.237 *** -0.145 -0.05 -0.012 0.073 *** -0.069 -0.025 0.284 *** -0.275 0.16 *** 24.704 23.925 2.103 4.609 7.877 -0.871 -0.898 -0.259 3.420 -1.634 -0.402 4.943 -1.395 7.724 0.000 0.000 0.036 0.000 0.000 0.384 0.369 0.796 0.001 0.102 0.688 0.000 0.164 0.000
EXTINT2 0.432 *** 1.206 *** 0.372 *** 0.391 *** 0.303 *** 0.071 -0.027 0.144 *** 0.228 *** 0.107 *** 0.112 ** 0.326 *** -0.051 0.244 *** 41.239 38.591 5.714 14.105 10.498 0.763 -0.588 3.723 11.920 2.896 1.970 6.604 -0.266 10.924 0.000 0.000 0.000 0.000 0.000 0.446 0.557 0.000 0.000 0.004 0.049 0.000 0.790 0.000
EXTINT3 0.607 *** 1.521 *** 0.478 *** 0.674 *** 0.452 *** 0.377 *** 0.248 *** 0.215 *** 0.383 *** 0.245 *** 0.19 *** 0.667 *** 0.276 0.392 *** 40.666 32.327 7.479 16.215 10.859 3.650 4.102 4.792 11.515 5.995 2.655 9.046 1.310 10.068 0.000 0.000 0.000 0.000 0.000 0.000 0.000 0.000 0.000 0.000 0.008 0.000 0.191 0.000
EXTINT4 0.786 *** 1.454 *** 0.802 *** 0.895 *** 0.748 *** 0.789 *** 0.304 *** 0.069 0.671 *** 0.455 *** 0.467 *** 0.964 *** 0.354 * 0.609 *** 72.047 31.223 14.991 30.002 16.784 7.891 6.850 1.530 28.932 14.052 9.012 27.733 1.907 18.828 0.000 0.000 0.000 0.000 0.000 0.000 0.000 0.126 0.000 0.000 0.000 0.000 0.057 0.000
F 743.526 449.026 34.535 141.078 49.903 17.687 18.552 5.849 122.778 67.41 24.531 100.246 13.801 66.455 R2 0.32 0.414 0.198 0.315 0.146 0.192 0.113 0.021 0.193 0.171 0.167 0.435 0.097 0.165 R2-adj 0.319 0.413 0.193 0.313 0.143 0.18 0.106 0.016 0.192 0.168 0.16 0.431 0.082 0.163 Obs. 29828 5991 1185 2757 2515 578 1079 1681 5227 2572 957 1068 503 3715
implied export premium EXTINT1 1.35 2.33 1.21 1.19 1.27 0.87 1.08 1.33 1.17 EXTINT2 1.54 3.34 1.45 1.48 1.35 1.07 1.15 1.26 1.11 1.12 1.39 1.28 EXTINT3 1.83 4.58 1.61 1.96 1.57 1.46 1.28 1.24 1.47 1.28 1.21 1.95 1.48 EXTINT4 2.19 4.28 2.23 2.45 2.11 2.20 1.36 1.07 1.96 1.58 1.60 2.62 1.42 1.84
All regressions use a full set of time fixed effects. Coefficients of the constant and year fixed effects are not shown; t-values and p-values are shown below the respective coefficient. *** indicates significance at the 1% level, ** indicates significance at the 5% level, * indicates significance at the 10% level. The implied export premium is retrieved by making the coefficient of the export premium the exponent of e.

21
6.4 The export premia – controlling for additional firm characteristics
We now return to the level of manufacturing and re-estimate the export premia but this time controlling for additional firm characteristics. The reason for this is that the estimation of the export premia according to (1) may suffer from omitted variable bias. The variation in firms’ sale or labour productivity due to other factors such as investment in new technologies for example remains in the residuals. To the extent that investment in new technologies is also correlated with the export status variable, the latter suffers from an (upward) bias. In order to capture at least some of the potential bias in the estimates of the export premia we introduce employment to control for size and three technology-related variables. These are software investment per employee, R&D expenditure per employee, both in logs, and finally the share of R&D employees in total employees. These additional control variables are summarized in the X matrix in equation (2). The corresponding coefficients are denoted by φ .
εφδγβαι +⋅+⋅+⋅+⋅+⋅= XYEARINDESY INDln (2)
Table 9
Export premium for Austrian manufacturing firms, 2002-2006, including control variables (OLS) – manufacturing total
without constant sales labour productivity wages
software/employee 0.043 *** 0.043 *** 0.017 *** 6.566 6.759 6.162 0 0 0 R&D/employee 0.115 *** 0.116 *** 0.042 *** 12.219 12.795 8.729 0 0 0 share R&D personnel -0.273 -0.158 0.078 -1.291 -0.76 0.737 0.197 0.447 0.461 employment 1.086 *** 0.085 *** 0.068 *** 117.212 9.436 17.249 0 0 0 ES1 0.157 *** 0.161 *** 0.074 *** 3.866 3.98 4.438 0 0 0
F-tets 1058.245 52.704 83.665 R2 0.874 0.24 0.309 R2-adj 0.874 0.236 0.305 Obs. 3667 3667 3666
implied export premium 1.170 1.175 1.077
All regressions use a full set of industry dummies and time fixed effects. Coefficients of the constant, industry dummies and year fixed effects are not shown; t-values and p-values are shown below the respective coefficient. *** indicates significance at the 1% level, ** indicates significance at the 5% level, * indicates significance at the 10% level. The implied export premium is retrieved by making the coefficient of the export premium the exponent of e.

22
Table 9 shows the estimation result for sales, labour productivity and wages. A major result is that the export premium remains statistically significant. The results, however, show that the export premia are considerably smaller than in the specification without control variables. For example, the implied size premium of exporters in terms of sales is now of a factor 1.17 implying that exporters are 17% larger than non-exporters. The result on the sales premium – a size measure - is interesting because the explanatory variable includes another size measure, employment, and the export premium is still statistically significant. With respect to the control variables, these all turn out to be highly significant with the exception of the share of R&D personnel. Turning to the performance measures – labour productivity and wages – we find that these are also much lower than in the specification without control variables. Exporters are 17.5% more productive than non-exporters and they pay about 8% higher wages.15 The considerable reduction of the magnitudes of the export premia indicates that the additional control variables capture a good deal of the omitted variable bias. We therefore prefer these results over the more parsimonious OLS-specifications that only include year and industry dummies as control variables. Also, the size of the estimated export premia appears to be more plausible. 6.5 Changing the estimation technique: a random effects model
The panel structure of our data set allows us to apply panel estimation techniques. So far we have made use of the panel structure only by adding time fixed effects which have been included in all the estimations. We refer to these as ‘pooled model’ because of the absence of firm effects. Now we use a random effects estimator which implies that we assume a firm-specific error-component. The estimation results are shown in Table 10. In the firm random effects model the export premium for all our size and performance measures is statistically significant. The coefficients are comparable in magnitude with the results from the OLS-estimates including additional control variables. For example, the implied sales premium of exporters is 1.175 which is very close to the factor 1.170 reported in Table 9 above. Similarly, the random effects model finds exporters to be 18.5% more productive than non-exporters compared to 17.5% in the pooled model with control variables. The estimates are also comparable for the wage measure where the random effects model suggests a wage premium of factor 1.087, i.e. exporters pay 8.7% higher wages than non-exporters.
15 In contrast to other country studies we estimate the export premium for different dependent variables with the same set
of control variables instead of changing it for each of the independent variables (e.g. Greenaway and Kneller, 2004). This means that only a subset of our seven size and performance measures make sense while employment, the two investment measures and the wage sum are either impossible to estimate or to closely related to the explanatory variables included.

23
Table 10
Export premium for Austrian manufacturing firms, 2002-2006, including firm random effects (RE) – manufacturing total
Random Effects specification
sales wage sum employment investment labour productivity
wages investment intensity
ES1 0.161 *** 0.118 *** 0.090 *** 0.774 *** 0.170 *** 0.083 *** 0.417 *** 17.914 15.516 14.534 26.771 18.502 19.250 18.013 0.000 0.000 0.000 0.000 0.000 0.000 0.000
sigma_u 1.192 1.046 0.909 1.4 1.182 0.270 0.884sigma_e 0.236 0.2 0.162 1.019 0.241 0.139 1.014R2-overall 0.228 0.238 0.177 0.203 0.237 0.365 0.083R2-between 0.219 0.226 0.166 0.24 0.232 0.382 0.121R2-within 0.037 0.049 0.001 0 0.033 0.091 0.001Obs. 29854 29844 29841 28261 29836 29833 28253Nb of groups 8061 8053 8052 7848 8051 8046 7842
implied export premium
1.175 1.125 1.094 2.168 1.185 1.087 1.517
All regressions use a full set of firm random effects and time fixed effects. Coefficients of the constant, firm and year fixed effects are not shown; t-values and p-values are shown below the respective coefficient. *** indicates significance at the 1% level, ** indicates significance at the 5% level, * indicates significance at the 10% level. The implied export premium is retrieved by making the coefficient of the export premium the exponent of e.
While the results are very reassuring, a simple Hausman test suggests that a fixed effects model is to be preferred over a random effects model because of the latter lacking consistency. 6.6 Changing the hypothesis: a fixed effects model
Given the result of the Hausman test we could try to re-estimate again the export premia, this time including firm fixed effects. Because of the time fixed effects already incorporated we end up having a two-way fixed effects model which takes the form:
υδµβια µ +⋅+⋅+⋅+⋅= YEARZESYln (3)
where µZ is a large NT x N matrix with firm fixed effects and µµ is the corresponding
vector of coefficients with dimension N, the number of firms. The NT x 1 vector υ contains the error terms. All other variables are as before. In particular β remains the main variable of interest, although – as will be seen – its interpretation changes. This strategy however implies that we do not only change the estimator but also the hypothesis to be tested. With the fixed effects estimator only variations within firms are exploited so that our parameter of interest, β, only captures the difference in the dependent variable due to within firm changes in the export status over time. Thus, the way to interpret the estimated coefficient of the export status dummy variable is now different. It does no

24
longer indicate by how much exporters are larger or better performing than non-exporters; instead, it indicates by how much, on average, firms that switch from being a non-exporter to being an exporter (or vice versa) are larger or better performing in periods when they are exporters.16 The results for the fixed effects regression are summarized in Table 11. Table 11
Estimation results with firm fixed effects, simple export status (total manufacturing, 2002-2006)
sales wage sum
employ-ment
invest-ment
labour produc-
tivity
wage per employee
invest-ment
intensity
ES1 0.044 *** 0.032 *** 0.029 *** -0.001 0.017 ** 0.003 -0.032 4.892 4.197 4.676 -0.032 2.176 0.557 -0.807 0.000 0.000 0.000 0.974 0.030 0.578 0.420
F-test 240.587 294.695 21.026 10.251 219.313 490.170 10.204R2-overall 0.049 0.031 0.133 0.000 0.027 0.017 0.002R2-between 0.041 0.020 0.124 0.008 0.036 0.004 0.032R2-within 0.052 0.063 0.005 0.003 0.048 0.101 0.002Test for poolability 114.215 124.491 135.426 9.151 32.300 20.334 4.079Obs. 29854 29844 29841 28261 29828 29833 28253Nb of groups 8061 8053 8052 7848 8045 8046 7842
implied export premium 1.0450 1.0325 1.0294 1.0171
All regressions use a full set of firm and time fixed effects. Coefficients of the constant, firm and year fixed effects are not shown; t-values and p-values are shown below the respective coefficient.*** indicates significance at the 1% level, ** indicates significance at the 5% level, * indicates significance at the 10% level. The implied export premium is retrieved by making the coefficient of the export premium the exponent of e.
Table 11 shows that in the fixed effects model the export status coefficient is statistically significant in only four out of our seven measures. These are mainly the size measures (sales, wage sum and employment) but also labour productivity. In contrast, the coefficient of the export status dummy is not statistically significant for the investment measures and wages. Moreover, the magnitude of the estimated coefficients becomes rather small. The implied premium in terms of sales for example, is now only of a factor 1.045. But this is not to be interpreted as a premium that exporters enjoy over non-exporters. It rather indicates that, on average, switchers have 4.5% higher sales in periods where they are exporting than in periods where they are not exporting.17 For the productivity measure, this premium is only
16 This interpretation of the coefficient of the export dummy variable differs from that offered in the cross-country study by
ISGEP (2008). There the estimated coefficients of the export dummy variable is interpreted as the export premium, similar to a pooled specification without firm fixed effects.
17 When controlling for firm-fixed effects, the export status variable does not add any information for those firms that are either always exporting or never exporting. In these cases the export status is included in the fixed effect because it

25
1.7%. While these coefficients appear to be miniscule in comparison to the results from the previous specifications one has to bear in mind the difference in interpretation. The result that switching firms are significantly larger and more productive in periods of exporting even if only to a limited extent, in our view, gives additional support to the existence of an export premium. It is all the more remarkable as the number of switching firms that drive this result is not too large. Only 6.3% of the firms-year observations where firms initially did not export are switches to exporting while among exporters 4.2% of the observations are switches to non-exporting (Table 12). In total just 5.1% of the firms are export switchers. Table 12
Exporting, non-exporting and switching firms (transition matrix)
non-exporters switchers (to exporting)
obs total
no. of obs 8,963 601 9,564 in % of total 93.72 6.28 100 switchers
(to non-exporting) exporters obs total
no. of obs 514 11,710 12,224 in % of total 4.2 95.8 100
obs total no. of obs 9,477 12,311 21,788 in % of total 43.5 56.5 100
switchers total no. of obs 1,115 in % of total 5.1
7 The probability of exporting
Given the regression results so far it is safe to conclude that exporting coincides with larger size and better performance of firms. This correlation does not imply a causality running from exporting to firm size or performance just because we chose the latter to be the dependent variables and the export status to be the explanatory variable in our regression model. One way to approach the issue of causality is to switch from a linear regression model to a probit model and use the export status as the dependent variable. In order to study whether firm characteristics increase the probability of a firm being an exporter we take the (one period) lagged values of the explanatory variables which include firm characteristics such as employment and productivity. The probit model allows us to include a series of explanatory variables and evaluate their impact on the probability that a firm exports.
does not change over time. Note, however, that other studies which also report a fixed effect model in the context of export status estimation give the ‘classical’ export premium interpretation to the results (see ISGEP, 2008).

26
It takes the form:
( )ω⋅Φ== XXES )1Pr( (4)
where ( )⋅Φ is the standard normal cumulative distribution function and the matrix X contains all explanatory variables and ω is the corresponding vector of coefficients. In addition to the variables reported in Table 13 the matrix X also includes industry dummies and regional dummies for the nine Austrian regions (Bundesländer). In order to investigate the question weather firms self-select themselves into exporting, meaning they export because they are larger and more productive we include the explanatory variables in lagged form. Table 13
Results from probit estimation – total manufacturing, 2002-2006
Marginal effects from probit estimation
Explanatory variable (1) (2) (3) (4) (5) (6) (7) labour productivityt-1 0.359 *** 0.268 *** 0.166 *** 0.131 ***
53.451 38.252 16.882 12.944 0.000 0.000 0.000 0.000
employmentt-1 0.244 *** 0.192 *** 0.113 *** 0.091 *** 52.856 39.061 16.417 12.624 0.000 0.000 0.000 0.000 ESt-1 0.860 *** 0.857 *** 0.847 *** 0.847 *** 96.716 96.322 92.218 92.312 0.000 0.000 0.000 0.000 labour productivityt 0.135 ***
13.487 0.000
employmentt 0.091 *** 12.585 0.000
pseudo-R2 0.279 0.283 0.338 0.73 0.73 0.736 0.737 Obs. 21625 21629 21625 21625 21629 21625 21624
observed P 0.566 0.566 0.566 0.566 0.566 0.566 0.566 predicted P 0.592 0.611 0.610 0.627 0.638 0.637 0.637
Results from probit regression. All regressions use a full set of industry dummies and region dummies for the Austrian provinces. Coefficients of the constant, year fixed effects, industry and region dummies are not shown; t-values and p-values are shown below the respective coefficient.*** indicates significance at the 1% level, ** indicates significance at the 5% level, * indicates significance at the 10% level. Marginal effects evaluated at the mean of independent variables, except for the (lagged) export status where the marginal effect is the change in probability from a discrete change in this binary variable.
We report the marginal effects, evaluated at the mean of the explanatory variables in Table 13. The result suggests that both labour productivity (performance measure) and employment (size measure) significantly increase the probability of exporting. Also the individual effect of these firm characteristics is smaller when they enter the probit model simultaneously. In this case an infinitesimal increase in productivity and employment induce a change in export probability of 27% and 19% respectively (specification 3). The most striking result from the probit estimation, however, is the significant and very large

27
impact of the previous export status. Being an exporter in the previous period increases the probability of exporting by 85% in our preferred model which also includes labour productivity and employment (specification 6 in Table 13). The impact is very robust across all specifications. This is evidence for a strong persistence effect of exporting. These findings are in line with the result of Greenaway and Kneller (2004) for the United Kingdom and the relatively low number of export switchers in our firm sample. The inclusion of the lagged export status also further reduces the marginal effects of productivity and employment but their coefficients remain statistically significant. A marginal increase in productivity leads to an increase in the probability to export of 13%. The fact that past capabilities of firms increase the probability of exporting may be read as evidence for self-selection of firms into exporting, that is, larger and better performing firms also export. However, the overriding persistence of exporting reduces the possibility of deriving from the impact of ‘past talent’ on the probability to export a causality running from productivity to exporting. We show this by replacing the lagged variables for labour productivity and employment with their current values together with the lagged export status (specification 7). The result is almost identical with the specification including the variables in lagged form (specification 6) and weakens the case for a causal interpretation to the probit results despite the use of lagged dependent variables. 8 Conclusions
Drawing the main conclusions from our analysis of the characteristics of Austrian exporting and non-exporting firms in the manufacturing sector, Austrian exporting firms are larger in terms of various size measures employed and are performing better in terms of productivity, wages and investment intensity compared to non-exporting firms. These results are in line with those for other countries. While the result of the paper is hardly world-shattering it nevertheless fills a gap in the literature as for Austria, a detailed study on this issue has so far not existed. Employing a simple definition of the export status we estimate the export premium for four size measures (sales, the wage sum, employment, investment) and three performance measures (labour productivity, wages per employee, investment intensity). The results from the (descriptive) panel regression, which includes only time and industry dummies as control variables, suggest statistically significant and economically large export premia. We also regress the export premia at the level of industries and, in line with the descriptive statistics, find significant export premia although their size varies considerably over individual industries. We also show that export premia are increasing along with export intensity, both at the manufacturing level and the industry level. Adding additional (R&D-related) control variables significantly reduces the magnitude of the export premia to about 17% for sales and labour productivity and to 8% for wages. The statistical significance of the coefficients, however, remains perfectly intact. These results seem to us much more plausible than the more parsimonious model that includes
28
only industry and time dummies as controls which are severely (upward) biased. We are confident, however, that the results from our richer model with additional controls remedy a lot of the omitted variable bias and would conclude that the existence of statistically significant and economically important export premia is a very robust result. We further check the robustness of the export premia by using different panel estimation techniques. This check is successful in the case of the random effects model. A robustness check of the export premia result with a fixed effects model, however, is not possible as this model in fact tests another hypothesis, i.e. to what extent export switchers differ on average in periods when they export from periods when they do not export. The results from the fixed effects model are nevertheless interesting because they show that export switchers are 4.5% and 2.9% larger in terms of sales and employment respectively and are 1.7% more productive in periods where they export. This can be read as additional evidence that even first-time exporters may significantly differ from non-exporters. Apart from the result on switchers provided by the fixed effects estimation it is important, in our view, to point to the differences in hypothesis that a fixed effects model tests when applied to estimating the Bernard-Jensen type export premium. Finally, we find a huge persistence of exporting among the firms of our sample. In fact, having reached exporter status in the previous year increases the probability of exporting by 85% this year. There is also evidence for a positive impact of firms’ past performance on the probability of exporting, which lends support to the self-selection into export markets hypothesis proposed in the Melitz model. However, the large persistence of exporting weakens the case for arguing that the causality is running from firms’ performance to exporting and not vice versa. There is ample room for extending the estimation of the export premium in Austrian manufacturing. One obvious extension is to add total factor productivity as a performance measure. Moreover, the issue of causality could be further explored by tracking the development of productivity of export switchers before and after their entry into export. Finally, we could extend the observation period back until 1997 in order to gain variation over time within firms which might improve the results of our fixed effects estimations.

29
9 Literature
Altomonte, C. and G.I.P. Ottaviano (2008), ‘Internationalization of corporate activity and competitiveness of the European economy: theoretical and empirical issues’, Mycro-Dyn deliverable 28 – WP5.
Arnold, J.M. and K. Hussinger (2005), ‘Export Behavior and Firm Productivity in German Manufacturing: A Firm-Level Analysis’, Review of World Economics (Weltwirtschaftliches Archiv), Springer, Vol. 141, No. 2, pp. 219-243.
Bernard, A.B. and J.B. Jensen (1999), ‘Exceptional exporter performance: cause, effect, or both?’, Journal of International Economics, Vol. 47, pp. 1-25.
Bernard, A.B., J. Eaton, J.B. Jensen and S. Kortum (2003), ‘Plants and Productivity in International Trade’, American Economic Review, Vol. 93, pp. 1268-1290.
Bernard, A.B., S.J. Redding and P.K. Schott (2007), ‘Comparative Advantage and Heterogeneous Firms’, Review of Economic Studies, Vol. 74, pp. 31-66.
Clerides, S., S. Lach and J. Tybout (1998), ‘Is learning by exporting important? Micro-dynamic evidence from Colombia, Mexico and Morocco’, Quarterly Journal of Economics, Vol. 113, pp. 903-948.
Del Gatto, M., G. Mion and G.I.P. Ottaviano (2007), ‘Trade Integration Firm Selection and the Cost of Non Europe’, CRENOS working paper, No. 19, 2007/03.
Greenaway, D. and R. Kneller (2004), ‘Exporting and Productivity in the United Kingdom’, Oxford Review of Economic Policy, Vol. 20, No. 3., pp. 358-371.
Helpman, E., M.J. Melitz and S.R. Yeaple (2004), ‘Export Versus FDI with Heterogeneous Firms’, American Economic Review, American Economic Association, Vol. 94, No. 1, March, pp. 300-316.
ISGEP – International Study Group on Exports and Productivity (2008), ‘Understanding Cross-Country Differences in Exporter Premia: Comparable Evidence for 14 Countries’, Review of World Economics (Weltwirtschaftliches Archiv), Vol. 144, No. 4, pp. 596-635.
Kox, H.L.M. and H. Rojas-Romagosa (2010), ‘Exports and productivity selection effects for Dutch firms’, CPB discussion paper, No. 143, March.
Krugman, P. (1979) ‘Increasing Returns, Monopolistic Competition, and International Trade’, Journal of International Economics, Vol. 9, No. 4, pp. 469-479.
Mayer, T. and G.I.P. Ottaviano (2007), ‘The Happy Few: The Internationalization of European Firms. New Facts Based on Firm-Level Evidence’, Bruegel Blueprint 3.
Melitz, M.J. (2003), ‘The Impact of Trade on Intra-Industry Reallocations and Aggregate Industry Productivity’, Econometrica, Vol. 71, No. 6, pp.1695–1725.
Pöschl, J., R. Stehrer and R. Stöllinger (2009), ‘Characteristics of exporting and non-exporting firms in Austria’, FIW Research Reports 2009/2010, No. 01.

30
10 Appendix
Table A.1
NACE classification – divisions
NACE Description
15 Manufacture of food products and beverages
16 Manufacture of tobacco products
17 Manufacture of textiles
18 Manufacture of wearing apparel; dressing and dyeing of fur
19 Tanning and dressing of leather; manufacture of luggage, handbags, saddlery, harness and footwear
20 Manufacture of wood and of products of wood and cork, except furniture; manufacture of articles of straw and
plaiting materials
21 Manufacture of pulp, paper and paper products
22 Publishing, printing and reproduction of recorded media
23 Manufacture of coke, refined petroleum products and nuclear fuel
24 Manufacture of chemicals and chemical products
25 Manufacture of rubber and plastic products
26 Manufacture of other non-metallic mineral products
27 Manufacture of basic metals
28 Manufacture of fabricated metal products, except machinery and equipment
29 Manufacture of machinery and equipment n.e.c.
30 Manufacture of office machinery and computers
31 Manufacture of electrical machinery and apparatus n.e.c.
32 Manufacture of radio, television and communication equipment and apparatus
33 Manufacture of medical, precision and optical instruments, watches and clocks
34 Manufacture of motor vehicles, trailers and semi-trailers
35 Manufacture of other transport equipment
36 Manufacture of furniture; manufacturing n.e.c.
37 Recycling

31
Table A.2
NACE classification – subsections and divisions used in econometric part
NACE Description
DA Manufacture of food products, beverages and tobacco
DB Manufacture of textiles and textile products
DD Manufacture of wood and wood products
DE Manufacture of pulp, paper and paper products; publishing and printing
DG Manufacture of chemicals, chemical products and man-made fibres
DH Manufacture of rubber and plastic products
DI Manufacture of other non-metallic mineral products
DJ Manufacture of basic metals and fabricated metal products
DK Manufacture of machinery and equipment n.e.c.
DL 30-32 Manufacture of electrical equipment
DL 33 Manufacture of medical, precision and optical instruments, watches and clocks
DM Manufacture of transport equipment
DN Manufacture of furniture; manufacturing n.e.c. and Recycling Note: Sub-sections DC (leather) and DF (refined petroleum) have been excluded.


Short list of the most recent wiiw publications (as of July 2010) For current updates and summaries see also wiiw's website at www.wiiw.ac.at Austrian Exporters: A Firm-Level Analysis by Roman Stöllinger, Robert Stehrer and Johannes Pöschl
wiiw Working Papers, No. 67, July 2010 32 pages including 14 Tables and 4 Figures hardcopy: EUR 8.00 (PDF: free download from wiiw's website)
Will Exports Prevail over Austerity? by Vasily Astrov, Mario Holzner, Kazimierz Laski, Leon Podkaminer et al.
wiiw Current Analyses and Forecasts. Economic Prospects for Central, East and Southeast Europe, No. 6, July 2010 164 pages including 30 Tables and 33 Figures hardcopy: EUR 80.00 (PDF: EUR 65.00)
wiiw Monthly Report 7/10 edited by Leon Podkaminer
• A few reflections on fiscal and monetary policy in the euro area • Unit labour costs, exchange rates and responses to the crisis • Poland’s presidential election: and the winner is ... • Statistical Annex: Selected monthly data on the economic situation in Southeast Europe, Russia
and Ukraine wiiw, July 2010 28 pages including 9 Tables and 6 Figures (exclusively for subscribers to the wiiw Service Package)
Current State and Prospects of the Russian Energy Sector by Vasily Astrov
wiiw Research Reports, No. 363, June 2010 36 pages including 3 Tables and 11 Figures hardcopy: EUR 8.00 (PDF: free download from wiiw's website)
Tourism and Economic Development: the Beach Disease? by Mario Holzner
wiiw Working Papers, No. 66, June 2010 31 pages including 9 Tables and 1 Figure hardcopy: EUR 8.00 (PDF: free download from wiiw's website)

wiiw Monthly Report 6/10 edited by Leon Podkaminer
• Cohesion policy – does it have a future? • The great crisis and the American response • Export-led growth and trade among developing countries: tendencies and prospects • Statistical Annex: Selected monthly data on the economic situation in Central and Eastern
Europe wiiw, June 2010 30 pages including 8 Tables and 2 Figures (exclusively for subscribers to the wiiw Service Package)
European Energy Security in View of Russian Economic and Integration Prospects by Peter Havlik
wiiw Research Reports, No. 362, May 2010 42 pages including 1 Table and 14 Figures hardcopy: EUR 8.00 (PDF: free download from wiiw's website)
wiiw Database on Foreign Direct Investment in Central, East and Southeast Europe, 2010: FDI in the CEECs Hit Hard by the Global Crisis by Gábor Hunya. Database and layout by Monika Schwarzhappel
wiiw Database on Foreign Direct Investment in Central, East and Southeast Europe wiiw, Vienna, May 2010 (ISBN-978-3-85209-018-4) 107 pages including 86 Tables hardcopy: EUR 70.00 (PDF: EUR 65.00), CD-ROM (including hardcopy): EUR 145.00
A Contribution to the Theory of Financial Fragility and Crisis by Amit Bhaduri
wiiw Working Papers, No. 65, May 2010 18 pages including 2 Figures hardcopy: EUR 8.00 (PDF: free download from wiiw's website)
wiiw Monthly Report 5/10 edited by Leon Podkaminer
• European energy security: a concern common to both the EU and Russia • The current state and prospects of the Russian energy sector • Short-run projections of patterns of job contraction in the Czech Republic, Hungary, Slovakia
and Slovenia • Statistical Annex: Selected monthly data on the economic situation in Southeast Europe, Russia
and Ukraine wiiw, May 2010 26 pages including 13 Tables and 5 Figures (exclusively for subscribers to the wiiw Service Package)
Why Are Goods Cheaper in Rich Countries? Beyond the Balassa-Samuelson Effect by Leon Podkaminer
wiiw Working Papers, No. 64, April 2010 20 pages including 2 Tables and 6 Figures hardcopy: EUR 8.00 (PDF: free download from wiiw's website)

wiiw Monthly Report 4/10 edited by Leon Podkaminer
• Getting back to business in emerging Europe • The crisis of the euro area and the need for a structural reform • Real convergence and price levels in the enlarged European Union • Hungary after the elections • Statistical Annex: Selected monthly data on the economic situation in Central and Eastern
Europe wiiw, April 2010 28 pages including 10 Tables (exclusively for subscribers to the wiiw Service Package)
The Government Expenditure Multiplier and its Estimates for Poland in 2006-2009 by Kazimierz Laski, Jerzy Osiatynski and Jolanta Zieba
wiiw Working Papers, No. 63, March 2010 15 pages including 2 Tables and 1 Figure hardcopy: EUR 8.00 (PDF: free download from wiiw's website)
wiiw Monthly Report 3/10 edited by Leon Podkaminer
• Public debt developments in the CEE countries • China’s quest for oil abroad: between state and market • Regional development in Bulgaria • Statistical Annex: Selected monthly data on the economic situation in Southeast Europe, Russia
and Ukraine wiiw, March 2010 32 pages including 16 Tables, 5 Figures and 1 Map (exclusively for subscribers to the wiiw Service Package)
Crisis Is Over, but Problems Loom Ahead by Vladimir Gligorov, Peter Havlik, Michael Landesmann, Josef Pöschl, Sándor Richter et al.
wiiw Current Analyses and Forecasts. Economic Prospects for Central, East and Southeast Europe, No. 5, February 2010 170 pages including 45 Tables and 27 Figures hardcopy: EUR 80.00 (PDF: EUR 65.00)
Short-run Projections of Patterns of Job Contraction in the EU by Robert Stehrer and Terry Ward
wiiw Research Reports, No. 361, February 2010 79 pages including 36 Tables and 25 Figures hardcopy: EUR 8.00 (PDF: free download from wiiw's website)

wiiw Service Package
The Vienna Institute offers to firms and institutions interested in unbiased and up-to-date information on Central, East and Southeast European markets a package of exclusive services and preferential access to its publications and research findings, on the basis of a subscription at an annual fee of EUR 2,000.
This subscription fee entitles to the following package of Special Services:
– A free invitation to the Vienna Institute's Spring Seminar, a whole-day event at the end of March, devoted to compelling topics in the economic transformation of the Central and East European region (for subscribers to the wiiw Service Package only).
– Copies of, or online access to, The Vienna Institute Monthly Report, a periodical consisting of timely articles summarizing and interpreting the latest economic developments in Central and Eastern Europe and the former Soviet Union. The statistical annex to each Monthly Report contains, alternately, country-specific tables or graphs with monthly key economic indicators, economic forecasts, the latest data from the wiiw Industrial Database and excerpts from the wiiw FDI Database. This periodical is not for sale, it can only be obtained in the framework of the wiiw Service Package.
– Free copies of the Institute's Research Reports (including Reprints), Current Analyses and Forecasts, Country Profiles and Statistical Reports.
– A free copy of the wiiw Handbook of Statistics (published in October/November each year and containing more than 400 tables and graphs on the economies of Albania, Bosnia and Herzegovina, Bulgaria, Croatia, the Czech Republic, Estonia, Hungary, Latvia, Lithuania, Macedonia, Montenegro, Poland, Romania, Russia, Serbia, the Slovak Republic, Slovenia and Ukraine)
– Free online access to the wiiw Monthly Database, containing more than 1200 leading indicators monitoring the latest key economic developments in ten Central and East European countries.
– Consulting. The Vienna Institute is pleased to advise subscribers on questions concerning the East European economies or East-West economic relations if the required background research has already been undertaken by the Institute. We regret we have to charge extra for ad hoc research.
– Free access to the Institute's specialized economics library and documentation facilities.
Subscribers who wish to purchase wiiw data sets on CD-ROM or special publications not included in the wiiw Service Package are granted considerable price reductions.
For detailed information about the wiiw Service Package please visit wiiw's website at www.wiiw.ac.at

To The Vienna Institute for International Economic Studies Rahlgasse 3 A-1060 Vienna
Please forward more detailed information about the Vienna Institute's Service Package Please forward a complete list of the Vienna Institute's publications to the following address
Please enter me for
1 yearly subscription of Research Reports (including Reprints) at a price of EUR 120.00 (hardcopy, Austria), EUR 135.00 (hardcopy, Europe), EUR 155.00 (hardcopy, overseas) and EUR 48.00 (PDF download with password) respectively
1 yearly subscription of Current Analyses and Forecasts a price of EUR 150.00 (hardcopy, Austria), EUR 155.00 (hardcopy, Europe), EUR 170.00 (hardcopy, overseas) and EUR 120.00 (PDF download with password) respectively
Please forward
the following issue of Research Reports ..............................................................................................
the following issue of Current Analyses and Forecasts .......................................................................
the following issue of Working Papers .................................................................................................
the following issue of Research Papers in German language ............................................................
the following issue of wiiw Database on Foreign Direct Investment ...................................................
the following issue of wiiw Handbook of Statistics ...............................................................................
(other) ....................................................................................................................................................
.........................................................................................................................................................................................................
Name
.........................................................................................................................................................................................................
Address
.........................................................................................................................................................................................................
Telephone Fax E-mail
............................................................ ..........................................................
Date Signature
Herausgeber, Verleger, Eigentümer und Hersteller: Verein „Wiener Institut für Internationale Wirtschaftsvergleiche“ (wiiw), Wien 6, Rahlgasse 3 ZVR-Zahl: 329995655
Postanschrift: A-1060 Wien, Rahlgasse 3, Tel: [+431] 533 66 10, Telefax: [+431] 533 66 10 50
Internet Homepage: www.wiiw.ac.at
Nachdruck nur auszugsweise und mit genauer Quellenangabe gestattet.
P.b.b. Verlagspostamt 1060 Wien