Embed Size (px)
Citation preview
Hindawi Publishing CorporationComputational and Mathematical Methods in MedicineVolume 2013, Article ID 103476, 12 pageshttp://dx.doi.org/10.1155/2013/103476
Research ArticleAttenuation Correction for Small Animal PET Images:A Comparison of Two Methods
Daniela D’Ambrosio,1,2 Federico Zagni,1 Antonello E. Spinelli,3 and Mario Marengo1
1 Medical Physics Department, University Hospital S. Orsola-Malpighi, Via Massarenti 9, 40138 Bologna, Italy2Medical Physics Department, IRCCS Fondazione Maugeri, Via Salvatore Maugeri 4, 27100 Pavia, Italy3Medical Physics Department, IRCCS San Raffaele, Via Olgettina 60, 20132 Milano, Italy
Correspondence should be addressed to Mario Marengo; [email protected]
Received 18 December 2012; Revised 9 March 2013; Accepted 10 March 2013
Academic Editor: Peng Feng
Copyright © 2013 Daniela D’Ambrosio et al. This is an open access article distributed under the Creative Commons AttributionLicense, which permits unrestricted use, distribution, and reproduction in any medium, provided the original work is properlycited.
In order to extract quantitative parameters from PET images, several physical effects such as photon attenuation, scatter, and partialvolumemust be taken into account.Themain objectives of this workwere the evaluation of photon attenuation in small animals andthe implementation of two attenuation correctionmethods based onX-rays CT and segmentation of emission images.The accuracyof the first method with respect to the beam hardening effect was investigated by using Monte Carlo simulations. Mouse- and rat-sized phantoms were acquired in order to evaluate attenuation correction in terms of counts increment and recovery of uniformactivity concentration. Both methods were applied to mice and rat images acquired with several radiotracers such as 18F-FDG,11C-acetate, 68Ga-chloride, and 18F-NaF. The accuracy of the proposed methods was evaluated in heart and tumour tissues using18F-FDG images and in liver, kidney, and spinal column tissues using 11C-acetate, 68Ga-chloride, and 18F-NaF images, respectively.In vivo results from animal studies show that, except for bone scans, differences between the proposed methods were about 10%in rats and 3% in mice. In conclusion, both methods provide equivalent results; however, the segmentation-based approach hasseveral advantages being less time consuming and simple to implement.
1. Introduction
Positron emission tomography is a quantitative imaging tech-nique, capable to provide accurate values of radiotracer con-centration in each voxel of the reconstructed volume. Theknowledge of radiopharmaceutical concentration is impor-tant because, combined with adequate mathematical models,it allows to evaluate several physiological parameters of inter-est, such as perfusion, glucose metabolic rate, and receptorsdensity [1]. In order to obtain an accurate quantification ofradiotracer concentration, several physical factors must betaken into account, such as attenuation (AC) [2], scatter [3],and partial volume correction (PVC) [4]. In this work, theattention was focused on attenuation correction for smallanimal PET images, which is well known to be relevant forhuman patients [5] but could be also significant for smallanimals as well. Attenuation correction has been extensivelydiscussed in the literature for humanPET and SPECT studies;
however, only few papers focus on AC for small animals [6–11].
There are severalmethods to obtain attenuationmaps thatcould be employed to correct PET images for attenuation.They are mainly grouped into two categories: transmissionand transmissionless methods.
The first category of methods is based on the acqui-sition of a transmission image of the subject. The mostused approaches are based on (1) transmissive image using,for example, rotating or annular 68Ga / 68Ge sources, (2)segmented transmissive image, and (3) X-ray CT image.Transmission scanning can be performedboth in coincidenceand in single mode.
A quite simple approach consists of using an annular68Ga / 68Ge source surrounding the object and acquiringa transmission image in coincidence mode; however, theresulting image can be very noisy. An alternative approach isto use a rotating rod source; in this case, scatter and random
2 Computational and Mathematical Methods in Medicine
coincidences decrease because only the lines of response(LORs) collinear with the rod source are accepted. The rodsource is generally very active, and, thus, the detector nearthe source exhibits a high dead time causing an importantloss of counts [13]. The same problem happens also in thecase of single photon source; in order to acquire a goodquality transmissive image using a fully 3D scanner, a pointsource with a very high radioactivity concentration must beused. This problem can be solved with use of collimated,single photon, point sources [14, 15]. However, the singlemode acquisitionmethodhas also several disadvantages: (1) asignificant scatter component is included in the transmissiveimage, and (2) an energy scaling of the attenuation map isneeded because of the different photon energy of the trans-missive source. For example, 137Cs emits 662 keV photons.In this case, attenuation maps can be obtained segmentingtransmissive images, and the known attenuation coefficientsat 511 keV are assigned to each of the segmented regions [16,17].The last andmost used category of transmissionmethodsis based on the acquisition of CT images. Analogously to themethod described before, energy scaling of the attenuationcoefficients to 511 keV is needed.
Transmission methods are more accurate when estimat-ing attenuation maps because they take into account theinhomogeneities of the object attenuation coefficients. Eachof them has also several drawbacks; they are more time-consuming, as the animal has to be anesthetized for a longtime and also receives larger doses of radioactivity comparedto transmissionless methods. Transmissive PET images donot suffer from coregistration problems that may introduceartifacts in the attenuation map, but they can be very noisy.In order to reduce the noise in the transmissive PET images,segmentation was introduced, but other problems linked totime and dose still remained.
Transmissionless methods are carried out with manualor automatic delineation of body edges directly on emis-sive image assuming a uniform distribution of attenuationcoefficients inside the object [18, 19], or by automatic imagesegmentation using a fuzzy clustering algorithm [20]. Trans-missionlessmethods are less accurate in delineating the edgesand provide a less detailed attenuationmap, but they have theadvantages of being less time consuming, do not increase thedose to the animal, and allow for noiseless attenuation maps.Moreover, coregistration procedure is not required, and thusthe attenuation map are less sensitive to image artifacts.
In this work, two attenuation correction methods arepresented: a CT-based method and a transmissionless ACmethod based on segmentation of PET data. We firstly esti-mated the magnitude of attenuation effect in small animalsusing mice and rat phantoms. In order to implement the X-ray basedmethod, we calibrated the small animal CT scannerand we obtained a correspondence between CT and 511 keVattenuation coefficients. In order to evaluate the accuracy ofthe CT-based method with respect to beam-hardening, weperformed Monte Carlo simulation for rat-sized objects. AsCT scan adds either acquisition time or dose to the animal,we propose a further method based on segmentation of PETimages. PET data segmentation may not provide accurateattenuation maps because, depending on the radiotracer
used, the body edges are not always well delineated. Weacquired images using several radiotracers such as 18F-FDG,11C-acetate, 68Ga-chloride, and 18F-NaF and evaluated theaccuracy of the PET-based method with respect to CT-AC.
2. Methods and Materials
2.1. Photon Attenuation. As it is well known, transmission of511 keV photons crossing matter is expressed by an exponen-tial law formulated as follows:
Φ = Φ0𝑒−∫𝐿𝜇(𝑥,𝑦)𝑑𝑙, (1)
where Φ and Φ0are the transmitted and incident photon
fluences, 𝐿 is the path of the photon through the object, and𝜇(𝑥, 𝑦) is the linear attenuation coefficient map.
The exponential term, which we refer to as 𝑃, is theprobability that a photon reaches the detector. In PET, eventsare not detected if at least one of the two annihilation photonsis absorbed by the object. In this case, the number of eventsfor each LOR is reduced.The probability that an annihilationevent is recorded is given by the product of the probabilityof each photon reaching the detectors, as expressed by thefollowing equation:
𝑃 = 𝑃1𝑃2= 𝑒−∫𝐿1(𝑠,𝜙)𝜇(𝑥,𝑦)𝑑𝑙𝑒−∫𝐿2(𝑠,𝜙)𝜇(𝑥,𝑦)𝑑𝑙= 𝑒−∫𝐿(𝑠,𝜙)𝜇(𝑥,𝑦)𝑑𝑙,
(2)
where 𝐿 = 𝐿1+𝐿2, 𝜙 is the projection angle, and 𝑠 is the radial
position. As we can see in (2), the probability depends on thetotal length of the path of the two annihilation photons inthe object that in PET is the object thickness along the LOR.The value of 𝐿 is related to the projection angle and the radialposition. The equation describing the measured projectionsis the attenuated Radon transform, formulated as follows:
𝑝 (𝑠, 𝜙) = ∫𝐿(𝑠,𝜙)𝑓 (𝑥, 𝑦) 𝑒
−∫𝐿(𝑠,𝜙)𝜇(𝑥,𝑦)𝑑𝑙𝑑𝑟, (3)
where 𝑝(𝑠, 𝜙) are the projection data at angle 𝜙 and bin𝑠, 𝑓(𝑥, 𝑦) is a function representing the original activityconcentration image, 𝜇(𝑥, 𝑦) is the attenuation coefficientmap, and 𝐿(𝑠, 𝜙) represents the LOR.
2.2. Systems Descriptions. PET images were acquired withthe eXplore Vista preclinical PET tomograph (General Elec-tric) [21]. The scanner allows to acquire PET images usingthree different energy windows (100–700, 250–700, and400–700 keV). For our purposes, all images were acquiredusing the 400–700 keV energy window.The scanner detectorsystem consists of 36 detector blocks, arranged in two ringsof 11.8mm diameter. Each block is a 13 × 13 array of 1.45mmsquare phoswich crystals: a Lutetium Yttrium Orthosilicate(LYSO) crystal of 7mm depth optically coupled to an 8mmdepth crystal ofGadoliniumOrthosilicate (GSO).This designallows to obtain depth of interaction information [22]. Thetransverse and axial field of view (FOV) are equal to 6.9 cmand 4.6 cm, respectively. No corrections for randoms andscatter were performed in this study. All the images were
Computational and Mathematical Methods in Medicine 3
Iterative reconstruction
AC PET
Attenuation map
PET/CT
Resliced PET Resliced CT
PET
CT
Coregistration
Forward projection
Exponential function
Forward projection
HU-𝜇 conversion+
energy scaling at 511 keV
𝑋
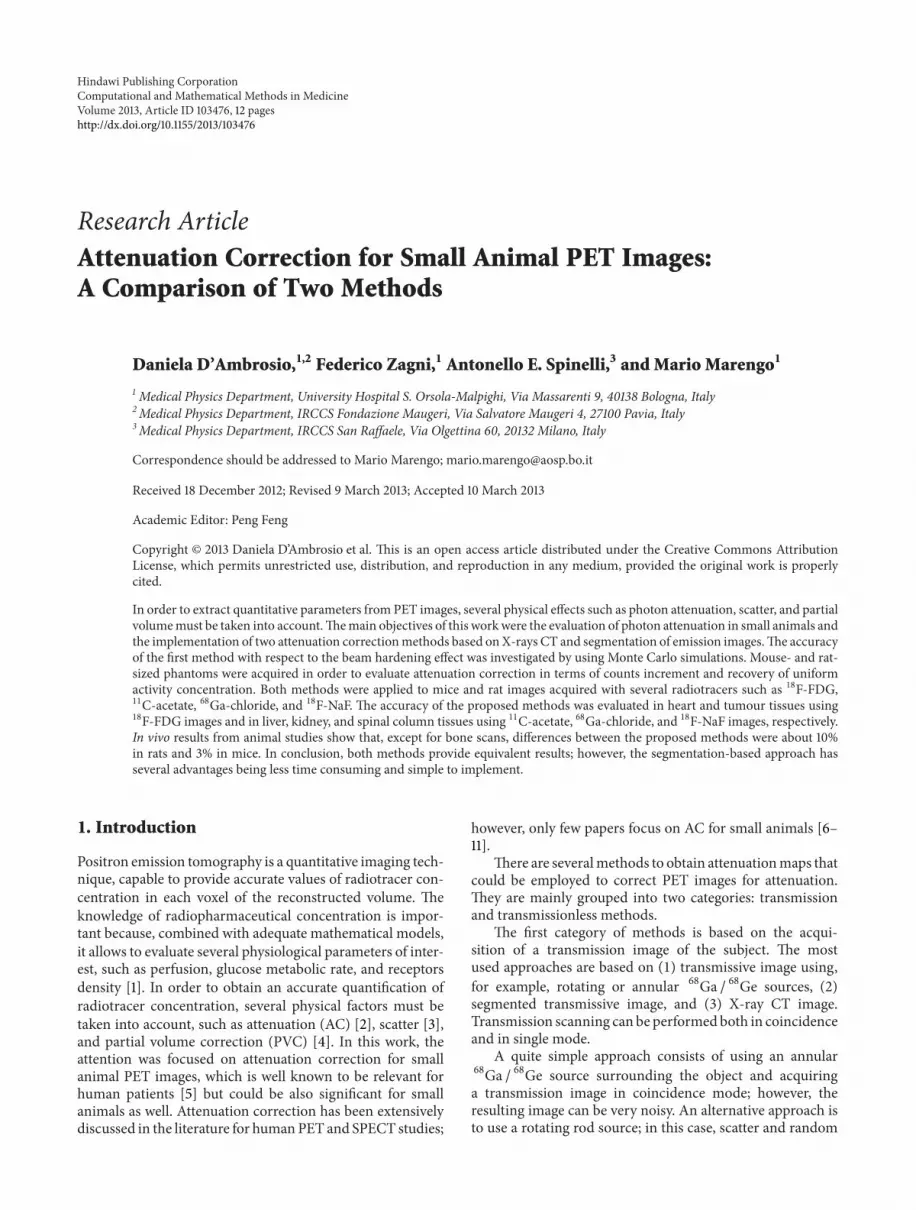
Figure 1: Schematic diagram of CT-AC method. CT-AC can be divided into three steps: coregistration, attenuation correction accordinglyto the attenuated Radon transform (see (3)), and iterative reconstruction. More details can be found in Section 2.3.1.
reconstructed using 2D-OSEM algorithm [23] after Fourierrebinning (FORE) [24]. CT images were acquired usingthe eXplore Locus small animal CT tomography (GeneralElectric). The tube voltage was 80 kV and the current was450𝜇A. The system is characterized by a fixed anode with aTungsten target source. The X-ray detector is a CCD arraycoupled to a Cesium Iodide (CsI) scintillation crystal. Thescanner allows to acquire and to reconstruct images withdifferent pixel binning and, thus, with different resolution
levels (27–93𝜇m). The transaxial FOV dimension is equalto 8 cm for acquisition at 93𝜇m resolution. The axial FOVis the same for all acquisition protocols, and it is equal to4.5 cm. For our purposes, all images were acquired using a93 𝜇m resolution. Image reconstruction was performed withthe Feldkamp cone beam algorithm [25].
2.3. Attenuation CorrectionMethods. All the images acquiredwith the eXplore Vista were attenuation-corrected using the
4 Computational and Mathematical Methods in Medicine
Iterative reconstruction
AC PET
Forward projection
Exponential function
Segmentation
PET SE
Forward projection
𝑋
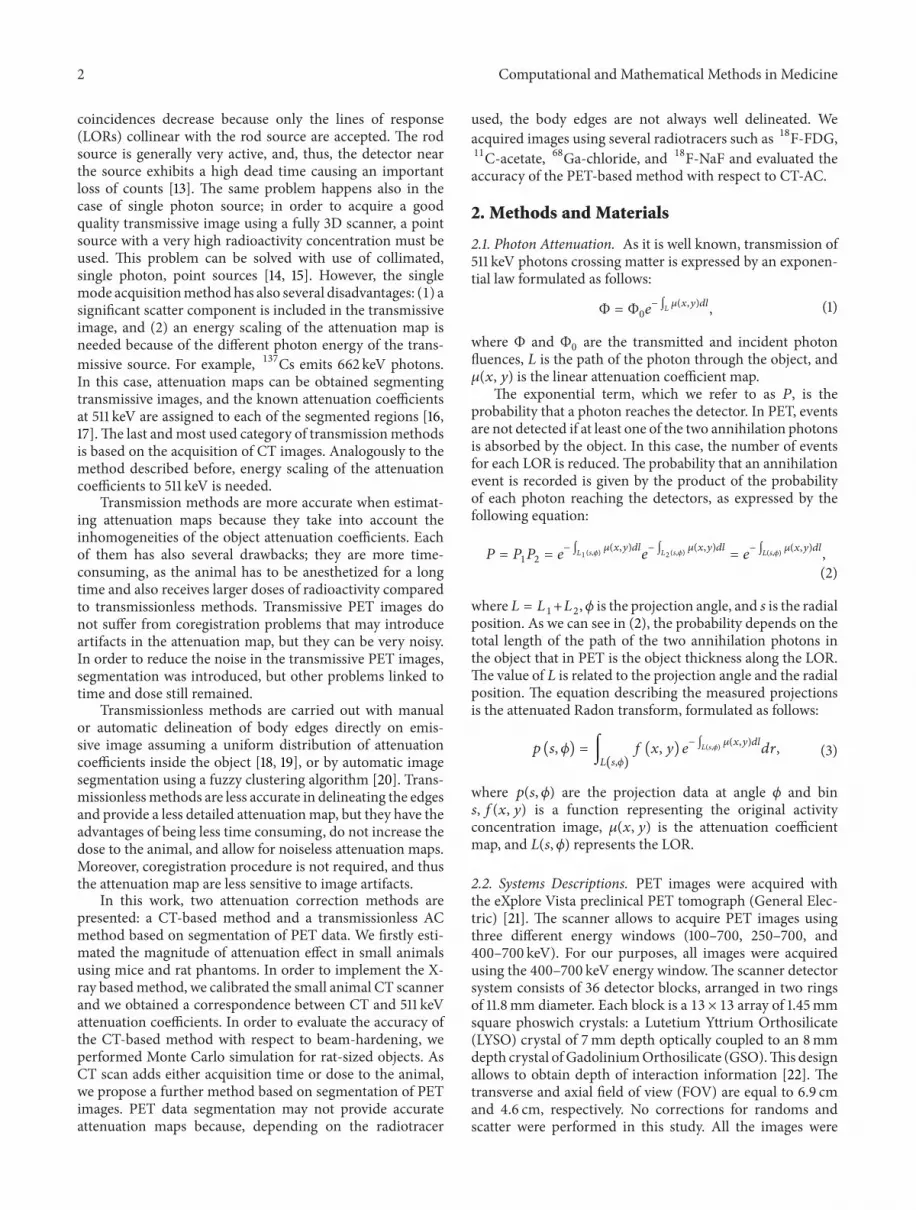
Figure 2: Schematic diagram of SE-AC method described inSection 2.3.2.
CT and SE methods as described later. The schematic diag-rams of CT-AC and SE-AC methods are showed in Figures 1and 2.
2.3.1. CT-AC Method. The CT AC method is based ona conversion between HU and the corresponding linearattenuation coefficients at 511 keV. CT images are usefulbecause they provide detailed attenuation coefficients maps.The most important problem when using CT images is thebeam hardening effect. In order to investigate the accuracyof the CT AC method, we used PeneloPET, a Monte Carlocode for PET simulations based on PENELOPE [27]. Thegeometry and composition of both rat-phantoms and eXploreVista scanner were implemented to match those employedin the real acquisitions. We chose to simulate only therat-phantom because the beam hardening effect is moreimportant in this case than in mouse-sized objects. TheCT-based attenuation corrected image was compared withimages simulated without attenuation material. On bothimages, line profiles and region of interest (ROI) analysis
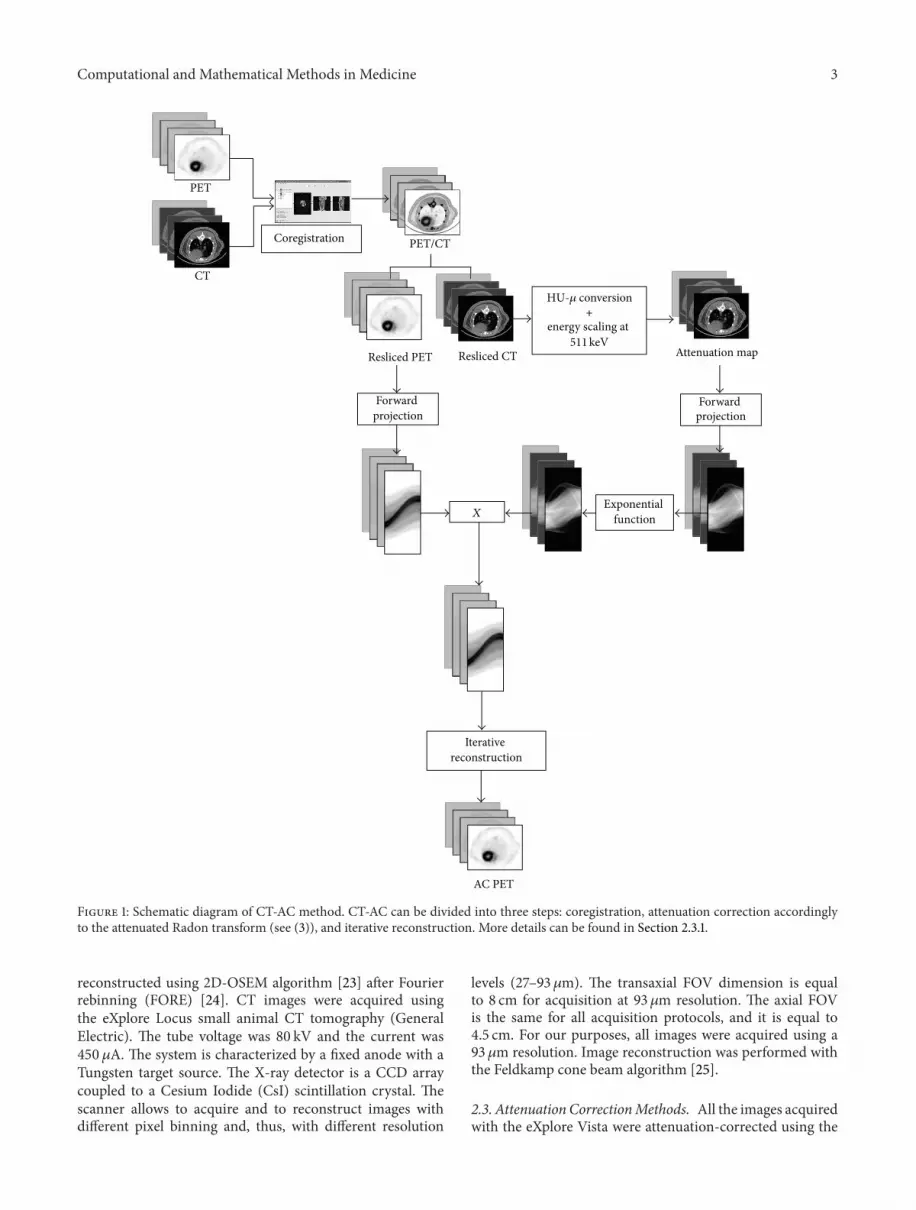
Table 1: Density and attenuation coefficient used to calibrate theCT scanner. Data were calculated by Hubbell and Seltzer and werepublished by the National Institute of Standards and Technology[26].
Material Density(g ⋅ cm−3)
Attenuation coefficientat 511 keV (cm−1)
Air 0.001 0Polyethylene 0.930 0.0925Polystyrene 1.060 0.0994Water 1.000 0.0969Acrylic 1.190 0.1120Polytetrafluoroethylene(Teflon) 2.250 0.1886
Aluminum 2.699 0.2280
were performed. The calibration procedure of the CT wasperformed by using the inserts of Mini CT QC Phantom 76–430 of Nuclear Associates. The inserts are cylinders havingdifferent values of density and linear attenuation coefficientsat 511 keV. The data published by the National Institute ofStandards and Technology are in Table 1 [26]. CT-AC wasimplemented using Matlab, and more precisely, PET and thecalibrated attenuation map images were forward projectedin order to perform attenuation correction according to theattenuated Radon transform (see (3)).
A CT image of each cylinder was acquired and a small(ROI) was drawn on the image in order to calculate the meanvalue of HU. The attenuation coefficients at 511 keV wereplotted with respect to the measured HU, and a quadratic fitto the data was performed.
2.3.2. Segmentation of Emission Image AC Method. Segmen-tation of emission image by a global threshold was performedby means of a Matlab code, in order to obtain a 2-levelimage, corresponding to air and soft tissues. For PET imagesof phantoms, the contours are always clear, and, thus, thesegmentation is quite easy to perform. In animal PET images,the detection of body edges depends on the biodistributionof the radiotracer injected. To assess applicability of theSE method, PET images with different radiotracers wereacquired.
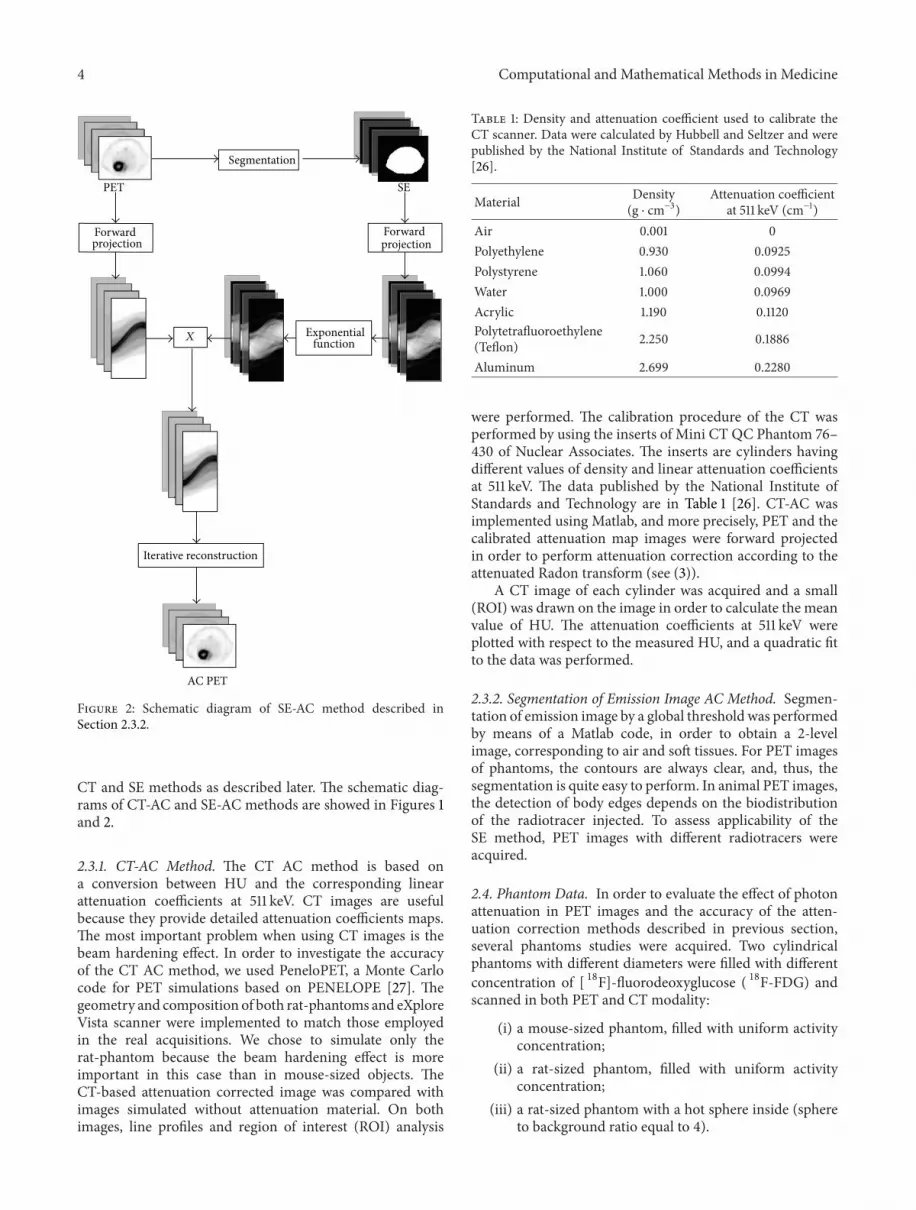
2.4. Phantom Data. In order to evaluate the effect of photonattenuation in PET images and the accuracy of the atten-uation correction methods described in previous section,several phantoms studies were acquired. Two cylindricalphantoms with different diameters were filled with differentconcentration of [ 18F]-fluorodeoxyglucose ( 18F-FDG) andscanned in both PET and CT modality:
(i) a mouse-sized phantom, filled with uniform activityconcentration;
(ii) a rat-sized phantom, filled with uniform activityconcentration;
(iii) a rat-sized phantom with a hot sphere inside (sphereto background ratio equal to 4).
Computational and Mathematical Methods in Medicine 5
A syringe of 30mm diameter filled to 30 cc was usedas mouse-sized phantom, while a cylindrical phantom withdiameter of 50mm and length of 80mm was used as rat-sized phantom. The mouse- and rat-sized phantoms werefilled with a solution of 18F-FDGwith activity concentrationsof about 1MBq/cc and 0.5MBq/cc, respectively. Severalzeolites soaked with a small amount of 18F-FDG (about5MBq/cc) were fixed around the two phantoms in order touse them as fiducial marks in the coregistration procedure[28]. For each phantom, a 20-minute PET scan and a 6-minute CT acquisition were performed. In order to align PETand CT, the two images were coregistered using rigid bodytransformation implemented in AMIDE [29].
In order to measure the improvement obtained with AC,line profiles and ROI analysis were performed. The recoveryvalues RV for each AC method were calculated with thefollowing equations:
RVCT =ROIAC-CT − ROINC
ROIAC-CT,
RVSE =ROIAC-SE − ROINC
ROIAC-CT,
(4)
where ROINC, ROIAC-CT, and ROIAC-SE are the mean valuesin a ROI drawn on the uncorrected image, on the AC-CT, andon the AC-SE image, respectively. In order to evaluate theshape recovery, we calculated also the flatness of the profile(i.e., the relative difference in the number of counts betweenthe edges and the centre of an uniform phantom) with thefollowing formula:
𝐹 =𝐶max − 𝐶min𝐶min
, (5)
where 𝐶max is the maximum and 𝐶min is the minimum of thecount profile. The rat-sized phantom with a hot sphere wasused to simulate a PET image of a hot lesion. The recoveryvalues RV in the sphere for each AC method were evaluated.
2.5. Animal Data. In order to test the attenuation correctionmethods and particularly the SE-AC on animal images, PETandCT scans ofmice and rats were performed using differentradiotracers, being all animals studies approved by the EthicalCommittee of our institution:
(i) 1 rat and 2 mice were injected with 18F-FDG (anoncological and a cardiac study);
(ii) 3 further rats were injected with 18F-NaF, 11C-acetate, and 68Ga-chloride.
All animals were anesthetized with 3%–5% of sevofluraneand 1 l/min of oxygen and were injected intravenously inthe tail with activity of about 30 and 50MBq, respectively.PET acquisitions of 20 minutes were performed after anuptake time depending on the radiotracer. The uptake was ofabout one hour for 18F-FDG and 18F-NaF studies, and about30 minutes for 68Ga-chloride acquisitions. The 11C-acetateimages were acquired immediately after the injection. A CT
Calibration function
0
0.05
0.1
0.15
0.2
0.25
Atte
nuat
ion
coeffi
cien
t (1/
cm)
−1000 −500 0 500 1000 1500 2000 2500HU
𝑟2 = 0.993
𝜇 = 𝑎1 · (𝐻𝑈)2 + 𝑎2 · 𝐻𝑈 + 𝑎3
𝑎1 = −2.05 · 10−8 cm−1
𝑎2 = 9.66 · 10−5 cm−1
𝑎3 = 0.12 cm−1
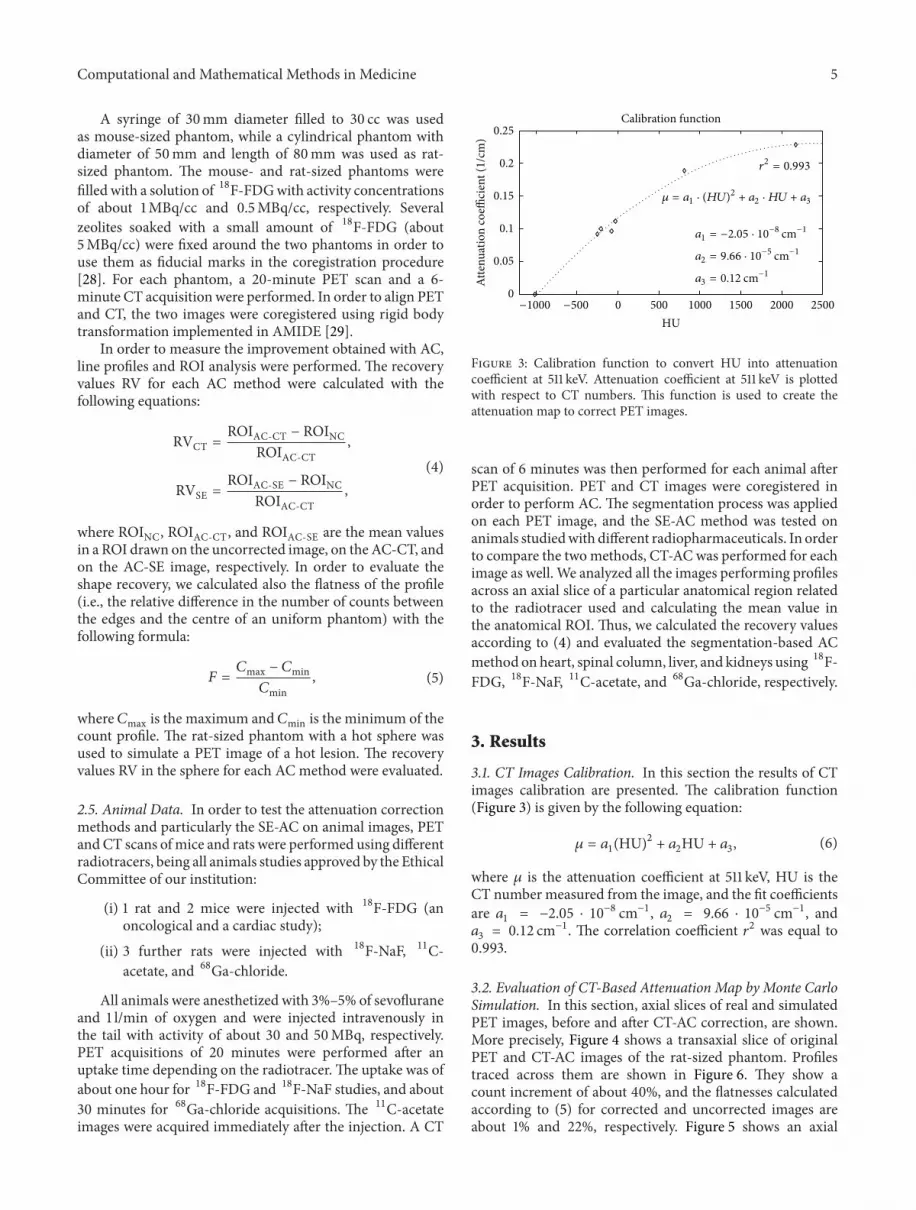
Figure 3: Calibration function to convert HU into attenuationcoefficient at 511 keV. Attenuation coefficient at 511 keV is plottedwith respect to CT numbers. This function is used to create theattenuation map to correct PET images.
scan of 6 minutes was then performed for each animal afterPET acquisition. PET and CT images were coregistered inorder to perform AC. The segmentation process was appliedon each PET image, and the SE-AC method was tested onanimals studiedwith different radiopharmaceuticals. In orderto compare the twomethods, CT-AC was performed for eachimage as well. We analyzed all the images performing profilesacross an axial slice of a particular anatomical region relatedto the radiotracer used and calculating the mean value inthe anatomical ROI. Thus, we calculated the recovery valuesaccording to (4) and evaluated the segmentation-based ACmethod on heart, spinal column, liver, and kidneys using 18F-FDG, 18F-NaF, 11C-acetate, and 68Ga-chloride, respectively.
3. Results
3.1. CT Images Calibration. In this section the results of CTimages calibration are presented. The calibration function(Figure 3) is given by the following equation:
𝜇 = 𝑎1(HU)2 + 𝑎
2HU + 𝑎
3, (6)
where 𝜇 is the attenuation coefficient at 511 keV, HU is theCT number measured from the image, and the fit coefficientsare 𝑎1= −2.05 ⋅ 10−8 cm−1, 𝑎
2= 9.66 ⋅ 10−5 cm−1, and
𝑎3= 0.12 cm−1. The correlation coefficient 𝑟2 was equal to
0.993.
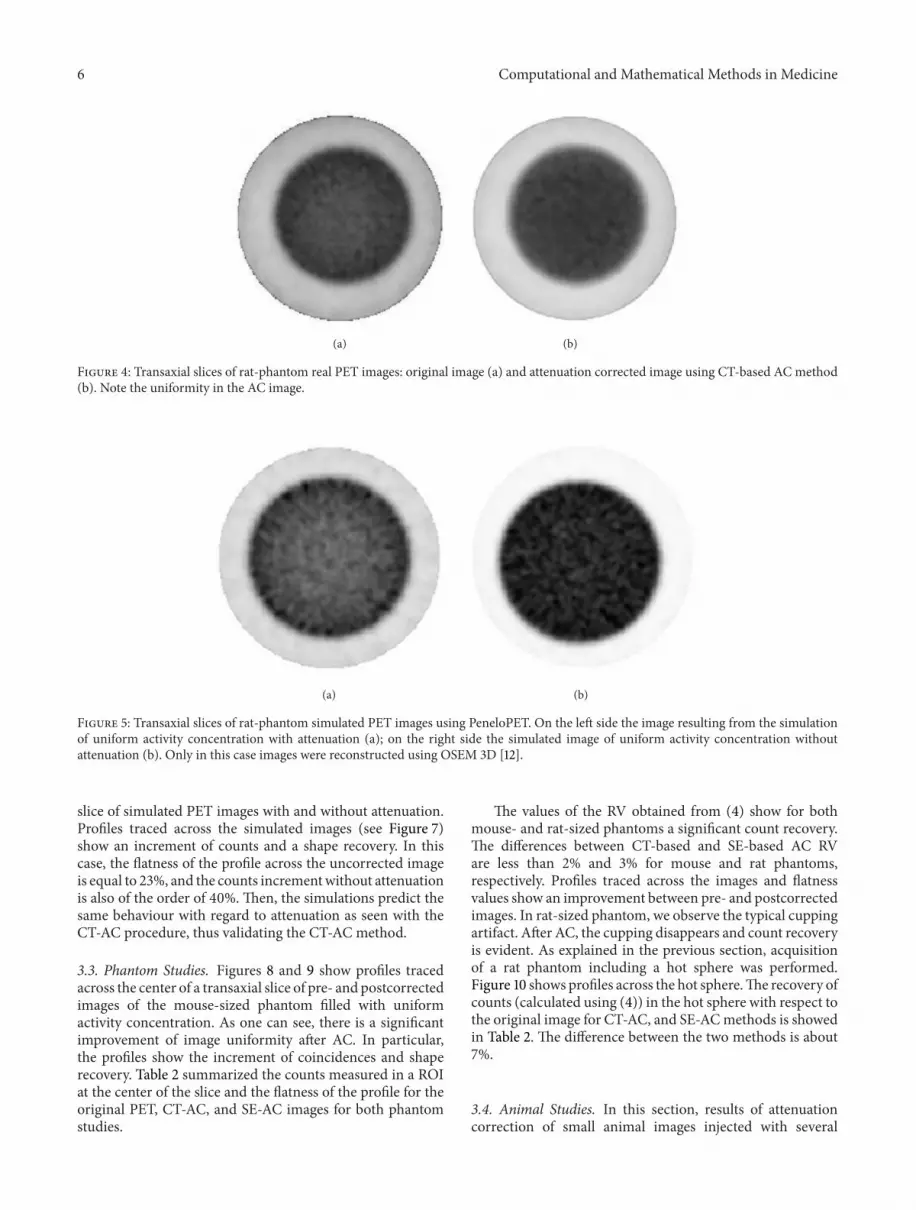
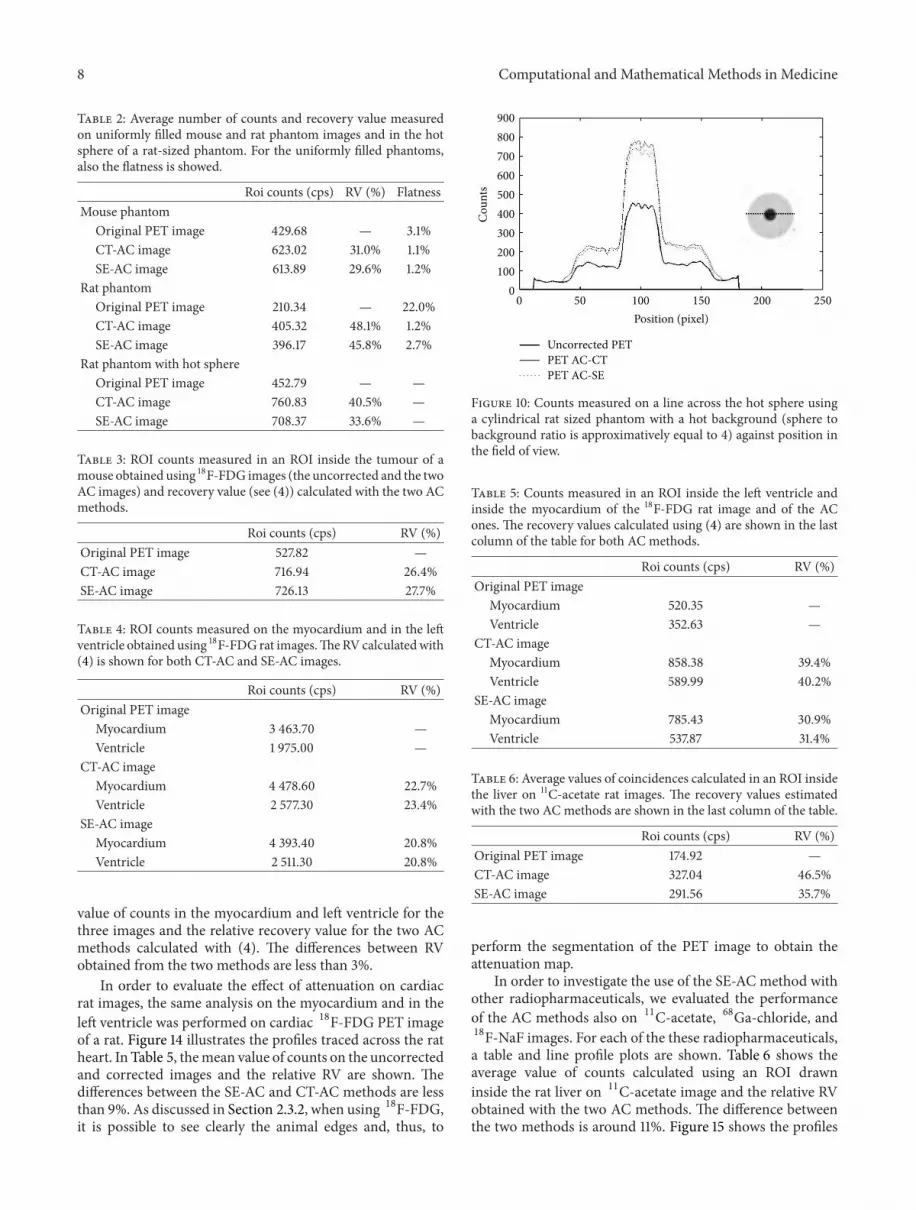
3.2. Evaluation of CT-Based Attenuation Map by Monte CarloSimulation. In this section, axial slices of real and simulatedPET images, before and after CT-AC correction, are shown.More precisely, Figure 4 shows a transaxial slice of originalPET and CT-AC images of the rat-sized phantom. Profilestraced across them are shown in Figure 6. They show acount increment of about 40%, and the flatnesses calculatedaccording to (5) for corrected and uncorrected images areabout 1% and 22%, respectively. Figure 5 shows an axial
6 Computational and Mathematical Methods in Medicine
(a) (b)
Figure 4: Transaxial slices of rat-phantom real PET images: original image (a) and attenuation corrected image using CT-based AC method(b). Note the uniformity in the AC image.
(a) (b)
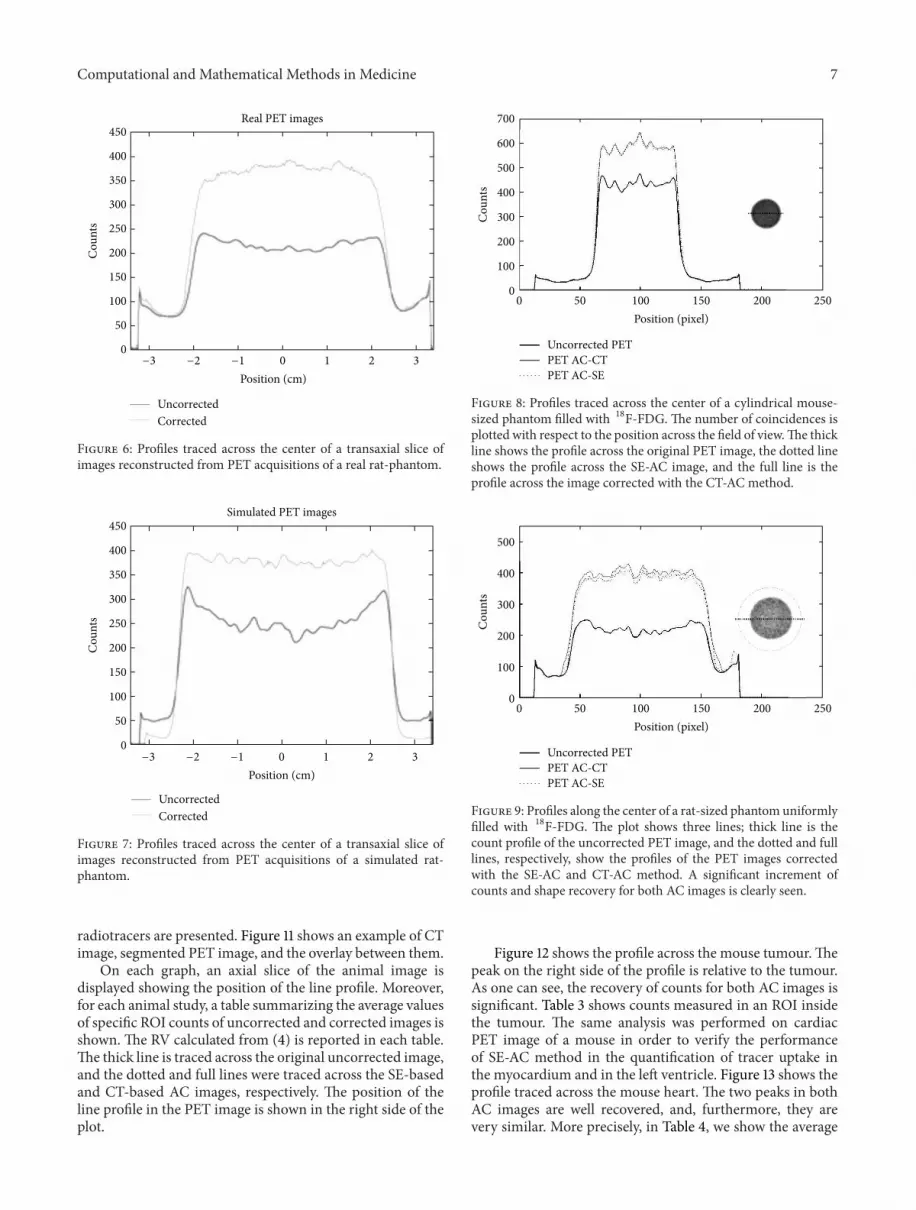
Figure 5: Transaxial slices of rat-phantom simulated PET images using PeneloPET. On the left side the image resulting from the simulationof uniform activity concentration with attenuation (a); on the right side the simulated image of uniform activity concentration withoutattenuation (b). Only in this case images were reconstructed using OSEM 3D [12].
slice of simulated PET images with and without attenuation.Profiles traced across the simulated images (see Figure 7)show an increment of counts and a shape recovery. In thiscase, the flatness of the profile across the uncorrected imageis equal to 23%, and the counts incrementwithout attenuationis also of the order of 40%. Then, the simulations predict thesame behaviour with regard to attenuation as seen with theCT-AC procedure, thus validating the CT-AC method.
3.3. Phantom Studies. Figures 8 and 9 show profiles tracedacross the center of a transaxial slice of pre- and postcorrectedimages of the mouse-sized phantom filled with uniformactivity concentration. As one can see, there is a significantimprovement of image uniformity after AC. In particular,the profiles show the increment of coincidences and shaperecovery. Table 2 summarized the counts measured in a ROIat the center of the slice and the flatness of the profile for theoriginal PET, CT-AC, and SE-AC images for both phantomstudies.
The values of the RV obtained from (4) show for bothmouse- and rat-sized phantoms a significant count recovery.The differences between CT-based and SE-based AC RVare less than 2% and 3% for mouse and rat phantoms,respectively. Profiles traced across the images and flatnessvalues show an improvement between pre- and postcorrectedimages. In rat-sized phantom, we observe the typical cuppingartifact. After AC, the cupping disappears and count recoveryis evident. As explained in the previous section, acquisitionof a rat phantom including a hot sphere was performed.Figure 10 shows profiles across the hot sphere.The recovery ofcounts (calculated using (4)) in the hot sphere with respect tothe original image for CT-AC, and SE-ACmethods is showedin Table 2. The difference between the two methods is about7%.
3.4. Animal Studies. In this section, results of attenuationcorrection of small animal images injected with several
Computational and Mathematical Methods in Medicine 7
0
50
100
150
200
250
300
350
400
450
Cou
nts
−3 −2 −1 0 1 2 3Position (cm)
UncorrectedCorrected
Real PET images
Figure 6: Profiles traced across the center of a transaxial slice ofimages reconstructed from PET acquisitions of a real rat-phantom.
0
50
100
150
200
250
300
350
400
450
Cou
nts
−3 −2 −1 0 1 2 3Position (cm)
Simulated PET images
UncorrectedCorrected
Figure 7: Profiles traced across the center of a transaxial slice ofimages reconstructed from PET acquisitions of a simulated rat-phantom.
radiotracers are presented. Figure 11 shows an example of CTimage, segmented PET image, and the overlay between them.
On each graph, an axial slice of the animal image isdisplayed showing the position of the line profile. Moreover,for each animal study, a table summarizing the average valuesof specific ROI counts of uncorrected and corrected images isshown. The RV calculated from (4) is reported in each table.The thick line is traced across the original uncorrected image,and the dotted and full lines were traced across the SE-basedand CT-based AC images, respectively. The position of theline profile in the PET image is shown in the right side of theplot.
0
100
200
300
400
500
600
700
Cou
nts
0 50 100 150 200 250Position (pixel)
Uncorrected PETPET AC-CTPET AC-SE
Figure 8: Profiles traced across the center of a cylindrical mouse-sized phantom filled with 18F-FDG. The number of coincidences isplotted with respect to the position across the field of view.The thickline shows the profile across the original PET image, the dotted lineshows the profile across the SE-AC image, and the full line is theprofile across the image corrected with the CT-AC method.
0
100
200
300
400
500
Cou
nts
0 50 100 150 200 250Position (pixel)
Uncorrected PETPET AC-CTPET AC-SE
Figure 9: Profiles along the center of a rat-sized phantom uniformlyfilled with 18F-FDG. The plot shows three lines; thick line is thecount profile of the uncorrected PET image, and the dotted and fulllines, respectively, show the profiles of the PET images correctedwith the SE-AC and CT-AC method. A significant increment ofcounts and shape recovery for both AC images is clearly seen.
Figure 12 shows the profile across the mouse tumour.Thepeak on the right side of the profile is relative to the tumour.As one can see, the recovery of counts for both AC images issignificant. Table 3 shows counts measured in an ROI insidethe tumour. The same analysis was performed on cardiacPET image of a mouse in order to verify the performanceof SE-AC method in the quantification of tracer uptake inthe myocardium and in the left ventricle. Figure 13 shows theprofile traced across the mouse heart. The two peaks in bothAC images are well recovered, and, furthermore, they arevery similar. More precisely, in Table 4, we show the average
8 Computational and Mathematical Methods in Medicine
Table 2: Average number of counts and recovery value measuredon uniformly filled mouse and rat phantom images and in the hotsphere of a rat-sized phantom. For the uniformly filled phantoms,also the flatness is showed.
Roi counts (cps) RV (%) FlatnessMouse phantom
Original PET image 429.68 — 3.1%CT-AC image 623.02 31.0% 1.1%SE-AC image 613.89 29.6% 1.2%
Rat phantomOriginal PET image 210.34 — 22.0%CT-AC image 405.32 48.1% 1.2%SE-AC image 396.17 45.8% 2.7%
Rat phantom with hot sphereOriginal PET image 452.79 — —CT-AC image 760.83 40.5% —SE-AC image 708.37 33.6% —
Table 3: ROI counts measured in an ROI inside the tumour of amouse obtained using 18F-FDG images (the uncorrected and the twoAC images) and recovery value (see (4)) calculated with the two ACmethods.
Roi counts (cps) RV (%)Original PET image 527.82 —CT-AC image 716.94 26.4%SE-AC image 726.13 27.7%
Table 4: ROI counts measured on the myocardium and in the leftventricle obtained using 18F-FDG rat images.TheRV calculatedwith(4) is shown for both CT-AC and SE-AC images.
Roi counts (cps) RV (%)Original PET image
Myocardium 3 463.70 —Ventricle 1 975.00 —
CT-AC imageMyocardium 4 478.60 22.7%Ventricle 2 577.30 23.4%
SE-AC imageMyocardium 4 393.40 20.8%Ventricle 2 511.30 20.8%
value of counts in the myocardium and left ventricle for thethree images and the relative recovery value for the two ACmethods calculated with (4). The differences between RVobtained from the two methods are less than 3%.
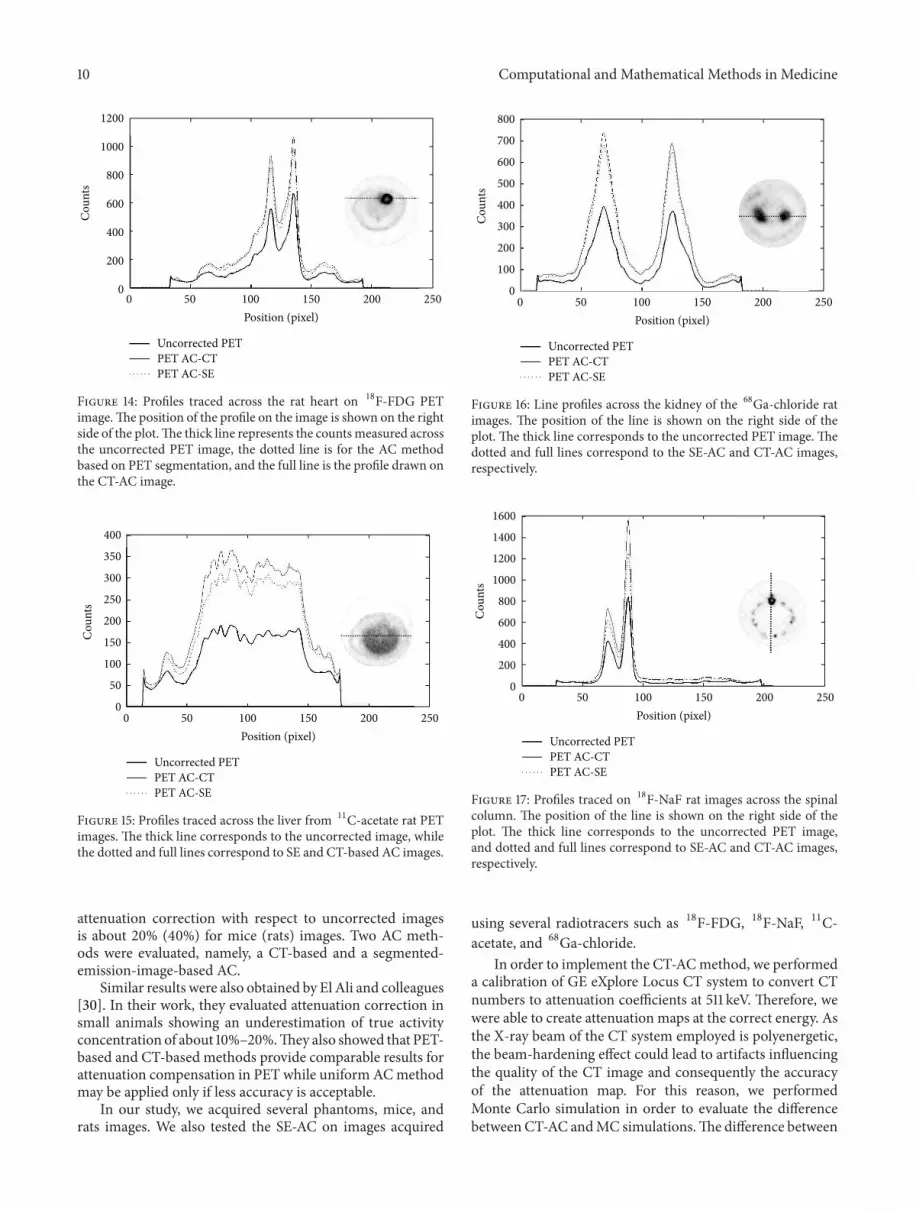
In order to evaluate the effect of attenuation on cardiacrat images, the same analysis on the myocardium and in theleft ventricle was performed on cardiac 18F-FDG PET imageof a rat. Figure 14 illustrates the profiles traced across the ratheart. In Table 5, themean value of counts on the uncorrectedand corrected images and the relative RV are shown. Thedifferences between the SE-AC and CT-AC methods are lessthan 9%. As discussed in Section 2.3.2, when using 18F-FDG,it is possible to see clearly the animal edges and, thus, to
0100200300400500
700600
900800
Cou
nts
0 50 100 150 200 250Position (pixel)
Uncorrected PETPET AC-CTPET AC-SE
Figure 10: Counts measured on a line across the hot sphere usinga cylindrical rat sized phantom with a hot background (sphere tobackground ratio is approximatively equal to 4) against position inthe field of view.
Table 5: Counts measured in an ROI inside the left ventricle andinside the myocardium of the 18F-FDG rat image and of the ACones. The recovery values calculated using (4) are shown in the lastcolumn of the table for both AC methods.
Roi counts (cps) RV (%)Original PET image
Myocardium 520.35 —Ventricle 352.63 —
CT-AC imageMyocardium 858.38 39.4%Ventricle 589.99 40.2%
SE-AC imageMyocardium 785.43 30.9%Ventricle 537.87 31.4%
Table 6: Average values of coincidences calculated in an ROI insidethe liver on 11C-acetate rat images. The recovery values estimatedwith the two AC methods are shown in the last column of the table.
Roi counts (cps) RV (%)Original PET image 174.92 —CT-AC image 327.04 46.5%SE-AC image 291.56 35.7%
perform the segmentation of the PET image to obtain theattenuation map.
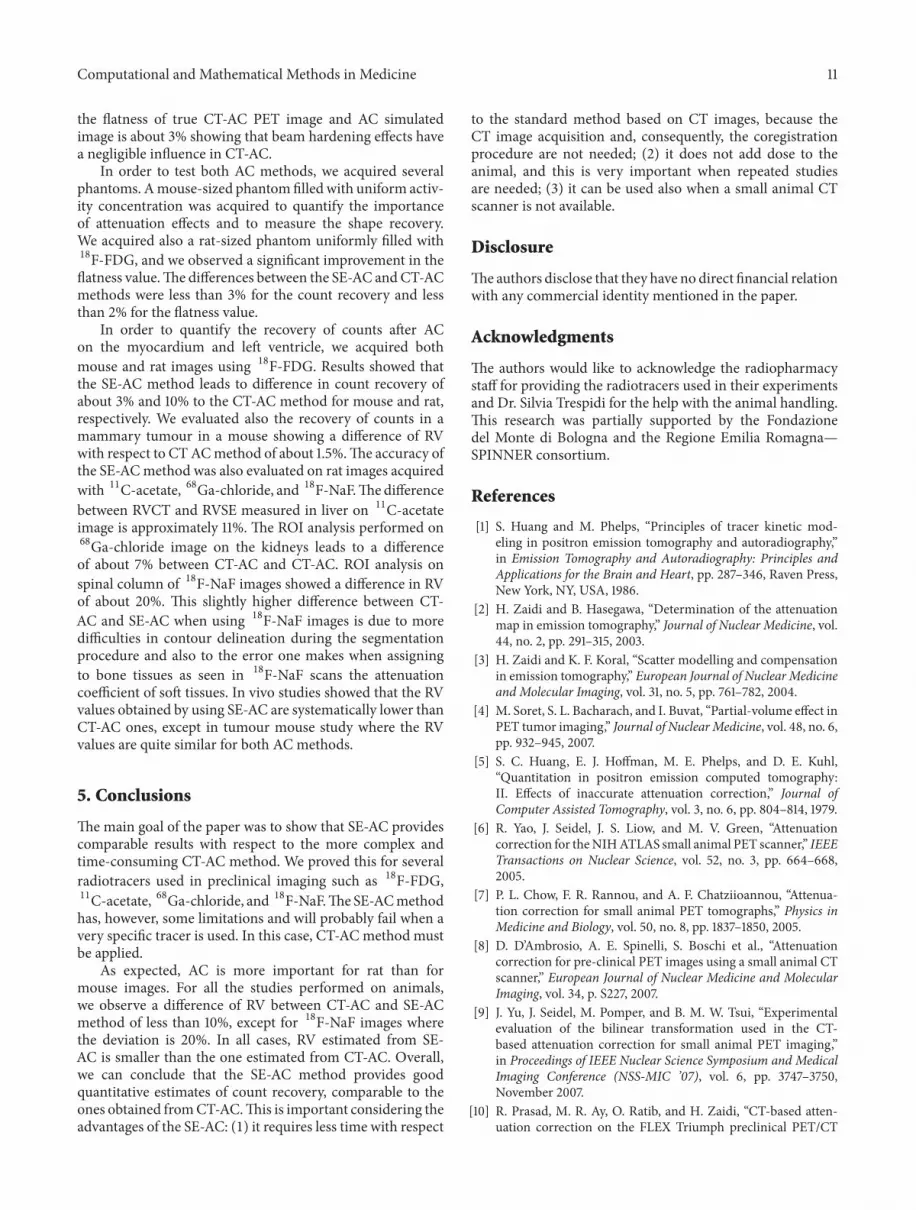
In order to investigate the use of the SE-AC method withother radiopharmaceuticals, we evaluated the performanceof the AC methods also on 11C-acetate, 68Ga-chloride, and18F-NaF images. For each of the these radiopharmaceuticals,a table and line profile plots are shown. Table 6 shows theaverage value of counts calculated using an ROI drawninside the rat liver on 11C-acetate image and the relative RVobtained with the two AC methods. The difference betweenthe two methods is around 11%. Figure 15 shows the profiles

Computational and Mathematical Methods in Medicine 9
(a) (b) (c)
Figure 11: Transaxial slices of rat images: CT image (a) and segmented PET image (b).The overlay of the two previous images (c) shows howmuch the segmented PET image differs from the CT image.
0
200
400
600
1000
800
Cou
nts
0 50 100 150 200 250Position (pixel)
Uncorrected PETPET AC-CTPET AC-SE
Figure 12: Counts profile across the mouse tumour for the uncor-rected 18F-FDG PET image (thick line) and for the two correctedimages (full and dotted lines refer to CT-AC and SE-AC images,resp.) The peak on the right side of the profile is relative to thetumour. The image on the right shows the profile position.
Table 7: Average values of counts measured in an ROI inside thekidney from a 68Ga-chloride rat PET image.The RV computed fromboth AC methods is shown in the last column of the table.
Roi counts (cps) RV (%)Original PET image 245.45 —CT-AC image 459.14 46.5%SE-AC image 427.37 39.6%
drawn across the rat liver on 11C-acetate image. The SE-ACmethod provides good results also for 11C-acetate images.
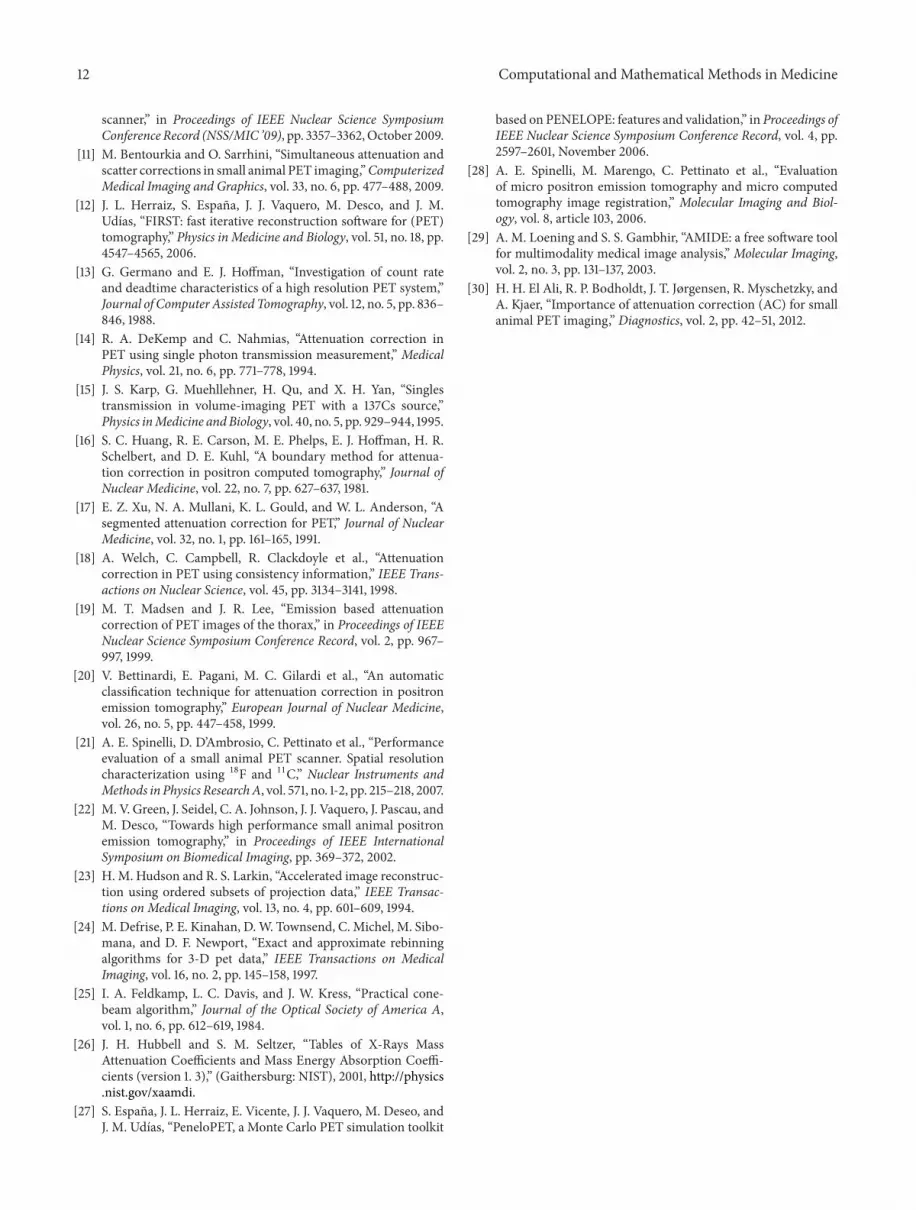
Figure 16 and Table 7 show the results of the two ACmethods for a 68Ga-chloride image. Note that the profilestraced across the two AC images are very similar; the differ-ence of RV between the two AC methods is approximately7%. Segmentation of 18F-NaF image to create the attenuationmap ismore difficult to obtain.Thedifference between theRVcalculated for both CT-AC and SE-AC methods amounts to
0
1000
2000
3000
6000
5000
4000C
ount
s
0 50 100 150 200 250Position (pixel)
Uncorrected PETPET AC-CTPET AC-SE
Figure 13: Profiles traced across mouse heart PET images acquiredusing 18F-FDG. More precisely, thick, dotted, and full lines weretraced on uncorrected PET, SE-AC, and CT-AC images.
Table 8: ROI average values computed from 18F-PET image of a ratcorresponding to the spinal column for uncorrected andAC images.In the last column of the table, the RV from both AC methods isshown.
Roi counts (cps) RV (%)Original PET image 419.70 —CT-AC image 770.14 45.5%SE-AC image 623.67 26.5%
20%. Profiles are shown in Figure 17, and results are shown inTable 8.
4. Discussion
In order to achieve accurate estimates of radiotracer concen-tration, corrections for attenuation, scatter, and partial vol-ume effects are necessary. Our main objectives were to assessthe importance of attenuation in small animal PET images.On average, our results showed that the count recovery after
10 Computational and Mathematical Methods in Medicine
0
200
400
600
1200
1000
800
Cou
nts
0 50 100 150 200 250Position (pixel)
Uncorrected PETPET AC-CTPET AC-SE
Figure 14: Profiles traced across the rat heart on 18F-FDG PETimage.The position of the profile on the image is shown on the rightside of the plot.The thick line represents the countsmeasured acrossthe uncorrected PET image, the dotted line is for the AC methodbased on PET segmentation, and the full line is the profile drawn onthe CT-AC image.
Cou
nts
0 50 100 150 200 250Position (pixel)
Uncorrected PETPET AC-CTPET AC-SE
0
50
100
150
200
250
300
350
400
Figure 15: Profiles traced across the liver from 11C-acetate rat PETimages. The thick line corresponds to the uncorrected image, whilethe dotted and full lines correspond to SE and CT-based AC images.
attenuation correction with respect to uncorrected imagesis about 20% (40%) for mice (rats) images. Two AC meth-ods were evaluated, namely, a CT-based and a segmented-emission-image-based AC.
Similar results were also obtained by El Ali and colleagues[30]. In their work, they evaluated attenuation correction insmall animals showing an underestimation of true activityconcentration of about 10%–20%.They also showed that PET-based and CT-based methods provide comparable results forattenuation compensation in PET while uniform ACmethodmay be applied only if less accuracy is acceptable.
In our study, we acquired several phantoms, mice, andrats images. We also tested the SE-AC on images acquired
0
100
200
300
400
500
600
700
800
Cou
nts
0 50 100 150 200 250Position (pixel)
Uncorrected PETPET AC-CTPET AC-SE
Figure 16: Line profiles across the kidney of the 68Ga-chloride ratimages. The position of the line is shown on the right side of theplot. The thick line corresponds to the uncorrected PET image. Thedotted and full lines correspond to the SE-AC and CT-AC images,respectively.
Cou
nts
0 50 100 150 200 250Position (pixel)
Uncorrected PETPET AC-CTPET AC-SE
0
200
400
600
800
1000
1200
1400
1600
Figure 17: Profiles traced on 18F-NaF rat images across the spinalcolumn. The position of the line is shown on the right side of theplot. The thick line corresponds to the uncorrected PET image,and dotted and full lines correspond to SE-AC and CT-AC images,respectively.
using several radiotracers such as 18F-FDG, 18F-NaF, 11C-acetate, and 68Ga-chloride.
In order to implement the CT-ACmethod, we performeda calibration of GE eXplore Locus CT system to convert CTnumbers to attenuation coefficients at 511 keV. Therefore, wewere able to create attenuation maps at the correct energy. Asthe X-ray beam of the CT system employed is polyenergetic,the beam-hardening effect could lead to artifacts influencingthe quality of the CT image and consequently the accuracyof the attenuation map. For this reason, we performedMonte Carlo simulation in order to evaluate the differencebetween CT-AC andMC simulations.The difference between
Computational and Mathematical Methods in Medicine 11
the flatness of true CT-AC PET image and AC simulatedimage is about 3% showing that beam hardening effects havea negligible influence in CT-AC.
In order to test both AC methods, we acquired severalphantoms. Amouse-sized phantomfilledwith uniform activ-ity concentration was acquired to quantify the importanceof attenuation effects and to measure the shape recovery.We acquired also a rat-sized phantom uniformly filled with18F-FDG, and we observed a significant improvement in theflatness value.The differences between the SE-AC andCT-ACmethods were less than 3% for the count recovery and lessthan 2% for the flatness value.
In order to quantify the recovery of counts after ACon the myocardium and left ventricle, we acquired bothmouse and rat images using 18F-FDG. Results showed thatthe SE-AC method leads to difference in count recovery ofabout 3% and 10% to the CT-AC method for mouse and rat,respectively. We evaluated also the recovery of counts in amammary tumour in a mouse showing a difference of RVwith respect to CTACmethod of about 1.5%.The accuracy ofthe SE-ACmethod was also evaluated on rat images acquiredwith 11C-acetate, 68Ga-chloride, and 18F-NaF.Thedifferencebetween RVCT and RVSE measured in liver on 11C-acetateimage is approximately 11%. The ROI analysis performed on68Ga-chloride image on the kidneys leads to a differenceof about 7% between CT-AC and CT-AC. ROI analysis onspinal column of 18F-NaF images showed a difference in RVof about 20%. This slightly higher difference between CT-AC and SE-AC when using 18F-NaF images is due to moredifficulties in contour delineation during the segmentationprocedure and also to the error one makes when assigningto bone tissues as seen in 18F-NaF scans the attenuationcoefficient of soft tissues. In vivo studies showed that the RVvalues obtained by using SE-AC are systematically lower thanCT-AC ones, except in tumour mouse study where the RVvalues are quite similar for both AC methods.
5. Conclusions
Themain goal of the paper was to show that SE-AC providescomparable results with respect to the more complex andtime-consuming CT-AC method. We proved this for severalradiotracers used in preclinical imaging such as 18F-FDG,11C-acetate, 68Ga-chloride, and 18F-NaF.TheSE-ACmethodhas, however, some limitations and will probably fail when avery specific tracer is used. In this case, CT-ACmethod mustbe applied.
As expected, AC is more important for rat than formouse images. For all the studies performed on animals,we observe a difference of RV between CT-AC and SE-ACmethod of less than 10%, except for 18F-NaF images wherethe deviation is 20%. In all cases, RV estimated from SE-AC is smaller than the one estimated from CT-AC. Overall,we can conclude that the SE-AC method provides goodquantitative estimates of count recovery, comparable to theones obtained fromCT-AC.This is important considering theadvantages of the SE-AC: (1) it requires less time with respect
to the standard method based on CT images, because theCT image acquisition and, consequently, the coregistrationprocedure are not needed; (2) it does not add dose to theanimal, and this is very important when repeated studiesare needed; (3) it can be used also when a small animal CTscanner is not available.
Disclosure
Theauthors disclose that they have no direct financial relationwith any commercial identity mentioned in the paper.
Acknowledgments
The authors would like to acknowledge the radiopharmacystaff for providing the radiotracers used in their experimentsand Dr. Silvia Trespidi for the help with the animal handling.This research was partially supported by the Fondazionedel Monte di Bologna and the Regione Emilia Romagna—SPINNER consortium.
References
[1] S. Huang and M. Phelps, “Principles of tracer kinetic mod-eling in positron emission tomography and autoradiography,”in Emission Tomography and Autoradiography: Principles andApplications for the Brain and Heart, pp. 287–346, Raven Press,New York, NY, USA, 1986.
[2] H. Zaidi and B. Hasegawa, “Determination of the attenuationmap in emission tomography,” Journal of Nuclear Medicine, vol.44, no. 2, pp. 291–315, 2003.
[3] H. Zaidi and K. F. Koral, “Scatter modelling and compensationin emission tomography,” European Journal of Nuclear Medicineand Molecular Imaging, vol. 31, no. 5, pp. 761–782, 2004.
[4] M. Soret, S. L. Bacharach, and I. Buvat, “Partial-volume effect inPET tumor imaging,” Journal of NuclearMedicine, vol. 48, no. 6,pp. 932–945, 2007.
[5] S. C. Huang, E. J. Hoffman, M. E. Phelps, and D. E. Kuhl,“Quantitation in positron emission computed tomography:II. Effects of inaccurate attenuation correction,” Journal ofComputer Assisted Tomography, vol. 3, no. 6, pp. 804–814, 1979.
[6] R. Yao, J. Seidel, J. S. Liow, and M. V. Green, “Attenuationcorrection for theNIHATLAS small animal PET scanner,” IEEETransactions on Nuclear Science, vol. 52, no. 3, pp. 664–668,2005.
[7] P. L. Chow, F. R. Rannou, and A. F. Chatziioannou, “Attenua-tion correction for small animal PET tomographs,” Physics inMedicine and Biology, vol. 50, no. 8, pp. 1837–1850, 2005.
[8] D. D’Ambrosio, A. E. Spinelli, S. Boschi et al., “Attenuationcorrection for pre-clinical PET images using a small animal CTscanner,” European Journal of Nuclear Medicine and MolecularImaging, vol. 34, p. S227, 2007.
[9] J. Yu, J. Seidel, M. Pomper, and B. M. W. Tsui, “Experimentalevaluation of the bilinear transformation used in the CT-based attenuation correction for small animal PET imaging,”in Proceedings of IEEE Nuclear Science Symposium and MedicalImaging Conference (NSS-MIC ’07), vol. 6, pp. 3747–3750,November 2007.
[10] R. Prasad, M. R. Ay, O. Ratib, and H. Zaidi, “CT-based atten-uation correction on the FLEX Triumph preclinical PET/CT
12 Computational and Mathematical Methods in Medicine
scanner,” in Proceedings of IEEE Nuclear Science SymposiumConference Record (NSS/MIC ’09), pp. 3357–3362,October 2009.
[11] M. Bentourkia and O. Sarrhini, “Simultaneous attenuation andscatter corrections in small animal PET imaging,”ComputerizedMedical Imaging and Graphics, vol. 33, no. 6, pp. 477–488, 2009.
[12] J. L. Herraiz, S. Espana, J. J. Vaquero, M. Desco, and J. M.Udıas, “FIRST: fast iterative reconstruction software for (PET)tomography,” Physics in Medicine and Biology, vol. 51, no. 18, pp.4547–4565, 2006.
[13] G. Germano and E. J. Hoffman, “Investigation of count rateand deadtime characteristics of a high resolution PET system,”Journal of Computer Assisted Tomography, vol. 12, no. 5, pp. 836–846, 1988.
[14] R. A. DeKemp and C. Nahmias, “Attenuation correction inPET using single photon transmission measurement,” MedicalPhysics, vol. 21, no. 6, pp. 771–778, 1994.
[15] J. S. Karp, G. Muehllehner, H. Qu, and X. H. Yan, “Singlestransmission in volume-imaging PET with a 137Cs source,”Physics inMedicine andBiology, vol. 40, no. 5, pp. 929–944, 1995.
[16] S. C. Huang, R. E. Carson, M. E. Phelps, E. J. Hoffman, H. R.Schelbert, and D. E. Kuhl, “A boundary method for attenua-tion correction in positron computed tomography,” Journal ofNuclear Medicine, vol. 22, no. 7, pp. 627–637, 1981.
[17] E. Z. Xu, N. A. Mullani, K. L. Gould, and W. L. Anderson, “Asegmented attenuation correction for PET,” Journal of NuclearMedicine, vol. 32, no. 1, pp. 161–165, 1991.
[18] A. Welch, C. Campbell, R. Clackdoyle et al., “Attenuationcorrection in PET using consistency information,” IEEE Trans-actions on Nuclear Science, vol. 45, pp. 3134–3141, 1998.
[19] M. T. Madsen and J. R. Lee, “Emission based attenuationcorrection of PET images of the thorax,” in Proceedings of IEEENuclear Science Symposium Conference Record, vol. 2, pp. 967–997, 1999.
[20] V. Bettinardi, E. Pagani, M. C. Gilardi et al., “An automaticclassification technique for attenuation correction in positronemission tomography,” European Journal of Nuclear Medicine,vol. 26, no. 5, pp. 447–458, 1999.
[21] A. E. Spinelli, D. D’Ambrosio, C. Pettinato et al., “Performanceevaluation of a small animal PET scanner. Spatial resolutioncharacterization using 18F and 11C,” Nuclear Instruments andMethods in Physics ResearchA, vol. 571, no. 1-2, pp. 215–218, 2007.
[22] M. V. Green, J. Seidel, C. A. Johnson, J. J. Vaquero, J. Pascau, andM. Desco, “Towards high performance small animal positronemission tomography,” in Proceedings of IEEE InternationalSymposium on Biomedical Imaging, pp. 369–372, 2002.
[23] H. M. Hudson and R. S. Larkin, “Accelerated image reconstruc-tion using ordered subsets of projection data,” IEEE Transac-tions on Medical Imaging, vol. 13, no. 4, pp. 601–609, 1994.
[24] M. Defrise, P. E. Kinahan, D.W. Townsend, C. Michel, M. Sibo-mana, and D. F. Newport, “Exact and approximate rebinningalgorithms for 3-D pet data,” IEEE Transactions on MedicalImaging, vol. 16, no. 2, pp. 145–158, 1997.
[25] I. A. Feldkamp, L. C. Davis, and J. W. Kress, “Practical cone-beam algorithm,” Journal of the Optical Society of America A,vol. 1, no. 6, pp. 612–619, 1984.
[26] J. H. Hubbell and S. M. Seltzer, “Tables of X-Rays MassAttenuation Coefficients and Mass Energy Absorption Coeffi-cients (version 1. 3),” (Gaithersburg: NIST), 2001, http://physics.nist.gov/xaamdi.
[27] S. Espana, J. L. Herraiz, E. Vicente, J. J. Vaquero, M. Deseo, andJ. M. Udıas, “PeneloPET, a Monte Carlo PET simulation toolkit
based on PENELOPE: features and validation,” in Proceedings ofIEEE Nuclear Science Symposium Conference Record, vol. 4, pp.2597–2601, November 2006.
[28] A. E. Spinelli, M. Marengo, C. Pettinato et al., “Evaluationof micro positron emission tomography and micro computedtomography image registration,” Molecular Imaging and Biol-ogy, vol. 8, article 103, 2006.
[29] A. M. Loening and S. S. Gambhir, “AMIDE: a free software toolfor multimodality medical image analysis,” Molecular Imaging,vol. 2, no. 3, pp. 131–137, 2003.
[30] H. H. El Ali, R. P. Bodholdt, J. T. Jørgensen, R. Myschetzky, andA. Kjaer, “Importance of attenuation correction (AC) for smallanimal PET imaging,” Diagnostics, vol. 2, pp. 42–51, 2012.


