Embed Size (px)
Citation preview
ORIGINAL ARTICLE
Attenuation correction for lung SPECT: evidenceof need and validation of an attenuation map derivedfrom the emission data
Margarita Núñez & Vineet Prakash & Ricardo Vila &
Fernando Mut & Omar Alonso & Brian F. Hutton
Received: 23 August 2008 /Accepted: 30 January 2009 /Published online: 24 February 2009# Springer-Verlag 2009
AbstractPurpose The aim of our study was to investigate theimportance of attenuation correction (AC) in reconstructedand reprojected images on lung SPECT studies.Methods Simulation studies were undertaken to evaluatethe influence of AC on defect-to-normal ratios (D/N), todemonstrate the influence of errors in the correction mapvalues and to detect lung boundaries used for AC. The useof a synthetic map (SM) for AC of the clinical data wasalso evaluated and the results compared with those obtainedwith data derived from CT (CTM). Additionally, the role ofAC in reprojected SPECT data was assessed and level ofnoise on the ‘planar-like’ images was measured.Results Phantom studies showed that AC markedly affectsthe D/N ratio. However, variations in µ values typical ofthose found in clinical studies resulted in relatively smallchanges in results. Eroded and dilated conditions did notcause any significant effect on D/N. The level of noise inthe reprojected images is reduced in comparison with realplanar data. Clinical SPECT/CT data reconstructed withAC using CTM and SM showed an excellent correlationbetween the two methods.
Conclusion AC improves D/N in lung SPECT studies, thuspotentially enhancing the diagnostic capability of themethod. The use of a synthetic map for AC is feasible,avoiding the need for an additional procedure and theincreased radiation dose involved. Planar-like imagesgenerated from reprojected SPECT data are well matchedto normal planar images provided AC is performed andattenuation included in the reprojection.
Keywords Image processing . SPECT. V/Q .
Pulmonary embolism . Reconstruction quantification
Introduction
Lung perfusion and ventilation (V/Q) studies have beenlargely used for non-invasive diagnosis of pulmonaryembolism (PE). Even in the era of spiral CT pulmonaryangiography (CTPA) and despite ongoing controversiesover which should be the first-line examination in patientswith suspected PE [1–6], the role of pulmonary nuclearmedicine has remained important due to the amount ofexperience accumulated with its use, the functional natureof the assessment, the wide availability of the method, thelower radiation dose delivered to the patient and itsrelatively low cost [2, 7–9]. According to a survey, by2001 in the USA there was a higher proportion of imagingwith CT than V/Q scintigraphy for PE (36 vs 32%), buteven so, in many individual institutions a majority ofpatients continued to have V/Q scans [4]. In fact, moststudies comparing the diagnostic accuracy of lung V/Q andCTPA have used planar scintigraphy, which is not state-of-the-art technology [10]. The application of single photonemission computed tomography (SPECT) allowing for thedetection of subsegmental defects more accurately than
Eur J Nucl Med Mol Imaging (2009) 36:1076–1089DOI 10.1007/s00259-009-1090-4
M. Núñez (*) :O. AlonsoUniversity School of Medical Technology,Montevideo, Uruguaye-mail: [email protected]
M. Núñez : R. Vila : F. Mut :O. AlonsoNuclear Medicine Department, Asociación Española,Montevideo, Uruguay
M. Núñez :V. Prakash :B. F. HuttonInstitute of Nuclear Medicine,UCL and UCLH NHS Foundation Trust,London, UK
with planar images [1, 10–13] and the introduction of fine-particle radiolabelled micro-aerosols (Technegas) withbetter definition of peripheral lung structures [10, 14–16]have improved the diagnostic possibilities of nuclearmedicine in this area leading to an increasing interest inthe use of this technology. Also, it has been demonstratedthat fast V/Q SPECT acquisition with standard doses isfeasible, achieving good quality images [17, 18].
One of the major limitations of lung studies that remainsis the scan interpretation and report. The characteristicfinding in PE is the presence of segmental or subsegmentalperfusion defects with preserved ventilation, the so-calledmismatch pattern. However, a pure version of this pattern,which is highly specific for PE [19, 20], is not frequentlyfound in clinical practice, making the interpretation difficultfor less experienced physicians [21, 22]. In fact, manypublished investigations recognize that inter-observerreproducibility is far from optimal in lung V/Q studies[23–26]. Several approaches aimed at standardizing thereporting criteria have been described to overcome thisproblem [27–30], most of which conclude in the definitionof a low, intermediate or high probability of PE. Studiesclassified as intermediate or indeterminate probability of PEare non-diagnostic and may account for as much as 40% ofthe cases [14, 27, 31, 32]. Hence, the use of an objective,semi-quantitative method of evaluation of lung V/Q would bedesirable which could facilitate interpretation, thus minimiz-ing the number of indeterminate results [33]. However, it isessential for this purpose that the activity distribution can beaccurately imaged without serious artefacts [34–43].
Although the benefits of SPECT techniques in terms ofsensitivity, specificity and inter-observer agreement for lungstudies have been demonstrated [1, 9, 11, 12, 17], the use ofSPECT also increases the amount of data to be analysed bythe physician in order to reach a diagnosis. Both the largeamount of data to analyse and the lack of familiarity ofreporting physicians with lung SPECT images haveprobably precluded the transition from planar to SPECTtechnique in this area. Furthermore, the PIOPED and othercriteria typically used to report lung studies were definedfor planar imaging, making it essential for physicians toevaluate the images in a similar way if they are to applythose same criteria. Thus, a method to present the data in amore condensed way in the form of a set of planar imageswhile keeping the advanced diagnostic potential of SPECTseems attractive, although the application of classic interpre-tation criteria would need clinical validation. Reprojection ofSPECT reconstructed data in the form of ‘planar-like’ imagesfollows this approach [44–46].
The importance of accurate compensation for attenuationeffects in SPECT is already widely recognized [34, 35,47, 48]. It is well known that attenuation may lead toartefacts and inaccuracies in reconstructed images, which
are particularly disturbing in the thorax because of thepresence of the highly non-uniform distribution ofattenuating tissues. Several correction methods have beenproposed to eliminate this effect in the thoracic region;however, such corrections have been frequently applied tocardiac studies but rarely to lung SPECT studies [47, 49, 50].
Non-uniform attenuation correction requires an attenu-ation map containing information about the densitydistribution of tissues in the thorax. Most clinicalattenuation compensation techniques use maps derivedfrom data obtained with transmission scans which aregenerated using either computed tomography (CT) orexternal transmission sources [35, 37, 47]. However, bothof these approaches require separate acquisitions, mayreduce the field of view due to use of a fan or cone beamcollimation for transmission imaging or may introducesome contamination of emission photons with transmission.Transmission acquisition is associated with additionalradiation dose to the patient, not to mention that in thecase of external sources, these are expensive and have to beperiodically replaced.
The idea of assigning a priori determined µ values inregions identified from transverse slices for non-uniformattenuation correction was first suggested in the early 1980s[51] and a contour detection method using the Comptonscattered data was proposed later [52]. In the 1990s, thesegmentation of the lung regions from emission studies wasinvestigated for application in cardiac studies [53, 54].Following these initial studies, the possibility of estimatingthe patient’s specific µ map from solely using the emissiondata of both photopeak and scatter energy windows tocorrect cardiac SPECT studies was reported [47, 49]. Theauthors demonstrated the feasibility of producing syntheticattenuation maps from emission data alone, by means ofsegmentation of reconstructed scatter and photopeakSPECT images and assigning constant values of attenuationcoefficients for lung and soft tissue. In a recent publication[46], the same approach was applied for lung SPECTstudies although the accuracy of the method was notvalidated by the authors.
The main objective of this study was to investigate theimportance of attenuation correction (AC) in lung SPECTstudies. Simulation studies were undertaken to evaluate theinfluence of AC on perfusion and ventilation lung countsand to demonstrate the influence of errors in the correctionmap values used for attenuation correction. We alsoevaluated the application of a synthetic map for AC andcompared the results with those obtained with data derivedfrom CT in an attempt to validate its use. Additionally, weassessed the role of attenuation in reprojected SPECT datagenerated in order to keep the appearance of the usualplanar projections while preserving the power of three-dimensional (3-D) data.
Eur J Nucl Med Mol Imaging (2009) 36:1076–1089 1077
Methods
The investigation included the following steps:
(a) Comparison of defect-to-normal ratios (D/N) with andwithout AC using a true attenuation map derived fromCT and a synthetic attenuation map
(b) Assessment of the influence of variation in lungattenuation coefficients
(c) Assessment of the influence of errors in the detectionof lung boundaries
(d) Validation of the synthetic map against a trueattenuation map from CT
(e) Evaluation of the effect of AC on reprojected planar-likeimages
The study was performed using the NURBS-based cardio-thoracic (NCAT) virtual phantom [55–57] and clinical studiesfrom ten patients referred for evaluation of suspected PE. TheNURBS-based cardiac-torso (NCAT) phantom was originallydeveloped to provide a realistic and flexible model of thehuman anatomy and physiology for use in nuclear medicineresearch, specifically emission tomography. Non-uniform ra-tional b-splines (NURBS) surfaces were used to construct theorgan shapes in the NCAT phantom based on 3-D CT data sets.NURBS surfaces can be altered easily to model anatomicalvariations and patient motion. Combined with accurate modelsof the imaging process, the NCAT is capable of simulatingimaging data close to that of actual patient studies.
Data acquisition—phantom studies
The 3-D NCAT phantom was used to simulate normal(ventilation) and abnormal (perfusion defect) lung SPECT
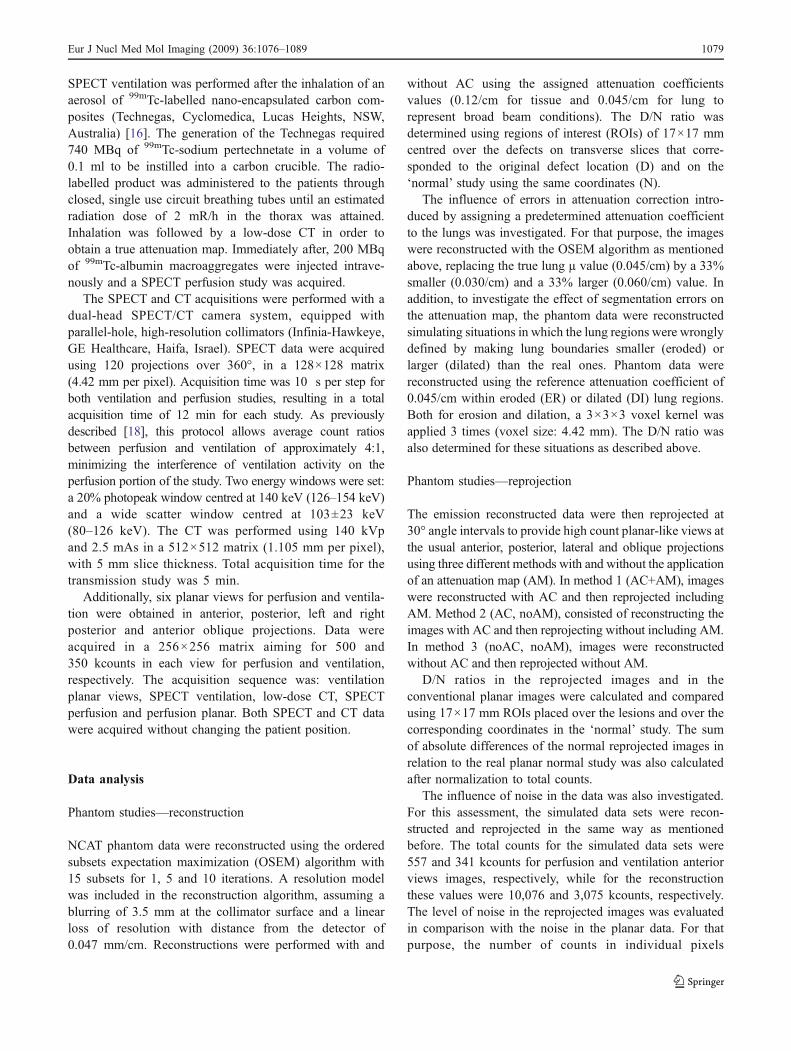
clinical studies. Three ‘cold perfusion defects’ with zerocounts were added to the phantom to simulate abnormalstudies. The perfusion defects (21×21×21 mm) wereplaced centrally in the lungs, one in the centre of the rightlung (RL) and two in the left lung (LL) in anterior andposterior locations (Fig. 1). Although the shape of defects isnot typical of PE, this was sufficient for evaluationpurposes. Projections were constructed for both ‘normal’and ‘abnormal’ lungs based on the corresponding attenua-tion maps with the attenuation coefficient (µ) for lung set to0.045/cm and collimator blurring representative of a high-resolution, parallel-hole collimator. High count studies weresimulated to minimize noise. Scatter was not included inthe projector but attenuation coefficient values wereassigned during both projection and reconstruction toapproximate a broad beam situation.
Additionally, six sets of ‘normal’ perfusion and ventila-tion studies were generated with a level of noise similar tothat encountered in clinical studies. Values for this purposewere derived from regions of interest drawn over the lungsin clinical perfusion studies (90±16 cts/pixel) and ventila-tion studies (25±6 cts/pixel). Poisson noise was generatedon projections.
Data acquisition—patient studies
Ten patients referred for investigation of suspected PE werealso studied. Patients were clinically evaluated to ensure nocontraindication was present and to confirm their ability totolerate the procedure. Acquisition was performed in thesupine position with the patient’s arms above the headwhenever this position was well tolerated. This positionwas kept the same for the V/Q SPECT and CT acquisitions.
Fig. 1 Placement of the three‘cold perfusion defects’ (blacksquares) on the NCAT phantomlocated in anterior, central andposterior aspects. From left toright: coronal, transverse andsagittal views. LL left lung, RLright lung. The arrow depictsone of the defects on the LL
1078 Eur J Nucl Med Mol Imaging (2009) 36:1076–1089
SPECT ventilation was performed after the inhalation of anaerosol of 99mTc-labelled nano-encapsulated carbon com-posites (Technegas, Cyclomedica, Lucas Heights, NSW,Australia) [16]. The generation of the Technegas required740 MBq of 99mTc-sodium pertechnetate in a volume of0.1 ml to be instilled into a carbon crucible. The radio-labelled product was administered to the patients throughclosed, single use circuit breathing tubes until an estimatedradiation dose of 2 mR/h in the thorax was attained.Inhalation was followed by a low-dose CT in order toobtain a true attenuation map. Immediately after, 200 MBqof 99mTc-albumin macroaggregates were injected intrave-nously and a SPECT perfusion study was acquired.
The SPECT and CT acquisitions were performed with adual-head SPECT/CT camera system, equipped withparallel-hole, high-resolution collimators (Infinia-Hawkeye,GE Healthcare, Haifa, Israel). SPECT data were acquiredusing 120 projections over 360°, in a 128×128 matrix(4.42 mm per pixel). Acquisition time was 10 s per step forboth ventilation and perfusion studies, resulting in a totalacquisition time of 12 min for each study. As previouslydescribed [18], this protocol allows average count ratiosbetween perfusion and ventilation of approximately 4:1,minimizing the interference of ventilation activity on theperfusion portion of the study. Two energy windows were set:a 20% photopeak window centred at 140 keV (126–154 keV)and a wide scatter window centred at 103±23 keV(80–126 keV). The CT was performed using 140 kVpand 2.5 mAs in a 512×512 matrix (1.105 mm per pixel),with 5 mm slice thickness. Total acquisition time for thetransmission study was 5 min.
Additionally, six planar views for perfusion and ventila-tion were obtained in anterior, posterior, left and rightposterior and anterior oblique projections. Data wereacquired in a 256×256 matrix aiming for 500 and350 kcounts in each view for perfusion and ventilation,respectively. The acquisition sequence was: ventilationplanar views, SPECT ventilation, low-dose CT, SPECTperfusion and perfusion planar. Both SPECT and CT datawere acquired without changing the patient position.
Data analysis
Phantom studies—reconstruction
NCAT phantom data were reconstructed using the orderedsubsets expectation maximization (OSEM) algorithm with15 subsets for 1, 5 and 10 iterations. A resolution modelwas included in the reconstruction algorithm, assuming ablurring of 3.5 mm at the collimator surface and a linearloss of resolution with distance from the detector of0.047 mm/cm. Reconstructions were performed with and
without AC using the assigned attenuation coefficientsvalues (0.12/cm for tissue and 0.045/cm for lung torepresent broad beam conditions). The D/N ratio wasdetermined using regions of interest (ROIs) of 17×17 mmcentred over the defects on transverse slices that corre-sponded to the original defect location (D) and on the‘normal’ study using the same coordinates (N).
The influence of errors in attenuation correction intro-duced by assigning a predetermined attenuation coefficientto the lungs was investigated. For that purpose, the imageswere reconstructed with the OSEM algorithm as mentionedabove, replacing the true lung µ value (0.045/cm) by a 33%smaller (0.030/cm) and a 33% larger (0.060/cm) value. Inaddition, to investigate the effect of segmentation errors onthe attenuation map, the phantom data were reconstructedsimulating situations in which the lung regions were wronglydefined by making lung boundaries smaller (eroded) orlarger (dilated) than the real ones. Phantom data werereconstructed using the reference attenuation coefficient of0.045/cm within eroded (ER) or dilated (DI) lung regions.Both for erosion and dilation, a 3×3×3 voxel kernel wasapplied 3 times (voxel size: 4.42 mm). The D/N ratio wasalso determined for these situations as described above.
Phantom studies—reprojection
The emission reconstructed data were then reprojected at30° angle intervals to provide high count planar-like views atthe usual anterior, posterior, lateral and oblique projectionsusing three different methods with and without the applicationof an attenuation map (AM). In method 1 (AC+AM), imageswere reconstructed with AC and then reprojected includingAM. Method 2 (AC, noAM), consisted of reconstructing theimages with AC and then reprojecting without including AM.In method 3 (noAC, noAM), images were reconstructedwithout AC and then reprojected without AM.
D/N ratios in the reprojected images and in theconventional planar images were calculated and comparedusing 17×17 mm ROIs placed over the lesions and over thecorresponding coordinates in the ‘normal’ study. The sumof absolute differences of the normal reprojected images inrelation to the real planar normal study was also calculatedafter normalization to total counts.
The influence of noise in the data was also investigated.For this assessment, the simulated data sets were recon-structed and reprojected in the same way as mentionedbefore. The total counts for the simulated data sets were557 and 341 kcounts for perfusion and ventilation anteriorviews images, respectively, while for the reconstructionthese values were 10,076 and 3,075 kcounts, respectively.The level of noise in the reprojected images was evaluatedin comparison with the noise in the planar data. For thatpurpose, the number of counts in individual pixels
Eur J Nucl Med Mol Imaging (2009) 36:1076–1089 1079
representative of four different lung regions on the planardata (superior and middle lobes of RL, superior and inferiorlobes of LL) and on each of the six sets of simulated normaldata was measured. The noise was calculated as thestandard deviation in counts across data sets for eachparticular pixel divided by the mean value. The averagenoise values for perfusion and ventilation were calculatedtaken for each number of iterations and compared with theplanar values for data both corrected (AC) and notcorrected for attenuation (noAC).
Patient studies—reconstruction
Patients’ data were reconstructed using OSEM (15subsets, 1 iteration) with and without AC. No resolutionmodel or scatter correction was included. For AC, twodifferent density maps were used: an attenuation mapgenerated from the transmission study (CTM) where theµ values were calculated from the CT numbers obtained(Hounsfield units) and a synthetic attenuation map (SM)generated from the emission study [46, 47, 49, 50, 52].To produce the SM, body boundaries were obtained fromreconstructed perfusion data corresponding to the scatterwindow, while lung boundaries were obtained from thereconstructed photopeak data. Fully 3-D segmentation ofsoft and lung tissue was performed using an in-housedeveloped counts threshold-based program. By default,threshold levels were set at 10% of the global maximumpixel count for body boundaries and 25% for lungboundaries [17, 46, 52]. Although in most situations thisautomatic thresholding appropriately matched the trueboundaries by visual estimation, in about 5% of the casesuser interaction was necessary to achieve a consistentboundary definition. A constant µ value was assigned tothe area for the defined body and lung segments.Typically, a µ value of 0.12/cm is applied for AC in brainstudies; however, it is common to use a lower µ value inthe body due to the additional scatter in the region. Wetherefore decided to use a preassigned broad beam valuefor soft tissue of 0.11/cm, and one third of this assigned µvalue was used for lung (0.036/cm). The imaging bed isincluded in the boundary detected during segmentation[52] and was assigned a µ value of 0.031/cm. Theattenuation coefficient value for the bed was calculatedusing the ratio of average Hounsfield units for thesegmented bed compared to lung as derived from CT.Both CT and synthetic attenuation maps were smoothedusing a 3-D 12-mm FWHM Gaussian filter in order toapproximately match the SPECT reconstructed spatialresolution.
For the validation of the SM, a ROI was placed overeach lung in a selected transverse slice of the reconstructeddata. The total counts of each area for the ten patients,
reconstructed with AC using the CTM and SM, werecompared using linear regression analysis.
Patient studies—reprojection
Reprojected planar-like images with and without AC weregenerated. As with the virtual phantom, the reconstructedphotopeak emission data were reprojected at 30° angleintervals to provide high count planar-like views at theusual anterior, posterior, lateral and oblique projections.The total counts for true planar and reprojected views werealso evaluated using linear regression.
A full clinical assessment was not undertaken as thiswould require a large number of patients with a wide range ofV/Q defects in order to provide valid statistical comparison.
Statistical analysis
Paired Student’s t tests were applied to determine statisti-cally significant differences in the quantitative values;p values <0.05 were considered significant. Linear regres-sion analysis was applied as mentioned above. GraphPadInStat version 3.06 for Windows (GraphPad Software, SanDiego, CA, USA) was used for statistical analysis.
Results
Phantom studies—reconstructed images
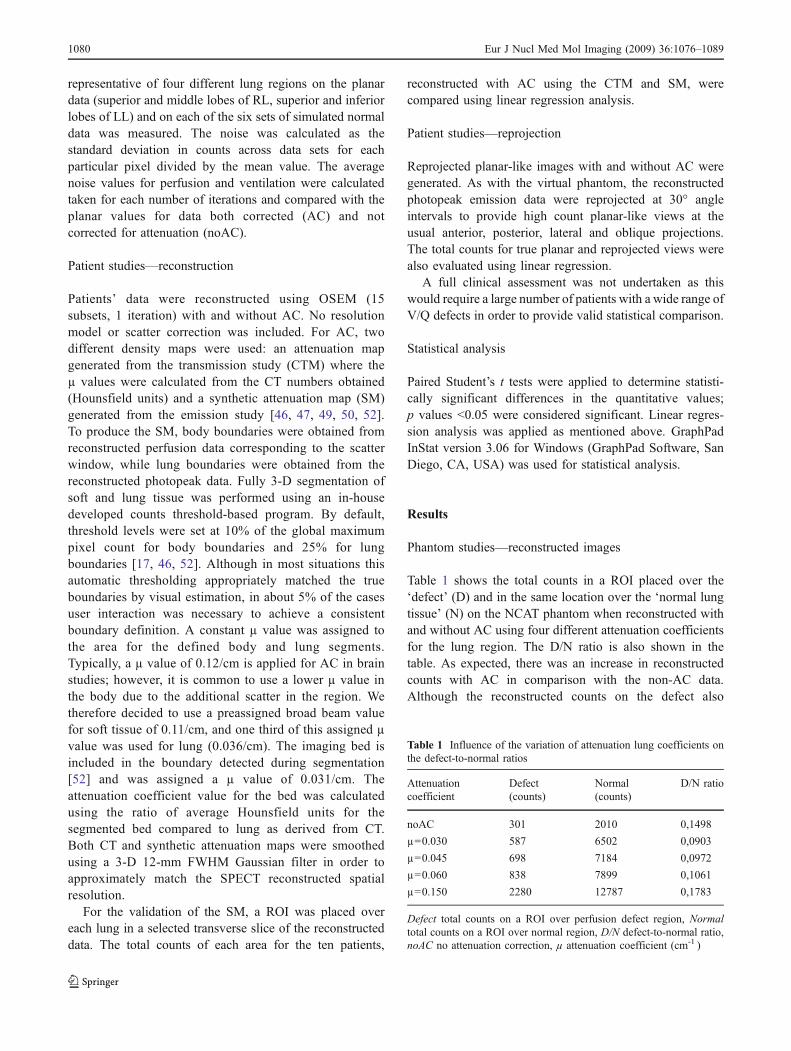
Table 1 shows the total counts in a ROI placed over the‘defect’ (D) and in the same location over the ‘normal lungtissue’ (N) on the NCAT phantom when reconstructed withand without AC using four different attenuation coefficientsfor the lung region. The D/N ratio is also shown in thetable. As expected, there was an increase in reconstructedcounts with AC in comparison with the non-AC data.Although the reconstructed counts on the defect also
Table 1 Influence of the variation of attenuation lung coefficients onthe defect-to-normal ratios
Attenuationcoefficient
Defect(counts)
Normal(counts)
D/N ratio
noAC 301 2010 0,1498
µ=0.030 587 6502 0,0903
µ=0.045 698 7184 0,0972
µ=0.060 838 7899 0,1061
µ=0.150 2280 12787 0,1783
Defect total counts on a ROI over perfusion defect region, Normaltotal counts on a ROI over normal region, D/N defect-to-normal ratio,noAC no attenuation correction, µ attenuation coefficient (cm-1 )
1080 Eur J Nucl Med Mol Imaging (2009) 36:1076–1089
increased when AC was performed, the D/N ratio improvedchanging results by more than 50% compared to thesituation in which AC was not performed or when µ valuesof soft tissue had been used. This improved contrastsuggests that AC should more accurately demonstrate V/Qlung SPECT ratios in clinical situations. Variations in µvalues typical of those found in clinical studies (0.045/cm ±33%) resulted in relatively small changes in results. For a µvalue of 0.030/cm, the D/N ratio was underestimated byless than 7% compared to the lung reference value (0.045/cm) while with a larger µ of 0.060/cm the D/N ratio wasoverestimated by 9%.
Table 2 shows the results of the NCAT phantomquantification, performed in the same way as mentionedabove, when reconstruction was performed with AC usingthe reference µ value for lung of 0.045/cm under ER and DIconditions. Results indicated that ER and DI did not causeany significant effect on D/N ratios changing results by lessthan 2%. This is expected since the total counts on the ROIon both defect and normal regions are similarly affected.
The results from Tables 1 and 2 suggest that the use ofan exact µ value is not essential and also small errors inboundary detection can be tolerated, thus the need of ameasured attenuation map may be avoided making possibleinstead the utilization of a synthetic map with predefinedattenuation coefficients.
Phantom studies—reprojected images
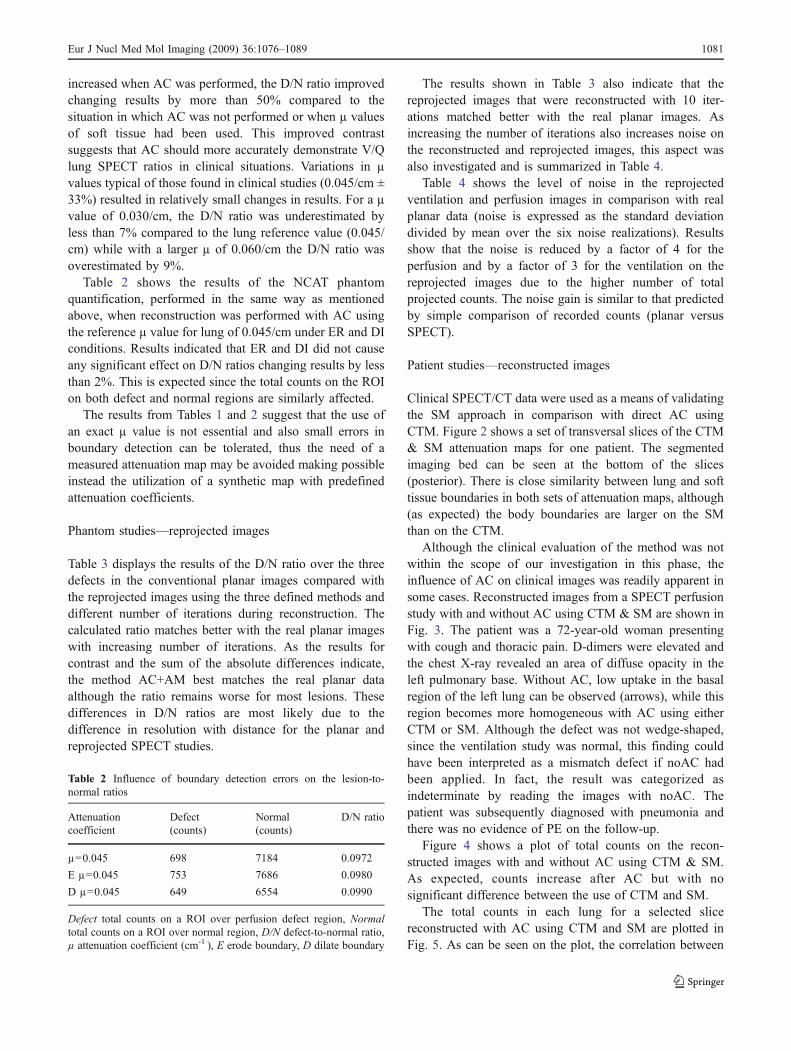
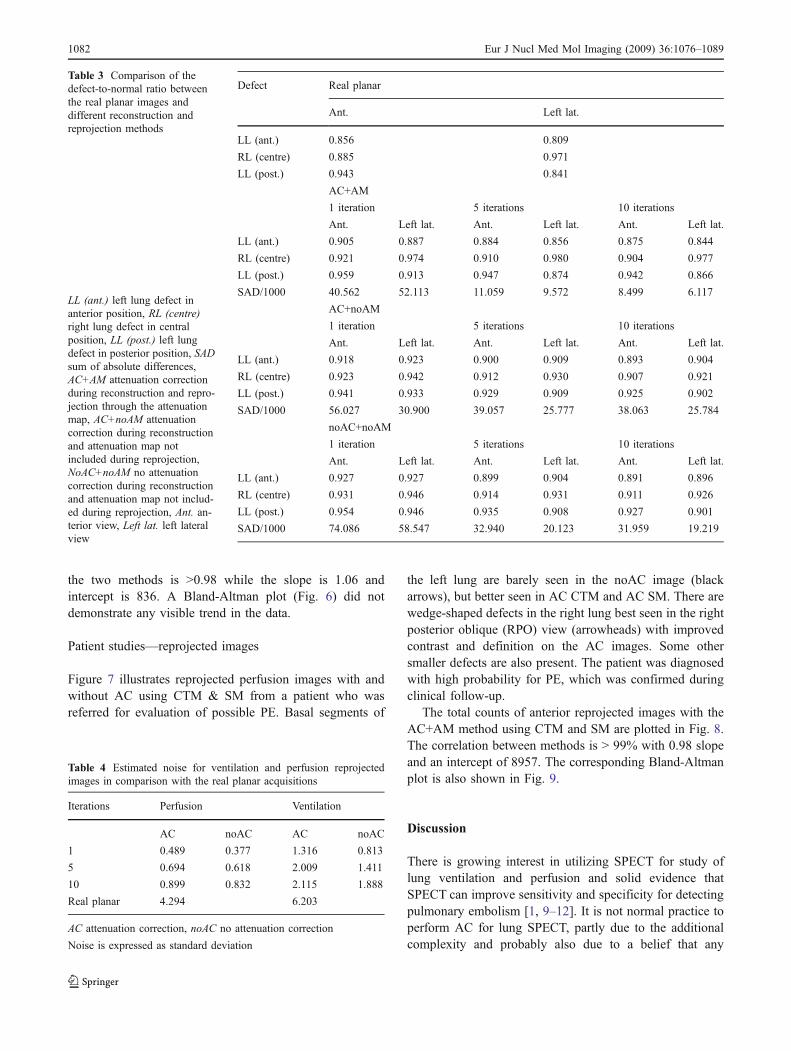
Table 3 displays the results of the D/N ratio over the threedefects in the conventional planar images compared withthe reprojected images using the three defined methods anddifferent number of iterations during reconstruction. Thecalculated ratio matches better with the real planar imageswith increasing number of iterations. As the results forcontrast and the sum of the absolute differences indicate,the method AC+AM best matches the real planar dataalthough the ratio remains worse for most lesions. Thesedifferences in D/N ratios are most likely due to thedifference in resolution with distance for the planar andreprojected SPECT studies.
The results shown in Table 3 also indicate that thereprojected images that were reconstructed with 10 iter-ations matched better with the real planar images. Asincreasing the number of iterations also increases noise onthe reconstructed and reprojected images, this aspect wasalso investigated and is summarized in Table 4.
Table 4 shows the level of noise in the reprojectedventilation and perfusion images in comparison with realplanar data (noise is expressed as the standard deviationdivided by mean over the six noise realizations). Resultsshow that the noise is reduced by a factor of 4 for theperfusion and by a factor of 3 for the ventilation on thereprojected images due to the higher number of totalprojected counts. The noise gain is similar to that predictedby simple comparison of recorded counts (planar versusSPECT).
Patient studies—reconstructed images
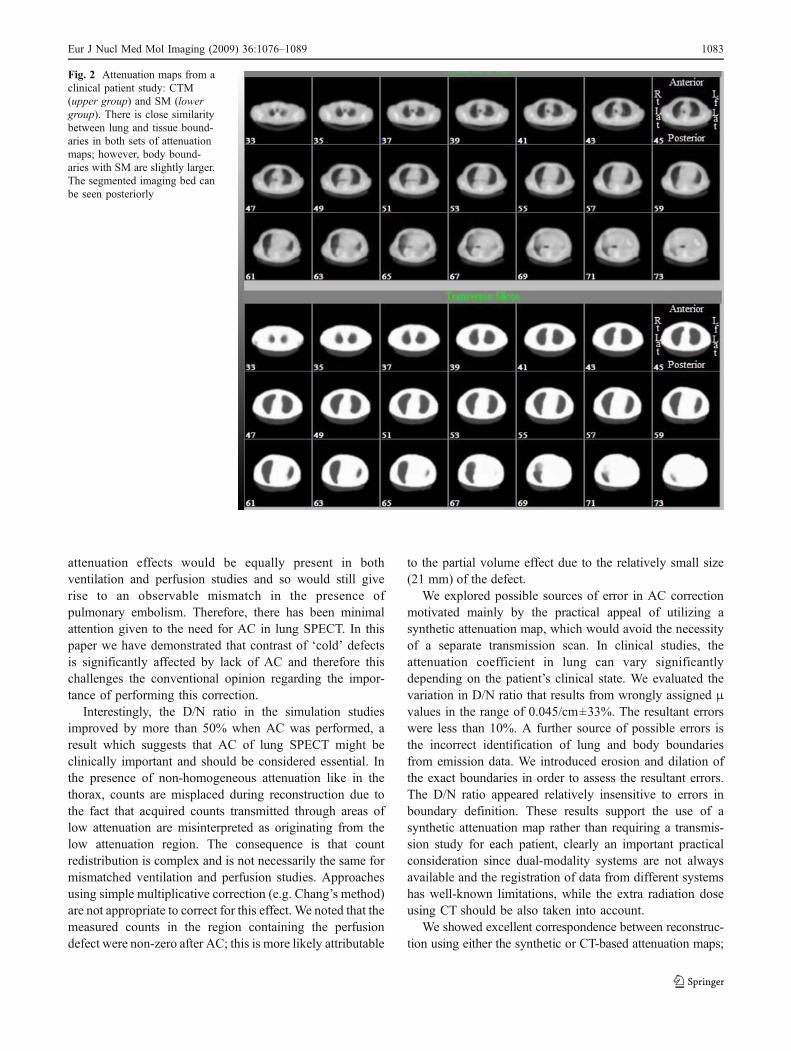
Clinical SPECT/CT data were used as a means of validatingthe SM approach in comparison with direct AC usingCTM. Figure 2 shows a set of transversal slices of the CTM& SM attenuation maps for one patient. The segmentedimaging bed can be seen at the bottom of the slices(posterior). There is close similarity between lung and softtissue boundaries in both sets of attenuation maps, although(as expected) the body boundaries are larger on the SMthan on the CTM.
Although the clinical evaluation of the method was notwithin the scope of our investigation in this phase, theinfluence of AC on clinical images was readily apparent insome cases. Reconstructed images from a SPECT perfusionstudy with and without AC using CTM & SM are shown inFig. 3. The patient was a 72-year-old woman presentingwith cough and thoracic pain. D-dimers were elevated andthe chest X-ray revealed an area of diffuse opacity in theleft pulmonary base. Without AC, low uptake in the basalregion of the left lung can be observed (arrows), while thisregion becomes more homogeneous with AC using eitherCTM or SM. Although the defect was not wedge-shaped,since the ventilation study was normal, this finding couldhave been interpreted as a mismatch defect if noAC hadbeen applied. In fact, the result was categorized asindeterminate by reading the images with noAC. Thepatient was subsequently diagnosed with pneumonia andthere was no evidence of PE on the follow-up.
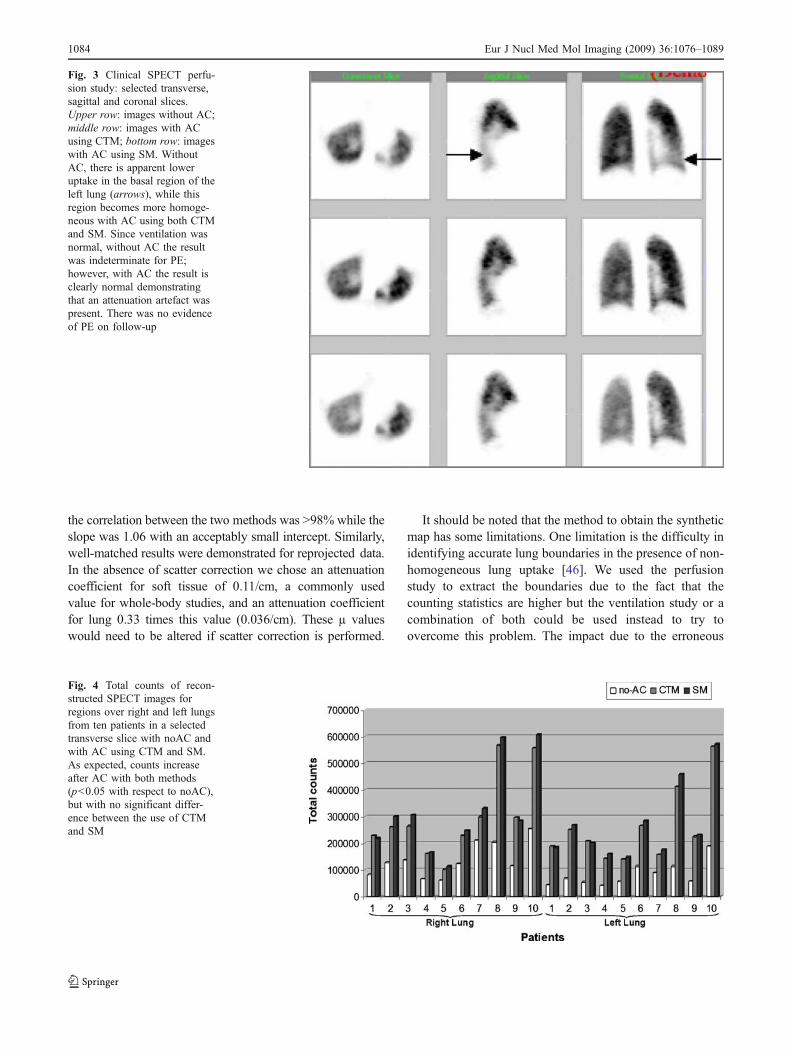
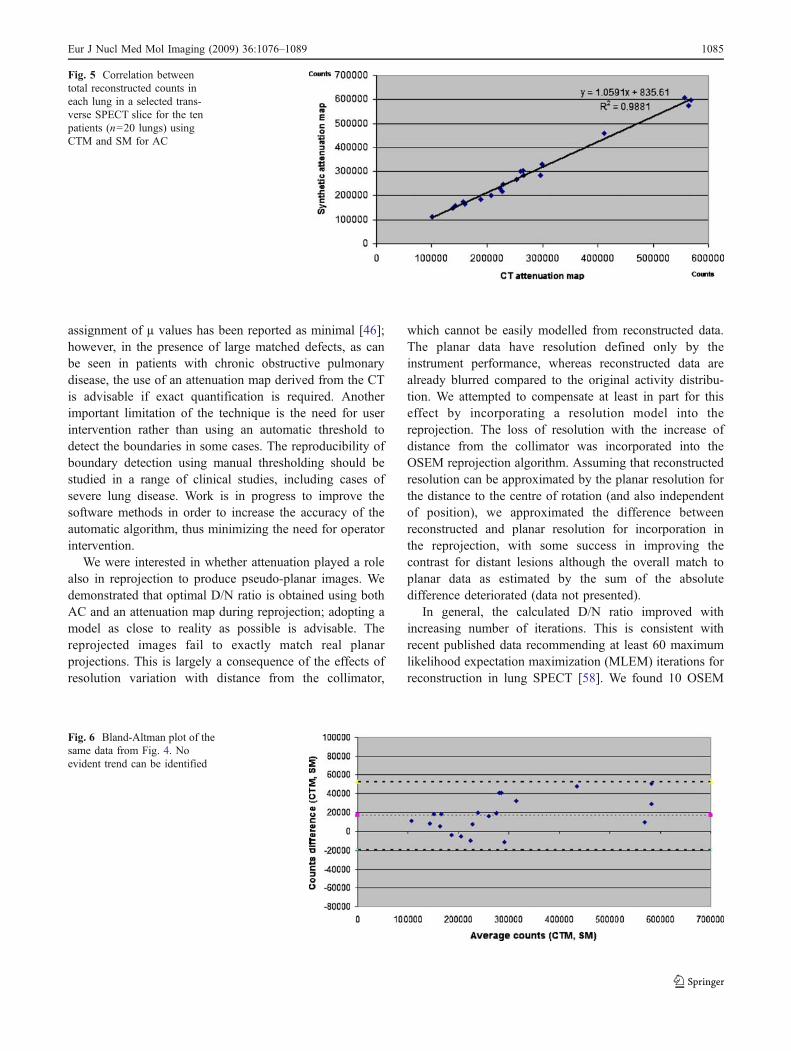
Figure 4 shows a plot of total counts on the recon-structed images with and without AC using CTM & SM.As expected, counts increase after AC but with nosignificant difference between the use of CTM and SM.
The total counts in each lung for a selected slicereconstructed with AC using CTM and SM are plotted inFig. 5. As can be seen on the plot, the correlation between
Table 2 Influence of boundary detection errors on the lesion-to-normal ratios
Attenuationcoefficient
Defect(counts)
Normal(counts)
D/N ratio
µ=0.045 698 7184 0.0972
E µ=0.045 753 7686 0.0980
D µ=0.045 649 6554 0.0990
Defect total counts on a ROI over perfusion defect region, Normaltotal counts on a ROI over normal region, D/N defect-to-normal ratio,µ attenuation coefficient (cm-1 ), E erode boundary, D dilate boundary
Eur J Nucl Med Mol Imaging (2009) 36:1076–1089 1081
the two methods is >0.98 while the slope is 1.06 andintercept is 836. A Bland-Altman plot (Fig. 6) did notdemonstrate any visible trend in the data.
Patient studies—reprojected images
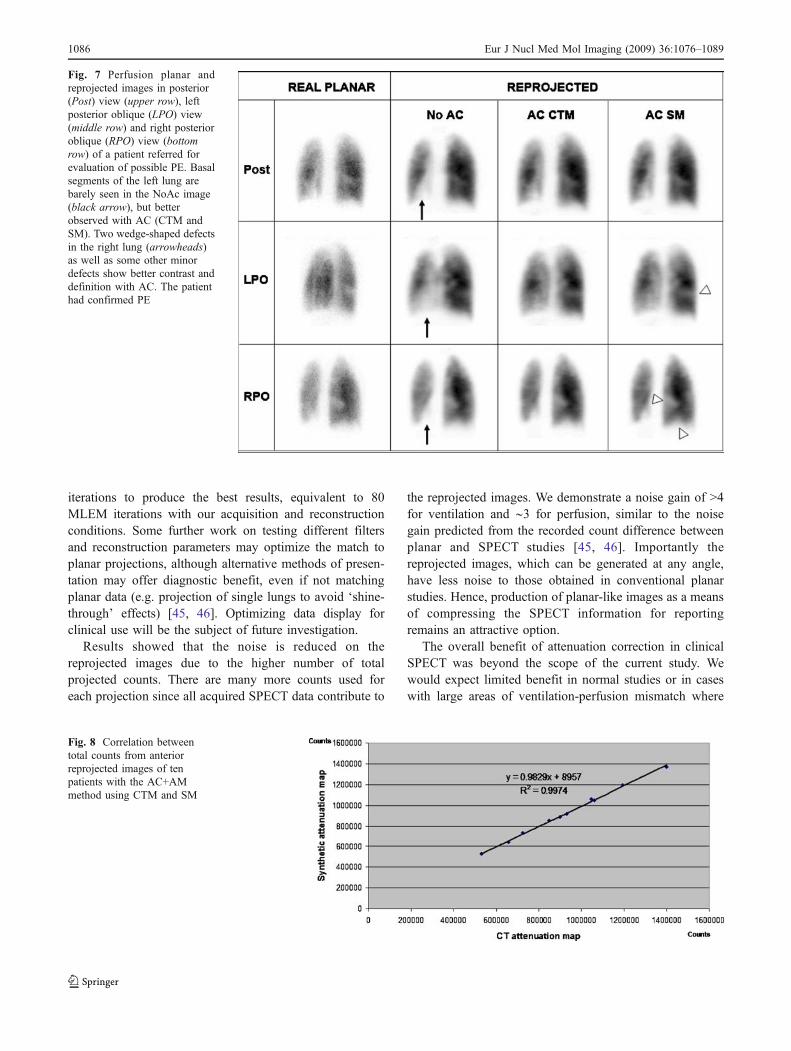
Figure 7 illustrates reprojected perfusion images with andwithout AC using CTM & SM from a patient who wasreferred for evaluation of possible PE. Basal segments of
the left lung are barely seen in the noAC image (blackarrows), but better seen in AC CTM and AC SM. There arewedge-shaped defects in the right lung best seen in the rightposterior oblique (RPO) view (arrowheads) with improvedcontrast and definition on the AC images. Some othersmaller defects are also present. The patient was diagnosedwith high probability for PE, which was confirmed duringclinical follow-up.
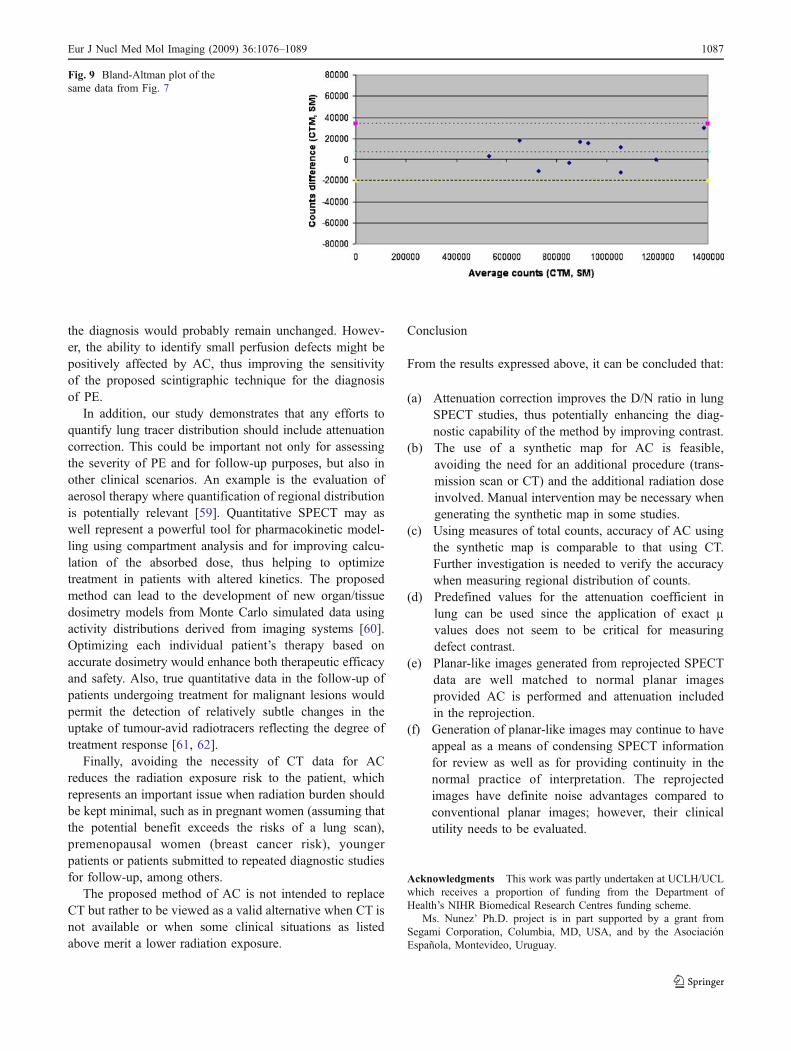
The total counts of anterior reprojected images with theAC+AM method using CTM and SM are plotted in Fig. 8.The correlation between methods is > 99% with 0.98 slopeand an intercept of 8957. The corresponding Bland-Altmanplot is also shown in Fig. 9.
Discussion
There is growing interest in utilizing SPECT for study oflung ventilation and perfusion and solid evidence thatSPECT can improve sensitivity and specificity for detectingpulmonary embolism [1, 9–12]. It is not normal practice toperform AC for lung SPECT, partly due to the additionalcomplexity and probably also due to a belief that any
Defect Real planar
Ant. Left lat.
LL (ant.) 0.856 0.809
RL (centre) 0.885 0.971
LL (post.) 0.943 0.841
AC+AM
1 iteration 5 iterations 10 iterations
Ant. Left lat. Ant. Left lat. Ant. Left lat.
LL (ant.) 0.905 0.887 0.884 0.856 0.875 0.844
RL (centre) 0.921 0.974 0.910 0.980 0.904 0.977
LL (post.) 0.959 0.913 0.947 0.874 0.942 0.866
SAD/1000 40.562 52.113 11.059 9.572 8.499 6.117
AC+noAM
1 iteration 5 iterations 10 iterations
Ant. Left lat. Ant. Left lat. Ant. Left lat.
LL (ant.) 0.918 0.923 0.900 0.909 0.893 0.904
RL (centre) 0.923 0.942 0.912 0.930 0.907 0.921
LL (post.) 0.941 0.933 0.929 0.909 0.925 0.902
SAD/1000 56.027 30.900 39.057 25.777 38.063 25.784
noAC+noAM
1 iteration 5 iterations 10 iterations
Ant. Left lat. Ant. Left lat. Ant. Left lat.
LL (ant.) 0.927 0.927 0.899 0.904 0.891 0.896
RL (centre) 0.931 0.946 0.914 0.931 0.911 0.926
LL (post.) 0.954 0.946 0.935 0.908 0.927 0.901
SAD/1000 74.086 58.547 32.940 20.123 31.959 19.219
Table 3 Comparison of thedefect-to-normal ratio betweenthe real planar images anddifferent reconstruction andreprojection methods
LL (ant.) left lung defect inanterior position, RL (centre)right lung defect in centralposition, LL (post.) left lungdefect in posterior position, SADsum of absolute differences,AC+AM attenuation correctionduring reconstruction and repro-jection through the attenuationmap, AC+noAM attenuationcorrection during reconstructionand attenuation map notincluded during reprojection,NoAC+noAM no attenuationcorrection during reconstructionand attenuation map not includ-ed during reprojection, Ant. an-terior view, Left lat. left lateralview
Table 4 Estimated noise for ventilation and perfusion reprojectedimages in comparison with the real planar acquisitions
Iterations Perfusion Ventilation
AC noAC AC noAC
1 0.489 0.377 1.316 0.813
5 0.694 0.618 2.009 1.411
10 0.899 0.832 2.115 1.888
Real planar 4.294 6.203
AC attenuation correction, noAC no attenuation correction
Noise is expressed as standard deviation
1082 Eur J Nucl Med Mol Imaging (2009) 36:1076–1089
attenuation effects would be equally present in bothventilation and perfusion studies and so would still giverise to an observable mismatch in the presence ofpulmonary embolism. Therefore, there has been minimalattention given to the need for AC in lung SPECT. In thispaper we have demonstrated that contrast of ‘cold’ defectsis significantly affected by lack of AC and therefore thischallenges the conventional opinion regarding the impor-tance of performing this correction.
Interestingly, the D/N ratio in the simulation studiesimproved by more than 50% when AC was performed, aresult which suggests that AC of lung SPECT might beclinically important and should be considered essential. Inthe presence of non-homogeneous attenuation like in thethorax, counts are misplaced during reconstruction due tothe fact that acquired counts transmitted through areas oflow attenuation are misinterpreted as originating from thelow attenuation region. The consequence is that countredistribution is complex and is not necessarily the same formismatched ventilation and perfusion studies. Approachesusing simple multiplicative correction (e.g. Chang’s method)are not appropriate to correct for this effect. We noted that themeasured counts in the region containing the perfusiondefect were non-zero after AC; this is more likely attributable
to the partial volume effect due to the relatively small size(21 mm) of the defect.
We explored possible sources of error in AC correctionmotivated mainly by the practical appeal of utilizing asynthetic attenuation map, which would avoid the necessityof a separate transmission scan. In clinical studies, theattenuation coefficient in lung can vary significantlydepending on the patient’s clinical state. We evaluated thevariation in D/N ratio that results from wrongly assigned μvalues in the range of 0.045/cm±33%. The resultant errorswere less than 10%. A further source of possible errors isthe incorrect identification of lung and body boundariesfrom emission data. We introduced erosion and dilation ofthe exact boundaries in order to assess the resultant errors.The D/N ratio appeared relatively insensitive to errors inboundary definition. These results support the use of asynthetic attenuation map rather than requiring a transmis-sion study for each patient, clearly an important practicalconsideration since dual-modality systems are not alwaysavailable and the registration of data from different systemshas well-known limitations, while the extra radiation doseusing CT should be also taken into account.
We showed excellent correspondence between reconstruc-tion using either the synthetic or CT-based attenuation maps;
Fig. 2 Attenuation maps from aclinical patient study: CTM(upper group) and SM (lowergroup). There is close similaritybetween lung and tissue bound-aries in both sets of attenuationmaps; however, body bound-aries with SM are slightly larger.The segmented imaging bed canbe seen posteriorly
Eur J Nucl Med Mol Imaging (2009) 36:1076–1089 1083
the correlation between the two methods was >98% while theslope was 1.06 with an acceptably small intercept. Similarly,well-matched results were demonstrated for reprojected data.In the absence of scatter correction we chose an attenuationcoefficient for soft tissue of 0.11/cm, a commonly usedvalue for whole-body studies, and an attenuation coefficientfor lung 0.33 times this value (0.036/cm). These µ valueswould need to be altered if scatter correction is performed.
It should be noted that the method to obtain the syntheticmap has some limitations. One limitation is the difficulty inidentifying accurate lung boundaries in the presence of non-homogeneous lung uptake [46]. We used the perfusionstudy to extract the boundaries due to the fact that thecounting statistics are higher but the ventilation study or acombination of both could be used instead to try toovercome this problem. The impact due to the erroneous
Fig. 3 Clinical SPECT perfu-sion study: selected transverse,sagittal and coronal slices.Upper row: images without AC;middle row: images with ACusing CTM; bottom row: imageswith AC using SM. WithoutAC, there is apparent loweruptake in the basal region of theleft lung (arrows), while thisregion becomes more homoge-neous with AC using both CTMand SM. Since ventilation wasnormal, without AC the resultwas indeterminate for PE;however, with AC the result isclearly normal demonstratingthat an attenuation artefact waspresent. There was no evidenceof PE on follow-up
Fig. 4 Total counts of recon-structed SPECT images forregions over right and left lungsfrom ten patients in a selectedtransverse slice with noAC andwith AC using CTM and SM.As expected, counts increaseafter AC with both methods(p<0.05 with respect to noAC),but with no significant differ-ence between the use of CTMand SM
1084 Eur J Nucl Med Mol Imaging (2009) 36:1076–1089
assignment of µ values has been reported as minimal [46];however, in the presence of large matched defects, as canbe seen in patients with chronic obstructive pulmonarydisease, the use of an attenuation map derived from the CTis advisable if exact quantification is required. Anotherimportant limitation of the technique is the need for userintervention rather than using an automatic threshold todetect the boundaries in some cases. The reproducibility ofboundary detection using manual thresholding should bestudied in a range of clinical studies, including cases ofsevere lung disease. Work is in progress to improve thesoftware methods in order to increase the accuracy of theautomatic algorithm, thus minimizing the need for operatorintervention.
We were interested in whether attenuation played a rolealso in reprojection to produce pseudo-planar images. Wedemonstrated that optimal D/N ratio is obtained using bothAC and an attenuation map during reprojection; adopting amodel as close to reality as possible is advisable. Thereprojected images fail to exactly match real planarprojections. This is largely a consequence of the effects ofresolution variation with distance from the collimator,
which cannot be easily modelled from reconstructed data.The planar data have resolution defined only by theinstrument performance, whereas reconstructed data arealready blurred compared to the original activity distribu-tion. We attempted to compensate at least in part for thiseffect by incorporating a resolution model into thereprojection. The loss of resolution with the increase ofdistance from the collimator was incorporated into theOSEM reprojection algorithm. Assuming that reconstructedresolution can be approximated by the planar resolution forthe distance to the centre of rotation (and also independentof position), we approximated the difference betweenreconstructed and planar resolution for incorporation inthe reprojection, with some success in improving thecontrast for distant lesions although the overall match toplanar data as estimated by the sum of the absolutedifference deteriorated (data not presented).
In general, the calculated D/N ratio improved withincreasing number of iterations. This is consistent withrecent published data recommending at least 60 maximumlikelihood expectation maximization (MLEM) iterations forreconstruction in lung SPECT [58]. We found 10 OSEM
Fig. 5 Correlation betweentotal reconstructed counts ineach lung in a selected trans-verse SPECT slice for the tenpatients (n=20 lungs) usingCTM and SM for AC
Fig. 6 Bland-Altman plot of thesame data from Fig. 4. Noevident trend can be identified
Eur J Nucl Med Mol Imaging (2009) 36:1076–1089 1085
iterations to produce the best results, equivalent to 80MLEM iterations with our acquisition and reconstructionconditions. Some further work on testing different filtersand reconstruction parameters may optimize the match toplanar projections, although alternative methods of presen-tation may offer diagnostic benefit, even if not matchingplanar data (e.g. projection of single lungs to avoid ‘shine-through’ effects) [45, 46]. Optimizing data display forclinical use will be the subject of future investigation.
Results showed that the noise is reduced on thereprojected images due to the higher number of totalprojected counts. There are many more counts used foreach projection since all acquired SPECT data contribute to
the reprojected images. We demonstrate a noise gain of >4for ventilation and ∼3 for perfusion, similar to the noisegain predicted from the recorded count difference betweenplanar and SPECT studies [45, 46]. Importantly thereprojected images, which can be generated at any angle,have less noise to those obtained in conventional planarstudies. Hence, production of planar-like images as a meansof compressing the SPECT information for reportingremains an attractive option.
The overall benefit of attenuation correction in clinicalSPECT was beyond the scope of the current study. Wewould expect limited benefit in normal studies or in caseswith large areas of ventilation-perfusion mismatch where
Fig. 7 Perfusion planar andreprojected images in posterior(Post) view (upper row), leftposterior oblique (LPO) view(middle row) and right posterioroblique (RPO) view (bottomrow) of a patient referred forevaluation of possible PE. Basalsegments of the left lung arebarely seen in the NoAc image(black arrow), but betterobserved with AC (CTM andSM). Two wedge-shaped defectsin the right lung (arrowheads)as well as some other minordefects show better contrast anddefinition with AC. The patienthad confirmed PE
Fig. 8 Correlation betweentotal counts from anteriorreprojected images of tenpatients with the AC+AMmethod using CTM and SM
1086 Eur J Nucl Med Mol Imaging (2009) 36:1076–1089
the diagnosis would probably remain unchanged. Howev-er, the ability to identify small perfusion defects might bepositively affected by AC, thus improving the sensitivityof the proposed scintigraphic technique for the diagnosisof PE.
In addition, our study demonstrates that any efforts toquantify lung tracer distribution should include attenuationcorrection. This could be important not only for assessingthe severity of PE and for follow-up purposes, but also inother clinical scenarios. An example is the evaluation ofaerosol therapy where quantification of regional distributionis potentially relevant [59]. Quantitative SPECT may aswell represent a powerful tool for pharmacokinetic model-ling using compartment analysis and for improving calcu-lation of the absorbed dose, thus helping to optimizetreatment in patients with altered kinetics. The proposedmethod can lead to the development of new organ/tissuedosimetry models from Monte Carlo simulated data usingactivity distributions derived from imaging systems [60].Optimizing each individual patient’s therapy based onaccurate dosimetry would enhance both therapeutic efficacyand safety. Also, true quantitative data in the follow-up ofpatients undergoing treatment for malignant lesions wouldpermit the detection of relatively subtle changes in theuptake of tumour-avid radiotracers reflecting the degree oftreatment response [61, 62].
Finally, avoiding the necessity of CT data for ACreduces the radiation exposure risk to the patient, whichrepresents an important issue when radiation burden shouldbe kept minimal, such as in pregnant women (assuming thatthe potential benefit exceeds the risks of a lung scan),premenopausal women (breast cancer risk), youngerpatients or patients submitted to repeated diagnostic studiesfor follow-up, among others.
The proposed method of AC is not intended to replaceCT but rather to be viewed as a valid alternative when CT isnot available or when some clinical situations as listedabove merit a lower radiation exposure.
Conclusion
From the results expressed above, it can be concluded that:
(a) Attenuation correction improves the D/N ratio in lungSPECT studies, thus potentially enhancing the diag-nostic capability of the method by improving contrast.
(b) The use of a synthetic map for AC is feasible,avoiding the need for an additional procedure (trans-mission scan or CT) and the additional radiation doseinvolved. Manual intervention may be necessary whengenerating the synthetic map in some studies.
(c) Using measures of total counts, accuracy of AC usingthe synthetic map is comparable to that using CT.Further investigation is needed to verify the accuracywhen measuring regional distribution of counts.
(d) Predefined values for the attenuation coefficient inlung can be used since the application of exact µvalues does not seem to be critical for measuringdefect contrast.
(e) Planar-like images generated from reprojected SPECTdata are well matched to normal planar imagesprovided AC is performed and attenuation includedin the reprojection.
(f) Generation of planar-like images may continue to haveappeal as a means of condensing SPECT informationfor review as well as for providing continuity in thenormal practice of interpretation. The reprojectedimages have definite noise advantages compared toconventional planar images; however, their clinicalutility needs to be evaluated.
Acknowledgments This work was partly undertaken at UCLH/UCLwhich receives a proportion of funding from the Department ofHealth’s NIHR Biomedical Research Centres funding scheme.
Ms. Nunez’ Ph.D. project is in part supported by a grant fromSegami Corporation, Columbia, MD, USA, and by the AsociaciónEspañola, Montevideo, Uruguay.
Fig. 9 Bland-Altman plot of thesame data from Fig. 7
Eur J Nucl Med Mol Imaging (2009) 36:1076–1089 1087
References
1. Bajc M, Bitzén U, Olsson B, Perez de Sá V, Palmer J, Jonson B.Lung ventilation/perfusion SPECT in the artificially embolizedpig. J Nucl Med 2002;43:640–7.
2. Burkill GJ, Bell JR, Padley SP. Survey on the use of pulmonaryscintigraphy, spiral CT and conventional pulmonary angiographyfor suspected pulmonary embolism in the British Isles. ClinRadiol 1999;54:807–10.
3. ACCP Consensus Committee on Pulmonary Embolism. Opinionsregarding the diagnosis and management of venous thromboem-bolic disease. Chest 1998;113:499–504.
4. Stein PD, Kayali F, Olson RE. Trends in the use of diagnosticimaging in patients hospitalized with acute pulmonary embolism.Am J Cardiol 2004;93:1316–7.
5. Gottschalk A, Sostman HD, Coleman RE, Juni JE, Thrall J,McKusick KA, et al. Ventilation-perfusion scintigraphy in thePIOPED study. Part II. Evaluation of the scintigraphic criteria andinterpretations. J Nucl Med 1993;34:1119–26.
6. Woodard PK. Pulmonary arteries must be seen before they can beassessed. Radiology 1997;204:11–2.
7. ICRP Publication. Radiation dose to patients from radiopharma-ceuticals (addendum 2 to ICRP publication 53). Ann ICRP1998;28(3):1–123.
8. Parkers MS, Hui FK, Camacho M, Chung JK, Broga DW, SethiNN. Female breast radiation exposure during CT pulmonaryangiography. AJR Am J Roentgenol 2005;185:1228–33.
9. Freeman L. Don’t bury the V/Q scan: it’s as good as multidetectorCT angiograms with a lot less radiation exposure. J Nucl Med2008;49:5–7.
10. Reinartz P, Wildberger JE, Schaefer W, Nowak B, Mahnken AH,Buell U. Tomographic imaging in the diagnosis of pulmonaryembolism: a comparison between V/Q lung scintigraphy inSPECT technique and multislice spiral CT. J Nucl Med2004;45:1501–8.
11. Collart JP, Roelants V, Vanpee D, Lacrosse M, Trigaux JP,Delaunois L, et al. Is a lung perfusion scan obtained by usingsingle photon emission computed tomography able to improve theradionuclide diagnosis of pulmonary embolism? Nucl MedCommun 2002;23:1107–13.
12. Corbus HF, Seitz JP, Larson RK, Stobbe DE, Wooten W, SayreJW, et al. Diagnostic usefulness of lung SPET in pulmonarythromboembolism: an outcome study. Nucl Med Commun1997;18:897–906.
13. Magnussen JS, Chicco P, Palmer AW, Bush V, Mackey DW,Storey G, et al. Single-photon emission tomography of acomputerised model of pulmonary embolism. Eur J Nucl Med1999;26:1430–8.
14. Martel AL, Tindale W. A comparative study of the effect ofTc-99 m Technegas and Tc-99mDTPA aerosol on image appearanceand lung scan reporting. Eur J Nucl Med 1994;21:731–6.
15. Lemb M, Pohlabein H. Pulmonary thromboembolism: a retrospec-tive study on the examination of 991 patients by ventilation/perfusionSPECT using Technegas. Nuklearmedizin 2001;40:179–86.
16. Senden TJ, Moock KH, Gerald JF, Burch WM, Browitt RJ, LingCD, et al. The physical and chemical nature of technegas. J NuclMed 1997;38:1327–33.
17. Palmer J, Bitzén U, Jonson B, Bajc M. Comprehensive ventila-tion/perfusion SPECT. J Nucl Med 2001;42:1288–94.
18. Núñez M, Beretta M, Mut F. Optimization of acquisitionparameters for fast lung ventilation and perfusion SPECT studies.J Nucl Med 2006;47 Suppl 1:530P.
19. Hartmann IJ, Hagen PJ, Melissant CF, Postmus PE, Prins MH.Diagnosing acute pulmonary embolism: effect of chronic obstruc-tive pulmonary disease on the performance of D-dimer testing,
ventilation/perfusion scintigraphy, spiral computed tomographicangiography, and conventional angiography. ANTELOPE StudyGroup. Advances in New Technologies Evaluating the Localiza-tion of Pulmonary Embolism. Am J Respir Crit Care Med2000;162:2232–7.
20. Briët E, van Beek EJ, Oudkerk M. Consensus diagnosispulmonary embolism (in Dutch). Ned Tijdschr Geneeskd1993;137(5):255–9.
21. Sostman HD, Coleman RE, DeLong DM, Newman GE, Paine S.Evaluation of revised criteria for ventilation-perfusion scintigraphyin patients with suspected pulmonary embolism. Radiology1994;193:103–7.
22. Christiansen F, Andersson T, Rydman H, Qvarner N, Måre K.Rater agreement in lung scintigraphy. Acta Radiol 1996;37(5):754–8.
23. Hagen JP, Hartmann IJ, Hoekstra OS, Stokkel MP, Postmus PE,Prins MH, et al. Comparison of observer variability and accuracyof different criteria for lung scan interpretation. J Nucl Med2003;44:739–44.
24. Christiansen F, Nilsson T, Måre K, Carlsson A. Observeragreement and accuracy for lung scintigraphy: a comparison withpulmonary angiography. Nucl Med Commun 1997;18(2):112–7.
25. Webber MM, Gomes AS, Roe D, La Fontaine RL, Hawkins RA.Comparison of Biello, McNeil, and PIOPED criteria for thediagnosis of pulmonary emboli on lung scans. AJR Am JRoentgenol 1990;154:975–81.
26. Sullivan DC, Coleman RE, Mills SR, Ravin CE, Hedlund LW.Lung scan interpretation: effect of different observers and differentcriteria. Radiology 1983;149:803–7.
27. The PIOPED investigators. Value of the ventilation/perfusion scanin acute pulmonary embolism. Results of the prospectiveinvestigation of pulmonary embolism diagnosis (PIOPED).JAMA 1990;263:2753–9.
28. Freitas JE, Sarosi MG, Nagle CC, Yeomans ME, Freitas AE, JuniJE. Modified PIOPED criteria used in clinical practice. J NuclMed 1995;36:1573–8.
29. Pistolesi M, Miniati M. Imaging techniques in treatment algorithmsof pulmonary embolism. Eur Respir J Suppl 2002;19:28s–39s.
30. Hagen PJ, Hartmann IJ, Hoekstra OS, Stokkel MP, Teule GJ,Prins MH. How to use a gestalt interpretation for ventilation-perfusion lung scintigraphy. J Nucl Med 2002;43:1317–23.
31. Rathbun SW, Whitsett TL, Vesely SK, Raskob GE. Clinical utilityof D-dimer in patients with suspected pulmonary embolism andnondiagnostic lung scans or negative CT findings. Chest2004;125:851–5.
32. Hull RD, Hirsh J, Carter CJ, Raskob GE, Gill JG, Jay RM, et al.Diagnostic value of ventilation-perfusion lung scanning in patientswith suspected pulmonary embolism. Chest 1985;88:819–28.
33. Howarth DM, Booker JA, Voutnis DD. Diagnosis of pulmonaryembolus using ventilation/perfusion lung scintigraphy: more than0.5 segment of ventilation/perfusion mismatch is sufficient. InternMed J 2006;36:281–8.
34. Gustafsson A, Bake B, Jacobsson L, Johansson A, LjungbergM, Moonen M. Evaluation of attenuation corrections usingMonte Carlo simulated lung SPECT. Phys Med Biol 1998;43:2325–36.
35. Gustafsson A, Jacobsson L, Johansson A, Moonen M, Tylen U,Bake B. Evaluation of various attenuation corrections in lungSPECT in healthy subjects. Nucl Med Commun 2003;24:1087–95.
36. Zaidi H, Hasegawa BH. Determination of the attenuation map inemission tomography. J Nucl Med 2003;44:291–315.
37. Willowson K, Bailey DL, Baldock C. Quantitative SPECTreconstruction using CT-derived corrections. Phys Med Biol2008;53:3099–112.
38. Meikle SR, Hutton BF, Bailey DL. A transmission-dependentmethod for scatter correction in SPECT. J Nucl Med 1994;35:360–7.
1088 Eur J Nucl Med Mol Imaging (2009) 36:1076–1089
39. Buvat I, Benali H, Todd-Pokropek A, Di Paola R. Scattercorrection in scintigraphy: the state of the art. Eur J Nucl Med1994;21:675–94.
40. Kashiwagi T, Yutani K, Fukuchi M, Naruse H, Iwasaki T,Yokozuka K, et al. Correction of nonuniform attenuation andimage fusion in SPECT imaging by means of separate X-ray CT.Ann Nucl Med 2002;16:255–61.
41. Larsson A, Johansson L, Sundström T, Ahlström KR. A method forattenuation and scatter correction of brain SPECT based on computedtomography images. Nucl Med Commun 2003;24:411–20.
42. Vandervoort E, Celler A, Harrop R. Implementation of an iterativescatter correction, the influence of attenuation map quality andtheir effect on absolute quantitation in SPECT. Phys Med Biol2007;52:1527–45.
43. NúñezM, Kacperski K, Hutton BF. Quantitative lung SPECTwithouttransmission acquisition: potential applications in 3D patient-specificdosimetry and in evaluation of treatment response. ProceedingsSeries, International Conference on Quality Assurance and NewTechniques in Radiation Medicine. Vienna: IAEA; 2006. p. 58.
44. Núñez M, Mut F, Beretta M, Alonso O, Hutton BF. Generación deimágenes planares a partir del estudio de SPECT pulmonar deventilación y perfusión. Alasbimn Journal 10 (40):April 2008.Article N° AJ40-3. http://www.alasbimnjournal.cl/
45. Harris B, Bailey DL, Roach PJ, Schembri GP, Hoshon I, Chicco P,et al. A clinical comparison between traditional planar V/Q imagesand planar images generated from SPECT V/Q scintigraphy. NuclMed Commun 2008;29:323–30.
46. Bailey DL, Schembri GP, Harris BE, Bailey EA, Cooper RA,Roach PJ. Generation of planar images from lung ventilation/perfusion SPECT. Ann Nucl Med 2008;22:437–45.
47. Pan TS, King M, Vries DJ, Ljungberg M. Segmentation of thebody and lungs from Compton scatter and photopeak window datain SPECT: a Monte-Carlo investigation. IEEE Trans Med Imaging1996;15(1):13–24.
48. Celler A, Dixon KL, Chang Z, Blinder S, Powe J, Harrop R.Problems created in attenuation-corrected SPECT images by artifactsin attenuationmaps: a simulation study. J NuclMed 2005;46:335–43.
49. Pan TS, King MA, Luo DS, Dahlberg ST, Villegas BJ. Estimationof attenuation maps from scatter and photopeak window singlephoton-emission computed tomographic images of technetium99m-labeled sestamibi. J Nucl Cardiol 1997;4(1 Pt 1):42–51.
50. Fukuchi K, Sago M, Nitta K, Fukushima K, Toba M, HayashidaK, et al. Attenuation correction for cardiac dual-head γ cameracoincidence imaging using segmented myocardial perfusionSPECT. J NucI Med 2000;41:919–25.
51. Budinger TF. Physical attributes of single-photon tomography. JNucl Med 1980;21:579–92.
52. Ben Younes R, Mas J, Bidet R. A fully automated contourdetection algorithm the preliminary step for scatter and attenuationcompensation in SPECT. Eur J Nucl Med 1988;14:586–9.
53. Madsen MT, Kirchner PT, Edlin JP, Nathan MA, Kahn D. Anemission-based technique for obtaining attenuation correction dataformyocardial SPECTstudies. NuclMedCommun 1993;14:689–95.
54. Fleming JS. Technique for the use of standard outlines forattenuation correction and quantification in SPECT. Nucl MedCommun 1990;11:685–96.
55. Segars WP, Lalush DS, Tsui BMW. A realistic spline-baseddynamic heart phantom. IEEE Trans Nucl Sci 1999;46:503–6.
56. Segars WP, Lalush DS, Tsui BMW. Modeling respiratorymechanics in the MCAT and spline-based MCAT phantoms.IEEE Trans Nucl Sci 2001;48:89–97.
57. Segars WP. Development and application of the new dynamicNURBS-based cardiac-torso (NCAT) phantom, PhD dissertation,The University of North Carolina, May 2001.
58. Norberg P, Bake B, Jacobsson L, Carlsson GA, Gustafsson A.Evaluation of reconstruction techniques for lung single photonemission tomography: a Monte Carlo study. Nucl Med Commun2007;28:929–36.
59. Itti E, Fauroux B, Pigeot J, Isabey D, Clement A, Evangelista E, etal. Quantitative lung perfusion scan as a predictor of aerosoldistribution heterogeneity and disease severity in children withcystic fibrosis. Nucl Med Commun 2004;25:563–9.
60. He B, Wahl RL, Du Y, Sgouros G, Jacene H, Flinn I, et al.Comparison of residence time estimation methods for radio-immunotherapy dosimetry and treatment planning—Monte Carlosimulation studies. IEEE Trans Med Imaging 2008;27:521–30.
61. Schuster DM, Alazraki N. Gallium and other agents in diseases ofthe lung. Semin Nucl Med 2002;32:193–211.
62. Danielsson R, Bååth M, Svensson L, Forslöv U, Kölbeck KG.Imaging of regional lymph node metastases with 99mTc-depreotide in patients with lung cancer. Eur J Nucl Med MolImaging 2005;32:925–31.
Eur J Nucl Med Mol Imaging (2009) 36:1076–1089 1089


