Embed Size (px)
Citation preview
ARTICLE IN PRESSDTD 5
Environmental Pollution -- (2005) ---–---
www.elsevier.com/locate/envpol
Atmospheric versus biological sources of polycyclic aromatichydrocarbons (PAHs) in a tropical rain forest environment
Martin Kraussa, Wolfgang Wilckea,*, Christopher Martiusb,Adelmar G. Bandeirac, Marcos V.B. Garciad, Wulf Amelunga
aDepartment of Soil Science, Institute of Ecology, Berlin University of Technology, Salzufer 11-12, 10587 Berlin, GermanybCenter for Development Research (ZEF), Walter-Flex-Strasse 3, 53113 Bonn, Germany
cDepartamento de Sistematica e Ecologia, Centro de Ciencias Exatas e da Natureza, Universidade Federal da Paraiba,
58051-900 Joao Pessoa/PB, BrazildEmbrapa Amazonia Ocidental, Caixa Postal 319, 69011-970 Manaus/AM, Brazil
Received 19 April 2004; accepted 10 September 2004
Evidence of non-pyrolytic, biogenic production of PAHs is provided.
Abstract
To distinguish between pyrogenic and biological sources of PAHs in a tropical rain forest near Manaus, Brazil, we determined
the concentrations of 21 PAHs in leaves, bark, twigs, and stem wood of forest trees, dead wood, mineral topsoil, litter layer, air, andNasutitermes termite nest compartments. Naphthalene (NAPH) was the most abundant PAH with concentrations of 35 ng m�3 inair (O85% of the
P21PAHs concentration), up to 1000 mg kg�1 in plants (O90%), 477 mg kg�1 in litter (O90%), 32 mg kg�1 in
topsoil (O90%), and 160 mg kg�1 (O55%) in termite nests. In plants, the concentrations of PAHs in general decreased in the order
leavesO barkO twigsO stem wood. The concentrations of most low-molecular weight PAHs in leaves and bark were nearequilibrium with air, but those of NAPH were up to 50 times higher. Thus, the atmosphere seemed to be the major source of allPAHs in plants except for NAPH. Additionally, phenanthrene (PHEN) had elevated concentrations in bark and twigs of Vismia
cayennensis trees (12–60 mg kg�1), which might have produced PHEN. In the mineral soil, perylene (PERY) was more abundantthan in the litter layer, probably because of in situ biological production. Nasutitermes nests had the highest concentrations of mostPAHs in exterior compartments (on average 8 and 15 mg kg�1 compared to !3 mg kg�1 in interior parts) and high PERY
concentrations in all compartments (12–86 mg kg�1), indicating an in situ production of PERY in the nests. Our results demonstratethat the deposition of pyrolytic PAHs from the atmosphere controls the concentrations of most PAHs. However, the occurrence ofNAPH, PHEN, and PERY in plants, termite nests, and soils at elevated concentrations supports the assumption of their biological
origin.� 2005 Elsevier Ltd. All rights reserved.
Keywords: Tropical rain forest; Amazon basin; Polycyclic aromatic hydrocarbons; Air; Plant; Soil; Termite nests
1. Introduction
The largest part of the PAH burden in temperateenvironments of the northern hemisphere results from
* Corresponding author. Tel.: C49 30 314 73538; fax: C49 30 314
73548.
E-mail address: [email protected] (W. Wilcke).
0269-7491/$ - see front matter � 2005 Elsevier Ltd. All rights reserved.
doi:10.1016/j.envpol.2004.09.012
human activities like burning of fossil fuels, coalgasification, or oil refining (Howsam and Jones, 1998).Non-anthropogenic sources like volcanic eruptions ornatural vegetation fires are generally thought to be lessimportant, as shown by the coincidence of energy con-sumption and PAH concentrations in archived soils(Jones et al., 1989) and dated sediments (Christensen andZhang, 1993; Lima et al., 2003) over more than a century.
ARTICLE IN PRESSDTD 5
2 M. Krauss et al. / Environmental Pollution -- (2005) ---–---
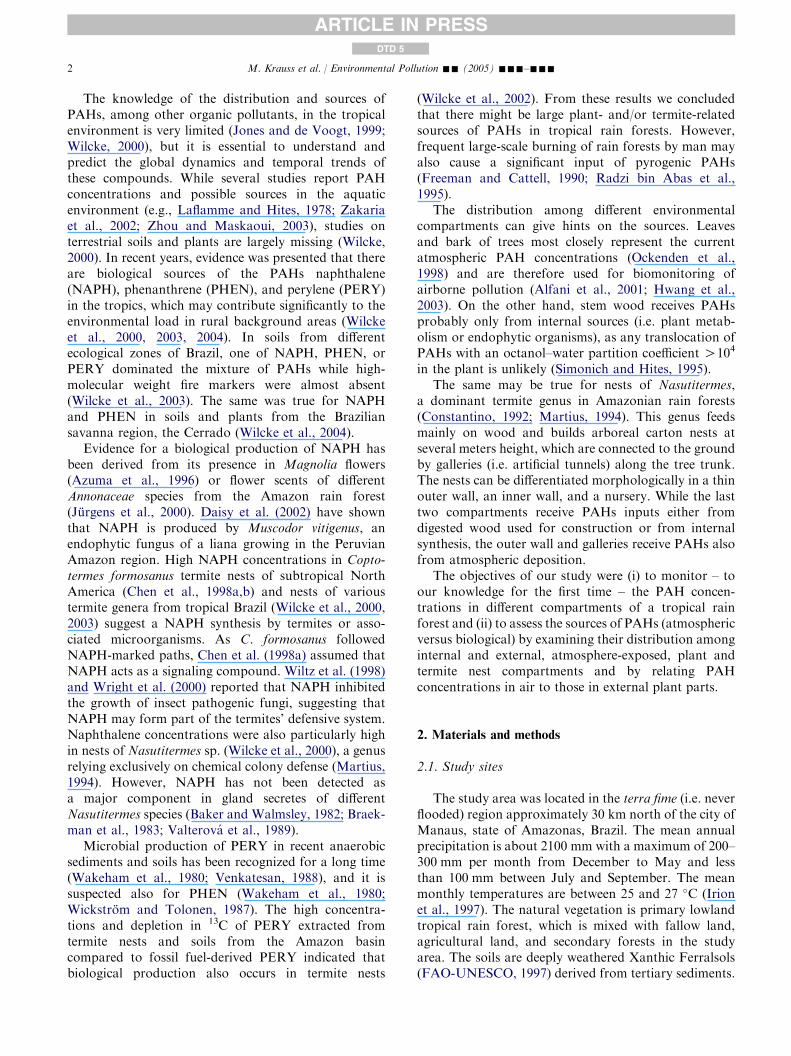
The knowledge of the distribution and sources ofPAHs, among other organic pollutants, in the tropicalenvironment is very limited (Jones and de Voogt, 1999;Wilcke, 2000), but it is essential to understand andpredict the global dynamics and temporal trends ofthese compounds. While several studies report PAHconcentrations and possible sources in the aquaticenvironment (e.g., Laflamme and Hites, 1978; Zakariaet al., 2002; Zhou and Maskaoui, 2003), studies onterrestrial soils and plants are largely missing (Wilcke,2000). In recent years, evidence was presented that thereare biological sources of the PAHs naphthalene(NAPH), phenanthrene (PHEN), and perylene (PERY)in the tropics, which may contribute significantly to theenvironmental load in rural background areas (Wilckeet al., 2000, 2003, 2004). In soils from differentecological zones of Brazil, one of NAPH, PHEN, orPERY dominated the mixture of PAHs while high-molecular weight fire markers were almost absent(Wilcke et al., 2003). The same was true for NAPHand PHEN in soils and plants from the Braziliansavanna region, the Cerrado (Wilcke et al., 2004).
Evidence for a biological production of NAPH hasbeen derived from its presence in Magnolia flowers(Azuma et al., 1996) or flower scents of differentAnnonaceae species from the Amazon rain forest(Jurgens et al., 2000). Daisy et al. (2002) have shownthat NAPH is produced by Muscodor vitigenus, anendophytic fungus of a liana growing in the PeruvianAmazon region. High NAPH concentrations in Copto-termes formosanus termite nests of subtropical NorthAmerica (Chen et al., 1998a,b) and nests of varioustermite genera from tropical Brazil (Wilcke et al., 2000,2003) suggest a NAPH synthesis by termites or asso-ciated microorganisms. As C. formosanus followedNAPH-marked paths, Chen et al. (1998a) assumed thatNAPH acts as a signaling compound. Wiltz et al. (1998)and Wright et al. (2000) reported that NAPH inhibitedthe growth of insect pathogenic fungi, suggesting thatNAPH may form part of the termites’ defensive system.Naphthalene concentrations were also particularly highin nests of Nasutitermes sp. (Wilcke et al., 2000), a genusrelying exclusively on chemical colony defense (Martius,1994). However, NAPH has not been detected asa major component in gland secretes of differentNasutitermes species (Baker and Walmsley, 1982; Braek-man et al., 1983; Valterova et al., 1989).
Microbial production of PERY in recent anaerobicsediments and soils has been recognized for a long time(Wakeham et al., 1980; Venkatesan, 1988), and it issuspected also for PHEN (Wakeham et al., 1980;Wickstrom and Tolonen, 1987). The high concentra-tions and depletion in 13C of PERY extracted fromtermite nests and soils from the Amazon basincompared to fossil fuel-derived PERY indicated thatbiological production also occurs in termite nests
(Wilcke et al., 2002). From these results we concludedthat there might be large plant- and/or termite-relatedsources of PAHs in tropical rain forests. However,frequent large-scale burning of rain forests by man mayalso cause a significant input of pyrogenic PAHs(Freeman and Cattell, 1990; Radzi bin Abas et al.,1995).
The distribution among different environmentalcompartments can give hints on the sources. Leavesand bark of trees most closely represent the currentatmospheric PAH concentrations (Ockenden et al.,1998) and are therefore used for biomonitoring ofairborne pollution (Alfani et al., 2001; Hwang et al.,2003). On the other hand, stem wood receives PAHsprobably only from internal sources (i.e. plant metab-olism or endophytic organisms), as any translocation ofPAHs with an octanol–water partition coefficient O104
in the plant is unlikely (Simonich and Hites, 1995).The same may be true for nests of Nasutitermes,
a dominant termite genus in Amazonian rain forests(Constantino, 1992; Martius, 1994). This genus feedsmainly on wood and builds arboreal carton nests atseveral meters height, which are connected to the groundby galleries (i.e. artificial tunnels) along the tree trunk.The nests can be differentiated morphologically in a thinouter wall, an inner wall, and a nursery. While the lasttwo compartments receive PAHs inputs either fromdigested wood used for construction or from internalsynthesis, the outer wall and galleries receive PAHs alsofrom atmospheric deposition.
The objectives of our study were (i) to monitor – toour knowledge for the first time – the PAH concen-trations in different compartments of a tropical rainforest and (ii) to assess the sources of PAHs (atmosphericversus biological) by examining their distribution amonginternal and external, atmosphere-exposed, plant andtermite nest compartments and by relating PAHconcentrations in air to those in external plant parts.
2. Materials and methods
2.1. Study sites
The study area was located in the terra fime (i.e. neverflooded) region approximately 30 km north of the city ofManaus, state of Amazonas, Brazil. The mean annualprecipitation is about 2100 mm with a maximum of 200–300 mm per month from December to May and lessthan 100 mm between July and September. The meanmonthly temperatures are between 25 and 27 �C (Irionet al., 1997). The natural vegetation is primary lowlandtropical rain forest, which is mixed with fallow land,agricultural land, and secondary forests in the studyarea. The soils are deeply weathered Xanthic Ferralsols(FAO-UNESCO, 1997) derived from tertiary sediments.
ARTICLE IN PRESSDTD 5
3M. Krauss et al. / Environmental Pollution -- (2005) ---–---
2.2. Samples
Particulate and gaseous PAHs in air were sampled bydrawing air with a membrane pump at a rate of ca.0.5 m3 h�1 through a glass fiber filter (55 mm diameter,Schleicher and Schull GF-6) followed by an adsorbentcartridge filled with 15 g of XAD-2. Three air sampleswere taken at a secondary forest site at 1.5 m heightbetween 20 and 29 September 2001, corresponding to26.8, 28.2, and 36.0 m3 of air. For comparison, onesample was taken in the city of Manaus (28–29September 2001), corresponding to 23.7 m3 of air. Thedaytime temperature was ca. 33 �C, the night-time tem-perature was 26 �C, the weather was sunny with a shortrainfall every second to third day. After the sampling,the glass fiber filters were wrapped in aluminum foil andthe XAD-2 traps were sealed. Samples were stored at�18 �C until analysis.
Plant samples were collected within an area of about10 km2 from one primary forest stand and threesecondary forest stands in September 2001. The latterhad established themselves in the last 15 years onabandoned plantations and were dominated by Vismiaspp. At the primary forest stand, 10 species of differentfamilies were sampled: Attalea attaleoides (Barb. Rodr.)Wess. Boer., Arecaceae; Rinorea racemosa (Mart.)Kuntze, Violaceae; Psychotria medusula Mull. Arg.,Rubiaceae; Naucleopsis ternostroemiiflora (Hildbr.)C.C.Berg, Moraceae; Swartzia cuspidata Benth., Faba-ceae; Swartzia ulei Harms, Fabaceae; Ocotea floribunda(Sw.) Mez, Lauraceae; Socratea exorrhiza (Mart.) H.Wendl., Arecaceae; Myrcia sp., Myrtaceae; and Pour-ouma ferruginea Standl., Cecropiaceae. At two differentsecondary forest stands we sampled six of the mostabundant tree species of different families: Vismiacayennensis (Jacq.) Pers., Clusiaceae; Pourouma cuspi-data Mildbr., Cecropiaceae; Xylopia nitida Duval,Annonaceae; Miconia tormentosa (Rich) D.Don, Mela-stomataceae; Loreya spruceana Benth. ex Triana,Melastomataceae; and Parkia decussata Ducke, Faba-ceae. At the third site L. spruceana was absent, and thusonly the other five species were sampled. We collectedleaves, bark, twigs (up to 1 cm diameter), and stemwood of one 4–7 m tall tree of each of the abovementioned species. All leaf, bark, and twig samples werecut to pieces of 2–8 mm within 4 h after sampling. Allsamples were stored in closed aluminum containers at�18 �C. The stem wood samples were cut in frozen statewith a blade-cutting mill in Berlin.
We sampled four arboreal nests of the termite generaNasutitermes (outer wall, inner wall, nursery, andgallery) at 4–8 m height. Two nests were located nearthe edge of a primary forest facing a plantation, the othertwo at the edges of secondary forests facing a forestclearing. We took one soil and one litter layer samplenear each termite nest combining five subsamples
representatively collected from an area of 25 m2. In thesame area, a composite dead wood sample was also col-lected. Termite nest (termites were carefully removed),dead wood, organic layer, and soil samples were homo-genized and stored in aluminum containers at �18 �C.
2.3. Analyses
We determined organic carbon (OC) and total nitro-gen in air-dried aliquots of all samples by dry combustionusing a Leco CN-2000 analyzer. The frozen samples(XAD-2, glass fiber filters, plants, soils, termite nests)were extracted with hexane:acetone 2:1 by pressurizedsolvent extraction using an ASE 200 (Dionex, Sunnyvale,CA) as described in Krauss and Wilcke (2003). Weevaporated the extracts to 1 ml and dried them by fil-tration over anhydrous Na2SO4. The extracts were puri-fied by solid phase extraction on aluminum oxide/silicagel columns (Krauss andWilcke, 2003) and evaporated toapproximately 500 ml before PAH measurement.
We separated 21 PAHs in all extracts by gaschromatography (Agilent 6890, Palo Alto, CA) usingan Agilent/J&W DB5-ms fused silica capillary column(30 m! 0.25 mm! 0.25 mm) and quantified them withmass spectrometry (Agilent 5973) with electron ioniza-tion at 70 eV in selected ion monitoring mode: naphtha-lene (NAPH), acenaphthylene (ACENY), acenaphthene(ACEN), fluorene (FLUO), phenanthrene (PHEN),anthracene (ANTH), fluoranthene (FLUA), pyrene(PYR), benz(a)-anthracene [B(A)A], chryseneC triphe-nylene (CHRY), benzo(bC jC k)fluoranthenes [B(BJK)],benzo(a)pyrene [B(A)P], benzo(e)pyrene [B(E)P], pery-lene (PERY), indeno(1,2,3-cd )pyrene (IND), dibenz-(a,h)anthracene (DIBE), benzo( ghi)perylene [B(GHI)],coronene (COR). The GC conditions were the same asdescribed in Krauss and Wilcke (2003). For quantifica-tion we used eight perdeuterated PAHs as internalstandards, which were spiked to the samples after extrac-tion. The recoveries of the internal standards rangedfrom 72G 20% (meanG standard deviation) to 86G10% relative to FLUA-D10 spiked to the extracts priorto injection.
2.4. Quality assurance and quality control
We used solvents of HPLC or residue analysis grade;all other chemicals were at least of ‘pro analysi’ grade. Allvessels used for analysis were pre-cleaned with ethylacetate followed by acetone and heated at 300 �Covernight. We ran one analytical blank with every batchof 15–20 samples to check background contaminationduring the extraction and purification steps. To removebackground contamination, we corrected PAH concen-trations by subtracting the mean of the analytical blanks.
The lower limit of determination of PAHs wasestimated from the smallest peak (signal-to-noise ratio
ARTICLE IN PRESSDTD 5
4 M. Krauss et al. / Environmental Pollution -- (2005) ---–---
O3:1 in the chromatograms) that could be integratedand was about 0.01 ng m�3 for each PAH for the airsamples and 5–20 ng kg�1 for the solid samples. Wetested the accuracy of PAH quantification by analyzingthe certified reference materials ‘‘CRM 104 – PAHcontaminated soil’’ (Resource Technology Corporation,Laramie, WY, USA). The average measured PAHconcentrations of three replicates were 88% (range 75–108%) of the reference values.
2.5. Calculations and statistical evaluation
All given concentrations are based on dry weight. Thesum of the concentrations of all 21 PAHs is referred toas
P21PAHs. The 18 clearly pyrogenic PAHs (i.e. all
except for NAPH, PHEN, and PERY) are referred to as‘‘pyrogenic PAHs’’ and the sum of their concentrationsis called
P18PAHs.
The KOA values of the PAHs at standard conditions(101.3 kPa, 25 �C) were taken from Horstmann andMcLachlan (1998) or, if no literature data were available,calculated from the subcooled liquid vapor pressures(taken from Mackay et al., 1992) according to Harnerand Bidleman (1996) using the equation for non-orthopolychlorinated biphenyls. Because a gas chromato-graphic separation of chrysene and triphenylene, and ofthe benzo(b, j, and k)fluoranthenes was not possible, weused as an approximation of the compound properties ofthe most abundant compounds in these mixtures, i.e.chrysene and benzo(b)fluoranthene, respectively.
Statistics was performed with STATISTICA forWindows 5.1 (StatSoft of Europe, Hamburg, Germany).Correlation and regression followed the least-squaresmethod. We identified significant differences of theconcentrations of individual PAHs between two com-partments using a t-test for dependent samples (‘‘paireddifferences’’ test). The significance level was set atP! 0.05. To compare the PAH concentrations in plantcompartments of the same species between the threesecondary forest sites, we used the non-parametricFriedman’s two-way analysis of variance. To comparePAHconcentrations and patterns among different speciesat the secondary forest sites, we used the non-parametricmedian test, which is equivalent to the parametric one-way analysis of variance. The use of parametric methodswas in both cases not meaningful, because means andvariances were correlated.
3. Results and discussion
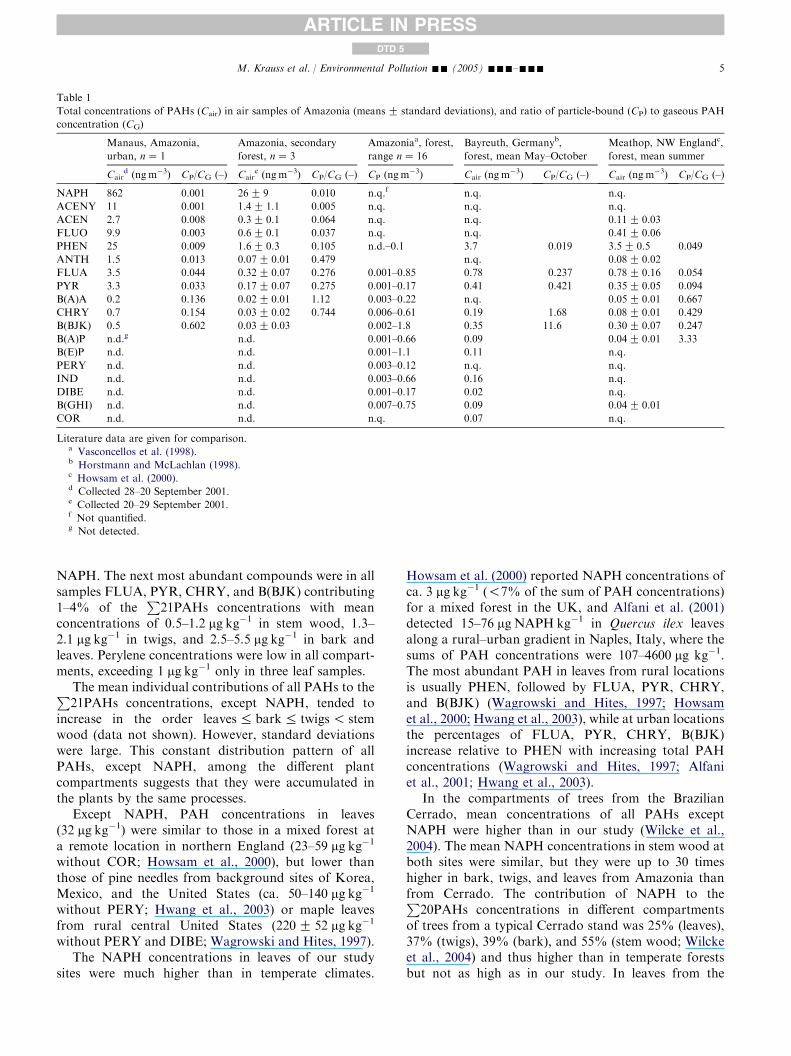
3.1. Air
The sum of the PAH concentrations (P
21PAHs) inthe air samples (sum of gaseous and particulate phase)at the secondary forest site was, on average, 35 ng m�3.
While NAPH accounted for 85% ofP
21PAHs, wedetected no five- and six-ring PAHs except for theB(BJK) in the gaseous or particulate phase (Table 1).The concentrations of individual PAHs were similar orlower than those reported for other tropical ortemperate forest sites (Vasconcellos et al., 1998;Horstmann and McLachlan, 1998; Howsam et al.,2000).
The PAH concentrations at the secondary forest sitewere 10 or more times lower than at an urban location inManaus. The sampling location in Manaus showed alsoa predominance of NAPH (93% of
P21PAHs).
Compared with other tropical and temperate urbanlocations, PAH concentrations in the air of Manauswere at the lower end of the reported range (Harrisonet al., 1996; Panther et al., 1999; Lee et al., 2001; Liuet al., 2001).
The distribution of PAHs among the gaseous andparticulate fractions was in the range of data reportedfor European locations in the summer (Harrison et al.,1996; Horstmann and McLachlan, 1998; Howsam et al.,2000).
3.2. Plants
Leaves had in general the highestP
21PAHs of allplant compartments (mean 593 mg kg�1) followed bybark (mean 363 mg kg�1) and twigs (mean 167 mg kg�1),although twigs and bark of some tree species had higherconcentrations than the leaves. Stem wood consistentlyhad the lowest
P21PAHs (mean 51 mg kg�1). TheP
18PAHs followed the same order and thus reflectedthe exposure of the plant surfaces to the atmosphere andthe ratio of the exposed surface to volume of thecompartment. However, there were large variations ofup to a factor of 100 in
P18PAHs concentrations for
the same compartment among different trees. This maybe explained by variations in exposure times, morphol-ogies, and/or microclimatic conditions, which all controlPAH accumulation by plants from the air (Barber et al.,2004). The PAH concentrations of the different com-partments of the same tree species at all three secondaryforest sites were similar. This indicated that the threestudied secondary forest sites received similar PAHinputs.
Naphthalene was by far the dominant PAH in allplant compartments and accounted, on average, for94% of the
P21PAHs in leaves, 91% in bark, 88% in
twigs, and 81% in stem wood. Phenanthrene was thesecond most abundant compound contributing, onaverage, 1.3% to the
P21PAHs in leaves, 3.3% in
bark, 4.4% in twigs, and 9.7% in stem wood. Itsconcentrations were, on average, highest in bark,followed by leaves, while twigs and stem wood hadsimilar concentrations (Table 2). The differences be-tween the compartments were less pronounced than for
ARTICLE IN PRESSDTD 5
5M. Krauss et al. / Environmental Pollution -- (2005) ---–---
Table 1
Total concentrations of PAHs (Cair) in air samples of Amazonia (meansG standard deviations), and ratio of particle-bound (CP) to gaseous PAH
concentration (CG)
Manaus, Amazonia,
urban, nZ 1
Amazonia, secondary
forest, nZ 3
Amazoniaa, forest,
range nZ 16
Bayreuth, Germanyb,
forest, mean May–October
Meathop, NW Englandc,
forest, mean summer
Caird (ngm�3) CP/CG (–) Cair
e (ng m�3) CP/CG (–) CP (ngm�3) Cair (ng m�3) CP/CG (–) Cair (ng m
�3) CP/CG (–)
NAPH 862 0.001 26G 9 0.010 n.q.f n.q. n.q.
ACENY 11 0.001 1.4G 1.1 0.005 n.q. n.q. n.q.
ACEN 2.7 0.008 0.3G 0.1 0.064 n.q. n.q. 0.11G 0.03
FLUO 9.9 0.003 0.6G 0.1 0.037 n.q. n.q. 0.41G 0.06
PHEN 25 0.009 1.6G 0.3 0.105 n.d.–0.1 3.7 0.019 3.5G 0.5 0.049
ANTH 1.5 0.013 0.07G 0.01 0.479 n.q. 0.08G 0.02
FLUA 3.5 0.044 0.32G 0.07 0.276 0.001–0.85 0.78 0.237 0.78G 0.16 0.054
PYR 3.3 0.033 0.17G 0.07 0.275 0.001–0.17 0.41 0.421 0.35G 0.05 0.094
B(A)A 0.2 0.136 0.02G 0.01 1.12 0.003–0.22 n.q. 0.05G 0.01 0.667
CHRY 0.7 0.154 0.03G 0.02 0.744 0.006–0.61 0.19 1.68 0.08G 0.01 0.429
B(BJK) 0.5 0.602 0.03G 0.03 0.002–1.8 0.35 11.6 0.30G 0.07 0.247
B(A)P n.d.g n.d. 0.001–0.66 0.09 0.04G 0.01 3.33
B(E)P n.d. n.d. 0.001–1.1 0.11 n.q.
PERY n.d. n.d. 0.003–0.12 n.q. n.q.
IND n.d. n.d. 0.003–0.66 0.16 n.q.
DIBE n.d. n.d. 0.001–0.17 0.02 n.q.
B(GHI) n.d. n.d. 0.007–0.75 0.09 0.04G 0.01
COR n.d. n.d. n.q. 0.07 n.q.
Literature data are given for comparison.a Vasconcellos et al. (1998).b Horstmann and McLachlan (1998).c Howsam et al. (2000).d Collected 28–20 September 2001.e Collected 20–29 September 2001.f Not quantified.g Not detected.
NAPH. The next most abundant compounds were in allsamples FLUA, PYR, CHRY, and B(BJK) contributing1–4% of the
P21PAHs concentrations with mean
concentrations of 0.5–1.2 mg kg�1 in stem wood, 1.3–2.1 mg kg�1 in twigs, and 2.5–5.5 mg kg�1 in bark andleaves. Perylene concentrations were low in all compart-ments, exceeding 1 mg kg�1 only in three leaf samples.
The mean individual contributions of all PAHs to theP21PAHs concentrations, except NAPH, tended to
increase in the order leaves% bark% twigs! stemwood (data not shown). However, standard deviationswere large. This constant distribution pattern of allPAHs, except NAPH, among the different plantcompartments suggests that they were accumulated inthe plants by the same processes.
Except NAPH, PAH concentrations in leaves(32 mg kg�1) were similar to those in a mixed forest ata remote location in northern England (23–59 mg kg�1
without COR; Howsam et al., 2000), but lower thanthose of pine needles from background sites of Korea,Mexico, and the United States (ca. 50–140 mg kg�1
without PERY; Hwang et al., 2003) or maple leavesfrom rural central United States (220G 52 mg kg�1
without PERY and DIBE; Wagrowski and Hites, 1997).The NAPH concentrations in leaves of our study
sites were much higher than in temperate climates.
Howsam et al. (2000) reported NAPH concentrations ofca. 3 mg kg�1 (!7% of the sum of PAH concentrations)for a mixed forest in the UK, and Alfani et al. (2001)detected 15–76 mg NAPH kg�1 in Quercus ilex leavesalong a rural–urban gradient in Naples, Italy, where thesums of PAH concentrations were 107–4600 mg kg�1.The most abundant PAH in leaves from rural locationsis usually PHEN, followed by FLUA, PYR, CHRY,and B(BJK) (Wagrowski and Hites, 1997; Howsamet al., 2000; Hwang et al., 2003), while at urban locationsthe percentages of FLUA, PYR, CHRY, B(BJK)increase relative to PHEN with increasing total PAHconcentrations (Wagrowski and Hites, 1997; Alfaniet al., 2001; Hwang et al., 2003).
In the compartments of trees from the BrazilianCerrado, mean concentrations of all PAHs exceptNAPH were higher than in our study (Wilcke et al.,2004). The mean NAPH concentrations in stem wood atboth sites were similar, but they were up to 30 timeshigher in bark, twigs, and leaves from Amazonia thanfrom Cerrado. The contribution of NAPH to theP
20PAHs concentrations in different compartmentsof trees from a typical Cerrado stand was 25% (leaves),37% (twigs), 39% (bark), and 55% (stem wood; Wilckeet al., 2004) and thus higher than in temperate forestsbut not as high as in our study. In leaves from the
ARTICLE IN PRESSDTD 5
6 M. Krauss et al. / Environmental Pollution -- (2005) ---–---
Table
2
Naphthalene,
phenanthrene,
perylene,
P18PAHs,organic
carbon(O
C)concentrations,andC/N
ratiosin
differentcompartments
ofanAmazonianrainforest
ecosystem
(meansandranges)
Plants
Termitenests
Compartment
Leaves
Bark
Twigs
Stem
wood
Deadwood
Litterlayer
Topsoil
Nursery
Inner
wall
Outerwall
Gallery
n27
(mgkg�1)
26
(mgkg�1)
23
(mgkg�1)
27
(mgkg�1)
4 (mgkg�1)
4 (mgkg�1)
4 (mgkg�1)
4 (mgkg�1)
4 (mgkg�1)
4 (mgkg�1)
4 (mgkg�1)
Naphthalene
560(289–973)
329(73–1001)
143(27–425)
42(11–78)
208(179–246)
327(192–477)
23(15–32)
116(75–158)
92(70–107)
95(65–115)
114(38–160)
Phenanthrene
8.1
(0.35–26)
13(1.2–105)
5.7
(n.d.–27)
4.5
(n.d.–23)
17a(–)
5.2
(1.9–9.7)
0.5
(n.d.–0.78)
0.4
(n.d.–0.53)
0.2
(n.d.–0.28)
10(8.1–15)
6.3
(4.2–7.2)
Perylene
0.45(0.05–3.2)
0.22(n.d.–0.75)
0.24(n.d.–0.50)
0.23(n.d.–0.48)
2.7
(n.d.–3.0)
0.5
(n.d.–0.7)
0.8
(0.10–2.0)
12(1.2–20)
86(15–193)
58(33–86)
73(69–104)
P18PAHs
24(2.5–80)
21(3.3–100)
18(1.8–181)
3.9
(0.61–7.8)
4.0
(0.90–11)
23(18–28)
2.0
(0.46–3.2)
2.6
(0.68–3.7)
2.8
(0.61–5.6)
15(7.1–21)
7.9
(6.5–10)
OC
454(377–511)
446(320–501)
454(372–544)
458(391–497)
457(415–485)
473(451–490)
33(22–39)
480(450–519)
472(414–501)
468(464–480)
453(430–469)
C/N
26(13–42)
46(14–77)
67(18–150)
138(59–364)
61(40–82)
33(23–46)
15(14–17)
52(28–80)
45(37–60)
40(31–51)
39(35–46)
aCompoundwasdetectedin
only
onesample.
Cerrado, PHEN, NAPH, ACEN, and FLUO were themost abundant compounds; in bark and twig samplesfrom the Cerrado, the contribution to the sum ofPAH concentrations decreased in the order, NAPHZPHENOPYROFLUAOFLUOOACEN (Wilckeet al., 2004). The PAH concentrations and patterns inleaves of the Amazonian rain forest are thus moresimilar to those of remote forests from temperatelocations than to those of the Cerrado; a remarkableexception, however, is the prominence of NAPH.
To assess a possible biological production of in-dividual PAHs, we compared PAH concentrations andpatterns among different tree species and plant compart-ments. In stem wood, we did not detect significantdifferences in the concentrations of any PAH amongdifferent species of the secondary forest. Vismia cayen-nesis had significantly higher concentrations of PHEN inbark (on average 60 mg kg�1) and twigs (16 mg kg�1)than all other species (range 1–21 mg kg�1 in bark, and0.8–11 mg kg�1 in twigs). The same was also true for thecontribution of PHEN to the
P21PAHs. The concen-
trations of PHEN were also increased in leaves of V.cayennensis (12 mg kg�1), P. cuspidata (17 mg kg�1), andL. spruceana (10 mg kg�1), but along with high concen-trations of one or more of FLUO, PYR, FLUA,CHRY, or B(BJK). Therefore a biological productionof PHEN by V. cayennensis seems possible. Our resultsindicate that this production might be located in thebark of stems and twigs. In the leaves, however, PHENprobably mainly originated from the atmosphere.
Naphthalene concentrations were not significantlydifferent among different species indicating that thepossible NAPH biogenesis would be a common featureof all studied trees. The distribution among the differentplant compartments (increasing concentrations frominner to outer parts) either could be attributable tobiological NAPH sources located in the outer parts, orthe NAPH concentrations in the outer plant partsreflected a combination of biological and atmosphericsources. Highest NAPH concentrations in the leaves arein contrast to the findings in the Cerrado where leaveshad the lowest mean NAPH concentrations of all plantcompartments (Wilcke et al., 2004). This might indicatea higher impact of atmospheric NAPH inputs inAmazonia than in the Cerrado.
3.3. Plant–air distribution
The distribution of nonpolar organic compoundsbetween plants (particularly their leaves) and air (plant–air distribution coefficients, KPA) in equilibrium isa function of the octanol–air partition coefficient(KOA; Paterson et al., 1991; Tolls and McLachlan,1994; McLachlan, 1999). To assess whether the leaves ofour study plants had PAH concentrations in equilibriumwith those of the air, we calculated leaf–air distribution
ARTICLE IN PRESSDTD 5
7M. Krauss et al. / Environmental Pollution -- (2005) ---–---
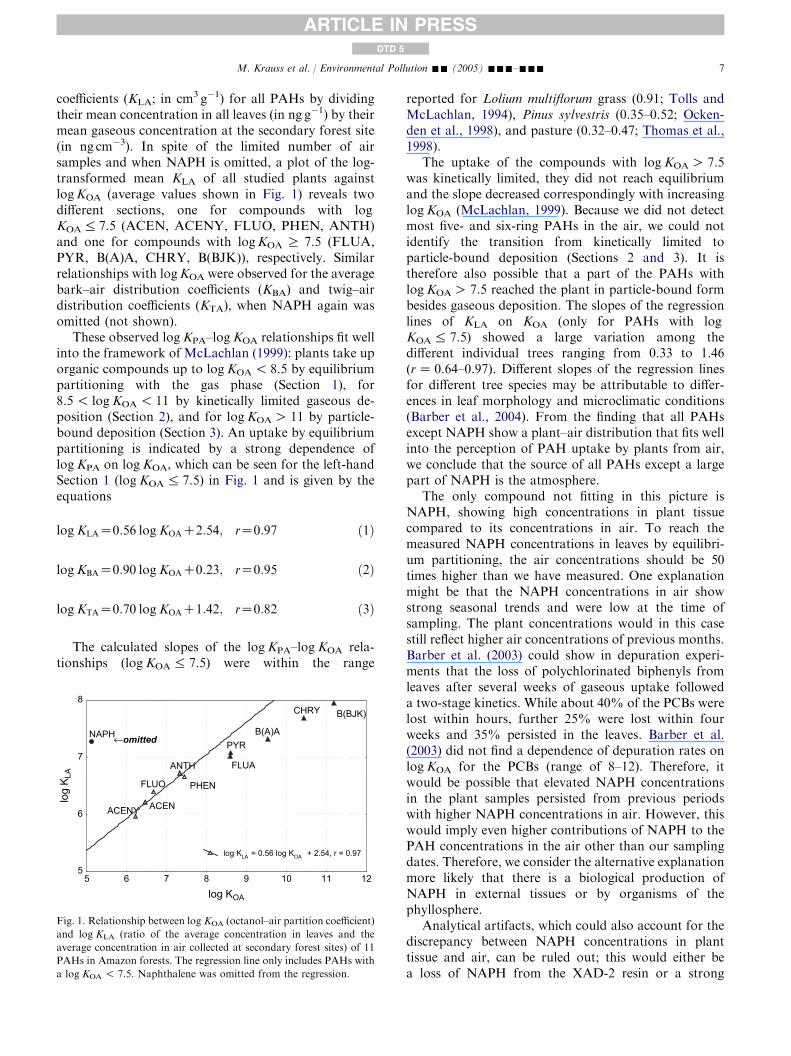
coefficients (KLA; in cm3 g�1) for all PAHs by dividingtheir mean concentration in all leaves (in ng g�1) by theirmean gaseous concentration at the secondary forest site(in ng cm�3). In spite of the limited number of airsamples and when NAPH is omitted, a plot of the log-transformed mean KLA of all studied plants againstlogKOA (average values shown in Fig. 1) reveals twodifferent sections, one for compounds with logKOA% 7.5 (ACEN, ACENY, FLUO, PHEN, ANTH)and one for compounds with logKOA R 7.5 (FLUA,PYR, B(A)A, CHRY, B(BJK)), respectively. Similarrelationships with logKOA were observed for the averagebark–air distribution coefficients (KBA) and twig–airdistribution coefficients (KTA), when NAPH again wasomitted (not shown).
These observed logKPA–logKOA relationships fit wellinto the framework of McLachlan (1999): plants take uporganic compounds up to logKOA! 8.5 by equilibriumpartitioning with the gas phase (Section 1), for8.5! logKOA! 11 by kinetically limited gaseous de-position (Section 2), and for logKOAO 11 by particle-bound deposition (Section 3). An uptake by equilibriumpartitioning is indicated by a strong dependence oflogKPA on logKOA, which can be seen for the left-handSection 1 (logKOA% 7.5) in Fig. 1 and is given by theequations
logKLAZ0:56 logKOAC2:54; rZ0:97 ð1Þ
logKBAZ0:90 logKOAC0:23; rZ0:95 ð2Þ
logKTAZ0:70 logKOAC1:42; rZ0:82 ð3Þ
The calculated slopes of the logKPA–logKOA rela-tionships (logKOA% 7.5) were within the range
log KOA
lo
g K L
A ANTH
PYRB(A)A
CHRY
ACENY
FLUO
NAPH
5
6
7
8
5 6 7 8 9 10 11 12
log KLA = 0.56 log KOA + 2.54, r = 0.97
PHEN
ACEN
FLUA
B(BJK)
←omitted
Fig. 1. Relationship between log KOA (octanol–air partition coefficient)
and log KLA (ratio of the average concentration in leaves and the
average concentration in air collected at secondary forest sites) of 11
PAHs in Amazon forests. The regression line only includes PAHs with
a log KOA ! 7.5. Naphthalene was omitted from the regression.
reported for Lolium multiflorum grass (0.91; Tolls andMcLachlan, 1994), Pinus sylvestris (0.35–0.52; Ocken-den et al., 1998), and pasture (0.32–0.47; Thomas et al.,1998).
The uptake of the compounds with logKOAO 7.5was kinetically limited, they did not reach equilibriumand the slope decreased correspondingly with increasinglogKOA (McLachlan, 1999). Because we did not detectmost five- and six-ring PAHs in the air, we could notidentify the transition from kinetically limited toparticle-bound deposition (Sections 2 and 3). It istherefore also possible that a part of the PAHs withlogKOAO 7.5 reached the plant in particle-bound formbesides gaseous deposition. The slopes of the regressionlines of KLA on KOA (only for PAHs with logKOA% 7.5) showed a large variation among thedifferent individual trees ranging from 0.33 to 1.46(rZ 0.64–0.97). Different slopes of the regression linesfor different tree species may be attributable to differ-ences in leaf morphology and microclimatic conditions(Barber et al., 2004). From the finding that all PAHsexcept NAPH show a plant–air distribution that fits wellinto the perception of PAH uptake by plants from air,we conclude that the source of all PAHs except a largepart of NAPH is the atmosphere.
The only compound not fitting in this picture isNAPH, showing high concentrations in plant tissuecompared to its concentrations in air. To reach themeasured NAPH concentrations in leaves by equilibri-um partitioning, the air concentrations should be 50times higher than we have measured. One explanationmight be that the NAPH concentrations in air showstrong seasonal trends and were low at the time ofsampling. The plant concentrations would in this casestill reflect higher air concentrations of previous months.Barber et al. (2003) could show in depuration experi-ments that the loss of polychlorinated biphenyls fromleaves after several weeks of gaseous uptake followeda two-stage kinetics. While about 40% of the PCBs werelost within hours, further 25% were lost within fourweeks and 35% persisted in the leaves. Barber et al.(2003) did not find a dependence of depuration rates onlogKOA for the PCBs (range of 8–12). Therefore, itwould be possible that elevated NAPH concentrationsin the plant samples persisted from previous periodswith higher NAPH concentrations in air. However, thiswould imply even higher contributions of NAPH to thePAH concentrations in the air other than our samplingdates. Therefore, we consider the alternative explanationmore likely that there is a biological production ofNAPH in external tissues or by organisms of thephyllosphere.
Analytical artifacts, which could also account for thediscrepancy between NAPH concentrations in planttissue and air, can be ruled out; this would either bea loss of NAPH from the XAD-2 resin or a strong
ARTICLE IN PRESSDTD 5
8 M. Krauss et al. / Environmental Pollution -- (2005) ---–---
contamination of plant material during the short timespan of cutting. The latter was not found for termite nestor dead wood samples, which would have been affectedin a similar way. The recovery of NAPH from XAD-2was similar to that of all other PAHs. A significantchromatographic breakthrough of NAPH on the XAD-2 traps is despite high air temperatures during samplingunlikely, as we observed a breakthrough !5% in thelaboratory for sampling periods of 7 d and fluxes of5 m3 h�1, which exceeded the sampling periods (2–3 d)and fluxes (0.5 m3 h�1) in this study considerably.
3.4. Dead wood
The sampled dead wood had undergone a consider-able degradation, as indicated by an obvious loss oftensile strength and decreased C/N ratios (61G 17) ascompared to stem wood (137G 77) while the OCcontent did not change (living wood: 458G 22 g kg�1;dead wood: 457G 30 g kg�1).
TheP
21PAHs in dead wood ranged from 192 to247 mg kg�1. While NAPH was predominant in all deadwood samples with concentrations from 179 to246 mg kg�1, the concentrations of other PAHs werehighly variable and in most samples only a fewcompounds were detectable (Table 2); PHEN was foundin one sample at 17 mg kg�1, PERY in two samples at2.0 and 2.4 mg kg�1, the
P18PAHs accounted for 0.9–
11.4 mg kg�1. Wilcke et al. (2003) reported in generalhigher PAH concentrations for dead wood samples ofAmazonia, particularly for NAPH. Dead wood sampledin the Cerrado had similar NAPH concentrations as inour Amazonian samples, but higher concentrations ofother PAHs (Wilcke et al., 2004).
The concentrations of NAPH were, on average, fivetimes higher in dead wood than in stem wood and theconcentrations of ACEN, PYR, and PERY were alsosignificantly higher in dead wood. However, the averageP
18PAHs concentrations were similar in stem woodand dead wood. This indicates an uptake of NAPH andperhaps to a lesser extent pyrogenic PAHs from theatmosphere because of its longer exposure to theatmosphere, or it again points to a biological pro-duction, particularly of NAPH. Whether PERY andPHEN, showing both higher concentrations in deadthan in stem wood (Table 2), had a biological origin(e.g., input by degrading organisms) cannot be assessedbecause of the low number of samples in which thesecompounds were detected.
3.5. Litter layer
TheP
21PAHs concentrations in the litter layerranged from 217 to 517 mg kg�1. Naphthalene was thedominant compound (192–477 mg kg�1), followed byPHEN (1.9–9.7 mg kg�1), CHRY (3.3–5.5 mg kg�1),
B(BJK) (2.9–5.4), and FLUA (1.6–5.1 mg kg�1). Meanconcentrations are given in Table 2. In contrast to this,litter layers of a temperate forest in Germany receivingexclusively pyrogenic PAHs (Krauss et al., 2000) andshowing a composition of the PAH mixture which istypical for temperate organic layers (Wilcke, 2000), hadlower NAPH concentrations, but approximately 10–50times higher concentrations of all other PAHs (Fig. 2).If NAPH was omitted, there was a close correlationbetween the concentrations of individual PAHs in theAmazonian and temperate litter layers (rZ 0.85) in-dicating that the PAH mixtures were similar except thehigh abundance of NAPH at the tropical site. Thisstrongly indicates that the PAHs in litter layers fromAmazonia consisted of a mixture of pyrogenic PAHsand a separate source of NAPH, which is likelybiological.
To assess transformation processes and possibleadditional PAH sources in the litter layer, we estimatedthe PAH concentrations in litter fall from literaturevalues of litter composition and compared them with thePAH concentrations in the living plant tissues. For ourcalculations we used litter fall data from Rodrigues et al.(2001) who reported that at a primary forest stand closeto our study area litter fall consisted of 78.4% leaves,15.7% woody matter, and 5.9% flowers and fruits. Ata secondary forest site of comparable age (14 years) andspecies composition as our secondary forests, 81.7% ofthe litter fall were leaves, 10.5% woody matter, and7.8% flowers and fruits (Rodrigues et al., 2001). Similar
NE Bavaria log [mg (kg OC)-1]
Amaz
onia
lo
g [m
g (k
g O
C)-1
]
-1
0
1
2
3
-1 0 1 2 3
y= 0.64 x -0.54, r=0.851:1 line
NAPH
↑ omitted
Fig. 2. Relationship between the OC-normalized concentrations of
individual PAHs in litter layers of Amazon forests (average of 4 sites)
and in litter layers of temperate forests in northeastern Bavaria
considered as representative for a variety of temperate forests (Krauss
et al., 2000; average of 18 sites). Naphthalene was omitted from the
regression.
ARTICLE IN PRESSDTD 5
9M. Krauss et al. / Environmental Pollution -- (2005) ---–---
findings have been reported by Martius et al. (in press)for primary and secondary forests near Manaus wherethe litter fall in primary and secondary forest and inpolycultures consisted of 67–82% of leaves, 8–14% offine wood, 0.1–2.8% of coarse wood, and 3–9% of finematter (including flowers and seeds) indicating that thevalues used for our PAH flux estimation are reasonable.To calculate PAH concentrations in the litter fall, weassumed that the concentrations in woody matter andflowers/fruits were the same as in twigs.
The PAH concentrations and the composition of thePAH mixture in the litter layer and the values estimatedfor the litter fall were in general similar. Additionally,we did not detect significant differences in the compo-sition of the PAH mixture between leaves or twigs andlitter layers. Thus, the composition of the PAH mixtureand the PAH concentrations in the litter layer resembledthose in fresh litter fall, indicating that no significanttransformation of the PAHs occurred during the shortlifetime of the thin litter layer. There were no hints toadditional PAH sources for the litter layer.
3.6. Mineral topsoil
The PAH concentrations of the mineral topsoilsamples (
P21PAHs: 16–38 mg kg�1) were at the lower
end of the range in tropical topsoils (7–397 mg kg�1 forthe sum of 16 PAHs; Wilcke, 2000). Naphthalene wasby far the most abundant compound (15–31 mg kg�1,Table 2). The concentrations of all other PAHs ingeneral did not exceed 0.5 mg kg�1 and were consider-ably lower than those in temperate forest topsoils ofnortheastern Bavaria (Krauss et al., 2000).
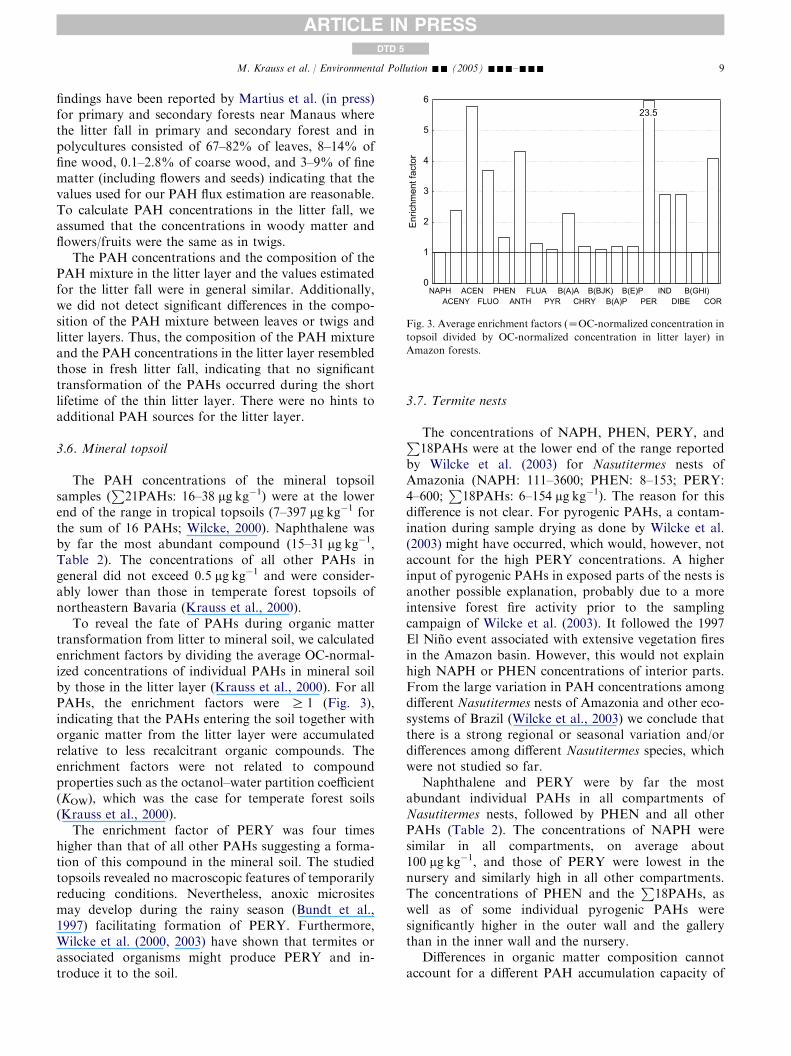
To reveal the fate of PAHs during organic mattertransformation from litter to mineral soil, we calculatedenrichment factors by dividing the average OC-normal-ized concentrations of individual PAHs in mineral soilby those in the litter layer (Krauss et al., 2000). For allPAHs, the enrichment factors were R 1 (Fig. 3),indicating that the PAHs entering the soil together withorganic matter from the litter layer were accumulatedrelative to less recalcitrant organic compounds. Theenrichment factors were not related to compoundproperties such as the octanol–water partition coefficient(KOW), which was the case for temperate forest soils(Krauss et al., 2000).
The enrichment factor of PERY was four timeshigher than that of all other PAHs suggesting a forma-tion of this compound in the mineral soil. The studiedtopsoils revealed no macroscopic features of temporarilyreducing conditions. Nevertheless, anoxic micrositesmay develop during the rainy season (Bundt et al.,1997) facilitating formation of PERY. Furthermore,Wilcke et al. (2000, 2003) have shown that termites orassociated organisms might produce PERY and in-troduce it to the soil.
3.7. Termite nests
The concentrations of NAPH, PHEN, PERY, andP18PAHs were at the lower end of the range reported
by Wilcke et al. (2003) for Nasutitermes nests ofAmazonia (NAPH: 111–3600; PHEN: 8–153; PERY:4–600;
P18PAHs: 6–154 mg kg�1). The reason for this
difference is not clear. For pyrogenic PAHs, a contam-ination during sample drying as done by Wilcke et al.(2003) might have occurred, which would, however, notaccount for the high PERY concentrations. A higherinput of pyrogenic PAHs in exposed parts of the nests isanother possible explanation, probably due to a moreintensive forest fire activity prior to the samplingcampaign of Wilcke et al. (2003). It followed the 1997El Nino event associated with extensive vegetation firesin the Amazon basin. However, this would not explainhigh NAPH or PHEN concentrations of interior parts.From the large variation in PAH concentrations amongdifferent Nasutitermes nests of Amazonia and other eco-systems of Brazil (Wilcke et al., 2003) we conclude thatthere is a strong regional or seasonal variation and/ordifferences among different Nasutitermes species, whichwere not studied so far.
Naphthalene and PERY were by far the mostabundant individual PAHs in all compartments ofNasutitermes nests, followed by PHEN and all otherPAHs (Table 2). The concentrations of NAPH weresimilar in all compartments, on average about100 mg kg�1, and those of PERY were lowest in thenursery and similarly high in all other compartments.The concentrations of PHEN and the
P18PAHs, as
well as of some individual pyrogenic PAHs weresignificantly higher in the outer wall and the gallerythan in the inner wall and the nursery.
Differences in organic matter composition cannotaccount for a different PAH accumulation capacity of
Enric
hmen
t fac
tor
0
1
2
3
4
5
6
NAPHACENY
ACENFLUO
PHENANTH
FLUAPYR
B(A)ACHRY
B(BJK)B(A)P
B(E)PPER
INDDIBE
B(GHI)COR
23.5
Fig. 3. Average enrichment factors (ZOC-normalized concentration in
topsoil divided by OC-normalized concentration in litter layer) in
Amazon forests.
ARTICLE IN PRESSDTD 5
10 M. Krauss et al. / Environmental Pollution -- (2005) ---–---
the compartments, as the whole nest was built fromdigested dead or living wood (Donovan et al., 2001;Amelung et al., 2002) and did not show significantdifferences in OC concentrations or C/N ratios (Table 2).
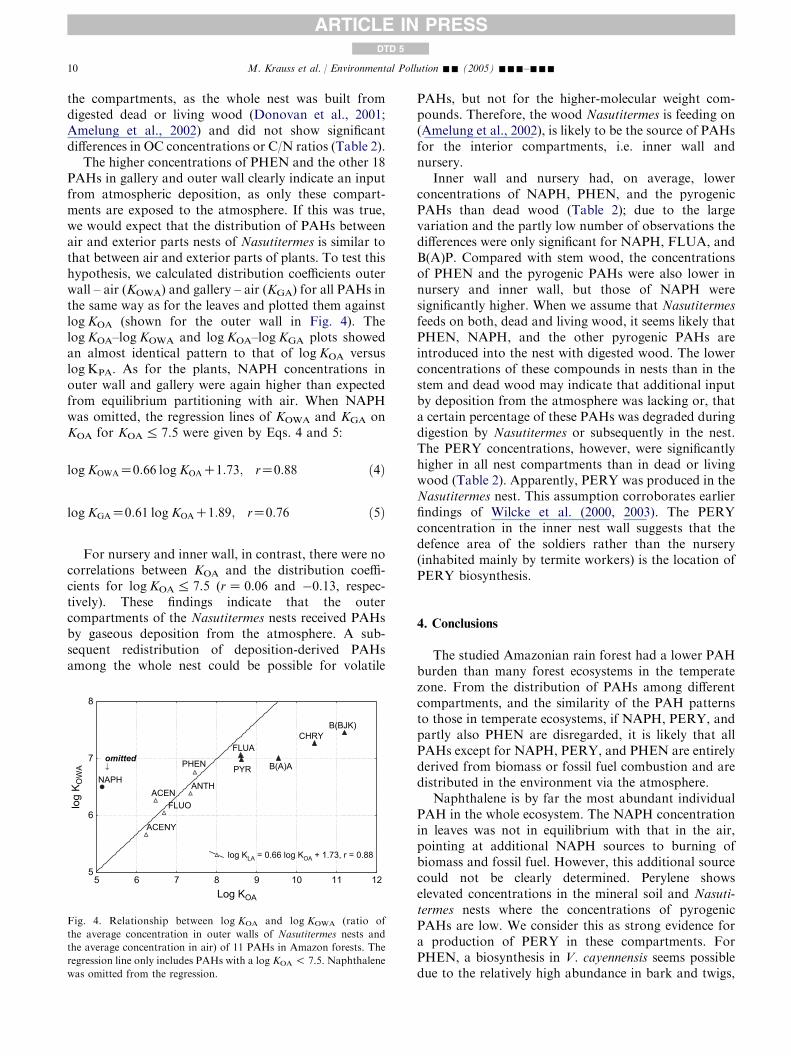
The higher concentrations of PHEN and the other 18PAHs in gallery and outer wall clearly indicate an inputfrom atmospheric deposition, as only these compart-ments are exposed to the atmosphere. If this was true,we would expect that the distribution of PAHs betweenair and exterior parts nests of Nasutitermes is similar tothat between air and exterior parts of plants. To test thishypothesis, we calculated distribution coefficients outerwall – air (KOWA) and gallery – air (KGA) for all PAHs inthe same way as for the leaves and plotted them againstlogKOA (shown for the outer wall in Fig. 4). ThelogKOA–logKOWA and logKOA–logKGA plots showedan almost identical pattern to that of logKOA versuslog KPA. As for the plants, NAPH concentrations inouter wall and gallery were again higher than expectedfrom equilibrium partitioning with air. When NAPHwas omitted, the regression lines of KOWA and KGA onKOA for KOA% 7.5 were given by Eqs. 4 and 5:
logKOWAZ0:66 logKOAC1:73; rZ0:88 ð4Þ
logKGAZ0:61 logKOAC1:89; rZ0:76 ð5Þ
For nursery and inner wall, in contrast, there were nocorrelations between KOA and the distribution coeffi-cients for logKOA% 7.5 (rZ 0.06 and �0.13, respec-tively). These findings indicate that the outercompartments of the Nasutitermes nests received PAHsby gaseous deposition from the atmosphere. A sub-sequent redistribution of deposition-derived PAHsamong the whole nest could be possible for volatile
Log KOA
lo
g K O
WA PHEN
ANTH
FLUACHRY
B(BJK)
ACENY
ACENFLUO
NAPH
5
6
7
8
5 6 7 8 9 10 11 12
B(A)APYR
log KLA = 0.66 log KOA + 1.73, r = 0.88
omitted
↓
Fig. 4. Relationship between log KOA and log KOWA (ratio of
the average concentration in outer walls of Nasutitermes nests and
the average concentration in air) of 11 PAHs in Amazon forests. The
regression line only includes PAHs with a log KOA ! 7.5. Naphthalene
was omitted from the regression.
PAHs, but not for the higher-molecular weight com-pounds. Therefore, the wood Nasutitermes is feeding on(Amelung et al., 2002), is likely to be the source of PAHsfor the interior compartments, i.e. inner wall andnursery.
Inner wall and nursery had, on average, lowerconcentrations of NAPH, PHEN, and the pyrogenicPAHs than dead wood (Table 2); due to the largevariation and the partly low number of observations thedifferences were only significant for NAPH, FLUA, andB(A)P. Compared with stem wood, the concentrationsof PHEN and the pyrogenic PAHs were also lower innursery and inner wall, but those of NAPH weresignificantly higher. When we assume that Nasutitermesfeeds on both, dead and living wood, it seems likely thatPHEN, NAPH, and the other pyrogenic PAHs areintroduced into the nest with digested wood. The lowerconcentrations of these compounds in nests than in thestem and dead wood may indicate that additional inputby deposition from the atmosphere was lacking or, thata certain percentage of these PAHs was degraded duringdigestion by Nasutitermes or subsequently in the nest.The PERY concentrations, however, were significantlyhigher in all nest compartments than in dead or livingwood (Table 2). Apparently, PERY was produced in theNasutitermes nest. This assumption corroborates earlierfindings of Wilcke et al. (2000, 2003). The PERYconcentration in the inner nest wall suggests that thedefence area of the soldiers rather than the nursery(inhabited mainly by termite workers) is the location ofPERY biosynthesis.
4. Conclusions
The studied Amazonian rain forest had a lower PAHburden than many forest ecosystems in the temperatezone. From the distribution of PAHs among differentcompartments, and the similarity of the PAH patternsto those in temperate ecosystems, if NAPH, PERY, andpartly also PHEN are disregarded, it is likely that allPAHs except for NAPH, PERY, and PHEN are entirelyderived from biomass or fossil fuel combustion and aredistributed in the environment via the atmosphere.
Naphthalene is by far the most abundant individualPAH in the whole ecosystem. The NAPH concentrationin leaves was not in equilibrium with that in the air,pointing at additional NAPH sources to burning ofbiomass and fossil fuel. However, this additional sourcecould not be clearly determined. Perylene showselevated concentrations in the mineral soil and Nasuti-termes nests where the concentrations of pyrogenicPAHs are low. We consider this as strong evidence fora production of PERY in these compartments. ForPHEN, a biosynthesis in V. cayennensis seems possibledue to the relatively high abundance in bark and twigs,
ARTICLE IN PRESSDTD 5
11M. Krauss et al. / Environmental Pollution -- (2005) ---–---
but the contribution to the total PHEN storage in therain forest remains to be elucidated.
Acknowledgments
We thank Brigitte Burghardt, Andrea Popp, SabineRautenberg, and Katja Thielemann for contributing tothe laboratory work, Andrea Hartmann, Sibylle Kaiser,and Thorsten Ullrich for their help during sampling andthe Embrapa Amazonia Ocidental and the BMBF-funded German-Brazilian SHIFT project ENV 52 fortheir invaluable support. We particularly thank MartinKaupenjohann for providing access to his laboratory.We gratefully acknowledge the funding of this study bythe Deutsche Forschungsgemeinschaft (DFG Wi 1601/2-1, -2). W. Wilcke furthermore thanks the DFG for theHeisenberg grant (Wi 1601/3-1, -2).
References
Alfani, A., Maisto, G., Prati, M.V., Baldantoni, D., 2001. Leaves of
Quercus ilex L. as biomonitors of PAHs in the air of Naples (Italy).
Atmos. Environ. 35, 3553–3559.
Amelung, W., Martius, C., Bandeira, A.G., Garcia, M.V.B., Zech, W.,
2002. Lignin characteristics and density fractions of termite nests in
an Amazonian rain forest – indicators of termite feeding guilds?
Soil Biol. Biochem. 34, 367–372.
Azuma, M., Toyota, Y.A., Kawano, S., 1996. Naphthalene –
a constituent of Magnolia flowers. Phytochemistry 42, 999–1004.
Baker, R., Walmsley, S., 1982. Soldier defense secretions of the South
American termites Cortaritermes silvestri, Nasutitermes sp. n.d. and
Nasutitermes kemneri. Tetrahedron 38, 1899–1910.
Barber, J.L., Thomas, G.O., Kerstiens, G., Jones, K.C., 2003. Study of
plant–air transfer of PCBs from an evergreen shrub: implications
for mechanisms and modeling. Environ. Sci. Technol. 37, 3838–
3844.
Barber, J.L., Thomas, G.O., Kerstiens, G., Jones, K.C., 2004. Current
issues and uncertainties in the measurement and modelling of air-
vegetation exchange and within-plant processing of POPs. Environ.
Pollut. 128, 99–138.
Braekman, J.C., Daloze, D., Dupont, A., Pasteels, J.M., Lefeuve, P.,
Bordereau, C., Declercq, J.P., van Meerssche, M., 1983. Chemical
composition of the frontal gland secretion from soldiers of
Nasutitermes lujae (Termitidae, Nasutitermitinae). Tetrahedron
39, 4237–4241.
Bundt, M., Kretzschmar, S., Zech, W., Wilcke, W., 1997. Seasonal
redistribution of manganese in soil aggregates of a Costa Rican
coffee field. Soil Sci. 162, 323–332.
Chen, J., Henderson, G., Grimm, C.C., Lloyd, S.W., Laine, R.A.,
1998a. Termites fumigate their nests with naphthalene. Nature 392,
558.
Chen, J., Henderson, G., Grimm, C.C., Lloyd, S.W., Laine, R.A.,
1998b. Naphthalene in Formosan subterranean termite carton
nests. J. Agric. Food Chem. 46, 2337–2339.
Christensen, E.R., Zhang, X., 1993. Sources of polycyclic aromatic
hydrocarbons to Lake Michigan determined from sedimentary
records. Environ. Sci. Technol. 27, 139–146.
Constantino, R., 1992. Abundance and diversity of termites (Insecta:
Isoptera) in two sites of primary rain forest in Brazilian Amazonia.
Biotropica 24, 420–430.
Daisy, B.H., Strobel, G.A., Castillo, U., Ezra, D., Sears, J., Weaver,
D.K., Runyon, J.B., 2002. Naphthalene, an insect repellent, is
produced by Muscodor vitigenus, a novel endophytic fungus.
Microbiology 148, 3737–3741.
Donovan, S.E., Eggleton, P., Bignell, D.E., 2001. Gut content analysis
and a new feeding group classification of termites. Ecol. Entomol.
26, 356–366.
FAO-UNESCO, 1997. Soil map of the world – revised legend with
corrections and updates. ISRIC, Wageningen, Netherlands.
Freeman, D.J., Cattell, F.C.R., 1990. Woodburning as a source of
atmospheric polycyclic aromatic hydrocarbons. Environ. Sci.
Technol. 24, 1581–1585.
Harner, T., Bidleman, T.F., 1996. Measurements of octanol–air
partition coefficients for polychlorinated biphenyls. J. Chem.
Eng. Data 41, 895–899.
Harrison, R.M., Smith, D.J.T., Luhana, L., 1996. Source apportion-
ment of atmospheric polycyclic aromatic hydrocarbons collected
from an urban location in Birmingham, U.K. Environ. Sci.
Technol. 30, 825–832.
Horstmann, M., McLachlan, M.S., 1998. Atmospheric deposition of
semivolatile organic compounds to two forest canopies. Atmos.
Environ. 32, 1799–1809.
Howsam, M., Jones, K.C., 1998. Sources of PAHs in the environment.
In: Neilson, A.H. (Ed.), PAHs and Related Compounds. In: The
Handbook of Environmental Chemistry, vol. 3I. Springer-Verlag,
Berlin, pp. 137–174.
Howsam, M., Jones, K.C., Ineson, P., 2000. PAHs associated with the
leaves of three deciduous tree species. I: concentrations and
profiles. Environ. Pollut. 108, 413–424.
Hwang, H.M., Wade, T.L., Sericano, J.L., 2003. Concentrations and
source characterization of polycyclic aromatic hydrocarbons in
pine needles from Korea, Mexico, and United States. Atmos.
Environ. 37, 2259–2267.
Irion, G., Junk, W.J., de Mello, J.A.S., 1997. The large central
Amazonian river floodplains near Manaus. Geological, climato-
logical, hydrological and geomorphological aspects. In: Junk, W.J.
(Ed.), The Central Amazon Floodplains. Springer-Verlag, Heidel-
berg, pp. 23–46.
Jones, K.C., Stratford, J.A., Waterhouse, K.S., Furlong, E.T., Giger,
W., Hites, R.A., Schaffner, C., Johnston, A.E., 1989. Increases in
the polynuclear aromatic hydrocarbon content of an agricultural
soil over the last century. Environ. Sci. Technol. 23, 95–101.
Jones, K.C., de Voogt, P., 1999. Persistent organic pollutants (POPs).
State of the science. Environ. Pollut. 100, 209–221.
Jurgens, A., Webber, A.C., Gottsberger, G., 2000. Floral scent
compounds of Amazonian Annonaceae species pollinated by small
beetles and thrips. Phytochemistry 55, 551–558.
Krauss, M., Wilcke, W., Zech, W., 2000. Polycyclic aromatic hydro-
carbons (PAHs) and polychlorinated biphenyls (PCBs) in forest
soils: depth distribution as indicator of different fate. Environ.
Pollut. 110, 79–88.
Krauss, M., Wilcke, W., 2003. Polychlorinated naphthalenes in urban
soils: analysis, concentrations, and relation to other persistent
organic pollutants. Environ. Pollut. 122, 75–89.
Laflamme, R.E., Hites, R.A., 1978. The global distribution of
polycyclic aromatic hydrocarbons in recent sediments. Geochim.
Cosmochim. Acta 42, 289–303.
Lee, S.C., Ho, K.F., Chan, L.Y., Zielinska, B., Chow, J.C., 2001.
Polycyclic aromatic hydrocarbons (PAHs) and carbonyl com-
pounds in urban atmosphere of Hong Kong. Atmos. Environ. 35,
5949–5960.
Lima, A.L.C., Eglinton, T.I., Reddy, C.M., 2003. High-resolution
record of pyrogenic polycyclic aromatic hydrocarbon deposition
during the 20th century. Environ. Sci. Technol. 37, 53–61.
Liu, Y., Zhu, L., Shen, X., 2001. Polycyclic aromatic hydrocarbons
(PAHs) in indoor and outdoor air of Hangzhou, China. Environ.
Sci. Technol. 35, 840–844.
ARTICLE IN PRESSDTD 5
12 M. Krauss et al. / Environmental Pollution -- (2005) ---–---
Mackay, D., Shiu, W.Y., Ma, K.C., 1992. Polynuclear Aromatic
Hydrocarbons, Polychlorinated Dibenzodioxins and Dibenzofur-
ans. Illustrated Handbook of Physical–Chemical Properties and
Environmental Fate for Organic Chemicals, vol. II. Lewis Publish-
ers, Boca Raton, FL, USA.
Martius, C., 1994. Diversity and ecology of termites in Amazonian
forests. Pedobiologia 38, 407–428.
Martius, C., Hofer, H., Garcia, M.V.B., Rombke, J., Hanagarth, W.
Litter fall, litter stocks and decomposition rates in rain forest and
agroforestry sites in central Amazonia. Nutr. Cycl. Agroecosyst.,
in press.
McLachlan, M.S., 1999. Framework for the interpretation of
measurements of SOCs in plants. Environ. Sci. Technol. 33,
1799–1804.
Ockenden, W.A., Steinnes, E., Parker, C., Jones, K.C., 1998.
Observations on persistent organic pollutants in plants: implica-
tions for their use as passive air samplers and for POP cycling.
Environ. Sci. Technol. 32, 2721–2726.
Panther, B.C., Hooper, M.A., Tapper, N.J., 1999. A comparison of air
particulate matter and associated polycyclic aromatic hydro-
carbons in some tropical and temperate urban environments.
Atmos. Environ. 33, 4087–4099.
Paterson, S., Mackay, D., Bacchi, E., Calamari, D., 1991. Correlation
of the equilibrium and kinetics of leaf–air exchange of hydrophobic
organic chemicals. Environ. Sci. Technol. 25, 866–871.
Radzi bin Abas, M., Simoneit, B.R.T., Elias, V., Cabral, J.A.,
Cardoso, J.N., 1995. Composition of higher molecular weight
organic matter in smoke aerosol from biomass combustion in
Amazonia. Chemosphere 30, 995–1015.
Rodrigues, W.A., Furch, K., Klinge, H., 2001. Comparative study of
the litter fall in a primary and secondary terra firme forest in the
vicinity of Manaus, State of Amazonas, Brazil. Amazoniana 16,
441–462.
Simonich, S.L., Hites, R.A., 1995. Organic pollutant accumulation in
vegetation. Environ. Sci. Technol. 29, 2905–2914.
Thomas, G.O., Sweetman, A.J., Ockenden, W.A., Mackay, D., Jones,
K.C., 1998. Air–pasture transfer of PCBs. Environ. Sci. Technol.
32, 936–942.
Tolls, J., McLachlan, M.S., 1994. Partitioning of semivolatile organic
compounds between air and Lolium multiflorum (Welsh ray grass).
Environ. Sci. Technol. 28, 159–166.
Valterova, I., Keek, J., Vrko, J., 1989. Intraspecific variation in the
defence secretions of Nasutitermes ephratae soldiers and the
biological activity of some of their components. Biochem. Syst.
Ecol. 17, 327–332.
Vasconcellos, P.C., Ciccioli, P., Artaxo, P., Brancaleoni, E., Cecinato,
A., Frattoni, M., 1998. Determinacao dos hidrocarbonetos
saturados e policıclicos aromaticos na atmosfera Amazonica.
Quım. Nova 21, 386–393.
Venkatesan, M.I., 1988. Occurrence and possible sources of perylene in
marine sediments – a review. Mar. Chem. 25, 1–27.
Wagrowski, D.M., Hites, R.A., 1997. Polycyclic aromatic hydrocar-
bon accumulation in urban, suburban, and rural vegetation.
Environ. Sci. Technol. 31, 279–282.
Wakeham, S.G., Schaffner, C., Giger, W., 1980. Polycyclic aromatic
hydrocarbons in recent lake sediments. 2. Compounds derived
from biogenic precursors during early diagenesis. Geochim.
Cosmochim. Acta 44, 415–429.
Wickstrom, K., Tolonen, K., 1987. The history of airborne polycyclic
aromatic hydrocarbons (PAH) and perylene as recorded in dated
lake sediments. Water Air Soil Pollut. 32, 155–175.
Wilcke, W., 2000. Polycyclic aromatic hydrocarbons (PAHs) in soil –
a review. J. Plant Nutr. Soil Sci. 163, 229–248.
Wilcke, W., Amelung, W., Martius, C., Garcia, M.V.B., Zech, W.,
2000. Biological sources of polycyclic aromatic hydrocarbons
(PAHs) in the Amazonian rain forest. J. Plant Nutr. Soil Sci.
163, 27–30.
Wilcke, W., Krauss, M., Amelung, W., 2002. Carbon isotope signature
of polycyclic aromatic hydrocarbons (PAHs): evidence for different
sources in tropical and temperate environments? Environ. Sci.
Technol. 36, 3530–3535.
Wilcke, W., Amelung, W., Krauss, M., Martius, C., Bandeira, A.,
Garcia, M.V.B., 2003. Polycyclic aromatic hydrocarbon (PAH)
patterns in climatically different ecological zones of Brazil. Org.
Geochem. 34, 1405–1417.
Wilcke, W., Krauss, M., Lilienfein, J., Amelung, W., 2004. Polycyclic
aromatic hydrocarbon storage in a typical Cerrado of the Brazilian
savanna. J. Environ. Qual. 33, 946–955.
Wiltz, B.A., Henderson, G., Chen, J., 1998. Effect of naphthalene,
butylated hydroxytoluene, dioctyl phthalate, and adipic dioctyl
ester, chemicals found in the nests of the formosan subterranean
termite (Isoptera: Rhinotermitidae) on a saprophytic Mucor sp.
(Zygomycetes: Mucorales). Environ. Entomol. 27, 936–940.
Wright, M.S., Lax, A.R., Henderson, G., Chen, J., 2000. Growth
response of Metarhizium anisopliae to two Formosan subterranean
termite nest volatiles, naphthalene and fenchone. Mycologia 92,
42–45.
Zakaria,M.P.,Takada,H.,Tsutsumi,S.,Ohno,K.,Yamada, J.,Kouno,E.,
Kumata,H., 2002.Distribution of polycyclic aromatic hydrocarbons
(PAHs) in rivers and estuaries in Malaysia: a widespread input of
petrogenic PAHs. Environ. Sci. Technol. 36, 1907–1918.
Zhou, J.L., Maskaoui, K., 2003. Distribution of polycyclic aromatic
hydrocarbons in water and surface sediments from Daya Bay,
China. Environ. Pollut. 121, 269–281.