Embed Size (px)
Citation preview

IntroductionIn many parts of Ghana the demand for water and subsequent abstraction for groundwater have increased in recent times. This is due partly to the seasonal and unreliable nature of surface water bodies, particularly rivers, especially during the dry season, when most small- to medium-size rivers dry up. In addition, most surface water bodies are susceptible to pollution, thereby
affecting the quality of the resource and the anticipated high cost of treating polluted surface water resources (Kortatsi, 2007). The pressure on groundwater resources is also attributed to the increased demand for domestic, agricultural and industrial use. Thus the welfare of every society is tied to the sustainable exploitation of water resources (Bear et al., 1999).
In Ghana, sustainable national economic
Assessment of Groundwater Quality and its Suitability for Domestic and Agricultural Purposes in parts of the Central Region, Ghana
1 2* 2 3Roland Asare , Patrick Asamoah Sakyi , Obed Fiifi Fynn , Gustav Merrit Osiakwan1Science and Technology Policy Research Institute, Council for Scientific and Industrial
Research (CSIR), Accra, Ghana2Department of Earth Science, School of Physical and Mathematical Sciences, University of
Ghana, P. O. Box LG 58, Legon-Accra, Ghana3Community Water and Sanitation Agency, Cape Coast, Ghana
*Corresponding author; Email: [email protected]
AbstractGroundwater in parts of the Central Region of Ghana was assessed to determine its suitability for domestic use and irrigation activities. Stiff and Piper diagrams show that the predominant water type in the area is Na-Cl, which is characterized by relatively high salinities. This water type occurs in aquifers underlying six coastal districts, namely; Abura-Asebu-Kwamankese (AA), Mfantseman (MF), Gomoa East (GE), Awutu Senya (AwS), Effutu (EF) and Cape Coast (CC). Other water types are Ca-HCO3, Ca-SO4 and Ca-Cl, that occur in districts located further away from the coast. Silicate weathering and ion exchange are identified as the geochemical processes responsible for the various ions in the groundwater. Possible processes that could be responsible for the source of Na+ and Cl- are sea water intrusion and dissolution of minerals. The results also show that the groundwater is mainly supersaturated with respect to both calcite and gypsum, indicating high concentrations of both bicarbonate and sulfate ions in solution. This is associated with considerable enrichment of the groundwater with sulfate, bicarbonate, and calcium ions. On a Wilcox diagram, the groundwater samples, mainly from the districts coded as AA, TLD, AS and AN, which are located away from the coast, plot within the “excellent to good” category, suggesting that water from the area is of acceptable quality for irrigation purposes. Similarly, Sodium Adsorption Ratio (SAR) and conductivity values for the groundwater in the AA, TLD, AS and AN districts indicate low SAR and low to medium salinity respectively. Groundwater in aquifers underlying these districts is therefore suitable for irrigation. Generally, groundwater samples from locations along the coast have high salinity and are not suitable for domestic and irrigation purposes. However, about 72% of the water samples predominantly in districts located away from the sea is suitable for the purposes stated.
West African Journal of Applied Ecology, vol. 24(2), 2016: 67–89

development is tied to the proper development and management of groundwater resources in conjunction with surface water resources for use in households, agriculture and industry (Banoeng-Yakubo et al., 2009). In Ghana, about 49% of the total population of 24.6 million people living in rural areas (Ghana Statistical Service, 2012), relies heavily on groundwater for their domestic and agricultural uses. Groundwater has therefore become the major source of potable water supply for most communities in Ghana. In the coastal regions in Ghana, notably the Western and Central Regions, and southern parts of the Volta Region (Kortatsi, 1994), the source of water for most irrigation schemes is groundwater from shallow aquifer systems. In the Keta basin of Ghana, a major problem associated with drinking water quality and management of domestic water supply is salinization of groundwater in hand-dug wells and in deep boreholes (Gill, 1969; Bannerman, 1994; Helstrup et al., 2007).
In most of the areas where boreholes are sited, sanitary conditions around the wellhead are very poor, potentially leading to contamination from surface sources. However, the use of groundwater with elevated salinity levels has the tendency to reduce soil and crop productivity in such areas by destroying soil permeability and reducing the osmotic potential of crops. The high salinities of groundwater in some of the boreholes in the coastal areas of the Central Region and the potential use of the groundwater resource for irrigation purposes have necessitated an overall assessment of the quality of the resource in the area for domestic and irrigation activities.
Multivariate statistical analytical techniques have proven to be highly important in the handling, interpreting and graphically representing data with regards to groundwater hydrochemistry. Both factor and cluster analyses have been greatly adopted by several authors to appropriately constrain groundwater characteristics (Usunoff & Guzmán-Guzmán, 1989; Güler et al., 2002; Liu et al., 2003; Mahlknecht et al., 2004; Kim et al., 2005; Cloutier et al., 2008; Yidana et
al., 2008; Tanaskovic et al., 2012). Statistically, Q-mode hierarchical cluster
analysis (HCA) and principal component analysis (PCA) were simultaneously applied to groundwater hydrochemical data by Belkhiri et al. (2011) in Algeria and revealed that the domain is characterized by three main hydrochemical facies. Again, Yidana et al. (2008) employed a multivariate statistical approach to identify the key process controlling the hydrochemistry of a basin in Ghana. This current study is of no exception to the use of geostatistical techniques in unravelling the hydrochemistry
of the groundwater resources in the Central Region of Ghana.
This study thererefore carried out comprehensive assessment of the quality of groundwater resources using multivariate statistical methods to determine its suitability for domestic and irrigation purposes in some parts of the Central Region of Ghana. The irrigation quality of groundwater in the study was assessed using conventional graphical methods, whereas the water quality parameters for domestic use were assessed using the standard conventional graphs.
68 West African Journal of Applied Ecology, vol. 24(2), 2016
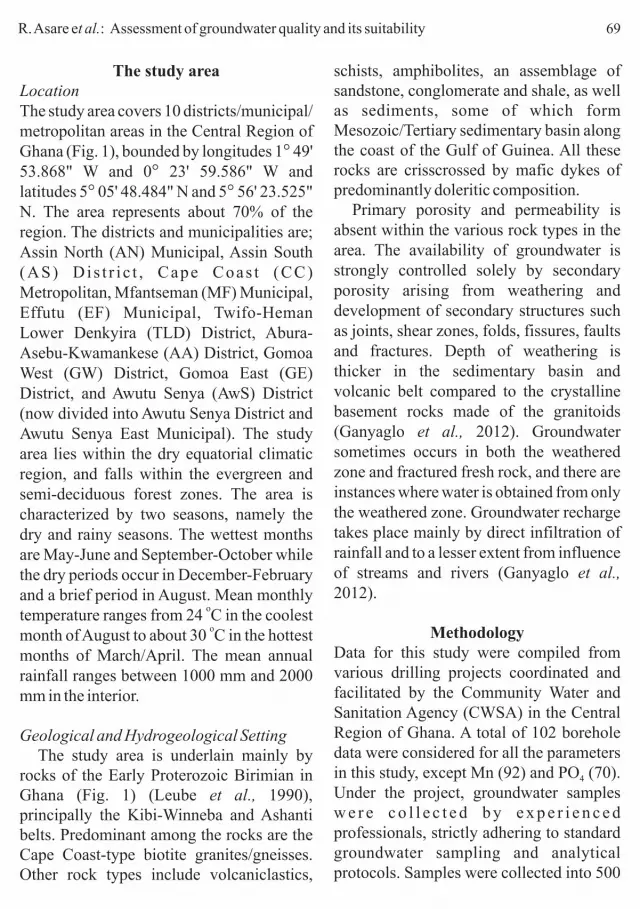
The study areaLocationThe study area covers 10 districts/municipal/ metropolitan areas in the Central Region of Ghana (Fig. 1), bounded by longitudes 1° 49' 53.868" W and 0° 23' 59.586" W and latitudes 5° 05' 48.484" N and 5° 56' 23.525" N. The area represents about 70% of the region. The districts and municipalities are; Assin North (AN) Municipal, Assin South (AS) Dis t r i c t , Cape Coas t (CC) Metropolitan, Mfantseman (MF) Municipal, Effutu (EF) Municipal, Twifo-Heman Lower Denkyira (TLD) District, Abura-Asebu-Kwamankese (AA) District, Gomoa West (GW) District, Gomoa East (GE) District, and Awutu Senya (AwS) District (now divided into Awutu Senya District and Awutu Senya East Municipal). The study area lies within the dry equatorial climatic region, and falls within the evergreen and semi-deciduous forest zones. The area is characterized by two seasons, namely the dry and rainy seasons. The wettest months are May-June and September-October while the dry periods occur in December-February and a brief period in August. Mean monthly
otemperature ranges from 24 C in the coolest
omonth of August to about 30 C in the hottest months of March/April. The mean annual rainfall ranges between 1000 mm and 2000 mm in the interior.
Geological and Hydrogeological SettingThe study area is underlain mainly by
rocks of the Early Proterozoic Birimian in Ghana (Fig. 1) (Leube et al., 1990), principally the Kibi-Winneba and Ashanti belts. Predominant among the rocks are the Cape Coast-type biotite granites/gneisses. Other rock types include volcaniclastics,
schists, amphibolites, an assemblage of sandstone, conglomerate and shale, as well as sediments, some of which form Mesozoic/Tertiary sedimentary basin along the coast of the Gulf of Guinea. All these rocks are crisscrossed by mafic dykes of predominantly doleritic composition.
Primary porosity and permeability is absent within the various rock types in the area. The availability of groundwater is strongly controlled solely by secondary porosity arising from weathering and development of secondary structures such as joints, shear zones, folds, fissures, faults and fractures. Depth of weathering is thicker in the sedimentary basin and volcanic belt compared to the crystalline basement rocks made of the granitoids (Ganyaglo et al., 2012). Groundwater sometimes occurs in both the weathered zone and fractured fresh rock, and there are instances where water is obtained from only the weathered zone. Groundwater recharge takes place mainly by direct infiltration of rainfall and to a lesser extent from influence of streams and rivers (Ganyaglo et al., 2012).
MethodologyData for this study were compiled from various drilling projects coordinated and facilitated by the Community Water and Sanitation Agency (CWSA) in the Central Region of Ghana. A total of 102 borehole data were considered for all the parameters in this study, except Mn (92) and PO (70). 4
Under the project, groundwater samples w e r e c o l l e c t e d b y e x p e r i e n c e d professionals, strictly adhering to standard groundwater sampling and analytical protocols. Samples were collected into 500
R. Asare et al.: Assessment of groundwater quality and its suitability 69
70 West African Journal of Applied Ecology, vol. 24(2), 2016
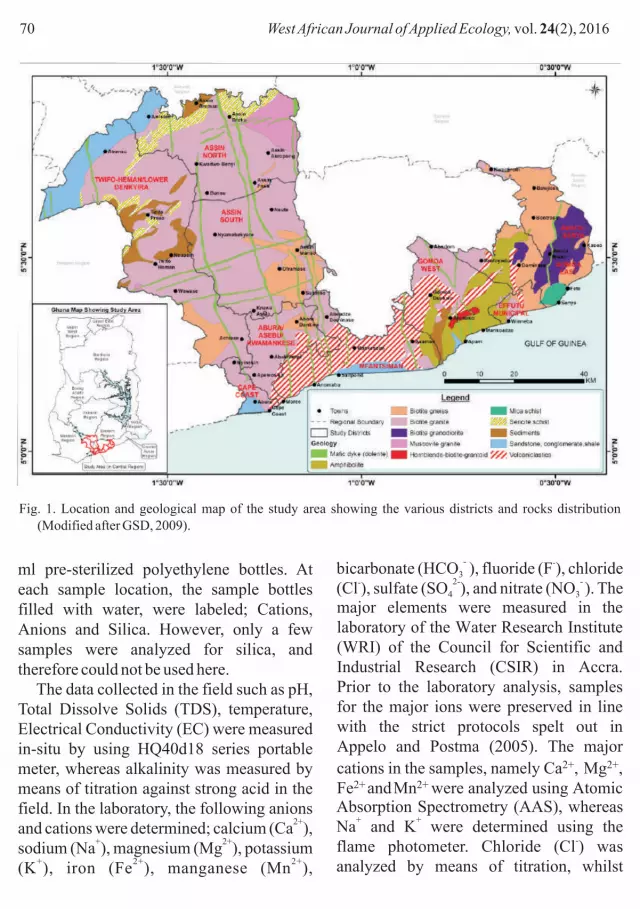
Fig. 1. Location and geological map of the study area showing the various districts and rocks distribution (Modified after GSD, 2009).
ml pre-sterilized polyethylene bottles. At each sample location, the sample bottles filled with water, were labeled; Cations, Anions and Silica. However, only a few samples were analyzed for silica, and therefore could not be used here.
The data collected in the field such as pH, Total Dissolve Solids (TDS), temperature, Electrical Conductivity (EC) were measured in-situ by using HQ40d18 series portable meter, whereas alkalinity was measured by means of titration against strong acid in the field. In the laboratory, the following anions
2+and cations were determined; calcium (Ca ),
+ 2+sodium (Na ), magnesium (Mg ), potassium
+ 2+ 2+(K ), iron (Fe ), manganese (Mn ),
- -bicarbonate (HCO ), fluoride (F ), chloride 32- - -(Cl ), sulfate (SO ), and nitrate (NO ). The 4 3
major elements were measured in the laboratory of the Water Research Institute (WRI) of the Council for Scientific and Industrial Research (CSIR) in Accra. Prior to the laboratory analysis, samples for the major ions were preserved in line with the strict protocols spelt out in Appelo and Postma (2005). The major
cations in the samples, namely Ca2+, Mg2+, Fe2+
and Mn2+ were analyzed using Atomic Absorption Spectrometry (AAS), whereas
+ +Na and K were determined using the
-flame photometer. Chloride (Cl ) was analyzed by means of titration, whilst

which is one of the most widely used t r a n s f o r m a t i o n m e t h o d s a n dstandardization was conducted to decrease the variation from the mean value in order that the parameters appear alike in the distribution of their data.
An R-mode factor analysis was employed in this current study. Similarly, Principal Component Analysis (PCA) was used as the extraction method and the Kaiser (1960) criterion as the normalization index (Cloutier et al., 2008). Equally, a varimax rotation matrix which functions as an orthogonal index to the factor matrix to heighten the differences between resulting factors for easy elucidation of the outcome was employed (Güler et al., 2002; Cloutier et al., 2008; Yidana et al., 2008; Tanaskovic et al., 2012). From the factor analysis, it was observed that PO4
3- recorded a communality less than 0.50 and thus considered inconsequential, and subsequently taken out during the rest of the analysis. This was carried out to check the significance of each parameter to the overall outcome of the analysis. The Kaiser criterion was used to constrain the required number of factors which characterize the domain based on the available data. The Kaiser Criterion states that, a factor in the final factor model requires an eigen value of at least 1.0. This means that, a factor should be able to account for the variance of at least one parameter in the data set (Güler et al., 2002; Cloutier et al., 2008; Yidana et al., 2008).
Sodium Absorption Ratio (SAR) is an important parameter for determining the suitability of groundwater for irrigation because it is a measure of alkalinity/sodium hazard to crops. SAR for the data was computed using equation 2 as follows:
- 3-nitrates (NO ), phosphate (PO ), sulfate 43
(SO42-) were analyzed using Brucine reagent,
Ascorbic Acid and Turbid metric methods respectively and Ultra Violet Spectrometer.
-Fluoride (F ) concentrations were obtained with the use of Hach Colorimeter.
Data for all the analyzed samples were subjected to internal consistency checks through the charge balance error (CBE) calculations using equation 1 (Appelo & Postma, 2005). As is consistent with standard practice, data from all the samples are required to be electrically balanced, which therefore requires that the CBE should not exceed the absolute value of ±10%.
.............(1)
where the concentrations of the major anions and cations are in meq/l.
Spatial geostatistical analysis was conducted on the data obtained from the laboratory to aid in constraining the relationship between the available g r o u n d w a t e r a n d i t s i m m e d i a t e environment . To achieve opt imal multivariate geostatistical analytical results, the data was subjected to a check for normality and skewness (Usunoff & Guzmán Guzmán, 1989; Lambrakis et al., 2004; Cloutier et al., 2008; Belkhiri et al., 2011; Tanaskovic et al., 2012). To this effect a normal descriptive statistical analysis was conducted using SPSS 22.0 on the data set to ascertain the validity of the data for geostatistical analysis. From the analysis, it
2+was observed that apart from pH, Mn and
3-PO which exhibited some level of 4
normality, all the measured parameters exhibited different degrees of deviations from the normal (Table 1). In this light, all the data were subjected to log transformation
%100xanionscations
anionscationsCBE
åååå
+
-=
R. Asare et al.: Assessment of groundwater quality and its suitability 71

Ca2+
..........(2)
where the concentrations are in mmol/l Irrigation waters having high SAR levels can lead to the build-up of high soil Na levels over time, which in turn can adversely affect soil infiltration and percolation rates. In addition excessive SAR can lead to soil crusting, poor seedling emergence, and poor aeration (Lesch & Suarez, 2009).
The sodium percentage (%Na) is widely utilized for evaluating the suitability of water quality for irrigation (Wilcox, 1948). Exces s sod ium concen t r a t i on in groundwater produces the undesirable effects because Na reacts with soil to reduce its permeability and support little or no plant growth (Raju et al., 2009; Vasanthavigar et al., 2010). If the concentration of sodium is high in irrigation water, sodium ions tend to be absorbed by clay particles, displacing
2+ 2+Mg and Ca ions. This exchange process in soil reduces the permeability and eventually results in deterioration of the soil structure and infiltration. Hence the circulation of air and water is restricted during wet conditions and such soils are usually hard when dry (Collins & Jenkins, 1996). The %Na for this study was calculated using equation 3:
.........(3)
where the concentrations of the individual species are expressed in meq/l
Results and discussions Processes influencing the general hydrochemistryA statistical summary of the physico-
chemical parameters analyzed in this study are presented in Table 1. The pH varies from an isolated 2.26 to 9.01 pH units, with a mean value of 6.34 and standard deviation of 0.762, indicating that the groundwater is predominantly acidic. The electrical conductivity (EC) ranges from a low value of 71.0 mS/cm to 9760 S/cm, yielding an average of ~1773 mS/cm. Generally, the high EC values occur along the coast, whereas the relatively low EC values occur in boreholes further inland. The total dissolved solids (TDS) concentrations range from 24.6 mg/l to 5,368 mg/l (Table 1). Groundwater with TDS values less than 1,000 mg/l has been described as fresh water whilst those with TDS values greater than 1,000 mg/l are classified as saline (Freeze & Cherry, 1979). The EC and TDS values suggest that groundwater in the area is predominantly fresh water, but saline water bodies are also present. Generally, boreholes along the coast recorded high concentrations of major cations such as
2+ 2+ + +Ca , Mg , K , Na , whereas boreholes located fur ther inland have low concentrations of these cations. The order
+ 2+ of abundance of these cations are Na > Ca+ 2+ +> K > Mg . Sodium ion (Na ) ranges from
0.00 to 1,366 mg/l with a mean value of 120 2+
mg/l, Ca is 3.20-601 mg/l (averaged 57.9 +
mg/l), K is between 0.0 and 80 mg/l, 2+
whereas Mg varies from 0.90 mg/L to 374 -
mg/l. The anions also occur in the order Cl - 2- - - -
> HCO > SO > NO > F . Cl ranges from 3 4 3
5 mg/l to 3216 mg/l, with a mean value of -
274.6 mg/l, whilst HCO concentrations 3
are 0.00–666 mg/l (averaged 133.6 mg/l). 2-
SO varies from < 0.001 to 403 mg/l, 4-
whereas NO ranges from < 0.001 to 27.3 3
mg/l. The chemical parameters are
m
72 West African Journal of Applied Ecology, vol. 24(2), 2016
+
= +Mg2+
NaSAR
100% ´+++
=KMgCaNa
NaNa

TABLE 1
Statistical summary (Descriptive Statistics) of the hydrochemical parameters in the study area
Parameter N Mean Minimum Maximum Std. Deviation
pH 102 6.34 2.26 9.01 0.762EC (mS/cm) 102 1117.79 71.00 9760.0 1773.19TDS (mg/l) 102 645.17 24.60 5368.0 1030.79TH (mg/l) 102 293.67 14.00 3040.0 514.74Na+ (mg/l) 102 120.02 0.00 1366.0 219.26K+ (mg/l) 102 11.55 0.00 80.0 13.99Ca2+ (mg/l) 102 57.91 3.20 601.0 96.20Mg2+ (mg/l) 102 37.45 0.90 374.0 75.86Fe2+ (mg/l) 102 0.458 <0.001 9.77 1.142HCO - (mg/l) 102 133.58 0.00 666.0 103.893SO 2- (mg/l) 102 64.31 <0.001 403.0 92.754Cl- (mg/l) 102 274.61 5.00 3216.0 569.44Mn2+ (mg/l) 92 0.339 0.00 2.15 0.442NO - (mg/l) 102 4.10 <0.001 27.3 5.323F- (mg/l) 102 1.02 0.002 3.39 0.861TA (mg/l) 102 112.30 20.0 546.0 86.78PO 3- (mg/l) 70 0.541 0.09 5.06 0.7214
Cape Coast (CC), Mfantseman (MF), Effutu (EF), Awutu Senya (AwS) and Gomoa East (GE). All these districts are located along the coast with the exception of AA, which is located away from the coast but its proximity to the coastline explains why its underlying aquifer contains Na-Cl water type. From the coastal areas, the water type changes further inland towards the north and northwestern parts of the Central Region, into minor facies namely; Ca-Cl, Ca-HCO and Ca-SO in that order. 3 4
Piper (1944) diagram has been traditionally and most commonly used to classify water into different water types based upon the anion and cation concentrations in the form of major ion percentage. Piper plots are more useful in bringing out the chemical relationships amongst groundwater samples in more
presented in Stiff (1951) diagrams in Fig. 2. The Stiff diagrams show the dominanceof monovalent ions over divalent ions. It is obvious from Fig. 2 that six out of the ten districts, code-named AA, CC, MF, EF, AwS and GE, display identical shapes, with
+ +Na +K ions being the dominant cations,
-whilst Cl is the predominant anion. Of the remaining four districts, Assin South (AS) and Twifo-Heman Lower Denkyira (TLD),
2+ -have Ca and HCO as the dominant cation 3
and anion, respectively; Assin North (AN) 2+ 2-
has Ca and SO as the dominant ions, 4
whereas Gomoa West (GW) is dominated by Ca2+ and Cl-.
Thus, the most predominant water type in the study area is Na-Cl. This water type occurs in aquifers underlying six district/municipal/metropolitan areas, namely; Abura-Asebu-Kwamankese (AA),
R. Asare et al.: Assessment of groundwater quality and its suitability 73

74 West African Journal of Applied Ecology, vol. 24(2), 2016
Fig. 2. Stiff (1951) diagrams for the average of the concentrations of the major ions in groundwater in the various districts. (a) Abura-Asebu-Kwamankese (AA) (b) Twifo-Heman Lower Denkyira (TLD), (c) Assin North (AN), (d) Assin South (AS), (e) Gomoa East (GE), (f) Gomoa West (GW), (g) Cape Coast (CC), (h) Mfantseman (MF), (i) Awutu Senya (AwS) and (j) Effutu (EF).

definite terms rather than with other possible plotting methods. In this study, the Piper diagram was used to further complement the classification of groundwater types as already established by the Stiff diagrams. Groundwater in AwS, AA, MF, EF, CC and to some extent GE display Na-Cl water type (Fig. 3a, b), with AS and TLD displaying Ca-HCO water type (Fig. 3c). The water type for
3
GW is not clearly defined because of the limited number of samples, however, a Ca-Cl (Fig. 3b) water type could be inferred for it. Similarly, that of AS is not clear, but a Ca-SO (Fig. 3c) water type could be inferred for 4
it. These classifications are similar to those observed on the Stiff diagrams. It is worth nothing that, Ca-HCO water type in Ghana 3
is associated with areas where rock-water interactions are the major causes of variation in the hydrochemistry of groundwater (Yidana et al., 2010; Ganyaglo et al., 2012). And fresh groundwaters in coastal aquifers are dominated by the Ca-HCO type waters 3
resulting from the weathering of carbonate minerals and incongruent silicate mineral weathering (Drever, 1988; Appelo & Postma, 2005).
In the coastal areas of Ghana, high electrical conductivities are commonly attributed to seawater intrusion (SWI). However, according to Armah (2002), dissolution of minerals in the rocks could also give rise to salinization in the area. A preliminary study conducted by Ganyaglo
et al. (2012) using 14 predominantly inland boreholes also concluded that NaCl in groundwater in the Central Region is concentrated in soil zone as a result of silicate weathering.
Water electrical conductivity (EC) is usually used as a salinity indicator. The
presence of dissolved salts in water is related to the value of its EC, as they provide electrical charges interacting as ions in movement. Chloride ions are the main constituents in waters and saline soils that directly affect the EC values; therefore, it is likely to establish a strong correlation
-between EC and Cl concentrations (Oteri, 1988; Hajrasuliha et al, 1991; Xu & Eckstein, 1997; McNeil & Cox, 2000; Abyaneh et al., 2005; Alhumoud et al.,
-2010). In this study, the Cl ions display strong positive correlation with the EC (Fig. 4), suggesting increased salinity of the
-groundwater. Moreover, the chloride (Cl ) concentrations are relatively very high in boreholes in the coastal areas and could possibly be originating from sea water intrusion.
To further complement this observation, a 1:1 plot of Na+ against Cl- in Fig. 5, akin to that proposed by Bear et al. (1999) was plotted to establish their ratio. The plot shows that some of the samples plot on the 1:1 equiline, thereby exhibiting Na+:Cl- ratios equal to 1, whereas a few others plot above the equiline, displaying a ratio greater than 1. According to Rao (2008), ratio equal to 1 indicates the dissolution of NaCl, whilst ratio >1 implies a release of Na+ from silicate weathering. Many
studies have used the Cl concentration in underground water to define the degree of saline intrusion. Some authors state that a threshold of chloride concentration ranging between 40 and 300 mg/l is an indication of seawater invasion (e.g., Edet & Okereke, 2001)
-
The geology of the study area, which is made up of about 85% crystalline basement rocks, notably granitoids, together with
R. Asare et al.: Assessment of groundwater quality and its suitability 75

Fig. 3. Piper diagrams for the districts in the study area: (a) Abura-Asebu-Kwamankese (AA) and Awutu Senya (AwS); (b) Effutu (EF), Gomoa East (GE), Gomoa West (GW), Cape Coast (CC) and Mfantseman (MF); (c) Twifo-Heman Lower Denkyira (TLD), Assin North (AN) and Assin South (AS).
76 West African Journal of Applied Ecology, vol. 24(2), 2016

-Fig. 4. Relation between Cl and EC in the Central Region groundwater.
Fig. 5. Relation between Na+ and Cl- in the Central Region groundwater. The solid line denotes 1:1 ratio.
R. Asare et al.: Assessment of groundwater quality and its suitability 77

schists, sandstones and some volcanic rocks, does not provide evidence of saline beds. However, almost all the boreholes with high
-Cl contents and high EC are located in the districts along the coast, whereas the those
-with low to moderately high Cl and EC values are in districts such as Assin North, Assin South and Twifo-Heman Lower Denkyira, located further inland. Based on these observations, it can be concluded that the NaCl in the groundwater can be attributed to sea water intrusion because of the proximity to the sea, and silicate weathering. In the underlying geology of the area, Na-rich feldspar (e.g., albite) is the dominant mineral, and the weathering of
+albite results in the release of Na (equation 4) into the soil zone that eventually finds itsway into the aquifer.
2NaAlSi3O8 + 2CO2 + 11H2O → 2Na+ + 2HCO3- (Albite)+4H4SiO4 + Al2Si2O5(OH)4 ..................................(4)
(Kaolinite)
This interpretation corroborates the findings of Ganyaglo et al. (2012) who
+further indicated that the source of Na in the aquifers could be attributed to the breakdown
-of albite, whereas the source of Cl may be from atmospheric input.
In the area, the Ca-HCO water type 3
occurs in Assin South (AS) and Twifo-Heman Lower Denkyira (TLD), and therefore may not have been affected by seawater intrusion, compared to the Na-Cl water types along the coast. Seawater is
+ -enriched in Na and Cl ions and therefore, groundwaters which are significantly influenced by seawater intrusion will inherit the hydrochemical signature of the seawater (Yidana et al., 2010). However, where the
2+freshwater was originally dominated by Ca
cations, the exchange sites will be dominated by this cation. Upon the
intrusion of Na+ dominated seawater, cation exchange occurs in which case the originally Ca-HCO freshwaters are 3
gradually replaced by Ca-Cl waters. Incongruent weathering of albite and related plagioclase feldspars could potentially result in Ca-HCO groundwater 3
type in the study area. Possible processes that could be responsible for the source of
+ -Na and Cl and subsequently the salinization of the groundwater are sea water intrusion, dissolution of minerals and ion exchange.
Because most parts of the study area are located along the coast, with the occurrence of seawater intrusion and possible presence of saline beds in some locations, the salinities are expected to be high in some of the boreholes. This assertion can be clearly
-seen in factor 1 (Table 2) as Cl concentrations are loaded highest (0.965). Factor 1 explains about 47.262 % (Table 3) of the total variation in the geochemistry of
the groundwater within the study area. It can clearly be seen that apart from Cl-, factor 1
also has high positive loadings for the major + 2+ 2+ + 2-
ions of Na , Mg , Ca , K and SO . These 4
elements are highly compatible in solution and could suggest a common source, possibly the underlying geology (Yidana
et al., 2008). The sources of Mg2+ in the
groundwater could be due to the weathering of biotite (K(Mg,Fe)3(AlSi3)O10(OH,F)2) and hornblende (Ca,Na)2–3(Mg,Fe,Al)5(Al,Si)8O22(OH)2 whereas Ca2+ could be leached from the weathering of calcic plagioclase feldspars such as andesine ((Ca,Na)(Al,Si)4O8) and oligoclase ((Ca,Na)(Si,Al)4O8), which are
78 West African Journal of Applied Ecology, vol. 24(2), 2016

TABLE 2R-mode factor analysis of parameter loadings
Parameters Factor 1 Factor 2 Factor 3 Factor 4
pH .000 .284 .168 .668EC (mS/cm) .870 .275 .144 .042TDS (mg/l) .956 .178 .054 .020TH (mg/l) .884 .379 .138 .007
+Na (mg/l) .913 .146 –.084 .048
+K (mg/l) .511 –.036 .618 –.191
2+Ca (mg/l) .781 .482 .147 –.004
2+Mg (mg/l) .869 .281 .041 .031
2+Fe (mg/l) –.125 .030 .718 –.014
-HCO (mg/l) .301 .883 .180 .0463
2-SO (mg/l) .579 .131 –.304 –.0364
-Cl (mg/l) .965 .073 –.053 –.0062+Mn (mg/l) .197 .485 –.213 –.082
-NO (mg/l) .035 –.293 –.075 .8153
-F (mg/l) .055 .149 .596 .337TA (mg/l) .333 .880 .185 .079
mineralogical components of the granitoids. Anorthite (CaAl Si O ), another high-2 2 8
temperature calcic plagioclase feldspar is ruled out because, at high temperature, its occurrence in granitic rocks in the area is not
2+likely. Other potential sources of Ca and
+Na in the groundwater are weathered
pyroxenes ((Na,Ca)(Mg,Fe,Al)(Al,Si) O ) 2 62-and hornblende. The source of the high SO 4
could possibly be from anthropogenic -
contamination such as farming. NO and 32-
SO represents the contribution of 4
a g r i c u l t u r a l c h e m i c a l s t o t h ehydrochemistry of these surface water basins. Nitrate- and sulfate-rich fertilizers and manures are extensively used in farming activities. The excess fertilizer is washed into the groundwater system, and this has the potential of raising the nitrate and sulfate levels beyond their natural concentrations. Equally, the high concentrations of these elements in solution could be contributing to
the observed high trend in TDS and EC values. The loadings of TH with respect
to Ca2+
and Mg2+
are highly correlatedsince hardness of groundwater is solely due to the high occurrence of these elements in solution.
Factor 2 observes high loadings in pH, -
HCO and TA and contributes about 3
11.373% (Table 3) of the total variation in the hydrochemistry of the available groundwater resource. Acids are chemical
+compounds that produce H ions when dissolved in water. The stronger the acid,
+the more H ions they produce. Incongruent silicate mineral weathering, expedited by carbonic acid, indicates the production of
-the bicarbonate ion (HCO ) and cations in 3
solution. The low pH characterizing the study area is indicative of abundant oxygen content and thus increasing the acidity of the medium, which is revealed in the high total alkalinity (TA) loading in factor 2. It
R. Asare et al.: Assessment of groundwater quality and its suitability 79

can therefore be deduced that carbonate mineral weathering is the main control in factor 2. Equally, it can be clearly seen that an increase in alkalinity would result in a contribution boost to the total percentage variance in factor 1, due to enrichment of HCO -
3
Factor 3 (Table 3) accounts for about 8.265% of the total variation in the hydrogeochemistry of the groundwater with
+ 2+
F-. Again, these elements are highly
compatible and suggest a common source, possibly the underlying geology (Appelo & Postma, 2005). These elements occur
naturally in nature. K+ in the groundwater
could be attributed to the alteration of
plagioclase feldspar ([KAl (Si Al)O2 3 10
(OH,F)]) in the underlying geology into 2+
sericite. The high concentrations of Fe as observed in some parts of the study area could not be attributed to anthropogenic activities, and as such the possible source being geogenic, through rock water interaction (Ganyaglo et al., 2012). The geology of the study area is underlain mainly by biotite-bearing Cape Coast granitoids which occupy about 85% of the
2+study area. The source of Fe in the groundwater could be due to weathering of biotite (K(Mg,Fe) AlSi O (OH,O,F) ), and 3 3 10 2
therefore, the observed high loadings of 2+Fe characterizing the domain. Fluoride
concentrations range from 0.002 to 3.39
TABLE 3
Total variances explained by the various factors
Component Initial eigen values Extraction sums of squared Rotation Sums of Squared
loadings Loadings
Total % of Cumula- Total % of Cumula- Total % of Cumula-
Variance tive % Variance tive % Variance tive %
1. 7.562 47.262 47.262 7.562 47.262 47.262 6.436 40.224 40.224
2. 1.820 11.373 58.635 1.820 11.373 58.635 2.586 16.163 56.387
3. 1.322 8.265 66.900 1.322 8.265 66.900 1.568 9.799 66.185
4. 1.169 7.303 74.204 1.169 7.303 74.204 1.283 8.018 74.204
5. .942 5.888 80.092
6. .818 5.115 85.206
7. .664 4.149 89.356
8. .580 3.623 92.979
9. .455 2.845 95.823
10. .250 1.564 97.388
11. .188 1.177 98.564
12. .141 .880 99.444
13. .040 .248 99.692
14. .031 .192 99.885
15. .010 .063 99.947
16. .008 .053 100.000
Extraction Method: Principal Component Analysis.
80 West African Journal of Applied Ecology, vol. 24(2), 2016
high loadings being observed in K , Fe and

mg/l with an average concentration of 1.02 mg/l. Of the 102 boreholes investigated, 87 of them, representing ~85% have fluoride concentrations less than or equal to 1.50 mg/l, falling within the WHO (2003) permissible levels of 1.5 mg/l. The remaining 15 samples representing ~15% ranged between 1.537 to 3.39 mg/l fall outside the WHO standard for permissible drinking water (WHO, 2003). The intermediate to lower value range according
to the above classification, occur in Cape Coast Municipality (CC), Abura-Asebu-
Kwamankese District (AA) and Assin South District (AS), whilst the higher range values can be found in Gomoa East (GE), Assin South (AS) and Twifo-Heman-Lower Denkyira (TLD) Districts.
The moderately high fluoride levels (>1.5 mg/l) in the groundwater in about 15% of the boreholes is a major concern for the communities in these areas, since water with such concentration of F- will cause skeletal and dental fluorosis when consumed. These areas are underlain predominantly by granitic intrusions, especially biotite granite. High fluoride levels have been recorded in groundwater in certain parts of the country. For example, in the Bongo District of the Upper East Region of Ghana, there are reported high levels of fluoride in groundwater (Apambire et al., 1997), which are attributed to the dissolution of fluorite in groundwater in the Bongo granite. Recent geochemical and petrographic study of granitoids in the Bole-Nangodi belt by Sakyi et al. (unpublished), has also revealed the presence of fluorite in the rocks, thereby confirming the study of Apambire et al. (1997). The occurrence of high fluoride concentrations in limited areas of the study districts could be attributed to localized
occurrence of fluorine-bearing minerals such as fluorite (CaF ), cryolite (Na AlF ), 2 3 6
and fluoroapatite (Ca (PO ) F) that 5 4 3
commonly occur as accessory minerals in the underlying granitoids rocks. Studies have also shown that biotite contributes up to 3400 ppm of fluoride in ground water (Deer et al., 1992). The high fluoride concentrations in groundwater in metamorphic terrains are due to the dissolution of biotite, which may contain significant fluorine at the OH sites of their octahedral sheet (Dharmagunawardhana, 2004; Tainosho et al., 2003; Nordstrom et al., 1989). This is corroborated by the findings of Kularatne & Pitawala (2012) that showed that highly weathered biotite
-will readily leach high concentration of Finto water percolating through the soil.
-Therefore the elevated F in some of the boreholes in the study area could be attributed to the weathering of biotite in the granitoids.
Factor 4, on the other hand, exhibits a
high positive loading for pH and an equally high loading for NO3
-, and contributing to about 7.303% (Table 3) of the total variation in the hydrochemistry of the groundwater. The loadings in factor 4 are attributable mainly to anthropogenic activities such as agriculture and improper disposal of waste. Nitrogen may also occur naturally in the soil in organic forms from the decay of plant and animal residues. The
-high loadings for NO and pH in factor 4 is 3
therefore an indicat ion that the -
concentration of NO contributes 3
significantly to the low pH as observed in the study area.
Gibbs (1970) diagram was employed to adequately constrain the hydrochemical
trends that characterize the study domain.
R. Asare et al.: Assessment of groundwater quality and its suitability 81

The diagram plots the total dissolved solids (TDS) on a logarithmic axis against the ratio of sodium and the sum of sodium and calcium on a linear axis, and is divided into zones based on the contribution of recharging precipitation, rock/mineral weathering and evaporation/crystallization on the hydrochemistry. The zonation is based on the ratio of the concentration of the Na+ ion to the sum of the concentrations of
+ 2+the Na and Ca ions in the hydrochemistry plotted against the TDS content of the water under investigation. Waters that are affected by high evaporative effects are generally
expected to display high TDS and Na/(Na +Ca) ratios, whereas those whose hydrochemistry is controlled primarily by mineral weathering processes, have
moderate TDS and moderate Na/(Ca+Na). In addition, waters that are influenced mainly by the hydrochemistry of precipitation are characterized by low TDS
and moderate to high Na/(Ca+Na) ratio. In Fig. 6, about 94% of the groundwater samples, spanning almost all the ten districts, plot within the “rock weathering” field. This suggests that rock dissolution is apparently the major process influencing groundwater hydrochemistry in the area, and this supports our earlier discussion on the prevailing processes and possible sources of the various ions.
Fig. 7 represents the stability diagram for the equilibrium relationship between calcite and gypsum for all the samples. In Fig. 7, all samples plot within the gypsum and calcite supersaturation field, suggesting the relatively high content of calcium in the system. It is apparent that groundwater in the aquifer underlying the study area is largely supersaturated with respect to both calcite
and gypsum, indicating high concentrations of both bicarbonate and sulfate ions in solution. This observed supersaturation of gypsum together with calcite is most likely associated with considerable enrichment of the groundwater with sulfate, bicarbonate, and calcium mainly through dissolution of minerals and subsequent reaction with other species. For the formation of calcite, as already discussed, the weathering of hornblende, plagioclase feldspar and pyroxene as well as hydrothermal alteration of the metavolcanics and metasediments
2+could release Ca into the groundwater. On the other hand, the reaction of infiltrating water and CO produced through the 2
decomposition of organic matter in the soil -
zone will generate HCO (Ganyaglo et al., 3
2012), and this will eventually react with 2+
Ca to form calcite. The equations below illustrate this; .... .................(5)
(carbonic acid) ..... ...................(6)
(bicarbonate) ................................ (7)
(carbonate ion) ....... .................. (8)
(calcite)+
The release of H could be responsible for the slightly acidic nature of the groundwater. In the absence of sea water intrusion that may influence the water type, the dissolution of the calcite could be responsible for the formation of the Ca-HCO water type. Similarly, gypsum can
be formed by the reaction of Ca2+, SO42-
and the groundwater. Possible sources of SO4
2- are atmospheric input and the application of chemical fertilizers for f a r m i n g a c t i v i t i e s i n t h e r e g i o n .
3
322)(2 COHOHCO aq ®+
-++®332 HCOHCOH
-+-+«
2
33 COHHCO
3
2
32 CaCOCOCa «+
-+
82 West African Journal of Applied Ecology, vol. 24(2), 2016

Fig. 6. Gibbs (1970) diagram showing the dominant source of variation in the groundwater
hydrochemistry in the study area.
Fig. 7. The stability field for gypsum and calcite in the study area.
R. Asare et al.: Assessment of groundwater quality and its suitability 83

Suitability of groundwater for irrigation purposes
The assessment of the quality of water in the area for irrigation is based on the salinity and sodium content relative to the concentrations of the other major cations in the water system. Electrical conductivity is a good measure of salinity hazard to crops as it reflects the total dissolved solids in groundwater. Salinity hazard and sodium hazard are the important water quality issues, especially in irrigated areas (Jalali, 2007; Raju et al., 2012). High salinity waters reduce the osmotic ability of plants and thus interfere with the capacity of plants to absorb water and nutrients from the soils and transport it to the branches and leaves (Saleh et al., 1999; Jalali, 2007). This leads to a physiological drought of the plant although there may be a lot of water in the soil. This condition can cause the wilting of plants leading to death. In addition to the salinity effects, high concentrations of specific ions such as sodium, bicarbonate, and boron can be lethal to irrigation crops. Even if the salinity is low, high concentrations of these ions can interfere with the ability of plants to absorb water from soils. The long term effects of using high salinity waters for irrigation is the accumulation of salts in soils, leading to a reduction in the hydraulic properties of irrigation soils with time. When this happens, the ability of such soils to support optimum plant growth and development is greatly inhibited.
In this study, the Wilcox diagram (Wilcox, 1955) which plots the sodium percent against the EC was used to assess the quality of the four major groundwater classes in the study area for irrigation activities. The Wilcox (1955) diagram (Fig. 8) shows that most of the samples plot mainly within “excellent to
good” and marginally in “good to permissible” irrigation quality. This category excludes most of the samples from the coastal districts of EF, AwS, GE, MF and some samples from CC, which represent areas characterized by Na-Cl water types. Samples from the above-mentioned districts plot mainly across fields defined as “permissible to doubtful”, “doubtful to unsuitable’ and ‘unsuitable”. This could possibly be due to the high salinity nature of groundwater samples from these districts, classified according to the water types. Consequently, they are not suitable for irrigation purposes. Instead, samples from districts located away from the coast, notably, AA, TLD, AS and to some extent, AN plot within “excellent to good” irrigation quality, and are therefore suitable for irrigation purposes. The generally low concentrations of the physico-chemical parameters in the groundwater in these districts is responsible for the low SAR and EC values, which have together influenced the irrigation quality of the groundwater in the area.
Fig. 9 presents the USSL (1954) diagram for the study area. Both the salinity and sodium content are generally low in the study area except a few other samples with high salinity and sodium content. Seventy three (73) samples, representing about 72%, plot within the C1-S1 and C2-S1 categories, representing low SAR and low to medium salinity. Samples within these two categories are mainly from AA, AS, AN, and TLD. Groundwaters from aquifers underlying these districts are interpreted to possess low SAR and low salinity and are therefore suitable for irrigation. The remaining 28% data points plot within
84 West African Journal of Applied Ecology, vol. 24(2), 2016

Fig. 8. Wilcox (1955) diagram used to assess the irrigation quality of groundwater in the study area.
Fig. 9. USSL (1954) diagram for the assessment of the irrigation quality of groundwater in the study area.
R. Asare et al.: Assessment of groundwater quality and its suitability 85

other categories ranging from medium to very high SAR and high salinity. Samples in the very high SAR/salinity are mainly from districts coded as CC, MF, EF, AwS, and GE. These are districts mainly bounded by the Gulf of Guinea, and may have experienced seawater intrusion, resulting in high salinity and thereby rendering such water types unsuitable for irrigation purposes. This suggests that the use of water mainly from the coastal districts in the Central Region of Ghana is likely to pose sodium or salinity effects. This is however dependent on the conditions of the soils, whereby poor drainage can lead to the retention of salts in the soil zone, thus leading to the accumulation of salts in these soils over the long term. On the contrary, in the districts located away from the coastal areas, the water quality is suitable for the intended purpose.
ConclusionGroundwater samples from ten districts in the Central Region of Ghana were analyzed and assessed to determine the suitability of the groundwater for domestic and irrigation purposes. Here, we make the following conclusions from our results; Groundwater in the area is weakly acidic with average acidity of 6.34 pH units. TDS ranges from 24.6 to 5368 mg/l, while the EC varies from 71 to 9760 mS/cm. Both EC and TDS values
decrease from the coast toward inland, and suggest that groundwater in the area is predominantly fresh water, but saline water bodies also exist.
The order of abundance of the cations are + 2+ + 2+
Na > Ca > K > Mg , whiles that of the - - 2- - -
anions are Cl > HCO > SO > NO > F . 3 4 3
One major and three minor hydrochemical facies have been identified, namely; Na-Cl,
which is the dominant water type, and Ca-Cl, Ca-HCO and Ca-SO . In the order 3 4
stated the water type changes from the coastal areas towards the north and northwestern parts of the region. The Na-Cl water type occurs in aquifers underlying the six coastal districts, namely; Abura-Asebu-Kwamankese (AA), Cape Coast (CC). Mfantseman (MF), Effutu (EF), Awutu Senya (AwS) and Gomoa East (GE). Assin South (AS) and Twifo-
Heman Lower Denkyira (TLD) have Ca-HCO3 water type, Assin North (AN) has Ca-SO4, whereas Gomoa West (GW) is characterized by Ca-Cl facies.
Silicate weathering and ion exchange are identified as the predominant geochemical processes responsible for the various ions in the groundwater. Possible processes that
+could be responsible for the source of Na
-and Cl are sea water intrusion and dissolution of minerals.
Generally, groundwater underlying districts coded as AA, TLD, AS and AN, that are located away from the coast, plot within the “excellent to good” category, suggesting that water from the area is of acceptable quality for irrigation purposes. The remaining districts are underlain by groundwater of variable qualities. Similarly, SAR and conductivity values for the groundwater from the same districts indicate low SAR and low to medium salinity, suggesting that the water in these districts is suitable for both domestic and irrigational purposes.
ReferencesAbyaneh H. Z. Nazemi A. H., Neyshabori M. R.,
Mohammadi K. and Majzoobi G. H. (2005). Chloride estimation in ground water from electrical conductivity measurement. Tarim Bilimleri Dergisi 11: 110–114.
86 West African Journal of Applied Ecology, vol. 24(2), 2016

Alhumoud J. M., Al-Ruwaih F. M. and Al- Dhafeeri Z. M. (2010). Groundwater quality analysis of limestone aquifer of Al-Sulaibiya field, Kuwait. Desalination 254: 58–67.
Apambire W. B., Boyle D. R. and Michel F. A. (1997). Geochemistry, genesis, and health implications of fluoriferous groundwaters in the Upper Regions of Ghana. Environmental Geology 33: 13–24.
Appelo C. A. J. and Postma D. (2005). Geochemistry, Groundwater and Pollution; 2nd Edition, Balkerma, Netherlands. 683 pp.
Armah T. E. K. (2002). Hydrochemical and geophysical studies of groundwater salinity, Central Region. A. PhD thesis, the Department of Geology, University of Ghana, Legon.
Bannerman, R.R. (1994). Appraisal of the limestone aquifer of the Keta Basin, Ghana. In: Soveri J. and Suokko T. (Eds.), Future Groundwater Resources at Risk. Publ. 222. International Association for Hydrological Sciences, Wallingford, pp. 315–321.
Banoeng-Yakubo B., Yidana S. M. and Nti E. (2009). An evaluation of the genesis and suitability of groundwater for irrigation in the Volta Region, Ghana. Environmental Geology 57: 1005–1010.
Bear J., Cheng A. H. D., Sorek S., Ouazar D. and Herrera I. (Eds.) (1999). Seawater Intrusion in Coastal Aquifers: Concepts, Methods and Practices. Springer. 625 pp
Belkhiri L., Boudoukha A. and Mouni L. (2011). A multivariate statistical analysis of groundwater chemistry data. International Journal of Environmental Research, 5(2): 537–544.
Cloutier V., Lefebvre R., Therrien R. and Savard M. M. (2008). Multivariate statistical analysis of geochemical data as indicative of the hydrogeochemical evolution of groundwater in a sedimentary rock aquifer system. Journal of Hydrology. 353(3): 294–313.
Collins R. and Jenkins A. (1996). The impact of agricultural land use on stream chemistry in the middle Hills of Himalayas, Nepal. Journal of Hydrology 185: 71-86.
Deer W. A., Howie R. A. and Zussman J. (1996). An Introduction to the Rock-Forming Minerals, ELBS, Essex, UK, 2nd edition. 712 pp.
Dharmagunawardhana H. A. (2004). Fluoride in Groundwater, Surface water, Rocks and Soils of an area of endemic fluorosis in the dry zone of Sri
Lanka. In Proceedings of the 4th International Workshop on Fluorine Prevention and Defluoridation of Water, p. 7.
Drever J. I. (1988). The Geochemistry of Natural
Waters, 2nd Edition. Englewood Cliffs, New
Jersey, Prentice-Hall. 437 pp.Edet A. and Okereke C. (2001). A regional study of
saltwater intrusion in southeastern Nigeria based
on the analysis of geoelectr ical and
hydrochemical data. Environmental Geology 40
(10): 1278–1289.Freeze R. A. and Cherry J. A. (1979). Groundwater.
Prentice-Hall, Englewood Cliffs. 604 pp. Geological Survey Department (GSD) (2009).
Geological Map of Ghana 1: 1000000. Published
by the Geological Survey Department, Accra,
Ghana in collaboration with Bundesanstalt für
Geowissenschaften und Rohstoffe (BGR),
Hannover, Germany.Ghana Statistical Service (GSS) (2012). Summary
report of final results for 2010 population and
housing census. Ghana Statistical Service. Accra,
Ghana. Gibbs R. J. (1970). Mechanisms controlling world
water chemistry. Science 17: 1088–1090.Gill H. E. (1969). A groundwater reconnaissance of
the Republic of Ghana, with a description of
geohydrologic provinces. US Geological Survey
Water-supply Paper 1757-K Washington, DC, 37
pp. Güler C., Thyne G. D., McCray J. E. and Turner K.
A. (2002). Evaluation of graphical and
multivariate statistical methods for classification
of water chemistry data. Hydrogeology Journal.
10(4): 455–474.Hajrasuliha S., Cassel D. K. and Rezainejad Y.
(1991). Estimation of chloride ion concentration
in saline soils from measurement of electical
conductivity of saturated soil extracts. Geoderma
49: 127–117. Helstrup T., Jorgensen N. O. and Banoeng-Yakubo
B. (2007). Investigation of hydrochemical
characteristics of groundwater from the
Cretaceous–Eocene limestone in southern Ghana
R. Asare et al.: Assessment of groundwater quality and its suitability 87

and southern Togo using hierarchical cluster
analysis; Hydrogeology 15: 977–989.Jalali M. (2007). Salinization of Groundwater in Arid
and Semi-Arid Zones: An Example from Tajarak,
Western Iran. Environmental Geology 52:
1133–1149. Kaiser H. F. (1960). The application of electronic
computers to factor analysis. Educational and Psychological Measurement. 20: 141–151.
Kim J. H., Kim R. H., Lee J. H., Cheong T. J., Yum B. W. and Chang H. W. (2005). Multivariate statistical analysis to identify the major factors governing groundwater quality in the coastal area of Kimje, South Korea. Hydrological Processes. 19 (6): 1261–1276.
Kortatsi B. K. (1994). Groundwater utilization in Ghana. Future Groundwater Resources at Risk (Proceedings of the Helsinki Conference). IAHS Publ. no. 222.
Kortatsi B. K. (2007). Hydrochemical framework of groundwater in the Ankobra Basin, Ghana. Aquatic Geochemistry 13: 41–74.
Kularatne K. U. K. S. and Pitawala, H. M. T. G. A. (2012). Leaching of Fluoride from Biotite Mica in Soil: Implications for Fluoride in Shallow Groundwater. ISRN Soil Science, vol. 2012, Article I D 7 3 9 0 5 1 , 7 p a g e s , 2 0 1 2 .doi:10.5402/2012/739051.
Lambrakis N., Antonakos A. and Panagopoulos G. (2004). The use of multicomponent statistical analysis in hydrogeological environmental research. Water Research 38(7): 1862–1872.
Lesch S. M. and Suarez D. L. (2009). A short note on calculating the adjusted SAR index. Transactions of the American Society of Agricultural and Biological Engineers 52(2): 493–496.
Leube A., Hirdes W., Mauer R. and Kesse G. O. (1990). The early Proterozoic Birimian supergroup of Ghana and some aspects of its associated gold mineralisation. Precambrian Research 46: 139–165
Li Z., Tainosho Y., Shiraishi K. and Owada M. (2003). Chemical characteristics of fluorine-bearing biotite of early Paleozoic plutonic rocks from the Sor Rondane Mountains, East Antarctica. Geochemical Journal 37(2): 145–161.
Liu C. W., Lin K. H. and Kuo Y. M. (2003). Application of factor analysis in the assessment of
groundwater quality in a blackfoot disease area in Taiwan. The Science of the Total Environment. 313: 77–89.
Mahlknecht J., Steinich B. and Navarro de León I. (2004). Groundwater chemistry and mass transfers in the Independence aquifer, central Mexico, by using multivariate statistics and mass-balance models. Environmental Geology 45: 781–795.
McNeil V. H. and Cox M. E. (2000). Relationship between conductivity and analysed composition in a large set of natural surface-water samples, Queensland, Australia. Environmental Geology 39: 1325–1333.
Nordstrom D. K., Ball J. W., Donahoe R. J. and Whittemore D. (1989). Groundwater chemistry and water-rock interactions at Stripa. Geochimica et Cosmochimica Acta 53(8): 1727–1740.
Oteri A. U. (1988). Electric log interpretation for the evaluation of salt water intrusion in the eastern Niger Delta. Hydrological Sciences Journal 1: 19–30.
Piper A. M. (1944). A graphic procedure in the geochemical interpretation of water-analyses. American Geophysical Union Transactions 25: 914-923.
Raju N. J., Dey S., Gossel W. and Wycisk P. (2012). Fluoride hazard and assessment of groundwater quality in the semi-arid upper Panda River Basin, Sonbhadra District, Uttar Pradesh, India. Hydrological Sciences Journal 57: 1433–1452.
Raju, N.J., Ram, P. and Dey, S. (2009). Groundwater Quality in the Lower Varuna River Basin, Varanasi District, Uttar Pradesh, India. Journal of the Geological Society of India 7: 178–192.
Rao S. N. (2008). Factors controlling the salinity of in groundwater in parts of Guntur district, Andhra
Pradesh, India. Environmental Monitoring and Assessment. 1 3 8 ( 1 - 3 ) : 327–341. doi: 10.1007/s10661-077-9801-4.
Saleh A., Al-Ruwaih F. and Shehata M. (1999). Hydrogeochemical processes operating within
the main aquifers of Kuwait. Journal of Arid Environments 42: 195–209.
Stiff, H. A Jr. The Interpretation of Chemical Water Analysis by Means of Patterns. Journal of Petroleum Technology. 3(10):15-17.
88 West African Journal of Applied Ecology, vol. 24(2), 2016
USSL (1954) Diagnosis and Improvement of Saline and Alkali Soils. US Department of Agriculture. Handbook 60, 147 pp.
Usunoff E. J. and GuzmánGuzmán A. (1989). Multivariate analysis in hydrochemistry: an example of the use of factor and correspondence analyses. Groundwaters 27: 27–34.
Vasanthavigar M., Srinivasamoorthy K., Vijayaragavan K., Rajiv Ganthi R. , Chidambaram S., Anandhan P., Manivannan R. and Vasudevan S. (2010). Application of Water Quality Index for Groundwater Quality Assessment: Thirumanimuttar Sub-Basin, Tamilnadu, India. Environmental Monitoring and Assessment 171: 595–609.
Wilcox L. V. (1948). Classification and Use of Irrigation Waters. United States Department of Agriculture, Technical Bulletin 962 Washington DC. 40 pp.
Wilcox L. V. (1955). Classification and Use of Irrigation Water. United States Department of Agriculture, Circular No. 696, Washington
DC. 16 pp.World Health Organization (WHO) (2003).
Guidelines for drinking water quality; Revision of the 1993 Guidelines. Final Task Group Meeting, Geneva.
Xu M. and Eckstain Y. (1997). Statistical analysis of the relationships between dispersivity and other physical propert ies of porous media. Hydrogeology Journal 5: 4–20.
Yidana S. M., Banoeng-Yakubo B. and Akabzaa T. (2010). Analysis of groundwater quality using multivariate and spatial analyses in the Keta Basin, Ghana. Journal of African Earth Sciences 58: 220–234.
Yidana S. M., Ophori D. and Banoeng-Yakubo B. (2008). A multivariate statistical analysis of surface water chemistry data-The Ankobra Basin, Ghana. Journal of Environmental Management 86(1): 80–87.
R. Asare et al.: Assessment of groundwater quality and its suitability 89
Tanaskovic I., Golobocanin D. and Miljevic N.(2012). Multivariate statistical analysis of hydrochemical and radiological data of Serbian spa waters. Journal of Geochemical Exploration 112: 226–234.


