Embed Size (px)
Citation preview
ASSESSMENTIn Special and Inclusive Education
Eleventh Edition
John SalviaThe Pennsylvania State University
James E.YsseldykeUniversity of Minnesota
Sara BoltMichigan State University
Australia • Brazil • Japan • Korea • Mexico • Singapore • Spain • United Kingdom • United States
Library of Congress Control Number: 2008938346
ISBN-13: 978-0-547-13437-6
ISBN-10: 0-547-13437-1
Wadsworth 10 Davis DriveBelmont, CA 94002-3098USA
Cengage Learning products are represented in Canada by Nelson Education, Ltd.
For your course and learning solutions, visit www.cengage.com.
Purchase any of our products at your local college store or at our preferred online store www.ichapters.com.
Assessment: In Special and Inclusive Education, Eleventh Edition
John Salvia, James Ysseldyke, Sara Bolt
Acquisition Editor: Christopher Shortt
Marketing Manager: Kara Parsons
Development Editor: Julia Giannotti
Associate Media Editor: Ashley Cronin
Assistant Editor: Diane Mars
Editorial Assistant: Linda Stewart
Media Editor: Mary Noel
Marketing Coordinator: Andy Yap
Senior Content Project Manager, Editorial Production: Margaret Park Bridges
Art and Design Manager: Jill Haber
Manufacturing Buyer: Arethea L. Thomas
Senior Rights Acquisition Account Manager: Katie Huha
Text Researcher: Mary Dalton-Hoff man
Production Service: Matrix Productions
Senior Photo Editor: Jennifer Meyer Dare
Cover Designer: Alisa Aronson Graphic Design
Cover Image Credit: © iStockphoto.com/Emilia Kun
Compositor: Integra
Printed in the United States of America1 2 3 4 5 6 7 13 12 11 10 09
© 2010, 2007 Wadsworth, Cengage Learning
ALL RIGHTS RESERVED. No part of this work covered by the copyright herein may be reproduced, transmitted, stored, or used in any form or by any means graphic, electronic, or mechanical, including but not limited to photocopying, recording, scanning, digitizing, taping, Web distribution, information networks, or information storage and retrieval systems, except as permitted under Section 107 or 108 of the 1976 United States Copyright Act, without the prior written permission of the publisher.
For product information and technology assistance, contact us at Cengage Learning Academic Resource Center, 1-800-423-0563.
For permission to use material from this text or product,submit all requests online at www.cengage.com/permissions.
Further permissions questions can be e-mailed to [email protected].
v
CONTENTS
Introduction: The Context for Assessment in Schools and Current Assessment Practices 2
Assessment Defi ned 4
The Importance of Assessment in School and Society 5
Types of Assessment Decisions Made by Educators 6
Screening Decisions: Are There Unrecognized Problems? 7
Progress Monitoring Decisions: Is the Student Making Adequate Progress? 7
Instructional Planning and Modifi cation Decisions: What Can We Do to Enhance Competence and Build Capacity, and How Can We Do It? 8
Resource Allocation Decisions: Are Additional Resources Necessary? 9
Eligibility for Special Education Services Decisions: Is the Student Eligible for Special Education and Related Services? 9
Program Evaluation: Are Instructional Programs Effective? 10
Accountability Decisions: Does What We Do Lead to Desired Outcomes? 10
Important Things to Think About as You Read and Study This Textbook 11
The Type of Decision Determines the Type of Information Needed 11
Focus on Alterable Behaviors 11
Assess Instruction Before Assessing Learners 11
Assessment Is Broader Than Testing 13
Assessments Have Consequences 14
Not All Assessments Are Equal 15
Assessment Practices Are Dynamic 15
Important Considerations as You Prepare to Learn About Assessment in Special and Inclusive Education in Today’s School 17
Why Learn About Assessment? 17
Good News: Signifi cant Improvements in Assessment Have Happened and Continue to Happen 18
Chapter Comprehension Questions 18
Legal and Ethical Considerations in Assessment 19 Laws 20
Section 504 of the Rehabilitation Act of 1973 22
Major Assessment Provisions of the Individuals with Disabilities Education Improvement Act 22
The No Child Left Behind Act of 2001 27
2004 Reauthorization of IDEA 27
Ethical Considerations 28
Benefi cence 28
Recognition of the Boundaries of Professional Competence 28
Respect for the Dignity of Persons 29
Adherence to Professional Standards on Assessment 29
Test Security 30
Chapter Comprehension Questions 30
2
Preface xii
1
Part 1 Assessment: An Overview 1
vi Contents
Test Scores and How to Use Them 31Basic Quantitative Concepts 32
Scales of Measurement 32
Characteristics of Distributions 33
Average Scores 34
Measures of Dispersion 34
Correlation 35
Scoring Student Performance 36
Objective Versus Subjective Scoring 36
Summarizing Student Performance 37
Interpretation of Test Performance 39
Criterion-Referenced Interpretations 39
Achievement Standards-Referenced Interpretations 39
Norm-Referenced Interpretations 39
Norms 46
Important Characteristics 47
Proportional Representation 50
Number of Subjects 50
Age of Norms 50
Relevance of Norms 51
Chapter Comprehension Questions 52
Technical Adequacy 53Reliability 54
Error in Measurement 54
The Reliability Coeffi cient 54
Standard Error of Measurement 60
Estimated True Scores 62
Confi dence Intervals 62
Validity 62
General Validity 64
Methods of Validating Test Inferences 64
Factors Affecting General Validity 68
Responsibility for Valid Assessment 71
Chapter Comprehension Questions 71
Using Test Adaptations and Accommodations 72Why Be Concerned About Testing Adaptations? 73
Changes in Student Population 73
Changes in Educational Standards 74
The Need for Accurate Measurement 74
It Is Required by Law 75
The Importance of Promoting Test Accessibility 76
Concept of Universal Design 77
Applying Universal Design in Test Development and Use 77
Universal Design Applications Promote Better Testing for All 78
Factors to Consider in Making Accommodation Decisions 78
Ability to Understand Assessment Stimuli 78
Ability to Respond to Assessment Stimuli 78
Normative Comparisons 79
Appropriateness of the Level of the Items 79
Exposure to the Curriculum Being Tested (Opportunity to Learn) 79
Environmental Considerations 80
Cultural Considerations 80
Linguistic Considerations 81
Categories of Testing Accommodations 83
Recommendations for Making Accommodation Decisions During Eligibility Testing 87
Students with Disabilities 87
Students with Limited English Profi ciency 88
Recommendations for Making Accommodation Decisions During Accountability Testing 92
Chapter Comprehension Questions 93
3
4
5
Contents vii
Assessing Behavior Through Observation 96General Considerations 97
Live or Aided Observation 99
Obtrusive Versus Unobtrusive Observation 99
Contrived Versus Naturalistic Observation 100
Defi ning Behavior 100
Measurable Characteristics of Behavior 101
Sampling Behavior 102
Contexts 102
Times 103
Behaviors 105
Conducting Systematic Observations 106
Preparation 106
Data Gathering 109
Data Summarization 111
Criteria for Evaluating Observed Performances 111
Chapter Comprehension Questions 114
Teacher-Made Tests of Achievement 115Uses 117
Ascertain Skill Development 117
Monitor Instruction 118
Document Instructional Problems 119
Make Summative Judgments 119
Dimensions of Academic Assessment 120
Content Specifi city 120
Testing Frequency 121
Testing Formats 122
Considerations in Preparing Tests 123
Selecting Specifi c Areas of the Curriculum 124
Writing Relevant Questions 124
Organizing and Sequencing Items 124
Developing Formats for Presentation and Response Modes 124
Writing Directions for Administration 124
Developing Systematic Procedures for Scoring Responses 125
Establishing Criteria to Interpret Student Performance 125
Response Formats 125
Selection Formats 125
Supply Formats 131
Assessment in Core Achievement Areas 133
Reading 134
Mathematics 137
Spelling 139
Written Language 139
Potential Sources of Diffi culty in the Use of Teacher-Made Tests 140
Chapter Comprehension Questions 142
Managing Classroom Assessment 143Preparing for and Managing Mandated Tests 144
Preparing for and Managing Progress Monitoring 145
Establish Routines 145
Create Assessment Stations 146
Prepare Assessment Materials 146
Organize Materials 147
Involve Others 148
Data Displays 148
Interpreting Data: Decision-Making Rules 151
Model Progress Monitoring Projects 152
Heartland Area Education Agency and the Iowa Problem-Solving Model 152
Chapter Comprehension Questions 155
6
7
8
Part 2 Assessment in Classrooms 95
viii Contents
How to Evaluate a Test 158Selecting a Test to Review 159
How Do We Review a Test? 160
Test Purposes 160
Test Content and Assessment Procedures 161
Scores 161
Norms 162
Reliability 163
Validity 164
Making a Summative Evaluation 165
Chapter Comprehension Questions 165
Assessment of Academic Achievement with Multiple-Skill Devices 166Considerations for Selecting a Test 168
Categories of Achievement Tests 169
Why Do We Assess Academic Achievement? 172
Specifi c Tests of Academic Achievement 173
Stanford Achievement Test Series (SESAT, SAT, and TASK) 173
TerraNova, Third Edition 177
Peabody Individual Achievement Test–Revised–Normative Update 179
Wide Range Achievement Test–4 181
Wechsler Individual Achievement Test–Second Edition 182
Diagnostic Achievement Battery–Third Edition 184
Getting the Most Out of an Achievement Test 187
Summary 189
Chapter Comprehension Questions 189
Using Diagnostic Reading Measures 190Why Do We Assess Reading? 191
The Ways in Which Reading Is Taught 191
Skills Assessed by Diagnostic Reading Tests 194
Oral Reading 194
Assessment of Reading Comprehension 196
Assessment of Word-Attack Skills 196
Assessment of Word Recognition Skills 197
Assessment of Other Reading and Reading-Related Behaviors 197
Specifi c Diagnostic Reading Tests 198
Group Reading Assessment and Diagnostic Evaluation (GRADE) 198
Dynamic Indicators of Basic Early Literacy Skills, Sixth Edition (DIBELS) 203
The Test of Phonological Awareness, Second Edition: Plus (TOPA 2+) 204
Chapter Comprehension Questions 206
Using Diagnostic Mathematics Measures 207Why Do We Assess Mathematics? 208
Behaviors Sampled by Diagnostic Mathematics Tests 209
Specifi c Diagnostic Mathematics Tests 211
Group Mathematics Assessment and Diagnostic Evaluation (G•MADE) 211
KeyMath-3 Diagnostic Assessment (KeyMath-3 DA) 215
Chapter Comprehension Questions 217
Resource for Further Investigation 217
Using Measures of Oral and Written Language 218Terminology 220
Why Assess Oral and Written Language? 221
Considerations in Assessing Oral Language 221
Considerations in Assessing Written Language 222
Observing Language Behavior 225
Spontaneous Language 225
Imitation 225
9
10
11
12
13
Part 3 Assessment Using Formal Measures 157
Contents ix
Elicited Language 226
Advantages and Disadvantages of Each Procedure 226
Specifi c Oral and Written Language Tests 228
Test of Written Language–Fourth Edition (TOWL-4) 228
Test of Language Development: Primary–Fourth Edition 233
Test of Language Development: Intermediate–Fourth Edition 235
Oral and Written Language Scales (OWLS) 236
Chapter Comprehension Questions 239
Using Measures of Intelligence 240The Effect of Pupil Characteristics on Assessment of Intelligence 242
Behaviors Sampled by Intelligence Tests 245
Discrimination 245
Generalization 245
Motor Behavior 246
General Knowledge 246
Vocabulary 246
Induction 247
Comprehension 247
Sequencing 247
Detail Recognition 247
Analogical Reasoning 247
Pattern Completion 248
Abstract Reasoning 248
Memory 249
Factors Underlying Intelligence Test Behaviors 249
Commonly Interpreted Factors on Intelligence Tests 250
Assessment of Processing Defi cits 250
Types of Intelligence Tests 253
Individual Tests 253
Group Tests 253
Nonverbal Intelligence Tests 254
Assessment of Intelligence: Commonly Used Tests 254
Wechsler Intelligence Scale for Children–IV 254
Woodcock–Johnson–III Normative Update: Tests of Cognitive Abilities and Tests of Achievement 261
Peabody Picture Vocabulary Test–Fourth Edition (PPVT-4) 266
Chapter Comprehension Questions 269
Using Measures of Perceptual and Perceptual–Motor Skills 270Why Do We Assess Perceptual–Motor Skills? 272
Specifi c Tests of Perceptual and Perceptual–Motor Skills 272
The Bender Visual–Motor Gestalt Test Family 272
Bender Visual–Motor Gestalt Test, Second Edition 273
Koppitz-2 Scoring System for the BVMGT-2 275
Developmental Test of Visual–Motor Integration (Beery VMI) 276
Chapter Comprehension Questions 279
Using Measures of Social and Emotional Behavior 280Ways of Assessing Problem Behavior 282
Interview Techniques 282
Situational Measures 283
Rating Scales 283
Why Do We Assess Problem Behavior? 283
Functional Behavioral Assessment and Analysis 284
Steps for Completing a Functional Behavior Assessment 284
Specifi c Rating Scales of Social–Emotional Behavior 288
Behavior Assessment System for Children, Second Edition (BASC-2) 290
Chapter Comprehension Questions 295
14
15
16
x Contents
Using Measures of Adaptive Behavior 296Defi ning Adaptive Behavior 297
Physical Environment 297
Social and Cultural Expectations 297
Age and Adaptation 298
Performance Versus Ability 298
Maladaption 298
Context 298
Frequency and Amplitude 299
Assessing Adaptive Behavior 299
Why Do We Assess Adaptive Behavior? 306
Chapter Comprehension Questions 307
Using Measures of Infants, Toddlers, and Preschoolers 308Why Do We Assess Infants, Toddlers, and Preschoolers? 310
Tests Used with Infants, Toddlers, and Preschoolers 313
Bayley Scales of Infant Development, Third Edition (Bayley-III) 313
Developmental Indicators for the Assessment of Learning, Third Edition (DIAL-3) 317
Chapter Comprehension Questions 319
Using Technology-Enhanced Measures 320Continuous Technology-Enhanced Assessment Systems 327
Accelerated MathTM 327
Periodic Technology-Enhanced Assessment Systems 328
STAR Math 329
STAR Reading 330
AIMSweb 331
Handheld Observation Systems 333
Classroom Response Systems 333
Computer Scoring Systems 335
Chapter Comprehension Questions 336
17
18
19
Making Instructional Decisions 338Decisions Prior to Referral 339
Decision: Are There Unrecognized Problems? 339
Decision: Is the Student Making Adequate Progress in Regular Education? 340
Decision: What Can We Do to Enhance Competence and Build Capacity? 344
Decision: Should the Student Be Referred to an Intervention Assistance Team? 345
Decision: Should the Student Be Referred for Multidisciplinary Evaluation 351
Decisions Made in Special Education 351
Decision: What Should Be Included in a Student’s IEP? 352
Decision: What Is the Least Restrictive Appropriate Environment? 359
Decision: Is the Instructional Program Effective? 362
Chapter Comprehension Questions 362
Making Special Education Eligibility Decisions 363Offi cial Student Disabilities 364
Autism 365
Mental Retardation 365
Specifi c Learning Disability 366
Emotional Disturbance 368
Traumatic Brain Injury 368
20
21
Part 4 Using Assessment Results to Make Educational Decisions 337
Contents xi
Speech or Language Impairment 369
Visual Impairment 370
Deafness and Hearing Impairment 370
Orthopedic Impairments 370
Other Health Impairments 371
Deaf–Blindness 371
Multiple Disabilities 371
Developmental Delay 372
Establishing Educational Need for Special Education 372
The Multidisciplinary Team 373
Composition of the MDT 373
Responsibilities of the MDT 373
The Process of Determining Eligibility 374
Procedural Safeguards 374
Valid Assessments 374
Team Process 375
Problems in Determining Special Education Eligibility 379
Chapter Comprehension Questions 380
Making Accountability Decisions 381Legal Requirements 384
Important Terminology 385
It’s All About Meeting Standards 385
Alternate Assessment 389
Developing Standards-Based Accountability Systems 390
Establish a Solid Foundation for Assessment Efforts 391
Decide What Data Will Be Collected and What Rewards and Sanctions Will Be Used 393
Establish a Data Collection and Reporting System 393
Install a Standards-Based Accountability System 394
Current State Assessment and Accountability Practices 395
Important Considerations in Assessment for the Purpose of Making Accountability Decisions 395
Best Practices in High-Stakes Assessment and Accountability 396
Chapter Comprehension Questions 397
Communicating Assessment Information 398Characteristics of Effective School Teams 399
Types of School Teams 403
Schoolwide Assistance Teams 403
Problem-Solving Teams 404
Child Study Teams 404
Multidisciplinary Teams 405
Individual Education Plan Teams 405
Communicating Assessment Information to Parents 405
Communicating Assessment Information Through Written Records 408
Collection of Pupil Information 409
Maintenance of Pupil Information 414
Dissemination of Pupil Information 414
Chapter Comprehension Questions 415
22
23
Glossary 416References 427Credits 436Index 437
xii
PREFACEAs indicated by the title of the eleventh edition, Assessment: In Special and Inclusive Education, we continue to be concerned about assessing the perfor-mance and progress of students with disabilities regardless of whether their edu-cation occurs in general or special education settings. Since the initial publication of Assessment in 1978, educational and psychological assessment of students with disabilities has changed dramatically. Sweeping federal legislation has guar-anteed the rights of students with disabilities to free and appropriate public edu-cation; students and their parents are guaranteed a variety of meaningful legal protections throughout the evaluation process. The quality of tests has improved dramatically. Where once it could be diffi cult to fi nd a device that had suffi cient reliability, validity, and normative data for use in making important educational decisions on behalf of students, teachers and psychologists now have numerous such devices from which to choose.
At the same time, information science has changed. Colleges and universities have gone from a “hard copy” to digital institutions. The Internet has more infor-mation than a scholar can pore through in a lifetime, and now users are not tied to a fi xed terminal. The Internet is accessible anywhere there is wifi or a wireless telephone signal.
Clearly, the time had come for Assessment to change, and the eleventh edition has changed substantially. We have streamlined the text and we make far greater use of our website. There is a new, student-friendly design and new features are introduced. The statistical and measurement content now focuses on informa-tion commonly needed in schools; the more technical information in earlier edi-tions has moved to our website. The number of specifi c tests reviewed has been reduced to the most commonly used tests; reviews of less frequently used tests (as well as dated tests) have moved to our website. We have added new chapters on managing assessment in classrooms, uses of technology in assessment, and communicating assessment results. We have incorporated much of the content from “Testing Students with Limited English Profi ciency,” “Assessing Instructional Ecology,” and “Assessing Response to Instruction” into other chapters; we have also placed those chapters on our website for students who prefer the informa-tion in that form. Finally, we dropped three other chapters (“Portfolio Analysis,” “Assessment of Intelligence: Group Tests,” and “Assessment of Sensory Acuity”) because, although important, we felt they were peripheral to the focus of the book. However, two of those chapters are available on the website, and some of the content of the third has been incorporated into other chapters.
Many of the same philosophical differences continue to divide the assessment community. Disputes continue over the value of standardized and unstandard-ized test administration, objective and subjective scoring, generalizable and non-generalizable measurement, interpersonal and intrapersonal comparisons, and so forth. After carefully considering the various approaches to assessment, we remain committed to approaches that facilitate data-based decision making. Thus
Preface xiii
we believe students and society are best served by the objective, reliable, and valid assessment of student abilities and of meaningful educational results.
Our position is based on several conclusions. First, the IDEA requires objective assessment, largely because it usually leads to better decision making. Second, we are encouraged by the substantial improvement in assessment devices and practices over the past twenty-plus years. Third, although some alternatives are merely unproven, other innovative approaches to assessment—especially those that celebrate subjec-tivity—have severe shortcomings that have been understood since the early 1900s. Fortunately, much of the initial enthusiasm for those approaches is already begin-ning to wane. Fourth, we believe it is unwise to abandon effective procedures with-out substantial evidence that the proposed alternatives really are better. Too often, we learned that an educational innovation was ineffective after it had failed far too many students.
From the fi rst edition, we tried to make Assessment a comprehensive book that was suitable for novice and expert. We provided comprehensive coverage of measurement concepts, commonly used tests, and important educational decisions. We explained the calculation of descriptive statistics (e.g., means and standard deviations), basic measurement statistics (reliability coeffi cients), and advanced measurement statistics (e.g., reliability of predicted differences). We reviewed most of the commonly used devices that were current. We explained the types of decisions that educators make in the process of identifying and serving students with disabilities. And we discussed the role of assessment accountability decisions. As education law evolved, as measurement theory developed, as more tests were introduced, successive editions of Assessment grew.
Audience for This Book
Assessment: In Special and Inclusive Education, Eleventh Edition, is intended for a fi rst course in assessment taken by those whose careers require understanding and informed use of assessment data. The primary audience is made up of those who are or will be teachers in special education at the elementary or secondary level. The secondary audience is the large support system for special educators: school psychologists, child development specialists, counselors, educational administra-tors, nurses, preschool educators, reading specialists, social workers, speech and language specialists, and specialists in therapeutic recreation. Additionally, in today’s reform climate, many classroom teachers enroll in the assessment course as part of their own professional development. In writing for those who are tak-ing their fi rst course in assessment, we have assumed no prior knowledge of mea-surement and statistical concepts.
Purpose
Students with disabilities have the right to an appropriate evaluation and to an appropriate education in the least restrictive educational environment. Those who assess have a tremendous responsibility; assessment results are used to make decisions that directly and signifi cantly affect students’ lives. Those who assess are
responsible for knowing the devices and procedures they use and for understand-ing the limitations of those devices and procedures. Decisions regarding a stu-dent’s eligibility for special education and related services must be based on valid information; decisions about how and where to educate students with disabilities must be based on valid data.
The New Edition
CoverageThe eleventh edition continues to offer straightforward and clear coverage of basic assessment concepts, evenhanded evaluations of standardized tests in each domain, and illustrations of applications to the decision-making process. Most chapters have been updated, and several have been revised substantially. The organization of the eleventh edition has changed. We now have four parts: Assessment: An Overview, Assessment in Classrooms, Assessment Using Formal Measures, and Using Assessment Results to Make Educational Decisions.
New Pedagogical FeaturesEach chapter starts out with the new clearly stated chapter goals and list of key terms. Main headings throughout the chapter are then linked to the chapter goal that they address. These elements promote active reading and learning.
The new Scenario in Assessment feature connects the concepts highlighted in the chapter to the real-life classroom. In this feature, students read vignettes that describe assessment situations in which new teachers might fi nd themselves.
Tests ReviewedOne of the most notable changes is a reduction in the number of tests reviewed in Part 3. We have opted to place tests that are less frequently used on our website, http://www.cengage.com/education/salvia.
There are several new and revised tests and measures in the book, includ-ing the Woodcock–Johnson–III Normative Update: Tests of Cognitive Abilities and Tests of Achievement (WJ-III NU); Peabody Picture Vocabulary Test–Fourth Edition; TerraNova, Third Edition; STAR Reading; KeyMath–3 Diagnostic Assessment; Test of Language Development: Primary–Fourth Edition; Test of Language Development: Intermediate–Fourth Edition; Test of Written Language–Fourth Edition; and AIMSweb. These new tests are indicated by an asterisk in the list of all tests reviewed in this edition, which appears on the inside front cover and fi rst page of this book.
New Chapters
The following are brand-new chapters to this edition:
Chapter 1, “Introduction: The Context for Assessment in Schools and ■
Current Assessment Practices”
Chapter 3, “Test Scores and How to Use Them,” combines the fundamental ■
information from previous chapters on “Descriptive Statistics,” “Norms,” and “Quantifi cation of Test Performance.”
xiv Preface
Preface xv
Chapter 4, “Technical Adequacy,” combines the fundamental information ■
from previous chapters on “Reliability” and “Validity.”
Chapter 8, “Managing Classroom Assessment,” explains the characteristics ■
of effective testing programs with special emphasis on monitoring students’ responses to instruction, how to manage regular classroom assessments, and how to make classroom decisions using student progress data.
Chapter 14, “Using Measures of Intelligence,” combines three previous ■
chapters (“Assessment of Intelligence: An Overview,” “Assessment of Intelligence: Group Tests,” and Assessment of Intelligence: Individual Tests”).
Chapter 19, “Using Technology-Enhanced Measures,” explains and provides ■
examples of the use of technology for both continuous and periodic progress monitoring; it also describes classroom response systems, classroom observation systems, and programs used to score tests and write reports.
Chapter 23, “Communicating Assessment Information,” discusses ■
communication between school teams and parents about assessment and decision making. It includes information about the characteristics of effective school teams, the types of teams commonly formed in school settings, strategies for effectively communicating assessment information to parents, how assessment information is communicated and maintained in written formats, and various related rules concerning data collection and record keeping.
OrganizationPart 1, “Assessment: An Overview,” places testing in the broader context of assess-ment: In Chapter 1, “Introduction: The Context for Assessment in Schools and Current Assessment Practices,” we describe assessment as a multifaceted process. The kinds of decisions made using assessment data are delineated, and basic termi-nology and concepts are introduced. In Chapter 2, “Legal and Ethical Considerations in Assessment,” we describe the ways assessment practices are regulated and mandated by legislation and litigation. In Chapter 3, “Test Scores and How to Use Them,” we describe the commonly used ways to quantify test performance and provide interpretative data. In Chapter 4, “Technical Adequacy,” we explain the basic measurement concepts of reliability and validity. In Chapter 5, “Using Test Adaptations and Accommodations,” we discuss how tests can be adapted to accommodate students with disabilities and English Language Learners.
Part 2, “Assessment in Classrooms,” provides readers with fundamental knowl-edge necessary to conduct assessments in the classrooms. Chapter 6, “Assessing Behavior Through Observation,” explains the major concepts in conducting sys-tematic observations of student behavior. Chapter 7, “Teacher-Made Tests of Achievement,” provides a systematic overview of tests that teachers can create to measure students’ learning and progress in the curriculum. Chapter 8, “Managing Classroom Assessment,” is devoted to helping educators plan assessment programs that are effi cient and effective in the use of both teacher and student time.
In Part 3, “Assessment Using Formal Measures,” we provide information about the abilities and skills most commonly tested in the schools. Part 3 begins with Chapter 9, “How to Evaluate a Test.” This chapter is a primer on what to look for when considering the use of a commercially produced test. The next nine chapters in Part 3, provide an overview of the domain and reviews of the most frequently used measures: Chapter 10 (Assessment of Academic Achievement with
Multiple-Skill Devices), Chapter 11, (Using Diagnostic Reading Measures), Chapter 12 (Using Diagnostic Mathematics Measures), Chapter 13 (Using Measures of Oral and Written Language), Chapter 14 (Using Measures of Intelligence), Chapter 15 (Using Measures of Perceptual and Perceptual–Motor Skills), Chapter 16 (Using Measures of Social and Emotional Behavior), Chapter 17 (Using Measures of Adaptive Behavior), and Chapter 18 (Using Measures of Infants, Toddlers, and Preschoolers). Part 3 concludes with Chapter 19, “Using Technology-Enhanced Assessments,” which describes computerized approaches to testing and systematic observation.
In Part 4, “Using Assessment Results to Make Educational Decisions,” we discuss the most important decisions educators make on behalf of students with disabilities. In Chapter 20, “Making Instructional Decisions,” we discuss the deci-sions that are made prior to a student’s referral for special education and those that are made in special education settings. In Chapter 21, “Making Special Education Eligibility Decisions,” we discuss the role of multidisciplinary teams and the process for determining a student’s eligibility for special education and related services. In Chapter 22, “Making Accountability Decisions,” we explain the legal requirements for states and districts to meet the standards of No Child Left Behind and IDEA, achievement standards, and important considerations in making accountability decisions. In Chapter 23, “Communicating Assessment Information,” we provide an overview of communicating with school teams and parents about assessment and decision making, and include information about the characteristics of effective school teams, strategies for effectively communicating assessment information to parents, and the rules concerning data collection and record-keeping.
Instructor and Student Websites
These websites extend the textbook content and provide resources for further explo-ration into assessment practices. There are chapters and test reviews from previous editions, appendixes, and additional resources helpful for students and instructors.
Visit www.cengage.com/education/salvia for additional tests and resources. Test development is an ongoing process. It is our intent to review new tests as they become available and to place the reviews on the website.
Acknowledgments
Over the years, many people have assisted in our efforts. In the preparation of this edition, we express our sincere appreciation to Julia Giannotti for her assistance throughout the development of this edition. We remain indebted to Lisa Mafrici, senior developmental editor, and Loretta Wolozin, who sponsored eight of the pre-vious editions. We also appreciate the assistance of Heidi Triezenberg for her work on the Instructor’s Resource Manual with Test Items, which accompanies this text.
John Salvia
Jim Ysseldyke
Sara Bolt
xvi Preface
ASSESSMENT

This page intentionally left blank
PART 1those scores. It is intended for the person with little or no background in descriptive statistics; it contains a discussion of the major concepts necessary for understanding most of the remaining chapters in this part and later parts of the book.
Chapter 4 is focused on the technical adequacy of tests. The main focus is on reliability (the important concept that scores are fallible, and the amount of error associated with scores) and validity (the extent to which a test or other procedure leads to valid inferences about tested performance). Validity is the most important and inclusive aspect of a test’s technical adequacy.
Chapter 5 includes a description of important considerations in adapting tests to accommodate the specifi c needs of students with disabilities and English language learners.
Assessment: An Overview
School personnel regularly use assessment information to make important decisions about students. Part 1 of this text looks at basic considerations in psychological and educational assessment of students, and introduces concepts and principles that constitute a foundation for informed and
critical use of assessment information. Chapter 1 provides a description of the
kinds of decisions made using assessment information, and considers the ways in which assessment impacts society, children, and their education. Chapter 2 includes a description of the major laws that affect assessment in schools, and describes ethical considerations in best assessment practices. Chapter 3 includes a des-cription of the kinds of scores one obtains from tests and a set of considerations on how to use
2
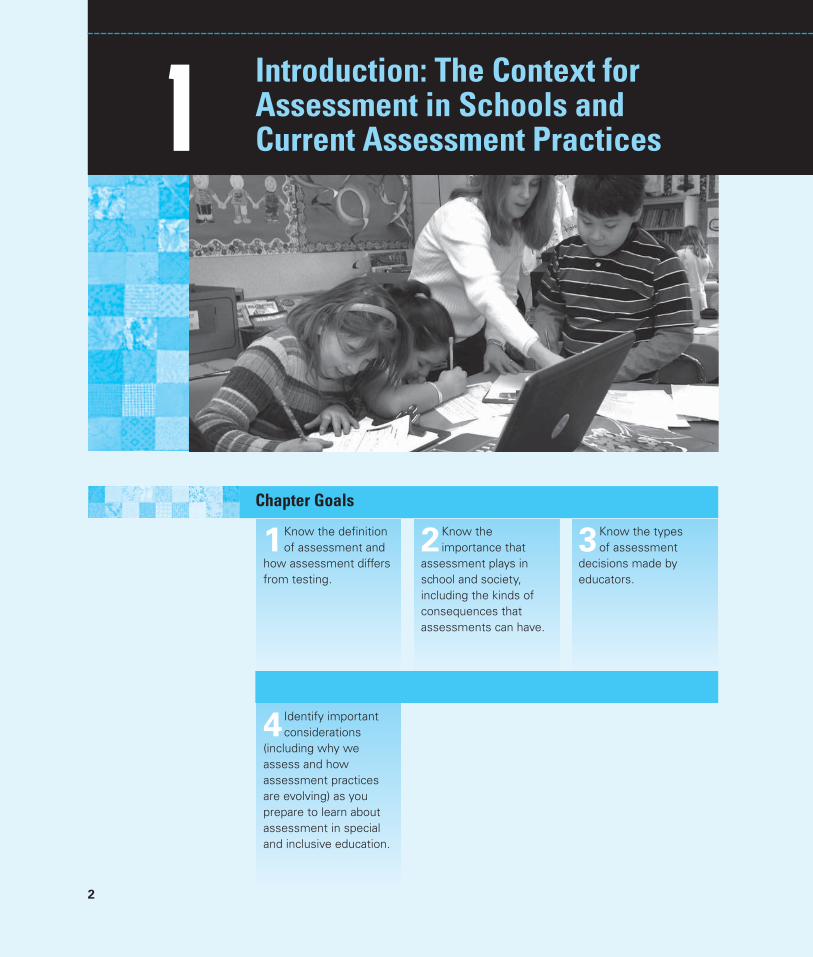
Introduction: The Context for Assessment in Schools and Current Assessment Practices1
1Know the definition of assessment and
how assessment differs from testing.
Chapter Goals
2Know the importance that
assessment plays in school and society, including the kinds of consequences that assessments can have.
3Know the types of assessment
decisions made by educators.
4 Identify important considerations
(including why we assess and how assessment practices are evolving) as you prepare to learn about assessment in special and inclusive education.
Key Terms assessment
inclusive education
competence enhancement
testing
capacity building
screening decisions
progress monitoring decisions
individual goals
state standards
No Child Left Behind Act
Individuals with Disabilities Education Improvement Act
resource allocation decisions
eligibility decisions
program evaluation decisions
accountability decisions
adequate yearly progress
instructional environment
observation
professional judgment
recollection
Education is intended to provide all students with the skills and competencies they need to enhance their lives and the lives of their fellow citizens. This function would be extremely difficult even if all students entered school with the same abilities and competencies and even if students learned in the same way and at the same rate. However, they do not.
Some are very smart, and some are not; some have mastered much of the first-grade curriculum before they enter school, whereas others need unusual amounts of help to learn the same material; some are fluent in English, and oth-ers are not; many have appropriate school behavior, and some do not. Also, the students attending schools today are a much more diverse group than in the past. Today’s classrooms are multicultural, multiethnic, and multilingual. Students demonstrate a significant range of academic skills; in some large urban environ-ments, for example, 75 percent of sixth graders are reading more than 2 years below grade level, and there is as much as a 10-year range in skill level in math in a sixth-grade classroom. More than 200,000 infants and toddlers, and more than 6.5 million children and youth with disabilities (approximately 13 percent of the school-age population) receive special education and related services. Most of these children and youth are attending schools in their own neighborhoods—this was not always the case in the past—and fewer students with disabilities are in separate buildings or separate classes, instead learning in classes with their peers. Thus, the focus of this book is on students in special and inclusive education.
In the United States, there are two major expectations for schools: excellence and equity. It is expected that students will work toward and achieve high standards, and it is expected that all students will do so. All students are entitled to a free and appropriate public education. The job of schools and the personnel who work in them is twofold: We are to enhance the competence of all students, and we are to build the capacity of systems (broadly conceived as communi-ties, schools, parents and caregivers, and service agencies) to meet the needs of individual students.
School personnel are confronted with the significant challenge of meeting the needs of a very diverse group of students. This is why assessment is such an important activity. Assessment is the process that professionals use to understand and address individual differences in the schools. Assessment is a problem analysis and problem-solving activity that enables school personnel to identify students’
Introduction: The Context for Assessment 3
4 Chapter 1 ■ Introduction: The Context for Assessment in Schools
current level of skills, target instruction at students’ personal levels, monitor student progress and make adjustments in instruction, and evaluate the extent to which students have met instructional goals. One purpose of assessment is to help plan instructional activities that will take students from wherever they are in skill acquisition and move them toward where we want them to be (competence enhancement). Another purpose of assessment is to let us know how schools are doing with all students and to help us build the capacity of schools to enhance student competence (capacity building).
1 Assessment Defi ned
Assessment is a process of collecting data for the purpose of making decisions about students or schools. School personnel use assessment information to make decisions about what students have learned, what and where they should be taught, and the kinds of related services (for example, speech and language services, and psychological services) they need. Throughout their professional careers, teachers, guidance counselors, school social workers, school psychologists, and school administrators are required to give, score, and interpret a wide variety of tests. Because professional school personnel routinely receive test information from their colleagues within the schools and from pro-fessionals outside the schools, they need a working knowledge of important aspects of testing.
School personnel also use assessment information to make decisions about schools. School districts increasingly are being held accountable for the performance of their pupils. Parents, the general public, legislators, and bureaucrats want to know the extent to which students are profiting from their schooling experiences. Federal education policy contains specific expectations for states to develop high educational standards and to use tests to measure the extent to which students meet the standards.
When we assess students, we measure their competence. Specifically, we measure their progress toward attaining those competencies that their schools or parents want them to master. In schools, we are concerned about competence in three domains in which teachers provide interventions: academic, behavioral (including social), and physical. Historically, the focus of assessment has been on measuring student progress toward instructional goals and on diagnos-ing the need for special programs and related services. For example, we may want to know whether Antoine needs special education services to help him in developing his reading skills (need for service in an academic domain), whether Claude’s behavior in class is sufficiently atypical to require special treatments or interventions (behavioral domain), or the extent to which Ellen is developing physically at a normal rate (measuring progress in the physical domain).
In this text, we address primarily the use of assessment information to make educational decisions about individual students and groups. We also describe the use of tests in making accountability decisions for schools and school systems. Our coverage of assessments is broad, including both formal and informal assessments, multiple methods for collecting information, and the many purposes for which the collected information is used.
The Importance of Assessment in School and Society 5
2 The Importance of Assessment in School and Society
Assessment touches everyone’s life. It especially affects the lives of people who work with children and youth and who work in schools. As you begin your study of the assessment of students, consider the following ways in which assessment affects people’s lives:
You learn that as part of the state certification process, you must take ■
tests that assess your knowledge of teaching practices, learning, and child development.
Mr. and Mrs. Johnson receive a call from their child’s third-grade teacher, ■
who says he is concerned about Morgan’s performance on a reading test. He would like to refer Morgan for further testing to determine whether Morgan has a learning disability.Mr. and Mrs. Erffmeyer tell you that their son is not eligible for special ■
education services because he scored “too high” on an intelligence test.In response to publication of test results showing that U.S. students rank low ■
in comparison to students in other industrialized nations, the U.S. Secretary of Education issues a call for more rigorous educational standards for all students.The superintendent of schools in a large urban district learns that only 40 percent ■
of the students in her school district passed the state graduation test.Your local school district asks for volunteers to serve on a task force to design ■
a measure of technological literacy to use as a test with students.
Everyone thinks they are an expert on education, and assessment is one of the most hotly debated issues among not only educators but also the general public. People react strongly when test scores are used to make interpersonal comparisons in which they or those they love look inferior. We expect parents to react strongly when test scores are used to make decisions about their children’s life opportunities—for example, whether or not their child could enter college, pass a class, be promoted to the next grade, receive special education, or be placed in a program for gifted and talented students. Unwanted outcomes often lead to questions about the kinds of tests used, the skills or behaviors they measure, and their technical adequacy. Probably no other activity that takes place in educa-tion brings with it so many challenges. Testing plays a critical role in schools and in society. Entire communities are keenly interested when test scores from their schools are reported and compared with scores from schools in other communities. Often, tests are used to make high-stakes decisions that may have a direct and significant effect on the continued funding of schools and school systems. The joint committee of three professional associations that developed a set of standards for test construction and use has addressed the importance of testing:
Educational and psychological testing are among the most important contribu-tions of behavioral science to our society, providing fundamental and significant improvements over previous practices. Although not all tests are well developed nor are all testing practices wise and beneficial, there is extensive evidence docu-menting the effectiveness of well-constructed tests for uses supported by validity
6 Chapter 1 ■ Introduction: The Context for Assessment in Schools
evidence. The proper use of tests can result in wiser decisions about individuals and programs than would be the case without their use and also can provide a route to broader and more equitable access to education and employment. The improper use of tests, however, can cause considerable harm to test- takers and other parties affected by test-based decisions. (American Educational Research Association, American Psychological Association, & National Council on Measurement in Education, 1999, p. 1).
3 Types of Assessment Decisions Made by Educators
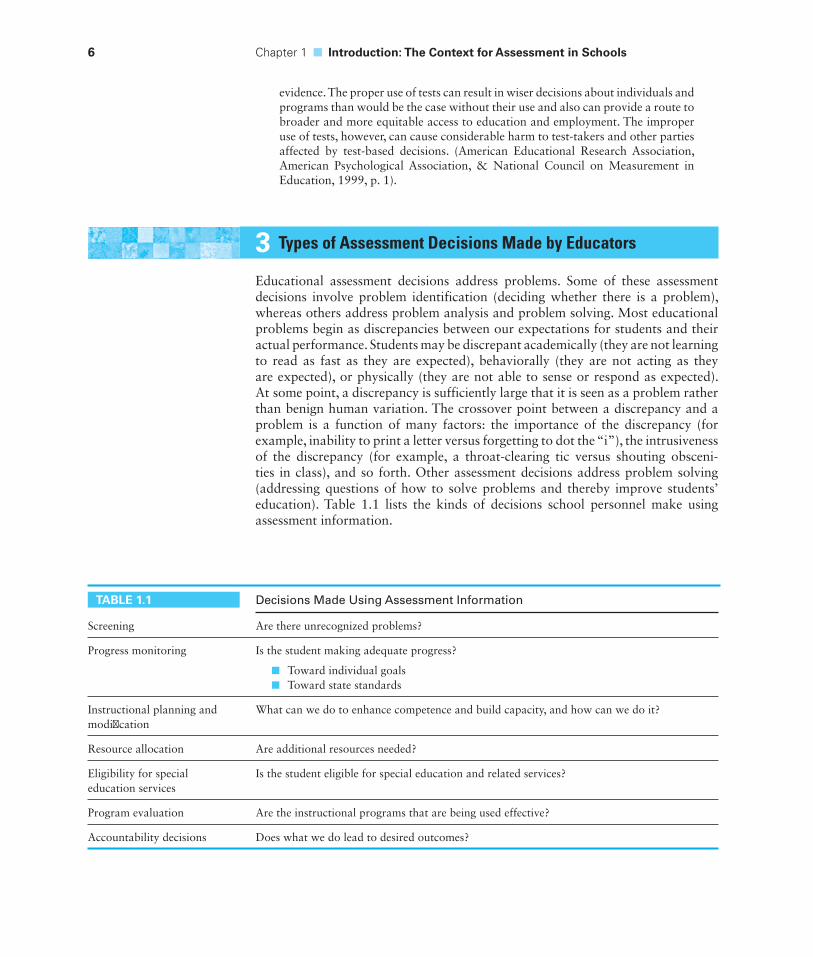
Educational assessment decisions address problems. Some of these assessment decisions involve problem identification (deciding whether there is a problem), whereas others address problem analysis and problem solving. Most educational problems begin as discrepancies between our expectations for students and their actual performance. Students may be discrepant academically (they are not learning to read as fast as they are expected), behaviorally (they are not acting as they are expected), or physically (they are not able to sense or respond as expected). At some point, a discrepancy is sufficiently large that it is seen as a problem rather than benign human variation. The crossover point between a discrepancy and a problem is a function of many factors: the importance of the discrepancy (for example, inability to print a letter versus forgetting to dot the “i”), the intrusiveness of the discrepancy (for example, a throat-clearing tic versus shouting obsceni-ties in class), and so forth. Other assessment decisions address problem solving (addressing questions of how to solve problems and thereby improve students’ education). Table 1.1 lists the kinds of decisions school personnel make using assessment information.
TABLE 1.1 Decisions Made Using Assessment Information
Screening Are there unrecognized problems?
Progress monitoring Is the student making adequate progress?
Toward individual goals ■
Toward state standards ■
Instructional planning and modifi cation
What can we do to enhance competence and build capacity, and how can we do it?
Resource allocation Are additional resources needed?
Eligibility for special education services
Is the student eligible for special education and related services?
Program evaluation Are the instructional programs that are being used effective?
Accountability decisions Does what we do lead to desired outcomes?
Screening Decisions: Are There Unrecognized Problems?Educators now recognize that it is very important to identify physical, academic, or behavior problems early in students’ school careers. Early identification enables us to develop interventions that may alleviate or eliminate later difficulties. Educators also understand that it is important to screen for specific conditions such as visual difficulties because prescription of corrective lenses enables students to be more successful in school. School personnel engage in universal screening (they test everyone) for some kinds of potential problems. All young children are screened for vision or hearing problems with the understanding that identifica-tion of sensory problems allows us to prescribe corrective measures (glasses, con-tacts, hearing aids, or amplification equipment) that will alleviate the problems. All students are required to have a physical examination, and most students are assessed for “school readiness” prior to entrance into school.
Progress Monitoring Decisions: Is the Student Making Adequate Progress?School personnel assess students for the purpose of making two kinds of prog-ress monitoring decisions: (1) Is the student making adequate progress toward individual goals? and (2) Is the student making adequate progress toward state standards?
Monitoring Progress Toward Individual Goals
School personnel regularly assess the specific skills that students do or do not have in specific academic content areas such as decoding words, comprehending what they read, performing math calculations, solving math problems, or writing. We want to know whether the student’s rate of acquisition will allow the completion of all instructional goals within the time allotted (for example, by the end of the school year or by the completion of secondary education). The data are collected for the purpose of making decisions about what to teach and the level at which to teach. For example, students who have mastered single-digit addition need no further instruction (although they may still need practice) in single-digit addition. Students who do not demonstrate those skills need further instruction. The specific goals and objectives for students who receive special education services are listed in their individualized educational programs (IEPs).
The focus in assessment is helping students move toward the competencies we want them to attain so that we can modify instruction or interventions that are not meeting desired effects. Progress may be monitored continuously or periodically to ensure students have acquired the information and skills being taught, can maintain the newly acquired skills and information over time, and can appropriately generalize the newly acquired skills and information. The IEPs of students who receive special education services must contain statements of the methods that will be used to assess their progress toward attaining these goals. In any case, the information is used to make decisions about whether the instruction or intervention is working and whether there is a need to alter instruction.
Types of Assessment Decisions Made by Educators 7
8 Chapter 1 ■ Introduction: The Context for Assessment in Schools
Monitoring Progress Toward State Standards
School personnel set goals/standards/expectations for performance of schools, classes, and individual students. All states have identified academic content and performance standards that specify what students are expected to learn in reading, mathematics, social studies, science, and so forth. Some students may have addi-tional goals. Students with significant cognitive disabilities may be required to work toward a set of alternative achievement standards, or standards may be modified for students with disabilities that interfere with their movement toward state goals or standards (this is discussed in detail in Chapter 22). Moreover, states are required by law to have in place a system of assessments aligned with their goals/standards/expectations. The assessments that are used to identify the standing of groups are also used to ascertain if individuals have met or exceeded state standards/goals.
Instructional Planning and Modifi cation Decisions: What Can We Do to Enhance Competence and Build Capacity, and How Can We Do It?Inclusive education teachers are able to take a standard curriculum and plan instruction based on it. Although curricula vary from district to district—largely as a function of the values of community and school—they are appropriate for most students at a given age or grade level. However, what should teachers do for those students who differ significantly from their peers or from district standards in their academic and behavioral competencies? These students need special help to benefit from classroom curriculum and instruction, and school personnel must gather data to plan special programs for these students.
Three kinds of decisions are made in instructional planning: (1) what to teach, (2) how to teach it, and (3) what expectations are realistic. Deciding what to teach is a content decision usually made on the basis of a systematic analysis of the skills that students do and do not have. Scores on tests and other information help teachers decide whether students have specific competencies. Test information may be used to determine placement in reading groups or assignment to specific compensatory or remedial programs. Teachers also use information gathered from observations and interviews in deciding what to teach. They obtain information about how to teach by trying different methods of teaching and monitoring students’ progress toward instructional goals. Finally, decisions about realistic expectations are always inferences, based largely on observations of performance in school settings and perfor-mance on tests.
One of the provisions of the No Child Left Behind Act, the major federal law governing delivery of elementary and secondary education, states that schools are to use “evidence-based” instructional practices. There are a number of inter-ventions with empirical evidence to support their use with students with special needs. A number of websites are devoted to evidence-based teaching, including the following: U.S. Department of Education (www.ed.gov/index.jhtml), Campbell Collaboration (www.campbellcollaboration.org), and What Works Clearinghouse (www.whatworks.ed.gov).
Resource Allocation Decisions: Are Additional Resources Necessary?Assessment results may indicate that individual students need special help or enrichment. These students may be referred to a teacher assistance team,1 or they may be referred for evaluation to a multidisciplinary team that will decide whether these students are entitled to special education services. School personnel gather data on student sensory difficulties or on academic skills for the purpose of deciding whether or not additional resources are necessary. They also use assessment information to make decisions about how to enlist parents, schools, teachers or community agencies in enhancing student competence.
When it is clear that many or all students require additional programs or support, system change and increased capacity may be indicated. Clear examples of building the capacity of schools to meet student needs include preschool educa-tion for all, federal funding to increase student competence in math and science, and federal requirements for school personnel to develop individualized plans to guide the transition from high school to postschool employment.
Eligibility for Special Education Services Decisions: Is the Student Eligible for Special Education and Related Services?School personnel use assessment information to make decisions about whether students are eligible for special education and related services. Before a student may be declared eligible for special education services, he or she must be shown to be exceptional (have a disability or a gift or talent) and to have special learning needs. It is not enough to be disabled or to have special learning needs. Students can be disabled and not require special education services. Students can have special learning needs but not meet the state criteria for being declared disabled. For example, there is no federal mandate for provision of special education services to students with behavior disorders, and in many states students with behavior disor-ders are not eligible for special education services (students need to be identified as emotionally disturbed to receive special education services). Students who receive special education (1) have diagnosed disabilities and (2) need special education services to achieve educational outcomes.
In addition to the classification system employed by the federal government, every state has an education code that specifies the kinds of students considered disabled. States may have different names for the same disability. For example, in California, some students are called “deaf” or “hard of hearing”; in other states, such as Colorado, the same kinds of students are called “hearing impaired.” States
1Two kinds of teams typically operate in schools. The fi rst, usually composed of teachers only, is designed as a fi rst line of assistance to help classroom teachers solve problems with individual stu-dents in their class. These teams, often called teacher assistance teams, mainstream assistance teams, or schoolwide assistance teams, meet regularly to brainstorm possible solutions to problems teachers confront. The second kind of team is the multidisciplinary team that is required by law for purposes of making special education eligibility decisions. These teams are usually made up of a principal, regular and special education teachers, and related services personnel such as school psychologists, speech and language pathologists, occupational therapists, and nurses. These teams have different names in different places. Most often, they are called child study teams, but in Minneapolis, for example, they are called special education referral committees or IEP teams.
Types of Assessment Decisions Made by Educators 9
10 Chapter 1 ■ Introduction: The Context for Assessment in Schools
may expand special education services to provide for students with disabilities that are not listed in the Individuals with Disabilities Education Improvement Act (IDEA), but states may not exclude from services the disabilities listed in the IDEA. Some states consider gifted students to be exceptional and entitled to special education services; other states do not.
Program Evaluation: Are Instructional Programs Effective?Assessment data are collected to evaluate specific programs. Here the emphasis is on gauging the effectiveness of the curriculum in meeting the goals and objec-tives of the school. School personnel typically use this information for schoolwide curriculum planning. For example, schools can compare two approaches to teach-ing in a content area by (1) giving tests at the beginning of the year, (2) teaching comparable groups two different ways, and (3) giving tests at the end of the year. By comparing students’ performances before and after, the schools are able to evaluate the effectiveness of the two competing approaches.
The process of assessing educational programs can be complex if numer-ous students are involved and if the criteria for making decisions are written in statistical terms. For example, an evaluation of two instructional programs might involve gathering data from hundreds of students and comparing their performances and applying many statistical tests. Program costs, teacher and student opinions, and the nature of each program’s goals and objectives might be compared to determine which program is more effective. This kind of large-scale evaluation probably would be undertaken by a group of administrators working for a school district. Of course, program evaluations can be much less formal. For example, Martha is a third-grade teacher. When Martha wants to know the effectiveness of an instructional method she is using, she does her own evaluation. Recently, she wanted to know whether phonics instruction in reading is better than using flashcards to teach word recognition. She used both approaches for 2 weeks and found that students learned to recognize words much more rapidly when she used a phonics approach.
Accountability Decisions: Does What We Do Lead to Desired Outcomes?Under the provisions of the No Child Left Behind Act, schools, school districts, and state education agencies are now held accountable for individual student performance and progress. School districts must report annually to their state’s department of education the performance of all students, including students with disabilities, on tests the state requires students to take. By law, states, districts, and individual schools must demonstrate that the students they teach are making adequate yearly progress (AYP). When it is judged by the state that a school is not making AYP, or when specified subgroups of students (disadvantaged students, students with disabilities, or specific racial/ethnic groups) are not making AYP, sanctions are applied. The school is said to be a school in need of improvement. When schools fail to make AYP for 2 years, parents of the children who attend those schools are permitted to transfer their children to other schools that are not considered in need of improvement. When the school fails to make AYP for 3 years, students are entitled to supplemental educational services (usually
after-school tutoring). Failure to make AYP for longer periods of time results in increasing sanctions until finally the state can take over the school or district and reconstitute it.
4 Important Things to Think About as You Read and Study This Textbook
There are a number of things to think about as you proceed through this book. In this section, we describe several things to bear in mind.
The Type of Decision Determines the Type of Information NeededIn assessing students, it is critical to think about the kind of decision you are making. Different kinds of decisions require different kinds of assessments (both different tests and different assessment processes). For example, if one is attempting to decide whether Millie meets the state eligibility criteria for being classified mentally retarded, it would be necessary to administer an individual intelligence test. If one is attempting to plan an instructional program for Millie, who is mentally retarded, it is not necessary to administer an intelligence test. Rather, we need to know the specific skills that she does and does not have. Such information is best obtained by assessing her level of skill attainment or achieve-ment. Finally, if one wants to know whether Millie is making progress in her instructional program, progress monitoring provides this information.
Focus on Alterable BehaviorsAfter we decide a student is eligible for special education services, our focus should be on assessment of alterable behaviors (behaviors that can be changed). Educators can work to enhance student competence in reading, math, writing, and other academic content areas. They can change the way they teach students to decode words or to write in complete sentences. As educators, we can change what happens in school. As citizens, we can work to change what happens outside of school.
Assess Instruction Before Assessing LearnersWhen a student is experiencing difficulty in school, two related and complemen-tary types of assessment should be performed. First, the instruction a student has received is assessed to ascertain whether the student’s difficulties stem from inappropriate curriculum or inadequate teaching. When instruction is found to be inadequate, the student should be given appropriate instruction to determine whether it alleviates the difficulty. When appropriate instruction fails to remediate the difficulty, further assessment of the student is carried out. Each approach is described in this section.
Assessing Instruction
Until the early 1980s, most assessment activities in school settings consisted of efforts to assess the learner. Yet school personnel often have difficulty developing
Important Things to Think About as You Read and Study This Textbook 11
12 Chapter 1 ■ Introduction: The Context for Assessment in Schools
instructional recommendations solely on the basis of information about the characteristics of students. Englemann, Granzin, and Severson (1979) recommended that assessment begin with instructional diagnosis “to determine aspects of instruction that are inadequate, to find out precisely how they are inadequate, and to imply what must be done to correct their inadequacy” (p. 361). In this approach, assessment consists of systematic analysis of instruction in terms of its appropri-ateness for the learner. Two dimensions are usually considered when instruction is assessed: instructional challenge and instructional environment.
Instructional Challenge For instruction to be effective, it must be possible for the learner, with a reasonable effort, to master the information (the facts, skills, behaviors, or processes) being taught. If the degree to which information challenges a learner is thought of as a continuum, we can think of material as ranging from too easy (unchallenging), through approximately right in degree of diffi culty (appropriately challenging), to too diffi cult (overly challenging). School personnel endeavor to match instruction so that there is an appropriate level of challenge—usually approximately 90 percent known to 10 percent unknown. To do so, they must know the level of skill development of the learner. Thus, they typically gather data on the skills that students do and do not have. Then they plan instruction matched to the students’ skill level.
Instructional Environment Instruction involves more than appropriate curricu-lum. It is a complex activity, the outcomes of which depend on the interaction of many factors. Recognition of this fact has led to efforts to assess the qualitative nature of students’ instructional environments (Ysseldyke & Christenson, 2002). In doing so, educators gather information on the extent to which evidence-based components of effective instruction are present in the instruction that individual students receive. Two dimensions of instruction (classroom management and learning management) are worth describing here.
Classroom management: Classroom management refers to a collection of organizational goals centered on using time wisely in order to maximize learning and on maintaining a safe classroom environment that is conducive to student learning. In classrooms that are poorly organized, students lose learning opportunities because of disruptions by other students, ineffective grouping, poor transitions between activities, and so forth. In contrast, well-organized classrooms have clearly stated and well-understood procedures, consistent consequences for student behavior, and student freedom within a structured environment.
Learning management: The organization and management of the classroom to ensure learning require careful attention to detail. Essentially, teachers must oversee the learning situation. Effective teachers (1) demonstrate what is to be learned and then provide adequate opportunities for meaningful rehearsal and guided and independent practice with appropriate materials until skills become automatic; (2) give students immediate, specifi c, and corrective feedback about their performances and provide opportunities to correct mistakes; (3) reinforce desired outcomes; and (4) stress understanding, application, and transfer of information.
Assessing Learners
When students have received appropriate instruction but are still experiencing academic or behavioral problems, school personnel usually begin to assemble existing information to document the nature of the problem (that is, to identify specific learning strengths and weaknesses) and to generate hypotheses about the problem’s likely solution. They do so using observations, recollections, tests, and professional judgments.
Assessment Is Broader Than TestingSchool personnel sometimes equate testing and assessment. Testing consists of administering a particular set of questions to an individual or group of individuals to obtain a score. That score is the end product of testing. A test is only one of several assessment techniques or procedures for gathering information. During the process of assessment, data from observations, recollections, tests, and profes-sional judgments all come into play.
Observations
Observations can provide highly accurate, detailed, verifiable information not only about the person being assessed but also about the surrounding contexts. Observations can be categorized as either nonsystematic or systematic. In non-systematic, or informal, observation, the observer simply watches an individual in his or her environment and notes the behaviors, characteristics, and personal interactions that seem significant. In systematic observation, the observer sets out to observe one or more precisely defined behaviors. The observer specifies observ-able events that define the behavior and then counts the frequency or measures the frequency, duration, amplitude, or latency of the behaviors.
Recollections
Recalled observations and interpretations of behavior and events are frequently used as an additional source of information. People who are familiar with the student can be very useful in providing information through interviews and rating scales. Interviews can range in structure from casual conversations to highly struc-tured processes in which the interviewer has a predetermined set of questions that are asked in a specified sequence. Generally, the more structured the interview, the more accurate are the comparisons of the results of several different interviews. Rating scales can be considered the most formal type of interview. Rating scales allow questions to be asked in a standardized way and to be accompanied by the same stimulus materials, and they provide a standardized and limited set of response options.
Tests
A test is a predetermined set of questions or tasks for which predetermined types of behavioral responses are sought. Tests are particularly useful because they permit tasks and questions to be presented in exactly the same way to each person tested. Because a tester elicits and scores behavior in a predetermined and consis-tent manner, the performances of several different test takers can be compared, no
Important Things to Think About as You Read and Study This Textbook 13
14 Chapter 1 ■ Introduction: The Context for Assessment in Schools
matter who does the testing. Hence, tests tend to make many contextual factors in assessment consistent for all those tested. The price of this consistency is that the predetermined questions, tasks, and responses may not be equally relevant to all students. Tests yield two types of information—quantitative and qualitative. Quantitative data are the actual scores achieved on the test. An example of quan-titative data is Lee’s score of 80 on her math test. Qualitative data consist of other observations made while a student is tested; they tell us how Lee achieved her score. For example, Lee may have solved all of the addition and subtraction problems with the exception of those that required regrouping. When tests are used, we usually want to know both the scores and how the student earned those scores.
Professional Judgments
The judgments and assessments made by others can play an important role in assessment. Diagnosticians occasionally seek out other professionals to complement their own skills and background. Thus, referring a student to various specialists (hearing specialists, vision specialists, reading teachers, and so on) is a common and desirable practice in assessment. Judgments by teachers, counselors, psychologists, and practically any other professional school employee may be useful in particular circumstances.
Expertise in making judgments is often a function of familiarity with the student being assessed. Teachers regularly express professional judgments; for example, teacher comments on a student’s report card represent a teacher’s judgment.
Assessments Have ConsequencesDecisions in school frequently have important, and occasionally lifelong, conse-quences. The procedures for gathering data and conducting assessments are matters that are rightfully of great concern to the general public—both individuals who are directly affected by the assessments (such as parents, students, and classroom teachers) and individuals who are indirectly affected (for example, taxpayers and elected officials). These matters are also of great concern to individuals and agen-cies that license or certify assessors to work in the schools. Finally, these matters are of great concern to the assessment community. For convenience, the concerns of these groups are discussed separately; however, the reader should recognize that many of the concerns overlap and are not the exclusive domain of one group or another.
Concerns of the General Public
The individuals who are affected by educational decisions are rightly concerned about assessment procedures. They want, and deserve, good decisions. However, any decision can have undesired consequences. Decision making creates “haves” and “have-nots.” Most people who take a test for a driver’s license pass the test; some people fail the test and are denied driving privileges. College entrance tests determine admission for some students and exclusion for others. In the same way, decisions about special and remedial education have consequences. Some
consequences are desired, such as extra services for students who are entitled to special education. Other consequences are unwanted, such as denial of spe-cial education services or diminished self-esteem resulting from a disability label. Concerns of laypeople generally surface when the educational decisions have undesired consequences and are viewed as undemocratic, elitist, or simply unfair.
Concerns of Certifi cation Boards
Certification and licensure boards establish standards to ensure that assessors are appropriately qualified to conduct assessments.2 Test administration, scor-ing, and interpretation require different degrees of training and expertise, depending on the kind of test being administered. All states certify teachers and psychologists who work in the schools; all states require formal training, and some require competency testing. Although most teachers can readily admin-ister or learn to administer group intelligence and achievement tests, as well as classroom assessments of achievement, a person must have considerable training to score and interpret most individual intelligence and personality tests. Therefore, when pupils are tested, we should be able to assume that the person doing the testing has adequate training to conduct the testing correctly (that is, establish rapport, administer the test correctly, score the test, and accurately interpret the test).
Not All Assessments Are EqualTests are samples of behavior. Different tests sample different behavior, and tests differ in their technical adequacy. It is important when interpreting test results that users take into serious account the kinds of behaviors sampled by the tests and the tests’ technical adequacy. You will learn by reading this text the kinds of tests that are available for use in educational settings, the kinds of behaviors sampled by tests that are said to assess the same domain (for example, reading), and the technical adequacy of the tests. We focus on the extent to which students who are assessed are representative of those on whom and for whom a test was built. We also focus on the extent to which tests provide consistent results (are reliable) and actually measure what their authors say they measure (validity). When tests do not meet professional standards, we say so. Assessment is a process of collecting data for the purpose of making decisions about students. It is critical that it be done cor-rectly and that those who assess students do so with technical accuracy, fidelity, and integrity.
Assessment Practices Are DynamicEducational personnel regularly change their assessment practices. New federal or state laws, regulations, or guidelines specify and, in some cases, mandate new assessment practices. New tests become available, and old ones go away. States change their special education eligibility criteria, and technological advances enable us to gather data in new and more efficient ways. Also, the population of students
2These boards also sanction professionals for practicing beyond their competence.
Important Things to Think About as You Read and Study This Textbook 15
16 Chapter 1 ■ Introduction: The Context for Assessment in Schools
Ima
Ima Tryun is an eighth grader who was retained in first grade. Ima has been identified as a student with a learning disability in the area of written communi-cation/basic reading skills. Ima attends school regu-larly and has an integrated special/regular instruction schedule. He receives resource services and in-class support for mathematics, science, and social studies taken in the general education classroom.
Ima reads on a third-grade level. His writing is hampered by his inability to spell. He has wonderful ideas and communicates them well. With the use of a tape recorder, Ima is able to record his ideas. His writing skills are improving with his reading skills. Ima shows excellent auditory comprehension and his attention to task is above average. He actively partic-ipates in class activities and discussions. Ima exhibits low self-esteem toward school. However, he will ask for and accept help from teachers. He is well accepted by his peers and is “looked up to.”
1. Does Ima have a problem? If so, what is it?
2. What kinds of assessment decisions do you need to make about teaching Ima?
3. What kinds of further information do you need in order to teach Ima? How might you gather that information?
4. How might you change the way you teach Ima or the way he responds to you?
Mohammed
It is May 12. The year is nearly over (well, at least you are on a downhill slope to summer vacation). The prin-
cipal walks Mohammed into your room and says to Mohammed, “This is your new teacher, just do what she says and all will be ok.” A Somalian interpreter is present and communicates this to Mohammed. He also lets you know that Mohammed arrived in the United States 3 weeks ago and just moved to your town yesterday. The interpreter tells you that he has no clue whether Mohammed ever went to school in his native Somalia, and there are no educational records. The principal says, “That’s why we put this kid in your class rather than in Roger’s or Audrey’s section. You are the best; you’ll figure out what to do.” You rethink year end. You already have most of the struggling stu-dents in your class. You feel dumped on. You know you have four students who likely will not pass bench-mark tests by the end of the year, and you already have students who speak three different languages.
What would you do?
1. Does Mohammed have a problem? If so, what is it?
2. What issues do you face in attempting to deal with Mohammed and his educational needs in the context of a classroom in which you have others who are struggling and you do not want to ignore the needs of those who are doing just fi ne?
3. Would it matter what grade or subject matter content you are teaching?
4. What kinds of assessment decisions do you need to make about teaching Mohammed?
5. What kinds of information do you need in order to do an effective job of teaching Mohammed?
Scenario in Assessment
Ima and Mohammed
attending schools changes, bringing new challenges to educational personnel who are working to enhance the academic and behavioral competence of all students. We address the dynamic nature of assessment by maintaining a website for this book. On that website we can inform you of changes that take place in laws, instruments, practices, or procedures.
5 Important Considerations as You Prepare to Learn About Assessment in Special and Inclusive Education in Today’s School
Why Learn About Assessment?Educational professionals must assess. Assessment is a critical practice engaged in for the purpose of matching instruction to the level of students’ skills, monitoring student progress, modifying instruction, and working hard to enhance student competence. It is a critical component of teaching, and thus it is necessary that teachers have good skills in assessment and good understanding of assessment information.
Although assessment can be a scary topic for practicing professionals as well as individuals training to become professionals, learning the different important facets helps people become less apprehensive. Educational assessments always have consequences that are important for students and their families. We can expect that good assessments lead to good decisions—decisions that facilitate a student’s progress toward the desired goal (especially long term) of the student becoming a happy, well-adjusted, independent, productive member of society. Poor assessments can slow that progress, stop progress, and sometimes reverse progress. The assessment process is also scary because there is so much to know; a student of assessment can easily get lost in the details of measurement theory, legal requirements, teaching implications, and national politics. Things were much simpler when the first edition of this book was published in 1978. The federal legislation and court cases that governed assessment were minimal. Some states had various legal protections for the assessment of students; others did not. There were many fewer tests used with students in special education, and many of them were technically inadequate (that is, they lacked validity for various reasons). Psychologists decided if a student was entitled to special education, and students did not have IEPs. Back then, the major problems we addressed were how to choose a technically adequate test, how to use it appropriately, and how to inter-pret test scores correctly. Although the quality of published tests has increased dramatically throughout the years, there are still poor tests being used.
Things are more complex today. Federal law regulates the assessment of children for and in special education. Educators and psychologists have many more tools at their disposal—some excellent, some not so good. Educators and psychologists must make more difficult decisions than ever before. For example, the law recognizes more disabilities, and educators need to be able to distinguish important differences among disabilities.
Measurement theory and scoring remain difficult but integral parts of assess-ment. Failure to understand the basic requirements for valid measurement or the precise meaning of test scores inescapably leads to faulty decision making.
Assessment results often bring unwanted news to the community, parents, students, and teachers. Because property values fluctuate with the perceived quality of the local schools, bad news about how students are doing in schools brings bad news to the real estate market. Parents never want to hear that their children are not succeeding or that their children’s prospects for adult life are limited. Students do not want to hear that they are different or not doing as well as their peers; they
Important Considerations as You Prepare to Learn 17
18 Chapter 1 ■ Introduction: The Context for Assessment in Schools
CHAPTER COMPREHENSION QUESTIONSWrite your answers to each of the following questions, and then compare your responses to the text.
1. Defi ne assessment and state how it differs from testing.
2. What role does assessment play in school and society?
3. What are the kinds of assessment decisions educators make?
4. Identify four important considerations in why we assess and how assessment practices are evolving as you prepare to learn about assessment in special and inclusive education.
certainly do not want to be called handicapped or disabled. Teachers do not want to hear that their instruction has not produced learning or that their classroom management techniques are adding to a student’s inappropriate classroom behavior. Inadequate student achievement often leads teachers to deny that student achieve-ment really is inadequate; educators proclaim that tests measure trivial knowledge (not the important things they teach), that they decontextualize knowledge, making it fragmented and artificial, and so on. Other teachers accept their students’ failures (for example, the teachers burn out). The good teachers work harder (for example, learn instructional techniques that actually work and individualize instruction).
Good News: Signifi cant Improvements in Assessment Have Happened and Continue to HappenThe good news is that there have been significant improvements in assessment since the first edition of Assessment in 1978. Assessment is evolving in a number of important ways.
Methods of test construction have changed. ■
New kinds of statistical analyses have enabled test authors to do a better job ■
of building their assessments.
Skills and abilities that we assess have changed as theory and knowledge ■
have evolved. We recognize attention deficit disorder and autism as separate disabilities; intelligence tests reflect theories of intelligence.
Good new assessment methods have worked their way into practice: ■
systematic observation, functional assessment, curriculum-based measurement, curriculum-based assessment, and technology-enhanced assessment and instructional management.
Advancements in technology are making the collection, storage, and analysis ■
of assessment data much more manageable and user-friendly.
Federal laws prescribe the procedures that schools must follow in conducting ■
assessments and hold schools more accountable for the assessments they conduct.
We have every reason to expect that assessment practices will continue to change for the better.
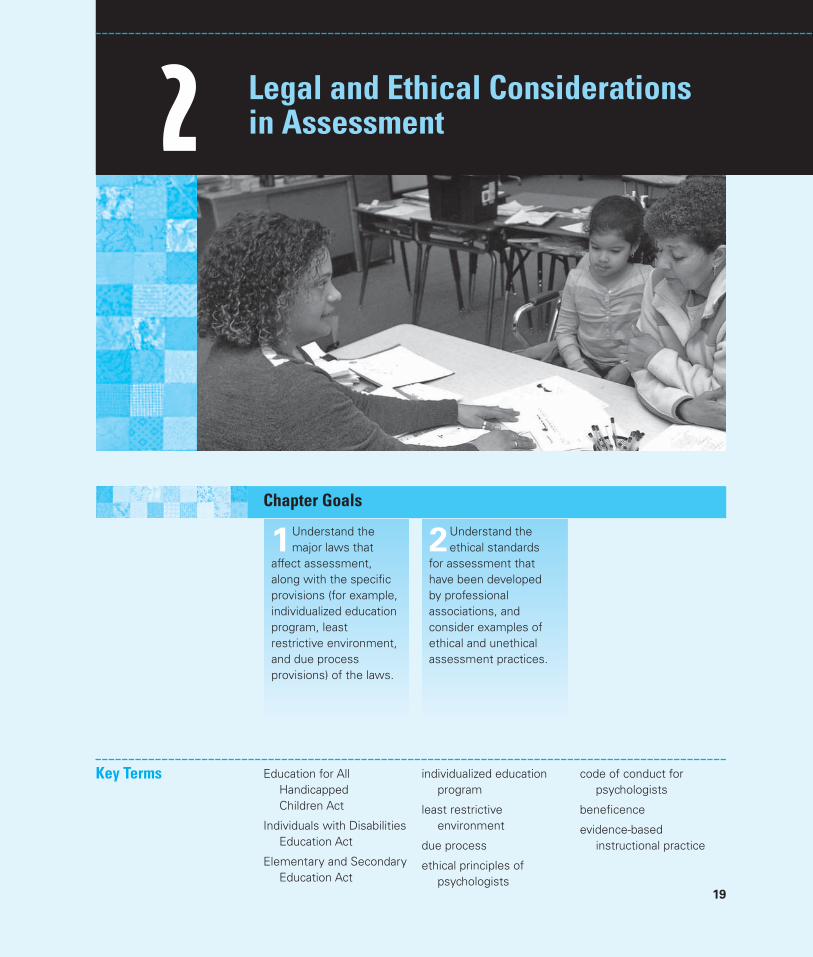
19
Legal and Ethical Considerations in Assessment2
Chapter Goals
Key Terms Education for All Handicapped Children Act
Individuals with Disabilities Education Act
Elementary and Secondary Education Act
individualized education program
least restrictive environment
due process
ethical principles of psychologists
code of conduct forpsychologists
benefi cence
evidence-based instructional practice
1Understand the major laws that
affect assessment, along with the specifi c provisions (for example, individualized education program, least restrictive environment, and due process provisions) of the laws.
2Understand the ethical standards
for assessment that have been developed by professional associations, and consider examples of ethical and unethical assessment practices.
20 Chapter 2 ■ Legal and Ethical Considerations in Assessment
Much of the practice of assessing students is the direct result of federal laws, court rulings, and professional standards and ethics. Federal laws mandate that students be assessed before they are entitled to special education services. Federal laws also mandate that there be an individualized education pro-gram for every student with a disability; that instructional objectives for each of these students be derived from a comprehensive individualized assessment; and that states provide an annual report to the U.S. Department of Education on the academic performance of all students, including students with disabilities. Professional associations (for example, the Council for Exceptional Children, the National Association of School Psychologists, and the American Psychological Association) specify standards for good professional practice and ethical prin-ciples to guide the behavior of those who assess students.
1 Laws
Prior to 1975, there was no federal requirement that students with disabilities attend school, or that schools should make an effort to teach students with disabilities. Requirements were on a state-by-state basis, and they differed and were applied differently in the states. Since the mid-1970s, the delivery of services to students in special and inclusive education has been governed by fed-eral laws. An important federal law, called Section 504 of the Rehabilitation Act of 1973, gave individuals with disabilities equal access to programs and ser-vices funded by federal monies. In 1975, Congress passed the Education for All Handicapped Children Act (Public Law 94-142), which included many instruc-tional and assessment requirements. The law was reauthorized, amended, and updated in 1986, 1990, 1997, and 2004. In 1990, the law was given a new name: the Individuals with Disabilities Education Act (IDEA). To reflect contemporary practices, Congress replaced references to “handicapped children” with “chil-dren with disabilities.” In the 2004 reauthorization, the law was again retitled the Individuals with Disabilities Education Improvement Act to highlight the fact that the major intent of the law is to improve educational services for students with disabilities.
One other federal law, the 2001 Elementary and Secondary Education Act (commonly referred to as the No Child Left Behind Act (NCLB)), is especially important to contemporary assessment practices. Table 2.1 lists the federal laws that are especially important to assessment practices, and the major new provisions of each of the laws are highlighted.
National Association of School Psychologists’ Principles for Professional Ethics
National Education Associa-tion’s Code of Ethics of the Education Profession
No Child Left Behind Act
nondiscriminatory assessment
protection in evaluation procedures (PEPs)
Public Law 94-142
Section 504 of the Rehabilitation Act of 1973
standards for educational and psychological testing
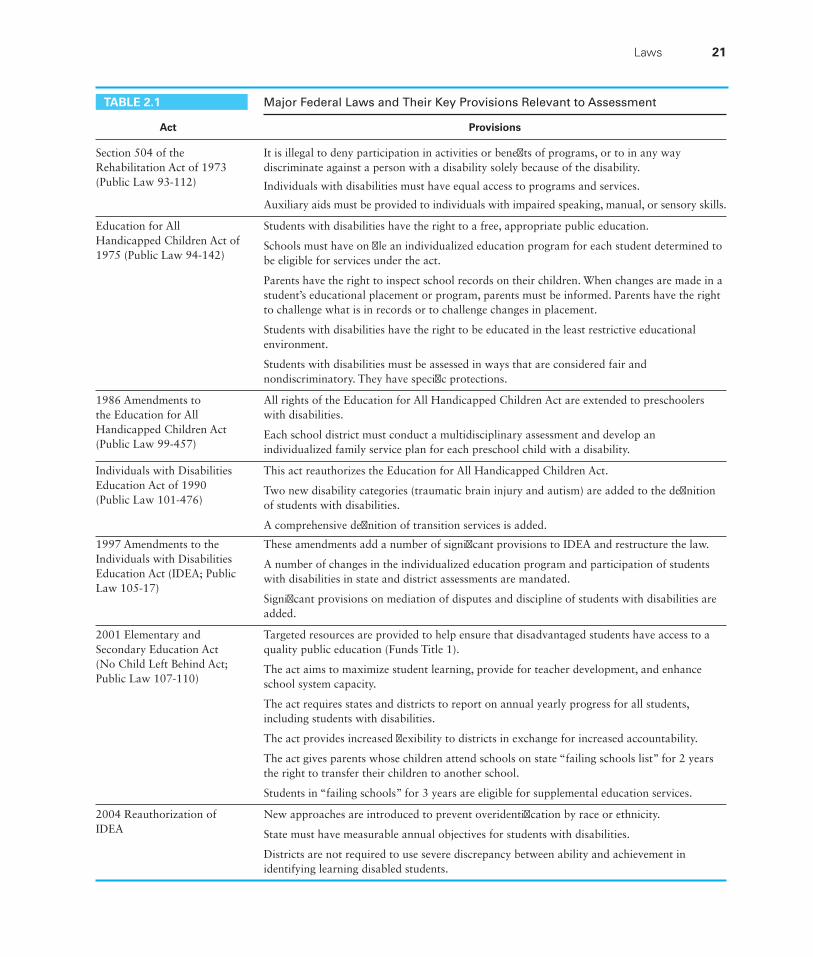
TABLE 2.1 Major Federal Laws and Their Key Provisions Relevant to Assessment
Act Provisions
Section 504 of the Rehabilitation Act of 1973 (Public Law 93-112)
It is illegal to deny participation in activities or benefi ts of programs, or to in any way discriminate against a person with a disability solely because of the disability.
Individuals with disabilities must have equal access to programs and services.
Auxiliary aids must be provided to individuals with impaired speaking, manual, or sensory skills.
Education for All Handicapped Children Act of 1975 (Public Law 94-142)
Students with disabilities have the right to a free, appropriate public education.
Schools must have on fi le an individualized education program for each student determined to be eligible for services under the act.
Parents have the right to inspect school records on their children. When changes are made in a student’s educational placement or program, parents must be informed. Parents have the right to challenge what is in records or to challenge changes in placement.
Students with disabilities have the right to be educated in the least restrictive educational environment.
Students with disabilities must be assessed in ways that are considered fair and nondiscriminatory. They have specifi c protections.
1986 Amendments to the Education for All Handicapped Children Act (Public Law 99-457)
All rights of the Education for All Handicapped Children Act are extended to preschoolers with disabilities.
Each school district must conduct a multidisciplinary assessment and develop an individualized family service plan for each preschool child with a disability.
Individuals with Disabilities Education Act of 1990 (Public Law 101-476)
This act reauthorizes the Education for All Handicapped Children Act.
Two new disability categories (traumatic brain injury and autism) are added to the defi nition of students with disabilities.
A comprehensive defi nition of transition services is added.
1997 Amendments to the Individuals with Disabilities Education Act (IDEA; Public Law 105-17)
These amendments add a number of signifi cant provisions to IDEA and restructure the law.
A number of changes in the individualized education program and participation of students with disabilities in state and district assessments are mandated.
Signifi cant provisions on mediation of disputes and discipline of students with disabilities are added.
2001 Elementary and Secondary Education Act (No Child Left Behind Act; Public Law 107-110)
Targeted resources are provided to help ensure that disadvantaged students have access to a quality public education (Funds Title 1).
The act aims to maximize student learning, provide for teacher development, and enhance school system capacity.
The act requires states and districts to report on annual yearly progress for all students, including students with disabilities.
The act provides increased fl exibility to districts in exchange for increased accountability.
The act gives parents whose children attend schools on state “failing schools list” for 2 years the right to transfer their children to another school.
Students in “failing schools” for 3 years are eligible for supplemental education services.
2004 Reauthorization of IDEA
New approaches are introduced to prevent overidentifi cation by race or ethnicity.
State must have measurable annual objectives for students with disabilities.
Districts are not required to use severe discrepancy between ability and achievement in identifying learning disabled students.
Laws 21
22 Chapter 2 ■ Legal and Ethical Considerations in Assessment
Section 504 of the Rehabilitation Act of 1973Section 504 of the Rehabilitation Act of 1973 prohibits discrimination against persons with disabilities. The act states:
No otherwise qualified handicapped individual shall, solely by reason of his handicap, be excluded from the participation in, be denied the benefits of, or be subjected to discrimination in any program or activity receiving federal financial assistance.
If the Office of Civil Rights (OCR) of the U.S. Department of Education finds that a state education agency (SEA) or local education agency (LEA) is not in compliance with Section 504, and that a state or district chooses not to act to correct the noncompliance, the OCR may withhold federal funds from that SEA or LEA.
Most of the provisions of Section 504 were incorporated into and expanded in the Education for All Handicapped Children Act of 1975 (Public Law 94-142) and are a part of the Individuals with Disabilities Education Improvement Act of 2004. Section 504 is broader than those other acts because its provisions are not restricted to a specific age group or to education. Section 504 is the law most often cited in court cases involving either employment of people with disabilities or appropriate education in colleges and universities for students with disabilities. Section 504 has been used to secure services for students with conditions not for-mally listed in the disabilities education legislation.
Major Assessment Provisions of the Individuals with Disabilities Education Improvement ActWhen Congress passed the Education for All Handicapped Children Act in 1975, it included four major requirements relative to assessment: (1) an individualized education program (IEP) for each student with a disability, (2) protection in eval-uation procedures, (3) education in the least restrictive appropriate environment (LRE), and (4) due process rights. The provisions of federal law continued with the 2004 reauthorized Individuals with Disabilities Education Improvement Act.
The Individualized Education Program Provisions
Public Law 94-142 (the Education for All Handicapped Children Act of 1975) specified that all students with disabilities have the right to a free, appropriate pub-lic education and that schools must have an IEP for each student with a disability. In the IEP, school personnel must specify the long-term and short-term goals of the instructional program. IEPs must be based on a comprehensive assessment by a multidisciplinary team. We stress that assessment data are collected for the purpose of helping team members specify the components of the IEP. The team must specify not only goals and objectives but also plans for implementing the instructional pro-gram. They must specify how and when progress toward accomplishment of objec-tives will be evaluated. Figure 2.1 illustrates an IEP for a student in a Minnesota school district. Note that specific assessment activities that form the basis of the program are listed, as are specific instructional goals or objectives. IEPs are to be formulated by a multidisciplinary child study team that meets with the parents. Parents have the right to agree or disagree with the contents of the program.
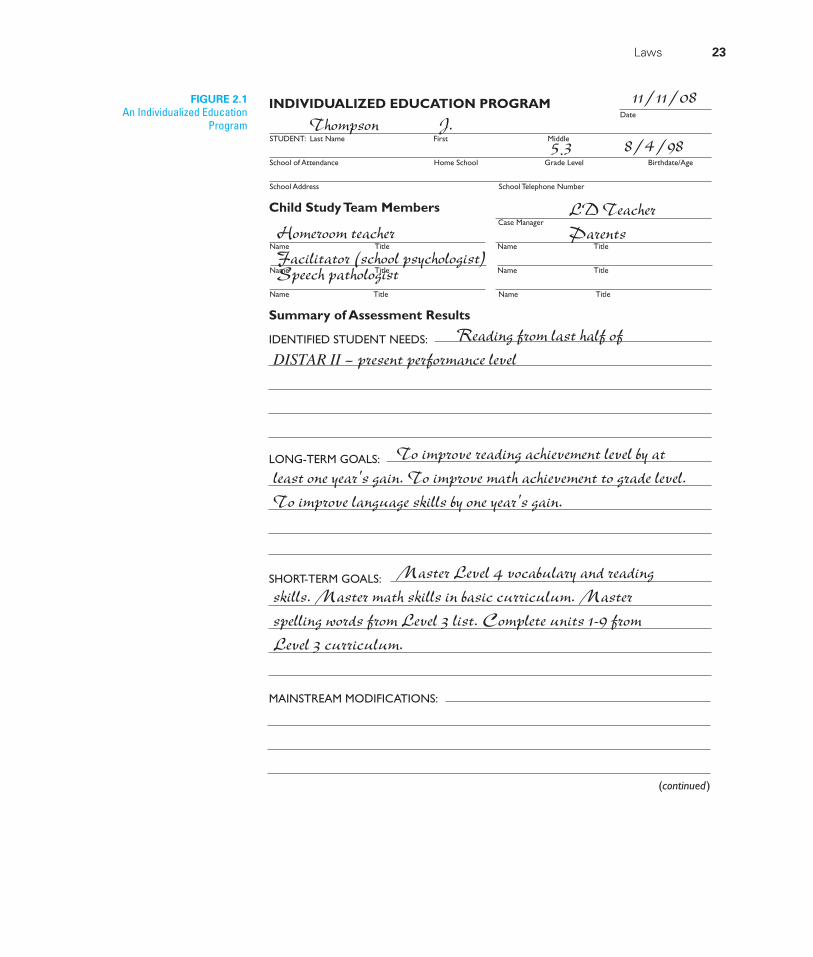
Laws 23
FIGURE 2.1An Individualized Education
Program
INDIVIDUALIZED EDUCATION PROGRAM
Child Study Team Members
Summary of Assessment Results
IDENTIFIED STUDENT NEEDS:
LONG-TERM GOALS:
SHORT-TERM GOALS:
MAINSTREAM MODIFICATIONS:
STUDENT: Last Name First Middle
School of Attendance Home School Grade Level Birthdate/Age
School Address School Telephone Number
Case Manager
Name Title Name Title
Name Title Name Title
Name Title Name Title
Date
Reading from last half of
DISTAR II — present performance level
To improve reading achievement level by at
least one year's gain. To improve math achievement to grade level.
To improve language skills by one year's gain.
Master Level 4 vocabulary and reading
skills. Master math skills in basic curriculum. Master
spelling words from Level 3 list. Complete units 1-9 from
Level 3 curriculum.
11/11/08
Thompson J.
5.3 8/4/98
LD Teacher
ParentsHomeroom teacher
Facilitator (school psychologist)Speech pathologist
(continued)
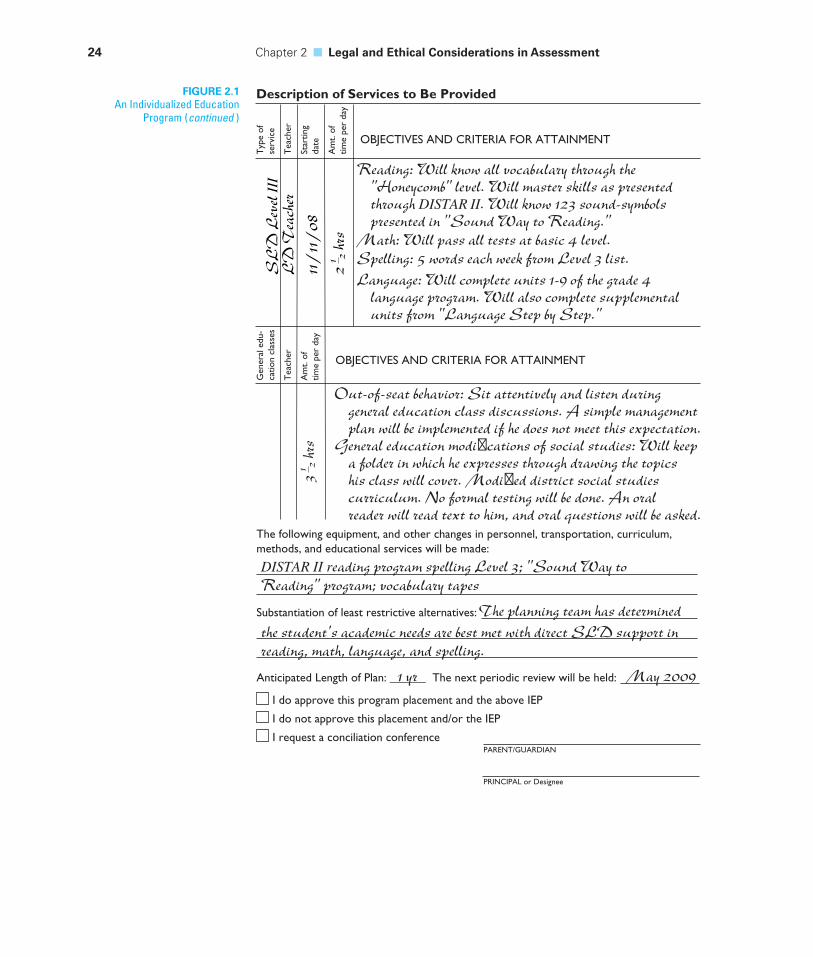
24 Chapter 2 ■ Legal and Ethical Considerations in Assessment
Description of Services to Be Provided
Typ
e of
serv
ice
Tea
cher
Star
ting
date
Am
t. of
time
per
day
Gen
eral
edu
-ca
tion
clas
ses
Tea
cher
Am
t. of
tim
e pe
r da
y
The following equipment, and other changes in personnel, transportation, curriculum, methods, and educational services will be made:
Substantiation of least restrictive alternatives:
Anticipated Length of Plan: ______ The next periodic review will be held:
I do approve this program placement and the above IEP
I do not approve this placement and/or the IEP
I request a conciliation conferencePARENT/GUARDIAN
PRINCIPAL or Designee
Reading: Will know all vocabulary through the
"Honeycomb" level. Will master skills as presented
through DISTAR II. Will know 123 sound-symbols
presented in "Sound Way to Reading."
Math: Will pass all tests at basic 4 level.
Spelling: 5 words each week from Level 3 list.
Language: Will complete units 1-9 of the grade 4
language program. Will also complete supplemental
units from "Language Step by Step."
Out-of-seat behavior: Sit attentively and listen during
general education class discussions. A simple management
plan will be implemented if he does not meet this expectation.
General education modifications of social studies: Will keep
a folder in which he expresses through drawing the topics
his class will cover. Modified district social studies
curriculum. No formal testing will be done. An oral
reader will read text to him, and oral questions will be asked.
.
SL
D L
evel
III
LD
Tea
cher
11/
11/
08
2 1 2
hrs
3 1 2
hrs
OBJECTIVES AND CRITERIA FOR ATTAINMENT
OBJECTIVES AND CRITERIA FOR ATTAINMENT
May 2009
The planning team has determined
the student's academic needs are best met with direct SLD support in
reading, math, language, and spelling.
DISTAR II reading program spelling Level 3; "Sound Way to
Reading" program; vocabulary tapes
1 yr
FIGURE 2.1An Individualized Education
Program (continued )
Laws 25
Lee is a young man with autism whose achievements belie his disability. An African American graduate of a public high school, Lee was valedictorian of his class, went on to college, earned a degree, and entered the world of work. Lee is one of many young people who have benefited from the landmark law we now know as the Individuals with Disabilities Education Act (IDEA).
Congress enacted what was then the Educa-tion for All Handicapped Children Act (Public Law 94-142) on November 29, 1975. The law was intended to support states and localities in protect-ing the rights of, meeting the individual needs of, and improving the results for infants, toddlers, children, and youths with disabilities and their families.
Before IDEA, many children like Lee were denied access to education and opportunities to learn. For example, in 1970, U.S. schools educated only one in fi ve children with disabilities, and many states had laws excluding certain students, including children who were deaf, blind, emotionally disturbed, or men-tally retarded, from its schools.
Today, thanks to IDEA, early intervention pro-grams and services are provided to more than 200,000 eligible infants and toddlers and their families, while about 6.5 million children and youths receive special education and related services to meet their individual needs. More students with disabilities are attending schools in their own neighborhoods—schools that may not have been open to them previously. And few-er students with disabilities are in separate buildings or separate classrooms on school campuses, and are instead learning in classes with their peers.
When President Bush and Congress set out to reauthorize the IDEA legislation in 2004, they made sure it called for states to establish goals for the perfor-mance of children with disabilities that are aligned with each state’s defi nition of “adequate yearly progress” under the No Child Left Behind Act of 2001 (NCLB). Together, NCLB and IDEA hold schools accountable for making sure students with disabilities achieve high standards. In the words of Secretary Spellings, “The days when we looked past the underachievement of
these students are over. No Child Left Behind and the IDEA 2004 have not only removed the fi nal barrier separating special education from general education, they also have put the needs of students with disabilities front and center. Special education is no longer a pe-ripheral issue. It’s central to the success of any school.”
IDEA is now aligned with the important princi-ples of NCLB in promoting accountability for results, enhancing the role of parents, and improving student achievement through instructional approaches that are based on scientifi c research. While IDEA focuses on the needs of individual students and NCLB focuses on school accountability, both laws share the goal of improving academic achievement through high expectations and high-quality education programs.
Through these efforts, we are reaching beyond physical access to the education system toward achiev-ing full access to high-quality curricula and instruction to improve education outcomes for children and youths with disabilities.
Evidence that this approach is working can be found in the increase in the number of students with disabilities graduating from high school instead of dropping out. The National Longitudinal Transition Study-2 (NLTS2), which documented the experiences of a national sample of students with disabilities over several years as they moved from secondary school into adult roles, shows that the incidence of students with disabilities complet-ing high school rather than dropping out increased by 17 percentage points between 1987 and 2003.
During the same period, their postsecondary educa-tion participation more than doubled to 32 percent. In 2003, 70 percent of students with disabilities who had been out of school for up to 2 years had paying jobs, compared to only 55 percent in 1987. Employment and independence are important pieces of the American Dream. In today’s world, getting there depends on hav-ing the foundation of a good education. Through IDEA and NCLB, students with disabilities have the support that they need to be the best they can be.
Source: U.S. Department of Education (www.ed.gov/policy/speced/leg/idea/history30.html).
Scenario in Assessment
Lee
26 Chapter 2 ■ Legal and Ethical Considerations in Assessment
In the 1997 amendments, Congress mandated a number of changes to the IEP. The core IEP team was expanded to include both a special education teacher and a general education teacher. The 1997 law also specified that students with disabilities are to be included in state- and districtwide assessments and that states must report annually on the performance and progress of all students, including students with disabilities. The IEP team must decide whether the student will take the assessments with or without accommodations or take an alternate or modified assessment.
Protection in Evaluation Procedures Provisions
Congress included a number of specific requirements in Public Law 94-142. These requirements were designed to protect students and help ensure that assess-ment procedures and activities would be fair, equitable, and nondiscriminatory. Specifically, Congress mandated eight provisions:
1. Tests are to be selected and administered so as to be racially and culturally nondiscriminatory.
2. To the extent feasible, students are to be assessed in their native language or primary mode of communication (such as American Sign Language or communication board).
3. Tests must have been validated for the specifi c purpose for which they are used.
4. Tests must be administered by trained personnel in conformance with the instructions provided by the test producer.
5. Tests used with students must include those designed to provide information about specifi c educational needs, not just a general intelligence quotient.
6. Decisions about students are to be based on more than their performance on a single test.
7. Evaluations are to be made by a multidisciplinary team that includes at least one teacher or other specialist with knowledge in the area of suspected disability.
8. Children must be assessed in all areas related to a specifi c disability, including—where appropriate—health, vision, hearing, social and emotional status, general intelligence, academic performance, communicative skills, and motor skills.
In passing the 1997 amendments and the 2004 amendments, Congress reau-thorized these provisions.
Least Restrictive Environment Provisions
In writing the 1975 Education for All Handicapped Children Act, Congress wanted to ensure that, to the greatest extent appropriate, students with disabilities would be placed in settings that would maximize their opportunities to interact with students without disabilities. Section 612(S)(B) states:
To the maximum extent appropriate, handicapped children . . . are educated with children who are not handicapped, and that special classes, separate schooling, or other removal of handicapped children from the regular educational environment occurs only when the nature or the severity of the handicap is such that educa-tion in regular classes with the use of supplementary aids and services cannot be achieved satisfactorily.
The LRE provisions arose out of court cases in which state and federal courts had ruled that when two equally appropriate placements were available for a
student with a disability, the most normal (that is, least restrictive) placement was preferred. The LRE provisions were reauthorized in all revisions of the law.
Due Process Provisions
In Public Law 94-142, Congress specified the procedures that schools and school personnel would have to follow to ensure due process in decision making. Specifically, when a decision affecting identification, evaluation, or placement of a student with disabilities is to be made, the student’s parents or guardians must be given both the opportunity to be heard and the right to have an impartial due process hearing to resolve conflicting opinions.
Schools must provide opportunities for parents to inspect the records that are kept on their children and to challenge material that they believe should not be included in those records. Parents have the right to have their child evaluated by an independent party and to have the results of that evaluation considered when psychoeducational decisions are made. In addition, parents must receive writ-ten notification before any education agency can begin an evaluation that might result in changes in the placement of a student.
In the 1997 amendments to IDEA, Congress specified that states must offer mediation as a voluntary option to parents and educators as an initial part of dispute resolution. If mediation is not successful, either party may request a due process hearing. The due process provisions were reauthorized in the 2004 IDEA.
The No Child Left Behind Act of 2001The No Child Left Behind Act of 2001 is the reform of the federal Elementary and Secondary Education Act. Signed into law on January 8, 2002, the act has several major provisions that affect assessment and instruction of students with disabilities and disadvantaged students. The law requires stronger accountabil-ity for results by specifying that states must have challenging state educational standards, test children in grades 3–8 every year, and specify statewide progress objectives that ensure proficiency of every child by grade 12. The law also provides increased flexibility and local control, specifying that states can decide their stan-dards and procedures but at the same time must be held accountable for results. Parents are given expanded educational options under this law, and students who are attending schools judged to be “failing schools” have the right to enroll in other public schools, including public charter schools. A major provision of this law is called “putting reading first,” a set of provisions ensuring all-out effort to have every child reading by the end of third grade. These provisions provide funding to schools for intensive reading interventions for children in grades K–3. Finally, the law specifies that all students have the right to be taught using “evidence-based instructional methods”—that is, teaching methods proven to work. The provisions of this law require that states include all students, among them students with dis-abilities and English-language learners, in their statewide accountability systems.
2004 Reauthorization of IDEAThe Individuals with Disabilities Education Act was reauthorized in 2004. Several of the new requirements of the law have special implications for assessment of students with disabilities. After much debate, Congress removed the requirement that students must have a severe discrepancy between ability and achievement
Laws 27
28 Chapter 2 ■ Legal and Ethical Considerations in Assessment
in order to be considered as having a learning disability. It replaced this provi-sion with permission to states and districts to use data on student responsiveness to intervention in making service eligibility decisions. We provide an extensive discussion of assessing response to intervention in Chapter 8. Congress also specified that states must have measurable goals, standards, or objectives for all students with disabilities.
2 Ethical Considerations
Professionals who assess students have the responsibility to engage in ethical behav-ior. Most professional associations have put together sets of standards to guide the ethical practice of their members; many of these standards relate directly to assess-ment practices. In publishing ethical and professional standards, the associations express serious concern and commitment to promoting high technical standards for assessment instruments and high ethical standards for the behavior of indi-viduals who work with assessments. Here, we cite a number of important ethical considerations, borrowing heavily from the American Psychological Association’s (2002) Ethical Principles of Psychologists and Code of Conduct, the National Association of School Psychologists’ (2002) Principles for Professional Ethics, and the National Education Association’s Code of Ethics of the Education Profession. We have not cited the standards explicitly, but we have distilled from them a num-ber of broad ethical principles that guide assessment practice and behavior.
Benefi cenceBeneficence, or responsible caring, means educational professionals do things that are likely to maximize benefit to students, or at least do no harm. This means that educational professionals always act in the best interests of the students they serve. The assessment of students is a social act that has specific social and educational consequences. Those who assess students use assessment data to make decisions about the students, and these decisions can significantly affect an individual’s life opportunities. Those who assess students must accept responsibility for the consequences of their work, and they must make every effort to be certain that their services are used appropriately. In short, they are committed to the appli-cation of professional expertise to promote improvement in the quality of life available to the student, family, school, and community. For the individual who assesses students, this ethical standard may mean refusing to engage in assessment activities that are desired by a school system but that are clearly inappropriate.
Recognition of the Boundaries of Professional CompetenceThose who are entrusted with the responsibility for assessing and making decisions about students have differing degrees of competence. Not only must professionals regularly engage in self-assessment to be aware of their own limitations but also they should recognize the limitations of the techniques they use. For individuals, this sometimes means refusing to engage in activities in areas in which they lack competence. It also means using techniques that meet recognized standards and engaging in the continuing education necessary to maintain high standards of
competence. As a professional who will assess students, it is imperative that you accept responsibility for the consequences of your work and work to offset any negative consequences of your work.
As schools become increasingly diverse, professionals must demonstrate sen-sitivity in working with people from different cultural and linguistic backgrounds and with children who have different types of disabling conditions. Assessors should have experience working with students of diverse backgrounds and should demonstrate competence in doing so, or they should refrain from assessing and making decisions about such students.
Respect for the Dignity of PersonsRespect for the dignity of persons means that educational professionals respect students’ right to privacy and confidentiality, and that they assess in fair and non-discriminatory ways.
Privacy and Confi dentiality of Information
Those who assess students regularly obtain a considerable amount of very per-sonal information about those students. Such information must be held in strict confidence. A general ethical principle held by most professional organizations is that confidentiality may be broken only when there is clear and imminent danger to an individual or to society. Results of pupil performance on tests must not be discussed informally with school staff members. Formal reports of pupil perfor-mance on tests must be released only with the permission of the persons tested or their parents or guardians.
Those who assess students are to make provisions for maintaining confiden-tiality in the storage and disposal of records. When working with minors or other persons who are unable to give voluntary informed consent, assessors are to take special care to protect these persons’ best interests.
Fairness and Nondiscrimination in Assessment
Those who assess students are responsible for selecting and administering tests in a fair and nonbiased manner. Assessment approaches must be selected that are valid and that provide an accurate representation of students’ skills and abilities rather than of their disabilities. Tests are to be selected and administered so as to be racially and culturally nondiscriminatory, and students should be assessed in their native language or primary mode of communication (for example, Braille or communication boards).
Adherence to Professional Standards on AssessmentA joint committee of the American Educational Research Association, the American Psychological Association, and the National Council on Measurement in Education (1999) published a document titled Standards for Educational and Psychological Testing. These standards specify a set of requirements for test devel-opment and use. It is imperative that those who develop tests behave in accor-dance with the standards, and that those who assess students use instruments and techniques that meet the standards.
Ethical Considerations 29
30 Chapter 2 ■ Legal and Ethical Considerations in Assessment
CHAPTER COMPREHENSION QUESTIONSWrite your answers to each of the following questions, and then compare your responses to the text.
1. What three major laws affect assessment practices?
2. How do the major components of IDEA (individualized educational plan, least restrictive environment,
protection in evaluation procedures, and due process) affect assessment practices?
3. How do the broad ethical principles of benefi cence, competence boundaries, respect for the dignity of persons, confi dentiality, and fairness affect assessment practices?
In Parts 3 and 4 of this text, we review commonly used tests and discuss the extent to which those tests meet the standards specified in Standards for Educational and Psychological Testing. We provide information to help test users make informed judgments about the technical adequacy of specific tests. There is no federal or state agency that acts to limit the publication or use of technically inadequate tests. Only by refusing to use technically inadequate tests will users force developers to improve them. After all, if you were a test developer, would you continue to publish a test that few people purchased and used? Would you invest your company’s resources to make changes in a technically inadequate test that yielded a large annual profit to your firm if people continued to buy and use it the way it was?
Test SecurityThose who assess students are expected to maintain test security. It is expected that assessors will not reveal to others the content of specific tests or test items. At the same time, assessors must be willing and able to back up with test data deci-sions that may adversely affect individuals.
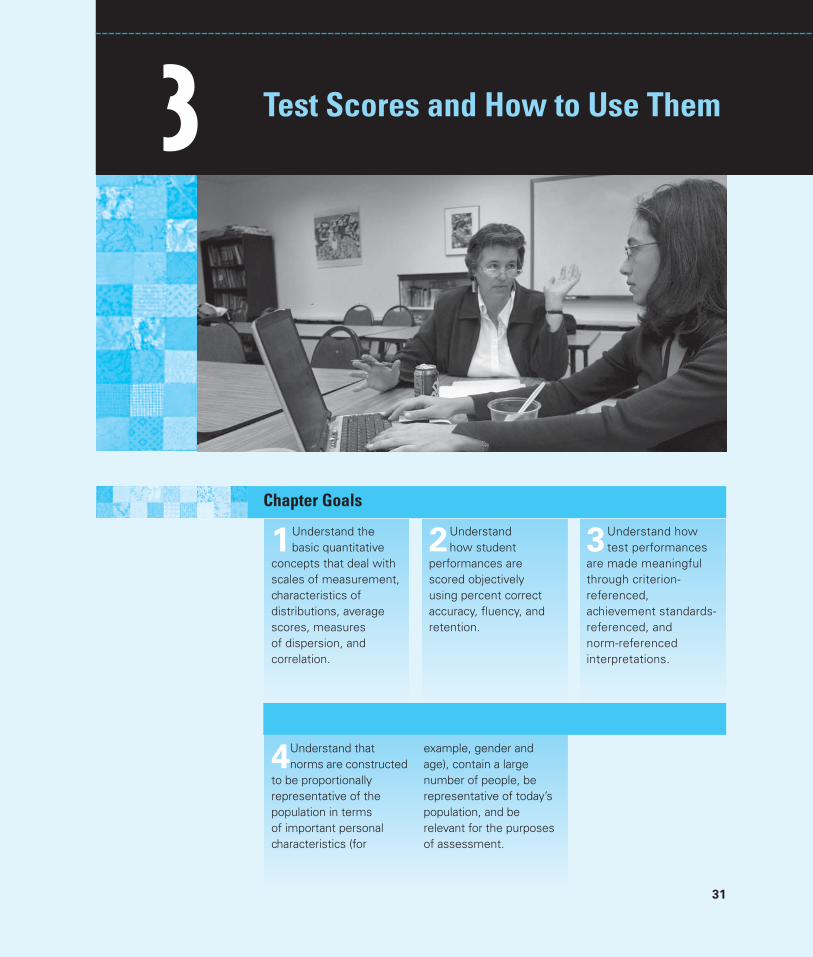
31
3 Test Scores and How to Use Them
4Understand that norms are constructed
to be proportionally representative of the population in terms of important personal characteristics (for
example, gender and age), contain a large number of people, be representative of today’s population, and be relevant for the purposes of assessment.
Chapter Goals
1Understand the basic quantitative
concepts that deal with scales of measurement, characteristics of distributions, average scores, measures of dispersion, and correlation.
2Understand how student
performances are scored objectively using percent correct accuracy, fl uency, and retention.
3Understand how test performances
are made meaningful through criterion-referenced, achievement standards-referenced, and norm-referenced interpretations.
32 Chapter 3 ■ Test Scores and How to Use Them
Key Terms ordinal scale
equal-interval scale
mean
variance
standard deviation
skew
kurtosis
mode
median
range
variance
correlation coeffi cient
objective scoring
subjective scoring
percent correct
accuracy
instructional level
frustration level
independent level
fl uency
retention
criterion-referenced
achievement standards-referenced
norm-referenced
age equivalent
grade equivalent
percentile ranks (percentiles)
standard scores
z scores
T scores
IQs
normal curve equivalents (NCEs)
stanines
norms
This chapter is an introduction to some of the basic quantitative concepts used in assessment. More information about descriptive statistics, test scores, and norms is available for download on the student website. There you will find more detailed explanations, information about how various scores or statistics are calculated, and information about more advanced topics. School personnel need to understand what test scores mean because they will be using test scores throughout their professional careers. Correct interpretations of scores can lead to good decision making, whereas incorrect interpretations cannot. To illustrate, suppose you are a teacher and learn that 65 percent of the students in your class earned scores of “proficient” in reading when they took the state test last spring; 22 percent of your students earned scores of “basic.” You are told that Willis has an IQ of 87 and is considered a “slow learner,” and that he scored at the 22nd percentile on a measure of vocabulary. Elaine is said to have a grade equivalent of 4.2 on a math test. You are also told that your class scored at the state median on a measure of writing. Obviously, this information is supposed to mean something to you and could affect how you will teach. What do these scores mean? How do they affect the instructional decisions you will make?
1 Basic Quantitative Concepts
The basic quantitative concepts for beginning students deal with scales of mea-surement, characteristics of sets of scores, average scores, measures of dispersion, and correlation.
Scales of MeasurementAssessment in the real world is a quantitative activity. The type of mathematical operations that can be properly done depends on the nature of the score. There are four types of scores: nominal, ordinal, ratio, and equal interval (Stevens, 1951). The four scales differ in the relationship between possible consecutive values on
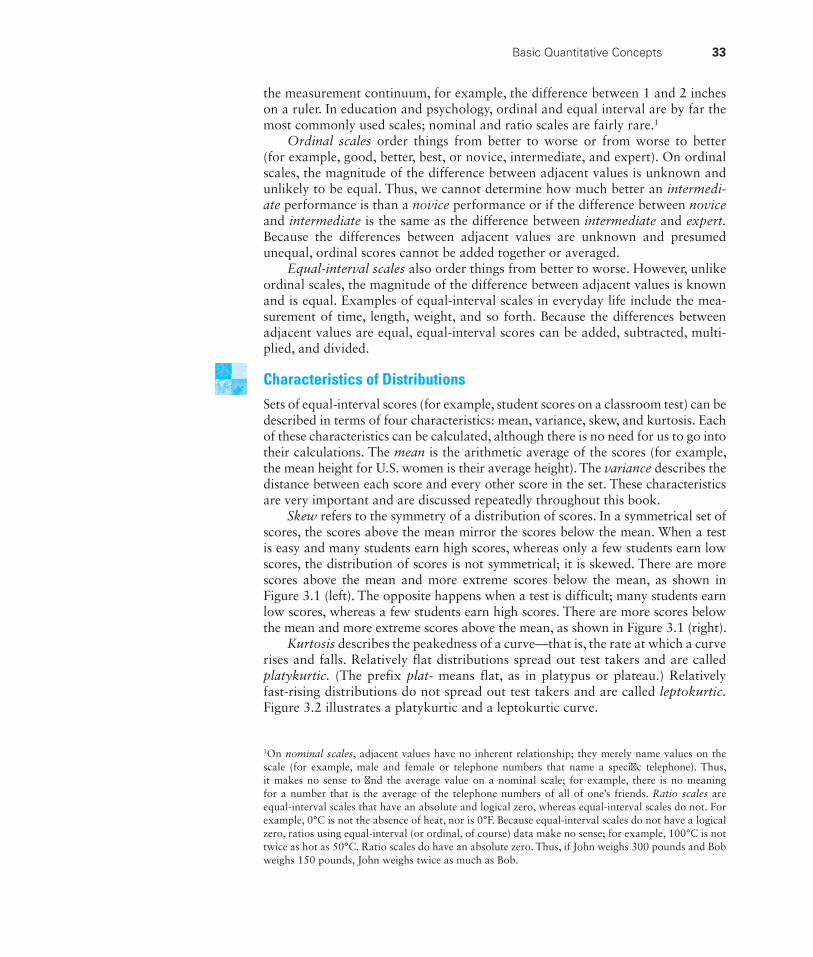
the measurement continuum, for example, the difference between 1 and 2 inches on a ruler. In education and psychology, ordinal and equal interval are by far the most commonly used scales; nominal and ratio scales are fairly rare.1
Ordinal scales order things from better to worse or from worse to better (for example, good, better, best, or novice, intermediate, and expert). On ordinal scales, the magnitude of the difference between adjacent values is unknown and unlikely to be equal. Thus, we cannot determine how much better an intermedi-ate performance is than a novice performance or if the difference between novice and intermediate is the same as the difference between intermediate and expert. Because the differences between adjacent values are unknown and presumed unequal, ordinal scores cannot be added together or averaged.
Equal-interval scales also order things from better to worse. However, unlike ordinal scales, the magnitude of the difference between adjacent values is known and is equal. Examples of equal-interval scales in everyday life include the mea-surement of time, length, weight, and so forth. Because the differences between adjacent values are equal, equal-interval scores can be added, subtracted, multi-plied, and divided.
Characteristics of DistributionsSets of equal-interval scores (for example, student scores on a classroom test) can be described in terms of four characteristics: mean, variance, skew, and kurtosis. Each of these characteristics can be calculated, although there is no need for us to go into their calculations. The mean is the arithmetic average of the scores (for example, the mean height for U.S. women is their average height). The variance describes the distance between each score and every other score in the set. These characteristics are very important and are discussed repeatedly throughout this book.
Skew refers to the symmetry of a distribution of scores. In a symmetrical set of scores, the scores above the mean mirror the scores below the mean. When a test is easy and many students earn high scores, whereas only a few students earn low scores, the distribution of scores is not symmetrical; it is skewed. There are more scores above the mean and more extreme scores below the mean, as shown in Figure 3.1 (left). The opposite happens when a test is difficult; many students earn low scores, whereas a few students earn high scores. There are more scores below the mean and more extreme scores above the mean, as shown in Figure 3.1 (right).
Kurtosis describes the peakedness of a curve—that is, the rate at which a curve rises and falls. Relatively flat distributions spread out test takers and are called platykurtic. (The prefix plat- means flat, as in platypus or plateau.) Relatively fast-rising distributions do not spread out test takers and are called leptokurtic. Figure 3.2 illustrates a platykurtic and a leptokurtic curve.
1On nominal scales, adjacent values have no inherent relationship; they merely name values on the scale (for example, male and female or telephone numbers that name a specifi c telephone). Thus, it makes no sense to fi nd the average value on a nominal scale; for example, there is no meaning for a number that is the average of the telephone numbers of all of one’s friends. Ratio scales are equal-interval scales that have an absolute and logical zero, whereas equal-interval scales do not. For example, 0°C is not the absence of heat, nor is 0°F. Because equal-interval scales do not have a logical zero, ratios using equal-interval (or ordinal, of course) data make no sense; for example, 100°C is not twice as hot as 50°C. Ratio scales do have an absolute zero. Thus, if John weighs 300 pounds and Bob weighs 150 pounds, John weighs twice as much as Bob.
Basic Quantitative Concepts 33
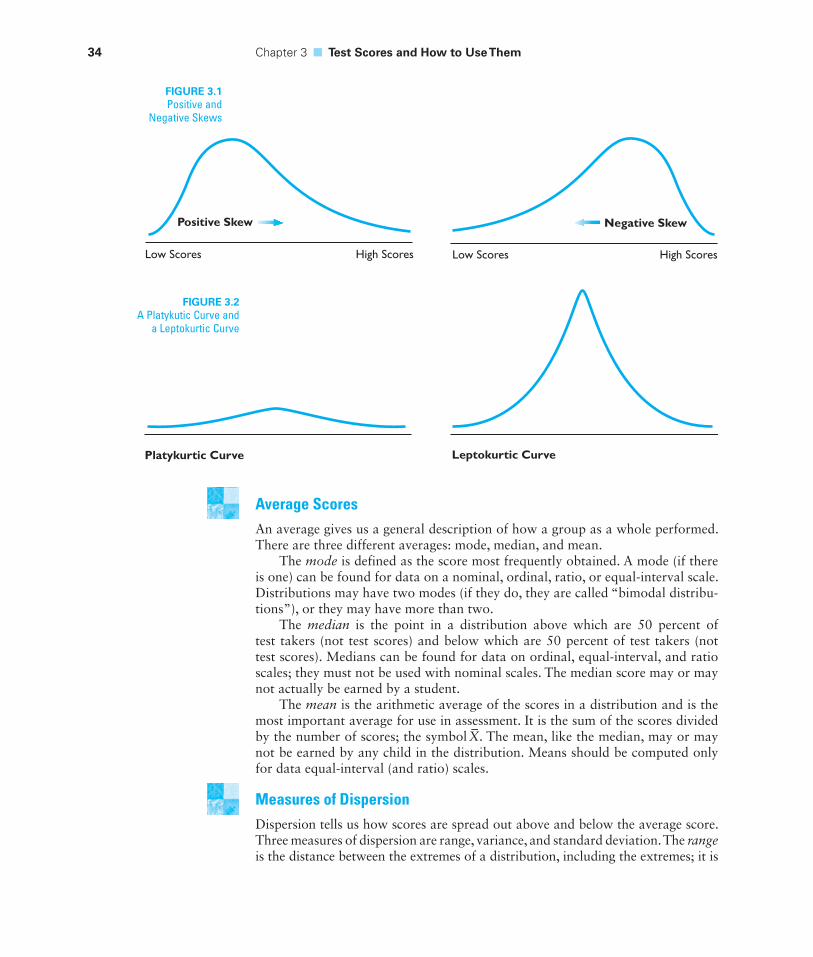
34 Chapter 3 ■ Test Scores and How to Use Them
Low Scores High Scores
Positive Skew
Low Scores High Scores
Negative Skew
FIGURE 3.1Positive and
Negative Skews
FIGURE 3.2A Platykutic Curve and
a Leptokurtic Curve
Average ScoresAn average gives us a general description of how a group as a whole performed. There are three different averages: mode, median, and mean.
The mode is defined as the score most frequently obtained. A mode (if there is one) can be found for data on a nominal, ordinal, ratio, or equal-interval scale. Distributions may have two modes (if they do, they are called “bimodal distribu-tions”), or they may have more than two.
The median is the point in a distribution above which are 50 percent of test takers (not test scores) and below which are 50 percent of test takers (not test scores). Medians can be found for data on ordinal, equal-interval, and ratio scales; they must not be used with nominal scales. The median score may or may not actually be earned by a student.
The mean is the arithmetic average of the scores in a distribution and is the most important average for use in assessment. It is the sum of the scores divided by the number of scores; the symbol
–X. The mean, like the median, may or may
not be earned by any child in the distribution. Means should be computed only for data equal-interval (and ratio) scales.
Measures of DispersionDispersion tells us how scores are spread out above and below the average score. Three measures of dispersion are range, variance, and standard deviation. The range is the distance between the extremes of a distribution, including the extremes; it is
Platykurtic Curve Leptokurtic Curve
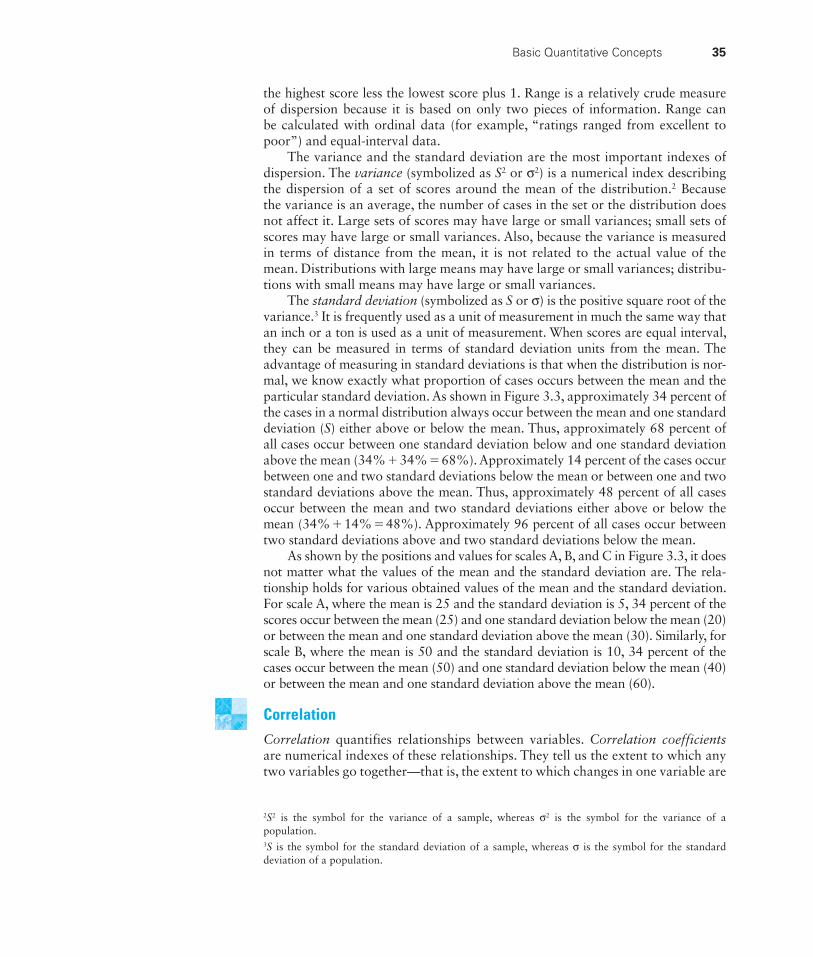
the highest score less the lowest score plus 1. Range is a relatively crude measure of dispersion because it is based on only two pieces of information. Range can be calculated with ordinal data (for example, “ratings ranged from excellent to poor”) and equal-interval data.
The variance and the standard deviation are the most important indexes of dispersion. The variance (symbolized as S2 or σ2) is a numerical index describing the dispersion of a set of scores around the mean of the distribution.2 Because the variance is an average, the number of cases in the set or the distribution does not affect it. Large sets of scores may have large or small variances; small sets of scores may have large or small variances. Also, because the variance is measured in terms of distance from the mean, it is not related to the actual value of the mean. Distributions with large means may have large or small variances; distribu-tions with small means may have large or small variances.
The standard deviation (symbolized as S or σ) is the positive square root of the variance.3 It is frequently used as a unit of measurement in much the same way that an inch or a ton is used as a unit of measurement. When scores are equal interval, they can be measured in terms of standard deviation units from the mean. The advantage of measuring in standard deviations is that when the distribution is nor-mal, we know exactly what proportion of cases occurs between the mean and the particular standard deviation. As shown in Figure 3.3, approximately 34 percent of the cases in a normal distribution always occur between the mean and one standard deviation (S) either above or below the mean. Thus, approximately 68 percent of all cases occur between one standard deviation below and one standard deviation above the mean (34% + 34% = 68%). Approximately 14 percent of the cases occur between one and two standard deviations below the mean or between one and two standard deviations above the mean. Thus, approximately 48 percent of all cases occur between the mean and two standard deviations either above or below the mean (34% + 14% = 48%). Approximately 96 percent of all cases occur between two standard deviations above and two standard deviations below the mean.
As shown by the positions and values for scales A, B, and C in Figure 3.3, it does not matter what the values of the mean and the standard deviation are. The rela-tionship holds for various obtained values of the mean and the standard deviation. For scale A, where the mean is 25 and the standard deviation is 5, 34 percent of the scores occur between the mean (25) and one standard deviation below the mean (20) or between the mean and one standard deviation above the mean (30). Similarly, for scale B, where the mean is 50 and the standard deviation is 10, 34 percent of the cases occur between the mean (50) and one standard deviation below the mean (40) or between the mean and one standard deviation above the mean (60).
CorrelationCorrelation quantifies relationships between variables. Correlation coefficients are numerical indexes of these relationships. They tell us the extent to which any two variables go together—that is, the extent to which changes in one variable are
2S2 is the symbol for the variance of a sample, whereas σ2 is the symbol for the variance of a population.3S is the symbol for the standard deviation of a sample, whereas σ is the symbol for the standard deviation of a population.
Basic Quantitative Concepts 35
36 Chapter 3 ■ Test Scores and How to Use Them
reflected by changes in the second variable. These coefficients are used in measure-ment to estimate both the reliability and the validity of a test. Correlation coef-ficients can range in value from .00 to either +1.00 or –1.00. The sign (+ or –) indicates the direction of the relationship; the number indicates the magnitude of the relationship. A correlation coefficient of .00 between two variables means that there is no relationship between the variables. The variables are indepen-dent; changes in one variable are not related to changes in the second variable. A correlation coefficient of either +1.00 or –1.00 indicates a perfect relationship between two variables. Thus, if you know a person’s score on one variable, you can predict that person’s score on the second variable without error. Correlation coefficients between .00 and 1.00 (or –1.00) allow some prediction, and the greater the coefficient, the greater its predictive power.
2 Scoring Student Performance
Tests are structured situations in which predetermined materials are presented to an individual in a predetermined manner in order to evaluate that individual’s responses. How a person’s responses are scored and interpreted depends on the materials used, the intent of the test author, and the diagnostician’s intention.
Objective Versus Subjective ScoringThere are two approaches to scoring a student’s response: objective and subjec-tive. By objective scoring, we mean scoring that is based on observable qualities and not influenced by emotion, guess, or personal bias. By subjective scoring, we mean scoring that is not based on observable qualities but relies on per-sonal impressions and private criteria. The clear intent of the Individuals with Disabilities Education Act is to require objective measurement (Federal Register 71(156), August 14, 2006).
–2S –1S X +1S +2S
Scale A 15 20 25 30 35(X = 25; S = 5)
Scale B 30 40 50 60 70(X = 50; S = 10)
Scale C 50 75 100 125 150(X = 100; S = 25)
2% 2%14% 14%
34% 34%
FIGURE 3.3Scores on Three Scales,
Expressed in Standard Deviation Units
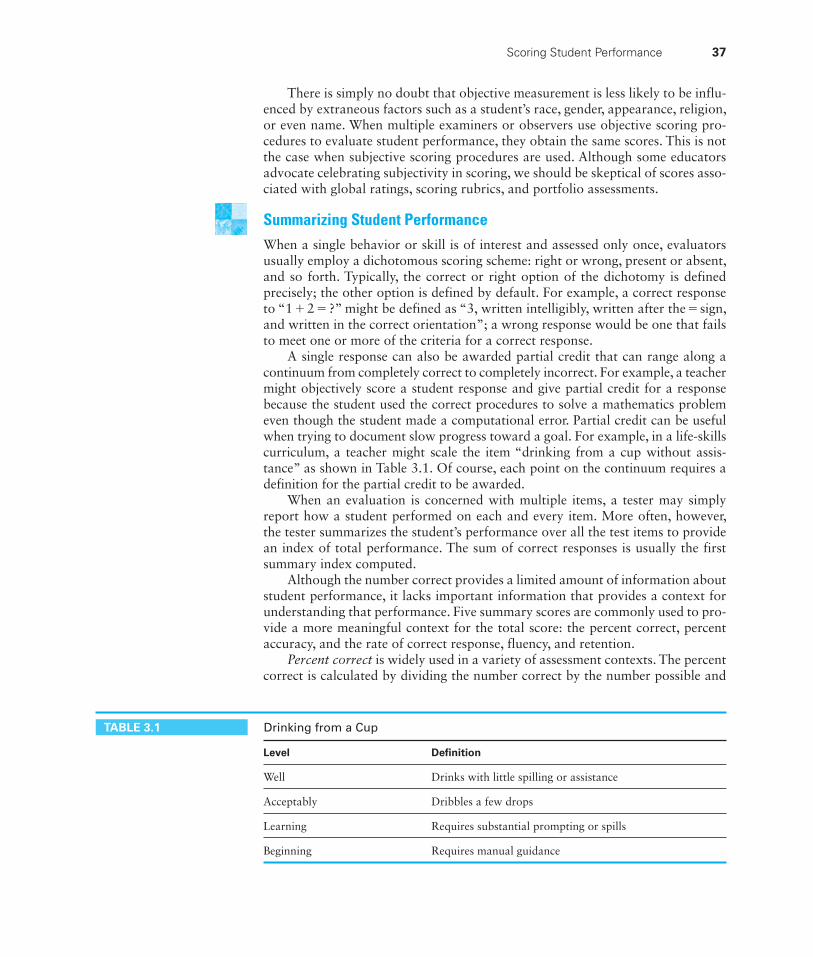
There is simply no doubt that objective measurement is less likely to be influ-enced by extraneous factors such as a student’s race, gender, appearance, religion, or even name. When multiple examiners or observers use objective scoring pro-cedures to evaluate student performance, they obtain the same scores. This is not the case when subjective scoring procedures are used. Although some educators advocate celebrating subjectivity in scoring, we should be skeptical of scores asso-ciated with global ratings, scoring rubrics, and portfolio assessments.
Summarizing Student PerformanceWhen a single behavior or skill is of interest and assessed only once, evaluators usually employ a dichotomous scoring scheme: right or wrong, present or absent, and so forth. Typically, the correct or right option of the dichotomy is defined precisely; the other option is defined by default. For example, a correct response to “1 + 2 = ?” might be defined as “3, written intelligibly, written after the = sign, and written in the correct orientation”; a wrong response would be one that fails to meet one or more of the criteria for a correct response.
A single response can also be awarded partial credit that can range along a continuum from completely correct to completely incorrect. For example, a teacher might objectively score a student response and give partial credit for a response because the student used the correct procedures to solve a mathematics problem even though the student made a computational error. Partial credit can be useful when trying to document slow progress toward a goal. For example, in a life-skills curriculum, a teacher might scale the item “drinking from a cup without assis-tance” as shown in Table 3.1. Of course, each point on the continuum requires a definition for the partial credit to be awarded.
When an evaluation is concerned with multiple items, a tester may simply report how a student performed on each and every item. More often, however, the tester summarizes the student’s performance over all the test items to provide an index of total performance. The sum of correct responses is usually the first summary index computed.
Although the number correct provides a limited amount of information about student performance, it lacks important information that provides a context for understanding that performance. Five summary scores are commonly used to pro-vide a more meaningful context for the total score: the percent correct, percent accuracy, and the rate of correct response, fluency, and retention.
Percent correct is widely used in a variety of assessment contexts. The percent correct is calculated by dividing the number correct by the number possible and
Scoring Student Performance 37
Level Defi nition
Well Drinks with little spilling or assistance
Acceptably Dribbles a few drops
Learning Requires substantial prompting or spills
Beginning Requires manual guidance
TABLE 3.1 Drinking from a Cup
38 Chapter 3 ■ Test Scores and How to Use Them
multiplying that quotient by 100. This index is best used with power tests—tests for which students have sufficient time to answer all of the questions.
Accuracy is the number of correct responses divided by the number of attempted responses multiplied by 100. Accuracy is appropriately used when an assessment procedure precludes a student from responding to all items.4 For example, a teacher may ask a student to read orally for 2 minutes, but it may not be possible for that student (or any other student) to read the entire passage in the time allotted. Thus, Benny may attempt 175 words in a 350-word passage in 2 minutes; if he reads 150 words correctly, his percentage correct would be approximately 86 percent—that is, 100 × (150/175).
Percentages are given verbal labels that are intended to facilitate instruction. The two most commonly used labels are “mastery” and “instructional level.” Mastery divides the percentage continuum in two: Mastery is generally set at 90 or 95 per-cent correct, and nonmastery is less than the level of mastery. The criterion for mas-tery is arbitrary, and in real life we frequently set the level for mastery too low.
Instructional level divides the percentage range into three segments: frustra-tion, instructional, and independent levels. When material is too difficult for a student, it is said to be at the frustration level; this level is usually defined as mate-rial for which a student knows less than 85 percent of it. An instructional level provides a degree of challenge where a student is likely to be successful, but success is not guaranteed; this level is usually defined by student responses between 85 and 95 percent correct. The independent level is defined as the point where a student can perform without assistance; this level is usually defined as student performance of more than 95 percent correct. For example, in reading, students who decode more than 95 percent of the words should be able to read a passage without assis-tance; students who decode between 85 and 95 percent of the words in a passage should be able to read and comprehend that passage with assistance; and students who cannot decode 85 percent of the words in a passage will probably have great difficulty decoding and comprehending the material, even with assistance.5
Fluency is the number of correct responses per minute. Teachers often want their students to have a supply of information at their fingertips so that they can respond fluently (or automatically) without thinking. For example, teachers may want their students to recognize sight words without having to sound them out, recall addition facts without having to think about them, or supply Spanish words for their English equivalents. Criterion rates for successful performance are usually determined empirically. For example, readers with satisfactory compre-hension usually read connected prose at rates of 100 or more words per minute (Mercer & Mercer, 1985). Readers interested in desired rates for a variety of aca-demic skills are referred to Salvia and Hughes (1990).
Retention refers to the percentage of learned information that is recalled. Retention may also be termed recall, maintenance, or memory of what has been learned. Regardless of the label, it is calculated in the same way: Divide the number recalled by the number originally learned, and multiply that ratio by 100. For exam-ple, if Helen learned 40 sight vocabulary words and recalled 30 of them 2 weeks
4A situation in which there are more opportunities to respond than time to respond is termed a free operant. Free operant situations arise in assessments that are timed to allow the opportunity for unlimited increases in rate.5Students should not be given homework (independent practice) until they are at the independent level.
later, her retention would be 75 percent—that is, 100 × (30/40). Because forgetting becomes more likely as the interval between the learning and the retention assess-ment increases, retention is usually qualified by the period of time between attain-ment of mastery and assessment of recall. Thus, Helen’s retention would be stated as 75 percent over a 2-week period.
3 Interpretation of Test Performance
There are three common ways to interpret an individual student’s performance in special and inclusive education: criterion-referenced, standards-referenced, and norm-referenced.
Criterion-Referenced InterpretationsWhen we are interested in a student’s knowledge about a single fact, we compare a student’s performance against an objective and absolute standard (criterion) of performance. Thus, to be considered criterion-referenced, there must be a clear, objective criterion for each of the correct responses to each question or to each portion of the question if partial credit is to be awarded.
Achievement Standards-Referenced InterpretationsIn large-scale assessments, school districts must ascertain the degree to which they are meeting state and national achievement standards. To do so, states specify the qualities and skills that competent learners need to demonstrate. These indices consist of four components.
Levels of performance: The entire range of possible student performances ■
(from very poor to excellent) is divided into a number of bands or ranges. Verbal labels that are attached to each of these ranges indicate increasing levels of accomplishment. For example, an emerging performance is less accomplished than an advanced performance, whereas an advanced performance is less accomplished than a profi cient performance.
Objective criteria: Each level of performance is defi ned by precise, ■
objective descriptions of student accomplishment relative to the task. These descriptions can be quantifi ed.
Examples: Examples of student work at each level are provided. These ■
examples illustrate the range of performance within each level.Cut scores: Cutoff scores are provided. These scores provide quantitative ■
criteria that clearly delineate student performance level.
Norm-Referenced InterpretationsSometimes testers are interested in knowing how a student’s performance compares to the performances of other students—usually students of similar demographic characteristics (age, gender, grade in school, and so forth). In order to make this type of comparison, a student’s score is transformed into a derived score. There are two types of derived scores: developmental scores and scores of relative standing.
Interpretation of Test Performance 39
40 Chapter 3 ■ Test Scores and How to Use Them
Mr. Stanley is a fi rst-year special education teacher who teaches intermediate-level children with learning problems in a district elementary school. His school’s principal asked him to participate in a multidisciplinary team meeting for a student who has been experiencing serious learning diffi culties. Because Mr. Stanley had never participated in an initial evaluation before and was a bit nervous, he asked the school psychologist what would happen at the meeting. The psychologist told him that she (the psychologist) would go over the student’s test results, specifi cally her scores on the Wechsler Intelligence Scale for Children (IV) and the Woodcock–Johnson Tests of Achievement (III). She
also told him to expect that parents and the general education teacher would provide their input to the process.
To prepare for the meeting, Mr. Stanley looked up the Wechsler and Woodcock–Johnson tests in his col-lege assessment text. Therein he reviewed what behav-iors the tests sampled and the derived scores he could expect to see reported. At the meeting, the psychologist reported the percentiles and standard scores earned by the student, and Mr. Stanley knew exactly what each meant. With this knowledge, he was able to participate meaningfully in the team’s discussion of the student’s disability and possible need for special education.
Scenario in Assessment
Mr. Stanley
Developmental Scores
There are two types of developmental scores: developmental equivalents and developmental quotients. Developmental equivalents may be age equivalents or grade equivalents. Developmental scores are based on the average performance of individuals of a given age or grade. Suppose the average performance of 10-year-old children on a test was 27 correct. Furthermore, suppose that Horace answered 27 questions correctly. Horace answered as many questions correctly as the average of 10-year-old children. He would earn an age equivalent of 10 years. An age equivalent means that a child’s raw score is the average (the median or mean) performance for that age group. Age equivalents are expressed in years and months; a hyphen is used in age scores (for example, 7-1 for 7 years, 1 month old). If the test measured mental ability, Horace’s score would have a mental age; if the test measured language, it would be called a language age. A grade equivalent means that a child’s raw score is the average (the median or mean) performance for a particular grade. Grade equivalents are expressed in grades and tenths of grades; a decimal point is used in grade scores (for example, 7.1). Age-equivalent and grade-equivalent scores are interpreted as a performance equal to the average of X-year-olds and the average of Xth graders’ performance, respectively.
The interpretation of age and grade equivalents requires great care. Five prob-lems occur in the use of developmental scores.
1. Systematic misinterpretation: Students who earn an age equivalent of 12-0 have merely answered as many questions correctly as the average for children 12 years of age. They have not necessarily performed as a 12-year-old child would; they may well have attacked the problems in a different way or demonstrated a different performance pattern from many 12-year-old
students. For example, a second grader and a ninth grader might both earn grade equivalents of 4.0, but they probably have not performed identically. We have known for more than 30 years that younger children perform lower level work with greater accuracy (for instance, successfully answered 38 of the 45 problems attempted), whereas older children attempt more problems with less accuracy (for instance, successfully answered 38 of the 78 problems attempted) (Thorndike & Hagen, 1978).
2. Need for interpolation and extrapolation: Average age and grade scores are estimated for groups of children who are never tested. Interpolated scores are estimated for groups of students between groups actually tested. For example, students within 30 days of their eighth birthday may be tested, but age equivalents are estimated for students who are 8-1, 8-2, and so on. Extrapolated scores are estimated for students who are younger and older than the children tested. For example, a student may earn an age equivalent of 5-0 even though no child younger than 6 was tested.
3. Promotion of typological thinking: An average 12-0 pupil is a statistical abstraction. The average 12-year-old is in a family with 1.2 other children, 0.8 of a dog, and 2.3 automobiles; in other words, the average child does not exist. Average 12-0 children more accurately represent a range of performances, typically the middle 50 percent.
4. Implication of a false standard of performance: Educators expect a third grader to perform at a third-grade level and a 9-year-old to perform at a 9-year-old level. However, the way equivalent scores are constructed ensures that 50 percent of any age or grade group will perform below age or grade level because half of the test takers earn scores below the median.
5. Tendency for scales to be ordinal, not equal interval: The line relating the number correct to the various ages is typically curved, with a fl attening of the curve at higher ages or grades. Figure 3.4 is a typical developmental curve. Because the scales are ordinal and not based on equal interval units, scores on these scales should not be added or multiplied in any computation.
To interpret a developmental score (for example, a mental age), it is usually helpful to know the age of the person whose score is being interpreted. Knowing developmental age as well as chronological age (CA) allows us to judge an indi-vidual’s relative performance. Suppose that Ana earns a mental age (MA) of 120 months. If Ana is 8 years (96 months) old, her performance is above average. If she is 35 years old, however, it is below average. The relationship between developmental age and chronological age is often quantified as a developmental quotient. For example, a ratio IQ is
IQ = MA (in months) × 100 ÷ CA (in months)
All the problems that apply to developmental levels also apply to developmental quotients.
Percentile Family
Percentile ranks (percentiles) are derived scores that indicate the percentage of people whose scores are at or below a given raw score. Although percentiles are
Interpretation of Test Performance 41
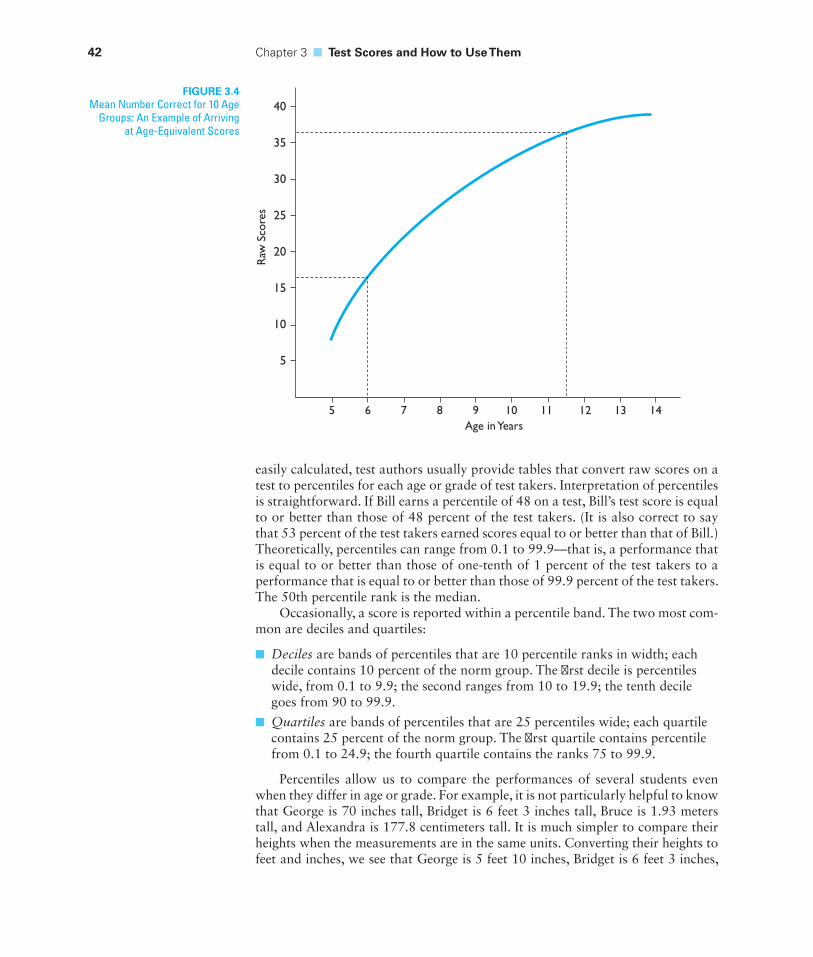
42 Chapter 3 ■ Test Scores and How to Use Them
easily calculated, test authors usually provide tables that convert raw scores on a test to percentiles for each age or grade of test takers. Interpretation of percentiles is straightforward. If Bill earns a percentile of 48 on a test, Bill’s test score is equal to or better than those of 48 percent of the test takers. (It is also correct to say that 53 percent of the test takers earned scores equal to or better than that of Bill.) Theoretically, percentiles can range from 0.1 to 99.9—that is, a performance that is equal to or better than those of one-tenth of 1 percent of the test takers to a performance that is equal to or better than those of 99.9 percent of the test takers. The 50th percentile rank is the median.
Occasionally, a score is reported within a percentile band. The two most com-mon are deciles and quartiles:
Deciles ■ are bands of percentiles that are 10 percentile ranks in width; each decile contains 10 percent of the norm group. The fi rst decile is percentiles wide, from 0.1 to 9.9; the second ranges from 10 to 19.9; the tenth decile goes from 90 to 99.9.
Quartiles ■ are bands of percentiles that are 25 percentiles wide; each quartile contains 25 percent of the norm group. The fi rst quartile contains percentile from 0.1 to 24.9; the fourth quartile contains the ranks 75 to 99.9.
Percentiles allow us to compare the performances of several students even when they differ in age or grade. For example, it is not particularly helpful to know that George is 70 inches tall, Bridget is 6 feet 3 inches tall, Bruce is 1.93 meters tall, and Alexandra is 177.8 centimeters tall. It is much simpler to compare their heights when the measurements are in the same units. Converting their heights to feet and inches, we see that George is 5 feet 10 inches, Bridget is 6 feet 3 inches,
FIGURE 3.4Mean Number Correct for 10 Age
Groups: An Example of Arriving at Age-Equivalent Scores
40
35
30
25
20
15
10
5
5 6 7 8 9 10 11 12 13 14
Raw
Sco
res
Age in Years
Bruce is 6 feet 4 inches, and Alexandra is 5 feet 10 inches. Percentiles put raw scores into comparable units. Similarly, it is not particularly helpful to know that George got 75 percent correct on the spelling portion of a group-administered test of achievement, 56 percent correct on the reading comprehension portion, and 63 percent on the mathematics portion. Without knowing how other students scored, such information offers little, if any, insight into George’s achievement. However, converting the percents correct into percentiles allows direct and easy comparison: 54th percentile in spelling, 47th percentile in reading comprehension, and 61st percentile in mathematics. The major disadvantage of percentiles is that they are not equal-interval scores. Therefore, they cannot be added together or subtracted from one another. Thus, it would be incorrect to say that George is 7 percentiles better in reading comprehension than in spelling, although it is correct to say that George did relatively better in spelling than in reading comprehension.
Standard Score Family
Standard scores are derived scores with a predetermined mean and standard deviation. The most basic standard score is the z distribution. In the distribution of z scores, the mean is always equal to 0.6 In the distribution of z scores, the stan-dard deviation is always equal to 1.7 Thus, regardless of the mean and standard deviation of the raw (obtained) scores, z scores transform those scores into a new distribution with a mean of 0 and a standard deviation of 1. Positive scores are above the mean; negative scores are below the mean. The larger the number, the more above or below the mean is the score. z scores are interpreted as being X number of standard deviations above or below the mean. When the distribution of scores is bell shaped or normal, we know the exact percentile that corresponds to a z score.
In assessment, it is customary to transform z scores into different standard scores with predetermined means and standard deviations. Four such scores are common in assessment: T scores, IQs, normal curve equivalents, and stanines.
A ■ T score is a standard score with a mean of 50 and a standard deviation of 10. A person earning a T score of 40 scored one standard deviation below the mean, whereas a person earning a T score of 60 scored one standard deviation above the mean.
IQs ■ are standard scores with a mean of 100 and a standard deviation of 15.8 A person earning an IQ of 85 scored one standard deviation below the mean, whereas a person earning an IQ of 115 scored one standard deviation above the mean.9
6This transformation is achieved by subtracting the mean of the obtained scores from each obtained score.7This transformation is achieved by dividing the difference between the obtained score less the mean of the obtained scores by the obtained standard deviation.8Some older tests have standard deviations that are 16 or another value.9When it was fi rst introduced, the IQ was defi ned as the ratio of mental age to chronological age, multiplied by 100. Statisticians soon found that MA has different variances and standard deviations at different chronological ages. Consequently, the same ratio IQ has different meanings at different ages—the same ratio IQ corresponds to different z scores and percentiles at different ages. To remedy this situation, scientist stopped using ratio IQs and began converting scores to standard scores.
Interpretation of Test Performance 43
44 Chapter 3 ■ Test Scores and How to Use Them
Normal curve equivalents ■ (NCEs) are standard scores with a mean equal to 50 and a standard deviation equal to 21.06. Although the standard deviation may at fi rst appear strange, this scale divides the normal curve into 100 equal intervals.
Stanines ■ (short for standard nines) are standard-score bands that divide a distribution into nine parts. The fi rst stanine includes all scores that are 1.75 standard deviations or more below the mean, and the ninth stanine includes all scores 1.75 or more standard deviations above the mean. The second through eighth stanines are each 0.5 standard deviation in width, with the fi fth stanine ranging from 0.25 standard deviations below the mean to 0.25 standard deviations above the mean.
Standard scores are frequently more difficult to interpret than percentile scores because the concepts of means and standard deviations are not widely understood by people without some statistical knowledge. Thus, standard scores may be more difficult for students and their parents to understand. Aside from this disadvantage, standard scores offer all the advantages of percentiles plus an additional advantage: Because standard scores are equal-interval, they can be combined (for example, added or averaged).10
Concluding Comments on Derived Scores
Test authors provide tables to convert raw scores into derived scores. Thus, test users do not have to calculate derived scores. Standard scores can be transformed into other standard scores readily; they can be converted to percentiles without conversion tables only when the distribution of scores is normal. In normal dis-tributions, the relationship between percentiles and standard scores is known. Figure 3.5 compares various standard scores and percentiles for normal distribu-tions. When the distribution of scores is not normal, conversion tables are necessary in order to convert percentiles to standard scores (or vice versa). These conversion tables are test specific, so only a test author can provide them. Moreover, conver-sion tables are always required in order to convert developmental scores to scores of relative standing, even when the distribution of test scores is normal. If the only derived score available for a test is an age equivalent, then there is no way for a test user to convert raw scores to percentiles. However, age or grade equivalents can be converted back to raw scores, which can be converted to standard scores if the raw score mean and standard deviation are provided.
10Standard scores also solve another subtle problem. When scores are combined in a total or compos-ite, the elements of that composite (for example, 18 scores from weekly spelling tests that are com-bined to obtain a semester average) do not count the same (that is, they do not carry the same weight) unless they have equal variances. Tests that have larger variances contribute more to the composite than tests with smaller variances. When each of the elements has been standardized into the same stan-dard scores (for example, when each of the weekly spelling tests has been standardized as z scores), the elements (that is, the weekly scores) will carry exactly the same weight when they are combined. Moreover, the only way a teacher can weight tests differentially is to standardize all the tests and then multiply by the weight. For example, if a teacher wished to count the second test as three times the fi rst test, the scores on both tests would have to be standardized, and the scores on the second test would then be multiplied by three before the scores were combined.
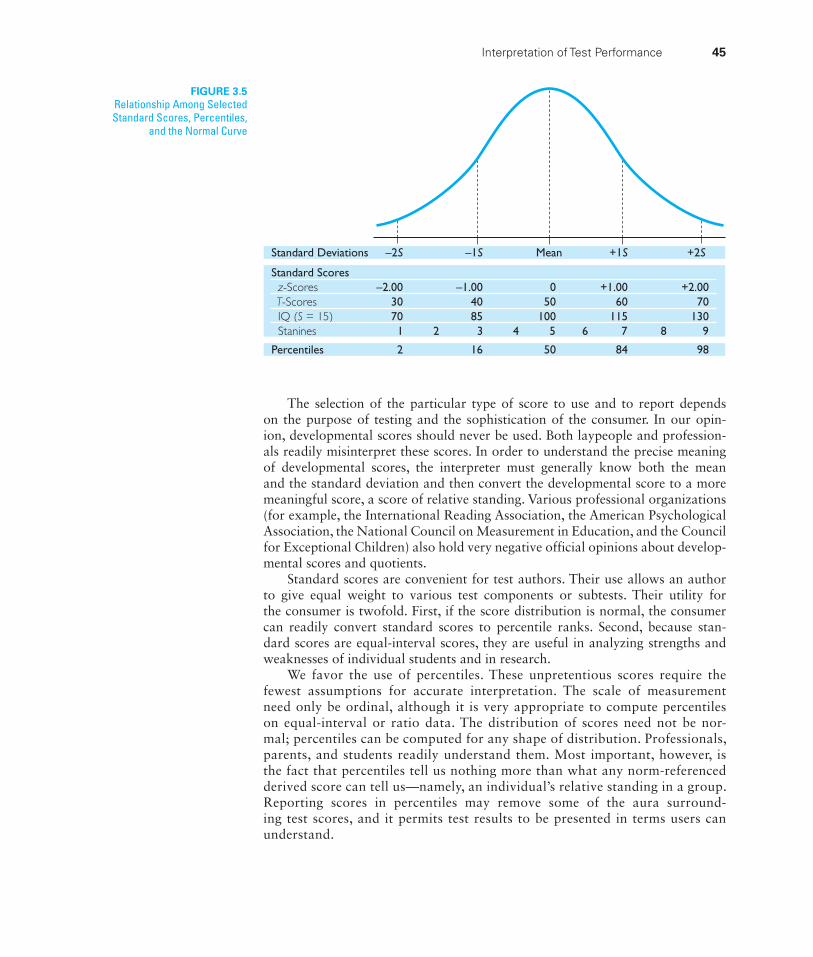
The selection of the particular type of score to use and to report depends on the purpose of testing and the sophistication of the consumer. In our opin-ion, developmental scores should never be used. Both laypeople and profession-als readily misinterpret these scores. In order to understand the precise meaning of developmental scores, the interpreter must generally know both the mean and the standard deviation and then convert the developmental score to a more meaningful score, a score of relative standing. Various professional organizations (for example, the International Reading Association, the American Psychological Association, the National Council on Measurement in Education, and the Council for Exceptional Children) also hold very negative official opinions about develop-mental scores and quotients.
Standard scores are convenient for test authors. Their use allows an author to give equal weight to various test components or subtests. Their utility for the consumer is twofold. First, if the score distribution is normal, the consumer can readily convert standard scores to percentile ranks. Second, because stan-dard scores are equal-interval scores, they are useful in analyzing strengths and weaknesses of individual students and in research.
We favor the use of percentiles. These unpretentious scores require the fewest assumptions for accurate interpretation. The scale of measurement need only be ordinal, although it is very appropriate to compute percentiles on equal-interval or ratio data. The distribution of scores need not be nor-mal; percentiles can be computed for any shape of distribution. Professionals, parents, and students readily understand them. Most important, however, is the fact that percentiles tell us nothing more than what any norm-referenced derived score can tell us—namely, an individual’s relative standing in a group. Reporting scores in percentiles may remove some of the aura surround-ing test scores, and it permits test results to be presented in terms users can understand.
FIGURE 3.5Relationship Among Selected Standard Scores, Percentiles,
and the Normal Curve
Interpretation of Test Performance 45
Standard Deviations –2S –1S Mean +1S +2S
Standard Scores z-Scores –2.00 –1.00 0 +1.00 +2.00 T-Scores 30 40 50 60 70 IQ (S = 15) 70 85 100 115 130Stanines 1 2 3 4 5 6 7 8 9
Percentiles 2 16 50 84 98
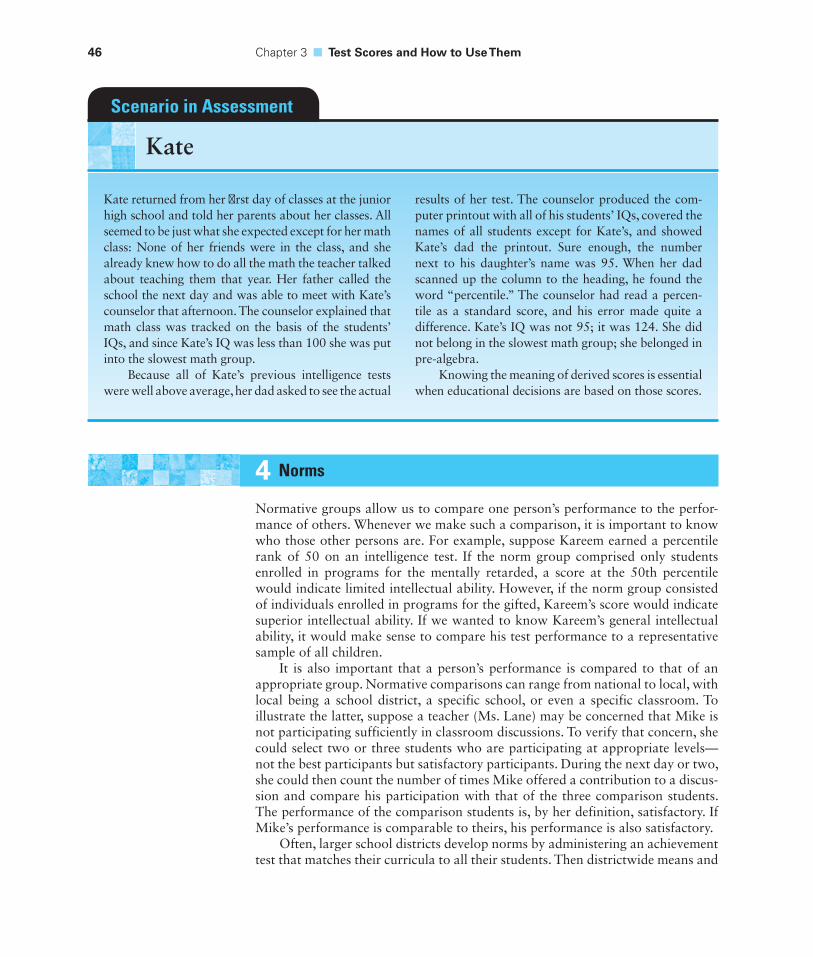
46 Chapter 3 ■ Test Scores and How to Use Them
4 Norms
Normative groups allow us to compare one person’s performance to the perfor-mance of others. Whenever we make such a comparison, it is important to know who those other persons are. For example, suppose Kareem earned a percentile rank of 50 on an intelligence test. If the norm group comprised only students enrolled in programs for the mentally retarded, a score at the 50th percentile would indicate limited intellectual ability. However, if the norm group consisted of individuals enrolled in programs for the gifted, Kareem’s score would indicate superior intellectual ability. If we wanted to know Kareem’s general intellectual ability, it would make sense to compare his test performance to a representative sample of all children.
It is also important that a person’s performance is compared to that of an appropriate group. Normative comparisons can range from national to local, with local being a school district, a specific school, or even a specific classroom. To illustrate the latter, suppose a teacher (Ms. Lane) may be concerned that Mike is not participating sufficiently in classroom discussions. To verify that concern, she could select two or three students who are participating at appropriate levels—not the best participants but satisfactory participants. During the next day or two, she could then count the number of times Mike offered a contribution to a discus-sion and compare his participation with that of the three comparison students. The performance of the comparison students is, by her definition, satisfactory. If Mike’s performance is comparable to theirs, his performance is also satisfactory.
Often, larger school districts develop norms by administering an achievement test that matches their curricula to all their students. Then districtwide means and
Kate returned from her fi rst day of classes at the junior high school and told her parents about her classes. All seemed to be just what she expected except for her math class: None of her friends were in the class, and she already knew how to do all the math the teacher talked about teaching them that year. Her father called the school the next day and was able to meet with Kate’s counselor that afternoon. The counselor explained that math class was tracked on the basis of the students’ IQs, and since Kate’s IQ was less than 100 she was put into the slowest math group.
Because all of Kate’s previous intelligence tests were well above average, her dad asked to see the actual
results of her test. The counselor produced the com-puter printout with all of his students’ IQs, covered the names of all students except for Kate’s, and showed Kate’s dad the printout. Sure enough, the number next to his daughter’s name was 95. When her dad scanned up the column to the heading, he found the word “percentile.” The counselor had read a percen-tile as a standard score, and his error made quite a difference. Kate’s IQ was not 95; it was 124. She did not belong in the slowest math group; she belonged in pre-algebra.
Knowing the meaning of derived scores is essential when educational decisions are based on those scores.
Scenario in Assessment
Kate
standard deviations can be used to convert individual scores to standard scores. This information allows two useful comparisons. First, the achievement of indi-vidual students can be compared to that of other students in the district in order to identify students in need of additional services, either remedial or enriching. Second, standard scores averaged by school allow school-by-school comparisons that can identify schools in which achievement is generally a problem. Whole states do essentially the same thing to evaluate the educational attainment by school districts.
Unlike local norms where an entire population of students is tested, national norms always involve sampling, and it is essential that we know the characteristics and abilities of the people sampled. Obviously, the accuracy and meaningfulness of a derived score for one student is inextricably tied to the characteristics of the norm sample. Thus, “it is important that the reference populations be carefully and clearly described” (American Educational Research Association [AERA], American Psychological Association, & National Council on Measurement in Education, 1999, p. 51).11 This description is absolutely essential for test users to judge if a test taker can be reasonably compared to the individuals within the norm sample. Representativeness hinges on two questions: (1) Does the norm sample contain individuals with relevant characteristics and experiences? and (2) Are the characteristics and experiences present in the sample in the same pro-portion as they are in the population of reference?12
Important CharacteristicsWhat makes a characteristic relevant depends on the construct being measured. Some characteristics have a clear logical and empirical relationship to a person’s development and are important for any psychoeducational construct.
Gender
Some differences between males and females may be relevant in understanding a stu-dent’s test score. For example, girls tend to physically develop faster than boys during the first year or two, and many more boys have delayed maturation than do girls dur-ing the preschool and primary school years. After puberty, men tend to be bigger and stronger than women. In addition to physical differences, gender role expectations may differ and systematically limit the types of activities in which a child participates because of modeling, peer pressure, or the responses of significant adults.
Nevertheless, on most psychological and educational tests, gender differ-ences are small, and the distributions of scores of males and females tend to overlap considerably. When gender differences are minor, norm groups clearly should contain the appropriate proportions of males (approximately 48 percent) and females (approximately 52 percent)—the proportion found in the general U.S. population. However, when gender differences are substantial, the correct course of action depends on the purpose of the normative comparison. If a test
11In practice, it is also impossible to test the entire population because the membership of the popula-tion is constantly changing. Fortunately, the characteristics of a population can be accurately esti-mated from the characteristics of a representative sample.12Characteristics expressed by less than 1 or 2 percent of the population may not be represented accurately.
Norms 47
48 Chapter 3 ■ Test Scores and How to Use Them
is intended to identify students with developmental lags and if gender differences are pronounced, it is better to have separate norms for males and females. For example, if 3-year-old Aaron earns a percentile of 45 on a developmental test that has both boys and girls in the norms, his score indicates that his development is slightly behind that of other children. However, he may actually be doing well for a boy at that age. On the other hand, if the purpose is to identify the students with the best background for advanced placement in a subject where there are gender differences, it is probably better to have a single norm sample composed of males and females.
Age
Chronological age is an important consideration for developmental skills and abilities. Norms for tests of ability compare the performances of individuals of essentially the same age. It would make no sense to compare the running perfor-mance of a 2-year-old to that of a 4-year-old.
We have known for more than 40 years that different psychological abilities develop at different rates.13 When an ability or skill is developing rapidly (for exam-ple, locomotion in infants and toddlers), the age range of the norm group must be much less than 1 year. Thus, on scales used to assess infants and young chil-dren, we often see norms in 3-month ranges. For children of school age, differences of less than a few months are usually unimportant. Thus, we typically see norms in 6-month and 12-month ranges. After an ability has matured, there may be no meaningful differences over several years. As a result, we often see norms in 10-year ranges on adult scales. Therefore, although 1-year norms are most common, devel-opmental theory and research can suggest norms of lesser or greater age ranges.
Grade in School
All achievement tests should measure learned facts and concepts that have been taught in school. The more grades completed by students (that is, the more schooling), the more they should have been taught. Thus, the most useful norm comparisons are usu-ally made to students of the same grade, regardless of their ages.14 It is also important to note that students of different ages are present in most grades; for example, some 7-year-old children may not be enrolled in school, some may be in kindergarten, some in first grade, some in second grade, and some even in third grade.
Acculturation of Parents
Acculturation is an imprecise concept that refers to an understanding of the lan-guage (including conventions and pragmatics), history, values, and social conven-tions of society at large. Nowhere are the complexities of acculturation more readily illustrated than in the area of language. Acculturation requires people to know more than standard American English; they must also know the appropriate contexts for various words and idioms, appropriate volume and distance between speaker and listener, appropriate posture to indicate respect, and so forth.
13See, for example, Guilford (1967, pp. 417–426).14In situations in which students are not grouped by grade, it may be necessary to use age comparisons.
Because acculturation is a broad and somewhat diffuse construct, it is difficult to define or measure precisely. Typically, test authors use the educational or occupa-tional attainment (socioeconomic status) of the parents as a general indication of the level of acculturation of the home. The socioeconomic status of a student’s parents is strongly related to that student’s scores on all sorts of tests—intelligence, achieve-ment, adaptive behavior, social functioning, and so forth. The children of middle- and upper-class parents have tended to score higher on such tests (see Gottesman, 1968; Herrnstein & Murray, 1994). Whatever the reasons for class differences in child development, norm samples certainly must include all segments of society (in the same proportion as in the general population) in order to be representative.
Race and Cultural Identity
Race and culture are particularly relevant to our discussion of norms for two reasons. First, the scientific and educational communities have often been insen-sitive and occasionally blatantly racist and classist. Second, differences in tested achievement and ability persist among races and cultural groups, although these differences continue to narrow.15 Inclusion of individuals of all racial, cultural, and socioeconomic groups is important for two reasons. First, to the extent that individuals of different groups undergo cultural experiences that differ even within a given social class and geographic region, norm samples that exclude (or underrepresent) one group are unrepresentative of the total population. Second, if individuals from various groups are excluded from field tests of test items, vari-ous statistics used in test development may be inaccurate,16 and the test’s scaling may be in error.
Geography
There are systematic differences in the attainment of individuals living in dif-ferent geographic regions of the United States, and various psychoeducational tests reflect these regional differences. Most consistently, the average scores of individuals living in the southeastern United States (excluding Florida) are often lower than the average scores of individuals living in other regions of the country. Moreover, community size, population density, and changes in population have also been related to academic and intellectual development.
There are several seemingly logical explanations for many of these relation-ships. For example, educational attainment is related to educational expenditures, and there are regional differences in the financial support of public education. Well-educated young adults tend to move away from communities with limited employ-ment and cultural opportunities. When brighter and better educated individuals leave a community, the average intellectual ability and educational attainment in that community decline, and the average ability and attainment of the communi-ties to which the brighter individuals move increase. Regardless of the reasons for geographical differences, test norms should include individuals from all geographic regions, as well as from urban, suburban, and rural communities.
15We also note that perhaps as much as 90 percent of observed racial and cultural differences can be attributed to socioeconomic differences.16For example, item diffi culty estimates (p values) and various item-total correlations.
Norms 49
50 Chapter 3 ■ Test Scores and How to Use Them
Intelligence
A representative sample of individuals in terms of their level of intellectual func-tioning is essential for standardizing an intelligence test and most other kinds of tests, including tests of achievement, linguistic or psycholinguistic ability, percep-tual skills, and perceptual–motor skills. In the development of norms, it is essen-tial to test the full range of intellectual ability. Limiting the sample to students enrolled in and attending school (usually general education classes) restricts the norms. Failure to consider individuals with mental retardation in standardiza-tion procedures introduces systematic bias into test norms by underestimating the population mean and standard deviation.
Proportional RepresentationImplicit in the preceding discussion of characteristics of people in a representa-tive normative sample is the idea that various kinds of people should be included in the sample in the same proportion as they occur in the general population. No matter how test norms are constructed, test authors should systematically compare the relevant characteristics of the population and their standardization samples. Although we frequently use the singular (that is, norm sample or group) when discussing norms, it is important to understand that tests have multiple normative samples. For example, an achievement test intended for use with stu-dents in kindergarten through twelfth grade has 13 norm groups (1 for each grade). If that achievement test has separate norms for males and females at each grade, then there are 26 norm groups. When we test a second-grade boy, we do not compare his performance with the performances of all students in the total norm sample. Rather, we compare the boy’s performance with that of other sec-ond graders (or of other second-grade boys if there are separate norms for boys and girls). Thus, the preceding discussions of representatives and the number of subjects apply to each specific comparison group within the norms—not to the aggregated or combined samples. Representativeness should be demonstrated for each comparison group.
Number of SubjectsThe number of participants in a norm sample is important for several reasons. First, the number of subjects should be large enough to guarantee stability. If a sample is very small, another group of participants might have a different mean and standard deviation. Second, the number of participants should be large enough to represent infrequent characteristics. For example, if approximately 1 percent of the population is Native American, a sample of 25 or 50 people will be unlikely to contain even 1 Native American. Third, there should be enough subjects so that there can be a full range of derived scores. In practice, 100 participants in each age or grade is considered the minimum.
Age of NormsFor a norm sample to be representative, it must represent the current population. Levels of skill and ability change over time. Skilled athletes of today run faster,
jump higher, and are stronger than the best athletes of a generation ago. Some of the improvement can be attributed to better training, but some can also be attributed to better nutrition and societal changes. Similarly, intellectual and educational per-formances have increased from generation to generation, although these increases are neither steady nor linear.
For example, on norm-referenced achievement tests, considerably more than half the students score above the average after the test has been in use 5–7 years.17 In such cases, the test norms are clearly dated because only half the population can ever be above the median. Although some increase in tested achievement can be attributed to teacher familiarity with test content, there is little doubt that some of the changes represent real improvement in achievement.
The important point is that old norms tend to estimate a student’s relative standing in the population erroneously because the old norms are too easy. The point at which norms become outdated will depend in part on the ability or skill being assessed. With this caution, it seems to us that approximately 15 years is the maximum useful life for norm samples used in ability testing; 7 years appears to be the maximum for norm life for achievement tests. Although test publishers should ensure that up-to-date norms are readily available, test users ultimately are responsible for avoiding the inappropriate use of out-of-date norms (AERA et al., 1999, p. 59).
Relevance of NormsNorms must provide comparisons that are relevant to the purpose of assess-ment. National norms are the most appropriate if we are interested in knowing how a particular student is developing intellectually, perceptually, linguistically, or physically. Norms developed on a particular portion of the population may be meaningful in special circumstances. Local norms can be useful in ascertain-ing the degree to which individual students have profited from their schooling in the local school district as well as in retrospective interpretations of a stu-dent’s performance. Norms based on particular groups may be more relevant than those based on the population as a whole. For example, the American Association on Mental Retardation’s Adaptive Behavior Scale was standardized on individuals who were mentally retarded; aptitude tests are often standardized on individuals in specific trades or professions. The utility of special population norms is similar to the utility of local norms: They are likely to be more useful in retrospective comparisons than in future predictions because unless we know how the special population corresponds to the general population, predictions may not be appropriate. In addition, “norms that are presented should refer to clearly described groups. These groups should be the ones with whom users of the test will ordinarily wish to compare the people who are tested” (AERA et al., 1997, p. 33).
17See, for example, Linn, Graue, and Sanders (1990).
Norms 51
52 Chapter 3 ■ Test Scores and How to Use Them
CHAPTER COMPREHENSION QUESTIONSWrite your answers to each of the following questions, and then compare your responses to the text.
1. Compare and contrast the two scales of measurement most commonly used in educational and psychological measurement.
2. Explain the following terms: mean, median, mode, variance, skew, and correlation coeffi cient.
3. Explain the statistical meaning of the following scores: percentile, z score, IQ, NCE, age equivalent, and grade equivalent.
4. Why is the acculturation of the parents of students in normative samples important?
53
4 Technical Adequacy
2Understand the general concept
of validity, how tests are validated, factors affecting general reliability, and responsibility for valid assessment.
1Understand the basic concept of
reliability, including error in measurement, reliability coeffi cients, standard error of measurement, estimated true scores, and confi dence intervals.
Chapter Goals
Key Terms measurement error
reliability coeffi cient
item reliability
alternate form reliability
internal consistency
stability
interobserver agreement
simple agreement
point-to-point agreement
standard error of measurement
estimated true scores
confi dence intervals
validity
content validity
concurrent criterion-related validity
predictive criterion-related validity
construct validity
systematic bias
54 Chapter 4 ■ Technical Adequacy
1 Reliability
None of us would consider having heart surgery on the basis of a diagnostic test known for its inaccuracy. Although educational decisions are not this dramatic, every day school personnel select, create, and use assessment pro-cedures that lead to educational decisions. Accurate evaluation results lead to good decision making, whereas inaccurate results cannot. To illustrate, suppose you learn that other teachers would count as correct test responses that you have marked incorrect, that students earned good grades on their weekly spelling tests but made numerous errors in their written work, and that students who were earning A’s in reading were scoring at the 30th percentile on standardized reading tests. What do these things suggest about the accuracy of your assessments? What do they suggest about the decisions based on these assessments?
When we test students, we want to get accurate information that is unlikely to be misinterpreted. The very nature of schooling presumes students will generalize what they have learned to situations and contexts outside of the school and after gradua-tion. Except for school-specific rules (for example, no running in the halls), nothing a student learns in school would have any value unless it generalized to life outside of school. When we test students or otherwise observe their performances, we always want to be able to generalize what we observe in a variety of ways. Moreover, we want those generalizations to be accurate—to be reliable. We also want to draw con-clusions about their performances, and we want those conclusions to be correct.
Error in MeasurementIn educational and psychological measurement, there are two types of error. Systematic or predictable error (also called bias) is error that affects a person’s (or group’s) score in one direction. Bias inflates people’s measured abilities above their true abilities. For example, suppose a teacher used only multiple-choice tests with a class of boys and girls. Since boys, as a group, tend to do better on this type of test, the boys’ abilities may be somewhat overestimated due to the way their knowledge was measured. Bias can also deflate people’s measured abilities above their true abilities. The girls’ abilities may be somewhat underestimated due to the use of multiple-choice tests that tested their knowledge; they may well have scored higher on an essay examination. The other type of error is random error; its direction and magnitude cannot be known for an individual test taker. This type of error can just as easily raise as lower estimates of student’s ability or knowledge. Reliability refers to the relative absence of random error present during measurement.
The Reliability Coeffi cientThe reliability coefficient is a special use of a correlation coefficient. The symbol for a correlation coefficient (r) is used with two identical subscripts (for example, rxx or raa) to indicate a reliability coefficient. The reliability coefficient indicates the proportion of variability in a set of scores that reflects true differences among individuals. If there is relatively little error, the ratio of true-score variance to obtained-score variance approaches a reliability index of 1.00 (perfect reliability); if there is a relatively large amount of error, the ratio of true-score variance to obtained-score variance approaches .00 (total unreliability). Thus, a test with a
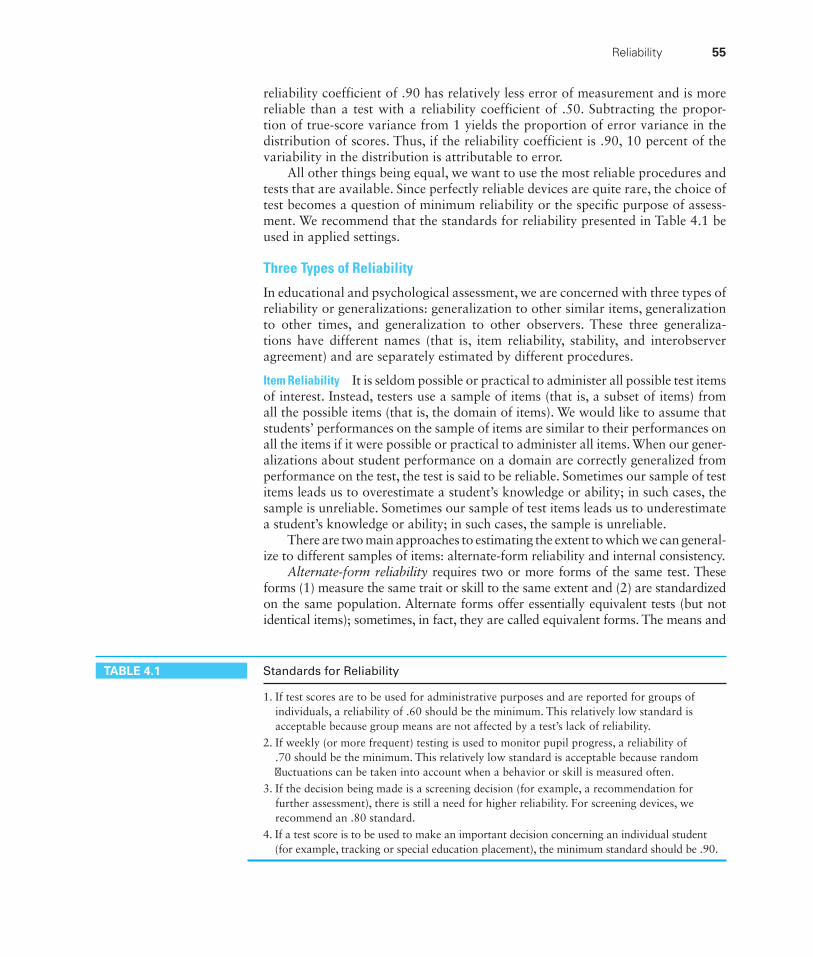
reliability coefficient of .90 has relatively less error of measurement and is more reliable than a test with a reliability coefficient of .50. Subtracting the propor-tion of true-score variance from 1 yields the proportion of error variance in the distribution of scores. Thus, if the reliability coefficient is .90, 10 percent of the variability in the distribution is attributable to error.
All other things being equal, we want to use the most reliable procedures and tests that are available. Since perfectly reliable devices are quite rare, the choice of test becomes a question of minimum reliability or the specific purpose of assess-ment. We recommend that the standards for reliability presented in Table 4.1 be used in applied settings.
Three Types of Reliability
In educational and psychological assessment, we are concerned with three types of reliability or generalizations: generalization to other similar items, generalization to other times, and generalization to other observers. These three generaliza-tions have different names (that is, item reliability, stability, and interobserver agreement) and are separately estimated by different procedures.
Item Reliability It is seldom possible or practical to administer all possible test items of interest. Instead, testers use a sample of items (that is, a subset of items) from all the possible items (that is, the domain of items). We would like to assume that students’ performances on the sample of items are similar to their performances on all the items if it were possible or practical to administer all items. When our gener-alizations about student performance on a domain are correctly generalized from performance on the test, the test is said to be reliable. Sometimes our sample of test items leads us to overestimate a student’s knowledge or ability; in such cases, the sample is unreliable. Sometimes our sample of test items leads us to underestimate a student’s knowledge or ability; in such cases, the sample is unreliable.
There are two main approaches to estimating the extent to which we can general-ize to different samples of items: alternate-form reliability and internal consistency.
Alternate-form reliability requires two or more forms of the same test. These forms (1) measure the same trait or skill to the same extent and (2) are standardized on the same population. Alternate forms offer essentially equivalent tests (but not identical items); sometimes, in fact, they are called equivalent forms. The means and
TABLE 4.1 Standards for Reliability
1. If test scores are to be used for administrative purposes and are reported for groups of individuals, a reliability of .60 should be the minimum. This relatively low standard is acceptable because group means are not affected by a test’s lack of reliability.
2. If weekly (or more frequent) testing is used to monitor pupil progress, a reliability of .70 should be the minimum. This relatively low standard is acceptable because random fl uctuations can be taken into account when a behavior or skill is measured often.
3. If the decision being made is a screening decision (for example, a recommendation for further assessment), there is still a need for higher reliability. For screening devices, we recommend an .80 standard.
4. If a test score is to be used to make an important decision concerning an individual student (for example, tracking or special education placement), the minimum standard should be .90.
Reliability 55
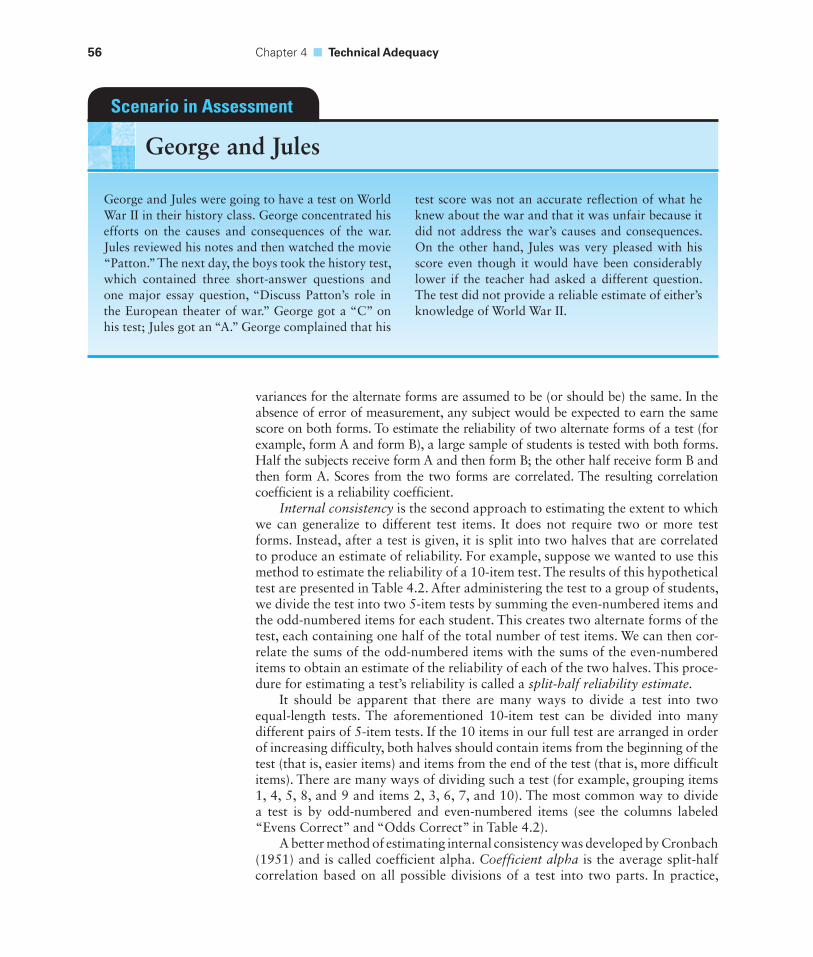
56 Chapter 4 ■ Technical Adequacy
George and Jules were going to have a test on World War II in their history class. George concentrated his efforts on the causes and consequences of the war. Jules reviewed his notes and then watched the movie “Patton.” The next day, the boys took the history test, which contained three short-answer questions and one major essay question, “Discuss Patton’s role in the European theater of war.” George got a “C” on his test; Jules got an “A.” George complained that his
test score was not an accurate reflection of what he knew about the war and that it was unfair because it did not address the war’s causes and consequences. On the other hand, Jules was very pleased with his score even though it would have been considerably lower if the teacher had asked a different question. The test did not provide a reliable estimate of either’s knowledge of World War II.
Scenario in Assessment
George and Jules
variances for the alternate forms are assumed to be (or should be) the same. In the absence of error of measurement, any subject would be expected to earn the same score on both forms. To estimate the reliability of two alternate forms of a test (for example, form A and form B), a large sample of students is tested with both forms. Half the subjects receive form A and then form B; the other half receive form B and then form A. Scores from the two forms are correlated. The resulting correlation coefficient is a reliability coefficient.
Internal consistency is the second approach to estimating the extent to which we can generalize to different test items. It does not require two or more test forms. Instead, after a test is given, it is split into two halves that are correlated to produce an estimate of reliability. For example, suppose we wanted to use this method to estimate the reliability of a 10-item test. The results of this hypothetical test are presented in Table 4.2. After administering the test to a group of students, we divide the test into two 5-item tests by summing the even-numbered items and the odd-numbered items for each student. This creates two alternate forms of the test, each containing one half of the total number of test items. We can then cor-relate the sums of the odd-numbered items with the sums of the even-numbered items to obtain an estimate of the reliability of each of the two halves. This proce-dure for estimating a test’s reliability is called a split-half reliability estimate.
It should be apparent that there are many ways to divide a test into two equal-length tests. The aforementioned 10-item test can be divided into many different pairs of 5-item tests. If the 10 items in our full test are arranged in order of increasing difficulty, both halves should contain items from the beginning of the test (that is, easier items) and items from the end of the test (that is, more difficult items). There are many ways of dividing such a test (for example, grouping items 1, 4, 5, 8, and 9 and items 2, 3, 6, 7, and 10). The most common way to divide a test is by odd-numbered and even-numbered items (see the columns labeled “Evens Correct” and “Odds Correct” in Table 4.2).
A better method of estimating internal consistency was developed by Cronbach (1951) and is called coefficient alpha. Coefficient alpha is the average split-half correlation based on all possible divisions of a test into two parts. In practice,
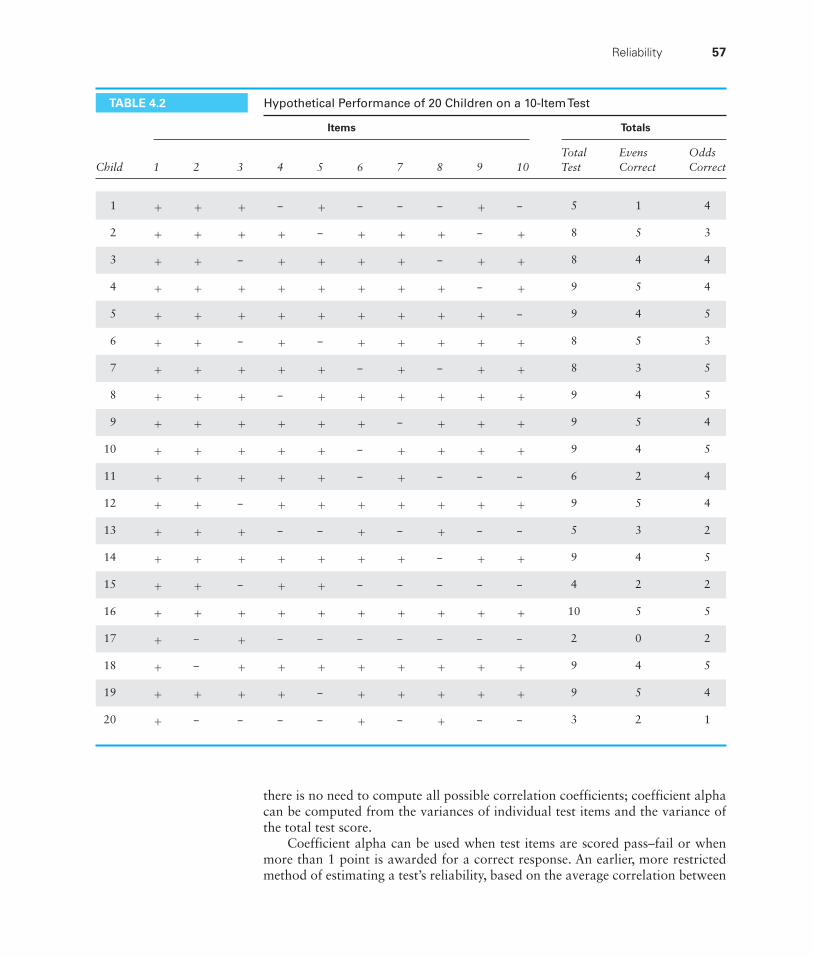
TABLE 4.2 Hypothetical Performance of 20 Children on a 10-Item Test
Items Totals
Child 1 2 3 4 5 6 7 8 9 10Total Test
Evens Correct
Odds Correct
1 + + + − + − − − + − 5 1 4
2 + + + + − + + + − + 8 5 3
3 + + − + + + + − + + 8 4 4
4 + + + + + + + + − + 9 5 4
5 + + + + + + + + + − 9 4 5
6 + + − + − + + + + + 8 5 3
7 + + + + + − + − + + 8 3 5
8 + + + − + + + + + + 9 4 5
9 + + + + + + − + + + 9 5 4
10 + + + + + − + + + + 9 4 5
11 + + + + + − + − − − 6 2 4
12 + + − + + + + + + + 9 5 4
13 + + + − − + − + − − 5 3 2
14 + + + + + + + − + + 9 4 5
15 + + − + + − − − − − 4 2 2
16 + + + + + + + + + + 10 5 5
17 + − + − − − − − − − 2 0 2
18 + − + + + + + + + + 9 4 5
19 + + + + − + + + + + 9 5 4
20 + − − − − + − + − − 3 2 1
there is no need to compute all possible correlation coefficients; coefficient alpha can be computed from the variances of individual test items and the variance of the total test score.
Coefficient alpha can be used when test items are scored pass–fail or when more than 1 point is awarded for a correct response. An earlier, more restricted method of estimating a test’s reliability, based on the average correlation between
Reliability 57
58 Chapter 4 ■ Technical Adequacy
all possible split halves, was developed by Kuder and Richardson. This procedure, called KR-20, is coefficient alpha for dichotomously scored test items (that is, items that can be scored only right or wrong).
Stability When students have learned information and behavior, we want to be confi dent that students can access that information and demonstrate those behaviors at times other than when they are assessed. We would like to be able to generalize today’s test results to other times in the future. Educators are interested in many human traits and characteristics that, theoretically, change very little over time. For example, children diagnosed as colorblind at age 5 years are expected to be diagnosed as colorblind at any time in their lives. Colorblindness is an inher-ited trait that cannot be corrected. Consequently, the trait should be perfectly stable. When an assessment identifi es a student as colorblind on one occasion and not colorblind on a later occasion, the assessment is unreliable.
Other traits are developmental. For example, people’s heights will increase from birth through adulthood. The increases are relatively slow and predictable. Consequently, we would not expect many changes in height over a 2-week period. Radical changes in people’s heights (especially decreases) over short periods of time would cause us to question the reliability of the measurement device. Most educational and psychological characteristics are conceptualized much as height is conceptualized. For example, we expect reading achievement to increase with length of schooling but to be relatively stable over short periods of time, such as 2 weeks. Devices used to assess traits and characteristics must produce sufficiently consistent and stable results if those results are to have practical meaning for making educational decisions. When our generalizations about student perfor-mance on a domain are correctly generalized from one time to another, the test is said to be stable or have test–retest reliability. Obviously, the notion of stability excludes changes that occur as the result of systematic interventions to change the behavior. Thus, if a test indicates that a student does not know the long vowel sounds and we teach those sounds to the student, the change in the student’s test performance would not be considered a lack of reliability.
The procedure for obtaining a stability coefficient is straightforward. A large number of students are tested and then retested after a short period of time (pref-erably 2 weeks later). The students’ scores from the two administrations are then correlated, and the obtained correlation coefficient is the stability coefficient.
Interobserver Agreement We would like to assume that if any other comparably qualifi ed examiner were to give the test, the results would be the same—we would like to be able to generalize to similar testers. Suppose Ms. Amig listened to her students say the letters of the alphabet. It would not be very useful if she assigned Barney a score of 70 percent correct, whereas another teacher (or education professional) who listened to Barney awarded a score of 50 percent correct or 90 percent correct for the same performance. When our scoring or other obser-vations agree with those of comparably trained observers who observe the same phenomena at the same time, the observations are said to have interobserver reliability or agreement.1 Ms. Amig would like to assume that any other education professional would score her students’ responses in the same way.
1Agreement among observers has several different names. Observers can be referred to as testers, scorers, or raters; it depends on the nature of their actions. Agreement can also be called reliability.
There are two very different approaches to estimating the extent to which we can generalize to different scorers: a correlational approach and a percentage of agreement approach. The correlational approach is similar to estimating reliability with alternate forms, which was previously discussed. Two testers score a set of tests independently. Scores obtained by each tester for the set are then correlated. The resulting correlation coefficient is a reliability coefficient for scorers.
Percentage of agreement is more common in classrooms and applied behavioral analysis. Instead of the correlation between two scorers’ ratings, a percentage of agreement between raters is computed. There are four ways of calculating percent agreement. The first two types of agreement we discuss are the most common, but the last two are more common in research publications.
Simple agreement is calculated by dividing the smaller number of occurrences by the larger number of occurrences and multiplying the quotient by 100. For example, suppose Ms. Amig and her teacher’s aide, Ms. Carter, observe Sam on 20 occasions to determine how frequently he is on task during reading instruc-tion. The results of their observations are shown in Table 4.3. Ms. Amig observes 12 occasions when Sam is on task, whereas Ms. Carter observes 10 occasions. Simple agreement is 83 percent; that is, 100 × (10/12).
The second type of percent agreement, point-to-point agreement, is a more precise way of computing percentage of agreement because each data point is considered. Point-to-point agreement is calculated by dividing the number of observations for which both observers agree (occurrence and nonoccurrence) by the total number of observations and multiplying the quotient by 100. Using data shown in Table 4.3, there are 14 occasions when Ms. Amig’s and Ms. Carter’s obser-vations agree. Point-to-point agreement is 70 percent; that is, 100 × (14/20).
The two other indices of percent agreement are agreement for occurrence and kappa. Explanations of these indices and their calculation are available in the download material.
Concluding Comments About the Reliability Coeffi cient
Generalization to other items, times, and observers are independent of each other. Therefore, each index of reliability provides information about only a part of the error associated with measurement.
In school settings, item reliability is not a problem when we test students on the entire domain (for example, naming all upper and lower case letters of the alpha-bet). Item reliability should be estimated when we test students on a sample of items from the domain (for example, a 20-item test on multiplication facts that is used to infer master on all facts). Interscorer reliability is usually not a problem when our assessments are objective and our criteria for a correct response clear (for example, a multiple-choice test). Interscorer reliability should be assessed whenever subjective or qualitative criteria are used to score student responses (for example, using a scor-ing rubric to assess the quality of written responses). When students are assessed frequently with interchangeable tests or probes, stability is usually assessed directly prior to intervention by administering tests on 3 or more days until the student’s performance has stabilized.2 If a test is given once, its stability should be estimated, although in practice teachers seldom estimate the stability of their tests.
2The period during which students are assessed prior to observation is generally called the baseline.
Reliability 59
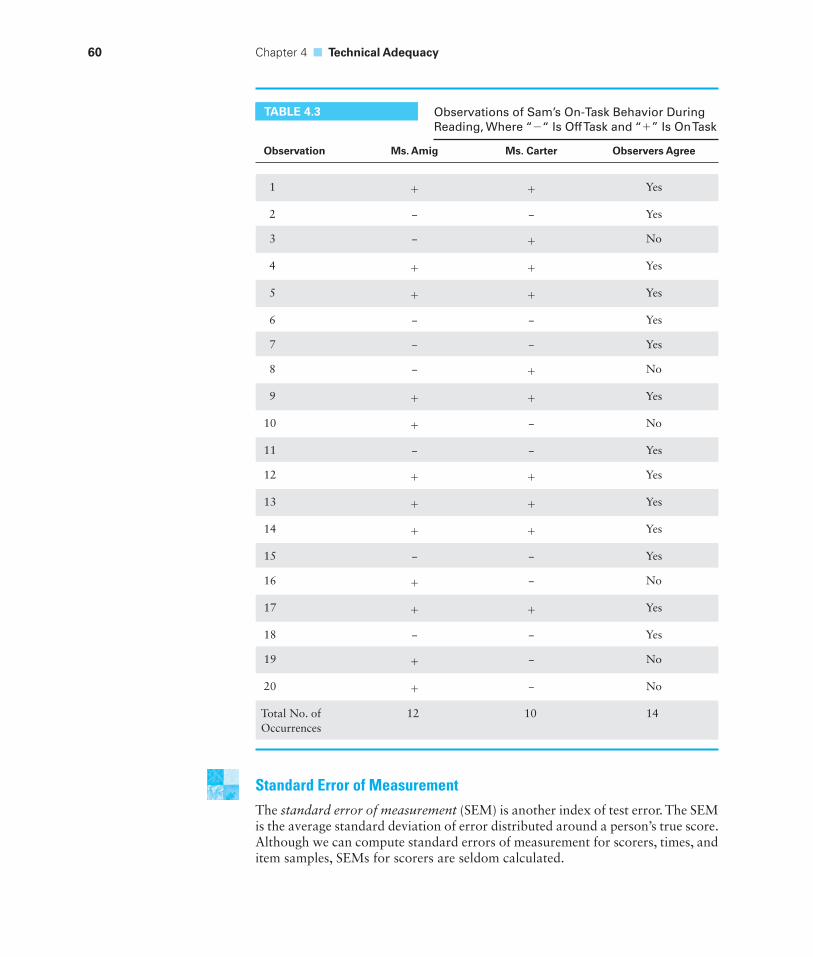
60 Chapter 4 ■ Technical Adequacy
Standard Error of MeasurementThe standard error of measurement (SEM) is another index of test error. The SEM is the average standard deviation of error distributed around a person’s true score. Although we can compute standard errors of measurement for scorers, times, and item samples, SEMs for scorers are seldom calculated.
TABLE 4.3 Observations of Sam’s On-Task Behavior During Reading, Where “−“ Is Off Task and “+” Is On Task
Observation Ms. Amig Ms. Carter Observers Agree
1 + + Yes
2 − − Yes
3 − + No
4 + + Yes
5 + + Yes
6 − − Yes
7 − − Yes
8 − + No
9 + + Yes
10 + − No
11 − − Yes
12 + + Yes
13 + + Yes
14 + + Yes
15 − − Yes
16 + − No
17 + + Yes
18 − − Yes
19 + − No
20 + − No
Total No. of Occurrences
12 10 14
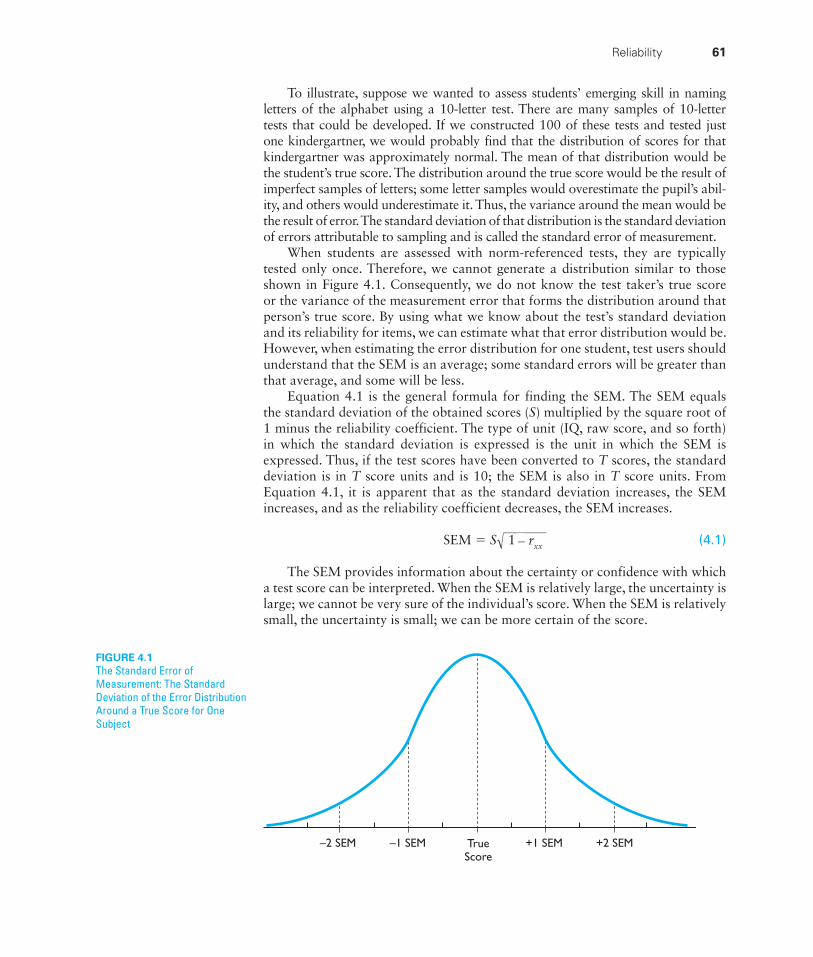
To illustrate, suppose we wanted to assess students’ emerging skill in naming letters of the alphabet using a 10-letter test. There are many samples of 10-letter tests that could be developed. If we constructed 100 of these tests and tested just one kindergartner, we would probably find that the distribution of scores for that kindergartner was approximately normal. The mean of that distribution would be the student’s true score. The distribution around the true score would be the result of imperfect samples of letters; some letter samples would overestimate the pupil’s abil-ity, and others would underestimate it. Thus, the variance around the mean would be the result of error. The standard deviation of that distribution is the standard deviation of errors attributable to sampling and is called the standard error of measurement.
When students are assessed with norm-referenced tests, they are typically tested only once. Therefore, we cannot generate a distribution similar to those shown in Figure 4.1. Consequently, we do not know the test taker’s true score or the variance of the measurement error that forms the distribution around that person’s true score. By using what we know about the test’s standard deviation and its reliability for items, we can estimate what that error distribution would be. However, when estimating the error distribution for one student, test users should understand that the SEM is an average; some standard errors will be greater than that average, and some will be less.
Equation 4.1 is the general formula for finding the SEM. The SEM equals the standard deviation of the obtained scores (S) multiplied by the square root of 1 minus the reliability coefficient. The type of unit (IQ, raw score, and so forth) in which the standard deviation is expressed is the unit in which the SEM is expressed. Thus, if the test scores have been converted to T scores, the standard deviation is in T score units and is 10; the SEM is also in T score units. From Equation 4.1, it is apparent that as the standard deviation increases, the SEM increases, and as the reliability coefficient decreases, the SEM increases.
SEM = S √_______
1 − r xx (4.1)
The SEM provides information about the certainty or confidence with which a test score can be interpreted. When the SEM is relatively large, the uncertainty is large; we cannot be very sure of the individual’s score. When the SEM is relatively small, the uncertainty is small; we can be more certain of the score.
FIGURE 4.1The Standard Error of Measurement: The Standard Deviation of the Error Distribution Around a True Score for One Subject
–2 SEM –1 SEM +1 SEM +2 SEMTrueScore
Reliability 61
r–
62 Chapter 4 ■ Technical Adequacy
Estimated True ScoresAn obtained score on a test is not the best estimate of the true score because obtained scores and errors are correlated. Scores above the test mean have more “lucky” error (error that raises the obtained score above the true score), whereas scores below the mean have more “unlucky” error (error that lowers the obtained score below the true score). An easy way to understand this effect is to think of a test on which Mike guesses on several test items. If all Mike’s guesses are correct, he has been very lucky and earns a score that is not represen-tative of what he truly knows. However, if all his guesses are incorrect, Mike has been unlucky and earns a score that is lower than a score that represents what he truly knows.
Confi dence IntervalsAlthough we can never know a person’s true score, we can estimate the likelihood that a person’s true score will be found within a specified range of scores. This range is called a confidence interval. Confidence intervals have two components. The first component is the score range within which a true score is likely to be found. For example, a range of 80 to 90 indicates that a person’s true score is likely to be contained within that range. The second component is the level of con-fidence, generally between 50 and 95 percent. The level of confidence tells us how certain we can be that the true score will be contained within the interval. Thus, if a 90 percent confidence interval for Jo’s IQ is 106 to 112, we can be 90 percent sure that Jo’s true IQ is between 106 and 112. It also means that there is a 5 percent chance her true IQ is higher than 112 and a 5 percent chance her true IQ is lower than 106. To have greater confidence would require a wider confidence interval.
Sometimes confidence intervals are implied. A score may be followed by a “±” and a number (for example, 109 ± 2). Unless otherwise noted, this nota-tion implies a 68 percent confidence interval with the number following the ± being the SEM. Thus, the lower limit of the confidence interval equals the score less the SEM (that is, 109 − 2) and the upper limit equals the score plus the SEM (that is, 109 + 2). The interpretation of this confidence interval is that we can be 68 percent sure that the student’s true score is between 107 and 111.
Another confidence interval is implied when a score is given with the probable error (PE) of measurement. For example, a score might be reported as 105 PE ± 1. A PE yields 50 percent confidence. Thus, 105 PE ± 1 means a 50 per-cent confidence interval that ranges from 104 to 106. The interpretation of this confidence interval is that we can be 50 percent sure that the student’s true score is between 104 and 106; 25 percent of the time the true score will be less than 104, and 25 percent of the time the true score will be greater than 106.
2 Validity
Validity refers to “the degree to which evidence and theory support the interpretation of test scores entailed by proposed uses of tests” (American Educational Research Association [AERA], American Psychological Association, & National Council on Measurement in Education, 1999, p. 9). Validity is therefore the most fundamental
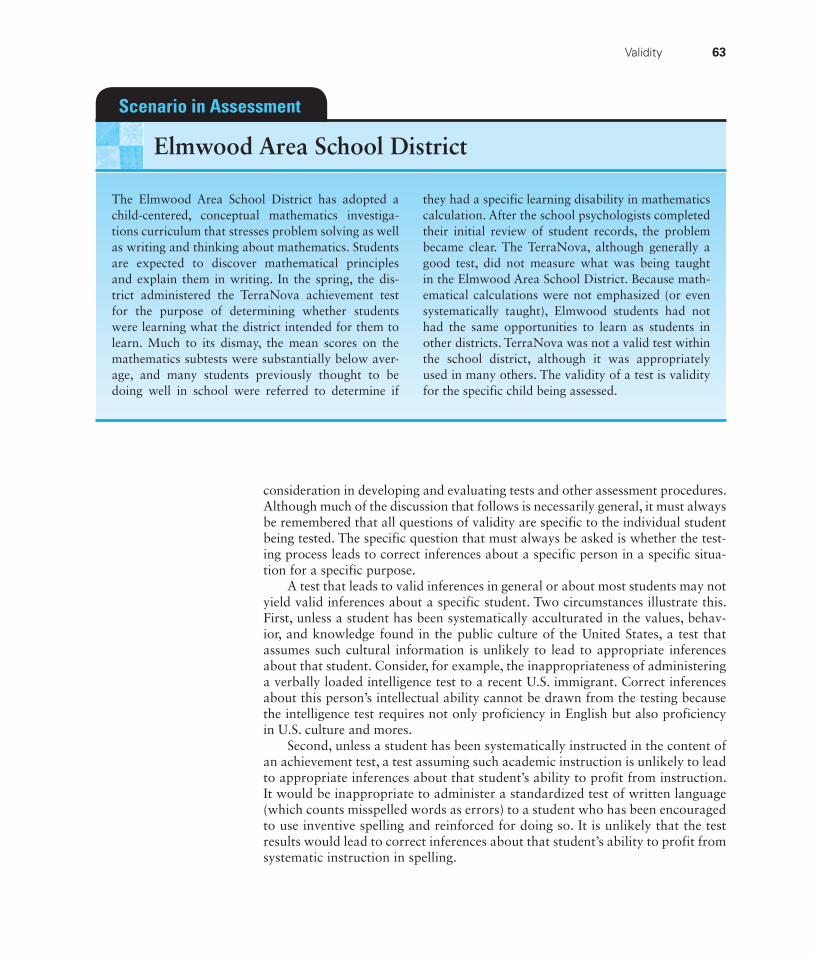
The Elmwood Area School District has adopted a child-centered, conceptual mathematics investiga-tions curriculum that stresses problem solving as well as writing and thinking about mathematics. Students are expected to discover mathematical principles and explain them in writing. In the spring, the dis-trict administered the TerraNova achievement test for the purpose of determining whether students were learning what the district intended for them to learn. Much to its dismay, the mean scores on the mathematics subtests were substantially below aver-age, and many students previously thought to be doing well in school were referred to determine if
they had a specific learning disability in mathematics calculation. After the school psychologists completed their initial review of student records, the problem became clear. The TerraNova, although generally a good test, did not measure what was being taught in the Elmwood Area School District. Because math-ematical calculations were not emphasized (or even systematically taught), Elmwood students had not had the same opportunities to learn as students in other districts. TerraNova was not a valid test within the school district, although it was appropriately used in many others. The validity of a test is validity for the specific child being assessed.
Scenario in Assessment
Elmwood Area School District
consideration in developing and evaluating tests and other assessment procedures. Although much of the discussion that follows is necessarily general, it must always be remembered that all questions of validity are specific to the individual student being tested. The specific question that must always be asked is whether the test-ing process leads to correct inferences about a specific person in a specific situa-tion for a specific purpose.
A test that leads to valid inferences in general or about most students may not yield valid inferences about a specific student. Two circumstances illustrate this. First, unless a student has been systematically acculturated in the values, behav-ior, and knowledge found in the public culture of the United States, a test that assumes such cultural information is unlikely to lead to appropriate inferences about that student. Consider, for example, the inappropriateness of administering a verbally loaded intelligence test to a recent U.S. immigrant. Correct inferences about this person’s intellectual ability cannot be drawn from the testing because the intelligence test requires not only proficiency in English but also proficiency in U.S. culture and mores.
Second, unless a student has been systematically instructed in the content of an achievement test, a test assuming such academic instruction is unlikely to lead to appropriate inferences about that student’s ability to profit from instruction. It would be inappropriate to administer a standardized test of written language (which counts misspelled words as errors) to a student who has been encouraged to use inventive spelling and reinforced for doing so. It is unlikely that the test results would lead to correct inferences about that student’s ability to profit from systematic instruction in spelling.
Validity 63
64 Chapter 4 ■ Technical Adequacy
General ValidityBecause it is impossible to validate all inferences that might be drawn from a test performance, test authors typically validate just the most common inferences. Thus, test users should expect some information about the degree to which each commonly encouraged inference has (or lacks) validity. Although the validity of each inference is based on all the information that accumulates over time, test authors are expected to provide some evidence of a test’s validity for specific inferences at the time the test is offered for use.
In addition, test authors should validate the inferences for groups of students with whom the test will typically be used.
Methods of Validating Test InferencesThe process of gathering information about the appropriateness of inferences is called validation. Several types of evidence can be considered (AERA et al., 1999, pp. 11–17).3
Evidence related to test content: Test content refers to “the themes, wording, ■
and format of the items, tasks, or question on a test, as well as the guidelines for procedures regarding administration and scoring” (AERA et al., 1999, p. 11).
Evidence related to internal structure: Internal structure refers to the number ■
of dimensions or components within a domain that are represented on the test. For example, if a test developer theorized that there were several components of intelligence, one would rightly expect the resulting test to contain several components of intelligence.
Evidence of the relationships between the test and other performances: The ■
relationship to other performances refers to the accuracy with which test scores predict performance on the same type of test or other similar tests.
Evidence of convergent and discriminant power: Convergent power refers to a ■
test’s ability to produce scores similar to those produced by other tests of the same ability or skills. Discriminant power refers to a test’s ability to produce scores different from those produced by other tests of a different ability or skill.
Evidence of the consequences of testing: Tests are administered with the ■
expectation that some benefit will be realized either to the test taker or to the organization requiring the test. In education, the possible benefits include the selection of efficacious instruction, materials, and placements. “A fundamental purpose of validation is to indicate whether these specific benefits are likely to be realized. Thus, in the case of a test used in a placement decision, the validation would be informed by evidence that alternative placements, in fact, are differentially beneficial to the persons and the institution” (AERA et al., 1999, p. 16).
Historically, the types of evidence under consideration have been categorized as follows: evidence of content validity, evidence of criterion-related validity, and
3AERA et al. (1999) also recognize evidence based on response processes that are usually described by test takers. This sort of evidence has not been widely accepted in special and inclusive education, perhaps because it can be diffi cult to obtain reliably from children and individuals with disabilities. Therefore, we do not deal with response processes in this text.
evidence of construct validity. Indeed, most test authors still use these categories. Therefore, we use these three categories in our discussions of validity in this chapter. Specifically, we consider evidence related to test content as content validity; evidence of the relationships between the test and other performances as criterion-related validity; and evidence related to internal structure, evidence of convergent and discriminant power, and evidence of the consequences of testing as construct validity. (We have already discussed in preceding chapters other evi-dence of a test’s validity—namely, the meaning of test scores, reliability, the ade-quacy of the test’s standardization, and, when applicable, the test’s norms.)
Content Validity
Content validity refers to the extent to which a test’s items actually represent the domain or universe to be measured. It is a major source of evidence for the validation for any educational or psychological test and many other forms of assess-ment (such as observations and ratings). Evidence of valid content is especially important in the measurement of achievement and adaptive behavior. Whether experts or those who use the tests examine the content, the judgment about a test’s validity requires a clear definition of the domain or universe represented.4
Appropriateness of Included Items In examining the appropriateness of the items included in a test, we must ask: Is this an appropriate test question, and does this test item really measure the domain or construct? Consider the four test items from a hypothetical primary (kindergarten through grade 2) arithmetic achievement test presented in Figure 4.2. The fi rst item requires the student to read and add two single-digit numbers, the sum of which is less than 10. This seems to be an appro-priate item for an elementary arithmetic achievement test. The second item requires the student to complete a geometric progression. Although this item is mathemati-cal, the skills and knowledge required to complete the question correctly are not taught in any elementary school curriculum by the second grade. Therefore, the question should be rejected as an invalid item for an arithmetic achievement test to be used with children from kindergarten through the second grade. The third item likewise requires the student to read and add two single-digit numbers, the sum of which is less than 10. However, the question is written in Spanish. Although the content of the question is suitable (this is an elementary addition problem), the method of presentation requires language skills that most U.S. students do not have. Failure to complete the item correctly could be attributed either to the fact that the child does not know Spanish or to the fact that the child does not know that 3 + 2 = 5. Test givers should conclude that the item is not valid for an arith-metic test for children who do not read Spanish. The fourth item requires that the student select the correct form of the Latin verb amare (“to love”). Clearly, this is an inappropriate item for an arithmetic test and should be rejected as invalid.
Content Not Included Test content must be examined to ascertain if important content is not included. For example, the validity of any elementary arithmetic test would be questioned if it included only problems requiring the addition of single-digit num-bers with a sum less than 10. Educators would reasonably expect an arithmetic
4There are statistical procedures that can be used by test authors to help validate the content validity of a test. See download.
Validity 65
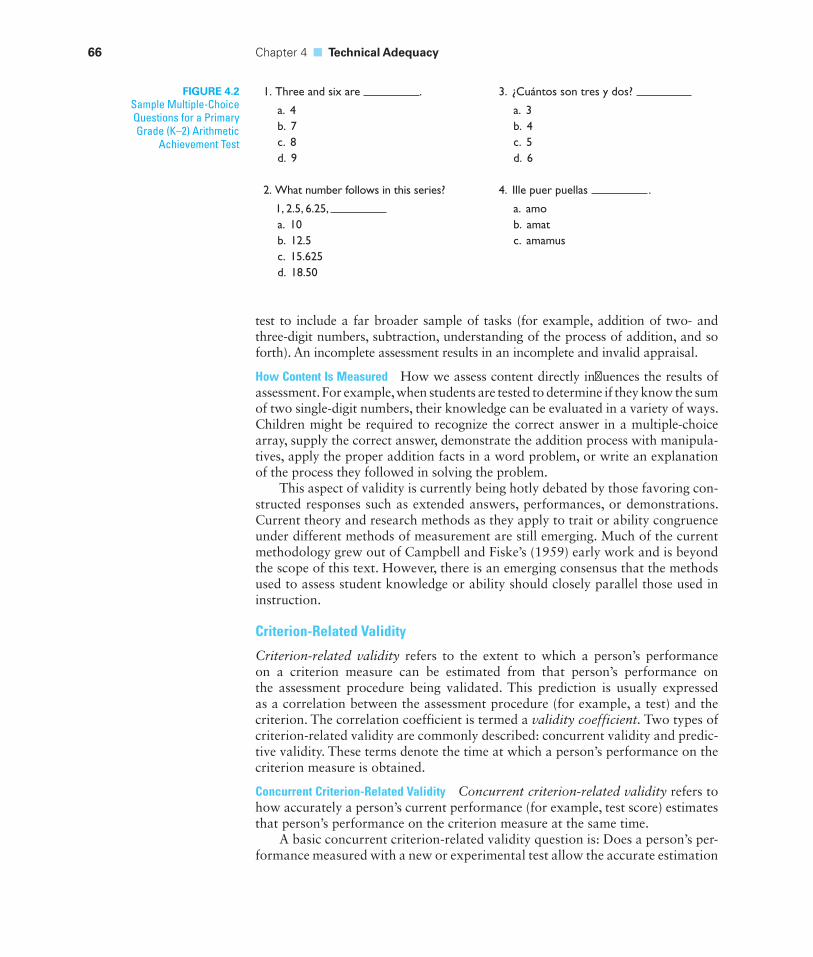
66 Chapter 4 ■ Technical Adequacy
test to include a far broader sample of tasks (for example, addition of two- and three-digit numbers, subtraction, understanding of the process of addition, and so forth). An incomplete assessment results in an incomplete and invalid appraisal.
How Content Is Measured How we assess content directly infl uences the results of assessment. For example, when students are tested to determine if they know the sum of two single-digit numbers, their knowledge can be evaluated in a variety of ways. Children might be required to recognize the correct answer in a multiple-choice array, supply the correct answer, demonstrate the addition process with manipula-tives, apply the proper addition facts in a word problem, or write an explanation of the process they followed in solving the problem.
This aspect of validity is currently being hotly debated by those favoring con-structed responses such as extended answers, performances, or demonstrations. Current theory and research methods as they apply to trait or ability congruence under different methods of measurement are still emerging. Much of the current methodology grew out of Campbell and Fiske’s (1959) early work and is beyond the scope of this text. However, there is an emerging consensus that the methods used to assess student knowledge or ability should closely parallel those used in instruction.
Criterion-Related Validity
Criterion-related validity refers to the extent to which a person’s performance on a criterion measure can be estimated from that person’s performance on the assessment procedure being validated. This prediction is usually expressed as a correlation between the assessment procedure (for example, a test) and the criterion. The correlation coefficient is termed a validity coefficient. Two types of criterion-related validity are commonly described: concurrent validity and predic-tive validity. These terms denote the time at which a person’s performance on the criterion measure is obtained.
Concurrent Criterion-Related Validity Concurrent criterion-related validity refers to how accurately a person’s current performance (for example, test score) estimates that person’s performance on the criterion measure at the same time.
A basic concurrent criterion-related validity question is: Does a person’s per-formance measured with a new or experimental test allow the accurate estimation
FIGURE 4.2Sample Multiple-Choice Questions for a Primary Grade (K–2) Arithmetic
Achievement Test
1. Three and six are .
a. 4 b. 7 c. 8 d. 9
2. What number follows in this series?
1, 2.5, 6.25, a. 10 b. 12.5 c. 15.625 d. 18.50
3. ¿Cuántos son tres y dos?
a. 3 b. 4 c. 5 d. 6
4. Ille puer puellas .
a. amo b. amat c. amamus
of that person’s performance on a criterion measure that has been widely accepted as valid? For example, if the Acme Ruler Company manufactures yardsticks, how do we know that a person’s height, as measured by an Acme yardstick, is that person’s true height? How do we know that the “Acme foot” is really a foot? The logical criterion measure is “the foot” maintained by the National Bureau of Standards. We can take several things to the bureau and measure them with both the Acme foot and the standard foot. If the two sets of measurements cor-respond closely (that is, are highly correlated and have very similar means and standard deviations), we can conclude that the Acme foot is a valid measure of length.
Similarly, if we are developing a test of achievement, we can ask: How does knowledge of a person’s score on our achievement test allow the estimation of that person’s score on a criterion measure? How do we know that our new test really measures achievement? Again, the first step is to find a valid criterion measure. However, there is no National Bureau of Standards for educational tests. Therefore, we must turn to a less-than-perfect criterion. There are two basic choices: (1) other achievement tests that are presumed to be valid and (2) judgments of achievement by teachers, parents, and students. We can, of course, use both tests and judg-ments. If our new test presents evidence of content validity and elicits test scores corresponding closely (correlating significantly) to judgments and scores from other achievement tests that are presumed to be valid, we can conclude that there is evidence for our new test’s criterion-related validity.
Predictive Criterion-Related Validity Predictive criterion-related validity refers to how accurately a person’s current performance (for example, test score) estimates that person’s performance on the criterion measure at a later time. Thus, concur-rent and predictive criterion-related validity refer to the temporal sequence by which a person’s performance on some criterion measure is estimated on the basis of that person’s current assessment; concurrent and predictive validity differ in the time at which scores on the criterion measure are obtained.
Suppose Acme Ruler Company decides to diversify and manufacture tests of color vision. How do we know that a diagnosis of colorblindness made on the basis of the Acme test is accurate? How do we know that an Acme-based diagnosis will correspond to next month’s diagnosis made by an ophthalmolo-gist? We can test several children with the Acme test, schedule appointments with an ophthalmologist, and compare the Acme-based diagnoses with the ophthal-mologist’s diagnoses. If the Acme test accurately predicts the ophthalmologist’s diagnoses, we can conclude that the Acme test is a valid measure of color vision. Similarly, if we are developing a test to assess reading readiness, we can ask: Does knowledge of a student’s score on our reading readiness test allow an accurate estimation of the student’s actual readiness for subsequent instruction? How do we know that our test really assesses reading readiness? Again, the first step is to find a valid criterion measure. In this case, the student’s initial progress in reading can be used. Reading progress can be assessed by a reading achievement test (presumed to be valid) or by teacher judgments of reading ability or reading readiness at the time reading instruction is actually begun. If our reading readi-ness test has content validity and corresponds closely with either later teacher judgments of readiness or validly assessed reading skill, we can conclude that ours is a valid test of reading readiness.
Validity 67
68 Chapter 4 ■ Technical Adequacy
Construct Validity
Construct validity refers to the extent to which a procedure or test measures a theoretical trait or characteristic. Construct validity is especially important for measures of process, such as intelligence or scientific inquiry. To provide evidence of construct validity, a test author must rely on indirect evidence and inference. The definition of the construct and the theory from which the construct is derived allow us to make certain predictions that can be confirmed or disconfirmed. In a real sense, we do not validate inferences from tests or other assessment proce-dures; rather, we conduct experiments to demonstrate that the inferences are not valid. The continued inability to disconfirm the inferences in effect validates the inferences.
For example, intellectual ability is generally believed to be developmental. We could hypothesize that if we were to conduct an investigation, intelligence test scores would be correlated with chronological age. If we found that a test of intelligence did not correlate with chronological age, this finding would cast serious doubt on the test as a measure of intelligence. (The experiment would disconfirm the test as a measure of intelligence.) However, the presence of a sub-stantial correlation between chronological age and scores on the test does not confirm that the test is a measure of intelligence.5 Gradually, the test developer accumulates evidence that the test continues to act in the way that it would if it were a valid measure of the construct. As the research evidence accumulates, the developer can make a stronger claim to construct validity.
Factors Affecting General ValidityWhenever an assessment procedure fails to measure what it purports to measure, validity is threatened. Consequently, any factor that results in measuring “some-thing else” affects validity. Both unsystematic error (unreliability) and systematic error (bias) threaten validity.
Reliability
Reliability sets the upper limit of a test’s validity, so reliability is a necessary but not a sufficient condition for valid measurement. Thus, all valid tests are reliable, unreliable tests are not valid, and reliable tests may or may not be valid. The valid-ity of a particular procedure can never exceed the reliability of that procedure because unreliable procedures measure error; valid procedures measure the traits they are designed to measure.
Systematic Bias
Several systematic biases can limit a test’s validity. The following are among the most common.
5Many test authors systematically ensure that their tests will be correlated with age by requiring that each item correlate positively with age or grade and passing. Also, in addition to intelligence, many other abilities correlate with chronological age—for example, achievement, perceptual abilities, and language skills.
Method of Measurement Students’ tested performance can be affected by the way in which they are tested. Skills can be assessed in a variety of ways (for example, by demonstration, description, and explanation). Each of the different ways could yield somewhat different assessments of student achievement.
Enabling Behaviors Enabling behaviors and knowledge are skills and facts that a person must rely on to demonstrate a target behavior or knowledge. For exam-ple, to demonstrate knowledge of causes of the American Civil War on an essay examination, a student must be able to write. The student cannot produce the targeted behavior (the written answer) without the enabling behavior (writing). Similarly, knowledge of the language of assessment is crucial. Many of the abuses in assessment are directly attributable to examiners’ failures in this area. For example, intelligence testing in English of non-English-speaking children at one time was suffi ciently commonplace that a group of parents brought suit against a school district (Diana v. State Board of Education, 1970). Students who are deaf are routinely given the Performance subtests of the Wechsler Adult Intelligence Scales (Baumgardner, 1993) even though they cannot hear the directions. Children with communication disorders are often required to respond orally to test questions. Such obvious limitations in or absences of enabling behaviors are frequently overlooked in testing situations, even though they invalidate the test’s inferences for these students.
Differential Item Effectiveness Test items should work the same way for various groups of students. Jensen (1980) discussed several empirical ways to assess item effectiveness for different groups of test takers. First, we should expect that the relative diffi culty of items is maintained across different groups. For example, the most diffi cult item for males should also be the most diffi cult item for females, the easiest item for whites should be the easiest item for nonwhites, and so forth. We should also expect that reliabilities and validities will be the same for all groups of test takers.
The most likely explanation for items having differential effectiveness for different groups of people is differential exposure to test content. Test items may not work in the same ways for students who experience different acculturation or different academic instruction. For example, standardized achievement tests presume that the students who are taking the tests have been exposed to similar curricula. If teachers have not taught the content being tested, that content will be more difficult for their students (and inferences about the students’ ability to profit from instruction will probably be incorrect).
Systematic Administration Errors
Unless a test is administered according to the standardized procedures, the inferences based on the test are invalid. Suppose Ms. Williams wishes to demonstrate how effective her teaching is by administering an intelligence test and an achievement test to her class. She allows the students 5 minutes less than the standardized time limits on the intelligence test and 5 minutes more on the standardized achievement test. The result is that the students earn higher achievement test scores (because they had too much time) and lower intelligence test scores (because they did not have enough time). The inference that less intelligent students have learned more than anticipated is not valid.
Validity 69
70 Chapter 4 ■ Technical Adequacy
Crina was born in Eastern Europe and spent most of the first 10 years of her life in an orphanage, where she looked after younger children. She was adopted shortly before her 11th birthday by an Ohio f amily. The only papers that accompanied Crina to the United States were her passport, baptismal certificate, and letter from the orphanage stating that Crina’s parents were deceased.
Crina’s adoptive parents learned some of Crina’s language, and Crina tried to learn English in the months before she was enrolled in the local school system. When she was enrolled in the local public school, she was placed in an age- appropriate regular classroom and received additional support from an English as a Second Language (ESL) teacher.
Things did not go well. Crina did not adapt to the school routine, had virtually no understanding of any content area, and was viewed as essentially unteachable. She spent most of her school time trying to help the teacher by neatening up the room, passing out materials, running errands, and so forth. Within Crina’s first week in school, her teacher sought additional help from the ESL teacher, the school principal, and the school psychologist. Although all offered suggestions, none of them seemed to work; the school was unable to find a native speaker of Crina’s language. Within the first month of school, Crina was referred to a child study team that in turn referred her for psychological and educational assessment.
The school psychologist administered the current Wechsler Intelligence Scale for Children and the Wechsler Individual Achievement Test, although both tests are administered in English. Crina did much better on tests that did not require her to speak or understand English—for example, block designs. Her estimated IQ was in the 40s and her achievement was so low that no derived scores were available.
Given her age and the extent of her needs, the school team recommended that she be placed in a life skills class with other moderately retarded stu-dents. Crina’s mother rejected that placement because Crina had already mastered most of the life skills she would be taught there; at the orphanage, she cleaned,
cooked, bathed and tended younger children, and so forth. In addition, her mother believed more verbal students than the ones in the life skills class would be better language models for Crina. Basically, her mother wanted a program of basic academics that would be more appropriate—a program in which Crina could learn to read and write English, learn basic computational skills, make friends, and become acculturated.
For reasons that were never entirely clear, the school refused to compromise and the dispute went to a due process hearing. The mother obtained an in-dependent educational evaluation. Her psychologist assessed Crina’s adaptive behavior; because the test had limited validity due to Crina’s unique circum-stances, the psychologist estimated that Crina was functioning within the average range for a person her age. Her psychologist also administered a nonverbal test of intelligence—one that neither required her to understand verbal directions nor to make verbal responses. With the same caveats, Crina was again estimated to be functioning in the average range for a person her age. To make a long story short, the school lost; Crina and her parents won.
The Moral. All validity is local. The district followed its policies for providing the teacher with support, for providing Crina with support, for convening a mul-tidisciplinary team, and so forth. The tests adminis-tered by the school were generally reliable, valid, and well normed. However, they were not appropriate for Crina and her unique circumstances. Obviously, she lacked the language skills, cultural knowledge, and academic background to be assessed validly by the tests given by the school. Although the tests given by the parents’ psychologist were better, they still had to be considered minimum estimates of her abilities due to the cultural considerations.
A Happy Ending. Crina learned enough English during the next several years to develop friendships, to read and write enough to be gainfully employed, and to leave school feeling positive about the experience and her accomplishments.
Scenario in Assessment
Crina
Norms
Scores based on the performance of unrepresentative norms lead to incorrect estimates of relative standing in the general population. To the extent that the normative sample is systematically unrepresentative of the general population in either central tendency or variability, the differences based on such scores are incorrect and invalid.
Responsibility for Valid AssessmentThe valid use of assessment procedures is the responsibility of both the author and the user of the assessment procedure. Test authors are expected to present evidence for the major types of inferences for which the use of a test is recommended, and a rationale should be provided to support the particular mix of evidence presented for the intended uses (AERA et al., 1997, p. 13). Test users are expected to ensure that the test is appropriate for the specific students being assessed.
CHAPTER COMPREHENSION QUESTIONSWrite your answers to each of the following questions, and then compare your responses to the text.
1. Explain the concept of measurement error.
2. What does a reliability coefficient of .75 tell you about true-score variability and error variability?
3. Compare and contrast item reliability, stability, and interobserver agreement.
4. What is the difference between simple agreement and point-to-point agreement, and when might you use each appropriately?
5. What is a standard error of measurement?
6. Explain the two types of criterion-related validity.
7. What is construct validity?
8. Explain three factors that can affect a test’s validity.
Validity 71
72
3Know eight factors to consider when
deciding whether test changes are necessary and, if so, which test changes might be appropriate.
2Be familiar with universal design and
know how the principles of universal design can be applied to promote accessible testing.
1Understand four reasons why you
should be concerned with test adaptations and accommodations.
Chapter Goals
5 Using Test Adaptations and Accommodations
4Know two categorization
schemes for accommodations, including one associated with accommodation type and one associated with accommodation validity.
5Know accommodation
guidelines you can use in making accommodation decisions for eligibility testing.
6Know accommodation
guidelines you can use in making accommodation decisions for accountability testing.
Why Be Concerned About Testing Adaptations? 73
Key Terms accommodation
limited English profi ciency/English language learners
universal design for assessment
presentation accommodations
response accommodations
setting accommodations
scheduling accommodations
native language accommodations
English language accommodations
test translations
Although the use of well-designed standardized tests can enhance assessment decision making, it does not result in optimal measurement for every student. In fact, for some students, the way that a test is administered under stan-dardized conditions may actually prohibit their demonstration of true knowledge and skill. For instance, some standardized test conditions require that students express their answers orally in English; this can make it difficult for students who are English language learners (ELLs) to demonstrate their knowledge. Some tests require that students print their answers in a test booklet; this can make it difficult for students with motor impairments to demonstrate their knowledge. Clearly, changes in test conditions may be needed. However, some changes can have a negative impact on the validity of test scores. Educators must attend to the kinds of adaptations that can be made without compromising the technical adequacy of tests. In this chapter, we consider issues associated with adapting tests and provid-ing accommodations for students with disabilities and those who are ELLs.
1 Why Be Concerned About Testing Adaptations?
Changes in Student PopulationThe diversity of students attending today’s schools is mind-boggling. When most people think of diversity, they think of race and ethnicity. Clearly, schools are more racially and ethnically diverse. However, they are becoming more diverse in other ways that concern assessment personnel. In large city school systems throughout the United States, students speak more than 50 different languages and dialects as their primary language. Diversity of language has created challenges in making instruction and assessment accessible to all students. Students enter school these days with a very diverse set of academic background experiences and oppor-tunities. Within the same classroom, students often vary considerably in their academic skill development. A clear challenge for all educational professionals is the design of instruction that will accommodate this vast range in skill develop-ment and, similarly, the use of assessments that will capture the large range in student skills.
Since the mid-1970s, considerable attention has been focused on including all students in neighborhood schools and general education settings. Much atten-tion has been focused on including students who are considered developmentally,
74 Chapter 5 ■ Using Test Adaptations and Accommodations
physically, or emotionally impaired. As federal and state officials make educa-tional policies, they are now compelled to make them for all children and youth, including those with severe disabilities. Also, as policymakers attempt to develop practices that will result in improved educational results, they rely on data from district- and state-administered tests. However, relying on assessment data pre-sents challenges associated with deciding whom to include in the multiple kinds of assessments and the kinds of changes that can be made to include them.
Although meaningful assessment of the skills of such a diverse student popu-lation is challenging, it is clear that all students need to be included in large-scale assessment programs. If students are excluded from large-scale assessments, then the data on which policy decisions are made represent only part of the school population. If students are excluded from accountability systems, they may also be denied access to the general education curriculum. If data are going to be gathered on all students, then major decisions must be made regarding the kinds of data to be collected and how tests are to be modified or adapted to include students with special needs. Historically, there has been widespread exclusion of students with disabilities from state and national testing (Thompson & Thurlow, 2001; McGrew, Thurlow, Shriner, & Spiegel, 1992). Participation in large- scale assessments is now recognized by many educators and parents as a critical element of equal opportunity and access to education. Thurlow and Thompson (2004) report that all states now require participation of all students. However, many questions remain about which participation and accommodation strategies are the best for particular students.
Changes in Educational StandardsPart of major efforts to reform or restructure schools has been a push to specify high standards for student achievement and an accompanying push to measure the extent to which students meet those high standards. It is expected that schools will include students with disabilities and ELLs in assessments, especially assess-ments completed for accountability purposes.
State education agencies in nearly every state are engaging in critical analyses of the standards, objectives, outcomes, results, skills, or behaviors that they want students to demonstrate upon completion of school. Content area profes-sional agencies, such as the National Council of Teachers of Mathematics and the National Science Foundation, have developed sets of standards in specific content areas, such as math, geography, and science. As they do so, they must decide the extent to which standards should be the same for students with and without disabilities. In Chapter 22, you will learn about current state efforts to develop alternate achievement standards and modified achievement standards for students with disabilities. Development of standards is not enough. Groups that develop standards must develop ways of assessing the extent to which students are meeting the standards.
The Need for Accurate MeasurementIt is critical that the assessment practices used for gathering information on indi-vidual students provide accurate information. Without accommodations, testing runs the risk of being unfair for certain students. Some test formats make it more difficult for students with disabilities to understand what they are supposed to do
Why Be Concerned About Testing Adaptations? 75
or what the response requirements are. Because of their disabilities, some students find it impossible to respond in a way that can be evaluated accurately.
It Is Required by LawBy law, students with disabilities have a right to be included in assessments used for accountability purposes, and accommodations in testing should be made to enable them to participate. This legal argument is derived largely from the Fourteenth Amendment to the U.S. Constitution (which guarantees the right to equal protection and to due process of law). The Individuals with Disabilities Education Act (IDEA) guarantees the right to education and to due process. Also, Section 504 of the Rehabilitation Act of 1973 indicates that it is illegal to exclude people from participation solely because of a disability.
The Americans with Disabilities Act of 1992 mandates that all individuals must have access to exams used to provide credentials or licenses. Agencies administer-ing tests must provide either auxiliary aids or modifications to enable individuals with disabilities to participate in assessment, and these agencies may not charge the individual for costs incurred in making special provisions. Adaptations that may be provided include an architecturally accessible testing site, a distraction-free space, or an alternative location; test schedule variation or extended time; the use of a scribe, sign language interpreter, reader, or adaptive equipment; and modifications of the test presentation or response format.
The 1997 and 2004 IDEA mandate that states include students with disabili-ties in their statewide assessment systems. The necessary accommodations are to be provided to enable students to participate. By July 2000, states were to have available alternate assessments. These are to be used by students who are unable to participate in the regular assessment even with accommodations. Alternate assessments are substitute ways of gathering data, often by means of portfolios or performance measures. The No Child Left Behind Act of 2001 included a requirement that states report annually on the performance and progress of all students, and this principle was reiterated in the 2004 reauthorization of IDEA. Furthermore, results are to be disaggregated by subgroups (for example, those with limited English proficiency and those with disabilities) when sufficient num-bers of students within these subgroups are present for the results to be reliable.
Although all of the previously discussed legal requirements are associated with assessment used for accountability purposes, there are other legal requirements associated with making test changes when making eligibility decisions. Within IDEA, there are particular procedures that are to be followed when assessing ELLs for the purpose of eligibility determination. Section 300.304(c)(1)(i–ii)(a)(2) states,
Assessments and other evaluation materials used [to make special education eli-gibility decisions] (i) are selected and administered so as not to be discriminatory on a racial or cultural basis; (ii) are provided and administered in the child’s native language or other mode of communication and in the form most likely to yield accurate information on what the child knows and can do academically, developmentally, and functionally, unless it is clearly not feasible to so provide or administer.
This principle is echoed in §300.306(b) of IDEA, which forbids a student to be identified as in need of special educational services if the determining factor is limited proficiency in English.
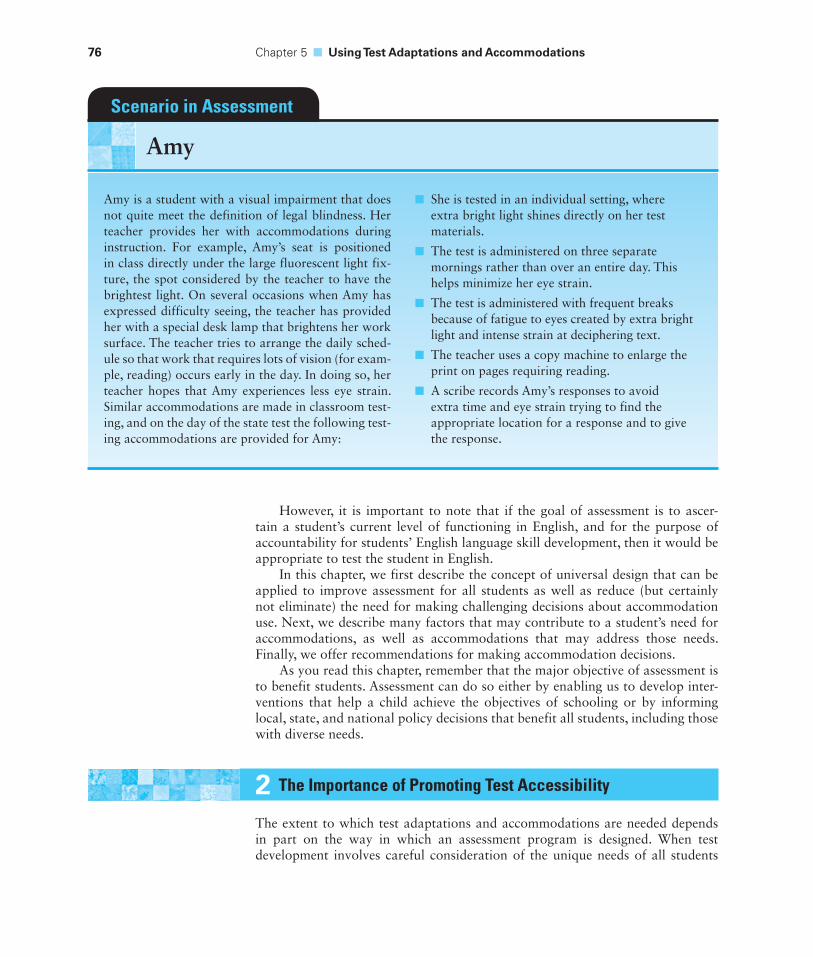
76 Chapter 5 ■ Using Test Adaptations and Accommodations
However, it is important to note that if the goal of assessment is to ascer-tain a student’s current level of functioning in English, and for the purpose of accountability for students’ English language skill development, then it would be appropriate to test the student in English.
In this chapter, we first describe the concept of universal design that can be applied to improve assessment for all students as well as reduce (but certainly not eliminate) the need for making challenging decisions about accommodation use. Next, we describe many factors that may contribute to a student’s need for accommodations, as well as accommodations that may address those needs. Finally, we offer recommendations for making accommodation decisions.
As you read this chapter, remember that the major objective of assessment is to benefit students. Assessment can do so either by enabling us to develop inter-ventions that help a child achieve the objectives of schooling or by informing local, state, and national policy decisions that benefit all students, including those with diverse needs.
2 The Importance of Promoting Test Accessibility
The extent to which test adaptations and accommodations are needed depends in part on the way in which an assessment program is designed. When test development involves careful consideration of the unique needs of all students
Amy is a student with a visual impairment that does not quite meet the definition of legal blindness. Her teacher provides her with accommodations during instruction. For example, Amy’s seat is positioned in class directly under the large fluorescent light fix-ture, the spot considered by the teacher to have the brightest light. On several occasions when Amy has expressed difficulty seeing, the teacher has provided her with a special desk lamp that brightens her work surface. The teacher tries to arrange the daily sched-ule so that work that requires lots of vision (for exam-ple, reading) occurs early in the day. In doing so, her teacher hopes that Amy experiences less eye strain. Similar accommodations are made in classroom test-ing, and on the day of the state test the following test-ing accommodations are provided for Amy:
She is tested in an individual setting, where ■
extra bright light shines directly on her test materials.
The test is administered on three separate ■
mornings rather than over an entire day. This helps minimize her eye strain.
The test is administered with frequent breaks ■
because of fatigue to eyes created by extra bright light and intense strain at deciphering text.
The teacher uses a copy machine to enlarge the ■
print on pages requiring reading.
A scribe records Amy’s responses to avoid ■
extra time and eye strain trying to find the appropriate location for a response and to give the response.
Scenario in Assessment
Amy

The Importance of Promoting Test Accessibility 77
who may eventually participate, less “after-the-fact” changes in test conditions will be needed. Application of the principles of universal design can improve accessibility, such that appropriate testing for all students is promoted.
Concept of Universal DesignUniversal design is a concept that was first applied in architectural design. Wheelchair ramps and curb cuts are features that were determined to be helpful when architects considered the many unique needs of individuals with disabilities while designing buildings and their surrounding areas.
The Center for Universal Design has provided the following definition and seven principles of universal design:
Universal design is the design of products and environments to be usable by all people, to the greatest extent possible, without the need for adaptation or specialized design.
Seven Principles of Universal Design
Equitable use: The design is useful and marketable to people with diverse ■
abilities.
Flexibility in use: The design accommodates a wide range of individual ■
preferences and abilities.
Simple and intuitive: Use of the design is easy to understand, regardless of the ■
user’s experience, knowledge, language skills, or current concentration level.
Perceptible information: The design communicates necessary information ■
effectively to the user, regardless of ambient conditions or the user’s sensory abilities.
Tolerance for error: The design minimizes hazards and the adverse ■
consequences of accidental or unintended actions.
Low physical effort: The design can be used efficiently and comfortably ■
and with a minimum of fatigue.
Size and space for approach and use: Appropriate size and space is ■
provided for approach, reach, manipulation, and use regardless of user’s body size, posture, or mobility.
From http://www.design.ncsu.edu/cud/about_ud/udprinciplestxt.htm. Reprinted by permission of the Center for Universal Design.
Applying Universal Design in Test Development and UseFollowing a review of the principles put forth by the Center for Universal Design, the National Center on Educational Outcomes identified several elements of uni-versal design that could be incorporated in the design of large-scale assessment pro-grams (Thompson, Johnstone, & Thurlow, 2002). These include the following:
1. Inclusive assessment population
2. Precisely defi ned constructs
3. Accessible, nonbiased items
4. Amenable to accommodations
5. Simple, clear, and intuitive instructions and procedures
6. Maximum readability and comprehensibility
7. Maximum legibility
78 Chapter 5 ■ Using Test Adaptations and Accommodations
According to IDEA 2004, states must incorporate the principles of universal design in the development of their assessment programs.
Universal Design Applications Promote Better Testing for AllAlthough universal design stems from a desire to address the unique needs of par-ticular individuals, it often improves assessment for many other students too. Just as wheelchair ramps can be extremely helpful to those of us who opt to use rolling carts to lug our many materials into buildings, universally designed assessment programs can facilitate better test measurement for a variety of students. For example, when test directions are simplified, this has the potential to promote better understanding by students both with and without special needs. When the legibility of items is improved, all students can exert fewer cognitive resources on deciphering item content and more resources on the specific processes or skills that the test is intended to measure.
Although application of universal design can reduce the need for accommo-dations among some students, it is not likely to eliminate the need for changes to address other unique student needs. In the following section, we describe factors that should be considered when determining whether an adaptation or accom-modation might be needed.
3 Factors to Consider in Making Accommodation Decisions
Six factors can impede getting an accurate picture of students’ abilities and skills during assessment: (1) the students’ ability to understand assessment stimuli, (2) the students’ ability to respond to assessment stimuli, (3) the nature of the norm group, (4) the appropriateness of the level of the items (sufficient basal and ceiling items), (5) the students’ exposure to the curriculum being tested (opportunity to learn), and (6) the nature of the testing environment. It is also important to take into consideration cultural and linguistic differences when thinking about students’ individual accommodation needs.
Ability to Understand Assessment StimuliAssessments are considered unfair if the test stimuli are in a format that, because of a disability, the student does not understand. For example, tests in print are considered unfair for students with severe visual impairments. Tests with oral directions are considered unfair for students with hearing impairments. In fact, because the law requires that students be assessed in their primary language and because the primary language of many deaf students is not English, written assess-ments in English are considered unfair and invalid for many deaf students. When students cannot understand test stimuli because of a sensory or mental limitation that is unrelated to what the test is targeted to measure, accurate measurement of the targeted skills is hindered by the sensory or mental limitation. Such a test is invalid, and failure to provide an accommodation is illegal.
Ability to Respond to Assessment StimuliTests typically require students to produce a response. For example, intelligence tests require verbal, motor (pointing or arranging), or written (including multiple-choice)
Factors to Consider in Making Accommodation Decisions 79
responses. To the extent that physical or sensory limitations inhibit accurate respond-ing, these test results are invalid. For example, some students with cerebral palsy may lack sufficient motor ability to arrange blocks. Others may have sufficient motor ability but have such slowed responses that timed tests are inappropriate estimates of their abilities. Yet others may be able to respond quickly but expend so much energy that they cannot sustain their efforts throughout the test. Not only are test results invalid in such instances but also the use of such test results is proscribed by federal law.
Normative ComparisonsNorm-referenced tests are standardized on groups of individuals, and the per-formance of the person assessed is compared with the performance of the norm group. To the extent that the test was administered to the student differently than the way it was administered to the norm group, you must be very care-ful in interpreting the results. Adaptations of measures require changing either stimulus presentation or response requirements. The adaptation may make the test items easier or more difficult, and it may change the construct being mea-sured. Although qualitative or criterion-referenced interpretations of such test performances are often acceptable, norm-referenced comparisons can be flawed. Standards for Educational and Psychological Testing (American Educational Research Association, American Psychological Association, & National Council on Measurement in Education, 1999) specifies that when tests are adapted, it is important that there is validity evidence for the change that is made. Otherwise, it is important to describe the change when reporting the score and to use caution in score interpretation.
Appropriateness of the Level of the ItemsTests are often developed for students who are in specific age ranges or who have a particular range of skills. They can sometimes seem inappropriate for students who are either very high or very low functioning compared to their age-mates. Assessors are tempted to give out-of-level tests when an age-appropriate test con-tains either an insufficient number of easy items or not enough easy items for the student being assessed. Of course, when out-of-level tests are given and norm-referenced interpretations are made, the students are compared with a group of students who differ from them. We have no idea how same-age or same-grade students would perform on the given test. Out-of-level testing may be appropri-ate to identify a student’s current level of educational performance or to evaluate the effectiveness of instruction with a student who is instructed out of grade level. It is inappropriate for accountability purposes.
Exposure to the Curriculum Being Tested (Opportunity to Learn)One of the issues of fairness raised by the general public is the administration of tests that contain material that students have not had an opportunity to learn. This same issue applies to the making of accommodation decisions. Students with sensory impairments have not had an opportunity to learn the content of test items that use verbal or auditory stimuli. Students receiving special education ser-vices who have not had adequate access to the general education curriculum have not had the same opportunity to master the general education curriculum.
80 Chapter 5 ■ Using Test Adaptations and Accommodations
To the extent that students have not had an opportunity to learn the content of the test (that is, they were absent when the content was taught, the content is not taught in the schools in which they were present, or the content was taught in ways that were not effective for the students), they probably will not perform well on the test. Their performance will reflect more a lack of opportunity to learn than limited skill and ability.
Environmental ConsiderationsStudents should be tested in settings in which they can demonstrate maximal performance. If students cannot easily gain access to a testing setting, this may diminish their performance. Tests should always be given in settings that students with disabilities can access with ease. The settings should also be quiet enough to minimize distractibility. Also, because fatigue is an issue, tests should be given in multiple short sessions (broken up with breaks) so students do not become overly tired.
Cultural ConsiderationsMany students with limited English proficiency come from cultures that are very different from the public culture of the United States. As a result, whenever a test relies on a student’s cultural knowledge to test some area of achievement or aptitude, the test will necessarily be invalid because it will also test the student’s knowledge of U.S. culture.
In some cultures, children are expected to speak minimally to adults or author-ity figures; elaboration or extensive verbal output may be viewed as disrespect-ful. In some cultures, answering questions may be viewed as self-aggrandizing, competitive, and immodest. These cultural values work against students in most testing situations. Male–female relations are also subject to cultural differences. Female students may be hesitant to speak to male teachers; male students (and their fathers) may not view female teachers as authority figures. Children may be hesitant to speak to adults from other cultures, and testers may be reluctant to encourage or say “no” to children whose culture is unfamiliar. Children new to the United States may have been traumatized by civil strife and therefore be wary of or frightened by strangers. It may therefore be difficult for an examiner to establish rapport with a student who has limited English proficiency. Some evidence suggests that children do better with examiners of the same race and cultural background (Fuchs & Fuchs, 1989).
Immigrant students and their families may have little experience with the types of testing done in U.S. schools. Consequently, these students may lack test-taking skills. Finally, doing well on tests may not be as valued within the first cultures of immigrant students.
Whereas some students from different cultural backgrounds may be relatively quick to assimilate with U.S. culture, other students may not. There are a variety of factors that may play a role in determining how quickly such students become familiar and integrated within U.S. culture. Some are immigrants or children of immigrants who have come to the United States seeking a better life. Others are fleeing repressive governments in their nation of origin. Some have plans to remain in the United States, whereas others are in the country just temporarily. Some have a large network of individuals nearby who speak their native language, whereas
Factors to Consider in Making Accommodation Decisions 81
others do not. All of these factors may play a role in the student’s motivation and need to be knowledgeable of U.S. culture, which may in turn relate to his or her performance on tests in the United States. As a result, merely knowing the student’s time of arrival in the United States may not be enough to help gauge whether he or she is familiar enough with U.S. culture; these other factors need to be taken into consideration.
Linguistic ConsiderationsThe overwhelming majority of classroom and commercially prepared tests are administered in English. Students who do not speak or read English cannot access the content and respond to these tests. Although a student with limited English proficiency may speak some English, knowing enough English for some social conversation is not the same as knowing enough English for instruction or for the nuances of highly abstract concepts that may be included as a part of testing. To assess students’ knowledge, skills, or abilities, students must have sufficient fluency in the language of the test. Although this proposition is logical and quite easy to say, the difficult part is in the doing. It is particularly challenging given the many different languages and language programs that are used in U.S. schools today, as well as the differences in rates of English language acquisition among students with different background characteristics.
Bilingual Students
“Bilingual” implies equal proficiency in two languages. Nevertheless, young children must learn which language to use with specific people. For example, they may be able to switch between English and Spanish with their siblings, speak only Spanish with their grandparents, and use only English with their older sister’s husband, who still has not learned Spanish. Although children can switch between languages, sometimes in midsentence, they are seldom truly bilingual.
When students grow up in a home in which two languages are spoken, they are seldom equally competent or comfortable in using both languages, regard-less of the context or situation. These students tend to prefer one language or the other for specific situations or contexts. For example, Spanish may be spoken at home and in the neighborhood, whereas English is spoken at school. Moreover, when two languages are spoken in the home, the family may develop a hybrid language borrowing a little from each. For example, in Spanish caro means “dear,” and car in English means “automobile.” In some bilingual homes (and communities), caro comes to mean “automobile.” These speakers may not be speaking “proper” Spanish or English, although they have no problem communicating.
These factors enormously complicate the testing of bilingual students. Some bilingual students may understand academic questions better in English, but the language in which they answer can vary. If the content was learned in English, they may be better able to answer in English. However, if the answer calls for a logical explanation or an integration of information, they may be better able to answer in their other language. Finally, it cannot be emphasized strongly enough that language dominance is not the same as language competence for testing
82 Chapter 5 ■ Using Test Adaptations and Accommodations
purposes. Because a student knows more Spanish than English does not mean that the student knows enough Spanish to be tested in that language.
English as a Second Language
It is critical to distinguish between social/interpersonal uses of language and cognitive/academic uses. Students learning English as a second language usually need at least 2 years to develop social and interpersonal communication skills. However, they require 5 or 6 years to develop language sufficient for cogni-tive and academic proficiency (Cummins, 1984). Thus, after even 3 or 4 years of schooling, students who demonstrate few problems with English usage in social situations still probably lack sufficient language competence to be tested in English.
At least three factors can affect the time required for students to attain cogni-tive and academic sufficiency in English.
1. Age: Young children are programmed to learn language. At approximately 12 to 14 years of age, learning another language becomes much more diffi cult. Thus, all things being equal, one should expect younger students to acquire English faster than older students.
2. Immersion in English: The more contexts in which English is used, the faster will be its acquisition. Thus, a student’s learning of English as a second language will depend in part on the language the parents speak at home. If the native language is spoken at home, progress in English will be slower. This creates a dilemma for parents who want their children to learn (or remember) their fi rst language and also learn English.
3. Similarity to English: Languages can vary along several dimensions. The phonology may be different. The 44 speech sounds of English may be the same as or different from the speech sounds of other languages. For example, Xhosa (an African language) has three different click sounds, whereas English has none. English lacks the sound equivalent of the Spanish ñ, the Portuguese -nh, and the Italian -gn. The orthography may be different. English uses the Latin alphabet. Other languages may use different alphabets (for example, Cyrillic) or no alphabet (Mandarin). English does not use diacritical marks; whereas other languages do. The letter-sound correspondences may be different. The letter h is silent in Spanish but pronounced as an English r in one Brazilian dialect. The grammar may be different. Whereas English tends to be noun dominated, other languages tend to be verb dominated. Word order varies. Adjectives precede nouns in English, but they follow nouns in Spanish. The more language features the second language has in common with the fi rst language, the easier it is to learn the second language.
There are certainly many things to take into consideration when determin-ing whether a test change is needed for a particular student, and what the most appropriate test change might be. Now that you have had an opportunity to con-sider many unique characteristics of students that may make it difficult for them to demonstrate knowledge through testing, we will consider changes that have the potential to make tests more accessible to individual children with unique needs.
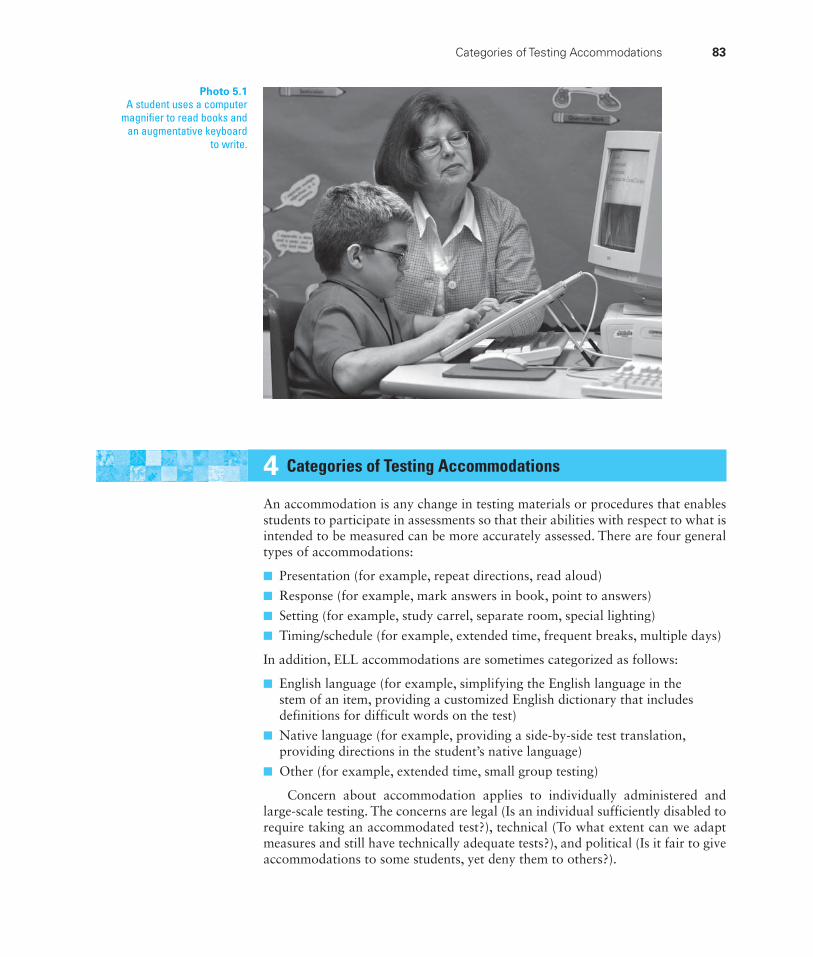
Categories of Testing Accommodations 83
4 Categories of Testing Accommodations
An accommodation is any change in testing materials or procedures that enables students to participate in assessments so that their abilities with respect to what is intended to be measured can be more accurately assessed. There are four general types of accommodations:
Presentation (for example, repeat directions, read aloud) ■
Response (for example, mark answers in book, point to answers) ■
Setting (for example, study carrel, separate room, special lighting) ■
Timing/schedule (for example, extended time, frequent breaks, multiple days) ■
In addition, ELL accommodations are sometimes categorized as follows:
English language (for example, simplifying the English language in the ■
stem of an item, providing a customized English dictionary that includes definitions for difficult words on the test)
Native language (for example, providing a side-by-side test translation, ■
providing directions in the student’s native language)
Other (for example, extended time, small group testing) ■
Concern about accommodation applies to individually administered and large-scale testing. The concerns are legal (Is an individual sufficiently disabled to require taking an accommodated test?), technical (To what extent can we adapt measures and still have technically adequate tests?), and political (Is it fair to give accommodations to some students, yet deny them to others?).
Photo 5.1A student uses a computer
magnifi er to read books and an augmentative keyboard
to write.
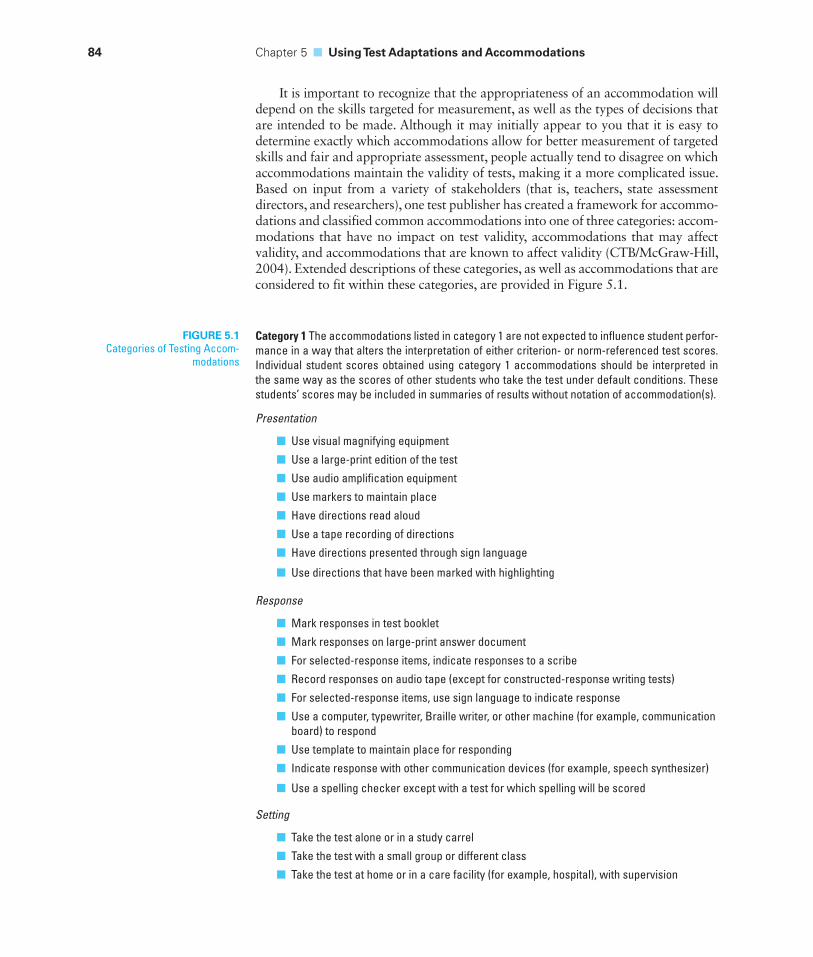
84 Chapter 5 ■ Using Test Adaptations and Accommodations
It is important to recognize that the appropriateness of an accommodation will depend on the skills targeted for measurement, as well as the types of decisions that are intended to be made. Although it may initially appear to you that it is easy to determine exactly which accommodations allow for better measurement of targeted skills and fair and appropriate assessment, people actually tend to disagree on which accommodations maintain the validity of tests, making it a more complicated issue. Based on input from a variety of stakeholders (that is, teachers, state assessment directors, and researchers), one test publisher has created a framework for accommo-dations and classified common accommodations into one of three categories: accom-modations that have no impact on test validity, accommodations that may affect validity, and accommodations that are known to affect validity (CTB/McGraw-Hill, 2004). Extended descriptions of these categories, as well as accommodations that are considered to fit within these categories, are provided in Figure 5.1.
FIGURE 5.1Categories of Testing Accom-
modations
Category 1 The accommodations listed in category 1 are not expected to infl uence student perfor-mance in a way that alters the interpretation of either criterion- or norm-referenced test scores. Individual student scores obtained using category 1 accommodations should be interpreted in the same way as the scores of other students who take the test under default conditions. These students’ scores may be included in summaries of results without notation of accommodation(s).
Presentation
Use visual magnifying equipment ■
Use a large-print edition of the test ■
Use audio amplifi cation equipment ■
Use markers to maintain place ■
Have directions read aloud ■
Use a tape recording of directions ■
Have directions presented through sign language ■
Use directions that have been marked with highlighting ■
Response
Mark responses in test booklet ■
Mark responses on large-print answer document ■
For selected-response items, indicate responses to a scribe ■
Record responses on audio tape (except for constructed-response writing tests) ■
For selected-response items, use sign language to indicate response ■
Use a computer, typewriter, Braille writer, or other machine (for example, communication ■
board) to respond
Use template to maintain place for responding ■
Indicate response with other communication devices (for example, speech synthesizer) ■
Use a spelling checker except with a test for which spelling will be scored ■
Setting
Take the test alone or in a study carrel ■
Take the test with a small group or different class ■
Take the test at home or in a care facility (for example, hospital), with supervision ■
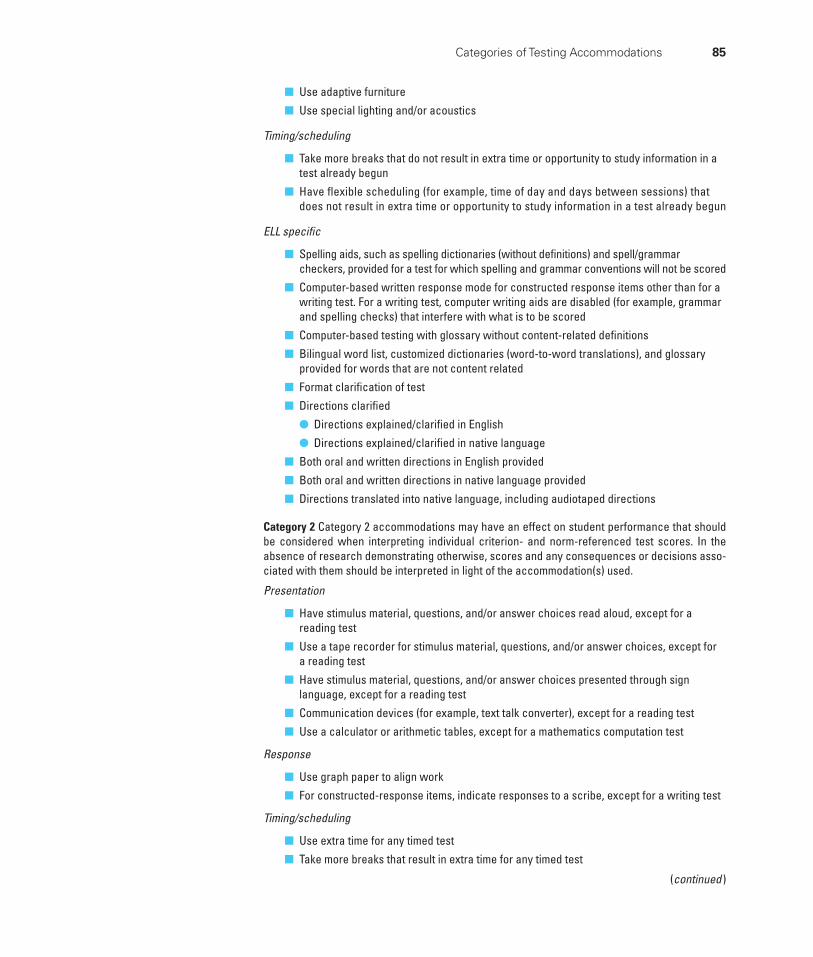
Categories of Testing Accommodations 85
Use adaptive furniture ■
Use special lighting and/or acoustics ■
Timing/scheduling
Take more breaks that do not result in extra time or opportunity to study information in a ■
test already begun
Have fl exible scheduling (for example, time of day and days between sessions) that ■
does not result in extra time or opportunity to study information in a test already begun
ELL specifi c
Spelling aids, such as spelling dictionaries (without definitions) and spell/grammar ■
checkers, provided for a test for which spelling and grammar conventions will not be scored
Computer-based written response mode for constructed response items other than for a ■
writing test. For a writing test, computer writing aids are disabled (for example, grammar and spelling checks) that interfere with what is to be scored
Computer-based testing with glossary without content-related defi nitions ■
Bilingual word list, customized dictionaries (word-to-word translations), and glossary ■
provided for words that are not content related
Format clarifi cation of test ■
Directions clarifi ed ■
Directions explained/clarifi ed in English ●
Directions explained/clarifi ed in native language ●
Both oral and written directions in English provided ■
Both oral and written directions in native language provided ■
Directions translated into native language, including audiotaped directions ■
Category 2 Category 2 accommodations may have an effect on student performance that should be considered when interpreting individual criterion- and norm-referenced test scores. In the absence of research demonstrating otherwise, scores and any consequences or decisions asso-ciated with them should be interpreted in light of the accommodation(s) used.
Presentation
Have stimulus material, questions, and/or answer choices read aloud, except for a ■
reading test
Use a tape recorder for stimulus material, questions, and/or answer choices, except for ■
a reading test
Have stimulus material, questions, and/or answer choices presented through sign ■
language, except for a reading test
Communication devices (for example, text talk converter), except for a reading test ■
Use a calculator or arithmetic tables, except for a mathematics computation test ■
Response
Use graph paper to align work ■
For constructed-response items, indicate responses to a scribe, except for a writing test ■
Timing/scheduling
Use extra time for any timed test ■
Take more breaks that result in extra time for any timed test ■
(continued )
86 Chapter 5 ■ Using Test Adaptations and Accommodations
(Figure 5.1 continued )
Extend the timed section of a test over more than one day, even if extra time does not result ■
Have fl exible scheduling that results in extra time ■
ELL specifi c
Test items read aloud in linguistically clarified* English on a test other than a reading test ■
Test items read aloud in native language on a test other than a reading test ■
Test items read aloud in English on a test other than a reading test ■
Audiotaped test items provided in English on a test other than a reading test ■
Test that is linguistically clarifi ed in English for words not related to content on nonreading ■
(for example, words defi ned or explained) in English
Oral response in English using a scribe for tests other than a writing test** ■
Written response in native language translated into English for tests other than a writing test** ■
Audiotaped test items provided in native language version provided for content other ■
than reading and writing test
Side-by-side bilingual test or translated version provided for content other than reading ■
and writing tests
* Linguistic clarifi cations are developed and provided by test publisher, not by test administrator.** These may be appropriate, but not feasible, for most ELL students.
Category 3 Category 3 accommodations change what is being measured and are likely to have an effect that alters the interpretation of individual criterion- and norm-referenced scores. This occurs when the accommodation is strongly related to the knowledge, skill, or ability being mea-sured (for example, having a reading comprehension test read aloud). In the absence of research demonstrating otherwise, criterion- and norm-referenced test scores and any consequences or decisions associated with them should be interpreted not only in light of the accommodation(s) used but also in light of how the accommodation(s) may alter what is measured.
Presentation
Use Braille or other tactile form of print ■
On a reading (decoding) test, have stimulus material, questions, and/or answer choices ■
presented through sign language
On a reading (decoding) test, use a text-talk converter, where the reader is required to ■
construct meaning and decode words from text
On a reading (decoding) test, use a tape recording of stimulus material, questions, and/or ■
answer choices
Have directions, stimulus material, questions, and/or answer choices paraphrased ■
For a mathematics computation test, use of a calculator or arithmetic tables ■
Use a dictionary, where language conventions are assessed ■
Response
For a constructed-response writing test, indicate responses to a scribe ■
Spelling aids, such as spelling dictionaries (without defi nitions) and spell/grammar ■
checkers, provided for a test for which spelling and grammar conventions will be scored
Use a dictionary to look up words on a writing test ■
From Guidelines for Inclusive Test Administration 2005, p. 8. Copyright © 2004 by CTB/McGraw-Hill LLC. Reproduced with permission of The McGraw-Hill Companies, Inc.
Recommendations for Making Accommodation Decisions During Eligibility Testing 87
Research continues to be conducted on accommodations to refine and pro-vide justification for how these accommodations are assigned to the various validity categories. We emphasize throughout this book the importance of con-sidering test purpose and the decisions that assessment is intended to inform when deciding what assessment tools to use. Deciding whether a particular accommodation is appropriate for testing is no different. When deciding on accommodation appropriateness, careful attention must be paid to what the test is intended to measure and what decisions are intended to be made with the results.
Progress is rapid in designing and validating test accommodations. You are advised to visit the website for the National Center on Educational Outcomes (http://cehd.umn.edu/nceo) to read the latest research and publications on state and national practice in testing accommodations.
5 Recommendations for Making Accommodation Decisions During Eligibility Testing
There are major debates about the kinds of accommodations that should be permitted in testing. There are also major arguments about the extent to which accommodations in testing destroy the technical adequacy of tests. We first provide recommendations for making accommodation decisions on tests that are commonly used to make decisions about individuals (for example, eligibility and instructional planning for exceptional children). Then, we provide recommenda-tions for making accommodation decisions on tests that are typically administered at the group level and used for accountability purposes.
The issues in making accommodation decisions extend to more than screening and accountability. In fact, they play a major role in decisions about exceptionality, special need, eligibility, and instructional planning. We think there are some rea-sonable guidelines for best practice in making decisions about individuals, and we offer associated guidelines here.
Students with DisabilitiesConduct all assessments in the student’s primary language or mode of ■
communication. The mode of communication is that normally used by the person (such as sign language, Braille, or oral communication). Loeding and Crittenden (1993, p. 19) note that for students who are deaf, the primary communication mode is either a visual–spatial, natural sign language used by members of the American Deaf Community called American Sign Language (ASL) or a manually coded form of English, such as Signed English, Pidgin Sign English, Seeing Essential English, Signing Exact English, or Sign-Supported Speech/English. Therefore, they argue, “traditional paper- and -pencil tests are inaccessible, invalid, and inappropriate to the deaf student because the tests are written in English only.”
Make accommodations in format when the purpose of testing is not ■
substantially impaired. It should be demonstrated that the accommodations assist the individual in responding but do not provide content assistance (for example, a scribe should record the response of the person being tested—not
88 Chapter 5 ■ Using Test Adaptations and Accommodations
interpret what the person says, include his or her additional knowledge, and then record a response). Personal assistants who are provided during testing, such as readers, scribes, and interpreters, should be trained in how to provide associated accommodations to ensure proper administration.
Make normative comparisons only with groups whose membership includes ■
students with background sets of experiences and opportunities like those of the students being tested.
Students with Limited English Profi ciencyLack of progress in learning English is the most common reason students with limited English proficiency are referred to ascertain eligibility for special edu-cation (Figueroa, 1990). It seems that most teachers do not understand that it usually takes several years to acquire sufficient fluency to be fully functional academically and cognitively in English. The fundamental principle when assess-ing students with limited English proficiency is to ensure that the assessment materials and procedures used actually assess students’ target knowledge, skill, or ability, and that it is not influenced by their inability (or limited ability) to understand and use English. Three basic approaches have been used to assess students whose English is sufficiently limited to make eligibility testing in English inappropriate: using nonverbal tests, testing in the student’s native language, and not testing at all. The strengths and weaknesses of each of these approaches are discussed.
Use Nonverbal Tests
Several nonverbal tests are available for testing intelligence. This type of test is believed to reduce the effects of language and culture on the assessment of intellectual abilities. Nonverbal tests do not, however, completely eliminate the effects of language and culture. Some tests involve oral directions, but the remaining aspects of the test do not require students to comprehend or express their responses in a particular language. Some tests (for example, the Comprehensive Test of Nonverbal Intelligence) allow testers to use either oral or pantomime directions. A few tests are exclusively nonverbal (for example, the Leiter International Performance Scale) and do not require language for direc-tions or responses.
Because students’ skills in language comprehension usually precede their skills in language production, performance tests with oral directions might be useful with some students. However, the testers should have objective evidence that a student sufficiently comprehends academic language for the test to be valid, and such evidence is generally not available. Tests that do not rely on oral direc-tions or responses are more useful because they do not make any assumptions about students’ language competence. However, other validity issues cloud the use of performance tests in the schools. For example, the nature of the tasks on nonverbal intelligence tests is usually less related to success in school than are the tasks on verbal intelligence tests.
Moreover, some cultural considerations are beyond the scope of directions and responses. For example, the very nature of testing may be more familiar in U.S. culture than in the cultures of other countries. When students are familiar
Recommendations for Making Accommodation Decisions During Eligibility Testing 89
with the testing process, they are likely to perform better. As another example, students from other cultures may respond differently to adults in authority, and these differences may alter estimates of their ability derived from tests. Thus, although performance and nonverbal tests may be a better option than verbal tests administered in English, they are not without problems.
Test in the Student’s Native Language
There are several ways to test students using directions and materials in their native language. Commercial tests may have been developed in the student’s native language. If such tests are not available, testers may locate a foreign- language version of the test. If foreign-language versions are not available, testers may be able to translate a test from English to the student’s native language, either on their own or through use of an interpreter.
Use Commercially Translated Tests Several tests are currently available in language versions other than English—most frequently, Spanish. These tests run the gamut from those that are translated to those that are renormed and those that are refor-matted for another language and culture. The difference among these approaches is signifi cant.
When tests are only translated, we can assume that the child understands the directions and the questions. However, the questions may be of different difficulty in U.S. culture and the English language for two reasons. First, the difficulty of the vocabulary can vary from language to language. For example, reading cat in English is different from reading gato in Spanish. Cat is a three-letter, one-syllable word containing two of the first three letters of the English alphabet; gato is a four-letter, two-syllable word with the first, seventh, fifteenth, and twentieth letters of the alphabet. The frequency of cat in each language is likely different, as is the popularity of cats as house pets.
The second reason that translated questions may be of different difficulty is that the difficulty of the content can vary from culture to culture because children from different cultures have not had the same opportunity to learn the informa-tion. For example, suppose we asked Spanish-speaking students from Venezuela, Cuba, and California who attended school in the United States to identify Simón Bolívar, Ernesto “Che” Guevara, and César Chávez. We could speculate that the three groups of students would probably identify the three men with different degrees of accuracy. The students from California would be most likely to recog-nize Chávez as an American labor organizer but less frequently recognize Bolívar and Guevara. Students from Venezuela would likely recognize Bolívar as a libera-tor of South America more often than would students from Cuba and the United States. Students from Cuba would be more likely to recognize Guevara as a revo-lutionary than would students from the other two countries. Thus, the difficulty of test content is embedded in culture.
Also, when tests are translated, we cannot assume that the psychological demands made by test items remain the same. For example, an intelligence test might ask a child to define peach. A child from equatorial South America may never have eaten, seen, or heard of a peach, whereas U.S. students are quite likely to have seen and eaten peaches. For U.S. students, the psychologi-cal demand of identifying a peach is to recall the biological class and essential
90 Chapter 5 ■ Using Test Adaptations and Accommodations
characteristics of something they have experienced. For South American chil-dren, the item measures their knowledge of an exotic fruit. For U.S. children, the test would measure intelligence; for South American children, the test would measure achievement.
Some of the problems associated with a simple translation of a test can be circumvented if the test is renormed on the target population and items are reor-dered in terms of their translated difficulties. For example, to use the Wechsler Intelligence Scale for Children, fourth edition, effectively with Spanish-speaking Puerto Ricans, the test could be normed on a representative sample of Spanish-speaking Puerto Rican students. Based on the performance of the new norma-tive sample, the items could be reordered as necessary. However, renorming and reordering do not reproduce the psychological demands made by test items in English.
Develop and Validate a Version of the Test for Each Cultural/Linguistic Group Given the problems associated with translations, tests developed in the student’s lan-guage and culture are clearly preferable to those that are not. For example, suppose one wished to develop a version of the Wechsler Intelligence Scale for Children para los Niños de Cuba. Test items could be developed within the Cuban American culture according to the general framework of the Wechsler scale. Specifi c items might or might not be the same. The new test would then need to be validated. For example, factor-analytic studies could be undertaken to ascertain whether the same four factors underlie the new test (that is, ver-bal comprehension, perceptual organization, freedom from distractibility, and processing speed).
Although they may be preferable, culture- and language-specific tests are not economically justifiable for test publishers except in the case of the very largest minorities—for example, Spanish-speaking students with much U.S. accultura-tion. The cost of standardizing a test is sizable, and the market for intelligence tests in, for example, Hmong, Ilocano, or Gujarathi is far too small to offset the devel-opment costs. Even if such tests were made, they would require someone familiar with the language to administer to students. For Spanish-speaking students, many publishers offer both English and Spanish versions. Some of these are translations, others are adaptations, and still others are independent tests. Test users must be careful to assess the appropriateness of the Spanish version to make sure that it is culturally appropriate for the test taker.
Use an Interpreter If the tester is fl uent in the student’s native language or if a quali-fi ed interpreter is available, it is possible (although undesirable) to administer tests that are interpreted for a student with limited English profi ciency. Interpretations can occur on an as-needed basis. For example, the tester can translate or interpret directions or test content and answer questions in the student’s native language. Although interpretation is an appealing, simple approach, it presents numerous problems. In addition to the problems associated with the commercial availability of translations, the accuracy of the interpretation is unknown.
Do Not Test
Not all educational decisions and not all assessments require testing. For students with limited English proficiency from a variety of cultures, testing for the purpose
Recommendations for Making Accommodation Decisions During Eligibility Testing 91
of determining eligibility is usually a bad idea. However, the school cannot over-look the possibility that students with limited English proficiency are really handi-capped beyond their English abilities.
Determination of disability can be made without psychological or educational testing. The determination of sensory or physical disability can be readily made with the use of interpreters. Students or their parents need little proficiency in English for professionals to determine if a student has a traumatic brain injury, other health impairments, or orthopedic, visual, or auditory dis-abilities. Disabilities based on impaired social function (such as emotional dis-turbance and autism) can be identified through direct observation of a student or interviews with family members (using interpreters if necessary), teachers, and so forth.
The appraisal of intellectual ability is required to identify students with men-tal retardation. When students have moderate to severe forms of mental retarda-tion, it may be possible to determine that they have limited intellectual ability without ever testing. For example, direct observation may reveal that a student has not acquired language (either English or the native language), communicates only by pointing and making grunting noises, is not toilet trained, and engages in inappropriate play whether judged by standards of the primary culture or by standards of U.S. culture. The student’s parents may recognize that the student is much slower than their other children and would be judged to have mental retar-dation in their native culture. In this case, parents may want special educational services for their child. In such a situation, identification would not be impeded by the student’s (or parents’) lack of English. However, students with mild mental retardation do not demonstrate such pronounced developmental delays; rather, their disability is relative and not easily separated from their limited proficiency in English.
The identification of students with specific learning disabilities seems par-ticularly difficult. IDEA 2004 requires that various conditions be considered indicative of a specific learning disability only if the student has been “pro-vided with learning experiences and instruction appropriate for the child’s age or state-approved grade-level standards” and that the condition is not a result of cultural disadvantage. Clearly, these conditions can rarely be met for stu-dents with limited English proficiency, especially when the students are also culturally diverse and have only attended U.S. public schools for a short period of time.
Finally, limited English proficiency should not be considered a speech or language impairment. Although it is quite possible for a student with limited English to have a speech or language impairment, that impairment would also be present in the student’s native language. Speakers of the student’s native language, such as the student’s parents, could verify the presence of stuttering, impaired articulation, or voice impairments; the identification of a language disorder would require a fluent speaker of the child’s native language.
When it is not possible to determine whether a student has a disability, stu-dents with limited English proficiency who are experiencing academic difficulties still need to have services besides special education available. Districts should have programs in English as a second language that could continue to help students after they have acquired social communication skills.
92 Chapter 5 ■ Using Test Adaptations and Accommodations
6 Recommendations for Making Accommodation Decisions During Accountability Testing
Many other accommodation recommendations can be implemented when collect-ing assessment data to make decisions about groups of students, specifically for the purpose of making accountability decisions. It is important to note that most states include language in their laws or regulations specifying the content areas for which students with limited English proficiency can be tested in a different language, as well as the number of years following enrollment in a U.S. public school during which they can take accountability tests in an alternate language. Students with limited English proficiency are typically required to take an annual test of their English language proficiency. These test results are used to determine whether they (as a group) are making progress in English language development and to hold schools accountable for providing effective English language devel-opment programs for those students who need them. Clearly, providing a native language accommodation on such tests would be highly inappropriate.
Thurlow, Elliott, and Ysseldyke (2003) suggest the following recommenda-tions about accommodation decision making for the purpose of accountability:
States and districts should have written guidelines for the use of ■
accommodations in large-scale assessments used for accountability purposes.
Decisions about accommodations should be made by one or more persons ■
who know the student, including the student’s strengths and weaknesses.
Decision makers should consider the student’s learning characteristics and the ■
accommodations currently used during classroom instruction and classroom testing.
The student’s category of disability or program setting should not influence ■
the decision.
The goal is to ensure that accommodations have been used by the student ■
prior to their use in an assessment—generally, in the classroom during instruction and in classroom testing situations. New accommodations should not be introduced for the district- or statewide assessment.
The decision is made systematically, using a form that lists questions to answer or ■
variables to consider in making the accommodation decision. Ideally, classroom data on the effects of accommodations are part of the information entered into decisions. Decisions and the reasons for them should be noted on the form.
Decisions about accommodations should be documented on the student’s ■
individualized educational program.
Parents should be involved in the decision by either participating in the decision- ■
making process or being given the analysis of the need for accommodations and by signing the form that indicates accommodations that are to be used.1
Accommodation decisions made to address individual student needs should ■
be reconsidered at least once a year, given that student needs are likely to change over time.
1Adapted from Thurlow, Elliott, and Ysseldyke (2003), pp. 46–47, with permission.
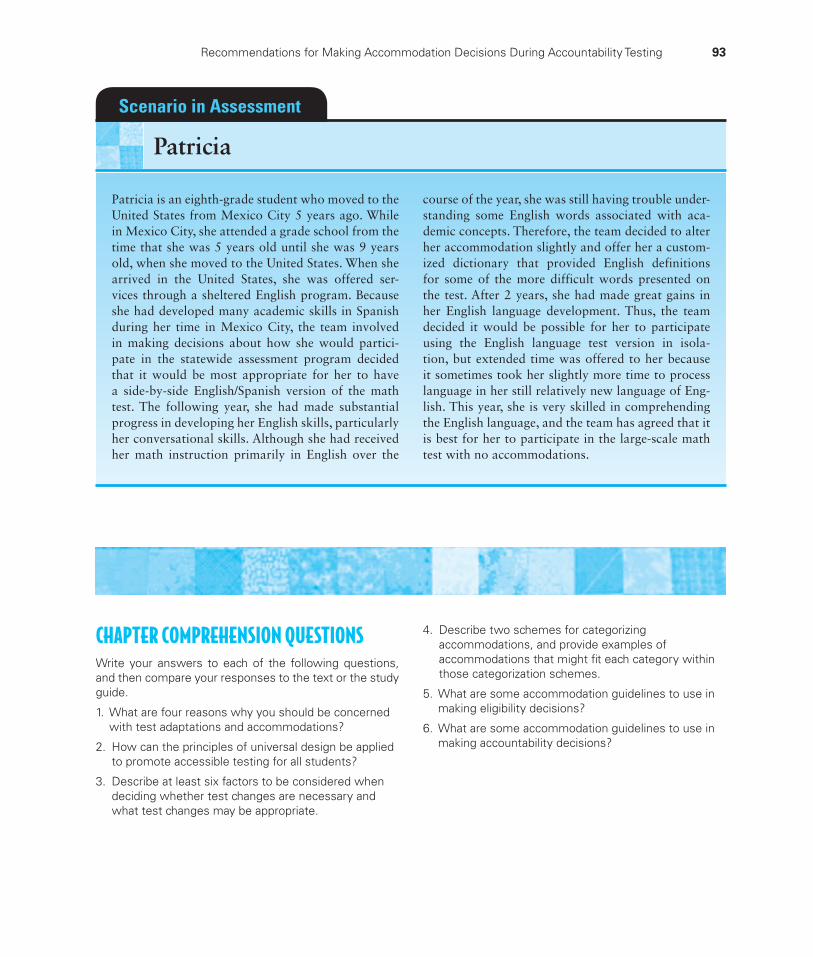
Recommendations for Making Accommodation Decisions During Accountability Testing 93
Patricia is an eighth-grade student who moved to the United States from Mexico City 5 years ago. While in Mexico City, she attended a grade school from the time that she was 5 years old until she was 9 years old, when she moved to the United States. When she arrived in the United States, she was offered ser-vices through a sheltered English program. Because she had developed many academic skills in Spanish during her time in Mexico City, the team involved in making decisions about how she would partici-pate in the statewide assessment program decided that it would be most appropriate for her to have a side-by-side English/Spanish version of the math test. The following year, she had made substantial progress in developing her English skills, particularly her conversational skills. Although she had received her math instruction primarily in English over the
course of the year, she was still having trouble under-standing some English words associated with aca-demic concepts. Therefore, the team decided to alter her accommodation slightly and offer her a custom-ized dictionary that provided English definitions for some of the more difficult words presented on the test. After 2 years, she had made great gains in her English language development. Thus, the team decided it would be possible for her to participate using the English language test version in isola-tion, but extended time was offered to her because it sometimes took her slightly more time to process language in her still relatively new language of Eng-lish. This year, she is very skilled in comprehending the English language, and the team has agreed that it is best for her to participate in the large-scale math test with no accommodations.
Scenario in Assessment
Patricia
CHAPTER COMPREHENSION QUESTIONSWrite your answers to each of the following questions, and then compare your responses to the text or the study guide.
1. What are four reasons why you should be concerned with test adaptations and accommodations?
2. How can the principles of universal design be applied to promote accessible testing for all students?
3. Describe at least six factors to be considered when deciding whether test changes are necessary and what test changes may be appropriate.
4. Describe two schemes for categorizing accommodations, and provide examples of accommodations that might fi t each category within those categorization schemes.
5. What are some accommodation guidelines to use in making eligibility decisions?
6. What are some accommodation guidelines to use in making accountability decisions?

This page intentionally left blank
PART 2different points. Thus today there is no shortage of opinions about how classroom assessments ought to be conducted. Some educators still rely on norm-referenced achievement tests to plan and evaluate instruction; some rely on systematic observation; some rely on teacher-made tests and curriculum-based assessment; some rely on subjective and qualitative judgments to assess classroom learning; and some rely on a combination of approaches.
In Part 2 of this text, we discuss the approaches most likely to be used by classroom teachers. We do not consider these approaches to be informal or unstandardized. They are frequently formal: Students know that they are being assessed and that the assessments count for something. They are also frequently standardized: Students receive the same directions and tasks, and their responses are frequently scored using the same criteria. These approaches to assessment are used most frequently by classroom teachers, but we recognize that some specialists (such as school psychologists and speech and language therapists) may also use these approaches.
Part 2 begins with Chapter 6, on observation, which provides a general overview of basic considerations and good practice. Chapter 7 provides an overview of objective and performance measures constructed by teachers. Chapter 8 gives you a set of steps and procedures for preparing for and managing mandated tests, monitoring progress, and interpreting data. The chapter concludes with a description of the Iowa problem-solving model used in the Heartland Area Education Agency.
Assessment in Classrooms
The development of assessment has never been static, and its improvement has seldom been merely incremental. Scientifi c positivism was embraced by the mental-testing (such as intelligence tests) movement, and objective (scientifi c) tests gained widespread accep tance during the
fi rst half of the twentieth century. By the 1960s, however, experience with the use of norm-referenced, objectively scored tests suggested that they had a variety of technical shortcomings. A subsequent fl urry of activity produced norm-referenced tests with greater reliability and substantially better norms. Nonetheless, educators frequently used these tests in inappropriate ways (for example, to plan and evaluate instruction).
As educators learned that these tests could not be used effectively to facilitate many classroom decisions, other assessment procedures were developed. Thus systematic observation procedures, so successful in experimental psychology, were adopted for classroom use. Similarly, there was renewed interest in the development of teacher-made tests. Although systematic observation and teacher-made tests were widely accepted and effectively used, many educators were still dissatisfi ed with the perceived limitations of these assessment techniques. During the late 1970s and 1980s, interest grew in assessing instruction and what went on in the classroom (rather than student abilities and skills). By the early 1990s, more subjective and qualitative approaches to assessment were advocated and tried.
Educational assessment may appear to have come full circle, but educators have gotten off at
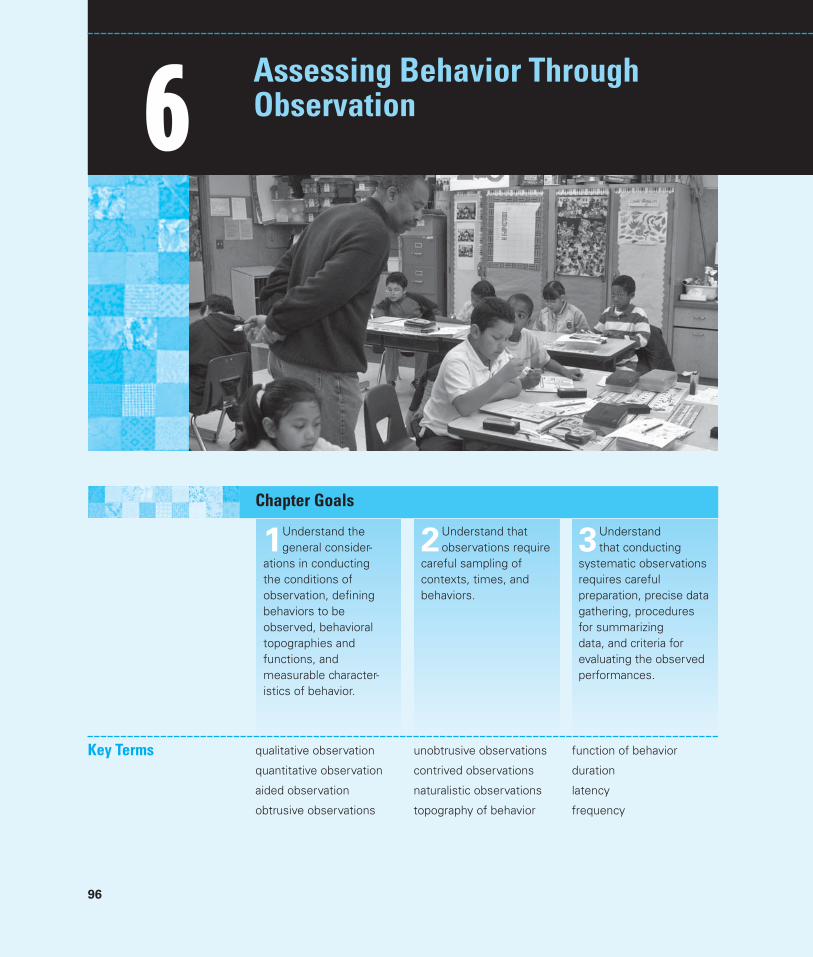
96
1Understand the general consider-
ations in conducting the conditions of observation, defi ning behaviors to be observed, behavioral topographies and functions, and measurable character-istics of behavior.
3Understand that conducting
systematic observations requires careful preparation, precise data gathering, procedures for summarizing data, and criteria for evaluating the observed performances.
2Understand that observations require
careful sampling of contexts, times, and behaviors.
6 Assessing Behavior Through Observation
Chapter Goals
Key Terms qualitative observation
quantitative observation
aided observation
obtrusive observations
unobtrusive observations
contrived observations
naturalistic observations
topography of behavior
function of behavior
duration
latency
frequency
General Considerations 97
amplitude
behavioral contexts
continuous recording
whole-interval sampling
partial-interval sampling
momentary time sampling
social comparison
social tolerance
aimline
1 General Considerations
Teachers are constantly monitoring themselves and their students. Sometimes they are just keeping an eye on things to make sure that their class-rooms are safe and goal oriented, to anticipate disruptive or dangerous situations, or just to keep track of how things are going in a general sense. Often, teachers notice behavior or situations that seem important and require their attention: The fire alarm has sounded, Harvey has a knife, Betty is asleep, Jo is wandering around the classroom, and so forth. In other situations, often as a result of their general monitoring, teachers look for very specific behavior to observe: social behavior that should be reinforced, attention to task, performance of particular skills, and so forth.
Systematic observations are also used to inform placement and instructional decisions. When assessment does not rely on permanent products (that is, written examinations and physical creations such as a table in shop or a dinner in home economics), observation is usually involved. Clearly, social behavior, learning behavior (for example, attention to task), and aberrant behavior (for example, hand flapping) are all suitable targets of systematic observation. Obviously, behavior can be an integral part of assessing physical and mental states, physical characteristics, and educational handicaps as well as monitoring student progress and attainment.
There are two basic approaches to observation: qualitative and quantitative. Qualitative observations can describe behavior as well as its contexts (that is, antecedents and consequences). These observations usually occur without pre-determining the behaviors to be observed or the times and contexts in which to observe. Instead, an observer monitors the situation and memorializes the obser-vations in a narrative, the most common form being anecdotal records. Good anecdotal records contain a complete description of the behavior and the context in which it occurred and can set the stage for more focused and precise quantita-tive observations.
We stress behavioral observation, a quantitative approach to observation. Measuring behavior through observation is distinguished by five steps that occur in advance of the actual observations: (1) The behavior is defined precisely and objectively, (2) the characteristics of the behavior (for example, frequency) are specified, (3) procedures for recording are developed, (4) the times and places for observation are selected and specified, and (5) procedures are developed to assess interobserver agreement. Beyond these defining characteristics, behavioral obser-vations can vary on a number of dimensions.
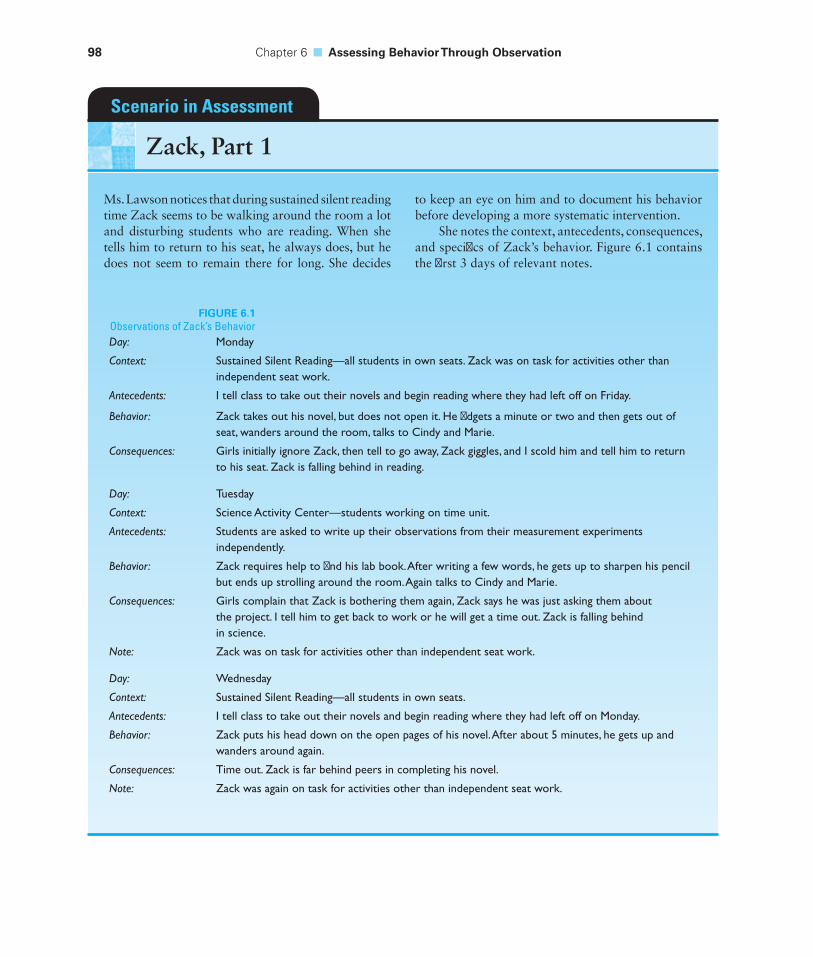
98 Chapter 6 ■ Assessing Behavior Through Observation
Ms. Lawson notices that during sustained silent reading time Zack seems to be walking around the room a lot and disturbing students who are reading. When she tells him to return to his seat, he always does, but he does not seem to remain there for long. She decides
to keep an eye on him and to document his behavior before developing a more systematic intervention.
She notes the context, antecedents, consequences, and specifi cs of Zack’s behavior. Figure 6.1 contains the fi rst 3 days of relevant notes.
Scenario in Assessment
Zack, Part 1
FIGURE 6.1Observations of Zack’s BehaviorDay: Monday
Context: Sustained Silent Reading—all students in own seats. Zack was on task for activities other than independent seat work.
Antecedents: I tell class to take out their novels and begin reading where they had left off on Friday.
Behavior: Zack takes out his novel, but does not open it. He fi dgets a minute or two and then gets out of seat, wanders around the room, talks to Cindy and Marie.
Consequences: Girls initially ignore Zack, then tell to go away, Zack giggles, and I scold him and tell him to return to his seat. Zack is falling behind in reading.
Day: Tuesday
Context: Science Activity Center—students working on time unit.
Antecedents: Students are asked to write up their observations from their measurement experiments independently.
Behavior: Zack requires help to fi nd his lab book. After writing a few words, he gets up to sharpen his pencil but ends up strolling around the room. Again talks to Cindy and Marie.
Consequences: Girls complain that Zack is bothering them again, Zack says he was just asking them about the project. I tell him to get back to work or he will get a time out. Zack is falling behind in science.
Note: Zack was on task for activities other than independent seat work.
Day: Wednesday
Context: Sustained Silent Reading—all students in own seats.
Antecedents: I tell class to take out their novels and begin reading where they had left off on Monday.
Behavior: Zack puts his head down on the open pages of his novel. After about 5 minutes, he gets up and wanders around again.
Consequences: Time out. Zack is far behind peers in completing his novel.
Note: Zack was again on task for activities other than independent seat work.
General Considerations 99
Live or Aided ObservationQuantitative analysis of behavior can occur in real time or after the behavior has occurred by means of devices such as video or audio recorders that can replay, slow down, or speed up records of behavior. Observation can be enhanced with equipment (for example, a telescope), or it can occur with only the observer’s unaided senses.
Obtrusive Versus Unobtrusive ObservationObservations are called obtrusive when it is obvious to the person being observed that he or she is being observed. The presence of an observer makes observation obvi-ous; for example, the presence of a practicum supervisor in the back of the classroom makes it obvious to student teachers that they are being observed. The presence of observation equipment makes it obvious; for example, a video camera with a red light lit makes it obvious that observation is occurring. Something added to a situa-tion can signal that someone is observing. For example, a dark, late-model, four-door sedan idling on the side of the road with a radar gun protruding from the driver’s window makes it obvious to approaching motorists that they are being observed, or a flickering light and noise coming from behind a mirror in a testing room indicate to test takers that there is someone or something watching from behind the mirror.
When observations are unobtrusive, the people being observed do not realize they are being watched. Observers may pretend that they are not observing or observe from hidden positions. They may use telescopes to watch from afar. They may use hidden cameras and microphones.
Unobtrusive observations are preferable for two reasons. First, people are reluctant to engage in certain types of behavior if another person is looking. Thus, when antisocial, offensive, or illegal behaviors are targeted for assessment, obser-vation should be conducted surreptitiously. Behavior of these types tends not to occur if they are overtly monitored. For example, Billy is unlikely to steal Bob’s lunch money when the teacher is looking, and Rodney is unlikely to spray-paint gang graffiti on the front doors of the school when other students are present.
Likewise, if people are being observed, they are reluctant to engage in highly personal behaviors in which they must expose private body parts. In these instances, the observer should obtain the permission of the person or the person’s guardian before conducting such observations. Moreover, a same-sex observer who does not know the person being observed (and whom the person being observed does not know) should conduct the observations.
The second reason that unobtrusive observations are preferable is that the presence of an observer alters the observation situation. Observation can change the behavior of those in the observation situation. For example, when a princi-pal sits in the back of a probationary teacher’s classroom to conduct an annual evaluation, both the teacher’s and the students’ behavior may be affected by the principal’s presence. Students may be better behaved or respond more enthusiasti-cally in the mistaken belief that the principal is there to watch them. The teacher may write on the chalkboard more frequently or give more positive reinforcement than usual in the belief that the principal values those techniques. Observation can also eliminate other types of behavior. For example, retail stores may mount circuit TV cameras and video monitors in obvious places to let potential thieves know that they are being watched constantly and to try to discourage shoplifting.
100 Chapter 6 ■ Assessing Behavior Through Observation
When the target behavior is not antisocial, offensive, highly personal, or unde-sirable, obtrusive observation may be used provided the persons being observed have been desensitized to the observers and/or equipment. It is fortunate that most people quickly become accustomed to observers in their daily environment— especially if observers make themselves part of the surroundings by avoiding eye contact, not engaging in social interactions, remaining quiet and not moving around, and so on. Observation and recording can become part of the everyday classroom routine. In any event, obtrusive observation should not begin until the persons to be observed are desensitized and are acting in their usual ways.
Contrived Versus Naturalistic ObservationContrived observations occur when a situation is set up before a student is intro-duced into it. For example, a playroom may be set up witho9 cessaithoncourage aggressive play (such as guns or punching-bag dolls) or withoitemsssaithpromote other types of behavior. A child may be given a book and told to go into the room and read or may simply be told to wait in the room. Other adults or children in the situation may be confederates of the observer and may be instructed to behave in particular ways. For example, an older child may be told not to share 9 ceswithothe child who is the target of the observation, or an adult may be told to initiate a conversation on a specific topic witho9he target child.
In contrast, naturalistic observations occur in settings saithare not contrived. For example, specific tocesare not added to or removed from a playroom; the furniture iesarranged as it always iesarranged.
Defining BehaviorBehavior is usually defined in terms of its topography, its function, and its char-acteristics. The function saitha behavior serves in the environment is not directly observable, whereas the characteristics and topography of behavior can be mea-sured directly.
Topography of Behavior
Behavioral topography refers to the wayha behavior is performed. For example, suppose the behavior of interest is holding a poncil to write and wesare interested in Patty’s topography for saithbehavior. The topography is readily observable: Patty holds the pencil itha 45-degree angle to the paper, graspedhbetween her thumb and index finger; she supports the pencil withoher middle finger; and so forth. Paul’s topography for holding a poncil is quite different. Paul holds the pen-cil between his great toe and second toe so saiththe point of the poncil is toward the sole of his foot, and so forth.
Function of Behavior
The function of a behavior is the reason a person behaves as he or she does or the purpose the behavior serves. Obviously, the reason for a behavior cannot be observed; it can only be inferred. Sometimes, a person may offer an explanation of a behavior’s function—for example, “I was screaming to make him stop.” We can accepththe explanation of the behavior’s function if it is consistent witho9he circumstances, or we can rejecththe explanation of the function when it is not
General Considerations 101
consistent with the circumstances or is unreasonable. Other times, we can infer a behavior’s function from its consequences. For example, Johnny stands screaming at the rear door of his house until his mother opens the door; then he runs into the back yard and stops screaming. We might infer that the function of Johnny’s screaming is to have the door opened. Behavior typically serves one or more of five functions: (1) social attention/communication; (2) access to tangibles or pre-ferred activities; (3) escape, delay, reduction, or avoidance of aversive tasks or activities; (4) escape or avoidance of other individuals; and (5) internal stimula-tion (Carr, 1994).
Measurable Characteristics of BehaviorThe measurement of behavior, whether individual behavior or a category of behav-ior, is based on four characteristics: duration, latency, frequency, and amplitude. These characteristics can be measured directly (Shapiro & Kratochwill, 2000).
Duration
Behaviors that have discrete beginnings and endings may be assessed in terms of their duration—that is, the length of time a behavior lasts. The duration of a behav-ior is usually standardized in two ways: average duration and total duration. For example, in computing average duration, suppose that Janice is out of her seat four times during a 30-minute activity, and the durations of the episodes are 1 minute, 3 minutes, 7 minutes, and 5 minutes. In this example, the average duration is 4 minutes—that is, (1 + 3 + 7 + 5)/4. To compute Janice’s total duration, we add 1 + 3 + 7 + 5 to conclude that she was out of her seat a total of 16 minutes. Often, total duration is expressed as a rate by dividing the total occurrence by the length of an observation. This proportion of duration is often called the “prevalence of the behavior.” In the preceding example, Janice’s prevalence is .53 (that is, 16/30).
Latency
Latency refers to the length of time between a signal to perform and the beginning of the behavior. For example, a teacher might ask students to take out their books. Sam’s latency for that task is the length of time between the teacher’s request and Sam’s placing his book on his desk. For latency to be assessed, the behavior must have a discrete beginning.
Frequency
For behaviors with discrete beginnings and endings, we often count frequency—that is, the number of times the behaviors occur. When behavior is counted during variable time periods, frequencies are usually converted to rates. Using rate of behavior allows observers to compare the occurrence of behavior across different time periods and settings. For example, three episodes of out-of-seat behavior in 15 minutes may be converted to a rate of 12 per hour.
Alberto and Troutman (2005) suggest that frequency should not be used under two conditions: (1) when the behavior occurs at such a high rate that it cannot be counted accurately (for example, many stereotypic behaviors, such as foot tapping, can occur almost constantly) and (2) when the behavior occurs over a prolonged period of time (for example, cooperative play during a game of Monopoly).
102 Chapter 6 ■ Assessing Behavior Through Observation
Amplitude
Amplitude refers to the intensity of the behavior. In many settings, amplitude can be measured precisely (for example, with noise meters). However, in the classroom, it is usually estimated with less precision. For example, amplitude can be estimated using a rating scale that calibrates the amplitude of the behavior (for example, crying might be scaled as “whimpering,” “sobbing,” “crying,” and “screaming”). Amplitude may also be calibrated in terms of its objective or subjective impact on others. For example, the objective impact of hitting might be scaled as “without apparent physical damage,” “resulting in bruising,” and “causing bleeding.” More subjective behavior ratings estimate the internal impact on others; for example, a student’s humming could be scaled as “does not disturb others,” “disturbs stu-dents seated nearby,” or “disturbs students in the adjoining classroom.”
Selecting the Characteristic to Measure
The behavioral characteristic to be assessed should make sense; we should assess the most relevant aspect of behavior in a particular situation. For example, if Burl is wandering around the classroom during the reading period, observing the duration of that behavior makes more sense than observing the frequency, latency, or amplitude of the behavior. If Camilla’s teacher is concerned about her loud utterances, amplitude may be the most salient characteristic to observe. If Molly is always slow to follow directions, observing her latency makes more sense than assessing the frequency or amplitude of her behavior. For most behaviors, how-ever, frequency and duration are the characteristics measured.
2 Sampling Behavior
As with any assessment procedure, we can assess the entire domain if it is finite and convenient. If it is not, we can sample from the domain. Important dimension for sampling behavior include the contexts in which the behaviors occur, the times at which the behaviors occur, and the behaviors themselves.
ContextsWhen specific behaviors become the targets of intervention, it is useful to measure the behavior in a variety of contexts. Usually, the sampling of contexts is purpose-ful rather than random. We might want to know, for example, how Jesse’s behavior in the resource room differs from his behavior in the general education classroom. Consistent or inconsistent performance across settings and contexts can provide useful information about what events might set the occasion for the behavior. Differences between the settings in which a behavior does and does not occur can provide potentially useful hypotheses about setting events (that is, environmental events that set the occasion for the performance of an action) and discriminative stimuli (that is, stimuli that are consistently present when a behavior is reinforced and that come to bring out behavior even in the absence of the original reinforcer).1
1Discriminative stimuli are not conditioned stimuli in the Pavlovian sense that they elicit refl exive behavior. Discriminative stimuli provide a signal to the individual to engage in a particular behavior because that behavior has been reinforced in the presence of that signal.
Sampling Behavior 103
Bringing behavior under the control of a discriminative stimulus is often an effec-tive way of modifying it. For example, students might be taught to talk quietly (to use their “inside voice”) when they are in the classroom or hallway.
Similarly, consistent or inconsistent performance across settings and contexts can provide useful information about how the consequences of a behavior are affecting that behavior. Some consequences of a behavior maintain, increase, or decrease behavior. Thus, manipulating the consequences of a behavior can increase or decrease its occurrence. For example, assume that Joey’s friends usually laugh and congratulate him when he makes a sexist remark and that Joey is reinforced by his friends’ behavior. If his friends could be made to stop laughing and con-gratulating him, Joey would probably make fewer sexist remarks.
TimesWith the exception of some criminal acts, few behaviors are noteworthy unless they happen more than once. Behavioral recurrence over time is termed stabil-ity or maintenance. In a person’s lifetime, there are almost an infinite number of times to exhibit a particular behavior. Moreover, it is probably impossible and certainly unnecessary to observe a person continuously during his or her entire life. Thus, temporal sampling is always performed, and any single observation is merely a sample from the person’s behavioral domain.
Time sampling always requires the establishment of blocks of time, termed observation sessions, in which observations will be made. A session might consist of a continuous period of time (for example, one school day). More often, sessions are discontinuous blocks of time (for example, every Monday for a semester or during daily reading time).
Continuous Recording
Observers can record behavior continuously within sessions. They count each occurrence of a behavior in the observation session; they can time the duration or latency of each occurrence within the observation session.
When the observation session is long (for example, when it spans several days), continuous sampling can be very expensive and is often intrusive. Two options are commonly used to estimate behavior in very long observation ses-sions: the use of rating scales to make estimates and time sampling. In the first option, rating scales are used to estimate one (or more) of the four characteristics of behavior. Following are some examples of such ratings:
Frequency: ■ A parent might be asked to rate the frequency of a behavior. How often does Patsy usually pick up her toys—always, frequently, seldom, never?
Duration: ■ A parent might be asked to rate how long Bernie typically watches TV each night—more than 3 hours, 2 or 3 hours, 1 or 2 hours, or less than 1 hour?
Latency: ■ A parent might be asked to rate how quickly Marisa usually responds to requests—immediately, quickly, slowly, or not at all (ignores requests)?
Amplitude: ■ A parent might be asked to rate how much of a fuss Jessica usually makes at bedtime—screams, cries, begs to stay up, or goes to bed without fuss?
104 Chapter 6 ■ Assessing Behavior Through Observation
In the second observation option, duration and frequency are sampled sys-tematically during prolonged observation intervals. Three different sampling plans have been advocated: whole-interval recording, partial-interval recording, and momentary time sampling.
Time Sampling
Continuous observation requires the expenditure of more resources than does discontinuous observation. Therefore, it is common to observe for a sample of times within an observation session.
In interval sampling, an observation session is subdivided into intervals dur-ing which behavior is observed. Usually, observation intervals of equal length are spaced equally through the session, although the recording and observation intervals need not be the same length. Three types of interval sampling and scor-ing are common.
1. In whole-interval sampling, a behavior is scored as having occurred only when it occurs throughout the entire interval. Thus, it is scored only if it is occurring when the interval begins and continues through the end of the interval.
2. Partial-interval sampling is quite similar to whole-interval recording. The difference between the two procedures is that in partial-interval recording, an occurrence is scored if it occurs during any part of the interval. Thus, if a behavior begins before the interval begins and ends within the interval, an occurrence is scored; if a behavior starts after the beginning of the interval, an occurrence is scored; if two or more episodes of behavior begin and end within the interval, one occurrence is scored.
3. Momentary time sampling is the most effi cient sampling procedure. An observation session is subdivided into intervals. If a behavior is occurring at the last moment of the interval, an occurrence is recorded; if the behavior is not occurring at the last moment of the interval, a nonoccurrence is recorded. For example, suppose we observe Robin during her 20-minute reading period. We fi rst select the interval length (for example, 10 seconds). At the end of the fi rst 10-second interval, we observe if the behavior is occurring; at the end of the second 10-second interval, we again observe. We continue observing until we have observed Robin at the end of the 60th 10-second interval.
Salvia and Hughes (1990) have summarized a number of studies investigat-ing the accuracy of these time-sampling procedures. Both whole-interval and partial-interval sampling procedures provide inaccurate estimates of duration and frequency.2 Momentary time sampling provides an unbiased estimate of the pro-portion of time that is very accurate when small intervals are used (that is, 10- to 15-second intervals). Continuous recording with shorter observation sessions is the better method of estimating the frequency of a behavior.
2Suen and Ary (1989) have provided procedures whereby the sampled frequencies can be adjusted to provide accurate frequency estimates, and the error associated with estimates of prevalence can be readily determined for each sampling plan.
Sampling Behavior 105
BehaviorsTeachers and psychologists may be interested in measurement of a particular behavior or a constellation of behaviors thought to represent a trait (for example, cooperation). When an observer views a target behavior as important in and of itself, only that specific behavior is observed. However, when a specific behavior is thought to be one element in a constellation of behaviors, other important behaviors within the constellation must also be observed in order to establish the content validity of the behavioral constellation. For example, if taking turns on a slide were viewed as one element of cooperation, we should also observe other behaviors indicative of cooperation (such as taking turns on other equipment, following the rules of games, and working with others to attain a common goal). Each of the behaviors in a behavioral constellation can be treated separately or aggregated for the purposes of observation and reporting.
Observations are usually conducted on two types of behavior. First, we regu-larly observe behavior that is desirable and that we are trying to increase. Behavior of this type includes all academic performances (for example, oral reading or science knowledge) and prosocial behavior (for example, cooperative behavior or polite language). Second, we regularly observe behavior that is undesirable or may indicate a disabling condition. These behaviors are harmful, stereotypic, inappropriately infrequent, or inappropriate at the times exhibited.
Harmful behavior: ■ Behavior that is self-injurious or physically dangerous to others is almost always targeted for intervention. Self-injurious behavior includes such actions as head banging, eye gouging, self-biting or self-hitting, smoking, and drug abuse. Potentially harmful behavior can include leaning back in a desk or being careless with reagents in a chemistry experiment. Behaviors harmful to others are those that directly inflict injury (for example, hitting or stabbing) or are likely to injure others (for example, pushing other students on stairs or subway platforms, bullying, or verbally instigating physical altercations). Unusually aggressive behavior may also be targeted for intervention. Although most students will display aggressive behavior, some children go far beyond what can be considered typical or acceptable. These students may be described as hot-tempered, quick-tempered, or volatile. Overly aggressive behavior may be physical or verbal. In addition to the possibility of causing physical harm, high rates of aggressive behavior may isolate the aggressor socially.
Stereotypic behavior: ■ Stereotypic behaviors, or stereotypies (for example, hand flapping, rocking, and certain verbalizations such as inappropriate shrieks), are outside the realm of culturally normative behavior. Such behavior calls attention to students and marks them as abnormal to trained psychologists or unusual to untrained observers. Stereotypic behaviors are often targeted for intervention.
Infrequent or absent desirable behavior: ■ Incompletely developed behavior, especially behavior related to physiological development (for example, walking), is often targeted for intervention. Intervention usually occurs when development of these behaviors will enable desirable functional skills or social acceptance. Shaping is usually used to develop absent behavior, whereas reinforcement is used to increase the frequency of behavior that is within a student’s repertoire but exhibited at rates that are too low.
106 Chapter 6 ■ Assessing Behavior Through Observation
Normal behavior exhibited in inappropriate contexts: ■ Many behaviors are appropriate in very specific contexts but are considered inappropriate or even abnormal when exhibited in other contexts. Usually, the problems caused by behavior in inappropriate contexts are attributed to lack of stimulus control. Behavior that is commonly called “private” falls into this category; elimination and sexual activity are two examples. The goal of intervention should be not to get rid of these behaviors but to confine them to socially appropriate conditions. Behavior that is often called “disruptive” also falls into this category. For example, running and yelling are very acceptable and normal when exhibited on the playground; they are disruptive in a classroom.
A teacher may decide on the basis of logic and experience that a particular behavior should be modified. For example, harmful behavior should not be toler-ated in a classroom or school, and behavior that is a prerequisite for learning aca-demic material must be developed. In other cases, a teacher may seek the advice of a colleague, supervisor, or parent about the desirability of intervention. For example, a teacher might not know whether certain behavior is typical of a stu-dent’s culture. In yet other cases, a teacher might rely on the judgments of students or adults as to whether a particular behavior is troublesome or distracting for them. For example, are others bothered when Bob reads problems aloud during arithmetic tests? To ascertain whether a particular behavior bothers others, teach-ers can ask students directly, have them rate disturbing or distracting behavior, or perhaps use sociometric techniques to learn whether a student is being rejected or isolated because of his or her behavior. The sociometric technique is a method for evaluating the social acceptance of individual pupils and the social structure of a group: Students complete a form indicating their choice of companions for seating, work, or play. Teachers look at the number of times an individual student is chosen by others. They also look at who chooses whom.
For infrequent prosocial behavior or frequent disturbing behavior, a teacher may wish to get a better idea of the magnitude and pervasiveness of the problem before initiating a comprehensive observational analysis. Casual observation can provide information about the frequency and amplitude of the behavior; carefully noting the antecedents, consequences, and contexts may provide useful information about possible interventions if an intervention is warranted. If casual observations are made, anecdotal records of these casual observations should be maintained.
3 Conducting Systematic Observations
PreparationCareful preparation is essential to obtaining accurate and valid observational data that are useful in decision making. Five steps should guide the preparation for systematic observation:
1. Defi ne target behaviors.
Use defi nitions that describe behavior in observable terms. ●
Avoid references to internal processes (for example, understanding or ●
appreciating).
Conducting Systematic Observations 107
Anticipate potentially diffi cult discriminations and provide examples of ●
instances and noninstances of the behavior. Include subtle instances of the target behavior, and use related behaviors and behavior with similar topographies as noninstances.
State the characteristic of the behavior that will be measured (for example, ●
frequency or latency).
2. Select contexts. Observe the target behavior systematically in at least three contexts: the context in which the behavior was noted as troublesome (for example, in reading instruction), a similar context (for example, in math instruction), and a dissimilar context (for example, in physical education or recess).
3. Select an observation schedule.
Choose the session length. In the schools, session length is usually related ●
to instructional periods or blocks of time within an instructional period (for example, 15 minutes in the middle of small-group reading instruction).
Decide between continuous and discontinuous observation. The choice ●
of continuous or discontinuous observation will depend on the resources available and the specifi c behaviors that are to be observed. When very low-frequency behavior or behavior that must be stopped (for example, physical assaults) is observed, continuous recording is convenient and effi cient. For other behavior, discontinuous observation is usually preferred, and momentary time sampling is usually the easiest and most accurate for teachers and psychologists to use. When a discontinuous observation schedule is used, the observer requires some equipment to signal exactly when observation is to occur. The most common equipment is a portable audiocassette player and a tape with pure tones, recorded at the desired intervals. One student or several students in sequence may be observed. For example, three students can be observed in a series of 5-second intervals. An audiotape would signal every 5 seconds. On the fi rst signal, Henry would be observed; on the second signal, Joyce would be observed; on the third signal, Bruce would be observed; on the fourth signal, Henry would be observed again; and so forth.
4. Develop recording procedures. The recording of observations must also be planned. When a few students are observed for the occurrence of relatively infrequent behaviors, simple procedures can be used. The behaviors can be observed continuously and counted using a tally sheet or a wrist counter. When time sampling is used, observations must be recorded for each time interval; thus, some type of recording form is required. In the simplest form, the recording sheet contains identifying information (for example, name of target student, name of observer, date and time of observation session, and observation-interval length) and two columns. The fi rst column shows the time interval, and the second column contains space for the observer to indicate whether the behavior occurred during each interval. More complicated recording forms may be used for multiple behaviors and/or multiple students. When multiple behaviors are observed, they are often given code numbers. For example, “out of seat” might be coded as 1, “in seat but off task” might be coded as 2, “in seat and on task” might be coded as 3, and “no opportunity to observe” might be coded as 4. Such codes should be
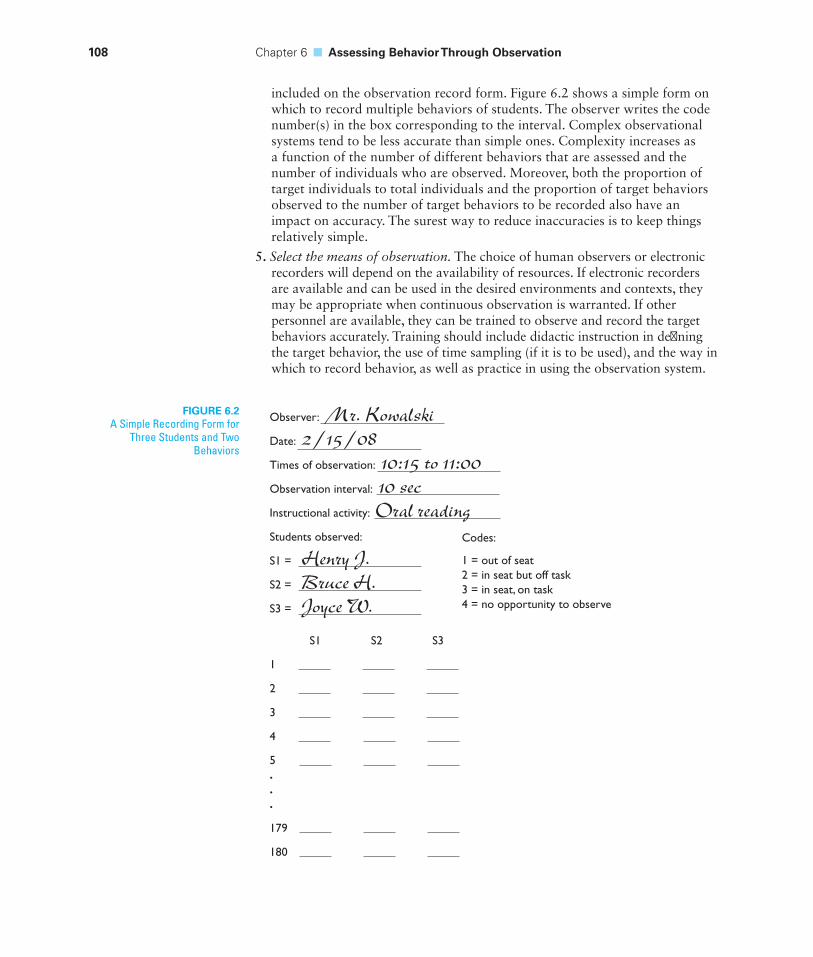
108 Chapter 6 ■ Assessing Behavior Through Observation
included on the observation record form. Figure 6.2 shows a simple form on which to record multiple behaviors of students. The observer writes the code number(s) in the box corresponding to the interval. Complex observational systems tend to be less accurate than simple ones. Complexity increases as a function of the number of different behaviors that are assessed and the number of individuals who are observed. Moreover, both the proportion of target individuals to total individuals and the proportion of target behaviors observed to the number of target behaviors to be recorded also have an impact on accuracy. The surest way to reduce inaccuracies is to keep things relatively simple.
5. Select the means of observation. The choice of human observers or electronic recorders will depend on the availability of resources. If electronic recorders are available and can be used in the desired environments and contexts, they may be appropriate when continuous observation is warranted. If other personnel are available, they can be trained to observe and record the target behaviors accurately. Training should include didactic instruction in defi ning the target behavior, the use of time sampling (if it is to be used), and the way in which to record behavior, as well as practice in using the observation system.
FIGURE 6.2A Simple Recording Form for
Three Students and Two Behaviors
Observer: Mr. Kowalski
Date: 2/15/08
Times of observation: 10:15 to 11:00
Observation interval: 10 sec
Instructional activity: Oral reading
Students observed:
S1 = Henry J.
S2 = Bruce H.
S3 = Joyce W.
S1 S2 S3
1
2
3
4
5...
179
180
Codes:
1 = out of seat2 = in seat but off task3 = in seat, on task4 = no opportunity to observe
Conducting Systematic Observations 109
Training is always continued until the desired level of accuracy is reached. Observers’ accuracy is evaluated by comparing each observer’s responses with those of the others or with a criterion rating (usually a previously scored videotape). Generally, very high agreement is required before anyone can assume that observers are ready to conduct observations independently. Ultimately, the decision of how to collect the data should also be based on effi ciency. For example, if it takes longer to desensitize students to an obtrusive video recorder than it takes to train observers, then human observers are preferred.
Data GatheringObservers should prepare a checklist of equipment and materials that will be used during the observation and assemble everything that is needed, including an extra supply of recording forms, spare pens or pencils, and something to write on (for example, a clipboard or tabletop). When electronic recording is used, equipment should be checked before every observation session to make sure it is in good working condition, and the observer should bring needed extras (for example, batteries, signal tapes, and recording tapes). Also, before the observation session, the observer should check the setting to locate appropriate vantage points for equipment or furniture. During observation, care should be taken to conduct the observations as planned. Thus, the observer should make sure that he or she adheres to the definitions of behavior, the observation schedules, and recording protocols. Careful preparation can head off trouble.
As with any type of assessment information, two general sources of error can reduce the accuracy of observation. Random error can result in over- or underes-timates of behavior. Systematic error can bias the data in a consistent direction—for example, behavior may be systematically overcounted or undercounted.
Random Error
Random errors in observation and recording usually affect observer agreement. Observers may change the criteria for the occurrence of a behavior, they may forget behavior codes, or they may use the recording forms incorrectly. Because changes in agreement can signal that something is wrong, the accuracy of obser-vational data should be checked periodically. The usual procedure is to have two people observe and record on the same schedule in the same session. The two records are then compared, and an index of agreement (for example, point-to-point agreement) is computed. Poor agreement suggests the need for retraining or for revision of the observation procedures. To alleviate some of these problems, we can provide periodic retraining and allow observers to keep the definitions and codes for target behaviors with them. Finally, when observers know that their accuracy is being systematically checked, they are usually more accurate. Thus, observers should not be told when they are being observed but to expect their observations to be checked.
One of the most vexing factors affecting the accuracy of observations is the incorrect recording of correctly observed behavior. Even when observers have applied the criterion for the occurrence of a behavior correctly, they may record their decision incorrectly. For example, if 1 is used to indicate occurrence and 0
110 Chapter 6 ■ Assessing Behavior Through Observation
is used to indicate nonoccurrence, the observer might accidentally record 0 for a behavior that has occurred. Inaccuracy can be attributed to three related factors.
1. Lack of familiarity with the recording system: Observers defi nitely need practice in using a recording system when several behaviors or several students are to be observed. They also need practice when the target behaviors are diffi cult to defi ne or when they are diffi cult to observe.
2. Insuffi cient time to record: Suffi cient time must be allowed to record the occurrence of behavior. Problems can arise when using momentary time sampling if the observation intervals are spaced too closely (for example, 1- or 5-second intervals). Observers who are counting several different high- frequency behaviors may record inaccurately. Generally, inadequate opportunities for observers to record can be circumvented by electronic recording of the observation session; when observers can stop and replay segments of interest, they essentially have unlimited time to observe and record.
3. Lack of concentration: It may be diffi cult for observers to remain alert for long periods of time (for example, 1 hour), especially if the target behavior occurs infrequently and is diffi cult to detect. Observers can reduce the time that they must maintain vigilance by either taking turns with several observers or recording observation sessions for later evaluation. Similarly, when it is diffi cult to maintain vigilance because the observational context is noisy, busy, or otherwise distracting, electronic recording may be useful in focusing on target subjects and eliminating ambient noise.
Systematic Error
Systematic errors are difficult to detect. To minimize error, four steps can be taken.
1. Guard against unintended changes in the observation process.3 When assessment is carried out over extended periods of time, observers may talk to each other about the defi nitions that they are using or about how they cope with diffi cult discriminations. Consequently, one observer’s departure from standardized procedures may spread to other observers. When the observers change together, modifi cations of the standard procedures and defi nitions will not be detected by examining interobserver agreement. Techniques for reducing changes in observers over time include keeping the scoring criteria available to observers, meeting with the observers on a regular basis to discuss diffi culties encountered during observation, and providing periodic retraining. Surprisingly, even recording equipment can change over time. Audio signal tapes (used to indicate the moment a student should be observed) may stretch after repeated uses; a 10-second interval may become an 11-second interval. Similarly, the batteries in playback units can lose power, and signal tapes may play more slowly. Therefore, equipment should be cleaned periodically, and signal tapes should be checked for accuracy.
2. Desensitize students. The introduction of equipment or new adults into a classroom, as well as changes in teacher routines, can signal to students that observations are going on. Overt measurement can alter the target behavior
3Technically, general changes in the observation process over time are called instrumentation problems.
Criteria for Evaluating Observed Performances 111
or the topography of the behavior. Usually, the pupil change is temporary. For example, when Janey knows that she is being observed, she may be more accurate, deliberate, or compliant. However, as observation becomes a part of the daily routine, students’ behavior usually returns to what is typical for them. This return to typical patterns of behavior functionally defi nes desensitization. The data generated from systematic observation should not be used until the students who are observed are no longer affected by the observation procedures and equipment or personnel. However, sometimes the change in behavior is permanent. For example, if a teacher was watching for the extortion of lunch money, Robbie might wait until no observers were present or might demand the money in more subtle ways. In such cases, valid data would not be obtained through overt observation, and either different procedures would have to be developed or the observation would have to be abandoned.
3. Minimize observer expectancies. Sometimes, what an observer believes will happen affects what is seen and recorded. For example, if an observer expects an intervention to increase a behavior, that observer might unconsciously alter the criteria for evaluating that behavior or might evaluate approximations of the target behavior as having occurred. The more subtle or complex the target behavior, the more susceptible it may be to expectation effects. The easiest way to avoid expectations during observations is for the observer to be blind to the purpose of the assessment. When video- or audiotapes are used to record behavior, the order in which they are evaluated can be randomized so that observers do not know what portion of an observation is being scored. When it is impossible or impractical to keep observers blind to the purpose, the importance of accurate observation should be stressed and such observation rewarded.
4. Motivate observers. Inaccurate observation is sometimes attributed to lack of motivation on the part of an observer. Motivation can be increased by providing rewards and feedback, stressing the importance of the observations, reducing the length of observation sessions, and not allowing observation sessions to become routine.
Data SummarizationDepending on the particular characteristic of behavior being measured, observa-tional data may be summarized in different ways. When duration or frequency is the characteristic of interest, observations are usually summarized as rates (that is, the prevalence or the number of occurrences per minute or other time interval). Latency and amplitude should be summarized statistically by the mean and the standard deviation or by the median and the range. All counts and calculations should be checked for accuracy.
4 Criteria for Evaluating Observed Performances
Once accurate observational data have been collected and summarized, they must be interpreted. Behavior is interpreted in one of two ways. For some behavior, its presence or absence is compared to an absolute criterion. Behaviors evaluated in this way include unsafe and harmful behavior, illegal behavior, and so forth.
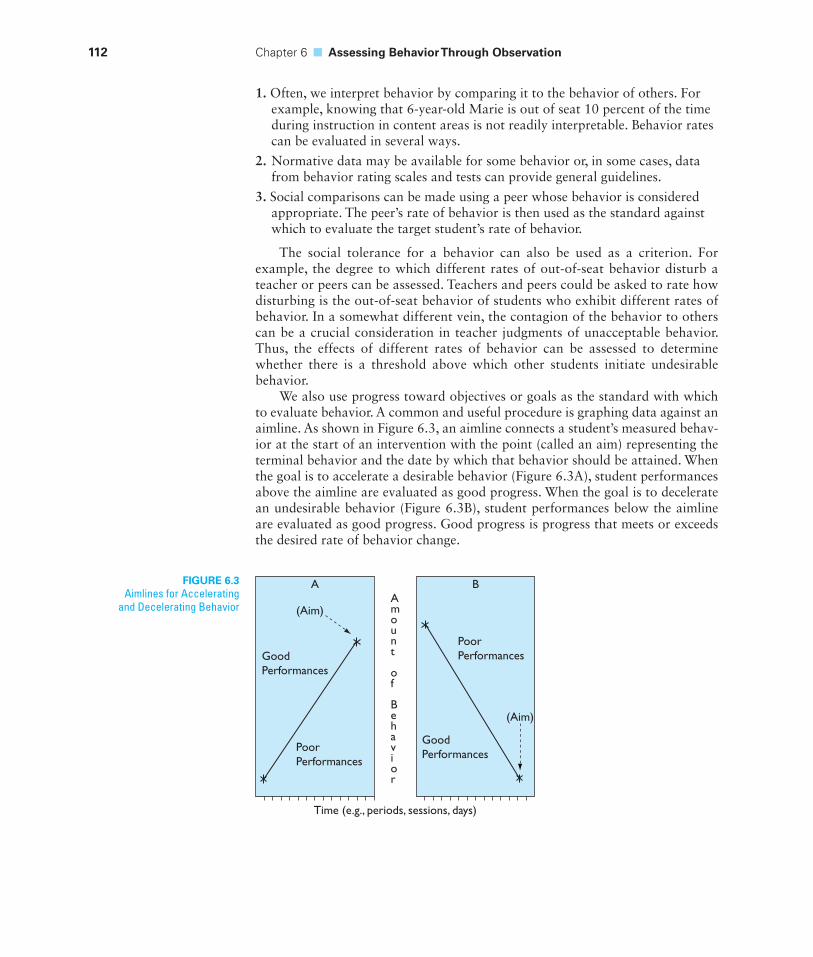
112 Chapter 6 ■ Assessing Behavior Through Observation
1. Often, we interpret behavior by comparing it to the behavior of others. For example, knowing that 6-year-old Marie is out of seat 10 percent of the time during instruction in content areas is not readily interpretable. Behavior rates can be evaluated in several ways.
2. Normative data may be available for some behavior or, in some cases, data from behavior rating scales and tests can provide general guidelines.
3. Social comparisons can be made using a peer whose behavior is considered appropriate. The peer’s rate of behavior is then used as the standard against which to evaluate the target student’s rate of behavior.
The social tolerance for a behavior can also be used as a criterion. For example, the degree to which different rates of out-of-seat behavior disturb a teacher or peers can be assessed. Teachers and peers could be asked to rate how disturbing is the out-of-seat behavior of students who exhibit different rates of behavior. In a somewhat different vein, the contagion of the behavior to others can be a crucial consideration in teacher judgments of unacceptable behavior. Thus, the effects of different rates of behavior can be assessed to determine whether there is a threshold above which other students initiate undesirable behavior.
We also use progress toward objectives or goals as the standard with which to evaluate behavior. A common and useful procedure is graphing data against an aimline. As shown in Figure 6.3, an aimline connects a student’s measured behav-ior at the start of an intervention with the point (called an aim) representing the terminal behavior and the date by which that behavior should be attained. When the goal is to accelerate a desirable behavior (Figure 6.3A), student performances above the aimline are evaluated as good progress. When the goal is to decelerate an undesirable behavior (Figure 6.3B), student performances below the aimline are evaluated as good progress. Good progress is progress that meets or exceeds the desired rate of behavior change.
FIGURE 6.3Aimlines for Accelerating
and Decelerating Behavior
GoodPerformances
GoodPerformances
(Aim)
(Aim)
PoorPerformances
Time (e.g., periods, sessions, days)
Amount
of
Behavior
PoorPerformances
A B
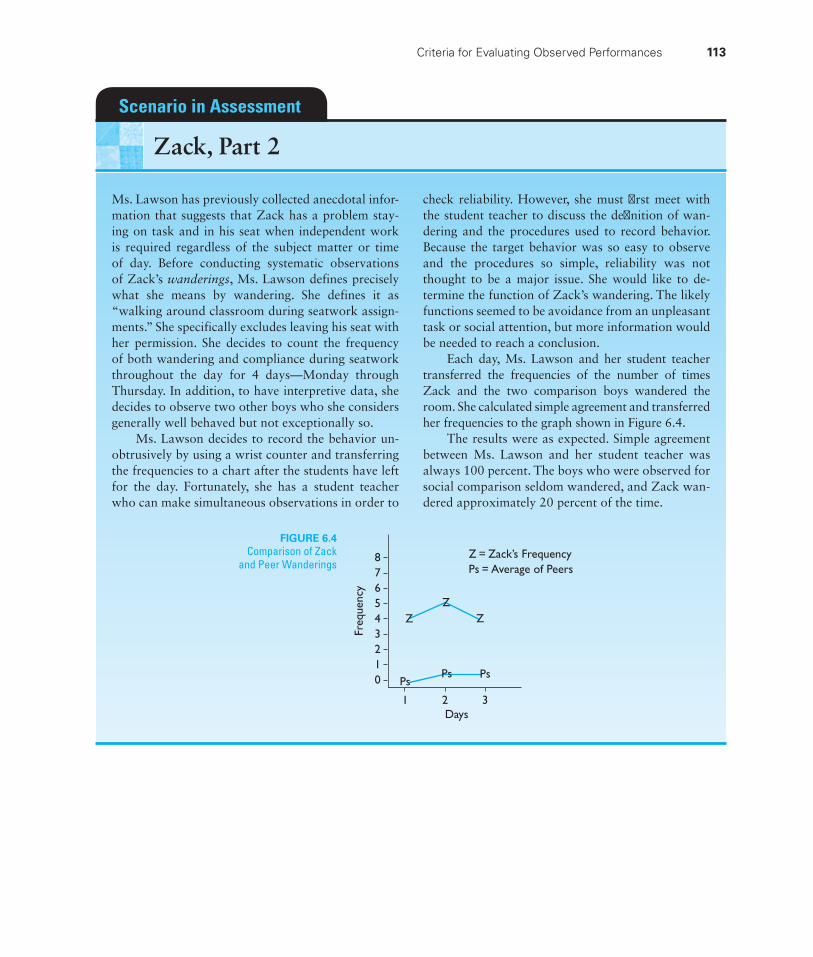
Criteria for Evaluating Observed Performances 113
Ms. Lawson has previously collected anecdotal infor-mation that suggests that Zack has a problem stay-ing on task and in his seat when independent work is required regardless of the subject matter or time of day. Before conducting systematic observations of Zack’s wanderings, Ms. Lawson defines precisely what she means by wandering. She defines it as “walking around classroom during seatwork assign-ments.” She specifically excludes leaving his seat with her permission. She decides to count the frequency of both wandering and compliance during seatwork throughout the day for 4 days—Monday through Thursday. In addition, to have interpretive data, she decides to observe two other boys who she considers generally well behaved but not exceptionally so.
Ms. Lawson decides to record the behavior un-obtrusively by using a wrist counter and transferring the frequencies to a chart after the students have left for the day. Fortunately, she has a student teacher who can make simultaneous observations in order to
check reliability. However, she must fi rst meet with the student teacher to discuss the defi nition of wan-dering and the procedures used to record behavior. Because the target behavior was so easy to observe and the procedures so simple, reliability was not thought to be a major issue. She would like to de-termine the function of Zack’s wandering. The likely functions seemed to be avoidance from an unpleasant task or social attention, but more information would be needed to reach a conclusion.
Each day, Ms. Lawson and her student teacher transferred the frequencies of the number of times Zack and the two comparison boys wandered the room. She calculated simple agreement and transferred her frequencies to the graph shown in Figure 6.4.
The results were as expected. Simple agreement between Ms. Lawson and her student teacher was always 100 percent. The boys who were observed for social comparison seldom wandered, and Zack wan-dered approximately 20 percent of the time.
Scenario in Assessment
Zack, Part 2
FIGURE 6.4Comparison of Zack
and Peer Wanderings
Freq
uenc
y
0
87654321
1
PsPs
ZZ
Z
Z = Zack’s FrequencyPs = Average of Peers
Ps
2Days
3
114 Chapter 6 ■ Assessing Behavior Through Observation
CHAPTER COMPREHENSION QUESTIONSWrite your answers to each of the following questions, and then compare your responses to the text or the study guide.
1. What fi ve steps should you follow in preparing to conduct systematic quantitative observations?
2. What is the difference between a behavior’s topography and function?
3. What characteristics of behavior (for example, amplitude) can be observed?
4. Explain the three ways in which behavior can be sampled and identify which is the best way.
5. What can an observer do to minimize or prevent errors in observations?
6. Explain the four ways in which behavior can be interpreted.

7 Teacher-Made Tests of Achievement
1Understand that teacher-made tests
can be used to ascertain skill development, monitor instruction, document instructional problems, and make summative judgments.
2Understand that teacher-made tests
vary on the dimensions of content specifi city, testing frequency, and testing formats.
3Know that considerations in
preparing tests include selecting specifi c areas of the curriculum, writing relevant questions, organizing and sequencing items, developing formats for presentation and response modes, writing directions for administration, developing systematic procedures for scoring responses, and establishing criteria to interpret student performance.
6Understand the potential sources of
diffi culty in the use of teacher-made tests.
5Understand that assessment in
the core achievement areas of reading, mathematics, spelling, and writing differs for beginning and advanced students.
4Know that response formats
use different types of questions and have special considerations for students with disabilities.
Chapter Goals
115
116 Chapter 7 ■ Teacher-Made Tests of Achievement
Key Terms data-driven decision making
celeration
content specifi city
frequency
testing formats
selection formats
supply formats
extended responses
Historically, teacher-made tests have not been held in high regard. For example, some measurement specialists (for example, Thorndike & Hagen, 1978) cite carefully prepared test items as an advantage of commercially available norm- referenced achievement tests. By implication, careful preparation of questions may not be a characteristic of teacher-made tests. In addition, adjectives such as “informal” or “unstandardized” have been used to describe teacher-made tests. As a group, however, teacher-made tests cannot be considered informal because they are not given haphazardly or casually. They cannot be considered unstan-dardized because students usually receive the same materials and directions, and the same criteria are usually used in correcting student answers. Although there is a place for commercially available norm-referenced achievement tests, we think that their value has been overestimated. Indeed, teacher-made tests can be bet-ter suited to evaluation of student achievement than are commercially prepared, norm- referenced achievement tests.
Achievement refers to what has been directly taught and learned by a student. It is different from attainment (what has been learned anywhere). Teachers are in the best position to know what has been (or at least should be) taught in their classrooms. This simple fact stands in sharp contrast to commercially prepared tests that are not designed to assess achievement within specific curricula (see, for example, Crocker, Miller, & Franks, 1989) or to meet a specific state’s standards. Rather, these tests are intentionally constructed to have general applicability so that they can be used with students in almost any curriculum or broad state stan-dards. Moreover, it is clear that various curriculum series differ from one another in the particular educational objectives covered, the performance level expected of students, and the sequence of objectives; for example, DISTAR mathematics differs from Scott, Foresman mathematics (Shriner & Salvia, 1988). Even within the same curriculum series, teachers modify instruction to provide enrichment or remedial instruction. Thus, two teachers using the same curriculum series and trying to meet the same state standards may offer different instruction. Although teachers may not construct tests that match the curriculum and state standards, they are the only ones capable of knowing precisely what has been taught and what level of performance is expected from students. Consequently, they are the only ones who can match testing to instruction.
In addition, teacher-made tests are usually designed to assess what students are learning or have learned. Commercially prepared, norm-referenced tests are designed to assess which students know more and which students know less (that is, to discriminate among test takers on the basis of what they know). Thus, teach-ers include enough items on their tests to make valid estimates of what students have learned, whereas developers of norm-referenced tests try to include the minimum number of test items that allow reliable discrimination. This differ-ence between teacher-made and commercially prepared tests has two important consequences. First, because teacher-made tests can include many more items
Uses 117
(even all of the items of interest), they can be much more sensitive to small but important changes in student learning. For example, a teacher-made test that included all of the addition facts could show whether a student has learned nine addition facts in the past 2 days; norm-referenced tests usually assess all of the mathematical operations and necessarily have only a few addition problems so that this level of specificity is not possible to attain with them. Also, teacher-made tests can show what content requires additional instruction and student practice; norm-referenced tests cannot. Finally, teacher-made tests can indicate when stu-dents have mastered an instructional goal so instruction can be provided on new objectives; norm-referenced tests cannot.
In short, teachers need tests that reflect what they are teaching and are sensitive to changes in student achievement.1 We strongly recommend that the assessments be objective—that is, based on observable phenomena and minimally affected by a variety of subjective factors. The use of objective methods is not merely a matter of personal preference. Federal regulations require that students with disabilities be evaluated using objective procedures.2 This chapter provides a general overview of objective practices for teachers who develop their own tests for classroom assessment in the core areas of reading, mathematics, spelling, and written language.
1 Uses
Teachers regularly set aside time to assess their pupils for a variety of purposes. Most commonly, they make up tests to ascertain the extent to which their students have learned or are learning what has been taught or assigned. Student achieve-ment is the basis on which teachers make decisions about student skill develop-ment, student progress, instructional problems, and grades. Often, an assessment can be used for more than one purpose. For example, assessments made to monitor instruction can be aggregated for use in making summative judgments.
Ascertain Skill DevelopmentA student’s level of skill development is a fundamental consideration in planning instruction. We want to know what instructional objectives our students have met in order to decide what things we should be teaching our students. Obviously, if students have met an instructional objective, we should not waste their time by continuing to teach what they have already learned. Rather, we should build on their learning by extending their learning (for example, planning for generaliza-tion of learning) or moving on to the next objective in the instructional sequence. Also, students who meet objectives so rapidly that they are being held back by slower peers can be grouped for enrichment activities or faster-paced instruction;
1Teachers assess frequently to detect changes in student achievement. However, frequent testing with exactly the same test usually produces a practice effect. Unless there are multiple forms for a test, student learning may be confused with practice effect.2Note that general educators are often trained in more subjective and holistic approaches, and the difference in approaches can cause many problems when general and special educators work together to provide an education for all students in an inclusive classroom.
118 Chapter 7 ■ Teacher-Made Tests of Achievement
slower students can be grouped so that they can learn necessary concepts to the point of mastery without impeding the progress of their faster-learning peers.
Monitor InstructionThe extent to which any lesson, program, or intervention will be effective with a specific student within a specific educational context cannot be known a priori. Although we know what techniques are generally effective with most students, those techniques may not work as well (or at all) with specific students because of their unique characteristics, the characteristics of their teachers, or the context in which the instruction occurs. Teachers can teach and hope that their students have learned, or they can check throughout the learning process to make sure that their students are learning correctly and efficiently.
The evidence is overwhelming that learning is much more efficient when student errors and misunderstandings are caught early and corrected. Catching student errors early saves time; students then do not have to unlearn incorrect material before learning the correct information or skill. Catching student errors early also means that they do not get left behind. Early detection of student errors is above all humane. Student achievement during instruction can be used to inform decisions about altering instruction, grouping students, evaluating teaching performance, and perhaps referring students to other educational specialists for additional instructional services.
Teachers should not rely on a single test or observation to monitor progress. It is better to collect data systematically and frequently and then to assemble the results into a readily interpretable format such as graphs. Thus, progress monitor-ing involves (1) collecting and analyzing data to ascertain student progress toward mastery of specific skills or general outcomes and (2) using the data collected to make instructional decisions—that is, “data-driven decision making.” Progress can be readily seen when student responses are graphed. When correct responses are plotted against an aimline,3 progress is indicated when student performance is consistently above the aimline. Figure 7.1 shows an example of satisfactory per-formance as judged from an aimline graph. When correct responses and errors are plotted in the same graph, satisfactory performance is indicated in four ways, as shown in Figure 7.2. Correct responses increase and/or errors decrease. The data in these two figures indicate clearly that the student is making good progress.
A different way to think about documenting student progress is with celeration, a word coined to describe the trend of data. Celeration quantifies the degree of student progress over time. White and Haring (1980) provided a method of calculating celeration that is still in use. To illustrate, suppose that a teacher had obtained data on a student’s rate of oral reading each day for 10 consecutive days. The teacher would first need to find the medians for the first and second half of the days (that is, week 1 and week 2). The smaller median would be divided by the larger median. If the smaller median occurred in the first half (week), a multiplication sign (×) is placed before the decimal; if the smaller median occurred in the second half (week), a division sign (÷) is used.
3Recall from Chapter 6 that an aimline connects a student’s measured behavior at the start of an intervention with the point (called an aim) representing the terminal behavior and the date by which that behavior should be attained.
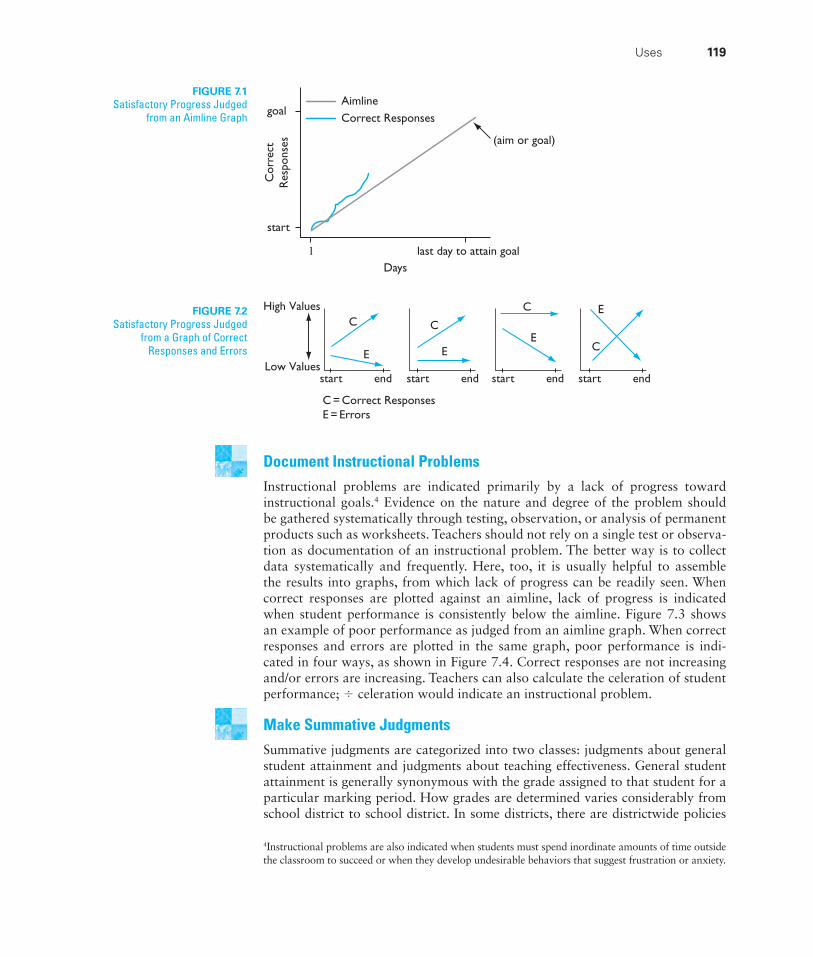
FIGURE 7.1Satisfactory Progress Judged
from an Aimline Graph
C = Correct ResponsesE = Errors
startLow Values
High Values
end
C
E
C
E
C
EC
E
start end start end start end
AimlineCorrect Responses
Cor
rect
Res
pons
es
1 last day to attain goal
(aim or goal)
Days
start
goal
Uses 119
Document Instructional ProblemsInstructional problems are indicated primarily by a lack of progress toward instructional goals.4 Evidence on the nature and degree of the problem should be gathered systematically through testing, observation, or analysis of permanent products such as worksheets. Teachers should not rely on a single test or observa-tion as documentation of an instructional problem. The better way is to collect data systematically and frequently. Here, too, it is usually helpful to assemble the results into graphs, from which lack of progress can be readily seen. When correct responses are plotted against an aimline, lack of progress is indicated when student performance is consistently below the aimline. Figure 7.3 shows an example of poor performance as judged from an aimline graph. When correct responses and errors are plotted in the same graph, poor performance is indi-cated in four ways, as shown in Figure 7.4. Correct responses are not increasing and/or errors are increasing. Teachers can also calculate the celeration of student performance; ÷ celeration would indicate an instructional problem.
Make Summative JudgmentsSummative judgments are categorized into two classes: judgments about general student attainment and judgments about teaching effectiveness. General student attainment is generally synonymous with the grade assigned to that student for a particular marking period. How grades are determined varies considerably from school district to school district. In some districts, there are districtwide policies
4Instructional problems are also indicated when students must spend inordinate amounts of time outside the classroom to succeed or when they develop undesirable behaviors that suggest frustration or anxiety.
FIGURE 7.2Satisfactory Progress Judged
from a Graph of Correct Responses and Errors
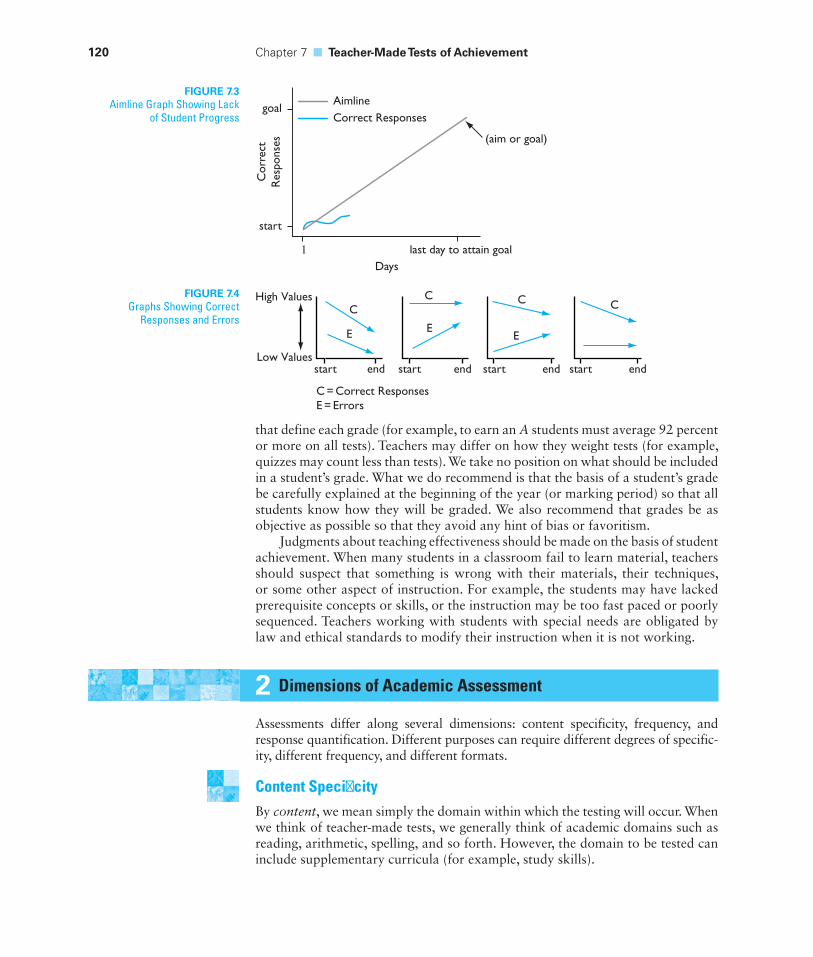
AimlineCorrect Responses
Cor
rect
Res
pons
es
1 last day to attain goal
(aim or goal)
Days
start
goal
C
E
C
E
C
E E
C
C = Correct ResponsesE = Errors
startLow Values
High Values
end start end start end start end
120 Chapter 7 ■ Teacher-Made Tests of Achievement
that define each grade (for example, to earn an A students must average 92 percent or more on all tests). Teachers may differ on how they weight tests (for example, quizzes may count less than tests). We take no position on what should be included in a student’s grade. What we do recommend is that the basis of a student’s grade be carefully explained at the beginning of the year (or marking period) so that all students know how they will be graded. We also recommend that grades be as objective as possible so that they avoid any hint of bias or favoritism.
Judgments about teaching effectiveness should be made on the basis of student achievement. When many students in a classroom fail to learn material, teachers should suspect that something is wrong with their materials, their techniques, or some other aspect of instruction. For example, the students may have lacked prerequisite concepts or skills, or the instruction may be too fast paced or poorly sequenced. Teachers working with students with special needs are obligated by law and ethical standards to modify their instruction when it is not working.
2 Dimensions of Academic Assessment
Assessments differ along several dimensions: content specificity, frequency, and response quantification. Different purposes can require different degrees of specific-ity, different frequency, and different formats.
Content Specifi cityBy content, we mean simply the domain within which the testing will occur. When we think of teacher-made tests, we generally think of academic domains such as reading, arithmetic, spelling, and so forth. However, the domain to be tested can include supplementary curricula (for example, study skills).
FIGURE 7.3Aimline Graph Showing Lack
of Student Progress
FIGURE 7.4Graphs Showing Correct
Responses and Errors
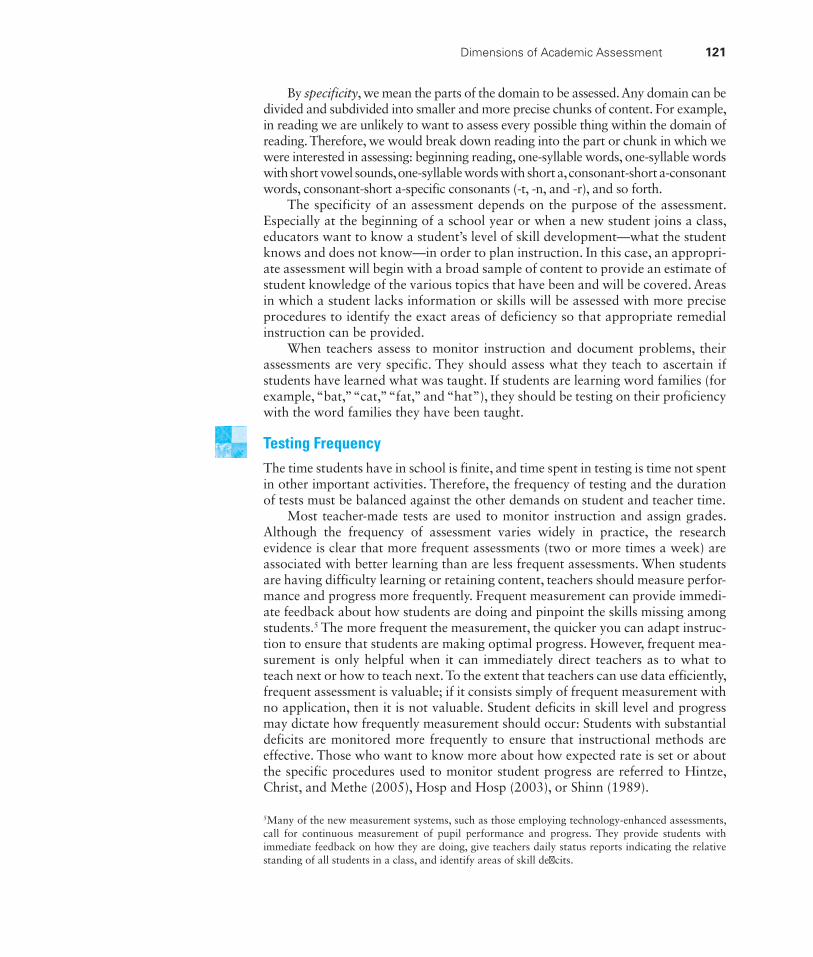
Dimensions of Academic Assessment 121
By specificity, we mean the parts of the domain to be assessed. Any domain can be divided and subdivided into smaller and more precise chunks of content. For example, in reading we are unlikely to want to assess every possible thing within the domain of reading. Therefore, we would break down reading into the part or chunk in which we were interested in assessing: beginning reading, one-syllable words, one-syllable words with short vowel sounds, one-syllable words with short a, consonant-short a- consonant words, consonant-short a-specific consonants (-t, -n, and -r), and so forth.
The specificity of an assessment depends on the purpose of the assessment. Especially at the beginning of a school year or when a new student joins a class, educators want to know a student’s level of skill development—what the student knows and does not know—in order to plan instruction. In this case, an appropri-ate assessment will begin with a broad sample of content to provide an estimate of student knowledge of the various topics that have been and will be covered. Areas in which a student lacks information or skills will be assessed with more precise procedures to identify the exact areas of deficiency so that appropriate remedial instruction can be provided.
When teachers assess to monitor instruction and document problems, their assessments are very specific. They should assess what they teach to ascertain if students have learned what was taught. If students are learning word families (for example, “bat,” “cat,” “fat,” and “hat”), they should be testing on their proficiency with the word families they have been taught.
Testing FrequencyThe time students have in school is finite, and time spent in testing is time not spent in other important activities. Therefore, the frequency of testing and the duration of tests must be balanced against the other demands on student and teacher time.
Most teacher-made tests are used to monitor instruction and assign grades. Although the frequency of assessment varies widely in practice, the research evidence is clear that more frequent assessments (two or more times a week) are associated with better learning than are less frequent assessments. When students are having difficulty learning or retaining content, teachers should measure perfor-mance and progress more frequently. Frequent measurement can provide immedi-ate feedback about how students are doing and pinpoint the skills missing among students.5 The more frequent the measurement, the quicker you can adapt instruc-tion to ensure that students are making optimal progress. However, frequent mea-surement is only helpful when it can immediately direct teachers as to what to teach next or how to teach next. To the extent that teachers can use data efficiently, frequent assessment is valuable; if it consists simply of frequent measurement with no application, then it is not valuable. Student deficits in skill level and progress may dictate how frequently measurement should occur: Students with substantial deficits are monitored more frequently to ensure that instructional methods are effective. Those who want to know more about how expected rate is set or about the specific procedures used to monitor student progress are referred to Hintze, Christ, and Methe (2005), Hosp and Hosp (2003), or Shinn (1989).
5Many of the new measurement systems, such as those employing technology-enhanced assessments, call for continuous measurement of pupil performance and progress. They provide students with immediate feedback on how they are doing, give teachers daily status reports indicating the relative standing of all students in a class, and identify areas of skill defi cits.
122 Chapter 7 ■ Teacher-Made Tests of Achievement
Broader assessments used for grading are given at the end of units or marking periods and cover considerable content. Thus, they must either be very general or be a limited sample of more specific content. In either case, the results of such assessments do not provide sufficiently detailed information about what a student knows and does not know for teachers to plan remediation.
Testing FormatsWhen a teacher wants either to compare (1) the performance of several students on a skill or set of skills or (2) one pupil’s performances on several occasions over time, the assessments must be the same. Standardization is the process of using the same materials, procedures (for example, directions and time allowed to com-plete a test), and scoring standards for each test taker each time the test is given. Without standardization, observed differences could be reasonably attributed to differences in testing procedures. Almost any test can be standardized if it results in observable behavior or a permanent product (for example, a student’s written response).
The first step in creating a test is knowing what knowledge and skills a stu-dent has been taught and how they have been taught. Thus, teachers will need to know the objectives, standards, or outcomes that they expect students to work toward mastering, and they will need to specify the level of performance that is acceptable.
Test formats can be classified along two dimensions: (1) the modality through which the item is presented—test items usually require a student to look at or to listen to the question, although other modalities may be substituted, depending on the particulars of a situation or on characteristics of students—and (2) the modality through which a student responds—test items usually require an oral or written response, although pointing responses are frequently used with students who are nonverbal. Teachers may use “see–write,” “see–say,” “hear–write,” and “hear–say” to specify the testing modality dimensions.
In addition, “write” formats can be of two types. Selection formats require students to indicate their choice from an array of possible answers (usually termed response options). True–false, multiple-choice, and matching are the three com-mon selection formats. However, they are not the only ones possible; for example, students may be required to circle incorrectly spelled words or words that should be capitalized in text. Formats requiring students to select the correct answer can be used to assess much more than the recognition of information, although they are certainly useful for that purpose. They can also be used to assess students’ understanding, their ability to draw inferences, and their correct application of principles. Select questions are not usually well suited for assessing achievement at the levels of analysis, synthesis, and evaluation.
Supply formats require a student to produce a written or an oral response. This response can be as restricted as the answer to a computation problem or a one-word response to the question, “When did the potato famine begin in Ireland?” Often, the response to supply questions is more involved and can require a student to produce a sentence, a paragraph, or several pages.
As a general rule, supply questions can be prepared fairly quickly, but scoring them may be very time-consuming. Even when one-word responses or numbers are requested, teachers may have difficulty finding the response on a student’s test paper,
Considerations in Preparing Tests 123
deciphering the handwriting, or correctly applying criteria for awarding points. In contrast, selection formats usually require a considerable amount of time to pre-pare, but once prepared, the tests can be scored quickly and by almost anyone.
The particular formats teachers choose are influenced by the purposes for test-ing and the characteristics of the test takers. Testing formats are essentially bottom up or top down. Bottom-up formats assess the mastery of specific objectives to allow generalizations about student competence in a particular domain. Top-down formats survey general competence in a domain and assess in greater depth those topics for which mastery is incomplete. For day-to-day monitoring of instruction and selecting short-term instructional objectives, we favor bottom-up assessment. With this type of assessment, a teacher can be relatively sure that specific objec-tives have been mastered and that he or she is not spending needless instructional time teaching students what they already know. For determining starting places for instruction with new students and for assessing maintenance and generaliza-tion of previously learned material, we favor top-down assessment. Generally, this approach should be more efficient in terms of teachers’ and students’ time because broader survey tests can cover a lot of material in a short period of time.
For students who are able to read and write independently, see–write formats are generally more efficient for both individual students and groups. When testing individual students, teachers or teacher aides can give the testing materials to the students and can proceed with other activities while the students are completing the test. Moreover, when students write their responses, a teacher can defer cor-recting the examinations until a convenient time.
See–say formats are also useful. Teacher aides or other students can listen to the test takers’ responses and can correct them on the spot or record them for later evaluation. Moreover, many teachers have access to electronic equipment that can greatly facilitate the use of see–say formats (for example, audio or video recorders).
The hear–write format is especially useful with selection formats for younger students and students who cannot read independently. This format can also be used for testing groups of students and is routinely used in the assessment of spell-ing when students are required to write words from dictation. With other con-tent, teachers can give directions and read the test questions aloud, and students can mark their responses. The primary difficulty with a hear–write format with groups of students is the pacing of test items; teachers must allot sufficient time between items for slower-responding students to make their selections.
Hear–say formats are most suitable for assessing individual students who do not write independently or who write at such slow speeds that their written responses are unrepresentative of what they know. Even with this format, teachers need not preside over the assessment; other students or a teacher aide can admin-ister, record, and perhaps evaluate the student’s responses.
3 Considerations in Preparing Tests
Teachers need to build skills in developing tests that are fair, reliable, and valid. The following kinds of considerations are important in developing or preparing tests.
124 Chapter 7 ■ Teacher-Made Tests of Achievement
Selecting Specifi c Areas of the CurriculumTests are samples of behavior. When narrow skills are being assessed (for example, spelling words from dictation), either all the components of the domain should be tested (in this case, all the assigned spelling words) or a representative sample should be selected and assessed. The qualifier “representative” implies that an appropriate number of easy and difficult words—and of words from the begin-ning, middle, and end of the assignment—will be selected. When more complex domains are assessed, teachers should concentrate on the more important facts or relationships and avoid the trivial.
Writing Relevant QuestionsTeachers must select and use enough questions to allow valid inferences about students’ mastery of short-term or long-term goals, and attainment of state stan-dards. Nothing offends test takers quite as much as a test’s failure to cover mate-rial they have studied and know, except perhaps their own failure to guess what content a teacher believes to be important enough to test. In addition, fairness demands that the way in which the question is asked be familiar and expected by the student. For example, if students were to take a test on the addition of single-digit integers, it would be a bad idea to test them using a missing-addend format (for example, “4 + _____ = 7”) unless that format had been specifically taught and was expected by the students.
Organizing and Sequencing ItemsThe organization of a test is a function of many factors. When a teacher wants a student to complete all the items and to indicate mastery of content (a power test), it is best to intersperse easy and difficult items. When the desire is to measure automaticity or the number of items that can be completed within a specific time period (a timed test), it is best to organize items from easy to difficult. Pages of test questions or problems to be solved should not be cluttered.
Developing Formats for Presentation and Response ModesDifferent response formats can be used within the same test, although it is gener-ally a good idea to group together questions with the same format. Regardless of the format used, the primary consideration is that the test questions be a fair sample of the material being assessed.
Writing Directions for AdministrationRegardless of question format, the directions should indicate clearly what a student is to do—for example, “Circle the correct option,” “Choose the best answer,” and “Match each item in column b to one item in column a.” Also, teachers should explain what, if any, materials may be used by students, any time limits, any unusual scoring procedures (for example, penalties for guessing), and point values when the students are mature enough to be given questions that have different point values.
Response Formats 125
Developing Systematic Procedures for Scoring ResponsesAs discussed in the opening paragraphs of this chapter, teachers must have pre-determined and systematic criteria for scoring responses. However, if a teacher discovers an error or omission in criteria, the criteria should be modified. Obviously, previously scored responses must be rescored with the revised criteria.
Establishing Criteria to Interpret Student PerformanceTeachers should specify in advance the criteria they will use for assigning grades or weighting assignments. For example, they may want to specify that students who earn a certain number of points on a test will earn a specific grade, or they may want to assign grades on the basis of the class distribution of performance. In either case, they must specify what it takes to earn certain grades or how assign-ments will be evaluated and weighted.
4 Response Formats
There are two basic types of test format. Selection formats require students to recognize a correct answer that is provided on the test. Supply formats require students to produce correct answers.
Selection FormatsThree types of selection formats are commonly used: multiple-choice, matching, and true–false. Of the three, multiple-choice questions are clearly the most useful.
Multiple-Choice Questions
Multiple-choice questions are the most difficult to prepare. These questions have two parts: (1) a stem that contains the question and (2) a response set that con-tains both the correct answer, termed the keyed response, and one or more incor-rect options, termed distractors. In preparing multiple-choice questions, teachers should generally follow these guidelines:
Keep the response options short and of approximately equal length. Students ■
quickly learn that longer options tend to be correct.
Keep material that is common to all options in the stem. For example, if the ■
first word in each option is “the,” it should be put into the stem and removed from the options.
A poorly worded question:A lasting contribution of the Eisenhower presidency was the creation of
a. the communication satellite system b. the interstate highway system c. the cable TV infrastructure d. the Eisenhower tank
126 Chapter 7 ■ Teacher-Made Tests of Achievement
Better wording:A lasting contribution of the Eisenhower presidency was the creation of the
a. communication satellite systemb. interstate highway systemc. cable TV infrastructured. Eisenhower tank
Avoid grammatical tip-offs. Students can discard grammatically incorrect ■
options. For example, when the correct answer must be plural, alert students will disregard singular options; when the correct answer must be a noun, students will disregard options that are verbs.
A poorly constructed question:A(n) _____ test measures what a student has learned that has been taught in school.
a. achievementb. intelligencec. sociald. portfolio
A better constructed question:_____ tests measure what a student has learned that has been taught in school.
a. achievementb. intelligencec. sociald. portfolio
Avoid implausible options. In the best questions, distractors should be ■
attractive to students who do not know the answer. Common errors and misconceptions are often good distractors.
A poorly constructed question:Which of the following persons was NOT a candidate of the Republican Party for President of the United States in the 2007/2008 primaries?
a. Bart Simpsonb. Mitt Romneyc. Mike Huckabeed. Rudy Giuliani
A better constructed question:Which of the following persons was NOT a candidate of the Republican Party for President of the United States in the 2007/2008 primaries?
a. John Edwardsb. Mitt Romneyc. Mike Huckabeed. Rudy Giuliani

Response Formats 127
Make sure that one and only one option is correct. Students should not have ■
to read their teacher’s mind to guess which wrong answer is the least wrong or which right answer is the most correct.
A poorly constructed question:Which of the following persons was NOT a candidate of the Republican Party for President of the United States in the 2007/2008 primaries?
a. John Edwardsb. Mitt Romneyc. Mike Huckabeed. Joseph Biden
A better constructed question:Which of the following persons was NOT a candidate of the Republican Party for President of the United States in the 2007/2008 primaries?
a. John Edwardsb. Mitt Romneyc. Mike Huckabeed. Rudy Giuliani
Avoid interdependent questions. Generally, it is bad practice to make the ■
selection of the correct option dependent on getting a prior question correct.
An early question:Which of the following persons was a candidate of the Democrat Party for President of the United States in the 2007/2008 primaries?
a. Tom Tancredob. Mitt Romneyc. Mike Huckabeed. Joseph Biden
A subsequent dependent question:The candidate in the preceding question was or is a
a. governorb. member of the U.S. House of Representativesc. U.S. senatord. U.S. ambassador to Russia
Avoid options that indicate multiple correct options (for example, “all the ■
above” or “both a and b are correct”). These options often simplify the question.
A poorly constructed question:Which of the following persons was a candidate of the Democrat Party for President of the United States in the 2007/2008 primaries?
a. John Edwardsb. Mitt Romneyc. both a and b are correctd. Ron Paul
128 Chapter 7 ■ Teacher-Made Tests of Achievement
A better constructed question:Which of the following persons was NOT a candidate of the Democrat Party for President of the United States in the 2007/2008 primaries?
a. John Edwardsb. Mitt Romneyc. Ron Pauld. Rudy Giuliani
Avoid similar incorrect options. Students who can eliminate one of the two ■
similar options can readily dismiss the other one. For example, if citrus fruit is wrong, lemon must be wrong.
A poorly constructed question:Eisenhower’s inspiration for the interstate highway system was the
a. Ohio Turnpikeb. modern German autobahnsc. Pennsylvania Turnpiked. Alcan Highway
A better constructed question:Eisenhower’s inspiration for the interstate highway system was the
a. ancient Roman highwaysb. modern German autobahnsc. Pennsylvania Turnpiked. Alcan Highway
Make sure that one question does not provide information that can be used ■
to answer another question.
An early question:A lasting contribution of the Eisenhower presidency was the creation of
a. the communication satellite system b. the interstate highway system c. the cable TV infrastructure d. the Eisenhower tank
A later question that answers a prior question:Eisenhower’s inspiration for the interstate highway system was the
a. ancient Roman highwaysb. modern German autobahnsc. Pennsylvania Turnpiked. Alcan Highway
Avoid using the same words and examples that were used in the students’ ■
texts or in class presentations.
Vary the position of the correct response in the options. Students will ■
recognize patterns of correct options (for example, when the correct answers to a sequence of questions are a, b, c, d, a, b, c, d) or a teacher’s preference for a specific position (usually c).
Response Formats 129
When appropriate, teachers can make multiple-choice questions more chal-lenging by asking students to recognize an instance of a rule or concept, by requir-ing students to recall and use material that is not present in the question, or by increasing the number of options. (For younger children, three options are generally difficult enough. Older students can be expected to answer questions with four or five options.) In no case should teachers deliberately mislead or trick students.
Matching Questions
Matching questions are a variant of multiple-choice questions in which a set of stems is simultaneously associated with a set of options. Generally, the content of matching questions is limited to simple factual associations (Gronlund, 1985). Teachers usually prepare matching questions so that there are as many options as stems, and an option can be associated only once with a stem in the set. Although we do not recommend their use, there are other possibilities: more options than stems, selection of all correct options for one stem, and multiple use of an option.6 These additional possibilities increase the difficulty of the question set considerably.
In general, we prefer multiple-choice questions to matching questions. Almost any matching question can be written as a series of multiple-choice questions in which the same or similar options are used. Of course, the correct response will change. However, teachers wishing to use matching questions should consider the following guidelines:
Each set of matching items should have some dimension in common (for ■
example, explorers and dates of discovery). This makes preparation easier for the teacher and provides the student with some insight into the relationship required to select the correct option.
Keep the length of the stems approximately the same, and keep the length and ■
grammar used in the options equivalent. At best, mixing grammatical forms will eliminate some options for some questions; at worst, it will provide the correct answer to several questions.
Make sure that one and only one option is correct for each stem. ■
Vary the sequence of correct responses when more than one matching ■
question is asked.
Avoid using the same words and examples that were used in the students’ ■
texts or in class presentations.
It is easier for a student when questions and options are presented in two columns. When there is a difference in the length of the items in each column, the longer item should be used as the stem. Stems should be placed on the left and options on the right, rather than stems above with options below them. Moreover, all the elements of the question should be kept on one page. Finally, teachers often allow students to draw lines to connect questions and options. Although this has the obvious advantage of helping students keep track of where their answers
6Scoring for these options is complicated. Generally, separate errors are counted for selecting an incorrect option and failing to select a correct option. Thus, the number of errors can be very large.
130 Chapter 7 ■ Teacher-Made Tests of Achievement
should be placed, erasures or scratch-outs can be a headache to the person who corrects the test. A commercially available product (Learning Wrap-Ups) has cards printed with stems and answers and a shoelace with which to “lace” stems to correct answers. The correct lacing pattern is printed on the back, so it is self-correcting. Teachers could make such cards fairly easily as an alternative to trying to correct tests with lots of erasures.
True–False Statements
In most cases, true–false statements should simply not be used. Their utility lies primarily in assessing knowledge of factual information, which can be better assessed with other formats. Effective true–false items are difficult to prepare. Because guessing the correct answer is likely—it happens 50 percent of the time—the reliability of true–false tests is generally low. As a result, they may well have limited validity. Nonetheless, if a teacher chooses to use this format, a few sugges-tions should be followed:
Avoid specific determiners such as “all,” “never,” “always,” and so on. ■
Avoid sweeping generalizations. Such statements tend to be true, but students ■
can often think of minor exceptions. Thus, there is a problem in the criterion for evaluating the truthfulness of the question. Attempts to avoid the problem by adding restrictive conditions (for example, “with minor exceptions”) either render the question obviously true or leave a student trying to guess what the restrictive condition means.
Avoid convoluted sentences. Tests should assess knowledge of content, not a ■
student’s ability to comprehend difficult prose.
Keep true and false statements approximately the same length. As is the case ■
with longer options on multiple-choice questions, longer true–false statements tend to be true.
Balance the number of true and false statements. If a student recognizes ■
that there are more of one type of statement than of the other, the odds of guessing the correct answer will exceed 50 percent.
Special Considerations for Students with Disabilities
In developing and using items that employ a selection format, teachers must pay attention to individual differences among students, particularly to disabilities that might interfere with performance. The individualized educational programs (IEPs) of students with disabilities often contain needed accommodations and adaptations. Prior to testing, it is always a good idea to double-check student’s IEPs to make sure that any required accommodations and adaptations have been made. For example, students who have skill deficits in remembering things for short periods of time, or who do not attend well to verbally or visually presented information, may need multiple-choice tests with fewer distractors. Students who have difficulty with the organization of visually presented material may need to have matching questions rewritten as multiple-choice questions. Remember, it is important to assess the skills that students have, not the effects of disability conditions.
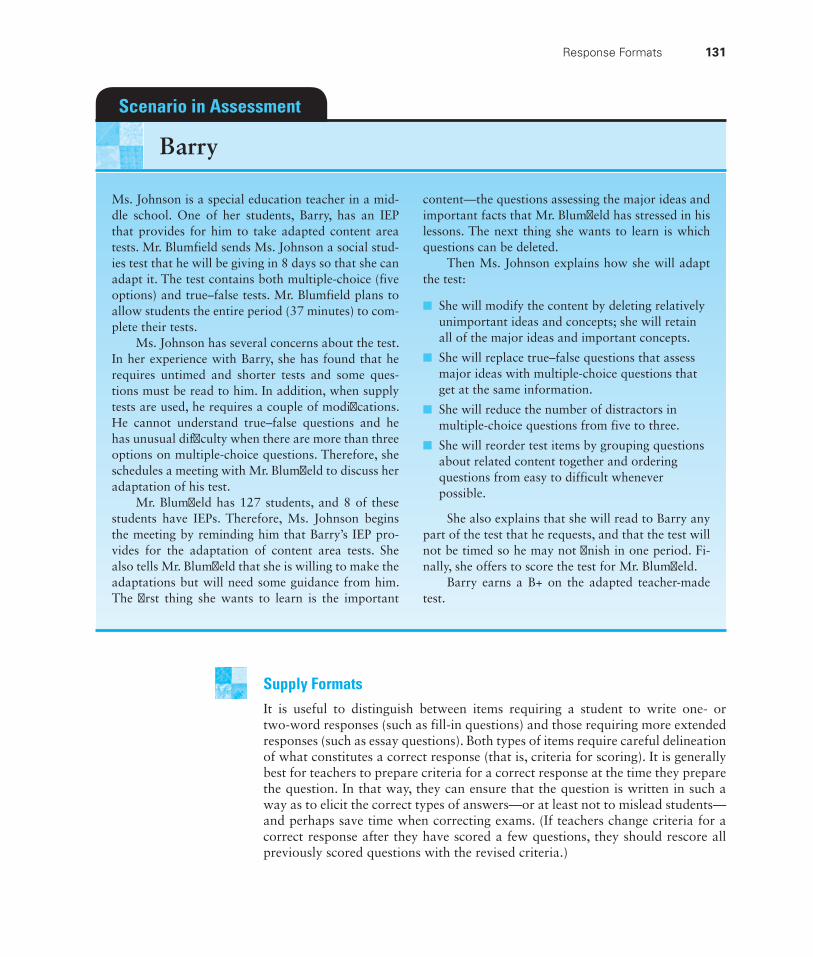
Ms. Johnson is a special education teacher in a mid-dle school. One of her students, Barry, has an IEP that provides for him to take adapted content area tests. Mr. Blumfield sends Ms. Johnson a social stud-ies test that he will be giving in 8 days so that she can adapt it. The test contains both multiple-choice (five options) and true–false tests. Mr. Blumfield plans to allow students the entire period (37 minutes) to com-plete their tests.
Ms. Johnson has several concerns about the test. In her experience with Barry, she has found that he requires untimed and shorter tests and some ques-tions must be read to him. In addition, when supply tests are used, he requires a couple of modifi cations. He cannot understand true–false questions and he has unusual diffi culty when there are more than three options on multiple-choice questions. Therefore, she schedules a meeting with Mr. Blumfi eld to discuss her adaptation of his test.
Mr. Blumfi eld has 127 students, and 8 of these students have IEPs. Therefore, Ms. Johnson begins the meeting by reminding him that Barry’s IEP pro-vides for the adaptation of content area tests. She also tells Mr. Blumfi eld that she is willing to make the adaptations but will need some guidance from him. The fi rst thing she wants to learn is the important
content—the questions assessing the major ideas and important facts that Mr. Blumfi eld has stressed in his lessons. The next thing she wants to learn is which questions can be deleted.
Then Ms. Johnson explains how she will adapt the test:
She will modify the content by deleting relatively ■
unimportant ideas and concepts; she will retain all of the major ideas and important concepts.
She will replace true–false questions that assess ■
major ideas with multiple-choice questions that get at the same information.
She will reduce the number of distractors in ■
multiple-choice questions from five to three.
She will reorder test items by grouping questions ■
about related content together and ordering questions from easy to difficult whenever possible.
She also explains that she will read to Barry any part of the test that he requests, and that the test will not be timed so he may not fi nish in one period. Fi-nally, she offers to score the test for Mr. Blumfi eld.
Barry earns a B+ on the adapted teacher-made test.
Scenario in Assessment
Barry
Response Formats 131
Supply FormatsIt is useful to distinguish between items requiring a student to write one- or two-word responses (such as fill-in questions) and those requiring more extended responses (such as essay questions). Both types of items require careful delineation of what constitutes a correct response (that is, criteria for scoring). It is generally best for teachers to prepare criteria for a correct response at the time they prepare the question. In that way, they can ensure that the question is written in such a way as to elicit the correct types of answers—or at least not to mislead students—and perhaps save time when correcting exams. (If teachers change criteria for a correct response after they have scored a few questions, they should rescore all previously scored questions with the revised criteria.)
132 Chapter 7 ■ Teacher-Made Tests of Achievement
Fill-In Questions
Aside from mathematics problems that require students to calculate an answer and writing spelling words from dictation, fill-in questions require a student to complete a statement by adding a concept or fact—for example, “_____ arrived in America in 1492.” Fill-ins are useful in assessing knowledge and comprehension objectives; they are not useful in assessing application, analysis, synthesis, or evaluation objec-tives. Teachers preparing fill-in questions should follow these guidelines:
Keep each sentence short. Generally, the less superfluous information in an ■
item, the clearer the question will be to the student and the less likely it will be that one question will cue another.
If a two-word answer is required, teachers should use two blanks to indicate ■
this in the sentence.
Avoid sentences with multiple blanks. For example, the item “In the year _____, ■
_____ discovered _____” is so vague that practically any date, name, and event can be inserted correctly, even ones that are irrelevant to the content; for example, “In the year 1999, Henry discovered girls.”
Keep the size of all blanks consistent and large enough to accommodate ■
readily the longest answer. The size of the blank should not provide a clue about the length of the correct word.
The most problematic aspect of fill-in questions is the necessity of developing an appropriate response bank of acceptable answers. Often, some student errors may consist of a partially correct response; teachers must decide which answers will receive partial credit, full credit, and no credit. For example, a question may anticipate “Columbus” as the correct response, but a student might write “that Italian dude who was looking for the shortcut to India for the Spanish king and queen.” In deciding how far afield to go in crediting unanticipated responses, teach-ers should look over test questions carefully to determine whether the student’s answer comes from information presented in another question (for example, “The Spanish monarch employed an Italian sailor to find a shorter route to”).
Extended Responses
Essay questions are most useful in assessing comprehension, application, analysis, synthesis, and evaluation objectives. There are two major problems associated with extended response questions. First, teachers are generally able to sample only a limited amount of information because answers may take a long time for students to write. Second, extended-essay responses are the most difficult type of answer to score. To avoid subjectivity and inconsistency, teachers should use a scoring key that assigns specific point values for each element in the ideal or criterion answer. In most cases, spelling and grammatical errors should not be deducted from the point total. Moreover, bonus points should not be awarded for particularly detailed responses; many good students will provide a complete answer to one question and spend any extra time working on questions that are more difficult for them.
Finally, teachers should be prepared to deal with responses in which a student tries to bluff a correct answer. Rather than leave a question unanswered, some stu-dents may answer a related question that was not asked, or they may structure their response so that they can omit important information that they cannot remember
Assessment in Core Achievement Areas 133
or never knew. Sometimes, they will even write a poem or a treatise on why the question asked is unimportant or irrelevant. Therefore, teachers must be very spe-cific about how they will award points, stick to their criteria unless they discover that something is wrong with them, and not give credit to creative bluffs.
Teachers should also be very precise in the directions that they give so that students will not have to guess what responses their teachers will credit. Following are a number of verbs (and their meanings) that are commonly used in essay ques-tions. It is often worthwhile to explain these terms in the test directions to make sure that students know what kind of answer is desired.
Describe ■ , define, and identify mean to give the meaning, essential characteristics, or place within a taxonomy.
List ■ means to enumerate and implies that complete sentences and paragraphs are not required unless specifically requested.
Discuss ■ requires more than a description, definition, or identification; a student is expected to draw implications and elucidate relationships.
Explain ■ means to analyze and make clear or comprehensible a concept, event, principle, relationship, and so forth; thus, explain requires going beyond a definition to describe the hows or whys.
Compare ■ means to identify and explain similarities between two or among more things.
Contrast ■ means to identify and explain differences between two or among more things.
Evaluate ■ means to give the value of something and implies an enumeration and explanation of assets and liabilities, pros and cons.
Finally, unless students know the questions in advance, teachers should allow students sufficient time for planning and rereading answers. For example, if teachers believe that 10 minutes is necessary to write an extended essay to answer a question that requires original thinking, they might allow 20 minutes for the question. The less fluent the students are, the greater is the proportion of time that should be allotted.
Special Considerations in Assessing Students with Disabilities
In developing items that employ a supply format, teachers must pay attention to individual differences among learners, particularly to disabilities that may interfere with performance. For example, students who write very slowly can be expected to have difficulty with fill-in or essay questions. Students who have considerable difficulty expressing themselves in writing will probably have difficulty completing or performing well on essay examinations. Teachers should make sure that they have included the adaptations and accommodations required in student IEPs.
5 Assessment in Core Achievement Areas
The assessment procedures used by teachers are a function of the content being taught, the criterion to which content is to be learned (such as 80 percent mastery), and the characteristics of the students. With primary-level curricula in core areas, teachers usually want more than knowledge from their students; they want the
134 Chapter 7 ■ Teacher-Made Tests of Achievement
material learned so well that correct responses are automatic. For example, teach-ers do not want their students to think about forming the letter “a,” sounding out the word “the,” or using number lines to solve simple addition problems such as “3 + 5 = ”; they want their students to respond immediately and correctly. Even for intermediate-level materials, teachers seek highly proficient responding from their students, whether that performance involves performing two-digit multipli-cation, reading short stories, writing short stories, or writing spelling words from dictation. However, teachers in all grades, but especially in secondary schools, are also interested in their students’ understanding of vast amounts of informa-tion about their social, cultural, and physical worlds, as well as their acquisition and application of critical thinking skills. The assessment of skills taught to high degrees of proficiency is quite different from the assessment of understanding and critical thinking skills.
In the following sections, core achievement areas are discussed in terms of three important attributes: the skills and information to be learned within the major strands of most curricula, the assessment of skills to be learned to profi-ciency, and the assessment of understanding of information and concepts. Critical thinking skills are usually embedded within content areas and are assessed in the same ways as understanding of information is assessed—with written multiple-choice and extended-essay questions.
ReadingReading is usually divided into decoding skills and comprehension. The specific behaviors included in each of these subdomains will depend on the particular cur-riculum and its sequencing.
Beginning Skills
Beginning decoding relies on students’ ability to analyze and manipulate sounds and syllables in words (Stanovich, 2000). Instruction in beginning reading can include letter recognition, letter–sound correspondences, sight vocabulary, phon ics, and, in some curricula, morphology. Automaticity is the goal for the skills to be learned. See–say (for example, “What letter is this?”) and hear–say (for example, “What sound does the letter make?”) formats are regularly used for both instruction and assessment. During students’ acquisition of specific skills, teachers should first stress the accuracy of student responses. Generally, this con-cern translates into allowing a moment or two for students to think about their responses. A generally accepted criterion for completion for early learning is 90 to 95 percent correct. As soon as accuracy has been attained (and sometimes before), teachers change their criteria from accurate responses to fast and accu-rate responses. For see–say formats, fluent students will need no thinking time for simple material; for example, they should be able to respond as rapidly as teach-ers can change stimuli to questions such as “What is this letter?” Once students accurately decode letters and letter combinations fluently, the emphasis shifts to fluency or the automatic retrieval of words. Fluency is a combination of speed and accuracy and is widely viewed as a fundamental prerequisite for reading comprehension (National Institute of Child Health and Human Development, 2000a, 2000b).
For beginners, reading comprehension is usually assessed in one of three ways: by assessing students’ retelling, their responses to comprehension questions, or their rate of oral reading. The most direct method is to have students retell what
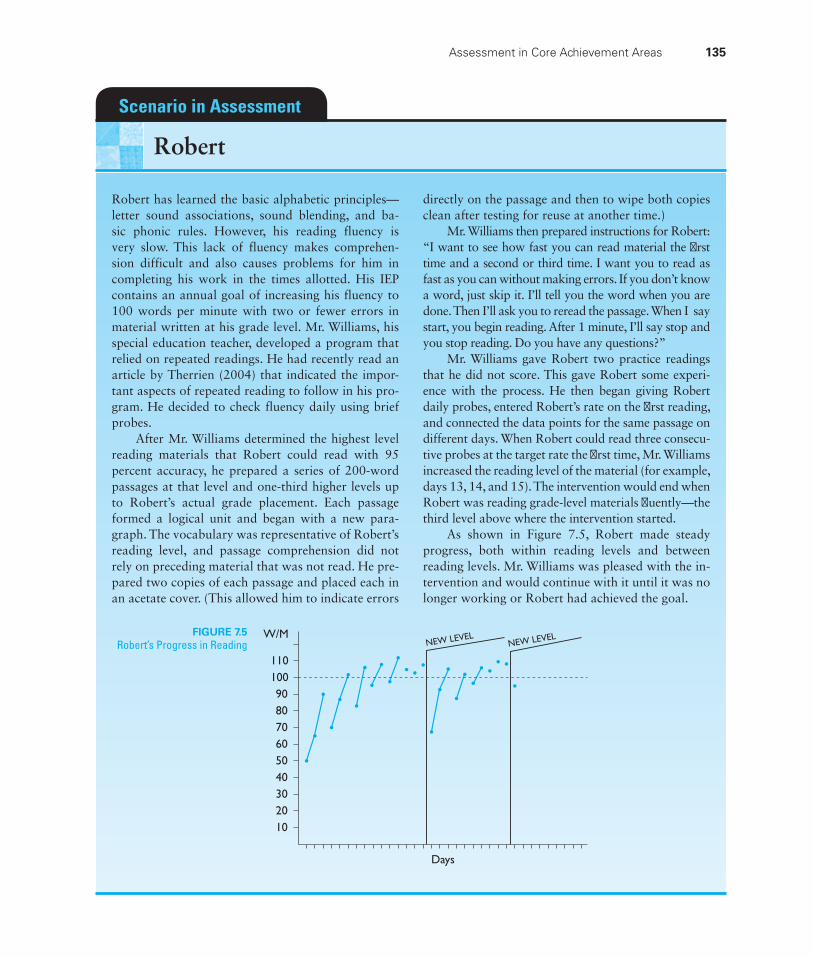
Robert has learned the basic alphabetic principles—letter sound associations, sound blending, and ba-sic phonic rules. However, his reading fluency is very slow. This lack of fluency makes comprehen-sion difficult and also causes problems for him in completing his work in the times allotted. His IEP contains an annual goal of increasing his fluency to 100 words per minute with two or fewer errors in material written at his grade level. Mr. Williams, his special education teacher, developed a program that relied on repeated readings. He had recently read an article by Therrien (2004) that indicated the impor-tant aspects of repeated reading to follow in his pro-gram. He decided to check fluency daily using brief probes.
After Mr. Williams determined the highest level reading materials that Robert could read with 95 percent accuracy, he prepared a series of 200-word passages at that level and one-third higher levels up to Robert’s actual grade placement. Each passage formed a logical unit and began with a new para-graph. The vocabulary was representative of Robert’s reading level, and passage comprehension did not rely on preceding material that was not read. He pre-pared two copies of each passage and placed each in an acetate cover. (This allowed him to indicate errors
directly on the passage and then to wipe both copies clean after testing for reuse at another time.)
Mr. Williams then prepared instructions for Robert: “I want to see how fast you can read material the fi rst time and a second or third time. I want you to read as fast as you can without making errors. If you don’t know a word, just skip it. I’ll tell you the word when you are done. Then I’ll ask you to reread the passage. When I say start, you begin reading. After 1 minute, I’ll say stop and you stop reading. Do you have any questions?”
Mr. Williams gave Robert two practice readings that he did not score. This gave Robert some experi-ence with the process. He then began giving Robert daily probes, entered Robert’s rate on the fi rst reading, and connected the data points for the same passage on different days. When Robert could read three consecu-tive probes at the target rate the fi rst time, Mr. Williams increased the reading level of the material (for example, days 13, 14, and 15). The intervention would end when Robert was reading grade-level materials fl uently—the third level above where the intervention started.
As shown in Figure 7.5, Robert made steady progress, both within reading levels and between reading levels. Mr. Williams was pleased with the in-tervention and would continue with it until it was no longer working or Robert had achieved the goal.
Scenario in Assessment
Robert
FIGURE 7.5Robert’s Progress in Reading
102030405060708090
100110
W/M
Days
NEW LEVELNEW LEVEL
Assessment in Core Achievement Areas 135
136 Chapter 7 ■ Teacher-Made Tests of Achievement
they have read without access to the reading passage. Retold passages may be scored on the basis of the number of words recalled. Fuchs, Fuchs, and Maxwell (1988) have offered two relatively simple scoring procedures that appear to offer valid indications of comprehension. Retelling may be conducted orally or in writ-ing. With students who have relatively undeveloped writing skills, retelling should be oral when it is used to assess comprehension, but it may be in writing as a prac-tice or drill activity. Teachers can listen to students retell, or students can retell using tape recorders so that their efforts can be evaluated later.
A second common method of assessing comprehension is to ask students questions about what they have read. Questions should address main ideas, important relationships, and relevant details. Questions may be in supply or selection formats, and either hear–say or see–write formats can be used conven-iently. As with retelling, teachers should concentrate their efforts on the gist of the passage.
A third convenient, although indirect, method of assessing reading compre-hension is to assess the rate of oral reading. One of the earliest attempts to explain the relationship between rate of oral reading and comprehension was offered by LaBerge and Samuels (1974), who noted that poor decoding skills created a bottleneck that impeded the flow of information, thus impeding comprehen-sion. The relationship makes theoretical sense: Slow readers must expend their energy decoding words (for example, attending to letters, remembering letter–sound associations, blending sounds, or searching for context cues) rather than concentrating on the meaning of what is written. Not only is the relationship between reading fluency and comprehension logical but also empirical research supports this relationship (Freeland, Skinner, Jackson, McDaniel, & Smith, 2000; National Institute of Child Health and Human Development, 2000a, 2000b; Sindelar, Monda, & O’Shea, 1990).
Therefore, teachers probably should concentrate on the rate of oral reading regularly with beginning readers. To assess reading rate, teachers should have stu-dents read for 2 minutes from appropriate materials. The reading passage should include familiar vocabulary, syntax, and content; the passage must be longer than the amount any student can read in the 2-minute period. Teachers have their own copy of the passage on which to note errors. The number of words read correctly and the number of errors made in 2 minutes are each divided by 2 to calculate the rate per minute. Mercer and Mercer (1985) suggest a rate of 80 words per minute (with two or fewer errors) as a desirable goal for reading words from lists and a rate of 100 words per minute (with two or fewer errors) for words in text. See Chapter 13 for a more complete discussion of errors in oral reading.
Advanced Skills
Students who have already mastered basic sight vocabulary and decoding skills generally read silently. Emphasis for these students shifts, and new demands are made. Decoding moves from oral reading to silent reading with subvocalization (that is, saying the words and phrases to themselves) to visual scanning with-out subvocalization; thus, the reading rates of some students may exceed 1,000 words per minute. Scanning for main ideas and information may also be taught systematically. The demands for reading comprehension may go well beyond the literal comprehension of a passage; summarizing, drawing inferences, recognizing
Assessment in Core Achievement Areas 137
and understanding symbolism, sarcasm, irony, and so forth may be systematically taught. For these advanced students, the gist of a passage is usually more impor-tant than the details. Teachers of more advanced students may wish to score retold passages on the basis of main ideas, important relationships, and details recalled correctly and the number of errors (that is, ideas, relationships, and details omitted plus the insertion of material not included in the passage). In such cases, the differ-ent types of information can be weighted differently, or the use of comprehension strategies (for example, summarization) can be encouraged. However, read–write assessment formats using multiple-choice and extended-essay questions are more commonly used.
Informal Reading Inventories
When making decisions about referral or initial placement in a reading curric-ulum, teachers often develop informal reading inventories (IRIs), which assess decoding and reading comprehension over a wide range of skill levels within the specific reading curricula used in a classroom. Thus, they are top-down assess-ments that span several levels of difficulty.
IRIs are given to locate the reading levels at which a student reads indepen-dently, requires instruction, and is frustrated. Techniques for developing IRIs and the criteria used to define independent, instructional, and frustration reading lev-els vary. Teachers should use a series of graded reading passages that range from below a student’s actual placement to a year or two above the actual placement. If a reading series prepared for several grade levels is used, passages can be selected from the beginning, middle, and end of each grade. Students begin reading the easiest material and continue reading until they can decode less than 85 percent of the words. Salvia and Hughes (1990) recommend an accuracy rate of 95 percent for independent reading and consider 85 to 95 percent accuracy the level at which a student requires instruction.
MathematicsThe National Council of Teachers of Mathematics has adopted standards for pre-kindergarten through secondary education. These standards deal with both content (that is, Number, Measurement, Algebra, Geometry, and Data and Statistics) and process (that is, Reasoning, Representation, Problem Solving, Connections, and Communication). Special education tends to share the goals of the National Mathematics Panel (2008), which has stressed computational profi-ciency and fluency in basic skills. In noninclusive special education settings, math content is generally stressed (that is, readiness skills, vocabulary and concepts, numeration, whole-number operations, fractions and decimals, ratios and per-centages, measurement, and geometry) (Salvia & Hughes, 1990). At any grade level, the specific skills and concepts included in each of these subdomains will depend on the state standards and the particular curriculum and its sequenc-ing. Mathematics curricula usually contain both problem sets that require only computations and word problems that require selection and application of the correct algorithm as well as computation. The difficulty of application prob-lems goes well beyond the difficulty of the computation involved and is related to three factors: (1) the number of steps involved in the solution (for exam-ple, a student might have to add and then multiply; Caldwell & Goldin, 1979),
138 Chapter 7 ■ Teacher-Made Tests of Achievement
(2) the amount of extraneous information (Englert, Cullata, & Horn, 1987), and (3) whether the mathematical operation is directly implied by the vocabulary used in the problem (for example, words such as and or more imply addition, whereas words such as each may imply division; see Bachor, Stacy, & Freeze, 1986). Although reading level is popularly believed to affect the difficulty of word problems, its effect has not been clearly established (see Bachor, 1990; Paul, Nibbelink, & Hoover, 1986).
Beginning Skills
The whole-number operations of addition, subtraction, multiplication, and division are the core of the elementary mathematics curriculum. Readiness for beginning students includes such basics as classification, one-to-one correspondence, and counting. Vocabulary and concepts are generally restricted to quantitative words (for example, “same,” “equal,” and “larger”) and spatial concepts (for example, left, above, and next to). Numeration deals with writing and identifying numerals, counting, ordering, and so forth.
See–write is probably the most frequently used assessment format for math-ematical skills, although see–say formats are not uncommon. For content asso-ciated with readiness, vocabulary and concepts, numeration, and applications, matching formats are commonly used. Accuracy is stressed, and 90 to 95 percent correct is commonly used as the criterion. For computation, accuracy and fluency are stressed in beginning mathematics; teachers do not stop their instruction when students respond accurately, but they continue instruction to build automaticity. Consequently, a teacher may accept somewhat lower rates of accuracy (that is, 80 percent).
When working toward fluency, teachers usually use probes. Probes are small samples of behavior. For example, in assessment of skill in addition of single-digit numbers, a student might be given only five single-digit addition problems. Perhaps the most useful criterion for math probes assessing computation is the number of correct digits (in an answer) written per minute, not the number of correct answers per minute. The actual criterion rate will depend on the operation, the type of material (for example, addition facts versus addition of two-digit numbers with regrouping), and the characteristics of the particular students. Students with motor difficulties may be held to a lower criterion or assessed with see–say formats. For see–write formats, students may be expected to write answers to addition and subtraction problems at rates between 50 and 80 digits per minute and to write answers to simple multiplication and division problems at rates between 40 and 50 digits per minute (Salvia & Hughes, 1990).
Advanced Skills
The more advanced mathematical skills (that is, fractions, decimals, ratios, percentages, and geometry) build on whole-number operations. These skills are taught to levels of comprehension and application. Unlike those for beginning skills, assessment formats are almost exclusively see–write, and accuracy is stressed over fluency, except for a few facts such as “half equals 0.5 equals 50 percent.” Teachers must take into account the extent to which specific student disabilities will interfere with performance of advanced skills. For example, dif-ficulties in sequencing of information and in comprehension may interfere with
Assessment in Core Achievement Areas 139
students’ performance on items that require problem solving and comprehension of mathematical concepts.
SpellingAlthough spelling is considered by many to be a component of written language, in elementary school it is generally taught as a separate subject. Therefore, we treat it separately in this chapter.
Spelling is the production of letters in the correct sequence to form a word. The specific words that are assigned as spelling words may come from several sources: spelling curricula, word lists, content areas, or a student’s own written work. In high school and college, students are expected to use dictionaries and to spell correctly any word they use. Between that point and approximately fourth grade, spelling words are typically assigned, and students are left to their own devices to learn them. In the first three grades, spelling is usually taught systemati-cally using phonics, morphology, rote memorization, or some combination of the three approaches.
Teachers may assess mastery of the prespelling rules associated with the par-ticular approach they are teaching. For example, when a phonics approach is used, students may have to demonstrate mastery of writing the letters associated with specific vowels, consonants, consonant blends, diphthongs, and digraphs. Teachers assess mastery of spelling in at least four ways:
1. Recognition response: The teacher provides students with lists of alternative spellings of words (usually three or four alternatives) and reads a word to the student. The student must select the correct spelling of the dictated word from the alternatives. Emphasis is on accuracy.
2. Spelling dictated single words: Teachers dictate words, and students write them down. Although teachers often give a spelling word and then use it in a sentence, students fi nd the task easier if just the spelling word is given (Horn, 1967). Moreover, the fi ndings from research performed in 1988 suggest that a 7-second interval between words is suffi cient (Shinn, Tindall, & Stein, 1988).
3. Spelling words in context: Students write paragraphs using words given by the teacher. This approach is as much a measure of written expression as of spelling. The teacher can also use this approach in instruction of written language by asking students to write paragraphs and counting the number of words spelled correctly.
4. Students’ self-monitoring of errors: Some teachers teach students to monitor their own performance by fi nding and correcting spelling errors in the daily assignments they complete.
Written LanguageWritten language is no doubt the most complex and difficult domain for teachers to assess. Assessment differs widely for beginners and advanced students. Once the preliminary skills of letter formation and rudimentary spelling have been mas-tered, written-language curricula usually stress both content and style (that is, grammar, mechanics, and diction).
140 Chapter 7 ■ Teacher-Made Tests of Achievement
Beginning Skills
The most basic instruction in written language is penmanship, in which the forma-tion and spacing of uppercase (capital) and lowercase printed and cursive letters are taught. Early instruction stresses accuracy, and criteria are generally qualita-tive. After accuracy has been attained, teachers may provide extended practice to move students toward automaticity. If this is done, teachers will evaluate perfor-mance on the basis of students’ rates of writing letters. Target rates are usually in the range of 80 to 100 letters per minute for students without motor handicaps.
Once students can fluently write letters and words, teachers focus on teach-ing students to write content. For beginners, content generation is often reduced to generation of words in meaningful sequence. Teachers may use story starters (that is, pictures or a few words that act as stimuli) to prompt student writing. When the allotted time for writing is over, teachers count the number of words or divide the number of words by the time to obtain a measure of rate. Although this sounds relatively easy, decisions as to what constitutes a word must be made. For example, one-letter words are seldom counted.
Teachers also use the percentage of correct words to assess content produc-tion. To be considered correct, the word must be spelled correctly, be capitalized if appropriate, be grammatically correct, and be followed by the correct punctua-tion (Isaacson, 1988). Criteria for an acceptable percentage of correct words are still the subject of discussion. For now, social comparison, by which one student’s writing output is compared with the output of students whose writing is judged acceptable, can provide teachers with rough approximations. Teaching usually boils down to focusing on capitalization, simple punctuation, and basic grammar (for example, subject–verb agreement). Teachers may also use multiple-choice or fill-in tests to assess comprehension of grammatical conventions or rules.
Advanced Skills
Comprehension and application of advanced grammar and mechanics can be tested readily with multiple-choice or fill-in questions. Thus, this aspect of written language can be assessed systematically and objectively. The evaluation of content generation by advanced students is far more difficult than counting correct words. Teachers may consider the quality of ideas, the sequencing of ideas, the coherence of ideas, and consideration of the reading audience. In practice, teachers use holis-tic judgments of content (Cooper, 1977). In addition, they may point out errors in style or indicate topics that might benefit from greater elaboration or clarifica-tion. Objective scoring of any of these attributes is very difficult, and extended scoring keys and practice are necessary to obtain reliable judgments, if they are ever attained. More objective scoring systems for content require computer analy-sis and are currently beyond the resources of most classroom teachers.
6 Potential Sources of Diffi culty in the Use of Teacher-Made Tests
To be useful, teacher-made tests must avoid three pitfalls: (1) relying on a single summative assessment, (2) using nonstandardized testing procedures, and (3) using technically inadequate assessment procedures. The first two are easily avoided; avoiding the third is more difficult.
Potential Sources of Diffi culty in the Use of Teacher-Made Tests 141
First, teachers should not rely solely on a single summative assessment to evaluate student achievement after a course of instruction. Such assessments do not provide teachers with information they can use to plan and modify sequences of instruction. Moreover, minor technical inadequacies can be magnified when a single summative measure is used. Rather, teachers should test progress toward educational objectives at least two or three times a week. Frequent testing is most important when instruction is aimed at developing automatic or fluent responses in students. Although fluency is most commonly associated with primary curric-ula, it is not restricted to reading, writing, and arithmetic. For example, instruc-tion in foreign languages, sports, and music is often aimed at automaticity.
Second, teachers should use standardized testing procedures. To conduct fre-quent assessments that are meaningful, the tests that are used to assess the same objectives must be equivalent. Therefore, the content must be equivalent from test to test; moreover, test directions, kinds of cues or hints, testing formats, criteria for correct responses, and type of score (for example, rates or percentage correct) must be the same.
Third, teachers should develop technically adequate assessment procedures. Two aspects of this adequacy are especially important: content validity and reliability. The tests must have content validity. There should seldom be problems with content validity when direct performances are used. For example, the materials used in deter-mining a student’s rate of oral reading should have content validity when they come from that student’s reading materials; tests used to assess mastery of addition facts will have content validity because they assess the facts that have been taught. A prob-lem with content validity is more likely when teachers use tests to assess achievement outside of the tool subjects (that is, other than reading, math, and language arts).
Although only teachers can develop tests that truly mirror instruction, teach-ers must not only know what has been taught but also prepare devices that test what has been taught. About the only way to guarantee that an assessment covers the content is to develop tables of specifications for the content of instruction and testing. However, test items geared to specific content may still be ineffective.
Careful preparation in and of itself cannot guarantee the validity of one question or set of questions. The only way a teacher can know that the questions are good is to field test the questions and make revisions based on the field test results. Realistically, teachers do not have time for field testing and revision prior to giving a test. Therefore, teachers must usually give a test and then delete or discount poor items. The poor items can be edited and the revised questions used the next time the examination is needed. In this way, the responses from one group of students become a field test for a subsequent group of students. When teachers use this approach, they should not return tests to students because students may pass questions down from year to year.
The tests must also be reliable. Interscorer agreement is a major concern for any test using a supply format but is especially important when extended responses are evaluated. Agreement can be increased by developing precise scoring guides for all questions of this type and by sticking with the criteria. Interscorer agreement should not be a problem for tests using select or restricted fill-in formats. For select and fill-in tests, internal consistency is of primary concern. Unfortunately, very few people can prepare a set of homogeneous test questions the first time. However, at the same time that they revise poor items, teachers can delete or revise items to increase a test’s homogeneity (that is, delete or revise items that have correlations with the total score of .25 or less). Additional items can also be prepared for the next test.
142 Chapter 7 ■ Teacher-Made Tests of Achievement
CHAPTER COMPREHENSION QUESTIONSWrite your answers to each of the following questions, and then compare your responses to the text or the study guide.
1. Explain three potential advantages of teacher-made tests.
2. How do skill attainment and progress monitoring differ?
3. Explain content specifi city.
4. Explain why frequent testing is valuable.
5. Give examples of a see–write, see–say, hear–write, and see–write formats.
6. Explain six common errors to avoid in developing multiple-choice tests.
7. Explain three things a teacher can do to prepare better matching questions.
8. Explain three things a teacher can do to prepare better true–false questions.
9. Explain three ways in which reading comprehension can be assessed.
10. Explain three ways of assessing spelling.
11. Why is fl uency an important dimension to assess in beginning skills?
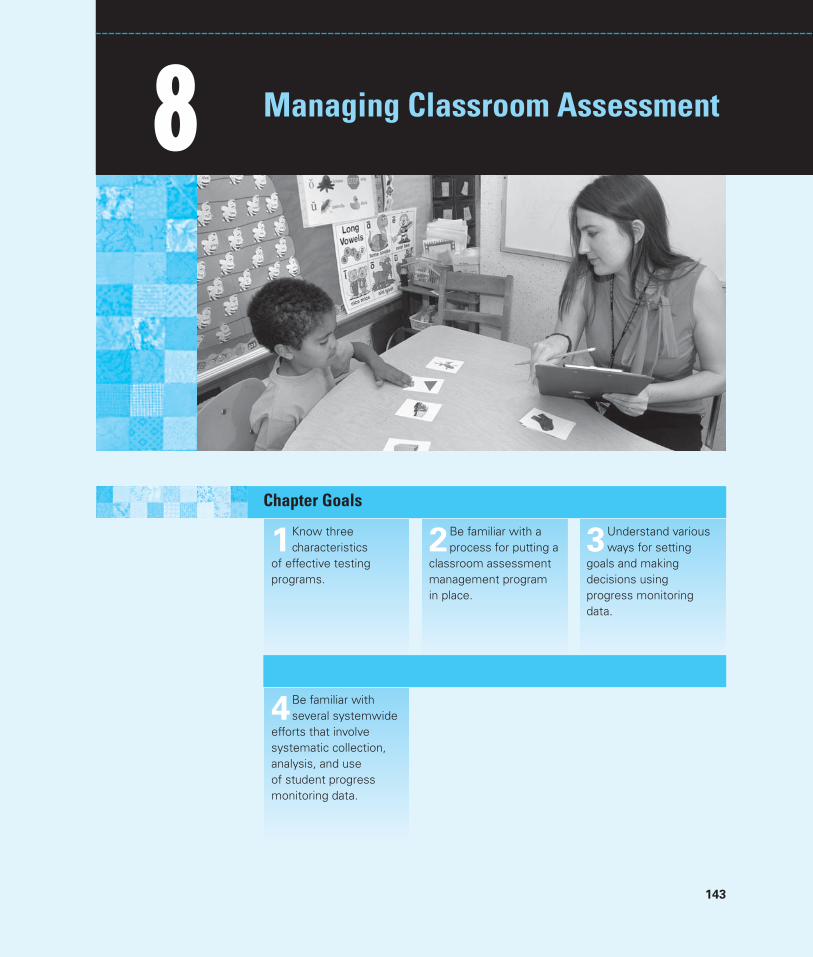
143
3Understand various ways for setting
goals and making decisions using progress monitoring data.
2Be familiar with a process for putting a
classroom assessment management program in place.
1Know three characteristics
of effective testing programs.
8 Managing Classroom Assessment
Chapter Goals
4Be familiar with several systemwide
efforts that involve systematic collection, analysis, and use of student progress monitoring data.
144 Chapter 8 ■ Managing Classroom Assessment
Key Terms mandated tests
progress monitoring
celeration charts
aimline
trendline
goal line
decision-making rules
Except for individual evaluations conducted by specialists such as psychologists and speech therapists, classroom teachers are responsible for most testing conducted in schools. When districts want group achievement tests on all of their students (or those in particular grades), teachers are the ones who admin-ister these tests in their classrooms. When the state requires all students to com-plete standards-based assessments, teachers are the ones who administer these tests in their classrooms. Beyond these mandated assessments, teachers routinely test to monitor student progress and ascertain the degree of student achievement on units and so forth.
Testing to monitor student progress during and after instruction is best when tests are carefully planned, thoughtfully managed, and fully incorporated into the class-room routines. In short, testing should be an easy and natural part of classroom life. Teachers should plan their testing programs at the beginning of the year. Good testing programs have three characteristics: efficiency, ease, and integration.
Efficiency. ■ Time spent in testing (including administration, scoring, and record keeping) is time not spent teaching and learning. Therefore, good assessment plans provide for the minimum assessments that are sufficient for decision making.
Ease. ■ Easy testing programs from the teacher’s perspective are those that minimize teacher time and effort in all aspects of testing (that is, preparation, administration, scoring, and record keeping). The easiest testing programs are those that can be carried out by paraprofessionals or by the students. Easy testing programs from the student’s perspective are those with which students are familiar, comfortable, and confident. Thus, it is important to set expectations about how assessment works in the classroom, how people are to behave, and so on early in the school year and reinforce these expectations periodically.
Integration. ■ Assessment activities can be integrated into the school day in two ways. First, teachers can monitor pupil performance during instructional activities. For example, basic skill drills can be structured to provide useful assessment information about accuracy and fluency. Second, teachers can establish a regular schedule for brief assessments, such as daily 1-minute oral reading probes. Making assessments frequent and part of the regular classroom routine has the added benefit of reducing student anxiety associated with higher stakes testing.
1 Preparing for and Managing Mandated Tests
When districtwide and statewide assessments are conducted, they generally occur within classrooms. Teachers usually have advance notice about when various man-dated tests will occur, how long they will take, and how they are to be administered. Teachers should become thoroughly familiar with expectations for their role, and
they should be thoroughly prepared with backup supplies of pencils, timers, answer sheets (if allowed), and so forth. Teachers should also provide their students with advanced knowledge in such a way as to reduce anxiety about these tests without diminishing their importance. For example, it is a good idea to tell students that all students in the district or all students in their grade are taking the test and that the tests are designed to help the district do a good job teaching all of the students.
In addition to these general considerations, teachers should check all of their students’ individualized educational programs (IEPs) to verify that each student is required to take the assessment and what, if any, adaptations or accommodations must be provided. Teachers should also check their students’ IEPs to determine whether any student is to receive an alternate assessment and if individual stu-dents need any alternate assessment accommodations.
2 Preparing for and Managing Progress Monitoring
Even the most extensively researched curriculum and teaching techniques may not work with every student. Moreover, there is currently no way to discern the students for whom the curriculum or methods will be effective from those for whom the educational procedures will not work. The only way to know if edu-cational procedures are effective is to determine if they were effective. That is, we can know if what we have done has worked, but we cannot know this before we do it. Thus, teachers are faced with a choice: They can either teach and hope that their instruction will work or they can teach and measure if their instruction has worked. We advocate the latter approach.
Monitoring student achievement allows teachers the chance to reteach unlearned material, provide alternative content or methods for those students who have not learned, or get additional help for them. Moreover, student prog-ress should be monitored frequently enough to allow early detection and error correction. Errors that are caught late in the learning process are much more difficult to correct because students have practiced the incorrect responses. Finally, the monitoring procedures must be sensitive to incremental changes in student achievement. Of all the ways teachers can monitor student learning, we prefer continuous (that is, daily or several times per week) and systematic moni-toring rather than periodic monitoring (that is, assessing student knowledge after instruction of large amounts of content or after several weeks of instruction).
Lack of time is the primary reason given by teachers for not measuring fre-quently or well. However, advanced planning and extra work in the beginning will save countless hours during the school year. Teachers can do five things to make assessment less time-consuming for themselves and their students: estab-lish testing routines, create assessment stations, prepare and organize materials, maintain assessment files, and involve other adults and students in the assessment process when possible.
Establish RoutinesEstablishing a consistent testing routine brings predictability for students. If stu-dents know they will be taking a brief vocabulary test in Spanish class each Friday or a timer will be used for the 2-minute quiz at the start of math class every
Preparing for and Managing Progress Monitoring 145
146 Chapter 8 ■ Managing Classroom Assessment
Tuesday and Thursday, they will require progressively fewer cues and less time to get ready to take the quizzes. For younger students, it helps to use the same cues that a quiz is coming. For example, “OK students, it’s time for a math probe. Clear your desks except for a pencil.” Similarly, if the test-taking rules are the same every time, student compliance becomes easier to obtain and maintain. For example, when teaching an assessment course to college students, we do not allow them to wear baseball caps (some write notes inside the bill), we allow them to use calcula-tors (but not those with alphanumeric displays because notes can be programmed into them), students must sit in every other file so that there is no one to their immediate left or right, and we do not return the exams to students (to allow the reuse of questions without fear of students having a file of previous questions), although we do go over the exam with students individually if they wish. After the first exam or two, students know the rules and seldom need to be reminded.
To the extent feasible, the same directions and cues should be used. For exam-ple, a teacher might always announce a quiz in the same way: “Quiz time. Get ready.” Directions for specific tests and quizzes may vary by content. For example, for an oral reading probe the teacher may say, “When I say ‘start,’ begin reading at the top of the page. Try to read each word. If you don’t know the word, you can skip it or I’ll read it for you. At the end of a minute, I’ll say ‘stop.’” A teacher can use similar directions for a math probe: “Write your name at the top of the paper. When I say ‘start,’ begin writing your answers. Write neatly. If you don’t know an answer, you can skip it. At the end of a minute, I’ll say ‘stop.’”
Create Assessment StationsAn assessment station is a place where individual testing can occur within a class-room. An assessment station should be large enough for an adult and student to work comfortably and be free of distractions. Stations are often placed in the back of the classroom, with chairs or desks facing the back wall and portable dividers walling off the left and right sides of the workspace.
Assessment stations allow classroom testing to occur concurrently with other classroom activities. They allow a teacher or an aide to test students or students to self-test. Student responses can be corrected during or after testing.
Prepare Assessment MaterialsThe first consideration in preparing assessment materials is that the assessment must match the instruction. Unless there is a good match between what is taught and what is tested, test results will lack validity. The best way for assessments to match curriculum is to use the actual content and formats that are used in instruc-tion. For example, to assess mastery of addition facts that have been taught as num-ber sentences, one would assess using number sentences as shown in Figure 8.1.1
If generic assessment devices are already available, there is no reason not to use them if they are appropriate. By appropriate, we mean that they represent measurement of the skills and knowledge that are part of the student’s instruc-tion. One advantage to using existing assessment devices is that many have been developed to ensure that the probes are of similar difficulty level across a year such that they can truly measure student progress over time. Now that Internet
1Obviously, if testing is done to assess generalization or application of material, test content and perhaps formats will vary from those used during instruction.
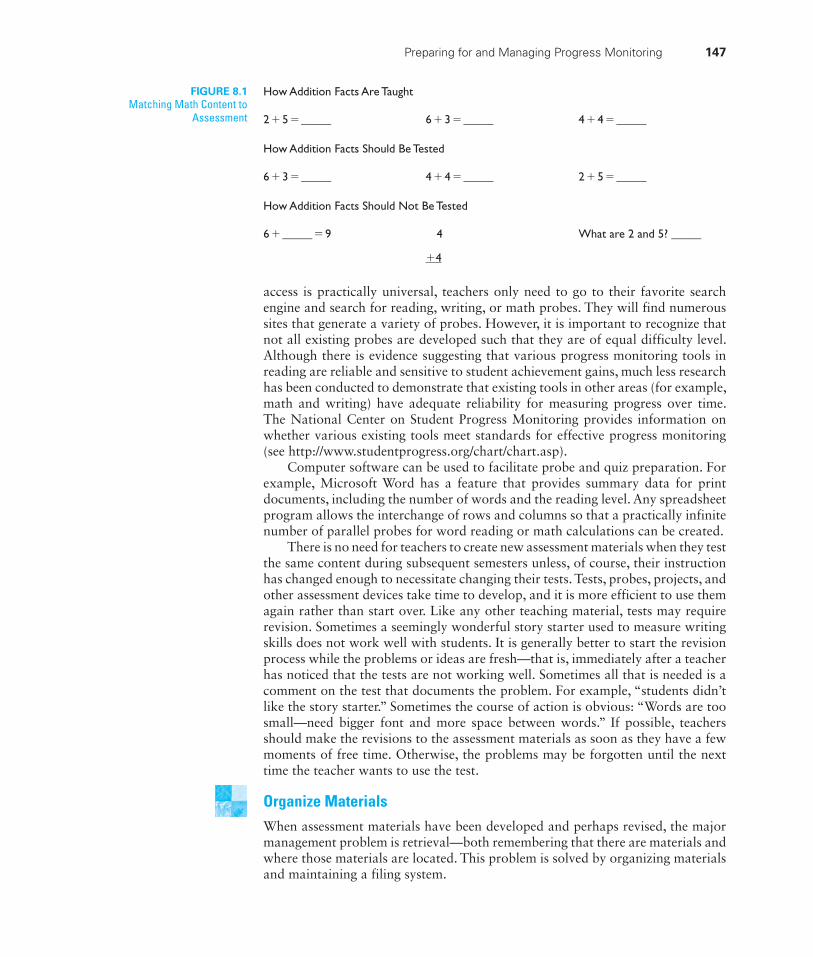
access is practically universal, teachers only need to go to their favorite search engine and search for reading, writing, or math probes. They will find numerous sites that generate a variety of probes. However, it is important to recognize that not all existing probes are developed such that they are of equal difficulty level. Although there is evidence suggesting that various progress monitoring tools in reading are reliable and sensitive to student achievement gains, much less research has been conducted to demonstrate that existing tools in other areas (for example, math and writing) have adequate reliability for measuring progress over time. The National Center on Student Progress Monitoring provides information on whether various existing tools meet standards for effective progress monitoring (see http://www.studentprogress.org/chart/chart.asp).
Computer software can be used to facilitate probe and quiz preparation. For example, Microsoft Word has a feature that provides summary data for print documents, including the number of words and the reading level. Any spreadsheet program allows the interchange of rows and columns so that a practically infinite number of parallel probes for word reading or math calculations can be created.
There is no need for teachers to create new assessment materials when they test the same content during subsequent semesters unless, of course, their instruction has changed enough to necessitate changing their tests. Tests, probes, projects, and other assessment devices take time to develop, and it is more efficient to use them again rather than start over. Like any other teaching material, tests may require revision. Sometimes a seemingly wonderful story starter used to measure writing skills does not work well with students. It is generally better to start the revision process while the problems or ideas are fresh—that is, immediately after a teacher has noticed that the tests are not working well. Sometimes all that is needed is a comment on the test that documents the problem. For example, “students didn’t like the story starter.” Sometimes the course of action is obvious: “Words are too small—need bigger font and more space between words.” If possible, teachers should make the revisions to the assessment materials as soon as they have a few moments of free time. Otherwise, the problems may be forgotten until the next time the teacher wants to use the test.
Organize MaterialsWhen assessment materials have been developed and perhaps revised, the major management problem is retrieval—both remembering that there are materials and where those materials are located. This problem is solved by organizing materials and maintaining a filing system.
Preparing for and Managing Progress Monitoring 147
How Addition Facts Are Taught
2 + 5 = _____ 6 + 3 = _____ 4 + 4 = _____
How Addition Facts Should Be Tested
6 + 3 = _____ 4 + 4 = _____ 2 + 5 = _____
How Addition Facts Should Not Be Tested
6 + _____ = 9 4 What are 2 and 5? _____
+4
FIGURE 8.1Matching Math Content to
Assessment
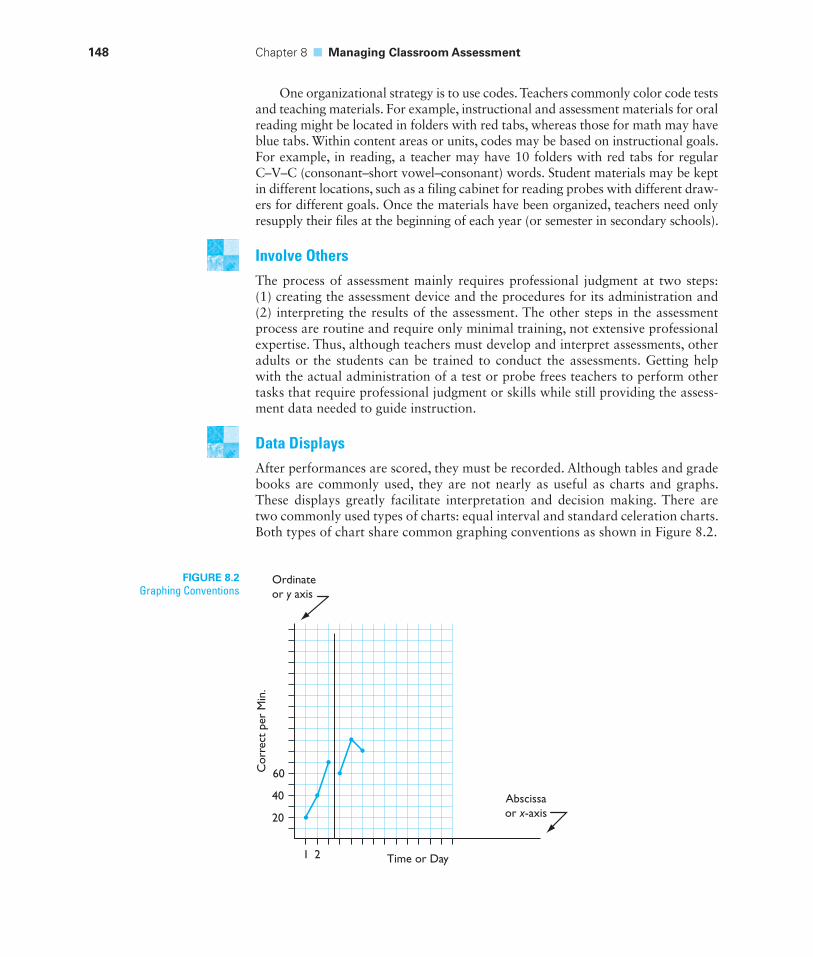
148 Chapter 8 ■ Managing Classroom Assessment
One organizational strategy is to use codes. Teachers commonly color code tests and teaching materials. For example, instructional and assessment materials for oral reading might be located in folders with red tabs, whereas those for math may have blue tabs. Within content areas or units, codes may be based on instructional goals. For example, in reading, a teacher may have 10 folders with red tabs for regular C–V–C (consonant–short vowel–consonant) words. Student materials may be kept in different locations, such as a filing cabinet for reading probes with different draw-ers for different goals. Once the materials have been organized, teachers need only resupply their files at the beginning of each year (or semester in secondary schools).
Involve OthersThe process of assessment mainly requires professional judgment at two steps: (1) creating the assessment device and the procedures for its administration and (2) interpreting the results of the assessment. The other steps in the assessment process are routine and require only minimal training, not extensive professional expertise. Thus, although teachers must develop and interpret assessments, other adults or the students can be trained to conduct the assessments. Getting help with the actual administration of a test or probe frees teachers to perform other tasks that require professional judgment or skills while still providing the assess-ment data needed to guide instruction.
Data DisplaysAfter performances are scored, they must be recorded. Although tables and grade books are commonly used, they are not nearly as useful as charts and graphs. These displays greatly facilitate interpretation and decision making. There are two commonly used types of charts: equal interval and standard celeration charts. Both types of chart share common graphing conventions as shown in Figure 8.2.
FIGURE 8.2Graphing Conventions
Ordinateor y axis
Time or Day
60
40
20
1 2
Abscissaor x-axis
Cor
rect
per
Min
.
The vertical ( ■ y) axis indicates the amount of the variable (that is, its frequency, percent correct, rate of correct responses, and so forth). The axis is labeled (for example, correct responses per minute).
The horizontal ( ■ x) axis indicates time, usually sessions or days. The axis is labeled (for example, school days).
Dots represent performances on specific days; a dot’s location on the chart is ■
the intersection of the day or session in which the performance occurred and the amount (for example, rate) of performance.
Dots for performances on the same behavior or skill are connected. For ■
example, performance in orally reading material written at the beginning first-grade level would be connected; performance in orally reading material written at the middle first-grade level would be connected but not connected to the performances on beginning first-grade material.
Vertical lines separate different types of performances or different ■
intervention conditions.
Charts contain identifying data, such as the student’s name and the objective ■
being measured.
Two types of charts are used in special education: equal-interval charts and standard celeration charts. The difference between the two types of charts con-cerns the calibration of the vertical axis.
Equal-interval charts are most likely to be familiar to beginning educators. On these charts, the differences between adjacent points are additive and equal.
After instruction and guided practice, Phil knows how to take his reading probes. He goes to the assess-ment center and follows the steps posted on the divider.
1. He checks his probe schedule and sees that he is supposed to take 2-minute oral reading probe No. 17.
2. He goes to the fi le, gets a copy of the probe, and lays it face up on the desk. He inserts a blank audio cassette into the tape recorder and rewinds to the beginning of the tape.
3. After locating the 3-minute timer on the desk, he starts recording.
4. He says the probe number and then sets the timer for 2 minutes.
5. He reads aloud into the tape recorder until the timer rings.
6. He stops the tape recorder, ejects it, and places it in the inbox on his teacher’s desk.
Phil then returns to his seat and begins working. At a convenient time, his teacher or the aide gets a copy of the probe that Phil read, slides it into an acetate cover, and notes errors on the cover, tallies the errors, calcu-lates Phil’s scores, and enters them on his chart. Then the teacher rewinds Phil’s tape, wipes the acetate cover clean, and places the probe back into the fi le for reuse.
Scenario in Assessment
Phil Self-Administers a Probe
Preparing for and Managing Progress Monitoring 149
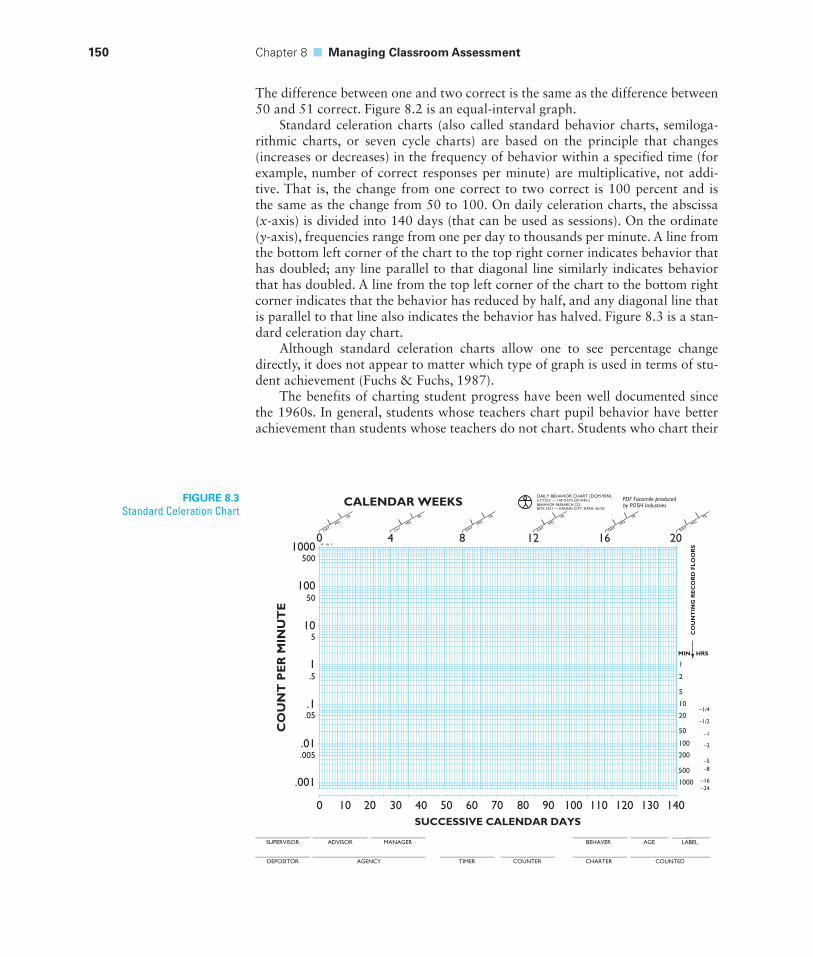
150 Chapter 8 ■ Managing Classroom Assessment
The difference between one and two correct is the same as the difference between 50 and 51 correct. Figure 8.2 is an equal-interval graph.
Standard celeration charts (also called standard behavior charts, semiloga-rithmic charts, or seven cycle charts) are based on the principle that changes (increases or decreases) in the frequency of behavior within a specified time (for example, number of correct responses per minute) are multiplicative, not addi-tive. That is, the change from one correct to two correct is 100 percent and is the same as the change from 50 to 100. On daily celeration charts, the abscissa (x-axis) is divided into 140 days (that can be used as sessions). On the ordinate (y-axis), frequencies range from one per day to thousands per minute. A line from the bottom left corner of the chart to the top right corner indicates behavior that has doubled; any line parallel to that diagonal line similarly indicates behavior that has doubled. A line from the top left corner of the chart to the bottom right corner indicates that the behavior has reduced by half, and any diagonal line that is parallel to that line also indicates the behavior has halved. Figure 8.3 is a stan-dard celeration day chart.
Although standard celeration charts allow one to see percentage change directly, it does not appear to matter which type of graph is used in terms of stu-dent achievement (Fuchs & Fuchs, 1987).
The benefits of charting student progress have been well documented since the 1960s. In general, students whose teachers chart pupil behavior have better achievement than students whose teachers do not chart. Students who chart their
FIGURE 8.3Standard Celeration Chart
DAYMO
YR
0
.001
SUPERVISOR
.005
M
0 10 20 30 40 50 60 70 80 90 100 110 120 130 140SUCCESSIVE CALENDAR DAYS
.01
.05.1
.51
510
50100
5001000
4 8 12 16 20DAY
MOYR
DAYMO
YR
DAYMO
YR
DAYMO
YR
DAYMO
YR
DEPOSITOR
ADVISOR
AGENCY
MANAGER
TIMER COUNTER CHARTER
BEHAVER AGE LABEL
COUNTED
CO
UN
T P
ER
MIN
UT
E
CALENDAR WEEKS
1000
500
200
100
50
20
10
5
2
1
W F
MIN HRS
CO
UN
TIN
G R
EC
OR
D F
LO
OR
S
–1
–5
–24
–1/2
–1/4
–2
–8
–16
DAILY BEHAVIOR CHART (DCM-9EN)6 CYCLE — 140 DAYS (20 WKS.)BEHAVIOR RESEARCH CO.BOX 3351 — KANSAS CITY, KANS. 66103
PDF Facsimile producedby POSH Industries
own performance have better achievement than students who do not chart their achievement. Finally, achievement tends to be best when both teachers and stu-dents chart pupil progress (see, for example, Fuchs & Fuchs, 1986).
3 Interpreting Data: Decision-Making Rules
Charting of data on student progress can help educators discern whether a student is making progress. After a baseline performance level is established, goals are typically set to assist with decision making. Goals may be set to ensure students reach the level of proficiency needed for them to be developmentally on track for a particular learning outcome (benchmark approach), or they can be set using anticipated rates of growth established through prior research inves-tigations, such as those described in Fuchs, Fuchs, Hamlett, Walz, & Germann (1993).
Results from brief tests such as those frequently used to monitor prog-ress can fluctuate, making it difficult to know whether the student is making progress toward meeting a goal. Sometimes fluctuations in performance are due to variations in the difficulty level of the test presented, sometimes they are due to student characteristics unrelated to what the test is intended to measure (for example, interest level and concentration level), and sometimes they are due to changes in student achievement, which are what you are intending to detect.
If a student is not improving in achievement at a rate needed to meet a prede-termined goal, it is important that changes be made in instruction. However, given that there may be substantial fluctuation in the measures taken, how can we truly know whether the student is failing to make progress? Several decision-making strategies have been developed to help make appropriate decisions using progress monitoring data.
Four-point rule: Once a goal or aimline has been drawn, each data point collected after the determination of initial performance should be plotted soon after each probe is administered. If four consecutive data points fall below the goal line, a teaching change or intervention is considered warranted.
Parallel rule: Educators can draw an aimline as previously discussed. After several data points are collected, the trend in the student’s performance can be compared to the aimline. If the instructional goal is the acquisition of a skill, the desired trendline is above the aimline and should be parallel or rise more steeply than the aimline. If the trendline does not meet the above criteria, instruction should be modifi ed.
4 Model Progress Monitoring Projects
As people have recognized the benefits of frequent measurement of student learn-ing, many educational systems have implemented systemwide changes that sup-port progress monitoring efforts and have provided intervention as needed to
Model Progress Monitoring Projects 151
152 Chapter 8 ■ Managing Classroom Assessment
those students who are not making adequate progress. The reauthorization of the Individuals with Disabilities Education Act in 2004 indicated that Response-to-Intervention can be used to identify students in need of special education services, so many educational agencies are incorporating systematic procedures for man-aging progress monitoring data and using such data to make a variety of deci-sions. Table 8.1 provides information on some projects that have supported such efforts. An expanded description of an educational agency that has been involved in systematic progress monitoring and using the collected data to inform decision making, namely the Heartland Area Education Agency, is provided in the follow-ing section.
Heartland Area Education Agency and the Iowa Problem-Solving ModelSchool personnel in the Heartland Education Agency in central Iowa were among the first in the nation to implement a formal model of problem solving that included direct and frequent assessment of student response to instruction. The model began to be implemented in approximately 1990 as part of an effort by the Iowa Department of Education to move away from a traditional service delivery model in which students were identified as having a disability based primarily on results from commercial norm-referenced testing and toward a problem-solving model in which the goal was to identify what interventions worked for a student and possibly qualify a student for services if it was identified that special edu-cation services were necessary for the student to make progress. The problem-solving model was initially implemented with individual students, but now many Iowa schools are also using problem solving to analyze data and target interven-tion toward schoolwide problems.
The Iowa problem-solving model had its origins in early work on behavioral consultation (Bergan, 1977; Tharp & Wetzel, 1969), and formal steps in problem solving were used with individual students. The steps are illustrated in Figure 8.4. When students experience academic difficulties, education professionals conduct an assessment to ascertain the difference between expected and actual student behavior or performance. Data are collected in an effort to clearly define the problem, determine why it is occurring, and identify an intervention that has a high likelihood of success. A plan is developed for addressing the problem, the plan is implemented, and the plan is evaluated using data from progress monitor-ing. “The process of defining problems, developing plans, implementing plans, and evaluating effectiveness is used with a greater degree of specificity and with additional resources as the intensity and severity of problems increases” (Grimes & Kurns, 2003).
In the past, this process has been applied at four different levels to address individual student problems of varying severity and need for resources. Recently, the model has been refined to address problems from a schoolwide perspective using a three-tier overlay to the traditional four-tier model. Core instruction is considered the “universal intervention,” or the set of experiences that stu-dents receive in general education. It is argued that “the most efficient manner of improving student performance is through the provision of an effective core curriculum and then early determination of performance gaps for students whose performance is not keeping pace with expectations” (Grimes & Kurns, 2003).
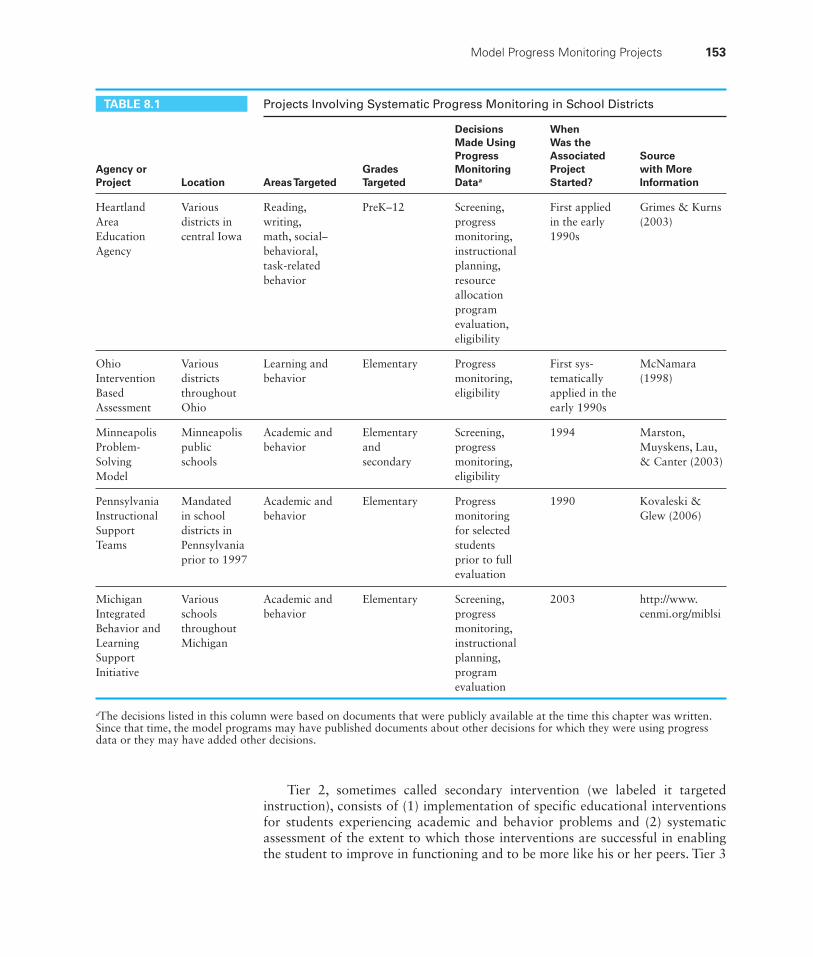
TABLE 8.1 Projects Involving Systematic Progress Monitoring in School Districts
Agency or Project Location Areas Targeted
Grades Targeted
Decisions Made Using Progress Monitoring Dataa
When Was the Associated Project Started?
Source with More Information
Heartland Area Education Agency
Various districts in central Iowa
Reading, writing, math, social–behavioral, task-related behavior
PreK–12 Screening, progress monitoring, instructional planning, resource allocation program evaluation, eligibility
First applied in the early 1990s
Grimes & Kurns (2003)
Ohio Intervention Based Assessment
Various districts throughout Ohio
Learning and behavior
Elementary Progress monitoring, eligibility
First sys-tematically applied in the early 1990s
McNamara (1998)
Minneapolis Problem-Solving Model
Minneapolis public schools
Academic and behavior
Elementary and secondary
Screening, progress monitoring, eligibility
1994 Marston, Muyskens, Lau, & Canter (2003)
Pennsylvania Instructional Support Teams
Mandated in school districts in Pennsylvania prior to 1997
Academic and behavior
Elementary Progress monitoring for selected students prior to full evaluation
1990 Kovaleski & Glew (2006)
Michigan Integrated Behavior and Learning Support Initiative
Various schools throughout Michigan
Academic and behavior
Elementary Screening, progress monitoring, instructional planning, program evaluation
2003 http://www.cenmi.org/miblsi
aThe decisions listed in this column were based on documents that were publicly available at the time this chapter was written. Since that time, the model programs may have published documents about other decisions for which they were using progress data or they may have added other decisions.
Tier 2, sometimes called secondary intervention (we labeled it targeted instruction), consists of (1) implementation of specific educational interventions for students experiencing academic and behavior problems and (2) systematic assessment of the extent to which those interventions are successful in enabling the student to improve in functioning and to be more like his or her peers. Tier 3
Model Progress Monitoring Projects 153
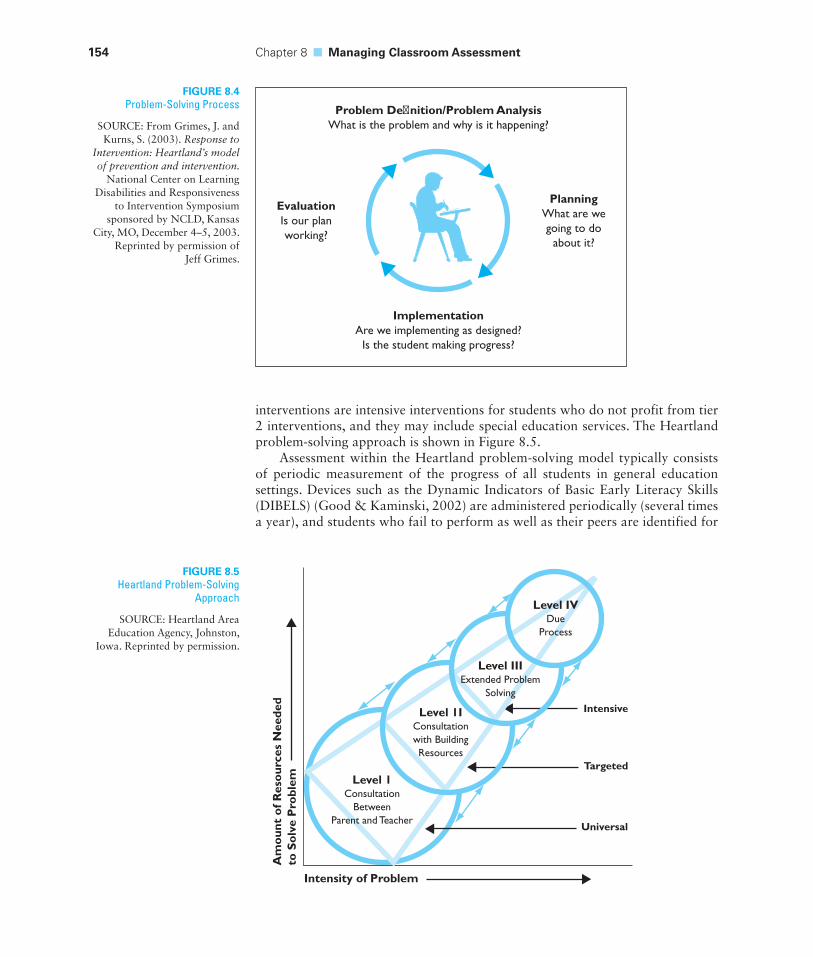
154 Chapter 8 ■ Managing Classroom Assessment
interventions are intensive interventions for students who do not profit from tier 2 interventions, and they may include special education services. The Heartland problem-solving approach is shown in Figure 8.5.
Assessment within the Heartland problem-solving model typically consists of periodic measurement of the progress of all students in general education settings. Devices such as the Dynamic Indicators of Basic Early Literacy Skills (DIBELS) (Good & Kaminski, 2002) are administered periodically (several times a year), and students who fail to perform as well as their peers are identified for
FIGURE 8.4Problem-Solving Process
SOURCE: From Grimes, J. and Kurns, S. (2003). Response to
Intervention: Heartland’s model of prevention and intervention.
National Center on Learning Disabilities and Responsiveness
to Intervention Symposium sponsored by NCLD, Kansas
City, MO, December 4–5, 2003. Reprinted by permission of
Jeff Grimes.
EvaluationIs our plan working?
PlanningWhat are we going to do
about it?
Problem Definition/Problem AnalysisWhat is the problem and why is it happening?
ImplementationAre we implementing as designed?
Is the student making progress?
FIGURE 8.5Heartland Problem-Solving
Approach
SOURCE: Heartland Area Education Agency, Johnston,
Iowa. Reprinted by permission.
Am
oun
t o
f Res
our
ces
Nee
ded
to S
olv
e P
robl
em
Intensity of Problem
Level 1Consultation
Between Parent and Teacher
Universal
Intensive
Targeted
Level 1IConsultationwith Building Resources
Level IIIExtended Problem
Solving
Level IVDue
Process
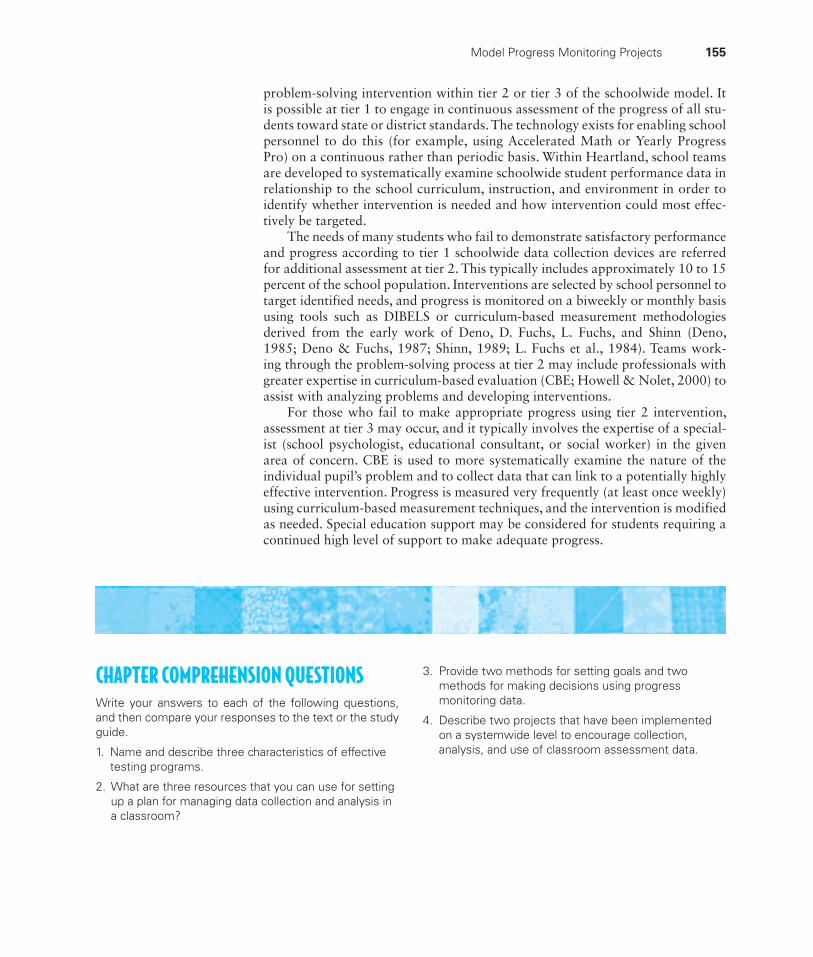
problem-solving intervention within tier 2 or tier 3 of the schoolwide model. It is possible at tier 1 to engage in continuous assessment of the progress of all stu-dents toward state or district standards. The technology exists for enabling school personnel to do this (for example, using Accelerated Math or Yearly Progress Pro) on a continuous rather than periodic basis. Within Heartland, school teams are developed to systematically examine schoolwide student performance data in relationship to the school curriculum, instruction, and environment in order to identify whether intervention is needed and how intervention could most effec-tively be targeted.
The needs of many students who fail to demonstrate satisfactory performance and progress according to tier 1 schoolwide data collection devices are referred for additional assessment at tier 2. This typically includes approximately 10 to 15 percent of the school population. Interventions are selected by school personnel to target identified needs, and progress is monitored on a biweekly or monthly basis using tools such as DIBELS or curriculum-based measurement methodologies derived from the early work of Deno, D. Fuchs, L. Fuchs, and Shinn (Deno, 1985; Deno & Fuchs, 1987; Shinn, 1989; L. Fuchs et al., 1984). Teams work-ing through the problem-solving process at tier 2 may include professionals with greater expertise in curriculum-based evaluation (CBE; Howell & Nolet, 2000) to assist with analyzing problems and developing interventions.
For those who fail to make appropriate progress using tier 2 intervention, assessment at tier 3 may occur, and it typically involves the expertise of a special-ist (school psychologist, educational consultant, or social worker) in the given area of concern. CBE is used to more systematically examine the nature of the individual pupil’s problem and to collect data that can link to a potentially highly effective intervention. Progress is measured very frequently (at least once weekly) using curriculum-based measurement techniques, and the intervention is modified as needed. Special education support may be considered for students requiring a continued high level of support to make adequate progress.
Model Progress Monitoring Projects 155
CHAPTER COMPREHENSION QUESTIONSWrite your answers to each of the following questions, and then compare your responses to the text or the study guide.
1. Name and describe three characteristics of effective testing programs.
2. What are three resources that you can use for setting up a plan for managing data collection and analysis in a classroom?
3. Provide two methods for setting goals and two methods for making decisions using progress monitoring data.
4. Describe two projects that have been implemented on a systemwide level to encourage collection, analysis, and use of classroom assessment data.

This page intentionally left blank
PART 3some basis for claiming that their tests are valid. Therefore, we searched the manuals for technical information that supports the test authors’ contentions. (2) An attempt to include the vast body of research literature on commonly used tests would have resulted in a multivolume opus that would be impossible to publish as a current work. Entire books have been written on the subject of using and interpreting single tests.
In reviewing each test, we always use the same format. We describe the general format of the test and the specifi c behaviors that the test is designed to sample; these descriptions allow the reader to evaluate the extent to which specifi c tests sample the domain. Next, we describe the kinds of scores that the test provides for the practitioner; this gives information about the meaning and interpretation of those scores. Subsequently, we examine the standardization sample for each test; this enables the reader to judge—recalling the discussion in Chapter 3, “Test Scores and How to Use Them”—the adequacy of the norm group and evaluate the appropriateness of each test for use with specifi c populations of students. After that, we evaluate the evidence of reliability and validity for each test, using the standards set forth in Chapter 4, “Technical Adequacy.” Finally, we give a summary of each test.
We urge our readers to examine the research on tests in which they might be interested. Test users are ultimately responsible for test selection and interpretation. Thus, if you are considering using a particular test that has incomplete or inadequate technical characteristics, it is your responsibility to demonstrate its validity. Current research may provide the support you need to demonstrate the validity of your assessment. Therefore, we urge our readers to go beyond our reviews.
Assessment: Using Formal Measures
The chapters in Part 3 describe the most common domains in which assessment of processes (or abilities) and products (or skills) are conducted. With the exception of “How to Evaluate a Test” (Chapter 9), each chapter in this part focuses on a different process or skill domain and opens with
an explanation of why the domain is assessed. We next provide a general overview of the components of the domain (that is, the behaviors that are usually assessed) and then discuss the more commonly used tests within the domain. Each chapter concludes with some suggestions for coping with problems in assessing the domain, and a set of chapter comprehension questions.
The criteria we used in selecting and reviewing specifi c tests warrant some discussion. First, in selecting tests we could not, and did not, include all the available measures for each domain. Rather, we tried to select representative and commonly used devices in each area. We moved some reviews that were included in previous editions of this textbook to the website for the book. And, as new tests become available, we will review them and include the reviews on the website. Readers interested in tests not reviewed in this book may want to consult the website fi rst, then consult books devoted entirely to test reviews, such as Buros’s Mental Measurements Yearbooks.
Second, in evaluating the technical adequacy of each test, we restricted our evaluation to information in the test manuals. There were two reasons for this decision: (1) As stated in the Standards for Educational and Psychological Testing (AERA et al., 1999), test authors are responsible for providing all necessary technical information in their test manuals. The test authors must have
158
Chapter Goals
1Understand the considerations
in selecting a test to review.
2Understand that reviewing a test
requires an analysis of the test’s purpose, content and assessment procedures, scores and norms, and reliability and validity in order to reach a summative evaluation.
9 How to Evaluate a Test
Selecting a Test to Review 159
1 Selecting a Test to Review
The first step in evaluating a test is to choose a test to evaluate. Unless we know the specific test we want to evaluate, our first task is to find a test to use. It is usually necessary to conduct a pre-review of the available tests in the domain of interest (for example, individually administered reading tests). Current publisher’s catalogs or a reference work [for example, Tests, Sixth Edition—A Comprehensive Reference for Assessments in Psychology, Education, and Business (Maddox, 2008)] can generally help us hone in on a few tests for further review.1
In this honing-in phase, we concentrate on five questions that can be answered with information in a test catalog or reference text:
1. What is the domain we want to test? Usually, we can fi nd suitable tests by simply reading test names.
2. Are we qualifi ed to administer the test? Some tests require special training to administer or specifi c licenses or credentials to purchase.
3. Can the test be used appropriately with students of the age or grade in which we are interested?
4. Can the test be administered to groups or must it be individually administered? If we are interested in testing one student or a group of students, a group administered test can be used appropriately. However, if we are going to be testing groups of students, an individually administered test cannot be given; we must use a group test.
5. How old is the test? Generally, tests that were published 15 or more years ago are dated and should not be used unless absolutely necessary (for example, it is the only test available to assess a specifi c domain or the newer tests lack adequate norms, reliability, or validity). Also, it is also a good idea to contact the publisher to make sure that you are considering the most recent version of a test. It is a waste of time to evaluate a test that is not the latest edition or one that will be replaced soon by a newer version.
The next step is to acquire all of the relevant materials. Usually, this means contacting a test publisher and obtaining a specimen kit and any supplementary manuals that are available. Sometimes publishers will give or lend specimen kits; sometimes they must be purchased. Tests are not just sold by the company that owns the copyright; the same test kit may be sold by several publishers. Usually, the com-pany that owns the copyright on a test is more willing to provide a specimen kit.
The last step in preparing to evaluate a test is to prepare the work area. For most of us, test materials are not spellbinding. Thus, the workspace in which the evaluation is conducted should not be conducive to nodding off. It is also a good idea to have a copy of Standards for Educational and Psychological Testing developed by the American Educational Research Association (AERA), American Psychological Association, and the National Council on Measurement in Education (1999). The standards provide guidelines about the kinds of evi-dence that should be used to evaluate a test’s usefulness.
1It is cumbersome and time-consuming, but one can visit the websites of specifi c publishers (such as Harcourt) to fi nd out what tests they have in a domain of interest.
160 Chapter 9 ■ How to Evaluate a Test
2 How Do We Review a Test?
Test users must determine if a test will result in accurate and appropriate infer-ences about the specific students who will be assessed. This and other books can only evaluate tests in terms of their general usefulness. There are so many idio-syncratic student characteristics and life circumstances that it is impossible to consider a test’s usefulness with all possible combinations of characteristics and circumstances in a general assessment text.
In evaluating the general accuracy and appropriateness of inferences drawnfrom students’ test performances, we rely on Standards for Educa tional and Psychological Testing (American Educational Research Association, American Psychological Association, and the National Council on Measurement in Edu-cation, 1999). However, our examination goes beyond checking to determine if specific information relating to important standards is provided; we also consider the quality of the evidence presented. Evaluating the evidence presented in test materials requires a “prove or show me” mind-set. Test authors must demonstrate to potential users that their tests provide accurate educational and psychological information that can be properly used to draw inferences about students. One should not rely on test authors to admit that their test was poorly normed because there was no money to pay testers or their test was unreliable because they devel-oped too few test items. One should expect that test authors will tend to put the best face on their tests.
Our first task is to locate the evidence presented by the author. Often, we find neatly organized test manuals that have useful chapter titles, subsections, and indexes so that we can readily find the sections we seek (for example, reli-ability). Even when a test manual is organized carefully, we often must extract the evidence we are seeking from large tables or appendices.
When test materials are not well organized or use idiosyncratic terminology, locating the evidence is more difficult. In such instances, we need to assemble all materials. (Because we often need to have all of them open at once, we will need a large workspace). Then we begin reading and making notes on the topics of interest, using different sheets of paper for the various topics of interest: purpose, content, testing procedures, scores, norms, reliability, and validity. It does not matter where one starts; however, validity and usefulness of inferences based on test scores are better left for last.
Test PurposesOur search begins by finding the uses that the author recommends for a test. For example, the authors of the Gray Oral Reading Test (Wiederholt & Bryant, 2001, p. 4) state that their test is intended to (1) help identify students who are significantly below their peers in oral reading proficiency, (2) aid in determin-ing particular kinds of reading strengths and weaknesses, (3) document students’ progress in reading as a consequence of special intervention programs, and (4) be used in research of the abilities of school children. Thus, in evaluating the Gray Oral or any other test, we look for evidence that the test can be used effectively for the purposes intended by the test authors.
How Do We Review a Test? 161
Test Content and Assessment ProceduresWe first look for a definition of the domain being assessed. The adequacy and usefulness of test interpretations depend on the rigor with which the purposes of the test and the domain represented by the test have been defined and explained (AERA et al., 1999, p. 43).
Some test manuals contain extensive descriptions of the domains they assess. Other manuals merely name the domains, and those names can imply a far broader assessment than the test content actually provides. For example, the Wide Range Achievement Test 3 claims to measure reading. However, cursory examination of the test’s content reveals that the test only assesses letter recognition, letter naming, and saying words in isolation. It does not assess accuracy and fluency of reading connected discourse (for example, prose); it does not assess comprehension.
We also examine testing procedures. Some tests use very tight testing proce-dures; the test specifies exactly how test materials are to be presented, how test questions are to be asked, if and when questions can be restated or rephrased, and how and when students can be asked to explain or elaborate on their answers. Other tests use loose testing procedures—that is, flexible directions and pro-cedures. In either case, the directions and procedures should contain sufficient detail so that test takers can respond to a task in the manner that the author intended (AERA et al., 1999, p. 47). When test authors provide adaptations and accommodations for students who lack the enabling skills to take the test in the usual manner, the author should provide evidence that the adaptations and accommodations produce scores with the same meaning as those produced by nonadapted, nonaccommodated procedures. Generally, the more flexible the materials and directions, the more valid the test results will be for students with severe disabilities. For example, the Scales of Independent Behavior–Revised can be administered to any respondent who is thoroughly familiar with the person being assessed.
It is also necessary to examine how test content is tested. Specifically, we look for evidence that the test’s content and scoring procedures represent the defined domain (AERA et al., 1999, p. 45). Evidence may include any of the following, alone or in combination:
Comparisons of tested content with some external standard. For example, ■
the National Council of Teachers of Mathematics has explicated extensive standards for what and how mathematical knowledge should be tested.
Comparisons of tested content with the content tested by other accepted tests. ■
Expert opinion. ■
Reasoned rationale for the inclusion and exclusion of test content as well as ■
assessment procedures.
ScoresFirst, we consider the types of derived scores available on a test. This should be the most straightforward aspect of gathering and evaluating evidence about a test. Information about the types of scores might be found in several places: in a section on scoring the test, in a description of the norms, in a separate section on scores, in a section on interpreting scores, on the scoring form, or in norm tables.
162 Chapter 9 ■ How to Evaluate a Test
Next, we must consider if the types of scores lead to correct inferences about students. For example, norm-referenced scores lead to inferences about a student’s relative standing on the skills or abilities tested. Such scores are appropriate when a student is being compared to other students, for example, when trying to deter-mine if a student is lagging behind peers significantly. Such scores are not appro-priate when trying to determine if a student has acquired specific information (for example, knows the meaning of various traffic signs) or skills (for example, can read fluently material at grade level). On the other hand, knowing that a student can perform accurately and fluently with grade level material provides no information about how that performance compares to the performances of other similarly situated students.2
If test authors use unique kinds of scores (or even scores that they create), it is their responsibility to define the scores. For example, the authors of the Woodcock–Johnson Psychoeducational Battery created a “W-Score” as one unit of analysis. They define the score and give examples of how to use it. We always look to see if the explanation of scores is clear, if they assume a great deal of technical knowl-edge that typical users cannot be expected to have (such as teacher knowledge of Rasch3 item calibrating procedures), or if the derivation and use of scores are clear.
NormsWhenever a student’s score is interpreted by comparing it to scores earned by a reference population (that is, scores earned by other test takers who comprise the normative sample), the reference population must be clearly and carefully described (AERA et al., 1999, p. 51). For example, whenever a student’s perfor-mance is converted to a percentile or some other derived score, it is essential that those students who make up the normative sample be of sufficient number and relevant characteristics.
In evaluating a test’s norms, we must first determine the groups to which students’ performances are actually compared.
Most often, a student’s score is never intended to be compared to the scores of all of the students in the normative sample. Rather, a student’s score is usually compared to the scores of same-age (or same-grade) students; sometimes they are compared to same-age (or -grade) and same-sex students. To ascertain to whom a student’s score is compared, we usually need only inspect a manual’s conversion tables or read their description in the manual.
A word of caution is warranted. In developing test norms, several thousand students may actually be tested, but not all of those students’ scores may be used. Scores might be dropped for any one of several reasons:
Demographic data are missing (for example, a student’s gender or age might ■
not be noted).
A student failed to complete the test or an examiner inadvertently failed to ■
administer all items.
2We repeat the warning that grade equivalents do not indicate the level of materials at which a student is instructional. A grade equivalent of 3.0 does not indicate that a student is accurate or fl uent in 3.0 materials. More likely, 3.0 materials are far too diffi cult for a person with a grade equivalent of 3.0.3More information about Rasch scaling and item response theory is available for download on the student website.
How Do We Review a Test? 163
A student failed to conform to criteria for inclusion in the norm group (for ■
example, he or she may be too old or too young).
A score may be an outlier (for example, a fifth grader may correctly answer ■
all of the questions that could be given to an adult).
Thus, the number of students initially tested will not be the same as the num-ber of students in the norm group.4
Good norms are based on far more that just the age (or grade) and gender of students. Norms must be generally representative of all students of that age or grade. Thus, we would expect students from major racial and ethnic groups (that is, Caucasian Americans, African Americans, Asian Americans, and Hispanic Americans) to be included. We would also expect students from throughout the United States as well as students from urban, suburban, and rural communities to be included. Finally, we would expect students from all socioeconomic classes to be included. Moreover, we would expect that the proportions of students from each of these groups would be approximately the same as the proportions found in the general population. Therefore, we look for a systematic comparison of the proportion of students with each characteristic to the general population for each separate norm group. For example, when the score of a 9-year-old girl is compared to those of 9-year-old girls in general, we look for evidence that the norm group of 9-year-old girls (1) consists of the correct proportions of Caucasian Americans, African Americans, and Asian Americans, (2) contains the correct proportion of Hispanic students, (3) contains the correct proportion of students from each region of the country and each type of community, and so forth. Because some authors do not use weighting procedures, we do not expect perfect congruence with the population proportions. However, when the majority group’s proportion differs by 5 or more percent from its proportion in the general population, we believe the norms may have problems. (We recognize that this is an arbitrary criterion; but it seems generally reasonable to us.)
ReliabilityFor every score that is recommended for interpretation, a test author must provide evidence of reliability. First, every score means all domain and norm comparisons scores. Domain scores are scores for each area or subarea that can be interpreted appropriately. For example, an author of an achievement test might recommend interpreting scores for reading, written language, and mathematics; an author might recommend interpreting scores for oral reading and reading comprehen-sion, whereas another author might use oral reading and reading comprehension as intermediate calculations that should not be interpreted. Next, norm compari-son means each normative group to which a person’s score could be compared (for example, a reading score for third-grade girls, for second-grade boys, or for fifth graders). Thus, if an author provides whole year norms for students (boys and girls combined) in the first through third grades in reading and mathemat-ics, there should be reliability information for 6 scores—that is, 3 (grades) mul-tiplied by 2 (subject matter areas). If there were whole year norms for students
4The difference between the number of students tested and the number of students actually used in the norms is of relevance only when a number of students are dropped and the validity of the norming process is therefore called into question.
164 Chapter 9 ■ How to Evaluate a Test
in the first through the twelfth grades in three subject matter areas, there would be 36 recommended scores—that is, 12 grades multiplied by 3 subject matter areas. In practice, it is not unusual to see reliability information for 100 or more domain-by-age (or grade) scores.5
As we have already learned, reliability is not a unitary concept. It refers to the consistency with which a test samples items from a domain (that is, item reli-ability), to the stability of scores over time, and to the consistency that testers score responses. Information about a test’s item reliability as well as its stability estimates must be presented; these indices are necessary for all tests. Information about interscorer reliability is only required when scoring is difficult or not highly objective. Thus, we expect to see estimates of item reliability and stability (and perhaps interscorer agreement) for each domain or subdomain by norm–group combination. If there are normative comparisons for reading and mathematics for students in the first through third grades, and item reliability and stability were estimated, there would be 12 reliability estimates: 6 estimates of item reliability for reading and mathematics at each grade and 6 estimates of stability for reading and mathematics at each grade.
Given modern computer technology, there is really no excuse for failing to provide all estimates of internal consistency. Collecting evidence of a test’s stabil-ity is far more expensive and time-consuming. Thus, we often find incomplete stability data. This can occur in a couple of ways. One way is for authors to report an average stability by using standard scores from a sample that represents the entire age or grade range of the test.6 Although this procedure gives an idea of the test’s stability in general, it provides no information about the stability of scores at a particular age or grade. Another way authors incompletely report stability data is to provide data for selected ages (or age ranges) that span a test’s age range. For example, if a test was intended for students in kindergarten through sixth grade, an author might report stability for first, third, and fifth grades.
It is not enough, however, for a test merely to contain the necessary reli-ability estimates. Every reliability estimate should be sufficient for every purpose for which the test was intended. Thus, tests (or subtests) used in making impor-tant educational decisions for students should have reliability estimates of .90 or higher. Also, each test (and subtest) must have sufficient reliability for each age or grade at which it is used. For example, if a reading test was highly reliable for all grades except second grade, it would not be suitable for use with second graders.
Finally, when test scoring is subjective, evidence of interscorer agreement must be provided. Failure to report this type of evidence severely limits the utility of a test.
ValidityThe evaluation of a test’s general validity can be the most complicated aspect of test evaluation. Strictly speaking, a test found lacking in its content, procedures, scores, norms, or reliability cannot yield valid inferences. Regardless of the domains
5Note that information about reliability coeffi cients applies to any type of score (for example, stan-dard scores, raw scores, and so forth). Information about standard errors of measurement is specifi c to each type of score.6Using raw scores would overestimate the test’s stability if raw scores were correlated with age or grade.
How Do We Review a Test? 165
they assess, all tests should present convincing evidence of general validity. General validity refers to evidence that a test measures what its authors claim it measures. Thus, we would expect some evidence for content validity, criterion-related validity, and construct validity.
However, we expect more. Test authors should also present evidence that their test leads to valid inferences for each recommended purpose of the test. For example, if test authors claim their test can be used to identify students with learning disabilities, we would expect to see evidence that use of the test leads to correct inferences about the presence of a disability. When these inferences rely on the use of cutoff scores, there should be evidence that a specific cutoff score is valid. Similarly, if test authors claim their test is useful in planning instruction, evidence is needed. Evidence for a standardized test’s utility in planning instruc-tion would consist of data showing how a test score or profile can be used to find instructional starting points—and the accuracy of those starting points.
Making a Summative EvaluationIn reaching an overall evaluation of a test, it is a good idea to remember that it is the test authors’ responsibility to convince potential test users of the usefulness of their test. However, once you use a test, you—not the test author—become responsible for test-based inferences.
Test-based inferences can only be correct when a test is properly normed, yields reliable scores, and has evidence for its general validity. If evidence for any one of these components is lacking or insufficient (for example, the norms are inadequate or the scores are unreliable), then the inferences cannot be trusted. Having found that a test is generally useful, it is still necessary to determine if it is appropriately used with the specific students you intend to test. Of course, a test that is not generally useful will not be useful with a specific student.
CHAPTER COMPREHENSION QUESTIONSWrite your answers to each of the following questions, and then compare your responses to the text or the study guide.
1. What are fi ve questions that you should ask when choosing a test for careful review?
2. What kinds of evidence should test authors provide to support the uses they recommend for their test?
3. What kinds of evidence should test authors provide to support the interpretations that they recommend for their test?
166
3Know the reasons why we assess
academic achievement.
6Know how to get the most out of an
achievement test.
2Know the categories of achievement
tests: group versus individual, norm referenced versus standards referenced, multiple skill versus single skill, and diagnostic versus survey.
5Know major dilemmas in the
current practice of achievement testing.
1Know factors to consider in selecting
an achievement test.
4Be able to describe and compare
representative achievement tests.
10 Assessment of Academic Achievement with Multiple-Skill Devices
Chapter Goals
Assessment of Academic Achievement with Multiple-Skill Devices 167
Key Terms achievement
attainment
norm referenced
standards referenced
diagnostic achievement test
instructional match
normative update
Stanford Achievement Test (SESAT, SAT, TASK)
TerraNova
Wechsler Individual Achievement Test
Peabody Individual Achievement Test
Wide Range Achievement Test
Diagnostic Achievement Battery
Achievement tests are the most frequently used tests in educational settings. Multiple-skill achievement tests evaluate knowledge and understand-ing in several curricular areas, such as reading, science, and math. These tests are intended to assess the extent to which students have profited from school-ing and other life experiences, compared with other students of the same age or grade. Consequently, most achievement tests are norm referenced, although some are standards-referenced measures. Norm-referenced and standards- referenced achievement tests are designed in consultation with subject matter experts and are believed to reflect national curricula and national curricular trends in general.
Achievement tests can be classified along several dimensions; perhaps the most important one describes their specificity and density of content. Diagnostic achievement tests have dense content; they have many more items to assess specific skills and concepts and allow finer analyses to pinpoint spe-cific strengths and weaknesses in academic development. Tests with fewer items per skill allow comparisons among test takers but do not have enough items to pinpoint students’ strengths and weaknesses. These tests may still be useful for estimating a student’s current general level of functioning in comparison with other students, and they estimate the extent to which an individual has acquired the skills and concepts that other students of the same age or grade have acquired.
Another important dimension is the number of students who can be tested at once. Achievement tests are designed to be given to groups of students or to indi-vidual students. Generally, group tests require students to read and either write or mark answers; individually administered tests may require an examiner to read questions to a student and may allow students to respond orally. The primary advantage of individually administered tests is that they afford examiners the opportunity to observe students working and solving problems. Therefore, exam-iners can glean valuable qualitative information in addition to the quantitative information that scores provide. Finally, a group test may be appropriately given to one student at a time, but individual tests should not be given to a group of students.
Table 10.1 shows the different categories of achievement tests. The Stanford Achievement Test (SAT), for example, is both a norm-referenced and a standards-referenced (objective-referenced), group-administered screening test that samples skill development in many content areas. The Stanford Diagnostic Reading Test (SDRT), detailed in Chapter 11, is both a norm-referenced, group-administered
168 Chapter 10 ■ Assessment of Academic Achievement with Multiple-Skill Devices
test and a standards-referenced, individually administered diagnostic test that samples skill development strengths and weaknesses in the single skill of read-ing. The SDRT is intended to provide a classroom teacher with a more detailed analysis of students’ strengths and weaknesses in reading, which may be of assis-tance in program planning and evaluation.
The most obvious advantage of multiple-skill achievement tests is that they can provide teachers or administrators with data showing the extent to which their pupils have acquired information and skills. By using group-administered, multiple-skill batteries, teachers and administrators can obtain a considerable amount of information in a relatively short time. They are especially useful in comparing classrooms, schools, districts, or individual students within those settings.
1 Considerations for Selecting a Test
In selecting a multiple-skill achievement test, teachers must consider four factors: content validity, stimulus–response modes, the standards used in his or her state, and relevant norms. First, teachers must evaluate evidence for content validity, the most important kind of validity for achievement tests. Many multiple-skill tests have general content validity—the tests measure important concepts and skills that are generally part of most curricula. This validity makes their content suitable for assessing general attainment.1 However, if a test is to be used to assess the extent to which students have profited from school instruction—that is, to measure student achievement—more than general content validity is required: The test must match the instruction provided. Tests that do not match instruction lack content validity, and decisions based on such tests should be restricted. When making decisions about content validity for students with disabilities, educators must consider the extent to which the student has had an opportunity to learn the content of the test. Many students with disabilities are assigned to a curriculum (often a functional curriculum) that differs from the curriculum to which non-disabled students are exposed. These students are often assessed using the same test that others take, but they are provided accommodations to compensate for their disability (see Chapter 5). Many students with severe cognitive impairments are given alternate assessments, and their performance is evaluated relative to modified achievement standards or alternate achievement standards. We discuss alternate assessment and modified assessment practices in Chapter 22.
Second, educators who use achievement tests for students with disabili-ties need to consider whether the stimulus–response modes of subtests may be exceptionally difficult for students with physical or motor problems. Tests that are timed may be inappropriately difficult for students whose reading or motor difficulties cause them to take more time on specific tasks. (Many of these issues were described in greater detail in Chapter 5.)
1Recall the previous discussion on the distinction between attainment and achievement. Achievement generally refers to content that has been learned as a product of schooling. Attainment is a broader term referring to what individuals have learned as a result of both schooling and other life experiences.
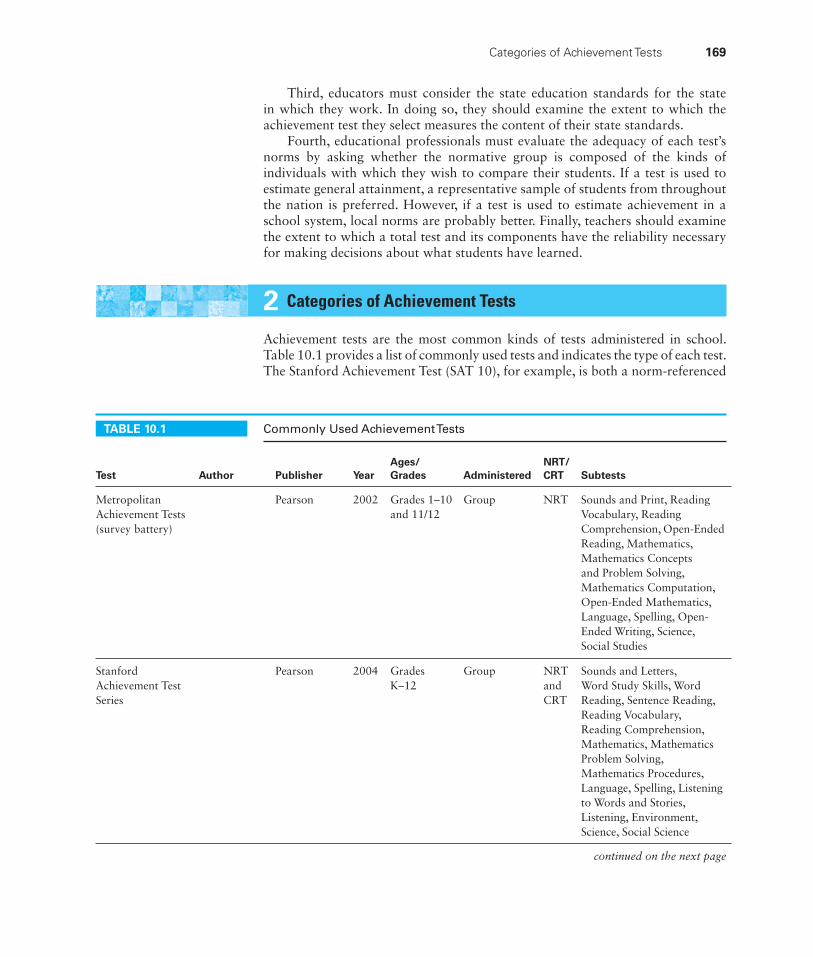
Categories of Achievement Tests 169
Third, educators must consider the state education standards for the state in which they work. In doing so, they should examine the extent to which the achievement test they select measures the content of their state standards.
Fourth, educational professionals must evaluate the adequacy of each test’s norms by asking whether the normative group is composed of the kinds of individuals with which they wish to compare their students. If a test is used to estimate general attainment, a representative sample of students from throughout the nation is preferred. However, if a test is used to estimate achievement in a school system, local norms are probably better. Finally, teachers should examine the extent to which a total test and its components have the reliability necessary for making decisions about what students have learned.
2 Categories of Achievement Tests
Achievement tests are the most common kinds of tests administered in school. Table 10.1 provides a list of commonly used tests and indicates the type of each test. The Stanford Achievement Test (SAT 10), for example, is both a norm- referenced
W
TABLE 10.1 Commonly Used Achievement Tests
Test Author Publisher YearAges/Grades Administered
NRT/CRT Subtests
Metropolitan Achievement Tests (survey battery)
Pearson 2002 Grades 1–10 and 11/12
Group NRT Sounds and Print, Reading Vocabulary, Reading Comprehension, Open-Ended Reading, Mathematics, Mathematics Concepts and Problem Solving, Mathematics Computation, Open-Ended Mathematics, Language, Spelling, Open-Ended Writing, Science, Social Studies
Stanford Achievement Test Series
Pearson 2004 Grades K–12
Group NRT and CRT
Sounds and Letters, Word Study Skills, Word Reading, Sentence Reading, Reading Vocabulary, Reading Comprehension, Mathematics, Mathematics Problem Solving, Mathematics Procedures, Language, Spelling, Listening to Words and Stories, Listening, Environment, Science, Social Science
continued on the next page
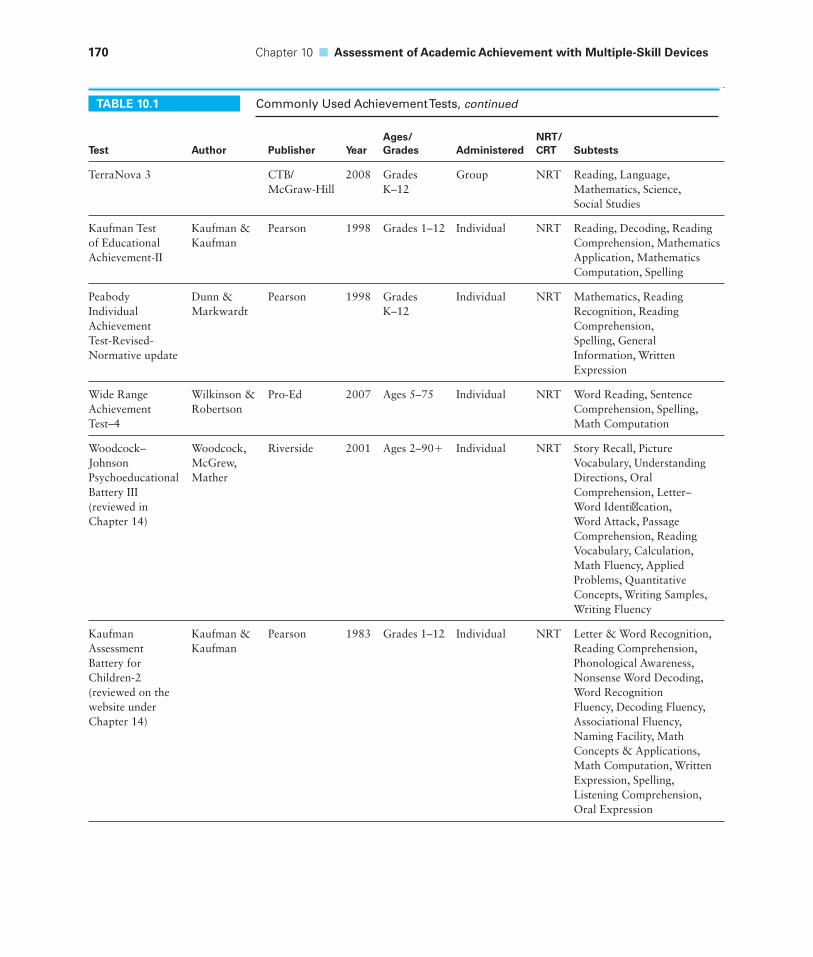
170 Chapter 10 ■ Assessment of Academic Achievement with Multiple-Skill Devices
TABLE 10.1 Commonly Used Achievement Tests, continued
Test Author Publisher YearAges/Grades Administered
NRT/CRT Subtests
TerraNova 3 CTB/McGraw-Hill
2008 Grades K–12
Group NRT Reading, Language, Mathematics, Science, Social Studies
Kaufman Test of Educational Achievement-II
Kaufman & Kaufman
Pearson 1998 Grades 1–12 Individual NRT Reading, Decoding, Reading Comprehension, Mathematics Application, Mathematics Computation, Spelling
Peabody Individual Achievement Test-Revised-Normative update
Dunn & Markwardt
Pearson 1998 Grades K–12
Individual NRT Mathematics, Reading Recognition, Reading Comprehension, Spelling, General Information, Written Expression
Wide Range Achievement Test–4
Wilkinson & Robertson
Pro-Ed 2007 Ages 5–75 Individual NRT Word Reading, Sentence Comprehension, Spelling, Math Computation
Woodcock–Johnson Psychoeducational Battery III (reviewed in Chapter 14)
Woodcock, McGrew, Mather
Riverside 2001 Ages 2–90+ Individual NRT Story Recall, Picture Vocabulary, Understanding Directions, Oral Comprehension, Letter–Word Identifi cation, Word Attack, Passage Comprehension, Reading Vocabulary, Calculation, Math Fluency, Applied Problems, Quantitative Concepts, Writing Samples, Writing Fluency
Kaufman Assessment Battery for Children-2(reviewed on the website under Chapter 14)
Kaufman & Kaufman
Pearson 1983 Grades 1–12 Individual NRT Letter & Word Recognition, Reading Comprehension, Phonological Awareness, Nonsense Word Decoding, Word Recognition Fluency, Decoding Fluency, Associational Fluency, Naming Facility, Math Concepts & Applications, Math Computation, Written Expression, Spelling, Listening Comprehension, Oral Expression
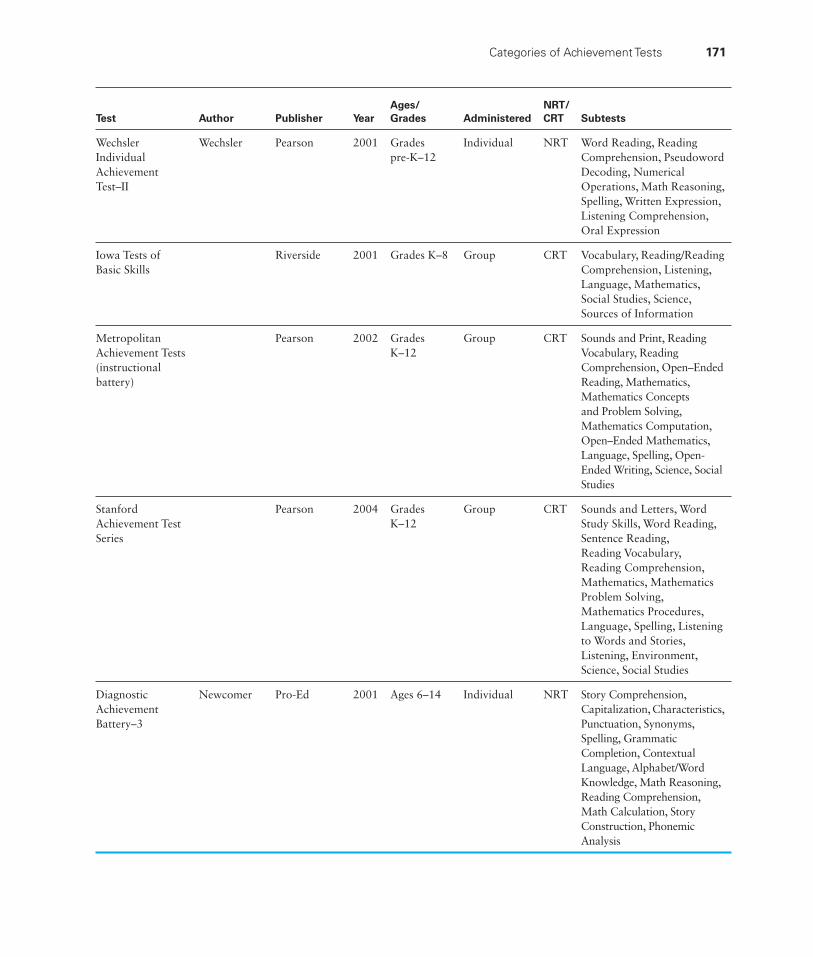
Categories of Achievement Tests 171
Test Author Publisher YearAges/Grades Administered
NRT/CRT Subtests
Wechsler Individual Achievement Test–II
Wechsler Pearson 2001 Grades pre-K–12
Individual NRT Word Reading, Reading Comprehension, Pseudoword Decoding, Numerical Operations, Math Reasoning, Spelling, Written Expression, Listening Comprehension, Oral Expression
Iowa Tests of Basic Skills
Riverside 2001 Grades K–8 Group CRT Vocabulary, Reading/Reading Comprehension, Listening, Language, Mathematics, Social Studies, Science, Sources of Information
Metropolitan Achievement Tests (instructional battery)
Pearson 2002 Grades K–12
Group CRT Sounds and Print, Reading Vocabulary, Reading Comprehension, Open–Ended Reading, Mathematics, Mathematics Concepts and Problem Solving, Mathematics Computation, Open–Ended Mathematics, Language, Spelling, Open-Ended Writing, Science, Social Studies
Stanford Achievement Test Series
Pearson 2004 Grades K–12
Group CRT Sounds and Letters, Word Study Skills, Word Reading, Sentence Reading, Reading Vocabulary, Reading Comprehension, Mathematics, Mathematics Problem Solving, Mathematics Procedures, Language, Spelling, Listening to Words and Stories, Listening, Environment, Science, Social Studies
Diagnostic Achievement Battery–3
Newcomer Pro-Ed 2001 Ages 6–14 Individual NRT Story Comprehension, Capitalization, Characteristics, Punctuation, Synonyms, Spelling, Grammatic Completion, Contextual Language, Alphabet/Word Knowledge, Math Reasoning, Reading Comprehension, Math Calculation, Story Construction, Phonemic Analysis
172 Chapter 10 ■ Assessment of Academic Achievement with Multiple-Skill Devices
and a criterion-referenced, group-administered screening test that samples skill development in many content areas. The most obvious advantage of multiple-skill achievement tests is that they can provide teachers with data showing the extent to which their pupils have acquired information and skills. By using group-administered, multiple-skill batteries, teachers can obtain a considerable amount of information in a relatively short time.
3 Why Do We Assess Academic Achievement?
The term screening device reflects the major purpose of achievement tests. These tests are used most often to screen students to identify those who demonstrate low-level, average, or high-level attainment in comparison with their peers. Achievement tests provide a global estimate of academic skill development and may be used to identify individual students for whom educational intervention is necessary, either in the form of remediation (for those who demonstrate relatively low-level skill development) or in the form of academic enrichment (for those who exhibit exceptionally high-level skill development). However, screening tests have limited behavior samples and lower requirements for reliability. Therefore, students who are identified with screening tests should be further assessed with diagnostic tests to verify their need for educational intervention.
Although multiple-skill, group-administered achievement tests are usually considered to be screening devices, they are occasionally used in eligibility decisions. In principle, such a use is generally inappropriate, although it may be justifiable and even desirable when the group tests (for example, the Stanford Achievement Test Series or the Metropolitan Achievement Tests) contain behavior samples that are more complete than those contained in some individually administered tests of achieve-ment used for placement (such as the Wide Range Achievement Test 4 [WRAT4]). Use of an achievement test with a better behavior sample is desirable if the tester goes beyond the scores earned to examine performance on specific test items.
Multiple-skill achievement tests may also be used for progress evaluation. Most school districts have routine testing programs at various grade levels to evaluate the extent to which pupils in their schools are progressing in comparison with state standards. Scores on achievement tests provide communities, school boards, and parents with an index of the quality of schooling. Schools and the teachers within those schools are often subject to question when pupils fail to demonstrate expected progress.
Finally, achievement tests are used to evaluate the relative effectiveness of alternative curricula. For instance, Brown School may choose to use the Read Well Reading Series in third grade, whereas Green School decides to use the Open Court Reading Program. If school personnel can assume that children were at relatively comparable reading levels when they entered the third grade, then achievement tests may be administered at the end of the year to ascertain the relative effective-ness of the Read Well and the Open Court programs. Educators must, of course, avoid many assumptions in such evaluations (for example, that the quality of individual teachers and the instructional environment are comparable in the two schools) and many research pitfalls if comparative evaluation is to have meaning.
Sp
ecifi c Tests of A
cadem
ic Ach
ievemen
t
Stanford Achievement Test Series (SESAT, SAT, and TASK) 173
SPECIFIC TESTS OF ACADEMIC ACHIEVEMENT
The remainder of this chapter addresses specific multiple-skill devices and examines two popular group-administered, multiple-skill batteries (the Stanford Achievement Test Series and TerraNova 3); one indi-vidually administered, multiple-skill battery (the Pea-body Individual Achievement Test–Revised–Normative Update [PIAT-R-NU]); and one individually adminis-tered, norm-referenced measure that is co-normed with intelligence tests (the Wechsler Individual Achievement Test–Second Edition [WIAT-II]); and one individually administered, norm-referenced, multiple-skill measure (the Diagnostic Achievement Battery–Third Edition [DAB-3]). Later chapters discuss both screening and diagnostic tests that are devoted to specific content areas, such as reading and mathematics. In Chapter 14, we review the Achievement Battery of the Woodcock–Johnson Psychoeducational Battery–IIINU.
Stanford Achievement Test Series(SESAT, SAT, and TASK)
Three separate measures are included in the Stanford Achievement Test Series, Tenth Edition (SAT-10; Harcourt Assessment, 2004), which is a test series that samples skill development in several different academic areas. The series includes the following: the Stanford Early School Achievement Test (SESAT), the Stanford Achievement Test (SAT), and the Test of Academic Skills (TASK). The SESAT has two levels and is intended for use in the assessment of kinder-garteners and first graders. There are eight levels of the SAT, seven of which are typically administered to first through seventh graders and one that is admin-istered to eighth and ninth graders; these eight levels are arranged according to primary, intermediate, and advanced categories. The TASK is intended for stu-dents in the ninth through twelfth grades.
All levels of the test are group administered. The test is both norm referenced and criterion referenced, and all items are presented in a multiple-choice format. The grades at which each subtest is administered, as
well the number of items and administration time associated with each subtest, are listed in Table 10.2. Although the extended version of the test is the focus of this review, an abbreviated version of the test is available that consists of a subset of items from the full-length test. Total administration time for the full-length test typically ranges from 2 hours, 15 minutes to 5 hours, 30 minutes. Administration time for the abbreviated format ranges from 1 hour, 41 minutes to 3 hours, 54 minutes.
SubtestsThis section describes the subtests of the Stanford series and the associated behaviors that are sampled.
Sounds and Letters. This subtest, included only in SESAT 1 and 2, assesses the following early reading skills: matching two words that begin or end with the same sound, recognizing letters, and matching letters to sounds.
Word Reading. This subtest, available only at the SESAT and Primary 1 levels, measures students’ abili-ties to recognize words by identifying the printed word for a given illustration or a spoken word.
Sentence Reading. This subtest, used at the SESAT 2 and Primary 1 levels, assesses students’ abilities to comprehend single, simple sentences.
Word Study Skills. This subtest, used in the Primary 1 through Intermediate 1 levels, measures students’ skills in decoding words and identifying relationships between sounds and spellings.
Reading Vocabulary. This subtest assesses a student’s vocabulary knowledge and acquisition strategies. Items focus on measuring student knowledge of synonyms (for example, general word knowledge), multiple-meaning words (defi ned based on the context), and using context clues (students must rely on other parts of the sentence in order to defi ne an unknown word).
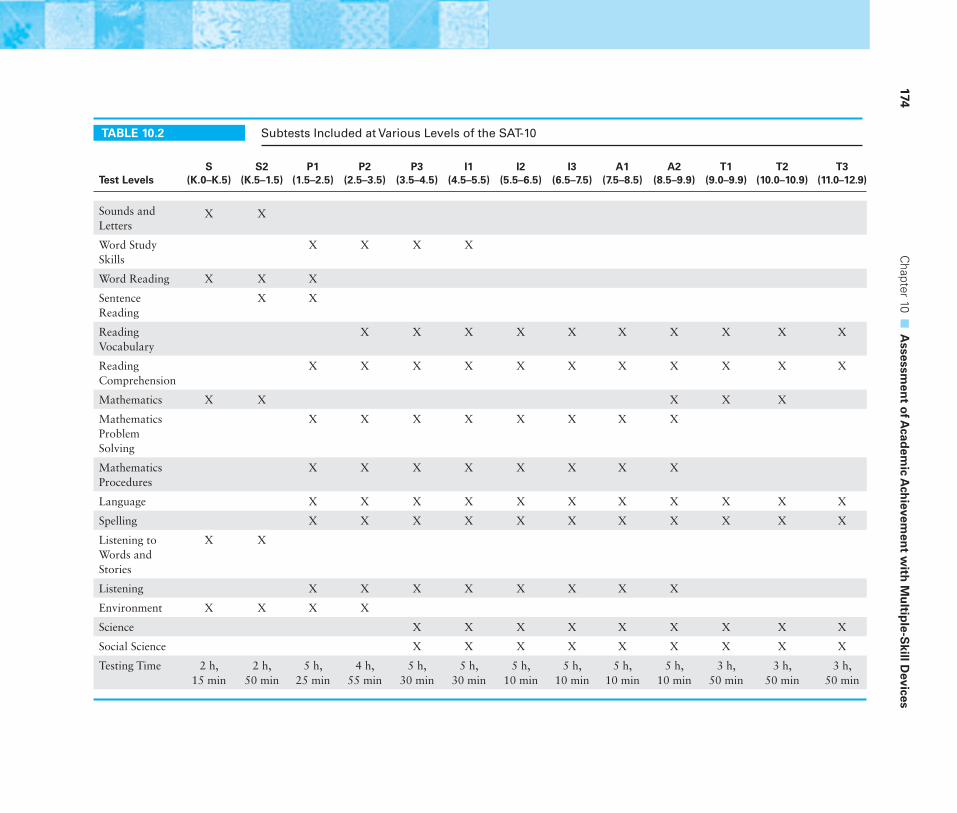
174 C
hapter 10 ■
Assessm
ent o
f Acad
emic A
chievem
ent w
ith M
ultip
le-Skill D
evices
TABLE 10.2 Subtests Included at Various Levels of the SAT-10
Test LevelsS
(K.0–K.5)S2
(K.5–1.5)P1
(1.5–2.5)P2
(2.5–3.5)P3
(3.5–4.5)I1
(4.5–5.5)I2
(5.5–6.5)I3
(6.5–7.5)A1
(7.5–8.5)A2
(8.5–9.9)T1
(9.0–9.9)T2
(10.0–10.9)T3
(11.0–12.9)
Sounds and Letters
X X
Word Study Skills
X X X X
Word Reading X X X
Sentence Reading
X X
Reading Vocabulary
X X X X X X X X X X
Reading Comprehension
X X X X X X X X X X X
Mathematics X X X X X
Mathematics Problem Solving
X X X X X X X X
Mathematics Procedures
X X X X X X X X
Language X X X X X X X X X X X
Spelling X X X X X X X X X X X
Listening to Words and Stories
X X
Listening X X X X X X X X
Environment X X X X
Science X X X X X X X X X
Social Science X X X X X X X X X
Testing Time 2 h,15 min
2 h,50 min
5 h,25 min
4 h,55 min
5 h,30 min
5 h,30 min
5 h,10 min
5 h,10 min
5 h,10 min
5 h,10 min
3 h,50 min
3 h,50 min
3 h,50 min
Stanford Achievement Test Series (SESAT, SAT, and TASK) 175
Reading Comprehension. At the Primary 1 level, this subtest assesses students’ abilities to identify a picture described by a two-sentence story that is read, complete sentences in short reading passages using the Cloze format, and answer more general questions about a passage. At the Primary 2 level and beyond, students read textual, functional, or recreational passages. These passages are followed by multiple-choice test items that assess important reading processes such as initial understanding, interpretation, critical analysis, and the use of read-ing strategies.
Mathematics. The Primary 1 through Advanced 2 lev-els include two mathematics subtests: Mathematics Problem Solving and Mathematics Procedures. The single subtest Mathematics is used at the SESAT and TASK levels. The Mathematics and Mathematics Problem-Solving Test both assess mathematical problem-solving processes. Calculators are allowed for some levels. Mathematics Procedures focuses on the application of math computation procedures; calculators are not allowed for this subtest. The math subtests were developed in alignment with the National Council of Teachers of Mathematics stan-dards for school mathematics (NCTM, 2000).
Language. This subtest is available in two formats: Traditional Language and Comprehensive Language. Traditional Language assesses students’ abilities in mechanics and expression. Comprehensive Language assesses profi ciency “through techniques that support actual instruction including prewriting, composing, and editing processes” (Harcourt Assessment, 2004, p. 65).
Spelling. In this subtest, students are presented with a sentence in which three words are underlined. Students must decide which word is misspelled. At higher lev-els, students are presented with a fourth “no mistake” option.
Environment. This is a teacher-dictated subtest that measures kindergarten through second grade stu-dent understanding of natural and social science concepts.
Science. This subtest measures students’ understand-ing of “life sciences, physical sciences, Earth and space sciences, and the nature of science” (Harcourt
Assessment, 2004, p. 66), with a focus on student knowledge of unifying themes in science rather than specifi c vocabulary. Test items assess students’ processing of science information and their science inquiry skills. In developing this subtest, the authors aligned item content with the standards and skills emphasized in the National Science Education Standards, Benchmarks for Science Literacy, and Science for All Americans (American Association for the Advancement of Science, 1987, 1993).
Social Science. This subtest measures students’ skill development in history, geography, political science, and economics, as well as students’ abilities to inter-pret data presented through maps, charts, or political cartoons. The authors state that this subtest “pri-marily measures students’ thinking skills” (Harcourt Assessment, 2004, p. 68), requiring students to use both acquired knowledge and processing skills in order to interpret associated data.
Listening. This subtest is used at the SESAT 1 through Advanced levels and is composed of both a listening vocabulary and listening comprehension section. In the listening vocabulary section, a sentence is read to the class and students must answer a question about the meaning of one of the words in the sentence. In the listening comprehension section, literary, informa-tional, and functional passages are read to students. Older students (grade 3 and higher) are encouraged to take notes as the tester reads the material. This sec-tion measures students’ initial understanding as well as their ability to interpret and analyze the material.
Special EditionsThere are three special editions of the Stanford Achievement Test. The Braille edition can be used to assess blind or partially sighted students. Harcourt also provides a large-print edition (with content iden-tical to the regular edition but containing adjusted graphics) for students who are visually impaired. There is also an edition for assessing students who are deaf and hearing impaired. This edition includes screening tests and special norms for students who are deaf and hearing impaired that were gathered by the Gallaudet Research Institute and the Harcourt Educational Measurement Research Group.
176 Chapter 10 ■ Assessment of Academic Achievement with Multiple-Skill Devices
The Technical Data Report manual provides additional information on the accommodations that are considered “standard” and “nonstandard” for the test.
ScoresA variety of transformed scores are obtained for the Stanford series: stanines, grade-equivalent scores, per-centiles, and various standard scores. The tests may be scored by hand or submitted to the publisher for machine scoring. When protocols are submitted to the publisher’s scoring service, the publisher can provide record sheets for individual students, forms for report-ing test results to parents, item analyses, class profiles, profiles comparing individual achievement with indi-vidual capability, analyses of each student’s attainment of specific objectives, local norms, and so forth.
Performance scores can also be obtained. Perfor-mance standards were developed through the expert judgment of national panels of educators in each content area. Performance is scored as Below Basic, Basic, Proficient, and Advanced. These standards have been linked to the performance standards devel-oped for the SAT 9.
NormsThe 10th edition of the Stanford Achievement Test Series was standardized simultaneously with the OLSAT 8 in both the spring and the fall of 2002. Separate norms are thus provided for schools in which students must be tested at these varying times of the year. Standardizing the series along with the OLSAT 8 enabled the authors to account for the ability levels of the students in the standardization population and also to develop a set of tables for comparison of ability to achievement.
Sample selection was based on several variables, including socioeconomic status, community type (urban, suburban, or rural), public/nonpublic school status, and ethnicity. Students from all but two states and the District of Columbia were included. Student scores were weighted to best match the afore-mentioned demographic characteristics of the U.S. population. For the most part, the fall and spring standardization samples appear to adequately repre-sent characteristics of the U.S. population, although there are a few examples of over- or underrepresenta-tion within a particular standardization sample (for
example, underrepresentation of students from the Northeast and from urban areas in the fall standard-ization sample). Approximately 250,000 students par-ticipated in the spring standardization, and 110,000 students participated in the fall standardization.
Cross-tabulations are not shown, so we do not know, for example, the number of eighth graders from urban areas.
ReliabilityReliability data for the SESAT, SAT, and TASK consist of KR-20 internal-consistency coefficients and alternate-forms reliability coefficients for each level of the test according to the fall and spring standardization data separately. KR-20 coefficients for subtests from the full-length test (Forms A and B) ranged from .69 to .97, with only 25 of the more than 400 coef-ficients below .80. KR-20 coefficients for the abbre-viated test (Forms A and B) ranged from .59 to .96. Alternate-forms reliability estimates (Forms A and B) ranged from .63 to 93.
Extensive tables listing reliability coefficients and standard errors of measurement are included in the technical manual. With only a few exceptions, the scores for subtests are reliable enough for group deci-sion making and reporting.
ValidityThe validity evidence provided for the Stanford series rests primarily on item development procedures. In developing the Stanford 10 items, the authors reviewed recent editions of textbooks, analyzed cur-rent curricula and instructional standards, and con-sulted professional organizations. Originally, pools of new test items were written by trained writers experi-enced in the different content areas. These items were then submitted to a group of content experts to estab-lish content accuracy and alignment to standards, levels, and processes. Measurement experts examined and edited the items, and the items were reviewed by general editors for writing clarity.
Following this process, an item tryout program was conducted in order to choose items for the final test. Of interest during the item tryout were issues relating to item format, question difficulty, item sen-sitivity, progressive difficulty of items, and test length. Teachers in tryout samples provided feedback on the clarity of the item layout, appropriateness, and
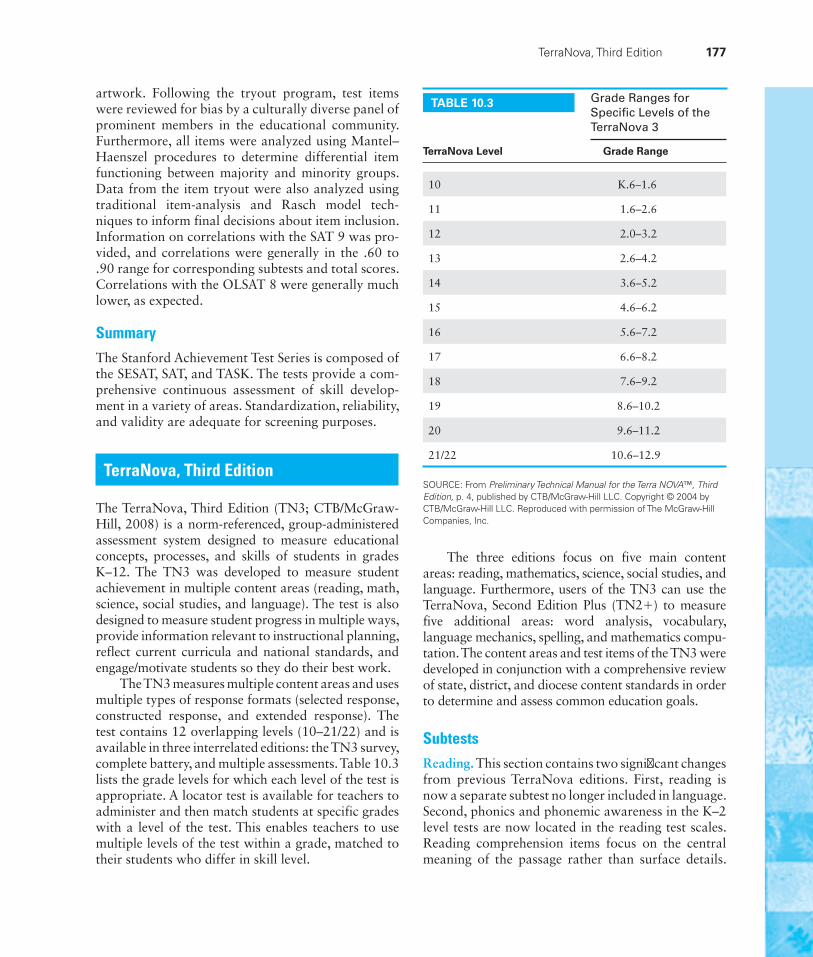
TerraNova, Third Edition 177
artwork. Following the tryout program, test items were reviewed for bias by a culturally diverse panel of prominent members in the educational community. Furthermore, all items were analyzed using Mantel–Haenszel procedures to determine differential item functioning between majority and minority groups. Data from the item tryout were also analyzed using traditional item-analysis and Rasch model tech-niques to inform final decisions about item inclusion. Information on correlations with the SAT 9 was pro-vided, and correlations were generally in the .60 to .90 range for corresponding subtests and total scores. Correlations with the OLSAT 8 were generally much lower, as expected.
SummaryThe Stanford Achievement Test Series is composed of the SESAT, SAT, and TASK. The tests provide a com-prehensive continuous assessment of skill develop-ment in a variety of areas. Standardization, reliability, and validity are adequate for screening purposes.
TerraNova, Third Edition
The TerraNova, Third Edition (TN3; CTB/McGraw-Hill, 2008) is a norm-referenced, group-administered assessment system designed to measure educational concepts, processes, and skills of students in grades K–12. The TN3 was developed to measure student achievement in multiple content areas (reading, math, science, social studies, and language). The test is also designed to measure student progress in multiple ways, provide information relevant to instructional planning, reflect current curricula and national standards, and engage/motivate students so they do their best work.
The TN3 measures multiple content areas and uses multiple types of response formats (selected response, constructed response, and extended response). The test contains 12 overlapping levels (10–21/22) and is available in three interrelated editions: the TN3 survey, complete battery, and multiple assessments. Table 10.3 lists the grade levels for which each level of the test is appropriate. A locator test is available for teachers to administer and then match students at specific grades with a level of the test. This enables teachers to use multiple levels of the test within a grade, matched to their students who differ in skill level.
TABLE 10.3 Grade Ranges forSpecifi c Levels of theTerraNova 3
TerraNova Level Grade Range
10 K.6–1.6
11 1.6–2.6
12 2.0–3.2
13 2.6–4.2
14 3.6–5.2
15 4.6–6.2
16 5.6–7.2
17 6.6–8.2
18 7.6–9.2
19 8.6–10.2
20 9.6–11.2
21/22 10.6–12.9
SOURCE: From Preliminary Technical Manual for the Terra NOVA™, Third Edition, p. 4, published by CTB/McGraw-Hill LLC. Copyright © 2004 by CTB/McGraw-Hill LLC. Reproduced with permission of The McGraw-Hill Companies, Inc.
The three editions focus on five main content areas: reading, mathematics, science, social studies, and language. Furthermore, users of the TN3 can use the TerraNova, Second Edition Plus (TN2+) to measure five additional areas: word analysis, vocabulary, language mechanics, spelling, and mathematics compu-tation. The content areas and test items of the TN3 were developed in conjunction with a comprehensive review of state, district, and diocese content standards in order to determine and assess common education goals.
SubtestsReading. This section contains two signifi cant changes from previous TerraNova editions. First, reading is now a separate subtest no longer included in language. Second, phonics and phonemic awareness in the K–2 level tests are now located in the reading test scales. Reading comprehension items focus on the central meaning of the passage rather than surface details.
178 Chapter 10 ■ Assessment of Academic Achievement with Multiple-Skill Devices
The progression of items in this section was designed as a continuum to refl ect the reading process by mov-ing from initial understanding to generalization of concepts to other contexts. The multiple assessment edition includes open-ended items that involve com-paring information across texts and extending mean-ing beyond the assessment.
Language. This section includes items that assess usage issues such as verb tense, subject–verb agree-ment, pronoun agreement, and modifi ers. Students are also evaluated on sentence formation, sentence combining, and paragraph writing skills. Students are required to use critical thinking skills to make deci-sions about conveying meaning.
Mathematics. In the TN3, emphasis is on sampling a balance of skills, concepts, knowledge, and prob-lem solving rather than on procedural/computational processes. The TN3 math section includes nonroutine problem-solving items in every test objective. The math section also includes a balance among numeration, number theory, data interpretation, pre-algebra, measurement, and geometry. Students are required to use calculators and rulers during the assessment.
Science. The science battery focuses on core concepts. Test items are based on recent national science stan-dards and are grouped into life, physical, and earth/space science. In the upper levels of the test, items assessing the history and nature of science are included. The test also extends these subject areas by relating science to technology and society. Furthermore, the test includes a separate objective that assesses student scientifi c inquiry skills. These items measure skills independent of content-specifi c knowledge.
Social Studies. This test aims to determine how well students understand the relationships between social studies disciplines. The test was designed based on state and national standards. Student ability to synthesize information and make interdisciplinary connections is also assessed.
The TN3 survey edition is designed to give educators norm- and curriculum-referenced information from a short testing period. The survey edition is available for levels 12 through 21/22 and, like the other edi-tions of the TN3, tests students on all content areas.
Developers suggest using the survey edition when testing time is at a premium. However, if educators need a larger array of diagnostic information, then the developers suggest using the TN3 complete bat-tery. The TN3 complete battery combines the items of the TN3 survey edition with additional selected response items. The complete battery edition is avail-able for levels 10 through 21/22 and tests on all of the content areas included in the survey edition. This edition of the TN3 also reduces measurement error due to its increased length.
The TN3 multiple assessments edition assesses students in the same five content areas. It is avail-able for levels 11 through 21/22 (except language, which is not available for levels 11 and 12). In each of the content areas, the test items from the survey edition are combined with constructed response items. During these items, students produce short and extended responses that are scored by readers accord-ing to TN3 scoring guides. The developers report that the addition of the constructed response information significantly extends the range of the competencies covered.
All three of the TN3 editions can be conjoined with the TN2+ in order to test five additional con-tent areas. The TN2+ assessments are available from level 11 to level 21/22. This additional battery of assessments adds supplemental tests in word analysis, vocabulary, language mechanics, spelling, and math-ematics computation.
Much of the development of the TN3 reflects the philosophy of the National Assessment of Educational Progress (for example, the TN3 reading passage types generally match the National Assessment of Educational Progress passage types). In order to develop the content of the TN3, developers conducted a comprehensive review of state, district, and dio-cese content standards and curriculum frameworks. Along with this review, the developers also carefully examined content of recent textbooks, instructional programs, and national standards publications.
ScoresThe TN3 yields multiple types of scores, including objective-, norm-, and curriculum-referenced scores. In the complete battery edition, every item contrib-utes to a scale score that is used to report a student’s norm-referenced information.
Peabody Individual Achievement Test–Revised–Normative Update 179
In all three editions of the TN3, each student’s score in a content area is totaled and labeled as a composite. The reading composite is the average of the TN3 read-ing and TN2+ vocabulary; the language composite is the average of the TN3 language and TN2+, language mechanics; and the math composite is the average of the TN3 math and TN2+ math computation. The TN3 also yields total scores that are obtained by tak-ing the averages of the three composite scores.
Student performance can also be described using a standards-referenced approach. TN3 will allow educators to measure progress by monitoring how many students are progressing through specific per-formance levels. The developers were in the process of identifying specific cut scores for performance lev-els at the time this book went to press.
NormsNorming of the TN3 occurred in three phases: fall, winter, and spring. Developers estimate that more than 210,000 students, grades K–12, participated in the fall and spring standardizations. The winter standard-ization included approximately 8,000 students. The students were identified using a stratified random sam-pling procedure in order to represent the nation’s school population. Schools were stratified by region (east, west, south, and middle continent states), community type, socioeconomic status, and public/private/parochial clas-sification. Developers asked schools to test all students who were included in regular testing. They also included students who required special testing accommodations as specified by their individualized education program.
ReliabilityDuring the fall standardization period, internal- consistency coefficients ranged from .77 to .90 for sur-vey battery subtests, .80 to .92 for complete battery subtests, and .84 to .93 for the multiple assessment battery subtests. Reliabilities of the winter and spring administrations are yet to be computed. The TerraNova has sufficient reliability to be used for screening pur-poses, but reliabilities are not high enough (they should exceed .90) to be used to make eligibility decisions.
ValidityContent-related validity of the TN3 is evidenced by a correspondence between test content and instructional
content. To ensure that the TN3 had high content-related validity, the developers used a comprehensive curriculum review to determine current educational goals and designed the test items to assess these goals. Also, developers examined differential item function-ing in order to minimize ethnic and gender bias in the TN3.
The criterion-related validity has not been estab-lished for the TN3. The developers report that per-formance on the TN3 will be examined according to the performance on other, similar assessments such as InView. These intercorrelations will be reported in a later TN3 manual.
Peabody Individual Achievement Test–Revised–Normative Update
The most recent edition of the Peabody Individual Achievement Test (PIAT; Markwardt, 1998) is not a new edition of the test but a normative update of the 1989 edition of the PIAT-R. The test is an indi-vidually administered, norm-referenced instrument designed to provide a wide-ranging screening meas-ure of academic achievement in six content areas. It can be used with students in kindergarten through twelfth grade. PIAT-R test materials are contained in four easel kits, one for each volume of the test. Easel kit volumes present stimulus materials to the student at eye level; the examiner’s instructions are placed on the reverse side. The student can see one side of the response plate, whereas the examiner can see both sides. The test is recommended by the author for use in individual evaluation, guidance, admissions and transfers, grouping of students, progress evaluation, and personnel selection.
The original PIAT (Dunn & Markwardt, 1970) included five subtests. The PIAT-R added a written expression subtest. The 1989 edition updated the content of the test. The 1998 edition is identical to the 1989 edition. Behaviors sampled by the six sub-tests of the PIAT-R-NU follow.
SubtestsMathematics. This subtest contains 100 multiple-choice items, ranging from items that assess such early skills as matching, discriminating, and recogniz-ing numerals to items that assess advanced concepts
180 Chapter 10 ■ Assessment of Academic Achievement with Multiple-Skill Devices
in geometry and trigonometry. The test is a measure of the student’s knowledge and application of math concepts and facts.
Reading Recognition. This subtest contains 100 items, ranging in diffi culty from preschool level through high school level. Items assess skill development in matching letters, naming capital and lowercase let-ters, and recognizing words in isolation.
Reading Comprehension. This subtest contains 81 multiple-choice items assessing skill development in understanding what is read. After reading a sentence, the student must indicate comprehension by choosing the correct picture out of a group of four.
Spelling. This subtest consists of 100 items sampling behaviors from kindergarten level through high school level. Initial items assess the student’s ability to distinguish a printed letter of the alphabet from pictured objects and to associate letter symbols with speech sounds. More diffi cult items assess the stu-dent’s ability to identify, from a response bank of four words, the correct spelling of a word read aloud by the examiner.
General Information. This subtest consists of 100 questions presented orally, which the student must answer orally. Items assess the extent to which the student has learned facts in social studies, science, sports, and the fi ne arts.
Written Expression. This subtest assesses written-language skills at two levels. Level I, appropriate for students in kindergarten and fi rst grade, is a measure of prewriting skills, such as skill in copying and writ-ing letters, words, and sentences from dictation. At Level II, the student writes a story in response to a picture prompt.
ScoresAll but one of the PIAT-R subtests are scored in the same way: The student’s response to each item is rated pass–fail. On these five subtests, raw scores are con-verted to grade and age equivalents, grade- and age-based standard scores, percentile ranks, normal-curve equivalents, and stanines. The Written Expression sub-test is scored differently from the other subtests. The examiner uses a set of scoring criteria included in an
appendix in the test manual. At Level I, the examiner scores the student’s writing of his or her name and then scores 18 items pass–fail. For the more difficult items at Level I, the student must earn a specified number of subcredits to pass the item. Methods for assigning subcredits are specified clearly in the man-ual. At Level II, the student generates a free response, and the assessor examines the response for certain specified characteristics. For example, the student is given credit for each letter correctly capitalized, each correct punctuation, and the absence of inappropri-ate words. Scores earned on the Written Expression subtest include grade-based stanines and develop-mental scaled scores (with mean = 8 and standard deviation = 3).
Three composite scores are used to summarize student performance on the PIAT-R: total read-ing, total test, and written language. Total reading is described as an overall measure of “reading abil-ity” and is obtained by combining scores on Reading Recognition and Reading Comprehension. The total test score is obtained by combining performance on the General Information, Reading Recognition, Reading Comprehension, Mathematics, and Spelling subtests. A third composite score, the written- language com-posite score, is optional and is obtained by combining performance on the Spelling and Written Expression subtests.
NormsThe 1989 edition of the PIAT-R was standardized on 1,563 students in kindergarten through grade 12. The 1998 normative update was completed in conjunc-tion with normative updating of the Kaufman Test of Educational Achievement, the Key Math–Revised, and the Woodcock Reading Mastery Tests–Revised. The sample for the normative updates was 3,184 stu-dents in kindergarten through grade 12. A stratified multistage sampling procedure was used to ensure selection of a nationally representative group at each grade level. Students in the norm group did not all take each of the five tests. Rather, one-fifth of the stu-dents took each test, along with portions of each of the other tests. Thus, the norm groups for the brief and comprehensive forms consist of approximately 600 students. There are as few as 91 students at 3-year age ranges. Because multiple measures were given to each student, the authors could use linking and equating to increase the size of the norm sample.
Wide Range Achievement Test–4 181
Approximately 10 years separate the data- collection periods for the original PIAT norms and the updated norms. Changes during that time in curriculum and educational practice, in population demographics, and in the general cultural environment may have affected levels of academic achievement.
ReliabilityAll data on the reliability of the PIAT-R-NU are for the original PIAT-R. The performance of students on the two measures has changed, and so the authors should have conducted a few reliability studies on students in the late 1990s. Generalizations from the reliability of the original PIAT-R to reliability of the PIAT-R-NU are suspect.
ValidityAll data on validity of the PIAT-R-NU are for the orig-inal PIAT-R. The performance of students on the two measures has changed, and so the authors should have conducted a few validity studies on students in the late 1990s. Generalizations from the validity of the origi-nal PIAT-R to validity of PIAT-R-NU are suspect. This is especially true for measures of validity based on relations with external measures where the measures (for example, the Wide Range Achievement Test or the Peabody Picture Vocabulary Test) have been revised.
SummaryThe PIAT-R is an individually administered achieve-ment test that was renormed in 1998. Reliability and validity information is based on studies of the 1989 edition of the test. As with any achievement test, the most crucial concern is content validity. Users must be sensitive to the correspondence of the content of the PIAT-R to a student’s curriculum. The test is essen-tially a 1970 test that was revised and renormed in 1989 and then renormed again in 1998. Data on reli-ability and validity are based on the earlier version of the scale, which of course has gone unchanged. The practice of updating norms without gathering data on continued technical adequacy is dubious.
Wide Range Achievement Test–4
The Wide Range Achievement Test–4 (WRAT4; Wilkinson & Robertson, 2007) is an individually administered
norm-referenced test designed to measure word recogni-tion, spelling, and math computation skills in individuals 5 to 94 years of age. The test takes approximately 15 to 25 minutes to administer to students ages 5 to 7 years and approximately 35 to 45 minutes for older students. There are two alternate forms of the WRAT4. The test contains four subtests.
SubtestsWord Reading. The student is required to name let-ters and read words.
Sentence Comprehension. The student is shown sentences and is to indicate understanding of the sen-tences by fi lling in missing words.
Spelling. The examiner dictates words and the stu-dent must write these down, earning credit for each word spelled correctly.
Math Computation. The student is required to solve basic computation problems through counting, iden-tifying numbers, solving simple oral problems, and calculating written math problems.
ScoresThe raw scores that students earn on the WRAT4 can be converted to standard scores, confidence intervals (85, 90, and 95%), percentiles, grade equivalents, nor-mal curve equivalents, and stanines. Separate scores are available for each subtest and for a reading com-posite (made up of Word Recognition and Sentence Comprehension).
NormsThe WRAT4 was standardized on a national sample of more than 3,000 individuals ages 5 to 94 years. The sample was stratified on the basis of age, gender, ethnicity, geographic region, and parental education. Although tables in the manual report the relationship between the standardization sample and the composi-tion of the U.S. population, cross-tabs (indicating, for example, the number of boys of each ethnicity from each geographic region) are not provided.
ReliabilityTwo kinds of reliability information are provided for the WRAT4: internal consistency and alternate-form
182 Chapter 10 ■ Assessment of Academic Achievement with Multiple-Skill Devices
reliability. Internal consistency coefficients range from .81 to .99, with median internal consistency coeffi-cients ranging from .87 to .96. Alternate-form reliabili-ties range from .78 to .89 for an age-based sample and from .86 to .90 for a grade-based sample. The reliabil-ities of the Math Computation subtest are noticeably lower than those for other subtests. Test–retest reli-abilities are sufficient, again with the exception of the Math Computation subtest. With the exception of the Math Computation subtest, the test is reliable enough for use in making screening decisions.
ValidityThe WRAT4 is a screening test that covers a broad range of behaviors, so there are few items of each specific type. This results in a relatively limited behavior sample. The authors provide evidence of validity by demonstrating that test scores increase with age, that intercorrelations among the various subtests are as theoretically would be expected, and that correlations are high among performance on WRAT4 and previous versions of the test. Validity is also demonstrated by high correlations among subtests of the WRAT4 and comparable sam-ples of behavior from the WIAT-II, Kaufman Test of Educational Achievement–II (KTEA-II), and the Woodcock–Johnson III Tests of Achievement (note: not the new normative update for this test). WRAT4 is valid for screening purposes.
Wechsler Individual Achievement Test–Second Edition
The WIAT-II (Psychological Corporation, 2001) is an individually administered, norm-referenced achieve-ment test designed to be used with students in grades pre-K through 12 who are between the ages of 4 and 19 years. A supplemental manual is available that pro-vides norms for adults through 85 years of age. The first edition (WIAT) was co-normed with the Wechsler series of intelligence tests: the Wechsler Preschool and Primary Scale on Intelligence–Revised (WPPSI-R), the WISC-III, and the WAIS-R. The WIAT-II was linked to the WPPSI-R, WISC-III, and WAIS-III through a sample of 1,069 individuals who took the WIAT-II and the age-appropriate intelligence test. The authors contend that this linking of ability and achievement tests provides more reliable estimates of a student’s aptitude–achievement discrepancy.
The test’s authors created subtests that parallel and, they argue, comprehensively cover the seven areas of learning disability specified in Public Law 94-142: basic reading skills, reading comprehension, mathematics reasoning, mathematics calculation, lis-tening comprehension, oral expression, and written expression. These seven domains, in addition to spell-ing and pseudoword (a combination of letters that can be pronounced but is not an English word) decoding, compose the nine subtests of the WIAT-II. The WIAT-II can be completed in approximately 45 minutes for very young children (pre-K and kindergarten), 90 minutes for grades 1 through 6, and 1 to 2 hours for grades 7 through 16. The behaviors sampled by the WIAT-II subtests are described in Table 10.4.
ScoresEight types of scores—standard, percentile rank, age equivalent, grade equivalent, normal-curve equiva-lent, stanine, quartile, and decile—can be derived from each of the subtests and five composites. The mathematics, oral language, and written language composites are each based on two subtests; the read-ing composite is based on three subtests. The total composite is based on all the subtests. The standard score, which has a mean of 100 and a standard deviation of 15, can be computed by age or grade. Quartile scores represent corresponding quarters of the distribution; decile scores represent corre-sponding tenths of the distribution (that is, a decile score of 1 represents the first tenth, or the bottom 10 percent, of the distribution). Ability–achievement discrepancy scores based on the WIAT-II standard scores and one of the three Wechsler ability tests (WPPSI-R, WISC-III, or WAIS-III) are also provided. The test authors provide two methods of computing discrepancy scores— simple difference and predicted achievement—and provide information regarding the limitations of each approach.
NormsThe WIAT-II was standardized on 3,600 children for the grade-based sample (K–12) and on 2,950 children for the age-based sample (ages 4 to 19 years); 2,171 students were included in both samples. A sample of 1,069 children was used to link the WIAT-II with the WPPSI-R, the WISC-III, and the WAIS-III. The infor-mation collected from the linking studies was used to develop the ability–achievement discrepancy statistics.
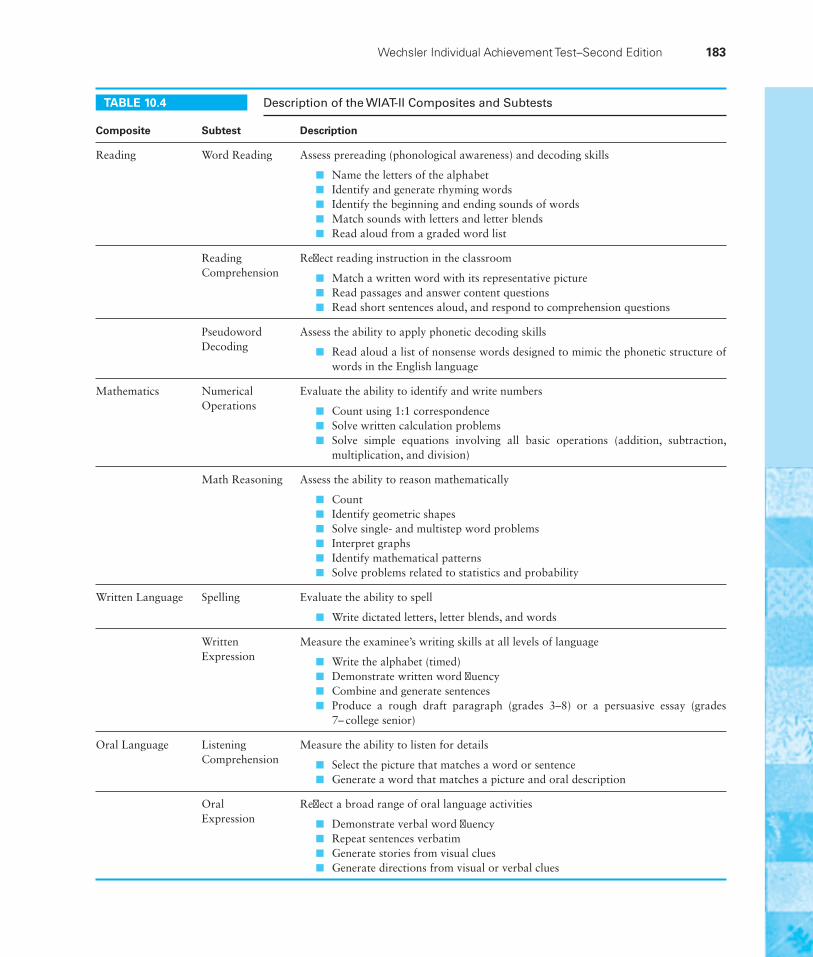
Wechsler Individual Achievement Test–Second Edition 183
TABLE 10.4 Description of the WIAT-II Composites and Subtests
Composite Subtest Description
Reading Word Reading Assess prereading (phonological awareness) and decoding skills
Name the letters of the alphabet ■
Identify and generate rhyming words ■
Identify the beginning and ending sounds of words ■
Match sounds with letters and letter blends ■
Read aloud from a graded word list ■
Reading Comprehension
Refl ect reading instruction in the classroom
Match a written word with its representative picture ■
Read passages and answer content questions ■
Read short sentences aloud, and respond to comprehension questions ■
Pseudoword Decoding
Assess the ability to apply phonetic decoding skills
Read aloud a list of nonsense words designed to mimic the phonetic structure of ■
words in the English language
Mathematics Numerical Operations
Evaluate the ability to identify and write numbers
Count using 1:1 correspondence ■
Solve written calculation problems ■
Solve simple equations involving all basic operations (addition, subtraction, ■
multiplication, and division)
Math Reasoning Assess the ability to reason mathematically
Count ■
Identify geometric shapes ■
Solve single- and multistep word problems ■
Interpret graphs ■
Identify mathematical patterns ■
Solve problems related to statistics and probability ■
Written Language Spelling Evaluate the ability to spell
Write dictated letters, letter blends, and words ■
Written Expression
Measure the examinee’s writing skills at all levels of language
Write the alphabet (timed) ■
Demonstrate written word fl uency ■
Combine and generate sentences ■
Produce a rough draft paragraph (grades 3–8) or a persuasive essay (grades ■
7– college senior)
Oral Language Listening Comprehension
Measure the ability to listen for details
Select the picture that matches a word or sentence ■
Generate a word that matches a picture and oral description ■
Oral Expression
Refl ect a broad range of oral language activities
Demonstrate verbal word fl uency ■
Repeat sentences verbatim ■
Generate stories from visual clues ■
Generate directions from visual or verbal clues ■
184 Chapter 10 ■ Assessment of Academic Achievement with Multiple-Skill Devices
The sample selection was based on 1998 U.S. census data. The sample was randomly selected and strati-fied by age, grade, gender, race/ethnicity, geographic region, and parent education. Economic status was not used as a stratification variable. Demographic information on race/ethnicity, gender, geographic region, and parent education is disaggregated by age and grade. Cross-tabulations of parent education level by ethnicity are also provided.
ReliabilityThree forms of reliability data were calculated for the WIAT-II. Split-half reliability coefficients based on age and grade subtest scores generally exceed .80. Numerical Operations, Written Expression, Listening Comprehension, and Oral Expression fall below .80 for certain ages and grades. The split-half coeffi-cients for the four composites are all greater than .80, with two of the four composites exceeding .90 at all age and grade levels (Reading and Written Expression). A sample of 297 students ages 6 to 19 years was selected to determine the test–retest reliability of the WIAT-II. The subtest reliabilities are all above .80; coefficients are provided according to three age groups (6 to 9 years, 10 to 12 years, and 13 to 19 years). Interrater agreement was calculated among 2,180 examinee responses for three subtests that require subjective scoring. The correlation between raters for Reading Comprehension ranges from .94 to .98. The interrater agreement for Oral Expression ranges from .91 to .99. The interrater agreement for Written Expression ranges from .71 to .94.
ValidityThe WIAT-II has evidence for validity based on test content, internal structure, and relations with other measures. Expert judgment and empirical item analy-ses were used to establish the content validity of the instrument. Experts analyzed the extent to which the items measured specific curriculum objectives. Empirical item analyses were used to eliminate poorly constructed items in order to prevent bias. The valid-ity based on internal structure of the WIAT-II was documented through analysis of subtest intercor-relations, correlations with ability measures, and expected developmental differences across age and grade groups.
Several forms of support for validity based on relations with external criteria are provided. There are many moderate correlations between WIAT-II subtests and subtests from the Wide Range Achievement Test–Third Edition, the Differential Ability Scales, and the Peabody Picture Vocabulary Test–Third Edition. The WIAT-II also correlated as would be expected with subtests of several group-administered achievement tests, including the Stanford Achievement Test–Ninth Edition and the Metropolitan Achievement Tests–Eighth Edition. The correlation between the WIAT-II and school grades was generally low, but this is no different from what would be expected, given the low reliability of school grades.
SummaryThe WIAT-II is an individually administered achieve-ment test that is linked to the Wechsler series of intel-ligence tests. The subtests are designed to measure the seven areas of learning disability defined in Public Law 94–142. The test has an adequate standardiza-tion sample and appears to be reliable and valid. Two methods and statistical tables for computing ability–achievement discrepancies are provided, along with a description of the limitations of each method.
Diagnostic Achievement Battery–Third Edition
The Diagnostic Achievement Battery–Third Edition (DAB-3; Newcomer, 2001) is an individually admin-istered measure of children’s skills in listening, speak-ing, reading, writing, and mathematics. Although the test is called “diagnostic,” it is essentially similar to the PIAT-R, WRAT3, and KTEA. Test givers use this test not to “diagnose” skill strengths and weaknesses in individual content areas but, rather, to obtain profile scores across areas. The test is designed to meet four purposes: (1) to identify students who are significantly below their peers in spoken language (listening and speaking), written language (reading and writing), and mathematics; (2) to ascertain an individual student’s skill-development strengths and weaknesses; (3) to document intervention progress for individual stu-dents; and (4) to conduct research. The test is designed to be administered to children between the ages of
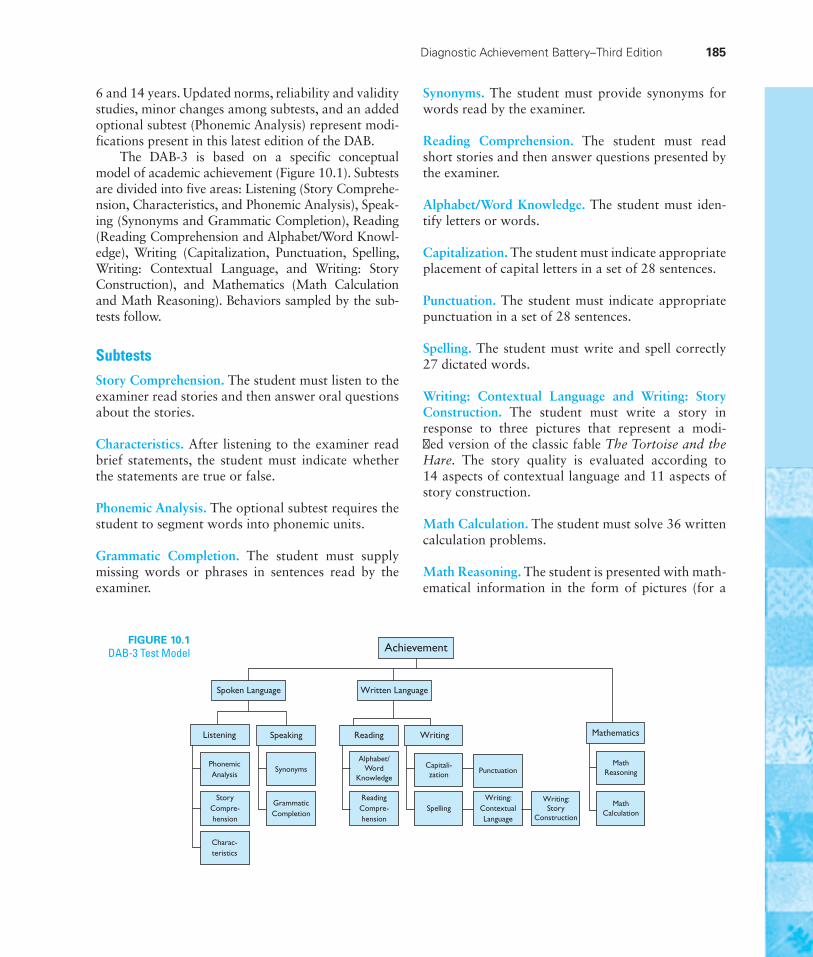
Diagnostic Achievement Battery–Third Edition 185
6 and 14 years. Updated norms, reliability and validity studies, minor changes among subtests, and an added optional subtest (Phonemic Analysis) represent modi-fications present in this latest edition of the DAB.
The DAB-3 is based on a specific conceptual model of academic achievement (Figure 10.1). Sub tests are divided into five areas: Listening (Story Comprehe-n sion, Characteristics, and Phonemic Analysis), Speak-ing (Synonyms and Grammatic Completion), Reading (Reading Comprehension and Alphabet/Word Knowl-edge), Writing (Capitalization, Punctuation, Spelling, Writing: Contextual Language, and Writing: Story Construction), and Mathematics (Math Calculation and Math Reasoning). Behaviors sampled by the sub-tests follow.
SubtestsStory Comprehension. The student must listen to the examiner read stories and then answer oral questions about the stories.
Characteristics. After listening to the examiner read brief statements, the student must indicate whether the statements are true or false.
Phonemic Analysis. The optional subtest requires the student to segment words into phonemic units.
Grammatic Completion. The student must supply missing words or phrases in sentences read by the examiner.
Synonyms. The student must provide synonyms for words read by the examiner.
Reading Comprehension. The student must read short stories and then answer questions presented by the examiner.
Alphabet/Word Knowledge. The student must iden-tify letters or words.
Capitalization. The student must indicate appropriate placement of capital letters in a set of 28 sentences.
Punctuation. The student must indicate appropriate punctuation in a set of 28 sentences.
Spelling. The student must write and spell correctly 27 dictated words.
Writing: Contextual Language and Writing: Story Construction. The student must write a story in response to three pictures that represent a modi-fi ed version of the classic fable The Tortoise and the Hare. The story quality is evaluated according to 14 aspects of contextual language and 11 aspects of story construction.
Math Calculation. The student must solve 36 written calculation problems.
Math Reasoning. The student is presented with math-ematical information in the form of pictures (for a
FIGURE 10.1DAB-3 Test Model Achievement
Written LanguageSpoken Language
Listening
PhonemicAnalysis
StoryCompre-hension
GrammaticCompletion
ReadingCompre-hension
SpellingWriting:
ContextualLanguage
Writing:Story
Construction
Charac-teristics
SynonymsAlphabet/
WordKnowledge
Capitali-zation Punctuation
Mathematics
MathReasoning
MathCalculation
Speaking Reading Writing
186 Chapter 10 ■ Assessment of Academic Achievement with Multiple-Skill Devices
young child) or statements presented orally and must use the information to solve math problems.
There are no set time limits for the DAB-3. Testing time typically ranges from 90 to 120 minutes. Most subtests are administered individually; however, the Punctuation, Spelling, Writing: Contextual Language, Writing: Story Construction, and Math Calculation subtests may be group administered.
ScoresRaw scores, percentile ranks, standard scores, and age/grade–equivalent scores can be calculated for each subtest. Standard scores for corresponding subtests are added and converted into a quotient (similar to a standard score) and percentile rank for each of the eight composites (Listening, Speaking, Reading, Writing, Mathematics, Spoken Language, Written Language, and Total Achievement) using tables in the back of the examiner’s manual. DAB-3 results can be compared to results from other standardized tests using formulas provided in the manual. Information is also provided for conduct-ing discrepancy analyses among the subtests and composites.
NormsThe DAB-3 norm sample consists of 1,094 indi-viduals from 16 states (ages 6 years, 0 months to 14 years, 11 months) who were tested between 1997 and 2000. Comparisons between the sample and the school-age population (U.S. Bureau of the Census, 1997) are provided for geographic area, gender, race, residence (urban versus rural), ethnicity, fam-ily income, parental education, and disability status. Stratifications are provided by age for each of these variables, with the exceptions of residence and disabil-ity status. No further cross-tabulations are provided in the manual, which makes it difficult to determine whether comparisons are appropriate (for example, all of the low-income students may be from the South and not representative of low-income students from throughout the nation).
ReliabilityCoefficient alphas for each subtest and composite according to age are provided by the author as a
measure of internal-consistency reliability. Of the 126 subtest coefficient alphas, 102 meet or exceed .80. Subtests having several lower coefficient alphas include Synonyms, Punctuation, and Math Reasoning. Among the composite scores, all have alpha coef-ficients that exceed .80, with the Listening, Spoken Language, and Written Language coefficients exceed-ing .90. The Total Achievement coefficients range from .98 to .99. Coefficient alphas are also provided for gender and ethnicity groups, as well as for students with learning disabilities. These reliabilities all meet or exceed .80, except those for Punctuation, Writing: Contextual Language, and Math Reasoning among students with learning disabilities, as well as Writing: Contextual Language among African American stu-dents. Test–retest was determined using a sample of 65 elementary and middle school students from Pennsylvania tested twice with an intervening 2-week period. Results indicated adequate test–retest reli-ability (greater than .80) for all subtests except for Writing: Contextual Language and Writing: Story Construction.
ValidityVarious measures of DAB-3 validity based on test con-tent and internal structure are described in the exam-iner’s manual. Rationale is provided for including the specific subtest content in the DAB-3, and com-parisons are made between the content of the DAB-3 and other widely used achievement tests. Relatively few items were identified as being moderately to severely biased for different ethnic groups, and none were identified as being gender biased. Evidence of validity based on relations with other measures is provided by correlating scores for the DAB-3 and the Stanford Achievement Test–Ninth Edition among a limited sample of 70 students from Pennsylvania. Seventy-five percent of the coefficients were in the “high” range (.60 to .80). Corresponding composite correlation coefficients (such as reading with reading and math with math) ranged from .52 to .80. Higher scores were obtained by older students than younger students, and scores for students who were expected to score lower or higher due to having a learning disability or being identified as gifted demonstrated corresponding performance on the DAB-3. Finally, evidence for validity based on internal structure was provided by demonstrating through confirmatory
Getting the Most Out of an Achievement Test 187
factor analyses an appropriate fit to both a one-factor and a five-factor model (corresponding to the Total Achievement and five composite scores). However, the Speaking and Listening factors were highly inter-correlated and therefore were considered to more accurately constitute one factor. No data are pre-sented to demonstrate that DAB-3 scores are useful for identifying children with academic difficulties or for monitoring intervention effects.
SummaryThe DAB-3 is an individually administered test of a variety of academic areas. The test has been slightly modified from the previous edition and has an updated norm sample and adequate reliability information. Limited stratification among the norm sample is evident; however, the manual displays con-siderable evidence of test validity.
4 Getting the Most Out of an Achievement Test
The achievement tests described in this chapter provide the teacher with global scores in areas such as word meaning and work-study skills. Although global scores can help in screening children, they generally lack the specificity to help in planning individu-alized instructional programs. The fact that Emily earned a standard score of 85 on the Mathematics Computation subtest of the ITBS does not tell us what math skills Emily has. In addition, a teacher cannot rely on test names as an indication of what is measured by a specific test. For example, a reading score of 115 on the WRAT3 tells a teacher nothing about reading comprehension or rate of oral reading.
A teacher must look at any screening test (or any test, for that matter) in terms of the behaviors sampled by that test. Here is a case in point. Suppose Richard
Dilemmas in Current Practice
ProblemTwo limitations affect the use of achievement tests as screen-ing devices: the match of the test to the content of the cur-riculum, and the fact that the tests are group administered. Unless the content assessed by an achievement test refl ects the content of the curriculum, the results are meaningless. Students will not have had a formal opportunity to learn the material tested. When students are tested on material they have not been taught, or tested in ways other than those by which they are taught, the test results will not refl ect their actual skills. Jenkins and Pany (1978) compared the contents of four reading achievement tests with the contents of fi ve commercial reading series at grades 1 and 2. Their major concern was the extent to which students might earn differ-ent scores on different tests of reading achievement simply as a function of the degree of overlap in content between tests and curricula. Jenkins and Pany calculated the grade scores that would be earned by students who had mastered the words taught in the respective curricula and who had
correctly read those words on the four tests. Grade scores are shown in Table 10.5. It is clear that different curricula result in different performances on different tests.
Authors’ ViewpointThe data produced by Jenkins and Pany are now more than 30 years old. Yet the table is still the best visual illustration of test curriculum overlap. Shapiro and Derr (1987) showed that the degree of overlap between what is taught and what is tested varied considerably across tests and curricula. Also, Good and Salvia (1988) demonstrated signifi cant differences in test performance for the same students on different read-ing tests. They indicate the signifi cance of the test curricu-lum overlap issue, stating,
Curriculum bias is undesirable because it severely limits the interpretation of a student’s test score. For example, it is unclear whether a student’s reading score of 78 refl ects defi cient reading skills or the selection of a test with poor content validity for the pupil’s curriculum. (p. 56)
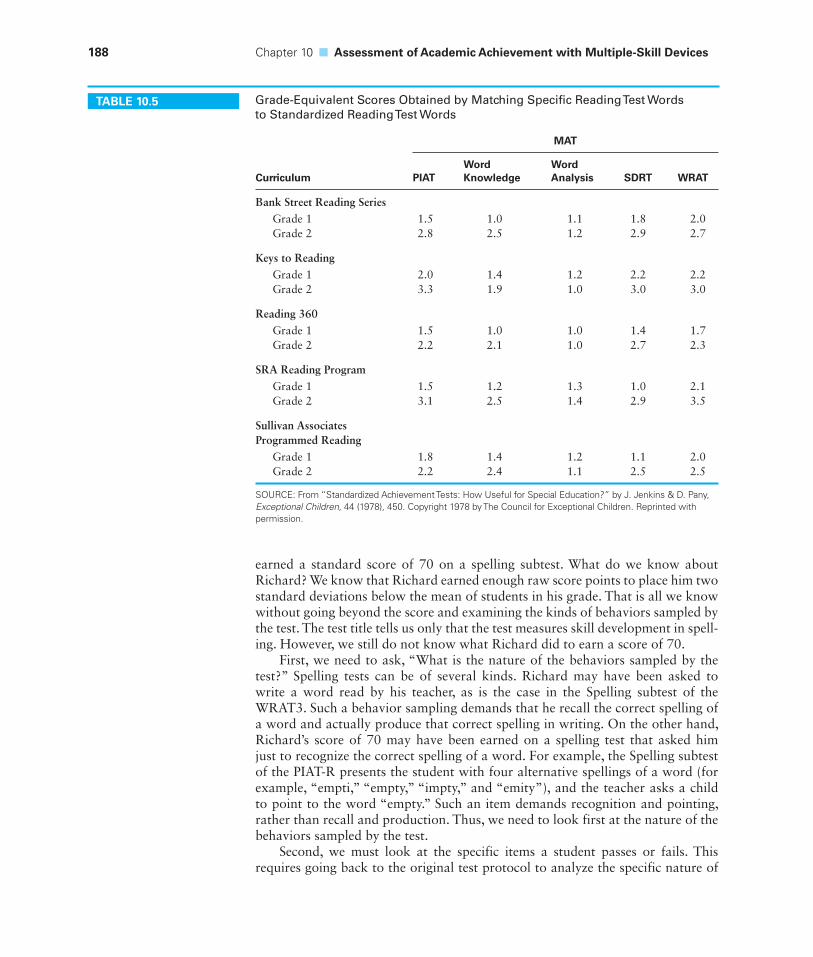
188 Chapter 10 ■ Assessment of Academic Achievement with Multiple-Skill Devices
earned a standard score of 70 on a spelling subtest. What do we know about Richard? We know that Richard earned enough raw score points to place him two standard deviations below the mean of students in his grade. That is all we know without going beyond the score and examining the kinds of behaviors sampled by the test. The test title tells us only that the test measures skill development in spell-ing. However, we still do not know what Richard did to earn a score of 70.
First, we need to ask, “What is the nature of the behaviors sampled by the test?” Spelling tests can be of several kinds. Richard may have been asked to write a word read by his teacher, as is the case in the Spelling subtest of the WRAT3. Such a behavior sampling demands that he recall the correct spelling of a word and actually produce that correct spelling in writing. On the other hand, Richard’s score of 70 may have been earned on a spelling test that asked him just to recognize the correct spelling of a word. For example, the Spelling subtest of the PIAT-R presents the student with four alternative spellings of a word (for example, “empti,” “empty,” “impty,” and “emity”), and the teacher asks a child to point to the word “empty.” Such an item demands recognition and pointing, rather than recall and production. Thus, we need to look first at the nature of the behaviors sampled by the test.
Second, we must look at the specific items a student passes or fails. This requires going back to the original test protocol to analyze the specific nature of
TABLE 10.5 Grade-Equivalent Scores Obtained by Matching Specifi c Reading Test Wordsto Standardized Reading Test Words
MAT
Curriculum PIATWord Knowledge
Word Analysis SDRT WRAT
Bank Street Reading Series Grade 1 Grade 2
1.52.8
1.02.5
1.11.2
1.82.9
2.02.7
Keys to Reading Grade 1 Grade 2
2.03.3
1.41.9
1.21.0
2.23.0
2.23.0
Reading 360 Grade 1 Grade 2
1.52.2
1.02.1
1.01.0
1.42.7
1.72.3
SRA Reading Program Grade 1 Grade 2
1.53.1
1.22.5
1.31.4
1.02.9
2.13.5
Sullivan Associates Programmed Reading Grade 1 Grade 2
1.82.2
1.42.4
1.21.1
1.12.5
2.02.5
SOURCE: From “Standardized Achievement Tests: How Useful for Special Education?” by J. Jenkins & D. Pany, Exceptional Children, 44 (1978), 450. Copyright 1978 by The Council for Exceptional Children. Reprinted with permission.
Summary 189
skill development in a given area. We need to ask, “What kinds of items did the child fail?” and then look for consistent patterns among the failures. In trying to identify the nature of spelling errors, we need to know, “Does the student consis-tently demonstrate errors in spelling words with long vowels? With silent e’s? With specific consonant blends?” and so on. The search is for specific patterns of errors, and we try to ascertain the student’s relative degree of consistency in making cer-tain errors. Of course, finding error patterns requires that the test content be suf-ficiently dense to allow a student to make the same error at least two times.
Similar procedures are followed with any screening device. Obviously, the information achieved is not nearly as specific as the information obtained from diagnostic tests. Administration of an achievement test that is a screening test gives the classroom teacher a general idea of where to start with any additional diagnostic assessment.
5 Summary
Screening devices used for assessing academic achievement provide a global picture of a student’s skill development in academic content areas. Screening tests must be selected on the basis of the kinds of behavior each test samples, the adequacy of its norms, its reliability, and its validity. When selecting an achievement test or when evaluating the results of a student’s performance on an achievement test, the classroom teacher needs to take into careful consideration not only the technical characteristics of the test but also the extent to which the behaviors sampled rep-resent the goals and objectives of the student’s curriculum. The teacher can adapt certain techniques for administering group tests and for getting the most mileage out of the results of group tests.
CHAPTER COMPREHENSION QUESTIONSWrite your answers to each of the following questions, and then compare your responses to the text or the study guide.
1. Identify at least four important considerations in selecting a specifi c achievement test for use with the third graders in your local school system.
2. Describe the major advantages and disadvantages of using group-administered, multiple-skill achievement tests.
3. A new student is assessed in September using the WRAT4. Her achievement test scores (using the PIAT-3NU) are forwarded from her previous school and place her in the 90th percentile overall. However, the latest
assessment places her only in the 77th percentile. Give three possible explanations for this discrepancy.
4. Ms. Epstein decides to assess the achievement of her fi fth-grade pupils. She believes that they are unusually “slow” learners and estimates that, in general, they are functioning on approximately a third-grade level. She decides to use Primary Level III of the SAT. What diffi culties will she face?
5. Mr. Fitzpatrick has used the results of a group-administered achievement test to make a placement decision concerning John. What facts about group-administered achievement tests has Mr. Fitzpatrick failed to attend to? Under what conditions could he use an achievement test designed to be administered to a group?
190
3Know the areas assessed by
diagnostic reading tests, including oral reading, comprehension, word-attack, reading recognition, and reading-related behaviors.
2Understand the ways in which
reading is taught.1Know why we
assess reading.
11 Using Diagnostic Reading Measures
Chapter Goals
4Be familiar with three reading tests. 5Be familiar with
some of the current dilemmas we face in using reading measures.
The Ways in Which Reading Is Taught 191
Key Terms oral reading
word-attack skills
rate of reading
word recognition skills
oral reading errors
literal comprehension
inferential comprehension
critical comprehension
affective comprehension
lexical comprehension
1 Why Do We Assess Reading?
Reading is one of the most fundamental skills that students learn. For poor readers, life in school is likely to be difficult even with appropriate curricu-lar and testing accommodations and adaptations, and life after school is likely to have constrained opportunities and less personal independence and satisfaction. Moreover, students who have not learned to read fluently by the end of third grade are unlikely ever to read fluently (Adams, 1990). For these reasons, stu-dents’ development of reading skills is closely monitored in order to identify those with problems early enough to enable remediation.
Diagnostic tests are used primarily to improve two educational decisions. First, they are administered to children who are experiencing difficulty in learn-ing to read. In this case, tests identify a student’s strengths and weaknesses so that educators can plan appropriate interventions. Second, they are given to ascertain a student’s initial or continuing eligibility for special services. Tests given for this purpose are used to compare a student’s achievement with the achievement of other students. Diagnostic reading tests may also be admin-istered to evaluate the effects of instruction. However, this use of diagnostic reading tests is generally unwise. Individually administered tests are an inef-ficient way to evaluate instructional effectiveness for large groups of students; group survey tests are generally more appropriate for this purpose. Diagnostic tests are generally too insensitive to identify small but important gains by indi-vidual students. Teachers should monitor students’ daily or weekly progress with direct performance measures (such as having a student read aloud cur-rently used materials to ascertain accuracy [percentage correct] and fluency [rate of correct words per minute]).
2 The Ways in Which Reading Is Taught
For approximately 150 years, educators have been divided (sometimes acrimoniously) over the issue of teaching the language code (letters and sounds). Some educators favor a “look–say” (or whole-word) approach, in which students learn whole words and practice them by reading appropriate stories and other passages. Proponents of this approach stress the meaning of the words and usually believe that students learn the code incidentally (or with a little coaching). Finally, proponents of this approach offer the opinion (contradicted by empirical research) that drilling children in letters and sounds destroys their motivation to read. Other educators favor systematically teaching the language code: how letters represent sounds and how sounds and letters
192 Chapter 11 ■ Using Diagnostic Reading Measures
are combined to form words—both spoken and written. Proponents of this approach argue that specifically and systematically teaching phonics produces more skillful readers more easily; they also argue that reading failure destroys motivation to read.
For the first 100 years or so of the debate, observations of reading were too crude to indicate more than that the reader looked at print and said the printed words (or answered questions about the content conveyed by those printed words). Consequently, theoreticians speculated about the processes occurring inside the reader, and the speculations of advocates of whole-word instruction dominated the debate until the 1950s. Thereafter, phonics instruction (systematically teaching beginning readers the relationships among the alphabetic code, phonemes, and words) increas-ingly became part of prereading and reading instruction. Some of that increased emphasis on phonics may be attributable to Why Johnny Can’t Read (Flesch, 1955), a book vigorously advocating phonics instruction; more important, the growing body of empirical evidence increasingly showed phonics instruction’s effectiveness. By 1967, there was substantial evidence that systematic instruction in phonics pro-duced better readers and that the effect of phonics instruction was greater for children of low ability or from disadvantaged backgrounds. With phonics instruction, begin-ning readers had better word recognition, better reading comprehension, and better reading vocabulary (Bond & Dykstra, 1967; Chall, 1967). Subsequent empirical evidence leads to the same conclusions (Rayner, Foorman, Perfetti, Pesetsky, & Seidenberg, 2001; National Institute of Child Health and Human Development, 2000a, 2000b; Adams, 1990; Foorman, Francis, Fletcher, Schatschneider, & Mehta, 1998; Pflaum, Walberg, Karegianes, & Rasher, 1980; Stanovich, 1986).
While some scholars were demonstrating the efficacy of phonics instruction, others began unraveling the ways in which beginners learn to read. Today, that process is much clearer than it was even in the 1970s. Armbruster and Osborn (2001) have provided an excellent summary of the processes involved in early reading. First, beginning readers must understand how words are made up of sounds before they need to read. This process, called “phonemic awareness,” is the ability to recognize and manipulate phonemes, which are the spoken sounds that affect the meaning of a communication. Phonemic awareness can be taught if it has not already developed before reading instruction begins. Second, beginning read-ers must associate graphemes (alphabet letters) with phonemes. Beginning readers learn these associations best through explicit phonics instruction. Third, beginning readers must read fluently in order to comprehend what they are reading.
After students become fluent decoders, they read more difficult material. This material often contains advanced vocabulary that students must learn. It contains more complex sentence structure, more condensed and abstract ideas, and perhaps less literal and more inferential meaning. Finally, more difficult material frequently requires that readers read with the purpose of understanding what they are reading.
While learning more about how students begin to read, scholars also learned that some long-held beliefs were not valid. For example, it is incorrect to say that poor readers read letter by letter, but skilled readers read entire words and phrases as a unit. Actually, skilled readers read letter by letter and word by word, but they do it so quickly that they appear to be reading words and phrases (see, for example, Snow, Burns, & Griffin, 1998). It is also incorrect to say that good readers rely heavily on context cues to identify words (Share & Stanovich, 1995). Good readers do use context cues to verify their decoding accuracy. Poor readers rely on them heavily, however, probably because they lack skill in more appropri-ate word-attack skills (see, for example, Briggs & Underwood, 1984).
Today, despite clear evidence indicating the essential role of phonics in reading and strong indications of the superiority of reading programs with direct instruction in phonics (Foorman et al., 1998), some professionals continue to reject phonics instruction. Perhaps this may explain why most students who are referred for psycho-logical assessment are referred because of reading problems and why most of these students have problems changing the symbols (that is, alphabet letters) into sounds and words. The obvious connection between phonics instruction and beginning read-ing has not escaped the notice of many parents, however. They have become eager consumers of educational materials (such as “Hooked on Phonics” and “The Phonics Game”) and private tutoring (for example, instruction at a Sylvan Learning Center).
Educators’ views of how students learn to read and how students should be taught will determine their beliefs about reading assessment. Thus, diagnostic testing in reading is caught between the opposing camps. If the test includes an assessment of the skills needed to decode text, it is attacked by those who reject
The Springfi eld School District uses a child-centered whole-language approach to teaching reading. Near the end of the school year, the district screened all fi rst-grade students to identify students who would require supplementary services in reading the follow-ing year. Lloyd earned a score that was at the seventh percentile on the district’s norms, and the district notifi ed his parents that he would be receiving addi-tional help the next year so that he could improve his skills. Lloyd’s parents were upset by the news because until the notifi cation they thought that Lloyd was progressing well in all school subjects.
The parents requested a meeting with Lloyd’s teacher, who also invited the reading specialist. At that meeting, the reading specialist told the parents that a fairly large percentage of fi rst graders were in the same predicament as Lloyd but not to worry because many students matured into readers. She said that Lloyd only needed time. She urged the parents to let Lloyd enjoy his summer, and the district would retest him at the beginning of the second grade to determine if he still needed the extra help.
Lloyd’s parents ignored the district’s advice and enrolled him in a reading course at a local tutoring program. Lloyd was fi rst tested to identify the exact nature of his problem. The test results indicated that
he had excellent phonemic awareness, could print and name all upper- and lowercase letters, knew all the consonant sounds, knew the sounds of all long vowels, did not know any of the short vowel sounds, could not sound blend, and had a sight vocabulary of approximately 50 words. Lloyd’s tutor taught him the short vowel sounds rather quickly. However, he had trouble with sound blending until his tutor used his interest and skill in math to explain the principles. She wrote: c + a + t = cat, and then said each of the three sounds and “cat.” As she explained to Lloyd’s parents, it was like a light going on in his head. He got it. The tutor spent a few more sessions using phon ics to help Lloyd increase his sight vocabulary.
In September, the district retested Lloyd as it had promised. The district sent home a form letter in which it explained that Lloyd was now at the 99th percentile in reading and no longer needed supple-mentary services. At the bottom was a hand-written note from the reading specialist: “Lloyd just needed a little time to become a reader. We’re so glad you let him just enjoy his summer!”
Epigram Lloyd did enjoy his summer as well as the second grade. Also, he won an award as the best second-grade reader in the district.
Scenario in Assessment
Lloyd
The Ways in Which Reading Is Taught 193
194 Chapter 11 ■ Using Diagnostic Reading Measures
analytic approaches to reading. If the test does not include an assessment of decod-ing skills, it is attacked by those who know the importance of those skills in begin-ning reading.
3 Skills Assessed by Diagnostic Reading Tests
Reading is a complex process that changes as readers develop. Beginning readers rely heavily on a complex set of decoding skills that can be assessed holistically by having a student read orally and assessing his or her accuracy and fluency. Decoding skills may also be measured analytically by having students apply these skills in isolation (for example, using phonics to read nonsense words). Once fluency in decoding has been attained, readers are expected to go beyond the comprehension of simple language and simple ideas to the process of understanding and evaluating what is written. Advanced readers rely on different skills (that is, linguistic competence and abstract reasoning) and different facts (that is, vocabulary, prior knowledge and experience, and beliefs). Comprehension may be assessed by having a student read a passage that deals with an esoteric topic and is filled with abstract concepts and difficult vocabulary; moreover, the sentences in that passage may have complicated grammar with minimal redundancy.
Oral ReadingA number of tests and subtests are designed to assess the accuracy and/or fluency of a student’s oral reading. Oral reading tests consist of a series of graded para-graphs that are read sequentially by a student. The examiner notes reading errors and behaviors that characterize the student’s oral reading.
Rate of Reading
Good readers are fluent; they recognize words quickly (without having to rely on phonetic analysis) and are in a good position to construct meaning of sen-tences and paragraphs. Readers who are not fluent have problems comprehend-ing what they read, and the problems become more severe as the complexity of the reading material increases. Indeed, reading fluency is an excellent general indicator of reading achievement. Consequently, increasingly more states are including reading fluency as part of their comprehensive reading assessment systems.
Nonetheless, many commercially available reading tests do not assess reading fluency. However, there are some exceptions. Two levels of the Stanford Diagnostic Reading Test have subtests to assess rate of reading. Tests such as the Gray Oral Reading Test–4 (GORT-4) are timed. A pupil who reads a passage on the GORT-4 slowly but makes no errors in reading may earn a lower score than a rapid reader who makes one or two errors in reading.
Oral Reading Errors
Oral reading requires that students say the word that is printed on the page cor-rectly. However, all errors made by a student are not equal. Some errors are relatively unimportant to the extent that they do not affect the student’s comprehension of the
Skills Assessed by Diagnostic Reading Tests 195
material. Other errors are ignored. Examiners may note characteristics of a student’s oral reading that are not counted as errors. Self-corrections are not counted as errors. Disregarded punctuation marks (for example, failing to pause for a comma or to inflect vocally to indicate a question mark) are not counted as errors. Repetitions and hesitations due to speech handicaps (for example, stuttering or stammering) are not counted as errors. Dialectic accents are not counted as mispronunciations.1
The following types of errors count against the student:
Teacher Pronunciation or Aid If a student either hesitates for a time without making an audible effort to pronounce a word or appears to be attempting for 10 seconds to pronounce the word, the examiner pronounces the word and records an error.
Hesitation The student hesitates for 2 or more seconds before pronouncing a word.
Gross Mispronunciation of a Word A gross mispronunciation is recorded when the pupil’s pronunciation of a word bears so little resemblance to the proper pronunciation that the examiner must be looking at the word to recognize it. An example of gross mispronunciation is reading “encounter” as “actors.”
Partial Mispronunciation of a Word A partial mispronunciation can be one of several different kinds of errors. The examiner may have to pronounce part of a word for the student (an aid); the student may phonetically mispronounce specifi c letters (for example, by reading “red” as “reed”); or the student may omit part of a word, insert elements of words, or make errors in syllabication, accent, or inversion.
Omission of a Word or Group of Words Omissions consist of skipping individual words or groups of words.
Insertion of a Word or Group of Words Insertions consist of the student’s putting one or more words into the sentence being read. The student may, for example, read “the dog” as “the mean dog.”
Substitution of One Meaningful Word for Another Substitutions consist of the replacement of one or more words in the passage by one or more different meaningful words. The student might read “dense” as “depress.” Students often replace entire sequences of words with others, as illustrated by the replacement of “he is his own mechanic” with “he sat on his own machine.” Some oral reading tests require that examiners record the specifi c kind of substitution error. Substitutions are classifi ed as meaning similarity (the words have similar meanings), function similarity (the two words have syntactically similar functions), graphic/phoneme similarity (the words look or sound alike), or a combination of the preceding.
Repetition Repetition occurs when students repeat words or groups of words while attempting to read sentences or paragraphs. In some cases, if a student repeats a group of words to correct an error, the original error is not recorded, but a repetition error is. In other cases, such behaviors are recorded simply as spontaneous self-corrections.
1Other characteristics of a student’s oral reading are problematic (although not errors): poor posture, inappropriate head movement, fi nger pointing, loss of place, lack of expression (for example, word-by-word reading, lack of phrasing, or monotone voice), and strained voice.
196 Chapter 11 ■ Using Diagnostic Reading Measures
Inversion, or Changing of Word Order Errors of inversion are recorded when the child changes the order of words appearing in a sentence; for example, “house the” is an inversion.
Assessment of Reading ComprehensionDiagnostic tests assess five different types of reading comprehension:
1. Literal comprehension entails understanding the information that is explicit in the reading material.
2. Inferential comprehension means interpreting, synthesizing, or extending the information that is explicit in the reading material.
3. Critical comprehension requires analyzing, evaluating, and making judgments about the material read.
4. Affective comprehension involves a reader’s personal and emotional responses to the reading material.
5. Lexical comprehension means knowing the meaning of key vocabulary words.
In our opinion, the best way to assess reading comprehension is to give readers access to the material and have them restate or paraphrase what they have read.
Poor comprehension has many causes. The most common is poor decoding, which affects comprehension in two ways. First, if a student cannot convert the symbols to words, he or she cannot comprehend the message conveyed by those words. The second issue is more subtle. If a student expends all of his or her mental resources on sounding out the words, he or she will have no resources left to process their meaning. For that reason, increasing reading fluency frequently eliminates problems in comprehension.
Another problem is that students may not know how to read for comprehen-sion (Taylor, Harris, Pearson, & Garcia, 1995). They may not actively focus on the meaning of what they read or know how to monitor their comprehension (for example, by asking themselves questions about what they have read or whether they understand what they have read). Students may not know how to foster comprehension (for example, by summarizing material, determining the main ideas and supporting facts, and integrating material with previous knowledge). Finally, individual characteristics can interact with the assessment of reading comprehension. For example, in an assessment of literal comprehension, a read-er’s memory capacity can affect comprehension scores unless the reader has access to the passage while answering questions about it or retelling its gist. Inferential comprehension depends on more than reading; it also depends on a reader’s abil-ity to see relationships (a defining element of intelligence) and on background information and experiences.
Assessment of Word-Attack SkillsWord-attack, or word analysis, skills are those used to derive the pronunciation or meaning of a word through phonic analysis, structural analysis, or context cues. Phonic analysis is the use of letter–sound correspondences and sound blending to identify words. Structural analysis is a process of breaking words into mor-phemes, or meaningful units. Words contain free morphemes (such as farm, book, and land) and bound morphemes (such as -ed, -s, and -er).
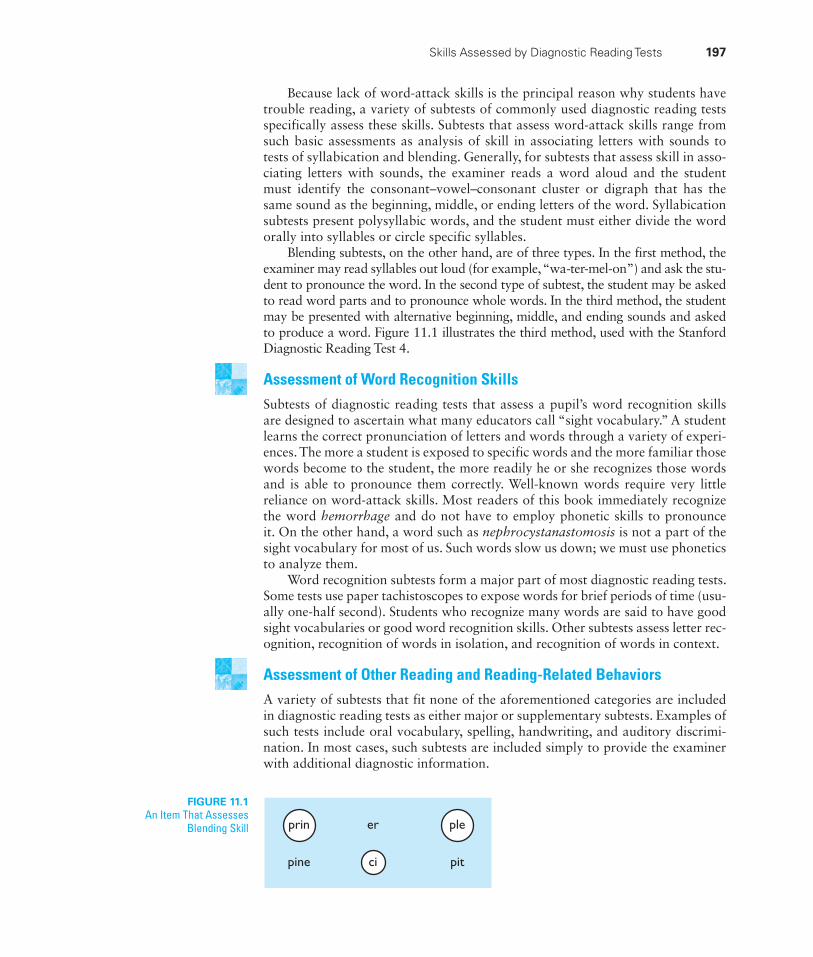
Because lack of word-attack skills is the principal reason why students have trouble reading, a variety of subtests of commonly used diagnostic reading tests specifically assess these skills. Subtests that assess word-attack skills range from such basic assessments as analysis of skill in associating letters with sounds to tests of syllabication and blending. Generally, for subtests that assess skill in asso-ciating letters with sounds, the examiner reads a word aloud and the student must identify the consonant–vowel–consonant cluster or digraph that has the same sound as the beginning, middle, or ending letters of the word. Syllabication subtests present polysyllabic words, and the student must either divide the word orally into syllables or circle specific syllables.
Blending subtests, on the other hand, are of three types. In the first method, the examiner may read syllables out loud (for example, “wa-ter-mel-on”) and ask the stu-dent to pronounce the word. In the second type of subtest, the student may be asked to read word parts and to pronounce whole words. In the third method, the student may be presented with alternative beginning, middle, and ending sounds and asked to produce a word. Figure 11.1 illustrates the third method, used with the Stanford Diagnostic Reading Test 4.
Assessment of Word Recognition SkillsSubtests of diagnostic reading tests that assess a pupil’s word recognition skills are designed to ascertain what many educators call “sight vocabulary.” A student learns the correct pronunciation of letters and words through a variety of experi-ences. The more a student is exposed to specific words and the more familiar those words become to the student, the more readily he or she recognizes those words and is able to pronounce them correctly. Well-known words require very little reliance on word-attack skills. Most readers of this book immediately recognize the word hemorrhage and do not have to employ phonetic skills to pronounce it. On the other hand, a word such as nephrocystanastomosis is not a part of the sight vocabulary for most of us. Such words slow us down; we must use phonetics to analyze them.
Word recognition subtests form a major part of most diagnostic reading tests. Some tests use paper tachistoscopes to expose words for brief periods of time (usu-ally one-half second). Students who recognize many words are said to have good sight vocabularies or good word recognition skills. Other subtests assess letter rec-ognition, recognition of words in isolation, and recognition of words in context.
Assessment of Other Reading and Reading-Related BehaviorsA variety of subtests that fit none of the aforementioned categories are included in diagnostic reading tests as either major or supplementary subtests. Examples of such tests include oral vocabulary, spelling, handwriting, and auditory discrimi-nation. In most cases, such subtests are included simply to provide the examiner with additional diagnostic information.
FIGURE 11.1An Item That Assesses
Blending Skill prin er ple
pine ci pit
Skills Assessed by Diagnostic Reading Tests 197
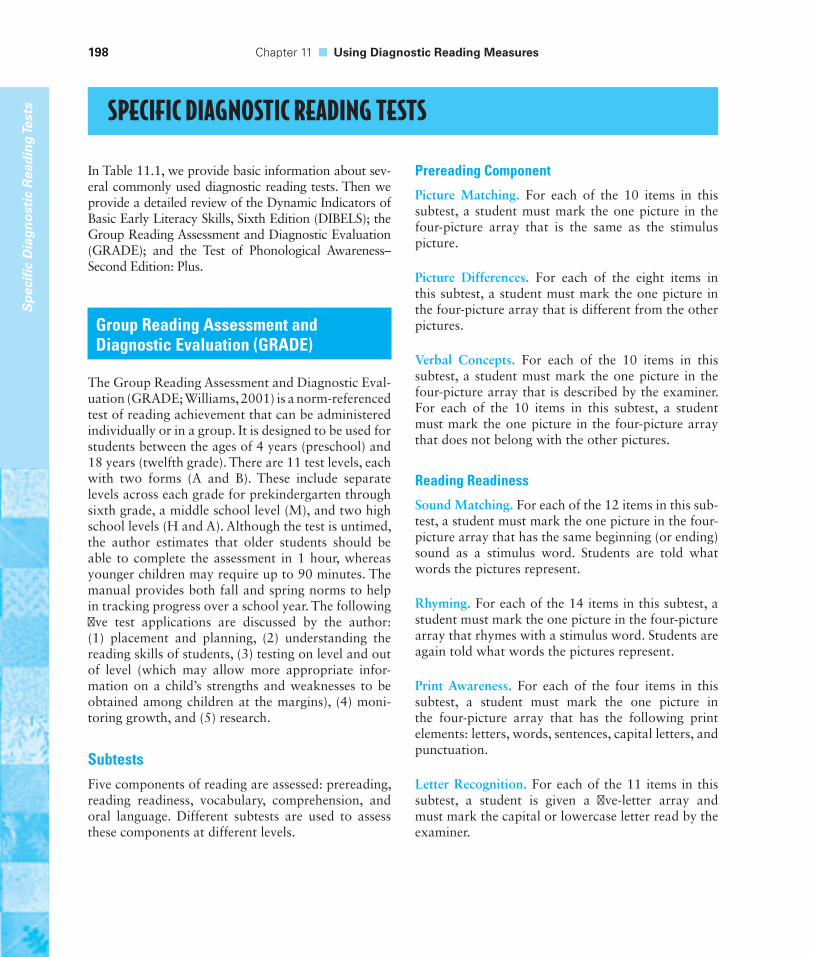
198 Chapter 11 ■ Using Diagnostic Reading Measures
Sp
ecifi
c D
iag
no
stic
Rea
din
g Te
sts
In Table 11.1, we provide basic information about sev-eral commonly used diagnostic reading tests. Then we provide a detailed review of the Dynamic Indicators of Basic Early Literacy Skills, Sixth Edition (DIBELS); the Group Reading Assessment and Diagnostic Evaluation (GRADE); and the Test of Phonological Awareness–Second Edition: Plus.
Group Reading Assessment and Diagnostic Evaluation (GRADE)
The Group Reading Assessment and Diagnostic Eval-uation (GRADE; Williams, 2001) is a norm-referenced test of reading achievement that can be administered individually or in a group. It is designed to be used for students between the ages of 4 years (preschool) and 18 years (twelfth grade). There are 11 test levels, each with two forms (A and B). These include separate levels across each grade for prekindergarten through sixth grade, a middle school level (M), and two high school levels (H and A). Although the test is untimed, the author estimates that older students should be able to complete the assessment in 1 hour, whereas younger children may require up to 90 minutes. The manual provides both fall and spring norms to help in tracking progress over a school year. The following fi ve test applications are discussed by the author: (1) placement and planning, (2) understanding the reading skills of students, (3) testing on level and out of level (which may allow more appropriate infor-mation on a child’s strengths and weaknesses to be obtained among children at the margins), (4) moni-toring growth, and (5) research.
SubtestsFive components of reading are assessed: prereading, reading readiness, vocabulary, comprehension, and oral language. Different subtests are used to assess these components at different levels.
Prereading Component
Picture Matching. For each of the 10 items in this subtest, a student must mark the one picture in the four-picture array that is the same as the stimulus picture.
Picture Differences. For each of the eight items in this subtest, a student must mark the one picture in the four-picture array that is different from the other pictures.
Verbal Concepts. For each of the 10 items in this subtest, a student must mark the one picture in the four-picture array that is described by the examiner. For each of the 10 items in this subtest, a student must mark the one picture in the four-picture array that does not belong with the other pictures.
Reading Readiness
Sound Matching. For each of the 12 items in this sub-test, a student must mark the one picture in the four-picture array that has the same beginning (or ending) sound as a stimulus word. Students are told what words the pictures represent.
Rhyming. For each of the 14 items in this subtest, a student must mark the one picture in the four-picture array that rhymes with a stimulus word. Students are again told what words the pictures represent.
Print Awareness. For each of the four items in this subtest, a student must mark the one picture in the four-picture array that has the following print elements: letters, words, sentences, capital letters, and punctuation.
Letter Recognition. For each of the 11 items in this subtest, a student is given a fi ve-letter array and must mark the capital or lowercase letter read by the examiner.
SPECIFIC DIAGNOSTIC READING TESTS
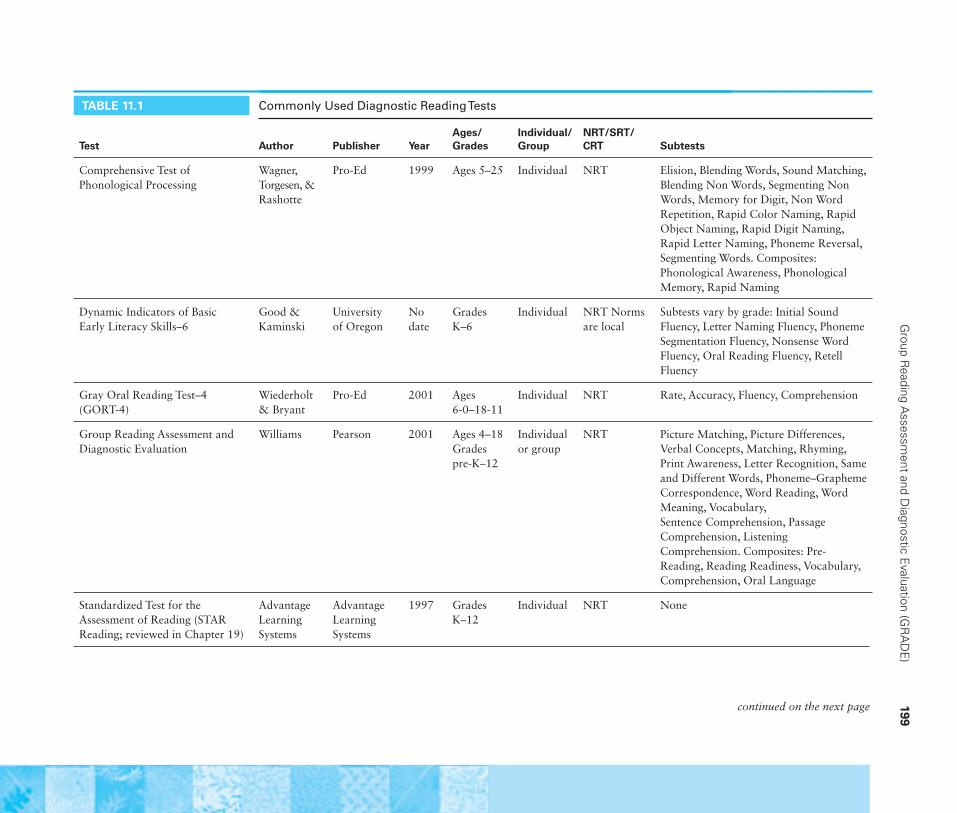
G
roup Reading A
ssessment and D
iagnostic Evaluation (G
RA
DE
) 199
continued on the next page
TABLE 11.1 Commonly Used Diagnostic Reading Tests
Test Author Publisher YearAges/Grades
Individual/Group
NRT/SRT/CRT Subtests
Comprehensive Test of Phonological Processing
Wagner, Torgesen, &Rashotte
Pro-Ed 1999 Ages 5–25 Individual NRT Elision, Blending Words, Sound Matching, Blending Non Words, Segmenting Non Words, Memory for Digit, Non Word Repetition, Rapid Color Naming, Rapid Object Naming, Rapid Digit Naming, Rapid Letter Naming, Phoneme Reversal, Segmenting Words. Composites: Phonological Awareness, Phonological Memory, Rapid Naming
Dynamic Indicators of Basic Early Literacy Skills–6
Good & Kaminski
University of Oregon
No date
Grades K–6
Individual NRT Norms are local
Subtests vary by grade: Initial Sound Fluency, Letter Naming Fluency, Phoneme Segmentation Fluency, Nonsense Word Fluency, Oral Reading Fluency, Retell Fluency
Gray Oral Reading Test–4 (GORT-4)
Wiederholt & Bryant
Pro-Ed 2001 Ages 6-0–18-11
Individual NRT Rate, Accuracy, Fluency, Comprehension
Group Reading Assessment and Diagnostic Evaluation
Williams Pearson 2001 Ages 4–18 Grades pre-K–12
Individual or group
NRT Picture Matching, Picture Differences, Verbal Concepts, Matching, Rhyming, Print Awareness, Letter Recognition, Same and Different Words, Phoneme–Grapheme Correspondence, Word Reading, Word Meaning, Vocabulary, Sentence Comprehension, Passage Comprehension, Listening Comprehension. Composites: Pre-Reading, Reading Readiness, Vocabulary, Comprehension, Oral Language
Standardized Test for the Assessment of Reading (STAR Reading; reviewed in Chapter 19)
Advantage Learning Systems
Advantage Learning Systems
1997 Grades K–12
Individual NRT None
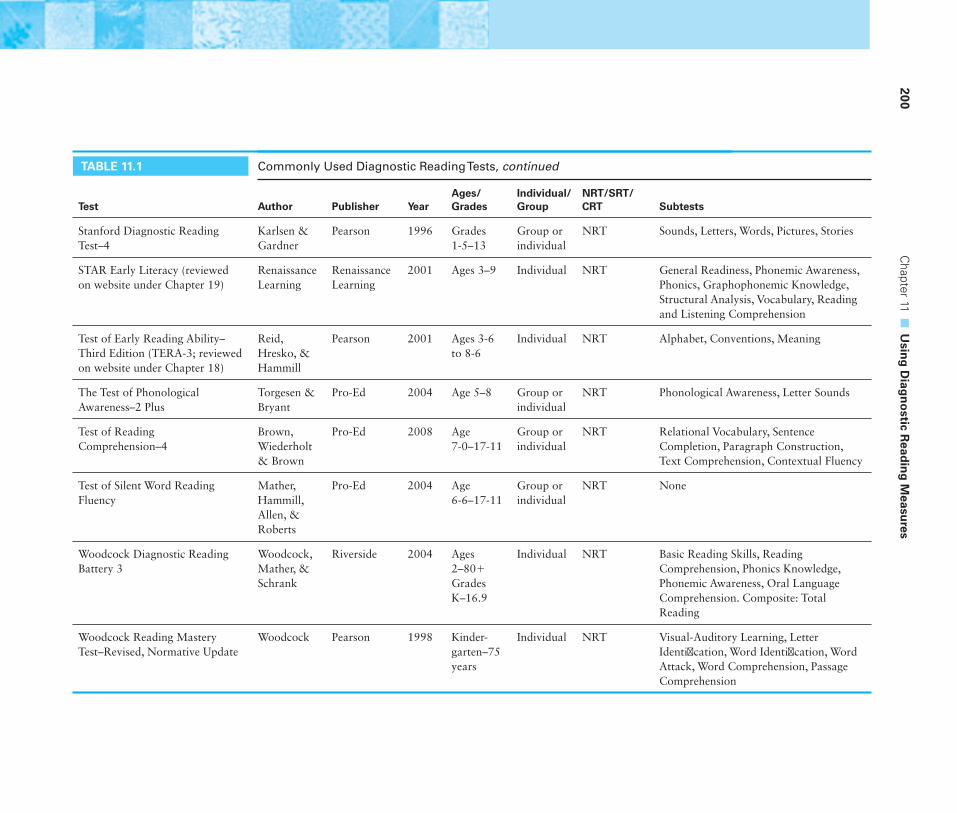
200 C
hapter 11 ■
Usin
g D
iagn
ostic R
eadin
g M
easures
TABLE 11.1 Commonly Used Diagnostic Reading Tests, continued
Test Author Publisher YearAges/Grades
Individual/Group
NRT/SRT/CRT Subtests
Stanford Diagnostic Reading Test–4
Karlsen & Gardner
Pearson 1996 Grades 1-5–13
Group or individual
NRT Sounds, Letters, Words, Pictures, Stories
STAR Early Literacy (reviewed on website under Chapter 19)
Renaissance Learning
Renaissance Learning
2001 Ages 3–9 Individual NRT General Readiness, Phonemic Awareness, Phonics, Graphophonemic Knowledge, Structural Analysis, Vocabulary, Reading and Listening Comprehension
Test of Early Reading Ability–Third Edition (TERA-3; reviewed on website under Chapter 18)
Reid, Hresko, & Hammill
Pearson 2001 Ages 3-6 to 8-6
Individual NRT Alphabet, Conventions, Meaning
The Test of Phonological Awareness–2 Plus
Torgesen & Bryant
Pro-Ed 2004 Age 5–8 Group or individual
NRT Phonological Awareness, Letter Sounds
Test of Reading Comprehension–4
Brown, Wiederholt & Brown
Pro-Ed 2008 Age 7-0–17-11
Group or individual
NRT Relational Vocabulary, Sentence Completion, Paragraph Construction, Text Comprehension, Contextual Fluency
Test of Silent Word Reading Fluency
Mather, Hammill, Allen, & Roberts
Pro-Ed 2004 Age 6-6–17-11
Group or individual
NRT None
Woodcock Diagnostic Reading Battery 3
Woodcock, Mather, & Schrank
Riverside 2004 Ages 2–80+ Grades K–16.9
Individual NRT Basic Reading Skills, Reading Comprehension, Phonics Knowledge, Phonemic Awareness, Oral Language Comprehension. Composite: Total Reading
Woodcock Reading Mastery Test–Revised, Normative Update
Woodcock Pearson 1998 Kinder-garten–75 years
Individual NRT Visual-Auditory Learning, Letter Identifi cation, Word Identifi cation, Word Attack, Word Comprehension, Passage Comprehension
Same and Different Words. For each of the nine items in this subtest, a student must mark the one word in the four-word array that is either the same as or different from the stimulus word.
Phoneme–Grapheme Correspondence. For each of the 16 items in this subtest, a student must mark the one letter in the four-word array that is the same as the beginning (or ending) sound of a word read by the examiner.
Vocabulary
Word Reading. The subtest contains 10 to 30 items, depending on the level. For each item in this subtest, a student is given a four-word array and must mark the word read by the examiner.
Word Meaning. For each of the 27 items in this subtest, a student must mark the one picture in the four-picture array that represents a written stimulus word.
Vocabulary. This subtest contains 30 to 40 items, de- pend ing on the test level. Students are presented a short written phrase or sentence that has one word bolded. A student must mark the one word in the four- or fi ve-word array that has the same meaning as the bolded word.
Comprehension
Sentence Comprehension. For each of the 19 Cloze items in this subtest, a student must choose the one word in the four- or fi ve-word array that best fi ts in the blank.
Passage Comprehension. The number of reading passages and items for this subtest varies by test level. A student must read a passage and answer several multiple-choice questions about the passage. Questions are of four types: questioning, clarifying, summarizing, and predicting.
Oral Language
Listening Comprehension. In this 17- or 18-item subtest, the test administrator reads aloud a sentence. A student must choose which of four pictures represents what was read. Items require students to comprehend basic words, understand grammar structure, make inferences,
understand idioms, and comprehend other nonliteral statements.
ScoresSubtest raw scores can be converted into stanines. Dep end ing on the level administered, certain subtest raw scores can be added to produce composite scores. Similarly, each level has a different set of subtest raw scores that are added in computing the total test raw score. Composite and total test raw scores can be converted to unweighted standard scores (mean of 100 and standard deviation of 15), stanines, percen-tiles, normal-curve equivalents, grade equivalents, and growth scale values.2 Conversion tables provide both fall and spring normative scores. For students who are very skilled or very unskilled readers in comparison to their same-grade peers, out-of-level tests may be administered. Appropriate normative tables are avail-able for some out-of-level tests in the teacher’s scoring and interpretative manuals. Other out-of-level norma-tive scores are reported only in the scoring and report-ing software.
NormsThe GRADE standardization sample included 16,408 students in the spring sample and 17,024 in the fall sample. Numbers of students tested in each grade ranged from 808 (seventh grade, spring) to 2,995 (kindergarten, spring). Gender characteristics of the sample were presented by grade level, and roughly equal numbers of males and females were represented in each grade and season level (fall and spring). Geographic region characteristics were pre-sented without disaggregating results by grade and were compared to the population data as reported by the U.S. Census Bureau (1998). Southern states were slightly overrepresented, whereas western states were slightly underrepresented in both the fall and the spring norm samples. Information on community type was also presented for the entire fall and spring
2Because growth scale values include all levels on the same scale, these scores make it possible to track a student’s reading growth when the student has been given different GRADE levels through-out the years. It is important to note, however, that particular skills measured on the test vary from level to level, so growth scale val-ues may not represent the same skills at different years.
Group Reading Assessment and Diagnostic Evaluation (GRADE) 201
202 Chapter 11 ■ Using Diagnostic Reading Measures
norm samples; the samples are appropriately repre-sentative of urban, suburban, and rural communities. Information on students receiving free lunch was also provided. Information on race was also compared to the percentages reported by the U.S. Census Bureau (1998) and appeared to be representative of the pop-ulation. It is important to note, again, that this infor-mation was not reported by grade level. Finally, the authors report that special education students were included in the sample but do not provide the number included.
ReliabilityTotal test coeffi cient alphas were calculated as meas-ures of internal consistency for each form of the test, for each season of administration (fall and spring). These ranged from .89 to .98. Coeffi cient alphas were also computed for various subtests and subtest combinations (for example, Picture Matching and Picture Differences were combined into a Visual Skills category at the preschool and kindergarten levels). These were calculated for each GRADE level, form, and season of administration; several reliabilities were calculated for out-of-level tests (for example, sepa-rate alpha coeffi cients were computed for preschool-ers and kindergartners taking the kindergarten-level test). These subtest–subtest combination coeffi cients ranged from .45 (Listening Comprehension, Form B, eleventh grade, spring administration) to .97 (Listening Comprehension, Form A, preschool, fall administration). Of the 350 coeffi cients calculated, 99 met or exceeded .90. The Comprehension Composite was found to be the most reliable composite score across levels. Listening Comprehension had consis-tently low coeffi cients from the fi rst grade level to the highest level (Level A); thus, these are not included in calculating the total test raw scores for these levels. Alternate-forms reliability was determined across a sample of 696 students (students were included at each grade level). Average time between testing ranged from 8 to 32.2 days. Correlation coeffi cients ranged from .81 (eleventh grade) to .94 (preschool and third grade). Test–retest reliability was determined from a sample of 816 students. The average interval between testing ranged from 3.5 days (eighth-grade students taking Form A of Level M) to 42 days (fi fth-grade students taking Form A of Level 5). Test–retest correlation coeffi cients ranged from .77 (fi fth-grade
students taking Form A of Level 5) to .98 (fourth-grade students taking Form A of Level 4). Reliability data were not provided on growth scale values.
ValidityThe author presents three types of validity: content, criterion-related, and construct validity. A rationale is provided for why particular item formats and subtests were included at particular ages and what skills each subtest is intended to measure. Also, a comprehensive item tryout was conducted on a sam-ple of children throughout the nation. Information from this tryout informed item revision procedures. Statistical tests and qualitative investigations of item bias were also conducted during the tryout. Finally, teachers were surveyed, and this information was used in modifying content and administration pro-cedures (although specifi c information on this survey is not provided). Criterion-related validity provided by the author included correlations of the GRADE total test standard score with fi ve other measures of reading achievement: the total reading standard score of the Iowa Test of Basic Skills, the California Achievement Test total reading score, the Gates–MacGinitie Reading Tests total score, the Peabody Individual Achievement Test–Revised (PIAT-R) scores (General Information, Reading Recognition, Reading Comprehension, and Total Reading subtests), and the TerraNova. Each of these correlation studies was conducted with somewhat limited samples of elemen-tary and middle school students. Coeffi cients ranged from .61 (GRADE total test score correlated with PIAT-R General Information among 30 fi fth-grade students) to .90 (GRADE total test score correlated with Gates total reading score for 177 fi rst-, second-, and sixth-grade students). Finally, construct validity was addressed by showing that the GRADE scores were correlated with age. Also, scores for students with dyslexia (N = 242) and learning disabilities in reading (N = 191) were compared with scores for students included in the standardization sample that were matched on GRADE level, form taken, gender, and race/ethnicity but who were not receiving special education services. As a group, students with dyslexia performed signifi cantly below the matched control group. Similarly, students with learning disabilities in reading performed signifi cantly below the matched control group.
SummaryThe GRADE is a standardized, norm-referenced test of reading achievement that can be group adminis-tered. It can be used with children of a variety of ages (4 to 18 years) and provides a “growth scale value” score that can be used to track growth in reading achievement over several years. Different subtests and skills are tested, depending on the grade level tested; 11 forms corresponding to 11 GRADE levels are included. Although the norm sample is large, cer-tain demographic information on the students in the sample is not provided, and in some cases, groups of students are over- or underrepresented. Total test score reliability data are strong. However, other subtest–subtest composite reliability data do not sup-port the use of these particular scores for decision-making purposes, although the validity data provided in the manual suggest that this test is a useful measure of reading skills.
Dynamic Indicators of Basic Early Literacy Skills, Sixth Edition (DIBELS)
The Dynamic Indicators of Basic Early Literacy Skills, Sixth Edition (DIBELS; Good & Kaminski, undated), is intended to screen and monitor progress in beginning reading three times each year, beginning in kindergarten and continuing through third grade. The DIBELS consists of seven individually adminis-tered tests assessing phonological awareness, alpha-betic understanding, and fl uency with connected text. The DIBELS has English and Spanish versions, is available on the Internet (at http://dibels.uoregon.edu), and materials can be downloaded without charge.
There are two measures of phonological aware-ness. Initial Sounds Fluency3 assesses the skill of pre-schoolers through mid-kindergartners in identifying and producing the initial sound of a given word. Students must select from an array of pictures named by the examiner the one picture that begins with a specifi c sound. Then students are asked to give the beginning sound of the previously named pictures.
3Developed by Roland H. Good III, Deborah Laimon, Ruth A. Kaminski, and Sylvia Smith.
Phonemic Segmentation Fluency4 assesses the skill of mid-kindergartners through students at the end of fi rst grade in segmenting words into phonemes. Students must produce the individual phonemes of words read by the examiner. In this task, examiners orally pres-ent words consisting of three or four phonemes, and students must verbally produce the individual pho-nemes that comprise the word.
There are two measures of alphabetic under-standing. Letter Naming Fluency5 assesses the skill of beginning kindergartners through beginning fi rst graders in naming upper- and lowercase letters in 1 minute. Nonsense Word Fluency6 assesses the knowledge of mid-kindergartners through students at the end of fi rst grade of letter–sound correspondences as well as their ability to blend letters using their most common sound to form nonsense words.
Fluency is measured by three tests. Oral Reading Fluency7 assesses the skill of students from the mid-fi rst grade through the end of second grade in read-ing aloud connected text in grade-level material for 1 minute. Retell Fluency is administered to check reading comprehension. Students retell everything they can re-member from the Oral Reading Fluency passage, and the number of words used in the student’s retell is tabu-lated. Word Use Fluency assesses the ability of students from the beginning of kindergarten through third grade to correctly use specifi c words in sentences.
ScoresExcept for Word Use Fluency, which uses the num-ber correct, student performances are converted to the number of correct responses per minute. Subtest scores are converted by grade placement to three ranges: students who are at risk for achieving early literacy benchmarks, at some risk for achieving those goals, and at low risk of achieving those goals.
NormsDIBELS tests are designed to provide local normative comparisons. As a result, the normative, or compari-
4Developed by Roland H. Good III, Ruth Kaminski, and Sylvia Smith.5Developed by Ruth A. Kaminski and Roland H. Good III.6Developed by Roland H. Good III and Ruth A. Kaminski.7Developed by Roland H. Good III, Ruth A. Kaminski, and Sheila Dill.
Dynamic Indicators of Basic Early Literacy Skills, Sixth Edition (DIBELS) 203
204 Chapter 11 ■ Using Diagnostic Reading Measures
son, sample is representative because it is the group to which scores are compared; the comparisons are current because the local districts provide the norma-tive information.
ReliabilityAlternate-form methods must be used to estimate the item sample reliability of timed tests. However, when there are weeks between administrations of the forms, error associated with time is added to error associated with item sampling. This appears to be the case for DIBELS tests. Combined item-stability estimates range from .72 for Initial Sounds Fluency to .94 for Oral Reading Fluency. When multiple tests (three seems to be suffi cient) are given, estimated reliability exceeds .90. No estimates of item-sample reliability are presented for Retell Fluency or Word Use Fluency.
ValidityThe DIBELS’s general validity rests on the content- and criterion-related validity. The content is directly based on current empirical research that stresses the importance of fl uency in basic skill areas: phonemic awareness, alphabetic principle, and reading fl uency. Fluency on each subtest is well documented in the research literature as essential to success in learning to read. Benchmark goals and timelines are based on research reviews.
In addition, numerous studies indicate that each subtest correlates well with established read-ing measures. For example, Letter Naming Fluency correlates .70 with the Readiness Cluster and .65 with the Reading Cluster of the Woodcock–Johnson Psychoeducational Battery–Revised; it correlates .77 with the Metropolitan Readiness Test. Oral Reading Fluency correlates .36 with the Reading Cluster of the Woodcock–Johnson. Phonemic Segmentation Fluency correlates .54 with Woodcock–Johnson Readiness Cluster and .65 with the Metropolitan Readiness Test. Correlations between Nonsense Word Fluency and the Woodcock–Johnson Readiness cluster range from .36 to .59, depending on the student’s grade; the correlation with Total Reading Cluster is .66. Oral Reading Fluency correlations with various reading measures range from .52 to .91.
SummaryThe DIBELS consists of seven individually adminis-tered tests assessing phonological awareness, alpha-betic understanding, and fl uency. Single tests are generally suffi cient for screening purposes; however, three or four tests must be administered for there to be suffi cient reliability to make important educational decisions regarding individual students. Evidence for content validity is excellent, and criterion-related validity is good.
The Test of Phonological Awareness, Second Edition: Plus (TOPA 2+)
The Test of Phonological Awareness, Second Edition: Plus (TOPA 2+; Torgesen & Bryant, 2004) is a norm-referenced device intended to identify students who need supplemental services in phonemic awareness and letter–sound correspondence. The TOPA 2+ can be administered individually or to groups of students between the ages of 5 and 8 years to assess phono-logical awareness and letter–sound correspondences.
Two forms are available: the Kindergarten form and the Early Elementary form for students in fi rst or second grades. The Kindergarten form has two subtests. The fi rst, Phonological Awareness, has two parts, each consisting of 10 items. In the fi rst part, stu-dents must select from a three-choice array the word that begins with the same sound as the stimulus word read by the examiner. In the second part, students must select from a three-choice array the word that begins with a different sound. The second subtest, Letter Sounds, consists of 15 items requiring students to mark the letter in a letter array that corresponds to a specifi c phoneme. The Early Elementary form also has two subtests. The fi rst, Phonological Awareness, also has two parts, each consisting of 10 items. In the fi rst part, students must select from a three-choice array the word that ends with the same sound as the stimulus word read by the examiner. In the second part, students must select from a three-choice array the word that ends with a different sound. The second subtest, Letter Sounds, requires students to spell 18 nonsense words that vary in length from two to fi ve phonemes.
ScoresThe number correct on each subtest is summed, and sums can be converted to percentiles and a variety of standard scores.
NormsSeparate norms for the Kindergarten form are in four 6-month age intervals (that is, 5-0 through 5-5, 5-6 through 5-11, 6-0 through 6-5, and 6-6 through 6-11). Separate norms for the Early Elementary form are in 12-month age groups (that is, 6-0 through 6-11, 7-0 through 7-11, and 8-0 through 8-11).
The TOPA 2+ was standardized on a total of 2,085 students, 1,035 of whom were in the Kindergarten form and the remaining 1,050 of whom were in the Early Elementary form. Norms for each form at each age are representative of the U.S. population in 2001 in terms of geographic regions, gender, race, ethnicity, and family income. Parents without a college education are slightly underrepresented.
ReliabilityCoeffi cient alpha was calculated for each subtest at each age. For the Kindergarten form, only Letter Sounds for 6-year-olds fell below .90; that subtest reliability was .88. For the Early Elementary form, all alphas were between .80 and .87. In addition, alphas were calculated separately for males and females, whites, blacks, Hispanics, and students with language or learning disabilities. These alphas ranged from .82 to .91.
Test–retest correlations were used to estimate stabilities. For the Kindergarten form, 51 students were retested within approximately a 2-week inter-val. Stability for Phonological Awareness was .87, and stability for Letter Sounds was .85. For the Early Elementary form, 88 students were retested within approximately a 2-week interval. Stability for Phonological Awareness was .81, and stability for Letter Sounds was .84.
Finally, interscorer agreement was evaluated by having two trained examiners each score 50 tests. On the Kindergarten form, interscorer agreement
for Phonological Awareness was .98 and for Letter Sounds was .99. On the Early Elementary form, interscorer agreement for Phonological Awareness was .98 and for Letter Sounds was .98.
Overall, care should be taken when interpret-ing the results of the TOPA 2+. The internal consis-tency is suffi cient for screening and in some cases for use in making important educational decisions for students.
ValidityEvidence for the general validity of the TOPA 2+ comes from several sources. First, the contents of scales were carefully developed to represent phonemic awareness and knowledge of letter–sound correspon-dence. For example, the words in the Phonological Awareness subscales come from the 2,500 most fre-quently used words in fi rst graders’ oral language, and all consonant phonemes had a median age of custom-ary articulation no later than 3.5 years of age. Next, the TOPA 2+ correlates well with another scale meas-uring similar skills and abilities (Dynamic Indicators of Basic Early Literacy Skills) and with teacher judg-ments of students’ reading abilities. Evidence for differentiated validity comes from the scales’ ability to distinguish students with language and learning disabilities from those without such problems. Other indices of validity include the absence of bias against males or females, whites, African Americans, and Hispanics.
SummaryThe TOPA 2+ assesses phonemic awareness using beginning and ending sounds and letter–sound cor-respondence at the kindergarten and early elementary levels. The norms appear representative and are well described. Coeffi cient alpha for phonemic awareness is generally good for kindergartners but only suitable for screening students in the early elementary grades and for letter–sound correspondence for all students. Stability was estimated in the .80s, but interscorer agreement was excellent. Overall, care should be taken when interpreting the results of the TOPA 2+. Evidence for validity is adequate.
The Test of Phonological Awareness, Second Edition: Plus (TOPA 2+) 205
206 Chapter 11 ■ Using Diagnostic Reading Measures
CHAPTER COMPREHENSION QUESTIONSWrite your answers to each of the following questions, and then compare your responses to the text or the study guide.
1. Why is reading important to assess?
2. Explain the two approaches traditionally used to teach reading.
3. Explain what is assessed in oral reading, word attack, reading recognition, and reading comprehension.
4. Explain two potential problems in diagnostic testing of reading.
Dilemmas in Current Practice
There are four major problems in the diagnostic assessment of reading strengths and weaknesses. The fi rst is the prob-lem of curriculum match. Students enrolled in different read-ing curricula have different opportunities to learn specifi c skills. Reading series differ in the skills that are taught, in the emphasis placed on different skills, in the sequence in which skills are taught, and in the time at which skills are taught. Tests differ in the skills they assess. Thus, it can be expected that pupils studying different curricula will perform differ-ently on the same reading test. It can also be expected that pupils studying the same curriculum will perform differently on different reading tests. Diagnostic personnel must be very careful to examine the match between skills taught in the students’ curriculum and skills tested. Most teachers’ manu-als for reading series include a listing of the skills taught at each level in the series. Many authors of diagnostic reading tests now include in test manuals a list of the objectives measured by the test. At the very least, assessors should carefully examine the extent to which the test measures what has been taught. Ideally, assessors would select specifi c parts of tests to measure exactly what has been taught. To the extent that there is a difference between what has been taught and what is tested, the test is not a valid measure.
The second problem is also a test–curriculum match problem. Most reading instruction now takes place in gener-al education classrooms, using the content of typical reading textbooks. This is true for developmental reading instruction, remedial reading instruction, and the teaching of reading to students with disabilities. Most diagnostic reading tests measure student skill-development competence in isolation. Also, they do not include assessments of the comprehension strategies, such as the metacognitive strategies that are now part of reading instruction.
A third problem is the selection of tests that are appro-priate for making different kinds of educational decisions. We noted that there are different types of diagnostic read-ing tests. In making classifi cation decisions, educators must administer tests individually. They may either use an indi-vidually administered test or give a group test to one individ-ual. For making instructional planning decisions, the most precise and helpful information will be obtained by giving individually administered criterion-referenced measures. Educators can, of course, systematically analyze pupil per-formance on a norm-referenced test, but the approach is diffi cult and time-consuming. It may also be futile because norm-referenced tests usually do not contain enough items on which to base a diagnosis. When evaluating individual pupil progress, assessors must consider carefully the kinds of comparisons they want to make. If they want to compare pupils with same-age peers, norm-referenced measures are useful. If, on the other hand, they want to know the extent to which individual pupils are mastering curriculum objectives, criterion-referenced measures are the tests of choice.
The fourth problem is one of generalization. Assessors are faced with the diffi cult task of describing or predicting pupil performance in reading. Yet reading itself is diffi cult to describe, being a complex behavior composed of numer-ous subskills. Those who engage in reading diagnosis will do well to describe pupil performance in terms of specifi c skills or subskills (such as recognition of words in isolation, listening comprehension, and specifi c word-attack skills). They should also limit their predictions to making statements about probable performance of specifi c reading behaviors, not probable performance in reading.
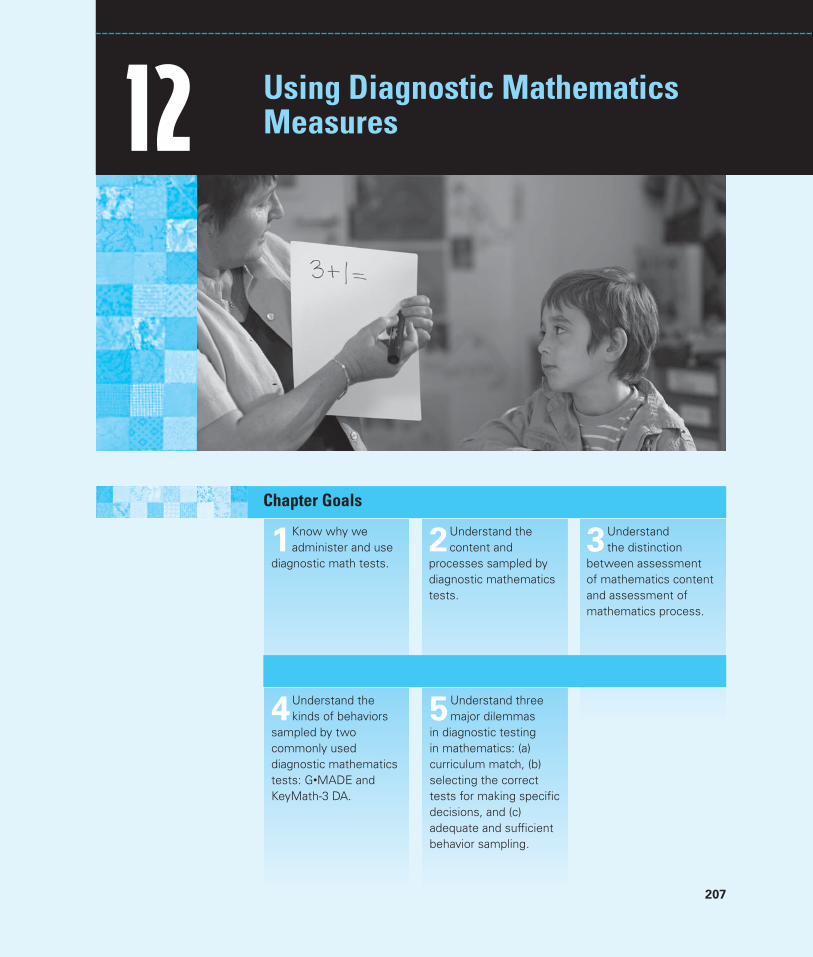
207
3Understand the distinction
between assessment of mathematics content and assessment of mathematics process.
2Understand the content and
processes sampled by diagnostic mathematics tests.
1Know why we administer and use
diagnostic math tests.
Chapter Goals
12 Using Diagnostic Mathematics Measures
4Understand the kinds of behaviors
sampled by two commonly used diagnostic mathematics tests: G•MADE and KeyMath-3 DA.
5Understand three major dilemmas
in diagnostic testing in mathematics: (a) curriculum match, (b) selecting the correct tests for making specifi c decisions, and (c) adequate and suffi cient behavior sampling.
208 Chapter 12 ■ Using Diagnostic Mathematics Measures
Key Terms NCTM standards
content standards
process standards
focal points
computer adaptive math tests
curriculum match
G•MADE
KeyMath-3 DA
STAR Math
Diagnostic testing in mathematics is designed to identify specific strengths and weaknesses in skill development. We have seen that all major achievement tests designed to assess multiple skills include subtests that measure mathematics competence. These tests are necessarily global and attempt to assess a wide range of skills. However, in most cases these multiple skills tests include only a small number of items assessing specifi c math skills and the sample of math behaviors is insuffi cient for diagnostic purposes. Diagnostic testing in mathemat-ics is more specifi c, providing more depth and a detailed assessment of skill devel-opment within specifi c areas.
There are fewer diagnostic math tests than diagnostic reading tests, but math assessment is more clear-cut. Because the successful performance of some mathematical operations clearly depends on the successful performance of other operations (for example, multiplication depends on addition), it is easier to sequence skill development and assessment in math than in reading. Diagnostic math tests generally sample similar behaviors. They sample various mathemati-cal contents, concepts, and operations, as well as applications of mathematical facts and principles. Some now also include assessment of students’ attitudes toward math.
1 Why Do We Assess Mathematics?
There are several reasons to assess mathematics skills. First, diagnostic math tests are intended to provide suffi ciently detailed information so that teachers and intervention-assistance teams can ascertain a student’s mastery of specifi c math skills and plan individualized math instruction. Second, some diagnostic math tests provide teachers with specifi c information on the kinds of items students in their classes pass and fail. This gives them information about the extent to which the curriculum and instruction in their class are working, and it provides opportunities to modify curricula. Third, all public school programs teach math facts and concepts. Teachers need to know whether pupils have mastered those facts and concepts. Finally, diagnostic math tests are occasionally used to make exceptionality and eligibility decisions. Individually administered tests are usually required for eligibility and placement decisions. Therefore, diagnostic math tests are often used to establish special learning needs and eligibility for programs for children with learning disabilities in mathematics.
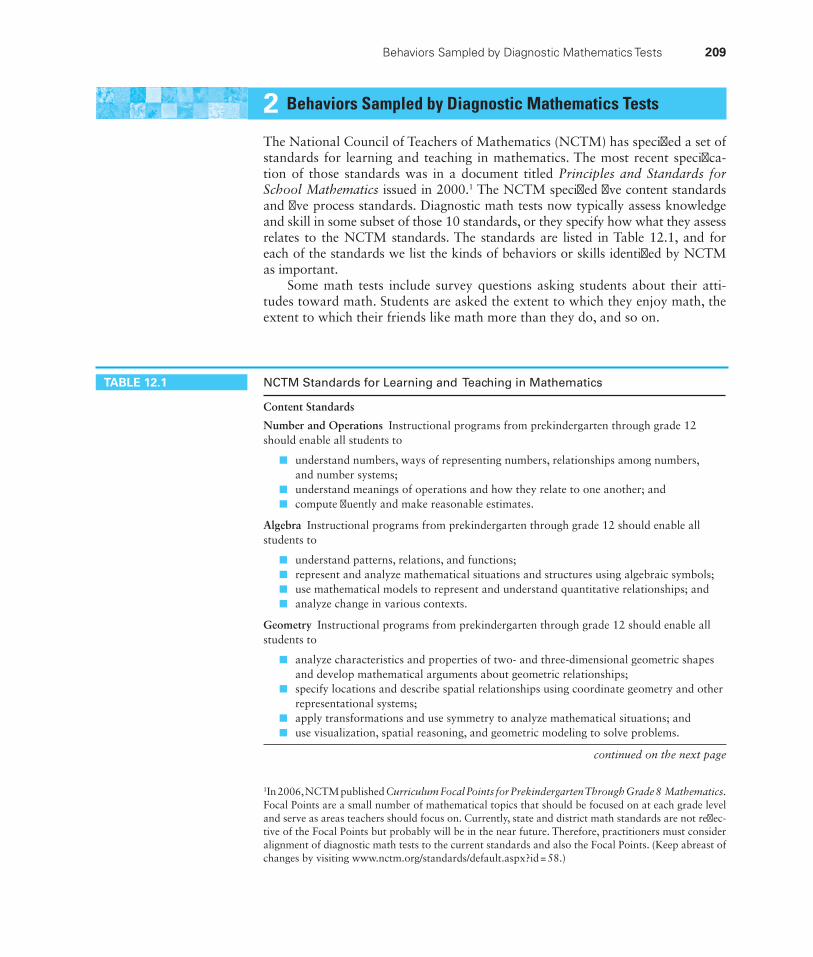
2 Behaviors Sampled by Diagnostic Mathematics Tests
The National Council of Teachers of Mathematics (NCTM) has specifi ed a set of standards for learning and teaching in mathematics. The most recent specifi ca-tion of those standards was in a document titled Principles and Standards for School Mathematics issued in 2000.1 The NCTM specifi ed fi ve content standards and fi ve process standards. Diagnostic math tests now typically assess knowledge and skill in some subset of those 10 standards, or they specify how what they assess relates to the NCTM standards. The standards are listed in Table 12.1, and for each of the standards we list the kinds of behaviors or skills identifi ed by NCTM as important.
Some math tests include survey questions asking students about their atti-tudes toward math. Students are asked the extent to which they enjoy math, the extent to which their friends like math more than they do, and so on.
Content Standards
Number and Operations Instructional programs from prekindergarten through grade 12 should enable all students to
understand numbers, ways of representing numbers, relationships among numbers, ■
and number systems;understand meanings of operations and how they relate to one another; and ■
compute fl uently and make reasonable estimates. ■
Algebra Instructional programs from prekindergarten through grade 12 should enable all students to
understand patterns, relations, and functions; ■
represent and analyze mathematical situations and structures using algebraic symbols; ■
use mathematical models to represent and understand quantitative relationships; and ■
analyze change in various contexts. ■
Geometry Instructional programs from prekindergarten through grade 12 should enable all students to
analyze characteristics and properties of two- and three-dimensional geometric shapes ■
and develop mathematical arguments about geometric relationships;specify locations and describe spatial relationships using coordinate geometry and other ■
representational systems;apply transformations and use symmetry to analyze mathematical situations; and ■
use visualization, spatial reasoning, and geometric modeling to solve problems. ■
TABLE 12.1 NCTM Standards for Learning and Teaching in Mathematics
1In 2006, NCTM published Curriculum Focal Points for Prekindergarten Through Grade 8 Mathematics. Focal Points are a small number of mathematical topics that should be focused on at each grade level and serve as areas teachers should focus on. Currently, state and district math standards are not refl ec-tive of the Focal Points but probably will be in the near future. Therefore, practitioners must consider alignment of diagnostic math tests to the current standards and also the Focal Points. (Keep abreast of changes by visiting www.nctm.org/standards/default.aspx?id = 58.)
continued on the next page
Behaviors Sampled by Diagnostic Mathematics Tests 209
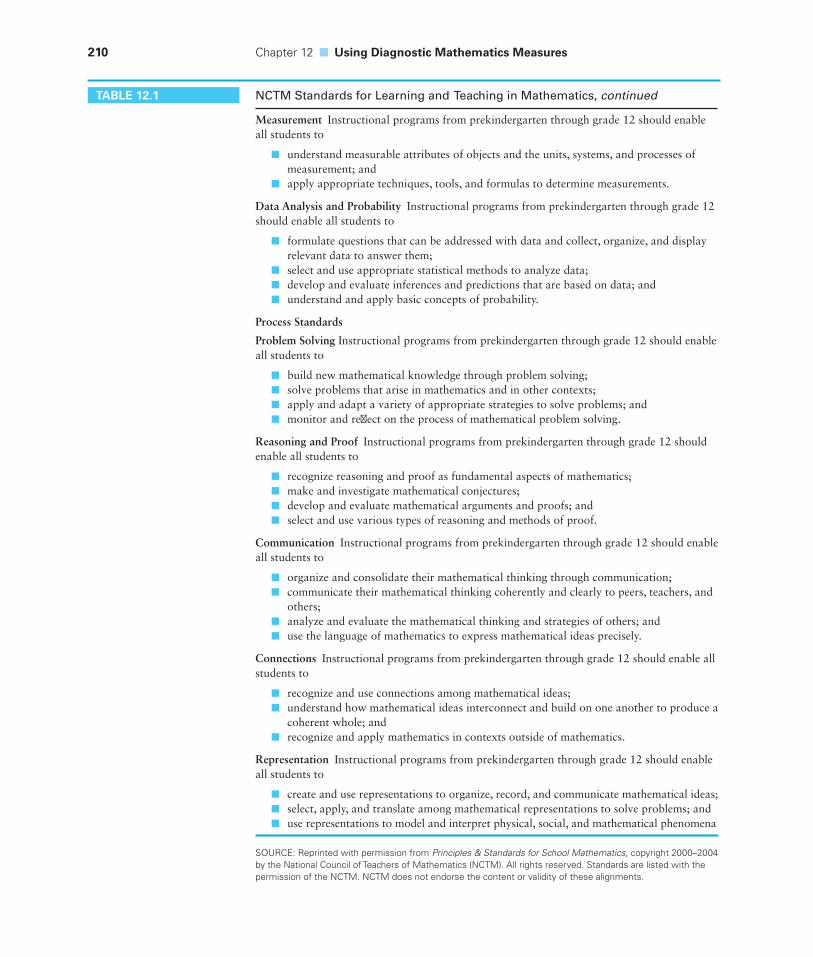
210 Chapter 12 ■ Using Diagnostic Mathematics Measures
Measurement Instructional programs from prekindergarten through grade 12 should enable all students to
understand measurable attributes of objects and the units, systems, and processes of ■
measurement; andapply appropriate techniques, tools, and formulas to determine measurements. ■
Data Analysis and Probability Instructional programs from prekindergarten through grade 12 should enable all students to
formulate questions that can be addressed with data and collect, organize, and display ■
relevant data to answer them;select and use appropriate statistical methods to analyze data; ■
develop and evaluate inferences and predictions that are based on data; and ■
understand and apply basic concepts of probability. ■
Process Standards
Problem Solving Instructional programs from prekindergarten through grade 12 should enable all students to
build new mathematical knowledge through problem solving; ■
solve problems that arise in mathematics and in other contexts; ■
apply and adapt a variety of appropriate strategies to solve problems; and ■
monitor and refl ect on the process of mathematical problem solving. ■
Reasoning and Proof Instructional programs from prekindergarten through grade 12 should enable all students to
recognize reasoning and proof as fundamental aspects of mathematics; ■
make and investigate mathematical conjectures; ■
develop and evaluate mathematical arguments and proofs; and ■
select and use various types of reasoning and methods of proof. ■
Communication Instructional programs from prekindergarten through grade 12 should enable all students to
organize and consolidate their mathematical thinking through communication; ■
communicate their mathematical thinking coherently and clearly to peers, teachers, and ■
others;analyze and evaluate the mathematical thinking and strategies of others; and ■
use the language of mathematics to express mathematical ideas precisely. ■
Connections Instructional programs from prekindergarten through grade 12 should enable all students to
recognize and use connections among mathematical ideas; ■
understand how mathematical ideas interconnect and build on one another to produce a ■
coherent whole; andrecognize and apply mathematics in contexts outside of mathematics. ■
Representation Instructional programs from prekindergarten through grade 12 should enable all students to
create and use representations to organize, record, and communicate mathematical ideas; ■
select, apply, and translate among mathematical representations to solve problems; and ■
use representations to model and interpret physical, social, and mathematical phenomena ■
TABLE 12.1 NCTM Standards for Learning and Teaching in Mathematics, continued
SOURCE: Reprinted with permission from Principles & Standards for School Mathematics, copyright 2000–2004 by the National Council of Teachers of Mathematics (NCTM). All rights reserved. Standards are listed with the permission of the NCTM. NCTM does not endorse the content or validity of these alignments.
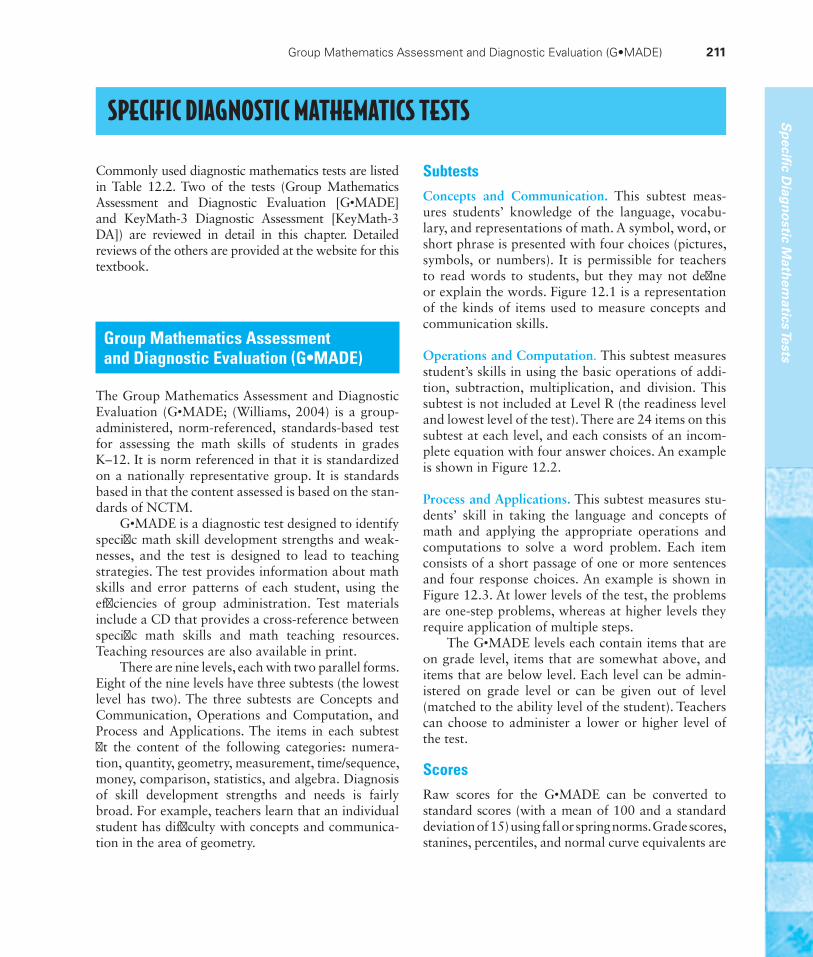
SPECIFIC DIAGNOSTIC MATHEMATICS TESTS
Commonly used diagnostic mathematics tests are listed in Table 12.2. Two of the tests (Group Mathematics Assessment and Diagnostic Evaluation [G•MADE] and KeyMath-3 Diagnostic Assessment [KeyMath-3 DA]) are reviewed in detail in this chapter. Detailed reviews of the others are provided at the website for this textbook.
Group Mathematics Assessment and Diagnostic Evaluation (G•MADE)
The Group Mathematics Assessment and Diagnostic Evaluation (G•MADE; (Williams, 2004) is a group-administered, norm-referenced, standards-based test for assessing the math skills of students in grades K–12. It is norm referenced in that it is standardized on a nationally representative group. It is standards based in that the content assessed is based on the stan-dards of NCTM.
G•MADE is a diagnostic test designed to identify specifi c math skill development strengths and weak-nesses, and the test is designed to lead to teaching strategies. The test provides information about math skills and error patterns of each student, using the effi ciencies of group administration. Test materials include a CD that provides a cross-reference between specifi c math skills and math teaching resources. Teaching resources are also available in print.
There are nine levels, each with two parallel forms. Eight of the nine levels have three subtests (the lowest level has two). The three subtests are Concepts and Communication, Operations and Computation, and Process and Applications. The items in each subtest fi t the content of the following categories: numera-tion, quantity, geometry, measurement, time/sequence, money, comparison, statistics, and algebra. Diagnosis of skill development strengths and needs is fairly broad. For example, teachers learn that an individual student has diffi culty with concepts and communica-tion in the area of geometry.
SubtestsConcepts and Communication. This subtest meas-ures students’ knowledge of the language, vocabu-lary, and representations of math. A symbol, word, or short phrase is presented with four choices (pictures, symbols, or numbers). It is permissible for teachers to read words to students, but they may not defi ne or explain the words. Figure 12.1 is a representation of the kinds of items used to measure concepts and communication skills.
Operations and Computation. This subtest measures student’s skills in using the basic operations of addi-tion, subtraction, multiplication, and division. This subtest is not included at Level R (the readiness level and lowest level of the test). There are 24 items on this subtest at each level, and each consists of an incom-plete equation with four answer choices. An example is shown in Figure 12.2.
Process and Applications. This subtest measures stu-dents’ skill in taking the language and concepts of math and applying the appropriate operations and computations to solve a word problem. Each item consists of a short passage of one or more sentences and four response choices. An example is shown in Figure 12.3. At lower levels of the test, the problems are one-step problems, whereas at higher levels they require application of multiple steps.
The G•MADE levels each contain items that are on grade level, items that are somewhat above, and items that are below level. Each level can be admin-istered on grade level or can be given out of level (matched to the ability level of the student). Teachers can choose to administer a lower or higher level of the test.
ScoresRaw scores for the G•MADE can be converted to standard scores (with a mean of 100 and a standard deviation of 15) using fall or spring norms. Grade scores, stanines, percentiles, and normal curve equivalents are
Group Mathematics Assessment and Diagnostic Evaluation (G•MADE) 211
Sp
ecifi c Diag
no
stic Math
ematics Tests
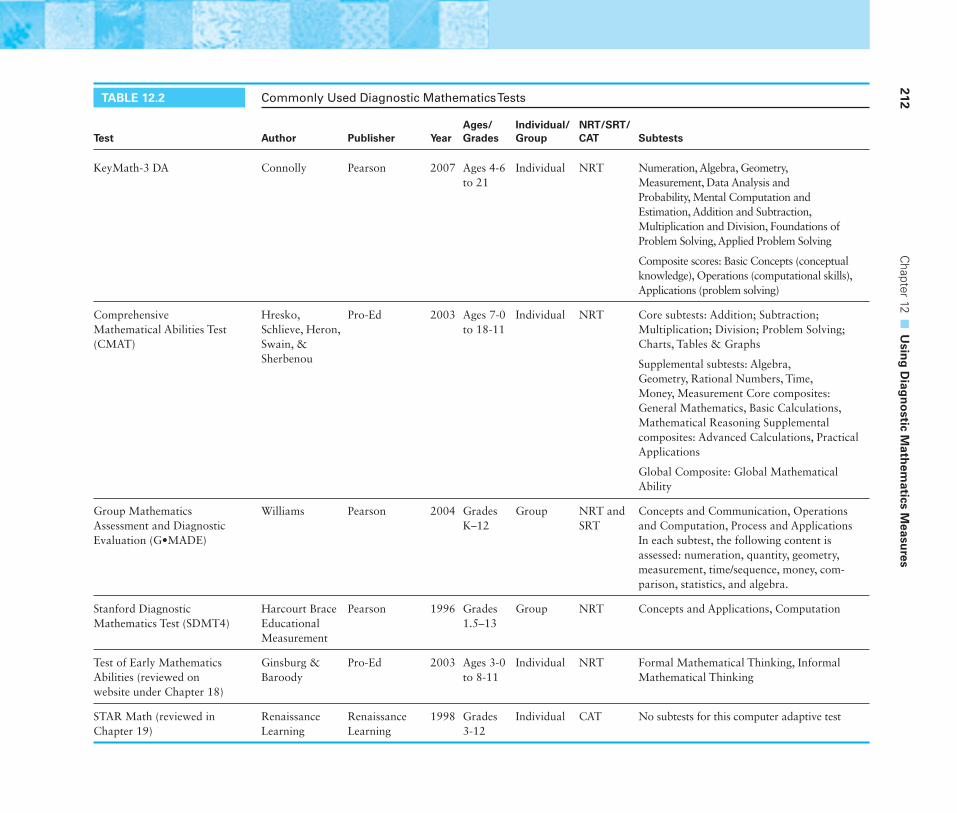
212 C
hapter 12 ■
Usin
g D
iagn
ostic M
athem
atics Measu
res
TABLE 12.2 Commonly Used Diagnostic Mathematics Tests
Test Author Publisher YearAges/Grades
Individual/Group
NRT/SRT/CAT Subtests
KeyMath-3 DA Connolly Pearson 2007 Ages 4-6 to 21
Individual NRT Numeration, Algebra, Geometry, Measurement, Data Analysis and Probability, Mental Computation and Estimation, Addition and Subtraction, Multiplication and Division, Foundations of Problem Solving, Applied Problem Solving
Composite scores: Basic Concepts (conceptual knowledge), Operations (computational skills), Applications (problem solving)
Comprehensive Mathematical Abilities Test (CMAT)
Hresko, Schlieve, Heron, Swain, & Sherbenou
Pro-Ed 2003 Ages 7-0 to 18-11
Individual NRT Core subtests: Addition; Subtraction; Multiplication; Division; Problem Solving; Charts, Tables & Graphs
Supplemental subtests: Algebra, Geometry, Rational Numbers, Time, Money, Measurement Core composites: General Mathematics, Basic Calculations, Mathematical Reasoning Supplemental composites: Advanced Calculations, Practical Applications
Global Composite: Global Mathematical Ability
Group Mathematics Assessment and Diagnostic Evaluation (G•MADE)
Williams Pearson 2004 Grades K–12
Group NRT and SRT
Concepts and Communication, Operations and Computation, Process and Applications In each subtest, the following content is assessed: numeration, quantity, geometry, measurement, time/sequence, money, com-parison, statistics, and algebra.
Stanford Diagnostic Mathematics Test (SDMT4)
Harcourt Brace Educational Measurement
Pearson 1996 Grades 1.5–13
Group NRT Concepts and Applications, Computation
Test of Early Mathematics Abilities (reviewed on website under Chapter 18)
Ginsburg & Baroody
Pro-Ed 2003 Ages 3-0 to 8-11
Individual NRT Formal Mathematical Thinking, Informal Mathematical Thinking
STAR Math (reviewed in Chapter 19)
Renaissance Learning
Renaissance Learning
1998 Grades 3-12
Individual CAT No subtests for this computer adaptive test
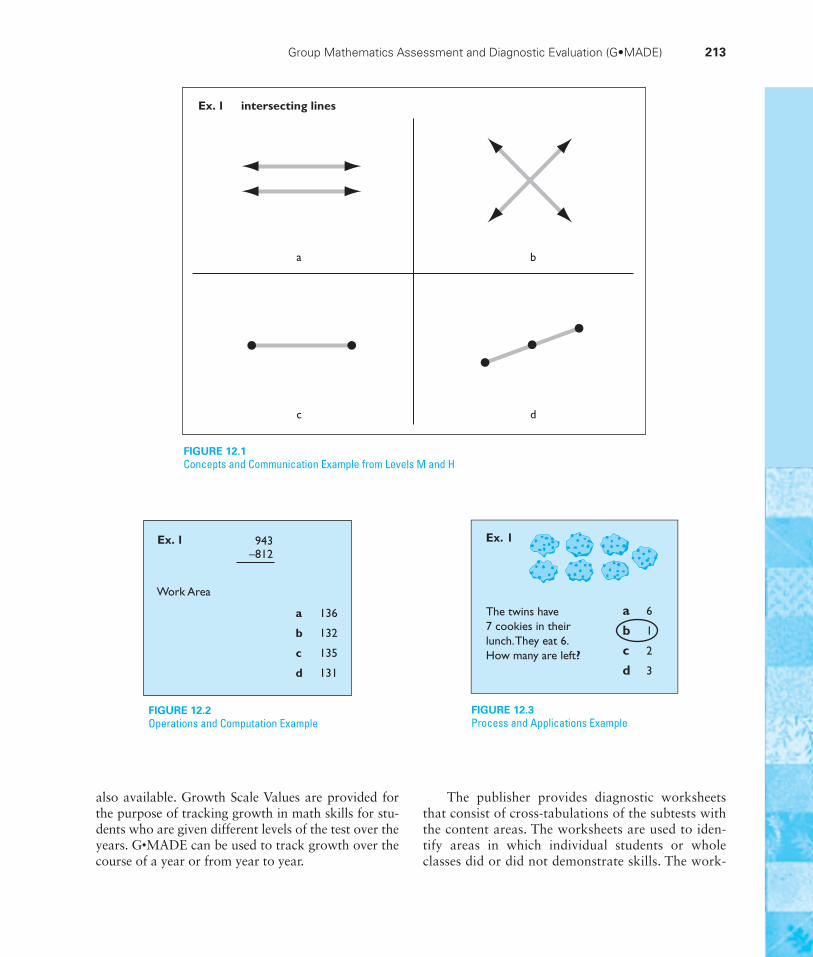
a b
c d
Ex. 1 intersecting lines
a 136
b 132
c 135
d 131
Ex. 1
Work Area
943–812
The twins have7 cookies in theirlunch. They eat 6.How many are left?
FIGURE 12.2Operations and Computation Example
FIGURE 12.3Process and Applications Example
FIGURE 12.1Concepts and Communication Example from Levels M and H
also available. Growth Scale Values are provided for the purpose of tracking growth in math skills for stu-dents who are given different levels of the test over the years. G•MADE can be used to track growth over the course of a year or from year to year.
The publisher provides diagnostic worksheets that consist of cross-tabulations of the subtests with the content areas. The worksheets are used to iden-tify areas in which individual students or whole classes did or did not demonstrate skills. The work-
Group Mathematics Assessment and Diagnostic Evaluation (G•MADE) 213
214 Chapter 12 ■ Using Diagnostic Mathematics Measures
sheets are used to prepare reports identifying specifi c areas of need. For example, the objective assessed by item 28 in Level 1, Form B is skill in solving a one-step sequence problem that requires the ability to recognize a pattern. When reporting on perfor-mance on this item, the teacher might report that “Joe did not solve one-step sequence problems that require the ability to recognize a pattern.” He might also indicate that “two-thirds of the class did not solve one-step problems that require the ability to recognize a pattern.”
NormsThere were two phases to standardization of the G•MADE. First, a study of bias by gender, race/ ethnicity, and region was conducted on more than 10,000 students during a national tryout. In addi-tion, the test was reviewed by a panel of educators who represented minority perspectives, and items they identifi ed as apparently biased were modifi ed or removed.
During the fall of 2002, G•MADE was stan-dardized on a nationwide sample of students at 72 sites. In spring 2003, the sampling was repeated at 71 sites. Approximately 1,000 students per level per grade participated in the standardization (a total of nearly 28,000 students). The sample was selected based on geographic region, community type (rural, and so on), and socioeconomic status (percentage of students on free and reduced-price lunch). Students with disabilities were included in the standardization if they attended regular education classes all or part of the day. Fall and spring grade-based and age-based norms are provided for each level of the G•MADE. Norms that allow for out-of-level testing are avail-able in a G•MADE Out-of-Level Norms Supplement and through the scoring and reporting software. Templates are available for hand scoring, or the test can be scored and reported by computer.
ReliabilityData on internal consistency and stability over time are presented in the G•MADE manual. Internal consis-tency reliabilities were computed for each G•MADE subtest and the total test score for each level and form using the split-half method. All reliabilities exceed .74, with more than 90 percent exceeding .80. The only
low reliabilities are at seventh grade for Concepts and Communications and for Process and Applications at all grades beyond grade 4. Thus, the only really ques-tionable subtest is Process and Applications beyond grade 4. Internal consistency reliability coeffi cients are above .90 for the total score at all levels of the test.
Alternate-form reliability was established on a sam-ple of 651 students, and all reliabilities exceeded .80. Stability of the test was established by giving it twice to a sample of 761 students. The test–retest reliability coeffi cients for this group of students exceeded .80, with the exception only of .78 for Level 4, Form A. Overall, there is good support for the reliability of the grade. Internal consistency and stability are suffi cient for using the test to make decisions about individuals. The two forms of the test are comparable.
ValidityThe content of the G•MADE is based on the NCTM Math Standards, though the test was developed fol-lowing a year-long research study of state standards, curriculum benchmarks, the score and sequence plans of commonly used math textbooks, and review of research on best practices for teaching math concepts and skills. The author provides a strong argument for the validity of the content of the G•MADE.
Several studies support the criterion-related valid-ity of the test. Correlations with subtests of the Iowa Tests of Basic Skills (ITBS), the TerraNova, and the Iowa Tests of Educational Development are reported. Surprisingly, correlations between G•MADE subtests and reading subtests of the ITBS are as high as they are between G•MADE subtests and math subtests of the G•MADE. This was not the case for correla-tions with the TerraNova, in which those with the math subtests exceeded by far correlations with the reading subtests. In a comparison of performance on KeyMath and the G•MADE, all correlations were in excess of .80. The two tests measure highly compa-rable skills.
SummaryThe G•MADE is a group-administered, norm- referenced, standards-based and diagnostic measure of student skill development in three separate areas. There is good evidence for the content validity of the test, and
the test was appropriately and adequately standardized. Evidence for reliability and validity of the G•MADE is good. The lone exception to this is the fi nding that performance on the test is as highly correlated with the reading subtests of some other criterion measures as it is with the math subtests of those measures.
KeyMath-3 Diagnostic Assessment (KeyMath-3 DA)
KeyMath-3 Diagnostic Assessment (KeyMath-3 DA; Connolly, 2007) is the third revision of the test origi-nally published in 1971. Over the three editions of the test, a number of “normative updates” have been published. KeyMath-3 DA is an untimed, individu-ally administered, norm-referenced test designed to provide a comprehensive assessment of essential math concepts and skills in individuals aged 4 years, 6 months through 21 years. The test takes 30 to 40 minutes for students in the lower elementary grades and 75 to 90 minutes for older students. Four uses are suggested for the test: (1) assess math profi -ciency by providing comprehensive coverage of the concepts and skills taught in regular math instruc-tion, (2) assess student progress in math, (3) support instructional planning, and (4) support educational placement decisions. The author designed this revi-sion of the test to refl ect the NCTM content and pro-cess standards described previously in this chapter.
KeyMath-3 DA includes a manual, two free-standing easels for either Form A or Form B, and 25 record forms with detachable Written Computation Examinee Booklets. Two ancillary products are available for KeyMath-3 DA: an ASSIST Scoring and Reporting Software program and a KeyMath-3 Essential Resources instructional program. There are two parallel forms (A and B) of the test, and each has 372 items divided into the following subtests: Numeration, Algebra, Geometry, Measurement, Data Analysis and Probability, Mental Computation and Estimation, Addition and Subtraction, Multiplication and Division, Foundations of Problem Solving, and Applied Problem Solving.
ScoresThe test can be hand scored or scored by using the KeyMath-3 DA ASSIST Scoring and Reporting
Software. Users can obtain three indices of relative standing (scale scores, standard scores, and percen-tile ranks) and three developmental scores (grade and age equivalents and growth scale values). Users also obtain three composite scores: Basic Concepts (conceptual knowledge), Operations (computational skills), and Application (problem solving). In addi-tion, tools are available to help users analyze students’ functional range in math, and they provide an analysis of students’ performance specifi c to focus items and behavioral objectives. The scoring software can be used to create progress reports across multiple admin-istrations of the test, produce a narrative summary report, export derived scores to Excel spreadsheets for statistical analysis, and generate reports for parents.
NormsKeyMath-3 DA was standardized on 3,630 individuals ages 4 years, 6 months to 21 years. The test was stan-dardized by contacting examiners and having them get permission to assess students, sending the permissions to the publisher, and then randomly selecting students to participate in the norming. The sample closely approximates the distributions reported in the 2004 census, and cross-tabs (i.e., how many males were from the Northeast) are reported in the manual. In addition, the test was standardized on representative proportions of students with specifi c learning disabil-ity, speech/language impairment, intellectual disability, emotional/behavioral disturbance, and developmental delays. The test appears adequately standardized.
ReliabilityThe author reports data on internal consistency, alternate-form, and test–retest reliability. Internal consistency reliabilities for students in kindergar-ten and fi rst grade are low. At other ages, internal consistency reliability coeffi cients generally exceed .80. Internal consistency coeffi cients for the composite scores exceed .90 except in grades K–2. Alternate-form reliabilities exceed .80 with the exception of the reliabilities for different forms of the Geometry and the Data Analysis and Probability subtests. Adjusted test–retest reliabilities based on the performance of 103 students (approximately half on each form) in grades K–12 generally exceed .80 with the exception of the Foundations of Problem Solving subtest (.70) and the Geometry subtest (.78). The reliability of all
KeyMath-3 Diagnostic Assessment (KeyMath-3 DA) 215
216 Chapter 12 ■ Using Diagnostic Mathematics Measures
Dilemmas in Current Practice
There are three major problems in the diagnostic assess-ment of math skills.
The fi rst problem is the recurring issue of curriculum match. There is considerable variation in math curricula. This variation means that diagnostic math tests will not be equally representative of all curricula or even appropriate for some commonly used ones. As a result, great care must be exercised in using diagnostic math tests to make vari-ous educational decisions. Assessment personnel must be extremely careful to note the match between test content and school curriculum. This should involve far more than a quick inspection of test items by someone unfamiliar with the specifi c classroom curriculum. For example, a profes-sional could inspect the teacher’s manual to ensure that the teacher assesses only material that has been taught and that there is reasonable correspondence between the relative emphasis placed on teaching the material and testing the material. To do this, the professional might have to develop a table of specifi cations for the math curriculum and compare test items with that table. However, once a table of specifi ca-tions has been developed for the curriculum, a better proce-dure would be to select items from a standards-referenced system to fi t the cells in the table exactly.
The second problem is selecting an appropriate test for the type of decision to be made. School personnel are usually
required to use individually administered norm-referenced devices in eligibility decisions. Decisions about a pupil’s eli-gibility for special services, however, need not be based on detailed information about the pupil’s strengths and weak-nesses, as provided by diagnostic tests; diagnosticians are interested in a pupil’s relative standing. In our opinion, the best mathematical achievement survey tests are subtests of group-administered tests. A practical solution is not to use a diagnostic math test for eligibility decisions but to administer individually a subtest from one of the better group- administered achievement tests.
The third problem is that most of the diagnostic tests in mathematics do not test a suffi ciently detailed sample of facts and concepts. Consequently, assessors must general-ize from a student’s performance on the items tested to his or her performance on the items that are not tested. The reli-abilities of the subtests of diagnostic math tests are often not high enough for educators to make such a generaliza-tion with any great degree of confi dence. As a result, these tests are not very useful in assessing readiness or strengths and weaknesses in order to plan instructional programs. We believe that the preferred practice in diagnostic testing in mathematics is for teachers to develop curriculum-based achievement tests that exactly parallel the curriculum being taught.
subtests and composites is adequate for screening purposes and good for diagnostic purposes.
ValidityThe authors report extensive validity information in the manual. All validity data are for composite scores. KeyMath-3 DA composites correlate very highly with scores on the KeyMath-Revised norma-tive update and math scores on the Kaufman Test of Educational Achievement (with the exception of the Applications and Mathematics Composite), ITBS, Measures of Academic Progress, and the G•MADE (with the exception of the operations composite [.63]). Evidence for content validity is
good based on alignment with state and NCTM standards. The authors provide data on how rep-resentatives of special populations perform relative to the general population, and scores are within expected ranges.
SummaryKeyMath-3 DA is a norm-referenced, individually administered comprehensive assessment of skills and problem solving in math appropriate for use with stu-dents 4–6 to 21 years of age. The test is adequately standardized, and there is good evidence for reliabil-ity and validity. Comparative data are provided on the performance of students with disabilities.
CHAPTER COMPREHENSION QUESTIONSWrite your answers to each of the following questions, and then compare your responses to the text or the study guide.
1. Why do we administer and use diagnostic math tests?
2. Provide two examples each of content and processes sampled by diagnostic mathematics tests.
3. What is the distinction between assessment of mathematics content and assessment of mathematics process?
4. Identify two differences in the kinds of behaviors sampled by two commonly used diagnostic mathematics tests: G•MADE and KeyMath-3 DA.
5. Briefl y describe three major dilemmas in diagnostic testing in mathematics:
a. Curriculum match
b. Selecting the correct tests for making specifi c decisions
c. Adequate and suffi cient behavior sampling
6. How can educational professionals overcome the problem of curriculum match in the diagnostic assessment of mathematical competence?
RESOURCE FOR FURTHER INVESTIGATIONNATIONAL COUNCIL OF TEACHERS OF MATHEMATWICS (NCTM)http://www.nctm.orgThis website is designed for teachers of mathematics and contains information and resources related to the subject of math.
Chapter Comprehension Questions 217

218
3Understand how cultural background
may infl uence language assessment.
2Understand various behaviors and
skills associated with language.
1Know why we assess oral and
written language.
Chapter Goals
13 Using Measures of Oral and Written Language
4Know methods for eliciting oral
language samples.5Be familiar with two
language tests. 6Be familiar with some of the
current dilemmas we face in using language measures.
Key Terms morphology
pragmatics
semantics
supralinguistic functioning
syntax
phonology
Using Measures of Oral and Written Language 219
The assessment of language competence should include evaluation of a student’s ability to process, both in comprehension and in expression, language in a spoken or written format. There are four major communication processes: oral comprehension (listening and comprehending speech), written comprehen-sion (reading), oral expression (speaking), and written expression (writing). These are illustrated in Figure 13.1.
In assessing language skills, it is important to break language down into processes and measure each one because each process makes different demands on the person’s ability to communicate. Performance in one area does not always predict performance in the others. For example, a child who has normal comprehension does not necessarily have normal production skills. Also, a child with relatively normal expressive skills may have prob-lems with receptive language. Therefore, a complete language assessment will include examination of both oral and written reception (comprehension) and expression (production).
Jill’s fi fth-grade teacher and parent expressed con-cerns to the Teacher Assistance Team at Brownville Elementary School. According to the teacher and parent, Jill was demonstrating all the classic signs of a student with a central auditory processing dis-order (CAPD). Her behavior in the classroom was characterized as often off task, and she had diffi culty attending to tasks and following oral directions, was easily distracted by noise, made frequent requests for repetition of information, daydreamed, often appeared not to be listening, and had poor memory skills. The teacher and parent completed checklists indicating concerns with central auditory processing. At the recommendation of the Teacher Assistance Team, Jill was taken to her family doctor to address concerns related to attention challenges and to rule these out as a possible reason for classroom perfor-mance issues. A trial of medication for attention defi cit disorder was completed and Jill showed remarkable
improvements in attention and focus but continued to struggle with what appeared to be listening and comprehension components of classroom activities. The speech–language pathologist was brought in to assess Jill’s language skills as well as make recommen-dations about audiological assessment for CAPD.
Jill completed the Clinical Evaluation of Lan-guage Fundamentals test. The results were surprising: Her receptive language standard score was 91 and expressive language standard score was 76. This child did not have a CAPD but, rather, expressive lan-guage impairment. She could understand and process what was taking place and being asked of her, but she could not organize or formulate the response. The speech language pathologist recommended extensive language therapy to address expressive language and the results have been amazing. Language testing is a vital component of assessing what disabilities are and are not present.
Scenario in Assessment
Jill
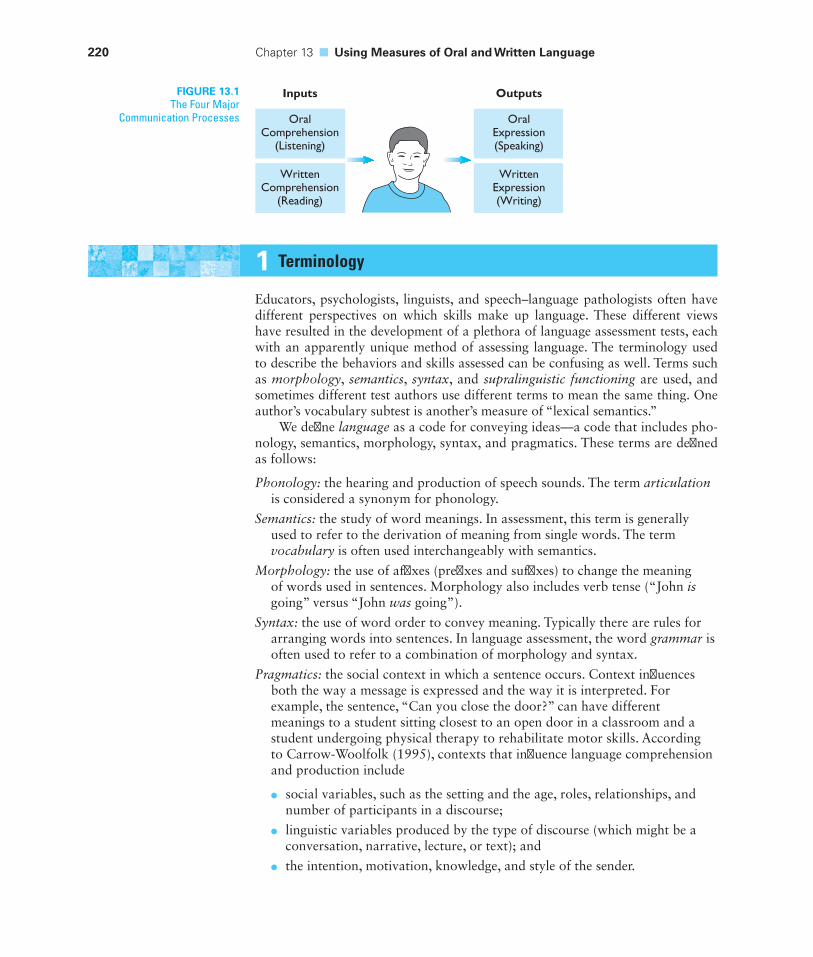
220 Chapter 13 ■ Using Measures of Oral and Written Language
FIGURE 13.1The Four Major
Communication Processes
1 Terminology
Educators, psychologists, linguists, and speech–language pathologists often have different perspectives on which skills make up language. These different views have resulted in the development of a plethora of language assessment tests, each with an apparently unique method of assessing language. The terminology used to describe the behaviors and skills assessed can be confusing as well. Terms such as morphology, semantics, syntax, and supralinguistic functioning are used, and sometimes different test authors use different terms to mean the same thing. One author’s vocabulary subtest is another’s measure of “lexical semantics.”
We defi ne language as a code for conveying ideas—a code that includes pho-nology, semantics, morphology, syntax, and pragmatics. These terms are defi ned as follows:
Phonology: the hearing and production of speech sounds. The term articulation is considered a synonym for phonology.
Semantics: the study of word meanings. In assessment, this term is generally used to refer to the derivation of meaning from single words. The term vocabulary is often used interchangeably with semantics.
Morphology: the use of affi xes (prefi xes and suffi xes) to change the meaning of words used in sentences. Morphology also includes verb tense (“John is going” versus “John was going”).
Syntax: the use of word order to convey meaning. Typically there are rules for arranging words into sentences. In language assessment, the word grammar is often used to refer to a combination of morphology and syntax.
Pragmatics: the social context in which a sentence occurs. Context infl uences both the way a message is expressed and the way it is interpreted. For example, the sentence, “Can you close the door?” can have different meanings to a student sitting closest to an open door in a classroom and a student undergoing physical therapy to rehabilitate motor skills. According to Carrow-Woolfolk (1995), contexts that infl uence language comprehension and production include
social variables, such as the setting and the age, roles, relationships, and ●
number of participants in a discourse;
linguistic variables produced by the type of discourse (which might be a ●
conversation, narrative, lecture, or text); and
the intention, motivation, knowledge, and style of the sender. ●
Inputs
OralComprehension
(Listening)
WrittenComprehension
(Reading)
Outputs
OralExpression(Speaking)
WrittenExpression(Writing)
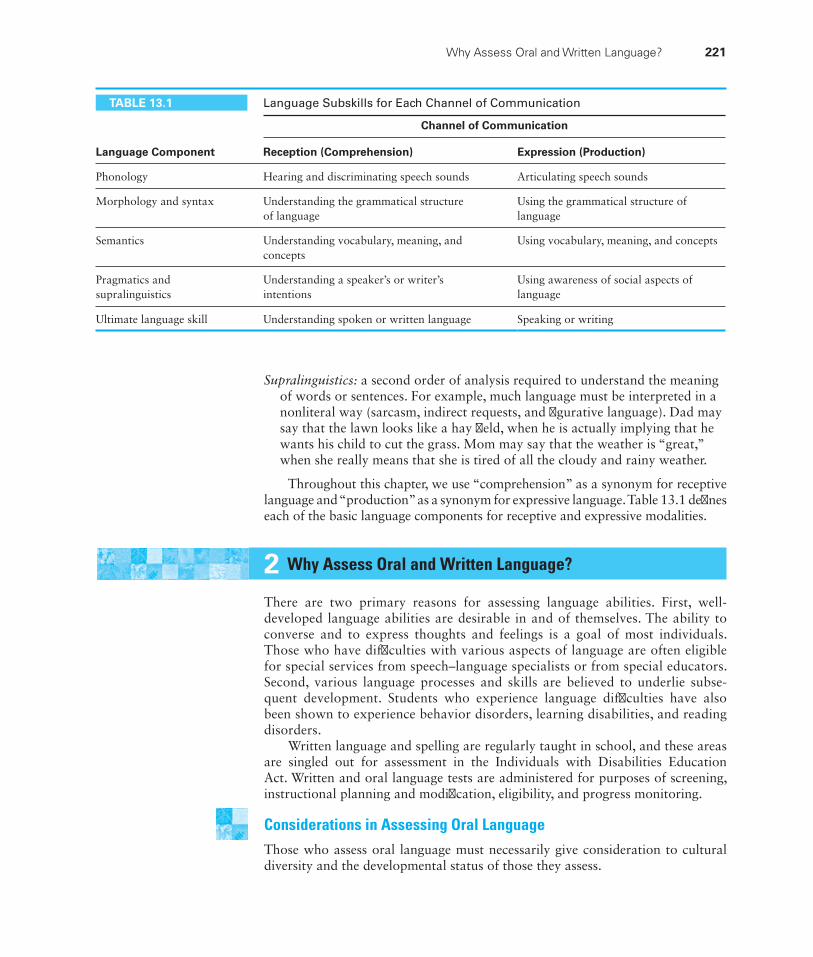
Why Assess Oral and Written Language? 221
Supralinguistics: a second order of analysis required to understand the meaning of words or sentences. For example, much language must be interpreted in a nonliteral way (sarcasm, indirect requests, and fi gurative language). Dad may say that the lawn looks like a hay fi eld, when he is actually implying that he wants his child to cut the grass. Mom may say that the weather is “great,” when she really means that she is tired of all the cloudy and rainy weather.
Throughout this chapter, we use “comprehension” as a synonym for receptive language and “production” as a synonym for expressive language. Table 13.1 defi nes each of the basic language components for receptive and expressive modalities.
2 Why Assess Oral and Written Language?
There are two primary reasons for assessing language abilities. First, well- developed language abilities are desirable in and of themselves. The ability to converse and to express thoughts and feelings is a goal of most individuals. Those who have diffi culties with various aspects of language are often eligible for special services from speech–language specialists or from special educators. Second, various language processes and skills are believed to underlie subse-quent development. Students who experience language diffi culties have also been shown to experience behavior disorders, learning disabilities, and reading disorders.
Written language and spelling are regularly taught in school, and these areas are singled out for assessment in the Individuals with Disabilities Education Act. Written and oral language tests are administered for purposes of screening, instructional planning and modifi cation, eligibility, and progress monitoring.
Considerations in Assessing Oral LanguageThose who assess oral language must necessarily give consideration to cultural diversity and the developmental status of those they assess.
TABLE 13.1 Language Subskills for Each Channel of Communication
Channel of Communication
Language Component Reception (Comprehension) Expression (Production)
Phonology Hearing and discriminating speech sounds Articulating speech sounds
Morphology and syntax Understanding the grammatical structure of language
Using the grammatical structure of language
Semantics Understanding vocabulary, meaning, and concepts
Using vocabulary, meaning, and concepts
Pragmatics and supralinguistics
Understanding a speaker’s or writer’s intentions
Using awareness of social aspects of language
Ultimate language skill Understanding spoken or written language Speaking or writing
222 Chapter 13 ■ Using Measures of Oral and Written Language
Cultural Diversity
Cultural background must be considered in assessing oral language compe-tence. Although most children in the United States learn English, the form of English they learn depends on where they were born, who their parents are, and so on. For example, in central Pennsylvania, a child might say, “My hands need washed” instead of the standard “My hands need to be washed.” In New York City, a child learning Black English might say “birfday” instead of “ birthday” or “He be running” instead of “He is running.” These and other culturally determined alternative constructions and pronunciations are not incorrect or inferior; they are just different. Indeed, they are appropriate within the child’s surrounding community. Children should be viewed as having a language dis-order only if they exhibit disordered production of their own primary language or dialect.
Cultural background is particularly important when the language assess-ment devices that are currently available are considered. Ideally, a child should be compared with others in the same language community. There should be sepa-rate norms for each language community, including Standard American English. Unfortunately, the norm samples of most language tests are heterogeneous, and scores on these tests may not be valid indicators of a child’s language ability. Consider Plate 25 of the original Peabody Picture Vocabulary Test. This plate contained four pictures, and the examiner said, “Show me the wiener.” There are many places in this country where the only word for that item is hot dog or frankfurter. Yet, because the test was standardized using wiener, the examiner was required to use that term. If a child had never heard “wiener,” he or she was penalized and received a lower score, even though the error was cultural and not indicative of a semantic or intellectual defi ciency. If there are a number of such items on a language test, the child’s score can hardly be considered a valid indica-tor of language ability.
Developmental Considerations
Age is a major consideration in assessment of the child’s language. Language acquisition is developmental; some sounds, linguistic structures, and even seman-tic elements are correctly produced at an earlier age than others. Thus, it is not unusual or indicative of language disorder for a 2-year-old child to say, “Kitty house” for “The cat is in the house,” although the same phrase would be an indi-cation of a disorder in a 3-year-old. It is important to be aware of developmental norms for language acquisition and to use those norms when making judgments about a child’s language competence.
Considerations in Assessing Written LanguageThere are two major components of written language: content and form. The con-tent of written expression is the product of considerable intellectual and linguistic activity: formulating, elaborating, sequencing, and then clarifying and revising ideas; choosing the precise word to convey meaning; and so forth. Moreover, much of what we consider to be content is the result of a creative endeavor. Our ability to use words to excite, to depict vividly, to imply, and to describe complex ideas is far more involved than simply putting symbols on paper.
Why Assess Oral and Written Language? 223
The form of written language is far more mechanistic than its content. For writer and reader to communicate, three sets of conventions or rules are used: penmanship, spelling, and style rules. The most fundamental rules deal with penmanship, the formation of individual letters and letter sequences that make up words. Although letter formation tends to become more individualistic with age, there are a limited number of ways, for example, that the letter A can be written and still be recognized as an A. Moreover, there are conventions about the relative spacing of letters between and within words.
Spelling is also rule governed. Although American English is more irregular phonetically than other languages, it remains largely regular, and students should be able to spell most words by applying a few phonetic rules. For example, we have known since the mid-1960s that approximately 80 percent of all consonants have a single spelling (Hanna, Hanna, Hodges, & Rudoff, 1966). Short vowels are the major source of diffi culty for most writers. The third set of conventions involves style. Style is a catchall term for rule-governed writing, which includes grammar (such as parts of speech, pronoun use, agreement, and verb voice and mood) and mechanics (such as punctuation, capitalization, abbreviations, and referencing).
The conventions of written language are tested on many standardized achieve-ment tests. However, the spelling words that students are to learn vary consider-ably from curriculum to curriculum. For example, Ames (1965) examined seven spelling series and found that they introduced an average of 3,200 words between the second and eighth grades. However, only approximately 1,300 words were common to all the series; approximately 1,700 words were taught in only one series. Moreover, those words that were taught in several series varied consider-ably in their grade placement, sometimes by as many as fi ve grades.
Capitalization and punctuation are also assessed on the current forms of sev-eral achievement batteries. Again, standardized tests are not well suited to mea-suring achievement in these areas because the grade level at which these skills are taught varies so much from one curriculum to another. To be valid, the measure-ment of achievement in these areas must be closely tied to the curriculum being taught. For example, pupils may learn in kindergarten, fi rst grade, second grade, or later that a sentence always begins with a capital letter. They may learn in the sixth grade or several grades earlier that commercial brand names are capital-ized. Students may be taught in the second or third grade that the apostrophe in “it’s” makes the word a contraction of “it is” or may still be studying “it’s” in high school. Finally, in assessing word usage, organization, and penmanship, we must take into account the emphasis that individual teachers place on these components of written language and when and how students are taught.
The more usual way to assess written language is to evaluate a student’s written work and to develop vocabulary and spelling tests, as well as written expression rubrics, that parallel the curriculum. In this way, teachers can be sure that they are measuring precisely what has been taught. Most teacher’s editions of language arts textbook series contain scope-and-sequence charts that specify fairly clearly the objectives that are taught in each unit. From these charts, teach-ers can develop appropriate criterion-referenced and curriculum-based assess-ments. There are also some rubrics available in the research literature that may be used by teachers to guide their instruction toward important components of writing content (Tindal & Hasbrouck, 1991).
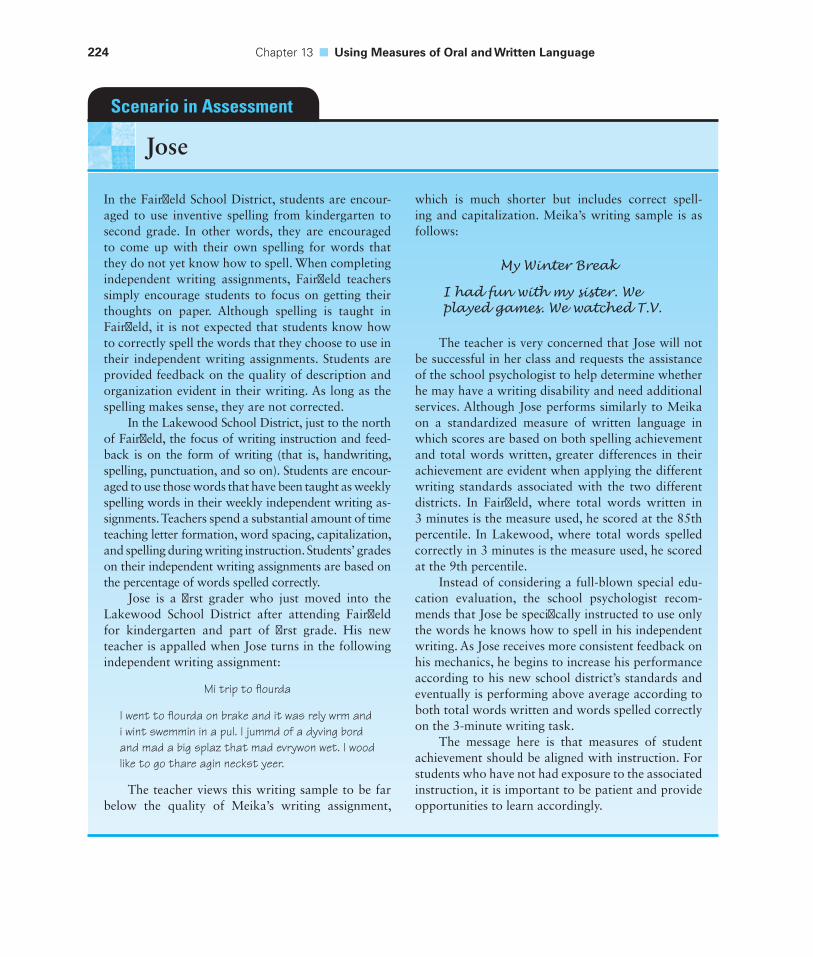
224 Chapter 13 ■ Using Measures of Oral and Written Language
In the Fairfi eld School District, students are encour-aged to use inventive spelling from kindergarten to second grade. In other words, they are encouraged to come up with their own spelling for words that they do not yet know how to spell. When completing independent writing assignments, Fairfi eld teachers simply encourage students to focus on getting their thoughts on paper. Although spelling is taught in Fairfi eld, it is not expected that students know how to correctly spell the words that they choose to use in their independent writing assignments. Students are provided feedback on the quality of description and organization evident in their writing. As long as the spelling makes sense, they are not corrected.
In the Lakewood School District, just to the north of Fairfi eld, the focus of writing instruction and feed-back is on the form of writing (that is, handwriting, spelling, punctuation, and so on). Students are encour-aged to use those words that have been taught as weekly spelling words in their weekly independent writing as-signments. Teachers spend a substantial amount of time teaching letter formation, word spacing, capitalization, and spelling during writing instruction. Students’ grades on their independent writing assignments are based on the percentage of words spelled correctly.
Jose is a fi rst grader who just moved into the Lakewood School District after attending Fairfi eld for kindergarten and part of fi rst grade. His new teacher is appalled when Jose turns in the following independent writing assignment:
Mi trip to fl ourda
I went to fl ourda on brake and it was rely wrm and i wint swemmin in a pul. I jummd of a dyving bord and mad a big splaz that mad evrywon wet. I wood like to go thare agin neckst yeer.
The teacher views this writing sample to be far below the quality of Meika’s writing assignment,
which is much shorter but includes correct spell-ing and capitalization. Meika’s writing sample is as follows:
My Winter Break
I had fun with my sister. We played games. We watched T.V.
The teacher is very concerned that Jose will not be successful in her class and requests the assistance of the school psychologist to help determine whether he may have a writing disability and need additional services. Although Jose performs similarly to Meika on a standardized measure of written language in which scores are based on both spelling achievement and total words written, greater differences in their achievement are evident when applying the different writing standards associated with the two different districts. In Fairfi eld, where total words written in 3 minutes is the measure used, he scored at the 85th percentile. In Lakewood, where total words spelled correctly in 3 minutes is the measure used, he scored at the 9th percentile.
Instead of considering a full-blown special edu-cation evaluation, the school psychologist recom-mends that Jose be specifi cally instructed to use only the words he knows how to spell in his independent writing. As Jose receives more consistent feedback on his mechanics, he begins to increase his performance according to his new school district’s standards and eventually is performing above average according to both total words written and words spelled correctly on the 3-minute writing task.
The message here is that measures of student achievement should be aligned with instruction. For students who have not had exposure to the associated instruction, it is important to be patient and provide opportunities to learn accordingly.
Scenario in Assessment
Jose
Observing Language Behavior 225
3 Observing Language Behavior
There has been some disagreement among language professionals about the most valid method of evaluating a child’s language performance, especially in the expressive channel of communication. There are three procedures used to gather a sample of a child’s language behavior: spontaneous, imitative, and elicited.
Spontaneous LanguageOne school of thought holds that the only valid measure of a child’s language abilities is one that studies the language the child produces spontaneously (for example, see Miller, 1981). Using this approach, the examiner records 50 to 100 consecutive utterances produced as the child is talking to an adult or playing with toys. With older children, conversations or storytelling tasks are often used. The child’s utterances are then analyzed in terms of phonology, semantics, morphol-ogy, syntax, and pragmatics in order to provide information about the child’s conversational abilities. Because the construct of pragmatics has been developed only recently, there are few standard assessment instruments available to sample this domain. Therefore, spontaneous language-sampling procedures are widely used to evaluate pragmatic abilities (see Prutting & Kirshner, 1987). Although analysis of a child’s spontaneous language production is not the purpose of any standard oral language assessment instruments, some interest has been shown in standard assessment of handwriting and spelling skills in an uncontrived, sponta-neous situation (for example, the revised Test of Written Language by Hammill and Larsen, 2008).
ImitationImitation tasks require a child to repeat directly the word, phrase, or sentence produced by the examiner. It might seem that such tasks bear little relation to spontaneous performance, but evidence suggests that such tasks are valid predic-tors of spontaneous production. In fact, many investigators have demonstrated that children’s imitative language is essentially the same in content and structure as their spontaneous language (R. Brown & Bellugi, 1964; Ervin, 1964; Slobin & Welsh, 1973). Evidently, children translate adult sentences into their own language system and then repeat the sentences using their own language rules. A young child might imitate “The boy is running and jumping” as “Boy run and jump.” Imitation thus seems to be a valuable tool for providing information about a child’s language abilities. We note one caution, however: Features of a child’s language systems can be obtained using imitation only if the stimulus sentences are long enough to tax the child’s memory, because a child will imitate any sen-tence perfectly if the length of that sentence is within the child’s memory capacity (Slobin & Welsh, 1973).
The use of imitation does not preclude the need for spontaneous sampling because the examiner also needs information derived from direct observation of conversational skills. Rather, imitation tasks should be used to augment
226 Chapter 13 ■ Using Measures of Oral and Written Language
the information obtained from the spontaneous sample because such tasks can be used to elicit forms that the child did not attempt in the conversations. Standardized imitation tasks are widely used in oral language assessment instru-ments (such as the Test of Language Development–P:4 and I:4). Assessment devices that use imitation usually contain a number of grammatically loaded words, phrases, or sentences that children are asked to imitate. The examiner records and transcribes the children’s responses and then analyzes their phonol-ogy, morphology, and syntax. (Semantics and pragmatics are rarely assessed using an imitative mode.) Finally, imitation generally is used only in assessing expressive oral language.
Elicited LanguageUsing a picture stimulus to elicit language involves no imitation on the part of the child, but the procedure cannot be classifi ed as totally spontaneous. In this type of task, the child is presented with a picture or pictures of objects or action scenes and is asked to do one of the following: (1) point to the correct object (a receptive vocabulary task), (2) point to the action picture that best describes a sentence (receptive language, including vocabulary), (3) name the picture (expressive vocabulary), or (4) describe the picture (expressive language, including vocabulary). Although only stimulus pictures are described in this section, some tests use concrete objects rather than pictures to elicit language responses.
Advantages and Disadvantages of Each ProcedureThere are advantages and disadvantages to all three methods of language obser-vation (spontaneous, imitative, and elicited). The use of spontaneous language samples has two major advantages. First, a child’s spontaneous language is undoubtedly the best and most natural indicator of everyday language perfor-mance. Second, the informality of the procedure often allows the examiner to assess children quite easily, without the diffi culties sometimes associated with a formal testing atmosphere.
The disadvantages associated with this procedure relate to the nonstandard-ized nature of the data collection. Although some aspects of language sampling are stable across a variety of parameters, this procedure shows much wider vari-ability than is seen with other standardized assessments. In addition, language sampling requires detailed analyses across language domains; such analyses are more time-consuming than administering a standardized instrument. Finally, because the examiner does not directly control the selection of target words and phrases, he or she may have diffi culty understanding a young child, or there may be several different interpretations of what a child intended to say. Moreover, the child may have avoided, or may not have had an opportunity to attempt, a par-ticular structure that is of interest to the examiner.
The use of imitation overcomes many of the disadvantages inherent in the spontaneous approach. An imitation task will often assess many different lan-guage elements and provide a representative view of a child’s language system.
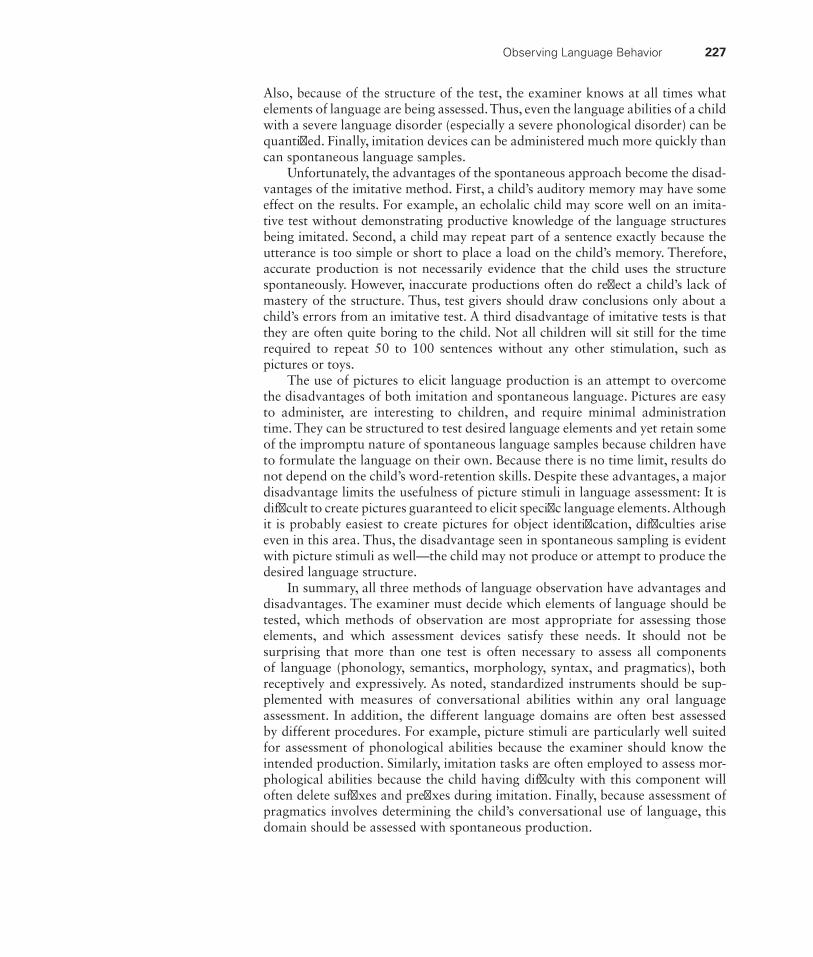
Observing Language Behavior 227
Also, because of the structure of the test, the examiner knows at all times what elements of language are being assessed. Thus, even the language abilities of a child with a severe language disorder (especially a severe phonological disorder) can be quantifi ed. Finally, imitation devices can be administered much more quickly than can spontaneous language samples.
Unfortunately, the advantages of the spontaneous approach become the disad-vantages of the imitative method. First, a child’s auditory memory may have some effect on the results. For example, an echolalic child may score well on an imita-tive test without demonstrating productive knowledge of the language structures being imitated. Second, a child may repeat part of a sentence exactly because the utterance is too simple or short to place a load on the child’s memory. Therefore, accurate production is not necessarily evidence that the child uses the structure spontaneously. However, inaccurate productions often do refl ect a child’s lack of mastery of the structure. Thus, test givers should draw conclusions only about a child’s errors from an imitative test. A third disadvantage of imitative tests is that they are often quite boring to the child. Not all children will sit still for the time required to repeat 50 to 100 sentences without any other stimulation, such as pictures or toys.
The use of pictures to elicit language production is an attempt to overcome the disadvantages of both imitation and spontaneous language. Pictures are easy to administer, are interesting to children, and require minimal administration time. They can be structured to test desired language elements and yet retain some of the impromptu nature of spontaneous language samples because children have to formulate the language on their own. Because there is no time limit, results do not depend on the child’s word-retention skills. Despite these advantages, a major disadvantage limits the usefulness of picture stimuli in language assessment: It is diffi cult to create pictures guaranteed to elicit specifi c language elements. Although it is probably easiest to create pictures for object identifi cation, diffi culties arise even in this area. Thus, the disadvantage seen in spontaneous sampling is evident with picture stimuli as well—the child may not produce or attempt to produce the desired language structure.
In summary, all three methods of language observation have advantages and disadvantages. The examiner must decide which elements of language should be tested, which methods of observation are most appropriate for assessing those elements, and which assessment devices satisfy these needs. It should not be surprising that more than one test is often necessary to assess all components of language (phonology, semantics, morphology, syntax, and pragmatics), both receptively and expressively. As noted, standardized instruments should be sup-plemented with measures of conversational abilities within any oral language assessment. In addition, the different language domains are often best assessed by different procedures. For example, picture stimuli are particularly well suited for assessment of phonological abilities because the examiner should know the intended production. Similarly, imitation tasks are often employed to assess mor-phological abilities because the child having diffi culty with this component will often delete suffi xes and prefi xes during imitation. Finally, because assessment of pragmatics involves determining the child’s conversational use of language, this domain should be assessed with spontaneous production.
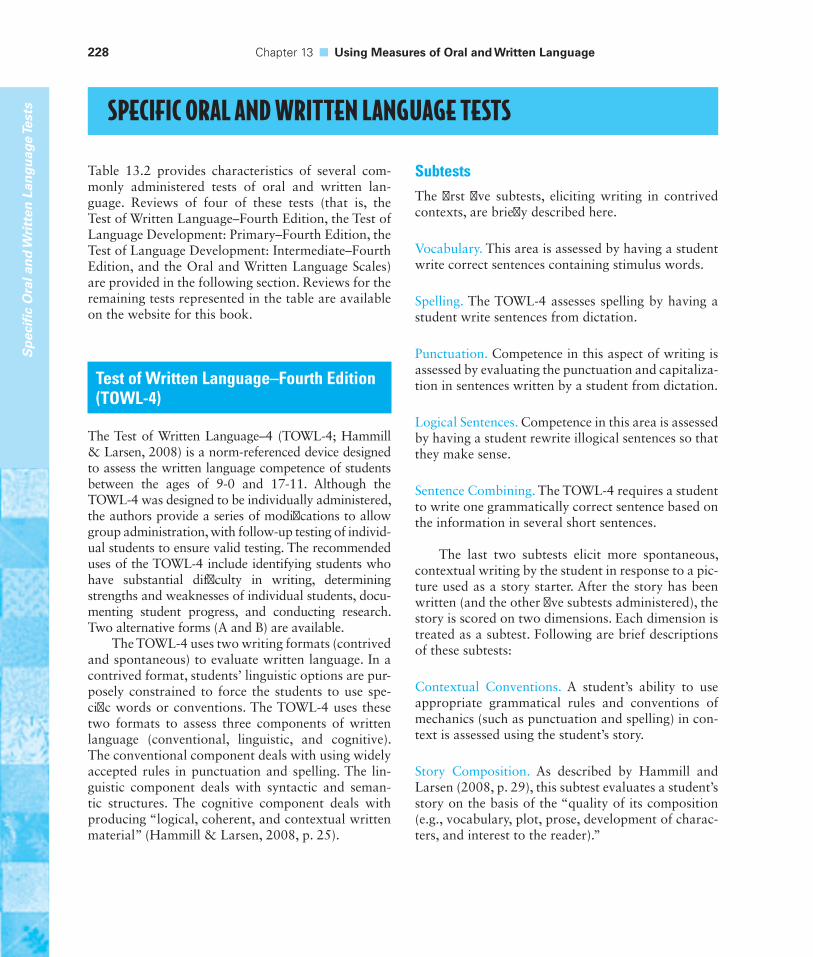
228 Chapter 13 ■ Using Measures of Oral and Written Language
Sp
ecifi
c O
ral a
nd
Wri
tten
Lan
gu
age
Test
s
Table 13.2 provides characteristics of several com-monly administered tests of oral and written lan-guage. Reviews of four of these tests (that is, the Test of Written Language–Fourth Edition, the Test of Language Development: Primary–Fourth Edition, the Test of Language Development: Intermediate–Fourth Edition, and the Oral and Written Language Scales) are provided in the following section. Reviews for the remaining tests represented in the table are available on the website for this book.
Test of Written Language–Fourth Edition (TOWL-4)
The Test of Written Language–4 (TOWL-4; Hammill & Larsen, 2008) is a norm-referenced device designed to assess the written language competence of students between the ages of 9-0 and 17-11. Although the TOWL-4 was designed to be individually administered, the authors provide a series of modifi cations to allow group administration, with follow-up testing of individ-ual students to ensure valid testing. The recommended uses of the TOWL-4 include identifying students who have substantial diffi culty in writing, determining strengths and weaknesses of individual students, docu-menting student progress, and conducting research. Two alternative forms (A and B) are available.
The TOWL-4 uses two writing formats (contrived and spontaneous) to evaluate written language. In a contrived format, students’ linguistic options are pur-posely constrained to force the students to use spe-cifi c words or conventions. The TOWL-4 uses these two formats to assess three components of written language (conventional, linguistic, and cognitive). The conventional component deals with using widely accepted rules in punctuation and spelling. The lin-guistic component deals with syntactic and seman-tic structures. The cognitive component deals with producing “logical, coherent, and contextual written material” (Hammill & Larsen, 2008, p. 25).
SubtestsThe fi rst fi ve subtests, eliciting writing in contrived contexts, are briefl y described here.
Vocabulary. This area is assessed by having a student write correct sentences containing stimulus words.
Spelling. The TOWL-4 assesses spelling by having a student write sentences from dictation.
Punctuation. Competence in this aspect of writing is assessed by evaluating the punctuation and capitaliza-tion in sentences written by a student from dictation.
Logical Sentences. Competence in this area is assessed by having a student rewrite illogical sentences so that they make sense.
Sentence Combining. The TOWL-4 requires a student to write one grammatically correct sentence based on the information in several short sentences.
The last two subtests elicit more spontaneous, contextual writing by the student in response to a pic-ture used as a story starter. After the story has been written (and the other fi ve subtests administered), the story is scored on two dimensions. Each dimension is treated as a subtest. Following are brief descriptions of these subtests:
Contextual Conventions. A student’s ability to use appropriate grammatical rules and conventions of mechanics (such as punctuation and spelling) in con-text is assessed using the student’s story.
Story Composition. As described by Hammill and Larsen (2008, p. 29), this subtest evaluates a student’s story on the basis of the “quality of its composition (e.g., vocabulary, plot, prose, development of charac-ters, and interest to the reader).”
SPECIFIC ORAL AND WRITTEN LANGUAGE TESTS
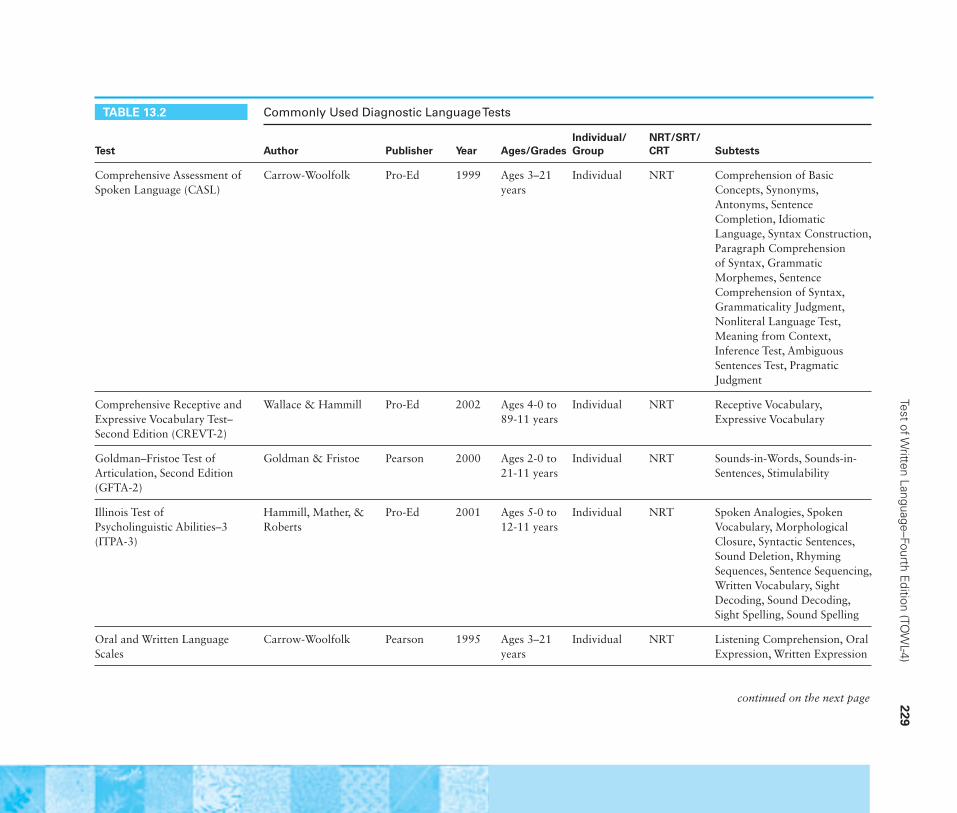
Test of W
ritten Language–Fourth Edition (TO
WL-4)
229
TABLE 13.2 Commonly Used Diagnostic Language Tests
Test Author Publisher Year Ages/GradesIndividual/Group
NRT/SRT/CRT Subtests
Comprehensive Assessment of Spoken Language (CASL)
Carrow-Woolfolk Pro-Ed 1999 Ages 3–21 years
Individual NRT Comprehension of Basic Concepts, Synonyms, Antonyms, Sentence Completion, Idiomatic Language, Syntax Construction, Paragraph Comprehension of Syntax, Grammatic Morphemes, Sentence Comprehension of Syntax, Grammaticality Judgment, Nonliteral Language Test, Meaning from Context, Inference Test, Ambiguous Sentences Test, Pragmatic Judgment
Comprehensive Receptive and Expressive Vocabulary Test–Second Edition (CREVT-2)
Wallace & Hammill Pro-Ed 2002 Ages 4-0 to 89-11 years
Individual NRT Receptive Vocabulary, Expressive Vocabulary
Goldman–Fristoe Test of Articulation, Second Edition (GFTA-2)
Goldman & Fristoe Pearson 2000 Ages 2-0 to 21-11 years
Individual NRT Sounds-in-Words, Sounds-in-Sentences, Stimulability
Illinois Test of Psycholinguistic Abilities–3 (ITPA-3)
Hammill, Mather, & Roberts
Pro-Ed 2001 Ages 5-0 to 12-11 years
Individual NRT Spoken Analogies, Spoken Vocabulary, Morphological Closure, Syntactic Sentences, Sound Deletion, Rhyming Sequences, Sentence Sequencing, Written Vocabulary, Sight Decoding, Sound Decoding, Sight Spelling, Sound Spelling
Oral and Written Language Scales
Carrow-Woolfolk Pearson 1995 Ages 3–21 years
Individual NRT Listening Comprehension, Oral Expression, Written Expression
continued on the next page
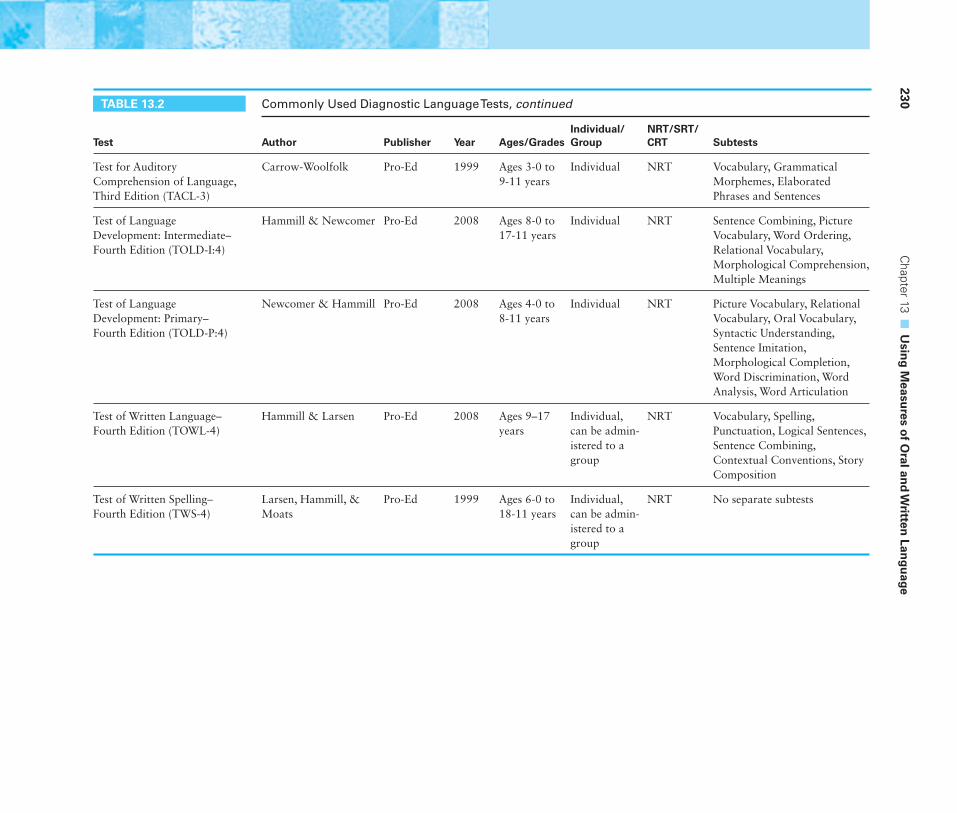
230 C
hapter 13 ■
Usin
g M
easures o
f Oral an
d W
ritten Lan
gu
age
TABLE 13.2 Commonly Used Diagnostic Language Tests, continued
Test Author Publisher Year Ages/GradesIndividual/Group
NRT/SRT/CRT Subtests
Test for Auditory Comprehension of Language, Third Edition (TACL-3)
Carrow-Woolfolk Pro-Ed 1999 Ages 3-0 to 9-11 years
Individual NRT Vocabulary, Grammatical Morphemes, Elaborated Phrases and Sentences
Test of Language Development: Intermediate–Fourth Edition (TOLD-I:4)
Hammill & Newcomer Pro-Ed 2008 Ages 8-0 to 17-11 years
Individual NRT Sentence Combining, Picture Vocabulary, Word Ordering, Relational Vocabulary, Morphological Comprehension, Multiple Meanings
Test of Language Development: Primary–Fourth Edition (TOLD-P:4)
Newcomer & Hammill Pro-Ed 2008 Ages 4-0 to 8-11 years
Individual NRT Picture Vocabulary, Relational Vocabulary, Oral Vocabulary, Syntactic Understanding, Sentence Imitation, Morphological Completion, Word Discrimination, Word Analysis, Word Articulation
Test of Written Language–Fourth Edition (TOWL-4)
Hammill & Larsen Pro-Ed 2008 Ages 9–17 years
Individual, can be admin-istered to a group
NRT Vocabulary, Spelling, Punctuation, Logical Sentences, Sentence Combining, Contextual Conventions, Story Composition
Test of Written Spelling–Fourth Edition (TWS-4)
Larsen, Hammill, & Moats
Pro-Ed 1999 Ages 6-0 to 18-11 years
Individual, can be admin-istered to a group
NRT No separate subtests
Test of Written Language–Fourth Edition (TOWL-4) 231
ScoresRaw scores for each subtest can be converted to percen-tiles or standard scores. The standard scores have a mean of 10 and a standard deviation of 3. Various combina-tions of subtests result in three composites: contrived writing (Vocabulary, Spelling, Punctuation, Logical Sentences, and Sentence Combining), spontaneous writ-ing (Contextual Conventions and Story Composition), and overall writing (all subtests). Subtest standard scores can be summed and converted to standard scores (that is, “index scores”) and percentiles for each composite. The composite index scores have a mean of 100 and a standard deviation of 15. Both age and grade equiva-lents are available; however, the authors appropriately warn against reporting these scores.
NormsTwo different sampling techniques were used to estab-lish norms for the TOWL-4. First, sites in each of the four geographic regions of the United States were selected, and 977 students were tested. Second, an additional 1,229 students were tested by volunteers who had previously purchased materials from the pub-lisher. The total sample is distributed such that there are at least 200 students represented at each age level; however, at some age levels there are very few students represented in either the fall or the spring sample. The total sample varies no more than 5 percent from infor-mation provided by the U.S. Census Bureau for the 2005 school-age population on various demographic variables (that is, gender, geographic region, ethnicity, family income, educational attainment of parents, and disability), with the exception that those with a very high household income are overrepresented (that is, 35 percent of the sample has a household income of more than $75,000, whereas just 27 percent of the population has this level of household income). The authors also present data for three age ranges (that is, 9 to 11, 12 to 14, and 15 to 17), showing that each age range also approximates information on the nation-wide school-age population for 2005. However, the comparisons of interest (that is, the degree to which each normative group approximates the census) are absent.
ReliabilityThree types of reliability are discussed in the TOWL-4 manual: internal consistencies (both coeffi cient alpha
and alternate-form reliability), stability, and inter scorer agreement.
Two procedures were used to estimate the internal consistency of the TOWL-4. First, a series of coeffi cient alphas was computed. Using the entire normative sam-ple, coeffi cient alpha was used to estimate the internal consistency of each score (age and grade) and com-posite on each form at each age. Of the 238 alphas reported, 85 are in the .90s, 80 are in the .80s, 62 are in the .70s, 10 are in the .60s, and 1 is below .60. Alphas are consistently higher on the Vocabulary, Punctuation, and Spelling subtests and lowest on the Logical Sentences and Story Composition sub-tests. As is typical, coeffi cient alpha was substantially higher for the composites. For Contrived Writing and Overall Writing, all coeffi cients equaled or exceeded .95. For Spontaneous Writing, they were substantially lower, with all in the .70s and .80s. Thus, two of the composites are suffi ciently reliable for making impor-tant educational decisions about students.
The authors are to be commended for also report-ing subtest internal consistencies for several demo-graphic subgroups (that is, males and females, Caucasian Americans, African Americans, Hispanic Americans, and Asian Americans), as well as students with disabilities (that is, learning disabled, speech impaired, and attention defi cit hyperactive). The obtained coeffi cients for the various demographic subgroups are comparable to those for the entire nor-mative sample.
Second, alternate-form reliability was also com-puted for each subtest and each composite at each age and grade, using the entire normative sample. These coeffi cients were distributed in approximately the same way as were the alphas.
The 2-week stability of each subtest and each composite on both forms was estimated with 84 students ranging in age from 9 to 17 years; results were examined according to two age and grade ranges. Of the 80 associated coeffi cients, 30 coef-fi cients equaled or exceeded .90, 34 were in the .80s, 15 were in the .70s, and 1 was in the .60s. These followed the pattern of other reliability indices, with higher coeffi cients identifi ed for the contrived writing and overall writing composites than for the spontaneous writing composite.
To estimate interscorer agreement, 41 TOWL-4 protocols were selected at random and scored. The correlations between scorers were remarkably con-sistent. Of the 40 coeffi cients associated with subtest
232 Chapter 13 ■ Using Measures of Oral and Written Language
and composite scoring agreement, 36 were in the .90s, 2 were in the .80s, and 2 were in the .70s. The scoring of written language samples is quite diffi cult, and unac-ceptably low levels of interscorer agreement appear to be the rule rather than the exception. It appears that the scoring criteria contained in the TOWL-4 manual are suffi ciently precise and clear to allow for consistent scoring. The only subtest with interscorer reliability below .90 was Story Composition.
ValiditySupport for content validity comes from the way in which the test was developed, the many dimen-sions of written language assessed, and the meth-ods by which competence in written language is assessed. The evidence for criterion-related valid-ity comes from a study in which three measures—the Written Language Observation Scale (Hammill & Larsen, 2009), the Reading Observation Scale (Hammill & Larsen, 2009), and the Test of Reading Comprehension–Fourth Edition (TORC-4; Brown, Wiederholt, & Hammill, 2009)—were correlated with each score on the TOWL-4. Correlations rang-ing from .34 (Story Composition correlated with the Written Language Observation Scale) to .80 (Spelling correlated with the TORC-4) provide somewhat lim-ited support for the TOWL-4’s validity; teacher ratings for reading correlated as well as or better than those for writing. The authors also conducted positive pre-dictive analyses using these data on the three literacy measures. Based on the results, which indicate lev-els of sensitivity and specifi city exist meeting the .70 threshold, the authors suggest that the TOWL-4 can be used to identify those students who have literacy diffi culties.
Construct validity is considered at some length in the TOWL-4 manual. First, the authors present evidence to show that TOWL-4 scores increase with age and grade. The correlations with age are substan-tially stronger for students between the ages of 9 and 12 years than for students 13 to 17 years old, for whom correlations are small. Second, in examining the subtest intercorrelations and conducting a factor analysis, the TOWL-4 appears to assess a single factor for the sample as a whole. Thus, although individual subtests (or the contrived and spontaneous compos-ites) may be of interest, they are not independent of the other skills measured on the test. Third, scores on the TOWL-4 for students with learning disabilities and
speech/language impairments, who are anticipated to struggle in the area of written language, were gener-ally lower than those for other subgroups. However, it is important to note that score differences for these exceptionality groups tended to be no more than one standard deviation below the average.
The authors were careful to examine the possi-bility of racial or ethnic bias in their assessment tool. They conducted reliability analyses separately by gender, race/ethnicity, and exceptionality grouping. They also conducted an analysis of differential item functioning in which they examined whether item characteristics varied by gender and ethnicity, which would suggest the possibility of item bias. Although two items were identifi ed with differences in item characteristics across groups, these represented less than 5 percent of the test items.
SummaryThe TOWL-4 is designed to assess written language competence of students aged 9-0 to 17-11. Contrived and spontaneous formats are used to evaluate the conventional, linguistic, and cognitive components of written language. The content and structure of the TOWL-4 appear appropriate.
Although the TOWL-4’s norms appear repre-sentative in general, the fall and spring samples tend to be uneven by age group, with some of these sea-sonal samples including very few students at certain grade levels. Interscorer reliability is quite good for this type of test. The internal consistencies of one composite (that is, Contrived Writing) and the total composite are high enough for use in making indi-vidual decisions; the stabilities of subtests and the remaining composite (that is, Spontaneous Writing) are lower.
Although the test’s content appears appropri-ate and well conceived, the validity of the inferences to be drawn from the scores is unclear. Specifi cally, group means are the only data to suggest that the TOWL-4 is useful in identifying students with dis-abilities or in determining strengths and weaknesses of individual students. Students with learning dis-abilities and speech/language disorders earn TOWL-4 subtest scores that are only 1 standard deviation (or less) below the mean; they earn composite scores that are no more than 1.2 standard deviations below the mean. However, because we do not know whether these students had disabilities in written language,
Test of Language Development: Primary–Fourth Edition 233
their scores tell us little about the TOWL-4’s ability to identify students with specifi c written language needs. Although positive predictive analyses were conducted to determine whether the TOWL-4 could identify stu-dents with literacy diffi culties, these similarly do not provide evidence that the test is particularly helpful in identifying specifi c written language diffi culties. Given that the TOWL-4 has only two forms and rela-tively low stability, its usefulness in evaluating pupil progress is also limited.
Test of Language Development: Primary–Fourth Edition
The Test of Language Development: Primary–Fourth Edition (TOLD-P:4; Newcomer & Hammill, 2008) is a norm-referenced, nontimed, individually admin-istered test designed to (1) identify children who are signifi cantly below their peers in oral language profi ciency, (2) determine a child’s specifi c strengths and weaknesses in oral language skills, (3) document progress in remedial programs, and (4) measure oral language in research studies (Newcomer & Hammill, 2008). The TOLD-P:4 is intended to be used with children ages 4-0 to 8-11 years. Although the test is not timed, the average student is able to complete the core subtests in 35 to 50 minutes and the supplemen-tal tests in an additional 30 minutes.
SubtestsThe TOLD-P:4 consists of nine subtests, each measur-ing different components of oral language. Six of the subtests are considered core subtests and their scores are combined to form composite scores. The compos-ite scores cover the main areas of language: semantics and grammar; listening, organizing, and speaking; and overall language ability. The subtests measuring phonology are excluded from the composite scores in order to create a clear separation between speech competence and language competence, making it eas-ier to determine specifi c disorders. Descriptions of the individual subtests are as follows:
Picture Vocabulary. This subtest assesses a child’s ability to understand the meaning of spoken English words (semantics and listening).
Relational Vocabulary. This subtest assesses a child’s understanding and ability to orally express the rela-tionships between two words spoken by the examiner (semantics and organizing).
Oral Vocabulary. This subtest assesses a child’s abil-ity to give oral directions to common English words that are spoken by the examiner (semantics and speaking).
Syntactic Understanding. This subtest assesses a child’s ability to understand the meaning of sentences (grammar and listening).
Sentence Imitation. This subtest assesses a child’s ability to imitate English sentences (grammar and organizing).
Morphological Completion. This subtest assesses a child’s ability to recognize, understand, and use com-mon English morphological forms (grammar and speaking).
Word Discrimination. This subtest assesses a child’s ability to recognize the differences in speech sounds (phonology and listening).
Word Analysis. This subtest assesses a child’s ability to segment words into smaller phonemic units (pho-nology and organizing)
Word Articulation. This subtest assesses a child’s abil-ity to produce various English speech sounds (pho-nology and speaking).
ScoresThe TOLD-P:4 generates four types of normative scores: age equivalents, percentile ranks, scaled scores, and composite indexes. The subtests of the TOLD-P:4 are designed on a two-dimensional model of linguis-tic features and linguistic systems. The subtests can be combined into the following six composites:
1. Listening (Picture Vocabulary and Syntactic Understanding)
2. Organizing (Relational Vocabulary and Sentence Imitation)
3. Speaking (Oral Vocabulary and Morphological Completion)
234 Chapter 13 ■ Using Measures of Oral and Written Language
4. Grammar (Syntactic Understanding, Sentence Imitation, and Morphological Completion)
5. Semantics (Picture Vocabulary, Relational Vocabulary, and Oral Vocabulary)
6. Spoken Language (Picture Vocabulary, Relational Vocabulary, Oral Vocabulary, Syntactic Understanding, Sentence Imitation, and Morphological Completion). This is a measure of the overall language ability.
NormsThe TOLD-P:4 was standardized in 2006 and 2007 on a demographic representative sample of 1,108 children from four regions of the United States. The norm sample was stratifi ed on the basis of gender, age, race, geographic region, Hispanic status, excep-tionality status (disability area), family income, and parental education level. The examiner’s manual con-tains charts indicating the breakdown of the norm sample according to the 2007 census. Some cross-tabs (for example, the number of students in each specifi c racial/ethnic group from each region) are provided, and there is good correspondence between census and norm sample data.
ReliabilityTo determine test reliability, the TOLD-P:4 uses three types of correlation coeffi cients—coeffi cient alpha, test–retest, and scorer difference—to meas-ure three types of error (content, time, and scorer). Coeffi cient alphas were calculated for each subtest and composite scores. The coeffi cients for the sub-tests exceeded .80, and seven of the nine subtest coef-fi cients exceeded .90. The composite scores averaged coeffi cients greater than .90. Test–retest reliability was completed using two groups of students ages 4 to 6 years and ages 7 to 8 years; time between assessments was 1 or 2 weeks. With the exception of one subtest, the reliability coeffi cients for the subtests for both groups were greater than .80. The coeffi -cients for the composites, with the exception of one, exceeded .90. Results indicate that TOLD-P:4 scores show little time sampling error. The scoring differ-ences were calculated and all coeffi cients exceeded .90. The TOLD-P:4 appears to meet and often exceed the standards for reliability.
ValidityThe examiner’s manual includes extensive informa-tion on the validity of the TOLD-P:4, including vari-ous studies validating content—description validity, criterion prediction validity, and construct identi-fi cation validity. The authors describe their theory of oral language development, indicate why they selected specifi c subtest measures, and provide a rationale for how each subtest matches their theory. The arguments are convincing. Evidence for crite-rion validity is based on correlations with scores on three other oral language measures: the Pragmatic Language Observation Scale, TOLD-I:4, and the WISC-IV Verbal Composite. Correlations were mod-erate, as would be expected, and comparable means and standard deviations were earned on the various measures.
Evidence for construct validity is based on test-ing hypotheses derived from theory, for example, “Because the TOLD-4:P subtests and composites are supposed to measure aspects of language, the test results should differentiate between groups of people known to be normal in language and those known to be poor in language” (Newcomer & Hammill, 2008, p. 60). Overall, there is good evidence for the validity of the TOLD-P:4.
SummaryThe TOLD-P:4 is an individually administered, nontimed, norm-referenced test used to evaluate the spoken language abilities of children ages 4 years to 8 years 11 months. The test contains nine subtests and yields subtest standard scores as well as compos-ite scores. The TOLD-P:4 contains new normative data obtained from a demographic representation of the 2005 U.S. population, an expanded study on bias items, an increased number of validity studies, and an updated and easy to use examiner’s manual. The TOLD-P:4 appears to meet and often exceed the standards for reliability. There is extensive information on content description validity, crite-rion prediction validity, and construct identifi ca-tion validity. The test seems appropriate to identify students’ oral language strengths and weaknesses, identify those who are below their peers in oral lan-guage skills, and document progress in intervention programs.
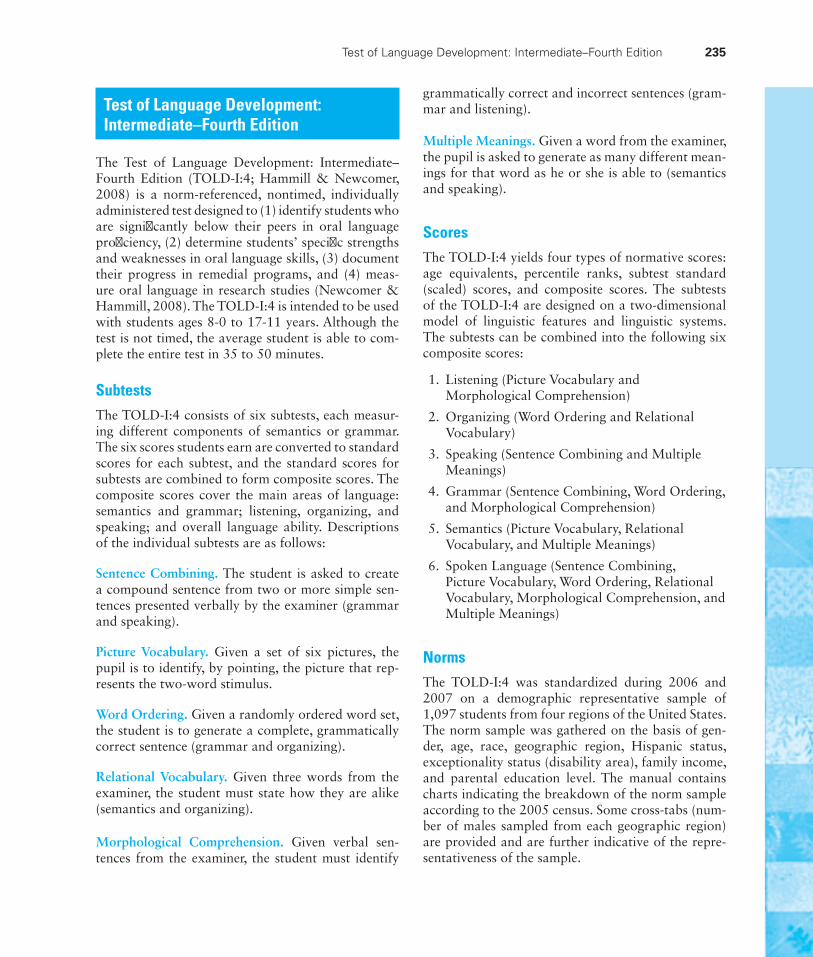
Test of Language Development: Intermediate–Fourth Edition 235
Test of Language Development: Intermediate–Fourth Edition
The Test of Language Development: Intermediate–Fourth Edition (TOLD-I:4; Hammill & Newcomer, 2008) is a norm-referenced, nontimed, individually administered test designed to (1) identify students who are signifi cantly below their peers in oral language profi ciency, (2) determine students’ specifi c strengths and weaknesses in oral language skills, (3) document their progress in remedial programs, and (4) meas-ure oral language in research studies (Newcomer & Hammill, 2008). The TOLD-I:4 is intended to be used with students ages 8-0 to 17-11 years. Although the test is not timed, the average student is able to com-plete the entire test in 35 to 50 minutes.
SubtestsThe TOLD-I:4 consists of six subtests, each measur-ing different components of semantics or grammar. The six scores students earn are converted to standard scores for each subtest, and the standard scores for subtests are combined to form composite scores. The composite scores cover the main areas of language: semantics and grammar; listening, organizing, and speaking; and overall language ability. Descriptions of the individual subtests are as follows:
Sentence Combining. The student is asked to create a compound sentence from two or more simple sen-tences presented verbally by the examiner (grammar and speaking).
Picture Vocabulary. Given a set of six pictures, the pupil is to identify, by pointing, the picture that rep-resents the two-word stimulus.
Word Ordering. Given a randomly ordered word set, the student is to generate a complete, grammatically correct sentence (grammar and organizing).
Relational Vocabulary. Given three words from the examiner, the student must state how they are alike (semantics and organizing).
Morphological Comprehension. Given verbal sen-tences from the examiner, the student must identify
grammatically correct and incorrect sentences (gram-mar and listening).
Multiple Meanings. Given a word from the examiner, the pupil is asked to generate as many different mean-ings for that word as he or she is able to (semantics and speaking).
ScoresThe TOLD-I:4 yields four types of normative scores: age equivalents, percentile ranks, subtest standard (scaled) scores, and composite scores. The subtests of the TOLD-I:4 are designed on a two-dimensional model of linguistic features and linguistic systems. The subtests can be combined into the following six composite scores:
1. Listening (Picture Vocabulary and Morphological Comprehension)
2. Organizing (Word Ordering and Relational Vocabulary)
3. Speaking (Sentence Combining and Multiple Meanings)
4. Grammar (Sentence Combining, Word Ordering, and Morphological Comprehension)
5. Semantics (Picture Vocabulary, Relational Vocabulary, and Multiple Meanings)
6. Spoken Language (Sentence Combining, Picture Vocabulary, Word Ordering, Relational Vocabulary, Morphological Comprehension, and Multiple Meanings)
NormsThe TOLD-I:4 was standardized during 2006 and 2007 on a demographic representative sample of 1,097 students from four regions of the United States. The norm sample was gathered on the basis of gen-der, age, race, geographic region, Hispanic status, exceptionality status (disability area), family income, and parental education level. The manual contains charts indicating the breakdown of the norm sample according to the 2005 census. Some cross-tabs (num-ber of males sampled from each geographic region) are provided and are further indicative of the repre-sentativeness of the sample.
236 Chapter 13 ■ Using Measures of Oral and Written Language
ReliabilityThe TOLD-I:4 uses coeffi cient alpha, test–retest, and scorer differences to measure three different types of test error: content, time, and scorer. Coeffi cient alphas were calculated for each subtest at 10 age intervals; in all subtests, the average coeffi cient alphas exceed .90. The composite scores average a coeffi cient of .90 or greater. Test–retest reliability was completed using two groups of students, ages 8 to 12 years and ages 13 to 17 years; time between assessments was no more than 2 weeks. The reliability coeffi cients for all subtests were at or above .80 and for all composite scores were above .90. The coeffi cients for interscorer agreement all exceeded .90. The TOLD-I:4 appears to meet and often exceed the standards for reliabil-ity necessary for making screening and diagnostic decisions.
ValidityThe examiner’s manual included extensive informa-tion on the validity of the TOLD-I:4, including stud-ies validating the content validity, criterion prediction validity, and construct validity. The authors provide an extensive rationale for selecting each of the sub-tests and for their method of measuring language skills. The arguments seem solid and are convincing. Criterion predictive validity was established by cor-relating performance on TOLD-I:4 subtests and com-posites with performance on eight other measures of spoken language, using a different sample of students for each comparison. There is good evidence for cri-terion predictive validity.
Evidence for construct validity is based on examination of the extent to which hypotheses based on theoretical analysis are supported; for example, “Because oral language ability is known to be related to literacy, the TOLD-4:I should correlate highly with tests of reading and writing.” (Hammill & Newcomer, 2008, p. 56). There is good evidence for the construct validity of the test.
SummaryThe TOLD-I:4 is an individually administered, non-timed, norm-referenced test used to evaluate the spoken language abilities of students ages 8 years 0 months to 17 years 11 months. The test contains six
subtests and yields standard scores, composite scores, and an overall spoken language score. The TOLD-I:4 contains new normative data obtained from a demographic representation of the 2005 U.S. population, the fl oor effect has been eliminated, an expanded study of test bias is provided, and many validity studies have been completed and included in the manual. Also, it contains a new composite (Organizing) and a Multiple Meanings subtest. The General and Multiple Meanings subtests have been renamed to better represent what they assess; the new names are Relational Vocabulary and Morphological Comprehension. The age range has been extended to include students ages 13-0 to 17-11 years, and an updated, easy to use examiner’s manual is included. The TOLD-I:4 appears to meet and often exceed reli-ability standards for making screening or diagnostic decisions. The manual contains extensive information on validity, and the evidence supports the validity of the scale. The test appears appropriate to identify stu-dents’ oral language strengths and weaknesses, iden-tify those who are below their peers in oral language functioning, and document progress in intervention programs.
Oral and Written Language Scales (OWLS)
The Oral and Written Language Scales (OWLS; Carrow-Woolfolk, 1995) are an individually admin-istered assessment of receptive and expressive lan-guage for children and young adults ages 3 through 21 years. The test includes three scales: Listening Comprehension, Oral Expression, and Written Expression. Test results are used to determine broad levels of language skills and specifi c performance in listening, speaking, and writing. The scales are described here.
SubtestsListening Comprehension. This scale is designed to measure understanding of spoken language. It con-sists of 111 items. The examiner reads aloud a verbal stimulus, and the student has to identify which of
Oral and Written Language Scales (OWLS) 237
four pictures is the best response to the stimulus. The scale takes 5 to 15 minutes to administer.
Oral Expression. This scale is a measure of under-standing and use of spoken language. It consists of 96 items. The examiner reads aloud a verbal stimulus and shows a picture. The student responds orally by answering a question, completing a sentence, or gen-erating one or more sentences. The scale takes 10 to 25 minutes to administer.
Written Expression. This scale is an assessment of written language for students 5 to 21 years of age. It is designed to measure ability to use conventions (spelling, punctuation, and so on), use syntactical forms (modifi ers, phrases, sentence structures, and so on), and communicate meaningfully (with appropri-ate content, coherence, organization, and so on). The student responds to direct writing prompts provided by the examiner.
The OWLS is designed to be used in identifi ca-tion of students with language diffi culties and dis-orders, in intervention planning, and in monitoring student progress.
NormsThe OWLS standardization sample consisted of 1,985 students chosen to match the U.S. census data from the 1991 Current Population Survey. The sample was stratifi ed within age group by gender, race, geographic region, and socioeconomic status. Tables in the manual show the comparison of the sample to the U.S. popula-tion. Cross-tabulations are shown only for age and not for other variables. The 14- to 21-year-old age group is overrepresented by students in the North Central region and underrepresented by students in the West.
ScoresThe OWLS produces raw scores, which may be trans-formed to standard scores with a mean of 100 and a standard deviation of 15. In addition, test age equiva-lents, normal-curve equivalents, percentiles, and sta-nines can be obtained. Scores are obtained for each subtest, for an oral language composite, and for a written language composite.
ReliabilityInternal consistency reliability was calculated using students in the standardization. Reliability coeffi cients range from .75 to .89 for Listening Comprehension, from .76 to .91 for Oral Expression, and from .87 to .94 for the oral composite. They range from .77 to .89 for Written Expression. Test–retest reliabilities were computed on a small sample of students who are not described. The coeffi cients range from .58 to .85 for the oral subtests and composite and from .66 to .83 for the Written Expression subtest. Reliabilities are suffi cient to use this measure as a screening device. They are not suffi cient to use it in making important decisions about individual students. This latter, of course, is the use the authors suggest for the test.
ValidityThe authors report the results of a set of external validity studies, each consisting of a comparison of performance on the OWLS to performance on other measures. Sample sizes were small, but correlations were in the expected range. The Written Expression subtest was compared to the Kaufman Test of Educational Achievement, the Peabody Individual Achievement Test–Revised, the Woodcock Reading Mastery Test, and the Peabody Picture Vocabulary Test. Student performance on the Oral Expression and Listening Comprehension subtests was com-pared to performance on the Test for Auditory Comprehension of Language–Revised, the Peabody Picture Vocabulary Test, the Clinical Evaluation of Language Fundamentals–Revised, and the Kaufman Assessment Battery for Children.
SummaryThe OWLS is a language test combining assessment of oral and written language. The test was standard-ized on the same population, so comparisons of stu-dent performance on oral and written measures are enhanced. The manual includes data showing that the standardization sample is generally representative of the U.S. population. Reliability coeffi cients are too low to permit use of this measure in making impor-tant decisions for individuals. Evidence for validity is good, although it is based on a set of studies with limited numbers of students.
238 Chapter 13 ■ Using Measures of Oral and Written Language
Dilemmas in Current Practice
Oral Language IssuesThree issues are particularly troublesome in the assess-ment of oral language: (1) ensuring that the elicited language assessment is a true refl ection of the child’s general sponta-neous language capacity; (2) using the results of standard-ized tests to generate effective therapy; and (3) adapting assessment to individuals who do not match the character-istics of the standardization sample. All these dilemmas stem from the limited nature of the standardized tests and must be addressed in practice.
From a practical standpoint, the clinician must use stan-dardized tests to identify a child with a language impairment. However, as noted previously in this chapter, such instru-ments may not directly measure a child’s true language abilities. Thus, the clinician must supplement the standard tests with nonstandard spontaneous language sampling. In addition, if possible, the child should be observed in a num-ber of settings outside the formal testing situation. After the spontaneous samples have been gathered, the results of these analyses should be compared with the performance on the standardized tests.
Selection of targets for intervention is one of the more dif-fi cult tasks facing the clinician. Many standardized tests that are useful for identifying language disorders in children may not lend themselves to determining effi cient treatment. The clinician must evaluate the results of both the standard and the nonstandard assessment procedures and decide which language skills are most important to the child. Although it is tempting simply to train the child to perform better on a particular test (hence boosting performance on that instru-ment), the clinician must bear in mind that such tasks are often metalinguistic in nature and will not ultimately result in generalized language skills. Rather, the focus of treatment should be on those language behaviors and structures that are needed for improved language competence in the home and in the classroom.
Authors’ ViewpointIn today’s language assessment environment, with a plethora of multicultural and socioeconomic variation within case-loads, a clinician is bound to encounter many children who differ in one or more respects from the normative sample of a particular test. Indeed, clinicians are likely to see children who do not match the normative sample of any standard-ized test. When this occurs, the clinician must interpret the
scores derived from these tests conservatively. Information from nonstandard assessment becomes even more impor-tant, and the clinician should obtain reports from parents, teachers, and peers regarding their impressions of the child’s language competence. The clinician should also determine whether local norms have been developed for the standard and nonstandard assessment procedures. As previously noted, it is inappropriate to treat multicultural language dif-ferences as if they were language disorders. However, the clinician performing an assessment must judge whether the child’s language is disordered within his or her language community and what impact such disorders may have on classroom performance and communication skills generally.
Written Language IssuesThere are two serious problems in the assessment of written language.
Problem 1The fi rst problem involves assessing the content of writ-ten expression. The content of written language is usually scored holistically and subjectively. Holistic evaluations tend to be unreliable. When content on the same topic and of the same genre (such as narratives) is scored, interscorer agreement varies from the .50 to .65 range (as in Breland, 1983; Breland, Camp, Jones, Morris, & Rock, 1987) to the .75 to .90 range immediately following intensive training (such as Educational Testing Service, 1990). Consistent scoring is even more diffi cult when topics and genres vary. Interscorer agreement can decrease to a range of .35 to .45 when the writing tasks vary (as in Breland, 1983; Breland et al., 1987). Subjective scoring and decision making are susceptible to the biasing effects associated with racial, ethnic, social class, gender, and disability stereotypes.
Authors’ ViewpointWe believe the best alternative to holistic and subjective scoring schemes is to use a measure of writing fl uency as an indicator of content generation. Two options have received some support in the research literature: (1) the number of words written (Shinn, Tindall, & Stein, 1988) and (2) the per-centage of correctly written words (Isaacson, 1988).
Problem 2The second problem is in identifying a match between what is taught in the school curriculum and what is tested. The
Chapter Comprehension Questions 239
great variation in the time at which various skills and facts are taught renders a general test of achievement inappro-priate. This dilemma also attends diagnostic assessment of written language. Commercially prepared tests have doubtful validity for planning individual programs and eval-uating the progress of individual pupils.
Authors’ ViewpointWe recommend that teachers and diagnosticians con-struct criterion-referenced achievement tests that closely parallel the curricula followed by the students being tested.
In cases in which normative data are required, there are three choices. Diagnosticians can (1) select the devices that most closely parallel the curriculum, (2) develop local norms, or (3) select individual students for comparative purposes. Care should be exercised in selecting methods of assessing language skills. For example, it is probably better to test pupils in ways that are familiar to them. Thus, if the teacher’s weekly spelling test is from dictation, then spelling tests using dictation are probably preferable to tests requiring the students to identify incorrectly spelled words.
CHAPTER COMPREHENSION QUESTIONSWrite your answers to each of the following questions, and then compare your responses to the text or the study guide.
1. Describe fi ve processes associated with communication.
2. Explain how cultural background may play a role in determining appropriate language expectations.
3. Identify and describe the three techniques for obtaining a sample of a child’s language.
4. What are the two major components of written language, and how might they be assessed?
5. What are some of the dilemmas associated with assessment of oral and written language?
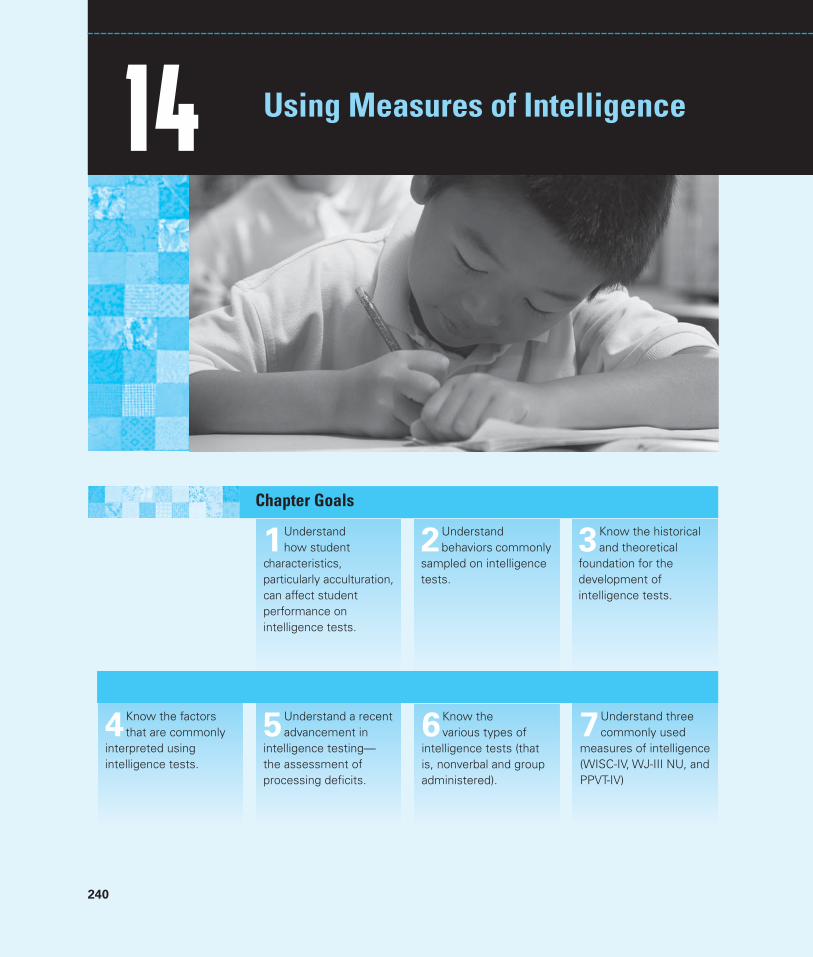
240
Chapter Goals
1Understand how student
characteristics, particularly acculturation, can affect student performance on intelligence tests.
2Understand behaviors commonly
sampled on intelligence tests.
3Know the historical and theoretical
foundation for the development of intelligence tests.
14
4Know the factors that are commonly
interpreted using intelligence tests.
5Understand a recent advancement in
intelligence testing—the assessment of processing defi cits.
6Know the various types of
intelligence tests (that is, nonverbal and group administered).
7Understand three commonly used
measures of intelligence (WISC-IV, WJ-III NU, and PPVT-IV)
Using Measures of Intelligence
Using Measures of Intelligence 241
Key Terms Thurstone
Cattell–Horn–Carroll theory
acculturation
processing defi cits
nonverbal tests
intelligence factors
Wechsler Intelligence Scale for Children–IV (WISC-IV)
Woodcock–Johnson III Normative Update (WJ-III NU)
Peabody Picture Vocabulary Test–IV (PPVT-IV)
No other area of assessment has generated as much attention, controversy, and debate as the testing of what we call “intelligence.” For centuries, philosophers, psychologists, educators, and laypeople have debated the meaning of intelligence. Numerous defi nitions of the term intelligence have been proposed, with each defi nition serving as a stimulus for counterdefi nitions and counterproposals. Several theories have been advanced to describe and explain intelligence and its development. Some theorists argue that intelligence is a general ability that enables people to do many different things, whereas other theorists contend that there are multiple intelligences and that people are better at some things than others. Some argue that, for the most part, intelligence is genetically determined (hereditary), inborn, and something you get from your parents. Others contend that intelligence is, for the most part, learned—that it is acquired through experience. Most theo-rists today recognize the importance of both heredity and experience, including the impact of parental education, parental experience, maternal nutrition, maternal substance abuse, and many other factors. However, most theorists take positions on the relative importance of these factors.
Both the interpretation of group differences in performance on intelligence tests and the practice of testing the intelligence of schoolchildren have been top-ics of recurrent controversy and debate. In some instances, the courts have acted to curtail or halt intelligence assessment in the public schools; in other cases, the courts have defi ned what composes intelligence assessment. Debate and contro-versy have fl ourished about whether intelligence tests should be given, what they measure, and how different levels of performance attained by different popula-tions are to be explained.
During the past 25 years, there has been a signifi cant decline in the use of intelligence tests in schools as a result of several factors. Teachers and related services personnel have found that knowing the score a student earns on an intel-ligence test (IQ or mental age) has not been especially helpful in making decisions about specifi c instructional interventions or teaching approaches to use. It has only provided them with general information about how rapidly to pace instruc-tion. Also, it is argued that scores on intelligence tests too often are used to set low expectations for students, resulting in diminished effort to teach students who earn low scores. This has been the case especially with students who were labeled mentally retarded on the basis of low scores on intelligence tests. In cases in which specifi c groups of students (such as African American or Hispanic stu-dents) have earned lower scores on tests and this has resulted in disproportionate placement of these groups of students in special education or diminished expecta-tions for performance, the courts have found intelligence tests discriminatory and mandated an end to their use.
242 Chapter 14 ■ Using Measures of Intelligence
No one has seen a specifi c thing called “intelligence.” Rather, we observe dif-ferences in the ways people behave—either differences in everyday behavior in a variety of situations or differences in responses to standard stimuli or sets of stimuli; then we attribute those differences to something we describe as intelligence. In this sense, intelligence is an inferred entity—a term or construct we use to explain differences in present behavior and to predict differences in future behavior.
We have repeatedly stressed the fact that all tests, including intelligence tests, assess samples of behavior. Regardless of how an individual’s performance on any given test is viewed and interpreted, intelligence tests—and the items on those tests—simply sample behaviors. A variety of different kinds of behavior samplings are used to assess intelligence; in most cases, the kinds of behaviors sampled refl ect a test author’s conception of intelligence. The behavior samples are combined in different ways by different authors based on how they conceive of intelligence. In this chapter, we review the kinds of behaviors sampled by intelligence tests, with emphasis on the psychological demands of different test items, as a function of pupil characteristics. We also describe several ways in which intelligence theo-rists and test authors have conceptualized the structure of intelligence.
In evaluating the performance of individuals on intelligence tests, teachers, administrators, counselors, and diagnostic specialists must go beyond test names and scores to examine the kinds of behaviors sampled on the test. They must be will-ing to question the ways in which test stimuli are presented, to question the response requirements, and to evaluate the psychological demands placed on the individual.
1 The Effect of Pupil Characteristics on Assessment of Intelligence
Acculturation is the most important characteristic to consider in evaluating per-formance on intelligence tests. Acculturation refers to an individual’s particular set of background experiences and opportunities to learn in both formal and informal educational settings. This, in turn, depends on the person’s culture, the experiences available in the person’s environment, and the length of time the person has had to assimilate those experiences. The culture in which an individual lives and the length of time the person has lived in that culture may infl uence the psychological demands presented by a test item. Simply knowing the kind of behavior sampled by a test is not enough because the same test item may create different psychologi-cal demands for people undergoing different experiences and acculturation.
Suppose, for example, that we assess intelligence by asking children to tell how hail and sleet are alike. Children may fail the item for very different reasons. Consider Juan (a student who recently moved to the United States from Mexico) and Marcie (a student from Michigan). Juan does not know what hail and sleet are, so he stands little chance of telling how hail and sleet are alike; he will fail the item simply because he does not know the meanings of the words. Marcie may know what hail is and what sleet is, but she fails the item because she is unable to inte-grate these two words into a conceptual category (precipitation). The psychological demand of the item changes as a function of the children’s knowledge. For the child who has not learned the meanings of the words, the item assesses vocabulary. For the child who knows the meanings of the words, the item is a generalization task.
The Effect of Pupil Characteristics on Assessment of Intelligence 243
In considering how individuals perform on intelligence tests, we need to know how acculturation affects test performance. Items on intelligence tests range along a continuum from items that sample fundamental psychological behaviors that are relatively unaffected by the test taker’s learning history to items that sample primarily learned behavior. To determine exactly what is being assessed, we need to know the essential background of the student. Consider the following item:
Jeff went walking in the forest. He saw a porcupine that he tried to take home for a pet. It got away from him, but when he got home, his father took him to the doctor. Why?
For a student who knows what a porcupine is, that a porcupine has quills, and that quills are sharp, the item can assess comprehension, abstract reason-ing, and problem-solving skill. The student who does not know any of this information may very well fail the item. In this case, failure is due not to an inability to comprehend or solve the problem but to a defi ciency in background experience.
Similarly, we could ask a child to identify the seasons of the year. The experi-ences available in children’s environments are refl ected in the way they respond to this item. Children from central Illinois, who experience four discernibly dif-ferent climatic conditions, may well respond “summer, fall, winter, and spring.” Children from central Pennsylvania, who also experience four discernibly differ-ent climatic conditions but who live in an environment in which hunting is preva-lent, might respond “buck season, doe season, small game and fi shing.” Within specifi c cultures, both responses are logical and appropriate; only one is scored as correct.
Items on intelligence tests also sample different behaviors as a function of the age of the child assessed. Age and acculturation are positively related: Older children in general have had more opportunities to acquire the skills and cul-tural knowledge assessed by intelligence tests. The performances of 5-year-old children on an item requiring them to tell how a cardinal, a blue jay, and a swallow are alike are almost entirely a function of their knowledge of the word meanings. Most college students know the meanings of the three words; for them, the item assesses primarily their ability to identify similarities and to inte-grate words or objects into a conceptual category. As children get older, they have increasing opportunities to acquire the elements of the collective intelli-gence of a culture.
The interaction between acculturation and the behavior sampled determines the psychological demands of an intelligence test item. For this reason, it is impos-sible to defi ne exactly what any one intelligence test would assess for any one student. Identical test items place different psychological demands on different children. Thirteen kinds of behaviors sampled by intelligence tests are described later in this chapter. These types of behavior will vary in their psychological demands based on the test taker’s experience and acculturation. Given the great number of potential questions that could be asked for each type of question as well as the number of combinations of question types, the number of questions is practically infi nite.
Used appropriately, intelligence tests can provide information that can lead to the enhancement of both individual opportunity and protection of the rights of students. Used inappropriately, they can restrict opportunity and rights.
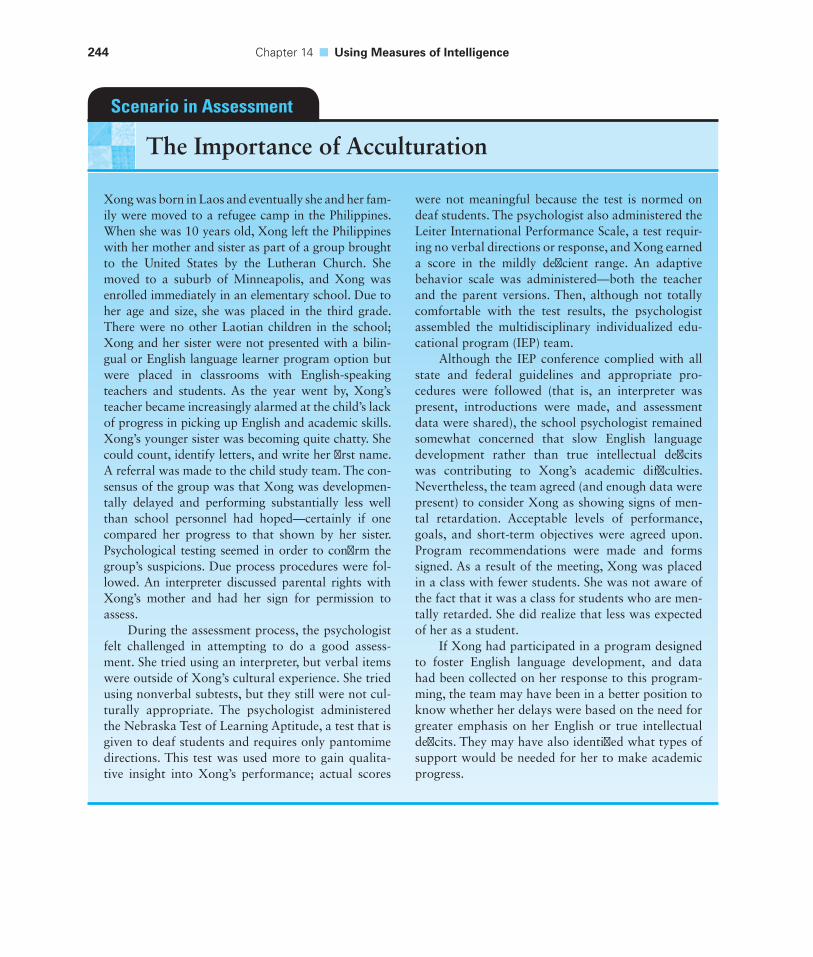
244 Chapter 14 ■ Using Measures of Intelligence
Xong was born in Laos and eventually she and her fam-ily were moved to a refugee camp in the Philippines. When she was 10 years old, Xong left the Philippines with her mother and sister as part of a group brought to the United States by the Lutheran Church. She moved to a suburb of Minneapolis, and Xong was enrolled immediately in an elementary school. Due to her age and size, she was placed in the third grade. There were no other Laotian children in the school; Xong and her sister were not presented with a bilin-gual or English language learner program option but were placed in classrooms with English-speaking teachers and students. As the year went by, Xong’s teacher became increasingly alarmed at the child’s lack of progress in picking up English and academic skills. Xong’s younger sister was becoming quite chatty. She could count, identify letters, and write her fi rst name. A referral was made to the child study team. The con-sensus of the group was that Xong was developmen-tally delayed and performing substantially less well than school personnel had hoped—certainly if one compared her progress to that shown by her sister. Psychological testing seemed in order to confi rm the group’s suspicions. Due process procedures were fol-lowed. An interpreter discussed parental rights with Xong’s mother and had her sign for permission to assess.
During the assessment process, the psychologist felt challenged in attempting to do a good assess-ment. She tried using an interpreter, but verbal items were outside of Xong’s cultural experience. She tried using nonverbal subtests, but they still were not cul-turally appropriate. The psychologist administered the Nebraska Test of Learning Aptitude, a test that is given to deaf students and requires only pantomime directions. This test was used more to gain qualita-tive insight into Xong’s performance; actual scores
were not meaningful because the test is normed on deaf students. The psychologist also administered the Leiter International Performance Scale, a test requir-ing no verbal directions or response, and Xong earned a score in the mildly defi cient range. An adaptive behavior scale was administered—both the teacher and the parent versions. Then, although not totally comfortable with the test results, the psychologist assembled the multidisciplinary individualized edu-cational program (IEP) team.
Although the IEP conference complied with all state and federal guidelines and appropriate pro-cedures were followed (that is, an interpreter was present, introductions were made, and assessment data were shared), the school psychologist remained somewhat concerned that slow English language development rather than true intellectual defi cits was contributing to Xong’s academic diffi culties. Nevertheless, the team agreed (and enough data were present) to consider Xong as showing signs of men-tal retardation. Acceptable levels of performance, goals, and short-term objectives were agreed upon. Program recommendations were made and forms signed. As a result of the meeting, Xong was placed in a class with fewer students. She was not aware of the fact that it was a class for students who are men-tally retarded. She did realize that less was expected of her as a student.
If Xong had participated in a program designed to foster English language development, and data had been collected on her response to this program-ming, the team may have been in a better position to know whether her delays were based on the need for greater emphasis on her English or true intellectual defi cits. They may have also identifi ed what types of support would be needed for her to make academic progress.
Scenario in Assessment
The Importance of Acculturation
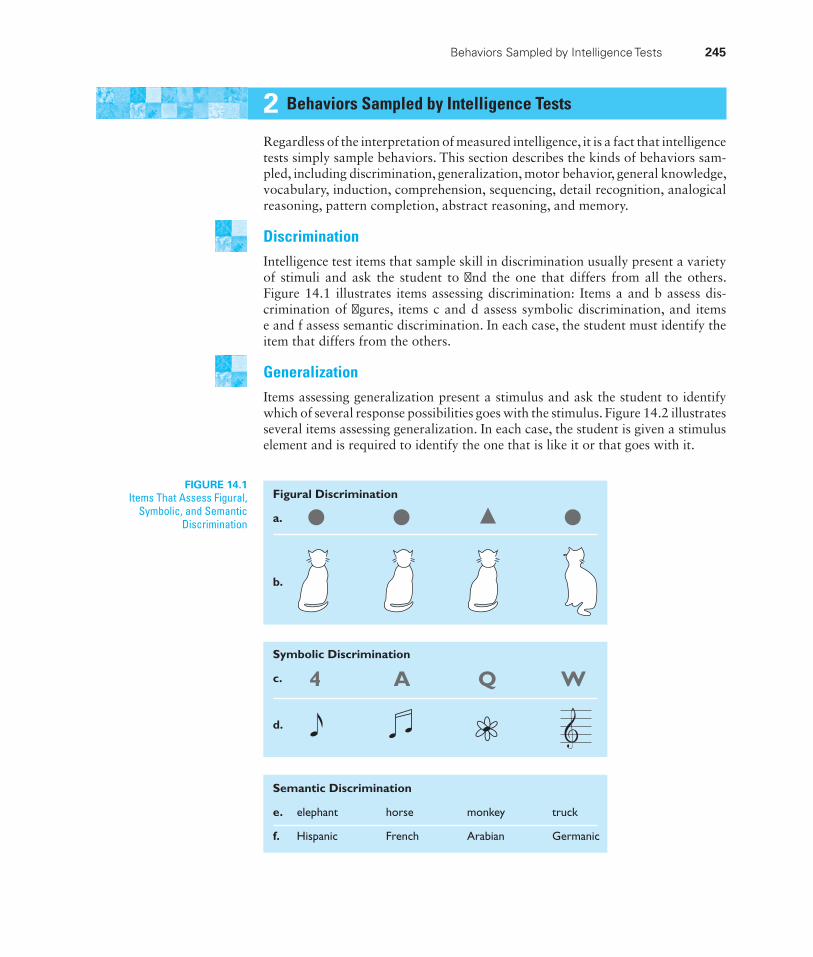
Behaviors Sampled by Intelligence Tests 245
2 Behaviors Sampled by Intelligence Tests
Regardless of the interpretation of measured intelligence, it is a fact that intelligence tests simply sample behaviors. This section describes the kinds of behaviors sam-pled, including discrimination, generalization, motor behavior, general knowledge, vocabulary, induction, comprehension, sequencing, detail recognition, analogical reasoning, pattern completion, abstract reasoning, and memory.
DiscriminationIntelligence test items that sample skill in discrimination usually present a variety of stimuli and ask the student to fi nd the one that differs from all the others. Figure 14.1 illustrates items assessing discrimination: Items a and b assess dis-crimination of fi gures, items c and d assess symbolic discrimination, and items e and f assess semantic discrimination. In each case, the student must identify the item that differs from the others.
GeneralizationItems assessing generalization present a stimulus and ask the student to identify which of several response possibilities goes with the stimulus. Figure 14.2 illustrates several items assessing generalization. In each case, the student is given a stimulus element and is required to identify the one that is like it or that goes with it.
FIGURE 14.1Items That Assess Figural,
Symbolic, and Semantic Discrimination
Figural Discrimination
a.
b.
Symbolic Discrimination
c.
d.
Semantic Discrimination
e. elephant horse monkey truck
f. Hispanic French Arabian Germanic
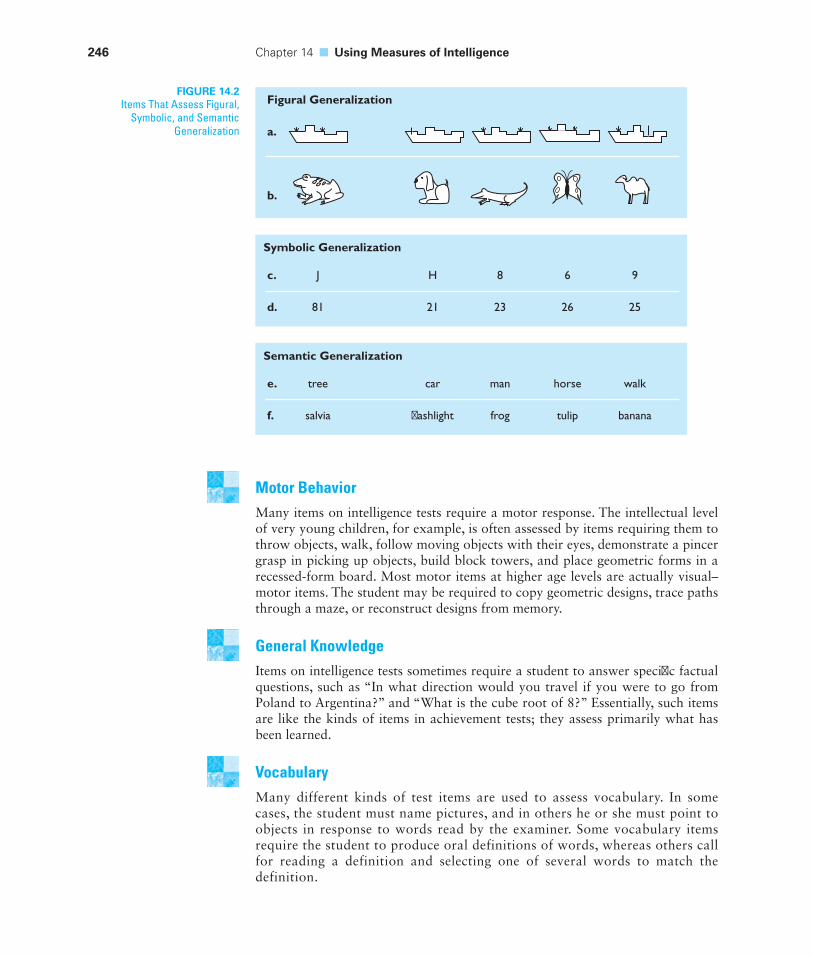
246 Chapter 14 ■ Using Measures of Intelligence
Motor BehaviorMany items on intelligence tests require a motor response. The intellectual level of very young children, for example, is often assessed by items requiring them to throw objects, walk, follow moving objects with their eyes, demonstrate a pincer grasp in picking up objects, build block towers, and place geometric forms in a recessed-form board. Most motor items at higher age levels are actually visual–motor items. The student may be required to copy geometric designs, trace paths through a maze, or reconstruct designs from memory.
General KnowledgeItems on intelligence tests sometimes require a student to answer specifi c factual questions, such as “In what direction would you travel if you were to go from Poland to Argentina?” and “What is the cube root of 8?” Essentially, such items are like the kinds of items in achievement tests; they assess primarily what has been learned.
VocabularyMany different kinds of test items are used to assess vocabulary. In some cases, the student must name pictures, and in others he or she must point to objects in response to words read by the examiner. Some vocabulary items require the student to produce oral definitions of words, whereas others call for reading a definition and selecting one of several words to match the definition.
Figural Generalization
a.
b.
c. J H 8 6 9
d. 81 21 23 26 25
Symbolic Generalization
e. tree car man horse walk
f. salvia flashlight frog tulip banana
Semantic Generalization
FIGURE 14.2Items That Assess Figural,
Symbolic, and Semantic Generalization
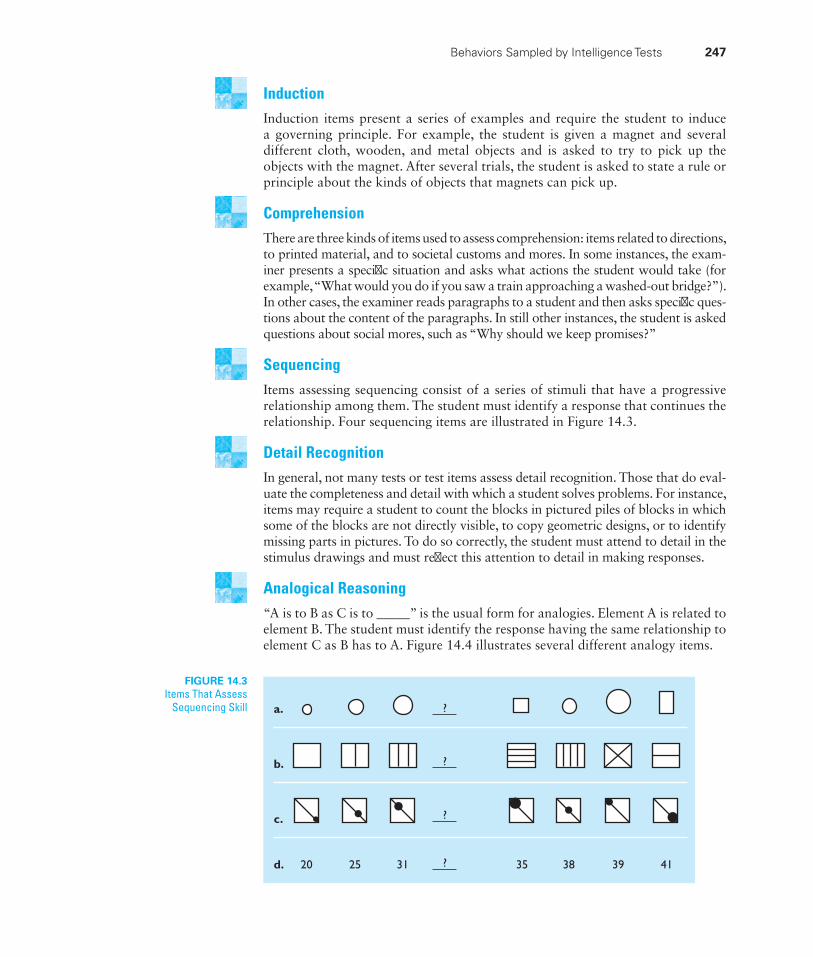
Behaviors Sampled by Intelligence Tests 247
InductionInduction items present a series of examples and require the student to induce a governing principle. For example, the student is given a magnet and several different cloth, wooden, and metal objects and is asked to try to pick up the objects with the magnet. After several trials, the student is asked to state a rule or principle about the kinds of objects that magnets can pick up.
ComprehensionThere are three kinds of items used to assess comprehension: items related to directions, to printed material, and to societal customs and mores. In some instances, the exam-iner presents a specifi c situation and asks what actions the student would take (for example, “What would you do if you saw a train approaching a washed-out bridge?”). In other cases, the examiner reads paragraphs to a student and then asks specifi c ques-tions about the content of the paragraphs. In still other instances, the student is asked questions about social mores, such as “Why should we keep promises?”
SequencingItems assessing sequencing consist of a series of stimuli that have a progressive relationship among them. The student must identify a response that continues the relationship. Four sequencing items are illustrated in Figure 14.3.
Detail RecognitionIn general, not many tests or test items assess detail recognition. Those that do eval-uate the completeness and detail with which a student solves problems. For instance, items may require a student to count the blocks in pictured piles of blocks in which some of the blocks are not directly visible, to copy geometric designs, or to identify missing parts in pictures. To do so correctly, the student must attend to detail in the stimulus drawings and must refl ect this attention to detail in making responses.
Analogical Reasoning“A is to B as C is to _____” is the usual form for analogies. Element A is related to element B. The student must identify the response having the same relationship to element C as B has to A. Figure 14.4 illustrates several different analogy items.
a.
b.
c.
d. 20 25 31 35 38 39 41
?
?
?
?
FIGURE 14.3Items That Assess
Sequencing Skill
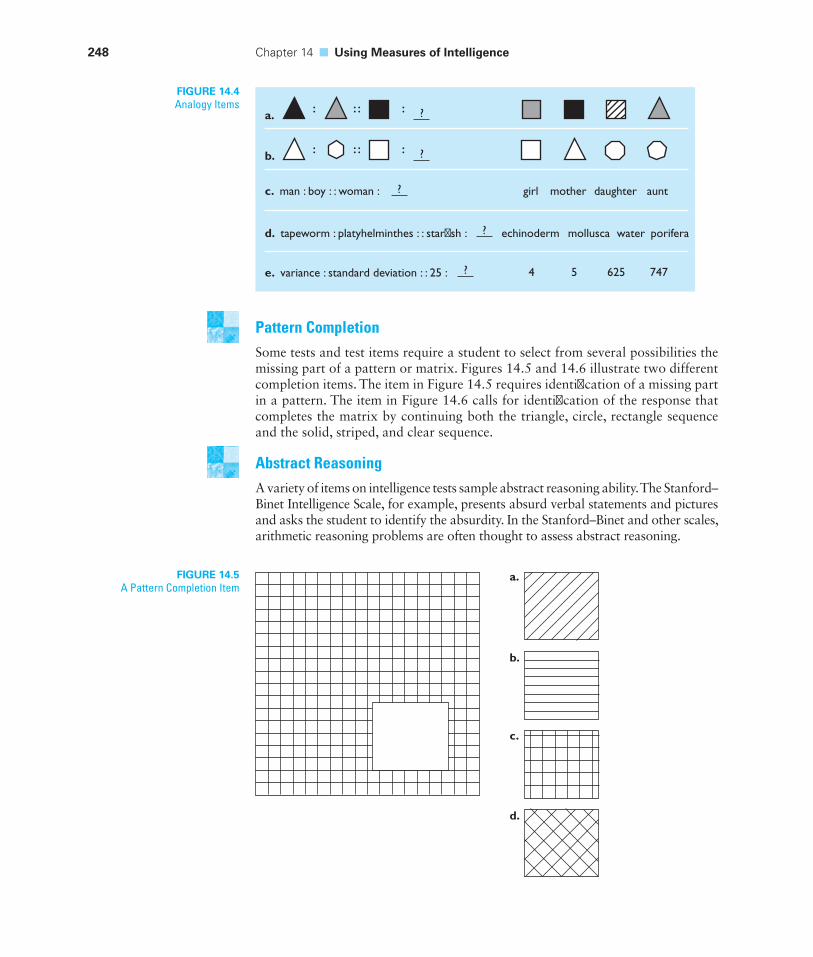
248 Chapter 14 ■ Using Measures of Intelligence
Pattern CompletionSome tests and test items require a student to select from several possibilities the missing part of a pattern or matrix. Figures 14.5 and 14.6 illustrate two different completion items. The item in Figure 14.5 requires identifi cation of a missing part in a pattern. The item in Figure 14.6 calls for identifi cation of the response that completes the matrix by continuing both the triangle, circle, rectangle sequence and the solid, striped, and clear sequence.
Abstract ReasoningA variety of items on intelligence tests sample abstract reasoning ability. The Stanford–Binet Intelligence Scale, for example, presents absurd verbal statements and pictures and asks the student to identify the absurdity. In the Stanford–Binet and other scales, arithmetic reasoning problems are often thought to assess abstract reasoning.
a.
b.
c. man : boy : : woman : girl mother daughter aunt
e. variance : standard deviation : : 25 :
d. tapeworm : platyhelminthes : : starfish : echinoderm
4 5 625 747
mollusca water porifera
?
?
?
?
?
a.
b.
c.
d.
FIGURE 14.4Analogy Items
FIGURE 14.5A Pattern Completion Item
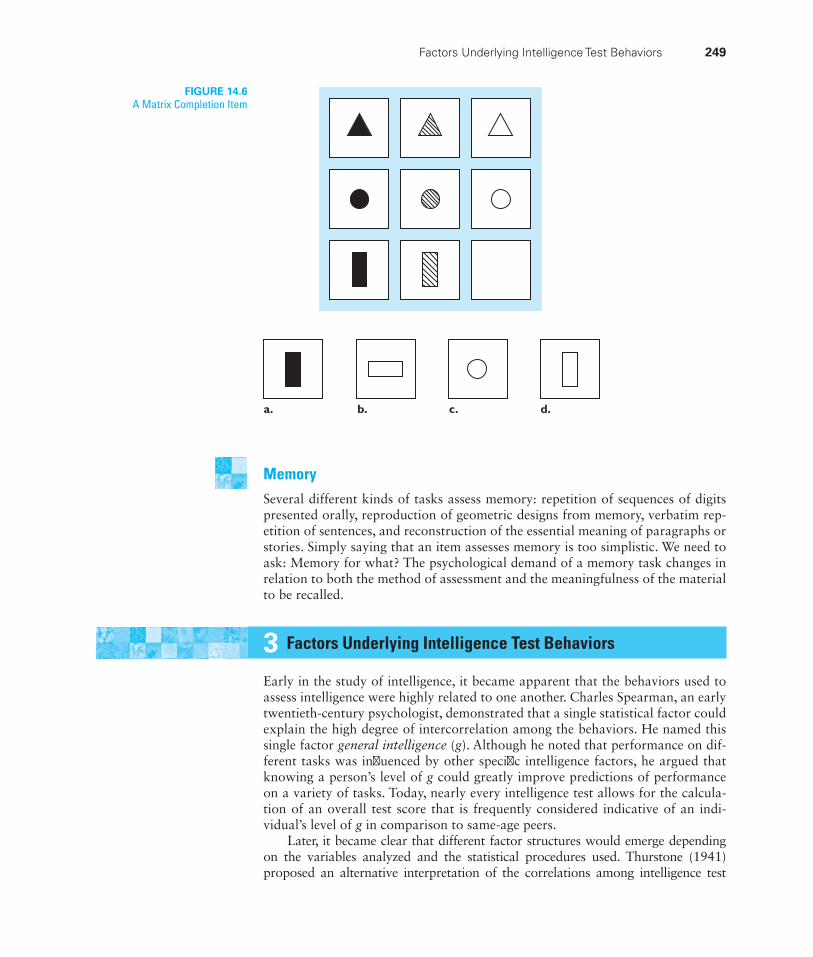
Factors Underlying Intelligence Test Behaviors 249
MemorySeveral different kinds of tasks assess memory: repetition of sequences of digits presented orally, reproduction of geometric designs from memory, verbatim rep-etition of sentences, and reconstruction of the essential meaning of paragraphs or stories. Simply saying that an item assesses memory is too simplistic. We need to ask: Memory for what? The psychological demand of a memory task changes in relation to both the method of assessment and the meaningfulness of the material to be recalled.
3 Factors Underlying Intelligence Test Behaviors
Early in the study of intelligence, it became apparent that the behaviors used to assess intelligence were highly related to one another. Charles Spearman, an early twentieth-century psychologist, demonstrated that a single statistical factor could explain the high degree of intercorrelation among the behaviors. He named this single factor general intelligence (g). Although he noted that performance on dif-ferent tasks was infl uenced by other specifi c intelligence factors, he argued that knowing a person’s level of g could greatly improve predictions of performance on a variety of tasks. Today, nearly every intelligence test allows for the calcula-tion of an overall test score that is frequently considered indicative of an indi-vidual’s level of g in comparison to same-age peers.
Later, it became clear that different factor structures would emerge depending on the variables analyzed and the statistical procedures used. Thurstone (1941) proposed an alternative interpretation of the correlations among intelligence test
a. b. c. d.
FIGURE 14.6A Matrix Completion Item
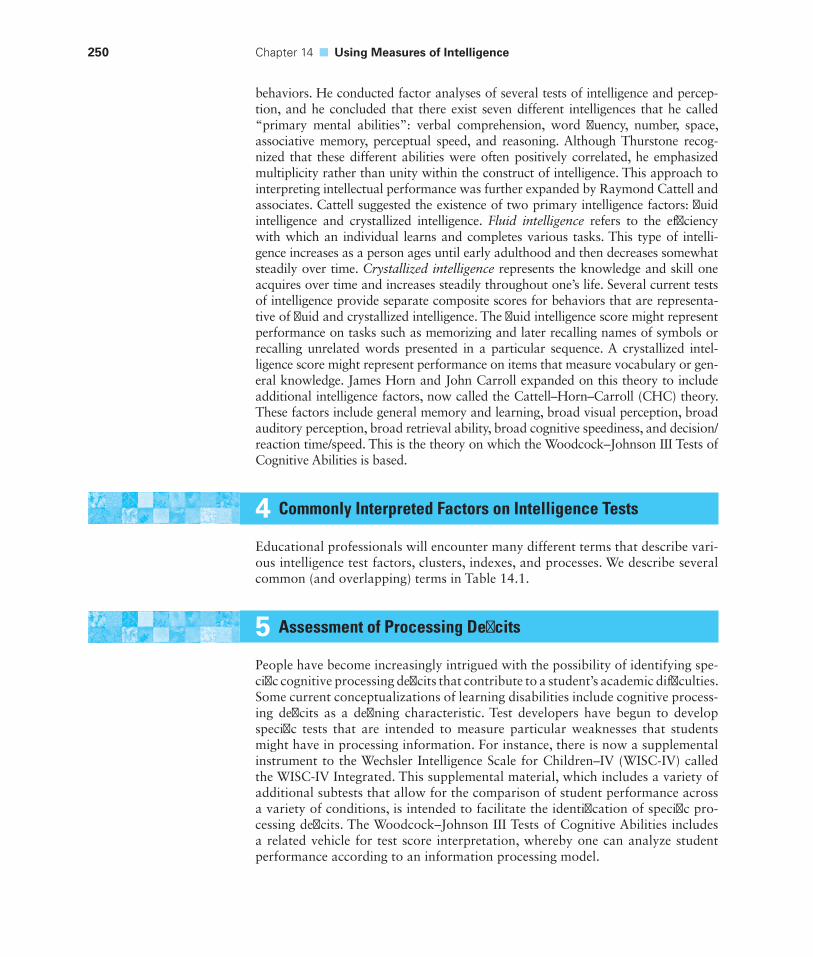
250 Chapter 14 ■ Using Measures of Intelligence
behaviors. He conducted factor analyses of several tests of intelligence and percep-tion, and he concluded that there exist seven different intelligences that he called “primary mental abilities”: verbal comprehension, word fl uency, number, space, associative memory, perceptual speed, and reasoning. Although Thurstone recog-nized that these different abilities were often positively correlated, he emphasized multiplicity rather than unity within the construct of intelligence. This approach to interpreting intellectual performance was further expanded by Raymond Cattell and associates. Cattell suggested the existence of two primary intelligence factors: fl uid intelligence and crystallized intelligence. Fluid intelligence refers to the effi ciency with which an individual learns and completes various tasks. This type of intelli-gence increases as a person ages until early adulthood and then decreases somewhat steadily over time. Crystallized intelligence represents the knowledge and skill one acquires over time and increases steadily throughout one’s life. Several current tests of intelligence provide separate composite scores for behaviors that are representa-tive of fl uid and crystallized intelligence. The fl uid intelligence score might represent performance on tasks such as memorizing and later recalling names of symbols or recalling unrelated words presented in a particular sequence. A crystallized intel-ligence score might represent performance on items that measure vocabulary or gen-eral knowledge. James Horn and John Carroll expanded on this theory to include additional intelligence factors, now called the Cattell–Horn–Carroll (CHC) theory. These factors include general memory and learning, broad visual perception, broad auditory perception, broad retrieval ability, broad cognitive speediness, and decision/reaction time/speed. This is the theory on which the Woodcock–Johnson III Tests of Cognitive Abilities is based.
4 Commonly Interpreted Factors on Intelligence Tests
Educational professionals will encounter many different terms that describe vari-ous intelligence test factors, clusters, indexes, and processes. We describe several common (and overlapping) terms in Table 14.1.
5 Assessment of Processing Defi cits
People have become increasingly intrigued with the possibility of identifying spe-cifi c cognitive processing defi cits that contribute to a student’s academic diffi culties. Some current conceptualizations of learning disabilities include cognitive process-ing defi cits as a defi ning characteristic. Test developers have begun to develop specifi c tests that are intended to measure particular weaknesses that students might have in processing information. For instance, there is now a supplemental instrument to the Wechsler Intelligence Scale for Children–IV (WISC-IV) called the WISC-IV Integrated. This supplemental material, which includes a variety of additional subtests that allow for the comparison of student performance across a variety of conditions, is intended to facilitate the identifi cation of specifi c pro-cessing defi cits. The Woodcock–Johnson III Tests of Cognitive Abilities includes a related vehicle for test score interpretation, whereby one can analyze student performance according to an information processing model.
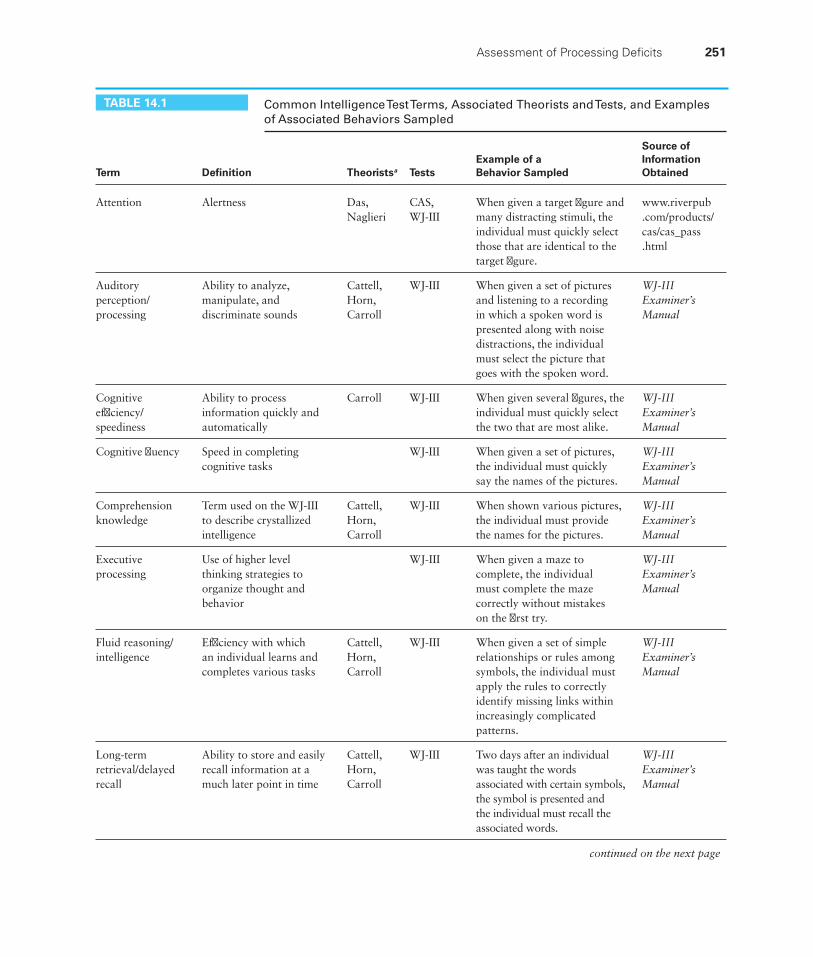
Assessment of Processing Defi cits 251
TABLE 14.1 Common Intelligence Test Terms, Associated Theorists and Tests, and Examples of Associated Behaviors Sampled
Term Defi nition Theoristsa TestsExample of a Behavior Sampled
Source of Information Obtained
Attention Alertness Das, Naglieri
CAS, WJ-III
When given a target fi gure and many distracting stimuli, the individual must quickly select those that are identical to the target fi gure.
www.riverpub.com/products/cas/cas_pass.html
Auditory perception/processing
Ability to analyze, manipulate, and discriminate sounds
Cattell, Horn, Carroll
WJ-III When given a set of pictures and listening to a recording in which a spoken word is presented along with noise distractions, the individual must select the picture that goes with the spoken word.
WJ-III Examiner’s Manual
Cognitive effi ciency/speediness
Ability to process information quickly and automatically
Carroll WJ-III When given several fi gures, the individual must quickly select the two that are most alike.
WJ-III Examiner’s Manual
Cognitive fl uency Speed in completing cognitive tasks
WJ-III When given a set of pictures, the individual must quickly say the names of the pictures.
WJ-III Examiner’s Manual
Comprehension knowledge
Term used on the WJ-III to describe crystallized intelligence
Cattell, Horn, Carroll
WJ-III When shown various pictures, the individual must provide the names for the pictures.
WJ-III Examiner’s Manual
Executive processing
Use of higher level thinking strategies to organize thought and behavior
WJ-III When given a maze to complete, the individual must complete the maze correctly without mistakes on the fi rst try.
WJ-III Examiner’s Manual
Fluid reasoning/intelligence
Effi ciency with which an individual learns and completes various tasks
Cattell, Horn, Carroll
WJ-III When given a set of simple relationships or rules among symbols, the individual must apply the rules to correctly identify missing links within increasingly complicated patterns.
WJ-III Examiner’s Manual
Long-term retrieval/delayed recall
Ability to store and easily recall information at a much later point in time
Cattell, Horn, Carroll
WJ-III Two days after an individual was taught the words associated with certain symbols, the symbol is presented and the individual must recall the associated words.
WJ-III Examiner’s Manual
continued on the next page
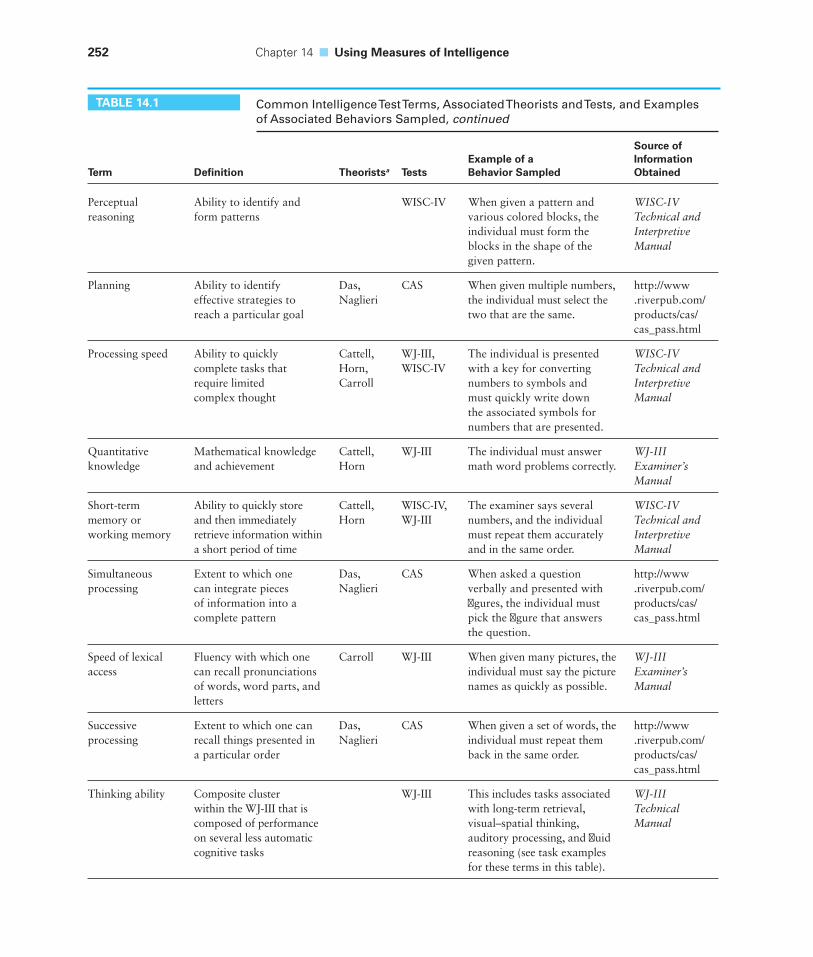
252 Chapter 14 ■ Using Measures of Intelligence
TABLE 14.1 Common Intelligence Test Terms, Associated Theorists and Tests, and Examples of Associated Behaviors Sampled, continued
Term Defi nition Theoristsa TestsExample of a Behavior Sampled
Source of Information Obtained
Perceptual reasoning
Ability to identify and form patterns
WISC-IV When given a pattern and various colored blocks, the individual must form the blocks in the shape of the given pattern.
WISC-IV Technical and Interpretive Manual
Planning Ability to identify effective strategies to reach a particular goal
Das, Naglieri
CAS When given multiple numbers, the individual must select the two that are the same.
http://www.riverpub.com/products/cas/cas_pass.html
Processing speed Ability to quickly complete tasks that require limited complex thought
Cattell, Horn, Carroll
WJ-III, WISC-IV
The individual is presented with a key for converting numbers to symbols and must quickly write down the associated symbols for numbers that are presented.
WISC-IV Technical and Interpretive Manual
Quantitative knowledge
Mathematical knowledge and achievement
Cattell, Horn
WJ-III The individual must answer math word problems correctly.
WJ-III Examiner’s Manual
Short-term memory or working memory
Ability to quickly store and then immediately retrieve information within a short period of time
Cattell, Horn
WISC-IV, WJ-III
The examiner says several numbers, and the individual must repeat them accurately and in the same order.
WISC-IV Technical and Interpretive Manual
Simultaneous processing
Extent to which one can integrate pieces of information into a complete pattern
Das, Naglieri
CAS When asked a question verbally and presented with fi gures, the individual must pick the fi gure that answers the question.
http://www.riverpub.com/products/cas/cas_pass.html
Speed of lexical access
Fluency with which one can recall pronunciations of words, word parts, and letters
Carroll WJ-III When given many pictures, the individual must say the picture names as quickly as possible.
WJ-III Examiner’s Manual
Successive processing
Extent to which one can recall things presented in a particular order
Das, Naglieri
CAS When given a set of words, the individual must repeat them back in the same order.
http://www.riverpub.com/products/cas/cas_pass.html
Thinking ability Composite cluster within the WJ-III that is composed of performance on several less automatic cognitive tasks
WJ-III This includes tasks associated with long-term retrieval, visual–spatial thinking, auditory processing, and fl uid reasoning (see task examples for these terms in this table).
WJ-III Technical Manual
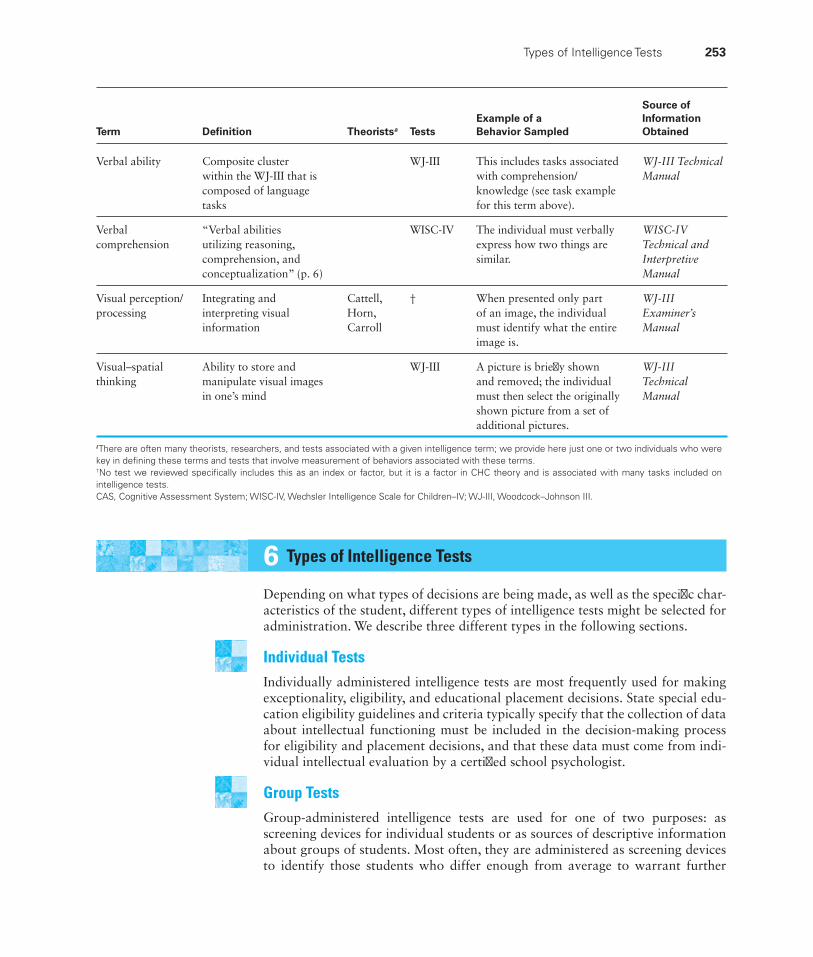
Types of Intelligence Tests 253
6 Types of Intelligence Tests
Depending on what types of decisions are being made, as well as the specifi c char-acteristics of the student, different types of intelligence tests might be selected for administration. We describe three different types in the following sections.
Individual TestsIndividually administered intelligence tests are most frequently used for making exceptionality, eligibility, and educational placement decisions. State special edu-cation eligibility guidelines and criteria typically specify that the collection of data about intellectual functioning must be included in the decision-making process for eligibility and placement decisions, and that these data must come from indi-vidual intellectual evaluation by a certifi ed school psychologist.
Group TestsGroup-administered intelligence tests are used for one of two purposes: as screening devices for individual students or as sources of descriptive information about groups of students. Most often, they are administered as screening devices to identify those students who differ enough from average to warrant further
Term Defi nition Theoristsa TestsExample of a Behavior Sampled
Source of Information Obtained
Verbal ability Composite cluster within the WJ-III that is composed of language tasks
WJ-III This includes tasks associated with comprehension/knowledge (see task example for this term above).
WJ-III Technical Manual
Verbal comprehension
“Verbal abilities utilizing reasoning, comprehension, and conceptualization” (p. 6)
WISC-IV The individual must verbally express how two things are similar.
WISC-IV Technical and Interpretive Manual
Visual perception/processing
Integrating and interpreting visual information
Cattell, Horn, Carroll
† When presented only part of an image, the individual must identify what the entire image is.
WJ-III Examiner’s Manual
Visual–spatial thinking
Ability to store and manipulate visual images in one’s mind
WJ-III A picture is briefl y shown and removed; the individual must then select the originally shown picture from a set of additional pictures.
WJ-III Technical Manual
aThere are often many theorists, researchers, and tests associated with a given intelligence term; we provide here just one or two individuals who were key in defi ning these terms and tests that involve measurement of behaviors associated with these terms.†No test we reviewed specifi cally includes this as an index or factor, but it is a factor in CHC theory and is associated with many tasks included on intelligence tests.CAS, Cognitive Assessment System; WISC-IV, Wechsler Intelligence Scale for Children–IV; WJ-III, Woodcock–Johnson III.
254 Chapter 14 ■ Using Measures of Intelligence
Ass
essm
ent
of
Inte
llige
nce
: Co
mm
on
ly U
sed
Test
s
assessment. In these cases, the tests’ merit is that teachers can administer them relatively quickly to large numbers of students. The tests suffer from the same lim-itations as any group test: They can be made to yield qualitative information only with diffi culty, and they require students to sit still for approximately 20 minutes, to mark with a pencil, and, often, to read. During the past 25 years, it has become increasingly common for school districts to eliminate the practice of group intel-ligence testing. When administrators are asked why they are doing so, they cite (1) the limited relevance of knowing about students’ capability, as opposed to knowing about the subject matter skills (such as for reading and math) that stu-dents do and do not have; (2) the diffi culty teachers experience in trying to use the test results for instructional purposes; and (3) the cost of a schoolwide intellectual screening program.
Nonverbal Intelligence TestsA number of nonverbal tests are among the most widely used tests for assessment of intelligence, particularly when there are questions about the intelligence of a child who is not profi cient in English or who is deaf. Some nonverbal tests are designed to measure intelligence broadly; others are called “picture–vocabulary tests.” The latter are not measures of intelligence per se; rather, they measure only one aspect of intelligence—receptive vocabulary. In picture–vocabulary tests, pic-tures are presented to the test taker, who is asked to identify those pictures that correspond to words read by the examiner. Some authors of picture–vocabulary measures state that the tests measure receptive vocabulary; others equate receptive vocabulary with intelligence and claim that their tests assess intelligence. Because the tests measure only one aspect of intelligence, they should not be used to make eligibility decisions.
ASSESSMENT OF INTELLIGENCE: COMMONLY USED TESTS
In this section, we provide information on some of the most commonly used intelligence tests. Table 14.2 provides information on other intelligence tests that you may come across in educational settings; more extensive reviews of these tests are available on the website. Following the table, we also provide more detailed reviews of several intelligence tests, with special reference to the kinds of behaviors they sample and to their technical adequacy. Although some individual intelligence tests may be appro-priately administered by teachers, counselors, or other specialists, the intelligence tests on which school personnel rely most heavily must be given by psychologists.
Wechsler Intelligence Scale for Children–IV
The Wechsler Intelligence Scale for Children–IV (WISC-IV; Wechsler, 2003)1 is the latest version of the WISC and is designed to assess the cognitive ability
1The WISC-IV is also available as the WISC-IV Integrated (Kaplan, Fein, Kramer, Morris, Delis, & Maerlender, 2004). The WISC-IV Integrated is composed of the core and supplemental subtests of the WISC-IV plus 16 additional process-oriented subtests. The WISC-IV Integrated is a clinical instrument that, in our opinion, has limited application to school settings. The process-oriented subtests of the WISC-IV Integrated do not have suffi cient reliability to be used to make decisions in school settings. The 16 process-oriented subtests are in addition to the core and supplemental subtests, and they can not be substituted for core or supplemental subtests.
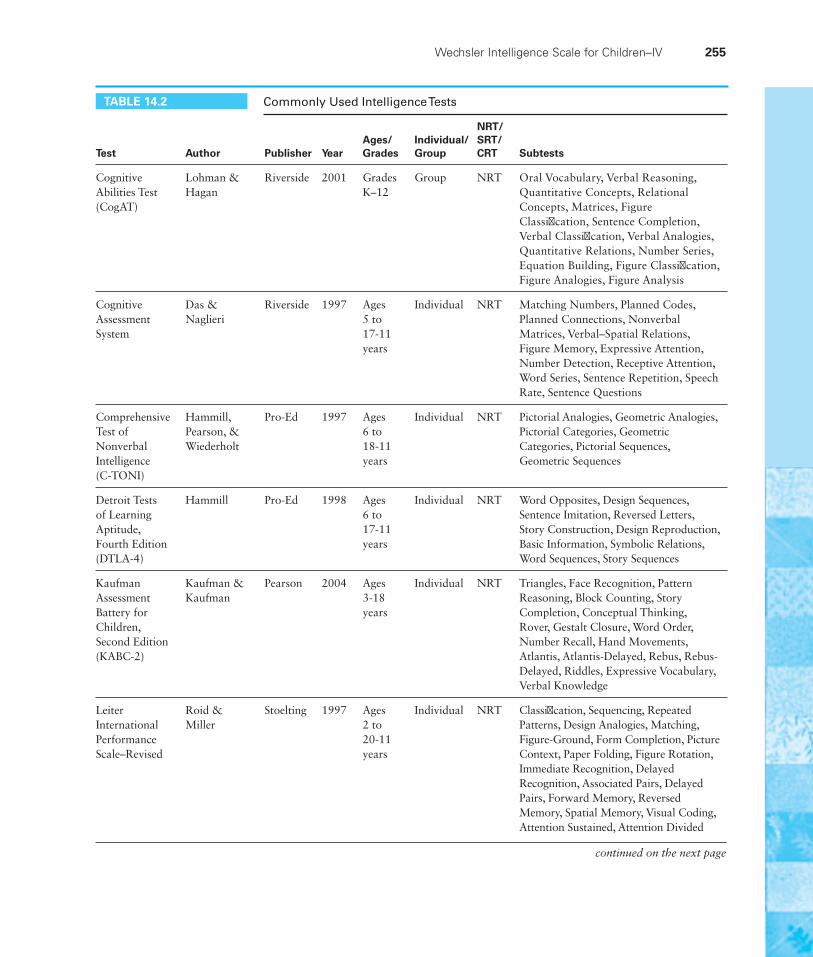
TABLE 14.2 Commonly Used Intelligence Tests
Test Author Publisher YearAges/Grades
Individual/Group
NRT/SRT/CRT Subtests
Cognitive Abilities Test (CogAT)
Lohman & Hagan
Riverside 2001 Grades K–12
Group NRT Oral Vocabulary, Verbal Reasoning, Quantitative Concepts, Relational Concepts, Matrices, Figure Classifi cation, Sentence Completion, Verbal Classifi cation, Verbal Analogies, Quantitative Relations, Number Series, Equation Building, Figure Classifi cation, Figure Analogies, Figure Analysis
Cognitive Assessment System
Das & Naglieri
Riverside 1997 Ages 5 to 17-11 years
Individual NRT Matching Numbers, Planned Codes, Planned Connections, Nonverbal Matrices, Verbal–Spatial Relations, Figure Memory, Expressive Attention, Number Detection, Receptive Attention, Word Series, Sentence Repetition, Speech Rate, Sentence Questions
Comprehensive Test of Nonverbal Intelligence (C-TONI)
Hammill, Pearson, & Wiederholt
Pro-Ed 1997 Ages 6 to 18-11 years
Individual NRT Pictorial Analogies, Geometric Analogies, Pictorial Categories, Geometric Categories, Pictorial Sequences, Geometric Sequences
Detroit Tests of Learning Aptitude, Fourth Edition (DTLA-4)
Hammill Pro-Ed 1998 Ages 6 to 17-11 years
Individual NRT Word Opposites, Design Sequences, Sentence Imitation, Reversed Letters, Story Construction, Design Reproduction, Basic Information, Symbolic Relations, Word Sequences, Story Sequences
Kaufman Assessment Battery for Children, Second Edition (KABC-2)
Kaufman & Kaufman
Pearson 2004 Ages 3-18 years
Individual NRT Triangles, Face Recognition, Pattern Reasoning, Block Counting, Story Completion, Conceptual Thinking, Rover, Gestalt Closure, Word Order, Number Recall, Hand Movements, Atlantis, Atlantis-Delayed, Rebus, Rebus-Delayed, Riddles, Expressive Vocabulary, Verbal Knowledge
Leiter International Performance Scale–Revised
Roid & Miller
Stoelting 1997 Ages 2 to 20-11 years
Individual NRT Classifi cation, Sequencing, Repeated Patterns, Design Analogies, Matching, Figure-Ground, Form Completion, Picture Context, Paper Folding, Figure Rotation, Immediate Recognition, Delayed Recognition, Associated Pairs, Delayed Pairs, Forward Memory, Reversed Memory, Spatial Memory, Visual Coding, Attention Sustained, Attention Divided
continued on the next page
Wechsler Intelligence Scale for Children–IV 255
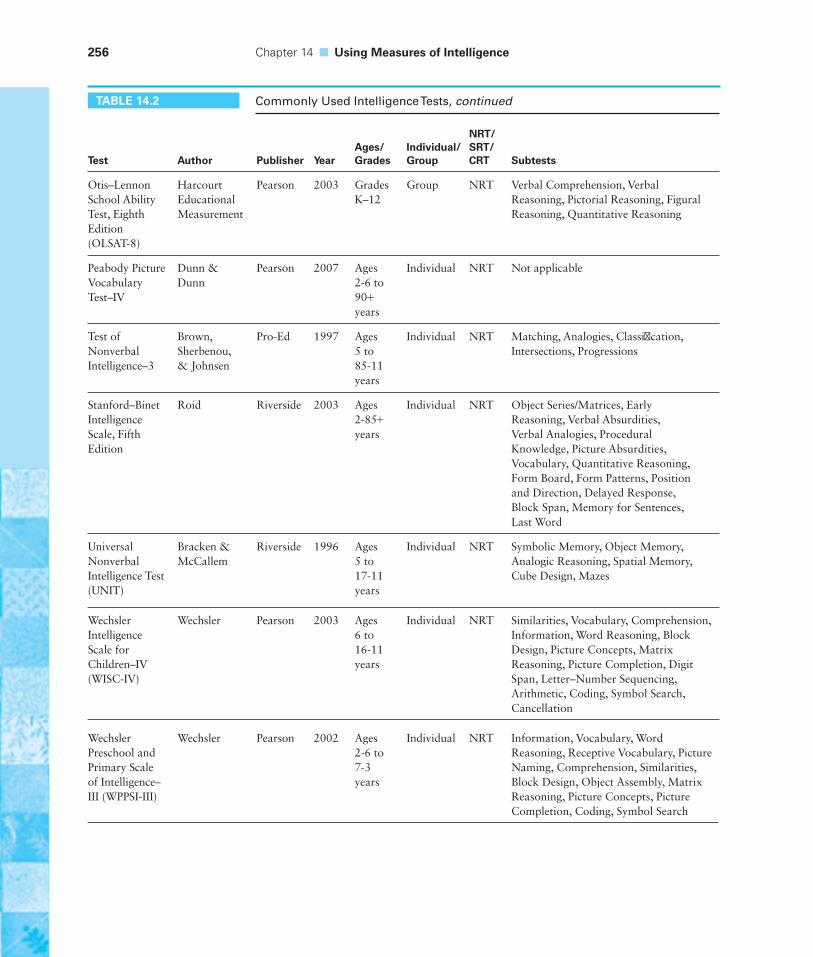
256 Chapter 14 ■ Using Measures of Intelligence
TABLE 14.2 Commonly Used Intelligence Tests, continued
Test Author Publisher YearAges/Grades
Individual/Group
NRT/SRT/CRT Subtests
Otis–Lennon School Ability Test, Eighth Edition (OLSAT-8)
Harcourt Educational Measurement
Pearson 2003 Grades K–12
Group NRT Verbal Comprehension, Verbal Reasoning, Pictorial Reasoning, Figural Reasoning, Quantitative Reasoning
Peabody Picture Vocabulary Test–IV
Dunn & Dunn
Pearson 2007 Ages 2-6 to 90+ years
Individual NRT Not applicable
Test of Nonverbal Intelligence–3
Brown, Sherbenou, & Johnsen
Pro-Ed 1997 Ages 5 to 85-11 years
Individual NRT Matching, Analogies, Classifi cation, Intersections, Progressions
Stanford–Binet Intelligence Scale, Fifth Edition
Roid Riverside 2003 Ages 2-85+ years
Individual NRT Object Series/Matrices, Early Reasoning, Verbal Absurdities, Verbal Analogies, Procedural Knowledge, Picture Absurdities, Vocabulary, Quantitative Reasoning, Form Board, Form Patterns, Position and Direction, Delayed Response, Block Span, Memory for Sentences, Last Word
Universal Nonverbal Intelligence Test (UNIT)
Bracken & McCallem
Riverside 1996 Ages 5 to 17-11 years
Individual NRT Symbolic Memory, Object Memory, Analogic Reasoning, Spatial Memory, Cube Design, Mazes
Wechsler Intelligence Scale for Children–IV (WISC-IV)
Wechsler Pearson 2003 Ages 6 to 16-11 years
Individual NRT Similarities, Vocabulary, Comprehension, Information, Word Reasoning, Block Design, Picture Concepts, Matrix Reasoning, Picture Completion, Digit Span, Letter–Number Sequencing, Arithmetic, Coding, Symbol Search, Cancellation
Wechsler Preschool and Primary Scale of Intelligence–III (WPPSI-III)
Wechsler Pearson 2002 Ages 2-6 to 7-3 years
Individual NRT Information, Vocabulary, Word Reasoning, Receptive Vocabulary, Picture Naming, Comprehension, Similarities, Block Design, Object Assembly, Matrix Reasoning, Picture Concepts, Picture Completion, Coding, Symbol Search
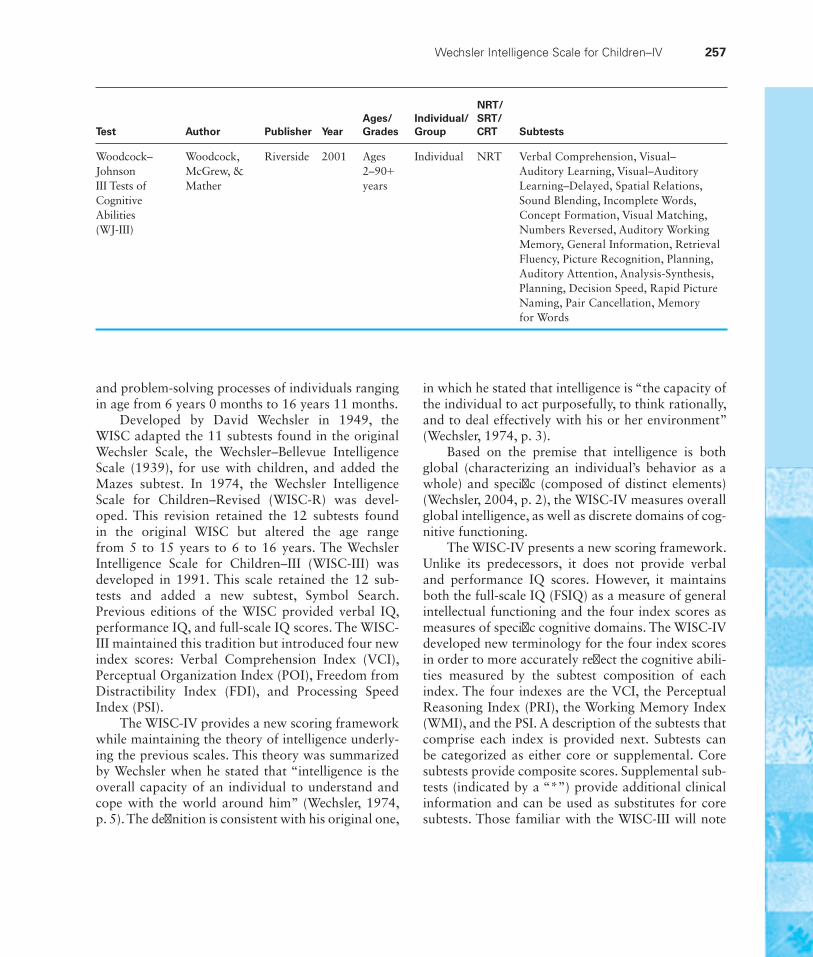
and problem-solving processes of individuals ranging in age from 6 years 0 months to 16 years 11 months.
Developed by David Wechsler in 1949, the WISC adapted the 11 subtests found in the original Wechsler Scale, the Wechsler–Bellevue Intelligence Scale (1939), for use with children, and added the Mazes subtest. In 1974, the Wechsler Intelligence Scale for Children–Revised (WISC-R) was devel-oped. This revision retained the 12 subtests found in the original WISC but altered the age range from 5 to 15 years to 6 to 16 years. The Wechsler Intelligence Scale for Children–III (WISC-III) was developed in 1991. This scale retained the 12 sub-tests and added a new subtest, Symbol Search. Previous editions of the WISC provided verbal IQ, performance IQ, and full-scale IQ scores. The WISC-III maintained this tradition but introduced four new index scores: Verbal Comprehension Index (VCI), Perceptual Organization Index (POI), Freedom from Distractibility Index (FDI), and Processing Speed Index (PSI).
The WISC-IV provides a new scoring framework while maintaining the theory of intelligence underly-ing the previous scales. This theory was summarized by Wechsler when he stated that “intelligence is the overall capacity of an individual to understand and cope with the world around him” (Wechsler, 1974, p. 5). The defi nition is consistent with his original one,
in which he stated that intelligence is “the capacity of the individual to act purposefully, to think rationally, and to deal effectively with his or her environment” (Wechsler, 1974, p. 3).
Based on the premise that intelligence is both global (characterizing an individual’s behavior as a whole) and specifi c (composed of distinct elements) (Wechsler, 2004, p. 2), the WISC-IV measures overall global intelligence, as well as discrete domains of cog-nitive functioning.
The WISC-IV presents a new scoring framework. Unlike its predecessors, it does not provide verbal and performance IQ scores. However, it maintains both the full-scale IQ (FSIQ) as a measure of general intellectual functioning and the four index scores as measures of specifi c cognitive domains. The WISC-IV developed new terminology for the four index scores in order to more accurately refl ect the cognitive abili-ties measured by the subtest composition of each index. The four indexes are the VCI, the Perceptual Reasoning Index (PRI), the Working Memory Index (WMI), and the PSI. A description of the subtests that comprise each index is provided next. Subtests can be categorized as either core or supplemental. Core subtests provide composite scores. Supplemental sub-tests (indicated by a “*”) provide additional clinical information and can be used as substitutes for core subtests. Those familiar with the WISC-III will note
Wechsler Intelligence Scale for Children–IV 257
Woodcock–Johnson III Tests of Cognitive Abilities (WJ-III)
Woodcock, McGrew, & Mather
Riverside 2001 Ages 2–90+ years
Individual NRT Verbal Comprehension, Visual–Auditory Learning, Visual–Auditory Learning–Delayed, Spatial Relations, Sound Blending, Incomplete Words, Concept Formation, Visual Matching, Numbers Reversed, Auditory Working Memory, General Information, Retrieval Fluency, Picture Recognition, Planning, Auditory Attention, Analysis-Synthesis, Planning, Decision Speed, Rapid Picture Naming, Pair Cancellation, Memory for Words
Test Author Publisher YearAges/Grades
Individual/Group
NRT/SRT/CRT Subtests
258 Chapter 14 ■ Using Measures of Intelligence
that in the WISC-IV revisions, 3 subtests have been dropped, 10 subtests have been retained, and 5 sub-tests have been added (indicated with an asterisk).
SubtestsVerbal Comprehension Subtests
Similarities. This subtest requires identifi cation of similarities or commonalities in superfi cially unre-lated verbal stimuli.
Vocabulary. Items on this subtest assess ability to defi ne words. Beginning items require individuals to name picture objects. Later items require individuals to ver-bally defi ne words that are read aloud by the examiner.
Comprehension. This subtest assesses ability to com-prehend verbal directions or to understand specifi c customs and mores. The examinee is asked questions such as “Why is it important to wear boots after a large snowfall?”
Information. This subtest assesses ability to answer specifi c factual questions. The content is learned; it consists of information that a person is expected to have acquired in both formal and informal educational settings. The examinee is asked questions such as “Which fast-food franchise is represented by the symbol of golden arches?”
Word Reasoning*. In this subtest, individuals are pre-sented with a clue or a series of clues and must identify the common concept that each clue or group of clues describes. It is thought to measure comprehension, identifi cation of analogies, generalization, and verbal abstraction. A sample item for this scale is “This has a long handle and is used with water to clean the fl oor” (mop). When partially correct responses are given, additional clues are provided.
Perceptual Reasoning Subtests
Block Design. In this subtest, individuals are given a specifi ed amount of time to manipulate blocks in order to reproduce a stimulus design that is presented visually.
Picture Concepts*. In this subtest, an individual is shown two or three rows of pictures and must choose one picture from each row in order to form a group that shares a common characteristic. For example, an individual would choose the picture of the horse in row 1 and the picture of the mouse in row 2 because they are both animals. This is basically a picture clas-sifi cation task.
Matrix Reasoning*. In this subtest, children must select the missing portion of an incomplete matrix given fi ve response options. Matrices range from 2 × 2 to 3 × 3. The last item differs from this general form, requiring individuals to identify the fi fth square in a row of six.
Picture Completion. This subtest assesses the ability to identify missing parts in pictures within a specifi ed time limit.
Working Memory Subtests
Digit Span. This subtest assesses immediate recall of orally presented digits. In Digit Span Forward, children repeat numbers in the same order that they were presented aloud by the examiner. In Digit Span Backward, children repeat numbers in the reverse of the order that they were presented by the examiner.
Letter–Number Sequencing*. This subtest assesses an individual’s ability to recall and mentally manip-ulate a series of numbers and letters that are orally presented to them. After hearing a random sequence of numbers and letters, individuals must fi rst repeat the numbers in ascending order and then repeat the letters in alphabetical order.
Arithmetic. This subtest assesses ability to solve prob-lems requiring the application of arithmetic operations. In this subtest, children must mentally solve problems presented orally within a specifi ed time limit.
Processing Speed Subtests
Coding. This subtest assesses the ability to associate symbols with either geometric shapes or numbers and to copy these symbols onto paper within a specifi ed time limit.
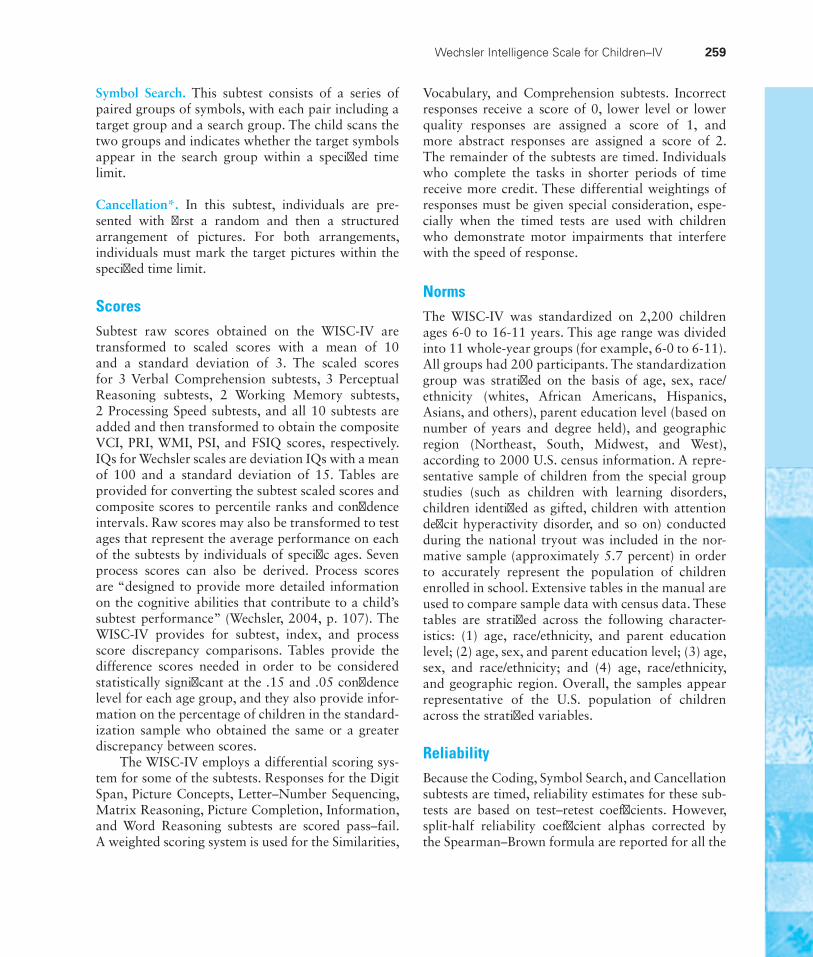
Symbol Search. This subtest consists of a series of paired groups of symbols, with each pair including a target group and a search group. The child scans the two groups and indicates whether the target symbols appear in the search group within a specifi ed time limit.
Cancellation*. In this subtest, individuals are pre-sented with fi rst a random and then a structured arrangement of pictures. For both arrangements, individuals must mark the target pictures within the specifi ed time limit.
ScoresSubtest raw scores obtained on the WISC-IV are transformed to scaled scores with a mean of 10 and a standard deviation of 3. The scaled scores for 3 Verbal Comprehension subtests, 3 Perceptual Reasoning subtests, 2 Working Memory subtests, 2 Processing Speed subtests, and all 10 subtests are added and then transformed to obtain the composite VCI, PRI, WMI, PSI, and FSIQ scores, respectively. IQs for Wechsler scales are deviation IQs with a mean of 100 and a standard deviation of 15. Tables are provided for converting the subtest scaled scores and composite scores to percentile ranks and confi dence intervals. Raw scores may also be transformed to test ages that represent the average performance on each of the subtests by individuals of specifi c ages. Seven process scores can also be derived. Process scores are “designed to provide more detailed information on the cognitive abilities that contribute to a child’s subtest performance” (Wechsler, 2004, p. 107). The WISC-IV provides for subtest, index, and process score discrepancy comparisons. Tables provide the difference scores needed in order to be considered statistically signifi cant at the .15 and .05 confi dence level for each age group, and they also provide infor-mation on the percentage of children in the standard-ization sample who obtained the same or a greater discrepancy between scores.
The WISC-IV employs a differential scoring sys-tem for some of the subtests. Responses for the Digit Span, Picture Concepts, Letter–Number Sequencing, Matrix Reasoning, Picture Completion, Information, and Word Reasoning subtests are scored pass–fail. A weighted scoring system is used for the Similarities,
Vocabulary, and Comprehension subtests. Incorrect responses receive a score of 0, lower level or lower quality responses are assigned a score of 1, and more abstract responses are assigned a score of 2. The remainder of the subtests are timed. Individuals who complete the tasks in shorter periods of time receive more credit. These differential weightings of responses must be given special consideration, espe-cially when the timed tests are used with children who demonstrate motor impairments that interfere with the speed of response.
NormsThe WISC-IV was standardized on 2,200 children ages 6-0 to 16-11 years. This age range was divided into 11 whole-year groups (for example, 6-0 to 6-11). All groups had 200 participants. The standardization group was stratifi ed on the basis of age, sex, race/ethnicity (whites, African Americans, Hispanics, Asians, and others), parent education level (based on number of years and degree held), and geographic region (Northeast, South, Midwest, and West), according to 2000 U.S. census information. A repre-sentative sample of children from the special group studies (such as children with learning disorders, children identifi ed as gifted, children with attention defi cit hyperactivity disorder, and so on) conducted during the national tryout was included in the nor-mative sample (approximately 5.7 percent) in order to accurately represent the population of children enrolled in school. Extensive tables in the manual are used to compare sample data with census data. These tables are stratifi ed across the following character-istics: (1) age, race/ethnicity, and parent education level; (2) age, sex, and parent education level; (3) age, sex, and race/ethnicity; and (4) age, race/ethnicity, and geographic region. Overall, the samples appear representative of the U.S. population of children across the stratifi ed variables.
ReliabilityBecause the Coding, Symbol Search, and Cancellation subtests are timed, reliability estimates for these sub-tests are based on test–retest coeffi cients. However, split-half reliability coeffi cient alphas corrected by the Spearman–Brown formula are reported for all the
Wechsler Intelligence Scale for Children–IV 259
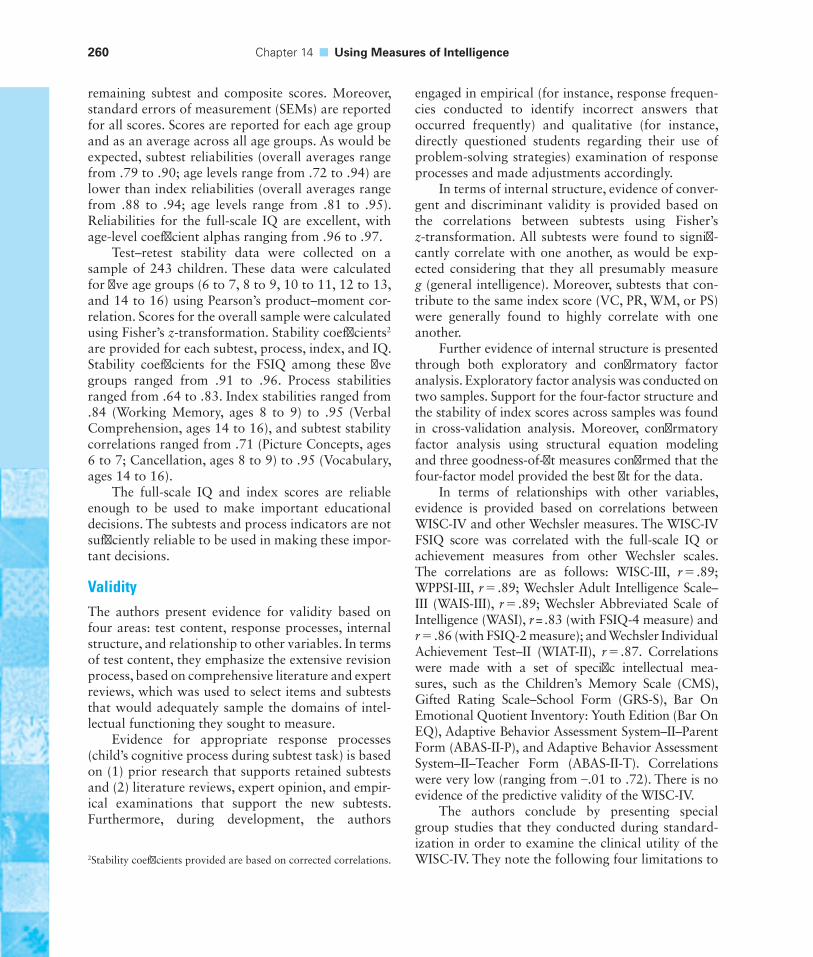
260 Chapter 14 ■ Using Measures of Intelligence
remaining subtest and composite scores. Moreover, standard errors of measurement (SEMs) are reported for all scores. Scores are reported for each age group and as an average across all age groups. As would be expected, subtest reliabilities (overall averages range from .79 to .90; age levels range from .72 to .94) are lower than index reliabilities (overall averages range from .88 to .94; age levels range from .81 to .95). Reliabilities for the full-scale IQ are excellent, with age-level coeffi cient alphas ranging from .96 to .97.
Test–retest stability data were collected on a sample of 243 children. These data were calculated for fi ve age groups (6 to 7, 8 to 9, 10 to 11, 12 to 13, and 14 to 16) using Pearson’s product–moment cor-relation. Scores for the overall sample were calculated using Fisher’s z-transformation. Stability coeffi cients2 are provided for each subtest, process, index, and IQ. Stability coeffi cients for the FSIQ among these fi ve groups ranged from .91 to .96. Process stabilities ranged from .64 to .83. Index stabilities ranged from .84 (Working Memory, ages 8 to 9) to .95 (Verbal Comprehension, ages 14 to 16), and subtest stability correlations ranged from .71 (Picture Concepts, ages 6 to 7; Cancellation, ages 8 to 9) to .95 (Vocabulary, ages 14 to 16).
The full-scale IQ and index scores are reliable enough to be used to make important educational decisions. The subtests and process indicators are not suffi ciently reliable to be used in making these impor-tant decisions.
ValidityThe authors present evidence for validity based on four areas: test content, response processes, internal structure, and relationship to other variables. In terms of test content, they emphasize the extensive revision process, based on comprehensive literature and expert reviews, which was used to select items and subtests that would adequately sample the domains of intel-lectual functioning they sought to measure.
Evidence for appropriate response processes (child’s cognitive process during subtest task) is based on (1) prior research that supports retained subtests and (2) literature reviews, expert opinion, and empir-ical examinations that support the new subtests. Furthermore, during development, the authors
2Stability coeffi cients provided are based on corrected correlations.
engaged in empirical (for instance, response frequen-cies conducted to identify incorrect answers that occurred frequently) and qualitative (for instance, directly questioned students regarding their use of problem-solving strategies) examination of response processes and made adjustments accordingly.
In terms of internal structure, evidence of conver-gent and discriminant validity is provided based on the correlations between subtests using Fisher’s z-transformation. All subtests were found to signifi -cantly correlate with one another, as would be exp-ected considering that they all presumably measure g (general intelligence). Moreover, subtests that con-tribute to the same index score (VC, PR, WM, or PS) were generally found to highly correlate with one another.
Further evidence of internal structure is presented through both exploratory and confi rmatory factor analysis. Exploratory factor analysis was conducted on two samples. Support for the four-factor structure and the stability of index scores across samples was found in cross-validation analysis. Moreover, confi rmatory factor analysis using structural equation modeling and three goodness-of-fi t measures confi rmed that the four-factor model provided the best fi t for the data.
In terms of relationships with other variables, evidence is provided based on correlations between WISC-IV and other Wechsler measures. The WISC-IV FSIQ score was correlated with the full-scale IQ or achievement measures from other Wechsler scales. The correlations are as follows: WISC-III, r = .89; WPPSI-III, r = .89; Wechsler Adult Intelligence Scale–III (WAIS-III), r = .89; Wechsler Abbreviated Scale of Intelligence (WASI), r = .83 (with FSIQ-4 measure) and r = .86 (with FSIQ-2 measure); and Wechsler Individual Achievement Test–II (WIAT-II), r = .87. Correlations were made with a set of specifi c intellectual mea-sures, such as the Children’s Memory Scale (CMS), Gifted Rating Scale–School Form (GRS-S), Bar On Emotional Quotient Inventory: Youth Edition (Bar On EQ), Adaptive Behavior Assessment System–II–Parent Form (ABAS-II-P), and Adaptive Behavior Assessment System–II–Teacher Form (ABAS-II-T). Correlations were very low (ranging from –.01 to .72). There is no evidence of the predictive validity of the WISC-IV.
The authors conclude by presenting special group studies that they conducted during standard-ization in order to examine the clinical utility of the WISC-IV. They note the following four limitations to
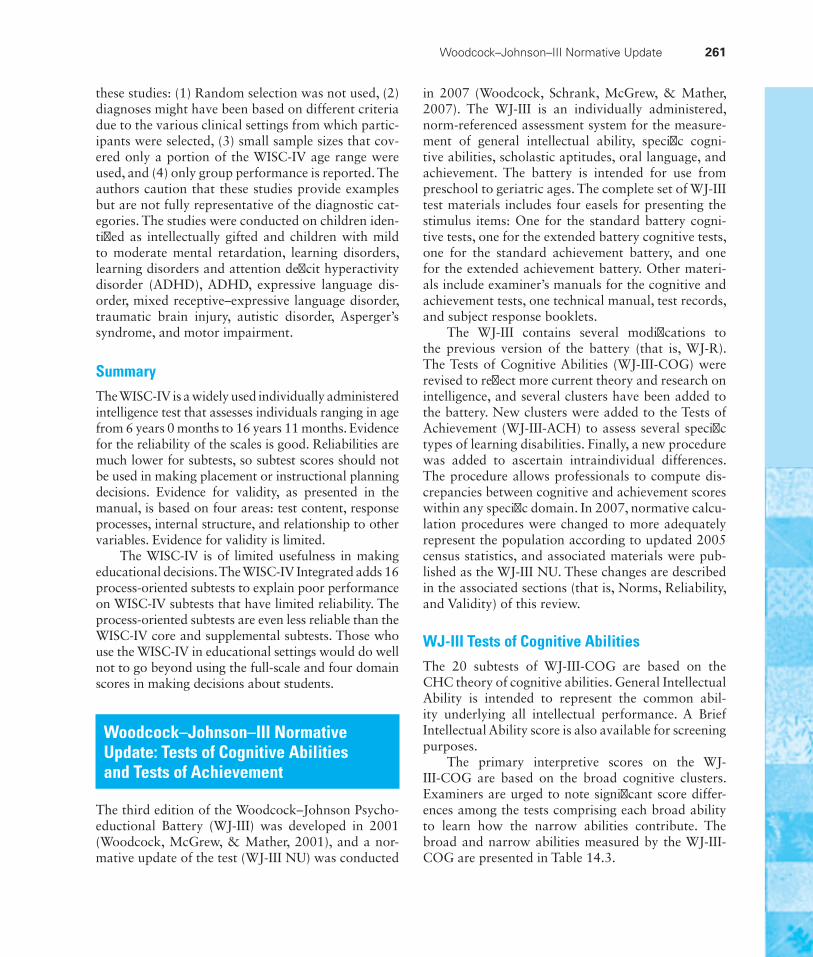
these studies: (1) Random selection was not used, (2) diagnoses might have been based on different criteria due to the various clinical settings from which partic-ipants were selected, (3) small sample sizes that cov-ered only a portion of the WISC-IV age range were used, and (4) only group performance is reported. The authors caution that these studies provide examples but are not fully representative of the diagnostic cat-egories. The studies were conducted on children iden-tifi ed as intellectually gifted and children with mild to moderate mental retardation, learning disorders, learning disorders and attention defi cit hyperactivity disorder (ADHD), ADHD, expressive language dis-order, mixed receptive–expressive language disorder, traumatic brain injury, autistic disorder, Asperger’s syndrome, and motor impairment.
SummaryThe WISC-IV is a widely used individually administered intelligence test that assesses individuals ranging in age from 6 years 0 months to 16 years 11 months. Evidence for the reliability of the scales is good. Reliabilities are much lower for subtests, so subtest scores should not be used in making placement or instructional planning decisions. Evidence for validity, as presented in the manual, is based on four areas: test content, response processes, internal structure, and relationship to other variables. Evidence for validity is limited.
The WISC-IV is of limited usefulness in making educational decisions. The WISC-IV Integrated adds 16 process-oriented subtests to explain poor performance on WISC-IV subtests that have limited reliability. The process-oriented subtests are even less reliable than the WISC-IV core and supplemental subtests. Those who use the WISC-IV in educational settings would do well not to go beyond using the full-scale and four domain scores in making decisions about students.
Woodcock–Johnson–III Normative Update: Tests of Cognitive Abilities and Tests of Achievement
The third edition of the Woodcock–Johnson Psycho-e ductional Battery (WJ-III) was developed in 2001 (Woodcock, McGrew, & Mather, 2001), and a nor-mative update of the test (WJ-III NU) was conducted
in 2007 (Woodcock, Schrank, McGrew, & Mather, 2007). The WJ-III is an individually administered, norm-referenced assessment system for the measure-ment of general intellectual ability, specifi c cogni-tive abilities, scholastic aptitudes, oral language, and achievement. The battery is intended for use from preschool to geriatric ages. The complete set of WJ-III test materials includes four easels for presenting the stimulus items: One for the standard battery cogni-tive tests, one for the extended battery cognitive tests, one for the standard achievement battery, and one for the extended achievement battery. Other materi-als include examiner’s manuals for the cognitive and achievement tests, one technical manual, test records, and subject response booklets.
The WJ-III contains several modifi cations to the previous version of the battery (that is, WJ-R). The Tests of Cognitive Abilities (WJ-III-COG) were revised to refl ect more current theory and research on intelligence, and several clusters have been added to the battery. New clusters were added to the Tests of Achievement (WJ-III-ACH) to assess several specifi c types of learning disabilities. Finally, a new procedure was added to ascertain intraindividual differences. The procedure allows professionals to compute dis-crepancies between cognitive and achievement scores within any specifi c domain. In 2007, normative calcu-lation procedures were changed to more adequately represent the population according to updated 2005 census statistics, and associated materials were pub-lished as the WJ-III NU. These changes are described in the associated sections (that is, Norms, Reliability, and Validity) of this review.
WJ-III Tests of Cognitive AbilitiesThe 20 subtests of WJ-III-COG are based on the CHC theory of cognitive abilities. General Intellectual Ability is intended to represent the common abil-ity underlying all intellectual performance. A Brief Intellectual Ability score is also available for screening purposes.
The primary interpretive scores on the WJ- III-COG are based on the broad cognitive clusters. Examiners are urged to note signifi cant score differ-ences among the tests comprising each broad ability to learn how the narrow abilities contribute. The broad and narrow abilities measured by the WJ-III-COG are presented in Table 14.3.
Woodcock–Johnson–III Normative Update 261
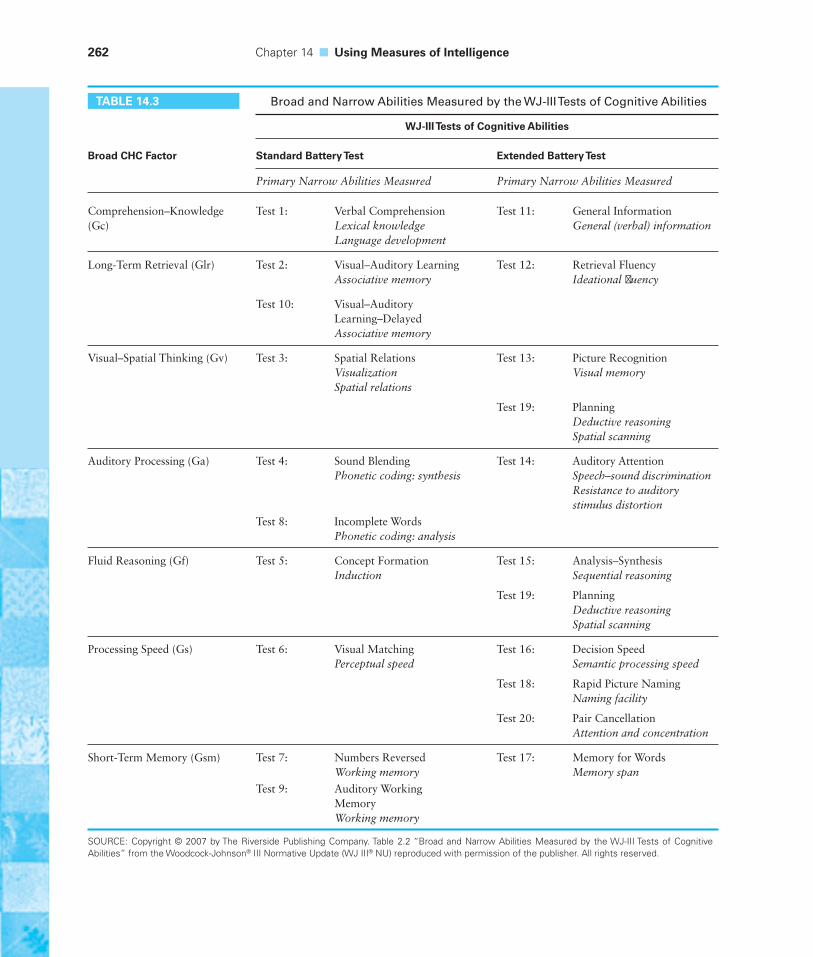
262 Chapter 14 ■ Using Measures of Intelligence
TABLE 14.3 Broad and Narrow Abilities Measured by the WJ-III Tests of Cognitive Abilities
WJ-III Tests of Cognitive Abilities
Broad CHC Factor Standard Battery Test Extended Battery Test
Primary Narrow Abilities Measured Primary Narrow Abilities Measured
Comprehension–Knowledge (Gc)
Test 1: Verbal Comprehension Lexical knowledge Language development
Test 11: General Information General (verbal) information
Long-Term Retrieval (Glr) Test 2: Visual–Auditory Learning Associative memory
Test 12: Retrieval Fluency Ideational fl uency
Test 10: Visual–Auditory Learning–Delayed Associative memory
Visual–Spatial Thinking (Gv) Test 3: Spatial Relations Visualization Spatial relations
Test 13: Picture Recognition Visual memory
Test 19: Planning Deductive reasoning Spatial scanning
Auditory Processing (Ga) Test 4: Sound Blending Phonetic coding: synthesis
Test 14: Auditory Attention Speech–sound discrimination Resistance to auditory stimulus distortion
Test 8: Incomplete Words Phonetic coding: analysis
Fluid Reasoning (Gf) Test 5: Concept Formation Induction
Test 15: Analysis–Synthesis Sequential reasoning
Test 19: Planning Deductive reasoning Spatial scanning
Processing Speed (Gs) Test 6: Visual Matching Perceptual speed
Test 16: Decision Speed Semantic processing speed
Test 18: Rapid Picture Naming Naming facility
Test 20: Pair Cancellation Attention and concentration
Short-Term Memory (Gsm) Test 7: Numbers Reversed Working memory
Test 17: Memory for Words Memory span
Test 9: Auditory Working Memory Working memory
SOURCE: Copyright © 2007 by The Riverside Publishing Company. Table 2.2 “Broad and Narrow Abilities Measured by the WJ-III Tests of Cognitive Abilities” from the Woodcock-Johnson® III Normative Update (WJ III® NU) reproduced with permission of the publisher. All rights reserved.
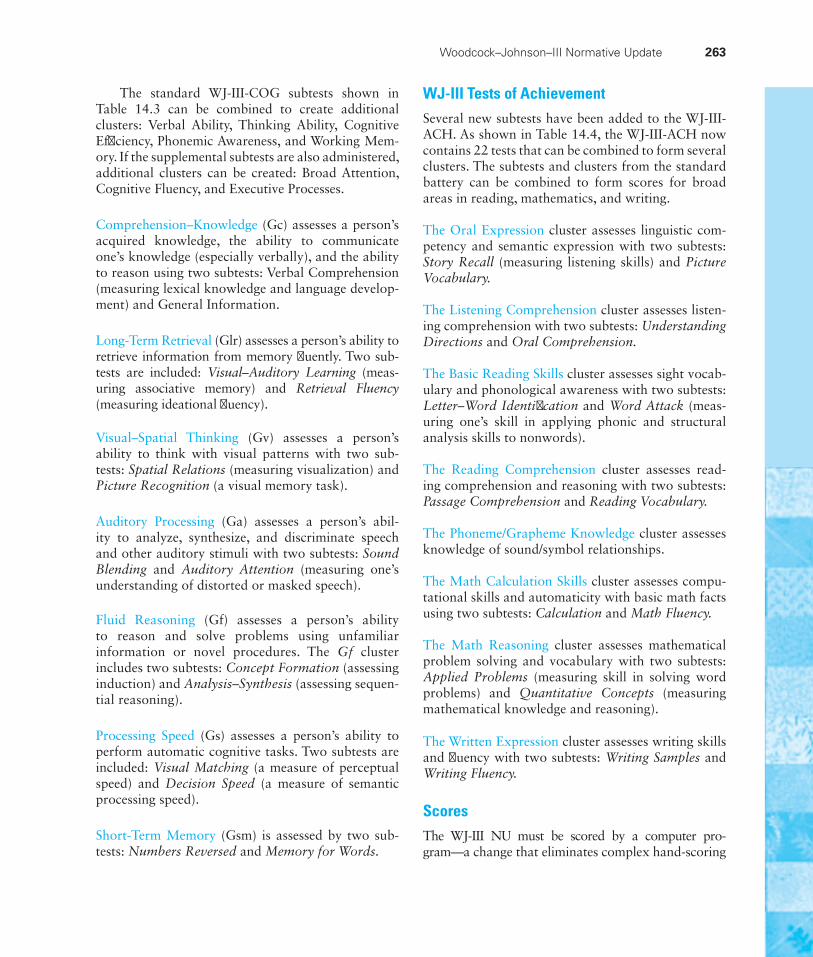
The standard WJ-III-COG subtests shown in Table 14.3 can be combined to create additional clusters: Verbal Ability, Thinking Ability, Cognitive Effi ciency, Phonemic Awareness, and Working Mem-ory. If the supplemental subtests are also administered, additional clusters can be created: Broad Attention, Cognitive Fluency, and Executive Processes.
Comprehension–Knowledge (Gc) assesses a person’s acquired knowledge, the ability to communicate one’s knowledge (especially verbally), and the ability to reason using two subtests: Verbal Comprehension (measuring lexical knowledge and language develop-ment) and General Information.
Long-Term Retrieval (Glr) assesses a person’s ability to retrieve information from memory fl uently. Two sub-tests are included: Visual–Auditory Learning (meas-uring associative memory) and Retrieval Fluency (measuring ideational fl uency).
Visual–Spatial Thinking (Gv) assesses a person’s ability to think with visual patterns with two sub-tests: Spatial Relations (measuring visualization) and Picture Recognition (a visual memory task).
Auditory Processing (Ga) assesses a person’s abil-ity to analyze, synthesize, and discriminate speech and other auditory stimuli with two subtests: Sound Blending and Auditory Attention (measuring one’s understanding of distorted or masked speech).
Fluid Reasoning (Gf) assesses a person’s ability to reason and solve problems using unfamiliar information or novel procedures. The Gf cluster includes two subtests: Concept Formation (assessing induction) and Analysis–Synthesis (assessing sequen-tial reasoning).
Processing Speed (Gs) assesses a person’s ability to perform automatic cognitive tasks. Two subtests are included: Visual Matching (a measure of perceptual speed) and Decision Speed (a measure of semantic processing speed).
Short-Term Memory (Gsm) is assessed by two sub-tests: Numbers Reversed and Memory for Words.
WJ-III Tests of AchievementSeveral new subtests have been added to the WJ-III-ACH. As shown in Table 14.4, the WJ-III-ACH now contains 22 tests that can be combined to form several clusters. The subtests and clusters from the standard battery can be combined to form scores for broad areas in reading, mathematics, and writing.
The Oral Expression cluster assesses linguistic com-petency and semantic expression with two subtests: Story Recall (measuring listening skills) and Picture Vocabulary.
The Listening Comprehension cluster assesses listen-ing comprehension with two subtests: Understanding Directions and Oral Comprehension.
The Basic Reading Skills cluster assesses sight vocab-ulary and phonological awareness with two subtests: Letter–Word Identifi cation and Word Attack (meas-uring one’s skill in applying phonic and structural analysis skills to nonwords).
The Reading Comprehension cluster assesses read-ing comprehension and reasoning with two subtests: Passage Comprehension and Reading Vocabulary.
The Phoneme/Grapheme Knowledge cluster assesses knowledge of sound/symbol relationships.
The Math Calculation Skills cluster assesses compu-tational skills and automaticity with basic math facts using two subtests: Calculation and Math Fluency.
The Math Reasoning cluster assesses mathematical problem solving and vocabulary with two subtests: Applied Problems (measuring skill in solving word problems) and Quantitative Concepts (measuring mathematical knowledge and reasoning).
The Written Expression cluster assesses writing skills and fl uency with two subtests: Writing Samples and Writing Fluency.
ScoresThe WJ-III NU must be scored by a computer pro-gram—a change that eliminates complex hand- scoring
Woodcock–Johnson–III Normative Update 263
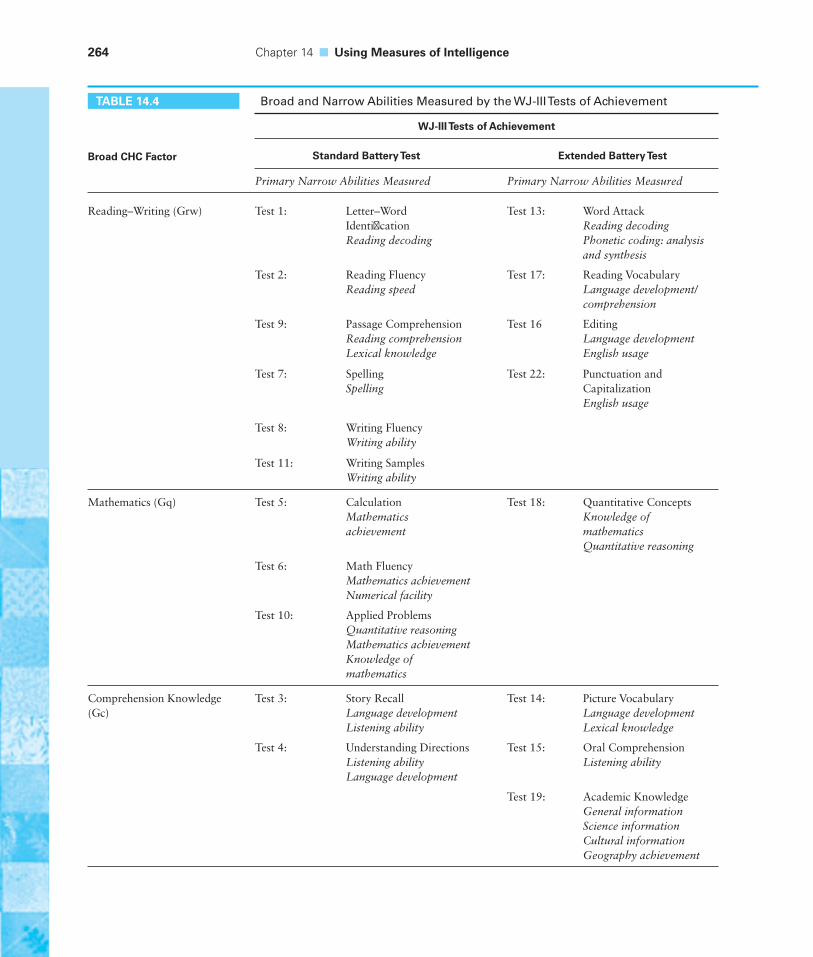
264 Chapter 14 ■ Using Measures of Intelligence
TABLE 14.4 Broad and Narrow Abilities Measured by the WJ-III Tests of Achievement
WJ-III Tests of Achievement
Broad CHC Factor Standard Battery Test Extended Battery Test
Primary Narrow Abilities Measured Primary Narrow Abilities Measured
Reading–Writing (Grw) Test 1: Letter–Word Identifi cationReading decoding
Test 13: Word AttackReading decodingPhonetic coding: analysis and synthesis
Test 2: Reading FluencyReading speed
Test 17: Reading VocabularyLanguage development/comprehension
Test 9: Passage ComprehensionReading comprehensionLexical knowledge
Test 16 EditingLanguage developmentEnglish usage
Test 7: SpellingSpelling
Test 22: Punctuation and CapitalizationEnglish usage
Test 8: Writing FluencyWriting ability
Test 11: Writing SamplesWriting ability
Mathematics (Gq) Test 5: CalculationMathematics achievement
Test 18: Quantitative ConceptsKnowledge of mathematicsQuantitative reasoning
Test 6: Math FluencyMathematics achievementNumerical facility
Test 10: Applied ProblemsQuantitative reasoningMathematics achievementKnowledge of mathematics
Comprehension Knowledge (Gc)
Test 3: Story RecallLanguage developmentListening ability
Test 14: Picture Vocabulary Language developmentLexical knowledge
Test 4: Understanding DirectionsListening abilityLanguage development
Test 15: Oral ComprehensionListening ability
Test 19: Academic KnowledgeGeneral informationScience informationCultural informationGeography achievement
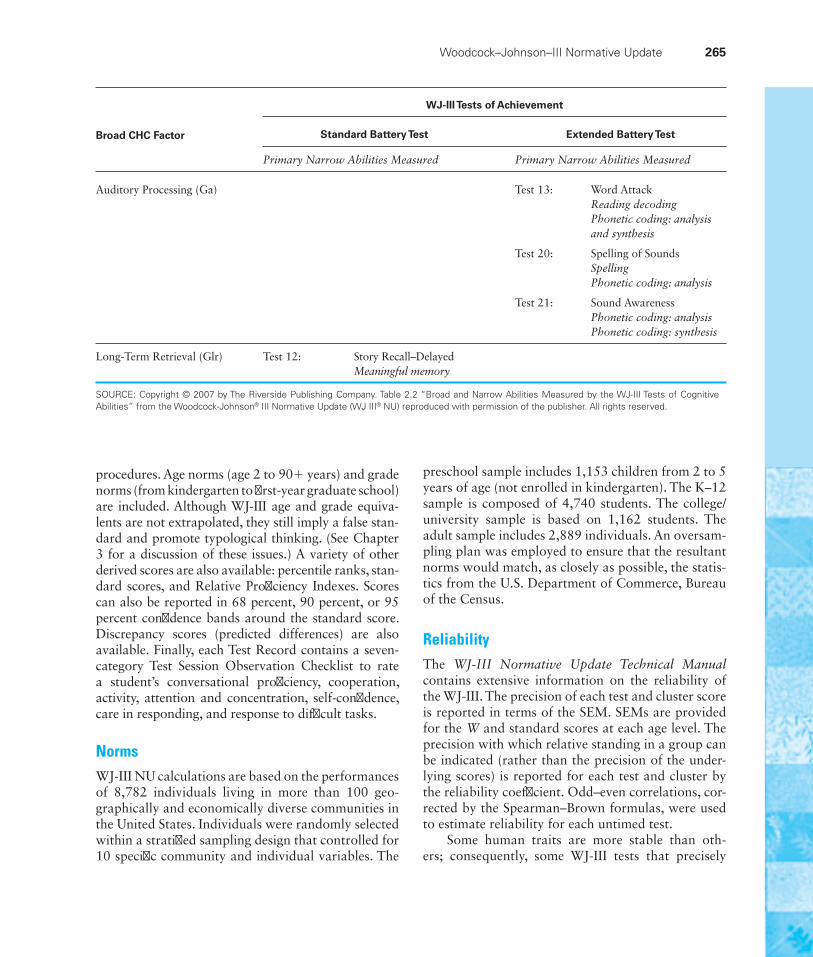
procedures. Age norms (age 2 to 90+ years) and grade norms (from kindergarten to fi rst-year graduate school) are included. Although WJ-III age and grade equiva-lents are not extrapolated, they still imply a false stan-dard and promote typological thinking. (See Chapter 3 for a discussion of these issues.) A variety of other derived scores are also available: percentile ranks, stan-dard scores, and Relative Profi ciency Indexes. Scores can also be reported in 68 percent, 90 percent, or 95 percent confi dence bands around the standard score. Discrepancy scores (predicted differences) are also available. Finally, each Test Record contains a seven-category Test Session Observation Checklist to rate a student’s conversational profi ciency, cooperation, activity, attention and concentration, self-confi dence, care in responding, and response to diffi cult tasks.
NormsWJ-III NU calculations are based on the performances of 8,782 individuals living in more than 100 geo-graphically and economically diverse communities in the United States. Individuals were randomly selected within a stratifi ed sampling design that controlled for 10 specifi c community and individual variables. The
preschool sample includes 1,153 children from 2 to 5 years of age (not enrolled in kindergarten). The K–12 sample is composed of 4,740 students. The college/university sample is based on 1,162 students. The adult sample includes 2,889 individuals. An oversam-pling plan was employed to ensure that the resultant norms would match, as closely as possible, the statis-tics from the U.S. Department of Commerce, Bureau of the Census.
ReliabilityThe WJ-III Normative Update Technical Manual contains extensive information on the reliability of the WJ-III. The precision of each test and cluster score is reported in terms of the SEM. SEMs are provided for the W and standard scores at each age level. The precision with which relative standing in a group can be indicated (rather than the precision of the under-lying scores) is reported for each test and cluster by the reliability coeffi cient. Odd–even correlations, cor-rected by the Spearman–Brown formulas, were used to estimate reliability for each untimed test.
Some human traits are more stable than oth-ers; consequently, some WJ-III tests that precisely
Woodcock–Johnson–III Normative Update 265
WJ-III Tests of Achievement
Broad CHC Factor Standard Battery Test Extended Battery Test
Primary Narrow Abilities Measured Primary Narrow Abilities Measured
Auditory Processing (Ga) Test 13: Word AttackReading decoding Phonetic coding: analysis and synthesis
Test 20: Spelling of SoundsSpellingPhonetic coding: analysis
Test 21: Sound AwarenessPhonetic coding: analysisPhonetic coding: synthesis
Long-Term Retrieval (Glr) Test 12: Story Recall–DelayedMeaningful memory
SOURCE: Copyright © 2007 by The Riverside Publishing Company. Table 2.2 “Broad and Narrow Abilities Measured by the WJ-III Tests of Cognitive Abilities” from the Woodcock-Johnson® III Normative Update (WJ III® NU) reproduced with permission of the publisher. All rights reserved.
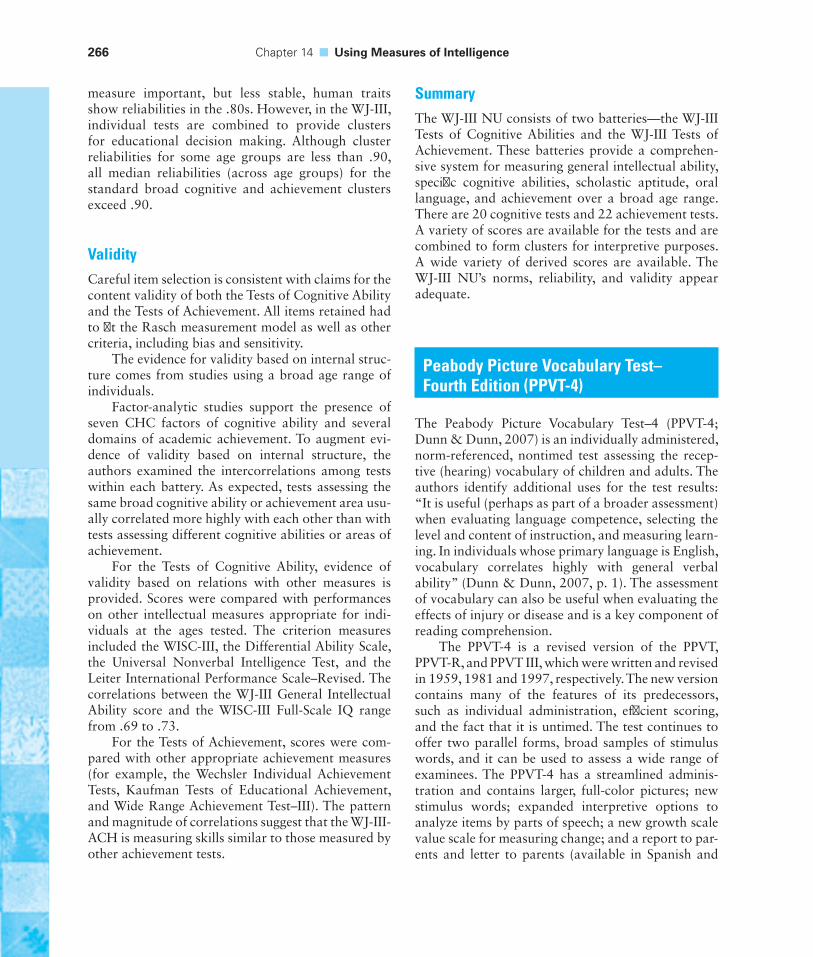
266 Chapter 14 ■ Using Measures of Intelligence
measure important, but less stable, human traits show reliabilities in the .80s. However, in the WJ-III, individual tests are combined to provide clusters for educational decision making. Although cluster reliabilities for some age groups are less than .90, all median reliabilities (across age groups) for the standard broad cognitive and achievement clusters exceed .90.
ValidityCareful item selection is consistent with claims for the content validity of both the Tests of Cognitive Ability and the Tests of Achievement. All items retained had to fi t the Rasch measurement model as well as other criteria, including bias and sensitivity.
The evidence for validity based on internal struc-ture comes from studies using a broad age range of individuals.
Factor-analytic studies support the presence of seven CHC factors of cognitive ability and several domains of academic achievement. To augment evi-dence of validity based on internal structure, the authors examined the intercorrelations among tests within each battery. As expected, tests assessing the same broad cognitive ability or achievement area usu-ally correlated more highly with each other than with tests assessing different cognitive abilities or areas of achievement.
For the Tests of Cognitive Ability, evidence of validity based on relations with other measures is provided. Scores were compared with performances on other intellectual measures appropriate for indi-viduals at the ages tested. The criterion measures included the WISC-III, the Differential Ability Scale, the Universal Nonverbal Intelligence Test, and the Leiter International Performance Scale–Revised. The correlations between the WJ-III General Intellectual Ability score and the WISC-III Full-Scale IQ range from .69 to .73.
For the Tests of Achievement, scores were com-pared with other appropriate achievement measures (for example, the Wechsler Individual Achievement Tests, Kaufman Tests of Educational Achievement, and Wide Range Achievement Test–III). The pattern and magnitude of correlations suggest that the WJ-III-ACH is measuring skills similar to those measured by other achievement tests.
SummaryThe WJ-III NU consists of two batteries—the WJ-III Tests of Cognitive Abilities and the WJ-III Tests of Achievement. These batteries provide a comprehen-sive system for measuring general intellectual ability, specifi c cognitive abilities, scholastic aptitude, oral language, and achievement over a broad age range. There are 20 cognitive tests and 22 achievement tests. A variety of scores are available for the tests and are combined to form clusters for interpretive purposes. A wide variety of derived scores are available. The WJ-III NU’s norms, reliability, and validity appear adequate.
Peabody Picture Vocabulary Test–Fourth Edition (PPVT-4)
The Peabody Picture Vocabulary Test–4 (PPVT-4; Dunn & Dunn, 2007) is an individually administered, norm-referenced, nontimed test assessing the recep-tive (hearing) vocabulary of children and adults. The authors identify additional uses for the test results: “It is useful (perhaps as part of a broader assessment) when evaluating language competence, selecting the level and content of instruction, and measuring learn-ing. In individuals whose primary language is English, vocabulary correlates highly with general verbal ability” (Dunn & Dunn, 2007, p. 1). The assessment of vocabulary can also be useful when evaluating the effects of injury or disease and is a key component of reading comprehension.
The PPVT-4 is a revised version of the PPVT, PPVT-R, and PPVT III, which were written and revised in 1959, 1981 and 1997, respectively. The new version contains many of the features of its predecessors, such as individual administration, effi cient scoring, and the fact that it is untimed. The test continues to offer two parallel forms, broad samples of stimulus words, and it can be used to assess a wide range of examinees. The PPVT-4 has a streamlined adminis-tration and contains larger, full-color pictures; new stimulus words; expanded interpretive options to analyze items by parts of speech; a new growth scale value scale for measuring change; and a report to par-ents and letter to parents (available in Spanish and
English). Other conveniences include a carrying tote and optional computerized scoring.
The PPVT-4 is administered using an easel. The examinee is shown a series of plates, each containing a set of four colored pictures. The examiner states a word and the examinee selects the picture that best represents the stimulus word. The PPVT-4 is an untimed power test, usually fi nished in 20 minutes or less. It consists of stimuli sets of 12 and examinees are tested at their abil-ity or age level; therefore, test items that are either too diffi cult or too easy are not administered. The authors provide recommended starting points by age.
ScoresExaminees earn a raw score based on the number of pictures correctly identifi ed between basal and ceiling items. A basal is defi ned as the lowest set administered that contains one or no errors. A ceiling is defi ned as the highest set administered that contains eight or more error responses. Once a ceiling is established, testing is discontinued. The raw score is determined by subtracting the total number of errors from the ceiling item. The PPVT-4 has two types of normative scores: deviation (standard scores, percentiles, normal curve equivalents, and stanines) and developmental (age equivalent and grade equivalent). The test also produces a nonnormative score called a growth scale value that measures change in PPVT-4 performance over time. It is a nonnormative score because it does not involve comparison with a norm group.
NormsTwo national tryouts were conducted in 2004 and 2005 to determine stimulus items for the test. Both classical and Rasch item analysis methods were applied to determine item diffi culty, discrimination, bias, distracter performance, reliability, and the range of raw score by age. Some items from the previous versions of the PPVT were maintained in the develop-ment of the PPVT-4. The PPVT-4 contains two paral-lel forms with a total of 456 items, 340 of which were adapted from the third edition and 116 were created for this edition.
The PPVT-4 was standardized on a representa-tive national sample of 3,540 people ages 2 years 6 months to 90 years or older (for age norms) and a subsample of 2,003 individuals from kindergarten
through grade 12 (for grade norms). The goal was to have approximately 100 to 200 cases in each age group, with the exception of the oldest two age groups, for which the target was 60. Due to rapid vocabulary growth in young children, the samples were divided into 6-month age intervals at ages 2 years 6 months through 6 years. Whole-year intervals were used for ages 7 through 14 years. The adult age groups use multiyear age intervals. The manual includes a table showing the number of individuals at each age level included in the standardization.
The standardization sample for the PPVT-4 was composed of more than 450 examiners tested at 320 sites in four geographical areas of the United States. Background information, including birth date, sex, race/ethnicity, number of years of education com-pleted, school enrollment status, special education status, and English language profi ciency, was gath-ered either from the examinee (those older than 18 years) or from parents for children 17 years old or younger. All potential examinee information was entered, a stratifi ed random sampling was made from the pool, and testing assignments for each site were determined. More cases were collected than planned, allowing the opportunity to choose fi nal age and grade samples that closely matched the U.S. popula-tion characteristics. The test appears to adequately represent the population at each age and grade level.
ReliabilityThere are multiple kinds of reliability reported for the PPVT-4. The manual contains detailed information on reliability data. The PPVT-4 reports split-half reliabil-ity and coeffi cient alpha as indicators of internal con-sistency reliability; also included are alternate-form reliability and test–retest reliability. The split-half reli-abilities average .94 or .95 for each form across the entire age and grade ranges. Coeffi cient alpha is also consistently high across all ages and grades, averag-ing .97 for Form A and .96 for Form B. During the standardization, a total of 508 examinees took both Form A and Form B (most during the same testing session, but some as many as 7 days apart). The alter-nate-form reliability is very high, falling between .87 and .93 with a mean of .89. The average test–retest correlation, reported on 349 examinees retested with the same form an average of 4 weeks after initial trial, is .93. The information on reliability indicates
Peabody Picture Vocabulary Test–Fourth Edition (PPVT-4) 267
268 Chapter 14 ■ Using Measures of Intelligence
Dilemmas in Current Practice
The practice of assessing children’s intelligence is currently marked by controversy. Intelligence tests simply assess samples of behavior, and different intelligence tests sample different behaviors. For that reason, it is wrong to speak of a person’s IQ. Instead, we can refer only to a person’s IQ on a specifi c test. An IQ on the Stanford–Binet Intelligence Scale is not derived from the same samples of behavior as an IQ on any other intelligence test. Because the behavior samples are different for different tests, educators and others must always ask, “IQ on what test?”
This should also be considered when interpreting factor scores for different intelligence tests. Just as the measure-ment of overall intelligence varies across tests, factor struc-tures and the behaviors that comprise factors differ across tests. Although authors of intelligence tests may include similar factor names, these factors may represent different behaviors across different tests. It is helpful to understand that, for the most part, the particular kinds of items and sub-tests found on an intelligence test are a matter of the way in which a test author defi nes intelligence and thinks about the kinds of behaviors that represent it.
When interpreting intelligence test scores, it is best to avoid making judgments that involve a high level of inference (judgments that suggest that the score represents much more than the specifi c behaviors sampled). Always remem-ber that these factor, index, and cluster scores represent merely student performance on certain sampled behaviors
and that the quality of measurement can be affected by a host of unique student characteristics that need to be taken into consideration.
Authors’ ViewpointInterpreting a student’s performance on intelligence tests must be done with great caution. First, it is important to note that factor scores tend to be less reliable than total scores because they have fewer items. Second, the same test may make different psychological demands on various test tak-ers, depending on their ages and acculturation. Test results mean different things for different students. It is imperative that we be especially aware of the relationship between a person’s acculturation and the acculturation of the norm group with which that person is compared.
We think it is also important to note that many of the behaviors sampled on intelligence tests are more indicative of actual achievement than ability to achieve. For instance, quantitative reasoning (a factor commonly included in intel-ligence tests) typically involves measuring a student’s math knowledge and skill. Students who have had more oppor-tunities to learn and achieve are likely to perform better on intelligence tests than those who have had less exposure to information, even if they both have the same overall poten-tial to learn. Intelligence tests, as they are currently avail-able, are by no means a pure representation of a student’s ability to learn.
that the PPVT-4 scores are very precise and users can depend on consistent scores from the PPVT-4.
ValidityThe manual discusses in detail validity information. Five studies were conducted comparing the PPVT-4 with the Expressive Vocabulary Test, second edition; the Comprehensive Assessment of Spoken Language; the Clinical Evaluation of Language Fundamentals, fourth edition; the PPVT-III; and the Group Reading Assessment and Diagnostic Evaluation. The PPVT-4 scores correlate highly with those of the previously mentioned assessments. Note that slightly lower correlations were found on assessments that measured broader areas of language than primarily vocabulary.
The authors provide data on how representatives of special populations (speech and language impair-ment, hearing impairment, specifi c learning disability, mental retardation, giftedness, emotional/behavioral disturbances, and ADHD) perform in relation to the general population. The results indicate the value of the PPVT-4 in assessing special populations.
SummaryThe PPVT-4 is an individually administered, norm-referenced, nontimed test assessing the receptive vocabulary of children and adults. The test is adequately standardized, and there is good evidence for reliability and validity. Data are also included on the testing and performance of students with disabilities.
Chapter Comprehension Questions 269
CHAPTER COMPREHENSION QUESTIONSWrite your answers to each of the following questions, and then compare your responses to the text or the study guide.
1. Explain the possible impact of acculturation on intelligence test performance.
2. Describe four behaviors that are commonly sampled on intelligence tests.
3. Describe the theoretical contributions of three individuals to the development of intelligence tests.
4. Describe four commonly interpreted factors in intelligence testing.
5. What are processing defi cits, and what tests are currently being used to assess them?
6. What are three types of intelligence testing, and for what purposes might you use each of them?
7. Compare and contrast three commonly used tests of intelligence.
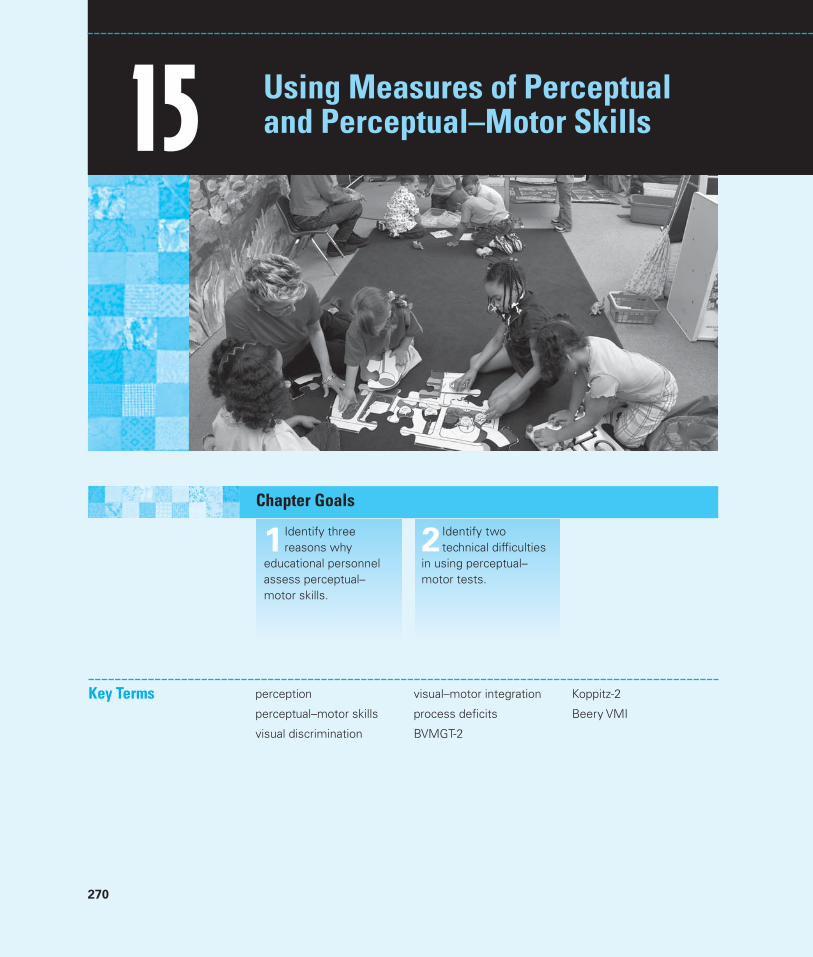
270
Using Measures of Perceptual and Perceptual–Motor Skills
2 Identify two technical diffi culties
in using perceptual–motor tests.
1 Identify three reasons why
educational personnel assess perceptual–motor skills.
Chapter Goals
Key Terms perception
perceptual–motor skills
visual discrimination
visual–motor integration
process defi cits
BVMGT-2
Koppitz-2
Beery VMI
15
Using Measures of Perceptual and Perceptual–Motor Skills 271
Perception is the process of acquiring, interpreting, and organizing sensory information. Experience, learning, cognitive ability, and personality all infl uence how one interprets and organizes that sensory information. Perceptual–motor skills refer to the production of motor behavior that is dependent on sen-sory information.
Educators and psychologists recognize that adequate perception and perceptual–motor skills are important in and of themselves. Thus, perception and perceptual–motor tasks are regularly incorporated in tests of intelligence. For example, the Perceptual Organization portion of the Wechsler Intelligence Scale for Children–IV requires visual discrimination, attention to visual detail, sequencing, spatial and nonverbal problem solving, part-to-whole relationships, visual motor coordination, and concentration. Many perceptual and perceptual–motor skills (especially those involving vision, audi-tion, and proprioception) are necessary for school success. For example, the ability to coordinate visual information with motor performance is essential in writing and drawing.
Psychologists have long been interested in perceptual distortions and perceptual–motor diffi culties for at least two reasons. First, various groups of individuals with disabilities demonstrate distorted perceptions. Some individu-als with diagnosed psychoses show distortions in visual, auditory, and olfactory perceptions. Many individuals known to have sustained brain damage have great
Kenneth is an 8-year-old second grader with notice-able motor diffi culties and considerable diffi culty acquiring basic reading skills. At age 6 years, his teacher referred him for a psychological evaluation and the individualized educational program (IEP) team identifi ed him as a student with development disabilities in visual–motor development and early reading skills. The IEP team thought that it would be better to work on development of skills that were believed to underlie reading diffi culties before engag-ing in intensive reading instruction. The team recom-mended an adaptive physical education program and visual–motor services in a special education resource room. The resource teacher worked with Kenneth on tracing patterns, reproduction of designs, rhythm tapping, tracing paths through mazes, and fi gural discrimination and generalization skills (fi nding which of several shapes differed from the others and fi nding shapes that were alike). In adaptive physical
education, the focus was on balance (balancing on his toes and walking on a balance beam) and locomotor skills such as jumping in place with both feet together, hopping, skipping, marching in place, and swinging his arms when walking. Kenneth also participated in “object control” activities such as throwing a softball underhand, dribbling a basketball, and catching a softball.
For all of fi rst grade, Kenneth participated in the perceptual and motor training. The IEP team met to draft an IEP for the second grade. The team noted Ken-neth was better in directionality, rhythm, and throw-ing; his printing and fi ne motor skills had shown good improvement. He still had diffi culty in balance and tasks requiring alternating left-to-right movements. He had made little progress in reading. Kenneth’s special education teacher questioned if the time spent focus-ing on development of visual and motor skills might better have been spent teaching him to read.
Scenario in Assessment
Kenneth
272 Chapter 15 ■ Using Measures of Perceptual and Perceptual–Motor Skills
Sp
ecifi
c Te
sts
of
Perc
eptu
al a
nd
Per
cep
tual
–Mo
tor
Ski
lls
diffi culty writing and copying, regularly reverse letters and other symbols, have distortions in fi gure-ground perception, and show defi cits in attention and focus. Moreover, some educators and psychologists believe that learning and behavior invariably build on and evolve out of early perceptual–motor integration, and any failures in early learning will adversely affect later learning. Thus, some pro-fessionals in the 1960s and 1980s sought to remediate learning disabilities by fi rst remediating perceptual–motor problems (Barsch, 1966; Doman et al., 1967; Kephart, 1971), visual–perceptual problems (Frostig, 1968), psycholinguistic problems (Kirk & Kirk, 1971), or sensory integration (Johnson & Myklebust, 1967; Ayers, 1981). Although many of these approaches were recognized as lack-ing merit (see, for example, Ysseldyke & Salvia, 1974) and have subsequently been abandoned because of a lack of evidence of their effi cacy, some (such as sen-sory integration) persist today. Recently, professional interest in process defi cits and learning disabilities has increased and has resulted in much better assessment procedures.
1 Why Do We Assess Perceptual–Motor Skills?
Perceptual and perceptual–motor skills are assessed for four reasons. In the schools, these tests are used to screen students who may need instruction to reme-diate or ameliorate visual or auditory perceptual problems before they interfere with school learning. Second, they are used to assess perceptual and perceptual–motor problems in students who are already experiencing school learning prob-lems. If such students also demonstrate poor perceptual–motor performance, they may also receive special instruction aimed at improving their perceptual abilities. Third, perceptual–motor tests are often used in assessments to determine a stu-dent’s eligibility for special education. Students thought to be learning disabled are often given these tests to ascertain whether perceptual problems coexist with learning problems. Moreover, in some states, there is a specifi c category of “per-ceptually handicapped”; tests of perceptual–motor skills would likely be used in eligibility decisions for this category. Finally, perceptual–motor tests are often used by clinical psychologists as an adjunct in the diagnosis of brain injury or emotional disturbance.
In Table 15.1, we provide a list of commonly used perceptual and perceptual–motor tests. In the sections that follow, we review the Bender Family of Tests with the Koppitz scoring system, and the Developmental Test of Visual–Motor Integration (Beery VMI). The other tests shown in the table are reviewed on the website for this text.
The Bender Visual–Motor Gestalt Test Family
Among the perceptual–motor tests used in schools are two tests that are derived from early work begun on assessment of visual–motor skills by Lauretta Bender
SPECIFIC TESTS OF PERCEPTUAL AND PERCEPTUAL–MOTOR SKILLS
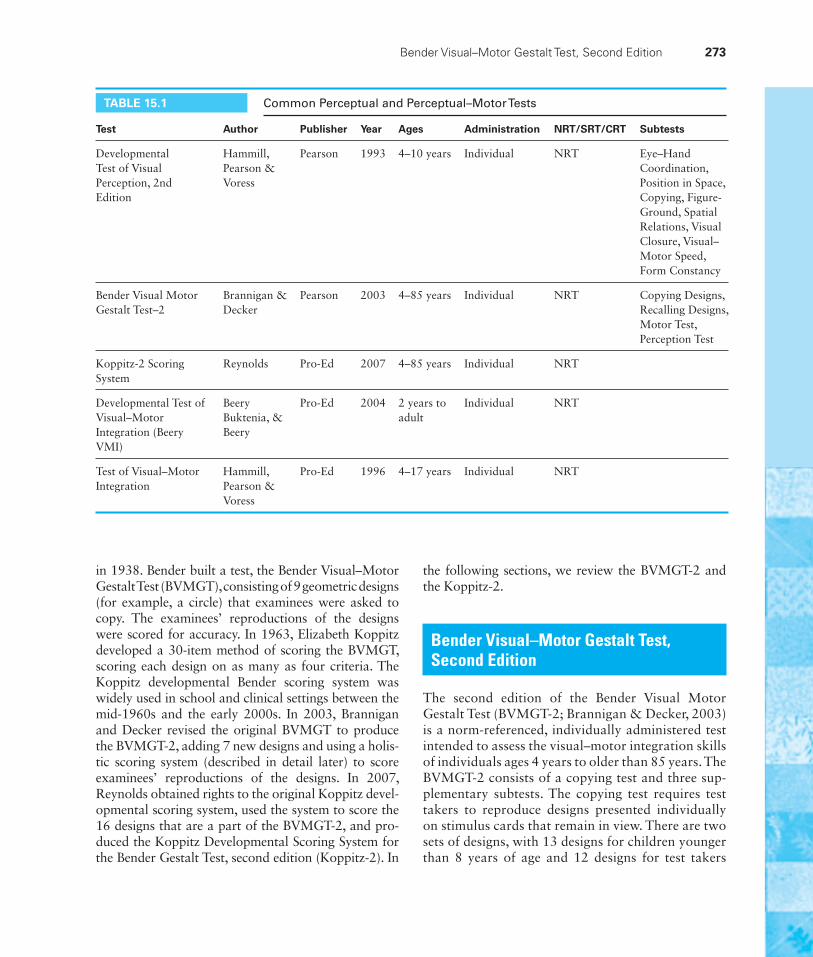
Bender Visual–Motor Gestalt Test, Second Edition 273
in 1938. Bender built a test, the Bender Visual–Motor Gestalt Test (BVMGT), consisting of 9 geometric designs (for example, a circle) that examinees were asked to copy. The examinees’ reproductions of the designs were scored for accuracy. In 1963, Elizabeth Koppitz developed a 30-item method of scoring the BVMGT, scoring each design on as many as four criteria. The Koppitz developmental Bender scoring system was widely used in school and clinical settings between the mid-1960s and the early 2000s. In 2003, Brannigan and Decker revised the original BVMGT to produce the BVMGT-2, adding 7 new designs and using a holis-tic scoring system (described in detail later) to score examinees’ reproductions of the designs. In 2007, Reynolds obtained rights to the original Koppitz devel-opmental scoring system, used the system to score the 16 designs that are a part of the BVMGT-2, and pro-duced the Koppitz Developmental Scoring System for the Bender Gestalt Test, second edition (Koppitz-2). In
the following sections, we review the BVMGT-2 and the Koppitz-2.
Bender Visual–Motor Gestalt Test, Second Edition
The second edition of the Bender Visual Motor Gestalt Test (BVMGT-2; Brannigan & Decker, 2003) is a norm-referenced, individually administered test intended to assess the visual–motor integration skills of individuals ages 4 years to older than 85 years. The BVMGT-2 consists of a copying test and three sup-plementary subtests. The copying test requires test takers to reproduce designs presented individually on stimulus cards that remain in view. There are two sets of designs, with 13 designs for children younger than 8 years of age and 12 designs for test takers
Test Author Publisher Year Ages Administration NRT/SRT/CRT Subtests
Developmental Test of Visual Perception, 2nd Edition
Hammill, Pearson & Voress
Pearson 1993 4–10 years Individual NRT Eye–Hand Coordination, Position in Space, Copying, Figure-Ground, Spatial Relations, Visual Closure, Visual–Motor Speed, Form Constancy
Bender Visual Motor Gestalt Test–2
Brannigan & Decker
Pearson 2003 4–85 years Individual NRT Copying Designs, Recalling Designs, Motor Test, Perception Test
Koppitz-2 Scoring System
Reynolds Pro-Ed 2007 4–85 years Individual NRT
Developmental Test of Visual–Motor Integration (Beery VMI)
Beery Buktenia, & Beery
Pro-Ed 2004 2 years to adult
Individual NRT
Test of Visual–Motor Integration
Hammill, Pearson & Voress
Pro-Ed 1996 4–17 years Individual NRT
TABLE 15.1 Common Perceptual and Perceptual–Motor Tests
274 Chapter 15 ■ Using Measures of Perceptual and Perceptual–Motor Skills
8 years of age or older. The two sets have 8 designs that are common to both sets. The test is untimed. The three supplementary tests are a design recall subtest, a motor subtest, and a perception subtest.
Recalling Designs. After the designs and the stimulus materials have been copied and removed from sight, test takers are asked to draw as many of the designs as they can remember. The subtest is untimed.
Motor Test. This test consists of four test items, and each item contains three fi gures. Test takers are required to connect dots in each fi gure without lifting their pencil, erasing, or tilting their paper. Four min-utes are allowed to complete the subtest.
Perception Test. This test consists of 10 items that require a test taker to match a design in a multiple-choice array to a stimulus design. Four minutes are allowed to complete the task.
ScoresEach copied and recalled design is scored holistically on a 5-point scale: 0 = no resemblance to the stimulus; 1 = slight or vague resemblance to the stimulus; 2 = some or moderate resemblance to the stimulus; 3 = strong or close resemblance to the stimulus; and 4 = nearly perfect. Examples of each score are presented for each design in the test manual. Each fi gure on the motor sub-test and each item on the perception subtest are scored pass or fail. Raw scores from the copying and recall sub-tests can be converted to standard scores (mean = 100; standard deviation = 15) and percentiles; 90 percent and 95 percent confi dence intervals are available for standard scores. Percentiles are available for the motor and perception subtests.
NormsThe normative sample consists of 4,000 individuals ages 4 years to older than 85 years. Individuals with limited English profi ciency, severe sensory or commu-nication defi cits, traumatic brain injury, and severe behavioral or emotional disorders were excluded from the normative sample. Students placed in special education for more than 50 percent of the school day were also excluded from the normative sample. Approximately 5 percent of the school-age population was included in regular education classrooms. Thus,
the normative sample systematically underrepresents the proportion of students with disabilities, the population with whom the BVMGT-2 is intended to be used. For students of preschool and school age, the norms appear generally representative in terms of race/ethnicity, educational level of parents, and geographical region for each age group.
ReliabilityCorrected split-half correlations were used to esti-mate the internal consistency of the copying test. Of the 14 coeffi cients for students between 4 and 20 years of age, only 4 were less than .90, and they were in the .80s. Thus, the BVMGT-2 usually has suf-fi cient reliability for use in making important educa-tion decisions.
Stability of the copying and recall tests was estimated by test–retest using the standard scores of 213 individuals in four age groups. There were 39 stu-dents in the 5- to 7-year-old group and 62 students in the 8- to 17-year-old group. The obtained correlation for the younger group was .77, and the correlation for the older group was .76. Thus, the BVMGT-2 is insuffi ciently stable to use in making important education decisions.
Interscorer agreement was assessed in two ways. Five experienced scorers scored 30 protocols indepen-dently. Correlations among scorers for copied designs ranged from .83 to .94; correlations for recalled designs were adequate, ranging from .94 to .97. The agreement between the scoring of 60 protocols by one experienced and one inexperienced scorer was also examined. The correlation for copied designs was .85, whereas the correlation for recalled designs was .92. Thus, the scoring of copied designs may not consistently have suffi cient reliability for use in making important educational decisions on behalf of students.
No reliability data of any kind are presented for the motor or perception subtests.
ValidityEvidence for the internal validity of the copying test of the BVMGT-2 comes from three sources. First, the items were carefully developed to assess the ability to reproduce designs. Second, factor analysis of test items using the normative sample suggests that a sin-gle factor underlies copying test performance. Third, copying test performance varies with age in expected
Koppitz-2 Scoring System for the BVMGT-2 275
ways: It increases sharply at approximately age 7 years and continues to increase, although less rapidly, until approximately age 15 years, when it plateaus until approximately age 40 years, after which it begins to decline. No evidence of content validity is presented for the recall, motor, or perception subtests.
Criterion-related validity was examined by study-ing the relationship between the BVMGT-2 and the Beery–Buktenica Developmental Test of Visual–Motor Integration (DTVMI) with 75 individuals between the ages of 4 and 17 years. The obtained correlation between the copying score on the BVMGT-2 and the DTVMI was .55, whereas the obtained correlation between the recall score and the DTVMI was .32.
Other studies examined the relationship between copying and recall on the BVMGT-2 and aca-demic achievement. Obtained correlations with the Woodcock–Johnson Psychoeducational Battery, Achievement Battery–III for the copying test ranged from .22 (with Basic Reading) to .43 (with Math Reasoning), and obtained correlations for the recall subtest ranged from .21 (with Basic Reading) to .38 (with Broad Math). Obtained correlations with the Wechsler Individual Achievement Test–II for the copy-ing test ranged from .18 (with Oral Language) to .42 (with Written Language), and the obtained cor-relations for the recall subtest ranged from .18 (with Written Language) to .32 (with Math). The relation-ship between performance on this test and academic achievement is very low.
The relationship between BVMGT-2 scores and IQs was also examined. In one study, the Stanford–Binet Intelligence Scale, Fifth Edition, was used as the criterion measure. Obtained correlations for the copy-ing test ranged from .47 with verbal IQ to .51 with nonverbal IQ; obtained correlations for the recall subtest ranged from .44 with verbal IQ to .47 with nonverbal IQ. In another study, copying and recall scores were correlated with IQs from the Wechsler Intelligence Scale for Children–III. Obtained correla-tions for the copying test ranged from .31 with Verbal IQ to .62 with Performance IQ; obtained correlations for the recall subtest ranged from .16 with VIQ to .32 with PIQ. A third study with the Wechsler Adult Intelligence Scale–III had similar fi ndings.
Finally, evidence is presented for differential per-formance by groups of individuals with disabilities. The means of individuals with mental retardation, learning disabilities in reading, learning disabilities
in math, learning disabilities in written language, autism, and attention defi cit hyperactivity disorder are all signifi cantly lower than those of nondisabled individuals on both the copying and the recall tests. Gifted students earn signifi cantly higher scores on the copying and recall tests.
No evidence of validity is presented for motor or perception subtests.
SummaryThe BVMGT-2 is a norm-referenced, individually administered test intended to assess an individual’s ability to copy and recall geometric designs as well as to connect dots and perform match-to-sample tasks with such designs. The norms for school-age people appear generally representative, although they exclude some of the very individuals with whom the test is in tended to be used. No reliability data of any kind are presented for the motor or perception subtests. The copying test appears generally to have adequate internal consistency, but there is no information about the internal consistency of the recall subtest. The copy-ing and recall tests have poor stability and may have inadequate interscorer agreement. Evidence for the content validity of the copying test is adequate, but the correlations to establish criterion-related validity are too low to be compelling. Although the copying and recall tests of the BVMGT-2 can discriminate groups of individuals known to have disabilities, no evidence is presented regarding these tests’ accuracy in categorizing undiagnosed individuals. Reliability and validity evidence for the motor and perception subtests is absent; these subtests should not be used in educational decision making and are of unknown value in clinical situations.
Koppitz-2 Scoring System for the BVMGT-2
The Koppitz developmental scoring system for the BVMGT, developed in 1963, received widespread application in school and clinic settings. Once the BVMGT was revised as the BVMGT-2 and PRO-ED received the rights to the original Koppitz scoring system, it was only a matter of time until the author (Reynolds, 2007) developed the Koppitz-2 as a scoring system for the BVMGT-2.
276 Chapter 15 ■ Using Measures of Perceptual and Perceptual–Motor Skills
The Koppitz scoring system is applied to the same 16 cards given for the BVMGT-2. The cards can be obtained as part of the Koppitz-2, or the Koppitz materials may be ordered separately by those who already have the BVMGT-2 stimulus cards. Additional materials included with the Koppitz-2 are two record forms (one for ages 5 to 7 years and the other for individuals older than 8 years), a supplemental emo-tional indicators record form, a scoring template, and an examiner’s manual that includes detailed instruc-tions for scoring.
The Koppitz-2 developmental scoring system has 45 items as opposed to the 30 items that were part of the original Koppitz system. Examinees copy the BVMGT-2 designs and then a standardized set of rules is applied to score their performance. There are as many as 5 items for each design. The author states that the Koppitz-2 scoring system is designed to document the presence and degree of visual–motor diffi culties, identify candidates for referral, assess effectiveness of intervention programs, research, and assist in differential diagnosis of various neuropsy-chological and psychological conditions.
ScoresRaw scores earned using the Koppitz-2 scoring system are converted to scaled scores with a mean of 100 and a standard deviation of 15. Descriptive ratings of per-formance (for example, average and below average) are assigned. Scaled scores can be converted to T scores, Z scores, normal curve equivalents, stanines, and age equivalents. Time to complete the drawings is also recorded. The author states that a short completion time may refl ect impulsive responding and problems with impulse control and planning ability.
NormsThe standardization sample for the Koppitz-2 scoring system is identical to that for the BVMGT-2.
ReliabilityData on internal consistency are reported in the manual separately for each age range. Coeffi cients range from .77 to .91, with all but one coeffi cient greater than .80. Reliabilities are also shown for sub-groups such as racial/ethnic groups and disability groups. Test–retest reliabilities are reported on 202
individuals ages 5 to 85 years, and they range from .75 to .84. The test is reliable for screening purposes but not for diagnostic purposes. Interscorer reliabilities average .91 for ages 5 to 7 years and .93 for those older than 8 years.
ValidityThe author presents theory-based, logic-based, and empirically based evidence for the validity of the Koppitz-2 scoring system. The theory-based argument is relatively weak, consisting primarily of the conten-tion that the test is valid because scores increase with age. As empirical evidence for validity of the Koppitz-2 scoring system, the test is compared to measures of intelligence, academic achievement, other visual– motor tests, and clinical and academic status. It is argued that the fact that the application of the scoring system to the BVMGT-2 shows that correlations with verbal measures (average .34) are half what they are with nonverbal measures (.63) is evidence for valid-ity of the scoring system. In describing the relation-ship of scores earned on the Koppitz-2 system with other perceptual–motor measures, the author reports moderate correlations with an old version of the Beery VMI with only 45 examinees. The author states that demonstration of validity is a work in progress.
SummaryThe Koppitz-2 is a revision of a 1963 Koppitz system of scoring, the BVMGT. The Koppitz-2 scoring sys-tem is applied to the BVMGT-2 as an alternative way to score that test. There is no comparison of results obtained when the two systems are compared, reliabil-ity is adequate for screening purposes, and evidence for validity is very limited.
Developmental Test of Visual–Motor Integration (Beery VMI)
The Developmental Test of Visual–Motor Integration (Beery VMI; Beery, Buktenia, & Beery, 2004) is a set of geometric forms to be copied on paper using a pencil. The authors contend that the set of forms is arranged in a developmental sequence from easy to more dif-fi cult. The Beery VMI is designed to assess the extent to which individuals can integrate their visual and
Developmental Test of Visual–Motor Integration (Beery VMI) 277
motor abilities. The authors state that the primary purpose of the Beery VMI is to “help identify, through early screening, signifi cant diffi culties that some children have integrating, or coordinating their visual– perceptual and motor (fi nger and hand move-ment) abilities” (p. 9). The authors defi ne visual–motor integration as the degree to which visual perception and fi nger–hand movements are well coordinated (p. 12). They indicate that if a child performs poorly on the Beery VMI, it could be because he or she has ade-quate visual–perceptual and motor coordination abili-ties but has not yet learned to integrate, or coordinate, these two domains. Two supplemental tests, the Beery VMI Visual Perception Test and the Beery VMI Motor Coordination Test, are provided to enable users to attempt to sort out the relative contribution of visual and motor diffi culties to poor performance on mea-sures of visual–motor integration.
There are two versions of the Beery VMI. The full Beery VMI is intended for use with individuals from age 2 years to adults. It contains all 30 VMI forms, including the initial 3 that are both imitated and copied directly. The short Beery VMI contains 21 items and is intended for use with children ages 2 to 7 years. Items for the supplemental tests are identical to items for the full VMI. The VMI may be administered individually or to groups. The test can be administered and scored by a classroom teacher and usually takes approxi-mately 15 minutes. Scoring is relatively easy because the designs are scored pass–fail, and individual proto-cols can be scored in a few minutes.
ScoresThe manual for the Beery VMI includes two pages of scoring information for each of the 30 designs. The child’s reproduction of each design is scored pass–fail, and criteria for successful performance are clearly articulated. A raw score for the total test is obtained by adding the number of reproductions copied correctly before the test taker has three consecutive f ailures. Normative tables provided in the manual allow the examiner to convert the total raw score to a develop-mental age equivalent, grade equivalent, standard score, scaled score, stanine, or percentile.
NormsThe Beery VMI has been standardized in the United States fi ve times since its initial development in 1967.
The test was originally standardized on 1,030 childrenin rural, urban, and suburban Illinois. In 1981, the test was cross-validated with samples of children “from various ethnic and income groups in California” (Beery, 1982, p. 10). In 1988, the test was again cross-validated with an unspecifi ed group of stu-dents “from several Eastern, Northern and Southern states” (Beery, 1989, p. 10). The 1988 norm sample is not representative of the U.S. population with respect to ethnicity and residence of the students. The Beery VMI and its supplemental tests were normed in 2003 on 2,512 children 2 to 18 years of age selected from fi ve major areas of the United States. The sample was selected by contacting school psychologists and learning disabilities specialists chosen at random from membership lists of major professional orga-nizations. Those who indicated a willingness to par-ticipate tested the subjects. A total of 23 child care, preschool, private, and public schools participated. Although the norms collectively were representative of the U.S. population, cross-tabulations are shown only for age by gender, ethnicity, socioeconomic sta-tus, and geographic region. Thus, we do not know whether, for example, all the African American students were from middle-socioeconomic status families, from the East, and so on.
ReliabilityThe authors report the results of studies of internal consistency on an unspecifi ed sample of individuals. Internal consistency ranges from .76 to .91, with an average of .85. Interscorer reliability is .92 for the Beery VMI, .98 for the Beery visual supplement, and .93 for the motor supplement. Test–retest reliability was assessed by administering the Beery VMI to 122 children between the ages of 6 and 10 years in gen-eral education public school classrooms. The sample is not further defi ned. Test–retest reliability is .87 for the Beery VMI, .84 for the visual supplement, and .83 for the motor supplement. The Beery VMI has adequate reliability for screening purposes.
ValidityThe authors contend that the Beery VMI has good content validity because of the way in which the items were selected. Evidence for validity based on inter-nal structure comes from comparing results of per-formance on the Beery VMI to performance results
278 Chapter 15 ■ Using Measures of Perceptual and Perceptual–Motor Skills
on the copying subtest of the Developmental Test of Visual Perception–2 and the drawing subtest of the Wide Range Assessment of Visual–Motor Abilities. The sample is described only as 122 students attending public schools. Correlations were moderate.
The authors provide evidence for validity based on internal structure by (1) generating a set of hypoth-eses about what performance on the test would look like if it were measuring what is intended and (2) pro-viding answers to the hypotheses. They show that the abilities measured by the Beery VMI are developmen-tal; that they are related to one another; and that the supplements measure a part, but not the whole, of the abilities measured by the Beery VMI. They also show that performance on the Beery VMI is related more closely to nonverbal than to verbal aspects of
intelligence, that performance on the test correlates moderately with performance on academic achieve-ment tests, and that test performance is related to disabling conditions.
SummaryThe Beery VMI is designed to assess the integration of visual and motor skills by asking a child to copy geometric designs. As is the case with other such tests, the behavior sampling is limited, although the 30 items on the VMI certainly provide a larger sample of behavior than is provided by the 9 items on the BVMGT. The VMI has relatively high reliability and validity in comparison with other measures of perceptual–motor skills.
Dilemmas in Current Practice
The assessment of perceptual–motor skills or visual–motor integration is a diffi cult undertaking. Without an adequate defi nition of perceptual and perceptual–motor skills and with few technically adequate tests to rely on, the assessor is in a bind. Usually, the best way to cope with these problems is not to test. If assessments cannot be done properly or are not educationally necessary, they should not be conducted. Assessment of perceptual and perceptual–motor skills usu-ally falls into this category. We encourage those who are concerned about development of these skills to engage in direct systematic observation in the natural environment in which these skills actually occur. After all, when students cannot print legibly, we do not need to know that they have diffi culty copying geometric designs.
Authors’ ViewpointIt is important to realize that when test authors write about per-ceptual–motor skills, they are talking only about a very small sub-set of those skills—visual perception and fi ne hand movements. These tests do not address auditory or proprioceptive percep-tion, and they do not address gross motor skills or fi ne motor skills other than manual ones. It is also important to recognize that much of the theoretical importance of perceptual–motor assessment is not well founded. First, the specifi c mechanisms by which perceptual–motor development affects reading are seldom specifi ed and never validated. Thus, theorists may opine that perceptual–motor skills are necessary for reading, but they do not specify what those skills are and how they affect read-
ing. Other than focusing on print material and turning pages, the motor component of reading is unclear. Second, it is based on an incorrect interpretation of the correlation between achieve-ment and perceptual–motor skills. For example, it is well estab-lished that poor readers also tend to have poorly developed perceptual–motor skills. However, it is not poor perceptual–motor skills that cause poor reading. Rather, it is poor reading that causes poor perceptual–motor skills. Perceptual–motor skills improve with practice, and learning academics provides that practice. Thus, good readers of material written in English typically develop good left-to-right tracking because they prac-tice tracking from left to right as they read.
The practice of perceptual–motor assessment is linked directly to perceptual–motor training or remediation. There is an appalling lack of empirical evidence to support the claim that specifi c perceptual–motor training facilitates the acquisi-tion of academic skills or improves the chances of academic success. In fact, major professional associations and insur-ance companies have taken strong stands against the practice of perceptual–motor assessment and training (see the box for material published on the Cigna Insurance Company website). Perceptual–motor training will improve perceptual–motor functioning. When the purpose of perceptual–motor assess-ment is to identify specifi c important perceptual and motor behaviors that children have not yet mastered, some of the devices reviewed in this chapter may provide useful informa-tion; performance on individual items will indicate the extent to which specifi c skills (for example, walking along a straight
Chapter Comprehension Questions 279
The American Association for Pediatric Ophthalmology and Strabismus (AAPOS), in “Learning Disabilities: Infor-mation for Parents” (2005), states, “There is no scientifi c evidence to suggest that any ophthalmologic manipulation or therapy including vision training, orthoptic exercises, visual perceptual training, or colored spectacle lenses will improve academic performance in children with learning disabilities.”
The Committee on Children with Disabilities of the American Academy of Pediatrics, the American Acad-emy of Ophthalmology (AAO), and AAPOS statement, “Learning Disabilities, Dyslexia, and Vision: A Subject Review” (1998), states, “No scientifi c evidence sup-ports claims that the academic abilities of children with learning disabilities can be improved with treat-ments that are based on (1) visual training, including muscle exercises, ocular pursuit, tracking exercises, or ‘training’ glasses (with or without bifocals or prisms), (2) neurologic organizational training (laterality train-ing, crawling, balance board, perceptual training), or (3) colored lenses. These more controversial methods of treatment may give parents and teachers a false sense of security that a child’s reading diffi culties are being addressed, which may delay proper instruction or
remediation. The expense of these methods is unwar-ranted, and they cannot be substituted for appropriate educational measures.”
The AAO (2001) states, “It seems intuitive that oculo-motor abilities and visual perception play a role in learning skills such as reading and writing. However, several stud-ies in the literature demonstrate that eye movements and visual perception are not critical factors in the reading impairment found in dyslexia, but that brain processing of language plays a greater role.”
SummaryVisual perceptual training has been proposed as a treatment for learning disabilities or disorders. Visual perceptualtraining is considered behavioral training and educational/training in nature. Evidence in the published, peer- reviewed scientifi c literature does not indicate that visual perceptual therapy is a treatment for any type of learning disability or disorder. The available evidence does not support the conclusion that visual perceptual training will improve learning skills or treat the underlying cause of the learning disability.
Source: www.cigna.com.
CHAPTER COMPREHENSION QUESTIONSWrite your answers to each of the following questions, and then compare your responses to the text or the study guide.
1. Identify three reasons why educational personnel administer perceptual–motor tests.
2. Identify two technical diffi culties in using perceptual–motor tests.
3. Assume that you have to assess a student’s perceptual–motor skills. How would you go about doing this in a way that would be appropriate?
4. Homer, age 6-3, takes two visual–perceptual–motor tests, the BVMGT-2 and the DTVMI. On the BVMGT-2, he earns a developmental age of 5-6, and on the DTVMI he earns a developmental age of 7-4. Give two different explanations for the discrepancy between the scores.
5. Performance on the BVMGT–2 is used as a criterion in the differential identifi cation of children as brain injured, perceptually handicapped, or emotionally disturbed. Why must the examiner use caution in interpreting and using test results for these purposes?
line) have been mastered. There is no support for the use of perceptual–motor tests in planning programs designed
to facilitate academic learning or to remediate academic d iffi culties.
280
Using Measures of Social and Emotional Behavior16
Chapter Goals
1Know several methods for
assessing social–emotional functioning.
2Know two reasons for assessing social–
emotional functioning.3Understand the
components of a functional behavioral assessment.
4Be familiar with some commonly
used scales for assessing social–emotional functioning.
Using Measures of Social and Emotional Behavior 281
Key Terms internalizing problems
externalizing problems
acquisition defi cit
performance defi cit
multiple gating
peer-acceptance nomination scales
sociometric ranking
Systematic Screening for Behavior Disorders
functional behavioral assessment
Behavior Assessment System for Children, Second Edition (BASC-2)
Social and emotional functioning often plays an important role in the development of student academic skills. When students either lack or fail to dem-onstrate a certain repertoire of expected behavioral, coping, and social skills, their academic learning can be hindered. The reverse is also true: School experiences can impact student social–emotional well-being and related behaviors. To be successful in school, students frequently need to engage in certain positive social behaviors, such as turn taking and responding appropriately to criticism. Other behaviors, such as name calling and uttering self-deprecating remarks, may cause concern and can denote underlying social and emotional problems. In Chapter 6, we noted that teachers, psychologists, and other diagnosticians systematically observe a variety of student behaviors. In this chapter, we discuss additional methods and consider-ations for the assessment of behaviors variously called social, emotional, and prob-lem behaviors.
The appropriateness of social and emotional behavior is somewhat depen-dent on societal expectations, which may vary according to the age of a child, the setting in which the behavior occurs, the frequency or duration of the behavior, and the intensity of the behavior. For example, it is not uncommon for preschool students to cry in front of other children when their parents send them off on the fi rst day of school. However, the same behavior would be considered atypi-cal if exhibited by an eleventh grader. It would be even more problematic if the eleventh grader cried every day in front of her peers at school. Some behaviors are of concern even when they occur infrequently, if they are very intense. For example, setting fi re to an animal is signifi cant even if it occurs rarely—only every year or so.
Although some social and emotional problems that students experience are clearly apparent, others may be much less easily observed, even though they have a similar negative impact on overall student functioning. Externalizing problems, particularly those that contribute to disruption in classroom routines, are typi-cally quite easily detected. Excessive shouting, hitting or pushing of classmates, and talking back to the teacher are behaviors that are not easily overlooked. Internalizing problems, such as anxiety and depression, are often less readily identifi ed. These problems might be manifested in the form of social isolation, excessive fatigue, or self-destructive behavior. In assessing both externalizing and internalizing problems, it can be helpful to identify both behavioral excesses (for instance, out-of-seat behavior or interrupting) and defi cits (such as shar-ing, positive self-talk, and other coping skills) that can then become targets for intervention.
Sometimes students fail to behave in expected ways because they do not have the requisite coping or social skills; in other cases, students may actually have the necessary skills but fail to demonstrate them under certain conditions.
282 Chapter 16 ■ Using Measures of Social and Emotional Behavior
Bandura (1969) points to the importance of distinguishing between such acquisition and performance defi cits in the assessment of social behavior. If students never demonstrate certain expected social behaviors, they may need to be instructed how to do so, or it may be necessary for someone to more frequently model the expected behavior for them. If the behavior is expected to be demonstrated across all contexts and is restricted to one or few contexts, there may be discriminative stimuli unique to the few environments that occa-sion the behavior, or there may be specifi c contingencies in those environments that increase or at least maintain the behavior. An analysis of associated envi-ronmental variables can help determine how best to intervene. When problem-atic behavior is generalized across a variety of settings, it can be particularly diffi cult to modify and may have multiple determinants, including biological underpinnings.
1 Ways of Assessing Problem Behavior
Four methods are commonly used, singly or in combination, to gather informa-tion about social and emotional functioning: observational procedures, interview techniques, situational measures, and rating scales. Direct observation of social and emotional behavior is often preferred, given that the results using this method are generally quite accurate. However, obtaining useful observational data across multiple settings can be time-consuming, particularly when the behavior is very limited in frequency or duration. Furthermore, internalizing problems can go undetected unless specifi c questions are posited, given that the associated behav-iors may be less readily detected. The use of rating scales and interviews can often allow for more effi cient collection of data across multiple settings and infor-mants, which is particularly important in the assessment of social and emotional behavior. Observational procedures were discussed in Chapter 6; the remaining methods are described in the following sections.
Interview TechniquesInterviews are most often used by experienced professionals to gain informa-tion about the perspectives of various knowledgeable individuals, as well as to gain further insight into a student’s overall patterns of thinking and behaving. Martin (1988) maintains that self-reports of “aspirations, anxieties, feelings of self-worth, attributions about the causes of behavior, and attitudes about school are [important] regardless of the theoretical orientation of the psychologist” (p. 230). There are many variations on the interview method—most distinctions are made along a continuum from structured to unstructured or from formal to informal. Regardless of the format, Merrell (1994) suggests that most interviews probe for information in one or more of the following areas of functioning and development: medical/developmental history, social–emotional functioning, edu-cational progress, and community involvement. Increasingly, the family as a unit (or individual family members) is the focus of interviews that seek to identify salient home environment factors that may be having an impact on the student (Broderick, 1993).
Why Do We Assess Problem Behavior? 283
Situational MeasuresSituational measures of social–emotional behavior can include nearly any reason-able activity (D. K. Walker, 1973), but two well-known methods are peer-acceptance nomination scales and sociometric ranking techniques. Both types of measures provide an indication of an individual’s social status and may help describe the atti-tude of a particular group (such as the class) toward the target student. Peer nomi-nation techniques require that students identify other students whom they prefer on some set of criteria (such as students they would like to have as study partners). From these measurements, sociograms, pictorial representations of the results, can be created. Overall, sociometric techniques provide a contemporary point of refer-ence for comparisons of a student’s status among members of a specifi ed group.
Rating ScalesThere are several types of rating scales; generally a parent, teacher, peer, or “sig-nifi cant other” in a student’s environment must rate the extent to which that student demonstrates certain desirable or undesirable behaviors. Raters are often asked to determine the presence or absence of a particular behavior and may be asked to quantify the amount, intensity, or frequency of the behavior. Rating scales are popular because they are easy to administer and useful in providing basic information about a student’s level of functioning. They bring structure to an assessment or evaluation and can be used in almost any environment to gather data from almost any source. The important concept to remember is that rating scales provide an index of someone’s perception of a student’s behavior. Different raters will probably have different perceptions of the same student’s behavior and are likely to provide different ratings of the student; each is likely to have differ-ent views of acceptable and unacceptable expectations or standards. Self-report is also often a part of rating scale systems. Gresham and Elliott (1990) point out that rating scales are inexact and should be supplemented by other data collection methods.
One procedure that has been developed to incorporate multiple methods in the assessment of social and emotional behavior is multiple gating (Walker & Severson, 1992). This procedure is evident in the Systematic Screening for Behavior Disorders, which involves the systematic screening of all students using brief rating scales. Screening is followed by the use of more extensive rating scales, interviews, and observations for those students who are identifi ed as likely to have social–emotional problems. Multiple gating may help limit the number of undetected problems, as well as target time-consuming assessment methods toward the most severe problems.
2 Why Do We Assess Problem Behavior?
There are two major reasons for assessing problem behavior: (1) identifi cation and classifi cation and (2) intervention. First, some disabilities are defi ned, in part, by inappropriate behavior. For example, the regulations for implementing the Individuals with Disabilities Education Act (IDEA) describe in general terms the types of inappropriate behavior that are indicative of emotional disturbance and
284 Chapter 16 ■ Using Measures of Social and Emotional Behavior
autism. Thus, to classify a pupil as having a disability and in need of special edu-cation, educators need to assess social and emotional behavior.
Second, assessment of problem behavior may lead to appropriate interven-tion. For students whose disabilities are defi ned by behavior problems, the need for intervention is obvious. However, the development and demonstration of social and coping skills, and the reduction of problem behavior, are worthwhile goals for any student. Both during and after intervention, behaviors are monitored and assessed to learn whether the treatment has been successful and the desired behavior has generalized.
3 Functional Behavioral Assessment and Analysis
One assessment strategy that has become more commonly used to address problem behavior is functional behavioral assessment (FBA). An FBA repre-sents a set of assessment procedures used to identify the function of a student’s problematic behavior, as well as the various conditions under which it tends to occur. Those who conduct FBAs may use a variety of different assessment methods and tools (for example, interviews, observations, and rating scales), depending on the nature of the student’s behavioral diffi culties. Once an FBA has been conducted, a behavior intervention plan can be developed that has a high likelihood of reducing the problem behavior. According to IDEA 2004, an FBA must be conducted for any student undergoing special education eligibil-ity evaluation in which problem behavior is of concern. An FBA must also be conducted (or reviewed) following a manifestation determination review1 in which the associated suspensions from school were determined to be due to the child’s disability. FBAs are to be conducted by those who have been appropri-ately trained.
Steps for Completing a Functional Behavior AssessmentAlthough a variety of different tools and measures might be used to conduct an FBA, certain steps are essential to the process. These include the following:
Defi ning the behavior. Although a student may display a variety of problematic behaviors, for the purpose of conducting a functional behavioral assessment, it is important to narrow in on just one or two of the most problematic behaviors. For example, although Annie may exhibit a variety of problematic behaviors, including excessive crying, self-mutilation (that is, repeatedly banging her head against her desk until she develops bruises), and noncompliance with teacher directions, a support team may decide to focus on her self-mutilation behavior, given that it is particularly intense and harmful to her body. It is important to defi ne the behavior such that it is observable, measurable, and specifi c (see Chapter 6 for ways in which behaviors can be measured). A review of records, interviews with
1A manifestation determination review must be conducted when a student receiving special education services has been the recipient of disciplinary action that constitutes a change of placement for more than 10 days within a school year.
Functional Behavioral Assessment and Analysis 285
teachers and caregivers, and direct observations may help in defi ning the behavior of concern.
Identifying the conditions under which behavior is manifested. Once the behavior has been carefully defi ned, it is necessary to identify any patterns associated with occurrences of the behavior. In doing so, it is important to identify the following:
Antecedents: These represent events that occur immediately before ●
the problem behavior. They may include such things as being asked to complete a particular task, having a particularly disliked person enter the room, or receiving a bad grade.
Setting events: These represent events that make it such that the student ●
is particularly sensitive to the antecedents and consequences associated with the problem behavior. For example, a setting event might include not having gotten enough sleep the night before school, such that the student is particularly sensitive to a teacher’s request for her to fi nish work quickly and subsequently acts out in response to the teacher’s request.
Consequences: These represent what happens as a result of the behavior. ●
For example, the consequence for a student tearing up a paper that he or she does not want to work on may be that the student does not have to complete the diffi cult task presented on the paper. Or, if a student hits another student in the arm, the consequence may be that he is sent to the offi ce, and his parents are called to pick him up and take him home.
Developing a hypothesis about the function of the behavior. Using information that is collected about antecedents, setting events, and consequences through record review, interview, and observation, one can begin to develop hypotheses about the function of the behavior. In Chapter 6, we described several different functions of behavior, including (1) social attention/communication; (2) access to tangibles or preferred activities; (3) escape, delay, reduction, or avoidance of aversive tasks or activities; (4) escape or avoidance of other individuals; and (5) internal stimulation (Carr, 1994).
Testing the hypothesized function of the behavior. Although this step is typically considered part of a functional behavioral analysis (as opposed to a functional behavioral assessment), it is important to verify that your hypothesis about the function of the behavior is correct. Otherwise, the associated intervention plan may not work. By manipulating the antecedents and consequences, one can determine whether the function is correct. For example, if it is assumed that escape from diffi cult tasks is a function of the student’s problematic behavior of tearing up assignments, one could provide tasks that the student fi nds easy, and enjoys, and examine whether he or she tears up the paper. If not, this would provide evidence that the function of the behavior may be to escape from a diffi cult task.
Developing a behavioral intervention plan. Although this comes after the actual FBA, it is important to know how to use the assessment data that
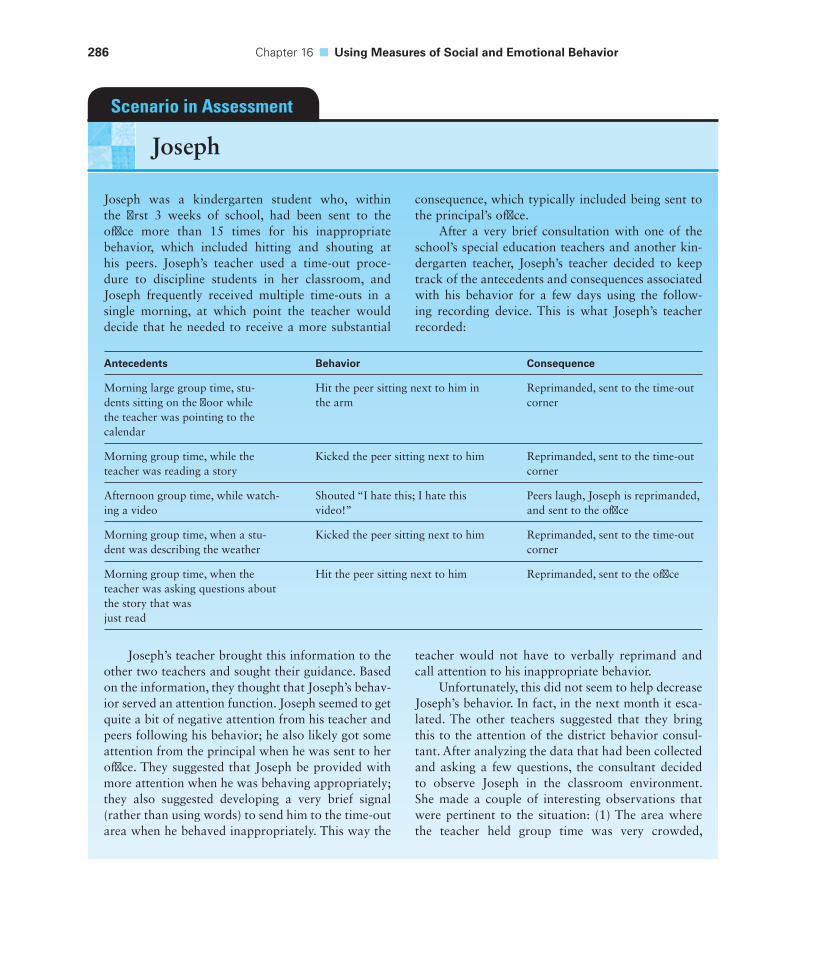
286 Chapter 16 ■ Using Measures of Social and Emotional Behavior
Joseph was a kindergarten student who, within the fi rst 3 weeks of school, had been sent to the offi ce more than 15 times for his inappropriate behavior, which included hitting and shouting at his peers. Joseph’s teacher used a time-out proce-dure to discipline students in her classroom, and Joseph frequently received multiple time-outs in a single morning, at which point the teacher would decide that he needed to receive a more substantial
consequence, which typically included being sent to the principal’s offi ce.
After a very brief consultation with one of the school’s special education teachers and another kin-dergarten teacher, Joseph’s teacher decided to keep track of the antecedents and consequences associated with his behavior for a few days using the follow-ing recording device. This is what Joseph’s teacher recorded:
Scenario in Assessment
Joseph
Antecedents Behavior Consequence
Morning large group time, stu-dents sitting on the fl oor while the teacher was pointing to the calendar
Hit the peer sitting next to him in the arm
Reprimanded, sent to the time-out corner
Morning group time, while the teacher was reading a story
Kicked the peer sitting next to him Reprimanded, sent to the time-out corner
Afternoon group time, while watch-ing a video
Shouted “I hate this; I hate this video!”
Peers laugh, Joseph is reprimanded, and sent to the offi ce
Morning group time, when a stu-dent was describing the weather
Kicked the peer sitting next to him Reprimanded, sent to the time-out corner
Morning group time, when the teacher was asking questions about the story that was just read
Hit the peer sitting next to him Reprimanded, sent to the offi ce
Joseph’s teacher brought this information to the other two teachers and sought their guidance. Based on the information, they thought that Joseph’s behav-ior served an attention function. Joseph seemed to get quite a bit of negative attention from his teacher and peers following his behavior; he also likely got some attention from the principal when he was sent to her offi ce. They suggested that Joseph be provided with more attention when he was behaving appropriately; they also suggested developing a very brief signal (rather than using words) to send him to the time-out area when he behaved inappropriately. This way the
teacher would not have to verbally reprimand and call attention to his inappropriate behavior.
Unfortunately, this did not seem to help decrease Joseph’s behavior. In fact, in the next month it esca-lated. The other teachers suggested that they bring this to the attention of the district behavior consul-tant. After analyzing the data that had been collected and asking a few questions, the consultant decided to observe Joseph in the classroom environment. She made a couple of interesting observations that were pertinent to the situation: (1) The area where the teacher held group time was very crowded,
Functional Behavioral Assessment and Analysis 287
(2) Joseph tended to engage in the problem behavior toward the end of group times, and (3) he had a very diffi cult time sitting still during group time. This led her to believe that the function of the behavior was to escape from having to do something he had not yet developed the skill to do (that is, sit and listen for long periods of time). If this was the case, the teacher’s consequence of time-out would only serve to reinforce the problem behavior. The consultant suggested developing an intervention that involved changing the space available for the group activities
such that there was more of it, teaching Joseph how to appropriately signal when he needed a break from activities, reinforcing him for appropriately asking for a break, and eventually increasing the amount of time that he was expected to stay in the group prior to being able to take a break. Using this interven-tion plan, Joseph’s behavioral problems decreased dramatically.
Conclusion: Make sure you appropriately iden-tify the function of a problem behavior; without this, the intervention is not likely to work.
are collected to inform the development of an intervention plan. Ideally, a behavior intervention plan will involve the following:
Identifying, teaching, and reinforcing a replacement behavior. As part ●
of the behavior intervention plan, the support team needs to identify a behavior that the student can use to address the identifi ed function in an appropriate manner. For example, if the function of a problematic behav-ior (such as tearing up work) is escape from a diffi cult task, the student might be taught how to request a break from the diffi cult task, such that the same function (escape) would be met when the student engaged in a more appropriate behavior. Although some might initially think that teach-ing replacement behaviors (that is, to ask for a break and have it granted) results in a lowering of standards, it is important to highlight that having the student ask for a break is certainly more socially appropriate behavior than tearing up an assignment, and it is a step in the right direction. In order to ensure that the student makes use of newly taught replacement behaviors, the intervention plan might include a reward for when the stu-dent initially makes appropriate use of the replacement behavior.
Appropriately addressing setting events, antecedents, and consequences. ●
Behavior intervention plans may include an alteration of the conditions surrounding antecedents and/or a change in consequences. For example, if escape from diffi cult items presented on a worksheet is the function of a behavior, and the antecedent is presentation of those diffi cult items, the teacher might set up a task to begin with a few very easy tasks, followed by a medium task, some more easy tasks, and perhaps one diffi cult task toward the end. If peer attention is the function of a behavior, the teacher might train the entire class how to ignore the target student’s problematic behavior.
Once a behavior intervention plan is developed, it is important to also create a method for measuring implementation integrity as well as a monitoring strategy to determine whether the behavioral intervention plan is appropriately addressing the student’s problem behavior.
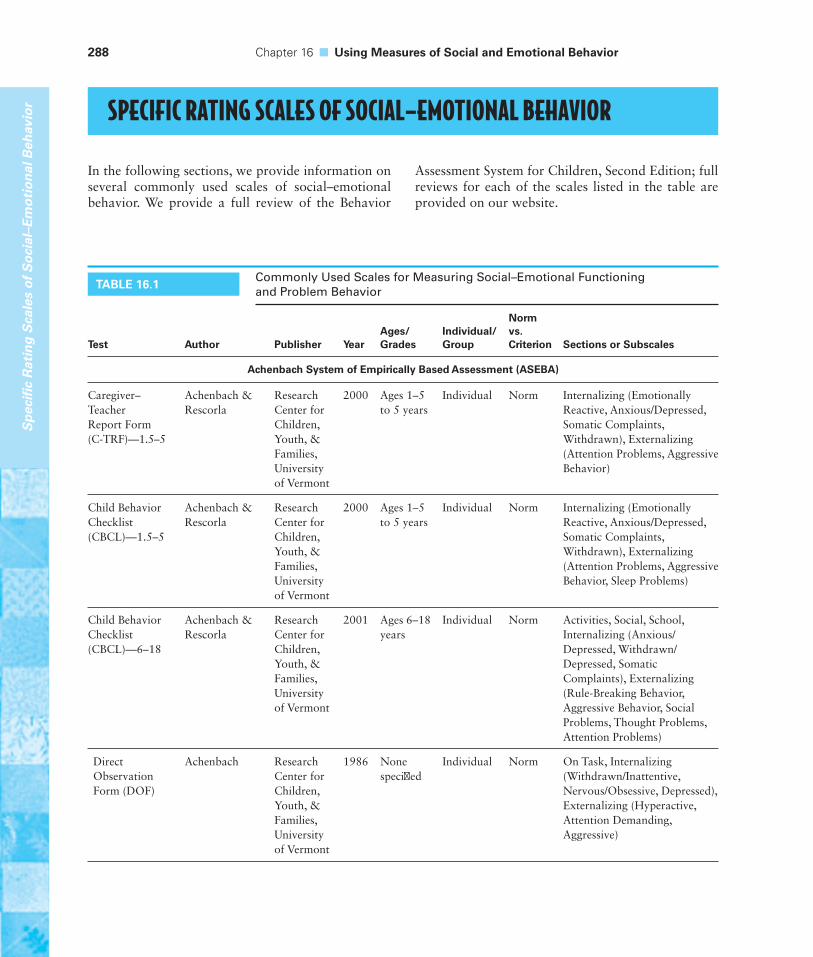
288 Chapter 16 ■ Using Measures of Social and Emotional Behavior
Sp
ecifi
c R
atin
g S
cale
s o
f S
oci
al–E
mo
tio
nal
Beh
avio
r
In the following sections, we provide information on several commonly used scales of social–emotional behavior. We provide a full review of the Behavior
Assessment System for Children, Second Edition; full reviews for each of the scales listed in the table are provided on our website.
SPECIFIC RATING SCALES OF SOCIAL–EMOTIONAL BEHAVIOR
Test Author Publisher YearAges/Grades
Individual/Group
Norm vs. Criterion Sections or Subscales
Achenbach System of Empirically Based Assessment (ASEBA)
Caregiver–Teacher Report Form (C-TRF)—1.5–5
Achenbach & Rescorla
Research Center for Children, Youth, & Families, University of Vermont
2000 Ages 1–5 to 5 years
Individual Norm Internalizing (Emotionally Reactive, Anxious/Depressed, Somatic Complaints, Withdrawn), Externalizing (Attention Problems, Aggressive Behavior)
Child Behavior Checklist (CBCL)—1.5–5
Achenbach & Rescorla
Research Center for Children, Youth, & Families, University of Vermont
2000 Ages 1–5 to 5 years
Individual Norm Internalizing (Emotionally Reactive, Anxious/Depressed, Somatic Complaints, Withdrawn), Externalizing (Attention Problems, Aggressive Behavior, Sleep Problems)
Child Behavior Checklist (CBCL)—6–18
Achenbach & Rescorla
Research Center for Children, Youth, & Families, University of Vermont
2001 Ages 6–18 years
Individual Norm Activities, Social, School, Internalizing (Anxious/Depressed, Withdrawn/Depressed, Somatic Complaints), Externalizing (Rule-Breaking Behavior, Aggressive Behavior, Social Problems, Thought Problems, Attention Problems)
Direct Observation Form (DOF)
Achenbach Research Center for Children, Youth, & Families, University of Vermont
1986 None specifi ed
Individual Norm On Task, Internalizing (Withdrawn/Inattentive, Nervous/Obsessive, Depressed), Externalizing (Hyperactive, Attention Demanding, Aggressive)
TABLE 16.1Commonly Used Scales for Measuring Social–Emotional Functioning and Problem Behavior
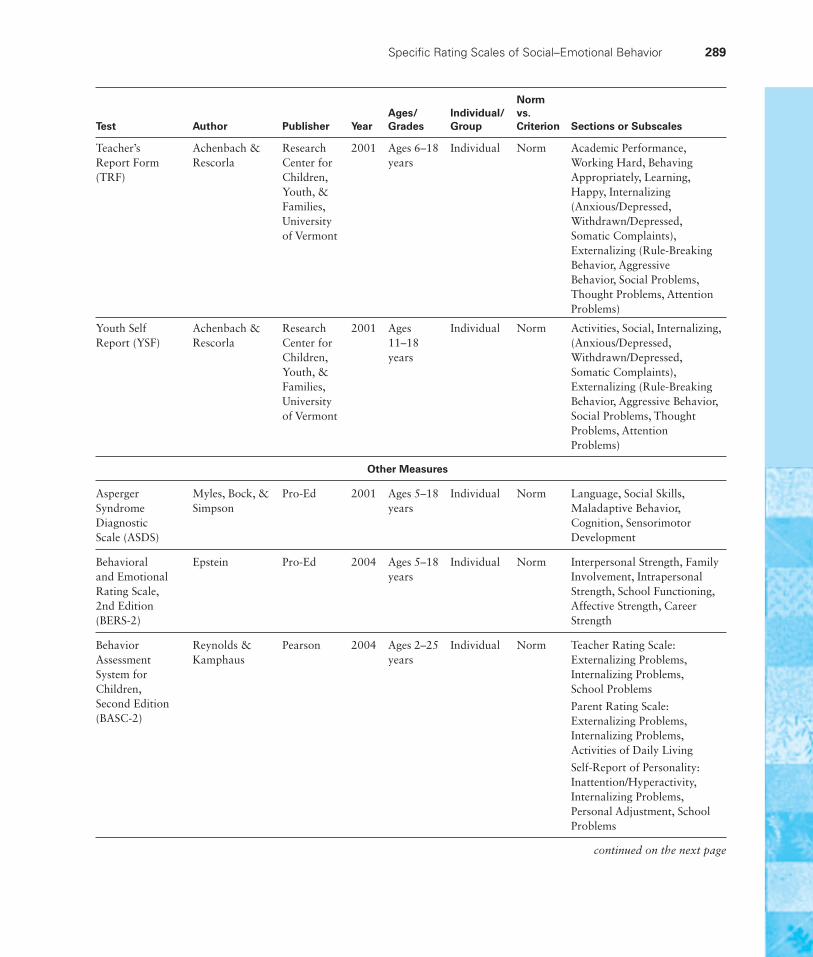
Specifi c Rating Scales of Social–Emotional Behavior 289
Test Author Publisher YearAges/Grades
Individual/Group
Norm vs. Criterion Sections or Subscales
Teacher’s Report Form (TRF)
Achenbach & Rescorla
Research Center for Children, Youth, & Families, University of Vermont
2001 Ages 6–18 years
Individual Norm Academic Performance, Working Hard, Behaving Appropriately, Learning, Happy, Internalizing (Anxious/Depressed, Withdrawn/Depressed, Somatic Complaints), Externalizing (Rule-Breaking Behavior, Aggressive Behavior, Social Problems, Thought Problems, Attention Problems)
Youth Self Report (YSF)
Achenbach & Rescorla
Research Center for Children, Youth, & Families, University of Vermont
2001 Ages 11–18 years
Individual Norm Activities, Social, Internalizing, (Anxious/Depressed, Withdrawn/Depressed, Somatic Complaints), Externalizing (Rule-Breaking Behavior, Aggressive Behavior, Social Problems, Thought Problems, Attention Problems)
Other Measures
Asperger Syndrome Diagnostic Scale (ASDS)
Myles, Bock, & Simpson
Pro-Ed 2001 Ages 5–18 years
Individual Norm Language, Social Skills, Maladaptive Behavior, Cognition, Sensorimotor Development
Behavioral and Emotional Rating Scale, 2nd Edition (BERS-2)
Epstein Pro-Ed 2004 Ages 5–18 years
Individual Norm Interpersonal Strength, Family Involvement, Intrapersonal Strength, School Functioning, Affective Strength, Career Strength
Behavior Assessment System for Children, Second Edition (BASC-2)
Reynolds & Kamphaus
Pearson 2004 Ages 2–25 years
Individual Norm Teacher Rating Scale: Externalizing Problems, Internalizing Problems, School Problems
Parent Rating Scale: Externalizing Problems, Internalizing Problems, Activities of Daily Living
Self-Report of Personality: Inattention/Hyperactivity, Internalizing Problems, Personal Adjustment, School Problems
continued on the next page
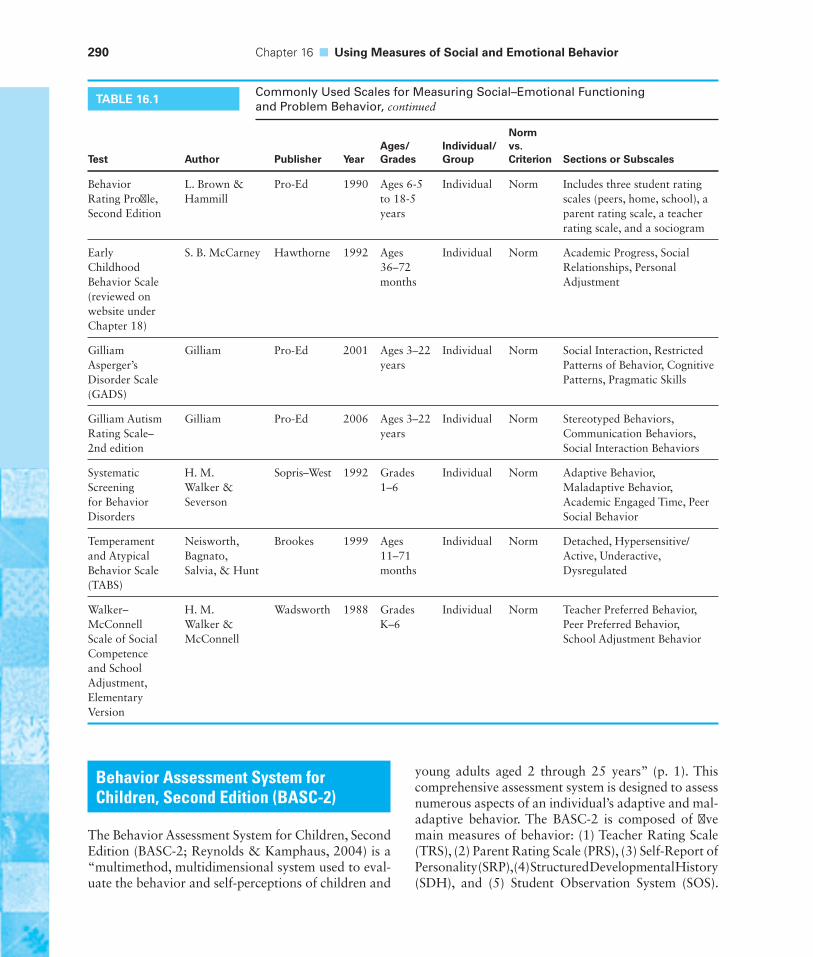
290 Chapter 16 ■ Using Measures of Social and Emotional Behavior
Behavior Rating Profi le, Second Edition
L. Brown & Hammill
Pro-Ed 1990 Ages 6-5 to 18-5 years
Individual Norm Includes three student rating scales (peers, home, school), a parent rating scale, a teacher rating scale, and a sociogram
Early Childhood Behavior Scale (reviewed on website under Chapter 18)
S. B. McCarney Hawthorne 1992 Ages 36–72 months
Individual Norm Academic Progress, Social Relationships, Personal Adjustment
Gilliam Asperger’s Disorder Scale (GADS)
Gilliam Pro-Ed 2001 Ages 3–22 years
Individual Norm Social Interaction, Restricted Patterns of Behavior, Cognitive Patterns, Pragmatic Skills
Gilliam Autism Rating Scale– 2nd edition
Gilliam Pro-Ed 2006 Ages 3–22 years
Individual Norm Stereotyped Behaviors, Communication Behaviors, Social Interaction Behaviors
Systematic Screening for Behavior Disorders
H. M. Walker & Severson
Sopris–West 1992 Grades 1–6
Individual Norm Adaptive Behavior, Maladaptive Behavior, Academic Engaged Time, Peer Social Behavior
Temperament and Atypical Behavior Scale (TABS)
Neisworth, Bagnato, Salvia, & Hunt
Brookes 1999 Ages 11–71 months
Individual Norm Detached, Hypersensitive/Active, Underactive, Dysregulated
Walker–McConnell Scale of Social Competence and School Adjustment, Elementary Version
H. M. Walker & McConnell
Wadsworth 1988 Grades K–6
Individual Norm Teacher Preferred Behavior, Peer Preferred Behavior, School Adjustment Behavior
Behavior Assessment System for Children, Second Edition (BASC-2)
The Behavior Assessment System for Children, Second Edition (BASC-2; Reynolds & Kamphaus, 2004) is a “multimethod, multidimensional system used to eval-uate the behavior and self-perceptions of children and
young adults aged 2 through 25 years” (p. 1). This comprehensive assessment system is designed to assess numerous aspects of an individual’s adaptive and mal-adaptive behavior. The BASC-2 is composed of fi ve main measures of behavior: (1) Teacher Rating Scale (TRS), (2) Parent Rating Scale (PRS), (3) Self-Report of Personality (SRP), (4) Structured Developmental History (SDH), and (5) Student Obser vation System (SOS).
TABLE 16.1Commonly Used Scales for Measuring Social–Emotional Functioning and Problem Behavior, continued
Test Author Publisher YearAges/Grades
Individual/Group
Norm vs. Criterion Sections or Subscales
Behavior Assessment System for Children, Second Edition (BASC-2) 291
The test authors indicate that the BASC-2 can be used for clinical diagnosis, educational classifi cation, and program evaluation. They indicate that it can facilitate treatment planning and describe how it may be used in forensic evaluation and research, as well as in mak-ing manifestation determination decisions.
Behaviors SampledThe Teacher Rating Scale (TRS) is a comprehensive measure of both adaptive and problem behaviors that children exhibit in school and caregiving settings. Three different forms are available—preschool (2 to 5 years), child (6 to 11 years), and adolescent (12 to 21 years)—with the behavior items specifi cally tailored for each age range. Teachers, school personnel, or care-givers rate children on a list of behavioral descriptions using a 4-point scale of frequency (“never,” “some-times,” “often,” or “almost always”). Estimated time to complete the TRS is 10 to 15 minutes. The TRS for preschool is composed of 100 items; the TRS for children, 139 items; and the TRS for adolescents, 139 items. Items consist of ratings of behaviors similar to the following: “Has the fl u,” “Displays fear in new settings,” “Speeds through assignments without care-ful thought,” and “Works well with others.”
The Parent Rating Scale (PRS) is a comprehensive measure of a child’s adaptive and problem behavior exhibited in community and home settings. The PRS uses the same 4-point rating scale as the TRS. In addition, three forms are provided by age groups, as defi ned previously. Estimated time to complete this measure is 10 to 20 minutes.
The Self-Report of Personality (SRP) contains short statements that a student is expected to mark as either true or false or to provide a rating ranging from “never” to “almost always.” Three forms are available by age/schooling level: child (8 to 11 years), adolescent (12 to 21 years), and young adult/college (for 18- to 25-year-old students in a postsecondary educational setting). Estimated administration time is 20 to 30 minutes. Spanish translations of the PRS and SRP are available.
The Structured Developmental History (SDH) is a broad-based developmental history instrument devel-oped to obtain information on the following areas: social, psychological, developmental, educational, and medical history. The SDH may be used either as an interview format or as a questionnaire. The organiza-tion of the SDH may help in conducting interviews and obtaining important historical information that may be benefi cial in the diagnostic process.
The Student Observation System (SOS) is an observation tool developed to facilitate diagnosis and monitoring of intervention programs. Both adap-tive and maladaptive behaviors are coded during a 15-minute classroom observation. An electronic version of the SOS is available for use on a laptop computer or personal digital assistant.
The SOS is divided into three parts. The fi rst section, the Behavior Key and Checklist, is a list of 65 specifi c behaviors organized into 13 categories (4 categories of positive behavior and 9 categories of problem behav-ior). Following the 15-minute observation, the coder rates the child on the 65 items according to a 3-point frequency gradation (“never observed,” “sometimes observed,” and “frequently observed”). The rater can separately indicate whether the behavior is disruptive.
The second part, Time Sampling of Behavior, requires the informant to decide whether a behavior is present during a 3-second period following each 30-second interval of the 15-minute observation. Observers place a check mark in separate time columns next to any of the 13 categories of behavior that occur during any one interval. The third section, Teacher’s Interaction, is completed following the 15-minute observation. The observer scores the teacher’s interac-tions with the students on three aspects of classroom interactions: (1) teacher position during the observa-tion, (2) teacher techniques to change student behavior, and (3) additional observations that are relevant to the assessment process.
ScoresThe BASC-2 can be either hand or computer scored. A hand-scored response form can be used for the fi rst three instruments (TRS, PRS, and SRP). The hand-scored protocols are constructed in a unique format, using pressure-sensitive paper that provides the exam-iner with an immediate translation of ratings to scores. After administration of the different rating forms, the administrator removes the outer page to reveal a scoring key. Scale and composite scores are totaled easily, and a behavior profi le is available to represent the data graphically. Validity scores are tabulated to evaluate the quality of completed forms and to guard against response patterns that may skew the data pro-fi les positively or negatively. Detailed scoring proce-dures that use a 10-step procedure for each of these scales are described in the administration manual.
Raw scores for each scale are transferred to a summary table for each individual measure. T-scores
292 Chapter 16 ■ Using Measures of Social and Emotional Behavior
(mean = 50, standard deviation = 10), 90 percent confi -dence intervals, and percentile ranks are obtained after selecting appropriate norm tables for comparisons. In addition, a high/low column is provided to give the assessor a quick and effi cient method for evaluating whether differences among composite scores for the individual are statistically signifi cant.
The TRS produces three composite scores of clin-ical problems: Externalizing Problems, Internalizing Problems, and School Problems. Externalizing prob-lems include aggression, hyperactivity, and conduct problems. Internalizing problems include anxiety, depression, and somatization. School problems are broken down into attention and learning problems. A broad composite score of overall problem behaviors is provided on the Behavioral Symptoms Index, which includes several of the subscales listed previously in addition to Atypicality and Withdrawal. In addition, positive behaviors are included in an adaptive skills composite; these include the Leadership, Social Skills, Study Skills, Adaptability, and Fun ctional Com muni-cation subscales. An optional content scale can also be used, which provides information according to the following subscales: Anger Control, Bullying, Developmental Social Disorders, Emotional Self-Control, Executive Functioning, Negative Emo-tionality, and Resiliency. The PRS provides the same scoring categories and subscales, with the exception that the School Problems composite scores, composed of subscales for learning problems and study skills, are omitted, and Activities of Daily Living is added.
The SRP produces four composite scores— Inat tention/Hyperactivity, Internalizing Problems, Personal Adjustment, and School Problems—and an overall composite score referred to as an Emotion Symptoms Index (ESI). The composite ESI score includes both negative and adaptive scales. Inattention/Hyperactivity includes the Attention Problems and Hyperactivity subscales. The Internalizing Problems composite includes atypicality, locus of control, social stress, anxiety, depression, and sense of inadequacy. Personal Adjustment groupings include relations with parents, interpersonal relations, self-esteem, and self-reliance. The School Problems composite includes attitude to school and attitude to teachers. Additional subscales, including Sensation Seeking, Alcohol Abuse, School Adjustment, and Somatization, are included in the ESI. An optional content scale is also available that includes the following subscales: Anger Control, Ego Strength, Mania, and Test Anxiety.
Three validity scores are provided. To detect either consistently negative bias or consistently positive bias in the responses provided by the student, there is an F index (“fakes bad”) and an L index (“fakes good”). The V index incorporates nonsensical items (similar to “Spiderman is a real person”), such that a child who consistently marks these items “true” may be exhibiting poor reading skills, may be uncooperative, or may have poor contact with reality.
The SDH and SOS are not norm-referenced mea-sures and do not provide individual scores of com-parison. Rather, these instruments provide additional information about a child, which may be used to describe his or her strengths and weaknesses.
NormsStandardization and norm development for the gen-eral and clinical norms on the TRS, PRS, and SRP took place between August 2002 and May 2004. Data were collected from more than 375 sites. The number of children who received or provided behavioral rat-ings across the different measures were, for the TRS, N = 4,650; for the PRS, N = 4,800; and for the SRP, N = 3,400. Efforts were made to ensure that the stan-dardization sample was representative of the U.S. population of children ages 2 to 18 years, including exceptional children. The standardization sample was compared with census data for gender, geographic region, socioeconomic status (SES; as measured by mother’s education level), placement in special educa-tion and gifted/talented programs, and race/ethnicity. Several cross-tabulations are provided (for instance, geographic region by gender by age, race by gender by age, and so forth). Data collected through Spanish ver-sions of the PRS and SRP are included in the standard-ization sample. The authors present data to support mostly balanced norms; however, the 2- to 3-year-old sample tends to vary somewhat from the characteris-tics of the population. For instance, 2- to 3-year-old students of low SES (mother’s education level) tend to be underrepresented, whereas 2- to 3-year-old students of high SES tend to be overrepresented. The authors claim that children with behavioral–emotional distur-bances are represented appropriately at each grade level of each instrument, and the data provided in the manual support this claim.
A separate norm sample was collected for the col-lege level of the SRP. This sample consisted of 706 stu-dents ages 18 to 25 years who were attending various
Behavior Assessment System for Children, Second Edition (BASC-2) 293
postsecondary educational institutions. Information on the degrees sought by participants is presented, along with information on the frequency by age and gender of participants in this standardization sample. No comparisons to the U.S. population are presented. Females appear to be overrepresented in this sample.
Clinical population sample norms consist of data collected on children receiving school or clinical services for emotional, behavioral, or physical prob-lems. Sample sizes were, for the TRS, N = 1,779; for the PRS, N = 1,975; and for the SRP, N = 1,527. The authors state that the clinical sample was not con-trolled demographically because this subgroup is not a random set of children. For example, signifi cantly more males were included than females.
ReliabilityThe manual has a chapter devoted to the techni-cal information supporting reliability and validity for each normed scale (TRS, PRS, and SRP). Three types of reliability are provided within the technical manual: internal consistency, test–retest, and inter-rater agreement.
Internal Consistency. Coeffi cient alpha reliabilities are provided for the TRS and PRS by gender accord-ing to the following six age levels: ages 2 to 3, ages 4 to 5, ages 6 to 7, ages 8 to 11, ages 12 to 14, and ages 15 to 18 years. Median reliabilities for the TRS subscales for these age/gender groups range from .84 to .89. Lower reliabilities are evi-dent for subscales associated with the Internalizing Problems scale (including Anxiety, Depression, and Somatization) than for those associated with the Externalizing Problems scale. Median reliabilities for the PRS subscales range from .80 to .87 across these age/gender groups; reliabilities tend to be lower at the preschool-and-below ages. SRP coeffi cient alpha reliabilities are provided according to the following age levels: ages 8 to 11, ages 12 to 14, ages 15 to 18, and ages 18 to 25 years. Median subscale reliabili-ties for the SRP range from .79 to .83. The Sensation Seeking, Somatization, and Self-Reliance subscales tended to be particularly low (<.70) at certain age levels. Internal consistency reliabilities for the com-posite scales exceeded .80 across all three scales for each age/gender group. Coeffi cient alphas are also provided for certain disability groups within the clin-ical sample by gender (such as learning disabilities,
ADHD, and all clinical) and for those taking the Spanish version of the SRP and the PRS. Coeffi cient alpha reliabilities for the clinical groups are similar to those provided for the general norm sample; those for the Spanish version are slightly lower.
Test–Retest Reliability. TRS test–retest reliability was computed by having teachers rate the same child twice, with 8 to 65 days intervening between rating periods; this was done for a total of 240 students. Results are presented by age level (preschool, child, and adolescent) for each subscale and composite. Adjusted reliabilities ranged from .81 to .93 for com-posites and from .64 to .90 for the subscales. PRS test–retest reliability was determined based on par-ent ratings of 252 students, with an intervening time period of 9 to 70 days. Adjusted reliabilities for the PRS composites ranged from .78 to .92; those for the subscales ranged from .72 to .88. Test–retest reliabili-ties for the SRP were based on ratings provided by 279 students, for which there was an intervening time period of 13 to 66 days. Adjusted composite reliabili-ties ranged from .74 to .93; adjusted subscale reli-abilities ranged from .61 to .99.
Interrater Reliability. A total of 170 students were rated according to the TRS by two teachers to deter-mine interrater reliability of the TRS. Adjusted reli-abilities ranged from .48 to .81 for the composite scales and from .19 to .82 for the subscales. Parents and caregivers completed the PRS for 134 students, such that two rating scales were completed for each student by different individuals. Adjusted reliabilities for the PRS composite scales ranged from .65 to .86; associated reliabilities for the PRS subscales ranged from .53 to .88. No interrater reliability study was conducted for the SRP, given that the scale is a self-report instrument.
Correlations were calculated across the PRS and the TRS by age level (preschool, child, and adolescent) for students in the standardization samples that had both forms completed (N = 2,324). Correlations for the related composites ranged from .17 to .52 for the preschool forms, from .22 to .50 for the child forms, and from .36 to .51 for the adolescent forms. The inter-nalization composite scale tended to have the lowest correlations across forms. Correlations between the SRP and both the PRS and the TRS are also provided; however, the composites are substantially different
294 Chapter 16 ■ Using Measures of Social and Emotional Behavior
for the SRP, making the presence of lower correlations among composites diffi cult to interpret.
ValidityThe authors describe the procedures used to develop and select items for inclusion in the BASC-2. Many of the items included on the BASC-2 are taken directly from the original BASC. In the development of the original items, alternate behavior rating scales and related instruments were examined, and clinicians pro-vided consultation in the selection of items to meas-ure both problem and adaptive behaviors. Students and teachers were also involved in item development. The items went through several cycles of testing via expert and statistical review for inclusion in the origi-nal BASC. Several new items were developed for the BASC-2 to replace those with poor technical char-acteristics. More extensive revisions were conducted for the SRP, in which the item response format was altered from the previous edition, based on results of research studies examining internal consistency and factor loadings across the two formats. Confi rmatory factor analysis was used to examine item characteris-tics to assist with decision making about inclusion in the fi nal instrument. Items that correlated substantially with alternate composite scales that were not intended to be measured with the item, as well as those items that had low factor loadings on the intended compos-ite scale, were eliminated. Analyses of partial correla-tions and differential item-functioning analyses were conducted to examine whether items were measuring appropriately across various student demographic groups (for instance, females versus males, African Americans versus non-Hispanics, and Hispanics ver-sus non-Hispanics). A total of fi ve items were elimi-nated based on bias reviews. Both exploratory and confi rmatory factor analytic procedures were used to examine the appropriateness of the composite scale structure for the TRS, PRS, and SRP. These analyses supported the three-factor and four-factor child and adolescent composite scores.
Criterion-Related Validity. The TRS was compared with several related behavior rating scales, includ-ing various portions of the Achenbach System of Empirically Based Assessment (ASEBA; Achenbach & Rescorla, 2001), the Conners Teacher Rating Scale–Revised (Conners, 1997), and the original BASC TRS.
Ratings from the preschool form of the TRS were com-pared to an associated form of the ASEBA among 46 children ages 2 to 5 years. Fifty-seven children ages 6 to 11 years and 39 adolescents ages 12 to 18 years sim-ilarly had corresponding rating forms from the BASC and the ASEBA compared. Correlations for related subscales were primarily in the .60 to .90 range, with the exception of Somatization subscales, which tended to be very weakly correlated across rating scales. Correlations across composite scales were higher; however, Internalizing Problems composites tended to be lower than the other composite scale correlations.
Correlations with the Conners Teacher Rating Scale–Revised were based on teacher ratings for 59 children ages 6 to 11 years and 45 adolescents ages 12 to 18 years. Associated subscale adjusted correlations ranged from .26 (Anxiety scales for adolescents) to .94 (Aggression/Oppositional scales for adolescents). Composite behavior scale correlations (Conners Global Index and the BASC Behavioral Symptoms Index) were .84 at the child level and .69 at the adolescent level. Information is presented on the correlations with ratings from the original BASC for the standardization samples. As expected, the results for the BASC and the BASC-2 were very similar, with correlations exceeding .90 for the majority of composite and subscales.
The PRS was also compared to a variety of similar rating scales, including the following: related forms of the ASEBA, Conners Parent Rating Scale–Revised, the Behavior Rating Inventory of Executive Functioning (Gioia, Isquith, Guy, & Kenworthy, 2000), and the original BASC PRS. The associated parent rating forms for the ASEBA and the BASC-2 were completed for 53 young children, 65 school-age children, and 67 ado-lescents. Adjusted correlations for associated subscales ranged from .34 to .77; adjusted correlations for asso-ciated composites ranged from .67 to .84. Internalizing Problems composites tend to have weaker correlations than Externalizing Problems composites.
Correlations with the Conners Parent Rating Scale were determined based on 60 children ages 6 to 11 years and 55 adolescents ages 12 to 18 years. The Conners Global Index and the BASC-2 Behavioral Symptoms Index correlated .79 at the child level and .65 at the adolescent level. Subscale adjusted correla-tions ranged from .41 to .84 at the child level and .35 to .64 at the adolescent level. The BASC-2 and the Behavior Rating Inventory of Executive Functioning (Gioia et al., 2000) were administered to 51 children
Chapter Comprehension Questions 295
ages 6 to 11 years and 40 adolescents ages 12 to 18 years. Broad composite scores correlated .67 at the child level and .80 at the adolescent level. Finally, cor-relations with the original BASC PRS were primarily in the .80 to .95 range, as expected.
Criterion-related validity of the SRP was evidenced through correlations with the associated forms of the ASEBA, the Conners–Wells Adolescent Self-Report Scale (Conners, 1997), the Children’s Depression Inventory (Kovacs, 1992), and the Revised Children’s Manifest Anxiety Scale (Reynolds & Richmond, 2000). The associated scale of the ASEBA was admin-istered concurrently with the SRP among 51 adoles-cents. Associated composite adjusted correlations were in the .75 to .80 range. All associated subscales of the Conners–Wells Adolescent Self-Report correlated positively (.52 to .67) with the BASC-2 scales among 54 adolescents, with an exception being the negative correlations showing up as expected for the relation-ship between “family problems” and “relations with parents” across these scales. Finally, the associated scales of the Children’s Depression Inventory and the Children’s Manifest Anxiety Scale correlated positively with the Depression and Anxiety scales on the BASC-2 SRP. Correlations for a group (N = 86) of students in postsecondary settings who took the college level of the SRP and the ASEBA self-report ranged from .38 to .61 for associated composite and subscales.
Evidence for criterion-related validity of the col-lege level of the BASC-2 SRP is also presented using the Brief Symptom Inventory (Derogatis, 1993) and the Minnesota Multiphasic Personality Inventory–2 (Butcher, Graham, BenPorath, Tellegen, Dahlstrom, & Kaemmer, 2001). Correlations of the BASC-2 SRP with the original BASC SRP were lower than corre-
sponding correlations for the TRS and PRS, but they were still positive.
Although there appears to be evidence of valid-ity for using the BASC-2 in making diagnostic decisions, no evidence of validity for the purposes of program evaluation and treatment planning is provided.
SummaryThe BASC-2 is a comprehensive instrument that may be used to evaluate the behavior and self-per-ception of children ages 2 to 25 years. The inte-grated system comprises fi ve separate measures of behavior: (1) Teacher Rating Scale, (2) Parent Rating Scale, (3) Self-Report of Personality, (4) Structured Developmental History Inventory, and (5) Student Observation Scale. Although the multimethod and multidimensional approach should be commended, the TRS, PRS, and SRP are the only scales for which normative data are provided on which any classifi ca-tion statements can be made. Norms for the BASC are more than adequate, with general and clinical norm data provided. Reliability of the composite scales is good, although the internalizing composites tend to have lower reliability coeffi cients, along with lower reliability coeffi cients evident for very young children. The BASC-2, like the ASEBA, provides one of the most comprehensive assessment tools on the market today. Good evidence of reliability and valid-ity is presented via analysis of standardization sample data and correlations with additional behavior rat-ing scales; however, validity evidence is not present for all of the possible uses described by the authors.
CHAPTER COMPREHENSION QUESTIONSWrite your answers to each of the following questions, and then compare your responses to the text or the study guide.
1. What are four methods for assessing social–emotional functioning?
2. Describe two reasons for assessing social–emotional functioning.
3. Describe the steps that you would follow in conducting a functional behavioral assessment.
4. Name and describe one commonly used measure of social–emotional functioning. What evidence of reliability and validity is available for this measure?
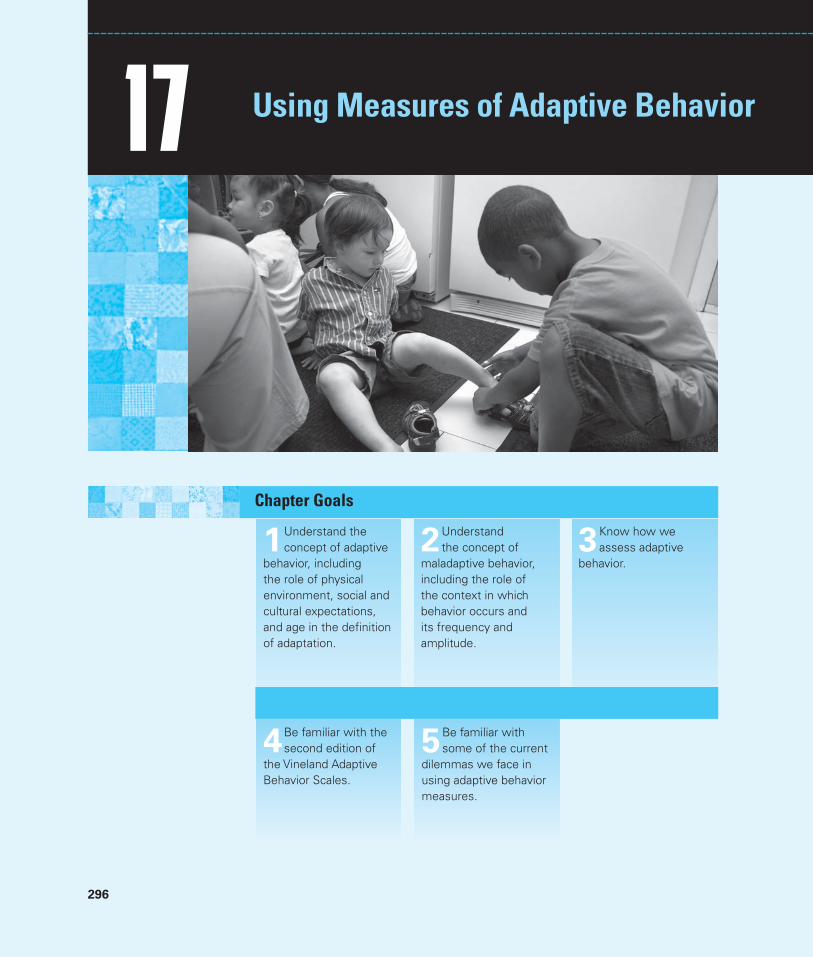
296
3Know how we assess adaptive
behavior.2Understand
the concept of maladaptive behavior, including the role of the context in which behavior occurs and its frequency and amplitude.
1Understand the concept of adaptive
behavior, including the role of physical environment, social and cultural expectations, and age in the defi nition of adaptation.
17 Using Measures of Adaptive Behavior
Chapter Goals
4Be familiar with the second edition of
the Vineland Adaptive Behavior Scales.
5Be familiar with some of the current
dilemmas we face in using adaptive behavior measures.
Defi ning Adaptive Behavior 297
Key Terms adaptive behavior
maladaption
respondent
daily living skills
interrespondent reliability
social skills and relationships
interinterviewer reliability
Adaptive behavior is the way individuals adapt themselves to the requirements of their physical and social environment (Schmidt & Salvia, 1984). In part, adaptation means survival: Adaptive behaviors are those that allow individuals to continue to live by avoiding dangers and by taking reasonable pre-cautions to ensure their safety. Yet adaptivity refers to more than mere survival; it implies the ability to thrive in both good and adverse times.
Adaptive behavior also requires more than an appropriate response to the demands of the immediate environment; it requires preparation for responses to probable future environments. Certain current behaviors (for example, smok-ing or high-risk sexual activity) can have life-threatening future consequences. Similarly, acquiring more education or job training and saving money increase the likelihood of thriving in later years. Adaptive behavior, in the present and for the future, must also take into account the demands of a person’s physical surround-ings and the expectations of that person’s culture.
1 Defi ning Adaptive Behavior
Physical EnvironmentThe knowledge and skill required to avoid danger (or to react appropriately when in danger) vary considerably from environment to environment. For example, dif-ferent environments require different protective clothing and different precautions against climatic conditions. Living in the desert Southwest in summer requires guarding against dehydration and heat stroke, whereas living in New England in the winter requires guarding against hypothermia and frostbite. Different envi-ronments have different dangerous wildlife: alligators in southeastern swamps, scorpions and Gila monsters in the Southwest, rats in many urban areas, and so forth. In addition to natural hazards, different environments present human-made hazards: automobiles, electrical appliances, cutting tools, chemicals, and so forth.
Social and Cultural ExpectationsSocial expectations vary considerably from culture to culture, and the ability to thrive in a culture requires some degree of conformity to that society’s cultural norms. Societal expectations manifest themselves in language usage (for example, polite or respectful language, speaking distance, and speaking volume), role performance, personal responsibility, and independence.
298 Chapter 17 ■ Using Measures of Adaptive Behavior
Age and AdaptationSociocultural expectations are also a function of the person’s age. In the United States, we have different expectations of infants, children, adolescents, and adults. For infants and young children, expectations center on maturational processes; at some points in these processes, refl exive behavior (for example, sucking) is a necessary component of survival. After infancy, maturational pro-cesses merely enable behavior. “Thus, goodness of vision and hearing, intact-ness of motor skills, neuromotor integrity, and similar characteristics are not adaptive behaviors of the individual; they are biological characteristics of the human species and provide the basis for behavior” (Salvia, Neisworth, & Schmidt, 1990, p. 57). Therefore, for older individuals, adaptive behavior is learned behavior.
We expect youngsters to use language socially, to play appropriately, to assume limited responsibilities (for example, picking up toys), and to function in increasingly independent ways (for example, self-feeding, self-dressing, and moving around in their homes and neighborhoods). As children get older, the expectations for independence and responsibility increase, both at home and in school. With adolescence come demands for making the transition to adulthood (for example, preparing for employment and accepting more complete personal responsibility).
Performance Versus AbilityThe ability to behave in expected ways is not synonymous with the performance of adaptive behavior. Knowing how to survive and thrive does not ensure that people will behave accordingly. For example, children may know that they should look both ways before crossing streets, and they may know how to do so; how-ever, the important consideration is whether they do look both ways. Not only must a behavior be performed regularly (habitually and customarily) but also it must be performed without prompting or assistance.
2 Maladaption
In their defi nitions of adaptive behavior, some theorists include an absence of marked maladaption. Although such a position may have intuitive appeal, there are at least two conceptual problems with including maladaptive behavior on formal tests. First, the absence of maladaptive behavior does not imply the pres-ence of adaptive behavior. Second, except for suicidal behavior and a very few universally taboo behaviors (for example, adolescents’ or adults’ smearing human excrement on themselves), maladaptive behavior is determined by context, as well as by frequency and amplitude.
ContextThe context of behavior refers to both social tolerance and the specifi c situation in which a behavior occurs. Social tolerance is an important qualifi er because very few behaviors are universally taboo. For example, certain types of hallucinations may be prized as religious experiences in some societies but seen as psychotic in
Assessing Adaptive Behavior 299
others; homosexuality is accepted in some societies but punished in others. The list of potential examples is very long. Within a society, taboo behavior is codifi ed by custom, religion, and law.
Some behaviors are evaluated solely on the basis of context. For example, disrobing is usually considered deviant in a classroom full of students but normal before bathing; failure to disrobe is normal in classrooms but abnormal before bathing. Even when certain behaviors are proscribed, the circumstances in which those behaviors are demonstrated are important. For example, in the United States, killing another person is not necessarily murder. The context in which the death occurred determines whether it is a crime (murder or voluntary manslaugh-ter) or not (self-defense or accidental death).
Finally, for a behavior to be considered deviant, either the behavior or its consequence must be observed. If no one witnesses the act or its consequence, it will not be considered maladaptive. Moreover, the person observing the behavior (or consequence) must be willing and must have the authority to label the behav-ior as deviant.
Frequency and AmplitudeThe frequency and amplitude of behavior are also important in labeling a behavior as maladaptive. Some behavior will be tolerated or condoned if it occurs infrequently. For example, occasional drunkenness may be ignored, but chronic drunkenness is considered alcoholism. The boundaries separating tolerated occa-sional misbehavior from deviance vary with context, status of the person, and consequences of the behavior. The amplitude of behavior also affects social and cultural tolerance. For example, fi ngernail biting is seldom, in and of itself, con-sidered signifi cant. However, when fi ngernail biting produces bleeding, scarring, and deformity, the behavior has crossed a line into self-mutilation.
3 Assessing Adaptive Behavior
Historically, the assessment of adaptive behavior has relied on the report of a third person (typically designated as a “respondent”). Thus, we do not assess an individual’s adaptive behavior directly; an examiner does not test or observe the individual being assessed. Instead, the examiner relies on the cumulative observations of a respondent who is both truthful and suffi ciently familiar with the subject of the assessment to make a judgment about that subject’s behavior.
This method of administration is susceptible to a variety of errors and biases. The student being evaluated may generally conceal behavior that is cul-turally taboo, or the student may conceal behavior from the respondent if the student knows that the respondent disapproves of the behavior. The student being evaluated may selectively demonstrate the behavior. For example, when the respondent (a parent or teacher) is present, the student may behave appro-priately; when the respondent is absent, the student may not. Finally, when respondents have a stake in the outcome, they may be less than truthful or objective. For example, if a parent respondent does not want a student classifi ed as mentally retarded, that parent may give the child the benefi t of the doubt in every response.
300 Chapter 17 ■ Using Measures of Adaptive Behavior
Sp
ecifi
c Te
sts
of A
dap
tive
Beh
avio
r
Remember Crina from Chapter 4? She was the girl from Eastern Europe who was adopted by an Ameri-can family when she was 10 years old. Crina was evaluated by a district multidisciplinary team that recommended placement in a life skills class because her scores on the English language intelligence test and achievement tests were in the retarded range. Crina’s mother disagreed with the school’s diagnosis and obtained an independent educational evalu-ation that included an assessment of her adaptive behavior. That assessment indicated that Crina was functioning within the average range for a person her age. Nonetheless, the district remained adamant about the recommended placement, and the dispute was eventually settled at a due process hearing that was won by the parents.
In her opinion, the hearing offi cer wrote the following:
The IDEA is clear with respect to the defi nition of mental retardation. It is “ signifi cantly subaverage general intellectual functioning, existing concurrently with defi cits in adaptive behavior and manifested during the developmental period, that adversely aff ects a child’s educational performance” (§300.7(c)(6)). The evidence in this case is overwhelming: Crina, while having severe academic problems, does not have defi cits in adaptive behavior. Therefore, she cannot be classifi ed as a student with mental retardation. The District has erred in its clas-sifi cation and this order will prohibit her classifi cation as such a student.
The parents not only prevailed at the hearing but also the district was severely reprimanded for its failure to follow both state and federal law.Conclusion: To classify a student as mentally retarded, there must be an evaluation of adaptive behavior.
Scenario in Assessment
Crina
In Table 17.1, we provide basic information about several commonly used adaptive behavior scales. Then we provide a detailed review of the Vineland Adaptive Behavior Scales, Second Edition (VABS II).
Vineland Adaptive Behavior Scales, Second Edition (VABS II)
The Vineland Adaptive Behavior Scales, Second Edition (VABS II; Sparrow, Cicchetti, & Balla, 2005), is an individually administered adaptive behavior scale for use with individuals from birth through 90 years of age. The VABS II is intended for use in diagnostic evaluations, monitoring a student’s progress, planning
educational and treatment plans, and research. The scale is completed by respondents who are familiar with the target individual’s behavior. Respondents can either complete a rating form or participate in a structured third-party interview. The VABS II authors recommend using the interview form for diagnostic decisions and the rating form for program planning and evaluation. A Spanish translation and a teacher form are avail-able, and available computer software can convert raw scores to derived scores and generate score reports.
The Survey Interview Form consists of 413 questions distributed among fi ve domains:
Communication. ■ This domain has two subdomains. Expressive Communication consists of 54 items, such as crying when wet or hungry
SPECIFIC TEST OF ADAPTIVE BEHAVIOR
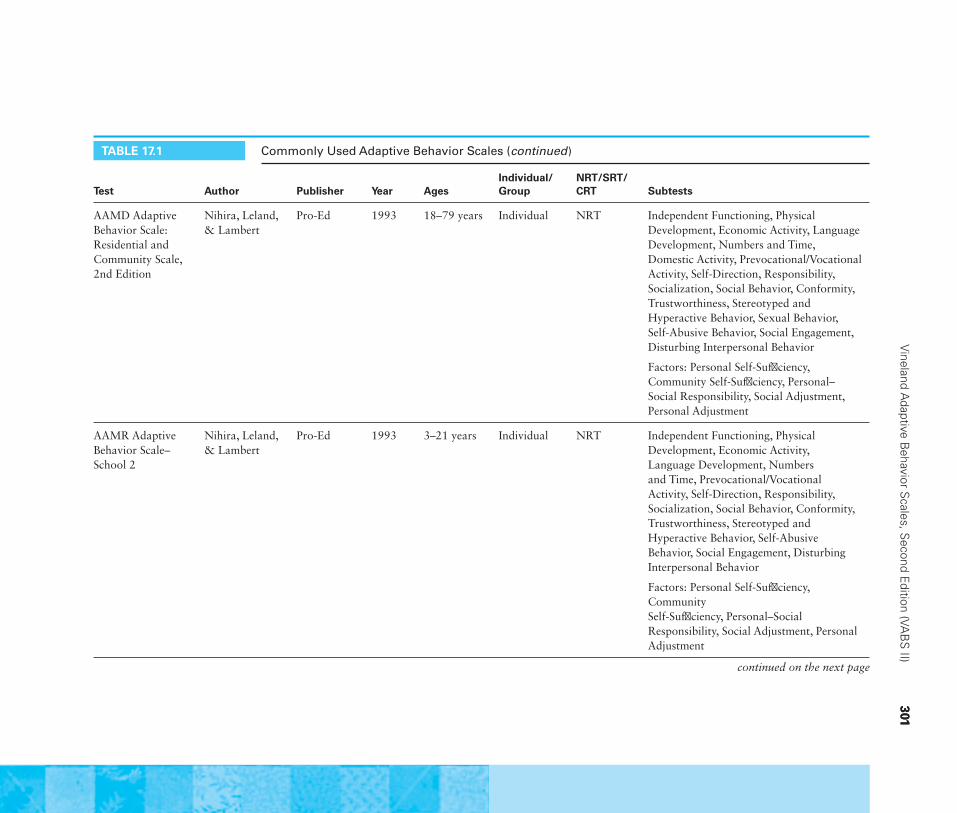
301
Vineland A
daptive Behavior S
cales, Second E
dition (VAB
S II)
301
Test Author Publisher Year AgesIndividual/Group
NRT/SRT/CRT Subtests
AAMD Adaptive Behavior Scale: Residential and Community Scale, 2nd Edition
Nihira, Leland, & Lambert
Pro-Ed 1993 18–79 years Individual NRT Independent Functioning, Physical Development, Economic Activity, Language Development, Numbers and Time, Domestic Activity, Prevocational/Vocational Activity, Self-Direction, Responsibility, Socialization, Social Behavior, Conformity, Trustworthiness, Stereotyped and Hyperactive Behavior, Sexual Behavior, Self-Abusive Behavior, Social Engagement, Disturbing Interpersonal Behavior
Factors: Personal Self-Suffi ciency, Community Self-Suffi ciency, Personal–Social Responsibility, Social Adjustment, Personal Adjustment
AAMR Adaptive Behavior Scale–School 2
Nihira, Leland, & Lambert
Pro-Ed 1993 3–21 years Individual NRT Independent Functioning, Physical Development, Economic Activity, Language Development, Numbers and Time, Prevocational/Vocational Activity, Self-Direction, Responsibility, Socialization, Social Behavior, Conformity, Trustworthiness, Stereotyped and Hyperactive Behavior, Self-Abusive Behavior, Social Engagement, Disturbing Interpersonal Behavior
Factors: Personal Self-Suffi ciency, Community Self-Suffi ciency, Personal–Social Responsibility, Social Adjustment, Personal Adjustment
TABLE 17.1 Commonly Used Adaptive Behavior Scales (continued)
continued on the next page
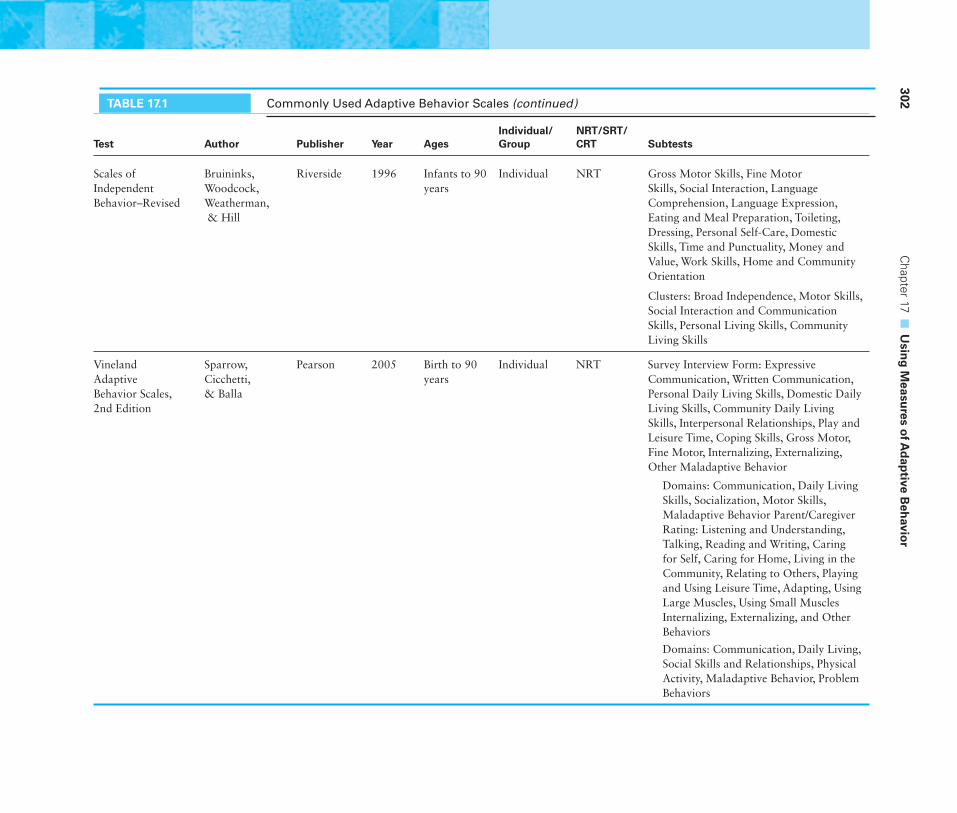
302 C
hapter 17 ■
Usin
g M
easures o
f Ad
aptive B
ehavio
r
Test Author Publisher Year AgesIndividual/Group
NRT/SRT/CRT Subtests
Scales of Independent Behavior–Revised
Bruininks, Woodcock, Weatherman, & Hill
Riverside 1996 Infants to 90 years
Individual NRT Gross Motor Skills, Fine Motor Skills, Social Interaction, Language Comprehension, Language Expression, Eating and Meal Preparation, Toileting, Dressing, Personal Self-Care, Domestic Skills, Time and Punctuality, Money and Value, Work Skills, Home and Community Orientation
Clusters: Broad Independence, Motor Skills, Social Interaction and Communication Skills, Personal Living Skills, Community Living Skills
Vineland Adaptive Behavior Scales, 2nd Edition
Sparrow, Cicchetti, & Balla
Pearson 2005 Birth to 90 years
Individual NRT Survey Interview Form: Expressive Communication, Written Communication, Personal Daily Living Skills, Domestic Daily Living Skills, Community Daily Living Skills, Interpersonal Relationships, Play and Leisure Time, Coping Skills, Gross Motor, Fine Motor, Internalizing, Externalizing, Other Maladaptive Behavior
Domains: Communication, Daily Living Skills, Socialization, Motor Skills, Maladaptive Behavior Parent/Caregiver Rating: Listening and Understanding, Talking, Reading and Writing, Caring for Self, Caring for Home, Living in the Community, Relating to Others, Playing and Using Leisure Time, Adapting, Using Large Muscles, Using Small Muscles Internalizing, Externalizing, and Other Behaviors
Domains: Communication, Daily Living, Social Skills and Relationships, Physical Activity, Maladaptive Behavior, Problem Behaviors
TABLE 17.1 Commonly Used Adaptive Behavior Scales (continued)
and saying one’s complete home address when asked. Written Communication consists of 25 items, such as recognizing one’s own name and writing business letters.
Daily Living Skills (DLS). ■ This domain has three subdomains. Personal DLS has 41 items, such as opening mouth when food is offered and making appointments for regular medical and dental checkups. Domestic DLS consists of 24 items, such as being careful with hot objects and planning and preparing the main meal of the day. Community DLS consists of 44 items, such as talking to familiar people on the telephone and budgeting for monthly expenses.
Socialization. ■ This domain has three subdomains. Interpersonal Relationships has 38 items, such as looking at a parent’s (caregiver’s) face and going on single dates. Play and Leisure Time has 31 items, such as responding to playfulness of a parent (or caregiver) and going to places in the evening with friends. Coping Skills consists of 30 items, such as apologizing for unintended mistakes and showing respect for coworkers.
Motor Skills. ■ This domain has two subdomains. Gross Motor consists of 40 items, such as holding head up for 15 seconds and pedaling a tricycle for 6 feet. Fine Motor consists of 36 items, such as reaching for a toy and using a keyboard to type 10 lines.
Maladaptive Behavior. ■ This domain has three subdomains. Internalizing consists of 11 items, such as being overly dependent and avoiding social interaction. Externalizing consists of 10 items, such as being impulsive and behaving inappropriately. Other Maladaptive Behavior consists of 15 items, such as sucking one’s thumb, being truant, and using alcohol or illegal drugs during the school or work day. Critical Items consists of 14 items, such as engaging in inappropriate sexual behavior, causing injury to self, and being unable to complete a normal school or work day because of psychological symptoms.
The Parent/Caregiver Rating Form consists of 433 questions distributed among six domains.
Communication. ■ This domain has three subdomains. Listening and Understanding consists of 20 items, such as responding to one’s
spoken name and listening to informational talk for 30 minutes. Talking consists of 54 items, such as crying or fussing when hungry or wet and using possessives in phrases or sentences to describing long-range goals. Reading and Writing consists of 25 items, such as recognizing one’s name when printed and editing or correcting one’s written work before handing it in.
Daily Living. ■ This domain has three subdomains. Caring for Self has 41 items, such as eating solid foods and keeping track of medications and refi lling them as needed. Caring for Home has 24 items, such as cleaning up play or work area at the end of an activity and performing routine maintenance tasks. Living in the Community consists of 44 items, such as being aware and demonstrating appropriate behavior when riding in a car and holding a full-time job for a year.
Social Skills and Relationships. ■ This domain has three subdomains. Relating to Others consists of 38 items, such as showing two or more emotions, recognizing the likes and dislikes of others, and starting conversations about things that interest others. Playing and Using Leisure Time consists of 31 items, such as playing simple interaction games (for example, peekaboo), showing good sportsmanship, and planning fun activities requiring arrangements for two or more things. Adapting has 30 items, such as saying thank you and controlling anger or hurt feelings when not getting one’s way.
Physical Activity. ■ This domain has two subdomains. Using Large Muscles has 40 items, such as climbing on and off an adult-sized chair and catching a tennis ball from10 feet. Using Small Muscles has 36 items, such as picking up small objects, holding a pencil in proper position for writing or drawing, and tying a bow.
Maladaptive Behavior Part 1. ■ This domain contains 36 items divided into three parts: Internalizing, Externalizing, and Other Behaviors. Maladaptive behaviors include both states (for example, being overly anxious or nervous) and behaviors (for example, tantruming and being truant).
Problem Behaviors Part 2. ■ This domain has 14 “critical” items, such as obsessing with objects or activities and being unaware of things happening around oneself.
Vineland Adaptive Behavior Scales, Second Edition (VABS II) 303
304 Chapter 17 ■ Using Measures of Adaptive Behavior
ScoresIndividual items are scored on a 4-point scale: 2 = usually, 1 = sometimes or partially, 0 = never, and DK = don’t know.1 To speed administration of the VABS II, basal and ceiling rules are used in all sub-tests except those assessing maladaptive behavior.
Raw scores are converted to v-scale scores, a standard score with a mean of 10 and a standard deviation of 3. Summed v-scale scores can be con-verted to normalized standard scores (mean = 100, standard deviation = 15) and stanines for subdomains; subdomain scores can be summed and converted to domain indexes and to an Adaptive Behavior Composite. Raw scores can also be converted to age equivalents.2 Percentiles are available for domain scores and the Adaptive Behavior Composite. Percentiles are based on the relationship between standard scores and percentiles in normal distributions.
NormsRegardless of the method of assessment (that is, inter-view or rating scale), one set of norms is used to inter-pret VABS II scores. The decision to use a single set of norms was based on the results of a study comparing the results from both interviews and rating scales for 760 individuals. Three of the four analyses performed by the authors support the decision to use a single set of norms. However, the analysis of correlations between the two methods of assessment does not sup-port that conclusion. For individuals 6 years of age or older, less than 10 percent of the correlations between the two assessment methods equal or exceed .90; almost half are less than .80. Clearly, the scores are not interchangeable.
The normative sample consists of 3,695 individuals selected to represent the U.S. population. The manual offers only the most cursory explanation of how these individuals were selected from a larger pool of poten-tial subjects: Selections were made electronically “in a way that matched the demographic variable targets within each age group” (Sparrow et al., 2005, p. 93).
1If the number of items scored DK is greater than two, the subdomain should not be scored.2Age equivalents are defi ned on the VABS II as representing “the age at which that score is average.” It is unclear whether the aver-age refers to the mean, the median, or the mode.
The number of persons within each age group var-ies considerably from age to age. Samples of children younger than 2 years of age, the sample of children 4 to 4.5 years old, the sample of individuals between 19 and 21 years, and samples of adults older than 31 years of age each contain fewer than 100 indi-viduals. The norms are generally representative in terms of ethnicity (African American, Hispanic, and Caucasian), educational level of the respondents, and geographic region.
ReliabilitySplit-half estimates of internal consistency for adap-tive behavior are provided for 19 age groups: 1-year age groups from 0 through 11 years, 2-year groups from 12 to 21 years, and four multiyear ranges from 22 through 90 years. The reliability of 18 of the 19 Adaptive Behavior Composites equals or exceeds .90; the exception is the 32- to 51-year-old age group. Domain scores are generally less reliable. In 6 of the 19 age groups, the reliability of the Communication domain is less than .90; in 9 of the 19 age groups, the reliability of the Daily Living Skills domain is less than .90; in 7 of the 19 age groups, the reliability of the Socialization domain is less than .90; and in 5 of the 9 age groups, the reliability of the Motor Skills domain is less than .90. Coeffi cient alpha is also reported for Part 1 Maladaptive Behavior for 5 age groups: 3 to 5, 6 to 11, 12 to 18, 19 to 30, and 40 to 90 years. No alpha for the Internalizing composite reaches .90, and only one (for 12- to 18-year-olds) equals .90. Only the alphas for the Maladaptive Behavior index for individuals 6 to 11 years old (.90) and for individuals 12 to 18 years old (.91) are large enough to use in making important individual decisions.
Test–retest estimates of reliability for adaptive behavior are provided for six age ranges.3 Except for the 14- to 21-year-old age group, the obtained stability4 of the Adaptive Behavior Composite equals or exceeds .90; stability for the same group is .81. Stabilities of
3Although it appears that standard scores were used to estimate the stability of domain scores, it is unclear what scores were used to estimate the stability of subdomain scores. We note that the use of raw scores would infl ate stability estimates.4The authors report both obtained and adjusted stability estimates. We prefer interpreting the reliability estimates that were actually obtained and therefore do not discuss adjusted estimates.
Vineland Adaptive Behavior Scales, Second Edition (VABS II) 305
domains are lower; 11 of the 18 reported stability coeffi cients are less than .90. Stabilities of subdomain scores are generally less than those for the domains; 45 of the 50 subdomain stabilities reported are less than .90. Test–retest estimates are also provided for Part 1 Maladaptive Behavior for fi ve age groups: 3 to 5, 6 to 11, 12 to 18, 19 to 39, and 40 to 71 years. Only the Externalizing and Maladaptive indexes for individuals between 40 and 71 years old reach the .90 level. All estimates of internalizing behavior and all other estimates of Externalizing and Maladaptive Behavior indexes are between .72 and .89.
Interinterviewer reliability was also evaluated for the interview form. Two interviewers interviewed the same respondent at different times. For adaptive behavior, two age ranges were used: 0 to 6 and 7 to 18 years. No VABS II score had an estimated reliabil-ity of .90 or higher, and most estimates were in the .40 to .60 range. For Part 1 Maladaptive Behavior, three age ranges were used: 3 to 11, 112 to 18, and 19 to 70 years. Estimated interinterviewer reliabilities ranged from .44 to .83.
Interrespondent reliability was evaluated by hav-ing two respondents rate the same individual. For adaptive behavior, two age ranges were again used: 0 to 6 and 7 to 18 years. In neither age group did the Adaptive Behavior Composite or any domain score reach an estimated reliability of .90. Most estimates were in the .60 to .80 range. For Part 1 Maladaptive Behavior, three age ranges were again used: 3 to 11, 112 to 18, and 19 to 70 years. Estimated interrater reliabilities ranged from .32 to .81.
ValidityFive types of information about the VABS II validity are included in the manual: test content, response process, test structure, clinical groups, and relationship with other measures. The description of content devel-opment lacks suffi cient detail to allow a systematic analysis of that process. Similarly, the description of how items were selected is vague. In contrast, factor-analytic studies support the existence of separate domains and subdomains, whereas the examination of test content for sex bias, socioeconomic status bias, and ethnic bias indicates a lack of bias. Also, VABS II raw scores show a consistent developmental pattern, as would be expected with any measure of adaptive behavior.
Previously identifi ed groups of individuals with mental retardation, autism, attention defi cit hyper-activity disorder, emotional disturbance, learning disability, and vision and hearing impairments each earned the types of scores that would be expected for persons with those disabilities. For example, individuals with mental retardation all showed sig-nifi cant defi cits on the Adaptive Behavior Composite and domain scores.
The VABS II correlates well with the previous edition of the scale. Correlations vary by age and domain, ranging from .65 (Communication for chil-dren 0 to 2 years of age) to .94 (Socialization for children 3 to 6 years of age). The VABS II correlates moderately with the Adaptive Behavior Assessment System, Second Edition, and the Behavior Assessment System for Children, Second Edition.
SummaryThe VABS II is an individually administered, norm- referenced scale for evaluating the adaptive behavior of individuals from birth to 90 years of age. The scale can be administered as a structured interview or as a rat-ing scale, but these two methods appear to yield some-what different results (that is, they are not so highly correlated that they can be used interchangeably). Despite the differences in the results of the two admin-istrations, one set of norms is used to convert raw scores to derived scores. Thus, although norms appear representative, their use for both methods of adminis-tration is problematic.
Reliability is generally inadequate for making important individual decisions about students, especially adolescents. Both interinterviewer and interrespon-dent reliability are too low to use the VABS II with confi dence. The internal consistency of the Adaptive Behavior Composite is generally reliable enough to use in making important educational decisions for students. Domain, subdomain, and maladaptive reli-abilities are not. Except for adolescents, the stability of the Adaptive Behavior Composite is adequate; the domain, subdomain, and maladaptive items stabilities are usually too low for making important individual decisions.
General indications of validity are adequate. However, no data are presented to indicate that the VABS II is valid for monitoring a student’s progress or planning educational and treatment plans.
306 Chapter 17 ■ Using Measures of Adaptive Behavior
Dilemmas in Current Practice
There are three major problems in the use of currently avail-able instruments to assess adaptive behavior: (1) lack of internal consistency, (2) poor norms, and (3) lack of interrater agreement.
The fi rst problem is that there is no theoretical reason that adaptive behavior scales should not be internally consistent. That some scales are not homogeneous can reasonably be attributed to the lack of a clear defi nition of adaptive behav-ior, a problem to which we alluded previously in this chapter. There is no professional consensus about the types of be-havior that are indicative of adaptation. Indeed, inspection of the behaviors sampled by the various devices suggests a lack of agreement about what adaptive behavior is—there is a broad range of behaviors sampled and of orientations toward measurement. Without a more precise concept of adaptive behavior, we should probably expect heteroge-neous operationalizations of the defi nition (that is, heteroge-neous scales of adaptive behavior) to continue.
The second problem is that scales of adaptive behavior frequently are poorly normed (sometimes normed only on individuals with disabilities). If its norm samples are unrep-resentative, a scale should not be used.
The third and most vexing problem, both theoretically and practically, is the lack of agreement among raters. When reported at all for adaptive behavior scales, interrater agreement is often poor. Poor agreement indicates a lack of reliability. Thus, we would suspect at least three potential problems: (1) The specifi c items are diffi cult to understand or interpret, (2) the criteria used to rate the behavior are subjective, or (3) one or both of the raters are insuffi ciently familiar with the student. Lack of interrater agreement also leads to a lack of validity. In practice, examiners have few options beyond gathering more data when faced with rater disagreement.
4 Why Do We Assess Adaptive Behavior?
There are two major reasons for assessing adaptive behavior: (1) identifi cation of mental retardation and (2) program planning. First, mental retardation is gener-ally defi ned, in part, as a failure of adaptive behavior. In theory, in order to classify a pupil as having mental retardation, for example, an evaluator needs to assess adaptive behavior. More important, however, are the federal regulations and state school codes requiring that adaptive behavior be assessed before a pupil can be considered mentally retarded.
Second, for program planning, educational objectives in the domain of adap-tive behavior are frequently developed for individuals with moderate to severe retardation, as well as for students with other disabilities. Adaptive behavior is often important in planning habilitative and transition services for various students. Thus, scales of adaptive behavior are often the source of educational goals.
Chapter Comprehension Questions 307
CHAPTER COMPREHENSION QUESTIONSWrite your answers to each of the following questions, and then compare your responses to the text or the study guide.
1. How do the physical environment, age, and social and cultural expectations affect the defi nition of adaptation?
2. How do the context in which behavior occurs and its frequency and amplitude affect the defi nition of maladaption?
3. Why do we assess adaptive behavior?
4. Explain two potential problems in the assessment of adaptive behavior.
308
1Know why we assess infants,
toddlers, and preschoolers.
3Understand methods that
are commonly used for assessing young children.
2Understand unique challenges
associated with measuring development among young children.
Chapter Goals
18 Using Measures of Infants, Toddlers, and Preschoolers
4Be familiar with several commonly
used infant, toddler, and preschool measures.
Using Measures of Infants, Toddlers, and Preschoolers 309
Key Terms developmental milestones
Individual Growth and Developmental Indicators (IGDIs)
Head Start/Early Head Start
Bayley Scales of Infant and Toddler Development, Third Edition (Bayley-3)
Developmental Indicators for the Assessment of Learning–Third Edition (DIAL-3)
With the passage of Public Law 99-457 in 1986, states were required to serve children with disabilities between 3 and 5 years of age. In addition, this law extended services to children from birth to 3 years of age, provided that the children (1) have physical or mental conditions with a high probability of produc-ing developmental delays (for example, cerebral palsy or trisomy); (2) are at risk medically or environmentally for developmental delay; or (3) have developmental delays in cognition, physical development, speech and language, or psychosocial behavior. Since the law’s passage, it has no longer been legally acceptable to delay or deny school admission to children who are developmentally delayed or otherwise disabled. Emphasis has changed from testing young children for school readiness to comprehensively assessing infants, toddlers, and young children to address their educational and developmental needs. Furthermore, states must demonstrate that young children who are served through the associated funds are acquiring and using knowledge and skills, as well as developing positive social relationships.
Recently, interest in the assessment of all young children (including those without disabilities) has been on the rise. Recognizing the important role that early childhood programming can play in each student’s future academic and social development, the federal government has provided substantial support for programs such as Head Start (ages 3 to 5 years) and Early Head Start (birth to 2 years) that are targeted to address the needs of students from low socioeconomic backgrounds. Accountability for family and child outcomes associated with early childhood programming has similarly increased. Early childhood initiatives such as “Good Start, Grow Smart,” which was established in 2002, encourage states to develop early childhood standards for literacy and language on which to assess the performance and progress of young children.
According to a position statement on early childhood curriculum, assessment, and program evaluation put forth by the National Association for the Education of Young Children (2003), early childhood assessment should “use methods that are developmentally appropriate, culturally and linguistically responsive, tied to children’s daily activities, supported by professional development, inclusive of families, and connected to specifi c, benefi cial purposes” (p. 1). The assessment of young children is quite different from the assessment of older individuals. The types of behavior assessed differ from the behaviors of older individuals. Infants and young children are not miniature adults possessed of adult abilities and behavior. Infant behavior is undifferentiated, molar, and limited; for example, infants fuss with their bodies and their voices. Infant assessment frequently involves neurobiological appraisal in four areas: neurological integrity (for example, refl exes and postural responses), behavioral organization (for example, attention and response to social stimuli), temperament (for example, consolability and responsivity), and state of consciousness (for exam-ple, sleep patterns and attention). As infants develop into toddlers and preschoolers, their behavior differentiates, and broad domains of behavior emerge. Assessment of toddlers and preschoolers frequently involves appraisal of communication, cognition, personal–social behavior, and motor behavior.
310 Chapter 18 ■ Using Measures of Infants, Toddlers, and Preschoolers
The evaluation of toddlers and preschoolers generally relies on their attainment of developmental milestones (signifi cant developmental accomplishments), such as using words and walking. Although children’s development is quite vari-able, c hildren are usually considered to be at risk for later problems when their attainment of developmental milestones is delayed. Thus, examiners must have a thorough understanding of normal development. Moreover, examiners must understand family systems and the role of culture in child-rearing practices so that they can understand the environments in which infants, toddlers, and preschoolers are developing. As is the case for school-age assessment practices, assessment tools are increasingly being designed to be aligned with the standards and curricula associated with early childhood programming, such that monitoring of child progress toward instructional targets is facilitated.
The Individual Growth and Development Indicators (IGDIs) represent sets of tools that have been developed at the infant, toddler, and preschool levels to monitor student progress and assist with intervention design and modifi cation. At the infant and toddler levels, these include both child and family (that is, parent–child interaction) measures.
Finally, the procedures used to assess infants, toddlers, and preschoolers often differ from those used to evaluate older children and adults. Bailey and Rouse (1989) have reported a number of reasons why infants and young children are diffi cult to test. Infants between 6 and 18 months are distressed by unfamiliar adults. Although they may have better responses to strangers when held by their caregivers, they may still refuse to respond to an unfamiliar adult. Infants and pre-schoolers may be very active, inattentive, and distractible; they frequently perform inconsistently in strange situations. Because the language of these children is, by defi nition, undeveloped, they may not completely understand even simple questions and oral requests. Thus, traditional assessment formats in which students respond to examiner questions can be problematic. Not surprisingly, many toddlers and preschoolers are described as untestable. Rather than rely on traditional testing formats, assessment of young children typically involves observations of struc-tured play activities and caregivers’ ratings of the child’s behavior. Having parents and caregivers complete a developmental history can be very helpful, and in some cases it is essential for appropriate decision making.
When assessing young children who are diagnosed as having severe disabilities, it is particularly important to recognize and show sensitivity to the family’s emo-tional responses. Parents have many hopes and dreams for young children, and often they must go through a long grieving process as they recognize how these original hopes and dreams will not be actualized. Parents often need assistance in seeking out resources to help them cope with such grief.
1 Why Do We Assess Infants, Toddlers, and Preschoolers?
There are several reasons to assess young children. Assessments can play an integral role in guiding instructional planning decisions for early childhood programs, as well as in the development of individualized family service plans for students eli-gible to receive special education services. Delayed developmental areas may be targeted for intervention. Tests and rating scales are often used to conduct program evaluation and to monitor progress toward standards for children with and without disabilities. Many measures currently available for use with very young children
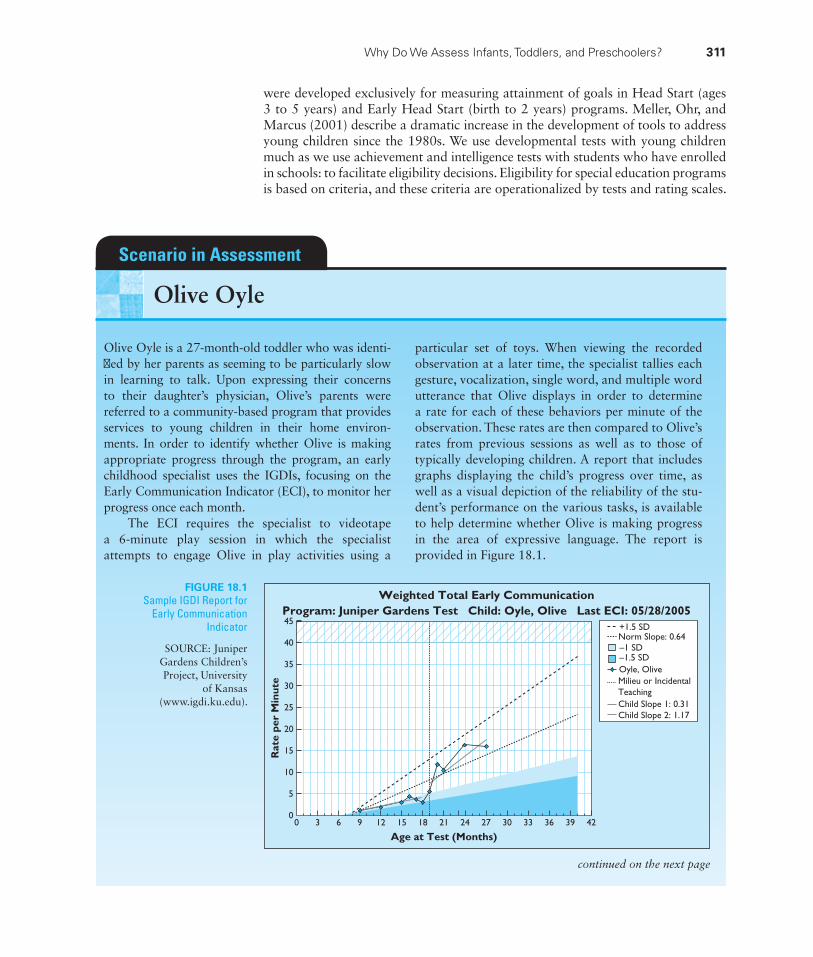
Why Do We Assess Infants, Toddlers, and Preschoolers? 311
Olive Oyle is a 27-month-old toddler who was identi-fi ed by her parents as seeming to be particularly slow in learning to talk. Upon expressing their concerns to their daughter’s physician, Olive’s parents were referred to a community-based program that provides services to young children in their home environ-ments. In order to identify whether Olive is making appropriate progress through the program, an early childhood specialist uses the IGDIs, focusing on the Early Communication Indicator (ECI), to monitor her progress once each month.
The ECI requires the specialist to videotape a 6-minute play session in which the specialist attempts to engage Olive in play activities using a
particular set of toys. When viewing the recorded observation at a later time, the specialist tallies each gesture, vocalization, single word, and multiple word utterance that Olive displays in order to determine a rate for each of these behaviors per minute of the observation. These rates are then compared to Olive’s rates from previous sessions as well as to those of typically developing children. A report that includes graphs displaying the child’s progress over time, as well as a visual depiction of the reliability of the stu-dent’s performance on the various tasks, is available to help determine whether Olive is making progress in the area of expressive language. The report is provided in Figure 18.1.
Scenario in Assessment
Olive Oyle
were developed exclusively for measuring attainment of goals in Head Start (ages 3 to 5 years) and Early Head Start (birth to 2 years) programs. Meller, Ohr, and Marcus (2001) describe a dramatic increase in the development of tools to address young children since the 1980s. We use developmental tests with young children much as we use achievement and intelligence tests with students who have enrolled in schools: to facilitate eligibility decisions. Eligibility for special education pr ograms is based on criteria, and these criteria are operationalized by tests and rating scales.
FIGURE 18.1Sample IGDI Report for
Early Communication Indicator
SOURCE: Juniper Gardens Children’s Project, University
of Kansas (www.igdi.ku.edu).
Weighted Total Early CommunicationProgram: Juniper Gardens Test Child: Oyle, Olive Last ECI: 05/28/200545
40
35
30
25
20
15
10
5
00 3 6 9 12 15 18
Age at Test (Months)
Rat
e pe
r M
inut
e
21 24 27 30 33 36 39 42
+1.5 SDNorm Slope: 0.64–1 SD–1.5 SDOyle, OliveMilieu or IncidentalTeachingChild Slope 1: 0.31Child Slope 2: 1.17
continued on the next page
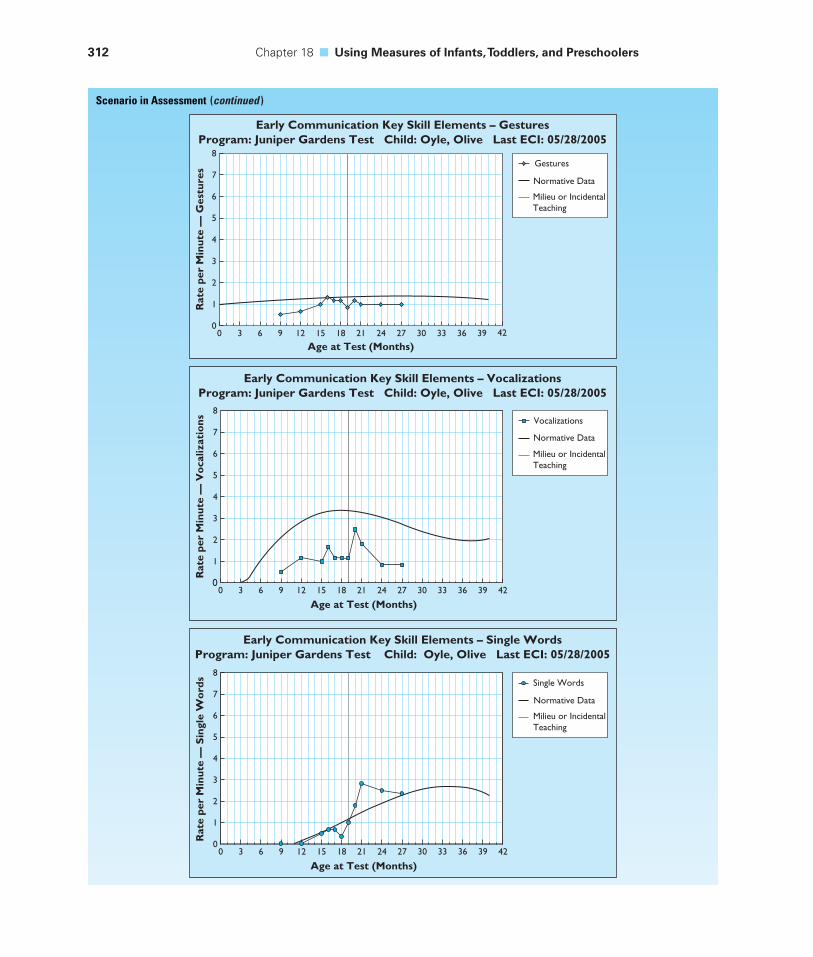
312 Chapter 18 ■ Using Measures of Infants, Toddlers, and Preschoolers
Early Communication Key Skill Elements – VocalizationsProgram: Juniper Gardens Test Child: Oyle, Olive Last ECI: 05/28/2005
8
7
6
5
4
3
2
1
00 3 6 9 12 15 18
Age at Test (Months)
Rat
e pe
r M
inut
e —
Vo
caliz
atio
ns
21 24 27 30 33 36 39 42
Vocalizations
Normative Data
Milieu or IncidentalTeaching
Early Communication Key Skill Elements – Single WordsProgram: Juniper Gardens Test Child: Oyle, Olive Last ECI: 05/28/2005
Single Words
Normative Data
Milieu or IncidentalTeaching
8
7
6
5
4
3
2
1
00 3 6 9 12 15 18
Age at Test (Months)
Rat
e pe
r M
inut
e —
Sin
gle
Wo
rds
21 24 27 30 33 36 39 42
Early Communication Key Skill Elements – GesturesProgram: Juniper Gardens Test Child: Oyle, Olive Last ECI: 05/28/2005
Gestures
Normative Data
Milieu or IncidentalTeaching
8
7
6
5
4
3
2
1
00 3 6 9 12 15 18
Age at Test (Months)
Rat
e pe
r M
inut
e —
Ges
ture
s
21 24 27 30 33 36 39 42
Scenario in Assessment (continued )
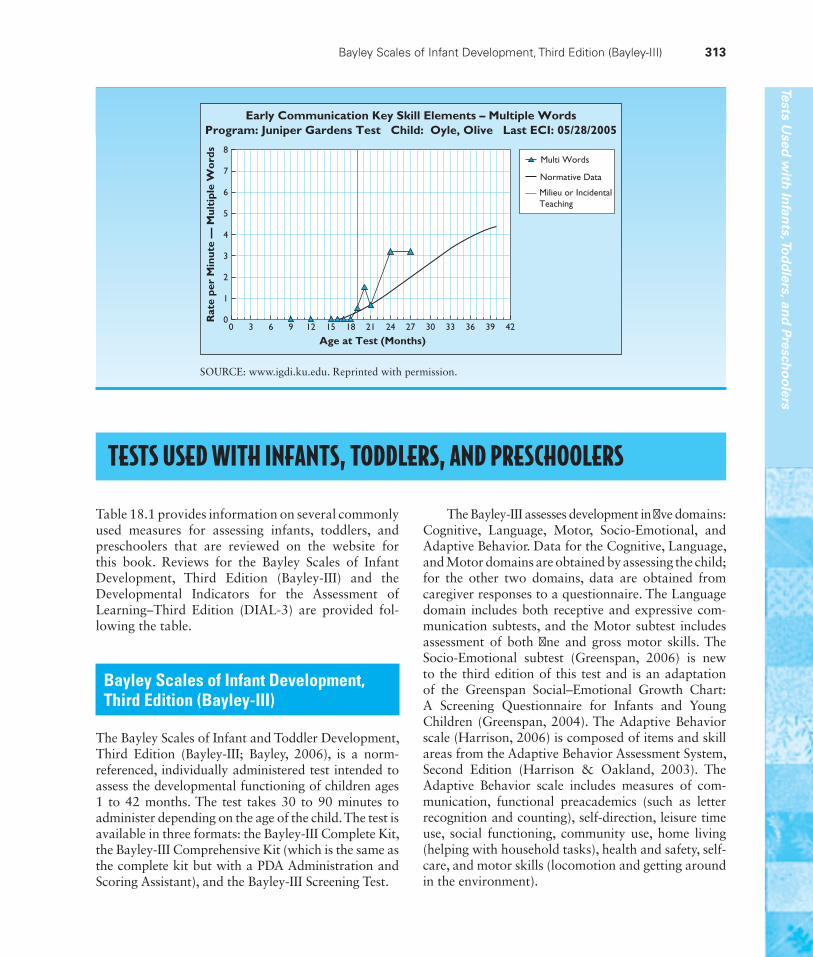
Bayley Scales of Infant Development, Third Edition (Bayley-III) 313
Table 18.1 provides information on several commonly used measures for assessing infants, toddlers, and preschoolers that are reviewed on the website for this book. Reviews for the Bayley Scales of Infant Development, Third Edition (Bayley-III) and the Developmental Indicators for the Assessment of Learning–Third Edition (DIAL-3) are provided fol-lowing the table.
Bayley Scales of Infant Development, Third Edition (Bayley-III)
The Bayley Scales of Infant and Toddler Development, Third Edition (Bayley-III; Bayley, 2006), is a norm-referenced, individually administered test intended to assess the developmental functioning of children ages 1 to 42 months. The test takes 30 to 90 minutes to administer depending on the age of the child. The test is available in three formats: the Bayley-III Complete Kit, the Bayley-III Comprehensive Kit (which is the same as the complete kit but with a PDA Administration and Scoring Assistant), and the Bayley-III Screening Test.
The Bayley-III assesses development in fi ve do mains: Cognitive, Language, Motor, Socio-Emotional, and Adaptive Behavior. Data for the Cognitive, Language, and Motor domains are obtained by assessing the child; for the other two domains, data are obtained from caregiver responses to a questionnaire. The Language domain includes both receptive and expressive com-munication subtests, and the Motor subtest includes assessment of both fi ne and gross motor skills. The Socio-Emotional subtest (Greenspan, 2006) is new to the third edition of this test and is an adaptation of the Greenspan Social–Emotional Growth Chart: A Screening Questionnaire for Infants and Young Children (Greenspan, 2004). The Adaptive Behavior scale (Harrison, 2006) is composed of items and skill areas from the Adaptive Behavior Assessment System, Second Edition (Harrison & Oakland, 2003). The Adaptive Behavior scale includes measures of com-munication, functional preacademics (such as letter recognition and counting), self-direction, leisure time use, social functioning, community use, home living (helping with household tasks), health and safety, self-care, and motor skills (locomotion and getting around in the environment).
TESTS USED WITH INFANTS, TODDLERS, AND PRESCHOOLERS
Early Communication Key Skill Elements – Multiple WordsProgram: Juniper Gardens Test Child: Oyle, Olive Last ECI: 05/28/2005
8
7
6
5
4
3
2
1
00 3 6 9 12 15 18
Age at Test (Months)
Rat
e pe
r M
inut
e —
Mul
tipl
e W
ord
s
21 24 27 30 33 36 39 42
Multi Words
Normative Data
Milieu or IncidentalTeaching
Tests Used
with
Infan
ts, Tod
dlers, an
d P
rescho
olers
SOURCE: www.igdi.ku.edu. Reprinted with permission.
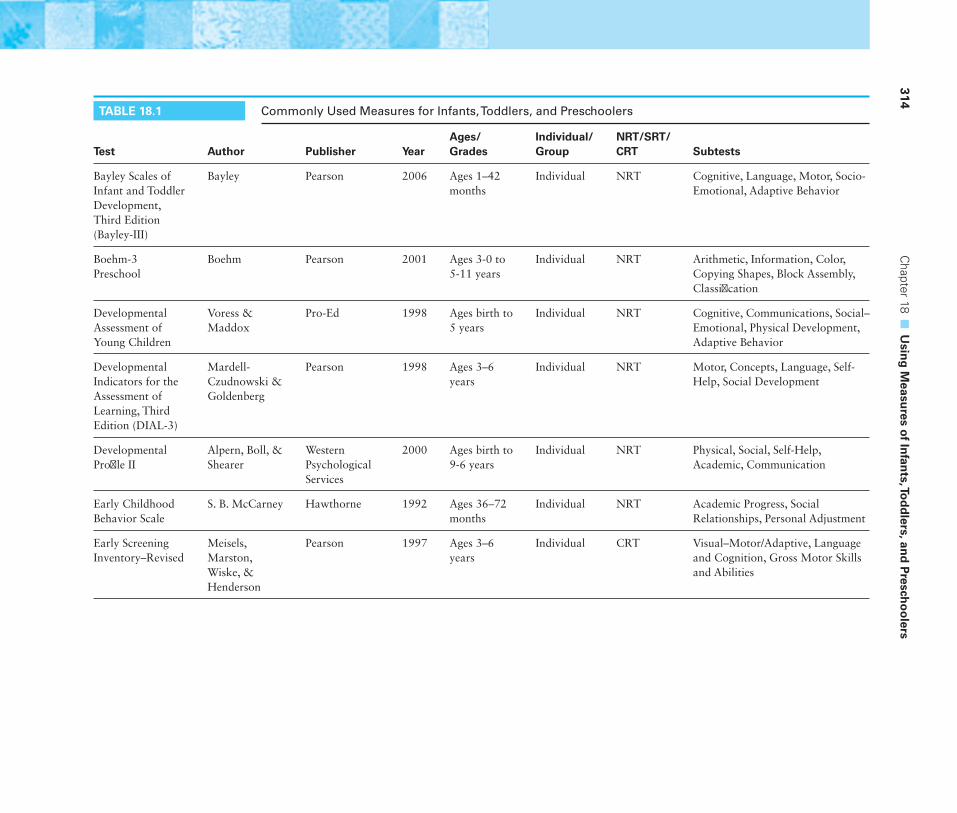
314 C
hapter 18 ■
Usin
g M
easures o
f Infan
ts, Tod
dlers, an
d P
rescho
olers
TABLE 18.1 Commonly Used Measures for Infants, Toddlers, and Preschoolers
Test Author Publisher YearAges/Grades
Individual/Group
NRT/SRT/CRT Subtests
Bayley Scales of Infant and Toddler Development, Third Edition (Bayley-III)
Bayley Pearson 2006 Ages 1–42 months
Individual NRT Cognitive, Language, Motor, Socio-Emotional, Adaptive Behavior
Boehm-3 Preschool
Boehm Pearson 2001 Ages 3-0 to 5-11 years
Individual NRT Arithmetic, Information, Color, Copying Shapes, Block Assembly, Classifi cation
Developmental Assessment of Young Children
Voress & Maddox
Pro-Ed 1998 Ages birth to 5 years
Individual NRT Cognitive, Communications, Social–Emotional, Physical Development, Adaptive Behavior
Developmental Indicators for the Assessment of Learning, Third Edition (DIAL-3)
Mardell-Czudnowski & Goldenberg
Pearson 1998 Ages 3–6 years
Individual NRT Motor, Concepts, Language, Self-Help, Social Development
Developmental Profi le II
Alpern, Boll, & Shearer
Western Psychological Services
2000 Ages birth to 9-6 years
Individual NRT Physical, Social, Self-Help, Academic, Communication
Early Childhood Behavior Scale
S. B. McCarney Hawthorne 1992 Ages 36–72 months
Individual NRT Academic Progress, Social Relationships, Personal Adjustment
Early Screening Inventory–Revised
Meisels, Marston, Wiske, & Henderson
Pearson 1997 Ages 3–6 years
Individual CRT Visual–Motor/Adaptive, Language and Cognition, Gross Motor Skills and Abilities
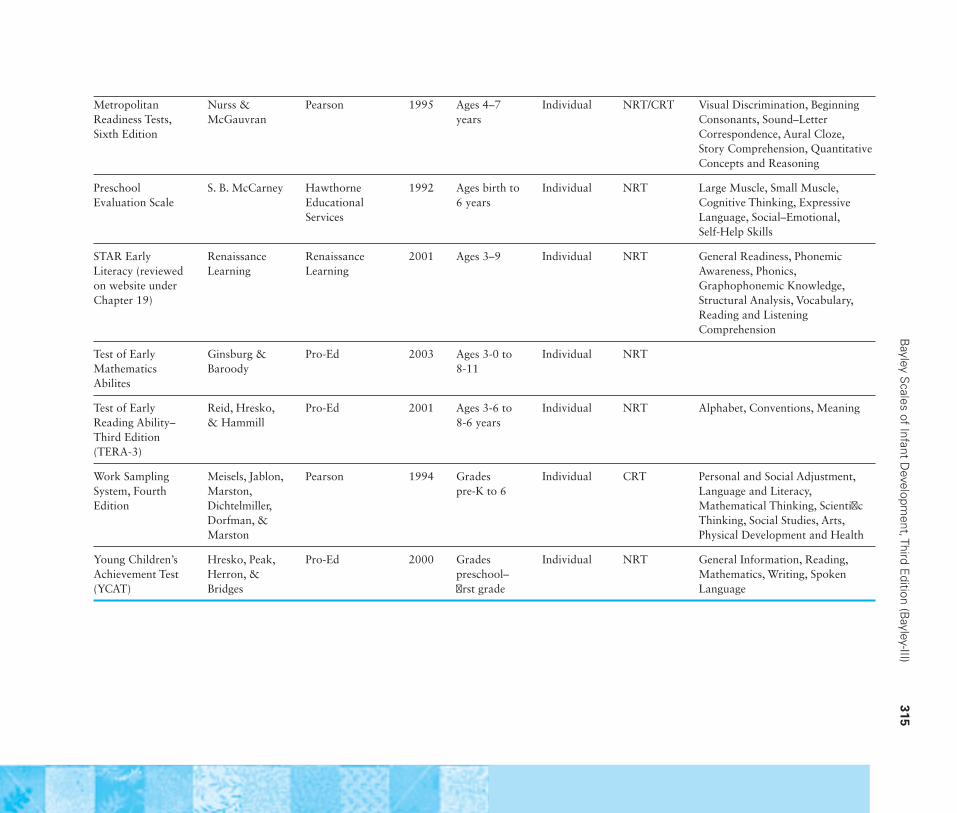
B
ayley Scales of Infant D
evelopment, Third E
dition (Bayley-III)
315
Metropolitan Readiness Tests, Sixth Edition
Nurss & McGauvran
Pearson 1995 Ages 4–7 years
Individual NRT/CRT Visual Discrimination, Beginning Consonants, Sound–Letter Correspondence, Aural Cloze, Story Comprehension, Quantitative Concepts and Reasoning
Preschool Evaluation Scale
S. B. McCarney Hawthorne Educational Services
1992 Ages birth to 6 years
Individual NRT Large Muscle, Small Muscle, Cognitive Thinking, Expressive Language, Social–Emotional, Self-Help Skills
STAR Early Literacy (reviewed on website under Chapter 19)
Renaissance Learning
Renaissance Learning
2001 Ages 3–9 Individual NRT General Readiness, Phonemic Awareness, Phonics, Graphophonemic Knowledge, Structural Analysis, Vocabulary, Reading and Listening Comprehension
Test of Early Mathematics Abilites
Ginsburg & Baroody
Pro-Ed 2003 Ages 3-0 to 8-11
Individual NRT
Test of Early Reading Ability–Third Edition(TERA-3)
Reid, Hresko, & Hammill
Pro-Ed 2001 Ages 3-6 to 8-6 years
Individual NRT Alphabet, Conventions, Meaning
Work Sampling System, Fourth Edition
Meisels, Jablon, Marston, Dichtelmiller, Dorfman, & Marston
Pearson 1994 Grades pre-K to 6
Individual CRT Personal and Social Adjustment, Language and Literacy, Mathematical Thinking, Scientifi c Thinking, Social Studies, Arts, Physical Development and Health
Young Children’s Achievement Test (YCAT)
Hresko, Peak, Herron, & Bridges
Pro-Ed 2000 Grades preschool–fi rst grade
Individual NRT General Information, Reading, Mathematics, Writing, Spoken Language
316 Chapter 18 ■ Using Measures of Infants, Toddlers, and Preschoolers
ScoresPerformance on the Bayley-III can be represented in the form of scaled scores, composite scores, percentile ranks, and growth scores. Developmental age equivalents are available for some subtests. The growth scores are used to plot individual child development over time.
NormsThere were several phases to standardization of the Bayley-III. First, a pilot study was conducted on 353 children. This pilot included items from the second edition of the Bayley, along with a subset of new items. Data were also collected from two clinical groups of children: those born prematurely and children with developmental delays. The data obtained from this pilot were used to construct a preliminary version of the test. This preliminary version was then applied with 1,923 children in a national tryout phase. Data obtained from this national tryout were used to con-struct a version of the test that was submitted to an additional minipilot with 20 children. Then a fi nal version of the Bayley-III was developed.
The Bayley-III was standardized on a sample of 1,700 children ages 16 days to 43 months 15 days and to samples of children from “special groups.” The sample was stratifi ed on the basis of gender, geo-graphic region, race/ethnicity, and parent education level. Norms for the Socio-Emotional scale were derived from 456 children in the standardization sample of the Greenspan Social-Emotional Growth Chart, whereas norms for the Adaptive Behavior scale were derived from 1,350 children who partici-pated in the standardization of the Adaptive Behavior Assessment Scale–II. Data in the technical manual for the test show that each age group closely approxi-mates the 2000 U.S. census in terms of race/ethnicity, geographic region, parental education, and gender.
ReliabilityAlphas were used to estimate the internal consistency of the Cognitive, Language, and Motor scales at each age. For the Cognitive scale, alpha ranged from .79to .97; 10 of the 17 coeffi cients equaled or exceeded .90. For the Motor scale, alpha ranged from .86 to .96; 14 of the 17 coeffi cients exceeded .90. Alphas for the Language scale ranged from .82 to .98. Across all three domains, internal consistency coeffi cients are
lower for children younger than 1 year of age than they are for older children. Reliabilities for the Socio-Emotional and Adaptive Behavior scales generally are in the .70s for children younger than 1 year of age and .80s for older children.
Test–retest stability coeffi cients are generally in the .70s—too low for use in making important decisions for young children (those younger than 26 months of age). Some stability coeffi cients for children in the age range of 33 to 43 months are barely satisfactory for making important decisions.
Given the fact that it is very diffi cult to obtain stable performance over time for very young children, the Bayley-III is about as reliable as other measures designed for use with infants and toddlers.
ValidityData are provided in the technical manual showing evidence for validity based on test content, evidence based on internal structure, and evidence based on relation with other variables. Evidence based on test content is limited to the author’s argument that the test measures content consistent with theoretical con-ceptions of the development of infants and toddlers. Evidence based on internal structure consists of good evidence of the convergent and discriminant validity of the test. Evidence is provided that the Language subtests are more highly correlated with each other than with the Motor subtests and that they are mod-erately correlated with the Cognitive scale. There is also evidence for moderate correlations between the Motor and Cognitive scales. The author argues that the moderate correlation between scores on the Language and Cognitive scales refl ects the close rela-tionship between these domains.
Evidence for validity based on relation with other measures is based on examination of the relationship between performance on the Bayley-III and the sec-ond edition of the Bayley Scales of Infant Develop-ment, WPPSI-III, Preschool Language Scale 4, Peabody Developmental Motor Scales–II, and the Adaptive Behavior Assessment–2. The data presented provide reasonable evidence for the validity of the test.
There are several studies of the validity of the Bayley-III with special populations of students. Data are provided on the validity of the Bayley-III with children with Down syndrome and children identi-fi ed as exhibiting “pervasive developmental disorder,
Developmental Indicators for the Assessment of Learning–Third Edition (DIAL-3) 317
children with cerebral palsy, those with specifi c lan-guage impairment, children with motor and physical impairments, those exposed prenatally or at birth to specifi c risks (asphyxiation at birth, prenatal alcohol exposure), and children born premature or with low birth weight.” The scale is sensitive to performance differences between children in the normative sample and samples of children with various conditions that place them at risk for developmental delay.
SummaryThe Bayley-III is a norm-referenced, individually administered test intended to assess developmental functioning of children between 1 and 42 months of age. The test has fi ve subscales: the Cognitive scale, the Motor scale, the Language scale, a Socio-Emotional scale, and an Adaptive Behavior scale. The scales’ norms appear representative in terms of race/ethnic-ity, geographic region, parental education, and gender, although cross-tabulations are not provided for these variables. There is good evidence for the reliability and validity of the scale, especially for children older than 1 year of age.
Developmental Indicators for the Assessment of Learning–Third Edition (DIAL-3)
The Developmental Indicators for the Assessment of Learning–Third Edition (DIAL-3; Mardell-Czudnowski & Goldenberg, 1998) is an individually administered, 30-minute screening test to assess the development of children between the ages of 3-0 and 6-11 years. Several new items were developed for this edition of the scale, and a Parental Questionnaire was added to assess self-help, social development, family background, and general developmental information. Finally, a short form (called the Speed DIAL) is now available. Both the DIAL-3 and the Speed DIAL can be administered in English or Spanish. Although individual children are screened, the testing procedures are designed to handle large numbers of children; different examin-ers (called operators) administer the Motor, Concepts, and Language subtests to a child, who moves from one testing area (and one tester) to another. There are no special qualifi cations for operators.
SubtestsThree subtests (called Areas on the DIAL-3) require direct observation of a child’s performance on vari-ous items that may require multiple responses. The Speed DIAL includes eight of the DIAL-3 subtests.1 Here, we describe the subtests and name and describe the items.
Motor. This subtest includes catching a beanbag with one and two hands, jump–hop–skip, build-ing with blocks, touching thumbs and fi ngers of the same hand in various sequences, cutting with scissors, copying four geometric shapes and four letters, and writing the child’s own name.
Concepts. This subtest includes pointing to body parts, identifi cation of colors, rapid color naming, rote counting, using blocks to demonstrate relative positions (front, down, and so forth), concepts (for example, “big”), and sorting by shapes.
Language. This subtest includes providing personal data (name, age, and so forth), articulation (repeating the names of objects), naming objects and actions, let-ters and sounds (saying the alphabet, naming letters presented in random order, and producing the sound of a letter), rhyming and “I Spy” (rhyming and allit-eration), oral problem solving about social situations, and intelligibility rating by the examiner.
Self-Help. Parents rate their children’s development of eating, toileting, dressing, and other daily living skills. Parents indicate whether the child performs the skill most of the time with no help, sometimes or with help, not yet, or not allowed.
Social Development. Parents rate the frequency with which their children exhibit feelings and behaviors that are related to successful relationships with family and peers.
ScoresRaw scores for each item are converted to an interme-diate score called a scaled score for the areas/subtests of Motor, Concepts, and Language, as well as the Speed
1This item is also used in the Speed DIAL.
318 Chapter 18 ■ Using Measures of Infants, Toddlers, and Preschoolers
DIAL.2 The scaled scores for each subtest can also be summed into the DIAL-3 Total score. Testers can look up children’s ages (in 2-month intervals) in tables to convert scaled score sums to percentiles and cutoff lev-els for potential delay. Raw score sums for Self-Help and Social Development ratings can also be converted to percentiles and cutoff levels for potential delay.
The authors provide multiple ways to use the DIAL-3 scores to reach a decision and identify a child as needing further assessment. However, they offer users little guidance beyond the fact that more chil-dren can be identifi ed with less stringent criteria and fewer children with criteria that are more rigorous.
NormsThe DIAL-3 was standardized on 1,560 children between the ages of 3-0 and 6-11 years who were tested between November 1995 and June 1997. The children resided in 36 states, the District of Columbia, Puerto Rico, and Panama. The proportions of individuals in the DIAL-3 norms are comparable to the 1994 census in terms of gender, race/ethnicity, geographic region, and parental educational level.
ReliabilityInternal consistency was estimated using coeffi cient alpha for eight 6-month age groups (3-0 to 3-5, 3-6 to 3-11, and so forth). We consider .80 to be the min-imum reliability for a screening device. The Motor, Language, and Self-Help subtests are usually not suffi ciently reliable to use for screening decisions: For Motor, none of the alphas for the eight age groups equals or exceeds .80; for Language and Self-Help,
2Scaled score usually refers to a standard score with a predeter-mined mean and standard deviation. However, the DIAL-3 manual defi nes a scaled score as the median of an age distribution, so it is a developmental score. (A scaled score of 0 is the median for children younger than age 3 years, 1 is the median for 3-year-olds, 2 is the median for 4-year-olds, 3 is the median for 5-year-olds, and 4 is the median for 6-year-olds.) The manual provides no explanation for the ranges associated with each scaled score. For example, in Rapid Color Naming, a scaled score of 0 corresponds to raw scores of 0 to 4, a scaled score of 1 corresponds to raw scores of 5 to 9, a scaled score of 2 corresponds to raw scores of 10 to 19, and so forth. It appears that the scaled scores on the DIAL-3 are at best ordinal and cannot provide for equal weighting of items, as claimed on page 70 of the manual.
two of the eight alphas equal or exceed .80. The remaining two subtests have more age groups for which alphas equal or exceed .80: six age groups for Concepts and all eight for Social Development. The reliability of the Speed DIAL equals or exceeds .80 in half of the age groups, and the reliability of the DIAL-3 Total exceeds .80 except for the oldest group of children.
To estimate stability, 158 children were divided into two groups. A younger group contained 80 children between 3-6 and 4-5 years, and an older group contained 78 children between 4-6 and 5-10 years. The children were retested on average after approximately 28 days. For the younger group, two subtests had stability estimates that equaled or exceeded .80; stabilities for the DIAL-3 Total and the Speed DIAL both exceeded .80. For the older group, Social Development was the only subtest that exceeded .80; stabilities for the DIAL-3 Total and the Speed DIAL both exceeded .80.
Thus, only the DIAL-3 Total appears to have suffi cient reliability for use in making screening deci-sions. It should also be noted that the age groups used to estimate reliability are not the same as the age groups used to convert raw scores to percentiles and delay ratings.
ValiditySome claim can be made for the content validity of the DIAL-3 because of the careful selection and fi eld test-ing of the items. Some evidence for criterion-related validity comes from modest (that is, .25 to .45) cor-relations with similar subtests on the Early Screening Profi le, moderate (that is, .30 to .55) correlations with similar subtests on the Battelle Screening Test, and fairly strong correlations of the total score on the Brigance Preschool Screen with Concepts Language and the DIAL-3 Total (that is, .53 to .79) and of Language with the Peabody Picture Vocabulary Test. The Self-Help and Social Development ratings were also correlated with parent ratings of social skills on the Social Skills Rating System. Finally, children with disabilities who were identifi ed by means other than the DIAL-3 earned lower normalized standard scores. However, although this fi nding is interesting, it is diffi cult to interpret because no standard scores are available for the DIAL-3.
Chapter Comprehension Questions 319
The validity of the Speed DIAL rests on the validity of the DIAL-3. There is a strong correlation (.94) between the two when scores are converted to normalized stan-dard scores. However, no data are presented about fre-quency of false negatives and false positives.
SummaryThe DIAL-3 is an individually administered screening device assessing development in motor, conceptual,
language, self-help, and social development domains. The norms are generally representative, the reliabil-ity for the total score is generally adequate (although the reliabilities of the subtests usually are not), and the validity appears clearly established. Users are urged to make screening decisions based on the total score.
CHAPTER COMPREHENSION QUESTIONSWrite your answers to each of the following questions, and then compare your responses to the text or the study guide.
1. Describe four reasons why you might assess infants, toddlers, and preschoolers.
2. What characteristics of young children can make it particularly challenging to assess their skill development?
3. Describe a measure you might use to monitor the progress of a toddler.
4. Describe one commonly used measure for assessment of infant development. Include information on the reliability and validity of the measure.
Dilemmas in Current Practice
There are three major dilemmas in assessing infants, toddlers, and preschoolers. The fi rst is that the performances of children who are very young are so variable that long-term prediction (for example, 1 year) is not feasible. This inability to predict pre-cisely is particularly pronounced with shorter, quickly adminis-tered (and less reliable) measures. Because there is relatively poor predictive validity, most inferences must be drawn with great care. If individuals wish to use these measures to pre-dict school success, they should recognize that the closer the predicted measure (that is, the criterion) is to the predictor measure (that is, the test), the greater is the accuracy of the prediction. For example, language tests predict later language skills better than perceptual–motor tests do.
The second dilemma occurs when using preschool tests to measure current attainment and child progress. To use developmental measures in this way, educators must ensure that there is appropriate linkage between the curriculum and the content of the test.
The third dilemma is the fact that students must be labeled to be eligible for certain preschool programs, but the act of labeling may set up expectations for limited pupil perfor-mance. Those who assess infants, toddlers, and preschool children need to assess within a context of situational speci-fi city. There is much situational variability in performance, and this must be taken into account when making predictions or planning interventions.
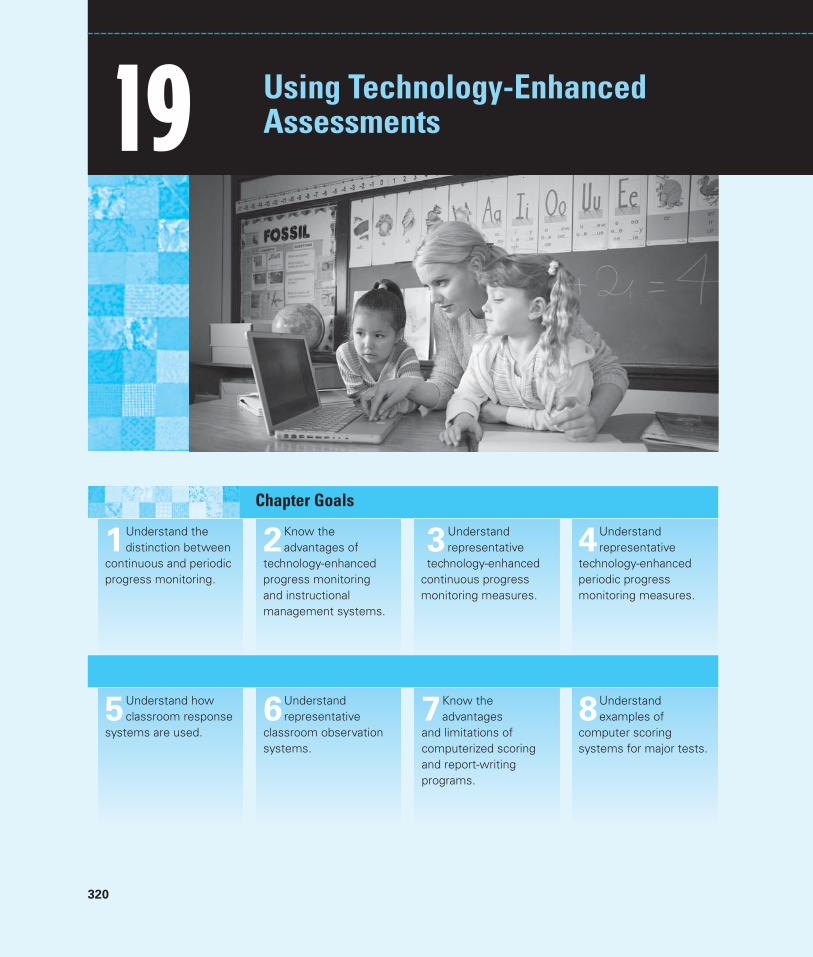
320
19
Chapter Goals
2Know the advantages of
technology-enhanced progress monitoring and instructional management systems.
3Understand representative
technology-enhanced continuous progress monitoring measures.
4Understand representative
technology-enhanced periodic progress monitoring measures.
6Understand representative
classroom observation systems.
7Know the advantages
and limitations of computerized scoring and report-writing programs.
8Understand examples of
computer scoring systems for major tests.
1Understand the distinction between
continuous and periodic progress monitoring.
5Understand how classroom response
systems are used.
Using Technology-Enhanced Assessments
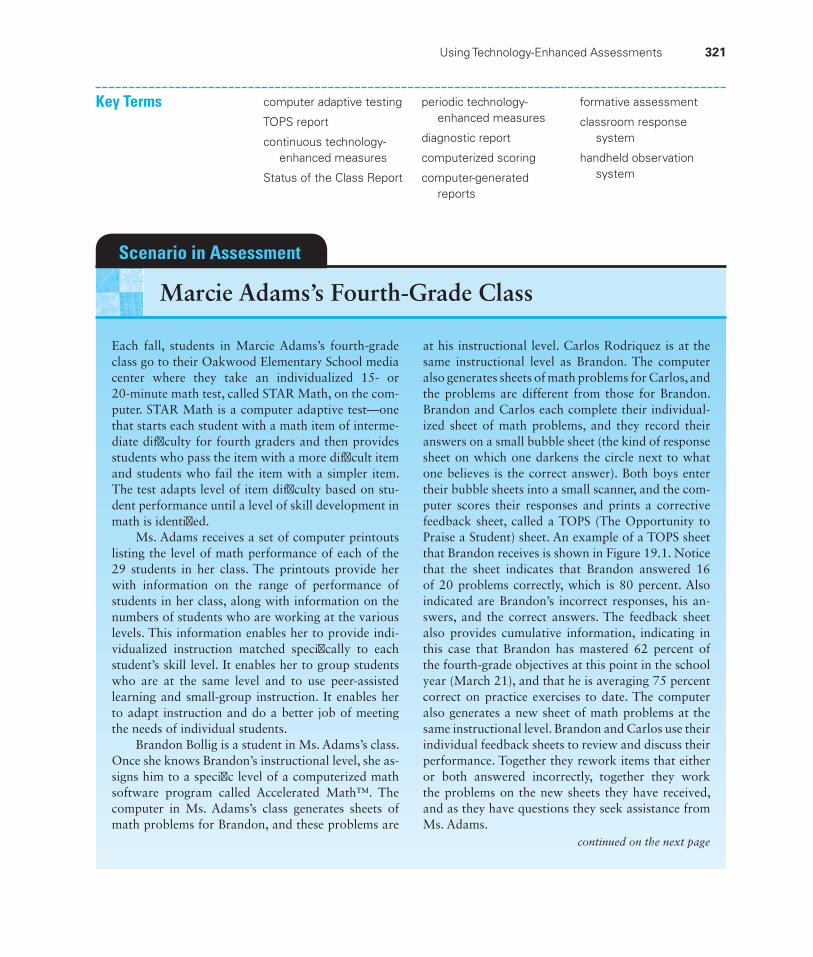
Using Technology-Enhanced Assessments 321
Key Terms computer adaptive testing
TOPS report
continuous technology-enhanced measures
Status of the Class Report
periodic technology-enhanced measures
diagnostic report
computerized scoring
computer-generated reports
formative assessment
classroom response system
handheld observation system
Each fall, students in Marcie Adams’s fourth-grade class go to their Oakwood Elementary School media center where they take an individualized 15- or 20-minute math test, called STAR Math, on the com-puter. STAR Math is a computer adaptive test—one that starts each student with a math item of interme-diate diffi culty for fourth graders and then provides students who pass the item with a more diffi cult item and students who fail the item with a simpler item. The test adapts level of item diffi culty based on stu-dent performance until a level of skill development in math is identifi ed.
Ms. Adams receives a set of computer printouts listing the level of math performance of each of the 29 students in her class. The printouts provide her with information on the range of performance of students in her class, along with information on the numbers of students who are working at the various levels. This information enables her to provide indi-vidualized instruction matched specifi cally to each student’s skill level. It enables her to group students who are at the same level and to use peer-assisted learning and small-group instruction. It enables her to adapt instruction and do a better job of meeting the needs of individual students.
Brandon Bollig is a student in Ms. Adams’s class. Once she knows Brandon’s instructional level, she as-signs him to a specifi c level of a computerized math software program called Accelerated Math™. The computer in Ms. Adams’s class generates sheets of math problems for Brandon, and these problems are
at his instructional level. Carlos Rodriquez is at the same instructional level as Brandon. The computer also generates sheets of math problems for Carlos, and the problems are different from those for Brandon. Brandon and Carlos each complete their individual-ized sheet of math problems, and they record their answers on a small bubble sheet (the kind of response sheet on which one darkens the circle next to what one believes is the correct answer). Both boys enter their bubble sheets into a small scanner, and the com-puter scores their responses and prints a corrective feedback sheet, called a TOPS (The Opportunity to Praise a Student) sheet. An example of a TOPS sheet that Brandon receives is shown in Figure 19.1. Notice that the sheet indicates that Brandon answered 16 of 20 problems correctly, which is 80 percent. Also indicated are Brandon’s incorrect responses, his an-swers, and the correct answers. The feedback sheet also provides cumulative information, indicating in this case that Brandon has mastered 62 percent of the fourth-grade objectives at this point in the school year (March 21), and that he is averaging 75 percent correct on practice exercises to date. The computer also generates a new sheet of math problems at the same instructional level. Brandon and Carlos use their individual feedback sheets to review and discuss their performance. Together they rework items that either or both answered incorrectly, together they work the problems on the new sheets they have received, and as they have questions they seek assistance from Ms. Adams.
Scenario in Assessment
Marcie Adams’s Fourth-Grade Class
continued on the next page
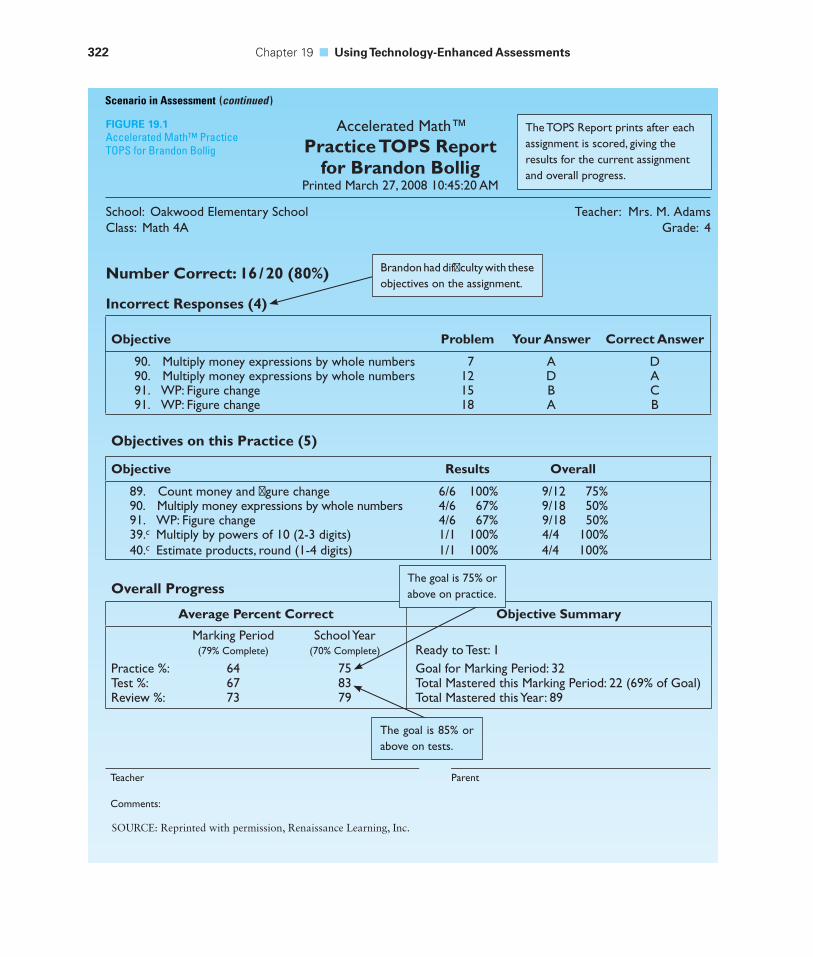
322 Chapter 19 ■ Using Technology-Enhanced Assessments
Accelerated Math™Practice TOPS Report
for Brandon BolligPrinted March 27, 2008 10:45:20 AM
School: Oakwood Elementary SchoolClass: Math 4A
Teacher: Mrs. M. AdamsGrade: 4
Number Correct: 16 / 20 (80%)
Incorrect Responses (4)
Objective Problem Your Answer Correct Answer
90. Multiply money expressions by whole numbers 7 A D90. Multiply money expressions by whole numbers 12 D A91. WP: Figure change 15 B C91. WP: Figure change 18 A B
Objectives on this Practice (5)
Objective Results Overall
89. Count money and fi gure change 6/6 100% 9/12 75%90. Multiply money expressions by whole numbers 4/6 67% 9/18 50%91. WP: Figure change 4/6 67% 9/18 50%39.c Multiply by powers of 10 (2-3 digits) 1/1 100% 4/4 100%40.c Estimate products, round (1-4 digits) 1/1 100% 4/4 100%
Teacher
Overall Progress
Average Percent Correct Objective Summary
Marking Period(79% Complete)
School Year(70% Complete) Ready to Test: 1
Practice %:Test %:Review %:
646773
758379
Goal for Marking Period: 32Total Mastered this Marking Period: 22 (69% of Goal)Total Mastered this Year: 89
Parent
Comments:
FIGURE 19.1Accelerated Math™ Practice TOPS for Brandon Bollig
The TOPS Report prints after each assignment is scored, giving the results for the current assignment and overall progress.
Brandon had diffi culty with these objectives on the assignment.
Scenario in Assessment (continued )
The goal is 75% or above on practice.
The goal is 85% or above on tests.
SOURCE: Reprinted with permission, Renaissance Learning, Inc.
Using Technology-Enhanced Assessments 323
Brandon and Carlos continue working on sheets of math practice items that are tailored to their in-dividual skill level until they consistently achieve 75 percent success rates on practice exercises for four objectives. The computer then signals Ms. Adams that the student is ready to take a test on the objec-tive. She pushes a button to generate the test, and the computer generates the test. Brandon takes the test, records his answers on a bubble sheet, and scans his answers. The computer provides him with corrective feedback on the test. He continues to take tests until he achieves the required 85 percent accuracy. Once Brandon achieves 85 percent accuracy on a test, the computer moves him to the next objective and prints a sheet of practice items for that objective. The practice–practice–practice–test process is repeated.
Each morning, Ms. Adams uses the Accelerated Math™ software to print a Status of the Class Report. A copy of the kind of report she receives is illus-trated in Figure 19.2. Notice that the computer lists the students in her class (we shortened the report to 12 students for purposes of illustration) and identifi es students who need assignments and students who need help with two practice objectives. The Status of the Class Report indicates that Brandon needs help with practice items for two objectives that he is currently working on, and that he is not yet ready to test on any objectives. At the bottom of the sheet, Ms. Adams sees the specifi c objectives for which Brandon needs help: multiplying money expressions by whole numbers and word problems that require him to fi gure change. She is also able to see that Carlos is currently working but that she needs to print a test for him to take. Test printing is always under the control of the teacher.
The Status of the Class Report also alerts Ms. Adams to specifi c objectives that are causing dif-fi culty for three or more students. She learns that Michelle, Lisa, and Tyler are having diffi culty with telling time to the hour and minute, and she is alerted that she should provide small-group instruction on this objective to those three students. The report also gives her a summary of the status of the students in her class. She learns that one student needs to have a specifi c objective assigned, three students are ready to test, and two students need intervention.
Once a week, Ms. Adams prints a Diagnostic Re-port (an example is shown in Figure 19.3). The report
gives her a snapshot of every student and the class as a whole. She reviews the report weekly to monitor student performance and look for students who may need help. She is able to see that on average, students in her class have completed 380 problems, are getting 83 percent correct on practice items, and are averaging 86 percent correct on regular tests. Note that she is also able to see that Brandon is performing below expectation (only achieving 64 percent correct on practice exercise and 67 percent correct on regular tests). Brandon is identifi ed as a student at risk and one who is in need of intervention. The overall goal is to have fewer than 10 percent of the students in a class at risk. When students are persis-tently at risk, teachers can use this information to make informed decisions to refer students for additional as-sistance or psychoeducational evaluation.
School administrators can periodically review the Diagnostic Reports for the classes in their build-ings or district. When they identify classes in which more than 10 percent of the students are at risk, they can intervene to assign additional resources (para-professionals or resource teachers) to these classes. Both teachers and administrators can use these technology-enhanced assessment systems to moni-tor student progress and make data-driven decisions about referral, instruction, program evaluation, and accountability.
These examples illustrate the ways in which technology is being used to enhance assessment and decision making. Ms. Adams uses the Accelerated Math™ software to manage practice and monitor individual student progress in math for each of the students in her class. She is able to shift her very valuable time from assigning instruction, grading papers, and providing feedback to provision of in-dividualized and small-group instruction to students experiencing diffi culty. Also, she receives informa-tion on the specifi c nature of the diffi culty they are having, enabling her to provide precisely relevant remedial instruction.
Computer software is now available to assist teachers in continuous or periodic monitoring of stu-dent performance and progress. Compared to a static paper-and-pencil multiple-choice test where everyone takes a fi xed set of items, computer adaptive testing requires fewer items to arrive at equally accurate scores.
continued on the next page
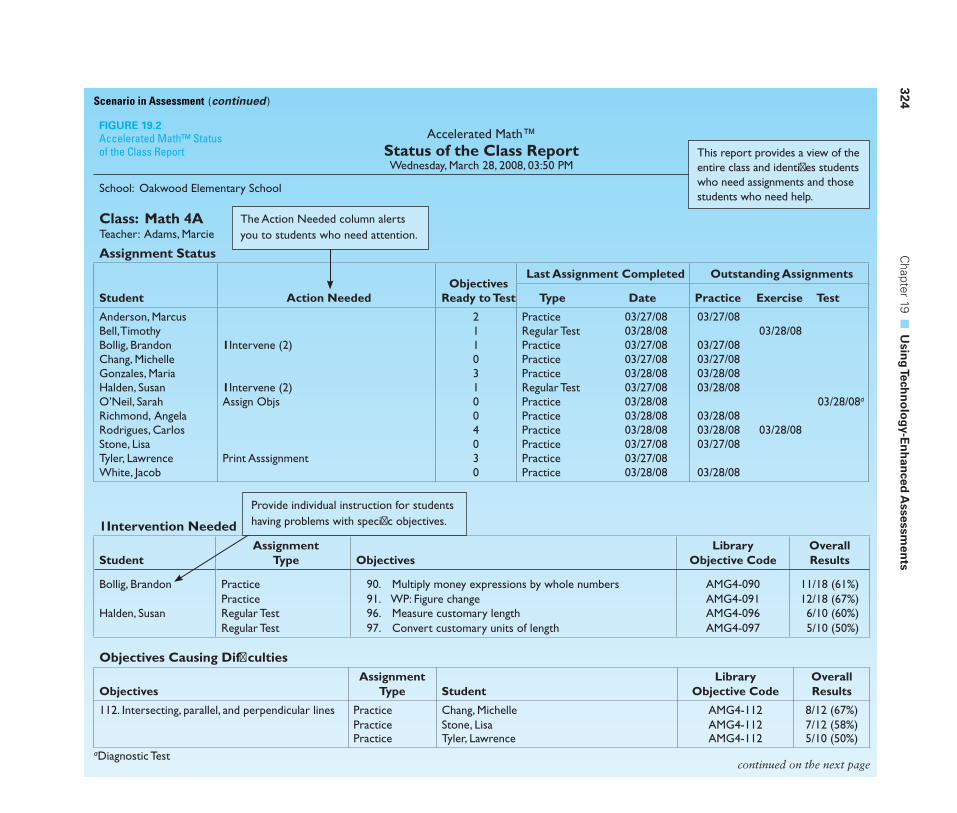
324 C
hapter 19 ■
Usin
g Tech
no
logy-E
nh
anced
Assessm
ents
1Intervention Needed
StudentAssignment
Type ObjectivesLibrary
Objective CodeOverall Results
Bollig, Brandon Practice 90. Multiply money expressions by whole numbers AMG4-090 11/18 (61%)Practice 91. WP: Figure change AMG4-091 12/18 (67%)
Halden, Susan Regular Test 96. Measure customary length AMG4-096 6/10 (60%)Regular Test 97. Convert customary units of length AMG4-097 5/10 (50%)
Objectives Causing Diffi culties
ObjectivesAssignment
Type StudentLibrary
Objective CodeOverall Results
112. Intersecting, parallel, and perpendicular lines Practice Chang, Michelle AMG4-112 8/12 (67%)Practice Stone, Lisa AMG4-112 7/12 (58%)Practice Tyler, Lawrence AMG4-112 5/10 (50%)
aDiagnostic Test
Accelerated Math™Status of the Class ReportWednesday, March 28, 2008, 03:50 PM
School: Oakwood Elementary School
Class: Math 4ATeacher: Adams, Marcie
Assignment Status
Student Action NeededObjectives
Ready to Test
Last Assignment Completed Outstanding Assignments
Type Date Practice Exercise Test
Anderson, Marcus 2 Practice 03/27/08 03/27/08Bell, Timothy 1 Regular Test 03/28/08 03/28/08Bollig, Brandon 1Intervene (2) 1 Practice 03/27/08 03/27/08Chang, Michelle 0 Practice 03/27/08 03/27/08Gonzales, Maria 3 Practice 03/28/08 03/28/08Halden, Susan 1Intervene (2) 1 Regular Test 03/27/08 03/28/08O’Neil, Sarah Assign Objs 0 Practice 03/28/08 03/28/08a
Richmond, Angela 0 Practice 03/28/08 03/28/08Rodrigues, Carlos 4 Practice 03/28/08 03/28/08 03/28/08Stone, Lisa 0 Practice 03/27/08 03/27/08Tyler, Lawrence Print Asssignment 3 Practice 03/27/08White, Jacob 0 Practice 03/28/08 03/28/08
Provide individual instruction for students having problems with specifi c objectives.
The Action Needed column alerts you to students who need attention.
This report provides a view of the entire class and identifi es students who need assignments and those students who need help.
FIGURE 19.2Accelerated Math™ Status of the Class Report
Scenario in Assessment (continued)
continued on the next page
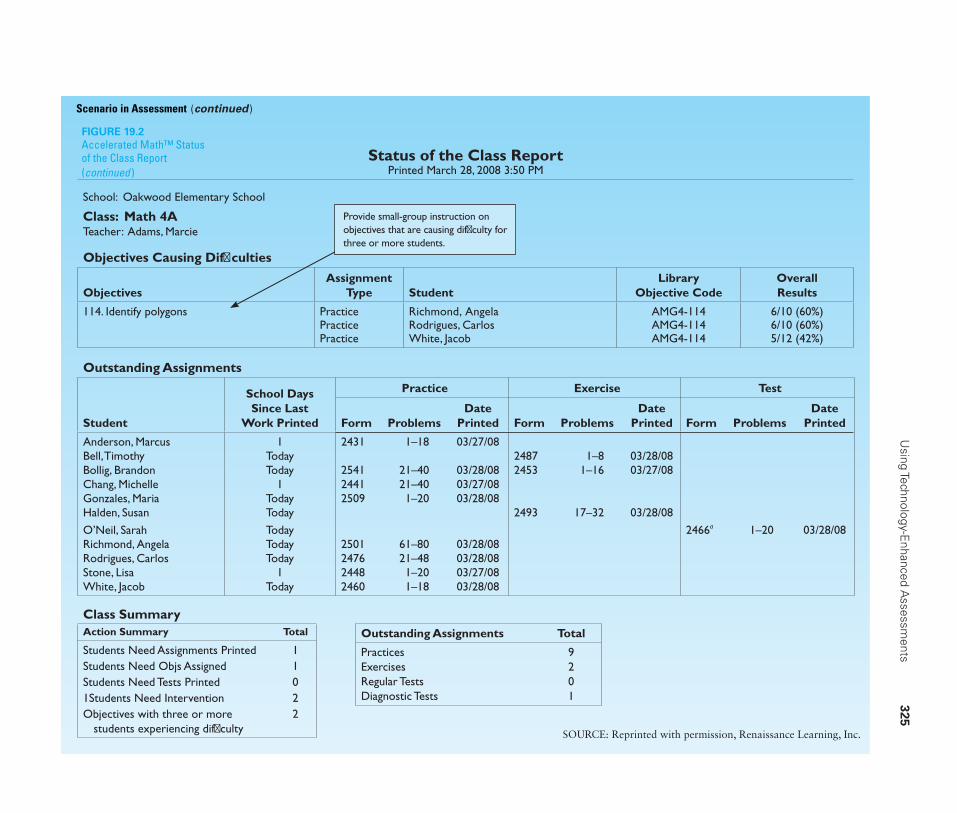
U
sing Technology-Enhanced A
ssessments
325
FIGURE 19.2Accelerated Math™ Status of the Class Report (continued )
Status of the Class ReportPrinted March 28, 2008 3:50 PM
School: Oakwood Elementary School
Class: Math 4ATeacher: Adams, Marcie
Objectives Causing Diffi culties
ObjectivesAssignment
Type StudentLibrary
Objective CodeOverall Results
114. Identify polygons Practice Richmond, Angela AMG4-114 6/10 (60%)Practice Rodrigues, Carlos AMG4-114 6/10 (60%)Practice White, Jacob AMG4-114 5/12 (42%)
Outstanding Assignments
Student
School Days Since Last
Work Printed
Practice Exercise Test
Form ProblemsDate
Printed Form ProblemsDate
Printed Form ProblemsDate
Printed
Anderson, Marcus 1 2431 1–18 03/27/08Bell, Timothy Today 2487 1–8 03/28/08Bollig, Brandon Today 2541 21–40 03/28/08 2453 1–16 03/27/08Chang, Michelle 1 2441 21–40 03/27/08Gonzales, Maria Today 2509 1–20 03/28/08Halden, Susan Today 2493 17–32 03/28/08
O’Neil, Sarah Today 2466a 1–20 03/28/08Richmond, Angela Today 2501 61–80 03/28/08Rodrigues, Carlos Today 2476 21–48 03/28/08Stone, Lisa 1 2448 1–20 03/27/08White, Jacob Today 2460 1–18 03/28/08
Class SummaryAction Summary Total
Students Need Assignments Printed Students Need Objs AssignedStudents Need Tests Printed1Students Need InterventionObjectives with three or more students experiencing diffi culty
11022
Outstanding Assignments Total
PracticesExercisesRegular TestsDiagnostic Tests
9201
Scenario in Assessment (continued)
Provide small-group instruction on objectives that are causing diffi culty for three or more students.
SOURCE: Reprinted with permission, Renaissance Learning, Inc.
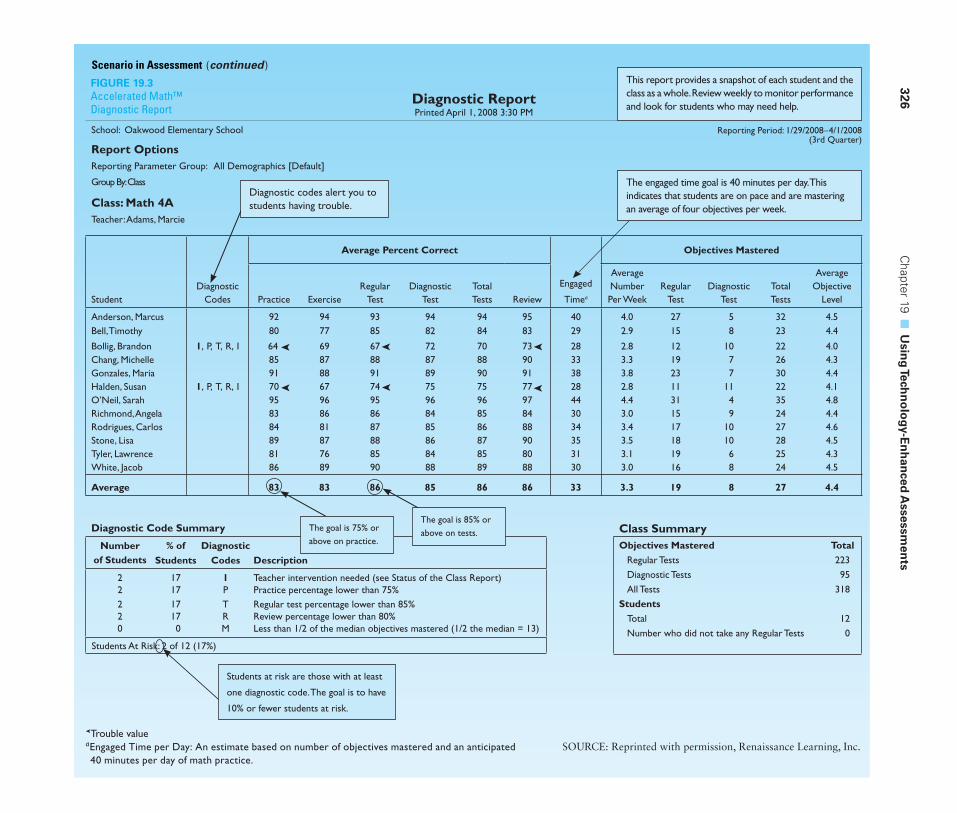
326 C
hapter 19 ■
Usin
g Tech
no
logy-E
nh
anced
Assessm
ents
Diagnostic ReportPrinted April 1, 2008 3:30 PM
School: Oakwood Elementary School
Report OptionsReporting Parameter Group: All Demographics [Default]
Group By: Class
Class: Math 4ATeacher: Adams, Marcie
StudentDiagnostic
Codes
Average Percent Correct
Engaged
Timea
Objectives Mastered
Practice ExerciseRegular
TestDiagnostic
TestTotal Tests Review
Average Number Per Week
Regular Test
Diagnostic Test
Total Tests
Average Objective
Level
Anderson, Marcus 92 94 93 94 94 95 40 4.0 27 5 32 4.5Bell, Timothy 80 77 85 82 84 83 29 2.9 15 8 23 4.4
Bollig, Brandon 1, P, T, R, I 64 ➤ 69 67 72 70 73 28 2.8 12 10 22 4.0Chang, Michelle 85 87 88 87 88 90 33 3.3 19 7 26 4.3Gonzales, Maria 91 88 91 89 90 91 38 3.8 23 7 30 4.4Halden, Susan 1, P, T, R, I 70 67 74 75 75 77 28 2.8 11 11 22 4.1O’Neil, Sarah 95 96 95 96 96 97 44 4.4 31 4 35 4.8Richmond, Angela 83 86 86 84 85 84 30 3.0 15 9 24 4.4Rodrigues, Carlos 84 81 87 85 86 88 34 3.4 17 10 27 4.6Stone, Lisa 89 87 88 86 87 90 35 3.5 18 10 28 4.5Tyler, Lawrence 81 76 85 84 85 80 31 3.1 19 6 25 4.3White, Jacob 86 89 90 88 89 88 30 3.0 16 8 24 4.5
Average 83 83 86 85 86 86 33 3.3 19 8 27 4.4
Diagnostic Code Summary
Number of Students
% of Students
Diagnostic Codes Description
2 17 1 Teacher intervention needed (see Status of the Class Report)2 17 P Practice percentage lower than 75%2 17 T Regular test percentage lower than 85%2 17 R Review percentage lower than 80%0 0 M Less than 1/2 of the median objectives mastered (1/2 the median = 13)
Students At Risk: 2 of 12 (17%)
This report provides a snapshot of each student and the class as a whole. Review weekly to monitor performance and look for students who may need help.
The engaged time goal is 40 minutes per day. This indicates that students are on pace and are mastering an average of four objectives per week.
Class SummaryObjectives Mastered
Regular Tests
Diagnostic Tests
All Tests
StudentsTotal
Number who did not take any Regular Tests
Total223
95
318
12
0
➤
Trouble valueaEngaged Time per Day: An estimate based on number of objectives mastered and an anticipated 40 minutes per day of math practice.
Diagnostic codes alert you to students having trouble.
The goal is 75% or above on practice.
The goal is 85% or above on tests.
Reporting Period: 1/29/2008–4/1/2008(3rd Quarter)
Students at risk are those with at least
one diagnostic code. The goal is to have
10% or fewer students at risk.
➤
➤
➤
➤
➤
FIGURE 19.3Accelerated Math™ Diagnostic Report
Scenario in Assessment (continued)
SOURCE: Reprinted with permission, Renaissance Learning, Inc.
Accelerated Math™ 327
During the past 10 years, there have been major advances in the development of technology-enhanced assessment systems. These are designed to assist teachers in monitoring the progress of individuals or classes, and typically they are not specifi c to any one curriculum. In this chapter, we describe two kinds of technology-enhanced assessment systems: those intended to be used continuously during instruction and those that are administered periodically (for example, once every 10 days or every 2 weeks). The intent of both kinds of systems is the same: to provide teachers with information on the extent to which students are making progress toward instruc-tional goals. The major reason why teachers choose to administer these tests is so that they can identify very early those students who are not on target for individual goals or school district goals and intervene to make changes in the students’ instruc-tional program. When education professionals use information to make changes in students’ instruction, we often label this formative assessment.
At the same time, computerized scoring systems are available for individually administered assessments. These allow assessors to enter a student’s raw score on subtests and to receive a variety of subtests scores, composite scores, confi dence intervals, and computed signifi cance of differences among scores. There are three parts to this chapter. In the fi rst, we describe technology-enhanced assessment sys-tems designed for use in continuous assessment of student progress. In the second part, we describe technology-enhanced assessment systems designed for use in periodic assessment of student progress. In the third part, we describe commonly used computerized scoring systems.
It is important to recognize that the measures described in this chapter are not computer-assisted instruction systems. Rather, they are assessment systems, designed to monitor pupil progress and help teachers manage instruction. They often provide guidance for decision making about what to teach, but they are certainly not a substitute for instruction. We have included reviews of assessment systems that are not linked directly to any one curriculum or textbook series.
CONTINUOUS TECHNOLOGY-ENHANCED ASSESSMENT SYSTEMS
Examples of commonly used technology-enhanced assessments designed for continuous progress moni-toring are listed in Table 19.1. We describe one of these systems, Accelerated Math™, in the following section.
Accelerated Math™
Accelerated Math™ (AM) (Renaissance Learning, 1998) is a technology-enhanced system designed to monitor student progress toward instructional goals and manage student practice of relevant instruc-tional tasks. We illustrated the system in the story
about students in Marcie Adams’s class. Students are placed at an instructional level dependent on their level of skill development in math as determined by an assessment such as STAR Math (described later). They are taught at that level, and then they com-plete practice exercises that enable them to apply what they have learned. The computer is used to monitor accuracy and task completion, and stu-dents move at their own pace. The AM program is used to provide teachers with daily information on the progress of individual students, on the sta-tus of all students in the class, and to alert teach-ers when individual students are having diffi culty. The program can be used by administrators to track
Co
ntin
uo
us Tech
no
logy-E
nh
anced
Assessm
ent S
ystems
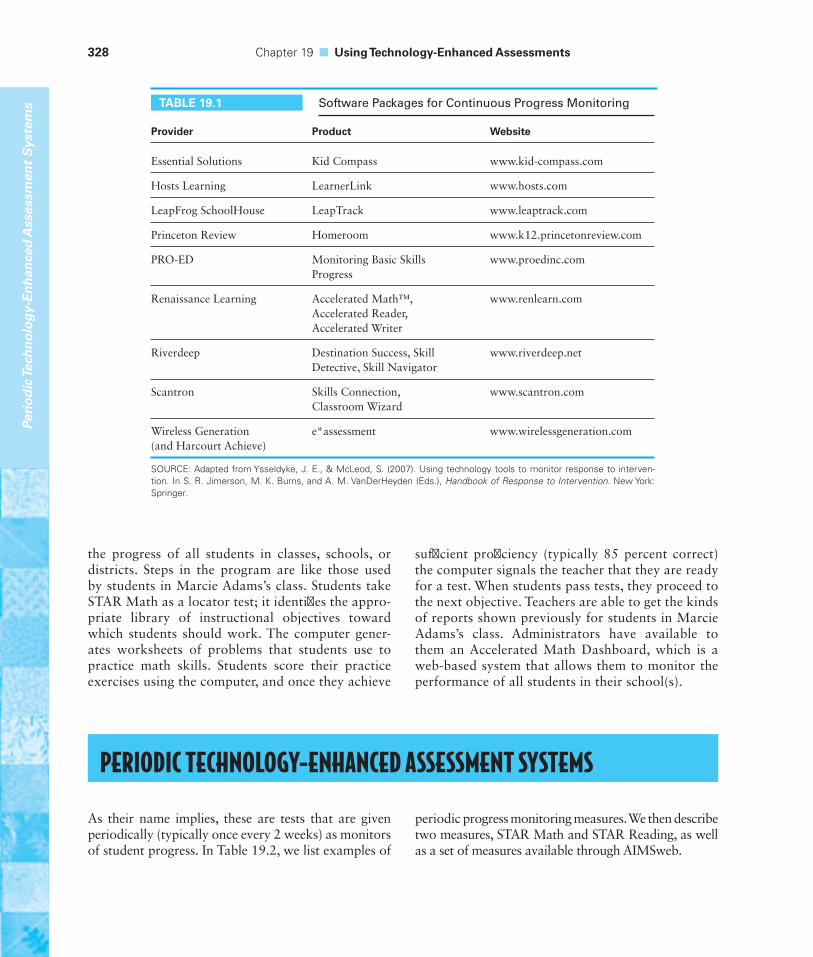
328 Chapter 19 ■ Using Technology-Enhanced Assessments
suffi cient profi ciency (typically 85 percent correct) the computer signals the teacher that they are ready for a test. When students pass tests, they proceed to the next objective. Teachers are able to get the kinds of reports shown previously for students in Marcie Adams’s class. Administrators have available to them an Accelerated Math Dashboard, which is a web-based system that allows them to monitor the performance of all students in their school(s).
the progress of all students in classes, schools, or districts. Steps in the program are like those used by students in Marcie Adams’s class. Students take STAR Math as a locator test; it identifi es the appro-priate library of instructional objectives toward which students should work. The computer gener-ates worksheets of problems that students use to practice math skills. Students score their practice exercises using the computer, and once they achieve
Provider Product Website
Essential Solutions Kid Compass www.kid-compass.com
Hosts Learning LearnerLink www.hosts.com
LeapFrog SchoolHouse LeapTrack www.leaptrack.com
Princeton Review Homeroom www.k12.princetonreview.com
PRO-ED Monitoring Basic Skills Progress
www.proedinc.com
Renaissance Learning Accelerated Math™, Accelerated Reader, Accelerated Writer
www.renlearn.com
Riverdeep Destination Success, Skill Detective, Skill Navigator
www.riverdeep.net
Scantron Skills Connection, Classroom Wizard
www.scantron.com
Wireless Generation (and Harcourt Achieve)
e*assessment www.wirelessgeneration.com
SOURCE: Adapted from Ysseldyke, J. E., & McLeod, S. (2007). Using technology tools to monitor response to interven-tion. In S. R. Jimerson, M. K. Burns, and A. M. VanDerHeyden (Eds.), Handbook of Response to Intervention. New York: Springer.
TABLE 19.1 Software Packages for Continuous Progress Monitoring
PERIODIC TECHNOLOGY-ENHANCED ASSESSMENT SYSTEMS
As their name implies, these are tests that are given periodically (typically once every 2 weeks) as monitors of student progress. In Table 19.2, we list examples of
periodic progress monitoring measures. We then describe two measures, STAR Math and STAR Reading, as well as a set of measures available through AIMSweb.
Peri
od
ic Te
chn
olo
gy-E
nh
ance
d A
sses
smen
t S
yste
ms
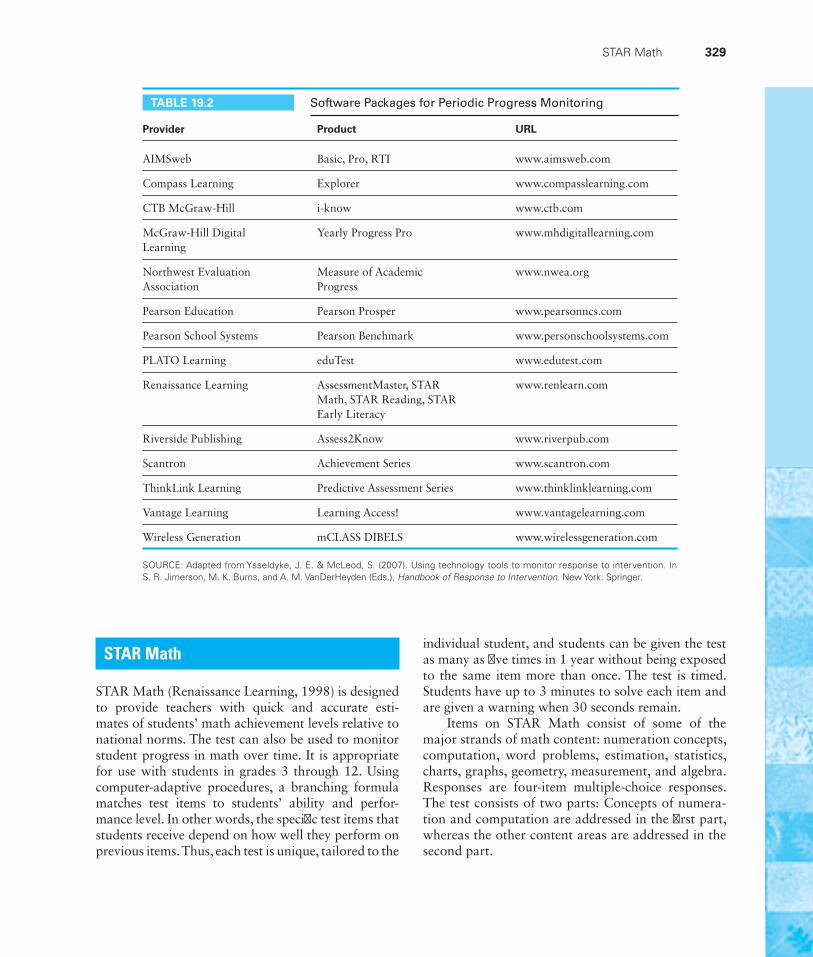
STAR Math 329
individual student, and students can be given the test as many as fi ve times in 1 year without being exposed to the same item more than once. The test is timed. Students have up to 3 minutes to solve each item and are given a warning when 30 seconds remain.
Items on STAR Math consist of some of the major strands of math content: numeration concepts, computation, word problems, estimation, statistics, charts, graphs, geometry, measurement, and algebra. Responses are four-item multiple-choice responses. The test consists of two parts: Concepts of numera-tion and computation are addressed in the fi rst part, whereas the other content areas are addressed in the second part.
STAR Math
STAR Math (Renaissance Learning, 1998) is designed to provide teachers with quick and accurate esti-mates of students’ math achievement levels relative to national norms. The test can also be used to monitor student progress in math over time. It is appropriate for use with students in grades 3 through 12. Using computer-adaptive procedures, a branching formula matches test items to students’ ability and perfor-mance level. In other words, the specifi c test items that students receive depend on how well they perform on previous items. Thus, each test is unique, tailored to the
Provider Product URL
AIMSweb Basic, Pro, RTI www.aimsweb.com
Compass Learning Explorer www.compasslearning.com
CTB McGraw-Hill i-know www.ctb.com
McGraw-Hill Digital Learning
Yearly Progress Pro www.mhdigitallearning.com
Northwest Evaluation Association
Measure of Academic Progress
www.nwea.org
Pearson Education Pearson Prosper www.pearsonncs.com
Pearson School Systems Pearson Benchmark www.personschoolsystems.com
PLATO Learning eduTest www.edutest.com
Renaissance Learning AssessmentMaster, STAR Math, STAR Reading, STAR Early Literacy
www.renlearn.com
Riverside Publishing Assess2Know www.riverpub.com
Scantron Achievement Series www.scantron.com
ThinkLink Learning Predictive Assessment Series www.thinklinklearning.com
Vantage Learning Learning Access! www.vantagelearning.com
Wireless Generation mCLASS DIBELS www.wirelessgeneration.com
SOURCE: Adapted from Ysseldyke, J. E. & McLeod, S. (2007). Using technology tools to monitor response to intervention. In S. R. Jimerson, M. K. Burns, and A. M. VanDerHeyden (Eds.), Handbook of Response to Intervention. New York: Springer.
TABLE 19.2 Software Packages for Periodic Progress Monitoring
330 Chapter 19 ■ Using Technology-Enhanced Assessments
ScoresUsers of STAR Math can obtain grade equivalents, percentile ranks, normal-curve equivalents, and scaled scores. The software provided with the test is used to score the test and give users immediate feedback on student performance.
NormsSTAR Math was standardized on 25,800 students who attended 256 schools in 42 states. Norming was completed in spring 1998 using a sample that was stratifi ed on the basis of geographic region, school location (urban, rural, and suburban), gender, and ethnicity. The sample is representative of the U.S. population, as are the proportions of the various kinds of students in the sample.
ReliabilityReliability was calculated using a test–retest method with 1,541 students, who took alternative forms of the test because of its computer-adaptive nature. Reliabilities at grades 3 through 6 are in the high .70s, whereas at higher grades they are in the .80s. The test has suffi cient reliability for use as a screening test but not for making eligibility decisions.
ValidityPerformance on STAR Math was correlated with performance on a number of standardized math tests administered during standardization of the test. An extensive table in the manual reports these results. Comparison tests included the California Achievement Test, Comprehensive Test of Basic Skills, Iowa Tests of Basic Skills, and Metropolitan Achievement Test. Scores were moderately high and approximately as would be expected.
SummarySTAR Math is a norm-referenced, computer-adaptive math test that gives teachers information about stu-dents’ instructional levels as well as their level of performance relative to a national sample. The test was standardized on a large representative sample. It provides teachers with immediate diagnostic profi les on student performance. Evidence for reliability is limited, but evidence for validity is good.
STAR Reading
STAR Reading (Renaissance Learning, 1997) is designed to provide teachers with quick and accurate estimates of students’ instructional reading levels and estimates of their reading levels relative to national norms. The test is administered using computer software, so the specifi c test items each student receives are determined by his or her responses to previous test items. Using computer-adaptive procedures, a branching formula matches test items to student ability and performance level. The test uses a vocabulary-in-context format in which students must identify the best choice for a missing word in a single-context sentence. Correct answers fi t both the semantics and the syntax of the sentence. All incorrect answers either fi t the syntax of the sentence or relate to the meaning of something in the sentence.
ScoresUsers of STAR Reading may obtain grade equiva-lents, percentile ranks, normal-curve equivalents, and scaled scores. In addition, they may obtain informa-tion about the zone of proximal development, an index of the low and high ends of the range at which students can read. The software used to administer the test provides the information, and scores are obtained immediately.
NormsItems for STAR Reading were developed using 13,846 students from 59 schools. The development sample was stratifi ed on the basis of gender, grade, geographic region, district socioeconomic status, school type, and district enrollment. The primary unit of selection was school rather than students. Tables in the manual contrast sample characteristics with national popula-tion characteristics. For the most part, sample char-acteristics approximate population characteristics. Notable exceptions include an underrepresentation of students from the Northeast (9 percent versus 20 percent in the population) and of schools with small (<2,500) and large (<25,000) enrollments.
STAR Reading was standardized on 42,000 stu-dents from 171 schools. The standardization sample was stratifi ed on the basis of geographic region, school system and per-grade district enrollment, and socio-economic status. Sample characteristics very closely
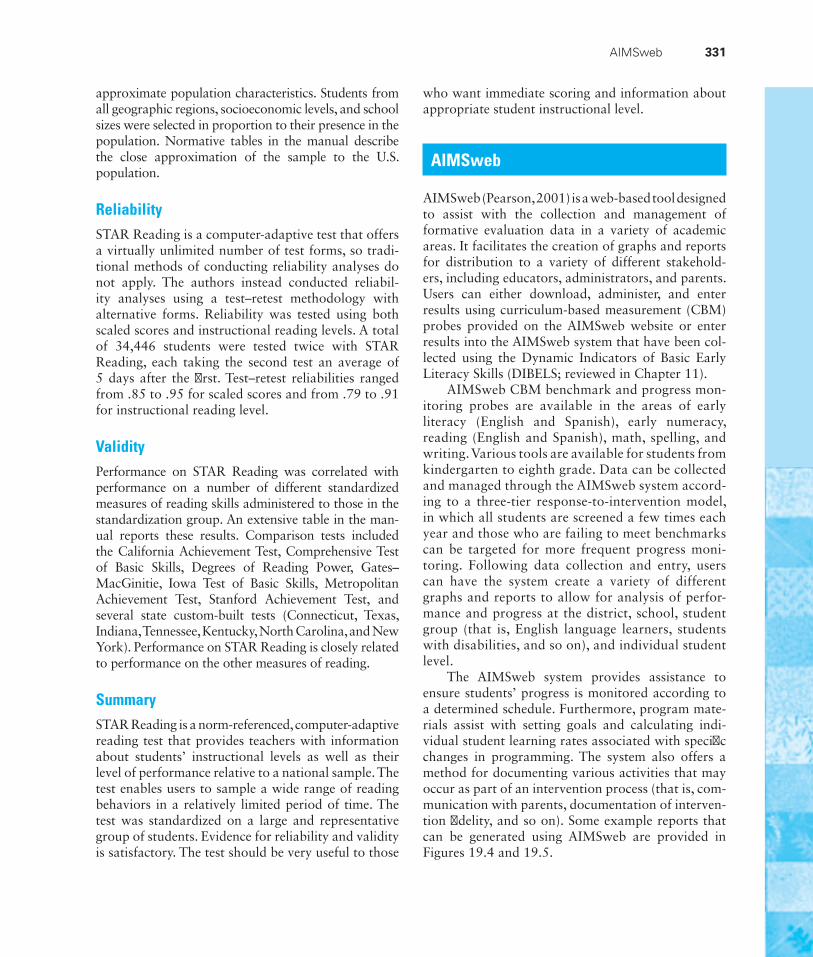
AIMSweb 331
approximate population characteristics. Students from all geographic regions, socioeconomic levels, and school sizes were selected in proportion to their presence in the population. Normative tables in the manual describe the close approximation of the sample to the U.S. population.
ReliabilitySTAR Reading is a computer-adaptive test that offers a virtually unlimited number of test forms, so tradi-tional methods of conducting reliability analyses do not apply. The authors instead conducted reliabil-ity analyses using a test–retest methodology with alternative forms. Reliability was tested using both scaled scores and instructional reading levels. A total of 34,446 students were tested twice with STAR Reading, each taking the second test an average of 5 days after the fi rst. Test–retest reliabilities ranged from .85 to .95 for scaled scores and from .79 to .91 for instructional reading level.
ValidityPerformance on STAR Reading was correlated with performance on a number of different standardized measures of reading skills administered to those in the standardization group. An extensive table in the man-ual reports these results. Comparison tests included the California Achievement Test, Comprehensive Test of Basic Skills, Degrees of Reading Power, Gates–MacGinitie, Iowa Test of Basic Skills, Metropolitan Achievement Test, Stanford Achievement Test, and several state custom-built tests (Connecticut, Texas, Indiana, Tennessee, Kentucky, North Carolina, and New York). Performance on STAR Reading is closely related to performance on the other measures of reading.
SummarySTAR Reading is a norm-referenced, computer-adaptive reading test that provides teachers with information about students’ instructional levels as well as their level of performance relative to a national sample. The test enables users to sample a wide range of reading behaviors in a relatively limited period of time. The test was standardized on a large and representative group of students. Evidence for reliability and validity is satisfactory. The test should be very useful to those
who want immediate scoring and information about appropriate student instructional level.
AIMSweb
AIMSweb (Pearson, 2001) is a web-based tool de signed to assist with the collection and management of formative evaluation data in a variety of academic areas. It facilitates the creation of graphs and reports for distribution to a variety of different stakehold-ers, including educators, administrators, and parents. Users can either download, administer, and enter results using curriculum-based measurement (CBM) probes provided on the AIMSweb website or enter results into the AIMSweb system that have been col-lected using the Dynamic Indicators of Basic Early Literacy Skills (DIBELS; reviewed in Chapter 11).
AIMSweb CBM benchmark and progress mon-itoring probes are available in the areas of early literacy (English and Spanish), early numeracy, reading (English and Spanish), math, spelling, and writing. Various tools are available for students from kindergarten to eighth grade. Data can be collected and managed through the AIMSweb system accord-ing to a three-tier response-to-intervention model, in which all students are screened a few times each year and those who are failing to meet benchmarks can be targeted for more frequent progress moni-toring. Following data collection and entry, users can have the system create a variety of different graphs and reports to allow for analysis of perfor-mance and progress at the district, school, student group (that is, English language learners, students with disabilities, and so on), and individual student level.
The AIMSweb system provides assistance to ensure students’ progress is monitored according to a determined schedule. Furthermore, program mate-rials assist with setting goals and calculating indi-vidual student learning rates associated with specifi c changes in programming. The system also offers a method for documenting various activities that may occur as part of an intervention process (that is, com-munication with parents, documentation of interven-tion fi delity, and so on). Some example reports that can be generated using AIMSweb are provided in Figures 19.4 and 19.5.
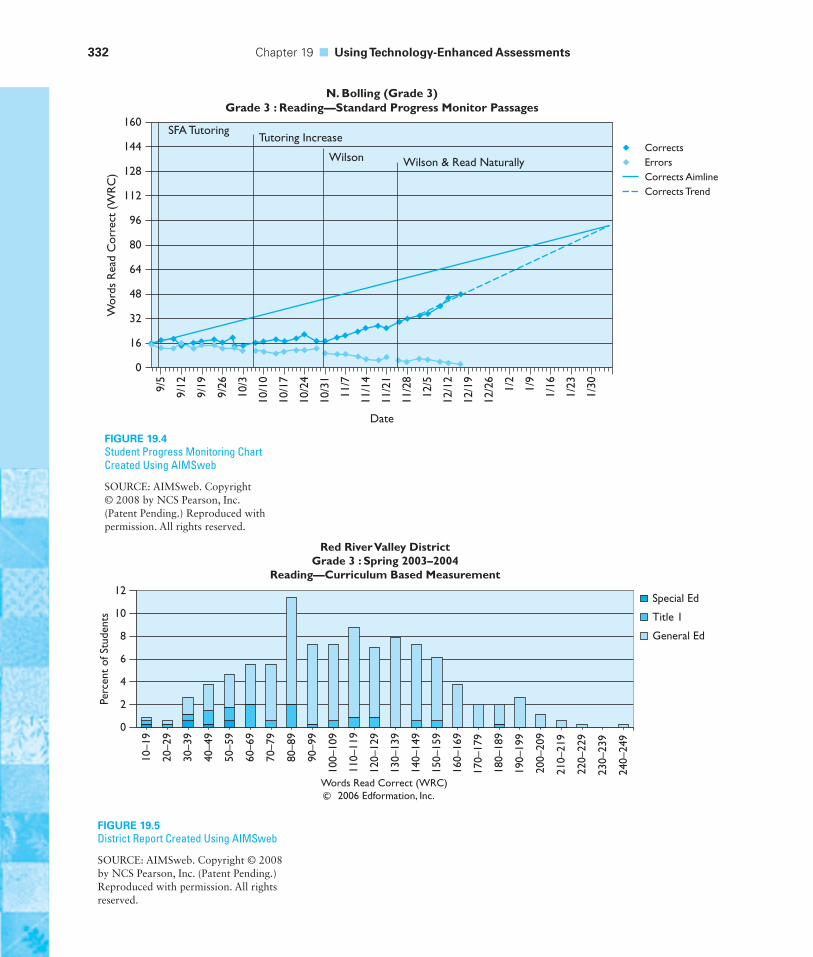
332 Chapter 19 ■ Using Technology-Enhanced Assessments
160W
ords
Rea
d C
orre
ct (
WR
C)
SFA TutoringTutoring Increase
Wilson Wilson & Read NaturallyCorrectsErrorsCorrects AimlineCorrects Trend
N. Bolling (Grade 3)Grade 3 : Reading—Standard Progress Monitor Passages
144
128
112
96
80
64
48
32
Date
16
0
9/5
9/12
9/19
9/26
10/3
10/1
0
10/1
7
10/2
4
10/3
1
11/7
11/1
4
11/2
1
11/2
8
12/5
12/1
2
12/1
9
12/2
6
1/2
1/9
1/16
1/23
1/30
FIGURE 19.4Student Progress Monitoring Chart Created Using AIMSweb
SOURCE: AIMSweb. Copyright © 2008 by NCS Pearson, Inc. (Patent Pending.) Reproduced with permission. All rights reserved.
0
12
10
8
Perc
ent
of S
tude
nts
6
4
2
10–1
9
20–2
9
30–3
9
40–4
9
50–5
9
60–6
9
70–7
9
80–8
9
90–9
9
100–
109
110–
119
120–
129
130–
139
140–
149
150–
159
160–
169
170–
179
180–
189
190–
199
200–
209
210–
219
220–
229
230–
239
240–
249
Red River Valley DistrictGrade 3 : Spring 2003–2004
Reading—Curriculum Based Measurement
Special Ed
Title 1
General Ed
Words Read Correct (WRC) 2006 Edformation, Inc.c
FIGURE 19.5District Report Created Using AIMSweb
SOURCE: AIMSweb. Copyright © 2008 by NCS Pearson, Inc. (Patent Pending.) Reproduced with permission. All rights reserved.
Classroom Response Systems 333
HANDHELD OBSERVATION SYSTEMS
Personal digital assistants (PDAs) represent another set of tools that are becoming more widely used in educational settings. They can be used to facilitate data collection for a variety of assessment purposes. PDAs can be particularly helpful in conducting struc-tured classroom observations. Without them, struc-tured observations require observers to pay close attention to both a stopwatch and the child they are observing, while at the same time recording their observations using paper and pencil. After collecting the data, the observer then needs to develop a way to organize, analyze, summarize, and display the results. Today, programs for PDAs have been developed that prompt observers at set time intervals to report on various conditions present in the classroom, as well as the behavior of target students and their peers. The observer can report the behaviors observed directly into the PDA, and the program then does the job of organizing, analyzing, and displaying the data. The data can be analyzed nearly instantaneously to deter-mine the relationship between various teacher behav-iors and how students behave in order to inform the development of an intervention plan. Overall, PDAs can allow the observer to conduct observations in an accurate, effi cient, and unobtrusive manner.
We highlight two programs that are available to assist with structured observations. The Behavioral Observation of Students in Schools (Shapiro, 2003) is a program intended for use on PDAs that facili-tates direct assessment of student behavior and is intended for use in school settings for children pre-K
through twelfth grade. Observations can be set to run for 5 to 60 minutes and are used to determine the frequency with which students engage in par-ticular appropriate or inappropriate behaviors. The Portable Observation Program is an ancillary to the Behavioral Assessment System for Children–2 (BASC-2; Reynolds & Kamphaus, 2004). It allows observers to design their own template for observa-tion and to collect data on student behavior using a PDA that can likewise inform intervention planning and allow one to monitor the effects of an interven-tion on student behavior.
PDAs are also increasingly being used to assist with data collection associated with academic skill development. For instance, it is now possible to use a PDA to score and manage data associated with meas-ures of oral reading fl uency. AIMSweb has software called Palm Link that allows users to administer and score data from curriculum-based measurements directly on a PDA; the device can then be directed to immediately score, summarize, and save the results. The results can eventually be uploaded to AIMSweb to assist with further analysis and reporting.
Although PDAs offer many additional help-ful features for keeping track of schedules, sending e-mail, and accessing the Internet, we chose to high-light those programs associated with the collection of assessment data. In the future, you should expect to fi nd many more technological advances that facilitate the collection and analysis of data used to positively impact student learning.
CLASSROOM RESPONSE SYSTEMS
The days are gone when teachers have to call on indi-vidual students one by one to check on the extent to which they understand what they are being taught. New technological advances enable teachers to ask students questions and have them enter their responses
on classroom responders or small computers. Results are transmitted wirelessly to the teacher’s computer, and the teacher can view a graph showing the num-bers of students who answered questions correctly/incorrectly. In this way, teachers obtain immediate
Han
dh
eld O
bservatio
n S
ystems
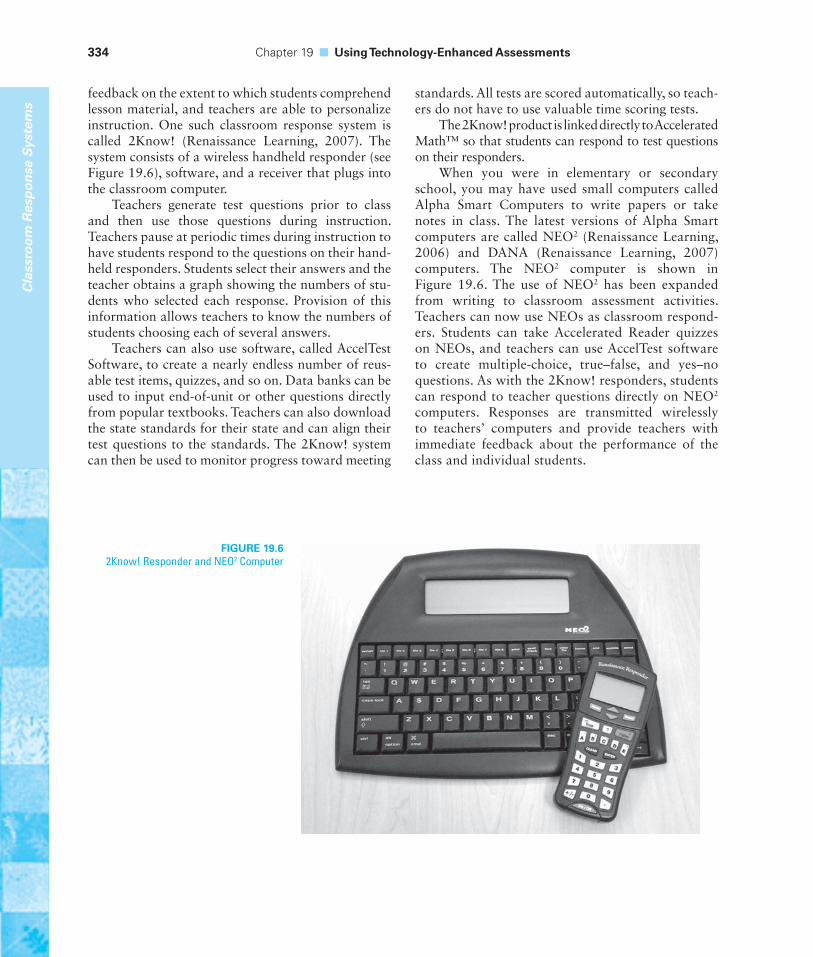
334 Chapter 19 ■ Using Technology-Enhanced Assessments
feedback on the extent to which students comprehend lesson material, and teachers are able to personalize instruction. One such classroom response system is called 2Know! (Renaissance Learning, 2007). The system consists of a wireless handheld responder (see Figure 19.6), software, and a receiver that plugs into the classroom computer.
Teachers generate test questions prior to class and then use those questions during instruction. Teachers pause at periodic times during instruction to have students respond to the questions on their hand-held responders. Students select their answers and the teacher obtains a graph showing the numbers of stu-dents who selected each response. Provision of this information allows teachers to know the numbers of students choosing each of several answers.
Teachers can also use software, called AccelTest Software, to create a nearly endless number of reus-able test items, quizzes, and so on. Data banks can be used to input end-of-unit or other questions directly from popular textbooks. Teachers can also download the state standards for their state and can align their test questions to the standards. The 2Know! system can then be used to monitor progress toward meeting
standards. All tests are scored automatically, so teach-ers do not have to use valuable time scoring tests.
The 2Know! product is linked directly to Accelerated Math™ so that students can respond to test questions on their responders.
When you were in elementary or secondary school, you may have used small computers called Alpha Smart Computers to write papers or take notes in class. The latest versions of Alpha Smart computers are called NEO2 (Renaissance Learning, 2006) and DANA (Renaissance Learning, 2007) computers. The NEO2 computer is shown in Figure 19.6. The use of NEO2 has been expanded from writing to classroom assessment activities. Teachers can now use NEOs as classroom respond-ers. Students can take Accelerated Reader quizzes on NEOs, and teachers can use AccelTest software to create multiple-choice, true–false, and yes–no questions. As with the 2Know! responders, students can respond to teacher questions directly on NEO2 computers. Responses are transmitted wirelessly to teachers’ computers and provide teachers with immediate feedback about the performance of the class and individual students.
FIGURE 19.62Know! Responder and NEO2 Computer
Cla
ssro
om
Res
po
nse
Sys
tem
s
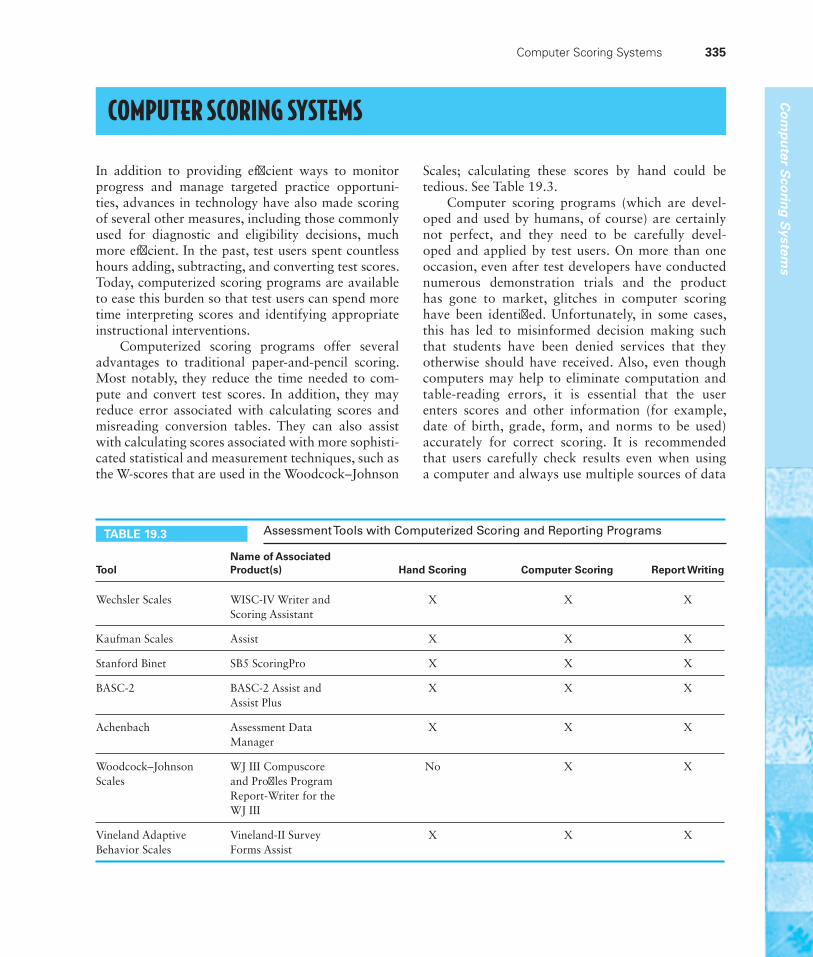
Computer Scoring Systems 335
COMPUTER SCORING SYSTEMS
In addition to providing effi cient ways to monitor progress and manage targeted practice opportuni-ties, advances in technology have also made scoring of several other measures, including those commonly used for diagnostic and eligibility decisions, much more effi cient. In the past, test users spent countless hours adding, subtracting, and converting test scores. Today, computerized scoring programs are available to ease this burden so that test users can spend more time interpreting scores and identifying appropriate instructional interventions.
Computerized scoring programs offer several advantages to traditional paper-and-pencil scoring. Most notably, they reduce the time needed to com-pute and convert test scores. In addition, they may reduce error associated with calculating scores and misreading conversion tables. They can also assist with calculating scores associated with more sophisti-cated statistical and measurement techniques, such as the W-scores that are used in the Woodcock–Johnson
Scales; calculating these scores by hand could be tedious. See Table 19.3.
Computer scoring programs (which are devel-oped and used by humans, of course) are certainly not perfect, and they need to be carefully devel-oped and applied by test users. On more than one occasion, even after test developers have conducted numerous demonstration trials and the product has gone to market, glitches in computer scoring have been identifi ed. Unfortunately, in some cases, this has led to misinformed decision making such that students have been denied services that they otherwise should have received. Also, even though computers may help to eliminate computation and table- reading errors, it is essential that the user enters scores and other information (for example, date of birth, grade, form, and norms to be used) accurately for correct scoring. It is recommended that users carefully check results even when using a computer and always use multiple sources of data
ToolName of Associated Product(s) Hand Scoring Computer Scoring Report Writing
Wechsler Scales WISC-IV Writer and Scoring Assistant
X X X
Kaufman Scales Assist X X X
Stanford Binet SB5 ScoringPro X X X
BASC-2 BASC-2 Assist and Assist Plus
X X X
Achenbach Assessment Data Manager
X X X
Woodcock–Johnson Scales
WJ III Compuscore and Profi les Program Report-Writer for the WJ III
No X X
Vineland Adaptive Behavior Scales
Vineland-II Survey Forms Assist
X X X
TABLE 19.3 Assessment Tools with Computerized Scoring and Reporting Programs
Co
mp
uter S
corin
g S
ystems
336 Chapter 19 ■ Using Technology-Enhanced Assessments
when making important decisions. Storing electronic copies of scoring records can also pose challenges. It is important to ensure that only those individuals with a need to know the given test score results have access to such data. This may require the develop-ment of special electronic passwords known only to those who administer the test.
When fi rst learning a new test that has both a hand and a computer scoring option, it may be ben-efi cial to learn how to hand score the test in order to understand how the scores are derived. This can allow you to better understand the nature of the scores that you interpret. However, once you have a good under-standing of how the test scores are calculated, use of a computer scoring program can help you score more quickly and accurately.
With advances in technology, computer pro-grams are becoming more widely available to not only assist with calculating and converting scores but also discriminate correct and incorrect responses. Whereas it may be relatively simple to design a com-puter program to score selected response items, it is more diffi cult to design programs that can accurately score constructed response items and essay responses. Yet, such programs are being created. Although such software may help reduce problems associated with poor interrater reliability, it may be diffi cult for such
programs to accurately score unique and creative responses.
In addition to offering automated scoring, some test packages that are used to make special educa-tion eligibility decisions offer computer-generated reports. These make use of predetermined language and table formats that are intended to facilitate com-munication of score results to parents and educators. Although it may be appropriate to incorporate some of the language and tables from a computer-generated report program, it is important to recognize how such reports, when used in their entirety and without edit-ing, may lead users away from incorporating multi-ple assessment methods and measures in their overall evaluation. Because a report-writing program is often specifi c to a given test, it will focus on presenting scores obtained through the given test alone, and it may not easily allow a user to incorporate additional data collected from multiple sources. Furthermore, standard language presented through a computer-generated report may not optimally convey the infor-mation to certain audiences; users should edit such information in order to communicate most effectively with the individuals with whom they are working. We discourage the use of computer-generated reports and instead encourage assessors to write reports that are tailored specifi cally to the students they test.
CHAPTER COMPREHENSION QUESTIONSWrite your answers to each of the following questions, and then compare your responses to the text or the study guide.
1. What is the distinction between continuous and periodic progress monitoring?
2. What are the advantages of using technology-enhanced assessment systems?
3. How does a technology-enhanced continuous progress monitoring measure work?
4. Identify representative technology-enhanced periodic progress monitoring measures.
5. Identify two handheld observation systems, and indicate how they might be used in today’s classrooms.
6. Identify two ways in which you might use classroom responders in your class.
7. What are the advantages and limitations of computerized scoring and report-writing programs?
8. Give examples of computer scoring systems for major tests.
PART 4
Using Assessment Results to Make Educational Decisions
and periodic measures of student performance and progress, so we provided a separate chapter on these measures.
Part 4 returns to the assessment of students. It contains chapters that discuss how, in practice, decisions are made. Chapter 20 discusses various instructional decisions and the assessment information used to make those decisions. We differentiate those classroom instructional decisions that are made prior to referral and those that are made for students who receive special education. Chapter 21 discusses decisions related to special education eligibility and how they are made. Specifi cally, we discuss how to determine whether a student has a disability and whether a disabled student needs special education. We provide examples of how specifi c test results are used in making these decisions. Chapter 22 describes current legal requirements and practices in developing and using standards-based large-scale accountability measures. We include a discussion of alternate assessments linked to grade-level content standards, modifi ed achievement standards, and alternate achievement standards. Chapter 23 addresses best practices in communicating assessment information to multiple audiences. We include a description of team decision-making practices and describe the kinds of teams that communicate assessment information. We include a section on the collection, maintenance, and dissemination of written records on student assessment performance.
Assessment is the process of collecting data for the purpose of making decisions about students. The fourth part of this text is about using assessment information to make decisions.
We began this text by developing the basic foundations of assessment. In the
fi rst part we provided an overview of assessment in special and inclusive education (the context for assessment in schools and current assessment practices, legal and ethical considerations in assessment, test scores and how to use them, and an overview of technical adequacy) before turning to a chapter on test accommodations and adaptations. In the second part we described assessment in classrooms, with attention to observation as a form of assessment, teacher-made tests, and the management of classroom assessments. In Part 3 we fi rst described how to evaluate a test, and then described commercially available tests that are commonly used with students with disabilities. These tests and procedures deal with testing academic achievement (multiple skill tests and measures of specifi c skills in reading and mathematics), psychological processes (intelligence perceptual motor skills, language), socio-emotional behavior, and adaptive behavior. Because the behavior of infants and toddlers tends to be undifferentiated and its measurement fraught with diffi culties, we provided a separate chapter on this topic. Increasingly, school personnel are using technology-enhanced assessments as continuous
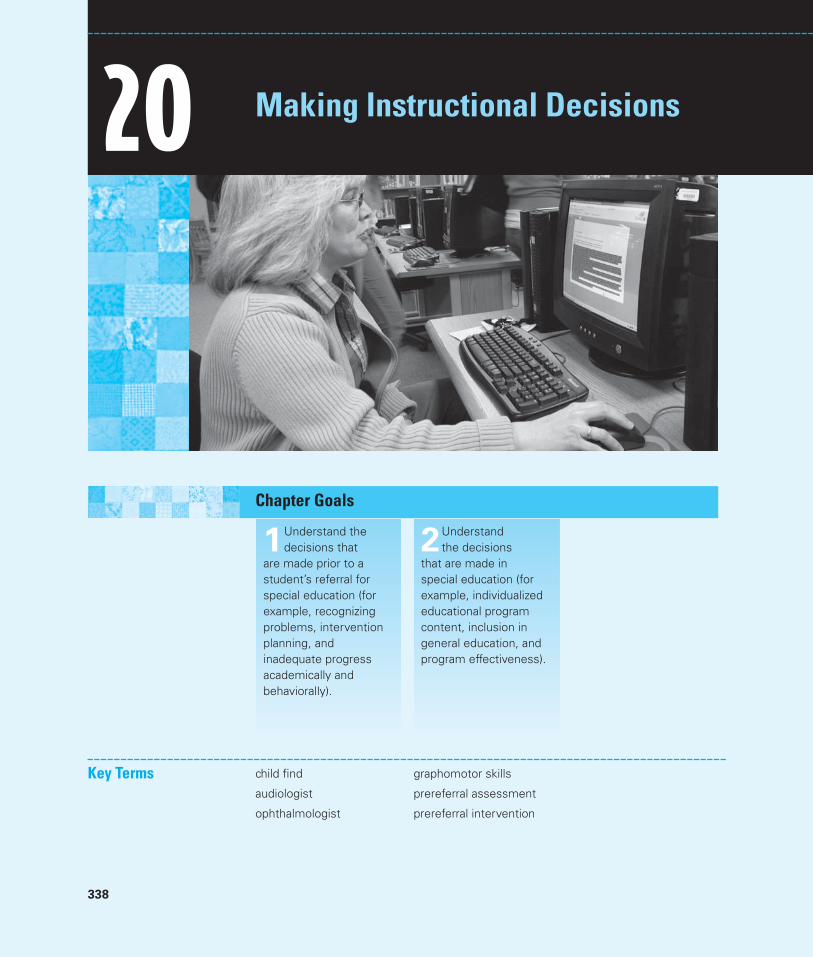
338
Chapter Goals
1Understand the decisions that
are made prior to a student’s referral for special education (for example, recognizing problems, intervention planning, and inadequate progress academically and behaviorally).
2Understand the decisions
that are made in special education (for example, individualized educational program content, inclusion in general education, and program effectiveness).
20 Making Instructional Decisions
Key Terms child fi nd
audiologist
ophthalmologist
graphomotor skills
prereferral assessment
prereferral intervention
Decisions Prior to Referral 339
Each regular and special education teacher makes literally hundreds of professional decisions every day. Some decisions affect classroom manage-ment; others affect instructional management. Some types of decisions occur infrequently; others occur several times each day. In this chapter, we are primarily concerned with the decisions that teachers make about the adequacy and appro-priateness of instruction for students who need special assistance, students who are at risk, and students who have disabilities.
Both general and special educators share responsibility for students who are disabled. General educators are largely responsible for identifying students with suffi ciently severe learning or behavior problems to be referred for special education services. General and special educators share responsibility for the education of students with disabilities who are included in general education classrooms. Special educators are responsible for students whose disabilities are so severe that they cannot be educated in general education settings even with a full complement of related services and classroom adaptations and accommodations.
1 Decisions Prior to Referral
The overwhelming majority of children enter school under the presumption that they do not have disabilities, and most complete their schooling under the same presumption. Approximately 40 percent of all students will experience diffi culty during their school career. Here, we deal with those decisions that precede entitle-ment to special education. Before referring students for possible identifi cation as exceptional, general educators take several steps, some of which are mandated by federal and state regulations. The fi rst step is to recognize that a problem exists; the remaining steps may vary in sequence, depending on the state or district.
Decision: Are There Unrecognized Problems?Federal regulations (§300.125) require that all states have policies and procedures to ensure all children with disabilities who need special education and related ser-vices are identifi ed, located, and evaluated. This requirement is generally referred to as child fi nd. In practice, this means that local school districts and other agen-cies inform parents of available services through strategically placed fl yers, notices in local newspapers, and so forth. Children with moderate or severe disabilities are usually recognized before the age of 3 or 4 years and identifi ed as disabled upon enrolling in school.
However, some children have undiagnosed sensory diffi culties that may not have been readily apparent to parents, physicians, or teachers. Therefore, schools routinely screen all children to identify these hidden or unrecognized hearing and vision problems as a fi rst step in providing services for them. Sensory screening is usually conducted by a school nurse with the intention of fi nding children who require diagnosis by a health care professional—a hearing specialist such as an audiologist or a vision specialist such as an optometrist or ophthalmologist. The critical point is that screening, by itself, cannot be used to identify a student as disabled. There must be follow-up.
340 Chapter 20 ■ Making Instructional Decisions
Decision: Is the Student Making Adequate Progress in Regular Education?General educators may recognize that some students are not making adequate progress toward individual, classroom, or state goals. These students may require additional assistance to help them achieve the desired educational outcomes. The threshold of recognition varies from teacher to teacher and may be a function of several factors: teacher skill and experience, class size, availability of alternative materials and curriculum, ability and behavior of other students in the class, and the teacher’s tolerance for atypical progress or behavior. Generally, when a stu-dent is performing at a rate that is between 20 and 50 percent of the rate of other students, a teacher has reason to be concerned.
Academic Needs
The following might signal that students are having academic diffi culty:
Students ask questions that indicate that they do not understand new ■
material.
Students do not know material that was previously taught and presumed to ■
be mastered.
Students make numerous errors and few correct responses. ■
Students do not keep up with peers, in general or in their instructional ■
groups.
Students’ work is so far behind that of their peers that they cannot be ■
maintained in the lowest instructional group in a class—that is, the students become instructionally isolated.
Student work deteriorates from good or acceptable to poor or unacceptable. ■
Students perform adequately in most academic areas but have extreme ■
diffi culty in one or more important core skill areas.
Why a student is having diffi culty is seldom clear at this point in the decision-making process. There are multiple reasons for school failure, and these reasons may often interact with one another. The reasons for these differences generally fall into two broad categories: ineffective instruction or individual differences.
Some students make progress under almost any instructional conditions. When students with emerging skills and a wealth of information enter a learning situation, such students merely need the opportunity to continue learning and developing skills. These students often learn despite ineffective instructional meth-odology. However, some students enter a learning situation with poorly developed skills and require much more effective instruction. Without good instruction, these students are in danger of becoming casualties of the educational system. This situation can occur in at least fi ve ways.
1. Students’ lack of prerequisite knowledge or skill. Some students may lack the prerequisites for learning specifi c content. In such cases, the content to be learned may be too diffi cult because the student must learn the prerequisites and the new content simultaneously. For example, Mr. Santos may give Alex a reader in which he knows only 70 percent of the words. Alex will be forced
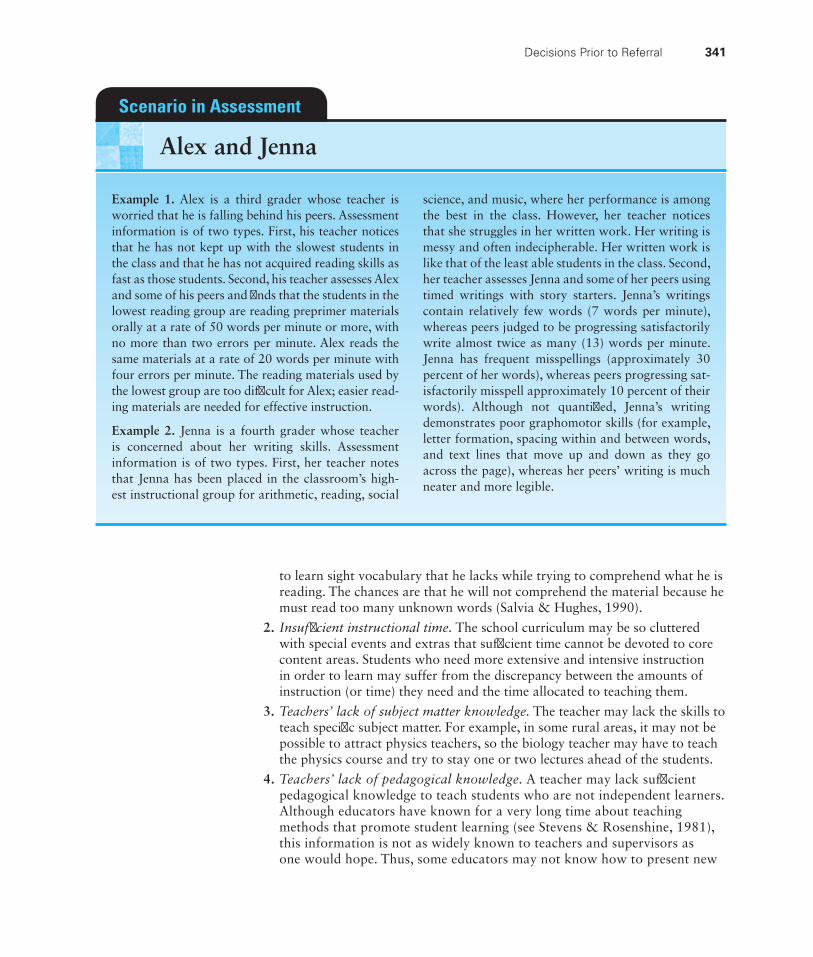
Decisions Prior to Referral 341
to learn sight vocabulary that he lacks while trying to comprehend what he is reading. The chances are that he will not comprehend the material because he must read too many unknown words (Salvia & Hughes, 1990).
2. Insuffi cient instructional time. The school curriculum may be so cluttered with special events and extras that suffi cient time cannot be devoted to core content areas. Students who need more extensive and intensive instruction in order to learn may suffer from the discrepancy between the amounts of instruction (or time) they need and the time allocated to teaching them.
3. Teachers’ lack of subject matter knowledge. The teacher may lack the skills to teach specifi c subject matter. For example, in some rural areas, it may not be possible to attract physics teachers, so the biology teacher may have to teach the physics course and try to stay one or two lectures ahead of the students.
4. Teachers’ lack of pedagogical knowledge. A teacher may lack suffi cient pedagogical knowledge to teach students who are not independent learners. Although educators have known for a very long time about teaching methods that promote student learning (see Stevens & Rosenshine, 1981), this information is not as widely known to teachers and supervisors as one would hope. Thus, some educators may not know how to present new
Example 1. Alex is a third grader whose teacher is worried that he is falling behind his peers. Assessment information is of two types. First, his teacher notices that he has not kept up with the slowest students in the class and that he has not acquired reading skills as fast as those students. Second, his teacher assesses Alex and some of his peers and fi nds that the students in the lowest reading group are reading preprimer materials orally at a rate of 50 words per minute or more, with no more than two errors per minute. Alex reads the same materials at a rate of 20 words per minute with four errors per minute. The reading materials used by the lowest group are too diffi cult for Alex; easier read-ing materials are needed for effective instruction.
Example 2. Jenna is a fourth grader whose teacher is concerned about her writing skills. Assessment information is of two types. First, her teacher notes that Jenna has been placed in the classroom’s high-est instructional group for arithmetic, reading, social
science, and music, where her performance is among the best in the class. However, her teacher notices that she struggles in her written work. Her writing is messy and often indecipherable. Her written work is like that of the least able students in the class. Second, her teacher assesses Jenna and some of her peers using timed writings with story starters. Jenna’s writings contain relatively few words (7 words per minute), whereas peers judged to be progressing satisfactorily write almost twice as many (13) words per minute. Jenna has frequent misspellings (approximately 30 percent of her words), whereas peers progressing sat-isfactorily misspell approximately 10 percent of their words). Although not quantifi ed, Jenna’s writing demonstrates poor graphomotor skills (for example, letter formation, spacing within and between words, and text lines that move up and down as they go across the page), whereas her peers’ writing is much neater and more legible.
Scenario in Assessment
Alex and Jenna
342 Chapter 20 ■ Making Instructional Decisions
material, structure learning opportunities, provide opportunities for guided and independent practice, or give effective feedback. Also, given the number of families in which all adults work, there is less opportunity for parents to provide supplementary instruction at home to overcome ineffective instruction at school.
5. Teachers’ commitment to ineffective methods. A teacher may be committed to ineffective instructional methods. A considerable amount of effort has gone into the empirical evaluation of various instructional approaches. Yet much of this research fails to fi nd its way into the classroom. For example, a number of school districts have rejected systematic instruction in phonics. However, the empirical research is more than clear that early and systematic phonics instruction leads to better reading (Adams, 1990; Foorman, Francis, Fletcher, Shatschneider, & Mehta, 1998; Pfl aum, Walberg, Karegianes, & Rasher, 1980; Stanovich, 1986).
Before investing in expensive and extensive assessment of the student, it is almost always preferable to examine the effectiveness of the curriculum and the instruction. If students begin to make better progress with more effective instruc-tional procedures, there is no need to refer them.
A few students make little progress despite systematic application of sound instructional principles that have been shown to be generally effective. There are at least three reasons for this.
1. Student ability may affect instruction. Obviously, instruction that relies heavily on visual or auditory presentation will be less effective with students who have severe visual or auditory impairments.1 Just as obviously, slow learners require more practice to acquire various skills and knowledge.
2. Some students may fi nd a particular subject inherently interesting and be motivated to learn, whereas other students may fi nd the content to be boring and require additional incentives to learn.
3. Cultural differences can affect academic learning and behavior. For example, reading is an interactive process in which an author’s writing is interpreted on the basis of a reader’s experience and knowledge. To the extent that students from different cultures have different experiences, their comprehension of some written materials may differ. Thus, students from different cultural groups may have different understandings of, for example, “all men are created equal.” Similarly, cultural norms for instructional dialogues between teacher and student may also vary, especially when the teacher and student are of different genders. Boys and girls may be raised differently, with different expectations, in some cultures. Thus, it may be culturally appropriate for women and girls to be reticent in their responses to male teachers. Similarly, teachers may feel ill equipped to teach students from different cultures. For example, teachers may be hesitant to discipline students from another culture, or they may not have culturally relevant examples to illustrate concepts and ideas.
1The instructional importance of other abilities has been asserted; however, there is scant evidence to support such assertions. There is limited and dated support for the notion that intelligence interacts with teaching methods in mathematics. Maynard and Strickland (1969) found that students with high IQs tended to learn mathematics somewhat better when discovery methods were used, although more direct methods were equally effective with students with lower IQs.
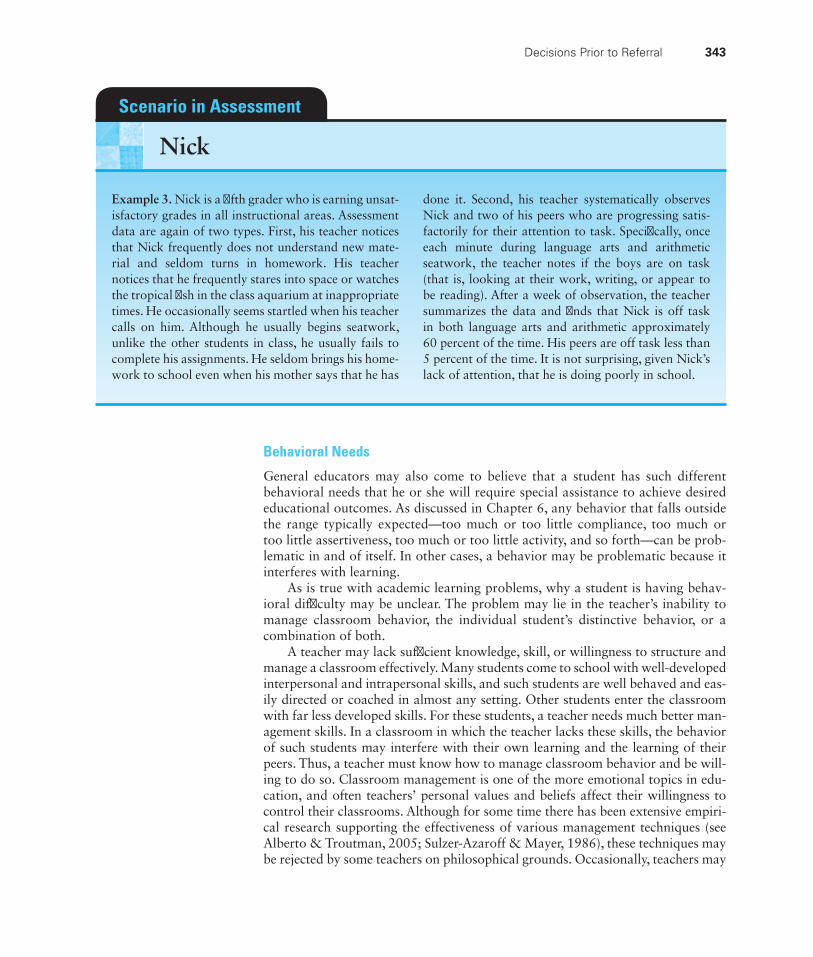
Decisions Prior to Referral 343
Behavioral Needs
General educators may also come to believe that a student has such different behavioral needs that he or she will require special assistance to achieve desired educational outcomes. As discussed in Chapter 6, any behavior that falls outside the range typically expected—too much or too little compliance, too much or too little assertiveness, too much or too little activity, and so forth—can be prob-lematic in and of itself. In other cases, a behavior may be problematic because it interferes with learning.
As is true with academic learning problems, why a student is having behav-ioral diffi culty may be unclear. The problem may lie in the teacher’s inability to manage classroom behavior, the individual student’s distinctive behavior, or a combination of both.
A teacher may lack suffi cient knowledge, skill, or willingness to structure and manage a classroom effectively. Many students come to school with well- developed interpersonal and intrapersonal skills, and such students are well behaved and eas-ily directed or coached in almost any setting. Other students enter the classroom with far less developed skills. For these students, a teacher needs much better man-agement skills. In a classroom in which the teacher lacks these skills, the behavior of such students may interfere with their own learning and the learning of their peers. Thus, a teacher must know how to manage classroom behavior and be will-ing to do so. Classroom management is one of the more emotional topics in edu-cation, and often teachers’ personal values and beliefs affect their willingness to control their classrooms. Although for some time there has been extensive empiri-cal research supporting the effectiveness of various management techniques (see Alberto & Troutman, 2005; Sulzer-Azaroff & Mayer, 1986), these techniques may be rejected by some teachers on philosophical grounds. Occasionally, teachers may
Example 3. Nick is a fi fth grader who is earning unsat-isfactory grades in all instructional areas. Assessment data are again of two types. First, his teacher notices that Nick frequently does not understand new mate-rial and seldom turns in homework. His teacher notices that he frequently stares into space or watches the tropical fi sh in the class aquarium at inappropriate times. He occasionally seems startled when his teacher calls on him. Although he usually begins seatwork, unlike the other students in class, he usually fails to complete his assignments. He seldom brings his home-work to school even when his mother says that he has
done it. Second, his teacher systematically observes Nick and two of his peers who are progressing satis-factorily for their attention to task. Specifi cally, once each minute during language arts and arithmetic seatwork, the teacher notes if the boys are on task (that is, looking at their work, writing, or appear to be reading). After a week of observation, the teacher summarizes the data and fi nds that Nick is off task in both language arts and arithmetic approximately 60 percent of the time. His peers are off task less than 5 percent of the time. It is not surprising, given Nick’s lack of attention, that he is doing poorly in school.
Scenario in Assessment
Nick
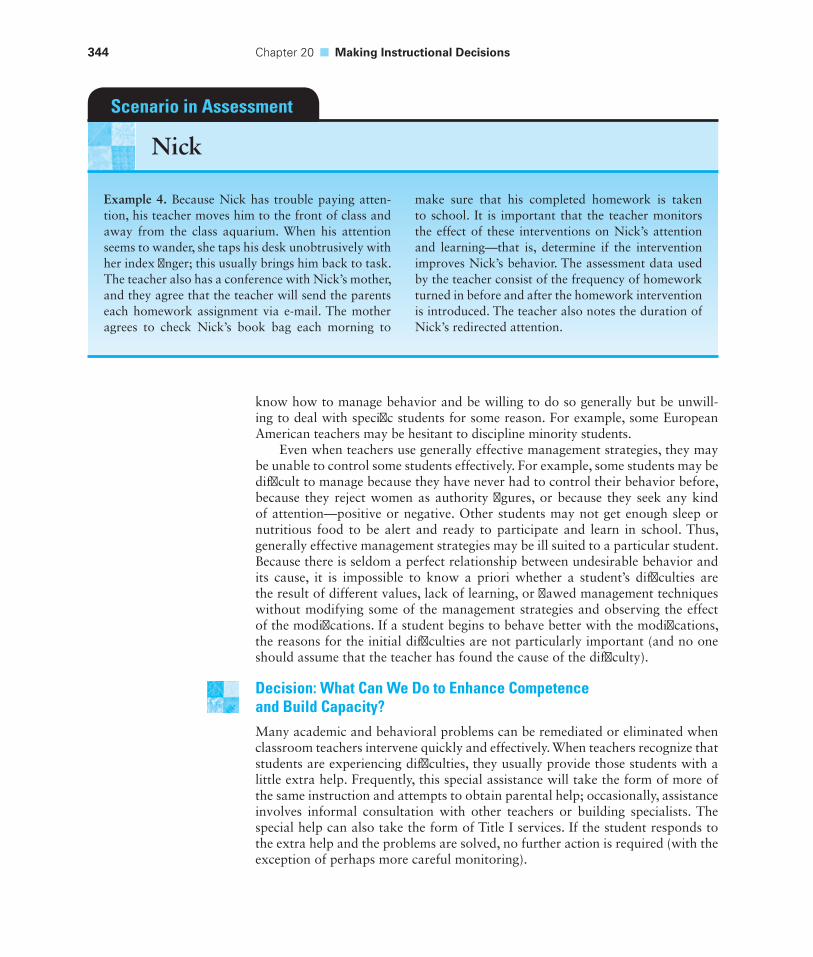
344 Chapter 20 ■ Making Instructional Decisions
know how to manage behavior and be willing to do so generally but be unwill-ing to deal with specifi c students for some reason. For example, some European American teachers may be hesitant to discipline minority students.
Even when teachers use generally effective management strategies, they may be unable to control some students effectively. For example, some students may be diffi cult to manage because they have never had to control their behavior before, because they reject women as authority fi gures, or because they seek any kind of attention—positive or negative. Other students may not get enough sleep or nutritious food to be alert and ready to participate and learn in school. Thus, generally effective management strategies may be ill suited to a particular student. Because there is seldom a perfect relationship between undesirable behavior and its cause, it is impossible to know a priori whether a student’s diffi culties are the result of different values, lack of learning, or fl awed management techniques without modifying some of the management strategies and observing the effect of the modifi cations. If a student begins to behave better with the modifi cations, the reasons for the initial diffi culties are not particularly important (and no one should assume that the teacher has found the cause of the diffi culty).
Decision: What Can We Do to Enhance Competence and Build Capacity?Many academic and behavioral problems can be remediated or eliminated when classroom teachers intervene quickly and effectively. When teachers recognize that students are experiencing diffi culties, they usually provide those students with a little extra help. Frequently, this special assistance will take the form of more of the same instruction and attempts to obtain parental help; occasionally, assistance involves informal consultation with other teachers or building specialists. The special help can also take the form of Title I services. If the student responds to the extra help and the problems are solved, no further action is required (with the exception of perhaps more careful monitoring).
Example 4. Because Nick has trouble paying atten-tion, his teacher moves him to the front of class and away from the class aquarium. When his attention seems to wander, she taps his desk unobtrusively with her index fi nger; this usually brings him back to task. The teacher also has a conference with Nick’s mother, and they agree that the teacher will send the parents each homework assignment via e-mail. The mother agrees to check Nick’s book bag each morning to
make sure that his completed homework is taken to school. It is important that the teacher monitors the effect of these interventions on Nick’s attention and learning—that is, determine if the intervention improves Nick’s behavior. The assessment data used by the teacher consist of the frequency of homework turned in before and after the homework intervention is introduced. The teacher also notes the duration of Nick’s redirected attention.
Scenario in Assessment
Nick
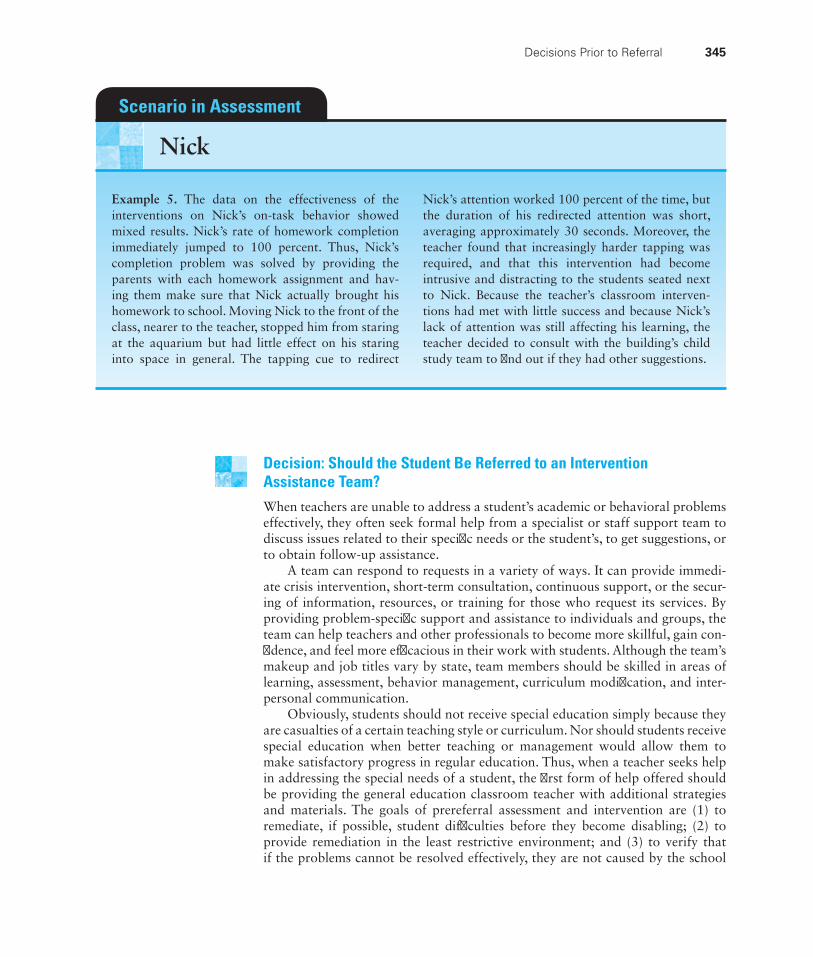
Decisions Prior to Referral 345
Decision: Should the Student Be Referred to an Intervention Assistance Team?When teachers are unable to address a student’s academic or behavioral problems effectively, they often seek formal help from a specialist or staff support team to discuss issues related to their specifi c needs or the student’s, to get suggestions, or to obtain follow-up assistance.
A team can respond to requests in a variety of ways. It can provide immedi-ate crisis intervention, short-term consultation, continuous support, or the secur-ing of information, resources, or training for those who request its services. By providing problem-specifi c support and assistance to individuals and groups, the team can help teachers and other professionals to become more skillful, gain con-fi dence, and feel more effi cacious in their work with students. Although the team’s makeup and job titles vary by state, team members should be skilled in areas of learning, assessment, behavior management, curriculum modifi cation, and inter-personal communication.
Obviously, students should not receive special education simply because they are casualties of a certain teaching style or curriculum. Nor should students receive special education when better teaching or management would allow them to make satisfactory progress in regular education. Thus, when a teacher seeks help in addressing the special needs of a student, the fi rst form of help offered should be providing the general education classroom teacher with additional strategies and materials. The goals of prereferral assessment and intervention are (1) to remediate, if possible, student diffi culties before they become disabling; (2) to provide remediation in the least restrictive environment; and (3) to verify that if the problems cannot be resolved effectively, they are not caused by the school
Example 5. The data on the effectiveness of the interventions on Nick’s on-task behavior showed mixed results. Nick’s rate of homework completion immediately jumped to 100 percent. Thus, Nick’s completion problem was solved by providing the parents with each homework assignment and hav-ing them make sure that Nick actually brought his homework to school. Moving Nick to the front of the class, nearer to the teacher, stopped him from staring at the aquarium but had little effect on his staring into space in general. The tapping cue to redirect
Nick’s attention worked 100 percent of the time, but the duration of his redirected attention was short, averaging approximately 30 seconds. Moreover, the teacher found that increasingly harder tapping was required, and that this intervention had become intrusive and distracting to the students seated next to Nick. Because the teacher’s classroom interven-tions had met with little success and because Nick’s lack of attention was still affecting his learning, the teacher decided to consult with the building’s child study team to fi nd out if they had other suggestions.
Scenario in Assessment
Nick
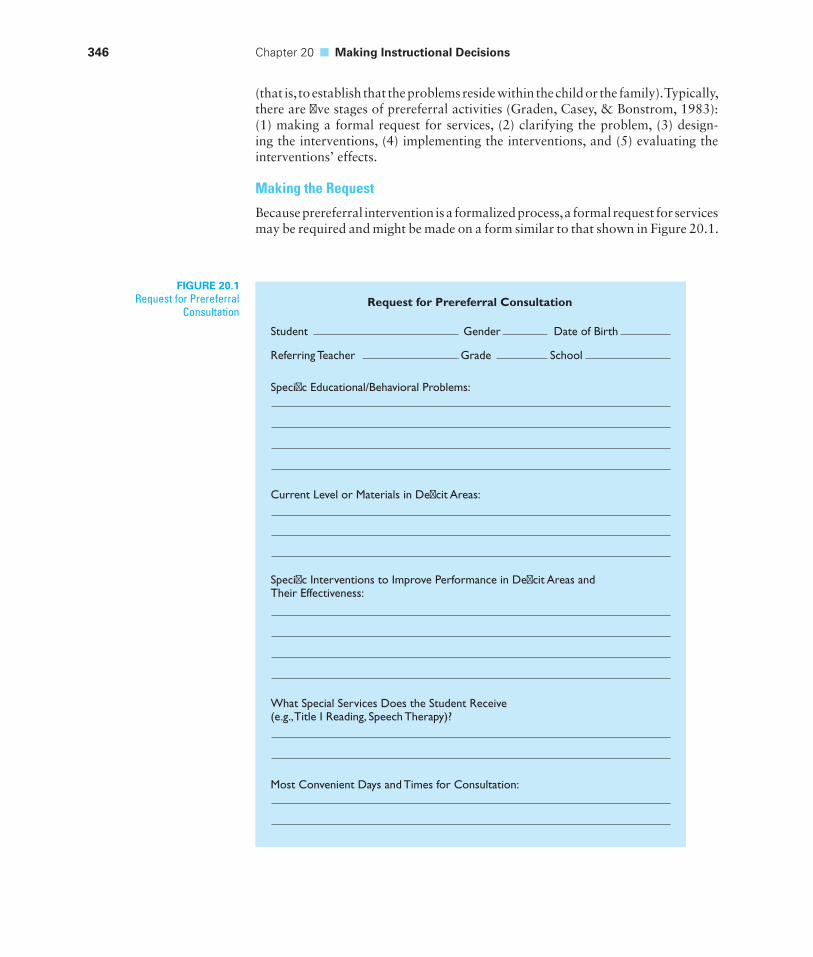
346 Chapter 20 ■ Making Instructional Decisions
(that is, to establish that the problems reside within the child or the family). Typically, there are fi ve stages of prereferral activities (Graden, Casey, & Bonstrom, 1983): (1) making a formal request for services, (2) clarifying the problem, (3) design-ing the interventions, (4) implementing the interventions, and (5) evaluating the interventions’ effects.
Making the Request
Because prereferral intervention is a formalized process, a formal request for services may be required and might be made on a form similar to that shown in Figure 20.1.
FIGURE 20.1Request for Prereferral
Consultation
Student Gender Date of Birth
Referring Teacher Grade School
Specific Educational/Behavioral Problems:
Current Level or Materials in Deficit Areas:
Specific Interventions to Improve Performance in Deficit Areas andTheir Effectiveness:
What Special Services Does the Student Receive(e.g., Title I Reading, Speech Therapy)?
Most Convenient Days and Times for Consultation:
Request for Prereferral Consultation
Decisions Prior to Referral 347
When a prereferral2 form is used, it should contain identifying information (such as teacher and student names), the specifi c problems for which the teacher is seek-ing consultation, the interventions that have already been attempted in the class-room, the effectiveness of those interventions, and current academic instructional levels. This information allows those responsible for providing consultation to decide whether the problem warrants their further attention.
Clarifying the Problem
In the initial consultation, the team works with the classroom teacher to specify the nature of a problem or the specifi c areas of diffi culty. These diffi culties should be stated in terms of observable behavior, not hypothesized causes of the problem. For example, the teacher may specify a problem by saying that “Jenna does not write legibly” or that “Nick does not complete homework assignments as regu-larly as other students in his class.” The focus is on the discrepancy between actual and desired performance.
The team may seek additional information. For example, the referring teacher may be asked to describe in detail the contexts in which problems occur, the student’s curriculum, the way in which the teacher interacts with or responds to the student, the student’s interactions with the teacher and with classmates, the student’s instructional groupings and seating arrangements, and antecedents and consequences of the stu-dent’s behaviors. The referring teacher may also be asked to specify the ways in which the student’s behavior affects the teacher or other students and the extent to which the behavior is incongruent with the teacher’s expectations. When multiple problems are identifi ed, they may be ranked in order of importance for action.
Finally, as part of the consultation, a member of the staff support team may observe the pupil in the classroom to verify the nature and extent of the problem. In relevant school settings, a designated member of the team observes the stu-dent, notes the frequency and duration of behaviors of concern, and ascertains the extent to which the student’s behavior differs from that of classmates. At this point (or later in the process), the perceptions of the student and the student’s parents may also be sought.
Designing the Interventions
Next, the team and the referring teacher design interventions to remediate the most pressing problems. The team may need to coach the referring teacher on how to implement the interventions. Initially, the interventions should be based on empirically validated procedures that are known to be generally effective. In addition, parents, other school personnel, and the student may be involved in the intervention.
A major factor determining whether an intervention will be tried or implemented by teachers is feasibility. Those who conduct assessments and make recommendations
2Early on, special educators adopted the term referral to designate a request that a student be evalu-ated for special education eligibility and entitlement. Subsequently, an additional step was inserted into the process. Because referral had already gained widespread acceptance, the new step was called “prereferral,” although this step clearly involves referral, too. We use the term prereferral to describe assessment and intervention activities that occur prior to formal referral to determine eligibility for special education.
348 Chapter 20 ■ Making Instructional Decisions
about teaching must consider the extent to which the interventions they recommend are doable. (Unfortunately, too often feasibility is determined on the basis of how much of a hassle the intervention planning will be or how much work it will take to implement a given program.) Phillips (1990) identifi es eight major considerations in making decisions about feasibility, which we suggest that assessors address.
1. Degree of disruption. How much will the intervention the teacher recommends disrupt school procedures or teacher routines?
2. Side effects. To what extent are there undesirable side effects for the student (for example, social ostracism), peers, home and family, and faculty?
3. Support services required. How readily available are the support services required, and are the costs reasonable?
4. Prerequisite competencies. Does the teacher have the necessary knowledge, motivation, and experience to be able to implement the intervention? Does the teacher have a philosophical bias against the recommended intervention?
5. Control. Does the teacher have control of the necessary variables to ensure the success of the intervention?
6. Immediacy of results. Will the student’s behavioral change be quick enough for the teacher to be reinforced for implementing the intervention?
7. Consequences of nonintervention. What are the short- and long-term prognoses for the student if the behaviors are left uncorrected?
8. Potential for transition. Is it reasonable to expect that the intervention will lead to student self-regulation and generalize to other settings, curriculum areas, or even to other students who are experiencing similar diffi culties?
The intervention plan should include a clear delineation of the skills to be developed or the behavior to be changed, the methods to be used to effect the change, the duration of the intervention, the location of the intervention, and the names of the individuals responsible for each aspect of the intervention. Moreover, the criteria for a successful intervention should be clear. At a minimum, the inter-vention should bring a student’s performance to an acceptable or tolerable level. For academic diffi culties, this usually means accelerating the rate of acquisition. For an instructional isolate, achievement must improve suffi ciently to allow place-ment in an instructional group. For example, if Bernie currently cannot read the material used in the lowest reading group, the team would need to know the level of the materials used by the lowest instructional group. In addition, the team would need to know the probable level of materials that the group will be using when Bernie’s intervention has been completed. For students with more variable patterns of achievement, intervention is directed toward improving performance in areas of weakness to a level that approximates performance in areas of strength.
Setting the criterion for a behavioral intervention involves much the same pro-cess as setting targets for academic problems. When the goal is to change behavior, the teacher should select two or three students who are behaving appropriately. These students should not be the best behaved students but, rather, those in the middle of the range of acceptable behavior. The frequency, duration, latency, or amplitude of their behavior should be used as the criterion. Usually, the behavior of the appropriate students is stable, so the team does not have to predict where they will be at the end of the intervention.
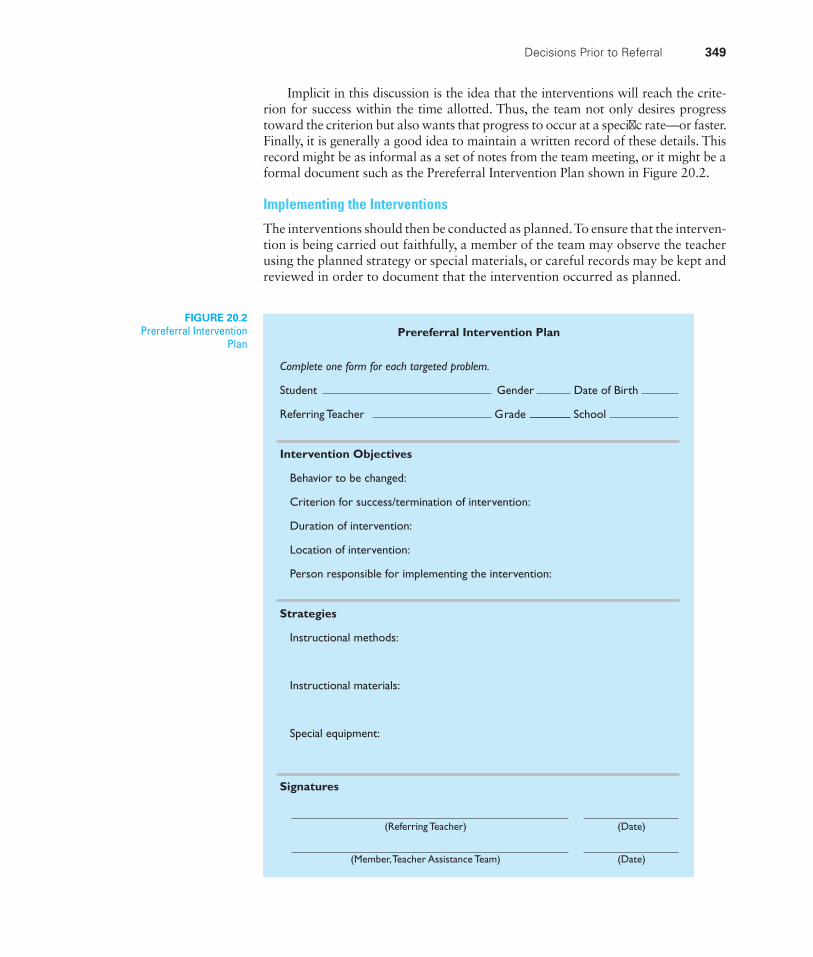
Decisions Prior to Referral 349
Implicit in this discussion is the idea that the interventions will reach the crite-rion for success within the time allotted. Thus, the team not only desires progress toward the criterion but also wants that progress to occur at a specifi c rate—or faster. Finally, it is generally a good idea to maintain a written record of these details. This record might be as informal as a set of notes from the team meeting, or it might be a formal document such as the Prereferral Intervention Plan shown in Figure 20.2.
Implementing the Interventions
The interventions should then be conducted as planned. To ensure that the interven-tion is being carried out faithfully, a member of the team may observe the teacher using the planned strategy or special materials, or careful records may be kept and reviewed in order to document that the intervention occurred as planned.
FIGURE 20.2Prereferral Intervention
Plan
Complete one form for each targeted problem.
Student Gender Date of Birth
Referring Teacher Grade School
Intervention Objectives
Behavior to be changed:
Criterion for success/termination of intervention:
Duration of intervention:
Location of intervention:
Person responsible for implementing the intervention:
Strategies
Instructional methods:
Instructional materials:
Special equipment:
Signatures
Prereferral Intervention Plan
(Referring Teacher)
(Member, Teacher Assistance Team)
(Date)
(Date)
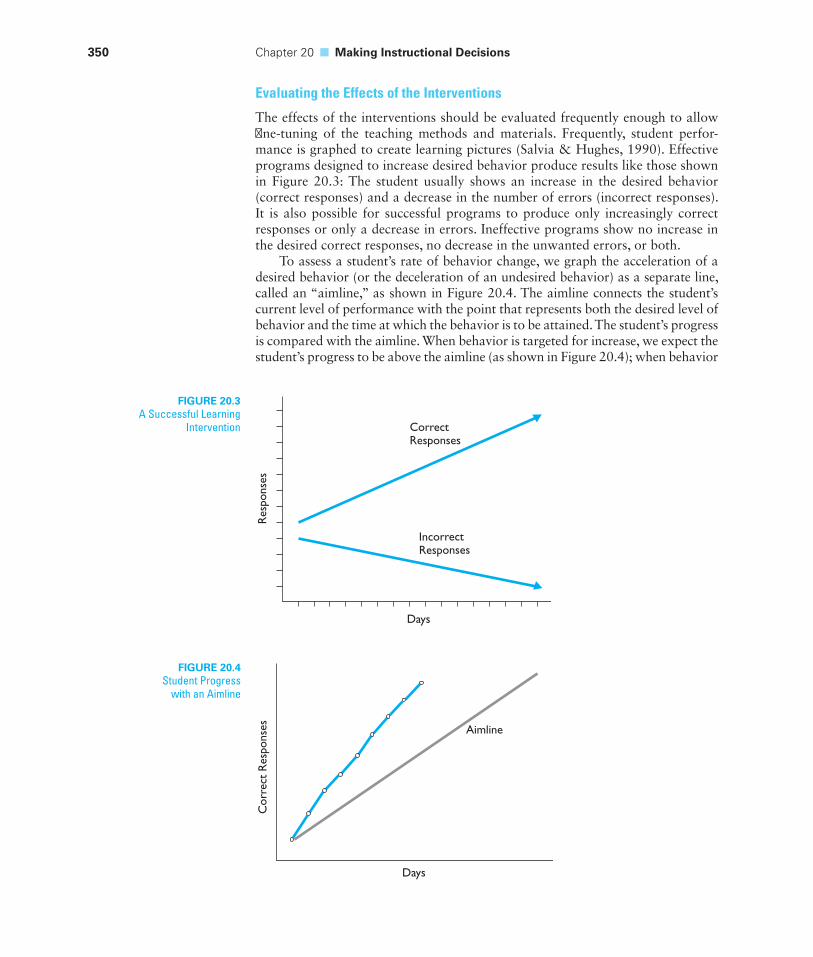
350 Chapter 20 ■ Making Instructional Decisions
Evaluating the Effects of the Interventions
The effects of the interventions should be evaluated frequently enough to allow fi ne-tuning of the teaching methods and materials. Frequently, student perfor-mance is graphed to create learning pictures (Salvia & Hughes, 1990). Effective programs designed to increase desired behavior produce results like those shown in Figure 20.3: The student usually shows an increase in the desired behavior (correct responses) and a decrease in the number of errors (incorrect responses). It is also possible for successful programs to produce only increasingly correct responses or only a decrease in errors. Ineffective programs show no increase in the desired correct responses, no decrease in the unwanted errors, or both.
To assess a student’s rate of behavior change, we graph the acceleration of a desired behavior (or the deceleration of an undesired behavior) as a separate line, called an “aimline,” as shown in Figure 20.4. The aimline connects the student’s current level of performance with the point that represents both the desired level of behavior and the time at which the behavior is to be attained. The student’s progress is compared with the aimline. When behavior is targeted for increase, we expect the student’s progress to be above the aimline (as shown in Figure 20.4); when behavior
FIGURE 20.3A Successful Learning
Intervention
Res
pons
es
Days
CorrectResponses
IncorrectResponses
FIGURE 20.4Student Progress
with an Aimline
Days
Aimline
Cor
rect
Res
pons
es
Decisions Made in Special Education 351
is targeted for decrease, we expect the student’s progress to be below the aimline (not shown). Thus, a teacher, the intervention assistance team, or the student can look at the graph and make a decision about the adequacy of progress.
When adequate progress is being made, the intervention should obviously be continued until the criterion is reached. When better than anticipated progress is being made, the teacher or team can decide to set a more ambitious goal (that is, raise the level of desired performance) without changing the aim date, or they can set an earlier target for achieving the criterion without changing the level of performance.
When inadequate progress is being made, teachers can take several steps to fi ne-tune the student’s program. Salvia and Hughes (1990, pp. 121–122) offer various suggestions for instructional modifi cation, depending on the pattern of student performance in relation to the aimline. Although a discussion of instruc-tional methods is beyond the scope of this text, some examples can illustrate the kinds of things a teacher might do when faced with inadequate progress. When a student demonstrates no correct responses (or too few), the goal may be too diffi -cult; the team should consider changing the goal to include attainment of a prereq-uisite skill. When a student demonstrates correct responses but too many errors, the teacher should consider modeling or prompting and more closely monitoring practice. When a student demonstrates accurate but slow responding, the teacher can encourage faster performance by providing incentives or additional practice. When performance is consistently below the aimline (3 or 4 days are generally considered a signifi cant amount of time), the teacher might consider varying the instructional methods or incentives. Finally, when a student’s performance wors-ens, the teacher should question the motivational value of the task, vary any drill or practice activities, or discuss the performance directly with the student.
Decision: Should the Student Be Referred for Multidisciplinary Evaluation?When several attempted interventions have not led to suffi cient success, the student is likely to be referred for psychoeducational evaluation to ascertain eligibility for special education.
2 Decisions Made in Special Education
Approximately 10 to 12 percent of all students who enter school will experience suffi cient diffi culty to be identifi ed as having a disability at some time during their school career. Most of these students will receive special education services because they need special instruction. Some students with disabilities (such as students with certain chronic health impairments) will not need special education but will require special related services that must be provided under Section 504 of the Rehabilitation Act of 1973.
After students have been determined to be eligible for special education, special education decisions revolve around design and implementation of their individu-alized education plans (IEPs). An IEP is a blueprint for instruction and speci-fi es the goals, procedures, and related services for an individual eligible student.
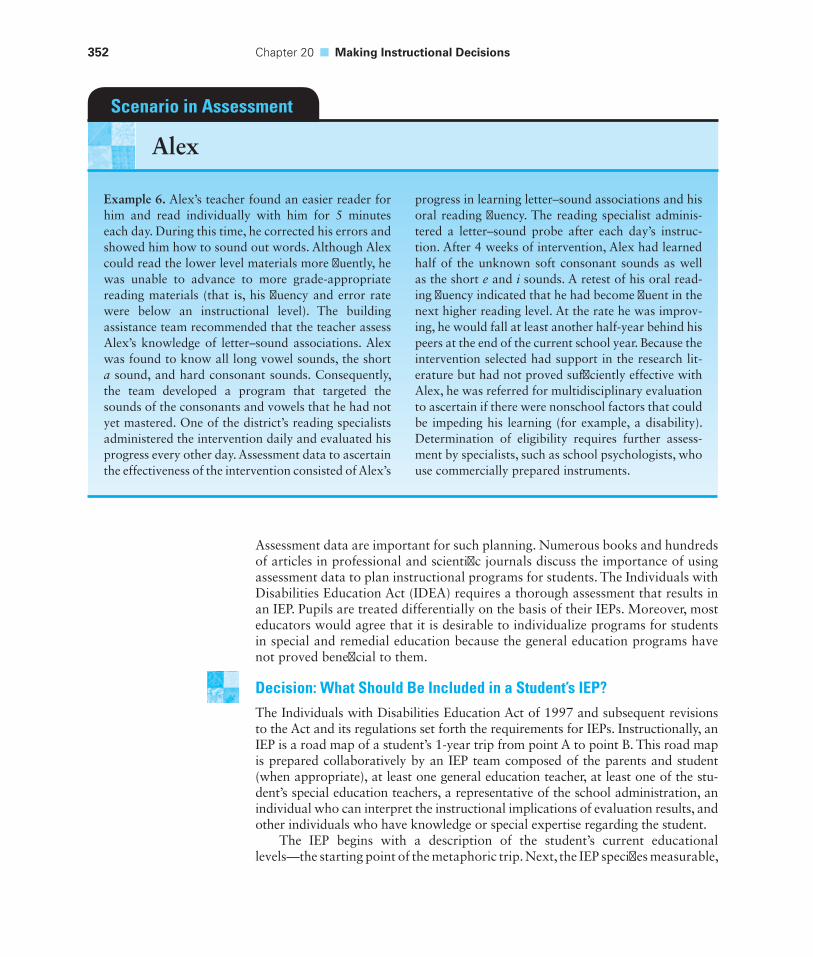
352 Chapter 20 ■ Making Instructional Decisions
Assessment data are important for such planning. Numerous books and hundreds of articles in professional and scientifi c journals discuss the importance of using assessment data to plan instructional programs for students. The Individuals with Disabilities Education Act (IDEA) requires a thorough assessment that results in an IEP. Pupils are treated differentially on the basis of their IEPs. Moreover, most educators would agree that it is desirable to individualize programs for students in special and remedial education because the general education programs have not proved benefi cial to them.
Decision: What Should Be Included in a Student’s IEP?The Individuals with Disabilities Education Act of 1997 and subsequent revisions to the Act and its regulations set forth the requirements for IEPs. Instructionally, an IEP is a road map of a student’s 1-year trip from point A to point B. This road map is prepared collaboratively by an IEP team composed of the parents and student (when appropriate), at least one general education teacher, at least one of the stu-dent’s special education teachers, a representative of the school administration, an individual who can interpret the instructional implications of evaluation results, and other individuals who have knowledge or special expertise regarding the student.
The IEP begins with a description of the student’s current educational levels—the starting point of the metaphoric trip. Next, the IEP specifi es measurable,
Example 6. Alex’s teacher found an easier reader for him and read individually with him for 5 minutes each day. During this time, he corrected his errors and showed him how to sound out words. Although Alex could read the lower level materials more fl uently, he was unable to advance to more grade- appropriate reading materials (that is, his fl uency and error rate were below an instructional level). The building assistance team recommended that the teacher assess Alex’s knowledge of letter–sound associations. Alex was found to know all long vowel sounds, the short a sound, and hard consonant sounds. Consequently, the team developed a program that targeted the sounds of the consonants and vowels that he had not yet mastered. One of the district’s reading specialists administered the intervention daily and evaluated his progress every other day. Assessment data to ascertain the effectiveness of the intervention consisted of Alex’s
progress in learning letter–sound associations and his oral reading fl uency. The reading specialist adminis-tered a letter–sound probe after each day’s instruc-tion. After 4 weeks of intervention, Alex had learned half of the unknown soft consonant sounds as well as the short e and i sounds. A retest of his oral read-ing fl uency indicated that he had become fl uent in the next higher reading level. At the rate he was improv-ing, he would fall at least another half-year behind his peers at the end of the current school year. Because the intervention selected had support in the research lit-erature but had not proved suffi ciently effective with Alex, he was referred for multidisciplinary evaluation to ascertain if there were nonschool factors that could be impeding his learning (for example, a disability). Determination of eligibility requires further assess-ment by specialists, such as school psychologists, who use commercially prepared instruments.
Scenario in Assessment
Alex
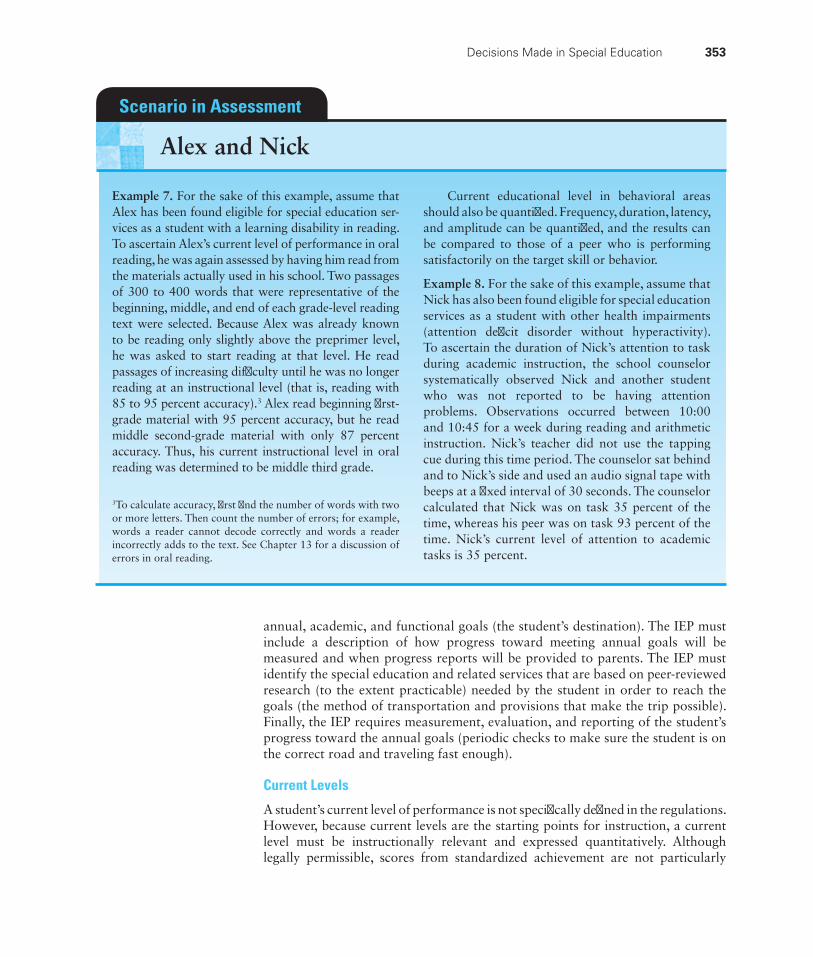
Decisions Made in Special Education 353
annual, academic, and functional goals (the student’s destination). The IEP must include a description of how progress toward meeting annual goals will be measured and when progress reports will be provided to parents. The IEP must identify the special education and related services that are based on peer-reviewed research (to the extent practicable) needed by the student in order to reach the goals (the method of transportation and provisions that make the trip possible). Finally, the IEP requires measurement, evaluation, and reporting of the student’s progress toward the annual goals (periodic checks to make sure the student is on the correct road and traveling fast enough).
Current Levels
A student’s current level of performance is not specifi cally defi ned in the regulations. However, because current levels are the starting points for instruction, a current level must be instructionally relevant and expressed quantitatively. Although legally permissible, scores from standardized achievement are not particularly
Example 7. For the sake of this example, assume that Alex has been found eligible for special education ser-vices as a student with a learning disability in reading. To ascertain Alex’s current level of performance in oral reading, he was again assessed by having him read from the materials actually used in his school. Two passages of 300 to 400 words that were representative of the beginning, middle, and end of each grade-level reading text were selected. Because Alex was already known to be reading only slightly above the preprimer level, he was asked to start reading at that level. He read passages of increasing diffi culty until he was no longer reading at an instructional level (that is, reading with 85 to 95 percent accuracy).3 Alex read beginning fi rst-grade material with 95 percent accuracy, but he read middle second-grade material with only 87 percent accuracy. Thus, his current instructional level in oral reading was determined to be middle third grade.1
3To calculate accuracy, fi rst fi nd the number of words with two or more letters. Then count the number of errors; for example, words a reader cannot decode correctly and words a reader incorrectly adds to the text. See Chapter 13 for a discussion of errors in oral reading.
Current educational level in behavioral areas should also be quantifi ed. Frequency, duration, latency, and amplitude can be quantifi ed, and the results can be compared to those of a peer who is performing satisfactorily on the target skill or behavior.
Example 8. For the sake of this example, assume that Nick has also been found eligible for special education services as a student with other health impairments (attention defi cit disorder without hyperactivity). To ascertain the duration of Nick’s attention to task during academic instruction, the school counselor systematically observed Nick and another student who was not reported to be having attention problems. Observations occurred between 10:00 and 10:45 for a week during reading and arithmetic instruction. Nick’s teacher did not use the tapping cue during this time period. The counselor sat behind and to Nick’s side and used an audio signal tape with beeps at a fi xed interval of 30 seconds. The counselor calculated that Nick was on task 35 percent of the time, whereas his peer was on task 93 percent of the time. Nick’s current level of attention to academic tasks is 35 percent.
Scenario in Assessment
Alex and Nick
354 Chapter 20 ■ Making Instructional Decisions
useful. The fact that a student is reading less well than 90 percent of students in the grade is not useful information about where the teacher should begin instruction. If a student is physically aggressive in the third-grade classroom, that alone is too vague to allow a teacher, parents, and the student to tell whether progress toward acceptable behavior is being made. We think a current educational level in an aca-demic area should be the level at which a student is appropriately instructed.
Annual Goals
IEPs must contain a statement of measurable annual goals, which meet each edu-cational need arising from the student’s disability and ensure the student’s access to the general education curriculum (or appropriate activities, if a preschooler). Thus, for each area of need, parents and schools must agree on what should be a student’s level of achievement after 1 year of instruction.
In part, the selection of long-term goals is based on the aspirations and progno-sis for a student’s postschool outcomes. Although these are not formally required by federal law until a special education student reaches 16 years of age, the expected or desired postschool outcomes shape the special education a student receives. For students with pervasive and severe cognitive disabilities, the prognosis may be assisted living with supported employment. With this prognosis, educational goals are likely to center on daily living, social skills, and leisure rather than academic areas. For students with moderate disabilities, the prognosis may be independent living and unskilled or semiskilled employment. With this prognosis, educational goals are likely to be basic academics and vocational skills. For students with mild disabilities, the prognosis may be professional or skilled employment. For these students, educational goals can prepare students for college or technical schools.
In part, the selection of long-term goals is based on the degree to which the educational defi cit caused by the disability is remediable. All students receiving special education will lag signifi cantly behind their nondisabled peers.43Except when students have severe and pervasive disabilities, special educators and parents generally try to remediate the educational defi cits fi rst. The benefi t of this approach is that it allows the student the fullest access to later school and postschool oppor-tunities. When remediation repeatedly fails, parents and teachers usually turn to compensatory mechanisms so that the student can attain the more generally desired educational outcomes. For example, if Cliff just cannot learn math facts, he may be allowed to use a calculator. The advantage of this option is that it allows Cliff to move to higher curricular goals; the disadvantage is that the defi cits will always be with Cliff, and he will always behave to compensate for them. When a student cannot master the curriculum with compensatory mechanisms, parents and teachers may adapt the curriculum by reducing the complexity of some com-ponents. For example, in social studies all students might be required to learn about taxes, but LeShaun might not have to learn about the constitutional issues surrounding the creation of the federal income tax. If reducing the complexity is not appropriate, areas of the curriculum may be eliminated for individual students with disabilities. Obviously, this option is the last resort, but it may be appropriate when a child’s disabilities are profound. For example, we would not expect all
4Some gifted students have learning disabilities. Thus, these gifted students will also have signifi cant defi cits.
Decisions Made in Special Education 355
deaf students to be fl uent oral communicators, although we would expect them to attain other generally prescribed educational outcomes; we would not expect quadriplegics to pass a swimming test, although we might well expect them to meet other educational outcomes.
Annual goals are derived directly from a student’s curriculum and a student’s current instructional levels. When continued academic integration is the desired educational outcome, a student’s goals are mastery of the same content at the same rate as nondisabled peers. Thus, after 1 year, the student would be expected to be instructional in the same materials as his or her peers. When reintegration is the desired educational outcome, a student’s goal depends on where the regular class peers will be in 1 year. For students pursuing alternative curricula, the IEP team makes an educated guess about where the student should be after 1 year of instruction.
Specially Designed Instruction
IDEA defi nes special education, in part, as specially designed instruction that is provided in classrooms, the home, or other settings (see 34 CFR §300.26). It includes the adaptation of instructional content, methods, or delivery to meet the needs of a student with disabilities.
Currently, the best way to teach handicapped learners appears to rely on generally effective procedures.5 Teachers can do several things to make it easier for their4 pupils to learn facts and concepts, skills, or behavior. They can model the desired behavior. They can break down the terminal goal into its compo-nent parts and teach each of the steps and their integration. They can teach the objective in a variety of contexts with a variety of materials to facilitate gener-alization. They can provide time for practice, and they can choose the schedule on which practice is done (in other words, they can offer distributed or massed practice). Several techniques that are under the direct control of the teacher can be employed to instruct any learner effectively. To help pupils recall information that has been taught, teachers may organize the material that a pupil is to learn, pro-vide rehearsal strategies, or employ overlearning or distributed practice. There are also a number of things that teachers can do to elicit responses that have already been acquired: Various reinforcers and punishers have been shown to be effective in the control of behavior.
Assessment personnel can help teachers identify specifi c areas in which instruc-tional diffi culties exist, and they can help teachers plan interventions in light of infor-mation gained from assessments. Certain procedures (Ysseldyke & Christenson,
5Historically, some psychologists and educators have believed that students learn better when instruction is matched to test-identifi ed abilities. This approach led to the development of instructional procedures that capitalized on areas of strength or avoided weaker abilities. For example, test scores from the fi rst edition of the Developmental Test of Visual Perception (Frostig, Maslow, Lefever, & Whittlesey, 1964), the Illinois Test of Psycholinguistic Abilities (Kirk, McCarthy, & Kirk, 1968), and the Purdue Perceptual–Motor Survey (Roach & Kephart, 1966) were at one time believed to be instructionally useful. In part because test-identifi ed abilities were frequently unreliable and in part because special instructional methods did not result in better learning, this approach to instruction gradually lost favor, although some educators today still cling to a belief in it. In the 1980s, attempts to match instruction to specifi c student attributes resurfaced. However, hypothetical cognitive structures and learning processes replaced the hypothetical abilities of the 1960s (for example, see Resnick, 1987). This approach is interesting but has yet to be validated.
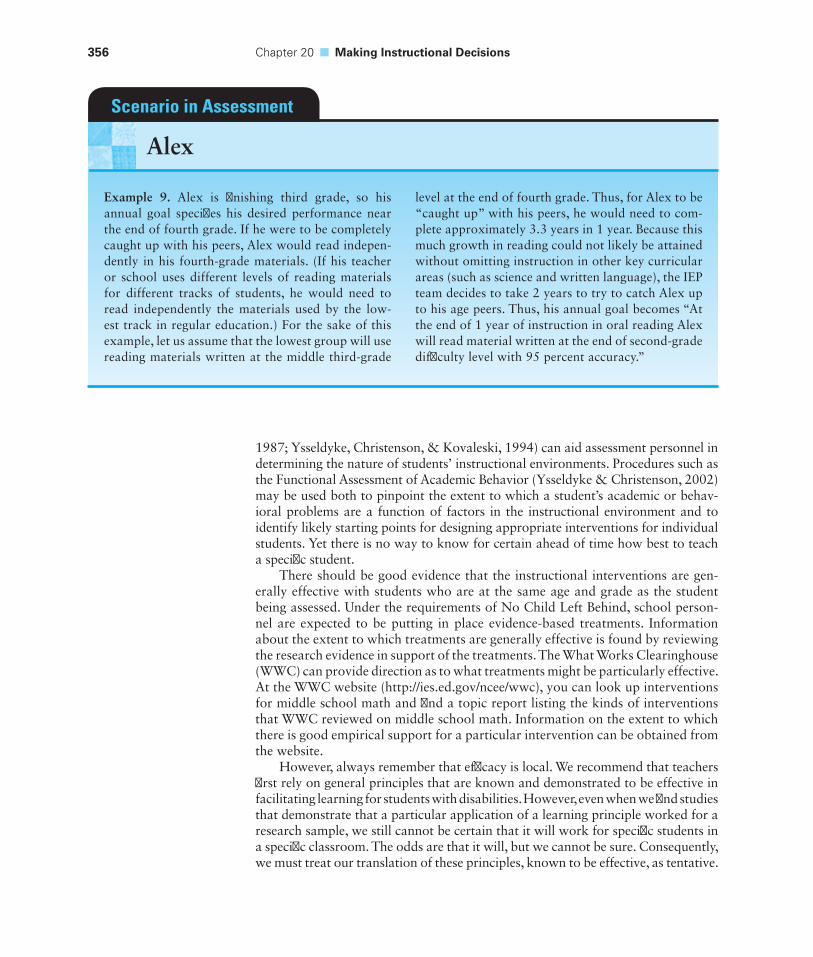
356 Chapter 20 ■ Making Instructional Decisions
1987; Ysseldyke, Christenson, & Kovaleski, 1994) can aid assessment personnel in determining the nature of students’ instructional environments. Procedures such as the Functional Assessment of Academic Behavior (Ysseldyke & Christenson, 2002) may be used both to pinpoint the extent to which a student’s academic or behav-ioral problems are a function of factors in the instructional environment and to identify likely starting points for designing appropriate interventions for individual students. Yet there is no way to know for certain ahead of time how best to teach a specifi c student.
There should be good evidence that the instructional interventions are gen-erally effective with students who are at the same age and grade as the student being assessed. Under the requirements of No Child Left Behind, school person-nel are expected to be putting in place evidence-based treatments. Information about the extent to which treatments are generally effective is found by reviewing the research evidence in support of the treatments. The What Works Clearinghouse (WWC) can provide direction as to what treatments might be particularly effective. At the WWC website (http://ies.ed.gov/ncee/wwc), you can look up interventions for middle school math and fi nd a topic report listing the kinds of interventions that WWC reviewed on middle school math. Information on the extent to which there is good empirical support for a particular intervention can be obtained from the website.
However, always remember that effi cacy is local. We recommend that teachers fi rst rely on general principles that are known and demonstrated to be effective in facilitating learning for students with disabilities. However, even when we fi nd studies that demonstrate that a particular application of a learning principle worked for a research sample, we still cannot be certain that it will work for specifi c students in a specifi c classroom. The odds are that it will, but we cannot be sure. Consequently, we must treat our translation of these principles, known to be effective, as tentative.
Example 9. Alex is fi nishing third grade, so his annual goal specifi es his desired performance near the end of fourth grade. If he were to be completely caught up with his peers, Alex would read indepen-dently in his fourth-grade materials. (If his teacher or school uses different levels of reading materials for different tracks of students, he would need to read independently the materials used by the low-est track in regular education.) For the sake of this example, let us assume that the lowest group will use reading materials written at the middle third-grade
level at the end of fourth grade. Thus, for Alex to be “caught up” with his peers, he would need to com-plete approximately 3.3 years in 1 year. Because this much growth in reading could not likely be attained without omitting instruction in other key curricular areas (such as science and written language), the IEP team decides to take 2 years to try to catch Alex up to his age peers. Thus, his annual goal becomes “At the end of 1 year of instruction in oral reading Alex will read material written at the end of second-grade diffi culty level with 95 percent accuracy.”
Scenario in Assessment
Alex
Decisions Made in Special Education 357
In a real sense, we hypothesize that our treatment will work, but we need to verify that it has worked. The point was made years ago by Deno and Mirkin (1977) and remains true today:
At the present time we are unable to prescribe specifi c and effective changes in instruction for individual pupils with certainty. Therefore, changes in instruc-tional programs that are arranged for an individual child can be treated only as hypotheses that must be empirically tested before a decision can be made about whether they are effective for that child. (p. 11)
Teaching is often experimental in nature. When there is no database to guide our selection of specifi c tasks or materials, decisions must be tentative. The deci-sion maker makes some good guesses about what will work and then implements an instructional program. We do not know whether a decision is correct until we gather data on the extent to which the instructional program actually works. We never know if the program will work until it has worked.
Tests do provide some very limited information about how to teach. Tests of intelligence, for example, yield information that gives a teacher some hints about teaching. Generally, the lower a pupil’s intelligence, the more practice the student will require for mastery. A score of 55 on the Wechsler Intelligence Scale for Children–IV does not tell the teacher whether a pupil needs 25 percent or 250 percent more practice, but it does alert the teacher to the likelihood that the pupil will need more practice than the average student will need. Other tenuous hints can be derived, but we believe that it is better to rely on direct observa-tion of how a student learns in order to make adjustments in the learning pro-gram. Thus, to determine whether we had provided enough practice, we would observe Sally’s recall of information rather than looking at Sally’s IQ. We cannot do anything about Sally’s IQ, but we can do something about the amount of practice she gets.
Related Services
In addition to special instruction, eligible students are entitled to developmental, corrective, and other supportive services if such services are needed in order for the students to benefi t from special education; federal legislation uses the term related services, which has been widely adopted by states and school districts. Related services include both those not typically provided by schools and those typically provided (34 CFR §300.24).
Schools must provide to students with disabilities a variety of services to which nondisabled students are seldom entitled. Services described in 34 CFR §300.24 include, but are not limited to, the following types:
1. Audiology. Allowable services include evaluation of hearing, habilitation (for example, programs in auditory training, speech reading, and speech conservation), amplifi cation (including the fi tting of hearing aids), and hearing conservation programs.
2. Psychological services. Psychological services allowed include testing, observation, and consultation.
3. Physical and occupational therapy. These therapies can be used to (a) improve, develop, or restore functional impairments caused by illness, injury, or deprivation; and (b) improve independent functioning. These therapies
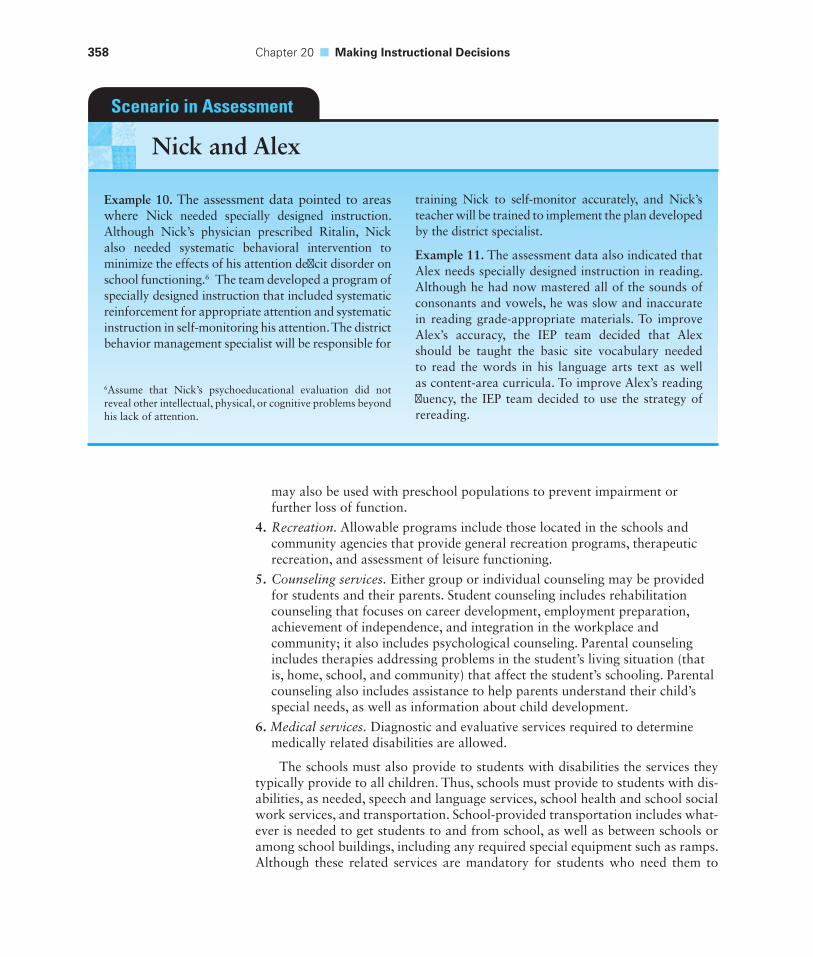
358 Chapter 20 ■ Making Instructional Decisions
may also be used with preschool populations to prevent impairment or further loss of function.
4. Recreation. Allowable programs include those located in the schools and community agencies that provide general recreation programs, therapeutic recreation, and assessment of leisure functioning.
5. Counseling services. Either group or individual counseling may be provided for students and their parents. Student counseling includes rehabilitation counseling that focuses on career development, employment preparation, achievement of independence, and integration in the workplace and community; it also includes psychological counseling. Parental counseling includes therapies addressing problems in the student’s living situation (that is, home, school, and community) that affect the student’s schooling. Parental counseling also includes assistance to help parents understand their child’s special needs, as well as information about child development.
6. Medical services. Diagnostic and evaluative services required to determine medically related disabilities are allowed.
The schools must also provide to students with disabilities the services they typically provide to all children. Thus, schools must provide to students with dis-abilities, as needed, speech and language services, school health and school social work services, and transportation. School-provided transportation includes what-ever is needed to get students to and from school, as well as between schools or among school buildings, including any required special equipment such as ramps. Although these related services are mandatory for students who need them to
Example 10. The assessment data pointed to areas where Nick needed specially designed instruction. Although Nick’s physician prescribed Ritalin, Nick also needed systematic behavioral intervention to minimize the effects of his attention defi cit disorder on school functioning.61 The team developed a program of specially designed instruction that included systematic reinforcement for appropriate attention and systematic instruction in self- monitoring his attention. The district behavior management specialist will be responsible for
6Assume that Nick’s psychoeducational evaluation did not reveal other intellectual, physical, or cognitive problems beyond his lack of attention.
training Nick to self-monitor accurately, and Nick’s teacher will be trained to implement the plan developed by the district specialist.
Example 11. The assessment data also indicated that Alex needs specially designed instruction in reading. Although he had now mastered all of the sounds of consonants and vowels, he was slow and inaccurate in reading grade-appropriate materials. To improve Alex’s accuracy, the IEP team decided that Alex should be taught the basic site vocabulary needed to read the words in his language arts text as well as content-area curricula. To improve Alex’s reading fl uency, the IEP team decided to use the strategy of rereading.
Scenario in Assessment
Nick and Alex
Decisions Made in Special Education 359
profi t from their special education, there is nothing to prohibit a school from offering other services. Thus, schools may offer additional services free of charge to eligible students.
Although federal law is very clear about the need to provide related services to students with disabilities, how that need should be established remains unclear. In practice, most schools or parents seek an evaluation by a specialist. The spe-cialist notes a problem and expresses a belief that a specifi c therapy could be successful and benefi t the student. Thus, need is frequently based on professional opinion. We must also note that related services can be very costly, and some school districts try to avoid providing them. We have heard of districts maintain-ing that they do not offer a particular service even though federal law mandates that service should be provided to students who need it.
Decision: What Is the Least Restrictive Appropriate Environment?Federal law expresses a clear preference for educating students with disabilities as close as possible to their home and with their nondisabled peers to the maximum extent appropriate. Education in “special classes, separate schooling or other removal of children with disabilities from the regular educational environment occurs only if the nature or severity of the disability is such that education in regular classes with the use of supplementary aids and services cannot be achieved satisfactorily” (34 CFR §300.550).
Placement Options
A hierarchy of placements ranges from the least restrictive (educating students with disabilities in a general education classroom with a general education teacher who receives consultative services from a special education teacher) to the most restrictive (educating students with disabilities in segregated residential facili-ties that provide services only to students with disabilities). Between these two extremes are at least fi ve other options:
1. Instructional support from a special education teacher in the general education classroom. In this arrangement, eligible students remain in the general education classroom in their neighborhood schools, and the special education teacher comes to the student to provide whatever specialized instruction is necessary.
2. Instructional support from a special education teacher in a resource room. In this arrangement, eligible students remain in a general education classroom for most of the day. When they need specialized instruction, they go to a special education resource room to receive services from a special education teacher. Because districts may not have enough students with disabilities in each school to warrant establishing a resource room program at each school, a student may be assigned to a general education classroom that is not in the student’s neighborhood school.
3. Part-time instruction in a special education classroom. In this arrangement, eligible students have some classes or subject matter taught by the special education teacher and the rest taught in the general education classroom. As is the case with resource rooms, the general education classroom may not be in the student’s neighborhood school.
360 Chapter 20 ■ Making Instructional Decisions
4. Full-time instruction in a special education classroom, with limited integration. In this arrangement, eligible students receive all academic instruction from a special education teacher in a special classroom. Eligible students may be integrated with nondisabled peers for special events or activities (such as lunch, recess, and assemblies) and nonacademic classes (such as art and music).
5. Full-time instruction in a special education classroom, without integration. In this arrangement, eligible students have no interaction with their nondisabled peers, and their classrooms may be in a special day school that serves only students with disabilities.
Factors Affecting the Placement Choice
The selection of a particular option should be based on the intensity of education needed by the eligible student: The less intensive the intervention needed by the student, the less restrictive the environment; the more intensive the intervention needed by the student, the more restrictive the environment. The procedure for determining the intensity of an intervention is less than scientifi c. Frequently, there is some correspondence between the severity of disability and the intensity of ser-vice needed, but that correspondence is not perfect. Therefore, special education teachers and parents should consider the frequency and duration of the needed interventions. The more frequent an intervention is (for instance, every morning versus one morning per week) and the longer its duration (for example, 30 min-utes versus 15 minutes per morning), the more likely it is that the intervention will be provided in more, rather than less, restrictive settings. When frequent and long interventions are needed, the student will have less opportunity to partici-pate with nondisabled peers, no matter what the student’s placement. Obviously, if students require round-the-clock intervention, they cannot get what they need from a resource room program.
In addition to the nature of needed interventions, parents and teachers may also reasonably consider the following factors when deciding on the type of placement:
1. Disruption. Bringing a special education teacher into or pulling a student out of a general education classroom may be disruptive. For example, some students with disabilities cannot handle transitions: They get lost between classrooms, or they forget to go to their resource rooms. When eligible students have a lot of diffi culty changing schedules or making transitions between events, less restrictive options may not be appropriate.
2. Well-being of nondisabled individuals. Eligible students will seldom be integrated when they present a clear danger to the welfare of nondisabled peers or teachers. For example, assaultive and disruptive students are likely to be placed in more restrictive environments.
3. Well-being of the student who has a disability. Many students with disabilities require some degree of protection—in some cases, from nondisabled peers who may tease or physically abuse a student who is different; in other cases, from other students with disabilities. For example, the parents of a seriously withdrawn student may decide not to place their child in a classroom for students with emotional disabilities when those students are assaultive.
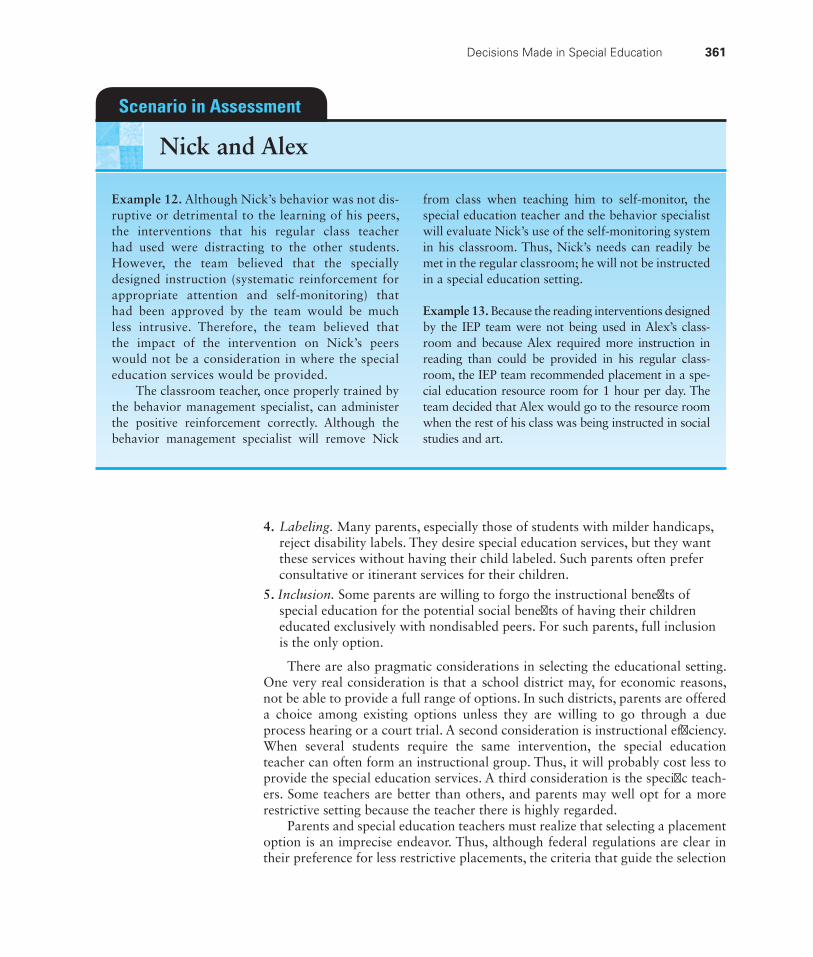
Decisions Made in Special Education 361
4. Labeling. Many parents, especially those of students with milder handicaps, reject disability labels. They desire special education services, but they want these services without having their child labeled. Such parents often prefer consultative or itinerant services for their children.
5. Inclusion. Some parents are willing to forgo the instructional benefi ts of special education for the potential social benefi ts of having their children educated exclusively with nondisabled peers. For such parents, full inclusion is the only option.
There are also pragmatic considerations in selecting the educational setting. One very real consideration is that a school district may, for economic reasons, not be able to provide a full range of options. In such districts, parents are offered a choice among existing options unless they are willing to go through a due process hearing or a court trial. A second consideration is instructional effi ciency. When several students require the same intervention, the special education teacher can often form an instructional group. Thus, it will probably cost less to provide the special education services. A third consideration is the specifi c teach-ers. Some teachers are better than others, and parents may well opt for a more restrictive setting because the teacher there is highly regarded.
Parents and special education teachers must realize that selecting a placement option is an imprecise endeavor. Thus, although federal regulations are clear in their preference for less restrictive placements, the criteria that guide the selection
Example 12. Although Nick’s behavior was not dis-ruptive or detrimental to the learning of his peers, the interventions that his regular class teacher had used were distracting to the other students. However, the team believed that the specially designed instruction (systematic reinforcement for appropriate attention and self-monitoring) that had been approved by the team would be much less intrusive. Therefore, the team believed that the impact of the intervention on Nick’s peers would not be a consideration in where the special education services would be provided.
The classroom teacher, once properly trained by the behavior management specialist, can administer the positive reinforcement correctly. Although the behavior management specialist will remove Nick
from class when teaching him to self-monitor, the special education teacher and the behavior specialist will evaluate Nick’s use of the self-monitoring system in his classroom. Thus, Nick’s needs can readily be met in the regular classroom; he will not be instructed in a special education setting.
Example 13. Because the reading interventions desi gned by the IEP team were not being used in Alex’s class-room and because Alex required more instruction in reading than could be provided in his regular class-room, the IEP team recommended placement in a spe-cial education resource room for 1 hour per day. The team decided that Alex would go to the resource room when the rest of his class was being instructed in social studies and art.
Scenario in Assessment
Nick and Alex
362 Chapter 20 ■ Making Instructional Decisions
of one option over another are unclear. Choices among placement options should be regarded as best guesses.
Decision: Is the Instructional Program Effective?IEPs are supposed to result in effective instruction for students with disabilities.IDEA requires that each student’s IEP contain a statement detailing the way in which progress toward annual goals will be measured and how parents will be informed of their child’s progress (34 CFR §300.347). In addition, IDEA requires IEP teams to review each student’s IEP “periodically, but not less than annually, to determine whether the annual goals for the child are being achieved.” (34 CFR §300.343). If adequate progress is not being made, IEP teams are required to revise the IEPs of students who are not making expected progress toward their annual goals. An exception to this rule is that according to IDEA 2004, some states may put in place comprehensive multiyear IEPs for those students who have milder disabilities and for whom parents agree a multiyear IEP is suffi cient.
Throughout this book, we have discussed procedures that are useful in col-lecting information about students’ achievement and behavior. We have also dis-cussed how that information can be systematized using graphs and charts. We have offered guidelines about how to reach decisions about a student’s progress. All of these discussions are relevant to the decision about the effectiveness of each component of a student’s instructional program. Judgments about the simultane-ous effectiveness of all of the components of an instructional program are geomet-rically more complicated. Based on our personal experience, a program is effective if the most important goals are achieved. What makes a goal important varies by student. For an aggressive, acting-out student, self-control may be more important than quadratic equations. For a bright student with a learning disability, learning to read may be more important than improvement in spelling.
CHAPTER COMPREHENSION QUESTIONSWrite your answers to each of the following questions, and then compare your responses to the text or the study guide.
1. List and explain three instructional decisions that are made prior to a student being found eligible for special education.
2. List and explain three instructional decisions that are made after a student has been found eligible for special education.

363
Chapter Goals
3Understand multidisciplinary
teams (their composition and responsibilities).
2Understand how the need for
special education is established.
1Understand the disabilities
recognized by the Individuals with Disabilities Education Improvement Act.
Making Special Education Eligibility Decisions21
4Understand the process for
determining eligibility (including procedural safeguards, the requirements for valid assessment, and the team process).
5Understand common problems
in determining eligibility.
364 Chapter 21 ■ Making Special Education Eligibility Decisions
Key Terms autism
mental retardation
specifi c learning disability
severe discrepancy
response to instruction
emotional disturbance
traumatic brain injury
speech or language impairment
deafness and hearing impairment
visual impairment
orthopedic impairments
other health impairments
deaf–blindness
multiple disabilities
developmental delay
need for special education
multidisciplinary team
procedural safeguards
The issue of eligibility for special education hinges on two questions: (1) Does the student have a disability? and (2) If so, does the student need special education? Both questions must be answered in the affi rmative to be eligible for special education and related services. Students who have disabilities but do not need special education are not eligible (although they may well be eligible for services under Section 504 of the Rehabilitation Act of 1973). Students who do not have disabilities but need (or would benefi t from) special education services are not eligible. Once students have been determined to be eligible for special education, they are automatically entitled to procedural safeguards, special ser-vices, altered outcome expectations, and special fi scal arrangements, as discussed in Chapter 2.
1 Offi cial Student Disabilities
Students are classifi ed as having a disability under several laws; three are particu-larly important: The Americans with Disabilities Act (Public Law 101-336), Section 504 of the Rehabilitation Act of 1973, and the Individuals with Disabilities Education Improvement Act (IDEA; 34 CFR §300.7). In the schools and other educational settings, the following disabilities, enumerated in regulations of IDEA (34 CFR §300.7), are the most frequently used: autism, mental retardation, specifi c learning disability, emotional disturbance, traumatic brain injury, speech or lan-guage impairment, visual impairment, deafness and hearing impairment, orthope-dic impairments, other health impairments, deaf–blindness, multiple disabilities, and developmental delay.1 Identifi cation under §300.8 of the IDEA requires that
a group of qualifi ed professionals and the parent(s) of the child determine ■
whether the child has a disability, and the public agency provides a copy of the evaluation report and the documentation of determination of eligibility at no cost to the parent(s); and
a child cannot be determined to have a disability if the determinant factor ■
for that determination is lack of appropriate instruction in reading, lack of appropriate instruction in math, or limited English profi ciency, or if the child does not otherwise meet the eligibility criteria.
1The defi nitions in IDEA (excluding the need for special education) are generally used for entitlements under Section 504.
Offi cial Student Disabilities 365
In addition, the identifi cation must
draw upon information from a variety of sources, including aptitude and ■
achievement tests, input from parents, and teachers, as well as information about the child’s physical condition, social or cultural background, and adaptive behavior; and
ensure that information obtained from all of these sources is documented and ■
carefully considered.
§300.8 of the IDEA regulations defi ne the specifi c disabilities. These defi ni-tions are given below.
AutismAutistic students are those who demonstrate “developmental disability signifi -cantly affecting verbal and nonverbal communication and social interaction, generally evident before age 3, that adversely affects a child’s educational per-formance. Other characteristics often associated with autism are engagement in repetitive activities and stereotyped movements, resistance to environmental change or change in daily routines, and unusual responses to sensory experiences. Autism does not apply if a child’s educational performance is adversely affected primarily because the child has an emotional disturbance.”
Students with suspected autism are usually evaluated by speech and language specialists and psychologists after it has been determined that some aspects of their educational performance fall outside the normal range and various attempts to remedy the educational problems have failed. Frequently, a speech and lan-guage specialist would look for impaired verbal and nonverbal communication. A large proportion of autistic children are mute, an impairment that is readily apparent. Autism in students with speech and language might manifest itself as overly concrete thinking. For example, an autistic student might react to a statement such as “don’t cry over spilled milk” quite literally (“I didn’t spill any milk”). Another manifestation would be a lack of conversational reciproc-ity (usually long, often tedious, orations about a favorite subject) and failure to recognize a listener’s waning interest. Moreover, this impaired social com-munication would be a consistent feature of the student’s behavior rather than an occasional overexuberance. A psychologist looks for behavior that defi nes the condition: repetitive activities (for example, self-stimulating behavior, spin-ning objects, aligning objects, and smelling objects), stereotyped movements (for example, hand fl apping, rocking, and head banging), resistance to change (for example, eating only certain foods or tantruming when activities are ended). A psychologist may also administer a behavior rating scale (for example, the Gilliam Autism Rating Scale) as an aid to diagnosis. Finally, a psycholo-gist rules out emotional disturbance as a cause of the student’s behavior and impairments.
Mental RetardationStudents with mental retardation are those who demonstrate “signifi cantly subaverage general intellectual functioning, existing concurrently with defi cits in adaptive behavior and manifested during the developmental period, that
366 Chapter 21 ■ Making Special Education Eligibility Decisions
adversely affects a child’s educational performance.” Students who are eventu-ally labeled “mentally retarded” are often referred because of generalized slow-ness: They lag behind their age mates in most areas of academic achievement, social and emotional development, language ability, and, perhaps, physical development.
Usually, a psychologist will administer a test of intelligence that is appropriate in terms of the student’s age, acculturation, and physical and sensory capabilities. In most states, students must have an IQ that is two standard deviations or more below the mean (usually 70 or less) on a validly administered test. However, a test of intelligence is not enough. The pupil must also demonstrate impairments in adaptive behavior. There is no federal requirement that a test or rating scale be used to assess adaptive behavior psychometrically. In practice, most school psychologists will administer an adaptive behavior scale (for example, the Vineland Adaptive Behavior Scale II). However, when it is not possible to do so appropriately, a psy-chologist will interview parents or guardians and make a clinical judgment about a student’s adaptive behavior.
Specifi c Learning DisabilityStudents with learning-disabilities are those who demonstrate “a disorder in one or more of the basic psychological processes involved in understanding or in using language, spoken or written, that may manifest itself in the imperfect ability to listen, think, speak, read, write, spell, or to do mathematical calculations, includ-ing conditions such as perceptual disabilities, brain injury, minimal brain dysfunc-tion, dyslexia, and developmental aphasia. . . . Specifi c learning disability does not include learning problems that are primarily the result of visual, hearing, or motor disabilities, of mental retardation, of emotional disturbance, or of environmental, cultural, or economic disadvantage.”
Students who are eventually labeled as having a learning disability do not achieve adequately or meet state-approved grade-level standards in one or more of the core achievement areas when provided with learning experiences and instruction appropriate for the child’s age or state-approved grade-level standards.
Regardless of the approach used, the committee responsible for making the actual determination that a student has a learning disability must rule out other causes for poor achievement in oral expression, listening comprehension, written expression, basic reading skill, reading comprehension, mathematics calculation, and mathematics reasoning. IDEA specifi cally forbids that the student’s achieve-ment problem be the result of a visual, hearing, or motor impairment; mental retardation; emotional disturbance; or environmental, cultural, or economic disadvantage.
The formal evaluation of students suspected of having a learning disability begins after it has been determined that the student’s educational performance in the specifi ed areas (for example, basic reading skill) falls outside the normal range and various attempts to remedy the educational problems have failed. The evalu-ation of these students must include an observation of each student in the stu-dent’s learning environment to document the student’s academic performance and behavior in the areas of concern (§300.310). The student may also be evaluated
Offi cial Student Disabilities 367
by a speech and language specialist who would look for manifestations of a dis-order in producing or understanding language. This specialist may conduct an assessment of a student’s spontaneous or elicited language during an interview or play situation; the specialist may administer a formal test such as the Test for Auditory Comprehension of Language–Third Edition or the Test of Language Development–Primary, Fourth Edition. There are no quantitative guidelines in the regulations to indicate a language disorder, but a child with a disability in language would be expected to earn scores that are substantially below average. The evaluations to determine special education eligibility can take one of two paths—severe discrepancy or response to intervention.
Severe discrepancy. ■ In this approach, students suspected of having a learning disability are evaluated by psychologists. All psychologists should look for manifestations of a disorder in the areas specifi ed in IDEA. This search requires the results from a current individually administered test of intelligence to rule out mental retardation (as required by the federal defi nition of learning disability) and to establish the level of ability that was needed to ascertain if a student had a signifi cant discrepancy between ability and achievement. Psychologists usually administered a standardized achievement test such as the Woodcock–Johnson Psychoeducational Battery–III: Tests of Achievement or the Wechsler Individual Achievement Test in all areas of possible learning disability. The results of the achievement tests served two purposes. First, they verifi ed that the student was indeed having diffi culties in oral expression, listening comprehension, written expression, basic reading skill, reading comprehension, mathematics calculation, or mathematics reasoning. Second, the standard scores in these areas were systematically compared to the student’s IQ to determine if a signifi cant discrepancy existed between the scores. Because IDEA does not specify the number of standard score points required for a difference in scores to be considered a signifi cant discrepancy, practice is inconsistent from state to state—and from district to district within a state.2 Some psychologists may also administer tests to assess basic psychological processes such as visual perception (for example, the Developmental Test of Visual Perception).
Response to intervention. ■ In this approach, students suspected of having a learning disability receive more intensive instruction using methods of proven effectiveness (that is, by objective, empirical research). The student’s progress is repeatedly and appropriately monitored to ascertain if achievement has improved. Lack of improvement is evidence of a learning disability. There are multiple models for assessing response to intervention. Interested readers should read the material related to response to intervention on the student website.
2Some psychologists will defi ne a severe discrepancy as a difference greater than chance fl uctuation. Psychologists who use this approach may use the reliability of an obtained difference or the reliability of the predicted difference to reach their decision. Some psychologists will use the rarity of a differ-ence, which is often provided by test authors when they have normed both the intelligence and the achievement tests on the same sample.
368 Chapter 21 ■ Making Special Education Eligibility Decisions
Emotional DisturbanceEmotional disturbance means “a condition exhibiting one or more of the fol-lowing characteristics over a long period of time and to a marked degree that adversely affects a child’s educational performance: (1) an inability to learn that cannot be explained by intellectual, sensory, or health factors; (2) an inability to build or maintain satisfactory interpersonal relationships with peers and teach-ers; (3) inappropriate types of behavior or feelings under normal circumstances; (4) a general pervasive mood of unhappiness or depression; (5) a tendency to develop physical symptoms or fears associated with personal or school prob-lems.” This disability includes schizophrenia but excludes “children who are socially maladjusted, unless it is determined that they have an emotional dis-turbance.” Students who are eventually labeled as having an emotional disorder are often referred for problems in interpersonal relations (for example, fi ghting or extreme noncompliance) or unusual behavior (for example, unexplained epi-sodes of crying or extreme mood swings).
Students suspected of being emotionally disturbed are evaluated by a psychologist after it has been determined that some of their school performance falls outside the normal range and various attempts to remedy the school prob-lems have failed. Requirements for establishing a pupil’s eligibility as a student with emotional disturbance vary among the states. However, multidisciplinary teams usually obtain a developmental and health history from a student’s par-ent or guardian to rule out sensory and health factors as causes of a student’s inability to learn. A parent or guardian is usually interviewed about the stu-dent’s relationships with peers, feelings (for example, anger, alienation, depres-sion, and fears), and physical symptoms (for example, headaches or nausea). Parents or guardians may also be asked to complete a behavior rating scale such as Achenbach’s Child Behavior Checklist to obtain normative data on the student’s behavior. Teachers will likely be interviewed about their relationships with the student and the student’s relationships with peers at school. They may also be asked to complete a rating scale (for example, the Walker–McConnell Scale of Social Competence and School Adjustment) to obtain normative data for in-school behavior. In addition, a psychologist might be asked to admin-ister a norm-referenced achievement battery to verify that the student’s edu-cational performance has been negatively affected by the student’s emotional problems.
Traumatic Brain InjuryStudents with traumatic brain injury have “an acquired injury to the brain caused by an external physical force, resulting in total or partial functional disability or psychosocial impairment, or both, that adversely affects a child’s educational per-formance. Traumatic brain injury applies to open or closed head injuries resulting in impairments in one or more areas, such as cognition; language; memory; atten-tion; reasoning; abstract thinking; judgment; problem solving; sensory, percep-tual, and motor abilities; psychosocial behavior; physical functions; information processing; and speech. Traumatic brain injury does not apply to brain injuries that are congenital or degenerative, or to brain injuries induced by birth trauma.” Students with traumatic brain injury have normal development until they sustain
Offi cial Student Disabilities 369
a severe head injury. As a result of this injury, they have a disability. Most head injuries are the result of an accident (frequently an automobile accident), but they may also occur as a result of physical abuse or intentional harm (for example, being shot).
Traumatic brain injury will be diagnosed by a physician, who is usually a specialist (a neurologist). The need of a student with brain injury for special edu-cation will be based fi rst on a determination that the student’s school performance falls outside the normal range and various attempts to remedy the educational problems have failed. Next, a school psychologist will likely administer a stan-dardized achievement battery to verify that the student’s achievement has been adversely affected.
Speech or Language ImpairmentA student with a speech or language impairment has “a communication disor-der, such as stuttering, impaired articulation, a language impairment, or a voice impairment, that adversely affects a child’s educational performance.” Many children will experience some developmental problems in their speech and lan-guage. For example, children frequently have diffi culty with the r sound and say “wabbit” instead of “rabbit.” Similarly, many children will use incorrect gram-mar, especially with internal plurals; for example, children may say, “My dog has four foots.” Such diffi culties are so common as to be considered a part of normal speech development. However, when such speech and language errors continue to occur beyond the age when most children have developed correct speech or language, there is cause for concern. Not all students who require intervention for speech or language problems are eligible for special education. A student may be eligible for speech or language services but not have a problem that adversely affects his or her school performance. Thus, for a student to be eligible for special education as a person with a speech or language impairment, that student must not only have a speech/language impairment but also need special education.
The identifi cation of students with speech and language impairments proceeds along two separate paths. School personnel identify the educational disability in the same way that other educational disabilities are identifi ed. When extra help from a teacher does not solve the problem, the student is referred to a child study team for prereferral intervention. If those interventions fail to remedy the achievement problem, the student is referred for multidisciplinary evaluation. A psychologist or educational diagnostician will likely administer a norm- referenced achievement test to verify the achievement problem. At the same time, speech and language spe-cialists will use a variety of assessment procedures (norm-referenced tests, system-atic observation, and criterion-referenced tests) to identify the speech and language disability. If the student has both need and disability, the student will be eligible for special education and related services.
Visual ImpairmentA student with a visual impairment has “an impairment in vision that, even with correction, adversely affects a child’s educational performance. The term includes both partial sight and blindness.” Students with severe visual impairments are usually identifi ed by an ophthalmologist before they enter school. Many students
370 Chapter 21 ■ Making Special Education Eligibility Decisions
who are partially sighted will be identifi ed by routine vision screening that usually takes place in the primary grades; others will be identifi ed when visual demands increase (for example, when font size is reduced from the larger print used in beginning reading materials). Severe visual impairment is always presumed to adversely affect their educational development, and students with this disability are presumed to require special education services and curricular adaptations (for example, mobility training, instruction in Braille, and talking books). A vision specialist usually assesses functional vision through systematic observation of a student’s responses to various types of paper, print sizes, lighting conditions, and so forth. For more information about vision screening, see the material on sensory screening on the student website.
Deafness and Hearing ImpairmentDeafness is an impairment in hearing “that is so severe that the child is impaired in processing linguistic information through hearing, with or without amplifi ca-tion, and that adversely affects a child’s educational performance.” A student with a hearing impairment has “an impairment in hearing, whether permanent or fl uc-tuating, that adversely affects educational performance but that is not included under the defi nition of deafness.”
Most students classifi ed as deaf will be identifi ed before they enter school. Deafness will be presumed to adversely affect a student’s educational develop-ment, and students with this disability are presumed to require special education services and curricular adaptations. However, even severe hearing impairments may be diffi cult to identify in the fi rst years of life, and students with milder hearing impairments may not be identifi ed until school age. Referrals for undiag-nosed hearing-impaired students may indicate expressive and receptive language problems, variable hearing performance, problems in attending to aural tasks, and perhaps problems in peer relationships. Diagnosis of hearing impairment is usually made by audiologists, who identify the auditory disability, in conjunction with school personnel, who identify the educational disability. For more informa-tion about vision screening, see the material on sensory screening on the student website.
Orthopedic ImpairmentsAn orthopedic impairment is “a severe impairment that adversely affects a child’s educational performance. The term includes impairments caused by a congenital anomaly, impairments caused by disease (such as poliomyelitis and bone tuber-culosis), and impairments from other causes (such as cerebral palsy, amputations, and fractures or burns that cause contractures).”
Physical disabilities are generally identifi ed prior to entering school. However, accidents and disease may impair a student who previously did not have a dis-ability. Medical diagnosis establishes the presence of the condition. The severity of the condition may be established in part by medical opinion and in part by systematic observation of the particular student. For many students with physi-cal disabilities, the ability to learn is not affected. These students may not require special education classes, but they will need accommodations and modifi cations to the curriculum—and perhaps the school building—that can be managed
Offi cial Student Disabilities 371
through a 504 plan. For example, a student may require a personal care aide to help with positioning, braces, and catheterization; educational technology (for example, a voice-activated computer); and transportation to and from school that can accommodate a wheelchair. When such adaptations and accommodations are insuffi cient to allow adequate school progress, special education is indicated. The specially designed instruction can include alternate assignments, alternative cur-ricula, alternative testing procedures, and special instruction.
Other Health ImpairmentsOther health impairment “means having limited strength, vitality, or alertness, including a heightened alertness to environmental stimuli, that results in limited alertness with respect to the educational environment that (i) is due to chronic or acute health problems such as asthma, attention defi cit disorder or attention defi cit hyperactivity disorder, diabetes, epilepsy, a heart condition, hemophilia, lead poisoning, leukemia, nephritis, rheumatic fever, sickle cell anemia, and Tourette syndrome; and (ii) adversely affects a child’s educational performance.” Diagnosis of health impairments is usually made by physicians, who identify the health problems, and school personnel, who identify the educational disabil-ity. For some students with other health impairments, the ability to learn is not affected. These students may not require special education classes, but they will need accommodations and modifi cations to the curriculum that can be man-aged through a 504 plan. For example, a student may require nursing services to administer medication, times and places to rest during the day, and provisions for instruction in the home. When health impairments adversely affect educational progress even with the curricular adaptations and modifi cations, special educa-tion is indicated.
Deaf–BlindnessDeaf–blindness means “concomitant hearing and visual impairments, the com-bination of which causes such severe communication and other developmental and educational needs that they cannot be accommodated in special education programs solely for children with deafness or children with blindness.”
Only a small number of students are deaf–blind, and their assessment is typi-cally complex. Tests that compensate for loss of vision usually rely on auditory processes; tests that compensate for loss of hearing usually rely on visual processes. Psychological and educational evaluations of students who are both deaf and blind rely on observations as well as interviews of and ratings by individuals suffi ciently familiar with the student to provide useful information. For more information about vision screening, see the material on sensory screening on the student website.
Multiple DisabilitiesMultiple disabilities “means concomitant impairments (such as mental retardation–blindness or mental retardation–orthopedic impairment), the combination of which causes such severe educational needs that they cannot be accommodated in special education programs solely for one of the impairments. The term does not include deaf–blindness.”
372 Chapter 21 ■ Making Special Education Eligibility Decisions
Developmental DelayAlthough not mandated by IDEA, states may use the category of developmental delay for children between the ages of 3 and 9 years who need special education and are “(1) experiencing developmental delays, as defi ned by the state and as measured by appropriate diagnostic instruments and procedures, in one or more of the following areas: physical development, cognitive development, communi-cation development, social or emotional development, or adaptive development; and (2) . . . need special education and related services.” Diagnosis of develop-mental delay is usually made by school personnel, who identify the educational disability, and other professionals (such as speech and language specialists, physi-cians, and psychologists), who identify the delays in the developmental domains.
2 Establishing Educational Need for Special Education
In addition to having one (or more) of the disabilities specifi ed in IDEA, a student must experience a lack of academic success. This criterion is either implicit or explicit in the IDEA defi nitions of disabilities. Autism, hearing impairment, mental retardation, and six other disabling conditions are defi ned as “adversely affecting a child’s educational performance.” Multiple disabilities (such as deaf–blindness) cause “severe educational needs.” Learning disability results in an “imperfect ability” to learn basic academic skills.
Most students without obvious sensory or motor disabilities are presumed to not have disabilities when they enter school. However, during their educa-tion, it becomes clear to school personnel that these students have signifi cant problems. They fail to behave appropriately or to meet state-approved grade-level standards in one or more core achievement areas when provided with appropriate instruction. In short, they demonstrate marked discrepancies from mainstream expectations or from the achievement and behavior of typical peers. The magni-tude of the discrepancy necessary to consider a student for special education is not codifi ed, and there are many opinions on this issue. Whereas some say that a student should be performing at half the level of his or her peers, others believe that only a 20 percent discrepancy demonstrates educational need. Marston and Magnusson (1985) recommend that students receive special education services when they are 2 years behind their peers.
The presence of a discrepancy alone does not establish need, because there are many causes for a discrepancy. Thus, school personnel usually should engage in a number of remedial and compensatory activities designed to reduce or eliminate the discrepancy. As discussed in Chapter 20, interventions initially may be designed and implemented by the classroom teacher. When the teacher’s interventions are unsuccessful, the student is referred to a teacher assistance team that designs and may help implement further interventions. Need for special educational services for students is established when one of two conditions is met. First, if a stu-dent fails to respond to validated and carefully implemented interventions, need for special education is indicated. We address the specifi cs of decision making at greater length in the response-to-intervention materials on the student web-site. Second, successful interventions may be too intensive or extensive for use in regular education. That is, the interventions needed to remediate the student’s
The Multidisciplinary Team 373
academic or behavioral defi cits are so intrusive, labor-intensive, or specialized that a general education classroom teacher cannot implement them without the assistance of a special education teacher or without seriously detracting from the education of other students in the classroom.
Some students have such obvious sensory or motor problems that they are identifi ed as having a disability before they enter school. From accumulated research and professional experience, educators know that students with certain disabilities (for example, blindness, deafness, and severe mental retardation) will not succeed in school without special education. Thus, educators (and relevant regulations) assume that the presence of a severe disability is suffi cient to demon-strate the need for special educational services.
3 The Multidisciplinary Team
The determination that a student has a disability is made by a team of profession-als called a multidisciplinary team (MDT). The team conducts a multidisciplinary evaluation (MDE) by collecting, assembling, and evaluating information to deter-mine whether a student meets the conditions that defi ne a handicap as set forth in IDEA and state law.3
Composition of the MDTIDEA requires that the team have members with the same qualifi cations as those who must serve on IEP teams and “other qualifi ed professionals, as appropriate” (34 CFR §300.533). Thus, the team must include the student’s parents (and the student, if appropriate), a general education teacher, a special education teacher, a representative of the school administration, and an individual who can interpret the instructional implications of evaluation results. If the student is suspected of having a learning disability, the team must also include “at least one person quali-fi ed to conduct individual diagnostic examinations of children, such as a school psychologist, speech–language pathologist, or remedial reading teacher” (34 CFR §300.540). In practice, school psychologists are usually members of most MDTs.
Responsibilities of the MDTThe team is responsible for gathering information and determining if a student has a disability. In theory, the decision-making process is straightforward. The MDT assesses the student to determine whether he or she meets the criteria for a spe-cifi c disability. Thus, the MDT must collect, at a minimum, information required by the defi nition of the disability being considered. Moreover, federal regulations (34 CFR §300.532) require that a student be “assessed in all areas related to the suspected disability, including, if appropriate, health, vision, hearing, social and
3Note that there are two types of teams required under special education law, and the same people may or may not serve on the two types of teams: evaluation teams (usually called MDTs) and indi-vidualized educational program (IEP) teams (always called IEP teams). In addition, many schools have teacher teams (often called child study teams) that deal with student diffi culties before a student is referred for evaluation.
374 Chapter 21 ■ Making Special Education Eligibility Decisions
emotional status, general intelligence, academic performance, communicative sta-tus, and motor abilities.”
In reaching its decision about eligibility, the team must do two things. First, it must draw upon information from a variety of sources, including aptitude and achievement tests, parent input, and teacher recommendations, as well as infor-mation about the child’s physical condition, social or cultural background, and adaptive behavior. Second, it must ensure that information obtained from all of these sources is documented and carefully considered [§300.306(c)].
4 The Process of Determining Eligibility
IDEA has established rules that MDTs must follow in determining whether a student is eligible for special education and related services. The fi rst set of rules provide a variety of procedural safeguards intended to provide students and their parents the right to full and meaningful participation in the evaluation process.
Procedural SafeguardsAs specifi ed in §300.504, school districts and other public agencies must give parents a copy of the procedural safeguards relating to
independent educational evaluation; ■
prior written notice in the native language of the parent or other mode of ■
communication used by the parent;
parental consent; ■
access to educational records; ■
opportunity to present complaints to initiate due process hearings; ■
the child’s placement during pendency of due process proceedings; ■
procedures for students who are subject to placement in an interim ■
alternative educational setting;
requirements for unilateral placement by parents of children in private ■
schools at public expense;
mediation; ■
due process hearings, including requirements for disclosure of evaluation ■
results and recommendations;
state-level appeals (if applicable in that state); ■
civil actions; ■
attorneys’ fees; and ■
the state complaint procedures. ■
Valid AssessmentsThe next set of rules require valid and meaningful assessments. School districts and other public agencies must ensure that students are assessed in all areas related to their suspected disabilities, including, if appropriate, health, vision, hearing, social and
The Process of Determining Eligibility 375
emotional status, general intelligence, academic performance, communicative status, and motor abilities. The evaluations must be suffi ciently comprehensive to identify all of the child’s special education and related services needs, whether or not they are commonly linked to the disability category in which the child has been classifi ed.
School districts and other public agencies must ensure that the assessment includes a variety of techniques, including information provided by the parent, that provide relevant information about
whether the student is a student with a disability; and ■
the student’s involvement and progress in the general curriculum. ■
The assessments must be conducted by trained and knowledgeable personnel in accordance with any instructions provided by the producer of the tests (and if an assessment is not conducted under standard conditions, a description of the extent to which it varied from standard conditions must be provided in the evalu-ation report). As specifi ed in §300.304(c), only tests or other evaluation materials may be used that are
“not racially or culturally discriminatory”; ■
“administered in the child’s native language or other mode of communication” ■
(In addition, for students with limited English profi ciency, districts and other public agencies must select and use materials and procedures that measure the extent to which the child has a disability and needs special education, rather than measuring the child’s English language skills.);
“selected and administered so as best to ensure that if a test is administered ■
to a child with impaired sensory, manual, or speaking skills, the test results accurately refl ect the child’s aptitude or achievement level or whatever other factors the test purports to measure, rather than refl ecting the child’s impaired sensory, manual, or speaking skills (unless those skills are the factors that the test purports to measure)”;
technically sound instruments that may assess the relative contribution of ■
cognitive and behavioral factors, in addition to physical or developmental factors;
“tailored to assess specifi c areas of educational need and not merely designed ■
to provide a single general intelligence quotient”; and
relevant in assisting persons determining the educational needs of the student. ■
Team ProcessThe fi nal set of requirements sets forth the process for determining a student’s eligibility for special education and related services. The MDT team follows four basic steps as specifi ed in §§300.305/306:
1. The team reviews existing evaluation data to determine if additional data are needed.
2. The team gathers any additional data that are needed, ensuring that information obtained from all sources is documented.
3. The team determines if the student is a child with a disability by considering information from a variety of sources (that is, aptitude and achievement tests, parent input, teacher recommendations (including response to intervention), physical condition, social or cultural background, and adaptive behavior)
376 Chapter 21 ■ Making Special Education Eligibility Decisions
and comparing this information to the state and federal standards for the suspected disability.
4. The team prepares an evaluation report.
In practice, deciding whether a student is entitled to special education can be complex. Sometimes, the problems a student is experiencing can suggest a specifi c disability to team members. For example, having problems maintaining atten-tion, being fi dgety, and being disorganized may suggest the possibility of attention defi cit disorder; persistent and major diffi culties learning letter–sound corres-pondences despite many interventions may suggest a learning disability. MDTs should do more than simply confi rm a disability. MDTs should adopt a point of view that is, in part, disconfi rmatory—a point of view that seeks to disprove the working hypothesis.
Many behaviors are indicative of different disabilities. For example, stereotyp-ies such as hand fl apping are associated with autism, severe retardation, and some emotional disturbances. Assessors must be open to alternative explanations for the behavior and, when appropriate, collect information that will allow them to reject a working hypothesis of a particular disability. For example, if Tom was referred for inconsistent performance in expressive language, even though his other skills—especially math and science—were average, an MDT might suspect that he could have a learning disability. What would it take to reject the hypothesis that he has such a disability? He would not be considered to have a learning disability if it could be shown that his problem was caused by a sensorineural hearing loss, his problem arose because his primary language is a dialect of English, he suffered from recur-rent bouts of otitis media (middle ear infections), and so forth. Therefore, the MDT would have to consider other possible causes of his behavior. Moreover, when there is evidence that something other than the hypothesized disability is the cause of the educational problems, the MDT would need to collect additional data that would allow it to evaluate these other explanations. Thus, MDT evaluations frequently (and correctly) go beyond the information required by the entitlement criteria to rule out other possible disabling conditions or to arrive at a different diagnosis.
Finally, in attempting to establish that a student should be classifi ed with a disability, we often must choose among competing procedures and tests. However, as indicated in Chapter 14, individual tests of intelligence are not interchangeable. They differ signifi cantly in the behaviors they sample and in the adequacy of their norms and reliability and slightly in their standard deviations. A dull, but normal, person may earn an IQ of less than 70 on one or two tests of intelligence but earn scores greater than 70 on two others. Thus, if we had to assess such a student, we could be caught in a dilemma of confl icting information.
The routes around and through the eligibility process are easier to state than to accomplish. First, we should choose (and put the most faith in) objective, technically adequate (reliable and well-normed) procedures that have demonstrated validity for the particular purpose of classifi cation. Second, we must consider the specifi c validity. For example, we must consider the culture in which the student grew up and how that culture interacts with the content of the test. A test’s technical manuals may contain information about the wisdom of using the test with individuals of various cultures, or the research literature may have information for the particular cultural group to which a student belongs. Often, theory can guide us in the absence of research. Sometimes it is just not possible to test validly, and we must also recognize that fact.
The Process of Determining Eligibility 377
Cheryl was the youngest of the three children of Jack and Melinda Stenman. Cheryl was a full-term baby but weighed only 1800 grams (4 pounds) at birth. In addition to her signifi cantly low birth weight, she was placed in the neonatal intensive care unit for almost 3 days and was not released from the hospital until she was 10 days old. Although her health during her early years was unremarkable, she was slower to attain the common developmental milestones (walk-ing and talking) than her older siblings.
Cheryl entered a local daycare center at the age of 3 years. Little information is available from the center except the general perception that Cheryl did not en-gage in developmentally appropriate play activities. The daycare center provided no interventions because its philosophy was that each child developed uniquely and there was plenty of time for intervention.
Mrs. Stenman enrolled Cheryl in the local school district’s half-day kindergarten the September when she was 5 years and 8 months of age. Cheryl was slow compared to her peers. She still had toileting accidents, had immature speech and language, and did not engage in cooperative play, preferring paral-lel play instead. At the end of the fi rst semester of kindergarten, she had not learned her colors, whereas her peers had mastered the primary and additive col-ors (that is, red, green, blue, yellow, violet, blue-green, brown, black, and white); she recognized only fi ve capital letters (that is, A, B C, D, and S), whereas most of her peers recognized and could write all upper- and lowercase letters. Her teacher characterized her as fol-lowing other children around but not joining in the various activities. In January, Cheryl’s teacher sought the help of the school’s student assistance team. The team met with Mr. and Mrs. Stenman and agreed that some interventions would be appropriate to try to accelerate her academic progress. They agreed that Cheryl should attend all-day kindergarten and devel-oped a program in which the teachers or the reading
specialist provided individual direct instruction in the recognition and writing of all letters of the alphabet; they also developed a behavior plan that reinforced Cheryl for successive approximations of coopera-tive play. From the very beginning, the classroom interventions did not work. Cheryl would seem to have learned one or two new letters but forget them the next day. The team met with the teacher several times and modifi ed the instructional program, but Cheryl’s progress was slow. She could not seem to master more than two letters per week, and that rate of progress was simply not enough to get her ready for fi rst grade. The results of the behavioral interven-tions were similarly unsuccessful. At the end of the year, all kindergartners received a district screening test. Cheryl scored at or below the fi rst percentile in all academic areas.
The teacher and the student assistance team (which included the parents) weighed various options for Cheryl’s next year: retention, promotion with help from the student assistance team, and referral for an MDE to determine if Cheryl had a disability that required special education and related services. After some discussion, the team was unanimous in its recommendation that Cheryl should be evaluated for eligibility for special education.
An MDT was appointed and consisted of Cheryl’s kindergarten teacher, a special education teacher who worked with children of Cheryl’s age, the school principal (who chaired the meetings), and the school psychologist assigned to Cheryl’s school. At the fi rst team meeting, the principal gave the parents a copy of the procedural safeguards guaranteed by IDEA and the state. The principal also explained each element carefully and answered all of the parents’ questions to their satisfaction. Next, the team reviewed all relevant documents: attendance records, data from the inter-ventions developed by the student assistance team, the results of the district’s routine hearing and vision
Scenario in Assessment
Cheryl
continued on the next page
378 Chapter 21 ■ Making Special Education Eligibility Decisions
screening (which indicated Cheryl was normal), and the results from the district’s fi rst-grade readiness assessment. After reviewing the data and discussing Cheryl’s strengths and weaknesses, the MDT decided that additional data would be necessary to determine if Cheryl was eligible for special education and re-lated services. The team discussed the possibility of special language or cultural considerations and concluded there were none. The team then decided that it needed (1) the results of a valid, individually administered test of intelligence; (2) the results of a valid, individually administered test of achievement; (3) ratings from a validly administered scale of social and emotional development; and (4) the ratings from a valid evaluation of adaptive behavior. The principal would be responsible for distributing and collecting the results from the social–emotional rating scale; the school psychologist would be responsible for admin-istering and scoring the test of intelligence and the adaptive behavior scale and also for scoring and in-terpreting the social–emotional ratings provided by the teachers.
The testing went smoothly. Teachers completed the Behavior Assessment System for Children, Second Edition; the parents completed the Vineland Adap-tive Behavior Scales, Second Edition; and the school psychologist administered the Wechsler Intelligence Scale for Children–Fourth Edition and the Stanford–Binet Intelligence Scale, Fifth Edition. The school psychologist drafted an evaluation report and dis-tributed copies to each team member. The MDT then met to consider the results of their evaluation and to decide if additional data might be needed to make sure that their evaluation examined all areas of potential disability. If the evaluation results were complete and suffi cient, the team would decide if Cheryl was a student with a disability under IDEA and state law. The school psychologist affi rmed that all of the instruments were administered under stan-dard conditions and that she believed the results to be valid. She next interpreted the evaluation results and answered all of the questions posed by the parents
and educators. The results indicated that Cheryl’s level of general intellectual functioning was 59 ± 4 points. Her achievement in Reading, Mathematics, and Written Language was at the second percentile. Her parent’s ratings of adaptive behavior resulted in a composite (total) score of 64, with Daily Living her area of highest functioning and Communication her lowest area. Although the evaluation results sug-gested that Cheryl was a student with mental retarda-tion, the parents believed that Cheryl was too young to be diagnosed with such a stigmatizing diagnosis. After some discussion, the team unanimously agreed that a diagnosis of developmental delay would be appropriate at that time. Cheryl met the criteria for that disability, and she would not be 9 years of age for almost 3 years.
The MDT next turned to the question of need for special education. The team relied heavily on Cheryl’s lack of progress when she was given the maximum amount of intervention services with-in the regular education curriculum. Clearly, she needed more services. The MDT added recommen-dations for special education and related services to the evaluation report. The team noted that Cheryl needed direct instruction in the core academic ar-eas of reading, writing, and mathematics. The team recommended that Cheryl’s social interactions be monitored for possible intervention later in the fi rst semester. The MDT also recommended that Cheryl be evaluated by a speech and language therapist to determine if the teacher should have ongoing consul-tations with the therapist about curriculum or meth-ods and/or if Cheryl would benefi t from direct speech and language services. The team also recommended that Cheryl should be included in all nonacademic activities with her same-age peers. Finally, it recom-mended that Cheryl receive her special education services from an itinerant special education teacher in the general education classroom who would also consult with the regular education teacher, who would also be implementing portions of Cheryl’s educational program.
Scenario in Assessment, (continued)
Problems in Determining Special Education Eligibility 379
5 Problems in Determining Special Education Eligibility
Four problems with the criteria used to determine eligibility for special services are especially noteworthy. First, we fi nd the prevalent (but mistaken) belief that special educational services are for students who could benefi t from them. Thus, in many circles, educational need is believed to be suffi cient for entitlement. Clearly, this belief is contradicted by pertinent law, regulations, and litigation. Students must need the services and meet the criteria for a specifi c disability. Nonetheless, some educators have such strong humanitarian beliefs that when they see students with problems, they want to get those students the services that they believe are needed. Too often, the regulations may be bent so that students fi t entitlement criteria.
Second, the defi nitions that appear in state and federal regulations are fre-quently very imprecise. The imprecision of federal regulations creates variability in standards among states, and the imprecision of state regulations creates variability in standards among districts within states. Thus, students who are eligible in one state or district may not be eligible in other states or districts. For example, some states and school districts may defi ne a learning disability as a severe discrepancy between measured intellectual ability and actual school achievement. However, there is no consensus about the meaning of “severe discrepancy”; certainly, there is no widely accepted mathematical formula to ascertain severe discrepancy. To some extent, discrepancies between achievement and intelligence are determined by the specifi c tests used. Thus, one test battery might produce a signifi cant dis-crepancy, whereas another battery would not produce such a discrepancy for the same student. Other states and school districts may defi ne a learning disability by an inadequate response to intervention. Yet, what constitutes an inadequate response is ambiguous.
Third, the defi nitions treat disabilities as though they were discrete categories. However, most diagnosticians are hard-pressed to distinguish between primary and secondary mental retardation or between primary and secondary emotional disturbance. Also, for example, distinctions between individuals with autism and individuals with severe mental retardation and autistic-like behaviors are practi-cally impossible to make with any certainty.
Fourth, parents may often prefer the label associated with one disability (for example, autism or learning disability) over the label associated with another (for example, mental retardation). Because of the procedural safeguards afforded students with special needs and their parents, school districts may become embroiled in lengthy and unnecessarily adversarial hearings in which each side has an expert testifying that a particular label is correct even though those labels are contradictory and sometimes mutually exclusive. School personnel fi nd them-selves in a no-win situation because the defi nitions and their operationalizations are so imprecise. As a result, school districts frequently give parents the label they want rather than what educators, in their best professional judgments, believe to be correct. Districts may be reluctant to risk litigation because parents can frequently fi nd an expert to contradict the district staff members. In some states, special educational services are noncategorical. In these states, a label qualifi es a student for special education but does not determine the nature of the special education; that is determined by the individual student’s needs, not label.
380 Chapter 21 ■ Making Special Education Eligibility Decisions
CHAPTER COMPREHENSION QUESTIONSWrite your answers to each of the following questions, and then compare your responses to the text or the study guide.
1. List and defi ne each disability recognized by IDEA.
2. How is the need for special education established?
3. What are the responsibilities of the MDT?
4. What procedural safeguards are guaranteed by IDEA?
5. What constitutes a valid assessment under IDEA?
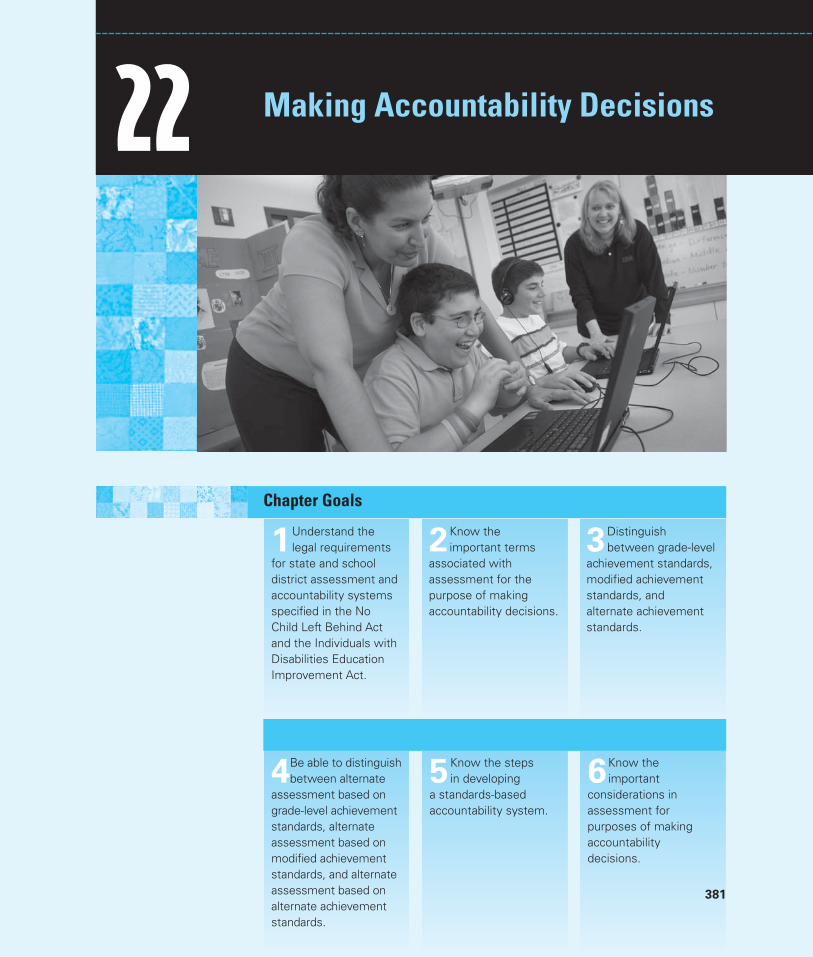
Chapter Goals
1Understand the legal requirements
for state and school district assessment and accountability systems specifi ed in the No Child Left Behind Act and the Individuals with Disabilities Education Improvement Act.
3Distinguish between grade-level
achievement standards, modifi ed achievement standards, and alternate achievement standards.
2Know the important terms
associated with assessment for the purpose of making accountability decisions.
22 Making Accountability Decisions
4Be able to distinguish between alternate
assessment based on grade-level achievement standards, alternate assessment based on modifi ed achievement standards, and alternate assessment based on alternate achievement standards.
6Know the important
considerations in assessment for purposes of making accountability decisions.
5Know the steps in developing
a standards-based accountability system.
381
382 Chapter 22 ■ Making Accountability Decisions
Key Termsaccountability
adequate yearly progress
modifi ed achievement standards
content standards
performance standards
alternate achievement standards
assessment alignment
alternate assessment
benchmarks
cut scores
out-of-level testing
Are our schools producing the results we want? To what extent are individual students meeting the goals, standards, or outcomes that their schools have set for them? What goals or standards should we expect students and schools to meet? How should we assess progress toward meeting standards? During the past 15 years, there has been an increased focus on the results of education for all students, including students with disabilities. In this chapter, we examine the collection and use of assessment information for the purpose of making account-ability decisions.
A powerful idea dominates policy discussions about schools: the notion that “students should be held to high, common standards for academic performance and that schools and the people who work in them should be held accountable for ensuring that students—all students—are able to meet those standards” (Elmore, 2002, p. 3). It has not always been that way. Until the early to mid-1990s, school personnel focused on the process of providing services to students. They provided evidence that they were teaching students, and often evidence that they were teaching specifi c types of students (for example, Title 1, mentally retarded, deaf, or disadvantaged students). When administrators were asked about special education students or services, typically they described the numbers and kinds of students who were tested or taught, the settings in which they were taught, or the numbers of special education teachers who tested and taught them (for example, “We have 2,321 students with disabilities in our district; 1,620 are educated in general edu-cation classes with special education supports, and the remainder are in resource rooms, self-contained classes and out-of-school settings; the students are served by 118 special education teachers and 19 related services personnel”). Few admin-istrators could provide evidence for the results or outcomes of the services being provided. Since the early 1990s, there has been a dramatic shift in focus from serv-ing students with disabilities to measuring the results of the services provided. This shift has paralleled the total quality management (TQM; Deming, 1994, 2000), results-based management, and management by objectives (Olson, 1964) move-ments in business and, more recently, in federal and state government.
Much of the impetus for this shift to a focus on results was the publication of A Nation at Risk: The Imperative for Educational Reform (National Commission of Excellence in Education, 1983). In this document, the then-secretary of educa-tion revealed the low status of U.S. schoolchildren relative to their counterparts in other nations and reported that “the educational foundations of our society are presently being eroded by a rising tide of mediocrity that threatens our very future as a nation and a people” (p. 5). In this report, the secretary argued that the nation was at risk because mediocrity, not excellence, was the norm in education. Recommendations included more time for learning; better textbooks and other materials; more homework; higher expectations; stricter attendance policies; and
Making Accountability Decisions 383
improved standards, salaries, rewards, and incentives for teachers. The entire nation began to focus on raising educational standards, measuring performance, and achieving results. Policymakers and bureaucrats, who had been spending a great deal of money to fund special education, began demanding evidence of its effectiveness. In essence, they employed the old saw, “The proof of the pudding is in the eating”—arguing that it matters little what you do if it does not produce what you want.
In 1994, the Clinton administration specifi ed a set of national education goals. Called “Goals 2000,” these were a list of goals that students should achieve by the year 2000. The 1994 reauthorization of the Elementary and Secondary Education Act, known as the Improving American Schools Act, included a requirement that in Title I schools, disadvantaged students should be expected to attain the same chal-lenging standards as all other students. The 1997 reauthorization of the Individuals with Disabilities Education Act (IDEA) included provisions specifying that students with disabilities should participate in states’ assessment and accountability systems; that states needed to specify standards to be attained by all students; and that states would report each year on the extent to which all students, including students with disabilities, met state-specifi ed standards. In 2004, Congress again amended IDEA and reaffi rmed those requirements. The No Child Left Behind Act of 2001 (NCLB; a portion of the Improving America’s Schools Act) included requirements that states report annually on the performance and progress of all students. All states now have accountability systems and are required by law to report on the par-ticipation and performance of students with disabilities on their state assessments. Within state or district systems, there may be two kinds of accountability. One kind assigns responsibility to the student (student accountability) and the other assigns responsibility to the educational system or individuals within that system (system accountability). System accountability is designed to improve educational programs, whereas student accountability is designed to motivate students to do their best. System accountability is the focus of federal education reform efforts. All states have some type of system accountability, but not all states have student accountability. Accountability systems hold schools responsible for helping all stu-dents reach high challenging standards, and they provide rewards to schools that reach those standards and sanctions to schools that do not. States or school dis-tricts specify goals they aim to achieve and then apply certain positive or negative consequences meant to promote reform to schools that meet certain performance criteria in specifi c areas (Marion & Gong, 2003).
Today, the consequences of accountability systems are becoming more signifi -cant, often referred to as “high stakes.” States are relying on evidence from state and district assessments to determine high stakes. The most common high-stakes use of assessment evidence for individual students is to determine whether a stu-dent receives a standard high school diploma or some other type of document. Another type of student accountability, appearing with increasing frequency, is the use of test scores to determine whether a student will move from one grade to another. All states are required to have an accountability system with sanctions and rewards. Imposing sanctions to schools or administrators is slightly more prevalent than providing rewards. Among the sanctions that states commonly use are assigning negative labels to schools, removing staff, and fi ring principals. Rewards include assigning positive labels to schools and giving extra funding to schools or cash awards to staff.
384 Chapter 22 ■ Making Accountability Decisions
Steven is a third-grade student diagnosed with autism. Steven receives instruction in the general education setting for most of his day, although he needs a teacher assistant to assist with implementation of his compre-hensive behavior plan. This plan involves providing him with a variety of cues and reminders about the daily classroom schedule and how he is expected to behave during various activities. He has a very diffi cult time behaving appropriately when there are changes in the classroom schedule; in such cases, he often becomes very anxious, sometimes throws tantrums, and rarely completes his work.
This is the fi rst year that Steven is expected to complete the statewide assessment used for account-ability purposes, and his individualized education program team must determine how he can best par-ticipate. At fi rst, Steven’s parents are very concerned that he will have an anxious reaction to testing, and they do not want him to participate. His general edu-cation teacher is also fearful that he will not be able to focus and complete the test.
Steven’s school district has been warned by the state that it needs to increase its rates of participa-tion of students with disabilities in the statewide assessment; in the past, many students with disabili-ties were excluded from statewide testing. Steven’s school is under considerable pressure to show that it is including all students, particularly those with disabilities, in the accountability program. At the meeting, the administrator, special educator, and school psychologist explain how important it is for Steven to participate, in order for the education that he and students like him receive to be of concern to
those who help in determining how resources will be allocated throughout the district. They also point out how he is working toward all the same grade-level achievement standards as other students, and that his participation may help them determine what he can and cannot do. They explain the variety of ways in which Steven can be accommodated during testing. For instance, they can continue to have the teacher assistant implement his behavior management plan. They can role play in the days prior to the test what the test will be like. Also, they can develop a picture schedule that is similar to the one he uses in the class-room to go along with the testing schedule.
After presenting the underlying rationale for having Steven participate, as well as the ways in which he could be accommodated during testing, the team agrees that it is appropriate to have Steven attempt the statewide assessment toward grade-level achievement standards. His teacher assistant is pro-vided specifi c training on how she can and cannot assist Steven during testing in order to ensure that his results are as accurate as possible.
The day of the test was considerably draining for Steven and his teacher assistant, but Steven man-aged to complete the test. Although his total score fell below the profi ciency standard, and his teachers questioned whether it is an optimal measure of his skills and knowledge, his teachers and parents were impressed with the fact that he did not score in the lowest profi ciency category. In fact, Steven was able to correctly answer many of the items on the test; he was able to demonstrate some of what he knew when pro-vided appropriate accommodations during testing.
Scenario in Assessment
Steven
1 Legal Requirements
The 1997 reauthorization of IDEA challenged all states to develop accountability systems that were sensitive to the educational progress of all students. The law was based on the beliefs that all children can learn, all students are to be held to the same
Its All About Meeting Standards 385
high standards, and schools should be held accountable to ensure that all students are achieving to the same high standards. IDEA 1997 introduced the requirement for alternate assessments. The law led to a push for specifi cation of standards, devel-opment of assessments to measure student progress toward standards, and annual reporting on how schools and students are doing. It required alternate assessments for all students unable to participate in statewide assessments even with accommo-dations. The 2004 reauthorization of IDEA contains those same requirements.
NCLB included the requirement that states have assessment and account-ability systems, report annually on the performance and progress of all students, and have alternate assessments in place for reporting on the annual yearly prog-ress of all students in reading, math, and science. In 2003, the U.S. Department of Education issued a set of guidelines for alternate assessments that included the concept of alternate achievement standards. States, school districts, and indi-vidual schools are required by law to measure the performance and progress of all students, and school personnel need to know much about how assessment information is used by State Education Agency personnel to make accountability decisions. The law requires that school systems consider not only how their stu-dents are doing as a whole but also how particular groups of students are doing. To be considered successful, schools must succeed with all students.
2 Important Terminology
The standards-based assessment and accountability movement and the federal laws that accompany it have brought a new assessment vocabulary that includes terms such as “alternate achievement standards,” “modifi ed achievement stan-dards,” “adequate yearly progress,” and “schools in need of improvement.” Some of these terms are used in many different ways in the professional and popular literature. In fact, the multiple uses of the terms cause confusion. The Council of Chief State School Offi cers publishes a Glossary of Assessment Terms and Acronyms Used in Assessing Special Education, which is a good source of defi -nitions for terms used in assessment and accountability systems. We include an adapted version of this glossary in Table 22.1.
3 It’s All About Meeting Standards
Assessments completed for accountability purposes involve measuring the extent to which students are learning what we want them to learn, or the extent to which school systems are accomplishing what we want them to accomplish. To do this, state education agency personnel must specify the standards that schools and stu-dents will work toward. They typically do so by specifying a set of academic content standards, which are statements of the subject-specifi c knowledge and skills that schools are expected to teach students, indicating what students should know and be able to do. States are required by law to specify academic content standards in reading, math, and science. Many states specify academic content standards in other areas. States must also specify academic achievement standards (sometimes called performance standards), which are statements of the levels at which or the
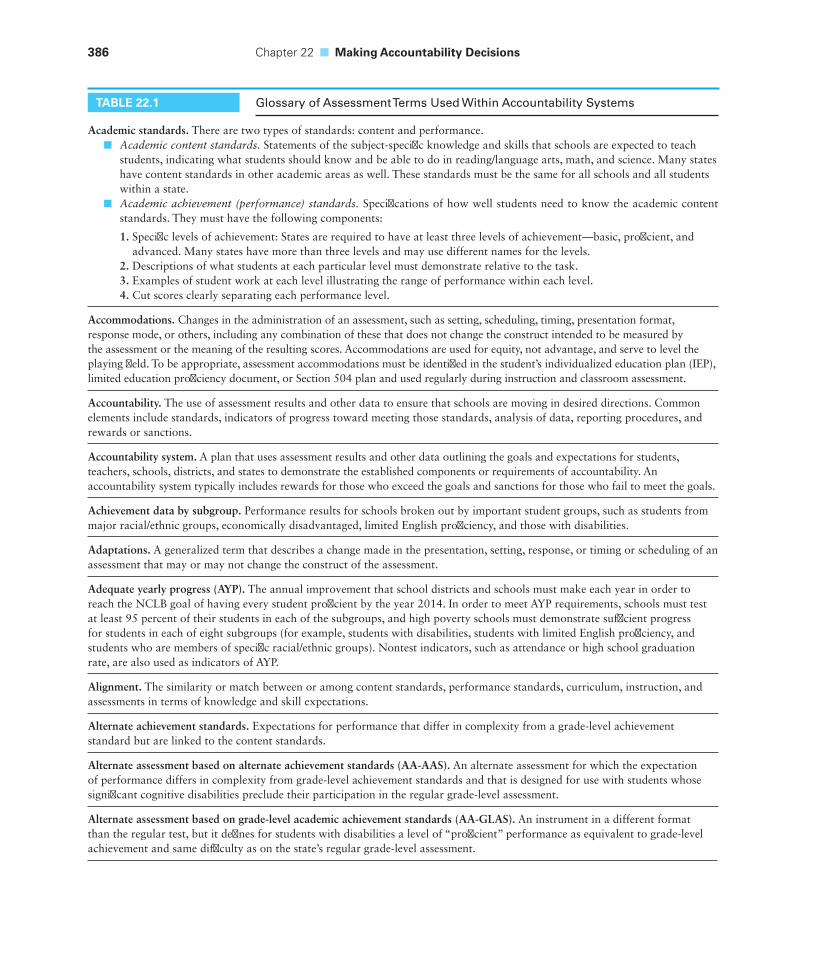
386 Chapter 22 ■ Making Accountability Decisions
TABLE 22.1 Glossary of Assessment Terms Used Within Accountability Systems
Academic standards. There are two types of standards: content and performance.Academic content standards. ■ Statements of the subject-specifi c knowledge and skills that schools are expected to teach students, indicating what students should know and be able to do in reading/language arts, math, and science. Many states have content standards in other academic areas as well. These standards must be the same for all schools and all students within a state.Academic achievement (performance) standards. ■ Specifi cations of how well students need to know the academic content standards. They must have the following components:
1. Specifi c levels of achievement: States are required to have at least three levels of achievement—basic, profi cient, and advanced. Many states have more than three levels and may use different names for the levels.
2. Descriptions of what students at each particular level must demonstrate relative to the task.3. Examples of student work at each level illustrating the range of performance within each level.4. Cut scores clearly separating each performance level.
Accommodations. Changes in the administration of an assessment, such as setting, scheduling, timing, presentation format, response mode, or others, including any combination of these that does not change the construct intended to be measured by the assessment or the meaning of the resulting scores. Accommodations are used for equity, not advantage, and serve to level the playing fi eld. To be appropriate, assessment accommodations must be identifi ed in the student’s individualized education plan (IEP), limited education profi ciency document, or Section 504 plan and used regularly during instruction and classroom assessment.
Accountability. The use of assessment results and other data to ensure that schools are moving in desired directions. Common elements include standards, indicators of progress toward meeting those standards, analysis of data, reporting procedures, and rewards or sanctions.
Accountability system. A plan that uses assessment results and other data outlining the goals and expectations for students, teachers, schools, districts, and states to demonstrate the established components or requirements of accountability. An accountability system typically includes rewards for those who exceed the goals and sanctions for those who fail to meet the goals.
Achievement data by subgroup. Performance results for schools broken out by important student groups, such as students from major racial/ethnic groups, economically disadvantaged, limited English profi ciency, and those with disabilities.
Adaptations. A generalized term that describes a change made in the presentation, setting, response, or timing or scheduling of an assessment that may or may not change the construct of the assessment.
Adequate yearly progress (AYP). The annual improvement that school districts and schools must make each year in order to reach the NCLB goal of having every student profi cient by the year 2014. In order to meet AYP requirements, schools must test at least 95 percent of their students in each of the subgroups, and high poverty schools must demonstrate suffi cient progress for students in each of eight subgroups (for example, students with disabilities, students with limited English profi ciency, and students who are members of specifi c racial/ethnic groups). Nontest indicators, such as attendance or high school graduation rate, are also used as indicators of AYP.
Alignment. The similarity or match between or among content standards, performance standards, curriculum, instruction, and assessments in terms of knowledge and skill expectations.
Alternate achievement standards. Expectations for performance that differ in complexity from a grade-level achievement standard but are linked to the content standards.
Alternate assessment based on alternate achievement standards (AA-AAS). An alternate assessment for which the expectation of performance differs in complexity from grade-level achievement standards and that is designed for use with students whose signifi cant cognitive disabilities preclude their participation in the regular grade-level assessment.
Alternate assessment based on grade-level academic achievement standards (AA-GLAS). An instrument in a different format than the regular test, but it defi nes for students with disabilities a level of “profi cient” performance as equivalent to grade-level achievement and same diffi culty as on the state’s regular grade-level assessment.
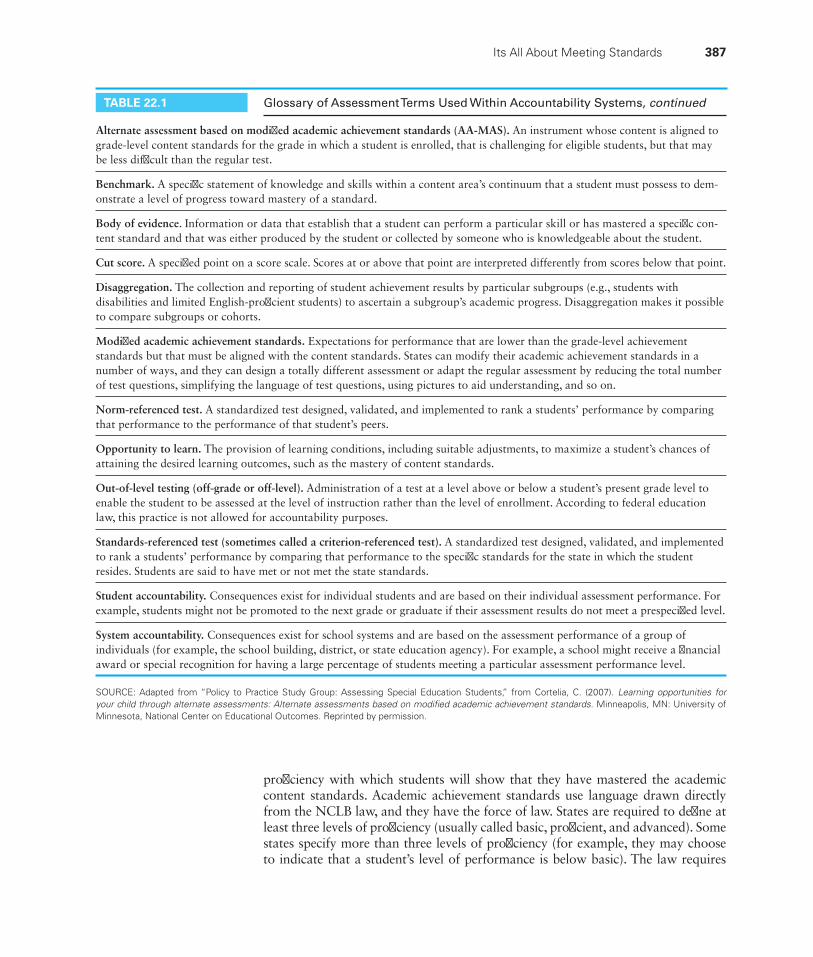
Its All About Meeting Standards 387
TABLE 22.1 Glossary of Assessment Terms Used Within Accountability Systems, continued
Alternate assessment based on modifi ed academic achievement standards (AA-MAS). An instrument whose content is aligned to grade-level content standards for the grade in which a student is enrolled, that is challenging for eligible students, but that may be less diffi cult than the regular test.
Benchmark. A specifi c statement of knowledge and skills within a content area’s continuum that a student must possess to dem-onstrate a level of progress toward mastery of a standard.
Body of evidence. Information or data that establish that a student can perform a particular skill or has mastered a specifi c con-tent standard and that was either produced by the student or collected by someone who is knowledgeable about the student.
Cut score. A specifi ed point on a score scale. Scores at or above that point are interpreted differently from scores below that point.
Disaggregation. The collection and reporting of student achievement results by particular subgroups (e.g., students with disabilities and limited English-profi cient students) to ascertain a subgroup’s academic progress. Disaggregation makes it possible to compare subgroups or cohorts.
Modifi ed academic achievement standards. Expectations for performance that are lower than the grade-level achievement standards but that must be aligned with the content standards. States can modify their academic achievement standards in a number of ways, and they can design a totally different assessment or adapt the regular assessment by reducing the total number of test questions, simplifying the language of test questions, using pictures to aid understanding, and so on.
Norm-referenced test. A standardized test designed, validated, and implemented to rank a students’ performance by comparing that performance to the performance of that student’s peers.
Opportunity to learn. The provision of learning conditions, including suitable adjustments, to maximize a student’s chances of attaining the desired learning outcomes, such as the mastery of content standards.
Out-of-level testing (off-grade or off-level). Administration of a test at a level above or below a student’s present grade level to enable the student to be assessed at the level of instruction rather than the level of enrollment. According to federal education law, this practice is not allowed for accountability purposes.
Standards-referenced test (sometimes called a criterion-referenced test). A standardized test designed, validated, and implemented to rank a students’ performance by comparing that performance to the specifi c standards for the state in which the student resides. Students are said to have met or not met the state standards.
Student accountability. Consequences exist for individual students and are based on their individual assessment performance. For example, students might not be promoted to the next grade or graduate if their assessment results do not meet a prespecifi ed level.
System accountability. Consequences exist for school systems and are based on the assessment performance of a group of individuals (for example, the school building, district, or state education agency). For example, a school might receive a fi nancial award or special recognition for having a large percentage of students meeting a particular assessment performance level.
SOURCE: Adapted from “Policy to Practice Study Group: Assessing Special Education Students,” from Cortelia, C. (2007). Learning opportunities for your child through alternate assessments: Alternate assessments based on modifi ed academic achievement standards. Minneapolis, MN: University of Minnesota, National Center on Educational Outcomes. Reprinted by permission.
profi ciency with which students will show that they have mastered the academic content standards. Academic achievement standards use language drawn directly from the NCLB law, and they have the force of law. States are required to defi ne at least three levels of profi ciency (usually called basic, profi cient, and advanced). Some states specify more than three levels of profi ciency (for example, they may choose to indicate that a student’s level of performance is below basic). The law requires
388 Chapter 22 ■ Making Accountability Decisions
that all students be assessed related to the state content and achievement standards. The state must provide for students with disabilities reasonable adaptations and accommodations necessary to measure their academic achievement relative to state academic content and state student academic achievement standards.
Two other kinds of standards apply specifi cally to students with disabilities: alternate achievement standards and modifi ed achievement standards. Alternate achievement standards are expectations for performance that differ in complexity from grade-level achievement standards, but they are linked to those general edu-cation standards. States are permitted to defi ne alternate achievement standards to evaluate the achievement of students with the most signifi cant cognitive dis-abilities. Modifi ed achievement standards are intended to provide reliable and valid information about the academic achievement and progress of a unique group of students. These students are pursuing grade-level academic content standards and attend general education classes with their peers, but they have “persistent academic disabilities”—that is, their performance may be hampered by signifi cant learning disabilities and other cognitive limitations. These students’ IEP teams are reason-ably certain they are not likely to achieve grade-level profi ciency within the school year covered by the IEP. Although the meaning of the term “modifi ed achievement standards” is still being debated, and although the concept may well change by the time this book appears in print, modifi ed standards are specifi ed for students who have not responded to appropriate instruction and for whom an IEP team believes will not learn grade-level academic content with the same depth and breadth as other students and whose learning is likely to progress more slowly. These are students whose cognitive academic functioning and instructional programs make them ineligible for the alternate assessments based on alternate achievement stan-dards that are intended for students with signifi cant cognitive disabilities, and for whom general education grade-level assessments are considered inappropriate, even with test accommodations. The National Center on Educational Outcomes (NCEO) has produced some very helpful documents on alternate assessments based on modifi ed achievement standards, including the following:
States’ Alternate Assessments Based on Modifi ed Achievement Standards ■ (AA-MAS) (Synthesis Report 67)
Identifying Students with Disabilities Who Are Eligible to Take an Alternate ■
Assessment Based on Modifi ed Academic Achievement Standards
A Technical Design and Documentation Workbook for Assessments Based on ■
Modifi ed Achievement Standards
All three documents are available at the NCEO website (www.cehd.umn.edu/nceo/).
Standards-based assessment is characterized by specifying what all students can be expected to learn and then expecting that time will vary but that all will achieve the standards. States are required to have in place assessments of student profi ciency relative to academic content standards. The following are reasons why school personnel would want to assess student performance and progress relative to standards in addition to the state tests:
To ascertain the extent to which individual students are meeting state ■
standards—that is, accomplishing what it is that society wants them to accomplish
Its All About Meeting Standards 389
To identify student strengths and weaknesses for instructional planning ■
To allocate supports and resources ■
To ascertain the extent to which specifi c schools within states are providing ■
the kinds of educational opportunities and experiences that enable their students to achieve state-specifi ed standards
To provide data on student or school performance that can be helpful ■
in making instructional policy decisions (curricula or instructional methodologies to use)
To decide who should receive a diploma as indicated by performance on tests ■
that measure whether standards are met
To inform the public on the performance of schools or school districts ■
To know the extent to which specifi c subgroups of students are meeting ■
specifi ed standards
Alternate AssessmentRegardless of where students receive instruction, all students with disabilities should have access to, participate in, and make progress in the general curriculum. Thus, all students with disabilities must be included in state assessment systems and in state reporting of AYP toward meeting the state’s standards. We have noted that states must specify academic content standards and academic achievement standards, and they must have assessments aligned to those standards. To address the needs of students with substantial concerns, states may choose to develop alternate achievement standards and modifi ed achievement standards that are based on the expectations for all students.
States must include all students in their assessment and accountability sys-tems. However, not all students can participate in the general state assessments, even with assessment accommodations designed to compensate for their spe-cifi c needs. IDEA 1997 included a provision that by the year 2000 states would have in place alternate assessments intended for use with those students who evidenced severe cognitive impairments. In August 2002, the U.S. Secretary of Education proposed a regulation to allow states to develop and use alternate achievement standards for students with the most signifi cant cognitive disabili-ties for the purpose of determining the AYP of states, local education agencies, and schools. In August 2003, the secretary specifi ed that the number of students considered profi cient using alternate assessments toward alternate achievement standards could not exceed 1 percent of all students, and on April 7, 2005, the Secretary of Education issued a rule that states could have an alternate assess-ment for an additional group of students who evidence persistent academic diffi culties and thus are working toward “modifi ed achievement standards.” Although there is no limit on the number of students to whom an AA-MAS can be given, states cannot count as profi cient more than 2 percent of students based on the AA-MAS. The term “modifi ed achievement standards” was not defi ned. States thus may count as profi cient up to 1 percent of students in the alternate assessment intended for students with signifi cant cognitive disabilities who are working toward alternate achievement standards and 2 percent of students in an alternate assessment intended for students with “persistent aca-demic diffi culties” who are working toward modifi ed achievement standards.
390 Chapter 22 ■ Making Accountability Decisions
An alternate assessment is defi ned in the NCLB federal regulations as “an assessment designed for the small number of students with disabilities who are unable to participate in the regular state assessment, even with appropriate accom-modations.” It is further indicated that “an alternate assessment may include materials collected under several circumstances, including (1) teacher observation of the student, (2) samples of student work produced during regular classroom instruction that demonstrate mastery of specifi c instructional strategies . . . , or (3) standardized performance tasks produced in an ‘on demand’ setting, such as completion of an assigned task on test day” (p. 7). The assessments must yield results separately in both reading/language arts and mathematics, and they must be designed and implemented in a manner that supports use of the results as an indicator of AYP.
Alternate assessments are not simply compilations of student work, some-times referred to as box or folder stuffi ng. Rather, they must have a clearly defi ned structure, specifi c participation guidelines, and clearly defi ned scoring criteria and procedures; must meet requirements for technical adequacy; and must have a reporting format that clearly communicates student performance in terms of the academic achievement standards specifi ed by the state. They must meet the same standards for technical adequacy as does the general assessment. It has been a struggle for some states to satisfy this NCLB requirement. Alternate assessments may be needed for students with a broad array of disabling conditions, so a state may use more than one alternate assessment.
Alternate assessments can be designed to measure student performance toward grade-level standards, alternate achievement standards, or modifi ed achievement standards. Recall that an alternate achievement standard is an expectation of per-formance that differs in complexity from a grade-level standard. For example, the Massachusetts Curriculum Frameworks include the following content standard: “Students will identify, analyze, and apply knowledge of the purpose, structure, and elements of nonfi ction or informational materials and provide evidence from the text to support their understanding.” A less complex demonstration of this standard is “to gain information from signs, symbols, and pictures in the environ-ment”; a more complex demonstration is to “gain information from captions, titles, and table of contents in an informational text” (Massachusetts Department of Education, 2001). As previously mentioned, modifi ed achievement standards are a very new concept, and many are only in the very beginning stages of consid-ering what these standards might look like (Figure 22.1).
4 Developing Standards-Based Accountability Systems
Nationally, there is no consensus on educational standards. States have been devel-oping standards-based accountability systems, and these are revised and rewritten regularly. There is also much debate about whether alternate assessments must be aligned to the general education standards or simply linked to those standards. The National Center on Educational Outcomes developed a self-study guide for states and school districts to use in the development of accountability systems (Ysseldyke & Thurlow, 1993). In this section, we rely on the content of the self-study guide and describe the process that a school or school district would go
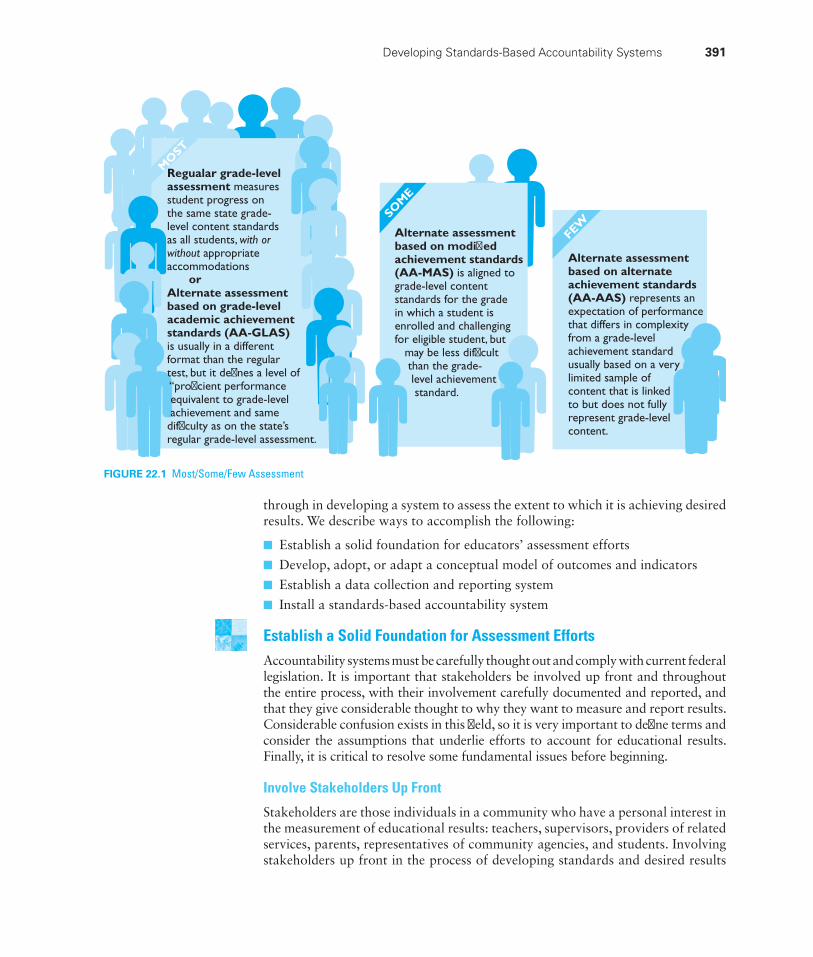
Developing Standards-Based Accountability Systems 391
MO
ST
SOM
E
FEW
or
Regualar grade-levelassessment measuresstudent progress onthe same state grade-level content standardsas all students, with orwithout appropriateaccommodations
Alternate assessmentbased on grade-levelacademic achievementstandards (AA-GLAS)is usually in a differentformat than the regulartest, but it defines a level of “proficient performance equivalent to grade-level achievement and samedifficulty as on the state’sregular grade-level assessment.
Alternate assessmentbased on modifiedachievement standards(AA-MAS) is aligned to grade-level contentstandards for the gradein which a student isenrolled and challengingfor eligible student, but may be less difficult than the grade- level achievement standard.
Alternate assessmentbased on alternateachievement standards(AA-AAS) represents anexpectation of performancethat differs in complexityfrom a grade-levelachievement standardusually based on a verylimited sample ofcontent that is linkedto but does not fullyrepresent grade-levelcontent.
FIGURE 22.1 Most/Some/Few Assessment
through in developing a system to assess the extent to which it is achieving desired results. We describe ways to accomplish the following:
Establish a solid foundation for educators’ assessment efforts ■
Develop, adopt, or adapt a conceptual model of outcomes and indicators ■
Establish a data collection and reporting system ■
Install a standards-based accountability system ■
Establish a Solid Foundation for Assessment EffortsAccountability systems must be carefully thought out and comply with current federal legislation. It is important that stakeholders be involved up front and throughout the entire process, with their involvement carefully documented and reported, and that they give considerable thought to why they want to measure and report results. Considerable confusion exists in this fi eld, so it is very important to defi ne terms and consider the assumptions that underlie efforts to account for educational results. Finally, it is critical to resolve some fundamental issues before beginning.
Involve Stakeholders Up Front
Stakeholders are those individuals in a community who have a personal interest in the measurement of educational results: teachers, supervisors, providers of related services, parents, representatives of community agencies, and students. Involving stakeholders up front in the process of developing standards and desired results
392 Chapter 22 ■ Making Accountability Decisions
enhances their feeling of investment in the assessment process and their desire to participate in it. Involvement up front empowers those individuals or groups to chart their own activities and futures.
Decide Why We Measure and Account for Results
There are four major reasons why stakeholders want to measure educational results: instructional improvement, public accountability, public information, and policy formulation. First, data on the results of service provision can be useful in improv-ing instructional programs for students. In fact, to improve instructional practices, it is imperative that school personnel have data illustrating the extent to which what they are doing is achieving the desired results. For example, school personnel might want to know the extent to which the math curriculum they are using is resulting in students earning high scores on math tests. Knowledge of results enables profession-als to consider making changes in instructional programs. For instructional improve-ment, it is important that stakeholders reach agreement on assessment goals.
Second, data on results are important for accountability—to document for people in authority that desired goals are being met. Tests are regularly given to students, and data indicating how pupils are doing are provided to state agencies and school districts within states. The test scores can be used by legislators and policymakers to decide whether they are getting their money’s worth from funds invested in education.
Third, data on educational results are useful in providing public information on the outcomes of schooling. You may have seen reports in newspapers indicating how the nation’s youth is doing in math, reading, science, or other forms of literacy.
Fourth, data on results are useful in policy formulation. Those who formulate educational policy repeatedly indicate the need to have information about outcomes of schooling in order to allocate resources and establish instructional processes.
Consider the Assumptions That Underlie an Accountability System
Any accountability system is based on a number of assumptions. Those who want to assess educational results will have to consider carefully the assumptions that underlie the system they develop. There is general agreement on the following:
Accountability systems are needed for all students and, at the broadest level, ■
should apply to all students, regardless of the characteristics of individuals.
Accountability systems should primarily focus on intended outcomes but be ■
sensitive to unintended outcomes of schooling.
Indicators of results for students receiving special education services should ■
be related, conceptually and statistically, to those identifi ed for students without disabilities.
Indicators should refl ect the diversity of gender, culture, race, and other ■
characteristics of the students in today’s school population.
An accountability system should provide the data needed to make policy ■
decisions at the national, state, and local levels.
An accountability system should be fl exible, dynamic, and responsive to ■
review and criticism. It should also change to meet identifi ed needs and future developments in the measurement of educational inputs, contexts, processes, and results.
Developing Standards-Based Accountability Systems 393
Decide What Data Will Be Collected and What Rewards and Sanctions Will Be UsedSpecify Content Domains for Data Collection
School personnel typically restrict data collection to academic content domains. In some instances, states specify both academic and functional literacy domains.
Specify Rewards and Sanctions
Educational professionals must decide the kinds of rewards that will be provided for students, teachers, schools, and districts who provide evidence of making annual yearly progress for all students. Also, they must specify the kinds of sanc-tions that will be given to those who fail to show progress.
Establish a Data Collection and Reporting SystemStakeholders should give considerable thought to sources of information or data that can be used to illustrate educational results. Decisions need to be made about where data will come from, how they will be collected, and how results will be reported to and used by the general community.
Identify Data Sources
Those who engage in standards-based accountability will necessarily have to identify sources from which they can get data or the extent to which results are being achieved. A fundamental premise to guide the data collection process is that it should rely as much as possible on the use of existing information.
Defi ne the Population of Students for Whom AlternateAssessments Will Be Used
States must have general assessments and may have three kinds of alternate assessments: those aligned to grade-level standards, those aligned to modifi ed achievement standards, and those aligned to alternate achievement standards. Particularly among those states that choose to have multiple alternate assessments, it is necessary to specify the kinds of students for whom each of the kinds of alternate assessments will be used. It is expected that students assessed relative to modifi ed achievement standards are the approximately 2 percent of students whose persistent academic diffi culties preclude their learning at the same speed and with the same depth as other students. It is expected that students assessed relative to alternate achievement standards are the approximately 1 percent of students with signifi cant cognitive disabilities.1
1The percentages specifi ed are percentages of all students, not percentages of students with disabilities. Remember that approximately 13 percent of students have disabilities. Those eligible for alternate assessments are the most severely disabled but represent 1 percent of the total population of students rather than 1 percent of the 13 percent who have disabilities. Two of the authors of this text have attended administrative speeches in which administrators mistakenly informed school personnel that alternative assessments were for “1 percent of students with disabilities.” Both administrators also argued that this was “not many kids so the policy changes were not all that important.”
394 Chapter 22 ■ Making Accountability Decisions
Develop Rules or Guidelines for IEP Teams to Use in Deciding Who Takes What Kind of Assessment
It is expected that all students will participate in state assessments. That does not mean that all students take the regular state assessment. Rather, decisions about the kind of assessment to be taken (AA-GLAS, AA-MAS, or AA-AAS), and any assess-ment accommodations to be provided, are made by IEP teams. It will be necessary to give teams guidelines to work with. Failure to do so could result in different kinds of students taking the different kinds of tests with or without accommodations.
Develop or Adapt Data Collection and Analysis Mechanisms
School personnel fi nd that they have to create new data collection mechanisms to address new indicators or to include new populations that have not been included before. Data collection systems must be designed in such a way that they are sensitive to cultural differences during sampling, instrument development, data collection, and data analysis.
Decide How Information Will Be Reported and Used
Information on educational results (accountability systems) needs to be reported in ways that are meaningful to the intended audience. It is important to ask mem-bers of the audience (for instance, administrators and school board members) what would help them make decisions consistent with the stated purpose of the accountability system (such as program improvement, public information, or policy formulation). Probably the most important decision to be made is how the data will be used. Will rewards and consequences be given as a result of educa-tional outcomes? Other reporting decisions to be made include levels of reporting (system versus individual), formats and types of reports, types of comparisons to be reported, ways of presenting and grouping data, and vehicles for dissemination of information.
Install a Standards-Based Accountability SystemAn accountability system cannot be installed overnight. Those who use the infor-mation on results will need to see personal and programmatic benefi ts before the system can be considered fully in place. There must be incentives for teachers, parents, and administrators who will ultimately ensure the success of the system.
Two commonly used incentives are public comparisons and sanctions for failure to meet standards or goals. Public comparisons formally display schools, districts, or states side by side. Sanctioning involves negative techniques such as withdrawal of accreditation, takeovers of schools, and reduction of funding based on identifi cation of inadequate outcomes. Both comparisons and sanctions are high-stakes uses of any accountability system. They can lead to overemphasis on appearances, without substantive changes.
Change in measurement and accountability systems occurs in the same way as it occurs in any system. State or governmental agencies fund research and demon-stration projects, establish networking and recognition systems, and provide tech-nical assistance and resources for use of outcomes-based accountability systems. Personnel in state departments of education provide technical assistance to local school districts that are trying to implement accountability systems.
Purpose of Making Accountability Decisions 395
Once an outcomes-based accountability system is in place and being used, we may be able to identify the extent to which the interventions used with individu-als who have disabilities are working as we would like them to work. Systemwide accountability assessment should enable us to make judgments about the extent of the system’s success.
Current State Assessment and Accountability PracticesState assessment and accountability systems change often and rapidly. State edu-cation agency personnel are always working on refi nement of academic content standards and working to improve their assessment systems. In Appendix 3 (available on the website) we provide the list of tests /assessments used in each of the states that provide this information on their websites. The information is from the 2005–2006 academic year, the most recent available at the time of pub-lication of this edition. Refer to that appendix and look at the kinds of tests used in the various states. What tests are used most often? Are states using primarily off-the-shelf norm-referenced tests such as the Stanford Achievement Tests, or are they using primarily standards-based measures that they or others design? What tests were used in your state in 2005–2006? How does the system used in your state compare to the systems used in the states that border yours? NCEO regularly publishes the results of their surveys of state assessment practices. Go to the NCEO website (www.cehd.umn.edu/nceo) and review the most recent state survey results. Discuss with your classmates the changes that have taken place in your assessment system since 2005–2006. NCEO also provides a “data viewer.” The NCEO Data Viewer lets you view information related to students with dis-abilities and create individualized reports based on criteria that you can choose. Two major databases are currently available for your use:
1. State Policies on Assessment Participation and Accommodations for Students with Disabilities (this lists the kinds of accommodations that are permitted in your state)
2. Annual Performance Reports (this is a detailed summary of the report that your state submitted to the federal government on performance of students in the state)
You should also visit the website www.schoolmatters.com, where you can obtain detailed information on the numbers of students classifi ed as disabled, the kinds of disabilities they have, and data on how students perform on tests.
5 Important Considerations in Assessment for the Purpose of Making Accountability Decisions
As a result of accountability system implementation, student assessment data have become much more readily available to the public. Although this public reporting is intended to promote better student instruction and learning, it is important that those who have access to the data know how to appropriately interpret the infor-mation. Without these skills, poor judgments and decisions may be made that are harmful to students. For instance, it is important for consumers of accountability information to understand that most tests used for accountability purposes are
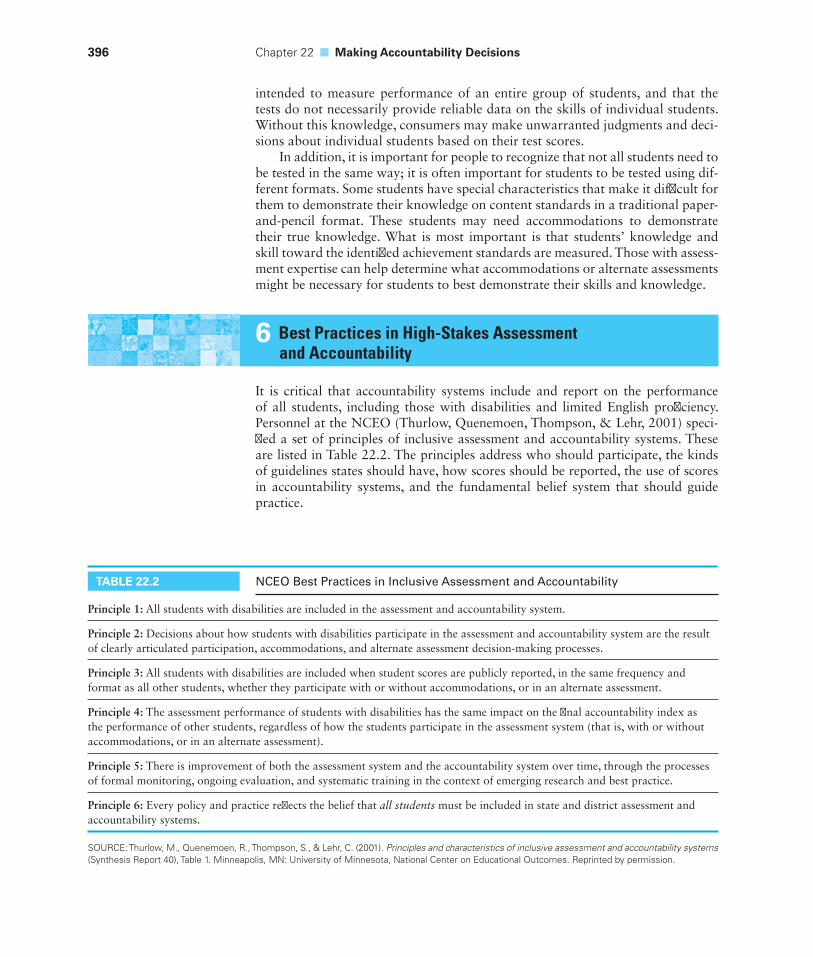
396 Chapter 22 ■ Making Accountability Decisions
intended to measure performance of an entire group of students, and that the tests do not necessarily provide reliable data on the skills of individual students. Without this knowledge, consumers may make unwarranted judgments and deci-sions about individual students based on their test scores.
In addition, it is important for people to recognize that not all students need to be tested in the same way; it is often important for students to be tested using dif-ferent formats. Some students have special characteristics that make it diffi cult for them to demonstrate their knowledge on content standards in a traditional paper-and-pencil format. These students may need accommodations to demonstrate their true knowledge. What is most important is that students’ knowledge and skill toward the identifi ed achievement standards are measured. Those with assess-ment expertise can help determine what accommodations or alternate assessments might be necessary for students to best demonstrate their skills and knowledge.
6 Best Practices in High-Stakes Assessment and Accountability
It is critical that accountability systems include and report on the performance of all students, including those with disabilities and limited English profi ciency. Personnel at the NCEO (Thurlow, Quenemoen, Thompson, & Lehr, 2001) speci-fi ed a set of principles of inclusive assessment and accountability systems. These are listed in Table 22.2. The principles address who should participate, the kinds of guidelines states should have, how scores should be reported, the use of scores in accountability systems, and the fundamental belief system that should guide practice.
TABLE 22.2 NCEO Best Practices in Inclusive Assessment and Accountability
Principle 1: All students with disabilities are included in the assessment and accountability system.
Principle 2: Decisions about how students with disabilities participate in the assessment and accountability system are the result of clearly articulated participation, accommodations, and alternate assessment decision-making processes.
Principle 3: All students with disabilities are included when student scores are publicly reported, in the same frequency and format as all other students, whether they participate with or without accommodations, or in an alternate assessment.
Principle 4: The assessment performance of students with disabilities has the same impact on the fi nal accountability index as the performance of other students, regardless of how the students participate in the assessment system (that is, with or without accommodations, or in an alternate assessment).
Principle 5: There is improvement of both the assessment system and the accountability system over time, through the processes of formal monitoring, ongoing evaluation, and systematic training in the context of emerging research and best practice.
Principle 6: Every policy and practice refl ects the belief that all students must be included in state and district assessment and accountability systems.
SOURCE: Thurlow, M., Quenemoen, R., Thompson, S., & Lehr, C. (2001). Principles and characteristics of inclusive assessment and accountability systems (Synthesis Report 40), Table 1. Minneapolis, MN: University of Minnesota, National Center on Educational Outcomes. Reprinted by permission.
Chapter Comprehension Questions 397
CHAPTER COMPREHENSION QUESTIONSWrite your answers to each of the following questions, and then compare your responses to the text or the study guide.
1. What legal requirements for state and school district assessment and accountability systems are specifi ed in NCLB and IDEA 2004?
2. Distinguish between grade-level achievement standards, modifi ed achievement standards, and alternate achievement standards.
3. Distinguish between alternate assessment based on grade-level achievement standards, alternate assessment based on modifi ed achievement standards, and alternate assessment based on alternate achievement standard.
4. What are the steps in developing a standards-based accountability system?
5. State two important considerations in assessment for purposes of making accountability decisions.
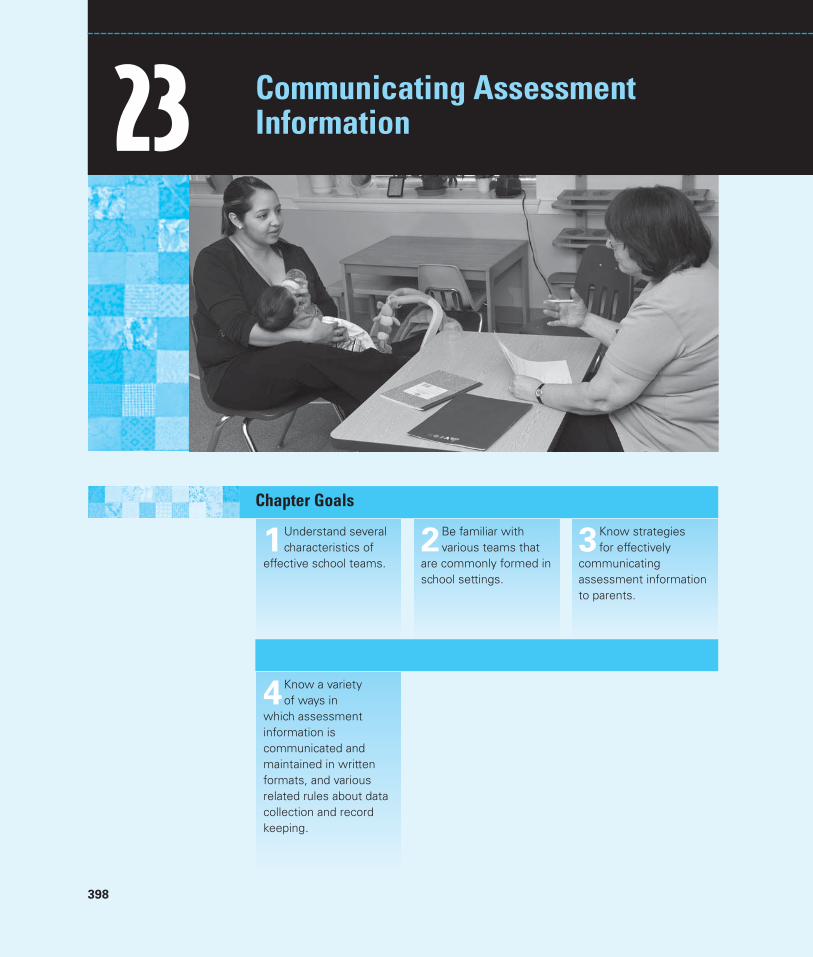
398
Chapter Goals
3Know strategies for effectively
communicating assessment information to parents.
2Be familiar with various teams that
are commonly formed in school settings.
1Understand several characteristics of
effective school teams.
23 Communicating Assessment Information
4Know a variety of ways in
which assessment information is communicated and maintained in written formats, and various related rules about data collection and record keeping.
Characteristics of Effective School Teams 399
Key Terms school wide assistance teams
problem-solving teams
child study teams
groupthink
Family Educational Rights and Privacy Act (FERPA)
The extent to which assessment information has a positive impact on student learning ultimately depends on your ability to (1) be an informed con-sumer of assessment information and (2) effectively communicate that knowl-edge to those responsible for decision making. In schools, important decisions are made by teams of individuals. Although some team members may be well-versed in assessment concepts, others may need considerable support to under-stand and effectively use assessment data. Research conducted through the Center for Research on Evaluation, Standards, and Student Testing suggests that many educational professionals do not know how to carefully examine and use assess-ment data (Baker, Bewley, Herman, Lee, & Mitchell, 2001; Baker & Linn, 2002). Parents may need considerable support to understand and make appropriate use of assessment information that is collected. Some professional associations (for example, the American Psychological Association, the Council for Exceptional Children, and the National Association of School Psychologists) specify in their ethical standards or principles that their members are responsible for accurate and sensitive communication of assessment information.
In this chapter, we provide information on the many different teams that may be formed to examine assessment data and suggestions for making appropriate team decisions. We offer guidelines for communicating assessment information in both oral and written formats, as well as rules concerning record keeping and the dissemination of information collected in school settings.
1 Characteristics of Effective School Teams
Many individuals play important roles in promoting student learning; each brings unique expertise that can be useful in the process of decision making. In using assessment data to make decisions, you will work with special and general edu-cators, administrators, speech/language pathologists, school psychologists, social workers, nurses, physicians, physical therapists, occupational therapists, audiolo-gists, counselors, curriculum directors, attorneys, child advocates, and probably many others. Effective communication and collaboration is essential to promoting positive student outcomes. Although the expertise each individual offers can be an asset to decision making, it is important to recognize that group decision making does not necessarily result in better decisions than individual decision making. Unfortunately, there are many ways in which group dynamics can hinder appro-priate decision making. Gutkin and Nemeth (1997) summarize ways in which group decision making can go awry, including (1) the tendency for groups to concede to the majority opinion regardless of whether it is accurate, and (2) group polarization, in which groups tend to become more extreme in their decision mak-ing than what any individual originally intended (which could either hinder or promote best practice). In order to avoid making poor decisions, it is important
400 Chapter 23 ■ Communicating Assessment Information
to adhere to several principles when working as a team. Although the goals and purposes of school teams may vary, certain principles of effective teaming appear to be universal. These are described next.
Have shared goals and purpose. Unnecessary confl ict and ineffi ciencies in decision making occur when team members do not understand the team’s purpose and when their activities do not refl ect that purpose. For example, some members of prereferral intervention teams may view the team’s purpose as “just one more hoop to jump through” before a referral for evaluation to determine special education eligibility is made, whereas others may view it as an opportunity to identify the conditions under which a student learns best. Those holding the former perspective may be less inclined to put forth substantial effort in associated team activities, which may reduce team effectiveness. It is important for the team’s purpose and function to be clearly articulated when the team is formed and for all team members to be committed to working toward that goal.
Clearly articulate the roles and functions of team members. Team composition needs to be determined carefully, balancing the need for unique expertise and the need for a team to effi ciently complete commissioned tasks. More team members is not always better; managing large teams can be overwhelming and may intimidate important members of the team (for example, some parents may be intimidated when they walk into a team meeting that includes many school professionals). In addition, large teams may lead to decisions that are informed by just one or two particularly dominant team members (Moore, Fifi eld, Spira, & Scarlato, 1989). Those team members who are selected for participation need to be fully aware of the unique expertise that they bring as well as their knowledge limitations. The appointment of a team meeting facilitator can be helpful in assisting the team in following appropriate organizational procedures and ensure that all team members are fully able to share their expertise and knowledge in ways that facilitate progress toward the team’s goal.
Listen to and respect each team member’s contributions. Teams sometimes gravitate toward “groupthink” (that is, agreeing with the majority opinion) despite the fact that group decisions can be inaccurate (Gutkin & Nemeth, 1997). It is important for those with minority opinions to be given the opportunity to express their positions and for their ideas to be respected and considered within the group’s functioning. Creative and effective problem solving can occur when all individuals are encouraged to contribute.
Balance structure and fl exibility within team meetings. It can often be helpful for teams to develop and implement systematic procedures for operation. In many cases, teams may have forms that facilitators use to guide team meetings (see Figure 23.1 for an example of such a form). The facilitator might create a written agenda for team meetings, in which there is time for those who have collected information to present their fi ndings, time for additional input from team members, and time for group decision making. Such procedures and structures can help teams maintain attention to task and promote effi ciency toward addressing the team’s goals. When team members want to discuss important issues that are not associated with the specifi c decisions to be made, it is important to know how to tactfully
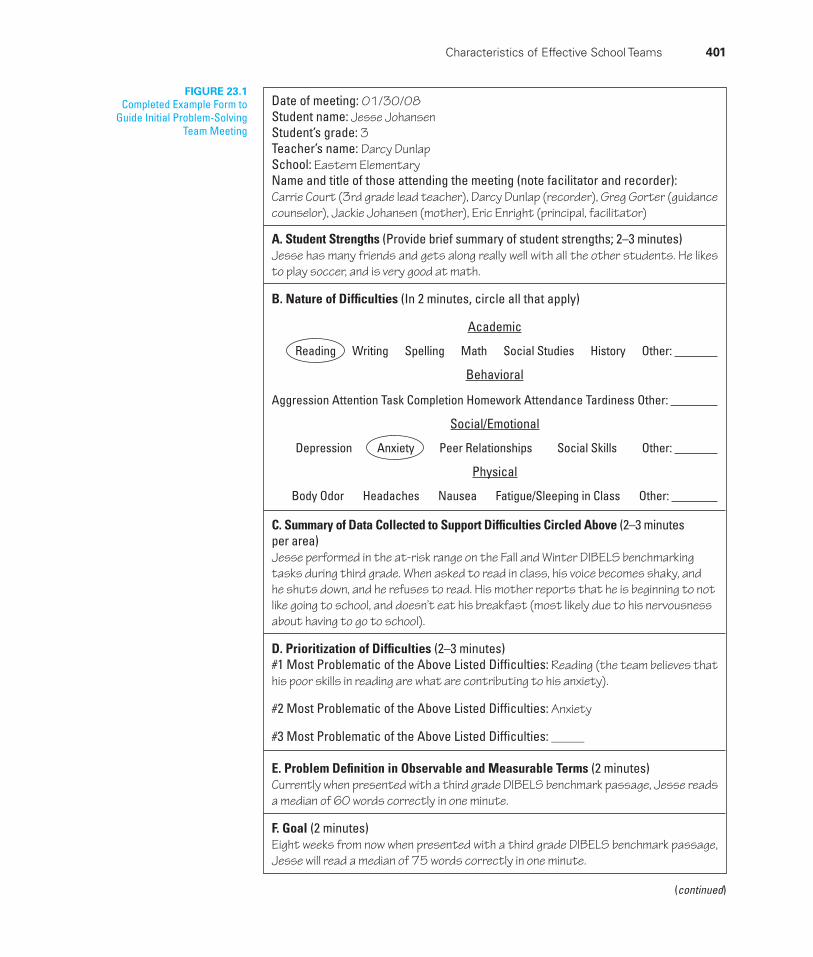
Characteristics of Effective School Teams 401
FIGURE 23.1Completed Example Form to
Guide Initial Problem-Solving Team Meeting
Date of meeting: 01/30/08Student name: Jesse JohansenStudent’s grade: 3Teacher’s name: Darcy DunlapSchool: Eastern ElementaryName and title of those attending the meeting (note facilitator and recorder):Carrie Court (3rd grade lead teacher), Darcy Dunlap (recorder), Greg Gorter (guidance counselor), Jackie Johansen (mother), Eric Enright (principal, facilitator)
A. Student Strengths (Provide brief summary of student strengths; 2–3 minutes)Jesse has many friends and gets along really well with all the other students. He likes to play soccer, and is very good at math.
B. Nature of Diffi culties (In 2 minutes, circle all that apply)
Academic
Reading Writing Spelling Math Social Studies History Other:
Behavioral
Aggression Attention Task Completion Homework Attendance Tardiness Other:
Social/Emotional
Depression Anxiety Peer Relationships Social Skills Other:
Physical
Body Odor Headaches Nausea Fatigue/Sleeping in Class Other:
C. Summary of Data Collected to Support Diffi culties Circled Above (2–3 minutes per area)Jesse performed in the at-risk range on the Fall and Winter DIBELS benchmarking tasks during third grade. When asked to read in class, his voice becomes shaky, and he shuts down, and he refuses to read. His mother reports that he is beginning to not like going to school, and doesn’t eat his breakfast (most likely due to his nervousness about having to go to school).
D. Prioritization of Diffi culties (2–3 minutes)#1 Most Problematic of the Above Listed Diffi culties: Reading (the team believes that his poor skills in reading are what are contributing to his anxiety).
#2 Most Problematic of the Above Listed Diffi culties: Anxiety
#3 Most Problematic of the Above Listed Diffi culties: _____
E. Problem Defi nition in Observable and Measurable Terms (2 minutes)Currently when presented with a third grade DIBELS benchmark passage, Jesse reads a median of 60 words correctly in one minute.
F. Goal (2 minutes)Eight weeks from now when presented with a third grade DIBELS benchmark passage, Jesse will read a median of 75 words correctly in one minute.
(continued)
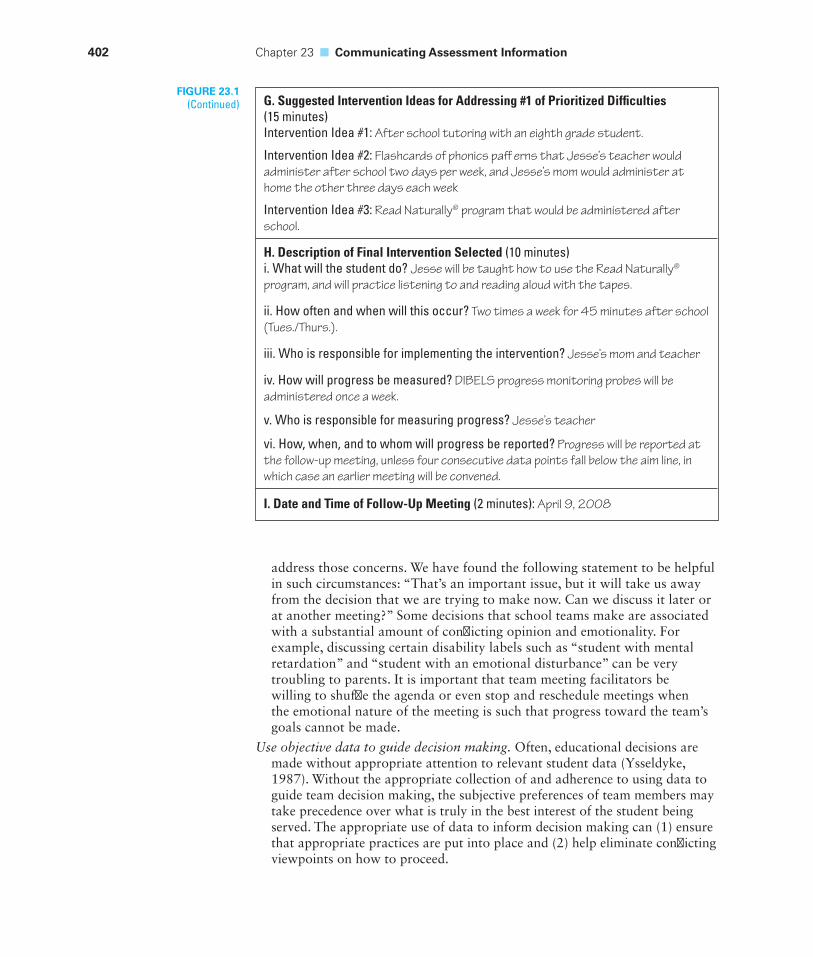
402 Chapter 23 ■ Communicating Assessment Information
address those concerns. We have found the following statement to be helpful in such circumstances: “That’s an important issue, but it will take us away from the decision that we are trying to make now. Can we discuss it later or at another meeting?” Some decisions that school teams make are associated with a substantial amount of confl icting opinion and emotionality. For example, discussing certain disability labels such as “student with mental retardation” and “student with an emotional disturbance” can be very troubling to parents. It is important that team meeting facilitators be willing to shuffl e the agenda or even stop and reschedule meetings when the emotional nature of the meeting is such that progress toward the team’s goals cannot be made.
Use objective data to guide decision making. Often, educational decisions are made without appropriate attention to relevant student data (Ysseldyke, 1987). Without the appropriate collection of and adherence to using data to guide team decision making, the subjective preferences of team members may take precedence over what is truly in the best interest of the student being served. The appropriate use of data to inform decision making can (1) ensure that appropriate practices are put into place and (2) help eliminate confl icting viewpoints on how to proceed.
FIGURE 23.1(Continued) G. Suggested Intervention Ideas for Addressing #1 of Prioritized Diffi culties
(15 minutes)Intervention Idea #1: After school tutoring with an eighth grade student.
Intervention Idea #2: Flashcards of phonics patt erns that Jesse’s teacher would administer after school two days per week, and Jesse’s mom would administer at home the other three days each week
Intervention Idea #3: Read Naturally® program that would be administered after school.
H. Description of Final Intervention Selected (10 minutes)i. What will the student do? Jesse will be taught how to use the Read Naturally® program, and will practice listening to and reading aloud with the tapes.
ii. How often and when will this occur? Two times a week for 45 minutes after school (Tues./Thurs.).
iii. Who is responsible for implementing the intervention? Jesse’s mom and teacher
iv. How will progress be measured? DIBELS progress monitoring probes will be administered once a week.
v. Who is responsible for measuring progress? Jesse’s teacher
vi. How, when, and to whom will progress be reported? Progress will be reported at the follow-up meeting, unless four consecutive data points fall below the aim line, in which case an earlier meeting will be convened.
I. Date and Time of Follow-Up Meeting (2 minutes): April 9, 2008
Types of School Teams 403
Work to ensure confi dentiality. Those who study team decision making fi nd that eventually confi dentiality breaks down. When this happens and a member learns that someone betrayed confi dentiality, the team ceases to function well. It is suggested that this be handled by regular reminders from an administrator, school psychologist, or other team leader that meeting discussions are confi dential. We suggest that the leader tell members at the very fi rst meeting that confi dentiality is critical and that he or she will be reminding members of this regularly. Then the reminders do not raise questions of “I wonder who talked inappropriately about what we are discussing.”
Regularly evaluate team outcomes and processes to promote continuous improvement in team functioning. Team processes and procedures can always be improved. It is important for the team to engage in periodic self-evaluation in order to ensure that it is meeting identifi ed goals and objectives and that it is respectful of all team members’ contributions. In some cases, it may be helpful to ask someone uninvolved in the team functioning to do an evaluation of a team’s functioning. This can help to ensure that all team members are able to contribute their skills and knowledge in a way that is most benefi cial to students.
2 Types of School Teams
There are many different teams created to examine assessment data and inform decision making in schools. These teams may have very different names and be composed of professionals with varying expertise. Although all the teams described here are typically involved in examination of data for the purpose of decision making, the teams vary considerably in the types of decisions made and, therefore, the nature of data collected, analyzed, and interpreted. Although we provide titles for these teams, it is important to recognize that there may be a vari-ety of different terms used to describe similarly functioning teams in the schools and districts you encounter.
Schoolwide Assistance TeamsWith the development of technology for managing large amounts of student data, as well as increased attention to accountability for student outcomes, teams of educational professionals are more frequently being formed to collect, analyze, and interpret data on students across the entire school or district. The ultimate purpose of these teams is to inform instructional planning and resource allocation at school and district levels such that student achievement is optimized. Sometimes these teams are referred to as “resource teams.” Team members may consist of those with special expertise in data analysis, curriculum, and instruction. These indi-viduals come together to examine statewide assessment data, results from school-wide screening efforts, and information on existing educational programming, with the purpose of identifying strategies for improving student achievement. In some cases, such teams may be created by grade level, such that all teachers from a particular grade meet on a regular basis with the administrator and someone with expertise in assessment in order to identify areas for instructional improvement.
404 Chapter 23 ■ Communicating Assessment Information
Following a systematic analysis of data, the team may make recommendations for professional development and changes in school programming.
Participants on these teams who have specialized expertise in assessment can contribute to the team by (1) helping the school identify methods for collecting relevant data on all students effectively and effi ciently, (2) creating and interpreting visual displays of assessment data for the purpose of decision making, (3) recog-nizing areas in which additional assessment is needed prior to making substantial changes in school programming, and (4) identifying methods for monitoring the effectiveness of any associated changes in school programming.
Problem-Solving TeamsProblem-solving teams are formed to address diffi culties that small groups of stu-dents or individual students experience within general education classrooms. The purpose of the team is to defi ne the specifi c problem, analyze the problem in order to develop a targeted intervention plan, implement the intervention plan, monitor the plan implementation and student progress, and evaluate the effectiveness of the plan. Initially, the team may simply consist of a general education teacher and parents of the child involved. However, if the problem is not solved, additional school professionals may be added to the team in order to more systematically defi ne and analyze the problem and to inform the development of interventions that are of increasing intensity. The parent–teacher team might be expanded to include other teachers or the school guidance counselor; these individuals could help conduct a more in-depth problem analysis and brainstorm additional ideas for intervention. If that plan does not lead to progress, other personnel, such as the school psychologist, social worker, or special education teacher, might be added to the problem-solving team to provide additional support for assessment and inter-vention. Names for teams with a function similar to that of the problem-solving teams described previously include “teacher assistance teams,” “student assistance teams,” “building assistance teams,” and “instructional consultation teams.”
Those with expertise in assessment can assist these teams by helping to select and administer assessment tools that can assist with defi ning and analyzing the problem, as well as select tools for monitoring intervention integrity and student progress.
Child Study TeamsThese teams are typically developed to examine specifi c diffi culties that an indi-vidual child is experiencing prior to referral for special education evaluation. Although in some places these teams may function similarly to problem-solving teams, there tends to be a greater focus on identifying child characteristics that are contributing to the diffi culties rather than on instructional variables that may be altered to eliminate those diffi culties. Child study teams are composed of parents, teachers, and other specialists that may include a school psychologist, special edu-cator, speech/language pathologist, counselor, nurse, social worker, and principal. Together, these individuals identify prereferral intervention strategies to put into place prior to initiating a formal special education eligibility evaluation. Although not every student who is initially referred for consideration by a child study team goes through the special educational evaluation process, such has been the case for a large percentage of these students (Algozzine, Christenson, & Ysseldyke, 1982).
Communicating Assessment Information to Parents 405
Multidisciplinary TeamsThese teams are convened when a child is being considered for special education evaluation; the function and activities of these teams are more fully discussed in Chapter 20. They are charged with the responsibility of determining whether a student has a disability and is in need of special education services according to the Individuals with Disabilities Education Act (IDEA).
Individual Education Plan TeamsAfter a student is found eligible for special education services under IDEA, the individualized education program is developed by a team of individuals who have specialized knowledge in the specifi c areas of the child’s disability, as well as those who will be responsible for carrying out the plan and the child’s parents. These teams typically meet on an annual basis to review the progress and programming for each student receiving special education services individually.
3 Communicating Assessment Information to Parents
Parents and guardians are often the members of teams who have the least knowl-edge and skill in understanding assessment. Given the infl uential role that they play in the lives of their children, it is important for them to be equipped with knowl-edge to assist with interpreting assessment results. Parents need to be empowered to be active and helpful members of school decision-making teams.
A variety of things can limit parent understanding of assessment information and participation in team decision making. Language barriers can clearly hinder effective communication. Many parents may not have a schedule that permits partic-ipation in meetings as scheduled by school professionals. They may feel intimidated by various school professionals. They may not recognize the important knowledge that they can bring to the team or not understand how to effectively communi-cate that knowledge to the team. They may have strong emotional reactions to data that are presented about their child’s academic successes and failures, which may hinder rational decision making. They may have strong feelings and opinions about the quality of educational services provided to their child and about how their child’s needs might best be met by educational professionals. Unfortunately, parents’ unique knowledge about their child is often disregarded or ignored by school professionals, who often make decisions prior to team meetings.
Schools can take several steps to make communication with parents more effective. Better communication should result in more effective parental participa-tion in associated team decision making.
Communicate with parents frequently. ■ Often, parents are not made aware of diffi culties that their child is having until the child is being considered for special education evaluation. When this happens, it can lead to strong emotional reactions and frustration among parents. It can also lead to unnecessary confl ict if parents do not think that special education services would be in the best interest of their child. It is important that parents are provided frequent and accurate information on the progress of their child
406 Chapter 23 ■ Communicating Assessment Information
from the very beginning of their child’s enrollment in school. By providing this information, parents of those students who are consistently low performing may become more involved in helping to develop intervention plans that may reduce their child’s diffi culties. Furthermore, when parents receive frequent communication about their child’s progress (or lack thereof), they may more readily understand why a referral for special education eligibility evaluation is made.
Communicate both the child’s strengths and the child’s weaknesses. ■ Parents of students with special needs are often reminded of their child’s weaknesses and diffi culties in school and may rarely be alerted to their child’s successes and strengths. Other parents may overvalue their child’s relative strengths and ignore or minimize their child’s weaknesses. In order to work effectively with parents, and to facilitate creative problem solving as a part of a team, it is important to recognize and communicate about a child’s specifi c strengths as well as weaknesses.
Translate assessment information and team communications as needed. ■ Assessment data that are reported to all parents (for example, statewide assessment results and screening results) should be made available in the parent’s primary language or mode of communication. To facilitate participation in team meetings, interpreters should be provided. In order to interpret well, they may need special training in how to communicate the pertinent information to parents, as well as how to ensure that parents’ questions, concerns, and contributions have a voice within team meanings.
Be aware of how cultural differences may impact the understanding of ■
assessment information. It is also suggested that when cultural differences exist, a person who understands both the student’s culture and educational matters be present. This may be necessary even when language differences are nonexistent (for example, the student is Amish and the culture of the school is not Amish). This can help a team identify issues that may be cultural in nature.
Schedule meetings to facilitate parent attendance. ■ Efforts should be made to schedule meetings at a time when parents can be present. Challenges associated with transportation should be addressed. In certain circumstances, it may be necessary for school professionals to meet at a location that is more convenient for parents than the school setting. It may also be necessary for school personnel to communicate directly with an employer, encouraging the employer to allow the parent to be excused from work. This is especially true in communities in which one company (for example, a paper mill, an automobile factory, or a meat packing plant) is the employer of many parents. In this case, a blanket arrangement could be made in which the company agrees to release the parent for school meetings if a request is made by the school.
Clearly explain the purpose of any assessment activities, as well as the potential ■
outcomes. Whereas school professionals may be very familiar with assessment-related processes and procedures, and associated decisions that are made, parents often are new to the process. It is important to prepare them for what to expect as it relates to using the results of assessment data that are collected. Sometimes, it can be helpful for school professionals to contact parents before a meeting to explain the purpose of the meeting and what they can expect to happen at the meeting. Parents should be informed of all potential outcomes of a particular meeting (for example, development of an intervention plan,
Communicating Assessment Information to Parents 407
Ineffective Communication of Assessment Information with Parents
In early November, Mr. and Mrs. Martinez were noti-fi ed that a meeting was being scheduled to discuss their third-grade daughter Amelia’s failure to make progress in reading. The meeting was scheduled as part of a series of child study team meetings, in which a total of seven children from her elementary school would be discussed by a team of individuals who included the principal, guidance counselor, and the students’ general education teachers. General educators were rotated into the meeting at 10-minute intervals, as each child was being discussed. Although Mr. and Mrs. Martinez were notifi ed by Amelia’s teacher that the meeting would be held, they were told that it was not important for them to attend, and that it would probably be better for them to plan to attend the meeting that would likely be held in mid-December to discuss Amelia’s need for special education services. A few days later, Amelia’s parents received a letter and consent form in the mail asking them to sign for permission to conduct an assessment to determine whether Amelia was eligible to receive special education services. Amelia’s parents, although discouraged and confused about what this meant, promptly signed and returned the form, assuming that the school knew what was in Amelia’s best aca-demic interests.
On December 15, a multidisciplinary team meet-ing was held. Mr. Martinez could not make it to the early afternoon meeting, given his work schedule. Mrs. Martinez was able to catch a bus and arrive at the school with her two young children 30 minutes prior to the meeting. At the meeting, several different professionals shuffl ed into the room at different times, with each presenting results from speech/ language testing, intelligence testing, achievement testing, and classroom observations of Amelia. Toward the end of the meeting, a special education teacher asked Mrs. Martinez to sign some forms, which she was
told would allow Amelia to get the services she need-ed, given that Amelia was in the words of her teacher “clearly a student with a learning disability.”
Effective Communication of Assessment Information with Parents
In January of Amelia Martinez’s fi rst-grade year, Mr. and Mrs. Martinez received a phone call from her teacher. The teacher indicated that although Amelia was making many friends in fi rst grade and seemed to get along very well with her classmates, she was performing below expectations in her development of early literacy skills as measured by the early literacy screening measures administered to all students in the fall and winter. The teacher invited Amelia’s parents to attend a meeting in which they would discuss strat-egies for targeting instruction to Amelia’s needs and discuss the possibility of implementing strategies at home for helping her develop early literacy skills.
At the meeting, Mr. and Mrs. Martinez, along with the classroom teacher and a more experienced kindergarten teacher, discussed the fact that Amelia did not demonstrate adequate letter–sound corre-spondence. They developed a plan that allowed her to receive additional instruction and practice in this area at both home and school (with the teacher assistant) each day for 6 weeks, after which they would recon-vene as a team to examine the progress that she had made. After 6 weeks, the two teachers and Amelia’s parents met, and an additional person (that is, an intervention specialist) was added to the team to help identify any additional assessment and intervention that might be applied, given that Amelia had not made the progress needed to put her on track for learning how to read by the end of third grade. After reviewing Amelia’s progress together, and recognizing that she had made small gains as a result of the intervention, they decided to intensify the support she was receiv-ing by providing her more intervention time during
Scenario in Assessment
Amelia
continued on the next page
408 Chapter 23 ■ Communicating Assessment Information
decision to collect more data, and decision that the student is eligible to receive special education services) so that they are not caught off guard.
Communicate using nontechnical language as much as possible. ■ By now, you have most certainly recognized that language used in educational circles is full of acronyms. It is important for these, as well as all of the other technical terms that may be used, to be fully explained to parents so that they can be in dialog with team members. Whereas some parents may understand technical terms associated with assessment data, others may not. It is more appropriate to err on the side of using language that is easier to understand than to assume that parents understand terminology that is used by school professionals.
Maintain a solution-focused orientation and avoid pointing blame. ■ Just about every school team meeting is intended to promote student achievement, whether directly or indirectly. Making this goal happen requires that individual team members focus on alterable rather than unalterable variables and on what can be changed in the future to promote student learning rather than dwelling on what has happened in the past. Unfortunately, there can be a tendency to focus on what people may have done or failed to do in the past rather than making plans for the future. Although it is important to learn from past mistakes, team members should focus on what can be done in the future to improve student learning. Focusing on past failure can decrease morale and contribute to unnecessary confl ict among team members.
4 Communicating Assessment Information Through Written Records
Although presentation of assessment information and related decision making is frequently done verbally and in team meetings, assessment data are also col-lected, summarized, and interpreted in written form. Policies and standards for the collection, maintenance, and dissemination of information in written formats must balance two sometimes confl icting needs. Parents and children have a basic right to privacy; schools need to collect and use information about children (and
the school day, and they continued to monitor her progress. Her mother was provided simple phonemic awareness development activities to practice with Amelia at home in the evening.
Soon after spring break of her fi rst-grade year, the team reconvened to examine Amelia’s progress, which continued to be below expectations. Together, the team decided that an evaluation for special education services was warranted. Mr. and Mrs. Martinez were provided information on their rights as parents of a child undergoing evaluation to determine special
education eligibility. They were briefl y told about the types of testing that would occur and how this would help determine whether Amelia might be in need of and benefi t from special education services. At the end of her fi rst-grade year, the team was brought to-gether to examine the assessment results. Based on the information collected, it was clear that Amelia met the state criteria for having a specifi c learning disability in reading, and the team identifi ed instruc-tional strategies that were benefi cial to include as part of an individualized education program for Amelia.
Scenario in Assessment, (continued)
Communicating Assessment Information Through Written Records 409
sometimes parents) in order to plan appropriate educational programs. Schools and parents have a common goal: to promote the welfare of children. In theory, schools and parents should agree on what constitutes and promotes a child’s wel-fare, and in practice, schools and parents generally do work cooperatively.
In 1974, many of these recommended guidelines became federal law when the Family Educational Rights and Privacy Act (Public Law 93-380, commonly called FERPA) was enacted. The basic provisions of the act are quite simple. All educa-tional agencies that accept federal money (preschools, elementary and secondary schools, community colleges, and colleges and universities) must grant parents the opportunity to inspect and challenge student records. Regardless of whether the school decides to change the records according to parent input, parents have the right to supplement the records with what they understand to be true or an explanation as to why they believe the fi le to be inaccurate. The only records to which parental access may be denied are the personal notes of teachers, supervi-sors, administrators, and other educational personnel that are kept in the sole possession of the maker of the records. Also, educational agencies must not release identifi able data without the parents’ written consent. However, at age 18 years, the student becomes the individual who has the authority to provide consent for his or her data to be released to others. Violators of the provisions of FERPA are subject to sanctions; federal funds may be withheld from agencies found to be in violation of the law.
The following section discusses specifi c issues and principles in the collection, maintenance, and dissemination of pupil information through written records and reports.
Collection of Pupil InformationSchools routinely collect massive amounts of information about individual pupils and their parents, and not all of this information requires parental permission to collect or maintain. As discussed in Chapter 1, information can be used for a number of legitimate educational decisions: screening, progress monitoring, instructional planning and modifi cation, resource allocation, special education eligibility determination, program evaluation, and accountability. Considerable data must be collected if a school system is to function effectively, both in deliver-ing educational services to children and in reporting the results of its educational programs to the various community, state, and federal agencies to which it may be responsible.
Schoolwide Screening
Many schools systematically collect and keep written records of hearing, vision, and basic skill development across all students. The associated screening measures are intended to identify all students who have the potential for additional diffi cul-ties very early in time, and they are purposely developed to overidentify students. This can help to ensure that true diffi culties are not missed, and that diffi culties can be addressed earlier rather than later in time. When students fail to meet minimum thresholds of performance on screening measures, they may be referred for addi-tional assessment to determine whether true diffi culties exist. Vision and hearing screening records are typically maintained at the school for a substantial amount of time; review of this information can help determine that basic abilities such as hear-ing and vision are not contributing to diffi culties that a student may experience.
410 Chapter 23 ■ Communicating Assessment Information
Vision Most schools have vision screening programs, but the effectiveness of these programs varies. Two fundamentally different kinds of tests are used: those that screen only central visual acuity at a distance and those that assess both central visual acuity and a number of other visual capabilities. Most preschool screening programs also include screening for amblyopia, often called “lazy eye.”
Schools conduct vision screening, whereas vision testing is done clinically by ophthalmologists and optometrists. When a student experiences learning diffi -culties, or when routine vision screening indicates visual diffi culties, the child is referred for a clinical vision exam. If the clinical exam indicates 20/20 vision, no additional visual assessment needs to be done by educational personnel. Similarly, if visual acuity is limited but can be corrected by glasses, no visual assessments need be conducted by education personnel. However, if vision is 20/70 or less with best correction, or if there is a limited visual fi eld, educational personnel must ensure that a clinical low vision exam, functional vision assessment, or learning-media assessment is conducted. The purpose of these tests is intervention planning.
Hearing The identifi cation of preschool and school-age children with hearing problems usually falls within the realm of a hearing screening program, which may also be called a “hearing conservation program,” a “hearing loss identifi -cation program,” or “identifi cation audiometry.” All states have laws requiring hearing screening of school-age children. Unfortunately, hearing screening for many children in preschool programs is not mandated by state or federal laws. Therefore, many preschool children who have educationally signifi cant hearing losses are not being identifi ed and may become educationally delayed. Hearing-screening programs generally have three components: the actual hearing screen-ing, follow-up hearing threshold tests for those who fail the screening, and referral for those diagnosed with hearing impairment.
Early detection of hearing problems in preschool and school-age children is imperative so that appropriate remedial or compensatory procedures can be insti-tuted. Children with hearing problems characteristically fail to pay attention, pro-vide wrong answers to simple questions, frequently ask to have words or sentences repeated, and hear better in quiet conditions and when watching the teacher’s face. Such children often function below their educational potential, are withdrawn, or exhibit behavior problems. Children who are repeatedly sick, having frequent ear-aches, colds, or other upper respiratory infections, allergies, or fl uid draining from their ears, may also have a concomitant hearing problem. Furthermore, children who do not speak clearly or who show other types of speech or language prob-lems, and children who fail to discriminate between sounds or words with similar vowels but different consonants, may also have hearing problems. Finally, some preschool and school-age children are more at risk for hearing problems, includ-ing children with craniofacial anomalies such as cleft palate or Down syndrome; children from a lower socioeconomic class; Native Americans and Eskimos, who may not receive appropriate and routine health care (Northern & Downs, 1991, pp. 22–24); and children with mental retardation or severe disabilities who can-not express that they have trouble hearing.
Any child, regardless of age, who has one or more of the aforementioned hear-ing loss symptoms and any child at risk for hearing loss should be referred for a hearing test. Depending on the school system, the hearing test may be given by the school nurse, a speech/language pathologist, a hearing therapist, an audiologist, or a trained technician. In a preschool setting, support personnel for assessing
Communicating Assessment Information Through Written Records 411
hearing problems may not be available. Children in such a setting should be referred to their family physician or directly to a hearing specialist.
If a hearing problem is detected or if the child is diffi cult to test, making the results questionable, the child should be referred to a physician specializing in disorders of the ear, called an otologist or an otolaryngologist, or to a special-ist in hearing evaluation and rehabilitation, called an audiologist. The otologist and the audiologist often work together as a team. An otologist has expertise in physical examination of the ears and in diagnosing and treating ear disorders. If a child has a correctable hearing loss, the otologist can provide the appropriate treatment (such as drug therapy or surgery). The audiologist has expertise in hear-ing assessment and rehabilitation. If a child has an educationally signifi cant and noncorrectable hearing loss, the audiologist can prescribe, fi t, and monitor the use of hearing aids. Furthermore, the audiologist can make recommendations to teachers, hearing therapists, speech/language pathologists, and parents concern-ing the child’s hearing ability in different listening environments.
Academic Screening and Monitoring Increasingly, schools are implementing univer-sal screening and monitoring in order to ensure early identifi cation of academic problems. Programs such as DIBELS, AIMSweb, and others described in Chapter 8 may be used to screen for academic problems and monitor student progress. Some screening is done schoolwide; however, other screening may occur for individual students who are initially identifi ed as having diffi culties. Students who do not meet benchmark levels on screening measures and fail to make expected levels of progress toward meeting profi ciency may be identifi ed for additional assess-ment and referred to a school problem-solving team. Although it is best practice to remain in frequent communication with parents about data that are collected about their children, it is not always necessary to get their explicit permission for data collection. For example, prior to holding a problem-solving team meeting, a school professional may collect data to inform the selection of an intervention that would target a student’s individual academic defi cits. Such assessment would not necessarily require explicit parent permission.
Consent for Additional Data Collection
Although it is best practice to communicate with parents frequently about student progress, and to alert them to any academic diffi culties that the student is having as soon as possible, schools are not required to have parent consent for additional data collection unless a change in educational placement or the provision of a free and appropriate public education according to the Individuals with Disabilities Education Act (IDEA) is being considered.1 In the section on procedural safeguards, IDEA mandates that prior written notice be given to the parents or guardians of
1This is also the case if data are to be collected for the purpose of research. The collection of research data requires the individual informed consent of parents. Various professional groups, such as the American Psychological Association and the National Association of School Psychologists, consider the collection of data without informed consent to be unethical; according to the Buckley amendment, it is illegal to experiment with children without prior informed consent. Typically, informed consent for research-related data collection requires that the pupil or parents understand (1) the purpose of and procedures involved in the investigations, (2) any risks inherent in participation in the research, (3) the fact that all participants will remain anonymous, and (4) the participants’ option to withdraw from the research at any time.
412 Chapter 23 ■ Communicating Assessment Information
a child whenever an educational agency proposes to initiate or change (or refuses to initiate or change) either the identifi cation, evaluation, or educational place-ment of the child or the provision of a free and appropriate education to the child. It further requires that the notice fully inform the parent, in the parent’s native language, regarding all appeal procedures available. Thus, schools must inform parents of their right to present any and all complaints regarding the identifi ca-tion, evaluation, or placement of their child; their right to an impartial due process hearing; and their right to appeal decisions reached at a due process hearing, if necessary, by bringing civil action against a school district.
Verifi cation
Verifying information means ascertaining or confi rming the information’s truth, accuracy, or correctness. Depending on the type of information, verifi cation may take several forms. For observations or ratings, verifi cation means confi rmation by another individual. For standardized test data, verifi cation means conducting a reliable and valid assessment. (The concepts of reliability and validity are defi ned and discussed in detail in Chapter 4.)
Unverifi ed information can be collected, but every attempt should be made to verify such information before it is retained in a student’s records. For example, serious misconduct or extremely withdrawn behavior is of direct concern to the schools. Initial reports of such behavior by a teacher or counselor are typically based on observations that can be corroborated by other witnesses. Behavior that cannot be verifi ed can still provide useful hints, hypotheses, and starting points for diagnosis. Ultimately, when the data are not confi rmable, they should not be collected and must not be retained. We believe that this requirement should also apply to unreliable or invalid test data that cannot otherwise be substantiated.
Summarization and Interpretation
When additional assessment data are collected as a part of an evaluation to deter-mine whether a student is eligible to receive special education services under IDEA, a written report is typically developed prior to the multidisciplinary team meeting that is held to determine whether a student is eligible for services. The purpose of the report is to summarize the assessment data collected. Written reports commu-nicate information to both existing team members and those who may review the child’s fi le in the future. Although the content of these reports will vary depending on the nature of data needed to determine eligibility, certain principles should be used to promote effective written communication about the data that are col-lected. These are discussed here.
Organize the report. In general, an eligibility evaluation report will include the following information: a reason for referral, identifying and background information about the student, a description of the assessment methods and instruments used, information on observations conducted while assessment data were being collected (that is, to substantiate that test results represent accurate measures of typical student behavior), assessment results, recommendations, and a summary of the assessment procedures and results. In order for readers to easily access the information presented, it can be helpful to present assessment results in tables and fi gures.
Communicating Assessment Information Through Written Records 413
Use language that is easily understood by team members. As when communicating assessment information orally, it is important that your language is accessible to parents and other school professionals. Avoid jargon, and carefully explain all terminology that may be unfamiliar to any members of your audience. When reporting scores, it is important to use scores (like percentiles) that are easily interpreted by those who will read your report. When you are not sure whether readers will understand reported scores, explain them clearly. It is always best to err on the side of “overexplaining” than “underexplaining.”
Focus on the reporting of observed behaviors. In report writing, it is important to be transparent in how you describe assessment tasks and results. In your writing, clearly communicate that scores represent performance on particular tasks rather than innate student qualities or characteristics. In doing so, you will more accurately refl ect the nature of the data collected and help to avoid misinterpretations and high-level inferences based on collected data.
Poor example of a report statement: John is average in his short-term memory capabilities.
Better example of a report statement: On tasks that required John to listen to and recall numbers in the order that were verbally communicated to him by the examiner, John performed in the average range in comparison to his same-grade peers.
However, it is important to ensure that the specifi c content of test items remains secure. When offering example items in written reports, avoid providing the exact content of test items and/or paraphrasing or revising an item in such a way that the item is essentially the same as the original.
Focus on relevant information. You will likely sift through and collect a large amount of information in the process of conducting a special education eligibility evaluation. Instead of reporting on all information examined and collected, it is important to report only the most relevant information. In order to determine whether the information is relevant, ask yourself the following: (1) To what extent is the given information needed to answer the specifi c referral question? and (2) To what extent will the given information promote the provision of better educational services to the student? Include only those data that address these questions.
Clearly convey your level of certainty. The potential for error is always present. When reporting the results of tests, it is important to convey this potential. In the presentation of test scores, we suggest explaining and providing confi dence intervals for reported scores in order to appropriately communicate the existence of error in testing.
Make data-based recommendations. The assessment summary and recommendations sections are by far the most frequently read sections of assessment reports. Recommendations are perhaps the most important aspect of reports; it is important that they are made very carefully and are clearly supported by the data collected. Although it is expected that the recommendation section will document what students need in order to ensure that they receive a free and appropriate public education, recommendations that are made carelessly and without adequate support can result in ineffi cient use of educational resources.
414 Chapter 23 ■ Communicating Assessment Information
Maintenance of Pupil InformationThe decision to keep test results and other information should be governed by three principles: (1) retention of pupil information for limited periods of time, (2) parental rights of inspection and amendment, and (3) assurance of protection against inappropriate snooping. First, the information should be retained only as long as there is a continuing need for it. Only verifi ed data of clear educa-tional value should be retained. A pupil’s school records should be periodically examined, and information that is no longer educationally relevant or no longer accurate should be removed. Natural transition points (for example, promotion from elementary school to junior high) should always be used to remove material from students’ fi les.
The second major principle in the maintenance of pupil information is that parents have the right to inspect, challenge, and supplement student records. Parents of children with disabilities or with special gifts and talents have had the right to inspect, challenge, and supplement their children’s school records for some time. Parents or guardians must be given the opportunity to examine all relevant records with respect to the identifi cation, evaluation, and educational placement of the child and the free and appropriate public education of the child, and they must be given the opportunity to obtain an independent evaluation of the child. Again, if parents have complaints, they may request an impartial due process hear-ing to challenge either the records or the school’s decision regarding their child.
The third major principle in the maintenance of pupil records is that the records should be protected from snoopers, both inside and outside the school sys-tem. In the past, secretaries, custodians, and even other students have had access, at least potentially, to pupil records. Curious teachers and administrators who had no legitimate educational interest had access. Individuals outside the schools, such as credit bureaus, have often found it easy to obtain information about for-mer or current students. To ensure that only individuals with a legitimate need have access to the information contained in a pupil’s records, it is recommended that pupil records be kept under lock and key. Adequate security mechanisms are necessary to ensure that the information in a pupil’s records is not available to unauthorized personnel.
Dissemination of Pupil InformationEducators need to consider both access to information by offi cials and dissemina-tion of information to individuals and agencies outside the school. In both cases, the guiding principles are (1) the protection of pupils’ and parents’ rights to pri-vacy and (2) the legitimate need to know particular information, as demonstrated by the person or agency to whom the information is disseminated.
Access Within the Schools
Those desiring access to pupil records must sign a form stating why they need to inspect the records. A list of people who have had access to their child’s fi les and the reasons that access was sought should be available to parents. The provisions of FERPA as well as IDEA state that all persons, agencies, or organizations desir-ing access to the records of a student shall be required to sign a written form that shall be kept permanently with the fi le of the student, but only for inspection by
Chapter Comprehension Questions 415
the parents or student, indicating specifi cally the legitimate educational or other interest that each person, agency, or organization has in seeking this information (§438, 4A; §300.563).
When a pupil transfers from one school district to another, that pupil’s records are also transferred. FERPA is very specifi c with regard to the conditions of transfer. When a pupil’s fi le is transferred to another school or school system in which the pupil plans to enroll, the school must (1) notify the pupil’s parents that the records have been transferred, (2) send the parents a copy of the transferred records if the parents so desire, and (3) provide the parents with an opportunity to challenge the content of the transferred data.
Access for Individuals and Agencies Outside the Schools
School personnel collect information about pupils enrolled in the school system for educationally relevant purposes. There is an implicit agreement between the schools and the parents that the only justifi cation for collecting and keeping any pupil data is educational relevance. However, because the schools have so much information about pupils, they are often asked for pupil data by potential employ-ers, credit agencies, insurance companies, police, the armed services, the courts, and various social agencies. To divulge information to any of these sources is a violation of this implicit trust unless the pupil (if older than 18 years) or the par-ents request that the information be released. Note that the courts and various administrative agencies have the power to subpoena pupil records from schools. In such cases, FERPA requires that the parents be notifi ed that the records will be turned over in compliance with the subpoena.
Except in the case of the subpoena of records or the transfer of records to another school district, no school personnel should release any pupil information without the written consent of the parents. FERPA states that no educational agency may release pupil information unless “there is written consent from the student’s parents specifying records to be released, the reasons for such release, and to whom, and with a copy of the records to be released to the student’s par-ents and the student if desired by the parents” (§438, b2A).
CHAPTER COMPREHENSION QUESTIONSWrite your answers to each of the following questions, and then compare your responses to the text or the study guide.
1. Describe four characteristics of effective school teams.
2. Name and describe the functions of four types of teams commonly formed in school settings.
3. What are some potential barriers to communicating effectively about assessment with parents? What are some ways to overcome these barriers?
4. What are some ways in which assessment information is communicated in written form in schools? What are the rules governing who has access to this information?
416
GLOSSARYabscissa The horizontal axis of a graph, representing the
continuum on which individuals are measuredaccess Availability of an assessment to consumersaccommodation A change in testing materials or
procedures that enables students to participate in assessments in ways that refl ect their skills and abilities rather than their disabilities
accommodative ability The automatic adjustment of the eyes for seeing at different distances
accountability, accountability system The use of assessment results and other data to ensure that schools are moving in desired directions; common elements include standards, indicators of progress toward meeting those standards, analysis of data, reporting procedures, and rewards or sanctions
acculturation A child’s particular set of background experiences and opportunities to learn in both formal and informal educational settings
accuracy Usually the percentage of a student’s attempted responses that are correct; accuracy is most important during a student’s acquisition of new information
achievement What has been learned as a result of instruction
achievement-standards referenced A type of test that involves ascertaining the degree to which students are meeting state and national standards, which specify the qualities and skills that competent learners need to demonstrate
achievement test A measure of what students have been taught and learned
acquisition defi cit Failure to learn a particular skill adaptations A generalized term that describes a change
made in the presentation, setting, response, or timing or scheduling of an assessment that may or may not change the construct of the assessment
adaptive behavior Behavior that allows individuals to adapt themselves to the expectations of nature and society
adequate yearly progress (AYP) A provision of the federal No Child Left Behind (NCLB, 2001) legislation requiring schools, districts, and states to demonstrate that students are making academic progress based on test scores; each state was required by NCLB to submit by January 31, 2003, a specifi c plan for monitoring AYP
affective comprehension A reader’s personal and emotional responses to the reading material
age equivalent A derived score that expresses a person’s performance as the average (the median or mean) performance for that age group; age equivalents are expressed in years and months, with a hyphen used in age scores (e.g., 7-1 is 7 years, 1 month); an age-equivalent score is interpreted to mean that the test taker’s performance is equal to the average performance of an X-year-old
aid An error in oral reading, recorded when a student hesitates for more than ten seconds and the word or words are supplied by the teacher
aided observation Use of recording devices to allow for review of observations
aimline On a progress monitoring chart, a line that connects a student’s baseline performance level with a goal performance level to show an expected rate of growth over time
algorithm The steps, processes, or procedures used for solving a problem or reaching a goal
alignment The similarity or match between or among content standards, performance standards, curriculum, instruction, and assessments in terms of knowledge and skill expectations
alternate assessment Substitute way of gathering data, often by means of portfolio or performance measures; alternate assessments are intended for students with signifi cant disabilities that keep them from participating in the regular assessment
alternate form reliability The correlation of student performance on multiple equivalent forms of the test
alternate forms Two tests that measure the same trait or skill to the same extent and that are standardized on the same population; alternate forms offer essentially equivalent tests and are sometimes called “equivalent forms”
alternative achievement standard Expectations for performance that differ in complexity from a grade-level achievement standard, but are linked to the content standards
amplitude The intensity of a behaviorassessment The process of collecting data for the
purpose of (1) specifying and verifying problems, and (2) making decisions about students
Glossary 417
attainment What an individual has learned, regardless of where it has been learned
audiogram A graph of the results of the pure-tone threshold test
basal That item in a test below which it is assumed the student will get all items correct
behavioral contexts The array of setting events and discriminative stimuli that may be associated with demonstration of a particular behavior
behavioral observation Observation of spontaneous behavior, which has not been elicited by a predetermined and standardized set of stimuli (that is, not test behavior)
behavioral topography The way in which a behavior is performed
benchmark A specifi c statement of knowledge and skills within a content area’s continuum that a student must possess to demonstrate a level of progress toward mastery of a standard
benefi cence Responsible caring; educational professionals do things that are likely to maximize benefi t to students, or at least do no harm
bimodal distribution A distribution that has two modesbiserial correlation coeffi cient An index of association
between two variables, one of which has been forced into an arbitrary dichotomy (e.g., smart/dull) and one of which is equal interval (e.g., grade point average)
body of evidence Information or data that establish that a student can perform a particular skill or has mastered a specifi c content standard and that was either produced by the student or collected by someone who is knowledgeable about the student
capacity building Working with systems (community agencies, schools, families, churches, businesses, related services personnel) to help enhance student competence
cash validity The notion that frequently used tests are valid tests
Category A data The basic, minimum information schools need in order to operate an educational program, including identifying information, as well as information about a student’s educational progress
Category B data Test results and other verifi ed information useful to the schools in planning a student’s educational program or maintaining a student safely in school
Category C data Information that may be potentially useful to schools, including any unverifi ed information, scores on personality tests, etc.
Cattell-Horn-Carroll (CHC) theory A theory of intelligence that articulates intelligence as being composed of several factors
ceiling That item in a test above which it is assumed the student will fail all items
celeration charts Charts based on the principle that changes (increases or decreases) in the frequency of behavior within a specifi ed time (e.g., number of correct responses per minute) are multiplicative not additive; also called standard behavior charts, semilogarithmic charts, or seven cycle charts
classifi cation A type of decision that concerns a pupil’s eligibility for special services, special education services, remedial education services, speech services, etc.
classroom response systems Handheld devices, often called “clickers,” that are used in class to simultaneously assess all students: students are presented with a multiple choice question, and click the responder to indicate their answer; teachers get an immediate graph or table showing all students’ responses
coeffi cient alpha The average split-half correlation based on all possible divisions of a test into two parts; coeffi cient alpha can be computed directly from the variances of individual test items and the variance of the total test score
competence enhancement Helping students build those skills and behaviors that enable them to meet standards or achieve desired outcomes; basically, this involves helping students get better at what they do
computer adaptive testing An assessment method whereby items are selected for administration based on the student’s performance on earlier items within the test
computer-generated reports A feature of many standardized tests in which a report is generated based on data about the student that the examiner enters into the computer; when used to inform special education eligibility, these decisions may not allow for appropriate tailoring based on individual characteristics and needs
computerized scoring A feature of many standardized tests that has the potential to increase effi ciency and accuracy in scoring; an examiner enters student responses and the computer calculates scores
concurrent criterion-related validity A measure of how accurately a person’s current test score can be used to estimate a score on a criterion measure
conductive hearing loss Abnormal hearing associated with poor air-conduction sensitivity but normal bone-conduction sensitivity
confi dence interval The range of scores within which a person’s true score will fall with a given probability
418 Glossary
construct validity A measure of the extent to which a test measures a theoretical trait or characteristic
consultation A meeting between a resource teacher or other specialist and a classroom teacher to verify the existence of a problem, specify the nature of the problem, and develop strategies that might relieve the problem
content standard Statement of the specifi c content or skills that students are expected to have mastered at a specifi c point in time
content validity A measure of the extent to which a test is an adequate measure of the content it is designed to cover; content validity is established by examining three factors: the appropriateness of the types of items included, the comprehensiveness of the item sample, and the way in which the items assess the content
continuous recording A way to record behavior in which the observer counts each occurrence of a behavior in the observation session; the duration or latency of each occurrence within the observation session can be timed
continuous technology-enhanced measures Computer-administered tests that are used in continuous (ongoing or daily) progress monitoring
contrived observations An observation in which a situation is set up before a student is introduced into it
correlation A measure of the degree of relationship between two or more variables; a correlation indicates the extent to which any two variables go together—that is, the extent to which changes in one variable are refl ected by changes in the second variable
correlation coeffi cient A numerical index of the relationship between two or more variables
criterion-referenced test Test that measures a person’s skills in terms of absolute levels of mastery
criterion-related validity A measure of the extent to which a person’s score on a criterion measure can be estimated from that person’s score on a test of unknown validity
critical comprehension Analyzing, evaluating, and making judgments about material read
crystallized intelligence (gc) General knowledge and skill that an individual acquires over time (compare with fl uid intelligence)
curriculum-based assessment Use of assessment materials and procedures that mirror instruction in order to ascertain whether specifi c instructional objectives have been accomplished, and monitor progress directly in the curriculum being taught
cut score A specifi ed point on a score scale; scores at or above that point are interpreted differently from scores below that point (also called a cutoff score)
daily living skills A domain measured within the Vineland Adaptive Behavior Scales, 2nd edition, that consists of personal, domestic, and community living skills
decile A band of percentiles that is ten percentile ranks in width; each decile contains 10 percent of the norm group
decision-making rules Rules commonly applied to progress monitoring results to inform the need for instructional change
derived score A general term for a raw score that is transformed to a developmental score or to a score of relative standing
descriptive statistics Numerical values, such as mean, standard deviation, or correlation, that describe a data set
developmental age A test score expressed as an age equivalent; the score represents the average score earned by individuals of a specifi c age
developmental equivalent A type of derived score in which raw scores are converted to the mean or median for a particular age or grade (e.g., a grade equivalent expresses a test taker’s raw score as the mean of a school grade; a grade equivalent of 7.0 means that the raw score was the mean of students in the beginning of seventh grade. An age equivalent of 7-0 means that the raw score was the mean of seven-year-old test takers. Age equivalents are also sometimes divided by chronological age to create a developmental quotient.)
developmental milestones Signifi cant developmental accomplishments (such as using words and walking) commonly used to determine whether infants and toddlers are developing as expected
developmental score A raw score that has been transformed into age equivalent (AE) (e.g., mental age), grade equivalent, or developmental quotient
deviation IQ A standard score with a mean of 100 and a standard deviation of 15 or 16 (depending on the test)
deviation score The distance between an individual’s score and the average score for the group, such as z-scores and T-scores
diagnostic achievement test A test designed to identify a student’s specifi c skill development strengths and weaknesses
diagnostic report A report commonly generated by technology-enhanced assessment programs that can provide data on individual students, classrooms, schools, and districts
disaggregation The collection and reporting of student achievement results by particular subgroups (e.g., students with disabilities, limited-English-profi cient students) to ascertain the subgroup’s academic progress; disaggregation makes it possible to compare subgroups or cohorts
Glossary 419
discriminative stimulus A stimulus that is consistently present when a behavior is reinforced and that elicits the behavior even in the absence of the original reinforcer
disregard of punctuation An error in oral reading in which a student fails to give appropriate infl ection in response to punctuation; e.g., a student may not pause for a comma, stop for a period, or indicate voice infl ection at a question mark or exclamation point
distractor An incorrect option contained in a response setdistribution The way in which scores in a set array
themselves; a distribution may be graphed to demonstrate visually the relations among the scores in the group or set
due process provisions A set of legal provisions specifying that schools and the personnel who work in schools must respect all the rights that students are entitled to as persons; specifi cally, IDEA includes specifi cation of steps school personnel must go through before assessing or changing the placement of students, or resolving confl icting opinion between school personnel and parents
duration The length of time a behavior lasts
ecobehaviorial assessment Observations of functional relationships between student behavior and ecological or environmental factors (What environmental factors are related to specifi c student behaviors?); enables educators to identify natural instructional conditions that are associated with academic success, behavioral competence, or problem behaviors
ecobehavioral observation Observation targeting the interaction among student behavior, teacher behavior, time allocated to instruction, physical grouping structures, the types of tasks being used, and instructional content
ecology Mutual relationships between organisms and their environments
effi ciency The speed and economy with which data are collected
English language accommodation A change in a test for an English language learner that involves providing support using the English language
English language learner (ELL) An individual who is acquiring the English language and has a non-English primary language
entitlement In special education, the right to a free and appropriate education, related services, and due process
equal-interval scale A scale in which the differences between adjacent values are equal, but in which there is no absolute or logical zero
error Misrepresentation of a person’s score as a result of failure to obtain a representative sample of times, items, or scorers
ethnographic observation Observation in which the observer does not participate in what is occurring
etiology The cause of a disorderevidence-based An assessment or instructional approach
that has been shown through research to be effectiveexpectancy The tendency of an observer to see behaviors
consistent with her or his beliefs about what should happen
expressive language The production of languageextended responses A testing format in which student
response is in the form of an essay; typically it is most useful for testing comprehension, application, analysis, synthesis, and evaluation objectives
externalizing problems Problems in social-emotional functioning that are characterized by aggressive and acting-out behavior
fl uency The rate and automaticity with which an individual can complete a given task
fl uid intelligence (gc) The effi ciency with which an individual learns and completes various tasks (compare with crystallized intelligence)
focal points A small number of mathematical topics that should be focused on at each grade level and serve as areas teachers should focus on; the National Council of Teachers of Mathematics published a document detailing these
formative assessment Administration of a continuous or periodic tests and use of the test results to adjust teaching or learning while they are happening
formative evaluation Ongoing frequent evaluation as the thing being evaluated is occurring; in instructional evaluation, collection of data as instruction is occurring
free operant A test situation that presents more problems than a student can answer in the given time period
frequency The tabulation of the number of behaviors with discrete beginnings and endings that occur in a predetermined time frame; when the time periods in which the behavior is counted vary, frequencies are usually converted to rates
frustration level Usually accuracy that is less than 85 percent correct; when a student is performing at frustration level, the material is too diffi cult
functional behavioral assessment Collecting data in order to identify the function of a student’s problematic behavior, which is then used to inform the development of an intervention
function of behavior The reason a person behaves as he or she does, or the purpose the behavior serves
420 Glossary
goal line On a progress monitoring chart, a line that connects a student’s baseline performance level with a goal performance level to show an expected rate of growth over time
grade equivalent A derived score that expresses a student’s performance as the average (the median or mean) performance for a particular grade; grade equivalents are expressed in grades and tenths of grades, with a decimal point used in grade scores (e.g., 7.1 is grade 7 and one-tenth)
gross mispronunciation An error in oral reading in which a student’s pronunciation of a word is in no way similar to the word in the text
halo effect The tendency of an observer to make subjective judgments on the basis of general attributes, such as race or social class
handheld observation system Observational systems available for personal digital assistants (PDA) that can facilitate observation of classroom behavior
hesitation An error in oral reading in which a student pauses for two or more seconds before pronouncing a word
histogram A representation of frequency distribution by means of rectangles whose widths are class intervals and whose areas are proportional to corresponding frequencies
historical information Information that describes how a person has functioned in the past
inclusive education Education of people with and without disabilities in the same classes or school environments
independent level Usually accuracy that is 95 percent or higher
indicator The symbolic representation of one or more outcomes that can be used to make comparisons among students or schools
individual consent Consent by parent (or pupil) required for the collection of family information (religion, income, occupation, and so on), personality data, and other noneducational information
individualized education plan (IEP) A document that specifi es the long-term and short-term goals of an instructional program, where the program will be delivered, who will deliver the program, and how progress will be evaluated
inferential comprehension Interpreting, synthesizing, or extending the information that is explicit in the reading material
informal assessment Any assessment that involves collection of data by anything other than a norm-referenced (standardized) test
informal reading inventory (IRI) Usually a test without a normative sample, consisting of graded reading passages and vocabulary words that span a wide range of skill levels; IRIs are used to assess decoding and comprehension in order to locate the level at which a student reads at an instructional level (with about 90 percent accuracy)
informed consent Consent that a parent or a student gives for the collection or dissemination of information not directly relevant and essential to the child’s education; the assumption underlying the notion of informed consent is that the parent (or pupil) is “reasonably competent to understand the nature and consequences of his [or her] decision” (Goslin, 1969, p. 17)
insertion An error in oral reading in which a student inappropriately adds one or more words to the sentence being read
instructional ecology Relationships between students and their instructional environments
instructional environment Those contexts in which learning takes place (schools, classrooms, homes), as well as the interface of essential contexts for children’s learning (home-school relationships)
instructional level Usually accuracy that is between 85 and 95 percent correct
instructional match Instruction that is matched to a student’s specifi c level of skill development
intelligence An inferred ability; a term or construct used to explain differences in present behavior and to predict differences in future behavior
intelligence factors Components that are considered to be part of intelligence
inter-interviewer reliability The extent to which multiple interviewers who rate behavior of an individual based on interviews with a respondent at different times rate the individual’s behavior similarly
internal consistency A measure of the extent to which items in a test correlate with one another
internalizing problems Problems in social-emotional functioning that are characterized by withdrawn, anxious, or depressed behaviors
inter-observer agreement The extent to which results can be generalized to different observers, which is determined by having two observers provide scores/ratings, and then determining either percent agreement or the correlation between scores/ratings
inter-respondent reliability The extent to which multiple respondents who indirectly rate behavior of an individual based on cumulative exposure to the individual rate the behavior similarly
interscorer reliability An estimate of the degree of agreement between two or more scores on the same test
Glossary 421
intervention assistance team (IAT) A group of teachers (and sometimes other professionals, such as school psychologists or speech-language pathologists) who meet to review student diffi culties, try to ascertain the kinds of interventions to implement to try to alleviate diffi culties in the regular classroom, and monitor the extent to which the interventions work; sometimes called “mainstream assistance team” or “prereferral team”
inversion An error in oral reading in which a student says the words in an order different from the order in which they are written
Iowa problem-solving model A systematic process used to assess and intervene on behalf of students with academic and behavioral problems
item reliability The extent to which one can assume that performance on a set of items can generalize to performance on other items within the domain
keyed response The correct answer in a response setKR-20 An estimate of the internal consistency of a test
when test items are scored dichotomouslykurtosis The peakedness of a curve, or the rate at which
a curve rises
language A code for conveying ideas; although there is some variation, language theorists propose fi ve basic components to describe the code: phonology, semantics, morphology, syntax, and pragmatics
language mechanics Punctuation and capitalizationlatency The amount of time between a signal to
initiate the behavior and the actual beginning of the behavior
least restrictive environment The specifi cation in IDEA that to the maximum extent appropriate students with disabilities are to be educated with children who are not disabled, and that they should be removed to separate classes, schools, or elsewhere only when the nature or severity of their disability is such that education in regular classes with the use of supplementary aids and services cannot be achieved satisfactorily
leptokurtic curve A fast-rising curve; tests that do not spread out (or discriminate among) those taking the test are typically leptokurtic
lexical comprehension Knowing the meaning of key vocabulary words
Likert scale A technique in which a set of attitude statements is presented and respondents are asked to express degree of agreement or disagreement, usually on a fi ve- or seven-point scale ranging from strongly agree to strongly disagree; each degree of agreement is given a numerical value, and a total numerical value can be calculated from all the responses
limited English profi ciency (LEP) Used to describe an individual who has a native language other than English, such that it affects the individual’s ability to learn in an English-speaking classroom
literal comprehension Understanding information that is explicit in the reading material
maladaption Behavior that does not promote surviving and thriving as an individual; often, it is determined based on context, age, and social/cultural expectations; an absence of this is sometimes used in defi nitions of adaptive behavior
mandated tests Tests that are administered as a result of legislation
mastery Usually accuracy that equals or exceeds 90 to 95 percent correct
mean The arithmetic average of scores in a distributionmeasurement error The difference between observed
score and true score; the distribution of measurement error can be determined using the test’s standard deviation and reliability
median A score that divides the top 50 percent of test takers from the bottom 50 percent; the point on a scale above which 50 percent of the cases (not the scores) occur and below which 50 percent of the cases occur
metalinguistic Relating to the direct examination of the structural aspects of language
mixed hearing loss Abnormal hearing attributed to abnormal bone conduction and even more abnormal air conduction
mode The most frequently obtained score in a distribution
modifi ed achievement standards Expectations for performance that are lower than the grade-level achievement standards, but linked to or aligned with the content standards; this term will be further defi ned by policy makers in the near future
momentary time sampling A procedure used in systematic observation to determine when observations will occur; a behavior is scored as an occurrence if it is present at the last moment of an observation interval; if the behavior is not occurring at the last moment of the interval, a nonoccurrence is recorded
morphology The use of affi xes (prefi xes and suffi xes) to change the meaning of words used in sentences
multiple gating A method for conducting assessment that involves screening, followed by increasingly comprehensive assessment for students who are identifi ed to be at-risk
multiple-skill battery A test that measures skill development in several achievement areas
422 Glossary
native language accommodation A change in a test for an English language learner that involves providing support using a student’s native language
naturalistic observations Observations that occur in settings that are not contrived
NCTM Standards Math standards and results specifi ed by the National Council of Teachers of Mathematics
negatively skewed distribution An asymmetric distribution in which scores tail off to the low end of the continuum; a distribution in which there are more scores above the mean than below it
nominal scale A scale of measurement in which there is no inherent relationship among adjacent values
nonsystematic observation Observation in which the observer notes behaviors, characteristics, and personal interactions that seem of signifi cance
nonverbal tests Tests, such as some intelligence tests, where students can understand and respond to items without verbal language
normal-curve equivalent Standard score with a mean equal to 100 and a standard deviation equal to 21.06
normative sample (norm group) A group of subjects of known demographic characteristics (age, gender, grade in school, and so on) to whom a person’s performance may be compared
normative update The re-standardization of a test by giving it to a new norm sample without changing the test items
norm group See standardization samplenorm-referenced device Test that compares an
individual’s performance to the performance of his or her peers
objective-referenced assessment Tests referenced to specifi c instructional objectives rather than to the performance of a peer group or norm group
objective scoring Scoring that is based on observable qualities and not infl uenced by emotion, guess, or personal bias
observation The process of gaining information through one’s senses—visual, auditory, etc.; observation can be used to assess behavior, states, physical characteristics, and permanent products of behavior (such as a child’s poem)
obtrusive observations Observations in which it is obvious to the person being observed that they are being observed
omission An error in oral reading in which a student skips a word or a group of words
operationalize To defi ne a behavior or event in terms of the operations used to measure it; e.g., an operational defi nition of intelligence would be a score on a specifi c intelligence test
oral reading A skill often measured in diagnostic reading tests; students are asked to read a series of passages
and the examiner takes note of fl uency, accuracy, errors, and other characteristics of reading quality
oral reading errors Instances in which a student misreads a printed word
ordinal scale A scale on which values of measurement are ordered from best to worst or from worst to best; on ordinal scales, the differences between adjacent values are unknown
ordinate The vertical axis of a graph of a distribution, showing the frequency (or the number) of individuals earning any given score
outcome The result of interactions between individuals and schooling experiences
out-of-level test A lower- or higher-level test that is judged appropriate for the student’s developmental level rather than the student’s age/grade level
partial-interval recording A procedure used in systematic observation in which an occurrence is scored if the behavior occurs during any part of the interval
partial mispronunciation One of several kinds of errors in oral reading, including partial pronunciation, phonetic mispronunciation of part of the word, omission of part of the word, or insertion of elements of words
participant-observer observation Observation in which the observer joins the target social group and participates in its activities
Pearson product-moment correlation coeffi cient (r) An index of the straight-line (linear) relationship between two or more variables measured on an equal-interval scale
peer acceptance nomination scales Scales that provide an indication of an individual’s social status and may help describe the attitude of a particular group (such as the class) toward a target student
penmanship The formation of individual letters and letter sequences that make up words
percentile rank (percentile) Derived score that indicates the percentage of people whose scores are at or below a given raw score; percentiles are useful for both ordinal and equal-interval scales
perception Any ability or skill involving the interaction of perception and voluntary movement (e.g., typing)
performance defi cit A particular skill that has been learned, but is not used appropriately
performance standard A statement of the degree of mastery (such as “with 80 percent accuracy”) that students are expected to demonstrate
periodic technology-enhanced measures Computer-administered tests that are used in periodic (bi-weekly, monthly, quarterly) progress monitoring
phi coeffi cient An index of linear correlation between two sets of naturally dichotomous variables (e.g., male/female, dead/alive)
Glossary 423
phonology The hearing and production of speech soundsplatykurtic curve A curve that is fl at and slow risingpoint biserial correlation coeffi cient An index of
linear correlation between one naturally occurring dichotomous variable (such as gender) and a continuous, equal-interval variable (such as height measured in inches)
point-to-point agreement A method of determining inter-observer agreement, calculated by dividing the number of observations where both observers agree (occurrence and nonoccurrence) by the total number of observations and multiplying the quotient by 100
portfolio A collection of products that provide a basis for judging student accomplishment; in school settings, portfolios typically contain extended projects and may also contain drafts, teacher comments and evaluations, and self-evaluations
positively skewed distribution An asymmetrical distribution in which scores tail off to the higher end of the continuum; a distribution in which there are more scores below the mean than above it
power test An untimed test in which the interest is in how many items a student can complete correctly
pragmatics The social context in which language occurspredictive criterion-related validity A measure of the
extent to which a person’s current test scores can be used to estimate accurately what that person’s criterion scores will be at a later time
prereferral Activities that occur prior to formal referral, assessment, and consideration for placement; the goal of prereferral and intervention is twofold: (1) verifi cation and specifi cation of the nature of a student’s diffi culties and (2) provision of services in the least restrictive environment
presentation accommodation A change in how a test is presented that facilitates appropriate testing of an individual student
probe A special testing format that is well suited to the assessment of direct performances; probes are brief (usually three minutes or less), timed, frequently administered assessments that can be used for any purpose
processing defi cits Defi cits in cognitive functioning that are sometimes used in defi nitions of learning disabilities
process standards Statements of the specifi c processes students should go through in solving problems
prognosis A prediction of future performanceprogress monitoring The collection of data that is used
to determine the impact of instruction and intervention over a short period of time
protection in evaluation procedures provisions The specifi cation in IDEA that assessment procedures and activities must be fair, equitable, and non-discriminatory
qualitative data Information consisting of nonsystematic and unquantifi ed observations
qualitative observation A description of behavior, its function, and its context; the observer begins without preconceived ideas about what will be observed and describes behavior that seems important
quantitative data Observations that have been tabulated or otherwise given numerical values
quantitative observation A type of observation that is focused on quantifi cation of a specifi c behavior, with procedures for recording that behavior at selected times and in selected places
quartile A band of percentiles that is 25 percentile ranks in width; each quartile contains 25 percent of the norm group
random error In measurement, sources of variation in scores that make it impossible to generalize from an observation of a specifi c behavior observed at a specifi c time by a specifi c person to observations conducted on similar behavior, at different times, or by different observers
range The distance between the extremes in a set of scores, including those extremes; the highest score less the lowest score, plus one
rate The number of responses per minute; rate measures are thought to indicate a student’s fl uency or automaticity of response
rate of reading Often used to measure reading skill; tells how quickly and automatically a student can decode words
rating scale A standardized assessment procedure whereby behavior, states, or feelings are quantifi ed; most rating scales rely on ordinal measurement of recalled observations
ratio IQ A derived score based on mental age (MA), in relation to chronological age (CA), in which IQ equals
MA (in months)
_______________ CA (in months)
× 100
ratio scale A scale of measurement in which the difference between adjacent values is equal and in which there is a logical and absolute zero
raw score The quantifi ed evaluation of a test item or group of test items such as right or wrong on a specifi c item, or the number of right or wrong items on a student’s test; in standardized testing, raw scores are usually transformed to derived scores
readiness The extent of preparation to participate in an activity; most often refers to readiness to enter school, but applies to all levels
receptive language The comprehension of languagereferral A request for help from a specialist; e.g., a
teacher or parent may refer a student to a specialist
424 Glossary
who can provide the student with an appropriate educational program
reliability In measurement, the extent to which it is possible to generalize from an observation of a specifi c behavior observed at a specifi c time by a specifi c person to observations conducted on similar behavior, at different times, or by different observers
reliability coeffi cient An index of the extent to which observations can be generalized; the square of the correlation between obtained scores and true scores on a measure r2
xt
repetition An error in oral reading in which a student repeats words or groups of words
representational consent Consent to collect data, given by appropriately elected offi cials such as members of a state legislature
respondent A person who is relied on to provide judgment about behavior based on cumulative observations
RTI (response to instruction) How students respond to core instruction or universal programming (the everyday instruction that occurs for students)
response accommodation A change in how a student may respond to a test that facilitates appropriate testing of that student
response to intervention Students’ responses when substantial changes are made in regular classroom instruction
retention The percentage of correct responses recalled following learning; also called “maintenance,” “recall,” or “memory”
sample A representative subset of a populationscheduling accommodation A change in the scheduling
of a test that facilitates appropriate testing of an individual student
scoring rubric An ordinal scale used to rate a product; rubrics typically use verbal descriptions to anchor the end intermediate points of the scale
scotoma A visionless spot in the eyescreening An initial stage of assessment in which those
who may exhibit a particular problem, disorder, disability, or disease are discriminated from the general population
selection format A method of presenting test questions in which students indicate their choice from an array of the possible test answers (usually called “response options”); true-false, multiple-choice, and matching are the three most common selection formats
semantics The study of word meanings; although the scope of the term can extend beyond individual words to include sentence meaning, the term generally applies to words
sensitivity An assessment procedure’s capacity to detect small differences among or within students
sensorineural hearing loss Abnormal hearing associated with both poor bone-conduction sensitivity and poor air-conduction sensitivity
setting accommodation A change in the testing environment that facilitates appropriate testing of an individual student
setting event An environmental event that sets the occasion for the performance of an action
simple agreement A method of determining inter-observer agreement, calculated by dividing the smaller number of occurrences by the larger number of occurrences and multiplying the quotient by 100
single-skill test A test designed to measure skill development in one specifi c content area (e.g., reading)
skew Asymmetry in a distribution; the distribution of scores below the mean is not a mirror image of the distribution above the mean
social comparison Observing a peer whose behavior is considered to be appropriate and using the peer’s rate of behavior as the standard against which to evaluate the target student’s rate of behavior
social skills and relationships A domain measured within the Vineland Adaptive Behavior Scales, 2nd edition, that consists of Relating to Others, Playing and Using Leisure Time, and Adapting
social tolerance The threshold above which behaviors are viewed as undesirable by others
social validity A consumer’s access to and satisfaction with an intervention or assessment
sociometric ranking Provides an indication of an individual’s social status and may help describe the attitude of a particular group (such as the class) toward a target student
Spearman rho An index of correlation between two variables measured on an ordinal scale
speed test A timed testspelling The formation of words from letters according
to accepted usagesplit-half reliability estimate An estimate of internal-
consistency reliability derived by correlating people’s scores on two halves of a test
stability coeffi cient Another name for test-retest reliability coeffi cient; quantifi es the consistency of scores over time
standard deviation A measure of the degree of dispersion in a distribution; the square root of the variance
standard error of measurement (SEM) The standard deviation of error around a person’s true score
standardization sample The group of individuals on whom a test is standardized; also called “the norm group”
Glossary 425
standards Statements of desired goals or outcomesstandard score The general name for a derived score that
has been transformed to produce a distribution with a predetermined mean and standard deviation
stanine Short for standard nines; a standard-score band that divides a distribution into nine parts; the middle seven stanines are each 0.50 standard deviation wide, and the fi fth stanine is centered on the mean
stem In selection formats, the part of a problem that contains the question
student accountability The idea that consequences exist for individual students, and are based on their individual assessment performance; for example, students might not be promoted to the next grade or graduate if their assessment results do not meet a pre-specifi ed level
subjective scoring Scoring that is not based on observable qualities but relies on personal impressions and private criteria
substitution An error in oral reading in which a student replaces one or more words in the passage with one or more meaningful words (synonyms)
supply format A method of presenting test questions in which a student is required to produce a written or oral response; this response can be as restricted as a number or a word and can be as extensive as a sentence, a paragraph, or several pages of written response
supralinguistics A second order of analysis required to understand the meaning of words or sentences
syntax Word order of sentences; includes a description of the rules for arranging the words into a sentence
system accountability The idea that consequences exist for school systems, and are based on the assessment performance of a group of individuals (e.g., school building, district, or state education agency); for example, a school might receive a fi nancial award or special recognition for having a large percent of students meeting a particular assessment performance level
systematic bias A type of error that can threaten validity; it can consist of the method of measurement, enabling behaviors, differential item effectiveness, systematic administration errors, and unrepresentative norms
systematic error A consistent error that can be predicted; bias
systematic observation Observation in which an observer specifi es or defi nes the behaviors to be observed and then counts or otherwise measures the frequency, duration, magnitude, or latency of the behaviors
test A predetermined set of questions or tasks to which predetermined types of behavioral responses are sought
testing Administering a particular set of questions to an individual or group of individuals in order to obtain a score
testing formats The methods by which test items are presented and responded to
test-retest reliability An index of stability over timetest translation A test that was developed in one
language and converted into another language tetrachoric correlation coeffi cient An index of
correlation between two arbitrarily dichotomized variables (e.g., tall/short, smart/dull)
topography of behavior The way a behavior is performed transformed score A special form of z-score that allows
the transformation of a z-score to a distribution defi ned by the user:
Transformed score = Mean + (z * Standard deviation)
where the z-score is computed from existing data and the mean and standard deviation are defi ned according to the needs of the user
trendline On a progress monitoring chart, a line that represents the student’s actual growth
true score The score that a student would earn if the entire domain of items was assessed
T-score A standard score with a mean of 50 and a standard deviation of 10
tunnel vision Normal central visual acuity with a restricted peripheral fi eld
universal design for assessment The design of assessment programs that involves consideration of the needs of all participants
unobtrusive observations An observation in which the people being observed do not realize they are being watched
validity The extent to which a test measures what its authors or users claim it measures; specifi cally, test validity concerns the appropriateness of the inferences that can be made on the basis of test results
validity coeffi cient A coeffi cient that measures the correlation between a test of unknown validity and an established criterion measure
variance A numerical index describing the dispersion of a set of scores around the mean of the distribution; specifi cally, the average squared distance of the scores from the mean
visual acuity The clarity or sharpness with which a person sees
whole-interval recording A procedure used in systematic observation in which an occurrence is scored if the behavior is present throughout the entire observation interval
426 Glossary
word-attack skills Skills used to derive the pronunciation or meaning of a word through phonic analysis, structural analysis, or context cues
word recognition skills Used to refer to skills in recognizing words by sight rather than through use of word attack skills
writing style Rule-governed writing, which includes grammar (e.g., verb tense and use) and mechanics (e.g., punctuation and capitalization)
z-score Standard score with a mean of 0 and a standard deviation of 1
427
REFERENCESAchenbach, T. M. (1986). The Direct Observation Form
(DOF). Burlington: University of Vermont, Department of Psychiatry.
Achenbach, T. M., & Rescorla, L. A. (2000). Manual for the ASEBA Preschool Forms and Profi les. Burlington: University of Vermont, Department of Psychiatry.
Achenbach, T. M., & Rescorla, L. A. (2001). Manual for the ASEBA School-Age Forms and Profi les. Burlington: University of Vermont, Department of Psychiatry.
Adams, M. (1990). Beginning to read: Thinking and learning about print. Cambridge, MA: MIT Press.
Alberto, P. A., & Troutman, A. C. (2005). Applied behavior analysis for teachers (7th ed.). Upper Saddle River, NJ: Prentice-Hall.
Algozzine, B. A., Christenson, S. L., & Ysseldyke, J. E. (1982). Probabilities associated with the referral to placement process. Teacher Education and Special Education, 5, 19–23.
American Association for the Advancement of Science. (1987). Science for all Americans. New York: Oxford University Press.
American Association for the Advancement of Science. (1993). Benchmarks for science literacy. New York: Oxford University Press.
American Educational Research Association (AERA), American Psychological Association, & National Council on Measurement in Education. (1997). Standards for educational and psychological testing. Washington, DC: American Educational Research Association.
American Educational Research Association (AERA), American Psychological Association, & National Council on Measurement in Education. (1999). Standards for educational and psychological testing. Washington, DC: American Educational Research Association.
American Psychological Association. (1992). Ethical principles of psychologists and code of conduct. Washington, DC: Author.
Ames, W. (1965). A comparison of spelling textbooks. Elementary English, 42, 146–150, 214.
Armbruster, B., & Osborn, J. (2001). Put reading fi rst: The research building blocks for teaching children to read. Jessup, MD: Partnership for Reading. Available from the National Institute for Literacy website: www.nifl .gov.
Ayers, A. (1981). Sensory integration and the child. Los Angeles, CA: Western Psychological Services.
Bachor, D. (1990). The importance of shifts in language level and extraneous information in determining word-problem diffi culty: Steps toward individual assessment. Diagnostique, 14, 94–111.
Bachor, D., Stacy, N., & Freeze, D. (1986). A conceptual framework for word problems: Some preliminary results. Paper presented at the conference of the Canadian Society for Studies in Education, Winnipeg, Manitoba.
Bailey, D. B., & Rouse, T. L. (1989). Procedural considerations in assessing infants and preschoolers with handicaps. In D. B. Bailey & M. Wolery (Eds.), Assessing infants and preschoolers with handicaps. Columbus, OH: Merrill.
Baker, E. L., Bewley, W. L., Herman, J. L., Lee, J. J., & Mitchell, D. S. (2001). Upgrading America’s use of information to improve student performance (Proposal to the U.S. Secretary of Education). Los Angeles: University of California, National Center for Research on Evaluation, Standards, and Student Testing.
Baker, E. L., & Linn, R. L. (2002). Validity issues for accountability systems. Los Angeles, CA: University of California, National Center for Research on Evaluation, Standards, and Student Testing.
Bandura, A. (1969). Principles of behavior modifi cation. Oxford: Holt, Rinehart, & Winston.
Barsch, R. (1966). Teacher needs—motor training. In W. Cruickshank (Ed.), The teacher of brain-injured children. Syracuse, NY: Syracuse University Press.
Baumgardner, J. C. (1993). An empirical analysis of school psychological assessments: Practice with students who are deaf and bilingual. Unpublished doctoral dissertation, University of Minnesota, Minneapolis.
Bayley, N. (2006). Bayley Scales of Infant and Toddler Development. San Antonio, TX: Psychological Corporation.
Beery, K. E. (1982). Revised administration, scoring, and teaching manual for the Developmental Test of Visual-Motor Integration. Cleveland, OH: Modern Curriculum Press.
Beery, K. E. (1989). The Developmental Test of Visual-Motor Integration. Cleveland, OH: Modern Curriculum Press.
428 References
Beery, K. E., & Beery, N. (2004). Beery VMI. Minneapolis, MN: NCS Pearson.
Bender, L. (1938). Bender Visual-Motor Gestalt Test. New York: Grune & Stratton.
Boehm, A. E. (2001). Boehm Test of Basic Concepts—Third Edition. Bloomington, MN: Pearson.
Bond, G., & Dykstra, R. (1967). The cooperative research program in fi rst-grade reading instruction (1967). Reading Research Quarterly, 2, 5–142.
Bracken, B., & McCallum, R. S. (1998). Universal Nonverbal Intelligence Test. Itasca, IL: Riverside Publishing Company.
Brannigan, G., & Decker, S. (2003). Bender Visual-Motor Gestalt Test (2nd ed.). Itasca, IL: Riverside Publishing.
Breland, H. (1983). The direct assessment of writing skill: A measurement review (College Board Report No. 83-6). New York: College Entrance Examination Board.
Breland, H., Camp, R., Jones, R., Morris, M. M., & Rock, D. (1987). Assessing writing skill. New York: The College Board.
Briggs, A., & Underwood, G. (1984). Phonological coding in good and poor readers. Reading Research Quarterly, 20, 54–66.
Broderick, C. B. (1993). Understanding family process: Basics of family systems theory. Newbury Park, CA: Sage.
Brown, L., & Hammill, D. (1990). Behavior Rating Profi le (2nd ed.). Austin, TX: Pro-Ed.
Brown, L., Hammill, D., & Wiederholt, J. L. (1995). Test of Reading Comprehension–3. Austin, TX: Pro-Ed.
Brown, L., Sherbenou, R., & Johnsen, S. (1997). Test of Nonverbal Intelligence–3. Austin, TX: Pro-Ed.
Brown, R., & Bellugi, U. (1964). Three processes in the child’s acquisition of syntax. Harvard Educational Review, 34, 133–151.
Brown, V., Wiederholt, J. L., & Hammill, D. D. (2009). Test of reading comprehension (4th ed.). Austin, TX: PRO-ED.
Bruininks, R., Woodcock, R., Weatherman, R., & Hill, B. (1996). Scales of Independent Behavior, Revised, comprehensive manual. Chicago: Riverside Publishing Company.
Butcher, N. N., Graham, J. R., Ben-Porath, Y. S., Tellegen, Y. S., Dahlstrom, W. G., & Kaemmer, B. (2001). Minnesota Multiphasic Personality Inventory–2. Minneapolis, MN: University of Minnesota Press.
Caldwell, J., & Goldin, J. (1979). Variables affecting word problem diffi culty in elementary school mathematics. Journal of Research in Mathematics Education, 10, 323–335.
Campbell, D., & Fiske, D. (1959). Convergent and discriminate validation by the multi-trait–multi-method matrix. Psychological Bulletin, 56, 81–105.
Carr, E. (1994). Emerging themes in functional analysis of problem behavior. Journal of Applied Behavioral Analysis, 27, 393–400.
Carrow-Woolfolk, E. (1995). Manual for the Listening Comprehension and Oral Language Subtests of the Oral and Written Language Scales. Circle Pines, MN: American Guidance Service.
Carrow-Woolfolk, E. (1999a). Comprehensive Assessment of Spoken Language. Circle Pines, MN: American Guidance Service.
Carrow-Woolfolk, E. (1999b). Test for Auditory Comprehension of Language (3rd ed.). San Antonio, TX: Harcourt.
Center for Universal Design. (1997). The principles of universal design, version 2.0. Raleigh: North Carolina State University.
Chall, J. (1967). Learning to read: The great debate. New York: McGraw-Hill.
Conners, C. K. (1997). Conners Parent Rating Scale–Revised. New York: Psychological Corporation.
Connolly, J. (2007). KeyMath 3 Diagnostic Assessment (KeyMath 3 DA). Minneapolis, MN: Pearson.
Cooper, C. (1977). Holistic evaluation of writing. In C. Cooper & L. Odell (Eds.), Evaluating writing: Describing, measuring, judging. Buffalo, NY: National Council of Teachers of English.
Crocker, L. M., Miller, M. D., & Franks, E. A. (1989). Quantitative methods for assessing the fi t between test and curriculum. Applied Measurement in Education, 2(2), 179–194.
Cronbach, L. (1951). Coeffi cient alpha and the internal structure of tests. Psychometrika, 16, 297–334.
CTB/McGraw-Hill. (2004). Guidelines for inclusive test administration 2005. Monterey, CA: Author.
CTB/McGraw-Hill. (2008). TerraNova—Third Edition. Monterey, CA: Author.
Cummins, J. (1984). Bilingual special education: Issues in assessment and pedagogy. San Diego, CA: College Hill.
Das, J., & Naglieri, J. (1997). Cognitive Assessment System. Itasca, IL: Riverside Publishing.
Deming, W. E. (1994). The new economics for industry, government and education. Cambridge, MA: MIT, Center for Advanced Educational Services.
Deming, W. E. (2000). The new economics for industry, government and education (2nd ed.). Cambridge, MA: MIT Press.
Deno, S. L. (1985). Curriculum-based assessment: The emerging alternative. Exceptional Children, 52, 219–232.
Deno, S. L., & Fuchs, L. S. (1987). Developing curriculum-based measurement systems for data-based special education problem solving. Focus on Exceptional Children, 19, 1–16.
Deno, S. L., & Mirkin, P. (1977). Data-based program modifi cation: A manual. Reston, VA: Council for Exceptional Children.
Derogatis, L. R. (1993). Brief Symptom Inventory. Minneapolis, MN: National Computer Systems.
References 429
Diana v. State Board of Education, 1970 (Diana v. State Board of Education, C-70: 37RFT) (N.D. Cal., 1970).
Doman, R., Spitz, E., Zuckerman, E., Delacato, C., & Doman, G. (1967). Children with severe brain injuries: Neurological organization in terms of mobility. In E. C. Frierson & W. B. Barbe (Eds.), Educating children with learning disabilities. New York: Appleton-Century-Crofts.
Dunn, L. M., & Dunn, M. (2007). Peabody Picture Vocabulary Test (4th ed.). San Antonio, TX: Pearson Assessment.
Dunn, L. M., & Markwardt, F. C. (1970). Peabody Individual Achievement Test. Circle Pines: MN: American Guidance Service.
Dunn, L. M., & Markwardt, F. C. (1998). Peabody Individual Achievement Test—Revised/Normative Update. Circle Pines, MN: American Guidance Service.
Edformation (2006). AIMSweb. Available at www.edformation.com.
Educational Testing Service. (1990). Exploring new methods for collecting students’ school-based writing: NAEP’s 1990 portfolio study (ED 343154). Washington, DC: U.S. Department of Education.
Elmore, R. (2002). Bridging the gap between standards and achievement. Washington, DC: The Albert Shanker Institute.
Englemann, S., Granzin, A., & Severson, H. (1979). Diagnosing instruction. Journal of Special Education, 13, 355–365.
Englert, C., Cullata, B., & Horn, D. (1987). Infl uence of irrelevant information in addition word problems on problem solving. Learning Disabilities Quarterly, 10, 29–36.
Epstein, M. H. (2004). Examiner’s manual for the Behavioral and Emotional Rating Scale (2nd ed.). Austin, TX: Pro-Ed.
Ervin, S. M. (1964). Imitation and structural change in children’s language. In E. H. Lenneberg (Ed.), New directions in the study of language. Cambridge, MA: MIT Press.
Figueroa, R. (1990). Assessment of linguistic minority group children. In C. R. Reynolds & R. W. Kamp-haus (Eds.), Handbook of psychological assessment of children. New York: Guilford Press.
Flesch, R. (1955). Why Johnny can’t read. New York: Harper & Row.
Foorman, B., Francis, D., Fletcher, J., Schatschneider, C., & Mehta, P. (1998). The role of instruction in learning to read: Preventing reading failure in at-risk children. Journal of Educational Psychology, 90, 1–13.
Freeland, J., Skinner, C., Jackson, B., McDaniel, C., & Smith, S. (2000). Measuring and increasing silent reading comprehension rates: Empirically validating a
related reading intervention. Psychology in the Schools, 37(5), 415–429.
Frostig, M. (1968). Education for children with learning disabilities. In H. Myklebust (Ed.), Progress in learning disabilities. New York: Grune & Stratton.
Frostig, M., Maslow, P., Lefever, D. W., & Whittlesey, J. R. (1964). The Marianne Frostig Developmental Test of Visual Perception: 1963 standardization. Palo Alto, CA: Consulting Psychologists Press.
Fuchs, D., & Fuchs, L. S. (1989). Effects of examiner familiarity on black, Caucasian, and Hispanic children: A meta-analysis. Exceptional Children, 55(4), 303–308.
Fuchs, L. S., Deno, S. L., & Mirkin, P. (1984). The effects of frequent curriculum based measurement and evaluation on pedagogy, student achievement and student awareness of learning. American Educational Research Journal, 21, 449–460.
Fuchs, L. S., & Fuchs, D. (1986). Effects of systematic formative evaluation: A meta-analysis. Exceptional Children, 53, 199–208.
Fuchs, L. S., & Fuchs, D. (1987). The relation between methods of graphing student performance data and achievement: A meta-analysis. Journal of Special Education Technology, 8(3). 5–13.
Fuchs, L. S., Fuchs, D., Hamlett, C. L., Walz, L., & Germann, G. (1993). Formative evaluation of academic progress: How much growth can we expect? School Psychology Review, 22, 27–48.
Fuchs, L. S., Fuchs, D., & Maxwell, L. (1988). The validity of informal reading comprehension measures. Remedial and Special Education, 20–28.
Gilliam, J. E. (2001). Manual for the Gilliam Asperger Disorder Scale. Circle Pines, MN: American Guidance Service.
Ginsburg, H., & Baroody, A. (2003). Test of Early Mathematics Ability (3rd ed.). Austin, TX: Pro-Ed.
Gioia, G. A., Isquith, P. K., Guy, S. C., & Kenworthy, L. (2000). Behavior Rating Inventory of Executive Functioning (BRIEF). Lutz, FL: Psychological Assessment Resources.
Goldman, R., & Fristoe, M. (2000). Goldman-Fristoe Test of Articulation (2nd ed.). Circle Pines, MN: American Guidance Service.
Good, R. H., & Kaminski, R. A. (Eds.). (2002). Dynamic Indicators of Basic Early Literacy Skills (6th ed.). Eugene, OR: Institute for the Development of Educational Achievement. Available at dibels.uoregon. edu. Also available in print form from Sopris West Educational Publishers (sopriswest.com).
Good, R. H., & Salvia, J. A. (1988). Curriculum bias in published norm-referenced reading tests: Demonstrable effects. School Psychology Review, 17(1), 51–60.
430 References
Gottesman, I. (1968). Biogenics of race and class. In M. Deutsch, I. Katz, & A. Jensen (Eds.), Social class, race, and psychological development. New York: Holt, Rinehart, & Winston.
Graden, J., Casey, A., & Bonstrom, O. (1983). Prereferral interventions: Effects on referral rates and teacher attitudes (Research Report No. 140). Minneapolis: Minnesota Institute for Research on Learning Disabilities.
Greenspan, S. I. (2004). Greenspan Social Emotional Growth Chart: A Screening Questionnaire for Infants and Young Children. San Antonio, TX: Harcourt Educational Measurement.
Greenspan, S. I. (2006). Bayley Scales of Infant and Toddler Development: Socio-Emotional Subtest. San Antonio, TX: Harcourt Educational Measurement.
Gresham, F., & Elliott, S. N. (1990). Social Skills Rating System. Circle Pines, MN: American Guidance Service.
Grimes, J., & Kurns, S. (2003, December). Response to intervention: Heartland’s model of prevention and intervention. National Research Center on Learning Disabilities Responsiveness to Intervention Symposium, Kansas City.
Gronlund, N. E. (1985). Measurement and evaluation in teaching (5th ed.; Part 2: Constructing classroom tests). New York: Macmillan.
Guilford, J. P. (1967). The nature of human intelligence. New York: McGraw-Hill.
Gutkin, T. B., & Nemeth, C. (1997). Selected factors impacting decision making in prereferral intervention and other school-based teams: Exploring the intersection between school and social psychology. Journal of School Psychology, 35, 195–216.
Hammill, D. (1998). Examiner’s manual: Detroit Tests of Learning Aptitude. Austin, TX: Pro-Ed.
Hammill, D., & Larsen, S. (2008). Examiner’s manual for the Test of Written Language, Fourth Edition. Austin, TX: PRO-ED.
Hammill, D. D., & Larsen, S. C. (2009). Written language observation scale. Austin, TX: Hammill Institute on Disabilities.
Hammill, D., Mather, H., & Roberts, R. (2001). Illinois Test of Psycholinguistic Abilities (3rd ed.). Austin, TX: Pro-Ed.
Hammill, D., & Newcomer, P. (2008). Test of Language Development–Intermediate (4th ed.). Austin, TX: PRO-ED.
Hammill, D., Pearson, N., & Voress, J. (1993). Examiner’s manual: Developmental Test of Visual Perception (2nd ed.). Austin, TX: Pro-Ed.
Hammill, D., Pearson, N., & Voress, J. (1996). Test of Visual-Motor Integration. Austin, TX: Pro-Ed.
Hammill, D., Pearson, N., & Wiederholt, L. (1997). Comprehensive Test of Nonverbal Intelligence. Austin, TX: Pro-Ed.
Hanna, P., Hanna, J., Hodges, R., & Rudoff, E. (1966). Phoneme-grapheme correspondence as cues to spelling improvement. Washington, DC: U.S. Department of Health, Education, and Welfare.
Harcourt Assessment, Inc. (2004). Stanford Achievement Test series, Tenth Edition technical data report. San Antonio, TX: Author.
Harcourt Brace Educational Measurement. (1996). Stanford Diagnostic Mathematics Test 4. San Antonio, TX: Psychological Corporation.
Harcourt Educational Measurement. (2002). Metropolitan Achievement Test (8th ed.). San Antonio, TX: Author.
Harcourt Educational Measurement. (2003). Otis Lennon School Ability Test (8th ed.). San Antonio, TX: Author.
Harrison, P. (2006). Bayley Scales of Infant and Toddler Development: Adaptive Behavior Subtest. San Antonio, TX: Harcourt Educational Measurement.
Harrison, P., & Oakland, T. (2003). Adaptive Behavior System, Second Edition. San Antonio, TX: Harcourt Educational Measurement.
Herrnstein, R., & Murray, C. (1994). The bell curve: Intelligence and class structure in American life. New York: The Free Press.
Hintze, J., Christ, T., & Methe, S. (2005). Curriculum-based assessment. Psychology in the Schools, 43(1), 45–56.
Horn, E. (1967). What research says to the teacher: Teaching spelling. Washington, DC: National Education Association.
Hosp, M. K., & Hosp, J. L. (2003). Curriculum-based measurement for reading, spelling, and math: How to do it and why. Preventing School Failure, 48(1), 10–17.
Howell, K. W., & Nolet, V. (2000). Curriculum-based evaluation (3rd ed.). Atlanta, GA: Wadsworth.
Hresko, W., Peak, P., Herron, S., & Bridges, D. L. (2000). Young Children’s Achievement Test. Austin, TX: Pro-Ed.
Hresko, W. P., Schlieve, P. L., Herron, S. R., Swain, C., & Sherbenou, R. J. (2003). Comprehensive Mathe-matical Abilities Test. Austin, TX: Pro-Ed.
Isaacson, S. (1988). Assessing the writing product: Qualitative and quantitative measures. Exceptional Children, 54, 528–534.
Jenkins, J., & Pany, D. (1978). Standardized achievement tests: How useful for special education? Exceptional Children, 44, 448–453.
Jensen, A. R. (1980). Bias in mental testing. New York: The Free Press.
Johnson, D., & Myklebust, H. (1967). Learning disabilities: Educational principles and practices. New York: Grune & Stratton.
References 431
Kaplan, E., Fein, D., Kramer, J., Morris, R., Delis, D., & Maerlender, A. (2004). Wechsler Intelligence Scale for Children (4th ed., Integrated). San Antonio, TX: Psychological Corporation.
Kaufman, A. S. & Kaufman, N. L. (1998). Kaufman Test of Educational Achievement—Second Edition. Circle Pines, MN: American Guidance Service.
Kaufman, A., & Kaufman, N. (2004). Kaufman Assessment Battery for Children, Second Edition.Bloomington, MN: Pearson.
Kephart, N. (1971). The slow learner in the classroom. Columbus, OH: Merrill.
Kirk, S., & Kirk, W. (1971). Psycholinguistic disabilities. Urbana: University of Illinois Press.
Kirk, S., McCarthy, J., & Kirk, W. (1968). Illinois Test of Psycholinguistic Abilities. Urbana: University of Illinois Press.
Koppitz, E. M. (1963). The Bender Gestalt Test for Young Children. New York: Grune & Stratton.
Kovacs, M. (1992). Children’s Depression Inventory: Manual. North Tonawanda, NY: Multi-Health Systems.
Kovaleski, J., & Glew, M. (2006). Bringing instructional support teams to scale: Implications of the Pennsylvania experience. Remedial and Special Education, 27, 16–25.
LaBerge, D., & Samuels, S. (1974). Toward a theory of automatic information processing in reading. Cognitive Psychology, 6, 293–323.
Larsen, S., Hammill, D. D., & Moats, L. (1999). Test of Written Spelling–4. Austin, TX: Pro-Ed.
Linn, R., Graue, E., & Sanders, N. (1990). Comparing state and district test results to national norms: The validity of claims that “everyone is above average.” Educational Measurement: Issues and Practice, 9(3), 5–14.
Loeding, B. L., & Crittenden, J. B. (1993). Inclusion of children and youth who are hearing impaired and deaf in outcomes assessment. In J. E. Ysseldyke & M. L. Thurlow (Eds.), Views on inclusion and testing accommodations for students with disabilities. Minneapolis: University of Minnesota, National Center on Educational Outcomes.
Lohman, D., & Hagan, E. (2001). Cognitive Abilities Test. Chicago: Riverside Publishing.
Maddox, T. (Ed.). (2008). Tests, sixth edition—A comprehensive reference for assessments in psychology, education, and business. Austin, TX: PRO-ED.
Mardell-Czudnowski, C., & Goldenberg, D. (1998). Manual: Developmental indicators for the assessment of learning (3rd ed.). Circle Pines, MN: American Guidance Service.
Marion, S., & Gong, B. (2003, October). Evaluating the validity of state accountability systems. Paper presented at the Ed Reidy, Jr. Interactive Lecture Series, Nashua, NH.
Markwardt, F. (1998). Peabody Individual Achievement Test–Revised–Normative update. Circle Pines, MN: American Guidance Service.
Marston, D., & Magnusson, D. (1985). Implementing curriculum-based measurement in special and regular education settings. Exceptional Children, 52, 266–276.
Marston, D., Muyskens, P., Lau, M., & Canter, A. (2003). Problem-solving model for decision making with high-incidence disabilities: The Minneapolis experience. Learning Disabilities Research and Practice, 18(3), 187–200.
Martin, R. P. (1988). Assessment of personality and behavior problems: Infancy through adolescence. New York: Guilford Press.
Massachusetts Department of Education. (2001). Resource Guide to the Massachusetts Curriculum Frameworks for Students with Signifi cant Disabilities–English Language Arts Section. Retrieved April 5, 2005, from www.doe.mass.edu/mcas/alt/rg/ela.pdf
Mather, N., Hammill, D., Allen, E., & Roberts, R. (2004). Test of Silent Word Reading Fluency. Austin, TX: Pro-Ed.
Maynard, F., & Strickland, J. (1969). A comparison of three methods of teaching selected mathematical content in eighth and ninth grade general mathematics courses (ED 041763). Athens, GA: University of Georgia.
McCarney, S. B. (1992a). Early Childhood Behavior Scale: Technical manual. Columbia, MO: Hawthorne Educational Services.
McCarney, S. B. (1992b). Preschool Evaluation Scale. Columbia, MO: Hawthorne Educational Services.
McGraw-Hill Digital Learning. (2004). Yearly Progress Pro. Columbus, OH: Author.
McGrew, K., Thurlow, M. L., Shriner, J., & Spiegel, A. N. (1992). Inclusion of students with disabilities in national and state data collection programs (Technical Report 2). Minneapolis: University of Minnesota, National Center on Educational Outcomes.
McGrew, K. S., & Woodcock, R. W. (2001). Woodcock-Johnson III: Technical manual. Itasca, IL: Riverside Publishing Company.
McNamara, K. (1998). Adoption of intervention-based assessment for special education: Trends in case management variables. School Psychology International, 19, 251–266.
Meller, P. J., Ohr, P. S., & Marcus, R. A. (2001). Family-oriented, culturally sensitive (FOCUS) assessment of young children. In L. A. Suzuki, J. G. Ponterotto, & P. J. Meller (Eds.), Handbook of multicultural assessment: Clinical, psychological, and educational applications (2nd ed., pp. 461–496). San Francisco: Jossey-Bass.
432 References
Mercer, C., & Mercer, A. (1985). Teaching students with learning problems (2nd ed.). Columbus, OH: Merrill.
Merrell, K. W. (1994). Assessment of behavioral, social, and emotional problems. New York: Longman.
Miller, J. (1981). Assessing language production in children. Austin, TX: Pro-Ed.
Moore, K. J., Fifi eld, M. B., Spira, D. A., & Scarlato, M. (1989). Child study team decision making in special education: Improving the process. Remedial and Special Education, 10, 50–58.
Mullen, E. (1995). Mullen Scales of Early Learning: AGS Edition. Circle Pines, MN: American Guidance Service.
Myles, B., Bock, S., & Simpson, R. (2001). Examiner’s manual for the Asperger Syndrome Diagnostic Scale. Circle Pines, MN: American Guidance Service.
Naglieri, J. (2008). Naglieri Nonverbal Ability Test (2nd ed.). San Antonio, TX: Pearson Assessment.
National Association for the Education of Young Children. (2003). Position statement on early childhood curriculum, assessment, and program evaluation. Washington, DC: Author. [Retrieved June 14, 2008, at www.naeyc.org/about/positions/pdf/pscape.pdf]
National Association of School Psychologists. (2002). Principles for professional ethics. Bethesda, MD: Author.
National Commission of Excellence in Education. (1983). A nation at risk: The imperative for educational reform. Washington, DC: U.S. Government Printing Offi ce.
National Council of Teachers of Mathematics. (2000). Principles and standards for school mathematics. Reston, VA: Author.
National Institute of Child Health and Human Development. (2000a). Report of the National Reading Panel. Teaching children to read: An evidence-based assessment of the scientifi c research literature on reading and its implication for reading instruction (NIH Publication 00-4). Washington, DC: U.S. Government Printing Offi ce.
National Institute of Child Health and Human Development. (2000b). Report of the National Reading Panel. Teaching children to read: An evidence-based assessment of the scientifi c research literature on reading and its implication for reading instruction: Reports of the Subgroups (Chapter 2, Part II). Available at www.nichd.hih.gov/publications/nrp/ch2-II.pdf
Neisworth, J., Bagnato, S., Salvia, J. A., & Hunt, F. (1999). Temperament and Atypical Behavior Scale. Baltimore, MD: Paul H. Brookes.
Newcomer, P. (2001). Diagnostic Achievement Battery (3rd ed.). Austin, TX: Pro-Ed.
Newcomer, P., & Hammill, D. (2008). Test of Language Development–Primary (4th ed.). Austin, TX: Pro-Ed.
Nihira, K., Leland, H., & Lambert, N. (1993a). AAMR Adaptive Behavior Scale–School (2nd ed.). Austin, TX: Pro-Ed.
Nihira, K., Leland, H., & Lambert, N. (1993b). Examiner’s manual, AAMR Adaptive Behavior Scale–Residential and Community (2nd ed.). Austin, TX: Pro-Ed.
Northern, J. L., & Downs, M. P. (1991). Hearing in children (4th ed). Baltimore, MD: Williams & Wilkens.
Nunnally, J. (1967). Psychometric theory. New York: McGraw-Hill.
Nurss, J., & McGauvran, M. (1995). The Metropolitan Readiness Tests: Norms book (6th ed.). San Antonio, TX: Harcourt Brace.
Olson, D. (1964). Management by objectives. Auckland, NZ: Pacifi c Book Publishers.
Otis, A. S., & Lennon, R. T. (2003). Otis-Lennon School Ability Test (8th ed.). San Antonio, TX: Harcourt Educational Measurement.
Paul, D., Nibbelink, W., & Hoover, H. (1986). The effects of adjusting readability on the diffi culty of mathematics story problems. Journal of Research in Mathematics Education, 17, 163–171.
Pearson. (2001). AIMSweb. San Antonio, TX: Author. Pfl aum, S., Walberg, H., Karegianes, M., & Rasher, S.
(1980). Reading instruction: A quantitative analysis. Educational Researcher, 9, 12–18.
Phillips, K. (1990). Factors that affect the feasibility of interventions. Workshop presented at Mounds View Schools, unpublished.
Prutting, C., & Kirshner, D. (1987). A clinical appraisal of the pragmatic aspects of language. Journal of Speech and Hearing Disorders, 52, 105–119.
Psychological Corporation. (2001). Wechsler Individual Achievement Test (2nd ed.). San Antonio, TX: Author.
Rayner, K., Foorman, B., Perfetti, C., Pesetsky, D., & Seidenberg, M. (2001). How psychological science informs the teacher of reading. Psychological Science in the Public Interest, 2, 31–73.
Reid, D., Hresko, W., & Hammill, D. (2001). Test of Early Reading Ability (3rd ed.). Austin, TX: Pro-Ed.
Renaissance Learning. (1997). Standardized Test for the Assessment of Reading. Wisconsin Rapids, WI: Author.
Renaissance Learning. (1998). STAR Math. Wisconsin Rapids, WI: Author.
Renaissance Learning. (2006). NEO-2. Wisconsin Rapids, WI: Author.
Renaissance Learning. (2007). DANA. Wisconsin Rapids, WI: Author.
References 433
Resnick, L. (1987). Education and learning to think. Washington, DC: National Academy Press.
Reynolds, C. R. (2007). Koppitz Developmental Scoring System for the Bender Gestalt Test–Second Edition (Koppitz-2). Austin, TX: Pro-Ed.
Reynolds, C. R., & Kamphaus, R. W. (2004). Behavior Assessment System for Children–Second Edition–Manual. Circle Pines, MN: American Guidance Service.
Reynolds, C. R., & Richmond, B. O. (2000). Revised Children’s Manifest Anxiety Scale. Los Angeles: Wester Psychological Services.
Roach, E. F., & Kephart, N. C. (1966). The Purdue Perceptual-Motor Survey. Columbus, OH: Merrill.
Roid, G. (2003). Stanford-Binet Intelligence Scale (5th ed.). Chicago, IL: Riverside Publishing.
Roid, G., & Miller, N. (1997). Leiter International Performance Scale–Revised. Chicago: Stoelting.
Salvia, J. A., & Hughes, C. (1990). Curriculum-based assessment: Testing what is taught. New York: Macmillan.
Salvia, J. A., Neisworth, J., & Schmidt, M. (1990). Examiner’s manual: Responsibility and Independence Scale for Adolescents. Allen, TX: DLM.
Schmidt, M., & Salvia, J. A. (1984). Adaptive behavior: A conceptual analysis. Diagnostique, 9(2), 117–125.
Shapiro, E. S. (2003). BOSS—Behavioral Observation of Students in Schools. San Antonio, TX: Psychological Corporation. [Software for PDA platform]
Shapiro, E. S. (2004). Academic skills problems workbook. New York: Guilford Press.
Shapiro, E. S., & Derr, T. (1987). An examination of overlap between reading curricula and standardized reading tests. Journal of Special Education, 21(2), 59–67.
Shapiro, E. S., & Kratochwill, T. (Eds.). (2000). Behavioral assessment in schools: Theory, research, and clinical foundations (2nd ed.). New York: Guilford Press.
Share, D., & Stanovich, K. (1995). Cognitive processes in early reading development: A model of acquisition and individual differences. Issues in Education: Contributions from Educational Psychology, 1, 1–57.
Shinn, M. (1998). Advanced applications of curriculum-based measurement. New York: Guilford Press.
Shinn, M. R. (Ed.). (1989). Curriculum-based measurement: Assessing special children. New York: Guilford.
Shinn, M., Tindall, G., & Stein, S. (1988). Curriculum-based measurement and the identifi cation of mildly handicapped students: A review of research. Professional School Psychology, 3(1), 69–85.
Shriner, J., & Salvia, J. A. (1988). Content validity of two tests with two math curricula over three years: Another instance of chronic noncorrespondence. Exceptional Children, 55, 240–248.
Sindelar, P., Monda., L., & O’Shea, L. (1990). Effects of repeated readings on instructional- and mastery-level readers. Journal of Educational Research, 83(4), 220–226.
Slobin, D. I., & Welsh, C. A. (1973). Elicited imitation as a research tool in developmental psycholinguistics. In C. Ferguson & D. Slobin (Eds.), Studies of child language development. New York: Holt, Rinehart, and Winston.
Snow, C., Burns, M., & Griffi n, P. (1998). Preventing reading diffi culties in young children. Washington, DC: National Academy Press.
Sparrow, S., Cicchetti, D., & Balla, D. (2005). Vineland Adaptive Behavior Scales (2nd ed.). Circle Pines, MN: American Guidance Service.
Stanovich, K. (1986). Matthew effects in reading: Some consequences of individual differences in the acquisition of literacy. Reading Research Quarterly, 21, 360–406.
Stanovich, K. (2000). Progress in understanding reading: Scientifi c foundations and new frontiers. New York: Guilford Press.
Stevens, R., & Rosenshine, B. (1981). Advances in research on teaching. Exceptional Education Quarterly, 2(1), 1–9.
Stevens, S. S. (1951). Mathematics, measurement, and psychophysics. In S. S. Stevens (Ed.), Handbook of experimental psychology (p. 23). New York: Wiley.
Suen, H., & Ary, D. (1989). Analyzing quantitative behavioral observation data. Hillsdale, NJ: Lawrence Erlbaum Associates.
Sulzer-Azaroff, B., & Mayer, G. Roy (1986). Achieving educational excellence: Using behavior strategies. New York: Holt, Rinehart, and Winston.
Taylor, B., Harris, L., Pearson, P. D., & Garcia, G. (1995). Reading diffi culties: Instruction and assessment (2nd ed.). New York: McGraw-Hill.
Tharp, R. G., & Wetzel, R. J. (1969). Behavior modifi cation in the natural environment. New York: Aca demic Press.
Therrien, W. (2004). Fluency and comprehension gains as a result of repeated reading: A meta-analysis. Remedial and Special Education, 25(4), 252–261.
Thompson, S., & Thurlow, M. (2001). State special education outcomes: A report on state activities at the beginning of the new decade. Minneapolis: University of Minnesota, National Center on Educational Outcomes.
Thompson, S. J., Johnstone, C. J., & Thurlow, M. L. (2002). Universal design applied to large scale assessments (Synthesis Report 44). Minneapolis: University of Minnesota, National Center on Educational Outcomes. [Retrieved April 9, 2008, at http://cehd.umn.edu/NCEO/OnlinePubs/Synthesis44.html]
434 References
Thorndike, R. L., & Hagen, E. (1978). Measurement and evaluation in psychology and education. New York: Wiley.
Thurlow, M. L., Elliott, J. L., & Ysseldyke, J. E. (2003). Testing students with disabilities: Practical strategies for complying with district and state requirements (2nd ed.). Thousand Oaks, CA: Corwin Press.
Thurlow, M. L., Elliott, J. L., & Ysseldyke, J. E. (2003). Testing students with disabilities: Procedures for complying with district and state requirements. Thousand Oaks, CA: Corwin Press.
Thurlow, M. L., Quenemoen, R., Thompson, S., & Lehr, C. (2001). Principles and characteristics of inclusive assessment and accountability systems (Synthesis Report 40). Minneapolis, MN: National Center on Educational Outcomes, University of Minnesota.
Thurlow, M. L., & Thompson, S. (2004). 2003 state special education outcomes. Minneapolis: University of Minnesota, National Center on Educational Outcomes.
Thurstone, T. G. (1941). Primary mental abilities in children. Educational and Psychological Measurement, 1, 105–116.
Tindal, G., & Hasbrouck, J. (1991). Analyzing student writing to develop instructional strategies. Learning Disabilities: Research and Practice, 6, 237–245.
Torgesen, J., & Bryant, B. (2004). The Test of Phonological Awareness, Second Edition: Plus, Examiner’s Manual. Austin, TX: Pro-Ed.
U.S. Census Bureau. (1998). Current population survey. Washington, DC: Author.
Voress, J., & Maddox, T. (1998). Developmental Assessment of Young Children. Austin, TX: Pro-Ed.
Wagner, R., Torgesen, J., & Rashotte, C. (1999). Comprehensive Test of Phonological Processing. Austin, TX: Pro-Ed.
Walker, D. K. (1973). Socioemotional measures for preschool and kindergarten children. San Francisco: Jossey-Bass.
Walker, H. M., & McConnell, S. R. (1988). Walker-McConnell Scale of Social Competence. Austin, TX: Pro-Ed.
Walker, H. M., & Severson, H. H. (1992). Systematic screening for behavior disorders (2nd ed.). Longmont, CO: Sopris West.
Wallace, G., & Hammill, D. (2002). Comprehensive Receptive and Expressive Vocabulary Test (2nd ed.). Austin, TX: Pro-Ed.
Wechsler, D. (1939). Wechsler-Bellevue Intelligence Scale. New York: Psychological Corporation.
Wechsler, D. (1974). Manual for the Wechsler Intelligence Scale for Children–Revised. Cleveland, OH: Psychological Corporation.
Wechsler, D. (2001). Wechsler Individual Achievement Test—Second Edition. San Antonio, TX: Psychological Corporation.
Wechsler, D. (2002). Wechsler Preschool and Primary Scale of Intelligence (3rd ed.). San Antonio, TX: Pearson Assessment.
Wechsler, D. (2003). Wechsler Intelligence Scale for Children (4th ed.). San Antonio, TX: Psychological Corporation.
Wechsler, D. (2004). Wechsler Intelligence Scale for Children, Fourth Edition–Integrated: Technical and interpretive manual. San Antonio, TX: Psychological Corporation.
Wechsler, D. (2008). Wechsler Adult Intelligence Scale (4th ed.). San Antonio, TX: Pearson Assessment.
White, O., & Haring, N. (1980). Exceptional teaching (2nd ed.). Columbus, OH: Merrill.
Wiederholt, L., & Bryant, B. (2001). Gray Oral Reading Tests–4. Austin, TX: Pro-Ed.
Wiederholt, L., & Bryant, B. (2001). Examiner’s manual: Gray Oral Reading Tests–3. Austin, TX: Pro-Ed.
Wilkinson, G. S., & Robertson, G. J. (2007). Wide Range Achievement Test 4 (WRAT 4). Lutz, FL: Psychological Assessment Resources.
Williams, K. (2001). Group reading assessment and diagnostic evaluation. Circle Pines, MN: American Guidance Service.
Williams, K. T. (2004). Group Mathematics Assessment and Diagnostic Evaluation. Circle Pines, MN: AGS Publishing.
Woodcock, R. W. (1998). Woodcock Reading Mastery Tests–Revised: Normative update. Circle Pines, MN: American Guidance Service.
Woodcock, R. W., Mather, N., & Schrank, F. A. (2004). Woodcock-Johnson III Diagonistic Reading Battery. Itasca, IL: Riverside Publishing.
Woodcock, R. W., McGrew, K. S., & Mather, N. (2001). WJ-III Tests of Cognitive Abilities and Tests of Achievement. Itasca, IL: Riverside Publishing.
Woodcock, R. W., McGrew, K. S., & Mather, N. (2003). Woodcock-Johnson III Tests of Cognitive Abilities. Itasca, IL: Riverside Publishing.
Woodcock, R. W., Schrank, F. A., McGrew, K. S., & Mather, N. (2007). Woodcock–Johnson III Normative Update. Itasca, IL: Riverside.
Ysseldyke, J. E. (1987). Classifi cation of handicapped students. In M. C. Wang, M. Reynolds, & H. J. Walberg (Eds.), Handbook of special education: Research & practice (vol. 1, pp. 253–271). New York: Pergamon.
Ysseldyke, J. E., & Christenson, S. L. (1987). The Instructional Environment Scale. Austin, TX: Pro-Ed.
References 435
Ysseldyke, J. E., & Christenson, S. L. (2002). Functional assessment of academic behavior: Creating successful learning environments. Longmont, CO: Sopris West.
Ysseldyke, J. E., Christenson, S. L., & Kovaleski, J. F. (1994). Identifying students’ instructional needs in the context of classroom and home environments. Teaching Exceptional Children, 26(3), 37–41.
Ysseldyke, J. E., & McLeod, S. (2007). Using technology tools to monitor response to intervention. In S. R. Jimerson, M. K. Burns, and A. M. VanDerHeyden
(Eds.), Handbook of response to intervention. New York: Springer.
Ysseldyke, J. E., & Salvia, J. A. (1974). Diagnostic-prescriptive teaching: Two models. Exceptional Children, 41, 181–186.
Ysseldyke, J. E., & Thurlow, M. L. (1993). Self-study guide to the development of educational outcomes and indicators. Minneapolis: University of Minnesota, National Center on Educational Outcomes.
436
CREDITSp. 213, Figure 12.1: Concepts and Communication
Example 1 from Levels M and H from Group Mathematics Assessment and Diagnostic Evaluation (G•MADE): Technical Manual ALL Levels, Figure 2.1, p. 18 by Kathleen T. Williams, Ph.D., NCSP © 2004 American Guidance Service, Inc., 4201 Woodland Road Circle Pines, MN 55014-1796. Reproduced with permission. All rights reserved.
p. 213, Figure 12.2: Operations and Computation Example 1 from Level 4 from Group Mathematics Assessment and Diagnostic Evaluation (G•MADE): Technical Manual ALL Levels, Figure 2.2, p. 20 by Kathleen T. Williams, Ph.D., NCSP © 2004 American Guidance Service, Inc., 4201 Woodland Road Circle Pines, MN 55014-1796. Reproduced with permission. All rights reserved.
p. 213, Figure 12.3: Process and Applications Example 1 from Level 1 from Group Mathematics Assessment and Diagnostic Evaluation (G•MADE): Technical Manual ALL Levels, Figure 2.3, p. 22 by Kathleen T. Williams, Ph.D., NCSP © 2004 American Guidance Service, Inc., 4201 Woodland Road Circle Pines, MN 55014-1796. Reproduced with permission. All rights reserved.
p. 391, Figure 22.1: Alternate Assessment Based on Modifi ed Academic Achievement, August 2007, Minneapolis, MN: University of Minnesota, National Center on Educational Outcomes. Reprinted by permission. http://cehd.umn.edu/nceo/OnlinePubs/AAMASParentGuide.pdf
437
INDEXNote: Page numbers followed by n indicate footnotes.
AA-AAS (alternate assessment based on alternate achievement standards), 386, 391
AA-GLAS (alternate assessment based on grade-level academic achievement standards), 386, 391
AA-MAS (alternate assessment based on modifi ed academic achievement standards), 387, 388, 389, 391
AAMD Adaptive Behavior Scale: Residential and Community Scale, 2nd Edition, 301
AAMR Adaptive Behavior Scale–School 2, 301
Ability versus performance, 298Absolute zero for ratio scales, 33nAbstract reasoning, intelligence test items
sampling, 248Academic achievement standards, 385,
386, 388Academic content standards, 209–210,
385, 386Academic needs, prereferral decisions
about, 340–342Academic screening, 411Accelerated Math (AM) software,
321–326, 327–328Accelerated Reader software, 328, 334Accelerated Writer software, 328AccelTest software, 334Accommodation, defi ned, 83, 386Accommodations in testing. See Testing
accommodationsAccountability, 386
adequate yearly progress (AYP), 10–11, 386, 390, 399
alternate achievement standards for, 386, 388, 391
alternate assessment for, 386–387, 389–390, 391, 393
assessment considerations for decision making, 395–396
content standards for, 385decisions made using assessment, 6,
10–11Goals 2000 and, 383high-stakes, 383, 396legislation mandating, 10, 384–385modifi ed achievement standards for,
387, 388, 390, 391
NCEO best practices for, 396performance standards for, 385, 388standards-based assessment for,
388–389standards-based systems of, 390–395terminology, 385, 386–387testing accommodations for, 73–74, 92
Accountability systems, 386benefi ts of, 383standards-based, 390–395
Acculturation. See also Cultural identityas imprecise concept, 48, 49intelligence tests and, 242–243, 244of parents, normative groups and,
48–49Accuracy. See also Reliability; Validity;
specifi c kinds of errorscalculating for reading, 353nfactors impeding accurate testing,
78–82importance for assessment, 54as scoring measure, 38testing accommodations for, 74–75of time-sampling for behavior, 104, 104n
Achenbach, T. M., 288, 289, 294, 368Achenbach computerized scoring, 334Achenbach System of Empirically Based
Assessment (ASEBA), 288–289, 294Achievement, 116
attainment versus, 116, 168nAchievement data by subgroup, 386Achievement Series software, 329Achievement standards-referenced
interpretations, 39Achievement tests. See also Intelligence tests;
Teacher-made achievement testscategories of, 167–168, 169–172characteristics of, 167commonly used tests (table), 169–171core achievement areas, 133–140density of content in, 167diagnostic, 167getting the most out of, 187–189limitations of, 187norm-referenced, 167reasons for using, 172as screening devices, 172, 187selecting a test, 168–169for severe discrepancy
determination, 367size of group for testing, 167specifi city of, 167standards-referenced, 167–168
Acquisition defi cits, 282Adams, M., 191, 192, 321, 323, 327,
328, 342Adaptations in testing. See Testing
accommodationsAdaptive behavior assessment. See also
Social and emotional behavior assessment
commonly used scales (table), 301–302
daily living skills, 300, 303defi ning adaptive behavior, 297–298internal consistency of scales, 306maladaptation, 298–299, 303for mental retardation
determination, 366norms issues, 306problems in, 306reasons for, 306respondent for, 299
Adaptive behavior, defi ning, 297–298Adequate yearly progress (AYP), 386
alternate assessment and, 389, 390NCLB mandate for, 10–11
AERA. See American Educational Research Association
Affective comprehension, 196African Americans, representation in test
norms, 163Age-equivalent scores, 40
conversion to standard scores, 44problems in the use of, 40–41ratio IQ using, 41, 43n
Age of norms, 50–51Age of students. See Chronological age (CA)Age of tests, 159Aided observation, 99, 108Aimlines
for behavior, 112, 118ncomparing goal lines with, 151equal-interval charts for drawing, 150for evaluating interventions, 350–351for monitoring academic progress,
118, 119AIMSweb software, 329, 331–332, 333Alberto, P. A., 101, 343Algozzine, B. A., 404Alignment, defi ned, 386Allen, E., 200Alpha Smart computers, 334Alterable behaviors, 11Alternate achievement standards, 386,
388, 391
438 Index
Alternate assessment based on alternate achievement standards (AA-AAS), 386, 391
Alternate assessment based on grade-level academic achievement standards (AA-GLAS), 386, 391
Alternate assessment based on modifi ed academic achievement standards (AA-MAS), 387, 388, 389, 391
Alternate assessment for accountability, 386–387, 389–390, 391, 393
Alternate-form reliability, 55–56AM. See Accelerated Math (AM) softwareAmerican Academy of Ophthalmology
(AAO), 279American Academy of Pediatrics, 279American Association for Pediatric
Ophthalmology and Strabismus (AAPOS), 279
American Association for the Advancement of Science, 175
American Association on Mental Retardation, 51
American Deaf Community, 87American Educational Research
Association (AERA), 6, 47, 51, 62, 64, 64n, 71, 160, 161, 162
Standards for Educational and Psychological Testing, 29–30, 79, 159
American Psychological Association, 6, 20, 45, 47, 62, 160, 399, 411
Ethical Principles of Psychologists and Code of Conduct, 28
Standards for Educational and Psychological Testing, 29–30, 79, 159
Americans with Disabilities Act (Public Law 101-336), 364
Ames, W., 223Amplitude of behavior, 102
continuous recording for assessing, 103
maladaptive label and, 299Analogical reasoning, intelligence test
items sampling, 247–248Armbruster, B., 192Ary, D., 104nASEBA (Achenbach System of Empirically
Based Assessment), 288–289, 294Asian Americans, representation in test
norms, 163Asperger Syndrome Diagnostic Scale
(ASDS), 289Assessment, 4
as broader than testing, 13–14communicating information to
parents, 405–408competencies measured by, 4consequences of, 14–15decisions made using, 6–11
as dynamic practice, 15–16high-stakes, best practices for, 396importance in school and society, 5–6improvements in, 18of instruction before learners, 11–13involving stakeholders in, 391–392reasons for learning about, 17–18written records of, 408–415
AssessmentMaster software, 329Assessment stations, 146, 149Assess2Know software, 329Attainment versus achievement,
116, 168nAttention (intelligence test term), 251Audiologist, 339Audiology, 357Auditory perception/processing, 251Autism, 365Average. See Mean; Median; ModeAyers, A., 272AYP. See Adequate yearly progress
Bachor, D., 138Bagnato, S., 290Bailey, D. B., 310Baker, E. L., 399Balla, D., 300, 302Bandura, A., 282Baroody, A., 212Barsch, R., 272BASC-2. See Behavior Assessment System
for Children, Second EditionBASC-2 computerized scoring, 334Battelle Developmental Inventory–Second
Edition, 314Baumgardner, J. C., 69Bayley, N., 313, 314Bayley Scales of Infant Development,
Third Edition (Bayley-III), 313, 314, 316–317
Beery, K. E., 273, 276, 277Beery, N., 273, 276Beery VMI, 273, 276–278Beery VMI Motor Coordination Test, 277Beery VMI Visual Perception Test, 277Behavior. See also Adaptive behavior
assessment; Social and emotional behavior assessment
adaptive, 297–298aimlines for, 112, 118namplitude of, 102, 103, 299criteria for evaluating, 111–112daily living skills, 300, 303desirable, infrequent or absent,
105, 106deviant, 299duration of, 101, 103, 104externalizing problems, 281frequency of, 101, 103, 104n, 299functions of, 100–101harmful, 105, 106
inappropriate contexts for, 106internalizing problems, 281, 282language, 225–227latency of, 101, 103maladaptation, 298–299, 303measurable characteristics of,
101–102modifying, 106normative data for, 112performance versus ability, 298prereferral decisions about behavioral
needs, 343–344reading-related, 197sampled by diagnostic mathematics
tests, 209–210sampled by intelligence tests, 242,
245–249social comparisons for, 112, 113social tolerance for, 112, 298–299stability or maintenance, 103stereotypic, 105topography of, 100
Behavioral and Emotional Rating Scale, 2nd Edition (BERS-2), 289
Behavioral contextsbehavior inappropriate for, 106maladaptation and, 298–299for sampling behavior, 102–103for systematic observation, 107
Behavioral intervention. See InterventionsBehavioral observation
criteria for evaluating performances, 111–112
defi ning behavior, 100–101functional behavior assessment (FBA),
113, 284–285, 287harmful behaviors, 105, 106inappropriate contexts for behavior, 106infrequent or absent desirable
behaviors, 105, 106of language, 225–227measurable characteristics of behavior,
101–102sampling behavior, 102–106selecting characteristics to measure, 102steps for, 97stereotypic behaviors, 105
Behavioral Observation of Students in Schools program, 333
Behavior Assessment System for Children, Second Edition (BASC-2), 289 (table), 290–295
behaviors sampled by, 290–291computerized scoring system, 334norms, 292–293Portable Observation Program
ancillary, 333reliability, 293scores, 291–292validity, 294–295
Behavior charts, 150
Index 439
Behavior Rating Profi le, Second Edition, 289
Bellugi, U., 225Benchmark, defi ned, 387Benchmarks for Science Literacy, 175Bender, L., 272Bender Visual–Motor Gestalt Test Family,
272–273Bender Visual–Motor Gestalt Test, Second
Edition (BVMGT-2), 273 (table), 273–275
Benefi cence, 28Ben-Porath, Y. S., 295Bergan, J. R., 152BERS-2 (Behavioral and Emotional
Rating Scale, 2nd Edition), 289Bewley, W. L., 399Bias. See also Validity
curriculum, 187defi ned, 54systematic, validity affected by, 68–69
Bilingual students, testing accommodations for, 81–82
Bimodal distributions, 34Bock, S., 289Body of evidence, 387Boehm, A. E., 314Boehm-3 Preschool, 314Bond, G., 192Bonstrom, O., 346Bottom-up testing formats, 123Bracken, B., 256Braille edition of SAT-10Brannigan, G., 273Breland, H., 238Bridges, D. L., 315Briggs, A., 192Broderick, C. B., 282Brown, L., 200, 256, 289Brown, R., 225Brown, V., 232Bruininks, R., 302Bryant, B., 160, 200, 204Burns, M., 192Burns, M. K., 328, 329Bush, George W., 25Butcher, N. N., 295BVMGT-2. See Bender Visual–Motor
Gestalt Test, Second Edition
Caldwell, J., 137Camp, R., 238Campbell, D., 66Campbell Collaboration, 8Canter, A., 153Capacity building, 3
assessment for, 4prereferral decisions about, 344resource allocation decisions for, 9
CAPD (central auditory processing disorder), 219
Capitalization. See also Written language assessment
assessment considerations for, 223percent correct scoring and, 140standardized tests not suited to
measuring, 223in writing style, 223
Caregiver–Teacher Report Form (C-TRF), 288
Carr, E., 101Carroll, J. B., 250, 251Carrow-Woolfolk, E., 220, 229, 230, 236Casey, A., 346Cattell, Raymond, 250Cattell–Horn–Carroll (CHC) theory, 250Caucasian Americans, representation in
test norms, 163CBCL (Child Behavior Checklist),
288, 368CBE, 155Celeration, 118
for quantifying student progress, 118–119
standard celeration charts, 150Center for Universal Design, 77Central auditory processing disorder
(CAPD), 219Certifi cation boards, assessment concerns
of, 15Chall, J., 192Charting student progress
benefi ts of, 151decision-making rules, 151equal-interval charts, 149–150graphing conventions, 148–149standard celeration charts, 150
CHC (Cattell–Horn–Carroll) theory, 250
Child Behavior Checklist (CBCL), 288, 368
Child fi nd, 339Child study teams, 9n, 404Christ, T., 121Christenson, S. L., 12, 355, 356, 404Chronological age (CA)
adaptation and, 298construct validity and, 68, 68nintelligence tests and, 243normative groups and, 48in ratio IQ, 41, 43n
Cicchetti, D., 300, 302Cigna Insurance Company, 278, 279Classroom assessment management
characteristics of good testing programs, 144
decision-making rules, 151interpreting data, 151for mandated tests, 144–145progress monitoring, 145–155,
Classroom management, 12Classroom response systems, 333–334
Classroom Wizard, 328CMAT (Comprehensive Mathematical
Abilities Test), 212Code of conduct for psychologists, 28Code of Ethics of the Education
Profession, 28Coeffi cient alphas, 56–58Cognitive Achievement Test (CogAT), 255Cognitive Assessment System, 255Cognitive effi ciency/speediness, 251Cognitive fl uency, 251Color coding tests and teaching
materials, 148Committee on Children with
Disabilities, 279Communicating assessment information
to parents, 405–408through written records, 408–415
Competence, boundaries of professional, 28–29
Competence enhancementalterable behaviors focus for, 11challenges for, 3–4, 16prereferral decisions about, 344resource allocation decisions and, 9
Comprehension assessment. See also Oral language assessment; Written language assessment
commonly used diagnostic language tests (table), 229–230
for oral language, 219in reading, 134, 136–137, 196types of comprehension, 196for written language, 140, 219
Comprehension, defi ned, 221Comprehension–knowledge, 251Comprehensive Assessment of Spoken
Language, 229Comprehensive Mathematical Abilities
Test (CMAT), 212Comprehensive Receptive and Expressive
Vocabulary Test–Second Edition (CREVT-2), 229
Comprehensive Test of Nonverbal Intelligence (C-TONI), 255
Comprehensive Test of Phonological Processing, 199
Computer adaptive testing, 212, 321Computer-assisted instruction, 327Computer-generated reports, 337Computerized scoring systems, 327,
336–337Concurrent criterion-related validity,
66–67Confi dence intervals, 62Confi dentiality issues, 29, 403Conners, C. K., 294, 295Connolly, J., 212, 215Consent for data collection, 411–412Constructed-response questions, 66Construct validity, 68
440 Index
Content density of achievement tests, 167
Content evaluation for tests, 161Content specifi city
of achievement tests, 167specifi city, defi ned, 121of teacher-made tests, 116–117,
120–121Content standards
for accountability, 385, 386for mathematics, 209–210
Content validity. See also Instructional match; Validity
appropriateness of included items and, 65
content not included and, 65–66defi ned, 65evaluating for tests, 168measurement of content and, 66opportunity to learn, 79–80testing accommodations and, 78–80
Contexts for behavior. See Behavioral contexts
Continuous measurementrecording behavior, 103–104software packages (table), 328technology-enhanced assessments for,
121n, 327–328Contrived observation, 100Cooper, C., 140Core achievement areas
mathematics, 137–139reading, 134–137spelling, 139teacher-made tests for, 133–140universal intervention in, 152–153written language, 139–140
Correlational approach to agreement, 59
Correlation coeffi cients, 35–36predictive power of, 36reliability coeffi cient, 54–55, 59validity coeffi cient, 66
Cortelia, C., 387Council for Exceptional Children, 20, 45,
188, 399Council of Chief State School Offi cers,
385, 387Counseling services, 358CREVT-2 (Comprehensive Receptive and
Expressive Vocabulary Test–Second Edition), 229
Criterion-referenced interpretations, 39Criterion-referenced tests, 387Criterion-related validity, 66
concurrent, 66–67Critical comprehension, 196Crittenden, J. B., 87Crocker, L. M., 116Cronbach, L., 56Crystallized intelligence, 250CTB/McGraw-Hill, 84, 86, 170, 177
C-TONI (Comprehensive Test of Nonverbal Intelligence), 255
C-TRF (Caregiver–Teacher Report Form), 288
Cullata, B., 138Cultural identity. See also Diversity
academic progress and, 342adaptation and, 297communicating assessment
information and, 406developing tests for, 90normative groups and, 49oral language assessment and, 222testing accommodations for, 80–81test norms and, 163
Cummins, J., 82Current Population Survey, 237Curriculum. See also Instructional match
achievement tests for evaluating, 172differences among series, 116opportunity to learn, 79–80selecting areas for testing, 124
Curriculum bias, 187Curriculum Focal Points for
Prekindergarten Through Grade 8 Mathematics, 209n
Cut score, 387
DAB-3 (Diagnostic Achievement Battery–Third Edition), 171, 184–187
Dahlstrom, W. G., 295Daily living skills, 300, 303DANA Alpha Smart computer, 334Data collection
pupil information, 409–413by school teams, 402for standards-based systems of
accountability, 393–394Data-driven decision making, 118, 151Deafness. See Hearing problemsDeciles, 42Decision-making rules, 151Decisions made using assessment. See also
Eligibility decisions; Instructional decision making; Prereferral decisions
accountability, 6, 10–11consequences of, 14–15instructional planning and
modifi cation, 6, 8matching the assessment to the
decision, 11program evaluation, 6, 10progress monitoring, 6, 7–8resource allocation, 6, 9screening, 6, 7, 172
Decker, S., 273Decoding skills
beginning skills, 134look-say approach to, 191–192phonics approach to, 192, 193, 342
Delayed recall. See Long-term retrieval/delayed recall
Delis, D., 254nDeming, W. E., 382Deno, S. L., 155, 357Denver Developmental Screening Test,
Second Edition, 314Derived scores
conversion tables for, 44developmental, 40–41evaluating for tests, 161–162percentile ranks (percentiles),
41–43, 45relationship among, 45selection of type of, 45standard scores, 42–43, 45
Derogatis, L. R., 295Derr, T., 187Destination Success software, 328Detail recognition, intelligence test items
sampling, 247Detroit Tests of Learning Aptitude, Fourth
Edition (DTLA-4), 255Developmental acquisition of
language, 222Developmental Assessment of Young
Children, 314Developmental delay, 372Developmental Indicators for the
Assessment of Learning–Third Edition (DIAL-3), 314 (table), 317–319
Speed DIAL (short form), 317, 318, 319
Developmental milestones, 310Developmental Profi le II, 314Developmental scores
age equivalents, 40–41conversion to standard scores, 44developmental equivalents, 40–41developmental quotients, 40, 41grade equivalents, 40–41interpolation and extrapolation
with, 41, 42misinterpretation of, 40–41, 45problems in the use of, 40–41
Developmental Test of Visual–Motor Integration (Beery VMI), 273, 276–278
Developmental Test of Visual Perception, 368
Deviant behavior, 299Diagnostic Achievement Battery–Third
Edition (DAB-3), 171, 184–187Diagnostic achievement tests. See
Achievement testsDiagnostic Assessments of
Reading–2, 199Diagnostic language tests. See also Oral
language assessment; Written language assessment
commonly used tests (table), 212
Index 441
Diagnostic mathematics tests. See also Mathematics
behaviors sampled by, 209–210commonly used tests (table), 212generalization issues, 216problems in the use of, 216reasons for using, 208selecting appropriate tests, 216table summarizing, 212test-curriculum match issues, 146,
147, 216Diagnostic reading measures. See also
Reading assessmentcommonly used tests (table),
199–200generalization issues, 206problems in the use of, 206reasons for using, 191selecting appropriate tests, 206skills assessed by, 194–197teaching methods and, 191–194test-curriculum match issues, 206
Diagnostic Reports, 323, 326DIAL-3. See Developmental Indicators for
the Assessment of Learning–Third Edition
Diana v. State Board of Education, 69DIBELS. See Dynamic Indicators of Basic
Early Literacy Skills, Sixth EditionDichtelmiller, M. L., 315Differential item effectiveness, 69Dill, Sheila, 203nDirections for tests, 124, 133, 146Direct Observation Form (DOF), 288Disabilities. See also Eligibility decisions;
Individuals with Disabilities Education Improvement Act (IDEA); Testing accommodations
achievement test considerations, 168autism, 365deaf–blindness, 371deafness and hearing impairment, 370developmental delay, 372differing names for, 9eligibility testing recommendations,
87–88emotional disturbance, 368environmental considerations for
tests, 80in gifted students, 354nIEPs for students with, 130, 131label preferences for, 379legislation classifying, 364–365mental retardation, 365–366multiple, 371NLTS2 study, 25not testing for eligibility, 90–91objective assessment requirements
with, 117offi cial student disabilities, 364–372orthopedic impairments, 370–371other health impairments, 371
percent of students identifi ed as having, 351
problems with defi nitions of, 379Public Law 99-457 and, 309selection formats for tests and, 130, 131specifi c learning disability, 366–368speech or language impairment, 369state and federal regulations for, 9supply formats for tests and, 133traumatic brain injury, 368–369universal design applications for,
77–78visual impairment, 369–370
Disaggregation, 387Discrimination, intelligence test items
sampling, 245Discriminative stimuli, 102–103, 102nDispersion measures
range, 34–35standard deviation, 35, 35n, 36, 43,
61, 366variance, 33, 35, 35n
Dissemination of pupil information, 414–415
Distributionsbimodal, 34kurtosis, 33, 34skew, 33, 34
Diversityequity as U.S. expectation for schools, 3importance of assessment for, 3–4oral language assessment and, 222scenarios in assessment, 16testing accommodations for, 73–74varieties of, 73
DOF (Direct Observation Form), 288Domains
evaluating tests for, 161item reliability for, 55–58, 164selecting tests for, 159, 159n
Doman, R., 272Dorfman, A., 315Downs, M. P., 410DTLA-4 (Detroit Tests of Learning
Aptitude, Fourth Edition), 255Due process, 27, 75Dunn, L. M., 170, 179, 256, 266Dunn, M., 256, 266Duration of behavior, 101
accuracy issues with time sampling, 104continuous recording for assessing, 103
Dykstra, R., 192Dynamic Indicators of Basic Early
Literacy Skills, Sixth Edition (DIBELS), 199 (table), 203–204
Heartland problem-solving model use of, 154, 155
Dynamic nature of assessment practices, 15–16
e*assessment software, 328Early Childhood Behavior Scale, 290
Early Communication Indicator (ECI), 311–313
Early Head Start program, 309, 311Early Screening Inventory–Revised, 315Ease of good testing programs, 144ECI (Early Communication Indicator),
311–313Edformation, Inc., 332Educational Testing Service, 238Education for All Handicapped Children
Act of 1975 (Public Law 94-142). See also Individuals with Disabilities Education Improvement Act (IDEA)
1986 amendments, 21due process provisions, 27history of, 20, 22, 25IEP provisions, 22LRE provisions, 26overview of provisions, 21protection in evaluation procedures
provisions, 26Section 504 provisions incorporated
into, 22eduTest software, 329Effi ciency of good testing programs, 144Elementary and Secondary Education Act
of 2001. See No Child Left Behind Act (NCLB)
Elicited language, 226, 227Eligibility decisions. See also Prereferral
decisions; Screening decisionsachievement tests for, 172establishing educational need,
372–373example, 377–378legislation mandating, 364multidisciplinary team for, 373–374,
375–376, 377–378not testing for, 90–91offi cial student disabilities, 364–372problems in, 379procedural safeguards for, 374process for, 374–376questions pertinent to, 364response to intervention approach,
366, 367severe discrepancy approach, 366,
367–368, 367nfor special education, 6, 9–10, 9nteacher assistance teams for, 9ntesting students with disabilities,
87–88testing students with limited English
profi ciency, 88–91valid assessments for, 374–375
Elliott, J. L., 92Elliott, S. N., 283Elmore, R., 382Emotional behavior assessment. See Social
and emotional behavior assessmentEmotional disturbance, 368
442 Index
Enabling behaviors, 69Englemann, S., 12Englert, C., 138English language learners (ELLs)
categories of accommodations for, 83, 85, 86
developing tests for, 90eligibility testing recommendations,
88–91IDEA provisions for, 75intelligence tests and, 244interpreters for testing, 90native language tests for, 89–90nonverbal tests for, 88–89, 254not testing for eligibility, 90–91testing accommodations for, 73, 74,
75–76, 82, 83, 85, 86, 88–91time required to attain suffi ciency in
English, 82translated tests for, 89–90
Entitlement. See Eligibility decisions; Prereferral decisions; Screening decisions
Environmental considerations for tests, 80Epstein, M. H., 289Equal-interval charts, 149–150Equal-interval scales, 33, 33n, 41Equity. See DiversityErvin, S. M., 225Essay (extended response) questions,
132–133Estimated true scores, 62Ethical considerations
adherence to professional standards on assessment, 29–30
benefi cence, 28codes of ethics, 28recognition of boundaries of
professional competence, 28–29respect for dignity of persons, 29test security, 30
Ethical Principles of Psychologists and Code of Conduct, 28
Evaluating testsassessment procedures and, 161norms and, 162–163reliability and, 163–164scores and, 161–162selecting a test to review, 159summative evaluation, 164–165test content and, 161, 168test purposes and, 160validity and, 164–165
Evidence-based teaching, 8Excellence, as U.S. expectation for
schools, 3Executive processing, 251Explorer software, 329Expressive language skills. See also Oral
language assessment; Written language assessment
oral versus written, 219
as production, 221receptive skills versus, 219subskills (table), 221terminology, 220–221VABS II domain for, 300, 303
Extended response questions, 132–133Externalizing problems, 281Extrapolation, for age- and grade-
equivalent scores, 41, 42
Fairness in assessment, 29Family Educational Rights and Privacy
Act (FERPA), 409, 414, 415FBA (functional behavior assessment),
113, 284–285, 287Federal Register, 36Fein, D., 254nFigueroa, R., 88Fill-in questions, 132Fiske, D., 66Flesch, R., 192Fletcher, J., 192, 342Fluency, as scoring measure, 38Fluid reasoning/intelligence, 250, 251Focal Points for mathematics, 209nFoorman, B., 192, 193, 342Formative assessment, 327, 331Four-point rule, 151Fourteenth Amendment to the U.S.
Constitution, 75Four-tier model for intervention, 152–155Francis, D., 192, 342Franks, E. A., 116Freeland, J., 136Free operant situations, 38nFreeze, D., 138Frequency of behavior, 101
accuracy issues with time sampling, 104, 104n
continuous recording for assessing, 103, 104
maladaptive label and, 299Frequency of testing
practice effect and, 117nprogress monitoring, 145with teacher-made tests, 117n,
121–122Fristoe, M., 229Frostig, M., 272, 355nFrustration level, 38Fuchs, D., 80, 136, 150, 151Fuchs, L. S., 80, 136, 150, 151, 155Functional behavior assessment (FBA),
113, 284–285, 287Functions of behavior, 100–101
GADS (Gilliam Asperger’s Disorder Scale), 290
Gallaudet Research Institute, 175Garcia, G., 196Gardner, E. F., 200Gates–MacGinitie Reading Tests–4, 199
Gender, normative groups and, 47–48General intelligence, 249Generalization, intelligence test items
sampling, 245–246Generalization issues in assessment, 206,
216General knowledge, intelligence test items
sampling, 246Geography, normative groups and, 49Germann, G., 151GFTA-2 (Goldman–Fristoe Test of
Articulation, Second Edition), 229Gifted students, disabilities in, 354nGilliam, J. E., 290Gilliam Asperger’s Disorder Scale
(GADS), 290Gilliam Autism Rating Scale, 365Ginsburg, H., 212Gioia, G. A., 294Glew, M., 153Glossary of Assessment Terms and
Acronyms Used in Assessing Special Education, 385
G•MADE (Group Mathematics Assessment and Diagnostic Evaluation), 211, 212, 213–215
Goal lines, 150, 151Goals
comparing aimline with goal line, 151mathematics, for special education, 137progress monitoring toward, 7, 151shared, for school teams, 400
Goals 2000, 383Goldenberg, D., 314, 317Goldin, J., 137Goldman, R., 229Goldman–Fristoe Test of Articulation,
Second Edition (GFTA-2), 229Gong, B., 383Good, R. H., 154, 187, 199, 203, 203nGORT-4 (Gray Oral Reading Test–4), 160Gottesman, I., 49Grade-equivalent scores, 40–41, 44GRADE (Group Reading Assessment and
Diagnostic Evaluation), 198, 200, 201–203
Grade in schoolgrade-equivalent scores, 40–41, 44normative groups and, 47–48
Graden, J., 346Graham, J. R., 295Granzin, A., 12Graphing. See Charting student progressGraphomotor skills, 341Graue, E., 51nGray Oral Reading Test–4 (GORT-4),
160, 194Greenspan, S. I., 313Gresham, F., 283Griffi n, P., 192Grimes, J., 152, 153, 154Gronlund, N. E., 129
Index 443
Gross mispronunciation in oral reading, 195
Group Mathematics Assessment and Diagnostic Evaluation (G•MADE), 211, 212, 213–215
Group Reading Assessment and Diagnostic Evaluation (GRADE), 198, 200, 201–203
Groupthink, 400Guilford, J. P., 48nGutkin, T. B., 399, 400Guy, S. C., 294
Hagan, E., 255Hagen, E., 41, 116Hamlett, C. L., 151Hammill, D., 200, 225, 228, 229, 230,
233, 234, 235, 236, 255, 273, 289, 315
Hammill, D. D., 232Handheld observation systems, 333Handicaps. See DisabilitiesHanna, J., 223Hanna, P., 223Harcourt Assessment, Inc., 173, 175Harcourt Brace Educational
Measurement, 212Harcourt Educational Measurement
Research Group, 175Haring, N., 118Harmful behaviors, 105, 106. See also
Social and emotional behavior assessment
Harris, L., 196Harrison, P., 313Hasbrouck, J., 223Head Start program, 309, 311Hearing problems
deaf–blindness, 371deafness and hearing impairment, 370differing names for, 9eligibility testing recommendations, 87nonverbal intelligence tests for, 254SAT-10 edition for, 175schoolwide screening for, 410–411screening for, 7, 339
Hear-say testing formats, 122, 123Heartland Area Education Agency,
152–155Hear-write testing formats, 122, 123Henderson, L. W., 315Herman, J. L., 399Hernstein, R., 49Heron, S. R., 212Herron, S., 315Hesitation in oral reading, 195High-stakes accountability, 383, 396Hill, B., 302Hintze, J., 121Hispanic students, representation in test
norms, 163Hodges, R., 223
Homeroom software, 328Homework, independent level needed
for, 38nHoover, H., 138Horn, D., 138Horn, James, 250Hosp, J. L., 121Hosp, M. K., 121Hresko, W., 315Hresko, W. P., 212Hughes, C., 38, 104, 137, 138, 341,
350, 351Hunt, F., 290
IDEA. See Individuals with Disabilities Education Improvement Act
IEPs. See Individualized educational programs
IEP teams, 9nIGDIs (Individual Growth and
Development Indicators), 310, 311–313
i-know software, 329Illinois Test of Psycholinguistic Abilities–3
(ITPA-3), 229Imitative language, 225–227Inclusive education, instructional
planning for, 8Independent level, 38, 38nIndividual educational plan teams, 405Individual goals, progress monitoring
toward, 7, 151Individual Growth and Development
Indicators (IGDIs), 310, 311–313Individualized educational programs
(IEPs). See also Special education services
annual goals in, 354–355content of, 352–353current educational levels in, 353–354deciding what to include in, 352–359defi ned, 351–352example program, 23–24individual educational plan teams for,
405intelligence tests and, 244legislation mandating, 22, 26, 352,
362mandated tests and, 145modifi ed achievement standards for,
388perceptual and motor training in, 271progress monitoring for, 7related services in, 357–359specially designed instruction in,
355–357for students with disabilities, 130, 131
Individuals with Disabilities Education Improvement Act (IDEA)
accountability provisions, 25, 383, 384–385, 389
alignment with NCLB provisions, 25
amendments in 1997, 21, 26, 27benefi ts of, 25developmental delay provisions, 372disabilities identifi cation provisions,
364–365disabilities not listed in, 10due process provisions, 27eligibility regulations, 91history of, 20IEP provisions, 22, 26, 352, 362LRE provisions, 26, 359overview of provisions, 21protection in evaluation procedures
provisions, 26Public Law 94-142 as precursor to,
20, 21, 22, 26reauthorization in 2004, 21, 25,
27–28, 152related services provisions, 357Response-to-Intervention provisions,
152Section 504 provisions incorporated
into, 22severe discrepancy provisions, 368specially designed instruction
provisions, 355testing accommodations mandated
by, 75Induction, intelligence test items
sampling, 247Infant assessment, 309–319
challenges of, 310commonly used measures (table),
314–315developmentally appropriate methods
for, 309Early Head Start program and, 309,
311Individual Growth and Development
Indicators (IGDIs) for, 310problems with, 319Public Law 99-457 and, 309reasons for, 310–311
Inferential comprehension, 196Informal reading inventories (IRIs), 137Informal tests, teacher-made tests not, 116Insertion errors in oral reading, 195Instructional challenge, managing, 12Instructional decision making. See also
Decisions made using assessment; Prereferral decisions
data-driven, 118, 151for instructional planning, 6, 8prior to referral, 339–351rules for instructional planning, 151rules for interpreting data, 151in special education, 351–362
Instructional environment, assessing, 12Instructional level, as scoring measure, 38Instructional match. See also Content
validityfor achievement tests, 168, 187, 224
444 Index
effectiveness of learning and, 355–356n
inventive spelling and, 224for mathematics assessment, 146,
147, 216for reading assessment, 206for written language assessment,
238–239Instructional problem indicators,
119, 119nInstructional time, insuffi cient, 341Integration of good testing programs, 144Intelligence. See also IQs
Cattell–Horn–Carroll (CHC) theory, 250
crystallized, 250factors underlying test behaviors,
249–250fl uid, 250, 251as inferred entity, 242meanings of, 241normative groups and, 49pupil characteristics and, 242–243Thurstone theory of intelligences, 250
Intelligence testsacculturation and, 242–243, 244age and, 243behaviors sampled by, 242, 245–249commonly used tests (table), 255–257decline in use of, 241factors underlying test behaviors,
249–250group, 253–254individual, 253for mental retardation
determination, 366nonverbal, 254, 255–256problems in the use of, 268processing defi cits assessment by, 250for severe discrepancy determination,
367terminology (table), 251–253
Interinterviewer reliability for VABS II, 305Internal consistency. See also Coeffi cient
alphas; Split-half reliability estimate
of adaptive behavior scales, 306coeffi cient alpha for, 56–58split-half reliability estimate for, 56
Internalizing problems, 281, 282International Reading Association, 45Internet resources
continuous progress monitoring software, 328
evidence-based teaching, 8modifi ed achievement standards
documents, 388periodic progress monitoring
software, 329for test information, 159n
Interobserver agreement or interscorer reliability
adaptive behavior assessment issues, 306correlational approach, 59differing names for, 58nkappa indice for, 59occurrence indice for, 59overview, 58–59percentage of agreement approach, 59point-to-point agreement, 59simple agreement, 59for teacher-made tests, 141
Interpolation for age- and grade-equivalent scores, 41
Interpretation of pupil information, 412–413
Interpretations of test performanceachievement standards-referenced, 39criterion-referenced, 39norm-referenced, 39–45problems with developmental scores,
40–41with teacher-made tests, 125
Interpreters for eligibility testing, 90Interrespondent reliability for VABS II, 305Interscorer or interrater reliability. See
Interobserver agreement or interscorer reliability
Interval sampling of behavior, 104Intervention assistance teams
clarifying the problem, 347designing interventions, 347–349evaluating effects of interventions,
350–351implementing interventions, 349Prereferral Intervention Plan, 349Request for Prereferral Consultation,
346–347types of responses by, 345
Interventionsdecision-making rules for, 151designing interventions, 347–349evaluating effects of, 350–351factors affecting feasibility, 348implementing, 349language assessment and, 219,
224, 238prereferral, goals of, 345–346Prereferral Intervention Plan, 349Request for Prereferral Consultation,
346–347response to intervention, 366, 368secondary, 153–154three-tier and four-tier models for,
152–155universal, 152–153
Interview techniques, 282Inventive spelling, 224Inversion errors in oral reading, 196Iowa Department of Education, 152Iowa problem-solving model, 152–155Iowa Tests of Basic Skills, 171IQs. See also Intelligence
defi ned, 43
mathematics teaching methods and, 342n
mental retardation, 366ratio IQ, 41, 43nfor severe discrepancy
determination, 367IRIs (informal reading inventories), 137Isaacson, S., 140, 238Isquith, P. K., 294Item reliability. See also Alternate-form
reliability; Internal consistencyalternate-form reliability for, 55–56evaluating for tests, 164internal consistency for, 56–58
ITPA-3 (Illinois Test of Psycholinguistic Abilities–3), 229
Jablon, J., 315Jackson, B., 136Jenkins, J., 187, 188Jensen, A. R., 69Jimerson, S. R., 328, 329Johnson, D., 272Johnson, S., 256Johnstone, C. J., 77Jones, R., 238Juniper Gardens Children’s Project, 311
KABC-2 (Kaufman Assessment Battery for Children, Second Edition), 170, 255
Kaemmer, B., 295Kaminski, R. A., 154, 199, 203, 203nKamphaus, R. W., 289, 290, 333Kaplan, E., 254nKappa indice for percent agreement, 59Karegianes, M., 192, 342Karlsen, B., 200Kaufman, A., 170, 255Kaufman, N., 170, 255Kaufman Assessment Battery for
Children, Second Edition (KABC-2), 170, 255
Kaufman Scales computerized scoring, 334Kaufman Test of Educational
Achievement-II, 170Kenworthy, L., 294Kephart, N., 272Kephart, N. C., 355nKeyMath–3 Diagnostic Assessment
(KeyMath-3 DA), 212, 215–216Kid Compass software, 328Kirk, S., 272, 355nKirk, W., 272, 355nKirshner, D., 225Koppitz, E. M., 273Koppitz-2 scoring system for BVMGT-2,
273, 275–276Kovacs, M., 295Kovaleski, J., 153Kovaleski, J. F., 356Kramer, J., 254n
Index 445
Kratochwill, T., 101KR-20 coeffi cient alpha, 57–58, 176Kurns, S., 152, 153, 154Kurtosis, 33, 34
LaBerge, D., 136Laimon, Deborah, 203nLambert, N., 301Language. See also English language
learners (ELLs); Oral language assessment; Written language assessment
behavioral observation, 225–227as core achievement area, 139–140defi ned, 220developmental acquisition of, 222elicited, 226, 227expressive versus receptive skills,
219, 221imitative, 225–227reasons for assessing, 221spontaneous, 225, 226, 227terminology, 220–221testing accommodations for bilingual
students, 81–82Language impairment, 369Larsen, S., 225, 228, 230Larsen, S. C., 232Latency of behavior, 101, 103Lau, M., 153Laws. See Legislation; specifi c lawsLEA (local education agency), 22LeapTrack software, 328LearnerLink software, 328Learning Access! software, 329Learning disability, 366–368Learning management, 12Least restrictive environment (LRE)
factors affecting placement choice, 360–362
legislation mandating, 26, 359placement options, 359–360
Lee, J. J., 399Lefever, D. W., 355nLegislation. See also specifi c laws
accountability mandated by, 10, 384–385
disabilities classifi ed by, 364–365eligibility decisions mandated by, 364IEPs mandated by, 22, 26, 352, 362LRE mandated by, 26, 359on multidisciplinary teams, 373–374overview of, 20–28PEPs mandated by, 26on testing accommodations, 75–76
Lehr, C., 396Leiter International Performance
Scale–Revised, 255Leland, H., 301Leptokurtic curves, 33, 34Lexical comprehension, 196
Licensure boards, assessment concerns of, 15
Limited English profi ciency, 88–91. See also English language learners (ELLs)
Linn, R., 51nLinn, R. L., 399Literal comprehension, 196Local education agency (LEA), 22Loeding, B. L., 87Logical zero for ratio scales, 33nLohman, D., 255Long-term retrieval/delayed recall, 251Look-say approach to reading, 191–192LRE. See Least restrictive environment
Maddox, T., 159, 314Maerlender, A., 254nMagnusson, D., 372Maintenance of behavior, 103Maintenance of pupil information, 414Maladaptation, 298–299, 303MA (mental age) in ratio IQ, 41, 43nMandated tests, preparing for and
managing, 144–145Marcus, R. A., 311Mardell-Czudnowski, C., 314, 317Marion, S., 383Markwardt, F., 179Markwardt, F. C., 170, 179Marston, D., 153, 372Marston, D. B., 315Martin, R. P., 282Maslow, P., 355nMassachusetts Department of
Education, 390Matching questions, 129–130, 129nMathematics. See also Diagnostic
mathematics testsadvanced skills, 138–139application problem challenges,
137–138beginning skills, 138building capacity for, 9curriculum series differences for, 116Focal Points, 209nIQs and teaching methods for, 342nmatching content to assessment, 146,
147, 216NCLB and, 385special education goals for, 137standards for, 137, 209–210, 385teacher-made tests for, 137–139
Mather, H., 229Mather, N., 170, 200, 257, 261Matrix completion, intelligence test items
sampling, 248, 249Maxwell, L., 136Maynard, F., 342nMcCallem, R. S., 256McCarney, S. B., 290, 315
McCarthy, J., 355nMcConnell, S. R., 290McDaniel, C., 136McGauvren, M., 315McGrew, K., 74McGrew, K. S., 170, 257, 261, 262, 265mCLASS DIBELS software, 329McLeod, S., 328, 329McNamara, K., 153MDE (multidisciplinary evaluation), 373MDT. See Multidisciplinary teamMean, 33, 34
for developmental scores, 40of IQs, 43of NCEs, 43scales appropriate for, 34standard deviation from, 35, 36in stanines, 43symbol for, 34of T scores, 43variance not related to, 35of z scores, 43
Measurement error, 54, 68–69Measure of Academic Progress
software, 329Median, 34, 40Medical services, 358Mehta, P., 192, 342Meisels, S. J., 315Meller, P. J., 311Memory, intelligence test items
sampling, 249Mental age (MA) in ratio IQ, 41, 43nMental retardation, 365–366Mercer, A., 38, 136Mercer, C., 38, 136Merrell, K. W., 282Metalinguistics, 220, 238Methe, S., 121Metropolitan Achievement Tests,
169, 171Metropolitan Readiness Tests, Sixth
Edition, 315Michigan Integrated Behavior and
Learning Support Initiative, 153Milestones, developmental, 310Miller, J., 225Miller, M. D., 116Miller, N., 255Minneapolis problem-solving
model, 153Mirkin, P., 357Mispronunciation in oral reading, 195Mitchell, D. S., 399Moats, L., 230Mode, 34Modifi ed achievement standards, 387,
388, 390, 391Momentary time sampling, 104Monda, L., 136Monitoring Basic Skills Progress
software, 328
446 Index
Monitoring progress. See Progress monitoring
Morphology, 220in reception and expression
channels, 221Morris, M. M., 238Morris, R., 254nMotor behavior, intelligence test items
sampling, 246Motor skills assessment. See Perceptual
and perceptual–motor skills assessment
Mullen, E., 315Mullen Scales of Early Learning: AGS
Edition, 315Multidisciplinary evaluation (MDE), 373Multidisciplinary team (MDT), 377–378
composition of, 373described, 405emotional disturbance determination
by, 368example, 377–378legislation regarding, 373–374procedural safeguards, 374responsibilities of, 373–374speech or language impairment
determination by, 369team process, 375–376valid assessments required for,
374–375Multiple-choice questions
content validity issues, 65, 66distractors in, 125guidelines for preparing, 125–129keyed response for, 125making more challenging, 129stem of, 125
Multiple disabilities, 371Multiple gating, 283Murray, C., 49Muyskens, P., 153Myklebust, H., 272Myles, B., 289
Naglieri, J., 256Naglieri Nonverbal Ability Test–Second
Edition (NNAT2), 256National Assessment of Educational
Progress, 178National Association for the Education of
Young Children, 309National Association of School
Psychologists, 20, 399, 411Principles for Professional Ethics, 28
National Bureau of Standards, 67National Center on Educational
Outcomes (NCEO), 77, 87, 387best practices for accountability, 396Data Viewer, 395modifi ed achievement standards
documents, 388
self-study guide for accountability systems, 390
website, 388, 395National Center on Learning Disabilities,
154National Center on Student Progress
Monitoring, 147National Commission of Excellence in
Education, 382National Council of Teachers of
Mathematics (NCTM), 74, 137, 161, 175
Curriculum Focal Points for Prekindergarten Through Grade 8 Mathematics, 209n
Principles and Standards for School Mathematics, 209
standards for learning and teaching in mathematics, 209–210
website, 217National Council on Measurement in
Education, 6, 45, 47, 62, 160Standards for Educational and
Psychological Testing, 29–30, 79, 159
National Education Association’s Code of Ethics of the Education Profession, 28
National Institute of Child Health and Human Development, 134, 136, 192
National Longitudinal Transition Study-2 (NLTS2), 25
National Mathematics Advisory Panel, 137National Science Education Standards, 175National Science Foundation, 74Nation at Risk, A: The Imperative for
Educational Reform, 382Native language tests, 89–90Naturalistic observation, 100NCEO. See National Center on
Educational OutcomesNCEs (normal curve equivalents), 43NCLB. See No Child Left Behind ActNCTM. See National Council of Teachers
of MathematicsNeisworth, J., 290, 298Nemeth, C., 399, 400NEO2 Alpha Smart computer, 334Newcomer, P., 171, 184, 230, 233, 234,
235, 236Nibbelink, W., 138Nihira, K., 301NLTS2 (National Longitudinal Transition
Study-2), 25NNAT2 (Naglieri Nonverbal Ability
Test–Second Edition), 256No Child Left Behind Act (NCLB)
accountability provisions, 383, 385, 387adequate yearly progress (AYP)
mandated by, 10–11benefi ts of, 25
evidence-based teaching mandated by, 8IDEA aligned with, 25importance to assessment practices, 20provisions, 21, 27testing accommodations and, 75
Nominal scales, 33nNondiscrimination in assessment, 29Nonverbal tests
for ELLs, 88–89for intelligence measurement, 254,
255–256Normal curve equivalents (NCEs), 43Normal distribution
relationship to standard scores and percentiles, 45
standard deviation for, 35, 36Normative comparisons, 79, 88Normative samples, 50, 71, 162Norm-referenced interpretations, 39–45.
See also Derived scoresNorm-referenced tests. See also Norms
data for testsachievement tests, 167defi ned, 387teacher-made tests versus, 116–117testing accommodations and, 79, 88
Normsacculturation considerations, 48–49achievement test selection and, 169adaptive behavior assessment
issues, 306age considerations, 48age of, 50–51for behaviors, 112evaluating for tests, 162–163gender considerations, 47–48geographical considerations, 49intelligence considerations, 50local versus national, 46, 51number of subjects for, 50, 162–163,
163nproportional representation for, 50race and cultural identity
considerations, 49relevance of, 51sampling use for, 47, 47n, 50school grade considerations, 48scores dropped for, 162–163, 163nusing entire population, 46–47, 47nvalidity affected by, 71
Northern, J. L., 410Nurss, J., 315
Oakland, T., 313Objective scoring, 36–37Observation
aimlines for behavior, 112behavioral, 97, 100–106, 111–112contrived versus naturalistic, 100criteria for evaluating performances,
111–112
Index 447
handheld observation systems, 333interobserver agreement, 58–59of language behavior, 225–227learner assessment using, 13live versus aided, 99, 108obtrusive versus unobtrusive, 99–100of qualitative data during testing, 14qualitative versus quantitative, 97sampling behavior, 102–106for social and emotional behavior
assessment, 282systematic, 97, 106–111, 113
Observation sessions, 103Obtrusive observation, 99–100Occupational therapy, 357–358Occurrence indice for percent agreement, 59Offi ce of Civil Rights (OCR), 22Off-level or off-grade testing, 387Ohio Intervention Based Assessment
project, 153Ohor, P. S., 311OLSAT-8 (Otis–Lennon School Ability
Test, Eighth Edition), 176, 256Olson, D., 382Omission errors in oral reading, 195Ophthalmologist, 339Opportunity to learn, 79–80, 387The Opportunity to Praise a Student
(TOPS) report, 321, 322Optometrist, 339Oral and Written Language Scales
(OWLS), 229, 236–237Oral language assessment. See also
Language; Written language assessment
commonly used tests (table), 229–230cultural diversity and, 222developmental considerations, 222expressive versus receptive skills,
219, 221problems in the use of, 238processes assessed, 219reasons for, 221subskills for communication channels
(table), 221terminology, 220–221
Oral readingerrors in, 194–196rate of, 136, 194
Ordinal scales, 33, 41Organization of teacher-made tests, 124Organizing testing materials, 147–148Orthopedic impairments, 370–371Osborn, J., 192O’Shea, L., 136Other health impairments (disability
classifi cation), 371Otis–Lennon School Ability Test, Eighth
Edition (OLSAT-8), 176, 256Out-of-level testing, 387OWLS (Oral and Written Language
Scales), 229, 236–237
Palm Link software, 333Pany, D., 187, 188Parents
communicating assessment information to, 405–408
consent for data collection, 411–412Partial-interval sampling of behavior, 104Partial mispronunciation in oral
reading, 195Pattern completion, intelligence test items
sampling, 248, 249Paul, D., 138PDAs (personal digital assistants), 333Peabody Individual Achievement
Test–Revised (PIAT-R), 170 (table), 179–181
grade-equivalent scores for reading, 188
normative update for, 179, 180Peabody Picture Vocabulary Test–Fourth
Edition (PPVT-4), 256 (table), 266–268
cultural diversity and, 222Peak, P., 315Pearson, N., 255, 273Pearson, P. D., 196Pearson Benchmark software, 329Pearson Prosper software, 329Pedagogical knowledge, lack of, 341–342Peer-acceptance nomination scales, 283Penmanship, 140, 223. See also Written
language assessmentPennsylvania Instructional Support Teams
project, 153PEPs (protection in evaluation
procedures), 26Percentage of agreement, 59Percent correct, 37–38
percentiles versus, 43for power tests, 38for written language assessment, 140
Percentile ranks (percentiles), 41benefi ts of, 45conversion tables for, 42deciles, 42percent correct versus, 43quartiles, 42standard scores compared to, 44, 45
Perception, defi ned, 271Perceptual and perceptual–motor skills
assessmentcommonly used tests (table), 273perception, defi ned, 271perceptual–motor skills, defi ned, 271problems with, 278–279reasons for, 272
Perceptual–motor skills, defi ned, 271Perceptual reasoning, 252, 258Perfetti, C., 192Performance defi cits, 282Performance standards, 385, 386, 388Performance versus ability, 298
Periodic technology-enhanced measures, 328–332
Personal digital assistants (PDAs), 333Pesetsky, D., 192Pfl aum, S., 192, 342Phillips, S., 348Phonics approach to reading, 192, 193,
342Phonology, 220, 221Physical activity, VABS II domain for, 303Physical disabilities, 369–371Physical environment, adaptation and, 297Physical therapy, 357–358PIAT-R. See Peabody Individual
Achievement Test–RevisedPlanning (intelligence test term), 252Platykurtic curves, 33, 34Point-to-point agreement, 59Portable Observation Program, 333Power tests, 38PPVT-4. See Peabody Picture Vocabulary
Test–Fourth EditionPractice effect, 117nPragmatics, 220, 221Predictable error, 54. See also BiasPredictive Assessment Series software, 329Predictive criterion-related validity, 67Prereferral assessment goals, 345–346Prereferral decisions, 339–351. See also
Eligibility decisions; Screening decisions
diagnosing unrecognized problems, 339referral versus prereferral, 347
Prereferral Intervention Plan, 349Prereferral intervention process, 346Preschooler assessment, 309–319
challenges of, 310commonly used measures (table),
314–315developmentally appropriate methods
for, 309developmental milestones and, 310Head Start program and, 309, 311Individual Growth and Development
Indicators (IGDIs) for, 310problems with, 319Public Law 99-457 and, 309reasons for, 310–311
Preschool Evaluation Scale, 315Presentation accommodations
categories of, 83, 84, 85, 86legal requirements for, 75need for, 78for normative comparisons, 79
Presentation formats for teacher-made tests, 122, 124
Principles and Standards for School Mathematics, 209
Principles for Professional Ethics, 28Privacy issues, 29Problem behavior assessment. See Social
and emotional behavior assessment
448 Index
Problem-solving teams, 404Procedural safeguards for eligibility, 374Process defi cits, 272Processing defi cits assessment, 250Processing speed, 252Process standards for mathematics, 210Production, defi ned, 221Professional judgment, 14Program evaluation decisions, 6, 10Progress monitoring
assessment stations for, 146, 149benefi ts of, 145charting student progress, 148–151decisions made using assessment,
6, 7–8frequency of, 145involving others in, 148managing, 145–151model projects, 152–155organizing materials for, 147–148preparing materials for, 146–147for prereferral decisions, 340–344reusing materials for, 147schoolwide, 411self-administered, 149teacher-made tests for, 118–119testing routine for, 145–146toward individual goals, 7, 151toward state standards, 8
Proportional representation for norms, 50Prosocial behaviors, infrequent, 105, 106Protection in evaluation procedures
(PEPs), 26Prutting, C., 225Psychological Corporation, 182Psychological services, 357Public, assessment concerns of, 14–15Public Law 101-336 (Americans with
Disabilities Act), 364Public Law 101-476. See Individuals
with Disabilities Education Improvement Act (IDEA)
Public Law 107-110. See No Child Left Behind Act (NCLB)
Public Law 93-112 (Section 504 of the Rehabilitation Act of 1973), 20, 21, 351, 364
Public Law 93-380 (FERPA), 409, 414, 415Public Law 94-142. See Education for All
Handicapped Children Act of 1975Public Law 99-457, 309Punctuation. See also Written language
assessmentassessment considerations for, 223percent correct scoring and, 140standardized tests not suited to
measuring, 223in writing style, 223
Pupil information collectionconsent for, 411–412dissemination of information,
414–415
maintenance of information, 414schoolwide screening for, 409–411summarizing and interpreting
information, 412–413verifying information, 412
Purposes of test, evaluating, 160
Qualitative data, defi ned, 14Qualitative observation, 14, 97Quantitative data, defi ned, 14Quantitative knowledge (intelligence test
term), 252Quantitative observation, 97, 99Quartiles, 42Quenemoen, R., 396
Race, normative groups and, 49Random error, 54, 109–110Range of distribution, 34–35Rasher, S., 192, 342Rashotte, C., 199Rate of reading, 136, 194Rater reliability. See Interobserver
agreement or interscorer reliabilityRatio IQ, 41, 43nRatio scales, 33nRayner, K., 192Reading assessment. See also Diagnostic
reading measuresaccuracy calculation, 353nof advanced skills, 136–137of beginning skills, 134, 136of comprehension, 134, 136–137, 196decoding skills, 134example, 135grade-equivalent scores, 188informal reading inventories (IRIs)
for, 137of oral rate, 136, 194of oral reading errors, 194–196of reading-related behaviors, 197reasons for, 191retelling for, 134, 136self-administered probes for, 149state standards, 385teacher-made tests for, 134–137teaching methods and, 191–194types of comprehension, 196of word-attack skills, 196–197of word recognition skills, 197
Reading instructionincorrect beliefs long held, 192look-say approach, 191–192NCLB and, 385phonics approach, 192, 193, 342
Receptive language skills, 219, 220–221. See also Oral language assessment; Written language assessment
Recollection, learner assessment using, 13Recreational therapy, 358Referral. See also Eligibility decisions;
Prereferral decisions
Diagnostic Reports for, 323informal reading inventories (IRIs)
for, 137prereferral versus, 347response to intervention and, 366
Referral committees, 9nRehabilitation Act of 1973, Section 504
(Public Law 93-112), 20, 21, 22, 351, 364
Reid, D., 315Related services, 357–359Reliability
as absence of random error, 54confi dence intervals, 62estimated true scores, 62evaluating for tests, 163–164for generalizations from assessment, 54interobserver agreement for, 58–59item reliability, 55–58, 164reliability coeffi cient, 54–55, 59, 164,
164nstability coeffi cient for, 57–58, 59, 164standard error of measurement (SEM),
60–61standards for, 55of teacher-made tests, 141of true-false tests, 130types of error, 54validity affected by, 68
Reliability coeffi cientsin correlational approach to
agreement, 59evaluating for tests, 164, 164noverview, 54–55in school settings, 59for standards of reliability, 55
Renaissance Learning, 327, 329, 330, 334Repetition in oral reading, 195Request for Prereferral Consultation,
346–347Rescorla, L. A., 288, 289, 294Resnick, L., 356nResource allocation decisions, 6, 9Resource teams, 403–404Respondent for adaptive behavior
assessment, 299Response accommodations
categories of, 83, 84, 85, 86example, 76legal requirements for, 75need for, 78–79for normative comparisons, 79not providing content assistance,
87–88Response formats for teacher-made tests,
122–123, 124Response to intervention, 366, 367Retention, as scoring measure, 38–39Reynolds, C. R., 273, 275, 289, 290,
295, 333Richmond, B. O., 295Roach, E. F., 355n
Index 449
Roberts, R., 200, 229Robertson, G. J., 170, 181Rock, D., 238Roid, G., 255, 256Roles of school team members, 400Rosenshine, B., 341Rouse, T. L., 310Routines for testing, 145–146Roy Mayer, G., 343Rudoff, E., 223
Salvia, J. A., 38, 104, 116, 137, 138, 187, 272, 290, 297, 298, 341, 350, 351
Sampling behaviorcontexts for, 102–103discriminative stimuli, 102–103, 102nsetting events, 102, 103times for, 103–104
Sampling use for norms, 47, 47n, 50Samuels, S., 136Sanders, N., 51nSAT. See Stanford Achievement TestSAT-10. See Stanford Achievement Test
Series, Tenth EditionScales of Independent Behavior–
Revised, 302Scales of measurement
equal-interval, 33, 33n, 41nominal, 33nordinal, 33, 41ratio, 33ntypes of, 32–33
Schatschneider, C., 192, 342Scheduling accommodations
categories of, 83, 85, 86example, 76legal requirements for, 75
Schlieve, P. L., 212Schmidt, M., 297, 298School grade. See Grade in schoolSchool teams. See also Multidisciplinary
team (MDT)characteristics of effective, 399–403child study teams, 404communicating assessment
information to parents, 405–408form to guide initial problem-solving
meeting, 401–402individual educational plan teams, 405pitfalls of group decision making, 399problem-solving teams, 404school wide assistance teams, 403–404written assessment records by,
408–415School wide assistance teams, 403–404Science
building capacity for, 9NCLB and, 385standards for, 74, 385
Science for All Americans, 175Scores. See also Scoring
cut score, 387
dropped for norms, 162–163, 163nevaluating for tests, 161–162
Scoring. See also Scoresaccuracy, 38average measures, 34computerized scoring systems, 327,
336–337correlation coeffi cients, 35–36derived scores, 39–45dispersion measures, 34–35, 36distribution characteristics, 33–34fl uency, 38instructional level, 38matching questions, 129nobjective versus subjective, 36–37percent correct, 37–38retention, 38–39scales of measurement for, 32–33summarizing student performance,
37–39supply formats for tests and, 131teacher-made tests, 125
Screening decisions. See also Eligibility decisions; Prereferral decisions
achievement tests for, 172for disabilities, 7for unrecognized problems, 6, 339
SDMT4 (Stanford Diagnostic Mathematics Test), 212
SDRT. See Stanford Diagnostic Reading Test
SEA (state education agency), 22Section 504 of the Rehabilitation Act of
1973 (Public Law 93-112), 20, 21, 22, 351, 364
Security of tests, 30See-say testing formats
for mathematics, 138in teacher-made tests, 122, 123
See-write testing formatsfor mathematics, 138in teacher-made tests, 122, 123
Seidenberg, M., 192Selection formats for tests
matching questions, 129–130, 129nmultiple-choice questions, 65, 66,
125–129for students with disabilities, 130, 131teacher-made tests, 122–123, 125–130true-false statements, 130
Self-administered probes, 149Semantics, 220, 221Semilogarithmic charts, 150SEM (standard error of measurement),
60–61Sensory problems. See Hearing problems;
Vision problemsSequencing, intelligence test items
sampling, 247Sequencing of teacher-made test items, 124SESAT (Stanford Early School
Achievement Test), 173, 176. See
also Stanford Achievement Test Series, Tenth Edition (SAT-10)
Setting accommodationscategories of, 83, 84eligibility testing recommendations, 92environmental considerations, 80example, 76
Seven cycle charts, 150Severe discrepancy approach to eligibility,
366, 367–368, 367nSeverson, H., 12Severson, H. H., 283, 290Shapiro, E. S., 101, 187, 333Share, D., 192Sherbenou, R., 256Sherbenou, R. J., 212Shinn, M., 139, 238Shinn, M. R., 121, 155Short-term memory, 252, 262, 263Shrank, F. A., 261Shriner, J., 74, 116Simple agreement, 59Simpson, R., 289Simultaneous processing, 252Sindelar, P., 136Skew, 33, 34Skill Detective software, 328Skill development, teacher-made tests for,
117–118Skill Navigator software, 328Skills Connection software, 328Skinner, C., 136Slobin, D. L., 225Smith, S., 136Smith, Sylvia, 203nSnow, R., 192Social and emotional behavior
assessment. See also Adaptive behavior assessment
example, 286–287functional behavior assessment,
284–285, 287importance of, 281–282interview techniques for, 282observation for, 282rating scales of, 283, 288–290reasons for, 283–284situational measures for, 283
Social comparisons for behavior, 112, 113Social expectations, adaptation and, 297Socialization, VABS II domain for, 303Social skills and relationships, VABS II
domain for, 303Social tolerance for behavior, 112,
298–299Sociometric ranking scales, 283Sparrow, S., 300, 302, 304Spearman, Charles, 249Special education referral committees, 9nSpecial education services. See also
Eligibility decisions; Individualized educational programs (IEPs)
450 Index
alterable behaviors focus of, 11chart types used in, 149–150decisions made in, 351–362establishing need for, 372–373least restrictive environment for, 26,
359–362mathematics goals for, 137percent of students needing, 351prereferral decisions for, 339–351progress monitoring for, 7resource allocation for, 9
Specifi c learning disability, 366–368Speech impairment, 369Speed DIAL (DIAL-3 short form), 317,
318, 319Speed of lexical access, 252Spelling assessment
commonly used diagnostic language tests (table), 229–230
considerations for, 223for dictated single words, 139extended response questions and, 132hear-write testing format for, 123inventive spelling and, 63, 224kinds of, 188for recognition response, 139standard scores for, 44nfor student self-monitoring of
errors, 139teacher-made tests for, 139for words in context, 139
Spellings, M., 25Spiegel, A., 74Split-half reliability estimate, 56Spontaneous language, 225, 226, 227Stability coeffi cients, 57–58, 59
evaluating tests using, 164Stability of behavior, 103Stacy, N., 138Stakeholders, involving in assessment
process, 391–392Standard celeration charts, 150Standard deviation, 35
of IQs, 43for mental retardation, 366of NCEs, 43for normal distribution, 35, 36in standard error of measurement
(SEM), 61in stanines, 43symbols for, 35, 35nof T scores, 43of z scores, 43
Standard error of measurement (SEM), 60–61
Standardized Test for the Assessment of Reading, 200
Standard nines (stanines), 43Standards
academic achievement (performance), 385, 386, 388
academic content, 209–210, 385, 386
alternate achievement, 386, 388, 391on assessment, professional, 29–30consensus lacking for, 390for mathematics, 137, 209–210modifi ed achievement, 387, 388,
390, 391process, 210for reliability, 55state standards, 8, 169, 390
Standards-based assessment, 388–389Standards-based systems of accountability
assumptions underlying, 392current state practices, 395data collection for, 393–394establishing foundation for assessment
for, 391–392installing, 394–395involving stakeholders in, 391–392NCEO self-study guide for, 390rewards and sanctions specifi cation
for, 393Standard scores, 43
benefi ts of, 45composite scores using, 44, 44nIQs, 43normal curve equivalents (NCEs), 43percentiles compared to, 44, 45stanines (standard nines), 43T scores, 43z scores, 43
Standards for Educational and Psychological Testing, 29–30, 79, 159
Standards-referenced tests, 167–168, 387Stanford Achievement Test (SAT). See also
Stanford Achievement Test Series, Tenth Edition (SAT-10)
categories of, 167reliability, 176
Stanford Achievement Test Series, Tenth Edition (SAT-10), 169 (table), 171, (table), 173–177
norms for, 176reliability of, 176scores for, 176special editions, 175–176subtests, 173–175Technical Data Report manual, 176validity of, 176–177
Stanford–Binet Intelligence Scale, Fifth Edition, 256, 334
Stanford Diagnostic Mathematics Test (SDMT4), 212
Stanford Diagnostic Reading Test (SDRT), 200 (table)
categories of, 167–168grade-equivalent scores for reading, 188
Stanford Early School Achievement Test (SESAT), 173, 176. See also Stanford Achievement Test Series, Tenth Edition (SAT-10)
Stanines (standard nines), 43
Stanovich, K., 134, 192, 342STAR Early Literacy, 329STAR Math, 212 (table), 329–330
Accelerated Math software with, 321, 327, 328
as computer adaptive test, 212, 321STAR Reading, 330–331State education agency (SEA), 22States’ Alternate Assessments Based on
Modifi ed Achievement Standards (AA-MAS), 388
State standards. See also Standardsachievement test selection and, 169consensus lacking for, 390progress monitoring toward, 8
Status of the Class Report, 323, 324–325Stein, S., 139, 238Stereotypic behaviors, 105Stevens, R., 341Stevens, S. S., 32Strickland, J., 342nStudent accountability, 387Style, writing, 223, 228. See also Written
language assessmentSubjective scoring, 36–37Substitution errors in oral reading, 195Successive processing, 252Suen, H., 104nSulzer-Azaroff, B., 343Summative judgments, teacher-made tests
for, 119–120Supply formats for tests
criteria for scoring, 131extended responses (essay questions),
132–133fi ll-in questions, 132for students with disabilities, 133teacher-made tests, 122–123, 131–133
Supralinguistic functioning, 221Swain, C., 212Sylvan Learning Center, 193Syntax, 220, 221System accountability, 387Systematic administration errors, 69Systematic error. See also Bias
administration errors, 69defi ned, 54differential item effectiveness and, 69enabling behaviors and, 69methods of measurement and, 69in observations, 110–111validity affected by, 68–69
Systematic observationavoiding changes in the observation
process, 110contexts for, 107criteria for evaluating performances,
111–112data gathering, 109–111data summarizations, 111desensitizing students to, 110–111example scenario, 113
Index 451
means of observation, 108minimizing observer expectancies, 111motivating observers, 111placement and instructional decisions
using, 97preparing for, 106–108random errors in, 109–110recording procedures for, 107–108sample recording form, 108schedule for, 107systematic errors in, 110–111targets for, 97, 106–107
Systematic Screening for Behavior Disorders, 283, 290
TABS (Temperament and Atypical Behavior Scale), 290
TACL-3 (Test for Auditory Comprehension of Language, Third Edition), 230
Targeted instruction, 153–154TASK (Test of Academic Skills), 173. See
also Stanford Achievement Test Series, Tenth Edition (SAT-10)
Taylor, B., 196Teacher assistance teams, 9nTeacher-made achievement tests
advantages of, 116–117commercially prepared tests versus,
116–117content specifi city of, 116–117,
120–121for core achievement areas, 133–140formats of, 122–123frequency of testing, 117n, 121–122not informal or unstandardized, 116preparation of, 123–125response formats for, 125–133sources of diffi culty in use of, 140–141uses for, 117–120
Teacher’s Report Form (TRF), 289Technical adequacy. See Reliability;
ValidityTechnology-enhanced assessments
Accelerated Math software for, 321–326, 327–328, 334
aided observation, 99, 108AIMSweb software for, 329,
331–332, 333classroom response systems,
333–334computer adaptive testing, 212, 321computer-assisted instruction
versus, 327computer-generated reports for, 337computerized scoring systems, 327,
336–337continuous measurement using, 121n,
327–328Diagnostic Reports for, 323, 326example, 321–326formative assessment, 327, 331
handheld observation systems, 333periodic measurement using,
328–332probe and quiz preparation, 147Status of the Class Report for, 323,
324–325Tellegen, Y. S., 295Temperament and Atypical Behavior Scale
(TABS), 290TERA-3 (Tests of Early Reading Ability–
Third Edition), 315TerraNova, Third Edition (TN3), 170,
177–179Tester reliability. See Interobserver
agreement or interscorer reliabilityTest for Auditory Comprehension of
Language, Third Edition (TACL-3), 230
Testing. See also Progress monitoring; Testing accommodations; Tests
assessment broader than, 13–14evaluating procedures for tests, 161frequency of, 117n, 121–122importance in school and society, 5–6involving others in, 148learner assessment using, 13–14routines for, 145–146security issues, 30
Testing accommodationsaccommodation, defi ned, 83, 386for accountability testing, 92for accurate measurement, 74–75adaptations, defi ned, 386categories of, 83–87content validity considerations, 78–80cultural considerations, 80–81for educational standards changes, 74for eligibility testing, 87–91environmental considerations, 80factors impeding accurate testing,
78–82legal requirements for, 75–76linguistic considerations, 81–82norm-referenced tests and, 79opportunity to learn considerations,
79–80presentation accommodations, 75, 78,
79, 83, 84, 85, 86promoting test accessibility, 76–78response accommodations, 75, 76,
78–79, 83, 84, 85, 86, 87–88SAT-10 special editions, 175–176setting accommodations, 76, 80, 83,
84, 92for student population changes,
73–74for students with disabilities, 87–88for students with limited English
profi ciency, 88–91timing/scheduling accommodations,
75, 76, 83, 85, 86Testing formats, 122–123
Test itemsability to respond to, 78–79ability to understand, 78appropriateness of level of, 79content validity issues, 65–66differential item effectiveness, 69for intelligence tests, 245–249item reliability, 55–58organizing and sequencing, 124
Test of Academic Skills (TASK), 173, 176. See also Stanford Achievement Test Series, Tenth Edition (SAT-10)
Test of Early Mathematics Abilities, 212Test of Language Development:
Intermediate–Fourth Edition (TOLD-I:4), 230, 235–236
Test of Language Development: Primary–Fourth Edition (TOLD-P:4), 230, 233–234
Test of Nonverbal Intelligence–3, 256Test of Phonological Awareness, Second
Edition: Plus (TOPA 2+), 200, 204–205
Test of Reading Comprehension–3, 200Test of Silent Word Reading
Fluency, 200Test of Written Language–Fourth Edition
(TOWL-4), 228, 230 (table), 231–233
contrived and spontaneous writing formats, 228
spontaneous language and, 225Test of Written Spelling–Fourth Edition
(TWS-4), 230Test-retest reliability, 58Tests. See also Instructional match; Scores;
Scoring; Testing; specifi c testscultural identity and, 80–81defi ned, 14environmental considerations for, 80evaluating, 159–165interpretations, 39–45mandated, 144–145power tests, 38quality variations of, 15security issues, 30
Tests: A Comprehensive Reference for Assessments in Psychology, Education, and Business (Maddox), 159
Tests of Early Reading Ability–Third Edition (TERA-3), 315
Tharp, R. G., 152Thinking ability (intelligence test
term), 253Thompson, S., 74, 396Thompson, S. J., 77Thorndike, R. L., 41, 116Three-tier model for intervention,
152–155Thurlow, M., 74Thurlow, M. L., 74, 77, 92, 390, 396
452 Index
Thurstone, T. G., 249–250Thurstone theory of intelligences, 250Times for sampling behavior, 103–104,
104nTindal, G., 223Tindall, G., 139, 238TN3 (TerraNova, Third Edition), 170,
177–179Toddler assessment, 309–319
challenges of, 310commonly used measures (table),
314–315developmentally appropriate methods
for, 309developmental milestones and, 310example, 311–313Head Start or Early Head Start
programs and, 309, 311problems with, 319Public Law 99-457 and, 309reasons for, 310–311
TOLD-I:4 (Test of Language Development: Intermediate–Fourth Edition), 230, 235–236
TOLD-P:4 (Test of Language Development: Primary–Fourth Edition), 230, 233–234
TOPA 2+ (Test of Phonological Awareness, Second Edition: Plus), 200, 204–205
Top-down testing formats, 123Topography of behavior, 100TOPS (The Opportunity to Praise
Student) report, 321, 322Torgesen, J., 199, 200, 204TOWL-4. See Test of Written Language–
Fourth EditionTQM, 382Translated tests, 89–90Translating assessment information, 406Traumatic brain injury, 368–369Trendlines, 150TRF (Teacher’s Report Form), 289Troutman, A. C., 101, 343True-false statements, guidelines for, 130T scores, 432Know! Classroom response
system, 334TWS-4 (Test of Written Spelling–Fourth
Edition), 230Typological thinking, 41
Underwood, G., 192Universal design, 77–78Universal Nonverbal Intelligence Test
(UNIT), 256University of Kansas, 311University of Minnesota, 387Unobtrusive observation, 99Unstandardized tests, teacher-made tests
not, 116
U.S. Census Bureau, 186, 201, 202, 231, 265
U.S. Constitution, Fourteenth Amendment, 75
U.S. Department of Commerce, 265U.S. Department of Education, 8, 20, 22,
25, 385U.S. Secretary of Education, 389
VABS II. See Vineland Adaptive Behavior Scales, Second Edition
Validity. See also Content validityconstruct, 68criterion-related, 66–67defi ned, 62evaluating for tests, 164–165factors affecting, 68–69, 71general, 64, 68–69, 71local nature of, 70methods of validating test inferences,
64–68responsibility for, 71of teacher-made tests, 141testing accommodations and,
78–79types of evidence for, 64–65
Validity coeffi cient, 66VanDerHeyden, M., 328, 329Variance, 33, 35, 35nVerbal ability (intelligence test term), 253Verbal comprehension, 253, 258Verifying pupil information, 412Vineland Adaptive Behavior Scales,
Second Edition (VABS II), 300, 302 (table), 303–305
computerized scoring system, 334for mental retardation
determination, 366Parent/Caregiver Rating Form
domains, 303Survey Interview Form domains,
300, 303Vision problems
deaf–blindness, 371differing names for, 9screening for, 7, 339visual impairment, 369–370
Visual discrimination, 271Visual perception/processing, 253Visual–spatial thinking, 253, 262, 263Vocabulary. See also Language
cultural diversity and, 222intelligence test items sampling, 246
Voress, J., 273, 314
Wagner, R., 199WAIS-IV (Wechsler Adult Intelligence
Scale–IV), 256Walberg, H., 192, 342Walker, D. K., 283Walker, H. M., 283, 290
Walker–McConnell Scale of Social Competence and School Adjustment, Elementary Version, 290, 368
Wallace, G., 229Walz, L., 151Weatherman, R., 302Wechsler, D., 171, 254, 256, 257, 259Wechsler Adult Intelligence Scale–IV
(WAIS-IV), 256Wechsler Individual Achievement
Test–Second Edition (WIAT-II), 171 (table), 182–184
for severe discrepancy determination, 367
Wechsler Intelligence Scale for Children–IV (WISC-IV), 254, 256 (table), 257–261
para los Niños de Cuba, 90perceptual and perceptual–motor
skills assessment in, 271WISC-IV Integrated edition,
250, 254nWechsler Preschool and Primary Scale of
Intelligence–III (WPPSI-III), 257Wechsler Scales computerized
scoring, 334Welsh, C. A., 225Wetzel, R. J., 152What Works Clearinghouse (WWC),
8, 356White, O., 118Whittlesey. J., 355nWhole-interval sampling of behavior, 104Whole-word approach to reading,
191–192WIAT-II. See Wechsler Individual
Achievement Test–Second EditionWide Range Achievement Test–4
(WRAT4), 170, 181–182Wiederholt, J. L., 200, 232Wiederholt, L., 160, 255Wilkinson, G. S., 170, 181Williams, K., 198Williams, K. T., 211, 212WISC-IV. See Wechsler Intelligence Scale
for Children–IVWiske, M. S., 315WJ-III Normative Update Technical
Manual, 265Woodcock, R., 302Woodcock, R. W., 170, 257, 261,
262, 265Woodcock–Johnson III Tests of
Achievement (WJ-III-ACH), 263–266
broad and narrow abilities measured by (table), 264–265
Woodcock–Johnson III Tests of Cognitive Abilities (WJ-III-COG), 257 (table), 261–263
Index 453
broad and narrow abilities measured by (table), 262
Cattell–Horn–Carroll (CHC) theory as basis of, 250
processing defi cits assessment by, 250
Woodcock–Johnson Psychoeducational Battery III (WJ-III), 170 (table)
normative update, 261norms, 265reliability, 265scores, 263, 265for severe discrepancy determination,
367validity, 266W-Score for, 162
Woodcock–Johnson Scales computerized scoring, 334
Word-attack skills, 196–197
Word order changes in oral reading, 196Word recognition skills, 197Working memory, 252, 258Work Sampling System, Fourth Edition, 315WPPSI-III (Wechsler Preschool and Primary
Scale of Intelligence–III), 257WRAT4 (Wide Range Achievement
Test–4), 170, 181–182Written language assessment. See
also Language; Oral language assessment; Spelling assessment
advanced skills, 140beginning skills, 140commonly used tests (table), 229–230complexity of, 139content considerations, 222expressive versus receptive skills,
219, 221form considerations, 223
instructional match issues, 238–239problems in the use of, 238–239processes assessed, 219reasons for, 221subskills for communication channels
(table), 221teacher-made tests for, 139–140terminology, 220–221
Written records of assessment, 408–415
Yearly Progress Pro software, 329Young Children’s Achievement Test
(YCAT), 315Youth Self Report (YSF), 289Ysseldyke, J. E., 12, 92, 272, 328, 329,
355, 356, 390, 402, 404
Z scores, 43

This page intentionally left blank
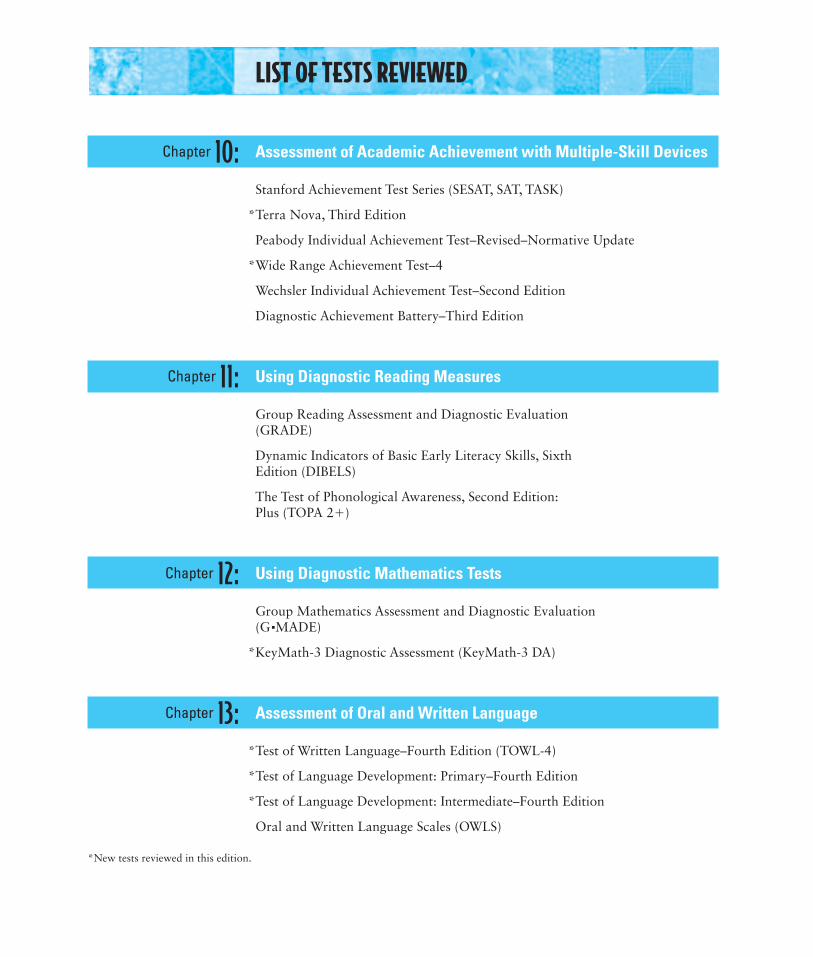
LIST OF TESTS REVIEWED
Chapter 10: Assessment of Academic Achievement with Multiple-Skill Devices
Stanford Achievement Test Series (SESAT, SAT, TASK)
*Terra Nova, Third Edition
Peabody Individual Achievement Test–Revised–Normative Update
*Wide Range Achievement Test–4
Wechsler Individual Achievement Test–Second Edition
Diagnostic Achievement Battery–Third Edition
Chapter 11: Using Diagnostic Reading Measures
Group Reading Assessment and Diagnostic Evaluation (GRADE)
Dynamic Indicators of Basic Early Literacy Skills, Sixth Edition (DIBELS)
The Test of Phonological Awareness, Second Edition: Plus (TOPA 2+)
Chapter 12: Using Diagnostic Mathematics Tests
Group Mathematics Assessment and Diagnostic Evaluation (G ■ MADE)
*KeyMath-3 Diagnostic Assessment (KeyMath-3 DA)
Chapter 13: Assessment of Oral and Written Language
*Test of Written Language–Fourth Edition (TOWL-4)
*Test of Language Development: Primary–Fourth Edition
*Test of Language Development: Intermediate–Fourth Edition
Oral and Written Language Scales (OWLS)
*New tests reviewed in this edition.
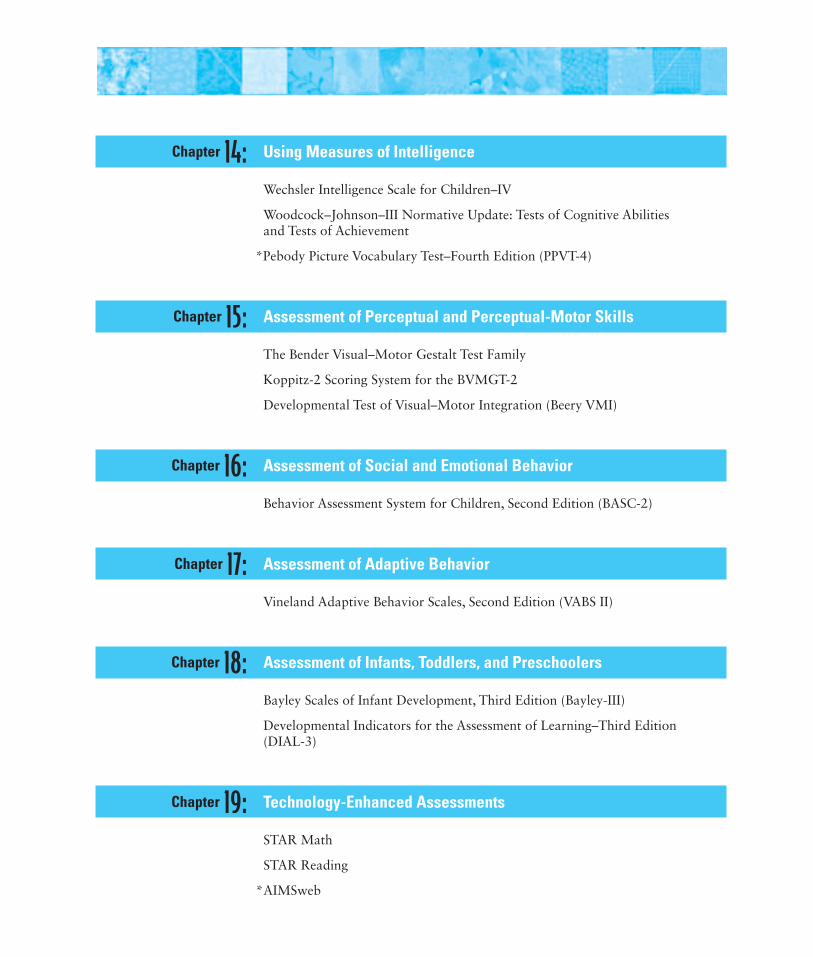
Chapter 14: Using Measures of Intelligence
Wechsler Intelligence Scale for Children–IV
Woodcock–Johnson–III Normative Update: Tests of Cognitive Abilities and Tests of Achievement
*Pebody Picture Vocabulary Test–Fourth Edition (PPVT-4)
Chapter 15: Assessment of Perceptual and Perceptual-Motor Skills
The Bender Visual–Motor Gestalt Test Family
Koppitz-2 Scoring System for the BVMGT-2
Developmental Test of Visual–Motor Integration (Beery VMI)
Chapter 16: Assessment of Social and Emotional Behavior
Behavior Assessment System for Children, Second Edition (BASC-2)
Chapter 17: Assessment of Adaptive Behavior
Vineland Adaptive Behavior Scales, Second Edition (VABS II)
Chapter 18: Assessment of Infants, Toddlers, and Preschoolers
Bayley Scales of Infant Development, Third Edition (Bayley-III)
Developmental Indicators for the Assessment of Learning–Third Edition (DIAL-3)
Chapter 19: Technology-Enhanced Assessments
STAR Math
STAR Reading
*AIMSweb
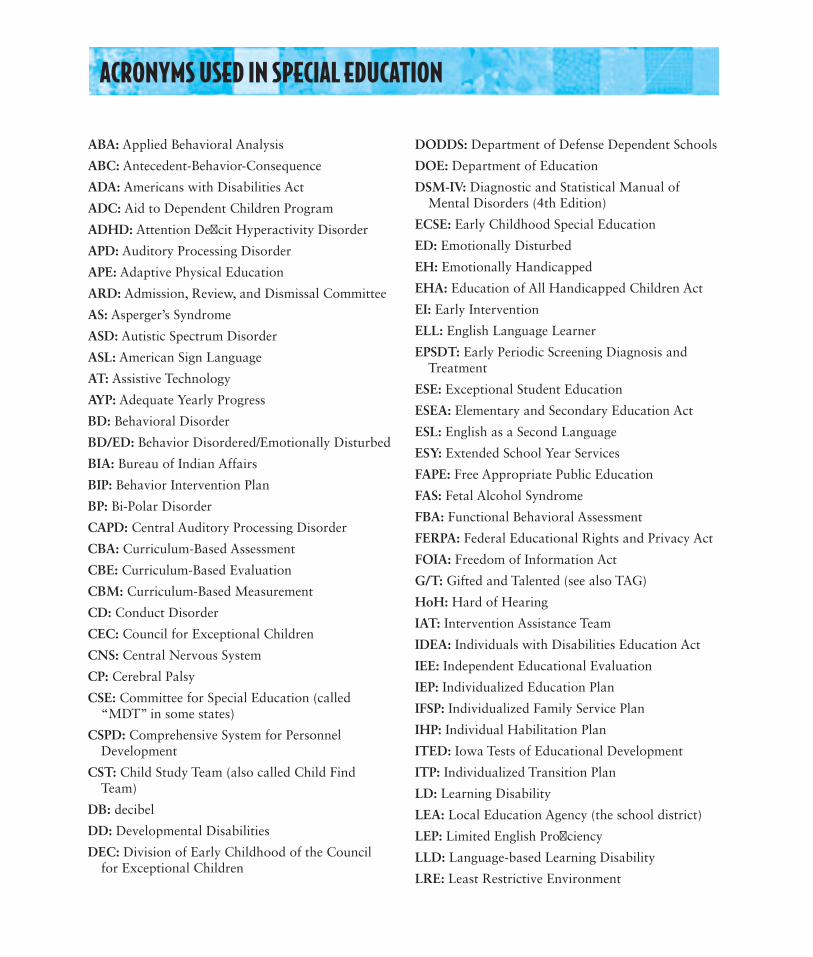
ACRONYMS USED IN SPECIAL EDUCATION
ABA: Applied Behavioral Analysis
ABC: Antecedent-Behavior-Consequence
ADA: Americans with Disabilities Act
ADC: Aid to Dependent Children Program
ADHD: Attention Defi cit Hyperactivity Disorder
APD: Auditory Processing Disorder
APE: Adaptive Physical Education
ARD: Admission, Review, and Dismissal Committee
AS: Asperger’s Syndrome
ASD: Autistic Spectrum Disorder
ASL: American Sign Language
AT: Assistive Technology
AYP: Adequate Yearly Progress
BD: Behavioral Disorder
BD/ED: Behavior Disordered/Emotionally Disturbed
BIA: Bureau of Indian Affairs
BIP: Behavior Intervention Plan
BP: Bi-Polar Disorder
CAPD: Central Auditory Processing Disorder
CBA: Curriculum-Based Assessment
CBE: Curriculum-Based Evaluation
CBM: Curriculum-Based Measurement
CD: Conduct Disorder
CEC: Council for Exceptional Children
CNS: Central Nervous System
CP: Cerebral Palsy
CSE: Committee for Special Education (called “MDT” in some states)
CSPD: Comprehensive System for Personnel Development
CST: Child Study Team (also called Child Find Team)
DB: decibel
DD: Developmental Disabilities
DEC: Division of Early Childhood of the Council for Exceptional Children
DODDS: Department of Defense Dependent Schools
DOE: Department of Education
DSM-IV: Diagnostic and Statistical Manual of Mental Disorders (4th Edition)
ECSE: Early Childhood Special Education
ED: Emotionally Disturbed
EH: Emotionally Handicapped
EHA: Education of All Handicapped Children Act
EI: Early Intervention
ELL: English Language Learner
EPSDT: Early Periodic Screening Diagnosis and Treatment
ESE: Exceptional Student Education
ESEA: Elementary and Secondary Education Act
ESL: English as a Second Language
ESY: Extended School Year Services
FAPE: Free Appropriate Public Education
FAS: Fetal Alcohol Syndrome
FBA: Functional Behavioral Assessment
FERPA: Federal Educational Rights and Privacy Act
FOIA: Freedom of Information Act
G/T: Gifted and Talented (see also TAG)
HoH: Hard of Hearing
IAT: Intervention Assistance Team
IDEA: Individuals with Disabilities Education Act
IEE: Independent Educational Evaluation
IEP: Individualized Education Plan
IFSP: Individualized Family Service Plan
IHP: Individual Habilitation Plan
ITED: Iowa Tests of Educational Development
ITP: Individualized Transition Plan
LD: Learning Disability
LEA: Local Education Agency (the school district)
LEP: Limited English Profi ciency
LLD: Language-based Learning Disability
LRE: Least Restrictive Environment
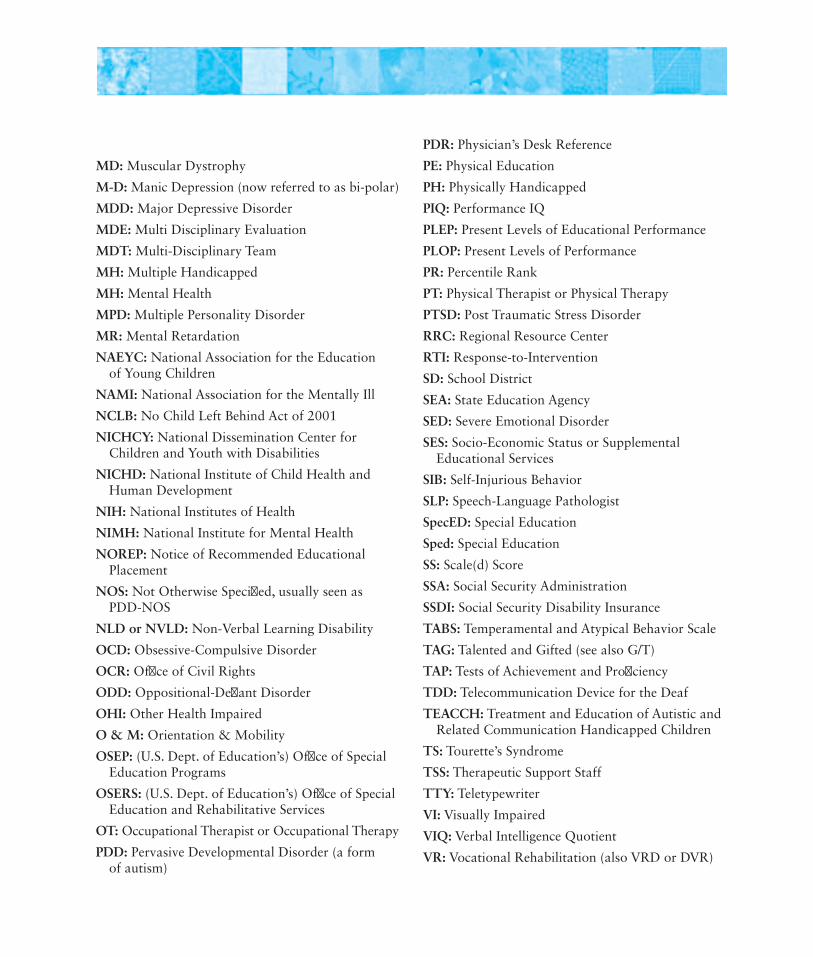
MD: Muscular Dystrophy
M-D: Manic Depression (now referred to as bi-polar)
MDD: Major Depressive Disorder
MDE: Multi Disciplinary Evaluation
MDT: Multi-Disciplinary Team
MH: Multiple Handicapped
MH: Mental Health
MPD: Multiple Personality Disorder
MR: Mental Retardation
NAEYC: National Association for the Education of Young Children
NAMI: National Association for the Mentally Ill
NCLB: No Child Left Behind Act of 2001
NICHCY: National Dissemination Center for Children and Youth with Disabilities
NICHD: National Institute of Child Health and Human Development
NIH: National Institutes of Health
NIMH: National Institute for Mental Health
NOREP: Notice of Recommended Educational Placement
NOS: Not Otherwise Specifi ed, usually seen as PDD-NOS
NLD or NVLD: Non-Verbal Learning Disability
OCD: Obsessive-Compulsive Disorder
OCR: Offi ce of Civil Rights
ODD: Oppositional-Defi ant Disorder
OHI: Other Health Impaired
O & M: Orientation & Mobility
OSEP: (U.S. Dept. of Education’s) Offi ce of Special Education Programs
OSERS: (U.S. Dept. of Education’s) Offi ce of Special Education and Rehabilitative Services
OT: Occupational Therapist or Occupational Therapy
PDD: Pervasive Developmental Disorder (a form of autism)
PDR: Physician’s Desk Reference
PE: Physical Education
PH: Physically Handicapped
PIQ: Performance IQ
PLEP: Present Levels of Educational Performance
PLOP: Present Levels of Performance
PR: Percentile Rank
PT: Physical Therapist or Physical Therapy
PTSD: Post Traumatic Stress Disorder
RRC: Regional Resource Center
RTI: Response-to-Intervention
SD: School District
SEA: State Education Agency
SED: Severe Emotional Disorder
SES: Socio-Economic Status or Supplemental Educational Services
SIB: Self-Injurious Behavior
SLP: Speech-Language Pathologist
SpecED: Special Education
Sped: Special Education
SS: Scale(d) Score
SSA: Social Security Administration
SSDI: Social Security Disability Insurance
TABS: Temperamental and Atypical Behavior Scale
TAG: Talented and Gifted (see also G/T)
TAP: Tests of Achievement and Profi ciency
TDD: Telecommunication Device for the Deaf
TEACCH: Treatment and Education of Autistic and Related Communication Handicapped Children
TS: Tourette’s Syndrome
TSS: Therapeutic Support Staff
TTY: Teletypewriter
VI: Visually Impaired
VIQ: Verbal Intelligence Quotient
VR: Vocational Rehabilitation (also VRD or DVR)


