Embed Size (px)
Citation preview
Health & Place 18 (2012) 991–999
Contents lists available at SciVerse ScienceDirect
Health & Place
1353-82
http://d
n Corr
E-m
journal homepage: www.elsevier.com/locate/healthplace
Assessing urban walking trail use and changes in the trail environment usingsystematic observational protocols
Duncan C. Meyers a,n, Dawn K. Wilson a, Kassandra A. Kugler a, Natalie Colabianchi a,Thomas L. McKenzie b, Barbara E. Ainsworth c, Julian Reed d, Sara C. Schmidt a
a University of South Carolina, 1512 Pendleton St., Columbia, SC 29208, USAb San Diego State University, USAc Arizona State University, USAd Furman University, USA
a r t i c l e i n f o
Article history:
Received 15 December 2011
Received in revised form
6 April 2012
Accepted 15 June 2012Available online 28 June 2012
Keywords:
Physical activity
Observational methods
Low income
African Americans
Walking trails
92/$ - see front matter & 2012 Elsevier Ltd. A
x.doi.org/10.1016/j.healthplace.2012.06.008
esponding author. Tel.: þ1 803 414 1090; fax
ail address: [email protected] (D.C. M
a b s t r a c t
This study evaluated the extent to which two systematic observation protocols which were modified for
underserved communities (low income, minorities) could be utilized to reliably assess (a) use of walking
trails and (b) physical environmental features of these trails. This study was a supplement to the Positive
Action for Today’s Health (PATH) walking trial. The modified tools were shown to be reliable methods for
(a) measuring trail use and (b) assessing physical features of the trail in underserved environments.
Reliability data for measuring trail use were found to be high (ICC¼ .98, po .01). Reliabilities for measuring
features of the trail ranged from fair to highly reliable (k¼ .77�1.00; ICC¼ .34–1.00). The observation tools
that were customized for this study were shown to be reliable instruments for measuring trail use and
assessing physical features of walking trails in underserved communities.
& 2012 Elsevier Ltd. All rights reserved.
1. Introduction
Systematic observation procedures are particularly importantfor assessing physical activity (PA) (McKenzie, 2010) because theycan be designed for a particular purpose (e.g., observing walkingbehavior) and include protocols for quantifying specific behaviorsor other categories of interest. Such protocols can be used toassess the extent to which community members engage in PA andthe adequacy of physical supports for PA in communities (e.g.,walking trails). Assessing such behaviors and supports is animportant step in understanding how community-based inter-ventions impact walking and other PA.
Relative to assessing walking and other PA, self-report meth-odology has substantial limitations related to estimating time andrecall bias, and accelerometer data do not provide information onactivity contexts (McKenzie, 2010; Sallis and Owen, 1999). Giventhese limitations, systematic observation is important because itallows for the measurement of activity levels as well as when,where, and with whom it occurs. Measurement tools have beendeveloped to count people in specific settings, including thoseusing walking tracks (e.g., McKenzie and Cohen, 2007).
ll rights reserved.
: þ1 803 777 9558.
eyers).
Audit tools are often used to identify physical environmentalqualities (e.g., quality of sidewalks) that are related to PA(Brownson et al., 2009). While there is no widely acceptedstandard protocol for measuring parks and recreation environ-ments, the high-quality tools that are currently available enableresearchers to expand the base of evidence on how parks andrecreation areas contribute to PA (Floyd et al., 2009). A remainingchallenge, however, is to continually improve these measures toensure their relevance for diverse populations and contexts(Brownson et al., 2009). While much progress has been maderegarding measures that help researchers and practitioners assessthe built environment, these can be considered ‘‘first-generation’’measures that need further development (Brownson et al., 2009).
Measures for assessing trail use and physical trail qualitieshave yet to be refined and modified for use in underservedcommunities. Two systematic observational protocols weredeveloped and utilized as part of the present study as a supple-ment to the Positive Action for Today’s Health (PATH) walkingtrial. PATH employed a police-patrolled walking intervention toincrease safety (training community leaders as walking captains,hiring off-duty police officers to patrol the walking trail, andcontaining stray dogs) and access for PA (marking a walkingroute) in communities with a history of high crime rates and lowmedian household income (Wilson et al., 2010). The purposeof the current study was to describe the protocols used in the
D.C. Meyers et al. / Health & Place 18 (2012) 991–999992
PATH project and present the reliability data collected in twocommunities.
First, information is presented regarding a modified observa-tional protocol to assess the use of an urban walking trail. Weconceptualize a walking trail as a marked or established routewith a starting and end point that can be used for exercise,recreation, and/or commuting. These walking trails could belocated in a variety of settings (e.g., parks, neighborhoods, indoorfacilities like gymnasiums) in any type of community (e.g., ruralor urban). The walking trails investigated in this study wereidentified on existing sidewalks in underserved communities.Features of this protocol were designed to capture (1) participa-tion in organized walking groups – a component of the PATHintervention – as well as (2) trail use at the community level.Next, a separate systematic observational protocol is discussedthat assesses physical features of the trail in relation to design andfunctionality, safety, and trail maintenance. For both protocols,existing systematic observation procedures were modified for usein underserved neighborhoods (high crime, low income). Finally,reliability data (inter-observer agreement reliability) from base-line data are presented to document the reliability of using thesemodified protocols.
2. Methods
2.1. Study design
The PATH project is a randomized trial designed to examine a24-month environmental intervention designed to improve safetyand access for PA and trail use in three underserved communitiesthat has been previously described (Wilson et al., 2010). Threecommunities were matched based on census tract level informa-tion (e.g., race, median income, poverty status, crime index, healthindex score, physical inactivity), with two communities receivingan intervention and the third serving as a comparison. The twocommunities that received the walking trail intervention (i.e., thePATH intervention communities) were the settings in which datafor this study were collected.
In 2009 the populations of the PATH intervention communitieswere 38,412 and 32,180 (United States Census Bureau, 2012).Census data from 2009 indicate that 99% of persons in the censustracts that were selected for this study were African American(Wilson et al., 2010). The percent of foreign born persons in thesecommunities for 2006–2010 was 2.6% and 4.1% (United StatesCensus Bureau, 2012). These communities experienced high levelsof chronic disease, poverty, and crime relative to state and nationalaverages and were therefore considered underserved. For example,in 2009, 38–32% of households in the two PATH interventioncommunities (defined by the US census tracts they fall within)experienced poverty compared to national rates of 14.3% (DeNavas-Walt et al., 2010). Census data from 2009 also indicate that medianhousehold in the communities participating in this study rangedfrom $16,804 to $22,088 compared to a median income for all UShouseholds of $49,777 (DeNavas-Walt et al., 2010). For the countiesthat PATH intervention communities are located in, county-levelcrime rates (index total per capita crime) in 2006 were 666.9 and570.2 compared to the state county-level average of 500.5 (Office ofResearch and Statistics, 2006).
Local community centers in these PATH intervention commu-nities serve as the facilities for all project-related activities. Thewalking trails were identified by community stakeholders (e.g.,community center staff, community residents) who were knowl-edgeable of the neighborhood climate, residents, and street system.The trails were on pre-existing sidewalks throughout each neigh-borhood, and these trails made a circular loop which allowed for
walks to start and end at the same location (i.e., the communitycenter).
Each walking trail was divided into segments to break the trailup into smaller – observable – units. In one of the two commu-nities, there were 17 total segments equaling 1.33 total miles. Inthe other, there were 24 segments, totaling 2.35 miles. Themajority of the segments were identified based on intersections(e.g., segments started whenever there was a road which inter-sected the trail). Although intersecting roads served as the mostcommon means to divide the trail into segments, in someinstances landmarks (e.g., municipal signs, fence posts) were usedto disaggregate long segments which lacked intersecting roads.Some segments of the trail were adjacent to major roads, whileothers were adjacent to residential side streets. These identifiedtrails were typified by mixed land-use and had segments thatwere adjacent to green space (e.g., fields and parks), commercialand civic properties (e.g., convenience stores, churches, restau-rants, schools, strip malls), residential properties (e.g., apartmentcomplexes, houses), and industrial facilities. Maps were devel-oped for data collection which marked the trail segments.
Two coders completed the data collection protocols simulta-neously, thereby providing a measure of inter-observer reliability.Having two coders also enhanced the safety of the data collectionprocess. This study was deemed exempt by the UniversityInstitutional Review Board since de-identified data were used.
2.2. PATH systematic observation protocols
Instruments were used to assess (a) trail use and (b) featuresof the trail environment. The System for Observing Play andRecreation in Communities (SOPARC; McKenzie and Cohen, 2007)was modified to assess trail use. For assessing features of the trailenvironment, a modified version of the Path Environmental AuditTool (PEAT; Troped et al., 2006) was used. The data collection forthese instruments took place on the walking trails in the PATHintervention communities.
2.3. SOPARC modified observational tool of community walking
(SOPARC PATH)
The modified version of the SOPARC (McKenzie and Cohen,2007) was used to assess the number and characteristics ofwalking trail users and their PA levels. The original SOPARCprotocol has been used to assess use of a bicycle path (Cohenet al., 2008), PA in parks located in underserved communities(McKenzie et al., 2006), and has been modified to enhance itsrelevance for assessing use of walking trails with multiple accesspoints (Reed et al., 2011). This is the first study to modify theSOPARC tool to enhance its relevance for assessing use of awalking trail in underserved communities.
Through the use of momentary time sampling techniques, theSOPARC tool allows for systematic scans of each trail user withintrail segments. During these systematic scans, the activity level ofeach trail user was coded as sedentary (e.g., lying down, sitting,standing, or being pushed in a stroller, wagon, wheelchair, etc.),walking (e.g., shifting weight back and forth, walking at a steadypace), or vigorous (e.g., any activity considered to have a greaterenergy expenditure than walking, such as running, in-line skating,biking, etc.). Since this tool uses momentary time sampling, theactivity level that was first observed was recorded, even if the trailuser changed activity levels on a given segment. Other usercharacteristics assessed in this study included age category(child—0–12 years of age, teen—13–20 years of age, adult—21–59years of age, and senior—60 years of age and older), gender (male,female), and ethnicity (black, other ethnicity). In this way, theSOPARC tool allows for an estimate of the number of individuals
D.C. Meyers et al. / Health & Place 18 (2012) 991–999 993
engaged in PA, intensity with which they engaged in this activitythroughout the day, plus demographic variables.
SOPARC observations were made during specified times in themorning, noon, afternoon, and evening. Having specified observa-tion times permitted comparisons to be made between all PATHintervention communities in this study since all observationswere made at the same time in both communities and on thesame day. Data were collected during seven random non-contig-uous days of clement weather for each day of the week (e.g.,Sunday through Saturday; observation days did not directlyfollow one another) in a given month.
Reliability for SOPARC has been previously reported elsewhere(McKenzie et al., 2006; Tester and Baker, 2009). Specifically, bothhigh percent agreements (McKenzie et al., 2006) and intra-classcorrelations (Tester and Baker, 2009) have been demonstrated.The tool’s activity codes have been used and validated throughsimilar observation systems used with youth in various PAsettings, such as community parks (McKenzie et al., 2000; vander Mars et al., 2004). Furthermore, there is an abundance ofevidence available indicating that momentary time samplingtechniques yield valid behavioral samples (McKenzie, 2010).Support for the tool’s validity and reliability has been demon-strated during its use in underserved urban community parks(e.g., McKenzie et al., 2006); however, whether this tool can bemodified for use on urban walking trails and still be used reliablyhas yet to be established.
The modified SOPARC protocol – which is referred to asSOPARC PATH – utilizes both stationary observations (whichwere intended to capture participation in the organized walkinggroups that were a PATH intervention component in both com-munities) and mobile observations along the walking trail (whichwere intended to capture community level trail use).
2.3.1. Stationary observations
The original SOPARC tool specifies procedures for codingtrail use on a walking/jogging track (McKenzie and Cohen,2007). These observations are to be made from a standardpre-determined location (i.e., the coding station) from which allobservational scans are conducted. For this study, the purpose ofthe stationary observations was to capture participation inorganized walking groups (a PATH intervention component inboth communities). To accomplish this, the coding station waslocated on the PATH walking trails at a location within closeproximity to the community center to ensure that participants inscheduled PATH walks would pass the coding station. Stationaryobservations took place in the early morning and evening tocoincide with the times during which the organized PATH walksoccurred (6:00 am–8:30 am; 6:00 pm–7:30 pm).
During stationary observations, all trail users on the walkingtrail who passed by the coding station were coded for activitylevel and characteristics. Similar to the original SOPARC tool,individuals were coded each time they passed the coding station.When trail users were observed twice during a stationary obser-vation (e.g., if they made multiple laps around the trail and passedthe coding station more than once) they were only counted as oneobservation. Coders indicated individuals who were observedtwice during a given stationary observation on the data collectionform to aid in data analyses.
2.3.2. Mobile observations
Trail use was also assessed for each segment of the trails viamobile observations (e.g., Reed et al., 2011). These observationswere added given that stationary observations were unable tocapture use of the trail as a whole since community memberscould have accessed the trail at multiple points (e.g., intersections
and sidewalks), and not just the specified starting points at thecommunity centers. These mobile observations allowed trail useto be assessed at many points at which community memberscould access the trail since they required coders to walk the trailand code community-level trail use for each and every trailsegment.
For SOPARC PATH mobile observations, coders started at thecommunity center (i.e., the starting point of the trail) andremained there for 1.5 min. During this time, coders recordedany person they observed who set foot on the trail or who wereobserved to be sedentary on the trail (e.g., being pushed in astroller, sitting on a bench with their feet touching the trail). Afterthe 1.5 min at the community center had elapsed, the codersbegan walking to the next segment (all coders walked in the samedirection along the trail as did the organized PATH walkinggroups). While walking to the next segment the coders continuedto code any persons in front of them observed setting foot on thetrail or observed to be sedentary on the trail. When coders arrivedat the next trail segment they again remained at the beginning ofthat segment for 1.5 min coding trail use, after which they walkedthe segment coding trail use until they reached that segment’send. When trail users were observed on multiple segments (e.g., ifa given trail user was seen on more than one segment), codersindicated so on the data collection form. These trail users wereonly counted once in the data analyses even though they wereobserved on multiple segments of the trail. This systematicprocess continued until the coders had walked the entire trailwhich ended at the community center.
Mobile observations took place at four specified observationintervals: (1) 7:30 am, (2) 11:30 am, (3) 2:00 pm, and (4) 4:30 pm.These times were selected as they are the same intervals utilized inthe original SOPARC protocol. These predetermined intervals arebased in momentary time sampling techniques and allow forperiodic snapshots of community-level walking trail usage overdifferent time periods throughout the day.
2.3.3. SOPARC PATH coding conventions
Coding conventions are a prominent feature of systematicobservation and should be based on a particular setting andcontext (McKenzie, 2002). Such conventions were especiallyimportant since the SOPARC tool requires coders to code eachvariable for each observed person even if the coder was not surewhat to record. For example, activity level represents the inten-sity of PA, and codes for this variable were based on energyexpenditure. More specifically, trail users were coded as walkingif their energy expenditure appeared to be within the range ofshifting weight from one foot to another up to walking at anormal pace. Any activity that appeared to expend more energythan walking at a normal pace (e.g., power walking, walking usingweights, riding a bike or skateboarding) was coded as vigorous.Another convention was implemented for ethnicity. Because bothcommunities were comprised of a predominately African Amer-ican population, the default code for ethnicity was African Amer-ican. For example, if a coder observed a trail user who appeared tobe biracial, the coder would have coded ‘‘African American’’ sincethey cannot be sure of the individual’s race unless they asked thatperson.
2.3.4. SOPARC PATH logistical considerations
Data collected via the SOPARC PATH protocol was recordedwith pencil-and-paper versions of the SOPARC coding form(McKenzie and Cohen, 2007). One SOPARC coding form wascompleted for each trail segment, and these forms were custo-mized from the forms that were published with the original tool.The form is a series of rows and columns, with a row for each

Table 1Coding conventions for the PATH PEAT.
Item Coding convention
Access points Only include the community center as an official access
point related to the organized walking program
(component of the PATH intervention)
Animal droppings Bird droppings included
Buffer along
adjacent road
Buffer is defined as ‘‘something used to protect a trail
user from an adjacent road’’. This could be a strip of grass
or other expanse – or a physical barrier like a concrete
wall – that separates the trail from a road. The
identifying feature for a buffer is that it serves to protect
trail users whether or not it was designed for safety
purposes. ‘‘Buffers’’ enhance safety while ‘‘shoulders’’
(described below) provide a means to pass others (which
enhances trail functionality)
Commercial
destinations
Only code if on the segment of interest; only code once
(do not code if located on an adjacent segment); if the
destination is on the segment of interest but is directly
across the street only code if pedestrians could easily
access the destination (e.g., they did not have to cross
multiple lanes of busy traffic) and it is reasonable that
pedestrians would utilize the trail to access such a site
(e.g., retail stores, restaurants)
Condition of path
surface
Overgrowth from vegetation is not considered part of
path surface (there is a separate item on the PATH PEAT
for overgrowth)
Cultural or civic
institutions
Only code if on the segment of interest; only code once
(do not code if located on an adjacent segment); if the
institution is on the segment of interest but is directly
across the street only code if pedestrians could easily
access the institution (e.g., they did not have to cross
multiple lanes of busy traffic) and it is reasonable that a
pedestrians would utilize the trail to access such a site
(e.g., churches, schools)
Exercise or play
equipment
Only code if on the segment of interest; only code once
(do not code if located on an adjacent segment); if the
equipment is on the segment of interest but is directly
across the street only code if pedestrians could easily
access the equipment (e.g., they did not have to cross
multiple lanes of busy traffic) and it is reasonable that
pedestrians would utilize the trail to access the
equipment (e.g., parks that are accessible to the public
and not behind locked fences)
Lighting Only consider lighting on the segment of interest (do not
include lighting across the street). Coder does not need
to determine if light actually functions properly as this is
assessed via a separate lighting assessment conducted in
the evening
Presence of
shoulder
A shoulder is defined as ‘‘an intentionally cleared area
used to pass others’’. Shoulders could be a strip of grass,
gravel, or other expanse that allows trail users to safely
pass others on the trail
Temporary barrier Can include cars and garbage cans that impede travel on
path
D.C. Meyers et al. / Health & Place 18 (2012) 991–999994
person observed using the trail and a column for each of thevariables of interest (e.g., gender, age category, ethnicity, activitylevel). Once data were recorded on these pencil-and-paper forms,they were then transferred onto PDAs during down time inbetween observations.
For each interval – both stationary and mobile – coders filledout a separate cover sheet. This cover sheet indicated the date ofobservation, name of the observer, which community they wereobserving, the weather and temperature, whether the trail waswell lit, whether the coder felt uncomfortable at any point duringthe observation, whether an organized walking group wasobserved, whether police support was seen accompanying theorganized walking group, and the number of stray dogs observed.More pertinent to the stationary observations were the itemsconcerning whether an organized walking group was observed,and whether there appeared to be a walking leader accompanyingthe organized walking group (often identified by the presence of arequired red first aid kit and walkie-talkie, both for safetypurposes). Trail team members used stopwatches to accuratelytime observations. Another logistical consideration was that datawere collected in two shifts in order to minimize coder fatigue.
2.4. Assessment of environmental features with modified PEAT tool
The PEAT tool was used to measure factors of the physicalenvironment thought to influence trail use. It was used at multi-ple time points in the study to conduct environmental trail auditsto assess changes in features of the trail environment over time.The items on the PEAT tool relate to design features andfunctionality (e.g., whether the path is adjacent to a road,condition of the path surface, slope of the path), amenities (e.g.,presence of lighting, garbage cans, commercial or cultural institu-tions), trail maintenance (e.g., presence of litter and graffiti), andcharacteristics of any intersections (e.g., safety features likepedestrian crossing signals and curb cuts). The details of thedevelopment and of the PEAT have been previously published,and the tool has been found to have acceptable levels of reliabilityfor most of its primary items (Troped et al., 2006). A subset of itsitems demonstrated adequate validity via global positioningsystem (GPS)-derived measures (Troped et al., 2006).
PEAT items are scaled either as dichotomous (yes/no) or on anordinal scale (e.g., 1¼very poor condition, 2¼poor condition,3¼moderate condition, 4¼good condition, 5¼ excellent condition).Data were collected over four days, with two days spent in each ofthe two PATH intervention communities. On a given data collectionday, four trail team members audited the trail in pairs. Each pairaudited half of the trail. Approaching data collection in this wayproved to be an efficient method for collecting data for every trailsegment in only one day. Trail auditing pairs audited the trail byentering their codes directly into an electronic data collection formvia a PDA. The PEAT protocol encourages coders to re-walk the trailsegments as needed to ensure accuracy. A separate electronic datacollection form was completed for each trail segment.
2.4.1. Modifications to the PEAT protocol (PATH PEAT)
All items contained in the PEAT manual were retained for thePATH PEAT; however, three dichotomous items (i.e., yes/no) wereadded to the PATH PEAT based on guidance provided by one ofthe consultants on the project and feedback from communitymembers at baseline. The additional sub-items assess specificattributes of the surface of the path which may impede or limittravel, including (1) presence of overgrowth from vegetation (e.g.,shrubs or bushes), (2) presence of a man-made structure (e.g., firehydrants, power transformers), or (3) presence of debris (e.g.,pinecones).
Additionally, coding conventions were developed for several of thePEAT items (see Table 1). The purpose of the coding conventions wasto adapt the instrument for use on urban walking trails in under-served communities. The coding conventions helped to increaseconsistency of the ratings by providing guidelines for the specifieditems. Coding conventions were implemented for items that wereless straightforward, such as the distinction between ‘‘shoulders’’ and‘‘buffers’’. In other instances, coding conventions helped to make theprotocol better suited for urban trail use, such as adding in additionaltypes of temporary barriers that could be encountered.
2.5. Recruitment and interview process
A variety of methods were employed to recruit trail teammembers for both SOPARC and PEAT data collection. Specificuniversity departments (psychology, exercise science, sociology,social work, public health, and geography) were contacted via
D.C. Meyers et al. / Health & Place 18 (2012) 991–999 995
respective administrative assistants to request that they forwarda recruitment email and flyer to students and faculty.
2.6. SOPARC and PEAT training
For each time point (baseline, 12-month follow up, 18-monthfollow up), SOPARC training was conducted before PEAT training.This was decided because it was desired that trail team candi-dates practice the SOPARC protocol in intervention communitieswithout first being exposed to the PEAT tool. It was important topractice the SOPARC in the participating communities so the trailteam candidates would be acquainted with the context of thesecommunities and the different visual cues on the trail that canhelp ensure accurate coding of trail use (e.g., cues which helpidentify the end-point of particularly long trail segments).
Training for SOPARC consisted of two phases: didactic trainingand hands-on practice. The first day of SOPARC training involvedan overview of the project, the certification process, the datacollection calendar, the SOPARC PATH protocol, and other studymeasures. Applicants viewed slides which showed individualsand groups engaging in various levels of PA or sedentary beha-viors to facilitate a discussion around strategies for accuratelyrating age category, ethnicity, and gender with the SOPARC PATHtool. Hands-on practice at a pre-determined location was alsopart of this training so candidates could practice their datacollection skills and receive corrective feedback.
The second day of SOPARC training included a brief review ofthe previous day’s training, as well as practice using the SOPARCtool in both PATH intervention communities. Candidates first metcommunity center staff and police officers. Then, they becameacquainted with the trail and the neighborhood context throughwalking the entire trail with a training facilitator and practicingcoding trail use with the SOPARC PATH tool as a group. Oneadditional day of practice in each intervention community wasconducted. Such an approach is in line with recent recommenda-tions for a combination of classroom training and trainingsessions in the field where teams can practice the protocol anddiscuss results with a training facilitator (Brownson et al., 2009).Applicants practiced both stationary and mobile observations andreceived corrective feedback from the training facilitator.
Training for the PATH PEAT consisted of both didactic andbehaviorally based activities. The first day of training includeddidactic presentations focusing on the purpose of the tool, basicsabout its use, and an item-by-item discussion during which thecoding conventions were discussed. At the end of the first day thecandidates and training facilitators travelled to a local recreationalwalking trail to practice auditing the trail using the PATH PEAT.Segments used for training were pre-selected as they containedvarious trail conditions, amenities, signage, and other aspects of theprotocol.
During the second day of PEAT training the candidates andtraining facilitators travelled to a neighborhood similar to PATHintervention communities. The neighborhood was specificallyselected as a preferred training site since it had a similar mix oftrail features (e.g., slope), amenities (e.g., public transit stops), anddestinations (e.g., churches and schools). In addition, this neighbor-hood had various trail conditions that were to be coded on the PATHPEAT tool and therefore exposed the candidates to a wide variety ofitems. Training on this day consisted of auditing the trail with thePATH PEAT, and after each trail segment the group discussed theircodes and was provided feedback by the facilitator.
2.7. Trail team certification
All applicants completed two certification tasks for theSOPARC PATH: the coding of PowerPoint slides and the coding
of DVD segments. Slides contained static pictures of individualsengaging in PA. Candidates coded the following: gender, age, andethnicity categories. Candidates’ scores were compared to acriterion measure which was established by consultants on theproject. Candidates needed to earn scores that were within atleast 80% agreement or higher with the criterion. An ‘‘agreement’’was defined as a match between the candidate’s codes and thecriterion codes for age category, ethnicity, and gender.
For the DVD component, candidates rated clips presentingindividuals engaging in PA from ‘‘Systematic Observation:SOPLAY/SOPARC’’ (McKenzie, 2005). They were asked only tocode the activity level (sedentary, walking, or vigorous) of theindividuals in the clips. The activity level codes provided by thecandidates were compared to a criterion measure which was asestablished by project consultants. Since the activity level dataare at the ordinal level of measurement, Spearman’s Rho was usedas a reliability statistic (Cohen et al., 2003); candidates needed toreach r4 .80 to meet the reliability standard.
Certification for the PEAT required the candidates to audit foursegments in a community near the university campus. While thesegments selected for certification were not in the PATH inter-vention communities, the segments had features that weresimilar to what would be encountered in the intervention com-munities. Applicants met reliability standards if their codes werein an acceptable range of agreement with a criterion measureestablished by project consultants (i.e., Kappa and intraclasscorrelation values above . 80).
After candidates demonstrated adequate reliability for eitherthe SOPARC, PEAT, or both of these measures, they were invited toparticipate in Phase II of certification. During this second phase,applicants met with the study coordinator for one hour to reviewthe following: issues related to safety, what to do in the case ofinclement weather, and other problem solving vignettes thatfacilitated discussion and learning around behaving respectfullyin the intervention communities and how to interact with policesupport. This meeting helped ensure that candidates understoodexpectations and recognized the importance of the establishedsafety protocols.
2.8. Data analyses
Baseline data were used for analyses, and these data werecollected during October, November, and December 2008. Inter-observer reliability was assessed at the individual item level. ForSOPARC PATH data, the total number of walkers was summed,along with the total number of walkers who were coded forgender, age category, ethnicity, and their level of activity. Thesesums were calculated for each trail segment. Having these sumsfor each segment allowed for a comparison of segment totalsbetween coding partners. For PATH PEAT data, agreementbetween coders was assessed for each item on each individualtrail segment, and each of the codes for every PATH PEAT itemwas compared between raters.
The intraclass correlation (ICC) was chosen as a metric of inter-observer reliability for ordinal (e.g., Likert-type PATH PEAT items)or continuous (e.g., frequency of SOPARC PATH variables)responses. ICCs were chosen for such items because this statisticis sensitive to both association and absolute differences betweencoders (Muller and Buttner, 1994; Shrout and Fleiss, 1979). Two-way random effects single rater ICCs were calculated for each ofthe continuous SOPARC PATH variables and ordinal PATH PEATitems given that coders were considered a random sample of allpotential and future coders (Muller and Buttner, 1994; Shrout andFleiss, 1979). The single measure ICC was selected because theunit of analysis is the individual coder who collected the data,rather than an average across coders. Inter-observer reliability for
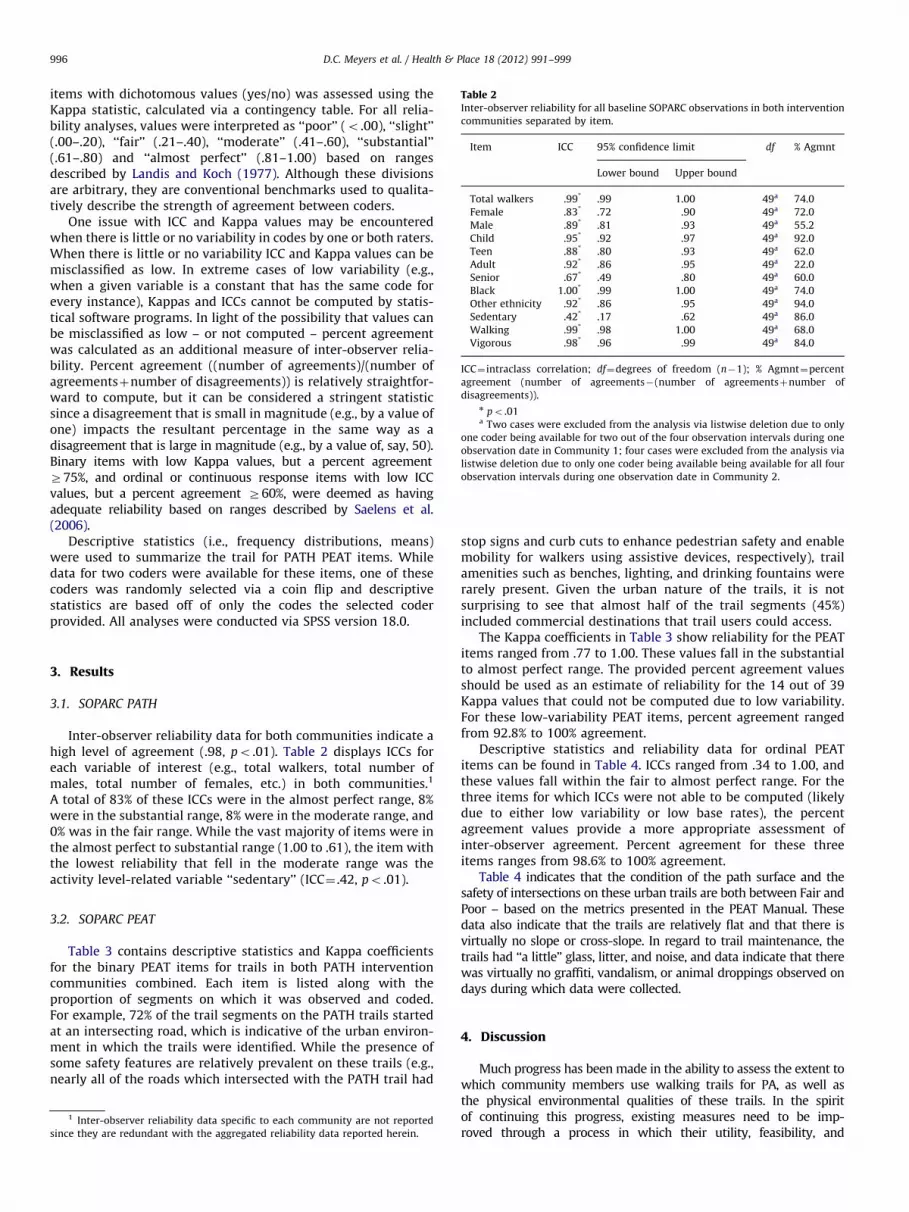
Table 2Inter-observer reliability for all baseline SOPARC observations in both intervention
communities separated by item.
Item ICC 95% confidence limit df % Agmnt
Lower bound Upper bound
Total walkers .99* .99 1.00 49a 74.0
Female .83* .72 .90 49a 72.0
Male .89* .81 .93 49a 55.2
Child .95* .92 .97 49a 92.0
Teen .88* .80 .93 49a 62.0
Adult .92* .86 .95 49a 22.0
Senior .67* .49 .80 49a 60.0
Black 1.00* .99 1.00 49a 74.0
Other ethnicity .92* .86 .95 49a 94.0
Sedentary .42* .17 .62 49a 86.0
Walking .99* .98 1.00 49a 68.0
Vigorous .98* .96 .99 49a 84.0
ICC¼ intraclass correlation; df¼degrees of freedom (n�1); % Agmnt¼percent
agreement (number of agreements�(number of agreementsþnumber of
disagreements)).n po .01a Two cases were excluded from the analysis via listwise deletion due to only
one coder being available for two out of the four observation intervals during one
observation date in Community 1; four cases were excluded from the analysis via
listwise deletion due to only one coder being available being available for all four
observation intervals during one observation date in Community 2.
D.C. Meyers et al. / Health & Place 18 (2012) 991–999996
items with dichotomous values (yes/no) was assessed using theKappa statistic, calculated via a contingency table. For all relia-bility analyses, values were interpreted as ‘‘poor’’ (o .00), ‘‘slight’’(.00–.20), ‘‘fair’’ (.21–.40), ‘‘moderate’’ (.41–.60), ‘‘substantial’’(.61–.80) and ‘‘almost perfect’’ (.81–1.00) based on rangesdescribed by Landis and Koch (1977). Although these divisionsare arbitrary, they are conventional benchmarks used to qualita-tively describe the strength of agreement between coders.
One issue with ICC and Kappa values may be encounteredwhen there is little or no variability in codes by one or both raters.When there is little or no variability ICC and Kappa values can bemisclassified as low. In extreme cases of low variability (e.g.,when a given variable is a constant that has the same code forevery instance), Kappas and ICCs cannot be computed by statis-tical software programs. In light of the possibility that values canbe misclassified as low – or not computed – percent agreementwas calculated as an additional measure of inter-observer relia-bility. Percent agreement ((number of agreements)/(number ofagreementsþnumber of disagreements)) is relatively straightfor-ward to compute, but it can be considered a stringent statisticsince a disagreement that is small in magnitude (e.g., by a value ofone) impacts the resultant percentage in the same way as adisagreement that is large in magnitude (e.g., by a value of, say, 50).Binary items with low Kappa values, but a percent agreementZ75%, and ordinal or continuous response items with low ICCvalues, but a percent agreement Z60%, were deemed as havingadequate reliability based on ranges described by Saelens et al.(2006).
Descriptive statistics (i.e., frequency distributions, means)were used to summarize the trail for PATH PEAT items. Whiledata for two coders were available for these items, one of thesecoders was randomly selected via a coin flip and descriptivestatistics are based off of only the codes the selected coderprovided. All analyses were conducted via SPSS version 18.0.
3. Results
3.1. SOPARC PATH
Inter-observer reliability data for both communities indicate ahigh level of agreement (.98, po .01). Table 2 displays ICCs foreach variable of interest (e.g., total walkers, total number ofmales, total number of females, etc.) in both communities.1
A total of 83% of these ICCs were in the almost perfect range, 8%were in the substantial range, 8% were in the moderate range, and0% was in the fair range. While the vast majority of items were inthe almost perfect to substantial range (1.00 to .61), the item withthe lowest reliability that fell in the moderate range was theactivity level-related variable ‘‘sedentary’’ (ICC¼ .42, po .01).
3.2. SOPARC PEAT
Table 3 contains descriptive statistics and Kappa coefficientsfor the binary PEAT items for trails in both PATH interventioncommunities combined. Each item is listed along with theproportion of segments on which it was observed and coded.For example, 72% of the trail segments on the PATH trails startedat an intersecting road, which is indicative of the urban environ-ment in which the trails were identified. While the presence ofsome safety features are relatively prevalent on these trails (e.g.,nearly all of the roads which intersected with the PATH trail had
1 Inter-observer reliability data specific to each community are not reported
since they are redundant with the aggregated reliability data reported herein.
stop signs and curb cuts to enhance pedestrian safety and enablemobility for walkers using assistive devices, respectively), trailamenities such as benches, lighting, and drinking fountains wererarely present. Given the urban nature of the trails, it is notsurprising to see that almost half of the trail segments (45%)included commercial destinations that trail users could access.
The Kappa coefficients in Table 3 show reliability for the PEATitems ranged from .77 to 1.00. These values fall in the substantialto almost perfect range. The provided percent agreement valuesshould be used as an estimate of reliability for the 14 out of 39Kappa values that could not be computed due to low variability.For these low-variability PEAT items, percent agreement rangedfrom 92.8% to 100% agreement.
Descriptive statistics and reliability data for ordinal PEATitems can be found in Table 4. ICCs ranged from .34 to 1.00, andthese values fall within the fair to almost perfect range. For thethree items for which ICCs were not able to be computed (likelydue to either low variability or low base rates), the percentagreement values provide a more appropriate assessment ofinter-observer agreement. Percent agreement for these threeitems ranges from 98.6% to 100% agreement.
Table 4 indicates that the condition of the path surface and thesafety of intersections on these urban trails are both between Fair andPoor – based on the metrics presented in the PEAT Manual. Thesedata also indicate that the trails are relatively flat and that there isvirtually no slope or cross-slope. In regard to trail maintenance, thetrails had ‘‘a little’’ glass, litter, and noise, and data indicate that therewas virtually no graffiti, vandalism, or animal droppings observed ondays during which data were collected.
4. Discussion
Much progress has been made in the ability to assess the extent towhich community members use walking trails for PA, as well asthe physical environmental qualities of these trails. In the spiritof continuing this progress, existing measures need to be imp-roved through a process in which their utility, feasibility, and
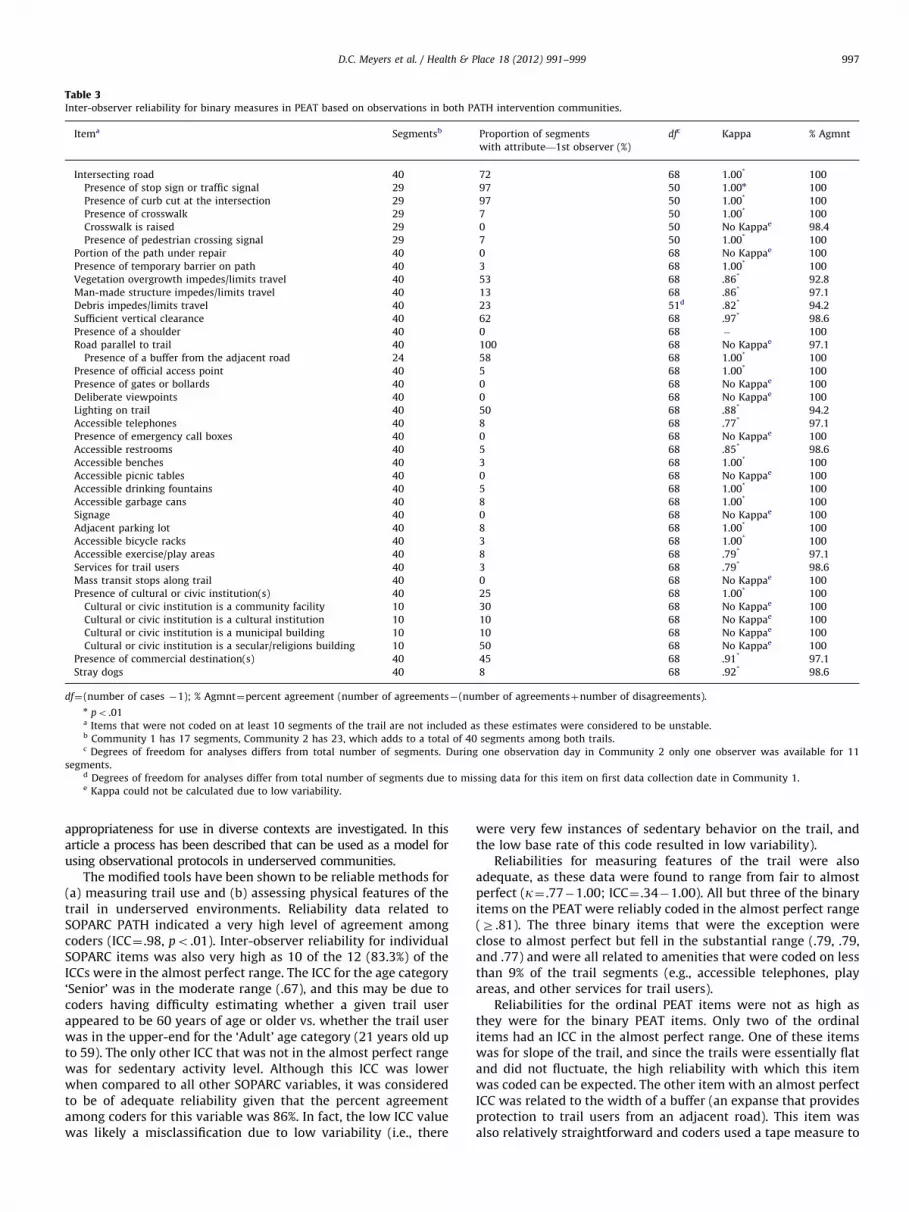
Table 3Inter-observer reliability for binary measures in PEAT based on observations in both PATH intervention communities.
Itema Segmentsb Proportion of segments
with attribute—1st observer (%)
dfc Kappa % Agmnt
Intersecting road 40 72 68 1.00* 100
Presence of stop sign or traffic signal 29 97 50 1.00n 100
Presence of curb cut at the intersection 29 97 50 1.00* 100
Presence of crosswalk 29 7 50 1.00* 100
Crosswalk is raised 29 0 50 No Kappae 98.4
Presence of pedestrian crossing signal 29 7 50 1.00* 100
Portion of the path under repair 40 0 68 No Kappae 100
Presence of temporary barrier on path 40 3 68 1.00* 100
Vegetation overgrowth impedes/limits travel 40 53 68 .86* 92.8
Man-made structure impedes/limits travel 40 13 68 .86* 97.1
Debris impedes/limits travel 40 23 51d .82* 94.2
Sufficient vertical clearance 40 62 68 .97* 98.6
Presence of a shoulder 40 0 68 � 100
Road parallel to trail 40 100 68 No Kappae 97.1
Presence of a buffer from the adjacent road 24 58 68 1.00* 100
Presence of official access point 40 5 68 1.00* 100
Presence of gates or bollards 40 0 68 No Kappae 100
Deliberate viewpoints 40 0 68 No Kappae 100
Lighting on trail 40 50 68 .88* 94.2
Accessible telephones 40 8 68 .77* 97.1
Presence of emergency call boxes 40 0 68 No Kappae 100
Accessible restrooms 40 5 68 .85* 98.6
Accessible benches 40 3 68 1.00* 100
Accessible picnic tables 40 0 68 No Kappae 100
Accessible drinking fountains 40 5 68 1.00* 100
Accessible garbage cans 40 8 68 1.00* 100
Signage 40 0 68 No Kappae 100
Adjacent parking lot 40 8 68 1.00* 100
Accessible bicycle racks 40 3 68 1.00* 100
Accessible exercise/play areas 40 8 68 .79* 97.1
Services for trail users 40 3 68 .79* 98.6
Mass transit stops along trail 40 0 68 No Kappae 100
Presence of cultural or civic institution(s) 40 25 68 1.00* 100
Cultural or civic institution is a community facility 10 30 68 No Kappae 100
Cultural or civic institution is a cultural institution 10 10 68 No Kappae 100
Cultural or civic institution is a municipal building 10 10 68 No Kappae 100
Cultural or civic institution is a secular/religions building 10 50 68 No Kappae 100
Presence of commercial destination(s) 40 45 68 .91* 97.1
Stray dogs 40 8 68 .92* 98.6
df¼(number of cases �1); % Agmnt¼percent agreement (number of agreements�(number of agreementsþnumber of disagreements).n po .01a Items that were not coded on at least 10 segments of the trail are not included as these estimates were considered to be unstable.b Community 1 has 17 segments, Community 2 has 23, which adds to a total of 40 segments among both trails.c Degrees of freedom for analyses differs from total number of segments. During one observation day in Community 2 only one observer was available for 11
segments.d Degrees of freedom for analyses differ from total number of segments due to missing data for this item on first data collection date in Community 1.e Kappa could not be calculated due to low variability.
D.C. Meyers et al. / Health & Place 18 (2012) 991–999 997
appropriateness for use in diverse contexts are investigated. In thisarticle a process has been described that can be used as a model forusing observational protocols in underserved communities.
The modified tools have been shown to be reliable methods for(a) measuring trail use and (b) assessing physical features of thetrail in underserved environments. Reliability data related toSOPARC PATH indicated a very high level of agreement amongcoders (ICC¼ .98, po .01). Inter-observer reliability for individualSOPARC items was also very high as 10 of the 12 (83.3%) of theICCs were in the almost perfect range. The ICC for the age category‘Senior’ was in the moderate range (.67), and this may be due tocoders having difficulty estimating whether a given trail userappeared to be 60 years of age or older vs. whether the trail userwas in the upper-end for the ‘Adult’ age category (21 years old upto 59). The only other ICC that was not in the almost perfect rangewas for sedentary activity level. Although this ICC was lowerwhen compared to all other SOPARC variables, it was consideredto be of adequate reliability given that the percent agreementamong coders for this variable was 86%. In fact, the low ICC valuewas likely a misclassification due to low variability (i.e., there
were very few instances of sedentary behavior on the trail, andthe low base rate of this code resulted in low variability).
Reliabilities for measuring features of the trail were alsoadequate, as these data were found to range from fair to almostperfect (k¼ .77�1.00; ICC¼ .34�1.00). All but three of the binaryitems on the PEAT were reliably coded in the almost perfect range(Z .81). The three binary items that were the exception wereclose to almost perfect but fell in the substantial range (.79, .79,and .77) and were all related to amenities that were coded on lessthan 9% of the trail segments (e.g., accessible telephones, playareas, and other services for trail users).
Reliabilities for the ordinal PEAT items were not as high asthey were for the binary PEAT items. Only two of the ordinalitems had an ICC in the almost perfect range. One of these itemswas for slope of the trail, and since the trails were essentially flatand did not fluctuate, the high reliability with which this itemwas coded can be expected. The other item with an almost perfectICC was related to the width of a buffer (an expanse that providesprotection to trail users from an adjacent road). This item wasalso relatively straightforward and coders used a tape measure to

Table 4Inter-observer reliability for ordered categorical measures in PEAT based on observations in both PATH intervention communities.
Item Segmentsa Mean rating—1st observer db Lower bound Upper bound ICC % Agmnt
Condition of the path surface 40 2.88 68 .37 .70 .56* 65.2
Safety of intersection 40 2.76 50 .38 .74 .59* 49
Slope of trail 40 1.08 68 1.00 1.00 1.00* 100
Cross slope of trail 40 1.00 68 � � No ICCc 100
Sight distance 40 1.13 68 .53 .79 .68* 92.8
Width of buffer 24 1.33 68 .88 .95 .93* 100
Lateral visibility 40 1.97 68 .16 .57 .38* 95.7
Amount of glass 40 2.00 68 .60 .83 .73* 63.8
Amount of litter 40 2.33 68 .34 .68 .53* 65.2
Amount of graffiti 40 1.02 68 .51 .78 .66* 98.6
Amount of vandalism 40 1.00 68 � � No ICCc 98.6
Amount of odor 40 1.43 68 .11 .53 .34* 55.1
Amount of noise 40 2.65 68 .40 .72 .58* 59.4
Amount of animal droppings 40 1.00 68 � � No ICCc 100
df¼(number of cases�1); ICC¼ intra-class correlation; %Agmnt¼percent agreement (number of agreements�(number of agree-
mentsþnumber of disagreements).n po .01a Community 1 has 17 segments, Community 2 has 23, which adds to a total of 40 segments among both trails.b Degrees of freedom for analyses differs from total number of segments. During one observation day in Community 2 only one
observer was available for 11 segments.c ICC was unable to be calculated due to low variability.
D.C. Meyers et al. / Health & Place 18 (2012) 991–999998
determine width. Most of the ordinal items are subjective, whichmakes them more difficult to code. For example, indicatingwhether or not a garbage can is present (binary item requiringcoder to indicate yes or no) is much more straightforward thanrating the condition of the path surface (ordinal item on a 5-pointscale). Such ordinal items require the coder to review the PEATmanual carefully when collecting data and take into account theentirety of the segment, and at times it can be difficult to selectbetween two possible codes that are both marginally appropriate.Most of the ordinal PEAT items were in the substantial to fairrange, and the resulting values are similar to those found in thestudy that validated and established the reliability of the PEAT.For example, two items that were considered very important tocommunities who participated in this study–condition of the pathsurface and safety of intersections – were found to have valuesvery similar to those found in Troped et al. (2006).
Extensive training and certification processes should be imple-mented as modeled in this study as a quality assurance process.The purpose of planning and implementing high quality trainingis to ensure that a ‘‘common lens’’ is established for all coders thatis objective and nonjudgmental, and steps should be taken tosupport and maintain coders’ skills after training to preventagainst ‘‘coder drift’’ (McKenzie, 2010).
Modifying the SOPARC and PEAT tools was approached sys-tematically. These modifications were conducted in the spirit ofcontinually improving these measures to ensure their relevancefor diverse populations and contexts. Consultants with extensiveexperience using the protocols (B.E.A., N.C., T.L.M., & J.R.) guidedthe development of other protocol modifications, includingadjustments to how data were collected and establishing codingconventions. For the SOPARC PATH protocol, mobile observationswere added to capture use of the trail as a whole since trail userscould have accessed the trail at multiple points (e.g., intersectionsand sidewalks). The mobile protocol complemented the station-ary protocols which were better-suited to capture participation inorganized walking groups. For the PATH PEAT tool, the modifica-tion process involved community members who identified impor-tant items regarding trail safety in their community (e.g.,overgrowth from vegetation, presence of stray dogs on thewalking trail, lack of drug dealers). In addition coding conventionswere added to existing PEAT items to enhance relevance to urbanwalking trails in underserved communities (e.g., adding in
additional types of temporary barriers that could be encounteredlike parked cars and curbside garbage cans) and to enhance theclarity of items that coders found difficult during training andcertification (e.g., the distinction between ‘‘shoulders’’ and‘‘buffers’’).
While both the SOPARC PATH and PATH PEAT protocols havebeen modified for use in underserved communities, their use inother underserved communities may reveal additional adapta-tions that may be needed to ensure relevance and accuratecoding. It is suggested that any further modifications to theseprotocols or similar tools be done so with both communitymembers within the communities of focus along with developersand/or content experts who have a deep understanding of themeasures that are to be modified.
While these community- and expert-guided modifications arethought to strengthen the original protocols by enhancing theirrelevancy to the communities of focus, the modifications may notbe appropriate for other contexts and populations that differ fromthose observed in this study. It is also important to note that theseobservational protocols require a major time commitment toconduct appropriately. Training for these protocols is often con-ducted over multiple days and involves didactic activities(e.g., operational definitions), behavioral skill-based activities(e.g., practicing systematic observation in diverse settings andreceiving feedback on performance), and an assessment of trai-nees’ level of skill (e.g., McKenzie et al., 2006).
Despite all this certification and careful planning and coordi-nation among the study coordinators, community members,police officers providing oversight, and the Trail Team whocollected the data, inclement weather often disrupted datacollection days such that they had to be repeated. These dayswere repeated given that inclement weather has been establishedas an environmental barrier to PA (e.g., Tucker and Gilliland,2007) and we assumed that estimates of PA on these days wouldhave been biased due to such weather. Being at the mercy of theweather is an unavoidable drawback of randomly selecting daysto observe data on walking trails. That said, we acknowledge thatthis is a limitation of doing direct observations, and that collectingdata only during clement weather may present the ‘‘best-casescenario’’ for trail use. The protocols described herein are basedon published observational tools that have been used in multiplestudies of park and trail use.

D.C. Meyers et al. / Health & Place 18 (2012) 991–999 999
An additional limitation is that the interpretive ranges used forpercent agreement statistics in this study (percent agreementZ75% for binary items and ordinal or continuous response itemswith percent agreement Z60% were deemed as having adequatereliability) are arbitrary and based off of a single study (Saelenset al., 2006). These arbitrary interpretive ranges are not as wellestablished as those suggested by Landis and Koch, 1977 for ICCand Kappa statistics. We feel the guidelines suggested by theSaelens et al. study are appropriate given its similarities with thepresent study.
This study provides a model for applying modified SOPARC andPEAT protocols to be used in an underserved community. Theinstruments were useful and able to be applied with a high levelof reliability and their content are appropriate for assessing trailuse and features of the trail environment in these communities.Future directions for this work include assessing reliability datafor the 12- and 18-month follow up observations to determinethe extent to which trail use changes over time, the extent towhich features of the trail change over time, and the degree towhich these constructs are related to the PATH project’s inter-vention. While further modification of these protocols may bewarranted, these initial steps have helped establish currentlyavailable tools for use in underserved communities.
References
Brownson, R.C., Hoehner, C.M., Day, K., Forsyth, A., Sallis, J.F., 2009. Measuring thebuilt environment for physical activity: state of the science. American Journalof Preventive Medicine 36, S99–S123.
Cohen, D., Sehgal, A., Williamson, S., Golinelli, D., Lurie, N., McKenzie, T.L., Capone-Newton, P., 2008. Impact of a new bicycle path on physical activity. PreventiveMedicine 46, 80–81.
Cohen, J., Cohen, P., West, S.G., Aiken, L.S., 2003. Applied Multiple Regression/Correlation Analysis for the Social Sciences, 3rd ed. Lawrence ErlbaumAssociates, Publishers, Mahwah, NJ.
DeNavas-Walt, C., Proctor, B.D., Smith, J.C., 2010. Income, Poverty, and HealthInsurance Coverage in the United States: 2009, Current Population Reports.U.S. Government Printing Office, Washington, DC P60–P238.
Floyd, M.F., Taylor, W.C., Whitt-Glover, M., 2009. Measurement of park andrecreation environments that support physical activity in low-income com-munities of color: highlights of challenges and recommendations. AmericanJournal of Preventive Medicine 36, S156–S160.
Landis, J.R., Koch, G.G., 1977. The measurement of observer agreement forcategorical data. Biometrics 33, 159–174.
McKenzie, T.L., 2002. Use of direct observation to assess physical activity. In: Welk,G.J. (Ed.), Physical Activity Assessments for Health-related Research. HumanKinetics Publisher, Inc., Champaign, IL, pp. 179–195.
McKenzie, T.L., 2005. Systematic Observation: SOPLAY/SOPARC Introduction,Practice, and Assessment. San Diego State University, San Diego, CA.
McKenzie, T.L., 2010. 2009 C. H. McCloy Lecture. Seeing is believing: observingphysical activity and its contexts. Research Quarterly for Exercise and Sport81, 113–122 2009.
McKenzie, T.L., Cohen, D.A., 2007. System for Observing Play and Recreation inCommunities (SOPARC) Description and Procedures Manual.
McKenzie, T.L., Cohen, D.A., Sehgal, A., Williamson, S., Golinelli, D., 2006. Systemfor Observing Play and Recreation in Communities (SOPARC): reliability andfeasibility measures. Journal of Physical Activity & Health 3, S208–S222.
McKenzie, T.L., Marshall, S.J., Sallis, J.F., Conway, T.L., 2000. Leisure-time physicalactivity in school environments: an observation study using SOPLAY.Preventive Medicine 30, 70–77.
Muller, R., Buttner, P., 1994. A critical discussion of intraclass correlationcoefficients. Statistics in Medicine 13, 2465–2476.
Office of Research and Statistics, 2006. South Carolina Statistical Abstract.Reed, J.A., Hooker, S.P., Muthukrishnan, S., Hutto, B., 2011. User demographics and
physical activity behaviors on a newly constructed urban rail/trail conversion.Journal of Physical Activity & Health 8, 534–542.
Saelens, B.E., Frank, L.D., Auffrey, C., Whitaker, R.C., Burdette, H.L., Colabianchi, N.,2006. Measuring physical environments of parks and playgrounds: EAPRSinstrument development and inter-rater reliability. Journal of Physical Activityand Health 3, S190–S207.
Sallis, J.F., Owen, N., 1999. Physical Activity and Behavioral Medicine. SagePublications, Thousand Oaks, CA.
Shrout, P.E., Fleiss, J.L., 1979. Intraclass correlations: uses in assessing raterreliability. Psychological Bulletin 86, 420–428.
Tester, J., Baker, R., 2009. Making the playfields even: evaluating the impact of anenvironmental intervention on park use and physical activity. PreventiveMedicine 48, 316–320.
Troped, P.J., Cromley, E.K., Fragala, M.S., Melly, S.J., Hasbrouck, H.H., Gortmaker,S.L., Brownson, R.C., 2006. Development and reliability and validity testing ofan audit tool for trail/path characteristics: The Path Environment Audit Tool(PEAT). Journal of Physical Activity & Health 3, S158–S175.
Tucker, P., Gilliland, J., 2007. The effect of season and weather on physical activity:a systematic review. Public Health 121, 909–922.
United States Census Bureau, 2012. State & County QuickFacts.van der Mars, H., Rowe, P., Schuldheisz, J., Fox, S., 2004. Measuring students’
physical activity levels: validating SOFIT for use with high school students.Journal of Teaching Physical Education 23, 235–251.
Wilson, D.K., Trumpeter St., N.N., George, S.M., Coulon, S.M., Griffin, S., Van Horn,M.L., Lawman, H.G., Wandersman, A., Egan, B., Forthofer, M., Goodlett, B.D.,Kitzman-Ulrich, H., Gadson, B., 2010. An overview of the ‘‘Positive Action forToday’s Health’’ (PATH) trial for increasing walking in low income, ethnicminority communities. Contemporary Clinical Trials 31, 624–633.


