Embed Size (px)
Citation preview

Assessing Equity in Alternative Assessment:An Illustration of Opportunity-to-Learn Issues
CSE Technical Report 440
Joan L. Herman, Davina C. D. Klein, and Sara T. WakaiCRESST/University of California, Los Angeles
Tamela Heath, University of Maryland, College Park
December 1996
National Center for Research on Evaluation,Standards, and Student Testing (CRESST)Center for the Study of Evaluation (CSE)
Graduate School of Education & Information StudiesUniversity of California, Los Angeles
Los Angeles, CA 90024-6511(310) 206-1532

Copyright © 1997 The Regents of the University of California
The work reported herein was supported under the Educational Research and DevelopmentCenter Program cooperative agreement R117G10027 and CFDA Catalog number 84.117G asadministered by the Office of Educational Research and Improvement, U.S. Department ofEducation.
The findings and opinions expressed in this report do not reflect the policies of the Office ofEducational Research and Improvement or the U.S. Department of Education.
1
ASSESSING EQUITY IN ALTERNATIVE ASSESSMENT:
AN ILLUSTRATION OF OPPORTUNITY-TO-LEARN ISSUES
Joan L. Herman, Davina C. D. Klein, and Sara T. Wakai
UCLA, National Center for Research on Evaluation,
Standards, and Student Testing (CRESST)
Tamela Heath, University of Maryland, College Park
Abstract
Based on the 1993 California Learning Assessment System (CLAS) Middle GradesMathematics Performance Assessment, an innovative alternative assessment, thestudy explores whether all schools, regardless of the cultural, ethnic, or socioeconomicbackground of the students they serve, provide students equal opportunity to learnthat which is assessed. Opportunity to learn was defined to include a range ofvariables likely to influence student performance, including access to resources,access to high-quality instructional content and processes, extra-school opportunities,and direct preparation for the CLAS. Data collection efforts included teacherinterviews, student surveys, student retrospective think-aloud interviews, andclassroom observations of the assessment administration. Researchers chose 13schools across the state to represent three broad school categories: affluentsuburban; low-SES urban; and remote, mixed SES rural. Findings highlight somedifferences between school types in various opportunity-to-learn measures andsuggest directions for future research.
Introduction
Bolstered by research showing that traditional testing has encouragedteachers and students to focus on what is tested (Herman & Golan, 1991;Madaus, 1991; Shepard, 1991), but cognizant of findings suggesting that such afocus has distorted the curriculum for many students, narrowing it to basic, low-level skills (Herman & Dorr-Bremme, 1983; Herman & Golan, 1991; Kellaghan &Madaus, 1991; Shepard, 1991; Smith & Rottenberg, 1991), many in theeducational community are looking toward new kinds of assessments to supporteducational reform. They seek assessments that embody rigorous standards forstudent accomplishment and whose use will foster instructional improvement.

2
Will these assessments support instructional reform and stimulate allstudents to achieve rigorous standards, as intended? Although any number ofvariables will intervene to influence the answer, in this article we highlight onecritical link in the policy chain: that teachers and schools have the capability toand do provide all students with the opportunity to learn that which is assessed.Lacking such opportunity, interpretations of studentsÕ performance will be flawed,and the assessment will disadvantage those students who have not had equalopportunity to learn.
In this report, we use data collected in conjunction with the CaliforniaLearning Assessment System to illustrate the substance and challenge ofexploring this opportunity-to-learn issue, particularly in the context of concernsfor equity in opportunity. We pose the question: Does current practice present alevel playing fieldÑdo all schools, regardless of the cultural, socioeconomic, orcommunity background of the students they serve, provide students with similaropportunity to learn that which is valued by new assessments? We have cast ourdefinition of opportunity broadly to illustrate the range of variables likely toinfluence studentsÕ performance. Included in our definition were access toresources, such as qualified teachers and appropriate instructional tools; access tothe types of instructional content and processes likely to help students developthe complex knowledge and skills required by new assessments; extra-schoolopportunities; and direct preparation and practice for these new assessments. Inthe sections that follow, we provide background on study methodology, a summaryof our findings, and implications for policy and practice, including methodologicaland substantive challenges in assessing and assuring adequate opportunity tolearn.
Methodology1
Assessment Context: California Learning Assessment System (CLAS)
Middle Grades Mathematics Performance Assessment
California, at the time of the study, was known as a front-runner incurriculum and assessment reform. Planning for the stateÕs new mathematicscurriculum framework started in 1989, resulting in a published framework in 1992 1 See Herman, Klein, Heath, and Wakai (1994) for additional detail about study methodologyand findings.

3
(California State Department of Education, 1992). In assessment, the state had ahistory of using alternative assessment, having been an early adopter of directwriting assessment and having started its exploration of open-ended mathematicsproblems in 1989 (California State Department of Education, 1989).
The 1993 California Learning Assessment System (CLAS) Middle GradesMathematics Performance Assessment, the focus here, had been underdevelopment for a number of years and was in its first year of full operation at thetime of the study. Intended to support the stateÕs curriculum framework, theassessment was designed to measure studentsÕ complex mathematical thinking,communication, and problem-solving skills. CLAS used a matrix sampling designand at the eighth-grade level had a total of eight forms. In this study we focusedparticularly on one of these forms, the common form, which was speciallyadministered in all study classrooms on the day following the regular assessment.Like all of the forms, the common form consisted of two sections, the firstcontaining two open-ended tasks and the second composed of eight multiple-choiceitems. The two open-ended tasks were designed to pose authentic, relevantproblem situations for students to solve, asking students to explain theirassumptions and thinking and to construct their answers using multiple modes ofrepresentation. The multiple-choice items were intended to assess mathematicalthinking. While administrators were advised to give students whatever time theyneeded, designers expected that each test form would take about 45 minutes tocomplete, with students spending about 15 minutes on each of the open-endedtasks, and the remaining 15 minutes on the multiple-choice items.
School Sample
The studyÕs original design sought to contrast schools across the state,serving diverse school communities. Because of equity concerns, the contrasts ofparticular interest were between schools serving relatively affluent, suburbancommunities and schools thought to be potentially at risk: those serving inner-city, economically disadvantaged communities and those in more geographicallyremote rural areas. In addition, because inner-city students were considered mostat risk, inner-city schools were deliberately overrepresented. Within each school,three eighth-grade math classes, representing the range of eighth-grade classestypically taught at that school, were selected for study.
4
Built on and dependent on a larger state pilot study, the final sampleconsisted of 13 schools across the state, distributed over three broad categories:urban, rural, and suburban (see Table 1). The sample encompassed 27 teachers
Table 1
Breakdown of Schools Participating in the CLAS Study
Type of school Number of schools Number of classes
Urban 9 24
Rural 2 6
Suburban 2 6
(66.7% from urban schools, 14.8% from rural schools, and 18.5% from suburbanschools) and over 800 students (58.4% from urban schools, 20.2% from ruralschools, and 21.4% from suburban schools). (See Table 1 for a breakdown of theschool sample.) The urban schools were all economically disadvantaged andreflected a range of ethnic diversityÑprincipally Latino; mixed African Americanand Latino; mixed Asian American and White; mixed White, African American,and Latino. The suburban schools served predominantly White and some AsianAmerican high-wealth communities. The rural schools were mixed insocioeconomic status and served mainly White and Latino students. It isimportant to note that participating schools were volunteers, interested in beinginvolved in special pilot work for CLAS.
Instrumentation
Of the seven data sources used in the full study, results reported here drawprimarily on the following.
Teacher interviews. Interviews provided information about teachersÕeducational background and teaching experience, particularly in mathematics;classroom pedagogical practices; teachersÕ familiarity with and the extent towhich they prepared their students for CLAS-type items; calculator instructionand use in the classrooms; and teachersÕ reactions to the CLAS. In addition, duringthe interview, teachers were asked to provide researchers with (a) descriptions ofmajor assignments given to students during the year and (b) samples of tests and
5
quizzes given during the year. The teacher interview focused on the class that wasobserved and whose students completed student surveys for the study.
Student surveys. Students in sampled classrooms completed a survey onthe day following the common form administration. The survey solicited studentsÕviews on a number of issues, including: their instructional experience with andspecific preparation for the content and task types on the CLAS; access tocalculators at home and at school; the amount of mathematics homework theycompleted; attitudes towards math in general; and their affective responses toopen-ended tasks compared to multiple-choice tasks. Between the sets of studentand teacher questions, there was intentional overlap in the areas of instructionalpractices and content coverage. Substantive and factor analyses were used toaggregate studentsÕ responses to individual items related to opportunity to learninto more stable, conceptually distinct subscales. Our analysis of collectedinstructional artifacts generally confirmed the validity of these subscales. Forexample, aggregate ratings of the communication requirements of teacherassignments and assessment correlated .69 with the communication subscalecreated from student responses. Similarly, material ratings of opportunities forapplied problem solving correlated .52 with student reports.
Retrospective student interviews. In-depth student interviews wereconducted with six students randomly chosen from each classroom. The individualstudent interviews allowed us to obtain more detailed information on studentresponses to the open-ended and multiple-choice tasks included in the assessment.Think-aloud protocols asked students to recreate their thinking processes andexpectations as they approached and tried to solve one of the two open-endedtasks and the first multiple-choice item included on the common form. Studentswere asked to explain how they thought each task would be scored, their level ofpreparation for specific items, and their relative preferences, along a number ofaffective dimensions, for open-ended versus multiple-choice problems.
Classroom observations. In each study classroom, two trained datacollectors observed in each study classroom as the common form wasadministered. Using a standard protocol, two observers collected information onadministration conditions, studentsÕ reactions to the assessment, theirengagement level, their use of calculators, and their use of time and completion ofthe assessment.
6
Data were analyzed and statistical tests run using the classroom as the unitof analysis. Analysis of variance and chi square techniques were used to exploredifferences in classroom experiences by school type (i.e., urban, rural, andsuburban). Note that the relatively small sample of teachers and classroomsrepresents a significant constraint on the power of our analyses and an importantcaveat in interpreting results.
Results
Results are illustrated in three general areas: studentsÕ access to qualityresources; studentsÕ access to instruction consonant with the CLAS objectives;and studentsÕ preparation for the CLAS.
Access to Quality Resources
With regard to access to quality resources, the study looked at both teachersÕpreparation for teaching a Òthinking curriculumÓ in mathematics and studentsÕaccess to adequate instructional materials. In the first area, teacher interviewsprovided data on teachersÕ undergraduate fields, mathematics teaching credentialstatus, years of experience teaching mathematics, participation in recentprofessional development that would likely prepare them in the content andinstructional practices of a Òthinking curriculum,Ó and preparation for the CLASitself. StudentsÕ access to calculators and use of recent textbooks served asproxies for adequacy of instructional materials.
Teacher preparation. Although only half of our teacher sample had eithermajored (23.1%) or minored (26.9%) in a mathematics field (including engineeringand computer science), the majority of teachers (69.2%) had credentials to teachmathematics. Rural teachers were significantly less likely to have suchcertification; 82% of the urban teachers and 80% of the suburban teachers wereso certified, but only 25% of the rural teachers were. Similarly, suburban andurban teachers were more likely than rural teachers to have majored or minoredin mathematics as undergraduates, with no rural teachers claiming anundergraduate degree in mathematics.
Similar patterns emerged when data on in-service education were examined.Overall, 65.4% of the teachers had participated recently in more than 35 hours of

7
in-service education in mathematics and mathematics education. Urban andsuburban teachers were more likely to have done so: 71% of the urban teachersand 80% of the suburban teachers reported spending more than 35 hours over thelast three years in in-service education in mathematics or its teaching, while only25% of the rural teachers reported that level of activity. No differences were foundacross school type in years of teacher experience teaching mathematics, with amean of 11 years for the total sample.
With regard to teachersÕ specific preparation for the assessment, themajority of teachers reported participating in two to three extended workshopsand other special sessions acquainting them with the CLAS and the types ofmathematical thinking, communication, and problem solving contained on theassessment, in addition to reading advanced written materials, samplers, anddirections for administration. Yet despite this orientation, teachers in general didnot report being highly confident about their preparation to teach CLAS-typeobjectives, with no more than half the teachers representing each school typeexpressing that they felt Òvery wellÓ prepared (see Table 2).
Table 2
Percentage of Teachers Expressing Different Levels of Preparation to Teachthe CLAS by School Type (Teacher Interview Results)
Type of school Not well OK Very well
Urban 8.7 60.9 30.4
Rural 16.7 33.3 50.0
Suburban 16.7 33.3 50.0
Totals 11.4 51.4 37.1
Instructional resources. Because the National Council of Teachers ofMathematics (NCTM) standards and the California Curriculum Framework inMathematics are relatively new, it is unlikely that older texts are well aligned withthe reform ideas of these new standards. We thus viewed recency of texts as anindicator of access to relevant instruction resources; without access to recenttexts, teachers lack an important supplement to their own mathematicalbackground and to their thinking about effective instructional activities. The data
8
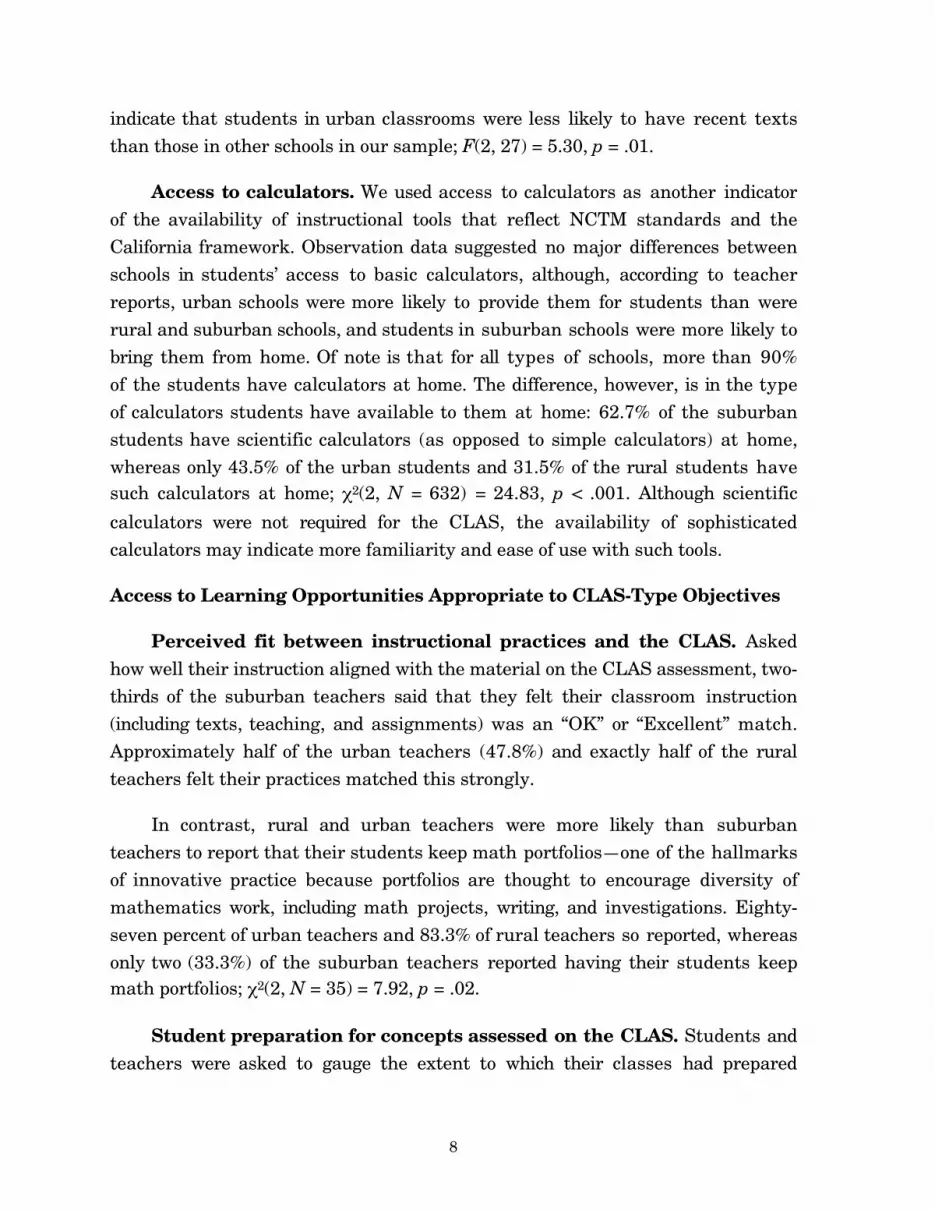
indicate that students in urban classrooms were less likely to have recent textsthan those in other schools in our sample; F(2, 27) = 5.30, p = .01.
Access to calculators. We used access to calculators as another indicatorof the availability of instructional tools that reflect NCTM standards and theCalifornia framework. Observation data suggested no major differences betweenschools in studentsÕ access to basic calculators, although, according to teacherreports, urban schools were more likely to provide them for students than wererural and suburban schools, and students in suburban schools were more likely tobring them from home. Of note is that for all types of schools, more than 90%of the students have calculators at home. The difference, however, is in the typeof calculators students have available to them at home: 62.7% of the suburbanstudents have scientific calculators (as opposed to simple calculators) at home,whereas only 43.5% of the urban students and 31.5% of the rural students havesuch calculators at home; c2(2, N = 632) = 24.83, p < .001. Although scientific
calculators were not required for the CLAS, the availability of sophisticatedcalculators may indicate more familiarity and ease of use with such tools.
Access to Learning Opportunities Appropriate to CLAS-Type Objectives
Perceived fit between instructional practices and the CLAS. Askedhow well their instruction aligned with the material on the CLAS assessment, two-thirds of the suburban teachers said that they felt their classroom instruction(including texts, teaching, and assignments) was an ÒOKÓ or ÒExcellentÓ match.Approximately half of the urban teachers (47.8%) and exactly half of the ruralteachers felt their practices matched this strongly.
In contrast, rural and urban teachers were more likely than suburbanteachers to report that their students keep math portfoliosÑone of the hallmarksof innovative practice because portfolios are thought to encourage diversity ofmathematics work, including math projects, writing, and investigations. Eighty-seven percent of urban teachers and 83.3% of rural teachers so reported, whereasonly two (33.3%) of the suburban teachers reported having their students keepmath portfolios; c2(2, N = 35) = 7.92, p = .02.
Student preparation for concepts assessed on the CLAS. Students andteachers were asked to gauge the extent to which their classes had prepared

9
students for some of the math concepts included on the CLASÑfocusingparticularly on the specific topic areas covered on the common CLAS form thatwas used for the retrospective s t u d e n t interviews. Students were asked howwell prepared they thought they were for fractions, area, perimeter, graphingdata, distance/time problems, and ratios. Similarly, teachers were asked howmuch class time was spent on these same areas. Students and teachers alikeseem to agree that students were at least somewhat prepared in each of theseareas, except for distance/time problems in urban classrooms and perimeterproblems in suburban schools. While the patterns are somewhat irregular forteacher reports, for the most part students in the suburban schools tended to feelthat they were better prepared in these content areas (see Tables 3 and 4).
Table 3
Percentage of Classes That Spent More Than Six Class Sessions onContent Areas by School Type (Teacher Interview Results)
Content area Urban Rural Suburban
Fractions 73.9 6 100.0
Area 47.8 83.3 50.0
Perimeter 40.9 66.7 33.4
Graphing data 78.2 66.7 100.0
Distance/time 34.7 83.4 50.0
Proportional reasoning 73.9 66.7 83.3
Table 4
Mean Comparisons of Student Ratings of Their Preparation in VariousContent Areas by School Type (Student Survey Results)
Content area Urban Rural Suburban F(2)
Fractions* 2.68 2.38 2.86 26.92
Area* 2.34 2.32 2.70 16.50
Perimeter* 2.25 2.41 2.72 22.60
Graphing data* 2.34 2.54 2.59 9.15
Distance/time* 2.16 2.28 2.40 5.69
Ratios* 2.11 1.85 2.58 30.65
Note. 1 = Little or none, 3 = Very well.*p < .05.
10
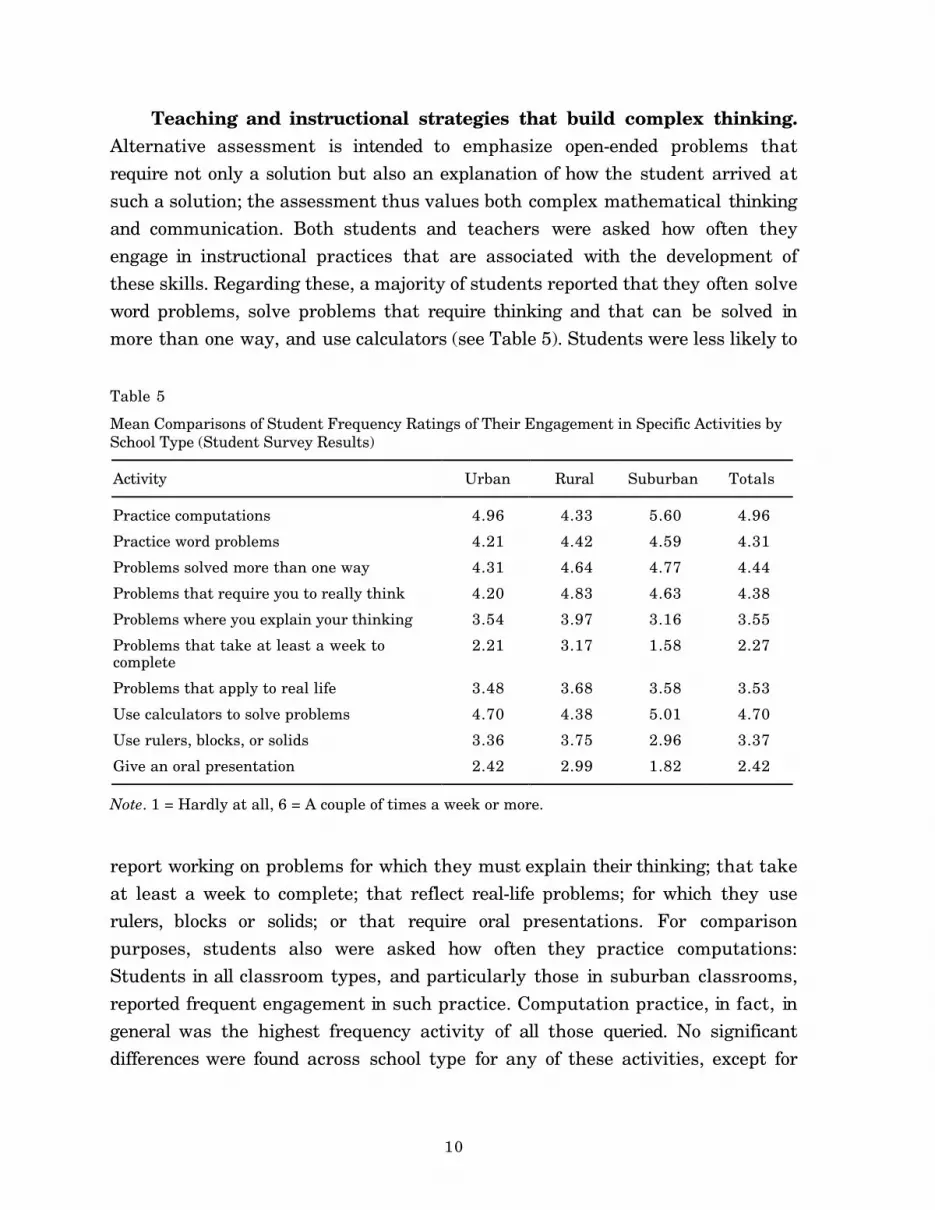
Teaching and instructional strategies that build complex thinking.Alternative assessment is intended to emphasize open-ended problems thatrequire not only a solution but also an explanation of how the student arrived atsuch a solution; the assessment thus values both complex mathematical thinkingand communication. Both students and teachers were asked how often theyengage in instructional practices that are associated with the development ofthese skills. Regarding these, a majority of students reported that they often solveword problems, solve problems that require thinking and that can be solved inmore than one way, and use calculators (see Table 5). Students were less likely to
Table 5
Mean Comparisons of Student Frequency Ratings of Their Engagement in Specific Activities bySchool Type (Student Survey Results)
Activity Urban Rural Suburban Totals
Practice computations 4.96 4.33 5.60 4.96
Practice word problems 4.21 4.42 4.59 4.31
Problems solved more than one way 4.31 4.64 4.77 4.44
Problems that require you to really think 4.20 4.83 4.63 4.38
Problems where you explain your thinking 3.54 3.97 3.16 3.55
Problems that take at least a week tocomplete
2.21 3.17 1.58 2.27
Problems that apply to real life 3.48 3.68 3.58 3.53
Use calculators to solve problems 4.70 4.38 5.01 4.70
Use rulers, blocks, or solids 3.36 3.75 2.96 3.37
Give an oral presentation 2.42 2.99 1.82 2.42
Note. 1 = Hardly at all, 6 = A couple of times a week or more.
report working on problems for which they must explain their thinking; that takeat least a week to complete; that reflect real-life problems; for which they userulers, blocks or solids; or that require oral presentations. For comparisonpurposes, students also were asked how often they practice computations:Students in all classroom types, and particularly those in suburban classrooms,reported frequent engagement in such practice. Computation practice, in fact, ingeneral was the highest frequency activity of all those queried. No significantdifferences were found across school type for any of these activities, except for
11
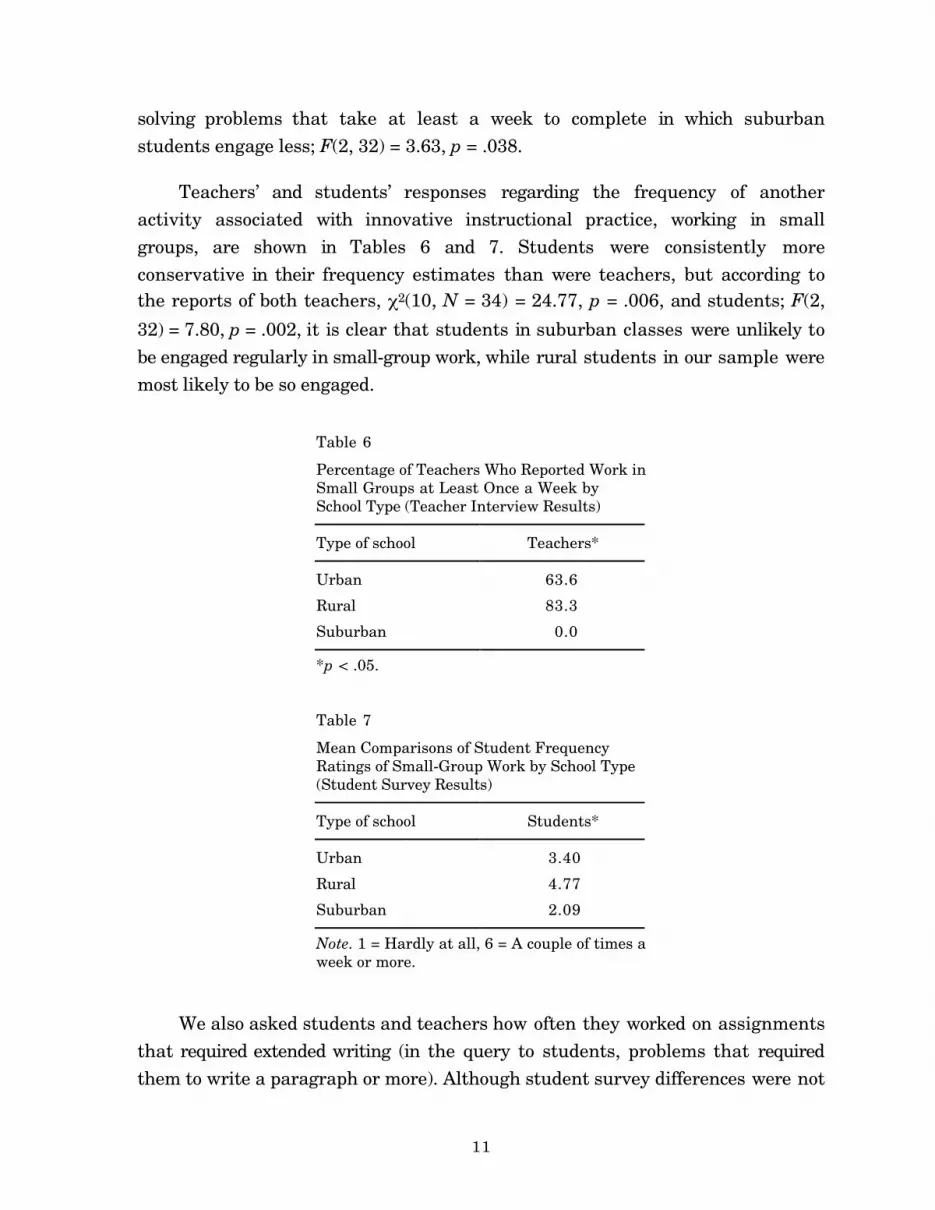
solving problems that take at least a week to complete in which suburbanstudents engage less; F(2, 32) = 3.63, p = .038.
TeachersÕ and studentsÕ responses regarding the frequency of anotheractivity associated with innovative instructional practice, working in smallgroups, are shown in Tables 6 and 7. Students were consistently moreconservative in their frequency estimates than were teachers, but according tothe reports of both teachers, c2(10, N = 34) = 24.77, p = .006, and students; F(2,
32) = 7.80, p = .002, it is clear that students in suburban classes were unlikely tobe engaged regularly in small-group work, while rural students in our sample weremost likely to be so engaged.
Table 6
Percentage of Teachers Who Reported Work inSmall Groups at Least Once a Week bySchool Type (Teacher Interview Results)
Type of school Teachers*
Urban 63.6
Rural 83.3
Suburban 0.0
*p < .05.
Table 7
Mean Comparisons of Student FrequencyRatings of Small-Group Work by School Type(Student Survey Results)
Type of school Students*
Urban 3.40
Rural 4.77
Suburban 2.09
Note. 1 = Hardly at all, 6 = A couple of times aweek or more.
We also asked students and teachers how often they worked on assignmentsthat required extended writing (in the query to students, problems that requiredthem to write a paragraph or more). Although student survey differences were not
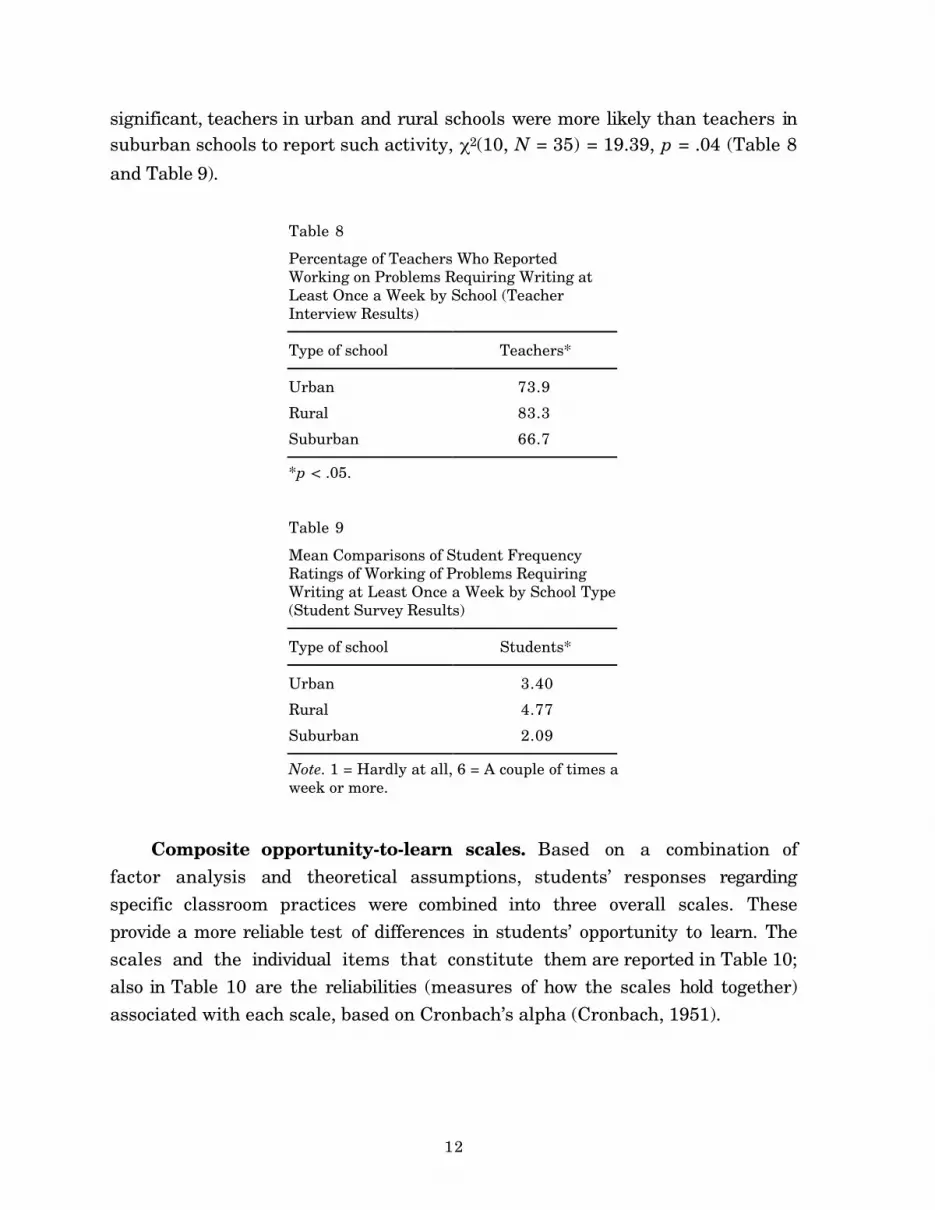
12
significant, teachers in urban and rural schools were more likely than teachers insuburban schools to report such activity, c2(10, N = 35) = 19.39, p = .04 (Table 8
and Table 9).
Table 8
Percentage of Teachers Who ReportedWorking on Problems Requiring Writing atLeast Once a Week by School (TeacherInterview Results)
Type of school Teachers*
Urban 73.9
Rural 83.3
Suburban 66.7
*p < .05.
Table 9
Mean Comparisons of Student FrequencyRatings of Working of Problems RequiringWriting at Least Once a Week by School Type(Student Survey Results)
Type of school Students*
Urban 3.40
Rural 4.77
Suburban 2.09
Note. 1 = Hardly at all, 6 = A couple of times aweek or more.
Composite opportunity-to-learn scales. Based on a combination offactor analysis and theoretical assumptions, studentsÕ responses regardingspecific classroom practices were combined into three overall scales. Theseprovide a more reliable test of differences in studentsÕ opportunity to learn. Thescales and the individual items that constitute them are reported in Table 10;also in Table 10 are the reliabilities (measures of how the scales hold together)associated with each scale, based on CronbachÕs alpha (Cronbach, 1951).

13
Table 10
Classroom Learning Opportunity Scales: Composite Items andReliabilities (Student Survey Results)
Mathematical communication scale (alpha = .66)
Problems which require you to explain your thinking
Work in small groups
Give an oral presentation
Problems that require a written paragraph
Applied problem solving scale (alpha = .69)
Practice word problems
Problems that can be solved in more than one way
Problems that require you to really think
Problems that take at least a week to complete
Problems that apply to real life
Use rulers, blocks or solids
Topic preparation scale (alpha = .76)
Perimeter
Graphing data
Distance/time
Fractions
Ratios
Area
The ÒcommunicationÓ scale is made up of items that indicate how oftenstudents practice problems that require them to communicate how they arethinking. The ÒappliedÓ scale refers to how often students practice practicalproblems using applied methods or real-life perspectives. As indicated in theMethods section above, these scales correlated highly with results of independentanalysis of teachersÕ instructional materials. The ÒpreparationÓ scale focuses onhow well prepared students felt for the specific math concepts required on theCLAS common form. Students in suburban schools engaged in less mathematicalcommunication than urban and rural students; F(2, 32) = 6.05, p = .006 (seeTableÊ11). Students in suburban schools felt better prepared than urban and ruralstudents for selected mathematics concepts required on the common formassessment; F(2, 771) = 28.73, p < .001. Insignificant trends also support thepossibility that suburban students practice computations more regularly

14
than other students in our sample. (ÒComputationÓ denotes frequency of practicein computation, a single item unrelated to other subscales.)
Table 11
Opportunity-to-Learn Composite Scales: ANOVA Findings by School Type (Student SurveyResults)
Type of school Communication Applied Preparation Computation
Urban 12.37 21.76 13.89 4.96
Rural 15.22 24.48 13.81 4.33
Suburban 9.25 22.12 15.86 5.60
Totals 12.32 22.29 14.32 4.96
Homework. StudentsÕ responses about the frequency with which they wereassigned homework and the difficulty level of that homework provide a possiblewindow into why suburban students tend to report themselves better preparedthan other students in our sample (see Table 12). Time on homework presumably
Table 12
Mean Comparisons of Student Ratings Regarding Homework by School Type (Student SurveyResults)
Type of schoolHow often homework
is assignedaHow long it takes tofinish homeworkb
How difficulthomework isc
Urban 5.32 2.57 3.03
Rural 3.54 2.68 3.02
Suburban 6.58 2.37 3.18
a 1 = Never, 7 = Every night.b 1 = 15 minutes, 5 = More than one hour.c 1 = Very easy, 5 = Very difficult.
represents learning time and thus additional opportunity to learn. In this regard,suburban students reported being assigned math homework more often than didurban students, who in turn reported more homework than did rural students; F(2,32) = 6.61, p = .004. Whereas suburban students reported having homework fourto five nights a week on average and urban students reported having homework

15
about three nights a week on average, rural students reported homeworkassignments only once or twice per week on average. No differences were found inthe time students reported spending on each homework assignment (30 to 45minutes on average) or in the difficulty level of that homework (ÒmoderateÓ onaverage). The time in the context of frequency of homework, however, meansthat suburban students spend significantly more time per week engaged inmathematics than their urban or rural peers do.
Preparation for the CLAS
StudentsÕ perceptions of preparedness. Teachers and students also werequeried about their direct preparation for the CLAS; how well students felt theywere prepared for the CLAS is reported in Table 13. A one-way analysis of
Table 13
Mean Comparisons of Student Ratings of TheirPreparation for the CLAS by School Type (StudentSurvey Results)
Type of school Preparation for the CLAS
Urban 2.76
Rural 2.50
Suburban 3.23
Note. 1 = Not at all, 4 = Very much so.
variance indicated that suburban students were significantly more confidentabout their preparedness for the CLAS than urban students, who were moreconfident than rural students; F(2, 780) = 29.77, p < .001. It is possible thatÑhaving done well on previous standardized testsÑstudents in suburban schoolsgenerally have more academic self-confidence than students in either rural orurban schools.
Teacher reports on direct preparation. Almost all teachers indicatedthat they engaged their students in specific activities to prepare students for theCLAS. The state provided schools with a ÒCLAS Mathematics SamplerÓ toacquaint teachers and students with the type and nature of assessment theywould encounter on the CLAS. The Sampler, as the name implies, included sample

16
problems, and teachers were free to assign and work through these problems withtheir students. The great majority of teachers interviewed (91%) had both seenthe Sampler and used it to prepare their students for the assessment, althoughrural teachers appeared less likely than other teachers to have done so (see Table14). On average, teachers reported devoting between three and five class periods
Table 14
Percentage of Teachers Using the CLAS Samplerby School Type (Teacher Interview Results)
Type of school Used CLAS Sampler
Urban 95.7
Rural 66.7
Suburban 100.0
(median response) to practice with the Sampler, although it is worth noting thatone third of our teacher respondents reported spending nine or more classroomperiods in such efforts. In order to prepare their students for the assessment, anumber of teachers mentioned giving students Òa problem of the weekÓ featuringproblems they thought typified the new mathematics curriculumÑproblems thathad no obvious solution, that could be solved in a number of ways, and/or thatwere drawn from real life.
How well teachers expect their students to do on the CLAS. Teacherswere asked to estimate the percentage of their students that they expected to dowell on the CLAS open-ended and multiple-choice items. For the most part,teachers tended to think that about half of their students would do well on theopen-ended portion of the assessment, and that a slightly higher proportion woulddo well on the multiple-choice items. Suburban teachers held the highestexpectations for their studentsÕ performance on the multiple-choice items; F(2, 32)= 4.85, p = .014 (see Table 15). On average, suburban teachers, mirroring theirstudentsÕ relative confidence, expected about 75% of their students to do well onthe multiple-choice portion of the assessment. No significant differences werefound by school type in teachersÕ expectations of their studentsÕ performance onopen-ended items.

17
Table 15
Mean Comparisons of TeachersÕ Expectations of HowMany of Their Students Will Perform Well on the CLASby School Type (Teacher Interview Results)
Type of school Open-ended Multiple-choice
Urban 3.87 4.09
Rural 3.83 3.67
Suburban 4.17 5.00
Note. 1 = None, 6 = Almost all.
Observations related to preparedness: Use of time. Because the CLASwas not intended as a timed test, and in fact teachers were instructed to Òmakespecial arrangements for students who are still productively engaged at the end of45 minutes, providing additional time for them to complete their work,Óobservation of the time students actually spent on the assessment provided someindication of their engagement level and the ease with which they completed theassessment. In addition, because an open-ended item appeared first on theassessment, observers were able to note how long students spent on that itemÑor at least whether students spent the time assessment developers had estimatedwas required for a thoughtful response.
Distributions of students in observed classes using at least 15 minutes tocomplete the first open-ended item are shown in Table 16. In general, most
Table 16
Class Distributions: Percentage of Students Using at Least 15 Minutes to AnswerFirst Open-Ended Problem by School Type (CLAS Administration ObservationResults)
Type of schoolA few
studentsAbout 25%of students
About 50%of students
About 75%of students
Almostall students
Urban 4.9 12.2 31.7 14.6 36.6
Rural 0 4.3 4.3 17.4 73.9
Suburban 0 0 0 0 100
Totals 2.4 7.1 16.7 11.9 61.9
18
students (75%-100%) spent at least 15 minutes on this item. However, resultsalso indicate significant differences in schools serving different types ofcommunities, c2(8, N = 84) = 28.92, p < .001. Whereas in 100% of the suburban
classrooms observed, almost all of the students used at least the allotted 15minutes to answer the first open-ended problem, such extended concentration bymost students was observed in only 37% of the urban classrooms. In nearly halfthe urban classrooms, 50% or more of the students were observed to have movedon earlier in the period. Students in rural classrooms more closely resembled thesuburban students, with about three-quarters of the students using the full 15minutes to answer the first problem.
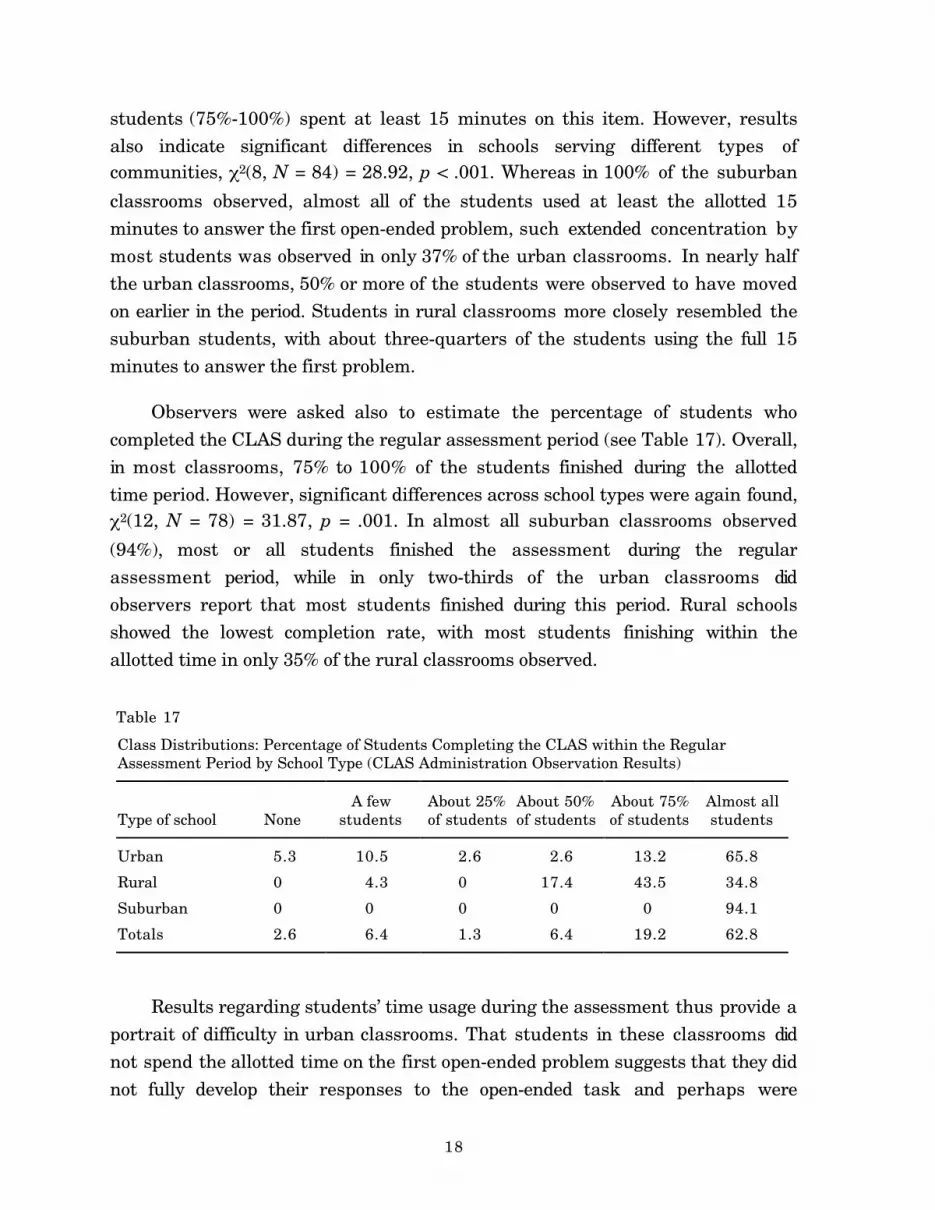
Observers were asked also to estimate the percentage of students whocompleted the CLAS during the regular assessment period (see Table 17). Overall,in most classrooms, 75% to 100% of the students finished during the allottedtime period. However, significant differences across school types were again found,c2(12, N = 78) = 31.87, p = .001. In almost all suburban classrooms observed
(94%), most or all students finished the assessment during the regularassessment period, while in only two-thirds of the urban classrooms didobservers report that most students finished during this period. Rural schoolsshowed the lowest completion rate, with most students finishing within theallotted time in only 35% of the rural classrooms observed.
Table 17
Class Distributions: Percentage of Students Completing the CLAS within the RegularAssessment Period by School Type (CLAS Administration Observation Results)
Type of school NoneA few
studentsAbout 25%of students
About 50%of students
About 75%of students
Almost allstudents
Urban 5.3 10.5 2.6 2.6 13.2 65.8
Rural 0 4.3 0 17.4 43.5 34.8
Suburban 0 0 0 0 0 94.1
Totals 2.6 6.4 1.3 6.4 19.2 62.8
Results regarding studentsÕ time usage during the assessment thus provide aportrait of difficulty in urban classrooms. That students in these classrooms didnot spend the allotted time on the first open-ended problem suggests that they didnot fully develop their responses to the open-ended task and perhaps were

19
frustrated by it. At the same time, urban students were less likely than theirsuburban peers to complete the full assessment in the 45 minutes generallyallocated to it. Where did urban students spend their time? Is it possible that thesestudents spent much more time on the multiple-choice problems, indicating theyhad greater difficulty with these items than students in other schools? It is alsopossible that students revisited their responses to the open-ended tasks later on inthe assessment period, and worked back and forth between the open-ended andmultiple-choice items. Although it also is conceivable that teachers at thedifferent school types reacted differently to the time constraint, influencing howcomfortable students felt in continuing to work past the allotted time period, itdoes appear that students in rural and suburban schools had more efficientstrategies for completing the assessment than did urban students.
Observations related to preparedness: StudentsÕ questions. The kindsof questions students have during the administration of a new assessment providea window on difficulties they may be experiencing. While classroom observationsindicated that students overall did not ask many questions during the CLAS(mean number of questions per classroom = 1.5), there were significant differencesacross school types; F(2, 85) = 3.21, p = .045, in both the frequency and types ofquestions asked (see Table 18). Suburban students asked the most questions andwere far more likely than other groups to pose procedural questions, such asÒWhere do I work the problem out?Ó or ÒWhere do I start the multiple-choice?Ó;c2(10, N = 86) = 25.01, p = .005.
Contrary results were found regarding questions about a key term,Òassumption,Ó which appeared in the directions for the second open-ended task.Students in the suburban classrooms rarely raised questions about the meaningof this term, but in about 40% of urban and rural classrooms, students asked forclarification; c2(8, N = 86) = 15.43, p = .05 (see Table 18). Clearly, since questions
in general tended to be raised less often in rural and urban classrooms than insuburban ones, the different frequency on the ÒassumptionÓ term cannot beattributed to studentsÕ propensities for asking questions. Rather, these findingsseem to indicate that relative to suburban students, students in rural andurban schools are less familiar with an important concept in mathematicalthinking and problem solving. Although this may be a problem of technicalvocabulary, as opposed to underlying conceptual understanding, it is clear that
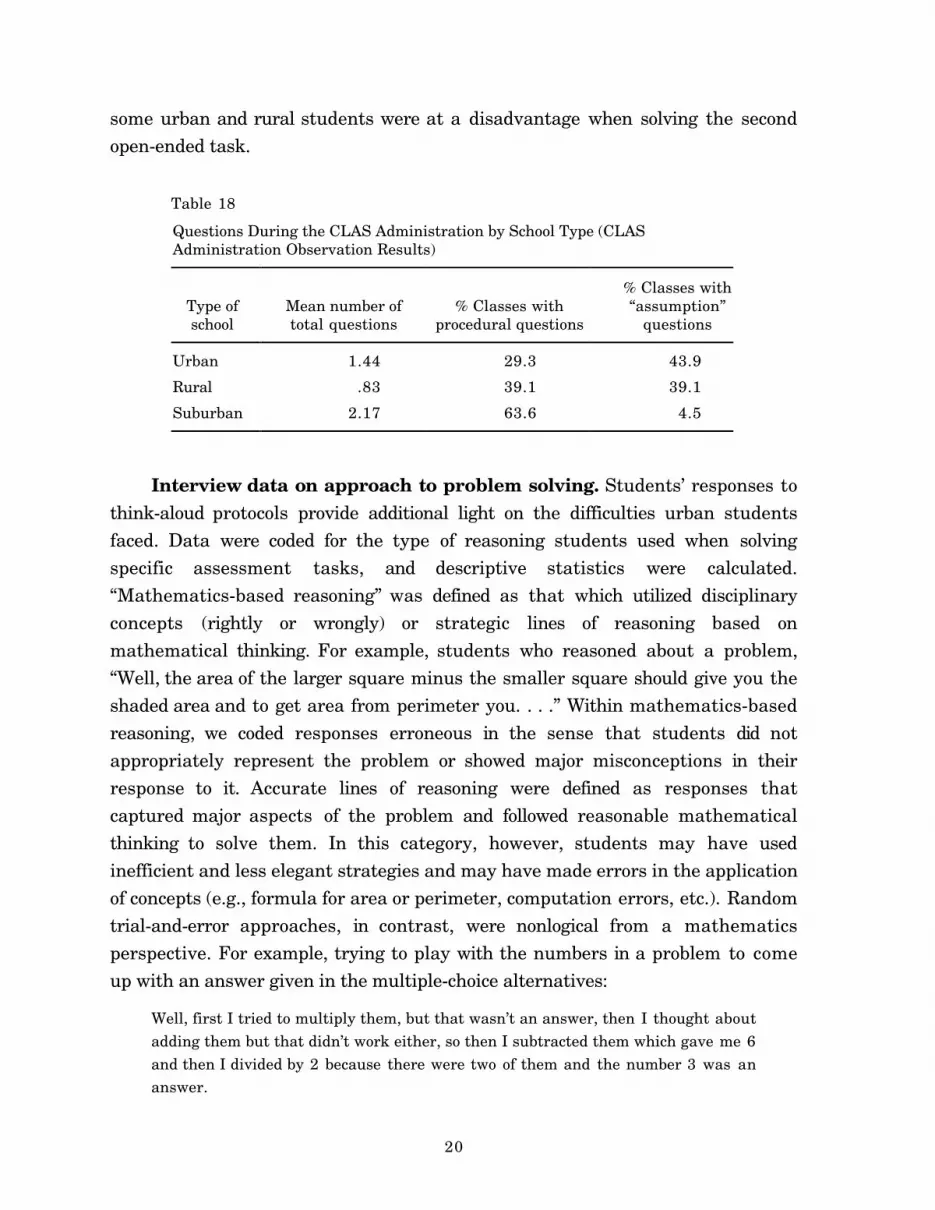
20
some urban and rural students were at a disadvantage when solving the secondopen-ended task.
Table 18
Questions During the CLAS Administration by School Type (CLASAdministration Observation Results)
Type ofschool
Mean number oftotal questions
% Classes withprocedural questions
% Classes withÒassumptionÓ
questions
Urban 1.44 29.3 43.9
Rural .83 39.1 39.1
Suburban 2.17 63.6 4.5
Interview data on approach to problem solving. StudentsÕ responses tothink-aloud protocols provide additional light on the difficulties urban studentsfaced. Data were coded for the type of reasoning students used when solvingspecific assessment tasks, and descriptive statistics were calculated.ÒMathematics-based reasoningÓ was defined as that which utilized disciplinaryconcepts (rightly or wrongly) or strategic lines of reasoning based onmathematical thinking. For example, students who reasoned about a problem,ÒWell, the area of the larger square minus the smaller square should give you theshaded area and to get area from perimeter you. . . .Ó Within mathematics-basedreasoning, we coded responses erroneous in the sense that students did notappropriately represent the problem or showed major misconceptions in theirresponse to it. Accurate lines of reasoning were defined as responses thatcaptured major aspects of the problem and followed reasonable mathematicalthinking to solve them. In this category, however, students may have usedinefficient and less elegant strategies and may have made errors in the applicationof concepts (e.g., formula for area or perimeter, computation errors, etc.). Randomtrial-and-error approaches, in contrast, were nonlogical from a mathematicsperspective. For example, trying to play with the numbers in a problem to comeup with an answer given in the multiple-choice alternatives:
Well, first I tried to multiply them, but that wasnÕt an answer, then I thought aboutadding them but that didnÕt work either, so then I subtracted them which gave me 6and then I divided by 2 because there were two of them and the number 3 was ananswer.
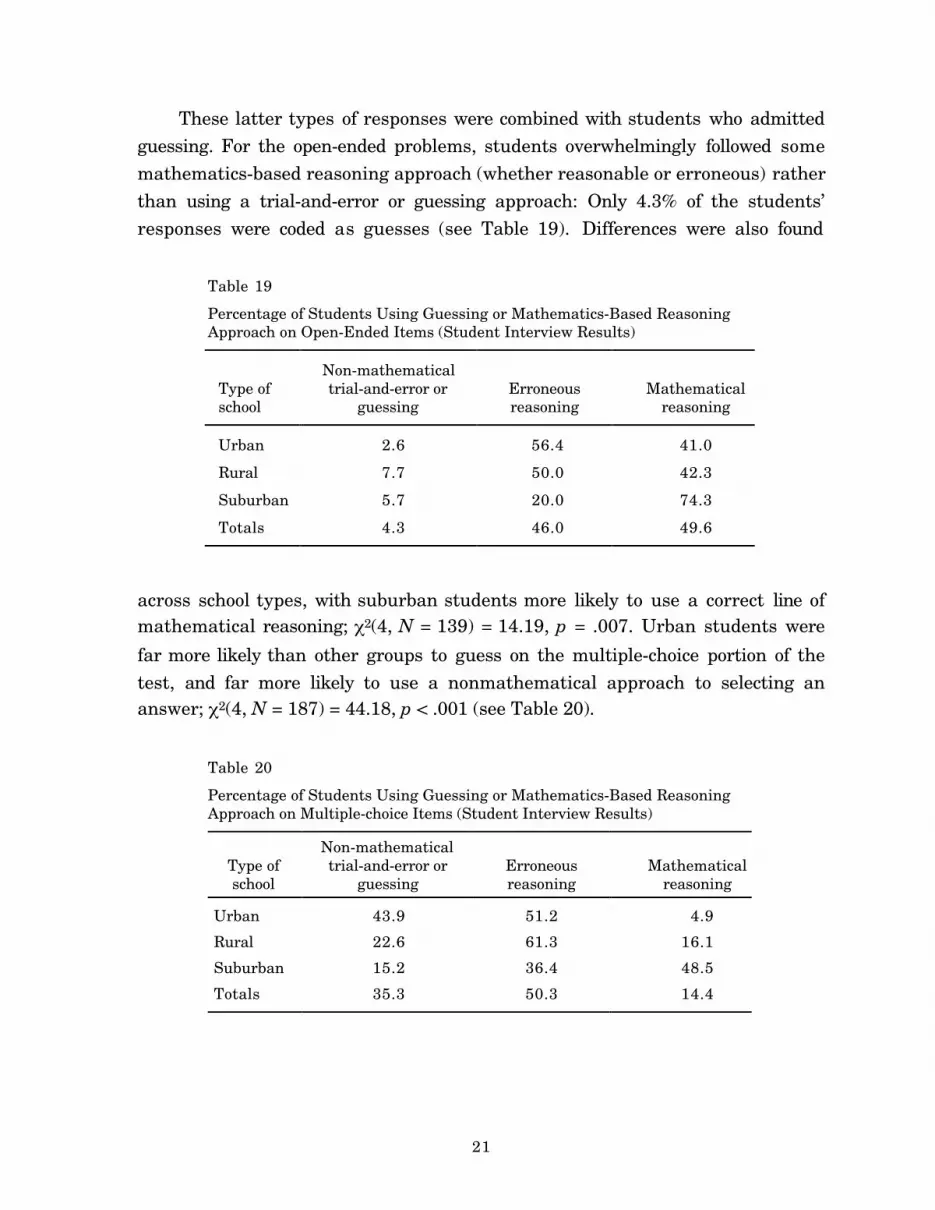
21
These latter types of responses were combined with students who admittedguessing. For the open-ended problems, students overwhelmingly followed somemathematics-based reasoning approach (whether reasonable or erroneous) ratherthan using a trial-and-error or guessing approach: Only 4.3% of the studentsÕresponses were coded as guesses (see Table 19). Differences were also found
Table 19
Percentage of Students Using Guessing or Mathematics-Based ReasoningApproach on Open-Ended Items (Student Interview Results)
Type ofschool
Non-mathematicaltrial-and-error or
guessingErroneousreasoning
Mathematicalreasoning
Urban 2.6 56.4 41.0
Rural 7.7 50.0 42.3
Suburban 5.7 20.0 74.3
Totals 4.3 46.0 49.6
across school types, with suburban students more likely to use a correct line ofmathematical reasoning; c2(4, N = 139) = 14.19, p = .007. Urban students were
far more likely than other groups to guess on the multiple-choice portion of thetest, and far more likely to use a nonmathematical approach to selecting ananswer; c2(4, N = 187) = 44.18, p < .001 (see Table 20).
Table 20
Percentage of Students Using Guessing or Mathematics-Based ReasoningApproach on Multiple-choice Items (Student Interview Results)
Type ofschool
Non-mathematicaltrial-and-error or
guessingErroneousreasoning
Mathematicalreasoning
Urban 43.9 51.2 4.9
Rural 22.6 61.3 16.1
Suburban 15.2 36.4 48.5
Totals 35.3 50.3 14.4
22
Summary and Conclusions
While the findings of our study are far from conclusive, they do raise anumber of important issues in providing to all students the opportunity to learnthe complex mathematical thinking and problem-solving skills that are at theheart of new kinds of mathematics assessments. Our work similarly illustratessome of the difficulties of assessing studentsÕ opportunity to learn and thechallenges of achieving meaningful educational reform. In reviewing our findings,readers will do well to keep in mind the volunteer status of our sample: That ourschools volunteered to take on more testing and effort in a special pilot study forthe state probably bespeaks their support and enthusiasm for the CLAS and thetypes of instruction and learning it emphasized. As a result, we suspect that ourfindings on opportunity to learn are likely to be rosier than they would be in a moretypical sample.
Thus, perhaps it is not surprising that a majority of teachers in the samplealready engage their students at least weekly in many of the instructionalactivities that the CLAS is intended to encourage: word problems, problems thatcan be solved in more than one way, problems that require extended writing, use ofcalculators, problems that require students to think critically, and small-groupwork. However, students perceive that other types of activities associated with athinking curriculum are less prevalent. Problems in which students explain theirthinking, oral representations, projects that take a week or more to complete, useof manipulatives, and real-life problems are less visible in the curriculum. As anadditional indicator of routine classroom practice, work with computations wasthe most frequently occurring activity of those queried, and teachers clearlyexpected their students to do less well on innovative open-ended items than ontraditional multiple-choice ones.
Given the equity impetus to our inquiry, it is encouraging that we did not findconsistent differences across school types in studentsÕ opportunity to learn. Thosedifferences that did emerge, however, represent teaching and learning issues ofsignificant consequence. On the one hand, contrary to the fears of some, urbanstudents in our sample were not limited to a meager Òdrill and killÓ curriculum, andin fact they and their rural peers appeared more likely than suburban students tobe engaged in constructivist instructional practices associated with recentcurriculum reforms (Resnick & Klopfer, 1989). Nonetheless, students in urban

23
classrooms were also more likely to have questions about a key concept inmathematical thinking, Òassumption,Ó and were less likely to have access torecent texts, raising questions about the depth of their preparation. Our suburbanstudents clearly felt better prepared for the assessment, and observations andthink-aloud protocol data strongly accentuate suburban studentsÕ preparednessrelative to their urban peers.
While we did not find differences by school types in teachersÕ backgrounds,the educational background of our teacher sample does raise basic questionsabout their expertise in the mathematics they are expected to teach. Half of thesample have neither an undergraduate major or minor in mathematics, and in oursample, only 25% of our math teachers had actually majored in math or matheducation during their college work. One must wonder, therefore, where suchteachers could have acquired the knowledge and sophisticated understanding ofmathematics required to fully support their studentsÕ developing understanding:Constructivist practices require teachers who can pose appropriate problems,probe, and respond productively to their studentsÕ mathematical thinking andreasoning. Such teaching requires grounding in the disciplineÑin the concepts,principles, and ways of thinking mathematically. While heartening to see that amajority of teachers had participated recently in professional development formathematics and mathematics education, one also wonders whether 40 hours orso of training is sufficient to provide teachers with the mathematical backgroundand capacity they need to implement the reform agenda for mathematicseducation. Lacking solid understanding or other access to expertise, how can suchteachers be expected to teach to rigorous mathematical standards?
That many teachers lack extensive background in mathematics,furthermore, intensifies the impact of insufficiencies in other resources. Forexample, when teachers themselves do not have abundant content knowledge,they become more dependent on texts for the content and activities of theirinstruction (Flanders, 1994), even though many instructional reformers adviseagainst overreliance on texts in instruction (Farnsworth, 1992). That students inurban classrooms were less likely than those in rural and suburban classrooms tohave recent mathematics texts, therefore, takes on added importance as anindicator of the opportunity to learn. Differences in homework frequency isanother example of an isolated finding of differences among schools, but one with
24
significant repercussions: Substantial differences in weekly time engaged inhomework translates into very significant differences in time engaged in learning,applying, and practicing mathematics over the course of a yearÑassuming ofcourse that homework assignments are meaningful and not trivial.
That urban students are clearly struggling despite data suggesting they areinvolved in innovative instructional practices raises questions about both thequality of our opportunity-to-learn measures and the quality of those instructionalpractices. Although, on one hand, the relationships between materials analysisand student reports are encouraging, differences between teacher and studentreports suggest that some of the answers one gets depend on whom one asks.Teacher and student reports were generally consistent in relative differencesacross school types, but the absolute level and frequency of activity reported bythese two sources often differed substantially. Whose views best represent realityand what other kinds of data are necessary to assure valid inferences about theopportunity to learn are serious methodological questions requiring additionalattention.
At best, our current measures provide data on the relative presence orabsence of various aspects of opportunity to learn and are silent on the quality ofimplementation. For example, how well are teachers involving students incooperative group activity? When urban teachers engage their students inextended explanations, do students receive appropriate feedback that enablesthem to understand possible misconceptions and deepen their mathematicsknowledge and thinking? Our current measures give precedence to form oversubstance. Given even the little data we have about studentsÕ performances,coupled with that on teachersÕ content background, we wonder whether currentinstructional practice similarly is more form than substance. Ultimately both ourmeasures and, more importantly, the opportunities they seek to assess, mustreflect the latterÑnot only opportunities, but high-quality opportunities that trulysupport student learning.

25
References
California Department of Education. (1989). A question of thinking: A first look atstudentsÕ performance on open-ended questions in mathematics. Sacramento,CA: Author.
California Department of Education. (1992). Mathematics framework forCalifornia public schools. Sacramento, CA: Author.
Cronbach, L. J. (1951). Coefficient alpha and the internal structure of tests.Psychometrika, 16, 297-334.
Farnsworth, W. E. (1992, May). In teaching science, let the textbook support theclasswork, not vice-versa. Scientist, 6(11), 12.
Flanders, J. R. (1994, May). Textbooks, teachers and the SIMS test. Journal forResearch in Mathematics Education, 25, 260-278.
Herman, J. L., & Dorr-Bremme, D. (1983). Uses of testing in the schools: Anational profile. New Directions for Testing and Measurement, 19, 7-17.
Herman, J. L., & Golan, S. (1991). Effects of standardized testing on teachers andlearningÑAnother look (CSE Tech. Rep. No. 334). Los Angeles: University ofCalifornia, Center for Research on Evaluation, Standards, and StudentTesting.
Herman, J. L., Klein, D. C. D., Heath, T. M., & Wakai, S. T. (1994). A first look: Areclaims for alternative assessment holding up (CSE Tech. Rep. No. 391). LosAngeles: University of California, Center for Research on Evaluation,Standards, and Student Testing.
Kellaghan, T., & Madaus, G. F. (1991). National testing: Lessons for America fromEurope. Educational Leadership, 49(3), 87-93.
Madaus, G. F. (1991). The effects of important tests on students: Implications fora national examination system. Phi Delta Kappan, 73, 226-231.
Resnick, L. B., & Klopfer, L. E. (1989). Toward the thinking curriculum: Anoverview. In L. B. Resnick & L. E. Klopfer (Eds.), Toward the thinkingcurriculum: Current cognitive research (1989 Yearbook of the Association forSupervision and Curriculum Development) (pp. 1-18). Alexandria, VA:Association for Supervision and Curriculum Development (ASCD).
Shepard, L. (1991). Will national tests improve student learning? Phi DeltaKappan, 73, 232-238.
Smith, M. L., & Rottenberg, C. (1991). Unintended consequences of externaltesting in elementary schools. Educational Measurement: Issues and Practice,10, 7-11.