Embed Size (px)
Citation preview
OPPORTUNITY,RESPONSIBILITY,
AND SECURITYA CONSENSUS PLAN FOR REDUCING POVERTY
AND RESTORING THE AMERICAN DREAM
AEI/Brookings Working Group on Poverty and Opportunity
Members of the AEI/BrookingsWorking Group on Poverty and Opportunity
LAWRENCE ABER, Willner Family Professor of Psychology and Public Policy, New York University
STUART BUTLER, Senior Fellow in Economic Studies, Brookings Institution SHELDON DANZIGER, President, Russell Sage Foundation
ROBERT DOAR, Morgridge Fellow in Poverty Studies, American Enterprise Institute
DAVID T. ELLWOOD, Scott M. Black Professor of Political Economy, Harvard University
JUDITH M. GUERON, President Emerita, MDRC
JONATHAN HAIDT, Thomas Cooley Professor of Ethical Leadership, New York University
RON HASKINS, Cabot Family Chair and Senior Fellow, Economic Studies, Brookings Institution
HARRY J. HOLZER, Professor of Public Policy, Georgetown University
KAY HYMOWITZ, William E. Simon Fellow, Manhattan Institute for Policy Research
LAWRENCE MEAD, Professor of Politics and Public Policy, New York University
RONALD MINCY, Maurice V. Russell Professor of Social Policy and Social Work Practice, Columbia University
RICHARD V. REEVES, Senior Fellow in Economic Studies, Brookings Institution
MICHAEL R. STRAIN, Deputy Director of Economic Policy Studies and Resident Scholar, American Enterprise Institute
JANE WALDFOGEL, Compton Foundation Centennial Professor for the Prevention of Children and Youth Problems, Columbia University
The American Enterprise Institute for Public Policy Research (AEI) and the Brookings Institution are nonpartisan, not-for-profit, 501(c)(3) educational organizations. The views expressed in AEI and Brookings publications are those of the authors. AEI and Brookings do not take institutional positions on any issues.
© 2015 by the American Enterprise Institute for Public Policy Research and the Brookings Institution. All rights reserved.
OPPORTUNITY,RESPONSIBILITY,
AND SECURITYA CONSENSUS PLAN FOR REDUCING POVERTY
AND RESTORING THE AMERICAN DREAM
AEI/Brookings Working Group on Poverty and Opportunity
05
07
16
42
70
30
54
7484
EXECUTIVE SUMMARY
CHAPTER 1. INTRODUCTION
CHAPTER 2. THE FACTS
CHAPTER 4. WORK
CHAPTER 6. THE WAY FORWARD
CHAPTER 3. FAMILY
CHAPTER 5. EDUCATION
ENDNOTES
BRIEF BACKGROUND OF WORKING GROUP MEMBERS
Table of Contents
List of Figures
F.1
F.4B
F.3
F.5
F.7
F.9
F.2
F.4C
F.4A
F.6
F.8
F.10
OFFICIAL POVERTY RATES FOR CHILDREN IN SINGLE-MOTHER HOUSEHOLDS, ALL CHILDREN, AND THE ELDERLY, 1959–2014
PERCENTAGE OF BIRTHS TO UNMARRIED WOMEN BY RACE/ETHNICITY, 1970–2010
INCOME QUINTILE OF CHILDREN WHEN THEY GROW UP RELATIVE TO THEIR PARENTS’ INCOME QUINTILE
EMPLOYMENT-TO-POPULATION RATIO FOR SELECTED POPULATIONS, 1980–2013
CUMULATIVE CHANGES IN REAL HOURLY WAGES OF WOMEN, BY INCOME PERCENTILE, 1979–2012
MEDIAN FAMILY INCOME OF ADULTS AGE 30-39 BY EDUCATION LEVEL, 1964–2014
POVERTY RATES UNDER THE OFFICIAL POVERTY MEASURE, THE COLUMBIA POVERTY MEASURE, AND THE CONSUMPTION-BASED POVERTY MEASURE, 1967–2012
CHANGES IN WOMEN’S FAMILY STRUCTURE AT AGE 35, 1970–2010
PERCENTAGE OF WOMEN MARRIED BY AGE, 1970–2010
CUMULATIVE CHANGES IN REAL HOURLY WAGES OF MEN, BY INCOME PERCENTILE, 1979–2012
EFFECT OF EARNINGS, TRANSFERS, AND TAXES ON THE POVERTY RATE AMONG HOUSEHOLDS HEADED BY SINGLE MOTHERS, 1987–2013
TREND IN 90/10 INCOME GAP IN READING, 1943–2001 COHORTS
Page 17
Page 20
Page 19
Page 24
Page 25
Page 28
Page 18
Page 21
Page 20
Page 24
Page 26
Page 29

{5}
As America recovers slowly from the Great Reces-sion, many of our fellow citizens remain mired in poverty. Economic trends, cultural changes, and
changes in family and marriage patterns are combining in new ways that make it harder for those born on the bottom rungs of the economic ladder to lift themselves up. Poverty is changing, and policy responses must change too.
One ray of hope is that Republicans and Democrats are increasingly talking about the intertwined problems of poverty and opportunity. But even if all agree that Amer-ica must act, our growing political polarization and legis-lative gridlock make action seem ever less likely with each passing year.
The only way forward, we believe, is to work together. No side has a monopoly on the truth, but each side can block legislative action. We therefore created a working group of top experts on poverty, evenly balanced between pro-gressives and conservatives (and including a few cen-trists). We obtained sponsorship and financial support from the American Enterprise Institute, the Brookings Institution, the Annie E. Casey Foundation, and the Ford Foundation. We worked together for fourteen months, drawing on principles designed to maximize civility, trust, and open-mindedness within the group. We knew that the final product would reflect compromises made by people of good will and differing views.
This is our report. In addition to the political diversity of its authors, our report is unusual in a second way: it is based on shared values. While working together, we discovered that the key to our cooperation was to recognize that pol-icy is often infused with moral values, and we identified three that we believe all Americans share: opportunity, responsibility, and security. We explain these values in the first chapter of the report, and we show how our rec-ommendations will help America and its citizens live up to these values. In Chapter 2, we offer a state-of-the-art review of what we know about poverty in America today, including several alarming trends that current policies either aren’t improving or are actively making worse.
The third way our report is unusual is that we identify three domains of life that interlock so tightly that they must be studied and improved together: family, work, and educa-tion. Those topics comprise Chapters 3, 4, and 5 of the report. In brief, we make twelve recommendations (each explained more fully in the report):
To strengthen families in ways that will prepare children for success in education and work:
1) Promote a new cultural norm surrounding parent-hood and marriage.
2) Promote delayed, responsible childbearing.3) Increase access to effective parenting education.4) Help young, less-educated men and women prosper
in work and family.
To improve the quantity and quality of work in ways that will better prepare young people—men as well as women—to assume the responsibilities of adult life and parenthood:
1) Improve skills to get well-paying jobs.2) Make work pay more for the less educated.3) Raise work levels among the hard-to-employ,
including the poorly educated and those with criminal records.
4) Ensure that jobs are available.
To improve education in ways that will better help poor children avail themselves of opportunities for self- advancement:
1) Increase public investment in two underfunded stages of education: preschool and postsecondary.
2) Educate the whole child to promote social-emo-tional and character development as well as academic skills.
3) Modernize the organization and accountability of education.
4) Close resource gaps to reduce education gaps.
In our final chapter, we discuss the costs of our propos-als, and how the nation might pay for this comprehensive approach to reducing poverty and enhancing opportuni-ty. We close with a call for America to live up to its noble identity and highest values, or, in the words of Abraham Lincoln: “to clear paths of laudable pursuit for all; to afford all an unfettered start, and a fair chance, in the race of life.”
Executive Summary


Chapter 1: Introduction
In 1931, the writer James Truslow Adams coined the term “The American Dream.” His definition holds up well today. The dream, he said, is of a land in which:
life should be better and richer and fuller for every-one, with opportunity for each according to ability or achievement. It is a difficult dream for the European upper classes to interpret adequately, and too many of us ourselves have grown weary and mistrustful of it. It is not a dream of motor cars and high wages merely, but a dream of social order in which each man and each woman shall be able to attain to the fullest stature of which they are … capable, and be recognized by others for what they are, regardless of the fortuitous circumstances of birth or position.1
{8}
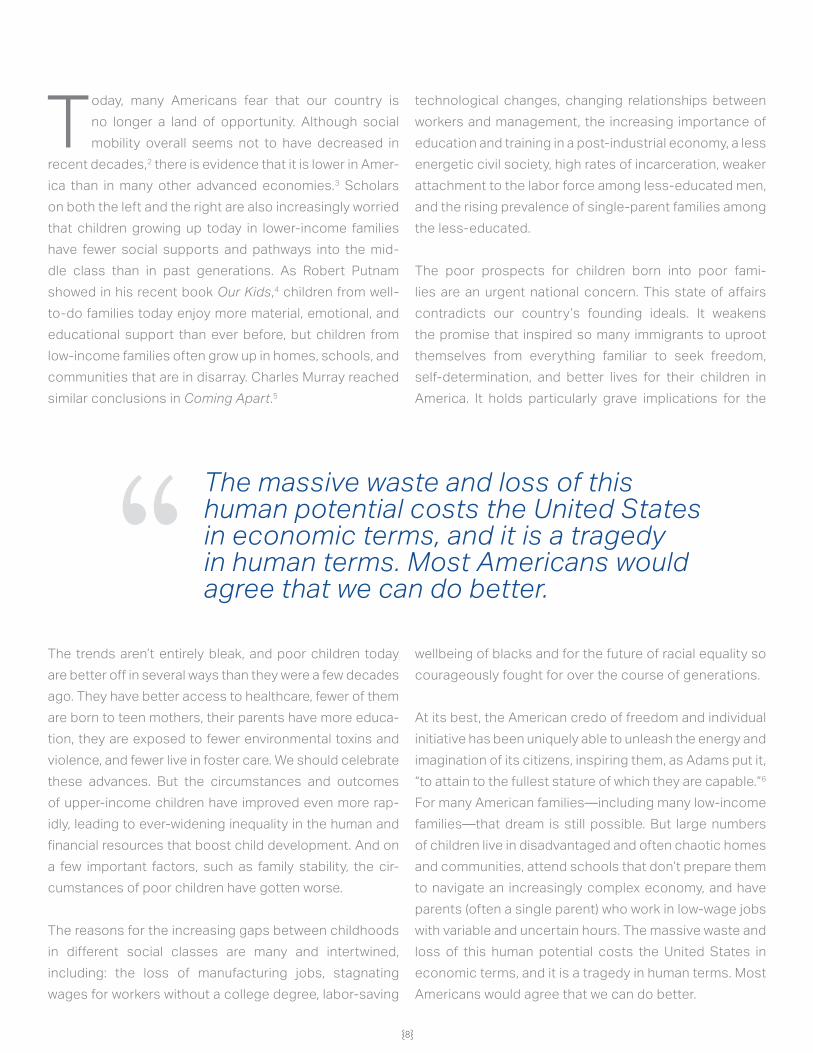
Today, many Americans fear that our country is no longer a land of opportunity. Although social mobility overall seems not to have decreased in
recent decades,2 there is evidence that it is lower in Amer-ica than in many other advanced economies.3 Scholars on both the left and the right are also increasingly worried that children growing up today in lower-income families have fewer social supports and pathways into the mid-dle class than in past generations. As Robert Putnam showed in his recent book Our Kids,4 children from well-to-do families today enjoy more material, emotional, and educational support than ever before, but children from low-income families often grow up in homes, schools, and communities that are in disarray. Charles Murray reached similar conclusions in Coming Apart.5
The trends aren’t entirely bleak, and poor children today are better off in several ways than they were a few decades ago. They have better access to healthcare, fewer of them are born to teen mothers, their parents have more educa-tion, they are exposed to fewer environmental toxins and violence, and fewer live in foster care. We should celebrate these advances. But the circumstances and outcomes of upper-income children have improved even more rap-idly, leading to ever-widening inequality in the human and financial resources that boost child development. And on a few important factors, such as family stability, the cir-cumstances of poor children have gotten worse.
The reasons for the increasing gaps between childhoods in different social classes are many and intertwined, including: the loss of manufacturing jobs, stagnating wages for workers without a college degree, labor-saving
technological changes, changing relationships between workers and management, the increasing importance of education and training in a post-industrial economy, a less energetic civil society, high rates of incarceration, weaker attachment to the labor force among less-educated men, and the rising prevalence of single-parent families among the less-educated.
The poor prospects for children born into poor fami-lies are an urgent national concern. This state of affairs contradicts our country’s founding ideals. It weakens the promise that inspired so many immigrants to uproot themselves from everything familiar to seek freedom, self-determination, and better lives for their children in America. It holds particularly grave implications for the
wellbeing of blacks and for the future of racial equality so courageously fought for over the course of generations.
At its best, the American credo of freedom and individual initiative has been uniquely able to unleash the energy and imagination of its citizens, inspiring them, as Adams put it, “to attain to the fullest stature of which they are capable.”6 For many American families—including many low-income families—that dream is still possible. But large numbers of children live in disadvantaged and often chaotic homes and communities, attend schools that don’t prepare them to navigate an increasingly complex economy, and have parents (often a single parent) who work in low-wage jobs with variable and uncertain hours. The massive waste and loss of this human potential costs the United States in economic terms, and it is a tragedy in human terms. Most Americans would agree that we can do better.
The massive waste and loss of this human potential costs the United States in economic terms, and it is a tragedy in human terms. Most Americans would agree that we can do better.“
{8} {9}
The political difficulty arises when we turn to solutions. Most new ideas for helping the poor are controversial and expensive, and when one political party offers a proposal, the other party usually disagrees with its premises or specifics. The parties often have deep philosophical dif-ferences, but research also shows that the mere fact that one party proposes an idea can motivate partisans on the other side to dismiss it.7 And yet, points of agreement are emerging that could serve as a foundation for consensus. Most Americans and their political representatives tend to agree on several key points. First, for able-bodied Amer-icans, it is far better to earn money than to depend on public assistance, although economic conditions some-times prevent people from becoming self-sufficient. Sec-ond, children are on average better off growing up with two parents committed to each other for the long term, an arrangement most likely to occur within the context of marriage. And third, our schools don’t adequately pre-pare the young for the economic and social environment in which they must make their way.
THE AEI-BROOKINGS WORKING GROUP
The authors of this report have come together to build on that consensus and propose a plan of action that will reduce poverty and improve opportunities for those at the bottom. Our report has three distinctive features. The first is the diversity of our perspectives and experiences. Some of us have served in Republican administrations or closely advised Republican candidates; others have done the same for Democrats. Some of us identify as conser-vatives, others as progressives, and others as centrists or nonpartisans. Some of us are economists, others are sociologists, others are psychologists. We share an intense belief that poverty and opportunity are profoundly consequential and that our nation’s future prosperity and our common humanity compel us to work together to find credible strategies to reduce poverty and increase eco-nomic mobility.
Most of us have spent our careers studying and evalu-ating the many policies tried since the War on Poverty began in the 1960s. We agree that some of those policies
had disappointing results, but even the failures have taught us important lessons. We also agree that many of these programs and policies have worked as intended, demonstrating the value of public policy that is carefully implemented and evaluated. As policy analysts and social scientists, we share a commitment to collecting empirical evidence and then developing and revising public policy based on that evidence. We differ on many issues. Yet while working together for the past year, we have come to respect one another’s sincerity and value each other’s ideas.
The second unique feature of our report is that we con-sider three major domains of life simultaneously: family, work, and education. Many individuals and groups have addressed each of these challenges separately. But as we show in this report, they are highly interconnected. Improving family stability helps children succeed in school; improving the fit between schools and jobs helps teenagers transition into the labor force; when young people can find work that pays well, they create more sta-ble families, and the cycle continues. In each of our three main chapters—on family, work, and education—we illus-trate these and many other links, and we propose policies that create synergies among the three domains.
Our report’s third distinctive feature is that it is grounded in values—the three broadly shared American values of opportunity, responsibility, and security. Focusing on these shared values has made it easier for us to work together and find many points of agreement. If our diverse group can come together to support a comprehensive and far-reaching set of proposals, based on shared val-ues, we believe our report can find support across the political spectrum in Washington and in state capitals.
AMERICAN VALUES: OPPORTUNITY, RESPONSIBILITY, AND SECURITY
When people talk about family, work, and education, they often talk as much about morals as about facts and pol-icies. Citizens and politicians from the left and the right often invoke different values, which are linked to different

{11}
theories about what causes poverty. But rather than become paralyzed by these conflicts, we believe that differences can be fruitful. Neither side has a monopoly on the truth; neither side has a complete explanation for poverty; neither side fully understands what factors pro-mote economic mobility. A comprehensive approach to the problem should draw on the best ideas from all sides.
We were particularly heartened when the same three val-ues recurred throughout our discussions: opportunity, responsibility, and security. The vast majority of Americans endorse these three values, at least in principle. When policy recommendations are grounded firmly in these widely shared values, they become more immediately understandable and more politically achievable. Because we have crafted our discussions of family, education, and work in terms of these values, we must explain what we mean by them before we present our recommendations.
OPPORTUNITY
The concept of “opportunity” draws nearly universal sup-port among Americans, and it’s the core concept of the American Dream. We endorse Truslow Adams’ definition of opportunity as the state of affairs when “each man and each woman shall be able to attain to the fullest stature of which they are capable,” regardless of the circumstances of their birth.8 America didn’t initially offer opportunity, in this sense, to all its residents. Any American whose skin wasn’t white was subject to severe discrimination, often supported and sometimes even promoted by govern-ment. But the Civil War and, much later, the civil rights movement and other rights movements have brought us closer to our ideal. We now broadly agree that discrimi-nation against anyone on the basis of race, sex, religion, or sexual orientation is unacceptable, even if it remains much too common in practice.
Of course, in a free society with a free market, some families will end up far wealthier than others, and some parents will be more inclined or more able than others to prepare their children to grasp the opportunities that will come their way. Children don’t begin life or education at
the same starting line, and the question of how much the government should do to narrow the gaps in opportunity is a difficult one. Progressives generally believe that gov-ernment should be more active and can be more effec-tive than do conservatives. But this difference shouldn’t obscure the fact that nearly all Americans would pre-fer to live in a society in which opportunities for self- advancement are more widely available, especially to those at the bottom of the income distribution, than is now the case.9
RESPONSIBILITY
America is a free society, but freedom comes with respon-sibilities. Responsibility is the state of being accountable for things over which one has control, or has a duty of care. Family life is a network of mutual responsibilities. So is work life. So is democratic citizenship. When peo-ple fail in their responsibilities, they should shoulder the blame—unless it’s clear that they tried hard to meet their responsibilities but were overwhelmed by forces beyond their control.
The values of responsibility and opportunity are closely linked in the American mind. We can see the link in a line from President Clinton’s 1993 Labor Day speech that has had bipartisan resonance:
We’ll think of the faith of our parents that was in-stilled in us here in America, the idea that if you work hard and play by the rules, you’ll be rewarded with a good life for yourself and a better chance for your children.10
The converse of this assertion is that if you fail to be responsible—if you don’t work hard or don’t play by the rules, then you aren’t entitled to a reward. These linked values of responsibility and opportunity were the linch-pins of the bipartisan welfare reform law of 1996—whose official name included both “Personal Responsibility” and “Opportunity.”11
{12}
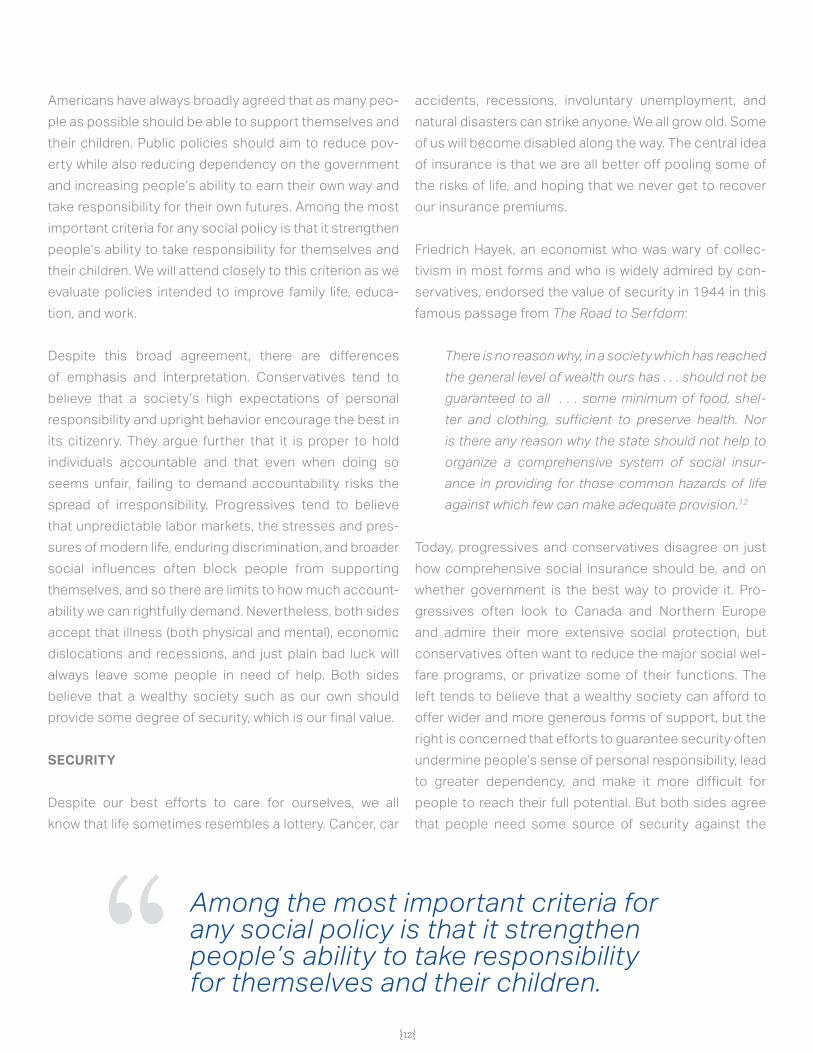
Americans have always broadly agreed that as many peo-ple as possible should be able to support themselves and their children. Public policies should aim to reduce pov-erty while also reducing dependency on the government and increasing people’s ability to earn their own way and take responsibility for their own futures. Among the most important criteria for any social policy is that it strengthen people’s ability to take responsibility for themselves and their children. We will attend closely to this criterion as we evaluate policies intended to improve family life, educa-tion, and work.
Despite this broad agreement, there are differences of emphasis and interpretation. Conservatives tend to believe that a society’s high expectations of personal responsibility and upright behavior encourage the best in its citizenry. They argue further that it is proper to hold individuals accountable and that even when doing so seems unfair, failing to demand accountability risks the spread of irresponsibility. Progressives tend to believe that unpredictable labor markets, the stresses and pres-sures of modern life, enduring discrimination, and broader social influences often block people from supporting themselves, and so there are limits to how much account-ability we can rightfully demand. Nevertheless, both sides accept that illness (both physical and mental), economic dislocations and recessions, and just plain bad luck will always leave some people in need of help. Both sides believe that a wealthy society such as our own should provide some degree of security, which is our final value.
SECURITY
Despite our best efforts to care for ourselves, we all know that life sometimes resembles a lottery. Cancer, car
accidents, recessions, involuntary unemployment, and natural disasters can strike anyone. We all grow old. Some of us will become disabled along the way. The central idea of insurance is that we are all better off pooling some of the risks of life, and hoping that we never get to recover our insurance premiums.
Friedrich Hayek, an economist who was wary of collec-tivism in most forms and who is widely admired by con-servatives, endorsed the value of security in 1944 in this famous passage from The Road to Serfdom:
There is no reason why, in a society which has reached the general level of wealth ours has . . . should not be guaranteed to all . . . some minimum of food, shel-ter and clothing, sufficient to preserve health. Nor is there any reason why the state should not help to organize a comprehensive system of social insur-ance in providing for those common hazards of life against which few can make adequate provision.12
Today, progressives and conservatives disagree on just how comprehensive social insurance should be, and on whether government is the best way to provide it. Pro-gressives often look to Canada and Northern Europe and admire their more extensive social protection, but conservatives often want to reduce the major social wel-fare programs, or privatize some of their functions. The left tends to believe that a wealthy society can afford to offer wider and more generous forms of support, but the right is concerned that efforts to guarantee security often undermine people’s sense of personal responsibility, lead to greater dependency, and make it more difficult for people to reach their full potential. But both sides agree that people need some source of security against the
Among the most important criteria for any social policy is that it strengthen people’s ability to take responsibility for themselves and their children.“
{12} {13}
vicissitudes of life. Both sides realize that there will always be some individuals who can’t care for themselves, for reasons beyond their control. Both sides are particularly concerned about children who, through no fault of their own, are being raised in terrible circumstances. We don’t blame or punish children for the faults, bad luck, or even the irresponsibility of their parents.
In fact, several decades of research show that increas-ing security for children can better prepare them to break the cycle of poverty and grow up to be more responsi-ble adults. A child’s brain is highly malleable. In the early years, when it is growing rapidly, the young brain responds to cues about the kind of environment that surrounds it. When children are raised in a chaotic and unpredictable environment, they become more attracted to immediate rewards, rather than larger but more distant rewards.13 Why invest in the future when the future is so uncertain? Chronic stress and unpredictability can cause substantial changes in children’s brains and therefore in their behav-ior, in ways that may impede later success in education, work, and the creation of stable families.14 The docu-mented effects include greater aggression and antisocial behavior for boys, and earlier menarche, sexual activity, and pregnancy for girls.15 Although children have great resilience and the capacity to overcome their early envi-ronment, some children—especially if they don’t have the benefit of interventions that reduce the stress to which they are exposed—are overwhelmed by early stress and trauma and suffer permanent damage.16
Conversely, when children are raised in more stable and predictable environments, they are more likely to learn that it pays to defer gratification and reap larger rewards in the future. Low stress, high predictability, and strong, stable relationships with caring adults all help children become measurably better at self-regulating, delaying gratification, and controlling their impulses.17 If we want adult citizens who can exercise responsibility, we should do as much as we can to improve the security of childhood, especially among the poor. Small investments in security could lead to large dividends in children’s later self-sufficiency.
We strongly and unanimously agree on one final point: stronger economic growth would contribute greatly to our goals of reducing poverty and improving mobility. Indeed, the strong economic growth we enjoyed in the roughly 25 years after World War II and more briefly in the middle to late 1990s helped generate the large poverty reductions and income growth that we experienced in those periods. Greater productivity growth in the U.S., which has lagged in the past decade (as it did in the 1970s and 1980s), would help raise real wages, while robust employment growth for the economy overall would certainly improve employment and earnings for lower-income groups.
Our report focuses on social and education policy, not on macroeconomics or other policy inducements to bolster efficiency and growth. Still, we believe that all of our rec-ommendations would be more successful in the context of a growing and vibrant economy, which we view as a top national priority.
THE STRUCTURE OF THIS REPORT
These three values guide the rest of our report. We offer a comprehensive plan for reducing poverty and promoting economic opportunity in the United States. In each chapter, we evaluate the best evidence about current approaches and then recommend policies that will increase opportu-nity, encourage people to take greater responsibility for their own lives, and increase security, especially among lower-income Americans and their children.
In Chapter 2, we report on where things stand now. What is the nature of poverty and economic opportunity in Amer-ica in 2015, and how has it changed since the 1960s? Is it true that America has less economic mobility than other nations? We conclude that the most alarming trends are the increasing gap in educational achievement between poor kids and rich kids; the increase in families headed by only one parent; the decline of work among men, espe-cially young black men; unstable work and work hours; stagnating wages; and high rates of incarceration.
{14}
The four decades of trends in family composition we review in Chapter 2 show that more and more children live in single-mother families, primarily because marriage rates have fallen and nonmarital birth rates have skyrock-eted. That change contributes greatly to the nation’s pov-erty rate; mothers and children in single-mother families are five times as likely to be poor as those in two-parent families. Children in single-mother families also experi-ence an array of developmental problems at much higher rates than children in married-couple families. Although there likely aren’t any quick fixes to increase the share of our children growing up with their married parents, in Chapter 3 we outline four policies that can begin to move the nation’s families toward greater stability and more effective childrearing. We propose a public interest cam-paign that would promote stable, two-parent families; pol-icies to increase effective contraception by couples who aren’t ready for children; programs to promote parenting skills among low-income parents; and programs to help young men with low earnings increase their education, employment, and family involvement.
It’s no surprise that our group unanimously placed employ-ment at the center of any national strategy to reduce poverty and increase mobility. But with a few exceptions, especially the second half of the 1990s, the nation’s labor market has been weak since 1979. Three problems are especially important: the share of men who have jobs has been declining; wages have been flat or growing slowly since roughly the 1970s, especially among workers in the bottom half of the wage distribution; and incarcera-tion rates, especially among black men, grew relentlessly until 2008 and remain at a very high level. Realizing that we face a difficult job market with low workforce attach-ment by some groups, in Chapter 4 we outline four sets of consensus policies that offer real hope for increasing employment and wages and thereby reducing poverty and increasing mobility. The first set of policies aims to increase the skills of low-income workers and their chil-dren; the second to make work pay better than it does now for less-educated workers; the third to expand work requirements and opportunities for the hard-to-employ
while simultaneously maintaining a work-based safety net for the most vulnerable; and the fourth to ensure that jobs are available.
If employment is central to our goals of reducing poverty and increasing mobility, education is central to improving the employment rate and wages of the disadvantaged. As we show in Chapter 2, for at least the past four decades, adults’ education levels have been increasingly associ-ated with their income. Those with less than a postsec-ondary education or a credential or certificate leading to a good job are falling further behind those who pos-sess these tickets to success in our twenty-first century economy. Moreover, the gap in educational attainment between children from well-to-do families and those from poor families has been growing. These two devel-opments led us to agree that unless we take action to close the education gap, it will be difficult to substantially reduce poverty or increase economic mobility. We make four sets of recommendations in Chapter 5 about how to close the education gap. These include increasing invest-ment in preschool and postsecondary education, pro-moting social-emotional and character development as well as academic skills, modernizing the organization and accountability of education, and closing the resource gap between schools that serve children from middle-class and poor families.
In the final chapter, we summarize our recommendations and suggest how the nation can pay for the policies we propose. We also lay out a path by which our recommen-dations might be carried out, evaluated, and improved, despite America’s political polarization.
We offer this report with our unanimous endorsement. This doesn’t mean that each one of us agrees with every claim the report makes and supports every specific policy rec-ommendation. Such unanimity could never be obtained from an intellectually diverse group for a report that is as comprehensive and detailed as ours. Rather, we all believe that America must take vigorous action to surmount the problems of poverty and stagnant economic opportunity.

{14} {15}
We all recognize that America is growing increasingly polarized18 along partisan lines, but we don’t accept the defeatist conclusion that polarization must preclude cooperation between conservatives and progressives.
We have negotiated and compromised to create a plan that we believe is the best way forward. We are all enthu-siastic about the final product because we believe it will reduce poverty and increase opportunity in America.

Chapter 2: The Facts
Senator Daniel Patrick Moynihan reputedly said that every-one is entitled to their own opinions, but not their own facts.19 We must establish a set of facts about poverty and economic opportunity that both progressives and conser-vatives agree are correct and that, taken together, paint an accurate portrait of the conditions that account for the extent of poverty and opportunity in America. We also need a solid set of facts on which to build our recommendations.
{17}
In the first part of this chapter, we review facts about the economic outcomes that we care about most: pov-erty and intergenerational economic mobility. Then we
review trends in family composition, employment and wages, and education, because they all affect poverty and economic mobility. We also show that inequality in these factors is mostly growing, which explains to a great extent why inequality in economic outcomes is growing as well and has proven so difficult to change.
ECONOMIC OUTCOMES
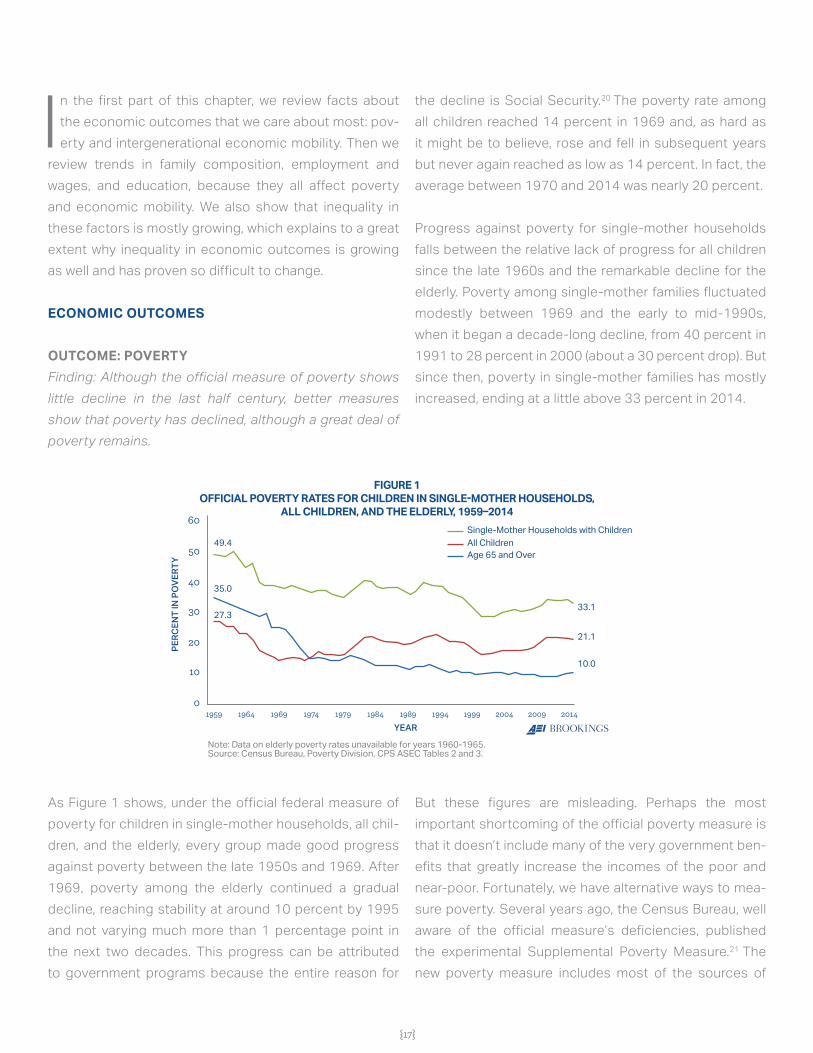
OUTCOME: POVERTYFinding: Although the official measure of poverty shows little decline in the last half century, better measures show that poverty has declined, although a great deal of poverty remains.
As Figure 1 shows, under the official federal measure of poverty for children in single-mother households, all chil-dren, and the elderly, every group made good progress against poverty between the late 1950s and 1969. After 1969, poverty among the elderly continued a gradual decline, reaching stability at around 10 percent by 1995 and not varying much more than 1 percentage point in the next two decades. This progress can be attributed to government programs because the entire reason for
the decline is Social Security.20 The poverty rate among all children reached 14 percent in 1969 and, as hard as it might be to believe, rose and fell in subsequent years but never again reached as low as 14 percent. In fact, the average between 1970 and 2014 was nearly 20 percent.
Progress against poverty for single-mother households falls between the relative lack of progress for all children since the late 1960s and the remarkable decline for the elderly. Poverty among single-mother families fluctuated modestly between 1969 and the early to mid-1990s, when it began a decade-long decline, from 40 percent in 1991 to 28 percent in 2000 (about a 30 percent drop). But since then, poverty in single-mother families has mostly increased, ending at a little above 33 percent in 2014.
But these figures are misleading. Perhaps the most important shortcoming of the official poverty measure is that it doesn’t include many of the very government ben-efits that greatly increase the incomes of the poor and near-poor. Fortunately, we have alternative ways to mea-sure poverty. Several years ago, the Census Bureau, well aware of the official measure’s deficiencies, published the experimental Supplemental Poverty Measure.21 The new poverty measure includes most of the sources of
FIGURE 1OFFICIAL POVERTY RATES FOR CHILDREN IN SINGLE�MOTHER HOUSEHOLDS,
ALL CHILDREN, AND THE ELDERLY, 1959�2014
1959
10
0
30
20
50
60
40
1964 1969 1974 1979 1984 1989
YEAR
PERC
ENT
IN P
OVE
RTY
1994 1999 2004 2009 2014
Note: Data on elderly poverty rates unavailable for years 1960-1965. Source: Census Bureau, Poverty Division, CPS ASEC Tables 2 and 3.
Single-Mother Households with ChildrenAll ChildrenAge 65 and Over
49.4
33.1
21.1
10.0
35.0
27.3
{18}
government benefits as income; deducts some expenses that are necessary to earn income, such as child care expenses; subtracts out-of-pocket expenses for health care payments; and makes a few other adjustments to income as well as to poverty thresholds. So far, the Cen-sus Bureau has published the new measure going back only to 2009. But recently a group of poverty experts at Columbia University used the Census Bureau’s methods for calculating the Supplemental Poverty Measure and produced poverty estimates going back to 1967.22
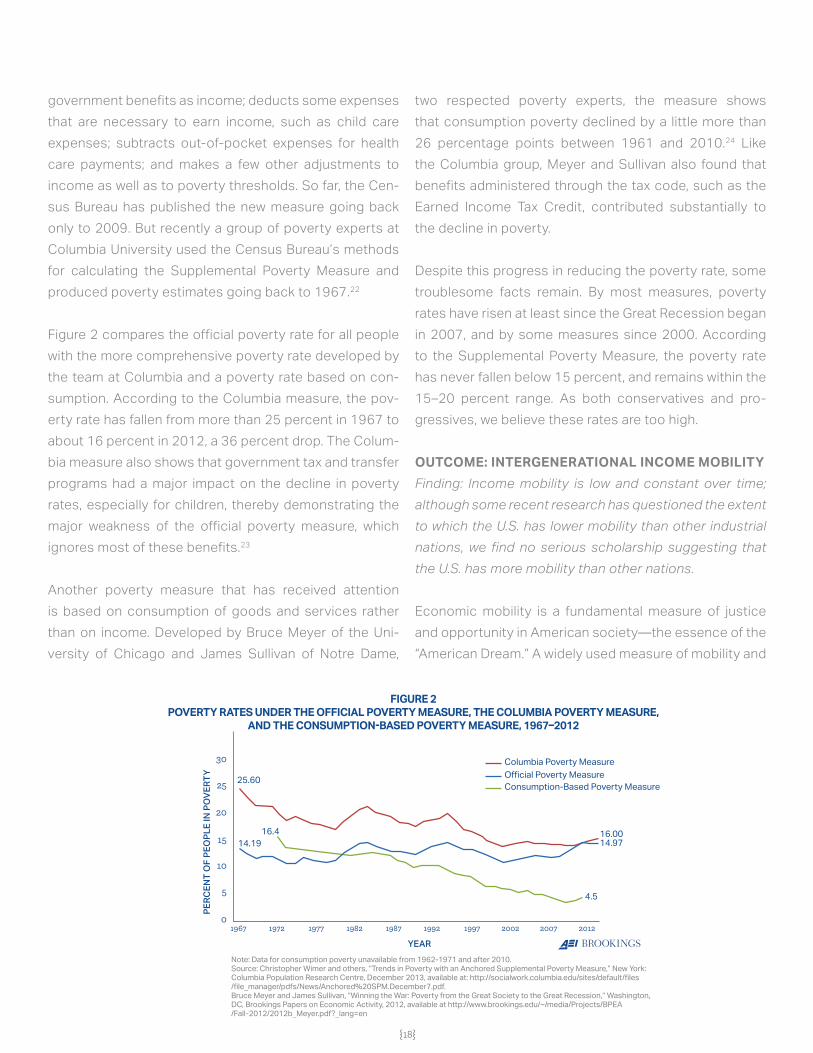
Figure 2 compares the official poverty rate for all people with the more comprehensive poverty rate developed by the team at Columbia and a poverty rate based on con-sumption. According to the Columbia measure, the pov-erty rate has fallen from more than 25 percent in 1967 to about 16 percent in 2012, a 36 percent drop. The Colum-bia measure also shows that government tax and transfer programs had a major impact on the decline in poverty rates, especially for children, thereby demonstrating the major weakness of the official poverty measure, which ignores most of these benefits.23
Another poverty measure that has received attention is based on consumption of goods and services rather than on income. Developed by Bruce Meyer of the Uni-versity of Chicago and James Sullivan of Notre Dame,
two respected poverty experts, the measure shows that consumption poverty declined by a little more than 26 percentage points between 1961 and 2010.24 Like the Columbia group, Meyer and Sullivan also found that benefits administered through the tax code, such as the Earned Income Tax Credit, contributed substantially to the decline in poverty.
Despite this progress in reducing the poverty rate, some troublesome facts remain. By most measures, poverty rates have risen at least since the Great Recession began in 2007, and by some measures since 2000. According to the Supplemental Poverty Measure, the poverty rate has never fallen below 15 percent, and remains within the 15–20 percent range. As both conservatives and pro-gressives, we believe these rates are too high.
OUTCOME: INTERGENERATIONAL INCOME MOBILITYFinding: Income mobility is low and constant over time; although some recent research has questioned the extent to which the U.S. has lower mobility than other industrial nations, we find no serious scholarship suggesting that the U.S. has more mobility than other nations.
Economic mobility is a fundamental measure of justice and opportunity in American society—the essence of the “American Dream.” A widely used measure of mobility and
FIGURE 2POVERTY RATES UNDER THE OFFICIAL POVERTY MEASURE, THE COLUMBIA POVERTY MEASURE,
AND THE CONSUMPTION�BASED POVERTY MEASURE, 1967�2012
1967 1972 1977 1982 1987 1992 1997 2002 2007 20120
5
10
15
20
25
30
YEAR
PERC
ENT
OF
PEO
PLE
IN P
OVE
RTY
Columbia Poverty MeasureOfficial Poverty MeasureConsumption-Based Poverty Measure
25.60
16.0014.97
4.5
16.414.19
Note: Data for consumption poverty unavailable from 1962-1971 and after 2010.Source: Christopher Wimer and others, “Trends in Poverty with an Anchored Supplemental Poverty Measure,” New York: Columbia Population Research Centre, December 2013, available at: http://socialwork.columbia.edu/sites/default/files/file_manager/pdfs/News/Anchored%20SPM.December7.pdf.Bruce Meyer and James Sullivan, “Winning the War: Poverty from the Great Society to the Great Recession,” Washington, DC, Brookings Papers on Economic Activity, 2012, available at http://www.brookings.edu/~/media/Projects/BPEA/Fall-2012/2012b_Meyer.pdf?_lang=en
{18} {19}
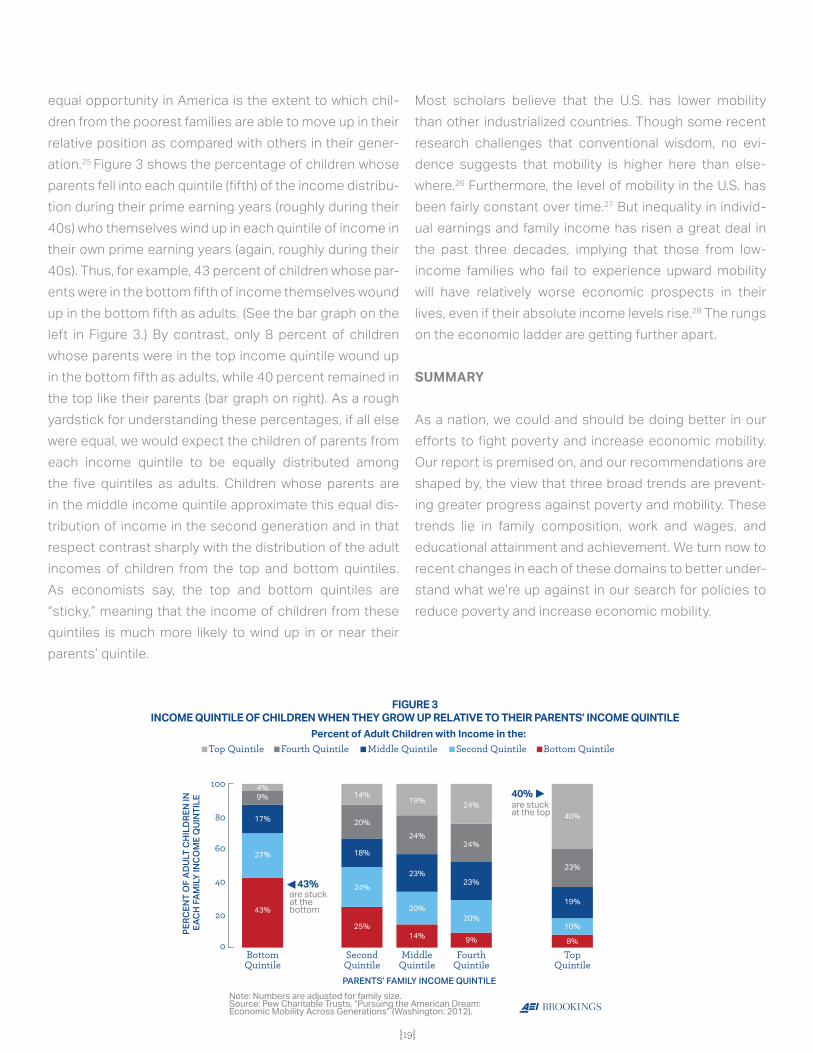
equal opportunity in America is the extent to which chil-dren from the poorest families are able to move up in their relative position as compared with others in their gener-ation.25 Figure 3 shows the percentage of children whose parents fell into each quintile (fifth) of the income distribu-tion during their prime earning years (roughly during their 40s) who themselves wind up in each quintile of income in their own prime earning years (again, roughly during their 40s). Thus, for example, 43 percent of children whose par-ents were in the bottom fifth of income themselves wound up in the bottom fifth as adults. (See the bar graph on the left in Figure 3.) By contrast, only 8 percent of children whose parents were in the top income quintile wound up in the bottom fifth as adults, while 40 percent remained in the top like their parents (bar graph on right). As a rough yardstick for understanding these percentages, if all else were equal, we would expect the children of parents from each income quintile to be equally distributed among the five quintiles as adults. Children whose parents are in the middle income quintile approximate this equal dis-tribution of income in the second generation and in that respect contrast sharply with the distribution of the adult incomes of children from the top and bottom quintiles. As economists say, the top and bottom quintiles are “sticky,” meaning that the income of children from these quintiles is much more likely to wind up in or near their parents’ quintile.
Most scholars believe that the U.S. has lower mobility than other industrialized countries. Though some recent research challenges that conventional wisdom, no evi-dence suggests that mobility is higher here than else-where.26 Furthermore, the level of mobility in the U.S. has been fairly constant over time.27 But inequality in individ-ual earnings and family income has risen a great deal in the past three decades, implying that those from low- income families who fail to experience upward mobility will have relatively worse economic prospects in their lives, even if their absolute income levels rise.28 The rungs on the economic ladder are getting further apart.
SUMMARY
As a nation, we could and should be doing better in our efforts to fight poverty and increase economic mobility. Our report is premised on, and our recommendations are shaped by, the view that three broad trends are prevent-ing greater progress against poverty and mobility. These trends lie in family composition, work and wages, and educational attainment and achievement. We turn now to recent changes in each of these domains to better under-stand what we’re up against in our search for policies to reduce poverty and increase economic mobility.
FIGURE 3INCOME QUINTILE OF CHILDREN WHEN THEY GROW UP RELATIVE TO THEIR PARENTS’ INCOME QUINTILE
Percent of Adult Children with Income in the:Top Quintile Fourth Quintile Middle Quintile Second Quintile Bottom Quintile
BottomQuintile
SecondQuintile
MiddleQuintile
FourthQuintile
TopQuintile
0
20
40
60
80
100
PARENTS’ FAMILY INCOME QUINTILE
PERC
ENT
OF
ADUL
T CH
ILD
REN
IN
EACH
FAM
ILY IN
COM
E Q
UINT
ILE
Note: Numbers are adjusted for family size.Source: Pew Charitable Trusts, “Pursuing the American Dream: Economic Mobility Across Generations” (Washington: 2012).
43%are stuckat the bottom
40%are stuckat the top
4%14%
19% 24%40%
23%
19%
10%
8%
24%
23%
20%
9%
24%
23%
20%
14%
20%
18%
24%
25%
9%
17%
27%
43%
{20}
OVERVIEW OF FACTORS SHAPING POVERTY AND OPPORTUNITY
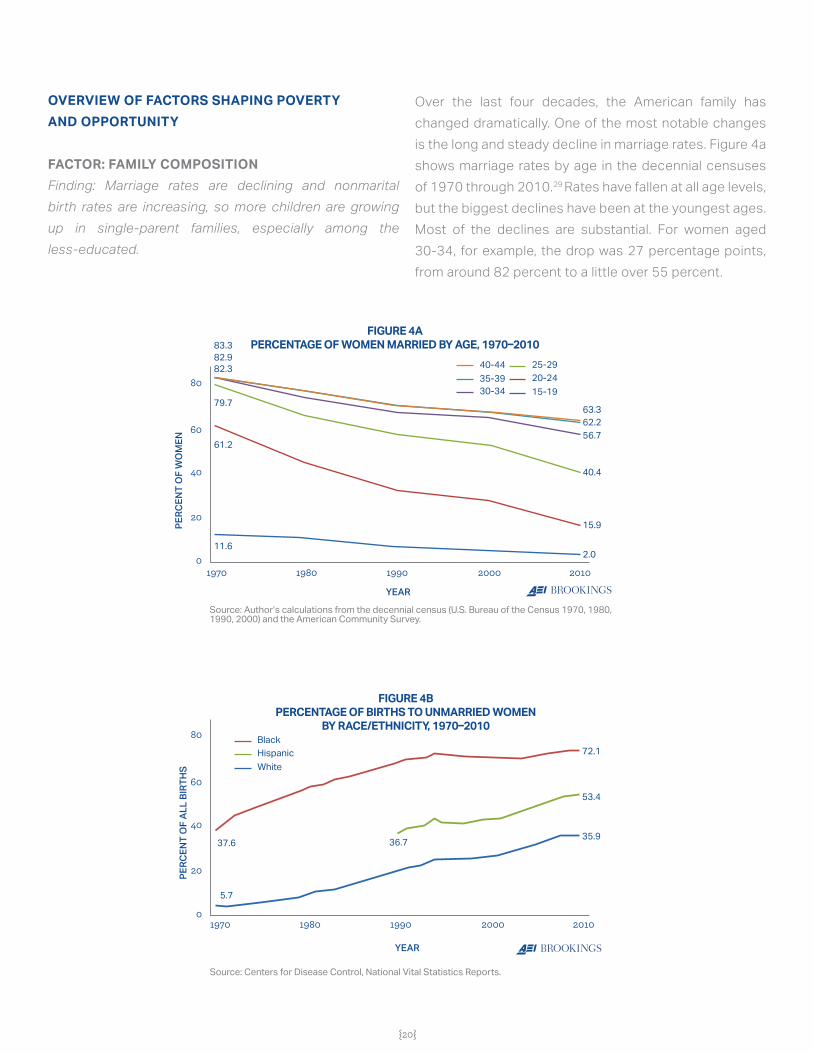
FACTOR: FAMILY COMPOSITIONFinding: Marriage rates are declining and nonmarital birth rates are increasing, so more children are growing up in single-parent families, especially among the less-educated.
Over the last four decades, the American family has changed dramatically. One of the most notable changes is the long and steady decline in marriage rates. Figure 4a shows marriage rates by age in the decennial censuses of 1970 through 2010.29 Rates have fallen at all age levels, but the biggest declines have been at the youngest ages. Most of the declines are substantial. For women aged 30-34, for example, the drop was 27 percentage points, from around 82 percent to a little over 55 percent.
FIGURE 4APERCENTAGE OF WOMEN MARRIED BY AGE, 1970�2010
1970 1980 1990 2000 20100
20
40
60
80
YEAR
PERC
ENT
OF
WO
MEN
40-4435-3930-34
25-2920-2415-19
83.3
63.362.256.7
40.4
15.9
2.0
82.982.3
79.7
61.2
11.6
Source: Author’s calculations from the decennial census (U.S. Bureau of the Census 1970, 1980, 1990, 2000) and the American Community Survey.
FIGURE 4BPERCENTAGE OF BIRTHS TO UNMARRIED WOMEN
BY RACE�ETHNICITY, 1970�2010
YEAR
PERC
ENT
OF
ALL
BIRT
HS
BlackHispanicWhite
37.6
5.7
36.7
53.4
72.1
35.9
Source: Centers for Disease Control, National Vital Statistics Reports.
1970 1980 1990 2000 20100
20
40
60
80
{20} {21}
An important consequence of the decline of marriage is that both men and women spend many years outside mar-riage, often their entire lives. But they don’t refrain from forming sexual relationships while single, one outcome of which is a rise in nonmarital births. As Figure 4b shows, the share of births occurring to unmarried mothers has increased substantially for blacks and whites since 1970 and for Hispanics since at least 1990 (the first year the Centers for Disease Control collected separate data for Hispanics). The share for blacks is now well over 70 per-cent, and more than 40 percent of all American babies are now born outside marriage.
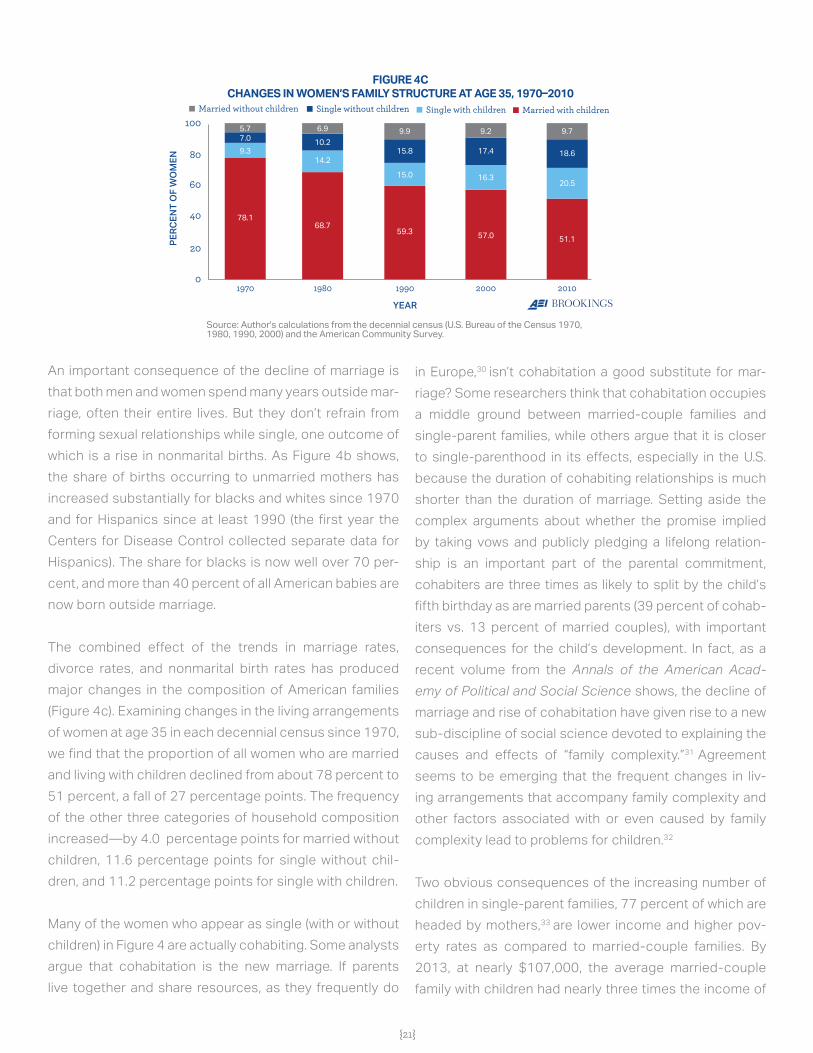
The combined effect of the trends in marriage rates, divorce rates, and nonmarital birth rates has produced major changes in the composition of American families (Figure 4c). Examining changes in the living arrangements of women at age 35 in each decennial census since 1970, we find that the proportion of all women who are married and living with children declined from about 78 percent to 51 percent, a fall of 27 percentage points. The frequency of the other three categories of household composition increased—by 4.0 percentage points for married without children, 11.6 percentage points for single without chil-dren, and 11.2 percentage points for single with children.
Many of the women who appear as single (with or without children) in Figure 4 are actually cohabiting. Some analysts argue that cohabitation is the new marriage. If parents live together and share resources, as they frequently do
in Europe,30 isn’t cohabitation a good substitute for mar-riage? Some researchers think that cohabitation occupies a middle ground between married-couple families and single-parent families, while others argue that it is closer to single-parenthood in its effects, especially in the U.S. because the duration of cohabiting relationships is much shorter than the duration of marriage. Setting aside the complex arguments about whether the promise implied by taking vows and publicly pledging a lifelong relation-ship is an important part of the parental commitment, cohabiters are three times as likely to split by the child’s fifth birthday as are married parents (39 percent of cohab-iters vs. 13 percent of married couples), with important consequences for the child’s development. In fact, as a recent volume from the Annals of the American Acad-emy of Political and Social Science shows, the decline of marriage and rise of cohabitation have given rise to a new sub-discipline of social science devoted to explaining the causes and effects of “family complexity.”31 Agreement seems to be emerging that the frequent changes in liv-ing arrangements that accompany family complexity and other factors associated with or even caused by family complexity lead to problems for children.32
Two obvious consequences of the increasing number of children in single-parent families, 77 percent of which are headed by mothers,33 are lower income and higher pov-erty rates as compared to married-couple families. By 2013, at nearly $107,000, the average married-couple family with children had nearly three times the income of
FIGURE 4CCHANGES IN WOMEN’S FAMILY STRUCTURE AT AGE 35, 1970�2010
1970 1980 1990 2000 20100
20
40
60
80
100
YEAR
PERC
ENT
OF
WO
MEN
Source: Author's calculations from the decennial census (U.S. Bureau of the Census 1970, 1980, 1990, 2000) and the American Community Survey.
Married with childrenSingle with childrenSingle without childrenMarried without children
5.7 6.9 9.9 9.2 9.7
18.6
20.5
51.1
17.4
16.3
57.0
15.8
15.0
59.3
10.2
14.2
68.7
7.09.3
78.1
{22}
the average single-mother family with children ($35,654). Similarly, between 1974 and 2013, the average pov-erty rate of single-mother families was usually between four and five times higher than the poverty rate of married-couple families; in 2013, the poverty rate for children in single-mother families was 45.8 percent, com-pared with 9.5 percent for children in married-couple families.34
Many factors besides marriage and cohabitation influ-ence the incomes and poverty rates of families with chil-dren. Perhaps the most important is the education level of the mothers and fathers involved. And not all of the very strong correlation between single parenthood and poverty reflects a causal effect of the former on the lat-ter. Even so, there is little doubt that single parenthood does cause increased poverty; therefore, if single moth-ers got married, household income would be likely to rise and poverty to fall.35 Cohabitation would produce similar though smaller effects.36
One way to think about these developments is that, in effect, the decline of marriage and rise of nonmarital births and single parenting is reducing the share of chil-dren in the family type in which they have, on average, high income and low poverty rates, while increasing the share of children in the family type that has lower income and higher poverty rates. It follows that even if govern-ment programs raise the income and reduce the poverty rate of single-mother families (which, as we show above, they do), average family income could still fall and poverty rates could still rise for families with children because of
the changes in family composition over the past half cen-tury. Policy has to run just to stay in place.
Another consequence of the rise of single parenting is its impact on child development and behavior. There now appears to be widespread and growing agreement among scholars that the best environment to rear children is the stable, two-parent family. Some of the measures of child development that have been linked with single-par-ent families are higher school dropout rates, lower aca-demic achievement, higher rates of teen pregnancy, more drug and alcohol use, higher rates of psycho-social problems (including suicide), and higher likelihood of not working and not being in school in late adolescence and early adulthood. Thus the increasing share of children in single-parent families not only is associated with rising poverty rates in the current generation, but it also con-tributes to reduced economic mobility as the children grow to adulthood.
FACTOR: WORK AND WAGESFinding: Less-educated men (especially blacks) have been working less over time, partly in response to their declining wages.
No story about the Great Recession of 2007–2009 has gotten more attention than the persistence of high unem-ployment rates. The unemployment rate began creeping up as early as the spring of 2007 and rose modestly, from 4.6 percent to 5.4 percent, between May 2007 and May 2008. Then it skyrocketed over the next 18 months to 10 percent, an increase of over 100 percent. But the large
Such a long and severe recession can affect long-term outcomes. Not only has unemployment risen since 2007, but the labor force participation rate—the percentage of the population age 16 and above that is working or seeking work—has also declined substantially, dropping from about 66 percent that year to under 63 percent now.
“
{22} {23}
rise in unemployment in such a short time wasn’t the only notable feature of unemployment. The rate reached 9 percent for the first time in April 2009, and the next time it fell below 9 percent was October 2011. Thus unemploy-ment was 9 percent or more for 29 months. We hadn’t seen anything like this since the Great Depression of the 1930s, although the back-to-back recessions of the early 1980s produced unemployment rates of 9 percent or more for 19 consecutive months.
Unemployment during the Great Recession had still another remarkable feature—a sharp increase in long-term unemployment, defined as the percentage of unem-ployed workers who have been out of a job for 27 weeks or longer. During the recovery period from the 2001 recession to the onset of the Great Recession in 2007, the long-term unemployment rate modestly declined. But beginning in spring 2008, it rose precipitously; it grew from around 18 percent to over 45 percent by January 2010. It then stayed above 40 percent for well over two years. In July 2015, more than four and a half years after the end of the Great Recession, the long-term unemploy-ment rate was still almost 27 percent, about twice its level when the recession began.37
If the recession was purely a cyclical—and therefore tem-porary—phenomenon, we wouldn’t be terribly concerned about its long-term effects on poverty or economic mobility. But, in fact, such a long and severe recession can affect long-term outcomes. Not only has unemployment risen since 2007, but the labor force participation rate—the percentage of the population age 16 and above that is working or seeking work—has also declined substantially, dropping from about 66 percent that year to under 63 percent now. Furthermore, although we always knew that labor force participation would drop as baby boomers hit age 65 and began retiring (or even taking early retirement beginning at age 62), about half the drop in workforce activity has taken place among the non-elderly. And some of this decline continues a trend that began well before the Great Recession, in which less-educated men have been dropping out of the labor force—reducing their employ-ment rates even during periods when unemployment is
low. This decline in male employment likely has negative consequences for family composition, as we note below.
A broader measure of work than unemployment or long-term unemployment rates is the employment-to-popula-tion ratio (EPR)—the proportion of the entire population not only in the labor force but actually employed. By con-trast with the EPR, the unemployment rate is defined as the percentage of those in the labor force who don’t have a job. In addition to the employed and those looking for work, a large group of people, often called “discouraged workers,” have left the labor force and given up looking for work. The unemployment rate sometimes falls not only because more people have found jobs but also because some jobless workers have left the labor force.38 For the broadest perspective on the labor market, the EPR includes everyone age 16 and above in the denominator (except people who are in the armed forces or institution-alized) and the number employed in the numerator, yield-ing a measure of employment that covers most of the population (or a given subgroup such as men or women, or men or women in a certain age range). EPR drops when unemployment rises but also when labor force partici-pation falls (including when it does so because of rising school enrollment or retirement).
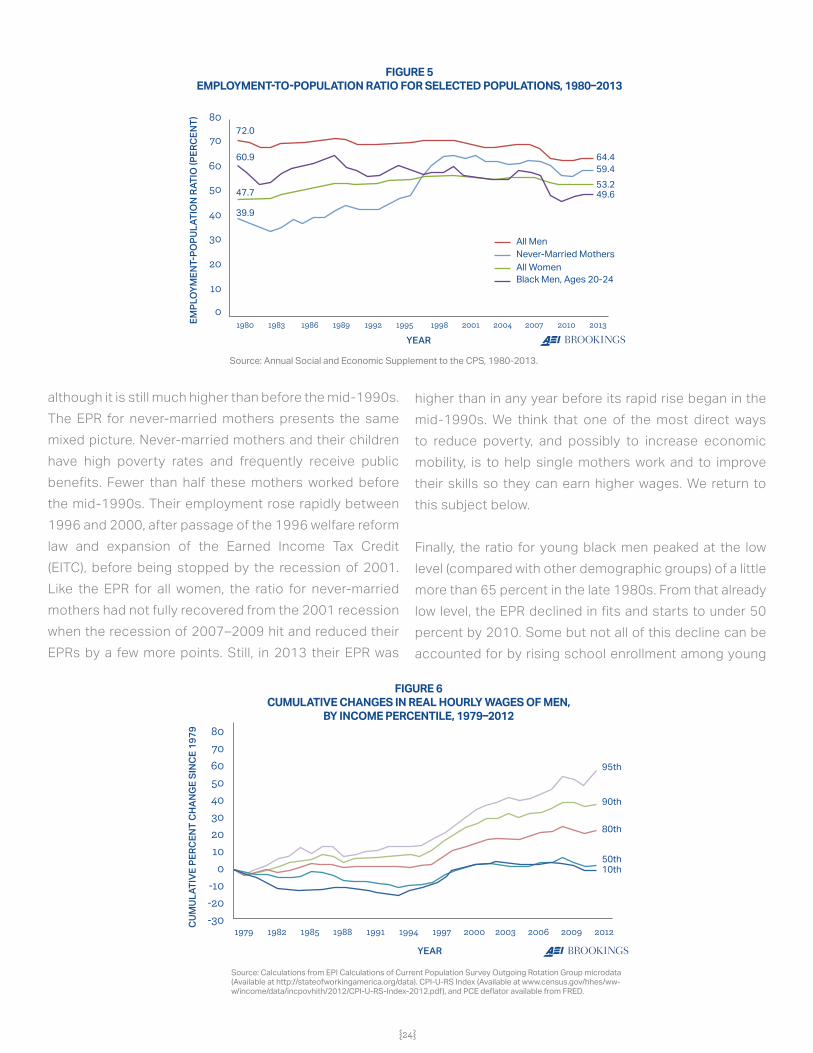
Figure 5 gives the EPRs for all men, all women, never- married mothers, and young black men ages 20-24 between 1980 and 2012. All four ratios convey at least some bad news. For one thing, employment ratios have fallen for all groups since the Great Recession began, and they haven’t fully recovered. And all groups experi-enced some declines in employment ratios even before the Great Recession—though the declines among men have been greater and started much earlier than those among women.
Overall, the employment ratios of all women and of never-married mothers trend somewhat positively over time, although they raise concerns as well. The EPR for all women, in one of the most important demographic developments since the 1960s, increased almost every year between 1980 and 2000. It fell a bit after that year,
{24}
although it is still much higher than before the mid-1990s. The EPR for never-married mothers presents the same mixed picture. Never-married mothers and their children have high poverty rates and frequently receive public benefits. Fewer than half these mothers worked before the mid-1990s. Their employment rose rapidly between 1996 and 2000, after passage of the 1996 welfare reform law and expansion of the Earned Income Tax Credit (EITC), before being stopped by the recession of 2001. Like the EPR for all women, the ratio for never-married mothers had not fully recovered from the 2001 recession when the recession of 2007–2009 hit and reduced their EPRs by a few more points. Still, in 2013 their EPR was
higher than in any year before its rapid rise began in the mid-1990s. We think that one of the most direct ways to reduce poverty, and possibly to increase economic mobility, is to help single mothers work and to improve their skills so they can earn higher wages. We return to this subject below.
Finally, the ratio for young black men peaked at the low level (compared with other demographic groups) of a little more than 65 percent in the late 1980s. From that already low level, the EPR declined in fits and starts to under 50 percent by 2010. Some but not all of this decline can be accounted for by rising school enrollment among young
FIGURE 5EMPLOYMENT�TO�POPULATION RATIO FOR SELECTED POPULATIONS, 1980�2013
YEAR
EMPL
OYM
ENT�
POPU
LATI
ON
RATI
O �P
ERCE
NT�
All MenNever-Married MothersAll WomenBlack Men, Ages 20-24
72.0
64.459.453.249.6
60.9
47.7
39.9
Source: Annual Social and Economic Supplement to the CPS, 1980-2013.
0
10
20
30
40
50
60
70
80
1980 1983 1986 1989 1992 1995 1998 2001 2004 2007 2010 2013
FIGURE 6CUMULATIVE CHANGES IN REAL HOURLY WAGES OF MEN,
BY INCOME PERCENTILE, 1979�2012
YEAR
CUM
ULAT
IVE
PERC
ENT
CHAN
GE
SINC
E 19
79
95th
90th
80th
50th10th
Source: Calculations from EPI Calculations of Current Population Survey Outgoing Rotation Group microdata (Available at http://stateofworkingamerica.org/data). CPI-U-RS Index (Available at www.census.gov/hhes/ww-w/income/data/incpovhith/2012/CPI-U-RS-Index-2012.pdf), and PCE deflator available from FRED.
1979 1982 1985 1988 1991 1994 1997 2000 2003 2006 2009 2012-30-20-10
01020304050607080
{24} {25}
black men. However, their school enrollment has risen less than that of any other racial/gender group, and their employment declines have been the most severe. And, if anything, this graph understates the downward trend in employment for this group, because incarcerated men aren’t included (young black men have the highest incar-ceration rate of all demographic groups) and because low-income men more broadly tend to be undercounted in Census surveys.39
Some evidence suggests that young women are less willing to marry men who don’t have a steady source of income, meaning that a rising share of young black men may be seen as unmarriageable by young women.40 It’s hard to imagine a vibrant community with strong families and safe neighborhoods for children when half the young men who live there don’t have regular employment.
As if men’s EPRs don’t present enough challenges for those concerned with family income, changes in men’s real hourly wages are also discouraging. Figure 6 shows men’s wages since 1979 at selected points in the wage distribution between the 10th and 95th percentile. The graphs plot trends in wages as a percentage of wages in 1979, a peak year in the American economy. The wages
of at least 90 percent of men have fallen since the Great Recession (though because benefits like health insurance have been a rising share of compensation, the trends in hourly compensation are lower than they would be if health benefits were included in wages).41 More worrisome, the wages of men at the 50th percentile and below are now similar to or lower than they were in 1979 (depending on the measure we use to adjust for inflation over time).42
This is not the way to increase families’ financial stability
or to reduce the poverty rate and increase mobility. And it likely helps us understand why so many low-income men drop out of the labor force—the rewards of working have declined for that group.43
It’s hard to imagine a vibrant community with strong families and safe neighborhoods for children when half the young men who live there don’t have regular employment.
“
FIGURE 7CUMULATIVE CHANGES IN REAL HOURLY WAGES OF WOMEN,
BY INCOME PERCENTILE, 1979�2012
YEAR
CUM
ULAT
IVE
PERC
ENT
CHAN
GE
SINC
E 19
79
95th
90th
80th
50th
10th
Source: Calculations from EPI calculations of Current Population Survey Outgoing Rotation Group microdata (Available at http://stateofworkingamerica.org/data/), CPI-U-RS Index (Available at https://www.census.gov/hhes/www/income/data/incpovhlth/2012/CPI-U-RS-Index-2012.pdf ), and PCE deflator available from FRED.
-30-20-1001020304050607080
1979 1982 1985 1988 1991 1994 1997 2000 2003 2006 2009
{26}
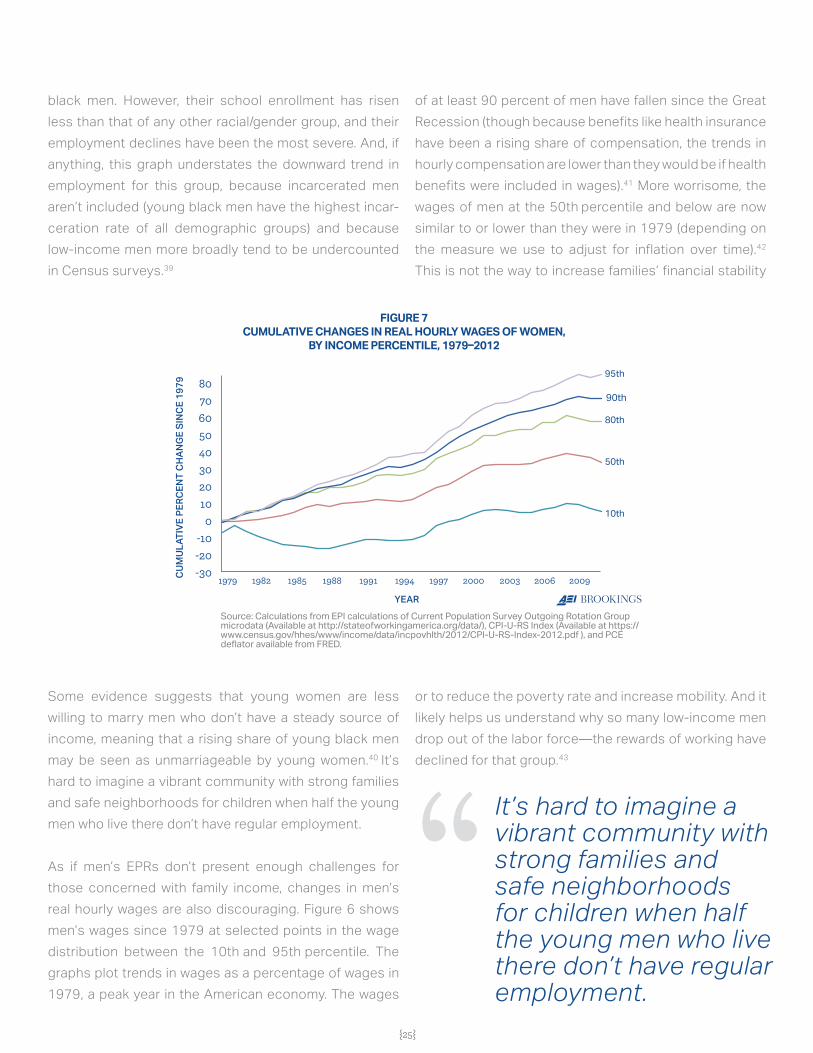
If the picture for low-income men’s work is discouraging, the picture for low-income women presents some room for optimism, for two reasons. First, as Figure 7 shows, women’s wages have generally risen more than men’s since 1979. Like men, women at the 10th percentile of the wage distribution had nearly the same wage in 2012 as they had in 1979. But throughout the rest of the wage distribution, their wages rose more than men’s did. Men’s wages all the way up to the 50th percentile, for example, were more or less the same as they had been in 1979, but women’s wages at the 50th percentile rose 35 per-cent over the period. At the 80th percentile, women’s wages had increased by around 58 percent as compared
with men’s roughly 20 percent increase. These relatively higher wage increases for women, however, must be bal-anced against the fact that even after these increases, women’s wages are only a little more than 80 percent of men’s wages, on average.44
The second reason for optimism about women’s labor force experience is a series of mostly bipartisan agreements in Congress about earnings supplements that were reached
between roughly the mid-1970s and the early 2000s. Con-gress intended to create what might be called a “work sup-port system” that would provide various cash and in-kind supplements to the earnings of low-wage workers with children. These earnings supplements would reduce the work disincentives inherent in the welfare system created by the fact that welfare benefits phase out as welfare recip-ients enter the workforce and earn money. Taken together, increased work and the generous work support system substantially reduced poverty among single-mother fam-ilies. Because the combination of work and work-support benefits is a promising strategy for reducing poverty, we turn to an explanation of how this approach works.
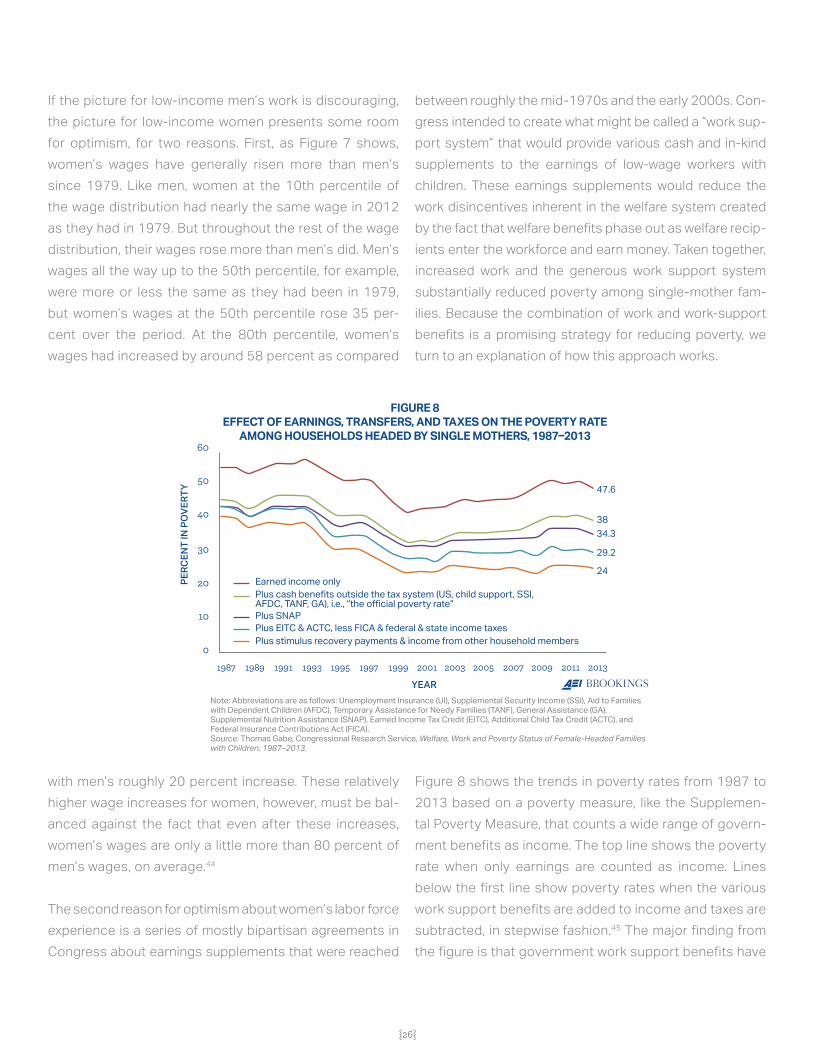
Figure 8 shows the trends in poverty rates from 1987 to 2013 based on a poverty measure, like the Supplemen-tal Poverty Measure, that counts a wide range of govern-ment benefits as income. The top line shows the poverty rate when only earnings are counted as income. Lines below the first line show poverty rates when the various work support benefits are added to income and taxes are subtracted, in stepwise fashion.45 The major finding from the figure is that government work support benefits have
FIGURE 8EFFECT OF EARNINGS, TRANSFERS, AND TAXES ON THE POVERTY RATE
AMONG HOUSEHOLDS HEADED BY SINGLE MOTHERS, 1987�2013
YEAR
PERC
ENT
IN P
OVE
RTY
Earned income onlyPlus cash benefits outside the tax system (US, child support, SSI,AFDC, TANF, GA), i.e., “the official poverty rate”Plus SNAP
Plus stimulus recovery payments & income from other household membersPlus EITC & ACTC, less FICA & federal & state income taxes
47.6
3834.3
29.2
24
Note: Abbreviations are as follows: Unemployment Insurance (UI), Supplemental Security Income (SSI), Aid to Families with Dependent Children (AFDC), Temporary Assistance for Needy Families (TANF), General Assistance (GA), Supplemental Nutrition Assistance (SNAP), Earned Income Tax Credit (EITC), Additional Child Tax Credit (ACTC), and Federal Insurance Contributions Act (FICA).Source: Thomas Gabe, Congressional Research Service, Welfare, Work and Poverty Status of Female-Headed Families with Children; 1987–2013.
0
10
20
30
40
50
60
1987 1991 1995 1999 2003 20071989 1993 1997 2001 2005 2009 2011 2013
{26} {27}
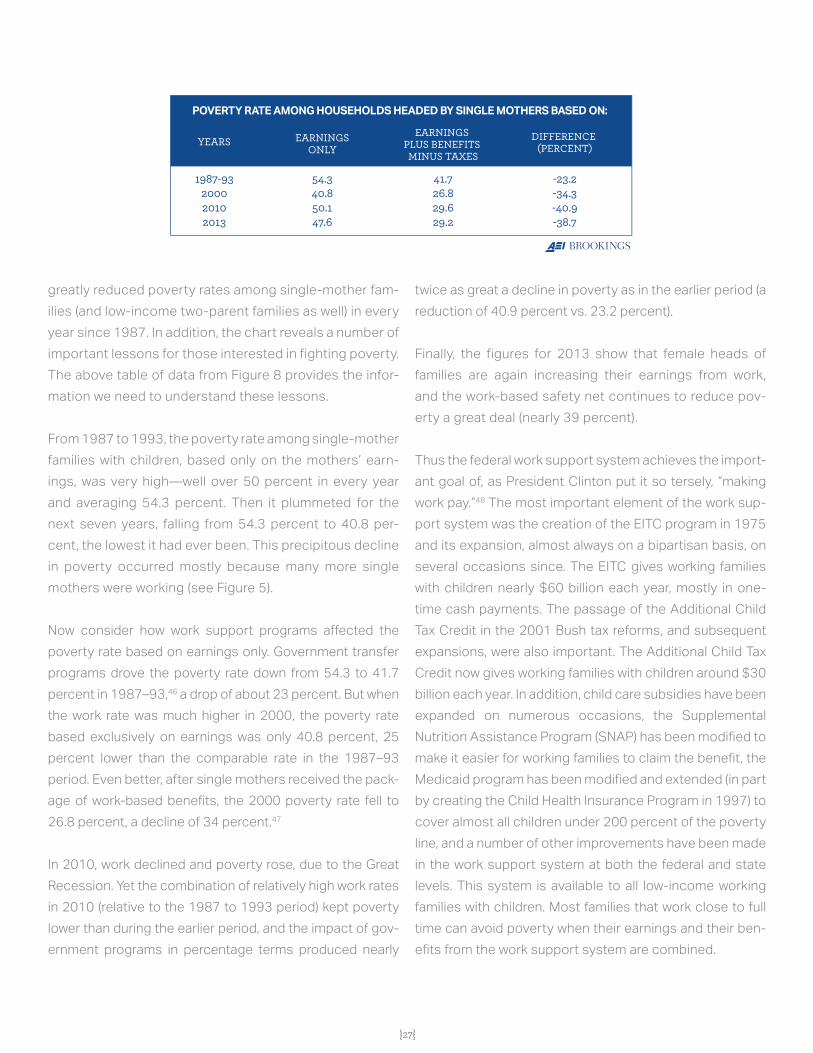
greatly reduced poverty rates among single-mother fam-ilies (and low-income two-parent families as well) in every year since 1987. In addition, the chart reveals a number of important lessons for those interested in fighting poverty. The above table of data from Figure 8 provides the infor-mation we need to understand these lessons.
From 1987 to 1993, the poverty rate among single-mother families with children, based only on the mothers’ earn-ings, was very high—well over 50 percent in every year and averaging 54.3 percent. Then it plummeted for the next seven years, falling from 54.3 percent to 40.8 per-cent, the lowest it had ever been. This precipitous decline in poverty occurred mostly because many more single mothers were working (see Figure 5).
Now consider how work support programs affected the poverty rate based on earnings only. Government transfer programs drove the poverty rate down from 54.3 to 41.7 percent in 1987–93,46 a drop of about 23 percent. But when the work rate was much higher in 2000, the poverty rate based exclusively on earnings was only 40.8 percent, 25 percent lower than the comparable rate in the 1987–93 period. Even better, after single mothers received the pack-age of work-based benefits, the 2000 poverty rate fell to 26.8 percent, a decline of 34 percent.47
In 2010, work declined and poverty rose, due to the Great Recession. Yet the combination of relatively high work rates in 2010 (relative to the 1987 to 1993 period) kept poverty lower than during the earlier period, and the impact of gov-ernment programs in percentage terms produced nearly
twice as great a decline in poverty as in the earlier period (a reduction of 40.9 percent vs. 23.2 percent).
Finally, the figures for 2013 show that female heads of families are again increasing their earnings from work, and the work-based safety net continues to reduce pov-erty a great deal (nearly 39 percent).
Thus the federal work support system achieves the import-ant goal of, as President Clinton put it so tersely, “making work pay.”48 The most important element of the work sup-port system was the creation of the EITC program in 1975 and its expansion, almost always on a bipartisan basis, on several occasions since. The EITC gives working families with children nearly $60 billion each year, mostly in one-time cash payments. The passage of the Additional Child Tax Credit in the 2001 Bush tax reforms, and subsequent expansions, were also important. The Additional Child Tax Credit now gives working families with children around $30 billion each year. In addition, child care subsidies have been expanded on numerous occasions, the Supplemental Nutrition Assistance Program (SNAP) has been modified to make it easier for working families to claim the benefit, the Medicaid program has been modified and extended (in part by creating the Child Health Insurance Program in 1997) to cover almost all children under 200 percent of the poverty line, and a number of other improvements have been made in the work support system at both the federal and state levels. This system is available to all low-income working families with children. Most families that work close to full time can avoid poverty when their earnings and their ben-efits from the work support system are combined.
POVERTY RATE AMONG HOUSEHOLDS HEADED BY SINGLE MOTHERS BASED ON:
YEARS
1987-93200020102013
EARNINGSONLY
54.340.850.147.6
EARNINGS PLUS BENEFITS MINUS TAXES
41.726.829.629.2
DIFFERENCE (PERCENT)
-23.2-34.3-40.9-38.7
{28}
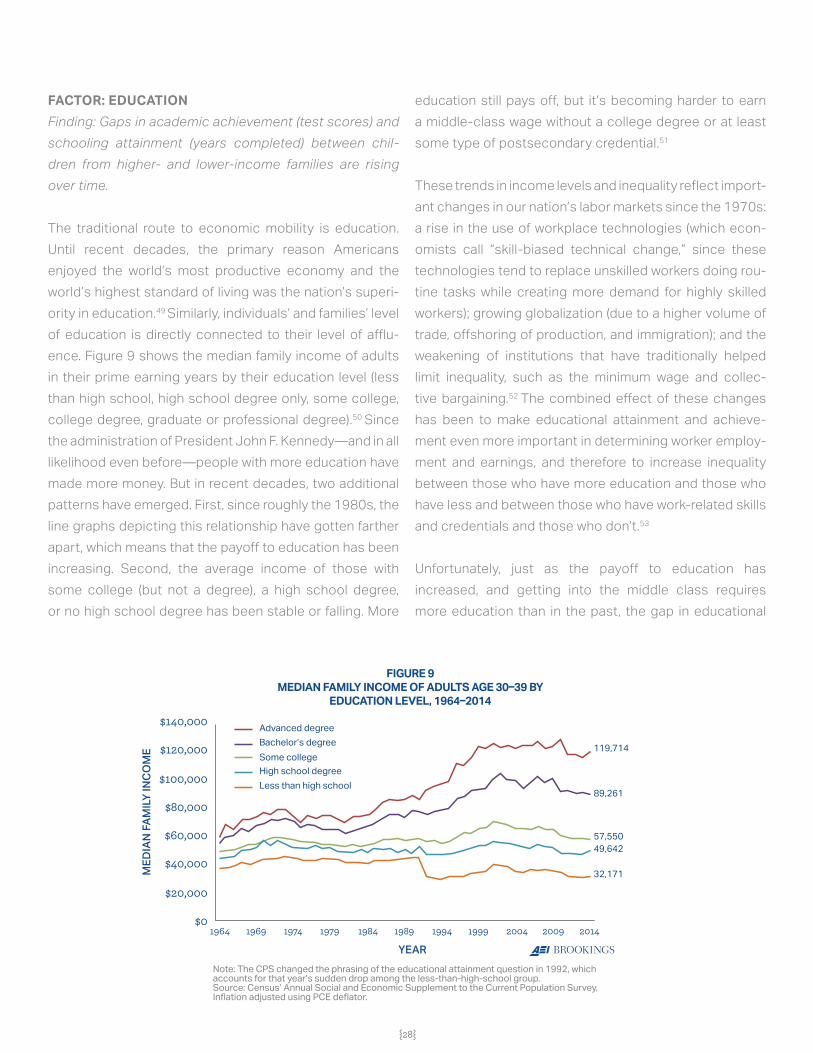
FACTOR: EDUCATIONFinding: Gaps in academic achievement (test scores) and schooling attainment (years completed) between chil-dren from higher- and lower-income families are rising over time.
The traditional route to economic mobility is education. Until recent decades, the primary reason Americans enjoyed the world’s most productive economy and the world’s highest standard of living was the nation’s superi-ority in education.49 Similarly, individuals’ and families’ level of education is directly connected to their level of afflu-ence. Figure 9 shows the median family income of adults in their prime earning years by their education level (less than high school, high school degree only, some college, college degree, graduate or professional degree).50 Since the administration of President John F. Kennedy—and in all likelihood even before—people with more education have made more money. But in recent decades, two additional patterns have emerged. First, since roughly the 1980s, the line graphs depicting this relationship have gotten farther apart, which means that the payoff to education has been increasing. Second, the average income of those with some college (but not a degree), a high school degree, or no high school degree has been stable or falling. More
education still pays off, but it’s becoming harder to earn a middle-class wage without a college degree or at least some type of postsecondary credential.51
These trends in income levels and inequality reflect import-ant changes in our nation’s labor markets since the 1970s: a rise in the use of workplace technologies (which econ-omists call “skill-biased technical change,” since these technologies tend to replace unskilled workers doing rou-tine tasks while creating more demand for highly skilled workers); growing globalization (due to a higher volume of trade, offshoring of production, and immigration); and the weakening of institutions that have traditionally helped limit inequality, such as the minimum wage and collec-tive bargaining.52 The combined effect of these changes has been to make educational attainment and achieve-ment even more important in determining worker employ-ment and earnings, and therefore to increase inequality between those who have more education and those who have less and between those who have work-related skills and credentials and those who don’t.53
Unfortunately, just as the payoff to education has increased, and getting into the middle class requires more education than in the past, the gap in educational
YEAR
MED
IAN
FAM
ILY IN
COM
E 119,714
89,261
57,55049,642
32,171
FIGURE 9MEDIAN FAMILY INCOME OF ADULTS AGE 30�39 BY
EDUCATION LEVEL, 1964�2014
Note: The CPS changed the phrasing of the educational attainment question in 1992, which accounts for that year’s sudden drop among the less-than-high-school group.Source: Census’ Annual Social and Economic Supplement to the Current Population Survey, Inflation adjusted using PCE deflator.
$0
$20,000
$40,000
$60,000
$80,000
$100,000
$120,000
$140,000
1964 1969 1974 1979 1984 1989 1994 1999 2004 2009 2014
Advanced degreeBachelor’s degreeSome college
Less than high schoolHigh school degree
{28} {29}
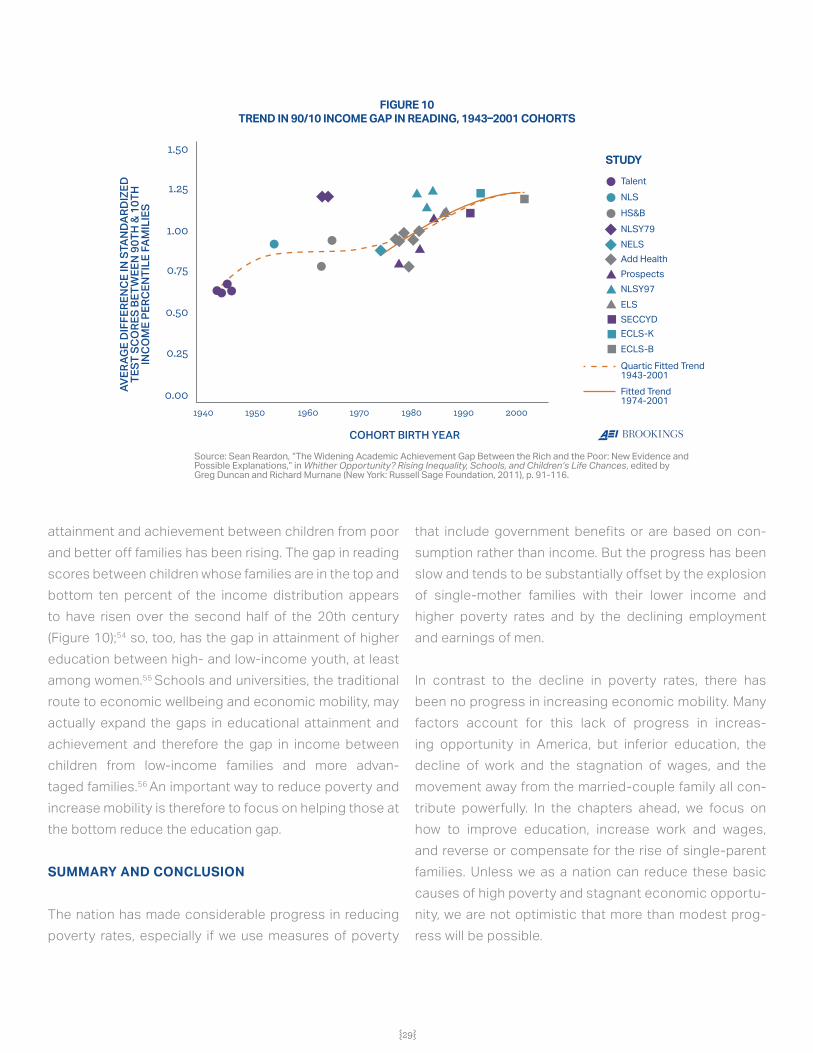
attainment and achievement between children from poor and better off families has been rising. The gap in reading scores between children whose families are in the top and bottom ten percent of the income distribution appears to have risen over the second half of the 20th century (Figure 10);54 so, too, has the gap in attainment of higher education between high- and low-income youth, at least among women.55 Schools and universities, the traditional route to economic wellbeing and economic mobility, may actually expand the gaps in educational attainment and achievement and therefore the gap in income between children from low-income families and more advan-taged families.56 An important way to reduce poverty and increase mobility is therefore to focus on helping those at the bottom reduce the education gap.
SUMMARY AND CONCLUSION
The nation has made considerable progress in reducing poverty rates, especially if we use measures of poverty
that include government benefits or are based on con-sumption rather than income. But the progress has been slow and tends to be substantially offset by the explosion of single-mother families with their lower income and higher poverty rates and by the declining employment and earnings of men.
In contrast to the decline in poverty rates, there has been no progress in increasing economic mobility. Many factors account for this lack of progress in increas-ing opportunity in America, but inferior education, the decline of work and the stagnation of wages, and the movement away from the married-couple family all con-tribute powerfully. In the chapters ahead, we focus on how to improve education, increase work and wages, and reverse or compensate for the rise of single-parent families. Unless we as a nation can reduce these basic causes of high poverty and stagnant economic opportu-nity, we are not optimistic that more than modest prog-ress will be possible.
COHORT BIRTH YEAR
AVER
AGE
DIF
FERE
NCE
IN S
TAND
ARD
IZED
TE
ST S
CORE
S BE
TWEE
N 90
TH &
10T
H
INCO
ME
PERC
ENTI
LE F
AMIL
IES
FIGURE 10TREND IN 90�10 INCOME GAP IN READING, 1943�2001 COHORTS
STUDY
Source: Sean Reardon, “The Widening Academic Achievement Gap Between the Rich and the Poor: New Evidence and Possible Explanations,” in Whither Opportunity? Rising Inequality, Schools, and Children’s Life Chances, edited by Greg Duncan and Richard Murnane (New York: Russell Sage Foundation, 2011), p. 91-116.
0.00
0.25
0.50
0.75
1.00
1.25
1.50
1940 1950 1960 1970 1980 1990 2000
TalentNLSHS&BNLSY79NELSAdd HealthProspectsNLSY97ELSSECCYDECLS-KECLS-B
Quartic Fitted Trend 1943-2001Fitted Trend1974-2001
Chapter 3: Family
Improving the family environment in which children are raised is vital to any serious effort to reduce poverty and expand opportunity. Twenty-five years of extensive and rigorous research has shown that children raised in stable, secure families have a better chance to flourish.57 Family structure is an important factor in reducing poverty, too: children raised in single-parent families are nearly five times as likely to be poor as those in married-couple fam-ilies.58 In part, this is the result of simple math: two par-ents, on average, have far greater resources to devote to raising children than does one parent attempting to raise children alone. “Social policy faces an uphill battle,” says Isabel Sawhill of the Brookings Institution, “as long as fam-ilies continue to fragment and children are deprived of the resources of two parents.”59

{32}
Marriage is more than an instrumental good; it is more than a mechanism through which house-holds receive two incomes. Marriage matters.
Marital commitment remains the principal foundation upon which most Americans can build a stable and secure family. Of course, this isn’t true for everybody. Marriage doesn’t automatically deliver what children most need—a stable and secure environment with two engaged, com-mitted, and nurturing parents—but it certainly offers the most reliable means to achieve those ends.
What can policymakers do to promote strong, stable, and committed families? Clearly these are difficult areas for
policy, since they involve deeply personal choices and values. Many of the challenges are about culture more than legislation or programs. We believe nonetheless that there is a role for government, educational institutions, and opinion leaders. Our group has reached agreement on four cornerstones of a pro-family, pro-opportunity agenda. We need to:
1) Promote marriage as the most reliable route to family stability and resources;
2) Promote delayed, responsible childbearing;3) Promote parenting skills and practices, especially
among low-income parents; and4) Promote skill development, family involvement, and
employment among young men as well as women.
We acknowledge the practical and political difficulties that public policies related to family life entail. But we also believe that policymakers and public leaders have a responsibility to frankly and openly address these issues and the policies related to them. Taken together, our proposals will send a strong message that marriage matters as a route to family stability and improved child
development; that deferring childbearing until individuals are ready for parenthood matters; that engaged parenting matters; and that responsible fatherhood matters along with responsible motherhood.
PROMOTING MARRIAGE
Family structure shapes child outcomes. A child raised by two parents outperforms a peer raised in a single-parent family on key developmental, educational, behavioral, and employment-related outcomes, controlling for other fac-tors.60 All else equal, two sets of hands to help, hold, pro-vide, and instruct are clearly better than one.
Parents who are married are much more likely to stay together and provide a stable environment; it should be no surprise, then, that children raised by married couples do much better in life. A recent study by Richard Reeves of the Brookings Institution (a member of our group) compared economic mobility by the income quintile in which children began their lives and found substantial differences between children of married and unmarried parents.61 Four out of five children who started out in the bottom quintile, but who were raised by parents married throughout their childhood, rose out of the bottom quintile as adults. In fact, such children born into the bottom quin-tile were more likely to rise to the top quintile (19 percent) than remain at the bottom (17 percent). In contrast, chil-dren raised in the bottom income quintile by a parent who remained unmarried throughout their childhood had a 50 percent chance of remaining there and only a 5 percent chance of reaching the top quintile.62 In another recent study, Raj Chetty of Harvard and his colleagues found that the share of single-parent families in a particular geo-graphic area was more strongly and negatively correlated
Marital commitment remains the principal foundation on which most Americans can build a stable and secure family.“
{32} {33}
with rates of upward economic mobility among residents than any other factor—including parents’ income, level of education, or race.63 Likewise, the share of a local pop-ulation that was married was positively associated with upward mobility rates.
A note of caution is needed here: these relationships are correlations, with no necessary causal implications, as the studies’ authors point out. Some scholars argue that children raised in two-parent families do better for rea-sons unrelated to family structure or marital status.64 One obvious possibility is that two-parent families, especially married ones, have more money. Married parents may also be more engaged in child rearing. Once we take such factors into account, the influence of family structure, including marriage, does diminish. But it doesn’t disap-pear: disparities associated with family structure remain even after controlling for these factors.65 A related argu-ment is that the positive benefits that appear to flow from marriage are the result of “selection effects.” Adults who possess certain characteristics, such as trustworthiness or perseverance, may be more inclined to marry, and chil-dren raised by adults with these characteristics may do better. If this is the case, the factors causing marriage are also improving children’s outcomes.
It is difficult to disentangle these effects. In any case, there’s a danger of simply going round in circles. It may well be true, for example, that cohabiting biological par-ents who remain together in a committed relationship while raising their children are very similar to married cou-ples with the same characteristics. But not many cohab-iting couples in the U.S. are like this. The evidence shows that in the U.S., marriage is clearly the best path to stabil-ity—it is the strongest predictor of stable, two-parent fam-ilies. Indeed, two-thirds of cohabiting parents have split up before their child reaches the age of 12, compared to only a quarter of married parents.66 Marriage itself is likely to serve as a “mechanism by which parents support a mutual commitment to invest intensively in their children’s human capital.”67 Following a recent, comprehensive review of the literature, marriage scholar David Ribar identified a range of means through which marriage can bolster
child wellbeing, including income, assets, time availability, economies of scale, specialization, and stability. Improv-ing any of these factors independently of marriage would be good for children, but would be “at best, partial substi-tutes.” Ribar concludes that “the advantages of marriage for children appear to be the sum of many, many parts.”68
Stronger families are an important step toward greater opportunity and less poverty, and marriage is an import-ant step toward a stronger family. Obviously, strengthen-ing families will not by itself solve America’s poverty and economic mobility problems. Major changes in employ-ment and education policy (which we discuss in Chapters 4 and 5) are also necessary. But improvements in employ-ment and education without stronger families won’t suf-fice. We need progress on all three fronts.
So what can be done? We’ve said that marriage matters. But past government efforts to encourage unmarried par-ents to marry have not proven very effective.69 Promoting marriage to strengthen American families isn’t primarily an issue of specific policies or programs in any case: it’s in large part a question of culture. Political leaders, edu-cators, and civic leaders—from both the political left and right—need to be clear and direct about how hard it is to raise children without a committed co-parent. We’ve effectively reduced major public health problems, such as smoking and teen pregnancy, through changes in cultural attitudes facilitated by public information campaigns. According to a review of the research by contraception expert Adam Thomas, mass media campaigns about the consequences of unprotected sex have reduced unplanned pregnancies.70 We propose a campaign of similar scope to emphasize the value of committed co- parenting and marriage.
It’s not a small thing for leaders to be clear in this way—cultural norms are influenced by the messages leaders send. Major cultural norms have been changed many times before when leaders expressed firm and unequiv-ocal views about even entrenched cultural attitudes, including norms surrounding civil rights and gay rights. Presidents, politicians, church leaders, newspaper
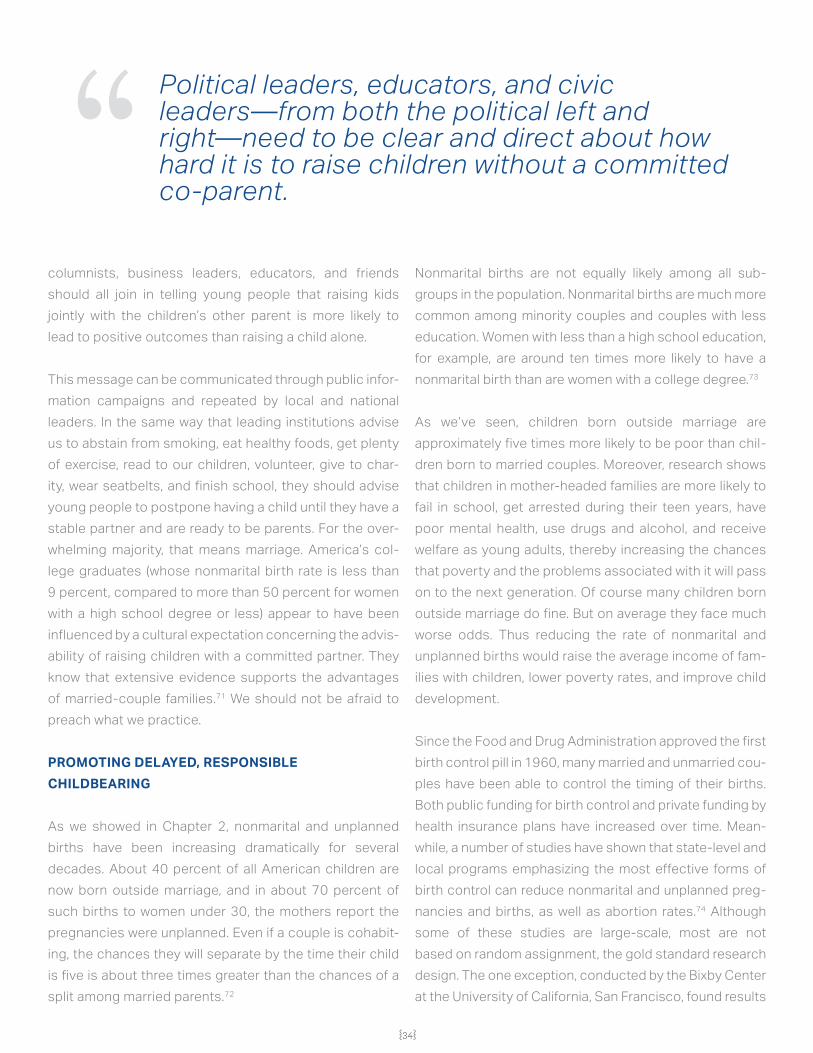
{34}
columnists, business leaders, educators, and friends should all join in telling young people that raising kids jointly with the children’s other parent is more likely to lead to positive outcomes than raising a child alone.
This message can be communicated through public infor-mation campaigns and repeated by local and national leaders. In the same way that leading institutions advise us to abstain from smoking, eat healthy foods, get plenty of exercise, read to our children, volunteer, give to char-ity, wear seatbelts, and finish school, they should advise young people to postpone having a child until they have a stable partner and are ready to be parents. For the over-whelming majority, that means marriage. America’s col-lege graduates (whose nonmarital birth rate is less than 9 percent, compared to more than 50 percent for women with a high school degree or less) appear to have been influenced by a cultural expectation concerning the advis-ability of raising children with a committed partner. They know that extensive evidence supports the advantages of married-couple families.71 We should not be afraid to preach what we practice.
PROMOTING DELAYED, RESPONSIBLE CHILDBEARING
As we showed in Chapter 2, nonmarital and unplanned births have been increasing dramatically for several decades. About 40 percent of all American children are now born outside marriage, and in about 70 percent of such births to women under 30, the mothers report the pregnancies were unplanned. Even if a couple is cohabit-ing, the chances they will separate by the time their child is five is about three times greater than the chances of a split among married parents.72
Nonmarital births are not equally likely among all sub-groups in the population. Nonmarital births are much more common among minority couples and couples with less education. Women with less than a high school education, for example, are around ten times more likely to have a nonmarital birth than are women with a college degree.73
As we’ve seen, children born outside marriage are approximately five times more likely to be poor than chil-dren born to married couples. Moreover, research shows that children in mother-headed families are more likely to fail in school, get arrested during their teen years, have poor mental health, use drugs and alcohol, and receive welfare as young adults, thereby increasing the chances that poverty and the problems associated with it will pass on to the next generation. Of course many children born outside marriage do fine. But on average they face much worse odds. Thus reducing the rate of nonmarital and unplanned births would raise the average income of fam-ilies with children, lower poverty rates, and improve child development.
Since the Food and Drug Administration approved the first birth control pill in 1960, many married and unmarried cou-ples have been able to control the timing of their births. Both public funding for birth control and private funding by health insurance plans have increased over time. Mean-while, a number of studies have shown that state-level and local programs emphasizing the most effective forms of birth control can reduce nonmarital and unplanned preg-nancies and births, as well as abortion rates.74 Although some of these studies are large-scale, most are not based on random assignment, the gold standard research design. The one exception, conducted by the Bixby Center at the University of California, San Francisco, found results
Political leaders, educators, and civic leaders—from both the political left and right—need to be clear and direct about how hard it is to raise children without a committed co-parent.
“

{34}
{36}
similar to those of the other large-scale studies, including a reduction of about half in the number of maternal reports of unplanned pregnancies.
Taken together, these studies give us solid evidence that programs that provide counseling, offer a range of birth control measures including long-acting forms, and pro-vide the services free can substantially reduce pregnancy rates among sexually active couples, including teenage and low-income couples, and enable them to avoid or plan childbearing.
Still, these programs remain controversial for sever-al reasons. The most effective contraception methods have proven to be Long Acting Reversible Contracep-tives (LARCs). They include injections, intrauterine devic-es (IUDs), and subdermal contraceptive implants. They remove any need for users to take daily actions or actions at the time of intercourse. These methods (unlike some IUDs of an earlier era) have so far proven to be quite safe and effective. But they do require medical personnel to di-rectly administer the contraceptive to young women, and in many cases to remove them as well. In addition, oppo-nents are concerned that the counseling offered by these programs amounts to the government nudging teen and low-income women towards using a form of contracep-tion over which they have much less direct control than condoms or the birth control pill. Moreover, some oppo-nents argue that part of the effectiveness of IUDs and similar devices comes from interfering with the capaci-ty of a fertilized egg to be implanted in the uterine wall and see it as potentially a form of abortion. Supporters of LARCs argue that such programs are designed to provide information and that they actually reduce later abortions significantly.
Our group was somewhat divided as a result. The majority support programs of this type, and urge states and local governments to take steps to ensure that women and men, both single and married, are aware of their options for planning pregnancies and births and have easy access to programs that help them do so. But some were
opposed to using government support that encourages young women to take LARCs.
Throughout this report we’ve emphasized the importance of individual responsibility. In this case, we emphasize the importance of what might be called couple respon-sibility. The contraceptive methods by which births can be planned are now diverse, highly effective, and widely available. It would be better for couples, for children, and for society if prospective parents plan their births and have children only when they are financially stable, are in a committed relationship (preferably marriage), and can provide a stable environment for their child.
PROMOTING BETTER PARENTING Raising kids is challenging for all, but some parents do a better job than others. Children in America face a large “parenting gap,” where some children receive significant quality time and attention from their parents, while oth-ers receive less. This gap affects their odds of success both in childhood and later in life. Increasing the share of two-parent families would make effective parenting easier, but we should also take on parenting practices directly.
Research suggests that differences in parenting explain roughly a third of the income-related gaps in child devel-opment.75 Policy should ensure that low-income parents can get guidance on developing their parenting skills to enhance their children’s social, physical, and cognitive growth. The government isn’t an effective parent, and it shouldn’t dictate to parents how to raise a child. But gov-ernment can play a positive role by providing guidance, almost always through a third party receiving government funding, on the practices and skills that fit best with the high aspirations that parents hold for their children. In that spirit, we support evidence-backed programs to help low-income parents nurture their children effectively.
Evidence-based home visiting programs, such as those funded federally through the Maternal, Infant, and Early Childhood Home Visiting program (MIECHV), can help
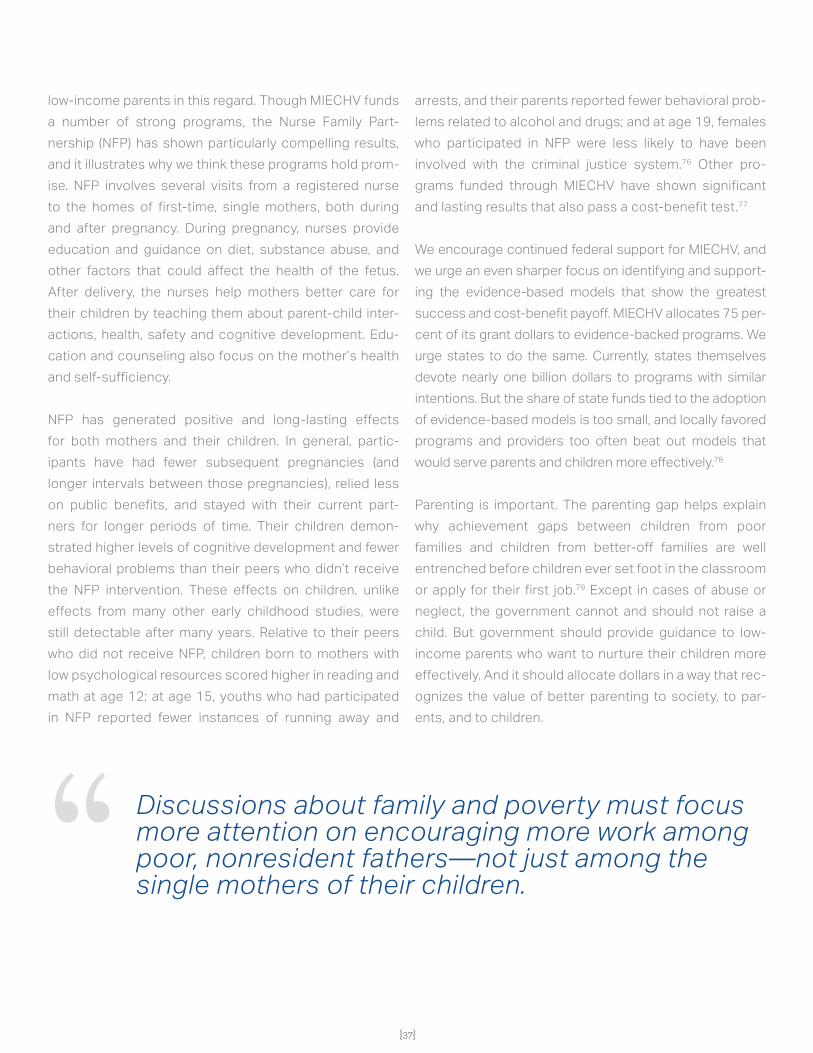
{36} {37}
low-income parents in this regard. Though MIECHV funds a number of strong programs, the Nurse Family Part-nership (NFP) has shown particularly compelling results, and it illustrates why we think these programs hold prom-ise. NFP involves several visits from a registered nurse to the homes of first-time, single mothers, both during and after pregnancy. During pregnancy, nurses provide education and guidance on diet, substance abuse, and other factors that could affect the health of the fetus. After delivery, the nurses help mothers better care for their children by teaching them about parent-child inter-actions, health, safety and cognitive development. Edu-cation and counseling also focus on the mother’s health and self-sufficiency.
NFP has generated positive and long-lasting effects for both mothers and their children. In general, partic-ipants have had fewer subsequent pregnancies (and longer intervals between those pregnancies), relied less on public benefits, and stayed with their current part-ners for longer periods of time. Their children demon-strated higher levels of cognitive development and fewer behavioral problems than their peers who didn’t receive the NFP intervention. These effects on children, unlike effects from many other early childhood studies, were still detectable after many years. Relative to their peers who did not receive NFP, children born to mothers with low psychological resources scored higher in reading and math at age 12; at age 15, youths who had participated in NFP reported fewer instances of running away and
arrests, and their parents reported fewer behavioral prob-lems related to alcohol and drugs; and at age 19, females who participated in NFP were less likely to have been involved with the criminal justice system.76 Other pro-grams funded through MIECHV have shown significant and lasting results that also pass a cost-benefit test.77
We encourage continued federal support for MIECHV, and we urge an even sharper focus on identifying and support-ing the evidence-based models that show the greatest success and cost-benefit payoff. MIECHV allocates 75 per-cent of its grant dollars to evidence-backed programs. We urge states to do the same. Currently, states themselves devote nearly one billion dollars to programs with similar intentions. But the share of state funds tied to the adoption of evidence-based models is too small, and locally favored programs and providers too often beat out models that would serve parents and children more effectively.78
Parenting is important. The parenting gap helps explain why achievement gaps between children from poor families and children from better-off families are well entrenched before children ever set foot in the classroom or apply for their first job.79 Except in cases of abuse or neglect, the government cannot and should not raise a child. But government should provide guidance to low- income parents who want to nurture their children more effectively. And it should allocate dollars in a way that rec-ognizes the value of better parenting to society, to par-ents, and to children.
Discussions about family and poverty must focus more attention on encouraging more work among poor, nonresident fathers—not just among the single mothers of their children.“
{38}
RECONNECTING DISCONNECTED MEN
Public assistance programs for low-income Americans have focused on single-mother households for good rea-son: we have a social obligation to ensure that children in poverty have a minimum standard of living, and poor chil-dren disproportionately live in households headed by a single mother. We believe such efforts are vital and should be maintained and strengthened. Yet policy has tended to ignore men, other than expecting them to pay child sup-port. If we believe that children need a stable and secure home with two loving and nurturing parents, fathers need to be taken seriously. Improving family life in America requires that we more effectively help disconnected men and women gain their footing in the labor market, and that we help non-resident fathers financially contribute to and constructively participate in their families.
As we discuss in detail in our chapters on work (Chap-ter 4) and education (Chapter 5), men who lack a college degree have experienced large declines in employment and earnings. These declines are bad not only for men—they’re bad for women and children as well. They’ve made marriage less appealing to women, especially in low- income communities, because young men with little edu-cation and uneven employment records tend to contrib-ute less to a household’s financial health. Reversing those declines may be the least controversial way to restore the benefits of marriage to more low-income families.
Enhancing wage subsidies such as the Earned Income Tax Credit (EITC) for childless adults and non-custodial parents could help. Both President Obama and Con-gressman Paul Ryan have proposed a significant increase in the EITC for adults without dependent children as a means to improve employment among disconnected men.80 Improving the federal EITC so that it is more gen-erous to low-income childless adults and non-custodial parents should be a priority not only to reverse declines in earnings and labor force participation, but to promote family stability as well.
Enhancing the EITC would also help reduce the imbal-ance between the support we provide for poor single mothers and the very modest support we provide to non-resident fathers in the same economic position. Current policy understandably offers more support to the custo-dial parent, typically the mother, than to the absent par-ent, usually the father. For example, a single mother with two children working 30 hours a week at an $8-per-hour job is likely to receive annual benefits of $5,495 from the Supplemental Nutrition Assistance Program (SNAP), $4,990 in federal EITC payments, up to $2,000 through the Child Tax Credit (up to $1,422 is refundable through the Additional Child Tax Credit), and health care coverage that could reasonably be valued at $4,101 depending on her state of residence. Child support collections, school lunch and breakfast, and child care subsidies can provide additional resources.81
By contrast, a nonresident father working the same job and living in the same area is likely to receive only $1,655 annually from SNAP, $179 from the federal EITC, and possibly some help with health insurance depending on where he lives. But he also is likely to have a child support obligation that would reduce his income and increase the mother’s. Collectively, the benefits provided to the single mother can almost double what she earns, while the nonresident father is eligible for little more than SNAP and a minimal EITC benefit. Discussions about family and poverty must focus more attention on encouraging more work among poor, nonresident fathers—not just among the single mothers of their children.
To help nonresident fathers better provide for their chil-dren, improving responsible fatherhood programs should also be a priority. Federal and state policy already requires fathers to take financial responsibility for their children, but we should help fathers realize that goal. Many state child support agencies now operate work programs to which men who owe child support and fail to work can be assigned. Some of these programs have shown prom-ising results and should be encouraged. Demonstra-tion projects such as Parents’ Fair Share (PFS), Fathers
{38} {39}
at Work, and Partners for Fragile Families (PFF) have improved employment, earnings, and child support pay-ments among participants.82 However, the gains were modest, and in some cases the evaluations weren’t rig-orous. Programming for poor, non-resident fathers can be difficult. We need to develop and evaluate quality pro-grams and expand those that have strong results. The federal Office of Child Support Enforcement is currently evaluating work demonstration programs in eight states. One well-evaluated work program has already shown evi-dence that it can increase both work and child support payments.83 It follows that other states should implement this promising approach and the programs that produce the biggest impacts on fathers’ work in the demonstra-tion programs.84
We also propose changing the way states set child sup-port orders and collect payments from low-income, nonresident parents to help them better provide regular financial support for their children. Many unmarried fathers have children before they are financially able to support a family. Some cohabit with the mother while their children are young, but these relationships are often short lived. Others never form a unit resembling the traditional family. These fathers tend to have much lower incomes than do fathers who marry before childbirth. When men become nonresident fathers, their ability to provide financial sup-port improves very little over time. One recent study esti-mates that almost 10 percent of nonresident fathers pay such a large share of their income in child support that they can meet their full obligations only by skimping on personal expenses such as rent, utilities, and transporta-tion to work.85 We are concerned that the child support obligation not only creates a work disincentive, but that less work by these fathers would reduce the effectiveness of our recommendation to increase the EITC for them.
Overdue child support payments are concentrated among lower-income, nonresident fathers. The penal-ties that induce higher-income fathers to pay can result in mounting debts for lower-income fathers, possibly decreasing average weeks worked among those with high past-due payments.86 The best way to ensure more
consistent financial support for children with nonresident fathers is to increase employment and earnings among these fathers, set more reasonable child support orders in the first instance, and make it easier to reduce orders when unemployment, imprisonment, or other circum-stances make it impossible for them to pay the amount they were ordered to pay when working. 87
We should also try to enroll more fathers in parenting pro-grams. Parenting programs rarely reach fathers or expect-ant fathers, despite evidence that early father involvement is good for infants and children.88 Father involvement during pregnancy substantially reduces infant mortal-ity as a whole and racial gaps in infant mortality, as well as the precursors of infant mortality, including low birth weight and inadequate prenatal care. 89 Fathers who are involved with their children early in life tend to be involved later as well, and their young children tend to fare bet-ter.90 Positive outcomes for young children, in turn, pre-dict success later in life.91 Parenting programs, like many assistance programs, have too often focused on mothers while excluding fathers. This should change.
The welfare reforms of the 1990s aggressively pushed single mothers seeking cash welfare into employment and rewarded work with other forms of assistance, such as the EITC, SNAP, child care assistance, and health insurance. But these positive reforms left many fathers behind. We must do more to reconnect low-income fathers with the institutions of work and family. In addition, child support enforcement reforms should recognize that some men become fathers before completing school or acquiring much work experience. These fathers must be required to take responsibility for and support their children, but public policy should more effectively help them deliver on those expectations.
CONCLUSION
In this chapter, we’ve highlighted four important ways to tackle the problems associated with single parenthood: 1) promoting a new cultural norm surrounding parenthood and marriage; 2) providing young adults with education
{40}
about and access to the full range of effective contracep-tive options; 3) increasing access to effective parenting education; and 4) helping to engage young, less-educated men in work and family through improvements to the EITC, child support enforcement, and fatherhood programs.
In the past, discussions of the family’s role in poverty and opportunity have broken down between those on the right who say it’s the biggest problem facing poor Americans, and those on the left who either minimize its importance
while emphasizing economic causes or say that there’s nothing we can do about it. We break from that standoff. We recognize the central role that families play in chil-dren’s development, and we believe that public policy can play an effective though limited role in promoting family formation. If we want more responsibility, greater oppor-tunity, and enhanced economic security, our nation must help parents provide greater stability in their homes. If we don’t, gains in the labor market and educational programs won’t do enough to improve poor children’s development.

{40}
Chapter 4: Work
Improving the labor market and encouraging work are central to our goals of achieving greater responsibility and opportunity in America. The private economy is the arena where most Americans work hard to realize their dreams. But employment today is failing to achieve the promise it did a few decades ago. Wages of the unskilled have been fairly stagnant in real terms (especially among men) and have fallen relative to those of more-educated workers; and some groups of Americans (like less-educated men generally and black men specifically) are working consid-erably less than they once did. Stagnant wages and low work participation among some groups of workers are blocking progress. Both must be addressed.
{43}
The Great Recession and the slow recovery after-ward have exacerbated the low wages and low employment we observe among the poor. But
even before the recession, during much of the preced-ing 30 years, relatively slow economic growth and weak labor markets limited employment and earnings gains of low-income workers. Improving economic growth, as well as returning to the tighter labor markets that we briefly saw in the latter half of the 1990s, would improve employ-ment and earnings among the poor, as they did then. But absent such economic and labor market conditions, a range of other policies could still help.
Almost all policy advocates want to improve employment rates and earnings among the poor, as well as the adult earnings of those who grew up poor. But in a difficult job market and with the low workforce attachment of some groups, what can we do to improve the employment and earnings of these Americans? We have reached consen-sus on the need to:
1) Expand opportunities for the disadvantaged by improving their skills;
2) Make work pay better than it does now for the less educated;
3) Expand both work requirements and opportunities for the hard to employ while maintaining an effective work-based safety net for the most vulnerable mem-bers of our society, especially children; and
4) Make more jobs available.
Taken together, these proposals will expand opportunity and promote income security among low-income work-ers, while requiring them to take responsibility to make every effort to work.
IMPROVING SKILLS TO GET WELL-PAYING JOBS
In the current labor market, it’s become very difficult to improve the earnings of less-educated workers without also improving their skills, so there is broad consensus that we need to do just that. For much of the last five decades, government-funded “job training” programs have aimed to improve the skills of low-income adults and youth. They include programs funded under the current Workforce Innovation and Opportunity Act (WIOA). Eval-uations of these programs have shown mixed and gen-erally limited effects. For this and other reasons, federal funding for such programs has greatly diminished.92
Instead, most of what we used to call training occurs today in higher education, primarily at community colleges, where less-educated youth and adult workers seek occu-pational certificates and associate degrees tied to partic-ular occupations such as nursing, welding, and computer repair and maintenance. As funding for WIOA and its ear-lier iterations has fallen, Pell grants and other forms of support for students from poor families have increased; they now fund more job training for the poor than all other federal workforce programs combined. As we will show in Chapter 5, college dropout rates are high among low- income students, and, when they do complete creden-tials, too many earn them in generic liberal arts programs that have relatively little labor market value.93
Going to college need not mean focusing only on the tra-ditional academic skills aimed at white collar jobs. Many students with limited or ineffective earlier schooling might do better in career and technical education (CTE) aimed at helping them qualify for skilled and well-paid blue collar positions. Community colleges are participating
Going to college need not mean focusing only on the traditional academic skills aimed at white collar jobs.“
{44}
in more “partnerships” with employers to generate industry-specific (or “sectoral”) training, which shows bet-ter impacts on low-income workers’ earnings in evaluation studies than did most earlier training programs.94 Many community colleges, in partnership with local workforce boards, are also building “career pathways” that combine classroom training, attainment of credentials, and rele-vant work experience. As an example, someone working as a nursing aide might first become a certified nursing assistant and then work toward getting an AA degree in licensed practical nursing.
States are trying to expand their industry-specific part-nerships and career pathway options. But how far can these successful programs be taken to scale so that they serve more workers?95 Right now, such activities are mar-ginal in many community colleges, since technical train-ing is relatively expensive (in terms of teacher pay and equipment costs) while colleges receive the same tui-tion and subsidies for CTE that they get when students enroll in lower-cost classes that the labor market values less. The community colleges have too few incentives to expand teaching capacity in high-demand fields. Many employers, especially those in small and medium-sized businesses, also hesitate to provide significant on-the-job training for a variety of reasons, though it might be in their own interests and those of their workers to do so.96
We believe the way forward is to both increase the finan-cial resources and strengthen the incentives for public two-year colleges to use the resources more effectively. We would start with stronger performance incentives. The outcomes that would be rewarded are college com-pletion rates and subsequent labor market earnings.
Thus, we propose that state legislators and governors make some significant part of state subsidies—perhaps as much as one-half—depend on colleges’ performance in these areas. So as not to encourage colleges to accom-plish this only by “creaming” in admissions (by avoiding riskier students and admitting better ones), states could reward colleges for strong outcomes among the groups whose academic performance tends to be weaker (such
as minority, first-generation, and low-income students), or by developing some measures of “value added” or “risk-adjusted” outcomes for all students.97 The admin-istrative data on education and earnings necessary to implement this proposal are already available, and the fed-eral government and other stakeholders should encour-age states to make better use of them.98
As for resources, we suggest that the federal government (perhaps through the Higher Education Act) or the states give two-year colleges more funding that is targeted specifically to raising teaching capacity in high-demand fields of study, and to support services that would likely improve education and employment outcomes for the poor. Higher expenditures in these areas would let the community colleges expand sector-based training and career pathways while helping students make better-in-formed choices about the benefits of enrolling in them.
In addition, both federal and state governments should expand work-based learning, starting in high school with high-quality Career and Technical Education options. Among the very best of these is the Career Academy. This model of an industry-focused school within a high school lets students take college preparatory classes while also gaining more specific technical training and work experi-ence. Rigorous evaluation shows that Career Academies raise earnings over the long term for at-risk young men by nearly 20 percent, while also improving their marriage rates.99 A Career Academy can also be embedded as one of several options within a broader model of high school reform like New York City’s Small Schools of Choice, which dramatically raised high school graduation rates and college enrollment among participants, especially young black men, while costing the public less than other high schools (see Chapter 5).100
Other forms of work-based learning involve employer- provided training on the job rather than classroom instruc-tion, and we should encourage more of this as well. Appren-ticeship is a particularly promising model of on-the-job learning that deserves more support.101 At a time when lower-income young people have difficulty obtaining both
{44} {45}
postsecondary credentials and early work experience, apprenticeships help them get both. The education and training they receive through apprenticeships is almost certain to be relevant to the types of jobs available in the local market. Apprenticeships are appealing to students, who enjoy being paid while they get an education. Employ-ers also favor apprenticeships because the participating students help them produce the skilled workers they need, without having to make a longer-term commitment before they can observe job performance. The training is often paid for through below-market wages during the training period. Yet another advantage of apprenticeships is that the training usually costs the public little.102
Since the free market alone won’t generate the socially optimum amount of work-based learning that is in both the private and public interest, the state or federal gov-ernment, or both, may need to offer some modest level of tax credits or grants and technical assistance to pro-mote these programs.103 Indeed, South Carolina is already using tax incentives to encourage their expansion, as have Great Britain and other industrial countries.104 South Carolina lets employers take a $1,000 tax credit for each new apprentice. Though we don’t yet have evaluation evi-dence on its impact, this strikes us as a reasonably sized incentive that might be replicated nationwide. At the very least, states should conduct experiments to see whether similar subsidies and/or technical assistance actually increase apprenticeships and skills. Programs that com-bine the on-the-job training of apprenticeships with the attainment of a college credential, such as a certificate or even an associate degree in a high-demand field, would also improve the attractiveness of the training for students and the portability of the skills acquired across employers and economic sectors.105
MAKE WORK PAY MORE FOR THE LESS-EDUCATED
No matter what we do in terms of educating and training low-income students, there is no doubt that many mil-lions will still have low skills and therefore will face a future of low earnings. Working year-round and full-time will often leave single and noncustodial parents in particular
with poverty-level earnings, although the Earned Income Tax Credit (EITC) and other benefits can and do help lift many low-income single-parent, cohabiting, and married- couple families out of poverty.106 And, as we noted in Chapter 2, low wages tend to discourage work, especially among less-educated men. We have therefore reached consensus on a pair of policies to “make work pay” better for less-educated and low-income groups. Specifically, we propose to expand the federal childless EITC and to raise the federal minimum wage.
The EITC has already successfully raised earnings among the poor in the past three decades, and it enjoys consid-erable support among both conservatives and progres-sives. Most—though not all—analysts believe that it also raises work levels among the poor.107 But while the fed-eral EITC very generously subsidizes the earnings of low- income single parents (usually mothers) with children, it currently offers very little to support childless adults, including non-custodial parents.
We support doubling the childless EITC to at least $1,000 per year. President Obama has released a proposal to dou-ble the size of the EITC for childless workers, to broaden its phase-out range, and to expand eligibility to younger
At a time when lower-income young people have difficulty obtaining both postsecondary credentials and early work experience, apprenticeships help them get both.
“
{46}
workers. Paul Ryan, now the Speaker of the U.S. House of Representatives, has proposed a similar EITC expansion. The support of both President Obama and Speaker Ryan shows that the expansion enjoys at least some bipartisan support. Moreover, an experiment to demonstrate how the expansion could be administered and what its impacts might be, called the Paycheck Plus pilot program, is now being carried out in New York City. The EITC in Paycheck Plus is worth a maximum of $2,000 per year.108
Although a higher wage subsidy generates an incentive to work, it might also reduce working hours among some people who are already employed and who would prefer to work less if they use the EITC to maintain their current level of income. To prevent this, some—though not all— in our group would, as in the New Hope Project109 and some welfare reform experiments, condition the sub-sidy on the recipient’s working 30 hours a week, to be assessed monthly.
Some members of our group also worry about increas-ing the “marriage tax” on poor recipients, some of whom would now qualify for two (both the mother and father) EITC payments if they were unmarried but would lose eligibility for one or both, depending on their combined earnings, if they married. The evidence to date suggests that the EITC has only small effects on marriage, and usually even positive ones, though the negative effects could rise with such an expansion.110 This possible neg-ative effect on work and marriage could be counteracted by slowing the phase-out of EITC benefits for married couples.111 For non-custodial parents, outstanding child support debts, if any, would be deducted from the sub-sidy. Thus a new benefit and opportunity for low-paid men would be linked to their responsibility to work steadily and support their children. This combination of helping poor men while making them meet their responsibilities par-allels the combination of new benefits and work require-ments used in welfare reform.
In addition, we endorse an increase in the statutory fed-eral minimum wage, which is currently $7.25 an hour. The public widely supports a minimum wage increase, which
would cost no public revenues. Roughly 25 states have already raised their statutory rates above the federal level. But because the higher rates impose higher labor costs on employers, standard economic theory predicts that raising the minimum wage should lower employment among the groups most concentrated in low-wage jobs (that is, very young, less-skilled, or part-time workers). While the risk of employment loss is real, empirical evi-dence suggests that the loss will be modest. The Con-gressional Budget Office (CBO) recently reviewed the research on this topic and predicted the likely effects of the Obama Administration’s proposal (to raise the min-imum up to $10.10 per hour over three years and then index it to inflation). Its estimate of the likely employment loss was 500,000 jobs over three years, with 16 million to 24 million workers enjoying wage increases and 1 million people being lifted out of poverty.112 But the study also found that more than 80 percent of the earnings increase would go to people already above the poverty line, and that it would modestly raise consumer prices, potentially hurting poor consumers who don’t have a family member who benefits from the raise.
In a clear example of how values can influence the read-ing of research evidence, many progressives believe that this tradeoff is worth making and thus embrace the Presi-dent’s proposal. By contrast, many conservatives believe that the estimated employment costs and the effects on prices are too high, that four-fifths of the increase in earn-ings would accrue to households that are not in poverty, and that the CBO might have underestimated the poten-tial employment losses. In addition, the vast research on the minimum wage says little about how increases affect long-run job growth; nor can it say much about larger increases in the minimum wage. The “net” job loss esti-mate might also obscure larger job losses among some groups of workers that may be balanced out by job gains to new entrants from other groups. Accordingly, many conservatives oppose expanding the minimum wage.113
But, in order to reach a consensus agreement, and given that we have less evidence to date on the effects of index-ing (which, at least potentially, could increase employment
{46} {47}
losses) and on potentially larger employment losses in the future, we recommend an increase below what the Administration has proposed, but still large enough to substantially improve the rewards associated with work among the less-skilled.
It is also important to note the strong complementarity that exists between EITC and minimum wage increases.114 A higher minimum wage would reduce government expen-ditures on the EITC by pushing more workers out of the income ranges at which the EITC payments are high. And the higher minimum wage would prevent market wage reductions that are otherwise created by an expanded EITC, as the available supply of low-wage workers grows.
Any reduction of employment opportunities for young workers should be avoided wherever possible, but the expansion of work-based education (especially appren-ticeships) and effective college training for the disadvan-taged that we have recommended should also help offset any such job losses.
Finally, we believe that states, and potentially the federal government, should take additional steps to make it easier for mothers with children to work. Though some of these steps will cost additional public dollars, they should help reduce turnover among working mothers and raise their employment rates. One effort that states should consider is the provision of paid family and medical leave. We believe the best way to provide paid leave is by funding it through an increase in state payroll taxes (as California, New Jer-sey, and Rhode Island have done), and not as a mandate on employers to provide it, which would further raise employ-ment costs and could thus discourage hiring.115
RAISING WORK LEVELS AMONG THE HARD-TO-EMPLOY
Employment levels, especially among less-educated work-ers, have declined over time. The reasons for falling work levels are not only low skills and wages, but also benefit programs that support people who don’t work. The special employment problems among low-skilled men, such as low education and incarceration, also contribute to lower work levels. While requiring non-disabled beneficiaries of various income support programs to work, we must also remove barriers they face when seeking employment; and, if we require more work as a condition of receiving public bene-fits, we should support policies expanding work availability to those who need it, especially during economic down-turns or in depressed regions of the country. Meanwhile, we believe that it’s important to maintain an effective work-based safety net (see Chapter 2) for vulnerable members of our society, especially children.
Since welfare reform in the mid-1990s, the nation has moved toward a work-based safety net in which the goal is to use welfare and other benefits to move recipients toward rather than away from employment.116 But sev-eral other federal and state programs providing benefits to non-workers likely still discourage some people from working, though the negative effects are no doubt con-siderably smaller than they were before welfare reform.117 Some of these programs should be considered “work sup-ports” when combined with low-wage jobs. But in some benefit programs, such as the Supplemental Nutrition Assistance Program (SNAP), we can do more to require or encourage more work (or productive work-related activity such as education and training).
The reasons for falling work levels are not only low skills and wages, but also benefit programs that support people who don’t work.“
{48}
TEMPORARY ASSISTANCE FOR NEEDY FAMILIES (TANF)
The TANF program has the strongest work requirements of any means-tested program. After TANF was created in 1996, work increased substantially among single mothers, and especially among never-married mothers, the most disadvantaged group of single mothers and the most likely to be on cash welfare.118 By 2000, after a 40 percent increase in the labor participation rate of never-married mothers, the child poverty rate among mother-headed families and among black children, the group of children most likely to live in single-parent fami-lies, reached their lowest levels ever. In part as a result of work, the TANF rolls declined about 60 percent by 2000. We often hear two criticisms of the TANF work require-ments: that states sanction too many families for failure to meet the work requirements, and that there are now too many single mothers, often called “disconnected mothers,” who have neither cash welfare benefits nor a job, some of whom were forced to leave TANF because of the five-year time limit.119 These two criticisms raise the question of whether welfare programs can have tough work requirements and time limits without unduly increas-ing the number of mothers who are unable to meet the requirements and become destitute. Our solution, in addition to the exemption from the time limit that already exists for 20 percent of the caseload, is to help states create more jobs; we discuss this proposal below. If nec-essary, the jobs could be government-supported, which would make it politically easier to enforce strict work requirements because mothers could always get a job.
THE SNAP PROGRAM
Once known as Food Stamps, the SNAP program has a major impact in keeping people out of poverty.120 As a food and nutrition program, SNAP has only modest work supports or requirements. The 2014 Farm Bill authorized $200 million for demonstration programs in ten states designed to show how to implement a variety of stronger SNAP work programs. These demonstrations are still in progress, so it is not known whether they have impacts on
work or nutrition. Once the demonstration programs have been implemented and evaluated, Congress should con-sider the ways in which SNAP recipients could engage more effectively in work, and take steps to maintain the availability of jobs and the nutrition of poor Americans.
Particular care should be taken when expanding work requirements in SNAP, since the SNAP program plays an important role in reducing hunger. We are somewhat more sympathetic to strengthening work requirements on cer-tain groups, like able-bodied adults without dependents. However, exemptions should be made for able-bodied adults who might have difficulty meeting work require-ments due to mental health or other problems.
HOUSING PROGRAMS
Housing programs have traditionally carried virtually no work requirements. The Housing Choice Voucher Program (Sec-tion 8) could experiment with work preparation, job search, or work requirements for recipients who are able to work.
DISABILITY PROGRAMS
Disability programs such as Social Security Disability Insurance (SSDI) and the Supplemental Security Income (SSI) program have recently grown rapidly, even though impairments that prevent work are, if anything, less preva-lent today than they were when the rolls were much lower. On the one hand, there are still some low-income Ameri-cans who would be eligible for one of these programs but have difficulty gaining access to it.121 On the other hand, these programs grant lifelong disability status to individ-uals who qualify for them, and strongly discourage them from working for the rest of their lives. We need to find a better way to handle these problems.
Expanding disability rolls have caused several European countries to reform their disability programs by tightening eligibility rules and making sure that current recipients are really unemployable. The U.S. should experiment with doing the same by creating stronger incentives for workers to stay off the rolls and to remain employed as much as possible
{48} {49}
after suffering illnesses or injuries, and for employers to try to accommodate workers with injuries or serious illnesses. One possible reform would be to vary the tax that employers pay for SSDI, which is now uniform, depending on how many of a firm’s employees go on the SSDI program, as we cur-rently do in Unemployment Insurance program. We strongly endorse some statewide pilot programs for these and other reforms, to test their fairness and cost-effectiveness.
DISCUSSION
Some members of our group are concerned that increas-ing work requirements for the poor, especially for the very hard-to-employ poor (whom employers tend not to hire) or those who live in depressed regions or in times of reces-sion, could mean greater hardship for the most vulnerable, especially children. We therefore believe that any legislation that requires work must be carefully implemented in ways that prevent hardships imposed on children and on dis-abled adults, and only if rigorously evaluated experiments generate evidence to support them. We must mention two more important issues in this regard. First, it’s important that some kind of work opportunity—or at least a work-re-lated activity or constructive pursuits such as education or work preparation—be available to anyone who faces loss of income support for failing to meet a work requirement. Although we endorse expanding public support for job cre-ation for the poor (discussed below), and also some exemp-tions from the work requirements, these might not always and everywhere be sufficient to cover all who need them. In these cases, some type of work activity—perhaps some form of “workfare”—should be offered to the program ben-eficiary before she is eliminated from the rolls. To be clear: we don’t endorse a new entitlement to publicly funded jobs for these recipients, or any loosening of existing work requirements in TANF; we would only require that some kind of constructive activity (even if unpaid) be available to all recipients before terminating their benefits.
Second, we should consider strengthening the work sup-port system, especially for children, even while requiring more work of beneficiaries. We endorse some specific proposals for improvements, like extending the Additional
Child Tax Credit beyond 2017 (when it is due to expire), so long as the credits are based on earnings from work rather than overall income. In addition, we believe several possible changes should at least be analyzed and evalu-ated, because they could help protect children in families with very low or no earnings, though as a group we offer no definitive recommendation on these additional ele-ments. These could include raising the EITC or the Addi-tional Child Tax Credit payments for families with children in the critical developmental age range of 0-5, providing more state funding for child care, allowing higher SNAP benefits for children in this age range, or offering summer nutrition programs for families with young children.
Another way to increase work rates is to reduce barriers to work facing low-skilled men. In addition to weak labor markets and employers’ hesitancy to hire them, these men also sometimes face disincentives to work because of their child support obligations. The Child Support Enforcement Program has become efficient at establish-ing the paternity of children born outside marriage and levying child support judgments on the noncustodial par-ent, usually the father. Doing so has generated valuable income for many single-parent families, but it also gener-ates a reason for absent fathers not to work because the child support payments function as a tax on their earnings. The resentment fathers feel about this system might, in some cases, be a greater deterrent to employment than the financial disincentive itself. A further impediment is that noncustodial fathers who fail to pay their judgments often accumulate large past-due payments, which cre-ate very high garnishing rates on their earnings, and thus even larger deterrents to work. In the worst cases, fathers can even be incarcerated for nonpayment. And many low-income fathers already face work barriers, such as very low earnings or criminal records.
Nonetheless, young men need to understand that par-enting is a serious responsibility and that they will be held accountable if they don’t meet it. Failing to expect both par-ents to support their children is not only unfair, it reduces marriage incentives, increases poverty rates for custodial mothers and children, and is likely to hurt children.

{51}
In a major step toward reducing the work disincentive inherent in child support, the Child Support Enforcement Program has begun to develop work programs to which absent fathers can be assigned if they have trouble work-ing and paying regularly. These programs combine “help and hassle” like the work programs for mothers in welfare reform. The father must join the program and begin to pay the past-due child support. If he can’t find employment, he is given an opportunity to work. If he refuses the job offer and doesn’t begin to pay child support, he could be subject to incarceration in some states.122 A related step is to allow fathers who owe past-due support to have their debt forgiven or reduced if they work steadily and pay their current child support consistently. The federal Office of Child Support Enforcement has funded several demonstrations of child support work programs.
Ex-offenders emerging from prisons at the end of their sentences or on parole represent an even more disad-vantaged group of low-skilled men, whose numbers now exceed 650,000 a year.123 The United States has over 2 million of its citizens behind bars. Incarceration has soared in recent decades as federal, state, and local gov-ernments toughened penalties for crimes, even for vic-timless offenses like drug possession. On both the left and right, however, many people are deeply troubled by the criminal justice system’s huge fiscal costs as well as its negative effects on prisoners’ future job prospects. Mass incarceration harms not only the offenders, but also the families and communities they leave behind.124
Federal and state governments should not only reduce imprisonment but take steps to promote the reentry of
ex-offenders into society. Whether people who leave prison avoid recidivism depends most of all on whether they get jobs quickly and work steadily.125 To that end, states and localities must reconsider the crippling legal disqualifica-tions that now bar ex-offenders from many positions, includ-ing high-growth, low-wage sectors like school custodians, bus drivers, and providers of elder care. Private employers are also often reluctant to hire ex-offenders, fearing threats to their safety or that of their customers and other workers (for which they could be held legally liable).
It is a violation of federal Equal Employment Opportunity (EEO) law for any employer to have a blanket policy of not hiring ex-offenders, without regard to the requirements of the job or the nature of the felony committed.126 This law must be strictly enforced. Cities and states should
also consider passing and enforcing “ban the box” ordi-nances, which forbid employers from asking about crim-inal records in written applications. Employers would still be free to check applicants for criminal backgrounds, which they do quite easily and cheaply on the Inter-net. But doing so later in the hiring process would give ex-offenders a better chance to impress employers with their positive skills or work experience. We support state demonstrations that test the impacts of ban the box ordinances, because answering yes to questions about incarceration likely eliminates an applicant’s chances of getting hired, even if he (or she) is otherwise fully qualified and poses no risk to employers, customers or coworkers. But uncertainty about the potential impacts mean that we should get more information by conducting high-quality studies of ban the box policies.127
Failing to expect both par ents to support their children is not only unfair, it reduces marriage incentives, increases poverty rates for custodial mothers and children, and is likely to hurt children.
“
{52}
Some localities have also developed reentry programs for these men that resemble their child support work programs. Indeed, such reentry programs often serve the same population, since ex-offenders are themselves often nonresident fathers who have accumulated large child support debts while in prison. Ex-offenders on parole are required to work in most states, and when they fail to do so, parole officers often refer them to these reentry work programs.128 However, work programs for ex-offenders are less well-developed than child support work programs, and they have weaker funding. The federal government should promote their further development and evaluation and consider funding them more fully.
ENSURING JOBS ARE AVAILABLE
Finally, we believe that the emergence of a work support system, promoted by the 1996 welfare reform law, should be accompanied by public efforts to ensure that work is, in fact, widely available to all or nearly all low-income adults who want it.129 During the late 1990s, when jobs were plen-tiful, employers willingly hired many of the millions of single mothers who left aid during welfare reform. But since 2000, and especially since the Great Recession of 2007–2009, employment rates among low-income single mothers have receded somewhat and then only partially recovered. They remain high relative to their pre-welfare reform level, but they have not fully recovered from the all-time high achieved in 2000 before two recessions struck (see Chap-ter 2). Therefore, we can’t assume that enough jobs are always available for all those who need them, especially for the hard to employ, those facing multiple barriers to work, those who live in depressed regions of the country, such as rural areas, and during economic downturns.
One way to create jobs is to subsidize employers’ hiring of hard-to-employ groups. Congress has enacted a number of employer tax credits to do just that. Most recently, the Work Opportunity Tax Credit (WOTC) subsidized hiring several groups with high unemployment, including welfare recip-ients, former felons, and jobless veterans. But evaluation evidence suggests that the WOTC’s effects on expanding employment for the disadvantaged have been limited.130
Another way to provide jobs is through public service employment. But such jobs are costly. They should be limited to serious economic downturns and should not support workers who could get regular employment in either government or the private sector. In other words, they should be truly jobs of last resort. Public unions are often skeptical of such programs, so net job creation might be limited if funds are used for jobs that would otherwise have already existed.131 On the other hand, if implemented carefully, public service employment can, in addition to providing employment, have the potential to create goods and services that have economic value to society. Some of us would also support PSE during peri-ods of overall economic expansion in parts of the country with persistently high unemployment rates, subject to the other restrictions mentioned above. Others believe that such a step would only be appropriate if coupled with sig-nificantly stronger safety net work requirements, and that other policy tools are better suited to help workers living in depressed areas.
A more promising approach to creating jobs is the emer-gency employment program created under TANF as part of the American Recovery and Reinvestment Act during 2009–10. In a short time, roughly 260,000 workers were placed in jobs created by this federal subsidy.132 A non-experimental evaluation suggested net employment growth among the employers who hired the subsidized applicants, along with some post-subsidy improvements in the employees’ earnings (relative to a carefully cho-sen comparison groups).133 Before expending substan-tial public resources in this area, we should experiment with and evaluate a program at some substantial scale, to improve our knowledge of what works and is cost- effective. Any such efforts should be modest during periods of strong economic growth and should grow in magnitude and funding during recessionary periods.
CONCLUSION
Progressive members of our group want to see opportunity expanded to ensure that all workers can find employment, and to see the government raise the earnings of poor and
{52} {53}
low-income workers, especially those supporting children. Conservative members of our group want more workers to take responsibility for themselves and their families by working, while government provides greater security to working families and their children by subsidizing their earnings. Our group has reached consensus on a set of proposals that we believe will meet all of these goals.
Some of our proposals seek to promote more employ-ment in the economy as it is, while others require the government to raise public spending to improve oppor-tunity for the poor. While the budgetary costs of some of our proposals—like increasing the EITC for childless workers—could be significant, they could be offset in the context of a broader tax reform. Some of the costs of our proposals will also be offset by other policies we suggest, such as increasing the minimum wage, which will push many workers into income categories where they are more self-sufficient and less dependent on government income support.
But improving employment prospects for low-income workers or others (such as working mothers who have difficulty paying for child care) need not be left only to the government. We all believe that private sector employ-ers should be encouraged to create upward employment
paths for their workers and to help resolve the work-family imbalances that plague working families by providing paid family leave or flexible schedules for parents of small chil-dren. It would be in the public interest for businesses to help their employees in these ways, and many can do so without incurring great expense.134
Although several of the policies we recommend are con-troversial, we have found a great deal of agreement on the three general employment and training issues we discuss in this chapter. Specifically, we all believe that education and training are one of the keys to reducing poverty and increasing economic mobility, that government policy should aim to make work pay more at the bottom of the earnings distribution, and that we should strive to find a reasonable balance between promoting or requiring work in public programs and ensuring economic security for all families. Yes, progressives and conservatives would select somewhat different paths to achieve these broad goals. But because we agree on the goals, there is every possibility that well-functioning federal and state govern-ments can find compromises such as our group has found. Together we can move the nation’s workers and families, especially those at the bottom, toward greater participa-tion in the nation’s economy, toward higher earnings and family incomes, and toward improved financial security.
Chapter 5: Education
For much of the 20th century, a cornerstone of the Amer-ican Dream has been the belief that, with hard work, all adults should be able to lift themselves and their fami-lies out of poverty. But over the last several decades, it has become clear that achieving the American Dream now takes both hard work and a good education—good enough to command a job that pays a non-poverty wage. The education level of adult heads of households has been increasingly associated with their income as the income gap between the well-educated and the less educated has grown steadily over the last four decades (see Chapter 2, Figure 9).
{55}
Not only is the income gap by educational attain-ment growing, we’ve also seen a growing edu-cational achievement gap by family income for
children (see Chapter 2, Figure 10). For these and many other reasons, a conservative/progressive consensus on how to reduce poverty and increase opportunity must tackle the question of how to reduce the growing gap in educational achievement between children from wealthy and poor families. That means not just closing a gap in years of schooling, but in cognitive academic skills and social-emotional skills as well.
The partisan political and cultural wars in education have been as fierce as in any domain of American life. Our group won’t try to broker a truce between progressives and conservatives on all features of the education policy wars. Nor do we aspire to analyze and critique the entire education system. But we have reached a consensus on several policy proposals that are consistent with our shared values of opportunity, responsibility and security. If these policies were implemented, they would help the poorest children and thereby reduce the growing educa-tion gap.
These are our four recommendations:
1) Increase public investment in two underfunded stages of education: preschool and postsecondary;
2) Educate the whole child to promote social-emotional as well as academic skills;
3) Modernize the organization and accountability of education; and
4) Close resource gaps to reduce education gaps.
In combination, we believe these four recommendations will help children on the bottom rungs of the economic ladder improve their educational achievement and attain-ment and thereby reduce the income gap in education.
INCREASE INVESTMENTS IN TWO UNDERFUNDED STAGES OF EDUCATION
Early childhood and postsecondary education are pri-orities for 21st century education policy. The scientific research is clear: learning and brain development are inextricably linked. They both begin in the womb and con-tinue at a rapid pace until at least the middle of the third decade of life.135 The United States makes its greatest public investments in the nation’s K–12 education sys-tem.136 But two other periods of the life cycle are also critical to learning: (a) early childhood, from conception to kindergarten; and (b) postsecondary, from the exit door of high school to the world of work. Because pub-lic investments in children’s education are lower in the early childhood and postsecondary years, parents’ and families’ roles and resources affect learning more during these stages than they do in the K–12 years. Compared with wealthier families, low-income families are at a dis-advantage in promoting their children’s learning at these two stages. Education policy should do more to reduce the gap in investments in children between low-income and high-income families during the early childhood and postsecondary years.
EARLY CHILDHOOD: INFANT/TODDLER YEARS AND PRE-K
INCOME GAP IN EARLY LEARNING
One of the challenges facing education policy is that the gap in learning—specifically in cognitive-language devel-opment and in social-emotional development—opens up well before children enter preschool or the K–12 sys-tem. A nationally representative sample of 11,000 infants born in 2001 (the Early Childhood Longitudinal Study—Birth Cohort) has enabled researchers to compare the
Consensus on how to reduce poverty and increase opportunity must tackle the question of how to reduce the growing gap in educational achievement between children from wealthy and poor families. “

{57}
early learning of children in families that earn less than 200 percent of the federal poverty line to the learning of children from families with higher incomes.137 As early as 9 months of age, low-income infants’ scores are below those of their higher-income peers on measures of cog-nitive and social-emotional development. By 24 months, this early learning gap has at least doubled.
A number of factors associated with parents’ low incomes are thought to explain this early learning and development gap. Low-income children are exposed to fewer words and have less access to cognitively stimulating materials and experiences in their homes. The toxic stress caused by economic hardship and violence can lead to harsh, abusive, disengaged, or neglectful parenting.138
INCOME GAP IN EARLY CARE
On average, 51 percent of toddlers are cared for exclu-sively by their parents. The other 49 percent are cared for by relatives (18 percent), family child care (care deliv-ered in the provider’s home; 15 percent), or center-based care (16 percent) during the day. Low-income infants and toddlers are more likely to be cared for by their parents than are higher-income infants and toddlers. When they are in non-parental settings, the care they receive is often lower in quality.139 Research indicates that both low maternal education and lower-quality non-parental care diminish toddlers’ cognitive development.140 In short, lower- quality care, whether in or out of the home, constrains the cognitive-language and social-emotional development of infants and toddlers in low-income homes.
These gaps in early learning and quality of care open and grow before children enter the formal K–12 education sys-tem. From these facts, we conclude that the nation must develop a robust early learning policy based on several principles. First, since the early learning and development gap appears in infancy and grows in toddlerhood, invest new resources to promote early learning as early as pos-sible in the child’s life. Second, because low income and low maternal education are such pervasive risk factors for falling behind in early cognitive and social-emotional
development, give priority in early learning policies to low-income infants and toddlers and their mothers. Third, because low-income infants and toddlers are more likely to experience lower-quality child care, and because lower-quality child care contributes to poor cognitive and social-emotional learning, target resources to improve the quality of early child care settings for low-income children. Fourth, because more than half of low-income infants and toddlers are cared for exclusively by their par-ents, create population-based approaches to developing and implementing early learning and development ser-vices and initiatives that don’t rely on child care programs (because they cover a minority of children) or schools (because they come too late in the game).
In response to these facts, our group has agreed that the nation would benefit from focusing on three policy initiatives. These three initiatives are scientifically sound, scalable within the current institutional infrastructure, relatively affordable even as universal strategies, and likely to be cost-effective.
First, the nation should use its universally available net-work of pediatric primary and preventive care practices to mount evidence-based parenting and early child devel-opment interventions. Thanks in large part to expansions of federal and state health insurance coverage of children, nearly all infants and toddlers have access to basic health care and are now taken to a schedule of 10–12 well-baby visits over the first three years of life.141 Consequently, pediatricians and other health service professionals have developed low-cost, evidence-based approaches to supplement pediatric visits with parent-child inter-ventions that can promote early cognitive-language and social-emotional development.142 The largest such ini-tiative is “Reach Out and Read,” which currently enrolls millions of low-income parents and their infants and tod-dlers. Reach Out and Read has stimulated new programs like VIP (Video Interaction Project) that have been rigor-ously evaluated and found to improve young children’s language and social-emotional development.143
Second, the federal government and the states should build on the recent bipartisan reauthorization of the
{58}
Child Care and Development Block Grant to continue to improve the quality of child care for low-income work-ing parents. As we noted earlier, the quality of child care is vital to whether poor children keep up with their better-off peers in early learning. If child care quality is low, the early learning gap between low-income children and their upper income peers grows. If child care qual-ity is high, many young children from low-income families can be prevented from falling further behind.
Third, the states should expand access to high-quality preschool education. Over the last several decades, state governments have invested more in public pre-school programs.144 Some states’ programs are high on access but low on quality (e.g., Wisconsin, Texas, and
Florida). Other states’ programs are high in quality but low on access (e.g., North Carolina, New Jersey, Wash-ington, and Kentucky). Two states have led the way in expanding access to high-quality care: Georgia and Okla-homa. Evidence suggests that their initiatives have both increased preschool enrollment rates in the short run and improved children’s test scores in elementary and middle school in the longer run. Some analysts question whether high-quality preschool education and care is really scal-able at acceptable costs to states. We propose that part of the strategy of expanding high-quality programs is for the federal government and the states to conduct exper-imental studies of how these programs can be expanded without sacrificing quality. The studies should focus on the technical aspects of successful scaling of quality pro-grams as well as the costs of expanding them.
POSTSECONDARY EDUCATION
Education in the years after high school graduation but before the attainment of a job that pays better than pov-erty wages also suffers from underfunding, especially for students from low-income families. College enrollment rates have risen considerably over the last 50 years for all socioeconomic groups, including the poor, but enroll-ment gaps between the poor and the affluent have none-theless increased. In addition, students from low-income families mostly attend community colleges and the lower tier of public four-year colleges. The educational out-comes that low-income students achieve remain disap-pointing. Their dropout rates are extremely high and far above those of their middle- and upper-income coun-
terparts. Unfortunately, many students, especially those who drop out before completing their degrees, are accu-mulating a great deal of debt when they attend college, only to find it difficult to service that debt, in large part because they can’t find well-paying jobs.145
The fact that low-income college students have poor out-comes can be at least partly explained by their weaker academic preparation in the K–12 years, their limited knowledge of the higher education system, and fam-ily pressures to generate income while enrolled (espe-cially if they are single parents). But these students are also hurt by their greater concentration in lower-quality colleges, which have relatively fewer resources as well, and by the rising costs of higher education.146 Some analysts emphasize that the academic performance of many low-income (or first-generation) students is limited both by their personal decisions regarding course work
The educational out comes that low-income students achieve remain disap pointing. Their dropout rates are extremely high and far above those of their middle- and upper-income counter parts.“
{58} {59}
and study habits and by their poor preparation for col-lege work; others emphasize the limited opportunities and higher costs that would-be students face in trying to attend the best schools.147 Still other analysts note that even the best-prepared high school graduates from poorer communities lack the information and encourage-ment they need to apply to top schools,148 and good stu-dents from such communities are more likely to drop out of college for social and other reasons. Given these facts, all agree that higher education in its current form is failing to achieve its promise for low-income youth and adults.
Consistent with this interpretation, students’ completion rates at lower-quality colleges and their subsequent earn-ings also appear limited by weak incentives for the insti-tutions to provide more information and to offer courses that are more likely to lead to good jobs. For example, low- income students get very little academic or career coun-seling before or during college, and very little guidance about choosing courses and majors that lead to labor market rewards. One prominent researcher has compared community colleges to a “shapeless river” in which stu-dents float along without structures to guide them.149 Col-leges have only modest incentives to provide enhanced services, such as selection of courses and career guid-ance, and little incentive to expand teaching capacity in high-demand areas. This is true because the institutions get subsidies based on “seat time” per student, rather than for achieving successful outcomes. Further, instruc-tors and equipment in many high-demand fields (like health technology, advanced manufacturing or nursing) make them the most expensive for colleges to provide. Thus new public resources invested in the community college system should be accompanied by careful target-ing and accountability to make sure that the new money is effective in improving outcomes for low-income students.
To ensure that the new resources and accountability suc-cessfully translate into better student outcomes, it would be wise to emulate some important and proven models for community (and other) colleges. One such model is the Accelerating Study in Associate Programs (ASAP) at the City University of New York, which has been rigorously
evaluated. ASAP requires participating students—who are mostly taking developmental (remedial) classes and who usually graduate in very low numbers—to attend col-lege full-time. They receive a range of academic supports while attending for free. The program nearly doubled stu-dent graduation rates over a three-year period, from 22 to 40 percent.150 States could provide technical assistance to colleges that wish to implement some version of this program, or other successful programs.
EDUCATE THE WHOLE CHILD TO PROMOTE SOCIAL-EMOTIONAL AND CHARACTER DEVELOPMENT AS WELL AS ACADEMIC SKILLS
Increasingly, economists, employers and corporate lead-ers are recognizing how vital “soft skills” are to success in the labor market and to the nation’s productivity.151 In an information and service economy, a variety of what some researchers (mistakenly) call “non-cognitive traits” are espe-cially important. These include workplace skills such as the ability to follow directions and take feedback from supervi-sors, cooperate with co-workers, and focus on tasks and complete them on time. They also include more personal skills like managing one’s own feelings and making respon-sible decisions about one’s personal life. These and other characteristics influence people’s educational attainment, employment and earnings as much as or more than aca-demic achievement as measured by standardized achieve-ment tests.152 In education policy and practice, these soft skills go by many names, most commonly social-emotional learning (SEL) or character development.153
The key to teaching SEL in school is to rebuild the trusting ties to competent adults that students should bring from home. Only then can behavior improve and academic learning begin. This may be the key to making low-income schools work.154 At its best, early childhood education teaches SEL as much as anything academic. One rea-son some charter schools, like the Knowledge Is Power Program (KIPP), are especially effective is that they focus above all on establishing order, clear academic standards, more time on task, and high expectations from teachers. As students adjust to those demands, they learn how they
{60}
are supposed to behave. Thus, social-emotional learning occurs, and then academic learning occurs. This com-bination of outcomes allows KIPP and similar schools to produce students who score well on standardized tests and have high graduation rates.155
But despite their importance to education, employment, and family life, the major educational and school reforms of the K–12 system over the last few decades have not focused sufficiently on the socio-emotional factors that are crucial to learning. Though most teachers believe that schools have a fundamental responsibility to educate the whole child, edu-cation policy has focused disproportionately on high-stakes accountability strategies based on results from standardized academic achievement tests. We believe that the education gap can’t be closed unless and until schools commit to and become skilled at educating the whole child.
Fortunately, the U.S. has been a hotbed of small-scale experimentation in school-based approaches to pro-moting children’s social-emotional learning. A 2011 study reviewed over 200 studies that involved more than 200,000 children. It found that school-based SEL pro-grams, implemented by teachers in primary, middle and
secondary schools not only improved children’s SEL skills, but also improved their mental health/behavioral prob-lems and their standardized achievement test scores.156 In short, we have a robust evidence-based approach to help close the cognitive/academic and social/emotional gaps in learning. What we need now are policies to scale up high-quality, evidence-based SEL programs and to make them a fundamental part of the education of all kids, but especially children who need it the most—low-income children who will fall further behind without it.
We recommend three policies to advance SEL. First, the federal government should provide resources for state and local education authorities to implement and scale evidence-based social-emotional learning practices and policies. Since 2011, several such pieces of legislation have been introduced (e.g., HR 2437, the Academic, Social and Emotional Learning Act of 2011; HR 3989, the Stu-dent Success Act of 2012; and HR 1875, the Academic, Social and Emotional Learning Act of 2013) to provide such resources. Whether as standalone legislation or as part of reauthorization of the Elementary and Second-ary Education Act (ESEA), federal legislation is critical to advance evidence-based SEL in America’s schools.157
Second, all states should implement high-quality social-emotional standards that cover the period from preschool through high school. If social-emotional learn-ing is a fundamental responsibility of schools, then log-ically we need learning standards to guide instruction that promotes SEL. A recent National Research Coun-cil report158 recommended the development of learning standards to promote intrapersonal, interpersonal and cognitive skills. Free-standing preschool standards for SEL exist in all states, but only three—Illinois, Kansas and Pennsylvania—have adopted comprehensive SEL stan-dards with age-appropriate benchmarks for their entire K–12 system. We need dramatically more progress in state SEL standards. To educate the whole child, all states should develop and implement clear, comprehensive SEL standards with age-appropriate benchmarks for pre-school through high school.159
Despite their importance to education, employment, and family life, the major educational and school reforms of the K–12 system over the last few decades have not focused sufficiently on the socio-emotional factors that are crucial to learning.
“
{60} {61}
Third, the federal government and the states should establish centers of excellence that can provide training and technical assistance to school districts in implement-ing evidence-based approaches to social-emotional learning. Training and continuous support are necessary to ensure that instructional leaders at the district and school levels, as well as teachers, understand SEL stan-dards and can implement evidence-based programs and practices with fidelity. SEL requires the same level of sup-port to provide high-quality, effective instruction as does literacy and numeracy.
In conclusion, federal legislation, state standards, and training and technical assistance resources for dis-tricts and schools can help to scale up evidence-based approaches to SEL and put education of the whole child at the center of education reforms. Complementing aca-demic learning with effective SEL policies is key to our strategy to reduce the education gap.
MODERNIZING THE ORGANIZATION AND ACCOUNTABILITY OF EDUCATION
The condition of the K–12 education system underscores the themes and challenges we’ve raised. Although high school completion rates are improving, only 82 percent of black Americans and 79 percent of Hispanics com-plete high school, compared with 89 percent of whites.160 Within these broad demographic patterns, there are deep differences between schools in low and high poverty neighborhoods in their academic offerings, extracurricu-lar activities, and outcomes.161 Moreover, a generation or two ago someone with a high school diploma could gen-erally make it up the economic ladder to the middle class; today a quality postsecondary education is necessary to achieve that goal.162 Much of higher education is failing to provide the skills young people need, completion rates for blacks and other minorities are low, and, higher edu-cation is slow to introduce affordable new ways to pro-vide the skills students need to succeed in the workforce. Many college graduates can’t find full-time work in their field, while employers grumble that graduates they hire are ill-equipped for the workplace.
Robert Putnam and others have raised another import-ant issue about American schools. Schools are a prod-uct of the community in which they are located as well as potential engines for upward economic mobility for the children from that community.163 The social and eco-nomic conditions of many poor neighborhoods affect the organizational culture and effectiveness of the schools themselves and thus the schools’ capability to offset the rising attainment and income gaps.
In short, there are many reasons to be concerned about whether the education system at all levels is preparing young people, especially those from poorer neighbor-hoods, for future success. To improve the educational system, we need policies that stimulate greater innova-tion in the organization and delivery systems of educa-tion and that foster rigorous accountability for new and existing approaches. Fortunately, American education encompasses a great deal of creativity. Our challenge is to spur innovation and customization to drive the system, especially for the benefit of the young people who face the greatest challenges.
HELP SCHOOLS SERVE AS COMMUNITY HUBS (K–12 EDUCATION)
They can be hubs to coordinate a range of services for chil-dren and, often, the wider community. The school setting should support a “two-generation” model that reinforces positive development for parents as well as their children.164 Within poorer communities especially, this means seeing the school as a hub for a range of health, social, and other services in addition to teaching. For very young children, combining development of skills in early childhood with strategies to improve the home and community environ-ment is key to the cognitive/language and social/emotional skills children need for success. Then, from pre-K through high school, we need similar approaches that bring parents and a range of services into the school, and that feature a multi-professional team to assist both parents and children within the school building.
{62}
The community school movement, as well as some inno-vative charter schools such as the KIPP system, the Dunbar Learning Complex in Atlanta, and Baltimore’s Henderson-Hopkins school, take this two-generational hub approach. In the school, a team of teachers, health professionals, and social workers addresses children’s social and health needs as well as their education. These schools also use a combination of requirements and inducements—for instance, day care for infants—to per-suade parents to take part in on-site job training and par-enting classes.165
Although these approaches are promising, we don’t know enough about either their effectiveness or the key fac-tors behind the results they do produce. For instance, one analysis of the Harlem Children’s Zone found that the Zone’s charter schools showed reasonable success, but that the wraparound social services didn’t have a signifi-cant impact on the children’s educational achievement.166 On the other hand, another study found that offering stu-dents a range of social service and other supports can contribute to academic progress.167
So although we argue for experimenting with this promis-ing approach, we also argue that experiments need to be carefully evaluated, with both trial evaluations to guide the experiments themselves and more rigorous evaluations before any approach is replicated and scaled up. Inte-grated approaches can be expensive and complicated, even if they yield long-term savings in health, social ser-vice and even crime costs in addition to improving chil-dren’s prospects. To identify the long-term benefits and
encourage the strategy, states, counties, and school districts need budgeting and accounting tools that let money be moved across program boundaries so that it can be spent where it does the most good.
In setting up such tools, states need to collect budget and longitudinal outcomes data to permit rigorous eval-uations of team approaches. The evaluations should include longitudinal data on how high school graduates perform in college and in the workforce, to provide feed-back for improvements at the high school level. Fortu-nately, such data are becoming more available. Forty-five states have received federal grants to develop statewide longitudinal data systems under the National Center for Education Statistics’ Statewide Longitudinal Data Sys-tems Grant Program. Most have linked K–12 and postsec-ondary information; some have also linked employment and health information. Meanwhile, the nonprofit National Clearinghouse can provide enrollment and degree infor-mation to high schools and to researchers.
Evaluation is a vital and underused tool for develop-ing good education policy. We believe the new norm should be to scale up evidence-based approaches only. No approach, even those we think are as promising as community schools, should be copied just because it’s innovative. To carry out such evaluations, states, coun-ties, and school districts need to collect longitudinal out-comes data. We also need more experimental evaluations of various teaching and learning approaches. Meanwhile, traditional approaches to education must also be subject to the same degree of evaluation and analysis.168
Evaluation is a vital and underused tool for developing good education policy. We believe the new norm should be to scale up evidence-based approaches only.
“
{62} {63}
ENCOURAGE CUSTOMIZATION AND INNOVATION TO ACHIEVE HIGH STANDARDS
If schools are to offer children the best opportunities and help them overcome their challenges, education needs to be customized for each child.169 More affluent and engaged parents routinely supplement their child’s reg-ular education with a wide range of other activities, from after-school music lessons to summer programs, while private tutors and counselors help deal with weaknesses and give children from well-off families an edge in college admission. Meanwhile, parents in poorer households also lack not only the financial resources but the information and professional networks to choose the best supple-mental education for their children.170
To encourage customization and pedagogical innovation, we urge states and localities to enact legislation to widen the use of innovative approaches to school organization. Several approaches look promising. Evaluations of char-ter schools, for instance, indicate that the best among them can have significant impacts both on school per-formance and on long-term attainment and earnings. A recent study by Mathematica Policy Research, using lon-gitudinal data for charters in Chicago and Florida, found large increases in the probability that children would both gain a high school diploma and attend college. In the Flor-ida case, Mathematica also found significant increases in earnings of charter school graduates compared with graduates of other high schools.171 Another Mathematica analysis of the KIPP schools found substantial impacts on achievement, which were apparently associated in part with changes in student behavior patterns.172 New York City’s Small High Schools of Choice are also associated with markedly higher graduation rates for disadvantaged students of color, according to a recent study by MDRC.173 Moreover, students attending these high schools are much more likely to go on to postsecondary institutions. And the Career Academies we discussed in Chapter 4 have been a successful element of school reform for more than three decades. Evaluations of these schools indicate that they significantly boost students’ post-school earn-ings and family stability, compared with a control group.174
We also find that when school systems train and retain good teachers, they produce significantly better results. That’s hardly a surprise, but research also suggests that effective teachers are associated not just with better test scores but also with improvements in adult earn-ings, reduced probability of out-of-wedlock childbearing, and social improvements in neighborhoods.175 Moreover, research suggests that high-quality teachers can poten-tially be identified quite early in their careers and that quality is not closely related to teaching credentials.176 Hence taking steps to attract and train teachers, assess them early in their careers, and weed out those who don’t show the potential for quality will likely have a significant impact on students’ performance in school and later suc-cess in life.
Though we encourage innovation and customization, nei-ther is an alternative to a robust core curriculum in our schools. An effective core curriculum gives each child alternative methods of achieving the standards, both academic and social-emotional, and it permits variations and additions to help each child make the best use of her talents. We share some of the concerns about the Com-mon Core standards, such as the excessive use of testing and undue restrictions on teacher flexibility, but we still believe that these standards can provide an improved foundation for primary and secondary education. We also believe that progress in adopting evidence-based cur-ricula for social-emotional learning and character devel-opment will support students in the self-regulation and persistence they need to achieve deeper learning and meet revised academic standards.
REFORMS OF HIGHER EDUCATION
The good news about higher education is that change is already taking place. From elite private institutions to the average state university and community college, adminis-trators are gradually seeking ways to slow cost increases and to respond to the opportunities and challenges of online education and of new institutions with innovative business models.177 What we need now is a policy frame-work to accelerate changes that will help higher education
{64}
transform more rapidly into a more effective vehicle for promoting equal opportunity and economic mobility.
Additional resources will need to be spent to improve higher education and employment outcomes for low-in-come students. But these resources need to be carefully targeted on support services like counseling and child care that will likely improve outcomes for the poor, includ-ing reducing their dropout rates. We also need resources for models like ASAP that have been proven to work. Com-bining these targeted resources with new accountability measures—such as requiring states to base their public subsidies for colleges at least partly on students’ educa-tion and employment outcomes—will ensure that the new resources are spent effectively. (We further developed these ideas about accountability in Chapter 4.)
Another essential step to improve workforce preparation is to supplement traditional accreditation with other methods of measuring quality, and to establish these alternative mea-sures as criteria for federal student aid. At best, the current process only gives students or their parents an indication that an entire institution meets certain quality measures, which in turn allows students from that school to qualify for federal aid. But accrediting an institution doesn’t mean that individual courses are of good quality, or are relevant for the workplace after graduation. Further, accreditation per-versely serves to protect traditional business models—it’s costly, time-consuming, and uncertain for new ventures to undergo the accreditation process.
We propose administrative and congressional action to provide alternative ways for institutions and courses to qualify as acceptable for student aid. One possibil-ity would be a fast-track federal accreditation system for online schools and other innovative models, as the Obama Administration is considering. Another would be to give states greater authority to provide a speedier track to federal accreditation. Yet another would be for the federal government to recognize competency-based credential-ing of courses as the equivalent of accreditation.
Inadequate information on institutions’ graduation rates and their students’ post-graduation income has caused millions to choose colleges and courses unwisely and to incur avoidable debt. For students from more mod-est backgrounds, with fewer networks and less access to useable information, unwise decisions are common and damaging.
The Administration has taken important steps to provide basic information on college performance to help guide students and their parents. The National Center for Edu-cational Statistics178 provides basic information on insti-tutions, such as typical costs of attendance, loan default rates, and graduation rates. This service supplements pri-vate “scorecards,” such as those compiled by US News & World Report and Forbes. The federal scorecard should offer more complete information, including more details on employment patterns after graduation. But we also caution against seeing a federal scorecard as the definitive rating. In addition to the danger that a rating system could become ossified and reflect traditional visions of quality, increasingly sophisticated private ratings are emerging, such as tools to identify the true “value added” of a college.179 For this rea-son, we recommend that the federal government open its rating platform to multiple scorecards that meet standards of integrity but reflect differing views of quality.
FOSTERING APPRENTICESHIPS AND OTHER PARTNERSHIPS
The changing nature of the workplace and needed work-force skills make the traditional distinctions between forms of higher education much less relevant today. Indeed, the fact that so many university graduates have an incomplete skill set underscores the need for institutions of higher education to provide a range of employment-related experiences, such as temporary workplace training programs (known as “externships”). As we pointed out earlier, our economy increasingly requires a range of social-emotional skills and work-related expe-riences and training along with academic courses.

{64}
{66}
We encourage states and the federal government to expand apprenticeships and other forms of work-re-lated learning at both the college and high school level. Some states, such as South Carolina, have already taken a strong lead in fostering college-business partnerships, as have some European-based companies from coun-tries with a long tradition of partnerships and appren-ticeships, such as Germany.180 Promising proposals that are under discussion include state tax incentives and a strengthened national apprenticeship program.181
It is widely thought in the United States that partnerships of this kind are suited only for students who are not quite up to university level work. Such thinking is a mistake, as the employment problems faced by many university grad-uates indicate. In fact, the university of the future seems likely to be a blend of experiences and forms of learning, from online courses to workplace-based blended courses to traditional residential courses.
CLOSE RESOURCE GAPS
INCREASE EDUCATIONAL RESOURCES AVAILABLE TO LOW-INCOME STUDENTS
Since the release of the Coleman Report in 1966, the evidence has been mounting that, after the socioeco-nomic status of students’ families, the largest in-school influence on students’ academic achievement is the socioeconomic status of their classmates.182 But a grow-ing number of low-income children are segregated from middle-class schoolmates. Socioeconomic segregation has been growing in U.S. public schools: The proportion of children attending schools where 75 percent of students
are eligible for reduced-price or free lunch grew from 10 percent in 2000 to 17 percent in 2008.183 The proportion of students in high-poverty schools is greatest in urban areas (40 percent) but significant in suburban and rural areas as well (13 percent and 10 percent, respectively).184
Higher proportions of middle-class schoolmates expose children to advantages like their larger and richer vocab-ularies, higher levels of engagement in productive activ-ities, and lower levels of behavioral problems. Schools with higher proportions of middle-class peers confer two other major advantages: engaged parents who are more active in the life of the school, and better teachers who are attracted to work in higher-functioning schools.
We propose extending the concept of “resource gaps” beyond differences among schools in per pupil expendi-tures to include the critical resources of classmates, their parents, and the schools’ teachers. When resources are understood in this manner, socioeconomic integration of schools becomes an important policy tool to increase education resources to low-income children. Indeed, education analysts on the left,185 and more recently on the right,186 see powerful evidence that, on the policy level, socioeconomic integration of schools can have clear population-level effects, improving the academic achievement of low-income children without hurting the achievement of middle-income children. But the key to both helping the low-income children and not hurting middle-income children is to maintain a numerical and cultural majority of middle-class students.187
In light of the limited success of the Bush Adminis-tration’s “No Child Left Behind” policy and the Obama
We endorse an alternative strategy: breaking up concentrations of school poverty by encouraging voluntary school choice that promotes socioeconomic integration—and, as a desirable byproduct, more racial integration.
“
{66} {67}
Administration’s “Race to the Top,” we endorse an alter-native strategy: breaking up concentrations of school poverty by encouraging voluntary school choice that promotes socioeconomic integration—and, as a desir-able byproduct, more racial integration. Richard Kahlen-berg, a major proponent of socioeconomic integration of schools, describes several strategies to do so that have been implemented by 80 districts serving 4 million stu-dents. These include: changing incentive structures so that high-performing schools are motivated to actively recruit low-income students rather than passively resist transfers; promoting public school choice across dis-tricts; and increasing funding for magnet schools in high-poverty urban areas.188 More recently, proposals have come forward to expand charter schools as a way to increase socioeconomic integration.189
Thus, despite the evidence that some individual high- poverty schools can be turned around, the best evidence for a strategy that is effective, scalable, and supported by reformers on the left and right is school socioeconomic integration via public school choice. But we still have much to learn about how best to integrate schools socioeconom-ically and how best to improve children’s academic and social-emotional learning via such integration. Thus, we also propose an expanded and rigorous program of research on the impact of various strategies for socioeconomic inte-gration so that we can address lingering concerns.
INCREASE AID AND FOCUS IT ON THE POOR
Today a college or college-equivalent education (such as apprenticeship and certification) has become the basic credential for a middle class life in America, just as a high school diploma was in the past. So we believe that quality postsecondary education should be affordable for Amer-icans—just as the country committed to making high school affordable. This doesn’t mean we must assure access to a traditional four-year residential education, which is not the best choice for everyone. But it does mean that we’ll need increased public investments in the postsecondary education of low-income students to ensure equal opportunity and to close the income-based
education gap. A high-quality postsecondary education that is appropriate for today’s workplace can encompass a range of courses and experiences, such as certificates and two-year degrees. Moreover, with the competition and customization we support, we believe the general cost of higher education in America will moderate, and perhaps even fall, making the commitment affordable to the nation.
Higher education should provide an opportunity for those near the bottom of the economic ladder to catch up, rather than—as is the case today—help those who already have family and economic advantages pull further ahead. For this reason, federal student aid should aim to make an adequate level of quality postsecondary education truly affordable for those who lack the means to acquire higher education without accumulating unreasonable debt.
While public support for low-income students is inadequate and often poorly spent, we don’t believe, when subsidized loans and other forms of finance are included, that the higher education sector as a whole is underfunded. But too much public support goes to students from middle- and upper-income households who don’t need it to manage the cost of an education that will yield a significant return on their investment. Thus we favor tapering down future public support for students from wealthier families. We recognize that this broad restructuring of public support for higher education will be controversial among some middle-class and affluent families, and it will take time and be difficult to accomplish. For this reason, we don’t believe support for students in need should be contingent on the success of the broader reform we propose.
CONCLUSION
Like our proposals on work and family, our proposals for education strive to draw on and advance the values of opportunity, responsibility and security. Policy proposals like ours, which aim to help poor children improve their academic achievement and educational attainment, are designed to expand educational opportunity in the short run and economic opportunity in the long run. Strategic
{68}
investments in early childhood and postsecondary edu-cation for low-income children, improving low-income children’s social-emotional learning and thereby their aca-demic learning, modernizing the organization and account-ability of U.S. schools (especially schools that serve low-income children), and reducing education resource gaps all hold great promise for increasing low-income chil-dren’s opportunity to attain a high-quality education.
Our proposals are also founded on and seek to strengthen responsibility—both the responsibility of students and parents themselves and of local schools. Parents have a responsibility to educate their own children, which includes teaching them life skills and overseeing their progress through formal schooling. Children, as they get older, assume a larger share of responsibility for academic effort and achievement. But given the enormous gaps in opportunity and resources that we have documented throughout this report, schools, communities, and gov-ernments have an urgent responsibility to do far more to help low-income parents and students. Increasing pub-lic investments in two underfunded stages of education acknowledges greater government responsibility to level the playing field for low-income children. In the 21st cen-tury, our policies must recognize that education begins at birth and continues into the twenties. Government has the responsibility to improve low-income children’s
access to quality early childhood and postsecondary education. Educating the whole child acknowledges the public education system’s responsibility to address the “non-cognitive” constraints on academic learning, educa-tional attainment, and future life chances. Our proposals to expand the responsibilities of schools, communities, and governments in these ways seek to complement, not to substitute for, parents’ primary responsibilities. Clos-ing the resource gaps between low-income and middle- income children by promoting voluntary socioeconomic integration of schools acknowledges the responsibility of local districts and states to provide a positive learning environment for all students, regardless of the income and social status of children’s families and neighborhoods.
Perhaps most important, our proposals aspire to enhance the security of low-income children and their families. The economic security of low-income parents will improve if the nation makes quality early childhood and postsecond-ary education more broadly accessible and effective. Not only students, but parents and teachers, will become more personally secure when evidence-based social-emotional learning programs and practices make schools safer and more supportive learning environments. And increasing the resources available to low-income children via volun-tary socioeconomic integration of schools can reduce the insecurities born of structural inequalities.

{68}
Chapter 6: The Way Forward
Reducing poverty and increasing social mobility are bipartisan national priorities. They are discussed often by the president and Congress, in think tanks and universities, in the press and in the public square. They are major issues for both parties in the 2016 presidential campaign.
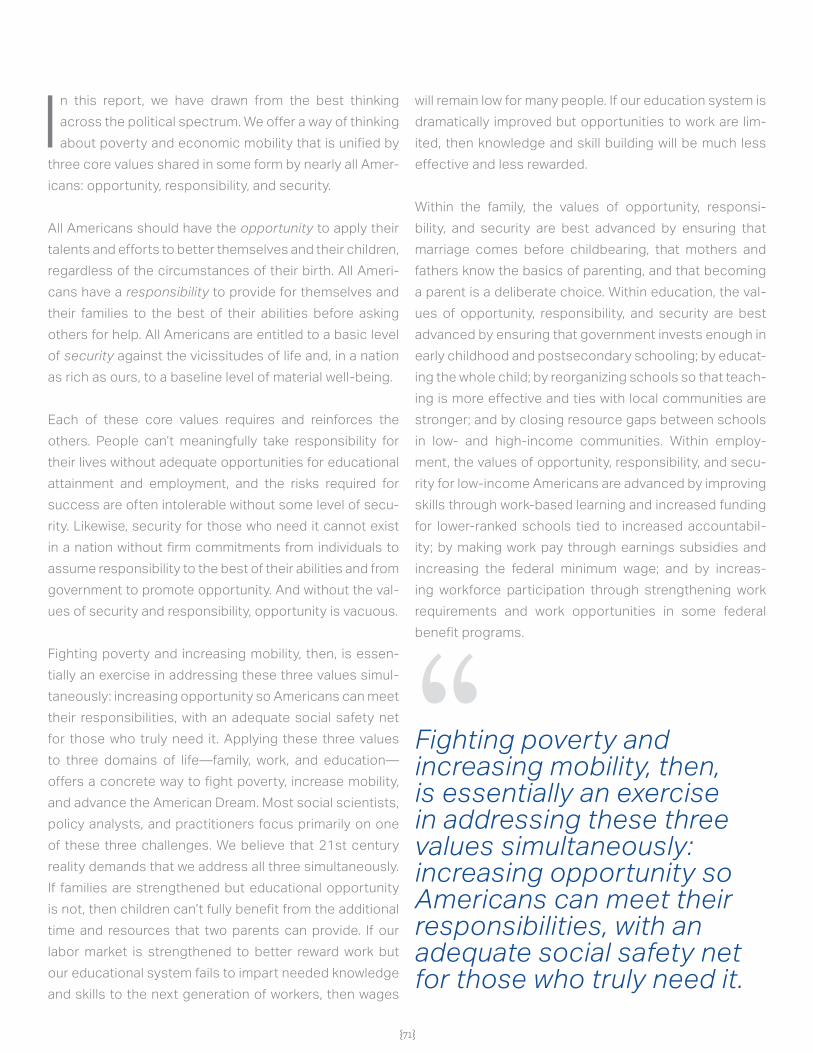
{71}
In this report, we have drawn from the best thinking across the political spectrum. We offer a way of thinking about poverty and economic mobility that is unified by
three core values shared in some form by nearly all Amer-icans: opportunity, responsibility, and security.
All Americans should have the opportunity to apply their talents and efforts to better themselves and their children, regardless of the circumstances of their birth. All Ameri-cans have a responsibility to provide for themselves and their families to the best of their abilities before asking others for help. All Americans are entitled to a basic level of security against the vicissitudes of life and, in a nation as rich as ours, to a baseline level of material well-being.
Each of these core values requires and reinforces the others. People can’t meaningfully take responsibility for their lives without adequate opportunities for educational attainment and employment, and the risks required for success are often intolerable without some level of secu-rity. Likewise, security for those who need it cannot exist in a nation without firm commitments from individuals to assume responsibility to the best of their abilities and from government to promote opportunity. And without the val-ues of security and responsibility, opportunity is vacuous.
Fighting poverty and increasing mobility, then, is essen-tially an exercise in addressing these three values simul-taneously: increasing opportunity so Americans can meet their responsibilities, with an adequate social safety net for those who truly need it. Applying these three values to three domains of life—family, work, and education—offers a concrete way to fight poverty, increase mobility, and advance the American Dream. Most social scientists, policy analysts, and practitioners focus primarily on one of these three challenges. We believe that 21st century reality demands that we address all three simultaneously. If families are strengthened but educational opportunity is not, then children can’t fully benefit from the additional time and resources that two parents can provide. If our labor market is strengthened to better reward work but our educational system fails to impart needed knowledge and skills to the next generation of workers, then wages
will remain low for many people. If our education system is dramatically improved but opportunities to work are lim-ited, then knowledge and skill building will be much less effective and less rewarded.
Within the family, the values of opportunity, responsi-bility, and security are best advanced by ensuring that marriage comes before childbearing, that mothers and fathers know the basics of parenting, and that becoming a parent is a deliberate choice. Within education, the val-ues of opportunity, responsibility, and security are best advanced by ensuring that government invests enough in early childhood and postsecondary schooling; by educat-ing the whole child; by reorganizing schools so that teach-ing is more effective and ties with local communities are stronger; and by closing resource gaps between schools in low- and high-income communities. Within employ-ment, the values of opportunity, responsibility, and secu-rity for low-income Americans are advanced by improving skills through work-based learning and increased funding for lower-ranked schools tied to increased accountabil-ity; by making work pay through earnings subsidies and increasing the federal minimum wage; and by increas-ing workforce participation through strengthening work requirements and work opportunities in some federal benefit programs.
Fighting poverty and increasing mobility, then, is essen tially an exercise in addressing these three values simul taneously: increasing opportunity so Americans can meet their responsibilities, with an adequate social safety net for those who truly need it.
“
{72}
This report contains a package of specific proposals, based on the best social science evidence, designed to achieve these goals. The proposals are public policies that advance the American Dream.
As a group, we offer this report with our unanimous endorse-ment. That doesn’t mean that every member of the group agrees with every proposal. Instead, our endorsement means that we believe this report, as a whole, represents a very good way forward. And if America’s leaders want to move forward together, in a bipartisan way, then this report is the most detailed plan available for doing so.
Our report is not comprehensive—policies other than the ones discussed here are surely needed. But as a nation, we have a long journey ahead of us, and we are confident that this report lays down a path for getting started in the right direction.
HOW TO PAY FOR OUR PROPOSALS
As we think about moving forward, a natural question arises, particularly in Washington: How are we going to pay for these proposals? Though it’s not the focus of this report, we must briefly address this important challenge. We’re committed to the principle that we shouldn’t fight poverty today by increasing the debt our children and grandchildren will face tomorrow. The nation thus has two options for funding our proposals: reducing the amount of money the federal government spends on other pro-grams or increasing the amount of revenue the federal government raises. Just as our proposals represent ideas from across the policy spectrum, there are reasonable ways both to cut spending and to raise revenue that are consistent with our core values.
For example, Social Security spending is projected to consume over one percentage point more of national income in 2040 than it does today. Medicare spending is on an even more rapid upward path, projected to increase from its current 3.5 percent of gross domestic product to 6.3 percent in 2040. Some of this increase is inevita-ble because of the aging of the baby boom generation.
Nonetheless, policy changes could both slow the growth of entitlement spending and ensure security for seniors who truly rely on government pensions and health care. Beyond reducing entitlement spending for the affluent, we recommend reducing the spending that’s commonly described as “corporate welfare,” such as agricultural sub-sidies. Surely a better use of these public funds is to chan-nel them to fighting poverty and increasing opportunity.
We must raise revenue as well. The tax code contains many deductions from gross income and tax credits, and it excludes certain types of income from taxation altogether. These provisions are labeled “tax expendi-tures” because they are, in effect, spending programs. We emphasize the fact that they overwhelmingly ben-efit high-income households. The mortgage interest deduction, for example, reduced revenue by $70 billion in 2013, and is projected to average more than $100 bil-lion per year for the following ten years. Over 90 percent of the benefit from this deduction accrued to house-holds in the top 40 percent of income, with 15 percent of the benefit going to households in the top 1 percent. By reducing the financial gain a well-off household can receive through tax expenditures, we can generate sig-nificant revenue to offset the spending required for our proposed policies.
These budgetary proposals are in keeping with this report’s emphasis on the values of opportunity, respon-sibility, and security. Their goal is to increase opportu-nity for Americans who need it most. They require that Americans take responsibility for their lives, to provide for themselves in old age, and to receive federal spending through the tax code only if they are not well-off. And they maintain security by keeping programs in place for those who truly need them.
CONCLUSION
In our nation’s time of darkest division—the opening months of the Civil War—Abraham Lincoln described the American experiment and the purpose of the American government. In his July 4, 1861, message to Congress,
{72} {73}
he said the government’s leading object is “to elevate the condition of men—to lift artificial weights from all shoul-ders; to clear paths of laudable pursuit for all; to afford all an unfettered start, and a fair chance, in the race of life.”
America made stunning progress toward those goals between 1865 and 2000, creating the world’s first mass prosperity society and the world’s most powerful mag-net for ambitious immigrants. Despite our many flaws, we were a model of freedom, constitutional democracy, and forward-looking innovation. Our culture and institu-tions were admired and copied by many nations around the world. When our country made reducing poverty a na-tional priority in the 1960s, we had some success, which carried through to a bipartisan commitment in the 1990s to create a work-based safety net.
But recently progress has stalled, and bipartisanship has become ever more elusive. That is why we came together and worked together, for more than a year, to find a way forward. In the course of our work, we all benefited from the political diversity and disciplinary breadth of our group. We believe that we have come up with the most compre-hensive and balanced analysis available anywhere on the current causes of American poverty. Based on that anal-ysis, we have offered a detailed plan for reducing poverty by increasing opportunity, responsibility, and security.
We as a nation can and must recommit ourselves to clearing “paths of laudable pursuit for all.” Our history, our identity, and our values require that we do what we can to give all of our fellow citizens “an unfettered start, and a fair chance, in the race of life.”
{74}
Endnotes
1James Truslow Adams, The Epic of America, p. 214-215. The word removed in the ellipsis in the last sentence is “innately”—a word that now has more biological connotations than it did in Adams’ time.
2 Raj Chetty et al., “Is the United States Still a Land of Opportunity? Recent Trends in Intergenerational Mobility,” American Economic Review Pa-pers and Proceedings 104, no. 5 (2014): 141-147.
3 Miles Corak, “Do Poor Children Become Poor Adults? Lessons from a Cross Country Comparison of Generational Earnings Mobility,” IZA discus-sion paper no. 1993 (2006). See Scott Winship for an analysis that reaches a different conclusion: “Does America Have Less Economic Mobility? Part 3,” Economic Policies for the 21st Century (blog), May 8, 2015, http://www.economics21.org/commentary/america-economic-mobility-in come-jantti-corak-05-07-2015.
4 Robert Putnam, Our Kids: The American Dream in Crisis (New York: Simon & Schuster, 2015).
5 Charles Murray, Coming Apart: The State of White America, 1960-2010 (New York: Crown Forum, 2013).
6 Adams, p. 215.
7 Geoffrey L. Cohen, “Party over Policy: The Dominating Impact of Group Influence on Political Beliefs,” Journal of Personality and Social Psychol-ogy 85, no. 5 (2003): 808-822.
8 Adams, p. 215.
9 “May 4, 2015: NBC News/Wall Street Journal – Nationwide poll on the income gap,” Spotlight on Poverty and Opportunity, accessed September 23, 2015, http://www.spotlightonpoverty.org/polling.aspx?id=b5e98ff4-2e53-4e65-a531-d7b10a90864e.
10 Quoted in the American Presidency Project, retrieved on November 5, 2015 from http://www.presidency.ucsb.edu/ws/?pid=47027.
11 The full name of the law was the “Personal Responsibility and Work Opportunity Reconciliation Act of 1996.”
12 Friedrich Hayek, The Road to Serfdom: A Classic Warning Against the Dangers to Freedom Inherent in Social Planning (Chicago: University of Chicago Press, 1976), 121.
13 Clancy Blair and C. Cybele Raver, “Child development in the context of adversity: Experiential canalization of brain and behavior,” American Psy-chologist 67 (2012): 309-318; Institute of Medicine, Transforming the Workforce for Children Birth through Age 8: A Unifying Foundation (Wash-ington: Institute of Medicine, April 2015).
14 Ross A. Thompson and Ron Haskins, “Early Stress Gets under the Skin: Promising Initiatives to Help Children Facing Chronic Adversity,” Future of Children, Policy Brief, Spring 2014.
15 Jay Belsky, Laurence Steinberg, and Patricia Draper, “Childhood experience, interpersonal development, and reproductive strategy: An evolu-tionary theory of socialization,” Child Development 62 (1991): 647-670; Jay Belsky, “Childhood experience and the development of reproductive strategies,” Psicothema 22 (2010): 28-34.
16 Thompson and Haskins; Blair and Raver.
17 Blair and Raver.
18 Pew Research Center, “Political Polarization in the American Public,” accessed September 23, 2015, http://www.people-press.org/2014/06/12/political-polarization-in-the-american-public/; see also new evidence on the rise of cross-party hostility.
19 Quoted in Timothy J. Penny, “Facts Are Facts,” National Review Online, September 4, 2003, http://www.nationalreview.com/articles/207925/facts-are-facts/timothy-j-penny.
20 Jonathan Gruber and Gary Engelhardt, “Social Security and the Evolution of Elderly Poverty,” in Public Policy and the Income Distribution, ed. Alan Auerback, David Card, and John Quigley (New York: Russell Sage Foundation, 2006), 259-287.
21 U.S. Census Bureau, Observations from the Interagency Technical Working Group on Developing a Supplemental Poverty Measure (Washington: U.S. Census Bureau, March 2010).
22 Christopher Wimer et al., Trends in Poverty with an Anchored Supplemental Poverty Measure (New York: Columbia Population Research Center, December 2013); see also Liana Fox et al., “Waging War on Poverty: Historical Trends in Poverty Using the Supplemental Poverty Measure,” NBER working paper 19789 (Cambridge, MA: National Bureau of Economic Research, 2014).
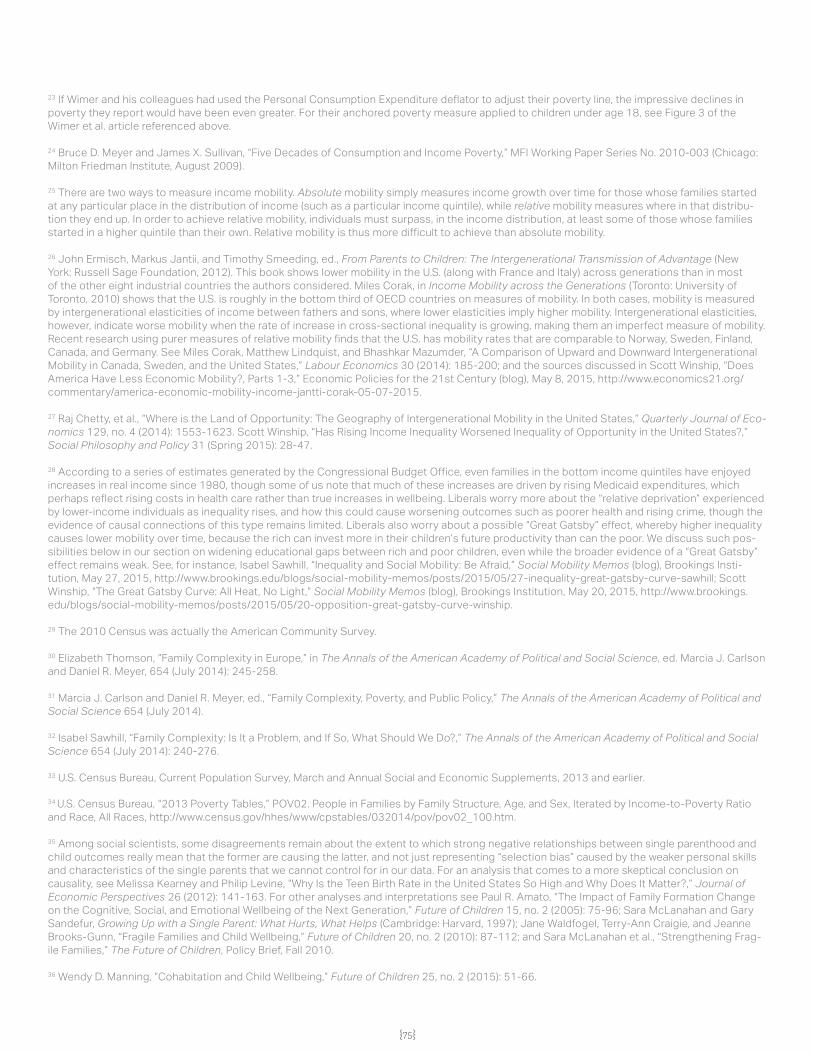
{74} {75}
23 If Wimer and his colleagues had used the Personal Consumption Expenditure deflator to adjust their poverty line, the impressive declines in poverty they report would have been even greater. For their anchored poverty measure applied to children under age 18, see Figure 3 of the Wimer et al. article referenced above.
24 Bruce D. Meyer and James X. Sullivan, “Five Decades of Consumption and Income Poverty,” MFI Working Paper Series No. 2010-003 (Chicago: Milton Friedman Institute, August 2009).
25 There are two ways to measure income mobility. Absolute mobility simply measures income growth over time for those whose families started at any particular place in the distribution of income (such as a particular income quintile), while relative mobility measures where in that distribu-tion they end up. In order to achieve relative mobility, individuals must surpass, in the income distribution, at least some of those whose families started in a higher quintile than their own. Relative mobility is thus more difficult to achieve than absolute mobility.
26 John Ermisch, Markus Jantii, and Timothy Smeeding, ed., From Parents to Children: The Intergenerational Transmission of Advantage (New York: Russell Sage Foundation, 2012). This book shows lower mobility in the U.S. (along with France and Italy) across generations than in most of the other eight industrial countries the authors considered. Miles Corak, in Income Mobility across the Generations (Toronto: University of Toronto, 2010) shows that the U.S. is roughly in the bottom third of OECD countries on measures of mobility. In both cases, mobility is measured by intergenerational elasticities of income between fathers and sons, where lower elasticities imply higher mobility. Intergenerational elasticities, however, indicate worse mobility when the rate of increase in cross-sectional inequality is growing, making them an imperfect measure of mobility. Recent research using purer measures of relative mobility finds that the U.S. has mobility rates that are comparable to Norway, Sweden, Finland, Canada, and Germany. See Miles Corak, Matthew Lindquist, and Bhashkar Mazumder, “A Comparison of Upward and Downward Intergenerational Mobility in Canada, Sweden, and the United States,” Labour Economics 30 (2014): 185-200; and the sources discussed in Scott Winship, “Does America Have Less Economic Mobility?, Parts 1-3,” Economic Policies for the 21st Century (blog), May 8, 2015, http://www.economics21.org/commentary/america-economic-mobility-income-jantti-corak-05-07-2015.
27 Raj Chetty, et al., “Where is the Land of Opportunity: The Geography of Intergenerational Mobility in the United States,” Quarterly Journal of Eco-nomics 129, no. 4 (2014): 1553-1623. Scott Winship, “Has Rising Income Inequality Worsened Inequality of Opportunity in the United States?,” Social Philosophy and Policy 31 (Spring 2015): 28-47.
28 According to a series of estimates generated by the Congressional Budget Office, even families in the bottom income quintiles have enjoyed increases in real income since 1980, though some of us note that much of these increases are driven by rising Medicaid expenditures, which perhaps reflect rising costs in health care rather than true increases in wellbeing. Liberals worry more about the “relative deprivation” experienced by lower-income individuals as inequality rises, and how this could cause worsening outcomes such as poorer health and rising crime, though the evidence of causal connections of this type remains limited. Liberals also worry about a possible “Great Gatsby” effect, whereby higher inequality causes lower mobility over time, because the rich can invest more in their children’s future productivity than can the poor. We discuss such pos-sibilities below in our section on widening educational gaps between rich and poor children, even while the broader evidence of a “Great Gatsby” effect remains weak. See, for instance, Isabel Sawhill, “Inequality and Social Mobility: Be Afraid,” Social Mobility Memos (blog), Brookings Insti-tution, May 27, 2015, http://www.brookings.edu/blogs/social-mobility-memos/posts/2015/05/27-inequality-great-gatsby-curve-sawhill; Scott Winship, “The Great Gatsby Curve: All Heat, No Light,” Social Mobility Memos (blog), Brookings Institution, May 20, 2015, http://www.brookings.edu/blogs/social-mobility-memos/posts/2015/05/20-opposition-great-gatsby-curve-winship.
29 The 2010 Census was actually the American Community Survey.
30 Elizabeth Thomson, “Family Complexity in Europe,” in The Annals of the American Academy of Political and Social Science, ed. Marcia J. Carlson and Daniel R. Meyer, 654 (July 2014): 245-258.
31 Marcia J. Carlson and Daniel R. Meyer, ed., “Family Complexity, Poverty, and Public Policy,” The Annals of the American Academy of Political and Social Science 654 (July 2014).
32 Isabel Sawhill, “Family Complexity: Is It a Problem, and If So, What Should We Do?,” The Annals of the American Academy of Political and Social Science 654 (July 2014): 240-276.
33 U.S. Census Bureau, Current Population Survey, March and Annual Social and Economic Supplements, 2013 and earlier.
34 U.S. Census Bureau, “2013 Poverty Tables,” POV02. People in Families by Family Structure, Age, and Sex, Iterated by Income-to-Poverty Ratio and Race, All Races, http://www.census.gov/hhes/www/cpstables/032014/pov/pov02_100.htm.
35 Among social scientists, some disagreements remain about the extent to which strong negative relationships between single parenthood and child outcomes really mean that the former are causing the latter, and not just representing “selection bias” caused by the weaker personal skills and characteristics of the single parents that we cannot control for in our data. For an analysis that comes to a more skeptical conclusion on causality, see Melissa Kearney and Philip Levine, “Why Is the Teen Birth Rate in the United States So High and Why Does It Matter?,” Journal of Economic Perspectives 26 (2012): 141-163. For other analyses and interpretations see Paul R. Amato, “The Impact of Family Formation Change on the Cognitive, Social, and Emotional Wellbeing of the Next Generation,” Future of Children 15, no. 2 (2005): 75-96; Sara McLanahan and Gary Sandefur, Growing Up with a Single Parent: What Hurts, What Helps (Cambridge: Harvard, 1997); Jane Waldfogel, Terry-Ann Craigie, and Jeanne Brooks-Gunn, “Fragile Families and Child Wellbeing,” Future of Children 20, no. 2 (2010): 87-112; and Sara McLanahan et al., “Strengthening Frag-ile Families,” The Future of Children, Policy Brief, Fall 2010.
36 Wendy D. Manning, “Cohabitation and Child Wellbeing,” Future of Children 25, no. 2 (2015): 51-66.
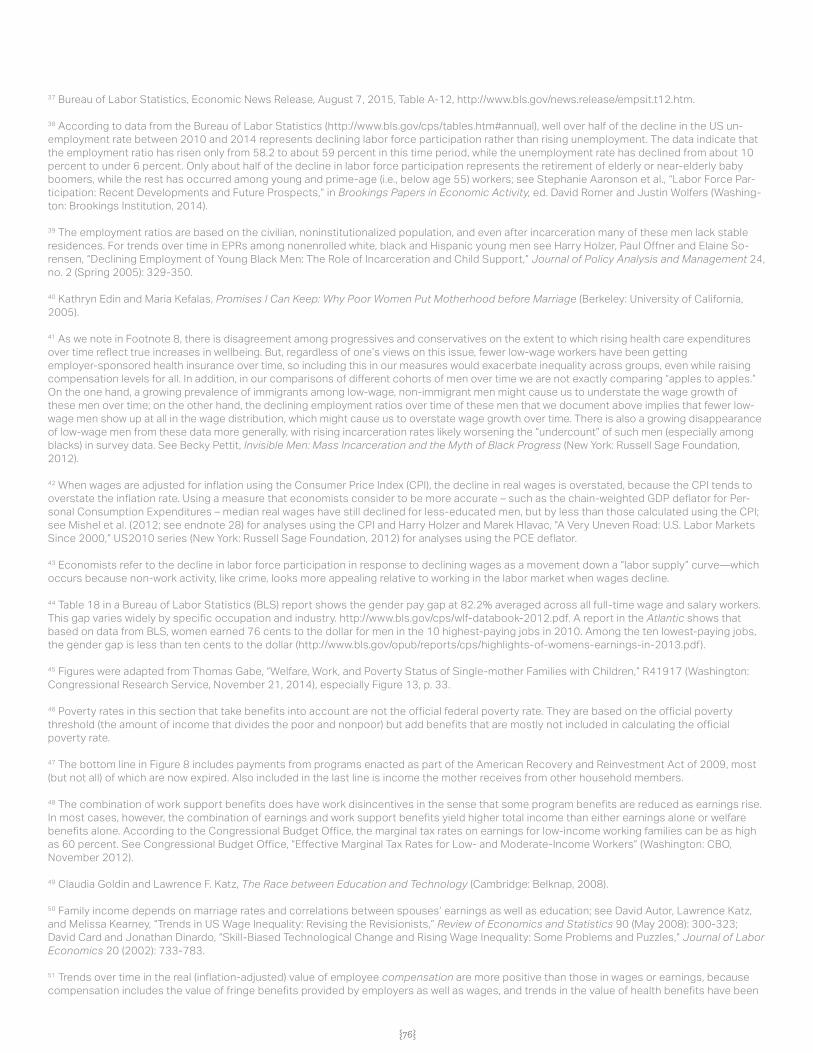
{76}
37 Bureau of Labor Statistics, Economic News Release, August 7, 2015, Table A-12, http://www.bls.gov/news.release/empsit.t12.htm.
38 According to data from the Bureau of Labor Statistics (http://www.bls.gov/cps/tables.htm#annual), well over half of the decline in the US un-employment rate between 2010 and 2014 represents declining labor force participation rather than rising unemployment. The data indicate that the employment ratio has risen only from 58.2 to about 59 percent in this time period, while the unemployment rate has declined from about 10 percent to under 6 percent. Only about half of the decline in labor force participation represents the retirement of elderly or near-elderly baby boomers, while the rest has occurred among young and prime-age (i.e., below age 55) workers; see Stephanie Aaronson et al., “Labor Force Par-ticipation: Recent Developments and Future Prospects,” in Brookings Papers in Economic Activity, ed. David Romer and Justin Wolfers (Washing-ton: Brookings Institution, 2014).
39 The employment ratios are based on the civilian, noninstitutionalized population, and even after incarceration many of these men lack stable residences. For trends over time in EPRs among nonenrolled white, black and Hispanic young men see Harry Holzer, Paul Offner and Elaine So-rensen, “Declining Employment of Young Black Men: The Role of Incarceration and Child Support,” Journal of Policy Analysis and Management 24, no. 2 (Spring 2005): 329-350.
40 Kathryn Edin and Maria Kefalas, Promises I Can Keep: Why Poor Women Put Motherhood before Marriage (Berkeley: University of California, 2005).
41 As we note in Footnote 8, there is disagreement among progressives and conservatives on the extent to which rising health care expenditures over time reflect true increases in wellbeing. But, regardless of one’s views on this issue, fewer low-wage workers have been getting employer-sponsored health insurance over time, so including this in our measures would exacerbate inequality across groups, even while raising compensation levels for all. In addition, in our comparisons of different cohorts of men over time we are not exactly comparing “apples to apples.” On the one hand, a growing prevalence of immigrants among low-wage, non-immigrant men might cause us to understate the wage growth of these men over time; on the other hand, the declining employment ratios over time of these men that we document above implies that fewer low-wage men show up at all in the wage distribution, which might cause us to overstate wage growth over time. There is also a growing disappearance of low-wage men from these data more generally, with rising incarceration rates likely worsening the “undercount” of such men (especially among blacks) in survey data. See Becky Pettit, Invisible Men: Mass Incarceration and the Myth of Black Progress (New York: Russell Sage Foundation, 2012).
42 When wages are adjusted for inflation using the Consumer Price Index (CPI), the decline in real wages is overstated, because the CPI tends to overstate the inflation rate. Using a measure that economists consider to be more accurate – such as the chain-weighted GDP deflator for Per-sonal Consumption Expenditures – median real wages have still declined for less-educated men, but by less than those calculated using the CPI; see Mishel et al. (2012; see endnote 28) for analyses using the CPI and Harry Holzer and Marek Hlavac, “A Very Uneven Road: U.S. Labor Markets Since 2000,” US2010 series (New York: Russell Sage Foundation, 2012) for analyses using the PCE deflator.
43 Economists refer to the decline in labor force participation in response to declining wages as a movement down a “labor supply” curve—which occurs because non-work activity, like crime, looks more appealing relative to working in the labor market when wages decline.
44 Table 18 in a Bureau of Labor Statistics (BLS) report shows the gender pay gap at 82.2% averaged across all full-time wage and salary workers. This gap varies widely by specific occupation and industry. http://www.bls.gov/cps/wlf-databook-2012.pdf. A report in the Atlantic shows that based on data from BLS, women earned 76 cents to the dollar for men in the 10 highest-paying jobs in 2010. Among the ten lowest-paying jobs, the gender gap is less than ten cents to the dollar (http://www.bls.gov/opub/reports/cps/highlights-of-womens-earnings-in-2013.pdf).
45 Figures were adapted from Thomas Gabe, “Welfare, Work, and Poverty Status of Single-mother Families with Children,” R41917 (Washington: Congressional Research Service, November 21, 2014), especially Figure 13, p. 33.
46 Poverty rates in this section that take benefits into account are not the official federal poverty rate. They are based on the official poverty threshold (the amount of income that divides the poor and nonpoor) but add benefits that are mostly not included in calculating the official poverty rate.
47 The bottom line in Figure 8 includes payments from programs enacted as part of the American Recovery and Reinvestment Act of 2009, most (but not all) of which are now expired. Also included in the last line is income the mother receives from other household members.
48 The combination of work support benefits does have work disincentives in the sense that some program benefits are reduced as earnings rise. In most cases, however, the combination of earnings and work support benefits yield higher total income than either earnings alone or welfare benefits alone. According to the Congressional Budget Office, the marginal tax rates on earnings for low-income working families can be as high as 60 percent. See Congressional Budget Office, “Effective Marginal Tax Rates for Low- and Moderate-Income Workers” (Washington: CBO, November 2012).
49 Claudia Goldin and Lawrence F. Katz, The Race between Education and Technology (Cambridge: Belknap, 2008).
50 Family income depends on marriage rates and correlations between spouses’ earnings as well as education; see David Autor, Lawrence Katz, and Melissa Kearney, “Trends in US Wage Inequality: Revising the Revisionists,” Review of Economics and Statistics 90 (May 2008): 300-323; David Card and Jonathan Dinardo, “Skill-Biased Technological Change and Rising Wage Inequality: Some Problems and Puzzles,” Journal of Labor Economics 20 (2002): 733-783.
51 Trends over time in the real (inflation-adjusted) value of employee compensation are more positive than those in wages or earnings, because compensation includes the value of fringe benefits provided by employers as well as wages, and trends in the value of health benefits have been
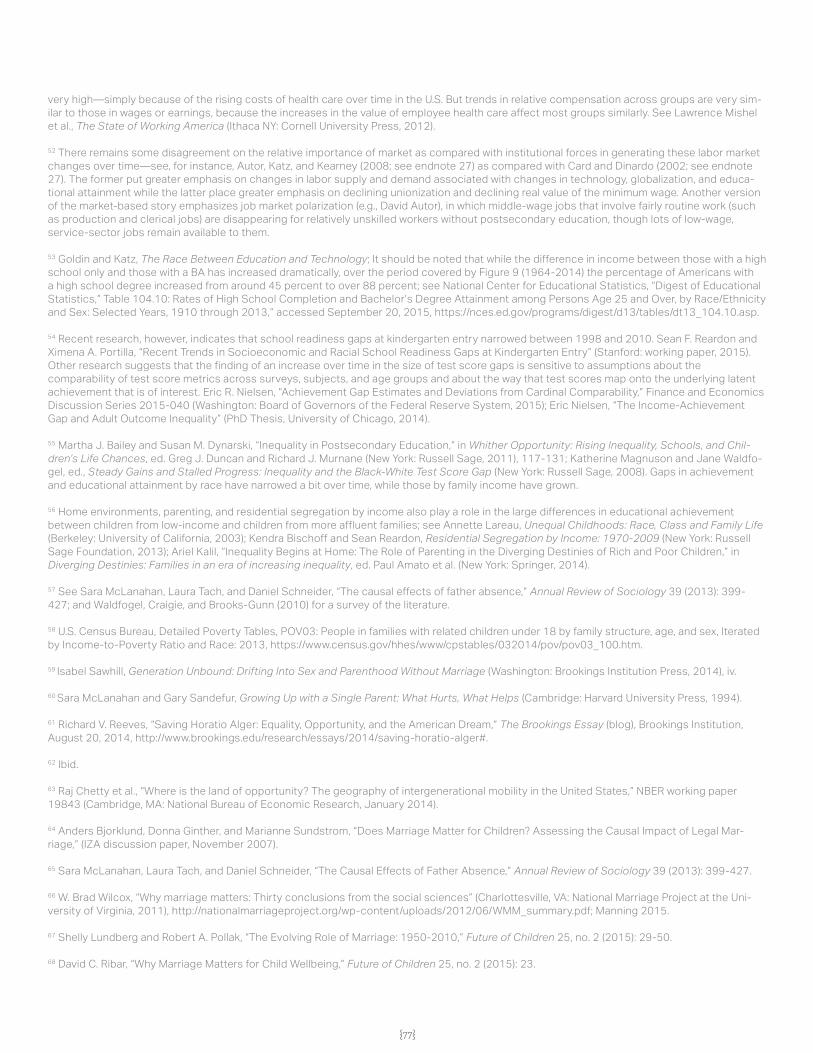
{76} {77}
very high—simply because of the rising costs of health care over time in the U.S. But trends in relative compensation across groups are very sim-ilar to those in wages or earnings, because the increases in the value of employee health care affect most groups similarly. See Lawrence Mishel et al., The State of Working America (Ithaca NY: Cornell University Press, 2012).
52 There remains some disagreement on the relative importance of market as compared with institutional forces in generating these labor market changes over time—see, for instance, Autor, Katz, and Kearney (2008; see endnote 27) as compared with Card and Dinardo (2002; see endnote 27). The former put greater emphasis on changes in labor supply and demand associated with changes in technology, globalization, and educa-tional attainment while the latter place greater emphasis on declining unionization and declining real value of the minimum wage. Another version of the market-based story emphasizes job market polarization (e.g., David Autor), in which middle-wage jobs that involve fairly routine work (such as production and clerical jobs) are disappearing for relatively unskilled workers without postsecondary education, though lots of low-wage, service-sector jobs remain available to them.
53 Goldin and Katz, The Race Between Education and Technology; It should be noted that while the difference in income between those with a high school only and those with a BA has increased dramatically, over the period covered by Figure 9 (1964-2014) the percentage of Americans with a high school degree increased from around 45 percent to over 88 percent; see National Center for Educational Statistics, “Digest of Educational Statistics,” Table 104.10: Rates of High School Completion and Bachelor’s Degree Attainment among Persons Age 25 and Over, by Race/Ethnicity and Sex: Selected Years, 1910 through 2013,” accessed September 20, 2015, https://nces.ed.gov/programs/digest/d13/tables/dt13_104.10.asp.
54 Recent research, however, indicates that school readiness gaps at kindergarten entry narrowed between 1998 and 2010. Sean F. Reardon and Ximena A. Portilla, “Recent Trends in Socioeconomic and Racial School Readiness Gaps at Kindergarten Entry” (Stanford: working paper, 2015). Other research suggests that the finding of an increase over time in the size of test score gaps is sensitive to assumptions about the comparability of test score metrics across surveys, subjects, and age groups and about the way that test scores map onto the underlying latent achievement that is of interest. Eric R. Nielsen, “Achievement Gap Estimates and Deviations from Cardinal Comparability,” Finance and Economics Discussion Series 2015-040 (Washington: Board of Governors of the Federal Reserve System, 2015); Eric Nielsen, “The Income-Achievement Gap and Adult Outcome Inequality” (PhD Thesis, University of Chicago, 2014).
55 Martha J. Bailey and Susan M. Dynarski, “Inequality in Postsecondary Education,” in Whither Opportunity: Rising Inequality, Schools, and Chil-dren’s Life Chances, ed. Greg J. Duncan and Richard J. Murnane (New York: Russell Sage, 2011), 117-131; Katherine Magnuson and Jane Waldfo-gel, ed., Steady Gains and Stalled Progress: Inequality and the Black-White Test Score Gap (New York: Russell Sage, 2008). Gaps in achievement and educational attainment by race have narrowed a bit over time, while those by family income have grown.
56 Home environments, parenting, and residential segregation by income also play a role in the large differences in educational achievement between children from low-income and children from more affluent families; see Annette Lareau, Unequal Childhoods: Race, Class and Family Life (Berkeley: University of California, 2003); Kendra Bischoff and Sean Reardon, Residential Segregation by Income: 1970-2009 (New York: Russell Sage Foundation, 2013); Ariel Kalil, “Inequality Begins at Home: The Role of Parenting in the Diverging Destinies of Rich and Poor Children,” in Diverging Destinies: Families in an era of increasing inequality, ed. Paul Amato et al. (New York: Springer, 2014).
57 See Sara McLanahan, Laura Tach, and Daniel Schneider, “The causal effects of father absence,” Annual Review of Sociology 39 (2013): 399-427; and Waldfogel, Craigie, and Brooks-Gunn (2010) for a survey of the literature.
58 U.S. Census Bureau, Detailed Poverty Tables, POV03: People in families with related children under 18 by family structure, age, and sex, Iterated by Income-to-Poverty Ratio and Race: 2013, https://www.census.gov/hhes/www/cpstables/032014/pov/pov03_100.htm.
59 Isabel Sawhill, Generation Unbound: Drifting Into Sex and Parenthood Without Marriage (Washington: Brookings Institution Press, 2014), iv.
60 Sara McLanahan and Gary Sandefur, Growing Up with a Single Parent: What Hurts, What Helps (Cambridge: Harvard University Press, 1994).
61 Richard V. Reeves, “Saving Horatio Alger: Equality, Opportunity, and the American Dream,” The Brookings Essay (blog), Brookings Institution, August 20, 2014, http://www.brookings.edu/research/essays/2014/saving-horatio-alger#.
62 Ibid.
63 Raj Chetty et al., “Where is the land of opportunity? The geography of intergenerational mobility in the United States,” NBER working paper 19843 (Cambridge, MA: National Bureau of Economic Research, January 2014).
64 Anders Bjorklund, Donna Ginther, and Marianne Sundstrom, “Does Marriage Matter for Children? Assessing the Causal Impact of Legal Mar-riage,” (IZA discussion paper, November 2007).
65 Sara McLanahan, Laura Tach, and Daniel Schneider, “The Causal Effects of Father Absence,” Annual Review of Sociology 39 (2013): 399-427.
66 W. Brad Wilcox, “Why marriage matters: Thirty conclusions from the social sciences” (Charlottesville, VA: National Marriage Project at the Uni-versity of Virginia, 2011), http://nationalmarriageproject.org/wp-content/uploads/2012/06/WMM_summary.pdf; Manning 2015.
67 Shelly Lundberg and Robert A. Pollak, “The Evolving Role of Marriage: 1950-2010,” Future of Children 25, no. 2 (2015): 29-50.
68 David C. Ribar, “Why Marriage Matters for Child Wellbeing,” Future of Children 25, no. 2 (2015): 23.
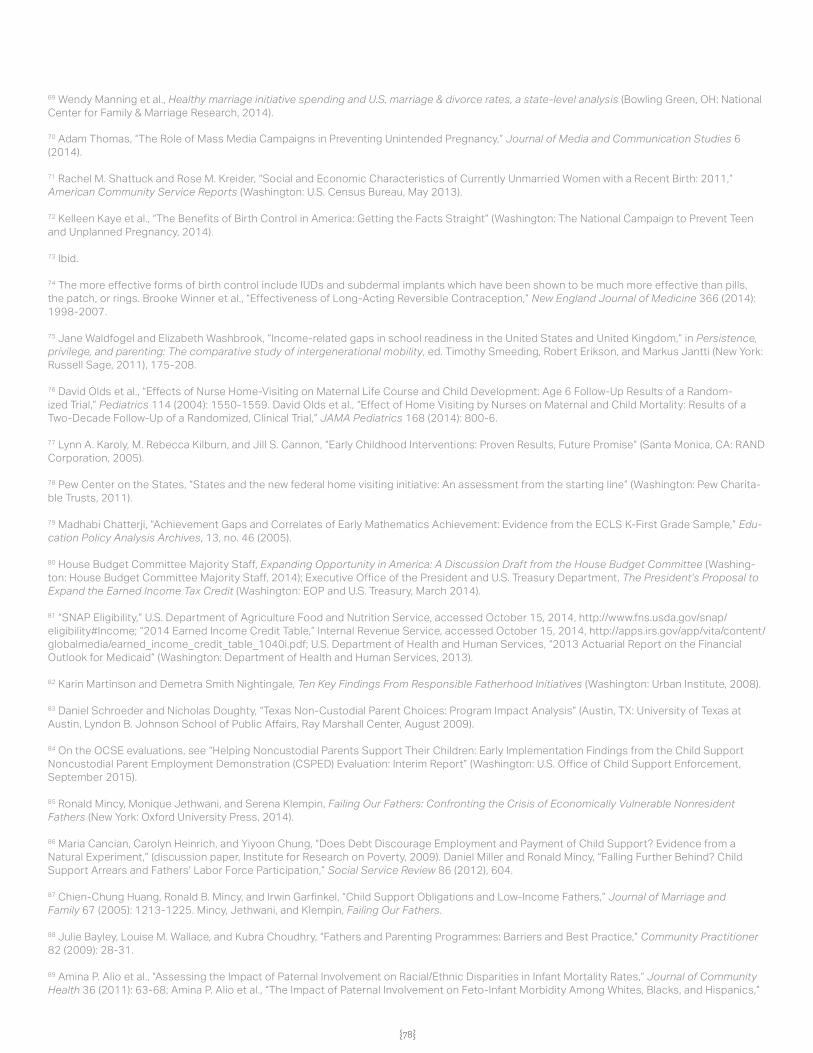
{78}
69 Wendy Manning et al., Healthy marriage initiative spending and U.S. marriage & divorce rates, a state-level analysis (Bowling Green, OH: National Center for Family & Marriage Research, 2014).
70 Adam Thomas, “The Role of Mass Media Campaigns in Preventing Unintended Pregnancy,” Journal of Media and Communication Studies 6 (2014).
71 Rachel M. Shattuck and Rose M. Kreider, “Social and Economic Characteristics of Currently Unmarried Women with a Recent Birth: 2011,” American Community Service Reports (Washington: U.S. Census Bureau, May 2013).
72 Kelleen Kaye et al., “The Benefits of Birth Control in America: Getting the Facts Straight” (Washington: The National Campaign to Prevent Teen and Unplanned Pregnancy, 2014).
73 Ibid.
74 The more effective forms of birth control include IUDs and subdermal implants which have been shown to be much more effective than pills, the patch, or rings. Brooke Winner et al., “Effectiveness of Long-Acting Reversible Contraception,” New England Journal of Medicine 366 (2014): 1998-2007.
75 Jane Waldfogel and Elizabeth Washbrook, “Income-related gaps in school readiness in the United States and United Kingdom,” in Persistence, privilege, and parenting: The comparative study of intergenerational mobility, ed. Timothy Smeeding, Robert Erikson, and Markus Jantti (New York: Russell Sage, 2011), 175-208.
76 David Olds et al., “Effects of Nurse Home-Visiting on Maternal Life Course and Child Development: Age 6 Follow-Up Results of a Random-ized Trial,” Pediatrics 114 (2004): 1550-1559. David Olds et al., “Effect of Home Visiting by Nurses on Maternal and Child Mortality: Results of a Two-Decade Follow-Up of a Randomized, Clinical Trial,” JAMA Pediatrics 168 (2014): 800-6.
77 Lynn A. Karoly, M. Rebecca Kilburn, and Jill S. Cannon, “Early Childhood Interventions: Proven Results, Future Promise” (Santa Monica, CA: RAND Corporation, 2005).
78 Pew Center on the States, “States and the new federal home visiting initiative: An assessment from the starting line” (Washington: Pew Charita-ble Trusts, 2011).
79 Madhabi Chatterji, “Achievement Gaps and Correlates of Early Mathematics Achievement: Evidence from the ECLS K-First Grade Sample,” Edu-cation Policy Analysis Archives, 13, no. 46 (2005).
80 House Budget Committee Majority Staff, Expanding Opportunity in America: A Discussion Draft from the House Budget Committee (Washing-ton: House Budget Committee Majority Staff, 2014); Executive Office of the President and U.S. Treasury Department, The President’s Proposal to Expand the Earned Income Tax Credit (Washington: EOP and U.S. Treasury, March 2014).
81 “SNAP Eligibility,” U.S. Department of Agriculture Food and Nutrition Service, accessed October 15, 2014, http://www.fns.usda.gov/snap/ eligibility#Income; “2014 Earned Income Credit Table,” Internal Revenue Service, accessed October 15, 2014, http://apps.irs.gov/app/vita/content/globalmedia/earned_income_credit_table_1040i.pdf; U.S. Department of Health and Human Services, “2013 Actuarial Report on the Financial Outlook for Medicaid” (Washington: Department of Health and Human Services, 2013).
82 Karin Martinson and Demetra Smith Nightingale, Ten Key Findings From Responsible Fatherhood Initiatives (Washington: Urban Institute, 2008).
83 Daniel Schroeder and Nicholas Doughty, “Texas Non-Custodial Parent Choices: Program Impact Analysis” (Austin, TX: University of Texas at Austin, Lyndon B. Johnson School of Public Affairs, Ray Marshall Center, August 2009).
84 On the OCSE evaluations, see “Helping Noncustodial Parents Support Their Children: Early Implementation Findings from the Child Support Noncustodial Parent Employment Demonstration (CSPED) Evaluation: Interim Report” (Washington: U.S. Office of Child Support Enforcement, September 2015).
85 Ronald Mincy, Monique Jethwani, and Serena Klempin, Failing Our Fathers: Confronting the Crisis of Economically Vulnerable Nonresident Fathers (New York: Oxford University Press, 2014).
86 Maria Cancian, Carolyn Heinrich, and Yiyoon Chung, “Does Debt Discourage Employment and Payment of Child Support? Evidence from a Natural Experiment,” (discussion paper, Institute for Research on Poverty, 2009). Daniel Miller and Ronald Mincy, “Falling Further Behind? Child Support Arrears and Fathers’ Labor Force Participation,” Social Service Review 86 (2012), 604.
87 Chien-Chung Huang, Ronald B. Mincy, and Irwin Garfinkel, “Child Support Obligations and Low‐Income Fathers,” Journal of Marriage and Family 67 (2005): 1213-1225. Mincy, Jethwani, and Klempin, Failing Our Fathers.
88 Julie Bayley, Louise M. Wallace, and Kubra Choudhry, “Fathers and Parenting Programmes: Barriers and Best Practice,” Community Practitioner 82 (2009): 28-31.
89 Amina P. Alio et al., “Assessing the Impact of Paternal Involvement on Racial/Ethnic Disparities in Infant Mortality Rates,” Journal of Community Health 36 (2011): 63-68; Amina P. Alio et al., “The Impact of Paternal Involvement on Feto-Infant Morbidity Among Whites, Blacks, and Hispanics,”
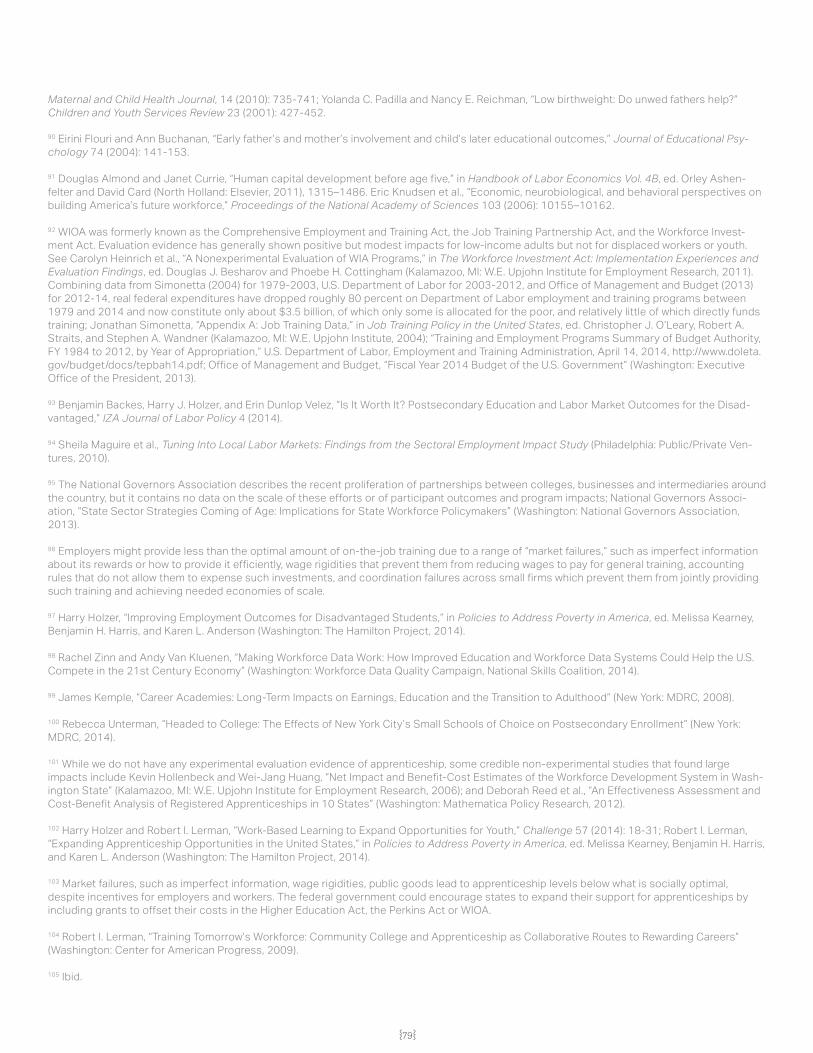
{78} {79}
Maternal and Child Health Journal, 14 (2010): 735-741; Yolanda C. Padilla and Nancy E. Reichman, “Low birthweight: Do unwed fathers help?” Children and Youth Services Review 23 (2001): 427-452.
90 Eirini Flouri and Ann Buchanan, “Early father’s and mother’s involvement and child’s later educational outcomes,” Journal of Educational Psy-chology 74 (2004): 141-153.
91 Douglas Almond and Janet Currie, “Human capital development before age five,” in Handbook of Labor Economics Vol. 4B, ed. Orley Ashen-felter and David Card (North Holland: Elsevier, 2011), 1315–1486. Eric Knudsen et al., “Economic, neurobiological, and behavioral perspectives on building America’s future workforce,” Proceedings of the National Academy of Sciences 103 (2006): 10155–10162.
92 WIOA was formerly known as the Comprehensive Employment and Training Act, the Job Training Partnership Act, and the Workforce Invest-ment Act. Evaluation evidence has generally shown positive but modest impacts for low-income adults but not for displaced workers or youth. See Carolyn Heinrich et al., “A Nonexperimental Evaluation of WIA Programs,” in The Workforce Investment Act: Implementation Experiences and Evaluation Findings, ed. Douglas J. Besharov and Phoebe H. Cottingham (Kalamazoo, MI: W.E. Upjohn Institute for Employment Research, 2011). Combining data from Simonetta (2004) for 1979-2003, U.S. Department of Labor for 2003-2012, and Office of Management and Budget (2013) for 2012-14, real federal expenditures have dropped roughly 80 percent on Department of Labor employment and training programs between 1979 and 2014 and now constitute only about $3.5 billion, of which only some is allocated for the poor, and relatively little of which directly funds training; Jonathan Simonetta, “Appendix A: Job Training Data,” in Job Training Policy in the United States, ed. Christopher J. O’Leary, Robert A. Straits, and Stephen A. Wandner (Kalamazoo, MI: W.E. Upjohn Institute, 2004); “Training and Employment Programs Summary of Budget Authority, FY 1984 to 2012, by Year of Appropriation,” U.S. Department of Labor, Employment and Training Administration, April 14, 2014, http://www.doleta.gov/budget/docs/tepbah14.pdf; Office of Management and Budget, “Fiscal Year 2014 Budget of the U.S. Government” (Washington: Executive Office of the President, 2013).
93 Benjamin Backes, Harry J. Holzer, and Erin Dunlop Velez, “Is It Worth It? Postsecondary Education and Labor Market Outcomes for the Disad-vantaged,” IZA Journal of Labor Policy 4 (2014).
94 Sheila Maguire et al., Tuning Into Local Labor Markets: Findings from the Sectoral Employment Impact Study (Philadelphia: Public/Private Ven-tures, 2010).
95 The National Governors Association describes the recent proliferation of partnerships between colleges, businesses and intermediaries around the country, but it contains no data on the scale of these efforts or of participant outcomes and program impacts; National Governors Associ-ation, “State Sector Strategies Coming of Age: Implications for State Workforce Policymakers” (Washington: National Governors Association, 2013).
96 Employers might provide less than the optimal amount of on-the-job training due to a range of “market failures,” such as imperfect information about its rewards or how to provide it efficiently, wage rigidities that prevent them from reducing wages to pay for general training, accounting rules that do not allow them to expense such investments, and coordination failures across small firms which prevent them from jointly providing such training and achieving needed economies of scale.
97 Harry Holzer, “Improving Employment Outcomes for Disadvantaged Students,” in Policies to Address Poverty in America, ed. Melissa Kearney, Benjamin H. Harris, and Karen L. Anderson (Washington: The Hamilton Project, 2014).
98 Rachel Zinn and Andy Van Kluenen, “Making Workforce Data Work: How Improved Education and Workforce Data Systems Could Help the U.S. Compete in the 21st Century Economy” (Washington: Workforce Data Quality Campaign, National Skills Coalition, 2014).
99 James Kemple, “Career Academies: Long-Term Impacts on Earnings, Education and the Transition to Adulthood” (New York: MDRC, 2008).
100 Rebecca Unterman, “Headed to College: The Effects of New York City’s Small Schools of Choice on Postsecondary Enrollment” (New York: MDRC, 2014).
101 While we do not have any experimental evaluation evidence of apprenticeship, some credible non-experimental studies that found large impacts include Kevin Hollenbeck and Wei-Jang Huang, “Net Impact and Benefit-Cost Estimates of the Workforce Development System in Wash-ington State” (Kalamazoo, MI: W.E. Upjohn Institute for Employment Research, 2006); and Deborah Reed et al., “An Effectiveness Assessment and Cost-Benefit Analysis of Registered Apprenticeships in 10 States” (Washington: Mathematica Policy Research, 2012).
102 Harry Holzer and Robert I. Lerman, “Work-Based Learning to Expand Opportunities for Youth,” Challenge 57 (2014): 18-31; Robert I. Lerman, “Expanding Apprenticeship Opportunities in the United States,” in Policies to Address Poverty in America, ed. Melissa Kearney, Benjamin H. Harris, and Karen L. Anderson (Washington: The Hamilton Project, 2014).
103 Market failures, such as imperfect information, wage rigidities, public goods lead to apprenticeship levels below what is socially optimal, despite incentives for employers and workers. The federal government could encourage states to expand their support for apprenticeships by including grants to offset their costs in the Higher Education Act, the Perkins Act or WIOA.
104 Robert I. Lerman, “Training Tomorrow’s Workforce: Community College and Apprenticeship as Collaborative Routes to Rewarding Careers” (Washington: Center for American Progress, 2009).
105 Ibid.
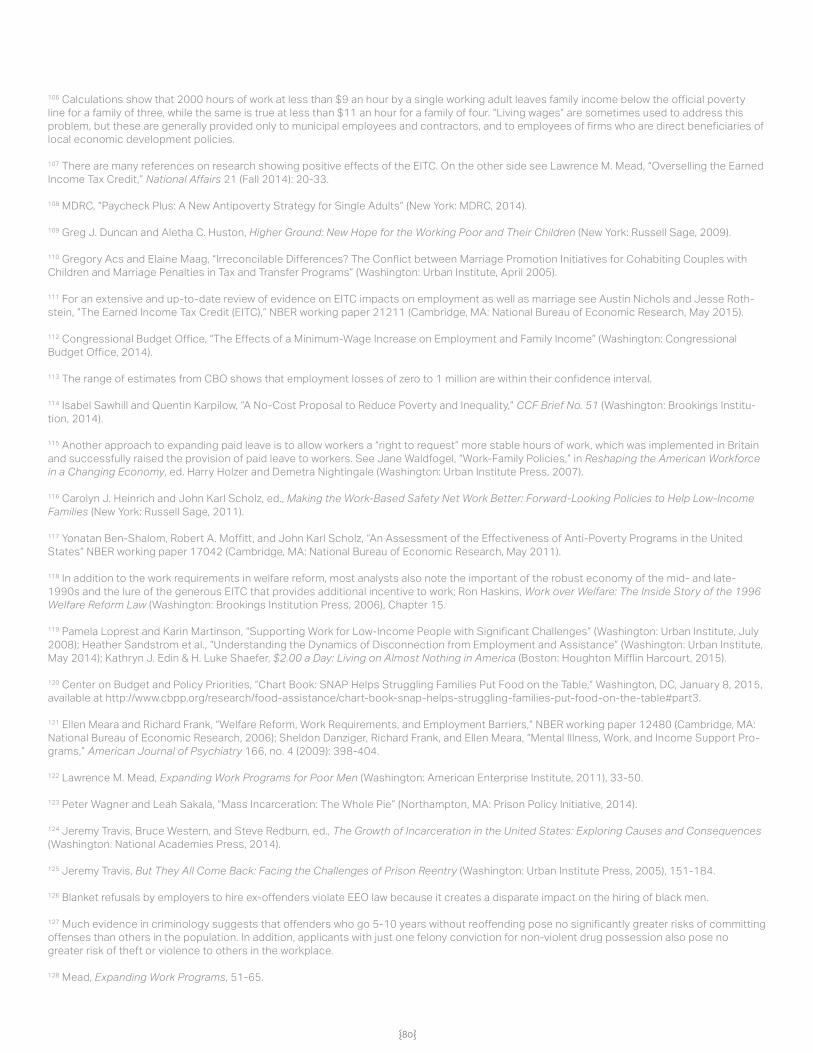
{80}
106 Calculations show that 2000 hours of work at less than $9 an hour by a single working adult leaves family income below the official poverty line for a family of three, while the same is true at less than $11 an hour for a family of four. “Living wages” are sometimes used to address this problem, but these are generally provided only to municipal employees and contractors, and to employees of firms who are direct beneficiaries of local economic development policies.
107 There are many references on research showing positive effects of the EITC. On the other side see Lawrence M. Mead, “Overselling the Earned Income Tax Credit,” National Affairs 21 (Fall 2014): 20-33.
108 MDRC, “Paycheck Plus: A New Antipoverty Strategy for Single Adults” (New York: MDRC, 2014).
109 Greg J. Duncan and Aletha C. Huston, Higher Ground: New Hope for the Working Poor and Their Children (New York: Russell Sage, 2009).
110 Gregory Acs and Elaine Maag, “Irreconcilable Differences? The Conflict between Marriage Promotion Initiatives for Cohabiting Couples with Children and Marriage Penalties in Tax and Transfer Programs” (Washington: Urban Institute, April 2005).
111 For an extensive and up-to-date review of evidence on EITC impacts on employment as well as marriage see Austin Nichols and Jesse Roth-stein, “The Earned Income Tax Credit (EITC),” NBER working paper 21211 (Cambridge, MA: National Bureau of Economic Research, May 2015).
112 Congressional Budget Office, “The Effects of a Minimum-Wage Increase on Employment and Family Income” (Washington: Congressional Budget Office, 2014).
113 The range of estimates from CBO shows that employment losses of zero to 1 million are within their confidence interval.
114 Isabel Sawhill and Quentin Karpilow, “A No-Cost Proposal to Reduce Poverty and Inequality,” CCF Brief No. 51 (Washington: Brookings Institu-tion, 2014).
115 Another approach to expanding paid leave is to allow workers a “right to request” more stable hours of work, which was implemented in Britain and successfully raised the provision of paid leave to workers. See Jane Waldfogel, “Work-Family Policies,” in Reshaping the American Workforce in a Changing Economy, ed. Harry Holzer and Demetra Nightingale (Washington: Urban Institute Press, 2007).
116 Carolyn J. Heinrich and John Karl Scholz, ed., Making the Work-Based Safety Net Work Better: Forward-Looking Policies to Help Low-Income Families (New York: Russell Sage, 2011).
117 Yonatan Ben-Shalom, Robert A. Moffitt, and John Karl Scholz, “An Assessment of the Effectiveness of Anti-Poverty Programs in the United States” NBER working paper 17042 (Cambridge, MA: National Bureau of Economic Research, May 2011).
118 In addition to the work requirements in welfare reform, most analysts also note the important of the robust economy of the mid- and late-1990s and the lure of the generous EITC that provides additional incentive to work; Ron Haskins, Work over Welfare: The Inside Story of the 1996 Welfare Reform Law (Washington: Brookings Institution Press, 2006), Chapter 15.
119 Pamela Loprest and Karin Martinson, “Supporting Work for Low-Income People with Significant Challenges” (Washington: Urban Institute, July 2008); Heather Sandstrom et al., “Understanding the Dynamics of Disconnection from Employment and Assistance” (Washington: Urban Institute, May 2014); Kathryn J. Edin & H. Luke Shaefer, $2.00 a Day: Living on Almost Nothing in America (Boston: Houghton Mifflin Harcourt, 2015).
120 Center on Budget and Policy Priorities, “Chart Book: SNAP Helps Struggling Families Put Food on the Table,” Washington, DC, January 8, 2015, available at http://www.cbpp.org/research/food-assistance/chart-book-snap-helps-struggling-families-put-food-on-the-table#part3.
121 Ellen Meara and Richard Frank, “Welfare Reform, Work Requirements, and Employment Barriers,” NBER working paper 12480 (Cambridge, MA: National Bureau of Economic Research, 2006); Sheldon Danziger, Richard Frank, and Ellen Meara, “Mental Illness, Work, and Income Support Pro-grams,” American Journal of Psychiatry 166, no. 4 (2009): 398-404.
122 Lawrence M. Mead, Expanding Work Programs for Poor Men (Washington: American Enterprise Institute, 2011), 33-50.
123 Peter Wagner and Leah Sakala, “Mass Incarceration: The Whole Pie” (Northampton, MA: Prison Policy Initiative, 2014).
124 Jeremy Travis, Bruce Western, and Steve Redburn, ed., The Growth of Incarceration in the United States: Exploring Causes and Consequences (Washington: National Academies Press, 2014).
125 Jeremy Travis, But They All Come Back: Facing the Challenges of Prison Reentry (Washington: Urban Institute Press, 2005), 151-184.
126 Blanket refusals by employers to hire ex-offenders violate EEO law because it creates a disparate impact on the hiring of black men.
127 Much evidence in criminology suggests that offenders who go 5-10 years without reoffending pose no significantly greater risks of committing offenses than others in the population. In addition, applicants with just one felony conviction for non-violent drug possession also pose no greater risk of theft or violence to others in the workplace.
128 Mead, Expanding Work Programs, 51-65.
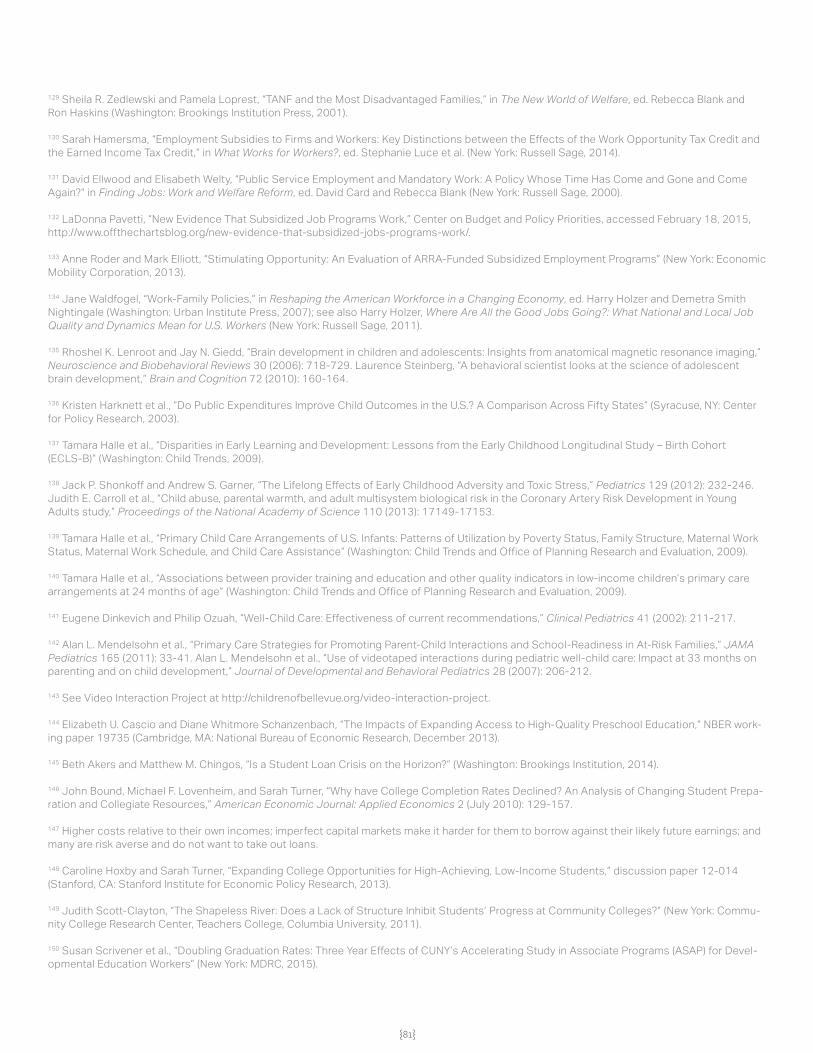
{80} {81}
129 Sheila R. Zedlewski and Pamela Loprest, “TANF and the Most Disadvantaged Families,” in The New World of Welfare, ed. Rebecca Blank and Ron Haskins (Washington: Brookings Institution Press, 2001).
130 Sarah Hamersma, “Employment Subsidies to Firms and Workers: Key Distinctions between the Effects of the Work Opportunity Tax Credit and the Earned Income Tax Credit,” in What Works for Workers?, ed. Stephanie Luce et al. (New York: Russell Sage, 2014).
131 David Ellwood and Elisabeth Welty, “Public Service Employment and Mandatory Work: A Policy Whose Time Has Come and Gone and Come Again?” in Finding Jobs: Work and Welfare Reform, ed. David Card and Rebecca Blank (New York: Russell Sage, 2000).
132 LaDonna Pavetti, “New Evidence That Subsidized Job Programs Work,” Center on Budget and Policy Priorities, accessed February 18, 2015, http://www.offthechartsblog.org/new-evidence-that-subsidized-jobs-programs-work/.
133 Anne Roder and Mark Elliott, “Stimulating Opportunity: An Evaluation of ARRA-Funded Subsidized Employment Programs” (New York: Economic Mobility Corporation, 2013).
134 Jane Waldfogel, “Work-Family Policies,” in Reshaping the American Workforce in a Changing Economy, ed. Harry Holzer and Demetra Smith Nightingale (Washington: Urban Institute Press, 2007); see also Harry Holzer, Where Are All the Good Jobs Going?: What National and Local Job Quality and Dynamics Mean for U.S. Workers (New York: Russell Sage, 2011).
135 Rhoshel K. Lenroot and Jay N. Giedd, “Brain development in children and adolescents: Insights from anatomical magnetic resonance imaging,” Neuroscience and Biobehavioral Reviews 30 (2006): 718-729. Laurence Steinberg, “A behavioral scientist looks at the science of adolescent brain development,” Brain and Cognition 72 (2010): 160-164.
136 Kristen Harknett et al., “Do Public Expenditures Improve Child Outcomes in the U.S.? A Comparison Across Fifty States” (Syracuse, NY: Center for Policy Research, 2003).
137 Tamara Halle et al., “Disparities in Early Learning and Development: Lessons from the Early Childhood Longitudinal Study – Birth Cohort (ECLS-B)” (Washington: Child Trends, 2009).
138 Jack P. Shonkoff and Andrew S. Garner, “The Lifelong Effects of Early Childhood Adversity and Toxic Stress,” Pediatrics 129 (2012): 232-246. Judith E. Carroll et al., “Child abuse, parental warmth, and adult multisystem biological risk in the Coronary Artery Risk Development in Young Adults study,” Proceedings of the National Academy of Science 110 (2013): 17149-17153.
139 Tamara Halle et al., “Primary Child Care Arrangements of U.S. Infants: Patterns of Utilization by Poverty Status, Family Structure, Maternal Work Status, Maternal Work Schedule, and Child Care Assistance” (Washington: Child Trends and Office of Planning Research and Evaluation, 2009).
140 Tamara Halle et al., “Associations between provider training and education and other quality indicators in low-income children’s primary care arrangements at 24 months of age” (Washington: Child Trends and Office of Planning Research and Evaluation, 2009).
141 Eugene Dinkevich and Philip Ozuah, “Well-Child Care: Effectiveness of current recommendations,” Clinical Pediatrics 41 (2002): 211-217.
142 Alan L. Mendelsohn et al., “Primary Care Strategies for Promoting Parent-Child Interactions and School-Readiness in At-Risk Families,” JAMA Pediatrics 165 (2011): 33-41. Alan L. Mendelsohn et al., “Use of videotaped interactions during pediatric well-child care: Impact at 33 months on parenting and on child development,” Journal of Developmental and Behavioral Pediatrics 28 (2007): 206-212.
143 See Video Interaction Project at http://childrenofbellevue.org/video-interaction-project.
144 Elizabeth U. Cascio and Diane Whitmore Schanzenbach, “The Impacts of Expanding Access to High-Quality Preschool Education,” NBER work-ing paper 19735 (Cambridge, MA: National Bureau of Economic Research, December 2013).
145 Beth Akers and Matthew M. Chingos, “Is a Student Loan Crisis on the Horizon?” (Washington: Brookings Institution, 2014).
146 John Bound, Michael F. Lovenheim, and Sarah Turner, “Why have College Completion Rates Declined? An Analysis of Changing Student Prepa-ration and Collegiate Resources,” American Economic Journal: Applied Economics 2 (July 2010): 129-157.
147 Higher costs relative to their own incomes; imperfect capital markets make it harder for them to borrow against their likely future earnings; and many are risk averse and do not want to take out loans.
148 Caroline Hoxby and Sarah Turner, “Expanding College Opportunities for High-Achieving, Low-Income Students,” discussion paper 12-014 (Stanford, CA: Stanford Institute for Economic Policy Research, 2013).
149 Judith Scott-Clayton, “The Shapeless River: Does a Lack of Structure Inhibit Students’ Progress at Community Colleges?” (New York: Commu-nity College Research Center, Teachers College, Columbia University, 2011).
150 Susan Scrivener et al., “Doubling Graduation Rates: Three Year Effects of CUNY’s Accelerating Study in Associate Programs (ASAP) for Devel-opmental Education Workers” (New York: MDRC, 2015).
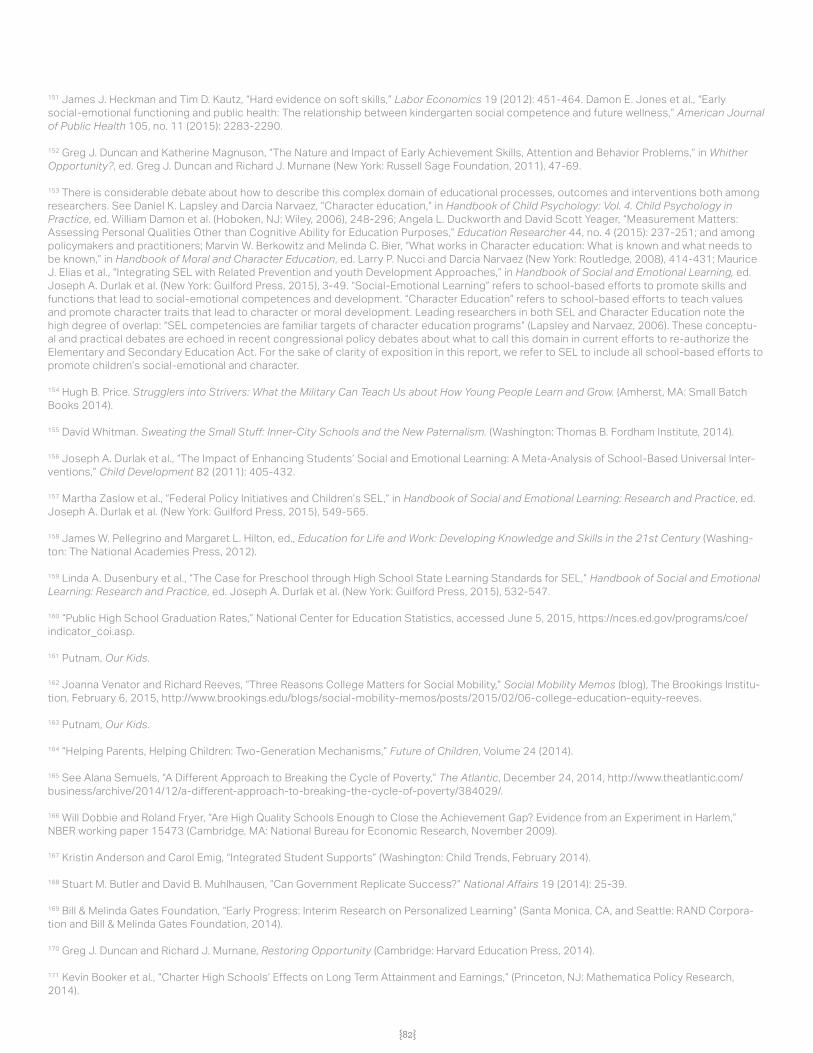
{82}
151 James J. Heckman and Tim D. Kautz, “Hard evidence on soft skills,” Labor Economics 19 (2012): 451-464. Damon E. Jones et al., “Early social-emotional functioning and public health: The relationship between kindergarten social competence and future wellness,” American Journal of Public Health 105, no. 11 (2015): 2283-2290.
152 Greg J. Duncan and Katherine Magnuson, “The Nature and Impact of Early Achievement Skills, Attention and Behavior Problems,” in Whither Opportunity?, ed. Greg J. Duncan and Richard J. Murnane (New York: Russell Sage Foundation, 2011), 47-69.
153 There is considerable debate about how to describe this complex domain of educational processes, outcomes and interventions both among researchers. See Daniel K. Lapsley and Darcia Narvaez, “Character education,” in Handbook of Child Psychology: Vol. 4. Child Psychology in Practice, ed. William Damon et al. (Hoboken, NJ: Wiley, 2006), 248-296; Angela L. Duckworth and David Scott Yeager, “Measurement Matters: Assessing Personal Qualities Other than Cognitive Ability for Education Purposes,” Education Researcher 44, no. 4 (2015): 237-251; and among policymakers and practitioners; Marvin W. Berkowitz and Melinda C. Bier, “What works in Character education: What is known and what needs to be known,” in Handbook of Moral and Character Education, ed. Larry P. Nucci and Darcia Narvaez (New York: Routledge, 2008), 414-431; Maurice J. Elias et al., “Integrating SEL with Related Prevention and youth Development Approaches,” in Handbook of Social and Emotional Learning, ed. Joseph A. Durlak et al. (New York: Guilford Press, 2015), 3-49. “Social-Emotional Learning” refers to school-based efforts to promote skills and functions that lead to social-emotional competences and development. “Character Education” refers to school-based efforts to teach values and promote character traits that lead to character or moral development. Leading researchers in both SEL and Character Education note the high degree of overlap: “SEL competencies are familiar targets of character education programs” (Lapsley and Narvaez, 2006). These conceptu-al and practical debates are echoed in recent congressional policy debates about what to call this domain in current efforts to re-authorize the Elementary and Secondary Education Act. For the sake of clarity of exposition in this report, we refer to SEL to include all school-based efforts to promote children’s social-emotional and character.
154 Hugh B. Price. Strugglers into Strivers: What the Military Can Teach Us about How Young People Learn and Grow. (Amherst, MA: Small Batch Books 2014).
155 David Whitman. Sweating the Small Stuff: Inner-City Schools and the New Paternalism. (Washington: Thomas B. Fordham Institute, 2014).
156 Joseph A. Durlak et al., “The Impact of Enhancing Students’ Social and Emotional Learning: A Meta-Analysis of School-Based Universal Inter-ventions,” Child Development 82 (2011): 405-432.
157 Martha Zaslow et al., “Federal Policy Initiatives and Children’s SEL,” in Handbook of Social and Emotional Learning: Research and Practice, ed. Joseph A. Durlak et al. (New York: Guilford Press, 2015), 549-565.
158 James W. Pellegrino and Margaret L. Hilton, ed., Education for Life and Work: Developing Knowledge and Skills in the 21st Century (Washing-ton: The National Academies Press, 2012).
159 Linda A. Dusenbury et al., “The Case for Preschool through High School State Learning Standards for SEL,” Handbook of Social and Emotional Learning: Research and Practice, ed. Joseph A. Durlak et al. (New York: Guilford Press, 2015), 532-547.
160 “Public High School Graduation Rates,” National Center for Education Statistics, accessed June 5, 2015, https://nces.ed.gov/programs/coe/indicator_coi.asp.
161 Putnam, Our Kids.
162 Joanna Venator and Richard Reeves, “Three Reasons College Matters for Social Mobility,” Social Mobility Memos (blog), The Brookings Institu-tion, February 6, 2015, http://www.brookings.edu/blogs/social-mobility-memos/posts/2015/02/06-college-education-equity-reeves.
163 Putnam, Our Kids.
164 “Helping Parents, Helping Children: Two-Generation Mechanisms,” Future of Children, Volume 24 (2014).
165 See Alana Semuels, “A Different Approach to Breaking the Cycle of Poverty,” The Atlantic, December 24, 2014, http://www.theatlantic.com/business/archive/2014/12/a-different-approach-to-breaking-the-cycle-of-poverty/384029/.
166 Will Dobbie and Roland Fryer, “Are High Quality Schools Enough to Close the Achievement Gap? Evidence from an Experiment in Harlem,” NBER working paper 15473 (Cambridge, MA: National Bureau for Economic Research, November 2009).
167 Kristin Anderson and Carol Emig, “Integrated Student Supports” (Washington: Child Trends, February 2014).
168 Stuart M. Butler and David B. Muhlhausen, “Can Government Replicate Success?” National Affairs 19 (2014): 25-39.
169 Bill & Melinda Gates Foundation, “Early Progress: Interim Research on Personalized Learning” (Santa Monica, CA, and Seattle: RAND Corpora-tion and Bill & Melinda Gates Foundation, 2014).
170 Greg J. Duncan and Richard J. Murnane, Restoring Opportunity (Cambridge: Harvard Education Press, 2014).
171 Kevin Booker et al., “Charter High Schools’ Effects on Long Term Attainment and Earnings,” (Princeton, NJ: Mathematica Policy Research, 2014).
{82} {83}
172 Christina Clark Tuttle et al., “KIPP Middle Schools: Impacts on Achievement and Other Outcomes” (Princeton, NJ: Mathematica Policy Research, 2013).
173 Rebecca Unterman, “Headed to College: The Effects of New York City’s Small High Schools of Choice on Postsecondary Enrollment” (New York: MDRC, 2014).
174 See James Kemple, “Career Academies.”
175 Raj Chetty, John Friedman, and John Rockoff, “The Long-Term Impacts of Teachers: Teacher Value-Added and Student Outcomes in Adult-hood” NBER working paper 17699 (Cambridge, MA: National Bureau of Economic Research, December 2011).
176 Caroline Hoxby, “Covering the Costs,” in What Lies Ahead for America’s Children and Their Schools, ed. Chester Finn and Richard Sousa (Stan-ford, CA: Hoover Institution Press, 2014).
177 Stuart Butler, “Tottering Ivory Towers,” American Interest, August 11, 2014, http://www.the-american-interest.com/2014/08/11/tottering- ivory-towers/.
178 National Center for Educational Statistics, College Navigator, available at https://nces.ed.gov/collegenavigator.
179 Jonathan Rothwell and Siddharth Kulkarni, “Beyond College Rankings: A Value-Added Approach to Assessing Two- and Four-Year Schools” (Washington: Brookings Institution, 2015).
180 Robert Lerman, “Expanding Apprenticeship: A Way to Enhance Skills and Careers” (Washington: The Urban Institute, 2010).
181 Ben Olinsky and Sarah Ayres, “Training for Success: A Policy to Expand Apprenticeships in the United States” (Washington: Center for Ameri-can Progress, 2013).
182 J.S. Coleman et al., “Equality of Educational Opportunity” (Washington: U.S. Government Printing Office, 1966); Russell W. Rumberger and Greg-ory J. Palardy, “Does Segregation Still Matter? The Impact of Student Composition on Academic Achievement in High School,” Teachers College Record, 107 (2005), 1999-2045.
183 National Center for Educational Statistics, “The Condition of Education” (Washington: U.S Government Printing Office, 2010).
184 Stacy Teicher Khadaroo, “Economic segregation rising in US public schools,” Christian Science Monitor, May 27, 2010.
185 Richard D. Kahlenberg, “From All Walks of Life: New Hope for School Integration,” American Educator, 36 (2013): 2-7, 10-14, 40.
186 Michael J. Petrilli, “The Diverse Schools Dilemma” (Washington: Thomas B. Fordham Institute, 2012).
187 Richard D. Kahlenberg, “All Together Now: Creating Middle Class Schools through Public School Choice” (Washington: Brookings Institution, 2001), 37-42.
188 Richard D. Kahlenberg, “Helping Children Move from Bad Schools to Good Ones” (New York: Century Foundation, 2006).
189 Halley Potter, “Charters without Borders: Using Inter-district Charter Schools as a Tool for Regional School Integration” (New York: Century Foundation, 2015).
{84}
Brief Background of Members of the AEI/BrookingsWorking Group on Poverty and OpportunityLAWRENCE ABER is the Willner Family Professor of Psychology and Public Policy at New York University where he is also board chair of its Institute for Human Development and Social Change. He also directed the National Center for Children in Poverty at Columbia University from 1994 to 2004 and has consulted to numerous community-based organizations, philanthropies, government agencies and policymakers on social policies and programs for low- income communities, families and children.
STUART BUTLER is a Senior Fellow in Economic Studies at the Brookings Institution. He is also a Visiting Fellow at the Convergence Center for Policy Resolution. Prior to joining Brookings he spent 35 years at The Heritage Foundation in senior research and management positions. He has written extensively on health and social policy, including on higher education reform and economic mobility. SHELDON DANZIGER is President of the Russell Sage Foundation which supports social science research “for the improvement of social and living conditions in the United States.” He is also Distinguished University Professor Emer-itus of Public Policy at the University of Michigan, where he was Director of the National Poverty Center. He is the coauthor of America Unequal (1995) and coeditor of Legacies of the War on Poverty (2013).
ROBERT DOAR is the Morgridge Fellow in Poverty Studies at the American Enterprise Institute (AEI). Before joining AEI, Doar was commissioner of New York City’s Human Resources Administration where he administered 12 public assistance programs including cash welfare, food assistance, public health insurance, home care for the elderly and disabled, energy assistance, child support enforcement services, adult protective services and domestic violence assistance, as well as help for people living with HIV/AIDS.
DAVID T. ELLWOOD is the Scott M. Black Professor of Political Economy at Harvard’s John F. Kennedy School of Government. From 2004 to 2015 he was Dean of the School. From 1993 to 1995, he served as Assistant Secretary for Planning and Evaluation at the U.S. Department of Health and Human Services (HHS) where he served as co-chair of President Clinton’s Working Group on Welfare Reform, Family Support and Independence.
JUDITH M. GUERON is President Emerita of MDRC. She joined MDRC in 1974 as its first research director and served as its president from 1986 through 2004. At MDRC, she directed some of the largest federal and state evaluations of social interventions for low-income adults, youth, and families and was a pioneer in promoting the use of random assignment to assess the effectiveness of real world programs. She is the coauthor of From Welfare to Work (1991) and Fighting for Reliable Evidence (2013).
JONATHAN HAIDT is the Thomas Cooley Professor of Ethical Leadership at New York University’s Stern School of Business. He is a social psychologist whose research examines the intuitive foundations of moral and political views. He has run numerous projects to promote political civility and cross-partisan understanding. He is the author of The Righteous Mind: Why Good People Are Divided by Politics and Religion.
{84} {85}
RON HASKINS is the Cabot Family Chair and Senior Fellow in Economic Studies at the Brookings Institution in Wash-ington, DC and a Senior Consultant at the Annie E. Casey Foundation. Formerly, Haskins was a Senior Advisor for Welfare Policy to President George W. Bush, a senior staffer for the House Committee on Ways and Means and a Research Professor at the Frank Porter Graham Child Development Center at the University of North Carolina. Haskins is a developmental psychologist.
HARRY J. HOLZER is a professor of public policy at the McCourt School of Public Policy at Georgetown University. He is also an institute fellow at the American Institutes for Research and a nonresident senior fellow at the Brookings Institution. He is a former Chief Economist at the US Department of Labor and a former faculty director and founder of the Georgetown Center on Poverty, Inequality and Public Policy. He has a BA and a Ph.D. in economics from Harvard University, and his research and writing focus on the low-wage labor market.
KAY HYMOWITZ is the William E. Simon Fellow at the Manhattan Institute for Policy Research and contributing edi-tor to City Journal. She is widely known for her writings on childhood, family issues, poverty, and cultural change in America in a variety of publications. She is the author of four books including Manning Up: How the Rise of Women Has Turned Men into Boys (2011) and Marriage and Caste in America: Separate and Unequal Families in a Post-Marital Age (2006). In addition to presenting her work at many conferences and media events, she sits on the board of the journals National Affairs and The Future of Children.
LAWRENCE M. MEAD is Professor of Politics and Public Policy at New York University and also a Visiting Scholar at the American Enterprise Institute. His several books on poverty and welfare reform include Beyond Entitlement (1986), The New Politics of Poverty (1992), Government Matters (2004), and Expanding Work Programs for Poor Men (2011).
RONALD B. MINCY is the Maurice V. Russell Professor of Social Policy and Social Work Practice at the Columbia Uni-versity School of Social Work, and a co-principal investigator of the Fragile Families and Child Wellbeing Study. From 1993-2000 he served as a senior program officer at the Ford Foundation. He is the coauthor of Failing Our Fathers: Confronting the Crisis of Economically Vulnerable Nonresident Fathers (2015) and editor of Black Males Left Behind (2006) and Nurturing Young Black Males: Challenges to Agencies, Programs, and Policies (1994).
RICHARD V. REEVES is a senior fellow in Economic Studies, co-director of the Center on Children and Families, and editor-in-chief of the Social Mobility Memos blog. His research focuses on social mobility, inequality, and family change. Between 2010 and 2012, he was director of strategy to the UK’s Deputy Prime Minister.
MICHAEL R. STRAIN is Deputy Director of Economic Policy Studies and Resident Scholar at the American Enterprise Institute. His research interests include labor economics, social policy, and public finance. He also writes frequently for popular audiences. Before joining AEI he worked in the Center for Economic Studies at the U.S. Census Bureau and in the macroeconomics research group at the Federal Reserve Bank of New York. He holds a Ph.D. in economics from Cornell University.
JANE WALDFOGEL is Compton Foundation Centennial Professor for the Prevention of Children and Youth Problems at Columbia University School of Social Work, and Visiting Professor at London School of Economics. Waldfogel received her Ph.D. in public policy from the Harvard Kennedy School in 1994. She has written extensively on the impact of public policies on poverty, inequality, and child and family well-being.