Embed Size (px)
Citation preview
Asian regionalism and its effects ontrade in the 1980s and 1990s$
Ramon Claretea, Christopher Edmondsb,*,Jessica Seddon Wallackc
aDiliman Campus, University of the Philippines, Quezon City, PhilippinesbEconomics and Research Department, Asian Development Bank, Manila 0980, Philippines
cGraduate School of Business, Stanford University, Stanford, CA, USA
Received 29 May 2002; received in revised form 5 September 2002; accepted 17 September 2002
Abstract
This paper begins by outlining the major preferential trade agreements (PTAs) in Asia and other
regions and reviewing trends in trade flows. The paper uses a gravity model augmented with several
sets of dummy variables to estimate the effect of various PTAs on trade flows within and across
membership groupings as well as the effect of PTAs on members’ trade with Asian countries. On the
basis of these estimates, we are able to categorize 11 major PTAs into those that increase intrabloc
trade at the expense of their respective imports from the rest of the world; those that expand their
respective trade among their members without reducing their trade with nonmembers; and those that
reduce trade with nonmembers without significant changes in intrabloc trade. The authors also show
that PTAs have augmented trade in Asia.
# 2002 Elsevier Science Inc. All rights reserved.
Keywords: Economic Integration; Trade Negotiations; Trade Forecasting and Simulation; Trade Policy; Asia
including Middle East; Regional Development Policy; International Economic Order
Journal of Asian Economics 14 (2003) 91–129
$ This paper was presented at the 24th International Conference on Asian Economic Studies held in Beijing
from May 26th to 29th, 2002. Please do not quote or cite without permission of the authors. The views expressed
in this paper are those of the authors and do not necessarily represent the views of the institutions with which
they are affiliated.* Corresponding author.
E-mail address: [email protected] (C. Edmonds).
1049-0078/02/$ – see front matter # 2002 Elsevier Science Inc. All rights reserved.
PII: S 1 0 4 9 - 0 0 7 8 ( 0 2 ) 0 0 2 4 2 - 7
1. Introduction
Recent years have seen a sharp upturn in interest and activity in the formation of
Preferential Trading Arrangements (PTAs) in the Asia and Pacific Region. Japan and
Singapore recently signed an Economic Partnership Agreement in February 2002.
Singapore also signed a bilateral trade agreement with New Zealand in 2001. Japanese
policymakers have proposed a Japan–ASEAN Comprehensive Economic Partnership, and
an ASEAN–China Free Trade Area was proposed by China and endorsed by ASEAN’s 10
leaders in the organization’s ministerial meeting in Brunei in October 2001. In February
2002, government representatives of 14 Pacific Island nations met and agreed to form a
FTA. These recent events follow more than a decade of increasing numbers of PTAs in the
Asian and Pacific Region (see Fig. 1) and a similar upsurge in the number of PTAs in the
world as a whole in the late 1980s and early 1990s. At present, about 97% of total global
trade involves countries that are members of at least one PTA. This compares with a 72%
share in 1990.
The increased interest in preferential trade agreements raises the important question of
whether these more limited, often regionally based, trading arrangements are beneficial to
Asian economies. As PTAs become a more commonly considered policy option, it is
increasingly important to evaluate how the economic effects of PTAs compare to the effects
of broader multilateral trading arrangements as well as how the PTAs affect world trade
flows in general.
This paper focuses on the latter question. The following section describes the debate over
PTAs’ effects on world trade flows and provides some background on the PTAs we include
in the analysis. Sections 3 and 4 present empirical and analytical explorations of trade flows
within and across preferential trade agreements. We first present a set of descriptive
measures of trade flows and Section 5 presents the result of an augmented gravity model
that estimates the effect that PTAs have on trade flows after controlling for non-policy
determinants of trade. Following Soloaga and Winters (2001), we use a combination of
dummy variables in the gravity model that allows us to separately identify the effects of PTA
on intra-bloc trade as well as trade between members and the rest of the world. Our
estimating equation also includes a set of dummy variables to identify the impact that PTAs
have had on trade with Asian countries in particular. Another contribution is to estimate the
model using data covering the years 1980–2000, a panel that allows us to consider how the
Asian financial crisis influenced trade flows and the effects of PTAs on trade flows.
Our main finding is that the effect of PTAs on trade flows varies widely across PTAs. We
estimated large positive ‘‘intra-bloc trade’’ effects for the Andean Pact, effects for the
Andean Pact, European Cooperation Organization (ECO), European Free Trade Associa-
tion (EFTA), Mercosur, South Asian Preferential Trade Arrangement (SAPTA), and South
Pacific Regional Trade and Economic Cooperation Agreement (SPARTECA). These trade
agreements appear to have had little effect on members’ trade with countries outside the
PTAs. Membership in Asia-Pacific Economic Cooperation forum (APEC) and the Eur-
opean Union (EU), in contrast, was estimated to expand significantly trade both between
members of the PTA and between members and to the rest of the world. Our gravity model
estimates indicate that CER had no incremental trade effect within or outside the bloc, and
most of the estimation coefficients for this PTA were not statistically different from zero.
92 R. Clarete et al. / Journal of Asian Economics 14 (2003) 91–129
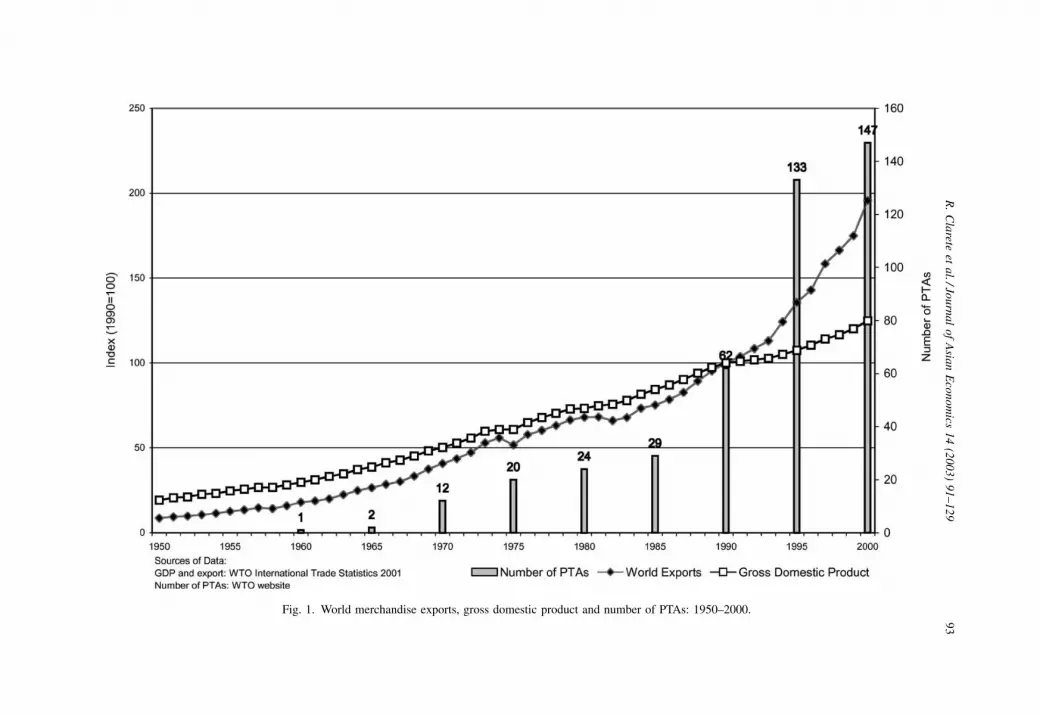
Fig. 1. World merchandise exports, gross domestic product and number of PTAs: 1950–2000.
R.
Cla
reteet
al./Jo
urn
al
of
Asia
nE
con
om
ics1
4(2
00
3)
91
–1
29
93
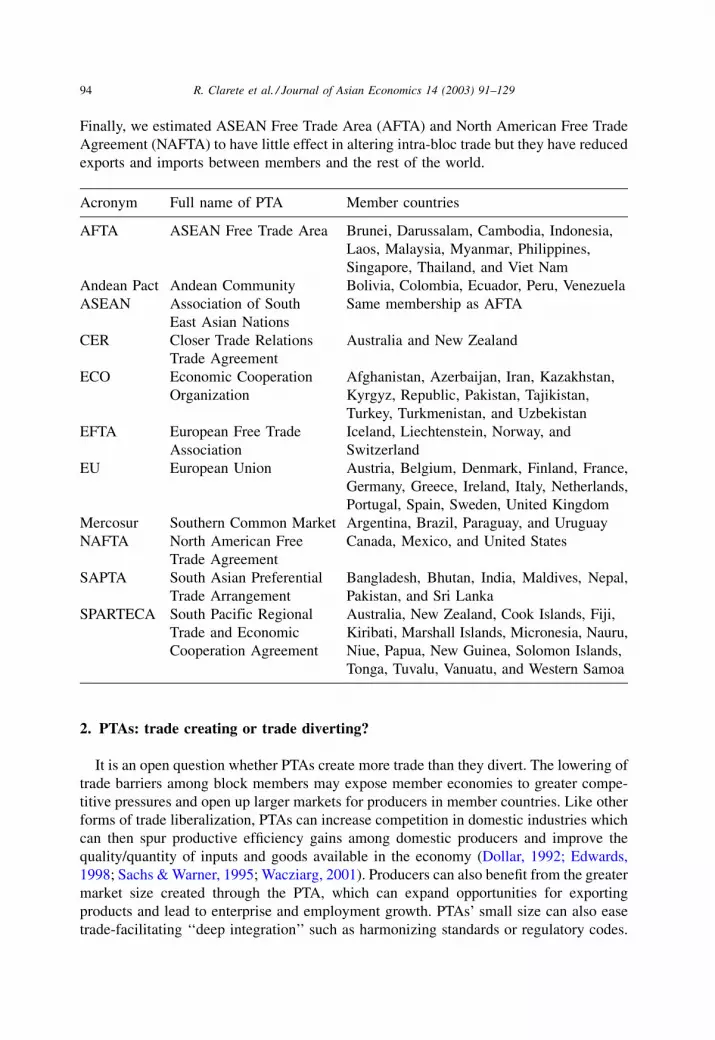
Finally, we estimated ASEAN Free Trade Area (AFTA) and North American Free Trade
Agreement (NAFTA) to have little effect in altering intra-bloc trade but they have reduced
exports and imports between members and the rest of the world.
Acronym Full name of PTA Member countries
AFTA ASEAN Free Trade Area Brunei, Darussalam, Cambodia, Indonesia,
Laos, Malaysia, Myanmar, Philippines,
Singapore, Thailand, and Viet Nam
Andean Pact Andean Community Bolivia, Colombia, Ecuador, Peru, Venezuela
ASEAN Association of South
East Asian Nations
Same membership as AFTA
CER Closer Trade Relations
Trade Agreement
Australia and New Zealand
ECO Economic Cooperation
Organization
Afghanistan, Azerbaijan, Iran, Kazakhstan,
Kyrgyz, Republic, Pakistan, Tajikistan,
Turkey, Turkmenistan, and Uzbekistan
EFTA European Free Trade
Association
Iceland, Liechtenstein, Norway, and
Switzerland
EU European Union Austria, Belgium, Denmark, Finland, France,
Germany, Greece, Ireland, Italy, Netherlands,
Portugal, Spain, Sweden, United Kingdom
Mercosur Southern Common Market Argentina, Brazil, Paraguay, and Uruguay
NAFTA North American Free
Trade Agreement
Canada, Mexico, and United States
SAPTA South Asian Preferential
Trade Arrangement
Bangladesh, Bhutan, India, Maldives, Nepal,
Pakistan, and Sri Lanka
SPARTECA South Pacific Regional
Trade and Economic
Cooperation Agreement
Australia, New Zealand, Cook Islands, Fiji,
Kiribati, Marshall Islands, Micronesia, Nauru,
Niue, Papua, New Guinea, Solomon Islands,
Tonga, Tuvalu, Vanuatu, and Western Samoa
2. PTAs: trade creating or trade diverting?
It is an open question whether PTAs create more trade than they divert. The lowering of
trade barriers among block members may expose member economies to greater compe-
titive pressures and open up larger markets for producers in member countries. Like other
forms of trade liberalization, PTAs can increase competition in domestic industries which
can then spur productive efficiency gains among domestic producers and improve the
quality/quantity of inputs and goods available in the economy (Dollar, 1992; Edwards,
1998; Sachs & Warner, 1995; Wacziarg, 2001). Producers can also benefit from the greater
market size created through the PTA, which can expand opportunities for exporting
products and lead to enterprise and employment growth. PTAs’ small size can also ease
trade-facilitating ‘‘deep integration’’ such as harmonizing standards or regulatory codes.
94 R. Clarete et al. / Journal of Asian Economics 14 (2003) 91–129
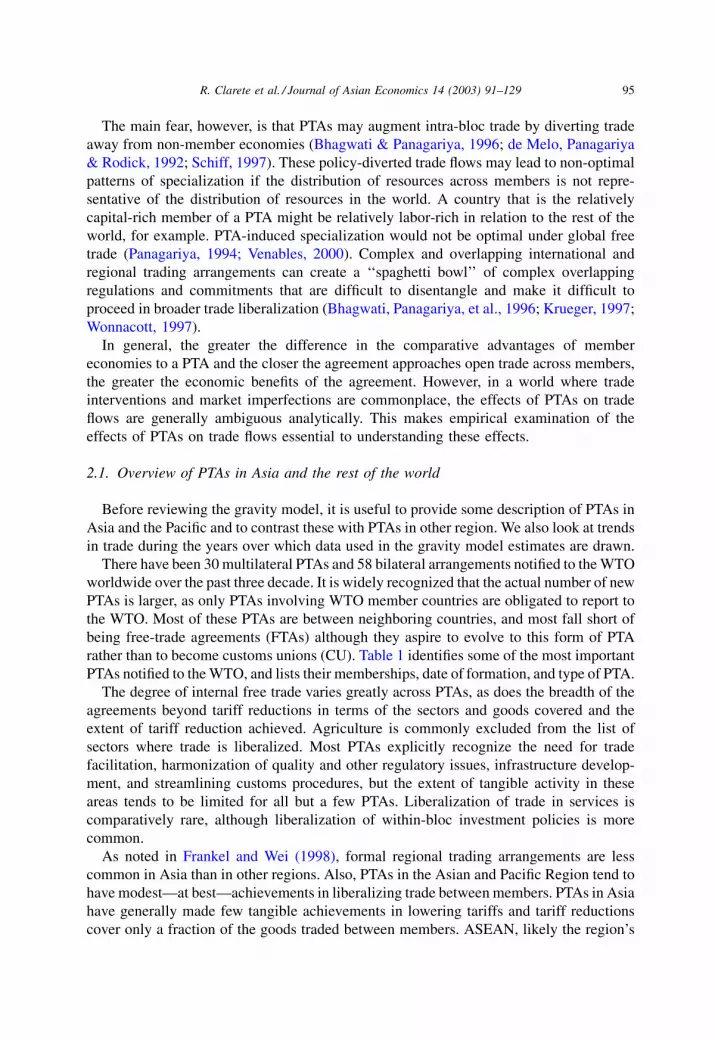
The main fear, however, is that PTAs may augment intra-bloc trade by diverting trade
away from non-member economies (Bhagwati & Panagariya, 1996; de Melo, Panagariya
& Rodick, 1992; Schiff, 1997). These policy-diverted trade flows may lead to non-optimal
patterns of specialization if the distribution of resources across members is not repre-
sentative of the distribution of resources in the world. A country that is the relatively
capital-rich member of a PTA might be relatively labor-rich in relation to the rest of the
world, for example. PTA-induced specialization would not be optimal under global free
trade (Panagariya, 1994; Venables, 2000). Complex and overlapping international and
regional trading arrangements can create a ‘‘spaghetti bowl’’ of complex overlapping
regulations and commitments that are difficult to disentangle and make it difficult to
proceed in broader trade liberalization (Bhagwati, Panagariya, et al., 1996; Krueger, 1997;
Wonnacott, 1997).
In general, the greater the difference in the comparative advantages of member
economies to a PTA and the closer the agreement approaches open trade across members,
the greater the economic benefits of the agreement. However, in a world where trade
interventions and market imperfections are commonplace, the effects of PTAs on trade
flows are generally ambiguous analytically. This makes empirical examination of the
effects of PTAs on trade flows essential to understanding these effects.
2.1. Overview of PTAs in Asia and the rest of the world
Before reviewing the gravity model, it is useful to provide some description of PTAs in
Asia and the Pacific and to contrast these with PTAs in other region. We also look at trends
in trade during the years over which data used in the gravity model estimates are drawn.
There have been 30 multilateral PTAs and 58 bilateral arrangements notified to the WTO
worldwide over the past three decade. It is widely recognized that the actual number of new
PTAs is larger, as only PTAs involving WTO member countries are obligated to report to
the WTO. Most of these PTAs are between neighboring countries, and most fall short of
being free-trade agreements (FTAs) although they aspire to evolve to this form of PTA
rather than to become customs unions (CU). Table 1 identifies some of the most important
PTAs notified to the WTO, and lists their memberships, date of formation, and type of PTA.
The degree of internal free trade varies greatly across PTAs, as does the breadth of the
agreements beyond tariff reductions in terms of the sectors and goods covered and the
extent of tariff reduction achieved. Agriculture is commonly excluded from the list of
sectors where trade is liberalized. Most PTAs explicitly recognize the need for trade
facilitation, harmonization of quality and other regulatory issues, infrastructure develop-
ment, and streamlining customs procedures, but the extent of tangible activity in these
areas tends to be limited for all but a few PTAs. Liberalization of trade in services is
comparatively rare, although liberalization of within-bloc investment policies is more
common.
As noted in Frankel and Wei (1998), formal regional trading arrangements are less
common in Asia than in other regions. Also, PTAs in the Asian and Pacific Region tend to
have modest—at best—achievements in liberalizing trade between members. PTAs in Asia
have generally made few tangible achievements in lowering tariffs and tariff reductions
cover only a fraction of the goods traded between members. ASEAN, likely the region’s
R. Clarete et al. / Journal of Asian Economics 14 (2003) 91–129 95
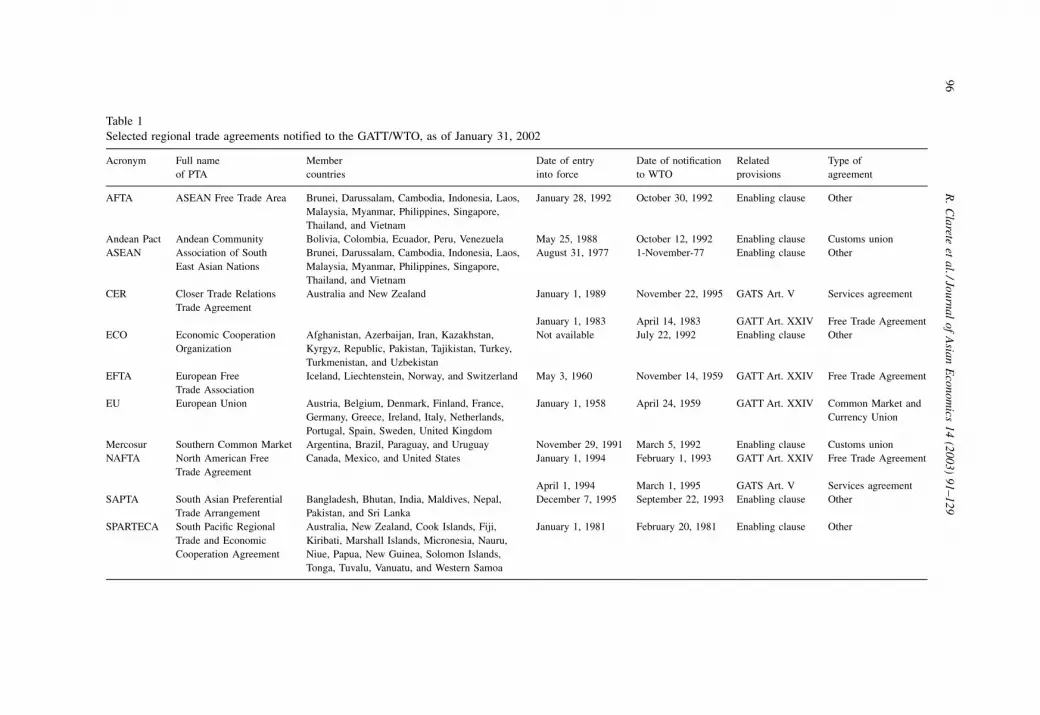
Table 1
Selected regional trade agreements notified to the GATT/WTO, as of January 31, 2002
Acronym Full name
of PTA
Member
countries
Date of entry
into force
Date of notification
to WTO
Related
provisions
Type of
agreement
AFTA ASEAN Free Trade Area Brunei, Darussalam, Cambodia, Indonesia, Laos,
Malaysia, Myanmar, Philippines, Singapore,
Thailand, and Vietnam
January 28, 1992 October 30, 1992 Enabling clause Other
Andean Pact Andean Community Bolivia, Colombia, Ecuador, Peru, Venezuela May 25, 1988 October 12, 1992 Enabling clause Customs union
ASEAN Association of South
East Asian Nations
Brunei, Darussalam, Cambodia, Indonesia, Laos,
Malaysia, Myanmar, Philippines, Singapore,
Thailand, and Vietnam
August 31, 1977 1-November-77 Enabling clause Other
CER Closer Trade Relations
Trade Agreement
Australia and New Zealand January 1, 1989 November 22, 1995 GATS Art. V Services agreement
January 1, 1983 April 14, 1983 GATT Art. XXIV Free Trade Agreement
ECO Economic Cooperation
Organization
Afghanistan, Azerbaijan, Iran, Kazakhstan,
Kyrgyz, Republic, Pakistan, Tajikistan, Turkey,
Turkmenistan, and Uzbekistan
Not available July 22, 1992 Enabling clause Other
EFTA European Free
Trade Association
Iceland, Liechtenstein, Norway, and Switzerland May 3, 1960 November 14, 1959 GATT Art. XXIV Free Trade Agreement
EU European Union Austria, Belgium, Denmark, Finland, France,
Germany, Greece, Ireland, Italy, Netherlands,
Portugal, Spain, Sweden, United Kingdom
January 1, 1958 April 24, 1959 GATT Art. XXIV Common Market and
Currency Union
Mercosur Southern Common Market Argentina, Brazil, Paraguay, and Uruguay November 29, 1991 March 5, 1992 Enabling clause Customs union
NAFTA North American Free
Trade Agreement
Canada, Mexico, and United States January 1, 1994 February 1, 1993 GATT Art. XXIV Free Trade Agreement
April 1, 1994 March 1, 1995 GATS Art. V Services agreement
SAPTA South Asian Preferential
Trade Arrangement
Bangladesh, Bhutan, India, Maldives, Nepal,
Pakistan, and Sri Lanka
December 7, 1995 September 22, 1993 Enabling clause Other
SPARTECA South Pacific Regional
Trade and Economic
Cooperation Agreement
Australia, New Zealand, Cook Islands, Fiji,
Kiribati, Marshall Islands, Micronesia, Nauru,
Niue, Papua, New Guinea, Solomon Islands,
Tonga, Tuvalu, Vanuatu, and Western Samoa
January 1, 1981 February 20, 1981 Enabling clause Other
96
R.
Cla
reteet
al./Jo
urn
al
of
Asia
nE
con
om
ics1
4(2
00
3)
91
–1
29
PTA that has expressed the clearest intention of becoming a true Free Trade Area, achieved
only modest liberalization until recent years.1 While formal national-level trading agree-
ments generally attract the most attention, it is also important to note the substantial effort
to facilitate trade via subregional economic zones (SREZs) and infrastructure policies. The
theme chapter of the Asian Development Outlook, 2002 provides more background on
these arrangements.
The PTAs in the Asia and Pacific region tend to be fairly outward looking and a large
percentage of members’ trade goes to non-member countries. The trade flows considered in
the next section of the paper generally illustrate this openness. This reflects the region’s
strong ties to the U.S., Europe, and some Latin American markets. Of all the PTAs
reviewed, AFTA and APEC members have the strongest links to the international economy.
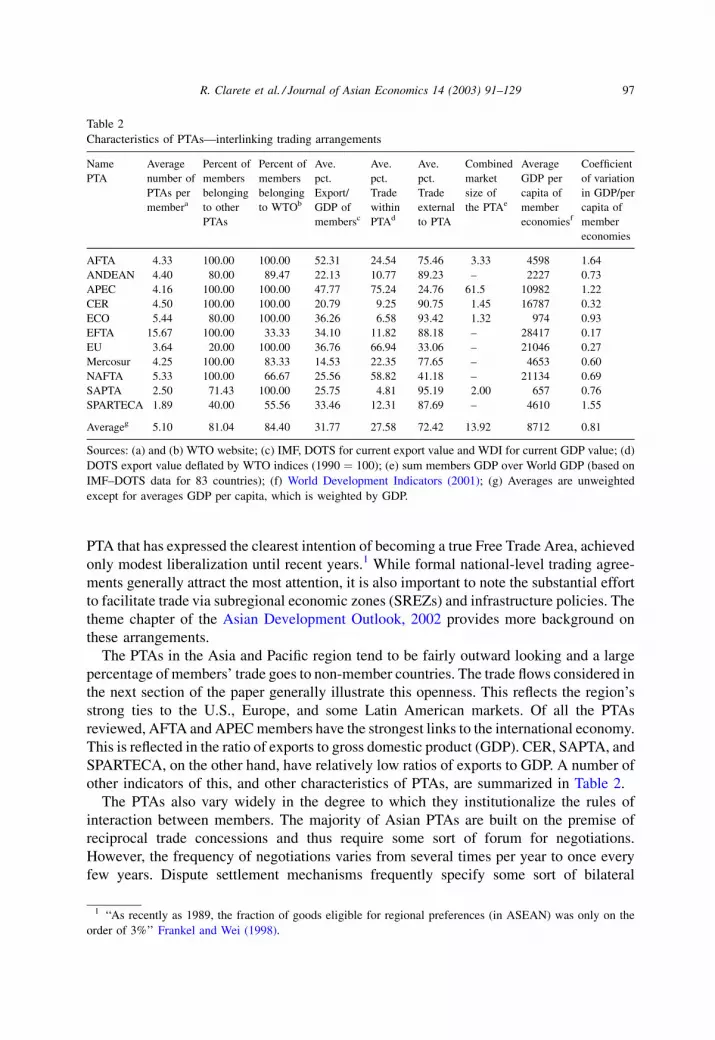
This is reflected in the ratio of exports to gross domestic product (GDP). CER, SAPTA, and
SPARTECA, on the other hand, have relatively low ratios of exports to GDP. A number of
other indicators of this, and other characteristics of PTAs, are summarized in Table 2.
The PTAs also vary widely in the degree to which they institutionalize the rules of
interaction between members. The majority of Asian PTAs are built on the premise of
reciprocal trade concessions and thus require some sort of forum for negotiations.
However, the frequency of negotiations varies from several times per year to once every
few years. Dispute settlement mechanisms frequently specify some sort of bilateral
Table 2
Characteristics of PTAs—interlinking trading arrangements
Name
PTA
Average
number of
PTAs per
membera
Percent of
members
belonging
to other
PTAs
Percent of
members
belonging
to WTOb
Ave.
pct.
Export/
GDP of
membersc
Ave.
pct.
Trade
within
PTAd
Ave.
pct.
Trade
external
to PTA
Combined
market
size of
the PTAe
Average
GDP per
capita of
member
economiesf
Coefficient
of variation
in GDP/per
capita of
member
economies
AFTA 4.33 100.00 100.00 52.31 24.54 75.46 3.33 4598 1.64
ANDEAN 4.40 80.00 89.47 22.13 10.77 89.23 – 2227 0.73
APEC 4.16 100.00 100.00 47.77 75.24 24.76 61.5 10982 1.22
CER 4.50 100.00 100.00 20.79 9.25 90.75 1.45 16787 0.32
ECO 5.44 80.00 100.00 36.26 6.58 93.42 1.32 974 0.93
EFTA 15.67 100.00 33.33 34.10 11.82 88.18 – 28417 0.17
EU 3.64 20.00 100.00 36.76 66.94 33.06 – 21046 0.27
Mercosur 4.25 100.00 83.33 14.53 22.35 77.65 – 4653 0.60
NAFTA 5.33 100.00 66.67 25.56 58.82 41.18 – 21134 0.69
SAPTA 2.50 71.43 100.00 25.75 4.81 95.19 2.00 657 0.76
SPARTECA 1.89 40.00 55.56 33.46 12.31 87.69 – 4610 1.55
Averageg 5.10 81.04 84.40 31.77 27.58 72.42 13.92 8712 0.81
Sources: (a) and (b) WTO website; (c) IMF, DOTS for current export value and WDI for current GDP value; (d)
DOTS export value deflated by WTO indices (1990 ¼ 100); (e) sum members GDP over World GDP (based on
IMF–DOTS data for 83 countries); (f) World Development Indicators (2001); (g) Averages are unweighted
except for averages GDP per capita, which is weighted by GDP.
1 ‘‘As recently as 1989, the fraction of goods eligible for regional preferences (in ASEAN) was only on the
order of 3%’’ Frankel and Wei (1998).
R. Clarete et al. / Journal of Asian Economics 14 (2003) 91–129 97

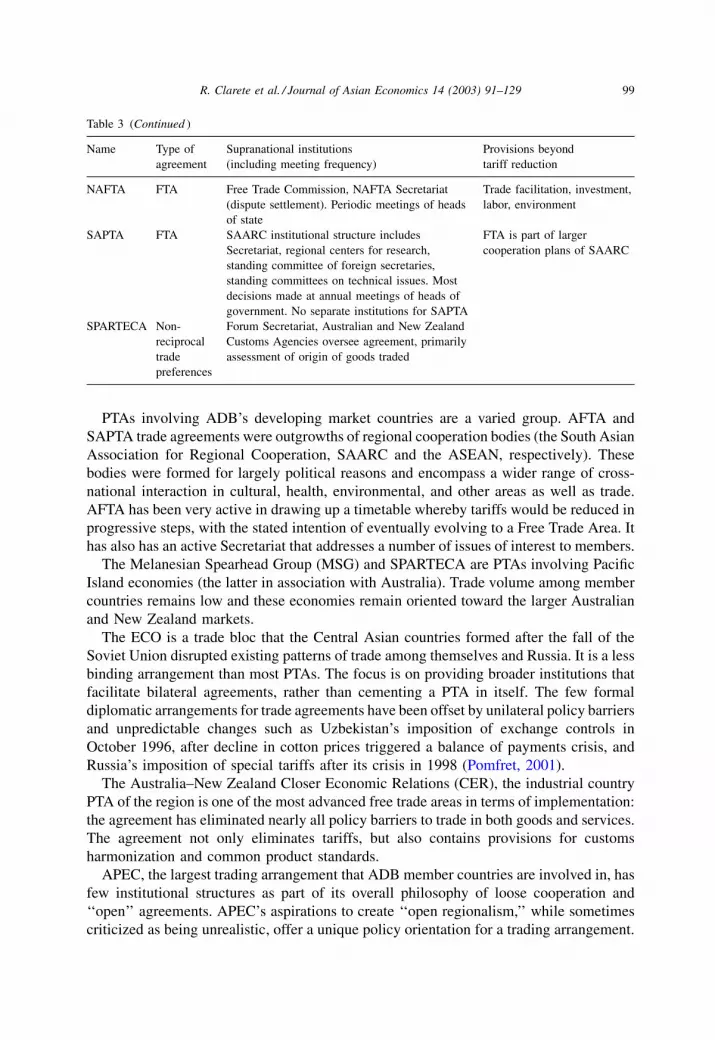
negotiation, and only a few agreements set up a multinational court to arbitrate disagree-
ments between members and oversee implementation of agreements. Many of the
agreements are more ambitious in aspiration than in implementation. This informality
contrasts with PTAs in other regions that establish stricter rules and more formal
institutional arrangements for advancing trade liberalization and for resolving disputes
between members (see Table 3).
Table 3
Institutional arrangements under existing PTAs
Name Type of
agreement
Supranational institutions
(including meeting frequency)
Provisions beyond
tariff reduction
AFTA FTA (within
general
cooperation
agreement
of ASEAN)
ASEAN institutions include Central Secretariat.
For the FTA, no separate supranational
institutions. Dispute settlement by bilateral
negotiations, with presentation of case before a
‘‘Senior Economic Officials Meeting’’ as a means
of resolving impasses. There is no standing body
for investigating disputes, panels of experts are
appointed as needed. ASEAN Economic Ministers
serve as final arbiters. Decision-making at annual
meetings of heads of state
Trade facilitation, investment,
industrial cooperation, services
trade. FTA is part of larger
regional cooperation plans
under ASEAN
ANDEAN CU Court of Justice (dispute settlement). General
Secretariat (administers integration). Andean
Parliament (deliberating body). Also annual
meetings of Andean Council of Presidents
and Council of Foreign Ministers
Services, migration,
investment, some foreign
policy, trade facilitation
APEC General
cooperation
No institutions. Annual meetings of heads of
state, ministers. Provisions are not binding,
so no mechanisms for dispute settlement
Trade facilitation, services,
investment, intellectual
property rights
CER FTA ‘‘Australia–New Zealand Affairs Secretariat’’
under the control of the Ministries of Foreign
Affairs (oversees implementation). Dispute
settlement by bilateral negotiations. Annual
meetings of economic and foreign affairs ministers
Trade facilitation, services,
investment
ECO General
cooperation
ECO Secretariat, Regional Council, Council of
Permanent Representatives, Regional Technical
Agencies. Annual ministers’ meetings, biennial
meetings of heads of states
Investment, trade facilitation.
Coordination of market-
oriented reforms
EFTA FTA EFTA Secretariat. Standing Committee of
EFTA States. Various advisory committees.
Parliamentary Committee (representatives from
members’ parliaments) meets four times a year,
ministers meet twice annually
Trade facilitation, migration,
investment
EU CU European Parliament, Council of the European
Union, European Central Bank, Various
Committees
Trade facilitation, services,
investment, migration, common
market, common currency
Mercosur CU Secretariat, Mercosur Trade Commission. Council
of the Common Market, Common Market Group.
Primary dispute settlement by bilateral negotiation,
referred to Common Market Group then Council
of Common Market in case of impasse
Trade facilitation, investment,
peace treaty, maintenance of
democracy
98 R. Clarete et al. / Journal of Asian Economics 14 (2003) 91–129
PTAs involving ADB’s developing market countries are a varied group. AFTA and
SAPTA trade agreements were outgrowths of regional cooperation bodies (the South Asian
Association for Regional Cooperation, SAARC and the ASEAN, respectively). These
bodies were formed for largely political reasons and encompass a wider range of cross-
national interaction in cultural, health, environmental, and other areas as well as trade.
AFTA has been very active in drawing up a timetable whereby tariffs would be reduced in
progressive steps, with the stated intention of eventually evolving to a Free Trade Area. It
has also has an active Secretariat that addresses a number of issues of interest to members.
The Melanesian Spearhead Group (MSG) and SPARTECA are PTAs involving Pacific
Island economies (the latter in association with Australia). Trade volume among member
countries remains low and these economies remain oriented toward the larger Australian
and New Zealand markets.
The ECO is a trade bloc that the Central Asian countries formed after the fall of the
Soviet Union disrupted existing patterns of trade among themselves and Russia. It is a less
binding arrangement than most PTAs. The focus is on providing broader institutions that
facilitate bilateral agreements, rather than cementing a PTA in itself. The few formal
diplomatic arrangements for trade agreements have been offset by unilateral policy barriers
and unpredictable changes such as Uzbekistan’s imposition of exchange controls in
October 1996, after decline in cotton prices triggered a balance of payments crisis, and
Russia’s imposition of special tariffs after its crisis in 1998 (Pomfret, 2001).
The Australia–New Zealand Closer Economic Relations (CER), the industrial country
PTA of the region is one of the most advanced free trade areas in terms of implementation:
the agreement has eliminated nearly all policy barriers to trade in both goods and services.
The agreement not only eliminates tariffs, but also contains provisions for customs
harmonization and common product standards.
APEC, the largest trading arrangement that ADB member countries are involved in, has
few institutional structures as part of its overall philosophy of loose cooperation and
‘‘open’’ agreements. APEC’s aspirations to create ‘‘open regionalism,’’ while sometimes
criticized as being unrealistic, offer a unique policy orientation for a trading arrangement.
Table 3 (Continued )
Name Type of
agreement
Supranational institutions
(including meeting frequency)
Provisions beyond
tariff reduction
NAFTA FTA Free Trade Commission, NAFTA Secretariat
(dispute settlement). Periodic meetings of heads
of state
Trade facilitation, investment,
labor, environment
SAPTA FTA SAARC institutional structure includes
Secretariat, regional centers for research,
standing committee of foreign secretaries,
standing committees on technical issues. Most
decisions made at annual meetings of heads of
government. No separate institutions for SAPTA
FTA is part of larger
cooperation plans of SAARC
SPARTECA Non-
reciprocal
trade
preferences
Forum Secretariat, Australian and New Zealand
Customs Agencies oversee agreement, primarily
assessment of origin of goods traded
R. Clarete et al. / Journal of Asian Economics 14 (2003) 91–129 99
While the exact nature of APEC’s trade liberalization agenda has been unclear, some credit
APEC’s efforts with contributing to the formation of FTAs among some of its member
countries.
Bilateral PTAs have also been common among less developed countries in the Asia and
Pacific Region, especially among India and its neighbors, and the central Asian member
countries. India gives duty free access to products from Bhutan, Nepal, and concessionary
customs duties to products from Bangladesh. The list of central Asian bilateral agreements
is quite long. Bilateral agreements between Georgia and Azerbaijan, Kazakhstan, and
Turkmenistan that were negotiated in the second half of the 1990s after the goal of
economic cooperation across the Commonwealth of Independent States (CIS) did not
materialize. The individual agreements borrow from the CIS institutions—rules of origin,
for example, are based on CIS guidelines. The Kyrgyz Republic was also highly involved in
bilateral agreements and has reported bilateral PTAs with Armenia, Kazakhstan, Moldova,
Russia, Ukraine, Uzbekistan, and Tajikistan. Other bilateral arrangements in Asia and the
Pacific include PTAs between Laos and Thailand and New Zealand and Singapore as well
as the above-mentioned Australia–New Zealand CER.
Within the Asian region there is no common pattern in the extent of overlapping PTA
membership. Aside from common membership in APEC, most of the other common
membership involves bilateral agreements. SPARTECA and SAPTA members have
relatively few commitments to other PTAs, most likely because these two agreements
involve least developed countries. APEC, AFTA, and ECO have a higher number of other
commitments because of the extent of bilateral agreements among member countries and
AFTA country membership in APEC.
The region’s PTAs vary with respect to the average level of income and economic
development of their constituent economies (see Table 2), a factor that is likely to affect the
degree to which they promote intra-bloc trade. Some PTAs have members whose levels of
economic development are fairly uniform with average per capita incomes falling in a
narrow range, while others have members that are highly heterogeneous economically. We
would expect higher intra-bloc trade among the latter, all other things equal. SAPTA and
ECO have the lowest average per capita incomes (less than US $1000) and also the smallest
variation in income per capita. Other PTAs in the region have higher average per capita
incomes and there is substantial variation in the level of income among members. AFTA,
and SPARTECA have the highest variation in GDP within the member countries. AFTA
brings the high-tech industrial Singapore together with the primarily rural economies of
Cambodia, Vietnamese, and Myanmar. SPARTECA’s high coefficient of variation is due to
the dispersion between the Pacific Islands and the New Zealand and Australian economies.
3. Trends and geographical concentration of trade in the Asia Pacific region
3.1. Trends in trade
World trade has grown substantially over the past half a century, particularly in the
1990s. As shown in Fig. 1, the growth rates of the volume of world merchandise exports
and world GDP have diverged since the 1950, indicating that the degree of trade has
100 R. Clarete et al. / Journal of Asian Economics 14 (2003) 91–129
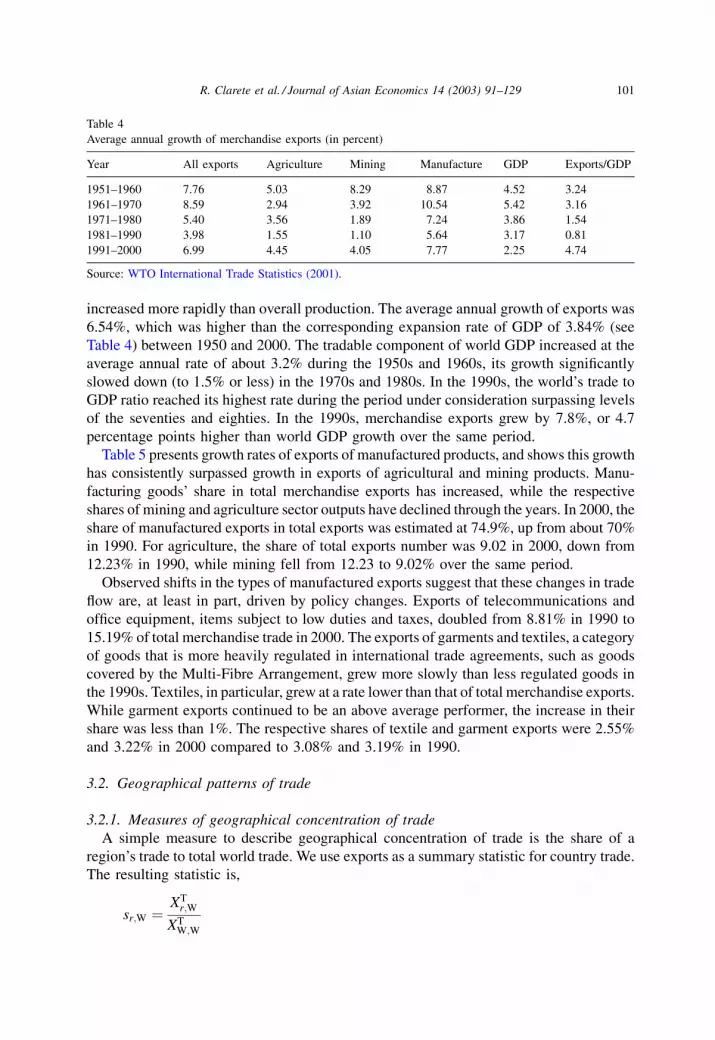
increased more rapidly than overall production. The average annual growth of exports was
6.54%, which was higher than the corresponding expansion rate of GDP of 3.84% (see
Table 4) between 1950 and 2000. The tradable component of world GDP increased at the
average annual rate of about 3.2% during the 1950s and 1960s, its growth significantly
slowed down (to 1.5% or less) in the 1970s and 1980s. In the 1990s, the world’s trade to
GDP ratio reached its highest rate during the period under consideration surpassing levels
of the seventies and eighties. In the 1990s, merchandise exports grew by 7.8%, or 4.7
percentage points higher than world GDP growth over the same period.
Table 5 presents growth rates of exports of manufactured products, and shows this growth
has consistently surpassed growth in exports of agricultural and mining products. Manu-
facturing goods’ share in total merchandise exports has increased, while the respective
shares of mining and agriculture sector outputs have declined through the years. In 2000, the
share of manufactured exports in total exports was estimated at 74.9%, up from about 70%
in 1990. For agriculture, the share of total exports number was 9.02 in 2000, down from
12.23% in 1990, while mining fell from 12.23 to 9.02% over the same period.
Observed shifts in the types of manufactured exports suggest that these changes in trade
flow are, at least in part, driven by policy changes. Exports of telecommunications and
office equipment, items subject to low duties and taxes, doubled from 8.81% in 1990 to
15.19% of total merchandise trade in 2000. The exports of garments and textiles, a category
of goods that is more heavily regulated in international trade agreements, such as goods
covered by the Multi-Fibre Arrangement, grew more slowly than less regulated goods in
the 1990s. Textiles, in particular, grew at a rate lower than that of total merchandise exports.
While garment exports continued to be an above average performer, the increase in their
share was less than 1%. The respective shares of textile and garment exports were 2.55%
and 3.22% in 2000 compared to 3.08% and 3.19% in 1990.
3.2. Geographical patterns of trade
3.2.1. Measures of geographical concentration of trade
A simple measure to describe geographical concentration of trade is the share of a
region’s trade to total world trade. We use exports as a summary statistic for country trade.
The resulting statistic is,
sr;W ¼XT
r;W
XTW;W
Table 4
Average annual growth of merchandise exports (in percent)
Year All exports Agriculture Mining Manufacture GDP Exports/GDP
1951–1960 7.76 5.03 8.29 8.87 4.52 3.24
1961–1970 8.59 2.94 3.92 10.54 5.42 3.16
1971–1980 5.40 3.56 1.89 7.24 3.86 1.54
1981–1990 3.98 1.55 1.10 5.64 3.17 0.81
1991–2000 6.99 4.45 4.05 7.77 2.25 4.74
Source: WTO International Trade Statistics (2001).
R. Clarete et al. / Journal of Asian Economics 14 (2003) 91–129 101

where Sr,W is the share of region r to total world trade; XTr;W is exports from region r to the
world trade; and XTW;W is all world exports.
Another measure, called the intra-regional or intra-bloc trade share highlights the
importance of intra-regional trade:
sr;r ¼XT
r;r
XTr;W
The intra-regional trade index is useful for comparing regional trade flows over time in a
PTA with constant membership, as it automatically increases with r and thus can be
misleading when comparing PTAs of differing sizes.
This problem may be overcome using the simple trade concentration ratio or trade
intensity ratio (Frankel, 1997; Petri, 1993):
Ir;r ¼XT
r;r=XTr;W
XTW;r=XT
W;W
Table 5
World merchandise and service exports: 1990, 1995, and 2000
1990 1995 2000
World merchandise trade (billion dollars) 3388 4934 6186
Share in world merchandise trade (percent)
Agricultural products (percent) 12.23 11.69 9.02
Food 9.30 8.98 7.15
Raw materials 2.92 2.71 1.87
Mining products 14.25 10.57 13.15
Ores and other minerals 1.56 1.21 1.00
Fuels 10.55 7.21 10.20
Non-ferrous metals 2.15 2.14 1.94
Manufactures 70.54 73.81 74.85
Iron and steel 3.12 3.05 2.32
Chemicals 8.73 9.44 9.28
Other semi-manufactures 7.78 7.88 7.26
Machinery and transport equipment 35.80 38.59 41.48
Automotive products 9.41 9.16 9.24
Office and telecom equipment 8.81 12.17 15.19
Other machinery and transport equipment 17.58 17.25 17.05
Textiles 3.08 3.03 2.55
Clothing 3.19 3.19 3.22
Other consumer goods 8.84 8.64 8.75
Total merchandise exports 100.00 100.00
All commercial services (billion dollars) 845.27 1246.50 1435.00
Share in world exports of commercial services (percent)
Transportation 28.50 25.20 23.00
Travel 33.80 33.60 32.40
Other commercial services 37.70 41.20 44.60
Source: WTO International Trade Statistics (2001).
102 R. Clarete et al. / Journal of Asian Economics 14 (2003) 91–129
If this index is one, bloc members are trading with each other in the same intensity as they
are trading with non-members.
3.2.2. Regional trade shares
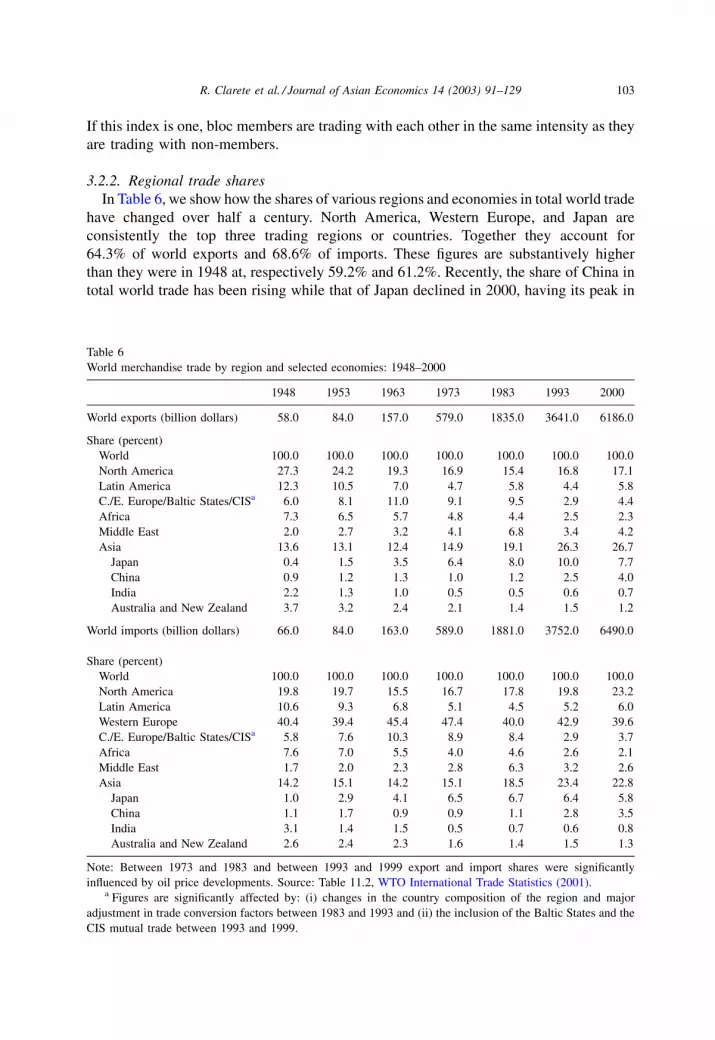
In Table 6, we show how the shares of various regions and economies in total world trade
have changed over half a century. North America, Western Europe, and Japan are
consistently the top three trading regions or countries. Together they account for
64.3% of world exports and 68.6% of imports. These figures are substantively higher
than they were in 1948 at, respectively 59.2% and 61.2%. Recently, the share of China in
total world trade has been rising while that of Japan declined in 2000, having its peak in
Table 6
World merchandise trade by region and selected economies: 1948–2000
1948 1953 1963 1973 1983 1993 2000
World exports (billion dollars) 58.0 84.0 157.0 579.0 1835.0 3641.0 6186.0
Share (percent)
World 100.0 100.0 100.0 100.0 100.0 100.0 100.0
North America 27.3 24.2 19.3 16.9 15.4 16.8 17.1
Latin America 12.3 10.5 7.0 4.7 5.8 4.4 5.8
C./E. Europe/Baltic States/CISa 6.0 8.1 11.0 9.1 9.5 2.9 4.4
Africa 7.3 6.5 5.7 4.8 4.4 2.5 2.3
Middle East 2.0 2.7 3.2 4.1 6.8 3.4 4.2
Asia 13.6 13.1 12.4 14.9 19.1 26.3 26.7
Japan 0.4 1.5 3.5 6.4 8.0 10.0 7.7
China 0.9 1.2 1.3 1.0 1.2 2.5 4.0
India 2.2 1.3 1.0 0.5 0.5 0.6 0.7
Australia and New Zealand 3.7 3.2 2.4 2.1 1.4 1.5 1.2
World imports (billion dollars) 66.0 84.0 163.0 589.0 1881.0 3752.0 6490.0
Share (percent)
World 100.0 100.0 100.0 100.0 100.0 100.0 100.0
North America 19.8 19.7 15.5 16.7 17.8 19.8 23.2
Latin America 10.6 9.3 6.8 5.1 4.5 5.2 6.0
Western Europe 40.4 39.4 45.4 47.4 40.0 42.9 39.6
C./E. Europe/Baltic States/CISa 5.8 7.6 10.3 8.9 8.4 2.9 3.7
Africa 7.6 7.0 5.5 4.0 4.6 2.6 2.1
Middle East 1.7 2.0 2.3 2.8 6.3 3.2 2.6
Asia 14.2 15.1 14.2 15.1 18.5 23.4 22.8
Japan 1.0 2.9 4.1 6.5 6.7 6.4 5.8
China 1.1 1.7 0.9 0.9 1.1 2.8 3.5
India 3.1 1.4 1.5 0.5 0.7 0.6 0.8
Australia and New Zealand 2.6 2.4 2.3 1.6 1.4 1.5 1.3
Note: Between 1973 and 1983 and between 1993 and 1999 export and import shares were significantly
influenced by oil price developments. Source: Table 11.2, WTO International Trade Statistics (2001).a Figures are significantly affected by: (i) changes in the country composition of the region and major
adjustment in trade conversion factors between 1983 and 1993 and (ii) the inclusion of the Baltic States and the
CIS mutual trade between 1993 and 1999.
R. Clarete et al. / Journal of Asian Economics 14 (2003) 91–129 103
1993. Like China, the share of the group comprising Central and Eastern Europe, Baltic
States, and CIS states has expanded in the 1990s.
Asia’s share of total world trade of merchandise exports doubled over the past 50 years,
while its share of world imports increased by only 60%. Eight countries account for 84% of
Asia’s export share in 2000 and 82% of its import share. These include Japan, China, and
six East Asian trading countries. About half a century ago, the corresponding figures
representing the contribution of these countries to Asia’s share in world trade were,
respectively 32% and 36%.
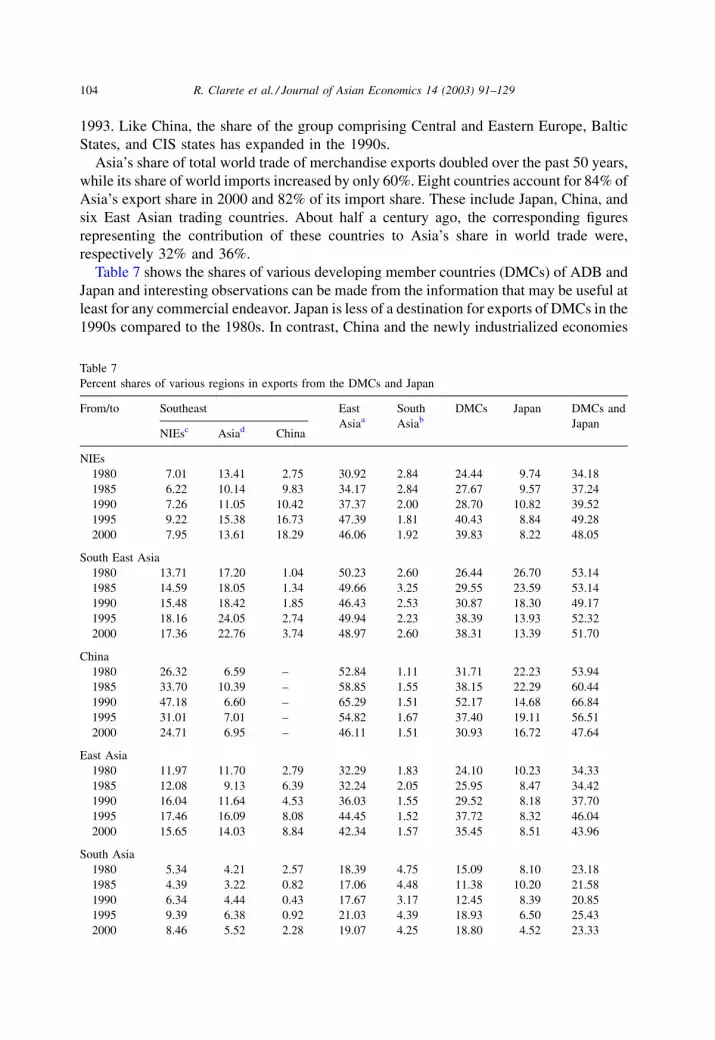
Table 7 shows the shares of various developing member countries (DMCs) of ADB and
Japan and interesting observations can be made from the information that may be useful at
least for any commercial endeavor. Japan is less of a destination for exports of DMCs in the
1990s compared to the 1980s. In contrast, China and the newly industrialized economies
Table 7
Percent shares of various regions in exports from the DMCs and Japan
From/to Southeast East
Asiaa
South
Asiab
DMCs Japan DMCs and
JapanNIEsc Asiad China
NIEs
1980 7.01 13.41 2.75 30.92 2.84 24.44 9.74 34.18
1985 6.22 10.14 9.83 34.17 2.84 27.67 9.57 37.24
1990 7.26 11.05 10.42 37.37 2.00 28.70 10.82 39.52
1995 9.22 15.38 16.73 47.39 1.81 40.43 8.84 49.28
2000 7.95 13.61 18.29 46.06 1.92 39.83 8.22 48.05
South East Asia
1980 13.71 17.20 1.04 50.23 2.60 26.44 26.70 53.14
1985 14.59 18.05 1.34 49.66 3.25 29.55 23.59 53.14
1990 15.48 18.42 1.85 46.43 2.53 30.87 18.30 49.17
1995 18.16 24.05 2.74 49.94 2.23 38.39 13.93 52.32
2000 17.36 22.76 3.74 48.97 2.60 38.31 13.39 51.70
China
1980 26.32 6.59 – 52.84 1.11 31.71 22.23 53.94
1985 33.70 10.39 – 58.85 1.55 38.15 22.29 60.44
1990 47.18 6.60 – 65.29 1.51 52.17 14.68 66.84
1995 31.01 7.01 – 54.82 1.67 37.40 19.11 56.51
2000 24.71 6.95 – 46.11 1.51 30.93 16.72 47.64
East Asia
1980 11.97 11.70 2.79 32.29 1.83 24.10 10.23 34.33
1985 12.08 9.13 6.39 32.24 2.05 25.95 8.47 34.42
1990 16.04 11.64 4.53 36.03 1.55 29.52 8.18 37.70
1995 17.46 16.09 8.08 44.45 1.52 37.72 8.32 46.04
2000 15.65 14.03 8.84 42.34 1.57 35.45 8.51 43.96
South Asia
1980 5.34 4.21 2.57 18.39 4.75 15.09 8.10 23.18
1985 4.39 3.22 0.82 17.06 4.48 11.38 10.20 21.58
1990 6.34 4.44 0.43 17.67 3.17 12.45 8.39 20.85
1995 9.39 6.38 0.92 21.03 4.39 18.93 6.50 25.43
2000 8.46 5.52 2.28 19.07 4.25 18.80 4.52 23.33
104 R. Clarete et al. / Journal of Asian Economics 14 (2003) 91–129
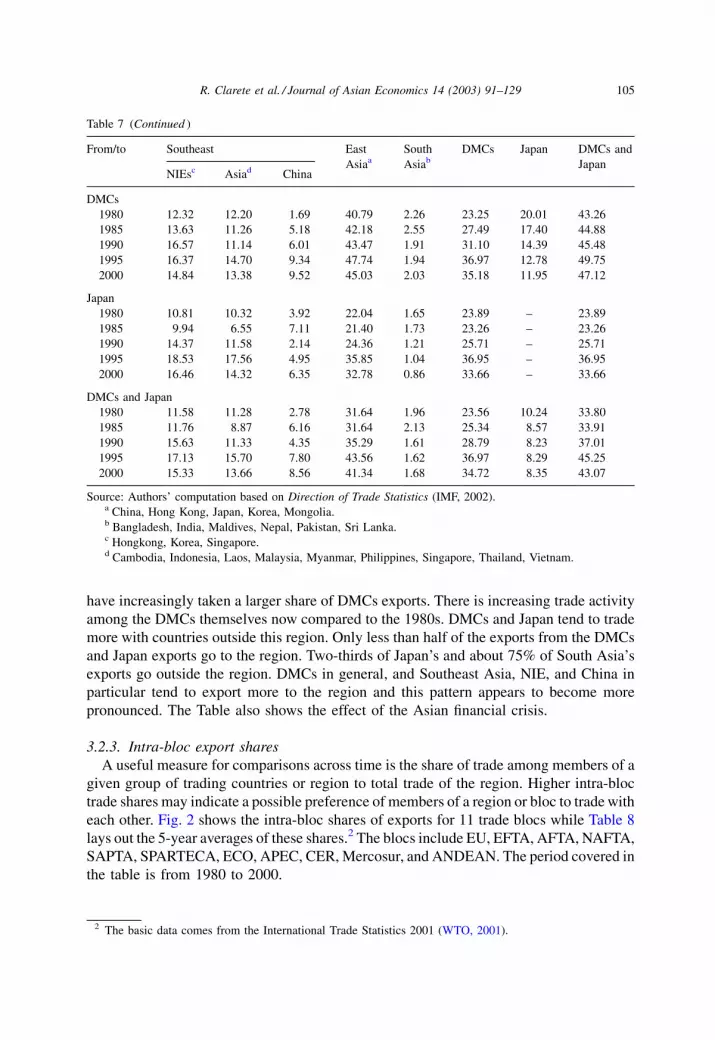
have increasingly taken a larger share of DMCs exports. There is increasing trade activity
among the DMCs themselves now compared to the 1980s. DMCs and Japan tend to trade
more with countries outside this region. Only less than half of the exports from the DMCs
and Japan exports go to the region. Two-thirds of Japan’s and about 75% of South Asia’s
exports go outside the region. DMCs in general, and Southeast Asia, NIE, and China in
particular tend to export more to the region and this pattern appears to become more
pronounced. The Table also shows the effect of the Asian financial crisis.
3.2.3. Intra-bloc export shares
A useful measure for comparisons across time is the share of trade among members of a
given group of trading countries or region to total trade of the region. Higher intra-bloc
trade shares may indicate a possible preference of members of a region or bloc to trade with
each other. Fig. 2 shows the intra-bloc shares of exports for 11 trade blocs while Table 8
lays out the 5-year averages of these shares.2 The blocs include EU, EFTA, AFTA, NAFTA,
SAPTA, SPARTECA, ECO, APEC, CER, Mercosur, and ANDEAN. The period covered in
the table is from 1980 to 2000.
Table 7 (Continued )
From/to Southeast East
Asiaa
South
Asiab
DMCs Japan DMCs and
JapanNIEsc Asiad China
DMCs
1980 12.32 12.20 1.69 40.79 2.26 23.25 20.01 43.26
1985 13.63 11.26 5.18 42.18 2.55 27.49 17.40 44.88
1990 16.57 11.14 6.01 43.47 1.91 31.10 14.39 45.48
1995 16.37 14.70 9.34 47.74 1.94 36.97 12.78 49.75
2000 14.84 13.38 9.52 45.03 2.03 35.18 11.95 47.12
Japan
1980 10.81 10.32 3.92 22.04 1.65 23.89 – 23.89
1985 9.94 6.55 7.11 21.40 1.73 23.26 – 23.26
1990 14.37 11.58 2.14 24.36 1.21 25.71 – 25.71
1995 18.53 17.56 4.95 35.85 1.04 36.95 – 36.95
2000 16.46 14.32 6.35 32.78 0.86 33.66 – 33.66
DMCs and Japan
1980 11.58 11.28 2.78 31.64 1.96 23.56 10.24 33.80
1985 11.76 8.87 6.16 31.64 2.13 25.34 8.57 33.91
1990 15.63 11.33 4.35 35.29 1.61 28.79 8.23 37.01
1995 17.13 15.70 7.80 43.56 1.62 36.97 8.29 45.25
2000 15.33 13.66 8.56 41.34 1.68 34.72 8.35 43.07
Source: Authors’ computation based on Direction of Trade Statistics (IMF, 2002).a China, Hong Kong, Japan, Korea, Mongolia.b Bangladesh, India, Maldives, Nepal, Pakistan, Sri Lanka.c Hongkong, Korea, Singapore.d Cambodia, Indonesia, Laos, Malaysia, Myanmar, Philippines, Singapore, Thailand, Vietnam.
2 The basic data comes from the International Trade Statistics 2001 (WTO, 2001).
R. Clarete et al. / Journal of Asian Economics 14 (2003) 91–129 105
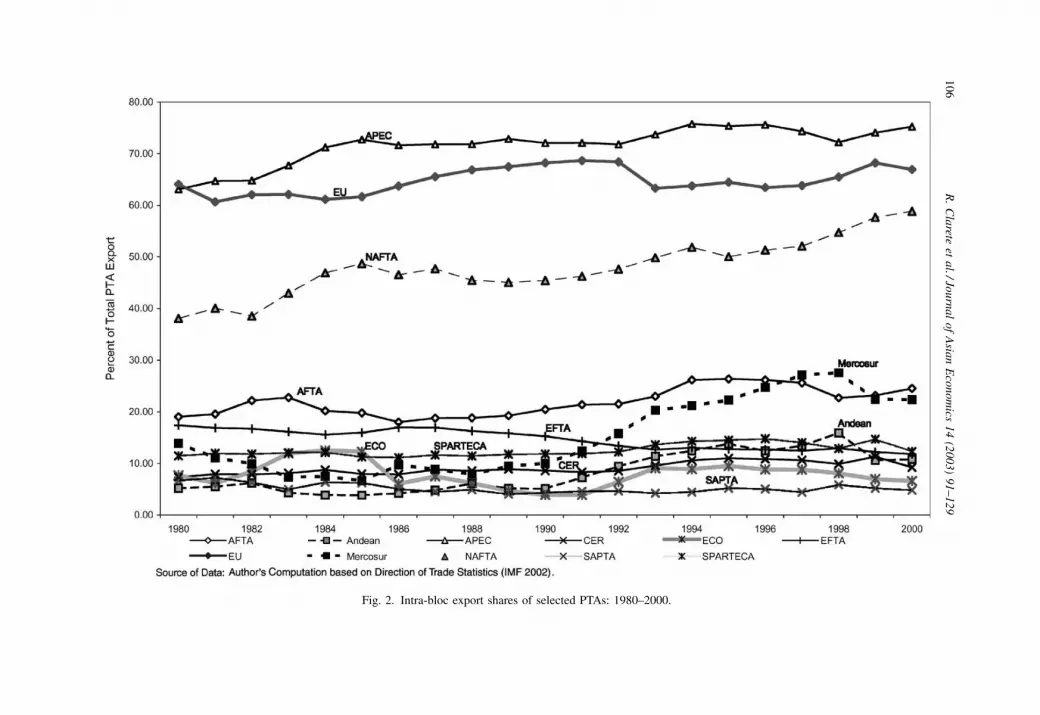
Fig. 2. Intra-bloc export shares of selected PTAs: 1980–2000.
10
6R
.C
larete
eta
l./Jou
rna
lo
fA
sian
Eco
no
mics
14
(20
03
)9
1–
12
9
Regional export shares exhibit a moderately rising trend towards the end of the 1990s.
This pattern is most noticeable in the case of NAFTA, APEC or ASEAN. Moderate growth
of the respective intra-regional export shares of the PTAs covered in this analysis may more
likely be attributed to changes in the composition of these groupings, rather than to any
intensification of preference of PTA members to trade among each other. In 1994, Canada
and U.S. brought Mexico in to their FTA to form NAFTA. Chile, Mexico, Papua New
Guinea joined APEC in 1993, while Peru, Russia, and Vietnam became members in 1998.
As for ASEAN, Vietnam, Laos, Cambodia, and Myanmar joined the organization between
1995 and 1998.
There have been instances where intra-bloc trade shares fell (e.g., ECO, Andean Pact,
and Mercosur between 1998 and 2000) as a result of external shocks and institutional
changes happening within these PTAs. Political instability and economic restructuring in
Central Asia combined with the lack of integration of ECO countries in the world economy
explain the fall in the ECO trade share. External shocks associated with the Asian financial
crisis likely contributed to a decline in Asian PTAs in the late 1990s.
Table 8 shows Asian PTAs (with the exception of APEC which has many Asian countries
as members but whose membership extends to North and South American countries as
well) tend to have the larger share of their respective trade with non-members—particu-
larly in comparison the EU and NAFTA. This observation may possibly be explained by the
nature of the PTAs themselves, as promoting intra-bloc trade among its members. That is,
NAFTA or EU members comprise a natural bloc and the preferential policies have
aggravated this natural attraction among members to trade with one another. This
explanation can hardly be applied, however, to the case of APEC, and we will return
to shortly when we take up the apparent limitation of intra-bloc trade shares for measuring
the impact of PTAs.
On the other side of the coin, one possible reason why intra-bloc trade shares are low for
Asia, Mercosur, or Andean is that these are developing country PTAs. Their smaller per
capita GDPs—in turn the outcome of their particular development status, economic
shocks, or political instability—are such that their trade will tend to flow towards more
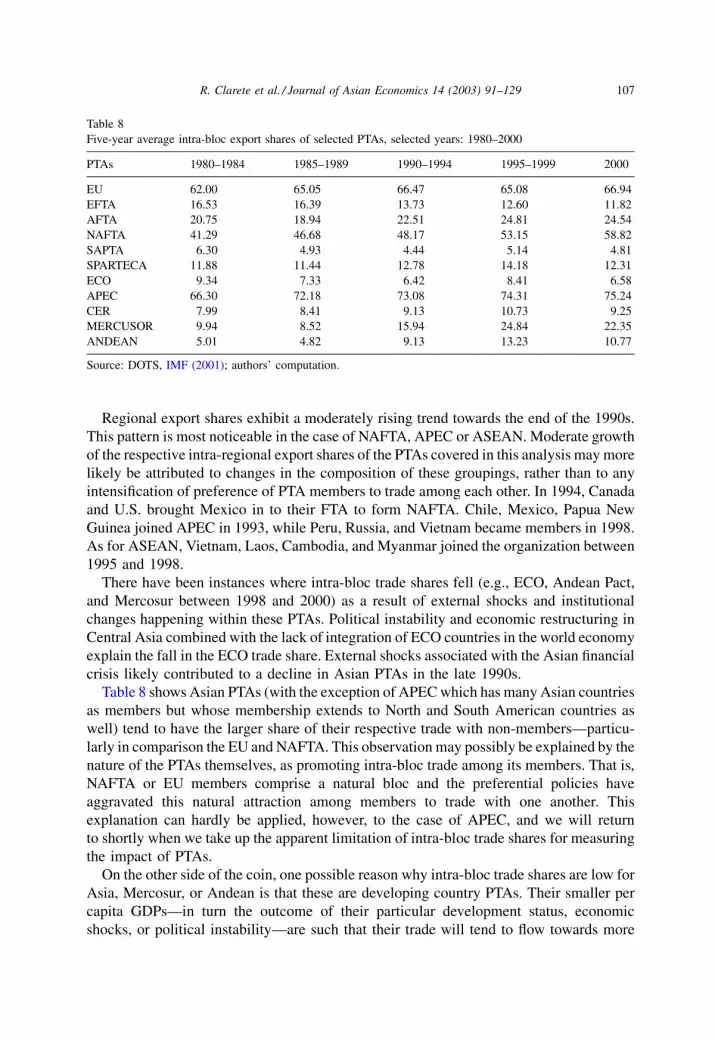
Table 8
Five-year average intra-bloc export shares of selected PTAs, selected years: 1980–2000
PTAs 1980–1984 1985–1989 1990–1994 1995–1999 2000
EU 62.00 65.05 66.47 65.08 66.94
EFTA 16.53 16.39 13.73 12.60 11.82
AFTA 20.75 18.94 22.51 24.81 24.54
NAFTA 41.29 46.68 48.17 53.15 58.82
SAPTA 6.30 4.93 4.44 5.14 4.81
SPARTECA 11.88 11.44 12.78 14.18 12.31
ECO 9.34 7.33 6.42 8.41 6.58
APEC 66.30 72.18 73.08 74.31 75.24
CER 7.99 8.41 9.13 10.73 9.25
MERCUSOR 9.94 8.52 15.94 24.84 22.35
ANDEAN 5.01 4.82 9.13 13.23 10.77
Source: DOTS, IMF (2001); authors’ computation.
R. Clarete et al. / Journal of Asian Economics 14 (2003) 91–129 107
wealthy countries even if their respective members share common borders. The Latin
American PTAs—Mercosur and the Andean Pact—trade predominantly with countries
outside of the PTA, which reflects the importance of the U.S. or EU as a trading partner in
that region.
It warrants note that the high intra-bloc shares for APEC, EU, and NAFTA in do not
necessarily indicate that the respective members of these prefer trade with other bloc
members to trade with non-members. The index tends to be higher PTAs that include more
or larger trading economies. Frankel (1997) cites the case of EU (EEC before) when the
PTA expanded from 6 members in 1960s to 12 in the 1990s, resulting in an increase of
EEC’s intra-regional trade share from 49% in 1962 to 60 in 1990. The small intra-bloc trade
share of EFTA (i.e., 12%) may likewise be explained by the fact that this PTA has lost many
of its larger economies to the EU.
3.3. Trade intensity indices
The weakness of intra-regional trade shares as measures of trade orientation can be
addressed by using simple concentration ratios or trade intensity indicators. The trade
concentration ratio is obtained by dividing the intra-regional trade share by the share of the
region to total world trade. PTA members are trading among themselves at the same
intensity as they are with non-members when this index is one. If there is extra trade that
goes on in the region beyond the normal pattern in the absence of the PTAs, then the trade
intensity exceeds one.
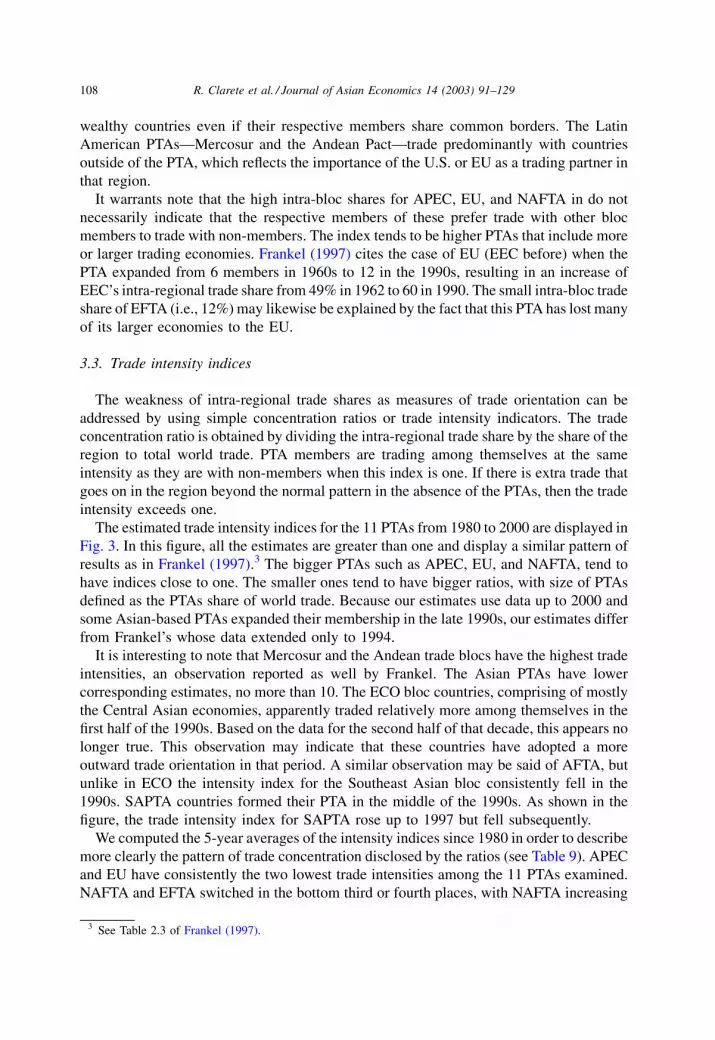
The estimated trade intensity indices for the 11 PTAs from 1980 to 2000 are displayed in
Fig. 3. In this figure, all the estimates are greater than one and display a similar pattern of
results as in Frankel (1997).3 The bigger PTAs such as APEC, EU, and NAFTA, tend to
have indices close to one. The smaller ones tend to have bigger ratios, with size of PTAs
defined as the PTAs share of world trade. Because our estimates use data up to 2000 and
some Asian-based PTAs expanded their membership in the late 1990s, our estimates differ
from Frankel’s whose data extended only to 1994.
It is interesting to note that Mercosur and the Andean trade blocs have the highest trade
intensities, an observation reported as well by Frankel. The Asian PTAs have lower
corresponding estimates, no more than 10. The ECO bloc countries, comprising of mostly
the Central Asian economies, apparently traded relatively more among themselves in the
first half of the 1990s. Based on the data for the second half of that decade, this appears no
longer true. This observation may indicate that these countries have adopted a more
outward trade orientation in that period. A similar observation may be said of AFTA, but
unlike in ECO the intensity index for the Southeast Asian bloc consistently fell in the
1990s. SAPTA countries formed their PTA in the middle of the 1990s. As shown in the
figure, the trade intensity index for SAPTA rose up to 1997 but fell subsequently.
We computed the 5-year averages of the intensity indices since 1980 in order to describe
more clearly the pattern of trade concentration disclosed by the ratios (see Table 9). APEC
and EU have consistently the two lowest trade intensities among the 11 PTAs examined.
NAFTA and EFTA switched in the bottom third or fourth places, with NAFTA increasing
3 See Table 2.3 of Frankel (1997).
108 R. Clarete et al. / Journal of Asian Economics 14 (2003) 91–129
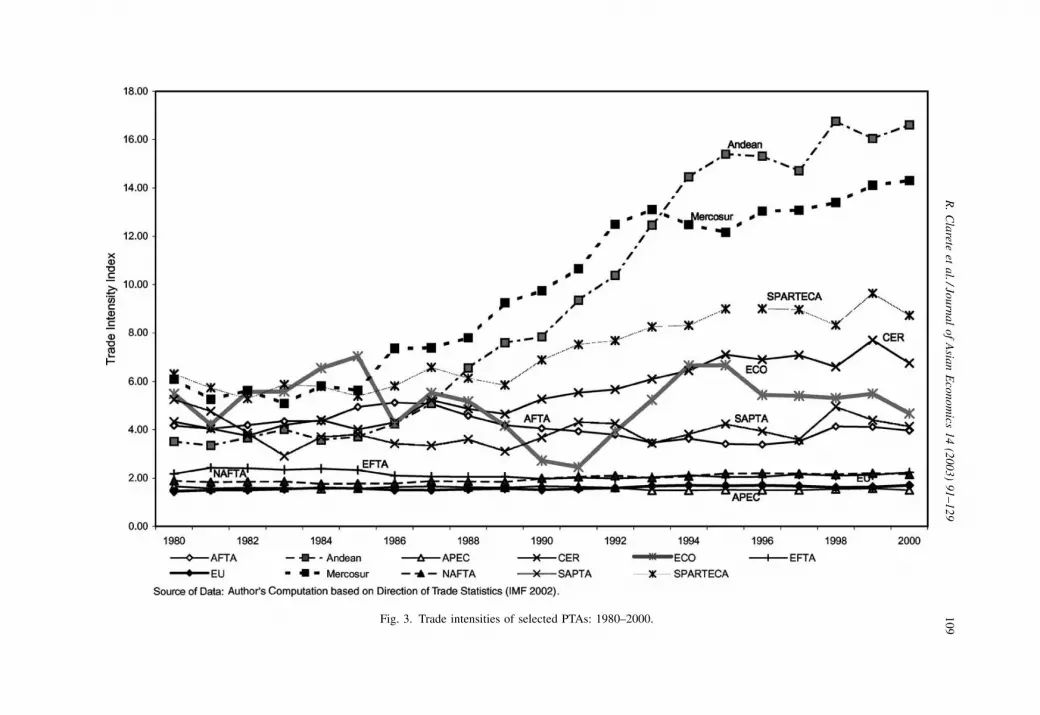
Fig. 3. Trade intensities of selected PTAs: 1980–2000.
R.
Cla
reteet
al./Jo
urn
al
of
Asia
nE
con
om
ics1
4(2
00
3)
91
–1
29
10
9
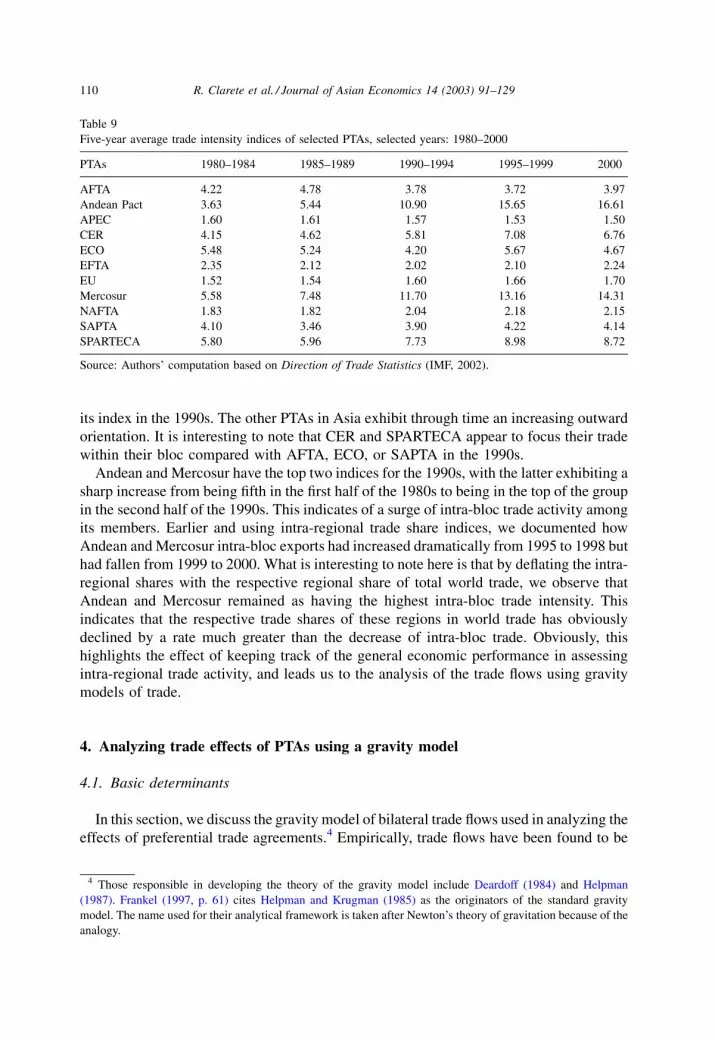
its index in the 1990s. The other PTAs in Asia exhibit through time an increasing outward
orientation. It is interesting to note that CER and SPARTECA appear to focus their trade
within their bloc compared with AFTA, ECO, or SAPTA in the 1990s.
Andean and Mercosur have the top two indices for the 1990s, with the latter exhibiting a
sharp increase from being fifth in the first half of the 1980s to being in the top of the group
in the second half of the 1990s. This indicates of a surge of intra-bloc trade activity among
its members. Earlier and using intra-regional trade share indices, we documented how
Andean and Mercosur intra-bloc exports had increased dramatically from 1995 to 1998 but
had fallen from 1999 to 2000. What is interesting to note here is that by deflating the intra-
regional shares with the respective regional share of total world trade, we observe that
Andean and Mercosur remained as having the highest intra-bloc trade intensity. This
indicates that the respective trade shares of these regions in world trade has obviously
declined by a rate much greater than the decrease of intra-bloc trade. Obviously, this
highlights the effect of keeping track of the general economic performance in assessing
intra-regional trade activity, and leads us to the analysis of the trade flows using gravity
models of trade.
4. Analyzing trade effects of PTAs using a gravity model
4.1. Basic determinants
In this section, we discuss the gravity model of bilateral trade flows used in analyzing the
effects of preferential trade agreements.4 Empirically, trade flows have been found to be
Table 9
Five-year average trade intensity indices of selected PTAs, selected years: 1980–2000
PTAs 1980–1984 1985–1989 1990–1994 1995–1999 2000
AFTA 4.22 4.78 3.78 3.72 3.97
Andean Pact 3.63 5.44 10.90 15.65 16.61
APEC 1.60 1.61 1.57 1.53 1.50
CER 4.15 4.62 5.81 7.08 6.76
ECO 5.48 5.24 4.20 5.67 4.67
EFTA 2.35 2.12 2.02 2.10 2.24
EU 1.52 1.54 1.60 1.66 1.70
Mercosur 5.58 7.48 11.70 13.16 14.31
NAFTA 1.83 1.82 2.04 2.18 2.15
SAPTA 4.10 3.46 3.90 4.22 4.14
SPARTECA 5.80 5.96 7.73 8.98 8.72
Source: Authors’ computation based on Direction of Trade Statistics (IMF, 2002).
4 Those responsible in developing the theory of the gravity model include Deardoff (1984) and Helpman
(1987). Frankel (1997, p. 61) cites Helpman and Krugman (1985) as the originators of the standard gravity
model. The name used for their analytical framework is taken after Newton’s theory of gravitation because of the
analogy.
110 R. Clarete et al. / Journal of Asian Economics 14 (2003) 91–129
higher between countries with larger economies, as if these exerted a larger ‘‘gravitional’’
pull. Also like gravity, trade flows. Additional variables, such as physical area, population,
indicators of cultural affinity, and sharing contiguous borders, are usually added to
empirical gravity models to elaborate on the ‘‘economic mass’’ and distance variables.
‘‘The total exports from country i to j are specified similarly to equations describing
gravitational force’’: the total merchandise exported by country i to country j (Xij) is
defined as follows:
Xij ¼ AYbi
i Ybj
j Hmi
i Hmj
j Ngi
i Ngj
j Daij�Ddj eij (1)
where Yi represents the gross domestic product of country i; Hi represents the geographic
size of country i; Ni represents the population of country i; Dij represents the distance
between country i and country j; �Di represents the average distance between country i and
its export markets in other countries; A is a constant; eij is an error term; and b, m > 0; and g,
a, d < 0. Taking the logarithm of (1), we get:
log Xij ¼ log A þ bi log Yi þ bj log Yj þ mi log Hi þ mj log Hj þ gi log Ni þ gj log Nj
þ a log Dij þ d log �Di þ log eij (2)
The regression equation typically used:
log Xij ¼ log A þ bi log Yi þ bj log Yj þ mi log Hi þ mj log Hj þ gi log Ni þ gj log Nj
þ a log Dij þ d log �Di þ a ADJij þ cIi þ dIj þ log eij (3)
includes several dummy variables ADJij, Ii, and Ij to capture additional feature of the
country pair such as whether the trading partners have adjacent borders (ADJ) or either
partner is an island economy (I). The error term is the standard Ordinary Least Squares
(OLS) residual.
Per capita GDP is considered a key variable in the model, and larger economies are
expected to engage in greater trade. However, a number of other factors act against the
‘‘gravity like’’ forces of economy size. Country geographic size and population are factors
expected to reduce trade orientation by increasing the size of the domestic market and
making economic activity more inwardly oriented. For example, Japan and China both have
large economies of roughly similar size, but trade little. This may be explained by the fact
that China has a lower per capita GDP, which weakens China’s capacity to attract trade from
Japan. China’s large population gives Chinese producers plenty of consumers domestically
and tends dampen rather than augment exports. Frankel (1997) explains that countries with
large populations tend to be more inwardly oriented than smaller countries because they are
better able to exploit scale economies in their large domestic markets. This may explain why
bilateral trade flows generally have an inverse relationship to population size. Like
population, physical area is expected to reduce trade flows to the extent that countries
with relatively small or limited natural resource endowments tend to be smaller and thus
depend more on trade to obtain natural resources not available in country.
Krugman (1991) considers the distance between two countries to be an important
determinant of geographical patterns of trade. Trade is attractive to the extent of the gains
from trading less the transaction cost incurred in realizing such gains. Distance tends to
R. Clarete et al. / Journal of Asian Economics 14 (2003) 91–129 111
increase the cost of transacting international exchange of goods and services. Beyond some
distance, costs of consummating a cross-border exchange become prohibitive and accord-
ingly no trade occurs. The farther apart two potential trading partners are, the more costly
their bilateral trade, which erodes possible gains from trade. Linneman (1966) categorizes
the costs of international trade transactions into three types: (i) shipping cost, including
freight and insurance, (ii) cost of time, and (iii) ‘‘psychic distance’’ or ‘‘cultural cost.’’
Distance is not the only determinant for shipping cost. In examining data on freight,
insurance, and shipping charges, Frankel (1997) notes that shipping costs vary widely
across countries in Central Africa, where two remote trading partners may have relatively
low aggregate shipping cost because only commodities that have relatively low shipping
cost are traded. Accordingly, commodity composition of trade is needed in order to
understand the relationship between distance and shipping cost.
Evidence suggests the effect of distance on trade flow has changed through time.
Estimates from a gravity model carried out by Boisso and Ferrantino (1997) using data
covering the years 1965–1985 suggest that distance had a deterrent effect on trade until the
middle of 1970s, but that since then this effect has declined. They claim that the average
distance between trading partners increased in the post-war period, indicating that shipping
costs have fallen steadily. Trading partners located far apart from each other will have to
require more time in transporting goods between each other, which discourages trade. This
cost includes the intrinsic value of the goods that is forgone if these are not delivered on
time. The ‘‘psychic distance’’ or ‘‘cultural cost’’ refers to the lack of familiarity by the
citizens of a country about their trading partners (Drysdale and Garnaut, 1982). Cultural or
linguistic affinity, shared borders, and whether the trading partner’s territories are islands
are factors that would tend to reduce cultural distance. Countries sharing a common
language or having citizens belonging to the same ethnic group are more likely to transact
business with each other.
In the specification of the basic gravity model used in this paper, following Soloaga and
Winters (2001) we include two variables in our basic gravity model to capture different
aspects of the influence of distance on trade flows. First, we include a variable measuring
the distance between the capital cities for each pair of trading countries (Dij). Second, we
include a measure of the remoteness of a country captured by the average distance between
the countries and the countries with which it trades (�Di). In examining the effect of PTAs on
the direction and volume of trade, it is important estimates controlled for the effect of
distance and these other factors on trade flows. Next, we incorporate the variables
representing PTAs, along with the other variables outlined as important in determining
trade flows, into a gravity model.
4.2. Preferential trade agreements in the gravity model
In adopting the basic gravity model framework to study the effect of PTA membership
on trade flows, Aitken (1973), and Braga, Safadi and Yeats (1994) introduce a variable that
takes the value of one if the two trading countries are both members of the PTA, and zero
otherwise into the model. They interpreted the estimated coefficient of this dummy variable
to be the sum of the trade-creation and trade-diversion effects of the PTAs. A positive
coefficient for the PTA dummy variable indicates that the PTA tends to generate more trade
112 R. Clarete et al. / Journal of Asian Economics 14 (2003) 91–129
amongst members than would be predicted based on the countries’ other geographic and
economic characteristics. There is no way of discerning, within this specification, of
whether the PTA countries trade also more than would be expected with non-members.
Bayoumi and Eichengreen (1995) and Frankel (1997) add a second variable to enable
trade creating and diverting effects of PTAs to be separated in the estimates. The variable
takes the value of one if the importing country is a member of the PTA and the exporting
country is a non-member; or zero, otherwise. The coefficient on the ‘‘extra-bloc’’ variable
represents PTA country imports from the rest of the world that would not be expected based
on economic and geographic characteristics. A negative value is evidence for trade
diversion, as it suggests that members of that PTA import less from non-members than
would be expected.
Soloaga and Winters (2001) introduce two additional PTA-related variables in order to
capture the effects of PTAs on trade in general. One variable captures the impact of non-
discriminatory import liberalization enacted through the PTA, and takes a value of one if
the importer is a member of a bloc and zero otherwise. This variable is different from the
extra-bloc PTA variable of Bayoumi and Eichengreen, and Frankel, because that variable
captures only the extra imports of members from non-members. Soloaga and Winters’
specification considers the extra imports of members of the PTA from all trading partners
regardless of their membership status. The coefficient on the dummy variable for both
countries being PTA members thus represents only the within-bloc trade that is above and
beyond the general liberalization that PTA members might undertake. A final dummy
variable introduced by Soloaga and Winters seeks to capture the extra exports of PTA
members to all their trading partners, and takes a value of one if the exporter is a member
and zero otherwise.
Eq. (4) represents the decomposition of the trade effects of PTAs that Soloaga and
Winters introduce:
log Xij ¼ log A þ bi log Yi þ bj log Yj þ mi log Hi þ mj log Hj þ gi log Ni
þ gj log Nj þ a log Dij þ d log �Di þ a ADJij þ cIi þ dIj þ bkPkiPkj
þ mkPkj þ nkPki þ log eij (4)
where Pki is a dummy variable that takes the value of one if exporting country i belongs to
PTA k and zero otherwise; and Pkj is a similarly defined dummy variable for importing
country j belonging to PTA k. The coefficient bk on the interaction of Pkj and Pki represents
the additional exports from i to j that occur when both countries are members of the PTA k.
The coefficient on Pkj, mk, represents the additional exports from country i, not a member of
PTA k, to a country j in PTA k. In other words, this dummy represents the additional imports
that country j in PTA k receives from the world outside the PTA. The coefficient nk has a
similar interpretation as country i’s exports to non-members of the PTA.
Soloaga and Winters’ elaboration of the earlier models adapted to examine the trade
effects of PTAs can be understood as seeking to measure the impact of PTAs on the trade of
their respective members, and not just on intra-bloc trade as in the traditional approach of
Aitken and Braga, Safadi and Yeats. The trade liberalization effects of PTAs are high-
lighted. The trade of members of the PTA is measured through the sum of the coefficients
of the intra-bloc variable and the extra-import and extra-export variables. The total effect of
R. Clarete et al. / Journal of Asian Economics 14 (2003) 91–129 113

the PTA on trade with bloc members is thus: bk þ mk þ nk, or the sum of trade diversion
(bk) and general trade liberalization effects on exports (nk) and imports (mk). The separate
dummy variables allow for us to assess the relative contribution of the PTA to narrow intra-
bloc trade as well as general trade with the world. In the most extreme trade-diverting case,
the coefficient bk would be positive (indicating increased exports from when both countries
are members of PTA k), and mk þ nk is negative (indicating that being in PTA k depresses a
country’s imports from the rest of the world more than that it increases its exports to the rest
of the world or vice versa so that the net effect on trade flows between PTA members and
the world is negative). In a case where the PTA expanded intra-bloc trade but trade with the
rest of the world increased as well, we might also have a positive intra-bloc effect as well as
positive import and export effects.
4.3. Modeling the effect of PTAs on Asian trade
Because the focus of the present study pertains to the effect of PTAs on Asian trade, we
introduce Asian variables into the gravity model in order to capture the effect of PTAs on
Asia’s trade. Following Soloaga and Winters, we separate the extra imports and the extra
exports that Asia gets because of a PTA. The ‘‘Asia extra import’’ effect of a PTA is denoted
by the estimation coefficient in Eq. (5) of the interaction between the ASIA dummy
variable j that takes the value of one if importer j is in Asia and the dummy variable Pki that
is one if the exporting country i is a member of PTA k. The estimation coefficient, mAk ,
measures the extra imports that Asian countries obtain from PTA k, regardless of whether
they are members of PTA k or not. The ‘‘Asian extra export’’ effect is defined similarly, nAk
measures the added exports Asian countries provide to member countries of PTA k. It is the
estimation coefficient of the interaction between the dummy variable denoting member-
ship of importer j to PTA k and the Asian status variable of exporter i. The estimation
equation is thus:
log Xij ¼ log A þ bi log Yi þ bj log Yj þ mi log Hi þ mj log Hj þ gi log Ni
þ gj log Nj þ a log Dij þ d log �Di þ a ADJij þ cIi þ dIj þ bkPki Pkj
þXk
k¼1
bkPkiPkj þ mkPkj þ nkPki þ mAk Pki ASIAj þ nA
k Pkj ASIAi þ log eij (5)
The Soloaga and Winters logic also applies to PTAs that include Asian and non-Asian
members. Under our specification, the effect of PTA k on members’ trade with Asian
members (above and beyond its trade with members in general) is given by:
mk þ nk þ mAk þ nA
k . This comprises: (i) the effect on Asian imports from bloc k, regardless
of whether Asian importers belong to PTA k or not (mk þ mAk ) and (ii) the effect on Asia’s
exports to bloc k, regardless of whether the Asian exporters are members of PTA k or not
(nk þ nAk ).
4.4. Data and estimation issues
The data used in estimating the gravity model comes from the 2001 IMF Direction of
Trade Statistics (DOTS). Eighty-three countries are included in the analysis, and bilateral
114 R. Clarete et al. / Journal of Asian Economics 14 (2003) 91–129
exports for every pair of these countries are extracted from the DOTS database for the years
1980–2000.5 The number of observations varies per year, and because the model was
estimated in logarithms, instances of zero trade between two countries were dropped from
the datasets used in estimations.6 Dropping these cases from our estimation implies that our
results should be interpreted as capturing the effect of PTAs on trade flows among trading
countries, conditional upon the decision to trade having been made. It seems reasonable to
assume that the source of truncation—the decision to not export at all to a particular
country—is at best only slightly correlated with memberships in PTAs and geographic
variables so that bias in the coefficients is minimal. This is clearly a second-best solution
that affects the efficiency of the OLS estimates, but the alternative of explicitly modeling
the decision to trade would, we feel, involve imposing too many assumptions on what are
essentially highly idiosyncratic economic and political decisions.
Export values are expressed in real terms, being deflated using a merchandise price index
(base year 1990) obtained from the WTO International Trade Statistics 2001, then
transformed into logarithms for the estimations. Estimates are carried one using both
single-year cross-sectional data and panel data constructed from 5-year intervals (1980,
1985, 1990, 1995, and 2000) of the available data. Population and GDP data was obtained
from the World Bank’s World Development indicators. The distance between capital cities
was obtained from John Havemann’s (2002) International Trade Data website, while the
data on land area was obtained from the World Factbook of the US Central Intelligence
Agency (2001).
5. Empirical results
In Tables 10–15, we report our gravity model estimation results. The model was
estimated two ways. Estimates were carried out using cross-sectional data sets for selected
single years of data (i.e., 1980, 1985, 1990, 1995 and 2000). Second, longitudinal estimates
were carried out using a panel of data constructed from 1985, 1995, and 2000 data. We
discuss these results next, starting with Table 10, which summarizes the estimation
coefficients for the basic variables of the gravity model. Tables 11 and 12 summarize
the estimated effects of each of the 11 PTAs whose effects on trade flows were assessed.
Across the six model estimates, between 68% and 73% of the variation of trade flows was
explained by the variables included in the gravity model, including the variables capturing
the effects of PTA membership.
5.1. Basic determinants of trade flows
As reported in Table 10, GDP, the distance between capitals, country land area, and
sharing a common border are statistically significant at the 95% confidence level or better
have the expected sign. Distance between two countries is shown to be the most important
5 These 83 countries accounted for roughly 73–85% of total global exports during the period 1980–2000.6 Across the 83 countries included in our dataset, instances of no trade between pairs of countries accounted
for between 16% and 20% of the total country pairs.
R. Clarete et al. / Journal of Asian Economics 14 (2003) 91–129 115
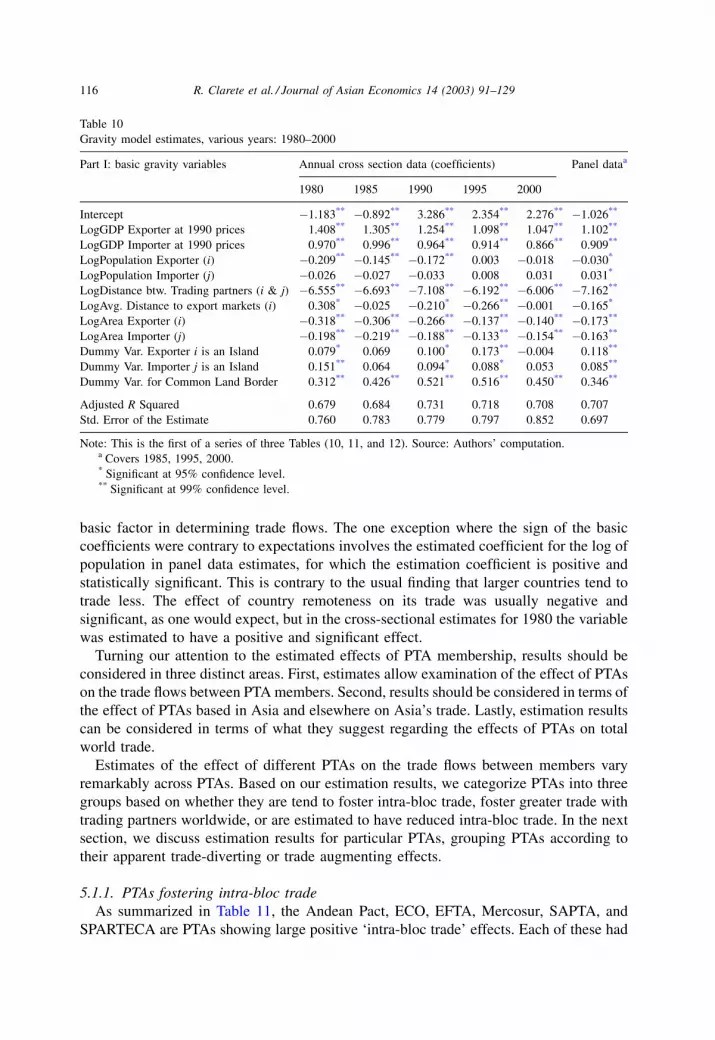
basic factor in determining trade flows. The one exception where the sign of the basic
coefficients were contrary to expectations involves the estimated coefficient for the log of
population in panel data estimates, for which the estimation coefficient is positive and
statistically significant. This is contrary to the usual finding that larger countries tend to
trade less. The effect of country remoteness on its trade was usually negative and
significant, as one would expect, but in the cross-sectional estimates for 1980 the variable
was estimated to have a positive and significant effect.
Turning our attention to the estimated effects of PTA membership, results should be
considered in three distinct areas. First, estimates allow examination of the effect of PTAs
on the trade flows between PTA members. Second, results should be considered in terms of
the effect of PTAs based in Asia and elsewhere on Asia’s trade. Lastly, estimation results
can be considered in terms of what they suggest regarding the effects of PTAs on total
world trade.
Estimates of the effect of different PTAs on the trade flows between members vary
remarkably across PTAs. Based on our estimation results, we categorize PTAs into three
groups based on whether they are tend to foster intra-bloc trade, foster greater trade with
trading partners worldwide, or are estimated to have reduced intra-bloc trade. In the next
section, we discuss estimation results for particular PTAs, grouping PTAs according to
their apparent trade-diverting or trade augmenting effects.
5.1.1. PTAs fostering intra-bloc trade
As summarized in Table 11, the Andean Pact, ECO, EFTA, Mercosur, SAPTA, and
SPARTECA are PTAs showing large positive ‘intra-bloc trade’ effects. Each of these had
Table 10
Gravity model estimates, various years: 1980–2000
Part I: basic gravity variables Annual cross section data (coefficients) Panel dataa
1980 1985 1990 1995 2000
Intercept �1.183** �0.892** 3.286** 2.354** 2.276** �1.026**
LogGDP Exporter at 1990 prices 1.408** 1.305** 1.254** 1.098** 1.047** 1.102**
LogGDP Importer at 1990 prices 0.970** 0.996** 0.964** 0.914** 0.866** 0.909**
LogPopulation Exporter (i) �0.209** �0.145** �0.172** 0.003 �0.018 �0.030*
LogPopulation Importer (j) �0.026 �0.027 �0.033 0.008 0.031 0.031*
LogDistance btw. Trading partners (i & j) �6.555** �6.693** �7.108** �6.192** �6.006** �7.162**
LogAvg. Distance to export markets (i) 0.308* �0.025 �0.210* �0.266** �0.001 �0.165*
LogArea Exporter (i) �0.318** �0.306** �0.266** �0.137** �0.140** �0.173**
LogArea Importer (j) �0.198** �0.219** �0.188** �0.133** �0.154** �0.163**
Dummy Var. Exporter i is an Island 0.079* 0.069 0.100* 0.173** �0.004 0.118**
Dummy Var. Importer j is an Island 0.151** 0.064 0.094* 0.088* 0.053 0.085**
Dummy Var. for Common Land Border 0.312** 0.426** 0.521** 0.516** 0.450** 0.346**
Adjusted R Squared 0.679 0.684 0.731 0.718 0.708 0.707
Std. Error of the Estimate 0.760 0.783 0.779 0.797 0.852 0.697
Note: This is the first of a series of three Tables (10, 11, and 12). Source: Authors’ computation.a Covers 1985, 1995, 2000.* Significant at 95% confidence level.** Significant at 99% confidence level.
116 R. Clarete et al. / Journal of Asian Economics 14 (2003) 91–129
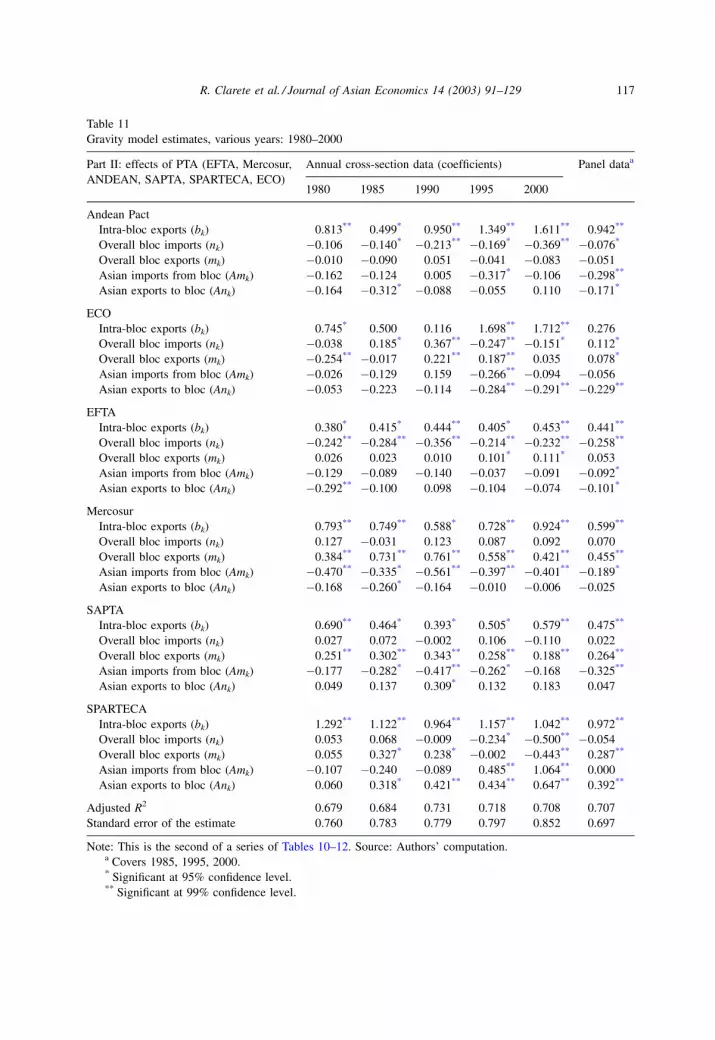
Table 11
Gravity model estimates, various years: 1980–2000
Part II: effects of PTA (EFTA, Mercosur,
ANDEAN, SAPTA, SPARTECA, ECO)
Annual cross-section data (coefficients) Panel dataa
1980 1985 1990 1995 2000
Andean Pact
Intra-bloc exports (bk) 0.813** 0.499* 0.950** 1.349** 1.611** 0.942**
Overall bloc imports (nk) �0.106 �0.140* �0.213** �0.169* �0.369** �0.076*
Overall bloc exports (mk) �0.010 �0.090 0.051 �0.041 �0.083 �0.051
Asian imports from bloc (Amk) �0.162 �0.124 0.005 �0.317* �0.106 �0.298**
Asian exports to bloc (Ank) �0.164 �0.312* �0.088 �0.055 0.110 �0.171*
ECO
Intra-bloc exports (bk) 0.745* 0.500 0.116 1.698** 1.712** 0.276
Overall bloc imports (nk) �0.038 0.185* 0.367** �0.247** �0.151* 0.112*
Overall bloc exports (mk) �0.254** �0.017 0.221** 0.187** 0.035 0.078*
Asian imports from bloc (Amk) �0.026 �0.129 0.159 �0.266** �0.094 �0.056
Asian exports to bloc (Ank) �0.053 �0.223 �0.114 �0.284** �0.291** �0.229**
EFTA
Intra-bloc exports (bk) 0.380* 0.415* 0.444** 0.405* 0.453** 0.441**
Overall bloc imports (nk) �0.242** �0.284** �0.356** �0.214** �0.232** �0.258**
Overall bloc exports (mk) 0.026 0.023 0.010 0.101* 0.111* 0.053
Asian imports from bloc (Amk) �0.129 �0.089 �0.140 �0.037 �0.091 �0.092*
Asian exports to bloc (Ank) �0.292** �0.100 0.098 �0.104 �0.074 �0.101*
Mercosur
Intra-bloc exports (bk) 0.793** 0.749** 0.588* 0.728** 0.924** 0.599**
Overall bloc imports (nk) 0.127 �0.031 0.123 0.087 0.092 0.070
Overall bloc exports (mk) 0.384** 0.731** 0.761** 0.558** 0.421** 0.455**
Asian imports from bloc (Amk) �0.470** �0.335* �0.561** �0.397** �0.401** �0.189*
Asian exports to bloc (Ank) �0.168 �0.260* �0.164 �0.010 �0.006 �0.025
SAPTA
Intra-bloc exports (bk) 0.690** 0.464* 0.393* 0.505* 0.579** 0.475**
Overall bloc imports (nk) 0.027 0.072 �0.002 0.106 �0.110 0.022
Overall bloc exports (mk) 0.251** 0.302** 0.343** 0.258** 0.188** 0.264**
Asian imports from bloc (Amk) �0.177 �0.282* �0.417** �0.262* �0.168 �0.325**
Asian exports to bloc (Ank) 0.049 0.137 0.309* 0.132 0.183 0.047
SPARTECA
Intra-bloc exports (bk) 1.292** 1.122** 0.964** 1.157** 1.042** 0.972**
Overall bloc imports (nk) 0.053 0.068 �0.009 �0.234* �0.500** �0.054
Overall bloc exports (mk) 0.055 0.327* 0.238* �0.002 �0.443** 0.287**
Asian imports from bloc (Amk) �0.107 �0.240 �0.089 0.485** 1.064** 0.000
Asian exports to bloc (Ank) 0.060 0.318* 0.421** 0.434** 0.647** 0.392**
Adjusted R2 0.679 0.684 0.731 0.718 0.708 0.707
Standard error of the estimate 0.760 0.783 0.779 0.797 0.852 0.697
Note: This is the second of a series of Tables 10–12. Source: Authors’ computation.a Covers 1985, 1995, 2000.* Significant at 95% confidence level.** Significant at 99% confidence level.
R. Clarete et al. / Journal of Asian Economics 14 (2003) 91–129 117
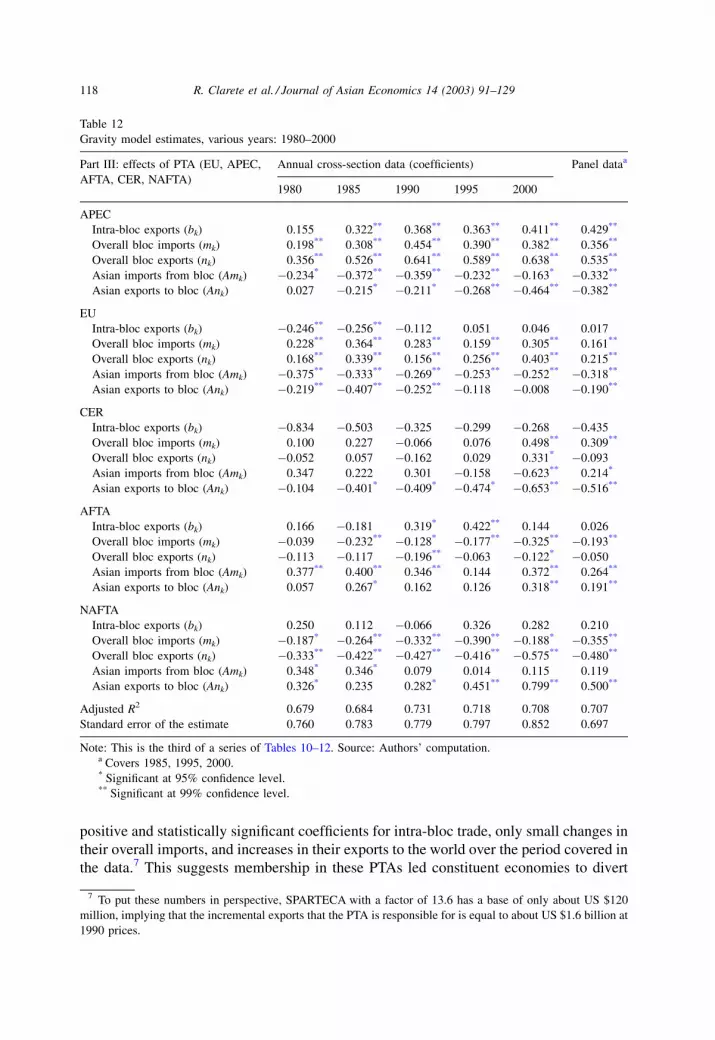
positive and statistically significant coefficients for intra-bloc trade, only small changes in
their overall imports, and increases in their exports to the world over the period covered in
the data.7 This suggests membership in these PTAs led constituent economies to divert
Table 12
Gravity model estimates, various years: 1980–2000
Part III: effects of PTA (EU, APEC,
AFTA, CER, NAFTA)
Annual cross-section data (coefficients) Panel dataa
1980 1985 1990 1995 2000
APEC
Intra-bloc exports (bk) 0.155 0.322** 0.368** 0.363** 0.411** 0.429**
Overall bloc imports (mk) 0.198** 0.308** 0.454** 0.390** 0.382** 0.356**
Overall bloc exports (nk) 0.356** 0.526** 0.641** 0.589** 0.638** 0.535**
Asian imports from bloc (Amk) �0.234* �0.372** �0.359** �0.232** �0.163* �0.332**
Asian exports to bloc (Ank) 0.027 �0.215* �0.211* �0.268** �0.464** �0.382**
EU
Intra-bloc exports (bk) �0.246** �0.256** �0.112 0.051 0.046 0.017
Overall bloc imports (mk) 0.228** 0.364** 0.283** 0.159** 0.305** 0.161**
Overall bloc exports (nk) 0.168** 0.339** 0.156** 0.256** 0.403** 0.215**
Asian imports from bloc (Amk) �0.375** �0.333** �0.269** �0.253** �0.252** �0.318**
Asian exports to bloc (Ank) �0.219** �0.407** �0.252** �0.118 �0.008 �0.190**
CER
Intra-bloc exports (bk) �0.834 �0.503 �0.325 �0.299 �0.268 �0.435
Overall bloc imports (mk) 0.100 0.227 �0.066 0.076 0.498** 0.309**
Overall bloc exports (nk) �0.052 0.057 �0.162 0.029 0.331* �0.093
Asian imports from bloc (Amk) 0.347 0.222 0.301 �0.158 �0.623** 0.214*
Asian exports to bloc (Ank) �0.104 �0.401* �0.409* �0.474* �0.653** �0.516**
AFTA
Intra-bloc exports (bk) 0.166 �0.181 0.319* 0.422** 0.144 0.026
Overall bloc imports (mk) �0.039 �0.232** �0.128* �0.177** �0.325** �0.193**
Overall bloc exports (nk) �0.113 �0.117 �0.196** �0.063 �0.122* �0.050
Asian imports from bloc (Amk) 0.377** 0.400** 0.346** 0.144 0.372** 0.264**
Asian exports to bloc (Ank) 0.057 0.267* 0.162 0.126 0.318** 0.191**
NAFTA
Intra-bloc exports (bk) 0.250 0.112 �0.066 0.326 0.282 0.210
Overall bloc imports (mk) �0.187* �0.264** �0.332** �0.390** �0.188* �0.355**
Overall bloc exports (nk) �0.333** �0.422** �0.427** �0.416** �0.575** �0.480**
Asian imports from bloc (Amk) 0.348* 0.346* 0.079 0.014 0.115 0.119
Asian exports to bloc (Ank) 0.326* 0.235 0.282* 0.451** 0.799** 0.500**
Adjusted R2 0.679 0.684 0.731 0.718 0.708 0.707
Standard error of the estimate 0.760 0.783 0.779 0.797 0.852 0.697
Note: This is the third of a series of Tables 10–12. Source: Authors’ computation.a Covers 1985, 1995, 2000.* Significant at 95% confidence level.** Significant at 99% confidence level.
7 To put these numbers in perspective, SPARTECA with a factor of 13.6 has a base of only about US $120
million, implying that the incremental exports that the PTA is responsible for is equal to about US $1.6 billion at
1990 prices.
118 R. Clarete et al. / Journal of Asian Economics 14 (2003) 91–129
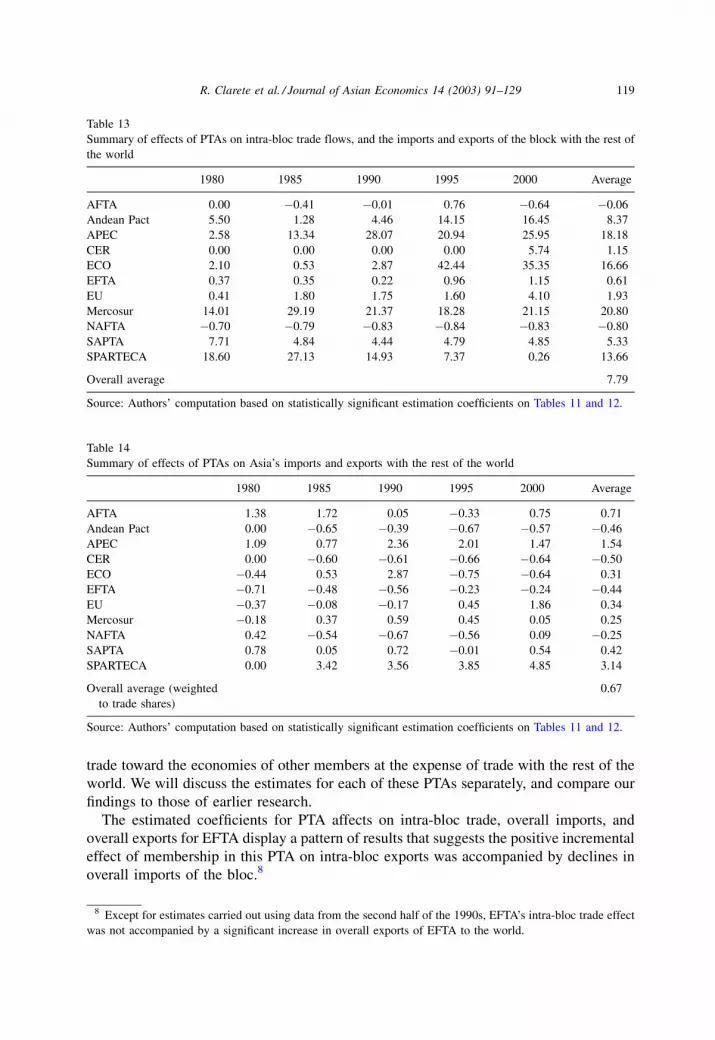
trade toward the economies of other members at the expense of trade with the rest of the
world. We will discuss the estimates for each of these PTAs separately, and compare our
findings to those of earlier research.
The estimated coefficients for PTA affects on intra-bloc trade, overall imports, and
overall exports for EFTA display a pattern of results that suggests the positive incremental
effect of membership in this PTA on intra-bloc exports was accompanied by declines in
overall imports of the bloc.8
Table 13
Summary of effects of PTAs on intra-bloc trade flows, and the imports and exports of the block with the rest of
the world
1980 1985 1990 1995 2000 Average
AFTA 0.00 �0.41 �0.01 0.76 �0.64 �0.06
Andean Pact 5.50 1.28 4.46 14.15 16.45 8.37
APEC 2.58 13.34 28.07 20.94 25.95 18.18
CER 0.00 0.00 0.00 0.00 5.74 1.15
ECO 2.10 0.53 2.87 42.44 35.35 16.66
EFTA 0.37 0.35 0.22 0.96 1.15 0.61
EU 0.41 1.80 1.75 1.60 4.10 1.93
Mercosur 14.01 29.19 21.37 18.28 21.15 20.80
NAFTA �0.70 �0.79 �0.83 �0.84 �0.83 �0.80
SAPTA 7.71 4.84 4.44 4.79 4.85 5.33
SPARTECA 18.60 27.13 14.93 7.37 0.26 13.66
Overall average 7.79
Source: Authors’ computation based on statistically significant estimation coefficients on Tables 11 and 12.
Table 14
Summary of effects of PTAs on Asia’s imports and exports with the rest of the world
1980 1985 1990 1995 2000 Average
AFTA 1.38 1.72 0.05 �0.33 0.75 0.71
Andean Pact 0.00 �0.65 �0.39 �0.67 �0.57 �0.46
APEC 1.09 0.77 2.36 2.01 1.47 1.54
CER 0.00 �0.60 �0.61 �0.66 �0.64 �0.50
ECO �0.44 0.53 2.87 �0.75 �0.64 0.31
EFTA �0.71 �0.48 �0.56 �0.23 �0.24 �0.44
EU �0.37 �0.08 �0.17 0.45 1.86 0.34
Mercosur �0.18 0.37 0.59 0.45 0.05 0.25
NAFTA 0.42 �0.54 �0.67 �0.56 0.09 �0.25
SAPTA 0.78 0.05 0.72 �0.01 0.54 0.42
SPARTECA 0.00 3.42 3.56 3.85 4.85 3.14
Overall average (weighted
to trade shares)
0.67
Source: Authors’ computation based on statistically significant estimation coefficients on Tables 11 and 12.
8 Except for estimates carried out using data from the second half of the 1990s, EFTA’s intra-bloc trade effect
was not accompanied by a significant increase in overall exports of EFTA to the world.
R. Clarete et al. / Journal of Asian Economics 14 (2003) 91–129 119
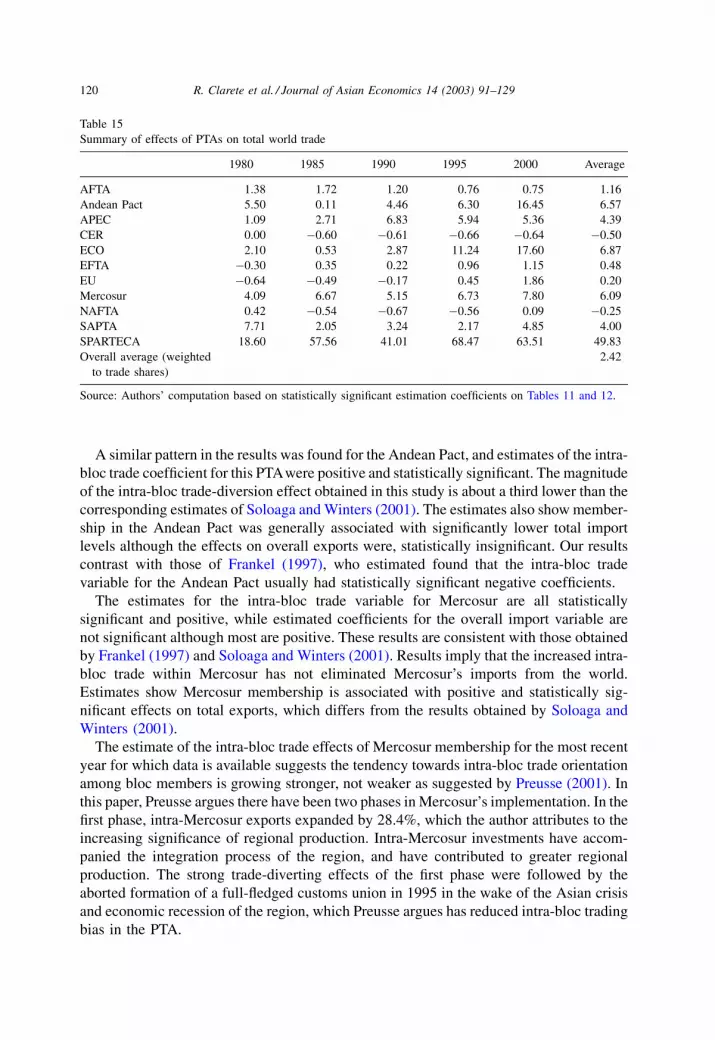
A similar pattern in the results was found for the Andean Pact, and estimates of the intra-
bloc trade coefficient for this PTAwere positive and statistically significant. The magnitude
of the intra-bloc trade-diversion effect obtained in this study is about a third lower than the
corresponding estimates of Soloaga and Winters (2001). The estimates also show member-
ship in the Andean Pact was generally associated with significantly lower total import
levels although the effects on overall exports were, statistically insignificant. Our results
contrast with those of Frankel (1997), who estimated found that the intra-bloc trade
variable for the Andean Pact usually had statistically significant negative coefficients.
The estimates for the intra-bloc trade variable for Mercosur are all statistically
significant and positive, while estimated coefficients for the overall import variable are
not significant although most are positive. These results are consistent with those obtained
by Frankel (1997) and Soloaga and Winters (2001). Results imply that the increased intra-
bloc trade within Mercosur has not eliminated Mercosur’s imports from the world.
Estimates show Mercosur membership is associated with positive and statistically sig-
nificant effects on total exports, which differs from the results obtained by Soloaga and
Winters (2001).
The estimate of the intra-bloc trade effects of Mercosur membership for the most recent
year for which data is available suggests the tendency towards intra-bloc trade orientation
among bloc members is growing stronger, not weaker as suggested by Preusse (2001). In
this paper, Preusse argues there have been two phases in Mercosur’s implementation. In the
first phase, intra-Mercosur exports expanded by 28.4%, which the author attributes to the
increasing significance of regional production. Intra-Mercosur investments have accom-
panied the integration process of the region, and have contributed to greater regional
production. The strong trade-diverting effects of the first phase were followed by the
aborted formation of a full-fledged customs union in 1995 in the wake of the Asian crisis
and economic recession of the region, which Preusse argues has reduced intra-bloc trading
bias in the PTA.
Table 15
Summary of effects of PTAs on total world trade
1980 1985 1990 1995 2000 Average
AFTA 1.38 1.72 1.20 0.76 0.75 1.16
Andean Pact 5.50 0.11 4.46 6.30 16.45 6.57
APEC 1.09 2.71 6.83 5.94 5.36 4.39
CER 0.00 �0.60 �0.61 �0.66 �0.64 �0.50
ECO 2.10 0.53 2.87 11.24 17.60 6.87
EFTA �0.30 0.35 0.22 0.96 1.15 0.48
EU �0.64 �0.49 �0.17 0.45 1.86 0.20
Mercosur 4.09 6.67 5.15 6.73 7.80 6.09
NAFTA 0.42 �0.54 �0.67 �0.56 0.09 �0.25
SAPTA 7.71 2.05 3.24 2.17 4.85 4.00
SPARTECA 18.60 57.56 41.01 68.47 63.51 49.83
Overall average (weighted
to trade shares)
2.42
Source: Authors’ computation based on statistically significant estimation coefficients on Tables 11 and 12.
120 R. Clarete et al. / Journal of Asian Economics 14 (2003) 91–129
Yeats (1998), research suggests an explanation for the results obtained in the present
study. In assessing Mercosur’s trade performance in the first half of the 1990s, Yeats noted
that intra-bloc trade increased substantially at the expense of trade with non-member
countries. This stemmed from the group’s ‘‘discriminatory tariffs against nonmembers,
which are four to six times higher’’ than those of the EU or NAFTA. It was further noted
that the intra-regional trade and export growth among members was concentrated in
products that were not competitive outside of the region. Extending the analysis to 2000,
our finding that Mercosur positively and significantly influenced the intra-bloc trade share
may well reflect the impact of accumulated inefficiencies induced by relatively high
discriminatory protection maintained earlier.
The coefficients of the intra-bloc trade are statistically significant and positive across all
our estimates for SAPTA. These findings differ from that of Frankel and Wei (1998) who
found SAPTA membership was associated with lower levels of trade between members
than would normally be expected. The results reported in Table 11 indicate that SAPTA
members traded at nearly twice the level they would be expected to trade given the sizes of
their economies, proximities, and similar characteristics. This is based on the coefficient of
the intra-bloc trade variable obtained in our panel data estimate. The estimates of the
impact of SAPTA membership on overall imports are all not significantly different from
zero, while estimates of the effect of membership on total exports are positive and
statistically significant. This result suggests there is an orientation toward intra-bloc trade
among SAPTA members. Members export at a 27% higher rate than the global average
according to our estimates.
The results for ECO suggest membership in this PTA had a positive and statistically
significant effect on intra-bloc trade between members in the early 1980s. During these
same years, membership in ECO was associated with no significant effects on overall
imports and a statistically significant decline in member economies’ overall exports.
However, these effects dissipated over time as ECO members appears to have carried out
structural adjustment and opened up their economies to global trade after 1985. Results in
the second half of the 1980s differ markedly from the earlier effects. The estimated effect
of membership on intra-bloc trade was not significantly different from zero, while
membership was associated with significantly higher total imports and exports in estimated
carried out using data from 1980 and 1990. However, in 1995 and 2000 estimates, ECO
membership was once again associated with greater intra-bloc trade. Membership in these
more years was also associated with lower total imports and higher total exports. Particular
caution is warranted in interpreting the gravity model results fro ECO since the transition
economies of Central Asia that make up ECO were undergoing dramatic changes in the
structure of their economies during the years over which the models were estimated. Basic
changes in the structure of economies, sectoral production, and prices may have had more
profound implications for trade flows to and from these countries than changes in tariffs or
other trade policies carried out under the aegis of ECO. Accordingly, one can reasonably
expect that much of the change in trade flows captured in our estimates were likely due in
greater part to the broader economic restructuring that was underway rather than to PTA
membership.
A final PTA that is estimated to have fostered greater intra-bloc trade was SPARTECA,
which involves Australia and New Zealand and several Pacific island countries. The
R. Clarete et al. / Journal of Asian Economics 14 (2003) 91–129 121
regression results indicating a strong intra-bloc effect are expected. Trade tended to flow
more intensely among the smaller Pacific island economies that are members of SPAR-
TECA and between Australia and New Zealand than between the Pacific island economies
and their larger neighbors—relative to the latter’s level of trade with the rest of the world.
The potential for more trade between Pacific island economies and Australia and New
Zealand is limited by the small size of the smaller economies domestic markets. The signs
of the coefficients of the intra-bloc dummy variable for SPARTECA membership are
positive and statistically significant in our estimates. The estimated coefficient for total
imports went from being not significantly different from zero in the 1980s to being negative
and statistically significant in the 1990s. The associated expansion of intra-bloc trade over
time appeared to occur at the expense of member economies’ imports from the rest of the
world. The estimates of the coefficients measuring the effect of membership on total
exports were all positive and statistically significant in our estimates.
5.1.2. PTAs fostering greater intra-bloc trade and greater trade with the rest of the world
Membership in APEC and EU was estimated to expand significantly trade between
members of the PTA as well as between members and to the rest of the world. These results
are summarized on Table 12.
The signs of the coefficients of variables capturing the effect of APEC membership on
intra-bloc trade and on total imports and exports are all positive and statistically significant.
This suggests that APEC is achieving its goals of open regionalism and augmenting total
trade. The results obtained in our estimates are consistent with those of Frankel (1997). As
with Frankel’s estimate, our estimated coefficient for the intra-APEC export dummy
variable is a large and positive and is statistically significant. The tendency for greater intra-
bloc trade identified in the analysis was accompanied by strong tendencies toward greater
trade with the rest of the world as well. While some researchers have argued that the size of
the coefficient of the intra-bloc variable for APEC obtained in Frankel’s estimate was too
high (Polak, 1996), Frankel attributed the strong effect to the large share of total world
trade accounted for by APEC member economies. He also noted the large coefficient
estimate was not due to the inclusion of entrepot economies, as his estimates excluded
Singapore or Hong Kong from APEC’s to control for the effect ‘‘extra open’’ economies
might have on estimates. Frankel concludes that the ‘‘APEC effect is genuine’’ and quoting
Garnaut (1994), he maintains that the trade augmenting impact identified for APEC is
consistent with the type of integration ‘‘where the initiative has remained primarily with
enterprises acting separately from state decisions, and where official encouragement of
regional integration does not include major elements of trade discrimination.’’
Across the years for which the gravity model was estimated, the estimated effect of EU
membership on intra-bloc trade shifted from being negative and statistically significant (in
the 1980s) to being positive although not statistically significant. All the estimates of the
effect of EU membership on total imports and total exports are positive and statistically
significant. These results differ from those of Soloaga and Winters (2001), which found
that EU has fostered neither overall trade nor intra-bloc trade, as would ordinarily be
expected. Soloaga and Winters offer the explanation that deeper economic integration
between member economies has reduced EU’s imports from non-members. The differ-
ences in these estimation results might be explained by differences in the data used to
122 R. Clarete et al. / Journal of Asian Economics 14 (2003) 91–129
estimate the gravity model across the two our study and the earlier one by Soloaga and
Winters. Soloaga and Winters used data on imports while our estimates were based exports
data.9 Bayoumi and Eichengreen (1997) observed that the strong intra-bloc effect of EEC
in the 1980s appeared to have dissipated by the early 1990s.
Our gravity model estimates indicate that CER had no incremental trade effect within or
outside the bloc, and most of the estimation coefficients for this PTA were not statistically
different from zero. Coefficients associated with trade flows between member countries are
no higher than we would expect them to be given the size of countries’ economies and their
proximity. The signs of the coefficients of the intra-bloc and Asian export variables are
almost all negative, except for 2000. In the estimates carried out using data from 2000,
many coefficients are statistically significant and suggest CER did not divert trade. The
coefficients for the variables capturing the effect of the PTA on total imports and exports
are positive and statistically significant.
Frankel’s (1997) estimation results for the intra-bloc trade effect for CER differ from
ours. He found the intra-bloc trade effects of the PTA were positive and statistically
significant. Frankel used total trade data, i.e., sum of exports and imports while we use
export data, which may account for the different results obtained in the two studies.
Differences in the model specification (e.g., exclusion of language dummy variables in our
estimates and the use of several additional dummy variables to gauge the effect of PTA
membership on trade included in our model) may also account for the different results
obtained.
5.1.3. PTAs that reduced gross trade but did not change intra-bloc trade significantly
In our estimates, AFTA and NAFTA were PTAs that showed no effect in altering intra-
bloc trade but appeared to have reduced exports and imports between members and the rest
of the world. The estimates obtained in this study for the coefficients of the intra-bloc,
overall import, and overall export variables for ASEAN are all not statistically significant.
This adds yet another study with results for AFTA that disagree with earlier those obtained
in earlier research. Frankel (1997), for example, found membership in AFTA was
associated with significantly more intra-bloc trade than would otherwise have been
expected. Soloaga and Winters (2001) found AFTA had a negative and statistically
significant effect on intra-bloc trade. A possible explanation for why the results of this
study differ from earlier research is that the data used in our estimates included new
members of ASEAN, namely Cambodia, Lao PDR, Myanmar, and Vietnam; while the
earlier estimates did not. As a group of countries that are less developed and less integrated
into the global economy than the previous five member countries of ASEAN, their
inclusion in the gravity model may have diluted the effect of ASEAN on its trade within
and outside the PTA.10
9 It is unclear how use of exports versus imports affects results, although Havrylyshyn and Pritchett (1991)
noted some of their gravity model estimates changed depending upon whether they used data on imports or
exports to estimate the model.10 Sensitivity analysis of the estimates result suggest that results are robust to changes in the specification of the
PTA membership variables, but that inclusion of new ASEAN members in the dataset did significantly influence
estimation results.
R. Clarete et al. / Journal of Asian Economics 14 (2003) 91–129 123
Estimation results related to the effect of NAFTA on intra-bloc trade and on the trade of
member economies with the rest of the world failed to reject the null hypothesis that the
PTA has no effect. Earlier studies (Frankel, 1997; Soloaga & Winters, 2001) had earlier
documented a similar result, so consensus is building that is NAFTA has not affected the
trade orientation of its constituent economies. In our panel estimates, NAFTA membership
was associated with lower although not statistically significant intra-bloc trade.
Our results suggest NAFTA members’ total exports and total imports were lower than
expected, and that the negative effect grew stronger over time. Soloaga and Winters had
obtained a similar result, finding which is that the coefficient for overall imports of NAFTA
members was negative and statistically significant after 1986. This same study found the
coefficients capturing the effect of the PTA on total exports of members went from being
positive in the early 1980s (specifically, 1980–1983) to being negative in the period after
1984. The results of these two studies suggest that NAFTA members may be reducing their
overall trade with the rest of the world. Although our results are essentially the same as
those obtained in earlier research, what is new about our results is that we have reached this
conclusion using the latest trade data.
5.2. Gross intra-bloc effect
Table 13 summarizes the effects of PTAs on the trade flows with their members and non-
members. The measure used is the anti-logarithm of the sum of the coefficients of the intra-
bloc, overall import and the overall export variables of the PTA minus one. Soloaga and
Winters refer to this sum of these logarithms as the ‘‘gross intra-bloc’’ effect. This exercise
involves adding up the coefficients reported in Tables 10–12. Since not all of these
coefficients are statistically significant, we accept the hypothesis that the coefficients
having estimates that are not significant at a 95% confidence level or higher are equal to
zero.
The estimates of the total trade effects vary markedly across the PTA’s treated in our
model estimates. APEC, ECO, and Mercosur appear to be the PTAs having the greatest
impact on members’ trade flows. At the other extreme, estimation results suggest AFTA
and NAFTA have reduced the trade of their member economies. The overall effect of the 11
PTAs is an expansion of gross intra-bloc trade by a factor of 7.8 according to our estimates.
Earlier studies of the effects of PTAs on trade flows that have applied gravity model
estimates have obtained similarly large effects of PTA membership (e.g., Frankel, 1997 and
Soloaga and Winters op. cit.).
5.3. Effect of PTAs on Asian trade
Our estimation model included two additional variables to capture the effect of PTAs on
the trade of Asian region as a whole. The estimated coefficients for the two dummy
variables representing Asian imports from and Asian exports to each PTA are also reported
in Tables 11 and 12. Overall, our results suggest that PTAs fall into two groups with respect
to their effects on Asian trade. In the first group, which tended to have insignificant intra-
bloc trade effects and neutral impact on member economies’ trade with the world (i.e.,
AFTA and NAFTA), members generally had higher than expected levels of trade with Asia.
124 R. Clarete et al. / Journal of Asian Economics 14 (2003) 91–129
The other PTAs, which displayed significant intra-bloc trade effects and in some cases
positive and significant effects on total trade, showed either no significant effects or
negative and significant effects on trade with Asia.
Considering PTAs as a whole, empirical estimates suggest trade in Asia has been
augmented by the existence of PTAs, including both PTAs within the region and as well as
PTAs based in other regions. As summarized in Table 14, results provide little support for
the assertion that PTAs have diverted trade to member countries at the expense of trade
outside the PTAs. The measure of this trade diversion/augmentation used in Table 14 is the
anti-logarithm of the sum the estimated coefficients for the overall import, overall export,
Asian import, and Asian export dummy variables in Eq. (4) minus one.11
According to our gravity model estimates, the general effect of PTAs on trade in Asia
and the Pacific is small compared to the effect of PTAs have in other regions. While some
individual PTAs (e.g., ANDEAN, CER, EFTA, and NAFTA) are estimated to reduce trade
flows between Asia and the member economies, the overall net effect of the 11 PTAs was
positive. The 11 PTAs treated in our estimations are found to be associated with a net
expansion of trade within Asia and between Asia and other regions by a factor of 0.67
according to the gravity model estimates presented in this paper. The figures reported on
Table 14 reflect the sum of the PTA’s effects on overall imports and exports, and on imports
and exports between member economies and Asian and Pacific economies. In some cases
(e.g., NAFTA), the positive effect of the PTA on Asian trade is outweighed by the negative
effects on overall trade. In the case of CER, negative effects of PTA membership on overall
trade flows and on trade flows between Australia and New Zealand and Asia and Pacific
countries combine to generate a stronger negative effect. The net influence of PTAs based
in Asia’s subregions, namely those involving countries of the South Pacific and Oceania
(SPARTECA), South Asia (SAPTA), and Southeast Asia (AFTA), appear to have been to
induce expanded trade in the greater Asian and Pacific region.
The effect of the EU on Asian trade suggested by estimates indicates a more complicated
picture. The EU was estimated to have a strong positive effect on trade flows between
member economies and the rest of the world—including trade to Asia. However, the
specific effect of EU on Asian trade was found to be negative and statistically significant.
Overall, the total trade effect dominates the Asia-specific effect, making the net effect of
the EU on Asian trade positive. It is also worth noting that cross-sectional estimation results
suggest the net effect of the EU on Asian trade has grown more positive over the past two
decades. Although not covered in our estimates, the new least developed countries
initiative for EU member countries, which grants non-reciprocal trade preferences towards
selected small and least developed countries, could carry negative consequences for the
EU’s level of trade with Asian countries excluded from the arrangement.
Trade between countries in Asia and the Pacific and Mercosur member economies was
estimated to have occurred at a rate higher than would be expected in the absence of the
PTA. Lastly, estimates show the effect of ECO on Asian trade varied greatly across years of
the cross-sectional estimates, which likely reflects the widespread structural changes in the
constituent economies during the 1980s and 1990s, but on average had a small positive
effect on trade flows to and from the Asia region as a whole and Central Asia.
11 The formula used is: Y ¼ AXb10bjða1D1þa2D2Þ.
R. Clarete et al. / Journal of Asian Economics 14 (2003) 91–129 125
5.4. PTAs’ contribution to world trade
In Table 15, the effects of PTAs on world trade in general are summarized. The indicator
used for this purpose is the anti-logarithm of the sum of the estimated coefficients of the
intra-bloc, overall import, overall export, Asian import and Asian export variables less one.
In general the indicators are positive. Only CER and NAFTA appear to have reduced trade.
It was discussed earlier that the effect of NAFTA on its members’ trade with the world was
significantly negative and this effect dominated the bloc’s positive effect on Asia’s trade
with its members. For CER, the negative effect of this PTA on its Asia’s exports to its
members explain why CER’s effect on world trade is also to reduce its members’ trade with
the world. Both NAFTA and CER have insignificant effects on intra-bloc trade. On
average, world trade is increased because of PTAs by a factor of 2.4. There is no guarantee
that these trade flows match the patterns that would take place under full multilateral
liberalization, but the gravity model analysis provides evidence that these PTAs create
trade.
6. Conclusions
In this study, we estimated a gravity model of bilateral trade involving 11 trading blocs
most of whom are from the Asia and Pacific region. The trade data used in estimating the
gravity model is that of 83 countries from 1980 to 2000. The estimated coefficients of the
basic determinants of the gravity model such as the GDP, distance between capitals of
trading partners, population, and physical area explain well cross-country trade flows.
Our estimates of the effect of different PTAs on the trade flows between members vary
remarkably across PTAs. Preferential trading agreements are categorized into three groups
based on whether they tend to foster intra-bloc trade, foster greater trade with trading
partners worldwide, or they reduced trade in general without changing their respective
intra-bloc trade. Andean Pact, ECO, EFTA, Mercosur, SAPTA, and SPARTECA belong to
the first group in varying intensity with respect to promoting intra-bloc trade. These tend to
expand their trade among their respective members at the expense of their members’
imports from the world, and exports as well although in a few instances these PTAs have a
positive effect on their exports to the world. Interestingly, these PTAs have the propensity
of expanding Asia’s trade.
APEC, CER, and EU belong to the second group of PTAs that have expanded or not have
not changed at all their intra-bloc trade, without reducing trade with the world. APEC and
CER in particular illustrate the type of PTAs that adhere to open regionalism. EU, being in
this list, is a surprise as other authors are of the view that EU is diverting trade towards its
members.
AFTA and NAFTA are the PTAs that have not changed their intra-bloc trade but reduced
their overall trade with the world. While other authors have regarded AFTA as trade
creating, the result may be explained by the fact that in this analysis the bloc includes its
new members. Earlier independent estimates had only included the original AFTA
contracting parties. The new AFTA members are less integrated with the world economy
as the founding members of this PTA.
126 R. Clarete et al. / Journal of Asian Economics 14 (2003) 91–129
In this study, we introduced two new dummy variables that allow the analyst to measure
the impact of PTAs on the trades of countries in the Asia and Pacific region, while retaining
the innovation made by Soloaga and Winters (2001) to the empirical gravity model
analysis. One variable is designed to capture the effects of PTAs on Asia’s imports from it.
The other variable measures the impact of the PTA on Asia’s exports to the trade bloc. The
resulting added feature of the gravity model makes possible the impact of PTAs on overall
Asia’s trade.
In summary, the PTAs in this analysis have contributed significantly to trade expansion
both at the global and regional (Asia and Pacific) levels. The results obtained in this study
provide evidence that PTAs can create rather than divert trade.
These results suggest to us that PTAs offer a next-best path towards expanding world
trade if negotiations for multilateral trade liberalization take a longer time to get
completed. It will be important to follow macro-level cross-country research such as this
paper with more focused studies on the dynamics of PTA members’ policies toward trade
with the rest of the world and participation in multilateral trading agreements such as the
WTO. One claim that could be tested, for example, is whether negotiating PTAs help
developing countries gain experience with trade liberalization on a limited scale that later
smoothes the way toward more general trade opening (Michalopoulos, 1999).
Having noted this potential, policy makers need to be aware that PTAs vary. There are
PTAs that tend to divert trade towards its members, be unnecessarily costly to administer,
or create opportunities for unproductive rent seeking activities. The challenge to policy
makers is to continue to innovate on their respective regional trade arrangements. A few
ideas include using the regional arrangement to solve for regional spillover problems or
facilitate trade and capital movements among members, thereby reducing the cost of doing
business and increasing investments and aggregate economic activity of its members.
Acknowledgements
The author’s gratefully acknowledge useful consultations with Kym Anderson in the
early phases of this research and the excellent research assistance of Catherine Lawas and
Cielo Magno were helpful to the paper’s completion. We also wish to express our thanks to
the many participants of the Beijing Conference who offered useful comments on an earlier
draft of the paper. Comments on an earlier paper related to this work from Malcolm
Dowling, Jeffrey Liang, J.P. Verbiest, and Xianbin Yao on are also gratefully acknowl-
edged. This research was carried out with the financial support of the Asian Development
Bank.
References
Aitken, N. D. (1973). The effect of the EEC and EFTA on European trade: a temporal cross-section analysis.
American Economic Review, 63, 881–892.
Asian Development Bank. (2002). Asian Development Outlook 2002. Manila, Philippines: ADB.
Bayoumi, T., & Eichengreen, B. (1995). Is regionalism simply a diversion? Evidence from the evolution of the
EC and EFTA. IMF Working Paper 109. Washington, DC.
R. Clarete et al. / Journal of Asian Economics 14 (2003) 91–129 127
Bayoumi, T., & Eichengreen, B. (1997). Is regionalism simply a diversion: evidence from the evolution of the
EC and EFTA. In T. Ito & A. Krueger (Eds.), Regionalism versus multilateral trade arrangements. NBER
East Asia Seminar on Economics 6. Chicago: Chicago University Press.
Bhagwati, J. N., & Panagariya, A. (1996). The economics of preferential trade agreements. Washington, D.C.:
AEI Press.
Bhagwati, J. N., Panagariya, A., et al. (1996, June 25). Free trade target date essential to remove ‘spaghetti bowl’
of Barriers. Financial Times.
Boisso, D., & Ferrantino, M. (1997). Economic distance, cultural distance, and openness in international trade:
empirical puzzles. Journal of Economic Integration, 12(4), 456–484.
Braga, P., Sadafi, R., & Yeats, A. (1994). Regional integration in the Americas: deja vu all over again? World
Economy, 17, 577–601.
CIA. (2001). CIA World Factbook. Available online at: http://www.cia.gov/cia/publications/factbook/
default.htm.
de Melo, J., Panagariya, A., & Rodrik, D. (1992). The new regionalism: a country perspective. CEPR Discussion
Paper 715, Center for Economic and Policy Research, Washington, D.C.
Deardoff, A. (1984). Testing trade theories and predicting trade flows. In R. W. Jones & P. B. Kenen (Eds.),
Handbook of international economics 1. Amsterdam: Elsevier Science Publishers.
Dollar, D. (1992). Outward-oriented developing economies really do grow more rapidly: evidence from 95
LDCs, 1976–1985. Economic Development and Cultural Change, 40, 523–544.
Drysdale, P., & Garnaut, R. (1982). Trade intensities and the analysis of bilateral trade flows in a many-country
world. Hitotsubashi Journal of Economics, 22, 62–84.
Edwards, S. (1998). Openness, productivity and growth: what do we really know? Economic Journal, 20, 383–
398.
Frankel, J. (1997). Regional trading blocs in the world economic system. Washington, DC: Institute for
International Economics.
Frankel, J. A., & Wei, S.-J. (1998). Regionalization of world trade and currencies: economics and politics. In J.
Frankel (Ed.), The regionalization in the world economy. Chicago: University of Chicago Press.
Garnaut, R. (1994). Open regionalism: its analytic basis and relevance to the international system. Journal of
Asian Economics, 5(2), 273–290.
Havemann, J. (2002). International Trade Data web site http://www.macalester.edu/research/economics/PAGE/
HAVEMAN/Trade.Resources/TradeData.html.
Havrylyshyn, O., & Pritchett, L. (1991). European trade patterns after the transition. Policy, research, and
external affairs. Working Paper Series No. 74. Washington, DC: The World Bank.
Helpman, E. (1987). Imperfect competition and international trade: evidence from 14 industrial countries.
Journal of the Japanese and International Economics, 1, 62–81.
Helpman, E., & Krugman, P. (1985). Market structure and foreign trade. Cambridge, MA: MIT Press.
International Monetary Fund. (2001). Direction Of Trade Statistics. USA: IMF Publications Services.
Krueger, A. (1997). Free trade agreements versus customs unions. Journal of Development Economics, 54,
169–187.
Krugman, P. (1991). Geography and trade. Cambridge, MA: MIT Press.
Linneman, H. (1966). An econometric study of international trade flows. Amsterdam: North Holland.
Michalopoulos, C. (1999, September). The integration of transition economies into the world trading system.
World Bank Working Paper 2182. Washington, DC: World Bank.
Panagariya, A. (1994). East Asia and the new regionalism in world trade. World Economy, 17, 817–839.
Petri, P. A. (1993). The East Asian trading bloc: an analytical history. In J. Frankel & M. Kahler (Eds.),
Regionalism and rivalry: Japan and the U.S. in Pacific Asia (pp. 21–25). Chicago: University of Chicago
Press.
Polak, J. J. (1996). Is APEC a natural regional trading bloc? The World Economy, September, 533–543.
Pomfret, R. (2001, March). National borders and disintegration of market area in Central Asia after 1991. Paper
prepared for the pre-conference, Frankfurt. Mimeo.
Preusse, H. (2001). Mercosur—another failed move towards regional integration? World Economy, 24,
911–931.
Sachs, J. D., & Warner, A. (1995). Economic reform and the process of global integration. Brookings Paper on
Economic Activity, 1, 1–95.
128 R. Clarete et al. / Journal of Asian Economics 14 (2003) 91–129
Schiff, M. (1997). Small is beautiful: preferential trade agreements and the impact of country size, market share,
and smuggling. Journal of Economic Integration, 12(3), 359–387.
Soloaga, I., & Winters, A. (2001). Regionalism in the nineties: what effect on trade? North American Journal of
Economics and Finance, 12, 1–29.
Venables, A. (2000). ‘‘Les accords d’integration regionale: facteurs de convergence ou de divergence?’’. Revue
d’Economie du Developpement, 0(1/2), 227–246.
Wacziarg, R. (2001). Measuring the dynamic gains from trade. World Bank Economic Review, 15(3), 393–429.
Wonnacott, P. (1997). Beyond NAFTA—the design of a Free Trade Agreement of the Americas. In J. Bhagwati
& A. Panagariya (Eds.), The economics of preferential trade agreements. Washington, DC: AEI Press.
World Bank. (2001). World development indicators. Washington, DC: World Bank.
World Trade Organization. (WTO). (2001). International trade statistics. Geneva: WTO.
Yeats, A. J. (1998). Does Mercosur’s trade performance raise concerns about the effects of regional trade
arrangements? World Bank Economic Review, 12(1), 1–28.
R. Clarete et al. / Journal of Asian Economics 14 (2003) 91–129 129
!["Speak, Memory," Psychiatric Times 21 March 2014 [debate on role of American psychiatry in the satanic ritual abuse moral panic of the 1980s and 1990s]](https://img.dokumen.tips/doc/110x75/6317eaa765e4a6af370f2c3c/speak-memory-psychiatric-times-21-march-2014-debate-on-role-of-american-psychiatry.jpg)


