Embed Size (px)
Citation preview
ed: CK/ sa: PY, CS
Resilient packaging demand despite COVID-19 pandemic • Packaging demand to grow at CAGR of c.3-4%
• Upstream chemical players more affected by
environmental concerns than packaging producers
• Strong demand for hygiene and medical products can
boost the prices of certain chemicals in short-run
• PTL, SCGP and UTP are the winners
Packaging demand to grow at CAGR of c.3-4% over 2019-2022F, driven by megatrend of i) booming e-commerce, ii) low packaging penetration rate, iii) rising transportation/logistic activity, iv) COVID-19 pandemic concerns, v) demographics and lifestyle changes, vi) uptrend for fast-moving consumer goods (FMCGs), and vii) uptrend for parcel delivery services.
Upstream chemical players hit by environmental concerns and single-use plastic ban. Polystyrene (PS), Polyethylene (PE) and Polypropylene (PP) are the key raw materials of single-use plastic and are slated to be banned in the near future. As a result, upstream chemical players such as IRPC Plc (IRPC TB) and PTT Global Chemical (PTTGC TB) will be the most affected.
Increasing awareness of cleanliness and hygiene driven by COVID-19 pandemic. During the outbreak of COVID-19, there was a shortage of medical equipment and hygiene products – thanks to a spike in demand during 1H20. In turn, this has led to a surge in demand for certain chemical materials that are the key components for producing medical equipment and hygiene products, such as PE, PP, Polyethylene Terephthalate (PET) and butadiene, as there are still no signs that the coronavirus can be contained, at least in short-run.
PTL, SCGP and UTP are clear winners. According to 2Q20 results, sales of consumer products dropped by c.20% q-o-q, due to mall closures and travel restrictions caused by the COVID-19 pandemic. However, the packaging business’s performance was rather resilient than the overall consumer sector, as c.50-70% of the former’s sales volumes involve consumer staple goods. Additionally, packaging players are less affected by environmental concerns due to the higher recyclability of their products.
SET : 1,433.56
Analyst
Duladeth BIK, CFA, FRM, CAIA +66 28577833
Thailand Research Team +66 28577833; [email protected]
Index performance (year-to-date basis)
Source: SETSMART, DBSVTH, data as of 18 Nov 2020
DBS Group Research . Equity
27 Nov 2020
Asian Insights SparX: Resilient packaging demand while
sustainability principles remain intact
Chemical/Packaging/Paper Refer to important disclosures at the end of this report
STOCKS
12-mth
Price Mkt Cap Target Price Performance (%)
Bt US$m Bt 3 mth 12 mth Rating
Indorama Ventures 30.25 5,607 24.00 24.5 (13.6) HOLD
IRPC PCL 2.88 1,943 2.30 18.0 (17.7) HOLD
Polyplex (Thailand) 22.30 663 27.50 (10.8) 58.2 BUY
PTT Global
Chemical 59.25 8,776 44.00 24.7 8.7 HOLD
Siam Cement 375 14,855 417 7.8 (4.6) BUY
SCG Packaging
PCL 41.50 5,881 44.00 N.A N.A BUY
Thai Oil PCL 51.25 3,451 41.00 19.2 (27.3) HOLD
United Paper 13.50 290 16.50 (8.8) 37.8 BUY
Asian Insights SparX: Resilent packaging
demand while sustainability remains intact
Chemical/Packaging/Paper
Page 2
The DBS Asian Insights SparX report is a deep dive look into thematic angles impacting the longer term investment thesis for a sector, country or the region. We view this as an ongoing conversation rather than a one off treatise on the topic, and invite feedback from our readers, and in particular welcome follow on questions worthy of closer examination.
Table of Contents
Executive Summary 3
What is packaging? 8
Part 1: Resilient packaging demand driven by megatrends 9
Part 2: Long-run impact from environmental concern and sustainability principles 20
Part 3: Outbreak of COVID-19 boosts demand for certain types of plastic 26
Part 4: Implications and selection of winners 29
Stock Profile 37
Indorama Ventures 38
IRPC PCL 44
Polyplex (Thailand) 50
PTT Global Chemical 57
Siam Cement 63
SCG Packaging PCL 69
Thai Oil PCL 94
United Paper 101
Asian Insights SparX: Resilent packaging
demand while sustainability remains intact
Chemical/Packaging/Paper
Page 3
Executive Summary
Resilient packaging business amid COVID-19 pandemic. While
the global economy is being hit by the pandemic of COVID-
19, we think business segments related to consumer staples
goods and consumption, such as packaging, will be more
resilient than those related to cyclicality and exports such as
commodities and tourism. According to the 2Q20 results of
the consumer/commerce sectors, the revenue of key
consumer players such as HomePro, CPALL and Robinson
Department Store, to name a few, dropped by c.20% q-o-q,
weighed down by travel restrictions, city lockdowns, malls
closures during Mar-May 2020. On the other hand, the
packaging business was rather resilient than the overall
consumer sector with the former’s total sales volume, on
average, coming in flat. We believe that the reasons behind
the packaging business’s resilient sales volume are i) c.70% of
packaging sales volume came from consumer staples which
were least affected by the pandemic, ii) packaging cost
accounted for only c.3-4% of the total cost of finished
products, and iii) demand stickiness from food and beverage
manufacturers that are reluctant to change packaging
supplies for the fear of eroding the quality of their product
packaging.
Evidently, based on the data compiled by McKinsey, online
sales of grocery and fresh food in China doubled within a 10-
day period in Jan 2020, at the early stage of the country’s
outbreak of COVID-19. Moreover, there is a spike in volume
of online shopping as well as rising demand for delivery
services (both food and beverage and parcel), due to work-
from-home policies, and the high demand for medical care
and hygiene products. Hence, packaging products such as
corrugated paper, flexible, and rigid plastic were in high
demand.
Expect resilent packaging demand during 2020-2022F, driven
by megatrends. The outbreak of the COVID-19 pandemic in
early 2020 has caused disruptions to businesses and economic
activities the world over. This has temporarily led to a global
economic slowdown, and the packaging business is no
exception. However, we believe the adverse impact on
packaging demand would be limited in view of i) c.70% of
packaging material is used in consumer stable goods which
were least affected by the pandemic, ii) demographics and
lifestyle changes that will lead to a gradual increase in
packaging demand over time, and iii) the boom of e-
commerce that is supported by internet network
advancements and greater internet penetration rate.
As a result, we expect the demand for packaging, both paper-
based and polymer-based products, to remain solid and grow
at a CAGR of 3-4% in during 2019-2022F, driven by the
following factors: i) the boom of online shopping (e-
commerce), ii) low packaging penetration rate in ASEAN, iii)
rising transportation activity, iv) COVID-19 pandemic
concerns, v) demographic and lifestyle changes, vi) uptrend
for FMCG, vii) rising income from the middle class in
Southeast Asia (Indonesia, the Philippines, Vietnam and
Thailand), viii) improving Internet network and penetration
rate, ix) increasing digital banking transactions, x) uptrend for
parcel delivery services and cheaper delivery fee, and xi)
growing popularity of social and mobile commerce services.
More negative impact for chemical players than packaging
producers with respect to environmental concerns and
sustainability principles
i) Ban on seven types of single-use plastics
In 2018, the sub-committee on plastic waste management
looked at the plan of action on reducing and banning the
use of seven types of single-use plastics between 2019
and 2025. In 2019, the use of the following products is
expected to be banned i) cap seals made from PVC films,
ii) products that use Oxo alcohol (OXO), which is usually
found in HDPE and LDPE, and iii) micro-beads made from
plastic. In 2022, the targeted plastic products to be
banned include i) plastic carrier bags that are thinner than
36 microns (usually made from LLDPE), and ii) foam food
containers. As for 2025, the plastic products being
targeted are i) single-use plastic cups and ii) plastic straws.
The majority of foam containers, cups, and plastic straws
are made from PS. We believe LLDPE will be the most
affected chemical product. This because it is used in the
making of carrier bags and packaging films, accounting
for over 55% in the process of producing plastic products.
Asian Insights SparX: Resilent packaging
demand while sustainability remains intact
Chemical/Packaging/Paper
Page 4
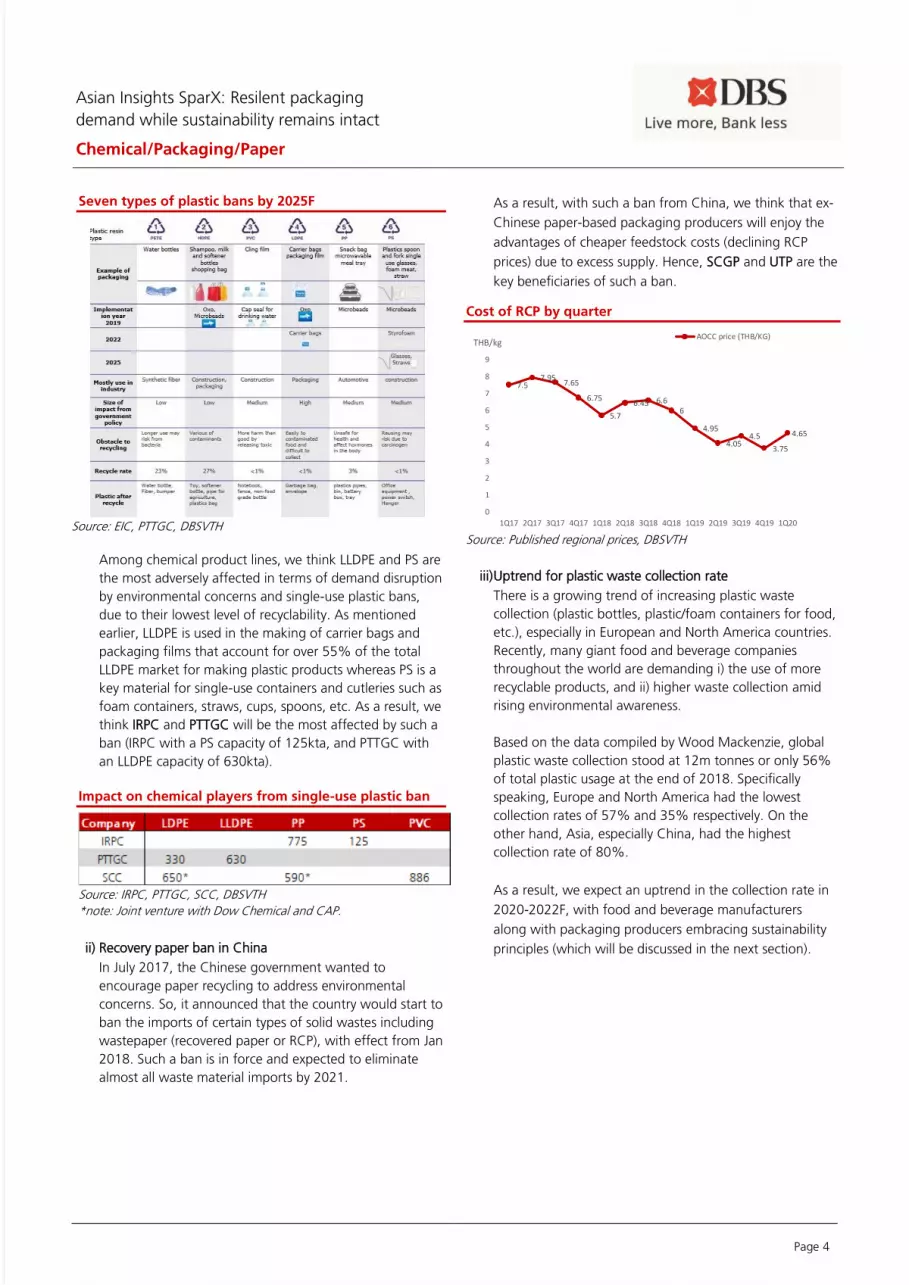
Seven types of plastic bans by 2025F
Source: EIC, PTTGC, DBSVTH
Among chemical product lines, we think LLDPE and PS are
the most adversely affected in terms of demand disruption
by environmental concerns and single-use plastic bans,
due to their lowest level of recyclability. As mentioned
earlier, LLDPE is used in the making of carrier bags and
packaging films that account for over 55% of the total
LLDPE market for making plastic products whereas PS is a
key material for single-use containers and cutleries such as
foam containers, straws, cups, spoons, etc. As a result, we
think IRPC and PTTGC will be the most affected by such a
ban (IRPC with a PS capacity of 125kta, and PTTGC with
an LLDPE capacity of 630kta).
Impact on chemical players from single-use plastic ban
Source: IRPC, PTTGC, SCC, DBSVTH
*note: Joint venture with Dow Chemical and CAP.
ii) Recovery paper ban in China
In July 2017, the Chinese government wanted to
encourage paper recycling to address environmental
concerns. So, it announced that the country would start to
ban the imports of certain types of solid wastes including
wastepaper (recovered paper or RCP), with effect from Jan
2018. Such a ban is in force and expected to eliminate
almost all waste material imports by 2021.
As a result, with such a ban from China, we think that ex-
Chinese paper-based packaging producers will enjoy the
advantages of cheaper feedstock costs (declining RCP
prices) due to excess supply. Hence, SCGP and UTP are the
key beneficiaries of such a ban.
Cost of RCP by quarter
Source: Published regional prices, DBSVTH
iii) Uptrend for plastic waste collection rate
There is a growing trend of increasing plastic waste
collection (plastic bottles, plastic/foam containers for food,
etc.), especially in European and North America countries.
Recently, many giant food and beverage companies
throughout the world are demanding i) the use of more
recyclable products, and ii) higher waste collection amid
rising environmental awareness.
Based on the data compiled by Wood Mackenzie, global
plastic waste collection stood at 12m tonnes or only 56%
of total plastic usage at the end of 2018. Specifically
speaking, Europe and North America had the lowest
collection rates of 57% and 35% respectively. On the
other hand, Asia, especially China, had the highest
collection rate of 80%.
As a result, we expect an uptrend in the collection rate in
2020-2022F, with food and beverage manufacturers
along with packaging producers embracing sustainability
principles (which will be discussed in the next section).
7.57.95
7.65
6.75
5.7
6.45 6.66
4.95
4.054.5
3.75
4.65
0
1
2
3
4
5
6
7
8
9
1Q17 2Q17 3Q17 4Q17 1Q18 2Q18 3Q18 4Q18 1Q19 2Q19 3Q19 4Q19 1Q20
THB/kgAOCC price (THB/KG)

Asian Insights SparX: Resilent packaging
demand while sustainability remains intact
Chemical/Packaging/Paper
Page 5
Plastic waste collection around the globe
Source: Company, Wood Mackenzie, DBSVTH
iv) Sustainability principles
There is growing concern over sustainability as well as ESG
(environment, social, and governance) for both end-
consumers, i.e. households, and packaging customers, i.e.
food and beverage manufacturers, homecare, personal-
care, healthcare products manufacturers. So, there is high
demand for the recycling of feedstock materials and/or
recyclable products from these producers. For example,
large multi-national companies (MNC) of beverage and
consumer-care product producers such as Coca Cola,
PepsiCo, Unilever, Procter and Gamble, and Starbucks
demand their packaging materials such as PET bottles,
product containers to be i) made from recycled materials,
and ii) recyclable. Hence, we expect many chemical and
packaging companies to start focusing on sustainability
initiatives going forward in 2021F. Our channel checks
with several companies reveal the growing popularity of
the following practices:
a) The need to utilise less energy
consumption/usage during the production
process
b) Increase renewable energy sources to reduce
greenhouse and carbon emissions to the
atmosphere
c) Optimise resources and energy sources for
maximum production efficiency
d) Increase the proportion of renewable and
recyclable feedstock
e) Increase investments in R&D for product
innovations that are environmentally friendly
As a result, most packaging companies are in the process of i)
improving their energy usage and production process
efficiency, ii) investing in projects to reduce their carbon
footprint, iii) developing environmentally friendly and
degradable products, and iv) investing in renewable energy
sources. Hence, we believe they might incur additional cost
that can erode their profitability as a result of complying with
sustainability principles.
In the following analysis, we will focus on the downside risks
to corporate earnings in light of the compression of margins
for stocks under our coverage (IVL, PTL, SCGP and UTP).
Based on our sensitivity analysis, every 1% reduction in gross
profit margin (GPM) would erode our FY21F net profit
projection for IVL/PTL/SCGP/UTP by c.53%/7%/15%/4%
respectively. This is based on the assumptions of i) gross profit
margin (GPM) of c.10%31%/26%/39% respectively, and ii)
holding everything else constant. Note that IVL has the
greatest downside risk relative to others, due to i) its
commodity-centric nature, as over 80% of its products are
linked to commodities prices, ii) its thinner GPM relative to
peers, and iii) only c.7% of its production volume comes from
the packaging business.
Sensitivity analysis of FY21F net profit
Source: DBSVTH
Increasing awareness of cleanliness and hygiene driven by
COVID-19 pandemic. During the outbreak of COVID-19, there
was a shortage of medical, surgery, and personal protective
equipment for the eye and face (safety glasses, and face
shields), hand (natural latex gloves, nitrile gloves, vinyl gloves),
body, and respiratory system (surgery masks, N95 masks, and
full-face respirators). Moreover, there is a spike in demand for
hygiene products in developing countries in Africa, Southeast
Asia, and South America, where the healthcare spending per
capita is relatively lower than the global averages and peers.
Asian Insights SparX: Resilent packaging
demand while sustainability remains intact
Chemical/Packaging/Paper
Page 6
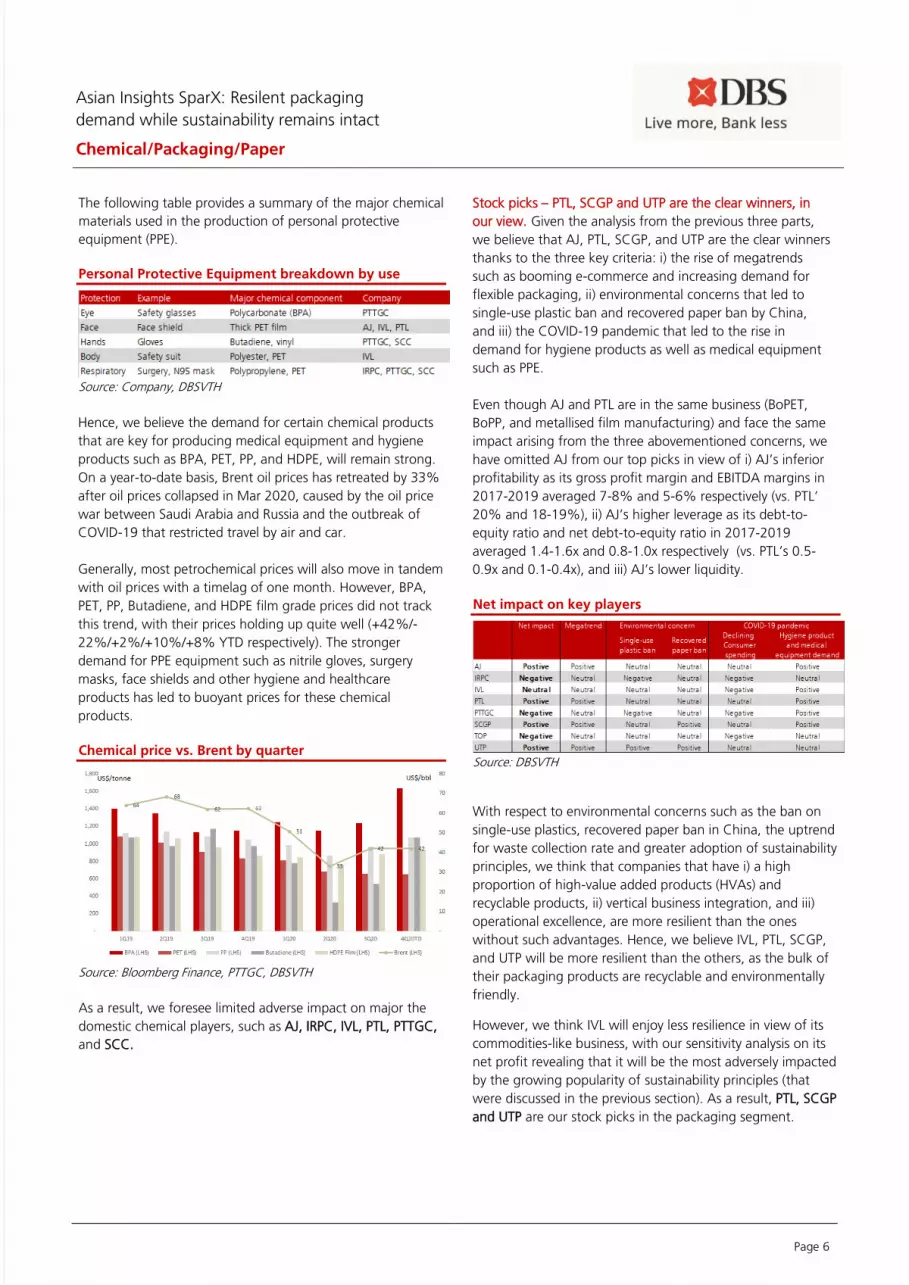
The following table provides a summary of the major chemical
materials used in the production of personal protective
equipment (PPE).
Personal Protective Equipment breakdown by use
Source: Company, DBSVTH
Hence, we believe the demand for certain chemical products
that are key for producing medical equipment and hygiene
products such as BPA, PET, PP, and HDPE, will remain strong.
On a year-to-date basis, Brent oil prices has retreated by 33%
after oil prices collapsed in Mar 2020, caused by the oil price
war between Saudi Arabia and Russia and the outbreak of
COVID-19 that restricted travel by air and car.
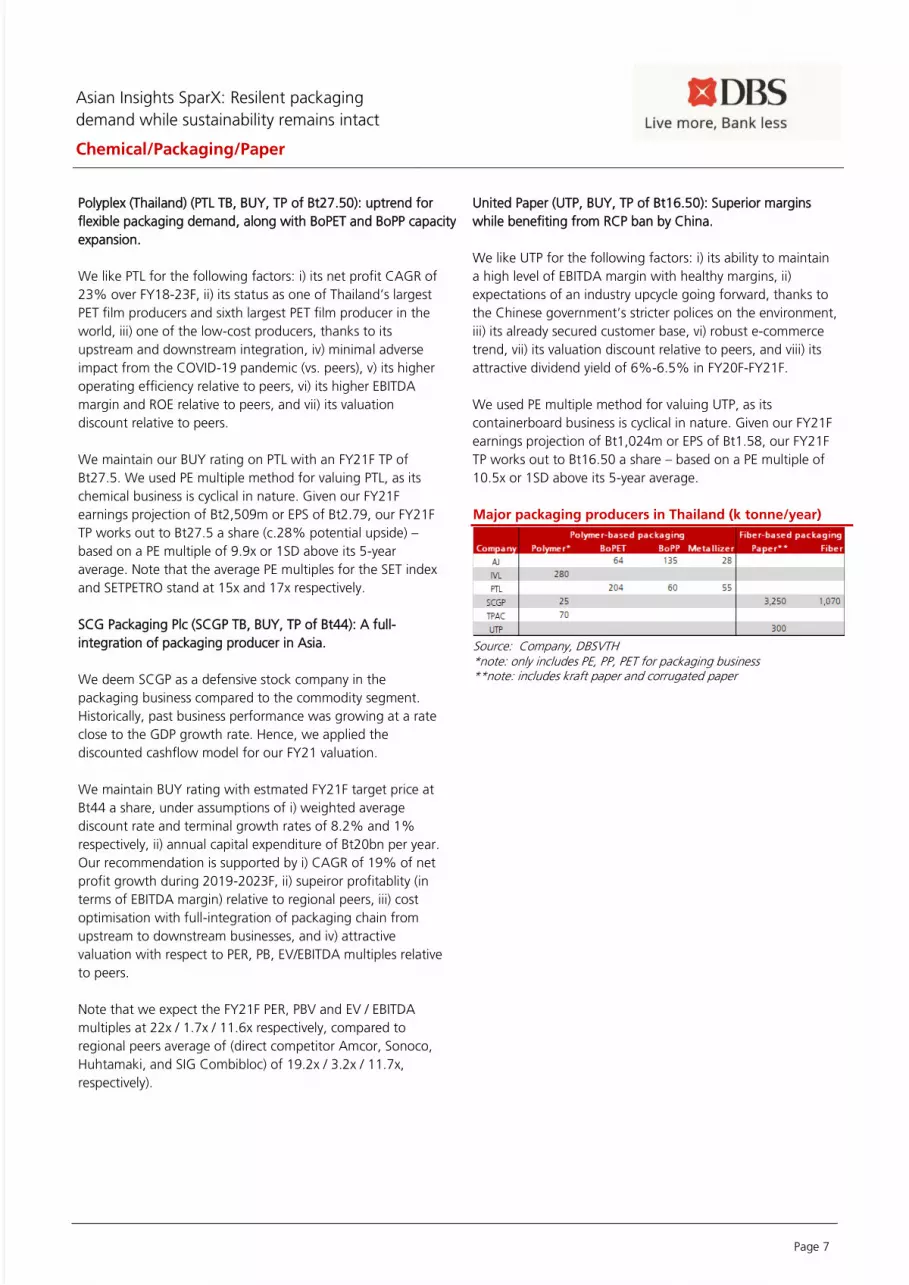
Generally, most petrochemical prices will also move in tandem
with oil prices with a timelag of one month. However, BPA,
PET, PP, Butadiene, and HDPE film grade prices did not track
this trend, with their prices holding up quite well (+42%/-
22%/+2%/+10%/+8% YTD respectively). The stronger
demand for PPE equipment such as nitrile gloves, surgery
masks, face shields and other hygiene and healthcare
products has led to buoyant prices for these chemical
products.
Chemical price vs. Brent by quarter
Source: Bloomberg Finance, PTTGC, DBSVTH
As a result, we foresee limited adverse impact on major the
domestic chemical players, such as AJ, IRPC, IVL, PTL, PTTGC,
and SCC.
Stock picks – PTL, SCGP and UTP are the clear winners, in
our view. Given the analysis from the previous three parts,
we believe that AJ, PTL, SCGP, and UTP are the clear winners
thanks to the three key criteria: i) the rise of megatrends
such as booming e-commerce and increasing demand for
flexible packaging, ii) environmental concerns that led to
single-use plastic ban and recovered paper ban by China,
and iii) the COVID-19 pandemic that led to the rise in
demand for hygiene products as well as medical equipment
such as PPE.
Even though AJ and PTL are in the same business (BoPET,
BoPP, and metallised film manufacturing) and face the same
impact arising from the three abovementioned concerns, we
have omitted AJ from our top picks in view of i) AJ’s inferior
profitability as its gross profit margin and EBITDA margins in
2017-2019 averaged 7-8% and 5-6% respectively (vs. PTL’
20% and 18-19%), ii) AJ’s higher leverage as its debt-to-
equity ratio and net debt-to-equity ratio in 2017-2019
averaged 1.4-1.6x and 0.8-1.0x respectively (vs. PTL’s 0.5-
0.9x and 0.1-0.4x), and iii) AJ’s lower liquidity.
Net impact on key players
Source: DBSVTH
With respect to environmental concerns such as the ban on
single-use plastics, recovered paper ban in China, the uptrend
for waste collection rate and greater adoption of sustainability
principles, we think that companies that have i) a high
proportion of high-value added products (HVAs) and
recyclable products, ii) vertical business integration, and iii)
operational excellence, are more resilient than the ones
without such advantages. Hence, we believe IVL, PTL, SCGP,
and UTP will be more resilient than the others, as the bulk of
their packaging products are recyclable and environmentally
friendly.
However, we think IVL will enjoy less resilience in view of its
commodities-like business, with our sensitivity analysis on its
net profit revealing that it will be the most adversely impacted
by the growing popularity of sustainability principles (that
were discussed in the previous section). As a result, PTL, SCGP
and UTP are our stock picks in the packaging segment.
Asian Insights SparX: Resilent packaging
demand while sustainability remains intact
Chemical/Packaging/Paper
Page 7
Polyplex (Thailand) (PTL TB, BUY, TP of Bt27.50): uptrend for
flexible packaging demand, along with BoPET and BoPP capacity
expansion.
We like PTL for the following factors: i) its net profit CAGR of
23% over FY18-23F, ii) its status as one of Thailand’s largest
PET film producers and sixth largest PET film producer in the
world, iii) one of the low-cost producers, thanks to its
upstream and downstream integration, iv) minimal adverse
impact from the COVID-19 pandemic (vs. peers), v) its higher
operating efficiency relative to peers, vi) its higher EBITDA
margin and ROE relative to peers, and vii) its valuation
discount relative to peers.
We maintain our BUY rating on PTL with an FY21F TP of
Bt27.5. We used PE multiple method for valuing PTL, as its
chemical business is cyclical in nature. Given our FY21F
earnings projection of Bt2,509m or EPS of Bt2.79, our FY21F
TP works out to Bt27.5 a share (c.28% potential upside) –
based on a PE multiple of 9.9x or 1SD above its 5-year
average. Note that the average PE multiples for the SET index
and SETPETRO stand at 15x and 17x respectively.
SCG Packaging Plc (SCGP TB, BUY, TP of Bt44): A full-
integration of packaging producer in Asia.
We deem SCGP as a defensive stock company in the
packaging business compared to the commodity segment.
Historically, past business performance was growing at a rate
close to the GDP growth rate. Hence, we applied the
discounted cashflow model for our FY21 valuation.
We maintain BUY rating with estmated FY21F target price at
Bt44 a share, under assumptions of i) weighted average
discount rate and terminal growth rates of 8.2% and 1%
respectively, ii) annual capital expenditure of Bt20bn per year.
Our recommendation is supported by i) CAGR of 19% of net
profit growth during 2019-2023F, ii) supeiror profitablity (in
terms of EBITDA margin) relative to regional peers, iii) cost
optimisation with full-integration of packaging chain from
upstream to downstream businesses, and iv) attractive
valuation with respect to PER, PB, EV/EBITDA multiples relative
to peers.
Note that we expect the FY21F PER, PBV and EV / EBITDA
multiples at 22x / 1.7x / 11.6x respectively, compared to
regional peers average of (direct competitor Amcor, Sonoco,
Huhtamaki, and SIG Combibloc) of 19.2x / 3.2x / 11.7x,
respectively).
United Paper (UTP, BUY, TP of Bt16.50): Superior margins
while benefiting from RCP ban by China.
We like UTP for the following factors: i) its ability to maintain
a high level of EBITDA margin with healthy margins, ii)
expectations of an industry upcycle going forward, thanks to
the Chinese government’s stricter polices on the environment,
iii) its already secured customer base, vi) robust e-commerce
trend, vii) its valuation discount relative to peers, and viii) its
attractive dividend yield of 6%-6.5% in FY20F-FY21F.
We used PE multiple method for valuing UTP, as its
containerboard business is cyclical in nature. Given our FY21F
earnings projection of Bt1,024m or EPS of Bt1.58, our FY21F
TP works out to Bt16.50 a share – based on a PE multiple of
10.5x or 1SD above its 5-year average.
Major packaging producers in Thailand (k tonne/year)
Source: Company, DBSVTH *note: only includes PE, PP, PET for packaging business **note: includes kraft paper and corrugated paper
Asian Insights SparX: Resilent packaging
demand while sustainability remains intact
Chemical/Packaging/Paper
Page 8
What is packaging?
Our daily-life activities involve the use of packaging for
essential household items (toothpaste tube, soap and
shampoo bottles, sanitizer bottles, etc.), food packaging and
cutlery (cup, straw, food ware, etc.), food preservation and
lifespan extension, and product containers (delivery boxes,
paper cushion, etc.). Generally, there are three types of
packaging, as follows:
i) Primary packaging – a packaging material, such as flexible
and rigid plastic in food and beverage and homecare
segments, is used for wrapping or enclosing goods and
products and is the innermost packaging closest to the
product itself such as a snack bag, yogurt cup, or any
packaging that has direct contact with the product.
ii) Secondary packaging – a packaging material, such as
folding carton, is used for product display and holds the
primary packaging together for protection purpose.
iii) Tertiary packaging – a packaging material, such as
corrugated containers, paper pallets, and corner guards in
the e-commerce and electronic segments, is designed to
hold the weight of products and to protect from damage
during storage and transportation.
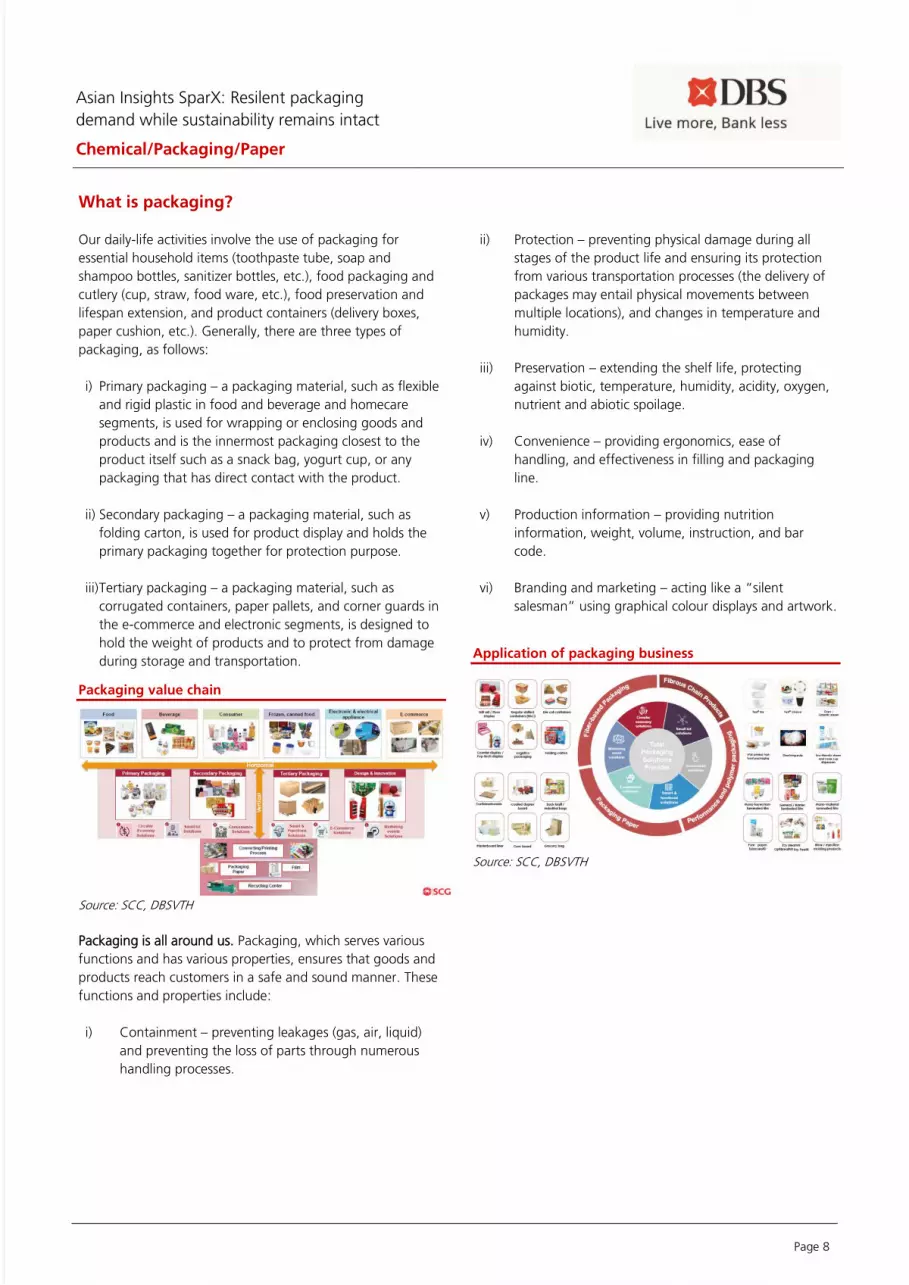
Packaging value chain
Source: SCC, DBSVTH
Packaging is all around us. Packaging, which serves various
functions and has various properties, ensures that goods and
products reach customers in a safe and sound manner. These
functions and properties include:
i) Containment – preventing leakages (gas, air, liquid)
and preventing the loss of parts through numerous
handling processes.
ii) Protection – preventing physical damage during all
stages of the product life and ensuring its protection
from various transportation processes (the delivery of
packages may entail physical movements between
multiple locations), and changes in temperature and
humidity.
iii) Preservation – extending the shelf life, protecting
against biotic, temperature, humidity, acidity, oxygen,
nutrient and abiotic spoilage.
iv) Convenience – providing ergonomics, ease of
handling, and effectiveness in filling and packaging
line.
v) Production information – providing nutrition
information, weight, volume, instruction, and bar
code.
vi) Branding and marketing – acting like a “silent
salesman” using graphical colour displays and artwork.
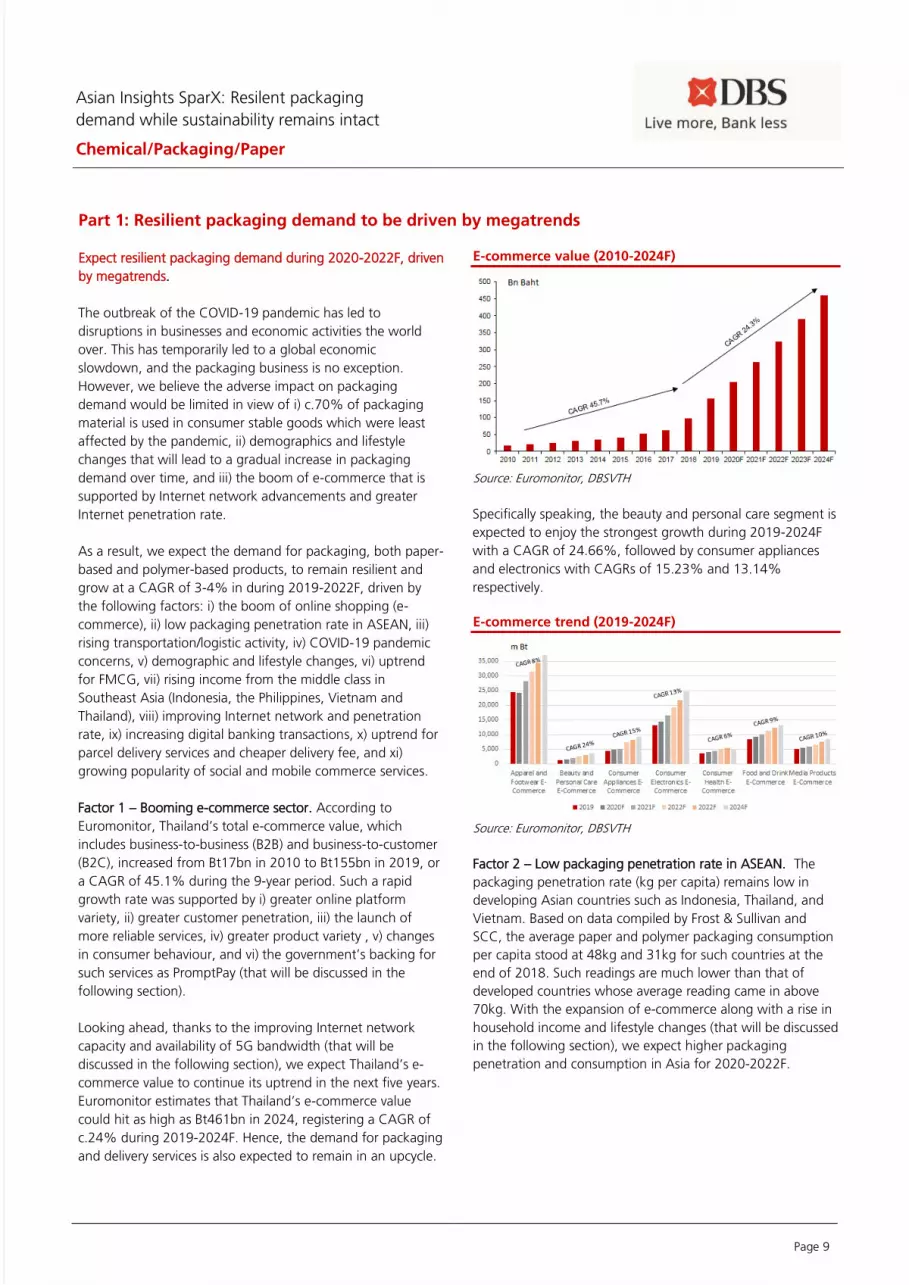
Application of packaging business
Source: SCC, DBSVTH
Asian Insights SparX: Resilent packaging
demand while sustainability remains intact
Chemical/Packaging/Paper
Page 9
Part 1: Resilient packaging demand to be driven by megatrends
Expect resilient packaging demand during 2020-2022F, driven
by megatrends.
The outbreak of the COVID-19 pandemic has led to
disruptions in businesses and economic activities the world
over. This has temporarily led to a global economic
slowdown, and the packaging business is no exception.
However, we believe the adverse impact on packaging
demand would be limited in view of i) c.70% of packaging
material is used in consumer stable goods which were least
affected by the pandemic, ii) demographics and lifestyle
changes that will lead to a gradual increase in packaging
demand over time, and iii) the boom of e-commerce that is
supported by Internet network advancements and greater
Internet penetration rate.
As a result, we expect the demand for packaging, both paper-
based and polymer-based products, to remain resilient and
grow at a CAGR of 3-4% in during 2019-2022F, driven by
the following factors: i) the boom of online shopping (e-
commerce), ii) low packaging penetration rate in ASEAN, iii)
rising transportation/logistic activity, iv) COVID-19 pandemic
concerns, v) demographic and lifestyle changes, vi) uptrend
for FMCG, vii) rising income from the middle class in
Southeast Asia (Indonesia, the Philippines, Vietnam and
Thailand), viii) improving Internet network and penetration
rate, ix) increasing digital banking transactions, x) uptrend for
parcel delivery services and cheaper delivery fee, and xi)
growing popularity of social and mobile commerce services.
Factor 1 – Booming e-commerce sector. According to
Euromonitor, Thailand’s total e-commerce value, which
includes business-to-business (B2B) and business-to-customer
(B2C), increased from Bt17bn in 2010 to Bt155bn in 2019, or
a CAGR of 45.1% during the 9-year period. Such a rapid
growth rate was supported by i) greater online platform
variety, ii) greater customer penetration, iii) the launch of
more reliable services, iv) greater product variety , v) changes
in consumer behaviour, and vi) the government’s backing for
such services as PromptPay (that will be discussed in the
following section).
Looking ahead, thanks to the improving Internet network
capacity and availability of 5G bandwidth (that will be
discussed in the following section), we expect Thailand’s e-
commerce value to continue its uptrend in the next five years.
Euromonitor estimates that Thailand’s e-commerce value
could hit as high as Bt461bn in 2024, registering a CAGR of
c.24% during 2019-2024F. Hence, the demand for packaging
and delivery services is also expected to remain in an upcycle.
E-commerce value (2010-2024F)
Source: Euromonitor, DBSVTH
Specifically speaking, the beauty and personal care segment is
expected to enjoy the strongest growth during 2019-2024F
with a CAGR of 24.66%, followed by consumer appliances
and electronics with CAGRs of 15.23% and 13.14%
respectively.
E-commerce trend (2019-2024F)
Source: Euromonitor, DBSVTH
Factor 2 – Low packaging penetration rate in ASEAN. The
packaging penetration rate (kg per capita) remains low in
developing Asian countries such as Indonesia, Thailand, and
Vietnam. Based on data compiled by Frost & Sullivan and
SCC, the average paper and polymer packaging consumption
per capita stood at 48kg and 31kg for such countries at the
end of 2018. Such readings are much lower than that of
developed countries whose average reading came in above
70kg. With the expansion of e-commerce along with a rise in
household income and lifestyle changes (that will be discussed
in the following section), we expect higher packaging
penetration and consumption in Asia for 2020-2022F.

Asian Insights SparX: Resilent packaging
demand while sustainability remains intact
Chemical/Packaging/Paper
Page 10
Packaging penetration rate as of 2018
Source: Frost & Sullivan, SCC, DBSVTH
According to a Frost and Sullivan report, consumption per
capita of containerboard packaging in developing countries is
still very low as compared to the matured markets, e.g.
Thailand’s consumption of containerboard is only 48 per
kg/person/year compared to South Korea’s 91 per
kg/person/year.
Containerbord comsumption by countries (as of 2019)
Source: Frost and Sullivan, DBSVTH
Factor 3 – Rise in transportation/logistic activities. Over 2015-
2018, total transported goods, both domestically and
internationally, increased from c.804m tonnes in 2015 to
c.962m tonnes in 2018, or a CAGR of c.4.6%, with rapid
growth of 6-8% seen during 2017-2018. Such growth was
driven by a rise in demand for consumer staple goods,
agricultural products, electronic devices, and construction
materials. Additionally, this was also supported by increasing
demand for door-to-door delivery services that was in tandem
with the growing e-commerce business.
Logistics activities (2015-2018)
Source: NESDC, DBSVTH
Moreover, the logistics business for e-commerce posted a
solid CAGR of 26% over 2015-2017, rising from Bt64.1bn in
2015 to Bt126bn in 2017. Such growth was driven by i)
Alibaba and Jingdong’s (JD) logistics developments, and ii)
increasing delivery activities by Thailand Post, Lazada, Kerry
and Sokochan. Hence, we also expect the uptrend to
continue in the near future.
E-commerce value of the logistics business (2015-2018)
Source: NESDC, DBSVTH
Factor 4 – COVID-19 pandemic concerns. We believe the
impact on packaging demand and supply from the outbreak
of COVID-19 pandemic is mixed, depending on the product
segment and portfolio position of the packaging players.
However, we think the high demand for food, grocery,
healthcare products, personal-care products, food delivery
and e-commerce transportation will continue, as COVID-19
has turned out to be a hard-to-contain virus with second
waves appearing in many countries. Based on the data
compiled by Mckinsey, the online sales of grocery and fresh
food in China doubled within a 10-day period in Jan 2020,
during the early stages of the outbreak. Hence, demand was
high for packaging materials such as corrugated paper,
flexible, and rigid plastic. On the other hand, demand for
packaging materials for the industrial, luxury, alcohol and
business-to-business (B2B) segments such as bulk and
91
87
73
70
48
35
22
15
11
0 20 40 60 80 100
South Korea
USA
Germany
Japan
Thailand
China
Vietnam
Indonesia
Philiphine
kg/person/year
Asian Insights SparX: Resilent packaging
demand while sustainability remains intact
Chemical/Packaging/Paper
Page 11
transportation packaging could see a downward trend, as the
demand for such segments is highly correlated with the
domestic GDP performance. Note that the Bank of Thailand
(BOT) has revised down Thailand’s 2020F GDP growth
forecast to -8.1% in June 2020.
Thailand GDP growth rate (2010-2020F)
Source: BOT, DBSVTH
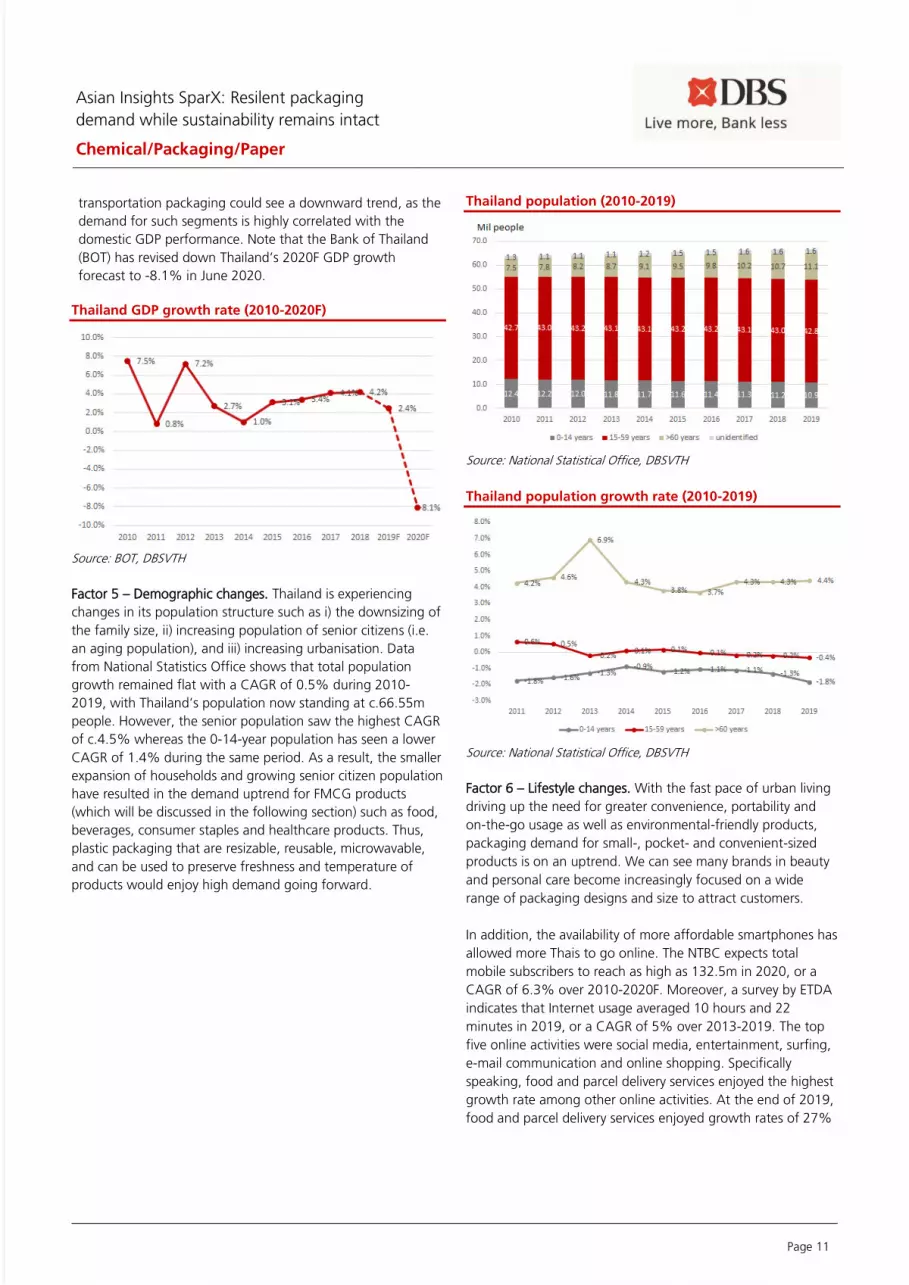
Factor 5 – Demographic changes. Thailand is experiencing
changes in its population structure such as i) the downsizing of
the family size, ii) increasing population of senior citizens (i.e.
an aging population), and iii) increasing urbanisation. Data
from National Statistics Office shows that total population
growth remained flat with a CAGR of 0.5% during 2010-
2019, with Thailand’s population now standing at c.66.55m
people. However, the senior population saw the highest CAGR
of c.4.5% whereas the 0-14-year population has seen a lower
CAGR of 1.4% during the same period. As a result, the smaller
expansion of households and growing senior citizen population
have resulted in the demand uptrend for FMCG products
(which will be discussed in the following section) such as food,
beverages, consumer staples and healthcare products. Thus,
plastic packaging that are resizable, reusable, microwavable,
and can be used to preserve freshness and temperature of
products would enjoy high demand going forward.
Thailand population (2010-2019)
Source: National Statistical Office, DBSVTH
Thailand population growth rate (2010-2019)
Source: National Statistical Office, DBSVTH
Factor 6 – Lifestyle changes. With the fast pace of urban living
driving up the need for greater convenience, portability and
on-the-go usage as well as environmental-friendly products,
packaging demand for small-, pocket- and convenient-sized
products is on an uptrend. We can see many brands in beauty
and personal care become increasingly focused on a wide
range of packaging designs and size to attract customers.
In addition, the availability of more affordable smartphones has
allowed more Thais to go online. The NTBC expects total
mobile subscribers to reach as high as 132.5m in 2020, or a
CAGR of 6.3% over 2010-2020F. Moreover, a survey by ETDA
indicates that Internet usage averaged 10 hours and 22
minutes in 2019, or a CAGR of 5% over 2013-2019. The top
five online activities were social media, entertainment, surfing,
e-mail communication and online shopping. Specifically
speaking, food and parcel delivery services enjoyed the highest
growth rate among other online activities. At the end of 2019,
food and parcel delivery services enjoyed growth rates of 27%

Asian Insights SparX: Resilent packaging
demand while sustainability remains intact
Chemical/Packaging/Paper
Page 12
y-o-y and 20% y-o-y respectively. Hence, we expect such solid
growth to continue, on the back of COVID-19.
Thailand’s mobile subscribers (2010-2020F)
Source: NBTC, DBSVTH
Mobile usage per day (2013-2019)
Source: ETDA, DBSVTH
Growth of top five online activities (2018-2019)
Source: ETDA, DBSVTH
Factor 7 – Growing FMCG trend. Consumer goods are
products purchased for consumption by the average
consumer. They are divided into three different categories:
durable, non-durable goods, and services. Durable goods
have a shelf life of three years or more while non-durable
goods have a shelf life of less than one year. FMCGs – a.k.a.
packaged consumer goods – form the largest segment of
consumer goods. They fall into the non-durable category, as
they are consumed immediately and have a short shelf life
(source: Investopedia). FMCGs are purchased frequently on a
daily basis, consumed rapidly, priced affordably and sold in
large quantities, and have low cost of production. They also
have a high turnover and will not stay long on store shelves.
They can be categorised in the following broad segments: i)
processed foods, ii) ready-to-eat meals, iii) beverages, iv)
groceries, v) frozen and dry foods, and vi) home-care
products.
Since FMCGs are mostly substitute products and have low
cost of production, the major manufacturers such as Coca-
Cola, Pepsi, Unilever, Procter & Gamble (P&G), Nestlé,
Johnson & Johnson, L’Oreal, Colgate, and Ajinomoto, need to
differentiate their products to gain market share at the
expense of their competitors.
Hence, we believe packaging formats will play an important
role in the production process as well as marketing campaigns
of the FMCG companies. Generally, logistics and distribution
systems often require secondary and tertiary packaging to
maximise efficiency, whereas attractive product displays and
pleasant user experience can also play a key role in selling
products. The unit pack or primary package is critical for
product protection and shelf life, and also provides
information and sales incentives to consumers.
Different types of packaging
Source: SCC, DBSVTH
Asian Insights SparX: Resilent packaging
demand while sustainability remains intact
Chemical/Packaging/Paper
Page 13
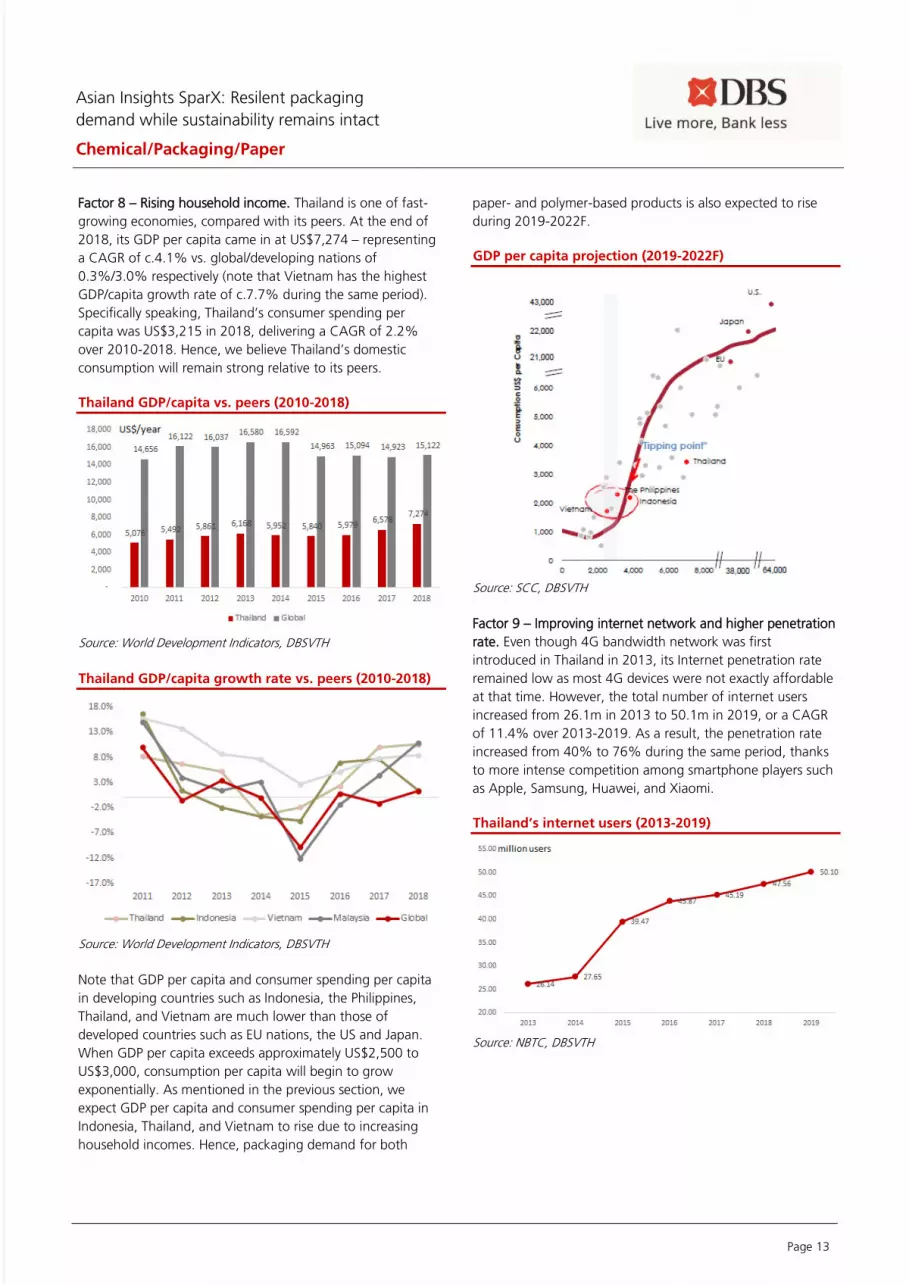
Factor 8 – Rising household income. Thailand is one of fast-
growing economies, compared with its peers. At the end of
2018, its GDP per capita came in at US$7,274 – representing
a CAGR of c.4.1% vs. global/developing nations of
0.3%/3.0% respectively (note that Vietnam has the highest
GDP/capita growth rate of c.7.7% during the same period).
Specifically speaking, Thailand’s consumer spending per
capita was US$3,215 in 2018, delivering a CAGR of 2.2%
over 2010-2018. Hence, we believe Thailand’s domestic
consumption will remain strong relative to its peers.
Thailand GDP/capita vs. peers (2010-2018)
Source: World Development Indicators, DBSVTH
Thailand GDP/capita growth rate vs. peers (2010-2018)
Source: World Development Indicators, DBSVTH
Note that GDP per capita and consumer spending per capita
in developing countries such as Indonesia, the Philippines,
Thailand, and Vietnam are much lower than those of
developed countries such as EU nations, the US and Japan.
When GDP per capita exceeds approximately US$2,500 to
US$3,000, consumption per capita will begin to grow
exponentially. As mentioned in the previous section, we
expect GDP per capita and consumer spending per capita in
Indonesia, Thailand, and Vietnam to rise due to increasing
household incomes. Hence, packaging demand for both
paper- and polymer-based products is also expected to rise
during 2019-2022F.
GDP per capita projection (2019-2022F)
Source: SCC, DBSVTH
Factor 9 – Improving internet network and higher penetration
rate. Even though 4G bandwidth network was first
introduced in Thailand in 2013, its Internet penetration rate
remained low as most 4G devices were not exactly affordable
at that time. However, the total number of internet users
increased from 26.1m in 2013 to 50.1m in 2019, or a CAGR
of 11.4% over 2013-2019. As a result, the penetration rate
increased from 40% to 76% during the same period, thanks
to more intense competition among smartphone players such
as Apple, Samsung, Huawei, and Xiaomi.
Thailand’s internet users (2013-2019)
Source: NBTC, DBSVTH
Asian Insights SparX: Resilent packaging
demand while sustainability remains intact
Chemical/Packaging/Paper
Page 14
In addition, we expect online shopping activities and
packaging demand to continue enjoying strong growth, as
the latest 5G bandwidth technology will enter the
commercialisation stage nationwide by the end of 2020F. This
technology could give rise to a safer online shopping
experience as well as cost savings arising from the use of
drones for logistics and delivery. Consumers will also get to
experience new online shopping platforms with 4K 360-
degree live video streaming, which bodes well for e-
commerce sales volume and revenue. Thus, demand for
packaging will also rise on the back of improving Internet
network capability.
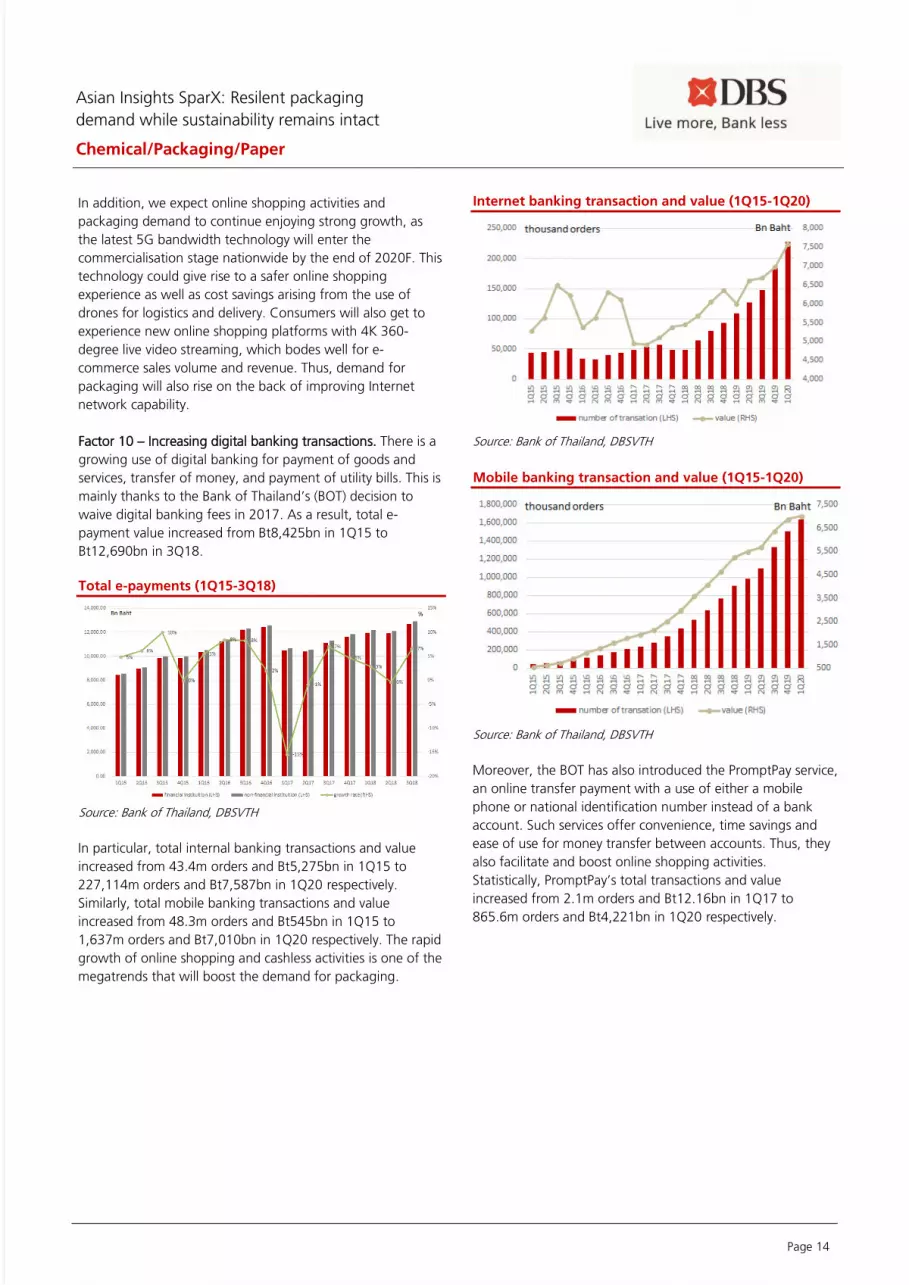
Factor 10 – Increasing digital banking transactions. There is a
growing use of digital banking for payment of goods and
services, transfer of money, and payment of utility bills. This is
mainly thanks to the Bank of Thailand’s (BOT) decision to
waive digital banking fees in 2017. As a result, total e-
payment value increased from Bt8,425bn in 1Q15 to
Bt12,690bn in 3Q18.
Total e-payments (1Q15-3Q18)
Source: Bank of Thailand, DBSVTH
In particular, total internal banking transactions and value
increased from 43.4m orders and Bt5,275bn in 1Q15 to
227,114m orders and Bt7,587bn in 1Q20 respectively.
Similarly, total mobile banking transactions and value
increased from 48.3m orders and Bt545bn in 1Q15 to
1,637m orders and Bt7,010bn in 1Q20 respectively. The rapid
growth of online shopping and cashless activities is one of the
megatrends that will boost the demand for packaging.
Internet banking transaction and value (1Q15-1Q20)
Source: Bank of Thailand, DBSVTH
Mobile banking transaction and value (1Q15-1Q20)
Source: Bank of Thailand, DBSVTH
Moreover, the BOT has also introduced the PromptPay service,
an online transfer payment with a use of either a mobile
phone or national identification number instead of a bank
account. Such services offer convenience, time savings and
ease of use for money transfer between accounts. Thus, they
also facilitate and boost online shopping activities.
Statistically, PromptPay’s total transactions and value
increased from 2.1m orders and Bt12.16bn in 1Q17 to
865.6m orders and Bt4,221bn in 1Q20 respectively.
Asian Insights SparX: Resilent packaging
demand while sustainability remains intact
Chemical/Packaging/Paper
Page 15
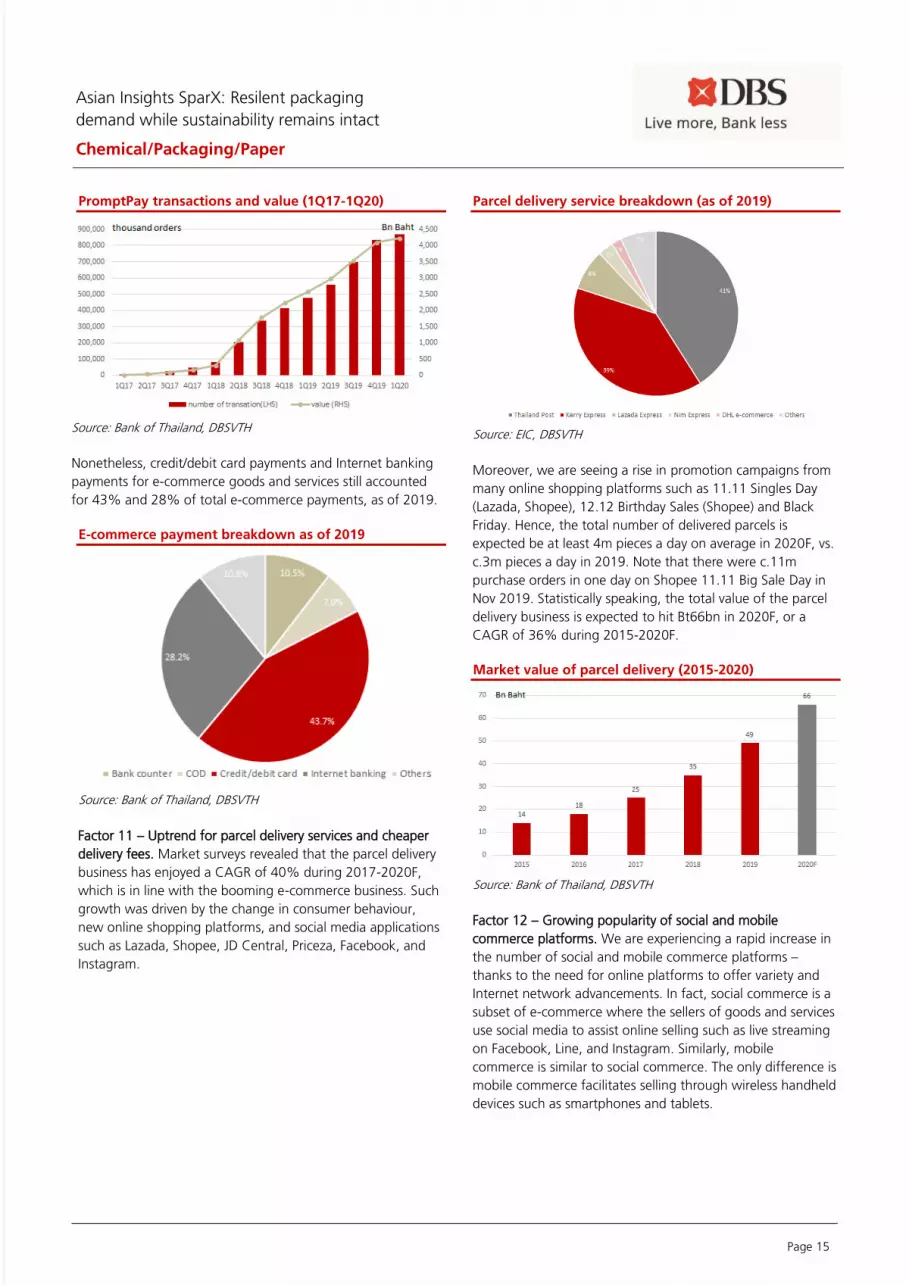
PromptPay transactions and value (1Q17-1Q20)
Source: Bank of Thailand, DBSVTH
Nonetheless, credit/debit card payments and Internet banking
payments for e-commerce goods and services still accounted
for 43% and 28% of total e-commerce payments, as of 2019.
E-commerce payment breakdown as of 2019
Source: Bank of Thailand, DBSVTH
Factor 11 – Uptrend for parcel delivery services and cheaper
delivery fees. Market surveys revealed that the parcel delivery
business has enjoyed a CAGR of 40% during 2017-2020F,
which is in line with the booming e-commerce business. Such
growth was driven by the change in consumer behaviour,
new online shopping platforms, and social media applications
such as Lazada, Shopee, JD Central, Priceza, Facebook, and
Instagram.
Parcel delivery service breakdown (as of 2019)
Source: EIC, DBSVTH
Moreover, we are seeing a rise in promotion campaigns from
many online shopping platforms such as 11.11 Singles Day
(Lazada, Shopee), 12.12 Birthday Sales (Shopee) and Black
Friday. Hence, the total number of delivered parcels is
expected be at least 4m pieces a day on average in 2020F, vs.
c.3m pieces a day in 2019. Note that there were c.11m
purchase orders in one day on Shopee 11.11 Big Sale Day in
Nov 2019. Statistically speaking, the total value of the parcel
delivery business is expected to hit Bt66bn in 2020F, or a
CAGR of 36% during 2015-2020F.
Market value of parcel delivery (2015-2020)
Source: Bank of Thailand, DBSVTH
Factor 12 – Growing popularity of social and mobile
commerce platforms. We are experiencing a rapid increase in
the number of social and mobile commerce platforms –
thanks to the need for online platforms to offer variety and
Internet network advancements. In fact, social commerce is a
subset of e-commerce where the sellers of goods and services
use social media to assist online selling such as live streaming
on Facebook, Line, and Instagram. Similarly, mobile
commerce is similar to social commerce. The only difference is
mobile commerce facilitates selling through wireless handheld
devices such as smartphones and tablets.
Asian Insights SparX: Resilent packaging
demand while sustainability remains intact
Chemical/Packaging/Paper
Page 16
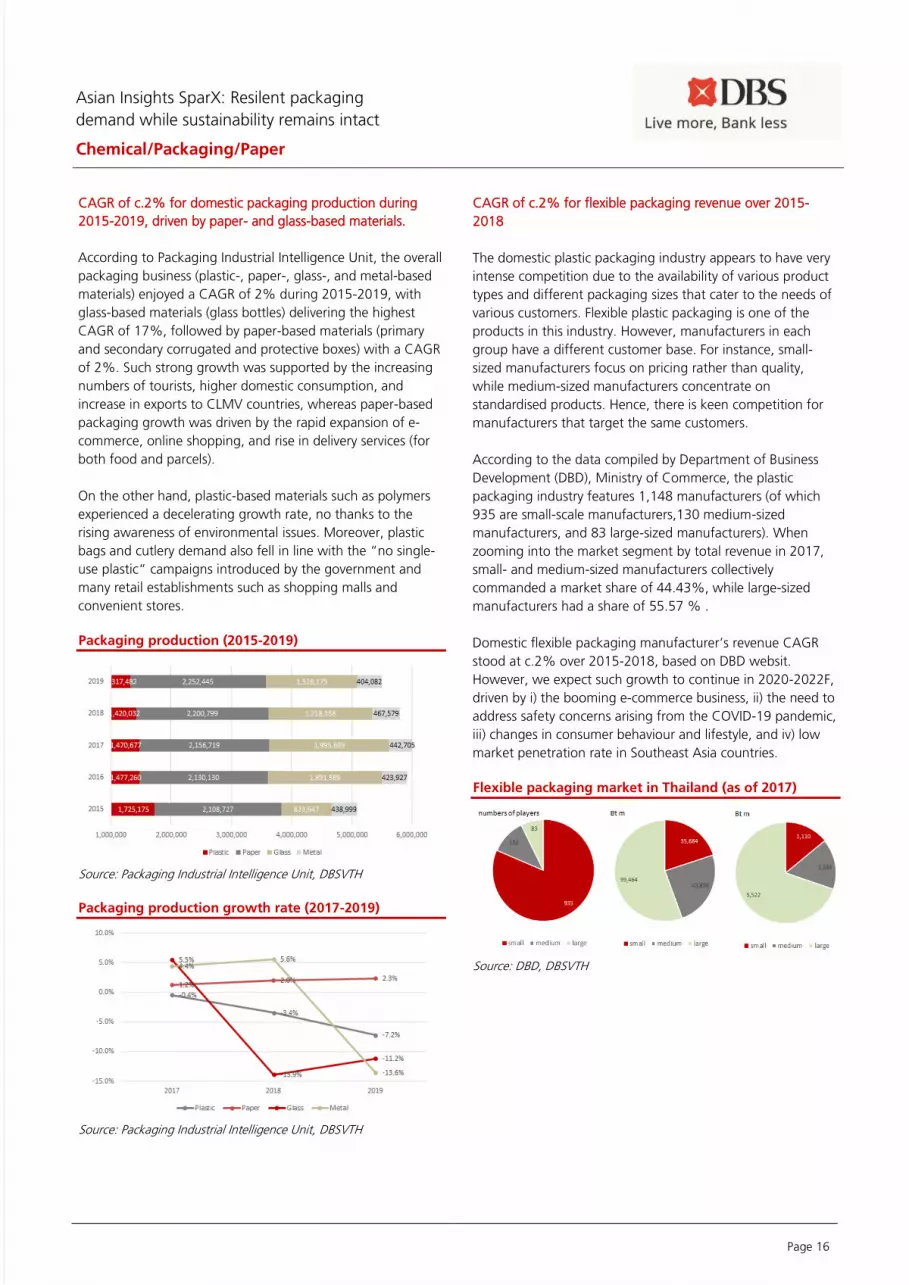
CAGR of c.2% for domestic packaging production during
2015-2019, driven by paper- and glass-based materials.
According to Packaging Industrial Intelligence Unit, the overall
packaging business (plastic-, paper-, glass-, and metal-based
materials) enjoyed a CAGR of 2% during 2015-2019, with
glass-based materials (glass bottles) delivering the highest
CAGR of 17%, followed by paper-based materials (primary
and secondary corrugated and protective boxes) with a CAGR
of 2%. Such strong growth was supported by the increasing
numbers of tourists, higher domestic consumption, and
increase in exports to CLMV countries, whereas paper-based
packaging growth was driven by the rapid expansion of e-
commerce, online shopping, and rise in delivery services (for
both food and parcels).
On the other hand, plastic-based materials such as polymers
experienced a decelerating growth rate, no thanks to the
rising awareness of environmental issues. Moreover, plastic
bags and cutlery demand also fell in line with the “no single-
use plastic“ campaigns introduced by the government and
many retail establishments such as shopping malls and
convenient stores.
Packaging production (2015-2019)
Source: Packaging Industrial Intelligence Unit, DBSVTH
Packaging production growth rate (2017-2019)
Source: Packaging Industrial Intelligence Unit, DBSVTH
CAGR of c.2% for flexible packaging revenue over 2015-
2018
The domestic plastic packaging industry appears to have very
intense competition due to the availability of various product
types and different packaging sizes that cater to the needs of
various customers. Flexible plastic packaging is one of the
products in this industry. However, manufacturers in each
group have a different customer base. For instance, small-
sized manufacturers focus on pricing rather than quality,
while medium-sized manufacturers concentrate on
standardised products. Hence, there is keen competition for
manufacturers that target the same customers.
According to the data compiled by Department of Business
Development (DBD), Ministry of Commerce, the plastic
packaging industry features 1,148 manufacturers (of which
935 are small-scale manufacturers,130 medium-sized
manufacturers, and 83 large-sized manufacturers). When
zooming into the market segment by total revenue in 2017,
small- and medium-sized manufacturers collectively
commanded a market share of 44.43%, while large-sized
manufacturers had a share of 55.57 % .
Domestic flexible packaging manufacturer’s revenue CAGR
stood at c.2% over 2015-2018, based on DBD websit.
However, we expect such growth to continue in 2020-2022F,
driven by i) the booming e-commerce business, ii) the need to
address safety concerns arising from the COVID-19 pandemic,
iii) changes in consumer behaviour and lifestyle, and iv) low
market penetration rate in Southeast Asia countries.
Flexible packaging market in Thailand (as of 2017)
Source: DBD, DBSVTH
Asian Insights SparX: Resilent packaging
demand while sustainability remains intact
Chemical/Packaging/Paper
Page 17
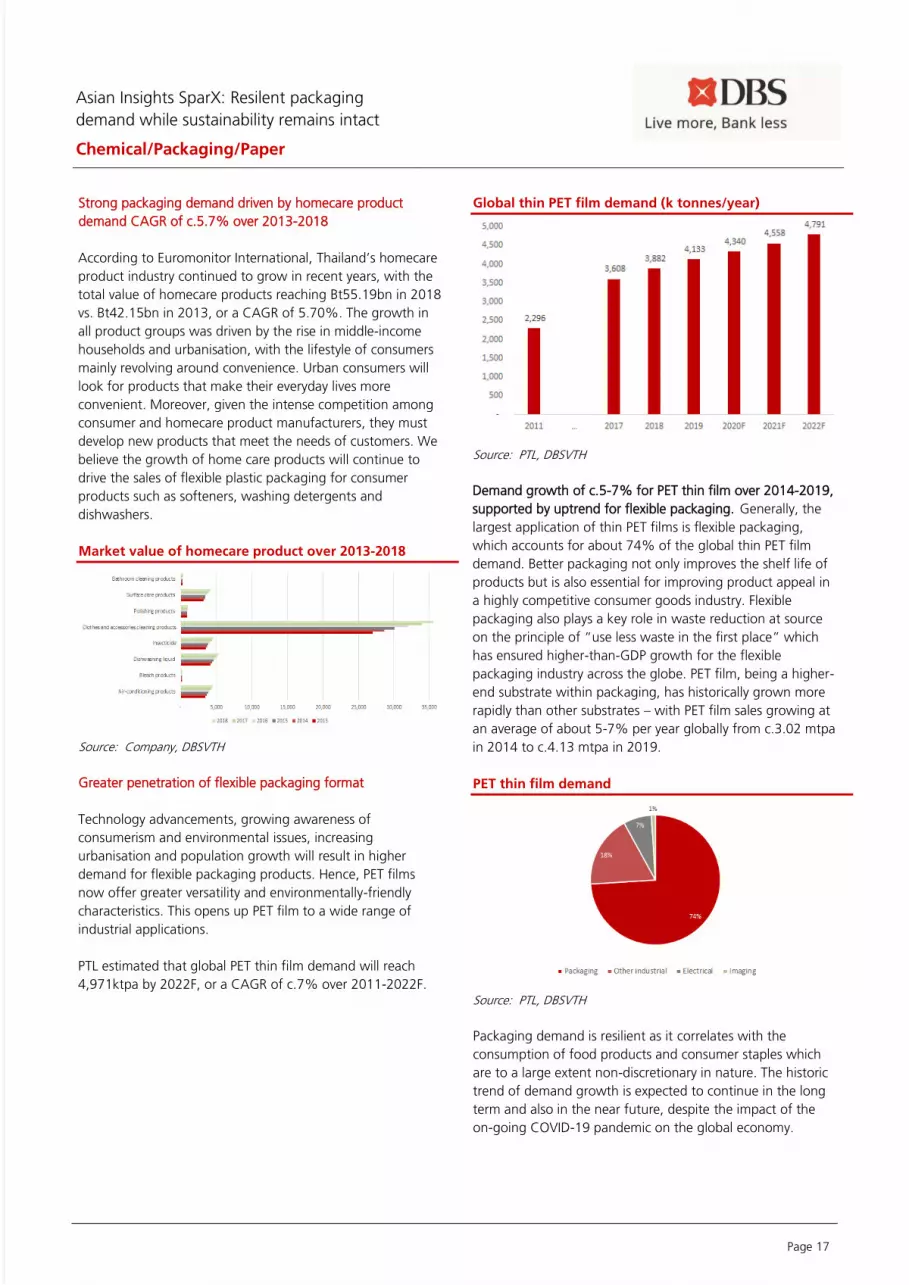
Strong packaging demand driven by homecare product
demand CAGR of c.5.7% over 2013-2018
According to Euromonitor International, Thailand’s homecare
product industry continued to grow in recent years, with the
total value of homecare products reaching Bt55.19bn in 2018
vs. Bt42.15bn in 2013, or a CAGR of 5.70%. The growth in
all product groups was driven by the rise in middle-income
households and urbanisation, with the lifestyle of consumers
mainly revolving around convenience. Urban consumers will
look for products that make their everyday lives more
convenient. Moreover, given the intense competition among
consumer and homecare product manufacturers, they must
develop new products that meet the needs of customers. We
believe the growth of home care products will continue to
drive the sales of flexible plastic packaging for consumer
products such as softeners, washing detergents and
dishwashers.
Market value of homecare product over 2013-2018
Source: Company, DBSVTH
Greater penetration of flexible packaging format
Technology advancements, growing awareness of
consumerism and environmental issues, increasing
urbanisation and population growth will result in higher
demand for flexible packaging products. Hence, PET films
now offer greater versatility and environmentally-friendly
characteristics. This opens up PET film to a wide range of
industrial applications.
PTL estimated that global PET thin film demand will reach
4,971ktpa by 2022F, or a CAGR of c.7% over 2011-2022F.
Global thin PET film demand (k tonnes/year)
Source: PTL, DBSVTH
Demand growth of c.5-7% for PET thin film over 2014-2019,
supported by uptrend for flexible packaging. Generally, the
largest application of thin PET films is flexible packaging,
which accounts for about 74% of the global thin PET film
demand. Better packaging not only improves the shelf life of
products but is also essential for improving product appeal in
a highly competitive consumer goods industry. Flexible
packaging also plays a key role in waste reduction at source
on the principle of “use less waste in the first place” which
has ensured higher-than-GDP growth for the flexible
packaging industry across the globe. PET film, being a higher-
end substrate within packaging, has historically grown more
rapidly than other substrates – with PET film sales growing at
an average of about 5-7% per year globally from c.3.02 mtpa
in 2014 to c.4.13 mtpa in 2019.
PET thin film demand
Source: PTL, DBSVTH
Packaging demand is resilient as it correlates with the
consumption of food products and consumer staples which
are to a large extent non-discretionary in nature. The historic
trend of demand growth is expected to continue in the long
term and also in the near future, despite the impact of the
on-going COVID-19 pandemic on the global economy.

Asian Insights SparX: Resilent packaging
demand while sustainability remains intact
Chemical/Packaging/Paper
Page 18
Demand growth of c.4-5% for PET thick films over 2014-
2019. Electrical and Industrial are the key segments in the PET
thick film industry. During 2014-2019, PET thick film demand
has been growing at a CAGR of about 4-5%. New
innovations and usage new applications in the electrical
segments (like flat screen panels, PV solar cells, etc.) have
been driving the growth in the past and would help this
industry to continue to grow at a healthy CAGR of about 4-
6% in the long term, although there is a temporary
contraction in demand due to the impact of COVID-19.
PET thick film global demand
Source: PTL, DBSVTH
Uptrend for flexible packaging demand that will unleash
higher value added
Currently, Thailand is importing plastic film packaging such as
plastic bags with aseptic aluminium lining that have high
value (due to demographics and lifestyle changes as
mentioned in the previous sections) while exporting
fundamental plastic goods including plastic carrier bags with
low added value. Therefore, when comparing the value of
plastic per tonne against plastic exporters in Asia, which are
China, Korea, Vietnam, Taiwan, Indonesia, and Japan,
Thailand is severely disadvantaged in the value of plastic
packaging per tonne. Thus, we believe there is an opportunity
for producers to develop the market for a plastic film that can
be used for flexible plastic packaging that will enjoy high
demand both domestically and internationally.
Based on the data collected by Packaging Intelligence Unit,
the amount of imported and exported plastic packaging
materials enjoyed CAGRs of 7% and 4% during 2013-2019.
This confirms our view that demand for flexible, reusable and
microwavable packaging that can be used to preserve
freshness and temperature of products, is on an uptrend.
Import/export of plastic packaging materials (2013-2019)
Source: Packaging Industrial Intelligence Unit, DBSVTH
Key listed domestic packaging players
AJ Plast Plc – (AJ TB) - AJ is a bi-axially-oriented film
manufacturer (BoPET, BoPP, and BoPA) that meets world-class
quality and standards, and ensures customer satisfaction via
its experience, innovations and advanced technologies. It has
a production capacity of 261,000 tonnes per year.
Indorama Ventures Plc (IVL TB, HOLD, TP of Bt24) – IVL is a
vertically integrated chemical player in the aromatics (PX, PTA,
PET) and olefins (EO, EG, IPA, MEG, MTBE) businesses. IVL has
an effective PET capacity of 12.05 mtpa, which is used to
produce a wide range range of products such as polyester,
PET bottle, specialty chemical, packaging (c.0.3mtpa), and
HVA products.
Polyplex (Thailand) Plc (PTL TB, BUY, TP of Bt27.5) – PTL has
the sixth largest capacity PET film globally and produces both
thin and thick PET films with various surface properties
covering a wide spectrum of applications. It has also
diversified into BOPP, Blown PP/PE and CPP films that are
produced in its state-of-the-art plants with economies of
scale. Its integrated downstream business covers metallizing,
silicone coating (offline chemical coating), extrusion coating
and transfer of metallized paper that offer further value
added.
SCG Packaging Plc (SCGP TB, BUY, TP of Bt44) – SCG
Packaging (SCGP), a subsidiary of SCC that will be listed ion
the Stock Exchange of Thailand, is a holding company that
offers packaging solutions through innovative products &
services and embraces sustainable business practices. SCGP
engages in fibre-based packaging, performance and polymer
packaging, as well as food service product and corrugated
containers, offering capacities of 4.0 and 1.1 mtpa
respectively. Moreover, it also has a flexible packaging
capacity of c.820m sqm per year.
Asian Insights SparX: Resilent packaging
demand while sustainability remains intact
Chemical/Packaging/Paper
Page 19
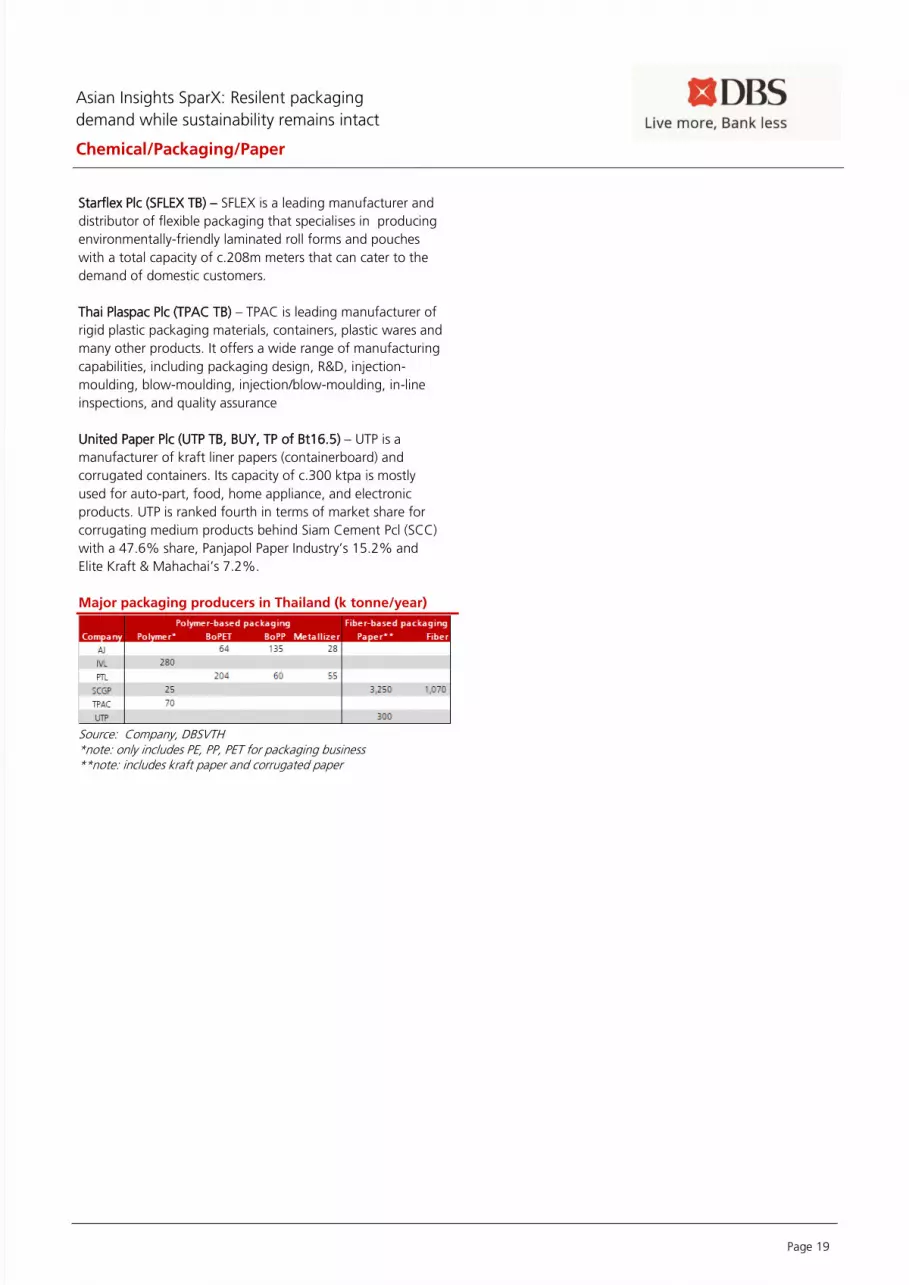
Starflex Plc (SFLEX TB) – SFLEX is a leading manufacturer and
distributor of flexible packaging that specialises in producing
environmentally-friendly laminated roll forms and pouches
with a total capacity of c.208m meters that can cater to the
demand of domestic customers.
Thai Plaspac Plc (TPAC TB) – TPAC is leading manufacturer of
rigid plastic packaging materials, containers, plastic wares and
many other products. It offers a wide range of manufacturing
capabilities, including packaging design, R&D, injection-
moulding, blow-moulding, injection/blow-moulding, in-line
inspections, and quality assurance
United Paper Plc (UTP TB, BUY, TP of Bt16.5) – UTP is a
manufacturer of kraft liner papers (containerboard) and
corrugated containers. Its capacity of c.300 ktpa is mostly
used for auto-part, food, home appliance, and electronic
products. UTP is ranked fourth in terms of market share for
corrugating medium products behind Siam Cement Pcl (SCC)
with a 47.6% share, Panjapol Paper Industry’s 15.2% and
Elite Kraft & Mahachai’s 7.2%.
Major packaging producers in Thailand (k tonne/year)
Source: Company, DBSVTH *note: only includes PE, PP, PET for packaging business **note: includes kraft paper and corrugated paper
Asian Insights SparX: Resilent packaging
demand while sustainability remains intact
Chemical/Packaging/Paper
Page 20
Part 2: Long-run impact from environmental concerns
i) Single-use plastic ban
Since 2013, the usage of plastic packaging in Thailand has
shown signs of a downtrend, in contrast to the strong growth
enjoyed by the plastic packaging industry previously. Based on
the data compiled by EIC, the usage of plastic packaging
grew at a CAGR of 7% over 2008-2012 before decelerating
to a CAGR of 3% between 2013-2017. When assessing the
share of plastic packaging usage, it was found that the use of
rigid plastic packaging that has decelerated in the past five
years. It share was eroded by the use of flexible plastic
packaging, due to demographic and lifestyle changes, and
rising awareness of environmental issues.
More than 8m tonnes per year of plastic waste being dumped
into water sources around the world. The Ocean
Conservancy, a non-profit organisation that studies the
conservation of marine resources, estimated that there are
currently c.150m tonnes of plastic waste circulating in the
oceans, seas and water sources and such waste can be traced
all the way back to 1950. The amount of plastic waste is also
likely to increase due to the ineffective management of waste
and the low amount of plastic recycling, especially in
developing countries. Subsequently, a considerable amount of
plastic waste will flow into water sources and into the sea,
and subsequently the ocean. As for Thailand, the pollution
control department estimated that there are more than 2m
tonnes of plastic waste amounting to 12% of the total waste
in the country annually. Although a proportion of the waste is
destroyed or recycled, c.1m tonnes of waste would be
dumped into the sea.
Acceleration of phase-out of single-use plastic spurred by
government and private businesses. The government has
three important and integrative goals in reducing plastic
waste, which are i) reducing the volume of waste plastic, ii)
developing innovative new plastic packaging materials that
are re-usable and more environmentally friendly, and iii)
increasing the re-use of post-consumption plastic to 60% by
2021. In this vein, the government will revisit the concept of
collecting taxes or introducing fees associated with the use of
plastic packaging such as a plastic bag or packaging tax.
Additionally, the Pollution Control Department of the Ministry
of Natural Resources and Environment has signed an MOU
with bottled water producers to stop using cap seals with the
aim of reducing plastic waste of 520 tonnes per year, or
260,000 kilometres of waste that could circle the earth 6.5
times, from 1 April 2018.
Meanwhile, the Department of Medical Services, Ministry of
Public Health, also announced that it has stopped using
plastic bags for storing medicines in every unit from 1 October
2018. This measure will reduce the annual usage of plastic
bags in hospitals under the department by more than 9m
bags. Similarly, the Thai private retail sector has its own
initiatives to reduce plastic packaging, involving grocery and
convenient stores like Tops Daily, Tesco Lotus, 7-11 as well as
shopping malls like Central Department Store, The Malls and
Starbucks.
We believe such measures being introduced by both the
public and private sectors may not have serious consequences
in the short term, as Thai people use more than 7bn plastic
bags per year. However, should the government be able to
achieve the goal of re-using plastic bags by 60% after their
initial consumption and the campaign of reducing the use of
such bags persist, producers of single-use plastic packaging
such as carrier bags and water bottles will be impacted rather
significantly.
Ban on seven types of single-use plastics by 2025. In 2018,
the sub-committee on plastic waste management looked at
the action plan of reducing and banning the use of seven
types of single-use plastics between 2019 and 2025. In 2019,
the use of the following products is expected to be banned i)
cap seals made from PVC films, ii) products that use Oxo
alcohol (OXO), which is usually found in HDPE and LDPE, and
iii) micro-beads made from plastic. In 2022, the targeted
plastic products to be banned include i) plastic carrier bags
that are thinner than 36 microns (usually made from LLDPE),
and ii) foam food containers. As for 2025, the plastic products
being targeted are i) single-use plastic cups and ii) plastic
straws. The majority of foam containers, cups, and plastic
straws are made from polystyrene (PS). We believe LLDPE will
be the most affected chemical product. This because it is used
in the making of carrier bags and packaging films, accounting
for over 55% in the process of producing plastic products.
Asian Insights SparX: Resilent packaging
demand while sustainability remains intact
Chemical/Packaging/Paper
Page 21
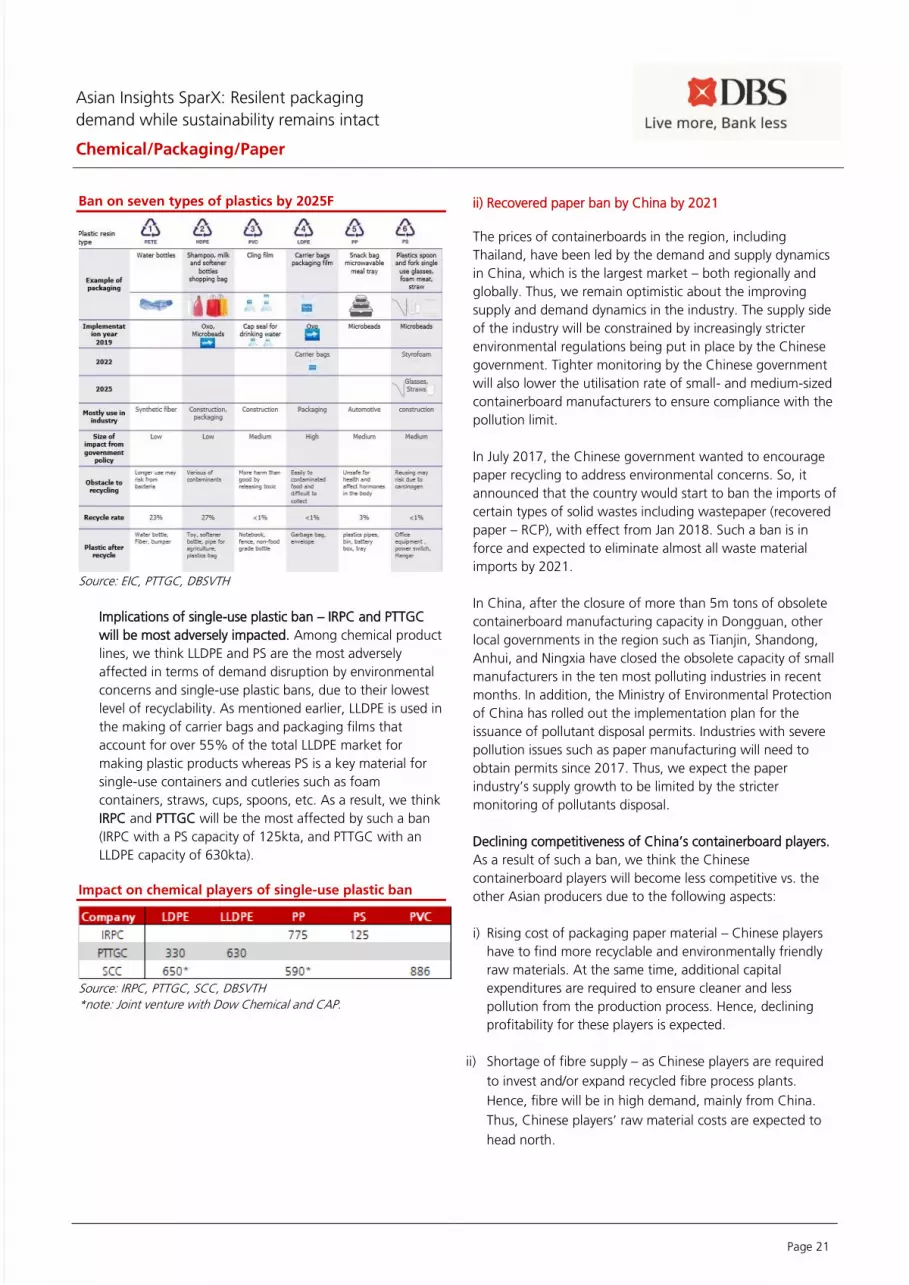
Ban on seven types of plastics by 2025F
Source: EIC, PTTGC, DBSVTH
Implications of single-use plastic ban – IRPC and PTTGC
will be most adversely impacted. Among chemical product
lines, we think LLDPE and PS are the most adversely
affected in terms of demand disruption by environmental
concerns and single-use plastic bans, due to their lowest
level of recyclability. As mentioned earlier, LLDPE is used in
the making of carrier bags and packaging films that
account for over 55% of the total LLDPE market for
making plastic products whereas PS is a key material for
single-use containers and cutleries such as foam
containers, straws, cups, spoons, etc. As a result, we think
IRPC and PTTGC will be the most affected by such a ban
(IRPC with a PS capacity of 125kta, and PTTGC with an
LLDPE capacity of 630kta).
Impact on chemical players of single-use plastic ban
Source: IRPC, PTTGC, SCC, DBSVTH
*note: Joint venture with Dow Chemical and CAP.
ii) Recovered paper ban by China by 2021
The prices of containerboards in the region, including
Thailand, have been led by the demand and supply dynamics
in China, which is the largest market – both regionally and
globally. Thus, we remain optimistic about the improving
supply and demand dynamics in the industry. The supply side
of the industry will be constrained by increasingly stricter
environmental regulations being put in place by the Chinese
government. Tighter monitoring by the Chinese government
will also lower the utilisation rate of small- and medium-sized
containerboard manufacturers to ensure compliance with the
pollution limit.
In July 2017, the Chinese government wanted to encourage
paper recycling to address environmental concerns. So, it
announced that the country would start to ban the imports of
certain types of solid wastes including wastepaper (recovered
paper – RCP), with effect from Jan 2018. Such a ban is in
force and expected to eliminate almost all waste material
imports by 2021.
In China, after the closure of more than 5m tons of obsolete
containerboard manufacturing capacity in Dongguan, other
local governments in the region such as Tianjin, Shandong,
Anhui, and Ningxia have closed the obsolete capacity of small
manufacturers in the ten most polluting industries in recent
months. In addition, the Ministry of Environmental Protection
of China has rolled out the implementation plan for the
issuance of pollutant disposal permits. Industries with severe
pollution issues such as paper manufacturing will need to
obtain permits since 2017. Thus, we expect the paper
industry’s supply growth to be limited by the stricter
monitoring of pollutants disposal.
Declining competitiveness of China’s containerboard players.
As a result of such a ban, we think the Chinese
containerboard players will become less competitive vs. the
other Asian producers due to the following aspects:
i) Rising cost of packaging paper material – Chinese players
have to find more recyclable and environmentally friendly
raw materials. At the same time, additional capital
expenditures are required to ensure cleaner and less
pollution from the production process. Hence, declining
profitability for these players is expected.
ii) Shortage of fibre supply – as Chinese players are required
to invest and/or expand recycled fibre process plants.
Hence, fibre will be in high demand, mainly from China.
Thus, Chinese players’ raw material costs are expected to
head north.
Asian Insights SparX: Resilent packaging
demand while sustainability remains intact
Chemical/Packaging/Paper
Page 22
iii) Inventory build-up by customers – In anticipation of
increasing RCP prices, most customers have built up their
RCP inventory. However, as the Chinese government
becomes stricter on environment protection and US-China
trade war tensions become more intense, a number of
customers are destocking their inventory and dumping their
RCP stock.
iv) High cost producers will exit the market – We expect some
producers to exit the market, especially the ones with
higher operating cost and/or those without vertical
packaging business integration.
Implications for other Southeast Asia players – ample
opportunities abound
We see huge opportunities for fibre-based packaging players
in Southeast Asia in light of the abundant supply of RCP and
marketing opportunities in the Chinese market. The following
outlines the key implications for non-Chinese players:
i) Declining RCP price – As mentioned earlier, a large amount
of RCP supply will flow from China to Southeast Asia. This
will drive down the cost of raw material for fibre-based
packaging producers.
ii) Better RCP quality – Southeast Asia players will gain access
to better quality RCP at low prices, which bodes well for
their profitability.
iii) Geographical proximity – Countries in Southeast Asia
would be best positioned to fill the gap of undersupply of
processed recycled fibre, as recycled pulp can be
transported in wet form vs. the need to ship pulp in dry
form from the US.
iv) Market opportunities in China – Southeast Asia players are
able to provide cheaper packaging paper alternatives and
to look for new markets for Chinese customers.
v) Relocation of Chinese plants – Chinese producers are likely
to re-locate their recycled fibre plants to other counties in
Southeast Asia. However, such process will take some time,
as they could struggle to adapt to an unfamiliar local
culture, and new regulations, laws, customs, etc.
vi) Environmental footprint – China’s ban of RCP signals that
the country is serious about addressing environmental
issues. This could spur other Asian countries to introduce
similar measures to incentivise localised recycling efforts
going forward.
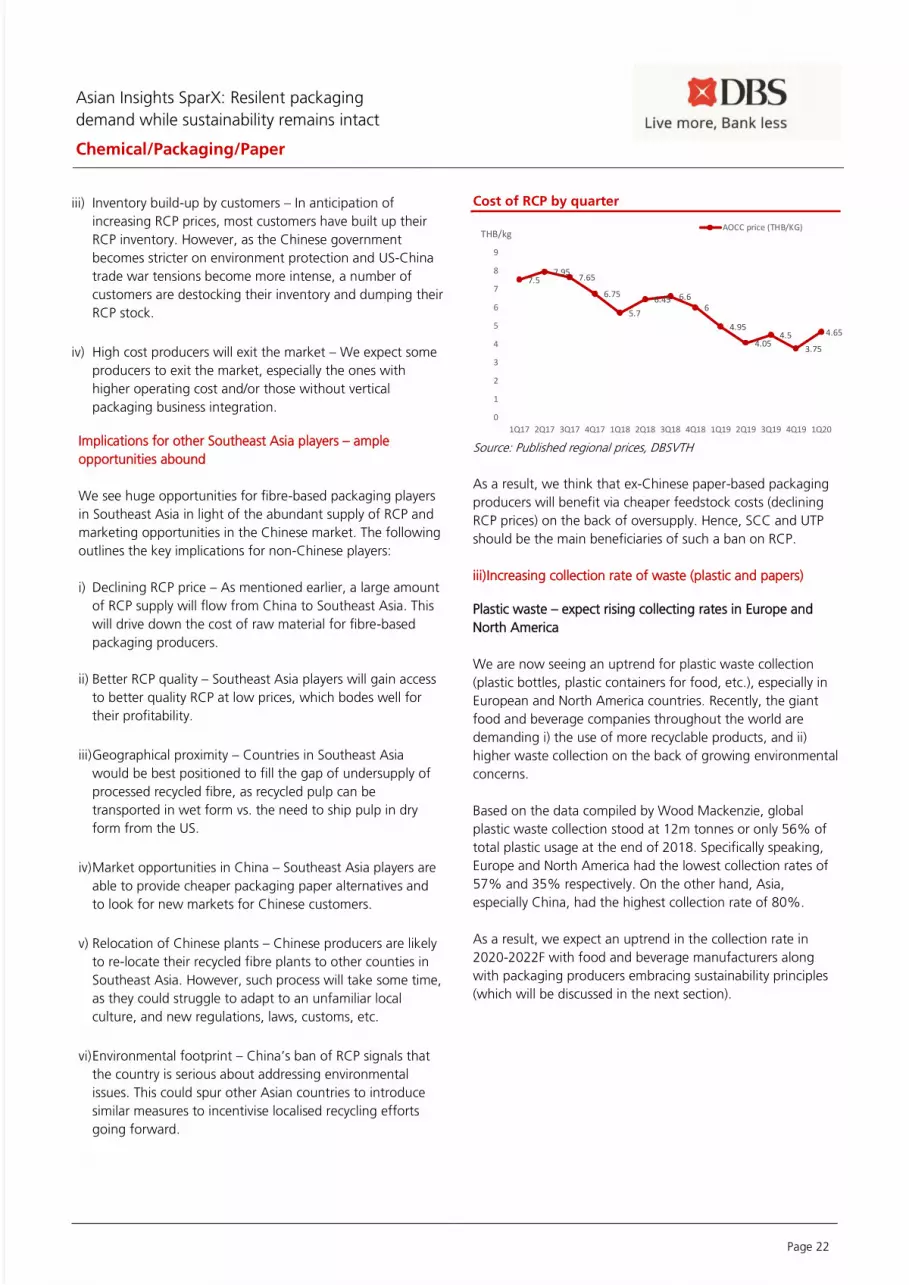
Cost of RCP by quarter
Source: Published regional prices, DBSVTH
As a result, we think that ex-Chinese paper-based packaging
producers will benefit via cheaper feedstock costs (declining
RCP prices) on the back of oversupply. Hence, SCC and UTP
should be the main beneficiaries of such a ban on RCP.
iii) Increasing collection rate of waste (plastic and papers)
Plastic waste – expect rising collecting rates in Europe and
North America
We are now seeing an uptrend for plastic waste collection
(plastic bottles, plastic containers for food, etc.), especially in
European and North America countries. Recently, the giant
food and beverage companies throughout the world are
demanding i) the use of more recyclable products, and ii)
higher waste collection on the back of growing environmental
concerns.
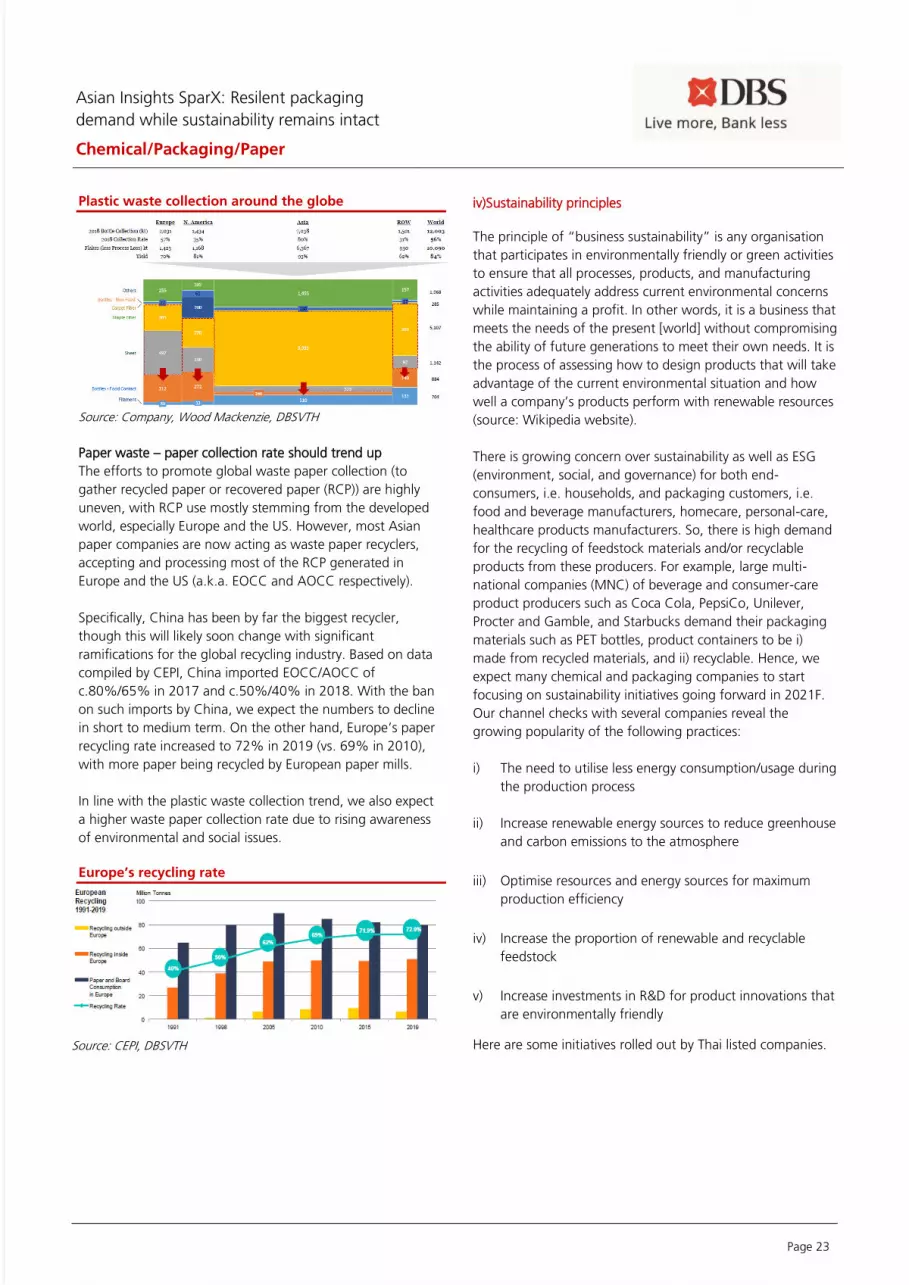
Based on the data compiled by Wood Mackenzie, global
plastic waste collection stood at 12m tonnes or only 56% of
total plastic usage at the end of 2018. Specifically speaking,
Europe and North America had the lowest collection rates of
57% and 35% respectively. On the other hand, Asia,
especially China, had the highest collection rate of 80%.
As a result, we expect an uptrend in the collection rate in
2020-2022F with food and beverage manufacturers along
with packaging producers embracing sustainability principles
(which will be discussed in the next section).
7.57.95
7.65
6.75
5.7
6.45 6.66
4.95
4.054.5
3.75
4.65
0
1
2
3
4
5
6
7
8
9
1Q17 2Q17 3Q17 4Q17 1Q18 2Q18 3Q18 4Q18 1Q19 2Q19 3Q19 4Q19 1Q20
THB/kgAOCC price (THB/KG)
Asian Insights SparX: Resilent packaging
demand while sustainability remains intact
Chemical/Packaging/Paper
Page 23
Plastic waste collection around the globe
Source: Company, Wood Mackenzie, DBSVTH
Paper waste – paper collection rate should trend up
The efforts to promote global waste paper collection (to
gather recycled paper or recovered paper (RCP)) are highly
uneven, with RCP use mostly stemming from the developed
world, especially Europe and the US. However, most Asian
paper companies are now acting as waste paper recyclers,
accepting and processing most of the RCP generated in
Europe and the US (a.k.a. EOCC and AOCC respectively).
Specifically, China has been by far the biggest recycler,
though this will likely soon change with significant
ramifications for the global recycling industry. Based on data
compiled by CEPI, China imported EOCC/AOCC of
c.80%/65% in 2017 and c.50%/40% in 2018. With the ban
on such imports by China, we expect the numbers to decline
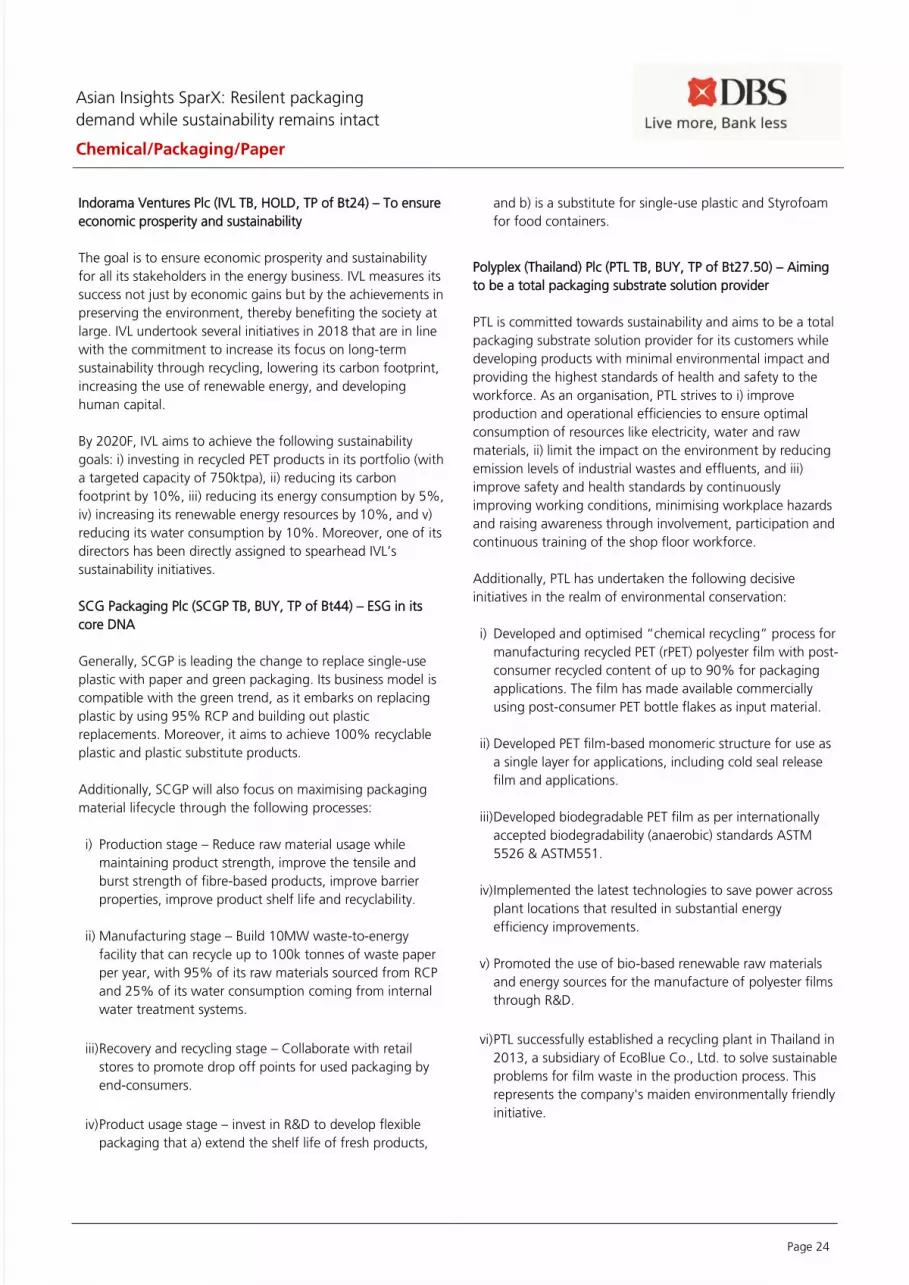
in short to medium term. On the other hand, Europe’s paper
recycling rate increased to 72% in 2019 (vs. 69% in 2010),
with more paper being recycled by European paper mills.
In line with the plastic waste collection trend, we also expect
a higher waste paper collection rate due to rising awareness
of environmental and social issues.
Europe’s recycling rate
Source: CEPI, DBSVTH
iv)Sustainability principles
The principle of “business sustainability” is any organisation
that participates in environmentally friendly or green activities
to ensure that all processes, products, and manufacturing
activities adequately address current environmental concerns
while maintaining a profit. In other words, it is a business that
meets the needs of the present [world] without compromising
the ability of future generations to meet their own needs. It is
the process of assessing how to design products that will take
advantage of the current environmental situation and how
well a company’s products perform with renewable resources
(source: Wikipedia website).
There is growing concern over sustainability as well as ESG
(environment, social, and governance) for both end-
consumers, i.e. households, and packaging customers, i.e.
food and beverage manufacturers, homecare, personal-care,
healthcare products manufacturers. So, there is high demand
for the recycling of feedstock materials and/or recyclable
products from these producers. For example, large multi-
national companies (MNC) of beverage and consumer-care
product producers such as Coca Cola, PepsiCo, Unilever,
Procter and Gamble, and Starbucks demand their packaging
materials such as PET bottles, product containers to be i)
made from recycled materials, and ii) recyclable. Hence, we
expect many chemical and packaging companies to start
focusing on sustainability initiatives going forward in 2021F.
Our channel checks with several companies reveal the
growing popularity of the following practices:
i) The need to utilise less energy consumption/usage during
the production process
ii) Increase renewable energy sources to reduce greenhouse
and carbon emissions to the atmosphere
iii) Optimise resources and energy sources for maximum
production efficiency
iv) Increase the proportion of renewable and recyclable
feedstock
v) Increase investments in R&D for product innovations that
are environmentally friendly
Here are some initiatives rolled out by Thai listed companies.
Asian Insights SparX: Resilent packaging
demand while sustainability remains intact
Chemical/Packaging/Paper
Page 24
Indorama Ventures Plc (IVL TB, HOLD, TP of Bt24) – To ensure
economic prosperity and sustainability
The goal is to ensure economic prosperity and sustainability
for all its stakeholders in the energy business. IVL measures its
success not just by economic gains but by the achievements in
preserving the environment, thereby benefiting the society at
large. IVL undertook several initiatives in 2018 that are in line
with the commitment to increase its focus on long-term
sustainability through recycling, lowering its carbon footprint,
increasing the use of renewable energy, and developing
human capital.
By 2020F, IVL aims to achieve the following sustainability
goals: i) investing in recycled PET products in its portfolio (with
a targeted capacity of 750ktpa), ii) reducing its carbon
footprint by 10%, iii) reducing its energy consumption by 5%,
iv) increasing its renewable energy resources by 10%, and v)
reducing its water consumption by 10%. Moreover, one of its
directors has been directly assigned to spearhead IVL’s
sustainability initiatives.
SCG Packaging Plc (SCGP TB, BUY, TP of Bt44) – ESG in its
core DNA
Generally, SCGP is leading the change to replace single-use
plastic with paper and green packaging. Its business model is
compatible with the green trend, as it embarks on replacing
plastic by using 95% RCP and building out plastic
replacements. Moreover, it aims to achieve 100% recyclable
plastic and plastic substitute products.
Additionally, SCGP will also focus on maximising packaging
material lifecycle through the following processes:
i) Production stage – Reduce raw material usage while
maintaining product strength, improve the tensile and
burst strength of fibre-based products, improve barrier
properties, improve product shelf life and recyclability.
ii) Manufacturing stage – Build 10MW waste-to-energy
facility that can recycle up to 100k tonnes of waste paper
per year, with 95% of its raw materials sourced from RCP
and 25% of its water consumption coming from internal
water treatment systems.
iii) Recovery and recycling stage – Collaborate with retail
stores to promote drop off points for used packaging by
end-consumers.
iv) Product usage stage – invest in R&D to develop flexible
packaging that a) extend the shelf life of fresh products,
and b) is a substitute for single-use plastic and Styrofoam
for food containers.
Polyplex (Thailand) Plc (PTL TB, BUY, TP of Bt27.50) – Aiming
to be a total packaging substrate solution provider
PTL is committed towards sustainability and aims to be a total
packaging substrate solution provider for its customers while
developing products with minimal environmental impact and
providing the highest standards of health and safety to the
workforce. As an organisation, PTL strives to i) improve
production and operational efficiencies to ensure optimal
consumption of resources like electricity, water and raw
materials, ii) limit the impact on the environment by reducing
emission levels of industrial wastes and effluents, and iii)
improve safety and health standards by continuously
improving working conditions, minimising workplace hazards
and raising awareness through involvement, participation and
continuous training of the shop floor workforce.
Additionally, PTL has undertaken the following decisive
initiatives in the realm of environmental conservation:
i) Developed and optimised “chemical recycling” process for
manufacturing recycled PET (rPET) polyester film with post-
consumer recycled content of up to 90% for packaging
applications. The film has made available commercially
using post-consumer PET bottle flakes as input material.
ii) Developed PET film-based monomeric structure for use as
a single layer for applications, including cold seal release
film and applications.
iii) Developed biodegradable PET film as per internationally
accepted biodegradability (anaerobic) standards ASTM
5526 & ASTM551.
iv) Implemented the latest technologies to save power across
plant locations that resulted in substantial energy
efficiency improvements.
v) Promoted the use of bio-based renewable raw materials
and energy sources for the manufacture of polyester films
through R&D.
vi) PTL successfully established a recycling plant in Thailand in
2013, a subsidiary of EcoBlue Co., Ltd. to solve sustainable
problems for film waste in the production process. This
represents the company's maiden environmentally friendly
initiative.
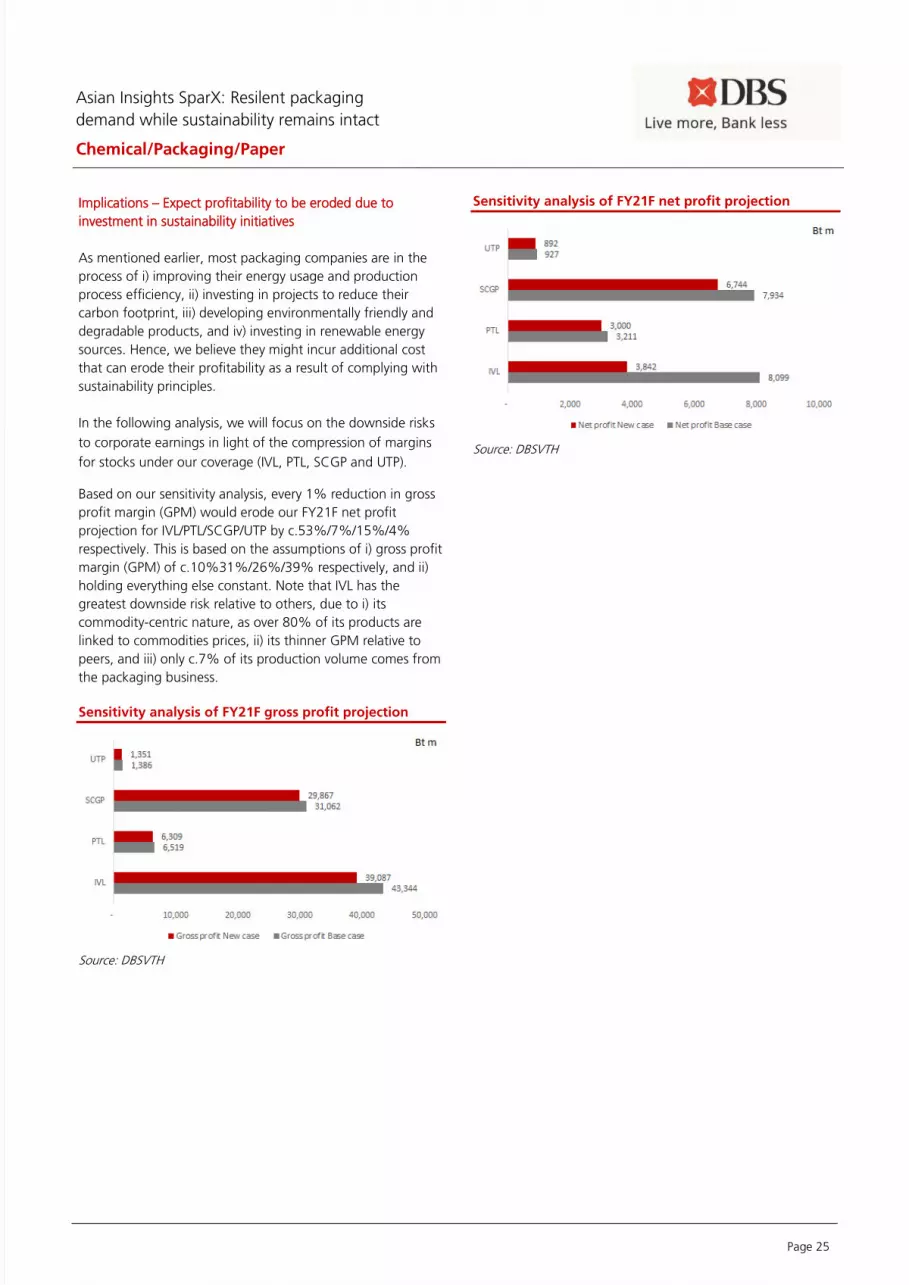
Asian Insights SparX: Resilent packaging
demand while sustainability remains intact
Chemical/Packaging/Paper
Page 25
Implications – Expect profitability to be eroded due to
investment in sustainability initiatives
As mentioned earlier, most packaging companies are in the
process of i) improving their energy usage and production
process efficiency, ii) investing in projects to reduce their
carbon footprint, iii) developing environmentally friendly and
degradable products, and iv) investing in renewable energy
sources. Hence, we believe they might incur additional cost
that can erode their profitability as a result of complying with
sustainability principles.
In the following analysis, we will focus on the downside risks
to corporate earnings in light of the compression of margins
for stocks under our coverage (IVL, PTL, SCGP and UTP).
Based on our sensitivity analysis, every 1% reduction in gross
profit margin (GPM) would erode our FY21F net profit
projection for IVL/PTL/SCGP/UTP by c.53%/7%/15%/4%
respectively. This is based on the assumptions of i) gross profit
margin (GPM) of c.10%31%/26%/39% respectively, and ii)
holding everything else constant. Note that IVL has the
greatest downside risk relative to others, due to i) its
commodity-centric nature, as over 80% of its products are
linked to commodities prices, ii) its thinner GPM relative to
peers, and iii) only c.7% of its production volume comes from
the packaging business.
Sensitivity analysis of FY21F gross profit projection
Source: DBSVTH
Sensitivity analysis of FY21F net profit projection
Source: DBSVTH
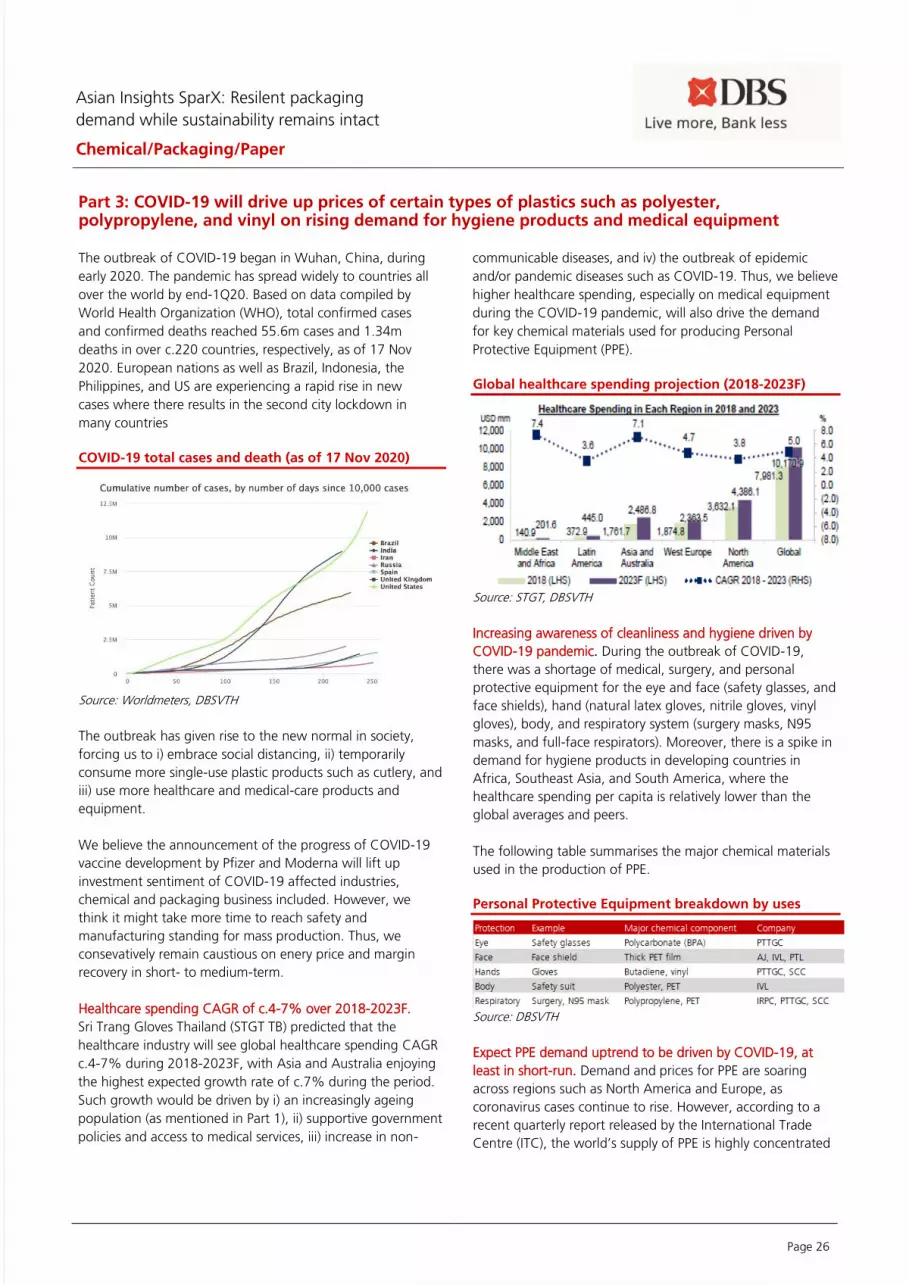
Asian Insights SparX: Resilent packaging
demand while sustainability remains intact
Chemical/Packaging/Paper
Page 26
Part 3: COVID-19 will drive up prices of certain types of plastics such as polyester, polypropylene, and vinyl on rising demand for hygiene products and medical equipment The outbreak of COVID-19 began in Wuhan, China, during
early 2020. The pandemic has spread widely to countries all
over the world by end-1Q20. Based on data compiled by
World Health Organization (WHO), total confirmed cases
and confirmed deaths reached 55.6m cases and 1.34m
deaths in over c.220 countries, respectively, as of 17 Nov
2020. European nations as well as Brazil, Indonesia, the
Philippines, and US are experiencing a rapid rise in new
cases where there results in the second city lockdown in
many countries
COVID-19 total cases and death (as of 17 Nov 2020)
Source: Worldmeters, DBSVTH
The outbreak has given rise to the new normal in society,
forcing us to i) embrace social distancing, ii) temporarily
consume more single-use plastic products such as cutlery, and
iii) use more healthcare and medical-care products and
equipment.
We believe the announcement of the progress of COVID-19
vaccine development by Pfizer and Moderna will lift up
investment sentiment of COVID-19 affected industries,
chemical and packaging business included. However, we
think it might take more time to reach safety and
manufacturing standing for mass production. Thus, we
consevatively remain caustious on enery price and margin
recovery in short- to medium-term.
Healthcare spending CAGR of c.4-7% over 2018-2023F.
Sri Trang Gloves Thailand (STGT TB) predicted that the
healthcare industry will see global healthcare spending CAGR
c.4-7% during 2018-2023F, with Asia and Australia enjoying
the highest expected growth rate of c.7% during the period.
Such growth would be driven by i) an increasingly ageing
population (as mentioned in Part 1), ii) supportive government
policies and access to medical services, iii) increase in non-
communicable diseases, and iv) the outbreak of epidemic
and/or pandemic diseases such as COVID-19. Thus, we believe
higher healthcare spending, especially on medical equipment
during the COVID-19 pandemic, will also drive the demand
for key chemical materials used for producing Personal
Protective Equipment (PPE).
Global healthcare spending projection (2018-2023F)
Source: STGT, DBSVTH
Increasing awareness of cleanliness and hygiene driven by
COVID-19 pandemic. During the outbreak of COVID-19,
there was a shortage of medical, surgery, and personal
protective equipment for the eye and face (safety glasses, and
face shields), hand (natural latex gloves, nitrile gloves, vinyl
gloves), body, and respiratory system (surgery masks, N95
masks, and full-face respirators). Moreover, there is a spike in
demand for hygiene products in developing countries in
Africa, Southeast Asia, and South America, where the
healthcare spending per capita is relatively lower than the
global averages and peers.
The following table summarises the major chemical materials
used in the production of PPE.
Personal Protective Equipment breakdown by uses
Source: DBSVTH
Expect PPE demand uptrend to be driven by COVID-19, at
least in short-run. Demand and prices for PPE are soaring
across regions such as North America and Europe, as
coronavirus cases continue to rise. However, according to a
recent quarterly report released by the International Trade
Centre (ITC), the world’s supply of PPE is highly concentrated
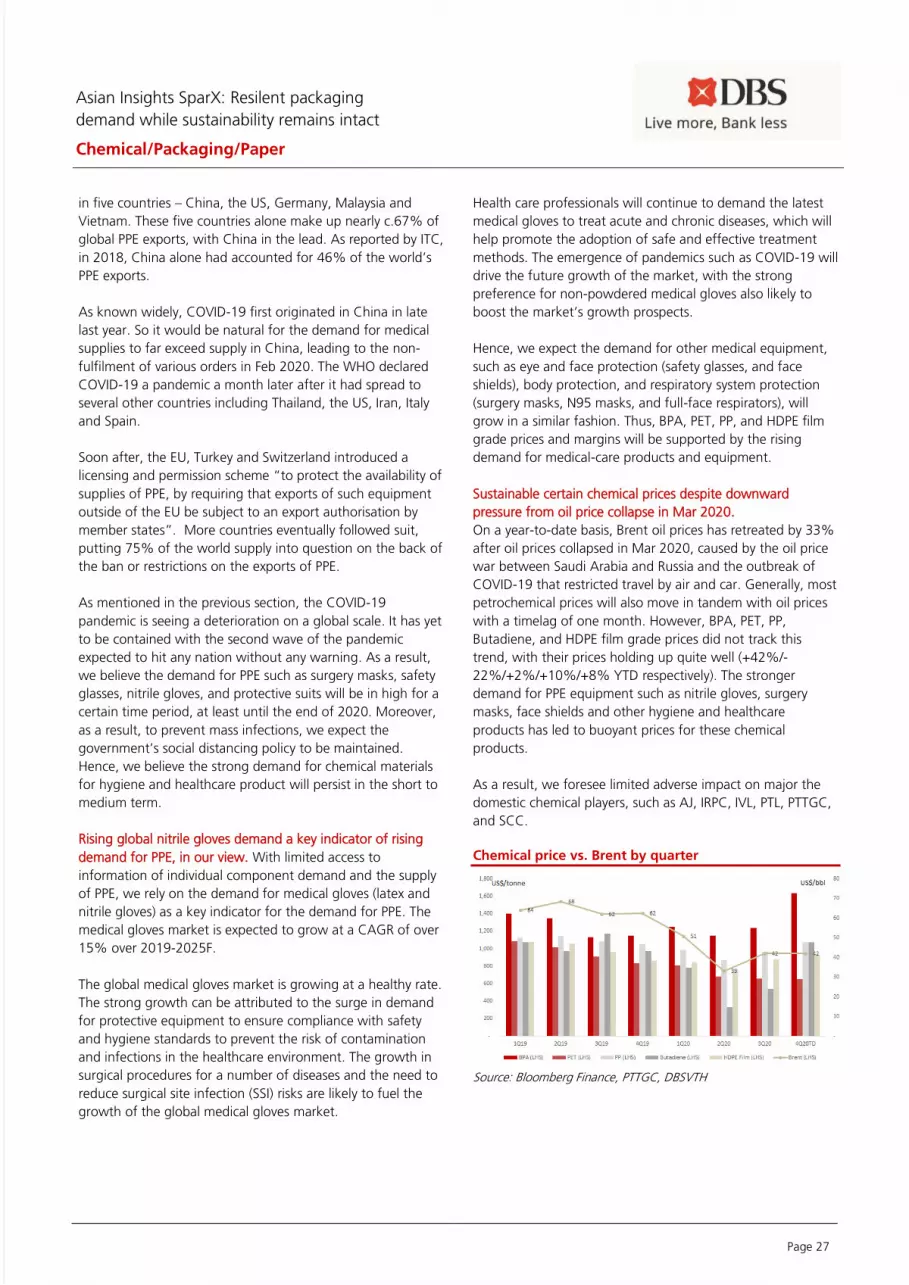
Asian Insights SparX: Resilent packaging
demand while sustainability remains intact
Chemical/Packaging/Paper
Page 27
in five countries – China, the US, Germany, Malaysia and
Vietnam. These five countries alone make up nearly c.67% of
global PPE exports, with China in the lead. As reported by ITC,
in 2018, China alone had accounted for 46% of the world’s
PPE exports.
As known widely, COVID-19 first originated in China in late
last year. So it would be natural for the demand for medical
supplies to far exceed supply in China, leading to the non-
fulfilment of various orders in Feb 2020. The WHO declared
COVID-19 a pandemic a month later after it had spread to
several other countries including Thailand, the US, Iran, Italy
and Spain.
Soon after, the EU, Turkey and Switzerland introduced a
licensing and permission scheme “to protect the availability of
supplies of PPE, by requiring that exports of such equipment
outside of the EU be subject to an export authorisation by
member states”. More countries eventually followed suit,
putting 75% of the world supply into question on the back of
the ban or restrictions on the exports of PPE.
As mentioned in the previous section, the COVID-19
pandemic is seeing a deterioration on a global scale. It has yet
to be contained with the second wave of the pandemic
expected to hit any nation without any warning. As a result,
we believe the demand for PPE such as surgery masks, safety
glasses, nitrile gloves, and protective suits will be in high for a
certain time period, at least until the end of 2020. Moreover,
as a result, to prevent mass infections, we expect the
government’s social distancing policy to be maintained.
Hence, we believe the strong demand for chemical materials
for hygiene and healthcare product will persist in the short to
medium term.
Rising global nitrile gloves demand a key indicator of rising
demand for PPE, in our view. With limited access to
information of individual component demand and the supply
of PPE, we rely on the demand for medical gloves (latex and
nitrile gloves) as a key indicator for the demand for PPE. The
medical gloves market is expected to grow at a CAGR of over
15% over 2019-2025F.
The global medical gloves market is growing at a healthy rate.
The strong growth can be attributed to the surge in demand
for protective equipment to ensure compliance with safety
and hygiene standards to prevent the risk of contamination
and infections in the healthcare environment. The growth in
surgical procedures for a number of diseases and the need to
reduce surgical site infection (SSI) risks are likely to fuel the
growth of the global medical gloves market.
Health care professionals will continue to demand the latest
medical gloves to treat acute and chronic diseases, which will
help promote the adoption of safe and effective treatment
methods. The emergence of pandemics such as COVID-19 will
drive the future growth of the market, with the strong
preference for non-powdered medical gloves also likely to
boost the market’s growth prospects.
Hence, we expect the demand for other medical equipment,
such as eye and face protection (safety glasses, and face
shields), body protection, and respiratory system protection
(surgery masks, N95 masks, and full-face respirators), will
grow in a similar fashion. Thus, BPA, PET, PP, and HDPE film
grade prices and margins will be supported by the rising
demand for medical-care products and equipment.
Sustainable certain chemical prices despite downward
pressure from oil price collapse in Mar 2020.
On a year-to-date basis, Brent oil prices has retreated by 33%
after oil prices collapsed in Mar 2020, caused by the oil price
war between Saudi Arabia and Russia and the outbreak of
COVID-19 that restricted travel by air and car. Generally, most
petrochemical prices will also move in tandem with oil prices
with a timelag of one month. However, BPA, PET, PP,
Butadiene, and HDPE film grade prices did not track this
trend, with their prices holding up quite well (+42%/-
22%/+2%/+10%/+8% YTD respectively). The stronger
demand for PPE equipment such as nitrile gloves, surgery
masks, face shields and other hygiene and healthcare
products has led to buoyant prices for these chemical
products.
As a result, we foresee limited adverse impact on major the
domestic chemical players, such as AJ, IRPC, IVL, PTL, PTTGC,
and SCC.
Chemical price vs. Brent by quarter
Source: Bloomberg Finance, PTTGC, DBSVTH

Asian Insights SparX: Resilent packaging
demand while sustainability remains intact
Chemical/Packaging/Paper
Page 28
Key listed domestic chemical players.
IRPC Plc (IRPC TB, HOLD, TP of Bt2.3) – IRPC is a fully
integrated refinery and naphtha-based petrochemical
producer that is involved in the upstream and downstream
aromatics supply chain. Its refinery is the second largest in
Thailand. Most of its refinery (total refining capacity of
c.210kbd) products serve as feedstock for the chemical
business.
Indorama Ventures (IVL TB, HOLD, TP of Bt24) – IVL is a
vertically integrated chemical player in the aromatics (PX, PTA,
PET) and olefins (EO, EG, IPA, MEG, MTBE) businesses. IVL has
an effective PET capacity of 12.05 mtpa which is used to
produce a wide variety of products such as polyester, PET
bottle, specialty chemical, packaging (c.0.3mtpa), and HVA
products.
PTT Global Chemical (PTTGC TB, HOLD, TP of Bt43) – PTTGC,
PTT’s flagship chemical company, operates an integrated
petrochemical complex that is mainly used for producing gas-
based olefins crackers and ethylene derivatives such as
polyethylene and polypropylene products.
Siam Cement (SCC TB, BUY, TP of Bt417) – SCC’s chemical
business, generally, contributes c.40% of its consolidated
EBITDA. SCC is a naphtha-cracker player that produces
polyethylene and polypropylene producers such as HDPE and
PP.
Thaioil Plc (TOP TB, HOLD, TP of Bt41) - Thaioil is Thailand's
largest refinery and the flagship refinery under PTT group. The
refinery is an integrated plant for producing petrochemicals
and lube base. Its by-products such as reformate/platformate
are upgraded to value-added products for use in the
upstream aromatics business.
Major chemical producers in Thailand (k tonne/year)
Source: Company, DBSVTH
*note: Integrated PET/PTA capacity in Asia, West, and North America
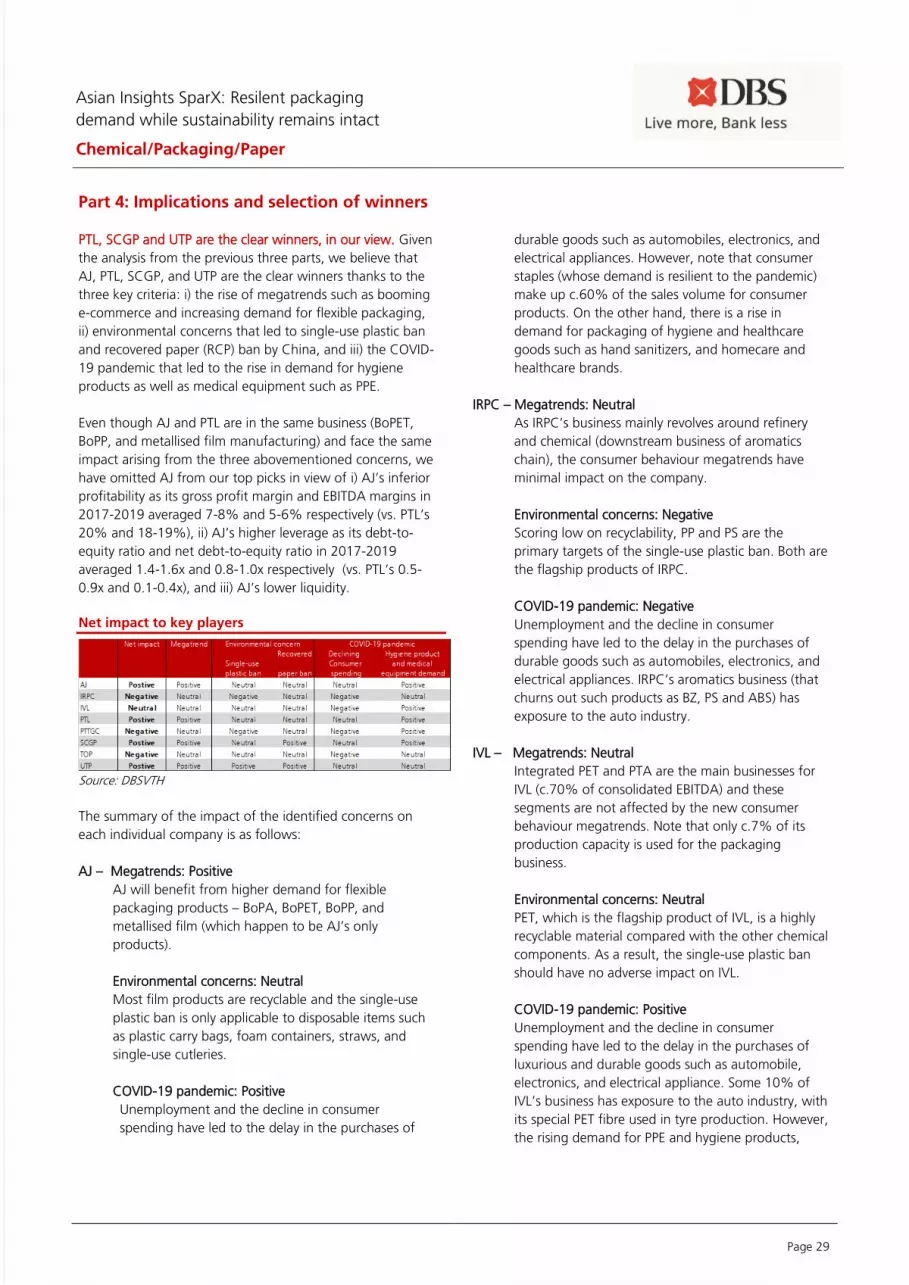
Asian Insights SparX: Resilent packaging
demand while sustainability remains intact
Chemical/Packaging/Paper
Page 29
Part 4: Implications and selection of winners
PTL, SCGP and UTP are the clear winners, in our view. Given
the analysis from the previous three parts, we believe that
AJ, PTL, SCGP, and UTP are the clear winners thanks to the
three key criteria: i) the rise of megatrends such as booming
e-commerce and increasing demand for flexible packaging,
ii) environmental concerns that led to single-use plastic ban
and recovered paper (RCP) ban by China, and iii) the COVID-
19 pandemic that led to the rise in demand for hygiene
products as well as medical equipment such as PPE.
Even though AJ and PTL are in the same business (BoPET,
BoPP, and metallised film manufacturing) and face the same
impact arising from the three abovementioned concerns, we
have omitted AJ from our top picks in view of i) AJ’s inferior
profitability as its gross profit margin and EBITDA margins in
2017-2019 averaged 7-8% and 5-6% respectively (vs. PTL’s
20% and 18-19%), ii) AJ’s higher leverage as its debt-to-
equity ratio and net debt-to-equity ratio in 2017-2019
averaged 1.4-1.6x and 0.8-1.0x respectively (vs. PTL’s 0.5-
0.9x and 0.1-0.4x), and iii) AJ’s lower liquidity.
Net impact to key players
Source: DBSVTH
The summary of the impact of the identified concerns on
each individual company is as follows:
AJ – Megatrends: Positive
AJ will benefit from higher demand for flexible
packaging products – BoPA, BoPET, BoPP, and
metallised film (which happen to be AJ’s only
products).
Environmental concerns: Neutral
Most film products are recyclable and the single-use
plastic ban is only applicable to disposable items such
as plastic carry bags, foam containers, straws, and
single-use cutleries.
COVID-19 pandemic: Positive
Unemployment and the decline in consumer
spending have led to the delay in the purchases of
durable goods such as automobiles, electronics, and
electrical appliances. However, note that consumer
staples (whose demand is resilient to the pandemic)
make up c.60% of the sales volume for consumer
products. On the other hand, there is a rise in
demand for packaging of hygiene and healthcare
goods such as hand sanitizers, and homecare and
healthcare brands.
IRPC – Megatrends: Neutral
As IRPC’s business mainly revolves around refinery
and chemical (downstream business of aromatics
chain), the consumer behaviour megatrends have
minimal impact on the company.
Environmental concerns: Negative
Scoring low on recyclability, PP and PS are the
primary targets of the single-use plastic ban. Both are
the flagship products of IRPC.
COVID-19 pandemic: Negative
Unemployment and the decline in consumer
spending have led to the delay in the purchases of
durable goods such as automobiles, electronics, and
electrical appliances. IRPC’s aromatics business (that
churns out such products as BZ, PS and ABS) has
exposure to the auto industry.
IVL – Megatrends: Neutral
Integrated PET and PTA are the main businesses for
IVL (c.70% of consolidated EBITDA) and these
segments are not affected by the new consumer
behaviour megatrends. Note that only c.7% of its
production capacity is used for the packaging
business.
Environmental concerns: Neutral
PET, which is the flagship product of IVL, is a highly
recyclable material compared with the other chemical
components. As a result, the single-use plastic ban
should have no adverse impact on IVL.
COVID-19 pandemic: Positive
Unemployment and the decline in consumer
spending have led to the delay in the purchases of
luxurious and durable goods such as automobile,
electronics, and electrical appliance. Some 10% of
IVL’s business has exposure to the auto industry, with
its special PET fibre used in tyre production. However,
the rising demand for PPE and hygiene products,
Asian Insights SparX: Resilent packaging
demand while sustainability remains intact
Chemical/Packaging/Paper
Page 30
driven by the COVID-19 pandemic, could boost the
demand for PET as well.
PTL – Megatrends: Positive
PTL can benefit from the increasing use of flexible
packaging. BoPET, BoPP, and metallised film happen
to be its only products.
Environmental concerns: Neutral
Most film products are recyclable and the single-use
plastic ban is only applicable to disposable items such
as plastic carry bags, foam containers, straws, and
single-use cutleries.
COVID-19 pandemic: Positive
Unemployment and the decline in consumer
spending have led to the delay in the purchases of
durable goods such as automobiles, electronics, and
electrical appliances. However, note that consumer
staples (whose demand is resilient to the pandemic)
make up c.70% of the sales volume for consumer
products. On the other hand, there is a rise in
demand for packaging of hygiene and healthcare
goods such as hand sanitizers, and homecare and
healthcare brands.
PTTGC – Megatrends: Neutral
As PTTGC’s business mainly revolves around
chemical, the consumer behaviour megatrends have
minimal impact on the company.
Environmental concerns: Negative
Scoring low on recyclability, LLDPE, LDPE, and PP are
the primary targets of the single-use plastic ban.
These three are the key products of PTTGC.
COVID-19 pandemic: Neutral
Unemployment and the decline in consumer
spending have led to the delay in the purchases of
durable goods such as automobiles, electronics, and
electrical appliances. However, PTTGC will partly
benefit from a spike in demand for BPA, butadiene
and PP on the back of rising demand for PPE and
other medical equipment.
SCGP – Megatrends: Positive
SCGP should benefit from the consumer behaviour
megatrends such as the e-commerce boom, growing
population, and demographics and lifestyle changes.
Thus, demand for SCGP’s flexible and paper-based
packaging products is likely to head north.
Environmental concerns: Positive
PE, PP, and PVC are the flagship products of SCC’s
chemical business (c.40% of consolidated EBITDA).
Hence, the single-use plastic ban is bound to have a
negative impact on PVC, in our view. However, the
production of the other polymers can be upgraded to
churn out flexible packaging whose demand is on the
rise. Moreover, c.95% of raw materials for the
packaging business are recyclable.
COVID-19 pandemic: Positive
Unemployment and spending decline caused a
purchase delay on durable goods such as auto,
electronics, and electrical segments. However, note
that consumer staples (whose demand is resilient to
the pandemic) make up c.70% of the sales volume
for consumer products. On the other hand, there is a
rise in demand for packaging of hygiene and
healthcare goods such as hand sanitizers, and
homecare and healthcare brands (that bodes well for
PP demand).
TOP – Megatrends: Neutral
As TOP’s business mainly revolves around refinery
and aromatics, the consumer behaviour megatrends
have minimal impact on the company.
Environmental concerns: Neutral
Most chemical products such as PX and BZ stem from
the aromatics supply chain that will be not affected
by the single-use plastic ban, unlike products from
the olefins and polymers supply chains. Thus, we
think there will be minimal impact on TOP in this
area.
COVID-19 pandemic: Negative
Unemployment and the decline in consumer
spending have led to the delay in the purchases of
durable goods such as automobiles, electronics, and
electrical appliances. TOP’s aromatics business (which
produces such products as BZ and derivatives) has
exposure to the auto industry.
UTP – Megatrends: Positive
UTP should benefit from the consumer behaviour
megatrends such as the e-commerce boom, growing
population, and demographics and lifestyle change..
Thus, demand for UTP’s containerboards and
corrugated packaging should be on an uptrend.

Asian Insights SparX: Resilent packaging
demand while sustainability remains intact
Chemical/Packaging/Paper
Page 31
Environmental concerns: Positive
The single-use plastic ban will apply to most chemical
components that are difficult to recycle. Moreover, in
view of China’s ban of imported waste paper (RCP),
UTP will benefit from rising paper-based packaging
demand and cheaper raw materials.
COVID-19 pandemic: Neutral
Unemployment and spending decline caused a
purchase delay on durable goods such as auto,
electronics, and electrical segments. However, note
that consumer staples (whose demand is resilient to
the pandemic) make up c.70% of the sales volume
for consumer products.
More business integration and M&As in the future?
Given the rapid changes in consumer behaviour and
competitive dynamics as well as rising awareness of
environmental concerns, we expect both chemical and
packaging players to strive for operational excellence and
embrace environmentally friendly practices. Towards this
end, the companies could pursue the following strategies:
i) Vertical business integration – This is to capture value-
chain and synergy benefits arising from feedstock
security to ensure higher margins and profitability for
end-user products.
ii) Horizontal integration – This is to capture and explore
market opportunities in the Southeast Asia region whose
population is growing.
iii) Merger and acquisition – Given the more intense
competition, we expect the higher cost players or those
with sub-optimal costs to become M&A targets for the
market leaders.
iv) Production base shift – Given the recent ban on single-
use plastic in many countries and recovered paper in
China, we expect players to move their production sites
to countries with less environmental restrictions and
regulations such as Indonesia.
v) Investing in green and product-differentiation initiatives –
In view of the rising awareness of environmental
concerns, we expect more capital spending on
operational improvements (cleaner energy, less energy
consumption, and less carbon emissions). There will also
be more efforts to upgrade production capacity to
ensure more environmentally friendly and degradable
products such as recyclable PET (rPET) and biochemicals.
vi) Knowledge sharing with the public – We note that many
chemical and packaging players are now promoting the
green nature of their businesses, with some highlighting
the environmentally-friendly practices used in the
production process. They are cognisant of the fact that
consumers are now becoming increasingly aware of
environmental issues, including the global greenhouse
effect and waste pollution (i.e. ocean waste).
Share price performance – SETPKG and SETPAPER have
outperformed SETPETRO and SET Indices
On a YTD basis, the SETPKG and SETPAPER indices have
outperformed the SETPETRO and SET indices. This is not a
surprise as packaging and paper businesses are more
resilient than the oil & gas and petrochemical businesses
that are highly cyclical. Moreover, the fortunes of the
SETPKG and SETPAPER segments are closely tied to the
everyday lives of consumers. As of 18 Nov 2020, the SETPKG
and SETPAPER indices delivered a YTD positive return of
35% and 47% respectively, whereas the SETPETRO and SET
indices plunged by 12% and 14% respectively.
Indices performance (year-to-date basis)
Source: SETSMART, DBSVTH, closing price as of 18 Nov2020
Going forward to 2021F, we expect some chemical and
packaging players such as PTL, SCGP, and UTP to remain
resilient to the short-term and long-term adverse
developments such as the COVID-19 pandemic and
environmental concerns. This is mainly thanks to their
diversified business portfolio and business practices that are
compatible with the various green energy initiatives. On the
other hand, IRPC, PTTGC and IVL should benefit from the
short-term spike in demand for medical equipment
(including PPE) and hygiene products. However, they could
be weighed down by the single-use plastic ban in the longer
term.
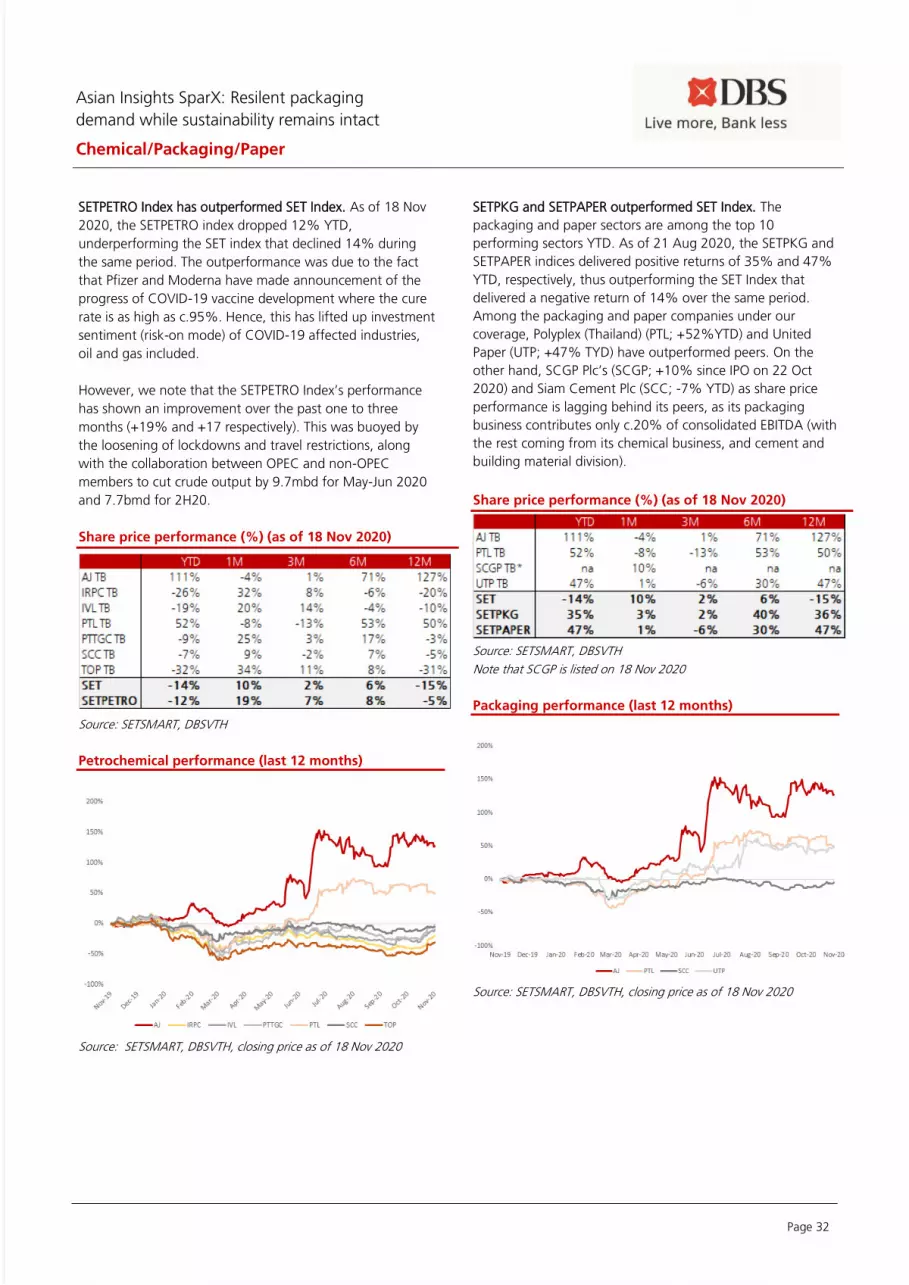
Asian Insights SparX: Resilent packaging
demand while sustainability remains intact
Chemical/Packaging/Paper
Page 32
SETPETRO Index has outperformed SET Index. As of 18 Nov
2020, the SETPETRO index dropped 12% YTD,
underperforming the SET index that declined 14% during
the same period. The outperformance was due to the fact
that Pfizer and Moderna have made announcement of the
progress of COVID-19 vaccine development where the cure
rate is as high as c.95%. Hence, this has lifted up investment
sentiment (risk-on mode) of COVID-19 affected industries,
oil and gas included.
However, we note that the SETPETRO Index’s performance
has shown an improvement over the past one to three
months (+19% and +17 respectively). This was buoyed by
the loosening of lockdowns and travel restrictions, along
with the collaboration between OPEC and non-OPEC
members to cut crude output by 9.7mbd for May-Jun 2020
and 7.7bmd for 2H20.
Share price performance (%) (as of 18 Nov 2020)
Source: SETSMART, DBSVTH
Petrochemical performance (last 12 months)
Source: SETSMART, DBSVTH, closing price as of 18 Nov 2020
SETPKG and SETPAPER outperformed SET Index. The
packaging and paper sectors are among the top 10
performing sectors YTD. As of 21 Aug 2020, the SETPKG and
SETPAPER indices delivered positive returns of 35% and 47%
YTD, respectively, thus outperforming the SET Index that
delivered a negative return of 14% over the same period.
Among the packaging and paper companies under our
coverage, Polyplex (Thailand) (PTL; +52%YTD) and United
Paper (UTP; +47% TYD) have outperformed peers. On the
other hand, SCGP Plc’s (SCGP; +10% since IPO on 22 Oct
2020) and Siam Cement Plc (SCC; -7% YTD) as share price
performance is lagging behind its peers, as its packaging
business contributes only c.20% of consolidated EBITDA (with
the rest coming from its chemical business, and cement and
building material division).
Share price performance (%) (as of 18 Nov 2020)
Source: SETSMART, DBSVTH
Note that SCGP is listed on 18 Nov 2020
Packaging performance (last 12 months)
Source: SETSMART, DBSVTH, closing price as of 18 Nov 2020
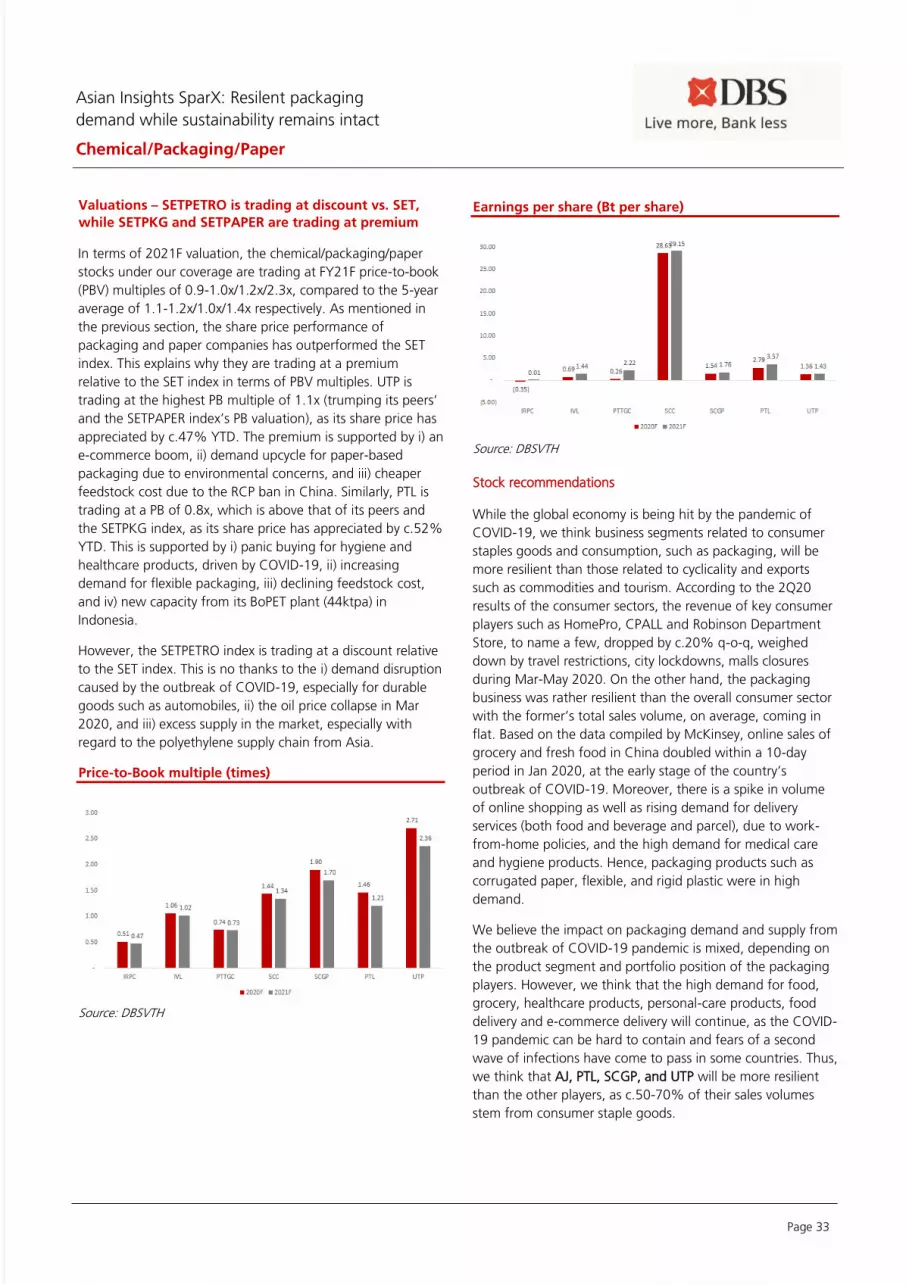
Asian Insights SparX: Resilent packaging
demand while sustainability remains intact
Chemical/Packaging/Paper
Page 33
Valuations – SETPETRO is trading at discount vs. SET,
while SETPKG and SETPAPER are trading at premium
In terms of 2021F valuation, the chemical/packaging/paper
stocks under our coverage are trading at FY21F price-to-book
(PBV) multiples of 0.9-1.0x/1.2x/2.3x, compared to the 5-year
average of 1.1-1.2x/1.0x/1.4x respectively. As mentioned in
the previous section, the share price performance of
packaging and paper companies has outperformed the SET
index. This explains why they are trading at a premium
relative to the SET index in terms of PBV multiples. UTP is
trading at the highest PB multiple of 1.1x (trumping its peers’
and the SETPAPER index’s PB valuation), as its share price has
appreciated by c.47% YTD. The premium is supported by i) an
e-commerce boom, ii) demand upcycle for paper-based
packaging due to environmental concerns, and iii) cheaper
feedstock cost due to the RCP ban in China. Similarly, PTL is
trading at a PB of 0.8x, which is above that of its peers and
the SETPKG index, as its share price has appreciated by c.52%
YTD. This is supported by i) panic buying for hygiene and
healthcare products, driven by COVID-19, ii) increasing
demand for flexible packaging, iii) declining feedstock cost,
and iv) new capacity from its BoPET plant (44ktpa) in
Indonesia.
However, the SETPETRO index is trading at a discount relative
to the SET index. This is no thanks to the i) demand disruption
caused by the outbreak of COVID-19, especially for durable
goods such as automobiles, ii) the oil price collapse in Mar
2020, and iii) excess supply in the market, especially with
regard to the polyethylene supply chain from Asia.
Price-to-Book multiple (times)
Source: DBSVTH
Earnings per share (Bt per share)
Source: DBSVTH
Stock recommendations
While the global economy is being hit by the pandemic of
COVID-19, we think business segments related to consumer
staples goods and consumption, such as packaging, will be
more resilient than those related to cyclicality and exports
such as commodities and tourism. According to the 2Q20
results of the consumer sectors, the revenue of key consumer
players such as HomePro, CPALL and Robinson Department
Store, to name a few, dropped by c.20% q-o-q, weighed
down by travel restrictions, city lockdowns, malls closures
during Mar-May 2020. On the other hand, the packaging
business was rather resilient than the overall consumer sector
with the former’s total sales volume, on average, coming in
flat. Based on the data compiled by McKinsey, online sales of
grocery and fresh food in China doubled within a 10-day
period in Jan 2020, at the early stage of the country’s
outbreak of COVID-19. Moreover, there is a spike in volume
of online shopping as well as rising demand for delivery
services (both food and beverage and parcel), due to work-
from-home policies, and the high demand for medical care
and hygiene products. Hence, packaging products such as
corrugated paper, flexible, and rigid plastic were in high
demand.
We believe the impact on packaging demand and supply from
the outbreak of COVID-19 pandemic is mixed, depending on
the product segment and portfolio position of the packaging
players. However, we think that the high demand for food,
grocery, healthcare products, personal-care products, food
delivery and e-commerce delivery will continue, as the COVID-
19 pandemic can be hard to contain and fears of a second
wave of infections have come to pass in some countries. Thus,
we think that AJ, PTL, SCGP, and UTP will be more resilient
than the other players, as c.50-70% of their sales volumes
stem from consumer staple goods.
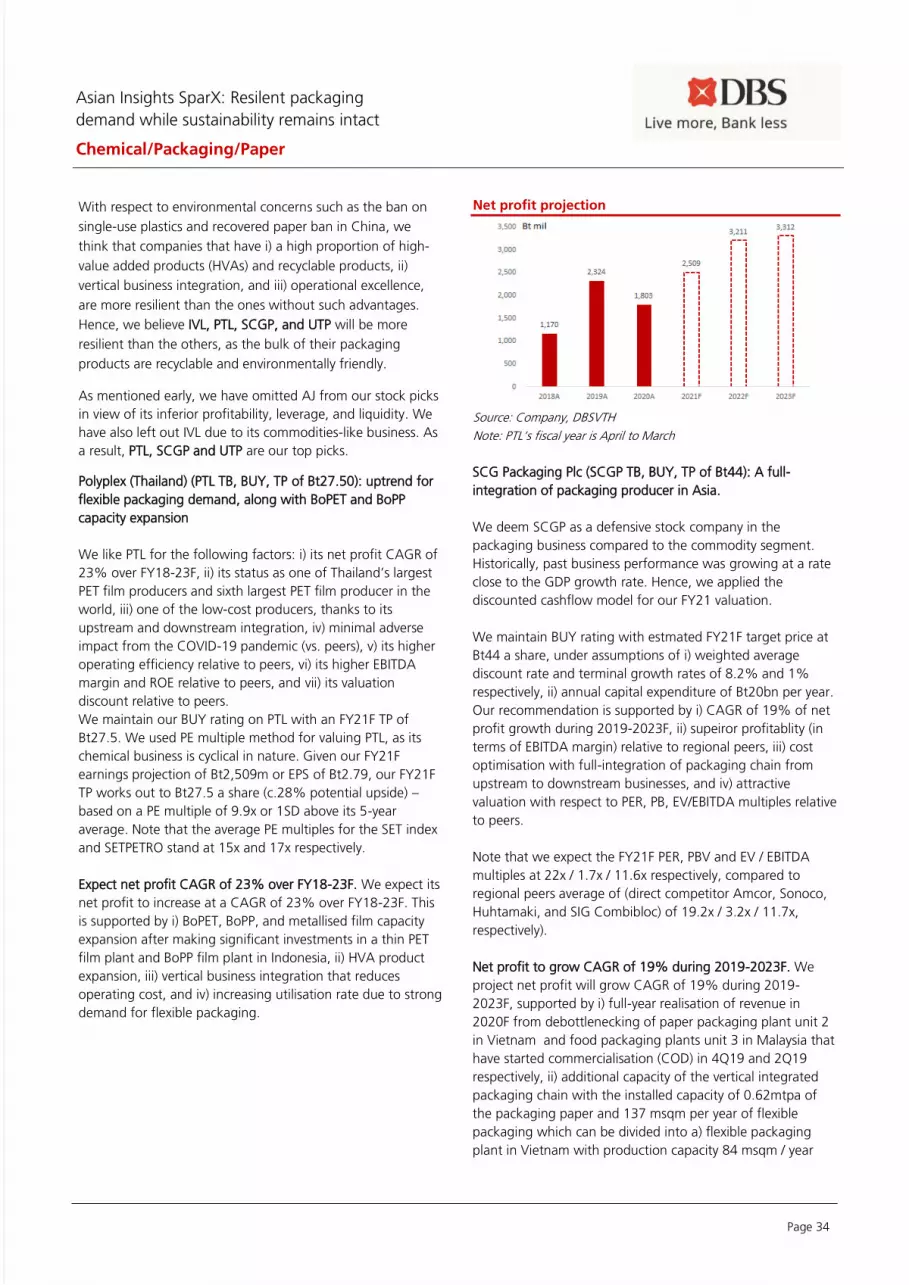
Asian Insights SparX: Resilent packaging
demand while sustainability remains intact
Chemical/Packaging/Paper
Page 34
With respect to environmental concerns such as the ban on
single-use plastics and recovered paper ban in China, we
think that companies that have i) a high proportion of high-
value added products (HVAs) and recyclable products, ii)
vertical business integration, and iii) operational excellence,
are more resilient than the ones without such advantages.
Hence, we believe IVL, PTL, SCGP, and UTP will be more
resilient than the others, as the bulk of their packaging
products are recyclable and environmentally friendly.
As mentioned early, we have omitted AJ from our stock picks
in view of its inferior profitability, leverage, and liquidity. We
have also left out IVL due to its commodities-like business. As
a result, PTL, SCGP and UTP are our top picks.
Polyplex (Thailand) (PTL TB, BUY, TP of Bt27.50): uptrend for
flexible packaging demand, along with BoPET and BoPP
capacity expansion
We like PTL for the following factors: i) its net profit CAGR of
23% over FY18-23F, ii) its status as one of Thailand’s largest
PET film producers and sixth largest PET film producer in the
world, iii) one of the low-cost producers, thanks to its
upstream and downstream integration, iv) minimal adverse
impact from the COVID-19 pandemic (vs. peers), v) its higher
operating efficiency relative to peers, vi) its higher EBITDA
margin and ROE relative to peers, and vii) its valuation
discount relative to peers.
We maintain our BUY rating on PTL with an FY21F TP of
Bt27.5. We used PE multiple method for valuing PTL, as its
chemical business is cyclical in nature. Given our FY21F
earnings projection of Bt2,509m or EPS of Bt2.79, our FY21F
TP works out to Bt27.5 a share (c.28% potential upside) –
based on a PE multiple of 9.9x or 1SD above its 5-year
average. Note that the average PE multiples for the SET index
and SETPETRO stand at 15x and 17x respectively.
Expect net profit CAGR of 23% over FY18-23F. We expect its
net profit to increase at a CAGR of 23% over FY18-23F. This
is supported by i) BoPET, BoPP, and metallised film capacity
expansion after making significant investments in a thin PET
film plant and BoPP film plant in Indonesia, ii) HVA product
expansion, iii) vertical business integration that reduces
operating cost, and iv) increasing utilisation rate due to strong
demand for flexible packaging.
Net profit projection
Source: Company, DBSVTH
Note: PTL’s fiscal year is April to March
SCG Packaging Plc (SCGP TB, BUY, TP of Bt44): A full-
integration of packaging producer in Asia.
We deem SCGP as a defensive stock company in the
packaging business compared to the commodity segment.
Historically, past business performance was growing at a rate
close to the GDP growth rate. Hence, we applied the
discounted cashflow model for our FY21 valuation.
We maintain BUY rating with estmated FY21F target price at
Bt44 a share, under assumptions of i) weighted average
discount rate and terminal growth rates of 8.2% and 1%
respectively, ii) annual capital expenditure of Bt20bn per year.
Our recommendation is supported by i) CAGR of 19% of net
profit growth during 2019-2023F, ii) supeiror profitablity (in
terms of EBITDA margin) relative to regional peers, iii) cost
optimisation with full-integration of packaging chain from
upstream to downstream businesses, and iv) attractive
valuation with respect to PER, PB, EV/EBITDA multiples relative
to peers.
Note that we expect the FY21F PER, PBV and EV / EBITDA
multiples at 22x / 1.7x / 11.6x respectively, compared to
regional peers average of (direct competitor Amcor, Sonoco,
Huhtamaki, and SIG Combibloc) of 19.2x / 3.2x / 11.7x,
respectively).
Net profit to grow CAGR of 19% during 2019-2023F. We
project net profit will grow CAGR of 19% during 2019-
2023F, supported by i) full-year realisation of revenue in
2020F from debottlenecking of paper packaging plant unit 2
in Vietnam and food packaging plants unit 3 in Malaysia that
have started commercialisation (COD) in 4Q19 and 2Q19
respectively, ii) additional capacity of the vertical integrated
packaging chain with the installed capacity of 0.62mtpa of
the packaging paper and 137 msqm per year of flexible
packaging which can be divided into a) flexible packaging
plant in Vietnam with production capacity 84 msqm / year

Asian Insights SparX: Resilent packaging
demand while sustainability remains intact
Chemical/Packaging/Paper
Page 35
(expected to COD in 3Q21), b) paper mill factory in Indonesia
with production capacity of 0.4mtpa (expected COD in
1Q21), c) local paper factory at The Philippines with
production capacity of 0.22 mtpa (expect COD in 2Q21) and
d) Expanded Prepack factory in Thailand with production
capacity of 53 msqm / year, (expected COD in 3Q21).
CAGR of 19% of net profit during 2019-2023F
Source: Company, DBSVTH
Expect EBITDA margin of 16% in the 2020F-2023F. In
addition to the similarity of earnings performance with
consumer business segment, we expect EBITDA margin to be
at least 16% during 2020F-2023F. This was driven by i) the
synergy benefit from the upstream to downstream business
(vertical integration), ii) the expansion of the capacity of both
packaging paper and performance polymers packaging (PPP)
where we expect gross profit margin and EBITDA margin of
20% and 15% respectively, and iii) potential merger &
partnership in a fragmented market that will create synergy
benefits and value chain for the packaging chain.
Solid gross and EBITDA margins during 2018-2023F
Source: Company, DBSVTH
United Paper (UTP, BUY, TP of Bt16.50): Superior margins
while benefiting from RCP ban by China.
We like UTP for the following factors: i) its ability to maintain
a high level of EBITDA margin with healthy margins, ii)
expectations of an industry upcycle going forward, thanks to
the Chinese government’s stricter polices on the environment,
iii) its already secured customer base, vi) robust e-commerce
trend, vii) its valuation discount relative to peers, and viii) its
attractive dividend yield of 6%-6.5% in FY20F-FY21F.
We used PE multiple method for valuing UTP, as its
containerboard business is cyclical in nature. Given our FY21F
earnings projection of Bt1,024m or EPS of Bt1.58, our FY21F
TP works out to Bt16.50 a share – based on a PE multiple of
10.5x or 1SD above its 5-year average.
Margin improvement over the past five years. During the
past five years, UTP’s EBITDA margin rose from 16.6% in
2015 to 34.2% in 2019. This is mainly due to i) increase in
capacity by 170% from 100,000 tons per year to 300,000
tons per year in July 2017 that resulted in better economies
of scale, ii) an industry upcycle, thanks to the Chinese
government's stricter policies on environment that caused a
supply shortage in China, and iii) high demand in the
domestic market.
We expect UTP to maintain its high EBITDA levels of 34%-
35% in FY20F-22F, thanks mainly to i) higher revenue
contribution from kraft liner boards that yield higher margins
of 30%-35% vs. margins of 20-25% for corrugating
medium boards, ii) wider product spreads arising from a
supply shortage in China, and iii) the accelerating e-
commerce trend in Thailand.
Gross and EBITDA margins
Source: Company, DBSVTH
13.5%15.7% 16.1%
26.1%
31.8% 32.0% 33.0% 33.0%
16.6%18.9%
21.8%
28.3%
34.2% 34.3%35.5% 35.5%
0.0%
5.0%
10.0%
15.0%
20.0%
25.0%
30.0%
35.0%
40.0%
2015 2016 2017 2018 2019 2020F 2021F 2022F
GPM EBITDA margin
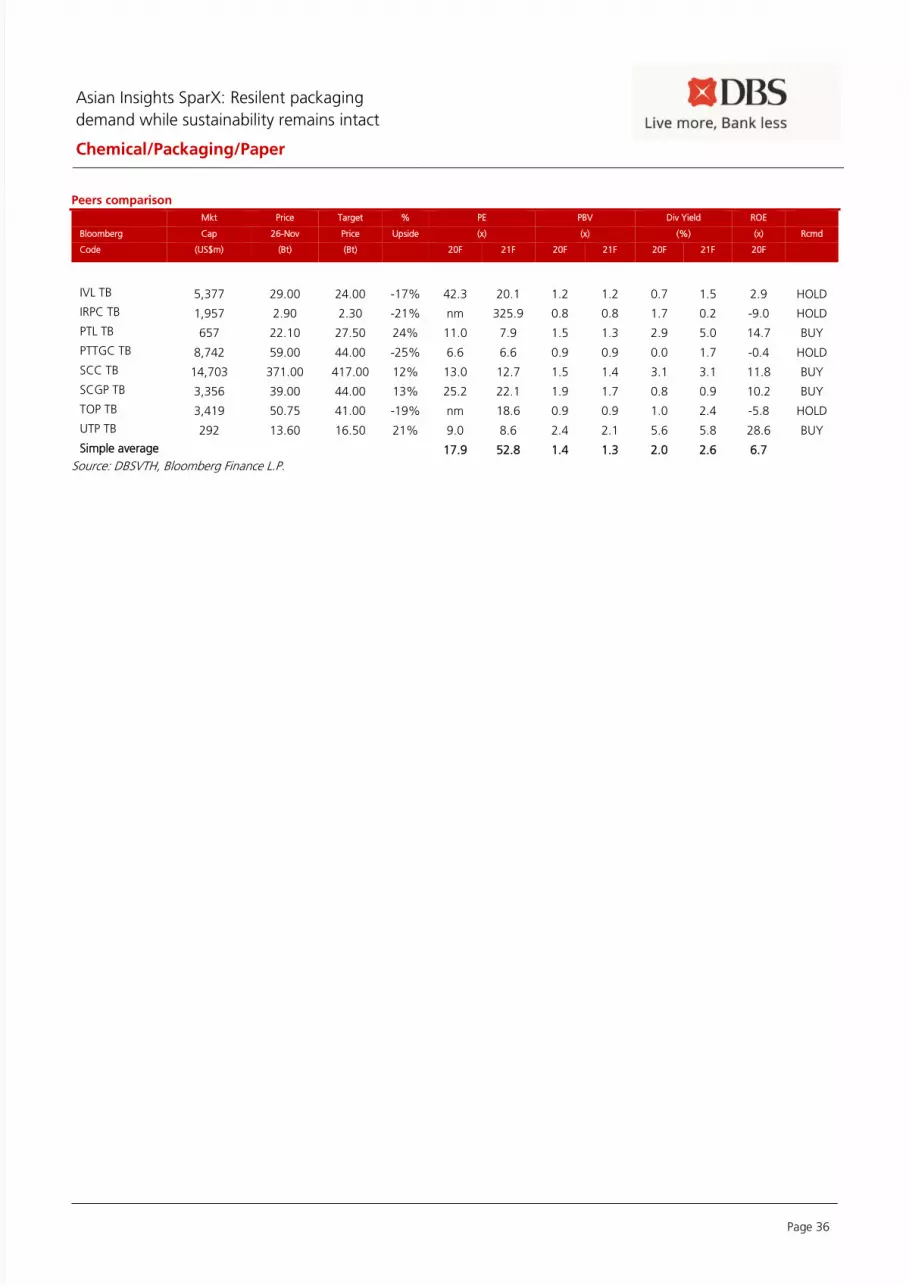
Asian Insights SparX: Resilent packaging
demand while sustainability remains intact
Chemical/Packaging/Paper
Page 36
Peers comparison
Mkt Price Target % PE PBV Div Yield ROE
Bloomberg Cap 26-Nov Price Upside (x) (x) (%) (x) Rcmd
Code (US$m) (Bt) (Bt) 20F 21F 20F 21F 20F 21F 20F
IVL TB 5,377 29.00 24.00 -17% 42.3 20.1 1.2 1.2 0.7 1.5 2.9 HOLD
IRPC TB 1,957 2.90 2.30 -21% nm 325.9 0.8 0.8 1.7 0.2 -9.0 HOLD
PTL TB 657 22.10 27.50 24% 11.0 7.9 1.5 1.3 2.9 5.0 14.7 BUY
PTTGC TB 8,742 59.00 44.00 -25% 6.6 6.6 0.9 0.9 0.0 1.7 -0.4 HOLD
SCC TB 14,703 371.00 417.00 12% 13.0 12.7 1.5 1.4 3.1 3.1 11.8 BUY
SCGP TB 3,356 39.00 44.00 13% 25.2 22.1 1.9 1.7 0.8 0.9 10.2 BUY
TOP TB 3,419 50.75 41.00 -19% nm 18.6 0.9 0.9 1.0 2.4 -5.8 HOLD
UTP TB 292 13.60 16.50 21% 9.0 8.6 2.4 2.1 5.6 5.8 28.6 BUY
Simple average 17.9 52.8 1.4 1.3 2.0 2.6 6.7 Source: DBSVTH, Bloomberg Finance L.P.
Asian Insights SparX: Resilent packaging
demand while sustainability remains intact
Chemical/Packaging/Paper
Page 37
Company Guide
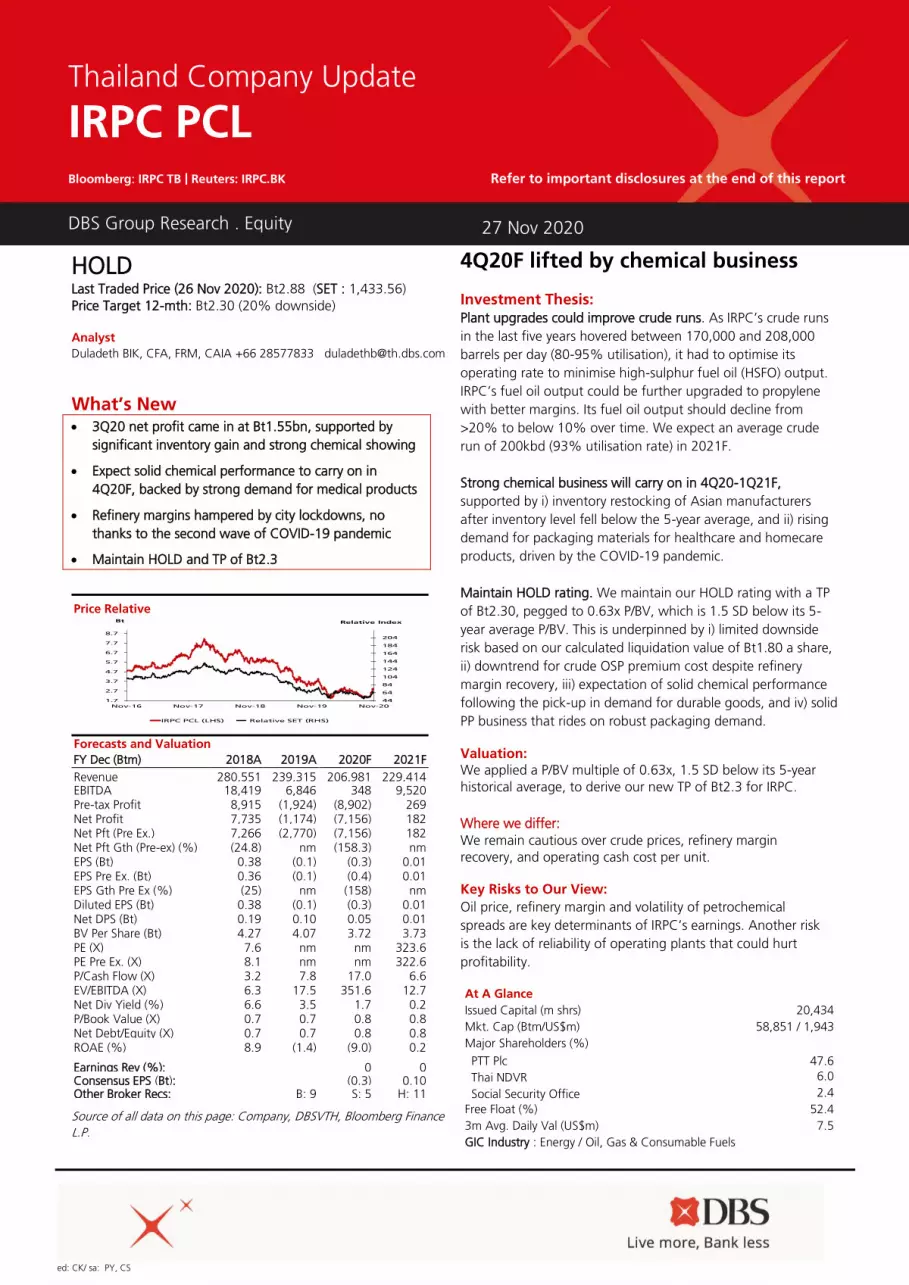
ed: CK/ sa: PY, CS
HOLD Last Traded Price (26 Nov 2020): Bt2.88 (SET : 1,433.56)
Price Target 12-mth: Bt2.30 (20% downside)
Analyst
Duladeth BIK, CFA, FRM, CAIA +66 28577833 [email protected]
What’s New • 3Q20 net profit came in at Bt1.55bn, supported by
significant inventory gain and strong chemical showing
• Expect solid chemical performance to carry on in
4Q20F, backed by strong demand for medical products
• Refinery margins hampered by city lockdowns, no
thanks to the second wave of COVID-19 pandemic
• Maintain HOLD and TP of Bt2.3
Source of all data on this page: Company, DBSVTH, Bloomberg Finance
L.P.
4Q20F lifted by chemical business Investment Thesis: Plant upgrades could improve crude runs. As IRPC’s crude runs
in the last five years hovered between 170,000 and 208,000
barrels per day (80-95% utilisation), it had to optimise its
operating rate to minimise high-sulphur fuel oil (HSFO) output.
IRPC’s fuel oil output could be further upgraded to propylene
with better margins. Its fuel oil output should decline from
>20% to below 10% over time. We expect an average crude
run of 200kbd (93% utilisation rate) in 2021F.
Strong chemical business will carry on in 4Q20-1Q21F,
supported by i) inventory restocking of Asian manufacturers
after inventory level fell below the 5-year average, and ii) rising
demand for packaging materials for healthcare and homecare
products, driven by the COVID-19 pandemic.
Maintain HOLD rating. We maintain our HOLD rating with a TP
of Bt2.30, pegged to 0.63x P/BV, which is 1.5 SD below its 5-
year average P/BV. This is underpinned by i) limited downside
risk based on our calculated liquidation value of Bt1.80 a share,
ii) downtrend for crude OSP premium cost despite refinery
margin recovery, iii) expectation of solid chemical performance
following the pick-up in demand for durable goods, and iv) solid
PP business that rides on robust packaging demand. Valuation:
We applied a P/BV multiple of 0.63x, 1.5 SD below its 5-year
historical average, to derive our new TP of Bt2.3 for IRPC.
Where we differ:
We remain cautious over crude prices, refinery margin
recovery, and operating cash cost per unit. Key Risks to Our View:
Oil price, refinery margin and volatility of petrochemical
spreads are key determinants of IRPC’s earnings. Another risk
is the lack of reliability of operating plants that could hurt
profitability.
At A Glance
Issued Capital (m shrs) 20,434
Mkt. Cap (Btm/US$m) 58,851 / 1,943
Major Shareholders (%)
PTT Plc 47.6
Thai NDVR 6.0
Social Security Office 2.4
Free Float (%) 52.4
3m Avg. Daily Val (US$m) 7.5
GIC Industry : Energy / Oil, Gas & Consumable Fuels
DBS Group Research . Equity
27 Nov 2020
Thailand Company Update
IRPC PCL Bloomberg: IRPC TB | Reuters: IRPC.BK Refer to important disclosures at the end of this report
Price Relative
Forecasts and Valuation
FY Dec (Btm) 2018A 2019A 2020F 2021F
Revenue 280,551 239,315 206,981 229,414 EBITDA 18,419 6,846 348 9,520 Pre-tax Profit 8,915 (1,924) (8,902) 269 Net Profit 7,735 (1,174) (7,156) 182 Net Pft (Pre Ex.) 7,266 (2,770) (7,156) 182 Net Pft Gth (Pre-ex) (%) (24.8) nm (158.3) nm EPS (Bt) 0.38 (0.1) (0.3) 0.01 EPS Pre Ex. (Bt) 0.36 (0.1) (0.4) 0.01 EPS Gth Pre Ex (%) (25) nm (158) nm Diluted EPS (Bt) 0.38 (0.1) (0.3) 0.01 Net DPS (Bt) 0.19 0.10 0.05 0.01 BV Per Share (Bt) 4.27 4.07 3.72 3.73 PE (X) 7.6 nm nm 323.6 PE Pre Ex. (X) 8.1 nm nm 322.6 P/Cash Flow (X) 3.2 7.8 17.0 6.6 EV/EBITDA (X) 6.3 17.5 351.6 12.7 Net Div Yield (%) 6.6 3.5 1.7 0.2 P/Book Value (X) 0.7 0.7 0.8 0.8 Net Debt/Equity (X) 0.7 0.7 0.8 0.8 ROAE (%) 8.9 (1.4) (9.0) 0.2 Earnings Rev (%): 0 0 Consensus EPS (Bt): (0.3) 0.10 Other Broker Recs: B: 9 S: 5 H: 11
44
64
84
104
124
144
164
184
204
1.7
2.7
3.7
4.7
5.7
6.7
7.7
8.7
Nov-16 Nov-17 Nov-18 Nov-19 Nov-20
Relative IndexBt
IRPC PCL (LHS) Relative SET (RHS)
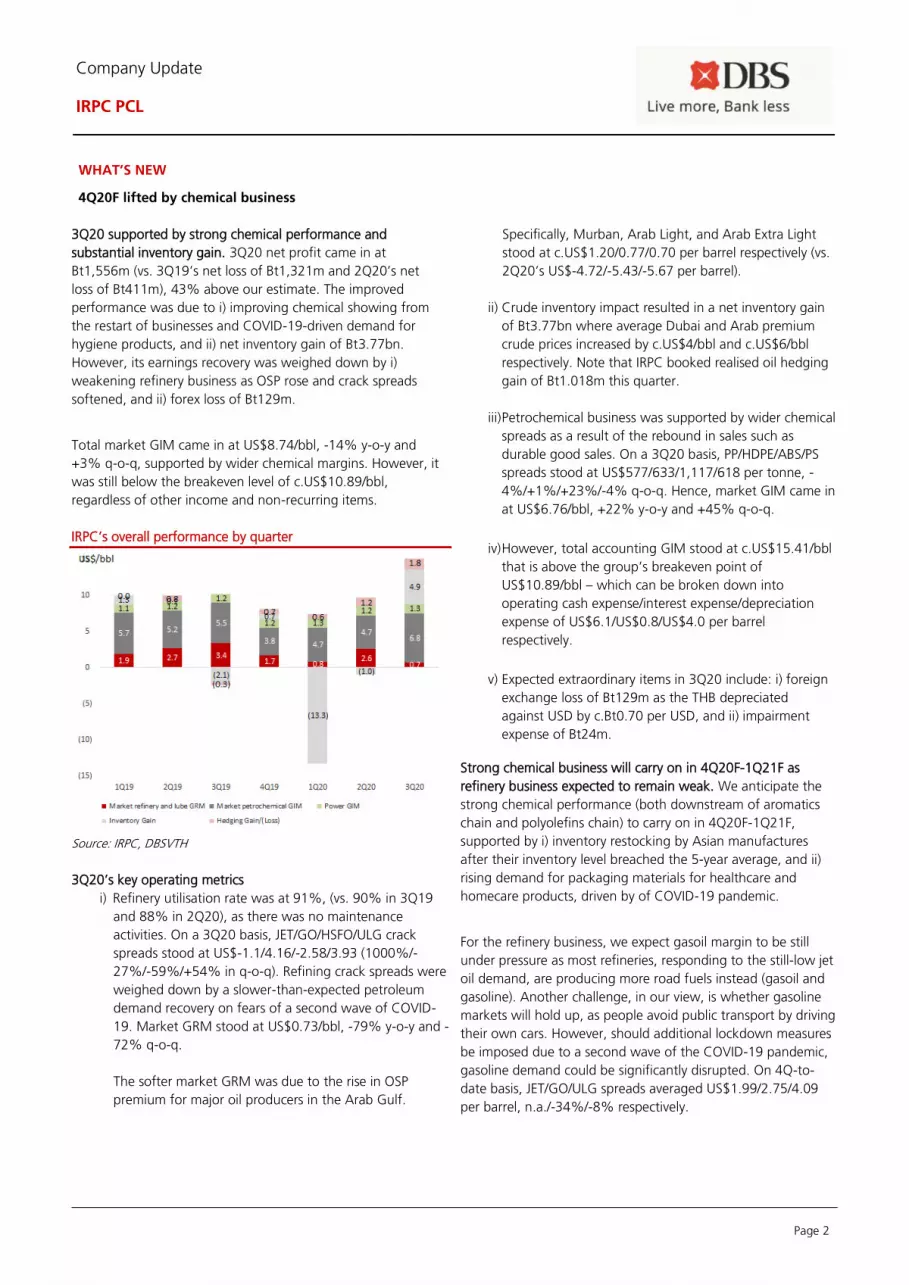
Page 2
Company Update
IRPC PCL
WHAT’S NEW
4Q20F lifted by chemical business
3Q20 supported by strong chemical performance and
substantial inventory gain. 3Q20 net profit came in at
Bt1,556m (vs. 3Q19’s net loss of Bt1,321m and 2Q20’s net
loss of Bt411m), 43% above our estimate. The improved
performance was due to i) improving chemical showing from
the restart of businesses and COVID-19-driven demand for
hygiene products, and ii) net inventory gain of Bt3.77bn.
However, its earnings recovery was weighed down by i)
weakening refinery business as OSP rose and crack spreads
softened, and ii) forex loss of Bt129m.
Total market GIM came in at US$8.74/bbl, -14% y-o-y and
+3% q-o-q, supported by wider chemical margins. However, it
was still below the breakeven level of c.US$10.89/bbl,
regardless of other income and non-recurring items.
IRPC’s overall performance by quarter
Source: IRPC, DBSVTH
3Q20’s key operating metrics
i) Refinery utilisation rate was at 91%, (vs. 90% in 3Q19
and 88% in 2Q20), as there was no maintenance
activities. On a 3Q20 basis, JET/GO/HSFO/ULG crack
spreads stood at US$-1.1/4.16/-2.58/3.93 (1000%/-
27%/-59%/+54% in q-o-q). Refining crack spreads were
weighed down by a slower-than-expected petroleum
demand recovery on fears of a second wave of COVID-
19. Market GRM stood at US$0.73/bbl, -79% y-o-y and -
72% q-o-q.
The softer market GRM was due to the rise in OSP
premium for major oil producers in the Arab Gulf.
Specifically, Murban, Arab Light, and Arab Extra Light
stood at c.US$1.20/0.77/0.70 per barrel respectively (vs.
2Q20’s US$-4.72/-5.43/-5.67 per barrel).
ii) Crude inventory impact resulted in a net inventory gain
of Bt3.77bn where average Dubai and Arab premium
crude prices increased by c.US$4/bbl and c.US$6/bbl
respectively. Note that IRPC booked realised oil hedging
gain of Bt1.018m this quarter.
iii) Petrochemical business was supported by wider chemical
spreads as a result of the rebound in sales such as
durable good sales. On a 3Q20 basis, PP/HDPE/ABS/PS
spreads stood at US$577/633/1,117/618 per tonne, -
4%/+1%/+23%/-4% q-o-q. Hence, market GIM came in
at US$6.76/bbl, +22% y-o-y and +45% q-o-q.
iv) However, total accounting GIM stood at c.US$15.41/bbl
that is above the group’s breakeven point of
US$10.89/bbl – which can be broken down into
operating cash expense/interest expense/depreciation
expense of US$6.1/US$0.8/US$4.0 per barrel
respectively.
v) Expected extraordinary items in 3Q20 include: i) foreign
exchange loss of Bt129m as the THB depreciated
against USD by c.Bt0.70 per USD, and ii) impairment
expense of Bt24m.
Strong chemical business will carry on in 4Q20F-1Q21F as
refinery business expected to remain weak. We anticipate the
strong chemical performance (both downstream of aromatics
chain and polyolefins chain) to carry on in 4Q20F-1Q21F,
supported by i) inventory restocking by Asian manufactures
after their inventory level breached the 5-year average, and ii)
rising demand for packaging materials for healthcare and
homecare products, driven by of COVID-19 pandemic.
For the refinery business, we expect gasoil margin to be still
under pressure as most refineries, responding to the still-low jet
oil demand, are producing more road fuels instead (gasoil and
gasoline). Another challenge, in our view, is whether gasoline
markets will hold up, as people avoid public transport by driving
their own cars. However, should additional lockdown measures
be imposed due to a second wave of the COVID-19 pandemic,
gasoline demand could be significantly disrupted. On 4Q-to-
date basis, JET/GO/ULG spreads averaged US$1.99/2.75/4.09
per barrel, n.a./-34%/-8% respectively.
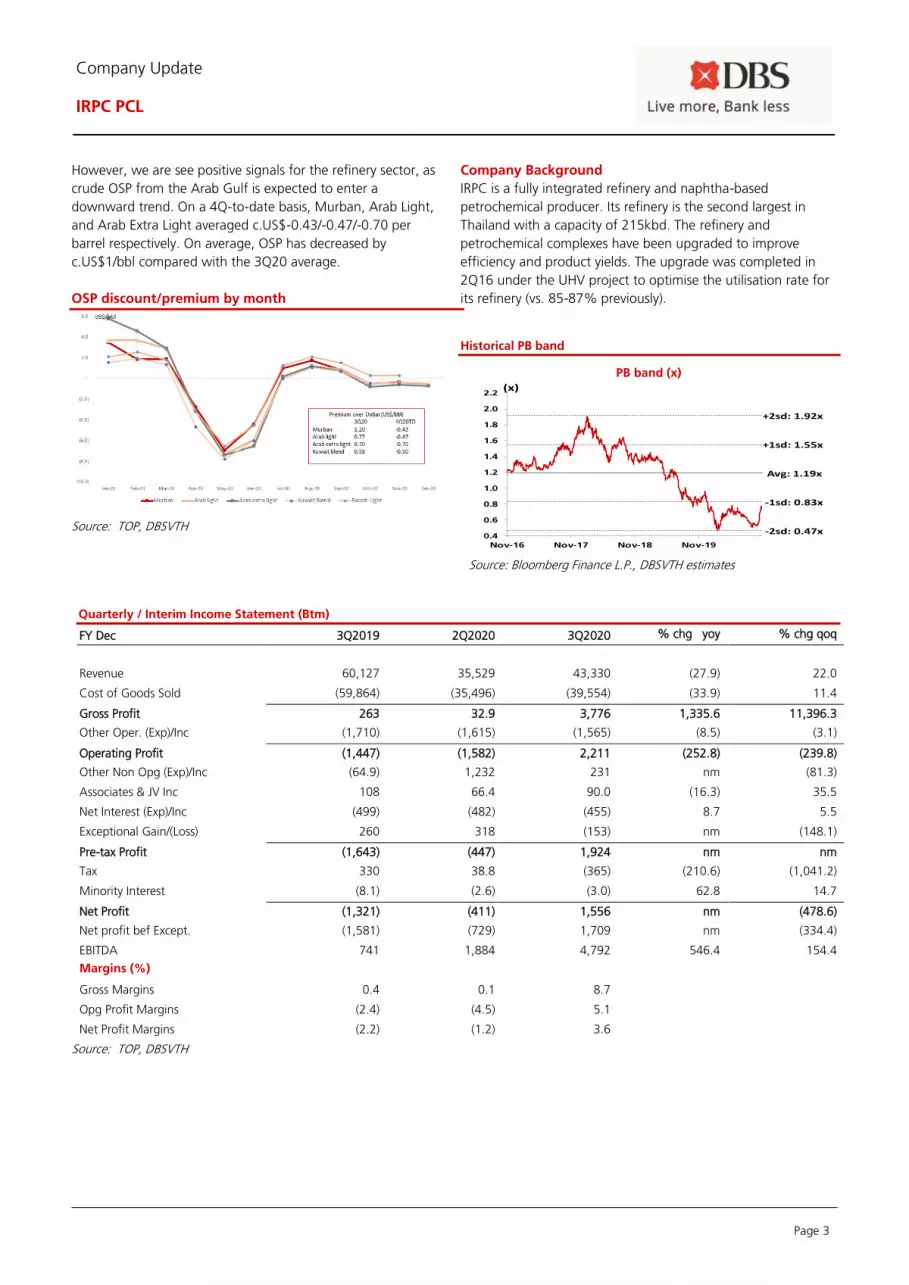
Page 3
Company Update
IRPC PCL
However, we are see positive signals for the refinery sector, as
crude OSP from the Arab Gulf is expected to enter a
downward trend. On a 4Q-to-date basis, Murban, Arab Light,
and Arab Extra Light averaged c.US$-0.43/-0.47/-0.70 per
barrel respectively. On average, OSP has decreased by
c.US$1/bbl compared with the 3Q20 average.
OSP discount/premium by month
Source: TOP, DBSVTH
Company Background
IRPC is a fully integrated refinery and naphtha-based
petrochemical producer. Its refinery is the second largest in
Thailand with a capacity of 215kbd. The refinery and
petrochemical complexes have been upgraded to improve
efficiency and product yields. The upgrade was completed in
2Q16 under the UHV project to optimise the utilisation rate for
its refinery (vs. 85-87% previously).
Historical PB band
PB band (x)
Source: Bloomberg Finance L.P., DBSVTH estimates
Quarterly / Interim Income Statement (Btm)
FY Dec 3Q2019 2Q2020 3Q2020 % chg yoy % chg qoq
Revenue 60,127 35,529 43,330 (27.9) 22.0
Cost of Goods Sold (59,864) (35,496) (39,554) (33.9) 11.4
Gross Profit 263 32.9 3,776 1,335.6 11,396.3
Other Oper. (Exp)/Inc (1,710) (1,615) (1,565) (8.5) (3.1)
Operating Profit (1,447) (1,582) 2,211 (252.8) (239.8)
Other Non Opg (Exp)/Inc (64.9) 1,232 231 nm (81.3)
Associates & JV Inc 108 66.4 90.0 (16.3) 35.5
Net Interest (Exp)/Inc (499) (482) (455) 8.7 5.5
Exceptional Gain/(Loss) 260 318 (153) nm (148.1)
Pre-tax Profit (1,643) (447) 1,924 nm nm
Tax 330 38.8 (365) (210.6) (1,041.2)
Minority Interest (8.1) (2.6) (3.0) 62.8 14.7
Net Profit (1,321) (411) 1,556 nm (478.6)
Net profit bef Except. (1,581) (729) 1,709 nm (334.4)
EBITDA 741 1,884 4,792 546.4 154.4
Margins (%)
Gross Margins 0.4 0.1 8.7
Opg Profit Margins (2.4) (4.5) 5.1
Net Profit Margins (2.2) (1.2) 3.6
Source: TOP, DBSVTH
Avg: 1.19x
+1sd: 1.55x
+2sd: 1.92x
-1sd: 0.83x
-2sd: 0.47x0.4
0.6
0.8
1.0
1.2
1.4
1.6
1.8
2.0
2.2
Nov-16 Nov-17 Nov-18 Nov-19
(x)
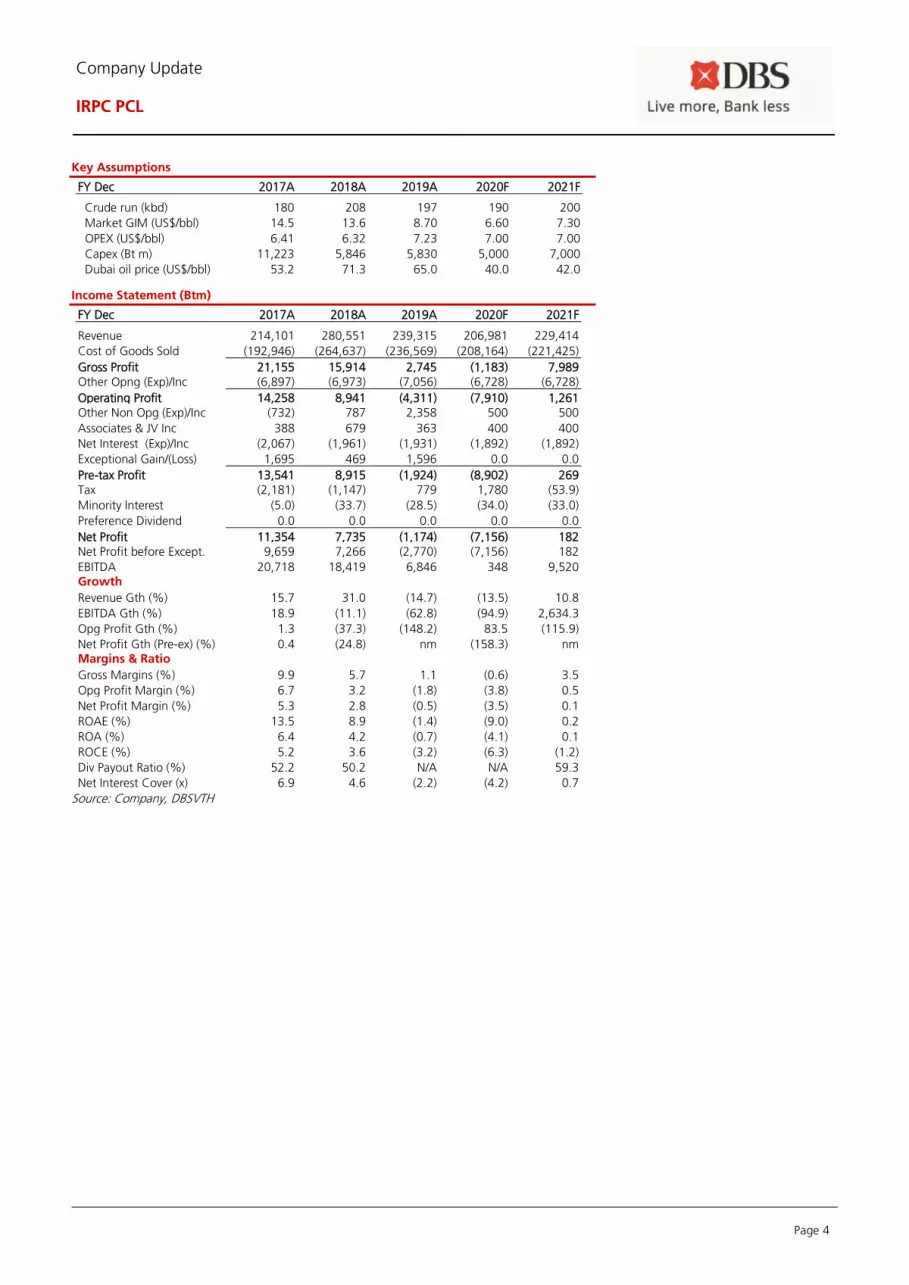
Page 4
Company Update
IRPC PCL
Key Assumptions
FY Dec 2017A 2018A 2019A 2020F 2021F
Crude run (kbd) 180 208 197 190 200
Market GIM (US$/bbl) 14.5 13.6 8.70 6.60 7.30
OPEX (US$/bbl) 6.41 6.32 7.23 7.00 7.00
Capex (Bt m) 11,223 5,846 5,830 5,000 7,000
Dubai oil price (US$/bbl) 53.2 71.3 65.0 40.0 42.0
Income Statement (Btm)
FY Dec 2017A 2018A 2019A 2020F 2021F
Revenue 214,101 280,551 239,315 206,981 229,414
Cost of Goods Sold (192,946) (264,637) (236,569) (208,164) (221,425)
Gross Profit 21,155 15,914 2,745 (1,183) 7,989 Other Opng (Exp)/Inc (6,897) (6,973) (7,056) (6,728) (6,728)
Operating Profit 14,258 8,941 (4,311) (7,910) 1,261 Other Non Opg (Exp)/Inc (732) 787 2,358 500 500
Associates & JV Inc 388 679 363 400 400
Net Interest (Exp)/Inc (2,067) (1,961) (1,931) (1,892) (1,892)
Exceptional Gain/(Loss) 1,695 469 1,596 0.0 0.0
Pre-tax Profit 13,541 8,915 (1,924) (8,902) 269 Tax (2,181) (1,147) 779 1,780 (53.9)
Minority Interest (5.0) (33.7) (28.5) (34.0) (33.0)
Preference Dividend 0.0 0.0 0.0 0.0 0.0
Net Profit 11,354 7,735 (1,174) (7,156) 182 Net Profit before Except. 9,659 7,266 (2,770) (7,156) 182
EBITDA 20,718 18,419 6,846 348 9,520 Growth
Revenue Gth (%) 15.7 31.0 (14.7) (13.5) 10.8
EBITDA Gth (%) 18.9 (11.1) (62.8) (94.9) 2,634.3
Opg Profit Gth (%) 1.3 (37.3) (148.2) 83.5 (115.9)
Net Profit Gth (Pre-ex) (%) 0.4 (24.8) nm (158.3) nm Margins & Ratio
Gross Margins (%) 9.9 5.7 1.1 (0.6) 3.5
Opg Profit Margin (%) 6.7 3.2 (1.8) (3.8) 0.5
Net Profit Margin (%) 5.3 2.8 (0.5) (3.5) 0.1
ROAE (%) 13.5 8.9 (1.4) (9.0) 0.2
ROA (%) 6.4 4.2 (0.7) (4.1) 0.1
ROCE (%) 5.2 3.6 (3.2) (6.3) (1.2)
Div Payout Ratio (%) 52.2 50.2 N/A N/A 59.3
Net Interest Cover (x) 6.9 4.6 (2.2) (4.2) 0.7
Source: Company, DBSVTH
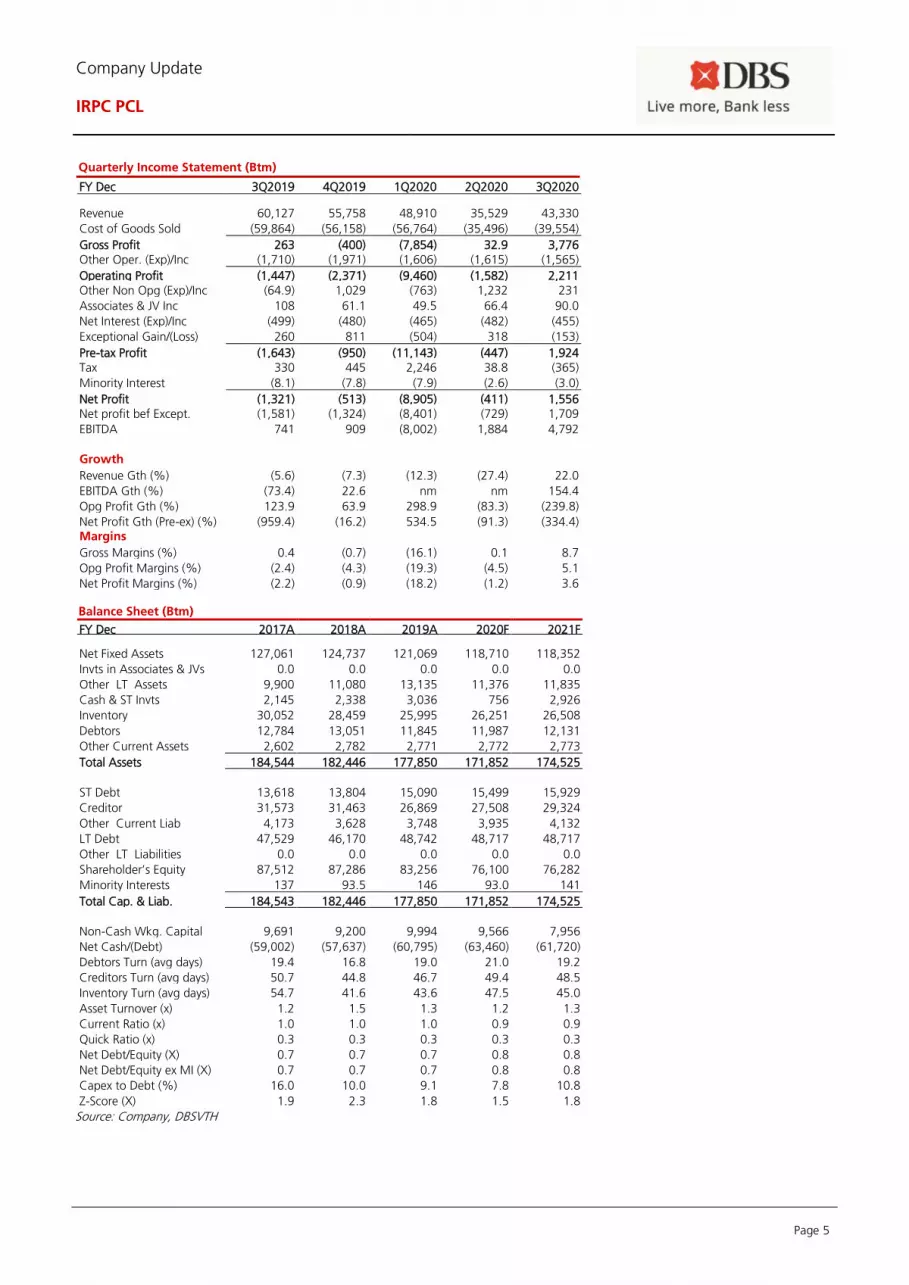
Page 5
Company Update
IRPC PCL
Quarterly Income Statement (Btm)
FY Dec 3Q2019 4Q2019 1Q2020 2Q2020 3Q2020
Revenue 60,127 55,758 48,910 35,529 43,330
Cost of Goods Sold (59,864) (56,158) (56,764) (35,496) (39,554)
Gross Profit 263 (400) (7,854) 32.9 3,776 Other Oper. (Exp)/Inc (1,710) (1,971) (1,606) (1,615) (1,565)
Operating Profit (1,447) (2,371) (9,460) (1,582) 2,211 Other Non Opg (Exp)/Inc (64.9) 1,029 (763) 1,232 231
Associates & JV Inc 108 61.1 49.5 66.4 90.0
Net Interest (Exp)/Inc (499) (480) (465) (482) (455)
Exceptional Gain/(Loss) 260 811 (504) 318 (153)
Pre-tax Profit (1,643) (950) (11,143) (447) 1,924 Tax 330 445 2,246 38.8 (365)
Minority Interest (8.1) (7.8) (7.9) (2.6) (3.0)
Net Profit (1,321) (513) (8,905) (411) 1,556 Net profit bef Except. (1,581) (1,324) (8,401) (729) 1,709
EBITDA 741 909 (8,002) 1,884 4,792 Growth
Revenue Gth (%) (5.6) (7.3) (12.3) (27.4) 22.0
EBITDA Gth (%) (73.4) 22.6 nm nm 154.4
Opg Profit Gth (%) 123.9 63.9 298.9 (83.3) (239.8)
Net Profit Gth (Pre-ex) (%) (959.4) (16.2) 534.5 (91.3) (334.4) Margins
Gross Margins (%) 0.4 (0.7) (16.1) 0.1 8.7
Opg Profit Margins (%) (2.4) (4.3) (19.3) (4.5) 5.1
Net Profit Margins (%) (2.2) (0.9) (18.2) (1.2) 3.6
Balance Sheet (Btm)
FY Dec 2017A 2018A 2019A 2020F 2021F Net Fixed Assets 127,061 124,737 121,069 118,710 118,352
Invts in Associates & JVs 0.0 0.0 0.0 0.0 0.0
Other LT Assets 9,900 11,080 13,135 11,376 11,835
Cash & ST Invts 2,145 2,338 3,036 756 2,926
Inventory 30,052 28,459 25,995 26,251 26,508
Debtors 12,784 13,051 11,845 11,987 12,131
Other Current Assets 2,602 2,782 2,771 2,772 2,773
Total Assets 184,544 182,446 177,850 171,852 174,525
ST Debt
13,618 13,804 15,090 15,499 15,929
Creditor 31,573 31,463 26,869 27,508 29,324
Other Current Liab 4,173 3,628 3,748 3,935 4,132
LT Debt 47,529 46,170 48,742 48,717 48,717
Other LT Liabilities 0.0 0.0 0.0 0.0 0.0
Shareholder’s Equity 87,512 87,286 83,256 76,100 76,282
Minority Interests 137 93.5 146 93.0 141
Total Cap. & Liab. 184,543 182,446 177,850 171,852 174,525
Non-Cash Wkg. Capital 9,691 9,200 9,994 9,566 7,956
Net Cash/(Debt) (59,002) (57,637) (60,795) (63,460) (61,720)
Debtors Turn (avg days) 19.4 16.8 19.0 21.0 19.2
Creditors Turn (avg days) 50.7 44.8 46.7 49.4 48.5
Inventory Turn (avg days) 54.7 41.6 43.6 47.5 45.0
Asset Turnover (x) 1.2 1.5 1.3 1.2 1.3
Current Ratio (x) 1.0 1.0 1.0 0.9 0.9
Quick Ratio (x) 0.3 0.3 0.3 0.3 0.3
Net Debt/Equity (X) 0.7 0.7 0.7 0.8 0.8
Net Debt/Equity ex MI (X) 0.7 0.7 0.7 0.8 0.8
Capex to Debt (%) 16.0 10.0 9.1 7.8 10.8
Z-Score (X) 1.9 2.3 1.8 1.5 1.8
Source: Company, DBSVTH
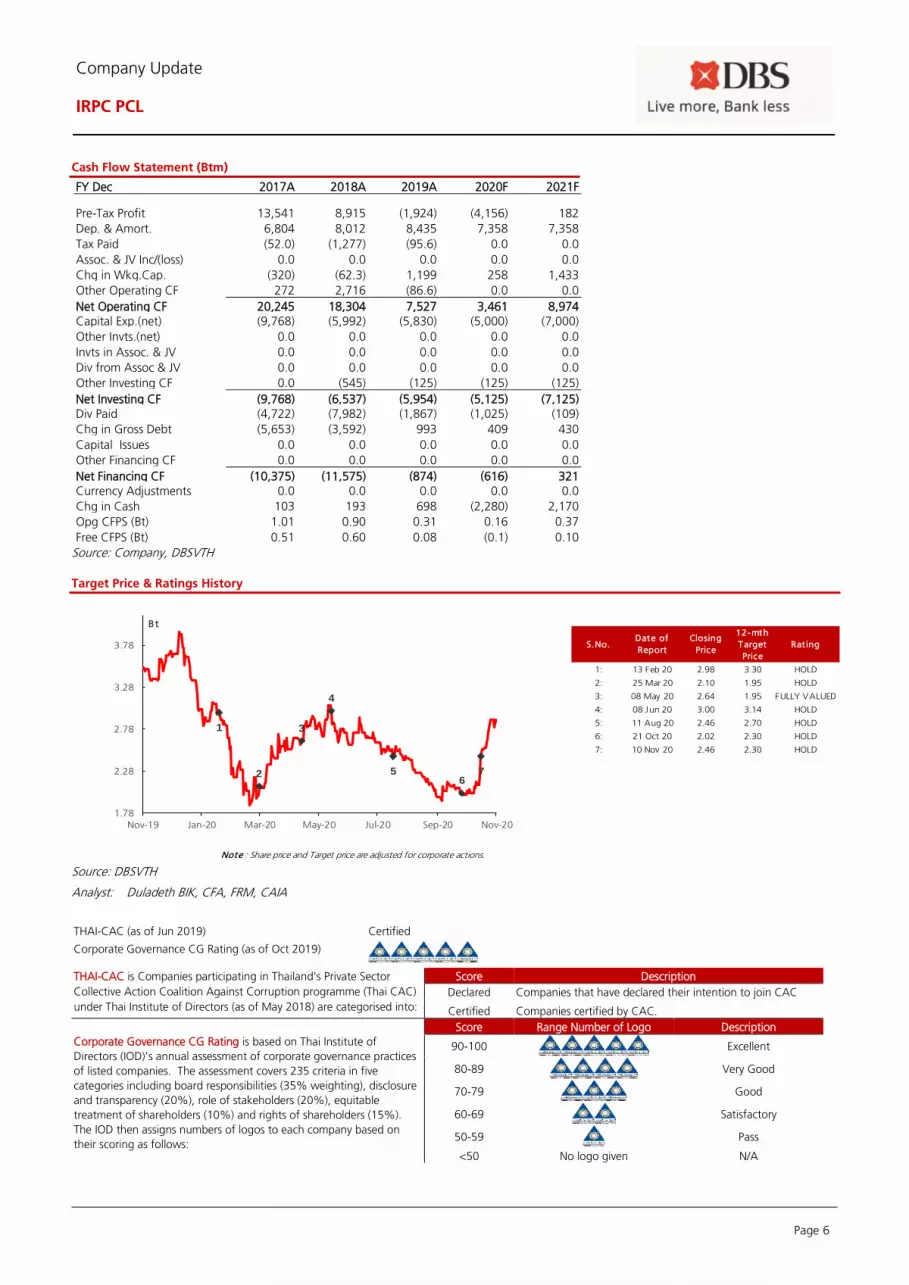
Page 6
Company Update
IRPC PCL
Cash Flow Statement (Btm)
FY Dec 2017A 2018A 2019A 2020F 2021F
Pre-Tax Profit 13,541 8,915 (1,924) (4,156) 182
Dep. & Amort. 6,804 8,012 8,435 7,358 7,358
Tax Paid (52.0) (1,277) (95.6) 0.0 0.0
Assoc. & JV Inc/(loss) 0.0 0.0 0.0 0.0 0.0
Chg in Wkg.Cap. (320) (62.3) 1,199 258 1,433
Other Operating CF 272 2,716 (86.6) 0.0 0.0
Net Operating CF 20,245 18,304 7,527 3,461 8,974 Capital Exp.(net) (9,768) (5,992) (5,830) (5,000) (7,000)
Other Invts.(net) 0.0 0.0 0.0 0.0 0.0
Invts in Assoc. & JV 0.0 0.0 0.0 0.0 0.0
Div from Assoc & JV 0.0 0.0 0.0 0.0 0.0
Other Investing CF 0.0 (545) (125) (125) (125)
Net Investing CF (9,768) (6,537) (5,954) (5,125) (7,125) Div Paid (4,722) (7,982) (1,867) (1,025) (109)
Chg in Gross Debt (5,653) (3,592) 993 409 430
Capital Issues 0.0 0.0 0.0 0.0 0.0
Other Financing CF 0.0 0.0 0.0 0.0 0.0
Net Financing CF (10,375) (11,575) (874) (616) 321 Currency Adjustments 0.0 0.0 0.0 0.0 0.0
Chg in Cash 103 193 698 (2,280) 2,170
Opg CFPS (Bt) 1.01 0.90 0.31 0.16 0.37
Free CFPS (Bt) 0.51 0.60 0.08 (0.1) 0.10
Source: Company, DBSVTH
Target Price & Ratings History
Source: DBSVTH
Analyst: Duladeth BIK, CFA, FRM, CAIA
THAI-CAC (as of Jun 2019) Certified
Corporate Governance CG Rating (as of Oct 2019)
THAI-CAC is Companies participating in Thailand's Private Sector
Collective Action Coalition Against Corruption programme (Thai CAC)
under Thai Institute of Directors (as of May 2018) are categorised into:
Score Description
Declared Companies that have declared their intention to join CAC
Certified Companies certified by CAC.
Corporate Governance CG Rating is based on Thai Institute of
Directors (IOD)’s annual assessment of corporate governance practices
of listed companies. The assessment covers 235 criteria in five
categories including board responsibilities (35% weighting), disclosure
and transparency (20%), role of stakeholders (20%), equitable
treatment of shareholders (10%) and rights of shareholders (15%).
The IOD then assigns numbers of logos to each company based on
their scoring as follows:
Score Range Number of Logo Description
90-100
Excellent
80-89
Very Good
70-79
Good
60-69
Satisfactory
50-59
Pass
<50 No logo given N/A
S.No.Date of
Report
Closing
Price
12-mth
Target
Price
Rat ing
1: 13 Feb 20 2.98 3.30 HOLD
2: 25 Mar 20 2.10 1.95 HOLD
3: 08 May 20 2.64 1.95 FULLY VALUED
4: 08 Jun 20 3.00 3.14 HOLD
5: 11 Aug 20 2.46 2.70 HOLD
6: 21 Oct 20 2.02 2.30 HOLD
7: 10 Nov 20 2.46 2.30 HOLD
Note : Share price and Target price are adjusted for corporate actions.
1
2
3
4
56
7
1.78
2.28
2.78
3.28
3.78
Nov-19 Jan-20 Mar-20 May-20 Jul-20 Sep-20 Nov-20
Bt

ed: CK/ sa: PY, CS
HOLD Last Traded Price (26 Nov 2020): Bt30.25 (SET : 1,433.56)
Price Target 12-mth: Bt24.00 (21% downside)
Analyst
Duladeth BIK, CFA, FRM, CAIA +66 28577833 [email protected]
What’s New • 3Q20 net profit came in at Bt380m, supported by rising
volume and inventory gain
• Core EBITDA/tonne came in at US$68/tonne (-19%y-o-
y, -28% q-o-q), hit by weakening demand amid COVID-
19 pandemic
• We expect 2021F to see normalised sales volume and
rebound of PET margins that are below the industry’s
conversion cash cost
• Maintain HOLD with an unchanged TP of Bt24
Source of all data on this page: Company, DBSVTH, Bloomberg Finance
L.P.
Bottoming of PET margins Investment Thesis: Capacity continues to grow. Acquiring operating assets in key
markets and consolidating the industry to rationalise market
supply are IVL’s main strategies to gain market share. Based on
its announced acquisitions, we expect its capacity to rise from
10.7mtpa at the end of 2017 to over 14mtpa by the end of
2021 (excluding joint ventures), implying an CAGR of c.10%.
This is thanks to acquisition of Huntsman’s assets in early 2020.
Expect earnings to recover in 2021F, supported by normalised
operations and rebound in margins, on the back of i)
normalising production volume after the integration of
Huntsman’s assets in early 2020, ii) gradual integrated PET
demand recovery, and iii) bottoming of margins, as they are
falling below the breakeven level for certain Asian producers.
Maintain HOLD and TP of Bt24, in view of the following: i) the
share price has factored in expectations of weak earnings in
2H20F after retreating more than 20% since Jul 2020, ii) signs
of recovery for integrated PTA/PET margins, iii) MTBE margin
recovery after the easing of lockdowns in many countries, and
iv) minimal impact from the COVID-19 pandemic, as c.75% of
its revenue is contributed by consumer staples.
Valuation:
Our FY21F TP of Bt24, pegged to a PE of 17x that is equivalent
to 0.5SD below its 5-year average.
Where we differ:
We are more conservative on the chemical outlook, as any
recovery in demand and purchasing power depends on the
discovery of an effective COVID-19 vaccine. Our FY20F/FY21F
EPS is 50%/27% below consensus.
Key Risks to Our View:
(1) Fluctuation in product spreads from demand and supply
balancing. (2) Lower-than-expected efficiency improvement for
newly acquired assets. (3) Operational instability. At A Glance Issued Capital (m shrs) 5,615
Mkt. Cap (Btm/US$m) 169,840 / 5,607
Major Shareholders (%)
Indorama Resources 62.4
Thai NVDR 5.6
Bangkok Bank 4.8
Free Float (%) 35.1
3m Avg. Daily Val (US$m) 32.3
GIC Industry : Materials / Chemicals
DBS Group Research . Equity
27 Nov 2020
Thailand Company Update
Indorama Ventures Bloomberg: IVL TB | Reuters: IVL.BK Refer to important disclosures at the end of this report
Price Relative
Forecasts and Valuation
FY Dec (Btm) 2018A 2019A 2020F 2021F
Revenue 347,171 352,692 393,750 425,700 EBITDA 44,126 25,843 24,700 29,799 Pre-tax Profit 30,151 5,898 5,575 10,579 Net Profit 26,467 5,252 3,853 8,099 Net Pft (Pre Ex.) 24,054 5,239 3,853 8,099 Net Pft Gth (Pre-ex) (%) 19.4 (78.2) (26.5) 110.2 EPS (Bt) 4.71 0.94 0.69 1.44 EPS Pre Ex. (Bt) 4.28 0.93 0.69 1.44 EPS Gth Pre Ex (%) 12 (78) (26) 110 Diluted EPS (Bt) 4.71 0.94 0.69 1.44 Net DPS (Bt) 1.40 1.23 0.21 0.43 BV Per Share (Bt) 25.8 23.1 23.5 24.6 PE (X) 6.4 32.3 44.1 21.0 PE Pre Ex. (X) 7.1 32.4 44.1 21.0 P/Cash Flow (X) 5.3 4.2 7.4 15.2 EV/EBITDA (X) 7.4 13.1 14.6 12.4 Net Div Yield (%) 4.6 4.0 0.7 1.4 P/Book Value (X) 1.2 1.3 1.3 1.2 Net Debt/Equity (X) 1.0 1.2 1.3 1.3 ROAE (%) 20.2 3.8 2.9 6.0 Earnings Rev (%): 0 0 Consensus EPS (Bt): 0.92 2.08 Other Broker Recs: B: 15 S: 2 H: 5
65
85
105
125
145
165
185
205
15.2
25.2
35.2
45.2
55.2
65.2
Nov-16 Nov-17 Nov-18 Nov-19 Nov-20
Relative IndexBt
Indorama Ventures (LHS) Relative SET (RHS)
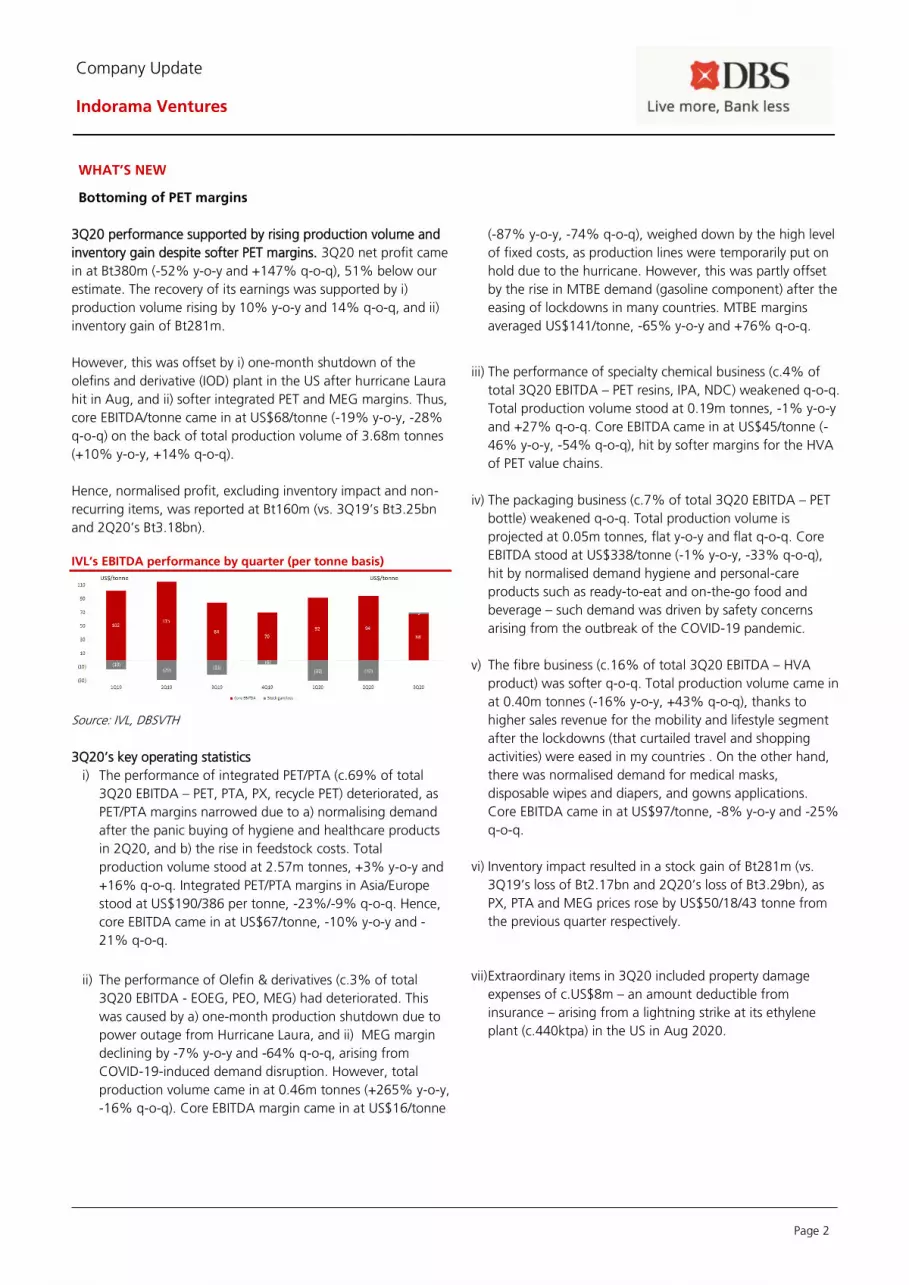
Page 2
Company Update
Indorama Ventures
WHAT’S NEW
Bottoming of PET margins
3Q20 performance supported by rising production volume and
inventory gain despite softer PET margins. 3Q20 net profit came
in at Bt380m (-52% y-o-y and +147% q-o-q), 51% below our
estimate. The recovery of its earnings was supported by i)
production volume rising by 10% y-o-y and 14% q-o-q, and ii)
inventory gain of Bt281m.
However, this was offset by i) one-month shutdown of the
olefins and derivative (IOD) plant in the US after hurricane Laura
hit in Aug, and ii) softer integrated PET and MEG margins. Thus,
core EBITDA/tonne came in at US$68/tonne (-19% y-o-y, -28%
q-o-q) on the back of total production volume of 3.68m tonnes
(+10% y-o-y, +14% q-o-q).
Hence, normalised profit, excluding inventory impact and non-
recurring items, was reported at Bt160m (vs. 3Q19’s Bt3.25bn
and 2Q20’s Bt3.18bn).
IVL’s EBITDA performance by quarter (per tonne basis)
Source: IVL, DBSVTH
3Q20’s key operating statistics
i) The performance of integrated PET/PTA (c.69% of total
3Q20 EBITDA – PET, PTA, PX, recycle PET) deteriorated, as
PET/PTA margins narrowed due to a) normalising demand
after the panic buying of hygiene and healthcare products
in 2Q20, and b) the rise in feedstock costs. Total
production volume stood at 2.57m tonnes, +3% y-o-y and
+16% q-o-q. Integrated PET/PTA margins in Asia/Europe
stood at US$190/386 per tonne, -23%/-9% q-o-q. Hence,
core EBITDA came in at US$67/tonne, -10% y-o-y and -
21% q-o-q.
ii) The performance of Olefin & derivatives (c.3% of total
3Q20 EBITDA - EOEG, PEO, MEG) had deteriorated. This
was caused by a) one-month production shutdown due to
power outage from Hurricane Laura, and ii) MEG margin
declining by -7% y-o-y and -64% q-o-q, arising from
COVID-19-induced demand disruption. However, total
production volume came in at 0.46m tonnes (+265% y-o-y,
-16% q-o-q). Core EBITDA margin came in at US$16/tonne
(-87% y-o-y, -74% q-o-q), weighed down by the high level
of fixed costs, as production lines were temporarily put on
hold due to the hurricane. However, this was partly offset
by the rise in MTBE demand (gasoline component) after the
easing of lockdowns in many countries. MTBE margins
averaged US$141/tonne, -65% y-o-y and +76% q-o-q.
iii) The performance of specialty chemical business (c.4% of
total 3Q20 EBITDA – PET resins, IPA, NDC) weakened q-o-q.
Total production volume stood at 0.19m tonnes, -1% y-o-y
and +27% q-o-q. Core EBITDA came in at US$45/tonne (-
46% y-o-y, -54% q-o-q), hit by softer margins for the HVA
of PET value chains.
iv) The packaging business (c.7% of total 3Q20 EBITDA – PET
bottle) weakened q-o-q. Total production volume is
projected at 0.05m tonnes, flat y-o-y and flat q-o-q. Core
EBITDA stood at US$338/tonne (-1% y-o-y, -33% q-o-q),
hit by normalised demand hygiene and personal-care
products such as ready-to-eat and on-the-go food and
beverage – such demand was driven by safety concerns
arising from the outbreak of the COVID-19 pandemic.
v) The fibre business (c.16% of total 3Q20 EBITDA – HVA
product) was softer q-o-q. Total production volume came in
at 0.40m tonnes (-16% y-o-y, +43% q-o-q), thanks to
higher sales revenue for the mobility and lifestyle segment
after the lockdowns (that curtailed travel and shopping
activities) were eased in my countries . On the other hand,
there was normalised demand for medical masks,
disposable wipes and diapers, and gowns applications.
Core EBITDA came in at US$97/tonne, -8% y-o-y and -25%
q-o-q.
vi) Inventory impact resulted in a stock gain of Bt281m (vs.
3Q19’s loss of Bt2.17bn and 2Q20’s loss of Bt3.29bn), as
PX, PTA and MEG prices rose by US$50/18/43 tonne from
the previous quarter respectively.
vii) Extraordinary items in 3Q20 included property damage
expenses of c.US$8m – an amount deductible from
insurance – arising from a lightning strike at its ethylene
plant (c.440ktpa) in the US in Aug 2020.

Page 3
Company Update
Indorama Ventures
Expect earnings recovery in 2021F, supported by normalised
operations and rebound in margins. Its performance in 2020F
was hit by i) softer overall chemical margins, hit by demand
disruptions caused by the COVID-19 pandemic, ii) sub-optimal
production volume where IOD plants in the US were shut down
for c.70 days in 1Q20 and c.30 days in 3Q20 after Hurricane
Laura hit in Aug, and iii) substantial inventory loss (1H20’s loss
stood at Bt6.7bn) after PX/PTA/MEG prices rose sharply in
tandem with crude oil prices.
We believe its performance in 2021F will be driven by i)
normalising production volume after the completion of the
integration of Huntsman’s assets in early 2020, ii) gradual
integrated PET demand recovery, and iii) bottoming of margins,
i.e., PET and MEG, as the current levels are below the operating
cash cost/breakeven for certain Asian producers.
Company Background
IVL is a global integrated PET/PTA producer with a combined
PET, fibre and PTA capacity of 13mtpa. Including MEG and
other high value-added products, its total capacity was 14mtpa
in 2019. The group operates production facilities in 21
countries, with a sales footprint covering over 100 countries.
Quarterly / Interim Income Statement (Btm)
FY Dec 3Q2019 2Q2020 3Q2020 % chg yoy % chg qoq
Revenue 84,478 75,010 81,019 (4.1) 8.0
Cost of Goods Sold (79,555) (70,760) (74,687) (6.1) 5.5
Gross Profit 4,923 4,250 6,332 28.6 49.0
Other Oper. (Exp)/Inc (3,009) (3,921) (4,259) 41.5 8.6
Operating Profit 1,914 329 2,073 8.3 530.7
Other Non Opg (Exp)/Inc 356 722 522 46.5 (27.8)
Associates & JV Inc (4.8) 65.6 41.7 nm (36.5)
Net Interest (Exp)/Inc (1,357) (1,785) (1,899) (39.9) (6.4)
Exceptional Gain/(Loss) (290) 260 (60.8) 79.0 (123.4)
Pre-tax Profit 618 (409) 677 9.5 nm
Tax (27.1) 569 (188) 595.1 (133.1)
Minority Interest 202 (6.3) (109) nm 1,637.2
Net Profit 793 154 380 (52.1) 147.5
Net profit bef Except. 1,083 (106) 441 (59.3) (515.1)
EBITDA 5,873 5,496 7,189 22.4 30.8
Margins (%)
Gross Margins 5.8 5.7 7.8
Opg Profit Margins 2.3 0.4 2.6
Net Profit Margins 0.9 0.2 0.5
Historical PE and PB band
Forward PE band (x) PB band (x)
Source: Bloomberg Finance L.P., DBSVTH estimates Source: Bloomberg Finance L.P., DBSVTH estimates
Avg: 27.9x
+1sd: 44.6x
+2sd: 61.3x
-1sd: 11.2x
-4.9
5.1
15.1
25.1
35.1
45.1
55.1
65.1
Nov-16 Nov-17 Nov-18 Nov-19
(x)
Avg: 1.8x
+1sd: 2.27x
+2sd: 2.75x
-1sd: 1.32x
-2sd: 0.85x
0.6
1.1
1.6
2.1
2.6
3.1
Nov-16 Nov-17 Nov-18 Nov-19
(x)
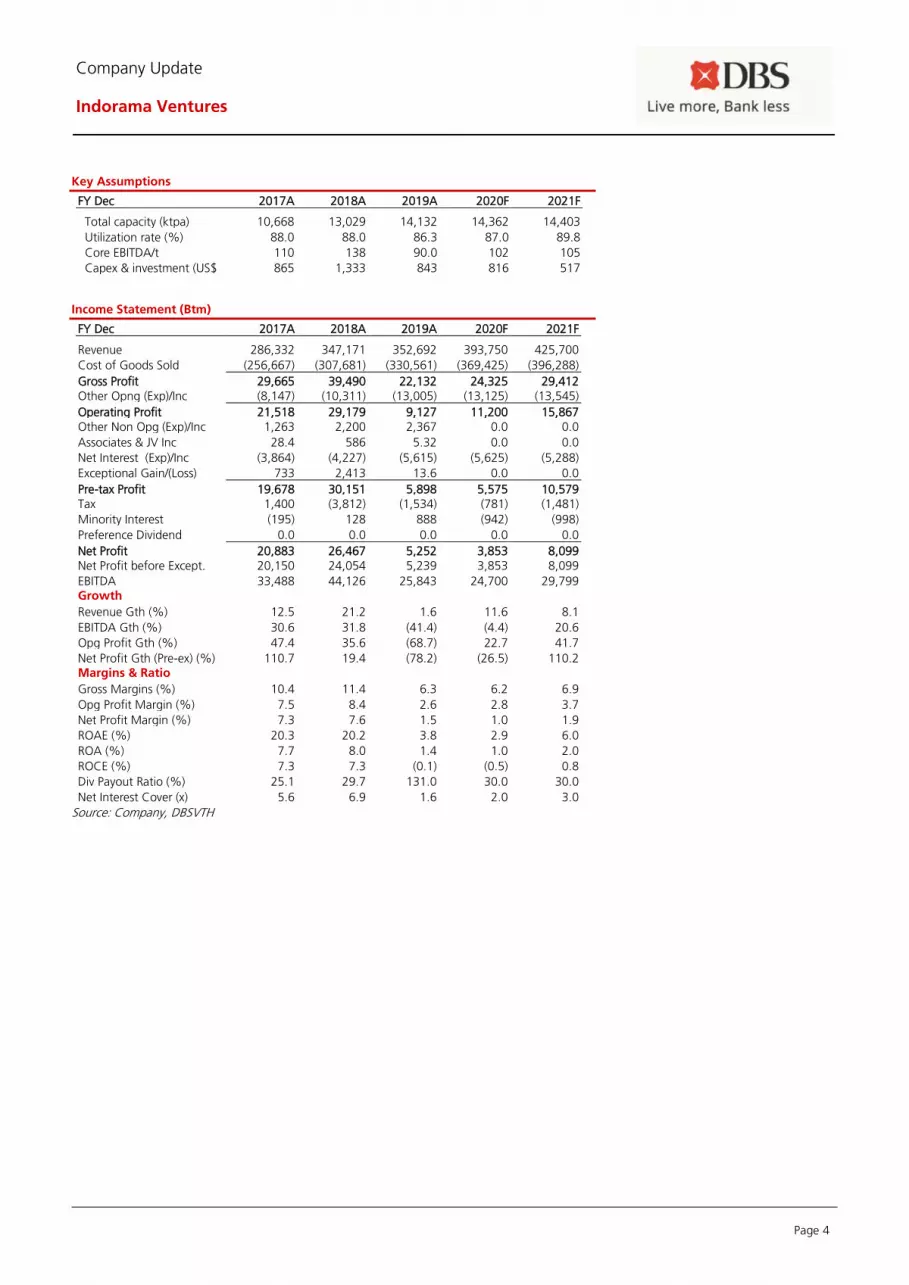
Page 4
Company Update
Indorama Ventures
Key Assumptions
FY Dec 2017A 2018A 2019A 2020F 2021F
Total capacity (ktpa) 10,668 13,029 14,132 14,362 14,403
Utilization rate (%) 88.0 88.0 86.3 87.0 89.8
Core EBITDA/t 110 138 90.0 102 105
Capex & investment (US$
m)
865 1,333 843 816 517
Income Statement (Btm)
FY Dec 2017A 2018A 2019A 2020F 2021F
Revenue 286,332 347,171 352,692 393,750 425,700
Cost of Goods Sold (256,667) (307,681) (330,561) (369,425) (396,288)
Gross Profit 29,665 39,490 22,132 24,325 29,412 Other Opng (Exp)/Inc (8,147) (10,311) (13,005) (13,125) (13,545)
Operating Profit 21,518 29,179 9,127 11,200 15,867 Other Non Opg (Exp)/Inc 1,263 2,200 2,367 0.0 0.0
Associates & JV Inc 28.4 586 5.32 0.0 0.0
Net Interest (Exp)/Inc (3,864) (4,227) (5,615) (5,625) (5,288)
Exceptional Gain/(Loss) 733 2,413 13.6 0.0 0.0
Pre-tax Profit 19,678 30,151 5,898 5,575 10,579 Tax 1,400 (3,812) (1,534) (781) (1,481)
Minority Interest (195) 128 888 (942) (998)
Preference Dividend 0.0 0.0 0.0 0.0 0.0
Net Profit 20,883 26,467 5,252 3,853 8,099 Net Profit before Except. 20,150 24,054 5,239 3,853 8,099
EBITDA 33,488 44,126 25,843 24,700 29,799 Growth
Revenue Gth (%) 12.5 21.2 1.6 11.6 8.1
EBITDA Gth (%) 30.6 31.8 (41.4) (4.4) 20.6
Opg Profit Gth (%) 47.4 35.6 (68.7) 22.7 41.7
Net Profit Gth (Pre-ex) (%) 110.7 19.4 (78.2) (26.5) 110.2 Margins & Ratio
Gross Margins (%) 10.4 11.4 6.3 6.2 6.9
Opg Profit Margin (%) 7.5 8.4 2.6 2.8 3.7
Net Profit Margin (%) 7.3 7.6 1.5 1.0 1.9
ROAE (%) 20.3 20.2 3.8 2.9 6.0
ROA (%) 7.7 8.0 1.4 1.0 2.0
ROCE (%) 7.3 7.3 (0.1) (0.5) 0.8
Div Payout Ratio (%) 25.1 29.7 131.0 30.0 30.0
Net Interest Cover (x) 5.6 6.9 1.6 2.0 3.0
Source: Company, DBSVTH
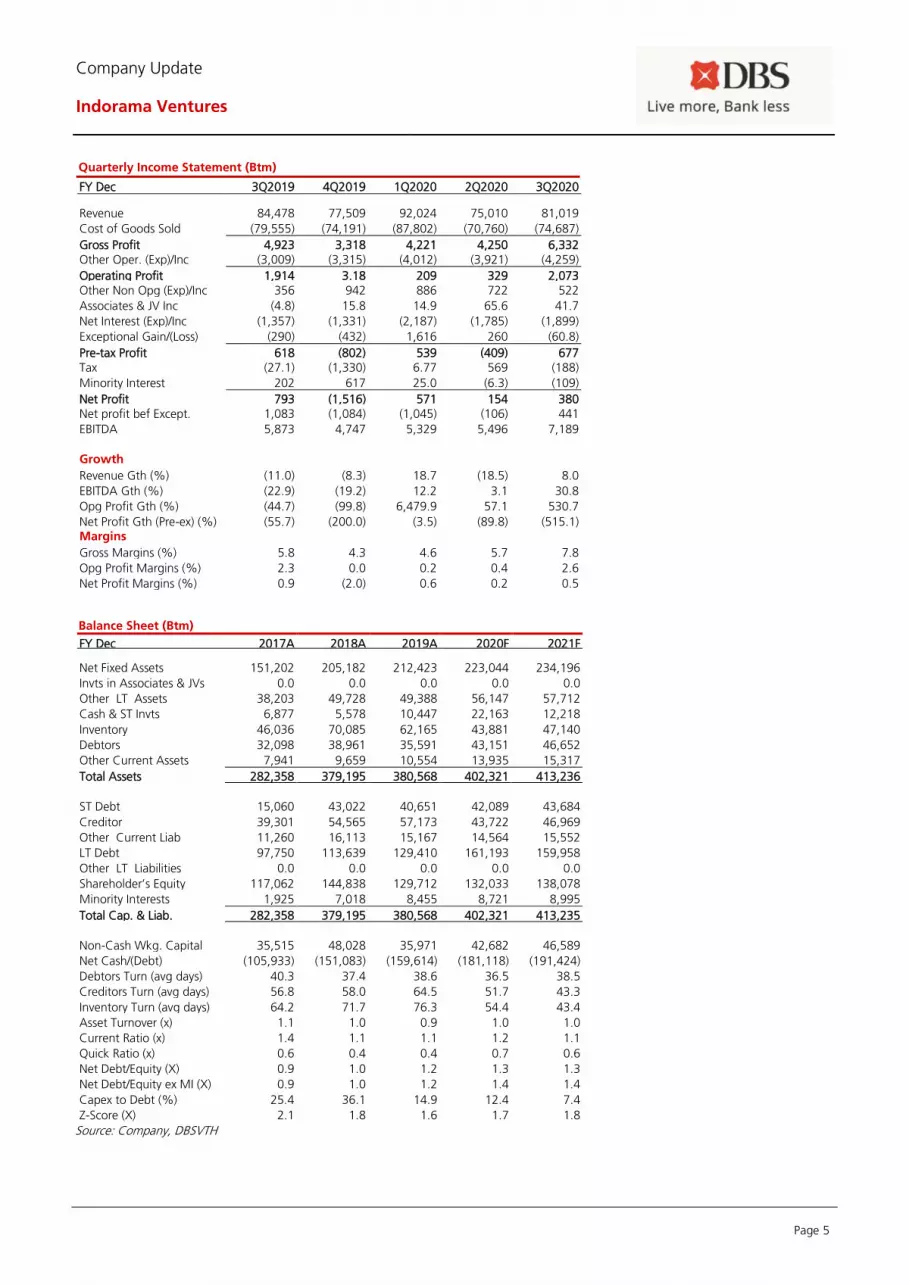
Page 5
Company Update
Indorama Ventures
Quarterly Income Statement (Btm)
FY Dec 3Q2019 4Q2019 1Q2020 2Q2020 3Q2020
Revenue 84,478 77,509 92,024 75,010 81,019
Cost of Goods Sold (79,555) (74,191) (87,802) (70,760) (74,687)
Gross Profit 4,923 3,318 4,221 4,250 6,332 Other Oper. (Exp)/Inc (3,009) (3,315) (4,012) (3,921) (4,259)
Operating Profit 1,914 3.18 209 329 2,073 Other Non Opg (Exp)/Inc 356 942 886 722 522
Associates & JV Inc (4.8) 15.8 14.9 65.6 41.7
Net Interest (Exp)/Inc (1,357) (1,331) (2,187) (1,785) (1,899)
Exceptional Gain/(Loss) (290) (432) 1,616 260 (60.8)
Pre-tax Profit 618 (802) 539 (409) 677 Tax (27.1) (1,330) 6.77 569 (188)
Minority Interest 202 617 25.0 (6.3) (109)
Net Profit 793 (1,516) 571 154 380 Net profit bef Except. 1,083 (1,084) (1,045) (106) 441
EBITDA 5,873 4,747 5,329 5,496 7,189 Growth
Revenue Gth (%) (11.0) (8.3) 18.7 (18.5) 8.0
EBITDA Gth (%) (22.9) (19.2) 12.2 3.1 30.8
Opg Profit Gth (%) (44.7) (99.8) 6,479.9 57.1 530.7
Net Profit Gth (Pre-ex) (%) (55.7) (200.0) (3.5) (89.8) (515.1) Margins
Gross Margins (%) 5.8 4.3 4.6 5.7 7.8
Opg Profit Margins (%) 2.3 0.0 0.2 0.4 2.6
Net Profit Margins (%) 0.9 (2.0) 0.6 0.2 0.5
Balance Sheet (Btm)
FY Dec 2017A 2018A 2019A 2020F 2021F Net Fixed Assets 151,202 205,182 212,423 223,044 234,196
Invts in Associates & JVs 0.0 0.0 0.0 0.0 0.0
Other LT Assets 38,203 49,728 49,388 56,147 57,712
Cash & ST Invts 6,877 5,578 10,447 22,163 12,218
Inventory 46,036 70,085 62,165 43,881 47,140
Debtors 32,098 38,961 35,591 43,151 46,652
Other Current Assets 7,941 9,659 10,554 13,935 15,317
Total Assets 282,358 379,195 380,568 402,321 413,236
ST Debt
15,060 43,022 40,651 42,089 43,684
Creditor 39,301 54,565 57,173 43,722 46,969
Other Current Liab 11,260 16,113 15,167 14,564 15,552
LT Debt 97,750 113,639 129,410 161,193 159,958
Other LT Liabilities 0.0 0.0 0.0 0.0 0.0
Shareholder’s Equity 117,062 144,838 129,712 132,033 138,078
Minority Interests 1,925 7,018 8,455 8,721 8,995
Total Cap. & Liab. 282,358 379,195 380,568 402,321 413,235
Non-Cash Wkg. Capital 35,515 48,028 35,971 42,682 46,589
Net Cash/(Debt) (105,933) (151,083) (159,614) (181,118) (191,424)
Debtors Turn (avg days) 40.3 37.4 38.6 36.5 38.5
Creditors Turn (avg days) 56.8 58.0 64.5 51.7 43.3
Inventory Turn (avg days) 64.2 71.7 76.3 54.4 43.4
Asset Turnover (x) 1.1 1.0 0.9 1.0 1.0
Current Ratio (x) 1.4 1.1 1.1 1.2 1.1
Quick Ratio (x) 0.6 0.4 0.4 0.7 0.6
Net Debt/Equity (X) 0.9 1.0 1.2 1.3 1.3
Net Debt/Equity ex MI (X) 0.9 1.0 1.2 1.4 1.4
Capex to Debt (%) 25.4 36.1 14.9 12.4 7.4
Z-Score (X) 2.1 1.8 1.6 1.7 1.8
Source: Company, DBSVTH
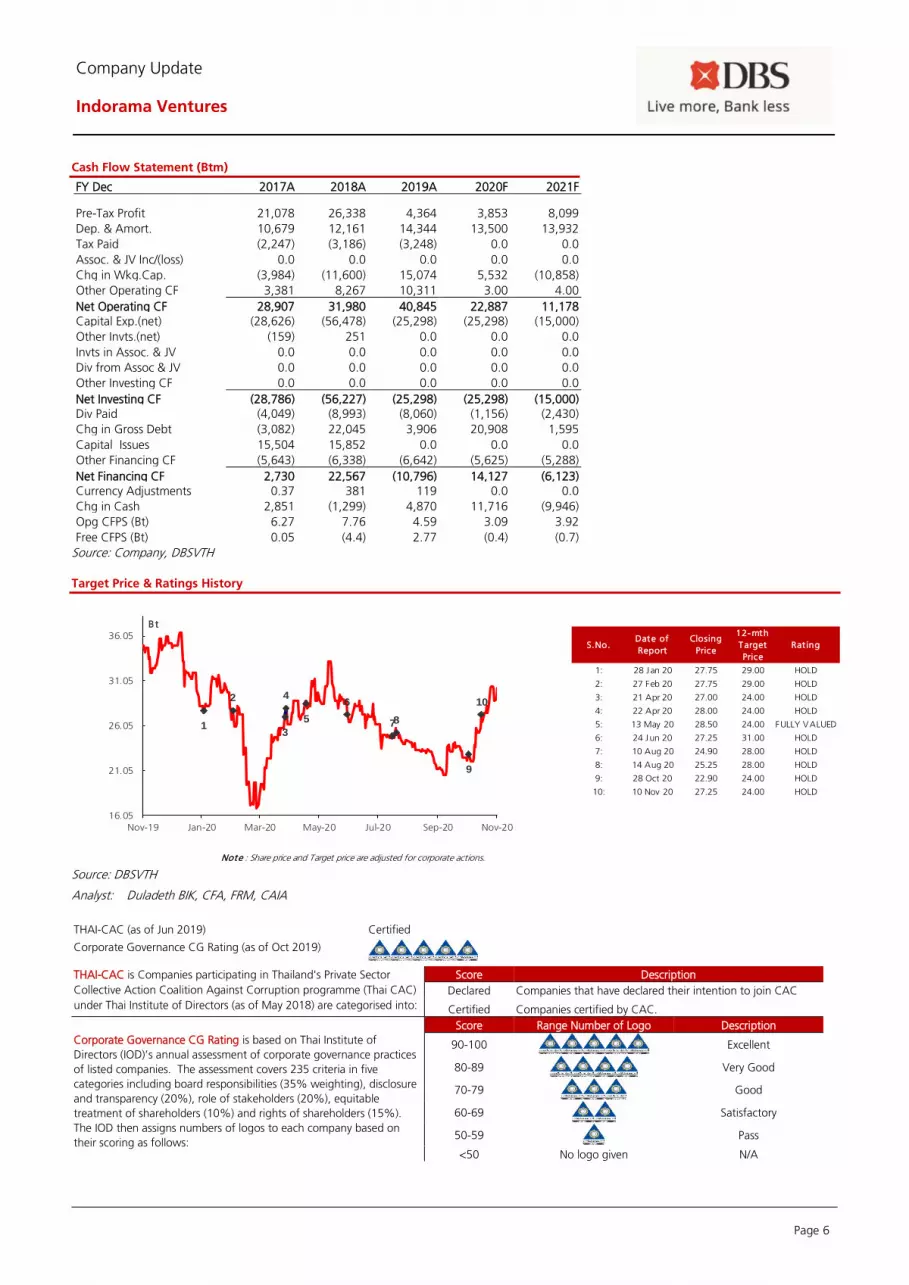
Page 6
Company Update
Indorama Ventures
Cash Flow Statement (Btm)
FY Dec 2017A 2018A 2019A 2020F 2021F
Pre-Tax Profit 21,078 26,338 4,364 3,853 8,099
Dep. & Amort. 10,679 12,161 14,344 13,500 13,932
Tax Paid (2,247) (3,186) (3,248) 0.0 0.0
Assoc. & JV Inc/(loss) 0.0 0.0 0.0 0.0 0.0
Chg in Wkg.Cap. (3,984) (11,600) 15,074 5,532 (10,858)
Other Operating CF 3,381 8,267 10,311 3.00 4.00
Net Operating CF 28,907 31,980 40,845 22,887 11,178 Capital Exp.(net) (28,626) (56,478) (25,298) (25,298) (15,000)
Other Invts.(net) (159) 251 0.0 0.0 0.0
Invts in Assoc. & JV 0.0 0.0 0.0 0.0 0.0
Div from Assoc & JV 0.0 0.0 0.0 0.0 0.0
Other Investing CF 0.0 0.0 0.0 0.0 0.0
Net Investing CF (28,786) (56,227) (25,298) (25,298) (15,000) Div Paid (4,049) (8,993) (8,060) (1,156) (2,430)
Chg in Gross Debt (3,082) 22,045 3,906 20,908 1,595
Capital Issues 15,504 15,852 0.0 0.0 0.0
Other Financing CF (5,643) (6,338) (6,642) (5,625) (5,288)
Net Financing CF 2,730 22,567 (10,796) 14,127 (6,123) Currency Adjustments 0.37 381 119 0.0 0.0
Chg in Cash 2,851 (1,299) 4,870 11,716 (9,946)
Opg CFPS (Bt) 6.27 7.76 4.59 3.09 3.92
Free CFPS (Bt) 0.05 (4.4) 2.77 (0.4) (0.7)
Source: Company, DBSVTH
Target Price & Ratings History
Source: DBSVTH
Analyst: Duladeth BIK, CFA, FRM, CAIA
THAI-CAC (as of Jun 2019) Certified
Corporate Governance CG Rating (as of Oct 2019)
THAI-CAC is Companies participating in Thailand's Private Sector
Collective Action Coalition Against Corruption programme (Thai CAC)
under Thai Institute of Directors (as of May 2018) are categorised into:
Score Description
Declared Companies that have declared their intention to join CAC
Certified Companies certified by CAC.
Corporate Governance CG Rating is based on Thai Institute of
Directors (IOD)’s annual assessment of corporate governance practices
of listed companies. The assessment covers 235 criteria in five
categories including board responsibilities (35% weighting), disclosure
and transparency (20%), role of stakeholders (20%), equitable
treatment of shareholders (10%) and rights of shareholders (15%).
The IOD then assigns numbers of logos to each company based on
their scoring as follows:
Score Range Number of Logo Description
90-100
Excellent
80-89
Very Good
70-79
Good
60-69
Satisfactory
50-59
Pass
<50 No logo given N/A
S.No.Date of
Report
Closing
Price
12-mth
Target
Price
Rat ing
1: 28 Jan 20 27.75 29.00 HOLD
2: 27 Feb 20 27.75 29.00 HOLD
3: 21 Apr 20 27.00 24.00 HOLD
4: 22 Apr 20 28.00 24.00 HOLD
5: 13 May 20 28.50 24.00 FULLY VALUED
6: 24 Jun 20 27.25 31.00 HOLD
7: 10 Aug 20 24.90 28.00 HOLD
8: 14 Aug 20 25.25 28.00 HOLD
9: 28 Oct 20 22.90 24.00 HOLD
10: 10 Nov 20 27.25 24.00 HOLD
Note : Share price and Target price are adjusted for corporate actions.
1
2
3
4
5
6
78
9
10
16.05
21.05
26.05
31.05
36.05
Nov-19 Jan-20 Mar-20 May-20 Jul-20 Sep-20 Nov-20
Bt
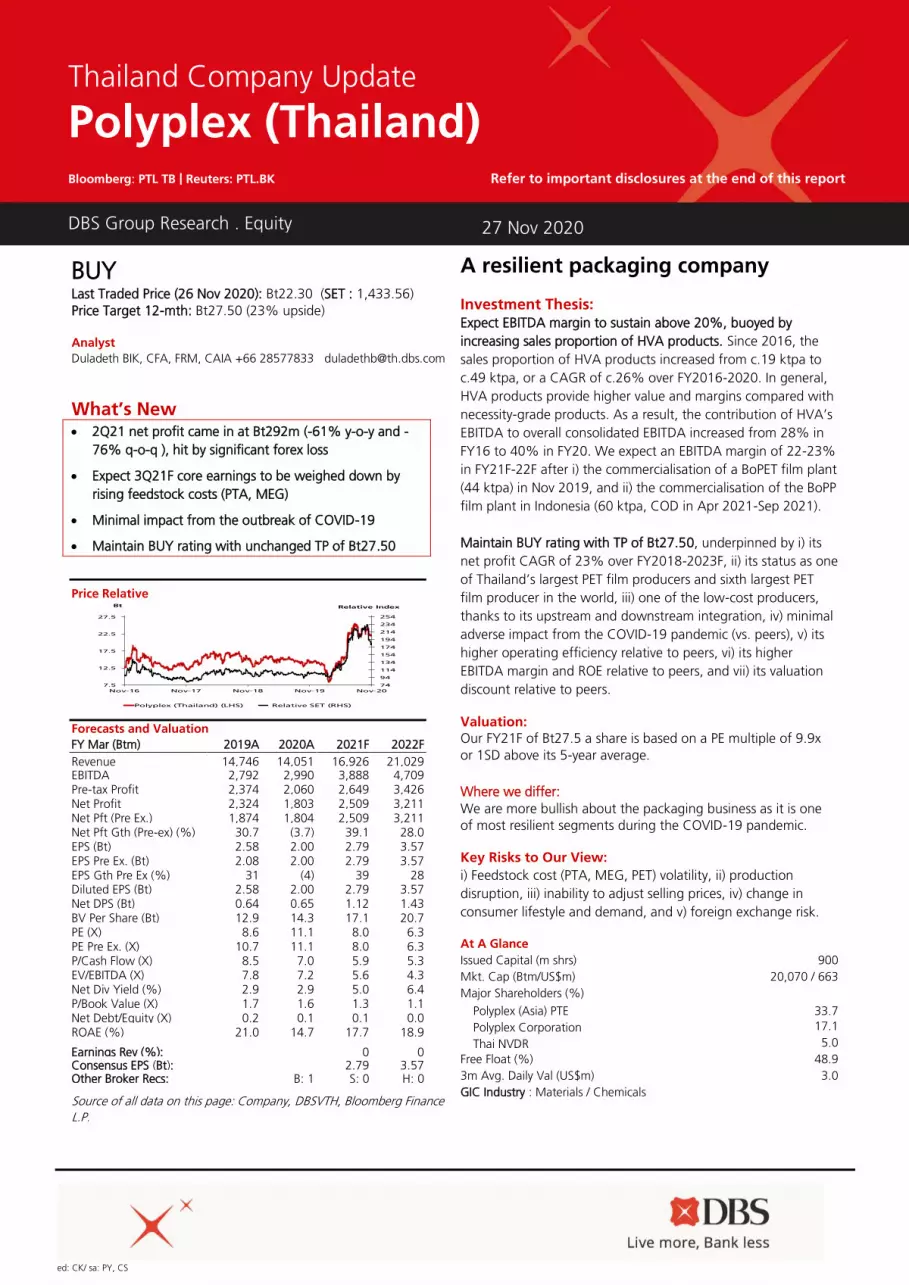
ed: CK/ sa: PY, CS
BUY Last Traded Price (26 Nov 2020): Bt22.30 (SET : 1,433.56)
Price Target 12-mth: Bt27.50 (23% upside)
Analyst
Duladeth BIK, CFA, FRM, CAIA +66 28577833 [email protected]
What’s New • 2Q21 net profit came in at Bt292m (-61% y-o-y and -
76% q-o-q ), hit by significant forex loss
• Expect 3Q21F core earnings to be weighed down by
rising feedstock costs (PTA, MEG)
• Minimal impact from the outbreak of COVID-19
• Maintain BUY rating with unchanged TP of Bt27.50
Source of all data on this page: Company, DBSVTH, Bloomberg Finance
L.P.
A resilient packaging company Investment Thesis: Expect EBITDA margin to sustain above 20%, buoyed by
increasing sales proportion of HVA products. Since 2016, the
sales proportion of HVA products increased from c.19 ktpa to
c.49 ktpa, or a CAGR of c.26% over FY2016-2020. In general,
HVA products provide higher value and margins compared with
necessity-grade products. As a result, the contribution of HVA’s
EBITDA to overall consolidated EBITDA increased from 28% in
FY16 to 40% in FY20. We expect an EBITDA margin of 22-23%
in FY21F-22F after i) the commercialisation of a BoPET film plant
(44 ktpa) in Nov 2019, and ii) the commercialisation of the BoPP
film plant in Indonesia (60 ktpa, COD in Apr 2021-Sep 2021).
Maintain BUY rating with TP of Bt27.50, underpinned by i) its
net profit CAGR of 23% over FY2018-2023F, ii) its status as one
of Thailand’s largest PET film producers and sixth largest PET
film producer in the world, iii) one of the low-cost producers,
thanks to its upstream and downstream integration, iv) minimal
adverse impact from the COVID-19 pandemic (vs. peers), v) its
higher operating efficiency relative to peers, vi) its higher
EBITDA margin and ROE relative to peers, and vii) its valuation
discount relative to peers.
Valuation: Our FY21F of Bt27.5 a share is based on a PE multiple of 9.9x
or 1SD above its 5-year average.
Where we differ:
We are more bullish about the packaging business as it is one
of most resilient segments during the COVID-19 pandemic. Key Risks to Our View:
i) Feedstock cost (PTA, MEG, PET) volatility, ii) production
disruption, iii) inability to adjust selling prices, iv) change in
consumer lifestyle and demand, and v) foreign exchange risk. At A Glance
Issued Capital (m shrs) 900
Mkt. Cap (Btm/US$m) 20,070 / 663
Major Shareholders (%)
Polyplex (Asia) PTE 33.7
Polyplex Corporation 17.1
Thai NVDR 5.0
Free Float (%) 48.9
3m Avg. Daily Val (US$m) 3.0
GIC Industry : Materials / Chemicals
DBS Group Research . Equity
27 Nov 2020
Thailand Company Update
Polyplex (Thailand) Bloomberg: PTL TB | Reuters: PTL.BK Refer to important disclosures at the end of this report
Price Relative
Forecasts and Valuation
FY Mar (Btm) 2019A 2020A 2021F 2022F
Revenue 14,746 14,051 16,926 21,029 EBITDA 2,792 2,990 3,888 4,709 Pre-tax Profit 2,374 2,060 2,649 3,426 Net Profit 2,324 1,803 2,509 3,211 Net Pft (Pre Ex.) 1,874 1,804 2,509 3,211 Net Pft Gth (Pre-ex) (%) 30.7 (3.7) 39.1 28.0 EPS (Bt) 2.58 2.00 2.79 3.57 EPS Pre Ex. (Bt) 2.08 2.00 2.79 3.57 EPS Gth Pre Ex (%) 31 (4) 39 28 Diluted EPS (Bt) 2.58 2.00 2.79 3.57 Net DPS (Bt) 0.64 0.65 1.12 1.43 BV Per Share (Bt) 12.9 14.3 17.1 20.7 PE (X) 8.6 11.1 8.0 6.3 PE Pre Ex. (X) 10.7 11.1 8.0 6.3 P/Cash Flow (X) 8.5 7.0 5.9 5.3 EV/EBITDA (X) 7.8 7.2 5.6 4.3 Net Div Yield (%) 2.9 2.9 5.0 6.4 P/Book Value (X) 1.7 1.6 1.3 1.1 Net Debt/Equity (X) 0.2 0.1 0.1 0.0 ROAE (%) 21.0 14.7 17.7 18.9 Earnings Rev (%): 0 0 Consensus EPS (Bt): 2.79 3.57 Other Broker Recs: B: 1 S: 0 H: 0
74
94
114
134
154
174
194
214
234
254
7.5
12.5
17.5
22.5
27.5
Nov-16 Nov-17 Nov-18 Nov-19 Nov-20
Relative IndexBt
Polyplex (Thailand) (LHS) Relative SET (RHS)

Page 2
Company Update
Polyplex (Thailand)
WHAT’S NEW
A resilient packaging company
2Q21 hit by substantial forex loss. Polyplex (Thailand) reported a
2Q21 (Jul-Sep 2020) net profit of Bt292m, -61% y-o-y and -
76% q-o-q. The performance deterioration is due to significant
foreign exchange loss of Bt510m. However, its core
performance remained healthy, supported by i) the rise in sales
volume, and ii) declining feedstock cost. Normalised net profit
came in at Bt803m, +65% y-o-y and -2% q-o-q.
2Q21 operating metrics
i) Sales volume – Total BoPET film sales volume stood at
55,218 tonnes, +28% y-o-y and +1% q-o-q. This is
thanks a) to the commercialisation of BoPET plant with a
capacity of 44ktpa in Indonesia in Nov 2019, and b)
increasing demand for flexible packaging materials such
as BoPET thin film.
Sales volume by quarter (tonnes)
Source: Company, DBSVTH
Note: PTL’s fiscal year is April to March
ii) Feedstock cost – PTA and MEG are major feedstock
materials for BoPET film production. On a calendar year
3Q20 basis, PTA and MEG reference prices averaged
US$442/tonne (-37% y-o-y and +4% q-o-q) and
US$584/tonne (-16% y-o-y and flat q-o-q). This is caused
by the oil price collapse since Mar 2020 arising from the
COVID-19 pandemic and oil price war.
PTA/MEG/PET price by quarter (US$/tonne)
Source: Company, DBSVTH
Note: calendar year
iii) Gross and EBITDA margins – Profitability is maintained at
the similar level q-o-q despite the lower selling product
prices given to the clients. Gross and EBITDA margins
came in at 31% and 29% respectively. This is thanks to
the softer feedstock costs for both PTA and MEG.
Gross and EBITDA margins
Source: Company, DBSVTH
Note: PTL’s fiscal year is April to March
iv) Extraordinary items – forex exchange loss of Bt510m as
the THB and IDR depreciated against the USD and EUR.

Page 3
Company Update
Polyplex (Thailand)
3Q21F weighed down by rising feedstock cost and expected
forex loss. We expect softer core earnings in 3Q21F (Oct-Dec
2020), pressured by i) up-trending feedstock cost where PTA
and MEG, on 4Q-to-date basis, averaged US$421/635 per
tonne, (-4%/+9% QTD), and ii) appreciation of the THB against
USD.However, we expect sales volume to remain flat q-o-q,
driven by strong demand for hygiene products and flexible
packaging materials.
Minimal adverse impact from COVID-19 outbreak, in our view.
We believe the impact on packaging demand from the
outbreak of COVID-19 pandemic is mixed, depending on the
product segment and portfolio position of packaging players.
However, we think that the high demand for food, grocery,
healthcare products, personal-care products, food delivery and
e-commerce delivery will continue, as the COVID-19 pandemic
can be hard to contain and fears of a second wave of
infections have come to pass in some countries. Based on the
data compiled by McKinsey, online sales of grocery and fresh
food in China doubled within a 10-day period in Jan 2020, at
the early stage of the country’s outbreak. Hence, packaging
products such as corrugated paper, flexible, and rigid plastic
were in high demand. On the other hand, packaging demand
(pertaining to bulk and transportation packaging) for industrial,
luxury, alcohol and business-to-business (B2B) merchandises
could see a downtrend, as such demand is highly correlated
with domestic GDP growth.
For PTL, consumer staples goods, which make up
approximately 70% of its sales volume, are expected to see
stable to elevated demand. In developed economies such as
Japan, Korea, Europe and the US, there is an increase in
demand for films going into flexible packaging, as consumers
gravitate towards more packaged goods to avoid the inherent
risk of contamination for fresh food. On the other hand, we
expect declining demand for the remaining c.30% of PTL’s PET
film sales volume, which is mostly used in durable and
industrial goods such as electronic devices. This can be
attributed to a global economic slowdown and consumers
delaying their purchases of durable goods. Hence, we
anticipate minimal net impact of COVID-19 on PTL’s
performance
Company Background
Since its inception in 2002, PTL has grown from a single-line
facility into a multinational with a turnover of more than half a
billion dollars, with manufacturing and distribution facilities in
India, South East Asia, Europe, the Americas and China. PTL’s
expansion model has allowed it to move geographically closer
to its regional markets, thus it now has the efficient and cost-
effective ability to deliver products to its customers. Its fully
integrated green-field film lines with upstream resin plants and
downstream metallisers, and other offline coating capabilities
ensure cost-competitiveness and environmental-friendliness,
besides being able to offer the advantages of being a single-
point supplier for a portfolio of film products to its customers.
PTL has a unique model of on-shore, off-shore and near-shore
business locations which complement its focus on customer
relationship, access and intimacy

Page 4
Company Update
Polyplex (Thailand)
Quarterly / Interim Income Statement (Btm)
FY Mar 2Q2020 1Q2021 2Q2021 % chg yoy % chg qoq
Revenue 3,348 3,759 3,748 12.0 (0.3)
Cost of Goods Sold (2,529) (2,576) (2,587) 2.3 0.4
Gross Profit 818 1,182 1,161 41.9 (1.8)
Other Oper. (Exp)/Inc (317) (327) (360) 13.6 10.0
Operating Profit 502 855 802 59.8 (6.3)
Other Non Opg (Exp)/Inc 12.9 8.97 15.9 23.4 77.0
Associates & JV Inc 0.0 0.0 0.0 nm nm
Net Interest (Exp)/Inc (15.0) (18.4) (14.8) 1.1 19.5
Exceptional Gain/(Loss) 253 400 (510) nm (227.4)
Pre-tax Profit 752 1,246 293 (61.1) (76.5)
Tax (11.9) (26.6) 0.02 (100.2) (100.1)
Minority Interest (0.9) (1.1) (0.6) 37.9 (47.9)
Net Profit 739 1,219 292 (60.5) (76.0)
Net profit bef Except. 487 818 802 64.8 (2.0)
EBITDA 702 1,096 1,050 49.6 (4.1)
Margins (%)
Gross Margins 24.4 31.5 31.0
Opg Profit Margins 15.0 22.8 21.4
Net Profit Margins 22.1 32.4 7.8
Historical PE and PB band
Forward PE band (x) PB band (x)
Source: Bloomberg Finance L.P., DBSVTH estimates Source: Bloomberg Finance L.P., DBSVTH estimates
Avg: 7.2x
+1sd: 8.7x
+2sd: 10.2x
-1sd: 5.7x
-2sd: 4.2x
2.7
4.7
6.7
8.7
10.7
12.7
Nov-16 Nov-17 Nov-18 Nov-19
(x)
Avg: 1.21x
+1sd: 1.41x
+2sd: 1.61x
-1sd: 1.02x
-2sd: 0.82x
0.5
0.7
0.9
1.1
1.3
1.5
1.7
1.9
Nov-16 Nov-17 Nov-18 Nov-19
(x)
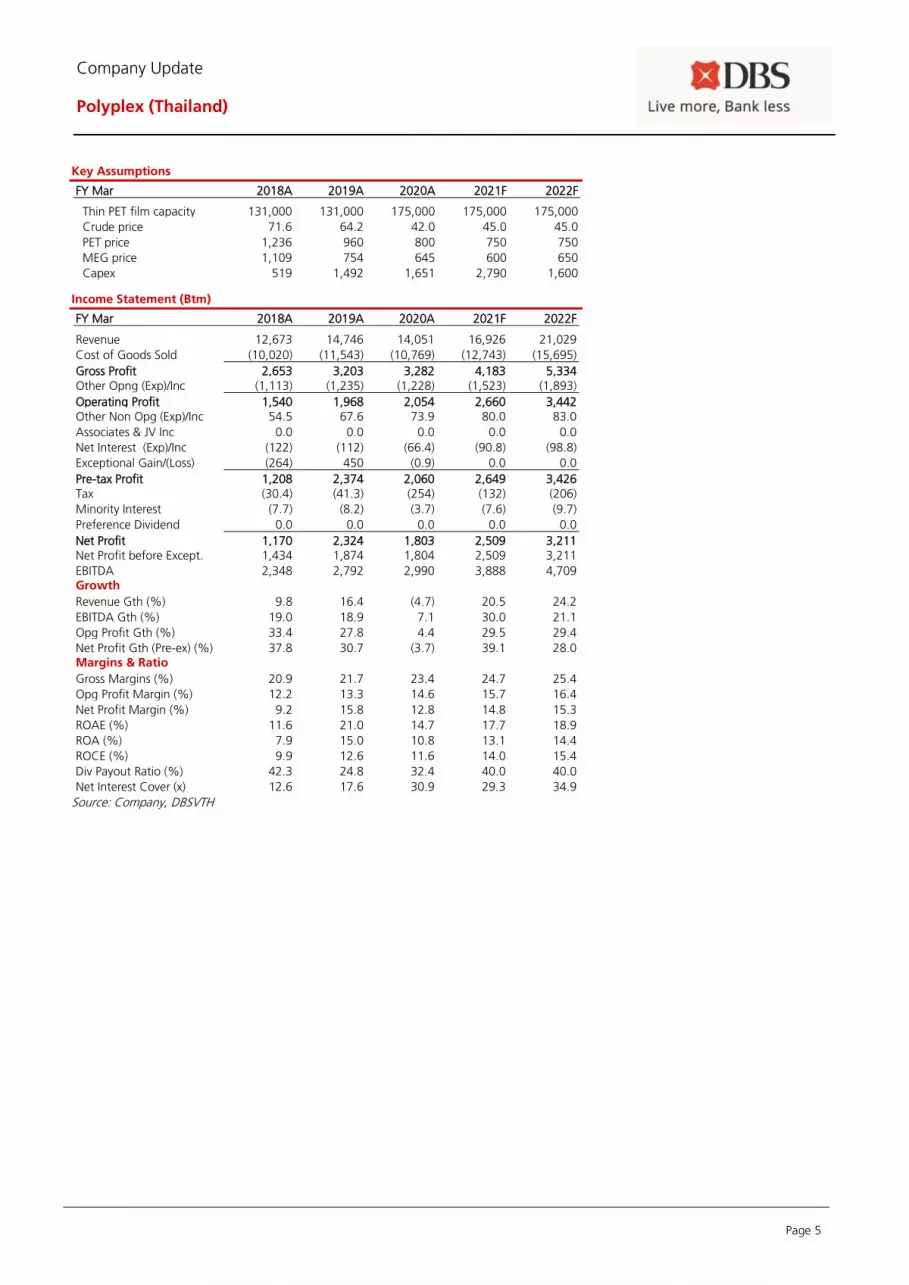
Page 5
Company Update
Polyplex (Thailand)
Key Assumptions
FY Mar 2018A 2019A 2020A 2021F 2022F
Thin PET film capacity 131,000 131,000 175,000 175,000 175,000
Crude price 71.6 64.2 42.0 45.0 45.0
PET price 1,236 960 800 750 750
MEG price 1,109 754 645 600 650
Capex 519 1,492 1,651 2,790 1,600
Income Statement (Btm)
FY Mar 2018A 2019A 2020A 2021F 2022F
Revenue 12,673 14,746 14,051 16,926 21,029
Cost of Goods Sold (10,020) (11,543) (10,769) (12,743) (15,695)
Gross Profit 2,653 3,203 3,282 4,183 5,334 Other Opng (Exp)/Inc (1,113) (1,235) (1,228) (1,523) (1,893)
Operating Profit 1,540 1,968 2,054 2,660 3,442 Other Non Opg (Exp)/Inc 54.5 67.6 73.9 80.0 83.0
Associates & JV Inc 0.0 0.0 0.0 0.0 0.0
Net Interest (Exp)/Inc (122) (112) (66.4) (90.8) (98.8)
Exceptional Gain/(Loss) (264) 450 (0.9) 0.0 0.0
Pre-tax Profit 1,208 2,374 2,060 2,649 3,426 Tax (30.4) (41.3) (254) (132) (206)
Minority Interest (7.7) (8.2) (3.7) (7.6) (9.7)
Preference Dividend 0.0 0.0 0.0 0.0 0.0
Net Profit 1,170 2,324 1,803 2,509 3,211 Net Profit before Except. 1,434 1,874 1,804 2,509 3,211
EBITDA 2,348 2,792 2,990 3,888 4,709 Growth
Revenue Gth (%) 9.8 16.4 (4.7) 20.5 24.2
EBITDA Gth (%) 19.0 18.9 7.1 30.0 21.1
Opg Profit Gth (%) 33.4 27.8 4.4 29.5 29.4
Net Profit Gth (Pre-ex) (%) 37.8 30.7 (3.7) 39.1 28.0 Margins & Ratio
Gross Margins (%) 20.9 21.7 23.4 24.7 25.4
Opg Profit Margin (%) 12.2 13.3 14.6 15.7 16.4
Net Profit Margin (%) 9.2 15.8 12.8 14.8 15.3
ROAE (%) 11.6 21.0 14.7 17.7 18.9
ROA (%) 7.9 15.0 10.8 13.1 14.4
ROCE (%) 9.9 12.6 11.6 14.0 15.4
Div Payout Ratio (%) 42.3 24.8 32.4 40.0 40.0
Net Interest Cover (x) 12.6 17.6 30.9 29.3 34.9
Source: Company, DBSVTH
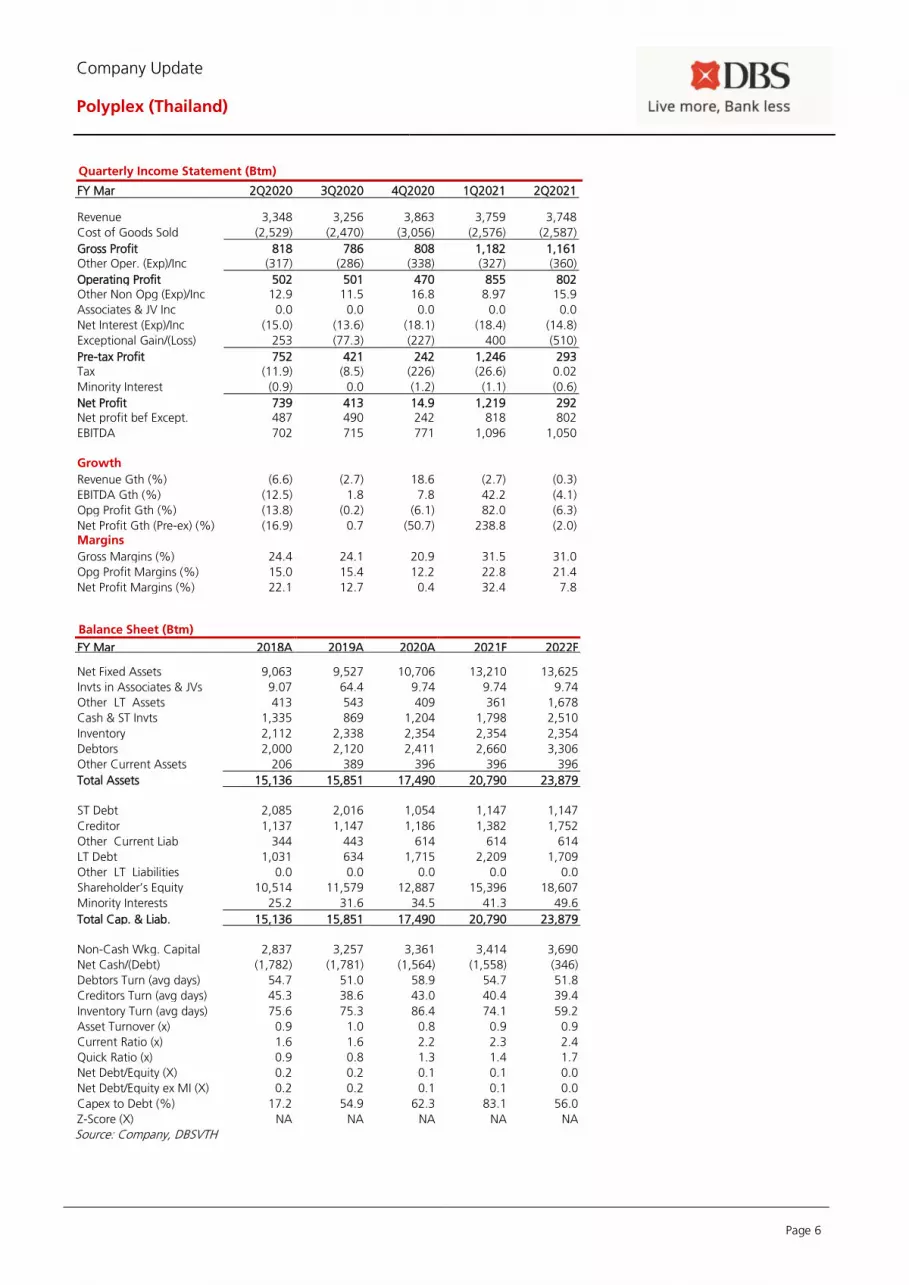
Page 6
Company Update
Polyplex (Thailand)
Quarterly Income Statement (Btm)
FY Mar 2Q2020 3Q2020 4Q2020 1Q2021 2Q2021
Revenue 3,348 3,256 3,863 3,759 3,748
Cost of Goods Sold (2,529) (2,470) (3,056) (2,576) (2,587)
Gross Profit 818 786 808 1,182 1,161 Other Oper. (Exp)/Inc (317) (286) (338) (327) (360)
Operating Profit 502 501 470 855 802 Other Non Opg (Exp)/Inc 12.9 11.5 16.8 8.97 15.9
Associates & JV Inc 0.0 0.0 0.0 0.0 0.0
Net Interest (Exp)/Inc (15.0) (13.6) (18.1) (18.4) (14.8)
Exceptional Gain/(Loss) 253 (77.3) (227) 400 (510)
Pre-tax Profit 752 421 242 1,246 293 Tax (11.9) (8.5) (226) (26.6) 0.02
Minority Interest (0.9) 0.0 (1.2) (1.1) (0.6)
Net Profit 739 413 14.9 1,219 292 Net profit bef Except. 487 490 242 818 802
EBITDA 702 715 771 1,096 1,050 Growth
Revenue Gth (%) (6.6) (2.7) 18.6 (2.7) (0.3)
EBITDA Gth (%) (12.5) 1.8 7.8 42.2 (4.1)
Opg Profit Gth (%) (13.8) (0.2) (6.1) 82.0 (6.3)
Net Profit Gth (Pre-ex) (%) (16.9) 0.7 (50.7) 238.8 (2.0) Margins
Gross Margins (%) 24.4 24.1 20.9 31.5 31.0
Opg Profit Margins (%) 15.0 15.4 12.2 22.8 21.4
Net Profit Margins (%) 22.1 12.7 0.4 32.4 7.8
Balance Sheet (Btm)
FY Mar 2018A 2019A 2020A 2021F 2022F Net Fixed Assets 9,063 9,527 10,706 13,210 13,625
Invts in Associates & JVs 9.07 64.4 9.74 9.74 9.74
Other LT Assets 413 543 409 361 1,678
Cash & ST Invts 1,335 869 1,204 1,798 2,510
Inventory 2,112 2,338 2,354 2,354 2,354
Debtors 2,000 2,120 2,411 2,660 3,306
Other Current Assets 206 389 396 396 396
Total Assets 15,136 15,851 17,490 20,790 23,879
ST Debt
2,085 2,016 1,054 1,147 1,147
Creditor 1,137 1,147 1,186 1,382 1,752
Other Current Liab 344 443 614 614 614
LT Debt 1,031 634 1,715 2,209 1,709
Other LT Liabilities 0.0 0.0 0.0 0.0 0.0
Shareholder’s Equity 10,514 11,579 12,887 15,396 18,607
Minority Interests 25.2 31.6 34.5 41.3 49.6
Total Cap. & Liab. 15,136 15,851 17,490 20,790 23,879
Non-Cash Wkg. Capital 2,837 3,257 3,361 3,414 3,690
Net Cash/(Debt) (1,782) (1,781) (1,564) (1,558) (346)
Debtors Turn (avg days) 54.7 51.0 58.9 54.7 51.8
Creditors Turn (avg days) 45.3 38.6 43.0 40.4 39.4
Inventory Turn (avg days) 75.6 75.3 86.4 74.1 59.2
Asset Turnover (x) 0.9 1.0 0.8 0.9 0.9
Current Ratio (x) 1.6 1.6 2.2 2.3 2.4
Quick Ratio (x) 0.9 0.8 1.3 1.4 1.7
Net Debt/Equity (X) 0.2 0.2 0.1 0.1 0.0
Net Debt/Equity ex MI (X) 0.2 0.2 0.1 0.1 0.0
Capex to Debt (%) 17.2 54.9 62.3 83.1 56.0
Z-Score (X) NA NA NA NA NA
Source: Company, DBSVTH
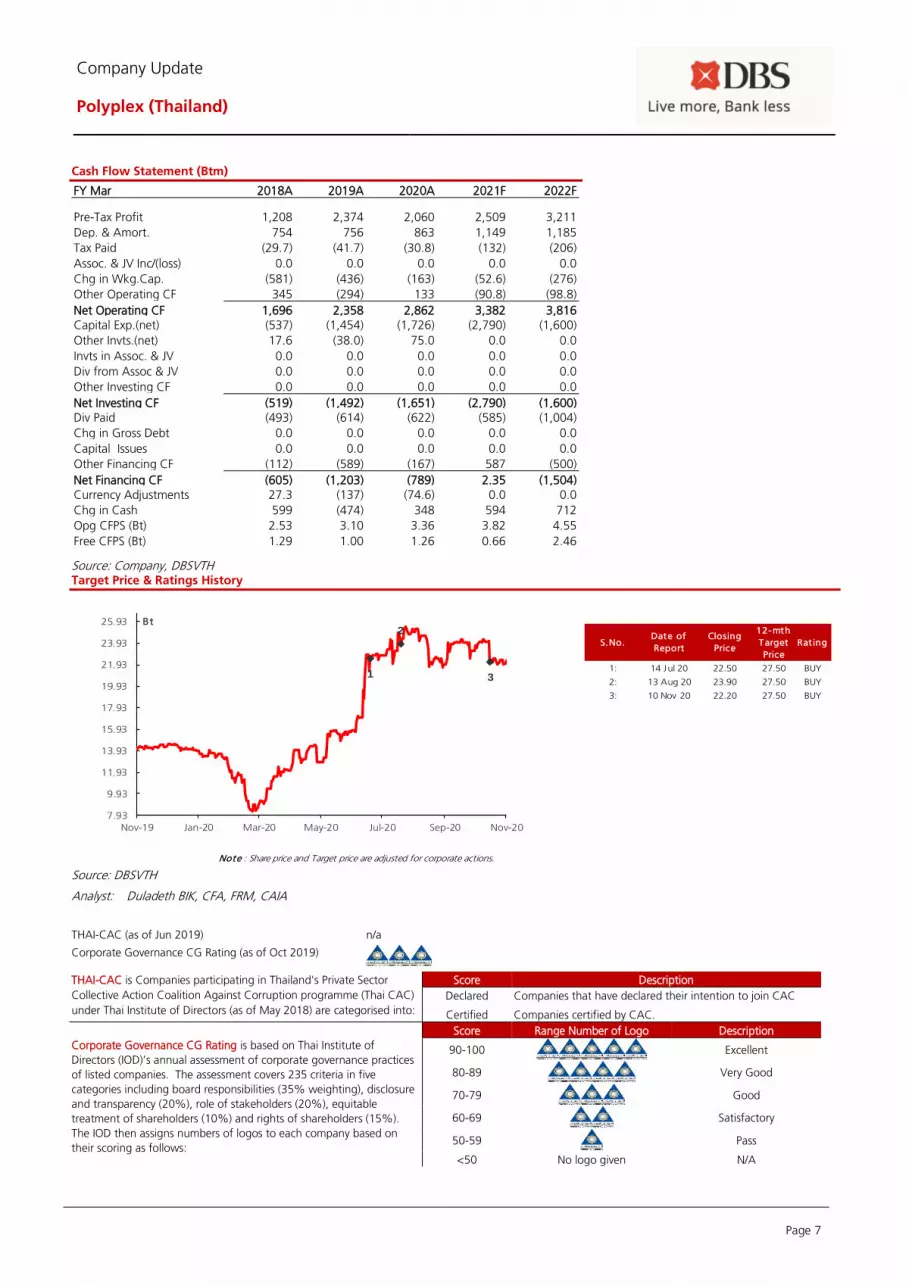
Page 7
Company Update
Polyplex (Thailand)
Cash Flow Statement (Btm)
FY Mar 2018A 2019A 2020A 2021F 2022F
Pre-Tax Profit 1,208 2,374 2,060 2,509 3,211
Dep. & Amort. 754 756 863 1,149 1,185
Tax Paid (29.7) (41.7) (30.8) (132) (206)
Assoc. & JV Inc/(loss) 0.0 0.0 0.0 0.0 0.0
Chg in Wkg.Cap. (581) (436) (163) (52.6) (276)
Other Operating CF 345 (294) 133 (90.8) (98.8)
Net Operating CF 1,696 2,358 2,862 3,382 3,816 Capital Exp.(net) (537) (1,454) (1,726) (2,790) (1,600)
Other Invts.(net) 17.6 (38.0) 75.0 0.0 0.0
Invts in Assoc. & JV 0.0 0.0 0.0 0.0 0.0
Div from Assoc & JV 0.0 0.0 0.0 0.0 0.0
Other Investing CF 0.0 0.0 0.0 0.0 0.0
Net Investing CF (519) (1,492) (1,651) (2,790) (1,600) Div Paid (493) (614) (622) (585) (1,004)
Chg in Gross Debt 0.0 0.0 0.0 0.0 0.0
Capital Issues 0.0 0.0 0.0 0.0 0.0
Other Financing CF (112) (589) (167) 587 (500)
Net Financing CF (605) (1,203) (789) 2.35 (1,504) Currency Adjustments 27.3 (137) (74.6) 0.0 0.0
Chg in Cash 599 (474) 348 594 712
Opg CFPS (Bt) 2.53 3.10 3.36 3.82 4.55
Free CFPS (Bt) 1.29 1.00 1.26 0.66 2.46
Source: Company, DBSVTH Target Price & Ratings History
Source: DBSVTH
Analyst: Duladeth BIK, CFA, FRM, CAIA
THAI-CAC (as of Jun 2019) n/a
Corporate Governance CG Rating (as of Oct 2019)
THAI-CAC is Companies participating in Thailand's Private Sector
Collective Action Coalition Against Corruption programme (Thai CAC)
under Thai Institute of Directors (as of May 2018) are categorised into:
Score Description
Declared Companies that have declared their intention to join CAC
Certified Companies certified by CAC.
Corporate Governance CG Rating is based on Thai Institute of
Directors (IOD)’s annual assessment of corporate governance practices
of listed companies. The assessment covers 235 criteria in five
categories including board responsibilities (35% weighting), disclosure
and transparency (20%), role of stakeholders (20%), equitable
treatment of shareholders (10%) and rights of shareholders (15%).
The IOD then assigns numbers of logos to each company based on
their scoring as follows:
Score Range Number of Logo Description
90-100
Excellent
80-89
Very Good
70-79
Good
60-69
Satisfactory
50-59
Pass
<50 No logo given N/A
S.No.Date of
Report
Closing
Price
12-mth
Target
Price
Rat ing
1: 14 Jul 20 22.50 27.50 BUY
2: 13 Aug 20 23.90 27.50 BUY
3: 10 Nov 20 22.20 27.50 BUY
Note : Share price and Target price are adjusted for corporate actions.
1
2
3
7.93
9.93
11.93
13.93
15.93
17.93
19.93
21.93
23.93
25.93
Nov-19 Jan-20 Mar-20 May-20 Jul-20 Sep-20 Nov-20
Bt
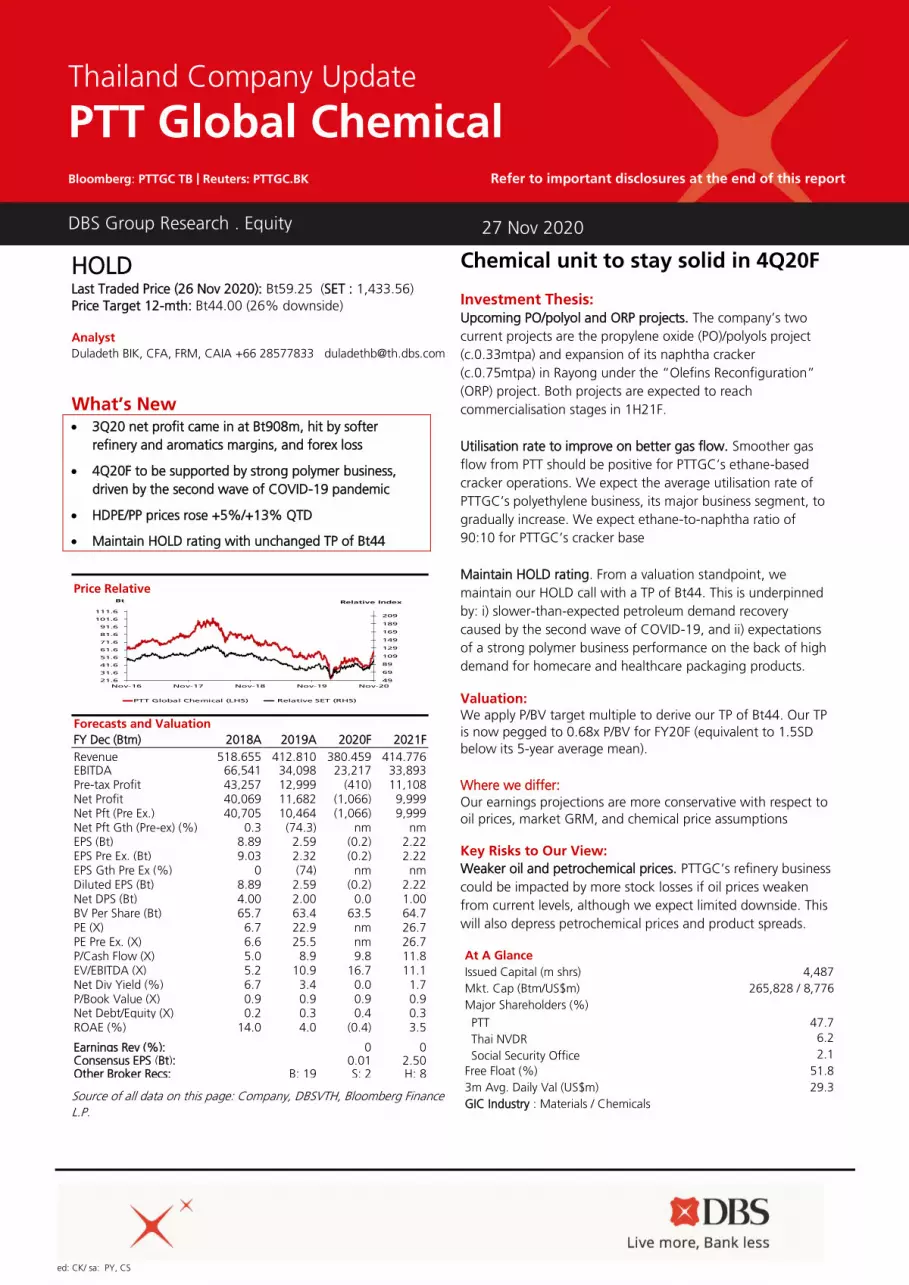
ed: CK/ sa: PY, CS
HOLD Last Traded Price (26 Nov 2020): Bt59.25 (SET : 1,433.56)
Price Target 12-mth: Bt44.00 (26% downside)
Analyst
Duladeth BIK, CFA, FRM, CAIA +66 28577833 [email protected]
What’s New • 3Q20 net profit came in at Bt908m, hit by softer
refinery and aromatics margins, and forex loss
• 4Q20F to be supported by strong polymer business,
driven by the second wave of COVID-19 pandemic
• HDPE/PP prices rose +5%/+13% QTD
• Maintain HOLD rating with unchanged TP of Bt44
Source of all data on this page: Company, DBSVTH, Bloomberg Finance
L.P.
Chemical unit to stay solid in 4Q20F Investment Thesis: Upcoming PO/polyol and ORP projects. The company’s two
current projects are the propylene oxide (PO)/polyols project
(c.0.33mtpa) and expansion of its naphtha cracker
(c.0.75mtpa) in Rayong under the “Olefins Reconfiguration”
(ORP) project. Both projects are expected to reach
commercialisation stages in 1H21F.
Utilisation rate to improve on better gas flow. Smoother gas
flow from PTT should be positive for PTTGC’s ethane-based
cracker operations. We expect the average utilisation rate of
PTTGC’s polyethylene business, its major business segment, to
gradually increase. We expect ethane-to-naphtha ratio of
90:10 for PTTGC’s cracker base
Maintain HOLD rating. From a valuation standpoint, we
maintain our HOLD call with a TP of Bt44. This is underpinned
by: i) slower-than-expected petroleum demand recovery
caused by the second wave of COVID-19, and ii) expectations
of a strong polymer business performance on the back of high
demand for homecare and healthcare packaging products. Valuation:
We apply P/BV target multiple to derive our TP of Bt44. Our TP
is now pegged to 0.68x P/BV for FY20F (equivalent to 1.5SD
below its 5-year average mean).
Where we differ:
Our earnings projections are more conservative with respect to
oil prices, market GRM, and chemical price assumptions Key Risks to Our View:
Weaker oil and petrochemical prices. PTTGC’s refinery business
could be impacted by more stock losses if oil prices weaken
from current levels, although we expect limited downside. This
will also depress petrochemical prices and product spreads. At A Glance Issued Capital (m shrs) 4,487
Mkt. Cap (Btm/US$m) 265,828 / 8,776
Major Shareholders (%)
PTT 47.7
Thai NVDR 6.2
Social Security Office 2.1
Free Float (%) 51.8
3m Avg. Daily Val (US$m) 29.3
GIC Industry : Materials / Chemicals
DBS Group Research . Equity
27 Nov 2020
Thailand Company Update
PTT Global Chemical Bloomberg: PTTGC TB | Reuters: PTTGC.BK Refer to important disclosures at the end of this report
Price Relative
Forecasts and Valuation
FY Dec (Btm) 2018A 2019A 2020F 2021F
Revenue 518,655 412,810 380,459 414,776 EBITDA 66,541 34,098 23,217 33,893 Pre-tax Profit 43,257 12,999 (410) 11,108 Net Profit 40,069 11,682 (1,066) 9,999 Net Pft (Pre Ex.) 40,705 10,464 (1,066) 9,999 Net Pft Gth (Pre-ex) (%) 0.3 (74.3) nm nm EPS (Bt) 8.89 2.59 (0.2) 2.22 EPS Pre Ex. (Bt) 9.03 2.32 (0.2) 2.22 EPS Gth Pre Ex (%) 0 (74) nm nm Diluted EPS (Bt) 8.89 2.59 (0.2) 2.22 Net DPS (Bt) 4.00 2.00 0.0 1.00 BV Per Share (Bt) 65.7 63.4 63.5 64.7 PE (X) 6.7 22.9 nm 26.7 PE Pre Ex. (X) 6.6 25.5 nm 26.7 P/Cash Flow (X) 5.0 8.9 9.8 11.8 EV/EBITDA (X) 5.2 10.9 16.7 11.1 Net Div Yield (%) 6.7 3.4 0.0 1.7 P/Book Value (X) 0.9 0.9 0.9 0.9 Net Debt/Equity (X) 0.2 0.3 0.4 0.3 ROAE (%) 14.0 4.0 (0.4) 3.5 Earnings Rev (%): 0 0 Consensus EPS (Bt): 0.01 2.50 Other Broker Recs: B: 19 S: 2 H: 8
49
69
89
109
129
149
169
189
209
21.6
31.6
41.6
51.6
61.6
71.6
81.6
91.6
101.6
111.6
Nov-16 Nov-17 Nov-18 Nov-19 Nov-20
Relative IndexBt
PTT Global Chemical (LHS) Relative SET (RHS)
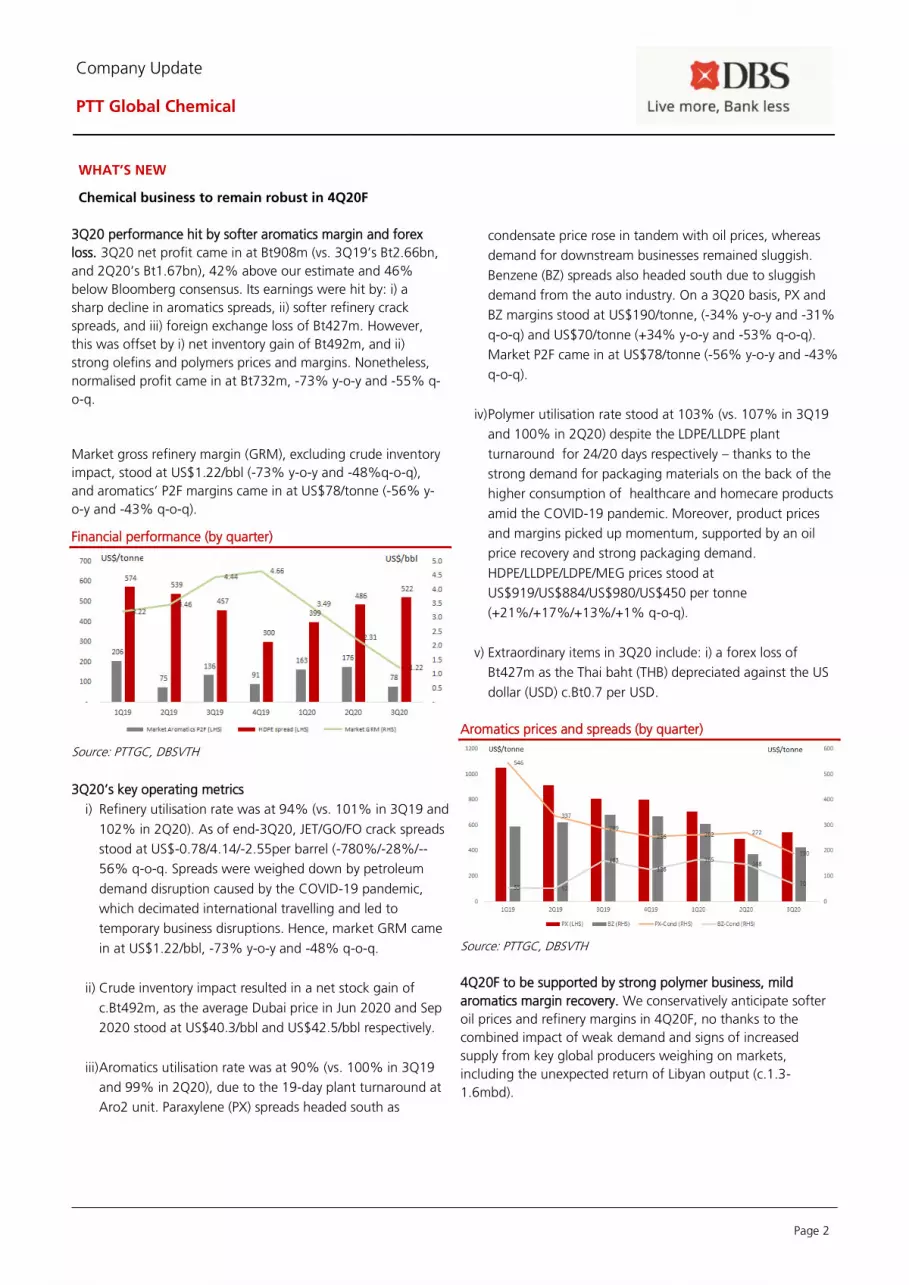
Page 2
Company Update
PTT Global Chemical
WHAT’S NEW
Chemical business to remain robust in 4Q20F
3Q20 performance hit by softer aromatics margin and forex
loss. 3Q20 net profit came in at Bt908m (vs. 3Q19’s Bt2.66bn,
and 2Q20’s Bt1.67bn), 42% above our estimate and 46%
below Bloomberg consensus. Its earnings were hit by: i) a
sharp decline in aromatics spreads, ii) softer refinery crack
spreads, and iii) foreign exchange loss of Bt427m. However,
this was offset by i) net inventory gain of Bt492m, and ii)
strong olefins and polymers prices and margins. Nonetheless,
normalised profit came in at Bt732m, -73% y-o-y and -55% q-
o-q.
Market gross refinery margin (GRM), excluding crude inventory
impact, stood at US$1.22/bbl (-73% y-o-y and -48%q-o-q),
and aromatics’ P2F margins came in at US$78/tonne (-56% y-
o-y and -43% q-o-q).
Financial performance (by quarter)
Source: PTTGC, DBSVTH
3Q20’s key operating metrics
i) Refinery utilisation rate was at 94% (vs. 101% in 3Q19 and
102% in 2Q20). As of end-3Q20, JET/GO/FO crack spreads
stood at US$-0.78/4.14/-2.55per barrel (-780%/-28%/--
56% q-o-q. Spreads were weighed down by petroleum
demand disruption caused by the COVID-19 pandemic,
which decimated international travelling and led to
temporary business disruptions. Hence, market GRM came
in at US$1.22/bbl, -73% y-o-y and -48% q-o-q.
ii) Crude inventory impact resulted in a net stock gain of
c.Bt492m, as the average Dubai price in Jun 2020 and Sep
2020 stood at US$40.3/bbl and US$42.5/bbl respectively.
iii) Aromatics utilisation rate was at 90% (vs. 100% in 3Q19
and 99% in 2Q20), due to the 19-day plant turnaround at
Aro2 unit. Paraxylene (PX) spreads headed south as
condensate price rose in tandem with oil prices, whereas
demand for downstream businesses remained sluggish.
Benzene (BZ) spreads also headed south due to sluggish
demand from the auto industry. On a 3Q20 basis, PX and
BZ margins stood at US$190/tonne, (-34% y-o-y and -31%
q-o-q) and US$70/tonne (+34% y-o-y and -53% q-o-q).
Market P2F came in at US$78/tonne (-56% y-o-y and -43%
q-o-q).
iv) Polymer utilisation rate stood at 103% (vs. 107% in 3Q19
and 100% in 2Q20) despite the LDPE/LLDPE plant
turnaround for 24/20 days respectively – thanks to the
strong demand for packaging materials on the back of the
higher consumption of healthcare and homecare products
amid the COVID-19 pandemic. Moreover, product prices
and margins picked up momentum, supported by an oil
price recovery and strong packaging demand.
HDPE/LLDPE/LDPE/MEG prices stood at
US$919/US$884/US$980/US$450 per tonne
(+21%/+17%/+13%/+1% q-o-q).
v) Extraordinary items in 3Q20 include: i) a forex loss of
Bt427m as the Thai baht (THB) depreciated against the US
dollar (USD) c.Bt0.7 per USD.
Aromatics prices and spreads (by quarter)
Source: PTTGC, DBSVTH
4Q20F to be supported by strong polymer business, mild
aromatics margin recovery. We conservatively anticipate softer
oil prices and refinery margins in 4Q20F, no thanks to the
combined impact of weak demand and signs of increased
supply from key global producers weighing on markets,
including the unexpected return of Libyan output (c.1.3-
1.6mbd).
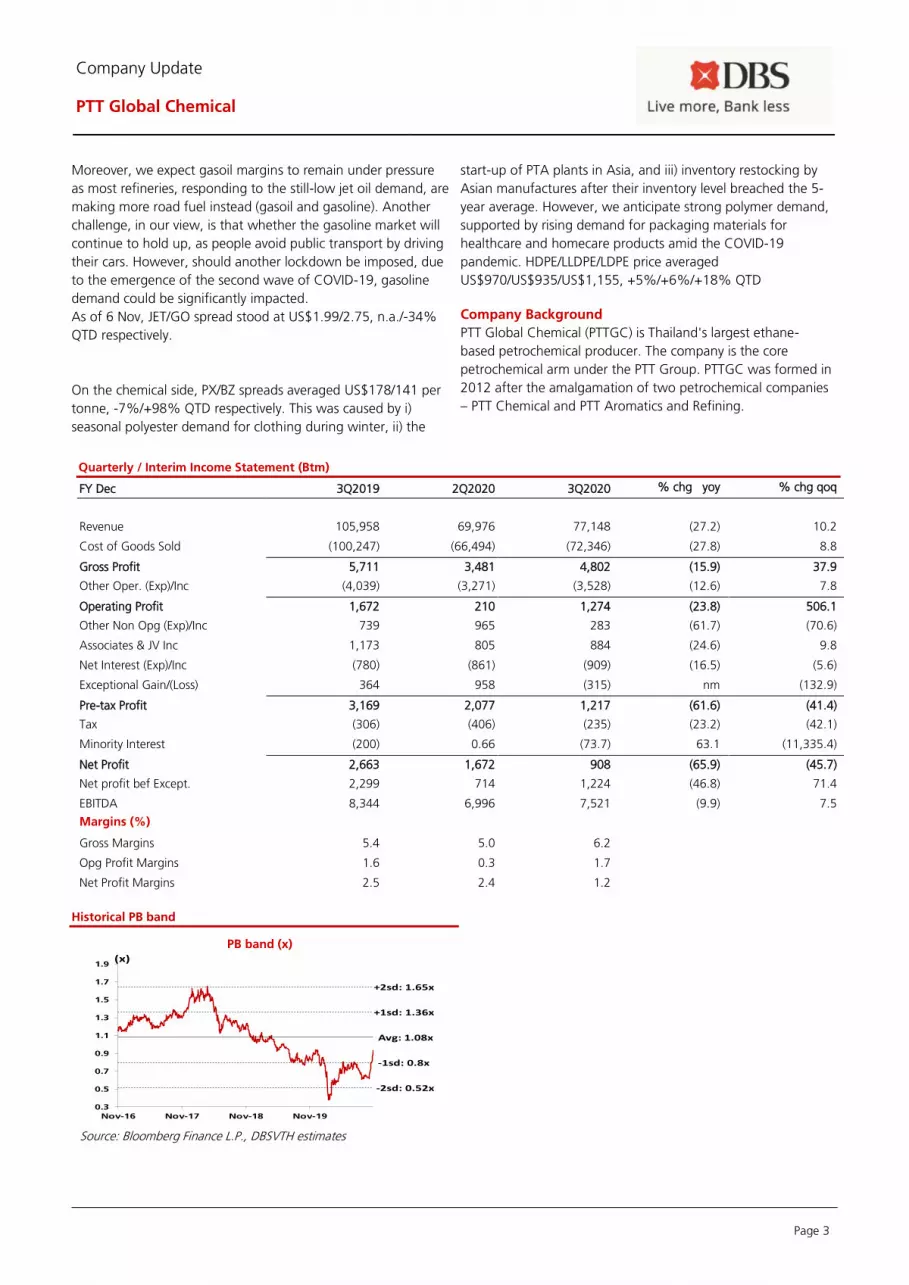
Page 3
Company Update
PTT Global Chemical
Moreover, we expect gasoil margins to remain under pressure
as most refineries, responding to the still-low jet oil demand, are
making more road fuel instead (gasoil and gasoline). Another
challenge, in our view, is that whether the gasoline market will
continue to hold up, as people avoid public transport by driving
their cars. However, should another lockdown be imposed, due
to the emergence of the second wave of COVID-19, gasoline
demand could be significantly impacted.
As of 6 Nov, JET/GO spread stood at US$1.99/2.75, n.a./-34%
QTD respectively.
On the chemical side, PX/BZ spreads averaged US$178/141 per
tonne, -7%/+98% QTD respectively. This was caused by i)
seasonal polyester demand for clothing during winter, ii) the
start-up of PTA plants in Asia, and iii) inventory restocking by
Asian manufactures after their inventory level breached the 5-
year average. However, we anticipate strong polymer demand,
supported by rising demand for packaging materials for
healthcare and homecare products amid the COVID-19
pandemic. HDPE/LLDPE/LDPE price averaged
US$970/US$935/US$1,155, +5%/+6%/+18% QTD
Company Background
PTT Global Chemical (PTTGC) is Thailand's largest ethane-
based petrochemical producer. The company is the core
petrochemical arm under the PTT Group. PTTGC was formed in
2012 after the amalgamation of two petrochemical companies
– PTT Chemical and PTT Aromatics and Refining.
Quarterly / Interim Income Statement (Btm)
FY Dec 3Q2019 2Q2020 3Q2020 % chg yoy % chg qoq
Revenue 105,958 69,976 77,148 (27.2) 10.2
Cost of Goods Sold (100,247) (66,494) (72,346) (27.8) 8.8
Gross Profit 5,711 3,481 4,802 (15.9) 37.9
Other Oper. (Exp)/Inc (4,039) (3,271) (3,528) (12.6) 7.8
Operating Profit 1,672 210 1,274 (23.8) 506.1
Other Non Opg (Exp)/Inc 739 965 283 (61.7) (70.6)
Associates & JV Inc 1,173 805 884 (24.6) 9.8
Net Interest (Exp)/Inc (780) (861) (909) (16.5) (5.6)
Exceptional Gain/(Loss) 364 958 (315) nm (132.9)
Pre-tax Profit 3,169 2,077 1,217 (61.6) (41.4)
Tax (306) (406) (235) (23.2) (42.1)
Minority Interest (200) 0.66 (73.7) 63.1 (11,335.4)
Net Profit 2,663 1,672 908 (65.9) (45.7)
Net profit bef Except. 2,299 714 1,224 (46.8) 71.4
EBITDA 8,344 6,996 7,521 (9.9) 7.5
Margins (%)
Gross Margins 5.4 5.0 6.2
Opg Profit Margins 1.6 0.3 1.7
Net Profit Margins 2.5 2.4 1.2
Historical PB band
PB band (x)
Source: Bloomberg Finance L.P., DBSVTH estimates
Avg: 1.08x
+1sd: 1.36x
+2sd: 1.65x
-1sd: 0.8x
-2sd: 0.52x
0.3
0.5
0.7
0.9
1.1
1.3
1.5
1.7
1.9
Nov-16 Nov-17 Nov-18 Nov-19
(x)
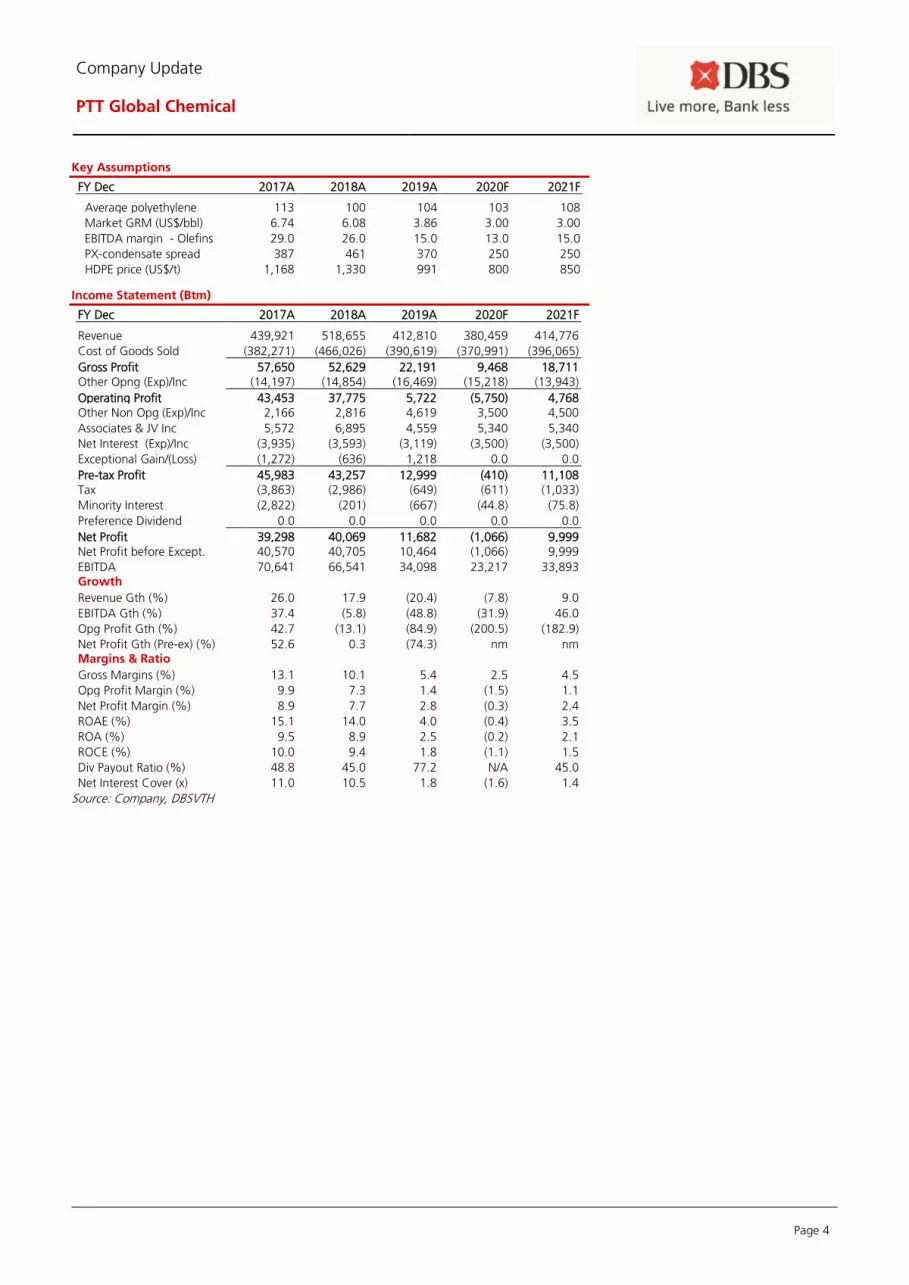
Page 4
Company Update
PTT Global Chemical
Key Assumptions
FY Dec 2017A 2018A 2019A 2020F 2021F
Average polyethylene
utilization (%)
113 100 104 103 108
Market GRM (US$/bbl) 6.74 6.08 3.86 3.00 3.00
EBITDA margin - Olefins
(%)
29.0 26.0 15.0 13.0 15.0
PX-condensate spread
(US$/t)
387 461 370 250 250
HDPE price (US$/t) 1,168 1,330 991 800 850
Income Statement (Btm)
FY Dec 2017A 2018A 2019A 2020F 2021F
Revenue 439,921 518,655 412,810 380,459 414,776
Cost of Goods Sold (382,271) (466,026) (390,619) (370,991) (396,065)
Gross Profit 57,650 52,629 22,191 9,468 18,711 Other Opng (Exp)/Inc (14,197) (14,854) (16,469) (15,218) (13,943)
Operating Profit 43,453 37,775 5,722 (5,750) 4,768 Other Non Opg (Exp)/Inc 2,166 2,816 4,619 3,500 4,500
Associates & JV Inc 5,572 6,895 4,559 5,340 5,340
Net Interest (Exp)/Inc (3,935) (3,593) (3,119) (3,500) (3,500)
Exceptional Gain/(Loss) (1,272) (636) 1,218 0.0 0.0
Pre-tax Profit 45,983 43,257 12,999 (410) 11,108 Tax (3,863) (2,986) (649) (611) (1,033)
Minority Interest (2,822) (201) (667) (44.8) (75.8)
Preference Dividend 0.0 0.0 0.0 0.0 0.0
Net Profit 39,298 40,069 11,682 (1,066) 9,999 Net Profit before Except. 40,570 40,705 10,464 (1,066) 9,999
EBITDA 70,641 66,541 34,098 23,217 33,893 Growth
Revenue Gth (%) 26.0 17.9 (20.4) (7.8) 9.0
EBITDA Gth (%) 37.4 (5.8) (48.8) (31.9) 46.0
Opg Profit Gth (%) 42.7 (13.1) (84.9) (200.5) (182.9)
Net Profit Gth (Pre-ex) (%) 52.6 0.3 (74.3) nm nm Margins & Ratio
Gross Margins (%) 13.1 10.1 5.4 2.5 4.5
Opg Profit Margin (%) 9.9 7.3 1.4 (1.5) 1.1
Net Profit Margin (%) 8.9 7.7 2.8 (0.3) 2.4
ROAE (%) 15.1 14.0 4.0 (0.4) 3.5
ROA (%) 9.5 8.9 2.5 (0.2) 2.1
ROCE (%) 10.0 9.4 1.8 (1.1) 1.5
Div Payout Ratio (%) 48.8 45.0 77.2 N/A 45.0
Net Interest Cover (x) 11.0 10.5 1.8 (1.6) 1.4
Source: Company, DBSVTH
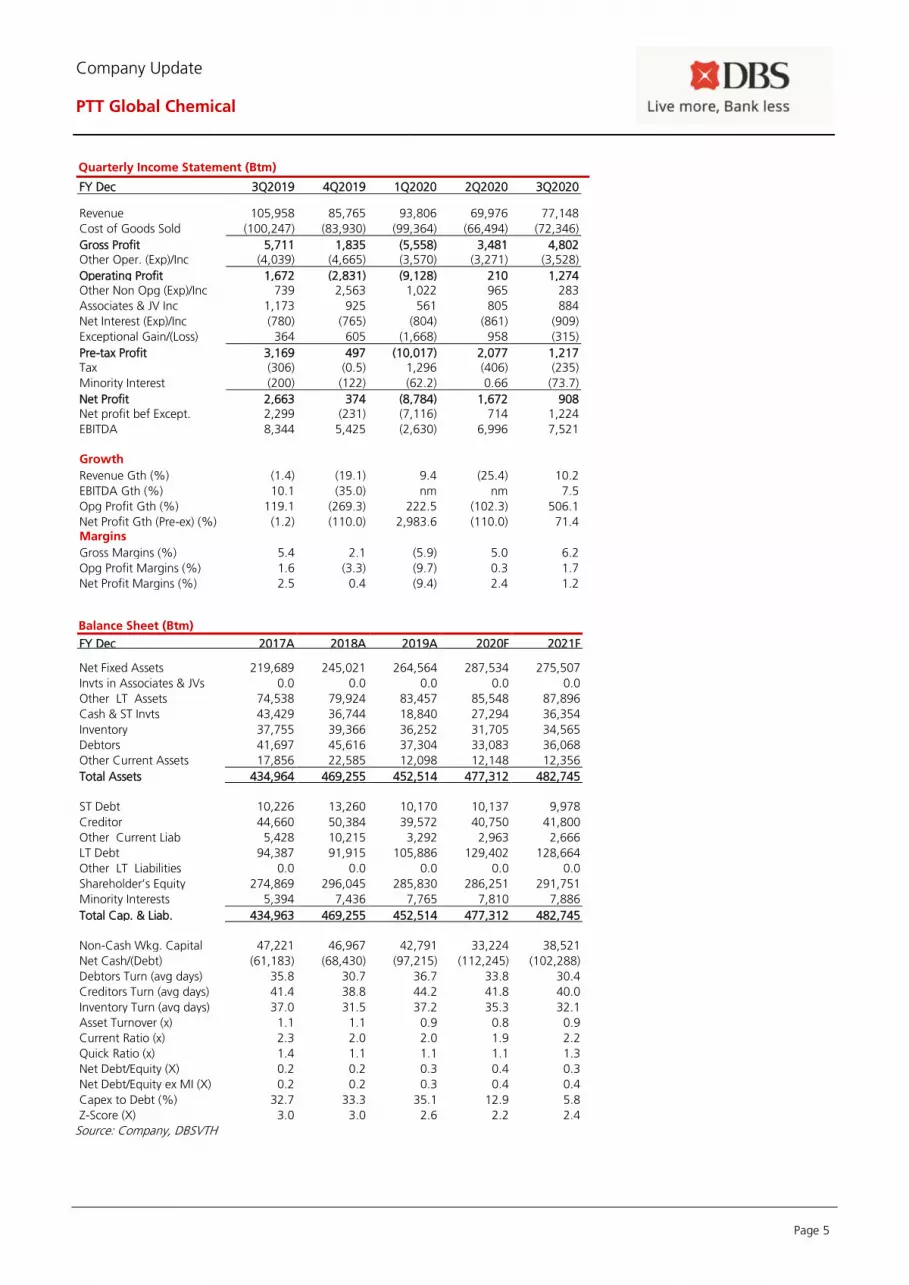
Page 5
Company Update
PTT Global Chemical
Quarterly Income Statement (Btm)
FY Dec 3Q2019 4Q2019 1Q2020 2Q2020 3Q2020
Revenue 105,958 85,765 93,806 69,976 77,148
Cost of Goods Sold (100,247) (83,930) (99,364) (66,494) (72,346)
Gross Profit 5,711 1,835 (5,558) 3,481 4,802 Other Oper. (Exp)/Inc (4,039) (4,665) (3,570) (3,271) (3,528)
Operating Profit 1,672 (2,831) (9,128) 210 1,274 Other Non Opg (Exp)/Inc 739 2,563 1,022 965 283
Associates & JV Inc 1,173 925 561 805 884
Net Interest (Exp)/Inc (780) (765) (804) (861) (909)
Exceptional Gain/(Loss) 364 605 (1,668) 958 (315)
Pre-tax Profit 3,169 497 (10,017) 2,077 1,217 Tax (306) (0.5) 1,296 (406) (235)
Minority Interest (200) (122) (62.2) 0.66 (73.7)
Net Profit 2,663 374 (8,784) 1,672 908 Net profit bef Except. 2,299 (231) (7,116) 714 1,224
EBITDA 8,344 5,425 (2,630) 6,996 7,521 Growth
Revenue Gth (%) (1.4) (19.1) 9.4 (25.4) 10.2
EBITDA Gth (%) 10.1 (35.0) nm nm 7.5
Opg Profit Gth (%) 119.1 (269.3) 222.5 (102.3) 506.1
Net Profit Gth (Pre-ex) (%) (1.2) (110.0) 2,983.6 (110.0) 71.4 Margins
Gross Margins (%) 5.4 2.1 (5.9) 5.0 6.2
Opg Profit Margins (%) 1.6 (3.3) (9.7) 0.3 1.7
Net Profit Margins (%) 2.5 0.4 (9.4) 2.4 1.2
Balance Sheet (Btm)
FY Dec 2017A 2018A 2019A 2020F 2021F Net Fixed Assets 219,689 245,021 264,564 287,534 275,507
Invts in Associates & JVs 0.0 0.0 0.0 0.0 0.0
Other LT Assets 74,538 79,924 83,457 85,548 87,896
Cash & ST Invts 43,429 36,744 18,840 27,294 36,354
Inventory 37,755 39,366 36,252 31,705 34,565
Debtors 41,697 45,616 37,304 33,083 36,068
Other Current Assets 17,856 22,585 12,098 12,148 12,356
Total Assets 434,964 469,255 452,514 477,312 482,745
ST Debt
10,226 13,260 10,170 10,137 9,978
Creditor 44,660 50,384 39,572 40,750 41,800
Other Current Liab 5,428 10,215 3,292 2,963 2,666
LT Debt 94,387 91,915 105,886 129,402 128,664
Other LT Liabilities 0.0 0.0 0.0 0.0 0.0
Shareholder’s Equity 274,869 296,045 285,830 286,251 291,751
Minority Interests 5,394 7,436 7,765 7,810 7,886
Total Cap. & Liab. 434,963 469,255 452,514 477,312 482,745
Non-Cash Wkg. Capital 47,221 46,967 42,791 33,224 38,521
Net Cash/(Debt) (61,183) (68,430) (97,215) (112,245) (102,288)
Debtors Turn (avg days) 35.8 30.7 36.7 33.8 30.4
Creditors Turn (avg days) 41.4 38.8 44.2 41.8 40.0
Inventory Turn (avg days) 37.0 31.5 37.2 35.3 32.1
Asset Turnover (x) 1.1 1.1 0.9 0.8 0.9
Current Ratio (x) 2.3 2.0 2.0 1.9 2.2
Quick Ratio (x) 1.4 1.1 1.1 1.1 1.3
Net Debt/Equity (X) 0.2 0.2 0.3 0.4 0.3
Net Debt/Equity ex MI (X) 0.2 0.2 0.3 0.4 0.4
Capex to Debt (%) 32.7 33.3 35.1 12.9 5.8
Z-Score (X) 3.0 3.0 2.6 2.2 2.4
Source: Company, DBSVTH
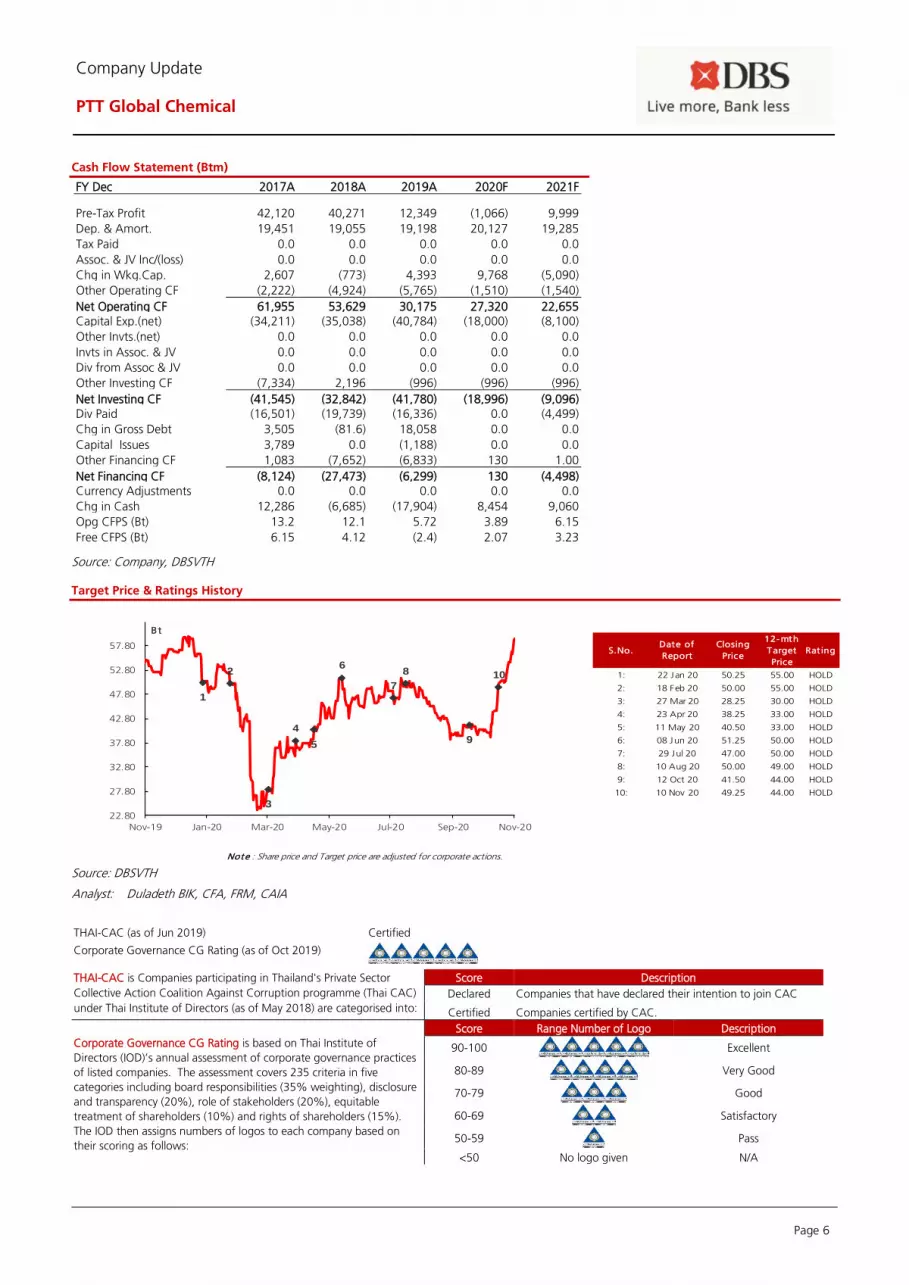
Page 6
Company Update
PTT Global Chemical
Cash Flow Statement (Btm)
FY Dec 2017A 2018A 2019A 2020F 2021F
Pre-Tax Profit 42,120 40,271 12,349 (1,066) 9,999
Dep. & Amort. 19,451 19,055 19,198 20,127 19,285
Tax Paid 0.0 0.0 0.0 0.0 0.0
Assoc. & JV Inc/(loss) 0.0 0.0 0.0 0.0 0.0
Chg in Wkg.Cap. 2,607 (773) 4,393 9,768 (5,090)
Other Operating CF (2,222) (4,924) (5,765) (1,510) (1,540)
Net Operating CF 61,955 53,629 30,175 27,320 22,655 Capital Exp.(net) (34,211) (35,038) (40,784) (18,000) (8,100)
Other Invts.(net) 0.0 0.0 0.0 0.0 0.0
Invts in Assoc. & JV 0.0 0.0 0.0 0.0 0.0
Div from Assoc & JV 0.0 0.0 0.0 0.0 0.0
Other Investing CF (7,334) 2,196 (996) (996) (996)
Net Investing CF (41,545) (32,842) (41,780) (18,996) (9,096) Div Paid (16,501) (19,739) (16,336) 0.0 (4,499)
Chg in Gross Debt 3,505 (81.6) 18,058 0.0 0.0
Capital Issues 3,789 0.0 (1,188) 0.0 0.0
Other Financing CF 1,083 (7,652) (6,833) 130 1.00
Net Financing CF (8,124) (27,473) (6,299) 130 (4,498) Currency Adjustments 0.0 0.0 0.0 0.0 0.0
Chg in Cash 12,286 (6,685) (17,904) 8,454 9,060
Opg CFPS (Bt) 13.2 12.1 5.72 3.89 6.15
Free CFPS (Bt) 6.15 4.12 (2.4) 2.07 3.23
Source: Company, DBSVTH Target Price & Ratings History
Source: DBSVTH
Analyst: Duladeth BIK, CFA, FRM, CAIA
THAI-CAC (as of Jun 2019) Certified
Corporate Governance CG Rating (as of Oct 2019)
THAI-CAC is Companies participating in Thailand's Private Sector
Collective Action Coalition Against Corruption programme (Thai CAC)
under Thai Institute of Directors (as of May 2018) are categorised into:
Score Description
Declared Companies that have declared their intention to join CAC
Certified Companies certified by CAC.
Corporate Governance CG Rating is based on Thai Institute of
Directors (IOD)’s annual assessment of corporate governance practices
of listed companies. The assessment covers 235 criteria in five
categories including board responsibilities (35% weighting), disclosure
and transparency (20%), role of stakeholders (20%), equitable
treatment of shareholders (10%) and rights of shareholders (15%).
The IOD then assigns numbers of logos to each company based on
their scoring as follows:
Score Range Number of Logo Description
90-100
Excellent
80-89
Very Good
70-79
Good
60-69
Satisfactory
50-59
Pass
<50 No logo given N/A
S.No.Date of
Report
Closing
Price
12-mth
Target
Price
Rat ing
1: 22 Jan 20 50.25 55.00 HOLD
2: 18 Feb 20 50.00 55.00 HOLD
3: 27 Mar 20 28.25 30.00 HOLD
4: 23 Apr 20 38.25 33.00 HOLD
5: 11 May 20 40.50 33.00 HOLD
6: 08 Jun 20 51.25 50.00 HOLD
7: 29 Jul 20 47.00 50.00 HOLD
8: 10 Aug 20 50.00 49.00 HOLD
9: 12 Oct 20 41.50 44.00 HOLD
10: 10 Nov 20 49.25 44.00 HOLD
Note : Share price and Target price are adjusted for corporate actions.
1
2
3
4
5
6
7
8
9
10
22.80
27.80
32.80
37.80
42.80
47.80
52.80
57.80
Nov-19 Jan-20 Mar-20 May-20 Jul-20 Sep-20 Nov-20
Bt
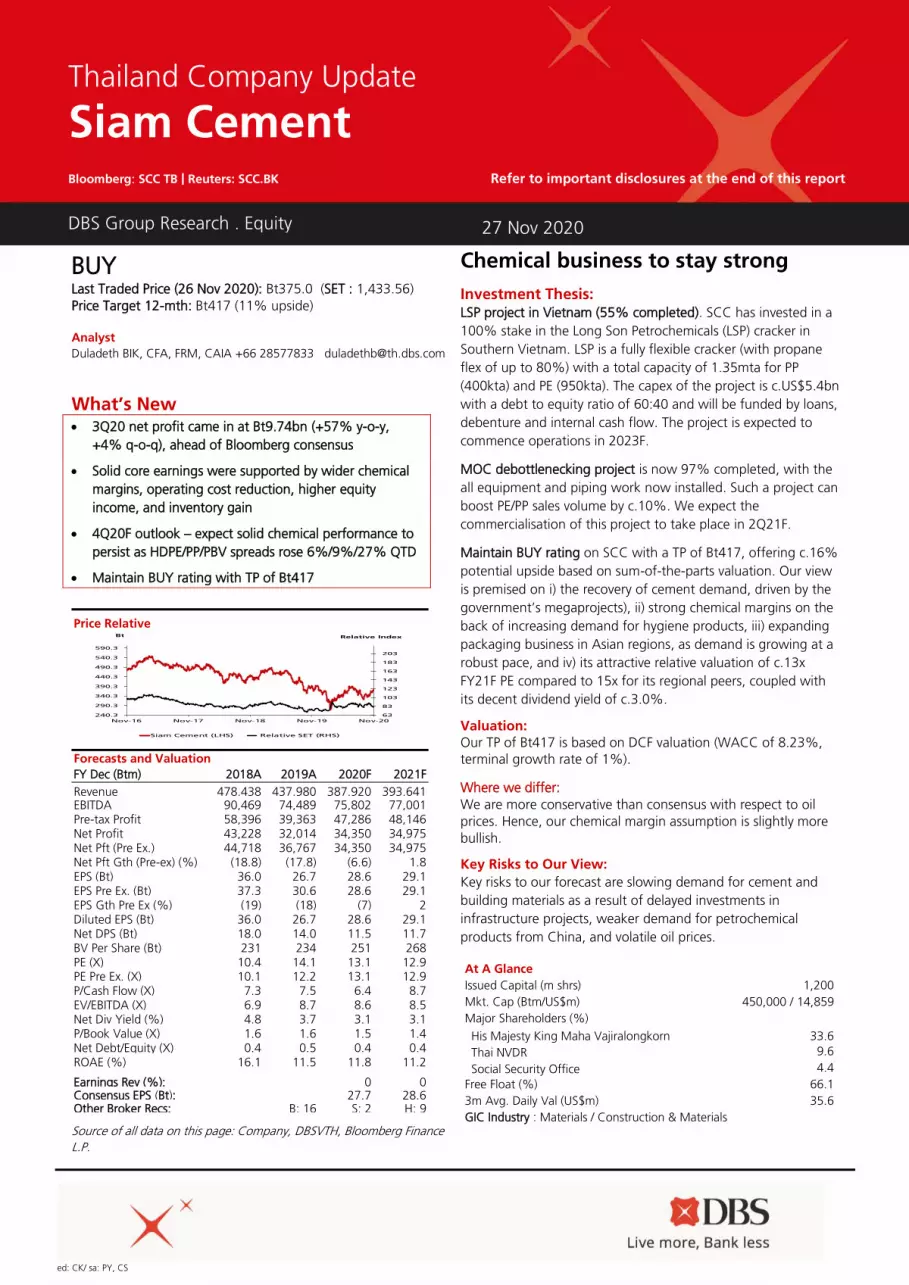
ed: CK/ sa: PY, CS
BUY Last Traded Price (26 Nov 2020): Bt375.0 (SET : 1,433.56)
Price Target 12-mth: Bt417 (11% upside)
Analyst
Duladeth BIK, CFA, FRM, CAIA +66 28577833 [email protected]
What’s New • 3Q20 net profit came in at Bt9.74bn (+57% y-o-y,
+4% q-o-q), ahead of Bloomberg consensus
• Solid core earnings were supported by wider chemical
margins, operating cost reduction, higher equity
income, and inventory gain
• 4Q20F outlook – expect solid chemical performance to
persist as HDPE/PP/PBV spreads rose 6%/9%/27% QTD
• Maintain BUY rating with TP of Bt417
Source of all data on this page: Company, DBSVTH, Bloomberg Finance
L.P.
Chemical business to stay strong
Investment Thesis: LSP project in Vietnam (55% completed). SCC has invested in a
100% stake in the Long Son Petrochemicals (LSP) cracker in
Southern Vietnam. LSP is a fully flexible cracker (with propane
flex of up to 80%) with a total capacity of 1.35mta for PP
(400kta) and PE (950kta). The capex of the project is c.US$5.4bn
with a debt to equity ratio of 60:40 and will be funded by loans,
debenture and internal cash flow. The project is expected to
commence operations in 2023F.
MOC debottlenecking project is now 97% completed, with the
all equipment and piping work now installed. Such a project can
boost PE/PP sales volume by c.10%. We expect the
commercialisation of this project to take place in 2Q21F.
Maintain BUY rating on SCC with a TP of Bt417, offering c.16%
potential upside based on sum-of-the-parts valuation. Our view
is premised on i) the recovery of cement demand, driven by the
government’s megaprojects), ii) strong chemical margins on the
back of increasing demand for hygiene products, iii) expanding
packaging business in Asian regions, as demand is growing at a
robust pace, and iv) its attractive relative valuation of c.13x
FY21F PE compared to 15x for its regional peers, coupled with
its decent dividend yield of c.3.0%.
Valuation:
Our TP of Bt417 is based on DCF valuation (WACC of 8.23%,
terminal growth rate of 1%).
Where we differ:
We are more conservative than consensus with respect to oil
prices. Hence, our chemical margin assumption is slightly more
bullish.
Key Risks to Our View:
Key risks to our forecast are slowing demand for cement and
building materials as a result of delayed investments in
infrastructure projects, weaker demand for petrochemical
products from China, and volatile oil prices. At A Glance Issued Capital (m shrs) 1,200
Mkt. Cap (Btm/US$m) 450,000 / 14,859
Major Shareholders (%)
His Majesty King Maha Vajiralongkorn 33.6
Thai NVDR 9.6
Social Security Office 4.4
Free Float (%) 66.1
3m Avg. Daily Val (US$m) 35.6
GIC Industry : Materials / Construction & Materials
DBS Group Research . Equity
27 Nov 2020
Thailand Company Update
Siam Cement Bloomberg: SCC TB | Reuters: SCC.BK Refer to important disclosures at the end of this report
Price Relative
Forecasts and Valuation
FY Dec (Btm) 2018A 2019A 2020F 2021F
Revenue 478,438 437,980 387,920 393,641 EBITDA 90,469 74,489 75,802 77,001 Pre-tax Profit 58,396 39,363 47,286 48,146 Net Profit 43,228 32,014 34,350 34,975 Net Pft (Pre Ex.) 44,718 36,767 34,350 34,975 Net Pft Gth (Pre-ex) (%) (18.8) (17.8) (6.6) 1.8 EPS (Bt) 36.0 26.7 28.6 29.1 EPS Pre Ex. (Bt) 37.3 30.6 28.6 29.1 EPS Gth Pre Ex (%) (19) (18) (7) 2 Diluted EPS (Bt) 36.0 26.7 28.6 29.1 Net DPS (Bt) 18.0 14.0 11.5 11.7 BV Per Share (Bt) 231 234 251 268 PE (X) 10.4 14.1 13.1 12.9 PE Pre Ex. (X) 10.1 12.2 13.1 12.9 P/Cash Flow (X) 7.3 7.5 6.4 8.7 EV/EBITDA (X) 6.9 8.7 8.6 8.5 Net Div Yield (%) 4.8 3.7 3.1 3.1 P/Book Value (X) 1.6 1.6 1.5 1.4 Net Debt/Equity (X) 0.4 0.5 0.4 0.4 ROAE (%) 16.1 11.5 11.8 11.2 Earnings Rev (%): 0 0 Consensus EPS (Bt): 27.7 28.6 Other Broker Recs: B: 16 S: 2 H: 9
63
83
103
123
143
163
183
203
240.3
290.3
340.3
390.3
440.3
490.3
540.3
590.3
Nov-16 Nov-17 Nov-18 Nov-19 Nov-20
Relative IndexBt
Siam Cement (LHS) Relative SET (RHS)
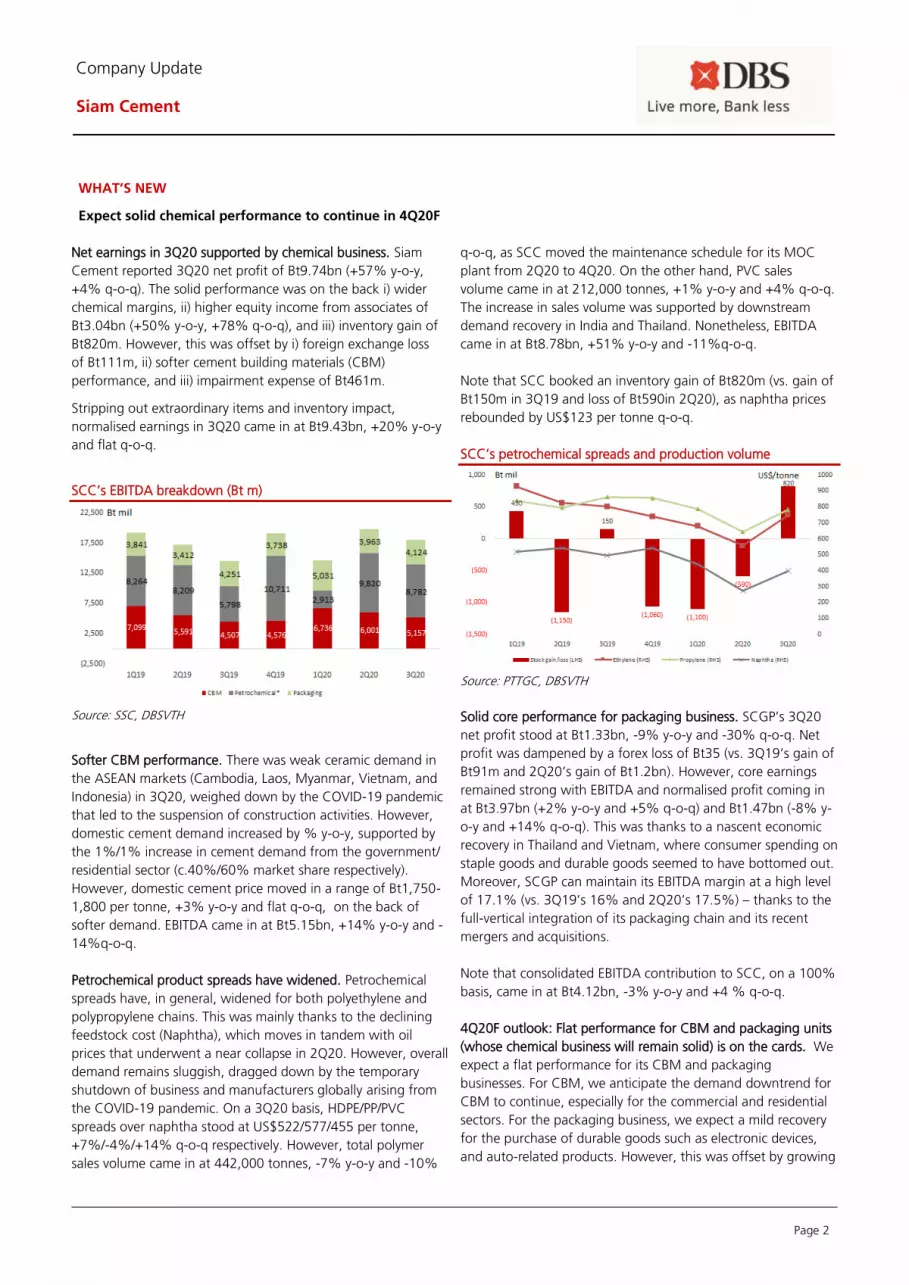
Page 2
Company Update
Siam Cement
WHAT’S NEW
Expect solid chemical performance to continue in 4Q20F
Net earnings in 3Q20 supported by chemical business. Siam
Cement reported 3Q20 net profit of Bt9.74bn (+57% y-o-y,
+4% q-o-q). The solid performance was on the back i) wider
chemical margins, ii) higher equity income from associates of
Bt3.04bn (+50% y-o-y, +78% q-o-q), and iii) inventory gain of
Bt820m. However, this was offset by i) foreign exchange loss
of Bt111m, ii) softer cement building materials (CBM)
performance, and iii) impairment expense of Bt461m.
Stripping out extraordinary items and inventory impact,
normalised earnings in 3Q20 came in at Bt9.43bn, +20% y-o-y
and flat q-o-q.
SCC’s EBITDA breakdown (Bt m)
Source: SSC, DBSVTH
Softer CBM performance. There was weak ceramic demand in
the ASEAN markets (Cambodia, Laos, Myanmar, Vietnam, and
Indonesia) in 3Q20, weighed down by the COVID-19 pandemic
that led to the suspension of construction activities. However,
domestic cement demand increased by % y-o-y, supported by
the 1%/1% increase in cement demand from the government/
residential sector (c.40%/60% market share respectively).
However, domestic cement price moved in a range of Bt1,750-
1,800 per tonne, +3% y-o-y and flat q-o-q, on the back of
softer demand. EBITDA came in at Bt5.15bn, +14% y-o-y and -
14%q-o-q.
Petrochemical product spreads have widened. Petrochemical
spreads have, in general, widened for both polyethylene and
polypropylene chains. This was mainly thanks to the declining
feedstock cost (Naphtha), which moves in tandem with oil
prices that underwent a near collapse in 2Q20. However, overall
demand remains sluggish, dragged down by the temporary
shutdown of business and manufacturers globally arising from
the COVID-19 pandemic. On a 3Q20 basis, HDPE/PP/PVC
spreads over naphtha stood at US$522/577/455 per tonne,
+7%/-4%/+14% q-o-q respectively. However, total polymer
sales volume came in at 442,000 tonnes, -7% y-o-y and -10%
q-o-q, as SCC moved the maintenance schedule for its MOC
plant from 2Q20 to 4Q20. On the other hand, PVC sales
volume came in at 212,000 tonnes, +1% y-o-y and +4% q-o-q.
The increase in sales volume was supported by downstream
demand recovery in India and Thailand. Nonetheless, EBITDA
came in at Bt8.78bn, +51% y-o-y and -11%q-o-q.
Note that SCC booked an inventory gain of Bt820m (vs. gain of
Bt150m in 3Q19 and loss of Bt590in 2Q20), as naphtha prices
rebounded by US$123 per tonne q-o-q.
SCC’s petrochemical spreads and production volume
Source: PTTGC, DBSVTH
Solid core performance for packaging business. SCGP’s 3Q20
net profit stood at Bt1.33bn, -9% y-o-y and -30% q-o-q. Net
profit was dampened by a forex loss of Bt35 (vs. 3Q19’s gain of
Bt91m and 2Q20’s gain of Bt1.2bn). However, core earnings
remained strong with EBITDA and normalised profit coming in
at Bt3.97bn (+2% y-o-y and +5% q-o-q) and Bt1.47bn (-8% y-
o-y and +14% q-o-q). This was thanks to a nascent economic
recovery in Thailand and Vietnam, where consumer spending on
staple goods and durable goods seemed to have bottomed out.
Moreover, SCGP can maintain its EBITDA margin at a high level
of 17.1% (vs. 3Q19’s 16% and 2Q20’s 17.5%) – thanks to the
full-vertical integration of its packaging chain and its recent
mergers and acquisitions.
Note that consolidated EBITDA contribution to SCC, on a 100%
basis, came in at Bt4.12bn, -3% y-o-y and +4 % q-o-q.
4Q20F outlook: Flat performance for CBM and packaging units
(whose chemical business will remain solid) is on the cards. We
expect a flat performance for its CBM and packaging
businesses. For CBM, we anticipate the demand downtrend for
CBM to continue, especially for the commercial and residential
sectors. For the packaging business, we expect a mild recovery
for the purchase of durable goods such as electronic devices,
and auto-related products. However, this was offset by growing
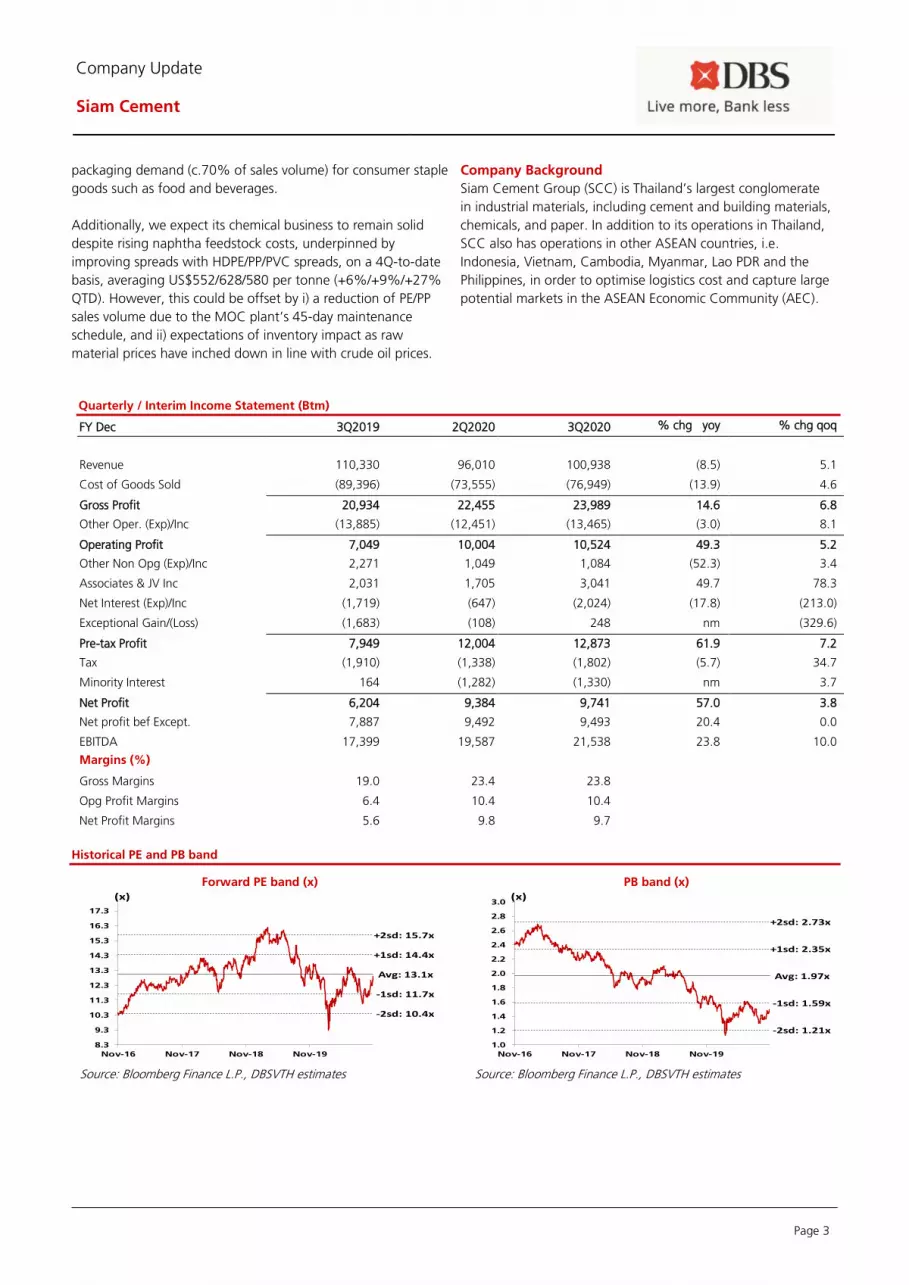
Page 3
Company Update
Siam Cement
packaging demand (c.70% of sales volume) for consumer staple
goods such as food and beverages.
Additionally, we expect its chemical business to remain solid
despite rising naphtha feedstock costs, underpinned by
improving spreads with HDPE/PP/PVC spreads, on a 4Q-to-date
basis, averaging US$552/628/580 per tonne (+6%/+9%/+27%
QTD). However, this could be offset by i) a reduction of PE/PP
sales volume due to the MOC plant’s 45-day maintenance
schedule, and ii) expectations of inventory impact as raw
material prices have inched down in line with crude oil prices.
Company Background
Siam Cement Group (SCC) is Thailand’s largest conglomerate
in industrial materials, including cement and building materials,
chemicals, and paper. In addition to its operations in Thailand,
SCC also has operations in other ASEAN countries, i.e.
Indonesia, Vietnam, Cambodia, Myanmar, Lao PDR and the
Philippines, in order to optimise logistics cost and capture large
potential markets in the ASEAN Economic Community (AEC).
Quarterly / Interim Income Statement (Btm)
FY Dec 3Q2019 2Q2020 3Q2020 % chg yoy % chg qoq
Revenue 110,330 96,010 100,938 (8.5) 5.1
Cost of Goods Sold (89,396) (73,555) (76,949) (13.9) 4.6
Gross Profit 20,934 22,455 23,989 14.6 6.8
Other Oper. (Exp)/Inc (13,885) (12,451) (13,465) (3.0) 8.1
Operating Profit 7,049 10,004 10,524 49.3 5.2
Other Non Opg (Exp)/Inc 2,271 1,049 1,084 (52.3) 3.4
Associates & JV Inc 2,031 1,705 3,041 49.7 78.3
Net Interest (Exp)/Inc (1,719) (647) (2,024) (17.8) (213.0)
Exceptional Gain/(Loss) (1,683) (108) 248 nm (329.6)
Pre-tax Profit 7,949 12,004 12,873 61.9 7.2
Tax (1,910) (1,338) (1,802) (5.7) 34.7
Minority Interest 164 (1,282) (1,330) nm 3.7
Net Profit 6,204 9,384 9,741 57.0 3.8
Net profit bef Except. 7,887 9,492 9,493 20.4 0.0
EBITDA 17,399 19,587 21,538 23.8 10.0
Margins (%)
Gross Margins 19.0 23.4 23.8
Opg Profit Margins 6.4 10.4 10.4
Net Profit Margins 5.6 9.8 9.7
Historical PE and PB band
Forward PE band (x) PB band (x)
Source: Bloomberg Finance L.P., DBSVTH estimates Source: Bloomberg Finance L.P., DBSVTH estimates
Avg: 13.1x
+1sd: 14.4x
+2sd: 15.7x
-1sd: 11.7x
-2sd: 10.4x
8.3
9.3
10.3
11.3
12.3
13.3
14.3
15.3
16.3
17.3
Nov-16 Nov-17 Nov-18 Nov-19
(x)
Avg: 1.97x
+1sd: 2.35x
+2sd: 2.73x
-1sd: 1.59x
-2sd: 1.21x
1.0
1.2
1.4
1.6
1.8
2.0
2.2
2.4
2.6
2.8
3.0
Nov-16 Nov-17 Nov-18 Nov-19
(x)
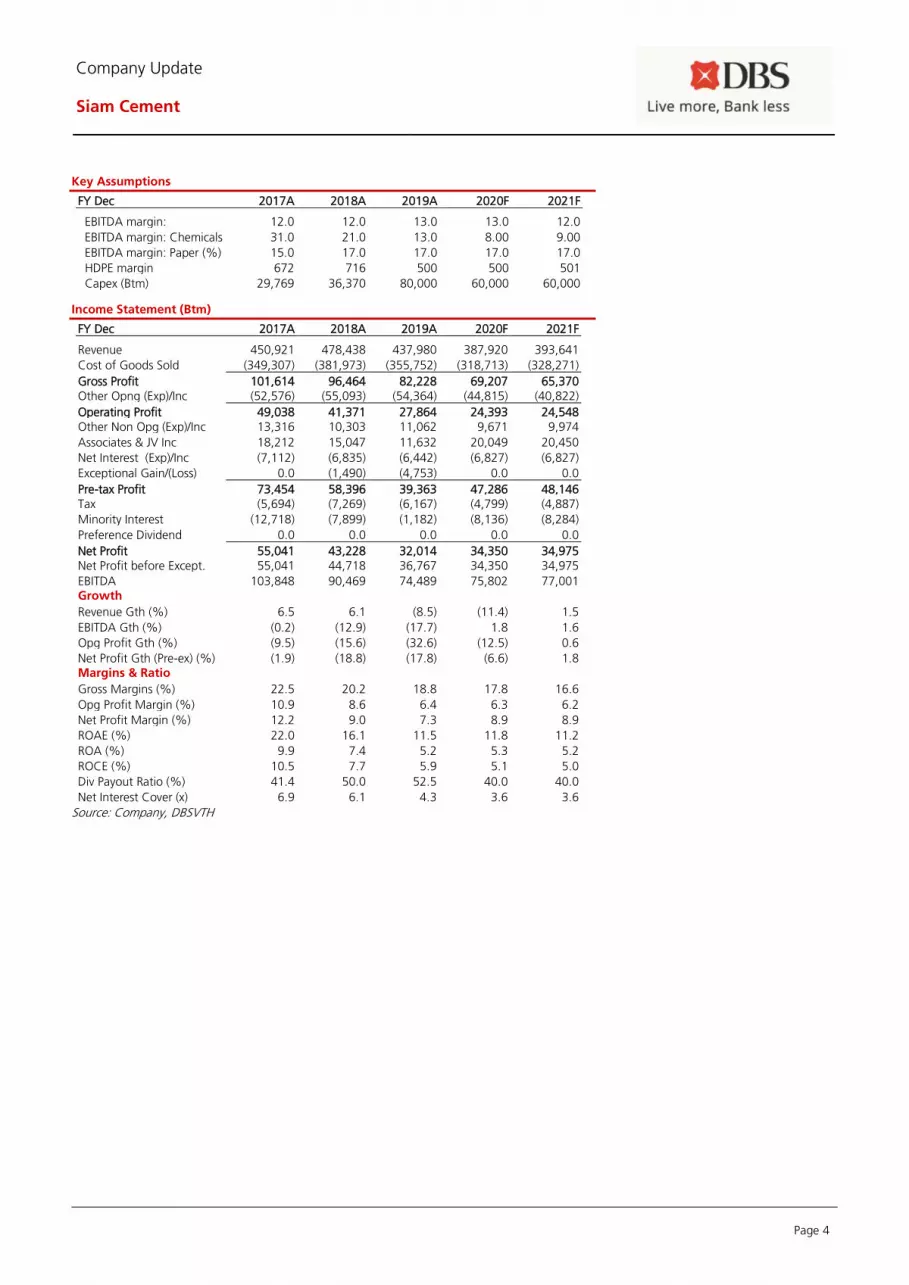
Page 4
Company Update
Siam Cement
Key Assumptions
FY Dec 2017A 2018A 2019A 2020F 2021F
EBITDA margin:
Cement&Bldg Mat (%)
12.0 12.0 13.0 13.0 12.0
EBITDA margin: Chemicals
(%)
31.0 21.0 13.0 8.00 9.00
EBITDA margin: Paper (%) 15.0 17.0 17.0 17.0 17.0
HDPE margin 672 716 500 500 501
Capex (Btm) 29,769 36,370 80,000 60,000 60,000
Income Statement (Btm)
FY Dec 2017A 2018A 2019A 2020F 2021F
Revenue 450,921 478,438 437,980 387,920 393,641
Cost of Goods Sold (349,307) (381,973) (355,752) (318,713) (328,271)
Gross Profit 101,614 96,464 82,228 69,207 65,370 Other Opng (Exp)/Inc (52,576) (55,093) (54,364) (44,815) (40,822)
Operating Profit 49,038 41,371 27,864 24,393 24,548 Other Non Opg (Exp)/Inc 13,316 10,303 11,062 9,671 9,974
Associates & JV Inc 18,212 15,047 11,632 20,049 20,450
Net Interest (Exp)/Inc (7,112) (6,835) (6,442) (6,827) (6,827)
Exceptional Gain/(Loss) 0.0 (1,490) (4,753) 0.0 0.0
Pre-tax Profit 73,454 58,396 39,363 47,286 48,146 Tax (5,694) (7,269) (6,167) (4,799) (4,887)
Minority Interest (12,718) (7,899) (1,182) (8,136) (8,284)
Preference Dividend 0.0 0.0 0.0 0.0 0.0
Net Profit 55,041 43,228 32,014 34,350 34,975 Net Profit before Except. 55,041 44,718 36,767 34,350 34,975
EBITDA 103,848 90,469 74,489 75,802 77,001 Growth
Revenue Gth (%) 6.5 6.1 (8.5) (11.4) 1.5
EBITDA Gth (%) (0.2) (12.9) (17.7) 1.8 1.6
Opg Profit Gth (%) (9.5) (15.6) (32.6) (12.5) 0.6
Net Profit Gth (Pre-ex) (%) (1.9) (18.8) (17.8) (6.6) 1.8 Margins & Ratio
Gross Margins (%) 22.5 20.2 18.8 17.8 16.6
Opg Profit Margin (%) 10.9 8.6 6.4 6.3 6.2
Net Profit Margin (%) 12.2 9.0 7.3 8.9 8.9
ROAE (%) 22.0 16.1 11.5 11.8 11.2
ROA (%) 9.9 7.4 5.2 5.3 5.2
ROCE (%) 10.5 7.7 5.9 5.1 5.0
Div Payout Ratio (%) 41.4 50.0 52.5 40.0 40.0
Net Interest Cover (x) 6.9 6.1 4.3 3.6 3.6
Source: Company, DBSVTH

Page 5
Company Update
Siam Cement
Quarterly Income Statement (Btm)
FY Dec 3Q2019 4Q2019 1Q2020 2Q2020 3Q2020
Revenue 110,330 106,177 105,741 96,010 100,938
Cost of Goods Sold (89,396) (86,135) (84,682) (73,555) (76,949)
Gross Profit 20,934 20,042 21,058 22,455 23,989 Other Oper. (Exp)/Inc (13,885) (14,593) (13,151) (12,451) (13,465)
Operating Profit 7,049 5,449 7,907 10,004 10,524 Other Non Opg (Exp)/Inc 2,271 4,024 2,236 1,049 1,084
Associates & JV Inc 2,031 2,836 1,245 1,705 3,041
Net Interest (Exp)/Inc (1,719) (1,521) (3,113) (647) (2,024)
Exceptional Gain/(Loss) (1,683) (1,391) (1,303) (108) 248
Pre-tax Profit 7,949 9,396 6,973 12,004 12,873 Tax (1,910) (1,907) (971) (1,338) (1,802)
Minority Interest 164 (386) 970 (1,282) (1,330)
Net Profit 6,204 7,104 6,971 9,384 9,741 Net profit bef Except. 7,887 8,495 8,274 9,492 9,493
EBITDA 17,399 18,499 18,159 19,587 21,538 Growth
Revenue Gth (%) 1.1 (3.8) (0.4) (9.2) 5.1
EBITDA Gth (%) (7.3) 6.3 (1.8) 7.9 10.0
Opg Profit Gth (%) (3.3) (22.7) 45.1 26.5 5.2
Net Profit Gth (Pre-ex) (%) (26.5) 7.7 (2.6) 14.7 0.0 Margins
Gross Margins (%) 19.0 18.9 19.9 23.4 23.8
Opg Profit Margins (%) 6.4 5.1 7.5 10.4 10.4
Net Profit Margins (%) 5.6 6.7 6.6 9.8 9.7
Balance Sheet (Btm)
FY Dec 2017A 2018A 2019A 2020F 2021F Net Fixed Assets 248,847 247,466 305,986 344,296 382,268
Invts in Associates & JVs 0.0 0.0 0.0 0.0 0.0
Other LT Assets 152,946 165,050 164,362 168,028 157,832
Cash & ST Invts 56,908 50,381 44,222 57,092 51,024
Inventory 57,650 60,817 56,411 45,836 46,512
Debtors 55,407 63,915 62,166 44,477 45,133
Other Current Assets 1,654 2,157 1,587 1,590 1,593
Total Assets 573,412 589,787 634,733 661,319 684,362
ST Debt
19,586 21,752 18,797 18,767 18,737
Creditor 46,056 48,992 55,887 46,550 47,237
Other Current Liab 50,366 37,056 56,822 57,225 57,669
LT Debt 155,580 164,118 175,485 190,423 191,381
Other LT Liabilities 0.0 0.0 0.0 0.0 0.0
Shareholder’s Equity 261,098 277,097 280,215 300,825 321,810
Minority Interests 40,727 40,773 47,528 47,528 47,528
Total Cap. & Liab. 573,412 589,787 634,733 661,319 684,362
Non-Cash Wkg. Capital 18,290 40,841 7,456 (11,873) (11,668)
Net Cash/(Debt) (118,258) (135,489) (150,060) (152,098) (159,094)
Debtors Turn (avg days) 42.0 45.5 52.5 50.2 41.5
Creditors Turn (avg days) 51.5 48.4 57.7 62.9 55.9
Inventory Turn (avg days) 62.1 60.4 64.5 62.8 55.0
Asset Turnover (x) 0.8 0.8 0.7 0.6 0.6
Current Ratio (x) 1.5 1.6 1.3 1.2 1.2
Quick Ratio (x) 1.0 1.1 0.8 0.8 0.8
Net Debt/Equity (X) 0.4 0.4 0.5 0.4 0.4
Net Debt/Equity ex MI (X) 0.5 0.5 0.5 0.5 0.5
Capex to Debt (%) 13.9 24.1 31.5 28.7 28.6
Z-Score (X) 2.9 2.9 2.4 2.3 2.3
Source: Company, DBSVTH

Page 6
Company Update
Siam Cement
Cash Flow Statement (Btm)
FY Dec 2017A 2018A 2019A 2020F 2021F
Pre-Tax Profit 67,760 52,647 33,197 34,350 34,975
Dep. & Amort. 23,282 23,747 23,932 21,690 22,028
Tax Paid (5,753) (6,552) (6,121) (4,799) (4,887)
Assoc. & JV Inc/(loss) 0.0 0.0 0.0 0.0 0.0
Chg in Wkg.Cap. (13,344) (3,982) 4,500 18,945 (627)
Other Operating CF (11,253) (4,175) 4,310 0.0 0.0
Net Operating CF 60,692 61,687 59,817 70,185 51,489 Capital Exp.(net) (24,298) (44,764) (61,176) (60,000) (60,000)
Other Invts.(net) 19,176 13,188 16,122 16,122 16,122
Invts in Assoc. & JV 0.0 0.0 0.0 0.0 0.0
Div from Assoc & JV 0.0 0.0 0.0 0.0 0.0
Other Investing CF 0.0 0.0 0.0 0.0 0.0
Net Investing CF (5,122) (31,576) (45,054) (43,878) (43,878) Div Paid (34,385) (30,225) (20,772) (13,740) (13,990)
Chg in Gross Debt (4,316) (14,760) 12,623 1.00 2.00
Capital Issues 0.0 0.0 233 0.0 0.0
Other Financing CF 0.0 0.0 (7,366) (30.1) (30.0)
Net Financing CF (38,700) (44,985) (15,282) (13,769) (14,018) Currency Adjustments (642) (273) (641) 0.0 0.0
Chg in Cash 16,227 (15,148) (1,162) 12,538 (6,407)
Opg CFPS (Bt) 61.7 54.7 46.1 42.7 43.4
Free CFPS (Bt) 30.3 14.1 (1.1) 8.49 (7.1)
Source: Company, DBSVTH
Target Price & Ratings History
Source: DBSVTH
Analyst: Duladeth BIK, CFA, FRM, CAIA
THAI-CAC (as of Jun 2019) Certified
Corporate Governance CG Rating (as of Oct 2019)
THAI-CAC is Companies participating in Thailand's Private Sector
Collective Action Coalition Against Corruption programme (Thai CAC)
under Thai Institute of Directors (as of May 2018) are categorised into:
Score Description
Declared Companies that have declared their intention to join CAC
Certified Companies certified by CAC.
Corporate Governance CG Rating is based on Thai Institute of
Directors (IOD)’s annual assessment of corporate governance practices
of listed companies. The assessment covers 235 criteria in five
categories including board responsibilities (35% weighting), disclosure
and transparency (20%), role of stakeholders (20%), equitable
treatment of shareholders (10%) and rights of shareholders (15%).
The IOD then assigns numbers of logos to each company based on
their scoring as follows:
Score Range Number of Logo Description
90-100
Excellent
80-89
Very Good
70-79
Good
60-69
Satisfactory
50-59
Pass
<50 No logo given N/A
S.No.Date of
Report
Closing
Price
12-mth
Target
Price
Rat ing
1: 13 Jan 20 368.00 417.00 BUY
2: 30 Jan 20 356.00 417.00 BUY
3: 10 Apr 20 324.00 417.00 BUY
4: 30 Apr 20 346.00 417.00 BUY
5: 10 Jul 20 383.00 417.00 BUY
6: 26 Nov 20 375.00 417.00 BUY
Note : Share price and Target price are adjusted for corporate actions.
1
2
3
4
5
6
253.00
273.00
293.00
313.00
333.00
353.00
373.00
393.00
413.00
Nov-19 Jan-20 Mar-20 May-20 Jul-20 Sep-20 Nov-20
Bt
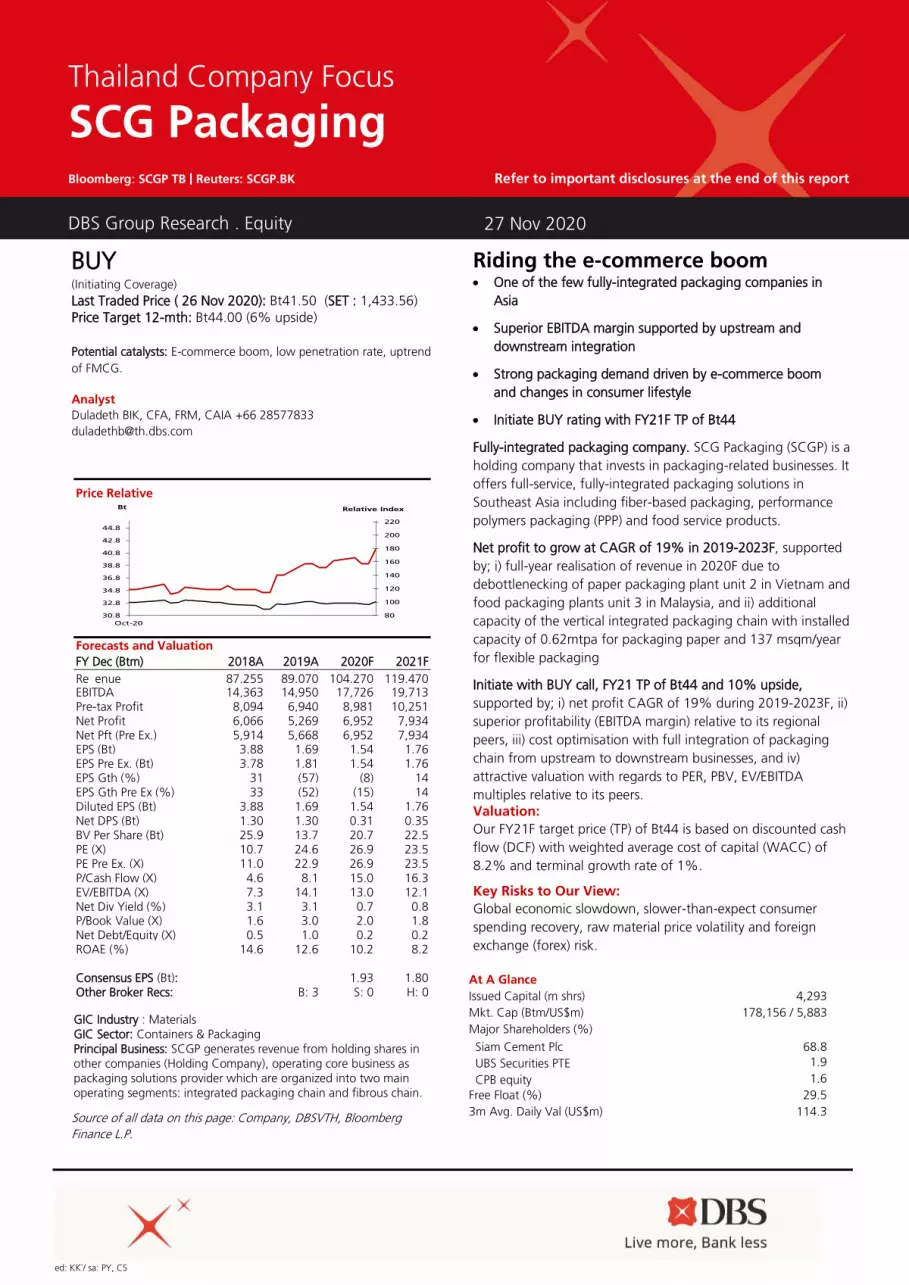
ed: KK`/ sa: PY, CS
BUY (Initiating Coverage)
Last Traded Price ( 26 Nov 2020): Bt41.50 (SET : 1,433.56)
Price Target 12-mth: Bt44.00 (6% upside)
Potential catalysts: E-commerce boom, low penetration rate, uptrend
of FMCG.
Analyst
Duladeth BIK, CFA, FRM, CAIA +66 28577833
Price Relative
Forecasts and Valuation
FY Dec (Btm) 2018A 2019A 2020F 2021F
Re enue 87,255 89,070 104,270 119,470 EBITDA 14,363 14,950 17,726 19,713 Pre-tax Profit 8,094 6,940 8,981 10,251 Net Profit 6,066 5,269 6,952 7,934 Net Pft (Pre Ex.) 5,914 5,668 6,952 7,934 EPS (Bt) 3.88 1.69 1.54 1.76 EPS Pre Ex. (Bt) 3.78 1.81 1.54 1.76 EPS Gth (%) 31 (57) (8) 14 EPS Gth Pre Ex (%) 33 (52) (15) 14 Diluted EPS (Bt) 3.88 1.69 1.54 1.76 Net DPS (Bt) 1.30 1.30 0.31 0.35 BV Per Share (Bt) 25.9 13.7 20.7 22.5 PE (X) 10.7 24.6 26.9 23.5 PE Pre Ex. (X) 11.0 22.9 26.9 23.5 P/Cash Flow (X) 4.6 8.1 15.0 16.3 EV/EBITDA (X) 7.3 14.1 13.0 12.1 Net Div Yield (%) 3.1 3.1 0.7 0.8 P/Book Value (X) 1.6 3.0 2.0 1.8 Net Debt/Equity (X) 0.5 1.0 0.2 0.2 ROAE (%) 14.6 12.6 10.2 8.2 Consensus EPS (Bt): 1.93 1.80 Other Broker Recs: B: 3 S: 0 H: 0 GIC Industry : Materials GIC Sector: Containers & Packaging Principal Business: SCGP generates revenue from holding shares in other companies (Holding Company), operating core business as packaging solutions provider which are organized into two main operating segments: integrated packaging chain and fibrous chain.
Source of all data on this page: Company, DBSVTH, Bloomberg
Finance L.P.
At A Glance Issued Capital (m shrs) 4,293
Mkt. Cap (Btm/US$m) 178,156 / 5,883
Major Shareholders (%)
Siam Cement Plc 68.8
UBS Securities PTE 1.9
CPB equity 1.6
Free Float (%) 29.5
3m Avg. Daily Val (US$m) 114.3
DBS Group Research . Equity
27 Nov 2020
Thailand Company Focus
SCG Packaging Bloomberg: SCGP TB | Reuters: SCGP.BK Refer to important disclosures at the end of this report
Riding the e-commerce boom • One of the few fully-integrated packaging companies in
Asia
• Superior EBITDA margin supported by upstream and
downstream integration
• Strong packaging demand driven by e-commerce boom
and changes in consumer lifestyle
• Initiate BUY rating with FY21F TP of Bt44
Fully-integrated packaging company. SCG Packaging (SCGP) is a
holding company that invests in packaging-related businesses. It
offers full-service, fully-integrated packaging solutions in
Southeast Asia including fiber-based packaging, performance
polymers packaging (PPP) and food service products.
Net profit to grow at CAGR of 19% in 2019-2023F, supported
by; i) full-year realisation of revenue in 2020F due to
debottlenecking of paper packaging plant unit 2 in Vietnam and
food packaging plants unit 3 in Malaysia, and ii) additional
capacity of the vertical integrated packaging chain with installed
capacity of 0.62mtpa for packaging paper and 137 msqm/year
for flexible packaging
Initiate with BUY call, FY21 TP of Bt44 and 10% upside,
supported by; i) net profit CAGR of 19% during 2019-2023F, ii)
superior profitability (EBITDA margin) relative to its regional
peers, iii) cost optimisation with full integration of packaging
chain from upstream to downstream businesses, and iv)
attractive valuation with regards to PER, PBV, EV/EBITDA
multiples relative to its peers.
Valuation:
Our FY21F target price (TP) of Bt44 is based on discounted cash
flow (DCF) with weighted average cost of capital (WACC) of
8.2% and terminal growth rate of 1%.
Key Risks to Our View:
Global economic slowdown, slower-than-expect consumer
spending recovery, raw material price volatility and foreign
exchange (forex) risk.
80
100
120
140
160
180
200
220
30.8
32.8
34.8
36.8
38.8
40.8
42.8
44.8
Oct-20
Relative IndexBt
SCG Packaging (LHS) Relative SET (RHS)
Page 2
Company Focus
SCG Packaging
Table of Contents
Investment Summary 3
Valuation & Peer Comparison 5
Company Background 7
Business Overview 9
Industry Overview 12
SWOT Analysis 16
Critical Factors 17
Key Risks 19
Financials 21
Assumption and Financial Tables 23
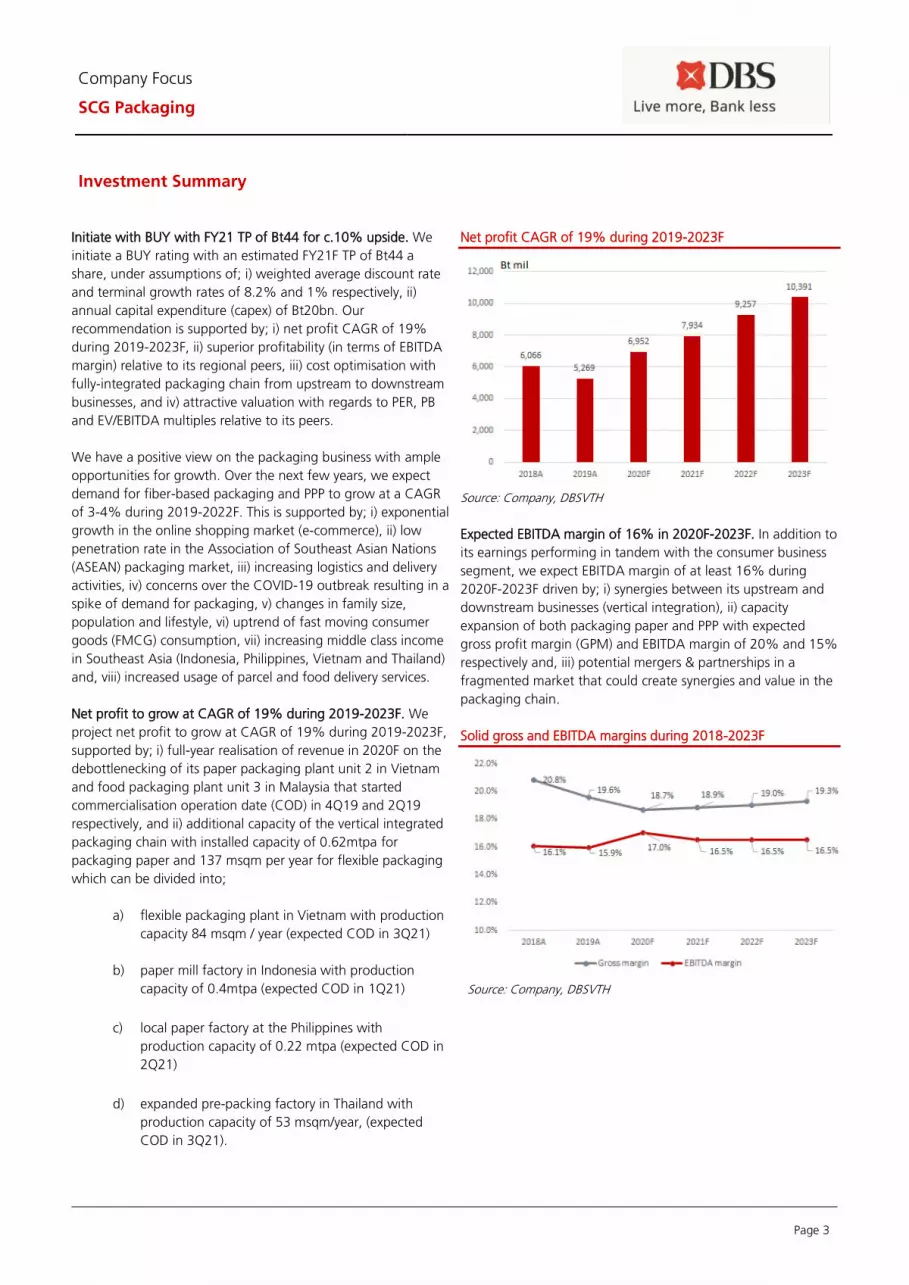
Page 3
Company Focus
SCG Packaging
Investment Summary
Initiate with BUY with FY21 TP of Bt44 for c.10% upside. We
initiate a BUY rating with an estimated FY21F TP of Bt44 a
share, under assumptions of; i) weighted average discount rate
and terminal growth rates of 8.2% and 1% respectively, ii)
annual capital expenditure (capex) of Bt20bn. Our
recommendation is supported by; i) net profit CAGR of 19%
during 2019-2023F, ii) superior profitability (in terms of EBITDA
margin) relative to its regional peers, iii) cost optimisation with
fully-integrated packaging chain from upstream to downstream
businesses, and iv) attractive valuation with regards to PER, PB
and EV/EBITDA multiples relative to its peers.
We have a positive view on the packaging business with ample
opportunities for growth. Over the next few years, we expect
demand for fiber-based packaging and PPP to grow at a CAGR
of 3-4% during 2019-2022F. This is supported by; i) exponential
growth in the online shopping market (e-commerce), ii) low
penetration rate in the Association of Southeast Asian Nations
(ASEAN) packaging market, iii) increasing logistics and delivery
activities, iv) concerns over the COVID-19 outbreak resulting in a
spike of demand for packaging, v) changes in family size,
population and lifestyle, vi) uptrend of fast moving consumer
goods (FMCG) consumption, vii) increasing middle class income
in Southeast Asia (Indonesia, Philippines, Vietnam and Thailand)
and, viii) increased usage of parcel and food delivery services.
Net profit to grow at CAGR of 19% during 2019-2023F. We
project net profit to grow at CAGR of 19% during 2019-2023F,
supported by; i) full-year realisation of revenue in 2020F on the
debottlenecking of its paper packaging plant unit 2 in Vietnam
and food packaging plant unit 3 in Malaysia that started
commercialisation operation date (COD) in 4Q19 and 2Q19
respectively, and ii) additional capacity of the vertical integrated
packaging chain with installed capacity of 0.62mtpa for
packaging paper and 137 msqm per year for flexible packaging
which can be divided into;
a) flexible packaging plant in Vietnam with production
capacity 84 msqm / year (expected COD in 3Q21)
b) paper mill factory in Indonesia with production
capacity of 0.4mtpa (expected COD in 1Q21)
c) local paper factory at the Philippines with
production capacity of 0.22 mtpa (expected COD in
2Q21)
d) expanded pre-packing factory in Thailand with
production capacity of 53 msqm/year, (expected
COD in 3Q21).
Net profit CAGR of 19% during 2019-2023F
Source: Company, DBSVTH
Expected EBITDA margin of 16% in 2020F-2023F. In addition to
its earnings performing in tandem with the consumer business
segment, we expect EBITDA margin of at least 16% during
2020F-2023F driven by; i) synergies between its upstream and
downstream businesses (vertical integration), ii) capacity
expansion of both packaging paper and PPP with expected
gross profit margin (GPM) and EBITDA margin of 20% and 15%
respectively and, iii) potential mergers & partnerships in a
fragmented market that could create synergies and value in the
packaging chain.
Solid gross and EBITDA margins during 2018-2023F
Source: Company, DBSVTH
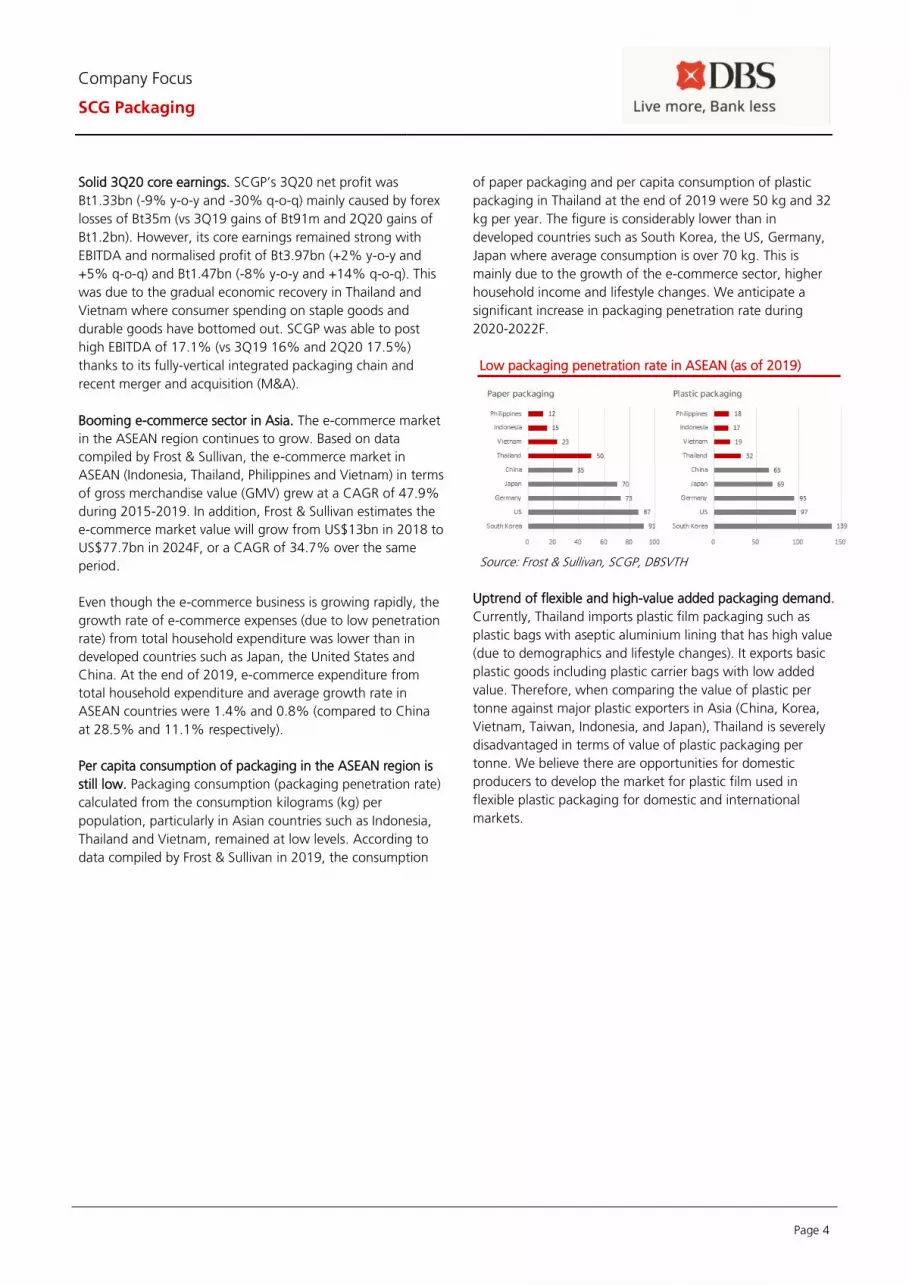
Page 4
Company Focus
SCG Packaging
Solid 3Q20 core earnings. SCGP’s 3Q20 net profit was
Bt1.33bn (-9% y-o-y and -30% q-o-q) mainly caused by forex
losses of Bt35m (vs 3Q19 gains of Bt91m and 2Q20 gains of
Bt1.2bn). However, its core earnings remained strong with
EBITDA and normalised profit of Bt3.97bn (+2% y-o-y and
+5% q-o-q) and Bt1.47bn (-8% y-o-y and +14% q-o-q). This
was due to the gradual economic recovery in Thailand and
Vietnam where consumer spending on staple goods and
durable goods have bottomed out. SCGP was able to post
high EBITDA of 17.1% (vs 3Q19 16% and 2Q20 17.5%)
thanks to its fully-vertical integrated packaging chain and
recent merger and acquisition (M&A).
Booming e-commerce sector in Asia. The e-commerce market
in the ASEAN region continues to grow. Based on data
compiled by Frost & Sullivan, the e-commerce market in
ASEAN (Indonesia, Thailand, Philippines and Vietnam) in terms
of gross merchandise value (GMV) grew at a CAGR of 47.9%
during 2015-2019. In addition, Frost & Sullivan estimates the
e-commerce market value will grow from US$13bn in 2018 to
US$77.7bn in 2024F, or a CAGR of 34.7% over the same
period.
Even though the e-commerce business is growing rapidly, the
growth rate of e-commerce expenses (due to low penetration
rate) from total household expenditure was lower than in
developed countries such as Japan, the United States and
China. At the end of 2019, e-commerce expenditure from
total household expenditure and average growth rate in
ASEAN countries were 1.4% and 0.8% (compared to China
at 28.5% and 11.1% respectively).
Per capita consumption of packaging in the ASEAN region is
still low. Packaging consumption (packaging penetration rate)
calculated from the consumption kilograms (kg) per
population, particularly in Asian countries such as Indonesia,
Thailand and Vietnam, remained at low levels. According to
data compiled by Frost & Sullivan in 2019, the consumption
of paper packaging and per capita consumption of plastic
packaging in Thailand at the end of 2019 were 50 kg and 32
kg per year. The figure is considerably lower than in
developed countries such as South Korea, the US, Germany,
Japan where average consumption is over 70 kg. This is
mainly due to the growth of the e-commerce sector, higher
household income and lifestyle changes. We anticipate a
significant increase in packaging penetration rate during
2020-2022F.
Low packaging penetration rate in ASEAN (as of 2019)
Source: Frost & Sullivan, SCGP, DBSVTH
Uptrend of flexible and high-value added packaging demand.
Currently, Thailand imports plastic film packaging such as
plastic bags with aseptic aluminium lining that has high value
(due to demographics and lifestyle changes). It exports basic
plastic goods including plastic carrier bags with low added
value. Therefore, when comparing the value of plastic per
tonne against major plastic exporters in Asia (China, Korea,
Vietnam, Taiwan, Indonesia, and Japan), Thailand is severely
disadvantaged in terms of value of plastic packaging per
tonne. We believe there are opportunities for domestic
producers to develop the market for plastic film used in
flexible plastic packaging for domestic and international
markets.
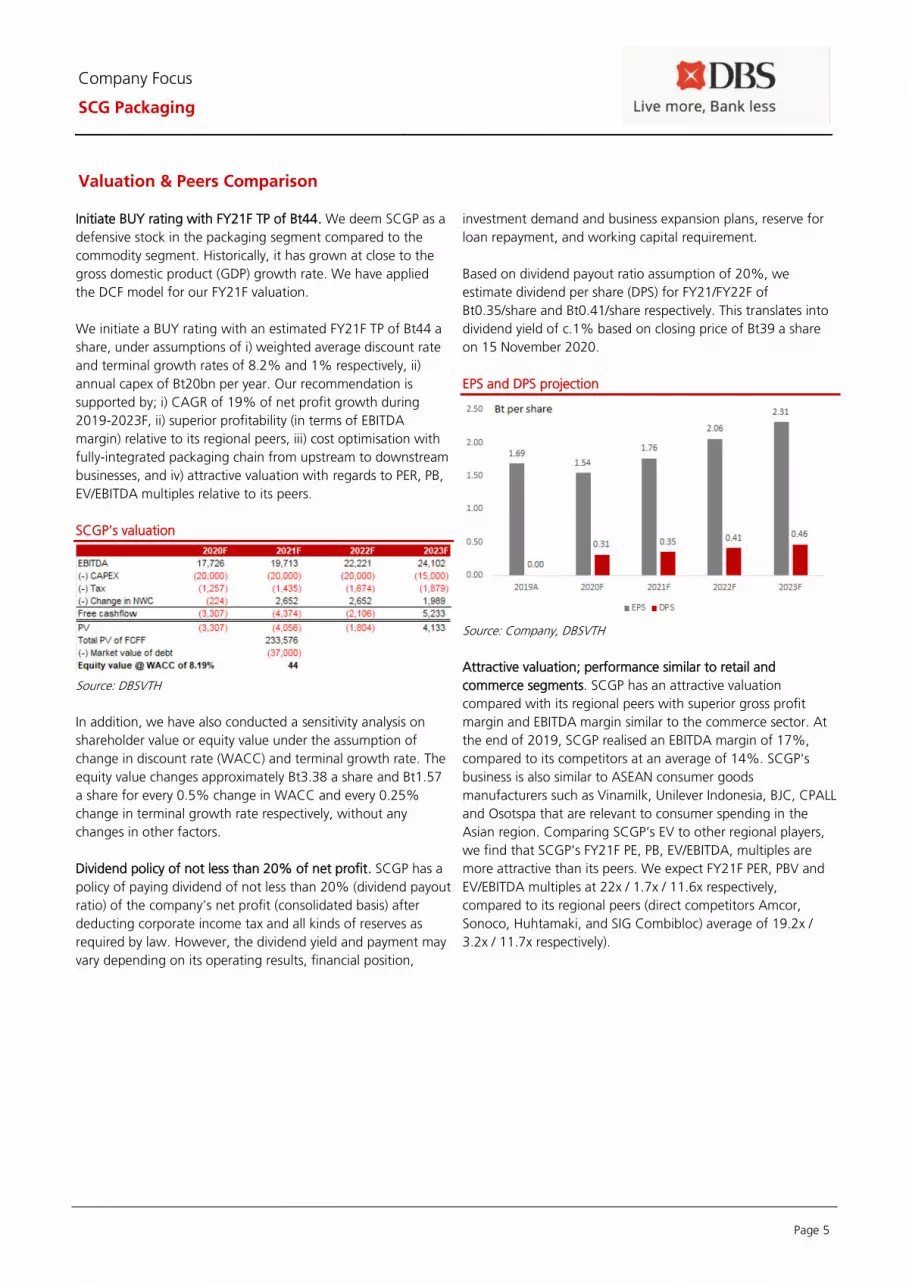
Page 5
Company Focus
SCG Packaging
Valuation & Peers Comparison Initiate BUY rating with FY21F TP of Bt44. We deem SCGP as a
defensive stock in the packaging segment compared to the
commodity segment. Historically, it has grown at close to the
gross domestic product (GDP) growth rate. We have applied
the DCF model for our FY21F valuation.
We initiate a BUY rating with an estimated FY21F TP of Bt44 a
share, under assumptions of i) weighted average discount rate
and terminal growth rates of 8.2% and 1% respectively, ii)
annual capex of Bt20bn per year. Our recommendation is
supported by; i) CAGR of 19% of net profit growth during
2019-2023F, ii) superior profitability (in terms of EBITDA
margin) relative to its regional peers, iii) cost optimisation with
fully-integrated packaging chain from upstream to downstream
businesses, and iv) attractive valuation with regards to PER, PB,
EV/EBITDA multiples relative to its peers.
SCGP’s valuation
Source: DBSVTH
In addition, we have also conducted a sensitivity analysis on
shareholder value or equity value under the assumption of
change in discount rate (WACC) and terminal growth rate. The
equity value changes approximately Bt3.38 a share and Bt1.57
a share for every 0.5% change in WACC and every 0.25%
change in terminal growth rate respectively, without any
changes in other factors.
Dividend policy of not less than 20% of net profit. SCGP has a
policy of paying dividend of not less than 20% (dividend payout
ratio) of the company’s net profit (consolidated basis) after
deducting corporate income tax and all kinds of reserves as
required by law. However, the dividend yield and payment may
vary depending on its operating results, financial position,
investment demand and business expansion plans, reserve for
loan repayment, and working capital requirement.
Based on dividend payout ratio assumption of 20%, we
estimate dividend per share (DPS) for FY21/FY22F of
Bt0.35/share and Bt0.41/share respectively. This translates into
dividend yield of c.1% based on closing price of Bt39 a share
on 15 November 2020.
EPS and DPS projection
Source: Company, DBSVTH
Attractive valuation; performance similar to retail and
commerce segments. SCGP has an attractive valuation
compared with its regional peers with superior gross profit
margin and EBITDA margin similar to the commerce sector. At
the end of 2019, SCGP realised an EBITDA margin of 17%,
compared to its competitors at an average of 14%. SCGP's
business is also similar to ASEAN consumer goods
manufacturers such as Vinamilk, Unilever Indonesia, BJC, CPALL
and Osotspa that are relevant to consumer spending in the
Asian region. Comparing SCGP’s EV to other regional players,
we find that SCGP's FY21F PE, PB, EV/EBITDA, multiples are
more attractive than its peers. We expect FY21F PER, PBV and
EV/EBITDA multiples at 22x / 1.7x / 11.6x respectively,
compared to its regional peers (direct competitors Amcor,
Sonoco, Huhtamaki, and SIG Combibloc) average of 19.2x /
3.2x / 11.7x respectively).
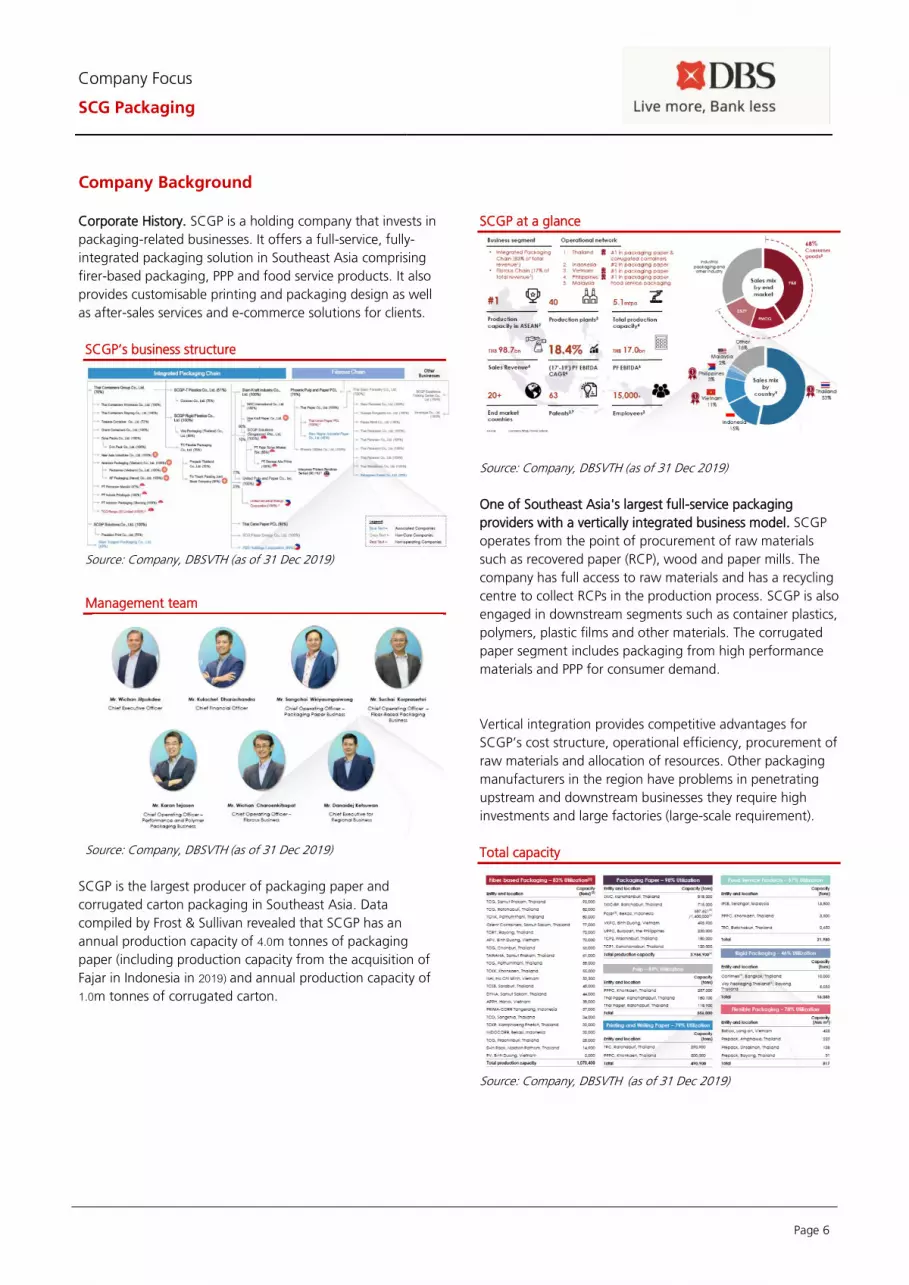
Page 6
Company Focus
SCG Packaging
Company Background Corporate History. SCGP is a holding company that invests in
packaging-related businesses. It offers a full-service, fully-
integrated packaging solution in Southeast Asia comprising
firer-based packaging, PPP and food service products. It also
provides customisable printing and packaging design as well
as after-sales services and e-commerce solutions for clients.
SCGP’s business structure
Source: Company, DBSVTH (as of 31 Dec 2019)
Management team
Source: Company, DBSVTH (as of 31 Dec 2019)
SCGP is the largest producer of packaging paper and
corrugated carton packaging in Southeast Asia. Data
compiled by Frost & Sullivan revealed that SCGP has an
annual production capacity of 4.0m tonnes of packaging
paper (including production capacity from the acquisition of
Fajar in Indonesia in 2019) and annual production capacity of
1.0m tonnes of corrugated carton.
SCGP at a glance
Source: Company, DBSVTH (as of 31 Dec 2019)
One of Southeast Asia's largest full-service packaging
providers with a vertically integrated business model. SCGP
operates from the point of procurement of raw materials
such as recovered paper (RCP), wood and paper mills. The
company has full access to raw materials and has a recycling
centre to collect RCPs in the production process. SCGP is also
engaged in downstream segments such as container plastics,
polymers, plastic films and other materials. The corrugated
paper segment includes packaging from high performance
materials and PPP for consumer demand.
Vertical integration provides competitive advantages for
SCGP’s cost structure, operational efficiency, procurement of
raw materials and allocation of resources. Other packaging
manufacturers in the region have problems in penetrating
upstream and downstream businesses they require high
investments and large factories (large-scale requirement).
Total capacity
Source: Company, DBSVTH (as of 31 Dec 2019)
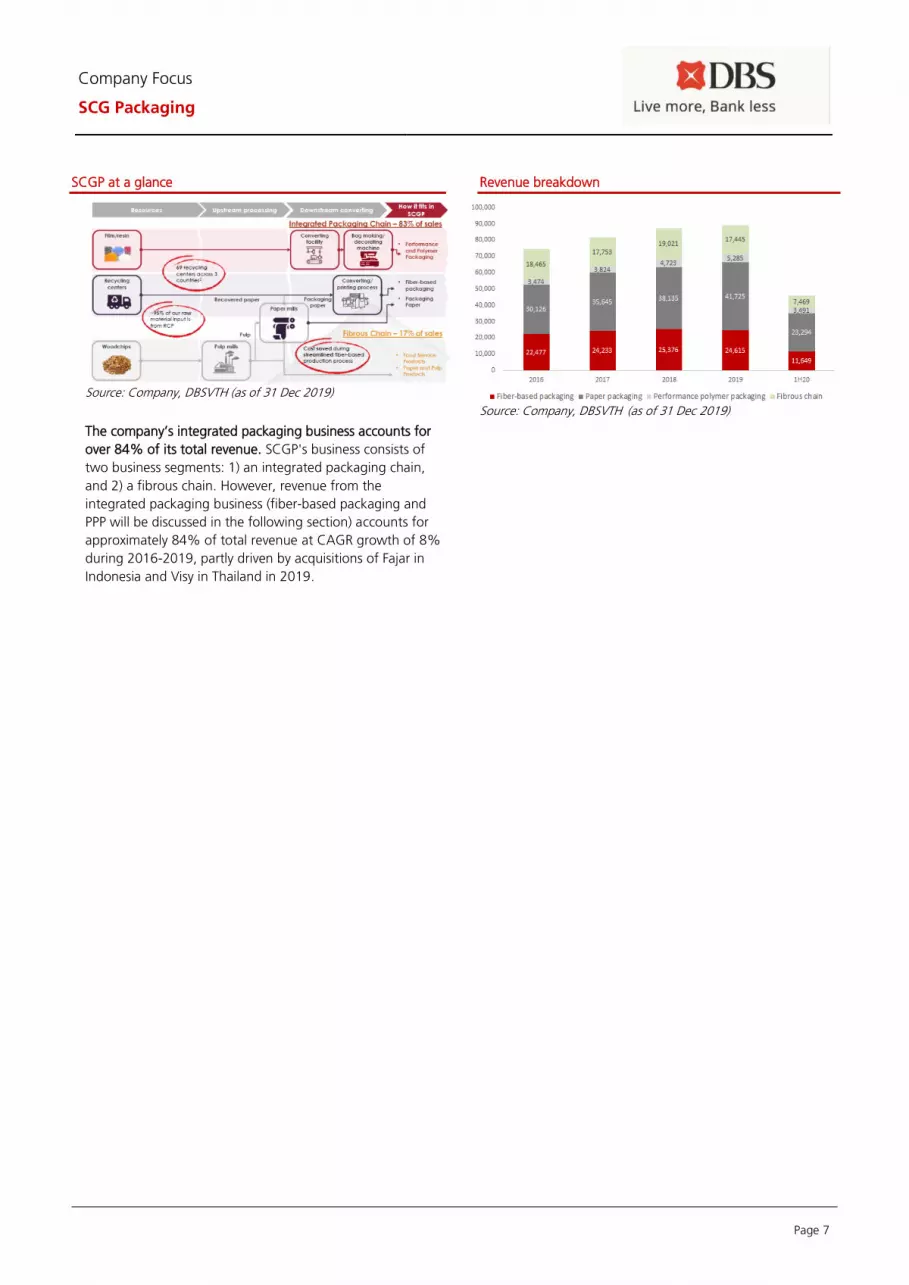
Page 7
Company Focus
SCG Packaging
SCGP at a glance
Source: Company, DBSVTH (as of 31 Dec 2019)
The company’s integrated packaging business accounts for
over 84% of its total revenue. SCGP's business consists of
two business segments: 1) an integrated packaging chain,
and 2) a fibrous chain. However, revenue from the
integrated packaging business (fiber-based packaging and
PPP will be discussed in the following section) accounts for
approximately 84% of total revenue at CAGR growth of 8%
during 2016-2019, partly driven by acquisitions of Fajar in
Indonesia and Visy in Thailand in 2019.
Revenue breakdown
Source: Company, DBSVTH (as of 31 Dec 2019)
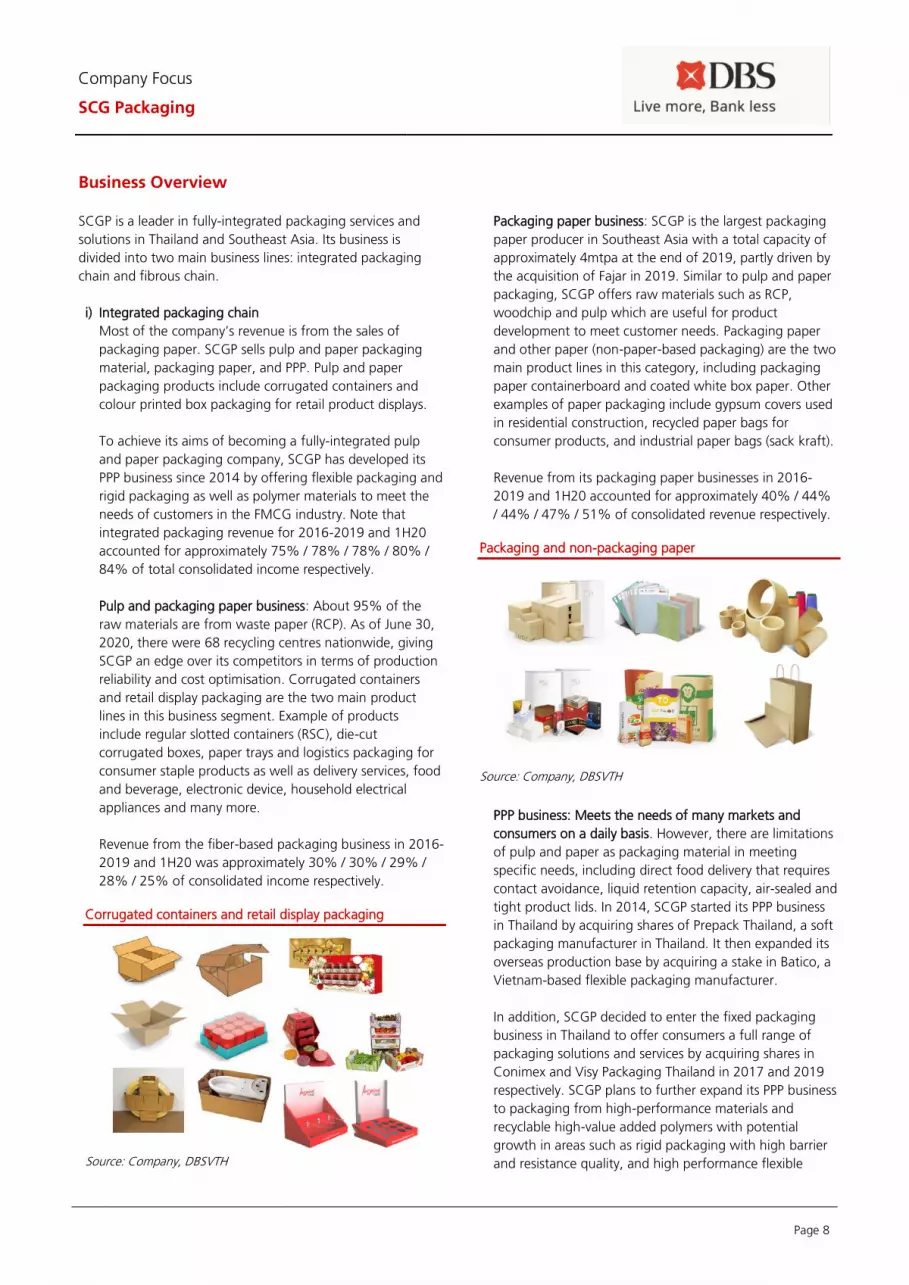
Page 8
Company Focus
SCG Packaging
Business Overview SCGP is a leader in fully-integrated packaging services and
solutions in Thailand and Southeast Asia. Its business is
divided into two main business lines: integrated packaging
chain and fibrous chain.
i) Integrated packaging chain
Most of the company’s revenue is from the sales of
packaging paper. SCGP sells pulp and paper packaging
material, packaging paper, and PPP. Pulp and paper
packaging products include corrugated containers and
colour printed box packaging for retail product displays.
To achieve its aims of becoming a fully-integrated pulp
and paper packaging company, SCGP has developed its
PPP business since 2014 by offering flexible packaging and
rigid packaging as well as polymer materials to meet the
needs of customers in the FMCG industry. Note that
integrated packaging revenue for 2016-2019 and 1H20
accounted for approximately 75% / 78% / 78% / 80% /
84% of total consolidated income respectively.
Pulp and packaging paper business: About 95% of the
raw materials are from waste paper (RCP). As of June 30,
2020, there were 68 recycling centres nationwide, giving
SCGP an edge over its competitors in terms of production
reliability and cost optimisation. Corrugated containers
and retail display packaging are the two main product
lines in this business segment. Example of products
include regular slotted containers (RSC), die-cut
corrugated boxes, paper trays and logistics packaging for
consumer staple products as well as delivery services, food
and beverage, electronic device, household electrical
appliances and many more.
Revenue from the fiber-based packaging business in 2016-
2019 and 1H20 was approximately 30% / 30% / 29% /
28% / 25% of consolidated income respectively.
Corrugated containers and retail display packaging
Source: Company, DBSVTH
Packaging paper business: SCGP is the largest packaging
paper producer in Southeast Asia with a total capacity of
approximately 4mtpa at the end of 2019, partly driven by
the acquisition of Fajar in 2019. Similar to pulp and paper
packaging, SCGP offers raw materials such as RCP,
woodchip and pulp which are useful for product
development to meet customer needs. Packaging paper
and other paper (non-paper-based packaging) are the two
main product lines in this category, including packaging
paper containerboard and coated white box paper. Other
examples of paper packaging include gypsum covers used
in residential construction, recycled paper bags for
consumer products, and industrial paper bags (sack kraft).
Revenue from its packaging paper businesses in 2016-
2019 and 1H20 accounted for approximately 40% / 44%
/ 44% / 47% / 51% of consolidated revenue respectively.
Packaging and non-packaging paper
Source: Company, DBSVTH
PPP business: Meets the needs of many markets and
consumers on a daily basis. However, there are limitations
of pulp and paper as packaging material in meeting
specific needs, including direct food delivery that requires
contact avoidance, liquid retention capacity, air-sealed and
tight product lids. In 2014, SCGP started its PPP business
in Thailand by acquiring shares of Prepack Thailand, a soft
packaging manufacturer in Thailand. It then expanded its
overseas production base by acquiring a stake in Batico, a
Vietnam-based flexible packaging manufacturer.
In addition, SCGP decided to enter the fixed packaging
business in Thailand to offer consumers a full range of
packaging solutions and services by acquiring shares in
Conimex and Visy Packaging Thailand in 2017 and 2019
respectively. SCGP plans to further expand its PPP business
to packaging from high-performance materials and
recyclable high-value added polymers with potential
growth in areas such as rigid packaging with high barrier
and resistance quality, and high performance flexible
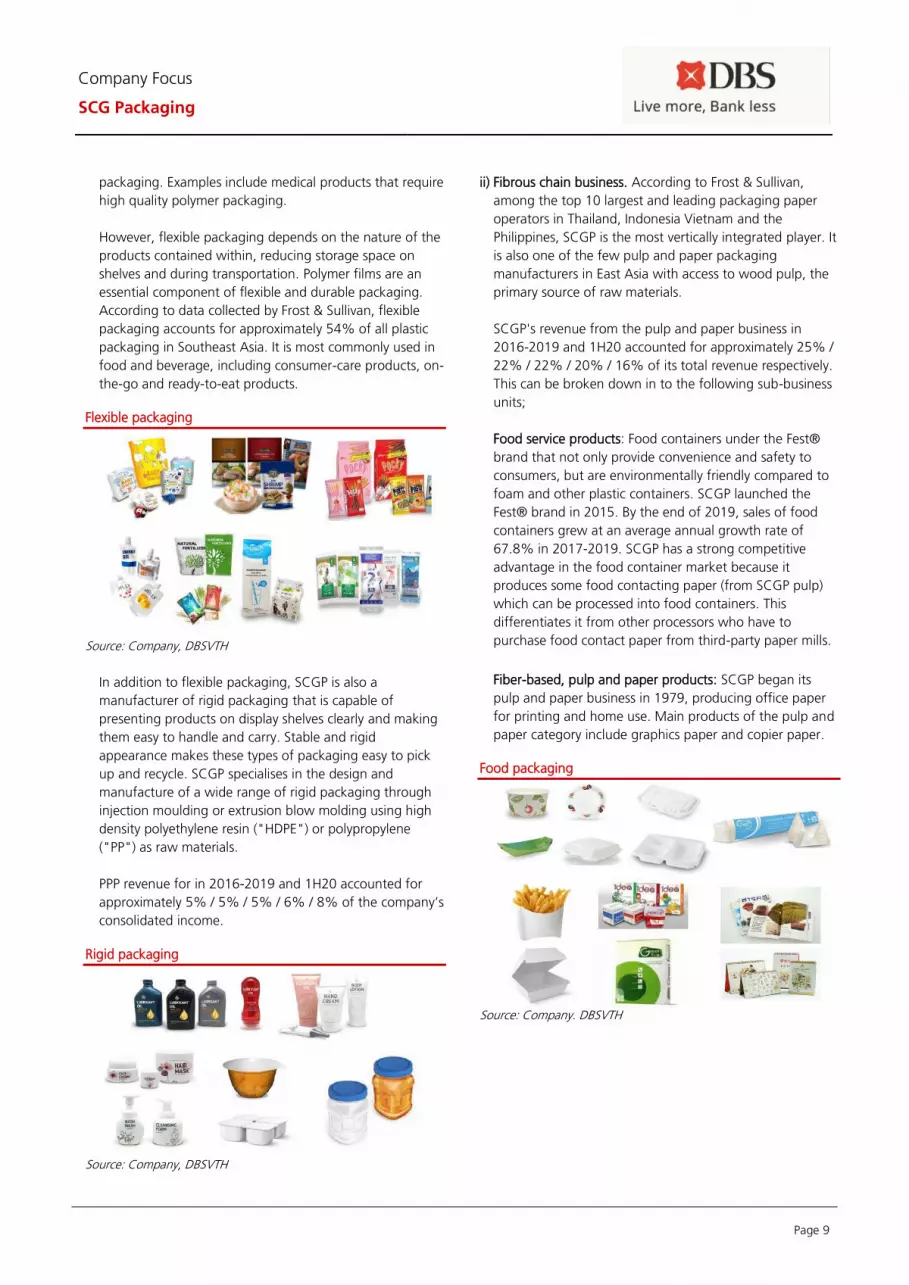
Page 9
Company Focus
SCG Packaging
packaging. Examples include medical products that require
high quality polymer packaging.
However, flexible packaging depends on the nature of the
products contained within, reducing storage space on
shelves and during transportation. Polymer films are an
essential component of flexible and durable packaging.
According to data collected by Frost & Sullivan, flexible
packaging accounts for approximately 54% of all plastic
packaging in Southeast Asia. It is most commonly used in
food and beverage, including consumer-care products, on-
the-go and ready-to-eat products.
Flexible packaging
Source: Company, DBSVTH
In addition to flexible packaging, SCGP is also a
manufacturer of rigid packaging that is capable of
presenting products on display shelves clearly and making
them easy to handle and carry. Stable and rigid
appearance makes these types of packaging easy to pick
up and recycle. SCGP specialises in the design and
manufacture of a wide range of rigid packaging through
injection moulding or extrusion blow molding using high
density polyethylene resin ("HDPE") or polypropylene
("PP") as raw materials.
PPP revenue for in 2016-2019 and 1H20 accounted for
approximately 5% / 5% / 5% / 6% / 8% of the company’s
consolidated income.
Rigid packaging
Source: Company, DBSVTH
ii) Fibrous chain business. According to Frost & Sullivan,
among the top 10 largest and leading packaging paper
operators in Thailand, Indonesia Vietnam and the
Philippines, SCGP is the most vertically integrated player. It
is also one of the few pulp and paper packaging
manufacturers in East Asia with access to wood pulp, the
primary source of raw materials.
SCGP's revenue from the pulp and paper business in
2016-2019 and 1H20 accounted for approximately 25% /
22% / 22% / 20% / 16% of its total revenue respectively.
This can be broken down in to the following sub-business
units;
Food service products: Food containers under the Fest®
brand that not only provide convenience and safety to
consumers, but are environmentally friendly compared to
foam and other plastic containers. SCGP launched the
Fest® brand in 2015. By the end of 2019, sales of food
containers grew at an average annual growth rate of
67.8% in 2017-2019. SCGP has a strong competitive
advantage in the food container market because it
produces some food contacting paper (from SCGP pulp)
which can be processed into food containers. This
differentiates it from other processors who have to
purchase food contact paper from third-party paper mills.
Fiber-based, pulp and paper products: SCGP began its
pulp and paper business in 1979, producing office paper
for printing and home use. Main products of the pulp and
paper category include graphics paper and copier paper.
Food packaging
Source: Company. DBSVTH
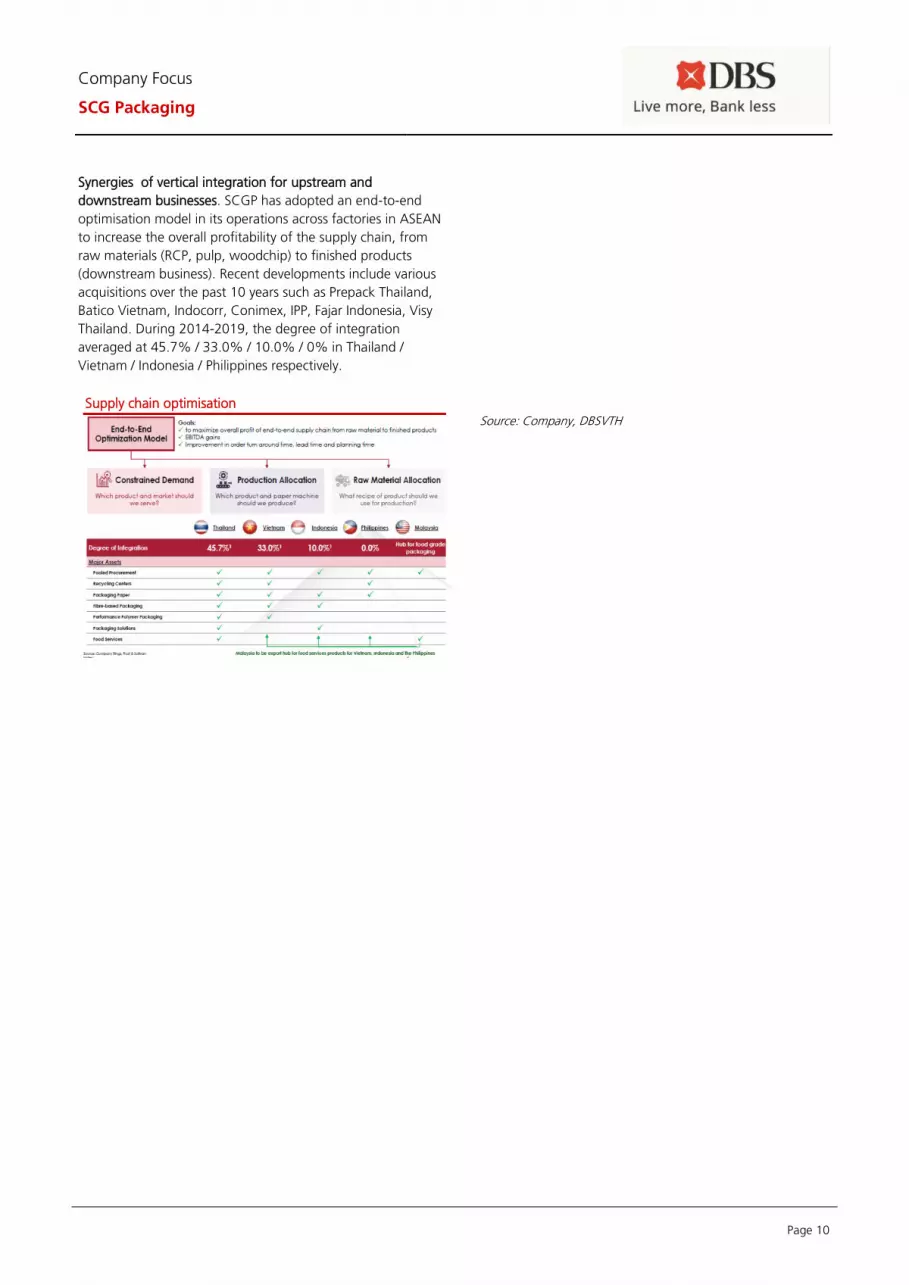
Page 10
Company Focus
SCG Packaging
Synergies of vertical integration for upstream and
downstream businesses. SCGP has adopted an end-to-end
optimisation model in its operations across factories in ASEAN
to increase the overall profitability of the supply chain, from
raw materials (RCP, pulp, woodchip) to finished products
(downstream business). Recent developments include various
acquisitions over the past 10 years such as Prepack Thailand,
Batico Vietnam, Indocorr, Conimex, IPP, Fajar Indonesia, Visy
Thailand. During 2014-2019, the degree of integration
averaged at 45.7% / 33.0% / 10.0% / 0% in Thailand /
Vietnam / Indonesia / Philippines respectively.
Supply chain optimisation
Source: Company, DBSVTH

Page 11
Company Focus
SCG Packaging
Industry Overview Our daily activities involve the use of packaging in important
household items (tubes, toothpaste, soap, shampoo,
disinfectant and others), food packaging, knives, cutlery
(cups, straws, food and beverage containers, etc.), food, shelf
storage and product containers (cartons, parcels, shockproof
paper, etc). In general, packaging can be divided into the
following 3 types:
i) Primary packaging has direct contact with products.
Functional packing is for product storage and prevention
from damage, and extending shelf life. This may reduce
waste and greenhouse gas emissions (carbon footprint).
PPP products are considered primary packaging, consisting
of flexible packaging, rigid packaging and food packaging
with barriers. Examples of high-barrier rigid food
packaging are coffee bags, shampoo bottles or yogurt
cups.
ii) Secondary packaging combines primary packaging with
convenience for efficient transportation and distribution. It
also adds value to the product with attractive print quality
and packaging design. It is also a crucial marketing tool
for branding and promotions. An example of secondary
packaging is folding cartons such as cookie boxes,
cosmetic boxes and shoe boxes.
iii) Tertiary packaging is mainly corrugated box packaging
that is strong to support the weight of products and
protect them from damaged during storage and handling.
In addition to corrugated box packaging, tertiary
packaging also includes paper pallets and corner guards.
Packaging value chain
Source: SCC, DBSVTH
Packaging has different features and functions depending on
the nature of the products and customer requirements.
Functions of packaging can be divided into the following
categories;
i) Containment - prevents leaks (gas, air, liquids) and avoids
loss of components through bulk handling processes.
ii) Prevention - prevents physical damage over the life of the
product and protects from deformation, drops, shaking
and vibration. Maintains temperature and humidity of the
products.
iii) Storage - extends shelf life, prevents biological changes,
temperature, humidity, acidity and oxygen within the
ingredients of the package.
iv) Convenience - increases convenience of management.
Sizing and improving filling and packaging efficiency.
v) Product information - provides nutritional information,
weight, quantity, order and barcode.
vi) Branding and marketing - acting as a “silent salesman”
through colourful displays, graphics and exhibitions.
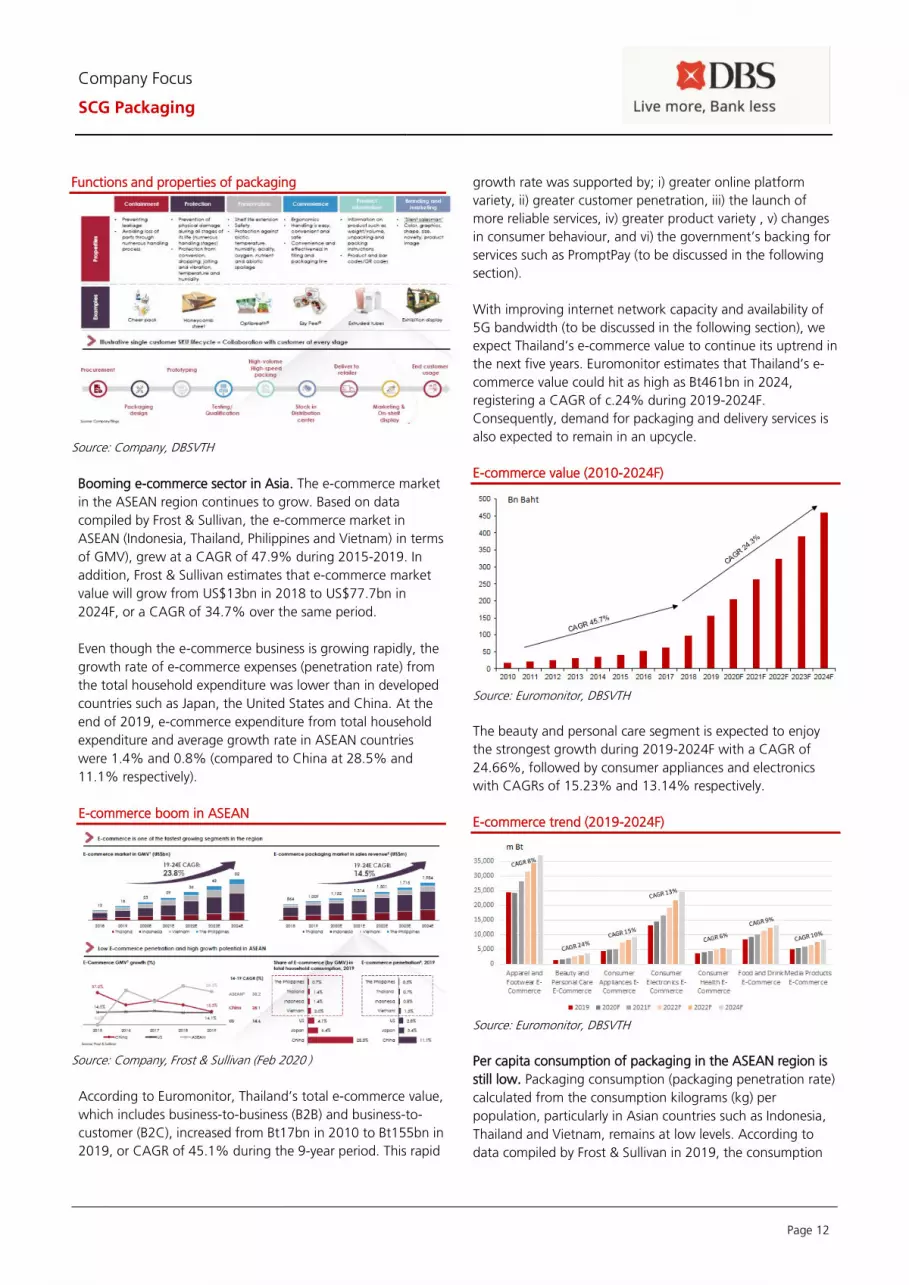
Page 12
Company Focus
SCG Packaging
Functions and properties of packaging
Source: Company, DBSVTH
Booming e-commerce sector in Asia. The e-commerce market
in the ASEAN region continues to grow. Based on data
compiled by Frost & Sullivan, the e-commerce market in
ASEAN (Indonesia, Thailand, Philippines and Vietnam) in terms
of GMV), grew at a CAGR of 47.9% during 2015-2019. In
addition, Frost & Sullivan estimates that e-commerce market
value will grow from US$13bn in 2018 to US$77.7bn in
2024F, or a CAGR of 34.7% over the same period.
Even though the e-commerce business is growing rapidly, the
growth rate of e-commerce expenses (penetration rate) from
the total household expenditure was lower than in developed
countries such as Japan, the United States and China. At the
end of 2019, e-commerce expenditure from total household
expenditure and average growth rate in ASEAN countries
were 1.4% and 0.8% (compared to China at 28.5% and
11.1% respectively).
E-commerce boom in ASEAN
Source: Company, Frost & Sullivan (Feb 2020 )
According to Euromonitor, Thailand’s total e-commerce value,
which includes business-to-business (B2B) and business-to-
customer (B2C), increased from Bt17bn in 2010 to Bt155bn in
2019, or CAGR of 45.1% during the 9-year period. This rapid
growth rate was supported by; i) greater online platform
variety, ii) greater customer penetration, iii) the launch of
more reliable services, iv) greater product variety , v) changes
in consumer behaviour, and vi) the government’s backing for
services such as PromptPay (to be discussed in the following
section).
With improving internet network capacity and availability of
5G bandwidth (to be discussed in the following section), we
expect Thailand’s e-commerce value to continue its uptrend in
the next five years. Euromonitor estimates that Thailand’s e-
commerce value could hit as high as Bt461bn in 2024,
registering a CAGR of c.24% during 2019-2024F.
Consequently, demand for packaging and delivery services is
also expected to remain in an upcycle.
E-commerce value (2010-2024F)
Source: Euromonitor, DBSVTH
The beauty and personal care segment is expected to enjoy
the strongest growth during 2019-2024F with a CAGR of
24.66%, followed by consumer appliances and electronics
with CAGRs of 15.23% and 13.14% respectively.
E-commerce trend (2019-2024F)
Source: Euromonitor, DBSVTH
Per capita consumption of packaging in the ASEAN region is
still low. Packaging consumption (packaging penetration rate)
calculated from the consumption kilograms (kg) per
population, particularly in Asian countries such as Indonesia,
Thailand and Vietnam, remains at low levels. According to
data compiled by Frost & Sullivan in 2019, the consumption

Page 13
Company Focus
SCG Packaging
of paper packaging and per capita consumption of plastic
packaging in Thailand at the end of 2019 were 50 kg and 32
kg per year. The figure is considerably lower than in
developed countries such as South Korea, the US, Germany,
Japan where average consumption is over 70 kg. This is
mainly due to the growth of the e-commerce sector, higher
household income and lifestyle changes. We anticipate a
significant increase in packaging penetration rate during
2020-2022F.
Low packaging penetration rate (as of 2019)
Source: Frost & Sullivan, SCGP, DBSVTH
Uptrend of flexible and high-value added packaging demand.
Currently, Thailand imports plastic film packaging such as
plastic bags with aseptic aluminium lining that has high value
(due to demographics and lifestyle changes). It exports basic
plastic goods including plastic carrier bags with low added
value. Therefore, when comparing the value of plastic per
tonne against major plastic exporters in Asia (China, Korea,
Vietnam, Taiwan, Indonesia, and Japan), Thailand is severely
disadvantaged in terms of value of plastic packaging per
tonne. We believe there are opportunities for domestic
producers to develop the market for plastic film used in
flexible plastic packaging for domestic and international
markets.
Based on data collected by the Packaging Intelligence Unit,
imported and exported plastic packaging materials had
CAGRs of 7% and 4% during 2013-2019. This confirms our
view that demand for flexible, reusable and microwavable
packaging to preserve freshness and temperature of products
is on an uptrend.
Imports/exports of plastic packaging materials (2013-2019)
Source: Packaging Industrial Intelligence Unit, DBSVTH
CAGR of c.2% for domestic packaging production during
2015-2019, driven by paper and glass-based materials. The
overall packaging business (plastic, paper, glass and metal-
based materials) enjoyed a CAGR of 2% during 2015-2019,
with glass-based materials (glass bottles) delivering the
highest CAGR of 17%, followed by paper-based materials
(primary and secondary corrugated and protective boxes) with
a CAGR of 2%. This strong growth was supported by the
increasing numbers of tourists, higher domestic consumption,
and increase in exports to Cambodia, Laos, Myanmar, and
Vietnam (CLMV). Growth of paper-based packaging was
driven by the rapid expansion of e-commerce, online
shopping and delivery services (for both food and parcels).
On the other hand, plastic-based materials such as polymers
experienced a decelerating growth rate, mainly due to rising
awareness of environmental issues. Demand for plastic bags
and cutlery also fell in line with the “no single-use plastic“
campaigns introduced by the government and many retail
establishments such as shopping malls and convenient stores.
Packaging production (2015-2019)
Source: Packaging Industrial Intelligence Unit, DBSVTH
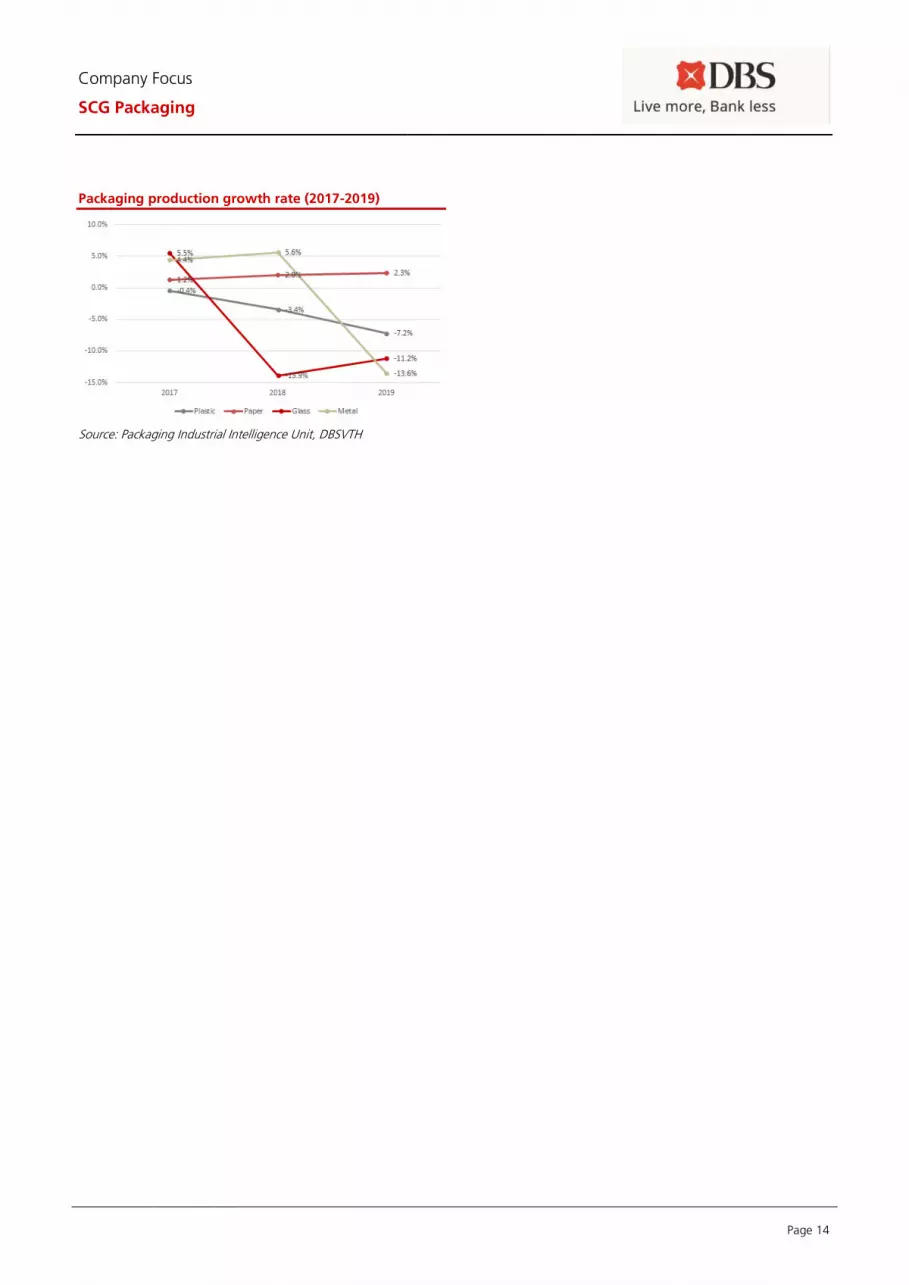
Page 14
Company Focus
SCG Packaging
Packaging production growth rate (2017-2019)
Source: Packaging Industrial Intelligence Unit, DBSVTH
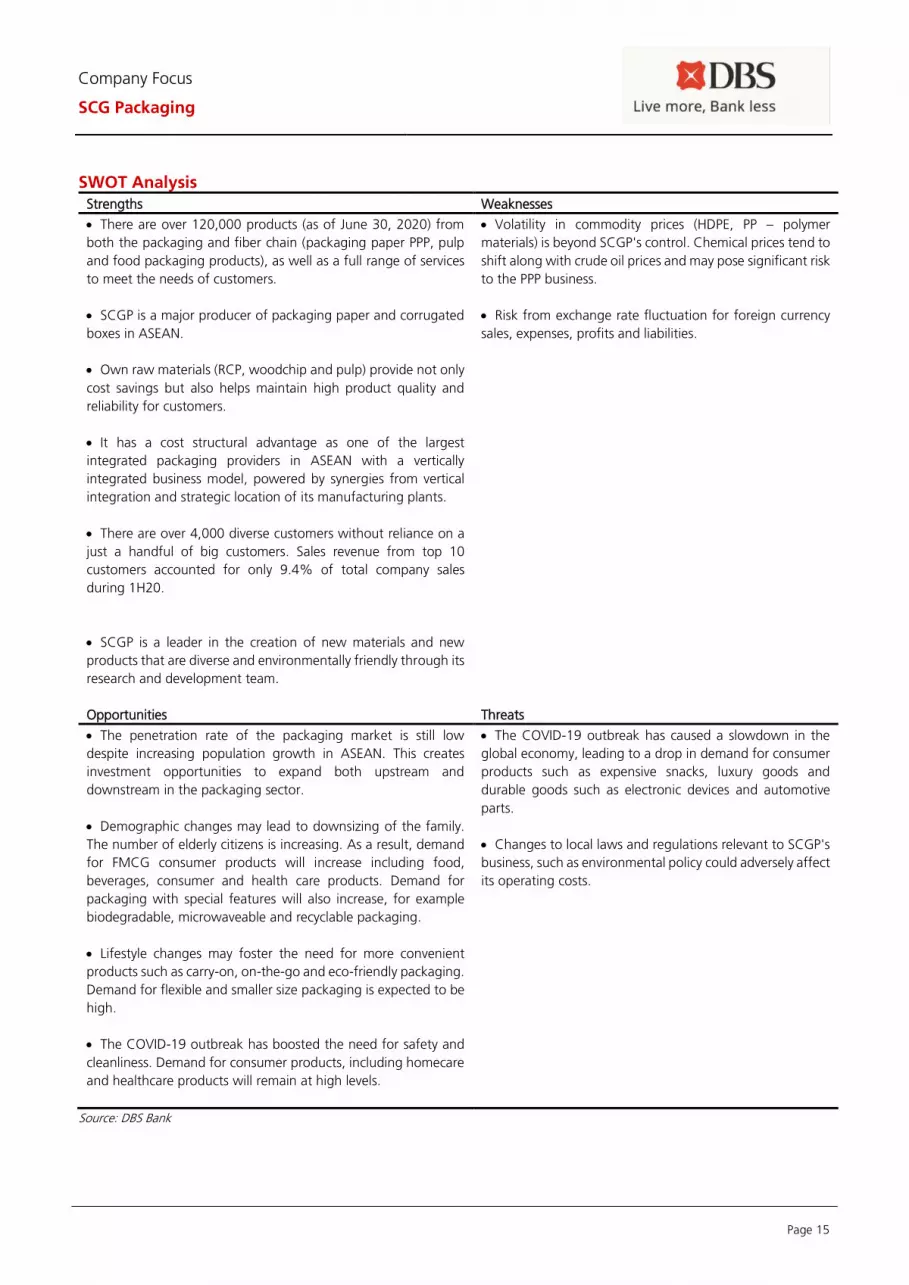
Page 15
Company Focus
SCG Packaging
SWOT Analysis
Strengths Weaknesses
• There are over 120,000 products (as of June 30, 2020) from
both the packaging and fiber chain (packaging paper PPP, pulp
and food packaging products), as well as a full range of services
to meet the needs of customers.
• SCGP is a major producer of packaging paper and corrugated
boxes in ASEAN.
• Own raw materials (RCP, woodchip and pulp) provide not only
cost savings but also helps maintain high product quality and
reliability for customers.
• It has a cost structural advantage as one of the largest
integrated packaging providers in ASEAN with a vertically
integrated business model, powered by synergies from vertical
integration and strategic location of its manufacturing plants.
• There are over 4,000 diverse customers without reliance on a
just a handful of big customers. Sales revenue from top 10
customers accounted for only 9.4% of total company sales
during 1H20.
• SCGP is a leader in the creation of new materials and new
products that are diverse and environmentally friendly through its
research and development team.
• Volatility in commodity prices (HDPE, PP – polymer
materials) is beyond SCGP's control. Chemical prices tend to
shift along with crude oil prices and may pose significant risk
to the PPP business.
• Risk from exchange rate fluctuation for foreign currency
sales, expenses, profits and liabilities.
Opportunities Threats
• The penetration rate of the packaging market is still low
despite increasing population growth in ASEAN. This creates
investment opportunities to expand both upstream and
downstream in the packaging sector.
• Demographic changes may lead to downsizing of the family.
The number of elderly citizens is increasing. As a result, demand
for FMCG consumer products will increase including food,
beverages, consumer and health care products. Demand for
packaging with special features will also increase, for example
biodegradable, microwaveable and recyclable packaging.
• Lifestyle changes may foster the need for more convenient
products such as carry-on, on-the-go and eco-friendly packaging.
Demand for flexible and smaller size packaging is expected to be
high.
• The COVID-19 outbreak has boosted the need for safety and
cleanliness. Demand for consumer products, including homecare
and healthcare products will remain at high levels.
• The COVID-19 outbreak has caused a slowdown in the
global economy, leading to a drop in demand for consumer
products such as expensive snacks, luxury goods and
durable goods such as electronic devices and automotive
parts.
• Changes to local laws and regulations relevant to SCGP's
business, such as environmental policy could adversely affect
its operating costs.
Source: DBS Bank
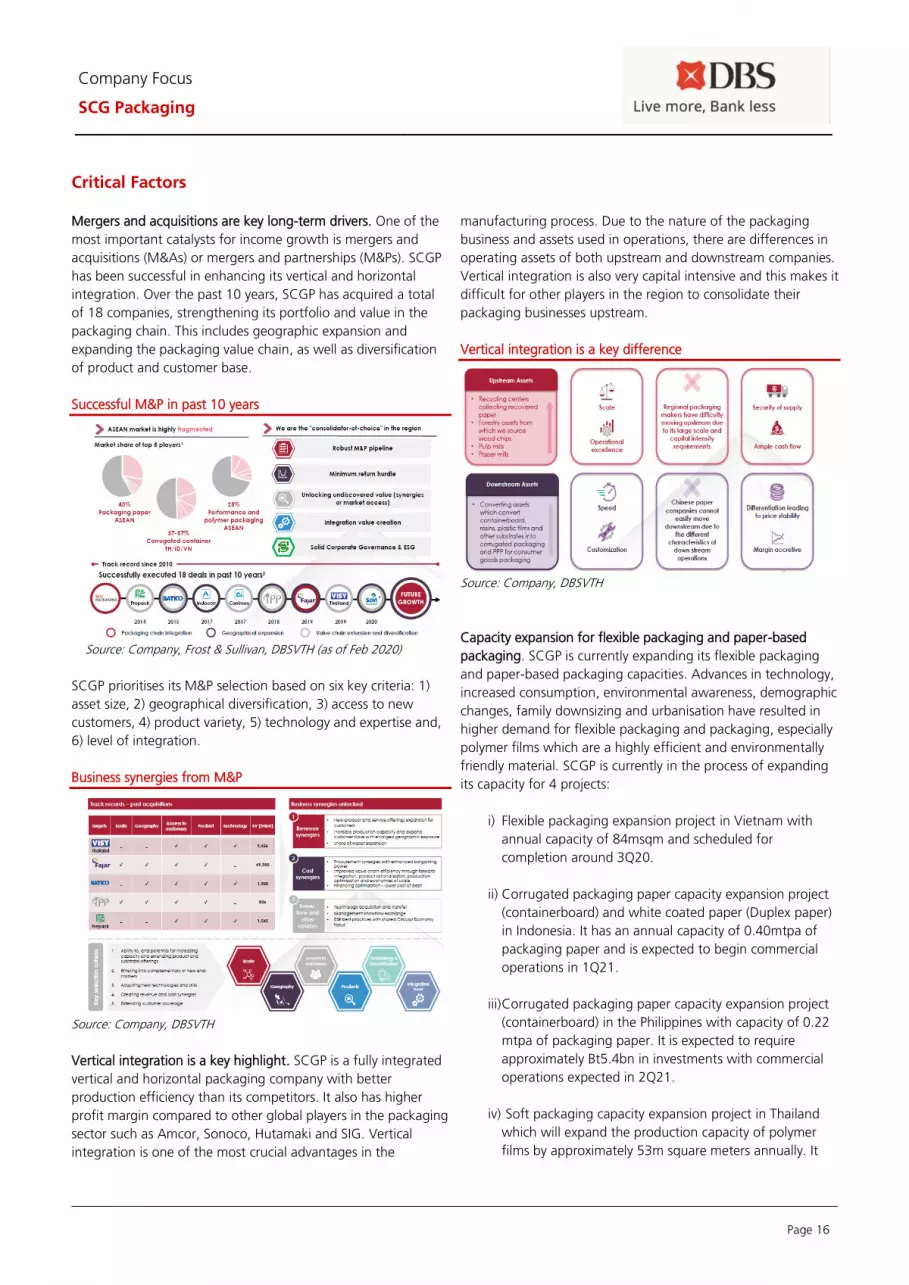
Page 16
Company Focus
SCG Packaging
Critical Factors Mergers and acquisitions are key long-term drivers. One of the
most important catalysts for income growth is mergers and
acquisitions (M&As) or mergers and partnerships (M&Ps). SCGP
has been successful in enhancing its vertical and horizontal
integration. Over the past 10 years, SCGP has acquired a total
of 18 companies, strengthening its portfolio and value in the
packaging chain. This includes geographic expansion and
expanding the packaging value chain, as well as diversification
of product and customer base.
Successful M&P in past 10 years
Source: Company, Frost & Sullivan, DBSVTH (as of Feb 2020)
SCGP prioritises its M&P selection based on six key criteria: 1)
asset size, 2) geographical diversification, 3) access to new
customers, 4) product variety, 5) technology and expertise and,
6) level of integration.
Business synergies from M&P
Source: Company, DBSVTH
Vertical integration is a key highlight. SCGP is a fully integrated
vertical and horizontal packaging company with better
production efficiency than its competitors. It also has higher
profit margin compared to other global players in the packaging
sector such as Amcor, Sonoco, Hutamaki and SIG. Vertical
integration is one of the most crucial advantages in the
manufacturing process. Due to the nature of the packaging
business and assets used in operations, there are differences in
operating assets of both upstream and downstream companies.
Vertical integration is also very capital intensive and this makes it
difficult for other players in the region to consolidate their
packaging businesses upstream.
Vertical integration is a key difference
Source: Company, DBSVTH
Capacity expansion for flexible packaging and paper-based
packaging. SCGP is currently expanding its flexible packaging
and paper-based packaging capacities. Advances in technology,
increased consumption, environmental awareness, demographic
changes, family downsizing and urbanisation have resulted in
higher demand for flexible packaging and packaging, especially
polymer films which are a highly efficient and environmentally
friendly material. SCGP is currently in the process of expanding
its capacity for 4 projects:
i) Flexible packaging expansion project in Vietnam with
annual capacity of 84msqm and scheduled for
completion around 3Q20.
ii) Corrugated packaging paper capacity expansion project
(containerboard) and white coated paper (Duplex paper)
in Indonesia. It has an annual capacity of 0.40mtpa of
packaging paper and is expected to begin commercial
operations in 1Q21.
iii) Corrugated packaging paper capacity expansion project
(containerboard) in the Philippines with capacity of 0.22
mtpa of packaging paper. It is expected to require
approximately Bt5.4bn in investments with commercial
operations expected in 2Q21.
iv) Soft packaging capacity expansion project in Thailand
which will expand the production capacity of polymer
films by approximately 53m square meters annually. It
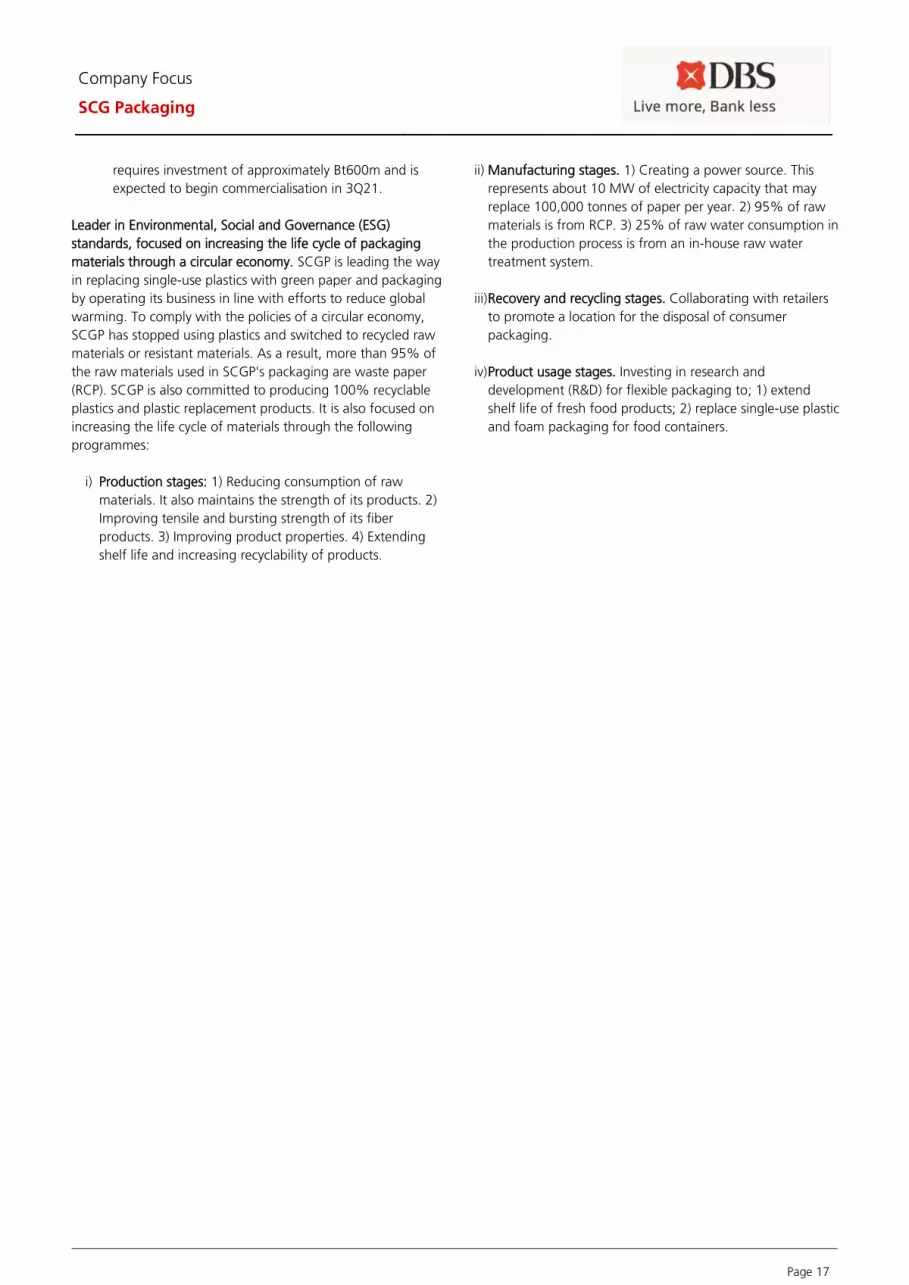
Page 17
Company Focus
SCG Packaging
requires investment of approximately Bt600m and is
expected to begin commercialisation in 3Q21.
Leader in Environmental, Social and Governance (ESG)
standards, focused on increasing the life cycle of packaging
materials through a circular economy. SCGP is leading the way
in replacing single-use plastics with green paper and packaging
by operating its business in line with efforts to reduce global
warming. To comply with the policies of a circular economy,
SCGP has stopped using plastics and switched to recycled raw
materials or resistant materials. As a result, more than 95% of
the raw materials used in SCGP's packaging are waste paper
(RCP). SCGP is also committed to producing 100% recyclable
plastics and plastic replacement products. It is also focused on
increasing the life cycle of materials through the following
programmes:
i) Production stages: 1) Reducing consumption of raw
materials. It also maintains the strength of its products. 2)
Improving tensile and bursting strength of its fiber
products. 3) Improving product properties. 4) Extending
shelf life and increasing recyclability of products.
ii) Manufacturing stages. 1) Creating a power source. This
represents about 10 MW of electricity capacity that may
replace 100,000 tonnes of paper per year. 2) 95% of raw
materials is from RCP. 3) 25% of raw water consumption in
the production process is from an in-house raw water
treatment system.
iii) Recovery and recycling stages. Collaborating with retailers
to promote a location for the disposal of consumer
packaging.
iv) Product usage stages. Investing in research and
development (R&D) for flexible packaging to; 1) extend
shelf life of fresh food products; 2) replace single-use plastic
and foam packaging for food containers.
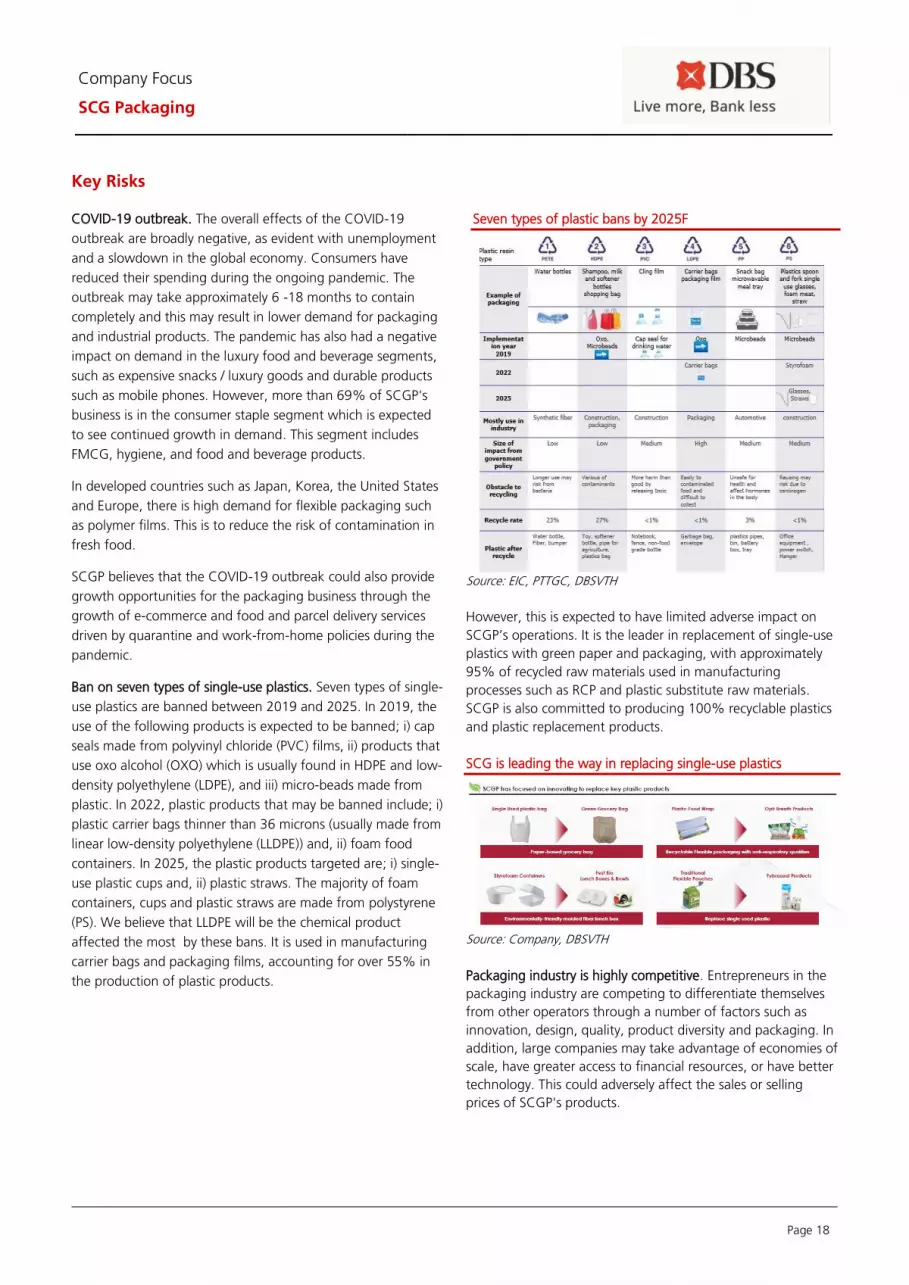
Page 18
Company Focus
SCG Packaging
Key Risks COVID-19 outbreak. The overall effects of the COVID-19
outbreak are broadly negative, as evident with unemployment
and a slowdown in the global economy. Consumers have
reduced their spending during the ongoing pandemic. The
outbreak may take approximately 6 -18 months to contain
completely and this may result in lower demand for packaging
and industrial products. The pandemic has also had a negative
impact on demand in the luxury food and beverage segments,
such as expensive snacks / luxury goods and durable products
such as mobile phones. However, more than 69% of SCGP's
business is in the consumer staple segment which is expected
to see continued growth in demand. This segment includes
FMCG, hygiene, and food and beverage products.
In developed countries such as Japan, Korea, the United States
and Europe, there is high demand for flexible packaging such
as polymer films. This is to reduce the risk of contamination in
fresh food.
SCGP believes that the COVID-19 outbreak could also provide
growth opportunities for the packaging business through the
growth of e-commerce and food and parcel delivery services
driven by quarantine and work-from-home policies during the
pandemic.
Ban on seven types of single-use plastics. Seven types of single-
use plastics are banned between 2019 and 2025. In 2019, the
use of the following products is expected to be banned; i) cap
seals made from polyvinyl chloride (PVC) films, ii) products that
use oxo alcohol (OXO) which is usually found in HDPE and low-
density polyethylene (LDPE), and iii) micro-beads made from
plastic. In 2022, plastic products that may be banned include; i)
plastic carrier bags thinner than 36 microns (usually made from
linear low-density polyethylene (LLDPE)) and, ii) foam food
containers. In 2025, the plastic products targeted are; i) single-
use plastic cups and, ii) plastic straws. The majority of foam
containers, cups and plastic straws are made from polystyrene
(PS). We believe that LLDPE will be the chemical product
affected the most by these bans. It is used in manufacturing
carrier bags and packaging films, accounting for over 55% in
the production of plastic products.
Seven types of plastic bans by 2025F
Source: EIC, PTTGC, DBSVTH
However, this is expected to have limited adverse impact on
SCGP’s operations. It is the leader in replacement of single-use
plastics with green paper and packaging, with approximately
95% of recycled raw materials used in manufacturing
processes such as RCP and plastic substitute raw materials.
SCGP is also committed to producing 100% recyclable plastics
and plastic replacement products.
SCG is leading the way in replacing single-use plastics
Source: Company, DBSVTH
Packaging industry is highly competitive. Entrepreneurs in the
packaging industry are competing to differentiate themselves
from other operators through a number of factors such as
innovation, design, quality, product diversity and packaging. In
addition, large companies may take advantage of economies of
scale, have greater access to financial resources, or have better
technology. This could adversely affect the sales or selling
prices of SCGP's products.

Page 19
Company Focus
SCG Packaging
Some of SCGP’s pulp products are corrugated packaging paper
(containerboard) that is easily available in the market with
selling prices dependent on commodity price cycles. There is
also the factor of increasing competition due to oversupply of
production capacity. Additionally, demand for other products,
such as SCGP's printing and writing paper, has also been
negatively impacted by disruptive technologies and new
consumer behaviour.
Raw material supply risk. SCGP’s raw materials in its integrated
packaging and pulp and paper business lines are commodities
that are volatile in supply. This is due to factors such as shifts in
supply and demand in the world market, inadequate raw
materials and energy resources, weather, natural disasters,
disease, agricultural instability, government policy and political
instability. Supply of raw materials is mostly based on spot
contracts and short-term contracts. Approximately 80% of
SCGP’s RCP volume is under spot contracts and 20% under
procurement contracts.
Raw material cost risk. SCGP relies on raw materials from
external sources and is vulnerable to price fluctuations due to
several macroeconomic factors such as economic conditions,
environmental regulations and environmental conservation,
natural disasters, weather and other factors beyond SCGP's
control. If cost of raw materials (such as RCP) increases, this
may have a significant negative impact on the company’s
business and financial performance.
RCP, wood, pulp and chemicals prices have fluctuated over the
years. In addition, there is demand volatility in Southeast Asia,
China and other countries. Changing production and storage
rates may also affect RCP prices. Import or export restrictions
of RPC may lead to changes in market prices.
The cost of RCP in 2017/2018/2019/1H20 accounted for
25.8% / 21.7% / 21.3% / 20.6% of SCGP’s total cost of sales
respectively.
Expansion and acquisition (M&P) Risk. SCGP's business growth
strategy is based on creating synergies and adding value to its
packaging chain. It is planning more joint ventures (JVs) with
other companies to strengthen its market position and expand
to new markets.
SCGP has completed M&As and investments in various
businesses in Thailand and neighbouring countries over the
past several years. In the past three years, it successfully
acquired shares in INDOCORR PPC CONIMEX and IPSB. In
2018, SCGP acquired a stake in Fajar for vertically integrated
operations in the Indonesian market. It also acquired a stake in
Visy Packaging Thailand to complement SCGP’s products line
(fixed packaging solutions)
Foreign exchange risk. Fluctuation of forex rates may affect
SCGP’s revenue from exports, long-term loan as well as cost of
some machinery and equipment. SCGP reports its financial
statements (functional currency) in Thai Baht (THB). As a result,
forex fluctuations may have a negative effect on earnings.
Regulatory risks in the country of operations. SCGP operates in
several countries in Southeast Asia. As of June 30, 2020, SCGP
had 40 plants in five countries. Any changes in laws and
regulations by local authorities could have an impact on
SCGP's operations and financial outlook.
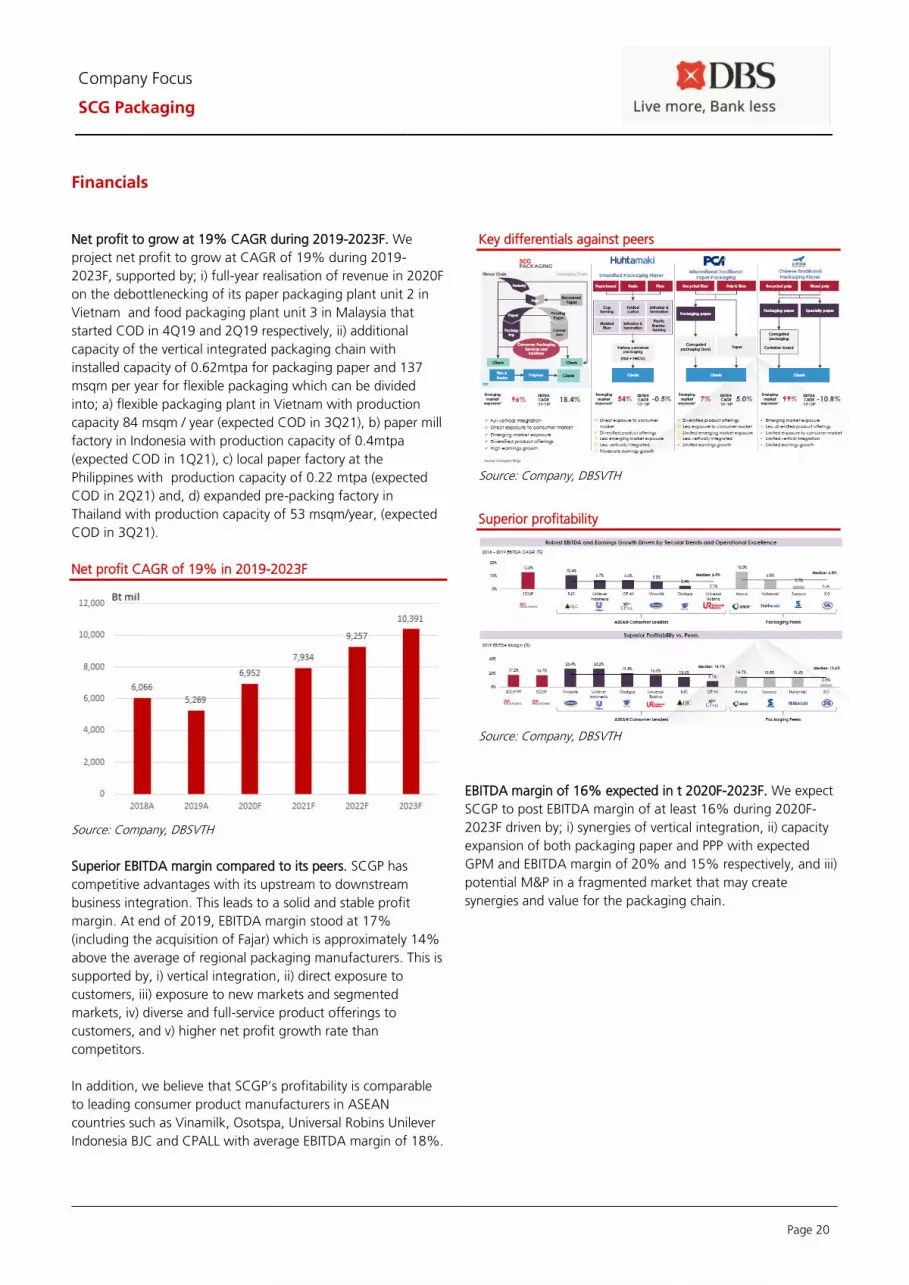
Page 20
Company Focus
SCG Packaging
Financials
Net profit to grow at 19% CAGR during 2019-2023F. We
project net profit to grow at CAGR of 19% during 2019-
2023F, supported by; i) full-year realisation of revenue in 2020F
on the debottlenecking of its paper packaging plant unit 2 in
Vietnam and food packaging plant unit 3 in Malaysia that
started COD in 4Q19 and 2Q19 respectively, ii) additional
capacity of the vertical integrated packaging chain with
installed capacity of 0.62mtpa for packaging paper and 137
msqm per year for flexible packaging which can be divided
into; a) flexible packaging plant in Vietnam with production
capacity 84 msqm / year (expected COD in 3Q21), b) paper mill
factory in Indonesia with production capacity of 0.4mtpa
(expected COD in 1Q21), c) local paper factory at the
Philippines with production capacity of 0.22 mtpa (expected
COD in 2Q21) and, d) expanded pre-packing factory in
Thailand with production capacity of 53 msqm/year, (expected
COD in 3Q21).
Net profit CAGR of 19% in 2019-2023F
Source: Company, DBSVTH
Superior EBITDA margin compared to its peers. SCGP has
competitive advantages with its upstream to downstream
business integration. This leads to a solid and stable profit
margin. At end of 2019, EBITDA margin stood at 17%
(including the acquisition of Fajar) which is approximately 14%
above the average of regional packaging manufacturers. This is
supported by, i) vertical integration, ii) direct exposure to
customers, iii) exposure to new markets and segmented
markets, iv) diverse and full-service product offerings to
customers, and v) higher net profit growth rate than
competitors.
In addition, we believe that SCGP’s profitability is comparable
to leading consumer product manufacturers in ASEAN
countries such as Vinamilk, Osotspa, Universal Robins Unilever
Indonesia BJC and CPALL with average EBITDA margin of 18%.
Key differentials against peers
Source: Company, DBSVTH
Superior profitability
Source: Company, DBSVTH
EBITDA margin of 16% expected in t 2020F-2023F. We expect
SCGP to post EBITDA margin of at least 16% during 2020F-
2023F driven by; i) synergies of vertical integration, ii) capacity
expansion of both packaging paper and PPP with expected
GPM and EBITDA margin of 20% and 15% respectively, and iii)
potential M&P in a fragmented market that may create
synergies and value for the packaging chain.
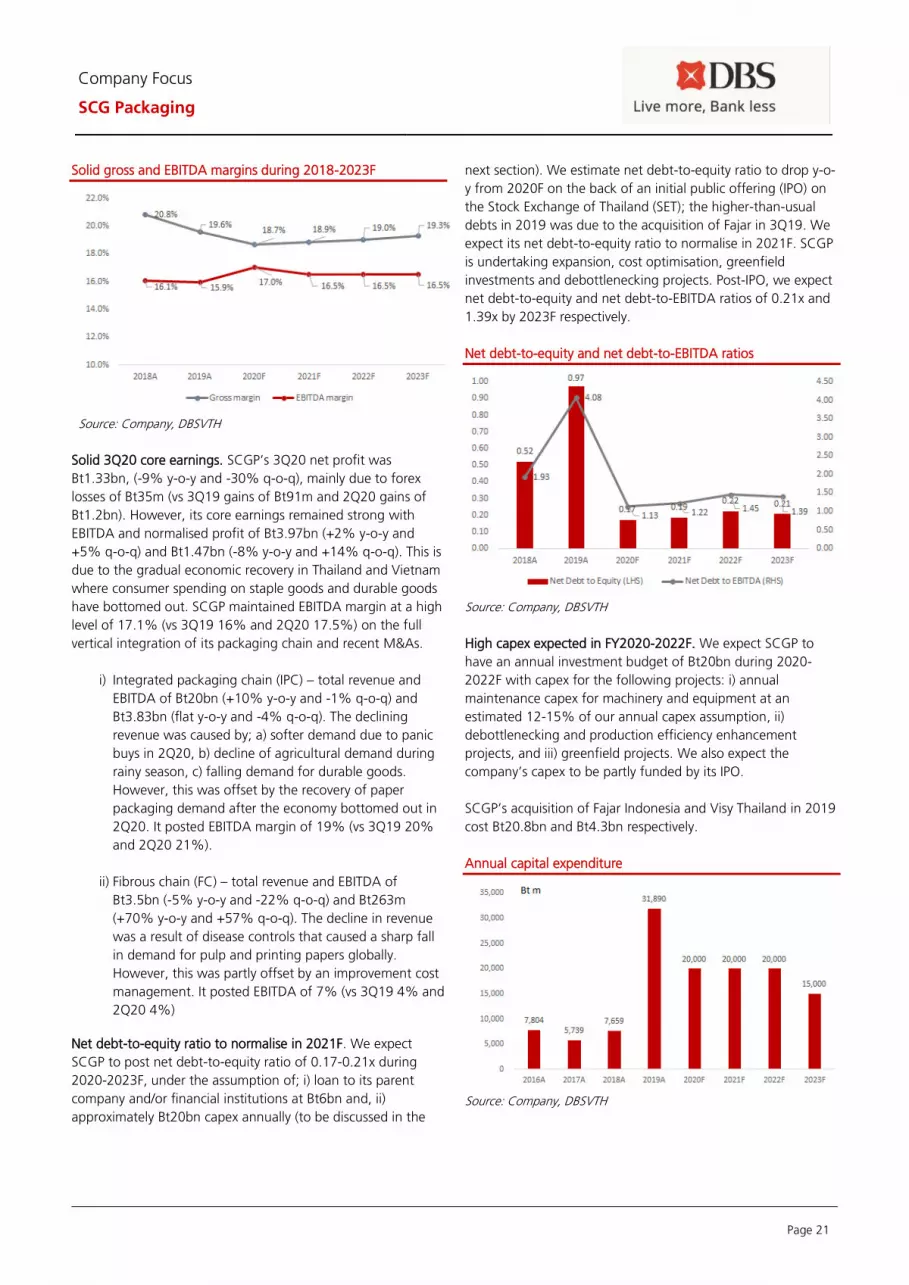
Page 21
Company Focus
SCG Packaging
Solid gross and EBITDA margins during 2018-2023F
Source: Company, DBSVTH
Solid 3Q20 core earnings. SCGP’s 3Q20 net profit was
Bt1.33bn, (-9% y-o-y and -30% q-o-q), mainly due to forex
losses of Bt35m (vs 3Q19 gains of Bt91m and 2Q20 gains of
Bt1.2bn). However, its core earnings remained strong with
EBITDA and normalised profit of Bt3.97bn (+2% y-o-y and
+5% q-o-q) and Bt1.47bn (-8% y-o-y and +14% q-o-q). This is
due to the gradual economic recovery in Thailand and Vietnam
where consumer spending on staple goods and durable goods
have bottomed out. SCGP maintained EBITDA margin at a high
level of 17.1% (vs 3Q19 16% and 2Q20 17.5%) on the full
vertical integration of its packaging chain and recent M&As.
i) Integrated packaging chain (IPC) – total revenue and
EBITDA of Bt20bn (+10% y-o-y and -1% q-o-q) and
Bt3.83bn (flat y-o-y and -4% q-o-q). The declining
revenue was caused by; a) softer demand due to panic
buys in 2Q20, b) decline of agricultural demand during
rainy season, c) falling demand for durable goods.
However, this was offset by the recovery of paper
packaging demand after the economy bottomed out in
2Q20. It posted EBITDA margin of 19% (vs 3Q19 20%
and 2Q20 21%).
ii) Fibrous chain (FC) – total revenue and EBITDA of
Bt3.5bn (-5% y-o-y and -22% q-o-q) and Bt263m
(+70% y-o-y and +57% q-o-q). The decline in revenue
was a result of disease controls that caused a sharp fall
in demand for pulp and printing papers globally.
However, this was partly offset by an improvement cost
management. It posted EBITDA of 7% (vs 3Q19 4% and
2Q20 4%)
Net debt-to-equity ratio to normalise in 2021F. We expect
SCGP to post net debt-to-equity ratio of 0.17-0.21x during
2020-2023F, under the assumption of; i) loan to its parent
company and/or financial institutions at Bt6bn and, ii)
approximately Bt20bn capex annually (to be discussed in the
next section). We estimate net debt-to-equity ratio to drop y-o-
y from 2020F on the back of an initial public offering (IPO) on
the Stock Exchange of Thailand (SET); the higher-than-usual
debts in 2019 was due to the acquisition of Fajar in 3Q19. We
expect its net debt-to-equity ratio to normalise in 2021F. SCGP
is undertaking expansion, cost optimisation, greenfield
investments and debottlenecking projects. Post-IPO, we expect
net debt-to-equity and net debt-to-EBITDA ratios of 0.21x and
1.39x by 2023F respectively.
Net debt-to-equity and net debt-to-EBITDA ratios
Source: Company, DBSVTH
High capex expected in FY2020-2022F. We expect SCGP to
have an annual investment budget of Bt20bn during 2020-
2022F with capex for the following projects: i) annual
maintenance capex for machinery and equipment at an
estimated 12-15% of our annual capex assumption, ii)
debottlenecking and production efficiency enhancement
projects, and iii) greenfield projects. We also expect the
company’s capex to be partly funded by its IPO.
SCGP’s acquisition of Fajar Indonesia and Visy Thailand in 2019
cost Bt20.8bn and Bt4.3bn respectively.
Annual capital expenditure
Source: Company, DBSVTH

Page 22
Company Focus
SCG Packaging
Key Assumptions
FY Dec 2016A 2017A 2018A 2019A 2020F 2021F
Packaging paper (mtpa) 2.60 2.60 2.60 4.00 4.22 4.62
PPP-flexbile packaging
(m sqm/year) 817 817 817 817 901 954
PPP-rigid packaging (m
sqm/year) 2,650 2,650 2,650 2,650 2,650 2,650
Food service packaging
(m pieces/year) 400 400 1,900 1,900 1,900 1,900
CAPEX (Bt m) 7,774 5,641 7,533 32,132 20,000 20,000
Income Statement (Btm)
FY Dec 2016A 2017A 2018A 2019A 2020F 2021F
Revenue 74,542 81,455 87,255 89,070 104,270 119,470
Cost of Goods Sold (61,499) (67,291) (69,074) (71,651) (84,779) (96,944)
Gross Profit 13,043 14,165 18,181 17,419 19,491 22,526
Other Opng (Exp)/Inc (8,388) (8,715) (9,547) (9,226) (9,384) (11,350)
Operating Profit 4,654 5,450 8,633 8,193 10,106 11,176
Other Non Opg (Exp)/Inc 447 1,249 363 714 0.0 0.0
Associates & JV Inc 4.56 4.13 (14.6) 52.7 0.0 0.0
Net Interest (Exp)/Inc (912) (883) (1,040) (1,619) (1,125) (925)
Exceptional Gain/(Loss) 139 158 152 (400) 0.0 0.0
Pre-tax Profit 4,334 5,978 8,094 6,940 8,981 10,251
Tax (483) (603) (1,268) (1,049) (1,257) (1,435)
Minority Interest (566) (949) (761) (623) (772) (882)
Preference Dividend 0.0 0.0 0.0 0.0 0.0 0.0
Net Profit 3,285 4,425 6,066 5,269 6,952 7,934
Net Profit before Except. 3,146 4,268 5,914 5,668 6,952 7,934
EBITDA 10,408 11,893 14,363 14,950 17,726 19,713
Growth
Revenue Gth (%) 232.1 9.3 7.1 2.1 17.1 14.6
EBITDA Gth (%) 197.3 14.3 20.8 4.1 18.6 11.2
Opg Profit Gth (%) 191.6 17.1 58.4 (5.1) 23.4 10.6
Net Profit Gth (Pre-ex)
(%) 61.2 35.7 38.6 (4.1) 22.6 14.1
Margins & Ratio
Gross Margins (%) 17.5 17.4 20.8 19.6 18.7 18.9
Opg Profit Margin (%) 6.2 6.7 9.9 9.2 9.7 9.4
Net Profit Margin (%) 4.4 5.4 7.0 5.9 6.7 6.6
ROAE (%) 8.6 10.6 14.6 12.6 10.2 8.2
ROA (%) 4.7 5.0 6.6 4.5 4.3 4.2
ROCE (%) 3.4 4.3 5.9 3.8 3.9 4.1
Div Payout Ratio (%) 52.5 42.3 33.5 77.1 20.0 20.0
Net Interest Cover (x) 5.1 6.2 8.3 5.1 9.0 12.1
Source: Company, DBSVTH
Margins Trend
5.0%
6.0%
7.0%
8.0%
9.0%
10.0%
11.0%
2017A 2018A 2019A 2020F 2021F
Operating Margin % Net Income Margin %
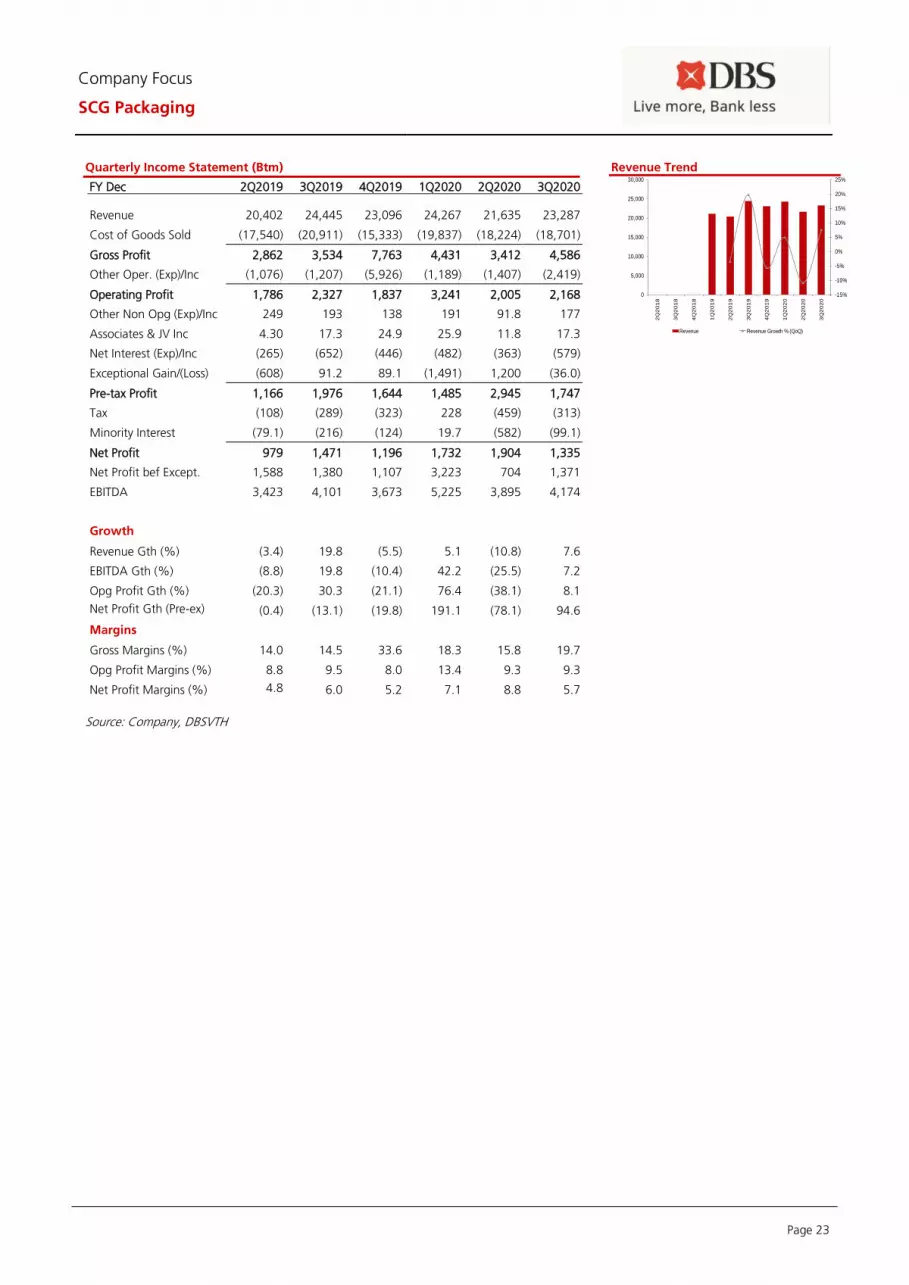
Page 23
Company Focus
SCG Packaging
Quarterly Income Statement (Btm)
FY Dec 2Q2019 3Q2019 4Q2019 1Q2020 2Q2020 3Q2020
Revenue 20,402 24,445 23,096 24,267 21,635 23,287
Cost of Goods Sold (17,540) (20,911) (15,333) (19,837) (18,224) (18,701)
Gross Profit 2,862 3,534 7,763 4,431 3,412 4,586
Other Oper. (Exp)/Inc (1,076) (1,207) (5,926) (1,189) (1,407) (2,419)
Operating Profit 1,786 2,327 1,837 3,241 2,005 2,168
Other Non Opg (Exp)/Inc 249 193 138 191 91.8 177
Associates & JV Inc 4.30 17.3 24.9 25.9 11.8 17.3
Net Interest (Exp)/Inc (265) (652) (446) (482) (363) (579)
Exceptional Gain/(Loss) (608) 91.2 89.1 (1,491) 1,200 (36.0)
Pre-tax Profit 1,166 1,976 1,644 1,485 2,945 1,747
Tax (108) (289) (323) 228 (459) (313)
Minority Interest (79.1) (216) (124) 19.7 (582) (99.1)
Net Profit 979 1,471 1,196 1,732 1,904 1,335
Net Profit bef Except. 1,588 1,380 1,107 3,223 704 1,371
EBITDA 3,423 4,101 3,673 5,225 3,895 4,174
Growth
Revenue Gth (%) (3.4) 19.8 (5.5) 5.1 (10.8) 7.6
EBITDA Gth (%) (8.8) 19.8 (10.4) 42.2 (25.5) 7.2
Opg Profit Gth (%) (20.3) 30.3 (21.1) 76.4 (38.1) 8.1
Net Profit Gth (Pre-ex)
(%) (0.4) (13.1) (19.8) 191.1 (78.1) 94.6
Margins
Gross Margins (%) 14.0 14.5 33.6 18.3 15.8 19.7
Opg Profit Margins (%) 8.8 9.5 8.0 13.4 9.3 9.3
Net Profit Margins (%) 4.8 6.0 5.2 7.1 8.8 5.7
Revenue Trend
Source: Company, DBSVTH
-15%
-10%
-5%
0%
5%
10%
15%
20%
25%
0
5,000
10,000
15,000
20,000
25,000
30,000
2Q
20
18
3Q
20
18
4Q
20
18
1Q
20
19
2Q
20
19
3Q
20
19
4Q
20
19
1Q
20
20
2Q
20
20
3Q
20
20
Revenue Revenue Growth % (QoQ)

Page 24
Company Focus
SCG Packaging
Balance Sheet (Btm)
FY Dec 2016A 2017A 2018A 2019A 2020F 2021F Net Fixed Assets 56,017 57,143 58,379 82,864 95,244 106,707
Invts in Associates & JVs 880 761 730 771 778 786
Other LT Assets 3,898 4,092 4,064 20,495 21,774 24,284
Cash & ST Invts 1,571 1,632 2,991 4,960 31,267 19,336
Inventory 10,592 13,417 12,894 13,276 15,800 18,103
Debtors 12,050 13,872 13,704 15,198 16,997 19,474
Other Current Assets 361 396 485 1,950 1,950 1,950
Total Assets 85,369 91,312 93,246 139,514 183,809 190,640
ST Debt
19,536 23,026 27,894 43,230 31,000 25,000
Creditor 7,820 9,095 8,574 10,059 14,605 16,734
Other Current Liab 415 327 724 725 725 725
LT Debt 4,847 3,213 2,795 22,683 20,365 18,365
Other LT Liabilities 0.0 0.0 0.0 0.0 0.0 0.0
Shareholder’s Equity 40,402 42,891 40,441 42,952 93,278 101,212
Minority Interests 12,349 12,759 12,819 19,864 23,837 28,604
Total Cap. & Liab. 85,369 91,312 93,246 139,513 183,809 190,640
Non-Cash Wkg. Capital 14,768 18,263 17,786 19,640 19,416 22,068
Net Cash/(Debt) (22,811) (24,608) (27,698) (60,953) (20,097) (24,029)
Debtors Turn (avg days) 36.5 58.1 57.7 59.2 56.3 55.7
Creditors Turn (avg days) 34.3 49.7 50.6 51.8 58.3 64.7
Inventory Turn (avg days) 35.7 70.6 75.4 72.7 68.8 70.0
Asset Turnover (x) 1.1 0.9 0.9 0.8 0.6 0.6
Current Ratio (x) 0.9 0.9 0.8 0.7 1.4 1.4
Quick Ratio (x) 0.5 0.5 0.4 0.4 1.0 0.9
Net Debt/Equity (X) 0.4 0.4 0.5 1.0 0.2 0.2
Net Debt/Equity ex MI (X) 0.6 0.6 0.7 1.4 0.2 0.2
Capex to Debt (%) 31.9 21.5 24.5 48.7 38.9 46.1
Source: Company, DBSVTH
Asset Breakdown
Net Fixed Assets -71.1%
Assocs'/JVs -0.7%
Bank, Cash and Liquid
Assets -3.8%
Inventory -11.4%
Debtors -13.0%
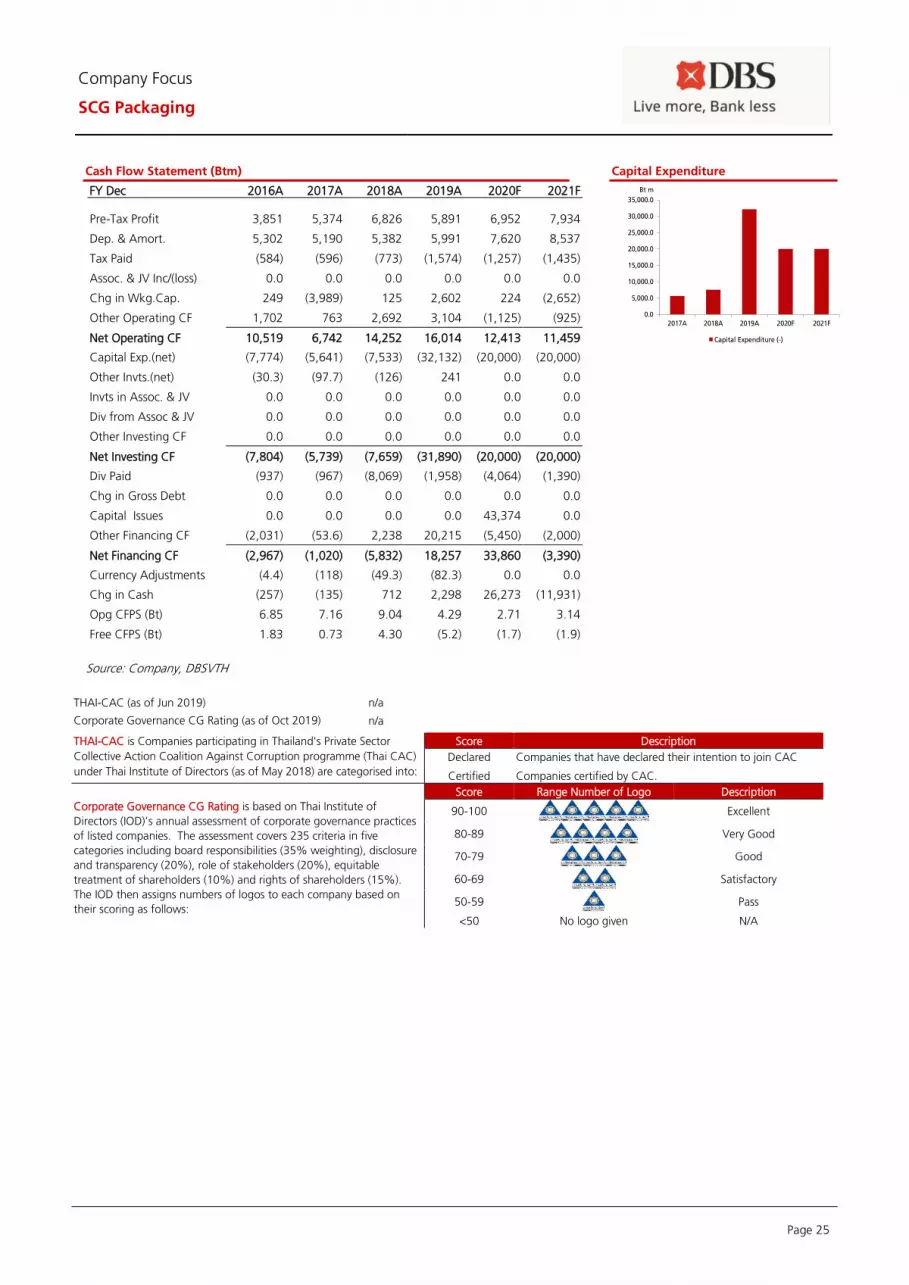
Page 25
Company Focus
SCG Packaging
Cash Flow Statement (Btm)
FY Dec 2016A 2017A 2018A 2019A 2020F 2021F
Pre-Tax Profit 3,851 5,374 6,826 5,891 6,952 7,934
Dep. & Amort. 5,302 5,190 5,382 5,991 7,620 8,537
Tax Paid (584) (596) (773) (1,574) (1,257) (1,435)
Assoc. & JV Inc/(loss) 0.0 0.0 0.0 0.0 0.0 0.0
Chg in Wkg.Cap. 249 (3,989) 125 2,602 224 (2,652)
Other Operating CF 1,702 763 2,692 3,104 (1,125) (925)
Net Operating CF 10,519 6,742 14,252 16,014 12,413 11,459
Capital Exp.(net) (7,774) (5,641) (7,533) (32,132) (20,000) (20,000)
Other Invts.(net) (30.3) (97.7) (126) 241 0.0 0.0
Invts in Assoc. & JV 0.0 0.0 0.0 0.0 0.0 0.0
Div from Assoc & JV 0.0 0.0 0.0 0.0 0.0 0.0
Other Investing CF 0.0 0.0 0.0 0.0 0.0 0.0
Net Investing CF (7,804) (5,739) (7,659) (31,890) (20,000) (20,000)
Div Paid (937) (967) (8,069) (1,958) (4,064) (1,390)
Chg in Gross Debt 0.0 0.0 0.0 0.0 0.0 0.0
Capital Issues 0.0 0.0 0.0 0.0 43,374 0.0
Other Financing CF (2,031) (53.6) 2,238 20,215 (5,450) (2,000)
Net Financing CF (2,967) (1,020) (5,832) 18,257 33,860 (3,390)
Currency Adjustments (4.4) (118) (49.3) (82.3) 0.0 0.0
Chg in Cash (257) (135) 712 2,298 26,273 (11,931)
Opg CFPS (Bt) 6.85 7.16 9.04 4.29 2.71 3.14
Free CFPS (Bt) 1.83 0.73 4.30 (5.2) (1.7) (1.9)
Source: Company, DBSVTH
Capital Expenditure
THAI-CAC (as of Jun 2019) n/a
Corporate Governance CG Rating (as of Oct 2019) n/a
THAI-CAC is Companies participating in Thailand's Private Sector
Collective Action Coalition Against Corruption programme (Thai CAC)
under Thai Institute of Directors (as of May 2018) are categorised into:
Score Description
Declared Companies that have declared their intention to join CAC
Certified Companies certified by CAC.
Corporate Governance CG Rating is based on Thai Institute of
Directors (IOD)’s annual assessment of corporate governance practices
of listed companies. The assessment covers 235 criteria in five
categories including board responsibilities (35% weighting), disclosure
and transparency (20%), role of stakeholders (20%), equitable
treatment of shareholders (10%) and rights of shareholders (15%).
The IOD then assigns numbers of logos to each company based on
their scoring as follows:
Score Range Number of Logo Description
90-100
Excellent
80-89
Very Good
70-79
Good
60-69
Satisfactory
50-59
Pass
<50 No logo given N/A
0.0
5,000.0
10,000.0
15,000.0
20,000.0
25,000.0
30,000.0
35,000.0
2017A 2018A 2019A 2020F 2021F
Capital Expenditure (-)
Bt m
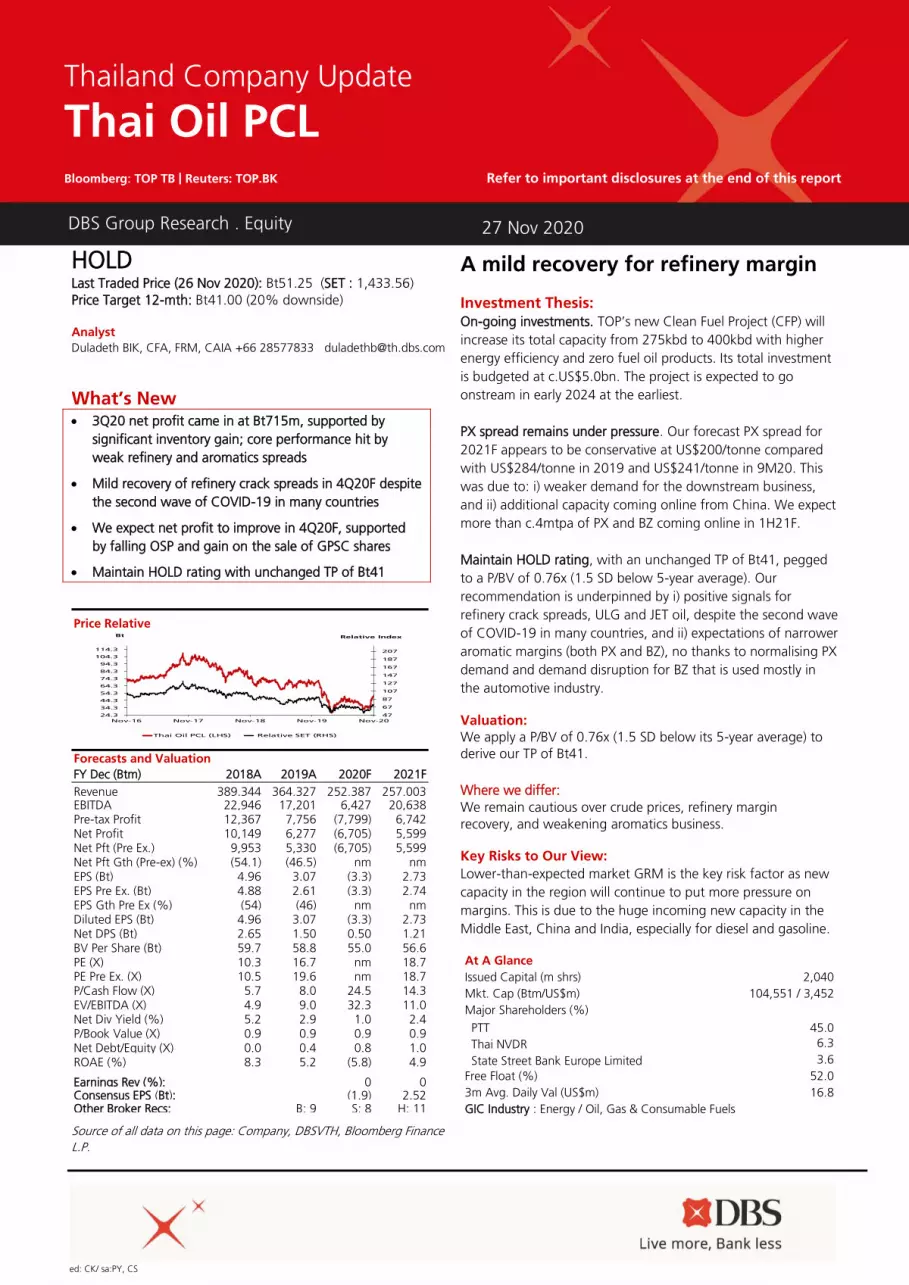
ed: CK/ sa:PY, CS
HOLD Last Traded Price (26 Nov 2020): Bt51.25 (SET : 1,433.56)
Price Target 12-mth: Bt41.00 (20% downside)
Analyst
Duladeth BIK, CFA, FRM, CAIA +66 28577833 [email protected]
What’s New • 3Q20 net profit came in at Bt715m, supported by
significant inventory gain; core performance hit by
weak refinery and aromatics spreads
• Mild recovery of refinery crack spreads in 4Q20F despite
the second wave of COVID-19 in many countries
• We expect net profit to improve in 4Q20F, supported
by falling OSP and gain on the sale of GPSC shares
• Maintain HOLD rating with unchanged TP of Bt41
Source of all data on this page: Company, DBSVTH, Bloomberg Finance
L.P.
A mild recovery for refinery margin Investment Thesis: On-going investments. TOP’s new Clean Fuel Project (CFP) will
increase its total capacity from 275kbd to 400kbd with higher
energy efficiency and zero fuel oil products. Its total investment
is budgeted at c.US$5.0bn. The project is expected to go
onstream in early 2024 at the earliest.
PX spread remains under pressure. Our forecast PX spread for
2021F appears to be conservative at US$200/tonne compared
with US$284/tonne in 2019 and US$241/tonne in 9M20. This
was due to: i) weaker demand for the downstream business,
and ii) additional capacity coming online from China. We expect
more than c.4mtpa of PX and BZ coming online in 1H21F.
Maintain HOLD rating, with an unchanged TP of Bt41, pegged
to a P/BV of 0.76x (1.5 SD below 5-year average). Our
recommendation is underpinned by i) positive signals for
refinery crack spreads, ULG and JET oil, despite the second wave
of COVID-19 in many countries, and ii) expectations of narrower
aromatic margins (both PX and BZ), no thanks to normalising PX
demand and demand disruption for BZ that is used mostly in
the automotive industry. Valuation:
We apply a P/BV of 0.76x (1.5 SD below its 5-year average) to
derive our TP of Bt41.
Where we differ:
We remain cautious over crude prices, refinery margin
recovery, and weakening aromatics business. Key Risks to Our View:
Lower-than-expected market GRM is the key risk factor as new
capacity in the region will continue to put more pressure on
margins. This is due to the huge incoming new capacity in the
Middle East, China and India, especially for diesel and gasoline. At A Glance Issued Capital (m shrs) 2,040
Mkt. Cap (Btm/US$m) 104,551 / 3,452
Major Shareholders (%)
PTT 45.0
Thai NVDR 6.3
State Street Bank Europe Limited 3.6
Free Float (%) 52.0
3m Avg. Daily Val (US$m) 16.8
GIC Industry : Energy / Oil, Gas & Consumable Fuels
DBS Group Research . Equity
27 Nov 2020
Price Relative
Forecasts and Valuation
FY Dec (Btm) 2018A 2019A 2020F 2021F
Revenue 389,344 364,327 252,387 257,003 EBITDA 22,946 17,201 6,427 20,638 Pre-tax Profit 12,367 7,756 (7,799) 6,742 Net Profit 10,149 6,277 (6,705) 5,599 Net Pft (Pre Ex.) 9,953 5,330 (6,705) 5,599 Net Pft Gth (Pre-ex) (%) (54.1) (46.5) nm nm EPS (Bt) 4.96 3.07 (3.3) 2.73 EPS Pre Ex. (Bt) 4.88 2.61 (3.3) 2.74 EPS Gth Pre Ex (%) (54) (46) nm nm Diluted EPS (Bt) 4.96 3.07 (3.3) 2.73 Net DPS (Bt) 2.65 1.50 0.50 1.21 BV Per Share (Bt) 59.7 58.8 55.0 56.6 PE (X) 10.3 16.7 nm 18.7 PE Pre Ex. (X) 10.5 19.6 nm 18.7 P/Cash Flow (X) 5.7 8.0 24.5 14.3 EV/EBITDA (X) 4.9 9.0 32.3 11.0 Net Div Yield (%) 5.2 2.9 1.0 2.4 P/Book Value (X) 0.9 0.9 0.9 0.9 Net Debt/Equity (X) 0.0 0.4 0.8 1.0 ROAE (%) 8.3 5.2 (5.8) 4.9 Earnings Rev (%): 0 0 Consensus EPS (Bt): (1.9) 2.52 Other Broker Recs: B: 9 S: 8 H: 11
Thailand Company Update
Thai Oil PCL Bloomberg: TOP TB | Reuters: TOP.BK Refer to important disclosures at the end of this report
47
67
87
107
127
147
167
187
207
24.3
34.3
44.3
54.3
64.3
74.3
84.3
94.3
104.3
114.3
Nov-16 Nov-17 Nov-18 Nov-19 Nov-20
Relative IndexBt
Thai Oil PCL (LHS) Relative SET (RHS)
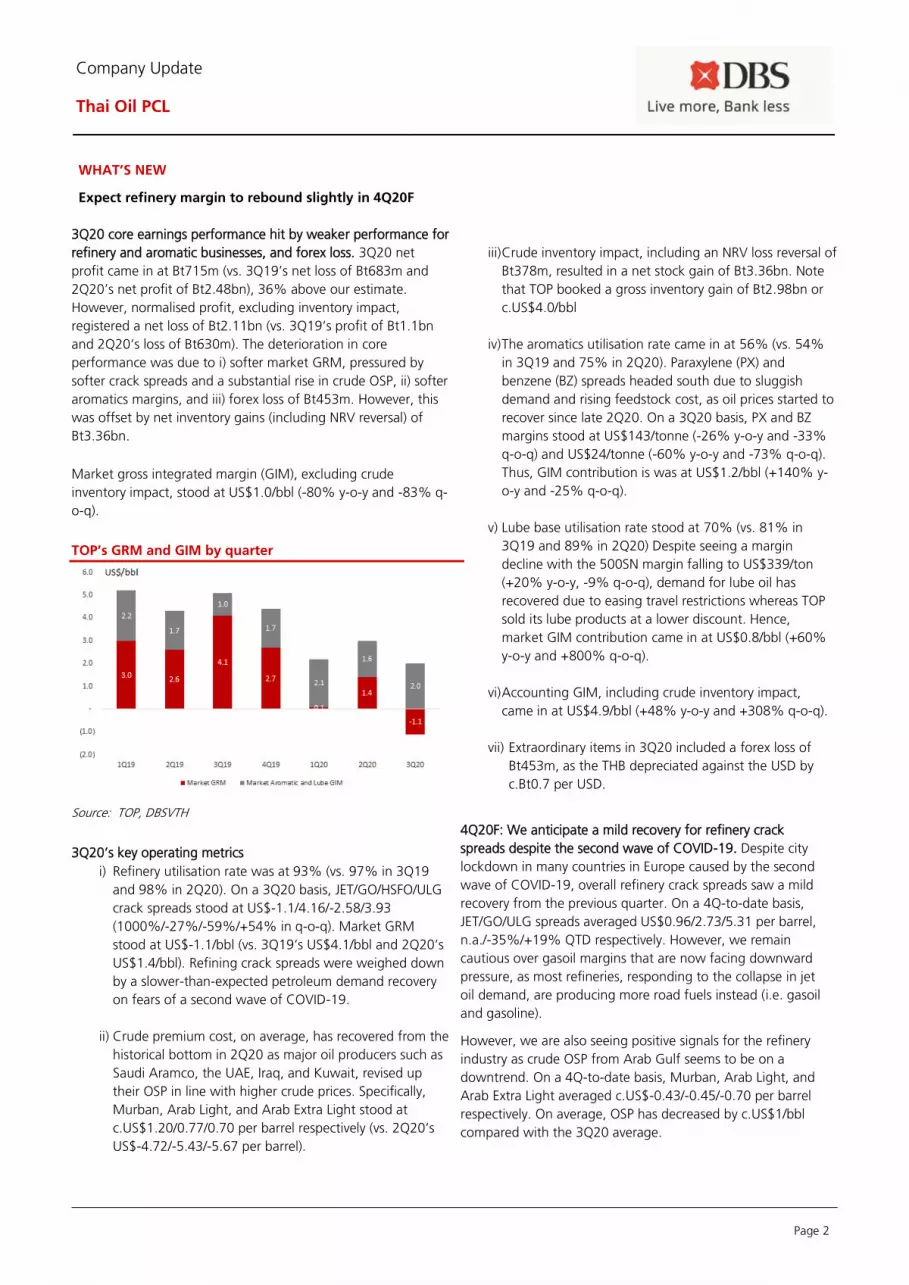
Page 2
Company Update
Thai Oil PCL
WHAT’S NEW
Expect refinery margin to rebound slightly in 4Q20F
3Q20 core earnings performance hit by weaker performance for
refinery and aromatic businesses, and forex loss. 3Q20 net
profit came in at Bt715m (vs. 3Q19’s net loss of Bt683m and
2Q20’s net profit of Bt2.48bn), 36% above our estimate.
However, normalised profit, excluding inventory impact,
registered a net loss of Bt2.11bn (vs. 3Q19’s profit of Bt1.1bn
and 2Q20’s loss of Bt630m). The deterioration in core
performance was due to i) softer market GRM, pressured by
softer crack spreads and a substantial rise in crude OSP, ii) softer
aromatics margins, and iii) forex loss of Bt453m. However, this
was offset by net inventory gains (including NRV reversal) of
Bt3.36bn.
Market gross integrated margin (GIM), excluding crude
inventory impact, stood at US$1.0/bbl (-80% y-o-y and -83% q-
o-q).
TOP’s GRM and GIM by quarter
Source: TOP, DBSVTH
3Q20’s key operating metrics
i) Refinery utilisation rate was at 93% (vs. 97% in 3Q19
and 98% in 2Q20). On a 3Q20 basis, JET/GO/HSFO/ULG
crack spreads stood at US$-1.1/4.16/-2.58/3.93
(1000%/-27%/-59%/+54% in q-o-q). Market GRM
stood at US$-1.1/bbl (vs. 3Q19’s US$4.1/bbl and 2Q20’s
US$1.4/bbl). Refining crack spreads were weighed down
by a slower-than-expected petroleum demand recovery
on fears of a second wave of COVID-19.
ii) Crude premium cost, on average, has recovered from the
historical bottom in 2Q20 as major oil producers such as
Saudi Aramco, the UAE, Iraq, and Kuwait, revised up
their OSP in line with higher crude prices. Specifically,
Murban, Arab Light, and Arab Extra Light stood at
c.US$1.20/0.77/0.70 per barrel respectively (vs. 2Q20’s
US$-4.72/-5.43/-5.67 per barrel).
iii) Crude inventory impact, including an NRV loss reversal of
Bt378m, resulted in a net stock gain of Bt3.36bn. Note
that TOP booked a gross inventory gain of Bt2.98bn or
c.US$4.0/bbl
iv) The aromatics utilisation rate came in at 56% (vs. 54%
in 3Q19 and 75% in 2Q20). Paraxylene (PX) and
benzene (BZ) spreads headed south due to sluggish
demand and rising feedstock cost, as oil prices started to
recover since late 2Q20. On a 3Q20 basis, PX and BZ
margins stood at US$143/tonne (-26% y-o-y and -33%
q-o-q) and US$24/tonne (-60% y-o-y and -73% q-o-q).
Thus, GIM contribution is was at US$1.2/bbl (+140% y-
o-y and -25% q-o-q).
v) Lube base utilisation rate stood at 70% (vs. 81% in
3Q19 and 89% in 2Q20) Despite seeing a margin
decline with the 500SN margin falling to US$339/ton
(+20% y-o-y, -9% q-o-q), demand for lube oil has
recovered due to easing travel restrictions whereas TOP
sold its lube products at a lower discount. Hence,
market GIM contribution came in at US$0.8/bbl (+60%
y-o-y and +800% q-o-q).
vi) Accounting GIM, including crude inventory impact,
came in at US$4.9/bbl (+48% y-o-y and +308% q-o-q).
vii) Extraordinary items in 3Q20 included a forex loss of
Bt453m, as the THB depreciated against the USD by
c.Bt0.7 per USD.
4Q20F: We anticipate a mild recovery for refinery crack
spreads despite the second wave of COVID-19. Despite city
lockdown in many countries in Europe caused by the second
wave of COVID-19, overall refinery crack spreads saw a mild
recovery from the previous quarter. On a 4Q-to-date basis,
JET/GO/ULG spreads averaged US$0.96/2.73/5.31 per barrel,
n.a./-35%/+19% QTD respectively. However, we remain
cautious over gasoil margins that are now facing downward
pressure, as most refineries, responding to the collapse in jet
oil demand, are producing more road fuels instead (i.e. gasoil
and gasoline).
However, we are also seeing positive signals for the refinery
industry as crude OSP from Arab Gulf seems to be on a
downtrend. On a 4Q-to-date basis, Murban, Arab Light, and
Arab Extra Light averaged c.US$-0.43/-0.45/-0.70 per barrel
respectively. On average, OSP has decreased by c.US$1/bbl
compared with the 3Q20 average.
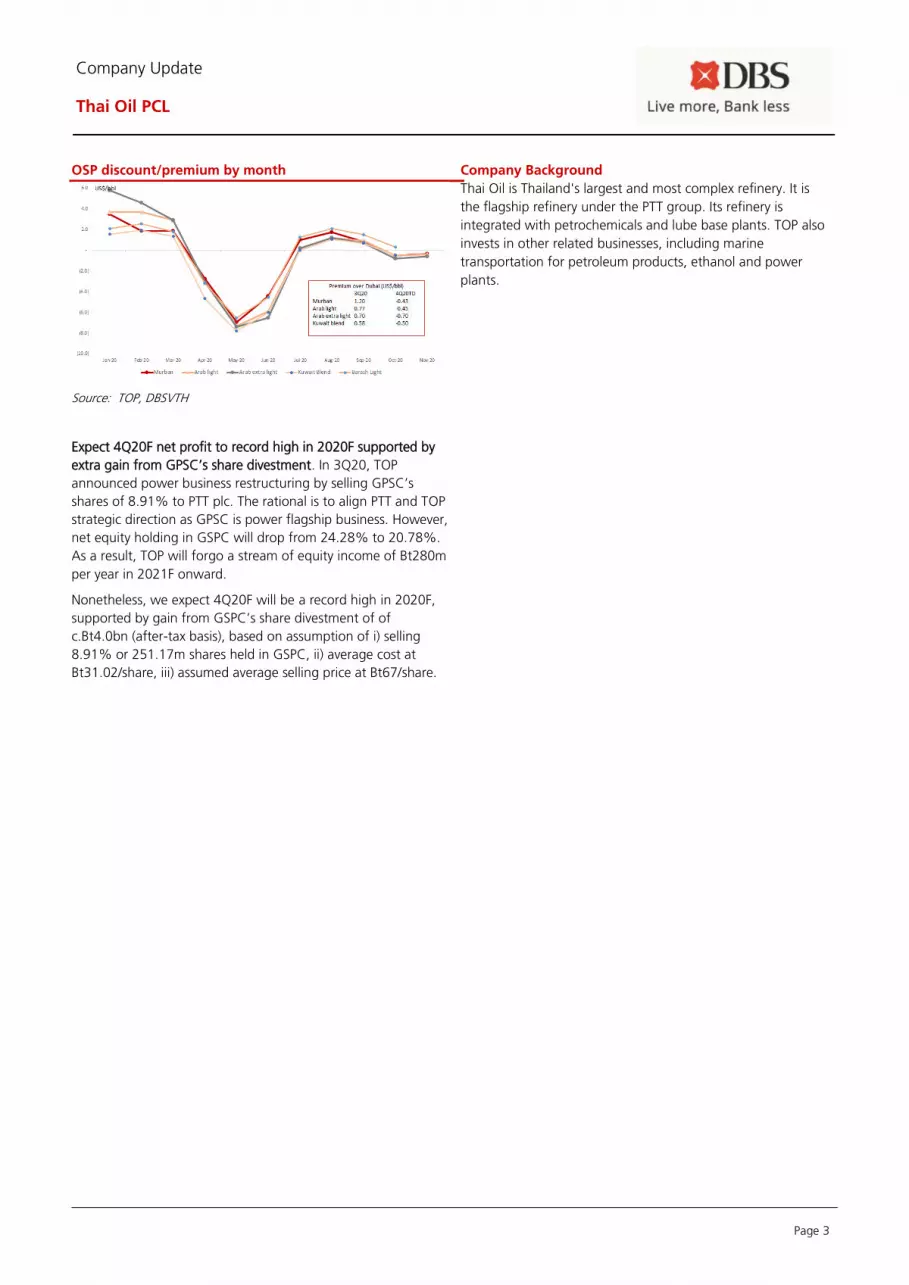
Page 3
Company Update
Thai Oil PCL
OSP discount/premium by month
Source: TOP, DBSVTH
Expect 4Q20F net profit to record high in 2020F supported by
extra gain from GPSC’s share divestment. In 3Q20, TOP
announced power business restructuring by selling GPSC’s
shares of 8.91% to PTT plc. The rational is to align PTT and TOP
strategic direction as GPSC is power flagship business. However,
net equity holding in GSPC will drop from 24.28% to 20.78%.
As a result, TOP will forgo a stream of equity income of Bt280m
per year in 2021F onward.
Nonetheless, we expect 4Q20F will be a record high in 2020F,
supported by gain from GSPC’s share divestment of of
c.Bt4.0bn (after-tax basis), based on assumption of i) selling
8.91% or 251.17m shares held in GSPC, ii) average cost at
Bt31.02/share, iii) assumed average selling price at Bt67/share.
Company Background
Thai Oil is Thailand's largest and most complex refinery. It is
the flagship refinery under the PTT group. Its refinery is
integrated with petrochemicals and lube base plants. TOP also
invests in other related businesses, including marine
transportation for petroleum products, ethanol and power
plants.
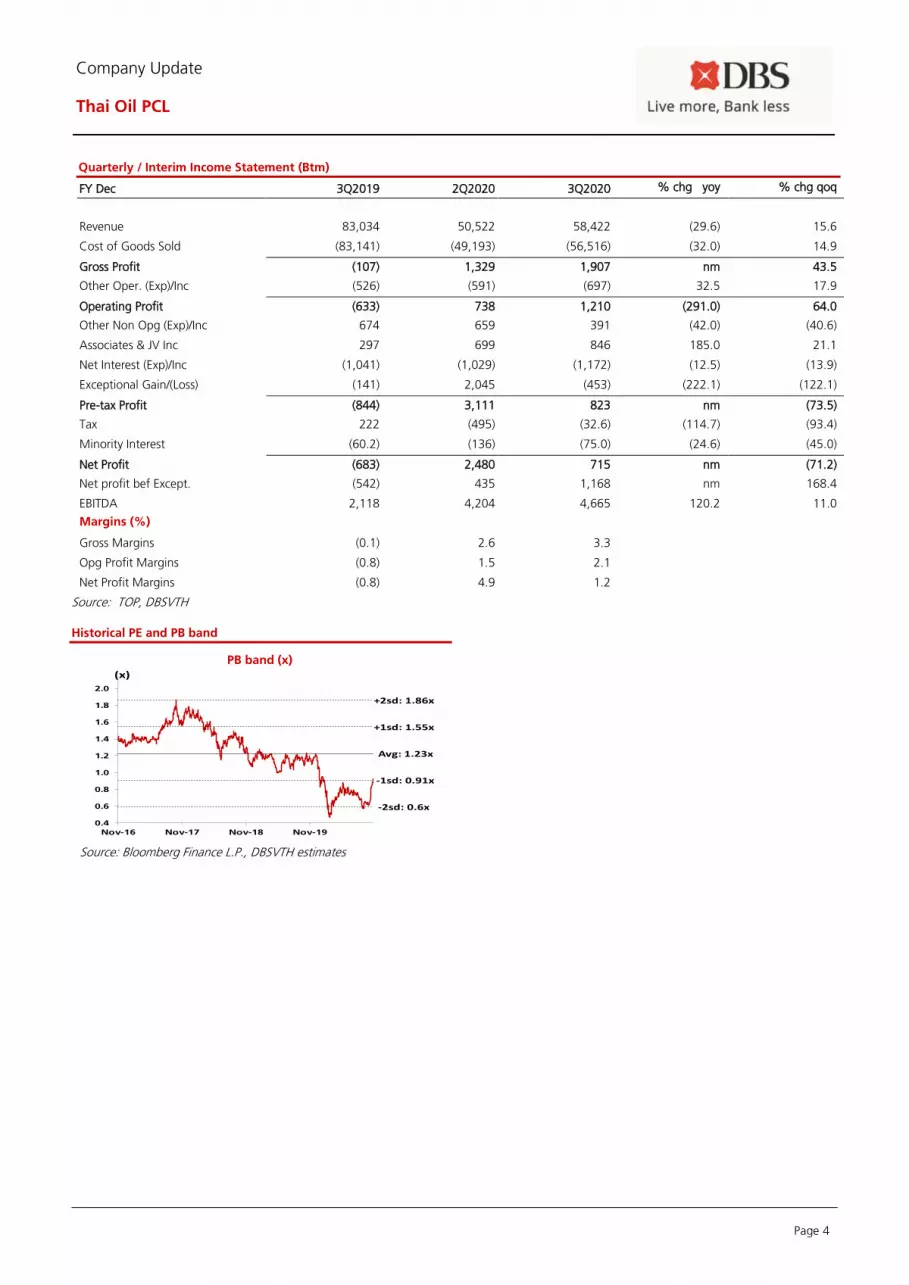
Page 4
Company Update
Thai Oil PCL
Quarterly / Interim Income Statement (Btm)
FY Dec 3Q2019 2Q2020 3Q2020 % chg yoy % chg qoq
Revenue 83,034 50,522 58,422 (29.6) 15.6
Cost of Goods Sold (83,141) (49,193) (56,516) (32.0) 14.9
Gross Profit (107) 1,329 1,907 nm 43.5
Other Oper. (Exp)/Inc (526) (591) (697) 32.5 17.9
Operating Profit (633) 738 1,210 (291.0) 64.0
Other Non Opg (Exp)/Inc 674 659 391 (42.0) (40.6)
Associates & JV Inc 297 699 846 185.0 21.1
Net Interest (Exp)/Inc (1,041) (1,029) (1,172) (12.5) (13.9)
Exceptional Gain/(Loss) (141) 2,045 (453) (222.1) (122.1)
Pre-tax Profit (844) 3,111 823 nm (73.5)
Tax 222 (495) (32.6) (114.7) (93.4)
Minority Interest (60.2) (136) (75.0) (24.6) (45.0)
Net Profit (683) 2,480 715 nm (71.2)
Net profit bef Except. (542) 435 1,168 nm 168.4
EBITDA 2,118 4,204 4,665 120.2 11.0
Margins (%)
Gross Margins (0.1) 2.6 3.3
Opg Profit Margins (0.8) 1.5 2.1
Net Profit Margins (0.8) 4.9 1.2
Source: TOP, DBSVTH Historical PE and PB band
PB band (x)
Source: Bloomberg Finance L.P., DBSVTH estimates
Avg: 1.23x
+1sd: 1.55x
+2sd: 1.86x
-1sd: 0.91x
-2sd: 0.6x
0.4
0.6
0.8
1.0
1.2
1.4
1.6
1.8
2.0
Nov-16 Nov-17 Nov-18 Nov-19
(x)
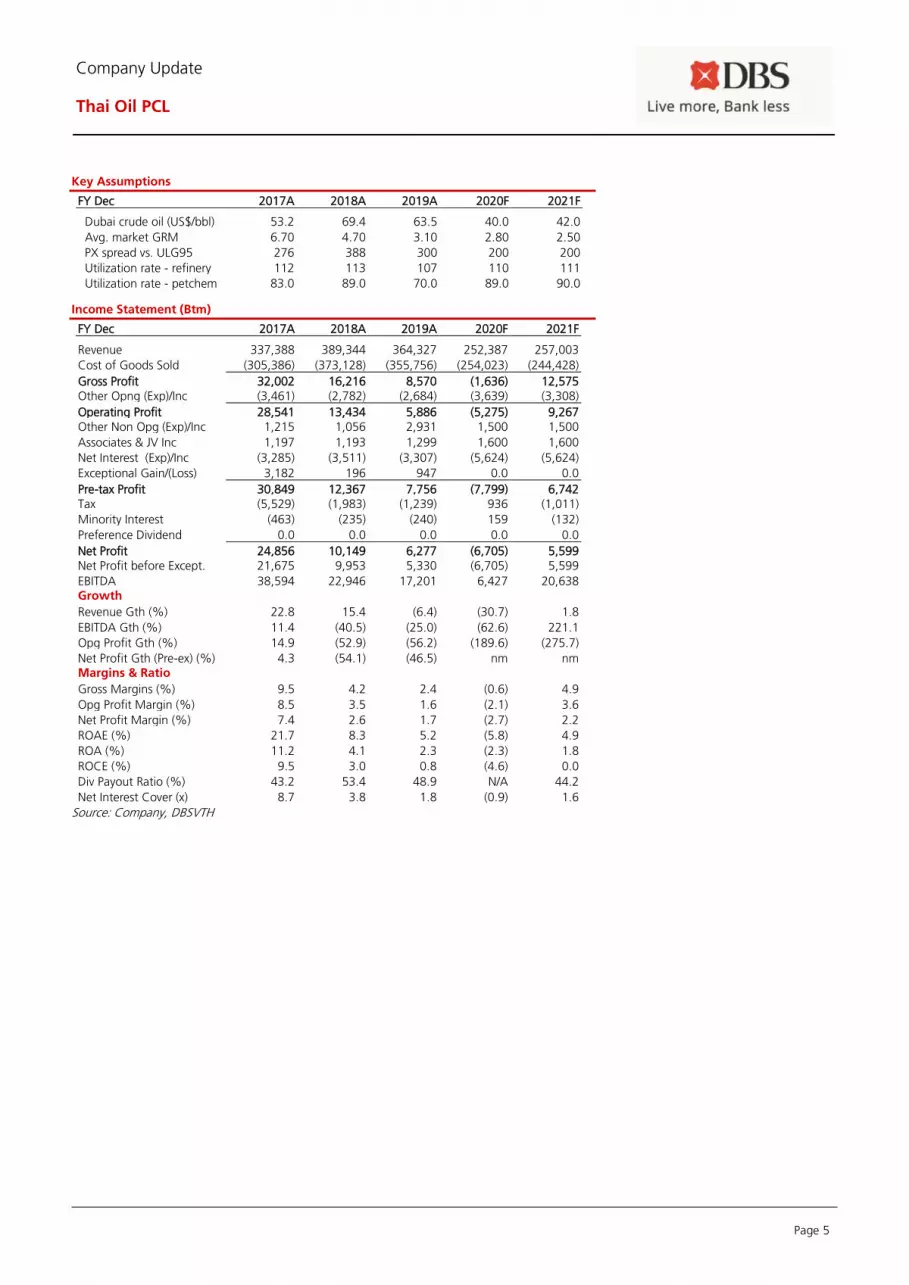
Page 5
Company Update
Thai Oil PCL
Key Assumptions
FY Dec 2017A 2018A 2019A 2020F 2021F
Dubai crude oil (US$/bbl) 53.2 69.4 63.5 40.0 42.0
Avg. market GRM
(US$/bbl)
6.70 4.70 3.10 2.80 2.50
PX spread vs. ULG95
(US$/t)
276 388 300 200 200
Utilization rate - refinery
(%)
112 113 107 110 111
Utilization rate - petchem
(%)
83.0 89.0 70.0 89.0 90.0
Income Statement (Btm)
FY Dec 2017A 2018A 2019A 2020F 2021F
Revenue 337,388 389,344 364,327 252,387 257,003
Cost of Goods Sold (305,386) (373,128) (355,756) (254,023) (244,428)
Gross Profit 32,002 16,216 8,570 (1,636) 12,575 Other Opng (Exp)/Inc (3,461) (2,782) (2,684) (3,639) (3,308)
Operating Profit 28,541 13,434 5,886 (5,275) 9,267 Other Non Opg (Exp)/Inc 1,215 1,056 2,931 1,500 1,500
Associates & JV Inc 1,197 1,193 1,299 1,600 1,600
Net Interest (Exp)/Inc (3,285) (3,511) (3,307) (5,624) (5,624)
Exceptional Gain/(Loss) 3,182 196 947 0.0 0.0
Pre-tax Profit 30,849 12,367 7,756 (7,799) 6,742 Tax (5,529) (1,983) (1,239) 936 (1,011)
Minority Interest (463) (235) (240) 159 (132)
Preference Dividend 0.0 0.0 0.0 0.0 0.0
Net Profit 24,856 10,149 6,277 (6,705) 5,599 Net Profit before Except. 21,675 9,953 5,330 (6,705) 5,599
EBITDA 38,594 22,946 17,201 6,427 20,638 Growth
Revenue Gth (%) 22.8 15.4 (6.4) (30.7) 1.8
EBITDA Gth (%) 11.4 (40.5) (25.0) (62.6) 221.1
Opg Profit Gth (%) 14.9 (52.9) (56.2) (189.6) (275.7)
Net Profit Gth (Pre-ex) (%) 4.3 (54.1) (46.5) nm nm Margins & Ratio
Gross Margins (%) 9.5 4.2 2.4 (0.6) 4.9
Opg Profit Margin (%) 8.5 3.5 1.6 (2.1) 3.6
Net Profit Margin (%) 7.4 2.6 1.7 (2.7) 2.2
ROAE (%) 21.7 8.3 5.2 (5.8) 4.9
ROA (%) 11.2 4.1 2.3 (2.3) 1.8
ROCE (%) 9.5 3.0 0.8 (4.6) 0.0
Div Payout Ratio (%) 43.2 53.4 48.9 N/A 44.2
Net Interest Cover (x) 8.7 3.8 1.8 (0.9) 1.6
Source: Company, DBSVTH
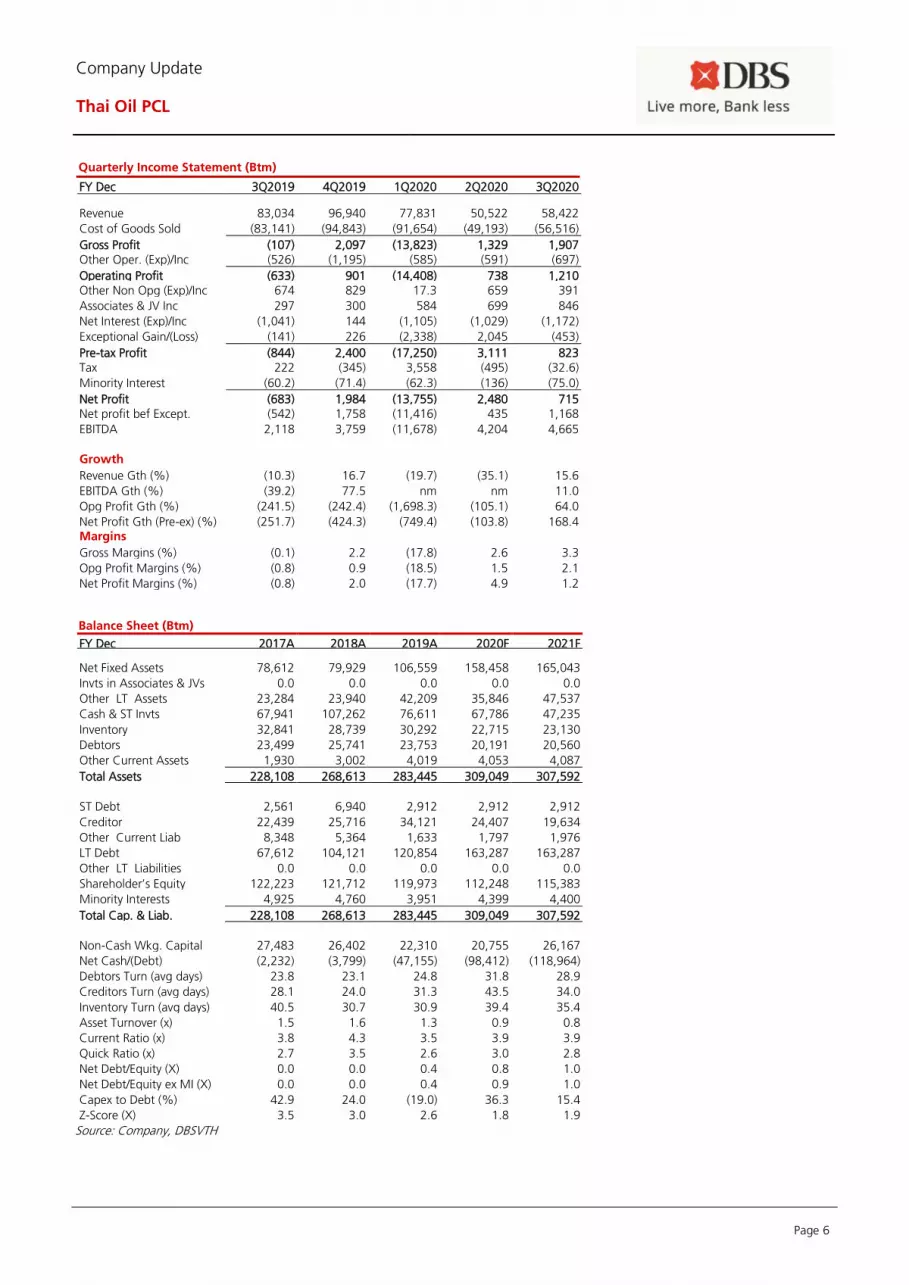
Page 6
Company Update
Thai Oil PCL
Quarterly Income Statement (Btm)
FY Dec 3Q2019 4Q2019 1Q2020 2Q2020 3Q2020
Revenue 83,034 96,940 77,831 50,522 58,422
Cost of Goods Sold (83,141) (94,843) (91,654) (49,193) (56,516)
Gross Profit (107) 2,097 (13,823) 1,329 1,907 Other Oper. (Exp)/Inc (526) (1,195) (585) (591) (697)
Operating Profit (633) 901 (14,408) 738 1,210 Other Non Opg (Exp)/Inc 674 829 17.3 659 391
Associates & JV Inc 297 300 584 699 846
Net Interest (Exp)/Inc (1,041) 144 (1,105) (1,029) (1,172)
Exceptional Gain/(Loss) (141) 226 (2,338) 2,045 (453)
Pre-tax Profit (844) 2,400 (17,250) 3,111 823 Tax 222 (345) 3,558 (495) (32.6)
Minority Interest (60.2) (71.4) (62.3) (136) (75.0)
Net Profit (683) 1,984 (13,755) 2,480 715 Net profit bef Except. (542) 1,758 (11,416) 435 1,168
EBITDA 2,118 3,759 (11,678) 4,204 4,665 Growth
Revenue Gth (%) (10.3) 16.7 (19.7) (35.1) 15.6
EBITDA Gth (%) (39.2) 77.5 nm nm 11.0
Opg Profit Gth (%) (241.5) (242.4) (1,698.3) (105.1) 64.0
Net Profit Gth (Pre-ex) (%) (251.7) (424.3) (749.4) (103.8) 168.4 Margins
Gross Margins (%) (0.1) 2.2 (17.8) 2.6 3.3
Opg Profit Margins (%) (0.8) 0.9 (18.5) 1.5 2.1
Net Profit Margins (%) (0.8) 2.0 (17.7) 4.9 1.2
Balance Sheet (Btm)
FY Dec 2017A 2018A 2019A 2020F 2021F Net Fixed Assets 78,612 79,929 106,559 158,458 165,043
Invts in Associates & JVs 0.0 0.0 0.0 0.0 0.0
Other LT Assets 23,284 23,940 42,209 35,846 47,537
Cash & ST Invts 67,941 107,262 76,611 67,786 47,235
Inventory 32,841 28,739 30,292 22,715 23,130
Debtors 23,499 25,741 23,753 20,191 20,560
Other Current Assets 1,930 3,002 4,019 4,053 4,087
Total Assets 228,108 268,613 283,445 309,049 307,592
ST Debt
2,561 6,940 2,912 2,912 2,912
Creditor 22,439 25,716 34,121 24,407 19,634
Other Current Liab 8,348 5,364 1,633 1,797 1,976
LT Debt 67,612 104,121 120,854 163,287 163,287
Other LT Liabilities 0.0 0.0 0.0 0.0 0.0
Shareholder’s Equity 122,223 121,712 119,973 112,248 115,383
Minority Interests 4,925 4,760 3,951 4,399 4,400
Total Cap. & Liab. 228,108 268,613 283,445 309,049 307,592
Non-Cash Wkg. Capital 27,483 26,402 22,310 20,755 26,167
Net Cash/(Debt) (2,232) (3,799) (47,155) (98,412) (118,964)
Debtors Turn (avg days) 23.8 23.1 24.8 31.8 28.9
Creditors Turn (avg days) 28.1 24.0 31.3 43.5 34.0
Inventory Turn (avg days) 40.5 30.7 30.9 39.4 35.4
Asset Turnover (x) 1.5 1.6 1.3 0.9 0.8
Current Ratio (x) 3.8 4.3 3.5 3.9 3.9
Quick Ratio (x) 2.7 3.5 2.6 3.0 2.8
Net Debt/Equity (X) 0.0 0.0 0.4 0.8 1.0
Net Debt/Equity ex MI (X) 0.0 0.0 0.4 0.9 1.0
Capex to Debt (%) 42.9 24.0 (19.0) 36.3 15.4
Z-Score (X) 3.5 3.0 2.6 1.8 1.9
Source: Company, DBSVTH
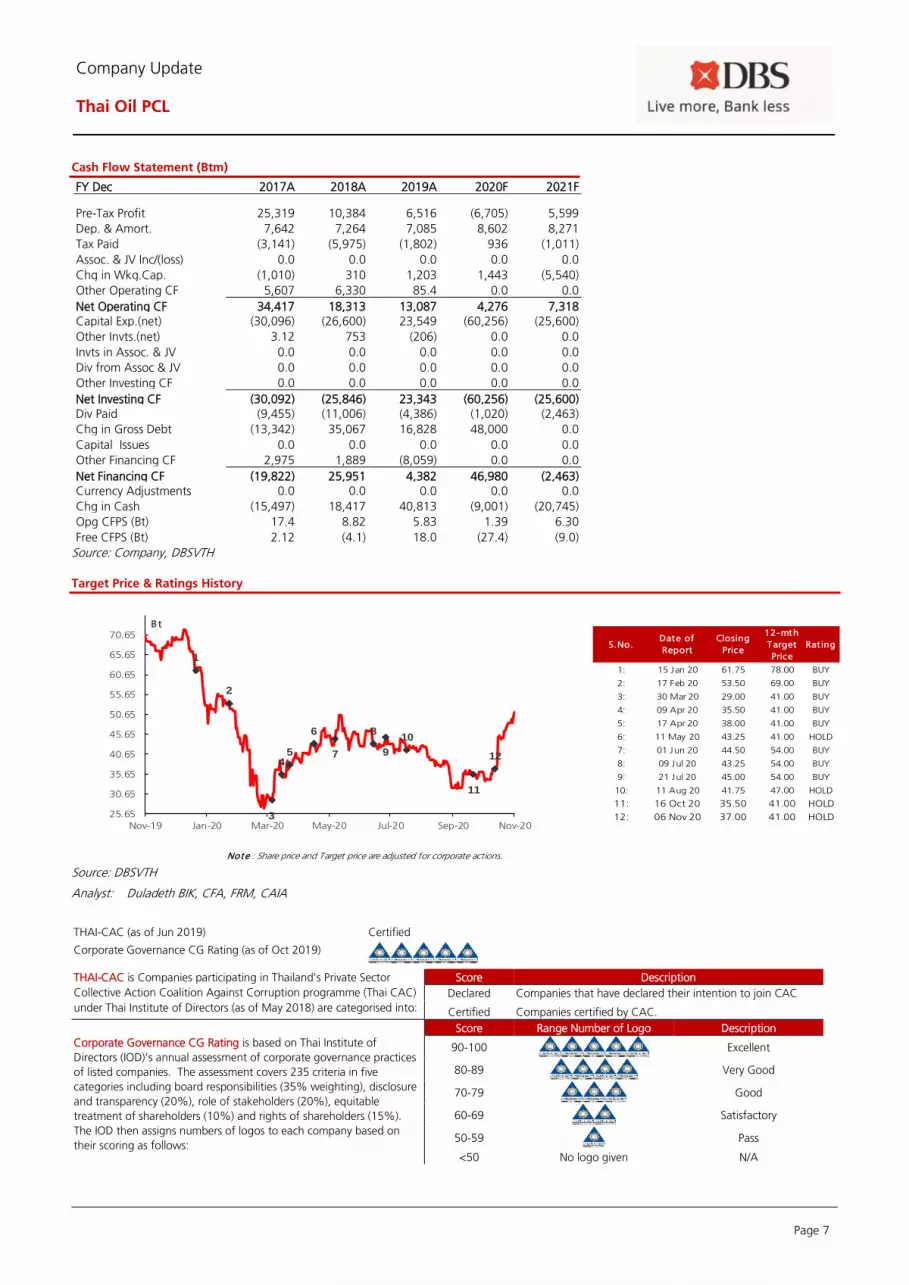
Page 7
Company Update
Thai Oil PCL
Cash Flow Statement (Btm)
FY Dec 2017A 2018A 2019A 2020F 2021F
Pre-Tax Profit 25,319 10,384 6,516 (6,705) 5,599
Dep. & Amort. 7,642 7,264 7,085 8,602 8,271
Tax Paid (3,141) (5,975) (1,802) 936 (1,011)
Assoc. & JV Inc/(loss) 0.0 0.0 0.0 0.0 0.0
Chg in Wkg.Cap. (1,010) 310 1,203 1,443 (5,540)
Other Operating CF 5,607 6,330 85.4 0.0 0.0
Net Operating CF 34,417 18,313 13,087 4,276 7,318 Capital Exp.(net) (30,096) (26,600) 23,549 (60,256) (25,600)
Other Invts.(net) 3.12 753 (206) 0.0 0.0
Invts in Assoc. & JV 0.0 0.0 0.0 0.0 0.0
Div from Assoc & JV 0.0 0.0 0.0 0.0 0.0
Other Investing CF 0.0 0.0 0.0 0.0 0.0
Net Investing CF (30,092) (25,846) 23,343 (60,256) (25,600) Div Paid (9,455) (11,006) (4,386) (1,020) (2,463)
Chg in Gross Debt (13,342) 35,067 16,828 48,000 0.0
Capital Issues 0.0 0.0 0.0 0.0 0.0
Other Financing CF 2,975 1,889 (8,059) 0.0 0.0
Net Financing CF (19,822) 25,951 4,382 46,980 (2,463) Currency Adjustments 0.0 0.0 0.0 0.0 0.0
Chg in Cash (15,497) 18,417 40,813 (9,001) (20,745)
Opg CFPS (Bt) 17.4 8.82 5.83 1.39 6.30
Free CFPS (Bt) 2.12 (4.1) 18.0 (27.4) (9.0)
Source: Company, DBSVTH
Target Price & Ratings History
Source: DBSVTH
Analyst: Duladeth BIK, CFA, FRM, CAIA
THAI-CAC (as of Jun 2019) Certified
Corporate Governance CG Rating (as of Oct 2019)
THAI-CAC is Companies participating in Thailand's Private Sector
Collective Action Coalition Against Corruption programme (Thai CAC)
under Thai Institute of Directors (as of May 2018) are categorised into:
Score Description
Declared Companies that have declared their intention to join CAC
Certified Companies certified by CAC.
Corporate Governance CG Rating is based on Thai Institute of
Directors (IOD)’s annual assessment of corporate governance practices
of listed companies. The assessment covers 235 criteria in five
categories including board responsibilities (35% weighting), disclosure
and transparency (20%), role of stakeholders (20%), equitable
treatment of shareholders (10%) and rights of shareholders (15%).
The IOD then assigns numbers of logos to each company based on
their scoring as follows:
Score Range Number of Logo Description
90-100
Excellent
80-89
Very Good
70-79
Good
60-69
Satisfactory
50-59
Pass
<50 No logo given N/A
S.No.Date of
Report
Closing
Price
12-mth
Target
Price
Rat ing
1: 15 Jan 20 61.75 78.00 BUY
2: 17 Feb 20 53.50 69.00 BUY
3: 30 Mar 20 29.00 41.00 BUY
4: 09 Apr 20 35.50 41.00 BUY
5: 17 Apr 20 38.00 41.00 BUY
6: 11 May 20 43.25 41.00 HOLD
7: 01 Jun 20 44.50 54.00 BUY
8: 09 Jul 20 43.25 54.00 BUY
9: 21 Jul 20 45.00 54.00 BUY
10: 11 Aug 20 41.75 47.00 HOLD
11: 16 Oct 20 35.50 41.00 HOLD
12: 06 Nov 20 37.00 41.00 HOLD
Note : Share price and Target price are adjusted for corporate actions.
1
2
3
45
6
7
8
9
10
11
12
25.65
30.65
35.65
40.65
45.65
50.65
55.65
60.65
65.65
70.65
Nov-19 Jan-20 Mar-20 May-20 Jul-20 Sep-20 Nov-20
Bt
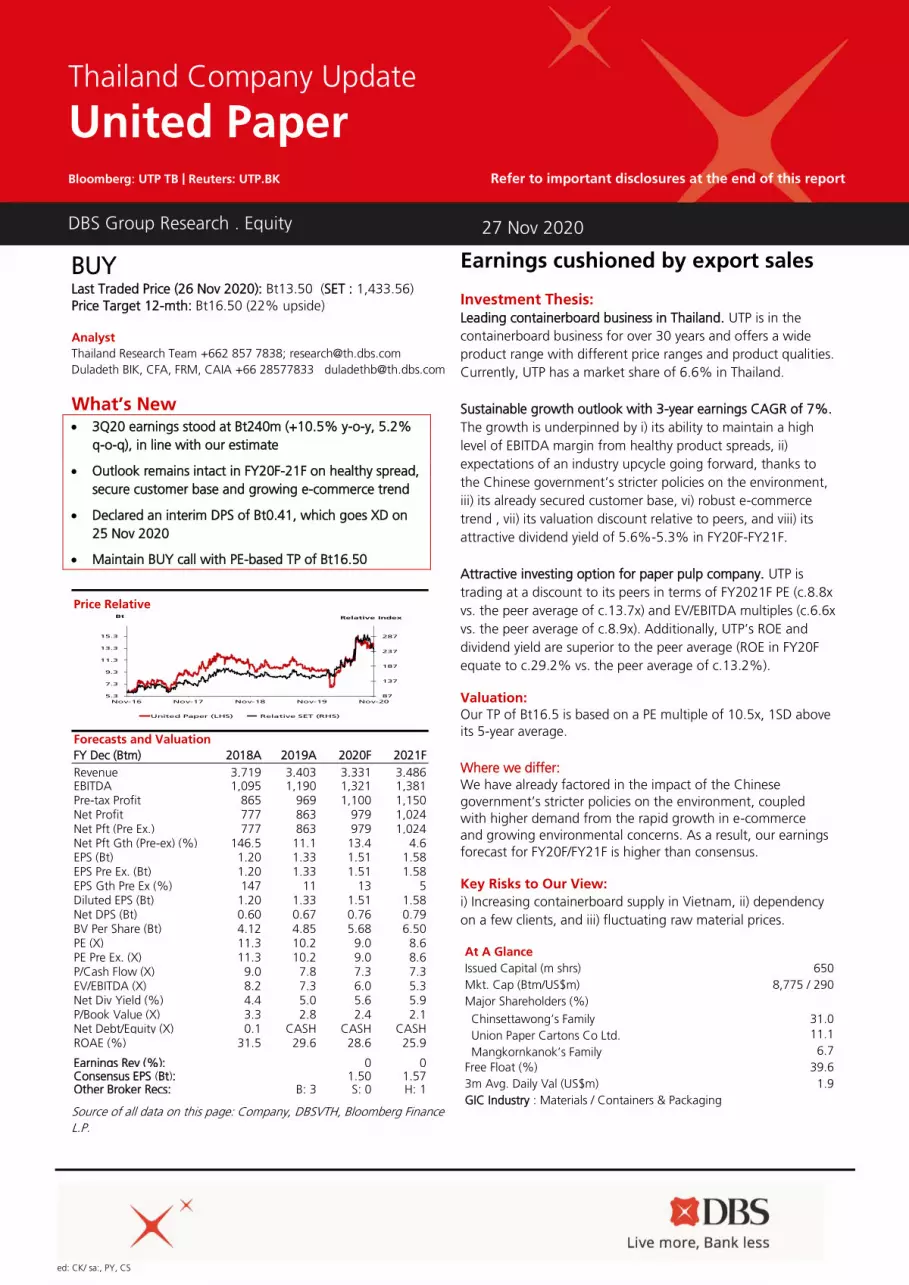
ed: CK/ sa:, PY, CS
BUY Last Traded Price (26 Nov 2020): Bt13.50 (SET : 1,433.56)
Price Target 12-mth: Bt16.50 (22% upside)
Analyst
Thailand Research Team +662 857 7838; [email protected]
Duladeth BIK, CFA, FRM, CAIA +66 28577833 [email protected]
What’s New • 3Q20 earnings stood at Bt240m (+10.5% y-o-y, 5.2%
q-o-q), in line with our estimate
• Outlook remains intact in FY20F-21F on healthy spread,
secure customer base and growing e-commerce trend
• Declared an interim DPS of Bt0.41, which goes XD on
25 Nov 2020
• Maintain BUY call with PE-based TP of Bt16.50
Source of all data on this page: Company, DBSVTH, Bloomberg Finance
L.P.
Earnings cushioned by export sales Investment Thesis: Leading containerboard business in Thailand. UTP is in the
containerboard business for over 30 years and offers a wide
product range with different price ranges and product qualities.
Currently, UTP has a market share of 6.6% in Thailand.
Sustainable growth outlook with 3-year earnings CAGR of 7%.
The growth is underpinned by i) its ability to maintain a high
level of EBITDA margin from healthy product spreads, ii)
expectations of an industry upcycle going forward, thanks to
the Chinese government’s stricter policies on the environment,
iii) its already secured customer base, vi) robust e-commerce
trend , vii) its valuation discount relative to peers, and viii) its
attractive dividend yield of 5.6%-5.3% in FY20F-FY21F.
Attractive investing option for paper pulp company. UTP is
trading at a discount to its peers in terms of FY2021F PE (c.8.8x
vs. the peer average of c.13.7x) and EV/EBITDA multiples (c.6.6x
vs. the peer average of c.8.9x). Additionally, UTP’s ROE and
dividend yield are superior to the peer average (ROE in FY20F
equate to c.29.2% vs. the peer average of c.13.2%). Valuation:
Our TP of Bt16.5 is based on a PE multiple of 10.5x, 1SD above
its 5-year average.
Where we differ:
We have already factored in the impact of the Chinese
government’s stricter policies on the environment, coupled
with higher demand from the rapid growth in e-commerce
and growing environmental concerns. As a result, our earnings
forecast for FY20F/FY21F is higher than consensus. Key Risks to Our View:
i) Increasing containerboard supply in Vietnam, ii) dependency
on a few clients, and iii) fluctuating raw material prices.
At A Glance Issued Capital (m shrs) 650
Mkt. Cap (Btm/US$m) 8,775 / 290
Major Shareholders (%)
Chinsettawong’s Family 31.0
Union Paper Cartons Co Ltd. 11.1
Mangkornkanok’s Family 6.7
Free Float (%) 39.6
3m Avg. Daily Val (US$m) 1.9
GIC Industry : Materials / Containers & Packaging
DBS Group Research . Equity
27 Nov 2020
Thailand Company Update
United Paper Bloomberg: UTP TB | Reuters: UTP.BK Refer to important disclosures at the end of this report
Price Relative
Forecasts and Valuation
FY Dec (Btm) 2018A 2019A 2020F 2021F
Revenue 3,719 3,403 3,331 3,486 EBITDA 1,095 1,190 1,321 1,381 Pre-tax Profit 865 969 1,100 1,150 Net Profit 777 863 979 1,024 Net Pft (Pre Ex.) 777 863 979 1,024 Net Pft Gth (Pre-ex) (%) 146.5 11.1 13.4 4.6 EPS (Bt) 1.20 1.33 1.51 1.58 EPS Pre Ex. (Bt) 1.20 1.33 1.51 1.58 EPS Gth Pre Ex (%) 147 11 13 5 Diluted EPS (Bt) 1.20 1.33 1.51 1.58 Net DPS (Bt) 0.60 0.67 0.76 0.79 BV Per Share (Bt) 4.12 4.85 5.68 6.50 PE (X) 11.3 10.2 9.0 8.6 PE Pre Ex. (X) 11.3 10.2 9.0 8.6 P/Cash Flow (X) 9.0 7.8 7.3 7.3 EV/EBITDA (X) 8.2 7.3 6.0 5.3 Net Div Yield (%) 4.4 5.0 5.6 5.9 P/Book Value (X) 3.3 2.8 2.4 2.1 Net Debt/Equity (X) 0.1 CASH CASH CASH ROAE (%) 31.5 29.6 28.6 25.9 Earnings Rev (%): 0 0 Consensus EPS (Bt): 1.50 1.57 Other Broker Recs: B: 3 S: 0 H: 1
87
137
187
237
287
5.3
7.3
9.3
11.3
13.3
15.3
Nov-16 Nov-17 Nov-18 Nov-19 Nov-20
Relative IndexBt
United Paper (LHS) Relative SET (RHS)
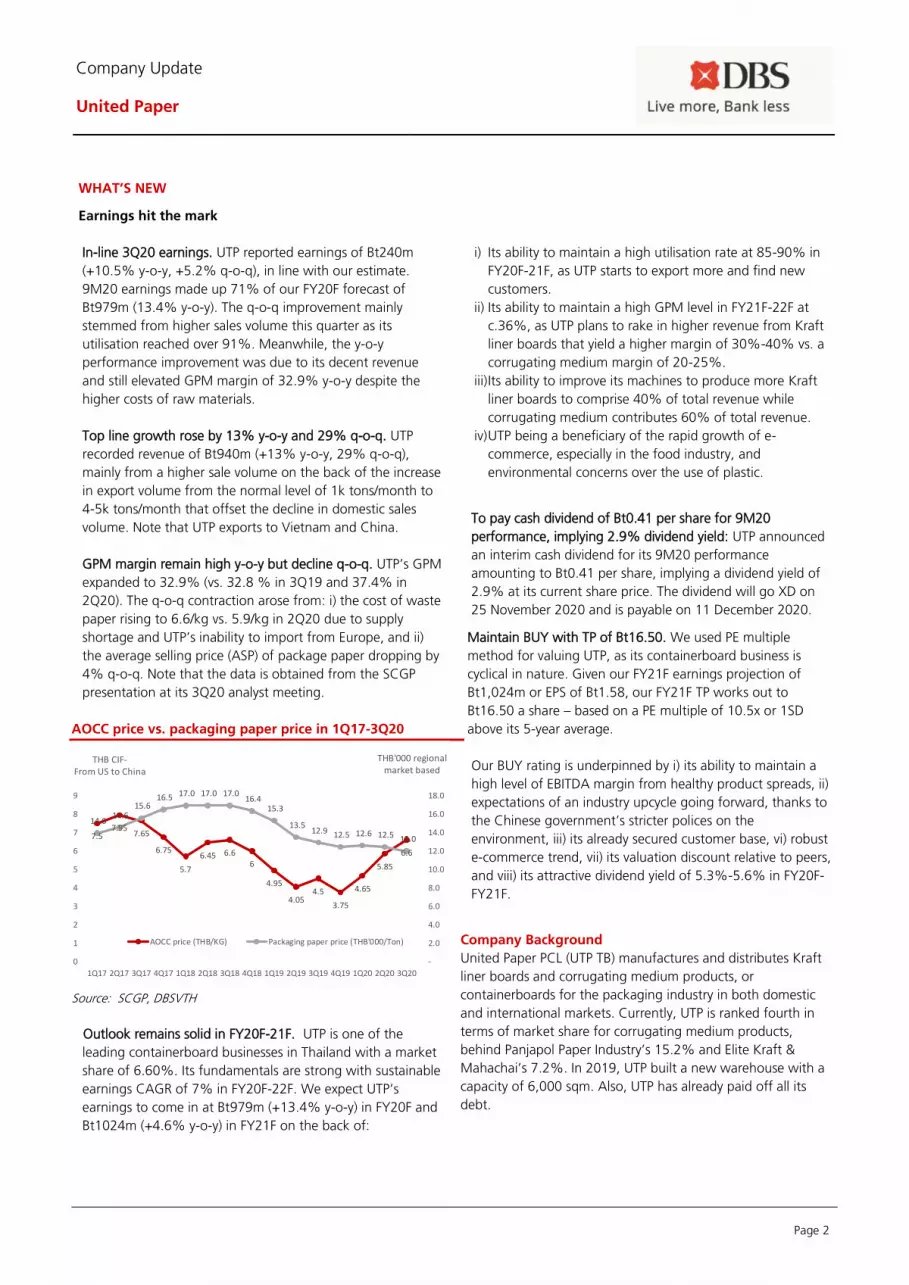
Page 2
Company Update
United Paper
WHAT’S NEW
Earnings hit the mark
In-line 3Q20 earnings. UTP reported earnings of Bt240m
(+10.5% y-o-y, +5.2% q-o-q), in line with our estimate.
9M20 earnings made up 71% of our FY20F forecast of
Bt979m (13.4% y-o-y). The q-o-q improvement mainly
stemmed from higher sales volume this quarter as its
utilisation reached over 91%. Meanwhile, the y-o-y
performance improvement was due to its decent revenue
and still elevated GPM margin of 32.9% y-o-y despite the
higher costs of raw materials.
Top line growth rose by 13% y-o-y and 29% q-o-q. UTP
recorded revenue of Bt940m (+13% y-o-y, 29% q-o-q),
mainly from a higher sale volume on the back of the increase
in export volume from the normal level of 1k tons/month to
4-5k tons/month that offset the decline in domestic sales
volume. Note that UTP exports to Vietnam and China.
GPM margin remain high y-o-y but decline q-o-q. UTP’s GPM
expanded to 32.9% (vs. 32.8 % in 3Q19 and 37.4% in
2Q20). The q-o-q contraction arose from: i) the cost of waste
paper rising to 6.6/kg vs. 5.9/kg in 2Q20 due to supply
shortage and UTP’s inability to import from Europe, and ii)
the average selling price (ASP) of package paper dropping by
4% q-o-q. Note that the data is obtained from the SCGP
presentation at its 3Q20 analyst meeting.
AOCC price vs. packaging paper price in 1Q17-3Q20
Source: SCGP, DBSVTH
Outlook remains solid in FY20F-21F. UTP is one of the
leading containerboard businesses in Thailand with a market
share of 6.60%. Its fundamentals are strong with sustainable
earnings CAGR of 7% in FY20F-22F. We expect UTP’s
earnings to come in at Bt979m (+13.4% y-o-y) in FY20F and
Bt1024m (+4.6% y-o-y) in FY21F on the back of:
i) Its ability to maintain a high utilisation rate at 85-90% in
FY20F-21F, as UTP starts to export more and find new
customers.
ii) Its ability to maintain a high GPM level in FY21F-22F at
c.36%, as UTP plans to rake in higher revenue from Kraft
liner boards that yield a higher margin of 30%-40% vs. a
corrugating medium margin of 20-25%.
iii) Its ability to improve its machines to produce more Kraft
liner boards to comprise 40% of total revenue while
corrugating medium contributes 60% of total revenue.
iv) UTP being a beneficiary of the rapid growth of e-
commerce, especially in the food industry, and
environmental concerns over the use of plastic.
To pay cash dividend of Bt0.41 per share for 9M20
performance, implying 2.9% dividend yield: UTP announced
an interim cash dividend for its 9M20 performance
amounting to Bt0.41 per share, implying a dividend yield of
2.9% at its current share price. The dividend will go XD on
25 November 2020 and is payable on 11 December 2020.
Maintain BUY with TP of Bt16.50. We used PE multiple
method for valuing UTP, as its containerboard business is
cyclical in nature. Given our FY21F earnings projection of
Bt1,024m or EPS of Bt1.58, our FY21F TP works out to
Bt16.50 a share – based on a PE multiple of 10.5x or 1SD
above its 5-year average.
Our BUY rating is underpinned by i) its ability to maintain a
high level of EBITDA margin from healthy product spreads, ii)
expectations of an industry upcycle going forward, thanks to
the Chinese government’s stricter polices on the
environment, iii) its already secured customer base, vi) robust
e-commerce trend, vii) its valuation discount relative to peers,
and viii) its attractive dividend yield of 5.3%-5.6% in FY20F-
FY21F.
Company Background
United Paper PCL (UTP TB) manufactures and distributes Kraft
liner boards and corrugating medium products, or
containerboards for the packaging industry in both domestic
and international markets. Currently, UTP is ranked fourth in
terms of market share for corrugating medium products,
behind Panjapol Paper Industry’s 15.2% and Elite Kraft &
Mahachai’s 7.2%. In 2019, UTP built a new warehouse with a
capacity of 6,000 sqm. Also, UTP has already paid off all its
debt.
7.57.95
7.65
6.75
5.7
6.45 6.66
4.95
4.054.5
3.75
4.65
5.85
6.6
14.0 14.6
15.6 16.5 17.0 17.0 17.0
16.4 15.3
13.5 12.9 12.5 12.6 12.5 12.0
-
2.0
4.0
6.0
8.0
10.0
12.0
14.0
16.0
18.0
0
1
2
3
4
5
6
7
8
9
1Q17 2Q17 3Q17 4Q17 1Q18 2Q18 3Q18 4Q18 1Q19 2Q19 3Q19 4Q19 1Q20 2Q20 3Q20
THB CIF-From US to China
THB'000 regional market based
AOCC price (THB/KG) Packaging paper price (THB'000/Ton)
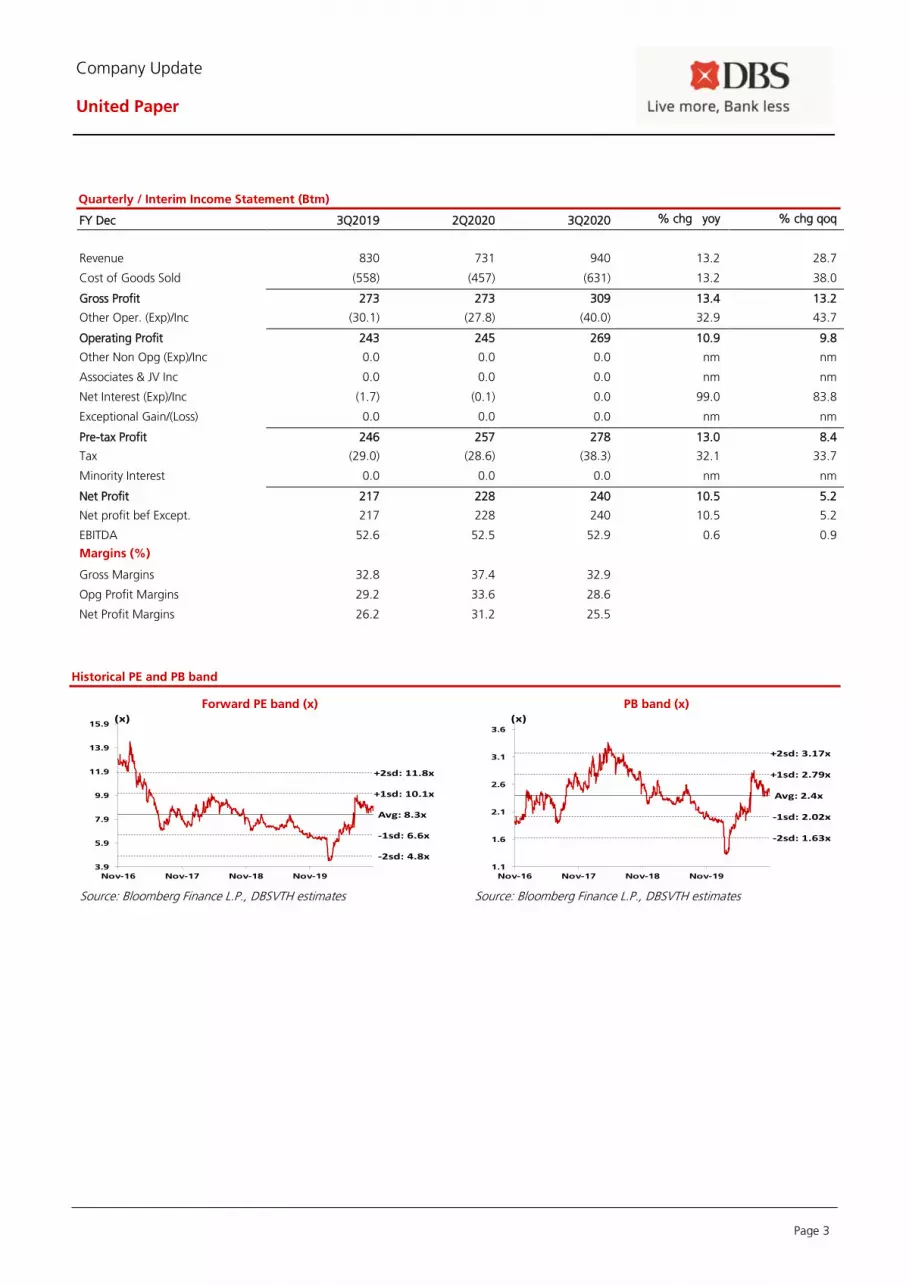
Page 3
Company Update
United Paper
Quarterly / Interim Income Statement (Btm)
FY Dec 3Q2019 2Q2020 3Q2020 % chg yoy % chg qoq
Revenue 830 731 940 13.2 28.7
Cost of Goods Sold (558) (457) (631) 13.2 38.0
Gross Profit 273 273 309 13.4 13.2
Other Oper. (Exp)/Inc (30.1) (27.8) (40.0) 32.9 43.7
Operating Profit 243 245 269 10.9 9.8
Other Non Opg (Exp)/Inc 0.0 0.0 0.0 nm nm
Associates & JV Inc 0.0 0.0 0.0 nm nm
Net Interest (Exp)/Inc (1.7) (0.1) 0.0 99.0 83.8
Exceptional Gain/(Loss) 0.0 0.0 0.0 nm nm
Pre-tax Profit 246 257 278 13.0 8.4
Tax (29.0) (28.6) (38.3) 32.1 33.7
Minority Interest 0.0 0.0 0.0 nm nm
Net Profit 217 228 240 10.5 5.2
Net profit bef Except. 217 228 240 10.5 5.2
EBITDA 52.6 52.5 52.9 0.6 0.9
Margins (%)
Gross Margins 32.8 37.4 32.9
Opg Profit Margins 29.2 33.6 28.6
Net Profit Margins 26.2 31.2 25.5
Historical PE and PB band
Forward PE band (x) PB band (x)
Source: Bloomberg Finance L.P., DBSVTH estimates Source: Bloomberg Finance L.P., DBSVTH estimates
Avg: 8.3x
+1sd: 10.1x
+2sd: 11.8x
-1sd: 6.6x
-2sd: 4.8x3.9
5.9
7.9
9.9
11.9
13.9
15.9
Nov-16 Nov-17 Nov-18 Nov-19
(x)
Avg: 2.4x
+1sd: 2.79x
+2sd: 3.17x
-1sd: 2.02x
-2sd: 1.63x
1.1
1.6
2.1
2.6
3.1
3.6
Nov-16 Nov-17 Nov-18 Nov-19
(x)
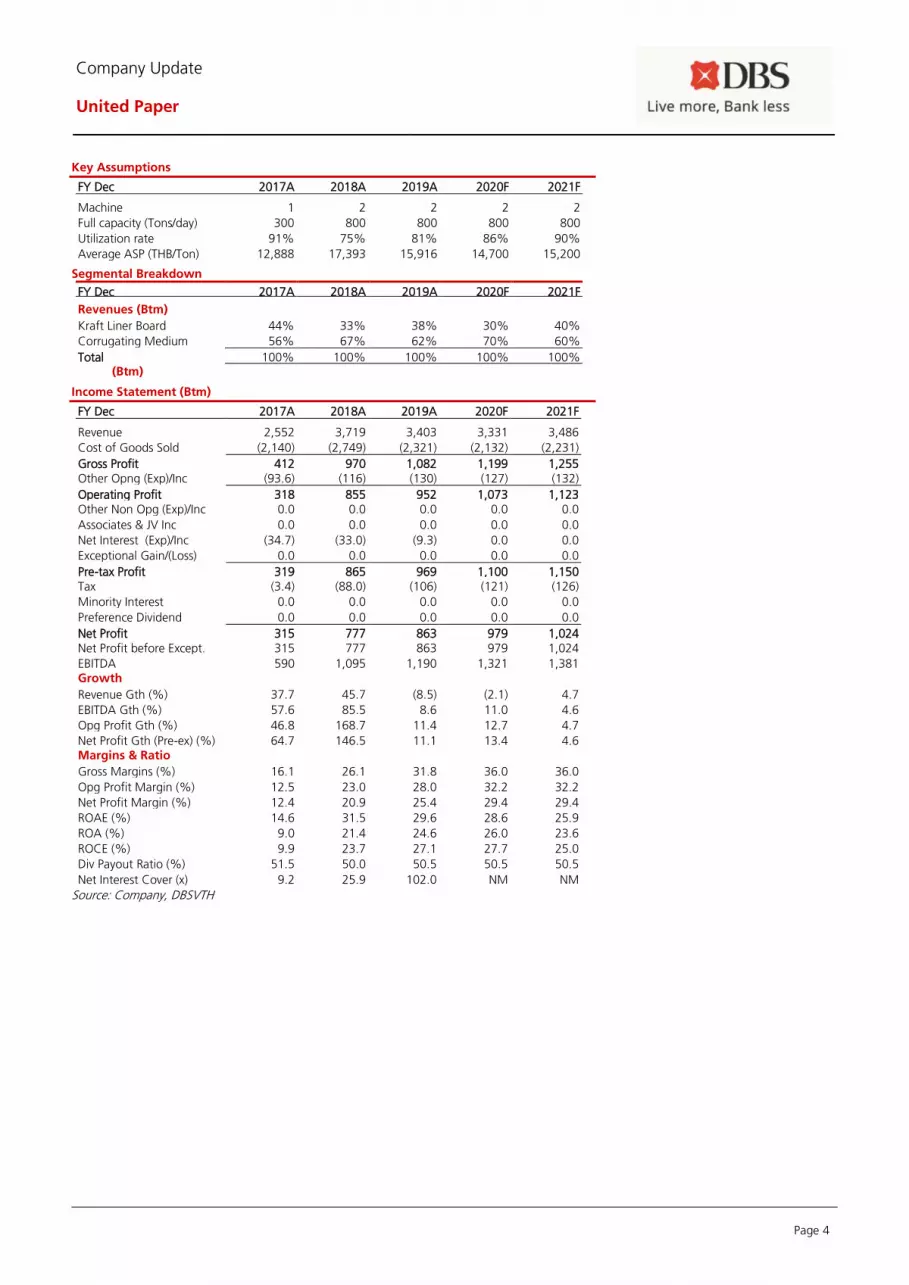
Page 4
Company Update
United Paper
Key Assumptions
FY Dec 2017A 2018A 2019A 2020F 2021F
Machine 1 2 2 2 2
Full capacity (Tons/day) 300 800 800 800 800
Utilization rate 91% 75% 81% 86% 90%
Average ASP (THB/Ton) 12,888 17,393 15,916 14,700 15,200
Segmental Breakdown
FY Dec 2017A 2018A 2019A 2020F 2021F Revenues (Btm)
Kraft Liner Board 44% 33% 38% 30% 40%
Corrugating Medium 56% 67% 62% 70% 60%
Total 100% 100% 100% 100% 100% (Btm)
Income Statement (Btm)
FY Dec 2017A 2018A 2019A 2020F 2021F
Revenue 2,552 3,719 3,403 3,331 3,486
Cost of Goods Sold (2,140) (2,749) (2,321) (2,132) (2,231)
Gross Profit 412 970 1,082 1,199 1,255 Other Opng (Exp)/Inc (93.6) (116) (130) (127) (132)
Operating Profit 318 855 952 1,073 1,123 Other Non Opg (Exp)/Inc 0.0 0.0 0.0 0.0 0.0
Associates & JV Inc 0.0 0.0 0.0 0.0 0.0
Net Interest (Exp)/Inc (34.7) (33.0) (9.3) 0.0 0.0
Exceptional Gain/(Loss) 0.0 0.0 0.0 0.0 0.0
Pre-tax Profit 319 865 969 1,100 1,150 Tax (3.4) (88.0) (106) (121) (126)
Minority Interest 0.0 0.0 0.0 0.0 0.0
Preference Dividend 0.0 0.0 0.0 0.0 0.0
Net Profit 315 777 863 979 1,024 Net Profit before Except. 315 777 863 979 1,024
EBITDA 590 1,095 1,190 1,321 1,381 Growth
Revenue Gth (%) 37.7 45.7 (8.5) (2.1) 4.7
EBITDA Gth (%) 57.6 85.5 8.6 11.0 4.6
Opg Profit Gth (%) 46.8 168.7 11.4 12.7 4.7
Net Profit Gth (Pre-ex) (%) 64.7 146.5 11.1 13.4 4.6 Margins & Ratio
Gross Margins (%) 16.1 26.1 31.8 36.0 36.0
Opg Profit Margin (%) 12.5 23.0 28.0 32.2 32.2
Net Profit Margin (%) 12.4 20.9 25.4 29.4 29.4
ROAE (%) 14.6 31.5 29.6 28.6 25.9
ROA (%) 9.0 21.4 24.6 26.0 23.6
ROCE (%) 9.9 23.7 27.1 27.7 25.0
Div Payout Ratio (%) 51.5 50.0 50.5 50.5 50.5
Net Interest Cover (x) 9.2 25.9 102.0 NM NM
Source: Company, DBSVTH
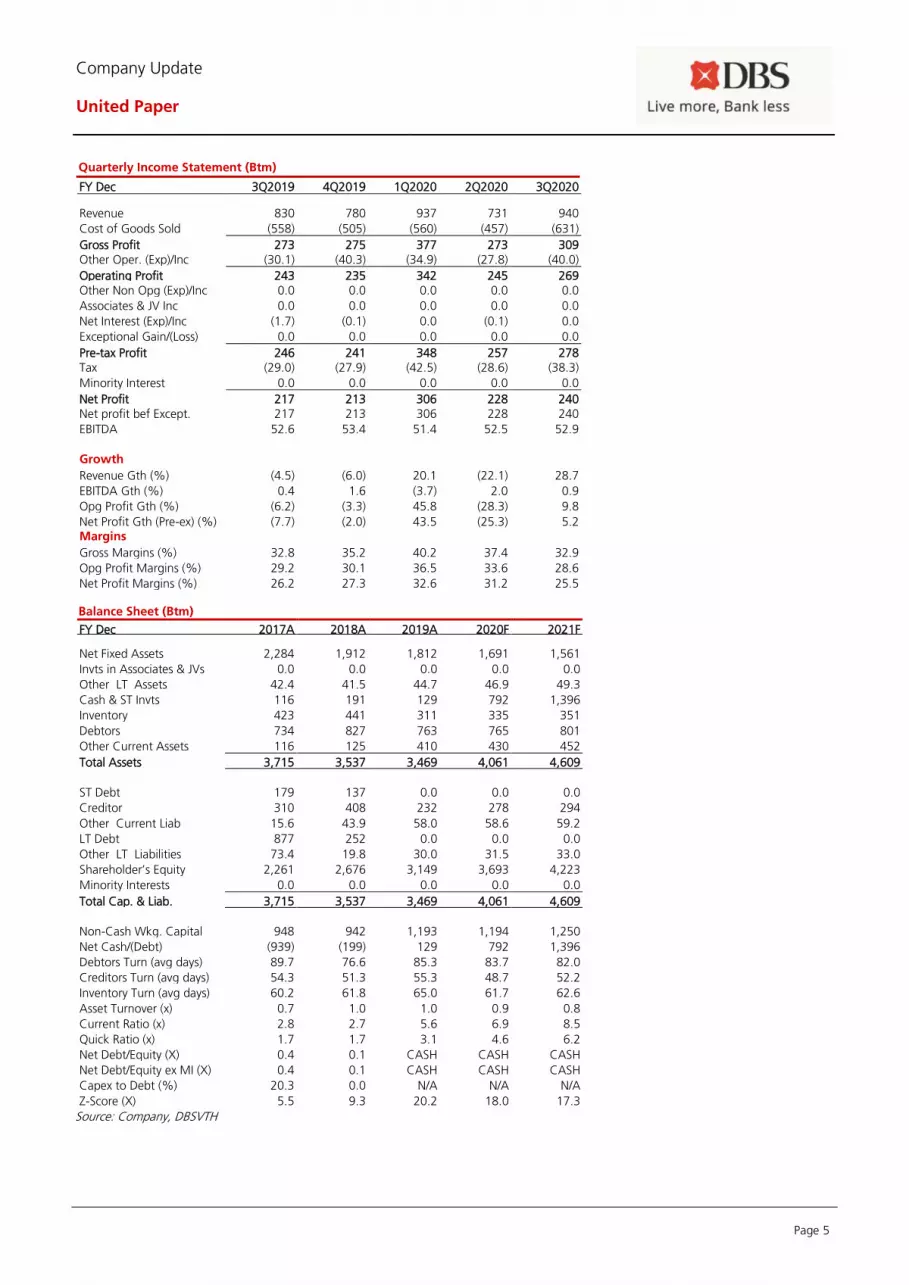
Page 5
Company Update
United Paper
Quarterly Income Statement (Btm)
FY Dec 3Q2019 4Q2019 1Q2020 2Q2020 3Q2020
Revenue 830 780 937 731 940
Cost of Goods Sold (558) (505) (560) (457) (631)
Gross Profit 273 275 377 273 309 Other Oper. (Exp)/Inc (30.1) (40.3) (34.9) (27.8) (40.0)
Operating Profit 243 235 342 245 269 Other Non Opg (Exp)/Inc 0.0 0.0 0.0 0.0 0.0
Associates & JV Inc 0.0 0.0 0.0 0.0 0.0
Net Interest (Exp)/Inc (1.7) (0.1) 0.0 (0.1) 0.0
Exceptional Gain/(Loss) 0.0 0.0 0.0 0.0 0.0
Pre-tax Profit 246 241 348 257 278 Tax (29.0) (27.9) (42.5) (28.6) (38.3)
Minority Interest 0.0 0.0 0.0 0.0 0.0
Net Profit 217 213 306 228 240 Net profit bef Except. 217 213 306 228 240
EBITDA 52.6 53.4 51.4 52.5 52.9 Growth
Revenue Gth (%) (4.5) (6.0) 20.1 (22.1) 28.7
EBITDA Gth (%) 0.4 1.6 (3.7) 2.0 0.9
Opg Profit Gth (%) (6.2) (3.3) 45.8 (28.3) 9.8
Net Profit Gth (Pre-ex) (%) (7.7) (2.0) 43.5 (25.3) 5.2 Margins
Gross Margins (%) 32.8 35.2 40.2 37.4 32.9
Opg Profit Margins (%) 29.2 30.1 36.5 33.6 28.6
Net Profit Margins (%) 26.2 27.3 32.6 31.2 25.5
Balance Sheet (Btm)
FY Dec 2017A 2018A 2019A 2020F 2021F Net Fixed Assets 2,284 1,912 1,812 1,691 1,561
Invts in Associates & JVs 0.0 0.0 0.0 0.0 0.0
Other LT Assets 42.4 41.5 44.7 46.9 49.3
Cash & ST Invts 116 191 129 792 1,396
Inventory 423 441 311 335 351
Debtors 734 827 763 765 801
Other Current Assets 116 125 410 430 452
Total Assets 3,715 3,537 3,469 4,061 4,609
ST Debt
179 137 0.0 0.0 0.0
Creditor 310 408 232 278 294
Other Current Liab 15.6 43.9 58.0 58.6 59.2
LT Debt 877 252 0.0 0.0 0.0
Other LT Liabilities 73.4 19.8 30.0 31.5 33.0
Shareholder’s Equity 2,261 2,676 3,149 3,693 4,223
Minority Interests 0.0 0.0 0.0 0.0 0.0
Total Cap. & Liab. 3,715 3,537 3,469 4,061 4,609
Non-Cash Wkg. Capital 948 942 1,193 1,194 1,250
Net Cash/(Debt) (939) (199) 129 792 1,396
Debtors Turn (avg days) 89.7 76.6 85.3 83.7 82.0
Creditors Turn (avg days) 54.3 51.3 55.3 48.7 52.2
Inventory Turn (avg days) 60.2 61.8 65.0 61.7 62.6
Asset Turnover (x) 0.7 1.0 1.0 0.9 0.8
Current Ratio (x) 2.8 2.7 5.6 6.9 8.5
Quick Ratio (x) 1.7 1.7 3.1 4.6 6.2
Net Debt/Equity (X) 0.4 0.1 CASH CASH CASH
Net Debt/Equity ex MI (X) 0.4 0.1 CASH CASH CASH
Capex to Debt (%) 20.3 0.0 N/A N/A N/A
Z-Score (X) 5.5 9.3 20.2 18.0 17.3
Source: Company, DBSVTH

Page 6
Company Update
United Paper
Cash Flow Statement (Btm)
FY Dec 2017A 2018A 2019A 2020F 2021F
Pre-Tax Profit 319 865 969 1,100 1,150
Dep. & Amort. 237 197 211 221 231
Tax Paid 0.0 0.0 0.0 0.0 0.0
Assoc. & JV Inc/(loss) 0.0 0.0 0.0 0.0 0.0
Chg in Wkg.Cap. 0.0 0.0 0.0 0.0 0.0
Other Operating CF (357) (92.2) (50.8) (121) (182)
Net Operating CF 199 970 1,130 1,199 1,199 Capital Exp.(net) (214) 0.0 (280) (100.0) (100.0)
Other Invts.(net) 3.00 (67.0) (133) 0.0 0.0
Invts in Assoc. & JV 0.0 0.0 0.0 0.0 0.0
Div from Assoc & JV 0.0 0.0 0.0 0.0 0.0
Other Investing CF 0.48 0.0 0.68 (2.2) (2.4)
Net Investing CF (211) (67.0) (412) (102) (102) Div Paid (97.5) (163) (390) (436) (494)
Chg in Gross Debt 203 (667) (389) 0.0 0.0
Capital Issues 0.0 0.0 0.0 0.0 0.0
Other Financing CF 0.0 0.0 0.0 1.50 1.57
Net Financing CF 106 (829) (779) (434) (492) Currency Adjustments 0.0 0.0 0.0 0.0 0.0
Chg in Cash 93.6 73.9 (61.5) 663 604
Opg CFPS (Bt) 0.31 1.49 1.74 1.84 1.84
Free CFPS (Bt) 0.0 1.49 1.31 1.69 1.69
Source: Company, DBSVTH
Target Price & Ratings History
Source: DBSVTH
Analyst: Thailand Research Team
Duladeth BIK, CFA, FRM, CAIA
THAI-CAC (as of Jun 2019) n/a
Corporate Governance CG Rating (as of Oct 2019)
THAI-CAC is Companies participating in Thailand's Private Sector
Collective Action Coalition Against Corruption programme (Thai CAC)
under Thai Institute of Directors (as of May 2018) are categorised into:
Score Description
Declared Companies that have declared their intention to join CAC
Certified Companies certified by CAC.
Corporate Governance CG Rating is based on Thai Institute of
Directors (IOD)’s annual assessment of corporate governance practices
of listed companies. The assessment covers 235 criteria in five
categories including board responsibilities (35% weighting), disclosure
and transparency (20%), role of stakeholders (20%), equitable
treatment of shareholders (10%) and rights of shareholders (15%).
The IOD then assigns numbers of logos to each company based on
their scoring as follows:
Score Range Number of Logo Description
90-100
Excellent
80-89
Very Good
70-79
Good
60-69
Satisfactory
50-59
Pass
<50 No logo given N/A
S.No.Date of
Report
Closing
Price
12-mth
Target
Price
Rat ing
1: 03 Aug 20 12.50 13.80 BUY
2: 11 Aug 20 14.60 13.80 BUY
3: 10 Sep 20 14.60 16.50 BUY
4: 14 Oct 20 14.20 16.50 BUY
Note : Share price and Target price are adjusted for corporate actions.
1
2
3
4
6.36
7.36
8.36
9.36
10.36
11.36
12.36
13.36
14.36
15.36
Nov-19 Jan-20 Mar-20 May-20 Jul-20 Sep-20 Nov-20
Bt

Asian Insights SparX: Resilent packaging
demand while sustainability remains intact
Chemical/Packaging/Paper
Page 38
DBSVTH recommendations are based on an Absolute Total Return* Rating system, defined as follows:
STRONG BUY (>20% total return over the next 3 months, with identifiable share price catalysts within this time frame)
BUY (>15% total return over the next 12 months for small caps, >10% for large caps)
HOLD (-10% to +15% total return over the next 12 months for small caps, -10% to +10% for large caps)
FULLY VALUED (negative total return, i.e., > -10% over the next 12 months)
SELL (negative total return of > -20% over the next 3 months, with identifiable share price catalysts within this time frame)
*Share price appreciation + dividends
Completed Date: 27 Nov 2020 06:07:27 (THA)
Dissemination Date: 27 Nov 2020 06:41:24 (THA)
Sources for all charts and tables are DBSVTH unless otherwise specified.
GENERAL DISCLOSURE/DISCLAIMER
This report is prepared by DBS Vickers Securities (Thailand) Co Ltd (''DBSVTH''). This report is solely intended for the clients of DBS Bank Ltd, its
respective connected and associated corporations and affiliates only and no part of this document may be (i) copied, photocopied or duplicated in
any form or by any means or (ii) redistributed without the prior written consent of DBS Vickers Securities (Thailand) Co Ltd (''DBSVTH'').
The research set out in this report is based on information obtained from sources believed to be reliable, but we (which collectively refers to DBS
Bank Ltd, its respective connected and associated corporations, affiliates and their respective directors, officers, employees and agents (collectively,
the “DBS Group”) have not conducted due diligence on any of the companies, verified any information or sources or taken into account any other
factors which we may consider to be relevant or appropriate in preparing the research. Accordingly, we do not make any representation or
warranty as to the accuracy, completeness or correctness of the research set out in this report. Opinions expressed are subject to change without
notice. This research is prepared for general circulation. Any recommendation contained in this document does not have regard to the specific
investment objectives, financial situation and the particular needs of any specific addressee. This document is for the information of addressees
only and is not to be taken in substitution for the exercise of judgement by addressees, who should obtain separate independent legal or financial
advice. The DBS Group accepts no liability whatsoever for any direct, indirect and/or consequential loss (including any claims for loss of profit)
arising from any use of and/or reliance upon this document and/or further communication given in relation to this document. This document is not
to be construed as an offer or a solicitation of an offer to buy or sell any securities. The DBS Group, along with its affiliates and/or persons
associated with any of them may from time to time have interests in the securities mentioned in this document. The DBS Group, may have
positions in, and may effect transactions in securities mentioned herein and may also perform or seek to perform broking, investment banking and
other banking services for these companies.
Any valuations, opinions, estimates, forecasts, ratings or risk assessments herein constitutes a judgment as of the date of this report, and there can
be no assurance that future results or events will be consistent with any such valuations, opinions, estimates, forecasts, ratings or risk assessments.
The information in this document is subject to change without notice, its accuracy is not guaranteed, it may be incomplete or condensed, it may
not contain all material information concerning the company (or companies) referred to in this report and the DBS Group is under no obligation to
update the information in this report.
This publication has not been reviewed or authorized by any regulatory authority in Singapore, Hong Kong or elsewhere. There is no planned
schedule or frequency for updating research publication relating to any issuer.
The valuations, opinions, estimates, forecasts, ratings or risk assessments described in this report were based upon a number of estimates and
assumptions and are inherently subject to significant uncertainties and contingencies. It can be expected that one or more of the estimates on
which the valuations, opinions, estimates, forecasts, ratings or risk assessments were based will not materialize or will vary significantly from actual
results. Therefore, the inclusion of the valuations, opinions, estimates, forecasts, ratings or risk assessments described herein IS NOT TO BE RELIED
UPON as a representation and/or warranty by the DBS Group (and/or any persons associated with the aforesaid entities), that:
(a) such valuations, opinions, estimates, forecasts, ratings or risk assessments or their underlying assumptions will be achieved, and
(b) there is any assurance that future results or events will be consistent with any such valuations, opinions, estimates, forecasts, ratings or risk
assessments stated therein.
Asian Insights SparX: Resilent packaging
demand while sustainability remains intact
Chemical/Packaging/Paper
Page 39
Please contact the primary analyst for valuation methodologies and assumptions associated with the covered companies or price targets.
Any assumptions made in this report that refers to commodities, are for the purposes of making forecasts for the company (or companies)
mentioned herein. They are not to be construed as recommendations to trade in the physical commodity or in the futures contract relating to the
commodity referred to in this report.
DBSVUSA, a US-registered broker-dealer, does not have its own investment banking or research department, has not participated in any public
offering of securities as a manager or co-manager or in any other investment banking transaction in the past twelve months and does not engage
in market-making.
ANALYST CERTIFICATION
The research analyst(s) primarily responsible for the content of this research report, in part or in whole, certifies that the views about the
companies and their securities expressed in this report accurately reflect his/her personal views. The analyst(s) also certifies that no part of his/her
compensation was, is, or will be, directly or indirectly, related to specific recommendations or views expressed in the report. The research analyst (s)
primarily responsible for the content of this research report, in part or in whole, certifies that he or his associate1 does not serve as an officer of the
issuer or the new listing applicant (which includes in the case of a real estate investment trust, an officer of the management company of the real
estate investment trust; and in the case of any other entity, an officer or its equivalent counterparty of the entity who is responsible for the
management of the issuer or the new listing applicant) and the research analyst(s) primarily responsible for the content of this research report or
his associate does not have financial interests2 in relation to an issuer or a new listing applicant that the analyst reviews. DBS Group has
procedures in place to eliminate, avoid and manage any potential conflicts of interests that may arise in connection with the production of
research reports. The research analyst(s) responsible for this report operates as part of a separate and independent team to the investment
banking function of the DBS Group and procedures are in place to ensure that confidential information held by either the research or investment
banking function is handled appropriately. There is no direct link of DBS Group's compensation to any specific investment banking function of the
DBS Group.
COMPANY-SPECIFIC / REGULATORY DISCLOSURES
1. DBS Bank Ltd, DBS HK, DBS Vickers Securities (Singapore) Pte Ltd (''DBSVS'') or their subsidiaries and/or other affiliates have
proprietary positions in Indorama Ventures, IRPC PCL, PTT Global Chemical, Siam Cement, Thai Oil PCL recommended in this report
as of 31 Oct 2020.
2. Neither DBS Bank Ltd nor DBS HK market makes in equity securities of the issuer(s) or company(ies) mentioned in this Research
Report.
Compensation for investment banking services:
1. DBS Bank Ltd, DBS HK, DBSVS their subsidiaries and/or other affiliates of DBSVUSA have received compensation, within the past 12
months for investment banking services from SCG Packaging as of 31 Oct 2020
2. DBS Bank Ltd, DBS HK, DBSVS, their subsidiaries and/or other affiliates of DBSVUSA have managed or co-managed a public offering
of securities for SCG Packagingin the past 12 months, as of 31 Oct 2020
3. DBSVUSA does not have its own investment banking or research department, nor has it participated in any public offering of
securities as a manager or co-manager or in any other investment banking transaction in the past twelve months. Any US persons
wishing to obtain further information, including any clarification on disclosures in this disclaimer, or to effect a transaction in any
security discussed in this document should contact DBSVUSA exclusively.
Disclosure of previous investment recommendation produced:
4. DBS Bank Ltd, DBS Vickers Securities (Singapore) Pte Ltd (''DBSVS''), their subsidiaries and/or other affiliates may have published
other investment recommendations in respect of the same securities / instruments recommended in this research report during the
preceding 12 months. Please contact the primary analyst listed in the first page of this report to view previous investment
recommendations published by DBS Bank Ltd, DBS Vickers Securities (Singapore) Pte Ltd (''DBSVS''), their subsidiaries and/or other
affiliates in the preceding 12 months.
1 An associate is defined as (i) the spouse, or any minor child (natural or adopted) or minor step-child, of the analyst; (ii) the trustee of a trust of
which the analyst, his spouse, minor child (natural or adopted) or minor step-child, is a beneficiary or discretionary object; or (iii) another person
accustomed or obliged to act in accordance with the directions or instructions of the analyst.
2 Financial interest is defined as interests that are commonly known financial interest, such as investment in the securities in respect of an issuer or a
new listing applicant, or financial accommodation arrangement between the issuer or the new listing applicant and the firm or analysis. This term
does not include commercial lending conducted at arm's length, or investments in any collective investment scheme other than an issuer or new
listing applicant notwithstanding the fact that the scheme has investments in securities in respect of an issuer or a new listing applicant.
Asian Insights SparX: Resilent packaging
demand while sustainability remains intact
Chemical/Packaging/Paper
Page 40
RESTRICTIONS ON DISTRIBUTION
General This report is not directed to, or intended for distribution to or use by, any person or entity who is a citizen or resident of or
located in any locality, state, country or other jurisdiction where such distribution, publication, availability or use would be
contrary to law or regulation.
Australia This report is being distributed in Australia by DBS Bank Ltd, DBSVS or DBSV HK. DBS Bank Ltd holds Australian Financial
Services Licence no. 475946.
DBSVS and DBSV HK are exempted from the requirement to hold an Australian Financial Services Licence under the
Corporation Act 2001 (“CA”) in respect of financial services provided to the recipients. Both DBS Bank Ltd and DBSVS are
regulated by the Monetary Authority of Singapore under the laws of Singapore, and DBSV HK is regulated by the Hong
Kong Securities and Futures Commission under the laws of Hong Kong, which differ from Australian laws.
Distribution of this report is intended only for “wholesale investors” within the meaning of the CA.
Hong Kong This report has been prepared by an entity(ies) which is not licensed by the Hong Kong Securities and Futures Commission
to carry on the regulated activity of advising on securities pursuant to the Securities and Futures Ordinance (Chapter 571 of
the Laws of Hong Kong). This report is being distributed in Hong Kong and is attributable to DBS Bank (Hong Kong)
Limited, a registered institution registered with the Hong Kong Securities and Futures Commission to carry on the regulated
activity of advising on securities pursuant to the Securities and Futures Ordinance (Chapter 571 of the Laws of Hong Kong).
DBS Bank Ltd., Hong Kong Branch is a limited liability company incorporated in Singapore.
For any query regarding the materials herein, please contact Carol Wu (Reg No. AH8283) at [email protected]
Indonesia This report is being distributed in Indonesia by PT DBS Vickers Sekuritas Indonesia.
Malaysia This report is distributed in Malaysia by AllianceDBS Research Sdn Bhd ("ADBSR"). Recipients of this report, received from
ADBSR are to contact the undersigned at 603-2604 3333 in respect of any matters arising from or in connection with this
report. In addition to the General Disclosure/Disclaimer found at the preceding page, recipients of this report are advised
that ADBSR (the preparer of this report), its holding company Alliance Investment Bank Berhad, their respective connected
and associated corporations, affiliates, their directors, officers, employees, agents and parties related or associated with any
of them may have positions in, and may effect transactions in the securities mentioned herein and may also perform or seek
to perform broking, investment banking/corporate advisory and other services for the subject companies. They may also
have received compensation and/or seek to obtain compensation for broking, investment banking/corporate advisory and
other services from the subject companies.
Wong Ming Tek, Executive Director, ADBSR
Singapore This report is distributed in Singapore by DBS Bank Ltd (Company Regn. No. 196800306E) or DBSVS (Company Regn No.
198600294G), both of which are Exempt Financial Advisers as defined in the Financial Advisers Act and regulated by the
Monetary Authority of Singapore. DBS Bank Ltd and/or DBSVS, may distribute reports produced by its respective foreign
entities, affiliates or other foreign research houses pursuant to an arrangement under Regulation 32C of the Financial
Advisers Regulations. Where the report is distributed in Singapore to a person who is not an Accredited Investor, Expert
Investor or an Institutional Investor, DBS Bank Ltd accepts legal responsibility for the contents of the report to such persons
only to the extent required by law. Singapore recipients should contact DBS Bank Ltd at 6327 2288 for matters arising from,
or in connection with the report.
Thailand This report is being distributed in Thailand by DBS Vickers Securities (Thailand) Co Ltd.
Asian Insights SparX: Resilent packaging
demand while sustainability remains intact
Chemical/Packaging/Paper
Page 41
United
Kingdom
This report is produced by DBS Vickers Securities (Thailand) Co Ltd which is regulated by the Securities and Exchange
Commission, Thailand.
This report is disseminated in the United Kingdom by DBS Vickers Securities (UK) Ltd, ("DBSVUK"). DBSVUK is authorised
and regulated by the Financial Conduct Authority in the United Kingdom.
In respect of the United Kingdom, this report is solely intended for the clients of DBSVUK, its respective connected and
associated corporations and affiliates only and no part of this document may be (i) copied, photocopied or duplicated in any
form or by any means or (ii) redistributed without the prior written consent of DBSVUK. This communication is directed at
persons having professional experience in matters relating to investments. Any investment activity following from this
communication will only be engaged in with such persons. Persons who do not have professional experience in matters
relating to investments should not rely on this communication.
Dubai
International
Financial
Centre
This research report is being distributed by DBS Bank Ltd., (DIFC Branch) having its office at units 608 - 610, 6th Floor, Gate
Precinct Building 5, PO Box 506538, DIFC, Dubai, United Arab Emirates. DBS Bank Ltd., (DIFC Branch) is regulated by The
Dubai Financial Services Authority. This research report is intended only for professional clients (as defined in the DFSA
rulebook) and no other person may act upon it.
United Arab
Emirates
This report is provided by DBS Bank Ltd (Company Regn. No. 196800306E) which is an Exempt Financial Adviser as defined
in the Financial Advisers Act and regulated by the Monetary Authority of Singapore. This report is for information purposes
only and should not be relied upon or acted on by the recipient or considered as a solicitation or inducement to buy or sell
any financial product. It does not constitute a personal recommendation or take into account the particular investment
objectives, financial situation, or needs of individual clients. You should contact your relationship manager or investment
adviser if you need advice on the merits of buying, selling or holding a particular investment. You should note that the
information in this report may be out of date and it is not represented or warranted to be accurate, timely or complete. This
report or any portion thereof may not be reprinted, sold or redistributed without our written consent.
United States This report was prepared by DBS Vickers Securities (Thailand) Co Ltd (''DBSVTH''). DBSVUSA did not participate in its
preparation. The research analyst(s) named on this report are not registered as research analysts with FINRA and are not
associated persons of DBSVUSA. The research analyst(s) are not subject to FINRA Rule 2241 restrictions on analyst
compensation, communications with a subject company, public appearances and trading securities held by a research
analyst. This report is being distributed in the United States by DBSVUSA, which accepts responsibility for its contents. This
report may only be distributed to Major U.S. Institutional Investors (as defined in SEC Rule 15a-6) and to such other
institutional investors and qualified persons as DBSVUSA may authorize. Any U.S. person receiving this report who wishes
to effect transactions in any securities referred to herein should contact DBSVUSA directly and not its affiliate.
Other
jurisdictions
In any other jurisdictions, except if otherwise restricted by laws or regulations, this report is intended only for qualified,
professional, institutional or sophisticated investors as defined in the laws and regulations of such jurisdictions.
Asian Insights SparX: Resilent packaging
demand while sustainability remains intact
Chemical/Packaging/Paper
Page 42
DBS Regional Research Offices
HONG KONG
DBS (Hong Kong) Ltd
Contact: Carol Wu
13th Floor One Island East,
18 Westlands Road,
Quarry Bay, Hong Kong
Tel: 852 3668 4181
Fax: 852 2521 1812
e-mail: [email protected]
MALAYSIA
AllianceDBS Research Sdn Bhd
Contact: Wong Ming Tek (128540 U)
19th Floor, Menara Multi-Purpose,
Capital Square,
8 Jalan Munshi Abdullah 50100
Kuala Lumpur, Malaysia.
Tel.: 603 2604 3333
Fax: 603 2604 3921
e-mail: [email protected]
SINGAPORE
DBS Bank Ltd
Contact: Janice Chua
12 Marina Boulevard,
Marina Bay Financial Centre Tower 3
Singapore 018982
Tel: 65 6878 8888
Fax: 65 65353 418
e-mail: [email protected]
Company Regn. No. 196800306E
INDONESIA
PT DBS Vickers Sekuritas (Indonesia)
Contact: Maynard Priajaya Arif
DBS Bank Tower
Ciputra World 1, 32/F
Jl. Prof. Dr. Satrio Kav. 3-5
Jakarta 12940, Indonesia
Tel: 62 21 3003 4900
Fax: 6221 3003 4943
e-mail: [email protected]
THAILAND
DBS Vickers Securities (Thailand) Co Ltd
Contact: Chanpen Sirithanarattanakul
989 Siam Piwat Tower Building,
9th, 14th-15th Floor
Rama 1 Road, Pathumwan,
Bangkok Thailand 10330
Tel. 66 2 857 7831
Fax: 66 2 658 1269
e-mail: [email protected]
Company Regn. No 0105539127012
Securities and Exchange Commission, Thailand