Embed Size (px)
Citation preview
India Studies in Business and Economics
Agricultural Value Chainsin India
Ashok GulatiKavery GangulyHarsh Wardhan Editors
Ensuring Competitiveness, Inclusiveness, Sustainability, Scalability, and Improved Finance

India Studies in Business and Economics

The Indian economy is considered to be one of the fastest growing economies ofthe world with India amongst the most important G-20 economies. Ever since theIndian economy made its presence felt on the global platform, the researchcommunity is now even more interested in studying and analyzing what India has tooffer. This series aims to bring forth the latest studies and research about India fromthe areas of economics, business, and management science. The titles featured inthis series will present rigorous empirical research, often accompanied by policyrecommendations, evoke and evaluate various aspects of the economy and thebusiness and management landscape in India, with a special focus on India’srelationship with the world in terms of business and trade.
More information about this series at https://link.springer.com/bookseries/11234
Ashok Gulati · Kavery Ganguly · Harsh WardhanEditors
Agricultural Value Chainsin IndiaEnsuring Competitiveness, Inclusiveness,Sustainability, Scalability, and ImprovedFinance
EditorsAshok GulatiIndian Council for Research onInternational Economic Relations (ICRIER)New Delhi, Delhi, India
Harsh WardhanIndian Council for Research onInternational Economic Relations (ICRIER)New Delhi, Delhi, India
Kavery GangulyIndian Council for Research onInternational Economic Relations (ICRIER)New Delhi, Delhi, India
ISSN 2198-0012 ISSN 2198-0020 (electronic)India Studies in Business and EconomicsISBN 978-981-33-4267-5 ISBN 978-981-33-4268-2 (eBook)https://doi.org/10.1007/978-981-33-4268-2
© The Editor(s) (if applicable) and The Author(s) 2022. This book is an open access publication.OpenAccess This book is licensed under the terms of the Creative Commons Attribution 4.0 InternationalLicense (http://creativecommons.org/licenses/by/4.0/), which permits use, sharing, adaptation, distribu-tion and reproduction in any medium or format, as long as you give appropriate credit to the originalauthor(s) and the source, provide a link to the Creative Commons license and indicate if changes weremade.The images or other third party material in this book are included in the book’s Creative Commons license,unless indicated otherwise in a credit line to the material. If material is not included in the book’s CreativeCommons license and your intended use is not permitted by statutory regulation or exceeds the permitteduse, you will need to obtain permission directly from the copyright holder.The use of general descriptive names, registered names, trademarks, service marks, etc. in this publicationdoes not imply, even in the absence of a specific statement, that such names are exempt from the relevantprotective laws and regulations and therefore free for general use.The publisher, the authors and the editors are safe to assume that the advice and information in this bookare believed to be true and accurate at the date of publication. Neither the publisher nor the authors orthe editors give a warranty, expressed or implied, with respect to the material contained herein or for anyerrors or omissions that may have been made. The publisher remains neutral with regard to jurisdictionalclaims in published maps and institutional affiliations.
Cover illustration: © Kavery Ganguly. Sketch done by Nayantara Rai, age 7 years, depicting an agri valuechain
This Springer imprint is published by the registered company Springer Nature Singapore Pte Ltd.The registered company address is: 152 Beach Road, #21-01/04 Gateway East, Singapore 189721,Singapore
Foreword
In response to changing consumption patterns, agricultural production has diversifiedfrom food grain to high-value commodities including horticulture, livestock andfisheries. Demand for value-added and nutrient-rich foods is fast replacing calorie-rich grain-based diets. India is the leading producer ofmilk and a significant producerof poultry meat, eggs, fruits and vegetables and pulses. This provides a huge scopefor India to cater to rising domestic as well as global demand for these commoditieswith potential gains for the farmers. Agricultural value chains in India have beenconfronted with a tough balance of improving efficiency and ensuring inclusivenessof the primary producer. This makes farmer–market linkages critical to deliveringassured returns to farmers and ensure farming remains profitable.
This study on Agricultural Value Chains in India analyzes the performance oftomato, onion andpotato (TOP), grapes, pomegranates,mango, banana, dairy, poultryand pulses value chains in terms of competitiveness, inclusiveness, sustainability andscalability and access to finance (CISS-F). This is a unique conceptual frameworkused to study agricultural value chains in a holistic manner. The authors focus on theneed and impact of striking a balance between the various elements of CISS-F. Thecommodity-specific deep dives clearly demonstrate how dairy value chain has beensuccessful in delivering higher returns to the farmers ((75–80)% of the consumerprice). Integrator-led poultry value chains have been phenomenal in undertakingcosts and risks associated with poultry farming, making it much more remunerativeand risk-free compared to backyard poultry. Similar gains in the TOP value chainsare much awaited, which currently deliver about 30% of the consumer price to thefarmers. Attaining a perfect score on CISS-F may not be possible, but technology,institutions andmarkets will continue to play an important role in strengthening thesevalue chains and delivering benefits to the farmers and consumers.
We are hopeful that this study will enrich the policy discourse on the need forimproving marketing opportunities for farmers by streamlining and organizing valuechains. This evidence-based research study will be useful for drawing valuableinsights by various stakeholders including policymakers, experts and practitionersfor informed policymaking, balanced discourse and improved value chain practices.
We at NABARD and ICRIER are extremely happy to see the research study shapeinto a book that will favourably impact the national and global outreach. We take
v
vi Foreword
this opportunity to congratulate Dr. Ashok Gulati, Infosys Chair Professor, ICRIER,who has been a champion of market led inclusive agricultural growth for undertakingthis important research study and for steering the ICRIER team towards a valuableoutput.
Dr. Deepak MishraDirector and Chief ExecutiveICRIER, New Delhi, India
Dr. G. R. ChintalaChairman
NABARD, Mumbai, India
Preface
Indian food basket has become increasingly diversified, and consumption of high-value agricultural commodities such as fruits, vegetables, milk, eggs, meat and fish,and value-added food has increased. This demand-driven structural change in Indianagriculture is attributed to rising incomes, increasing population, urbanisation andhigher export demand. The fast-developing high-value agricultural markets provideimmense opportunity to India’s small andmarginal farmers to diversify their croppingpatterns, boost their incomes and secure sustainable livelihoods.
India’s smallholders constitute 86.1% of total farm holdings. The all India averagelandholding size is 1.08 hectares (ha) (DoAC&FW, Agricultural Census, 2016).Despite being a smallholder economy, India has become self-reliant in cereal produc-tion and is a leading producer of many high value agricultural commodities. Indiaproduced 281.8 million tonnes of food grains, 307.7 million tonnes of horticul-ture crops, 176.5 million tonnes of milk, 96 billion eggs and 7.7 million tonnes ofmeat during TE 2018–19 (DES, 2020; Horticulture Division, 2020; and DAHDF,2020). However, this record level of production was not accompanied by commen-surate increase in farmers’ income. Lack of robust market linkages have resulted inpoor price realization for the farmers as well as forcing them to dump or destroythe fresh produce. Such instances have been reported several times in the case ofhorticulture produce which is highly perishable with very low shelf life. Agricul-tural value chains in India are subject to high fragmentation and intermediation,resulting in substantial losses in quantity and quality of produce, limited processingcapacities, and high price volatility. Agricultural policies in India have primarilyfocussed on augmenting production, without giving due attention towards devel-oping efficient value chains. Further, cereal-centric policies of the government donot adequately recognize the challenges faced by farmers growing non-cereal crops.These policies have led to environmental degradation including fast-depleting waterresources in key rice-growing states as well as soil contamination due to unabateduse of fertilisers and agrochemicals. The policies lack a holistic approach and long-term direction towards sustainability and scalability of successful value chains acrosscommodities and geographies.
In order to further study the issues and challenges faced by agricultural valuechains in India, NABARD initiated a project under theNABARDCentre for Research
vii
viii Preface
in Agri-Economics set up in ICRIER.This book is a culmination of the six commodityvalue chain studies done under this project over three years. The book presentsa comprehensive analysis and evaluation of the performance of selected agricul-tural value chains across major producing regions in India. The conceptual frame-work of competitiveness (domestic and international), inclusiveness, sustainability(financial and environmental), scalability (CISS) and access to finance (F) helps toanalyze the selected value chains in a holistic manner. The commodities includedin the study include vegetables (tomato, onion and potato (TOP)), fruits (bananaand mango, grapes and pomegranate), dairy, poultry and pulses (gram and pigeonpea/tur) accounting for more than half of gross value of output of agriculture andallied sectors. The research is based on a combination of secondary data analysis,field visits and discussions with key players in each of the value chains.
The book identifies the drivers of change—technology, institutions and markets,which together have strengthened agricultural value chains to become competi-tive, inclusive, sustainable and scalable and improved their access to finance. Thestudy finds that technology has catalyzed productivity gains through high-yieldingseeds and cross-breed technology for most of the commodities studied here, exceptpulses. Markets have played an important role in the success of dairy co-operatives,connecting the smallest milk producer to urban markets, poultry sector through inte-grator model and grapes through export market. However, similar market linkageshave not been possible in case of banana andmango. In case of tomatoes, onions, pota-toes and pulses, weak market linkages explain extreme price volatilities. Institutionsrelated to farmer collectives have ensured successful farmer-market linkages. Successof the Indian dairy sector is ascribed to the pioneering efforts of the co-operatives,particularly Amul, followed by the private sector, over time. Grapes value chain wasled byMahagrapes, a producer company that successfully linked small grape growersto export markets. Integrator-led poultry sector brought about phenomenal gains tothe small poultry growers in terms of risk management, backend support and assuredmarkets. Commodities like tomato, onion, potato, mango, banana, and pulses are yetto witness any such significant institutional impact. However, the Operation Greensscheme launched in 2018 for TOP and further extended to include 22 perishableswill take some time before an efficient and inclusive value chains of perishables aredeveloped.
The study shows that while some of the agricultural value chains have madeconsiderable progress on CISS-F, others have scope to catch up. For example, whilefruits and vegetables showed lower domestic competitiveness in terms of low farmersshare in consumer rupee, dairy farmers have benefited from high domestic compet-itiveness. In case of international competitiveness measured using nominal protec-tion coefficients (NPCs), all commodities except pomegranate, mango and milk (co-operativemodel), are found to be export competitive. Financial sustainability dependson the perishability and seasonality of the crop, which affect farm incomes. TOP andpulses are extremely price sensitive and driven by traditional marketing practices.In case of fruits, cultivation of bananas, mangoes, grapes as well as pomegranates isprofitable, but requires huge investment. The financial viability of dairy co-operativesis a matter of concern as about 58% of dairy co-operatives have accumulated losses
Preface ix
primarily because of governance issues. Indian dairying faces significant foddershortage which further threatens the financial sustainability of the sector. For poultrysector too, the availability of high-quality and affordable feed is critical for financialsustainability. However, it is environmentally efficient compared to other segments ofthe livestock sector, but challenged by frequent outbreaks of Avian Influenza (AI).Dairy on the other hand is a huge contributor to greenhouse gas (GHG) emissions andalso requires substantial quantity of water. All fruits and vegetables, except bananas,are non-water guzzlers, and so are pulses, indicating environmental sustainability.Scalability of agricultural value chains was measured in terms of area expansion orproductivity gains, which impact total production levels, and expansion of exportsand processing capacities. The potential of replicability of successful value chainsacross other commodities and states has been studied as well. Finally, existing gapsin financing, the current reach of organized finance and further potential of innovativefinancial intervention have been identified.
Based on the analysis presented in the book, important policy suggestions tomake agricultural value chains more competitive, inclusive, sustainable, scalablewith improved access to finance, have been put forth. These policy measures pertainto four pillars: agricultural finance, technology,markets and institutions. Agriculturalmarketing policy reforms have been focused on improving efficiency and deliveringthe economic gains to the farmers. The Farm Laws 2020 have the potential to furtherstrengthen the high-value agricultural value chains in India.
We hope that the research findings and policy suggestions presented in this bookwill be useful for policymakers, financial institutions, and practitioners, in identifyingthe challenges confronting agricultural value chains in India and framing policies andinnovative financing mechanism for each stakeholder in the value chain.
New Delhi, India Ashok GulatiKavery GangulyHarsh Wardhan
Acknowledgements
We are sincerely grateful to a number of individuals, without whose guidance, feed-back and patience this book would not have been possible. First of all, we are gratefulto the generous financial support provided by NABARD for carrying out this study.We express our sincere gratitude to Dr. G. R. Chintala, Chairman, NABARD, and hispredecessor, Dr. Harsh Kumar Bhanwala, for trusting us to do this important project.We are also grateful to the Department of Economic Analysis and Research (DEAR),NABARD, for sharing their valuable comments and reviews, especially Dr. K. J. S.Satyasai, Chief General Manager, NABARD, and his predecessor, Dr. U. S. Saha.We are truly grateful for their encouragement and understanding during the projectperiod. We record our gratitude to anonymous reviewers who shared their valuablefeedback and suggestions on the original research reports.
We would like to acknowledge Mr. Anwarul Hoda, Honorary Professor, ICRIER,and Dr. Bharat Sharma, Mr. Siraj Husain and Ms. Shweta Saini, Senior VisitingFellows, at ICRIER for their valuable guidance and feedback during the study. Wewould like to thank Nandini Jayakumar, Aniruddha Morey and Vishal Gaikwadfor their research contribution in value chain studies of potato, and grapes andpomegranate, respectively. Special thanks to Mr. Rahul Arora, ICRIER, for hisadministrative support and contribution towards the preparation of the manuscriptfor publication. Finally, we would like to express our humble appreciation for allfarmers, traders, commission agents, cold storage owners and experts who sharedtheir valuable insights with us.
Needless to mention, the responsibility of data and views in this book and anyomissions or errors that remain in the text are of the authors alone.
Ashok GulatiKavery GangulyHarsh Wardhan
xi
Disclaimer
ICRIER
Opinions and recommendations in the book are exclusively of the author(s) andnot of any other individual or institution including ICRIER. This book has beenprepared in good faith on the basis of information available at the date of publication.All interactions and transactions with industry sponsors and their representativeshave been transparent and conducted in an open, honest and independent manneras enshrined in ICRIER Memorandum of Association. ICRIER does not accept anycorporate funding that comes with a mandated research area which is not in line withICRIER’s research agenda. The corporate funding of an ICRIER activity does not, inany way, imply ICRIER’s endorsement of the views of the sponsoring organizationor its products or policies. ICRIER does not conduct research that is focused on anyspecific product or service provided by the corporate sponsor.
NABARD
This study has been supported by the National Bank for Agriculture and Rural Devel-opment (NABARD) under its Research andDevelopment (R&D) Fund. The contentsof this publication can be used for research and academic purposes only with duepermission and acknowledgement. They should not be used for commercial purposes.NABARD does not hold any responsibility for the facts and figures contained in thebook. The views are of the authors alone and should not be purported to be those ofNABARD.
xiii
Contents
1 Introduction . . . . . . . . . . . . . . . . . . . . . . . . . . . . . . . . . . . . . . . . . . . . . . . . . . . 1Ashok Gulati
2 Evaluating Agricultural Value Chains on CISS-F Framework . . . . . . 11Ashok Gulati, Kavery Ganguly, and T. Nanda Kumar
3 Tomato, Onion and Potato (TOP) Value Chains . . . . . . . . . . . . . . . . . . . 33Ashok Gulati, Harsh Wardhan, and Pravesh Sharma
4 Banana and Mango Value Chains . . . . . . . . . . . . . . . . . . . . . . . . . . . . . . . . 99Harsh Wardhan, Sandip Das, and Ashok Gulati
5 Grapes and Pomegranate Value Chains . . . . . . . . . . . . . . . . . . . . . . . . . . 145Manasi Phadke, Bhushana Karandikar, and Ashok Gulati
6 Dairy Value Chain . . . . . . . . . . . . . . . . . . . . . . . . . . . . . . . . . . . . . . . . . . . . . . 195T. Nanda Kumar, Sandip Das, and Ashok Gulati
7 Poultry Value Chain . . . . . . . . . . . . . . . . . . . . . . . . . . . . . . . . . . . . . . . . . . . . 227T. Nanda Kumar, Anisha Samantara, and Ashok Gulati
8 Pulses Value Chain- Pigeon Pea and Gram . . . . . . . . . . . . . . . . . . . . . . . . 253Kavery Ganguly and Ashok Gulati
9 Further Strengthening Agri-Value Chains in India—WayForward . . . . . . . . . . . . . . . . . . . . . . . . . . . . . . . . . . . . . . . . . . . . . . . . . . . . . . . 287Ashok Gulati, Pravesh Sharma, and Kavery Ganguly
xv
Editors and Contributors
About the Editors
Ashok Gulati is the Infosys Chair Professor for Agriculture at Indian Council forResearch on International Economic Relations (ICRIER). Dr. Gulati is an eminentagricultural economist and a former Chairman of the Commission for AgriculturalCosts and Prices (CACP), Government of India (2011–2014). He was on the CentralBoard of Directors of the Reserve Bank of India (RBI) and Board of Directors ofNational Bank for Agriculture and Rural Development (NABARD). He is currently aMember of the Tenth Audit Advisory Board of the Comptroller and Auditor Generalof India and also on the Board of Directors of National Commodity and DerivativesExchange Limited (NCDEX), Kotak Mahindra Bank Limited, and Godrej AgrovetLimited. He has 17 books and several research papers on Indian andAsian agricultureto his credit. Dr Gulati is a prolific writer in leading media on agri-policies. For hissignificant contribution in the area of agriculture economics and policy making, thePresident of India honoured him with the “Padma Shri” award in 2015.
Kavery Ganguly is a Senior Research Fellow at ICRIER. She began her career withInternational Food Policy Research Institute (IFPRI), and worked as Lead—PolicyAdvocacy and Research with CII-Food and Agriculture Centre of Excellence. Shealso worked as an independent consultant on Political Economy of Food Price Policy,jointly led byCopenhagenUniversity, Cornell University andUNU-WIDER.Kaveryhas been working in the area of agriculture and food policy research and advocacyfor the past 17 years. She has contributed to research publications including bookchapters, research reports, and peer reviewed papers.
Harsh Wardhan is a Consultant at ICRIER, working on issues related to agri-cultural and food policies, agricultural value chains and food prices. He has overseven years of research experience. Prior to ICRIER, he worked as a consultantwith Office of Economic Advisor, Ministry of Commerce & Industry, GoI and asResearch/AcademicAssociate at Indian Institute ofManagement (IIM),Ahmedabad.He has co-authored a book,Marketed and Marketable Surplus of Major Foodgrains
xvii
xviii Editors and Contributors
in India, Springer 2017. He has also published research reports, book chapters,and articles in reputed journals and newspapers. He has completed his Master’s inEconomics from Ambedkar University, Delhi (AUD) and Bachelor’s in Economicsfrom Kirori Mal College, University of Delhi.
Contributors
Sandip Das has been working as Senior Consultant at ICRIER since 2017. Priorto that, he worked as Special Correspondent with The Financial Express for nearlya decade, writing extensively on agriculture and food security. He has also workedwithmainstreammedia organisations such as Press Trust of India, Business Standard,Down to Earth magazine (published by Centre for Science and Environment). He haswritten research papers on food security and agricultural marketing and contributedto articles on food safety and consumer rights in leading national dailies. He holdsMaster’s degree in Political Science from Jawaharlal Nehru University (JNU), NewDelhi, and Diploma in Journalism.
Bhushana Karandikar is a postgraduate in economics and ex-civil servant, Maha-rashtra state. She has been working on issues related to global food trade, horticul-ture value chains, food safety, farmer producers organisations, and market access forsmall farmers, for last thirty years. Her expertise includes monitoring and evalua-tion techniques, specially of agriculture-related projects. She has worked as a SeniorConsultant with IFPRI, HarvestPlus, Gokhale Institute of Politics and Economics,and ICRIER. She has co-authored peer reviewed journal papers, research reports,and book chapters.
T. Nanda Kumar is a former civil servant with specialised knowledge in publicpolicy, agriculture, food, dairying, textiles and international trade and was SeniorVisiting Fellow at ICRIER. Prior to that, he was Chairman of the National DairyDevelopment Board, Anand, Gujarat. He served as Secretary in the Ministry of Food& Public Distribution andMinistry of Agriculture, Co-operation & FarmersWelfare,Government of India. He was also Member of the National Disaster ManagementAuthority (NDMA). He has served on the Boards of NABARD, NCDC, TextileExport Councils, Mother Dairy and various other companies. His work on “Impactof Uruguay Round on Global Spice Trade” was published by the International TradeCentre (WTO), Geneva, in the form of a book. Hewrites regularly for leading Englishnewspapers.
Manasi Phadke is a project consultant and economist and holds a Ph.D. in PublicFinance from Gokhale Institute of Politics and Economics, Pune. She has worked ina range of consultancy assignments spanning the fields of public finance and agri-culture economics. She has been involved in designing the results framework forthe World Bank-funded project titled State of Maharashtra’s Agriculture and Rural
Editors and Contributors xix
Transformation (SMART). She has given M&E support for the World Bank-fundedProject on Climate Resilient Agriculture (PoCRA) as well. Her other assignmentsinclude research on farmer producer companies, value chains and agriculture insur-ance carried out for the Union Ministry of Agriculture, International Food PolicyResearch Institute (IFPRI) and the Mahalanobis National Crop Forecasting Centre(MNCFC), New Delhi. She is a prolific writer and blogger and a regular contributorto columns in the Hindu Business Line and the Business Standard. She currentlyhosts a weekly column in the Marathi newspaper, Sakal.
Anisha Samantara is a Ph.D. scholar at the University of Bradford, UnitedKingdom. Previously, she worked as Research Assistant at the Indian Councilfor Research on International Economic Relations (ICRIER). She completed herMaster’s in Economics from University of Glasgow, Scotland, and Bachelors inEconomics from Lady Shri Ram College, University of Delhi.
Pravesh Sharma is Co-founder and CEO of Kamatan Farm Tech Pvt. Ltd., anagri start-up company. He was earlier affiliated with ICRIER as Visiting SeniorFellow. From 2010–2015, he was the Managing Director, Small Farmers’ Agribusi-ness Consortium (SFAC),Government of India. He is a former 1982 batch IAS officerwith extensive experience of the agriculture sector. In his long association with thesector, he served as Secretary, Department of Agriculture, Government of MadhyaPradesh, and India Representative of the UN International Fund for AgriculturalDevelopment (IFAD). He was also a Visiting Fellow at Princeton University.
Abbreviations
AEP Agriculture Export PolicyAHIDF Animal Husbandry Infrastructure Development FundAI Artificial inseminationAJWA Anakaputhur Jute Weavers’ AssociationAMFFRI Agricultural Marketing and Farmer Friendly Reforms IndexAP Andhra PradeshAPEDA Agricultural and Processed Food Products Export Development
AuthorityAPLM Agricultural Produce and Livestock Marketing (Promotion & Facili-
tation) ActAPMC Agricultural Produce Market CommitteeARR Accounting Rate of ReturnATMA Agricultural Technology Management AgencyAWS Automated Weather StationsBAU Business as usualBBY Bhavantar Bhugtan YojanaBCR Benefit–cost ratioBMC Bulk Milk CoolersBRC Bank Realization CertificateBRIC Brazil, Russia, India and ChinaCACP Commission for Agricultural Costs and PricesCAGR Compound annual growth rateCBI Centre for Promotion of Exports from Developing CountriesCIPHET Central Institute of Post-Harvest Engineering & TechnologyCISH Central Institute for Subtropical HorticultureCPDO Central Poultry Development OrganizationsCPRI Central Potato Research InstituteCSE Centre for Science and EnvironmentCSR Corporate social responsibilityCSS Centrally Sponsored SchemeCV Coefficient of variationDAC&FW Department of Agriculture, Co-operation and Farmers Welfare
xxi
xxii Abbreviations
DAHD Department of Animal Husbandry and DairyingDAHDF Department of Animal Husbandry, Dairy and FisheriesDC Distribution CentersDCS Dairy Co-operative SocietiesDEDS Dairy Entrepreneurship Development SchemeDES Directorate of Economics and StatisticsDGCIS Directorate General of Commercial Intelligence and StatisticsDGFT Directorate General of Foreign TradeDIDF Dairy Processing and Infrastructure Development FundDIPP Department of Industrial Policy & PromotionDMI Directorate of Marketing & InspectionDOGR Directorate of Onion and Garlic ResearchECA Essential Commodities ActECGC Export Credit Guarantee CorporationEDI Electronic Data InterchangeEGS Employment Guarantee SchemeEIA Export Inspection Agencye-NAM National Agriculture MarketEP Eutrophication PotentialEU European UnionFAO Food and Agriculture OrganizationFAOSTAT Food and Agriculture Organization Corporate Statistical DatabaseFAPAFS Farmers (Empowerment and Protection) Agreement on Price Assur-
ance and Farm Services ActFCI Food Corporation of IndiaFCR Feed conversion ratioFDI Foreign direct investmentFGP Farm gate priceFICCI Federation of Indian Chamber of Commerce and IndustryFL Family labourFLDG First Loss Default GuaranteeFOB Free on BoardFPC Farmer Producer CompanyFPO Farmer Producers OrganizationFPTC Farmers’ Produce Trade and Commerce (Promotion and Facilitation)FSSAI Food Safety and Standards Authority of IndiaFY Financial yearGAP Good agricultural practicesGCA Gross Cropped AreaGCMMF Gujarat Co-operative Milk Marketing FederationGDP Gross domestic productGHG Greenhouse GasGoI Government of IndiaGST Goods and Services TaxGVA Gross value added
Abbreviations xxiii
GVC Grape Value ChainGWP Global warming potentialHDP High-density plantingHOPCOMS Horticultural Producers’ Co-operative Marketing and Processing
SocietyHPAI Highly Pathogenic Avian InfluenzaHVA High-value agricultureHWT Hot water treatmentICAR Indian Council for Agricultural ResearchICLC Irrevocable commercial letter of creditICRISAT International Crops Research Institute for the Semi-Arid TropicsIDMC Indian Dairy Machinery Company Ltd.IFC International Finance CorporationIFGRI Indian Grassland and Fodder Research InstituteIIHR Indian Institute of Horticultural ResearchILRI International Livestock Research InstituteINDC Intended Nationally Determined ContributionsINR Indian rupeesIOSR The International Organization of Scientific ResearchIPCC Intergovernmental Panel on Climate ChangeIPPP Innovative Poultry Productivity ProjectIPR Intellectual Property RightIRR Internal rate of returnISRO Indian Space Research OrganizationITC-HS Indian Trade Clarification based on Harmonized SystemJDCC Jalgaon District Co-operative SocietyJISL Jain Irrigation Systems LimitedJNPT Jawaharlal Nehru Post TrustKCC Kisan Credit CardKI Key indicatorsKII Key information interviewKMF Karnataka Milk FederationKMS Kharif marketing seasonKPS Kesla Poultry SamitiLCS Land Custom StationsLIT Low-input technologyLK Late kharifLLPD Lakh litres per dayLMT Lakh metric tonnesLPAI Low pathogenic avian influenzaLPC Land Possession CertificateMAC Multi-Agency CentreMAH Milch Animal Owning HouseholdMDFVPL Mother Dairy Fruit and Vegetable Private LimitedMDM Mid-day meal
xxiv Abbreviations
MEIS Merchandise Exports from India SchemeMEP Minimum export priceMFPO Meat Food Products OrderMIDH Mission for Integrated Development of HorticultureMIP Market intervention priceMIS Market Intervention SchemeMMPO Milk and Milk Products OrderMMT Million metric tonnesMNAIS Modified National Agricultural Insurance SchemeMNC Multinational companyMoAFW Ministry of Agriculture & Farmers WelfareMoCI Ministry of Commerce and IndustriesMoFPI Ministry of Food Processing IndustriesMoSPI Ministry of Statistics and Programme ImplementationMOU Memorandum of understandingMP Madhya PradeshMPD Market price differentialMRDBS Maharashtra Rajya Draksha Bagayatdar SanghMRL Maximum residue limitsMSAMB Maharashtra State Agricultural Marketing BoardMSP Minimum support priceMSSL Mahindra Shubhlabh Services Ltd.MT Metric tonnesMTR Mavalli Tiffin RoomNABARD National Bank for Agriculture and Rural DevelopmentNAFED National Agricultural Co-operative Marketing Federation of IndiaNAIS National Agricultural Insurance SchemeNAPDD National Action Plan on Dairy DevelopmentNAS National Accounts StatisticsNCAER National Council of Applied Economic ResearchNCAP National Centre for Agricultural Economics and Policy ResearchNCCD National Centre for Cold-Chain DevelopmentNCDC National Co-operative Development CorporationNCDEX National Commodity and Derivatives ExchangeNCPAH National Committee on Plasticulture Applications in HorticultureNCR National Capital RegionNCRPB National Capital Region Planning BoardNDDB National Dairy Development BoardNDP National Dairy PlanNECC National Egg Coordination CommitteeNEFT National Electronic Fund TransferNeML NCDEX eMarkets LimitedNFN NDDB Foundation for NutritionNFSM National Food Security MissionNGO Non-governmental organization
Abbreviations xxv
NHB National Horticulture BoardNHM National Horticulture MissionNHRDF National Horticultural Research and Development FoundationNIAM National Institute of Agriculture MarketingNIANP National Institute of Animal Nutrition and PhysiologyNMAET National Mission on Agricultural Extension and TechnologyNMFP National Mission on Food ProcessingNPC Nominal Protection CoefficientNRC National Research Centre for GrapesNRCB National Research Centre for BananaNRP Nominal rate of protectionNSS National Sample SurveyNSSO National Sample Survey OfficeNWRS Negotiable Warehouse ReceiptsNZ New ZealandOECD Organization for Economic Co-operation and DevelopmentOF Operation FloodOIV International Organization of Vine and WinePAN Permanent Account NumberPHC Pre-harvest contractorPHM Post-harvest managementPIB Press Information BureauPMC Price Monitoring CellPMFBY Pradhan Mantri Fasal Bima YojanaPOPI Producers Organizations Promoting InstitutionsPPP Public–private partnershipPRADAN Professional Assistance for Development ActionPSF Price Stabilization FundPSS Price Support SchemePSU Public Sector UndertakingPVC Pomegranate Value ChainRBI Reserve Bank of IndiaRBP Ration Balancing ProgrammeRBPDP Rural Backyard Poultry Development ProgramRKVY Rashtriya Krishi Vikas YojanaRMS Rabi marketing seasonRPI Retail Price IndexSAMPADA Scheme for Agro-Marine Processing and Development of Agro-
Processing ClustersSBI State Bank of IndiaSC Schedule CasteSCH Single cross hybridSEP Small Exporter’s PolicySFAC Small Farmers’ Agribusiness ConsortiumSHG Self-Help Group
xxvi Abbreviations
SIDBI Small Industries Development Bank of IndiaSMART Maharashtra’s Agri-business and Rural Transformation ProgramSMP Skimmed milk powderSMSPM Sub-Mission on Seeds and Planting MaterialSOP Standard operating proceduresST Schedule TribesSWOT Strengths, weaknesses, opportunities, and threatsTE Triennium endingTOP Tomato, onion, potatoUAE United Arab EmiratesUK United KingdomUN United NationsUNCTAD United Nations Conference on Trade and DevelopmentUNFCCC United Nations Framework Convention on Climate ChangeUP Uttar PradeshUS United StatesUSA United States of AmericaUSD United States DollarUSDA United States Department of AgricultureUT Union territoryUV Unit valuesVAR Value at riskVHT Vapour heat treatmentVKGUY Vishesh Krishi and Gram Udyog YojanaWBCIS Weather Based Crop Insurance SchemeWDRA Warehouse Development and Regulatory AuthorityWOAH World Organization for Animal HealthWPI Wholesale Price IndexWRS Warehouse Receipt SystemWTO World Trade Organization
List of Figures
Fig. 1.1 Selection of commodities based on share in GVOof Agriculture and Allied Sectors: TE 2017–18 . . . . . . . . . . . . . . 4
Fig. 2.1 Technology, institutions and markets strengthening CISS-Fof value chains . . . . . . . . . . . . . . . . . . . . . . . . . . . . . . . . . . . . . . . . . 12
Fig. 2.2 Trade adjusted average nominal protection coefficients(NPC)-2002–03 to 2017–18 . . . . . . . . . . . . . . . . . . . . . . . . . . . . . . 19
Fig. 2.3 Share of small and marginal farmers in production processof selected commodities . . . . . . . . . . . . . . . . . . . . . . . . . . . . . . . . . 22
Fig. 3.1 Share of vegetables in area and value (TE 2018–19) . . . . . . . . . . 34Fig. 3.2 Exports of TOP vegetables from India . . . . . . . . . . . . . . . . . . . . . 35Fig. 3.3 Top export destinations for Indian tomato (five year
average of 2014–15 to 2018–19) . . . . . . . . . . . . . . . . . . . . . . . . . . 36Fig. 3.4 Tomato and tomato products net exports from India . . . . . . . . . . 36Fig. 3.5 Major export destinations for Indian onion (TE 2017–18) . . . . . . 37Fig. 3.6 Share in global dehydrated onion exports (TE 2018) . . . . . . . . . . 38Fig. 3.7 India’s potato exports, country-wise (TE 2018–19) . . . . . . . . . . . 38Fig. 3.8 NPC and export value for tomato . . . . . . . . . . . . . . . . . . . . . . . . . . 40Fig. 3.9 Market price differential (MPD) for tomato . . . . . . . . . . . . . . . . . 40Fig. 3.10 Nominal protection coefficient for importable
and exportable hypothesis for onion . . . . . . . . . . . . . . . . . . . . . . . 41Fig. 3.11 Nominal rate of protection for importable and exportable
hypothesis for Indian onion . . . . . . . . . . . . . . . . . . . . . . . . . . . . . . 41Fig. 3.12 Market price differential (MPD) for onion . . . . . . . . . . . . . . . . . . 42Fig. 3.13 Timeline for MEP and other trade policies for onions
in India . . . . . . . . . . . . . . . . . . . . . . . . . . . . . . . . . . . . . . . . . . . . . . . 42Fig. 3.14 Nominal protection coefficients for potato at wholesale
market level . . . . . . . . . . . . . . . . . . . . . . . . . . . . . . . . . . . . . . . . . . . 44Fig. 3.15 Market price differential (MPD) for potato . . . . . . . . . . . . . . . . . . 45Fig. 3.16 Major production and consumption centres for tomatoes
in India . . . . . . . . . . . . . . . . . . . . . . . . . . . . . . . . . . . . . . . . . . . . . . . 47Fig. 3.17 Major production and consumption centres for onions
in India . . . . . . . . . . . . . . . . . . . . . . . . . . . . . . . . . . . . . . . . . . . . . . . 48
xxvii
xxviii List of Figures
Fig. 3.18 Major production and consumption centres for potatoin India . . . . . . . . . . . . . . . . . . . . . . . . . . . . . . . . . . . . . . . . . . . . . . . 49
Fig. 3.19 Mark ups for tomato value chain . . . . . . . . . . . . . . . . . . . . . . . . . . 51Fig. 3.20 Mark ups for onion value chain . . . . . . . . . . . . . . . . . . . . . . . . . . . 53Fig. 3.21 Mark-ups for potato value chain . . . . . . . . . . . . . . . . . . . . . . . . . . 54Fig. 3.22 SAFAL value chain of fruits and vegetables . . . . . . . . . . . . . . . . . 60Fig. 3.23 Mark-ups for SAFAL fruits and vegetables value chain . . . . . . . . 61Fig. 3.24 Commission charges for fruits and vegetables at different
mandis across India . . . . . . . . . . . . . . . . . . . . . . . . . . . . . . . . . . . . . 64Fig. 3.25 Onion: cost of cultivation, wholesale and retail price . . . . . . . . . . 67Fig. 3.26 Potato cost of cultivation, wholesale and retail price . . . . . . . . . . 68Fig. 3.27 Tomato area, production and yield—All India . . . . . . . . . . . . . . . 76Fig. 3.28 Onion area, production and yield—All India . . . . . . . . . . . . . . . . 76Fig. 3.29 Potato area, production and yield—All India . . . . . . . . . . . . . . . . 76Fig. 3.30 Scalability in TOP acreage . . . . . . . . . . . . . . . . . . . . . . . . . . . . . . . 78Fig. 3.31 Scalability in TOP production . . . . . . . . . . . . . . . . . . . . . . . . . . . . 79Fig. 3.32 Scalability of onion exports . . . . . . . . . . . . . . . . . . . . . . . . . . . . . . 81Fig. 4.1 Share of fruits in area and value . . . . . . . . . . . . . . . . . . . . . . . . . . . 100Fig. 4.2 Country-wise share of banana production (TE 2017) . . . . . . . . . . 101Fig. 4.3 Banana productivities in selected countries . . . . . . . . . . . . . . . . . . 101Fig. 4.4 Productivity of selected banana-producing states . . . . . . . . . . . . . 102Fig. 4.5 Share in global banana exports (TE 2017) . . . . . . . . . . . . . . . . . . 103Fig. 4.6 Major export destinations for Indian bananas (TE 2017–18) . . . . 103Fig. 4.7 Top mango-producing countries (2017) . . . . . . . . . . . . . . . . . . . . . 105Fig. 4.8 Mango productivity in selected countries . . . . . . . . . . . . . . . . . . . 105Fig. 4.9 Production (MMT) in top mango-producing states . . . . . . . . . . . 106Fig. 4.10 Productivity of mango in selected states (TE 2018–19) . . . . . . . . 107Fig. 4.11 Share in global exports (mangoes, mangosteen,
guavas)—TE 2016 . . . . . . . . . . . . . . . . . . . . . . . . . . . . . . . . . . . . . 107Fig. 4.12 India’s mango exports (value and volume) . . . . . . . . . . . . . . . . . . 108Fig. 4.13 Processes for banana exports . . . . . . . . . . . . . . . . . . . . . . . . . . . . . 110Fig. 4.14 Port-wise banana exports from India (TE 2017–18) . . . . . . . . . . . 110Fig. 4.15 Nominal protection coefficients for importable
and exportable hypothesis for bananas . . . . . . . . . . . . . . . . . . . . . 111Fig. 4.16 Nominal protection coefficient for mangoes . . . . . . . . . . . . . . . . . 113Fig. 4.17 Source-wise banana arrivals to Azadpur, Delhi (TE 2017–
18) . . . . . . . . . . . . . . . . . . . . . . . . . . . . . . . . . . . . . . . . . . . . . . . . . . 115Fig. 4.18 Mark-ups for banana value chain (Jalgaon to Delhi) . . . . . . . . . . 116Fig. 4.19 Traditional value chain for fresh mangoes . . . . . . . . . . . . . . . . . . . 117Fig. 4.20 Markups for mango value chain . . . . . . . . . . . . . . . . . . . . . . . . . . . 118Fig. 4.21 List of value-added products from banana pseudo stem . . . . . . . . 127Fig. 4.22 Banana area, production and yield—All India . . . . . . . . . . . . . . . 128Fig. 4.23 Scalability in area and production of bananas in India . . . . . . . . . 129Fig. 4.24 Mango area, production and yield—All India . . . . . . . . . . . . . . . . 130Fig. 4.25 Banana exports as share of production . . . . . . . . . . . . . . . . . . . . . 132
List of Figures xxix
Fig. 5.1 Production of food grains, horticulture crops and fruitsin India for selected years . . . . . . . . . . . . . . . . . . . . . . . . . . . . . . . . 146
Fig. 5.2 Share of grapes and pomegranates in the value of top 5fruits in Maharashtra (2013–14) . . . . . . . . . . . . . . . . . . . . . . . . . . . 147
Fig. 5.3 Share (%) of grapes in value of top 6 globally traded fruitsin 2018 . . . . . . . . . . . . . . . . . . . . . . . . . . . . . . . . . . . . . . . . . . . . . . . 148
Fig. 5.4 Major grape producers in the world and share of tablegrapes, wine grapes and raisins in the total globalproduction of grapes . . . . . . . . . . . . . . . . . . . . . . . . . . . . . . . . . . . . 148
Fig. 5.5 Bi-decadal snapshot of production and consumptionof table grapes in select countries (‘000 MT) . . . . . . . . . . . . . . . . 148
Fig. 5.6 a Share of table grapes, wine grapes and raisins to the totalproduction of grapes in India (2014) and major grapevarieties in India. b Distribution of area under dominantgrape varieties in India . . . . . . . . . . . . . . . . . . . . . . . . . . . . . . . . . . 149
Fig. 5.7 Area (‘000 ha) and production (‘000 MT) of table grapesin India from 2000–01 to 2017–18 . . . . . . . . . . . . . . . . . . . . . . . . 150
Fig. 5.8 Export-to-production ratio for table grapes for top 10 tablegrape-producing countries (2014) . . . . . . . . . . . . . . . . . . . . . . . . . 151
Fig. 5.9 Exports of grapes (‘000 MT) from India from 2006–07to 2016–17 . . . . . . . . . . . . . . . . . . . . . . . . . . . . . . . . . . . . . . . . . . . . 151
Fig. 5.10 Share of value on grape exports from India in 2016 . . . . . . . . . . . 151Fig. 5.11 Map of pomegranate-producing countries in the world . . . . . . . . 152Fig. 5.12 Area (‘000 ha) and production (‘000MT) of pomegranates
in India (2006–07 to 2016–17) . . . . . . . . . . . . . . . . . . . . . . . . . . . . 153Fig. 5.13 Export and production of pomegranates from India, Iran
and Turkey (2014) . . . . . . . . . . . . . . . . . . . . . . . . . . . . . . . . . . . . . . 154Fig. 5.14 Export window for pomegranates from different countries . . . . . 154Fig. 5.15 Exports of pomegranates (volume ‘000 MT and value
USD million) from India from 2006–07 to 2016–17 . . . . . . . . . . 155Fig. 5.16 Major export destinations for Indian pomegranates in value
terms (TE 2018–19) . . . . . . . . . . . . . . . . . . . . . . . . . . . . . . . . . . . . 155Fig. 5.17 Major processes in the export value chains . . . . . . . . . . . . . . . . . . 156Fig. 5.18 Price-Risk interaction between major actants in the value
chain . . . . . . . . . . . . . . . . . . . . . . . . . . . . . . . . . . . . . . . . . . . . . . . . . 157Fig. 5.19 NPC for Indian grapes and exports (‘000 MT) from 2006–
07 to 2016–17 . . . . . . . . . . . . . . . . . . . . . . . . . . . . . . . . . . . . . . . . . 158Fig. 5.20 Comparison of share of agents in value chain up to JNPT
and value chain up to international retail consumer . . . . . . . . . . . 159Fig. 5.21 NPC for Indian pomegranates and exports (‘000 MT)
from 2006–07 to 2016–17 . . . . . . . . . . . . . . . . . . . . . . . . . . . . . . . 160Fig. 5.22 Comparison of share of agents in value chain up to JNPT
and value chain up to international retail consumer . . . . . . . . . . . 161Fig. 5.23 Domestic value chain of grapes and pomegranates . . . . . . . . . . . . 161
xxx List of Figures
Fig. 5.24 Indicative cost chart of domestic value chain (Nashikto Azadpur Mandi, New Delhi) for grapes for 2015–16 . . . . . . . . 162
Fig. 5.25 Share of actants in wholesale and retail value in domesticgrape value chain . . . . . . . . . . . . . . . . . . . . . . . . . . . . . . . . . . . . . . . 163
Fig. 5.26 Indicative cost chart of domestic value chain (Nashikto AzadpurMandi, New Delhi) for pomegranates for 2015–16 . . . . . . . . . . . . . . . . . . . . . . . . . . . . . . . . . . . . . . . . . . . . . . . . . . . 163
Fig. 5.27 Share of actants in wholesale and retail value in domesticpomegranate value chain . . . . . . . . . . . . . . . . . . . . . . . . . . . . . . . . 164
Fig. 5.28 Percentage of marginal and small, semi-medium, mediumand large farmers in grape cultivation . . . . . . . . . . . . . . . . . . . . . . 165
Fig. 5.29 Percentage of marginal and small, semi-medium, mediumand large holdings in pomegranate cultivation . . . . . . . . . . . . . . . 166
Fig. 5.30 Share of grapes and pomegranates exported by FarmersPrivate Ltd. Companies and corporate entities in 2010and 2017 . . . . . . . . . . . . . . . . . . . . . . . . . . . . . . . . . . . . . . . . . . . . . 167
Fig. 5.31 Production of grapes (‘000 MT) and Y-o-Y growth rateof production in India from 2000–01 to 2017–18 . . . . . . . . . . . . . 172
Fig. 5.32 Area under grapes (‘000 ha) in select States and in selectDistricts in Maharashtra . . . . . . . . . . . . . . . . . . . . . . . . . . . . . . . . . 172
Fig. 5.33 Area (‘000 ha) and production (‘000 MT) of pomegranatesin India (2006–07 to 2016–17) . . . . . . . . . . . . . . . . . . . . . . . . . . . . 173
Fig. 5.34 Tissue Culture based Pomegranate Plants sold by JainIrrigation (0.1 millions) from 2008–09 to 2014–15 . . . . . . . . . . . 173
Fig. 5.35 Annual average wholesale price and export volumesof pomegranates in India: 2007–08 to 2015–16 . . . . . . . . . . . . . . 174
Fig. 5.36 Process map from grape to raisin . . . . . . . . . . . . . . . . . . . . . . . . . . 175Fig. 5.37 Price index for raisins based on wholesale prices: 2016–17
and 2017–18 . . . . . . . . . . . . . . . . . . . . . . . . . . . . . . . . . . . . . . . . . . 176Fig. 6.1 India and USA milk production . . . . . . . . . . . . . . . . . . . . . . . . . . . 196Fig. 6.2 Country-wise share of global milk production (TE 2017) . . . . . . 197Fig. 6.3 Milk production in India . . . . . . . . . . . . . . . . . . . . . . . . . . . . . . . . . 199Fig. 6.4 Share of milk production in top 10 milk producing states
(TE 2018–19) . . . . . . . . . . . . . . . . . . . . . . . . . . . . . . . . . . . . . . . . . 199Fig. 6.5 Percentage of milk procured by co-operatives: 2018–19 . . . . . . . 200Fig. 6.6 SMP export from India . . . . . . . . . . . . . . . . . . . . . . . . . . . . . . . . . . 202Fig. 6.7 Historical overview of farm gate milk prices: Fonterra
(NZ) and GCMMF (Amul) . . . . . . . . . . . . . . . . . . . . . . . . . . . . . . . 203Fig. 6.8 SMP price comparison—co-operatives and global
(Oceania) prices . . . . . . . . . . . . . . . . . . . . . . . . . . . . . . . . . . . . . . . 204Fig. 6.9 Comparing NPCs (co-operative) and export volume . . . . . . . . . . 204Fig. 6.10 SMP price comparison—private and global (Oceania)
prices . . . . . . . . . . . . . . . . . . . . . . . . . . . . . . . . . . . . . . . . . . . . . . . . 205Fig. 6.11 Comparing NPCs (Private) and Export Volumes . . . . . . . . . . . . . 205
List of Figures xxxi
Fig. 6.12 Mark-ups of consumer rupee spend onmilk of co-operativesand private (organized) . . . . . . . . . . . . . . . . . . . . . . . . . . . . . . . . . . 206
Fig. 6.13 Distribution of Milch Animal Owning (MAH) households . . . . . 207Fig. 6.14 In-Milk Animal Yield (anticipated) . . . . . . . . . . . . . . . . . . . . . . . . 215Fig. 7.1 Top Eggs and Chicken Producing Countries (TE 2018) . . . . . . . . 229Fig. 7.2 State wise Poultry Meat and Egg Production (TE 2017–18) . . . . 231Fig. 7.3 All India egg production and exports . . . . . . . . . . . . . . . . . . . . . . . 232Fig. 7.4 All India chicken meat production and exports . . . . . . . . . . . . . . . 233Fig. 7.5 Egg exports and nominal protection coefficients . . . . . . . . . . . . . 235Fig. 7.6 Chicken meat exports and nominal protection coefficients . . . . . 236Fig. 7.7 Input cost (INR/kg) . . . . . . . . . . . . . . . . . . . . . . . . . . . . . . . . . . . . . 238Fig. 7.8 Markups for poultry meat (Andhra Pradesh and Tamil Nadu) . . . 238Fig. 7.9 The various stages of poultry revolution in India . . . . . . . . . . . . . 244Fig. 7.10 Key pillars of innovation for poultry sector . . . . . . . . . . . . . . . . . . 244Fig. 7.11 A typical integrator model of poultry . . . . . . . . . . . . . . . . . . . . . . 245Fig. 7.12 Top poultry meat-producing states over recent years . . . . . . . . . . 246Fig. 8.1 Trends in pulses production, area and yield in India
since 1950–51 . . . . . . . . . . . . . . . . . . . . . . . . . . . . . . . . . . . . . . . . . 255Fig. 8.2 Price formation in a domestic value chain of pigeon
peas/tur from Latur to Vashi and Mumbai city . . . . . . . . . . . . . . . 258Fig. 8.3 Wholesale price as a percentage of retail prices of pigeon
pea/tur in selected cities . . . . . . . . . . . . . . . . . . . . . . . . . . . . . . . . . 259Fig. 8.4 Wholesale price as a percentage of retail prices of Bengal
gram/chana in selected cities . . . . . . . . . . . . . . . . . . . . . . . . . . . . . 260Fig. 8.5 Per cent change in wholesale price index and retail price
index of pigeon pea/tur and gram . . . . . . . . . . . . . . . . . . . . . . . . . . 261Fig. 8.6 Import of pulses by quantity and value, 1996–97 to 2017–18 . . . 263Fig. 8.7 Import of pulses by types, 1996–97 to 2017–18 . . . . . . . . . . . . . . 263Fig. 8.8 Rising sharing of chickpeas in export of pulses: TE 2017–18 . . . 265Fig. 8.9 Percentage irrigated area under pulses, gram/chana
and pigeon pea/arhar . . . . . . . . . . . . . . . . . . . . . . . . . . . . . . . . . . . . 267Fig. 8.10 Per cent share of production marketed through different
agencies . . . . . . . . . . . . . . . . . . . . . . . . . . . . . . . . . . . . . . . . . . . . . . 268Fig. 8.11 Area under pulses—per cent irrigated and per cent of gross
cropped area: 1950–51 to 2013–14 . . . . . . . . . . . . . . . . . . . . . . . . 271Fig. 8.12 Statewise per cent area irrigated under pulses: 2013–14 . . . . . . . 271Fig. 8.13 Percent change in wholesale price index of pulses by types,
April 2013 to November 2018 . . . . . . . . . . . . . . . . . . . . . . . . . . . . 273Fig. 8.14 MSP for pigeon pea/tur and chana: 2012–13 to 2017–18 . . . . . . 273Fig. 8.15 Mapping domestic wholesale prices, international prices
and MSP of pigeon pea and bengal gram: 2013–2018(quarterly) . . . . . . . . . . . . . . . . . . . . . . . . . . . . . . . . . . . . . . . . . . . . 274
Fig. 8.16 Trends in cost of cultivation (A2 and C2) in INR per quintalfor pigeon pea and gram . . . . . . . . . . . . . . . . . . . . . . . . . . . . . . . . . 275
xxxii List of Figures
Fig. 8.17 Per cent share of major pulses in total area and production:TE 2015–16 . . . . . . . . . . . . . . . . . . . . . . . . . . . . . . . . . . . . . . . . . . . 276
Fig. 8.18 Statewise yield of pulses: TE 2015–16 . . . . . . . . . . . . . . . . . . . . . 276Fig. 8.19 Top five pulses producing states in India, TE 2015–16 . . . . . . . . 277Fig. 8.20 State-wise area under pulses as a per cent of gross cropped
area: TE 2015–16 . . . . . . . . . . . . . . . . . . . . . . . . . . . . . . . . . . . . . . 277Fig. 8.21 Top five states producing tur, gram, urad and moong
pulses, TE 2015–16 . . . . . . . . . . . . . . . . . . . . . . . . . . . . . . . . . . . . . 278Fig. 8.22 Comparison of yields of types of pulses by leading states,
average of 2014–15 and 2015–16 . . . . . . . . . . . . . . . . . . . . . . . . . 279Fig. 8.23 Per cent distribution of insured area under crops
and per cent of crops insured . . . . . . . . . . . . . . . . . . . . . . . . . . . . . 281
List of Tables
Table 1.1 Basic Statistics of Selected Commodities (TE 2018–19) . . . . . . 2Table 1.2 Details of field visits . . . . . . . . . . . . . . . . . . . . . . . . . . . . . . . . . . . 5Table 2.1 Domestic competitiveness of value chains . . . . . . . . . . . . . . . . . 18Table 3.1 Traditional value chain models for analysis of domestic
price formation . . . . . . . . . . . . . . . . . . . . . . . . . . . . . . . . . . . . . . . 46Table 3.2 Costs and margins of tomato value chain from producing
regions to Delhi . . . . . . . . . . . . . . . . . . . . . . . . . . . . . . . . . . . . . . . 50Table 3.3 Costs and margins of onion value chain from producing
regions to Delhi . . . . . . . . . . . . . . . . . . . . . . . . . . . . . . . . . . . . . . . 52Table 3.4 Costs and margins for potato value chain from producing
regions to Delhi . . . . . . . . . . . . . . . . . . . . . . . . . . . . . . . . . . . . . . . 54Table 3.5 Farmer’s share in consumer rupee in major metro cities . . . . . . 55Table 3.6 Potato value chain from Nalanda to Patna . . . . . . . . . . . . . . . . . 56Table 3.7 Costs, revenue and returns of McCain farmers in 2016–
17—Summary table . . . . . . . . . . . . . . . . . . . . . . . . . . . . . . . . . . . 60Table 3.8 Share of different farmer groups for major crops 2010–11 . . . . 62Table 3.9 Cost and returns for Karnataka Tomato farmers . . . . . . . . . . . . . 69Table 3.10 Lasalgaon onion farmer’s cost, price received and returns . . . . 70Table 3.11 Agra Potato farmers’ costs, price received and returns . . . . . . . 72Table 3.12 Water requirement and number of irrigations for potato
and onion . . . . . . . . . . . . . . . . . . . . . . . . . . . . . . . . . . . . . . . . . . . . 73Table 3.13 Compound Annual Growth Rates (CAGR) of Area (A),
Production (P) and Yield (Y) . . . . . . . . . . . . . . . . . . . . . . . . . . . . 77Table 3.14 Fruits (F) and vegetables (V) exports as share
of production . . . . . . . . . . . . . . . . . . . . . . . . . . . . . . . . . . . . . . . . . 80Table 4.1 Harvesting pattern in the leading mango growing states . . . . . . 106Table 4.2 Comparison of India with other banana countries (TE
2017) . . . . . . . . . . . . . . . . . . . . . . . . . . . . . . . . . . . . . . . . . . . . . . . 109Table 4.3 Share of different farm sizes for banana . . . . . . . . . . . . . . . . . . . 119Table 4.4 Share of different farm sizes for Mango . . . . . . . . . . . . . . . . . . . 119Table 4.5 Cost and returns for Jalgaon banana farmers (TE 2018–19) . . . 123
xxxiii
xxxiv List of Tables
Table 4.6 Average annual returns on mango orchard (INR/ha),Karnataka . . . . . . . . . . . . . . . . . . . . . . . . . . . . . . . . . . . . . . . . . . . 124
Table 4.7 Cost of cultivation and returns for Maharashtra mango(Kesar) farmers INR/quintal . . . . . . . . . . . . . . . . . . . . . . . . . . . . 124
Table 4.8 Irrigation requirement for mango plant . . . . . . . . . . . . . . . . . . . . 125Table 4.9 Compound annual growth rates for area, production
and yield of bananas in India . . . . . . . . . . . . . . . . . . . . . . . . . . . . 129Table 4.10 Funds allocated to states under MIDH (INR/crore) . . . . . . . . . . 131Table 4.11 Mango exports from Maharashtra . . . . . . . . . . . . . . . . . . . . . . . . 133Table 4.12 Loans for farmers . . . . . . . . . . . . . . . . . . . . . . . . . . . . . . . . . . . . . 135Table 4.13 APEDA assistances for mango and banana exporters . . . . . . . . 136Table 5.1 Top producers, consumers, exporters and importers
of table grapes (2014) . . . . . . . . . . . . . . . . . . . . . . . . . . . . . . . . . . 150Table 5.2 Production of pomegranates (‘000 MT) in major
producing countries (2014) . . . . . . . . . . . . . . . . . . . . . . . . . . . . . 153Table 5.3 Comparison of production and exports of table grapes
in India and other grape-producing countries . . . . . . . . . . . . . . . 157Table 5.4 Rates of return accruing to export-oriented
and domestically oriented grape and pomegranatefarmers under BAU . . . . . . . . . . . . . . . . . . . . . . . . . . . . . . . . . . . . 168
Table 5.5 Accounting rate of returns to export-oriented grapefarmers under various sensitivity scenarios . . . . . . . . . . . . . . . . 169
Table 5.6 Indicative revenues, costs and rate of returnsto export-oriented pomegranate farmers under varioussensitivity scenarios . . . . . . . . . . . . . . . . . . . . . . . . . . . . . . . . . . . 170
Table 5.7 Price escalation from grapes to raisins: 2018 . . . . . . . . . . . . . . . 176Table 5.8 Interest rate schedule for crop loans taken for grape
and pomegranate farming in Nashik in nationalized banks . . . . 178Table 5.9 Assistance provided by APEDA for PHM under various
schemes: 2018 . . . . . . . . . . . . . . . . . . . . . . . . . . . . . . . . . . . . . . . . 181Table 6.1 Global trade in SMP 2016 . . . . . . . . . . . . . . . . . . . . . . . . . . . . . . 198Table 6.2 Global market in dairy products (2016) . . . . . . . . . . . . . . . . . . . 198Table 6.3 Member farmers with Bihar State Milk Co-operative
Federation—Sudha (in lakhs) . . . . . . . . . . . . . . . . . . . . . . . . . . . 208Table 6.4 Fodder scarcity (units in MMT) . . . . . . . . . . . . . . . . . . . . . . . . . 211Table 6.5 Cattle productivity–average yield per in-milk animals
(kg/day) . . . . . . . . . . . . . . . . . . . . . . . . . . . . . . . . . . . . . . . . . . . . . 214Table 6.6 Bank loans to dairy units: 2013–14 to 2016–17 . . . . . . . . . . . . . 219Table 6.7 Projected investment required for increasing dairy
processing capacity . . . . . . . . . . . . . . . . . . . . . . . . . . . . . . . . . . . . 221Table 7.1 SWOT analysis: poultry sector (eggs and meat) . . . . . . . . . . . . . 234Table 7.2 Risk mitigation and assured return in the broiler
integration model . . . . . . . . . . . . . . . . . . . . . . . . . . . . . . . . . . . . . 237

List of Tables xxxv
Table 7.3 Financing requirements of poultry broiler farmers . . . . . . . . . . . 247Table 7.4 Costs, margins and sources of finance for poultry farmers . . . . 247Table 7.5 Share of formal finance by poultry farmers . . . . . . . . . . . . . . . . 249
Chapter 1Introduction
Ashok Gulati
1.1 Background and Scope of the Study
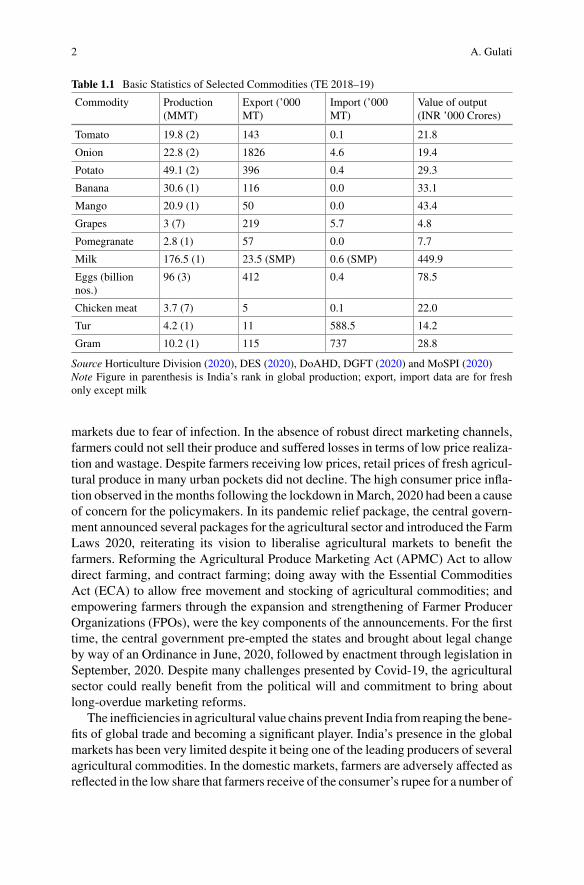
Changing consumption preferences towards high value, nutrient and protein richfoods are signaling agricultural diversification in India. Currently, India is the largestproducer of milk, pulses, banana, mango, pomegranate, papaya, lemon, okra, gingerand non-food crops like cotton and jute; the second-largest producer of rice, wheat,fruits and vegetables, tea and one of the leading producers of eggs and meat in theworld. India produced 281.8 million tonnes of food grains, 307.7 million tonnesof horticulture crops, 176.5 million tonnes of milk, 96 billion eggs and 7.7 milliontonnes of meat during TE 2018–19. Table 1.1 illustrates the production and tradestatistics for the selected commodities studied in this book.
However, this record level of production has not translated into commensurateincreased economic returns to the farmers in India. Unable to find markets for theirproduce, farmers have often taken to distress sales, burning crops, and dumpingproduce on the roads. Agricultural policymaking has for a very long time focused onincreasing production without giving due attention to the need to develop efficientvalue chains. While India has diversified significantly from producing grains to avariety of high-value commodities, these commodity value chains have remainedrelatively underdeveloped. Agricultural value chains are highly fragmented andsubject to a high degree of intermediation, resulting in poor price realization forfarmers, substantial losses in the quantity and quality of produce, limited scope forvalue addition, and high price volatility.
The vulnerability of agricultural value chains became more evident during thecoronavirus pandemic in 2020. With the sudden announcement of lockdown 1.0 inMarch, 2020 across the country, supply chains dealing in fresh andperishable producewere hit. Demand plummeted due to the restrictions imposed on the HoReCa (hotel,restaurant and catering) segment, and because of people keeping away from wet
A. Gulati (B)Indian Council for Research on International Economic Relations (ICRIER), New Delhi, India
© The Author(s) 2022A. Gulati et al. (eds.), Agricultural Value Chains in India, India Studies in Businessand Economics, https://doi.org/10.1007/978-981-33-4268-2_1
1
2 A. Gulati
Table 1.1 Basic Statistics of Selected Commodities (TE 2018–19)
Commodity Production(MMT)
Export (’000MT)
Import (’000MT)
Value of output(INR ’000 Crores)
Tomato 19.8 (2) 143 0.1 21.8
Onion 22.8 (2) 1826 4.6 19.4
Potato 49.1 (2) 396 0.4 29.3
Banana 30.6 (1) 116 0.0 33.1
Mango 20.9 (1) 50 0.0 43.4
Grapes 3 (7) 219 5.7 4.8
Pomegranate 2.8 (1) 57 0.0 7.7
Milk 176.5 (1) 23.5 (SMP) 0.6 (SMP) 449.9
Eggs (billionnos.)
96 (3) 412 0.4 78.5
Chicken meat 3.7 (7) 5 0.1 22.0
Tur 4.2 (1) 11 588.5 14.2
Gram 10.2 (1) 115 737 28.8
Source Horticulture Division (2020), DES (2020), DoAHD, DGFT (2020) and MoSPI (2020)Note Figure in parenthesis is India’s rank in global production; export, import data are for freshonly except milk
markets due to fear of infection. In the absence of robust direct marketing channels,farmers could not sell their produce and suffered losses in terms of low price realiza-tion and wastage. Despite farmers receiving low prices, retail prices of fresh agricul-tural produce in many urban pockets did not decline. The high consumer price infla-tion observed in themonths following the lockdown inMarch, 2020 had been a causeof concern for the policymakers. In its pandemic relief package, the central govern-ment announced several packages for the agricultural sector and introduced the FarmLaws 2020, reiterating its vision to liberalise agricultural markets to benefit thefarmers. Reforming the Agricultural Produce Marketing Act (APMC) Act to allowdirect farming, and contract farming; doing away with the Essential CommoditiesAct (ECA) to allow free movement and stocking of agricultural commodities; andempowering farmers through the expansion and strengthening of Farmer ProducerOrganizations (FPOs), were the key components of the announcements. For the firsttime, the central government pre-empted the states and brought about legal changeby way of an Ordinance in June, 2020, followed by enactment through legislation inSeptember, 2020. Despite many challenges presented by Covid-19, the agriculturalsector could really benefit from the political will and commitment to bring aboutlong-overdue marketing reforms.
The inefficiencies in agricultural value chains prevent India from reaping the bene-fits of global trade and becoming a significant player. India’s presence in the globalmarkets has been very limited despite it being one of the leading producers of severalagricultural commodities. In the domestic markets, farmers are adversely affected asreflected in the low share that farmers receive of the consumer’s rupee for a number of
1 Introduction 3
agricultural commodities. This makes it even harder for India’s predominantly largenumber of small and marginal farmers to earn remunerative prices. Given that 86.1%of total agricultural land holdings in India are small and marginal (area less than 2ha), any agriculture growth that does not deliver benefits to the small and marginalfarmers cannot be inclusive. Further, the cereal-centric policies of the governmenthave neglected the challenges faced by farmers growing non-cereal crops. Thesepolicies have exacerbated the concerns around environmental degradation includingdepleting water resources in key rice-growing states as well as soil contaminationdue to excessive use of chemicals. Very little attention has been given towards thesustainability and scalability of successful value chains across commodities andgeographies.
With rising incomes, the demand for high-value agricultural crops such as fruitsand vegetables, dairy products, eggs, chicken and fish in India has increased overthe years. Therefore, it is important to develop value chains that can handle the preand post-harvest requirements of such commodities, which are different from that ofcereals and pulses. First, the value chains should be domestically as well as globallycompetitive. Second, the value chains should be inclusive to ensure participationof marginal and small farmers. Third, it should be financially and environmentallysustainable; farmers should be able to earn remunerative returns but not at the cost ofenvironmental health and natural resources. Fourth, the impact of successful valuechains can be realized to the benefit of farmers and the agricultural sector, in general,if these chains can be scaled up across commodities and geographies. Last, accessto finance through innovative financing methods for all stakeholders in the valuechain is critical to ensure that these chains are competitive, inclusive, sustainableand scalable.
In this context, this ICRIER-NABARD research study on agricultural value chainswas undertaken to analyze and evaluate the performance of selected agricultural valuechains across major producing regions in India using the conceptual frameworkof competitiveness, inclusiveness, sustainability, scalability (CISS) and access tofinance (F). The study includes agricultural commodities such as vegetables (tomato,onion and potato (TOP)), fruits (banana, mango, grapes and pomegranate), dairy,poultry, and pulses. The conceptual framework of CISS-F helps understand how agri-cultural and food policies work on the ground and what more needs to be done at thepolicy, institutional and operational levels to strengthen the high-value agriculturalchains.
1.2 Methodological Framework
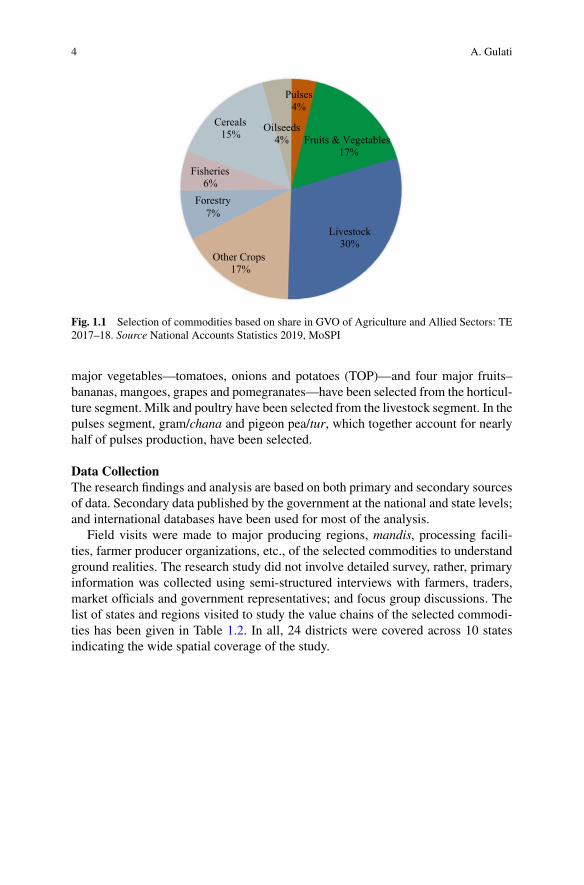
Commodity SelectionCommodities studied in this book include high-value agricultural commoditiessuch as fruits and vegetables, livestock and pulses, which account for more than50% of the value of output from agriculture and allied sectors (Fig. 1.1). Three
4 A. Gulati
Cereals15% Oilseeds
4%
Pulses4%
Fruits & Vegetables17%
Livestock30%
Other Crops17%
7%
Fisheries6%
Forestry
Fig. 1.1 Selection of commodities based on share in GVO of Agriculture and Allied Sectors: TE2017–18. Source National Accounts Statistics 2019, MoSPI
major vegetables—tomatoes, onions and potatoes (TOP)—and four major fruits–bananas, mangoes, grapes and pomegranates—have been selected from the horticul-ture segment. Milk and poultry have been selected from the livestock segment. In thepulses segment, gram/chana and pigeon pea/tur, which together account for nearlyhalf of pulses production, have been selected.
Data CollectionThe research findings and analysis are based on both primary and secondary sourcesof data. Secondary data published by the government at the national and state levels;and international databases have been used for most of the analysis.
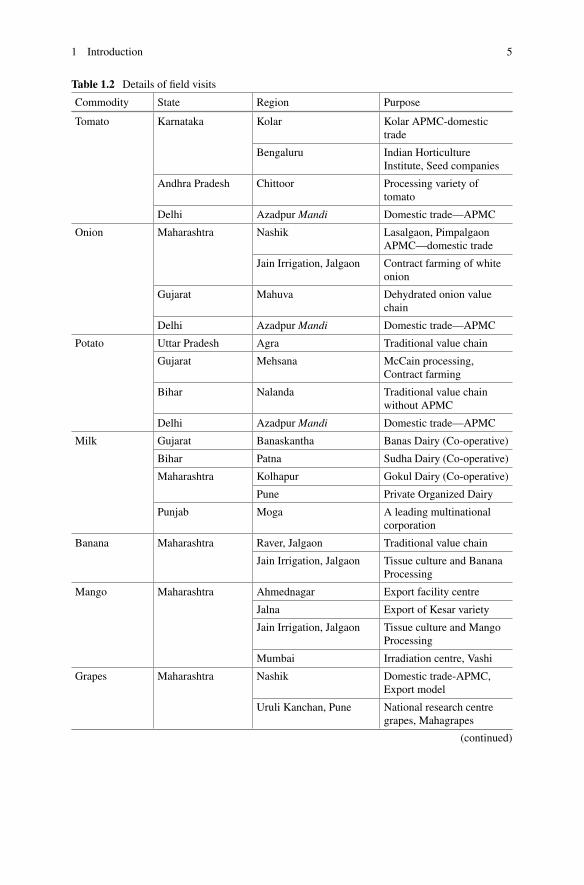
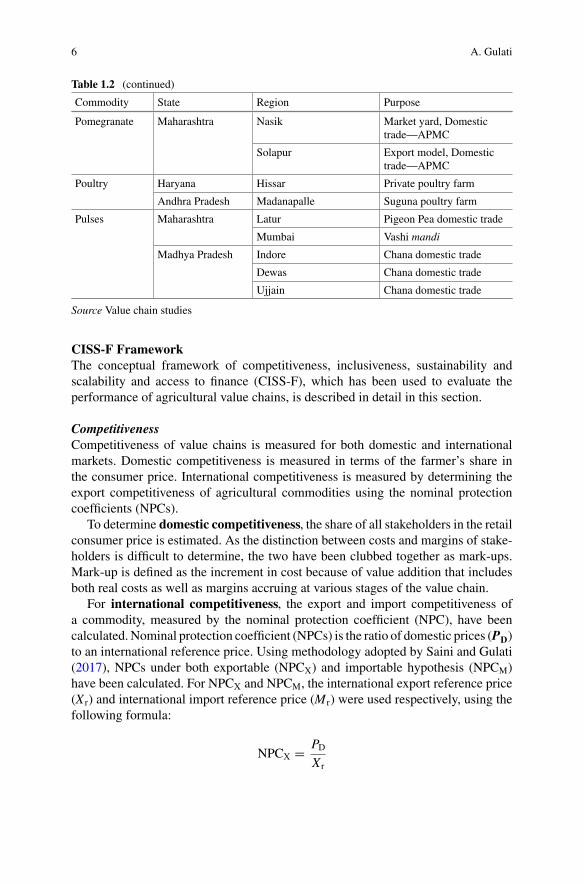
Field visits were made to major producing regions, mandis, processing facili-ties, farmer producer organizations, etc., of the selected commodities to understandground realities. The research study did not involve detailed survey, rather, primaryinformation was collected using semi-structured interviews with farmers, traders,market officials and government representatives; and focus group discussions. Thelist of states and regions visited to study the value chains of the selected commodi-ties has been given in Table 1.2. In all, 24 districts were covered across 10 statesindicating the wide spatial coverage of the study.
1 Introduction 5
Table 1.2 Details of field visits
Commodity State Region Purpose
Tomato Karnataka Kolar Kolar APMC-domestictrade
Bengaluru Indian HorticultureInstitute, Seed companies
Andhra Pradesh Chittoor Processing variety oftomato
Delhi Azadpur Mandi Domestic trade—APMC
Onion Maharashtra Nashik Lasalgaon, PimpalgaonAPMC—domestic trade
Jain Irrigation, Jalgaon Contract farming of whiteonion
Gujarat Mahuva Dehydrated onion valuechain
Delhi Azadpur Mandi Domestic trade—APMC
Potato Uttar Pradesh Agra Traditional value chain
Gujarat Mehsana McCain processing,Contract farming
Bihar Nalanda Traditional value chainwithout APMC
Delhi Azadpur Mandi Domestic trade—APMC
Milk Gujarat Banaskantha Banas Dairy (Co-operative)
Bihar Patna Sudha Dairy (Co-operative)
Maharashtra Kolhapur Gokul Dairy (Co-operative)
Pune Private Organized Dairy
Punjab Moga A leading multinationalcorporation
Banana Maharashtra Raver, Jalgaon Traditional value chain
Jain Irrigation, Jalgaon Tissue culture and BananaProcessing
Mango Maharashtra Ahmednagar Export facility centre
Jalna Export of Kesar variety
Jain Irrigation, Jalgaon Tissue culture and MangoProcessing
Mumbai Irradiation centre, Vashi
Grapes Maharashtra Nashik Domestic trade-APMC,Export model
Uruli Kanchan, Pune National research centregrapes, Mahagrapes
(continued)
6 A. Gulati
Table 1.2 (continued)
Commodity State Region Purpose
Pomegranate Maharashtra Nasik Market yard, Domestictrade—APMC
Solapur Export model, Domestictrade—APMC
Poultry Haryana Hissar Private poultry farm
Andhra Pradesh Madanapalle Suguna poultry farm
Pulses Maharashtra Latur Pigeon Pea domestic trade
Mumbai Vashi mandi
Madhya Pradesh Indore Chana domestic trade
Dewas Chana domestic trade
Ujjain Chana domestic trade
Source Value chain studies
CISS-F FrameworkThe conceptual framework of competitiveness, inclusiveness, sustainability andscalability and access to finance (CISS-F), which has been used to evaluate theperformance of agricultural value chains, is described in detail in this section.
CompetitivenessCompetitiveness of value chains is measured for both domestic and internationalmarkets. Domestic competitiveness is measured in terms of the farmer’s share inthe consumer price. International competitiveness is measured by determining theexport competitiveness of agricultural commodities using the nominal protectioncoefficients (NPCs).
To determine domestic competitiveness, the share of all stakeholders in the retailconsumer price is estimated. As the distinction between costs and margins of stake-holders is difficult to determine, the two have been clubbed together as mark-ups.Mark-up is defined as the increment in cost because of value addition that includesboth real costs as well as margins accruing at various stages of the value chain.
For international competitiveness, the export and import competitiveness ofa commodity, measured by the nominal protection coefficient (NPC), have beencalculated. Nominal protection coefficient (NPCs) is the ratio of domestic prices (PD)to an international reference price. Using methodology adopted by Saini and Gulati(2017), NPCs under both exportable (NPCX) and importable hypothesis (NPCM)have been calculated. For NPCX and NPCM, the international export reference price(X r) and international import reference price (Mr) were used respectively, using thefollowing formula:
NPCX = PDX r
1 Introduction 7
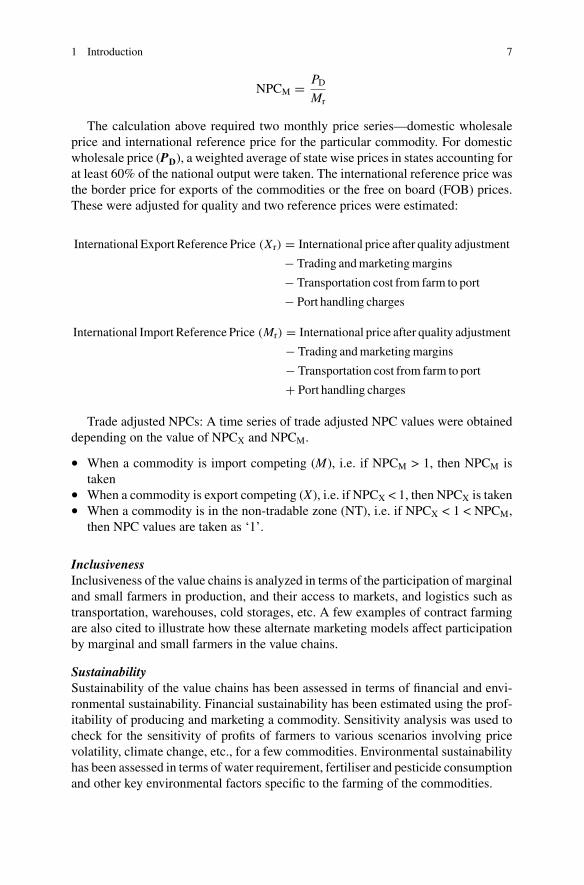
NPCM = PDMr
The calculation above required two monthly price series—domestic wholesaleprice and international reference price for the particular commodity. For domesticwholesale price (PD), a weighted average of state wise prices in states accounting forat least 60% of the national output were taken. The international reference price wasthe border price for exports of the commodities or the free on board (FOB) prices.These were adjusted for quality and two reference prices were estimated:
International Export Reference Price (Xr) = International price after quality adjustment
− Trading andmarketingmargins
− Transportation cost from farm to port
− Port handling charges
International Import Reference Price (Mr) = International price after quality adjustment
− Trading andmarketingmargins
− Transportation cost from farm to port
+ Port handling charges
Trade adjusted NPCs: A time series of trade adjusted NPC values were obtaineddepending on the value of NPCX and NPCM.
• When a commodity is import competing (M), i.e. if NPCM > 1, then NPCM istaken
• When a commodity is export competing (X), i.e. if NPCX < 1, then NPCX is taken• When a commodity is in the non-tradable zone (NT), i.e. if NPCX < 1 < NPCM,
then NPC values are taken as ‘1’.
InclusivenessInclusiveness of the value chains is analyzed in terms of the participation of marginaland small farmers in production, and their access to markets, and logistics such astransportation, warehouses, cold storages, etc. A few examples of contract farmingare also cited to illustrate how these alternate marketing models affect participationby marginal and small farmers in the value chains.
SustainabilitySustainability of the value chains has been assessed in terms of financial and envi-ronmental sustainability. Financial sustainability has been estimated using the prof-itability of producing and marketing a commodity. Sensitivity analysis was used tocheck for the sensitivity of profits of farmers to various scenarios involving pricevolatility, climate change, etc., for a few commodities. Environmental sustainabilityhas been assessed in terms of water requirement, fertiliser and pesticide consumptionand other key environmental factors specific to the farming of the commodities.
8 A. Gulati
ScalabilityScalability of the value chains has been measured in terms of past trends in areaexpansion or productivity gains, both of which affect the current production levelsas well as the future scope of increasing production. Expansion of exports, andopportunities for value addition, which are critical to the economics of scaling upproduction, have been considered as well. Also, for successful value chains, thepotential for replicability across states has been studied.
Access to FinanceFinally, access to finance by various stakeholders in the value chains and the roleof innovative financing methods have been studied. Existing gaps in financing, thecurrent reach of organized finance and the potential for innovative financial interven-tions have been identified. Financial interventions are suggested in order to increasecompetitiveness, inclusiveness, scalability or sustainability of participants in thevalue chain.
1.3 Organization of the Book
This book is organized into 9 chapters. This chapter introduces the background, scopeand methodological framework of the study. Chapter 2 presents a comprehensivesynthesis of all value chains analyzed in this study. The chapter brings out the roleof technology, institutions and markets in strengthening agricultural value chains bycatalysing each of the components of the CISS-F framework. Chapters 3–8 deal withcommodity-specific value chain studies. Chapter 3 explores the value chains of threemajor vegetables in India –tomatoes, onions and potatoes (TOP);Chap. 4 explores thevalue chains of twomajor fruits—bananas andmangoes; Chap. 5 deals with the valuechains of grapes and pomegranates; Chap. 6 presents the dairy value chain in Indiafocusing on the milk value chain; Chap. 7 relates to the poultry value chain in Indiaand Chap. 8 analyzes the pulses value chain in India, focusing on gram/chana andpigeon pea/tur. Each of these six value chain chapters analyze the performance of therespective commodity value chains in terms of their competitiveness, inclusiveness,sustainability, scalability and access to finance. The research findings are used tocome upwith commodity-specific policy suggestions that could help address existingchallenges and strengthen the value chains further. Finally, Chap. 9 presents the wayforward and provides some broad policy suggestions relevant for strengthening ofagricultural value chains.
References
DES (2020) Estimates of foodgrains production. Directorate of Economics and Statistics, Depart-ment of Agriculture, Cooperation and Farmers Welfare, Ministry of Agriculture and FarmersWelfare
1 Introduction 9
DGFT (2020) Export import databank. Retrieved Oct 2019 from Directorate General of ForeignTrade, Ministry of Commerce & Industry. https://tradestat.commerce.gov.in/eidb/default.asp
DoAHD (2020) Basic animal husbandry statistics 2019. Department of Animal Husbandry andDairying, Ministry of Fisheries, Animal Husbandry and Dairying
Horticulture Division (2020) Area and production of horticulture crops: all India. Department ofAgriculture, Cooperation and Farmers Welfare. Ministry of Agriculture and Farmers Welfare
MoSPI (2020) National account statistics. Ministry of Statistics and Program Implementation,Government of India, New Delhi
Saini S, Gulati A (2017) Price distortions in Indian agriculture. World Bank, New Delhi
Open Access This chapter is licensed under the terms of the Creative Commons Attribution 4.0International License (http://creativecommons.org/licenses/by/4.0/), which permits use, sharing,adaptation, distribution and reproduction in any medium or format, as long as you give appropriatecredit to the original author(s) and the source, provide a link to the Creative Commons license andindicate if changes were made.
The images or other third party material in this chapter are included in the chapter’s CreativeCommons license unless indicated otherwise in a credit line to the material. If material is notincluded in the chapter’s Creative Commons license and your intended use is not permitted bystatutory regulation or exceeds the permitted use, you will need to obtain permission directly fromthe copyright holder.
Chapter 2Evaluating Agricultural Value Chainson CISS-F Framework
Ashok Gulati, Kavery Ganguly, and T. Nanda Kumar
2.1 Technology, Institutions and Markets Driving ValueChains
Technology, institutions and markets together drive agricultural value chains inbecoming more competitive, inclusive, sustainable and scalable, and in improvingaccess to finance (Fig. 2.1). Technology has been instrumental in streamlining valuechains, improving efficiency, and enabling farmers’ participation. Institutions thatfocused on aggregating marginal and small farmers, empowering them with betterbargaining power, inducing economies of scale and creating market linkages havebeen pivotal in the successful transformation of agricultural value chains. Dairyco-operatives, co-operative unions in the case of grapes and the integrator modelin poultry, are some examples. Institutions have been effective in bringing in theright agricultural practices as observed in the case of pomegranate, banana, andmango. Institutions have a critical role in enhancing governance and accountabilityand addressing equity concerns in high-value agriculture.
Commodities like tomato, onion, potato and pulses, despite high volumes andvalue but marketed largely through traditional market channels, are more susceptibleto price volatility compared to grains. Time and again, farmers have suffered fromcrashing prices but have not gained as much from price escalation in the wholesaleor retail markets. Much of this can be explained by limited marketing opportunitiesfor farmers and the inability to undertake marketing risks. The role of technology,institutions and markets and their critical interplay have been analyzed in greaterdetail in assessing the value chains in the CISS-F framework.
A. Gulati (B) · K. GangulyIndian Council for Research on International Economic Relations (ICRIER), New Delhi, India
T. Nanda KumarFormer Senior Visiting Fellow, Indian Council for Research on International Economic Relations(ICRIER), New Delhi, India
© The Author(s) 2022A. Gulati et al. (eds.), Agricultural Value Chains in India, India Studies in Businessand Economics, https://doi.org/10.1007/978-981-33-4268-2_2
11
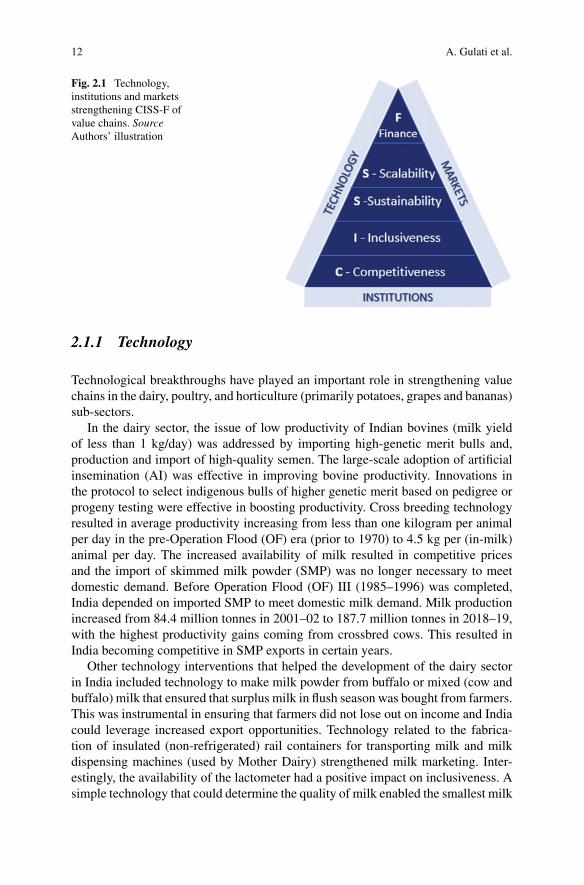
12 A. Gulati et al.
Fig. 2.1 Technology,institutions and marketsstrengthening CISS-F ofvalue chains. SourceAuthors’ illustration
2.1.1 Technology
Technological breakthroughs have played an important role in strengthening valuechains in the dairy, poultry, and horticulture (primarily potatoes, grapes and bananas)sub-sectors.
In the dairy sector, the issue of low productivity of Indian bovines (milk yieldof less than 1 kg/day) was addressed by importing high-genetic merit bulls and,production and import of high-quality semen. The large-scale adoption of artificialinsemination (AI) was effective in improving bovine productivity. Innovations inthe protocol to select indigenous bulls of higher genetic merit based on pedigree orprogeny testing were effective in boosting productivity. Cross breeding technologyresulted in average productivity increasing from less than one kilogram per animalper day in the pre-Operation Flood (OF) era (prior to 1970) to 4.5 kg per (in-milk)animal per day. The increased availability of milk resulted in competitive pricesand the import of skimmed milk powder (SMP) was no longer necessary to meetdomestic demand. Before Operation Flood (OF) III (1985–1996) was completed,India depended on imported SMP to meet domestic milk demand. Milk productionincreased from 84.4 million tonnes in 2001–02 to 187.7 million tonnes in 2018–19,with the highest productivity gains coming from crossbred cows. This resulted inIndia becoming competitive in SMP exports in certain years.
Other technology interventions that helped the development of the dairy sectorin India included technology to make milk powder from buffalo or mixed (cow andbuffalo) milk that ensured that surplus milk in flush season was bought from farmers.This was instrumental in ensuring that farmers did not lose out on income and Indiacould leverage increased export opportunities. Technology related to the fabrica-tion of insulated (non-refrigerated) rail containers for transporting milk and milkdispensing machines (used by Mother Dairy) strengthened milk marketing. Inter-estingly, the availability of the lactometer had a positive impact on inclusiveness. Asimple technology that could determine the quality of milk enabled the smallest milk
2 Evaluating Agricultural Value Chains on CISS-F Framework 13
farmer to participate in the value chain. The awareness that milk adulteration couldbe detected, and payments for milk were made on easily verifiable quality and quan-tity, prevented farmers from indulging in malpractices. This laid the foundation oftrust in the co-operative milk marketing system in India.
In the poultry sector, backyard poultry did not support the rapid expansion ofproduction through productivity breakthroughs or large-scale market integration.To overcome the productivity challenge, large-scale organized players demandedliberalization of import of improved genetic material. Until 2001, the import ofgrandparent stock was controlled by permits and governed by a duty structure. Abold decision to allow duty-free import of grandparent stock (like Bowans, Hyline,Lohman LSL, among others) from the USA and other countries enabled the devel-opment of crossbred varieties like BV-300. The egg productivity for improved fowlsincreased from237.5 per bird per year in 2000-01 to 297 per bird per year in 2017–18.
In the case of poultry meat, technology breakthrough with improved varieties likeCobb, Hubbard, Lohman, among others enabled India to achieve high-conversionratios and reduced the period needed for chicken to gain the required weight (33–45 days). The technologies suited the integrator model involving a large number ofsmall farmers. The integrators took the responsibility for running and maintaininghatcheries to ensure genetic purity and control over disease outbreak. The develop-ment of modern hatcheries in the private sector, modernization of feed mills, devel-opment of protocols for themanagement of small size (3000–5000 birds) farms, stan-dard operating procedures (SOP) for containment of disease and skill developmentat the farm level also contributed to the growth of the poultry sector in India.
In potato, the introduction of the early season variety Kufri Pukhraj and mid-season varieties by scientists at CPRI-Shimla enabled a productivity breakthroughand reduced crop duration. In tomato, a production breakthrough was achievedlargely through hybrids developed by the private sector and better crop management.In the case of both potato and tomato, large private processors brought in technolo-gies and best practices for pre- and post-harvest operations. In the case of onion, cropmanagement technology, raised bed planting, micro irrigation, and development ofseason specific varieties for the kharif , late kharif , and rabi seasons, made a lotof difference in productivity. Dehydration and storage technologies in onion furtherboosted value addition.
Grape cultivation was transformed by the introduction of the Thomson seedlesscultivar of the USA origin. It helped improve both the quality and volume of produc-tion to enable India to export table grapes and attain productivity levels compa-rable globally. In pomegranates, productivity and crop loss issues were overcomeby adopting tissue culture of sturdy varieties that could withstand water stress forlong spells. These varieties were developed by a private entrepreneur and distributedto farmers. Although aimed at export clusters, the introduction of good agriculturalpractices (GAP) and traceability criteria such as grape-net and mango-net by Agri-cultural and Processed Food Products Development Authority (APEDA) broughtabout positive changes in these value chains. Innovations in packaging also had apositive impact on the marketability of grapes.
Productivity gains in bananas was achieved through the introduction of GrandNain, a cultivar of the Cavendish variety imported by Jain Irrigation System Limited
14 A. Gulati et al.
(JISL) in 1994 and ready for adoption in the late 1990s-early 2000. Tissue culturetechnology was extensively used to produce disease free planting material in largequantities across the country. Grand Nain’s potential was 200–240 fruits of stan-dard size that is about 32 kg from one plant in about 250 days and yields up to 85tons per hectare. Such high-productivity levels enabled farmers to earn much higherreturns per unit of land. Ripening technologies in the banana sector has improvedthe quality of the fruit by slowing down the ripening process. Mango has been atraditional orchard crop in India. There was no major breakthrough in yields throughthe adoption of genetic technology in the case of mango. However, efficient manage-ment of orchards through ultra-density planting—a technology perfected by Israel—together with pruning of trees and access to micro irrigation improved productivitysignificantly.
Unlike in the case of wheat and rice (during the Green Revolution period), therewas no varietal breakthrough in pulses, resulting in volatility in domestic productionand increasing dependence on imports (with the exception of the year 2016–17).Efforts to enhance productivity of pulses date back to the National Pulses Develop-ment Scheme in the 7th five-year plan (1985–1990). Since then, pulses have beenpart of national technology missions, integrated schemes, National Food SecurityMission (NFSM), Rashtriya Krishi Vikas Yojana (RKVY), accelerated pulses devel-opment program, etc. However, the impact of these program has not been studiedadequately to enable an assessment of their role in increasing productivity. Increasedproduction of pulses together with cheap imports resulted in poor price realizationby farmers, making production unviable. This is an example of how the concernin agriculture has moved from boosting production to creating and strengtheningmarket linkages for farmers to sell their produce at remunerative prices.
2.1.2 Institutions
Institutions led by government, private sector, and farmers have had their impact onthe progress of Indian agriculture. It is interesting to note that each of these institutionshave co-existed together with varying degrees of importance, specific to the valuechains. Efforts have been made to revitalize institutions to realize higher economicgains as well as farmers’ welfare. Institutions have enabled technology adoption andcreation of market linkages as observed in the value chains studied here.
The success of Indian dairying is ascribed to co-operatives and, within that thesuccess of the Gujarat Co-operative Milk Marketing Federation Limited (GCMMF)or Amul stands out as exemplary. The co-operative revolution in Indian dairy and therise of Amul was rooted in the desire to put an end to the non-inclusive monopolyof Polson and tapping the big Bombay market. Support from leaders like SardarVallabhbhai Patel and Lal Bahadur Shastri, persistent ground work by local leaderslike Tribhuvandas Patel and the innovative genius and technological prowess of Dr.Verghese Kurien shaped the dairy co-operatives. Transparency, trust and technologywere the three pillars of the dairy co-operatives in India. The co-operatives were
2 Evaluating Agricultural Value Chains on CISS-F Framework 15
structured on democratic principles; farmers had their rightful share in the valuecreated and consumers received value for money in terms of safe pasteurized milk.The co-operatives also played an instrumental role in rendering the dairy value chaininclusive by linking the smallest milk farmer to the market. Milk farmers in co-operatives receive (75–80)% of the consumer price, which is the highest amongother high value chains. However, the success of Amul could not be replicated byother dairy co-operatives and their role in leveraging technology, creating marketaccess for farmers, and generating value addition in dairy has been limited. Designingfarmer-owned institutions need careful thought, committed leadership and sustainednurturing, which for several reasons were missing in co-operatives in other states.
The case of poultry is an equally fascinating story of how private sector-led insti-tutional architecture scripted a resounding success story. An integrator-led farmerparticipatorymodel allowed farmers to rear (3000–10,000) poultry birds on a contractbasis. The integrators developed an unambiguous farmer-friendly contract thatincluded conditional buyback arrangements. The integrator provided high-geneticmerit day-old chicks, arranged for vaccines, trained farmers in administering vaccina-tions, provided feed and bought back the birds and, in some cases, eggs at pre-agreedprices. The farmer was paid for managing the birds subject to a limit on mortalityand an agreed weight with premium on better management. Effectively, market andprice risks were undertaken by the integrator. The production risks were substantiallyreduced by technology and veterinary support. The contract farming model workedwell without the cumbersome legal arrangements envisaged in the erstwhile contractfarming law. The National Egg Coordination Committee (NECC), set up in 1982,provided a major price incentive by setting prices through voluntary compliancewhich it claims to have structured in such a way that farmers received about 75% ofthe consumer price. The call ‘my egg, my price, my life’ resonated well with farmers.
In the grape sector, Mahagrapes, a union of 16 grape growers’ co-operative soci-eties in Maharashtra, played a significant role in creating market linkages, ensuringfarmers’ participation in price discovery and gradually expanding exports. Maha-grapes was the first entity to venture into grape export. Subsequently, the privatesector, with the help of APEDA and easy access to financing took over the exportmarket andmost recently, Sahyadri—a farmer produces organization based inNashikhas emerged as the leading exporter of grapes. TheMaharashtraGrapeGrowersAsso-ciation (Maharashtra Rajya Drakasha Bagayatdar Sangh—MRDBS) ensures thatfarmers have access to technology related to production and provide the requiredsupport to make the chains competitive and inclusive. This is a case where farmerled association created synergies withmarketing organization and successfully deliv-ered the benefits to the farmers. Set in the same geographical region in Maharashtra,unlike in the case of grapes, there has been no major institutional development inthe case of pomegranates. In case of bananas, Mahabananas—a federation of 26banana growers’ co-operatives in Maharashtra comprising 8000 farmers—was setup on the same lines as Mahagrapes. However, it did not succeed in bringing aboutany significant transformation in the sector.
16 A. Gulati et al.
In case of tomato, onion and potato (TOP), any significant transformative role ofinstitutions is yet to be observed. Production, value addition and marketing of TOPare undertaken largely in the traditional way. Although, Operation Greens launchedin 2018 for TOP aimed at achieving price stabilization, and building efficient valuechains to enhance farmers’ share in consumer rupee. Similarly, for pulses, the valuechain is managed and operated in a traditional manner and there have been no majorinstitutional changes.
Dairy, poultry and grapes succeeded mainly on account of existence of one ofthe most important elements in a value chain, i.e., ‘trust.’ While the brands earnedconsumer trust, transparency in operations and processes helped earn farmers’ trustand the models successfully integrated small farmer producers in the value chain.The Anand pattern of milk marketing did not succeed in large parts of eastern India.Issues related to lower animal productivity and very low access to veterinary servicesas well as political and administrative meddling prevented the co-operative modelfrom being successful in the eastern region. The success of institutions in the grapesector has been limited to three districts inMaharashtra –Nashik, Sangli and Solapur.However, these models demonstrate the role of institutions in enabling successfuladoption of technology, creating market linkages and delivering gains to marginaland small farmers.
2.1.3 Markets
Economic growth and population increase have led to an increase in the demand forfood, particularly, milk, eggs, fruits, vegetables and pulses. The growth in the produc-tion of the commodities studied here has been largely in response to increasingmarketopportunities supported by technology and institutions. While increasing minimumsupport price (MSP) led to an increase in the production of pulses, failure of marketsleft large number of farmers unable to sell their products at remunerative prices.Markets played an important role in the success of dairy co-operatives. It was due tothe Bombay market that Amul could expand its operations and share the profits withfarmers. However, there have been times when co-operatives have delivered remu-nerative prices to the farmers, irrespective of market conditions. Inclusive marketaccess also ensured that the growth of the dairy sector had a positive impact on thelives of the smallest milk farmers. In the poultry sector, markets helped farmers earnhigher prices through integrators. In the case of grapes, tapping the export market byMahagrapes was critical in making grape cultivation a profitable venture for farmersin a very inclusivemanner. Similarmarket linkages aremissing inmango, banana andpomegranate. These value chains reflect the significance of institutions in creatinginclusive market access.
Weak market linkages in tomato, onion and potato explain the extreme pricefluctuations that impact both farmers and consumers. While there are large marketsfor these commodities, there are not many examples of innovative marketing modelsthat have enhanced market access for marginal and small farmers or have been
2 Evaluating Agricultural Value Chains on CISS-F Framework 17
sustainable and scalable across geographies. The success of contract farming in potatoand tomato has been very limited andhas had a negligible impact on stabilizing prices.Onion being a notified commodity and politically sensitive is largely traded throughregulated markets. Processing levels are quite low in these perishable commoditiesand for the value chains to be viable, the price points for fresh rawmaterial are critical.Hence, any escalation in prices has a negative impact on processing capacities.
Agricultural markets have been admittedly imperfect, influenced by frequentcentral and state government interventions, most of them with an unambiguousconsumer bias. Minimum export price (MEP) and export bans (as in the case ofonions), and imposition of ad hoc ban on stocking and enforcing stocking limits(as observed in the case of onions and pulses) have been used quite frequently toease price inflation. In addition, there are indirect controls like movement restric-tions within and outside the state implemented under the ambit of various controlorders promulgated under the Essential Commodities Act (ECA).Marketing throughAPMC markets attract dual levy of market fees when commodities move from onestate to another. Traditional market chains no longer serve the farmers the way it wasenvisaged. Farmers have little opportunity to sell their produce outside regulatedAPMC mandis. Traders and middlemen operating in these mandis through licensesare found to have a stronghold and operate like cartels influencing price discovery inthe market. Over time, the monopoly power of the APMCs has had a negative impacton market efficiency as well as on protecting the interests of the farmers. Often dairyco-operatives have to seek state government’s approvals to fix the sale price of milk,which often is not based onmarket demand, but political pressure. The only exceptionis the GCMMF (Amul), which has a larger consumer base outside Gujarat, unlikeother co-operatives, which operate within the state. With respect to internationaltrade, it is observed that even where export competitiveness is established, exportshave actually not taken place. This is on account of a policy environment that sacri-fices export potential to protect the interests of domestic consumers. OECD-ICRIER(2018) estimated the Producer Support Estimates (combined effect of input subsidiesand output pricing) for the period 2000 to 2016 at -14%. This implies an implicittaxation of agriculture and a pro-consumer bias driven by distortions in trade andmarketing policies.
Agricultural marketing reforms have been directed towards improving efficiencyof markets and delivering higher gains to the farmers, but implementation has beeninadequate. The Farm Laws 20201 have the potential to strengthen agricultural valuechains and render these chains profitable for the farmers by ensuring direct marketinglinkages, contract farming, rationalization of marketing costs, incentivizing storage,and aggregation of farmers through farmer producer organizations (FPOs).
For strengthening CISS-F of agricultural value chains, it is important for tech-nology, institutions and markets to work in tandem. It is difficult to segregate the
1 The Farmers’ Produce Trade and Commerce (Promotion and Facilitation) Act, 2020. Farmers(Empowerment and Protection) Agreement on Price Assurance and Farm Services Act, 2020.Essential Commodities (Amendment) Act, 2020.
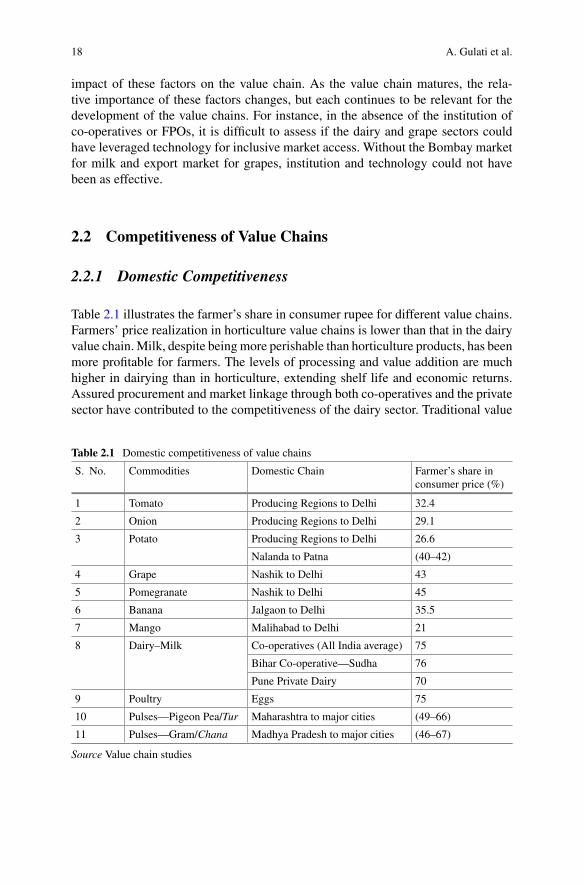
18 A. Gulati et al.
impact of these factors on the value chain. As the value chain matures, the rela-tive importance of these factors changes, but each continues to be relevant for thedevelopment of the value chains. For instance, in the absence of the institution ofco-operatives or FPOs, it is difficult to assess if the dairy and grape sectors couldhave leveraged technology for inclusive market access. Without the Bombay marketfor milk and export market for grapes, institution and technology could not havebeen as effective.
2.2 Competitiveness of Value Chains
2.2.1 Domestic Competitiveness
Table 2.1 illustrates the farmer’s share in consumer rupee for different value chains.Farmers’ price realization in horticulture value chains is lower than that in the dairyvalue chain.Milk, despite beingmore perishable than horticulture products, has beenmore profitable for farmers. The levels of processing and value addition are muchhigher in dairying than in horticulture, extending shelf life and economic returns.Assured procurement and market linkage through both co-operatives and the privatesector have contributed to the competitiveness of the dairy sector. Traditional value
Table 2.1 Domestic competitiveness of value chains
S. No. Commodities Domestic Chain Farmer’s share inconsumer price (%)
1 Tomato Producing Regions to Delhi 32.4
2 Onion Producing Regions to Delhi 29.1
3 Potato Producing Regions to Delhi 26.6
Nalanda to Patna (40–42)
4 Grape Nashik to Delhi 43
5 Pomegranate Nashik to Delhi 45
6 Banana Jalgaon to Delhi 35.5
7 Mango Malihabad to Delhi 21
8 Dairy–Milk Co-operatives (All India average) 75
Bihar Co-operative—Sudha 76
Pune Private Dairy 70
9 Poultry Eggs 75
10 Pulses—Pigeon Pea/Tur Maharashtra to major cities (49–66)
11 Pulses—Gram/Chana Madhya Pradesh to major cities (46–67)
Source Value chain studies
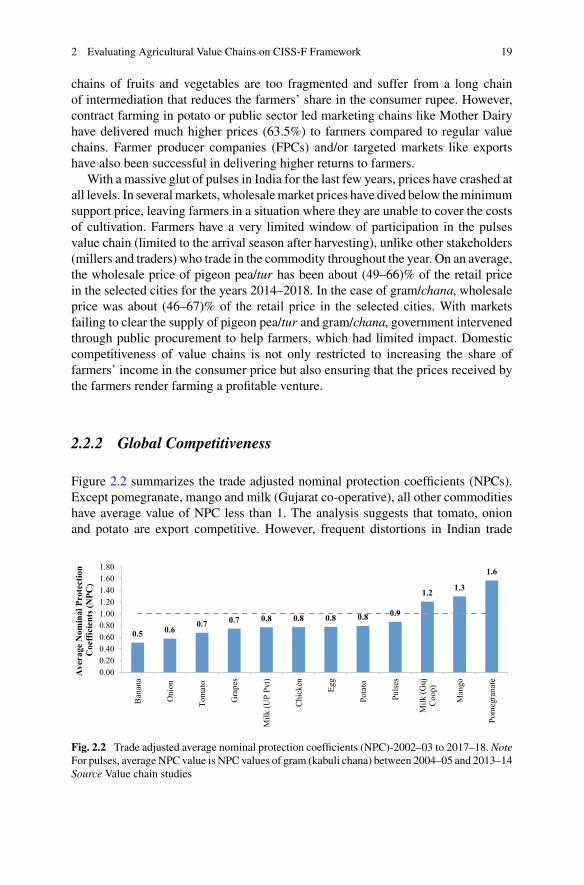
2 Evaluating Agricultural Value Chains on CISS-F Framework 19
chains of fruits and vegetables are too fragmented and suffer from a long chainof intermediation that reduces the farmers’ share in the consumer rupee. However,contract farming in potato or public sector led marketing chains like Mother Dairyhave delivered much higher prices (63.5%) to farmers compared to regular valuechains. Farmer producer companies (FPCs) and/or targeted markets like exportshave also been successful in delivering higher returns to farmers.
With a massive glut of pulses in India for the last few years, prices have crashed atall levels. In severalmarkets, wholesalemarket prices have dived below theminimumsupport price, leaving farmers in a situation where they are unable to cover the costsof cultivation. Farmers have a very limited window of participation in the pulsesvalue chain (limited to the arrival season after harvesting), unlike other stakeholders(millers and traders) who trade in the commodity throughout the year. On an average,the wholesale price of pigeon pea/tur has been about (49–66)% of the retail pricein the selected cities for the years 2014–2018. In the case of gram/chana, wholesaleprice was about (46–67)% of the retail price in the selected cities. With marketsfailing to clear the supply of pigeon pea/tur and gram/chana, government intervenedthrough public procurement to help farmers, which had limited impact. Domesticcompetitiveness of value chains is not only restricted to increasing the share offarmers’ income in the consumer price but also ensuring that the prices received bythe farmers render farming a profitable venture.
2.2.2 Global Competitiveness
Figure 2.2 summarizes the trade adjusted nominal protection coefficients (NPCs).Except pomegranate, mango and milk (Gujarat co-operative), all other commoditieshave average value of NPC less than 1. The analysis suggests that tomato, onionand potato are export competitive. However, frequent distortions in Indian trade
0.5 0.60.7 0.7 0.8 0.8 0.8 0.8 0.9
1.2 1.3
1.6
0.000.200.400.600.801.001.201.401.601.80
Ban
ana
Oni
on
Tom
ato
Gra
pes
Milk
(UP
Pvt)
Chi
cken
Egg
Pota
to
Puls
es
Milk
(Guj
Coo
p)
Man
go
Pom
egra
nate
Ave
rage
Nom
inal
Pro
tect
ion
Coe
ffici
ents
(NPC
)
Fig. 2.2 Trade adjusted average nominal protection coefficients (NPC)-2002–03 to 2017–18. NoteFor pulses, averageNPC value is NPC values of gram (kabuli chana) between 2004–05 and 2013–14Source Value chain studies
20 A. Gulati et al.
policies lead to substantial fluctuations in actual exports. India accounts for 3%of global tomato exports, occupying the 8th position in the world. However, it isa net importer of processed tomatoes. Despite being export competitive in freshtomatoes, India is not a major player in processed tomatoes owing to high-inputcosts. China is the global leader in tomato paste exports, attracting Indian ketchupmanufacturers, who find it cheaper to import Chinese tomato paste than to procurefrom India. Infrastructure constraints, the time of supply to exportmarkets and qualitydifferences, have affected efforts to increase exports. Policy uncertainties vis-à-visour largest market, viz., Pakistan has compounded the problem. Variability in theexport of onions has been moderate. Onion is included in the Essential CommoditiesAct (ECA), and its export is governed by a minimum export price (MEP) fixed bythe government from time-to-time. These discretionary steps have often made itdifficult to create a reliable and consistent export market for onions, lowering pricerealization by farmers. There has been high variability in the export of potatoes,which are competitive and the competitiveness has increased after 2014–15.
After 2011–12, exports of grapes became competitive and this is reflected in thegrowth of exports. According to primary research, farmers get 71% of f.o.b price.In the case of pomegranates, export became competitive after 2013–14. Farmersget nearly 80% of the f.o.b price in case of exports, which is much higher thanthat received in the domestic value chain. Competitiveness was created by plantinghigh-yielding plantingmaterial, undertaking disease control measures, incorporatingmarket requirements in the production cycle, and including small growers in all theseprocesses.
Since 2006–07, the export competitiveness of bananas has been increasing asNPCvalues have been declining. Indian farmers are selling bananas at a much cheaperrate and there is a dearth of trade policies that support banana farmers. It means eventhough bananas are export competitive in the international market, Indian farmers areunable to benefit due toweakmarket access. Lack of pre-harvest techniques results inpoor quality of bananas not suitable for exports and improper handling during post-harvest results in wastage to the tune of (20–24)% (NRCB 2015). Mangoes havebeen export competitive between 2002–03 and 2017–18. However, India’s mangoexport is based on the brand value of varieties like Alphonso, Kesar and Totapuri.Therefore, price comparison with other competing varieties may not give the rightpicture. This is evident from continuing exports of mangoes in spite of NPC beingabove one.
The export competitiveness of the dairy sector varies across states, co-operativesand private sector players, as well as liquidmilk and processed products. This reflectsthat competitiveness has been attained at the cost of inclusiveness. The private sectorin Uttar Pradesh (mostly unorganized) and Maharashtra has been competitive for agreater number of years (15 out of 17 years) compared to co-operatives in Maha-rashtra (9 out of 17); Gujarat (5 out of 17); and Uttar Pradesh (11 out of 17). Thehighly volatile global prices of SMP and the commitment of co-operatives to payhigher prices to farmers make the model uncompetitive. Co-operatives could exploreexporting processed dairy products to open upmarketing opportunities.Unless globalprices are really high, as was the case in 2012–13, co-operatives cannot compete in
2 Evaluating Agricultural Value Chains on CISS-F Framework 21
global markets. Unlike the private sector, co-operatives are not in a position to adjustprocurement according tomarket demand, which leaves themwith stocks that cannotbe sold off at competitive rates due to the highly volatile global price scenario.
Currently, India accounts for less than 0.4% of the global trade in poultry andpoultry products. India has proven to be competitive in egg exports (comprising ofhen eggs in shell, eggs dried and eggs-liquid). Japan and Gulf have been the majorexport destinations. Eggs have been export competitive since 2003, but have lost thecompetitive edge since 2014. India is yet to find a place in chicken meat exports dueto rising production costs, which have doubled since the Avian Influenza (AI) struckthe country in 2006. Poultry meat has been competitive from 2003–04, but was ableto find a place in the global market only after 2010.
India has been consistently importing pulses, primarily yellowpeas and chickpeas,which together account for 44% of pulses import (TE 2017–18). Import of pigeonpea/tur shot up in 2013–14, when domestic production fell. India is dependent onvery few countries for pulses import—53% of yellow peas are imported fromCanadaand 81%chickpeas fromAustralia, whichmakes it vulnerable to production and pricefluctuations in these countries. Nearly, 53% of the pigeon pea/tur is imported fromthe African countries and the rest fromMyanmar. In terms of trade competitiveness,Saini and Gulati 2017 estimate that India’s kabuli chana has been a net exportablecommodity since 2006–07, except for the years 2004–05 and 2005–06. Since 2005–06, nominal protection coefficients (NPCs) have been consistently below 1, exceptin 2012–13 when NPC was 0.96 due to rising domestic prices following a bad cropin 2011–12. India has been consistently dependent on imports to meet the domesticconsumption of pulses and hence incentivised imports by (0–10)% import duty (basiccustomduty), although there exists boundduty rate of 100%.With a glut in pigeon peaand gram/chana, the government raised tariff levels and brought about quantitativerestrictions on the import of these pulses in 2017 onwards.
2.3 Inclusiveness of Value Chains
Nearly 70% of farmers growing fruits and vegetables are small and marginal (oper-ating on less than 2 hectares) (Fig. 2.3). Small farmers have a comparative advantagein the production of horticulture commodities, which are highly labor intensive andshort duration crops. Most of the trade takes place at APMC markets, which areaccessible to all farmers, but has a monopolist nature and is dominated by a fewlarge traders and commission agents. Although farmers are inclusive by way ofparticipation, they have no role in price determination due to their low-bargainingpower. Contract farmingmodels such as those ofMcCain and PepsiCo for potato andJain Irrigation for onion have benefitted participating small and marginal farmers.The number of farmers engaged in such contract farming differs from companyto company. PepsiCo has been working with around 12,000 farmers, spread over6400 hectares across Punjab, Uttar Pradesh, Karnataka, Bihar, West Bengal, Gujaratand Maharashtra (Bayer CropScience 2010). Nearly 700 farmers were engaged incontract farming by McCain, covering an area of 7000 acres in Mehsana, Gujarat
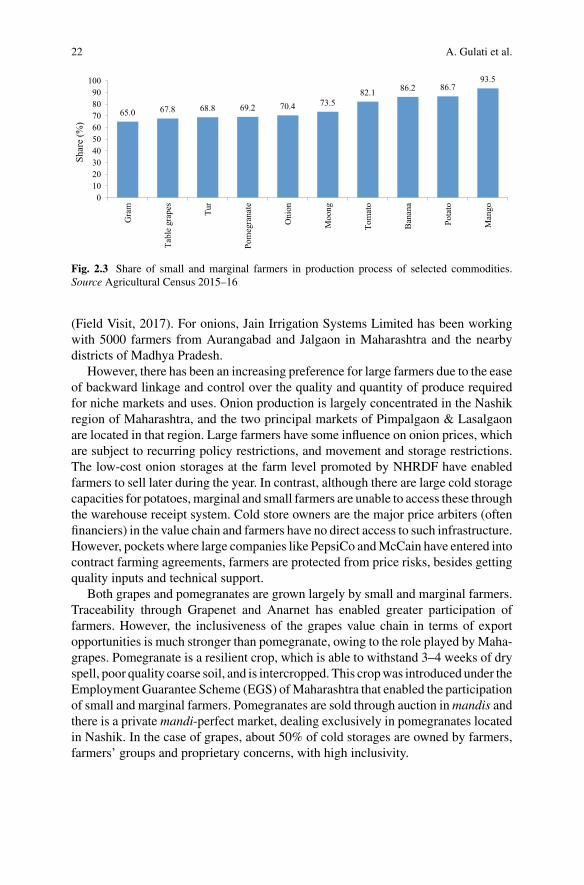
22 A. Gulati et al.
65.0 67.8 68.8 69.2 70.4 73.582.1 86.2 86.7
93.5
0102030405060708090
100
Gra
m
Tabl
e gr
apes Tur
Pom
egra
nate
Oni
on
Moo
ng
Tom
ato
Ban
ana
Pota
to
Man
go
Shar
e (%
)
Fig. 2.3 Share of small and marginal farmers in production process of selected commodities.Source Agricultural Census 2015–16
(Field Visit, 2017). For onions, Jain Irrigation Systems Limited has been workingwith 5000 farmers from Aurangabad and Jalgaon in Maharashtra and the nearbydistricts of Madhya Pradesh.
However, there has been an increasing preference for large farmers due to the easeof backward linkage and control over the quality and quantity of produce requiredfor niche markets and uses. Onion production is largely concentrated in the Nashikregion of Maharashtra, and the two principal markets of Pimpalgaon & Lasalgaonare located in that region. Large farmers have some influence on onion prices, whichare subject to recurring policy restrictions, and movement and storage restrictions.The low-cost onion storages at the farm level promoted by NHRDF have enabledfarmers to sell later during the year. In contrast, although there are large cold storagecapacities for potatoes, marginal and small farmers are unable to access these throughthe warehouse receipt system. Cold store owners are the major price arbiters (oftenfinanciers) in the value chain and farmers have no direct access to such infrastructure.However, pockets where large companies like PepsiCo andMcCain have entered intocontract farming agreements, farmers are protected from price risks, besides gettingquality inputs and technical support.
Both grapes and pomegranates are grown largely by small and marginal farmers.Traceability through Grapenet and Anarnet has enabled greater participation offarmers. However, the inclusiveness of the grapes value chain in terms of exportopportunities is much stronger than pomegranate, owing to the role played byMaha-grapes. Pomegranate is a resilient crop, which is able to withstand 3–4 weeks of dryspell, poor quality coarse soil, and is intercropped. This cropwas introduced under theEmployment Guarantee Scheme (EGS) ofMaharashtra that enabled the participationof small and marginal farmers. Pomegranates are sold through auction inmandis andthere is a private mandi-perfect market, dealing exclusively in pomegranates locatedin Nashik. In the case of grapes, about 50% of cold storages are owned by farmers,farmers’ groups and proprietary concerns, with high inclusivity.
2 Evaluating Agricultural Value Chains on CISS-F Framework 23
Mango, a less water intensive crop that is widely intercropped, provides seasonalincome to farmers. Mango is cultivated both as orchards and homestead gardens,but the bulk of production comes from the latter. Out of 2.1 million banana growers,nearly 87% are marginal and small. Small farmers have a comparative advantage ingrowing fruits as these are labor intensive, short duration crops and the returns aremuch higher than in the case of cereals. However, farmers’ participation in the valuechain is limited to the farm gate which deprives them of playing an active role inprice determination.
In dairying, co-operatives have been the most inclusive. All farmers who aremembers of co-operatives have ownership rights, participate in decision-making,have access to markets, are eligible for a share in profits based on the milk theysupply, and have a vote in co-operative elections.With about 18% of the co-operativemembers being women, the model is gender inclusive as well. In the case of privatedomestic and multinational players, milk procurement is driven by market demand.Many of the players are into value added products rather than in liquid milk, andtheir linkage with dairy farmers is supposedly somewhat limited.
The Indian poultry sector has attracted large and small farmers alike to improvetheir livelihoods. Backyard poultrywhich includes small growers comprise of 20%ofthe poultry operations. The non-governmental organizationmodel of poultry farmingprovides opportunities to small backyard poultry growers to participate in the poultryvalue chain. The integrator model driven by economies of scale, and stringent foodsafety standards that are required for catering to fresh and processed export markets,have provided market linkages to poultry farmers.
Pulses are less water intensive, more climate resilient, and require less crop care.These factors make it easier for resource poor smallholders to cultivate the crop.About 18.1% of the area under pulses was irrigated in TE 2013–14 and about 4% and35.1% of area under pigeon peas and gram, respectively. Participating in productionis the first step of the value chain and as one goes up the pulses value chain, it isobserved that it is not as inclusive and smallholders do not benefit from the way itis structured. At an aggregate level, (32–53)% of different types of pulses producedare marketed. In pulses, about 79% of moong, 63% urad; 50% of lentils (masur);and 44% of tur are marketed through local private traders, which restricts farmers’direct interface with the wholesale market and hence, their chances of higher pricerealization.General awareness aboutminimumsupport price (MSP) andprocurementagency is as low as (5–18)% among farmers growing pulses.
2.4 Sustainability of Value Chains
Tomato, onion and potato (TOP) form an integral part of the staple food in India,and their increasing production levels are capable of meeting export demand as well.These crops are also environmentally sustainable as these are not water intensive.Tomato is amenable to intensive cultivation on small plots of protected or open landincluding homestead gardens.An improved kharif production technology (raised bed
24 A. Gulati et al.
with micro irrigation) doubled the productivity of onion. The uptake of micro irri-gation for cultivation of tomato, onion and potato is possible under contract farmingarrangements.
While these crops are environmentally sustainable, the financial sustainability ofthese chains is quite fragile. Extreme price volatility, high perishability and pricesensitivity of these crops are some of the issues that affect farm incomes negatively.There have been recurrent periods when farmers have been saddled with production,but were unable to find markets, forcing them to dump the crops. This is commonlyobserved in the case of tomato and potato. Moreover, potato cold chains, where allprice arbitrage opportunities are controlled by cold store owners, offer farmers barelyany opportunity to realize the actual market price. Financial sustainability is not anissue specific to farmers, but affect other stages of the value chains. For instance,the onion dehydration industry (partly financed by government subsidy) in Mahuvahas been facing a serious crisis with only 15–17 out of 110 units being operationaland the others on the verge of closure (as in 2018).
Grapes and pomegranate cultivation are environmentally sustainable as thesecrops require 200 L (litres) and 180 L of water per kg of crop compared to 4000 Lrequired for rice cultivation.Unlike grapes, pomegranates aremore susceptible to pestattacks and diseases, which require the use of chemicals. Consequently, it adverselyaffects both environmental and financial sustainability (adverse effect on exporta-bility) because of the presence of pesticide residue. Grapes cultivation is a profitableactivity, but requires high investments and intense supervision. The rate of return oninvestment is high compared to many similar activities. There are large productionrisks as well. The accounting rate of return (ARR)2 is threatened by the issue ofnon-payment by exporters. About (50–60)% of export value is paid in advance tofarmers and the rest of the payment is uncertain. Improvement in varieties is likelyto enhance ARR significantly. Pomegranate farmers get a high return on investmentin the case of exports, while the variability in domestic market prices affects theirprofitability. The biggest threat to financial sustainability comes from water stress.The crop is unviable in water stressed years and the farmer often ends with a negativereturn.
Unlike the staple TOP vegetables, where price stability has been a major concernfor both farmers and consumers, banana prices have been less volatile. The benefitcost ratio (BCR) comes out to be 1.6, meaning bananas have been a profitable crop.3
Banana is a water intensive crop and needs timely irrigation, almost 70–75 timesannually. The annual water intake of banana is estimated to be 1800–2000 mm.This is greater than the 900–1300 mm water requirement of rice for 3–4 months.However, the adoption of drip and sprinkler irrigation systems reduces the waterintensity of the crop. Field visits showed that almost the entire area under banana
2 Accounting rate of return (ARR) is the rate of return calculated using present year revenues andrecurring costs. This is in contrast to Internal rate of return (IRR) IRR which uses costs incurredand revenues earned over the lifetime of the project.3 For every rupee incurred on the production and marketing of bananas, banana farmers get a returnof INR 1.6. BCR values of less than 1 will mean cultivation is not profitable.
2 Evaluating Agricultural Value Chains on CISS-F Framework 25
cultivation in the Jalgaon region in Maharashtra is under drip irrigation. Drip andsprinklers supplied by Jain Irrigation Systems Limited (JISL) are most suitable fortissue cultured banana plants, reducing water intake by 45%, and increasing yield byup to 52%. Bananas are one of the safest fruits for consumption in terms of pesticideresidue. However, according to Banana Link, since Cavendish is the single mosttraded variety in the world, it has become prone to pests, fungi and diseases.4 Due tothis, large quantities of insecticides and pesticides have to be sprayed on the plants.High dosage of fertilizers and pesticides has a huge environmental impact affectingthe soil, water, animals and humans. Banana fiber can be an excellent substitute forother water intensive natural fibers like cotton as these can be manufactured usingbanana pseudo stems which are usually discarded by farmers, and burnt.
Mango cultivation is a seasonal activity as India’s peak mango season is April-June. Mango trees do not need water throughout the year. Being a seasonal fruit, itdoes not require irrigation immediately after the harvesting season. As farmers growmango as part of an inter-cropping system, water requirement is much lower thanother horticultural crops such as banana. Mango grows well in region when thereis rainfall of 750–2500 mm during June–September. For zones receiving rainfall ofless than 750 mm, orchards must be irrigated two to three times after they begin tofruit. In terms of financial sustainability, growers who maintain their orchards welland market produce themselves find mango cultivation highly feasible. Commercialcultivation of Kesar has fetched 2.25 as return on investment, making it a highlyprofitable.
The Environment and financial sustainability of dairy sector are impacted bythe contribution of animals to greenhouse gas (GHG) emissions in the form ofenteric fermentation (methane emissions), water footprint of animal population, costof feed and fodder, and the overall financial condition of co-operatives and otherplayers. Within agriculture, livestock accounts for 54.6% GHG emissions as entericfermentation. Within livestock, buffaloes account for 40.2% of methane emissionfollowed by indigenous cattle at 36.4%, crossbred cattle at 15.8%, and the rest at7.6% (2016 data) (MoEFCC 2021). The ration balancing program under the NationalDairy Plan launched in 2012 has demonstrated reduction of enteric methane emis-sions per kg of milk in dairy cows and buffaloes by 13.7% (NDDB n.d.). Balancedrations have been effective is reducing the water footprint of milk by 14% (1236to 1062 litre/kg). Scientific feeding practices and use of water efficient fodder inthe form of Total Mixed Ration (TMR) can further reduce the water footprint ofmilk. Feeding accounts for (60–70)% of the cost of milk production and adequateavailability of quality feed has been a challenge. Balanced rations have also helpedfarmers reduce the cost of feeding animals by 16.3%. The financial viability of dairyco-operatives is a matter of concern. Data from 175 dairy co-operatives suggestthat about 58% co-operatives accumulated losses, primarily because of governanceissues. If the co-operatives are unable to sustain themselves financially, and largemilk producing regions are left uncovered, despite the preferential, concessional
4 BananaLink is a not-for-profit co-operative based inNorwich,whichworks for fair and sustainablebanana and pineapple trade.
26 A. Gulati et al.
finance, and subsidies provided to the sector, the growth of the sector across regionsis unlikely to be equitable.
For poultry sector to be sustainable, availability of high quality and affordable feedis crucial. About 47% of maize consumption in India is on account of poultry feed.Both productivity and price of maize affect the industry. Studies show that poultry isthe most environmentally efficient of all livestock (Sluis 2007). This could be usedto great advantage in promoting the sector. The environmental sustainability of thepoultry sector is challenged by frequent disease outbreak that affects small growersmuch more. With the wet market accounting for 90% of the domestic market, thesepose real environmental risks. The outbreak of Avian Influenza (AI) caused majorlosses to farmers because of production losses and sudden fall in demand and price.AI resulted in a major blow to layer and broiler producers in Manipur in 2007. With(43–79)% of their total household income generated from poultry farming, producerslost about INR 316 lakh, and received only INR 99 lakh, about 31% of the financialloss (Kumar et al. 2008). While the Prevention and Control of Infectious Diseasein Animals Act 2009 provides the basic legal framework to control such events,poor compliance in culling, disposal and quarantine remains a major issue and canthreaten the financial sustainability of the poultry sector.
Pulses are environmentally more benign, less water intensive and more climateresilient as compared tomany other crops. Hence, increasing the production of pulsesin an environmentally sustainable manner is feasible. In 2017–18, inflation in pulseswas at an unprecedented low of (−)26.7% compared to 34.6% in 2015–16 and 18.3%in 2016–17 which have a serious impact on the supply and demand situations. Withwholesale market prices below the MSP, farmers have been unable to recover theircosts of cultivation, which makes pulses cultivation financially unsustainable.
2.5 Scalability of Value Chains
Scalability of production of TOP is likely to come more from increase in yield levelsrather than increase in area.Given the current yield levels, there is scope for increasingproductionwith the aid of technology—high-yielding seeds, micro irrigation and soilmanagement. Besides, enhancing processing levels and increasing shelf life of freshproduce can add to the scalability of these value chains. Export opportunities canalso help scale up production.
Production of tomatoes increased from 7.2 million tonnes in 2000–01 to 20.7million tonnes in 2016–17. Between 2010 and 2017, production increased at a CAGRof 1.3% despite a decrease in cultivated area by 2.7%, owing to a CAGR in yield of4.1%. Similarly, onion production grew at 4.9% during the same period with the areaunder the crop increasing at 4% and yield growing at only 0.9%. Potato productionincreased at a rate of 2.4% with 2.2% coming from an expansion in area underthe crop and 0.2% coming from yield. Scalability of the onion value chain can beachieved through increase in exports. Although onion accounts for 50% of exports offruits and vegetables, onion exports as a percent of production declined from about
2 Evaluating Agricultural Value Chains on CISS-F Framework 27
24% in 2005–06 to about 10%, in recent years. However, unless farmers have directaccess to export markets, it is unlikely that farmers will be able to benefit from higherprice realization as these markets are controlled by traders and commission agents.In the context of the potato value chain, one of the interesting developments is theemergence of Banaskantha, a water stressed district in Gujarat, as the largest potatoproducing district. Here, yields have improved substantially with the adoption ofmicro irrigation promoted by large potato processing companies like McCain andBalaji wafers.
Production of grapes went up from 1 million tonnes in 2000–01 to 2.9 milliontonnes in 2017–18, registering a CAGR of 5%. About 75% of the area under grapesis in Maharashtra, followed by 20% in Karnataka. Grape farming in Maharashtrais concentrated in three districts (Nashik, Sangli, Solapur), mainly due to climaticfactors. Production is scalable vertically (economies of scale) provided it is confinedto areas suitable for grape farming. However, horizontal scalability (economiesof scope) across different related products (raisins and arils) needs induction andnurturing. Given the competitiveness in production, scalability of exports is feasiblewith more emphasis on pressed and dried categories, and the introduction of high-yielding red grape varieties. Production of pomegranates improved since 2007–08,primarily due to increased exports, and increase in domestic prices. The availability oftissue cultured planting materials from sturdier varieties has contributed immenselyto the growth in area and productivity. Cultivation of pomegranates expanded toGujarat, Andhra Pradesh, and Rajasthan. Scalability is possible in areas that areclimatically suitable for the crop. However, vertical scalability is possible only ifthere is a serious effort to make investments in technology for processing and exportof arils (pomegranate seeds).
India’s banana production increased from 10.1 million tonnes in TE 1993–94 to30.6 million tonnes in TE 2018–19. As bananas have proved to be a profitable crop,area under banana cultivation increased. Also, farmers have shown keen interestin newer technologies that yielded productivity increase. The introduction of tissueculture cultivars, especiallyGrandNain variety, has demonstrated significant increasein yields. Other reasons that triggered this quantum jump in banana production wereadoption of micro irrigation, precision farming, and high-density planting.
There has been notmuch change in themango production pattern in key producingstates.On thenewvarietal development front, there has not been amajor breakthroughin the last decade or so. The last mango variety (Arunika) was developed by CentralInstitute for Subtropical Horticulture (CISH) in 2008. The old variety, Amrapaliremains a favourite. Without varietal developmental, scalability of the mango valuechain will remain limited. There is a need for development of long shelf life mangovarieties without compromising on the taste or flavor. Due to its short shelf life,export opportunities for mango are limited. Lack of standardisation of productiontechnology and extension of technical knowledge to farmers has been responsiblefor the slow pace of adoption of high-density planting (HDP) technology in mangoplantations in the country. A reduction in the cost of HDP can improve scalability.There is hardly any advance estimates of production or sowing data available formangoes, unlike those available for cereals, pulses, oilseeds, potato, and onion crops.
28 A. Gulati et al.
These factors result in lower price discovery, which impede the scaling up of mangoproduction.
Birthal et al. (2006) estimated that 37% of the growth in milk production was onaccount of increase in productivity of in-milk animal. The average yield of indigenouscows are 2.8 kg per daywhile it is 7.5 kg per day for exotic/crossbred cows and 5.2 kgper day for buffaloes (for 2016–17). The strategy for increasing production primarilythrough an increase in bovine population is neither sustainable nor scalable. Increasein productivity on a continuous and sustainable basis is the only option, which canbe achieved through genetic improvement with adequate emphasis on genomics,Artificial insemination (AI) and the use of sex sorted semen. Processing of milk,which is 21% of production (2017–18), is likely to increase given the rising demandfor dairy products.
Despite there being favorable domestic and global demand conditions, issuesrelated to inadequate infrastructure, inefficient marketing linkages, and price insta-bility of poultry feed pose challenges to the scaling up of poultry farming. The Inno-vative Poultry Productivity Project (IPPP) launched in 2017 proposed to upgradethe subsistence model of backyard poultry farming (comprising of 45 chicks perbeneficiary) to an entrepreneur model with up to 600 broilers in a year and 400low-input technology (LIT) birds in about three years. The LIT birds model wouldhelp in the transition and subsequently, scaling up to (1000–2000) birds, towardslarger commercial scale poultry farming (DAHD 2017). Scalability could be furtherachieved through the introduction of broilers in (about 200–500 birds) backyardpoultry clusters, to cater to a large number of small markets. Development of indige-nous varieties to capture the new niche market for free range chickens is anotheroption. Environmental and food safety concerns will create large opportunities forprocessedmeat, particularly white lean chickenmeat. Animal welfare activism couldalso affect the current poultry farming and marketing models. This will require largeinvestments in processing facilities and the development of a cold chain right up tothe retailer.
There is scope for increasing production of pulses through increase in produc-tivity in the leading producing states. Nearly 60% of tur is produced by Maha-rashtra,MadhyaPradesh andKarnataka.Gram is predominantly produced inMadhyaPradesh accounting for about 40% of total production. In order to scale up produc-tion, pigeon pea and gram can be promoted in states such as Andhra Pradesh andGujarat, respectively that have lower production, but higher yield levels. Besides,diversifying to other types of pulses such as urad, moong andmasoor, among others,can provide greater consumption choices. Scaling up pulses production is somewhatconstrained by the import of cheaper pulses, which bring about immediate relief inthe event of high inflation.
2 Evaluating Agricultural Value Chains on CISS-F Framework 29
2.6 Access to Finance in the Value Chain
Various stakeholders such as farmers, traders, processors, exporters, and retailersaccess both formal and informal sources of finance. It includes government interven-tion in the form of particular schemes, subsidies, price support or interest subventionschemes. The usual financing patterns for processors, exporters and traders in thevalue chain in many ways determine the control of these stakeholders over the pricesand risks involved.
Farmers with kisan credit cards (KCCs) are able to access formal credit, but areforced to approach informal money lenders, friends and relatives because of theirinability to repay the loans. This has been observed in the case of potato farmers inBihar and grape farmers inMaharashtra. The interest rates charged by informal creditagents are exorbitantly high—(2 to 5)% per month. Field visits confirm that about80% of the TOP farmers depend on informal credit sources. In the comparativelydeveloped region of Nashik, onion farmers have access to institutional finance andhave been able to get KCC. A pledge loan scheme (at 6% interest per annum withan interest subsidy of 3%, if repayment is made within 180 days) of warehousereceipts is also implemented by Maharashtra State Agricultural Marketing Board(MSAMB) for all farmers growing different crops. The district co-operative bank isa major source of financing. In Mahuva, Gujarat, bank credit is not available to smallfarmers. Co-operative dairy farmers have better access to finance than those workingwith private players. In the poultry sector, the credit requirement of the farmers is verylimited because of the integrator model, which takes care of all investment relatedactivities in the chain. However, poultry farmers can avail the re-finance schemeoffered by NABARD.
There are several government schemes that extendfinancial support towards devel-opment of commodity value chains. The Pradhan Mantri Kisan SAMPADA Yojana(Scheme for Agro-Marine Processing and Development of Agro-Processing Clus-ters) of Ministry of Food Processing Industries (MOFPI) provides a subsidy of 35%for setting up of onion cold chains and processing units and similar support is avail-able for potato. There are subsidies from National Horticulture Board (NHB) andNationalHorticultureMission (NHM) for setting up grape gardens. APEDAprovidesfinancial support for post-harvest management and export infrastructure. There isneed to design a risk hedging instrument for farmers for export or market relatedrisks. Investments are required in cold chains for pomegranates and in technologyfor processing of arils. Government schemes like Mission for Integrated Develop-ment of Horticulture (MIDH), which provide subsidies for ripening chambers andpack houses, and the SAMPADA Yojana, which provides loans for processing unitsand cold chains, are some of the financing sources for intermediaries. To promotebanana exports, APEDA provides export promotion schemes. Subsidies under NHBand NHM are available to mango farmers. APEDA provides assistance for settingup pack-houses and vapor and hot water treatment facilities exclusively for exports.State governments have their own schemes to support farmers. The other majorfinanciers are cold storage owners who see arbitrage opportunities in the market.
30 A. Gulati et al.
Despite provision of the warehouse receipt system (WRS), farmers have not availedit to the desirable extent.
Financingof dairy co-operatives has beenpossiblewith support fromGovernment,NCDC, NDDB,World Bank and NABARD. However, private dairy processing unitshave not been provided similar benefits though their share in processing is almostthe same as the co-operative sector. Given the increasing demand for processing,financing options for the private sector need to be strengthened. Also, large numberof retailers will need to invest in the consumer end of the cold chain for effectivecompliance with quality standards, and will require financing. In the pulses sector,milling, processing, and marketing of pulses is financed by stakeholders throughbank loans and/or personal capital. Depending on the scale of business and relation-ship between millers, traders and commission agents, credit is available at marketdetermined interest rates.
2.7 Conclusion
The above synthesis provides a snapshot of how the selected value chains haveperformed in terms of the CISS-F framework and the role of technology, institutionsand markets in achieving key milestones. As Indian agriculture diversifies increas-ingly toward high-value commodities, value chains will have to be strengthenedin terms of CISS-F. Efficient market linkages will be important not only to matchdemand and supply, but also ensure that quality standards are maintained throughoutthe chain. For India, the issue of inclusiveness remains central to value chain effi-ciency. Hence, making agriculture profitable for small and marginal farmers throughhigher realizationof the value of output, andgreater riskmitigation,without distortingmarkets, will require more pragmatic policy interventions.
References
Bayer CropScience (2010) The Indian potato project. Global FoodChain Team, Bayer CropScience,Monheim am Rhein
Birthal, PS, Taneja VK, Thorpe W (2006) Smallholder livestock production in India: opportunitiesand challenges. In: Proceedings of an ICAR-ILRI international workshop, No. 14. NCAP-ICARand ILRI
DAHD (2017) Innovative Poultry Productivity Project (IPPP) under National Livestock Mission.2017. Department of Animal Husbandry and Dairying. Ministry of Agriculture & Farmers’Welfare. Government of India
Kumar BG, Joshi PK, Datta KK, Singh SB (2008, January–June) An assessment of economic lossesdue to avian flu in Manipur state. Agric Econ Res Rev 21:37–47
MoEFCC (2021) India: Third Biennial Update Report to theUnitedNations Framework Conventionon Climate Change. Ministry of Environment, Forest and Climate Change, Government of India
NDDB (n.d.) RationBalancing Programme.NationalDairyDevelopmentBoard. https://www.nddb.coop/services/animalnutrition/programmes/ration-balancing-programme
NRCB (2015) Vision 2050. ICAR-National Research Centre for Banana, Trichy
2 Evaluating Agricultural Value Chains on CISS-F Framework 31
OECD-ICRIER (2018)Agricultural Policies in India,OECDFoodandAgriculturalReviews,OECDPublishing, Paris. https://doi.org/10.1787/9789264302334-en
Sluis WVD (2007) Intensive poultry production better for global warming. World Poultry23(12):28–31. http://www.worldpoultry.net
Open Access This chapter is licensed under the terms of the Creative Commons Attribution 4.0International License (http://creativecommons.org/licenses/by/4.0/), which permits use, sharing,adaptation, distribution and reproduction in any medium or format, as long as you give appropriatecredit to the original author(s) and the source, provide a link to the Creative Commons license andindicate if changes were made.
The images or other third party material in this chapter are included in the chapter’s CreativeCommons license, unless indicated otherwise in a credit line to the material. If material is notincluded in the chapter’s Creative Commons license and your intended use is not permitted bystatutory regulation or exceeds the permitted use, you will need to obtain permission directly fromthe copyright holder.
Chapter 3Tomato, Onion and Potato (TOP) ValueChains
Ashok Gulati, Harsh Wardhan, and Pravesh Sharma
3.1 Introduction
Tomatoes, onions and potatoes, popularly known as TOP vegetables, are the threelargest cultivated, produced and consumed vegetables in India. Their production hasincreased dramatically over the years,making India the second-largest producer of allthe three vegetables in the world, after China. Recent figures put tomato productionat 19.8 million metric tonnes (MMT), onion production at 22.8 MMT and potatoproduction at 49.1 MMT in TE 2018–19. However, this does not bring much cheerto the vegetable farmers. Reeling under over production, they have been resorting todistress sales, burning their crop or discarding them on the roads. The current marketsituation begs the questionwhy, despite record levels of production, we have not beenable to do justice to our farmers. The answer lies in value chain fragmentation, pricevolatility, quality and quantity losses and low levels of processing that characterisethe market for horticultural crops in India. The prevalence of these problems hasweakened India’s potential in the global horticulture trade and also resulted in lowreturns to farmers.With around 41%share in total vegetable acreage, TOPcontributesonly 39% to total value of output of vegetables (Fig. 3.1).
Unlike cereals and dairy, where procurement and marketing are quite developed,a robust value chain for vegetables is missing. The reasons lie in the perishablenature of the crop, regional and seasonal concentration, and lack of storage facilities.Therefore, it is essential, to make the vegetable value chain more demand-driven,where the farmers do not face the problem of plenty. To overcome these issues,the Government of India had announced Operation Greens (OG) scheme for TOPcrops in 2018, on similar lines of the Operation Flood (OF) for milk. With an initial
A. Gulati (B) · H. WardhanIndian Council for Research on International Economic Relations (ICRIER), New Delhi, India
P. SharmaFormer Senior Visiting Fellow, Indian Council for Research on International Economic Relations(ICRIER), New Delhi, India
© The Author(s) 2022A. Gulati et al. (eds.), Agricultural Value Chains in India, India Studies in Businessand Economics, https://doi.org/10.1007/978-981-33-4268-2_3
33
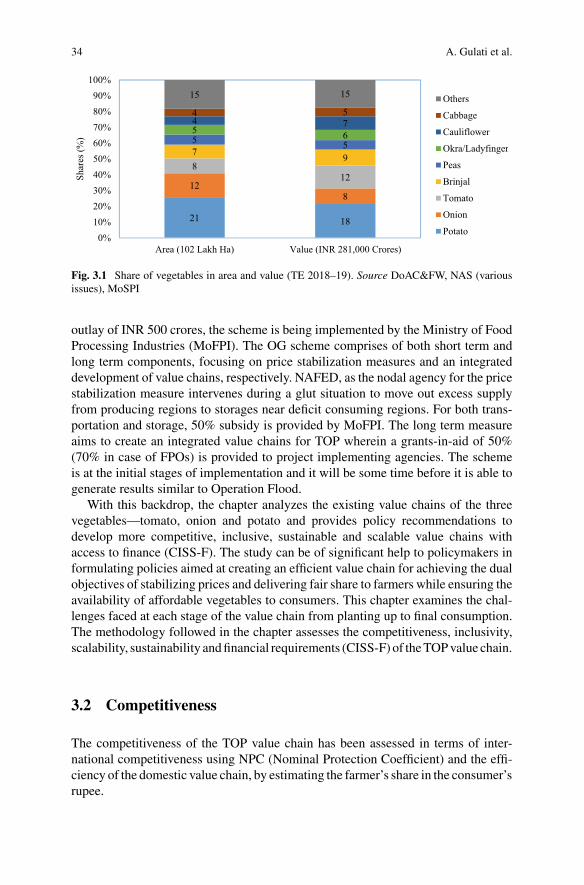
34 A. Gulati et al.
21 18
128
812
7 9
5 55 64 74 5
15 15
0%10%20%30%40%50%60%70%80%90%
100%
Area (102 Lakh Ha) Value (INR 281,000 Crores)
Shar
es (%
)
Others
Cabbage
Cauliflower
Okra/Ladyfinger
Peas
Brinjal
Tomato
Onion
Potato
Fig. 3.1 Share of vegetables in area and value (TE 2018–19). Source DoAC&FW, NAS (variousissues), MoSPI
outlay of INR 500 crores, the scheme is being implemented by the Ministry of FoodProcessing Industries (MoFPI). The OG scheme comprises of both short term andlong term components, focusing on price stabilization measures and an integrateddevelopment of value chains, respectively. NAFED, as the nodal agency for the pricestabilization measure intervenes during a glut situation to move out excess supplyfrom producing regions to storages near deficit consuming regions. For both trans-portation and storage, 50% subsidy is provided by MoFPI. The long term measureaims to create an integrated value chains for TOP wherein a grants-in-aid of 50%(70% in case of FPOs) is provided to project implementing agencies. The schemeis at the initial stages of implementation and it will be some time before it is able togenerate results similar to Operation Flood.
With this backdrop, the chapter analyzes the existing value chains of the threevegetables—tomato, onion and potato and provides policy recommendations todevelop more competitive, inclusive, sustainable and scalable value chains withaccess to finance (CISS-F). The study can be of significant help to policymakers informulating policies aimed at creating an efficient value chain for achieving the dualobjectives of stabilizing prices and delivering fair share to farmers while ensuring theavailability of affordable vegetables to consumers. This chapter examines the chal-lenges faced at each stage of the value chain from planting up to final consumption.The methodology followed in the chapter assesses the competitiveness, inclusivity,scalability, sustainability andfinancial requirements (CISS-F) of theTOPvalue chain.
3.2 Competitiveness
The competitiveness of the TOP value chain has been assessed in terms of inter-national competitiveness using NPC (Nominal Protection Coefficient) and the effi-ciency of the domestic value chain, by estimating the farmer’s share in the consumer’srupee.
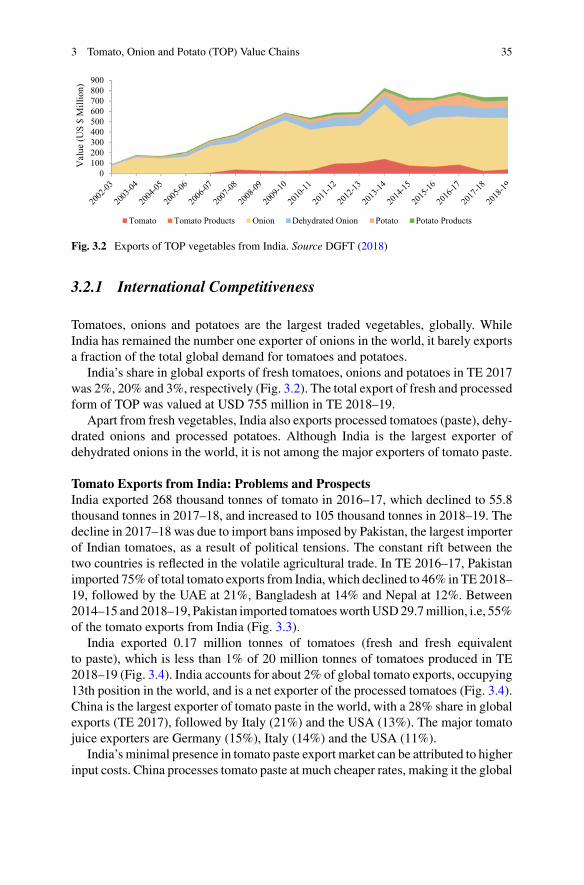
3 Tomato, Onion and Potato (TOP) Value Chains 35
0100200300400500600700800900
Val
ue (U
S $
Mill
ion)
Tomato Tomato Products Onion Dehydrated Onion Potato Potato Products
Fig. 3.2 Exports of TOP vegetables from India. Source DGFT (2018)
3.2.1 International Competitiveness
Tomatoes, onions and potatoes are the largest traded vegetables, globally. WhileIndia has remained the number one exporter of onions in the world, it barely exportsa fraction of the total global demand for tomatoes and potatoes.
India’s share in global exports of fresh tomatoes, onions and potatoes in TE 2017was 2%, 20% and 3%, respectively (Fig. 3.2). The total export of fresh and processedform of TOP was valued at USD 755 million in TE 2018–19.
Apart from fresh vegetables, India also exports processed tomatoes (paste), dehy-drated onions and processed potatoes. Although India is the largest exporter ofdehydrated onions in the world, it is not among the major exporters of tomato paste.
Tomato Exports from India: Problems and ProspectsIndia exported 268 thousand tonnes of tomato in 2016–17, which declined to 55.8thousand tonnes in 2017–18, and increased to 105 thousand tonnes in 2018–19. Thedecline in 2017–18 was due to import bans imposed by Pakistan, the largest importerof Indian tomatoes, as a result of political tensions. The constant rift between thetwo countries is reflected in the volatile agricultural trade. In TE 2016–17, Pakistanimported 75%of total tomato exports from India, which declined to 46% in TE 2018–19, followed by the UAE at 21%, Bangladesh at 14% and Nepal at 12%. Between2014–15 and 2018–19, Pakistan imported tomatoesworthUSD29.7million, i.e, 55%of the tomato exports from India (Fig. 3.3).
India exported 0.17 million tonnes of tomatoes (fresh and fresh equivalentto paste), which is less than 1% of 20 million tonnes of tomatoes produced in TE2018–19 (Fig. 3.4). India accounts for about 2% of global tomato exports, occupying13th position in the world, and is a net exporter of the processed tomatoes (Fig. 3.4).China is the largest exporter of tomato paste in the world, with a 28% share in globalexports (TE 2017), followed by Italy (21%) and the USA (13%). The major tomatojuice exporters are Germany (15%), Italy (14%) and the USA (11%).
India’s minimal presence in tomato paste export market can be attributed to higherinput costs. China processes tomato paste at much cheaper rates, making it the global
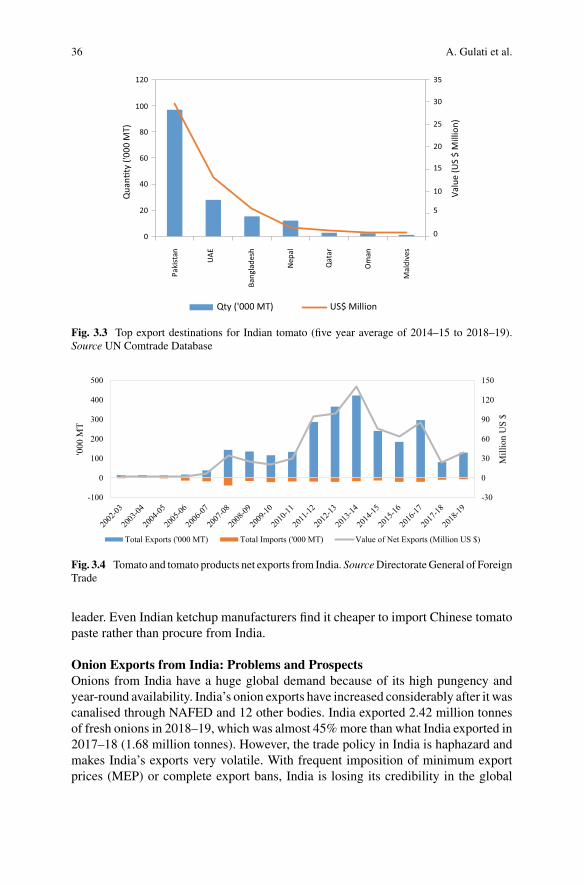
36 A. Gulati et al.
0
5
10
15
20
25
30
35
0
20
40
60
80
100
120
Valu
e (U
S $
Mill
ion)
Qua
n�ty
('00
0 M
T)
Qty ('000 MT) US$ Million
Paki
stan
UAE
Bang
lade
sh
Nep
al
Qat
ar
Om
an
Mal
dive
s
Fig. 3.3 Top export destinations for Indian tomato (five year average of 2014–15 to 2018–19).Source UN Comtrade Database
-30
0
30
60
90
120
150
-100
0
100
200
300
400
500
Mill
ion
US
$
'000
MT
Total Exports ('000 MT) Total Imports ('000 MT) Value of Net Exports (Million US $)
Fig. 3.4 Tomato and tomato products net exports from India. SourceDirectorateGeneral of ForeignTrade
leader. Even Indian ketchup manufacturers find it cheaper to import Chinese tomatopaste rather than procure from India.
Onion Exports from India: Problems and ProspectsOnions from India have a huge global demand because of its high pungency andyear-round availability. India’s onion exports have increased considerably after it wascanalised through NAFED and 12 other bodies. India exported 2.42 million tonnesof fresh onions in 2018–19, which was almost 45%more than what India exported in2017–18 (1.68 million tonnes). However, the trade policy in India is haphazard andmakes India’s exports very volatile. With frequent imposition of minimum exportprices (MEP) or complete export bans, India is losing its credibility in the global
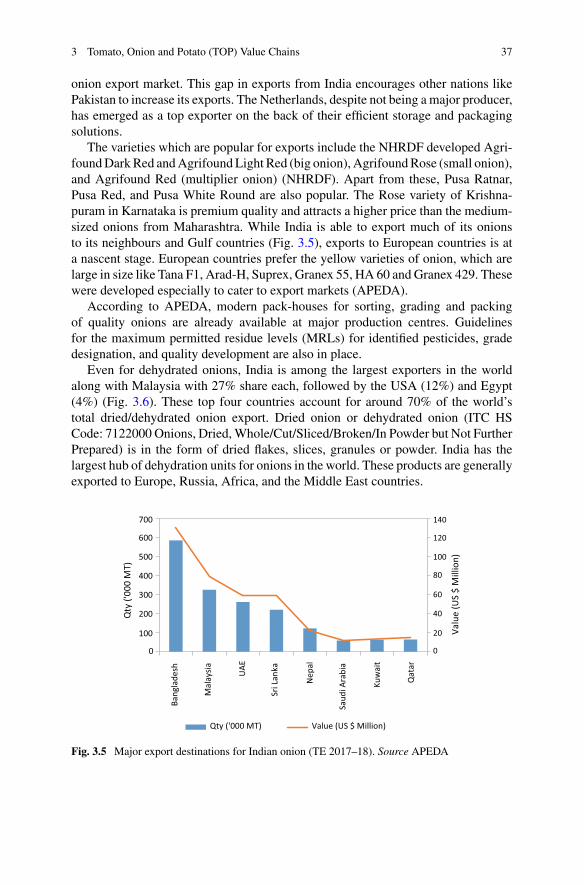
3 Tomato, Onion and Potato (TOP) Value Chains 37
onion export market. This gap in exports from India encourages other nations likePakistan to increase its exports. The Netherlands, despite not being a major producer,has emerged as a top exporter on the back of their efficient storage and packagingsolutions.
The varieties which are popular for exports include the NHRDF developed Agri-foundDarkRed andAgrifoundLight Red (big onion), AgrifoundRose (small onion),and Agrifound Red (multiplier onion) (NHRDF). Apart from these, Pusa Ratnar,Pusa Red, and Pusa White Round are also popular. The Rose variety of Krishna-puram in Karnataka is premium quality and attracts a higher price than the medium-sized onions from Maharashtra. While India is able to export much of its onionsto its neighbours and Gulf countries (Fig. 3.5), exports to European countries is ata nascent stage. European countries prefer the yellow varieties of onion, which arelarge in size like Tana F1, Arad-H, Suprex, Granex 55, HA 60 and Granex 429. Thesewere developed especially to cater to export markets (APEDA).
According to APEDA, modern pack-houses for sorting, grading and packingof quality onions are already available at major production centres. Guidelinesfor the maximum permitted residue levels (MRLs) for identified pesticides, gradedesignation, and quality development are also in place.
Even for dehydrated onions, India is among the largest exporters in the worldalong with Malaysia with 27% share each, followed by the USA (12%) and Egypt(4%) (Fig. 3.6). These top four countries account for around 70% of the world’stotal dried/dehydrated onion export. Dried onion or dehydrated onion (ITC HSCode: 7122000 Onions, Dried,Whole/Cut/Sliced/Broken/In Powder but Not FurtherPrepared) is in the form of dried flakes, slices, granules or powder. India has thelargest hub of dehydration units for onions in the world. These products are generallyexported to Europe, Russia, Africa, and the Middle East countries.
0
20
40
60
80
100
120
140
0
100
200
300
400
500
600
700
Valu
e (U
S $
Mill
ion)
Qty
('00
0 M
T)
Qty ('000 MT) Value (US $ Million)
Bang
lade
sh
Mal
aysia UAE
Sri L
anka
Nep
al
Saud
i Ara
bia
Kuw
ait
Qat
ar
Fig. 3.5 Major export destinations for Indian onion (TE 2017–18). Source APEDA
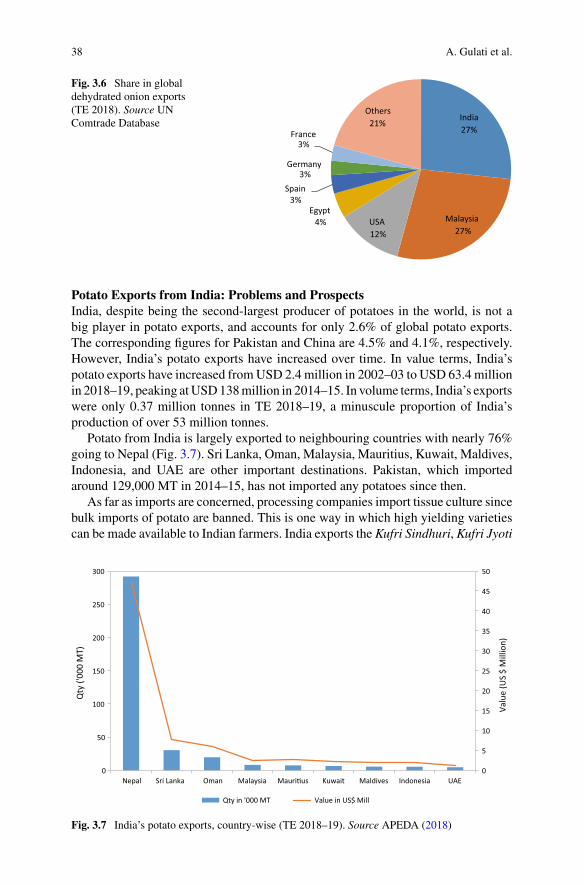
38 A. Gulati et al.
Fig. 3.6 Share in globaldehydrated onion exports(TE 2018). Source UNComtrade Database India
27%
Malaysia27%
USA12%
Egypt4%
Spain3%
Germany3%
France3%
Others21%
Potato Exports from India: Problems and ProspectsIndia, despite being the second-largest producer of potatoes in the world, is not abig player in potato exports, and accounts for only 2.6% of global potato exports.The corresponding figures for Pakistan and China are 4.5% and 4.1%, respectively.However, India’s potato exports have increased over time. In value terms, India’spotato exports have increased fromUSD 2.4 million in 2002–03 to USD 63.4 millionin 2018–19, peaking atUSD138million in 2014–15. In volume terms, India’s exportswere only 0.37 million tonnes in TE 2018–19, a minuscule proportion of India’sproduction of over 53 million tonnes.
Potato from India is largely exported to neighbouring countries with nearly 76%going to Nepal (Fig. 3.7). Sri Lanka, Oman, Malaysia, Mauritius, Kuwait, Maldives,Indonesia, and UAE are other important destinations. Pakistan, which importedaround 129,000 MT in 2014–15, has not imported any potatoes since then.
As far as imports are concerned, processing companies import tissue culture sincebulk imports of potato are banned. This is one way in which high yielding varietiescan be made available to Indian farmers. India exports the Kufri Sindhuri, Kufri Jyoti
0
5
10
15
20
25
30
35
40
45
50
0
50
100
150
200
250
300
Nepal Sri Lanka Oman Malaysia Mauri�us Kuwait Maldives Indonesia UAE
Valu
e (U
S $
Mill
ion)
Qty
('00
0 M
T)
Qty in '000 MT Value in US$ Mill
Fig. 3.7 India’s potato exports, country-wise (TE 2018–19). Source APEDA (2018)
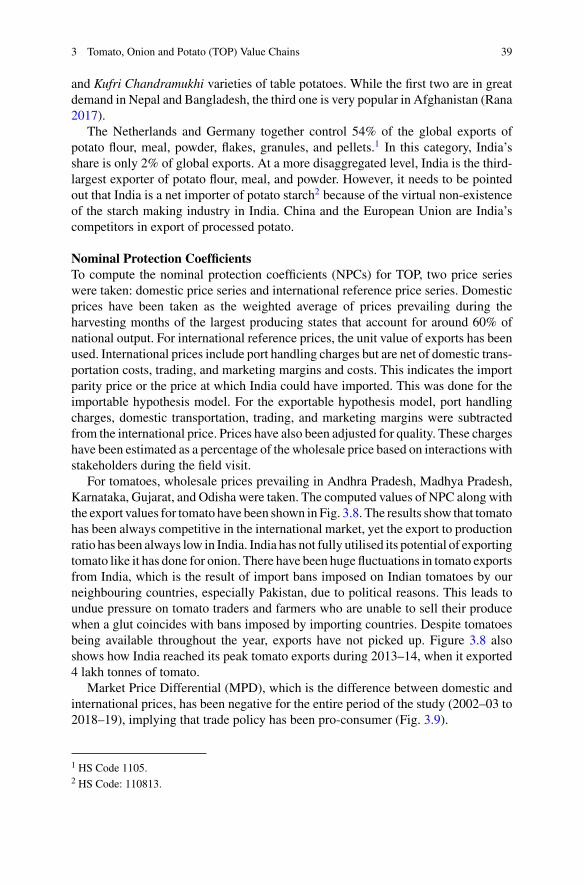
3 Tomato, Onion and Potato (TOP) Value Chains 39
and Kufri Chandramukhi varieties of table potatoes. While the first two are in greatdemand in Nepal and Bangladesh, the third one is very popular in Afghanistan (Rana2017).
The Netherlands and Germany together control 54% of the global exports ofpotato flour, meal, powder, flakes, granules, and pellets.1 In this category, India’sshare is only 2% of global exports. At a more disaggregated level, India is the third-largest exporter of potato flour, meal, and powder. However, it needs to be pointedout that India is a net importer of potato starch2 because of the virtual non-existenceof the starch making industry in India. China and the European Union are India’scompetitors in export of processed potato.
Nominal Protection CoefficientsTo compute the nominal protection coefficients (NPCs) for TOP, two price serieswere taken: domestic price series and international reference price series. Domesticprices have been taken as the weighted average of prices prevailing during theharvesting months of the largest producing states that account for around 60% ofnational output. For international reference prices, the unit value of exports has beenused. International prices include port handling charges but are net of domestic trans-portation costs, trading, and marketing margins and costs. This indicates the importparity price or the price at which India could have imported. This was done for theimportable hypothesis model. For the exportable hypothesis model, port handlingcharges, domestic transportation, trading, and marketing margins were subtractedfrom the international price. Prices have also been adjusted for quality. These chargeshave been estimated as a percentage of the wholesale price based on interactions withstakeholders during the field visit.
For tomatoes, wholesale prices prevailing in Andhra Pradesh, Madhya Pradesh,Karnataka, Gujarat, and Odisha were taken. The computed values of NPC along withthe export values for tomato have been shown in Fig. 3.8. The results show that tomatohas been always competitive in the international market, yet the export to productionratio has been always low in India. India has not fully utilised its potential of exportingtomato like it has done for onion. There have been huge fluctuations in tomato exportsfrom India, which is the result of import bans imposed on Indian tomatoes by ourneighbouring countries, especially Pakistan, due to political reasons. This leads toundue pressure on tomato traders and farmers who are unable to sell their producewhen a glut coincides with bans imposed by importing countries. Despite tomatoesbeing available throughout the year, exports have not picked up. Figure 3.8 alsoshows how India reached its peak tomato exports during 2013–14, when it exported4 lakh tonnes of tomato.
Market Price Differential (MPD), which is the difference between domestic andinternational prices, has been negative for the entire period of the study (2002–03 to2018–19), implying that trade policy has been pro-consumer (Fig. 3.9).
1 HS Code 1105.2 HS Code: 110813.
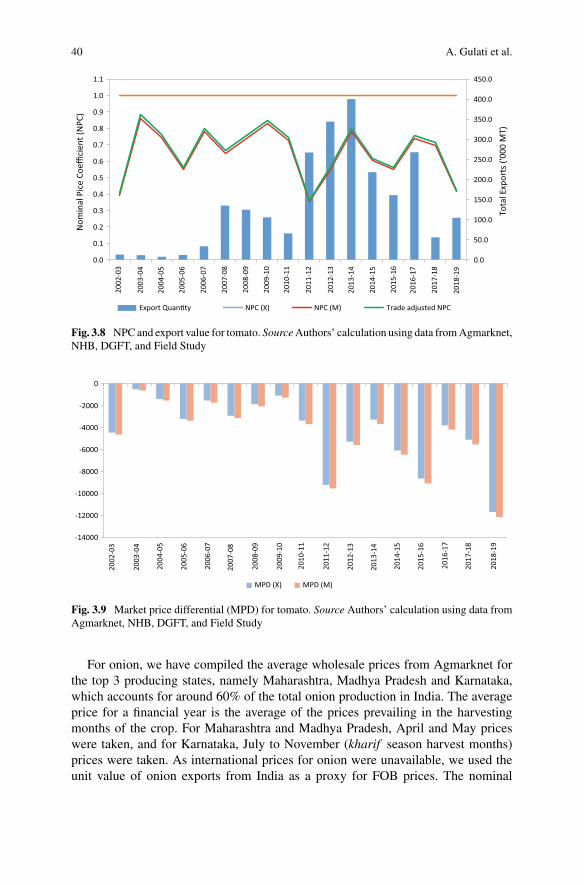
40 A. Gulati et al.
0.0
50.0
100.0
150.0
200.0
250.0
300.0
350.0
400.0
450.0
0.0
0.1
0.2
0.3
0.4
0.5
0.6
0.7
0.8
0.9
1.0
1.1
Tota
l Exp
orts
('00
0 M
T)
Nom
inal
Pic
e Co
effici
ent (
NPC
)
Export Quan�ty NPC (X) NPC (M) Trade adjusted NPC
2002
-03
2003
-04
2004
-05
2005
-06
2006
-07
2007
-08
2008
-09
2009
-10
2010
-11
2011
-12
2012
-13
2013
-14
2014
-15
2015
-16
2016
-17
2017
-18
2018
-19
Fig. 3.8 NPCand export value for tomato. SourceAuthors’ calculation using data fromAgmarknet,NHB, DGFT, and Field Study
-14000
-12000
-10000
-8000
-6000
-4000
-2000
0
MPD (X) MPD (M)
2002
-03
2003
-04
2004
-05
2005
-06
2006
-07
2007
-08
2008
-09
2009
-10
2010
-11
2011
-12
2012
-13
2013
-14
2014
-15
2015
-16
2016
-17
2017
-18
2018
-19
Fig. 3.9 Market price differential (MPD) for tomato. Source Authors’ calculation using data fromAgmarknet, NHB, DGFT, and Field Study
For onion, we have compiled the average wholesale prices from Agmarknet forthe top 3 producing states, namely Maharashtra, Madhya Pradesh and Karnataka,which accounts for around 60% of the total onion production in India. The averageprice for a financial year is the average of the prices prevailing in the harvestingmonths of the crop. For Maharashtra and Madhya Pradesh, April and May priceswere taken, and for Karnataka, July to November (kharif season harvest months)prices were taken. As international prices for onion were unavailable, we used theunit value of onion exports from India as a proxy for FOB prices. The nominal
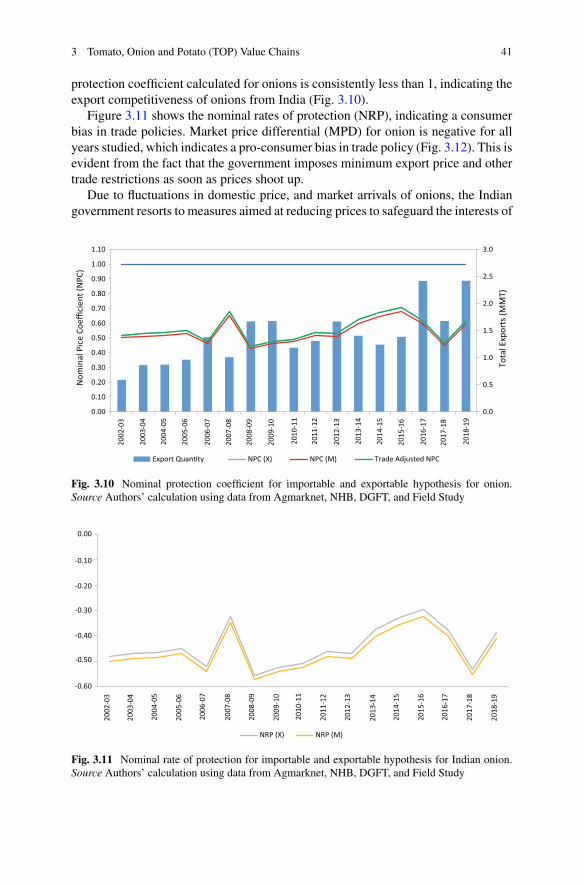
3 Tomato, Onion and Potato (TOP) Value Chains 41
protection coefficient calculated for onions is consistently less than 1, indicating theexport competitiveness of onions from India (Fig. 3.10).
Figure 3.11 shows the nominal rates of protection (NRP), indicating a consumerbias in trade policies. Market price differential (MPD) for onion is negative for allyears studied, which indicates a pro-consumer bias in trade policy (Fig. 3.12). This isevident from the fact that the government imposes minimum export price and othertrade restrictions as soon as prices shoot up.
Due to fluctuations in domestic price, and market arrivals of onions, the Indiangovernment resorts to measures aimed at reducing prices to safeguard the interests of
0.0
0.5
1.0
1.5
2.0
2.5
3.0
0.00
0.10
0.20
0.30
0.40
0.50
0.60
0.70
0.80
0.90
1.00
1.10
Tota
l Exp
orts
(MM
T)
Nom
inal
Pic
e Co
effici
ent (
NPC
)
Export Quan�ty NPC (X) NPC (M) Trade Adjusted NPC
2002
-03
2003
-04
2004
-05
2005
-06
2006
-07
2007
-08
2008
-09
2009
-10
2010
-11
2011
-12
2012
-13
2013
-14
2014
-15
2015
-16
2016
-17
2017
-18
2018
-19
Fig. 3.10 Nominal protection coefficient for importable and exportable hypothesis for onion.Source Authors’ calculation using data from Agmarknet, NHB, DGFT, and Field Study
-0.60
-0.50
-0.40
-0.30
-0.20
-0.10
0.00
NRP (X) NRP (M)
2002
-03
2003
-04
2004
-05
2005
-06
2006
-07
2007
-08
2008
-09
2009
-10
2010
-11
2011
-12
2012
-13
2013
-14
2014
-15
2015
-16
2016
-17
2017
-18
2018
-19
Fig. 3.11 Nominal rate of protection for importable and exportable hypothesis for Indian onion.Source Authors’ calculation using data from Agmarknet, NHB, DGFT, and Field Study
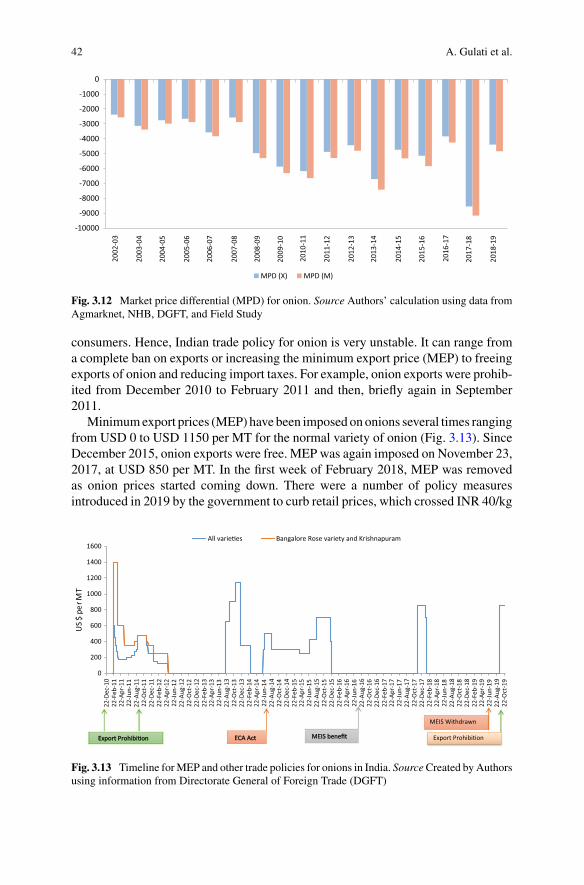
42 A. Gulati et al.
-10000
-9000
-8000
-7000
-6000
-5000
-4000
-3000
-2000
-1000
0
MPD (X) MPD (M)
2002
-03
2003
-04
2004
-05
2005
-06
2006
-07
2007
-08
2008
-09
2009
-10
2010
-11
2011
-12
2012
-13
2013
-14
2014
-15
2015
-16
2016
-17
2017
-18
2018
-19
Fig. 3.12 Market price differential (MPD) for onion. Source Authors’ calculation using data fromAgmarknet, NHB, DGFT, and Field Study
consumers. Hence, Indian trade policy for onion is very unstable. It can range froma complete ban on exports or increasing the minimum export price (MEP) to freeingexports of onion and reducing import taxes. For example, onion exports were prohib-ited from December 2010 to February 2011 and then, briefly again in September2011.
Minimumexport prices (MEP) have been imposed ononions several times rangingfrom USD 0 to USD 1150 per MT for the normal variety of onion (Fig. 3.13). SinceDecember 2015, onion exports were free. MEP was again imposed on November 23,2017, at USD 850 per MT. In the first week of February 2018, MEP was removedas onion prices started coming down. There were a number of policy measuresintroduced in 2019 by the government to curb retail prices, which crossed INR 40/kg
0
200
400
600
800
1000
1200
1400
1600
22-D
ec-1
022
-Feb
-11
22-A
pr-1
122
-Jun-
1122
-Aug
-11
22-O
ct-1
122
-Dec
-11
22-F
eb-1
222
-Apr
-12
22-Ju
n-12
22-A
ug-1
222
-Oct
-12
22-D
ec-1
222
-Feb
-13
22-A
pr-1
322
-Jun-
1322
-Aug
-13
22-O
ct-1
322
-Dec
-13
22-F
eb-1
422
-Apr
-14
22-Ju
n-14
22-A
ug-1
422
-Oct
-14
22-D
ec-1
422
-Feb
-15
22-A
pr-1
522
-Jun-
1522
-Aug
-15
22-O
ct-1
522
-Dec
-15
22-F
eb-1
622
-Apr
-16
22-Ju
n-16
22-A
ug-1
622
-Oct
-16
22-D
ec-1
622
-Feb
-17
22-A
pr-1
722
-Jun-
1722
-Aug
-17
22-O
ct-1
722
-Dec
-17
22-F
eb-1
822
-Apr
-18
22-Ju
n-18
22-A
ug-1
822
-Oct
-18
22-D
ec-1
822
-Feb
-19
22-A
pr-1
922
-Jun-
1922
-Aug
-19
22-O
ct-1
9
US $
per
MT
All varie�es Bangalore Rose variety and Krishnapuram
Export Prohibi�onExport Prohibi�on ECA Act ECA Act MEIS benefitMEIS benefit
MEIS Withdrawn
Export Prohibi�on
Fig. 3.13 Timeline forMEP and other trade policies for onions in India. SourceCreated byAuthorsusing information from Directorate General of Foreign Trade (DGFT)
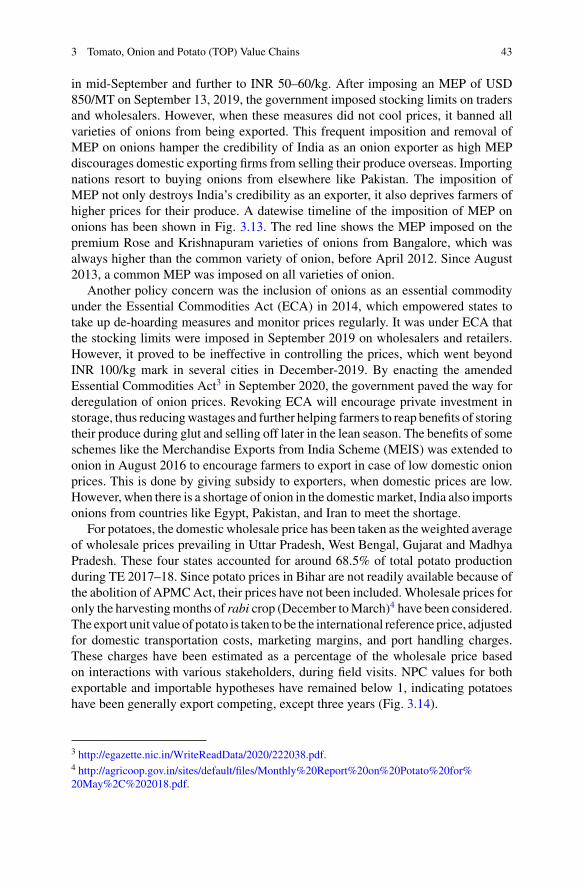
3 Tomato, Onion and Potato (TOP) Value Chains 43
in mid-September and further to INR 50–60/kg. After imposing an MEP of USD850/MT on September 13, 2019, the government imposed stocking limits on tradersand wholesalers. However, when these measures did not cool prices, it banned allvarieties of onions from being exported. This frequent imposition and removal ofMEP on onions hamper the credibility of India as an onion exporter as high MEPdiscourages domestic exporting firms from selling their produce overseas. Importingnations resort to buying onions from elsewhere like Pakistan. The imposition ofMEP not only destroys India’s credibility as an exporter, it also deprives farmers ofhigher prices for their produce. A datewise timeline of the imposition of MEP ononions has been shown in Fig. 3.13. The red line shows the MEP imposed on thepremium Rose and Krishnapuram varieties of onions from Bangalore, which wasalways higher than the common variety of onion, before April 2012. Since August2013, a common MEP was imposed on all varieties of onion.
Another policy concern was the inclusion of onions as an essential commodityunder the Essential Commodities Act (ECA) in 2014, which empowered states totake up de-hoarding measures and monitor prices regularly. It was under ECA thatthe stocking limits were imposed in September 2019 on wholesalers and retailers.However, it proved to be ineffective in controlling the prices, which went beyondINR 100/kg mark in several cities in December-2019. By enacting the amendedEssential Commodities Act3 in September 2020, the government paved the way forderegulation of onion prices. Revoking ECA will encourage private investment instorage, thus reducingwastages and further helping farmers to reap benefits of storingtheir produce during glut and selling off later in the lean season. The benefits of someschemes like the Merchandise Exports from India Scheme (MEIS) was extended toonion in August 2016 to encourage farmers to export in case of low domestic onionprices. This is done by giving subsidy to exporters, when domestic prices are low.However, when there is a shortage of onion in the domesticmarket, India also importsonions from countries like Egypt, Pakistan, and Iran to meet the shortage.
For potatoes, the domestic wholesale price has been taken as the weighted averageof wholesale prices prevailing in Uttar Pradesh, West Bengal, Gujarat and MadhyaPradesh. These four states accounted for around 68.5% of total potato productionduring TE 2017–18. Since potato prices in Bihar are not readily available because ofthe abolition of APMCAct, their prices have not been included.Wholesale prices foronly the harvestingmonths of rabi crop (December toMarch)4 have been considered.The export unit value of potato is taken to be the international reference price, adjustedfor domestic transportation costs, marketing margins, and port handling charges.These charges have been estimated as a percentage of the wholesale price basedon interactions with various stakeholders, during field visits. NPC values for bothexportable and importable hypotheses have remained below 1, indicating potatoeshave been generally export competing, except three years (Fig. 3.14).
3 http://egazette.nic.in/WriteReadData/2020/222038.pdf.4 http://agricoop.gov.in/sites/default/files/Monthly%20Report%20on%20Potato%20for%20May%2C%202018.pdf.
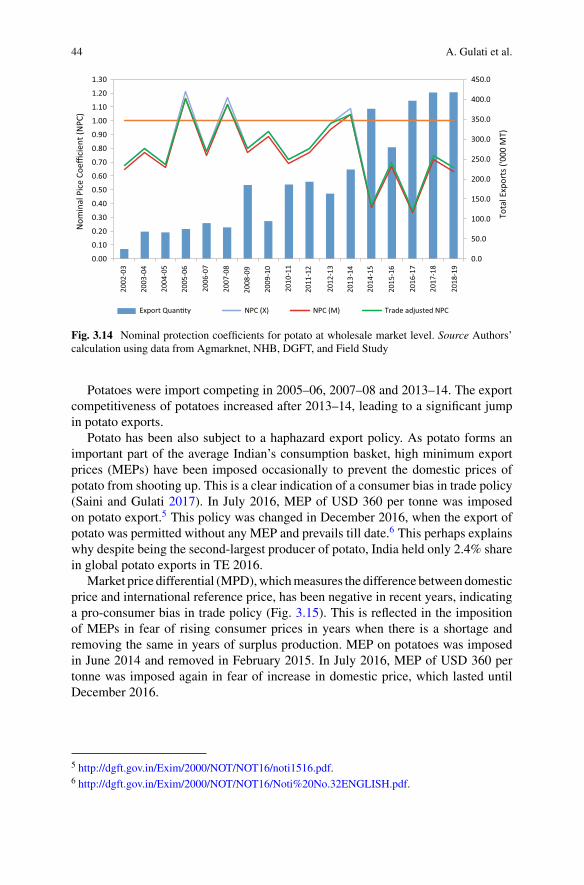
44 A. Gulati et al.
0.0
50.0
100.0
150.0
200.0
250.0
300.0
350.0
400.0
450.0
0.00
0.10
0.20
0.30
0.40
0.50
0.60
0.70
0.80
0.90
1.00
1.10
1.20
1.30
Tota
l Exp
orts
('00
0 M
T)
Nom
inal
Pic
e Co
effici
ent (
NPC
)
Export Quan�ty NPC (X) NPC (M) Trade adjusted NPC
2002
-03
2003
-04
2004
-05
2005
-06
2006
-07
2007
-08
2008
-09
2009
-10
2010
-11
2011
-12
2012
-13
2013
-14
2014
-15
2015
-16
2016
-17
2017
-18
2018
-19
Fig. 3.14 Nominal protection coefficients for potato at wholesale market level. Source Authors’calculation using data from Agmarknet, NHB, DGFT, and Field Study
Potatoes were import competing in 2005–06, 2007–08 and 2013–14. The exportcompetitiveness of potatoes increased after 2013–14, leading to a significant jumpin potato exports.
Potato has been also subject to a haphazard export policy. As potato forms animportant part of the average Indian’s consumption basket, high minimum exportprices (MEPs) have been imposed occasionally to prevent the domestic prices ofpotato from shooting up. This is a clear indication of a consumer bias in trade policy(Saini and Gulati 2017). In July 2016, MEP of USD 360 per tonne was imposedon potato export.5 This policy was changed in December 2016, when the export ofpotato was permitted without any MEP and prevails till date.6 This perhaps explainswhy despite being the second-largest producer of potato, India held only 2.4% sharein global potato exports in TE 2016.
Market price differential (MPD),whichmeasures the difference between domesticprice and international reference price, has been negative in recent years, indicatinga pro-consumer bias in trade policy (Fig. 3.15). This is reflected in the impositionof MEPs in fear of rising consumer prices in years when there is a shortage andremoving the same in years of surplus production. MEP on potatoes was imposedin June 2014 and removed in February 2015. In July 2016, MEP of USD 360 pertonne was imposed again in fear of increase in domestic price, which lasted untilDecember 2016.
5 http://dgft.gov.in/Exim/2000/NOT/NOT16/noti1516.pdf.6 http://dgft.gov.in/Exim/2000/NOT/NOT16/Noti%20No.32ENGLISH.pdf.
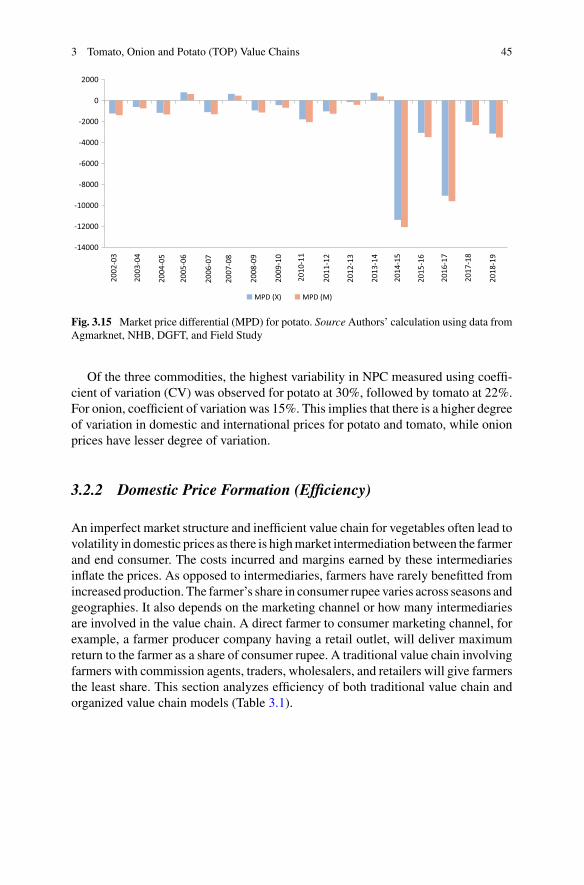
3 Tomato, Onion and Potato (TOP) Value Chains 45
-14000
-12000
-10000
-8000
-6000
-4000
-2000
0
2000
MPD (X) MPD (M)
2002
-03
2003
-04
2004
-05
2005
-06
2006
-07
2007
-08
2008
-09
2009
-10
2010
-11
2011
-12
2012
-13
2013
-14
2014
-15
2015
-16
2016
-17
2017
-18
2018
-19
Fig. 3.15 Market price differential (MPD) for potato. Source Authors’ calculation using data fromAgmarknet, NHB, DGFT, and Field Study
Of the three commodities, the highest variability in NPC measured using coeffi-cient of variation (CV) was observed for potato at 30%, followed by tomato at 22%.For onion, coefficient of variation was 15%. This implies that there is a higher degreeof variation in domestic and international prices for potato and tomato, while onionprices have lesser degree of variation.
3.2.2 Domestic Price Formation (Efficiency)
An imperfect market structure and inefficient value chain for vegetables often lead tovolatility in domestic prices as there is highmarket intermediation between the farmerand end consumer. The costs incurred and margins earned by these intermediariesinflate the prices. As opposed to intermediaries, farmers have rarely benefitted fromincreased production. The farmer’s share in consumer rupee varies across seasons andgeographies. It also depends on the marketing channel or how many intermediariesare involved in the value chain. A direct farmer to consumer marketing channel, forexample, a farmer producer company having a retail outlet, will deliver maximumreturn to the farmer as a share of consumer rupee. A traditional value chain involvingfarmers with commission agents, traders, wholesalers, and retailers will give farmersthe least share. This section analyzes efficiency of both traditional value chain andorganized value chain models (Table 3.1).
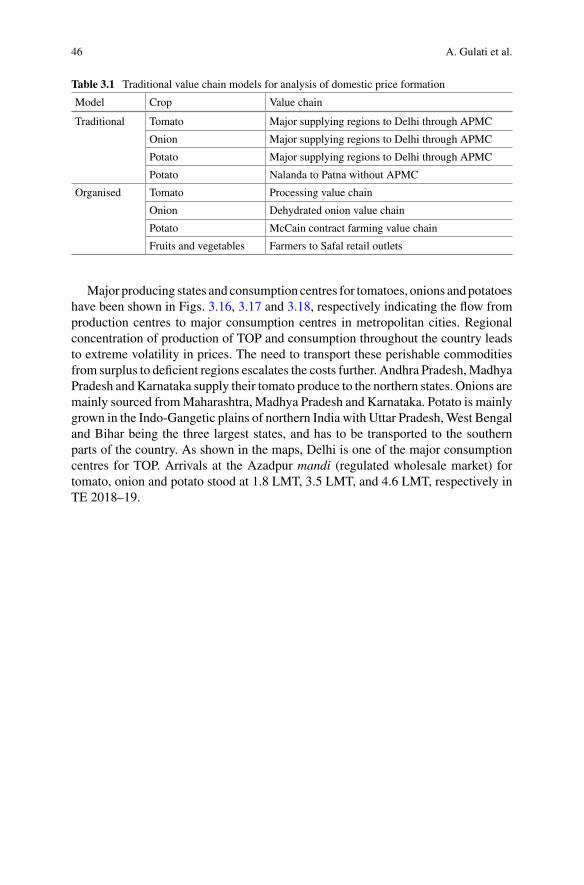
46 A. Gulati et al.
Table 3.1 Traditional value chain models for analysis of domestic price formation
Model Crop Value chain
Traditional Tomato Major supplying regions to Delhi through APMC
Onion Major supplying regions to Delhi through APMC
Potato Major supplying regions to Delhi through APMC
Potato Nalanda to Patna without APMC
Organised Tomato Processing value chain
Onion Dehydrated onion value chain
Potato McCain contract farming value chain
Fruits and vegetables Farmers to Safal retail outlets
Major producing states and consumption centres for tomatoes, onions andpotatoeshave been shown in Figs. 3.16, 3.17 and 3.18, respectively indicating the flow fromproduction centres to major consumption centres in metropolitan cities. Regionalconcentration of production of TOP and consumption throughout the country leadsto extreme volatility in prices. The need to transport these perishable commoditiesfrom surplus to deficient regions escalates the costs further. Andhra Pradesh,MadhyaPradesh andKarnataka supply their tomato produce to the northern states. Onions aremainly sourced fromMaharashtra, Madhya Pradesh and Karnataka. Potato is mainlygrown in the Indo-Gangetic plains of northern India with Uttar Pradesh,West Bengaland Bihar being the three largest states, and has to be transported to the southernparts of the country. As shown in the maps, Delhi is one of the major consumptioncentres for TOP. Arrivals at the Azadpur mandi (regulated wholesale market) fortomato, onion and potato stood at 1.8 LMT, 3.5 LMT, and 4.6 LMT, respectively inTE 2018–19.
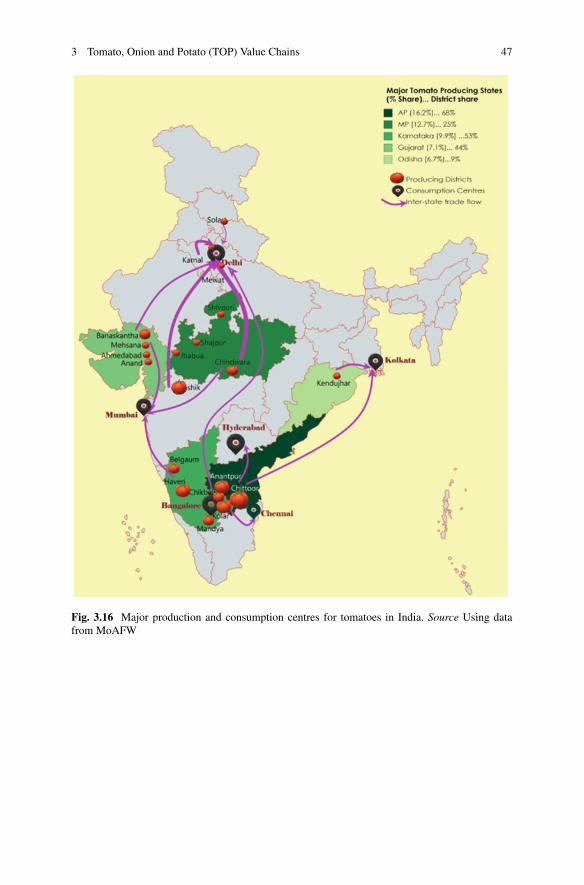
3 Tomato, Onion and Potato (TOP) Value Chains 47
Fig. 3.16 Major production and consumption centres for tomatoes in India. Source Using datafrom MoAFW
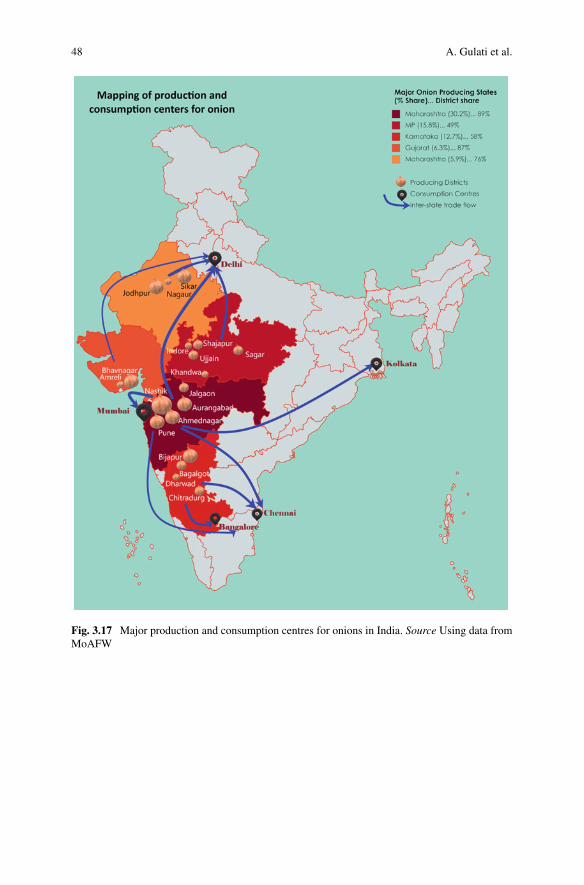
48 A. Gulati et al.
Fig. 3.17 Major production and consumption centres for onions in India. Source Using data fromMoAFW
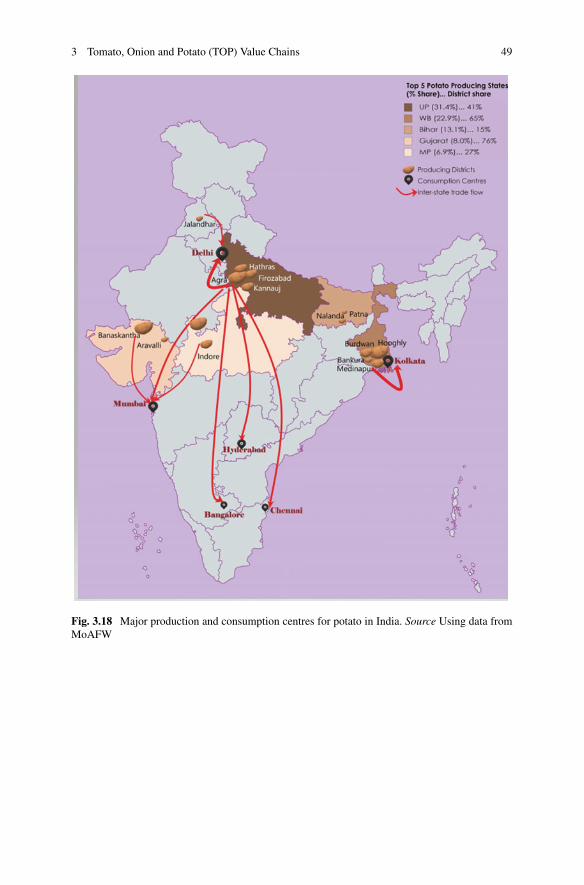
3 Tomato, Onion and Potato (TOP) Value Chains 49
Fig. 3.18 Major production and consumption centres for potato in India. Source Using data fromMoAFW
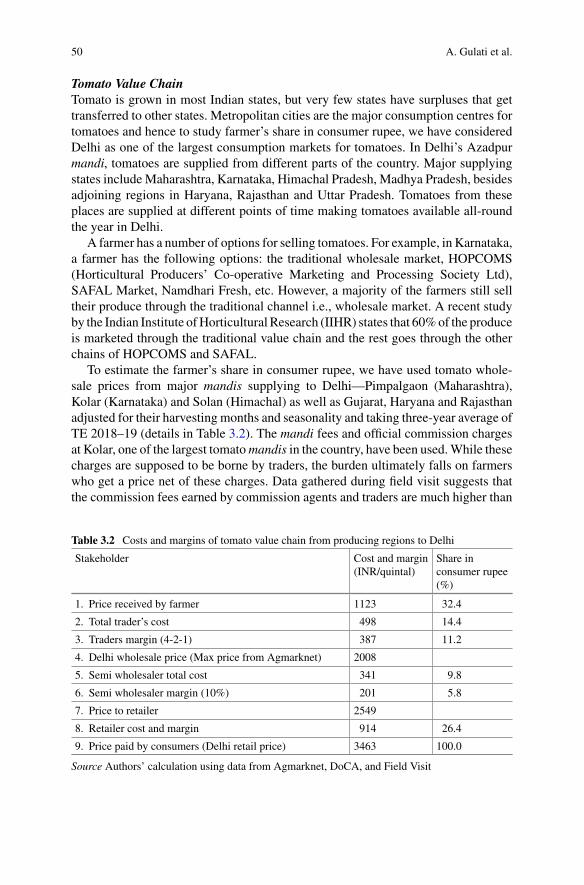
50 A. Gulati et al.
Tomato Value ChainTomato is grown in most Indian states, but very few states have surpluses that gettransferred to other states. Metropolitan cities are the major consumption centres fortomatoes and hence to study farmer’s share in consumer rupee, we have consideredDelhi as one of the largest consumption markets for tomatoes. In Delhi’s Azadpurmandi, tomatoes are supplied from different parts of the country. Major supplyingstates includeMaharashtra, Karnataka, Himachal Pradesh, Madhya Pradesh, besidesadjoining regions in Haryana, Rajasthan and Uttar Pradesh. Tomatoes from theseplaces are supplied at different points of time making tomatoes available all-roundthe year in Delhi.
A farmer has a number of options for selling tomatoes. For example, in Karnataka,a farmer has the following options: the traditional wholesale market, HOPCOMS(Horticultural Producers’ Co-operative Marketing and Processing Society Ltd),SAFAL Market, Namdhari Fresh, etc. However, a majority of the farmers still selltheir produce through the traditional channel i.e., wholesale market. A recent studyby the Indian Institute ofHorticultural Research (IIHR) states that 60%of the produceis marketed through the traditional value chain and the rest goes through the otherchains of HOPCOMS and SAFAL.
To estimate the farmer’s share in consumer rupee, we have used tomato whole-sale prices from major mandis supplying to Delhi—Pimpalgaon (Maharashtra),Kolar (Karnataka) and Solan (Himachal) as well as Gujarat, Haryana and Rajasthanadjusted for their harvesting months and seasonality and taking three-year average ofTE 2018–19 (details in Table 3.2). The mandi fees and official commission chargesat Kolar, one of the largest tomatomandis in the country, have been used.While thesecharges are supposed to be borne by traders, the burden ultimately falls on farmerswho get a price net of these charges. Data gathered during field visit suggests thatthe commission fees earned by commission agents and traders are much higher than
Table 3.2 Costs and margins of tomato value chain from producing regions to Delhi
Stakeholder Cost and margin(INR/quintal)
Share inconsumer rupee(%)
1. Price received by farmer 1123 32.4
2. Total trader’s cost 498 14.4
3. Traders margin (4-2-1) 387 11.2
4. Delhi wholesale price (Max price from Agmarknet) 2008
5. Semi wholesaler total cost 341 9.8
6. Semi wholesaler margin (10%) 201 5.8
7. Price to retailer 2549
8. Retailer cost and margin 914 26.4
9. Price paid by consumers (Delhi retail price) 3463 100.0
Source Authors’ calculation using data from Agmarknet, DoCA, and Field Visit
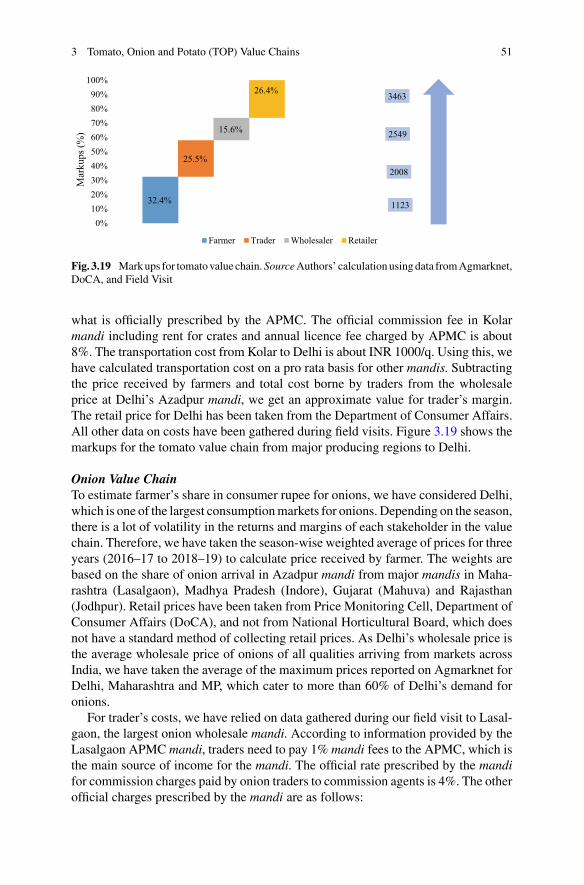
3 Tomato, Onion and Potato (TOP) Value Chains 51
32.4% 1123
25.5%2008
15.6% 2549
26.4% 3463
0%10%20%30%40%50%60%70%80%90%
100%M
arku
ps (%
)
Farmer Trader Wholesaler Retailer
Fig. 3.19 Markups for tomatovalue chain.SourceAuthors’ calculationusingdata fromAgmarknet,DoCA, and Field Visit
what is officially prescribed by the APMC. The official commission fee in Kolarmandi including rent for crates and annual licence fee charged by APMC is about8%. The transportation cost from Kolar to Delhi is about INR 1000/q. Using this, wehave calculated transportation cost on a pro rata basis for other mandis. Subtractingthe price received by farmers and total cost borne by traders from the wholesaleprice at Delhi’s Azadpur mandi, we get an approximate value for trader’s margin.The retail price for Delhi has been taken from the Department of Consumer Affairs.All other data on costs have been gathered during field visits. Figure 3.19 shows themarkups for the tomato value chain from major producing regions to Delhi.
Onion Value ChainTo estimate farmer’s share in consumer rupee for onions, we have considered Delhi,which is one of the largest consumptionmarkets for onions. Depending on the season,there is a lot of volatility in the returns and margins of each stakeholder in the valuechain. Therefore, we have taken the season-wise weighted average of prices for threeyears (2016–17 to 2018–19) to calculate price received by farmer. The weights arebased on the share of onion arrival in Azadpur mandi from major mandis in Maha-rashtra (Lasalgaon), Madhya Pradesh (Indore), Gujarat (Mahuva) and Rajasthan(Jodhpur). Retail prices have been taken from Price Monitoring Cell, Department ofConsumer Affairs (DoCA), and not from National Horticultural Board, which doesnot have a standard method of collecting retail prices. As Delhi’s wholesale price isthe average wholesale price of onions of all qualities arriving from markets acrossIndia, we have taken the average of the maximum prices reported on Agmarknet forDelhi, Maharashtra and MP, which cater to more than 60% of Delhi’s demand foronions.
For trader’s costs, we have relied on data gathered during our field visit to Lasal-gaon, the largest onion wholesale mandi. According to information provided by theLasalgaon APMC mandi, traders need to pay 1% mandi fees to the APMC, which isthe main source of income for the mandi. The official rate prescribed by the mandifor commission charges paid by onion traders to commission agents is 4%. The otherofficial charges prescribed by the mandi are as follows:
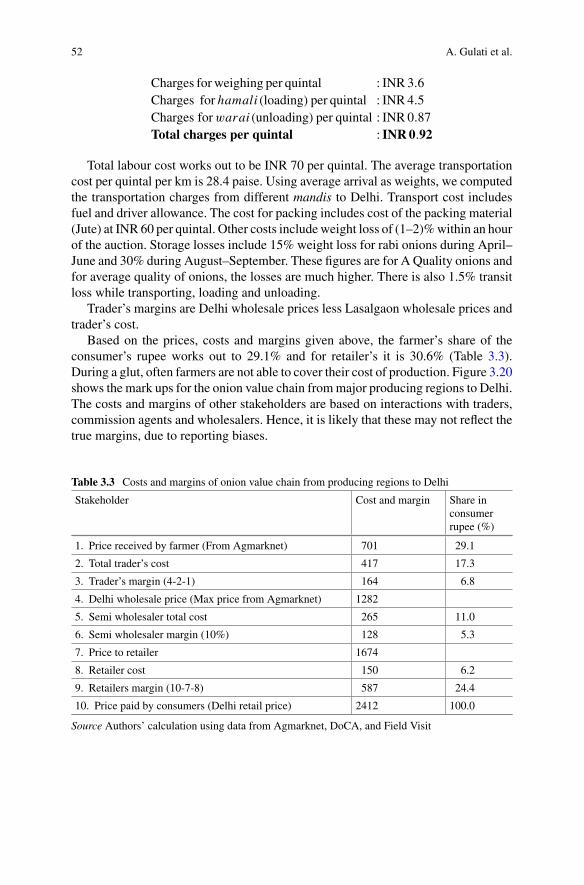
52 A. Gulati et al.
Charges for weighing per quintal : INR 3.6Charges for hamali(loading) per quintal : INR 4.5Charges forwarai(unloading) per quintal : INR 0.87Total charges per quintal : INR0.92
Total labour cost works out to be INR 70 per quintal. The average transportationcost per quintal per km is 28.4 paise. Using average arrival as weights, we computedthe transportation charges from different mandis to Delhi. Transport cost includesfuel and driver allowance. The cost for packing includes cost of the packing material(Jute) at INR 60 per quintal. Other costs includeweight loss of (1–2)%within an hourof the auction. Storage losses include 15% weight loss for rabi onions during April–June and 30% during August–September. These figures are for A Quality onions andfor average quality of onions, the losses are much higher. There is also 1.5% transitloss while transporting, loading and unloading.
Trader’s margins are Delhi wholesale prices less Lasalgaon wholesale prices andtrader’s cost.
Based on the prices, costs and margins given above, the farmer’s share of theconsumer’s rupee works out to 29.1% and for retailer’s it is 30.6% (Table 3.3).During a glut, often farmers are not able to cover their cost of production. Figure 3.20shows the mark ups for the onion value chain frommajor producing regions to Delhi.The costs and margins of other stakeholders are based on interactions with traders,commission agents and wholesalers. Hence, it is likely that these may not reflect thetrue margins, due to reporting biases.
Table 3.3 Costs and margins of onion value chain from producing regions to Delhi
Stakeholder Cost and margin Share inconsumerrupee (%)
1. Price received by farmer (From Agmarknet) 701 29.1
2. Total trader’s cost 417 17.3
3. Trader’s margin (4-2-1) 164 6.8
4. Delhi wholesale price (Max price from Agmarknet) 1282
5. Semi wholesaler total cost 265 11.0
6. Semi wholesaler margin (10%) 128 5.3
7. Price to retailer 1674
8. Retailer cost 150 6.2
9. Retailers margin (10-7-8) 587 24.4
10. Price paid by consumers (Delhi retail price) 2412 100.0
Source Authors’ calculation using data from Agmarknet, DoCA, and Field Visit
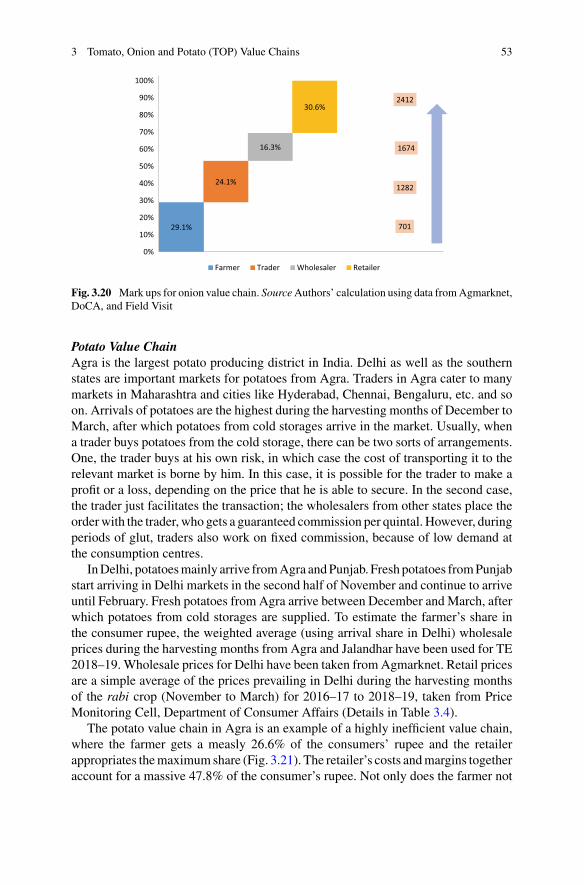
3 Tomato, Onion and Potato (TOP) Value Chains 53
29.1% 701
24.1%1282
16.3% 1674
30.6%2412
0%
10%
20%
30%
40%
50%
60%
70%
80%
90%
100%
Farmer Trader Wholesaler Retailer
Fig. 3.20 Mark ups for onion value chain. SourceAuthors’ calculation using data fromAgmarknet,DoCA, and Field Visit
Potato Value ChainAgra is the largest potato producing district in India. Delhi as well as the southernstates are important markets for potatoes from Agra. Traders in Agra cater to manymarkets in Maharashtra and cities like Hyderabad, Chennai, Bengaluru, etc. and soon. Arrivals of potatoes are the highest during the harvesting months of December toMarch, after which potatoes from cold storages arrive in the market. Usually, whena trader buys potatoes from the cold storage, there can be two sorts of arrangements.One, the trader buys at his own risk, in which case the cost of transporting it to therelevant market is borne by him. In this case, it is possible for the trader to make aprofit or a loss, depending on the price that he is able to secure. In the second case,the trader just facilitates the transaction; the wholesalers from other states place theorderwith the trader, who gets a guaranteed commission per quintal. However, duringperiods of glut, traders also work on fixed commission, because of low demand atthe consumption centres.
InDelhi, potatoesmainly arrive fromAgra andPunjab. Fresh potatoes fromPunjabstart arriving in Delhi markets in the second half of November and continue to arriveuntil February. Fresh potatoes from Agra arrive between December and March, afterwhich potatoes from cold storages are supplied. To estimate the farmer’s share inthe consumer rupee, the weighted average (using arrival share in Delhi) wholesaleprices during the harvesting months from Agra and Jalandhar have been used for TE2018–19. Wholesale prices for Delhi have been taken fromAgmarknet. Retail pricesare a simple average of the prices prevailing in Delhi during the harvesting monthsof the rabi crop (November to March) for 2016–17 to 2018–19, taken from PriceMonitoring Cell, Department of Consumer Affairs (Details in Table 3.4).
The potato value chain in Agra is an example of a highly inefficient value chain,where the farmer gets a measly 26.6% of the consumers’ rupee and the retailerappropriates themaximumshare (Fig. 3.21). The retailer’s costs andmargins togetheraccount for a massive 47.8% of the consumer’s rupee. Not only does the farmer not
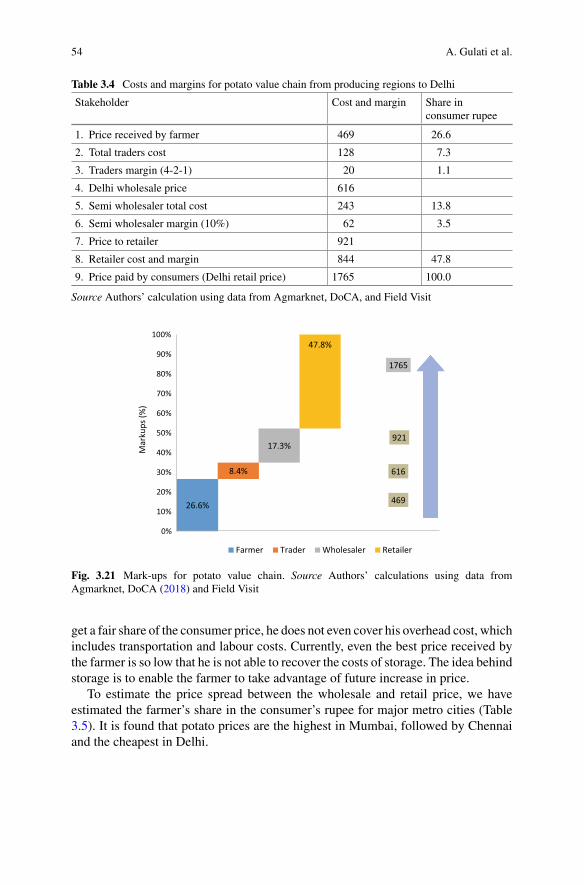
54 A. Gulati et al.
Table 3.4 Costs and margins for potato value chain from producing regions to Delhi
Stakeholder Cost and margin Share inconsumer rupee
1. Price received by farmer 469 26.6
2. Total traders cost 128 7.3
3. Traders margin (4-2-1) 20 1.1
4. Delhi wholesale price 616
5. Semi wholesaler total cost 243 13.8
6. Semi wholesaler margin (10%) 62 3.5
7. Price to retailer 921
8. Retailer cost and margin 844 47.8
9. Price paid by consumers (Delhi retail price) 1765 100.0
Source Authors’ calculation using data from Agmarknet, DoCA, and Field Visit
26.6% 469
8.4% 616
17.3%921
47.8%
1765
0%
10%
20%
30%
40%
50%
60%
70%
80%
90%
100%
Mar
kups
(%)
Farmer Trader Wholesaler Retailer
Fig. 3.21 Mark-ups for potato value chain. Source Authors’ calculations using data fromAgmarknet, DoCA (2018) and Field Visit
get a fair share of the consumer price, he does not even cover his overhead cost, whichincludes transportation and labour costs. Currently, even the best price received bythe farmer is so low that he is not able to recover the costs of storage. The idea behindstorage is to enable the farmer to take advantage of future increase in price.
To estimate the price spread between the wholesale and retail price, we haveestimated the farmer’s share in the consumer’s rupee for major metro cities (Table3.5). It is found that potato prices are the highest in Mumbai, followed by Chennaiand the cheapest in Delhi.
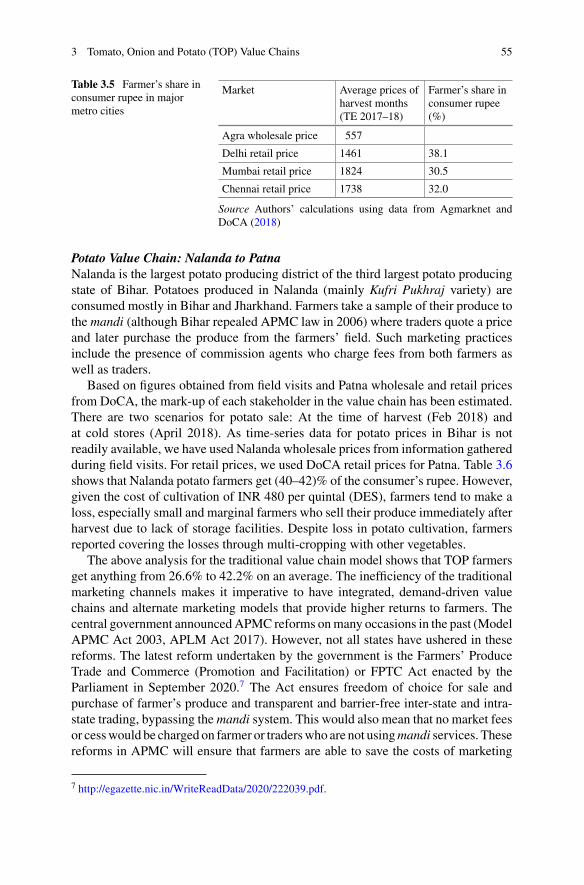
3 Tomato, Onion and Potato (TOP) Value Chains 55
Table 3.5 Farmer’s share inconsumer rupee in majormetro cities
Market Average prices ofharvest months(TE 2017–18)
Farmer’s share inconsumer rupee(%)
Agra wholesale price 557
Delhi retail price 1461 38.1
Mumbai retail price 1824 30.5
Chennai retail price 1738 32.0
Source Authors’ calculations using data from Agmarknet andDoCA (2018)
Potato Value Chain: Nalanda to PatnaNalanda is the largest potato producing district of the third largest potato producingstate of Bihar. Potatoes produced in Nalanda (mainly Kufri Pukhraj variety) areconsumed mostly in Bihar and Jharkhand. Farmers take a sample of their produce tothe mandi (although Bihar repealed APMC law in 2006) where traders quote a priceand later purchase the produce from the farmers’ field. Such marketing practicesinclude the presence of commission agents who charge fees from both farmers aswell as traders.
Based on figures obtained from field visits and Patna wholesale and retail pricesfrom DoCA, the mark-up of each stakeholder in the value chain has been estimated.There are two scenarios for potato sale: At the time of harvest (Feb 2018) andat cold stores (April 2018). As time-series data for potato prices in Bihar is notreadily available, we have used Nalanda wholesale prices from information gatheredduring field visits. For retail prices, we used DoCA retail prices for Patna. Table 3.6shows that Nalanda potato farmers get (40–42)% of the consumer’s rupee. However,given the cost of cultivation of INR 480 per quintal (DES), farmers tend to make aloss, especially small and marginal farmers who sell their produce immediately afterharvest due to lack of storage facilities. Despite loss in potato cultivation, farmersreported covering the losses through multi-cropping with other vegetables.
The above analysis for the traditional value chain model shows that TOP farmersget anything from 26.6% to 42.2% on an average. The inefficiency of the traditionalmarketing channels makes it imperative to have integrated, demand-driven valuechains and alternate marketing models that provide higher returns to farmers. Thecentral government announcedAPMC reforms onmany occasions in the past (ModelAPMC Act 2003, APLM Act 2017). However, not all states have ushered in thesereforms. The latest reform undertaken by the government is the Farmers’ ProduceTrade and Commerce (Promotion and Facilitation) or FPTC Act enacted by theParliament in September 2020.7 The Act ensures freedom of choice for sale andpurchase of farmer’s produce and transparent and barrier-free inter-state and intra-state trading, bypassing themandi system. This would also mean that no market feesor cesswould be charged on farmer or traderswho are not usingmandi services. Thesereforms in APMC will ensure that farmers are able to save the costs of marketing
7 http://egazette.nic.in/WriteReadData/2020/222039.pdf.
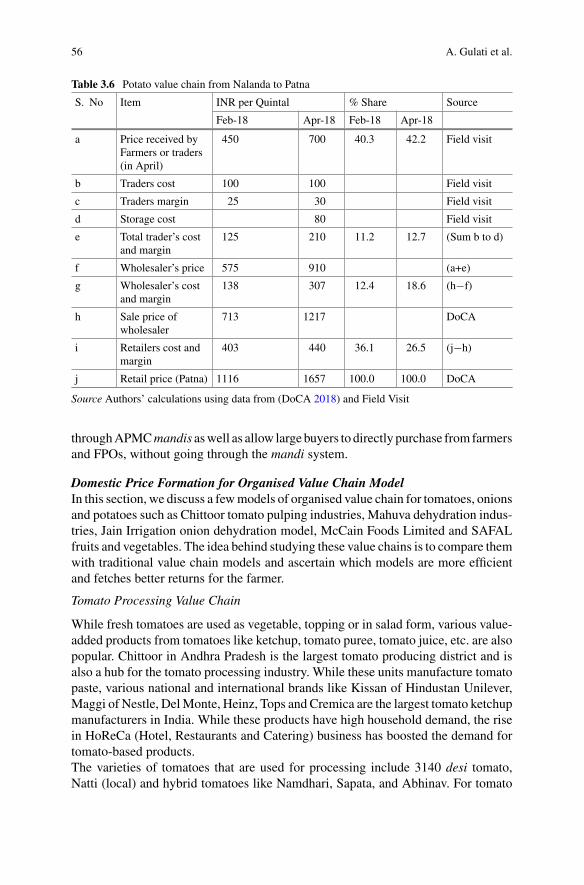
56 A. Gulati et al.
Table 3.6 Potato value chain from Nalanda to Patna
S. No Item INR per Quintal % Share Source
Feb-18 Apr-18 Feb-18 Apr-18
a Price received byFarmers or traders(in April)
450 700 40.3 42.2 Field visit
b Traders cost 100 100 Field visit
c Traders margin 25 30 Field visit
d Storage cost 80 Field visit
e Total trader’s costand margin
125 210 11.2 12.7 (Sum b to d)
f Wholesaler’s price 575 910 (a+e)
g Wholesaler’s costand margin
138 307 12.4 18.6 (h−f)
h Sale price ofwholesaler
713 1217 DoCA
i Retailers cost andmargin
403 440 36.1 26.5 (j−h)
j Retail price (Patna) 1116 1657 100.0 100.0 DoCA
Source Authors’ calculations using data from (DoCA 2018) and Field Visit
throughAPMCmandis aswell as allow large buyers to directly purchase from farmersand FPOs, without going through the mandi system.
Domestic Price Formation for Organised Value Chain ModelIn this section, we discuss a fewmodels of organised value chain for tomatoes, onionsand potatoes such as Chittoor tomato pulping industries, Mahuva dehydration indus-tries, Jain Irrigation onion dehydration model, McCain Foods Limited and SAFALfruits and vegetables. The idea behind studying these value chains is to compare themwith traditional value chain models and ascertain which models are more efficientand fetches better returns for the farmer.
Tomato Processing Value Chain
While fresh tomatoes are used as vegetable, topping or in salad form, various value-added products from tomatoes like ketchup, tomato puree, tomato juice, etc. are alsopopular. Chittoor in Andhra Pradesh is the largest tomato producing district and isalso a hub for the tomato processing industry. While these units manufacture tomatopaste, various national and international brands like Kissan of Hindustan Unilever,Maggi of Nestle, DelMonte, Heinz, Tops and Cremica are the largest tomato ketchupmanufacturers in India. While these products have high household demand, the risein HoReCa (Hotel, Restaurants and Catering) business has boosted the demand fortomato-based products.The varieties of tomatoes that are used for processing include 3140 desi tomato,Natti (local) and hybrid tomatoes like Namdhari, Sapata, and Abhinav. For tomato
3 Tomato, Onion and Potato (TOP) Value Chains 57
pulping industry in Chittoor, no contract farming with the producers are in place andprocessors procure their raw material from Kolar or Madanapalle mandi. Contractfarming with tomato growers was discontinued long ago because farmers tend tosell their produce in mandis whenever mandi prices are higher than the contractprice. However, farmers can bring their produce to the processing centres directly.However, Indian tomatoes have low yields which increase the cost of raw material,making India uncompetitive in processed tomato. Because of high fluctuations intomato prices in India, processing units are unable to process tomato round the yearand process other fruits and vegetables. It is only sustainable for the processors toprocess tomatoes when tomatoes are procured at prices less than INR 4 to 4.50 perkg. On the other hand, China is able to produce tomato paste at a much cheaperrate because of low cost of raw material and processing. Even Indian manufacturersprefer importing cheap Chinese tomato paste.
The process in a typical tomato pulping unit is as follows. Fresh tomatoes areprocured and sent to collection centres and washed. These can be stored at ambienttemperature (18 °C for up to 3–4 days) andwhen it is time to process, stored tomatoesare again washed by machines. These are then sorted and graded manually beforebeing crushed for the final product.
As tomato paste is one-step value addition, it is sold in a B2B model. Manufac-turers of tomato ketchup, puree and juice purchase tomato paste from these unitsfor manufacturing final products. Around 8 tonnes of the desi variety of fresh toma-toes is equivalent to 1 tonne of tomato paste and 7.5 tonnes of the hybrid variety isequivalent to 1 tonne of tomato paste.
One kilogram of branded tomato ketchup requires 333 g of tomato paste (30% istomato paste), which means that it requires 2.5 kg of fresh tomatoes (1 kg of tomatopaste requires 7.5 kg hybrid fresh tomatoes). This means if branded tomato ketchupin India is sold for INR 125 per kg and it used 2.5 kg of fresh tomatoes that werebought at INR 4/kg (i.e. for a total of INR 10) for the processor to be financiallyviable, the farmer’s share is 8% of the consumer price for tomato ketchup. This isbecause there are actual costs of processing involved.
Onion Processing Value Chain
Fresh onions can be processed into a number of dehydrated forms like onion flakes,powder, granules, etc. However, there is very low demand for these products domes-tically, as Indian consumers are used to fresh onions. India produces about 75,000MT of dehydrated onions, which is about (3–4)% of total onion production (1 kgdehydrated onion= 10 kg fresh onions). Processed onions largely cater to the exportmarket (80–85%) and the rest is mostly consumed by the domestic food industry.A majority of the dehydrated onion units in India are located in Bhavnagar districtof Gujarat, with a high concentration in Mahuva. These units procure the raw mate-rials (white or red onions) directly from the mandi without engaging in contractfarming; they operate for only a few months in a year (February to June) whenwhite onion prices are low. Hence, Mahuva farmers get no extra benefit because ofthe presence of dehydration units in their area. With low international demand and
58 A. Gulati et al.
negligible domestic demand for dehydrated onion products, these units often have ahigh pile-up of previous year’s stock, making them financially unsustainable.
On the other hand, Jain Irrigation Systems Ltd. (JISL) has emerged as India’sleading onion dehydration company and one of the world’s largest companies. Theonion dehydration model of JISL is one of the most successful onion value chainmodels in India. It has engaged with onion farmers around Jalgaon through contractfarming. The total number of farmers engaged in contract farming is about 5000 fromareas like Jalgaon, Dhule, Shahada in Maharashtra and even places like Khargone inMP.
JISL provides the following to contract farmers:
• Seeds at cost basis at 7 paise/sapling to be directly transplanted in the fields.• Drip irrigation equipment (at trade discount).• Sprinklers.
They also provide extension services to ensure that the specific standards of thecompany are met. One Jain agronomist (gramsevak) is deployed in each of thevillages to provide information on nutrition management, sowing, and harvesting.
The company works with mostly small and marginal farmers. With support fromJISL, they not only produce high yielding quality onions, but also get insured againstthe price volatility.
The price received by the growers is assured by the company before planting. In2018–19, the price was fixed at INR 5.50/Kg for rabi onions, when the market priceis usually lower than the assured price. If the market price is higher than the assuredprice, then the market price less 60 paise is given to the farmers. For example,if the market price is INR 11/Kg, then they are paid INR 10.40/Kg. In this way,onion contract farmers are able to overcome the risks of price volatility, which theircounterparts in Mahuva are not able to.
Potato Processing Value Chain
Among all TOP vegetables, potato has the highest share of processing at around 7%.Potatoes can be processed to make ready to eat products like chips, wafers; readyto cook snacks like potato patty, and French fries or dehydrated products like potatopowder. There are a number of national and international brands that are manufac-turing potato-based products with contract farmers. For instance, PepsiCo’s Frito Layis a good example of engaging smallholders to grow potatoes matching internationalstandards. A study by FAO shows that contract farming for Pepsi provides farmershigher margins, proper extension training and assured returns (Punjabi 2015).
In this section, we discuss the value chain model of McCain Foods Ltd. in detail.McCain Foods is the world’s largest producer of French fries and potato specialties.McCain’s products like French fries, potato wedges and patties are marketed inover 160 countries, with global sales of USD 6 billion. In addition, the Canadiangroup is one of McDonalds’ main suppliers of French Fries. In India, McCain has aworld-class potato processing facility in Mehsana, Gujarat.
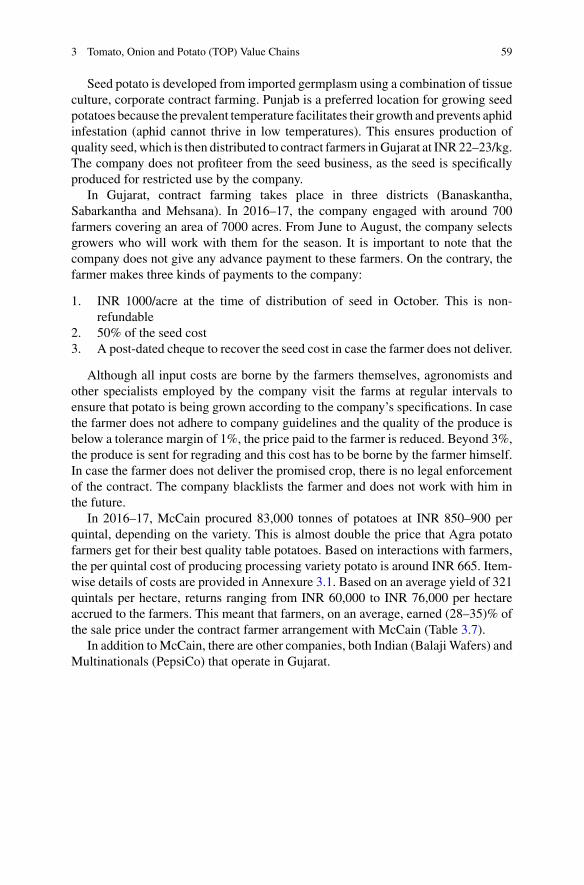
3 Tomato, Onion and Potato (TOP) Value Chains 59
Seed potato is developed from imported germplasm using a combination of tissueculture, corporate contract farming. Punjab is a preferred location for growing seedpotatoes because the prevalent temperature facilitates their growth and prevents aphidinfestation (aphid cannot thrive in low temperatures). This ensures production ofquality seed,which is then distributed to contract farmers inGujarat at INR22–23/kg.The company does not profiteer from the seed business, as the seed is specificallyproduced for restricted use by the company.
In Gujarat, contract farming takes place in three districts (Banaskantha,Sabarkantha and Mehsana). In 2016–17, the company engaged with around 700farmers covering an area of 7000 acres. From June to August, the company selectsgrowers who will work with them for the season. It is important to note that thecompany does not give any advance payment to these farmers. On the contrary, thefarmer makes three kinds of payments to the company:
1. INR 1000/acre at the time of distribution of seed in October. This is non-refundable
2. 50% of the seed cost3. A post-dated cheque to recover the seed cost in case the farmer does not deliver.
Although all input costs are borne by the farmers themselves, agronomists andother specialists employed by the company visit the farms at regular intervals toensure that potato is being grown according to the company’s specifications. In casethe farmer does not adhere to company guidelines and the quality of the produce isbelow a tolerance margin of 1%, the price paid to the farmer is reduced. Beyond 3%,the produce is sent for regrading and this cost has to be borne by the farmer himself.In case the farmer does not deliver the promised crop, there is no legal enforcementof the contract. The company blacklists the farmer and does not work with him inthe future.
In 2016–17, McCain procured 83,000 tonnes of potatoes at INR 850–900 perquintal, depending on the variety. This is almost double the price that Agra potatofarmers get for their best quality table potatoes. Based on interactions with farmers,the per quintal cost of producing processing variety potato is around INR 665. Item-wise details of costs are provided in Annexure 3.1. Based on an average yield of 321quintals per hectare, returns ranging from INR 60,000 to INR 76,000 per hectareaccrued to the farmers. This meant that farmers, on an average, earned (28–35)% ofthe sale price under the contract farmer arrangement with McCain (Table 3.7).
In addition toMcCain, there are other companies, both Indian (Balaji Wafers) andMultinationals (PepsiCo) that operate in Gujarat.
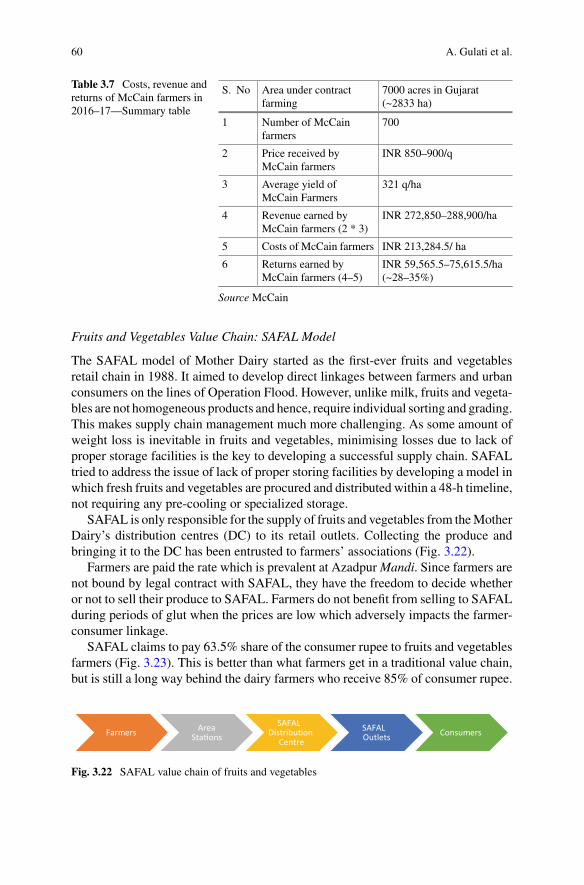
60 A. Gulati et al.
Table 3.7 Costs, revenue andreturns of McCain farmers in2016–17—Summary table
S. No Area under contractfarming
7000 acres in Gujarat(~2833 ha)
1 Number of McCainfarmers
700
2 Price received byMcCain farmers
INR 850–900/q
3 Average yield ofMcCain Farmers
321 q/ha
4 Revenue earned byMcCain farmers (2 * 3)
INR 272,850–288,900/ha
5 Costs of McCain farmers INR 213,284.5/ ha
6 Returns earned byMcCain farmers (4–5)
INR 59,565.5–75,615.5/ha(~28–35%)
Source McCain
Fruits and Vegetables Value Chain: SAFAL Model
The SAFAL model of Mother Dairy started as the first-ever fruits and vegetablesretail chain in 1988. It aimed to develop direct linkages between farmers and urbanconsumers on the lines of Operation Flood. However, unlike milk, fruits and vegeta-bles are not homogeneous products and hence, require individual sorting and grading.This makes supply chain management much more challenging. As some amount ofweight loss is inevitable in fruits and vegetables, minimising losses due to lack ofproper storage facilities is the key to developing a successful supply chain. SAFALtried to address the issue of lack of proper storing facilities by developing a model inwhich fresh fruits and vegetables are procured and distributed within a 48-h timeline,not requiring any pre-cooling or specialized storage.
SAFAL is only responsible for the supply of fruits and vegetables from theMotherDairy’s distribution centres (DC) to its retail outlets. Collecting the produce andbringing it to the DC has been entrusted to farmers’ associations (Fig. 3.22).
Farmers are paid the rate which is prevalent at AzadpurMandi. Since farmers arenot bound by legal contract with SAFAL, they have the freedom to decide whetheror not to sell their produce to SAFAL. Farmers do not benefit from selling to SAFALduring periods of glut when the prices are low which adversely impacts the farmer-consumer linkage.
SAFAL claims to pay 63.5% share of the consumer rupee to fruits and vegetablesfarmers (Fig. 3.23). This is better than what farmers get in a traditional value chain,but is still a long way behind the dairy farmers who receive 85% of consumer rupee.
Farmers Area Sta�ons
SAFAL Distribu�on
CentreSAFAL Outlets Consumers
Fig. 3.22 SAFAL value chain of fruits and vegetables
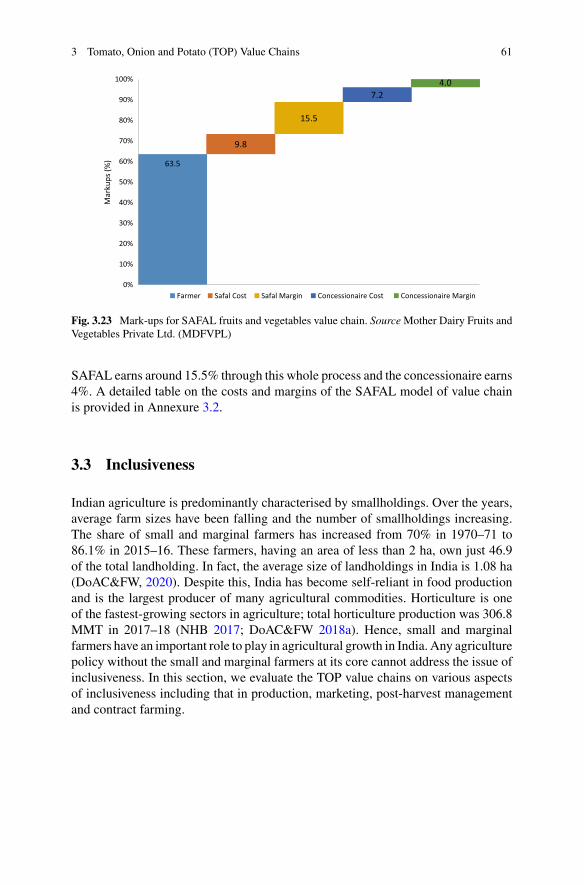
3 Tomato, Onion and Potato (TOP) Value Chains 61
63.5
9.8
15.5
7.24.0
0%
10%
20%
30%
40%
50%
60%
70%
80%
90%
100%
Mar
kups
(%)
Farmer Safal Cost Safal Margin Concessionaire Cost Concessionaire Margin
Fig. 3.23 Mark-ups for SAFAL fruits and vegetables value chain. SourceMother Dairy Fruits andVegetables Private Ltd. (MDFVPL)
SAFAL earns around 15.5% through this whole process and the concessionaire earns4%. A detailed table on the costs and margins of the SAFAL model of value chainis provided in Annexure 3.2.
3.3 Inclusiveness
Indian agriculture is predominantly characterised by smallholdings. Over the years,average farm sizes have been falling and the number of smallholdings increasing.The share of small and marginal farmers has increased from 70% in 1970–71 to86.1% in 2015–16. These farmers, having an area of less than 2 ha, own just 46.9of the total landholding. In fact, the average size of landholdings in India is 1.08 ha(DoAC&FW, 2020). Despite this, India has become self-reliant in food productionand is the largest producer of many agricultural commodities. Horticulture is oneof the fastest-growing sectors in agriculture; total horticulture production was 306.8MMT in 2017–18 (NHB 2017; DoAC&FW 2018a). Hence, small and marginalfarmers have an important role to play in agricultural growth in India. Any agriculturepolicy without the small and marginal farmers at its core cannot address the issue ofinclusiveness. In this section, we evaluate the TOP value chains on various aspectsof inclusiveness including that in production, marketing, post-harvest managementand contract farming.
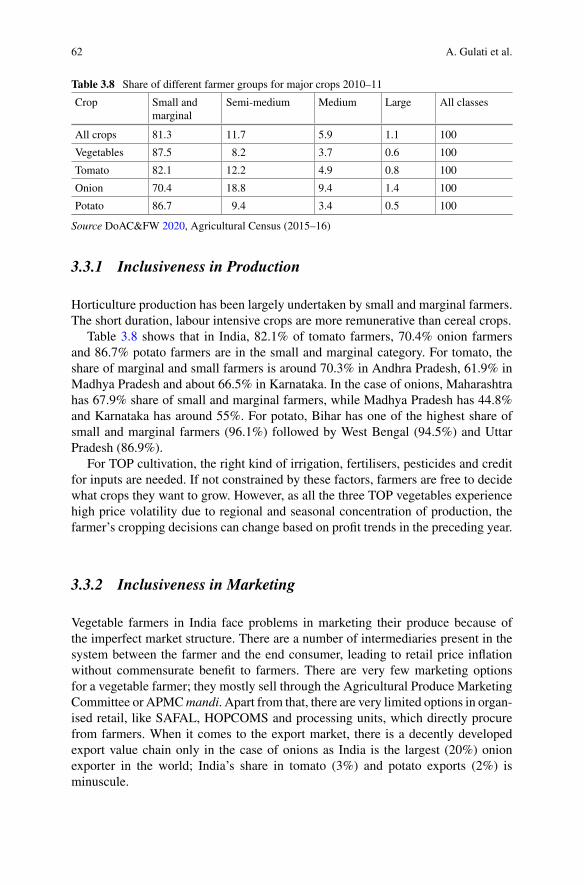
62 A. Gulati et al.
Table 3.8 Share of different farmer groups for major crops 2010–11
Crop Small andmarginal
Semi-medium Medium Large All classes
All crops 81.3 11.7 5.9 1.1 100
Vegetables 87.5 8.2 3.7 0.6 100
Tomato 82.1 12.2 4.9 0.8 100
Onion 70.4 18.8 9.4 1.4 100
Potato 86.7 9.4 3.4 0.5 100
Source DoAC&FW 2020, Agricultural Census (2015–16)
3.3.1 Inclusiveness in Production
Horticulture production has been largely undertaken by small and marginal farmers.The short duration, labour intensive crops are more remunerative than cereal crops.
Table 3.8 shows that in India, 82.1% of tomato farmers, 70.4% onion farmersand 86.7% potato farmers are in the small and marginal category. For tomato, theshare of marginal and small farmers is around 70.3% in Andhra Pradesh, 61.9% inMadhya Pradesh and about 66.5% in Karnataka. In the case of onions, Maharashtrahas 67.9% share of small and marginal farmers, while Madhya Pradesh has 44.8%and Karnataka has around 55%. For potato, Bihar has one of the highest share ofsmall and marginal farmers (96.1%) followed by West Bengal (94.5%) and UttarPradesh (86.9%).
For TOP cultivation, the right kind of irrigation, fertilisers, pesticides and creditfor inputs are needed. If not constrained by these factors, farmers are free to decidewhat crops they want to grow. However, as all the three TOP vegetables experiencehigh price volatility due to regional and seasonal concentration of production, thefarmer’s cropping decisions can change based on profit trends in the preceding year.
3.3.2 Inclusiveness in Marketing
Vegetable farmers in India face problems in marketing their produce because ofthe imperfect market structure. There are a number of intermediaries present in thesystem between the farmer and the end consumer, leading to retail price inflationwithout commensurate benefit to farmers. There are very few marketing optionsfor a vegetable farmer; they mostly sell through the Agricultural Produce MarketingCommittee or APMCmandi. Apart from that, there are very limited options in organ-ised retail, like SAFAL, HOPCOMS and processing units, which directly procurefrom farmers. When it comes to the export market, there is a decently developedexport value chain only in the case of onions as India is the largest (20%) onionexporter in the world; India’s share in tomato (3%) and potato exports (2%) isminuscule.
3 Tomato, Onion and Potato (TOP) Value Chains 63
While some states have taken fruit and vegetable out of APMC Act, some haveonly reduced or abolished the market fee charged. There are also states that havedelisted fruit and vegetable from APMC, but continue charging market fee or cess orservice charge (Chand and Singh 2016). A NITI Aayog report ranked states based onan Agricultural Marketing and Farmer Friendly Reforms Index (AMFFRI), an indexmeasuring the reforms and liberalization of APMC mandis in states. Maharashtra,Gujarat, Rajasthan, Madhya Pradesh and Haryana were the top five states in theimplementation of various reforms, while Puducherry and Delhi were at the bottomtwo. Among the top three potato producing states, Uttar Pradesh ranks a distant 13th,West Bengal ranks 19th and because Bihar repealed the APMCAct it was not part ofthe study. An analysis of marketing reforms undertaken by Uttar Pradesh shows thatthere is no provision for several farmer-friendly reforms in the UP APMCAct, 2003.For instance, there is no provision for farmer-consumer markets, direct marketingand contract farming in the Act. On the contrary, these reforms are provided forand notified in the Gujarat APMC Act. States that have not adopted the reforms yetshould implement these so that farmers are able to reap benefits. The FPTC Act of2020 announced by the Government of India, makes direct selling, bypassing themandi system possible.
In primary APMCmandis like Lasalgaon, Kolar andMahuva, the auction processis between farmer and trader through a commission agent. Upon bringing the produceto the mandi, the farmers participate in an open auction system in which the price oftheir produce is determined on the spot. After the auction, each farmer gets a receiptin which the farmer’s details, total amount sold and price received are entered anda similar slip is given to the trader. Farmers are paid either through cash, cheque orNEFT, mostly on the same day or within a few days.
As the auction process is open and any farmer can take part in the trading process,APMC mandis are inclusive. The user charge collected by the mandi is the solesource of income for APMC. Some of the mandis like one in Mahuva, Gujarat,introduced farmer-centric schemes and help farmers financially for fencing, irriga-tion and insurance, making the whole process more inclusive. With AgriculturalProduce Marketing Committees (APMCs) enjoying a monopoly due to lack of othermarketing channels, thewhole auctioning procedure is controlled by powerful tradersand commission agents; farmers have virtually no bargaining power. Layers ofmandifees and commission charges are added, increasing prices without any value addi-tion or benefit to farmers (Fig. 3.24). Our field visits to major mandis (Azadpur,Lasalgaon, Pimpalgaon, and Kolar) revealed that actual commissions charged areway above the prescribed charges. Although, officially these charges are levied onbuyers, the ultimate burden of commission falls on the farmers.
Central government through NAFED and state governments procure onion andpotatoes or give subsidy to the farmers. However, all farmers are not part of suchschemes as there is a lot of paper work involved and the volume of procurement isoften inadequate to cover all eligible farmers.
For onions, Lasalgaon and Pimpalgaon are the two largest mandis in India andonions from here are supplied to all parts of the country. Hence, the prices determinedhere has a cascading effect on onion prices in other markets across the country.AlthoughAPMCshaveprovision for transparent auctionprocess, it iswell known that
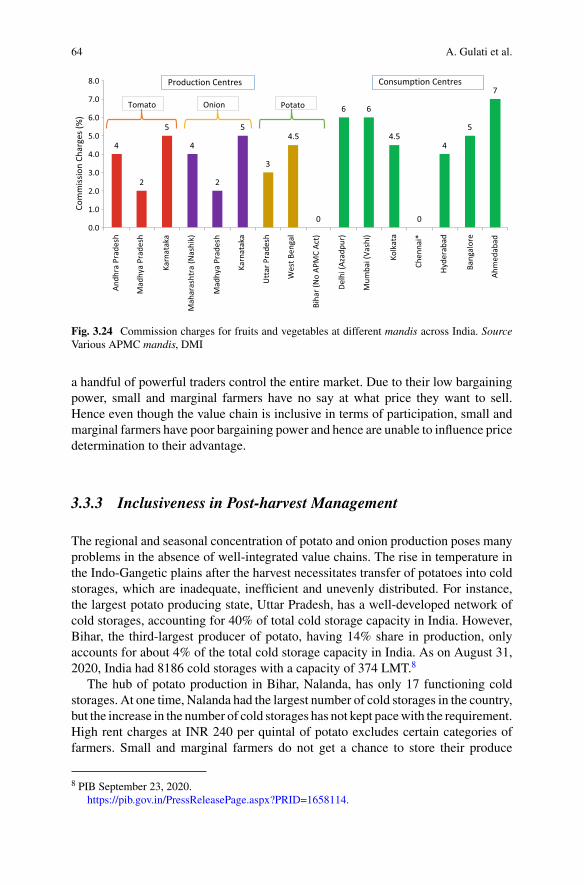
64 A. Gulati et al.
4
2
5
4
2
5
3
4.5
0
6 6
4.5
0
4
5
7
0.0
1.0
2.0
3.0
4.0
5.0
6.0
7.0
8.0Co
mm
issio
n Ch
arge
s (%
)
Tomato Onion
Production Centres Consumption Centres
PotatoAn
dhra
Pra
desh
Mad
hya
Prad
esh
Karn
atak
a
Mah
aras
htra
(Nas
hik)
Mad
hya
Prad
esh
Karn
atak
a
Utt
ar P
rade
sh
Wes
t Ben
gal
Biha
r (N
o AP
MC
Act)
Delh
i (Az
adpu
r)
Mum
bai (
Vash
i)
Kolk
ata
Chen
nai*
Hyde
raba
d
Bang
alor
e
Ahm
edab
ad
Fig. 3.24 Commission charges for fruits and vegetables at different mandis across India. SourceVarious APMC mandis, DMI
a handful of powerful traders control the entire market. Due to their low bargainingpower, small and marginal farmers have no say at what price they want to sell.Hence even though the value chain is inclusive in terms of participation, small andmarginal farmers have poor bargaining power and hence are unable to influence pricedetermination to their advantage.
3.3.3 Inclusiveness in Post-harvest Management
The regional and seasonal concentration of potato and onion production poses manyproblems in the absence of well-integrated value chains. The rise in temperature inthe Indo-Gangetic plains after the harvest necessitates transfer of potatoes into coldstorages, which are inadequate, inefficient and unevenly distributed. For instance,the largest potato producing state, Uttar Pradesh, has a well-developed network ofcold storages, accounting for 40% of total cold storage capacity in India. However,Bihar, the third-largest producer of potato, having 14% share in production, onlyaccounts for about 4% of the total cold storage capacity in India. As on August 31,2020, India had 8186 cold storages with a capacity of 374 LMT.8
The hub of potato production in Bihar, Nalanda, has only 17 functioning coldstorages. At one time, Nalanda had the largest number of cold storages in the country,but the increase in the number of cold storages has not kept pacewith the requirement.High rent charges at INR 240 per quintal of potato excludes certain categories offarmers. Small and marginal farmers do not get a chance to store their produce
8 PIB September 23, 2020.https://pib.gov.in/PressReleasePage.aspx?PRID=1658114.
3 Tomato, Onion and Potato (TOP) Value Chains 65
in cold storages as large traders or farmers pre-book their space in advance in thelimited number of cold storages available. This questions the inclusivity of farmersin post-harvest management.
Due to lack of storage facilities, high rent of existing cold storages, and the lack ofaccess to cold storages for small and marginal farmers, a large part of their produceis just sold right after harvest. Hence, there is not only a need for more cold storagesin the country but also efforts need to be made to make these cold storages moreaffordable and accessible to small and marginal farmers.
3.3.4 Inclusiveness in Contract Farming
In India, theModel APMCAct, 2003 andModel Contract FarmingAct, 2018 providefor contract farming after which a majority of states amended their APMC Act tomake a provision for contract farming. However, only 14 states have notified therules till date. The more recent ‘Farmers (Empowerment and Protection) Agreementon Price Assurance and Farm Services’ or the FAPAFS Act9 enacted by the Parlia-ment in September 2020 is another attempt by the government to legalize contractfarming. TheAct attempts at putting out a national framework for contract farming forfarm services and sale of farming produce between farmers and agri-business firms,processors, wholesalers, exporters or large retailers at mutually agreed remunerativeprices.
Contract farming is an alternative marketing arrangement that not only insulatesfarmers from risk, but also encourages innovation and technology adoption amongfarmers. Although there exists contract farming in fruits and vegetables, there isscope for further expansion.
McCain Foods Ltd is engaged in contract farming of potato in three districtsof Gujarat (Banaskantha, Sabarkantha and Mehsana). All input costs are borne byfarmers themselves and there are strict quality norms that farmers have to adhere to.In case of non-adherence to company guidelines or low quality of the produce, theprice paid to the farmer is reduced. In case the farmer does not deliver the promisedcrop, the farmer is blacklisted and cannot enter into future contracts with the firm.
McCain’s contract farming model gives better returns to the farmers compared towhat the traditional farmers receive, in the form of assured income especially in timesof glut. However, McCain plans to focus on improving yield through mechanizationand economizing on supervision costs. In 2017–18, they had planned to engage 600farmers, eventually bringing down their engagement to 500 farmers in the next fewyears. Therefore, the McCain model, though financially profitable for farmers, is notas inclusive. However, it is a good example of the success of the contract farmingmodel in providing an assured income to farmers.
PepsiCo’s Frito Lay is a popular example of inclusive contract farming model,where a large MNC has engaged with the smallest of potato farmers in West
9 http://egazette.nic.in/WriteReadData/2020/222040.pdf.
66 A. Gulati et al.
Bengal and other states. PepsiCo’s 360-degree farmer connect program has trans-formed the lives of small and marginal farmers across India. The program includesassured buy back, supply of high-quality seeds, advanced technical know-how, loansthrough SBI and insurance facilities from leading insurance companies. PepsiCo hasbeen engaging with Indian farmers since 2004–05 to produce processing variety ofpotatoes. Around 45% of these farmers across West Bengal, Maharashtra, Punjab,Gujarat, UP, Karnataka, Bihar, Haryana and Chhattisgarh are small and marginal.However, a few case studies (Kaur 2014; Dutta et al. 2016) conducted on PepsiCosuggest that marginal farmers are not preferred by the firm for contract farming. Eventhe participation of small farmers is less as compared to the semi-medium, mediumand large farmers. As a rule, only farmerswith 5 acres, of land ormore can be engagedas contract farmers, which excludes marginal farmers. The contracting player prefersto procure through aggregates rather than dealing with individual farmers.
Jain Irrigation Systems Ltd (JISL) entered into a contract with farmers in andaround Jalgaon, one of the major white onion growing regions of Maharashtra fortheir onion processing business. The company provides high yielding variety ofwhite onion seeds at subsidised rates to farmers. The company also takes care ofthe technological requirements of farmers like drip irrigation systems. Farmers alsobenefit from the extension services of the company, which are aimed to ensure thatthe produce meets specified quality standard. A case study by the FAO has shownthat the services provided by JISL to its contract farmers also contribute to mitigatingthe various risks faced by onion growers (Punjabi & Mukherjee 2015). The studyhas compared farmers associated with traditional value chain and those working withJISL on various parameters and concluded that contract farmers in JISL benefit fromhigher margins due to higher productivity and lower price risk due to the minimumguaranteed price. Because of these benefits, small and marginal farmers have anincentive to join the supply chain. JISL works with farmers on both ends of the valuechain providing themwith inputs like fertilisers, seeds, micro irrigation systems, andextension services, and finally purchasing their raw produce for processing.
Although contract farming has many benefits as farmers are able to access tech-nology, credit, marketing channels and information with low transaction costs, thereis a preference for large and medium farmers over small farmers, who have higheraccess to capital and greater risk taking ability. Technology adoption is easier forlarge farmers. As some of the requirements of contract farming makes the participa-tion of small and marginal farmers difficult, such impediments can be overcome byorganizing them into collectives like FPOs.
3.4 Sustainability
The consumption of fruits and vegetables has increased rapidly over the years inIndia. According to the 68th round of NSSO survey, monthly per capita consumptionof tomato, onion and potato has increased by 74%, 50% and 48%, respectively inrural areas and by 52%, 32% and 41%, respectively in urban areas between 2004–05and 2011–12. During 2011–12, NSSO reported monthly per capita consumption of
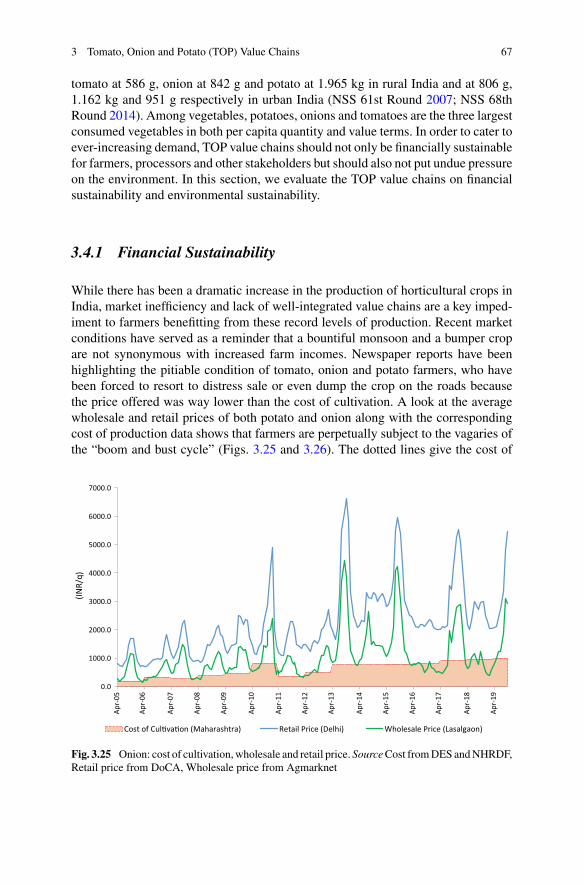
3 Tomato, Onion and Potato (TOP) Value Chains 67
tomato at 586 g, onion at 842 g and potato at 1.965 kg in rural India and at 806 g,1.162 kg and 951 g respectively in urban India (NSS 61st Round 2007; NSS 68thRound 2014). Among vegetables, potatoes, onions and tomatoes are the three largestconsumed vegetables in both per capita quantity and value terms. In order to cater toever-increasing demand, TOP value chains should not only be financially sustainablefor farmers, processors and other stakeholders but should also not put undue pressureon the environment. In this section, we evaluate the TOP value chains on financialsustainability and environmental sustainability.
3.4.1 Financial Sustainability
While there has been a dramatic increase in the production of horticultural crops inIndia, market inefficiency and lack of well-integrated value chains are a key imped-iment to farmers benefitting from these record levels of production. Recent marketconditions have served as a reminder that a bountiful monsoon and a bumper cropare not synonymous with increased farm incomes. Newspaper reports have beenhighlighting the pitiable condition of tomato, onion and potato farmers, who havebeen forced to resort to distress sale or even dump the crop on the roads becausethe price offered was way lower than the cost of cultivation. A look at the averagewholesale and retail prices of both potato and onion along with the correspondingcost of production data shows that farmers are perpetually subject to the vagaries ofthe “boom and bust cycle” (Figs. 3.25 and 3.26). The dotted lines give the cost of
0.0
1000.0
2000.0
3000.0
4000.0
5000.0
6000.0
7000.0
(INR/
q)
Cost of Cul�va�on (Maharashtra) Retail Price (Delhi) Wholesale Price (Lasalgaon)
Apr-
05
Apr-
06
Apr-
07
Apr-
08
Apr-
09
Apr-
10
Apr-
11
Apr-
12
Apr-
13
Apr-
14
Apr-
15
Apr-
16
Apr-
17
Apr-
18
Apr-
19
Fig. 3.25 Onion: cost of cultivation,wholesale and retail price. SourceCost fromDES andNHRDF,Retail price from DoCA, Wholesale price from Agmarknet
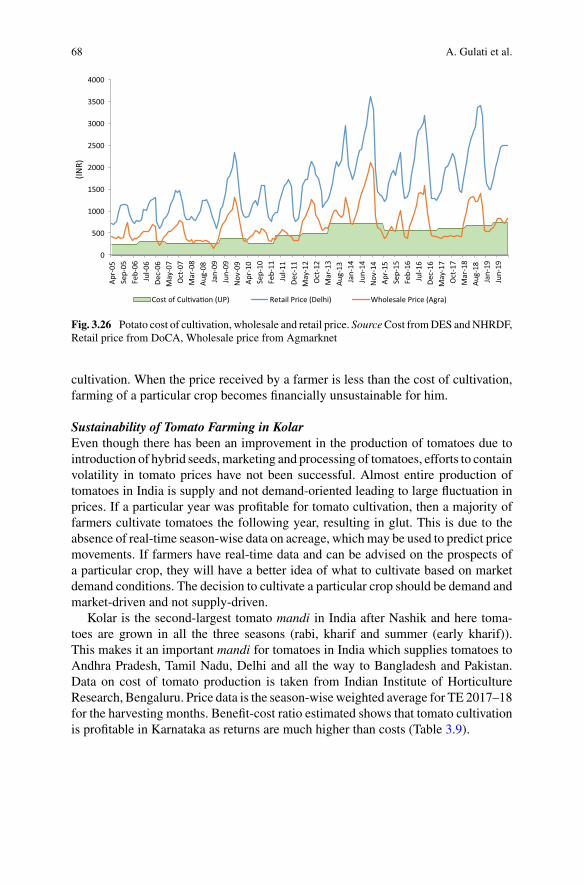
68 A. Gulati et al.
0
500
1000
1500
2000
2500
3000
3500
4000
Apr-
05Se
p-05
Feb-
06Ju
l-06
Dec-
06M
ay-0
7O
ct-0
7M
ar-0
8Au
g-08
Jan-
09Ju
n-09
Nov
-09
Apr-
10Se
p-10
Feb-
11Ju
l-11
Dec-
11M
ay-1
2O
ct-1
2M
ar-1
3Au
g-13
Jan-
14Ju
n-14
Nov
-14
Apr-
15Se
p-15
Feb-
16Ju
l-16
Dec-
16M
ay-1
7O
ct-1
7M
ar-1
8Au
g-18
Jan-
19Ju
n-19
(INR)
Cost of Cul�va�on (UP) Retail Price (Delhi) Wholesale Price (Agra)
Fig. 3.26 Potato cost of cultivation, wholesale and retail price. SourceCost fromDES andNHRDF,Retail price from DoCA, Wholesale price from Agmarknet
cultivation. When the price received by a farmer is less than the cost of cultivation,farming of a particular crop becomes financially unsustainable for him.
Sustainability of Tomato Farming in KolarEven though there has been an improvement in the production of tomatoes due tointroduction of hybrid seeds,marketing and processing of tomatoes, efforts to containvolatility in tomato prices have not been successful. Almost entire production oftomatoes in India is supply and not demand-oriented leading to large fluctuation inprices. If a particular year was profitable for tomato cultivation, then a majority offarmers cultivate tomatoes the following year, resulting in glut. This is due to theabsence of real-time season-wise data on acreage, whichmay be used to predict pricemovements. If farmers have real-time data and can be advised on the prospects ofa particular crop, they will have a better idea of what to cultivate based on marketdemand conditions. The decision to cultivate a particular crop should be demand andmarket-driven and not supply-driven.
Kolar is the second-largest tomato mandi in India after Nashik and here toma-toes are grown in all the three seasons (rabi, kharif and summer (early kharif)).This makes it an important mandi for tomatoes in India which supplies tomatoes toAndhra Pradesh, Tamil Nadu, Delhi and all the way to Bangladesh and Pakistan.Data on cost of tomato production is taken from Indian Institute of HorticultureResearch, Bengaluru. Price data is the season-wise weighted average for TE 2017–18for the harvesting months. Benefit-cost ratio estimated shows that tomato cultivationis profitable in Karnataka as returns are much higher than costs (Table 3.9).
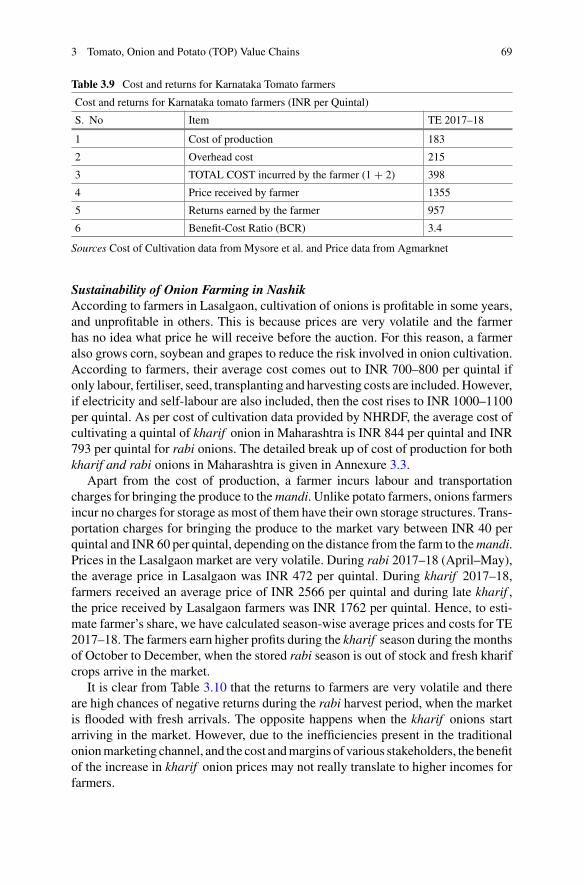
3 Tomato, Onion and Potato (TOP) Value Chains 69
Table 3.9 Cost and returns for Karnataka Tomato farmers
Cost and returns for Karnataka tomato farmers (INR per Quintal)
S. No Item TE 2017–18
1 Cost of production 183
2 Overhead cost 215
3 TOTAL COST incurred by the farmer (1 + 2) 398
4 Price received by farmer 1355
5 Returns earned by the farmer 957
6 Benefit-Cost Ratio (BCR) 3.4
Sources Cost of Cultivation data from Mysore et al. and Price data from Agmarknet
Sustainability of Onion Farming in NashikAccording to farmers in Lasalgaon, cultivation of onions is profitable in some years,and unprofitable in others. This is because prices are very volatile and the farmerhas no idea what price he will receive before the auction. For this reason, a farmeralso grows corn, soybean and grapes to reduce the risk involved in onion cultivation.According to farmers, their average cost comes out to INR 700–800 per quintal ifonly labour, fertiliser, seed, transplanting and harvesting costs are included.However,if electricity and self-labour are also included, then the cost rises to INR 1000–1100per quintal. As per cost of cultivation data provided by NHRDF, the average cost ofcultivating a quintal of kharif onion in Maharashtra is INR 844 per quintal and INR793 per quintal for rabi onions. The detailed break up of cost of production for bothkharif and rabi onions in Maharashtra is given in Annexure 3.3.
Apart from the cost of production, a farmer incurs labour and transportationcharges for bringing the produce to themandi. Unlike potato farmers, onions farmersincur no charges for storage as most of them have their own storage structures. Trans-portation charges for bringing the produce to the market vary between INR 40 perquintal and INR 60 per quintal, depending on the distance from the farm to themandi.Prices in the Lasalgaon market are very volatile. During rabi 2017–18 (April–May),the average price in Lasalgaon was INR 472 per quintal. During kharif 2017–18,farmers received an average price of INR 2566 per quintal and during late kharif ,the price received by Lasalgaon farmers was INR 1762 per quintal. Hence, to esti-mate farmer’s share, we have calculated season-wise average prices and costs for TE2017–18. The farmers earn higher profits during the kharif season during the monthsof October to December, when the stored rabi season is out of stock and fresh kharifcrops arrive in the market.
It is clear from Table 3.10 that the returns to farmers are very volatile and thereare high chances of negative returns during the rabi harvest period, when the marketis flooded with fresh arrivals. The opposite happens when the kharif onions startarriving in the market. However, due to the inefficiencies present in the traditionalonionmarketing channel, and the cost andmargins of various stakeholders, the benefitof the increase in kharif onion prices may not really translate to higher incomes forfarmers.
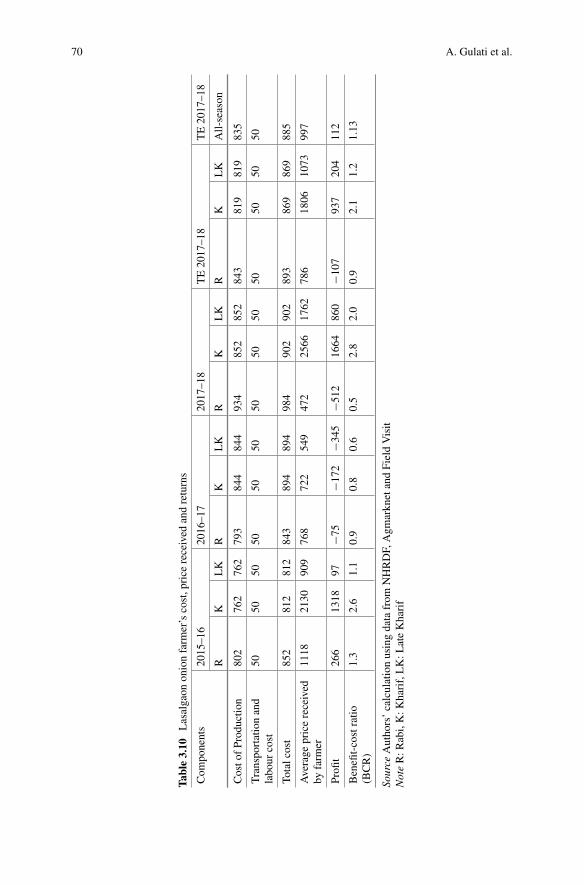
70 A. Gulati et al.
Table3.10
Lasalgaon
onionfarm
er’scost,price
received
andreturns
Com
ponents
2015–16
2016–17
2017–18
TE2017–18
TE2017–18
RK
LK
RK
LK
RK
LK
RK
LK
All-season
Costo
fProductio
n802
762
762
793
844
844
934
852
852
843
819
819
835
Transportationand
labour
cost
5050
5050
5050
5050
5050
5050
50
Totalcost
852
812
812
843
894
894
984
902
902
893
869
869
885
Average
pricereceived
byfarm
er1118
2130
909
768
722
549
472
2566
1762
786
1806
1073
997
Profi
t266
1318
97−7
5−1
72−3
45−5
121664
860
−107
937
204
112
Benefi
t-costratio
(BCR)
1.3
2.6
1.1
0.9
0.8
0.6
0.5
2.8
2.0
0.9
2.1
1.2
1.13
Source
Authors’calculationusingdatafrom
NHRDF,Agm
arknetandFieldVisit
NoteR:R
abi,K:K
harif,LK:L
ateKharif
3 Tomato, Onion and Potato (TOP) Value Chains 71
Sustainability of Onion Dehydration Industry in MahuvaMahuva, a small coastal town inBhavnagar district, around 265 km fromAhmedabadis the largest onion dehydration hub in India. Mahuva has around 130 dehydrationplants (110 in Mahuva and the rest around Mahuva) engaged in processing onions,garlic and other vegetables. However, onion dehydration is the main money-spinnerfor these plants as it accounts for 90% of the revenue. Mahuva is also the largestwhite onion growing region in India.
Since the middle of 2000s, Mahuva became the hub of dehydration industry inIndia. The industry flourished in Mahuva because of support from the state govern-ment in terms of their industrial policy, easier process for setting up industries andsubsidies and grants provided by the state government to agro-based industries inGujarat.
The minimum capacity is 6 tonnes per day per plant in Mahuva and the averageranges between 7 and 8 tonnes per day. This capacity is way below the capacityof Jain irrigation (JISL), which is the largest dehydration plant in India. The totalcapacity of all Mahuva units is around 1.25 lakh tonnes annually and the total valueof dehydrated onion is around INR (750–800) crore. Despite so much potential, thedomestic market for dehydrated onion in India is negligible. With 85% of productionexported, the industry caters mainly to overseas markets, primarily Europe, Russia,Africa and Middle East countries. Yet, it faces challenges on many fronts due toinefficient trade policies of both the Indian government as well as governments ofimporting countries. Lack of awareness about dehydrated onions among domesticconsumers has restricted domestic demand. Another challenge the industry facesis excess supply, resulting in low prices of the finished product. All these factorsthreaten the sustainability of dehydrated onion business. According to some mediareports10 and field visit to Mahuva, a majority of the dehydration plants are on theverge of closure. Even when the quality of the finished product is good, prices are notcompetitive and the benefit of dehydrated onions is going to foreigners. TheMinistryof Commerce and Industry had reduced transport assistance under the MEIS schemefrom 7% to 3%. This illustrates the unsustainability of dehydration units which havebeen driven by government subsidies and not actual demand of dehydrated onions.
Sustainability of Potato Farming in AgraIn TE 2014–15, 1.48 million tonnes of potato were produced in Agra. It is a majorhub from where potatoes are sent to markets across India, especially to Maharashtraand the southern states like Telangana, Andhra Pradesh, Tamil Nadu and Karnataka.Owing to a well-developed network of cold storages, almost 90% of the potatoproduced in Agra is stored in cold storages and the rest is sold immediately afterharvest. The farmers store their potatoes in cold storages by the end of March. Thecold storage effectively plays the role of the marketplace, where traders from UttarPradesh and other states converge to buy potatoes and then sell to wholesalers in
10 http://www.fnbnews.com/Fruits-Vegetable/gujarat-onion-dehydration-units-on-verge-of-closure-due-to-price-hike-41944.
http://knnindia.co.in/news/newsdetails/sectors/onion-dehydration-units-in-gujarat-are-at-dying-stage-due-to-rise-in-unsold-stocks.
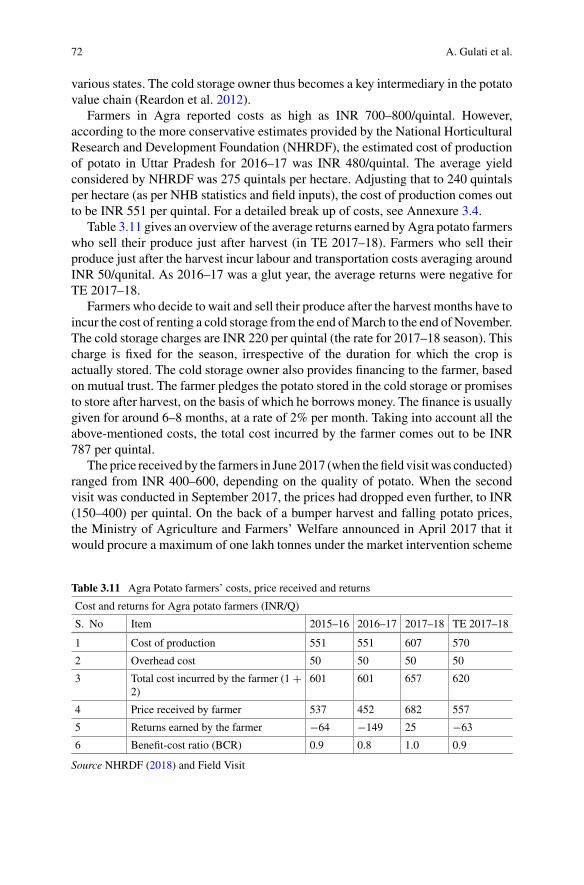
72 A. Gulati et al.
various states. The cold storage owner thus becomes a key intermediary in the potatovalue chain (Reardon et al. 2012).
Farmers in Agra reported costs as high as INR 700–800/quintal. However,according to the more conservative estimates provided by the National HorticulturalResearch and Development Foundation (NHRDF), the estimated cost of productionof potato in Uttar Pradesh for 2016–17 was INR 480/quintal. The average yieldconsidered by NHRDF was 275 quintals per hectare. Adjusting that to 240 quintalsper hectare (as per NHB statistics and field inputs), the cost of production comes outto be INR 551 per quintal. For a detailed break up of costs, see Annexure 3.4.
Table 3.11 gives an overview of the average returns earned byAgra potato farmerswho sell their produce just after harvest (in TE 2017–18). Farmers who sell theirproduce just after the harvest incur labour and transportation costs averaging aroundINR 50/qunital. As 2016–17 was a glut year, the average returns were negative forTE 2017–18.
Farmers who decide to wait and sell their produce after the harvest months have toincur the cost of renting a cold storage from the end ofMarch to the end of November.The cold storage charges are INR 220 per quintal (the rate for 2017–18 season). Thischarge is fixed for the season, irrespective of the duration for which the crop isactually stored. The cold storage owner also provides financing to the farmer, basedon mutual trust. The farmer pledges the potato stored in the cold storage or promisesto store after harvest, on the basis of which he borrows money. The finance is usuallygiven for around 6–8 months, at a rate of 2% per month. Taking into account all theabove-mentioned costs, the total cost incurred by the farmer comes out to be INR787 per quintal.
The price received by the farmers in June 2017 (when thefield visitwas conducted)ranged from INR 400–600, depending on the quality of potato. When the secondvisit was conducted in September 2017, the prices had dropped even further, to INR(150–400) per quintal. On the back of a bumper harvest and falling potato prices,the Ministry of Agriculture and Farmers’ Welfare announced in April 2017 that itwould procure a maximum of one lakh tonnes under the market intervention scheme
Table 3.11 Agra Potato farmers’ costs, price received and returns
Cost and returns for Agra potato farmers (INR/Q)
S. No Item 2015–16 2016–17 2017–18 TE 2017–18
1 Cost of production 551 551 607 570
2 Overhead cost 50 50 50 50
3 Total cost incurred by the farmer (1 +2)
601 601 657 620
4 Price received by farmer 537 452 682 557
5 Returns earned by the farmer −64 −149 25 −63
6 Benefit-cost ratio (BCR) 0.9 0.8 1.0 0.9
Source NHRDF (2018) and Field Visit
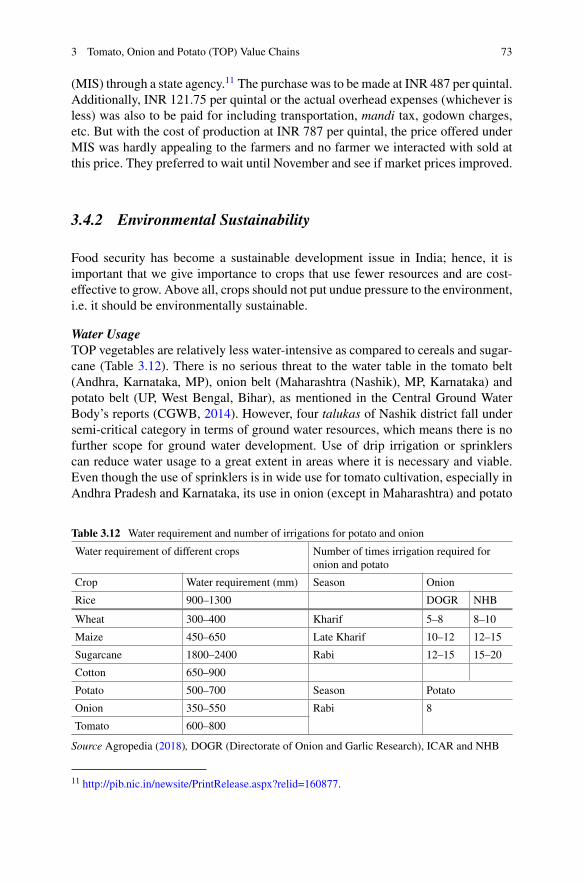
3 Tomato, Onion and Potato (TOP) Value Chains 73
(MIS) through a state agency.11 The purchase was to be made at INR 487 per quintal.Additionally, INR 121.75 per quintal or the actual overhead expenses (whichever isless) was also to be paid for including transportation, mandi tax, godown charges,etc. But with the cost of production at INR 787 per quintal, the price offered underMIS was hardly appealing to the farmers and no farmer we interacted with sold atthis price. They preferred to wait until November and see if market prices improved.
3.4.2 Environmental Sustainability
Food security has become a sustainable development issue in India; hence, it isimportant that we give importance to crops that use fewer resources and are cost-effective to grow. Above all, crops should not put undue pressure to the environment,i.e. it should be environmentally sustainable.
Water UsageTOP vegetables are relatively less water-intensive as compared to cereals and sugar-cane (Table 3.12). There is no serious threat to the water table in the tomato belt(Andhra, Karnataka, MP), onion belt (Maharashtra (Nashik), MP, Karnataka) andpotato belt (UP, West Bengal, Bihar), as mentioned in the Central Ground WaterBody’s reports (CGWB, 2014). However, four talukas of Nashik district fall undersemi-critical category in terms of ground water resources, which means there is nofurther scope for ground water development. Use of drip irrigation or sprinklerscan reduce water usage to a great extent in areas where it is necessary and viable.Even though the use of sprinklers is in wide use for tomato cultivation, especially inAndhra Pradesh and Karnataka, its use in onion (except in Maharashtra) and potato
Table 3.12 Water requirement and number of irrigations for potato and onion
Water requirement of different crops Number of times irrigation required foronion and potato
Crop Water requirement (mm) Season Onion
Rice 900–1300 DOGR NHB
Wheat 300–400 Kharif 5–8 8–10
Maize 450–650 Late Kharif 10–12 12–15
Sugarcane 1800–2400 Rabi 12–15 15–20
Cotton 650–900
Potato 500–700 Season Potato
Onion 350–550 Rabi 8
Tomato 600–800
Source Agropedia (2018), DOGR (Directorate of Onion and Garlic Research), ICAR and NHB
11 http://pib.nic.in/newsite/PrintRelease.aspx?relid=160877.
74 A. Gulati et al.
cultivation is limited. The Central Ground Water Board in its report on Aquifer Mapand Ground Water Management Plan (CGWB, 2018) states that micro irrigationtechniques in the cropped area under onion have the potential to save water at 0.26 mper km2. Traditional cultivation practices including flood irrigation are not sustain-able and should be replaced by micro irrigation systems. Contract farmers engagedwith private companies like McCain, PepsiCo and Jain Irrigation have been able toimprove productivity by using micro irrigation system. All the farmers working withMcCain have either drip or sprinkler irrigation systems installed in their fields. This isa mandatory condition imposed by the company. This bodes well for environmentalsustainability as these micro irrigation methods economize on water use by gener-ating savings of (30–50)% and facilitate 25% savings on fertilisers (ICAR-CentralPotato Research Institute 2015). If micro irrigation is adopted by traditional farmersas well, it will not only be beneficial for them but will save a lot of water.
Another important issue is that of ‘virtual trade of water’, which refers to theimport and export of hidden water in the form of commodities. India is a net exporterof water with food grains accounting for most of its export. India’s major exports arerice, cotton, sugar and soybean, all of which are water-intensive crops. China, on theother hand, is a net importer of water as it imports water-intensive soybeans, cotton,meat and cereals and exports fruits and vegetables, and processed food. Promotingthe cultivation of vegetables, which are not water-intensive, will go a long way inpromoting sustainable use of water in Indian agriculture.
Fertilisers and PesticidesSustainable agriculture practices minimize agricultural inputs while increasingproductivity and profitability. Research institutes for tomatoes, onions and potatoes(IIHR, DOGR, NHRDF and CPRI) have recommended balanced and sustainable useof fertilizer and pesticides. However, farmers often use excessive amounts of fertil-izer and pesticides in the hope of greater returns, resulting in high pesticide residuesin the product. In general, TOP crops do require manure and fertiliser, but the quan-tity depends on the variety, soil type, region, season, etc. Onions that yield 300 q/haremoves 73 kg nitrogen, 36 kg phosphorus and 68 kg potassium. Potatoes requirehigher amounts of fertilizer than onion—120–150 kg N, 45 kg P205 and 100 kg K2Oper hectare (NHRDF). Fertilizer and pesticide use in excess of recommended levelsis a risk to the environment. In fact, organic vegetable farming with multi-croppingand the use of vermicompost should be encouraged.
Organic Waste Disposal MechanismAccording to a report by ICAR-CIPHET, the overall harvest and post-harvest lossesin the case of potato ranged from (5 to 8)% and for onions from 5.49% in Gujaratto 12.72% in Maharashtra and other western hilly and plateau regions. The nationallevel average was reported to be 6.05%. The report further states that the storageloss has reduced considerably owing to the development of cold storage networks,most of which are used for storing potatoes (ICAR-CIPHET 2015). However, otherstudies consider the ICAR-CIPHET estimate to be an underestimate. According to
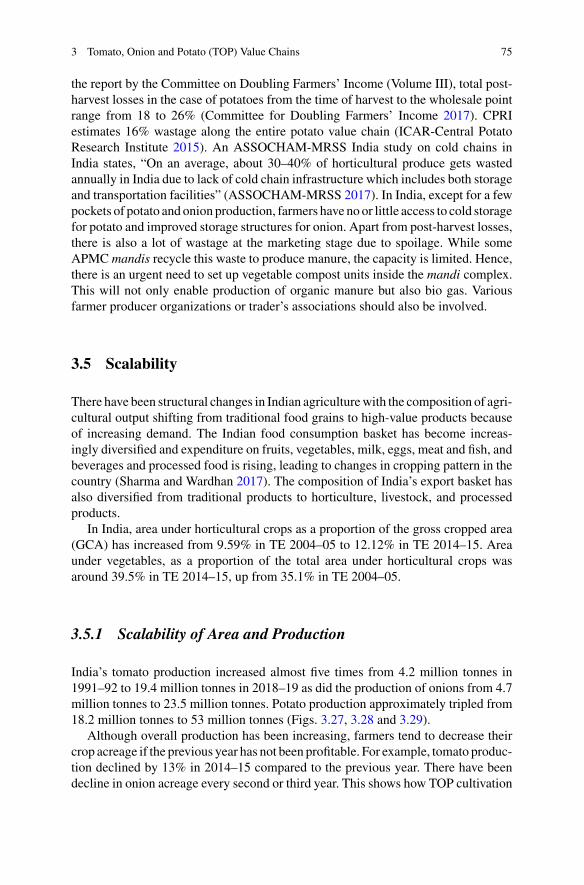
3 Tomato, Onion and Potato (TOP) Value Chains 75
the report by the Committee on Doubling Farmers’ Income (Volume III), total post-harvest losses in the case of potatoes from the time of harvest to the wholesale pointrange from 18 to 26% (Committee for Doubling Farmers’ Income 2017). CPRIestimates 16% wastage along the entire potato value chain (ICAR-Central PotatoResearch Institute 2015). An ASSOCHAM-MRSS India study on cold chains inIndia states, “On an average, about 30–40% of horticultural produce gets wastedannually in India due to lack of cold chain infrastructure which includes both storageand transportation facilities” (ASSOCHAM-MRSS 2017). In India, except for a fewpockets of potato and onion production, farmers have no or little access to cold storagefor potato and improved storage structures for onion. Apart from post-harvest losses,there is also a lot of wastage at the marketing stage due to spoilage. While someAPMC mandis recycle this waste to produce manure, the capacity is limited. Hence,there is an urgent need to set up vegetable compost units inside the mandi complex.This will not only enable production of organic manure but also bio gas. Variousfarmer producer organizations or trader’s associations should also be involved.
3.5 Scalability
There have been structural changes in Indian agriculturewith the composition of agri-cultural output shifting from traditional food grains to high-value products becauseof increasing demand. The Indian food consumption basket has become increas-ingly diversified and expenditure on fruits, vegetables, milk, eggs, meat and fish, andbeverages and processed food is rising, leading to changes in cropping pattern in thecountry (Sharma and Wardhan 2017). The composition of India’s export basket hasalso diversified from traditional products to horticulture, livestock, and processedproducts.
In India, area under horticultural crops as a proportion of the gross cropped area(GCA) has increased from 9.59% in TE 2004–05 to 12.12% in TE 2014–15. Areaunder vegetables, as a proportion of the total area under horticultural crops wasaround 39.5% in TE 2014–15, up from 35.1% in TE 2004–05.
3.5.1 Scalability of Area and Production
India’s tomato production increased almost five times from 4.2 million tonnes in1991–92 to 19.4 million tonnes in 2018–19 as did the production of onions from 4.7million tonnes to 23.5 million tonnes. Potato production approximately tripled from18.2 million tonnes to 53 million tonnes (Figs. 3.27, 3.28 and 3.29).
Although overall production has been increasing, farmers tend to decrease theircrop acreage if the previous year has not been profitable. For example, tomato produc-tion declined by 13% in 2014–15 compared to the previous year. There have beendecline in onion acreage every second or third year. This shows how TOP cultivation
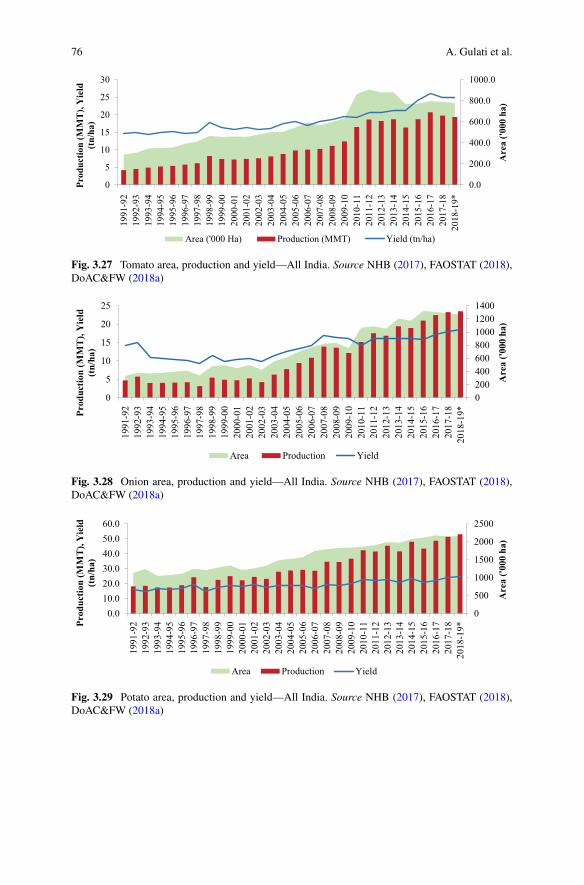
76 A. Gulati et al.
0.0
200.0
400.0
600.0
800.0
1000.0
0
5
10
15
20
25
30
1991
-92
1992
-93
1993
-94
1994
-95
1995
-96
1996
-97
1997
-98
1998
-99
1999
-00
2000
-01
2001
-02
2002
-03
2003
-04
2004
-05
2005
-06
2006
-07
2007
-08
2008
-09
2009
-10
2010
-11
2011
-12
2012
-13
2013
-14
2014
-15
2015
-16
2016
-17
2017
-18
2018
-19*
Are
a ('0
00 h
a)
Prod
uctio
n (M
MT
), Y
ield
(tn
/ha)
Area ('000 Ha) Production (MMT) Yield (tn/ha)
Fig. 3.27 Tomato area, production and yield—All India. Source NHB (2017), FAOSTAT (2018),DoAC&FW (2018a)
0200400600800100012001400
0
5
10
15
20
25
1991
-92
1992
-93
1993
-94
1994
-95
1995
-96
1996
-97
1997
-98
1998
-99
1999
-00
2000
-01
2001
-02
2002
-03
2003
-04
2004
-05
2005
-06
2006
-07
2007
-08
2008
-09
2009
-10
2010
-11
2011
-12
2012
-13
2013
-14
2014
-15
2015
-16
2016
-17
2017
-18
2018
-19*
Are
a ('0
00 h
a)
Prod
uctio
n (M
MT
), Y
ield
(tn
/ha)
Area Production Yield
Fig. 3.28 Onion area, production and yield—All India. Source NHB (2017), FAOSTAT (2018),DoAC&FW (2018a)
0
500
1000
1500
2000
2500
0.010.020.030.040.050.060.0
1991
-92
1992
-93
1993
-94
1994
-95
1995
-96
1996
-97
1997
-98
1998
-99
1999
-00
2000
-01
2001
-02
2002
-03
2003
-04
2004
-05
2005
-06
2006
-07
2007
-08
2008
-09
2009
-10
2010
-11
2011
-12
2012
-13
2013
-14
2014
-15
2015
-16
2016
-17
2017
-18
2018
-19*
Are
a ('0
00 h
a)
Prod
uctio
n (M
MT)
, Yie
ld
(tn/
ha)
Area Production Yield
Fig. 3.29 Potato area, production and yield—All India. Source NHB (2017), FAOSTAT (2018),DoAC&FW (2018a)
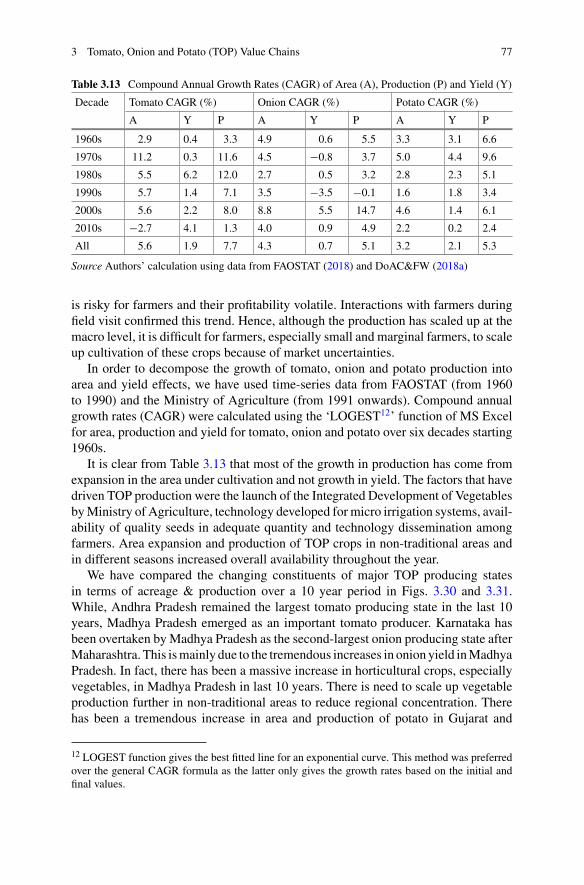
3 Tomato, Onion and Potato (TOP) Value Chains 77
Table 3.13 Compound Annual Growth Rates (CAGR) of Area (A), Production (P) and Yield (Y)
Decade Tomato CAGR (%) Onion CAGR (%) Potato CAGR (%)
A Y P A Y P A Y P
1960s 2.9 0.4 3.3 4.9 0.6 5.5 3.3 3.1 6.6
1970s 11.2 0.3 11.6 4.5 −0.8 3.7 5.0 4.4 9.6
1980s 5.5 6.2 12.0 2.7 0.5 3.2 2.8 2.3 5.1
1990s 5.7 1.4 7.1 3.5 −3.5 −0.1 1.6 1.8 3.4
2000s 5.6 2.2 8.0 8.8 5.5 14.7 4.6 1.4 6.1
2010s −2.7 4.1 1.3 4.0 0.9 4.9 2.2 0.2 2.4
All 5.6 1.9 7.7 4.3 0.7 5.1 3.2 2.1 5.3
Source Authors’ calculation using data from FAOSTAT (2018) and DoAC&FW (2018a)
is risky for farmers and their profitability volatile. Interactions with farmers duringfield visit confirmed this trend. Hence, although the production has scaled up at themacro level, it is difficult for farmers, especially small and marginal farmers, to scaleup cultivation of these crops because of market uncertainties.
In order to decompose the growth of tomato, onion and potato production intoarea and yield effects, we have used time-series data from FAOSTAT (from 1960to 1990) and the Ministry of Agriculture (from 1991 onwards). Compound annualgrowth rates (CAGR) were calculated using the ‘LOGEST12’ function of MS Excelfor area, production and yield for tomato, onion and potato over six decades starting1960s.
It is clear from Table 3.13 that most of the growth in production has come fromexpansion in the area under cultivation and not growth in yield. The factors that havedriven TOP production were the launch of the Integrated Development of VegetablesbyMinistry of Agriculture, technology developed for micro irrigation systems, avail-ability of quality seeds in adequate quantity and technology dissemination amongfarmers. Area expansion and production of TOP crops in non-traditional areas andin different seasons increased overall availability throughout the year.
We have compared the changing constituents of major TOP producing statesin terms of acreage & production over a 10 year period in Figs. 3.30 and 3.31.While, Andhra Pradesh remained the largest tomato producing state in the last 10years, Madhya Pradesh emerged as an important tomato producer. Karnataka hasbeen overtaken byMadhya Pradesh as the second-largest onion producing state afterMaharashtra. This ismainly due to the tremendous increases in onion yield inMadhyaPradesh. In fact, there has been a massive increase in horticultural crops, especiallyvegetables, in Madhya Pradesh in last 10 years. There is need to scale up vegetableproduction further in non-traditional areas to reduce regional concentration. Therehas been a tremendous increase in area and production of potato in Gujarat and
12 LOGEST function gives the best fitted line for an exponential curve. This method was preferredover the general CAGR formula as the latter only gives the growth rates based on the initial andfinal values.
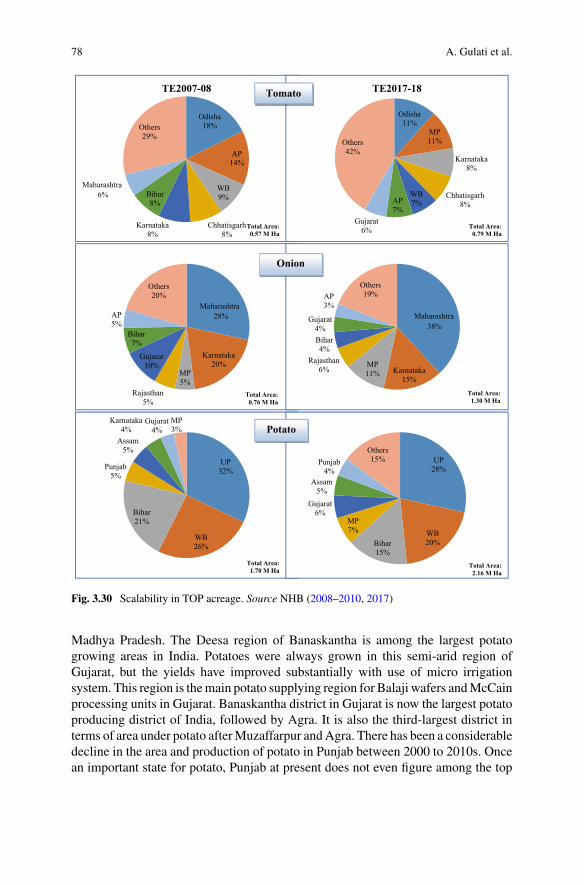
78 A. Gulati et al.
Odisha18%
AP14%
WB9%
Chhatisgarh8%
Karnataka8%
Bihar8%
Maharashtra6%
Others29%
TE2007-08
Total Area: 0.57 M Ha
Maharashtra28%
Karnataka20%
MP5%
Rajasthan5%
Gujarat10%
Bihar7%
AP5%
Others20%
Total Area: 0.76 M Ha
UP32%
WB26%
Bihar21%
Punjab5%
Assam5%
Karnataka4%
Gujarat4%
MP3%
Total Area: 1.70 M Ha
Odisha11%
MP11%
Karnataka8%
Chhatisgarh8%
WB7%AP
7%Gujarat
6%
Others42%
TE2017-18
Total Area: 0.79 M Ha
Maharashtra38%
Karnataka15%
MP11%
Rajasthan6%
Bihar4%
Gujarat4%
AP3%
Others19%
Total Area: 1.30 M Ha
UP28%
WB20%Bihar
15%
MP7%
Gujarat6%
Assam5%
Punjab4%
Others15%
Total Area: 2.16 M Ha
Potato
Onion
Tomato
Fig. 3.30 Scalability in TOP acreage. Source NHB (2008–2010, 2017)
Madhya Pradesh. The Deesa region of Banaskantha is among the largest potatogrowing areas in India. Potatoes were always grown in this semi-arid region ofGujarat, but the yields have improved substantially with use of micro irrigationsystem. This region is themain potato supplying region for Balaji wafers andMcCainprocessing units in Gujarat. Banaskantha district in Gujarat is now the largest potatoproducing district of India, followed by Agra. It is also the third-largest district interms of area under potato afterMuzaffarpur andAgra. There has been a considerabledecline in the area and production of potato in Punjab between 2000 to 2010s. Oncean important state for potato, Punjab at present does not even figure among the top
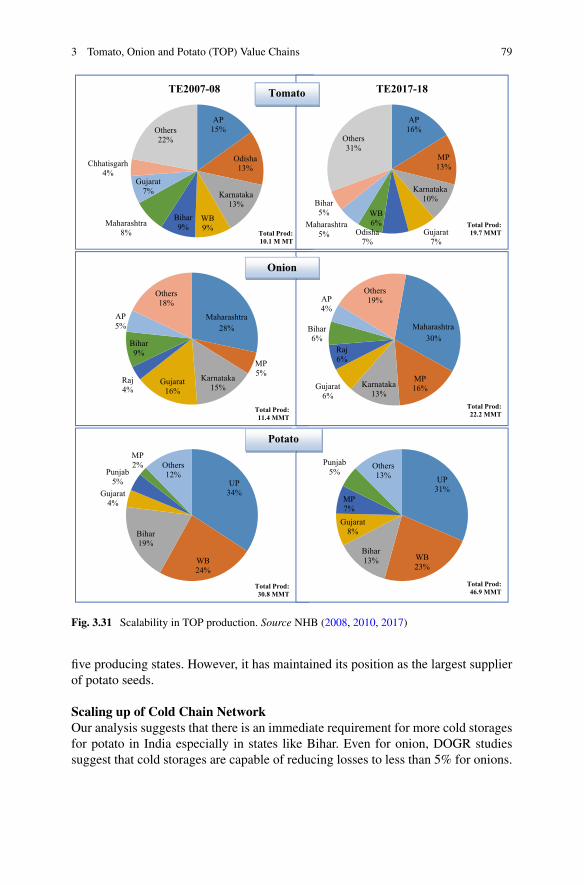
3 Tomato, Onion and Potato (TOP) Value Chains 79
AP15%
Odisha13%
Karnataka13%
WB9%
Bihar9%Maharashtra
8%
Gujarat7%
Chhatisgarh4%
Others22%
TE2007-08
Total Prod:10.1 M MT
Maharashtra28%
MP5%Karnataka
15%Gujarat
16%Raj4%
Bihar9%
AP5%
Others18%
Total Prod: 11.4 MMT
UP34%
WB24%
Bihar19%
Gujarat4%
Punjab5%
MP2% Others
12%
Total Prod: 30.8 MMT
AP16%
MP13%
Karnataka10%
Gujarat7%
Odisha7%
WB6%Maharashtra
5%
Bihar5%
Others31%
TE2017-18
Total Prod: 19.7 MMT
Maharashtra30%
MP16%Karnataka
13%Gujarat
6%
Raj6%
Bihar6%
AP4%
Others19%
Total Prod: 22.2 MMT
UP31%
WB23%
Bihar13%
Gujarat8%
MP7%
Punjab5%
Others13%
Total Prod: 46.9 MMT
Tomato
Onion
Potato
Fig. 3.31 Scalability in TOP production. Source NHB (2008, 2010, 2017)
five producing states. However, it has maintained its position as the largest supplierof potato seeds.
Scaling up of Cold Chain NetworkOur analysis suggests that there is an immediate requirement for more cold storagesfor potato in India especially in states like Bihar. Even for onion, DOGR studiessuggest that cold storages are capable of reducing losses to less than 5% for onions.
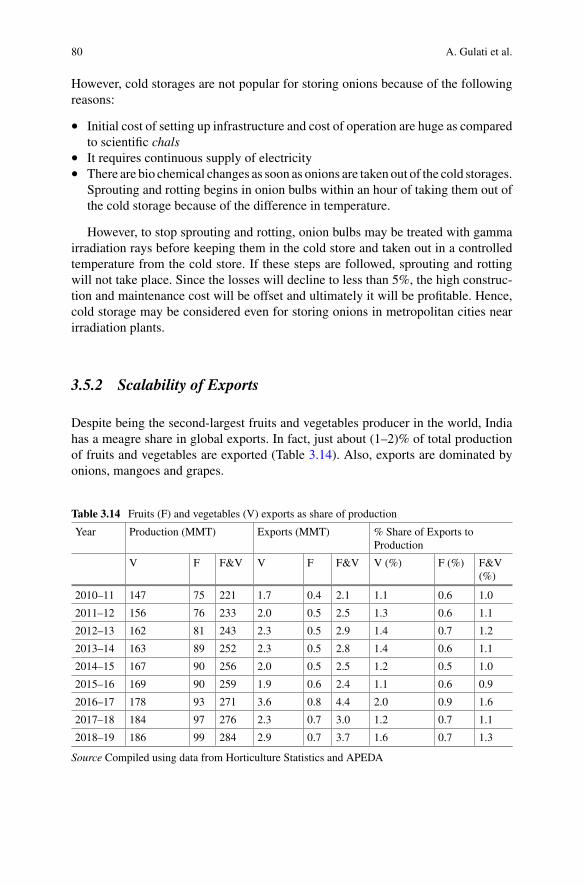
80 A. Gulati et al.
However, cold storages are not popular for storing onions because of the followingreasons:
• Initial cost of setting up infrastructure and cost of operation are huge as comparedto scientific chals
• It requires continuous supply of electricity• There are bio chemical changes as soon as onions are taken out of the cold storages.
Sprouting and rotting begins in onion bulbs within an hour of taking them out ofthe cold storage because of the difference in temperature.
However, to stop sprouting and rotting, onion bulbs may be treated with gammairradiation rays before keeping them in the cold store and taken out in a controlledtemperature from the cold store. If these steps are followed, sprouting and rottingwill not take place. Since the losses will decline to less than 5%, the high construc-tion and maintenance cost will be offset and ultimately it will be profitable. Hence,cold storage may be considered even for storing onions in metropolitan cities nearirradiation plants.
3.5.2 Scalability of Exports
Despite being the second-largest fruits and vegetables producer in the world, Indiahas a meagre share in global exports. In fact, just about (1–2)% of total productionof fruits and vegetables are exported (Table 3.14). Also, exports are dominated byonions, mangoes and grapes.
Table 3.14 Fruits (F) and vegetables (V) exports as share of production
Year Production (MMT) Exports (MMT) % Share of Exports toProduction
V F F&V V F F&V V (%) F (%) F&V(%)
2010–11 147 75 221 1.7 0.4 2.1 1.1 0.6 1.0
2011–12 156 76 233 2.0 0.5 2.5 1.3 0.6 1.1
2012–13 162 81 243 2.3 0.5 2.9 1.4 0.7 1.2
2013–14 163 89 252 2.3 0.5 2.8 1.4 0.6 1.1
2014–15 167 90 256 2.0 0.5 2.5 1.2 0.5 1.0
2015–16 169 90 259 1.9 0.6 2.4 1.1 0.6 0.9
2016–17 178 93 271 3.6 0.8 4.4 2.0 0.9 1.6
2017–18 184 97 276 2.3 0.7 3.0 1.2 0.7 1.1
2018–19 186 99 284 2.9 0.7 3.7 1.6 0.7 1.3
Source Compiled using data from Horticulture Statistics and APEDA
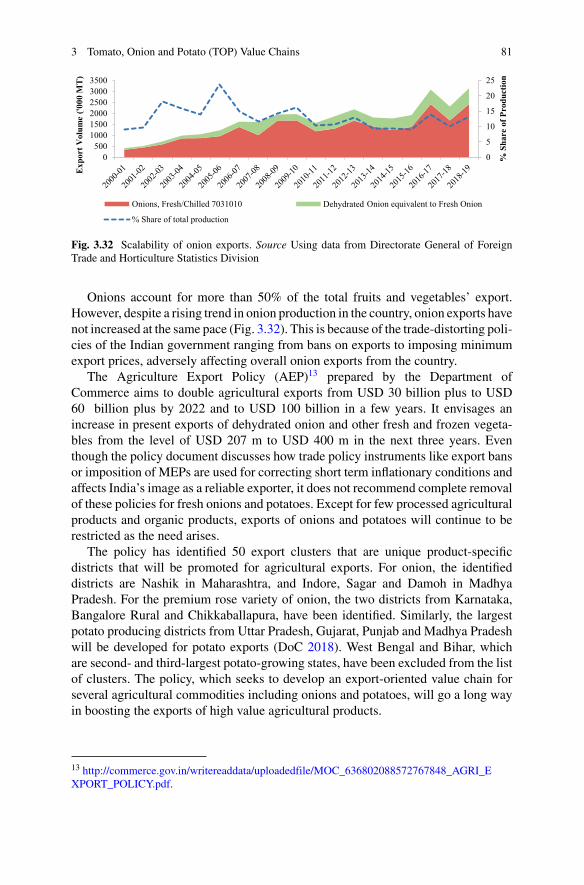
3 Tomato, Onion and Potato (TOP) Value Chains 81
0
5
10
15
20
25
0500
100015002000250030003500
% S
hare
of P
rodu
ctio
n
Exp
ort V
olum
e ('0
00 M
T)
Onions, Fresh/Chilled 7031010 Onion equivalent to Fresh Onion
% Share of total production
Dehydrated
Fig. 3.32 Scalability of onion exports. Source Using data from Directorate General of ForeignTrade and Horticulture Statistics Division
Onions account for more than 50% of the total fruits and vegetables’ export.However, despite a rising trend in onion production in the country, onion exports havenot increased at the same pace (Fig. 3.32). This is because of the trade-distorting poli-cies of the Indian government ranging from bans on exports to imposing minimumexport prices, adversely affecting overall onion exports from the country.
The Agriculture Export Policy (AEP)13 prepared by the Department ofCommerce aims to double agricultural exports from USD 30 billion plus to USD60 billion plus by 2022 and to USD 100 billion in a few years. It envisages anincrease in present exports of dehydrated onion and other fresh and frozen vegeta-bles from the level of USD 207 m to USD 400 m in the next three years. Eventhough the policy document discusses how trade policy instruments like export bansor imposition of MEPs are used for correcting short term inflationary conditions andaffects India’s image as a reliable exporter, it does not recommend complete removalof these policies for fresh onions and potatoes. Except for few processed agriculturalproducts and organic products, exports of onions and potatoes will continue to berestricted as the need arises.
The policy has identified 50 export clusters that are unique product-specificdistricts that will be promoted for agricultural exports. For onion, the identifieddistricts are Nashik in Maharashtra, and Indore, Sagar and Damoh in MadhyaPradesh. For the premium rose variety of onion, the two districts from Karnataka,Bangalore Rural and Chikkaballapura, have been identified. Similarly, the largestpotato producing districts from Uttar Pradesh, Gujarat, Punjab and Madhya Pradeshwill be developed for potato exports (DoC 2018). West Bengal and Bihar, whichare second- and third-largest potato-growing states, have been excluded from the listof clusters. The policy, which seeks to develop an export-oriented value chain forseveral agricultural commodities including onions and potatoes, will go a long wayin boosting the exports of high value agricultural products.
13 http://commerce.gov.in/writereaddata/uploadedfile/MOC_636802088572767848_AGRI_EXPORT_POLICY.pdf.
82 A. Gulati et al.
Box: Scaling Up of SAFAL ModelMother Dairy started its fresh fruits and vegetables operations through theirSAFAL chain of outlets in 1988 in Delhi. Like ‘Operation Green’, the SAFALmodel too was based on the success of Operation Flood. Although the milkmarketing model of Mother Dairy was successful, it did not succeed as muchin the case of fruits and vegetables.
Today, SAFAL has over 400 outlets in Delhi NCR and a few outlets inBangalore (NCCD 2017). The share of SAFAL in total supply of fruits andvegetables in Delhi NCR is just about 4%. This share has been almost thesame for the last many years. By contrast, the Mother Dairy milk chain, whichit tried to emulate; accounts for 66% of the total branded milk supply in Delhi.A majority of Delhi households still rely on their local vendors for fruits andvegetables, which are subject to large scale intermediation.
The number of farmers who are supplying their produce to SAFAL is8000, which is insubstantial. In over 30 years of SAFAL’s existence, it hasnot succeeded in expanding to any city other than Bangalore. In Bangalore,SAFAL adopted an auction system with no direct retailing, which has not beenas successful as planned. Over the years, SAFAL introduced a varied range ofproducts from frozen peas, juices and other daily need items like cooking oiland pulses. Recent introductions like frozen jackfruit and dehydrated onion,however, have not been successful.
3.6 Access to Finance
Cost-effective, easy and inclusive access to finance is crucial for any efficient valuechain to function. Value chain financing has been an issue of concern, particularlyfor small and marginal farmers. Farmers become indebted to money lenders, whocharge exorbitant interest rates, throughout their life. While there has been someeasing in terms of accessibility to finance, this has been confined to only mediumor large farmers in well off states. Field visits undertaken during the study revealedvast variations in access to finance across the country.
3.6.1 Financing of Farmers
Tomato Farmers in Kolar, KarnatakaAs crop-wise credit sources data for farmers are not readily available, data frominteractionswith stakeholders duringfield visitswere used to analyze existing sourcesof credit for different stakeholders. Our field visit to Kolar suggested that 80% ofsmall and marginal farmers source credit from the unorganized sector, comprising
3 Tomato, Onion and Potato (TOP) Value Chains 83
of commission agents, friends, relatives or through own sources. Large farmers ortraders are an integral credit source for small and marginal farmers. This is becauseof mutual trust and understanding that has developed over the years. Getting creditfor them is also easier and quicker as compared to taking loans from banks, whichrequires large amounts of paper work. Large farmers borrow only (30 to 35)% ofthe total cost of production. Of this, (60 to 70)% are borrowed from banks, less than30% from relatives and none at all from commission agents.
In terms of schemes for farmers, government provides 90% subsidy on drip irri-gation, the total cost of which is INR 25,000 per acre. However, the effective subsidyis just 70%; the 20% goes to middlemen. Farmers also get support in productiontechnologies—precision farming, pest management, and drip irrigation. The govern-ment also provides subsidy for mulching, the practice of covering the soil with blackpolythene to protect the tomato crops.
Onion Farmers in Nashik, MaharashtraIn the comparatively developed region of Nashik in Maharashtra, farmers do haveaccess to banking facilities and use Kisan Credit Cards (KCC). THEMSAMB imple-ments a pledge loan scheme at 3% per annum against warehouse receipts throughthe APMCs for the benefit of farmers. District co-operative banks in every villageis a major source of financing; however, (30–40)% of farmers have shifted towardsnationalized banks as district co-operative banks are loss-making and many are shut-ting down. There is also a provision of a crop loan of INR 30,000 per acre for onions.This is the minimum amount; the amount increases over time if instalments are paidregularly. An interest rate of 7% is charged for crop loan up to INR 3 lakhs andthere is a rebate of 2% for regular repayment. After the initial INR 3 lakhs crop loan,farmers get a cash credit loan at an interest rate of (10–11)% by nationalized banksand 12% by private banks.
During the field visit, APMCofficials said that both in Lasalgaon and Pimpalgaon,there is no role for commission agents as money lenders. According to some farmerswe spoke to, however, commission agents or other informal sources of financing areapproached when it is not possible to get loans from banks due to non-payment ofdues.
Onion Farmers in Mahuva, GujaratIn Mahuva, banks provide loans at an interest rate of 7%. However, commissionagents, who charge amonthly interest rate of around (2–3)%, are an important sourceof credit for farmers, Farmers, even if they have kisan credit cards, dependon commis-sion agents for financing, at least, in part because they may have defaulted on bankloans. They are also discouraged by the long paper work required for availing bankcredit.
Potato Farmers in Agra, Uttar PradeshThe field visits to Agra threw up interesting insights about the financing of the potatovalue chain. We found that most farmers have a kisan credit card (KCC) but as mostof them fail to repay loans on time, they end up paying higher and penal rates of
84 A. Gulati et al.
interest (7% or more). The failure to repay can be attributed to farmers using croploans for consumption purposes or to repay existing loans from informal sources.Even if farmers do not default, the loan amount received is often not enough forsmall farmers and they have to resort to some degree of informal borrowing. Due toa bumper crop, farmers received little return for their produce which has increasedthe dependence of many small and marginal farmers on sahukars (money lenders).The sahukars, many of them large farmers, charge a minimum of 2% per month (thiscould go as high as 5% per month in some cases). The transactions are based on anddictated by personal relationships.
Cold storage owners are another source of financing for farmers. They chargeas much as the sahukars (around 2% per month). The cold storages, in turn, availthe overdraft facility given by banks to lend to farmers. This enables cold storageowners to earn arbitrage since the interest rate they charge from farmers is twiceto five times higher than what they pay to the bank. Besides, the practice of notproviding proper receipts to farmers for the potatoes stored makes it difficult forfarmers to access other sources of credit. As Agra is home to a large number of coldstorages for potato, a warehouse receipt system should be made compulsory to helpfarmers access low-cost finance.
Potato Farmers in Nalanda, BiharNalanda in Bihar is a hub for vegetable farming; however, vegetable growers are notable to take loans, primarily because banks view vegetables as a high-risk activityand because of the high proportion of defaults by vegetable farmers. Besides, manyfarmers find it difficult to get a Land Possession Certificate (LPC), especially whenland records are in names of fathers/grandfathers, making it difficult for them to availbank loans. Hence, a very limited number of farmers who have proper land recordsare able to take formal loans. The interest rate charged by banks is 4% per annum ifpremiums are paid on time, but this could go up to (11–12)% per annum if there is adefault. Interest rates of loans from non-institutional sources are as high as (2.5–3)%per month.
Because of the lengthy procedure involved in sanctioning farm loans, farmers findit difficult to avail loans from banks when they need it the most, which is just ahead ofthe sowing season. This forces many to approach non-institutional sources of loans.Besides, due to high incidence of loan defaults, banks are reluctant to lend to farmers.A possible solution is to provide credit through FPOs to minimize defaults. This is aplausible solution as there are large numbers of upcoming FPOs especially after thesuccess of Jeevika led Women Farmer Producer Organizations in Bihar.
3.6.2 Financing of Infrastructure
As mentioned earlier, cold storages in Agra avail overdraft facility given by bankssolely for onward lending to potato farmers in Uttar Pradesh are charged around10–11% per annum by the banks.
3 Tomato, Onion and Potato (TOP) Value Chains 85
Unlike potato farmers in Agra, onion farmers still use non-cold storage structuresto store onions. DOGR and NHRDF have developed different kinds of low cost,improved storage structures using bamboos, asbestos, and other materials. Whilesome structures are three sides open, some are open on all sides with ventilationprovided at the bottom through a raised platform. Scientists at DOGR and NHRDFclaim that these structures are able to reduce post-harvest losses to (15–20)% ascompared to the (40–50)% when onions are stored in traditional structures. For theconstruction of these storage structures, the government provides a subsidy of 25%to farmers under the RKVY (Rashtriya Krishi Vikas Yojana) scheme. The schemewas entrusted to the Maharashtra State Agricultural Marketing Board (MSAMB),which administers it through the APMCs. The storage capacity ranged between 5MT costing INR 30,000 to 50 MT costing INR 3,00,000.
Another government scheme provides 35% subsidy for the construction of coldstorages as credit-linked back-ended subsidy, the cost of which comes to INR 3500per MT. However, since storing onions in cold storages in Nashik is not yet popular,these are used to store other fruits and vegetables like tomato and grapes.
While existing cold storages are concentrated in few states and (80–90)% ofavailable cold storages are used for potatoes, there is a dire need for cold storages inIndia. The Ministry of Food Processing Industry is building a National Cold ChainGrid in the country to connect major agricultural producing hubs to cold storage andprocessing industries. The Cold Chain and Value Addition Infrastructure scheme ofMoFPI provides financial support to the tune of INR 10 crores for setting up of suchfacilities (NCCD 2018).
Onion traders in Nashik get cash credit from banks at an interest rate of 18% perannum. This is done by keeping land as security. Traders reported that the rate ofinterest charged to them is much higher than that charged to farmers.
As marketing is a key aspect for any value chain, infrastructural developmentof existing APMCs and setting up of private mandis becomes important. Visits tovarious APMC mandis during the course of the study revealed that the existinginfrastructure of APMCs has run out of its capacity. For example, the largest tomatomandi in Kolar, which caters to more than 4 lakh MT of tomatoes a year, is spreadover 20 acres and is overflowing. The mandi requires complete renovation of theexisting infrastructure, as well as expansion of the market area.
3.6.3 Financing of Processors
The emergence of Mahuva as a dehydration hub can be attributed to the GujaratGovernment’s favourable policy regime. This includes subsidies to dehydration units.The Gujarat Government provides subsidy to cover 25% of the project cost up toINR 50 lakhs to set up such industries. Another interest subsidy of 7% on term loansfor micro and small industries has helped in setting up dehydration units in Mahuva.
86 A. Gulati et al.
The Government of India’s SAMPADA (Scheme for Agro-Marine Processingand Development of Agro-Processing Clusters) Yojana, which provides subsidyfor setting up food processing units is another scheme which has boosted the foodprocessing sector. It is an ongoing scheme for the food processing sector and hasbeen renamed to Pradhan Mantri Kisan SAMPADA Yojana14 with an allocation ofINR 6000 crore for the period 2016–20. This scheme of Ministry of Food ProcessingIndustries (MoFPI) provides a subsidy of 35%of the project cost up to INR5 crores toset up food processing units. The scheme also covers the setting up of the following:
• Mega Food Parks• Integrated Cold Chain and Value Addition Infrastructure• Creation/Expansion of Food Processing and Preservation Capacities• Infrastructure for Agro-processing Clusters• Creation of Backward and Forward Linkages• Food Safety and Quality Assurance Infrastructure• Human Resources and Institutions.
According to MoFPI, PM Kisan SAMPADA Yojana was expected to leverageinvestment of INR 31,400 crore for handling of 334 lakh MT of agro-producevalued at INR 1,04,125 crore, benefiting 20 lakh farmers and generating 5,30,500direct/indirect employment in the country by the year 2019–20” (MoFPI 2018).
3.7 Conclusion and Policy Recommendation
In this chapter, we highlight the fact that despite being the second-largest producer ofTOP vegetables, we have stopped well short of securing a good deal for our farmers.During a bumper crop, farmers struggle to cover their cost of production. The primaryreason for this is inefficient and fragmented value chains, which lead to low returnsfor farmers. Hence, to bring efficiency in the value chain of tomatoes, onions andpotatoes, policy recommendations should address the challenges faced at each stageof the value chain from seeds to final consumption. In our analysis based on theCISS-F framework, we seek to highlight the difference marketing reforms can makeon farm incomes.
First, we recommend some generic policy measures followed by recommenda-tions specific to each of the TOP vegetables.
Generic Policy Recommendations for TOP
1. Extension services:The horticulture sector throughout the country suffers fromserious gaps in extension services, which partly accounts for the uneven qualityof produce and the abnormally high post-harvest losses. Government extensionservices are focused on cereal crops and private sector capacity has not grown
14 http://mofpi.nic.in/Schemes/pradhan-mantri-kisan-sampada-yojana.
3 Tomato, Onion and Potato (TOP) Value Chains 87
adequately. Yet, without massive effort to skill horticulture farmers, integratedvalue chains are unlikely to emerge to link producers to end markets. Opera-tionalising a system of tax incentives to the private sector specifically to investin extension services will help. While such a step should cover all sub-sectorsof agriculture, it is most likely to attract private investment in the fast-growingareas of horticulture, poultry, livestock and dairy farming. Something like 150%tax deduction for eligible investments is likely to result in significant privateinterest in this area. At the same time, public extension services should alsobe revamped to focus on horticulture in general, and TOP crops in particular.This is an essential pre-requisite for the emergence of integrated value chainsfor these crops.
2. Agriculture credit: Agriculture credit for horticulture crops is another areawhich requires focused attention. Short-term crop credit is available only forcrop husbandry, leaving horticulture farmers largely at the mercy of informalcredit suppliers. This study has validated evidence from other sources thatmarket intermediaries (or mandi agents) are one of the primary sources ofcredit for horticulture cultivation. This makes the cost of cultivation unsus-tainably high, as interest rates on informal credit range between (24–48)% perannum.Providing access to institutional credit through kisan credit cards (KCC),SHG-bank linkage, and channelizing credit through FPOs is the way forwardto address this challenge.
3. Mechanization: The scope for mechanization to reduce production costs andwastage has not been adequately leveraged in horticulture. This is especially trueof the TOP vegetables. From seeding to harvest and storage, mechanization iswidely used even in our neighbourhood, especially in China. A focused policyon accelerating the scope of mechanisation in the TOP crops should be the fore-runner for a sector-wide approach to increase farmers’ access to hired mechan-ical aids. This is especially critical if we hope to break into export markets forthese crops, where our competitors with a higher level of mechanization areable to meet the exacting demand of buyers.
4. Farmer Collectives: The typical vegetable farmer being small, the organiza-tion of producers into collectives such as farmer producer companies and co-operatives is vital to attract market players at the backend. The experienceof the past few years shows that farmers’ collectives have been successfulin many instances in increasing the bargaining power of small producers inaccessing capital, technology and markets. Current efforts to promote FPOsshould be accelerated, with a cluster approach in the case of horticulture toattract processors, exporters, modern retail and others to source produce fromthe farm gate.
5. Risk insurance: To insure producers and exporters of TOP vegetables againstrisks, there is need for the creation of a formal advisory body that can assess thecredit worthiness of all stakeholders within the value chain. This credit ratingwill help producers and exporters to identify traders to deal with, based on theircredit worthiness. Insurance products that can help farmers in times of distressor adverse weather conditions should be promoted and these should be available
88 A. Gulati et al.
to farmers at affordable premium rates. Promotion of commodity derivatives andfutures trading in TOP can be another way to hedge risks for farmers.
Tomato Value Chain
1. Private companies have done well in introducing different varieties of hybridand disease-resistant seeds. However, in the absence of a strong intellectualproperty rights (IPR) regime, private companies find no incentive to furtherinvest in seed research as copying of genetic material of seed developed afteryears of research by a company is very common in India. Hence, there is needto strengthen the IPR regime for tomato seeds.
2. Indian tomato yields are very low as compared to yields in European countries.There is a need for large scale adoption of polyhouses to enhance the yieldof Indian tomatoes. This will help create a continuous cycle of tomato crop,and also help protect crop from pest attacks. Frequent spraying of pesticidesmakes Indian tomatoes unhealthy for domestic consumers, and non-tradable inthe international market. As polyhouse construction is capital intensive, govern-ment can subsidise such investments for individual large and medium farmers,or small and marginal farmers through FPOs, who are willing to adopt thistechnology.
3. Tomato exports from India are very limited, despite India being the second-largest producer in the world. A high degree of pesticide residue in the vegeta-bles makes it non-exportable in the world market and the exports remain limitedto our neighbouring countries. Precision farming that allows farmers to improvetheir farming practices and harvest safe and quality produce, need to be encour-aged and incentivized. Education and awareness about the negative impactof heavy usage of agro chemicals need to be stepped up through FPOs andorganizations working directly with farmers.
4. FPOs can be encouraged to set up small-scale processing plants to producetomato pulp and puree to supply to large-scale ketchup manufacturing plants.This will ensure surplus production is sold by farmers at remunerative pricesand they benefit from direct marketing opportunities.
5. The monopoly of APMC can be tackled by allowing private mandis on PPPbasis or by developing other marketing channels. The FPTC and FAPAFS Actsenacted by the Parliament in September 2020, will make it easier for privatesector to set up mandis. This will give farmers a wider choice to sell theirproduce at remunerative prices aswell as renderAPMCmarkets to becomemorecompetitive and improve their infrastructure and services.
6. Aggregation facilities for tomatoes should be done at farm-level itself withassaying, sorting and grading based on size, colour and texture and packagingwith tinker proof bar codes for easy traceability.
3 Tomato, Onion and Potato (TOP) Value Chains 89
Onion Value Chain
1. Even though cold storages are able to reduce post-harvest losses by 5%, theseare not popular in India. There is need for dry storage on-or near the farm,preferably owned by farmers. Only Maharashtra has invested to some extent inthis area. Hence, there is need to invest in the creation of scientific dry storagesfor onions, especially, in Madhya Pradesh, which has a huge infrastructure gapand has no policy to increase farm level storage.
2. An aggressive expansion of the area under onion with focus on states of Bihar,Odisha, Assam, and Chhattisgarh, will help cater to demand in east and north-east India, Nepal, and Bangladesh. It will reduce the need to transport onionat huge energy and financial costs across the country from Maharashtra, andcreate alternative crop choices for farmers in eastern India. But the foray intoeastern India must be preceded by varietal trials to select the best varieties,extension, development of storage and supply chain infrastructure, and creditfacilities. Leveraging private investment to expand onion value chains in newgeographies, and strengthening processing andmarketing segmentswithin thesevalue chains can provide diversified income opportunities for the farmers.
3. There is need for popularizing dehydrated onions among Indianconsumers through ad campaigns. Dehydrated onions could be affordablesubstitute for fresh onions, when prices escalate very sharply. Also, withchanging lifestyle and consumer preference, domestic market for dehydratedonions can take off. The dehydrating industry in Mahuva, Gujarat is quitelarge, but it mainly caters to the overseas market. Even when the quality of theproduct meets international standards, prices are not very remunerative becauseof oversupply and the business is not structured. Boosting domestic demandand creating an organized market will further promote the onion dehydrationindustry, benefit farmers in terms of assured remunerative prices, as well aspotentially address the consumer inflation woes.
4. There should be an overhaul of India’s onion trade policy. Instead of imposingminimum export price as and when onion price starts rising, government shouldinstead allow imports. The minimum export price policy for onion not onlyaffects India’s image as a credible exporter, but also deprives onion farmers thebenefit of higher prices in the international market.
5. For export purposes, India can cultivate foreign varieties of onion, which arebigger in size and less pungent and hence, less popular in the Indian market.These varieties could be grown to cater to the global market exclusively forexport purposes through contract farming.
6. FPOs can play an effective role in promoting collective farming of onionsmarketed as fresh as well as dehydrated. Direct marketing linkages and/orcontract farming will allow farmers to benefit from economies of scale andfair price realization. Existing government schemes and financial support canbe made available to the farmers through such farmer collectives to promoteonion farming as well as processing and marketing. There should be a mecha-nism where farmers can enter into contract farming with dehydration units so
90 A. Gulati et al.
that they are able to fetch a better price for their produce, which otherwise istoo low.
Potato Value Chain
1. Inadequate investments in research of table and processing varieties of potato inIndia needs to be addressed to overcome the issues related to yield stagnation dueto varietal reasons; threat of widespread viral and pest borne diseases; excessiveuse of agro chemicals; among others. While CPRI, Shimla has been leading theR&D in potato, there is scope for bringing in the private sector in R&D to endthe monopoly of CPRI, Shimla.
2. Potato farmers’ especially in Uttar Pradesh and Bihar can be organised intofarmer producer organizations (FPOs), which can help them secure qualityinputs at cheaper costs. During our field visits, farmers complained about theirbeing fleeced by input traders dealing in seed, fertilizers, and other agro chemi-cals. FPOs can enable farmers to access organizedmarkets for agri inputs aswellas create awareness among them about the right farm practices. For instance,farmers can be linked to entities like Mahindra-HZPC,15 which can provideaccess to high-quality seed. Finance can be made available to farmers throughthese FPOs, which can help farmers take care of their agri credit requirementsand address issues related to default to a large extent. FPOs can also help farmersaccess custom hiring centres or other rental models to adopt mechanization ontheir farms. Large scale mechanization can help them improve farm efficiencyas well as reduce cost of labour.
3. Cold storage plays an important role in the potato value chain. However, thecold storage infrastructure deficit and spatial mismatch needs to be corrected.For example, Bihar with a 14% share in potato production, accounts for only4% of the total cold storage capacity in the country. There is urgent need toset up cold storage facilities in Nalanda, and other potato producing districts inthe state. Financial incentives for setting up of energy-efficient, solar poweredcold storages would help the cold storage owners reduce their operational costsand make cold storage more affordable for the farmers. Farmers’ direct accessto cold storage enables him to access institutional credit at affordable interestrates. It also saves the farmers from distress sale of his produce during peakarrival months. Cold storage units registered under theWarehouse Developmentand Regulatory Authority (WDRA) can issue negotiable warehouse receipts(NWRs) and eNWRs to the farmers, which can serve as a collateral for thebanks and enable the farmer to meet his credit needs.
4. Efforts should bemade to give potato processing in India a boost. The number ofregistered fruit and vegetable (F&V) processing units in the top potato producingstates likeUttar Pradesh (42),West Bengal (58) andBihar (7) are a small fractionof the total (1256) (ASI, 2020). Agra and Nalanda, two of the largest potato
15 Mahindra—HZPC (Dutch Company) tie up seeks to bring high quality seed to Indian farmers,through the use of AERPONICS.
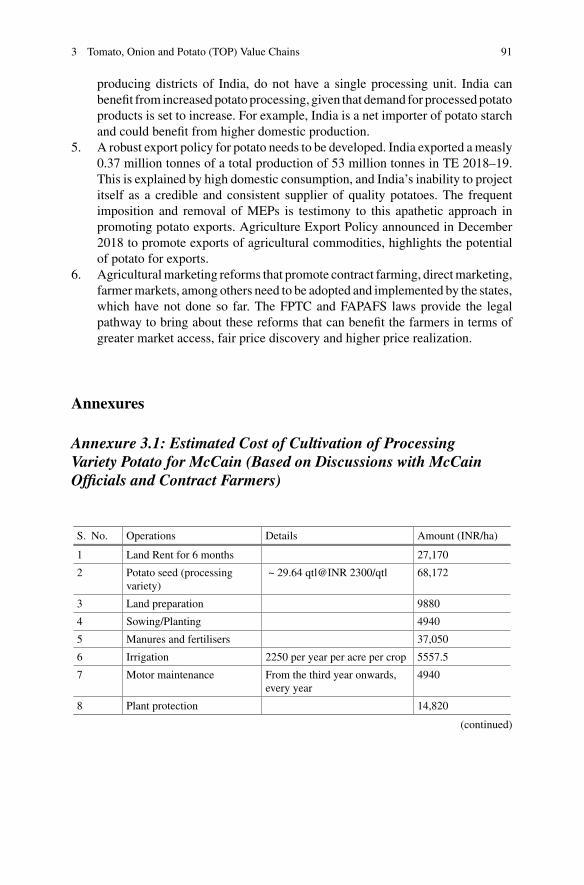
3 Tomato, Onion and Potato (TOP) Value Chains 91
producing districts of India, do not have a single processing unit. India canbenefit from increasedpotato processing, given that demand for processedpotatoproducts is set to increase. For example, India is a net importer of potato starchand could benefit from higher domestic production.
5. A robust export policy for potato needs to be developed. India exported ameasly0.37 million tonnes of a total production of 53 million tonnes in TE 2018–19.This is explained by high domestic consumption, and India’s inability to projectitself as a credible and consistent supplier of quality potatoes. The frequentimposition and removal of MEPs is testimony to this apathetic approach inpromoting potato exports. Agriculture Export Policy announced in December2018 to promote exports of agricultural commodities, highlights the potentialof potato for exports.
6. Agriculturalmarketing reforms that promote contract farming, directmarketing,farmermarkets, among others need to be adopted and implemented by the states,which have not done so far. The FPTC and FAPAFS laws provide the legalpathway to bring about these reforms that can benefit the farmers in terms ofgreater market access, fair price discovery and higher price realization.
Annexures
Annexure 3.1: Estimated Cost of Cultivation of ProcessingVariety Potato for McCain (Based on Discussions with McCainOfficials and Contract Farmers)
S. No. Operations Details Amount (INR/ha)
1 Land Rent for 6 months 27,170
2 Potato seed (processingvariety)
~ 29.64 qtl@INR 2300/qtl 68,172
3 Land preparation 9880
4 Sowing/Planting 4940
5 Manures and fertilisers 37,050
6 Irrigation 2250 per year per acre per crop 5557.5
7 Motor maintenance From the third year onwards,every year
4940
8 Plant protection 14,820
(continued)
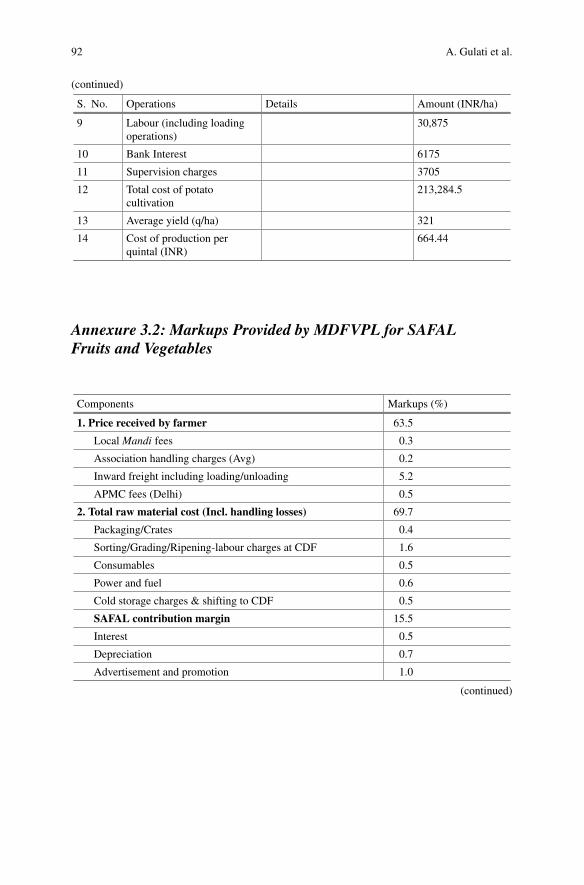
92 A. Gulati et al.
(continued)
S. No. Operations Details Amount (INR/ha)
9 Labour (including loadingoperations)
30,875
10 Bank Interest 6175
11 Supervision charges 3705
12 Total cost of potatocultivation
213,284.5
13 Average yield (q/ha) 321
14 Cost of production perquintal (INR)
664.44
Annexure 3.2: Markups Provided by MDFVPL for SAFALFruits and Vegetables
Components Markups (%)
1. Price received by farmer 63.5
LocalMandi fees 0.3
Association handling charges (Avg) 0.2
Inward freight including loading/unloading 5.2
APMC fees (Delhi) 0.5
2. Total raw material cost (Incl. handling losses) 69.7
Packaging/Crates 0.4
Sorting/Grading/Ripening-labour charges at CDF 1.6
Consumables 0.5
Power and fuel 0.6
Cold storage charges & shifting to CDF 0.5
SAFAL contribution margin 15.5
Interest 0.5
Depreciation 0.7
Advertisement and promotion 1.0
(continued)
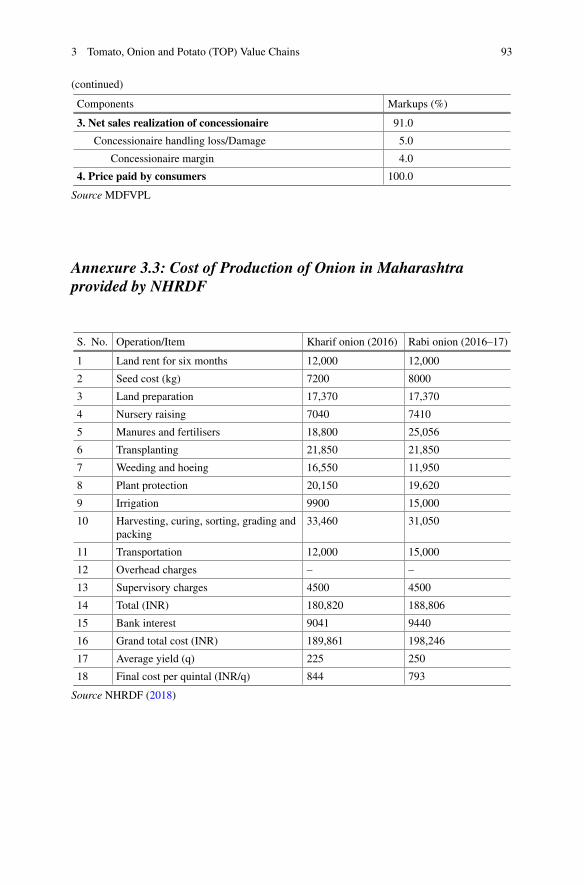
3 Tomato, Onion and Potato (TOP) Value Chains 93
(continued)
Components Markups (%)
3. Net sales realization of concessionaire 91.0
Concessionaire handling loss/Damage 5.0
Concessionaire margin 4.0
4. Price paid by consumers 100.0
Source MDFVPL
Annexure 3.3: Cost of Production of Onion in Maharashtraprovided by NHRDF
S. No. Operation/Item Kharif onion (2016) Rabi onion (2016–17)
1 Land rent for six months 12,000 12,000
2 Seed cost (kg) 7200 8000
3 Land preparation 17,370 17,370
4 Nursery raising 7040 7410
5 Manures and fertilisers 18,800 25,056
6 Transplanting 21,850 21,850
7 Weeding and hoeing 16,550 11,950
8 Plant protection 20,150 19,620
9 Irrigation 9900 15,000
10 Harvesting, curing, sorting, grading andpacking
33,460 31,050
11 Transportation 12,000 15,000
12 Overhead charges – –
13 Supervisory charges 4500 4500
14 Total (INR) 180,820 188,806
15 Bank interest 9041 9440
16 Grand total cost (INR) 189,861 198,246
17 Average yield (q) 225 250
18 Final cost per quintal (INR/q) 844 793
Source NHRDF (2018)
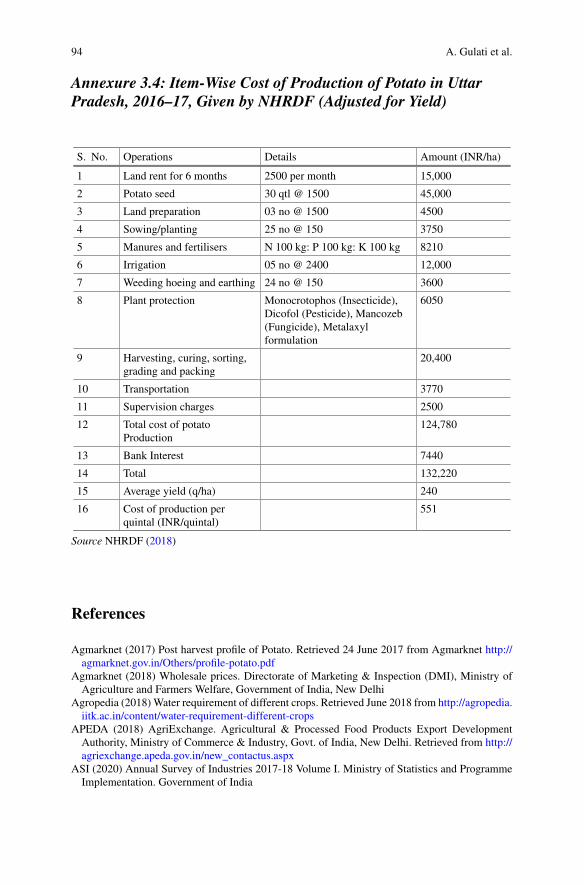
94 A. Gulati et al.
Annexure 3.4: Item-Wise Cost of Production of Potato in UttarPradesh, 2016–17, Given by NHRDF (Adjusted for Yield)
S. No. Operations Details Amount (INR/ha)
1 Land rent for 6 months 2500 per month 15,000
2 Potato seed 30 qtl @ 1500 45,000
3 Land preparation 03 no @ 1500 4500
4 Sowing/planting 25 no @ 150 3750
5 Manures and fertilisers N 100 kg: P 100 kg: K 100 kg 8210
6 Irrigation 05 no @ 2400 12,000
7 Weeding hoeing and earthing 24 no @ 150 3600
8 Plant protection Monocrotophos (Insecticide),Dicofol (Pesticide), Mancozeb(Fungicide), Metalaxylformulation
6050
9 Harvesting, curing, sorting,grading and packing
20,400
10 Transportation 3770
11 Supervision charges 2500
12 Total cost of potatoProduction
124,780
13 Bank Interest 7440
14 Total 132,220
15 Average yield (q/ha) 240
16 Cost of production perquintal (INR/quintal)
551
Source NHRDF (2018)
References
Agmarknet (2017) Post harvest profile of Potato. Retrieved 24 June 2017 from Agmarknet http://agmarknet.gov.in/Others/profile-potato.pdf
Agmarknet (2018) Wholesale prices. Directorate of Marketing & Inspection (DMI), Ministry ofAgriculture and Farmers Welfare, Government of India, New Delhi
Agropedia (2018)Water requirement of different crops. Retrieved June 2018 from http://agropedia.iitk.ac.in/content/water-requirement-different-crops
APEDA (2018) AgriExchange. Agricultural & Processed Food Products Export DevelopmentAuthority, Ministry of Commerce & Industry, Govt. of India, New Delhi. Retrieved from http://agriexchange.apeda.gov.in/new_contactus.aspx
ASI (2020) Annual Survey of Industries 2017-18 Volume I. Ministry of Statistics and ProgrammeImplementation. Government of India
3 Tomato, Onion and Potato (TOP) Value Chains 95
ASSOCHAM-MRSS (2017) Cold chain logistics: transforming agri-food supply chain. The Asso-ciated Chambers of Commerce and Industry of India, New Delhi. Retrieved from http://publication.assocham.tv/data/product-file/139_Cold%20Chain%20Report_Final%20Draft.pdf
CGWB (2014) District GroundWater Brochures: GroundWater Information. Central GroundWaterBoard. Ministry of Water Resources. Government of India
CGWB (2018) Aquifer Mapping and Management of Ground Water Resources. Central GroundWater Board. Ministry of Water Resources. Government of India
Chand R, Singh J (2016) Study report on agricultural marketing and farmer friendly reforms acrossIndian states and UTs. NITI Aayog, New Delhi
Chand R, Prasanna PL, Singh A (2011) Farm size and productivity: understanding the strengths ofsmallholders and improving. Econ Pol Wkly 46(26/27):5–11
Committee for Doubling Farmers’ Income (2017) Post-production interventions: agri-logistics,volume III. Department of Agriculture, Cooperation and Farmers’ Welfare, Ministry of Agri-culture and Farmers’Welfare. Retrieved from http://agricoop.gov.in/sites/default/files/DFI%20Volume%203.pdf
DES Cost of Cultivation Data (2018) Retrieved June 2018 from Directorate of Economics andStatistics, Ministry of Agriculture and Farmer’s Welfare, Government of India. https://eands.dacnet.nic.in/Cost_of_Cultivation.htm
DGFT (2018) Export import databank. Retrieved Feb 2018 from Directorate General of ForeignTrade, Ministry of Commerce & Industry: http://commerce-app.gov.in/eidb/ecom2q.asp
DoAC&FW (2017) Agricultural statistics at a glance—2016. Directorate of Economics and Statis-tics, Department of Agriculture, Cooperation & Farmers Welfare, Government of India, NewDelhi
DoAC&FW (2018a) Area and production of horticulture crops. Horticulture Statistics Division,Department of Agriculture, Cooperation & Farmers Welfare, Government of India
DoAC&FW (2018b) Third advance estimates of production of foodgrains for 2017–18. Agri-cultural Statistics Division, Directorate of Economics & Statistics, Department of Agriculture,Cooperation and Farmers Welfare, Government of India, New Delhi
DoAC&FW (2020) Agricultural census 2015–16. Department of Agriculture Cooperation andFarmer’s Welfare, Ministry of Agriculture, Government of India, New Delhi. Retrieved fromhttp://agcensus.dacnet.nic.in/
DoC (2018) Agricultural export policy. Department of Commerce, Ministry of Commerce &Industry, Government of India, New Delhi
DoCA (2018) PMC (pricemonitoring cell). Department of Consumer Affairs, NewDelhi. Retrievedfrom https://fcainfoweb.nic.in/reports/report_menu_web.aspx
Dutta A, Dutta A, Sengupta S (2016) A case study of PepsiCo contract farming for potatoes. IOSR JBus Manage 75–85. Retrieved from http://www.iosrjournals.org/iosr-jbm/papers/ICSE%20Conference/14.75-85.pdf
FAO (2011) Global food losses and food waste—Extent, causes and prevention. RomeFAOSTAT (2018) Food and agriculture data. Retrieved from Food and Agriculture Organization ofthe United Nations. http://www.fao.org/faostat/en/#data
ICAR-CIPHET (2015)Report on assessment of quantitative harvest and post-harvest losses ofmajorcrops and commodities in India. Ministry of Food Processing Industry (MOFPI), Government ofIndia (GOI)
ICAR-Central Potato Research Institute (2015) Vision 2050. Retrieved 29 July 2017, from IndianCouncil of Agricultural Research. http://www.icar.org.in/Vision%202050%20CPRI,%20Shimla.pdf
IDRC (2000) A handbook for value chain. Institute of Development Studies. Retrieved from http://www.ids.ac.uk/ids/global/pdfs/VchNov01.pdf
IFC (2014) Inclusive business case study: Jain Irrigation Systems Limited (JISL). Retrieved 16Mar2018, fromwww.ifc.org. https://www.ifc.org/wps/wcm/connect/f6fdcd8047e252ca9d05fd299ede9589/Jain%2BTemporary.pdf?MOD=AJPERES
96 A. Gulati et al.
Kaur P (2014) Contract farming of potatoes: a case study of PepsiCo plant. Int J Sci Res Publ 4(6).Retrieved from http://www.ijsrp.org/research-paper-0614/ijsrp-p3040.pdf
Land Use Statistics, DES (2018) Directorate of Economics and Statistics (DES), Department ofAgriculture and Cooperation, Government of India, New Delhi
MoFPI (2018) Pradhan Mantri Kisan SAMPADA Yojana. Retrieved June 2018 from Ministry ofFood Processing Industries. http://mofpi.nic.in/sites/default/files/important_notice-sampada-19.05.2017.pdf
Mysore S, TM, GD, S, Prakash C, Geethamma CA, M, Kamalamma (2013–14) Status, prospectusand profile of tomato cultivation in Karnataka. Indian Institute of Horticulture Research (IIHR),Bengaluru
NAS (Various Issues), MoSPI (n.d.) National account statistics. Ministry of Statistics and ProgramImplementation, Government of India, New Delhi
NCCD (2017) Analysing NDDB cluster model for marketing of vegetables. IJCM, New Delhi.Retrieved from https://nccd.gov.in/PDF/Analysis_NDDB_veg_model.pdf
NCCD (2018) Retrieved July 2018 fromNational Centre for Cold-chain Development. https://nccd.gov.in/
NHB (2008–2010) Indian horticulture database. National Horticulture Board, Government of India,New Delhi
NHB (2017) Horticultural statistics at a glance 2017. National Horticulture Board, Ministry ofAgriculture, New Delhi
NHRDF (2018) National Horticultural Research and Development Foundation, NashikNSS 61st Round (2007) Household consumption of various Goods and Services in India. NationalSample Survey Organization, New Delhi
NSS 68th Round (2014) Household consumption for various Goods and Services in India July2011–June 2012. National Sample Survey Organization, Ministry of Statistics and ProgrammeImplementation, New Delhi
Punjabi M (2015) Food and Agriculture Organization (FAO) of the United Nations. Retrieved fromFAO. http://www.fao.org/fileadmin/user_upload/ivc/PDF/Asia/15_Punjabi_potato_contract_farming_for_Pepsi_India_formatted.pdf
Punjabi M, Mukherjee A (2015) Supply chain for exports of dehydrated onions: case study of JainIrrigation Systems Limited in India. FAO
Rana RK (2017) Marketing and export of potato in India. Agrotech Publishing Academy, UdaipurRana RK, Martolia R, Singh V (2017) Trends in global potato processing: Industry-evidence frompatents’ analysis with special reference to Chinese experience. Potato J 44(1):37–44
Reardon T, Chen K, Minten B, Adriano L (2012) The Quiet revolution in staple food value chains.ADB-IFPRI, Phillipines
Saini S, Gulati A (2017) Price distortions in Indian agriculture. World Bank, New DelhiSharma VP, Wardhan H (2017) Marketed and marketable surplus of major food grains in India.Springer, Delhi
UN Comtrade Database (2018) Retrieved Feb 2018 from https://comtrade.un.org/data/Varma S (2010) The great Indian robbery. The Times of India, Delhi
3 Tomato, Onion and Potato (TOP) Value Chains 97
Open Access This chapter is licensed under the terms of the Creative Commons Attribution 4.0International License (http://creativecommons.org/licenses/by/4.0/), which permits use, sharing,adaptation, distribution and reproduction in any medium or format, as long as you give appropriatecredit to the original author(s) and the source, provide a link to the Creative Commons license andindicate if changes were made.
The images or other third party material in this chapter are included in the chapter’s CreativeCommons license, unless indicated otherwise in a credit line to the material. If material is notincluded in the chapter’s Creative Commons license and your intended use is not permitted bystatutory regulation or exceeds the permitted use, you will need to obtain permission directly fromthe copyright holder.
Chapter 4Banana and Mango Value Chains
Harsh Wardhan, Sandip Das, and Ashok Gulati
4.1 Introduction
Fruits are high-value agricultural crops, mostly managed by individual farmers inIndia unlike in the West where large private corporations are involved in productionand exports of fruit crops. India’s fruits production increased significantly from 28.6million metric tonnes (MMT) in 1991–92 to 96.8 MMT in 2018–19. Among fruits,mango and bananas are the most important crops with 50% share in fruits acreageas well as value dominated by mango (Fig. 4.1).
While Andhra Pradesh, Gujarat and Tamil Nadu are the largest banana-producingstates in India, Uttar Pradesh, Andhra Pradesh and Bihar are the three largest mango-producing states. However, Maharashtra is an important producer and exporter forboth. Despite being the largest producer of both bananas and mangoes, India’s posi-tion in the trade of both these fruits is unremarkable. India exported around 103thousand MT of bananas and another 46 thousand MT of mangoes during TE 2017–18,which is less than 1%of total production of the two crops. The processing capacityof these two crops is also limited in India. A significant volume of these fruit crops iswasted every year due to lack of proper post-harvest mechanisms. Banana andmangovalue chains did not witness the kind of success that was seen in grapes, which wasled byMahagrapes. Is it possible to develop banana and mango value chains on samelines as grapes model?
In order to answer this, the chapter strives to study and analyse banana andmango value chains in the CISS–F framework. The study identifies the challengesfaced by the sector at each stage of the value chain from cultivation to marketing. Italso discusses howpolicy reforms can strengthen these value chains to stabilise pricesand ensuring fair share to farmers while guaranteeing healthy and affordable fruitsto the consumers. It is expected that the results of this study and the policy recom-mendations suggested in the end would be useful for the policy planners formulating
H. Wardhan · S. Das · A. Gulati (B)Indian Council for Research on International Economic Relations (ICRIER), New Delhi, India
© The Author(s) 2022A. Gulati et al. (eds.), Agricultural Value Chains in India, India Studies in Businessand Economics, https://doi.org/10.1007/978-981-33-4268-2_4
99
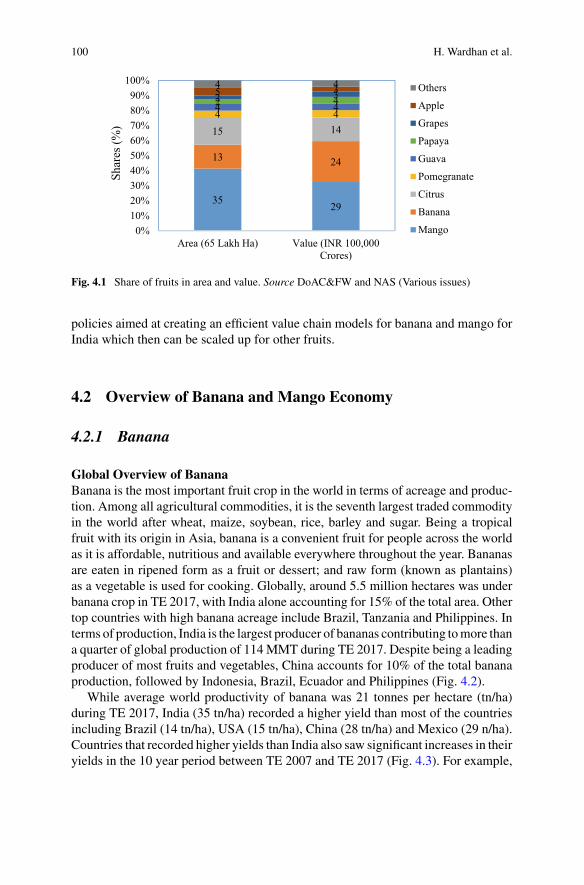
100 H. Wardhan et al.
35 29
13 24
15 144 44 42 42 35 34 4
0%10%20%30%40%50%60%70%80%90%
100%
Area (65 Lakh Ha) Value (INR 100,000Crores)
Shar
es (%
)
Others
Apple
Grapes
Papaya
Guava
Pomegranate
Citrus
Banana
Mango
Fig. 4.1 Share of fruits in area and value. Source DoAC&FW and NAS (Various issues)
policies aimed at creating an efficient value chain models for banana and mango forIndia which then can be scaled up for other fruits.
4.2 Overview of Banana and Mango Economy
4.2.1 Banana
Global Overview of BananaBanana is the most important fruit crop in the world in terms of acreage and produc-tion. Among all agricultural commodities, it is the seventh largest traded commodityin the world after wheat, maize, soybean, rice, barley and sugar. Being a tropicalfruit with its origin in Asia, banana is a convenient fruit for people across the worldas it is affordable, nutritious and available everywhere throughout the year. Bananasare eaten in ripened form as a fruit or dessert; and raw form (known as plantains)as a vegetable is used for cooking. Globally, around 5.5 million hectares was underbanana crop in TE 2017, with India alone accounting for 15% of the total area. Othertop countries with high banana acreage include Brazil, Tanzania and Philippines. Interms of production, India is the largest producer of bananas contributing tomore thana quarter of global production of 114MMT during TE 2017. Despite being a leadingproducer of most fruits and vegetables, China accounts for 10% of the total bananaproduction, followed by Indonesia, Brazil, Ecuador and Philippines (Fig. 4.2).
While average world productivity of banana was 21 tonnes per hectare (tn/ha)during TE 2017, India (35 tn/ha) recorded a higher yield than most of the countriesincluding Brazil (14 tn/ha), USA (15 tn/ha), China (28 tn/ha) and Mexico (29 n/ha).Countries that recorded higher yields than India also saw significant increases in theiryields in the 10 year period between TE 2007 and TE 2017 (Fig. 4.3). For example,
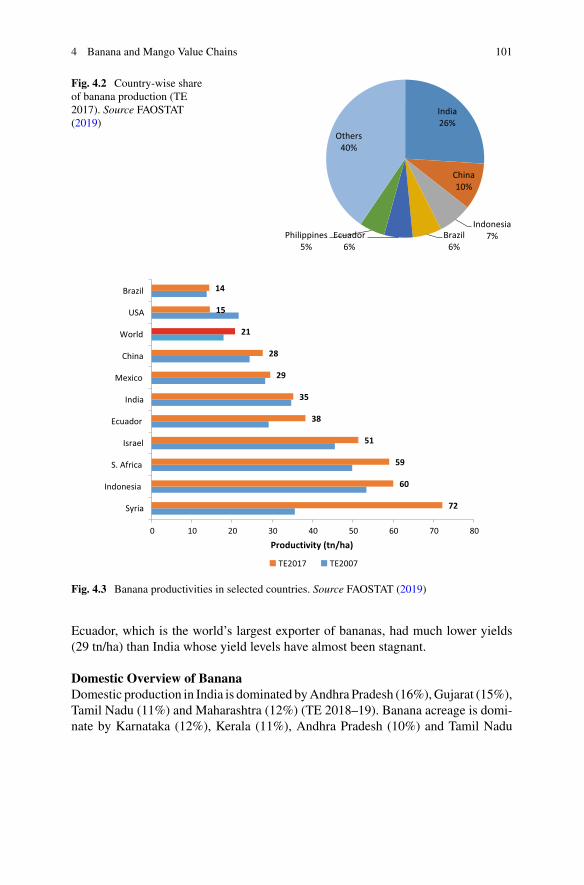
4 Banana and Mango Value Chains 101
Fig. 4.2 Country-wise shareof banana production (TE2017). Source FAOSTAT(2019)
India26%
China10%
Indonesia7%Brazil
6%Ecuador
6%Philippines
5%
Others40%
72
60
59
51
38
35
29
28
21
15
14
0 10 20 30 40 50 60 70 80
Syria
Indonesia
S. Africa
Israel
Ecuador
India
Mexico
China
World
USA
Brazil
Productivity (tn/ha)
TE2017 TE2007
Fig. 4.3 Banana productivities in selected countries. Source FAOSTAT (2019)
Ecuador, which is the world’s largest exporter of bananas, had much lower yields(29 tn/ha) than India whose yield levels have almost been stagnant.
Domestic Overview of BananaDomestic production in India is dominated byAndhra Pradesh (16%),Gujarat (15%),Tamil Nadu (11%) and Maharashtra (12%) (TE 2018–19). Banana acreage is domi-nate by Karnataka (12%), Kerala (11%), Andhra Pradesh (10%) and Tamil Nadu
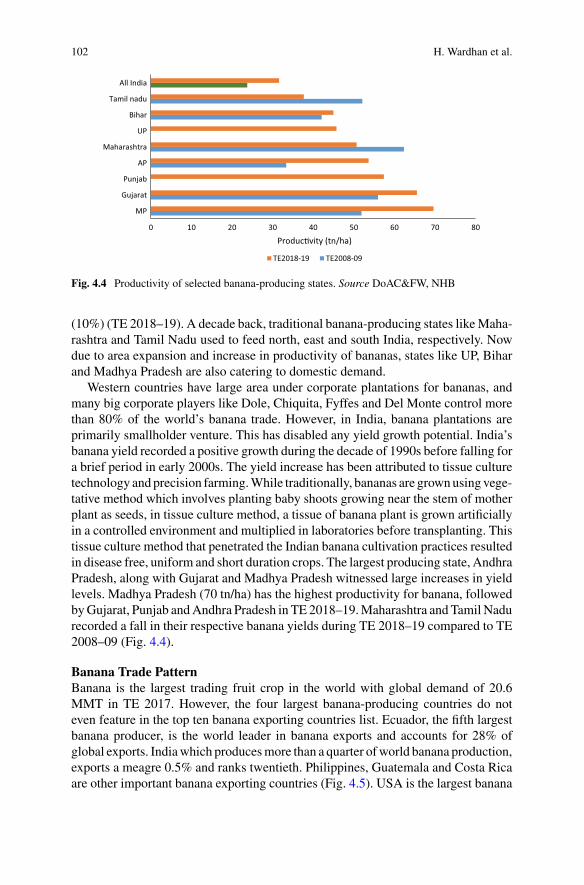
102 H. Wardhan et al.
0 10 20 30 40 50 60 70 80
MP
Gujarat
Punjab
AP
Maharashtra
UP
Bihar
Tamil nadu
All India
Produc�vity (tn/ha)
TE2018-19 TE2008-09
Fig. 4.4 Productivity of selected banana-producing states. Source DoAC&FW, NHB
(10%) (TE 2018–19). A decade back, traditional banana-producing states likeMaha-rashtra and Tamil Nadu used to feed north, east and south India, respectively. Nowdue to area expansion and increase in productivity of bananas, states like UP, Biharand Madhya Pradesh are also catering to domestic demand.
Western countries have large area under corporate plantations for bananas, andmany big corporate players like Dole, Chiquita, Fyffes and Del Monte control morethan 80% of the world’s banana trade. However, in India, banana plantations areprimarily smallholder venture. This has disabled any yield growth potential. India’sbanana yield recorded a positive growth during the decade of 1990s before falling fora brief period in early 2000s. The yield increase has been attributed to tissue culturetechnology andprecision farming.While traditionally, bananas are grownusing vege-tative method which involves planting baby shoots growing near the stem of motherplant as seeds, in tissue culture method, a tissue of banana plant is grown artificiallyin a controlled environment and multiplied in laboratories before transplanting. Thistissue culture method that penetrated the Indian banana cultivation practices resultedin disease free, uniform and short duration crops. The largest producing state, AndhraPradesh, along with Gujarat and Madhya Pradesh witnessed large increases in yieldlevels. Madhya Pradesh (70 tn/ha) has the highest productivity for banana, followedbyGujarat, Punjab andAndhra Pradesh in TE 2018–19.Maharashtra and Tamil Nadurecorded a fall in their respective banana yields during TE 2018–19 compared to TE2008–09 (Fig. 4.4).
Banana Trade PatternBanana is the largest trading fruit crop in the world with global demand of 20.6MMT in TE 2017. However, the four largest banana-producing countries do noteven feature in the top ten banana exporting countries list. Ecuador, the fifth largestbanana producer, is the world leader in banana exports and accounts for 28% ofglobal exports. Indiawhich producesmore than a quarter ofworld banana production,exports a meagre 0.5% and ranks twentieth. Philippines, Guatemala and Costa Ricaare other important banana exporting countries (Fig. 4.5). USA is the largest banana
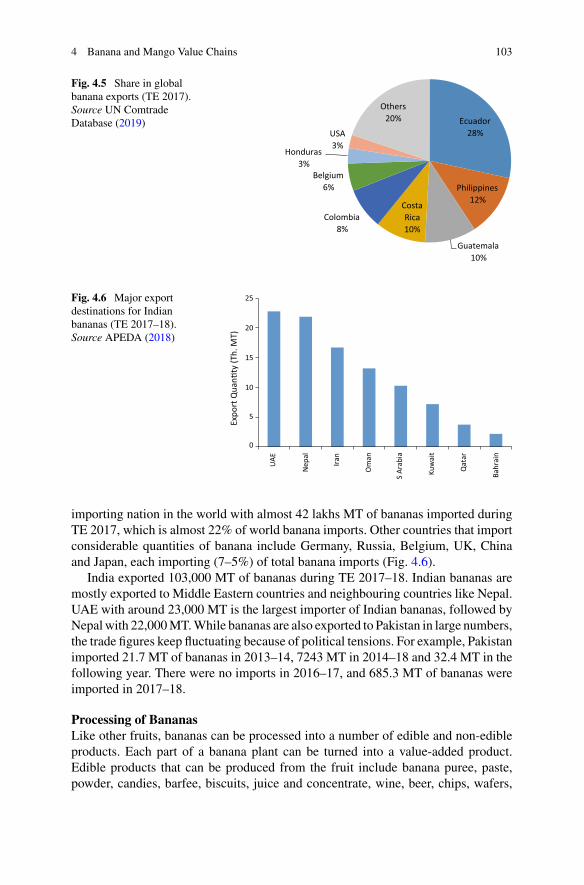
4 Banana and Mango Value Chains 103
Fig. 4.5 Share in globalbanana exports (TE 2017).Source UN ComtradeDatabase (2019) Ecuador
28%
Philippines12%
Guatemala10%
Costa Rica10%
Colombia8%
Belgium6%
Honduras3%
USA3%
Others20%
Fig. 4.6 Major exportdestinations for Indianbananas (TE 2017–18).Source APEDA (2018)
0
5
10
15
20
25
Expo
rt Q
uan�
ty (T
h. M
T)
UAE
Nep
al
Iran
Om
an
S Ar
abia
Kuw
ait
Qat
ar
Bahr
ain
importing nation in the world with almost 42 lakhs MT of bananas imported duringTE 2017, which is almost 22% of world banana imports. Other countries that importconsiderable quantities of banana include Germany, Russia, Belgium, UK, Chinaand Japan, each importing (7–5%) of total banana imports (Fig. 4.6).
India exported 103,000 MT of bananas during TE 2017–18. Indian bananas aremostly exported to Middle Eastern countries and neighbouring countries like Nepal.UAE with around 23,000 MT is the largest importer of Indian bananas, followed byNepalwith 22,000MT.While bananas are also exported to Pakistan in large numbers,the trade figures keep fluctuating because of political tensions. For example, Pakistanimported 21.7 MT of bananas in 2013–14, 7243 MT in 2014–18 and 32.4 MT in thefollowing year. There were no imports in 2016–17, and 685.3 MT of bananas wereimported in 2017–18.
Processing of BananasLike other fruits, bananas can be processed into a number of edible and non-edibleproducts. Each part of a banana plant can be turned into a value-added product.Edible products that can be produced from the fruit include banana puree, paste,powder, candies, barfee, biscuits, juice and concentrate, wine, beer, chips, wafers,
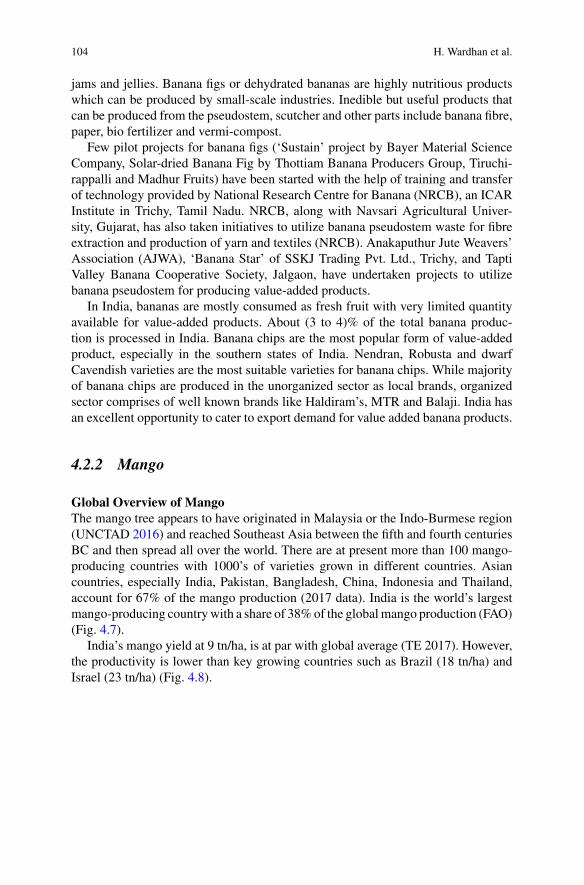
104 H. Wardhan et al.
jams and jellies. Banana figs or dehydrated bananas are highly nutritious productswhich can be produced by small-scale industries. Inedible but useful products thatcan be produced from the pseudostem, scutcher and other parts include banana fibre,paper, bio fertilizer and vermi-compost.
Few pilot projects for banana figs (‘Sustain’ project by Bayer Material ScienceCompany, Solar-dried Banana Fig by Thottiam Banana Producers Group, Tiruchi-rappalli and Madhur Fruits) have been started with the help of training and transferof technology provided by National Research Centre for Banana (NRCB), an ICARInstitute in Trichy, Tamil Nadu. NRCB, along with Navsari Agricultural Univer-sity, Gujarat, has also taken initiatives to utilize banana pseudostem waste for fibreextraction and production of yarn and textiles (NRCB). Anakaputhur Jute Weavers’Association (AJWA), ‘Banana Star’ of SSKJ Trading Pvt. Ltd., Trichy, and TaptiValley Banana Cooperative Society, Jalgaon, have undertaken projects to utilizebanana pseudostem for producing value-added products.
In India, bananas are mostly consumed as fresh fruit with very limited quantityavailable for value-added products. About (3 to 4)% of the total banana produc-tion is processed in India. Banana chips are the most popular form of value-addedproduct, especially in the southern states of India. Nendran, Robusta and dwarfCavendish varieties are the most suitable varieties for banana chips. While majorityof banana chips are produced in the unorganized sector as local brands, organizedsector comprises of well known brands like Haldiram’s, MTR and Balaji. India hasan excellent opportunity to cater to export demand for value added banana products.
4.2.2 Mango
Global Overview of MangoThe mango tree appears to have originated in Malaysia or the Indo-Burmese region(UNCTAD 2016) and reached Southeast Asia between the fifth and fourth centuriesBC and then spread all over the world. There are at present more than 100 mango-producing countries with 1000’s of varieties grown in different countries. Asiancountries, especially India, Pakistan, Bangladesh, China, Indonesia and Thailand,account for 67% of the mango production (2017 data). India is the world’s largestmango-producing countrywith a share of 38%of the globalmango production (FAO)(Fig. 4.7).
India’s mango yield at 9 tn/ha, is at par with global average (TE 2017). However,the productivity is lower than key growing countries such as Brazil (18 tn/ha) andIsrael (23 tn/ha) (Fig. 4.8).
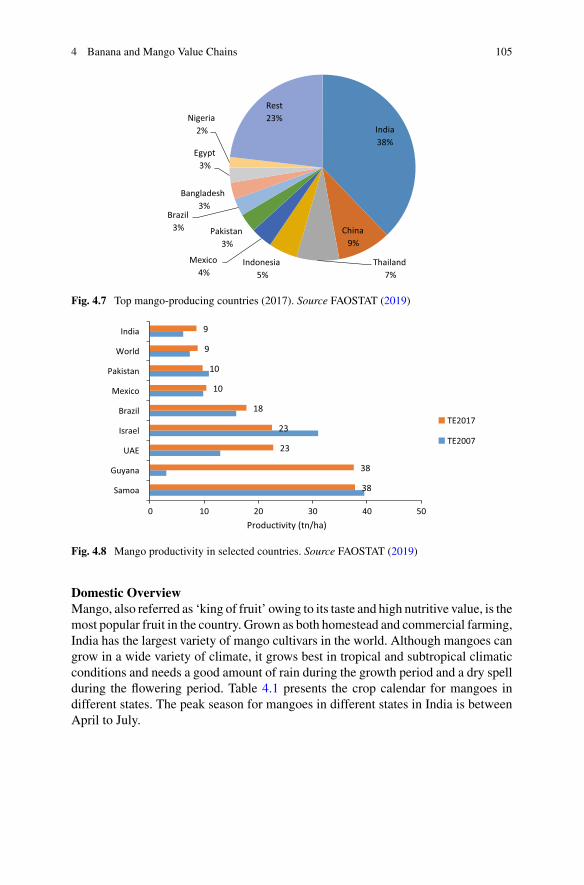
4 Banana and Mango Value Chains 105
India38%
China9%
Thailand7%
Indonesia5%
Mexico4%
Pakistan3%
Brazil3%
Bangladesh3%
Egypt3%
Nigeria2%
Rest23%
Fig. 4.7 Top mango-producing countries (2017). Source FAOSTAT (2019)
38
38
23
23
18
10
10
9
9
0 10 20 30 40 50
Samoa
Guyana
UAE
Israel
Brazil
Mexico
Pakistan
World
India
Productivity (tn/ha)
TE2017
TE2007
Fig. 4.8 Mango productivity in selected countries. Source FAOSTAT (2019)
Domestic OverviewMango, also referred as ‘king of fruit’ owing to its taste and high nutritive value, is themost popular fruit in the country. Grown as both homestead and commercial farming,India has the largest variety of mango cultivars in the world. Although mangoes cangrow in a wide variety of climate, it grows best in tropical and subtropical climaticconditions and needs a good amount of rain during the growth period and a dry spellduring the flowering period. Table 4.1 presents the crop calendar for mangoes indifferent states. The peak season for mangoes in different states in India is betweenApril to July.
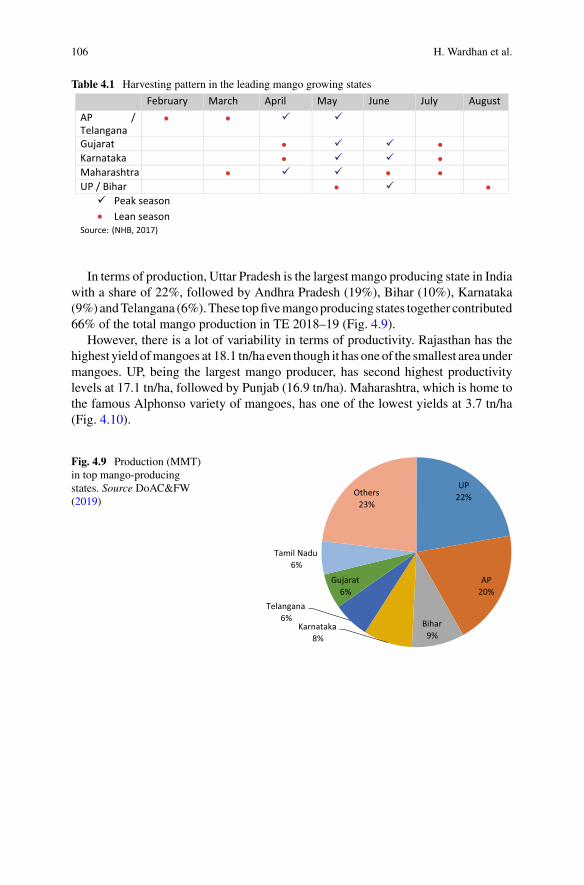
106 H. Wardhan et al.
Table 4.1 Harvesting pattern in the leading mango growing states
February March April May June July AugustAP / TelanganaGujaratKarnatakaMaharashtraUP / Bihar
Peak season Lean season
Source: (NHB, 2017)
In terms of production, Uttar Pradesh is the largest mango producing state in Indiawith a share of 22%, followed by Andhra Pradesh (19%), Bihar (10%), Karnataka(9%) andTelangana (6%).These topfivemangoproducing states together contributed66% of the total mango production in TE 2018–19 (Fig. 4.9).
However, there is a lot of variability in terms of productivity. Rajasthan has thehighest yield ofmangoes at 18.1 tn/ha even though it has oneof the smallest area undermangoes. UP, being the largest mango producer, has second highest productivitylevels at 17.1 tn/ha, followed by Punjab (16.9 tn/ha). Maharashtra, which is home tothe famous Alphonso variety of mangoes, has one of the lowest yields at 3.7 tn/ha(Fig. 4.10).
Fig. 4.9 Production (MMT)in top mango-producingstates. Source DoAC&FW(2019)
UP22%
AP20%
Bihar9%
Karnataka8%
Telangana6%
Gujarat6%
Tamil Nadu6%
Others23%
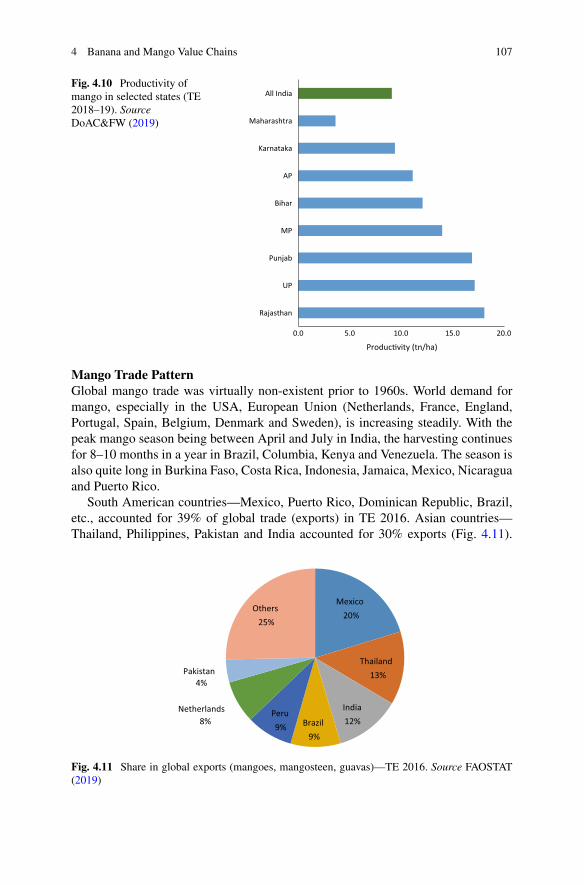
4 Banana and Mango Value Chains 107
Fig. 4.10 Productivity ofmango in selected states (TE2018–19). SourceDoAC&FW (2019)
0.0 5.0 10.0 15.0 20.0
Rajasthan
UP
Punjab
MP
Bihar
AP
Karnataka
Maharashtra
All India
Produc�vity (tn/ha)
Mango Trade PatternGlobal mango trade was virtually non-existent prior to 1960s. World demand formango, especially in the USA, European Union (Netherlands, France, England,Portugal, Spain, Belgium, Denmark and Sweden), is increasing steadily. With thepeak mango season being between April and July in India, the harvesting continuesfor 8–10 months in a year in Brazil, Columbia, Kenya and Venezuela. The season isalso quite long in Burkina Faso, Costa Rica, Indonesia, Jamaica, Mexico, Nicaraguaand Puerto Rico.
South American countries—Mexico, Puerto Rico, Dominican Republic, Brazil,etc., accounted for 39% of global trade (exports) in TE 2016. Asian countries—Thailand, Philippines, Pakistan and India accounted for 30% exports (Fig. 4.11).
Mexico20%
Thailand13%
India12%Brazil
9%
Peru9%
Netherlands8%
Pakistan4%
Others25%
Fig. 4.11 Share in global exports (mangoes, mangosteen, guavas)—TE 2016. Source FAOSTAT(2019)
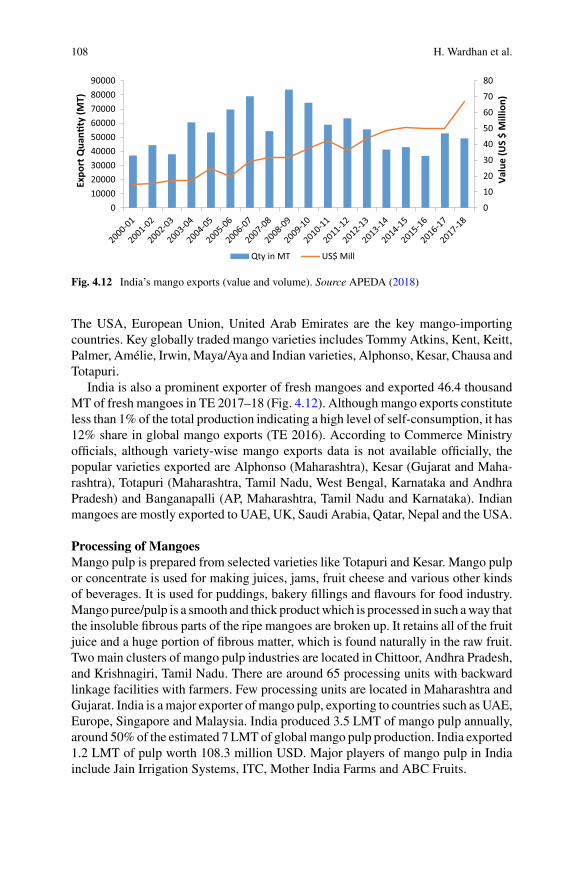
108 H. Wardhan et al.
0
10
20
30
40
50
60
70
80
0100002000030000400005000060000700008000090000
Valu
e (U
S $
Mill
ion)
Expo
rt Q
uan�
ty (M
T)
Qty in MT US$ Mill
Fig. 4.12 India’s mango exports (value and volume). Source APEDA (2018)
The USA, European Union, United Arab Emirates are the key mango-importingcountries. Key globally traded mango varieties includes Tommy Atkins, Kent, Keitt,Palmer, Amélie, Irwin, Maya/Aya and Indian varieties, Alphonso, Kesar, Chausa andTotapuri.
India is also a prominent exporter of fresh mangoes and exported 46.4 thousandMT of fresh mangoes in TE 2017–18 (Fig. 4.12). Although mango exports constituteless than 1% of the total production indicating a high level of self-consumption, it has12% share in global mango exports (TE 2016). According to Commerce Ministryofficials, although variety-wise mango exports data is not available officially, thepopular varieties exported are Alphonso (Maharashtra), Kesar (Gujarat and Maha-rashtra), Totapuri (Maharashtra, Tamil Nadu, West Bengal, Karnataka and AndhraPradesh) and Banganapalli (AP, Maharashtra, Tamil Nadu and Karnataka). Indianmangoes are mostly exported to UAE, UK, Saudi Arabia, Qatar, Nepal and the USA.
Processing of MangoesMango pulp is prepared from selected varieties like Totapuri and Kesar. Mango pulpor concentrate is used for making juices, jams, fruit cheese and various other kindsof beverages. It is used for puddings, bakery fillings and flavours for food industry.Mango puree/pulp is a smooth and thick productwhich is processed in such away thatthe insoluble fibrous parts of the ripe mangoes are broken up. It retains all of the fruitjuice and a huge portion of fibrous matter, which is found naturally in the raw fruit.Two main clusters of mango pulp industries are located in Chittoor, Andhra Pradesh,and Krishnagiri, Tamil Nadu. There are around 65 processing units with backwardlinkage facilities with farmers. Few processing units are located in Maharashtra andGujarat. India is amajor exporter of mango pulp, exporting to countries such as UAE,Europe, Singapore and Malaysia. India produced 3.5 LMT of mango pulp annually,around 50%of the estimated 7 LMTof global mango pulp production. India exported1.2 LMT of pulp worth 108.3 million USD. Major players of mango pulp in Indiainclude Jain Irrigation Systems, ITC, Mother India Farms and ABC Fruits.
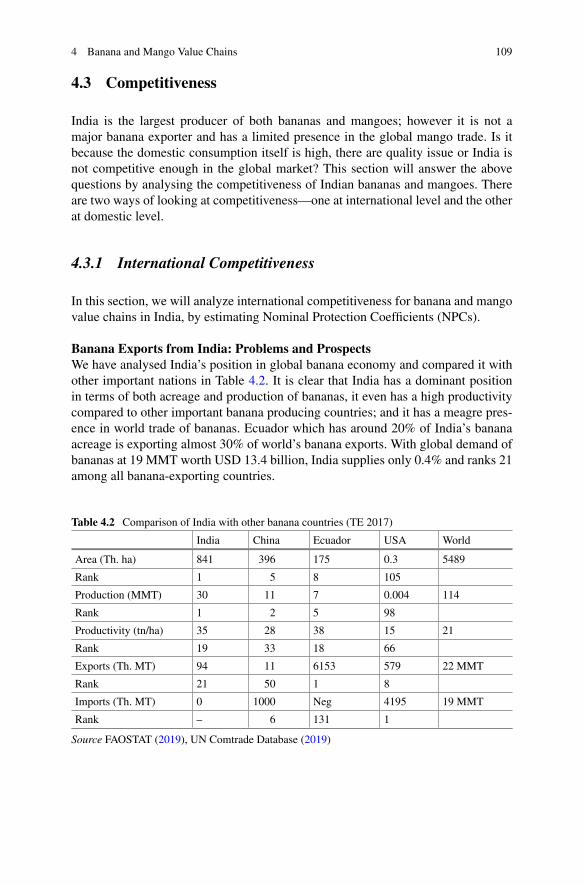
4 Banana and Mango Value Chains 109
4.3 Competitiveness
India is the largest producer of both bananas and mangoes; however it is not amajor banana exporter and has a limited presence in the global mango trade. Is itbecause the domestic consumption itself is high, there are quality issue or India isnot competitive enough in the global market? This section will answer the abovequestions by analysing the competitiveness of Indian bananas and mangoes. Thereare two ways of looking at competitiveness—one at international level and the otherat domestic level.
4.3.1 International Competitiveness
In this section, we will analyze international competitiveness for banana and mangovalue chains in India, by estimating Nominal Protection Coefficients (NPCs).
Banana Exports from India: Problems and ProspectsWe have analysed India’s position in global banana economy and compared it withother important nations in Table 4.2. It is clear that India has a dominant positionin terms of both acreage and production of bananas, it even has a high productivitycompared to other important banana producing countries; and it has a meagre pres-ence in world trade of bananas. Ecuador which has around 20% of India’s bananaacreage is exporting almost 30% of world’s banana exports. With global demand ofbananas at 19 MMT worth USD 13.4 billion, India supplies only 0.4% and ranks 21among all banana-exporting countries.
Table 4.2 Comparison of India with other banana countries (TE 2017)
India China Ecuador USA World
Area (Th. ha) 841 396 175 0.3 5489
Rank 1 5 8 105
Production (MMT) 30 11 7 0.004 114
Rank 1 2 5 98
Productivity (tn/ha) 35 28 38 15 21
Rank 19 33 18 66
Exports (Th. MT) 94 11 6153 579 22 MMT
Rank 21 50 1 8
Imports (Th. MT) 0 1000 Neg 4195 19 MMT
Rank – 6 131 1
Source FAOSTAT (2019), UN Comtrade Database (2019)
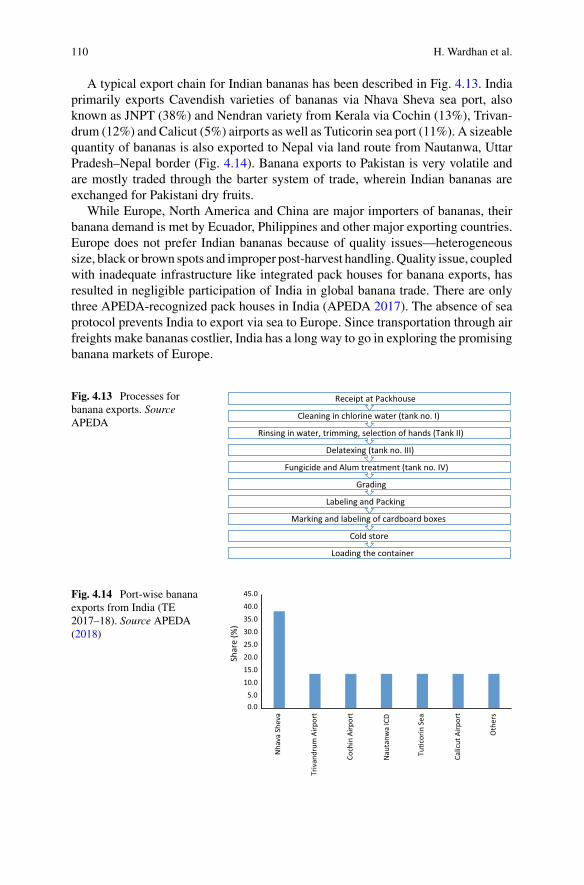
110 H. Wardhan et al.
A typical export chain for Indian bananas has been described in Fig. 4.13. Indiaprimarily exports Cavendish varieties of bananas via Nhava Sheva sea port, alsoknown as JNPT (38%) and Nendran variety from Kerala via Cochin (13%), Trivan-drum (12%) and Calicut (5%) airports as well as Tuticorin sea port (11%). A sizeablequantity of bananas is also exported to Nepal via land route from Nautanwa, UttarPradesh–Nepal border (Fig. 4.14). Banana exports to Pakistan is very volatile andare mostly traded through the barter system of trade, wherein Indian bananas areexchanged for Pakistani dry fruits.
While Europe, North America and China are major importers of bananas, theirbanana demand is met by Ecuador, Philippines and other major exporting countries.Europe does not prefer Indian bananas because of quality issues—heterogeneoussize, black or brown spots and improper post-harvest handling.Quality issue, coupledwith inadequate infrastructure like integrated pack houses for banana exports, hasresulted in negligible participation of India in global banana trade. There are onlythree APEDA-recognized pack houses in India (APEDA 2017). The absence of seaprotocol prevents India to export via sea to Europe. Since transportation through airfreights make bananas costlier, India has a long way to go in exploring the promisingbanana markets of Europe.
Fig. 4.13 Processes forbanana exports. SourceAPEDA
Loading the container
Cold store
Marking and labeling of cardboard boxes
Labeling and Packing
Grading
Fungicide and Alum treatment (tank no. IV)
Delatexing (tank no. III)
Rinsing in water, trimming, selec�on of hands (Tank II)
Cleaning in chlorine water (tank no. I)
Receipt at Packhouse
Fig. 4.14 Port-wise bananaexports from India (TE2017–18). Source APEDA(2018)
5.00.0
10.0
15.0
20.0
25.0
30.0
35.0
40.0
45.0
Shar
e (%
)
Nha
va S
heva
Triv
andr
um A
irpor
t
Coch
in A
irpor
t
Nau
tanw
a IC
D
Tu�c
orin
Sea
Calic
ut A
irpor
t
Oth
ers
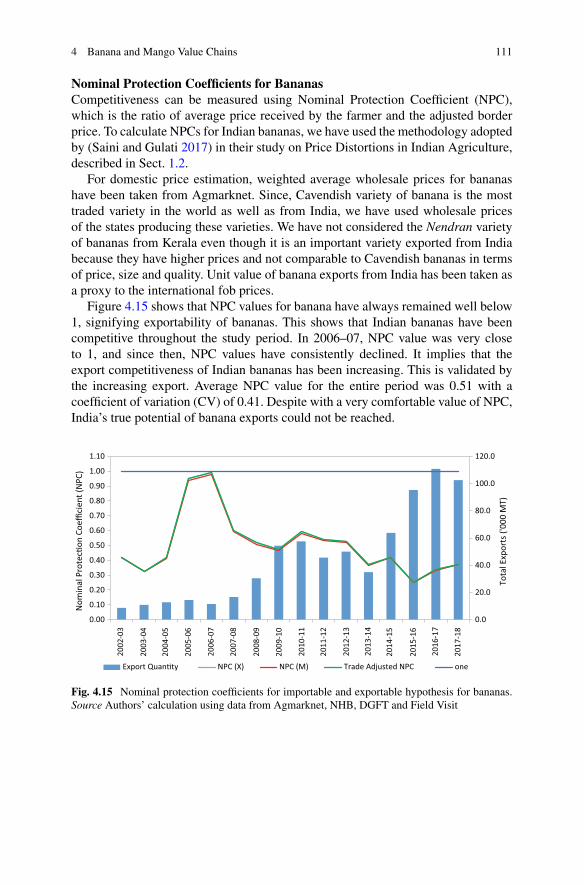
4 Banana and Mango Value Chains 111
Nominal Protection Coefficients for BananasCompetitiveness can be measured using Nominal Protection Coefficient (NPC),which is the ratio of average price received by the farmer and the adjusted borderprice. To calculate NPCs for Indian bananas, we have used the methodology adoptedby (Saini and Gulati 2017) in their study on Price Distortions in Indian Agriculture,described in Sect. 1.2.
For domestic price estimation, weighted average wholesale prices for bananashave been taken from Agmarknet. Since, Cavendish variety of banana is the mosttraded variety in the world as well as from India, we have used wholesale pricesof the states producing these varieties. We have not considered the Nendran varietyof bananas from Kerala even though it is an important variety exported from Indiabecause they have higher prices and not comparable to Cavendish bananas in termsof price, size and quality. Unit value of banana exports from India has been taken asa proxy to the international fob prices.
Figure 4.15 shows that NPC values for banana have always remained well below1, signifying exportability of bananas. This shows that Indian bananas have beencompetitive throughout the study period. In 2006–07, NPC value was very closeto 1, and since then, NPC values have consistently declined. It implies that theexport competitiveness of Indian bananas has been increasing. This is validated bythe increasing export. Average NPC value for the entire period was 0.51 with acoefficient of variation (CV) of 0.41. Despite with a very comfortable value of NPC,India’s true potential of banana exports could not be reached.
0.0
20.0
40.0
60.0
80.0
100.0
120.0
0.00
0.10
0.20
0.30
0.40
0.50
0.60
0.70
0.80
0.90
1.00
1.10
Tota
l Exp
orts
('00
0 M
T)
Nom
inal
Pro
tec�
on C
oeffi
cien
t (N
PC)
Export Quan�ty NPC (X) NPC (M) Trade Adjusted NPC one
2002
-03
2003
-04
2004
-05
2005
-06
2006
-07
2007
-08
2008
-09
2009
-10
2010
-11
2011
-12
2012
-13
2013
-14
2014
-15
2015
-16
2016
-17
2017
-18
Fig. 4.15 Nominal protection coefficients for importable and exportable hypothesis for bananas.Source Authors’ calculation using data from Agmarknet, NHB, DGFT and Field Visit
112 H. Wardhan et al.
Trade Policy of BananasAlthough bananas are export competitive in the international market, Indian farmersare unable to reap benefits of this fact. They are largely small holding farms for whomaccess to export market are non-existent.
Whatever little exports India manages in bananas is because of steps taken bygovernment agencies in terms of policies and infrastructural development.
India follows open export policy where banana exporters get an incentive of7% of FOB value under the Merchandise Exports from India (MEIS) Scheme.Import duties on bananas at 30% helps control import and enables the farmers tocater to domestic demand. To promote banana exports, APEDA provides subsidiesfor creation of ripening chambers, reefer vehicles, pack houses and cable systemof handling. There is also a provision for assistance in projects for quality devel-opment (certifications, handheld devices for traceability, water, soil and pesticidestesters, laboratory upgradations) and market development (trial shipments and brandregistrations).
Mango Exports from India: Problems and ProspectsIndia exports mangoes to around 60 countries. However, the major export destina-tions for Indian mangoes are United Arab Emirates, United Kingdom, Nepal, SaudiArabia, Qatar and the USA. Japan and South Korea are new markets for Indianmangoes. Mango exports to the USA, Europe, Japan and South Korea are sourcedfromAPEDA-approvedpackhouses.All consignments toEU,SouthKorea and Japanhave to undergo hot-water treatment (HWT) or vapour heat treatment (VHT). SouthKorean government annually deputes Quarantine Inspectors to India for verificationof mango consignments which undergo HWT or VHT.
As per norms agreed upon between India and USA, all the mangoes to be shippedhave to undergo irradiation process at the Maharashtra State Agricultural MarketingBoard facility at Vashi (Mumbai) and Lasalgaon. An official from USDA takes asample of the mangoes for testing at the irradiation facility. Irradiation is mandatoryfor the mango exports to USA as the process eliminates pests like stone wheeler andfruit flies.
According to a leading exporter, Indian mangoes are mostly consumed by Asianorigin population in the USA. The distinct feature of Indian mango is that it is ‘thin-skinned’ and has a flavour, while importedmangoes fromMexico and other countriesare ‘thick-skinned’ without much flavour. During our interaction with exporters, wefound out that Indian mangoes have a maximum shelf life of around 28 days, whileit takes about 20 days to transport mangoes from India to USA through sea route.According to APEDA officials, sea protocol has not been formulated yet because ofless shelf life ofmangoes.As all the consignments ofmangoes are transferred throughair, air-freight costs are high compared to mangoes imported from South Americancountries to USA. For mango exports to Europe, mangoes are put through hot-watertreatment and vapour treatment. For shipment to South Korea, its mandatory toconduct a pest risk analysis. APEDA has mandated the mango growers registeredwith it to adopt global GoodAgricultural Practices (GAP) norms for ensuring qualityproduce. Increasingly, consumers across the globe are demanding food products
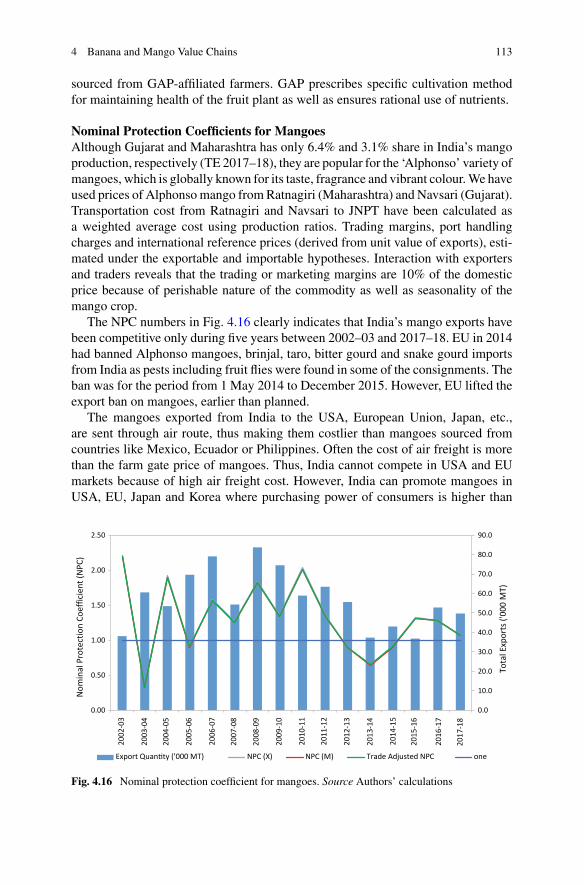
4 Banana and Mango Value Chains 113
sourced from GAP-affiliated farmers. GAP prescribes specific cultivation methodfor maintaining health of the fruit plant as well as ensures rational use of nutrients.
Nominal Protection Coefficients for MangoesAlthough Gujarat and Maharashtra has only 6.4% and 3.1% share in India’s mangoproduction, respectively (TE 2017–18), they are popular for the ‘Alphonso’ variety ofmangoes, which is globally known for its taste, fragrance and vibrant colour.We haveused prices of Alphonsomango fromRatnagiri (Maharashtra) and Navsari (Gujarat).Transportation cost from Ratnagiri and Navsari to JNPT have been calculated asa weighted average cost using production ratios. Trading margins, port handlingcharges and international reference prices (derived from unit value of exports), esti-mated under the exportable and importable hypotheses. Interaction with exportersand traders reveals that the trading or marketing margins are 10% of the domesticprice because of perishable nature of the commodity as well as seasonality of themango crop.
The NPC numbers in Fig. 4.16 clearly indicates that India’s mango exports havebeen competitive only during five years between 2002–03 and 2017–18. EU in 2014had banned Alphonso mangoes, brinjal, taro, bitter gourd and snake gourd importsfrom India as pests including fruit flies were found in some of the consignments. Theban was for the period from 1 May 2014 to December 2015. However, EU lifted theexport ban on mangoes, earlier than planned.
The mangoes exported from India to the USA, European Union, Japan, etc.,are sent through air route, thus making them costlier than mangoes sourced fromcountries like Mexico, Ecuador or Philippines. Often the cost of air freight is morethan the farm gate price of mangoes. Thus, India cannot compete in USA and EUmarkets because of high air freight cost. However, India can promote mangoes inUSA, EU, Japan and Korea where purchasing power of consumers is higher than
0.0
10.0
20.0
30.0
40.0
50.0
60.0
70.0
80.0
90.0
0.00
0.50
1.00
1.50
2.00
2.50
Tota
l Exp
orts
('00
0 M
T)
Nom
inal
Pro
tect
ion
Coef
ficie
nt (N
PC)
Export Quan ty ('000 MT) NPC (X) NPC (M) Trade Adjusted NPC one
2002
-03
2003
-04
2004
-05
2005
-06
2006
-07
2007
-08
2008
-09
2009
-10
2010
-11
2011
-12
2012
-13
2013
-14
2014
-15
2015
-16
2016
-17
2017
-18
Fig. 4.16 Nominal protection coefficient for mangoes. Source Authors’ calculations
114 H. Wardhan et al.
Middle East countries to promote the unique flavour, colour and taste of Indianmangoes abroad.
4.3.2 Domestic Price Formation
Banana Domestic Value ChainBananas are produced in India throughout the year in almost all major states, unlikegrapes and pomegranates that are concentrated only in Maharashtra. However, mostof the produce is consumed well within India.
In India, Andhra Pradesh, Gujarat, Tamil Nadu and Maharashtra are the fourlargest banana-producing states that supply bananas all over India. For years, Maha-rashtra and Gujarat held a dominant position in banana trade, supplying most ofthe bananas to north India. A horticulture special train that started in 2012 used totransport bananas from Jalgaon to Azadpur mandi in Delhi. From there on, bananaswere loaded on to trucks and supplied to various other states in north India.
The train however was suspended in 2016 because of changes in trading pattern,better road and highway connectivity, emergence of other major banana-producingregions (likeAndhra Pradesh, Uttar Pradesh andMadhya Pradesh), and long durationand high costs associated with transporting via train. Further, there were hassles oftransporting, loading and unloading bananas from truck to train and again from trainto trucks during the arrival at the destination. Since other north Indianmarkets startedreceiving bananas via trucks directly from Jalgaon, Delhi market could not absorbthe high arrivals, and hence, the train services stopped.
Jalgaon (part of the productive and irrigated region of Khandesh) supplies morethan 50% of its bananas to Delhi. Rest are sent to other northern and western states ofIndia likeHimachal, Punjab,Uttar Pradesh,MadhyaPradesh andwithinMaharashtra.Jalgaon is also known as the ‘Banana city’ of India because of its large bananaproduction, contributing about 50% of the total state production of Maharashtra.The presence of many small and major rivers from the Satpura range like Tapi hasmade Jalgaon very favourable for banana cultivation. Apart from this, Jain Irrigation(JISL) has developed and provided drip irrigation, sprinkler technologies and mostimportantly the tissue culture technology to the farmers that catalyzed a bananarevolution in India.
Even though banana can be cultivated throughout the year, the peak harvestingmonths for bananas in Jalgaon has been observed to be June–July. During this time,prices are very low as mango arrivals are also at peak during this time.
Unlike vegetable marketing at mandi premises, bananas are traded directly fromthe farms by post-harvest contractors, commission agents or directly by traders.Sorting, weighing, washing and packing are all done at the farm level itself beforeloading on to trucks. Nowadays, box packing is preferred over traditional way oftransporting loose bunches of bananas. This has considerably improved the qualityof bananas and also reduced wastages. The price in Jalgaon is based on the pricesdisplayed at Yawal APMC mandi board. The price for a day is decided the evening
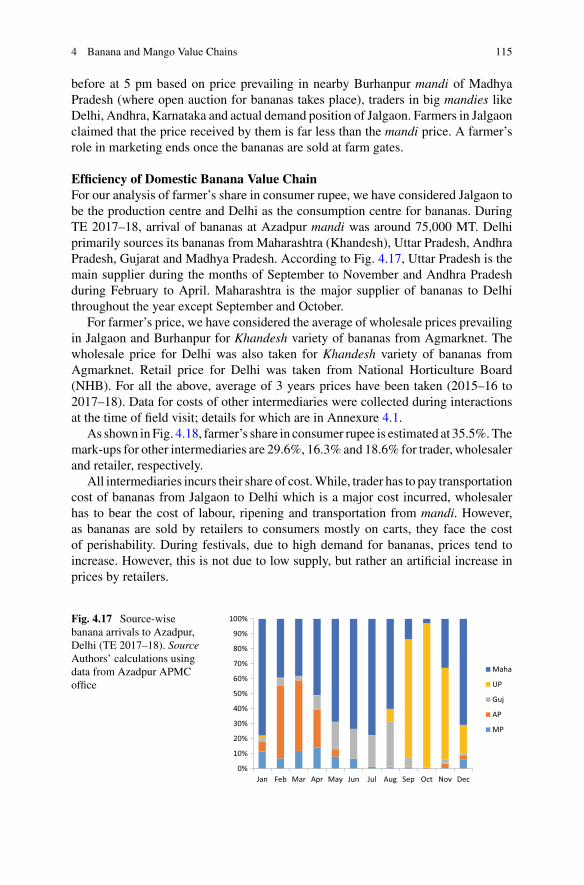
4 Banana and Mango Value Chains 115
before at 5 pm based on price prevailing in nearby Burhanpur mandi of MadhyaPradesh (where open auction for bananas takes place), traders in big mandies likeDelhi, Andhra, Karnataka and actual demand position of Jalgaon. Farmers in Jalgaonclaimed that the price received by them is far less than the mandi price. A farmer’srole in marketing ends once the bananas are sold at farm gates.
Efficiency of Domestic Banana Value ChainFor our analysis of farmer’s share in consumer rupee, we have considered Jalgaon tobe the production centre and Delhi as the consumption centre for bananas. DuringTE 2017–18, arrival of bananas at Azadpur mandi was around 75,000 MT. Delhiprimarily sources its bananas from Maharashtra (Khandesh), Uttar Pradesh, AndhraPradesh, Gujarat and Madhya Pradesh. According to Fig. 4.17, Uttar Pradesh is themain supplier during the months of September to November and Andhra Pradeshduring February to April. Maharashtra is the major supplier of bananas to Delhithroughout the year except September and October.
For farmer’s price, we have considered the average of wholesale prices prevailingin Jalgaon and Burhanpur for Khandesh variety of bananas from Agmarknet. Thewholesale price for Delhi was also taken for Khandesh variety of bananas fromAgmarknet. Retail price for Delhi was taken from National Horticulture Board(NHB). For all the above, average of 3 years prices have been taken (2015–16 to2017–18). Data for costs of other intermediaries were collected during interactionsat the time of field visit; details for which are in Annexure 4.1.
As shown inFig. 4.18, farmer’s share in consumer rupee is estimated at 35.5%.Themark-ups for other intermediaries are 29.6%, 16.3% and 18.6% for trader, wholesalerand retailer, respectively.
All intermediaries incurs their share of cost.While, trader has to pay transportationcost of bananas from Jalgaon to Delhi which is a major cost incurred, wholesalerhas to bear the cost of labour, ripening and transportation from mandi. However,as bananas are sold by retailers to consumers mostly on carts, they face the costof perishability. During festivals, due to high demand for bananas, prices tend toincrease. However, this is not due to low supply, but rather an artificial increase inprices by retailers.
Fig. 4.17 Source-wisebanana arrivals to Azadpur,Delhi (TE 2017–18). SourceAuthors’ calculations usingdata from Azadpur APMCoffice
0%
10%
20%
30%
40%
50%
60%
70%
80%
90%
100%
Jan Feb Mar Apr May Jun Jul Aug Sep Oct Nov Dec
Maha
UP
Guj
AP
MP
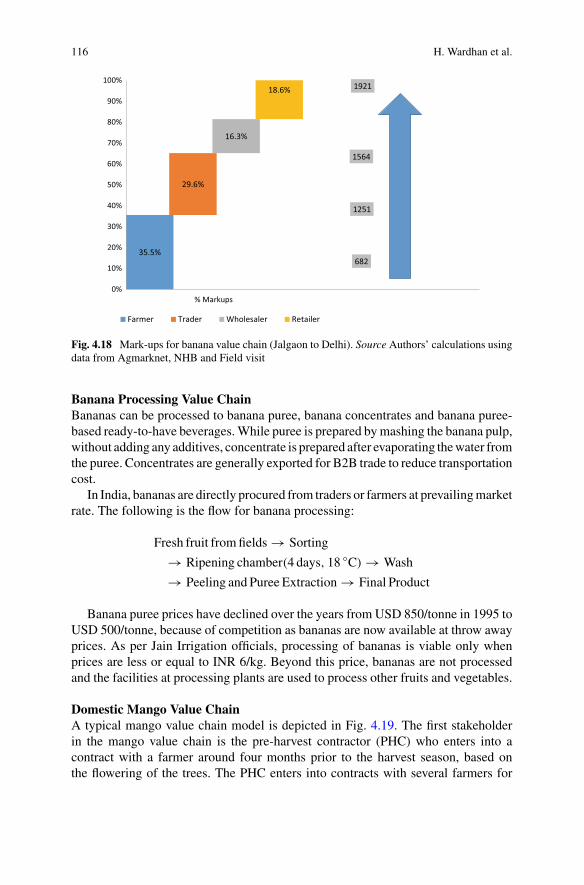
116 H. Wardhan et al.
35.5%682
29.6%
1251
16.3%
1564
18.6% 1921
0%
10%
20%
30%
40%
50%
60%
70%
80%
90%
100%
% Markups
Farmer Trader Wholesaler Retailer
Fig. 4.18 Mark-ups for banana value chain (Jalgaon to Delhi). Source Authors’ calculations usingdata from Agmarknet, NHB and Field visit
Banana Processing Value ChainBananas can be processed to banana puree, banana concentrates and banana puree-based ready-to-have beverages.While puree is prepared bymashing the banana pulp,without adding any additives, concentrate is prepared after evaporating thewater fromthe puree. Concentrates are generally exported for B2B trade to reduce transportationcost.
In India, bananas are directly procured from traders or farmers at prevailingmarketrate. The following is the flow for banana processing:
Fresh fruit fromfields → Sorting
→ Ripening chamber(4 days, 18 ◦C) → Wash
→ Peeling and Puree Extraction → Final Product
Banana puree prices have declined over the years from USD 850/tonne in 1995 toUSD 500/tonne, because of competition as bananas are now available at throw awayprices. As per Jain Irrigation officials, processing of bananas is viable only whenprices are less or equal to INR 6/kg. Beyond this price, bananas are not processedand the facilities at processing plants are used to process other fruits and vegetables.
Domestic Mango Value ChainA typical mango value chain model is depicted in Fig. 4.19. The first stakeholderin the mango value chain is the pre-harvest contractor (PHC) who enters into acontract with a farmer around four months prior to the harvest season, based onthe flowering of the trees. The PHC enters into contracts with several farmers for
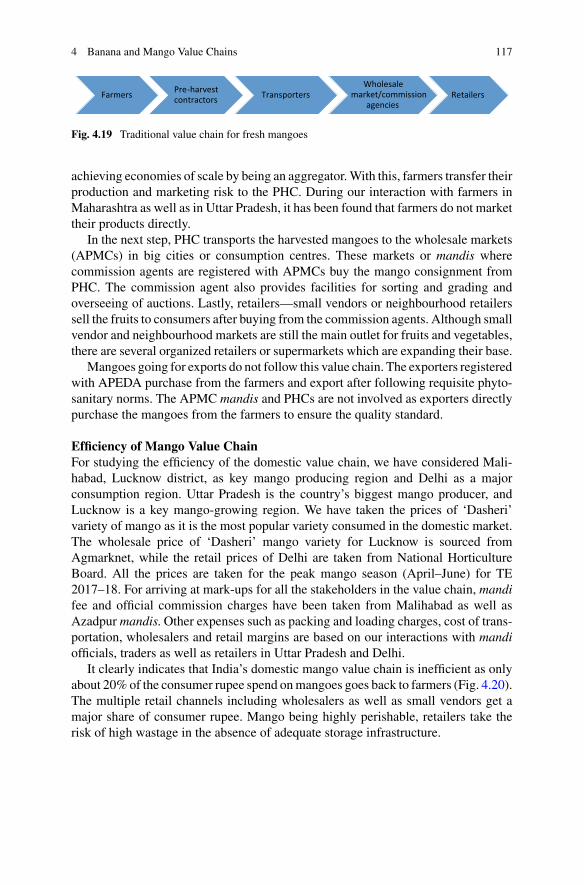
4 Banana and Mango Value Chains 117
Farmers Pre-harvest contractors Transporters
Wholesale market/commission
agenciesRetailers
Fig. 4.19 Traditional value chain for fresh mangoes
achieving economies of scale by being an aggregator.With this, farmers transfer theirproduction and marketing risk to the PHC. During our interaction with farmers inMaharashtra as well as in Uttar Pradesh, it has been found that farmers do not markettheir products directly.
In the next step, PHC transports the harvested mangoes to the wholesale markets(APMCs) in big cities or consumption centres. These markets or mandis wherecommission agents are registered with APMCs buy the mango consignment fromPHC. The commission agent also provides facilities for sorting and grading andoverseeing of auctions. Lastly, retailers—small vendors or neighbourhood retailerssell the fruits to consumers after buying from the commission agents. Although smallvendor and neighbourhood markets are still the main outlet for fruits and vegetables,there are several organized retailers or supermarkets which are expanding their base.
Mangoes going for exports do not follow this value chain. The exporters registeredwith APEDA purchase from the farmers and export after following requisite phyto-sanitary norms. The APMC mandis and PHCs are not involved as exporters directlypurchase the mangoes from the farmers to ensure the quality standard.
Efficiency of Mango Value ChainFor studying the efficiency of the domestic value chain, we have considered Mali-habad, Lucknow district, as key mango producing region and Delhi as a majorconsumption region. Uttar Pradesh is the country’s biggest mango producer, andLucknow is a key mango-growing region. We have taken the prices of ‘Dasheri’variety of mango as it is the most popular variety consumed in the domestic market.The wholesale price of ‘Dasheri’ mango variety for Lucknow is sourced fromAgmarknet, while the retail prices of Delhi are taken from National HorticultureBoard. All the prices are taken for the peak mango season (April–June) for TE2017–18. For arriving at mark-ups for all the stakeholders in the value chain, mandifee and official commission charges have been taken from Malihabad as well asAzadpur mandis. Other expenses such as packing and loading charges, cost of trans-portation, wholesalers and retail margins are based on our interactions with mandiofficials, traders as well as retailers in Uttar Pradesh and Delhi.
It clearly indicates that India’s domestic mango value chain is inefficient as onlyabout 20%of the consumer rupee spend onmangoes goes back to farmers (Fig. 4.20).The multiple retail channels including wholesalers as well as small vendors get amajor share of consumer rupee. Mango being highly perishable, retailers take therisk of high wastage in the absence of adequate storage infrastructure.
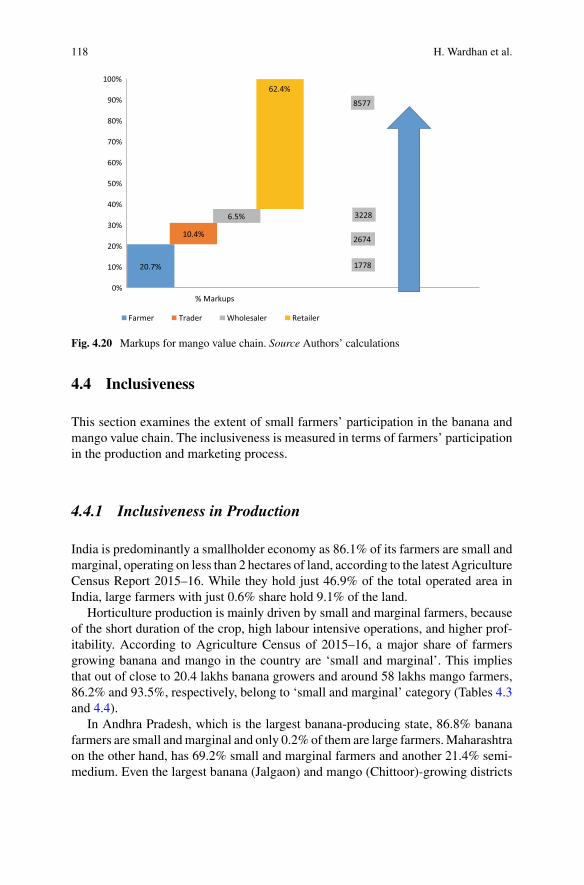
118 H. Wardhan et al.
20.7% 1778
10.4% 2674
6.5% 3228
62.4%
8577
0%
10%
20%
30%
40%
50%
60%
70%
80%
90%
100%
% Markups
Farmer Trader Wholesaler Retailer
Fig. 4.20 Markups for mango value chain. Source Authors’ calculations
4.4 Inclusiveness
This section examines the extent of small farmers’ participation in the banana andmango value chain. The inclusiveness is measured in terms of farmers’ participationin the production and marketing process.
4.4.1 Inclusiveness in Production
India is predominantly a smallholder economy as 86.1% of its farmers are small andmarginal, operating on less than 2 hectares of land, according to the latest AgricultureCensus Report 2015–16. While they hold just 46.9% of the total operated area inIndia, large farmers with just 0.6% share hold 9.1% of the land.
Horticulture production is mainly driven by small and marginal farmers, becauseof the short duration of the crop, high labour intensive operations, and higher prof-itability. According to Agriculture Census of 2015–16, a major share of farmersgrowing banana and mango in the country are ‘small and marginal’. This impliesthat out of close to 20.4 lakhs banana growers and around 58 lakhs mango farmers,86.2% and 93.5%, respectively, belong to ‘small and marginal’ category (Tables 4.3and 4.4).
In Andhra Pradesh, which is the largest banana-producing state, 86.8% bananafarmers are small andmarginal and only 0.2% of them are large farmers.Maharashtraon the other hand, has 69.2% small and marginal farmers and another 21.4% semi-medium. Even the largest banana (Jalgaon) and mango (Chittoor)-growing districts
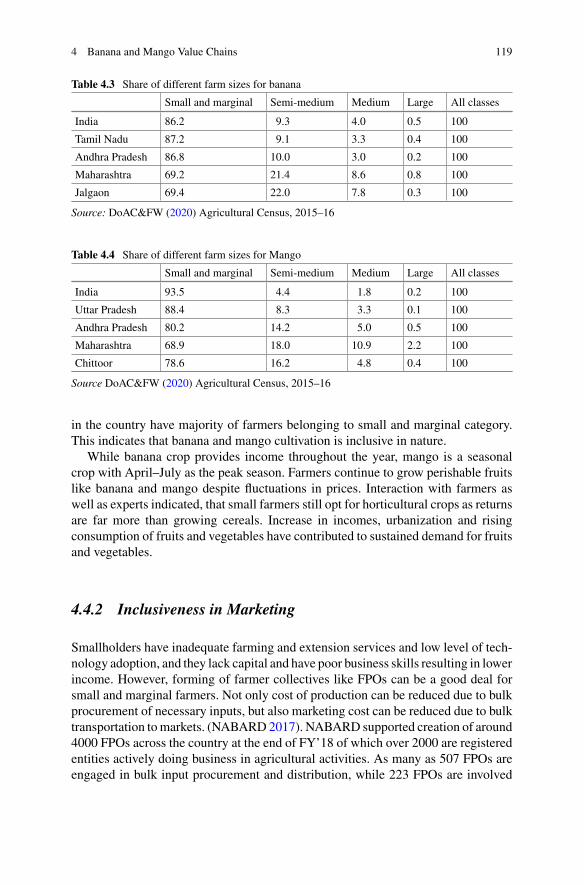
4 Banana and Mango Value Chains 119
Table 4.3 Share of different farm sizes for banana
Small and marginal Semi-medium Medium Large All classes
India 86.2 9.3 4.0 0.5 100
Tamil Nadu 87.2 9.1 3.3 0.4 100
Andhra Pradesh 86.8 10.0 3.0 0.2 100
Maharashtra 69.2 21.4 8.6 0.8 100
Jalgaon 69.4 22.0 7.8 0.3 100
Source: DoAC&FW (2020) Agricultural Census, 2015–16
Table 4.4 Share of different farm sizes for Mango
Small and marginal Semi-medium Medium Large All classes
India 93.5 4.4 1.8 0.2 100
Uttar Pradesh 88.4 8.3 3.3 0.1 100
Andhra Pradesh 80.2 14.2 5.0 0.5 100
Maharashtra 68.9 18.0 10.9 2.2 100
Chittoor 78.6 16.2 4.8 0.4 100
Source DoAC&FW (2020) Agricultural Census, 2015–16
in the country have majority of farmers belonging to small and marginal category.This indicates that banana and mango cultivation is inclusive in nature.
While banana crop provides income throughout the year, mango is a seasonalcrop with April–July as the peak season. Farmers continue to grow perishable fruitslike banana and mango despite fluctuations in prices. Interaction with farmers aswell as experts indicated, that small farmers still opt for horticultural crops as returnsare far more than growing cereals. Increase in incomes, urbanization and risingconsumption of fruits and vegetables have contributed to sustained demand for fruitsand vegetables.
4.4.2 Inclusiveness in Marketing
Smallholders have inadequate farming and extension services and low level of tech-nology adoption, and they lack capital and have poor business skills resulting in lowerincome. However, forming of farmer collectives like FPOs can be a good deal forsmall and marginal farmers. Not only cost of production can be reduced due to bulkprocurement of necessary inputs, but also marketing cost can be reduced due to bulktransportation tomarkets. (NABARD2017). NABARD supported creation of around4000 FPOs across the country at the end of FY’18 of which over 2000 are registeredentities actively doing business in agricultural activities. As many as 507 FPOs areengaged in bulk input procurement and distribution, while 223 FPOs are involved
120 H. Wardhan et al.
in aggregation and marketing of fruits and vegetables (NABARD press note, July2018) NABARD provides grant support to existing FPOs towards capacity building,market linkages, etc., along with the credit support of business development. Thecentral government also plans to create 10,000 FPOs by 2024.
Status of FPOsAccording to NABARD, FPOs are farmers’ collectives, with membership mainlycomprising small or marginal farmers (around 70–80%). Majority of these FPOs arein the nascent stage of their operations with shareholder membership ranging from100 to over 1000 farmers and require not only technical handholding support but alsoadequate capital and infrastructure facilities including market linkages for sustainingtheir business operations.
The Small Farmers’ Agribusiness Consortium (SFAC), under MoAC&FW, alsopromotes formation of FPOs for ensuring that smallholders have stake in marketingof their produce. Out of the total 897 FPOs supported by SFAC, only 38 are relatedto banana and mango. These FPOs are located mostly in Karnataka, Tamil Nadu,Uttar Pradesh, West Bengal and Madhya Pradesh.1
During our field visits in Jalgaon, Maharashtra, we interacted with a number ofFPOs who are engaged in marketing of banana and other agricultural produce. Outof total 41 FPOs in Jalgaon district as per records, only 14 FPOs were operationaland only few of themwere functioning with business plans.We identified three kindsof FPOs, visionary FPOs,which work like a proper company with a business plan inmind and not dependent on government subsidies and provide good-quality plantingand fertigation to member farmers, ensuring quality produce; non-visionary FPOswhich were established through Government of India orWorld Bank funds, facilitieslike ripening chambers with help of ATMA scheme, MIDH schemes and shares ofmember farmers. Then, there are dysfunctional FPOsmost of whichwere establishedto avail government subsidies and are not functional any more.
For ensuring that smallholders have control over the marketing channels, agen-cies such as NABARD, SFAC and state governments must play a pro-active role inpromoting FPOs and strengthening the dysfunctional FPOs. There is a huge oppor-tunity for creation of FPOs dedicated to banana and mango plantation and the focusshould be on imparting marketing skill so that FPOs are run professionally.
Currently, traders buy bananas directly from the farms. The bananas are sorted,weighed, washed, packed in cardboard boxes (16 kg) and loaded on trucks at thefarm itself. Our interactions with agents who buy banana at the farm gate in Jalgaonas well as traders in Azadpur mandi in Delhi reveal that farmers’ role in marketingends once the produce (in this case banana and mango) is sold at the farm gates. Thisdeprives the farmers in playing active role in price discovery.
In case of mangoes, there have been some attempts to create an electronic plat-form in Lucknow. The E-network platform, an online marketplace which connectsconsumer with farmer, removing middlemen, reducing farm-to-table time and mostimportantly, ensuring fresh produce reaches consumers (http://mangifera.res.in/e_market.php). However, our research reveals that such marketing networks have been
1 http://www.sfacindia.com.
4 Banana and Mango Value Chains 121
limited in their outreach so far. In case of mango trade, the pre-harvest contractor(PHC) continues to play critical role in marketing thus limiting farmers’ directinterface with the markets.
Exporters of mangoes and bananas enter into buy back agreement prior to theharvesting season. However because of phyto-sanitary norms insisted by manyimporting countries, the exporters also provide agricultural inputs and advisory forensuring quality produce. With majority of banana and mango growers being smalland marginal, there is a minimal or often no post-harvest management infrastructureavailable at farm level. Small farmers find it expensive to access any post-harvestinfrastructure facility, leading to highwastage and deterioration of quality, ultimatelyresulting in lower price yields. This necessitates expanding the role of farmer co-operatives or FPOs to create post-harvest infrastructure directly accessible to thefarmers.
Producers Organizations Promoting Institutions (POPI)NABARD has been encouraging formation of Farmer Producer Organizationspromoted by Producers Organizations Promoting Institutions (POPI). Any legalentity such as an NGO, bank, government department, co-operative society, associ-ation or federation can become POPI. A POPI has to ensure that requisite technicaland managerial capabilities are transferred to members of the FPOs so that they areable to work with an independent and sustainable business model.
Financial support is available to POPIs through SFAC and NABARD. NABARDprovides financial support to the FPOs through Producers Organisation DevelopmentFund based on project cost with a ceiling of 20% grant (NABKISAN).
4.4.3 Promotion of Small Scale Industries
A large number of value-added products can be manufactured from banana fruit,pseudostem and other waste products from banana cultivation in small-scale cottageindustries. Setting up of these industries helps small farmers to get additional returnfor thewaste or by products of banana tree. This also provides significant employmentopportunities for landless agricultural labourers. The governmentmust provide thruston extending credit for setting up of these industries. Jalgaon has a large number ofsmall units of banana chips, but the chips are not of a good quality. The traditionalfrying pans should be replaced with oil sprays like the ones used at big wafer makingcompanies. Quality standardization with branding can help farmers and processorsearn higher prices. Loans should be made available for machinery infrastructure andmarketing of value added products.
122 H. Wardhan et al.
4.5 Sustainability
In this section, we evaluate the financial and environmental sustainability of bananaand mango value chain models.
4.5.1 Financial Sustainability
Financial sustainability is achieved when the net returns from a particular businessis larger than the net costs. Similarly, farmers will be financially sustainable if theprices they receive for their produce are higher than the costs incurred, and they arecompensated for the fixed as well as variable costs.
Financial Sustainability of Banana Value ChainBanana being a cash crop because of its high value has been a lucrative option forfarmers. This is especially true for Jalgaon, which is a hub for banana productionbecause of the climate and geographical location. With advancement in technology,especially tissue culture and precision farming, banana farmers have been able toincrease the yield levels significantly. While the national average of banana yield is35 tn/ha, Jalgaon farmers grow 80 tonnes of bananas in one hectare. The presenceof Jain Irrigation Systems Limited (JISL), which pioneered banana tissue culturein India along with their drip irrigation technology proved to be a boon for bananafarmers of Jalgaon.
Tissue culture technology has helped reduce the planting to harvesting period fromabout 18 months to (9.5–11) months as the roots get developed in the laboratory andsent for primary and secondary hardening in nurseries in a controlled environment(greenhouses). Over time, as JISL tissue culture plants started spreading to otherparts of the country, and with better road connectivity, Jalgaon’s monopoly starteddiminishing. Jalgaon is now facing a stiff competition from other major banana-producing regions.
In order to be competitive, there have been several changes in the way bananasare cultivated and traded. Banana cultivation is done under high density with 6ft x 5ftspacing between each plant on a raised bed. Raising the bed helps in better utilizationof water, fertilizer and helps in draining excess water. Mulching helps in avoidingexcess water reaching the roots, especially during rainy season. Farmer receive 50%subsidy for drip irrigation technologies as well as rotavators. To make things moremechanized, there are mobile apps for controlling the timing of drip. A sapling oftissue culture banana is sold for INR 14, of which INR 4 needs to be paid at the timeof purchase, and the rest INR 10 is paid after planting.
Unlike vegetables, especially tomatoes, onions and potatoes (TOP), where pricestability has been a major concern and farmers are forced to throw their produce onroads, banana farmers have not faced such a situation.
Benefit–cost ratio has been evaluated for banana farmers in Jalgaon. For this, costof cultivation data for Grand Nain variety was used from a study done by Banana
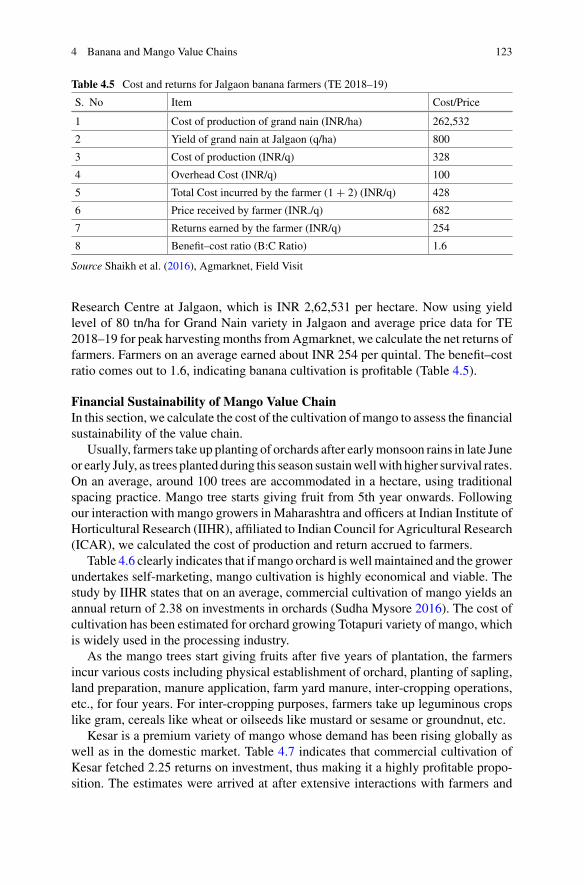
4 Banana and Mango Value Chains 123
Table 4.5 Cost and returns for Jalgaon banana farmers (TE 2018–19)
S. No Item Cost/Price
1 Cost of production of grand nain (INR/ha) 262,532
2 Yield of grand nain at Jalgaon (q/ha) 800
3 Cost of production (INR/q) 328
4 Overhead Cost (INR/q) 100
5 Total Cost incurred by the farmer (1 + 2) (INR/q) 428
6 Price received by farmer (INR./q) 682
7 Returns earned by the farmer (INR/q) 254
8 Benefit–cost ratio (B:C Ratio) 1.6
Source Shaikh et al. (2016), Agmarknet, Field Visit
Research Centre at Jalgaon, which is INR 2,62,531 per hectare. Now using yieldlevel of 80 tn/ha for Grand Nain variety in Jalgaon and average price data for TE2018–19 for peak harvestingmonths fromAgmarknet, we calculate the net returns offarmers. Farmers on an average earned about INR 254 per quintal. The benefit–costratio comes out to 1.6, indicating banana cultivation is profitable (Table 4.5).
Financial Sustainability of Mango Value ChainIn this section, we calculate the cost of the cultivation ofmango to assess the financialsustainability of the value chain.
Usually, farmers take up planting of orchards after earlymonsoon rains in late Juneor early July, as trees planted during this season sustainwellwith higher survival rates.On an average, around 100 trees are accommodated in a hectare, using traditionalspacing practice. Mango tree starts giving fruit from 5th year onwards. Followingour interaction with mango growers in Maharashtra and officers at Indian Institute ofHorticultural Research (IIHR), affiliated to Indian Council for Agricultural Research(ICAR), we calculated the cost of production and return accrued to farmers.
Table 4.6 clearly indicates that if mango orchard is well maintained and the growerundertakes self-marketing, mango cultivation is highly economical and viable. Thestudy by IIHR states that on an average, commercial cultivation of mango yields anannual return of 2.38 on investments in orchards (Sudha Mysore 2016). The cost ofcultivation has been estimated for orchard growing Totapuri variety of mango, whichis widely used in the processing industry.
As the mango trees start giving fruits after five years of plantation, the farmersincur various costs including physical establishment of orchard, planting of sapling,land preparation, manure application, farm yard manure, inter-cropping operations,etc., for four years. For inter-cropping purposes, farmers take up leguminous cropslike gram, cereals like wheat or oilseeds like mustard or sesame or groundnut, etc.
Kesar is a premium variety of mango whose demand has been rising globally aswell as in the domestic market. Table 4.7 indicates that commercial cultivation ofKesar fetched 2.25 returns on investment, thus making it a highly profitable propo-sition. The estimates were arrived at after extensive interactions with farmers and
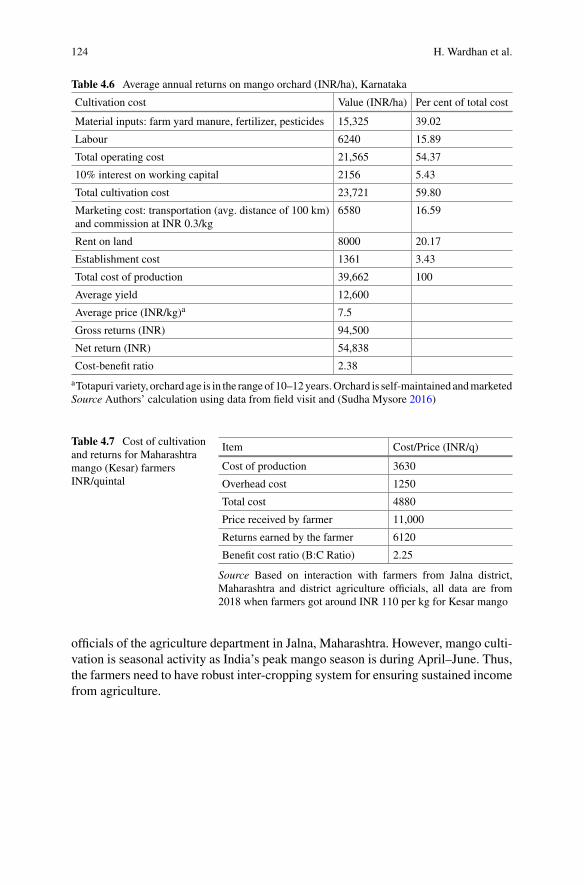
124 H. Wardhan et al.
Table 4.6 Average annual returns on mango orchard (INR/ha), Karnataka
Cultivation cost Value (INR/ha) Per cent of total cost
Material inputs: farm yard manure, fertilizer, pesticides 15,325 39.02
Labour 6240 15.89
Total operating cost 21,565 54.37
10% interest on working capital 2156 5.43
Total cultivation cost 23,721 59.80
Marketing cost: transportation (avg. distance of 100 km)and commission at INR 0.3/kg
6580 16.59
Rent on land 8000 20.17
Establishment cost 1361 3.43
Total cost of production 39,662 100
Average yield 12,600
Average price (INR/kg)a 7.5
Gross returns (INR) 94,500
Net return (INR) 54,838
Cost-benefit ratio 2.38
aTotapuri variety, orchard age is in the rangeof 10–12years.Orchard is self-maintained andmarketedSource Authors’ calculation using data from field visit and (Sudha Mysore 2016)
Table 4.7 Cost of cultivationand returns for Maharashtramango (Kesar) farmersINR/quintal
Item Cost/Price (INR/q)
Cost of production 3630
Overhead cost 1250
Total cost 4880
Price received by farmer 11,000
Returns earned by the farmer 6120
Benefit cost ratio (B:C Ratio) 2.25
Source Based on interaction with farmers from Jalna district,Maharashtra and district agriculture officials, all data are from2018 when farmers got around INR 110 per kg for Kesar mango
officials of the agriculture department in Jalna, Maharashtra. However, mango culti-vation is seasonal activity as India’s peak mango season is during April–June. Thus,the farmers need to have robust inter-cropping system for ensuring sustained incomefrom agriculture.
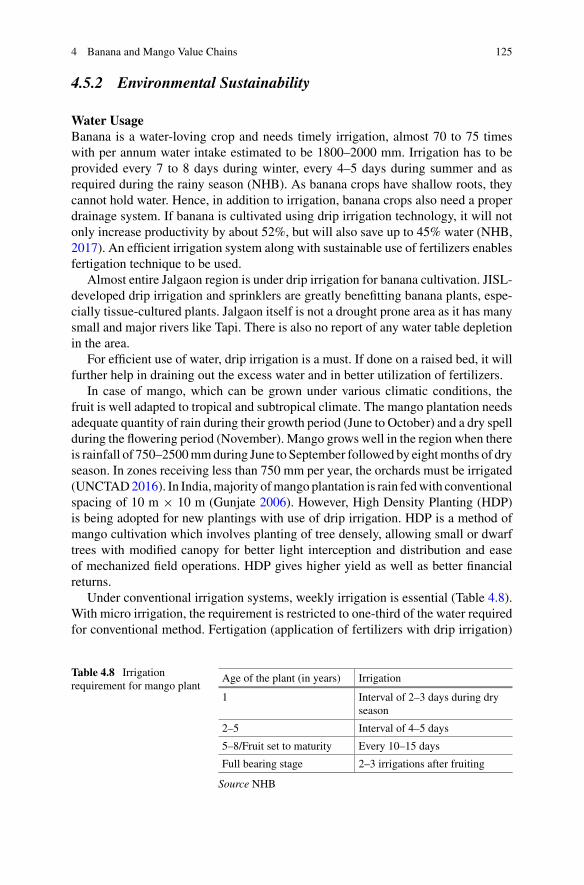
4 Banana and Mango Value Chains 125
4.5.2 Environmental Sustainability
Water UsageBanana is a water-loving crop and needs timely irrigation, almost 70 to 75 timeswith per annum water intake estimated to be 1800–2000 mm. Irrigation has to beprovided every 7 to 8 days during winter, every 4–5 days during summer and asrequired during the rainy season (NHB). As banana crops have shallow roots, theycannot hold water. Hence, in addition to irrigation, banana crops also need a properdrainage system. If banana is cultivated using drip irrigation technology, it will notonly increase productivity by about 52%, but will also save up to 45% water (NHB,2017). An efficient irrigation system along with sustainable use of fertilizers enablesfertigation technique to be used.
Almost entire Jalgaon region is under drip irrigation for banana cultivation. JISL-developed drip irrigation and sprinklers are greatly benefitting banana plants, espe-cially tissue-cultured plants. Jalgaon itself is not a drought prone area as it has manysmall and major rivers like Tapi. There is also no report of any water table depletionin the area.
For efficient use of water, drip irrigation is a must. If done on a raised bed, it willfurther help in draining out the excess water and in better utilization of fertilizers.
In case of mango, which can be grown under various climatic conditions, thefruit is well adapted to tropical and subtropical climate. The mango plantation needsadequate quantity of rain during their growth period (June to October) and a dry spellduring the flowering period (November). Mango grows well in the region when thereis rainfall of 750–2500mmduring June to September followed by eightmonths of dryseason. In zones receiving less than 750 mm per year, the orchards must be irrigated(UNCTAD2016). In India,majority ofmango plantation is rain fedwith conventionalspacing of 10 m × 10 m (Gunjate 2006). However, High Density Planting (HDP)is being adopted for new plantings with use of drip irrigation. HDP is a method ofmango cultivation which involves planting of tree densely, allowing small or dwarftrees with modified canopy for better light interception and distribution and easeof mechanized field operations. HDP gives higher yield as well as better financialreturns.
Under conventional irrigation systems, weekly irrigation is essential (Table 4.8).With micro irrigation, the requirement is restricted to one-third of the water requiredfor conventional method. Fertigation (application of fertilizers with drip irrigation)
Table 4.8 Irrigationrequirement for mango plant
Age of the plant (in years) Irrigation
1 Interval of 2–3 days during dryseason
2–5 Interval of 4–5 days
5–8/Fruit set to maturity Every 10–15 days
Full bearing stage 2–3 irrigations after fruiting
Source NHB
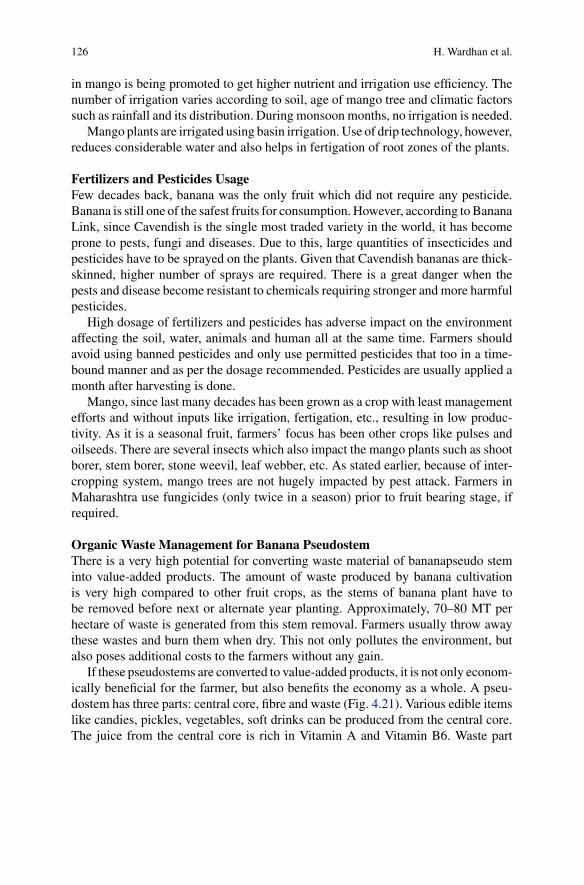
126 H. Wardhan et al.
in mango is being promoted to get higher nutrient and irrigation use efficiency. Thenumber of irrigation varies according to soil, age of mango tree and climatic factorssuch as rainfall and its distribution. During monsoon months, no irrigation is needed.
Mango plants are irrigated using basin irrigation. Use of drip technology, however,reduces considerable water and also helps in fertigation of root zones of the plants.
Fertilizers and Pesticides UsageFew decades back, banana was the only fruit which did not require any pesticide.Banana is still one of the safest fruits for consumption. However, according toBananaLink, since Cavendish is the single most traded variety in the world, it has becomeprone to pests, fungi and diseases. Due to this, large quantities of insecticides andpesticides have to be sprayed on the plants. Given that Cavendish bananas are thick-skinned, higher number of sprays are required. There is a great danger when thepests and disease become resistant to chemicals requiring stronger and more harmfulpesticides.
High dosage of fertilizers and pesticides has adverse impact on the environmentaffecting the soil, water, animals and human all at the same time. Farmers shouldavoid using banned pesticides and only use permitted pesticides that too in a time-bound manner and as per the dosage recommended. Pesticides are usually applied amonth after harvesting is done.
Mango, since last many decades has been grown as a crop with least managementefforts and without inputs like irrigation, fertigation, etc., resulting in low produc-tivity. As it is a seasonal fruit, farmers’ focus has been other crops like pulses andoilseeds. There are several insects which also impact the mango plants such as shootborer, stem borer, stone weevil, leaf webber, etc. As stated earlier, because of inter-cropping system, mango trees are not hugely impacted by pest attack. Farmers inMaharashtra use fungicides (only twice in a season) prior to fruit bearing stage, ifrequired.
Organic Waste Management for Banana PseudostemThere is a very high potential for converting waste material of bananapseudo steminto value-added products. The amount of waste produced by banana cultivationis very high compared to other fruit crops, as the stems of banana plant have tobe removed before next or alternate year planting. Approximately, 70–80 MT perhectare of waste is generated from this stem removal. Farmers usually throw awaythese wastes and burn them when dry. This not only pollutes the environment, butalso poses additional costs to the farmers without any gain.
If these pseudostems are converted to value-added products, it is not only econom-ically beneficial for the farmer, but also benefits the economy as a whole. A pseu-dostem has three parts: central core, fibre and waste (Fig. 4.21). Various edible itemslike candies, pickles, vegetables, soft drinks can be produced from the central core.The juice from the central core is rich in Vitamin A and Vitamin B6. Waste part
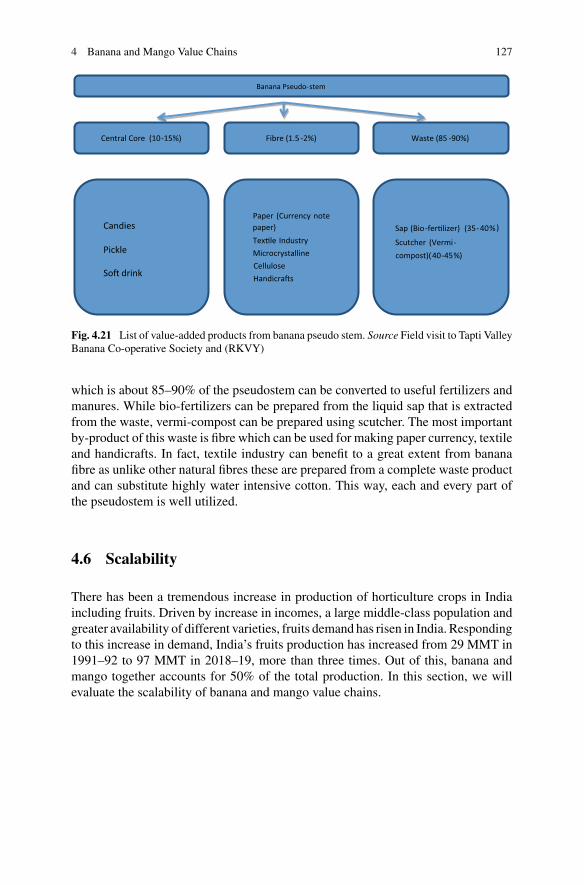
4 Banana and Mango Value Chains 127
Central Core (10-15%) Waste (85 -90%)Fibre (1.5 -2%)
Candies
Pickle
So� drink
Paper (Currency notepaper)Tex�le IndustryMicrocrystallineCelluloseHandicra�s
Sap (Bio-fer�lizer) (35-40%)
Scutcher (Vermi-compost)(40-45%)
Banana Pseudo-stem
Fig. 4.21 List of value-added products from banana pseudo stem. Source Field visit to Tapti ValleyBanana Co-operative Society and (RKVY)
which is about 85–90% of the pseudostem can be converted to useful fertilizers andmanures. While bio-fertilizers can be prepared from the liquid sap that is extractedfrom the waste, vermi-compost can be prepared using scutcher. The most importantby-product of this waste is fibre which can be used for making paper currency, textileand handicrafts. In fact, textile industry can benefit to a great extent from bananafibre as unlike other natural fibres these are prepared from a complete waste productand can substitute highly water intensive cotton. This way, each and every part ofthe pseudostem is well utilized.
4.6 Scalability
There has been a tremendous increase in production of horticulture crops in Indiaincluding fruits. Driven by increase in incomes, a large middle-class population andgreater availability of different varieties, fruits demand has risen in India. Respondingto this increase in demand, India’s fruits production has increased from 29 MMT in1991–92 to 97 MMT in 2018–19, more than three times. Out of this, banana andmango together accounts for 50% of the total production. In this section, we willevaluate the scalability of banana and mango value chains.
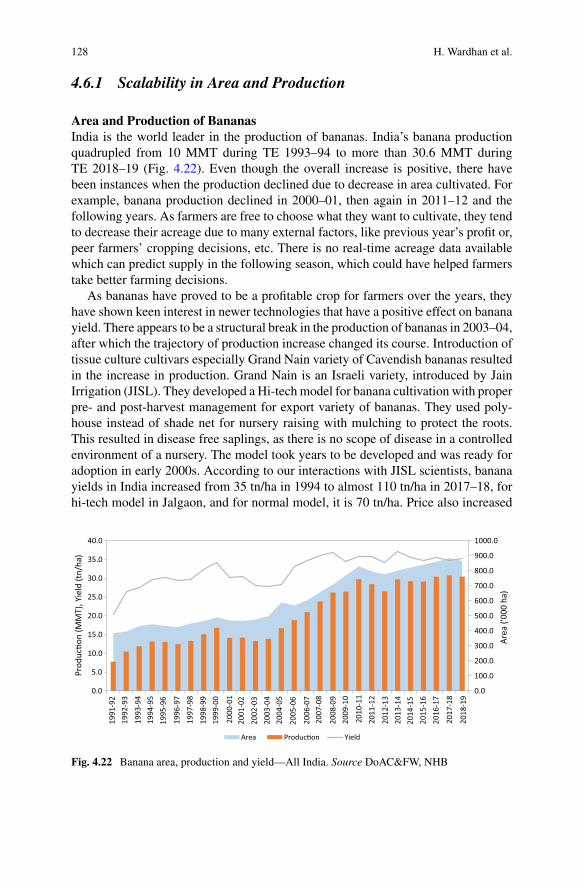
128 H. Wardhan et al.
4.6.1 Scalability in Area and Production
Area and Production of BananasIndia is the world leader in the production of bananas. India’s banana productionquadrupled from 10 MMT during TE 1993–94 to more than 30.6 MMT duringTE 2018–19 (Fig. 4.22). Even though the overall increase is positive, there havebeen instances when the production declined due to decrease in area cultivated. Forexample, banana production declined in 2000–01, then again in 2011–12 and thefollowing years. As farmers are free to choose what they want to cultivate, they tendto decrease their acreage due to many external factors, like previous year’s profit or,peer farmers’ cropping decisions, etc. There is no real-time acreage data availablewhich can predict supply in the following season, which could have helped farmerstake better farming decisions.
As bananas have proved to be a profitable crop for farmers over the years, theyhave shown keen interest in newer technologies that have a positive effect on bananayield. There appears to be a structural break in the production of bananas in 2003–04,after which the trajectory of production increase changed its course. Introduction oftissue culture cultivars especially Grand Nain variety of Cavendish bananas resultedin the increase in production. Grand Nain is an Israeli variety, introduced by JainIrrigation (JISL). They developed a Hi-tech model for banana cultivation with properpre- and post-harvest management for export variety of bananas. They used poly-house instead of shade net for nursery raising with mulching to protect the roots.This resulted in disease free saplings, as there is no scope of disease in a controlledenvironment of a nursery. The model took years to be developed and was ready foradoption in early 2000s. According to our interactions with JISL scientists, bananayields in India increased from 35 tn/ha in 1994 to almost 110 tn/ha in 2017–18, forhi-tech model in Jalgaon, and for normal model, it is 70 tn/ha. Price also increased
0.0
100.0
200.0
300.0
400.0
500.0
600.0
700.0
800.0
900.0
1000.0
0.0
5.0
10.0
15.0
20.0
25.0
30.0
35.0
40.0
Area
('00
0 ha
)
Prod
uc�o
n (M
MT)
, Yie
ld (t
n/ha
)
Area Produc�on Yield
1991
-92
1992
-93
1993
-94
1994
-95
1995
-96
1996
-97
1997
-98
1998
-99
1999
-00
2000
-01
2001
-02
2002
-03
2003
-04
2004
-05
2005
-06
2006
-07
2007
-08
2008
-09
2009
-10
2010
-11
2011
-12
2012
-13
2013
-14
2014
-15
2015
-16
2016
-17
2017
-18
2018
-19
Fig. 4.22 Banana area, production and yield—All India. Source DoAC&FW, NHB
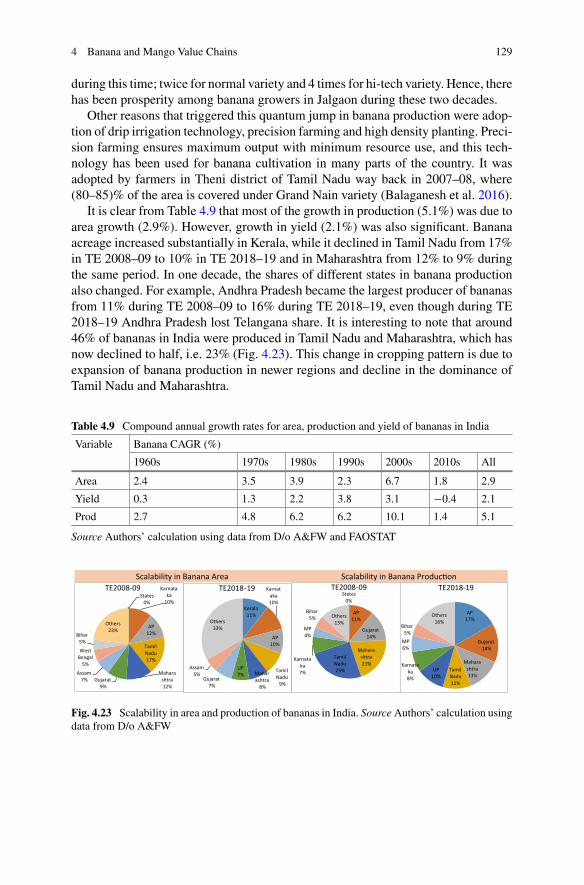
4 Banana and Mango Value Chains 129
during this time; twice for normal variety and 4 times for hi-tech variety. Hence, therehas been prosperity among banana growers in Jalgaon during these two decades.
Other reasons that triggered this quantum jump in banana production were adop-tion of drip irrigation technology, precision farming and high density planting. Preci-sion farming ensures maximum output with minimum resource use, and this tech-nology has been used for banana cultivation in many parts of the country. It wasadopted by farmers in Theni district of Tamil Nadu way back in 2007–08, where(80–85)% of the area is covered under Grand Nain variety (Balaganesh et al. 2016).
It is clear from Table 4.9 that most of the growth in production (5.1%) was due toarea growth (2.9%). However, growth in yield (2.1%) was also significant. Bananaacreage increased substantially in Kerala, while it declined in Tamil Nadu from 17%in TE 2008–09 to 10% in TE 2018–19 and in Maharashtra from 12% to 9% duringthe same period. In one decade, the shares of different states in banana productionalso changed. For example, Andhra Pradesh became the largest producer of bananasfrom 11% during TE 2008–09 to 16% during TE 2018–19, even though during TE2018–19 Andhra Pradesh lost Telangana share. It is interesting to note that around46% of bananas in India were produced in Tamil Nadu and Maharashtra, which hasnow declined to half, i.e. 23% (Fig. 4.23). This change in cropping pattern is due toexpansion of banana production in newer regions and decline in the dominance ofTamil Nadu and Maharashtra.
Table 4.9 Compound annual growth rates for area, production and yield of bananas in India
Variable Banana CAGR (%)
1960s 1970s 1980s 1990s 2000s 2010s All
Area 2.4 3.5 3.9 2.3 6.7 1.8 2.9
Yield 0.3 1.3 2.2 3.8 3.1 −0.4 2.1
Prod 2.7 4.8 6.2 6.2 10.1 1.4 5.1
Source Authors’ calculation using data from D/o A&FW and FAOSTAT
Scalability in Banana Area Scalability in Banana Produc�on
AP17%
Gujarat14%
Maharashtra13%
Tamil Nadu11%
UP10%
Karnataka8%
MP6%
Bihar5%
Others16%
TE2018-19States
0%
AP11%
Gujarat14%
Maharashtra21%
Tamil Nadu25%
Karnataka7%
MP4%
Bihar5% Others
13%
TE2008-09
Kerala11%
Karnataka10%
AP10%
Tamil Nadu
9%
Maharashtra
8%
UP7%
Gujarat7%
Assam5%
Others33%
TE2018-19States
0%
Karnataka
10%
AP12%
Tamil Nadu17%
Maharashtra12%
Gujarat9%
Assam7%
West Bengal
5%
Bihar5%
Others23%
TE2008-09
Fig. 4.23 Scalability in area and production of bananas in India. SourceAuthors’ calculation usingdata from D/o A&FW
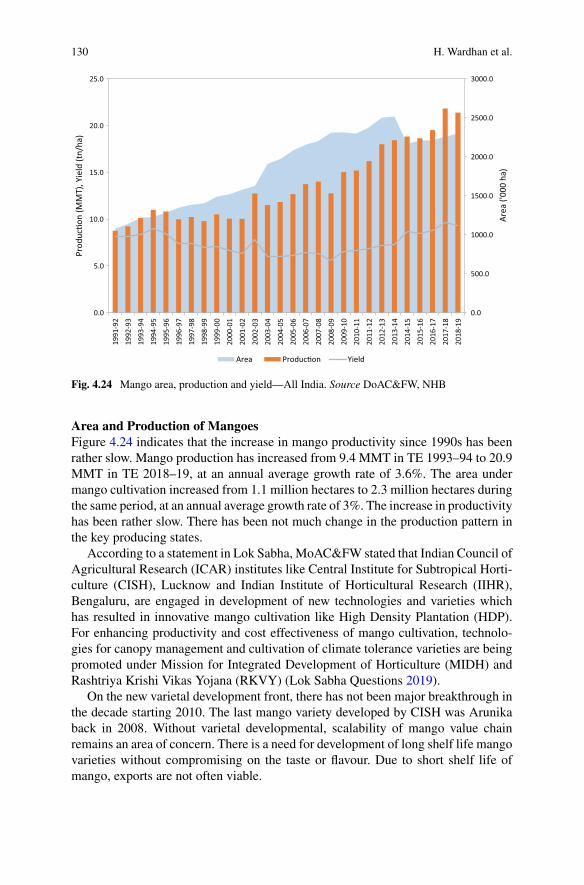
130 H. Wardhan et al.
0.0
500.0
1000.0
1500.0
2000.0
2500.0
3000.0
0.0
5.0
10.0
15.0
20.0
25.0
1991
-92
1992
-93
1993
-94
1994
-95
1995
-96
1996
-97
1997
-98
1998
-99
1999
-00
2000
-01
2001
-02
2002
-03
2003
-04
2004
-05
2005
-06
2006
-07
2007
-08
2008
-09
2009
-10
2010
-11
2011
-12
2012
-13
2013
-14
2014
-15
2015
-16
2016
-17
2017
-18
2018
-19
Area
('00
0 ha
)
Prod
uc�o
n (M
MT)
, Yie
ld (t
n/ha
)
Area Produc�on Yield
Fig. 4.24 Mango area, production and yield—All India. Source DoAC&FW, NHB
Area and Production of MangoesFigure 4.24 indicates that the increase in mango productivity since 1990s has beenrather slow. Mango production has increased from 9.4 MMT in TE 1993–94 to 20.9MMT in TE 2018–19, at an annual average growth rate of 3.6%. The area undermango cultivation increased from 1.1 million hectares to 2.3 million hectares duringthe same period, at an annual average growth rate of 3%. The increase in productivityhas been rather slow. There has been not much change in the production pattern inthe key producing states.
According to a statement in Lok Sabha, MoAC&FW stated that Indian Council ofAgricultural Research (ICAR) institutes like Central Institute for Subtropical Horti-culture (CISH), Lucknow and Indian Institute of Horticultural Research (IIHR),Bengaluru, are engaged in development of new technologies and varieties whichhas resulted in innovative mango cultivation like High Density Plantation (HDP).For enhancing productivity and cost effectiveness of mango cultivation, technolo-gies for canopy management and cultivation of climate tolerance varieties are beingpromoted under Mission for Integrated Development of Horticulture (MIDH) andRashtriya Krishi Vikas Yojana (RKVY) (Lok Sabha Questions 2019).
On the new varietal development front, there has not been major breakthrough inthe decade starting 2010. The last mango variety developed by CISH was Arunikaback in 2008. Without varietal developmental, scalability of mango value chainremains an area of concern. There is a need for development of long shelf life mangovarieties without compromising on the taste or flavour. Due to short shelf life ofmango, exports are not often viable.
4 Banana and Mango Value Chains 131
Table 4.10 Funds allocated to states under MIDH (INR/crore)
Funds allocated to states under MIDH (INR/crore)
2015–16 2016–17 2017–18 2018–19
1379 1238 1397 1846
Source Lok Sabha, 12 February, 2019
During our interaction with farmers and exporters, it was learnt that lack of stan-dardization of production technology and poor extension of technical knowledge tothe farmers resulted in slow adoption of HDP technology in mango plantation in thecountry. High initial establishment cost has been a deterrent for technology adoption(Table 4.10).
Another key concern regarding mango value chain is that there is hardly anyadvance production information available, like cereal crops. This puts farmers atthe mercy of traders for determining the prices, which has gone against scaling upmango trade in the country. In 2019, IIHR-Bengaluru and Indian Space ResearchOrganisation (ISRO) had commenced work on a pilot project to provide mangoproduction advisory to the Karnataka government. Such advisory services need to beexpanded to other key mango-producing states. ISRO advisory can give informationranging from flowering of the crop to the estimated crop size during the seasonconcerned. This would equip the state government in estimating the crop size, andhence provide advance information about prices to the farmers.
Role of ICAR InstitutionsIndian Council for Agricultural Research (ICAR) affiliated institutions such asNational Research Centre for Banana (NRCB), Trichy, and Central Institute ofSubtropical Horticulture (CISH), Lucknow, have made contribution towards varietaldevelopment of bananas and mangoes, respectively, over the last decades.
The ICAR-National Research Centre for Banana has significantly contributedtowards banana research and development. The centre has developed many newtechnologies related to production, protection and post-harvest management andvalue addition in banana. ICAR-NRCB has disseminated its new technologies to thefarmers and entrepreneurs, which have been adopted widely by the farming commu-nity (NRCB2015). The centre is one ofAsia’s largest genebankswith 361 indigenousaccessions.The centre has released three high-yieldingvarieties, namely—Udhayam,Saba and Bangrier, which are known for leaf spot resistance, tolerant to droughtand salt stress and short duration, respectively.
The centre has been instrumental in developing high density planting with fertiga-tion, organic cultivation of banana, pre- and post-harvestmanagement techniques anddevelopment of various value-added products like juices, figs, bars, jams. Some ofthe popular banana varieties developed byNRCB includes NamwaKhom, Popoulou,Manoranjitham selection with high yield and a fragrant variant.
Similarly, CISH has developed the High Density Planting (HDP) for improvingmango productivity aswell as higher economic returns per unit area. This has ensured
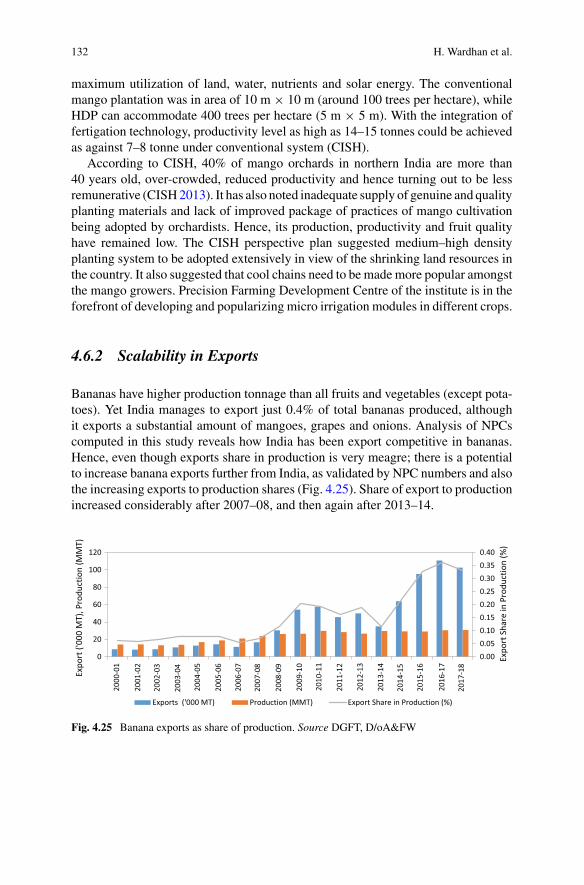
132 H. Wardhan et al.
maximum utilization of land, water, nutrients and solar energy. The conventionalmango plantation was in area of 10 m × 10 m (around 100 trees per hectare), whileHDP can accommodate 400 trees per hectare (5 m × 5 m). With the integration offertigation technology, productivity level as high as 14–15 tonnes could be achievedas against 7–8 tonne under conventional system (CISH).
According to CISH, 40% of mango orchards in northern India are more than40 years old, over-crowded, reduced productivity and hence turning out to be lessremunerative (CISH2013). It has also noted inadequate supply of genuine and qualityplanting materials and lack of improved package of practices of mango cultivationbeing adopted by orchardists. Hence, its production, productivity and fruit qualityhave remained low. The CISH perspective plan suggested medium–high densityplanting system to be adopted extensively in view of the shrinking land resources inthe country. It also suggested that cool chains need to be mademore popular amongstthe mango growers. Precision Farming Development Centre of the institute is in theforefront of developing and popularizing micro irrigation modules in different crops.
4.6.2 Scalability in Exports
Bananas have higher production tonnage than all fruits and vegetables (except pota-toes). Yet India manages to export just 0.4% of total bananas produced, althoughit exports a substantial amount of mangoes, grapes and onions. Analysis of NPCscomputed in this study reveals how India has been export competitive in bananas.Hence, even though exports share in production is very meagre; there is a potentialto increase banana exports further from India, as validated by NPC numbers and alsothe increasing exports to production shares (Fig. 4.25). Share of export to productionincreased considerably after 2007–08, and then again after 2013–14.
0.000.050.100.150.200.250.300.350.40
0
20
40
60
80
100
120
Expo
rt S
hare
in P
rodu
ctio
n (%
)
Expo
rt ('
000
MT)
, Pro
duct
ion
(MM
T)
Exports ('000 MT) Production (MMT) Export Share in Production (%)
2000
-01
2001
-02
2002
-03
2003
-04
2004
-05
2005
-06
2006
-07
2007
-08
2008
-09
2009
-10
2010
-11
2011
-12
2012
-13
2013
-14
2014
-15
2015
-16
2016
-17
2017
-18
Fig. 4.25 Banana exports as share of production. Source DGFT, D/oA&FW
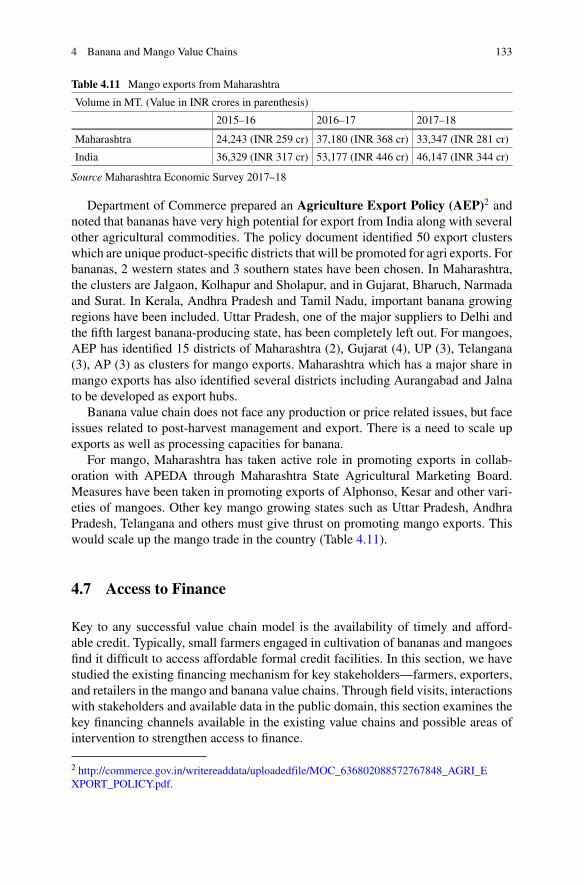
4 Banana and Mango Value Chains 133
Table 4.11 Mango exports from Maharashtra
Volume in MT. (Value in INR crores in parenthesis)
2015–16 2016–17 2017–18
Maharashtra 24,243 (INR 259 cr) 37,180 (INR 368 cr) 33,347 (INR 281 cr)
India 36,329 (INR 317 cr) 53,177 (INR 446 cr) 46,147 (INR 344 cr)
Source Maharashtra Economic Survey 2017–18
Department of Commerce prepared an Agriculture Export Policy (AEP)2 andnoted that bananas have very high potential for export from India along with severalother agricultural commodities. The policy document identified 50 export clusterswhich are unique product-specific districts that will be promoted for agri exports. Forbananas, 2 western states and 3 southern states have been chosen. In Maharashtra,the clusters are Jalgaon, Kolhapur and Sholapur, and in Gujarat, Bharuch, Narmadaand Surat. In Kerala, Andhra Pradesh and Tamil Nadu, important banana growingregions have been included. Uttar Pradesh, one of the major suppliers to Delhi andthe fifth largest banana-producing state, has been completely left out. For mangoes,AEP has identified 15 districts of Maharashtra (2), Gujarat (4), UP (3), Telangana(3), AP (3) as clusters for mango exports. Maharashtra which has a major share inmango exports has also identified several districts including Aurangabad and Jalnato be developed as export hubs.
Banana value chain does not face any production or price related issues, but faceissues related to post-harvest management and export. There is a need to scale upexports as well as processing capacities for banana.
For mango, Maharashtra has taken active role in promoting exports in collab-oration with APEDA through Maharashtra State Agricultural Marketing Board.Measures have been taken in promoting exports of Alphonso, Kesar and other vari-eties of mangoes. Other key mango growing states such as Uttar Pradesh, AndhraPradesh, Telangana and others must give thrust on promoting mango exports. Thiswould scale up the mango trade in the country (Table 4.11).
4.7 Access to Finance
Key to any successful value chain model is the availability of timely and afford-able credit. Typically, small farmers engaged in cultivation of bananas and mangoesfind it difficult to access affordable formal credit facilities. In this section, we havestudied the existing financing mechanism for key stakeholders—farmers, exporters,and retailers in the mango and banana value chains. Through field visits, interactionswith stakeholders and available data in the public domain, this section examines thekey financing channels available in the existing value chains and possible areas ofintervention to strengthen access to finance.
2 http://commerce.gov.in/writereaddata/uploadedfile/MOC_636802088572767848_AGRI_EXPORT_POLICY.pdf.
134 H. Wardhan et al.
4.7.1 Financing Mechanism for Farmers
The following institutional sources for credit are available for farmers:
• District cooperative banks finance several Kisan societies which further financefarmers. In Jalgaon, Jalgaon District Cooperative Society (JDCC) provides creditfacilities.
• Central Banks mainly through Kisan Credit Cards provide loans to farmers at7% interest per annum. If the premiums are paid on time, 3% is credited back tofarmers in about two years.
• Some successful Farmer Producer Organisation (FPOs) also provide loans tofarmers at about 12% per annum. However, a very small number of FPOs are actu-ally helping farmers to avail credit as most of the FPOs are either in dysfunctionalstate or operating at the mercy of government subsidies.
Among institutional sources, farmers have access to crop loans mainly throughKisan Credit Cards (KCCs) availed through district cooperatives societies, providedthere is no default on repayment of loans. While large mango farmers who constitutea small group, have access to credit from the banks, most of the small and marginalfarmers depend on self-financing mode for carrying out mango plantation. Most ofthe small farmers who grow mango as well as banana also grow several other crops.Mango farmers need credit only for few months of a year.
Non-institutional SourcesDespite the presence of banking facilities, small and marginal farmers are heavilydependent on non-institutional sources. This is because either the farmers aredefaulters, who have not paid back previously borrowed money from banks or theysimply do not want to go through the cumbersome paper work and land owner-ship certificates that have to be submitted. Besides, the processing time taken bybanks for granting loans to farmers are high and farmers prefer known commissionagents, sahukars, friends or relativeswho provide instant credit. However, the interestcharged by these entities is as high as (2–2.5)% per month and can go up to even 5%.
4.7.2 Government Schemes for Horticulture SectorDevelopment, and Processing
The public sector banks provide loans for development of fruit orchards like mango,chikoo, grapes, pomegranate, apple, etc., as well as short-term crops like banana,pineapple, flower in open and greenhouses and vegetable crops. However, the creditis available to those farmers who have cultivable lands, thus leaving out those farmerswho carry out tenancy farming without any land holdings (Table 4.12).
The loan repayment starts after the completion of the gestation period varyingfrom 4 to 7 years for different crops. Repayment commences from the time the cropgives economic yield and is linked to the income generation of each crop every yearand varies between 7 and 12 years.
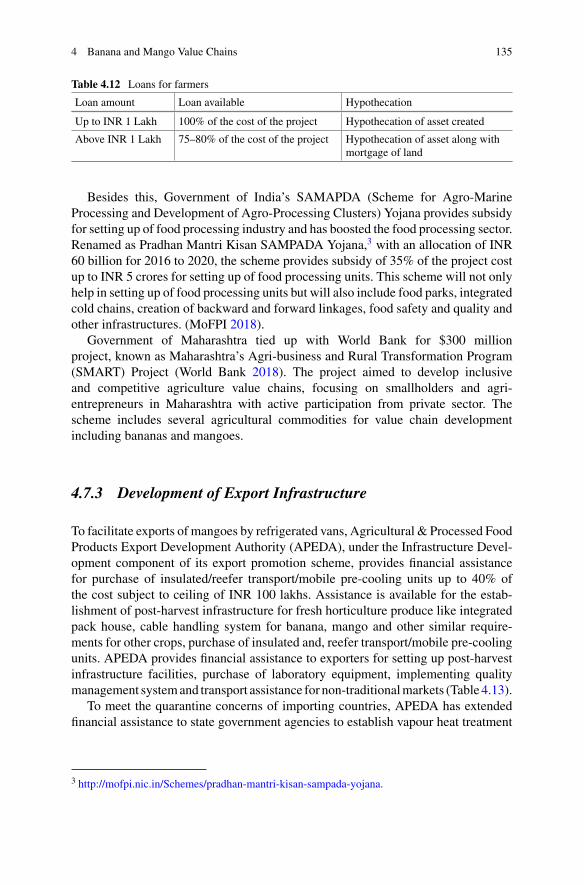
4 Banana and Mango Value Chains 135
Table 4.12 Loans for farmers
Loan amount Loan available Hypothecation
Up to INR 1 Lakh 100% of the cost of the project Hypothecation of asset created
Above INR 1 Lakh 75–80% of the cost of the project Hypothecation of asset along withmortgage of land
Besides this, Government of India’s SAMAPDA (Scheme for Agro-MarineProcessing and Development of Agro-Processing Clusters) Yojana provides subsidyfor setting up of food processing industry and has boosted the food processing sector.Renamed as Pradhan Mantri Kisan SAMPADA Yojana,3 with an allocation of INR60 billion for 2016 to 2020, the scheme provides subsidy of 35% of the project costup to INR 5 crores for setting up of food processing units. This scheme will not onlyhelp in setting up of food processing units but will also include food parks, integratedcold chains, creation of backward and forward linkages, food safety and quality andother infrastructures. (MoFPI 2018).
Government of Maharashtra tied up with World Bank for $300 millionproject, known as Maharashtra’s Agri-business and Rural Transformation Program(SMART) Project (World Bank 2018). The project aimed to develop inclusiveand competitive agriculture value chains, focusing on smallholders and agri-entrepreneurs in Maharashtra with active participation from private sector. Thescheme includes several agricultural commodities for value chain developmentincluding bananas and mangoes.
4.7.3 Development of Export Infrastructure
To facilitate exports of mangoes by refrigerated vans, Agricultural & Processed FoodProducts Export Development Authority (APEDA), under the Infrastructure Devel-opment component of its export promotion scheme, provides financial assistancefor purchase of insulated/reefer transport/mobile pre-cooling units up to 40% ofthe cost subject to ceiling of INR 100 lakhs. Assistance is available for the estab-lishment of post-harvest infrastructure for fresh horticulture produce like integratedpack house, cable handling system for banana, mango and other similar require-ments for other crops, purchase of insulated and, reefer transport/mobile pre-coolingunits. APEDA provides financial assistance to exporters for setting up post-harvestinfrastructure facilities, purchase of laboratory equipment, implementing qualitymanagement systemand transport assistance for non-traditionalmarkets (Table 4.13).
To meet the quarantine concerns of importing countries, APEDA has extendedfinancial assistance to state government agencies to establish vapour heat treatment
3 http://mofpi.nic.in/Schemes/pradhan-mantri-kisan-sampada-yojana.
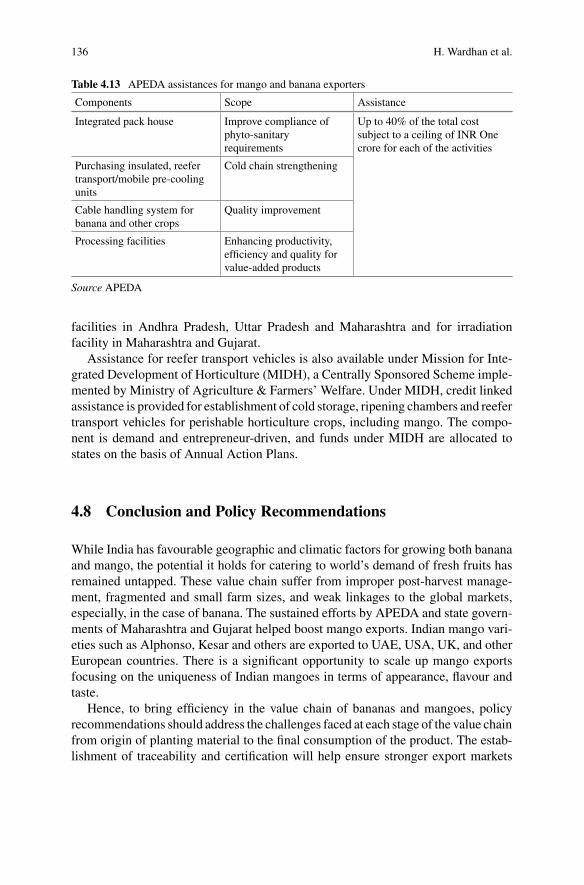
136 H. Wardhan et al.
Table 4.13 APEDA assistances for mango and banana exporters
Components Scope Assistance
Integrated pack house Improve compliance ofphyto-sanitaryrequirements
Up to 40% of the total costsubject to a ceiling of INR Onecrore for each of the activities
Purchasing insulated, reefertransport/mobile pre-coolingunits
Cold chain strengthening
Cable handling system forbanana and other crops
Quality improvement
Processing facilities Enhancing productivity,efficiency and quality forvalue-added products
Source APEDA
facilities in Andhra Pradesh, Uttar Pradesh and Maharashtra and for irradiationfacility in Maharashtra and Gujarat.
Assistance for reefer transport vehicles is also available under Mission for Inte-grated Development of Horticulture (MIDH), a Centrally Sponsored Scheme imple-mented by Ministry of Agriculture & Farmers’ Welfare. Under MIDH, credit linkedassistance is provided for establishment of cold storage, ripening chambers and reefertransport vehicles for perishable horticulture crops, including mango. The compo-nent is demand and entrepreneur-driven, and funds under MIDH are allocated tostates on the basis of Annual Action Plans.
4.8 Conclusion and Policy Recommendations
While India has favourable geographic and climatic factors for growing both bananaand mango, the potential it holds for catering to world’s demand of fresh fruits hasremained untapped. These value chain suffer from improper post-harvest manage-ment, fragmented and small farm sizes, and weak linkages to the global markets,especially, in the case of banana. The sustained efforts by APEDA and state govern-ments of Maharashtra and Gujarat helped boost mango exports. Indian mango vari-eties such as Alphonso, Kesar and others are exported to UAE, USA, UK, and otherEuropean countries. There is a significant opportunity to scale up mango exportsfocusing on the uniqueness of Indian mangoes in terms of appearance, flavour andtaste.
Hence, to bring efficiency in the value chain of bananas and mangoes, policyrecommendations should address the challenges faced at each stage of the value chainfrom origin of planting material to the final consumption of the product. The estab-lishment of traceability and certification will help ensure stronger export markets
4 Banana and Mango Value Chains 137
for Indian bananas, and mangoes. Farmers need good quality inputs such as seeds,fertigation, robust extension services, and affordable credit facilities. Based on ouranalysis of the value chains on the CISS-F framework, we put forth certain importantpolicy recommendations that will further strengthen these value chains.
4.8.1 Generic Policy Recommendations for Fruit Crops
1. Alternativemarkets for perishables: Despite delisting of fruits and vegetablesfrom APMC by several states, much of the marketing of these commodities isstill channeled through APMCmarkets. Traditional APMCmarkets are plaguedwith issues related to high cost of intermediation, opaque price discoverycontrolled by commission agents and traders, poor infrastructure facilities andservices that cannot handle perishable commodities. As a result, farmers sufferfrom highmarketing costs and lower price realization, adversely impacting theirincome levels. Agricultural marketing reforms are targeted towards stream-lining marketing operations, upgrading existing markets as well as broadeningthe spectrum of markets to include private markets, digital markets, farmers’market, and other direct marketing channels. The Farmers’ Produce Tradeand Commerce (Promotion and Facilitation) Act enacted by the Parliamentin September 2020 will be instrumental in setting up of these kind of alter-nate markets and lending greater access to the farmers. Incentives for privatesector participation in agriculturalmarkets and investments in building advancedvalue chains will improve both domestic and export marketability of thesecommodities.
2. Farmer collectives: Farmer Producer Organizations (FPOs) can be effectivein providing pre and post-harvest infrastructure and services to the farmers.Government schemes aimed at extending financial support towards buildingthese fruit value chains can be leveraged to the benefit of the farmers. FPOscan also facilitate direct market linkages with organized wholesalers, retailers,processors, and exporters, ensuring farmers the remunerative prices, and assuredmarket access. The recent Farmers (Empowerment and Protection) Agreementon Price Assurance and Farm Services or the FAPAFSAct enacted by the Parlia-ment in September 2020 is an attempt by the government to legalize contractfarming. Examples of Mahagrapes (grapes) and Sahyadri Farmer ProducerCompany Limited (fruits and vegetables) show how farmers can benefit fromfarmer-market linkages facilitated through such institutions, and importantlessons can be drawn.
3. Value Chain Financing: Horticulture farmers mostly access finance frominformal credit sources comprising of market intermediaries (commissionagents/arhatiyas), traders and/or self-finance. The rate of interest charged by theintermediaries range between (2–2.5)% and can go up to 5% per month. Bananaand mango farmers, especially small and marginal, need affordable and timelyaccess to institutional credit for buying plantingmaterial, automated fertigation,
138 H. Wardhan et al.
pipelines, tractors, etc. Such credit requirements can be made available throughKisan Credit Cards (KCC) or through FPOs.Given the widespread retail marketing of fruits and vegetables, in this casebananas and mangoes, access to affordable institutional finance can enablesmall retailers scale up and upgrade their business models. Being highly perish-able, storage facilities at the retail level can help extend the shelf life of thecommodities and allow retailers to avoid wastage and earn better incomes.
4.8.2 Banana Value Chain
1. Giving bunch treatment to banana plants before harvesting using bunching bagsimproves the quality of the fruit. This can be done by covering the bananabunches using bunching bags to avoid the spread of thrift pests, which scrapbanana juice, leading to brown spots on banana. The resultant spotless bananaswill further expand banana exports to promising markets, like the Europeanunion.
2. Indian bananas have negligible presence in the global export market. This isbecause bananas from India are not of the desired quality, are not homogeneouslysized, and there is no standardized protocol for handling bananas during harvest.Development of a sea protocol for banana exports which includes the numberof days of maturity, size parameters, and pesticide residue range will enableexpansion of banana exports via sea route to distant markets.
3. Mechanization of banana transplanting and harvesting should be explored toreduce production costs and wastages. Scaling up pilot projects on cable systemfor handling bananas, can be the starting point. Mechanization of banana valuechain will help reduce labour costs, undertake better cultivation practices thathave a favorable impact on quality, therebymaking banana cultivation profitablefor the farmers.
4. As bananas are water loving plants and its roots cannot hold water for long, itneeds efficient irrigation and drainage facilities. With drip irrigation in place,45% water can be saved and banana yields can also increase by 52%. WhileMaharashtra has adopted drip irrigation for banana cultivation to a large extent,other banana growing states should adopt drip irrigation facilities to makebanana cultivation environmentally sustainable.
5. Banana fibre is a great alternative to other natural fibres, like cotton as the formeris prepared from pseudo banana stem, which is a waste product in the bananavalue chain. In India, 70–80 tn/ha of banana pseudo stem is wasted, which hasthe potential to be converted into a number of value-added products includingpaper, handicrafts, fibre, bio-fertilizer, vermin compost, candies and pickle.Hence, it is not only an environmentally sustainable option, but also financiallylucrative for farmers as well as the entire banana economy. While a few pilotprojects have been started in Jalgaon and Trichy in India, the operations haveto be scaled up in other banana growing regions to acquire the desired scale.

4 Banana and Mango Value Chains 139
4.8.3 Mango Value Chain
1. As mango cultivation is mostly carried out by small and marginal farmers andit is a seasonal fruit, inter-cropping could be encouraged, keeping in mind thenature of soil as well as availability of water or irrigation. The role of ICARaffiliate institutes is critical in developing a sustainablemango cultivation systemwhich is remunerative for the farmers as well as environmentally sustainable.
2. There has been a slow increase in output, productivity, and area under mangocultivation across states, in the last few decades. The last mango variety wasdeveloped by CISH (Arunika) in 2008, and since then mango has not seen anysignificant breakthrough in varietal development. Development of long shelflife mango varieties without compromising on the taste or flavour, will ensurescalability of mango production in India.
3. There is a large asymmetry in post-harvest and export oriented infrastructurefacilities across states. While Maharashtra State Agricultural Marketing Boardruns irradiation facilities in Vashi and Lasalgaon and several Vapour Heat Treat-ment (VHT) facilities are located in mango-growing regions in Maharashtra,other states lack such facilities. In the absence of such facilities,mango exportersfrom Uttar Pradesh bring in their produce to Vashi or Lasalgaon (Maharashtra)for these treatments,which is amandatory requirement to cater to exportmarketsin many countries. Setting up such infrastructure in Uttar Pradesh, which is thelargest producer of mango, would help farmers in cutting cost of transportation,and ensure quicker shipments. All consignments to EU, South Korea, and Japanhave to undergo hot water treatment (HWT) or VHT. Irradiation is mandatoryfor the mango consignment sent to the USA. Hence, ramping up such facilitiesin other states, such that exporters can avail them easily will have a positiveimpact on export.
4. Logistics including cold chains, ripening chambers, reefer trucks, etc for perish-able commodities and in this context, mangoes, need to be developed and madeaccessible to the stakeholders in the value chain. Such logistics support willhelp improve the shelf life and quality of the fresh produce, reduce wastage,and enhance the marketability of the produce. Farmers can benefit from greaterdemand for mangoes as a result of robust value chain.
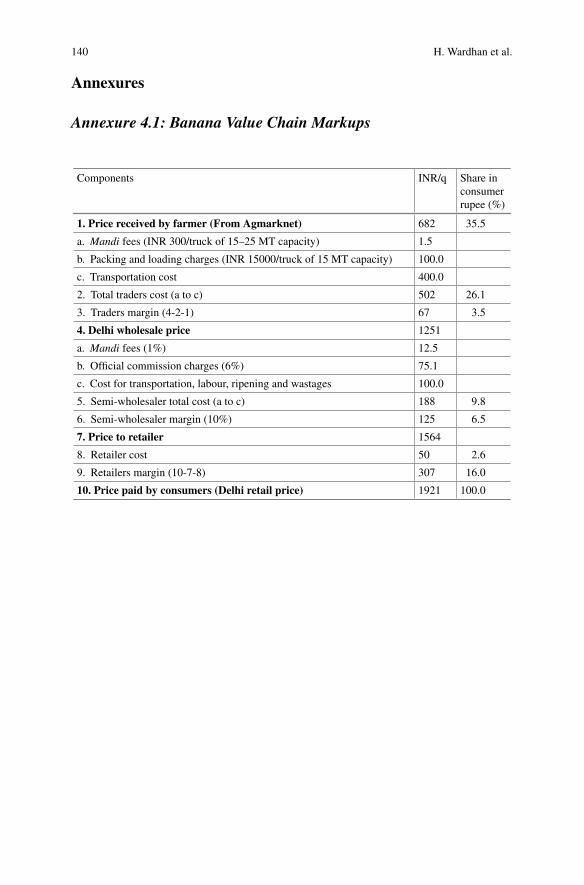
140 H. Wardhan et al.
Annexures
Annexure 4.1: Banana Value Chain Markups
Components INR/q Share inconsumerrupee (%)
1. Price received by farmer (From Agmarknet) 682 35.5
a. Mandi fees (INR 300/truck of 15–25 MT capacity) 1.5
b. Packing and loading charges (INR 15000/truck of 15 MT capacity) 100.0
c. Transportation cost 400.0
2. Total traders cost (a to c) 502 26.1
3. Traders margin (4-2-1) 67 3.5
4. Delhi wholesale price 1251
a. Mandi fees (1%) 12.5
b. Official commission charges (6%) 75.1
c. Cost for transportation, labour, ripening and wastages 100.0
5. Semi-wholesaler total cost (a to c) 188 9.8
6. Semi-wholesaler margin (10%) 125 6.5
7. Price to retailer 1564
8. Retailer cost 50 2.6
9. Retailers margin (10-7-8) 307 16.0
10. Price paid by consumers (Delhi retail price) 1921 100.0
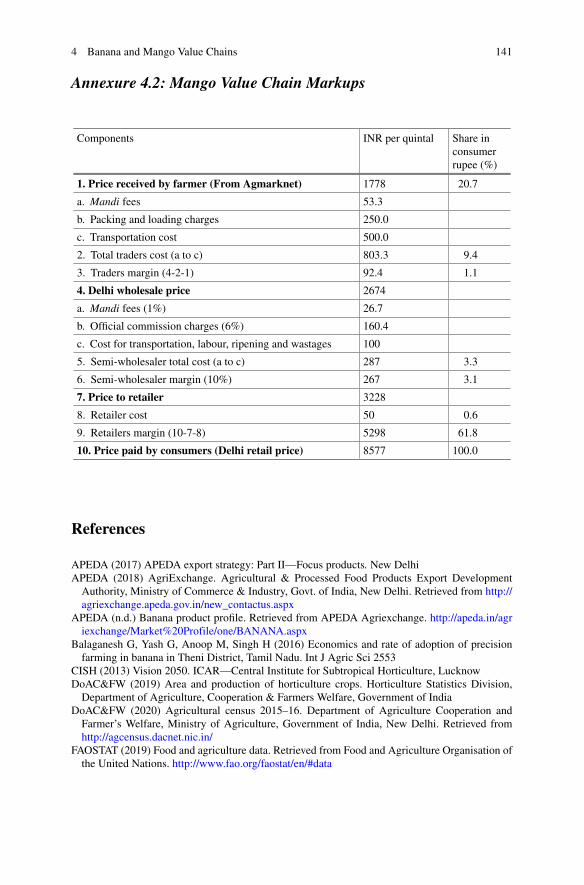
4 Banana and Mango Value Chains 141
Annexure 4.2: Mango Value Chain Markups
Components INR per quintal Share inconsumerrupee (%)
1. Price received by farmer (From Agmarknet) 1778 20.7
a. Mandi fees 53.3
b. Packing and loading charges 250.0
c. Transportation cost 500.0
2. Total traders cost (a to c) 803.3 9.4
3. Traders margin (4-2-1) 92.4 1.1
4. Delhi wholesale price 2674
a. Mandi fees (1%) 26.7
b. Official commission charges (6%) 160.4
c. Cost for transportation, labour, ripening and wastages 100
5. Semi-wholesaler total cost (a to c) 287 3.3
6. Semi-wholesaler margin (10%) 267 3.1
7. Price to retailer 3228
8. Retailer cost 50 0.6
9. Retailers margin (10-7-8) 5298 61.8
10. Price paid by consumers (Delhi retail price) 8577 100.0
References
APEDA (2017) APEDA export strategy: Part II—Focus products. New DelhiAPEDA (2018) AgriExchange. Agricultural & Processed Food Products Export DevelopmentAuthority, Ministry of Commerce & Industry, Govt. of India, New Delhi. Retrieved from http://agriexchange.apeda.gov.in/new_contactus.aspx
APEDA (n.d.) Banana product profile. Retrieved from APEDA Agriexchange. http://apeda.in/agriexchange/Market%20Profile/one/BANANA.aspx
Balaganesh G, Yash G, Anoop M, Singh H (2016) Economics and rate of adoption of precisionfarming in banana in Theni District, Tamil Nadu. Int J Agric Sci 2553
CISH (2013) Vision 2050. ICAR—Central Institute for Subtropical Horticulture, LucknowDoAC&FW (2019) Area and production of horticulture crops. Horticulture Statistics Division,Department of Agriculture, Cooperation & Farmers Welfare, Government of India
DoAC&FW (2020) Agricultural census 2015–16. Department of Agriculture Cooperation andFarmer’s Welfare, Ministry of Agriculture, Government of India, New Delhi. Retrieved fromhttp://agcensus.dacnet.nic.in/
FAOSTAT (2019) Food and agriculture data. Retrieved from Food and Agriculture Organisation ofthe United Nations. http://www.fao.org/faostat/en/#data
142 H. Wardhan et al.
Gunjate R (2006) Advances in mango culture in India. In: VIII International mango symposium,pp 69–78
Krishisandesh (n.d.) Cultivation of mango in ultra high density mango plantation. Retrievedfrom Krishisandesh. https://www.krishisandesh.com/mango-cultivation-ultra-high-density-plantation/
Lok Sabha Questions (2019) Lok Sabha, New DelhiMaharashtra Economic Survey 2017–18 (n.d.) Economic survey of Maharashtra 2017–18. Direc-torate of Finance and Statistics, Planning Department, Government of Maharashtra, Mumbai.Retrieved from https://mahades.maharashtra.gov.in/files/publication/ESM_17_18_eng.pdf
MoFPI (2018) Pradhan Mantri Kisan SAMPADA Yojana. Retrieved June 2018, from Ministry ofFood Processing Industries. http://mofpi.nic.in/sites/default/files/important_notice-sampada-19.05.2017.pdf
NABARD (2017) Farmer Producers’ Organizations (FPOs): status, issues. In: National Paper—PLP2019–20
NABKISAN (n.d.) Concept of producer organisation. Retrieved from June 2019 Nabkisan FinanceLimited. http://www.nabkisan.org/faq.php
NAS (2018) National accounts statistics. Ministry of Statistics and Programme Implementation,Government of India, New Delhi
NHB (2008–2010) Indian horticulture database. National Horticulture Board, Government of India,New Delhi
NHB (2017) Horticultural statistics at a glance 2017. National Horticulture Board, Ministry ofAgriculture, New Delhi
NHB (n.d.) Crop profile—Banana. RetrievedMarch 2019, fromNational Horticulture Board. http://nhb.gov.in/report_files/banana/BANANA.htm
NHB (n.d.) Mango profile. Retrieved March 2019, from National Horticulture Board: http://nhb.gov.in/report_files/mango/mango.htm
NRCB (2015) Vision 2050. ICAR—National Research Centre for Banana, Trichy, New DelhiNRCB (n.d.) Success Stories. Retrieved June 2019, from ICAR-National Research Centre forBanana. http://nrcb.res.in/success-stories.php
RKVY (n.d.) Processing of banana pseudo-stem into value added products: attempt for waste towealth. Retrieved February 2019, from RKVY. https://rkvy.nic.in/Uploads/SucessStory/MAHARASHTRA/2018/20181019311.%20Psuedo%20stem.pdf
Saini S, Gulati A (2017) Price distortions in Indian agriculture. World Bank: New DelhiShaikh N, Badgujar C, Rajenimbalkar V (2006) Performance of triploid cultivars of banana (Musaspp.) under Maharashtra conditions. Agric Sci Digest 36(2)
Sudha Mysore BB (2016) An economic crop profile of mango in Karnataka. Indian Institute ofHorticultural Research, Bengaluru
UNCTAD (2016) Mango: An INFOCOMM commodity profile. UNCTAD Trust Fund on MarketInformation on Agricultural Commodities, United Nations Conference on Trade and Develop-ment, New York and Geneva. Accessed from https://unctad.org/system/files/official-document/INFOCOMM_cp07_Mango_en.pdf
World Bank (2018) State of Maharashtra’s agribusiness and rural transformation project. WorldBank

4 Banana and Mango Value Chains 143
Open Access This chapter is licensed under the terms of the Creative Commons Attribution 4.0International License (http://creativecommons.org/licenses/by/4.0/), which permits use, sharing,adaptation, distribution and reproduction in any medium or format, as long as you give appropriatecredit to the original author(s) and the source, provide a link to the Creative Commons license andindicate if changes were made.
The images or other third party material in this chapter are included in the chapter’s CreativeCommons license, unless indicated otherwise in a credit line to the material. If material is notincluded in the chapter’s Creative Commons license and your intended use is not permitted bystatutory regulation or exceeds the permitted use, you will need to obtain permission directly fromthe copyright holder.
Chapter 5Grapes and Pomegranate Value Chains
Manasi Phadke, Bhushana Karandikar, and Ashok Gulati
5.1 Introduction
Horticulture has grown in size and importance within the agriculture landscape ofthe country. Horticulture production doubled from 191 million tonnes in 2006–07 tonearly 300million tonnes in 2016–17. In fact, by 2015–16, production of horticulturecrops was higher than that of food grains. Further, production of fruit crops as aproportion of horticulture crops increased from 29.5% in 2001–02 to 31.5% in 2015–16 (Fig. 5.1).
Within horticulture crops, grapes and pomegranates are very high-value fruitcrops. Grape cultivation in the world, as also in India, is distinct from other horti-culture crops in the sense that grape is a super-speciality science crop. The entireproduction protocol of grapes, right from plantation to pruning to spraying andharvesting, has been decoded scientifically. Grape farmers across the globe followregion-specific protocols for cultivating particular varieties of grapes. India cultivatestable grapes which are consumed as fresh grapes. In India, grape cultivation is largelypractised in Maharashtra, Karnataka, Andhra Pradesh and Telangana. However, interms of acreage, production as well as exports, the contribution of Maharashtrais indomitable. Around 76% of acreage and 80% of the production of grapes areconcentrated in Maharashtra, making it the definitive vineyard of India.
M. PhadkeFormer Senior External Consultant, Indian Council for Research on International EconomicRelations (ICRIER), New Delhi, Delhi, India
B. KarandikarFormer Senior External Consultant, Indian Council for Research on International EconomicRelations (ICRIER), New Delhi, Delhi, India
A. Gulati (B)Indian Council for Research on International Economic Relations (ICRIER), New Delhi, Delhi,India
© The Author(s) 2022A. Gulati et al. (eds.), Agricultural Value Chains in India, India Studies in Businessand Economics, https://doi.org/10.1007/978-981-33-4268-2_5
145
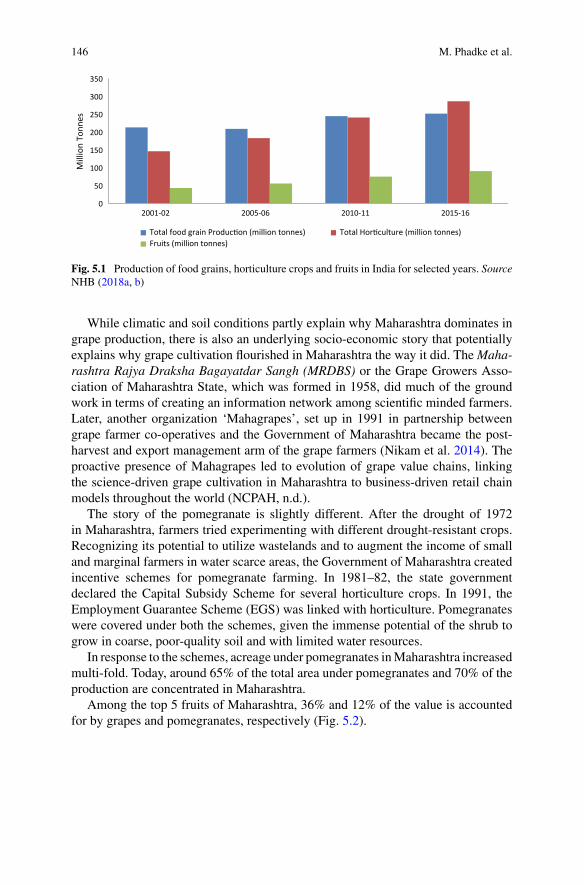
146 M. Phadke et al.
0
50
100
150
200
250
300
350
2001-02 2005-06 2010-11 2015-16
Mill
ion
Tonn
es
Total food grain Produc on (million tonnes) Total Hor culture (million tonnes)Fruits (million tonnes)
Fig. 5.1 Production of food grains, horticulture crops and fruits in India for selected years. SourceNHB (2018a, b)
While climatic and soil conditions partly explain why Maharashtra dominates ingrape production, there is also an underlying socio-economic story that potentiallyexplains why grape cultivation flourished in Maharashtra the way it did. TheMaha-rashtra Rajya Draksha Bagayatdar Sangh (MRDBS) or the Grape Growers Asso-ciation of Maharashtra State, which was formed in 1958, did much of the groundwork in terms of creating an information network among scientific minded farmers.Later, another organization ‘Mahagrapes’, set up in 1991 in partnership betweengrape farmer co-operatives and the Government of Maharashtra became the post-harvest and export management arm of the grape farmers (Nikam et al. 2014). Theproactive presence of Mahagrapes led to evolution of grape value chains, linkingthe science-driven grape cultivation in Maharashtra to business-driven retail chainmodels throughout the world (NCPAH, n.d.).
The story of the pomegranate is slightly different. After the drought of 1972in Maharashtra, farmers tried experimenting with different drought-resistant crops.Recognizing its potential to utilize wastelands and to augment the income of smalland marginal farmers in water scarce areas, the Government of Maharashtra createdincentive schemes for pomegranate farming. In 1981–82, the state governmentdeclared the Capital Subsidy Scheme for several horticulture crops. In 1991, theEmployment Guarantee Scheme (EGS) was linked with horticulture. Pomegranateswere covered under both the schemes, given the immense potential of the shrub togrow in coarse, poor-quality soil and with limited water resources.
In response to the schemes, acreage under pomegranates inMaharashtra increasedmulti-fold. Today, around 65% of the total area under pomegranates and 70% of theproduction are concentrated in Maharashtra.
Among the top 5 fruits of Maharashtra, 36% and 12% of the value is accountedfor by grapes and pomegranates, respectively (Fig. 5.2).
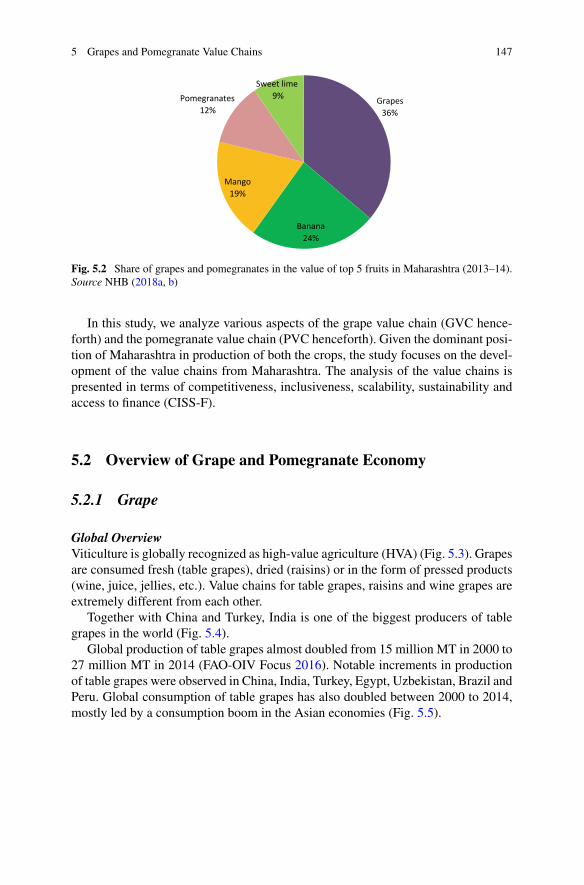
5 Grapes and Pomegranate Value Chains 147
Grapes36%
Banana24%
Mango19%
Pomegranates12%
Sweet lime9%
Fig. 5.2 Share of grapes and pomegranates in the value of top 5 fruits in Maharashtra (2013–14).Source NHB (2018a, b)
In this study, we analyze various aspects of the grape value chain (GVC hence-forth) and the pomegranate value chain (PVC henceforth). Given the dominant posi-tion of Maharashtra in production of both the crops, the study focuses on the devel-opment of the value chains from Maharashtra. The analysis of the value chains ispresented in terms of competitiveness, inclusiveness, scalability, sustainability andaccess to finance (CISS-F).
5.2 Overview of Grape and Pomegranate Economy
5.2.1 Grape
Global OverviewViticulture is globally recognized as high-value agriculture (HVA) (Fig. 5.3). Grapesare consumed fresh (table grapes), dried (raisins) or in the form of pressed products(wine, juice, jellies, etc.). Value chains for table grapes, raisins and wine grapes areextremely different from each other.
Together with China and Turkey, India is one of the biggest producers of tablegrapes in the world (Fig. 5.4).
Global production of table grapes almost doubled from 15 million MT in 2000 to27 million MT in 2014 (FAO-OIV Focus 2016). Notable increments in productionof table grapes were observed in China, India, Turkey, Egypt, Uzbekistan, Brazil andPeru. Global consumption of table grapes has also doubled between 2000 to 2014,mostly led by a consumption boom in the Asian economies (Fig. 5.5).
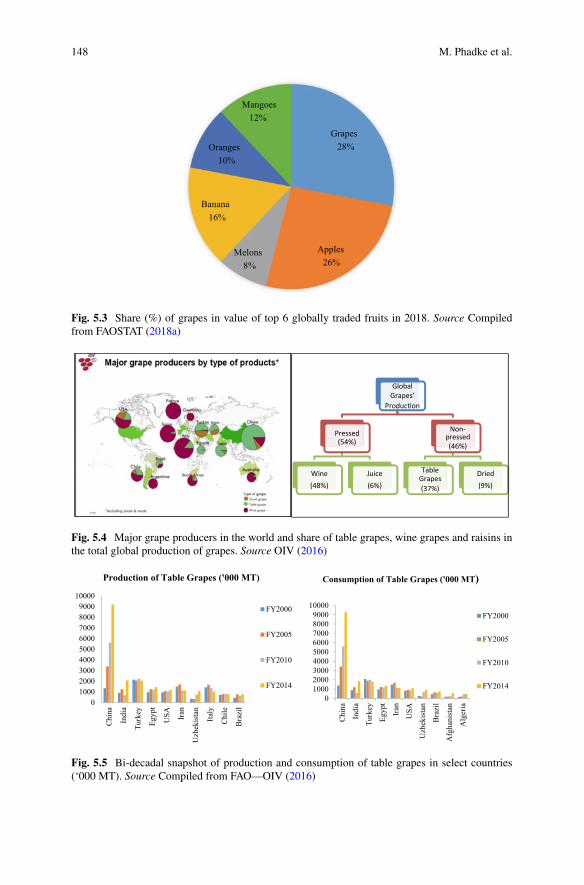
148 M. Phadke et al.
Grapes28%
Apples26%
Melons8%
Banana16%
Oranges10%
Mangoes12%
Fig. 5.3 Share (%) of grapes in value of top 6 globally traded fruits in 2018. Source Compiledfrom FAOSTAT (2018a)
Global Grapes’
Produc on
Pressed (54%)
Wine (48%)
Juice (6%)
Non-pressed (46%)
Table Grapes(37%)
Dried (9%)
Fig. 5.4 Major grape producers in the world and share of table grapes, wine grapes and raisins inthe total global production of grapes. Source OIV (2016)
0100020003000400050006000700080009000
10000
Chi
na
Indi
a
Turk
ey
Egyp
t
USA Iran
Uzb
ekis
tan
Italy
Chi
le
Bra
zil
Production of Table Grapes ('000 MT)
FY2000
FY2005
FY2010
FY2014
0100020003000400050006000700080009000
10000
Chi
na
Indi
a
Turk
ey
Egyp
t
Iran
USA
Uzb
ekis
tan
Bra
zil
Afg
hani
stan
Alg
eria
FY2000
FY2005
FY2010
FY2014
Consumption of Table Grapes ('000 MT)
Fig. 5.5 Bi-decadal snapshot of production and consumption of table grapes in select countries(‘000 MT). Source Compiled from FAO—OIV (2016)
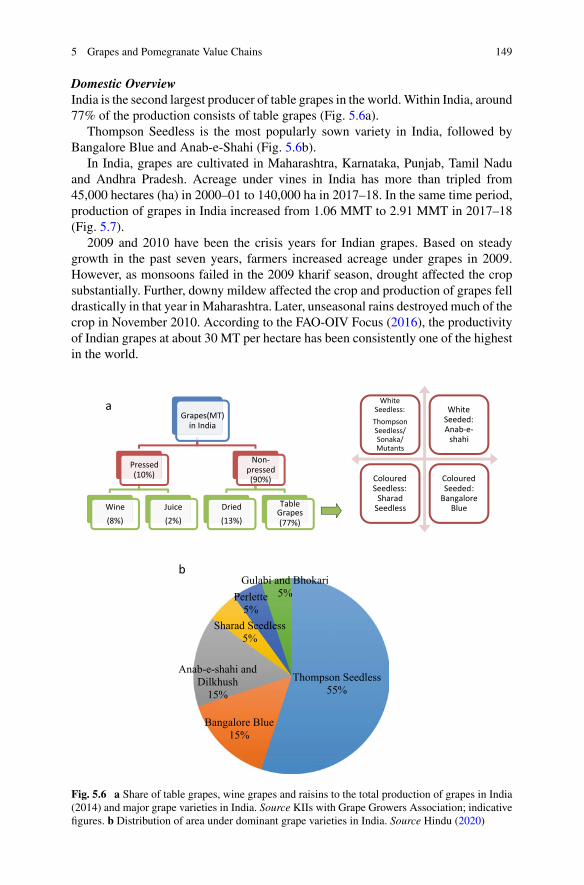
5 Grapes and Pomegranate Value Chains 149
Domestic OverviewIndia is the second largest producer of table grapes in the world.Within India, around77% of the production consists of table grapes (Fig. 5.6a).
Thompson Seedless is the most popularly sown variety in India, followed byBangalore Blue and Anab-e-Shahi (Fig. 5.6b).
In India, grapes are cultivated in Maharashtra, Karnataka, Punjab, Tamil Naduand Andhra Pradesh. Acreage under vines in India has more than tripled from45,000 hectares (ha) in 2000–01 to 140,000 ha in 2017–18. In the same time period,production of grapes in India increased from 1.06 MMT to 2.91 MMT in 2017–18(Fig. 5.7).
2009 and 2010 have been the crisis years for Indian grapes. Based on steadygrowth in the past seven years, farmers increased acreage under grapes in 2009.However, as monsoons failed in the 2009 kharif season, drought affected the cropsubstantially. Further, downy mildew affected the crop and production of grapes felldrastically in that year inMaharashtra. Later, unseasonal rains destroyed much of thecrop in November 2010. According to the FAO-OIV Focus (2016), the productivityof Indian grapes at about 30 MT per hectare has been consistently one of the highestin the world.
Grapes(MT) in India
Pressed (10%)
Wine (8%)
Juice (2%)
Non-pressed (90%)
Dried(13%)
Table Grapes (77%)
White Seedless:Thompson Seedless/ Sonaka/ Mutants
White Seeded: Anab-e-
shahi
Coloured Seedless:
Sharad Seedless
Coloured Seeded:
Bangalore Blue
a
b
Thompson Seedless55%
Bangalore Blue15%
Anab-e-shahi and Dilkhush
15%
Sharad Seedless5%
Perlette5%
Gulabi and Bhokari5%
Fig. 5.6 a Share of table grapes, wine grapes and raisins to the total production of grapes in India(2014) and major grape varieties in India. Source KIIs with Grape Growers Association; indicativefigures. b Distribution of area under dominant grape varieties in India. Source Hindu (2020)
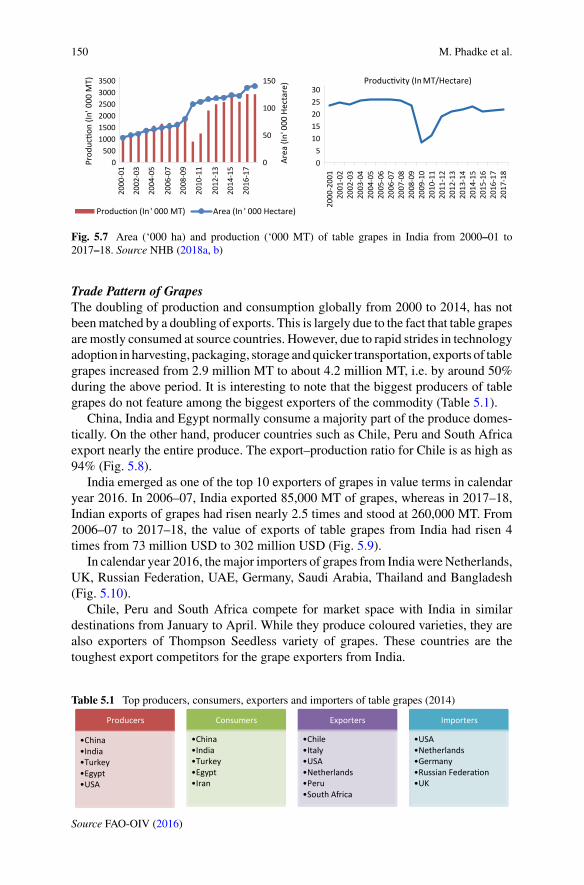
150 M. Phadke et al.
0
50
100
150
0500
100015002000250030003500
Area
(In '
000
Hect
are)
Prod
ucon
(In '
000
MT)
Produc on (In ' 000 MT) Area (In ' 000 Hectare)
05
1015202530
2000
-200
120
01-0
2
2000
-01
2002
-03
2002
-03
2003
-04
2004
-05
2004
-05
2005
-06
2006
-07
2006
-07
2007
-08
2008
-09
2008
-09
2009
-10
2010
-11
2010
-11
2011
-12
2012
-13
2012
-13
2013
-14
2014
-15
2014
-15
2015
-16
2016
-17
2016
-17
2017
-18
Produc vity (In MT/Hectare)
Fig. 5.7 Area (‘000 ha) and production (‘000 MT) of table grapes in India from 2000–01 to2017–18. Source NHB (2018a, b)
Trade Pattern of GrapesThe doubling of production and consumption globally from 2000 to 2014, has notbeenmatched by a doubling of exports. This is largely due to the fact that table grapesaremostly consumed at source countries. However, due to rapid strides in technologyadoption in harvesting, packaging, storage andquicker transportation, exports of tablegrapes increased from 2.9 million MT to about 4.2 million MT, i.e. by around 50%during the above period. It is interesting to note that the biggest producers of tablegrapes do not feature among the biggest exporters of the commodity (Table 5.1).
China, India and Egypt normally consume a majority part of the produce domes-tically. On the other hand, producer countries such as Chile, Peru and South Africaexport nearly the entire produce. The export–production ratio for Chile is as high as94% (Fig. 5.8).
India emerged as one of the top 10 exporters of grapes in value terms in calendaryear 2016. In 2006–07, India exported 85,000 MT of grapes, whereas in 2017–18,Indian exports of grapes had risen nearly 2.5 times and stood at 260,000 MT. From2006–07 to 2017–18, the value of exports of table grapes from India had risen 4times from 73 million USD to 302 million USD (Fig. 5.9).
In calendar year 2016, themajor importers of grapes from IndiawereNetherlands,UK, Russian Federation, UAE, Germany, Saudi Arabia, Thailand and Bangladesh(Fig. 5.10).
Chile, Peru and South Africa compete for market space with India in similardestinations from January to April. While they produce coloured varieties, they arealso exporters of Thompson Seedless variety of grapes. These countries are thetoughest export competitors for the grape exporters from India.
Table 5.1 Top producers, consumers, exporters and importers of table grapes (2014)
Producers
•China•India•Turkey•Egypt•USA
Consumers
•China•India•Turkey•Egypt•Iran
Exporters
•Chile•Italy•USA•Netherlands•Peru•South Africa
Importers
•USA•Netherlands•Germany•Russian Federa on•UK
Source FAO-OIV (2016)
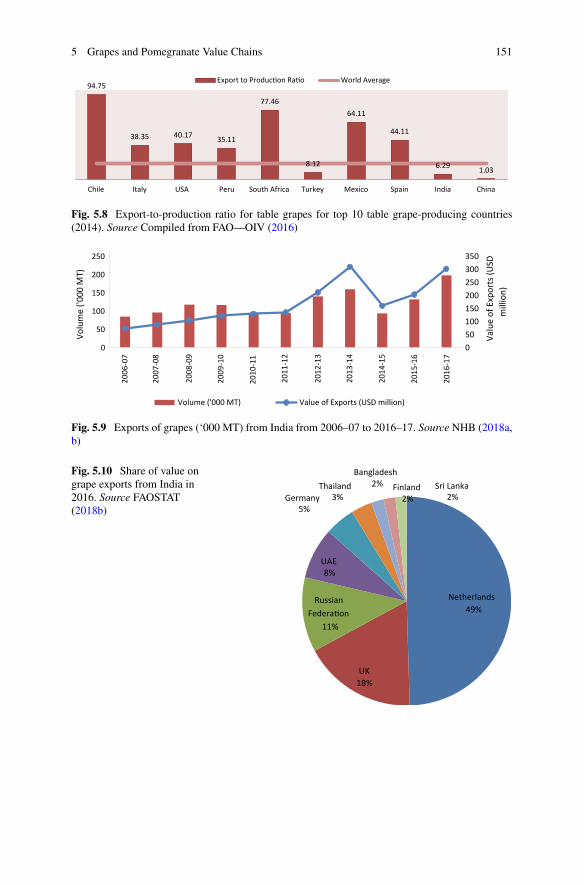
5 Grapes and Pomegranate Value Chains 151
94.75
38.35 40.17 35.11
77.46
8.12
64.11
44.11
6.29 1.03
Chile Italy USA Peru South Africa Turkey Mexico Spain India China
Export to Produc on Ra o World Average
Fig. 5.8 Export-to-production ratio for table grapes for top 10 table grape-producing countries(2014). Source Compiled from FAO—OIV (2016)
050100150200250300350
0
50
100
150
200
250
Valu
e of
Exp
orts
(USD
m
illio
n)
Volu
me
('000
MT)
Volume ('000 MT) Value of Exports (USD million)
2006
-07
2007
-08
2008
-09
2009
-10
2010
-11
2011
-12
2012
-13
2013
-14
2014
-15
2015
-16
2016
-17
Fig. 5.9 Exports of grapes (‘000 MT) from India from 2006–07 to 2016–17. Source NHB (2018a,b)
Fig. 5.10 Share of value ongrape exports from India in2016. Source FAOSTAT(2018b)
Netherlands49%
UK18%
Russian Federa on
11%
UAE8%
Germany5%
Thailand3%
Bangladesh2% Finland
2%Sri Lanka
2%
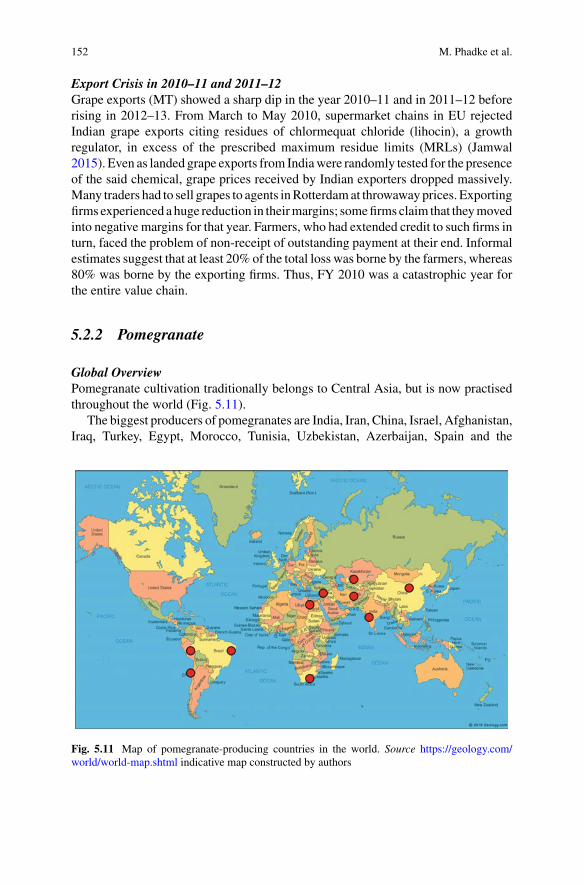
152 M. Phadke et al.
Export Crisis in 2010–11 and 2011–12Grape exports (MT) showed a sharp dip in the year 2010–11 and in 2011–12 beforerising in 2012–13. From March to May 2010, supermarket chains in EU rejectedIndian grape exports citing residues of chlormequat chloride (lihocin), a growthregulator, in excess of the prescribed maximum residue limits (MRLs) (Jamwal2015). Even as landed grape exports from Indiawere randomly tested for the presenceof the said chemical, grape prices received by Indian exporters dropped massively.Many traders had to sell grapes to agents inRotterdamat throwawayprices. Exportingfirms experienced ahuge reduction in theirmargins; somefirms claim that theymovedinto negative margins for that year. Farmers, who had extended credit to such firms inturn, faced the problem of non-receipt of outstanding payment at their end. Informalestimates suggest that at least 20% of the total loss was borne by the farmers, whereas80% was borne by the exporting firms. Thus, FY 2010 was a catastrophic year forthe entire value chain.
5.2.2 Pomegranate
Global OverviewPomegranate cultivation traditionally belongs to Central Asia, but is now practisedthroughout the world (Fig. 5.11).
The biggest producers of pomegranates are India, Iran, China, Israel, Afghanistan,Iraq, Turkey, Egypt, Morocco, Tunisia, Uzbekistan, Azerbaijan, Spain and the
Fig. 5.11 Map of pomegranate-producing countries in the world. Source https://geology.com/world/world-map.shtml indicative map constructed by authors
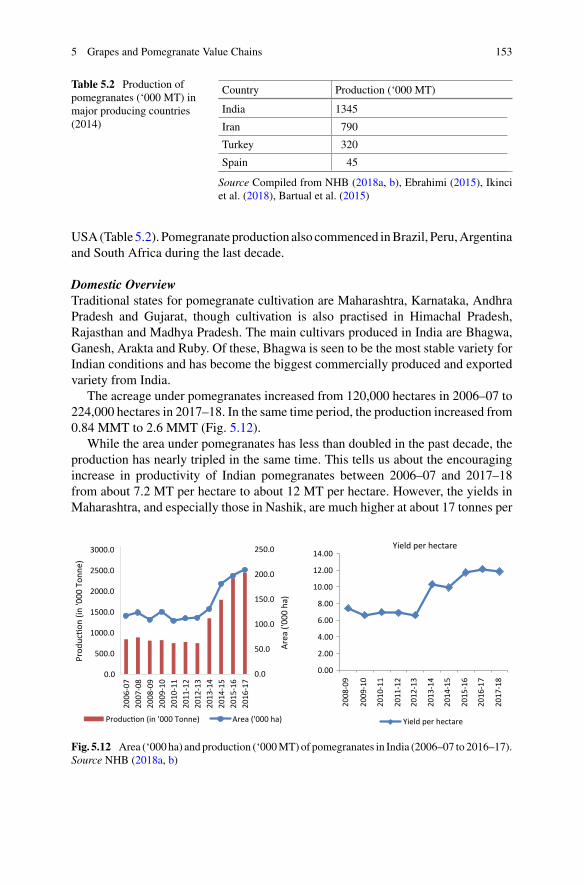
5 Grapes and Pomegranate Value Chains 153
Table 5.2 Production ofpomegranates (‘000 MT) inmajor producing countries(2014)
Country Production (‘000 MT)
India 1345
Iran 790
Turkey 320
Spain 45
Source Compiled from NHB (2018a, b), Ebrahimi (2015), Ikinciet al. (2018), Bartual et al. (2015)
USA(Table 5.2). Pomegranate production also commenced inBrazil, Peru,Argentinaand South Africa during the last decade.
Domestic OverviewTraditional states for pomegranate cultivation are Maharashtra, Karnataka, AndhraPradesh and Gujarat, though cultivation is also practised in Himachal Pradesh,Rajasthan and Madhya Pradesh. The main cultivars produced in India are Bhagwa,Ganesh, Arakta and Ruby. Of these, Bhagwa is seen to be the most stable variety forIndian conditions and has become the biggest commercially produced and exportedvariety from India.
The acreage under pomegranates increased from 120,000 hectares in 2006–07 to224,000 hectares in 2017–18. In the same time period, the production increased from0.84 MMT to 2.6 MMT (Fig. 5.12).
While the area under pomegranates has less than doubled in the past decade, theproduction has nearly tripled in the same time. This tells us about the encouragingincrease in productivity of Indian pomegranates between 2006–07 and 2017–18from about 7.2 MT per hectare to about 12 MT per hectare. However, the yields inMaharashtra, and especially those in Nashik, are much higher at about 17 tonnes per
0.0
50.0
100.0
150.0
200.0
250.0
0.0
500.0
1000.0
1500.0
2000.0
2500.0
3000.0
200
6-07
200
7-08
200
8-09
200
8-09
200
9-10
200
9-10
2010
-11
2010
-11
2011
-12
2011
-12
2012
-13
2012
-13
2013
-14
2013
-14
2014
-15
2014
-15
2015
-16
2015
-16
2016
-17
2017
-18
2016
-17
Area
('00
0 ha
)
Prod
ucon
(in
'000
Ton
ne)
Produc on (in '000 Tonne) Area ('000 ha)
0.00
2.00
4.00
6.00
8.00
10.00
12.00
14.00Yield per hectare
Yield per hectare
Fig. 5.12 Area (‘000ha) andproduction (‘000MT)of pomegranates in India (2006–07 to 2016–17).Source NHB (2018a, b)
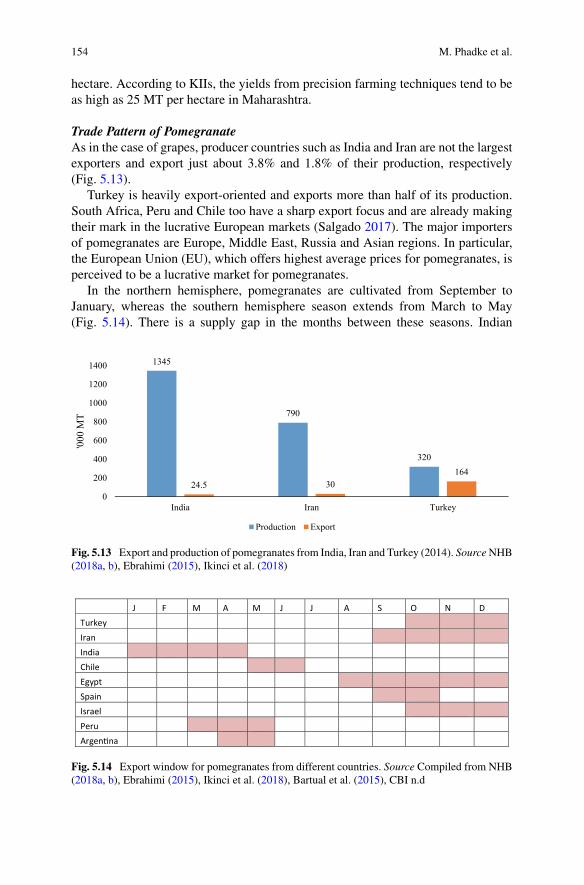
154 M. Phadke et al.
hectare. According to KIIs, the yields from precision farming techniques tend to beas high as 25 MT per hectare in Maharashtra.
Trade Pattern of PomegranateAs in the case of grapes, producer countries such as India and Iran are not the largestexporters and export just about 3.8% and 1.8% of their production, respectively(Fig. 5.13).
Turkey is heavily export-oriented and exports more than half of its production.South Africa, Peru and Chile too have a sharp export focus and are already makingtheir mark in the lucrative European markets (Salgado 2017). The major importersof pomegranates are Europe, Middle East, Russia and Asian regions. In particular,the European Union (EU), which offers highest average prices for pomegranates, isperceived to be a lucrative market for pomegranates.
In the northern hemisphere, pomegranates are cultivated from September toJanuary, whereas the southern hemisphere season extends from March to May(Fig. 5.14). There is a supply gap in the months between these seasons. Indian
1345
790
320
24.5 30164
0
200
400
600
800
1000
1200
1400
TurkeyIranIndia
'000
MT
Production Export
Fig. 5.13 Export and production of pomegranates from India, Iran and Turkey (2014). SourceNHB(2018a, b), Ebrahimi (2015), Ikinci et al. (2018)
J F M A M J J A S O N DTurkeyIranIndiaChileEgyptSpain IsraelPeruArgen na
Fig. 5.14 Export window for pomegranates from different countries. Source Compiled from NHB(2018a, b), Ebrahimi (2015), Ikinci et al. (2018), Bartual et al. (2015), CBI n.d
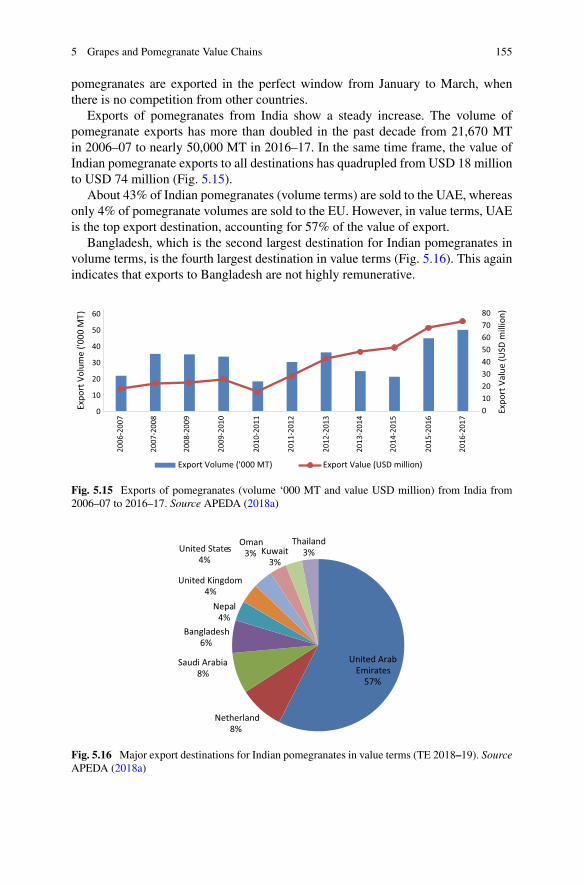
5 Grapes and Pomegranate Value Chains 155
pomegranates are exported in the perfect window from January to March, whenthere is no competition from other countries.
Exports of pomegranates from India show a steady increase. The volume ofpomegranate exports has more than doubled in the past decade from 21,670 MTin 2006–07 to nearly 50,000 MT in 2016–17. In the same time frame, the value ofIndian pomegranate exports to all destinations has quadrupled from USD 18 millionto USD 74 million (Fig. 5.15).
About 43% of Indian pomegranates (volume terms) are sold to the UAE, whereasonly 4% of pomegranate volumes are sold to the EU. However, in value terms, UAEis the top export destination, accounting for 57% of the value of export.
Bangladesh, which is the second largest destination for Indian pomegranates involume terms, is the fourth largest destination in value terms (Fig. 5.16). This againindicates that exports to Bangladesh are not highly remunerative.
01020304050607080
0
10
20
30
40
50
60
Expo
rt V
alue
(USD
mill
ion)
Expo
rt V
olum
e ('0
00 M
T)
Export Volume ('000 MT) Export Value (USD million)
2006
-200
7
2007
-200
8
2008
-200
9
2009
-201
0
2010
-201
1
2011
-201
2
2012
-201
3
2013
-201
4
2014
-201
5
2015
-201
6
2016
-201
7
Fig. 5.15 Exports of pomegranates (volume ‘000 MT and value USD million) from India from2006–07 to 2016–17. Source APEDA (2018a)
United Arab Emirates
57%
Netherland8%
Saudi Arabia8%
Bangladesh6%
Nepal4%
United Kingdom4%
United States4%
Kuwait3%
Oman3%
Thailand3%
Fig. 5.16 Major export destinations for Indian pomegranates in value terms (TE 2018–19). SourceAPEDA (2018a)
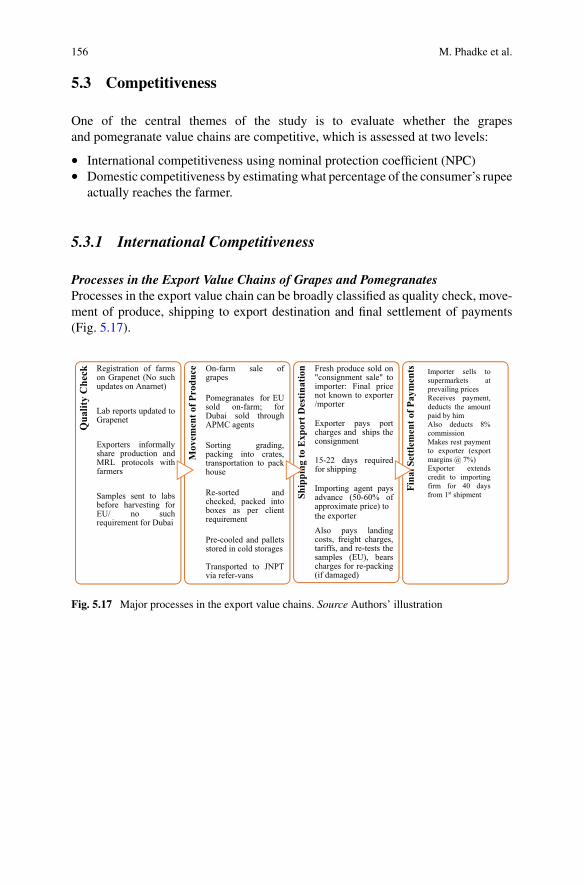
156 M. Phadke et al.
5.3 Competitiveness
One of the central themes of the study is to evaluate whether the grapesand pomegranate value chains are competitive, which is assessed at two levels:
• International competitiveness using nominal protection coefficient (NPC)• Domestic competitiveness by estimatingwhat percentage of the consumer’s rupee
actually reaches the farmer.
5.3.1 International Competitiveness
Processes in the Export Value Chains of Grapes and PomegranatesProcesses in the export value chain can be broadly classified as quality check, move-ment of produce, shipping to export destination and final settlement of payments(Fig. 5.17).
Qua
lity
Che
ck Registration of farmson Grapenet (No suchupdates on Anarnet)
Lab reports updated toGrapenet
Exporters informallyshare production andMRL protocols withfarmers
Samples sent to labsbefore harvesting forEU/ no suchrequirement for Dubai
Mov
emen
t of P
rodu
ce On-farm sale ofgrapes
Pomegranates for EUsold on-farm; forDubai sold throughAPMC agents
Sorting grading,packing into crates,transportation to packhouse
Re-sorted andchecked, packed intoboxes as per clientrequirement
Pre-cooled and palletsstored in cold storages
Transported to JNPTvia refer-vans
Ship
ping
to E
xpor
t Des
tinat
ion Fresh produce sold on
"consignment sale" toimporter: Final pricenot known to exporter/mporter
Exporter pays portcharges and ships theconsignment
15-22 days requiredfor shipping
Importing agent paysadvance (50-60% of
price) to the exporter
Also pays landingcosts, freight charges,tariffs, and re-tests thesamples (EU), bearscharges for re-packing(if damaged)
Fina
l Set
tlem
ent o
f Pay
men
ts
Importer sells to supermarkets at prevailing prices Receives payment, deducts the amount paid by him Also deducts 8% commission Makes rest payment to exporter (export margins @ 7%) Exporter extends credit to importing firm for 40 days from 1st shipment
approximate
Fig. 5.17 Major processes in the export value chains. Source Authors’ illustration
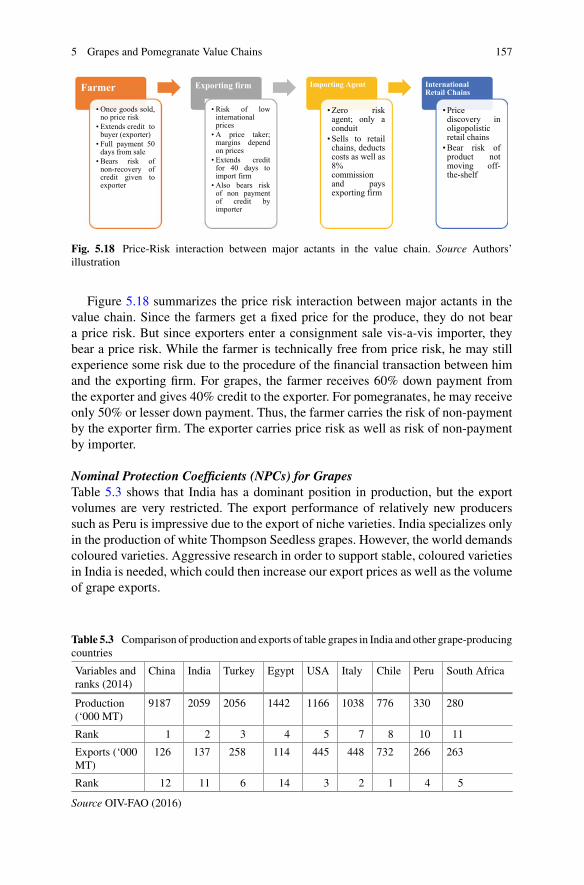
5 Grapes and Pomegranate Value Chains 157
Farmer
• Once goods sold,no price risk
• Extends credit tobuyer (exporter)
• Full payment 50days from sale
• Bears risk ofnon-recovery ofcredit given toexporter
Exporting firm
• Risk of lowinternationalprices
• A price taker;margins dependon prices
• Extends creditfor 40 days toimport firm
• Also bears riskof non paymentof credit byimporter
Importing Agent
• Zero riskagent; only aconduit
• Sells to retailchains, deductscosts as well as8%commissionand paysexporting firm
International Retail Chains
• Pricediscovery inoligopolisticretail chains
• Bear risk ofproduct notmoving off-the-shelf
Fig. 5.18 Price-Risk interaction between major actants in the value chain. Source Authors’illustration
Figure 5.18 summarizes the price risk interaction between major actants in thevalue chain. Since the farmers get a fixed price for the produce, they do not beara price risk. But since exporters enter a consignment sale vis-a-vis importer, theybear a price risk. While the farmer is technically free from price risk, he may stillexperience some risk due to the procedure of the financial transaction between himand the exporting firm. For grapes, the farmer receives 60% down payment fromthe exporter and gives 40% credit to the exporter. For pomegranates, he may receiveonly 50% or lesser down payment. Thus, the farmer carries the risk of non-paymentby the exporter firm. The exporter carries price risk as well as risk of non-paymentby importer.
Nominal Protection Coefficients (NPCs) for GrapesTable 5.3 shows that India has a dominant position in production, but the exportvolumes are very restricted. The export performance of relatively new producerssuch as Peru is impressive due to the export of niche varieties. India specializes onlyin the production of white Thompson Seedless grapes. However, the world demandscoloured varieties. Aggressive research in order to support stable, coloured varietiesin India is needed, which could then increase our export prices as well as the volumeof grape exports.
Table 5.3 Comparison of production and exports of table grapes in India and other grape-producingcountries
Variables andranks (2014)
China India Turkey Egypt USA Italy Chile Peru South Africa
Production(‘000 MT)
9187 2059 2056 1442 1166 1038 776 330 280
Rank 1 2 3 4 5 7 8 10 11
Exports (‘000MT)
126 137 258 114 445 448 732 266 263
Rank 12 11 6 14 3 2 1 4 5
Source OIV-FAO (2016)
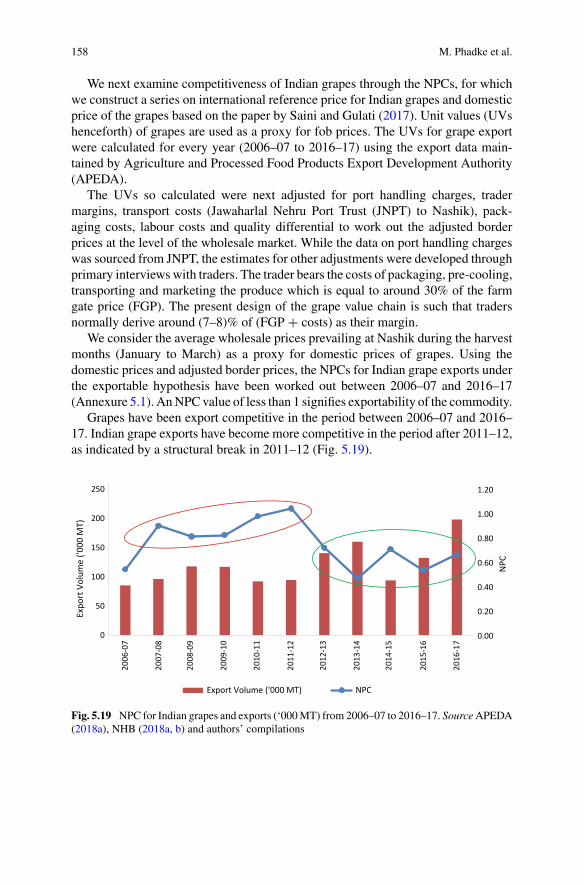
158 M. Phadke et al.
We next examine competitiveness of Indian grapes through the NPCs, for whichwe construct a series on international reference price for Indian grapes and domesticprice of the grapes based on the paper by Saini and Gulati (2017). Unit values (UVshenceforth) of grapes are used as a proxy for fob prices. The UVs for grape exportwere calculated for every year (2006–07 to 2016–17) using the export data main-tained by Agriculture and Processed Food Products Export Development Authority(APEDA).
The UVs so calculated were next adjusted for port handling charges, tradermargins, transport costs (Jawaharlal Nehru Port Trust (JNPT) to Nashik), pack-aging costs, labour costs and quality differential to work out the adjusted borderprices at the level of the wholesale market. While the data on port handling chargeswas sourced from JNPT, the estimates for other adjustments were developed throughprimary interviewswith traders. The trader bears the costs of packaging, pre-cooling,transporting and marketing the produce which is equal to around 30% of the farmgate price (FGP). The present design of the grape value chain is such that tradersnormally derive around (7–8)% of (FGP + costs) as their margin.
We consider the average wholesale prices prevailing at Nashik during the harvestmonths (January to March) as a proxy for domestic prices of grapes. Using thedomestic prices and adjusted border prices, the NPCs for Indian grape exports underthe exportable hypothesis have been worked out between 2006–07 and 2016–17(Annexure 5.1). AnNPCvalue of less than 1 signifies exportability of the commodity.
Grapes have been export competitive in the period between 2006–07 and 2016–17. Indian grape exports have become more competitive in the period after 2011–12,as indicated by a structural break in 2011–12 (Fig. 5.19).
0.00
0.20
0.40
0.60
0.80
1.00
1.20
0
50
100
150
200
250N
PC
Expo
rt V
olum
e ('0
00 M
T)
Export Volume ('000 MT) NPC
2006
-07
2007
-08
2008
-09
2009
-10
2010
-11
2011
-12
2012
-13
2013
-14
2014
-15
2015
-16
2016
-17
Fig. 5.19 NPC for Indian grapes and exports (‘000MT) from 2006–07 to 2016–17. SourceAPEDA(2018a), NHB (2018a, b) and authors’ compilations
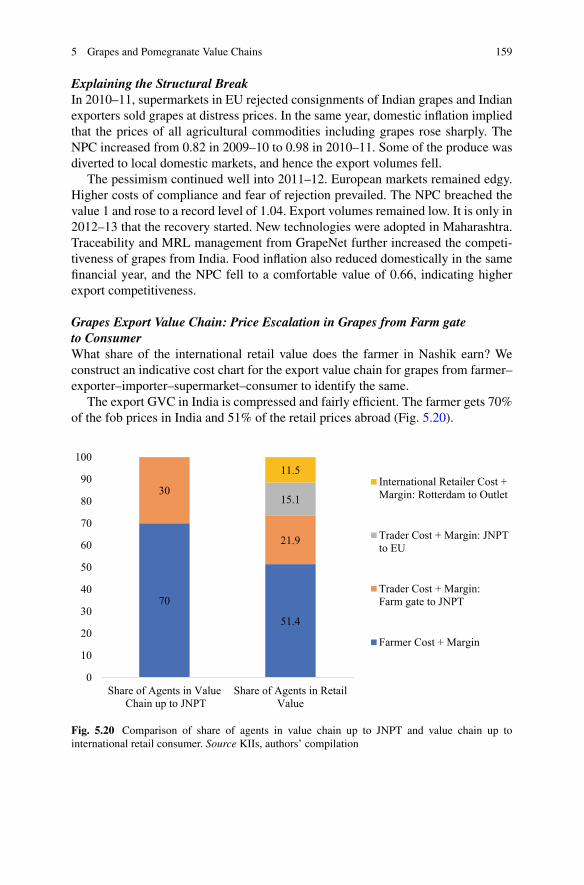
5 Grapes and Pomegranate Value Chains 159
Explaining the Structural BreakIn 2010–11, supermarkets in EU rejected consignments of Indian grapes and Indianexporters sold grapes at distress prices. In the same year, domestic inflation impliedthat the prices of all agricultural commodities including grapes rose sharply. TheNPC increased from 0.82 in 2009–10 to 0.98 in 2010–11. Some of the produce wasdiverted to local domestic markets, and hence the export volumes fell.
The pessimism continued well into 2011–12. European markets remained edgy.Higher costs of compliance and fear of rejection prevailed. The NPC breached thevalue 1 and rose to a record level of 1.04. Export volumes remained low. It is only in2012–13 that the recovery started. New technologies were adopted in Maharashtra.Traceability and MRL management from GrapeNet further increased the competi-tiveness of grapes from India. Food inflation also reduced domestically in the samefinancial year, and the NPC fell to a comfortable value of 0.66, indicating higherexport competitiveness.
Grapes Export Value Chain: Price Escalation in Grapes from Farm gateto ConsumerWhat share of the international retail value does the farmer in Nashik earn? Weconstruct an indicative cost chart for the export value chain for grapes from farmer–exporter–importer–supermarket–consumer to identify the same.
The export GVC in India is compressed and fairly efficient. The farmer gets 70%of the fob prices in India and 51% of the retail prices abroad (Fig. 5.20).
70
51.4
30
21.9
15.1
11.5
0
10
20
30
40
50
60
70
80
90
100
Share of Agents in ValueChain up to JNPT
Share of Agents in RetailValue
International Retailer Cost +Margin: Rotterdam to Outlet
Trader Cost + Margin: JNPTto EU
Trader Cost + Margin:Farm gate to JNPT
Farmer Cost + Margin
Fig. 5.20 Comparison of share of agents in value chain up to JNPT and value chain up tointernational retail consumer. Source KIIs, authors’ compilation
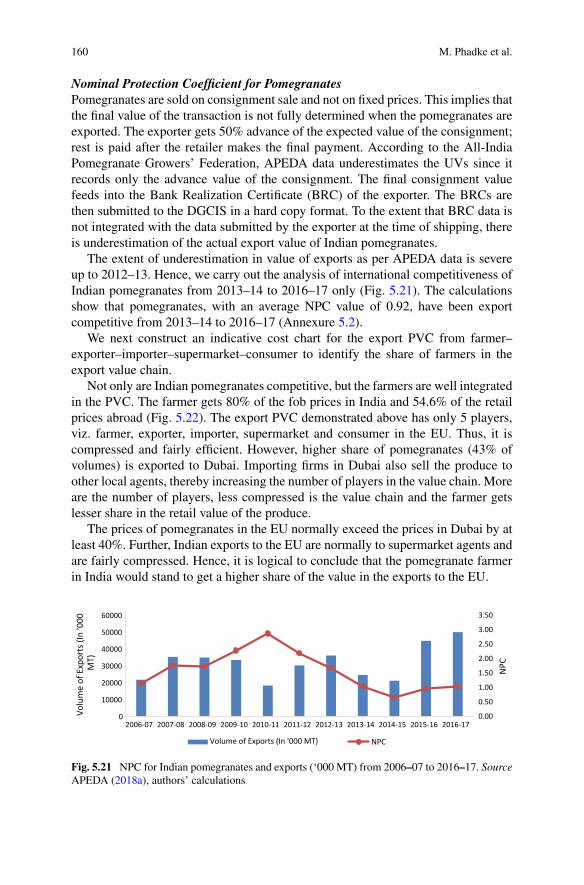
160 M. Phadke et al.
Nominal Protection Coefficient for PomegranatesPomegranates are sold on consignment sale and not on fixed prices. This implies thatthe final value of the transaction is not fully determined when the pomegranates areexported. The exporter gets 50% advance of the expected value of the consignment;rest is paid after the retailer makes the final payment. According to the All-IndiaPomegranate Growers’ Federation, APEDA data underestimates the UVs since itrecords only the advance value of the consignment. The final consignment valuefeeds into the Bank Realization Certificate (BRC) of the exporter. The BRCs arethen submitted to the DGCIS in a hard copy format. To the extent that BRC data isnot integrated with the data submitted by the exporter at the time of shipping, thereis underestimation of the actual export value of Indian pomegranates.
The extent of underestimation in value of exports as per APEDA data is severeup to 2012–13. Hence, we carry out the analysis of international competitiveness ofIndian pomegranates from 2013–14 to 2016–17 only (Fig. 5.21). The calculationsshow that pomegranates, with an average NPC value of 0.92, have been exportcompetitive from 2013–14 to 2016–17 (Annexure 5.2).
We next construct an indicative cost chart for the export PVC from farmer–exporter–importer–supermarket–consumer to identify the share of farmers in theexport value chain.
Not only are Indian pomegranates competitive, but the farmers are well integratedin the PVC. The farmer gets 80% of the fob prices in India and 54.6% of the retailprices abroad (Fig. 5.22). The export PVC demonstrated above has only 5 players,viz. farmer, exporter, importer, supermarket and consumer in the EU. Thus, it iscompressed and fairly efficient. However, higher share of pomegranates (43% ofvolumes) is exported to Dubai. Importing firms in Dubai also sell the produce toother local agents, thereby increasing the number of players in the value chain. Moreare the number of players, less compressed is the value chain and the farmer getslesser share in the retail value of the produce.
The prices of pomegranates in the EU normally exceed the prices in Dubai by atleast 40%. Further, Indian exports to the EU are normally to supermarket agents andare fairly compressed. Hence, it is logical to conclude that the pomegranate farmerin India would stand to get a higher share of the value in the exports to the EU.
0.00
0.50
1.00
1.50
2.00
2.50
3.00
3.50
0
10000
20000
30000
40000
50000
60000
2006-07 2007-08 2008-09 2009-10 2010-11 2011-12 2012-13 2013-14 2014-15 2015-16 2016-17
NPC
Volu
me
of E
xpor
ts (I
n '0
00
MT)
Volume of Exports (In '000 MT) NPC
Fig. 5.21 NPC for Indian pomegranates and exports (‘000 MT) from 2006–07 to 2016–17. SourceAPEDA (2018a), authors’ calculations
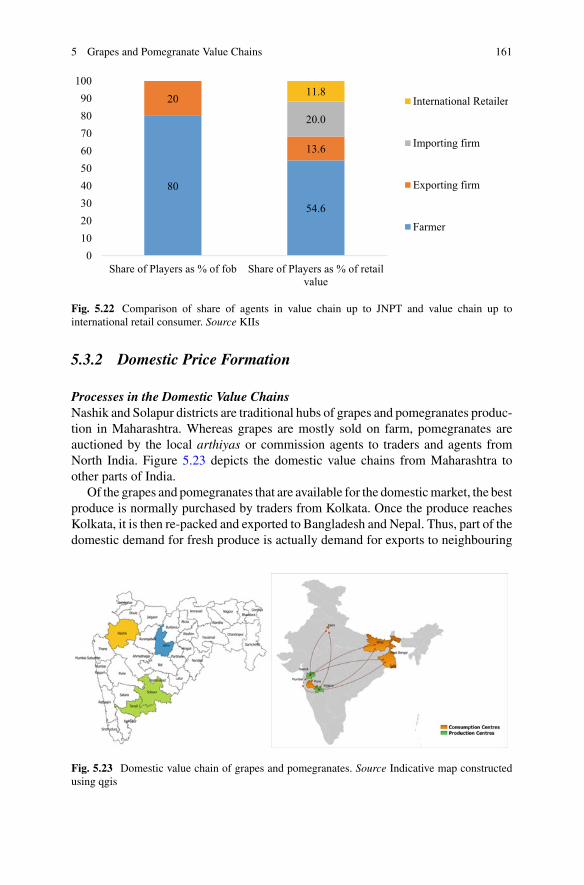
5 Grapes and Pomegranate Value Chains 161
80
54.6
20
13.6
20.0
11.8
0102030405060708090
100
Share of Players as % of fob Share of Players as % of retailvalue
International Retailer
Importing firm
Exporting firm
Farmer
Fig. 5.22 Comparison of share of agents in value chain up to JNPT and value chain up tointernational retail consumer. Source KIIs
5.3.2 Domestic Price Formation
Processes in the Domestic Value ChainsNashik and Solapur districts are traditional hubs of grapes and pomegranates produc-tion in Maharashtra. Whereas grapes are mostly sold on farm, pomegranates areauctioned by the local arthiyas or commission agents to traders and agents fromNorth India. Figure 5.23 depicts the domestic value chains from Maharashtra toother parts of India.
Of the grapes and pomegranates that are available for the domesticmarket, the bestproduce is normally purchased by traders from Kolkata. Once the produce reachesKolkata, it is then re-packed and exported to Bangladesh and Nepal. Thus, part of thedomestic demand for fresh produce is actually demand for exports to neighbouring
Fig. 5.23 Domestic value chain of grapes and pomegranates. Source Indicative map constructedusing qgis
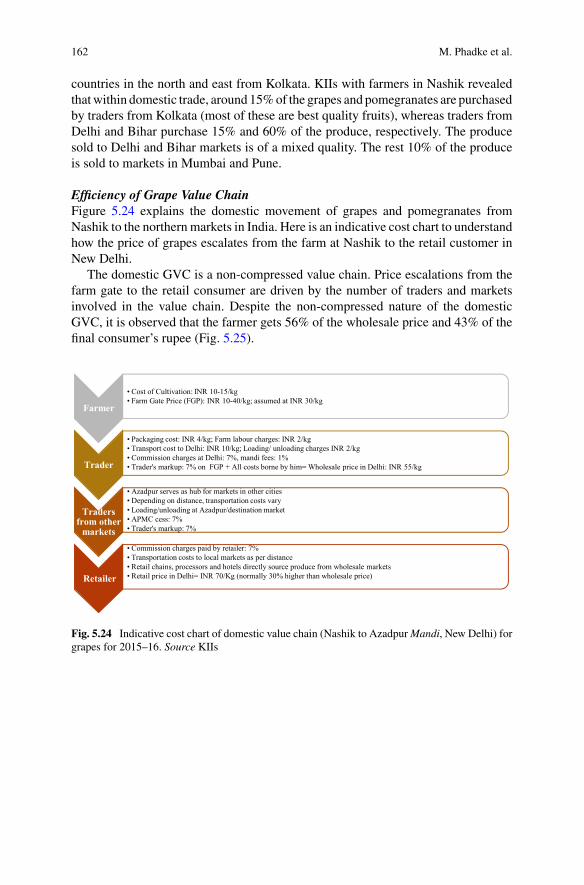
162 M. Phadke et al.
countries in the north and east from Kolkata. KIIs with farmers in Nashik revealedthatwithin domestic trade, around 15%of the grapes and pomegranates are purchasedby traders from Kolkata (most of these are best quality fruits), whereas traders fromDelhi and Bihar purchase 15% and 60% of the produce, respectively. The producesold to Delhi and Bihar markets is of a mixed quality. The rest 10% of the produceis sold to markets in Mumbai and Pune.
Efficiency of Grape Value ChainFigure 5.24 explains the domestic movement of grapes and pomegranates fromNashik to the northern markets in India. Here is an indicative cost chart to understandhow the price of grapes escalates from the farm at Nashik to the retail customer inNew Delhi.
The domestic GVC is a non-compressed value chain. Price escalations from thefarm gate to the retail consumer are driven by the number of traders and marketsinvolved in the value chain. Despite the non-compressed nature of the domesticGVC, it is observed that the farmer gets 56% of the wholesale price and 43% of thefinal consumer’s rupee (Fig. 5.25).
Farmer
• Cost of Cultivation: INR 10-15/kg• Farm Gate Price (FGP): INR 10-40/kg; assumed at INR 30/kg
Trader
• Packaging cost: INR 4/kg; Farm labour charges: INR 2/kg• Transport cost to Delhi: INR 10/kg; Loading/ unloading charges INR 2/kg• Commission charges at Delhi: 7%, mandi fees: 1%• Trader's markup: 7% on FGP + All costs borne by him= Wholesale price in Delhi: INR 55/kg
Tradersfrom other
markets
• Azadpur serves as hub for markets in other cities• Depending on distance, transportation costs vary• Loading/unloading at Azadpur/destination market• APMC cess: 7%• Trader's markup: 7%
Retailer
• Commission charges paid by retailer: 7%• Transportation costs to local markets as per distance• Retail chains, processors and hotels directly source produce from wholesale markets• Retail price in Delhi= INR 70/Kg (normally 30% higher than wholesale price)
Fig. 5.24 Indicative cost chart of domestic value chain (Nashik to AzadpurMandi, New Delhi) forgrapes for 2015–16. Source KIIs
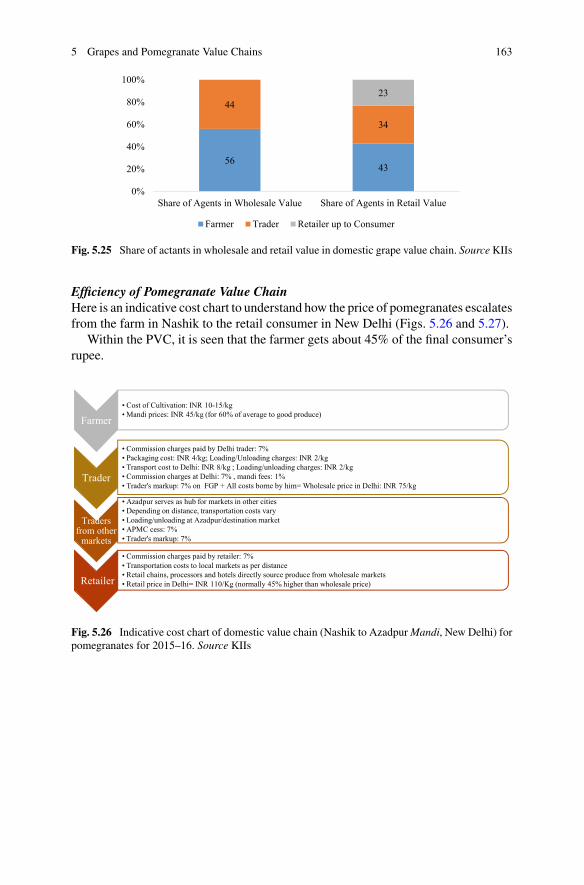
5 Grapes and Pomegranate Value Chains 163
5643
44
34
23
0%
20%
40%
60%
80%
100%
Share of Agents in Wholesale Value Share of Agents in Retail Value
Farmer Trader Retailer up to Consumer
Fig. 5.25 Share of actants in wholesale and retail value in domestic grape value chain. SourceKIIs
Efficiency of Pomegranate Value ChainHere is an indicative cost chart to understand how the price of pomegranates escalatesfrom the farm in Nashik to the retail consumer in New Delhi (Figs. 5.26 and 5.27).
Within the PVC, it is seen that the farmer gets about 45% of the final consumer’srupee.
Farmer• Cost of Cultivation: INR 10-15/kg• Mandi prices: INR 45/kg (for 60% of average to good produce)
Trader
• Commission charges paid by Delhi trader: 7%• Packaging cost: INR 4/kg; Loading/Unloading charges: INR 2/kg• Transport cost to Delhi: INR 8/kg ; Loading/unloading charges: INR 2/kg• Commission charges at Delhi: 7% , mandi fees: 1% • Trader's markup: 7% on FGP + All costs borne by him= Wholesale price in Delhi: INR 75/kg
Traders from other
markets
• Azadpur serves as hub for markets in other cities• Depending on distance, transportation costs vary• Loading/unloading at Azadpur/destination market• APMC cess: 7%• Trader's markup: 7%
Retailer
• Commission charges paid by retailer: 7%• Transportation costs to local markets as per distance• Retail chains, processors and hotels directly source produce from wholesale markets• Retail price in Delhi= INR 110/Kg (normally 45% higher than wholesale price)
Fig. 5.26 Indicative cost chart of domestic value chain (Nashik to AzadpurMandi, New Delhi) forpomegranates for 2015–16. Source KIIs
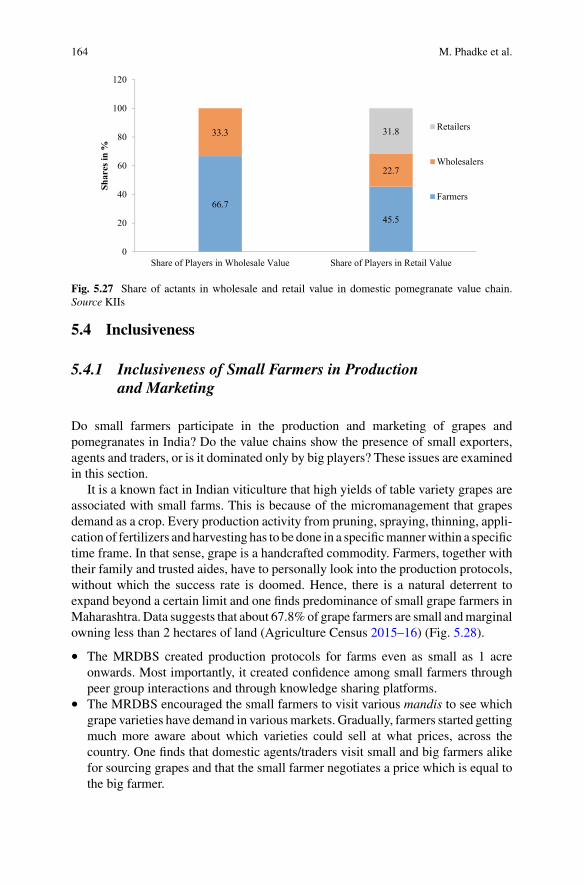
164 M. Phadke et al.
66.745.5
33.3
22.7
31.8
0
20
40
60
80
100
120
Share of Players in Wholesale Value Share of Players in Retail Value
Shar
es in
%
Retailers
Wholesalers
Farmers
Fig. 5.27 Share of actants in wholesale and retail value in domestic pomegranate value chain.Source KIIs
5.4 Inclusiveness
5.4.1 Inclusiveness of Small Farmers in Productionand Marketing
Do small farmers participate in the production and marketing of grapes andpomegranates in India? Do the value chains show the presence of small exporters,agents and traders, or is it dominated only by big players? These issues are examinedin this section.
It is a known fact in Indian viticulture that high yields of table variety grapes areassociated with small farms. This is because of the micromanagement that grapesdemand as a crop. Every production activity from pruning, spraying, thinning, appli-cation of fertilizers and harvesting has to be done in a specificmannerwithin a specifictime frame. In that sense, grape is a handcrafted commodity. Farmers, together withtheir family and trusted aides, have to personally look into the production protocols,without which the success rate is doomed. Hence, there is a natural deterrent toexpand beyond a certain limit and one finds predominance of small grape farmers inMaharashtra. Data suggests that about 67.8%of grape farmers are small andmarginalowning less than 2 hectares of land (Agriculture Census 2015–16) (Fig. 5.28).
• The MRDBS created production protocols for farms even as small as 1 acreonwards. Most importantly, it created confidence among small farmers throughpeer group interactions and through knowledge sharing platforms.
• The MRDBS encouraged the small farmers to visit various mandis to see whichgrape varieties have demand in variousmarkets. Gradually, farmers started gettingmuch more aware about which varieties could sell at what prices, across thecountry. One finds that domestic agents/traders visit small and big farmers alikefor sourcing grapes and that the small farmer negotiates a price which is equal tothe big farmer.
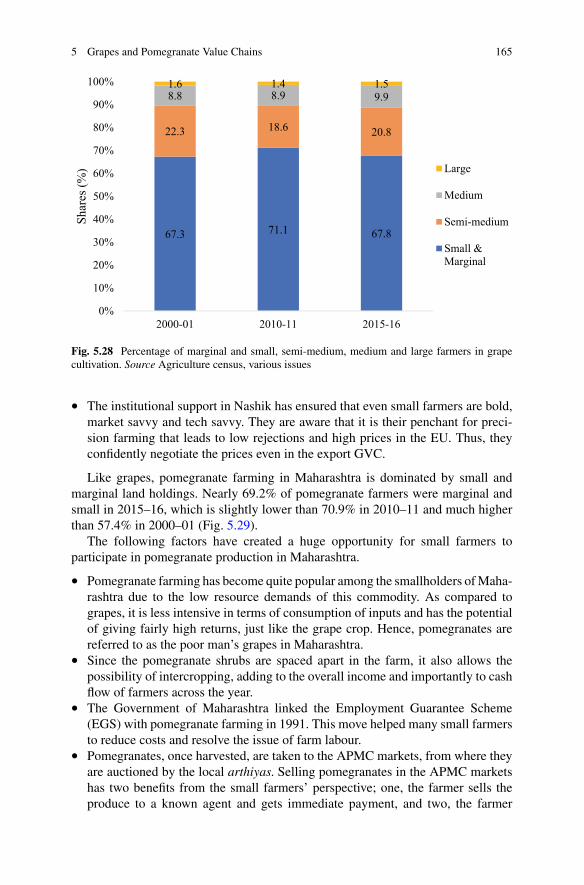
5 Grapes and Pomegranate Value Chains 165
67.3 71.1 67.8
22.3 18.6 20.8
8.8 8.9 9.91.6 1.4 1.5
0%
10%
20%
30%
40%
50%
60%
70%
80%
90%
100%
2000-01 2010-11 2015-16
Shar
es (%
) Large
Medium
Semi-medium
Small &Marginal
Fig. 5.28 Percentage of marginal and small, semi-medium, medium and large farmers in grapecultivation. Source Agriculture census, various issues
• The institutional support in Nashik has ensured that even small farmers are bold,market savvy and tech savvy. They are aware that it is their penchant for preci-sion farming that leads to low rejections and high prices in the EU. Thus, theyconfidently negotiate the prices even in the export GVC.
Like grapes, pomegranate farming in Maharashtra is dominated by small andmarginal land holdings. Nearly 69.2% of pomegranate farmers were marginal andsmall in 2015–16, which is slightly lower than 70.9% in 2010–11 and much higherthan 57.4% in 2000–01 (Fig. 5.29).
The following factors have created a huge opportunity for small farmers toparticipate in pomegranate production in Maharashtra.
• Pomegranate farming has become quite popular among the smallholders ofMaha-rashtra due to the low resource demands of this commodity. As compared tograpes, it is less intensive in terms of consumption of inputs and has the potentialof giving fairly high returns, just like the grape crop. Hence, pomegranates arereferred to as the poor man’s grapes in Maharashtra.
• Since the pomegranate shrubs are spaced apart in the farm, it also allows thepossibility of intercropping, adding to the overall income and importantly to cashflow of farmers across the year.
• The Government of Maharashtra linked the Employment Guarantee Scheme(EGS) with pomegranate farming in 1991. This move helped many small farmersto reduce costs and resolve the issue of farm labour.
• Pomegranates, once harvested, are taken to the APMC markets, from where theyare auctioned by the local arthiyas. Selling pomegranates in the APMC marketshas two benefits from the small farmers’ perspective; one, the farmer sells theproduce to a known agent and gets immediate payment, and two, the farmer
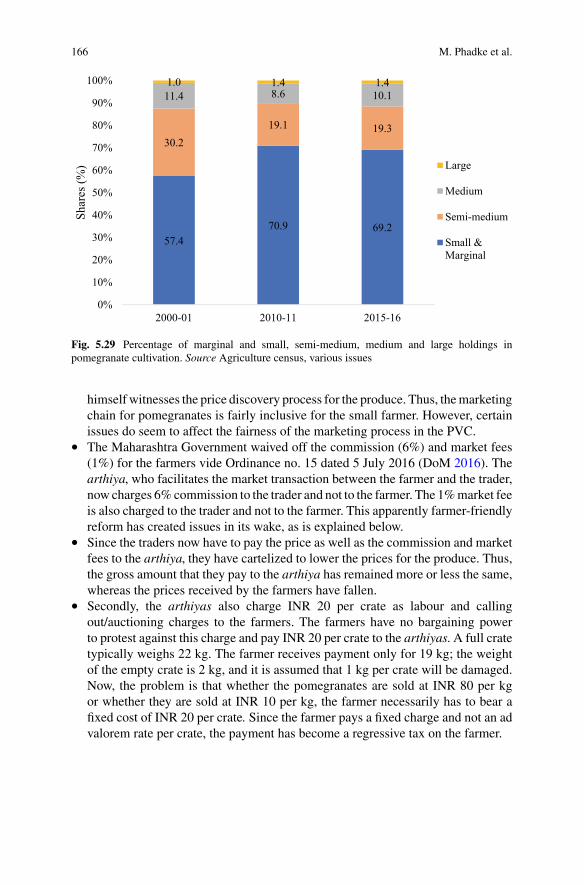
166 M. Phadke et al.
57.470.9 69.2
30.219.1 19.3
11.4 8.6 10.11.0 1.4 1.4
0%
10%
20%
30%
40%
50%
60%
70%
80%
90%
100%
2000-01 2010-11 2015-16
Shar
es (%
) Large
Medium
Semi-medium
Small &Marginal
Fig. 5.29 Percentage of marginal and small, semi-medium, medium and large holdings inpomegranate cultivation. Source Agriculture census, various issues
himself witnesses the price discovery process for the produce. Thus, themarketingchain for pomegranates is fairly inclusive for the small farmer. However, certainissues do seem to affect the fairness of the marketing process in the PVC.
• The Maharashtra Government waived off the commission (6%) and market fees(1%) for the farmers vide Ordinance no. 15 dated 5 July 2016 (DoM 2016). Thearthiya, who facilitates the market transaction between the farmer and the trader,now charges 6%commission to the trader and not to the farmer. The 1%market feeis also charged to the trader and not to the farmer. This apparently farmer-friendlyreform has created issues in its wake, as is explained below.
• Since the traders now have to pay the price as well as the commission and marketfees to the arthiya, they have cartelized to lower the prices for the produce. Thus,the gross amount that they pay to the arthiya has remained more or less the same,whereas the prices received by the farmers have fallen.
• Secondly, the arthiyas also charge INR 20 per crate as labour and callingout/auctioning charges to the farmers. The farmers have no bargaining powerto protest against this charge and pay INR 20 per crate to the arthiyas. A full cratetypically weighs 22 kg. The farmer receives payment only for 19 kg; the weightof the empty crate is 2 kg, and it is assumed that 1 kg per crate will be damaged.Now, the problem is that whether the pomegranates are sold at INR 80 per kgor whether they are sold at INR 10 per kg, the farmer necessarily has to bear afixed cost of INR 20 per crate. Since the farmer pays a fixed charge and not an advalorem rate per crate, the payment has become a regressive tax on the farmer.
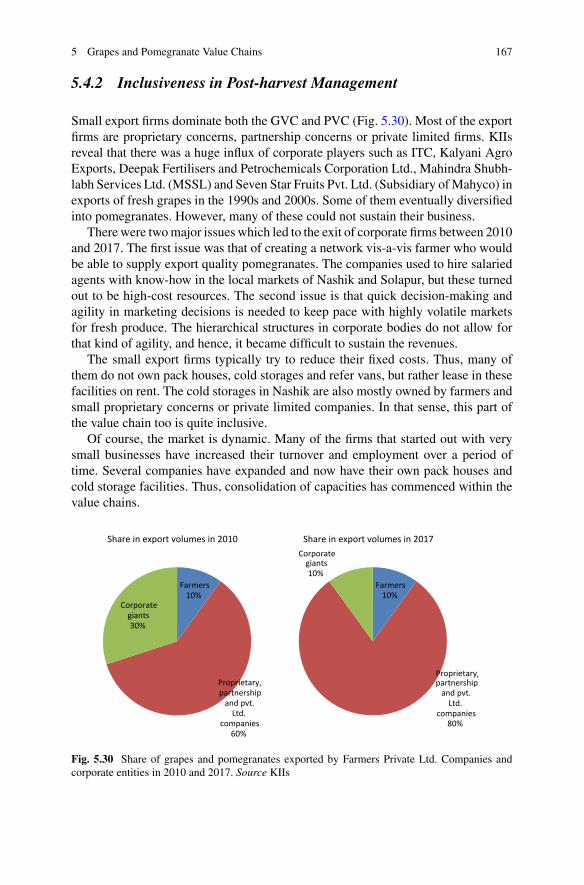
5 Grapes and Pomegranate Value Chains 167
5.4.2 Inclusiveness in Post-harvest Management
Small export firms dominate both the GVC and PVC (Fig. 5.30). Most of the exportfirms are proprietary concerns, partnership concerns or private limited firms. KIIsreveal that there was a huge influx of corporate players such as ITC, Kalyani AgroExports, Deepak Fertilisers and Petrochemicals Corporation Ltd., Mahindra Shubh-labh Services Ltd. (MSSL) and Seven Star Fruits Pvt. Ltd. (Subsidiary ofMahyco) inexports of fresh grapes in the 1990s and 2000s. Some of them eventually diversifiedinto pomegranates. However, many of these could not sustain their business.
There were twomajor issues which led to the exit of corporate firms between 2010and 2017. The first issue was that of creating a network vis-a-vis farmer who wouldbe able to supply export quality pomegranates. The companies used to hire salariedagents with know-how in the local markets of Nashik and Solapur, but these turnedout to be high-cost resources. The second issue is that quick decision-making andagility in marketing decisions is needed to keep pace with highly volatile marketsfor fresh produce. The hierarchical structures in corporate bodies do not allow forthat kind of agility, and hence, it became difficult to sustain the revenues.
The small export firms typically try to reduce their fixed costs. Thus, many ofthem do not own pack houses, cold storages and refer vans, but rather lease in thesefacilities on rent. The cold storages in Nashik are also mostly owned by farmers andsmall proprietary concerns or private limited companies. In that sense, this part ofthe value chain too is quite inclusive.
Of course, the market is dynamic. Many of the firms that started out with verysmall businesses have increased their turnover and employment over a period oftime. Several companies have expanded and now have their own pack houses andcold storage facilities. Thus, consolidation of capacities has commenced within thevalue chains.
Farmers10%
Proprietary, partnership
and pvt. Ltd.
companies60%
Corporate giants30%
Share in export volumes in 2010
Farmers10%
Proprietary,partnership
and pvt. Ltd.
companies80%
Corporate giants10%
Share in export volumes in 2017
Fig. 5.30 Share of grapes and pomegranates exported by Farmers Private Ltd. Companies andcorporate entities in 2010 and 2017. Source KIIs
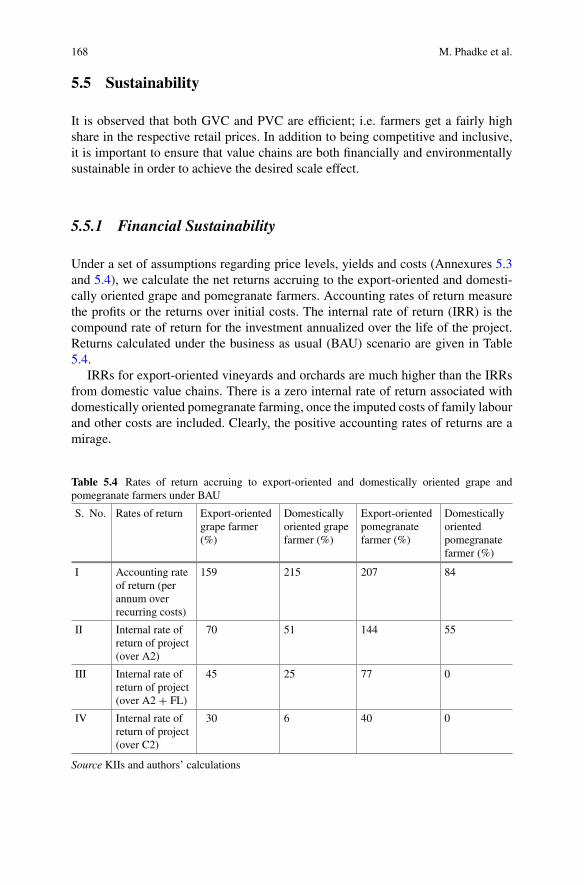
168 M. Phadke et al.
5.5 Sustainability
It is observed that both GVC and PVC are efficient; i.e. farmers get a fairly highshare in the respective retail prices. In addition to being competitive and inclusive,it is important to ensure that value chains are both financially and environmentallysustainable in order to achieve the desired scale effect.
5.5.1 Financial Sustainability
Under a set of assumptions regarding price levels, yields and costs (Annexures 5.3and 5.4), we calculate the net returns accruing to the export-oriented and domesti-cally oriented grape and pomegranate farmers. Accounting rates of return measurethe profits or the returns over initial costs. The internal rate of return (IRR) is thecompound rate of return for the investment annualized over the life of the project.Returns calculated under the business as usual (BAU) scenario are given in Table5.4.
IRRs for export-oriented vineyards and orchards are much higher than the IRRsfrom domestic value chains. There is a zero internal rate of return associated withdomestically oriented pomegranate farming, once the imputed costs of family labourand other costs are included. Clearly, the positive accounting rates of returns are amirage.
Table 5.4 Rates of return accruing to export-oriented and domestically oriented grape andpomegranate farmers under BAU
S. No. Rates of return Export-orientedgrape farmer(%)
Domesticallyoriented grapefarmer (%)
Export-orientedpomegranatefarmer (%)
Domesticallyorientedpomegranatefarmer (%)
I Accounting rateof return (perannum overrecurring costs)
159 215 207 84
II Internal rate ofreturn of project(over A2)
70 51 144 55
III Internal rate ofreturn of project(over A2 + FL)
45 25 77 0
IV Internal rate ofreturn of project(over C2)
30 6 40 0
Source KIIs and authors’ calculations
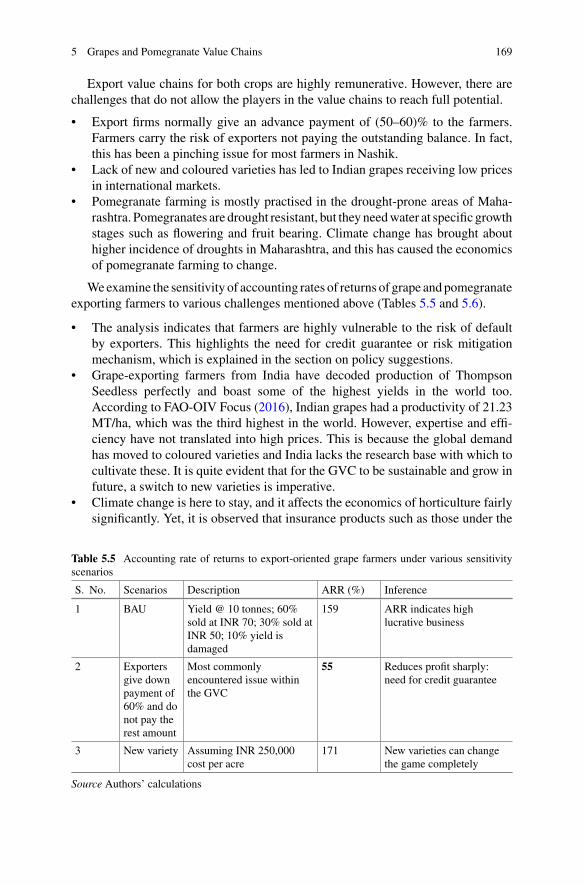
5 Grapes and Pomegranate Value Chains 169
Export value chains for both crops are highly remunerative. However, there arechallenges that do not allow the players in the value chains to reach full potential.
• Export firms normally give an advance payment of (50–60)% to the farmers.Farmers carry the risk of exporters not paying the outstanding balance. In fact,this has been a pinching issue for most farmers in Nashik.
• Lack of new and coloured varieties has led to Indian grapes receiving low pricesin international markets.
• Pomegranate farming is mostly practised in the drought-prone areas of Maha-rashtra. Pomegranates are drought resistant, but they needwater at specific growthstages such as flowering and fruit bearing. Climate change has brought abouthigher incidence of droughts in Maharashtra, and this has caused the economicsof pomegranate farming to change.
Weexamine the sensitivity of accounting rates of returns of grape andpomegranateexporting farmers to various challenges mentioned above (Tables 5.5 and 5.6).
• The analysis indicates that farmers are highly vulnerable to the risk of defaultby exporters. This highlights the need for credit guarantee or risk mitigationmechanism, which is explained in the section on policy suggestions.
• Grape-exporting farmers from India have decoded production of ThompsonSeedless perfectly and boast some of the highest yields in the world too.According to FAO-OIV Focus (2016), Indian grapes had a productivity of 21.23MT/ha, which was the third highest in the world. However, expertise and effi-ciency have not translated into high prices. This is because the global demandhas moved to coloured varieties and India lacks the research base with which tocultivate these. It is quite evident that for the GVC to be sustainable and grow infuture, a switch to new varieties is imperative.
• Climate change is here to stay, and it affects the economics of horticulture fairlysignificantly. Yet, it is observed that insurance products such as those under the
Table 5.5 Accounting rate of returns to export-oriented grape farmers under various sensitivityscenarios
S. No. Scenarios Description ARR (%) Inference
1 BAU Yield @ 10 tonnes; 60%sold at INR 70; 30% sold atINR 50; 10% yield isdamaged
159 ARR indicates highlucrative business
2 Exportersgive downpayment of60% and donot pay therest amount
Most commonlyencountered issue withinthe GVC
55 Reduces profit sharply:need for credit guarantee
3 New variety Assuming INR 250,000cost per acre
171 New varieties can changethe game completely
Source Authors’ calculations
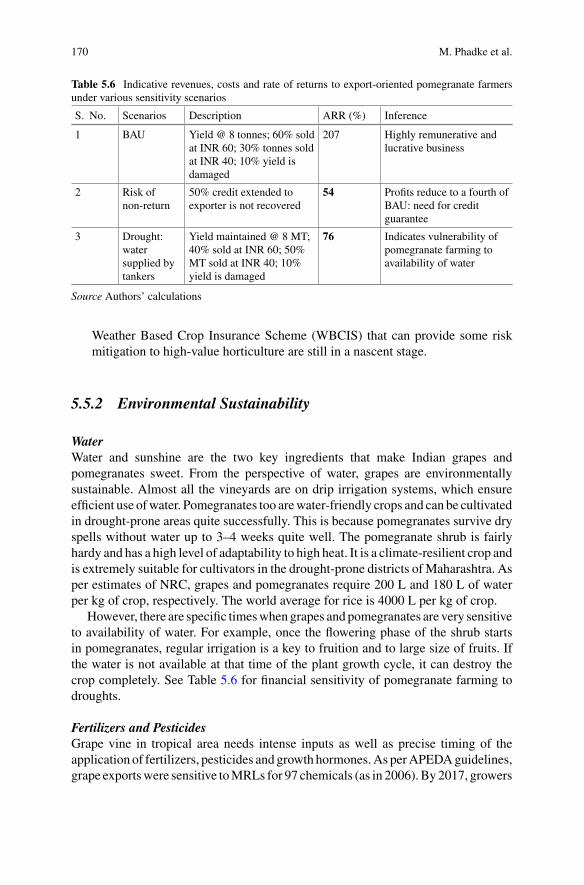
170 M. Phadke et al.
Table 5.6 Indicative revenues, costs and rate of returns to export-oriented pomegranate farmersunder various sensitivity scenarios
S. No. Scenarios Description ARR (%) Inference
1 BAU Yield @ 8 tonnes; 60% soldat INR 60; 30% tonnes soldat INR 40; 10% yield isdamaged
207 Highly remunerative andlucrative business
2 Risk ofnon-return
50% credit extended toexporter is not recovered
54 Profits reduce to a fourth ofBAU: need for creditguarantee
3 Drought:watersupplied bytankers
Yield maintained @ 8 MT;40% sold at INR 60; 50%MT sold at INR 40; 10%yield is damaged
76 Indicates vulnerability ofpomegranate farming toavailability of water
Source Authors’ calculations
Weather Based Crop Insurance Scheme (WBCIS) that can provide some riskmitigation to high-value horticulture are still in a nascent stage.
5.5.2 Environmental Sustainability
WaterWater and sunshine are the two key ingredients that make Indian grapes andpomegranates sweet. From the perspective of water, grapes are environmentallysustainable. Almost all the vineyards are on drip irrigation systems, which ensureefficient use ofwater. Pomegranates too arewater-friendly crops and can be cultivatedin drought-prone areas quite successfully. This is because pomegranates survive dryspells without water up to 3–4 weeks quite well. The pomegranate shrub is fairlyhardy and has a high level of adaptability to high heat. It is a climate-resilient crop andis extremely suitable for cultivators in the drought-prone districts of Maharashtra. Asper estimates of NRC, grapes and pomegranates require 200 L and 180 L of waterper kg of crop, respectively. The world average for rice is 4000 L per kg of crop.
However, there are specific timeswhengrapes and pomegranates are very sensitiveto availability of water. For example, once the flowering phase of the shrub startsin pomegranates, regular irrigation is a key to fruition and to large size of fruits. Ifthe water is not available at that time of the plant growth cycle, it can destroy thecrop completely. See Table 5.6 for financial sensitivity of pomegranate farming todroughts.
Fertilizers and PesticidesGrape vine in tropical area needs intense inputs as well as precise timing of theapplication of fertilizers, pesticides and growth hormones.As perAPEDAguidelines,grape exportswere sensitive toMRLs for 97 chemicals (as in 2006). By2017, growers
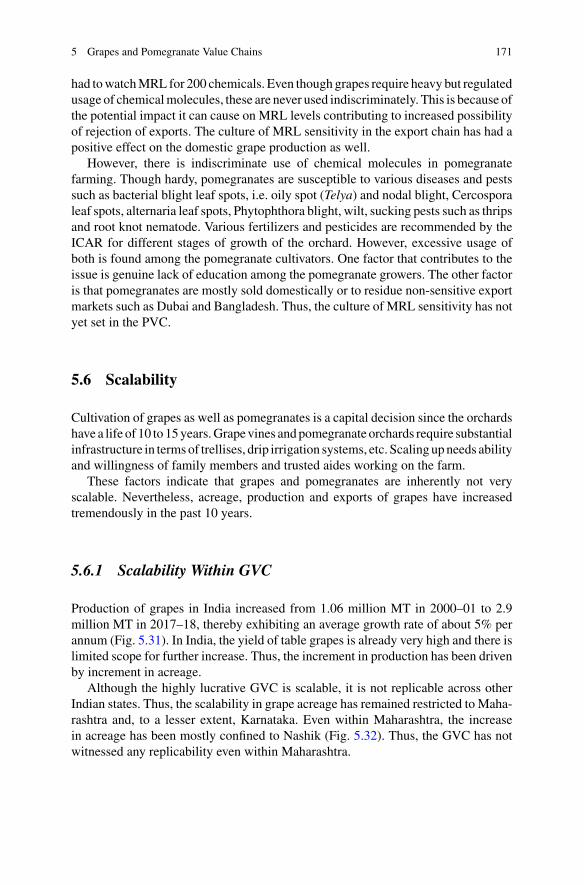
5 Grapes and Pomegranate Value Chains 171
had towatchMRL for 200 chemicals. Even though grapes require heavy but regulatedusage of chemicalmolecules, these are never used indiscriminately. This is because ofthe potential impact it can cause on MRL levels contributing to increased possibilityof rejection of exports. The culture of MRL sensitivity in the export chain has had apositive effect on the domestic grape production as well.
However, there is indiscriminate use of chemical molecules in pomegranatefarming. Though hardy, pomegranates are susceptible to various diseases and pestssuch as bacterial blight leaf spots, i.e. oily spot (Telya) and nodal blight, Cercosporaleaf spots, alternaria leaf spots, Phytophthora blight, wilt, sucking pests such as thripsand root knot nematode. Various fertilizers and pesticides are recommended by theICAR for different stages of growth of the orchard. However, excessive usage ofboth is found among the pomegranate cultivators. One factor that contributes to theissue is genuine lack of education among the pomegranate growers. The other factoris that pomegranates are mostly sold domestically or to residue non-sensitive exportmarkets such as Dubai and Bangladesh. Thus, the culture of MRL sensitivity has notyet set in the PVC.
5.6 Scalability
Cultivation of grapes as well as pomegranates is a capital decision since the orchardshave a life of 10 to 15years.Grapevines andpomegranate orchards require substantialinfrastructure in termsof trellises, drip irrigation systems, etc. Scalingupneeds abilityand willingness of family members and trusted aides working on the farm.
These factors indicate that grapes and pomegranates are inherently not veryscalable. Nevertheless, acreage, production and exports of grapes have increasedtremendously in the past 10 years.
5.6.1 Scalability Within GVC
Production of grapes in India increased from 1.06 million MT in 2000–01 to 2.9million MT in 2017–18, thereby exhibiting an average growth rate of about 5% perannum (Fig. 5.31). In India, the yield of table grapes is already very high and there islimited scope for further increase. Thus, the increment in production has been drivenby increment in acreage.
Although the highly lucrative GVC is scalable, it is not replicable across otherIndian states. Thus, the scalability in grape acreage has remained restricted to Maha-rashtra and, to a lesser extent, Karnataka. Even within Maharashtra, the increasein acreage has been mostly confined to Nashik (Fig. 5.32). Thus, the GVC has notwitnessed any replicability even within Maharashtra.
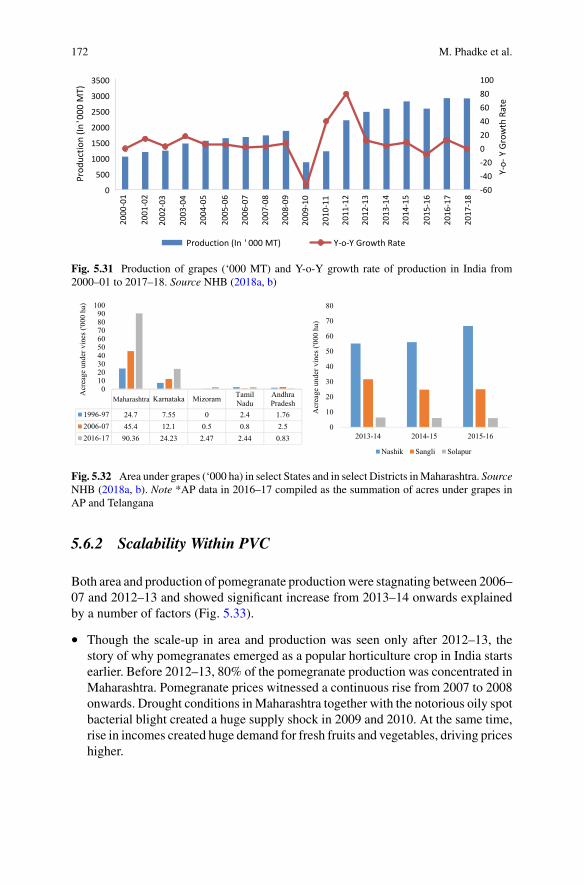
172 M. Phadke et al.
-60-40-20020406080100
0
500
1000
1500
2000
2500
3000
3500
Y-o-
Y G
row
th R
ate
Prod
uctio
n (In
' 000
MT)
Production (In ' 000 MT) Y-o-Y Growth Rate
2000
-01
2001
-02
2002
-03
2003
-04
2004
-05
2005
-06
2006
-07
2007
-08
2008
-09
2009
-10
2010
-11
2011
-12
2012
-13
2013
-14
2014
-15
2015
-16
2016
-17
2017
-18
Fig. 5.31 Production of grapes (‘000 MT) and Y-o-Y growth rate of production in India from2000–01 to 2017–18. Source NHB (2018a, b)
Maharashtra Karnataka Mizoram TamilNadu
AndhraPradesh
1996-97 24.7 7.55 0 2.4 1.762006-07 45.4 12.1 0.5 0.8 2.52016-17 90.36 24.23 2.47 2.44 0.83
0102030405060708090
100
Acr
eage
und
er v
ines
('00
0 ha
)
0
10
20
30
40
50
60
70
80
2013-14 2014-15 2015-16
Acr
eage
und
er v
ines
('00
0 ha
)
Nashik Sangli Solapur
Fig. 5.32 Area under grapes (‘000 ha) in select States and in select Districts inMaharashtra. SourceNHB (2018a, b). Note *AP data in 2016–17 compiled as the summation of acres under grapes inAP and Telangana
5.6.2 Scalability Within PVC
Both area and production of pomegranate productionwere stagnating between 2006–07 and 2012–13 and showed significant increase from 2013–14 onwards explainedby a number of factors (Fig. 5.33).
• Though the scale-up in area and production was seen only after 2012–13, thestory of why pomegranates emerged as a popular horticulture crop in India startsearlier. Before 2012–13, 80% of the pomegranate production was concentrated inMaharashtra. Pomegranate prices witnessed a continuous rise from 2007 to 2008onwards. Drought conditions inMaharashtra together with the notorious oily spotbacterial blight created a huge supply shock in 2009 and 2010. At the same time,rise in incomes created huge demand for fresh fruits and vegetables, driving priceshigher.
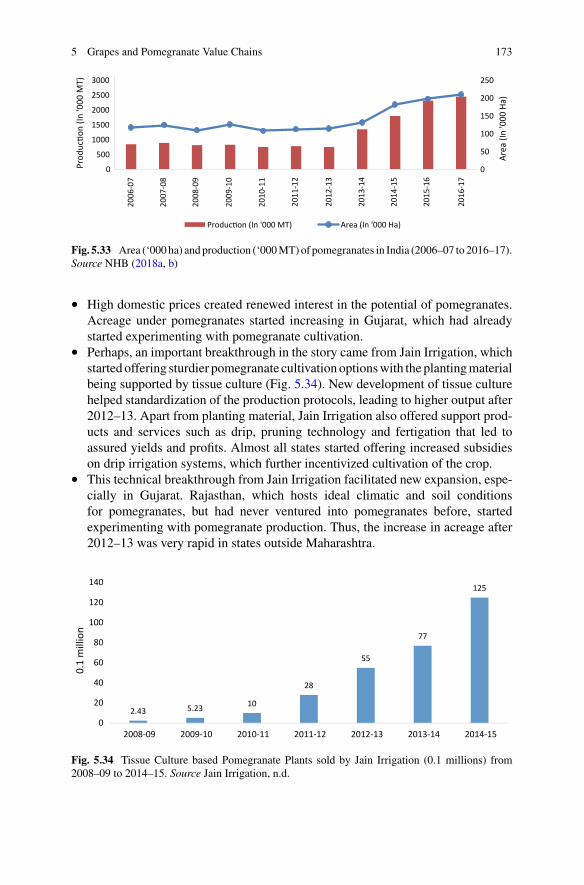
5 Grapes and Pomegranate Value Chains 173
0
50
100
150
200
250
0
500
1000
1500
2000
2500
3000
Area
(In
'000
Ha)
Prod
ucon
(In
'000
MT)
Produc on (In '000 MT) Area (In '000 Ha)
2006
-07
2007
-08
2008
-09
2009
-10
2010
-11
2011
-12
2012
-13
2013
-14
2014
-15
2015
-16
2016
-17
Fig. 5.33 Area (‘000ha) andproduction (‘000MT)of pomegranates in India (2006–07 to 2016–17).Source NHB (2018a, b)
• High domestic prices created renewed interest in the potential of pomegranates.Acreage under pomegranates started increasing in Gujarat, which had alreadystarted experimenting with pomegranate cultivation.
• Perhaps, an important breakthrough in the story came from Jain Irrigation, whichstarted offering sturdier pomegranate cultivation optionswith the plantingmaterialbeing supported by tissue culture (Fig. 5.34). New development of tissue culturehelped standardization of the production protocols, leading to higher output after2012–13. Apart from planting material, Jain Irrigation also offered support prod-ucts and services such as drip, pruning technology and fertigation that led toassured yields and profits. Almost all states started offering increased subsidieson drip irrigation systems, which further incentivized cultivation of the crop.
• This technical breakthrough from Jain Irrigation facilitated new expansion, espe-cially in Gujarat. Rajasthan, which hosts ideal climatic and soil conditionsfor pomegranates, but had never ventured into pomegranates before, startedexperimenting with pomegranate production. Thus, the increase in acreage after2012–13 was very rapid in states outside Maharashtra.
2.43 5.23 10
28
55
77
125
0
20
40
60
80
100
120
140
2008-09 2009-10 2010-11 2011-12 2012-13 2013-14 2014-15
0.1
mill
ion
Fig. 5.34 Tissue Culture based Pomegranate Plants sold by Jain Irrigation (0.1 millions) from2008–09 to 2014–15. Source Jain Irrigation, n.d.
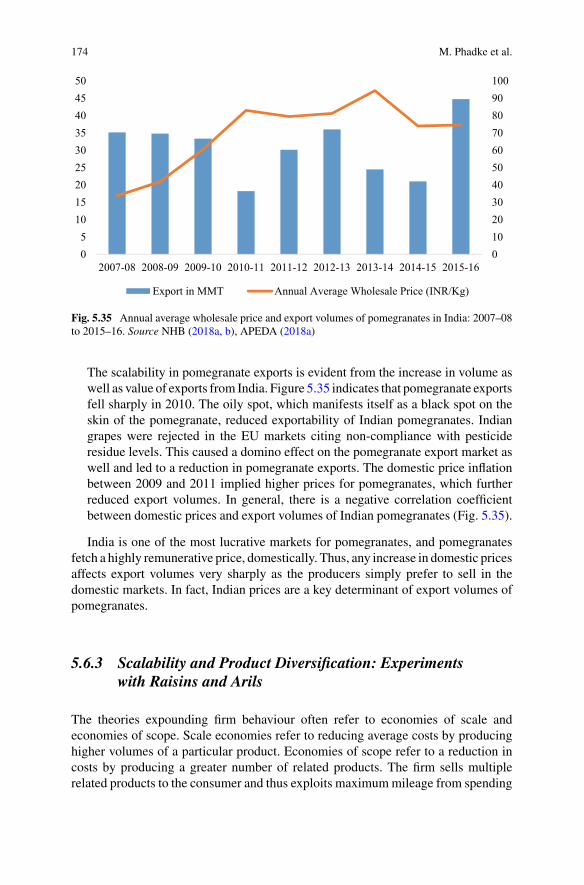
174 M. Phadke et al.
0102030405060708090100
05
101520253035404550
2007-08 2008-09 2009-10 2010-11 2011-12 2012-13 2013-14 2014-15 2015-16
Export in MMT Annual Average Wholesale Price (INR/Kg)
Fig. 5.35 Annual average wholesale price and export volumes of pomegranates in India: 2007–08to 2015–16. Source NHB (2018a, b), APEDA (2018a)
The scalability in pomegranate exports is evident from the increase in volume aswell as value of exports from India. Figure 5.35 indicates that pomegranate exportsfell sharply in 2010. The oily spot, which manifests itself as a black spot on theskin of the pomegranate, reduced exportability of Indian pomegranates. Indiangrapes were rejected in the EU markets citing non-compliance with pesticideresidue levels. This caused a domino effect on the pomegranate export market aswell and led to a reduction in pomegranate exports. The domestic price inflationbetween 2009 and 2011 implied higher prices for pomegranates, which furtherreduced export volumes. In general, there is a negative correlation coefficientbetween domestic prices and export volumes of Indian pomegranates (Fig. 5.35).
India is one of the most lucrative markets for pomegranates, and pomegranatesfetch a highly remunerative price, domestically. Thus, any increase in domestic pricesaffects export volumes very sharply as the producers simply prefer to sell in thedomestic markets. In fact, Indian prices are a key determinant of export volumes ofpomegranates.
5.6.3 Scalability and Product Diversification: Experimentswith Raisins and Arils
The theories expounding firm behaviour often refer to economies of scale andeconomies of scope. Scale economies refer to reducing average costs by producinghigher volumes of a particular product. Economies of scope refer to a reduction incosts by producing a greater number of related products. The firm sells multiplerelated products to the consumer and thus exploits maximummileage from spending
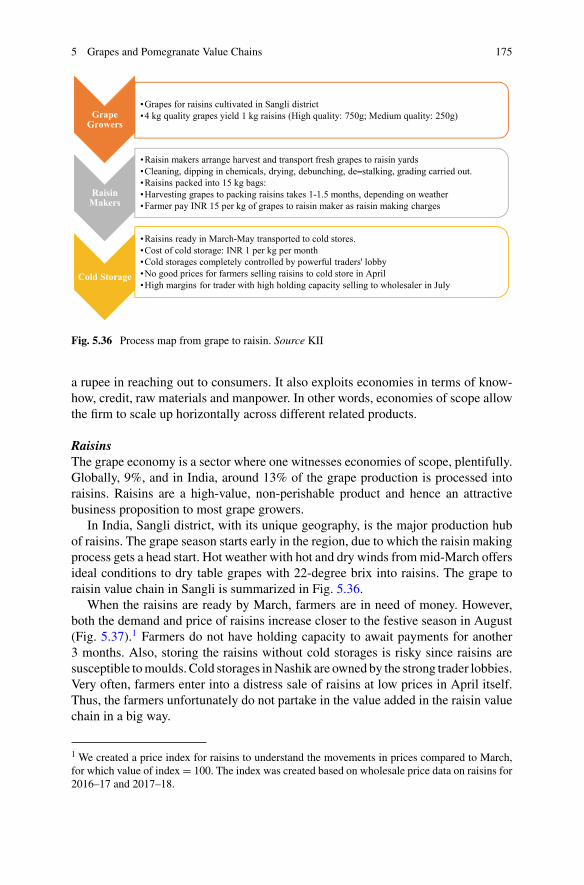
5 Grapes and Pomegranate Value Chains 175
Grape Growers
•Grapes for raisins cultivated in Sangli district•4 kg quality grapes yield 1 kg raisins (High quality: 750g; Medium quality: 250g)
Raisin Makers
•Raisin makers arrange harvest and transport fresh grapes to raisin yards•Cleaning, dipping in chemicals, drying, debunching, de stalking, grading carried out.•Raisins packed into 15 kg bags:•Harvesting grapes to packing raisins takes 1-1.5 months, depending on weather•Farmer pay INR 15 per kg of grapes to raisin maker as raisin making charges
Cold Storage
•Raisins ready in March-May transported to cold stores. •Cost of cold storage: INR 1 per kg per month •Cold storages completely controlled by powerful traders' lobby•No good prices for farmers selling raisins to cold store in April•High margins for trader with high holding capacity selling to wholesaler in July
-
Fig. 5.36 Process map from grape to raisin. Source KII
a rupee in reaching out to consumers. It also exploits economies in terms of know-how, credit, raw materials and manpower. In other words, economies of scope allowthe firm to scale up horizontally across different related products.
RaisinsThe grape economy is a sector where one witnesses economies of scope, plentifully.Globally, 9%, and in India, around 13% of the grape production is processed intoraisins. Raisins are a high-value, non-perishable product and hence an attractivebusiness proposition to most grape growers.
In India, Sangli district, with its unique geography, is the major production hubof raisins. The grape season starts early in the region, due to which the raisin makingprocess gets a head start. Hot weather with hot and dry winds frommid-March offersideal conditions to dry table grapes with 22-degree brix into raisins. The grape toraisin value chain in Sangli is summarized in Fig. 5.36.
When the raisins are ready by March, farmers are in need of money. However,both the demand and price of raisins increase closer to the festive season in August(Fig. 5.37).1 Farmers do not have holding capacity to await payments for another3 months. Also, storing the raisins without cold storages is risky since raisins aresusceptible tomoulds. Cold storages inNashik are owned by the strong trader lobbies.Very often, farmers enter into a distress sale of raisins at low prices in April itself.Thus, the farmers unfortunately do not partake in the value added in the raisin valuechain in a big way.
1 We created a price index for raisins to understand the movements in prices compared to March,for which value of index= 100. The index was created based on wholesale price data on raisins for2016–17 and 2017–18.
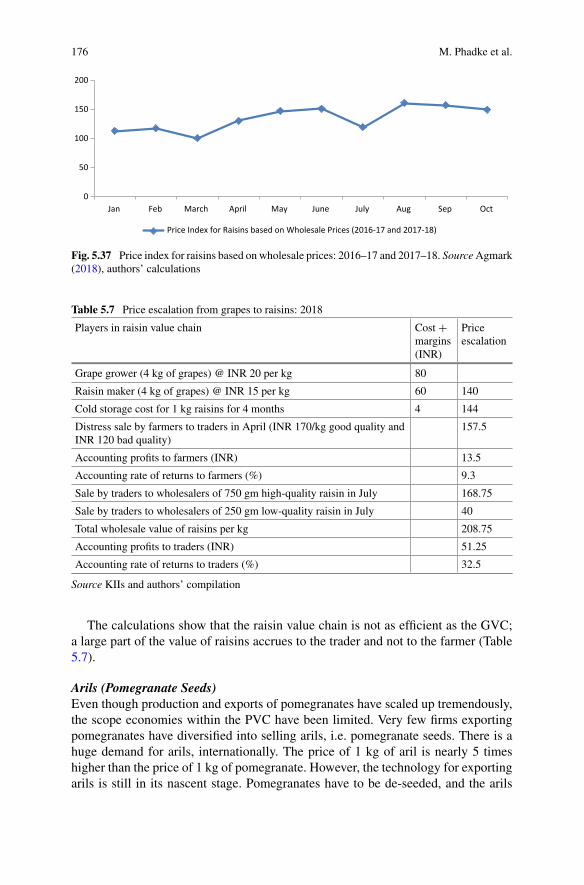
176 M. Phadke et al.
0
50
100
150
200
Jan Feb March April May June July Aug Sep Oct
Price Index for Raisins based on Wholesale Prices (2016-17 and 2017-18)
Fig. 5.37 Price index for raisins based on wholesale prices: 2016–17 and 2017–18. SourceAgmark(2018), authors’ calculations
Table 5.7 Price escalation from grapes to raisins: 2018
Players in raisin value chain Cost +margins(INR)
Priceescalation
Grape grower (4 kg of grapes) @ INR 20 per kg 80
Raisin maker (4 kg of grapes) @ INR 15 per kg 60 140
Cold storage cost for 1 kg raisins for 4 months 4 144
Distress sale by farmers to traders in April (INR 170/kg good quality andINR 120 bad quality)
157.5
Accounting profits to farmers (INR) 13.5
Accounting rate of returns to farmers (%) 9.3
Sale by traders to wholesalers of 750 gm high-quality raisin in July 168.75
Sale by traders to wholesalers of 250 gm low-quality raisin in July 40
Total wholesale value of raisins per kg 208.75
Accounting profits to traders (INR) 51.25
Accounting rate of returns to traders (%) 32.5
Source KIIs and authors’ compilation
The calculations show that the raisin value chain is not as efficient as the GVC;a large part of the value of raisins accrues to the trader and not to the farmer (Table5.7).
Arils (Pomegranate Seeds)Even though production and exports of pomegranates have scaled up tremendously,the scope economies within the PVC have been limited. Very few firms exportingpomegranates have diversified into selling arils, i.e. pomegranate seeds. There is ahuge demand for arils, internationally. The price of 1 kg of aril is nearly 5 timeshigher than the price of 1 kg of pomegranate. However, the technology for exportingarils is still in its nascent stage. Pomegranates have to be de-seeded, and the arils
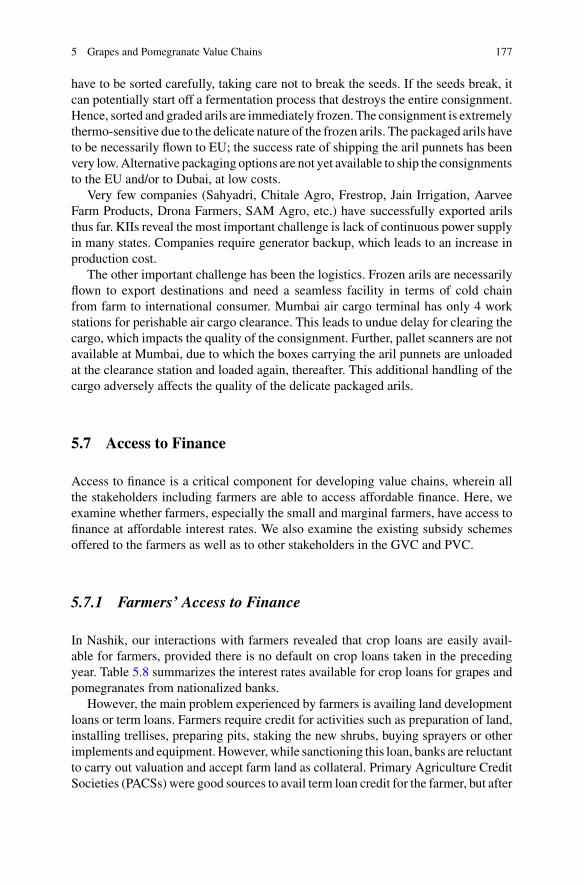
5 Grapes and Pomegranate Value Chains 177
have to be sorted carefully, taking care not to break the seeds. If the seeds break, itcan potentially start off a fermentation process that destroys the entire consignment.Hence, sorted and graded arils are immediately frozen. The consignment is extremelythermo-sensitive due to the delicate nature of the frozen arils. The packaged arils haveto be necessarily flown to EU; the success rate of shipping the aril punnets has beenvery low.Alternative packaging options are not yet available to ship the consignmentsto the EU and/or to Dubai, at low costs.
Very few companies (Sahyadri, Chitale Agro, Frestrop, Jain Irrigation, AarveeFarm Products, Drona Farmers, SAM Agro, etc.) have successfully exported arilsthus far. KIIs reveal the most important challenge is lack of continuous power supplyin many states. Companies require generator backup, which leads to an increase inproduction cost.
The other important challenge has been the logistics. Frozen arils are necessarilyflown to export destinations and need a seamless facility in terms of cold chainfrom farm to international consumer. Mumbai air cargo terminal has only 4 workstations for perishable air cargo clearance. This leads to undue delay for clearing thecargo, which impacts the quality of the consignment. Further, pallet scanners are notavailable at Mumbai, due to which the boxes carrying the aril punnets are unloadedat the clearance station and loaded again, thereafter. This additional handling of thecargo adversely affects the quality of the delicate packaged arils.
5.7 Access to Finance
Access to finance is a critical component for developing value chains, wherein allthe stakeholders including farmers are able to access affordable finance. Here, weexamine whether farmers, especially the small and marginal farmers, have access tofinance at affordable interest rates. We also examine the existing subsidy schemesoffered to the farmers as well as to other stakeholders in the GVC and PVC.
5.7.1 Farmers’ Access to Finance
In Nashik, our interactions with farmers revealed that crop loans are easily avail-able for farmers, provided there is no default on crop loans taken in the precedingyear. Table 5.8 summarizes the interest rates available for crop loans for grapes andpomegranates from nationalized banks.
However, the main problem experienced by farmers is availing land developmentloans or term loans. Farmers require credit for activities such as preparation of land,installing trellises, preparing pits, staking the new shrubs, buying sprayers or otherimplements and equipment. However, while sanctioning this loan, banks are reluctantto carry out valuation and accept farm land as collateral. Primary Agriculture CreditSocieties (PACSs) were good sources to avail term loan credit for the farmer, but after
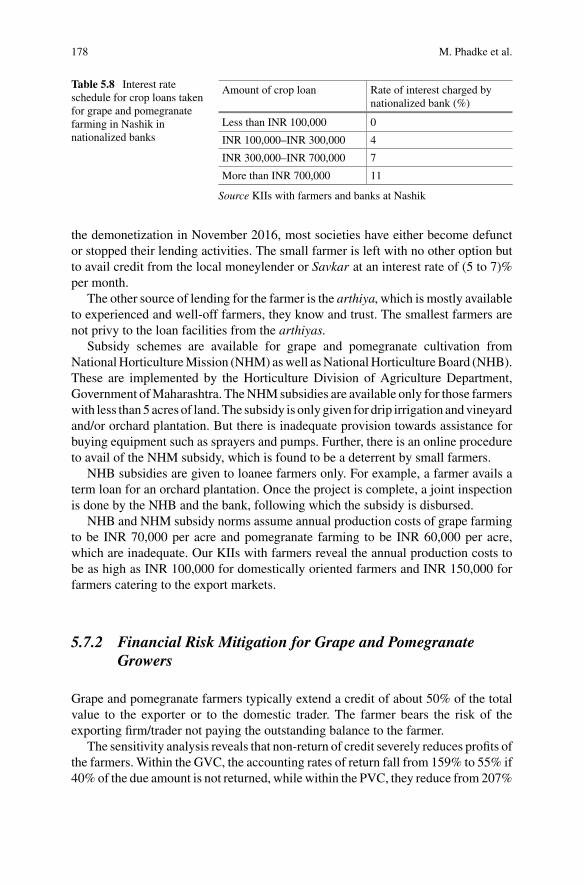
178 M. Phadke et al.
Table 5.8 Interest rateschedule for crop loans takenfor grape and pomegranatefarming in Nashik innationalized banks
Amount of crop loan Rate of interest charged bynationalized bank (%)
Less than INR 100,000 0
INR 100,000–INR 300,000 4
INR 300,000–INR 700,000 7
More than INR 700,000 11
Source KIIs with farmers and banks at Nashik
the demonetization in November 2016, most societies have either become defunctor stopped their lending activities. The small farmer is left with no other option butto avail credit from the local moneylender or Savkar at an interest rate of (5 to 7)%per month.
The other source of lending for the farmer is the arthiya, which is mostly availableto experienced and well-off farmers, they know and trust. The smallest farmers arenot privy to the loan facilities from the arthiyas.
Subsidy schemes are available for grape and pomegranate cultivation fromNationalHorticultureMission (NHM) aswell asNationalHorticultureBoard (NHB).These are implemented by the Horticulture Division of Agriculture Department,Government ofMaharashtra. TheNHMsubsidies are available only for those farmerswith less than5 acres of land.The subsidy is only given for drip irrigation andvineyardand/or orchard plantation. But there is inadequate provision towards assistance forbuying equipment such as sprayers and pumps. Further, there is an online procedureto avail of the NHM subsidy, which is found to be a deterrent by small farmers.
NHB subsidies are given to loanee farmers only. For example, a farmer avails aterm loan for an orchard plantation. Once the project is complete, a joint inspectionis done by the NHB and the bank, following which the subsidy is disbursed.
NHB and NHM subsidy norms assume annual production costs of grape farmingto be INR 70,000 per acre and pomegranate farming to be INR 60,000 per acre,which are inadequate. Our KIIs with farmers reveal the annual production costs tobe as high as INR 100,000 for domestically oriented farmers and INR 150,000 forfarmers catering to the export markets.
5.7.2 Financial Risk Mitigation for Grape and PomegranateGrowers
Grape and pomegranate farmers typically extend a credit of about 50% of the totalvalue to the exporter or to the domestic trader. The farmer bears the risk of theexporting firm/trader not paying the outstanding balance to the farmer.
The sensitivity analysis reveals that non-return of credit severely reduces profits ofthe farmers. Within the GVC, the accounting rates of return fall from 159% to 55% if40% of the due amount is not returned, while within the PVC, they reduce from 207%
5 Grapes and Pomegranate Value Chains 179
to 54% if 50% of the due amount is not returned (See Tables 5.5 and 5.6). In fact, nonpayment of outstanding balance by exporting firms and traders has become a seriousissue affecting the livelihood of grape farmers in the Nashik belt. There have beenseveral instances of the exporting firms and domestic traders disappearing withoutpaying the farmers, which severely threatens the income security of the farmers.
Export Credit Guarantee Corporation (ECGC)Farmers need a risk mitigation mechanism in order to hedge this risk. This riskmitigation mechanism could be simply in the form of a scheme modelled alongthe lines of the Export Credit Guarantee Corporation (ECGC). The ECGC existsto help exporters hedge risk of non-repayment by importing firms. ECGC basicallycreates a profile of the credit worthiness of the import firms and issues advisorieson the maximum line of credit that could be prudentially offered to the import firmbased on its assessment. It insures the exporter firm for credit given up to the limitsrecommended as per its assessment. Thus, the ECGC has essentially created aninsurance model to hedge the exporter against risk of non-payment by the importer.Such products are needed while dealing with new import firms as also in dealingwith relatively unknown markets such as Russia. Following are some of the schemesof the ECGC which could be effectively applied to FPOs/FPCs:
Small Exporter’s Policy (SEP): This is one of the standard products offered byECGC. See ECGC (n.d.a). It covers the exporter for multiple risks. These include riskof insolvency of buyer and political risks such as occurrence of war between exportand import countries. It is issued to exporters whose anticipated export turnover forthe period of one year does not exceed INR 50 million.
Buyer Exposure Policy: The Buyer Exposure Policy is to insure exporters havinga large number of shipments to a particular buyer with simplified procedure andrationalized premium. See ECGC (n.d.b). An exporter can choose to obtain exposure-based cover on a selected buyer. The cover would be against commercial and politicalrisks, as outlined in the Small Exporters’ Policy.
However, there is simply no advisory that creates a credit rating of the differentexport firms and domestic traders to help the farmer assess the risk involved in thetransactions. Obviously, no insurance products have been developed in this spaceat all. Thus, it is extremely important to create formal advisory services which canassess the credit worthiness of all actants within the value chain. It is also importantto design insurance products to help the actants hedge risks while dealing with otheractants in the respective value chains.
In 2017–18, as per APEDA (2018a), the total value of grape and pomegranateexports stood at INR19.59 billion and INR5.53 billion, respectively.Our calculationssuggest that the grape and pomegranate farmers get 71% and 80% of the fob value ofexports, respectively. This implies that around INR 18.33 billion would be the totalvalue accruing to the farmers from the export value chains. Credit extended to theexport firms would be around INR 9 billion. This is the value at risk (VAR) due tothe current absence of a risk-hedging intermediation within the export value chain.
180 M. Phadke et al.
Around INR 17 billion accrue to the farmers from the domestic trade, of whichthe credit extended, stands at about INR 8.5 billion. This is the VAR to the farmerfrom the domestic operations.
5.7.3 Access to Finance for Intermediaries
Exporter firms buy the produce on spot sale at the farms itself. This produce is thentaken to pack houses with pre-cooling and cold storage facilities; these are generallyleased in by the exporters. A few export firms have their own pre-cooling and coldstorage facilities. Nashik has a cold storage capacity of about 70,000 MT. However,many of these facilities (approximately 30%) were created during the 1990s, werelargely created in response to the emerging trend in grape export and are in urgentneed for upgradation. This implies that about 25,000 MT capacity needs urgentrenovation. This translates into a credit demand for about INR 2.5 billion just forcreation of cold storages within Nashik.
The All-India Pomegranate Growers’ Association claims that the current coldstorage facility at Solapur (mostly utilized for pomegranates) stands at 1000 MTbut needs to be rapidly upgraded to about 5000 MT by 2024–25. The new foodtrade regime demands accreditation of pack houses. As demand escalates, creationof modernized pack houses will be imperative to sustain the growth of pomegranatevalue chain. The total investment requirement in Solapur for creation of accreditedpack houses up to 2024–25 is about INR 500 million.
Given the increment in acreage under pomegranates in other districts in Maha-rashtra as well as in other states such as Gujarat, Madhya Pradesh and Rajasthan,credit will be required to facilitate cold storage creation as well as upgradation in allthe pomegranate-producing regions.
TheNHBgives 40%credit-linked capital subsidy for construction and/ormodern-ization of existing cold storages. A number of schemes and subsidies for post-harvestmanagement (PHM) are available from APEDA. The Maharashtra State AgricultureMarketing Board (MSAMB) is the nodal agency for implementation of APEDAschemes in Maharashtra. Assistance under the schemes is available for registeredexporters, FPOs, and central and state agencies. The major heads for the schemesare export infrastructure development, quality development andmarket development.
Details of assistance under the schemes are given in Table 5.9.APEDA gives assistance for infrastructure development such as cold storages,
pack house facilities and pre-shipment treatment facilities. However, APEDA givesassistance only when the exporter gets the necessary clearances from the banks andmultiple government departments. Multiple inspections and clearances add to thetime and transaction cost involved in obtaining the assistance from APEDA. Thus,themain constraint faced by stakeholders is lack of a singlewindow for all clearances.The other issue faced is that the schemeonly provides assistance for creation of capitalassets, but lack of working capital often makes the capital asset defunct.
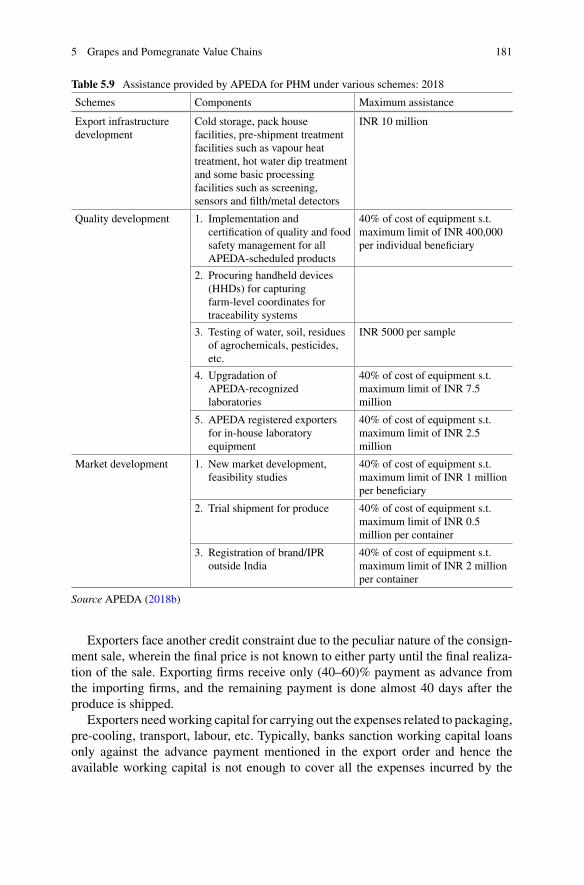
5 Grapes and Pomegranate Value Chains 181
Table 5.9 Assistance provided by APEDA for PHM under various schemes: 2018
Schemes Components Maximum assistance
Export infrastructuredevelopment
Cold storage, pack housefacilities, pre-shipment treatmentfacilities such as vapour heattreatment, hot water dip treatmentand some basic processingfacilities such as screening,sensors and filth/metal detectors
INR 10 million
Quality development 1. Implementation andcertification of quality and foodsafety management for allAPEDA-scheduled products
40% of cost of equipment s.t.maximum limit of INR 400,000per individual beneficiary
2. Procuring handheld devices(HHDs) for capturingfarm-level coordinates fortraceability systems
3. Testing of water, soil, residuesof agrochemicals, pesticides,etc.
INR 5000 per sample
4. Upgradation ofAPEDA-recognizedlaboratories
40% of cost of equipment s.t.maximum limit of INR 7.5million
5. APEDA registered exportersfor in-house laboratoryequipment
40% of cost of equipment s.t.maximum limit of INR 2.5million
Market development 1. New market development,feasibility studies
40% of cost of equipment s.t.maximum limit of INR 1 millionper beneficiary
2. Trial shipment for produce 40% of cost of equipment s.t.maximum limit of INR 0.5million per container
3. Registration of brand/IPRoutside India
40% of cost of equipment s.t.maximum limit of INR 2 millionper container
Source APEDA (2018b)
Exporters face another credit constraint due to the peculiar nature of the consign-ment sale, wherein the final price is not known to either party until the final realiza-tion of the sale. Exporting firms receive only (40–60)% payment as advance fromthe importing firms, and the remaining payment is done almost 40 days after theproduce is shipped.
Exporters needworking capital for carrying out the expenses related to packaging,pre-cooling, transport, labour, etc. Typically, banks sanction working capital loansonly against the advance payment mentioned in the export order and hence theavailable working capital is not enough to cover all the expenses incurred by the
182 M. Phadke et al.
exporting firms. According to the industry norm, working capital of INR 100,000is required to export a consignment of 1 MT. The working capital loans are usuallysanctioned by commercial banks at about 12% interest.
5.7.4 Access to Finance for FPOs/FPCs
Promotion of FPOs or FPCs specializing in grapes and/or pomegranates could beimmensely beneficial in strengthening the value chains and empowering farmers toearn higher prices. The FPCs can enable minimizing the pre and post-harvest costs,access to expert know-how as well as reduced costs in terms of chemical moleculesrequired for grape and pomegranate cultivation.
Sahyadri Farmers Producer Company Limited has emerged as a success story, andits journey is worth studying to understand how FPCs/FPOs can benefit farmers. It isthe largest FPC in India which started its operations with 10 marginal grape growersin 2004 in Nashik. The case of Sahyadri FPC Ltd. which formally registered as aFPC in 2011, is an interesting case of competitiveness, inclusiveness, sustainabilityand scalability. The company imports soluble fertilizers and other inputs for itsmembers and thus acts as an aggregator. The growth in all vineyards is trackedonline, and harvest is planned as per maturity of vineyards, storage capacities anddemand schedules. Sahyadri farmers are able to save nearly INR 20,000 per acre,and the members claim that their exportable output is 7 tonnes per acre as comparedto the Nashik average of 6 tonnes per acre. All activities such as production, pruningand spraying on farms of all 1000 plus members of Sahyadri are planned in the sameweeks. These are tracked on special digital apps, helping the members to adhere toproduction protocols gainfully.
Given the need to increase cold storage capacity in Solapur from 1000 to 5000MT over the next 5 years, such capacity expansion can be undertaken and financedthrough FPOs or FPCs. However, a common problem observed is that infrastructurecreated is often unused due to the unavailability of working capital at affordableinterest rates. Hence, once FPOs/FPCs are rated on the commercial sustainabilityof their venture, access to finance for creating cold storages or pack houses can beenhanced through matching equity grant schemes.
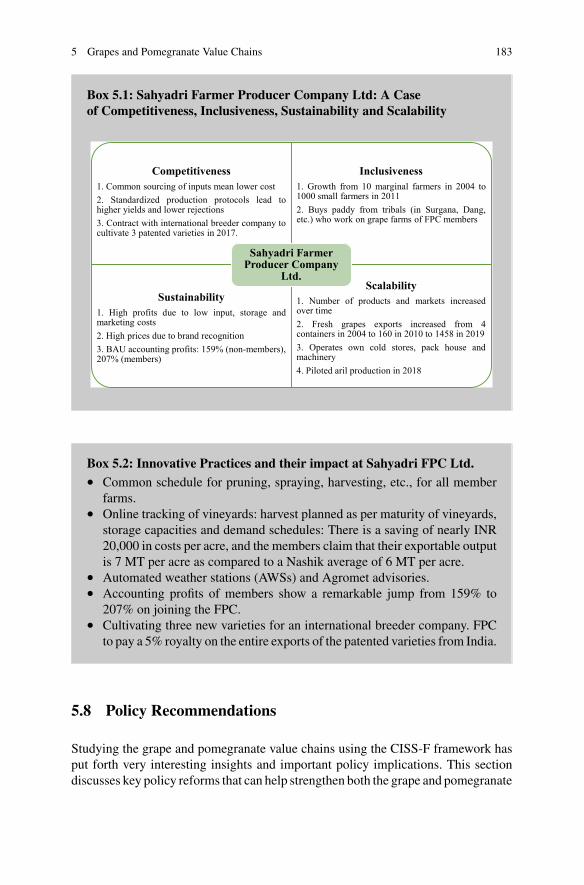
5 Grapes and Pomegranate Value Chains 183
Box 5.1: Sahyadri Farmer Producer Company Ltd: A Caseof Competitiveness, Inclusiveness, Sustainability and Scalability
Competitiveness1. Common sourcing of inputs mean lower cost2. Standardized production protocols lead tohigher yields and lower rejections3. Contract with international breeder company tocultivate 3 patented varieties in 2017.
Inclusiveness1. Growth from 10 marginal farmers in 2004 to1000 small farmers in 20112. Buys paddy from tribals (in Surgana, Dang,etc.) who work on grape farms of FPC members
Sustainability1. High profits due to low input, storage andmarketing costs2. High prices due to brand recognition3. BAU accounting profits: 159% (non-members),207% (members)
Scalability1. Number of products and markets increasedover time2. Fresh grapes exports increased from 4 containers in 2004 to 160 in 2010 to 1458 in 20193. Operates own cold stores, pack house andmachinery4. Piloted aril production in 2018
Sahyadri Farmer Producer Company
Ltd.
Box 5.2: Innovative Practices and their impact at Sahyadri FPC Ltd.• Common schedule for pruning, spraying, harvesting, etc., for all member
farms.• Online tracking of vineyards: harvest planned as per maturity of vineyards,
storage capacities and demand schedules: There is a saving of nearly INR20,000 in costs per acre, and the members claim that their exportable outputis 7 MT per acre as compared to a Nashik average of 6 MT per acre.
• Automated weather stations (AWSs) and Agromet advisories.• Accounting profits of members show a remarkable jump from 159% to
207% on joining the FPC.• Cultivating three new varieties for an international breeder company. FPC
to pay a 5% royalty on the entire exports of the patented varieties from India.
5.8 Policy Recommendations
Studying the grape and pomegranate value chains using the CISS-F framework hasput forth very interesting insights and important policy implications. This sectiondiscusses key policy reforms that can help strengthen both the grape and pomegranate
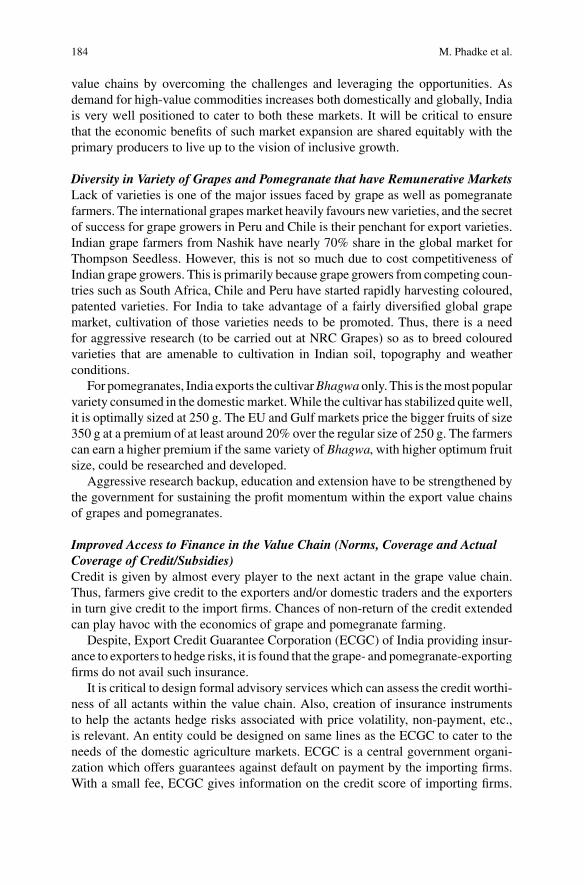
184 M. Phadke et al.
value chains by overcoming the challenges and leveraging the opportunities. Asdemand for high-value commodities increases both domestically and globally, Indiais very well positioned to cater to both these markets. It will be critical to ensurethat the economic benefits of such market expansion are shared equitably with theprimary producers to live up to the vision of inclusive growth.
Diversity in Variety of Grapes and Pomegranate that have Remunerative MarketsLack of varieties is one of the major issues faced by grape as well as pomegranatefarmers. The international grapesmarket heavily favours new varieties, and the secretof success for grape growers in Peru and Chile is their penchant for export varieties.Indian grape farmers from Nashik have nearly 70% share in the global market forThompson Seedless. However, this is not so much due to cost competitiveness ofIndian grape growers. This is primarily because grape growers from competing coun-tries such as South Africa, Chile and Peru have started rapidly harvesting coloured,patented varieties. For India to take advantage of a fairly diversified global grapemarket, cultivation of those varieties needs to be promoted. Thus, there is a needfor aggressive research (to be carried out at NRC Grapes) so as to breed colouredvarieties that are amenable to cultivation in Indian soil, topography and weatherconditions.
For pomegranates, India exports the cultivarBhagwa only. This is themost popularvariety consumed in the domesticmarket.While the cultivar has stabilized quite well,it is optimally sized at 250 g. The EU and Gulf markets price the bigger fruits of size350 g at a premium of at least around 20% over the regular size of 250 g. The farmerscan earn a higher premium if the same variety of Bhagwa, with higher optimum fruitsize, could be researched and developed.
Aggressive research backup, education and extension have to be strengthened bythe government for sustaining the profit momentum within the export value chainsof grapes and pomegranates.
Improved Access to Finance in the Value Chain (Norms, Coverage and ActualCoverage of Credit/Subsidies)Credit is given by almost every player to the next actant in the grape value chain.Thus, farmers give credit to the exporters and/or domestic traders and the exportersin turn give credit to the import firms. Chances of non-return of the credit extendedcan play havoc with the economics of grape and pomegranate farming.
Despite, Export Credit Guarantee Corporation (ECGC) of India providing insur-ance to exporters to hedge risks, it is found that the grape- and pomegranate-exportingfirms do not avail such insurance.
It is critical to design formal advisory services which can assess the credit worthi-ness of all actants within the value chain. Also, creation of insurance instrumentsto help the actants hedge risks associated with price volatility, non-payment, etc.,is relevant. An entity could be designed on same lines as the ECGC to cater to theneeds of the domestic agriculture markets. ECGC is a central government organi-zation which offers guarantees against default on payment by the importing firms.With a small fee, ECGC gives information on the credit score of importing firms.
5 Grapes and Pomegranate Value Chains 185
Hence, small exporters can take informed decisions on how much credit to extendto their importing counterparts.
This kind of a scheme is also needed for domestic markets as well, especiallyunder the framework of the new marketing laws, which allow farmers to trade withany other PAN card holding entity in India. If credit scores of buyers can be createdand provided to farmers, it will help the farmers to take an informed decision onextending credit to the buyers. As has been mentioned earlier, farmers extend creditto exporters as well as domestic traders and hence are vulnerable to a risk of defaultby these parties. Our calculations show that the value at risk (VAR) due to non-availability of insurance products stands at INR 17.5 billion within the grape andpomegranate value chains alone.
This entity would also be a logical plug-in to the e-NAM design. NHB and NHMsubsidy norms assume annual production costs of grape farming to be INR 70,000per acre and pomegranate farming to be INR 60,000 per acre, which is inadequate.Subsidy norms fixed by government agencies should reflect field realities accurately.
Strengthening Logistics to Enhance MarketabilityExporter firms buy the produce on spot sale at the farms. This produce is then takento pack houses with pre-cooling and cold storage facilities. Nashik has a cold storagecapacity of about 70,000MT. Newmulti-facility cold facilities that can be accreditedas export safe are required at Nashik, Solapur as well as Sangli. Other grape- and/orpomegranate-producing states such as Gujarat, Madhya Pradesh and Rajasthan alsoneed cold stores to be developed. If dedicated cold storage facilities for grapes andpomegranates could be developed in Bihar or Delhi, the farmers in Maharashtra canalso access the more remote and fairly remunerative markets of Jammu and Assam.
There are a number of inadequacies in the logistics chain that do not allowproductssuch as arils to be exported easily. Limited number of clearance stations at MumbaiCargo Terminal, lack of pallet scanners and multiple handling of the produce leadto product damage and rejection of the consignment. It puts exports into jeopardy.These facilities need to be provided so as to smooth out the rough edges connectedto aril exports.
Strengthening Institutions such as FPOs/FPCsFarmers in Sangli often have to sell off raisins to the traders at unremunerativeprices. The reason is that raisins require cold storage and these are largely controlledby raisin traders. FPC-promoted cold chains could be an effective solution to helpfarmers earn remunerative prices and make raisin value chains more inclusive forsmall and marginal farmers.
FPC membership has also improved the rates of returns experienced by smallfarmers sharply. Well-managed, professional FPCs might well evolve to be the bestbusiness models for grape and pomegranate value chains.
Both grapes and pomegranates are high-value commodities and have robustmarkets for fresh and value-added products. For small andmarginal farmers to accessthese domestic and global markets, FPCs can play a large enabling role. Aggregationof input and service requirement of farmers can help reduce costs of production.
186 M. Phadke et al.
Technology solutions for better value addition and meeting stringent quality stan-dards can be organized and made more affordable to the farmers. Professionallymanaged FPCs can help strengthen existing value chains and ensure that these areinclusive of small and marginal farmers.
States like Karnataka, Andhra Pradesh, Tamil Nadu, Punjab and Haryana havefavourable agro-climatic conditions that support vineyards. A cluster-based approachcould be adopted in these states to promote grape cultivation through handholdingof farmers, bringing in the right package of practices and providing the requiredinstitutional support. The demonstrated success of grape cultivation and marketingin Maharashtra can be shared with potential states to boost grape cultivation in thecountry.
Addressing Issues related to Climate ChangeClimate change has been impacting the profitability of grape as well as pomegranatecultivation for the farmers. Particularly, it affects pomegranate production more,because standardized production protocols are not yet developed. Thus, farmers arenot aware of the right technology solutions that can help them address issues relatedto a drought or a very cold spell. They cannot anticipate the onset of diseases dueto changes in weather conditions well in advance to control crop damage. On thecontrary, grape farmers are aware and better equipped with the technology solutionsand have been able to face climate uncertainties relatively better. Hence, there isneed for considerable research in designing production protocols for pomegranatesto help farmers cope with production uncertainties related to weather, environmentand diseases.
For grapes as well as pomegranates, if water is not available at the right time,it affects the yield as well as quality of produce. Farmers suffer losses as they areunable to sell in the export market and are forced to sell in the domestic market.Although farmers are quite vulnerable to the adversities arising out of climate change,insurance instruments to help them hedge against production and price risks are stillin a nascent stage. Farmer awareness regarding such products is also quite low.Hence,there is need for making such insurance available to the farmers and promote greaterawareness among them about the benefits of availing such risk mitigation measures.
Norms for Reporting Data Pertaining to Export of Horticulture ProduceAccording to the export firms interviewed during field visit, the importing firmnormally pays only 50%of the expected consignment sale value to the exporter on theday of shipping. The importing agent normally credits the rest of the amount to theexporter’s account after about 15 days after the consignment reaches the retailer. Onthe day of shipping, the exporter does not know thefinal value that hewill receive (thatdepends on the price movements in the next month) for the consignment. Hence, heonly submits a proforma invoice as a part of the documentation required by APEDA.The proforma invoice carries details of the value of the consignment as received bythe exporter on the day of shipping as well as details of the volume of the consign-ment shipped. However, the value received by the exporter on the day of shippingthe consignment is only (50–60)% of the actual value that he eventually receives.
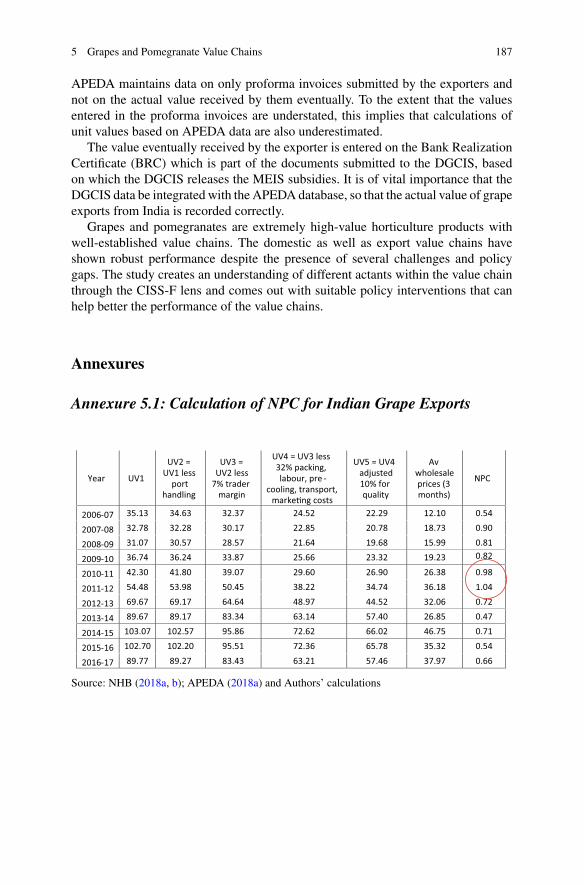
5 Grapes and Pomegranate Value Chains 187
APEDA maintains data on only proforma invoices submitted by the exporters andnot on the actual value received by them eventually. To the extent that the valuesentered in the proforma invoices are understated, this implies that calculations ofunit values based on APEDA data are also underestimated.
The value eventually received by the exporter is entered on the Bank RealizationCertificate (BRC) which is part of the documents submitted to the DGCIS, basedon which the DGCIS releases the MEIS subsidies. It is of vital importance that theDGCIS data be integrated with the APEDA database, so that the actual value of grapeexports from India is recorded correctly.
Grapes and pomegranates are extremely high-value horticulture products withwell-established value chains. The domestic as well as export value chains haveshown robust performance despite the presence of several challenges and policygaps. The study creates an understanding of different actants within the value chainthrough the CISS-F lens and comes out with suitable policy interventions that canhelp better the performance of the value chains.
Annexures
Annexure 5.1: Calculation of NPC for Indian Grape Exports
Year UV1
UV2 = UV1 less
port handling
UV3 = UV2 less
7% trader margin
UV4 = UV3 less 32% packing, labour, pre -
cooling, transport, marke�ng costs
UV5 = UV4 adjusted 10% for quality
Av wholesale prices (3 months)
NPC
2006-07 35.13 34.63 32.37 24.52 22.29 12.10 0.54
2007-08 32.78 32.28 30.17 22.85 20.78 18.73 0.90
2008-09 31.07 30.57 28.57 21.64 19.68 15.99 0.81
2009-10 36.74 36.24 33.87 25.66 23.32 19.23 0.82
2010-11 42.30 41.80 39.07 29.60 26.90 26.38 0.98
2011-12 54.48 53.98 50.45 38.22 34.74 36.18 1.04
2012-13 69.67 69.17 64.64 48.97 44.52 32.06 0.72
2013-14 89.67 89.17 83.34 63.14 57.40 26.85 0.47
2014-15 103.07 102.57 95.86 72.62 66.02 46.75 0.71
2015-16 102.70 102.20 95.51 72.36 65.78 35.32 0.54
2016-17 89.77 89.27 83.43 63.21 57.46 37.97 0.66
Source: NHB (2018a, b); APEDA (2018a) and Authors’ calculations
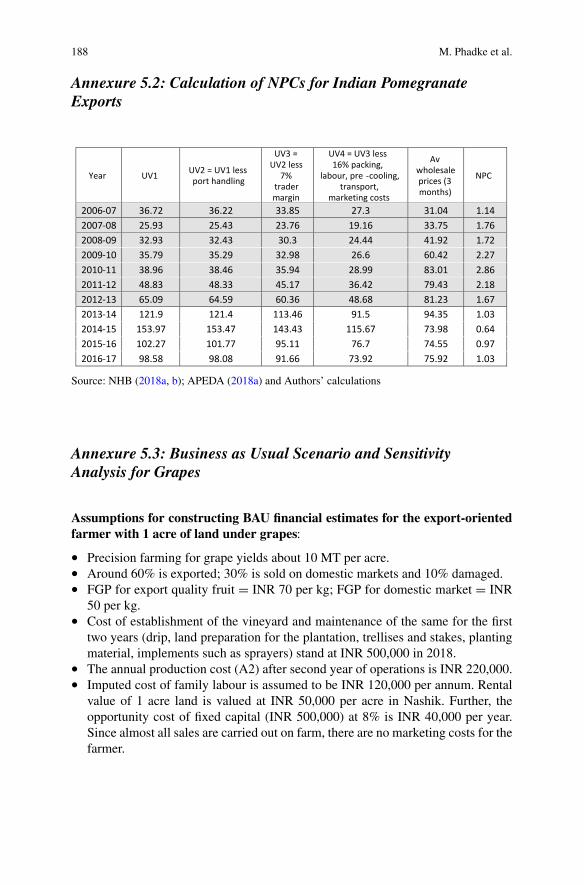
188 M. Phadke et al.
Annexure 5.2: Calculation of NPCs for Indian PomegranateExports
Year UV1 UV2 = UV1 less port handling
UV3 = UV2 less
7% trader margin
UV4 = UV3 less 16% packing,
labour, pre -cooling, transport,
marketing costs
Av wholesale prices (3 months)
NPC
2006-07 36.72 36.22 33.85 27.3 31.04 1.142007-08 25.93 25.43 23.76 19.16 33.75 1.762008-09 32.93 32.43 30.3 24.44 41.92 1.722009-10 35.79 35.29 32.98 26.6 60.42 2.272010-11 38.96 38.46 35.94 28.99 83.01 2.862011-12 48.83 48.33 45.17 36.42 79.43 2.182012-13 65.09 64.59 60.36 48.68 81.23 1.672013-14 121.9 121.4 113.46 91.5 94.35 1.032014-15 153.97 153.47 143.43 115.67 73.98 0.642015-16 102.27 101.77 95.11 76.7 74.55 0.972016-17 98.58 98.08 91.66 73.92 75.92 1.03
Source: NHB (2018a, b); APEDA (2018a) and Authors’ calculations
Annexure 5.3: Business as Usual Scenario and SensitivityAnalysis for Grapes
Assumptions for constructing BAU financial estimates for the export-orientedfarmer with 1 acre of land under grapes:
• Precision farming for grape yields about 10 MT per acre.• Around 60% is exported; 30% is sold on domestic markets and 10% damaged.• FGP for export quality fruit = INR 70 per kg; FGP for domestic market = INR
50 per kg.• Cost of establishment of the vineyard and maintenance of the same for the first
two years (drip, land preparation for the plantation, trellises and stakes, plantingmaterial, implements such as sprayers) stand at INR 500,000 in 2018.
• The annual production cost (A2) after second year of operations is INR 220,000.• Imputed cost of family labour is assumed to be INR 120,000 per annum. Rental
value of 1 acre land is valued at INR 50,000 per acre in Nashik. Further, theopportunity cost of fixed capital (INR 500,000) at 8% is INR 40,000 per year.Since almost all sales are carried out on farm, there are no marketing costs for thefarmer.
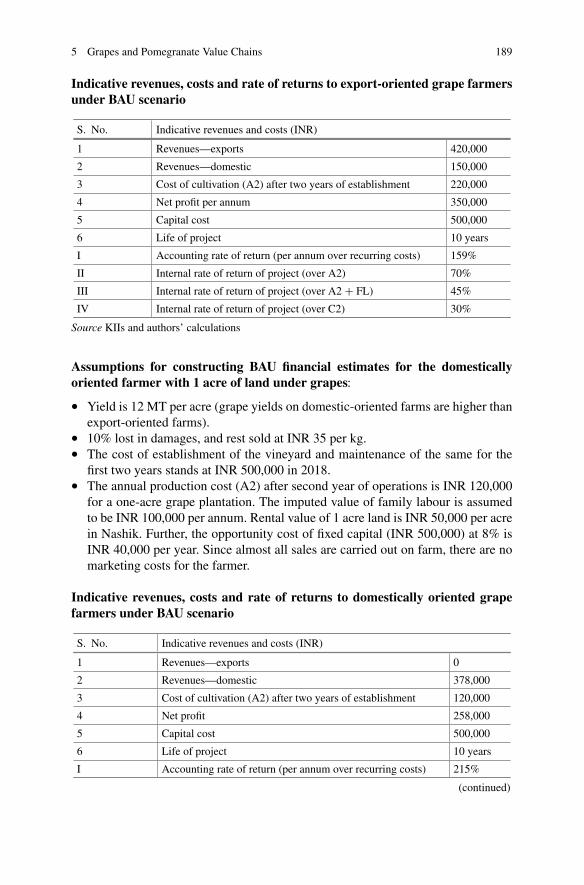
5 Grapes and Pomegranate Value Chains 189
Indicative revenues, costs and rate of returns to export-oriented grape farmersunder BAU scenario
S. No. Indicative revenues and costs (INR)
1 Revenues—exports 420,000
2 Revenues—domestic 150,000
3 Cost of cultivation (A2) after two years of establishment 220,000
4 Net profit per annum 350,000
5 Capital cost 500,000
6 Life of project 10 years
I Accounting rate of return (per annum over recurring costs) 159%
II Internal rate of return of project (over A2) 70%
III Internal rate of return of project (over A2 + FL) 45%
IV Internal rate of return of project (over C2) 30%
Source KIIs and authors’ calculations
Assumptions for constructing BAU financial estimates for the domesticallyoriented farmer with 1 acre of land under grapes:
• Yield is 12 MT per acre (grape yields on domestic-oriented farms are higher thanexport-oriented farms).
• 10% lost in damages, and rest sold at INR 35 per kg.• The cost of establishment of the vineyard and maintenance of the same for the
first two years stands at INR 500,000 in 2018.• The annual production cost (A2) after second year of operations is INR 120,000
for a one-acre grape plantation. The imputed value of family labour is assumedto be INR 100,000 per annum. Rental value of 1 acre land is INR 50,000 per acrein Nashik. Further, the opportunity cost of fixed capital (INR 500,000) at 8% isINR 40,000 per year. Since almost all sales are carried out on farm, there are nomarketing costs for the farmer.
Indicative revenues, costs and rate of returns to domestically oriented grapefarmers under BAU scenario
S. No. Indicative revenues and costs (INR)
1 Revenues—exports 0
2 Revenues—domestic 378,000
3 Cost of cultivation (A2) after two years of establishment 120,000
4 Net profit 258,000
5 Capital cost 500,000
6 Life of project 10 years
I Accounting rate of return (per annum over recurring costs) 215%
(continued)
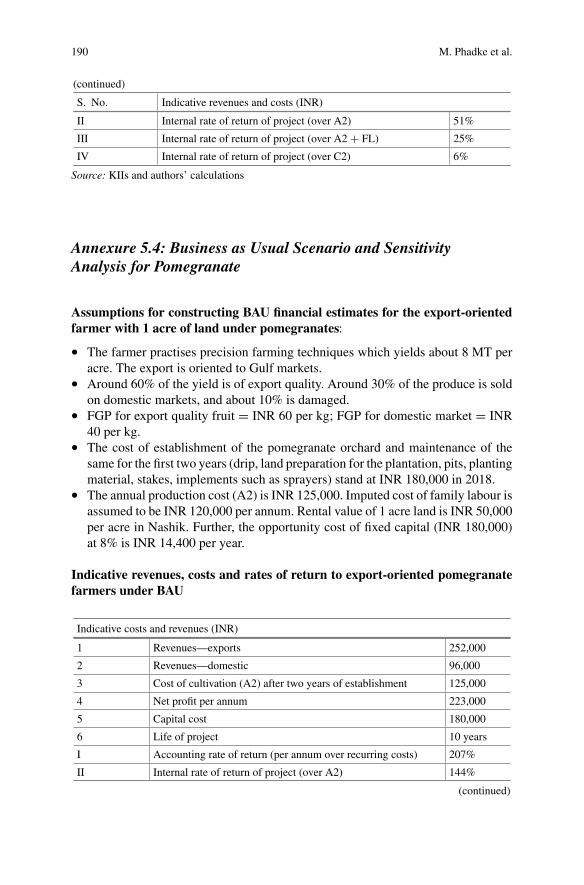
190 M. Phadke et al.
(continued)
S. No. Indicative revenues and costs (INR)
II Internal rate of return of project (over A2) 51%
III Internal rate of return of project (over A2 + FL) 25%
IV Internal rate of return of project (over C2) 6%
Source: KIIs and authors’ calculations
Annexure 5.4: Business as Usual Scenario and SensitivityAnalysis for Pomegranate
Assumptions for constructing BAU financial estimates for the export-orientedfarmer with 1 acre of land under pomegranates:
• The farmer practises precision farming techniques which yields about 8 MT peracre. The export is oriented to Gulf markets.
• Around 60% of the yield is of export quality. Around 30% of the produce is soldon domestic markets, and about 10% is damaged.
• FGP for export quality fruit = INR 60 per kg; FGP for domestic market = INR40 per kg.
• The cost of establishment of the pomegranate orchard and maintenance of thesame for the first two years (drip, land preparation for the plantation, pits, plantingmaterial, stakes, implements such as sprayers) stand at INR 180,000 in 2018.
• The annual production cost (A2) is INR 125,000. Imputed cost of family labour isassumed to be INR 120,000 per annum. Rental value of 1 acre land is INR 50,000per acre in Nashik. Further, the opportunity cost of fixed capital (INR 180,000)at 8% is INR 14,400 per year.
Indicative revenues, costs and rates of return to export-oriented pomegranatefarmers under BAU
Indicative costs and revenues (INR)
1 Revenues—exports 252,000
2 Revenues—domestic 96,000
3 Cost of cultivation (A2) after two years of establishment 125,000
4 Net profit per annum 223,000
5 Capital cost 180,000
6 Life of project 10 years
I Accounting rate of return (per annum over recurring costs) 207%
II Internal rate of return of project (over A2) 144%
(continued)
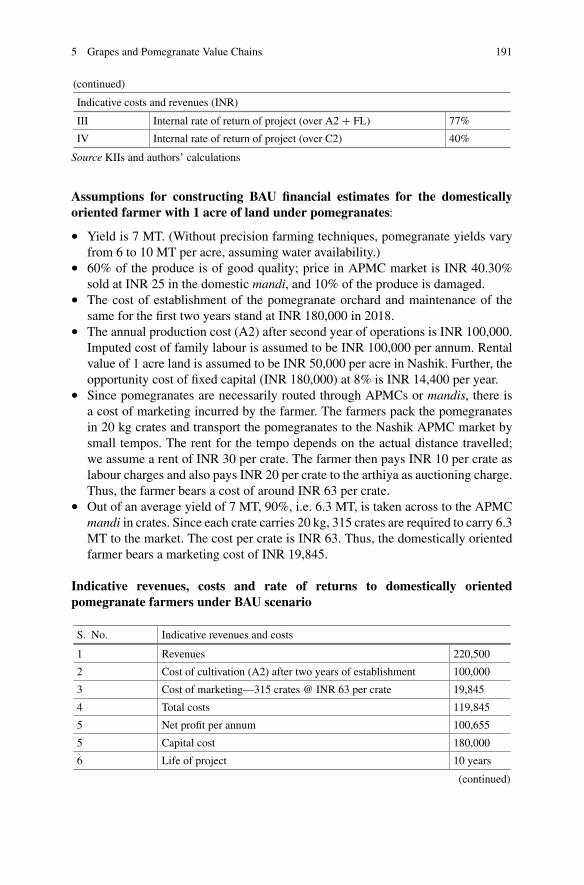
5 Grapes and Pomegranate Value Chains 191
(continued)
Indicative costs and revenues (INR)
III Internal rate of return of project (over A2 + FL) 77%
IV Internal rate of return of project (over C2) 40%
Source KIIs and authors’ calculations
Assumptions for constructing BAU financial estimates for the domesticallyoriented farmer with 1 acre of land under pomegranates:
• Yield is 7 MT. (Without precision farming techniques, pomegranate yields varyfrom 6 to 10 MT per acre, assuming water availability.)
• 60% of the produce is of good quality; price in APMC market is INR 40.30%sold at INR 25 in the domestic mandi, and 10% of the produce is damaged.
• The cost of establishment of the pomegranate orchard and maintenance of thesame for the first two years stand at INR 180,000 in 2018.
• The annual production cost (A2) after second year of operations is INR 100,000.Imputed cost of family labour is assumed to be INR 100,000 per annum. Rentalvalue of 1 acre land is assumed to be INR 50,000 per acre in Nashik. Further, theopportunity cost of fixed capital (INR 180,000) at 8% is INR 14,400 per year.
• Since pomegranates are necessarily routed through APMCs or mandis, there isa cost of marketing incurred by the farmer. The farmers pack the pomegranatesin 20 kg crates and transport the pomegranates to the Nashik APMC market bysmall tempos. The rent for the tempo depends on the actual distance travelled;we assume a rent of INR 30 per crate. The farmer then pays INR 10 per crate aslabour charges and also pays INR 20 per crate to the arthiya as auctioning charge.Thus, the farmer bears a cost of around INR 63 per crate.
• Out of an average yield of 7 MT, 90%, i.e. 6.3 MT, is taken across to the APMCmandi in crates. Since each crate carries 20 kg, 315 crates are required to carry 6.3MT to the market. The cost per crate is INR 63. Thus, the domestically orientedfarmer bears a marketing cost of INR 19,845.
Indicative revenues, costs and rate of returns to domestically orientedpomegranate farmers under BAU scenario
S. No. Indicative revenues and costs
1 Revenues 220,500
2 Cost of cultivation (A2) after two years of establishment 100,000
3 Cost of marketing—315 crates @ INR 63 per crate 19,845
4 Total costs 119,845
5 Net profit per annum 100,655
5 Capital cost 180,000
6 Life of project 10 years
(continued)
192 M. Phadke et al.
(continued)
S. No. Indicative revenues and costs
I Accounting rate of return (per annum over recurring costs) 84%
II Internal rate of return of project (over A2) 55%
III Internal rate of return of project (over A2 + FL) 0%
IV Internal rate of return of project (over C2) 0%
Source KIIs and authors’ calculations
References
Agmark (2018) www.agmark.nic.in. Last accessed December 2018Agriculture Census (Various Issues) http://agcensus.dacnet.nic.in/stateholdingsizeclass.aspx. Lastaccessed November 2018
Agriculture Census (2015–16) http://agcensus.dacnet.nic.in/stateholdingsizeclass.aspxAPEDA (2018a) http://agriexchange.apeda.gov.in/. Last accessed December 2018APEDA (2018b) apeda.gov.in/. Last accessed December 2018Bartual J, Fernandez-Zamudio MA, De-Miguel MD (2015) Situation of the production, researchand economics of the pomegranate industry in Spain. Acta Hortic 1089:345–349 https://doi.org/10.17660/ActaHortic.2015.1089.45
CBI (Centre for Promotion of Exports from Developing Countries, n.d.). Exporting freshpomegranates to Europe, Ministry of Foreign Affairs, Netherlands. Retrieved from https://www.cbi.eu/market-information/fresh-fruit-vegetables/pomegranates/europe
DoM (2016) Directorate of Marketing, Government of Maharashtra Ordinance No. 15, July 2016Ebrahimi MS (2015) Production and supply of pomegranate in Iran. Ekonomika, UDS338.4:634.64(55), Issue No. 7 (Ukraine)
ECGC (n.d.a) ECGC Ltd., Form No. 102. https://www.irdai.gov.in/ADMINCMS/cms/Uploadedfiles/NLP1516/20.pdf
ECGC (n.d.b) ECGC Ltd., Multi Buyer Exposure Policy in Foreign Currency Bond. https://www.irdai.gov.in/ADMINCMS/cms/UploadedFiles/NonLifeProducts/IRDAN124CP0001V01201819.pdf
FAO-OIV Focus (2016) Table and dried grapes, report, Paris, France, 2016. Retrieved from http://www.oiv.int/public/medias/5116/booklet-fao-oiv-grapes-focus.pdf
FAOSTAT (2018a) http://www.fao.org/faostat/en/#data/QC. Last accessed September 2018FAOSTAT (2018b) http://www.fao.org/faostat/en/#data/TP. Last accessed September 2018Hindu (2020) Farmers urged to cultivate grapes, The Hindu, February 2020. Retrievedfrom https://www.thehindu.com/news/cities/Tiruchirapalli/farmers-urged-to-cultivate-grapes/article30863120.ece
Ikinci A, Bolat I, Simsek M (2018) International pomegranate trade and pomegranate standard,abstract of paper. International GAP Agriculture and Livestock Congress, April 2018, Turkey
Jain Irrigation (n.d.). Jain tissue culture pomegranate planting material. http://jains.com/Tissue/images/TC_Pomegranate.pdf
Jamwal N (2015) EU rejects Indian grapes, report, down to earth. https://www.downtoearth.org.in/news/eu-rejects-indian-grapes-290
NCPAH (n.d.) Study of value chain for grapes in Nashik, Maharashtra, National Committee forPlasticulture Applications in Horticulture. Ministry of Agriculture and Farmers’ Welfare. NewDelhi
5 Grapes and Pomegranate Value Chains 193
NHB (2018a) Horticulture Statistics at a Glance, Horticulture Statistics Division, National Horti-culture Board, Department of Agriculture, Cooperation and Farmers’ Welfare, Ministry of Agri-culture and Farmers’ Welfare, Government of India. http://nhb.gov.in/statistics/Publication/Horticulture%20At%20a%20Glance%202017%20for%20net%20uplod%20(2).pdf
NHB (2018b) National Horticulture Board (NHB). www.nhb.org.in. Last accessed November 2018Nikam VR, Singh P, Kumar S, Vijayraghavan K (2014) Determinants of success of mahagrapes asperceived by Members. Int J Extension Educ 10:111–114
OIV (2016) World Vitiviniculture situation. International Organization of Vine and Wine. http://www.oiv.int/public/medias/5028/world-vitiviniculture-situation-2016.pdf
Saini S, Gulati A (2017) Price distortions in Indian agriculture. World Bank, New DelhiSalgado OM (2017) Pomegranate, presentation, Sapex pomegranate symposium, South Africa,September 2017. Retrieved from http://www.sapex.co.za/pdf/Sapex-Pomegranate-Symposium/2.pdf
Open Access This chapter is licensed under the terms of the Creative Commons Attribution 4.0International License (http://creativecommons.org/licenses/by/4.0/), which permits use, sharing,adaptation, distribution and reproduction in any medium or format, as long as you give appropriatecredit to the original author(s) and the source, provide a link to the Creative Commons license andindicate if changes were made.
The images or other third party material in this chapter are included in the chapter’s CreativeCommons license, unless indicated otherwise in a credit line to the material. If material is notincluded in the chapter’s Creative Commons license and your intended use is not permitted bystatutory regulation or exceeds the permitted use, you will need to obtain permission directly fromthe copyright holder.
Chapter 6Dairy Value Chain
T. Nanda Kumar, Sandip Das, and Ashok Gulati
6.1 Introduction
Livestock sector is the backbone of Indian agriculture and plays a crucial role inthe development of the rural economy. More than one-fifth (23%) of agriculturalhouseholds in India with area less than 0.01 hectare reported livestock as their prin-cipal source of income (GoI 2014). Livestock is one of the fastest-growing sectors ofIndian agriculture. Livestock sector accounts for 31% of the gross value of output inagriculture and allied sector (GVOA). Within livestock, milk is the biggest compo-nent with 20% share in GVOA. In fact, milk is the largest agriculture commodity interms of value of output, worth INR 772,705 crores, which was more than the valueof cereals, pulses, oilseeds and sugarcane combined, worth INR 623,462 crores in2018–19 (MoSPI 2021). Around 70 million rural households are engaged in milkproduction, most of them being landless or small and marginal farmers (DAHD2018). As a source of livelihood for millions of poor households, dairying alsosupplements their dietary sources of protein and nutrition, thus playing a critical rolein the country’s food security needs.
Globally, India is the largest milk producer and accounted for 20% of the milkproduction in 2017. In the 1950s and 1960s, the country’s milk production was stag-nant, even witnessing negative growth in many years. Imports of dairy commoditieswere a norm in the first two decades of the post-independence era. Operation Flood(OF) implemented by National Dairy Development Board (NDDB) (1972–1996)created a national milk grid linking rural producers to urban consumers througha network of dairy co-operatives. The dairy revolution or the white revolution in
T. Nanda KumarFormer Senior Visiting Fellow, Indian Council for Research on International Economic Relations(ICRIER), New Delhi, Delhi, India
S. Das · A. Gulati (B)Indian Council for Research on International Economic Relations (ICRIER), New Delhi, Delhi,India
© The Author(s) 2022A. Gulati et al. (eds.), Agricultural Value Chains in India, India Studies in Businessand Economics, https://doi.org/10.1007/978-981-33-4268-2_6
195
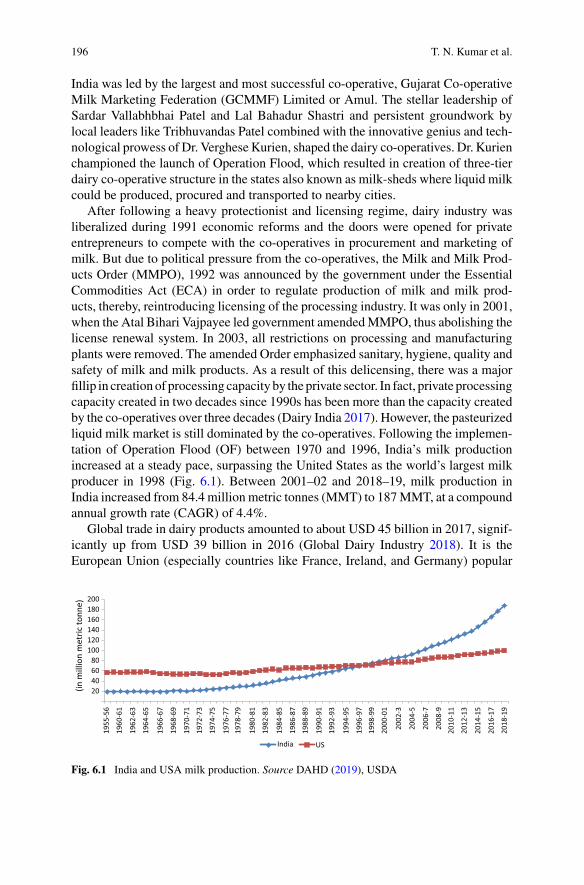
196 T. N. Kumar et al.
India was led by the largest and most successful co-operative, Gujarat Co-operativeMilk Marketing Federation (GCMMF) Limited or Amul. The stellar leadership ofSardar Vallabhbhai Patel and Lal Bahadur Shastri and persistent groundwork bylocal leaders like Tribhuvandas Patel combined with the innovative genius and tech-nological prowess of Dr. Verghese Kurien, shaped the dairy co-operatives. Dr. Kurienchampioned the launch of Operation Flood, which resulted in creation of three-tierdairy co-operative structure in the states also known as milk-sheds where liquid milkcould be produced, procured and transported to nearby cities.
After following a heavy protectionist and licensing regime, dairy industry wasliberalized during 1991 economic reforms and the doors were opened for privateentrepreneurs to compete with the co-operatives in procurement and marketing ofmilk. But due to political pressure from the co-operatives, the Milk and Milk Prod-ucts Order (MMPO), 1992 was announced by the government under the EssentialCommodities Act (ECA) in order to regulate production of milk and milk prod-ucts, thereby, reintroducing licensing of the processing industry. It was only in 2001,when the Atal Bihari Vajpayee led government amendedMMPO, thus abolishing thelicense renewal system. In 2003, all restrictions on processing and manufacturingplants were removed. The amended Order emphasized sanitary, hygiene, quality andsafety of milk and milk products. As a result of this delicensing, there was a majorfillip in creationof processing capacity by the private sector. In fact, private processingcapacity created in two decades since 1990s has been more than the capacity createdby the co-operatives over three decades (Dairy India 2017). However, the pasteurizedliquid milk market is still dominated by the co-operatives. Following the implemen-tation of Operation Flood (OF) between 1970 and 1996, India’s milk productionincreased at a steady pace, surpassing the United States as the world’s largest milkproducer in 1998 (Fig. 6.1). Between 2001–02 and 2018–19, milk production inIndia increased from 84.4 million metric tonnes (MMT) to 187MMT, at a compoundannual growth rate (CAGR) of 4.4%.
Global trade in dairy products amounted to about USD 45 billion in 2017, signif-icantly up from USD 39 billion in 2016 (Global Dairy Industry 2018). It is theEuropean Union (especially countries like France, Ireland, and Germany) popular
20406080
100120140160180200
(in m
illio
n m
etric
tonn
e)
India US
1955
-56
1960
-61
1962
-63
1964
-65
1966
-67
1968
-69
1970
-71
1972
-73
1974
-75
1976
-77
1978
-79
1980
-81
1982
-83
1984
-85
1986
-87
1988
-89
1990
-91
1992
-93
1994
-95
1996
-97
1998
-99
2000
-01
2002
-3
2004
-5
2006
-7
2008
-920
10-1
1
2012
-13
2014
-15
2016
-17
2018
-19
Fig. 6.1 India and USA milk production. Source DAHD (2019), USDA
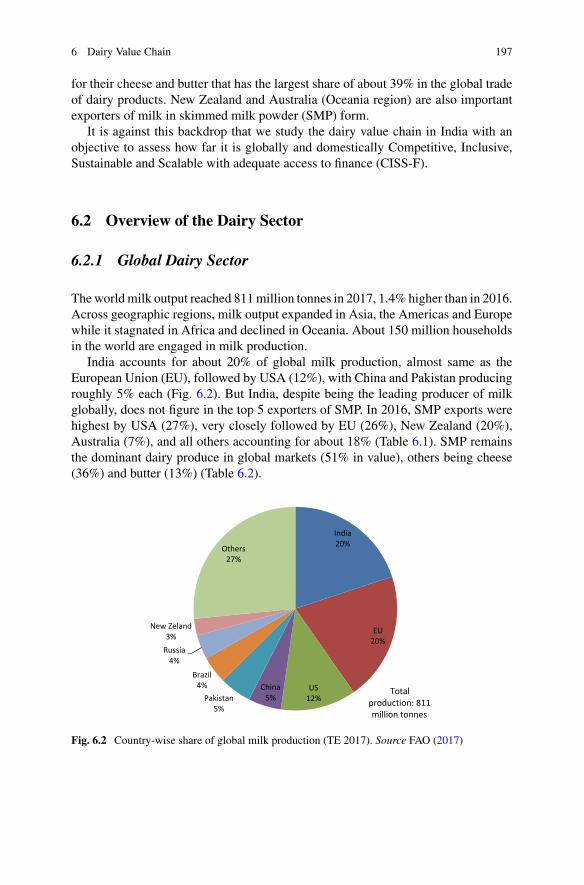
6 Dairy Value Chain 197
for their cheese and butter that has the largest share of about 39% in the global tradeof dairy products. New Zealand and Australia (Oceania region) are also importantexporters of milk in skimmed milk powder (SMP) form.
It is against this backdrop that we study the dairy value chain in India with anobjective to assess how far it is globally and domestically Competitive, Inclusive,Sustainable and Scalable with adequate access to finance (CISS-F).
6.2 Overview of the Dairy Sector
6.2.1 Global Dairy Sector
Theworldmilk output reached 811million tonnes in 2017, 1.4% higher than in 2016.Across geographic regions, milk output expanded in Asia, the Americas and Europewhile it stagnated in Africa and declined in Oceania. About 150 million householdsin the world are engaged in milk production.
India accounts for about 20% of global milk production, almost same as theEuropean Union (EU), followed by USA (12%), with China and Pakistan producingroughly 5% each (Fig. 6.2). But India, despite being the leading producer of milkglobally, does not figure in the top 5 exporters of SMP. In 2016, SMP exports werehighest by USA (27%), very closely followed by EU (26%), New Zealand (20%),Australia (7%), and all others accounting for about 18% (Table 6.1). SMP remainsthe dominant dairy produce in global markets (51% in value), others being cheese(36%) and butter (13%) (Table 6.2).
India20%
EU20%
US12%
China5%Pakistan
5%
Brazil4%
Russia4%
New Zeland3%
Others27%
Total production: 811 million tonnes
Fig. 6.2 Country-wise share of global milk production (TE 2017). Source FAO (2017)
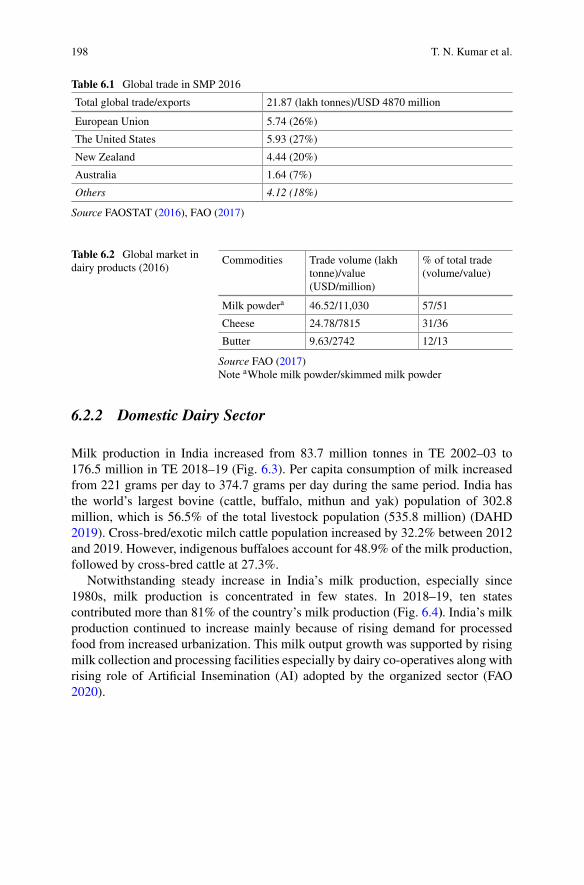
198 T. N. Kumar et al.
Table 6.1 Global trade in SMP 2016
Total global trade/exports 21.87 (lakh tonnes)/USD 4870 million
European Union 5.74 (26%)
The United States 5.93 (27%)
New Zealand 4.44 (20%)
Australia 1.64 (7%)
Others 4.12 (18%)
Source FAOSTAT (2016), FAO (2017)
Table 6.2 Global market indairy products (2016)
Commodities Trade volume (lakhtonne)/value(USD/million)
% of total trade(volume/value)
Milk powdera 46.52/11,030 57/51
Cheese 24.78/7815 31/36
Butter 9.63/2742 12/13
Source FAO (2017)Note aWhole milk powder/skimmed milk powder
6.2.2 Domestic Dairy Sector
Milk production in India increased from 83.7 million tonnes in TE 2002–03 to176.5 million in TE 2018–19 (Fig. 6.3). Per capita consumption of milk increasedfrom 221 grams per day to 374.7 grams per day during the same period. India hasthe world’s largest bovine (cattle, buffalo, mithun and yak) population of 302.8million, which is 56.5% of the total livestock population (535.8 million) (DAHD2019). Cross-bred/exotic milch cattle population increased by 32.2% between 2012and 2019. However, indigenous buffaloes account for 48.9% of the milk production,followed by cross-bred cattle at 27.3%.
Notwithstanding steady increase in India’s milk production, especially since1980s, milk production is concentrated in few states. In 2018–19, ten statescontributed more than 81% of the country’s milk production (Fig. 6.4). India’s milkproduction continued to increase mainly because of rising demand for processedfood from increased urbanization. This milk output growth was supported by risingmilk collection and processing facilities especially by dairy co-operatives along withrising role of Artificial Insemination (AI) adopted by the organized sector (FAO2020).
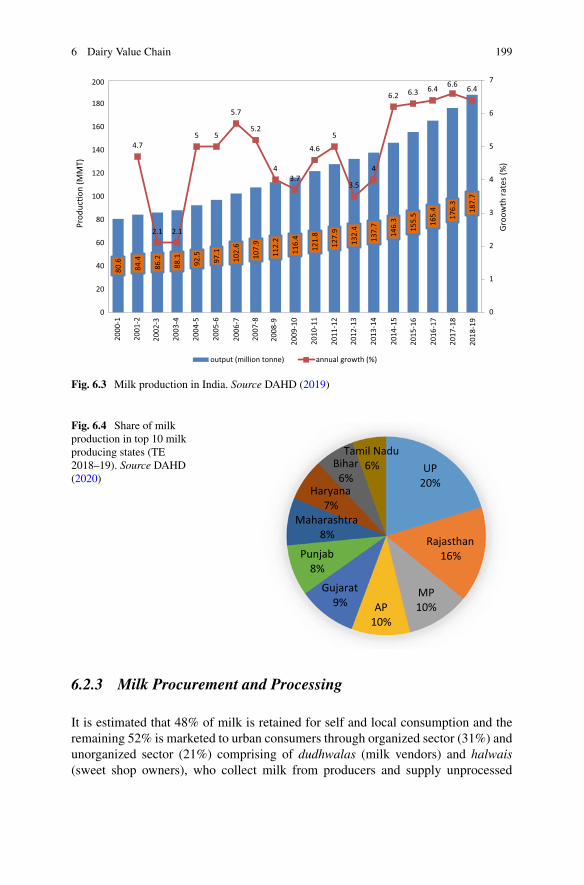
6 Dairy Value Chain 199
80.6
84.4
86.2
88.1
92.5
97.1
102.
6
107.
9
112.
2
116.
4
121.
8
127.
9
132.
4
137.
7
146.
3
155.
5
165.
4
176.
3
187.
7
4.7
2.1 2.1
5 5
5.7
5.2
43.7
4.6
5
3.5
4
6.2 6.3 6.4 6.6 6.4
0
1
2
3
4
5
6
7
0
20
40
60
80
100
120
140
160
180
200
Groo
wth
rate
s (%
)
Prod
uc�o
n (M
MT)
output (million tonne) annual growth (%)
2000
-1
2001
-2
2002
-3
2003
-4
2004
-5
2005
-6
2006
-7
2007
-8
2008
-9
2009
-10
2010
-11
2011
-12
2012
-13
2013
-14
2014
-15
2015
-16
2016
-17
2017
-18
2018
-19
Fig. 6.3 Milk production in India. Source DAHD (2019)
Fig. 6.4 Share of milkproduction in top 10 milkproducing states (TE2018–19). Source DAHD(2020)
UP20%
Rajasthan 16%
MP10% AP
10%
Gujarat 9%
Punjab8%
Maharashtra 8%
Haryana 7%
Bihar 6%
Tamil Nadu6%
6.2.3 Milk Procurement and Processing
It is estimated that 48% of milk is retained for self and local consumption and theremaining 52% is marketed to urban consumers through organized sector (31%) andunorganized sector (21%) comprising of dudhwalas (milk vendors) and halwais(sweet shop owners), who collect milk from producers and supply unprocessed
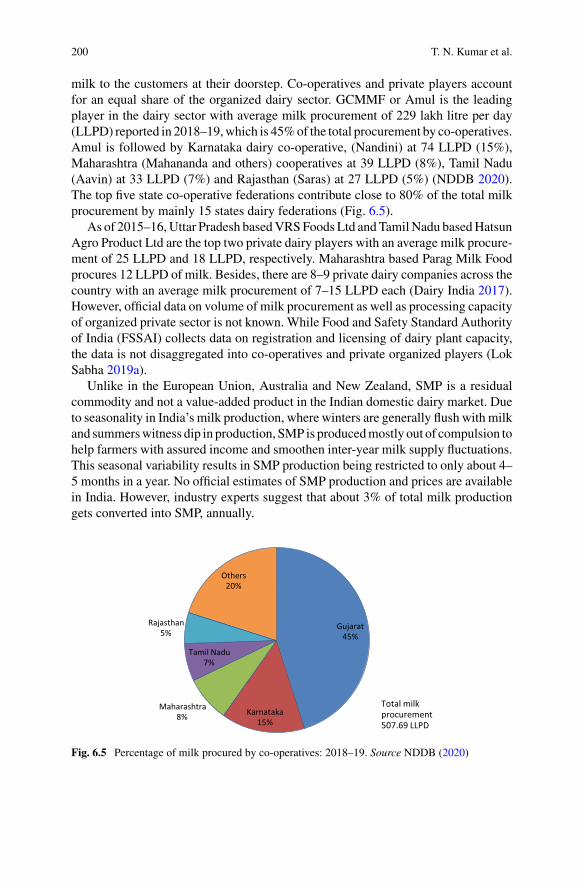
200 T. N. Kumar et al.
milk to the customers at their doorstep. Co-operatives and private players accountfor an equal share of the organized dairy sector. GCMMF or Amul is the leadingplayer in the dairy sector with average milk procurement of 229 lakh litre per day(LLPD) reported in 2018–19,which is 45%of the total procurement by co-operatives.Amul is followed by Karnataka dairy co-operative, (Nandini) at 74 LLPD (15%),Maharashtra (Mahananda and others) cooperatives at 39 LLPD (8%), Tamil Nadu(Aavin) at 33 LLPD (7%) and Rajasthan (Saras) at 27 LLPD (5%) (NDDB 2020).The top five state co-operative federations contribute close to 80% of the total milkprocurement by mainly 15 states dairy federations (Fig. 6.5).
As of 2015–16,Uttar Pradesh basedVRSFoods Ltd andTamilNadu basedHatsunAgro Product Ltd are the top two private dairy players with an average milk procure-ment of 25 LLPD and 18 LLPD, respectively. Maharashtra based Parag Milk Foodprocures 12 LLPD of milk. Besides, there are 8–9 private dairy companies across thecountry with an average milk procurement of 7–15 LLPD each (Dairy India 2017).However, official data on volume of milk procurement as well as processing capacityof organized private sector is not known. While Food and Safety Standard Authorityof India (FSSAI) collects data on registration and licensing of dairy plant capacity,the data is not disaggregated into co-operatives and private organized players (LokSabha 2019a).
Unlike in the European Union, Australia and New Zealand, SMP is a residualcommodity and not a value-added product in the Indian domestic dairy market. Dueto seasonality in India’s milk production, where winters are generally flush with milkand summerswitness dip in production, SMP is producedmostly out of compulsion tohelp farmers with assured income and smoothen inter-year milk supply fluctuations.This seasonal variability results in SMP production being restricted to only about 4–5 months in a year. No official estimates of SMP production and prices are availablein India. However, industry experts suggest that about 3% of total milk productiongets converted into SMP, annually.
Gujarat45%
Karnataka15%
Maharashtra8%
Tamil Nadu7%
Rajasthan5%
Others20%
Total milk procurement 507.69 LLPD
Fig. 6.5 Percentage of milk procured by co-operatives: 2018–19. Source NDDB (2020)
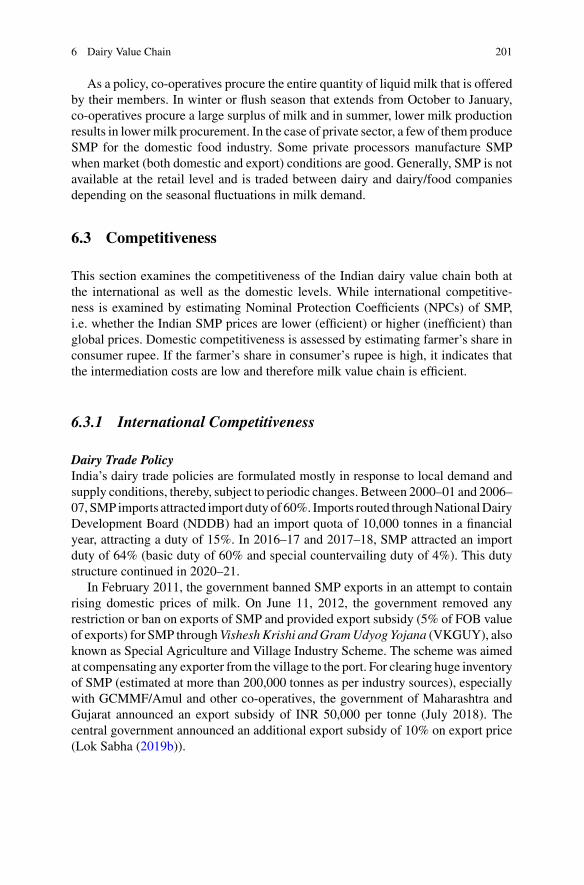
6 Dairy Value Chain 201
As a policy, co-operatives procure the entire quantity of liquid milk that is offeredby their members. In winter or flush season that extends from October to January,co-operatives procure a large surplus of milk and in summer, lower milk productionresults in lowermilk procurement. In the case of private sector, a few of them produceSMP for the domestic food industry. Some private processors manufacture SMPwhen market (both domestic and export) conditions are good. Generally, SMP is notavailable at the retail level and is traded between dairy and dairy/food companiesdepending on the seasonal fluctuations in milk demand.
6.3 Competitiveness
This section examines the competitiveness of the Indian dairy value chain both atthe international as well as the domestic levels. While international competitive-ness is examined by estimating Nominal Protection Coefficients (NPCs) of SMP,i.e. whether the Indian SMP prices are lower (efficient) or higher (inefficient) thanglobal prices. Domestic competitiveness is assessed by estimating farmer’s share inconsumer rupee. If the farmer’s share in consumer’s rupee is high, it indicates thatthe intermediation costs are low and therefore milk value chain is efficient.
6.3.1 International Competitiveness
Dairy Trade PolicyIndia’s dairy trade policies are formulated mostly in response to local demand andsupply conditions, thereby, subject to periodic changes. Between 2000–01 and 2006–07, SMP imports attracted import dutyof 60%. Imports routed throughNationalDairyDevelopment Board (NDDB) had an import quota of 10,000 tonnes in a financialyear, attracting a duty of 15%. In 2016–17 and 2017–18, SMP attracted an importduty of 64% (basic duty of 60% and special countervailing duty of 4%). This dutystructure continued in 2020–21.
In February 2011, the government banned SMP exports in an attempt to containrising domestic prices of milk. On June 11, 2012, the government removed anyrestriction or ban on exports of SMP and provided export subsidy (5% of FOB valueof exports) for SMP throughVisheshKrishi andGramUdyog Yojana (VKGUY), alsoknown as Special Agriculture and Village Industry Scheme. The scheme was aimedat compensating any exporter from the village to the port. For clearing huge inventoryof SMP (estimated at more than 200,000 tonnes as per industry sources), especiallywith GCMMF/Amul and other co-operatives, the government of Maharashtra andGujarat announced an export subsidy of INR 50,000 per tonne (July 2018). Thecentral government announced an additional export subsidy of 10% on export price(Lok Sabha (2019b)).
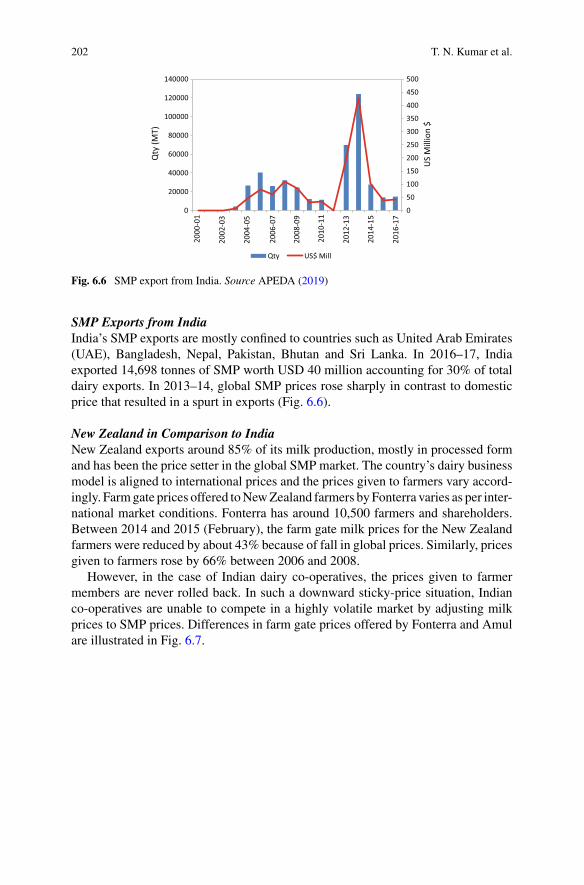
202 T. N. Kumar et al.
0
50
100
150
200
250
300
350
400
450
500
0
20000
40000
60000
80000
100000
120000
140000
US
Mill
ion
$
Qty
(MT)
Qty US$ Mill
2000
-01
2002
-03
2004
-05
2006
-07
2008
-09
2010
-11
2012
-13
2014
-15
2016
-17
Fig. 6.6 SMP export from India. Source APEDA (2019)
SMP Exports from IndiaIndia’s SMP exports are mostly confined to countries such as United Arab Emirates(UAE), Bangladesh, Nepal, Pakistan, Bhutan and Sri Lanka. In 2016–17, Indiaexported 14,698 tonnes of SMP worth USD 40 million accounting for 30% of totaldairy exports. In 2013–14, global SMP prices rose sharply in contrast to domesticprice that resulted in a spurt in exports (Fig. 6.6).
New Zealand in Comparison to IndiaNew Zealand exports around 85% of its milk production, mostly in processed formand has been the price setter in the global SMP market. The country’s dairy businessmodel is aligned to international prices and the prices given to farmers vary accord-ingly. Farmgate prices offered toNewZealand farmers byFonterra varies as per inter-national market conditions. Fonterra has around 10,500 farmers and shareholders.Between 2014 and 2015 (February), the farm gate milk prices for the New Zealandfarmers were reduced by about 43% because of fall in global prices. Similarly, pricesgiven to farmers rose by 66% between 2006 and 2008.
However, in the case of Indian dairy co-operatives, the prices given to farmermembers are never rolled back. In such a downward sticky-price situation, Indianco-operatives are unable to compete in a highly volatile market by adjusting milkprices to SMP prices. Differences in farm gate prices offered by Fonterra and Amulare illustrated in Fig. 6.7.
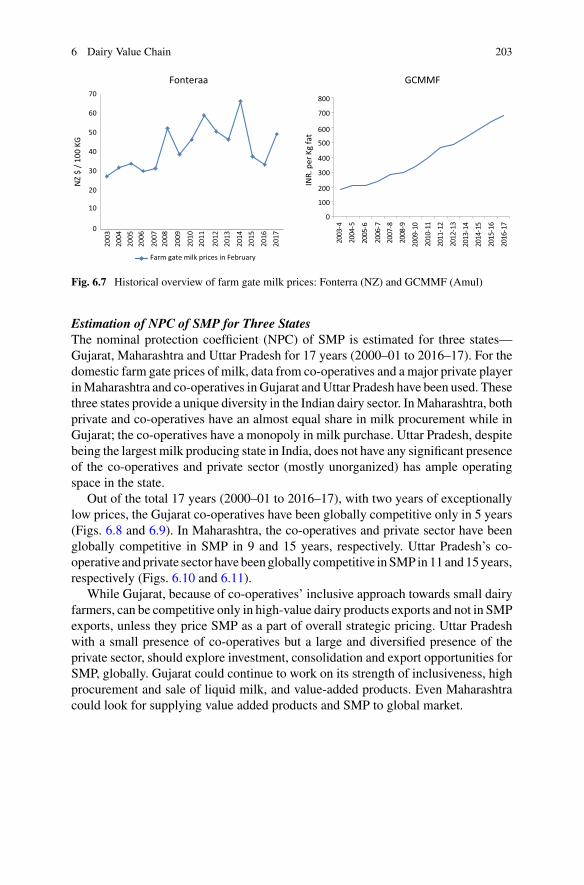
6 Dairy Value Chain 203
0
10
20
30
40
50
60
70
2003
2004
2005
2006
2007
2008
2009
2010
2011
2012
2013
2014
2015
2016
2017
NZ
$ / 1
00 K
G
Farm gate milk prices in February
0
100
200
300
400
500
600
700
800
INR.
per
Kg
fat
2003
-4
2004
-5
2005
-6
2006
-720
07-8
2008
-9
2009
-10
2010
-11
2011
-12
2012
-13
2013
-14
2014
-15
2015
-16
2016
-17
Fonteraa GCMMF
Fig. 6.7 Historical overview of farm gate milk prices: Fonterra (NZ) and GCMMF (Amul)
Estimation of NPC of SMP for Three StatesThe nominal protection coefficient (NPC) of SMP is estimated for three states—Gujarat, Maharashtra and Uttar Pradesh for 17 years (2000–01 to 2016–17). For thedomestic farm gate prices of milk, data from co-operatives and a major private playerinMaharashtra and co-operatives in Gujarat andUttar Pradesh have been used. Thesethree states provide a unique diversity in the Indian dairy sector. InMaharashtra, bothprivate and co-operatives have an almost equal share in milk procurement while inGujarat; the co-operatives have a monopoly in milk purchase. Uttar Pradesh, despitebeing the largest milk producing state in India, does not have any significant presenceof the co-operatives and private sector (mostly unorganized) has ample operatingspace in the state.
Out of the total 17 years (2000–01 to 2016–17), with two years of exceptionallylow prices, the Gujarat co-operatives have been globally competitive only in 5 years(Figs. 6.8 and 6.9). In Maharashtra, the co-operatives and private sector have beenglobally competitive in SMP in 9 and 15 years, respectively. Uttar Pradesh’s co-operative andprivate sector havebeenglobally competitive inSMP in11 and15years,respectively (Figs. 6.10 and 6.11).
While Gujarat, because of co-operatives’ inclusive approach towards small dairyfarmers, can be competitive only in high-value dairy products exports and not in SMPexports, unless they price SMP as a part of overall strategic pricing. Uttar Pradeshwith a small presence of co-operatives but a large and diversified presence of theprivate sector, should explore investment, consolidation and export opportunities forSMP, globally. Gujarat could continue to work on its strength of inclusiveness, highprocurement and sale of liquid milk, and value-added products. Even Maharashtracould look for supplying value added products and SMP to global market.
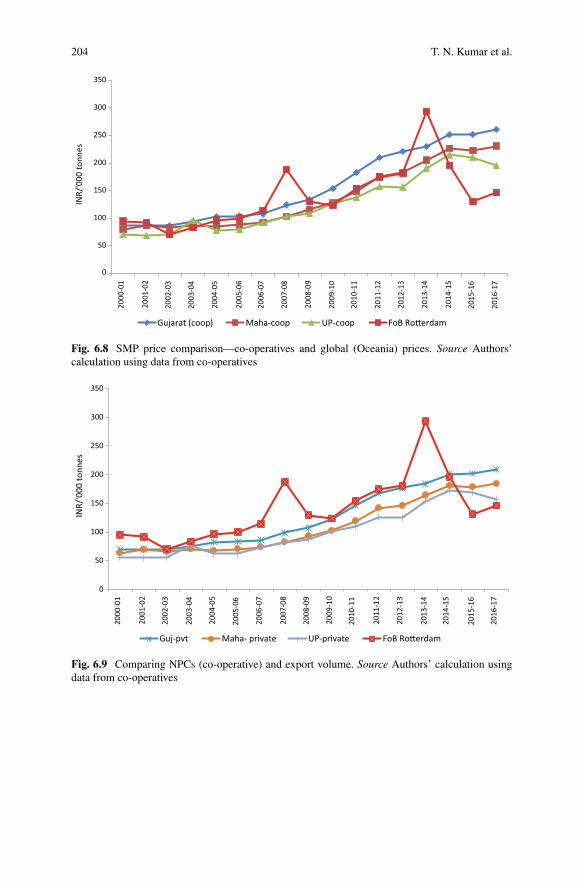
204 T. N. Kumar et al.
0
50
100
150
200
250
300
350IN
R/'0
00 to
nnes
Gujarat (coop) Maha-coop UP-coop FoB Ro�erdam
2000
-01
2001
-02
2002
-03
2003
-04
2004
-05
2005
-06
2006
-07
2007
-08
2008
-09
2009
-10
2010
-11
2011
-12
2012
-13
2013
-14
2014
-15
2015
-16
2016
-17
Fig. 6.8 SMP price comparison—co-operatives and global (Oceania) prices. Source Authors’calculation using data from co-operatives
0
50
100
150
200
250
300
350
INR/
'000
tonn
es
Guj-pvt Maha- private UP-private FoB Ro�erdam
2000
-01
2001
-02
2002
-03
2003
-04
2004
-05
2005
-06
2006
-07
2007
-08
2008
-09
2009
-10
2010
-11
2011
-12
2012
-13
2013
-14
2014
-15
2015
-16
2016
-17
Fig. 6.9 Comparing NPCs (co-operative) and export volume. Source Authors’ calculation usingdata from co-operatives
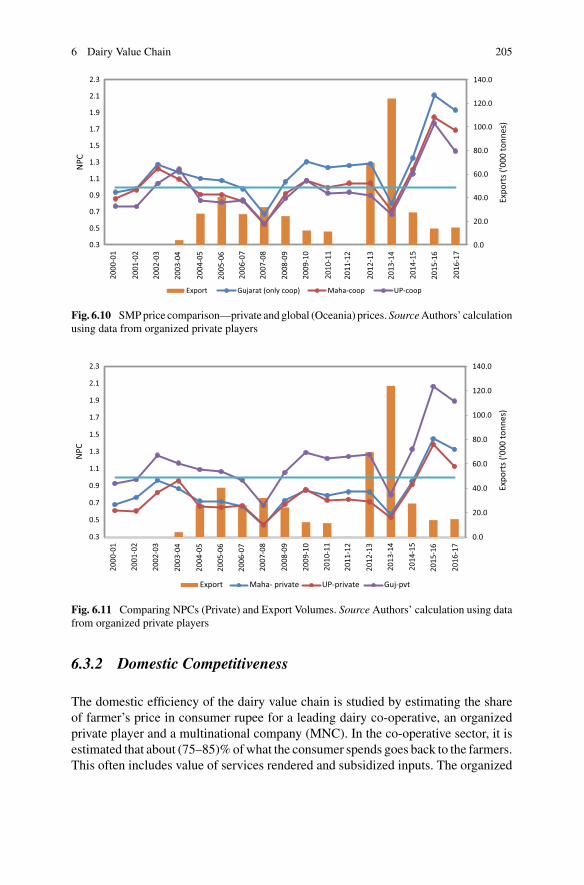
6 Dairy Value Chain 205
0.0
20.0
40.0
60.0
80.0
100.0
120.0
140.0
0.3
0.5
0.7
0.9
1.1
1.3
1.5
1.7
1.9
2.1
2.3
Expo
rts (
'000
tonn
es)
NPC
Export Gujarat (only coop) Maha-coop UP-coop
2000
-01
2001
-02
2002
-03
2003
-04
2004
-05
2005
-06
2006
-07
2007
-08
2008
-09
2009
-10
2010
-11
2011
-12
2012
-13
2013
-14
2014
-15
2015
-16
2016
-17
Fig. 6.10 SMPprice comparison—private and global (Oceania) prices. SourceAuthors’ calculationusing data from organized private players
0.0
20.0
40.0
60.0
80.0
100.0
120.0
140.0
0.3
0.5
0.7
0.9
1.1
1.3
1.5
1.7
1.9
2.1
2.3
Expo
rts (
'000
tonn
es)
NPC
Export Maha- private UP-private Guj-pvt
2000
-01
2001
-02
2002
-03
2003
-04
2004
-05
2005
-06
2006
-07
2007
-08
2008
-09
2009
-10
2010
-11
2011
-12
2012
-13
2013
-14
2014
-15
2015
-16
2016
-17
Fig. 6.11 Comparing NPCs (Private) and Export Volumes. Source Authors’ calculation using datafrom organized private players
6.3.2 Domestic Competitiveness
The domestic efficiency of the dairy value chain is studied by estimating the shareof farmer’s price in consumer rupee for a leading dairy co-operative, an organizedprivate player and a multinational company (MNC). In the co-operative sector, it isestimated that about (75–85)%ofwhat the consumer spends goes back to the farmers.This often includes value of services rendered and subsidized inputs. The organized
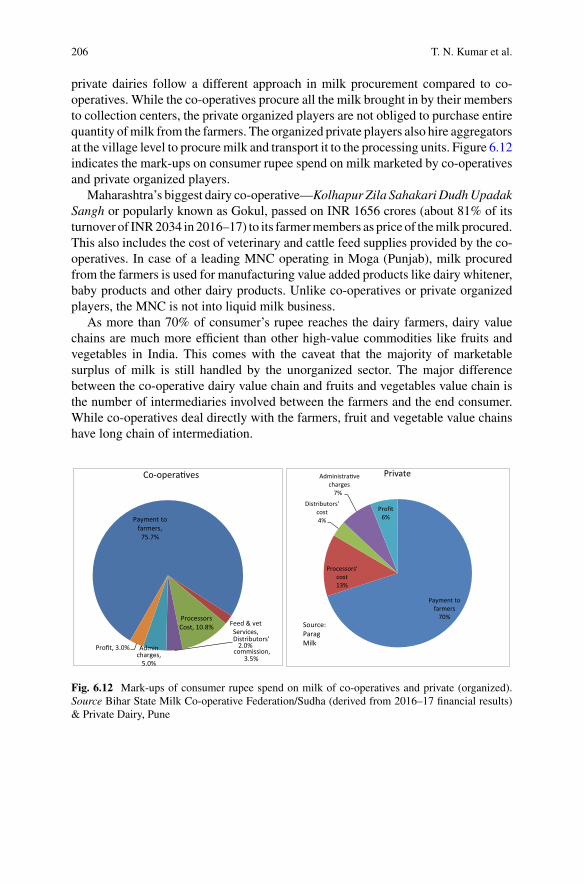
206 T. N. Kumar et al.
private dairies follow a different approach in milk procurement compared to co-operatives. While the co-operatives procure all the milk brought in by their membersto collection centers, the private organized players are not obliged to purchase entirequantity ofmilk from the farmers. The organized private players also hire aggregatorsat the village level to procuremilk and transport it to the processing units. Figure 6.12indicates the mark-ups on consumer rupee spend on milk marketed by co-operativesand private organized players.
Maharashtra’s biggest dairy co-operative—Kolhapur Zila SahakariDudhUpadakSangh or popularly known as Gokul, passed on INR 1656 crores (about 81% of itsturnover of INR2034 in 2016–17) to its farmermembers as price of themilk procured.This also includes the cost of veterinary and cattle feed supplies provided by the co-operatives. In case of a leading MNC operating in Moga (Punjab), milk procuredfrom the farmers is used for manufacturing value added products like dairy whitener,baby products and other dairy products. Unlike co-operatives or private organizedplayers, the MNC is not into liquid milk business.
As more than 70% of consumer’s rupee reaches the dairy farmers, dairy valuechains are much more efficient than other high-value commodities like fruits andvegetables in India. This comes with the caveat that the majority of marketablesurplus of milk is still handled by the unorganized sector. The major differencebetween the co-operative dairy value chain and fruits and vegetables value chain isthe number of intermediaries involved between the farmers and the end consumer.While co-operatives deal directly with the farmers, fruit and vegetable value chainshave long chain of intermediation.
Payment to farmers,
75.7%
Feed & vet Services,
2.0%
Processors Cost, 10.8%
Distributors'
commission, 3.5%
Admin charges,
5.0%
Profit, 3.0%
Co-opera�ves
Payment to farmers
70%
Processors' cost13%
Distributors' cost4%
Administra�vecharges
7%
Profit6%
Private
Source: Parag Milk
Fig. 6.12 Mark-ups of consumer rupee spend on milk of co-operatives and private (organized).Source Bihar State Milk Co-operative Federation/Sudha (derived from 2016–17 financial results)& Private Dairy, Pune
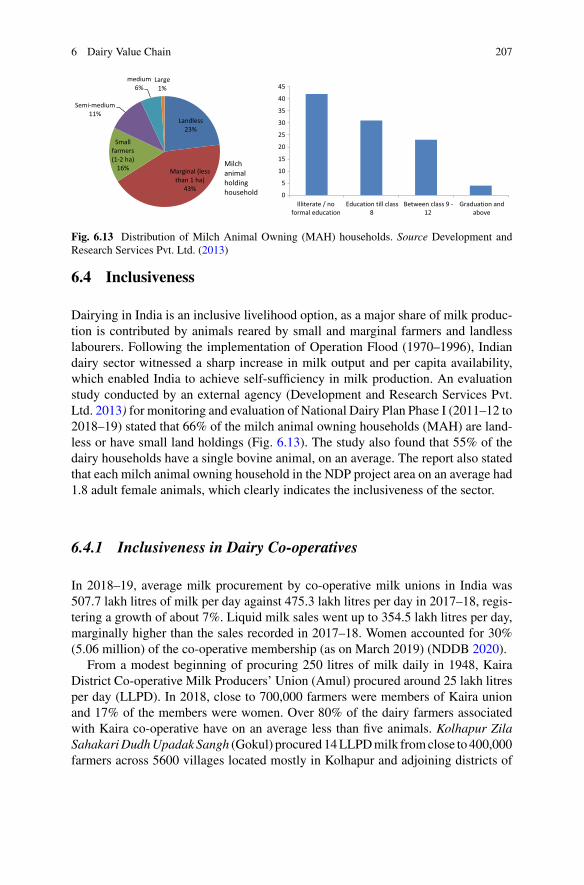
6 Dairy Value Chain 207
0
5
10
15
20
25
30
35
40
45
Illiterate / noformal education
Education till class8
Between class 9 -12
Graduation andabove
Landless 23%
Marginal (less than 1 ha)
43%
Small farmers (1-2 ha)
16%
Semi-medium11%
medium6%
Large1%
Milch animalholding household
Fig. 6.13 Distribution of Milch Animal Owning (MAH) households. Source Development andResearch Services Pvt. Ltd. (2013)
6.4 Inclusiveness
Dairying in India is an inclusive livelihood option, as a major share of milk produc-tion is contributed by animals reared by small and marginal farmers and landlesslabourers. Following the implementation of Operation Flood (1970–1996), Indiandairy sector witnessed a sharp increase in milk output and per capita availability,which enabled India to achieve self-sufficiency in milk production. An evaluationstudy conducted by an external agency (Development and Research Services Pvt.Ltd. 2013) for monitoring and evaluation of National Dairy Plan Phase I (2011–12 to2018–19) stated that 66% of the milch animal owning households (MAH) are land-less or have small land holdings (Fig. 6.13). The study also found that 55% of thedairy households have a single bovine animal, on an average. The report also statedthat each milch animal owning household in the NDP project area on an average had1.8 adult female animals, which clearly indicates the inclusiveness of the sector.
6.4.1 Inclusiveness in Dairy Co-operatives
In 2018–19, average milk procurement by co-operative milk unions in India was507.7 lakh litres of milk per day against 475.3 lakh litres per day in 2017–18, regis-tering a growth of about 7%. Liquid milk sales went up to 354.5 lakh litres per day,marginally higher than the sales recorded in 2017–18. Women accounted for 30%(5.06 million) of the co-operative membership (as on March 2019) (NDDB 2020).
From a modest beginning of procuring 250 litres of milk daily in 1948, KairaDistrict Co-operative Milk Producers’ Union (Amul) procured around 25 lakh litresper day (LLPD). In 2018, close to 700,000 farmers were members of Kaira unionand 17% of the members were women. Over 80% of the dairy farmers associatedwith Kaira co-operative have on an average less than five animals. Kolhapur ZilaSahakariDudhUpadakSangh (Gokul) procured14LLPDmilk fromclose to 400,000farmers across 5600 villages located mostly in Kolhapur and adjoining districts of
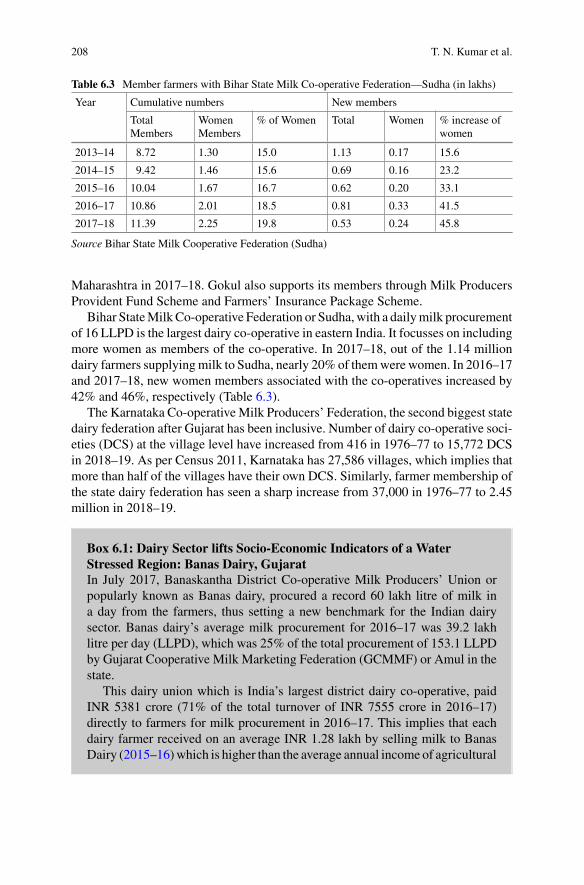
208 T. N. Kumar et al.
Table 6.3 Member farmers with Bihar State Milk Co-operative Federation—Sudha (in lakhs)
Year Cumulative numbers New members
TotalMembers
WomenMembers
% of Women Total Women % increase ofwomen
2013–14 8.72 1.30 15.0 1.13 0.17 15.6
2014–15 9.42 1.46 15.6 0.69 0.16 23.2
2015–16 10.04 1.67 16.7 0.62 0.20 33.1
2016–17 10.86 2.01 18.5 0.81 0.33 41.5
2017–18 11.39 2.25 19.8 0.53 0.24 45.8
Source Bihar State Milk Cooperative Federation (Sudha)
Maharashtra in 2017–18. Gokul also supports its members through Milk ProducersProvident Fund Scheme and Farmers’ Insurance Package Scheme.
Bihar StateMilkCo-operative Federation or Sudha,with a dailymilk procurementof 16 LLPD is the largest dairy co-operative in eastern India. It focusses on includingmore women as members of the co-operative. In 2017–18, out of the 1.14 milliondairy farmers supplyingmilk to Sudha, nearly 20% of themwerewomen. In 2016–17and 2017–18, new women members associated with the co-operatives increased by42% and 46%, respectively (Table 6.3).
The Karnataka Co-operativeMilk Producers’ Federation, the second biggest statedairy federation after Gujarat has been inclusive. Number of dairy co-operative soci-eties (DCS) at the village level have increased from 416 in 1976–77 to 15,772 DCSin 2018–19. As per Census 2011, Karnataka has 27,586 villages, which implies thatmore than half of the villages have their own DCS. Similarly, farmer membership ofthe state dairy federation has seen a sharp increase from 37,000 in 1976–77 to 2.45million in 2018–19.
Box 6.1: Dairy Sector lifts Socio-Economic Indicators of a WaterStressed Region: Banas Dairy, GujaratIn July 2017, Banaskantha District Co-operative Milk Producers’ Union orpopularly known as Banas dairy, procured a record 60 lakh litre of milk ina day from the farmers, thus setting a new benchmark for the Indian dairysector. Banas dairy’s average milk procurement for 2016–17 was 39.2 lakhlitre per day (LLPD), which was 25% of the total procurement of 153.1 LLPDby Gujarat Cooperative Milk Marketing Federation (GCMMF) or Amul in thestate.
This dairy union which is India’s largest district dairy co-operative, paidINR 5381 crore (71% of the total turnover of INR 7555 crore in 2016–17)directly to farmers for milk procurement in 2016–17. This implies that eachdairy farmer received on an average INR 1.28 lakh by selling milk to BanasDairy (2015–16)which is higher than the average annual income of agricultural
6 Dairy Value Chain 209
households (from four sources—agriculture, livestock, non-farm sector andwages and salaries) in the country at INR 8931 per month (INR 1.07 lakhannually) (NABARD 2018).
Dairying is the best livelihood option for the farmers inBanaskantha district,which is a water-stressed region. Average annual rainfall received in the districtis around 600 mm. Out of the total geographical area of district, about 47%of area is irrigated. The value of output of livestock products is considerablyhigher in arid and semi-arid areas like Banaskantha. The large number ofrural women find good opportunities to work in several operations of animalhusbandry (Government of Gujarat 2016).
The Banas dairy also provides cattle feed and round the clock veterinaryservices at subsidized rates to their farmer members. This implies that about80% of their sales income goes back to farmers as price for milk procurementand cost of additional services provided by the dairy. In 2018–19, around 4.2lakh dairy farmers poured milk into Banas dairy procurement system. Out of3.5 lakh registered farmers with village level societies or DCS of Banas dairy,1.2 lakh farmers are women. In most households, though men are registered asmembers, women look after most of the work related to dairying. With 1200Bulk Milk Chilling Units (BMCs) located across 1400 village-level dairy co-operative societies (DCS) in Banaskantha district, women engaged in dairy donot need to travel far to pour milk.
Majority of the farmers affiliated to Banas dairy own 2–5 animals on anaverage, thus providing vital supplementary income, especially when rainfallis deficient. Given the inclusive nature of Banas Dairy, it procures the entirequantity of milk brought to it by its member farmers or non member farmers.
6.4.2 Inclusiveness in Private and MNC Dairies
In case of organized private dairy companies,milk is procured either directly from thefarmers or through contractors, collection agents, service providers, or aggregatorsand transported to the nearest processing plants. A leading private dairy companyin Maharashtra procures about 13 LLPD milk from farmers mostly in and aroundPune district. The company undertakes direct milk procurement through its owninfrastructure network—Dudh Sankalan Kendras. The company procures aroundhalf of its milk requirement through bulk suppliers or contractors. A leadingMNC inPunjab procures around 8 LLPD milk from 80,000 small farmers (those who supply150 L or less milk daily) including 60,000 women farmers and around 2000 largefarmers mostly from one district in Punjab. The company also provides veterinary
210 T. N. Kumar et al.
services and feed at reasonable prices.More than 47%of themilk procured is sourcedfrom large farmers. The company provides incentives of about 8% over themilk priceto small farmers,who supplymore than 500Lofmilk, daily. For ensuring qualitymilkprocurement, the company has been focusing on large farmers and is non-inclusivein its approach. For large farmers, the company has installed bulk milk cooler at theirdoorsteps. The volume of milk procurement is based on demand and the companyhas not expanded its procurement operations extensively.
6.5 Sustainability
Dairy value chain has been studied with respect to its financial as well as environ-mental sustainability. While financial sustainability focuses on financial viability ofthe co-operative sector, environmental sustainability focuses on issues such as waterfootprint in dairy sector, availability of fodder and challenges of dealing with largelivestock population.
6.5.1 Financial Sustainability
Financial viability of dairy co-operatives is one of the key challenges.As per annual accounts and financial information from 175 co-operative milk
unions (out of 210) for the year 2013–14, 95 co-operative milk unions had accumu-lated net losses, of which 55 and 14 loss making unions were fromUttar Pradesh andTamil Nadu, respectively. The remaining 80 milk unions had reported net profits.If we take into account the support received from state and central governments bythese co-operatives, (the data is not available), the number of co-operatives makingprofits may be much less (Lok Sabha 2015).
There has been no visible attempt to restructure these co-operatives to makethem efficient and accountable farmers’ organizations as envisaged during OperationFlood. This has led to the collapse of the dairy co-operative sector in states like UttarPradesh. Successful co-operatives like GCMMF (Amul) forayed into other states,but not in the Anand pattern. Since farmers outside Gujarat cannot be members ofGCMMF, they do not get any bonus and they cannot be elected to the Board. Theseco-operatives become benevolent private sector entities in other states, unless theyare declared multi-state co-operatives.
6.5.2 Environmental Sustainability
The availability of adequate quality and quantity of feed and fodder is crucial forsustaining and improving the productivity of livestock. One of the major reasons
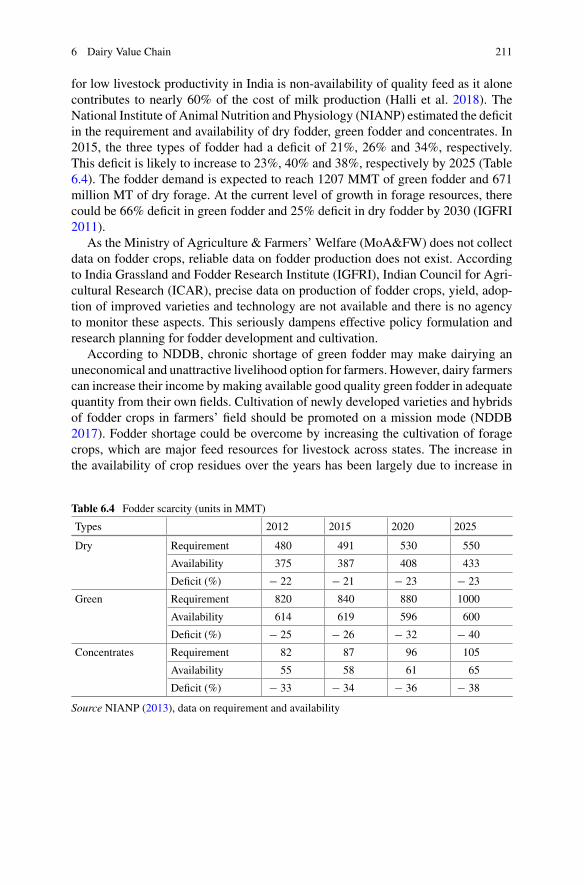
6 Dairy Value Chain 211
for low livestock productivity in India is non-availability of quality feed as it alonecontributes to nearly 60% of the cost of milk production (Halli et al. 2018). TheNational Institute of Animal Nutrition and Physiology (NIANP) estimated the deficitin the requirement and availability of dry fodder, green fodder and concentrates. In2015, the three types of fodder had a deficit of 21%, 26% and 34%, respectively.This deficit is likely to increase to 23%, 40% and 38%, respectively by 2025 (Table6.4). The fodder demand is expected to reach 1207 MMT of green fodder and 671million MT of dry forage. At the current level of growth in forage resources, therecould be 66% deficit in green fodder and 25% deficit in dry fodder by 2030 (IGFRI2011).
As the Ministry of Agriculture & Farmers’ Welfare (MoA&FW) does not collectdata on fodder crops, reliable data on fodder production does not exist. Accordingto India Grassland and Fodder Research Institute (IGFRI), Indian Council for Agri-cultural Research (ICAR), precise data on production of fodder crops, yield, adop-tion of improved varieties and technology are not available and there is no agencyto monitor these aspects. This seriously dampens effective policy formulation andresearch planning for fodder development and cultivation.
According to NDDB, chronic shortage of green fodder may make dairying anuneconomical and unattractive livelihood option for farmers. However, dairy farmerscan increase their income by making available good quality green fodder in adequatequantity from their own fields. Cultivation of newly developed varieties and hybridsof fodder crops in farmers’ field should be promoted on a mission mode (NDDB2017). Fodder shortage could be overcome by increasing the cultivation of foragecrops, which are major feed resources for livestock across states. The increase inthe availability of crop residues over the years has been largely due to increase in
Table 6.4 Fodder scarcity (units in MMT)
Types 2012 2015 2020 2025
Dry Requirement 480 491 530 550
Availability 375 387 408 433
Deficit (%) − 22 − 21 − 23 − 23
Green Requirement 820 840 880 1000
Availability 614 619 596 600
Deficit (%) − 25 − 26 − 32 − 40
Concentrates Requirement 82 87 96 105
Availability 55 58 61 65
Deficit (%) − 33 − 34 − 36 − 38
Source NIANP (2013), data on requirement and availability
212 T. N. Kumar et al.
production of paddy, wheat and other crops. There is a need to strengthen location-specific technologies for forage production, forage cropping systems and other land-use strategies to achieve higher production of fodder. There is also a need to identifysuitable varieties or cropping system to match the changing climate scenario.
Ecological SustainabilityLike other ruminants, buffaloes, sheep, goats and cows excrete substantial quantitiesofmethane, a greenhouse gas (GHG). India’s livestock farming is a significant anthro-pogenic source of methane (CH4) in the world. According to a study by NationalInstitute of Animal Nutrition and Physiology (NIANP), ICAR, while India accountsfor around 15% of global livestock population, its contribution to global methaneemissions is around 10.6%. The major chunk of Indian livestock rearing is based onopen grazing and straying on forestlands, community land, among others. The GHGnamely, methane (CH4) and nitrous oxide (N2O) are emitted by livestock throughenteric fermentation and manure (animal wastes) management. All livestock andpoultry contribute to GHG emissions, through N2O and CH4 from manure, nitrogenfromurine and feces (IPCC2007). In 2016, agriculture contributed 14%of total GHGemissions. Within agriculture, livestock sector (enteric fermentation) accounted for54.6% of GHG emissions of which buffalo and indigenous cattle accounting for40.2% and 36.4% respectively, followed by cross-bred cattle at 15.8% and rest at7.6% respectively (MoEFCC 2021).
India does not have legally binding emission reduction commitments with regardto reducing GHG. However, in its Intended Nationally Determined Contributions(INDC) submitted to UNFCCC in October 2015, India has volunteered to reduceemission intensity by (33–35)% by 2030 from 2005 level. India in its submissionto the UNFCCC, 2018 stated that there exists a potential for increasing produc-tion levels by addressing the problem of imbalanced nutrition with existing feedand animal resources. In its submission, India also stated that optimum feeding ofanimals through Ration Balancing Program (RBP) helps to enhance milk productioncommensurate with the genetic potential of the animals (UNFCC 2018). The RBPimplemented during 2012–2019, resulted in reduction of average cost of feeding perkg of milk by more than 10% and a reduction in enteric methane emission by 13.7%per kg of milk in lactating cows and buffaloes (World Bank 2020). RBP covered 2.86million milch animals in 33,374 villages across 18 states. If the program is extendedto all milch animals, there could be a substantive reduction in costs, GHG emissionsand fodder requirements.
Despite the huge increase in milk production, about 37% of the growth has beendue to increase in productivity of animals implying that the increase in the numberof livestock is the dominant source of growth in milk output. Such growth rate inmilk production driven by increase in number of livestock is not sustainable (Chand2017). India, with large cattle population along with low productivity faces chal-lenges in terms of curbing GHG emissions and rendering dairying environmentallysustainable.
6 Dairy Value Chain 213
Water Use IntensityDairy farming is a water-intensive activity as large amount of water is required forcultivation of forage crops, concentrate feed ingredients as well as to cater to thedrinking and cleaning requirements of animals. With the demand as well as supplyfor milk rising steadily, the water intensity of the sector remains an area of concernfrom the sustainability aspect of dairy value chain.
NDDB study on water foot prints of milk production states that the average waterfoot print of milk from indigenous cows, cross-bred cows and buffaloes in Gujaratwas 1970 and 1820 cubic meter1 (m3) per tonne, respectively. The study revealed thatfeeding animals in the traditional pattern led to a higher water footprint. In contrast,animals fed on a balanced ration, comprising a judicious mix of green fodder, dryfodder and concentrate feed ingredients, led to 14% lower2 water foot print from1236 to 1062 litre/Kg (NDDB 2020). NDDB and other government agencies haveto map water foot print of dairy sector extensively for formulating future strategywhich would ensure sustainable use of water.
6.6 Scalability
The Operation Flood helped quality milk reach consumers across 700 towns andcities through a National Milk Grid. The program also helped remove the needfor middlemen thereby reducing the seasonal price variations. Because of the co-operative structure, production and distribution of milk and milk products becameeconomically viable for farmers to undertake themselves. However, OF did notimpact dairy development evenly across the country. Especially in eastern and north-eastern regions, dairy co-operatives could not expand their procurement operationswith the exception of Bihar State Milk Co-operative Federation or Sudha, whichachieved limited success. Also, the per capita availability of milk remains far belowthe national average in the eastern and north-eastern states. Despite substantialsupport by the government, scaling up the co-operatives post OF in many statesseem unsustainable. The scaling up in these regions have to come from the privatesector.
Private sector organized dairies have expanded their base across states like UttarPradesh, Maharashtra, Tamil Nadu and Gujarat. Highest concentration of privatedairy units is in Uttar Pradesh and Maharashtra, accounting for half of the totaldairy plants in the country (Dairy India 2017). The future scaling of dairy processingwould be driven by the private sector. Keeping in mind the increasing role of privatesector in milk processing, the government had announced INR 15,000 crores Animal
1 One cubic meter is equal to 1000 L. Water foot print of milk is defined as the sum of the volumeof fresh water consumed in different steps of milk production chain, measured in units of waterconsumed (Litre per Kg of milk).2 https://www.nddb.coop/services/animalnutrition/climate-smart-dairying/water-footprint-of-milk.
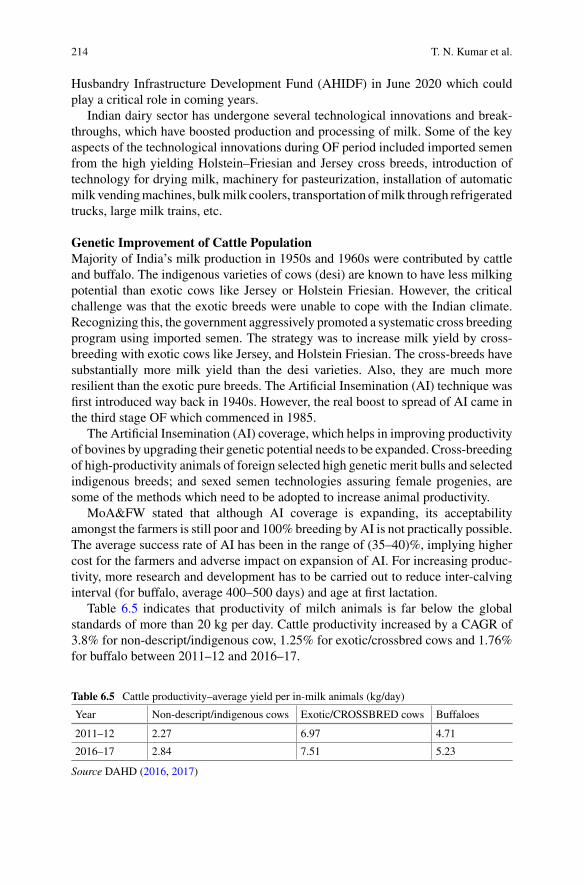
214 T. N. Kumar et al.
Husbandry Infrastructure Development Fund (AHIDF) in June 2020 which couldplay a critical role in coming years.
Indian dairy sector has undergone several technological innovations and break-throughs, which have boosted production and processing of milk. Some of the keyaspects of the technological innovations during OF period included imported semenfrom the high yielding Holstein–Friesian and Jersey cross breeds, introduction oftechnology for drying milk, machinery for pasteurization, installation of automaticmilk vendingmachines, bulkmilk coolers, transportation ofmilk through refrigeratedtrucks, large milk trains, etc.
Genetic Improvement of Cattle PopulationMajority of India’s milk production in 1950s and 1960s were contributed by cattleand buffalo. The indigenous varieties of cows (desi) are known to have less milkingpotential than exotic cows like Jersey or Holstein Friesian. However, the criticalchallenge was that the exotic breeds were unable to cope with the Indian climate.Recognizing this, the government aggressively promoted a systematic cross breedingprogram using imported semen. The strategy was to increase milk yield by cross-breeding with exotic cows like Jersey, and Holstein Friesian. The cross-breeds havesubstantially more milk yield than the desi varieties. Also, they are much moreresilient than the exotic pure breeds. The Artificial Insemination (AI) technique wasfirst introduced way back in 1940s. However, the real boost to spread of AI came inthe third stage OF which commenced in 1985.
The Artificial Insemination (AI) coverage, which helps in improving productivityof bovines by upgrading their genetic potential needs to be expanded. Cross-breedingof high-productivity animals of foreign selected high genetic merit bulls and selectedindigenous breeds; and sexed semen technologies assuring female progenies, aresome of the methods which need to be adopted to increase animal productivity.
MoA&FW stated that although AI coverage is expanding, its acceptabilityamongst the farmers is still poor and 100% breeding by AI is not practically possible.The average success rate of AI has been in the range of (35–40)%, implying highercost for the farmers and adverse impact on expansion of AI. For increasing produc-tivity, more research and development has to be carried out to reduce inter-calvinginterval (for buffalo, average 400–500 days) and age at first lactation.
Table 6.5 indicates that productivity of milch animals is far below the globalstandards of more than 20 kg per day. Cattle productivity increased by a CAGR of3.8% for non-descript/indigenous cow, 1.25% for exotic/crossbred cows and 1.76%for buffalo between 2011–12 and 2016–17.
Table 6.5 Cattle productivity–average yield per in-milk animals (kg/day)
Year Non-descript/indigenous cows Exotic/CROSSBRED cows Buffaloes
2011–12 2.27 6.97 4.71
2016–17 2.84 7.51 5.23
Source DAHD (2016, 2017)
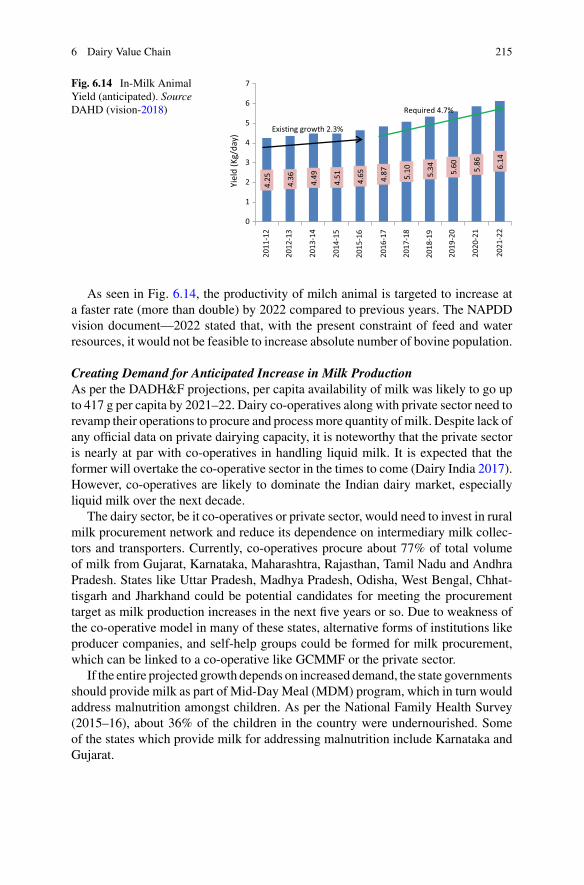
6 Dairy Value Chain 215
Fig. 6.14 In-Milk AnimalYield (anticipated). SourceDAHD (vision-2018)
4.25 4.36 4.49
4.51 4.65 4.87 5.10 5.34 5.60 5.86 6.14
0
1
2
3
4
5
6
7
Yiel
d (K
g/da
y)
2011
-12
2012
-13
2013
-14
2014
-15
2015
-16
2016
-17
2017
-18
2018
-19
2019
-20
2020
-21
2021
-22
Existing growth 2.3%
Required 4.7%
As seen in Fig. 6.14, the productivity of milch animal is targeted to increase ata faster rate (more than double) by 2022 compared to previous years. The NAPDDvision document—2022 stated that, with the present constraint of feed and waterresources, it would not be feasible to increase absolute number of bovine population.
Creating Demand for Anticipated Increase in Milk ProductionAs per the DADH&F projections, per capita availability of milk was likely to go upto 417 g per capita by 2021–22. Dairy co-operatives along with private sector need torevamp their operations to procure and processmore quantity ofmilk. Despite lack ofany official data on private dairying capacity, it is noteworthy that the private sectoris nearly at par with co-operatives in handling liquid milk. It is expected that theformer will overtake the co-operative sector in the times to come (Dairy India 2017).However, co-operatives are likely to dominate the Indian dairy market, especiallyliquid milk over the next decade.
The dairy sector, be it co-operatives or private sector, would need to invest in ruralmilk procurement network and reduce its dependence on intermediary milk collec-tors and transporters. Currently, co-operatives procure about 77% of total volumeof milk from Gujarat, Karnataka, Maharashtra, Rajasthan, Tamil Nadu and AndhraPradesh. States like Uttar Pradesh, Madhya Pradesh, Odisha, West Bengal, Chhat-tisgarh and Jharkhand could be potential candidates for meeting the procurementtarget as milk production increases in the next five years or so. Due to weakness ofthe co-operative model in many of these states, alternative forms of institutions likeproducer companies, and self-help groups could be formed for milk procurement,which can be linked to a co-operative like GCMMF or the private sector.
If the entire projected growth depends on increased demand, the state governmentsshould provide milk as part of Mid-DayMeal (MDM) program, which in turn wouldaddress malnutrition amongst children. As per the National Family Health Survey(2015–16), about 36% of the children in the country were undernourished. Someof the states which provide milk for addressing malnutrition include Karnataka andGujarat.
216 T. N. Kumar et al.
• Under the Karnataka’s Ksheera Bhagya scheme launched in 2013, more than 10million children get 150 ml of flavoured milk, five days a week, across all theanganwadis and government schools. The milk powder (SMP) for the schemeis provided by Karnataka Milk Federation (KMF), the country’s second-biggestmilk co-operative after GCMMF (Amul). Ksheera Bhagya was launched mainlyto fightmalnutrition amongst children and also allowKMF to dispose their surplusmilk.
• The Doodh Sanjeevani Yojana launched by Gujarat government in 2006–07provides 200 ml fortified milk to primary school children in the tribal talukasas part of their Mid-Day Meal (MDM) program. The focus of the program was toprevent dropouts from schools and ensure nutrition of the students. At present, theprogram covers more than 7.5 lakh students in 4700 primary schools. Pre-packedmilk to children and women through programs such as Integrated Child Devel-opment Services (ICDS) or MDM scheme would meet twin goals of tacklingmalnutrition as well as creating demand for surplus milk.
Through the Corporate Social Responsibility (CSR) initiatives like NDDB Foun-dation for Nutrition (NFN)’sGiftmilk program, demand for milk could be generated.Giftmilk, jointly promoted by NDDB and its subsidiaries (Indian ImmunologicalLimited, IDMC Limited, and Mother Dairy Fruit & Vegetables Private Limited) andGCMMF supplies and distributes flavoured milk to about 3500 underprivileged chil-dren (200/150 ml servings per day) in selected schools in Gujarat, Telangana andDelhi.
6.7 Access to Finance
The financing pattern of dairy value chain was analyzed taking into account themain stakeholders in the process—farmers or producers, entrepreneurs, dairy compa-nies, co-operatives and retailers operating in the production, procurement, processingand marketing of milk and milk products. Primary field study shows that at dairyfarmer level, there are no specific schemes for buying new cattle. However, there areprograms for financing small dairy units and both public and private banks provideloans to purchase milch animals.
6.7.1 Existing Financial Channels
Across the country, financing initiatives for dairy value chain being implementedinclude Dairy Processing and Infrastructure Development Fund (DIDF), DairyEntrepreneurship Development Scheme (DEDS), Animal Husbandry Infrastructure
6 Dairy Value Chain 217
Development Fund (AHIDF), NDDBTermLoans,Working Capital Finance Schemefor Dairy Co-operatives and the Ministry of Food Processing Industries sponsoredCold Chain scheme. The National Co-operative Development Corporation (NCDC)under MoA&FW also provides financing to dairy co-operatives. At the farmer level,programs such asPradhanMantriMudraYojana (PMMY),KisanCreditCards (KCC)for dairy farmers and financing by banks for setting up small dairy units are some ofthe existing channels of finance.
Dairy Processing and Infrastructure Development Fund (DIDF)In the Union budget 2017–18, the central government announced setting up ofthe Dairy Processing and Infrastructure Development Fund (DIDF) to upgrade andmodernize existing infrastructure for milk production and processing for dairy co-operatives—milk unions, state dairy federations, multi-statemilk co-operatives, milkproducer companies and NDDB subsidiaries. Since the dairy co-operatives generallypass on the maximum share of sales realization (usually between (75–80)% of theconsumer rupee) to the milk producers as well as ensure supply of milk at affordableprices to the consumers, they have lower financial resources to invest in setting upinfrastructure for increasing milk processing (NDDB no.date.).
The fundwhich was initially operational from 2017–18 to 2019–20with an outlayof INR 10,881 crore (NABARD loan of INR 8004 crore and borrowers’ contributionof INR2001 crore) has been extended until 2022–23. As on July 31, 2020, 37 projectsacross 11 states including Karnataka, Maharashtra, Punjab, and Haryana, worth INR1073 crore have been sanctioned underDIDF.NABARDalso raises fund frommarketand provides the same to NDDB or NCDC, which further provide loans at an annualinterest rate of 6.5% to borrowers with a repayment period spanning 10 years withinitial two years moratorium (Lok Sabha 2020). The concerned state governmentsare required to guarantee loan repayment.
The fund is being used by co-operatives for modernization and creation of milkprocessing facilities, creation of village-level chilling infrastructure and installationof bulk milk coolers (BMCs). DIDF aims to help more than 9.5 million farmers bycreating additional milk processing capacity of 12.6 million litres per day. It alsoaims at installation of 28,000 bulk milk cooling (BMCs) along with electronic milkadulteration testing equipment and value-added products manufacturing capacity of5.9 million litres per day.
Dairy Entrepreneurship Development Scheme (DEDS)DAHD has been implementing Dairy Entrepreneurship Development Scheme(DEDS) through NABARD since September 2010. The scheme provides capitalsubsidy of 25% (on loan amount) for general category beneficiaries and 33.33% for
218 T. N. Kumar et al.
SC/ST beneficiaries for purchase of cattle apart from other dairy activities. Under thescheme, the cost of amaximum10 animals is fixed at INR 6Lakh. Loans are providedunder DEDS for purchase of milking machines, other dairy processing equipment,cold storage facilities, dairy marketing outlets, etc. Rate of interest charged for theloan extended is as per RBI guideline (base rate) and the policy of the concernedbanks. Until May 2019, INR 1310 crore had been disbursed to around 3.2 lakhbeneficiaries.3 However, DEDS had been discontinued since August, 2020 (DAHD2020).
Inclusion of Dairy Farmers under Kisan Credit Cards SchemeFor meeting the working capital requirement of dairy farmers, central government inthe Union Budget 2018–19 announced the extension of Kisan Credit Cards (KCCs)to fisheries and animal husbandry farmers. A special drive had been undertaken byDAHD to provide KCCs to all dairy farmers associated with co-operatives and milkproducer companies. DAHD has been aiming to provide KCC to around 1.5 croredairy farmers associated with 230 milk unions in the country. As on 22nd December2020, milk unions collected 5.1 million applications of dairy farmers and forwarded4.14 million applications to the banks (PIB 2020).
Those who have KCCs, get agriculture credit at a reduced interest rate of 7% perannum while MoA&FW implements an interest subvention scheme for short termcrop loans up to INR 300,000. Under the subvention scheme, additional subventionof 3% is given to those farmers who repay their short-term crop loan on time, thusreducing the effective rate of interest to only 4% per annum. All farmers who owncultivable land, tenant farmers, share croppers and SHGs of farmers are eligible toavail credit under KCCs.
Animal Husbandry Infrastructure Development Fund (AHIDF)In June 2020, while announcing Atma Nirbhar Bharat Abhiyan stimulus package fordealing with the adverse impact of Covid 19 on the economy, the Cabinet Committeeon Economic Affairs approved Animal Husbandry Infrastructure Development Fund(AHIDF) worth INR 15,000 crores. The aim of this fund was to incentivize invest-ment in infrastructure development for the private sector engaged in dairy and meatprocessing. The eligible beneficiaries under AHIDF include farmer producer orga-nizations, medium and small enterprises, private companies and entrepreneurs, whowould contribute a minimum 10% margin money while balance 90% would be loancomponent from the scheduled banks. The government will provide 3% interestsubvention for loans under AHIDF, two years moratorium period for principal loanamount and six-year repayment period thereafter.As on22ndDecember 2020, projectloans worth INR 150 crores under AHIDF has been sanctioned by the banks (PIB2020).
3 Data provided by NABARD official, in May, 2019.
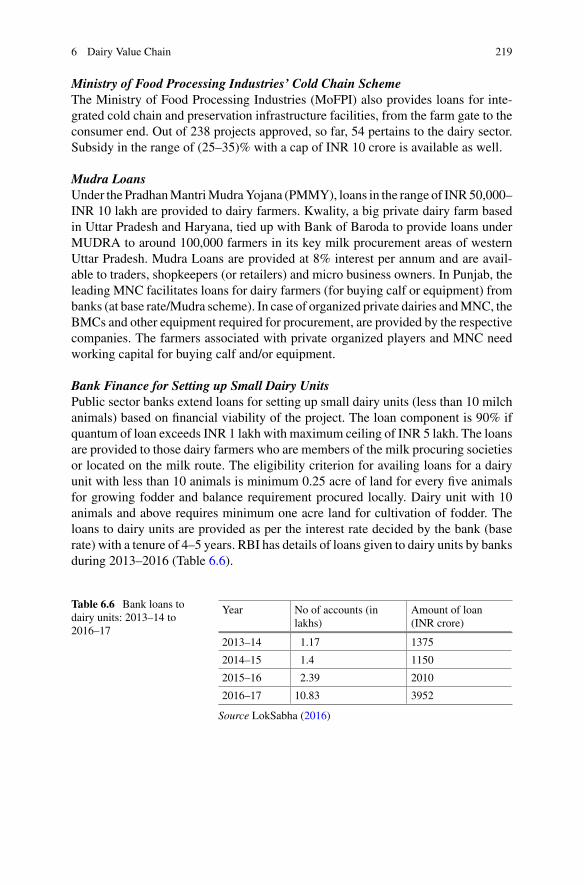
6 Dairy Value Chain 219
Ministry of Food Processing Industries’ Cold Chain SchemeThe Ministry of Food Processing Industries (MoFPI) also provides loans for inte-grated cold chain and preservation infrastructure facilities, from the farm gate to theconsumer end. Out of 238 projects approved, so far, 54 pertains to the dairy sector.Subsidy in the range of (25–35)% with a cap of INR 10 crore is available as well.
Mudra LoansUnder the PradhanMantriMudraYojana (PMMY), loans in the range of INR50,000–INR 10 lakh are provided to dairy farmers. Kwality, a big private dairy farm basedin Uttar Pradesh and Haryana, tied up with Bank of Baroda to provide loans underMUDRA to around 100,000 farmers in its key milk procurement areas of westernUttar Pradesh. Mudra Loans are provided at 8% interest per annum and are avail-able to traders, shopkeepers (or retailers) and micro business owners. In Punjab, theleading MNC facilitates loans for dairy farmers (for buying calf or equipment) frombanks (at base rate/Mudra scheme). In case of organized private dairies andMNC, theBMCs and other equipment required for procurement, are provided by the respectivecompanies. The farmers associated with private organized players and MNC needworking capital for buying calf and/or equipment.
Bank Finance for Setting up Small Dairy UnitsPublic sector banks extend loans for setting up small dairy units (less than 10 milchanimals) based on financial viability of the project. The loan component is 90% ifquantum of loan exceeds INR 1 lakh with maximum ceiling of INR 5 lakh. The loansare provided to those dairy farmers who are members of the milk procuring societiesor located on the milk route. The eligibility criterion for availing loans for a dairyunit with less than 10 animals is minimum 0.25 acre of land for every five animalsfor growing fodder and balance requirement procured locally. Dairy unit with 10animals and above requires minimum one acre land for cultivation of fodder. Theloans to dairy units are provided as per the interest rate decided by the bank (baserate) with a tenure of 4–5 years. RBI has details of loans given to dairy units by banksduring 2013–2016 (Table 6.6).
Table 6.6 Bank loans todairy units: 2013–14 to2016–17
Year No of accounts (inlakhs)
Amount of loan(INR crore)
2013–14 1.17 1375
2014–15 1.4 1150
2015–16 2.39 2010
2016–17 10.83 3952
Source LokSabha (2016)
220 T. N. Kumar et al.
Financing Opportunities at Retail LevelWith the growth and expansion of the dairy sector, there would be increasing oppor-tunities of financing at the retail levels. The biggest dairy co-operative—GCMMFor Amul has 10 lakh retailers and 10,000 dealers across the country. Therefore,combined financing opportunities at the retail level for dairy industry would be largefor financial institutions.
6.7.2 Key Financing Sources for Dairy Co-operatives
In this section, financing aspect of key dairy co-operatives—Banaskantha or Banasdairy (Gujarat), Sudha (Bihar State Milk Cooperative Federation) and Gokul(Kolhapur Zilla Sahakari Dudh Utpadak Sangh, Maharashtra) have been studied.
Banas Dairy: In 2018–19, leveraging its volume and financial capabilities, BanasDairy accessed loans from leading private sector banks at competitive rates forenhancing its processing capacity (INR 150 crores for a processing plant at a rateof interest of 6.5% per annum). It availed loan from NCDC at an interest rate of8%, while loans availed with support from NDDB via State Bank of India (INR 318crores) at an interest rate of 8.3%. Access to finance for meeting working capitalrequirements like cattle or equipment is not adequate. Farmers have been accessingfinances from informal sources at interest rates up to (25–30)% per annum or availingpersonal loan (at 10% interest per annum) from public sector banks. About 1200 outof 1400 DCSs have BMCs which cool the milk to 4 degree Celsius before it is trans-ported to processing units. Banas dairy provides loans to DCSs for setting up BMCsat an annual interest rate of 9%. There is a subsidy under the World Bank aidedNational Dairy Plan for setting up BMCs.
Sudha Dairy: In case of Bihar State Milk Cooperative Federation or Sudha, financefor expansion of processing capacity has been carried out throughNCDC loansworthINR 573 crores which were sanctioned in 2014 at the prevailing annual interest rateof 12.75%. This was brought down to 10.9% in 2018. The Bihar dairy federation hasavailed INR 225 crores loans so far for the six projects out of which 25% of the loanamount is subsidized, thus effectively bringing down the cost of financing further.
Gokul Dairy: The financing of the Maharashtra’s biggest dairy co-operative union’s(Kolhapur Zilla Sahakari Dudh Utpadak Sangh) operations are met through loanfrom NDDB and other government supported schemes. However, at the groundlevel, dairy farmers access loans from both public and private sector banks with theinterest rate ranging from (12–13)% annum for the purchase of cattle.4
4 Based on personal interactions with officials of Gokul as well as farmers.
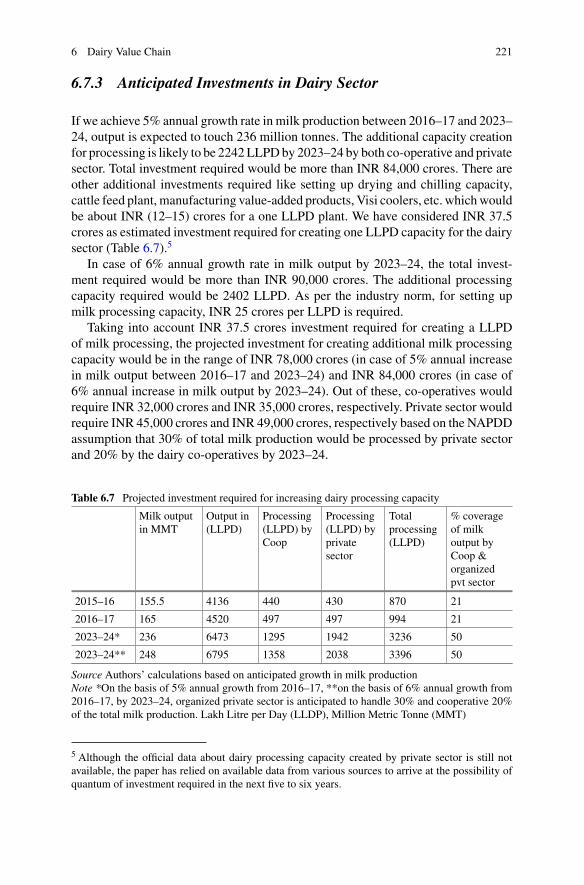
6 Dairy Value Chain 221
6.7.3 Anticipated Investments in Dairy Sector
If we achieve 5% annual growth rate in milk production between 2016–17 and 2023–24, output is expected to touch 236 million tonnes. The additional capacity creationfor processing is likely to be 2242LLPDby 2023–24 by both co-operative and privatesector. Total investment required would be more than INR 84,000 crores. There areother additional investments required like setting up drying and chilling capacity,cattle feed plant, manufacturing value-added products, Visi coolers, etc. whichwouldbe about INR (12–15) crores for a one LLPD plant. We have considered INR 37.5crores as estimated investment required for creating one LLPD capacity for the dairysector (Table 6.7).5
In case of 6% annual growth rate in milk output by 2023–24, the total invest-ment required would be more than INR 90,000 crores. The additional processingcapacity required would be 2402 LLPD. As per the industry norm, for setting upmilk processing capacity, INR 25 crores per LLPD is required.
Taking into account INR 37.5 crores investment required for creating a LLPDof milk processing, the projected investment for creating additional milk processingcapacity would be in the range of INR 78,000 crores (in case of 5% annual increasein milk output between 2016–17 and 2023–24) and INR 84,000 crores (in case of6% annual increase in milk output by 2023–24). Out of these, co-operatives wouldrequire INR 32,000 crores and INR 35,000 crores, respectively. Private sector wouldrequire INR 45,000 crores and INR 49,000 crores, respectively based on the NAPDDassumption that 30% of total milk production would be processed by private sectorand 20% by the dairy co-operatives by 2023–24.
Table 6.7 Projected investment required for increasing dairy processing capacity
Milk outputin MMT
Output in(LLPD)
Processing(LLPD) byCoop
Processing(LLPD) byprivatesector
Totalprocessing(LLPD)
% coverageof milkoutput byCoop &organizedpvt sector
2015–16 155.5 4136 440 430 870 21
2016–17 165 4520 497 497 994 21
2023–24* 236 6473 1295 1942 3236 50
2023–24** 248 6795 1358 2038 3396 50
Source Authors’ calculations based on anticipated growth in milk productionNote *On the basis of 5% annual growth from 2016–17, **on the basis of 6% annual growth from2016–17, by 2023–24, organized private sector is anticipated to handle 30% and cooperative 20%of the total milk production. Lakh Litre per Day (LLDP), Million Metric Tonne (MMT)
5 Although the official data about dairy processing capacity created by private sector is still notavailable, the paper has relied on available data from various sources to arrive at the possibility ofquantum of investment required in the next five to six years.
222 T. N. Kumar et al.
The DIDF and financing schemes of NDDB and NCDC would meet around halfof the amount required. Under DIDF, INR 10,800 crores is available to co-operativesfor creating additional processing capacity of 126 LLPD by 2019–20. Significantopportunity for the financial institution exists in the dairy sector as domestic demandfor processed products increase in the next few years. Animal Husbandry Infrastruc-ture Development Fund (AHIDF) worth INR 15,000 crores launched in June, 2020is being used by private sector. If NAPDD’s target of achieving 300 million tonnesof milk production by 2023–24 is to be achieved, the requirement for funds wouldbe much more.
Significant financing opportunity by the financial institutions exists in the dairysector as domestic demand for processed products increase in the next few years.While a portion of financing would come from DIDF, the rest of the finance or creditwould have to be met by various channels such as banks loans, bonds, etc.
6.7.4 Need for Finance at Reasonable Rate for Dairy Farmers
During the field visits, we found that inMaharashtra, village-level dairy co-operativesocieties (multiple societies at village level) are providing loans (INR 30,000) tofarmers to buy new calf at 9% rate of interest. Banks (public, private and co-operative)in Maharashtra are providing loans to dairy farmers at an interest rate ranging from(12–13)% per annum for a tenure of 3–5 years. Through interaction with farmers,we found that there are additional charges or cost of processing of the loans availedby the dairy farmers. On a loan of INR 10 lakh from a public sector bank for atenure of 3–5 years, the additional charges (about 5% of loan amount) include—mortgage fee (INR 15,000), application processing charges (INR 2500), registrationfee (INR 8000) and premium towards the term insurance (INR 30,000). This is wherethe cost of finance for the dairy farmers can be reduced by providing soft loansand handholding support provided by co-operatives and private sector on timelyprocurement of milk from the farmers.
6.8 Conclusion and Policy Recommendations
Following are the key recommendations to make the dairy value chain in India morecompetitive, inclusive, sustainable, and scalable with adequate access to finance.
1. Limited export opportunities for SMP exist for the private sector in SouthAsian countries, which needs to be encouraged. Particularly states like UttarPradesh should explore such opportunities. However, growth of the Indiandairy sector cannot be achieved from export competitiveness in SMP alone as
6 Dairy Value Chain 223
it is only a residual product. The dairy sector would need to focus on high-value dairy products for exports to specific markets of South Asia and Gulfcountries.
2. The key challenge is to include more women in actual functioning of co-operatives through greater representation in the board of dairy co-operatives.At present, less than 3% of the members of the board of the dairy co-operativesare women, although they constitute 18% of the membership.
3. There is a need for strengthening technologies for forage production, croppingsystems and other land-use strategies for ensuring sustainable growth of thedairy sector.
4. Another critical challenge the dairy sector is likely to face over the next fewyears pertains to impact of climate change which may pull down growth inmilk output in the country. Milk production may get hit following an averagerise in temperature which would create scarcity of water and dry fodder forthe cattle. A strategy needs to be developed to deal with the situation arisingout of climate variability.
5. Advanced herd management needs to be promoted for maintaining andimproving the genetic potential of the cattle.
6. The government agencies need to conduct extensive study on the water footprint of dairy sector for formulating future strategy keeping in mind water useefficiency of the sector.
7. Dairy co-operatives need to be treated as private enterprises of farmers andfreed from any government imposed controls. For ensuring transparency andaccountability, the government should ensure that co-operatives’ financialresults are disclosed in public.
8. The future growth in milk production should be driven by increasing yieldper cattle. There has to be an acceptable solution for disposal of male cattlenot wanted by farmers. Use of frontier technologies like sex-sorted semen,genomic selection of high merit animals, embryo transfer, data collection andanalytics need to be promoted on priority.
9. The co-operatives need to expand their base in states including Uttar Pradesh,Madhya Pradesh, Odisha, West Bengal, Chhattisgarh and Jharkhand formeeting the procurement target, as milk production increases.
10. The central government could consider providing vitamin-enriched milk tothe 100 million children currently covered under Mid-Day Meal (MDM) forboosting demand for milk. Compared to huge annual food subsidy budget, thecost of providing milk under MDM would be much smaller.
11. The financial institutions must provide working capital assistance to dairyfarmers at reasonable rates. In the absence of institutional financing struc-ture at the ground level, dairy farmers are forced to seek credit from theinformal sources at much higher interest rates. Provision of specific windowsfor accessing credit for purchase of animals need to be made. Kisan CreditCards to dairy farmers would help farmers in meeting their working capitalrequirements.
224 T. N. Kumar et al.
12. Expansion andmodernization ofmilk processing facilitieswould need substan-tial investments. Since amajor portion of this has to be carried out by the privatesector, a financing mechanism at par with co-operatives will have to be set upto ensure that dairy farmers in areas not covered by the co-operatives have theopportunity to enhance their incomes, significantly.
References
APEDA (2019) Agriexchange database. Available at http://agriexchange.apeda.gov.in/. Last accessdate 20th August 2019
Banas Dairy (2015–16) Banas dairy annual report 2016–17. Banaskantha District Co-operativeMilk Producers’ Union Ltd., Palanpur, Banaskantha
Chand R (2017) NITI Aayog, Strategy paper for Doubling Farmers’ income goal of the government,2017
Dairy India (2017) Dairy India yearbook. In: Gupta PR (2017). Dairy India, 7th edn. Dairy IndiaYearbook, New Delhi
DAHD (2016) Basic animal husbandry and fisheries statistics. Department of Animal Husbandry,Dairying and Fisheries. Ministry of Agriculture & Farmers’ Welfare. Government of India
DAHD (2017) Basic animal husbandry and fisheries statistics. Department of Animal Husbandry,Dairying and Fisheries. Ministry of Agriculture & Farmers’ Welfare. Government of India
DAHD (2018) National Action Plan for Dairy Development—vision 2022 (2018). Department ofAnimal Husbandry and Dairying, Government of India. Accessed from http://dahd.nic.in/sites/default/filess/Vision%202022-Dairy%20Development%20English_0_0.pdf
DAHD (2019) Basic animal husbandry statistics.Department of Animal Husbandry, Dairying andFisheries. Ministry of Agriculture & Farmers’ Welfare. Government of India
DAHD (2020) https://www.nabard.org/auth/writereaddata/file/GoI%20letter%20dated%2027.08.2020.pdf. 27 Aug 2020
Development andResearchServices Pvt. Ltd. (2013)Externalmonitoring and evaluation ofNationalDairy Plan Phase I (National Dairy Support Project). Baseline Study Final Report 2013. Availableat https://www.nddb.coop/sites/default/files/pdfs/baseline/Baseline_NDP_Main_report.pdf
FAO (2017) Food outlook biannual report on global food markets. Food and AgricultureOrganization of the United Nations. November 2017
FAO (2020) Dairy market review. FAO. March 2020. Available at http://www.fao.org/3/ca8341en/CA8341EN.pdf
FAOSTAT (2016) Food and agriculture data. Food and Agriculture Organization of the UnitedNations. Rome. Accessed from http://www.fao.org/faostat/en/#data
Global Dairy Industry (2018) Statistics and facts. Retrieved 14 May 2018 from https://www.statista.com
Government ofGujarat (2016)District humandevelopment reportAhmedabad. Social InfrastructureDevelopment Society, Gujarat
Government of India (2014) Key indicators of situation of agricultural households in India. NSS70th Round. (January–December 2013). National Sample Survey Office, Ministry of Statisticsand Programme Implementation, Government of India, New Delhi
Government of India (2021) The economic survey (2020–21). Ministry of Finance. Government ofIndia
Halli HM, Rathore SS, Manjunatha N, Wasnik VK (2018) Advances in agrnomic management forensuring fodder security in semi arid zones of India. Int JCurrMicrobiolAppl Sci 7(2):1912–1921
Households in India. National Sample Survey Office. Ministry of Statistics and ProgrammeImplementation. Government of India. New Delhi
6 Dairy Value Chain 225
IGFRI (2011) Vision 2030. IndianGrassland and Fodder Research Institute (IGFRI). Indian Councilfor Agricultural Research (ICAR). Available at http://www.igfri.res.in/pdf/Vision-2030.pdf
IPCC (2007) Climate change 2007: synthesis report. Contribution of Working Groups I, II and IIIto the fourth assessment report of the intergovernmental panel on climate change. In: PachauriRK, Reisinger A (eds) Core writing team, IPCC, Geneva, Switzerland
MoEFCC (2021) India: Third Biennial Update Report to theUnitedNations Framework Conventionon Climate Change. Ministry of Environment, Forest and Climate Change, Government of India
MoSPI (2021) National accounts statistics 2020. Central Statistical Organization. Ministry ofStatistics and Program Implementation
NABARD (2018) NABARD All India Rural Financial Inclusion Survey 2016–17. National Bankfor Agriculture & Rural Development. Available at https://www.nabard.org/auth/writereaddata/tender/1608180417NABARD-Repo-16_Web_P.pdf
NDDB (2017) Annual report 2016–17. National Dairy Development BoardNDDB (2020) Annual report 2018–19. National Dairy Development Board. https://www.nddb.coop/sites/default/files/NDDB-AR-2019-ENGLISH-24022020.pdf
NDDB (n.d.) DIDF in brief. National Dairy Development Board, Anand. Accessed fromhttps://www.nddb.coop/didf/didf-in-brief#:~:text=10%2C881%20crore.,a%20corpus%20fund%20of%20Rs.&text=12%20crore%20shall%20be%20the,(GoI)%20towards%20interest%20subvention
NIANP (2013) Vision 2050. National Institute of Animal Nutrition and Physiology, Bangalore.Accessed from http://nianp.res.in/static/docs/Nianp_vision_2050.pdf
Lok Sabha (2015) Lok Sabha unstarred question no. 1463, answered on 08.12.2015. Parliament ofIndia, New Delhi Accessed from http://164.100.24.220/loksabhaquestions/annex/6/AU1463.pdf
Lok Sabha (2016) Lok Sabha unstarred question no. 2960, answered on 02.12.2016. Parliamentof India, NewDelhi. Accessed from https://eparlib.nic.in/bitstream/123456789/691725/1/43684.pdf
Lok Sabha (2019a) Statement by Ministry of Fisheries, Animal Husbandry and Dairying, LokSabha, 25 June 2019
Lok Sabha (2019b) Statement by Ministry of Agriculture and Farmers Welfare. 12 Feb 2019.Available at http://164.100.47.194/loksabha/Questions/QResult15.aspx?qref=79971&lsno=16
Lok Sabha (2020) Department of Animal Husbandry and Dairying Statement, Lok Sabha, 15 Sept2020
PIB (2020) Ministry of Fisheries Animal Husbandry & Dairying. 22 Dec 2020. Available https://pib.gov.in/PressReleseDetail.aspx?PRID=1682680
The World Bank (2020 July) Implementation completion and results report. Agriculture and FoodGlobal Practice, SustainableDevelopment, SouthAsia Region. Accessed from https://www.nddb.coop/sites/default/files/pdfs/ndpi/NDPI_World_Bank_Evaluation_Report_(ICRR).pdf
UNFCC (2018) India: second Biennial update report to the United Nations framework conven-tion on climate change. Ministry of Environment, Forest and Climate Change, Governmentof India, 2018. Available at https://unfccc.int/sites/default/files/resource/INDIA%20SECOND%20BUR%20High%20Res.pdf

226 T. N. Kumar et al.
Open Access This chapter is licensed under the terms of the Creative Commons Attribution 4.0International License (http://creativecommons.org/licenses/by/4.0/), which permits use, sharing,adaptation, distribution and reproduction in any medium or format, as long as you give appropriatecredit to the original author(s) and the source, provide a link to the Creative Commons license andindicate if changes were made.
The images or other third party material in this chapter are included in the chapter’s CreativeCommons license, unless indicated otherwise in a credit line to the material. If material is notincluded in the chapter’s Creative Commons license and your intended use is not permitted bystatutory regulation or exceeds the permitted use, you will need to obtain permission directly fromthe copyright holder.
Chapter 7Poultry Value Chain
T. Nanda Kumar, Anisha Samantara, and Ashok Gulati
7.1 Introduction
In the livestock sector in India, poultry farming holds a prominent position owingto its impressive growth led by the private sector. Poultry sector has shown rapidgrowth, with chicken meat growing at an average annual growth rate of 9% and eggsgrowing at 6% from 2000–01 to 2018–19 (DAHD2020). The recent steady growth indomestic demand for chickenmeat has made it possible to increase production with aready market putting India among the top poultry producers in the world. India is thethird-largest egg producer after China and the USA with a production of 96 billioneggs and fifth-largest chicken meat producer with a production of 3.7 million tonnesin TE 2018–19 (FAOSTAT 2018). This transformation in the poultry sector has beenled by the commercial poultry industry, which contributes about 80% of the totalpoultry production. The other 20% is produced by the traditional backyard poultry.The broiler industry is concentrated in the southern and western states and accountsfor a major share of total output. Similarly, the layer industry is dominated by well-developed states like Andhra Pradesh, Tamil Nadu and Maharashtra, accounting fornearly 60% of the production (DAHDF 2017). Commercial poultry farming is yet tomake a mark in more populous states like Bihar, Odisha and Uttar Pradesh.
There has been evidently a sharp jump in India’s domestic egg and chicken meatproduction outpacing the two major competitors—beef and veal since 2004–05.Nearly 36% of the production of meat is contributed by poultry followed by buffalo
T. Nanda KumarFormer Senior Visiting Fellow, Indian Council for Research on International Economic Relations(ICRIER), New Delhi, Delhi, India
A. SamantaraFormer Research Assistant, ICRIER, New Delhi, India
A. Gulati (B)Indian Council for Research on International Economic Relations (ICRIER), New Delhi, Delhi,India
© The Author(s) 2022A. Gulati et al. (eds.), Agricultural Value Chains in India, India Studies in Businessand Economics, https://doi.org/10.1007/978-981-33-4268-2_7
227
228 T. N. Kumar et al.
(22%), goat (19%), pig (9%) and sheep (8%) (DAHDF 2015). Factors contributing tothis growth can be attributed to innovations in technology, institutions and markets.Supply side factors affecting growth arise from rapid technological changes thatwere absorbed by local producers creating spill-over effects across the industry. Theshift from backyard to commercial poultry operations has dramatically increased thenumber of birds a farmer can manage, resulting in a further replacement of labourwith capital and productivity gains (Narrod and Pray 2001). Innovations have playeda key role in the recent past. Factors attributed to innovations are initiation of pure-linebreeding, domestically, in both private and public sectors. At the same time, develop-ment of input sub-sectors like feed mill, hatchery and farm appliances, bio-securityand laboratories, and simultaneously aided vertical and horizontal integration inpoultry farming were instrumental in the development of the sector.
Poultry farming comes with its own risks, specifically in terms of marketinginfrastructure. Lack of adequate cold chain facilities and organized and regulatedwet markets results in volatile prices of poultry products. As marketing is controlledby commission agents and private traders, procurement from smallholders in remoteand backward areas is hardly prioritized. While it is clear that vertical coordinationin agriculture supply chain is instrumental in bringing down costs and risks forsmallholders, it has been difficult to prove that it takes place uniformly in the Indianpoultry sector. The monopolized concentration of commercial poultry in certainregions has led to a neglect of other rural areas from this revolution. To overcomethis, a strong marketing network to strengthen and expand direct farmer-marketlinkages is needed. Even with a shift towards non-vegetarianism, demand has notbeen able to keep pacewith production, coupledwith limited acceptance of processedpoultry products in domestic markets, which poses restrictions on the expansion ofthe sector.
This chapter seeks to capture the dynamics of poultry value chain with respect tofour critical aspects-Competitiveness, Inclusiveness, Scalability, and Sustainability,overarched by access to finance that intersect all of these (CISS-F). The study usesa combination of secondary data sources (production, exports and price data fromthe period 2000–01 to 2015–16) and interactions with different stakeholders duringfield visits. The study examines the trends and features of the Indian poultry sector,growth of integrators and contract farmingmodels, structural reforms in the livestocksector vis-à-vis poultry and its implication on inclusiveness of small farmers and thefinancial and environmental sustainability of such growth.
7.2 Overview of the Poultry Sector
7.2.1 Global Overview
The global poultry sector has undergone a series of structural changes during thelast two decades making it one of the fastest-growing livestock sectors. The poultry
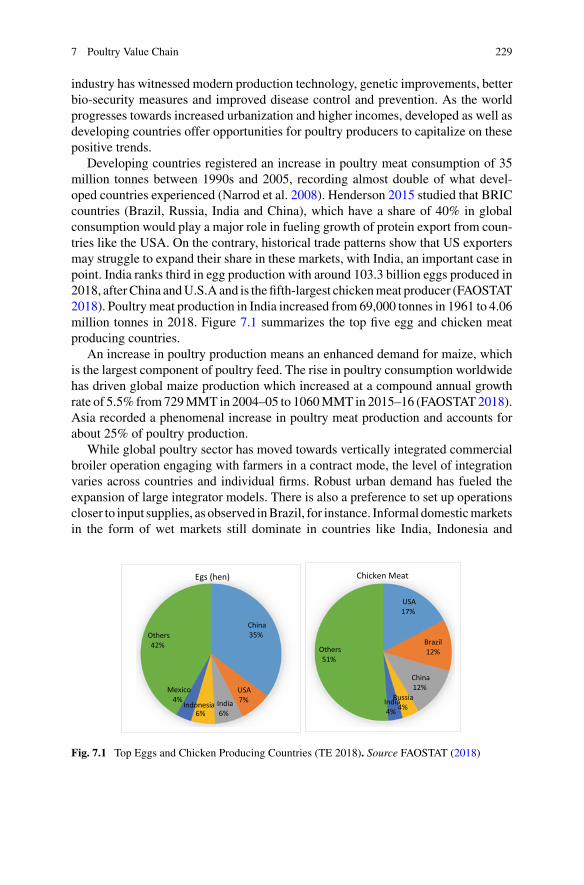
7 Poultry Value Chain 229
industry has witnessed modern production technology, genetic improvements, betterbio-security measures and improved disease control and prevention. As the worldprogresses towards increased urbanization and higher incomes, developed as well asdeveloping countries offer opportunities for poultry producers to capitalize on thesepositive trends.
Developing countries registered an increase in poultry meat consumption of 35million tonnes between 1990s and 2005, recording almost double of what devel-oped countries experienced (Narrod et al. 2008). Henderson 2015 studied that BRICcountries (Brazil, Russia, India and China), which have a share of 40% in globalconsumption would play a major role in fueling growth of protein export from coun-tries like the USA. On the contrary, historical trade patterns show that US exportersmay struggle to expand their share in these markets, with India, an important case inpoint. India ranks third in egg production with around 103.3 billion eggs produced in2018, afterChina andU.S.A and is the fifth-largest chickenmeat producer (FAOSTAT2018). Poultrymeat production in India increased from 69,000 tonnes in 1961 to 4.06million tonnes in 2018. Figure 7.1 summarizes the top five egg and chicken meatproducing countries.
An increase in poultry production means an enhanced demand for maize, whichis the largest component of poultry feed. The rise in poultry consumption worldwidehas driven global maize production which increased at a compound annual growthrate of 5.5% from729MMT in 2004–05 to 1060MMT in 2015–16 (FAOSTAT2018).Asia recorded a phenomenal increase in poultry meat production and accounts forabout 25% of poultry production.
While global poultry sector has moved towards vertically integrated commercialbroiler operation engaging with farmers in a contract mode, the level of integrationvaries across countries and individual firms. Robust urban demand has fueled theexpansion of large integrator models. There is also a preference to set up operationscloser to input supplies, as observed inBrazil, for instance. Informal domesticmarketsin the form of wet markets still dominate in countries like India, Indonesia and
China35%
USA7%India
6%Indonesia
6%
Mexico4%
Others42%
Egs (hen)
USA17%
Brazil12%
China12%
Russia4%
India4%
Others51%
Chicken Meat
Fig. 7.1 Top Eggs and Chicken Producing Countries (TE 2018). Source FAOSTAT (2018)
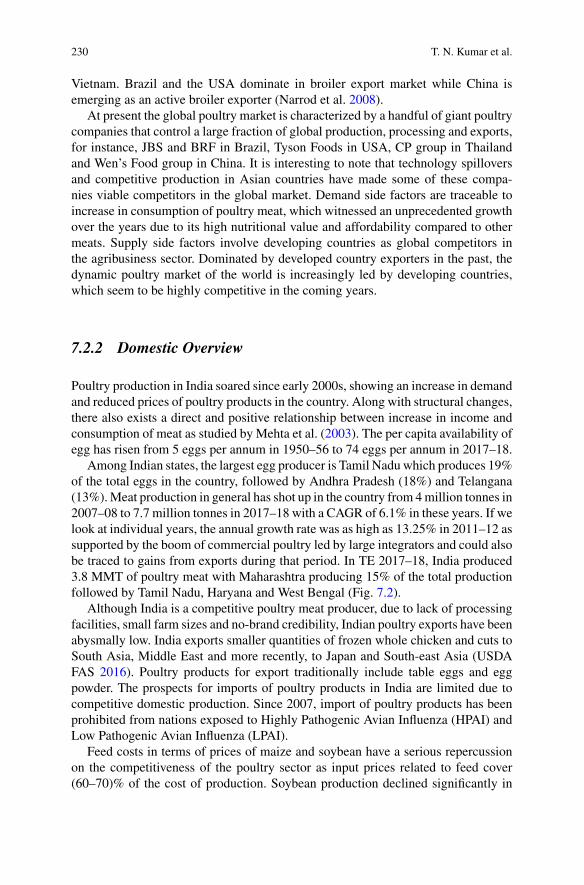
230 T. N. Kumar et al.
Vietnam. Brazil and the USA dominate in broiler export market while China isemerging as an active broiler exporter (Narrod et al. 2008).
At present the global poultry market is characterized by a handful of giant poultrycompanies that control a large fraction of global production, processing and exports,for instance, JBS and BRF in Brazil, Tyson Foods in USA, CP group in Thailandand Wen’s Food group in China. It is interesting to note that technology spilloversand competitive production in Asian countries have made some of these compa-nies viable competitors in the global market. Demand side factors are traceable toincrease in consumption of poultry meat, which witnessed an unprecedented growthover the years due to its high nutritional value and affordability compared to othermeats. Supply side factors involve developing countries as global competitors inthe agribusiness sector. Dominated by developed country exporters in the past, thedynamic poultry market of the world is increasingly led by developing countries,which seem to be highly competitive in the coming years.
7.2.2 Domestic Overview
Poultry production in India soared since early 2000s, showing an increase in demandand reduced prices of poultry products in the country. Along with structural changes,there also exists a direct and positive relationship between increase in income andconsumption of meat as studied by Mehta et al. (2003). The per capita availability ofegg has risen from 5 eggs per annum in 1950–56 to 74 eggs per annum in 2017–18.
Among Indian states, the largest egg producer is Tamil Naduwhich produces 19%of the total eggs in the country, followed by Andhra Pradesh (18%) and Telangana(13%).Meat production in general has shot up in the country from 4million tonnes in2007–08 to 7.7 million tonnes in 2017–18 with a CAGR of 6.1% in these years. If welook at individual years, the annual growth rate was as high as 13.25% in 2011–12 assupported by the boom of commercial poultry led by large integrators and could alsobe traced to gains from exports during that period. In TE 2017–18, India produced3.8 MMT of poultry meat with Maharashtra producing 15% of the total productionfollowed by Tamil Nadu, Haryana and West Bengal (Fig. 7.2).
Although India is a competitive poultry meat producer, due to lack of processingfacilities, small farm sizes and no-brand credibility, Indian poultry exports have beenabysmally low. India exports smaller quantities of frozen whole chicken and cuts toSouth Asia, Middle East and more recently, to Japan and South-east Asia (USDAFAS 2016). Poultry products for export traditionally include table eggs and eggpowder. The prospects for imports of poultry products in India are limited due tocompetitive domestic production. Since 2007, import of poultry products has beenprohibited from nations exposed to Highly Pathogenic Avian Influenza (HPAI) andLow Pathogenic Avian Influenza (LPAI).
Feed costs in terms of prices of maize and soybean have a serious repercussionon the competitiveness of the poultry sector as input prices related to feed cover(60–70)% of the cost of production. Soybean production declined significantly in
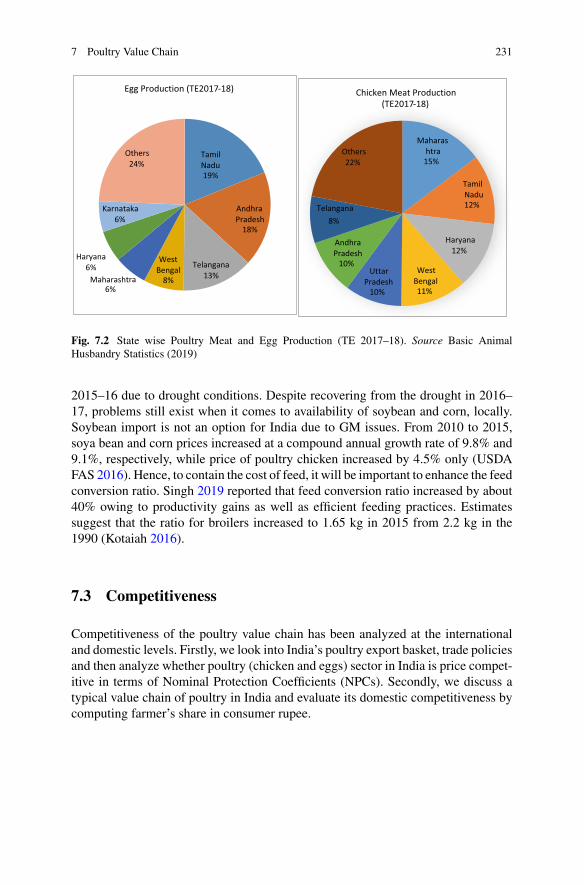
7 Poultry Value Chain 231
Tamil Nadu19%
Andhra Pradesh
18%
Telangana13%
West Bengal
8%Maharashtra6%
Haryana6%
Karnataka6%
Others24%
Egg Production (TE2017-18)
Maharashtra
15%
Tamil Nadu12%
Haryana12%
West Bengal11%
Uttar Pradesh
10%
Andhra Pradesh
10%
Telangana8%
Others22%
Chicken Meat Production (TE2017-18)
Fig. 7.2 State wise Poultry Meat and Egg Production (TE 2017–18). Source Basic AnimalHusbandry Statistics (2019)
2015–16 due to drought conditions. Despite recovering from the drought in 2016–17, problems still exist when it comes to availability of soybean and corn, locally.Soybean import is not an option for India due to GM issues. From 2010 to 2015,soya bean and corn prices increased at a compound annual growth rate of 9.8% and9.1%, respectively, while price of poultry chicken increased by 4.5% only (USDAFAS 2016). Hence, to contain the cost of feed, it will be important to enhance the feedconversion ratio. Singh 2019 reported that feed conversion ratio increased by about40% owing to productivity gains as well as efficient feeding practices. Estimatessuggest that the ratio for broilers increased to 1.65 kg in 2015 from 2.2 kg in the1990 (Kotaiah 2016).
7.3 Competitiveness
Competitiveness of the poultry value chain has been analyzed at the internationaland domestic levels. Firstly, we look into India’s poultry export basket, trade policiesand then analyze whether poultry (chicken and eggs) sector in India is price compet-itive in terms of Nominal Protection Coefficients (NPCs). Secondly, we discuss atypical value chain of poultry in India and evaluate its domestic competitiveness bycomputing farmer’s share in consumer rupee.
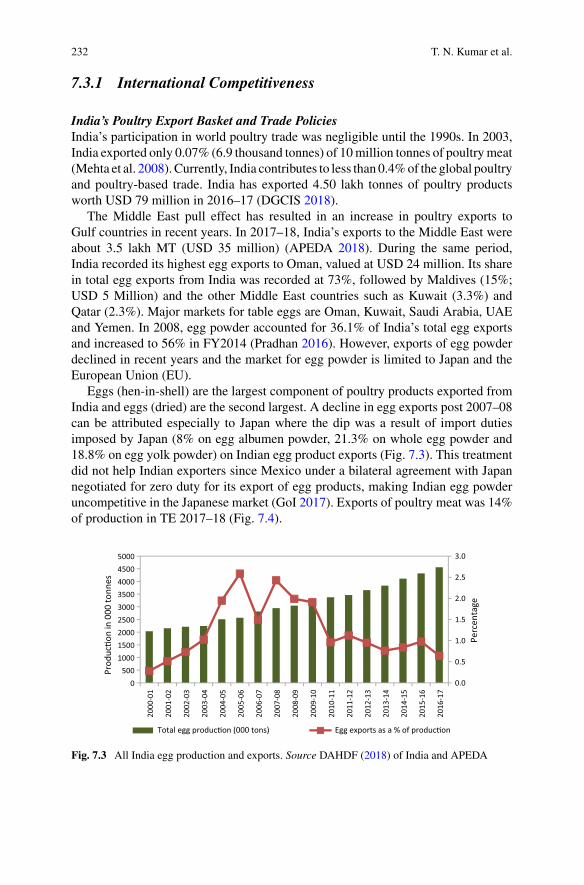
232 T. N. Kumar et al.
7.3.1 International Competitiveness
India’s Poultry Export Basket and Trade PoliciesIndia’s participation in world poultry trade was negligible until the 1990s. In 2003,India exported only 0.07% (6.9 thousand tonnes) of 10million tonnes of poultrymeat(Mehta et al. 2008). Currently, India contributes to less than 0.4%of the global poultryand poultry-based trade. India has exported 4.50 lakh tonnes of poultry productsworth USD 79 million in 2016–17 (DGCIS 2018).
The Middle East pull effect has resulted in an increase in poultry exports toGulf countries in recent years. In 2017–18, India’s exports to the Middle East wereabout 3.5 lakh MT (USD 35 million) (APEDA 2018). During the same period,India recorded its highest egg exports to Oman, valued at USD 24 million. Its sharein total egg exports from India was recorded at 73%, followed by Maldives (15%;USD 5 Million) and the other Middle East countries such as Kuwait (3.3%) andQatar (2.3%). Major markets for table eggs are Oman, Kuwait, Saudi Arabia, UAEand Yemen. In 2008, egg powder accounted for 36.1% of India’s total egg exportsand increased to 56% in FY2014 (Pradhan 2016). However, exports of egg powderdeclined in recent years and the market for egg powder is limited to Japan and theEuropean Union (EU).
Eggs (hen-in-shell) are the largest component of poultry products exported fromIndia and eggs (dried) are the second largest. A decline in egg exports post 2007–08can be attributed especially to Japan where the dip was a result of import dutiesimposed by Japan (8% on egg albumen powder, 21.3% on whole egg powder and18.8% on egg yolk powder) on Indian egg product exports (Fig. 7.3). This treatmentdid not help Indian exporters since Mexico under a bilateral agreement with Japannegotiated for zero duty for its export of egg products, making Indian egg powderuncompetitive in the Japanese market (GoI 2017). Exports of poultry meat was 14%of production in TE 2017–18 (Fig. 7.4).
0.0
0.5
1.0
1.5
2.0
2.5
3.0
0500
100015002000250030003500400045005000
2000
-01
2001
-02
2002
-03
2003
-04
2004
-05
2005
-06
2006
-07
2007
-08
2008
-09
2009
-10
2010
-11
2011
-12
2012
-13
2013
-14
2014
-15
2015
-16
2016
-17
Perc
enta
ge
Prod
uc�o
n in
000
tonn
es
Total egg produc�on (000 tons) Egg exports as a % of produc�on
Fig. 7.3 All India egg production and exports. Source DAHDF (2018) of India and APEDA
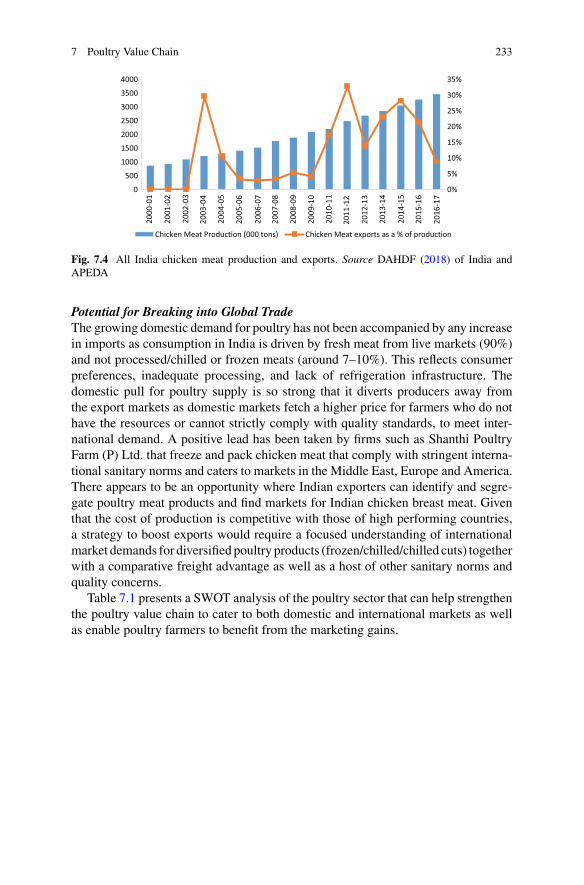
7 Poultry Value Chain 233
0%
5%
10%
15%
20%
25%
30%
35%
0
500
1000
1500
2000
2500
3000
3500
4000
Chicken Meat Production (000 tons) Chicken Meat exports as a % of production
2000
-01
2001
-02
2002
-03
2003
-04
2004
-05
2005
-06
2006
-07
2007
-08
2008
-09
2009
-10
2010
-11
2011
-12
2012
-13
2013
-14
2014
-15
2015
-16
2016
-17
Fig. 7.4 All India chicken meat production and exports. Source DAHDF (2018) of India andAPEDA
Potential for Breaking into Global TradeThe growing domestic demand for poultry has not been accompanied by any increasein imports as consumption in India is driven by fresh meat from live markets (90%)and not processed/chilled or frozen meats (around 7–10%). This reflects consumerpreferences, inadequate processing, and lack of refrigeration infrastructure. Thedomestic pull for poultry supply is so strong that it diverts producers away fromthe export markets as domestic markets fetch a higher price for farmers who do nothave the resources or cannot strictly comply with quality standards, to meet inter-national demand. A positive lead has been taken by firms such as Shanthi PoultryFarm (P) Ltd. that freeze and pack chicken meat that comply with stringent interna-tional sanitary norms and caters to markets in the Middle East, Europe and America.There appears to be an opportunity where Indian exporters can identify and segre-gate poultry meat products and find markets for Indian chicken breast meat. Giventhat the cost of production is competitive with those of high performing countries,a strategy to boost exports would require a focused understanding of internationalmarket demands for diversified poultry products (frozen/chilled/chilled cuts) togetherwith a comparative freight advantage as well as a host of other sanitary norms andquality concerns.
Table 7.1 presents a SWOT analysis of the poultry sector that can help strengthenthe poultry value chain to cater to both domestic and international markets as wellas enable poultry farmers to benefit from the marketing gains.
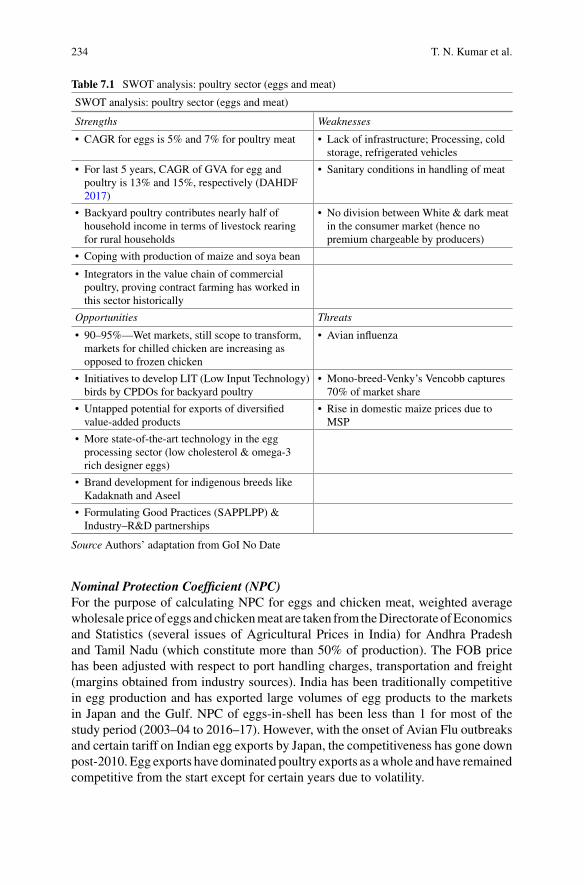
234 T. N. Kumar et al.
Table 7.1 SWOT analysis: poultry sector (eggs and meat)
SWOT analysis: poultry sector (eggs and meat)
Strengths Weaknesses
• CAGR for eggs is 5% and 7% for poultry meat • Lack of infrastructure; Processing, coldstorage, refrigerated vehicles
• For last 5 years, CAGR of GVA for egg andpoultry is 13% and 15%, respectively (DAHDF2017)
• Sanitary conditions in handling of meat
• Backyard poultry contributes nearly half ofhousehold income in terms of livestock rearingfor rural households
• No division between White & dark meatin the consumer market (hence nopremium chargeable by producers)
• Coping with production of maize and soya bean
• Integrators in the value chain of commercialpoultry, proving contract farming has worked inthis sector historically
Opportunities Threats
• 90–95%—Wet markets, still scope to transform,markets for chilled chicken are increasing asopposed to frozen chicken
• Avian influenza
• Initiatives to develop LIT (Low Input Technology)birds by CPDOs for backyard poultry
• Mono-breed-Venky’s Vencobb captures70% of market share
• Untapped potential for exports of diversifiedvalue-added products
• Rise in domestic maize prices due toMSP
• More state-of-the-art technology in the eggprocessing sector (low cholesterol & omega-3rich designer eggs)
• Brand development for indigenous breeds likeKadaknath and Aseel
• Formulating Good Practices (SAPPLPP) &Industry–R&D partnerships
Source Authors’ adaptation from GoI No Date
Nominal Protection Coefficient (NPC)For the purpose of calculating NPC for eggs and chicken meat, weighted averagewholesale price of eggs and chickenmeat are taken from theDirectorate ofEconomicsand Statistics (several issues of Agricultural Prices in India) for Andhra Pradeshand Tamil Nadu (which constitute more than 50% of production). The FOB pricehas been adjusted with respect to port handling charges, transportation and freight(margins obtained from industry sources). India has been traditionally competitivein egg production and has exported large volumes of egg products to the marketsin Japan and the Gulf. NPC of eggs-in-shell has been less than 1 for most of thestudy period (2003–04 to 2016–17). However, with the onset of Avian Flu outbreaksand certain tariff on Indian egg exports by Japan, the competitiveness has gone downpost-2010. Egg exports have dominated poultry exports as awhole and have remainedcompetitive from the start except for certain years due to volatility.
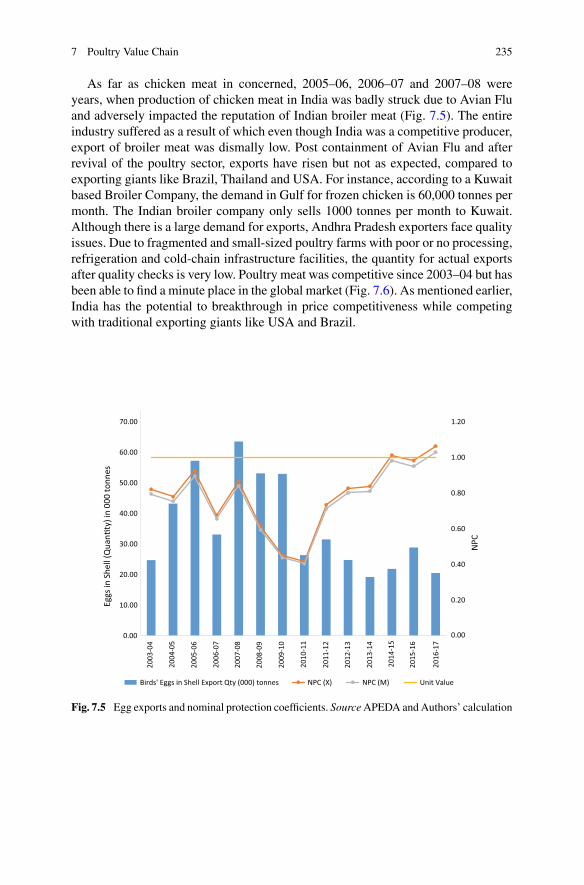
7 Poultry Value Chain 235
As far as chicken meat in concerned, 2005–06, 2006–07 and 2007–08 wereyears, when production of chicken meat in India was badly struck due to Avian Fluand adversely impacted the reputation of Indian broiler meat (Fig. 7.5). The entireindustry suffered as a result of which even though India was a competitive producer,export of broiler meat was dismally low. Post containment of Avian Flu and afterrevival of the poultry sector, exports have risen but not as expected, compared toexporting giants like Brazil, Thailand and USA. For instance, according to a Kuwaitbased Broiler Company, the demand in Gulf for frozen chicken is 60,000 tonnes permonth. The Indian broiler company only sells 1000 tonnes per month to Kuwait.Although there is a large demand for exports, Andhra Pradesh exporters face qualityissues. Due to fragmented and small-sized poultry farms with poor or no processing,refrigeration and cold-chain infrastructure facilities, the quantity for actual exportsafter quality checks is very low. Poultry meat was competitive since 2003–04 but hasbeen able to find a minute place in the global market (Fig. 7.6). As mentioned earlier,India has the potential to breakthrough in price competitiveness while competingwith traditional exporting giants like USA and Brazil.
0.00
0.20
0.40
0.60
0.80
1.00
1.20
0.00
10.00
20.00
30.00
40.00
50.00
60.00
70.00
NPC
Eggs
in S
hell
(Qua
n�ty
) in
000
tonn
es
Birds' Eggs in Shell Export Qty (000) tonnes NPC (X) NPC (M) Unit Value
2003
-04
2004
-05
2005
-06
2006
-07
2007
-08
2008
-09
2009
-10
2010
-11
2011
-12
2012
-13
2013
-14
2014
-15
2015
-16
2016
-17
Fig. 7.5 Egg exports and nominal protection coefficients. SourceAPEDA andAuthors’ calculation
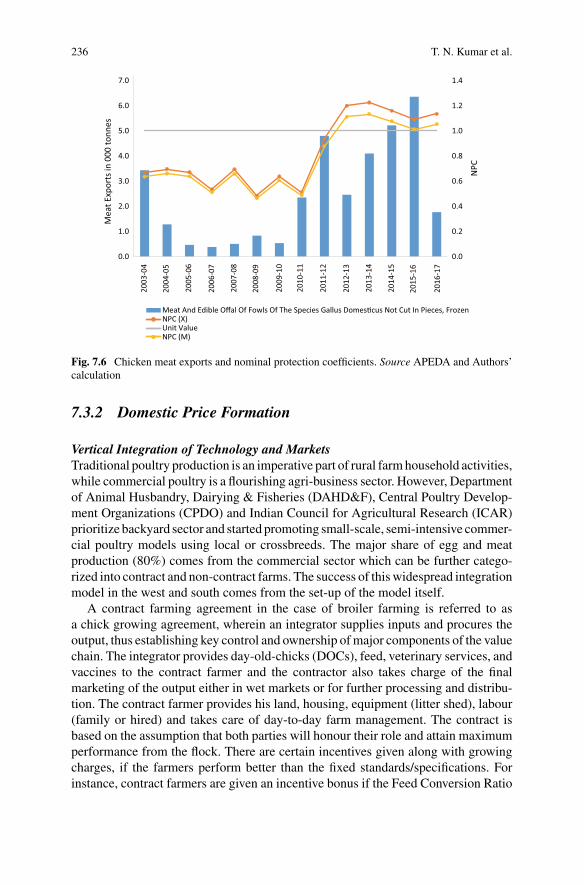
236 T. N. Kumar et al.
0.0
0.2
0.4
0.6
0.8
1.0
1.2
1.4
0.0
1.0
2.0
3.0
4.0
5.0
6.0
7.0
NPC
Mea
t Exp
orts
in 0
00 to
nnes
Meat And Edible Offal Of Fowls Of The Species Gallus Domes�cus Not Cut In Pieces, FrozenNPC (X)Unit ValueNPC (M)
2003
-04
2004
-05
2005
-06
2006
-07
2007
-08
2008
-09
2009
-10
2010
-11
2011
-12
2012
-13
2013
-14
2014
-15
2015
-16
2016
-17
Fig. 7.6 Chicken meat exports and nominal protection coefficients. Source APEDA and Authors’calculation
7.3.2 Domestic Price Formation
Vertical Integration of Technology and MarketsTraditional poultry production is an imperative part of rural farmhousehold activities,while commercial poultry is a flourishing agri-business sector. However, Departmentof Animal Husbandry, Dairying & Fisheries (DAHD&F), Central Poultry Develop-ment Organizations (CPDO) and Indian Council for Agricultural Research (ICAR)prioritize backyard sector and started promoting small-scale, semi-intensive commer-cial poultry models using local or crossbreeds. The major share of egg and meatproduction (80%) comes from the commercial sector which can be further catego-rized into contract and non-contract farms. The success of this widespread integrationmodel in the west and south comes from the set-up of the model itself.
A contract farming agreement in the case of broiler farming is referred to asa chick growing agreement, wherein an integrator supplies inputs and procures theoutput, thus establishing key control and ownership ofmajor components of the valuechain. The integrator provides day-old-chicks (DOCs), feed, veterinary services, andvaccines to the contract farmer and the contractor also takes charge of the finalmarketing of the output either in wet markets or for further processing and distribu-tion. The contract farmer provides his land, housing, equipment (litter shed), labour(family or hired) and takes care of day-to-day farm management. The contract isbased on the assumption that both parties will honour their role and attain maximumperformance from the flock. There are certain incentives given along with growingcharges, if the farmers perform better than the fixed standards/specifications. Forinstance, contract farmers are given an incentive bonus if the Feed Conversion Ratio
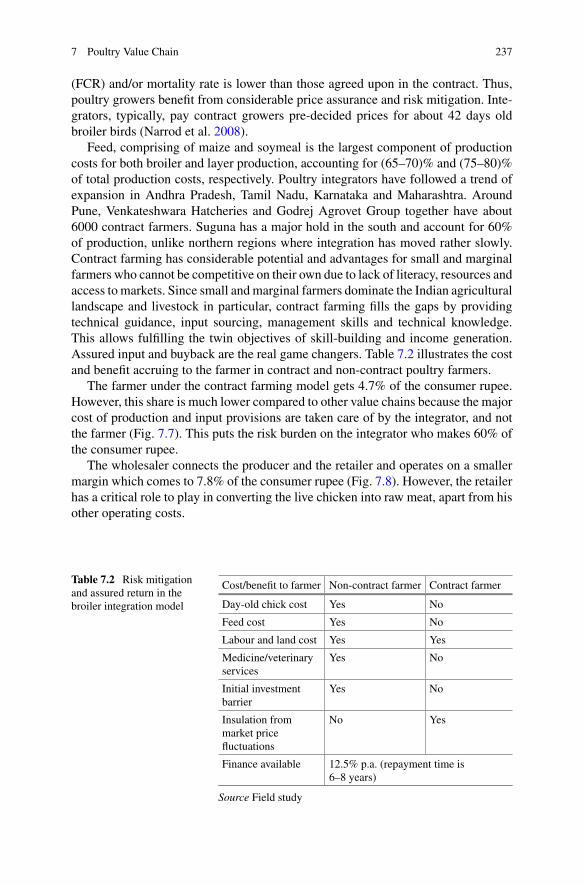
7 Poultry Value Chain 237
(FCR) and/or mortality rate is lower than those agreed upon in the contract. Thus,poultry growers benefit from considerable price assurance and risk mitigation. Inte-grators, typically, pay contract growers pre-decided prices for about 42 days oldbroiler birds (Narrod et al. 2008).
Feed, comprising of maize and soymeal is the largest component of productioncosts for both broiler and layer production, accounting for (65–70)% and (75–80)%of total production costs, respectively. Poultry integrators have followed a trend ofexpansion in Andhra Pradesh, Tamil Nadu, Karnataka and Maharashtra. AroundPune, Venkateshwara Hatcheries and Godrej Agrovet Group together have about6000 contract farmers. Suguna has a major hold in the south and account for 60%of production, unlike northern regions where integration has moved rather slowly.Contract farming has considerable potential and advantages for small and marginalfarmers who cannot be competitive on their own due to lack of literacy, resources andaccess to markets. Since small andmarginal farmers dominate the Indian agriculturallandscape and livestock in particular, contract farming fills the gaps by providingtechnical guidance, input sourcing, management skills and technical knowledge.This allows fulfilling the twin objectives of skill-building and income generation.Assured input and buyback are the real game changers. Table 7.2 illustrates the costand benefit accruing to the farmer in contract and non-contract poultry farmers.
The farmer under the contract farming model gets 4.7% of the consumer rupee.However, this share is much lower compared to other value chains because the majorcost of production and input provisions are taken care of by the integrator, and notthe farmer (Fig. 7.7). This puts the risk burden on the integrator who makes 60% ofthe consumer rupee.
The wholesaler connects the producer and the retailer and operates on a smallermargin which comes to 7.8% of the consumer rupee (Fig. 7.8). However, the retailerhas a critical role to play in converting the live chicken into raw meat, apart from hisother operating costs.
Table 7.2 Risk mitigationand assured return in thebroiler integration model
Cost/benefit to farmer Non-contract farmer Contract farmer
Day-old chick cost Yes No
Feed cost Yes No
Labour and land cost Yes Yes
Medicine/veterinaryservices
Yes No
Initial investmentbarrier
Yes No
Insulation frommarket pricefluctuations
No Yes
Finance available 12.5% p.a. (repayment time is6–8 years)
Source Field study
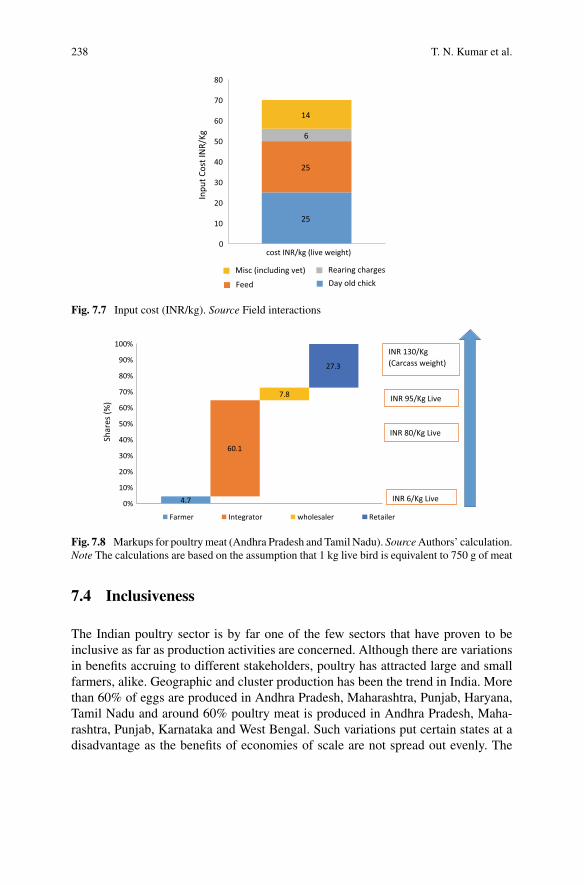
238 T. N. Kumar et al.
25
25
6
14
0
10
20
30
40
50
60
70
80
cost INR/kg (live weight)
Inpu
t Cos
t IN
R/Kg
Day old chickFeed
Rearing chargesMisc (including vet)
Fig. 7.7 Input cost (INR/kg). Source Field interactions
4.7
60.1
7.8
27.3
0%
10%
20%
30%
40%
50%
60%
70%
80%
90%
100%
Shar
es (%
)
Farmer Integrator wholesaler Retailer
INR 6/Kg Live
INR 80/Kg Live
INR 95/Kg Live
INR 130/Kg (Carcass weight)
Fig. 7.8 Markups for poultrymeat (Andhra Pradesh and Tamil Nadu). SourceAuthors’ calculation.Note The calculations are based on the assumption that 1 kg live bird is equivalent to 750 g of meat
7.4 Inclusiveness
The Indian poultry sector is by far one of the few sectors that have proven to beinclusive as far as production activities are concerned. Although there are variationsin benefits accruing to different stakeholders, poultry has attracted large and smallfarmers, alike. Geographic and cluster production has been the trend in India. Morethan 60% of eggs are produced in Andhra Pradesh, Maharashtra, Punjab, Haryana,Tamil Nadu and around 60% poultry meat is produced in Andhra Pradesh, Maha-rashtra, Punjab, Karnataka and West Bengal. Such variations put certain states at adisadvantage as the benefits of economies of scale are not spread out evenly. The
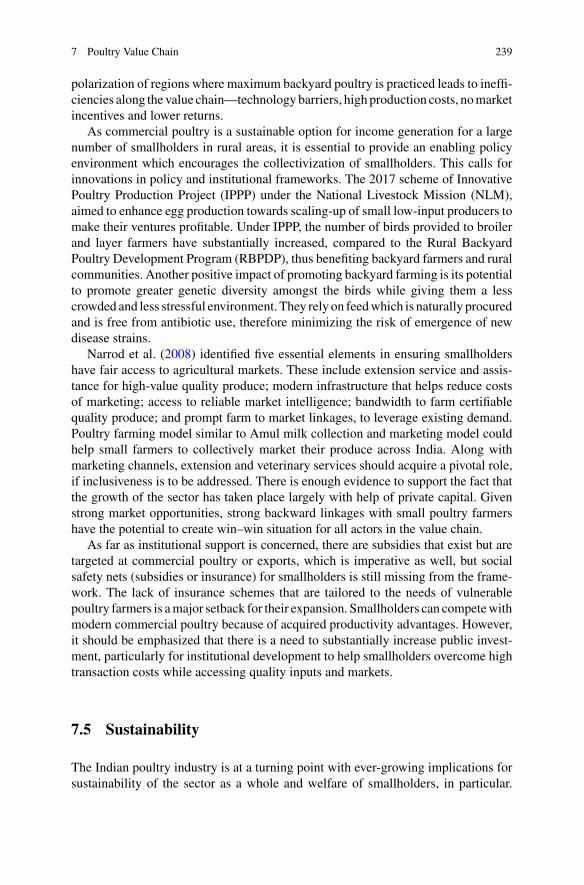
7 Poultry Value Chain 239
polarization of regions where maximum backyard poultry is practiced leads to ineffi-ciencies along the value chain—technologybarriers, high production costs, nomarketincentives and lower returns.
As commercial poultry is a sustainable option for income generation for a largenumber of smallholders in rural areas, it is essential to provide an enabling policyenvironment which encourages the collectivization of smallholders. This calls forinnovations in policy and institutional frameworks. The 2017 scheme of InnovativePoultry Production Project (IPPP) under the National Livestock Mission (NLM),aimed to enhance egg production towards scaling-up of small low-input producers tomake their ventures profitable. Under IPPP, the number of birds provided to broilerand layer farmers have substantially increased, compared to the Rural BackyardPoultry Development Program (RBPDP), thus benefiting backyard farmers and ruralcommunities. Another positive impact of promoting backyard farming is its potentialto promote greater genetic diversity amongst the birds while giving them a lesscrowded and less stressful environment. They rely on feedwhich is naturally procuredand is free from antibiotic use, therefore minimizing the risk of emergence of newdisease strains.
Narrod et al. (2008) identified five essential elements in ensuring smallholdershave fair access to agricultural markets. These include extension service and assis-tance for high-value quality produce; modern infrastructure that helps reduce costsof marketing; access to reliable market intelligence; bandwidth to farm certifiablequality produce; and prompt farm to market linkages, to leverage existing demand.Poultry farming model similar to Amul milk collection and marketing model couldhelp small farmers to collectively market their produce across India. Along withmarketing channels, extension and veterinary services should acquire a pivotal role,if inclusiveness is to be addressed. There is enough evidence to support the fact thatthe growth of the sector has taken place largely with help of private capital. Givenstrong market opportunities, strong backward linkages with small poultry farmershave the potential to create win–win situation for all actors in the value chain.
As far as institutional support is concerned, there are subsidies that exist but aretargeted at commercial poultry or exports, which is imperative as well, but socialsafety nets (subsidies or insurance) for smallholders is still missing from the frame-work. The lack of insurance schemes that are tailored to the needs of vulnerablepoultry farmers is amajor setback for their expansion. Smallholders can competewithmodern commercial poultry because of acquired productivity advantages. However,it should be emphasized that there is a need to substantially increase public invest-ment, particularly for institutional development to help smallholders overcome hightransaction costs while accessing quality inputs and markets.
7.5 Sustainability
The Indian poultry industry is at a turning point with ever-growing implications forsustainability of the sector as a whole and welfare of smallholders, in particular.
240 T. N. Kumar et al.
At this point, it becomes essential to analyze the viability of the sector, so far andwhat the future looks like, given the growing demand for poultry products drivenby consumer behaviour, technological breakthrough and adoption of the integratormodel. The question of sustainability thus rests on two pillars—environmental andfinancial. With strides in development, there are environmental costs that need to beabated because of rising pressure on resources, recognition of safety standards andanimal welfare conditions.
The vision of aligning Indian poultry with world standards and standing up to stiffcompetition would mean taking into consideration certain laws that demand qualityassurance. Thus, there is a shift to more evidence-based decision-making systemsand the need to establish traceability of poultry products. These factors affect theentire value chain starting from hatcheries to feed mixing units and the final sale offinished meat products.
7.5.1 Financial Sustainability
Feed Market Implications—Variation between Feed Price and Poultry ProductionIf production has to remain competitive, the sustained availability of high quality andaffordable feed is crucial. Poultry feed accounts for 47% of total maize consumption(FICCI 2018). Maize largely remains the preferred energy source for the sector andis expected to grow from 26 MMT in 2016–17 to 45 MMT by 2022 (India’s MaizeVision 2022). India’s maize yield of 2.5 MT/hectare is lower than the global averageof 5.5 MT/hectare (FICCI 2018), though there is evidence of much higher yieldsbeing obtained in various parts of India. One of the reasons explaining this couldbe the fact that only about 30% of the area is under SCH (Single Cross Hybrid).Adoption of SCH technology was the driving force behind increasing productivityof maize in countries like USA and China; replication of same in India calls for achange in policy perspective. Poultry sector in India can benefit from increased R&Din developing maize hybrids and their rapid adoption and the private sector can playa larger role in strengthening the maize value chain.
Catering to Markets and a Vision for the FutureIn India, there exists a dominant wet market for poultry meat, and rural and urbanconsumers, alike, prefer live meat markets. This limits the processed chicken meatsector to only (7–10)%. However, as firms start diversifying and expanding oper-ations, they come up with innovative marketing strategies. For example, Suguna’slayer variety, Lohmann LSL-Lite is capable of producing over 325 eggs in 72 weekssaving production cost of over 3% per egg. In terms of branding strategy, Suguna’seggs were priced more than the unbranded local eggs in the market and to justifythe premium, Suguna employed product differentiation; their eggs were clean, shinyand uniform in size and shape and packed attractively. Additionally, to cater to theneeds of high cholesterol patients, Suguna has a range of eggs under the variantSuguna-Heart which are rich in Omega-3 fatty acid and contain less cholesterol.
7 Poultry Value Chain 241
The firm’s product differentiation strategy is not only a domesticmarket-led initia-tive, it also places the firm at the centre of modern technology, which is recognizedglobally. The export impetus that India needs has come institutionally more from theprivate sector as far as breeding and export readiness are concerned. Suguna has aturnover of INR 7870 crores (in FY2019–20) and a state-of-the-art processing plantin Tamil Nadu with an operational capacity of 3600 birds (1500 MT) per month.Suguna’s processing plant is closely monitored by Export Inspection Agency (EIA)andMeat FoodProductsOrder (MFPO) of theMinistry of FoodProcessing Industries(MoFPI) as it is approved by the government for exports. Suguna was the pioneer inpoultry integration when it started a contract farming system with 200-layer birds inUdumalpet, Tamil Nadu in 1986. Now it boasts of a farmer network of 30,000 in 18states across the country.
The Integrator System and SustainabilityThe integrator model has been successful in making poultry farming profitable forsmall farmers by undertaking the costs and risk of poultry farming. This togetherwith the ability of the integrators to cater to a large market for poultry productsand investing in the supply chains have positive implications for its financial sustain-ability. By streamlining the value chain, integrators are able to cater to rising demandat affordable prices and deliver higher gains to the farmers. At first glance, it wouldseem that integrators assume a significant risk to protect farmers, but the returnsreceived cover their costs and risks, thus making them operate on a good profitmargin. Suguna’s average operating profit margin over five years is about (7–8)%and net profit margin is around 4%. For Venky’s, net profit for the first quarter of2018, stood at INR 69.42 crores, up by 66.4% from last quarter of 2017.
In addition to integrator model, poultry value chains driven by co-operatives andproducer companies have been successful in strengthening inclusive growth. Struc-tured on the lines of integrator model providing inputs, day-old chicks, advisoryand extension services as well as market linkages, such models have the potentialto positively impact large number of vulnerable people who struggle to participatein these mainstream livelihood options owing to lack of financial resources andabsence ofmarket linkages. One such example being that ofMadhya PradeshWomenPoultry Producers Company Private Limited that has its genesis in PRADAN ledpoultry producer collectives comprising of Gond tribal women in the Kesla blockin Madhya Pradesh in 1994. This market-led model was first of its kind in inte-grating women poultry producers living below poverty line to competitive poultrymarkets and delivering income security to the women. The first co-operative wasregistered in 2001 as Kesla Poultry Sahkari Society Maryadit. As on 2018–19, therewere 14 co-operatives and Poultry Producer Companies under the Madhya PradeshWomen Poultry Producers Company Private Limited, which is an apex federation.The membership stands at 8121 all women members with a sales turnover of INR297.7 crores and member profits of INR 24.9 crore, about 8.4% of the turnover.Under a smallholder broiler model, each woman producer has 500–1000 birds andrears five to six batches annually. This fetches an income of INR (40,000–80,000)per year for 200 days of work at the rate of 3–4 h a day. For layer farm of 400–500
242 T. N. Kumar et al.
bird size and yield of 320–340 eggs in 52–60 weeks, each woman producer makesabout INR (55,000–60,000) per year.1
Harshvardhan 2010 reports that KPS has been paying higher rearing charges to itspoultry growers compared to the integrators in different parts of India. While KPShas been successful in delivering higher incomes to individual growers, the largerimpact will be seen when small growers do not face any hurdles in joining suchcollectives. Models such as KPS that have come at par with integrators in terms ofscale of operations are enabling penetration of organized poultry farming beyondsouthern and western states. Also, the decentralized model of poultry farming willbe effective in strengthening the inclusiveness of poultry value chains.
7.5.2 Environmental and Epidemiological Implications
Efficient poultry farm management in terms of safe handling of dead birds and farmwaste are necessary to prevent environmental hazards includingwater contamination,among others. During disease outbreaks, it becomes critical to ensure safe disposalof dead and infected birds without which the environment can be adversely affected.The environmental impact of poultry production depends on farm size, productionsystems, diet composition of birds, type of infrastructure and bio-security levels.There have been rising sustainability concerns which in turn have led to recom-mending the use of poultry manure and litter as a soil fertilizer for crop production.Organic production of poultry has emerged as an alternative production system. Litterfrom birds contain significant amount of nutrients essential for plant growth and insome states under certain smallholder programs, poultry litter is converted to bio-gas,but a large-scale intervention is needed at the national level. Van der Sluis (2007)reported that poultry meat and egg production were environmentally less burdeningthan beef, sheep and pork production. For instance, global warming potential (CO2
equivalent) was 3.6 in poultry meat production compared to 15 in beef; and 17 insheep meat. Gerber et al. (2013) studied that while beef production accounted for41% of the GHG emissions, poultry meat and egg production contributed to 9% and8%, respectively.
Avian Influenza and the Degree of Economic Losses to ProducersThe single most devastating threat to the poultry sector are diseases like AvianFlu (highly pathogenic avian influenza (HPAI), A (H5N1) and H7N9), which cancompletely wreck the profitability and productivity of poultry, for big and smallplayers, alike. The severity of these disease outbreaks disrupt both production andconsumption patterns, as observed in India and other countries. World Organizationfor Animal Health (WOAH) and FAO play a critical role in issuing guidelines andcharting out clear actions with respect to monitoring and containing the outbreaksat a global level. India has benefitted from the Prevention and Control of Infectious
1 https://mpwpcl.org/.
7 Poultry Value Chain 243
and Contagious Disease in Animals Act, 2009, which regulates the outbreak acrossstates as well as provides quarantine guidelines. The relevant and applicable frame-work makes sure the spread of any infectious disease is contained in the particularstate/region and urgent steps are taken to reduce the far-reaching negative impactsof the outbreak. However, disease surveillance remains an area of concern in thelivestock sector.
HPAI has strong micro-impacts in the regions affected and a macro impact as aresult of an interconnected global trade route. With the onset of an epidemic, smallgrowers face significant costs related to culling of birds and restocking (Verbiestand Castillo 2004). Also, as measures to control the epidemic are rolled out, costof production increases, which again poses a financial burden on the small poultrygrowers. The study by Kumer et al. (2008) in Manipur, post the outbreak of HPAI inJuly 2007, shows that about 3.39 lakh birds were culled post the notification issuedby Government of India. With nearly (43–79)% of the household income inManipurcoming from the poultry sector, the outbreak had severe economic consequencesfor the layer and broiler producers. The study estimated that while the producerssuffered a loss of INR 31.6 million, the government compensation was only INR 9.9million, which was grossly inadequate. While the farm gate price of broiler was INR56/Kg, the compensation was INR 30/Kg and there was no mechanism to accountfor the economic losses suffered from damage of eggs. In addition to the income andlivelihood loss, such outbreak poses immense challenges related to compliance inbird culling and operations in containing the outbreak. Given that the poultry sector isthreatened by such disease outbreaks, sustainability of livelihoods of small growersemerges as a major concern.
7.6 Scalability
India’s poultry sector is characterized by the co-existence of a high capital and tech-nology intensive sector (which is controlled by integrators and has major potentialto propel India into global poultry trade), and backyard poultry sector (which hasstrong implications on poverty reduction and nutritional improvement in rural areas).
7.6.1 Vertically Integrated Production Systems and Inflowof Technology
The structural changes experienced by the poultry industry cannot be ignored asthe accelerated growth has benefitted small and marginal farmers by establishing acontract farming system with its own risk-assurance and extension services withinthe model (Fig. 7.9). The increase in consumer demand for poultry led to movementtowards mass production in 1980s in a unique manner which was not seen in anyother industry in the country during that period. Figure 7.10 provides a snapshot of
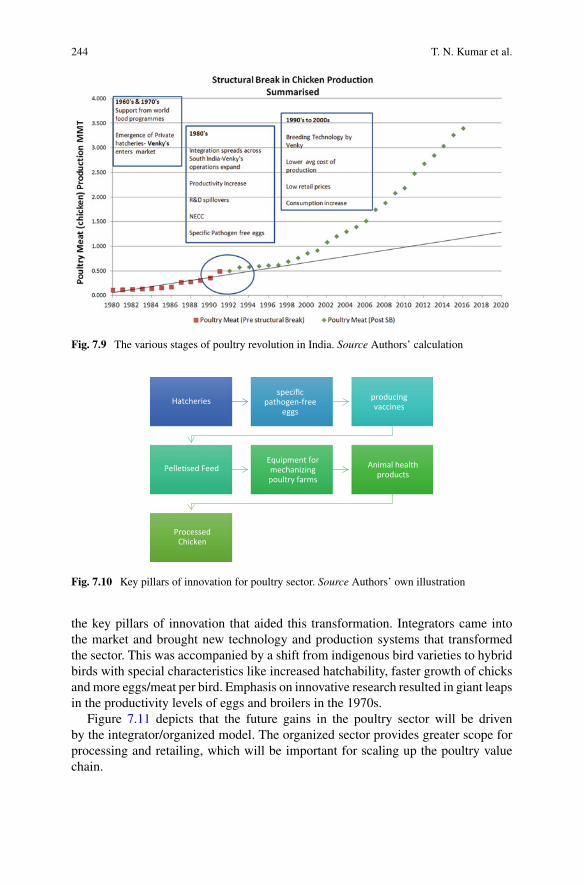
244 T. N. Kumar et al.
Fig. 7.9 The various stages of poultry revolution in India. Source Authors’ calculation
Hatcheries specific
pathogen-free eggs
producing vaccines
Pelle�sed FeedEquipment for mechanizing poultry farms
Animal health products
Processed Chicken
Fig. 7.10 Key pillars of innovation for poultry sector. Source Authors’ own illustration
the key pillars of innovation that aided this transformation. Integrators came intothe market and brought new technology and production systems that transformedthe sector. This was accompanied by a shift from indigenous bird varieties to hybridbirds with special characteristics like increased hatchability, faster growth of chicksandmore eggs/meat per bird. Emphasis on innovative research resulted in giant leapsin the productivity levels of eggs and broilers in the 1970s.
Figure 7.11 depicts that the future gains in the poultry sector will be drivenby the integrator/organized model. The organized sector provides greater scope forprocessing and retailing, which will be important for scaling up the poultry valuechain.
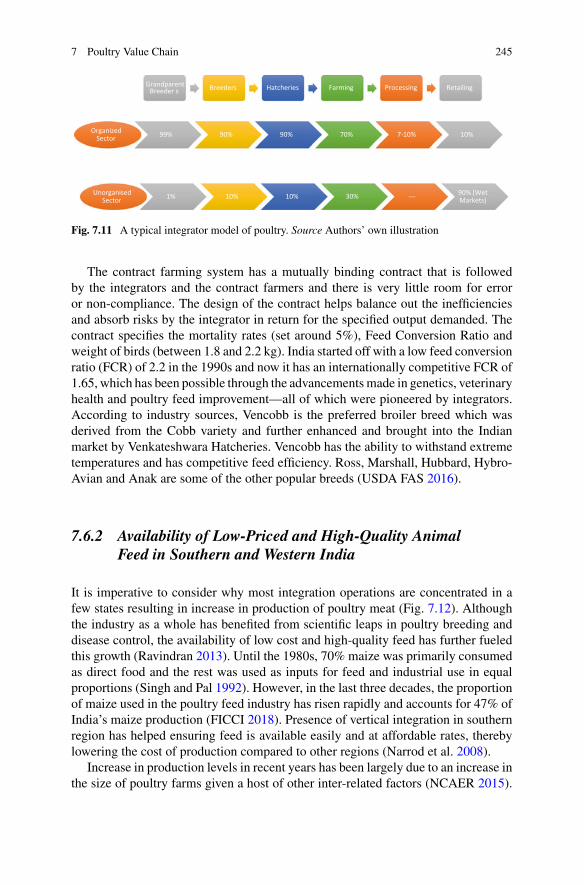
7 Poultry Value Chain 245
Grandparent Breeder s Breeders Hatcheries Farming Processing Retailing
Organized Sector 99% 90% 90% 70% 7-10% 10%
Unorganised Sector 1% 10% 10% 30% --- 90% (Wet
Markets)
Fig. 7.11 A typical integrator model of poultry. Source Authors’ own illustration
The contract farming system has a mutually binding contract that is followedby the integrators and the contract farmers and there is very little room for erroror non-compliance. The design of the contract helps balance out the inefficienciesand absorb risks by the integrator in return for the specified output demanded. Thecontract specifies the mortality rates (set around 5%), Feed Conversion Ratio andweight of birds (between 1.8 and 2.2 kg). India started off with a low feed conversionratio (FCR) of 2.2 in the 1990s and now it has an internationally competitive FCR of1.65, which has been possible through the advancementsmade in genetics, veterinaryhealth and poultry feed improvement—all of which were pioneered by integrators.According to industry sources, Vencobb is the preferred broiler breed which wasderived from the Cobb variety and further enhanced and brought into the Indianmarket by Venkateshwara Hatcheries. Vencobb has the ability to withstand extremetemperatures and has competitive feed efficiency. Ross, Marshall, Hubbard, Hybro-Avian and Anak are some of the other popular breeds (USDA FAS 2016).
7.6.2 Availability of Low-Priced and High-Quality AnimalFeed in Southern and Western India
It is imperative to consider why most integration operations are concentrated in afew states resulting in increase in production of poultry meat (Fig. 7.12). Althoughthe industry as a whole has benefited from scientific leaps in poultry breeding anddisease control, the availability of low cost and high-quality feed has further fueledthis growth (Ravindran 2013). Until the 1980s, 70% maize was primarily consumedas direct food and the rest was used as inputs for feed and industrial use in equalproportions (Singh and Pal 1992). However, in the last three decades, the proportionof maize used in the poultry feed industry has risen rapidly and accounts for 47% ofIndia’s maize production (FICCI 2018). Presence of vertical integration in southernregion has helped ensuring feed is available easily and at affordable rates, therebylowering the cost of production compared to other regions (Narrod et al. 2008).
Increase in production levels in recent years has been largely due to an increase inthe size of poultry farms given a host of other inter-related factors (NCAER 2015).
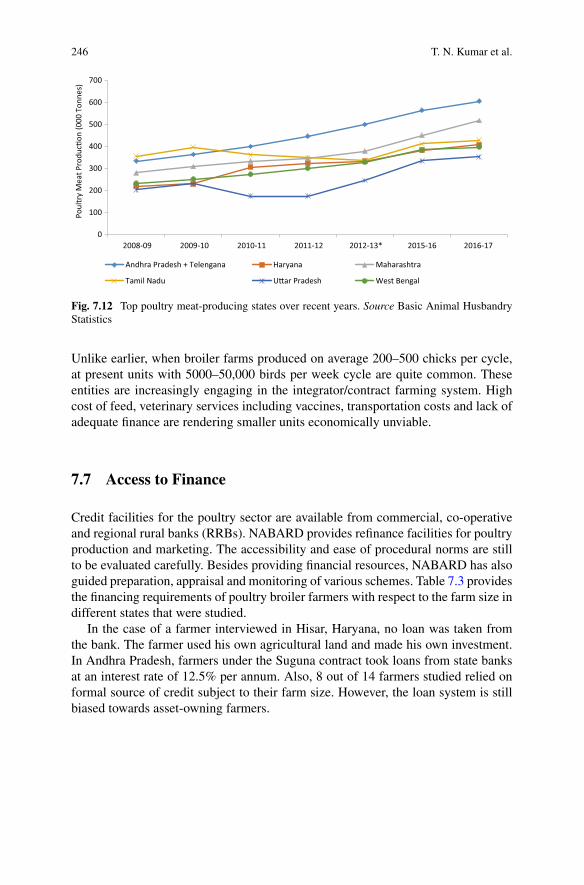
246 T. N. Kumar et al.
0
100
200
300
400
500
600
700
2008-09 2009-10 2010-11 2011-12 2012-13* 2015-16 2016-17
Poul
try
Mea
t Pro
duc�
on (0
00 T
onne
s)
Andhra Pradesh + Telengana Haryana Maharashtra
Tamil Nadu U�ar Pradesh West Bengal
Fig. 7.12 Top poultry meat-producing states over recent years. Source Basic Animal HusbandryStatistics
Unlike earlier, when broiler farms produced on average 200–500 chicks per cycle,at present units with 5000–50,000 birds per week cycle are quite common. Theseentities are increasingly engaging in the integrator/contract farming system. Highcost of feed, veterinary services including vaccines, transportation costs and lack ofadequate finance are rendering smaller units economically unviable.
7.7 Access to Finance
Credit facilities for the poultry sector are available from commercial, co-operativeand regional rural banks (RRBs). NABARD provides refinance facilities for poultryproduction and marketing. The accessibility and ease of procedural norms are stillto be evaluated carefully. Besides providing financial resources, NABARD has alsoguided preparation, appraisal and monitoring of various schemes. Table 7.3 providesthe financing requirements of poultry broiler farmers with respect to the farm size indifferent states that were studied.
In the case of a farmer interviewed in Hisar, Haryana, no loan was taken fromthe bank. The farmer used his own agricultural land and made his own investment.In Andhra Pradesh, farmers under the Suguna contract took loans from state banksat an interest rate of 12.5% per annum. Also, 8 out of 14 farmers studied relied onformal source of credit subject to their farm size. However, the loan system is stillbiased towards asset-owning farmers.
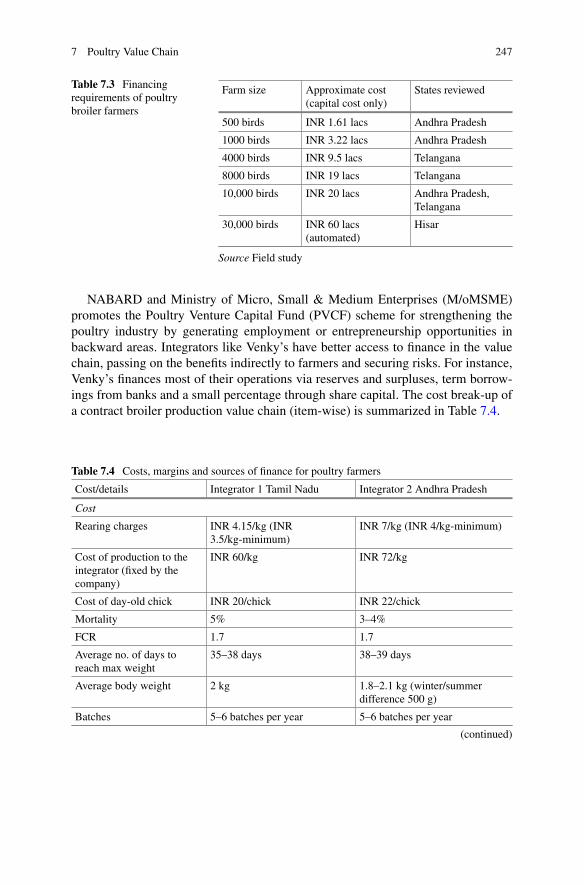
7 Poultry Value Chain 247
Table 7.3 Financingrequirements of poultrybroiler farmers
Farm size Approximate cost(capital cost only)
States reviewed
500 birds INR 1.61 lacs Andhra Pradesh
1000 birds INR 3.22 lacs Andhra Pradesh
4000 birds INR 9.5 lacs Telangana
8000 birds INR 19 lacs Telangana
10,000 birds INR 20 lacs Andhra Pradesh,Telangana
30,000 birds INR 60 lacs(automated)
Hisar
Source Field study
NABARD and Ministry of Micro, Small & Medium Enterprises (M/oMSME)promotes the Poultry Venture Capital Fund (PVCF) scheme for strengthening thepoultry industry by generating employment or entrepreneurship opportunities inbackward areas. Integrators like Venky’s have better access to finance in the valuechain, passing on the benefits indirectly to farmers and securing risks. For instance,Venky’s finances most of their operations via reserves and surpluses, term borrow-ings from banks and a small percentage through share capital. The cost break-up ofa contract broiler production value chain (item-wise) is summarized in Table 7.4.
Table 7.4 Costs, margins and sources of finance for poultry farmers
Cost/details Integrator 1 Tamil Nadu Integrator 2 Andhra Pradesh
Cost
Rearing charges INR 4.15/kg (INR3.5/kg-minimum)
INR 7/kg (INR 4/kg-minimum)
Cost of production to theintegrator (fixed by thecompany)
INR 60/kg INR 72/kg
Cost of day-old chick INR 20/chick INR 22/chick
Mortality 5% 3–4%
FCR 1.7 1.7
Average no. of days toreach max weight
35–38 days 38–39 days
Average body weight 2 kg 1.8–2.1 kg (winter/summerdifference 500 g)
Batches 5–6 batches per year 5–6 batches per year
(continued)
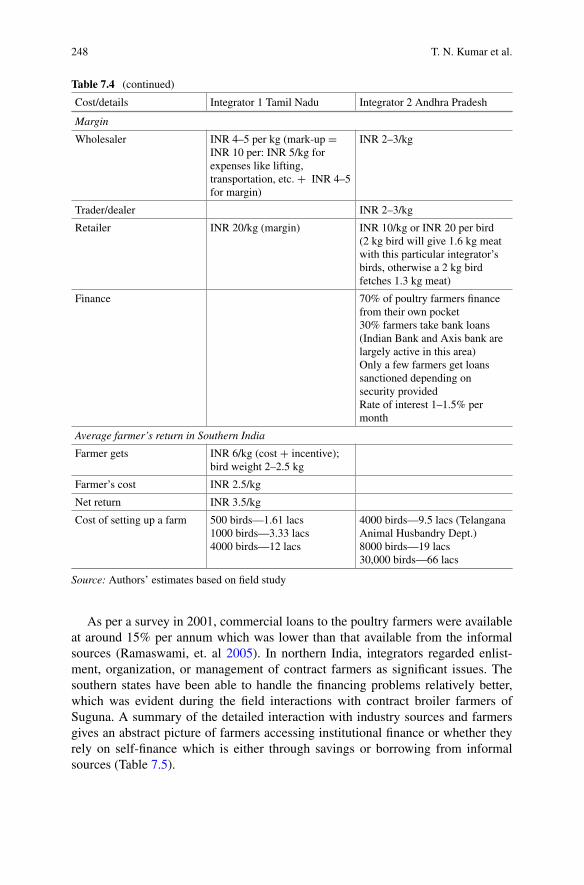
248 T. N. Kumar et al.
Table 7.4 (continued)
Cost/details Integrator 1 Tamil Nadu Integrator 2 Andhra Pradesh
Margin
Wholesaler INR 4–5 per kg (mark-up =INR 10 per: INR 5/kg forexpenses like lifting,transportation, etc. + INR 4–5for margin)
INR 2–3/kg
Trader/dealer INR 2–3/kg
Retailer INR 20/kg (margin) INR 10/kg or INR 20 per bird(2 kg bird will give 1.6 kg meatwith this particular integrator’sbirds, otherwise a 2 kg birdfetches 1.3 kg meat)
Finance 70% of poultry farmers financefrom their own pocket30% farmers take bank loans(Indian Bank and Axis bank arelargely active in this area)Only a few farmers get loanssanctioned depending onsecurity providedRate of interest 1–1.5% permonth
Average farmer’s return in Southern India
Farmer gets INR 6/kg (cost + incentive);bird weight 2–2.5 kg
Farmer’s cost INR 2.5/kg
Net return INR 3.5/kg
Cost of setting up a farm 500 birds—1.61 lacs1000 birds—3.33 lacs4000 birds—12 lacs
4000 birds—9.5 lacs (TelanganaAnimal Husbandry Dept.)8000 birds—19 lacs30,000 birds—66 lacs
Source: Authors’ estimates based on field study
As per a survey in 2001, commercial loans to the poultry farmers were availableat around 15% per annum which was lower than that available from the informalsources (Ramaswami, et. al 2005). In northern India, integrators regarded enlist-ment, organization, or management of contract farmers as significant issues. Thesouthern states have been able to handle the financing problems relatively better,which was evident during the field interactions with contract broiler farmers ofSuguna. A summary of the detailed interaction with industry sources and farmersgives an abstract picture of farmers accessing institutional finance or whether theyrely on self-finance which is either through savings or borrowing from informalsources (Table 7.5).
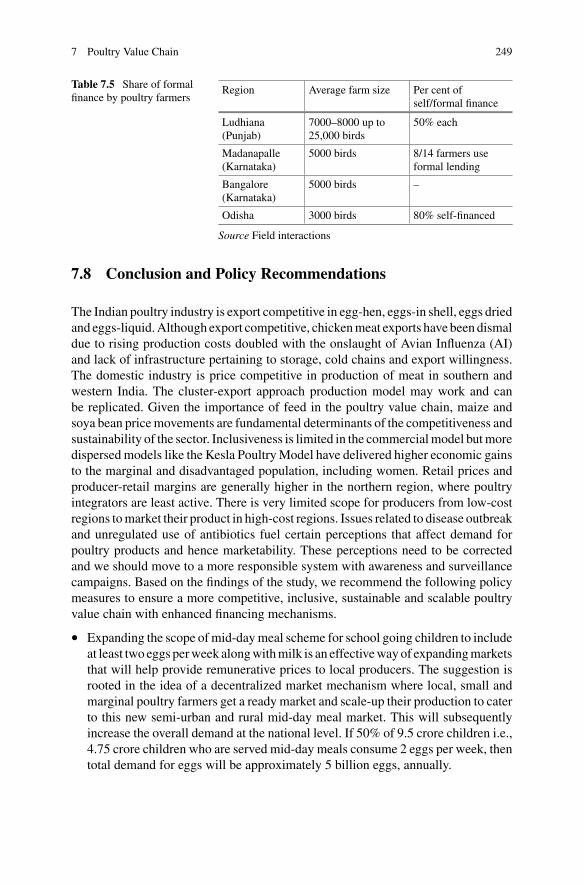
7 Poultry Value Chain 249
Table 7.5 Share of formalfinance by poultry farmers
Region Average farm size Per cent ofself/formal finance
Ludhiana(Punjab)
7000–8000 up to25,000 birds
50% each
Madanapalle(Karnataka)
5000 birds 8/14 farmers useformal lending
Bangalore(Karnataka)
5000 birds –
Odisha 3000 birds 80% self-financed
Source Field interactions
7.8 Conclusion and Policy Recommendations
The Indian poultry industry is export competitive in egg-hen, eggs-in shell, eggs driedand eggs-liquid.Although export competitive, chickenmeat exports have been dismaldue to rising production costs doubled with the onslaught of Avian Influenza (AI)and lack of infrastructure pertaining to storage, cold chains and export willingness.The domestic industry is price competitive in production of meat in southern andwestern India. The cluster-export approach production model may work and canbe replicated. Given the importance of feed in the poultry value chain, maize andsoya bean pricemovements are fundamental determinants of the competitiveness andsustainability of the sector. Inclusiveness is limited in the commercialmodel butmoredispersedmodels like the Kesla PoultryModel have delivered higher economic gainsto the marginal and disadvantaged population, including women. Retail prices andproducer-retail margins are generally higher in the northern region, where poultryintegrators are least active. There is very limited scope for producers from low-costregions tomarket their product in high-cost regions. Issues related to disease outbreakand unregulated use of antibiotics fuel certain perceptions that affect demand forpoultry products and hence marketability. These perceptions need to be correctedand we should move to a more responsible system with awareness and surveillancecampaigns. Based on the findings of the study, we recommend the following policymeasures to ensure a more competitive, inclusive, sustainable and scalable poultryvalue chain with enhanced financing mechanisms.
• Expanding the scope ofmid-daymeal scheme for school going children to includeat least two eggs perweek alongwithmilk is an effectivewayof expandingmarketsthat will help provide remunerative prices to local producers. The suggestion isrooted in the idea of a decentralized market mechanism where local, small andmarginal poultry farmers get a ready market and scale-up their production to caterto this new semi-urban and rural mid-day meal market. This will subsequentlyincrease the overall demand at the national level. If 50% of 9.5 crore children i.e.,4.75 crore children who are served mid-day meals consume 2 eggs per week, thentotal demand for eggs will be approximately 5 billion eggs, annually.
250 T. N. Kumar et al.
• Foreign direct investment (FDI) in the poultry value chain to upgrade infrastruc-ture, boost uptake of technology, improve farm management practices, can adda further boost to the sector for which the incentives and creation of an enablingenvironment will be critical.
• Poultry export market can be expanded, provided there is freight advantage andIndia is able to compete with Brazil and USA.
• Growth in the poultry sector is confined to zones and clusters in thewest and south-thus increasing the regional foot print in states with a higher potential (cateringto domestic markets). This needs to be panned out across the country to helppotential poultry farmers benefit from commercialization and greater integrationof poultry farming.
• Maize prices have a direct bearing on the cost of production and any policyaffecting prices would have a direct and critical impact on poultry producers’profitability. Hence policy measures to increase productivity of maize andmakingquality feed available at affordable prices should be a priority.
• Strengthening access to veterinary and extension services for non-contractfarmers, adequate provision must be made for the establishment of veterinaryITIs (as has been done in Andhra Pradesh), which would result in more numberof veterinary technicians at the grass-root level.
• Supporting collectivization of smallholders to achieve economies of scale (forexample, co-operatives, producer companies) would ensure the supply of inputs(day-old-chicks, veterinary services including vaccination, feed, productionsupervision and monitoring,); facilitate and enable market linkages; and mitigateprice risks.
• Addressing food safety issues along with effective surveillance (early detec-tion) and containment mechanism for diseases, especially, Avian Flu wouldsignificantly reduce the negative impact on domestic as well as export demand.
• Other important issues such as animal ethics andwelfarewill have to be consideredto strengthen the value chain. Technologies like artificial intelligence, robotics,etc. in the livestock sector will play an effective role in overcoming the challenges.
References
APEDA (2018) Agriexchange. The Agricultural and Processed Food Products Export DevelopmentAuthority. Ministry of Commerce and Industry, Government of India, New Delhi. Accessed fromhttps://agriexchange.apeda.gov.in/
DAHD (2020) Basic animal husbandry statistics 2020. Department of Animal Husbandry, Dairyingand Fisheries. Ministry of Agriculture & Farmers Welfare. Government of India
DAHDF (2015) Basic animal husbandry & fisheries statistics 2015. Department of AnimalHusbandry, Dairying and Fisheries. Ministry of Agriculture & Farmers Welfare. Governmentof India
DAHDF (2017) National action plan for egg & poultry-2022 for doubling farmers’ income by2022. Department ofAnimalHusbandry, Dairying&FisheriesMinistry ofAgriculture&FarmersWelfare Government of India
7 Poultry Value Chain 251
DAHDF (2018) Basic animal husbandry and fisheries statistics 2018. Department of AnimalHusbandry, Dairying and Fisheries. Ministry of Agriculture & Farmers Welfare. Governmentof India
DGCIS (2018) Export Import database. Department of Commerce. Ministry of Commerce andIndustry
FAOSTAT (2018) Food and agriculture data. Retrieved from Food and Agriculture Organization ofthe United Nations: http://www.fao.org/faostat/en/#data
FICCI (2018) Maize Vision 2022. Knowledge ReportGerber PJ, Steinfeld H, Henderson B, Mottet A, Opio C, Dijkman J, Falcucci A, Tempio G (2013)Tackling climate change through livestock—a global assessment of emissions and mitigationopportunities. Food and Agriculture Organization of the United Nations (FAO), Rome
Government of India (2017) Reviving and accelerating India’s exports: policy issues and sugges-tions. Working Paper No. 1/2017-DEA. Economic Division. Department of Economic Affairs.Ministry of Finance. Available at https://dea.gov.in/sites/default/files/RevivingAcceleratingIndiaExports_Issues_Suggestions.pdf
Government of India (No Date) National action plan for egg & poultry—2022 for doublingfarmers income by 2022. Department of Animal Husbandry, Dairying and Fisheries. Ministry ofAgriculture & Farmers’ Welfare. Government of India
Harshvardhan. (2010). Poultry rearing as an income-generating activity in Kesla: animpact assessment study. Pradan. NewsReach November-December 2010. Accessedfrom https://www.pradan.net/sampark/wp-content/uploads/2019/08/Poultry-Rearing-as-an-Income-generating-Activity-in-Kesla-An-Impact-Assessment-Study.pdf
Hellin J, Krishna V, Erenstein O, Boeber C (2015) India’s poultry revolution: implications forits sustenance and the global poultry trade. Int Food Agribusiness Manag Rev 18(1030-2016-83092):151–164
Henderson J (2015) Building US agricultural exports—one BRIC at a time. http://www.kansascityfed.org/publicat/econrev/pdf/11q1Henderson.pdf
Kotaiah T (2016) Poultry production in India—The current scenario. FnBnews.com. 10th March2016. Available at http://www.fnbnews.com/Poultry/poultry-production-in-india--the-current-scenario-38620. Last accessed on 5th August 2019. Last accessed on 20th July 2019
Kumar BG, Joshi PK, Datta KK, Singh SB (2008, January–June) An assessment of economic lossesdue to avian flu in Manipur state. Agric Econ Res Rev 21:37–47
Mehta R, Nambiar RG, Singh SK, Subrahmanyam S, Ravi C (2003) Policy, technical, and environ-mental determinants and implications of the scaling-up of broiler and egg production in India.IFPRI/FAO Livestock Industrialization Project, Phase II Project. Washington DC, InternationalFood Policy Research Institute
Mehta R, Narrod C, Tiongco M (2008) Livestock industrialization, trade and social-health-environment impacts in developing countries: a case of India poultry sector. MPRA Paper No.32678. Available at https://mpra.ub.uni-muenchen.de/32678/. Last accessed on 26th August 2019
Narrod C, Pray C (2001) Technology transfer, policies, and the global livestock revolution. In:Proceedings of the international agricultural trade research consortium symposium on trade inLivestock products. Auckland, New Zealand
Narrod C, Tiongco M, Costales A (2008) Global poultry sector trends and external drivers ofstructural change. In: Thieme O, Pilling D (eds) Poultry in the 21st Century: avian influenza andbeyond. Proceedings of the international poultry conference, held 5–7 November 2007, Bangkok,Thailand. FAO Animal Production and Health Proceedings, No. 9. Rome (extended electronicversion)
NCAER (2015, September) Agricultural outlook and situation analysis reports. Fourth semi-annualmedium-term agricultural outlook report. National Council of Applied Economic Research
Pradhan S (2016) Eggs—not so fragile profits! The dollar business. February 2016 Issue. Availableat https://www.thedollarbusiness.com/magazine/eggs---not-so-fragile-profits-/39583
252 T. N. Kumar et al.
Ramaswami B, Birthal PS, Joshi PK (2005) Efficiency and distribution in contract farming: the caseof Indian poultry growers. Discussion Paper 05-01. Indian Statistical Institute. Delhi PlanningUnit
Ravindran V (2013) Poultry feed availability and nutrition in developing countries. Poultry DevRev 60–63. FAO, Rome, Italy
Singh R (2019) Poultry sector of India can play a pivotal role in solving the present economic slow-down crisis. 6th Sept 2019. Available at https://www.pashudhanpraharee.com/poultry-sector-of-india-can-play-a-pivotal-role-in-solving-the-present-economic-slowdown-crisis/. Last accessedon 20th December 2019
Singh RP, Pal S (1992) Technological advancement and the state of maize development in India—anappraisal. Agric Situation India 47(4):245–252
USDAFAS (2016) Poultry and poultry products annual 2016. GAIN report number: IN 6151. India.New Delhi. Available at http://agriexchange.apeda.gov.in/MarketReport/Reports/Poultry_and_Poultry_Products_Annual_2016_New%20Delhi_India_12-1-2016.pdf. Last accessed on 29thApril 2018
Van Der Sluis W (2007) Intensive poultry production better for global warming.World Poul 23:12,28–31. www.worldpoultry.net
Verbiest JP, Castillo C (2004) Avian flu: an economic assessment for selected developing countriesin Asia. ERD Policy Brief No. 24, Economics and Research Department, Asian DevelopmentBank, Manila
Open Access This chapter is licensed under the terms of the Creative Commons Attribution 4.0International License (http://creativecommons.org/licenses/by/4.0/), which permits use, sharing,adaptation, distribution and reproduction in any medium or format, as long as you give appropriatecredit to the original author(s) and the source, provide a link to the Creative Commons license andindicate if changes were made.
The images or other third party material in this chapter are included in the chapter’s CreativeCommons license, unless indicated otherwise in a credit line to the material. If material is notincluded in the chapter’s Creative Commons license and your intended use is not permitted bystatutory regulation or exceeds the permitted use, you will need to obtain permission directly fromthe copyright holder.
Chapter 8Pulses Value Chain- Pigeon Peaand Gram
Kavery Ganguly and Ashok Gulati
8.1 Introduction
8.1.1 Significance of Pulses in India
Pulses form an important part of Indian agriculture given that the country is thelargest producer, consumer and importer of pulses. Owing to their natural resilienceto extreme weather conditions, low water requirements and being environmentallybenign, pulses have been traditionally a smallholder’s crop. However, with poorprice realization, farmers have been switching towards other remunerative cropssuch as sugarcane, soybean, among others. Unlike rice and wheat, pulses are notcovered by the regular public procurement system which makes marketing of pulsesat fair and remunerative prices, a challenge for the farmers. Pulses are no longer apoor man’s diet given the escalating consumer prices. Nonetheless, it is consideredas an important source of protein (given the large vegetarian diet base in India),consumption of which is being promoted to address the protein gap in the diets. Overtime, per capita availability of pulses has declined like other traditional cereals. Withchanging consumption patterns and emerging dietary deficiencies, there is scope forenhancing consumption of pulses through traditional and value-added products.
Pulses account for only 4% of the value of crop agriculture and cover about11.7% of the gross-cropped area. Since 1950s, area under pulses as a per cent oftotal area under food grain remained almost unchanged at 20% with some minorannual deviations. The share of pulses as a per cent of total food grain productiondeclined over a period of time and is about 7% average for the five-year periodending 2016–17. About 17% of the area under pulses is irrigated for the five-yearperiod average ending 2013–14. In addition to being less water intensive comparedto other crops, pulses can withstand extreme temperatures and also enable natural
K. Ganguly · A. Gulati (B)Indian Council for Research on International Economic Relations (ICRIER), New Delhi, Delhi,India
© The Author(s) 2022A. Gulati et al. (eds.), Agricultural Value Chains in India, India Studies in Businessand Economics, https://doi.org/10.1007/978-981-33-4268-2_8
253
254 K. Ganguly and A. Gulati
fixation of nitrogen in the soil due to its leguminous properties. Gram and pigeon peatogether account for 52% of pulses area and 61% of production (as estimated for TE2015–16). Agricultural imports in India largely comprise of pulses, after edible oils.Yellow peas accounted for 49% of pulses import for the period 2010–11 to 2016–17. Factors related to lack of expansion of area under pulses through persistent lowyields due to lack of anymajor technological breakthrough have restricted productionexpansion. Coupled with this, a weak procurement regime has resulted in inadequatedomestic availability of pulses. Owing to these gaps, Government of India (GoI)adopted a focussed policy thrust to augment pulses production and programs suchas the National Food Security Mission (NFSM); Integrated Development of PulsesVillages, among others. While these are more supply side policy efforts, enoughemphasis on marketing infrastructure and practices has been missing, resulting inpoor price realization for the farmers. Responding to situations when market pricesfell below minimum support price (MSP), government procured pulses through thepublic procurement agencies such as National Agricultural Cooperative MarketingFederation of India Limited (NAFED) and Small Farmers Agribusiness Consortium(SFAC) through the Price Stabilization Fund (PSF) and Price Support Scheme (PSS).In 2016–17 and 2017–18, farmers had been under severe distress owing to marketprices crashing below MSP resulting in state-wide agitation and demonstration bythe farmers. The crisis situation forced several state governments to ease off thepressure by announcing loan waivers and introducing price deficiency payments anddirect benefit transfer programs. Notably, Madhya Pradesh introduced the BhavantarBhugtanYojana (BBY) in September 2017, to compensate the farmers, the differencebetween MSP and average sale price without getting into physical procurement. Inthe case of loan waivers, there are concerns about the extent to which farmers underdistress actually benefit. Loan waivers have been widely debated and are perceivedto be more populist in nature and lacked economic rationale.
8.1.2 Major trends in Consumption and Production of Pulses
Pulses are an integral part of the staple vegetarian diet of Indians. Per capita avail-ability of pulses reduced by 38%, to 43.8 g per day in 2015 from a peak of 70.3 g perday in 1956. Pulses contributed to 10.6% of protein intake in rural areas and 12.4%in urban areas in 2011–12 (Government of India 2014a). The increase in proteinintake from pulses over the years has been the slowest among all other foods. Asper the NSSO estimates for 2011–12, an average Indian consumes 739 g per monthor 8.9 kg per annum of pulses in rural areas while and 857 g per month or 10.3 kgsper annum of pulses in urban areas. The share of pulses in per capita consumptionexpenditure on food has been fluctuating. It decreased from 5.9% in 1993–94 to 5.4%in 2004–05, then increased to 6.8% in 2009–10 and declined to 6.1% in 2011–12(Government of India 2014a). Prices of pulses have increased significantly, notablyin urad, tur and chana. Since April 2006, the highest peak in wholesale price indexof pulses was observed in November 2015. Although retail prices of pulses escalatedsharply, the same has not resulted in higher prices for farmers.
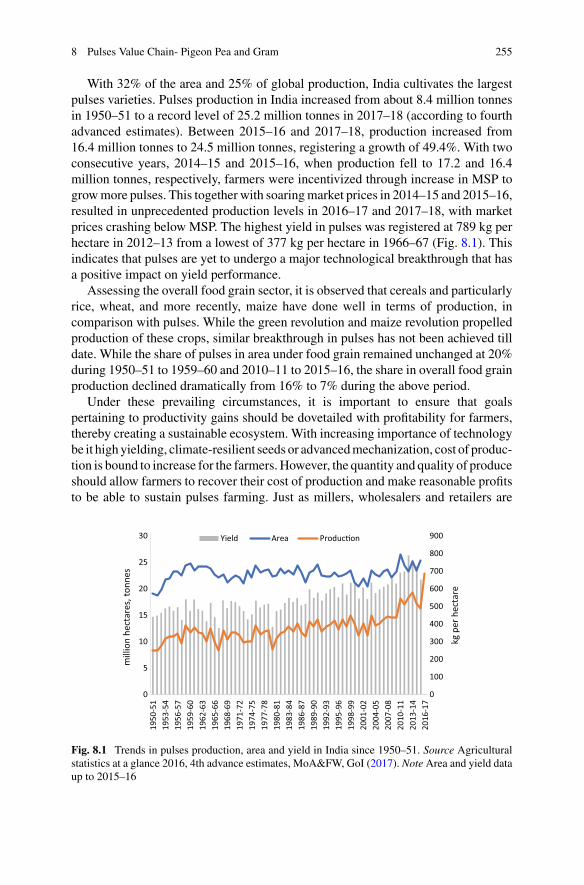
8 Pulses Value Chain- Pigeon Pea and Gram 255
With 32% of the area and 25% of global production, India cultivates the largestpulses varieties. Pulses production in India increased from about 8.4 million tonnesin 1950–51 to a record level of 25.2 million tonnes in 2017–18 (according to fourthadvanced estimates). Between 2015–16 and 2017–18, production increased from16.4 million tonnes to 24.5 million tonnes, registering a growth of 49.4%. With twoconsecutive years, 2014–15 and 2015–16, when production fell to 17.2 and 16.4million tonnes, respectively, farmers were incentivized through increase in MSP togrowmore pulses. This together with soaringmarket prices in 2014–15 and 2015–16,resulted in unprecedented production levels in 2016–17 and 2017–18, with marketprices crashing below MSP. The highest yield in pulses was registered at 789 kg perhectare in 2012–13 from a lowest of 377 kg per hectare in 1966–67 (Fig. 8.1). Thisindicates that pulses are yet to undergo a major technological breakthrough that hasa positive impact on yield performance.
Assessing the overall food grain sector, it is observed that cereals and particularlyrice, wheat, and more recently, maize have done well in terms of production, incomparison with pulses. While the green revolution and maize revolution propelledproduction of these crops, similar breakthrough in pulses has not been achieved tilldate. While the share of pulses in area under food grain remained unchanged at 20%during 1950–51 to 1959–60 and 2010–11 to 2015–16, the share in overall food grainproduction declined dramatically from 16% to 7% during the above period.
Under these prevailing circumstances, it is important to ensure that goalspertaining to productivity gains should be dovetailed with profitability for farmers,thereby creating a sustainable ecosystem. With increasing importance of technologybe it high yielding, climate-resilient seeds or advancedmechanization, cost of produc-tion is bound to increase for the farmers. However, the quantity and quality of produceshould allow farmers to recover their cost of production and make reasonable profitsto be able to sustain pulses farming. Just as millers, wholesalers and retailers are
0
100
200
300
400
500
600
700
800
900
0
5
10
15
20
25
30
1950
-51
1953
-54
1956
-57
1959
-60
1962
-63
1965
-66
1968
-69
1971
-72
1974
-75
1977
-78
1980
-81
1983
-84
1986
-87
1989
-90
1992
-93
1995
-96
1998
-99
2001
-02
2004
-05
2007
-08
2010
-11
2013
-14
2016
-17
kg p
er h
ecta
re
mill
ion
hect
ares
, ton
nes
Yield Area Produc�on
Fig. 8.1 Trends in pulses production, area and yield in India since 1950–51. Source Agriculturalstatistics at a glance 2016, 4th advance estimates, MoA&FW, GoI (2017). NoteArea and yield dataup to 2015–16
256 K. Ganguly and A. Gulati
able to play the markets, farmers should be given similar options. Hence, marketingopportunities need to be widened for the farmers to benefit from higher price real-ization either by streamlining the physical value chain and reducing the margins orproviding farmers the option of holding their produce inwarehouses and participatingin futures market.
8.1.3 Study Objective
The objective of the study is to map the current pulses value chain in the context ofcompetitiveness, inclusiveness, sustainability and scalability and access to finance(CISS-F). This study focusses on gram/chana and pigeon pea/tur/arhar, whichtogether account for nearly half of the pulses production basket.
• Competitiveness is assessed in terms of domestic price formation in the pigeonpea and chana value chains. Wholesale and retail prices are analyzed to assessthe spread of prices in the respective value chain. Since the study is not basedon primary representative surveys, obtaining the actual costs and margins in thechain was not feasible. Competitiveness also includes the international import andexport trends and tariff regulations.
• Inclusiveness is assessed in terms of the irrigated and non-irrigated area underpulses. Majority of the farmers are marginal and small and operate less than 2hectares of land, and pulses are largely rainfed. Access to irrigation results inhigher productivity of pulses and hence higher marketable surplus. Inclusivenessin terms of access to markets, storage and processing is also captured throughsecondary research.
• Sustainability is assessed at three levels for pigeon pea and chana value chains
– sustainability of production growth through increased productivity– environmental sustainability in terms of the impact of increasing production
on water and soil– financial sustainability in terms of cost of cultivating pigeon pea and chana
and the price received (MSP or wholesale market price)
• Scalability is assessed in terms of the potential to diversify to other pulses inaddition to chana and pigeon pea; diversify production of pulses to states otherthan Maharashtra and Madhya Pradesh that are agro climatically suitable forgrowing pulses and have the scope for improving yield levels.
• Access to finance is assessed in terms of farmers availing loans or subsidies ingeneral and those targeted to the pulses growing farmers. Also, financing of thevalue chain particularly, milling in the case of pulses, is also studied.
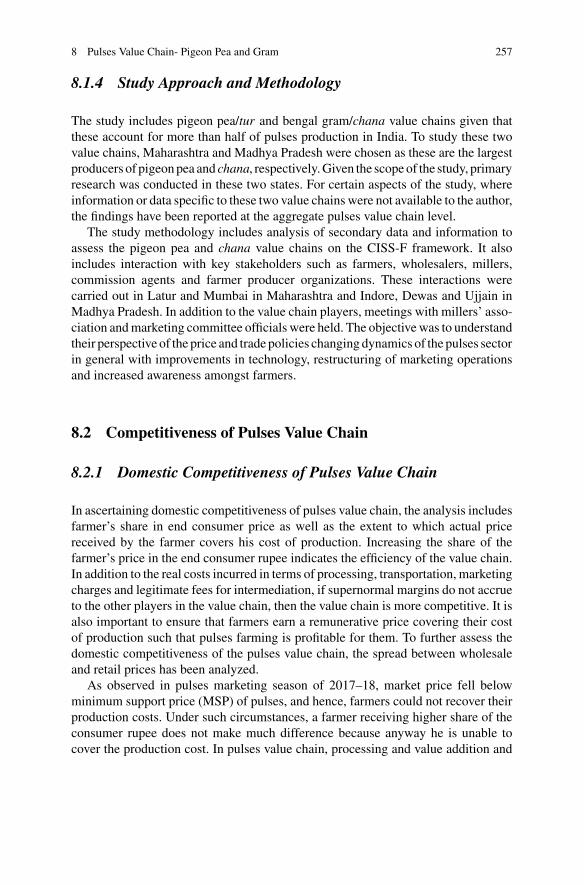
8 Pulses Value Chain- Pigeon Pea and Gram 257
8.1.4 Study Approach and Methodology
The study includes pigeon pea/tur and bengal gram/chana value chains given thatthese account for more than half of pulses production in India. To study these twovalue chains, Maharashtra and Madhya Pradesh were chosen as these are the largestproducers of pigeonpea and chana, respectively.Given the scopeof the study, primaryresearch was conducted in these two states. For certain aspects of the study, whereinformation or data specific to these two value chains were not available to the author,the findings have been reported at the aggregate pulses value chain level.
The study methodology includes analysis of secondary data and information toassess the pigeon pea and chana value chains on the CISS-F framework. It alsoincludes interaction with key stakeholders such as farmers, wholesalers, millers,commission agents and farmer producer organizations. These interactions werecarried out in Latur and Mumbai in Maharashtra and Indore, Dewas and Ujjain inMadhya Pradesh. In addition to the value chain players, meetings with millers’ asso-ciation andmarketing committee officials were held. The objectivewas to understandtheir perspective of the price and trade policies changingdynamics of the pulses sectorin general with improvements in technology, restructuring of marketing operationsand increased awareness amongst farmers.
8.2 Competitiveness of Pulses Value Chain
8.2.1 Domestic Competitiveness of Pulses Value Chain
In ascertaining domestic competitiveness of pulses value chain, the analysis includesfarmer’s share in end consumer price as well as the extent to which actual pricereceived by the farmer covers his cost of production. Increasing the share of thefarmer’s price in the end consumer rupee indicates the efficiency of the value chain.In addition to the real costs incurred in terms of processing, transportation, marketingcharges and legitimate fees for intermediation, if supernormal margins do not accrueto the other players in the value chain, then the value chain is more competitive. It isalso important to ensure that farmers earn a remunerative price covering their costof production such that pulses farming is profitable for them. To further assess thedomestic competitiveness of the pulses value chain, the spread between wholesaleand retail prices has been analyzed.
As observed in pulses marketing season of 2017–18, market price fell belowminimum support price (MSP) of pulses, and hence, farmers could not recover theirproduction costs. Under such circumstances, a farmer receiving higher share of theconsumer rupee does not make much difference because anyway he is unable tocover the production cost. In pulses value chain, processing and value addition and
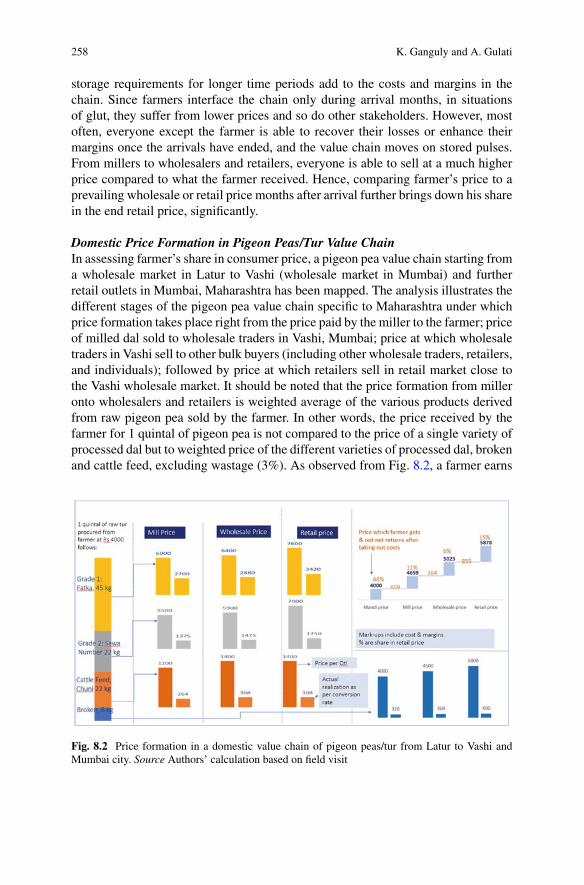
258 K. Ganguly and A. Gulati
storage requirements for longer time periods add to the costs and margins in thechain. Since farmers interface the chain only during arrival months, in situationsof glut, they suffer from lower prices and so do other stakeholders. However, mostoften, everyone except the farmer is able to recover their losses or enhance theirmargins once the arrivals have ended, and the value chain moves on stored pulses.From millers to wholesalers and retailers, everyone is able to sell at a much higherprice compared to what the farmer received. Hence, comparing farmer’s price to aprevailing wholesale or retail price months after arrival further brings down his sharein the end retail price, significantly.
Domestic Price Formation in Pigeon Peas/Tur Value ChainIn assessing farmer’s share in consumer price, a pigeon pea value chain starting froma wholesale market in Latur to Vashi (wholesale market in Mumbai) and furtherretail outlets in Mumbai, Maharashtra has been mapped. The analysis illustrates thedifferent stages of the pigeon pea value chain specific to Maharashtra under whichprice formation takes place right from the price paid by the miller to the farmer; priceof milled dal sold to wholesale traders in Vashi, Mumbai; price at which wholesaletraders in Vashi sell to other bulk buyers (including other wholesale traders, retailers,and individuals); followed by price at which retailers sell in retail market close tothe Vashi wholesale market. It should be noted that the price formation from milleronto wholesalers and retailers is weighted average of the various products derivedfrom raw pigeon pea sold by the farmer. In other words, the price received by thefarmer for 1 quintal of pigeon pea is not compared to the price of a single variety ofprocessed dal but to weighted price of the different varieties of processed dal, brokenand cattle feed, excluding wastage (3%). As observed from Fig. 8.2, a farmer earns
Fig. 8.2 Price formation in a domestic value chain of pigeon peas/tur from Latur to Vashi andMumbai city. Source Authors’ calculation based on field visit
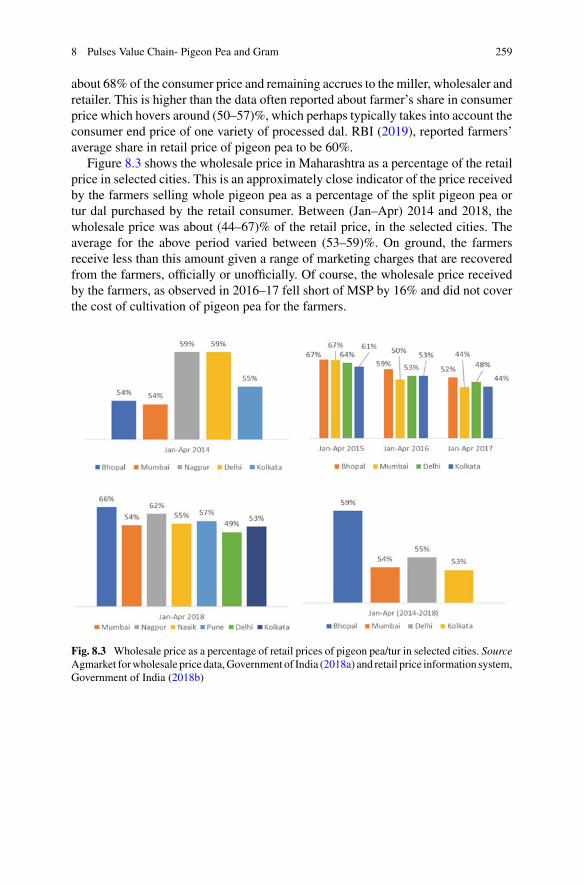
8 Pulses Value Chain- Pigeon Pea and Gram 259
about 68% of the consumer price and remaining accrues to the miller, wholesaler andretailer. This is higher than the data often reported about farmer’s share in consumerprice which hovers around (50–57)%, which perhaps typically takes into account theconsumer end price of one variety of processed dal. RBI (2019), reported farmers’average share in retail price of pigeon pea to be 60%.
Figure 8.3 shows the wholesale price in Maharashtra as a percentage of the retailprice in selected cities. This is an approximately close indicator of the price receivedby the farmers selling whole pigeon pea as a percentage of the split pigeon pea ortur dal purchased by the retail consumer. Between (Jan–Apr) 2014 and 2018, thewholesale price was about (44–67)% of the retail price, in the selected cities. Theaverage for the above period varied between (53–59)%. On ground, the farmersreceive less than this amount given a range of marketing charges that are recoveredfrom the farmers, officially or unofficially. Of course, the wholesale price receivedby the farmers, as observed in 2016–17 fell short of MSP by 16% and did not coverthe cost of cultivation of pigeon pea for the farmers.
Fig. 8.3 Wholesale price as a percentage of retail prices of pigeon pea/tur in selected cities. SourceAgmarket forwholesale price data,Government of India (2018a) and retail price information system,Government of India (2018b)
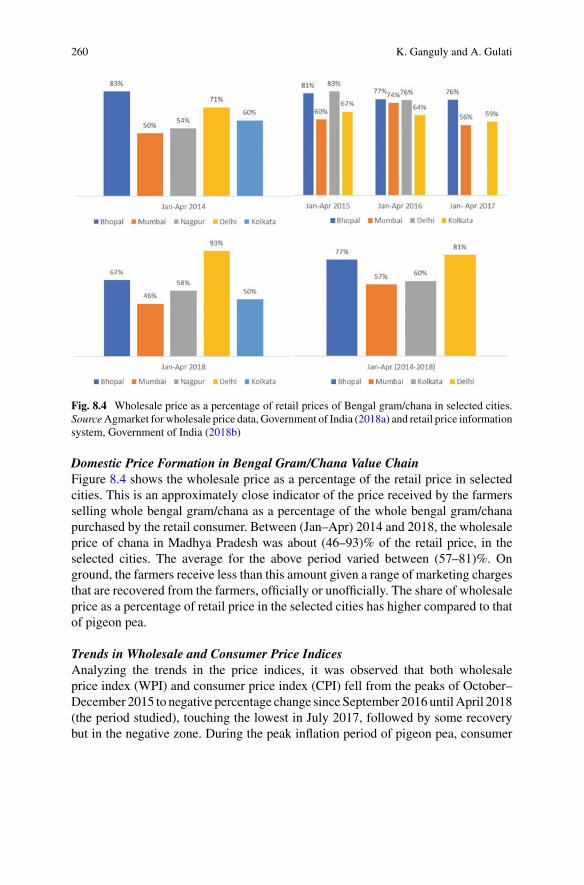
260 K. Ganguly and A. Gulati
Fig. 8.4 Wholesale price as a percentage of retail prices of Bengal gram/chana in selected cities.SourceAgmarket for wholesale price data, Government of India (2018a) and retail price informationsystem, Government of India (2018b)
Domestic Price Formation in Bengal Gram/Chana Value ChainFigure 8.4 shows the wholesale price as a percentage of the retail price in selectedcities. This is an approximately close indicator of the price received by the farmersselling whole bengal gram/chana as a percentage of the whole bengal gram/chanapurchased by the retail consumer. Between (Jan–Apr) 2014 and 2018, the wholesaleprice of chana in Madhya Pradesh was about (46–93)% of the retail price, in theselected cities. The average for the above period varied between (57–81)%. Onground, the farmers receive less than this amount given a range of marketing chargesthat are recovered from the farmers, officially or unofficially. The share of wholesaleprice as a percentage of retail price in the selected cities has higher compared to thatof pigeon pea.
Trends in Wholesale and Consumer Price IndicesAnalyzing the trends in the price indices, it was observed that both wholesaleprice index (WPI) and consumer price index (CPI) fell from the peaks of October–December 2015 to negative percentage change sinceSeptember 2016untilApril 2018(the period studied), touching the lowest in July 2017, followed by some recoverybut in the negative zone. During the peak inflation period of pigeon pea, consumer
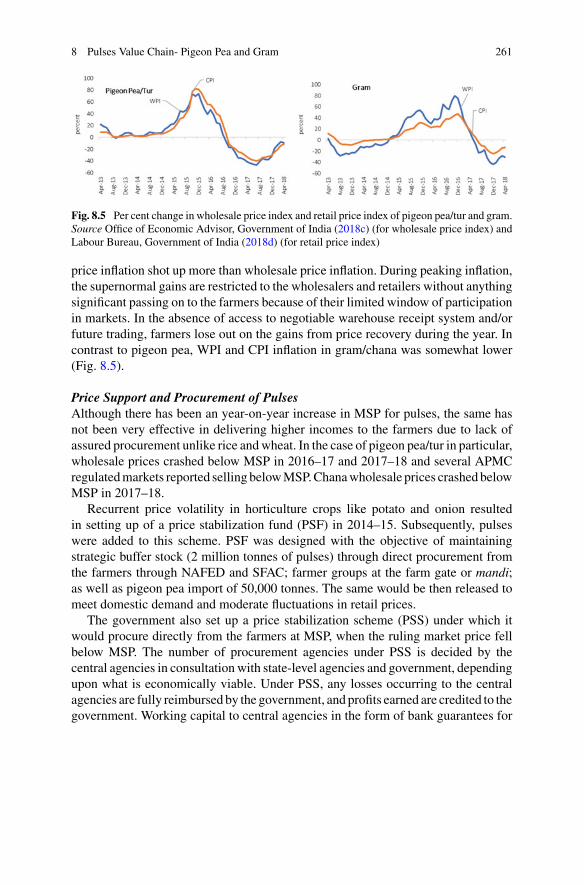
8 Pulses Value Chain- Pigeon Pea and Gram 261
Fig. 8.5 Per cent change in wholesale price index and retail price index of pigeon pea/tur and gram.Source Office of Economic Advisor, Government of India (2018c) (for wholesale price index) andLabour Bureau, Government of India (2018d) (for retail price index)
price inflation shot up more than wholesale price inflation. During peaking inflation,the supernormal gains are restricted to the wholesalers and retailers without anythingsignificant passing on to the farmers because of their limited window of participationin markets. In the absence of access to negotiable warehouse receipt system and/orfuture trading, farmers lose out on the gains from price recovery during the year. Incontrast to pigeon pea, WPI and CPI inflation in gram/chana was somewhat lower(Fig. 8.5).
Price Support and Procurement of PulsesAlthough there has been an year-on-year increase in MSP for pulses, the same hasnot been very effective in delivering higher incomes to the farmers due to lack ofassured procurement unlike rice andwheat. In the case of pigeon pea/tur in particular,wholesale prices crashed below MSP in 2016–17 and 2017–18 and several APMCregulatedmarkets reported selling belowMSP.Chanawholesale prices crashedbelowMSP in 2017–18.
Recurrent price volatility in horticulture crops like potato and onion resultedin setting up of a price stabilization fund (PSF) in 2014–15. Subsequently, pulseswere added to this scheme. PSF was designed with the objective of maintainingstrategic buffer stock (2 million tonnes of pulses) through direct procurement fromthe farmers through NAFED and SFAC; farmer groups at the farm gate or mandi;as well as pigeon pea import of 50,000 tonnes. The same would be then released tomeet domestic demand and moderate fluctuations in retail prices.
The government also set up a price stabilization scheme (PSS) under which itwould procure directly from the farmers at MSP, when the ruling market price fellbelow MSP. The number of procurement agencies under PSS is decided by thecentral agencies in consultationwith state-level agencies and government, dependingupon what is economically viable. Under PSS, any losses occurring to the centralagencies are fully reimbursed by the government, and profits earned are credited to thegovernment. Working capital to central agencies in the form of bank guarantees for
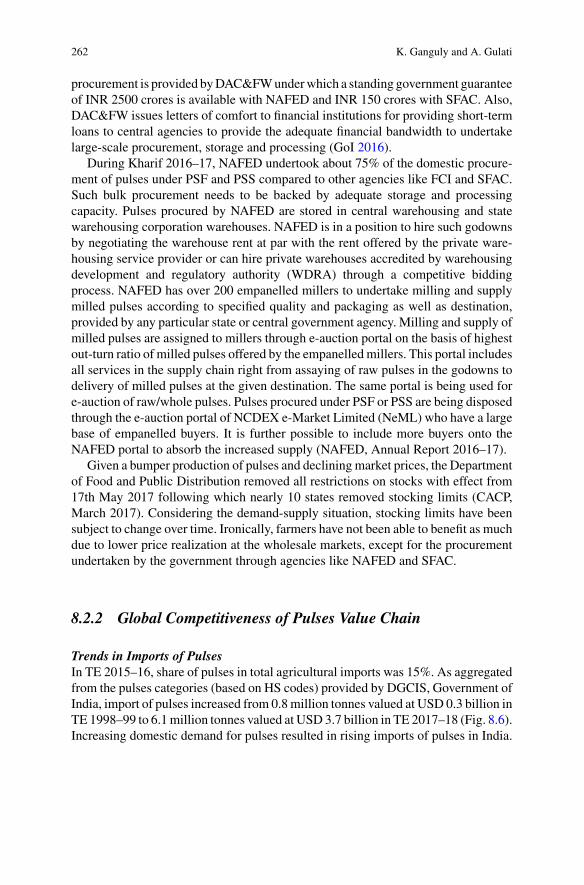
262 K. Ganguly and A. Gulati
procurement is provided byDAC&FWunderwhich a standing government guaranteeof INR 2500 crores is available with NAFED and INR 150 crores with SFAC. Also,DAC&FW issues letters of comfort to financial institutions for providing short-termloans to central agencies to provide the adequate financial bandwidth to undertakelarge-scale procurement, storage and processing (GoI 2016).
During Kharif 2016–17, NAFED undertook about 75% of the domestic procure-ment of pulses under PSF and PSS compared to other agencies like FCI and SFAC.Such bulk procurement needs to be backed by adequate storage and processingcapacity. Pulses procured by NAFED are stored in central warehousing and statewarehousing corporation warehouses. NAFED is in a position to hire such godownsby negotiating the warehouse rent at par with the rent offered by the private ware-housing service provider or can hire private warehouses accredited by warehousingdevelopment and regulatory authority (WDRA) through a competitive biddingprocess. NAFED has over 200 empanelled millers to undertake milling and supplymilled pulses according to specified quality and packaging as well as destination,provided by any particular state or central government agency. Milling and supply ofmilled pulses are assigned to millers through e-auction portal on the basis of highestout-turn ratio of milled pulses offered by the empanelled millers. This portal includesall services in the supply chain right from assaying of raw pulses in the godowns todelivery of milled pulses at the given destination. The same portal is being used fore-auction of raw/whole pulses. Pulses procured under PSF or PSS are being disposedthrough the e-auction portal of NCDEX e-Market Limited (NeML) who have a largebase of empanelled buyers. It is further possible to include more buyers onto theNAFED portal to absorb the increased supply (NAFED, Annual Report 2016–17).
Given a bumper production of pulses and declining market prices, the Departmentof Food and Public Distribution removed all restrictions on stocks with effect from17th May 2017 following which nearly 10 states removed stocking limits (CACP,March 2017). Considering the demand-supply situation, stocking limits have beensubject to change over time. Ironically, farmers have not been able to benefit as muchdue to lower price realization at the wholesale markets, except for the procurementundertaken by the government through agencies like NAFED and SFAC.
8.2.2 Global Competitiveness of Pulses Value Chain
Trends in Imports of PulsesIn TE 2015–16, share of pulses in total agricultural imports was 15%. As aggregatedfrom the pulses categories (based on HS codes) provided by DGCIS, Government ofIndia, import of pulses increased from 0.8million tonnes valued at USD 0.3 billion inTE 1998–99 to 6.1million tonnes valued at USD 3.7 billion in TE 2017–18 (Fig. 8.6).Increasing domestic demand for pulses resulted in rising imports of pulses in India.
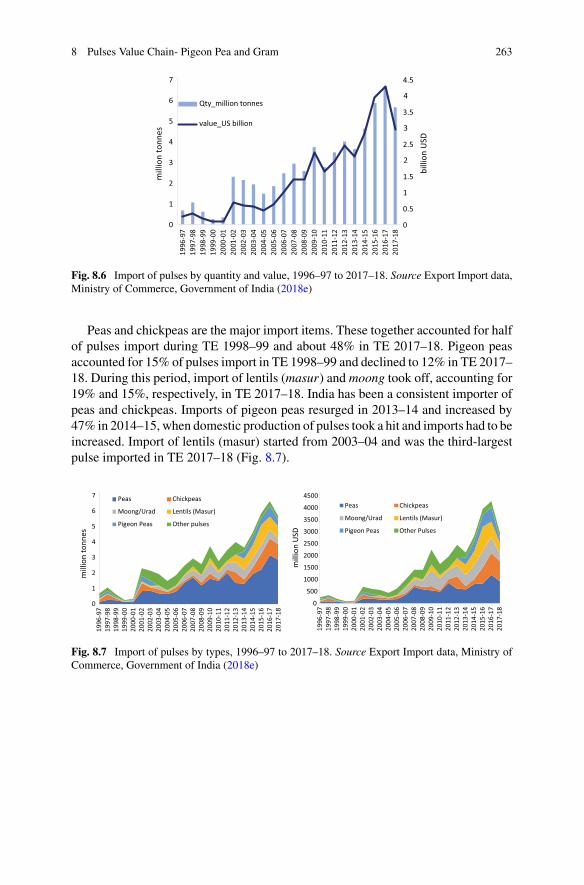
8 Pulses Value Chain- Pigeon Pea and Gram 263
0
0.5
1
1.5
2
2.5
3
3.5
4
4.5
0
1
2
3
4
5
6
7
1996
-97
1997
-98
1998
-99
1999
-00
2000
-01
2001
-02
2002
-03
2003
-04
2004
-05
2005
-06
2006
-07
2007
-08
2008
-09
2009
-10
2010
-11
2011
-12
2012
-13
2013
-14
2014
-15
2015
-16
2016
-17
2017
-18
billi
on U
SD
mill
ion
tonn
es
Qty_million tonnes
value_US billion
Fig. 8.6 Import of pulses by quantity and value, 1996–97 to 2017–18. Source Export Import data,Ministry of Commerce, Government of India (2018e)
Peas and chickpeas are the major import items. These together accounted for halfof pulses import during TE 1998–99 and about 48% in TE 2017–18. Pigeon peasaccounted for 15% of pulses import in TE 1998–99 and declined to 12% in TE 2017–18. During this period, import of lentils (masur) and moong took off, accounting for19% and 15%, respectively, in TE 2017–18. India has been a consistent importer ofpeas and chickpeas. Imports of pigeon peas resurged in 2013–14 and increased by47% in 2014–15, when domestic production of pulses took a hit and imports had to beincreased. Import of lentils (masur) started from 2003–04 and was the third-largestpulse imported in TE 2017–18 (Fig. 8.7).
0
500
1000
1500
2000
2500
3000
3500
4000
4500
1996
-97
1997
-98
1998
-99
1999
-00
2000
-01
2001
-02
2002
-03
2003
-04
2004
-05
2005
-06
2006
-07
2007
-08
2008
-09
2009
-10
2010
-11
2011
-12
2012
-13
2013
-14
2014
-15
2015
-16
2016
-17
2017
-18
mill
ion
USD
Peas Chickpeas
Moong/Urad Lentils (Masur)
Pigeon Peas Other Pulses
0
1
2
3
4
5
6
7
1996
-97
1997
-98
1998
-99
1999
-00
2000
-01
2001
-02
2002
-03
2003
-04
2004
-05
2005
-06
2006
-07
2007
-08
2008
-09
2009
-10
2010
-11
2011
-12
2012
-13
2013
-14
2014
-15
2015
-16
2016
-17
2017
-18
mill
ion
tonn
es
Peas Chickpeas
Moong/Urad Lentils (Masur)
Pigeon Peas Other pulses
Fig. 8.7 Import of pulses by types, 1996–97 to 2017–18. Source Export Import data, Ministry ofCommerce, Government of India (2018e)
264 K. Ganguly and A. Gulati
Major Import Origin Countries for PulsesIndia is dependent on very few countries for import of pulses and nearly on singlecountry for a particular pulse. This leaves India quite vulnerable to thin globalmarketsand fluctuations in prices. For instance, Canada is the major source of importing peaswith nearly 53% of the imports sourced from Canada during TE 2017–18 followedby Russia and Ukraine (replaced US as the third-largest country for sourcing peasin 2017–18). For chickpeas, Australia is the leading source of imports for Indiaaccounting for 81% during TE 2017–18. Myanmar is the leading source of importof moong/urad bean and accounted for 76% of the imports in TE 2017–18. Again,Canada is the largest destination for sourcing lentils (masur) accounting for 76% inTE2017–18.DuringTE2017–18, India imported 47%of pigeon peas fromMyanmarand remaining 53% from sixAfrican countries, viz,Mozambique, Tanzania,Malawi,Kenya, Sudan and Uganda. Earlier during 1996–97 to 2002–03, Myanmar was thesole country supplying pigeon pea to India.
The widening demand-supply gap in pulses before 2016–17, led to government togovernment (G2G) dialogues and private sector collaboration for producing pulsesin the African continent for imports to India. Indian companies like Mahindra andMahindra, Tata, among others invested in Africa to grow pulses leveraging theirexisting presence in agribusiness sector and/or through greenfield investment giventhe abundance of land and favourable climatic conditions. The government of Indiaalso pursued dialogues to develop a roadmap to ensure that India is able to sourceenough pulses for meeting domestic demand. These efforts resulted in stepping upimport of pulses from different African countries, particularly, Kenya, Tanzania,Mozambique, among others and most notably, pigeon peas since 2013–14. Consid-ering a perpetual deficit situation around pulses, India has been importing pulsesconsistently to meet the domestic demand and tame inflation. This has resulted inlowering of tariffs to incentivize import of pulses over several years.With the bumperproduction of pulses recorded in 2016–17 and 2017–18, tariffs have been raised tocontrol import of pulses and exports freed up. Like in the past, the decision to controlor stop imports of pulses or its implementation came in too late when the harvestwas already in the market and farmers could not fetch the minimum support pricefor their produce.
Trends in Export of Pulses from IndiaIndia is not a major exporter of pulses. In TE 2017–18, India exported USD 224million worth of pulses of which USD 167 million was chickpeas (kabuli chana)accounting for 74% of the export value (Fig. 8.8). Between 2007–08 to 2013–14,more than 95% of pulses export was chickpeas. In later years, India exported pigeonpeas, lentil and moong/urad with increasing domestic production.
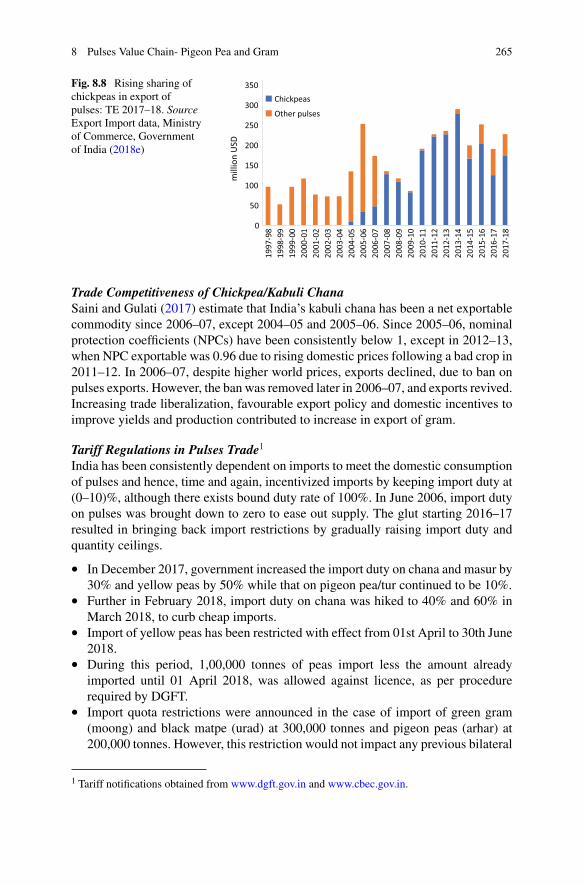
8 Pulses Value Chain- Pigeon Pea and Gram 265
Fig. 8.8 Rising sharing ofchickpeas in export ofpulses: TE 2017–18. SourceExport Import data, Ministryof Commerce, Governmentof India (2018e)
0
50
100
150
200
250
300
350
1997
-98
1998
-99
1999
-00
2000
-01
2001
-02
2002
-03
2003
-04
2004
-05
2005
-06
2006
-07
2007
-08
2008
-09
2009
-10
2010
-11
2011
-12
2012
-13
2013
-14
2014
-15
2015
-16
2016
-17
2017
-18
mill
ion
USD
Chickpeas
Other pulses
Trade Competitiveness of Chickpea/Kabuli ChanaSaini and Gulati (2017) estimate that India’s kabuli chana has been a net exportablecommodity since 2006–07, except 2004–05 and 2005–06. Since 2005–06, nominalprotection coefficients (NPCs) have been consistently below 1, except in 2012–13,when NPC exportable was 0.96 due to rising domestic prices following a bad crop in2011–12. In 2006–07, despite higher world prices, exports declined, due to ban onpulses exports. However, the ban was removed later in 2006–07, and exports revived.Increasing trade liberalization, favourable export policy and domestic incentives toimprove yields and production contributed to increase in export of gram.
Tariff Regulations in Pulses Trade1
India has been consistently dependent on imports to meet the domestic consumptionof pulses and hence, time and again, incentivized imports by keeping import duty at(0–10)%, although there exists bound duty rate of 100%. In June 2006, import dutyon pulses was brought down to zero to ease out supply. The glut starting 2016–17resulted in bringing back import restrictions by gradually raising import duty andquantity ceilings.
• In December 2017, government increased the import duty on chana and masur by30% and yellow peas by 50% while that on pigeon pea/tur continued to be 10%.
• Further in February 2018, import duty on chana was hiked to 40% and 60% inMarch 2018, to curb cheap imports.
• Import of yellow peas has been restricted with effect from 01st April to 30th June2018.
• During this period, 1,00,000 tonnes of peas import less the amount alreadyimported until 01 April 2018, was allowed against licence, as per procedurerequired by DGFT.
• Import quota restrictions were announced in the case of import of green gram(moong) and black matpe (urad) at 300,000 tonnes and pigeon peas (arhar) at200,000 tonnes. However, this restriction would not impact any previous bilateral
1 Tariff notifications obtained from www.dgft.gov.in and www.cbec.gov.in.
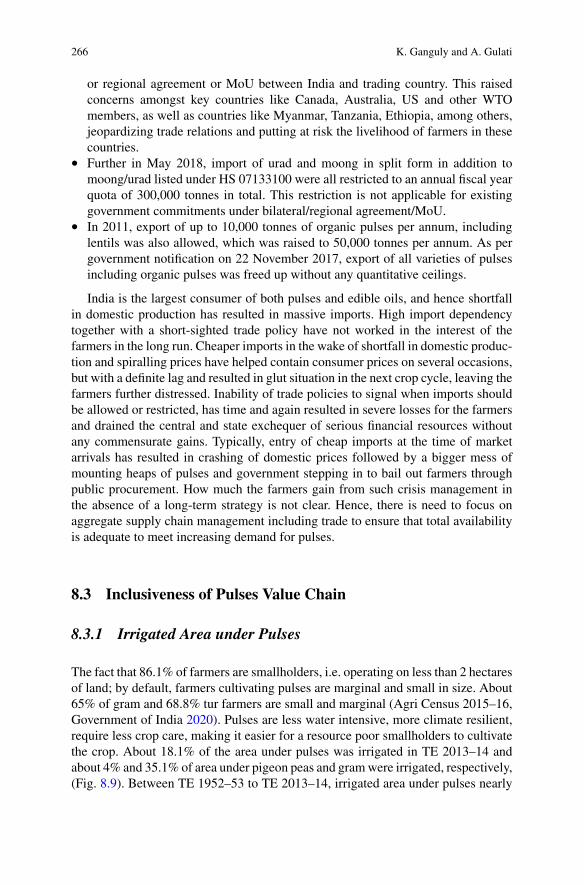
266 K. Ganguly and A. Gulati
or regional agreement or MoU between India and trading country. This raisedconcerns amongst key countries like Canada, Australia, US and other WTOmembers, as well as countries like Myanmar, Tanzania, Ethiopia, among others,jeopardizing trade relations and putting at risk the livelihood of farmers in thesecountries.
• Further in May 2018, import of urad and moong in split form in addition tomoong/urad listed under HS 07133100 were all restricted to an annual fiscal yearquota of 300,000 tonnes in total. This restriction is not applicable for existinggovernment commitments under bilateral/regional agreement/MoU.
• In 2011, export of up to 10,000 tonnes of organic pulses per annum, includinglentils was also allowed, which was raised to 50,000 tonnes per annum. As pergovernment notification on 22 November 2017, export of all varieties of pulsesincluding organic pulses was freed up without any quantitative ceilings.
India is the largest consumer of both pulses and edible oils, and hence shortfallin domestic production has resulted in massive imports. High import dependencytogether with a short-sighted trade policy have not worked in the interest of thefarmers in the long run. Cheaper imports in the wake of shortfall in domestic produc-tion and spiralling prices have helped contain consumer prices on several occasions,but with a definite lag and resulted in glut situation in the next crop cycle, leaving thefarmers further distressed. Inability of trade policies to signal when imports shouldbe allowed or restricted, has time and again resulted in severe losses for the farmersand drained the central and state exchequer of serious financial resources withoutany commensurate gains. Typically, entry of cheap imports at the time of marketarrivals has resulted in crashing of domestic prices followed by a bigger mess ofmounting heaps of pulses and government stepping in to bail out farmers throughpublic procurement. How much the farmers gain from such crisis management inthe absence of a long-term strategy is not clear. Hence, there is need to focus onaggregate supply chain management including trade to ensure that total availabilityis adequate to meet increasing demand for pulses.
8.3 Inclusiveness of Pulses Value Chain
8.3.1 Irrigated Area under Pulses
The fact that 86.1% of farmers are smallholders, i.e. operating on less than 2 hectaresof land; by default, farmers cultivating pulses are marginal and small in size. About65% of gram and 68.8% tur farmers are small and marginal (Agri Census 2015–16,Government of India 2020). Pulses are less water intensive, more climate resilient,require less crop care, making it easier for a resource poor smallholders to cultivatethe crop. About 18.1% of the area under pulses was irrigated in TE 2013–14 andabout 4% and 35.1% of area under pigeon peas and gramwere irrigated, respectively,(Fig. 8.9). Between TE 1952–53 to TE 2013–14, irrigated area under pulses nearly
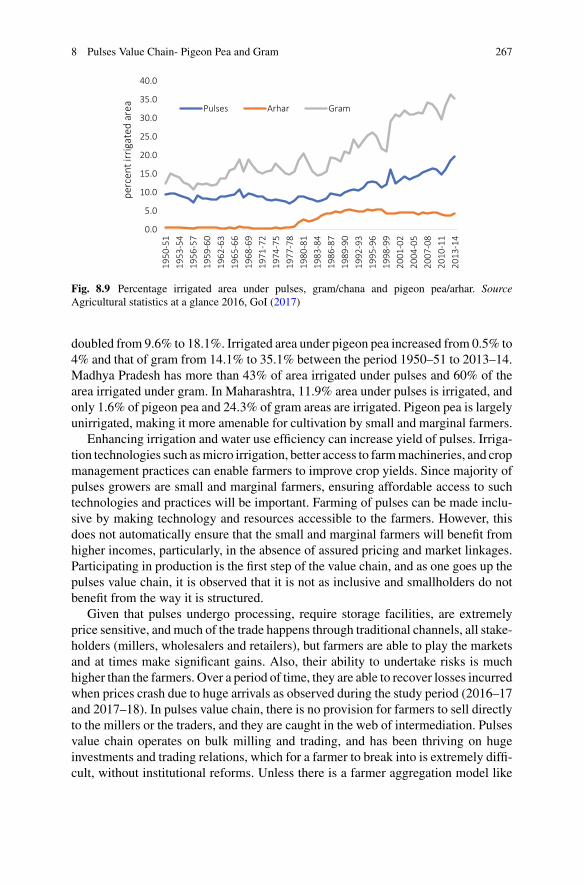
8 Pulses Value Chain- Pigeon Pea and Gram 267
0.0
5.0
10.0
15.0
20.0
25.0
30.0
35.0
40.0
1950
-51
1953
-54
1956
-57
1959
-60
1962
-63
1965
-66
1968
-69
1971
-72
1974
-75
1977
-78
1980
-81
1983
-84
1986
-87
1989
-90
1992
-93
1995
-96
1998
-99
2001
-02
2004
-05
2007
-08
2010
-11
2013
-14
perc
ent i
rrig
ated
are
a Pulses Arhar Gram
Fig. 8.9 Percentage irrigated area under pulses, gram/chana and pigeon pea/arhar. SourceAgricultural statistics at a glance 2016, GoI (2017)
doubled from 9.6% to 18.1%. Irrigated area under pigeon pea increased from 0.5% to4% and that of gram from 14.1% to 35.1% between the period 1950–51 to 2013–14.Madhya Pradesh has more than 43% of area irrigated under pulses and 60% of thearea irrigated under gram. In Maharashtra, 11.9% area under pulses is irrigated, andonly 1.6% of pigeon pea and 24.3% of gram areas are irrigated. Pigeon pea is largelyunirrigated, making it more amenable for cultivation by small and marginal farmers.
Enhancing irrigation and water use efficiency can increase yield of pulses. Irriga-tion technologies such asmicro irrigation, better access to farmmachineries, and cropmanagement practices can enable farmers to improve crop yields. Since majority ofpulses growers are small and marginal farmers, ensuring affordable access to suchtechnologies and practices will be important. Farming of pulses can be made inclu-sive by making technology and resources accessible to the farmers. However, thisdoes not automatically ensure that the small and marginal farmers will benefit fromhigher incomes, particularly, in the absence of assured pricing and market linkages.Participating in production is the first step of the value chain, and as one goes up thepulses value chain, it is observed that it is not as inclusive and smallholders do notbenefit from the way it is structured.
Given that pulses undergo processing, require storage facilities, are extremelyprice sensitive, andmuch of the trade happens through traditional channels, all stake-holders (millers, wholesalers and retailers), but farmers are able to play the marketsand at times make significant gains. Also, their ability to undertake risks is muchhigher than the farmers. Over a period of time, they are able to recover losses incurredwhen prices crash due to huge arrivals as observed during the study period (2016–17and 2017–18). In pulses value chain, there is no provision for farmers to sell directlyto the millers or the traders, and they are caught in the web of intermediation. Pulsesvalue chain operates on bulk milling and trading, and has been thriving on hugeinvestments and trading relations, which for a farmer to break into is extremely diffi-cult, without institutional reforms. Unless there is a farmer aggregation model like
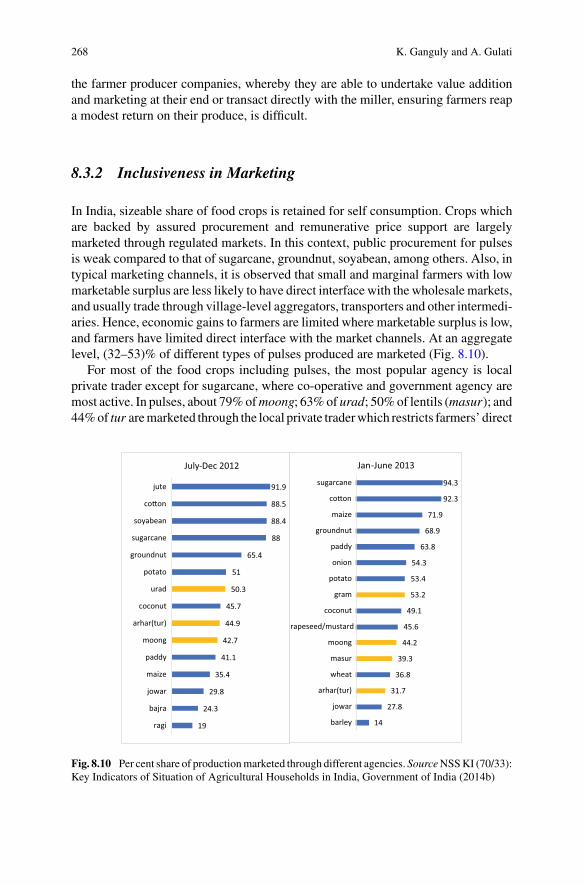
268 K. Ganguly and A. Gulati
the farmer producer companies, whereby they are able to undertake value additionand marketing at their end or transact directly with the miller, ensuring farmers reapa modest return on their produce, is difficult.
8.3.2 Inclusiveness in Marketing
In India, sizeable share of food crops is retained for self consumption. Crops whichare backed by assured procurement and remunerative price support are largelymarketed through regulated markets. In this context, public procurement for pulsesis weak compared to that of sugarcane, groundnut, soyabean, among others. Also, intypical marketing channels, it is observed that small and marginal farmers with lowmarketable surplus are less likely to have direct interface with the wholesale markets,and usually trade through village-level aggregators, transporters and other intermedi-aries. Hence, economic gains to farmers are limited where marketable surplus is low,and farmers have limited direct interface with the market channels. At an aggregatelevel, (32–53)% of different types of pulses produced are marketed (Fig. 8.10).
For most of the food crops including pulses, the most popular agency is localprivate trader except for sugarcane, where co-operative and government agency aremost active. In pulses, about 79%ofmoong; 63%of urad; 50%of lentils (masur); and44%of tur aremarketed through the local private traderwhich restricts farmers’ direct
19
24.3
29.8
35.4
41.1
42.7
44.9
45.7
50.3
51
65.4
88
88.4
88.5
91.9
ragi
bajra
jowar
maize
paddy
moong
arhar(tur)
coconut
urad
potato
groundnut
sugarcane
soyabean
co�on
jute
July-Dec 2012
14
27.8
31.7
36.8
39.3
44.2
45.6
49.1
53.2
53.4
54.3
63.8
68.9
71.9
92.3
94.3
barley
jowar
arhar(tur)
wheat
masur
moong
rapeseed/mustard
coconut
gram
potato
onion
paddy
groundnut
maize
co�on
sugarcane
Jan-June 2013
Fig. 8.10 Per cent share of productionmarketed through different agencies. SourceNSSKI (70/33):Key Indicators of Situation of Agricultural Households in India, Government of India (2014b)
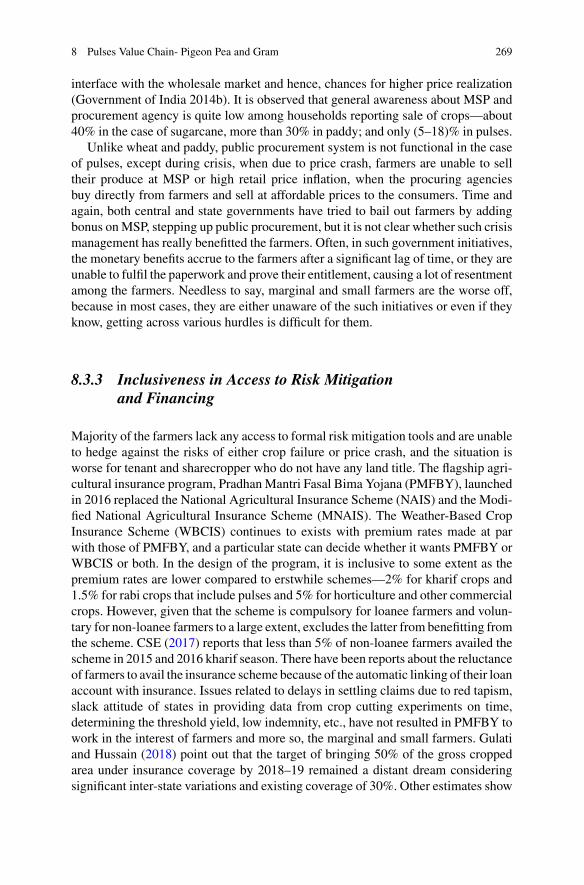
8 Pulses Value Chain- Pigeon Pea and Gram 269
interface with the wholesale market and hence, chances for higher price realization(Government of India 2014b). It is observed that general awareness about MSP andprocurement agency is quite low among households reporting sale of crops—about40% in the case of sugarcane, more than 30% in paddy; and only (5–18)% in pulses.
Unlike wheat and paddy, public procurement system is not functional in the caseof pulses, except during crisis, when due to price crash, farmers are unable to selltheir produce at MSP or high retail price inflation, when the procuring agenciesbuy directly from farmers and sell at affordable prices to the consumers. Time andagain, both central and state governments have tried to bail out farmers by addingbonus onMSP, stepping up public procurement, but it is not clear whether such crisismanagement has really benefitted the farmers. Often, in such government initiatives,the monetary benefits accrue to the farmers after a significant lag of time, or they areunable to fulfil the paperwork and prove their entitlement, causing a lot of resentmentamong the farmers. Needless to say, marginal and small farmers are the worse off,because in most cases, they are either unaware of the such initiatives or even if theyknow, getting across various hurdles is difficult for them.
8.3.3 Inclusiveness in Access to Risk Mitigationand Financing
Majority of the farmers lack any access to formal risk mitigation tools and are unableto hedge against the risks of either crop failure or price crash, and the situation isworse for tenant and sharecropper who do not have any land title. The flagship agri-cultural insurance program, PradhanMantri Fasal Bima Yojana (PMFBY), launchedin 2016 replaced the National Agricultural Insurance Scheme (NAIS) and the Modi-fied National Agricultural Insurance Scheme (MNAIS). The Weather-Based CropInsurance Scheme (WBCIS) continues to exists with premium rates made at parwith those of PMFBY, and a particular state can decide whether it wants PMFBY orWBCIS or both. In the design of the program, it is inclusive to some extent as thepremium rates are lower compared to erstwhile schemes—2% for kharif crops and1.5% for rabi crops that include pulses and 5% for horticulture and other commercialcrops. However, given that the scheme is compulsory for loanee farmers and volun-tary for non-loanee farmers to a large extent, excludes the latter from benefitting fromthe scheme. CSE (2017) reports that less than 5% of non-loanee farmers availed thescheme in 2015 and 2016 kharif season. There have been reports about the reluctanceof farmers to avail the insurance scheme because of the automatic linking of their loanaccount with insurance. Issues related to delays in settling claims due to red tapism,slack attitude of states in providing data from crop cutting experiments on time,determining the threshold yield, low indemnity, etc., have not resulted in PMFBY towork in the interest of farmers and more so, the marginal and small farmers. Gulatiand Hussain (2018) point out that the target of bringing 50% of the gross croppedarea under insurance coverage by 2018–19 remained a distant dream consideringsignificant inter-state variations and existing coverage of 30%. Other estimates show
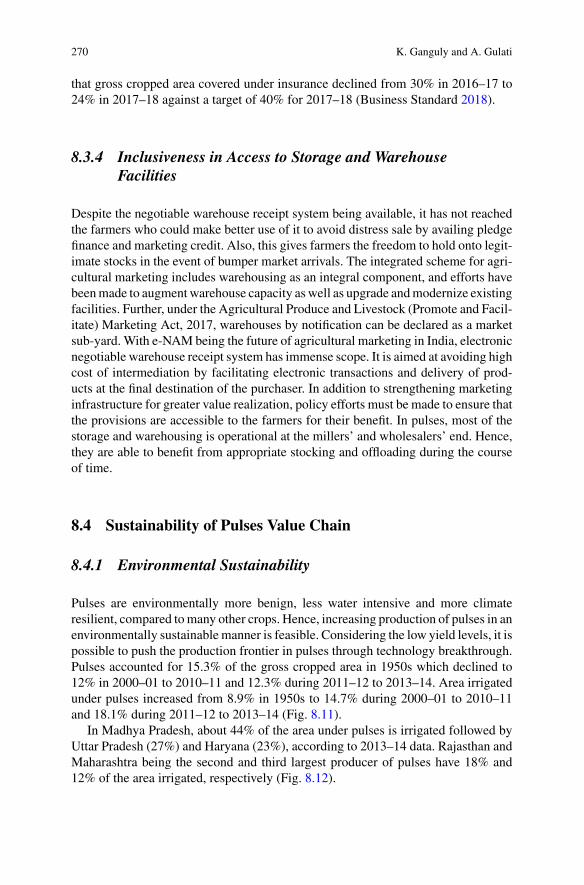
270 K. Ganguly and A. Gulati
that gross cropped area covered under insurance declined from 30% in 2016–17 to24% in 2017–18 against a target of 40% for 2017–18 (Business Standard 2018).
8.3.4 Inclusiveness in Access to Storage and WarehouseFacilities
Despite the negotiable warehouse receipt system being available, it has not reachedthe farmers who could make better use of it to avoid distress sale by availing pledgefinance and marketing credit. Also, this gives farmers the freedom to hold onto legit-imate stocks in the event of bumper market arrivals. The integrated scheme for agri-cultural marketing includes warehousing as an integral component, and efforts havebeenmade to augmentwarehouse capacity aswell as upgrade andmodernize existingfacilities. Further, under the Agricultural Produce and Livestock (Promote and Facil-itate) Marketing Act, 2017, warehouses by notification can be declared as a marketsub-yard. With e-NAM being the future of agricultural marketing in India, electronicnegotiable warehouse receipt system has immense scope. It is aimed at avoiding highcost of intermediation by facilitating electronic transactions and delivery of prod-ucts at the final destination of the purchaser. In addition to strengthening marketinginfrastructure for greater value realization, policy efforts must be made to ensure thatthe provisions are accessible to the farmers for their benefit. In pulses, most of thestorage and warehousing is operational at the millers’ and wholesalers’ end. Hence,they are able to benefit from appropriate stocking and offloading during the courseof time.
8.4 Sustainability of Pulses Value Chain
8.4.1 Environmental Sustainability
Pulses are environmentally more benign, less water intensive and more climateresilient, compared tomany other crops. Hence, increasing production of pulses in anenvironmentally sustainable manner is feasible. Considering the low yield levels, it ispossible to push the production frontier in pulses through technology breakthrough.Pulses accounted for 15.3% of the gross cropped area in 1950s which declined to12% in 2000–01 to 2010–11 and 12.3% during 2011–12 to 2013–14. Area irrigatedunder pulses increased from 8.9% in 1950s to 14.7% during 2000–01 to 2010–11and 18.1% during 2011–12 to 2013–14 (Fig. 8.11).
In Madhya Pradesh, about 44% of the area under pulses is irrigated followed byUttar Pradesh (27%) and Haryana (23%), according to 2013–14 data. Rajasthan andMaharashtra being the second and third largest producer of pulses have 18% and12% of the area irrigated, respectively (Fig. 8.12).
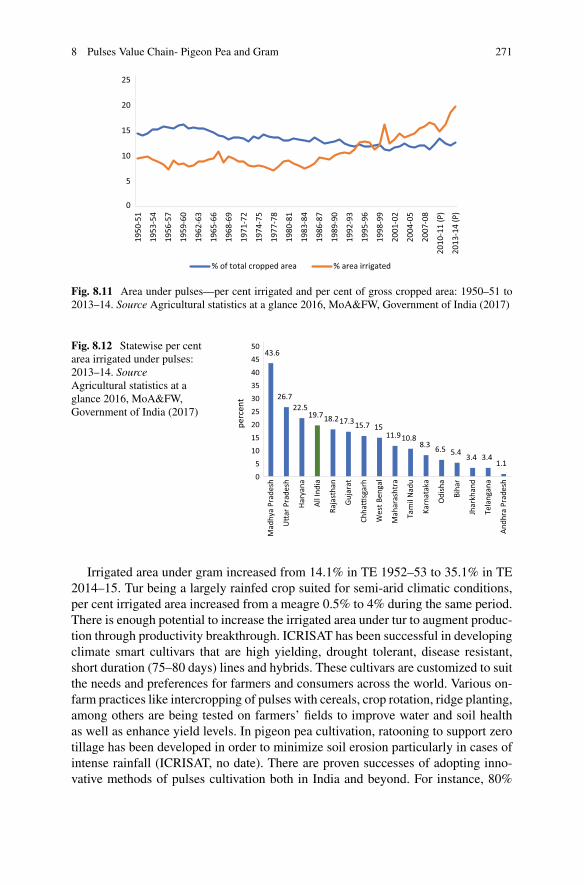
8 Pulses Value Chain- Pigeon Pea and Gram 271
0
5
10
15
20
25
1950
-51
1953
-54
1956
-57
1959
-60
1962
-63
1965
-66
1968
-69
1971
-72
1974
-75
1977
-78
1980
-81
1983
-84
1986
-87
1989
-90
1992
-93
1995
-96
1998
-99
2001
-02
2004
-05
2007
-08
2010
-11
(P)
2013
-14
(P)
% of total cropped area % area irrigated
Fig. 8.11 Area under pulses—per cent irrigated and per cent of gross cropped area: 1950–51 to2013–14. Source Agricultural statistics at a glance 2016, MoA&FW, Government of India (2017)
Fig. 8.12 Statewise per centarea irrigated under pulses:2013–14. SourceAgricultural statistics at aglance 2016, MoA&FW,Government of India (2017)
43.6
26.722.5
19.718.217.315.7 1511.910.8
8.3 6.5 5.4 3.4 3.41.1
0
5
10
15
20
25
30
35
40
45
50
Mad
hya
Prad
esh
U�a
r Pra
desh
Hary
ana
All I
ndia
Raja
stha
n
Guja
rat
Chha
�sg
arh
Wes
t Ben
gal
Mah
aras
htra
Tam
il N
adu
Karn
atak
a
Odi
sha
Biha
r
Jhar
khan
d
Tela
ngan
a
Andh
ra P
rade
sh
perc
ent
Irrigated area under gram increased from 14.1% in TE 1952–53 to 35.1% in TE2014–15. Tur being a largely rainfed crop suited for semi-arid climatic conditions,per cent irrigated area increased from a meagre 0.5% to 4% during the same period.There is enough potential to increase the irrigated area under tur to augment produc-tion through productivity breakthrough. ICRISAT has been successful in developingclimate smart cultivars that are high yielding, drought tolerant, disease resistant,short duration (75–80 days) lines and hybrids. These cultivars are customized to suitthe needs and preferences for farmers and consumers across the world. Various on-farm practices like intercropping of pulses with cereals, crop rotation, ridge planting,among others are being tested on farmers’ fields to improve water and soil healthas well as enhance yield levels. In pigeon pea cultivation, ratooning to support zerotillage has been developed in order to minimize soil erosion particularly in cases ofintense rainfall (ICRISAT, no date). There are proven successes of adopting inno-vative methods of pulses cultivation both in India and beyond. For instance, 80%
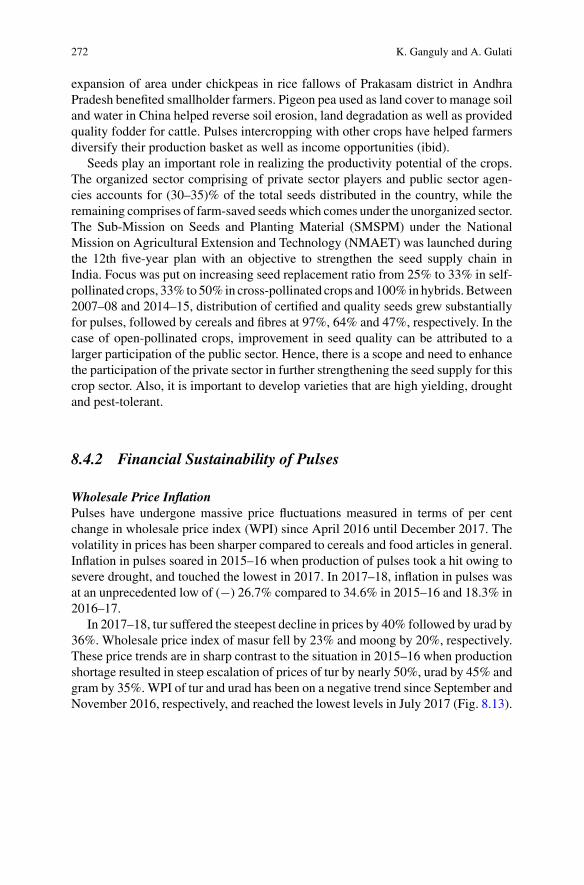
272 K. Ganguly and A. Gulati
expansion of area under chickpeas in rice fallows of Prakasam district in AndhraPradesh benefited smallholder farmers. Pigeon pea used as land cover to manage soiland water in China helped reverse soil erosion, land degradation as well as providedquality fodder for cattle. Pulses intercropping with other crops have helped farmersdiversify their production basket as well as income opportunities (ibid).
Seeds play an important role in realizing the productivity potential of the crops.The organized sector comprising of private sector players and public sector agen-cies accounts for (30–35)% of the total seeds distributed in the country, while theremaining comprises of farm-saved seeds which comes under the unorganized sector.The Sub-Mission on Seeds and Planting Material (SMSPM) under the NationalMission on Agricultural Extension and Technology (NMAET) was launched duringthe 12th five-year plan with an objective to strengthen the seed supply chain inIndia. Focus was put on increasing seed replacement ratio from 25% to 33% in self-pollinated crops, 33% to 50% in cross-pollinated crops and 100% in hybrids. Between2007–08 and 2014–15, distribution of certified and quality seeds grew substantiallyfor pulses, followed by cereals and fibres at 97%, 64% and 47%, respectively. In thecase of open-pollinated crops, improvement in seed quality can be attributed to alarger participation of the public sector. Hence, there is a scope and need to enhancethe participation of the private sector in further strengthening the seed supply for thiscrop sector. Also, it is important to develop varieties that are high yielding, droughtand pest-tolerant.
8.4.2 Financial Sustainability of Pulses
Wholesale Price InflationPulses have undergone massive price fluctuations measured in terms of per centchange in wholesale price index (WPI) since April 2016 until December 2017. Thevolatility in prices has been sharper compared to cereals and food articles in general.Inflation in pulses soared in 2015–16 when production of pulses took a hit owing tosevere drought, and touched the lowest in 2017. In 2017–18, inflation in pulses wasat an unprecedented low of (−) 26.7% compared to 34.6% in 2015–16 and 18.3% in2016–17.
In 2017–18, tur suffered the steepest decline in prices by 40% followed by urad by36%. Wholesale price index of masur fell by 23% and moong by 20%, respectively.These price trends are in sharp contrast to the situation in 2015–16 when productionshortage resulted in steep escalation of prices of tur by nearly 50%, urad by 45% andgram by 35%.WPI of tur and urad has been on a negative trend since September andNovember 2016, respectively, and reached the lowest levels in July 2017 (Fig. 8.13).
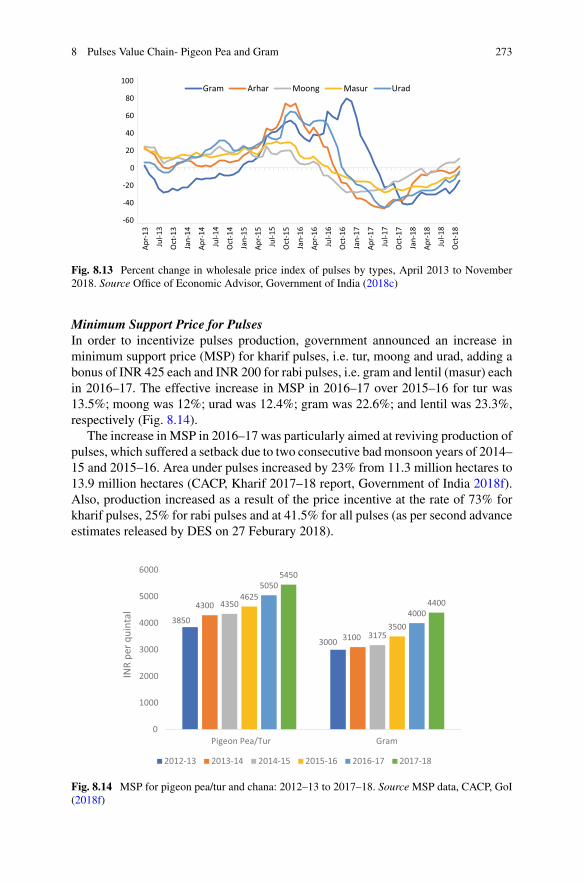
8 Pulses Value Chain- Pigeon Pea and Gram 273
-60
-40
-20
0
20
40
60
80
100
Apr-
13
Jul-1
3
Oct
-13
Jan-
14
Apr-
14
Jul-1
4
Oct
-14
Jan-
15
Apr-
15
Jul-1
5
Oct
-15
Jan-
16
Apr-
16
Jul-1
6
Oct
-16
Jan-
17
Apr-
17
Jul-1
7
Oct
-17
Jan-
18
Apr-
18
Jul-1
8
Oct
-18
Gram Arhar Moong Masur Urad
Fig. 8.13 Percent change in wholesale price index of pulses by types, April 2013 to November2018. Source Office of Economic Advisor, Government of India (2018c)
Minimum Support Price for PulsesIn order to incentivize pulses production, government announced an increase inminimum support price (MSP) for kharif pulses, i.e. tur, moong and urad, adding abonus of INR 425 each and INR 200 for rabi pulses, i.e. gram and lentil (masur) eachin 2016–17. The effective increase in MSP in 2016–17 over 2015–16 for tur was13.5%; moong was 12%; urad was 12.4%; gram was 22.6%; and lentil was 23.3%,respectively (Fig. 8.14).
The increase in MSP in 2016–17 was particularly aimed at reviving production ofpulses, which suffered a setback due to two consecutive bad monsoon years of 2014–15 and 2015–16. Area under pulses increased by 23% from 11.3 million hectares to13.9 million hectares (CACP, Kharif 2017–18 report, Government of India 2018f).Also, production increased as a result of the price incentive at the rate of 73% forkharif pulses, 25% for rabi pulses and at 41.5% for all pulses (as per second advanceestimates released by DES on 27 Feburary 2018).
3850
3000
4300
3100
4350
3175
4625
3500
5050
4000
5450
4400
0
1000
2000
3000
4000
5000
6000
Pigeon Pea/Tur Gram
INR
per q
uint
al
2012-13 2013-14 2014-15 2015-16 2016-17 2017-18
Fig. 8.14 MSP for pigeon pea/tur and chana: 2012–13 to 2017–18. SourceMSP data, CACP, GoI(2018f)
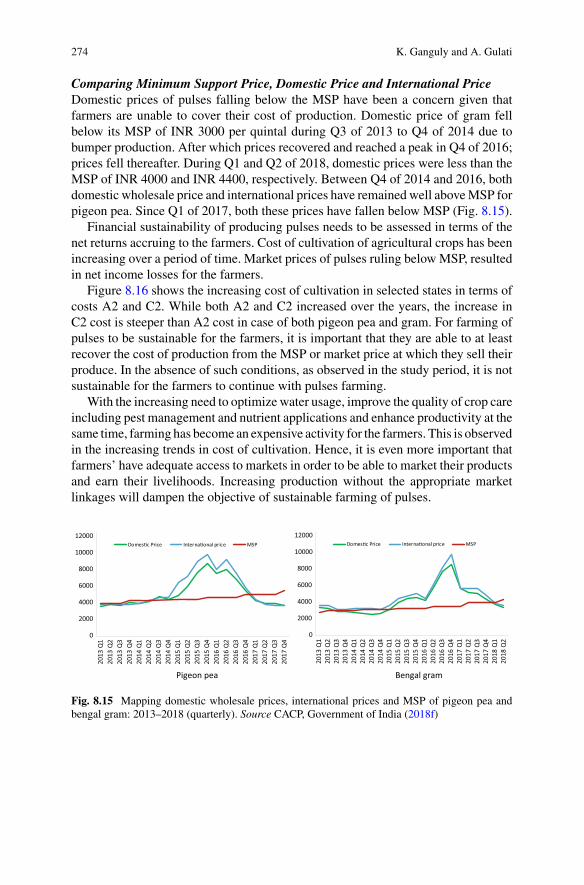
274 K. Ganguly and A. Gulati
Comparing Minimum Support Price, Domestic Price and International PriceDomestic prices of pulses falling below the MSP have been a concern given thatfarmers are unable to cover their cost of production. Domestic price of gram fellbelow its MSP of INR 3000 per quintal during Q3 of 2013 to Q4 of 2014 due tobumper production. After which prices recovered and reached a peak in Q4 of 2016;prices fell thereafter. During Q1 and Q2 of 2018, domestic prices were less than theMSP of INR 4000 and INR 4400, respectively. Between Q4 of 2014 and 2016, bothdomestic wholesale price and international prices have remained well aboveMSP forpigeon pea. Since Q1 of 2017, both these prices have fallen below MSP (Fig. 8.15).
Financial sustainability of producing pulses needs to be assessed in terms of thenet returns accruing to the farmers. Cost of cultivation of agricultural crops has beenincreasing over a period of time. Market prices of pulses ruling below MSP, resultedin net income losses for the farmers.
Figure 8.16 shows the increasing cost of cultivation in selected states in terms ofcosts A2 and C2. While both A2 and C2 increased over the years, the increase inC2 cost is steeper than A2 cost in case of both pigeon pea and gram. For farming ofpulses to be sustainable for the farmers, it is important that they are able to at leastrecover the cost of production from the MSP or market price at which they sell theirproduce. In the absence of such conditions, as observed in the study period, it is notsustainable for the farmers to continue with pulses farming.
With the increasing need to optimize water usage, improve the quality of crop careincluding pest management and nutrient applications and enhance productivity at thesame time, farming has become an expensive activity for the farmers. This is observedin the increasing trends in cost of cultivation. Hence, it is even more important thatfarmers’ have adequate access to markets in order to be able to market their productsand earn their livelihoods. Increasing production without the appropriate marketlinkages will dampen the objective of sustainable farming of pulses.
0
2000
4000
6000
8000
10000
12000
2013
Q1
2013
Q2
2013
Q3
2013
Q4
2014
Q1
2014
Q2
2014
Q3
2014
Q4
2015
Q1
2015
Q2
2015
Q3
2015
Q4
2016
Q1
2016
Q2
2016
Q3
2016
Q4
2017
Q1
2017
Q2
2017
Q3
2017
Q4
Domes�c Price Interna�onal price MSP
0
2000
4000
6000
8000
10000
12000
2013
Q1
2013
Q2
2013
Q3
2013
Q4
2014
Q1
2014
Q2
2014
Q3
2014
Q4
2015
Q1
2015
Q2
2015
Q3
2015
Q4
2016
Q1
2016
Q2
2016
Q3
2016
Q4
2017
Q1
2017
Q2
2017
Q3
2017
Q4
2018
Q1
2018
Q2
Domes�c Price Interna�onal price MSP
Pigeon pea Bengal gram
Fig. 8.15 Mapping domestic wholesale prices, international prices and MSP of pigeon pea andbengal gram: 2013–2018 (quarterly). Source CACP, Government of India (2018f)
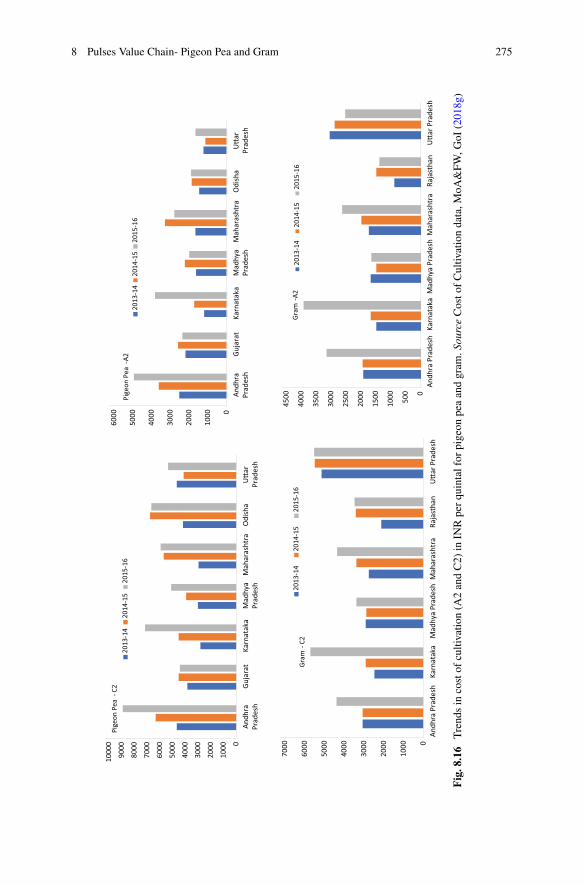
8 Pulses Value Chain- Pigeon Pea and Gram 275
Pige
on P
ea -
A2
0
1000
2000
3000
4000
5000
6000
Andh
raPr
ades
hGu
jara
tKa
rnat
aka
Mad
hya
Prad
esh
Mah
aras
htra
Odi
sha
U�
arPr
ades
h
2013
-14
2014
-15
2015
-16
Pige
on P
ea -
C2
0
1000
2000
3000
4000
5000
6000
7000
8000
9000
1000
0
Andh
raPr
ades
hGu
jara
tKa
rnat
aka
Mad
hya
Prad
esh
Mah
aras
htra
Odi
sha
U�
arPr
ades
h
2013
-14
2014
-15
2015
-16
Gram
-C2
0
1000
2000
3000
4000
5000
6000
7000
Andh
ra P
rade
shKa
rnat
aka
Mad
hya
Prad
esh
Mah
aras
htra
Raja
stha
nU
�ar
Pra
desh
2013
-14
2014
-15
2015
-16
Gram
-A2
0
500
1000
1500
2000
2500
3000
3500
4000
4500
Andh
ra P
rade
shKa
rnat
aka
Mad
hya
Prad
esh
Mah
aras
htra
Raja
stha
nU
�ar
Pra
desh
2013
-14
2014
-15
2015
-16
Fig.8.16
Trendsin
costof
cultivatio
n(A
2andC2)
inIN
Rperquintalfor
pigeon
peaandgram
.SourceCosto
fCultiv
ationdata,M
oA&FW
,GoI
(2018g)
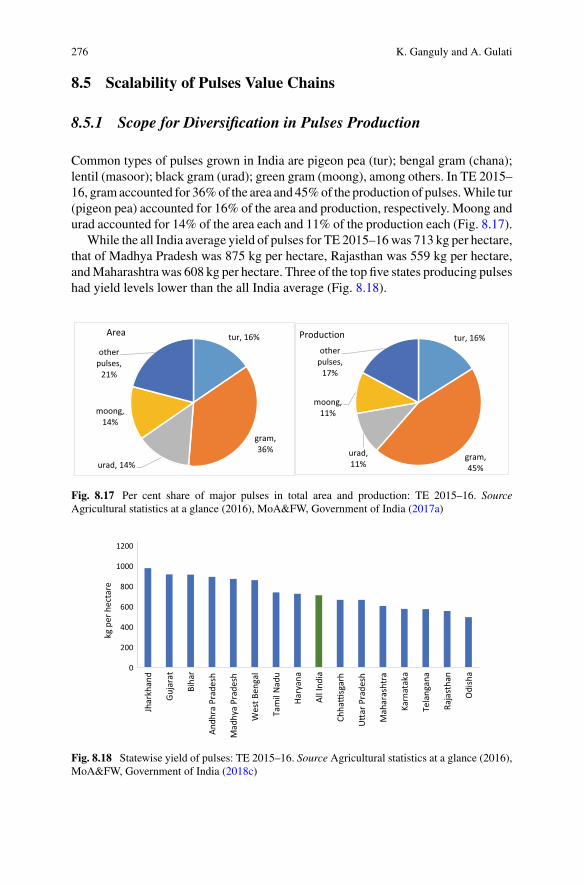
276 K. Ganguly and A. Gulati
8.5 Scalability of Pulses Value Chains
8.5.1 Scope for Diversification in Pulses Production
Common types of pulses grown in India are pigeon pea (tur); bengal gram (chana);lentil (masoor); black gram (urad); green gram (moong), among others. In TE 2015–16, gramaccounted for 36%of the area and 45%of the production of pulses.While tur(pigeon pea) accounted for 16% of the area and production, respectively. Moong andurad accounted for 14% of the area each and 11% of the production each (Fig. 8.17).
While the all India average yield of pulses for TE 2015–16was 713 kg per hectare,that of Madhya Pradesh was 875 kg per hectare, Rajasthan was 559 kg per hectare,andMaharashtra was 608 kg per hectare. Three of the top five states producing pulseshad yield levels lower than the all India average (Fig. 8.18).
tur, 16%
gram, 36%
urad, 14%
moong, 14%
other pulses,
21%
Area tur, 16%
gram, 45%
urad, 11%
moong, 11%
other pulses,
17%
Production
Fig. 8.17 Per cent share of major pulses in total area and production: TE 2015–16. SourceAgricultural statistics at a glance (2016), MoA&FW, Government of India (2017a)
0
200
400
600
800
1000
1200
Jhar
khan
d
Guja
rat
Biha
r
Andh
ra P
rade
sh
Mad
hya
Prad
esh
Wes
t Ben
gal
Tam
il N
adu
Hary
ana
All I
ndia
Chha
�sg
arh
U�
ar P
rade
sh
Mah
aras
htra
Karn
atak
a
Tela
ngan
a
Raja
stha
n
Odi
sha
kg p
er h
ecta
re
Fig. 8.18 Statewise yield of pulses: TE 2015–16. Source Agricultural statistics at a glance (2016),MoA&FW, Government of India (2018c)
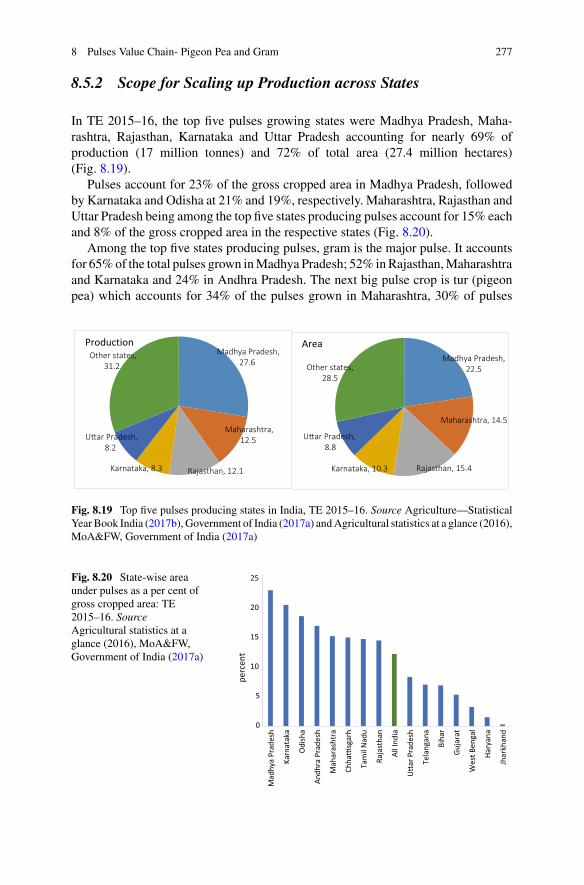
8 Pulses Value Chain- Pigeon Pea and Gram 277
8.5.2 Scope for Scaling up Production across States
In TE 2015–16, the top five pulses growing states were Madhya Pradesh, Maha-rashtra, Rajasthan, Karnataka and Uttar Pradesh accounting for nearly 69% ofproduction (17 million tonnes) and 72% of total area (27.4 million hectares)(Fig. 8.19).
Pulses account for 23% of the gross cropped area in Madhya Pradesh, followedby Karnataka and Odisha at 21% and 19%, respectively. Maharashtra, Rajasthan andUttar Pradesh being among the top five states producing pulses account for 15% eachand 8% of the gross cropped area in the respective states (Fig. 8.20).
Among the top five states producing pulses, gram is the major pulse. It accountsfor 65%of the total pulses grown inMadhya Pradesh; 52% inRajasthan,Maharashtraand Karnataka and 24% in Andhra Pradesh. The next big pulse crop is tur (pigeonpea) which accounts for 34% of the pulses grown in Maharashtra, 30% of pulses
Madhya Pradesh, 27.6
Maharashtra,12.5
Rajasthan, 12.1 Karnataka, 8.3
U�ar Pradesh, 8.2
Other states, 31.2
ProductionMadhya Pradesh,
22.5
Maharashtra, 14.5
Rajasthan, 15.4Karnataka, 10.3
U�ar Pradesh, 8.8
Other states, 28.5
Area
Fig. 8.19 Top five pulses producing states in India, TE 2015–16. Source Agriculture—StatisticalYear Book India (2017b), Government of India (2017a) andAgricultural statistics at a glance (2016),MoA&FW, Government of India (2017a)
Fig. 8.20 State-wise areaunder pulses as a per cent ofgross cropped area: TE2015–16. SourceAgricultural statistics at aglance (2016), MoA&FW,Government of India (2017a)
0
5
10
15
20
25
Mad
hya
Prad
esh
Karn
atak
a
Odi
sha
Andh
ra P
rade
sh
Mah
aras
htra
Chha
�sg
arh
Tam
il N
adu
Raja
stha
n
All I
ndia
U�
ar P
rade
sh
Tela
ngan
a
Biha
r
Guja
rat
Wes
t Ben
gal
Hary
ana
Jhar
khan
d
perc
ent
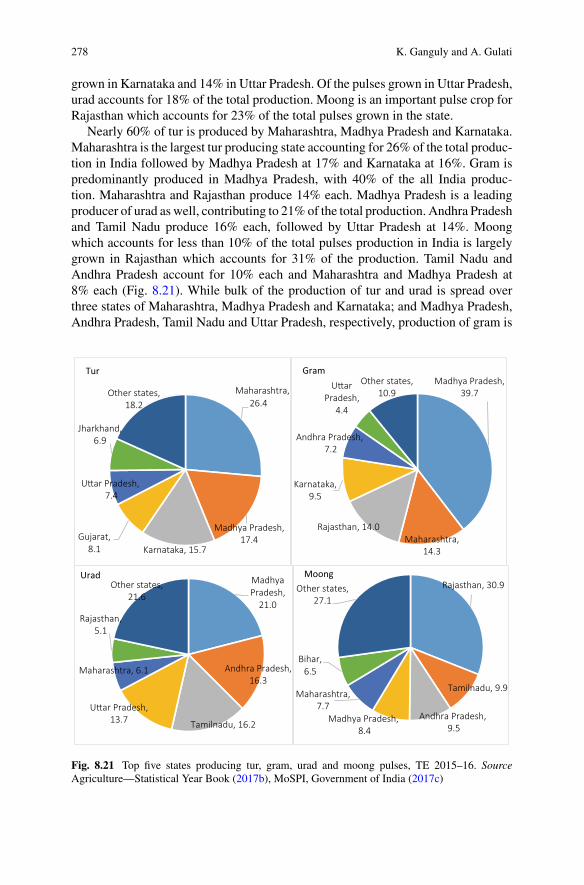
278 K. Ganguly and A. Gulati
grown in Karnataka and 14% in Uttar Pradesh. Of the pulses grown in Uttar Pradesh,urad accounts for 18% of the total production. Moong is an important pulse crop forRajasthan which accounts for 23% of the total pulses grown in the state.
Nearly 60% of tur is produced by Maharashtra, Madhya Pradesh and Karnataka.Maharashtra is the largest tur producing state accounting for 26% of the total produc-tion in India followed by Madhya Pradesh at 17% and Karnataka at 16%. Gram ispredominantly produced in Madhya Pradesh, with 40% of the all India produc-tion. Maharashtra and Rajasthan produce 14% each. Madhya Pradesh is a leadingproducer of urad as well, contributing to 21% of the total production. Andhra Pradeshand Tamil Nadu produce 16% each, followed by Uttar Pradesh at 14%. Moongwhich accounts for less than 10% of the total pulses production in India is largelygrown in Rajasthan which accounts for 31% of the production. Tamil Nadu andAndhra Pradesh account for 10% each and Maharashtra and Madhya Pradesh at8% each (Fig. 8.21). While bulk of the production of tur and urad is spread overthree states of Maharashtra, Madhya Pradesh and Karnataka; and Madhya Pradesh,Andhra Pradesh, Tamil Nadu and Uttar Pradesh, respectively, production of gram is
Maharashtra, 26.4
Madhya Pradesh, 17.4
Karnataka, 15.7Gujarat,
8.1
U�ar Pradesh, 7.4
Jharkhand,6.9
Other states, 18.2
TurMadhya Pradesh,
39.7
Maharashtra, 14.3
Rajasthan, 14.0
Karnataka,9.5
Andhra Pradesh, 7.2
U�ar Pradesh,
4.4
Other states, 10.9
Gram
Madhya Pradesh,
21.0
Andhra Pradesh, 16.3
Tamilnadu, 16.2
U�ar Pradesh, 13.7
Maharashtra, 6.1
Rajasthan,5.1
Other states, 21.6
UradRajasthan, 30.9
Tamilnadu, 9.9
Andhra Pradesh, 9.5
Madhya Pradesh, 8.4
Maharashtra,7.7
Bihar, 6.5
Other states, 27.1
Moong
Fig. 8.21 Top five states producing tur, gram, urad and moong pulses, TE 2015–16. SourceAgriculture—Statistical Year Book (2017b), MoSPI, Government of India (2017c)

8 Pulses Value Chain- Pigeon Pea and Gram 279
Fig. 8.22 Comparison of yields of types of pulses by leading states, average of 2014–15 and2015–16. SourceAgriculture—Statistical Year Book (2017b),MoSPI, Government of India (2017c)
more concentrated in Madhya Pradesh and moong in Rajasthan. Such geographicalspread of pulses could be used for developing pulse-specific storage, marketing andmilling infrastructure to reduce the cost of transaction. The same can be used to planany crop diversification interventions as well.
Considering the top six states in order of their contribution to the production of themajor pulses types, a wide disparity in yields is observed (Fig. 8.22). Maharashtrawith only 12% of the pulses area under irrigation has the lowest yields of nearlyall the major pulses such as tur, urad, gram and moong. Maharashtra which is theleading producer of tur has the lowest yield of 600 kg per hectare compared toother states. Gujarat has the highest yield of 1098 kg per hectare. In the case ofbengal gram, Madhya Pradesh which is a leading producer has a yield of 1039 kg perhectare compared to 1143 kg per hectare in Andhra Pradesh, which is the fifth-largestproducer of gram. In the case of urad, yield levels in Madhya Pradesh (499 kg perhectare) are nearly half of that in Andhra Pradesh (946 kg per hectare) and TamilNadu (960 kg per hectare), the second and third largest producer of urad. Rajasthan,the leading producer of moong recorded a yield of 515 kg per hectare, lower thanTamil Nadu, Andhra Pradesh and Bihar, the second, third and sixth-largest producerof moong.
There is considerable scope for improving existing yield levels of themajor pulsesgrown in India, particularly in states which account for a significant share of all Indiaproduction. This will improve the per unit land productivity as well as allowmultiplecropping, where feasible. Also, for states where the yield levels are already high butaccount for a smaller share of the all India production, efforts can be made to bringmore area under pulses in those states. However, incentivising production through
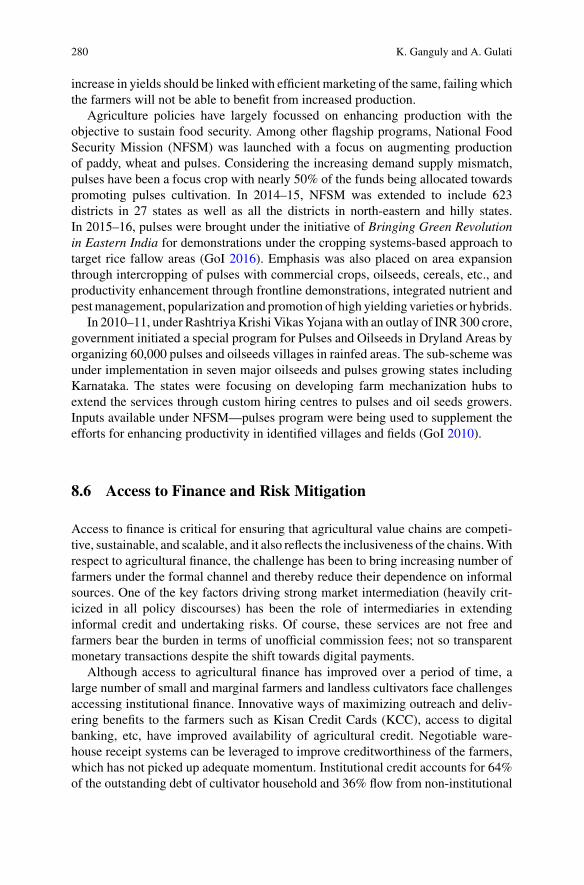
280 K. Ganguly and A. Gulati
increase in yields should be linkedwith efficient marketing of the same, failingwhichthe farmers will not be able to benefit from increased production.
Agriculture policies have largely focussed on enhancing production with theobjective to sustain food security. Among other flagship programs, National FoodSecurity Mission (NFSM) was launched with a focus on augmenting productionof paddy, wheat and pulses. Considering the increasing demand supply mismatch,pulses have been a focus crop with nearly 50% of the funds being allocated towardspromoting pulses cultivation. In 2014–15, NFSM was extended to include 623districts in 27 states as well as all the districts in north-eastern and hilly states.In 2015–16, pulses were brought under the initiative of Bringing Green Revolutionin Eastern India for demonstrations under the cropping systems-based approach totarget rice fallow areas (GoI 2016). Emphasis was also placed on area expansionthrough intercropping of pulses with commercial crops, oilseeds, cereals, etc., andproductivity enhancement through frontline demonstrations, integrated nutrient andpestmanagement, popularization and promotion of high yielding varieties or hybrids.
In 2010–11, under Rashtriya Krishi Vikas Yojanawith an outlay of INR 300 crore,government initiated a special program for Pulses and Oilseeds in Dryland Areas byorganizing 60,000 pulses and oilseeds villages in rainfed areas. The sub-scheme wasunder implementation in seven major oilseeds and pulses growing states includingKarnataka. The states were focusing on developing farm mechanization hubs toextend the services through custom hiring centres to pulses and oil seeds growers.Inputs available under NFSM—pulses program were being used to supplement theefforts for enhancing productivity in identified villages and fields (GoI 2010).
8.6 Access to Finance and Risk Mitigation
Access to finance is critical for ensuring that agricultural value chains are competi-tive, sustainable, and scalable, and it also reflects the inclusiveness of the chains.Withrespect to agricultural finance, the challenge has been to bring increasing number offarmers under the formal channel and thereby reduce their dependence on informalsources. One of the key factors driving strong market intermediation (heavily crit-icized in all policy discourses) has been the role of intermediaries in extendinginformal credit and undertaking risks. Of course, these services are not free andfarmers bear the burden in terms of unofficial commission fees; not so transparentmonetary transactions despite the shift towards digital payments.
Although access to agricultural finance has improved over a period of time, alarge number of small and marginal farmers and landless cultivators face challengesaccessing institutional finance. Innovative ways of maximizing outreach and deliv-ering benefits to the farmers such as Kisan Credit Cards (KCC), access to digitalbanking, etc, have improved availability of agricultural credit. Negotiable ware-house receipt systems can be leveraged to improve creditworthiness of the farmers,which has not picked up adequate momentum. Institutional credit accounts for 64%of the outstanding debt of cultivator household and 36% flow from non-institutional
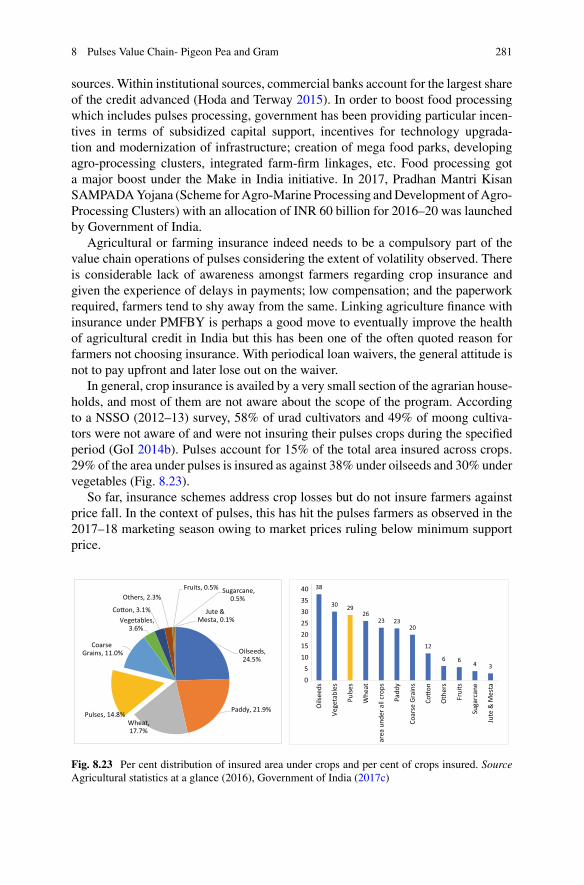
8 Pulses Value Chain- Pigeon Pea and Gram 281
sources. Within institutional sources, commercial banks account for the largest shareof the credit advanced (Hoda and Terway 2015). In order to boost food processingwhich includes pulses processing, government has been providing particular incen-tives in terms of subsidized capital support, incentives for technology upgrada-tion and modernization of infrastructure; creation of mega food parks, developingagro-processing clusters, integrated farm-firm linkages, etc. Food processing gota major boost under the Make in India initiative. In 2017, Pradhan Mantri KisanSAMPADAYojana (Scheme forAgro-Marine Processing andDevelopment ofAgro-Processing Clusters) with an allocation of INR 60 billion for 2016–20 was launchedby Government of India.
Agricultural or farming insurance indeed needs to be a compulsory part of thevalue chain operations of pulses considering the extent of volatility observed. Thereis considerable lack of awareness amongst farmers regarding crop insurance andgiven the experience of delays in payments; low compensation; and the paperworkrequired, farmers tend to shy away from the same. Linking agriculture finance withinsurance under PMFBY is perhaps a good move to eventually improve the healthof agricultural credit in India but this has been one of the often quoted reason forfarmers not choosing insurance. With periodical loan waivers, the general attitude isnot to pay upfront and later lose out on the waiver.
In general, crop insurance is availed by a very small section of the agrarian house-holds, and most of them are not aware about the scope of the program. Accordingto a NSSO (2012–13) survey, 58% of urad cultivators and 49% of moong cultiva-tors were not aware of and were not insuring their pulses crops during the specifiedperiod (GoI 2014b). Pulses account for 15% of the total area insured across crops.29% of the area under pulses is insured as against 38% under oilseeds and 30% undervegetables (Fig. 8.23).
So far, insurance schemes address crop losses but do not insure farmers againstprice fall. In the context of pulses, this has hit the pulses farmers as observed in the2017–18 marketing season owing to market prices ruling below minimum supportprice.
Oilseeds, 24.5%
Paddy, 21.9%
Wheat, 17.7%
Pulses, 14.8%
Coarse Grains, 11.0%
Vegetables, 3.6%
Co�on, 3.1%
Others, 2.3%Fruits, 0.5% Sugarcane,
0.5%
Jute & Mesta, 0.1%
38
30 2926
23 2320
12
6 6 4 3
05
10152025303540
Oils
eeds
Vege
tabl
es
Pulse
s
Whe
at
area
und
er a
ll cr
ops
Padd
y
Coar
se G
rain
s
Co�
on
Oth
ers
Frui
ts
Suga
rcan
e
Jute
& M
esta
Fig. 8.23 Per cent distribution of insured area under crops and per cent of crops insured. SourceAgricultural statistics at a glance (2016), Government of India (2017c)
282 K. Ganguly and A. Gulati
Price deficiency payment scheme such as Bhavantar Bhugtan Yojana (BBY) inMadhya Pradesh was aimed at bridging the gap between MSP and market pricethrough the difference payable by the state government to the farmers. BBY coveredeight crops, viz: soybean, maize, urad, tur, moong, groundnut, til and ramtil. Farmerswere required to register on the government portal and get their sown area verified bythe government in order to be eligible for the benefits of the scheme. The volume ofeach crop to be covered by BBY was determined based on the average productivityof the particular crop in a district and the area sown by the farmer. The differencebetween the average sale price (simpleweighted averagemandi prices in the state andadjoining two states) and MSP are paid directly to the farmer in their bank accounts.Gulati et. al. (2018) reported that 32% of urad production in MP was compensated.In moong, as little as 1.3% of the production was compensated under the scheme.Actual compensation for tur was not known.
There have been reports of several other issues related to BBY in terms of delaysin processing of payments, issues with registration and verification of area sown to beeligible for the benefits. Also, with the introduction of BBY, it is observed that tradershave colluded to keep the market prices deliberately lowwhich has a distorting effecton market functioning. Gulati and Hussain (2018) also analyze the financial viabilityof continuing with BBY given that if the total production eligible for the schemewas actually covered, it would have cost the government INR 8434 crores and notjust INR 1900 crores, which the government claims to have spent, thereby making ahuge dent into the state exchequer. Extending such price deficiency payment schememay not be financially viable. Instead a supply chain mechanism adequately backedby storage, processing and marketing opportunities including exports that are ableto clear out excess supply will work better in terms of upward correction of prices.
8.7 Key Policy Suggestions and Way Forward
Policy advocacy for strengthening pulses value chains like many other agriculturalcommodities cannot be limited to boosting productivity, and thereby production only.Focus should be on strengthening market access for farmers in terms of higher pricerealization and improved risk mitigation. Even if farmers harvest a bumper crop,there is no guarantee that they will be able to sell the produce at support prices,let alone remunerative prices. This has been the situation with respect to severalagricultural commodities in India with bumper harvests leaving the farmers helpless.Also, procurement without means to dispose raw or value-added products, either inthe domestic market or export market means losses at the end of the procuring entity.This is observed in the case of public procurement, when market prices crash belowsupport price. It is ironical that neither in the case of higher demand and consumerprice inflation nor in the case of bumper production, farmers benefit in terms ofhigher returns.
Some of the important policy measures pertaining to pulses value chain that needto be undertaken are as follows:
8 Pulses Value Chain- Pigeon Pea and Gram 283
Step up market access for farmers: Indian agriculture has passed the phase whenincreasing production was a key concern for the policymakers. In recent times, thecrisis has been around bumper production without adequate market access. Hence,it is utmost important to step up market access for the farmers be it through directsale to the millers, bypassing the mandis or through e-NAM, futures market, etc.A technology-enabled platform like e-NAM has the potential to aggregate marketdemand through inter mandi or inter-state trading systems which can help signalprices upwards. However, severalmandis which are enrolled under e-NAM have notbeen able to take off in e-trading of pulses due to issues related to assaying whichis critical for milling of pulses. Also, certain markets are in the process of settingup the infrastructure and services related to e-NAM. Futures market for tur and uradhas been banned since 2007 and that of chana which was suspended in 2016 wasagain revived around June 2017. Given that the prices of major pulses recurringlycrash below the MSP, futures market can be beneficial for the farmers in terms ofhigher price realization and hedging against price risk. However, there are certainconstraints with the functioning of the futures market for agricultural commodities ascited by NCDEX that there are not enough delivery centres, and resource constraintsmake it expensive to reach out to large farmer base (The Indian Express 2017). Thereal benefits of higher price discovery can accrue to the farmers if they are ableto directly trade on the futures platform through FPOs. In the absence of markets,assured procurement of pulses by the government either through central or state-levelagencies should be in place for commodities covered under support price. HigherMSP without assured procurement has no meaning for the farmers who are unableto cover the cost of production or earn remunerative prices for their produce. Thegovernment procurement options under PSS and PSF should be made available tothe farmers in a timely manner so that they do not bear the brunt of selling at marketprices lower than MSP.
Strengthen storage and warehouse facilities: The Warehousing Development andRegulatory Authority (WDRA) was established in 2007 under the Warehousing(Development and Regulation) Act, 2007. The primary objective of WDRA wasto develop and regulate warehousing, including registration and accreditation ofwarehousing that intend to issue negotiable warehouse receipts (NWRs) and elec-tronic NWRs (eNWRs). There are 123 agricultural commodities and 26 horticulturecommodities notified for negotiable warehouse receipts including cereals, pulses, oilseeds, spices, among others. Strengthening the access to NWRs particularly to thefarmers can be extremely beneficial in terms of avoiding distress sale and holdingonto stocks for better marketing opportunities. The margins in the pulses value chainaccumulate at the miller, wholesaler and retailer levels where each are able to hold onto stocks (within permissible limits) and play the market fluctuations to their benefit.This can be shifted to the farmers by improving access to storage and warehousefacilities at the farm gate level. Access to warehousing will also improve farmer’saccess to institutional credit through e-NWRs.
Create infrastructure and services for standardised commodity assaying: Duringexcess supply situations, it is easier for the traders to bargain for lower prices on the
284 K. Ganguly and A. Gulati
pretext of poor quality of pulses brought into themandi by the farmers. In the absenceof standardization of assaying parameters related to moisture, foreign particles, etc.,and lack of infrastructure for proper sorting and grading at the farmer level, fetchinghigher prices for quality produce becomes extremely difficult for the farmers. Theintroduction of e-NAM has brought about standardization of commodity assayingand related infrastructure and services at themandi level. However, the pace of imple-mentation is varied across mandis. Also, under e-NAM, assaying plays an importantrole in enabling e-trading, wherein eventually the traders undertaking inter statetrading, will have no scope to physically inspect the produce but have to rely onstandardized assaying measures. Hence, it is important to create the right infrastruc-ture and services at the farmer or village level for sorting, grading and packaging,which will also help avoid losses due to physical inspection and unpackaging andpackaging, at the mandi level. This will also involve training and capacity buildingof the farmers or service providers at the village level to undertake sorting, grading,and packaging and ensure that the quality claims by the farmers in the mandi aretrue, and there is no manipulation. In some cases, it is observed that farmers mixdifferent quality of the same products which often goes against their interest in termsof rejection or lower price realization.
Promote FPOs in pulses value chain: States and within them districts which havenatural advantages of growing certain types of pulses should be incentivized. Also,states with higher yields but relatively lower area under pulses could be incentivizedto increase area under pulses. Considering farmer aggregation model like FPO tobring about scale in farming as well as post-harvest activities like assaying, storage,value addition, and marketing can be beneficial to the farmers. Also, FPO can inter-face e-NAM to overcome the challenges faced by the farmers in terms of smallmarketable surplus and resource constraints in undertaking post-harvest activities.Direct linkage with the millers, particularly in case where pulses variety determinesmilling efficiency can be achieved through FPO and cluster-based model. FPOs canalso undertake dalmilling andmarketing to enable assuredmarkets and higher returnsto the farmers.
Institute dynamic pricing policy that links domestic prices with import tariffsand decisions related to trade of pulses: Advanced production estimates andthereby likely market arrivals should be used to calibrate both import and exportof pulses. In the event of bumper production, imports can be discouraged by raisingthe tariff levels. This will help revert situations of massive price crash, which hurt theinterest of the farmers. Prudent decisions related to opening up of exports can helptide over domestic supply shortages and at the same time ease out the inflationarypressures on consumers.
Strengthen risk mitigation and access to finance: While improving market accessis key to ensuring that farmers are able to earn the right price for their produce, it isalso important to ensure that the risks associated with production and marketing are
8 Pulses Value Chain- Pigeon Pea and Gram 285
covered. In the case of pulses, the measures that are available have been either inef-fective like the price support system; or not functional at a scale that has any demon-strated impact like the negotiable warehouse receipt system; or populist measureslike loan waivers which do not offer long term sustainable solution for the farmers.The outcomes of the price deficiency payment scheme–Bhavantar Bhugtan Yojana inMadhya Pradesh are not studied enough beyond the pilot.While futures offer optionsfor price risk hedging, themarket has been subjected to bans and suspensions, therebylimiting its scope.
References
Business Standard (2018) Modi’s flagship crop insurance scheme loses sheen as coverage areareduces. Business Standard. 25th March 2018. New Delhi. Available at https://www.business-standard.com/article/economy-policy/govt-s-flagship-crop-insuranceplan-lose-sheen-as-coverage-area-reduces-118032500201_1.html. Last access date 10 December 2018
CSE (2017) PradhanMantri Fasal Bima Yojana. Centre for Science and Environment. 26 July 2017.New Delhi. Available at https://www.cseindia.org/pradhan-mantri-fasal-bima-yojana-cse-7008.Last access date 10 December 2018
GoI (2010) Scheme for 60,000 pulses & oilseeds villages in rainfed areas. Press Information BureauGovernment of India. Ministry of Agriculture & Farmers Welfare. Available at http://pib.nic.in/newsite/PrintRelease.aspx?relid=67667. Last access date 15 March 2018
GoI (2017) Fourth Advance Estimates of Production of Foodgrains for 2016–17. Directorateof Economics and Statistics. Department of Agriculture, Cooperation and Farmers’ Welfare.Ministry of Agriculture and Farmers Welfare. Government of India. Available at https://eands.dacnet.nic.in/Advance_Estimate/4th_Adv_Estimates2016-17_Eng.pdf
Government of India (2014a, October) Nutritional intake in India. 2011–12. Report No.560(68/1.0/3. National Sample Survey, 68th Round. July 2011–June 2012. Ministry of Statisticsand Program Implementation. Government of India
Government of India (2014b, December) Key Indicators of Situation of agricultural households inIndia. National Sample Survey 70th Round. January–December 2013. Ministry of Statistics andProgram Implementation. Government of India
Government of India (2016) State of Indian Agriculture 2015–16. Directorate of Economics andStatistics.Department ofAgriculture,Cooperation andFarmers’Welfare.Ministry ofAgriculture,and Farmers’ Welfare. Government of India. New Delhi
Government of India (2017a) Agricultural statistics at a glance 2016. Ministry of Agriculture &Farmers’ Welfare. Government of India
Government of India (2017b) Agriculture—statistical year book 2017. Ministry of Statistics andProgram Implementation. Government of India. Available at http://mospi.nic.in/statistical-year-book-india/2017/177
Government of India (2017c) Price policy for kharif crops. Themarketing season 2017–18.Commis-sion for Agricultural Costs and Prices (CACP). Department of Agriculture, Cooperation &Farmers’ Welfare. Ministry of Agriculture & Farmers’ Welfare. Government of India
Government of India (2018a) Statewise monthly wholesale price. Agmarknet. Directorate ofMarketing & Inspection (DMI), Ministry of Agriculture and Farmers Welfare, Government ofIndia. Available at http://agmarknet.gov.in/Default.aspx
Government of India (2018b) Retail Price Information System.Directorate of Economics and Statis-tics. Department of Agriculture and Cooperation. Ministry of Agriculture & Farmers’ Welfare.Government of India. Available at https://rpms.dacnet.nic.in/QueryReport.aspx
Government of India (2018c) Consumer Price Indices. Time Series Data. Ministry of Statistics andProgramme Implementation. Government of India
286 K. Ganguly and A. Gulati
Government of India (2018d) Wholesale price index data series. Office of Economic Advisor.Department of Industrial Policy & Promotion (DIPP). Ministry of Commerce & Industry.Government of India. Available at http://eaindustry.nic.in/home.asp
Government of India (2018e) Export import data. Ministry of Commerce and Industry. Governmentof India
GoI (2018f) Price Policy for Kharif Crops: the marketing season 2017–18. Commission for Agri-cultural Costs and Prices. Deaprtment of Agriculture, Cooperation and FarmersWelfare.Ministryof agriculture and Farmers Welfare. Government of India
GoI (2018g) Cost of Cultivation and Production Related Data. Directorate of Economics and Statis-tics. Department of Agriculture, Cooperation and Farmers’ Welfare. Ministry of Agriculture andFarmers Welfare. Government of India. Available at https://eands.dacnet.nic.in/Cost_of_Cultivation.htm. Last access date 18 March 2018
Government of India (2020)All India report on agriculture census 2015–16.DepartmentOfAgricul-ture, Cooperation & Farmers Welfare. Ministry Of Agriculture & Farmers Welfare. GovernmentOf India
Gulati A, Hussain S (2018) From plate to plough: how to help the farmer. 29 Jan 2018. The IndianExpress
Gulati A, Chatterjee T, Hussain S (2018) Supporting Indian farmers: price support or directincome/investment support? Working Paper No. 357. Indian Council for Research on Inter-national Economic Relations (ICRIER). Available at http://icrier.org/pdf/Working_Paper_357.pdf
Hoda, Anwarul, Terway, Prerna (2015) Credit Policy for Agriculture in India - An Evalua-tion. Supporting Indian Farmers the Smart Way: Rationalizing Subsidies and Investments forFaster, Inclusive and Sustainable Growth. Working Paper 302. Indian Council for Research onInternational Economic Relations
Reserve Bank of India (2019) Supply chain dynamics and food inflation in India. Article. RBIBulletin 2019. Reserve Bank of India
Saini S, Gulati A (2017) Price distortions in Indian agriculture. TheWorld Bank and Indian Councilfor Research on International Economic Relations (ICRIER)
The Indian Express (2017) NCDEX seeks regulator nod to relaunch futures trading in pulses. 24Mar 2017
Open Access This chapter is licensed under the terms of the Creative Commons Attribution 4.0International License (http://creativecommons.org/licenses/by/4.0/), which permits use, sharing,adaptation, distribution and reproduction in any medium or format, as long as you give appropriatecredit to the original author(s) and the source, provide a link to the Creative Commons license andindicate if changes were made.
The images or other third party material in this chapter are included in the chapter’s CreativeCommons license, unless indicated otherwise in a credit line to the material. If material is notincluded in the chapter’s Creative Commons license and your intended use is not permitted bystatutory regulation or exceeds the permitted use, you will need to obtain permission directly fromthe copyright holder.
Chapter 9Further Strengthening Agri-ValueChains in India—Way Forward
Ashok Gulati, Pravesh Sharma, and Kavery Ganguly
The value chain analysis undertaken in this study reveals their varying performanceagainst the conceptual framework of CISS-F. This research has helped understand thefunctioning of the value chains and implications of key policy reforms on the ground.There are examples of successful agricultural value chains, which clearly indicatehow policies have worked in the interests of the farmers and contributed towardsmaking the chain more efficient. However, there are several challenges confrontingthese value chains that need further policy attention.Eachvalue chain study concludeswith a proposed list of desirable interventions, and way forward, very specific to thecommodity. These proposed interventions are by no means exhaustive. Rather, theyrepresent a set of critical and urgent actions which are necessary for the growth anddevelopment of that particular value chain.
This chapter provides the broad spectrum of certain macro-policy challengespertaining to agricultural technology, markets, institutions and finance, which arerelevant to this study. The objective is to look at the ecosystem which supportsagricultural value chains and suggest measures to plug the gaps that prevent therapid and inclusive growth of these value chains. Policy efforts in this direction havebeen underway since the 1990s, and a lot of the discussion and debate reiterated theneed to expand the horizon of agricultural marketing in India. With a clear policystatement and enabling legislative framework, high value chains can be incentivized.Quite clearly, huge investments in production technology, infrastructure, storage,value addition and human resources will be necessary, if large-sized value chains areto be a reality in the agriculture sector. The majority of these investments will have tobe made by private players, including farmers. Therefore, it is of utmost importancethat there is bipartisan political buy-in to the new policy reform. The significance of
A. Gulati (B) · K. GangulyIndian Council for Research on International Economic Relations (ICRIER), New Delhi, Delhi,India
P. SharmaFormer Senior Visiting Fellow, ICRIER, New Delhi, Delhi, India
© The Author(s) 2022A. Gulati et al. (eds.), Agricultural Value Chains in India, India Studies in Businessand Economics, https://doi.org/10.1007/978-981-33-4268-2_9
287
288 A. Gulati et al.
the recent Farm Laws 2020 should not be considered any less than the one whichwas made in 1991 to announce the end of industrial licensing. These laws allowfor a transparent legal pathway to further strengthen the efforts towards developinghigh-value agricultural value chains.
9.1 Technology
This section discusses the role of technology in a crop-neutral manner and presentssome macro-steps which are relevant from the point of view of building efficient andinclusive value chains.
• If indeed India aspires to be a major player in world agriculture trade, then thecurrent ad hoc, episodic approach towards technology development and acqui-sition will have to be abandoned. Instead, technology will have to be seen as astrategic investment which enables the development of global agricultural valuechains. The quickest andmost cost-efficientmeans of accessing technology and itswidespread dissemination then becomes an important element of policy-making.
• The commodity-specific value chain studies present specific instances of majortechnology gaps and lack of adequate research in varietal diversity, disease controland other areas which stunt value chain development. Given the fact that Indiainvests a mere 0.37% of agriculture GDP (Government of India 2019), it isunlikely that any major technological breakthrough will emerge. While expertscall for investing at least 1% of the agriculture GDP in research and highlightthe high economic and social returns of such investments, budgetary outlays haveremained more or less stagnant. Private sector research is held back on account ofpolicy uncertainties and a sclerotic regulatory regime, besides weak enforcementof intellectual property rights (IPR).
• The noisy nature of Indian democracy and the multiple stakeholders that exercisecompeting pressures on the central and state governments will impact investmentsin agricultural R&D. In the short run, India is unlikely to allocate significant publicresources to agricultural R&D, provide quick regulatory approvals to foreignplayers to bring in best-in-class technologies or even facilitate domestic privatesector players to invest in promising agricultural research. The practical approachshould be for the government to go out and make an outright purchase of thenecessary technology packages that can trigger productivity improvements. Onceacquired, the technology can be shared in an affordable and inclusive manner topenetrate the target value chain rapidly.
• The history of how breeder seed of high yielding varieties of wheat and paddy wasacquired by the government and disseminated is a good pointer to the success ofsuch an approach. And we are not alone in taking this road. In 2016, ChemChina,one of China’s largest agrochemical companies, announced the acquisition ofBasel-based Syngenta for a whopping USD 46 billion. It was the Chinese govern-ment, acting through its PSU, which took ownership of proprietary technologies
9 Further Strengthening Agri-Value Chains in India—Way Forward 289
developed by Syngenta, for meeting its food security objectives in the comingdecades.
– Therefore, a mechanism must be put in place for the identification and acqui-sition of vital agricultural technologies from both domestic and foreign R&Dplayers. This should cover not just seeds but planting material in general,besides agrochemicals and farm machinery. Once the government becomesthe owner of these technologies, it can decide the terms on which they willbe shared with both public and private sector entities for multiplication andfurther development. For a period of time, government may choose to offerselect technologies at token or very low costs to developers and farmers alikesuch that these technologies can be multiplied and adopted extensively in ashort time frame.
– However, this can be at best a short-term solution which helps us to closethe existing technology gap. We still need a long-term investment policy topromote the development of home-grown agricultural technology. In a devel-oping country like India, with multiple calls on the public exchequer, it willalways be a challenge to provide anoptimum level of taxpayer funds for agricul-tural R&D. Even as the countrymoves towards the goal of investing 1%of agri-cultural GDP in a (3–5) year framework, government can incentivize privateinvestment in agricultural research through an appropriate package of incen-tives. This will require going beyond the obvious tax breaks and addressingthe current misgivings on regulation and IPR issues.
– A balance will also have to be found between encouraging private sectorinvestments in this area while recognizing the role of farmers and tradi-tional communities in preserving seed varieties and germplasm. Sharing ofbenefits with those who have helped to preserve biodiversity should be anessential component of the new approach to technology. This innovation-driven approach can help foster a vibrant environment for farm-level researchwhich besides producing location-specific technologies will also create widelydispersed employment opportunities.
– This is not to reduce the importance of public research in agriculture. Invest-ment in agricultural R&D must remain a priority area for the government.However, there needs to be an overall strategic framework for agricultureresearch, clearly demarcating core areas for public and private sector focus.Some long-term themes, like climate change adaptation, rearranging croppingpatterns in view of fast developing natural resource constraints and the agri-cultural education framework, are best addressed by large national systems.However, the government agricultural R&D institutions have to develop easiernorms for collaboration with private sector and international research playersfor greater effectiveness.
• Related to technology acquisition and development is the challenge of exten-sion. The agriculture extension system in the crop husbandry segment is seri-ously weakened and is practically non-existent in high-value sub-sectors such
290 A. Gulati et al.
as horticulture and dairy. This weak lab-to-land link has resulted in even on-the-shelf technologies (especially in the horticulture sector) not penetratingdeeply into the value chains examined. Private sector players, almost withoutexception, promote their own products (like seed, agrochemicals, etc.) andthe related use-case technology. Thus, huge information asymmetry exists inawareness and adoption of available technology options in most of the cropswe studied.
– A manpower-centric extension system, as was set up in many states duringthe spread of Green Revolution technology, may not be affordable or eveneffective in the current context. Instead, the attempt should be to createchoices and easy access to digital technology for farmers by encouraging amultiplicity of players in the extension arena. The potential of informationtechnology remains to be harnessed in a scalable and impactful manner,even though many successful models exist at the level of small pilots. Hereagain, what is needed is an inclusive framework which embraces multipleplayers to support specific value chains. The example of grapes investi-gated in this study clearly shows that if there is a clear identification ofmarkets and their requirements, multiple stakeholders in the value chaincreate collaboration networks to achieve highly demanding quality norms.Farmers can be empowered to choose between various options through adirect income support option, rather than tied down to specific channels asper current practice.
9.2 Markets
• The absence of integrated agri-value chains is primarily the outcome of adoptinga fragmented approach to markets. The centrality of the Agriculture ProduceMarketing Committee (APMC)-controlled market yards or mandis has led tothe existence of more than 7500 highly restricted primary market yards in thecountry. At one level, these small market areas cater to the prevalent productionmodel which is dominated by small holdings. More than 86% of all agriculturalholdings are small and marginal, i.e. less than 2 hectares. The marketable surplusfrom thesemillions of small farms is typically too small and varied in quality termsto enable aggregation into viable lot sizes. This also means that large processors,retailers, exporters, etc., have little incentive to work with farmers and sourceproduce directly from farms. Thus, the value chain comprises of multiple tiers oftraders, from the village to the national level, who aggregate the produce, sort intodifferent quality categories and ultimately supply to the bulk buyers. However,the result is that economies of scale in production, harvesting, sorting, grading,transportation and storage cannot be leveraged, except for a handful of crops(grape is a good example of an alternative model, where exporters work closelywith farmers).
9 Further Strengthening Agri-Value Chains in India—Way Forward 291
– Therefore, building of agricultural value chains will require a completelydifferent policy approach to markets. For each and every agricultural productgenerated in India, policy has to consider the world, not even the country, asthe natural target market. As an opening move, a central legislation, on thelines of Goods and Services Tax (GST) enabling law, will be needed to createa single, unified market for all agriculture produce at least within the country.Agricultural markets need to be more competitive, and farmers should be freeto market their produce to any entity on mutually agreed terms. Competition isa key to building value chains, and anything which restricts competitive prac-tices, protects monopolies and reduces transparency should be identified andremoved.
– Since the early 1990s, there have been several attempts to liberalize agricul-tural markets to ensure thesemarkets are more competitive as well as inclusive.Important reforms were initiated in the beginning of 2000s, the key provi-sions of which included diluting the monopoly control of the Governmentover marketing practices, allowing farmers the freedom to sell to anyone andany place that they desire, and creating a level playing field for the privateplayers. Given that agriculture is a state subject, the central government’srole was limited to proposing policy reforms without any control over theadoption and implementation of the same by the states. Hence, all the majorreforms proposed since the early 2000s that include Model Act 2003, APLM2017 and Contract Farming 2018 have been adopted partially by few states.This resulted in market inefficiencies and poor implementation of flagshipprograms like e-NAM as well as other reforms related to rationalization ofcost of marketing, relieving farmers the burden of paying commission fees,among others. Agricultural markets continue to be fragmented in structureand operations, pose a heavy burden of fees and service charges to the usersand discourage direct marketing between farmers and buyers. This adverselyimpacts farmers’ income as well as scope for value addition and growth of theagricultural sector.
• In the wake of the COVID-19 pandemic, the central government made anunprecedented move of clearing the legal hurdles that impede agriculturalmarketing. First, on 5 June 2020, the central government announced threeordinances—Farmers’ Produce Trade and Commerce (Promotion and Facilita-tion) Ordinance, 2020; Farmers (Empowerment and Protection) Agreement ofPrice Assurance and Farm Services Ordinance, 2020; and Essential Commodi-ties (Amendment) Ordinance, 2020, that allowed direct marketing, contractfarming and abolished stocking restrictions, respectively. This was indeed ahistoric move given that the central government bypassed the states in bringingabout these important legal reforms which was critical to keep agriculturemoving amidst the lockdown and realize the long-termvision of one nation, onemarket. Subsequently, the Farmers’ Produce Trade and Commerce (Promotionand Facilitation) Bill, 2020, and the Farmers (Empowerment and Protection)Agreement of Price Assurance and Farm Services Bill, 2020, were passed by
292 A. Gulati et al.
Lok Sabha on 17 September 2020 and by the Rajya Sabha on 20 September2020.
• The Farm Laws 2020 provide a legal pathway for liberalization of agricul-tural markets, wherein wholesalers, retailers, exporters and processors haveequal opportunity to participate and farmers have the choice to sell his/herproduce for the highest price. This provides the opportunity for farmers tobenefit from higher income in two ways. One, farmers can trade directly withthe buyers without having to go through the market intermediaries and hencesave on the cost of market intermediation fees, transportation and market fees.Two, this legislation will enable creation of integrated markets for agriculturalcommodities, which will allow farmers to leverage higher aggregate demand.
• It is well researched that price setting (in the form of minimum support prices)and government procurement, especially of cereals like wheat and paddy, haveplayed a role in distortingmarkets and inhibiting value chain development. Themonopolistic procurement model often adopted by government agencies alsodiscourages competition in primary markets and keeps away private players.At the same time, MSP and government procurement are vital tools in the foodsecurity architecture of the country and are linked to key welfare objectives.
• However, we feel that the needs of food security and providing a minimumguarantee of food grains to vulnerable households need not be at the cost ofcompetitive markets and integrated value chain development. Measures suchas revised (and lower) norms for buffer stocking, engagement of private playersfor procurement, commitment to purchase a minimum volume directly fromprivate trade, as well as a combination of deficit price reimbursement andacreage-based direct income support can be used tomeet the desired objectives.Some of these ideas have been tried out at the local level in the past fewyears with mixed results. It requires the leadership and support of the centralgovernment to enlist the cooperation of state governments to choose from amenu of options most suited to their specific needs.
• Portal-based trading in agricultural commodities is another completely under-developed marketing channel, which holds the potential of promoting inte-grated, pan-India agricultural supply chains. Much hope was invested whenthe Government of India launched e-NAM, the electronic trading portal whichoffered screen-based spot trading in agricultural goods. However, havingcompleted five years in July 2021 since its launch, progress of e-NAM hasbeen very sluggish. A combination of poor design, opposition by APMCtrader lobbies, lack of awareness among farmers and weak implementationhas rendered the initiative infructuous. Given the challenge of uneven spreadof buyers and demand, e-NAM linked to warehouse-based trading (includinge-NWRS) and engagement of FPOs have the potential to transform agriculturemarketing. The role of futures market in higher price discovery and improvedprice risk management needs to be revisited for potato and piloted for onionand other commodities, which potentially impact a large farmer base. Withinfrastructure already in place, greater transparency and fair regulation canfurther strengthen futures market. To get this together, a strong political and
9 Further Strengthening Agri-Value Chains in India—Way Forward 293
administrative will is needed to push back against entrenched lobbies in thelarger interests of farmers.
9.3 Institutions
• Better co-ordination and consultation between various ministries, central andstate levels
– Sustainable agricultural value chains need a clearly defined regulatory frame-work to succeed. While there are dozens of promotional and regulatory agen-cies, both at the centre and in some states, there is little attempt to coordi-nate their respective roles for common objectives. While Ministry of Agri-culture and Farmers’ Welfare (MoA&FW) exhorts states to increase acreageunder various fruits and vegetable crops, Department of Commerce in thesame government imposes ad hoc and sudden bans on export as is commonin the case of onion. This is done with a perfunctory consultation with thepromoting ministry and without an attempt to ascertain the views of majorproducing states. Another body of the Ministry of Commerce, the Agricul-ture Produce Export Development Agency (APEDA), meanwhile pushes forincreasing exports of horticulture produce, largely in isolation of any co-ordination with the MoA&FW or the state governments. On the sidelines,the Ministry of Food Processing Industries launches its own schemes, oftenoverlapping with those of other ministries, and everyone seems to be engagedin small turf wars. These are but a few examples among what is commonlyobserved. Sub-optimal performance of many of these regulatory and promo-tional bodies, both at the centre and state levels, is partly responsible for theabsence of serious private sector investor interest in value chain development.
– What clearly emerges is the need for coordinated planning and implementa-tion, which is by no means easy, given the primacy of states in implementingagriculture policy. Therefore, it is important to reiterate the need for a standingmechanism to discuss and adopt policies with clear goals in the agriculturalsector. The lead for setting up such a mechanism has to come from the centralgovernment on the lines of the body consistingofStateFinanceMinisterswhichultimately helped to usher in the Goods and Services Tax (GST). Even afterthe necessary legislation, it has been seen that the GST Council continues toplay a role in ironing out implementation issues and addressing new challenges.Something on similar lines must be adopted for agriculture as a prerequisite forexpecting meaningful policy reform which can incentivize private investmentin agriculture value chains.
294 A. Gulati et al.
• Reforming land lease markets
– The primary factor of production, i.e. availability of land, remains a bottle-neck to promote integrated value chains. With millions of fragmented hold-ings and individual title holders, creating economies of scale in the production,aggregation, storage and value addition of high-value agricultural commodi-ties are impossible.Most importantly, whilemarkets demand consistent qualityand volumes, the current production system simply cannot deliver. Large landparcels cannot be created by leasing-in of land, as most states do not legallypermit such tenancies. Unless a solution is found to incentivize large landparcels, either through direct purchase by amending the land ceiling laws orthrough a leasing model which is sanctioned by statute, production of consis-tent quality agricultural produce is not feasible. This is one of the most criticalinterventions which should be taken up urgently to kick-start the consolidationof land.
• Promoting aggregation at farm level
– The principle of aggregation equally needs to be applied in the case ofproducers. With over 140 million farm households, India cannot viablyreach out to individual farmers for technology upgradation, services andmarket linkage. The answer is producer collectives in all forms: co-operatives,producer companies, associations, etc. Here again, policy should provide posi-tive incentives for individual producers to become members of collectives,linking such membership to cheaper and easier credit, access to commoninfrastructure and joint marketing.
– With the announcement in the Union Budget 2019 (MoF, 2019) to promote10,000 additional FPOs, a good beginning has been made. However, merelyregistering these bodies will not suffice. An entire ecosystem of support,including linking these institutions to equity and working capital, easinglicensing and compliance, creating back-end infrastructure for procurementand storage as well as making it attractive for bulk buyers to purchase directlyfrom these bodies, has to be created. This will require coordinated actionbetween central and state-level agencies so that millions of producers canbecomemeaningfully linked to large value chains. The FarmLaws 2020 recog-nize the role of FPOs in mobilizing and strengthening the bargaining powerof the farmers in trading with private buyers or entering into contract farmingagreements.
• Food Safety and Quality Standards
– The lack of commonly applied standards or quality control, and weak to non-existent enforcement of the few that exist, is another lacunawhich has inhibitedmarket players from investing in efforts to promote them. Amistake frequentlymade by policy-makers (witnessed recently again in the agricultural exportpolicy) is to advocate separate standards (usually stricter) for export markets
9 Further Strengthening Agri-Value Chains in India—Way Forward 295
while being casual (which means lax) towards domestic consumers. Thus,grapes destined for Europe must conform to high norms of food safety (typi-cally, low chemical residues from spraying), while domestic consumers enjoyno such attention and protection. The argument often heard in policy circles isthat mandating global norms for domestic produce will drive up prices. It begsthe argument why health and safety of Indian nationals should be compromisedwhen we can quite easily achieve the same standards.
– Thus, adoption of food safety standards for all agriculture produce in a phasedmanner and alignment to globally accepted norms is an essential component ofvalue chain development. This will require sustained efforts to assist farmersto adopt practices to achieve the desired standards, developing capacity fortesting, regulation and enforcement, as well as consumer education to helpsociety accept higher costs for agricultural produce. However, a clear articu-lation of social and economic cost–benefit analysis will smoothen the transi-tion and lay the foundation for integrating Indian farmers into global supplychains. The transformative impact of such a move on the agricultural economyin particular and the national economy in general is too obvious to be repeatedhere.
• Creating a Multi-Agency Centre (MAC) for building value chains
– The final piece in this mosaic would be a dedicated agency at the centre, withcounterparts in each state, which is tasked with coordinating all actions relatedto building value chains. While a large cast of actors will need to play theirroles to build global agriculture value chains, the big picture must be keptin view by a central champion. No single agency in the present landscapehas the mandate or capacity to play this role. Perhaps, it is also not practicalto propose such multidimensional role under one umbrella. What is requiredis to create a Multi-Agency Centre (MAC), drawing upon the resources ofseveral ministries and bodies, to undertake this task. So, while the MAC mayhave a small permanent secretariat, it should have senior representation fromkey ministries, agencies, financial institutions, states and, most importantly,the private sector. One model to build upon is the National Capital RegionPlanning Board (NCRPB), which has achieved some modicum of success incoordinating with multiple central and state-level authorities to achieve certaindesirable infrastructure outcomes in the NCR.
9.4 Finance
Lack of access to institutional finance has emerged as a major cause for the frag-mented and often stunted value chains for all the commodities studied in this book.This constraint is feltmost acutely by individual farmers, nearly 80%ofwhom rely oninformal sources of credit for investment and working capital needs. With traditionalsources of informal credit (moneylenders, mandi traders, big landlords, middlemen,
296 A. Gulati et al.
etc.) charging interest rates in the range of (36–120)%, it is hardly surprising thatinvestments in technology, basic farm machinery, storage infrastructure and otherstages of the value chain are abysmally low.
The situation is only marginally better for co-operatives and farmer producerorganizations (FPOs). With no dedicated development finance institution supportingagricultural value chains, most collectives (especially in dairy and poultry) rely oncommercial bankfinance for their requirements. Serious gaps in the outreach capacityof banks limit the financial outlays as observed in the value chains studied here. Theonly exception seems to be private dairies and poultry units, which find it relativelyeasier to attract bank finance and, increasingly, private equity. This is possibly dueto the physical assets that these units acquire and are able to offer as collateral tothe lenders. However, no significantly scaled-up and replicable financing model hasbeen discovered so far in products in the crop husbandry and horticulture sectors.
Given this scenario, there is an urgent need to address the financing gap thatconstrains the development of agricultural value chains. The following recommen-dations provide a direction towards addressing the financing gaps.
• The agriculture sector requires an investment policy which is targeted towardsbuilding global value chains. This would require going beyond the currentapproach of producing and consuming locally or regionally produced commodi-ties. Typically, aggregation of agricultural commodities takes place at either thelocalmandi or state level, as in case of milk. Fruits such as banana and mango areat most regional crops. It is impossible to find varieties of these crops grown, insouthern states, in the northern markets, just as those popular in the northern andwestern parts barely make it to southernmarkets. Tomake the value chains global,it will be important to shortlist products where India has a competitive advantageand identify specific need for investments and policy action. Such a policy willneed to consider the complementary competence of farmers, co-operatives andFPOs as well as public and private sector players.
• Creating the pipelines through which credit for investment and working capitalwill flow to players in different stages of agriculture value chains is another impor-tant step. Enabling institutional credit flows to farmers, co-operatives and FPOswho are at the first stage of the value chain is the centrepiece of this arrange-ment. Experience shows that leaving the task to banks and legacy financingsystems will not work. Therefore, policy needs to facilitate new-generationnon-banking finance companies (NBFCs) or the so-called fin-tech sector, toaddress this problem.With their flexible products and deeper integration of digitaltechnologies, NBFCs can step in to fill the gap left by traditional banks.
– However, given that NBFCs are presently not allowed to raise low-cost capital(such as public deposits, unlike banks), their loans are significantlymore expen-sive. They are also exposed to a greater risk of collapse in case of massiveborrower delinquency. Hence, it is critical tomitigate their risks in two possibleways: one, through a dedicated refinance facility (managed by NABARD,SIDBI, NCDC, etc.) for loans advanced to identified priority value chains at afixed cost, and two, through a first loss default guarantee (FLDG) offered by
9 Further Strengthening Agri-Value Chains in India—Way Forward 297
the same set of institutions to cover, say the first (10–15)% of default on theiragriculture value chain loan portfolio.
• Equity capital has played a key role in meeting the initial investment require-ments of technology-led start-up. These ventures have been reticent about enteringthe agriculture sector, largely owing to policy uncertainties and poorly under-stood risks. However, this form of risk finance is an essential ingredient for thefuture sustainable growth of agriculture value chains. While clarity on the policyapproach to building integrated value chains will be helpful, some initial comfortmay be required to kick-start the investment cycle in this category.
– An idea worth trying is the launch of a dedicated agriculture equity investmentvehicle, targeting both start-ups and growth stage enterpriseswhich are seekingto build agriculture value chains. This investment vehicle can be initially floatedby a group of public entities (NABARD, SIDBI, NCDC, SFAC) with financialand management contribution from private equity funds. Eventually, after afew years, the portfolio of investments can even be hived off entirely to privatesector players. But the initial presence of public entities will help to crowd-inprivate equity capital.
• Collateral financing solutions, hedging and futures contracts, typically, provideboth risk mitigation and liquidity solutions in developed agricultural markets.These are conspicuous by their absence in India, barring a narrowly traded list ofcommodities. This is an outcome of our wider policy ambiguity on giving marketinstruments greater role in the agricultural economy. However, if the policy objec-tive is to build agriculture value chains, the introduction of tried and tested hedgingand other products widely used in other countries is essential. It will provide a riskmanagement framework, as even the biggest andmost integrated agriculture valuechains will face periodical shocks on supply, price, quality issues, etc. Once a coreset of market-oriented instruments are introduced, innovation can be encouragedfor more context-specific products to be developed in an appropriate regulatoryenvironment.
9.5 Summing Up
For agricultural value chains to be more competitive, inclusive, sustainable and scal-able, an enabling policy environment supported by strong institutions is most impor-tant. The success of agricultural value chains has been a mixed bag, and there isenough scope to strengthen these value chains further to deliver higher returns tothe farmers as well as contribute to the overall growth of the agricultural sector.The COVID-19 pandemic ushered in some major policy reforms which were muchawaited. These reforms are aimed towards liberalization of agricultural markets,infusing greater competition and choice for the farmers, which are important factorsfor developing high-value chains.
298 A. Gulati et al.
References
Government of India (2019) The economic survey (2020–21). NewDelhi: Department of EconomicAffairs. Ministry of Finance. Government of India
MoF (2019) Speech of Nirmala Sitharaman, Minister of Finance, July 05, 2019. Union BudgetSpeech 2019–20. New Delhi: Ministry of Finance, Government of India
Open Access This chapter is licensed under the terms of the Creative Commons Attribution 4.0International License (http://creativecommons.org/licenses/by/4.0/), which permits use, sharing,adaptation, distribution and reproduction in any medium or format, as long as you give appropriatecredit to the original author(s) and the source, provide a link to the Creative Commons license andindicate if changes were made.
The images or other third party material in this chapter are included in the chapter’s CreativeCommons license, unless indicated otherwise in a credit line to the material. If material is notincluded in the chapter’s Creative Commons license and your intended use is not permitted bystatutory regulation or exceeds the permitted use, you will need to obtain permission directly fromthe copyright holder.


