Embed Size (px)
Citation preview
University of Tennessee, Knoxville
From the SelectedWorks of Carol Tenopir
June, 2006
Ashland University Faculty Journal ReadingPatternsCarol Tenopir, University of Tennessee - KnoxvilleLei WuXiang ZhouKitty McClanahanMax Steele, et al.
Available at: http://works.bepress.com/carol_tenopir/81/
1
Ashland University Faculty Journal Reading Patterns
Factual Summary of Results of the Survey Conducted Fall 2005
Carol Tenopir, Lei Wu, Xiang Zhou, Kitty McClanahan, Max Steele,
and Natalie Clewell University of Tennessee, Knoxville, TN
and Donald W. King, University of North Carolina, Chapel Hill
(funded with a grant from IMLS)
(June 15, 2006)
Introduction.
This is a question-by-question analysis of the results of the Ashland University survey of
faculty, conducted fall 2005 as part of a grant funded by IMLS (see Appendix for the
questionnaire). Final results may require further analysis or information about the library
context for complete analysis. At the same time as this survey, a survey of reading
patterns of Ashland students was conducted, with results presented in a separate report.
Also at the same time, surveys of faculty and students at three other Ohio universities and
the University of Tennessee were conducted. Comparisons among these will be included
in subsequent articles for publication. Malone College is the most similar to Ashland
University. This report is for internal use at Ashland or may be used to prepare
presentations and journal articles.
In October 2005 an email message from the Ashland University Library Director, with an
embedded link to a questionnaire housed on a University of Tennessee server, was sent to
approximately 400 Ashland faculty members. In addition, the questionnaire was linked
on the Ashland library website.
2
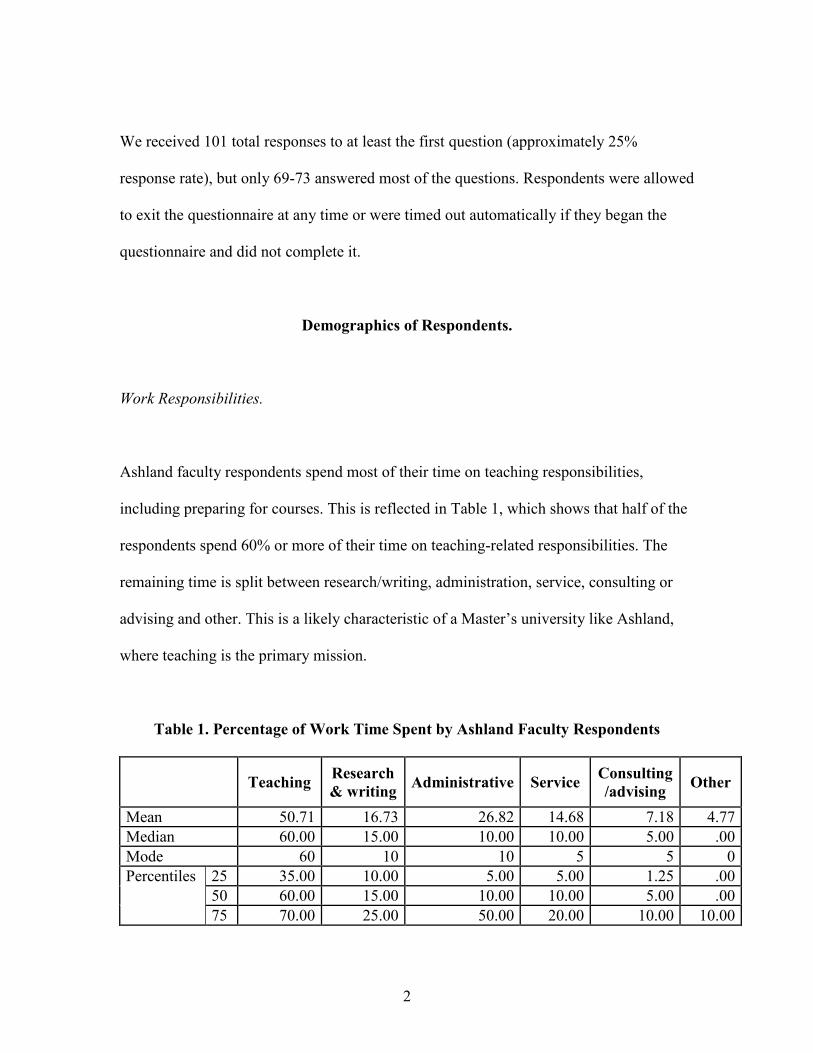
We received 101 total responses to at least the first question (approximately 25%
response rate), but only 69-73 answered most of the questions. Respondents were allowed
to exit the questionnaire at any time or were timed out automatically if they began the
questionnaire and did not complete it.
Demographics of Respondents.
Work Responsibilities.
Ashland faculty respondents spend most of their time on teaching responsibilities,
including preparing for courses. This is reflected in Table 1, which shows that half of the
respondents spend 60% or more of their time on teaching-related responsibilities. The
remaining time is split between research/writing, administration, service, consulting or
advising and other. This is a likely characteristic of a Master’s university like Ashland,
where teaching is the primary mission.
Table 1. Percentage of Work Time Spent by Ashland Faculty Respondents
Teaching
Research
& writing Administrative Service
Consulting
/advising Other
Mean 50.71 16.73 26.82 14.68 7.18 4.77
Median 60.00 15.00 10.00 10.00 5.00 .00
Mode 60 10 10 5 5 0
Percentiles 25 35.00 10.00 5.00 5.00 1.25 .00
50 60.00 15.00 10.00 10.00 5.00 .00
75 70.00 25.00 50.00 20.00 10.00 10.00
3
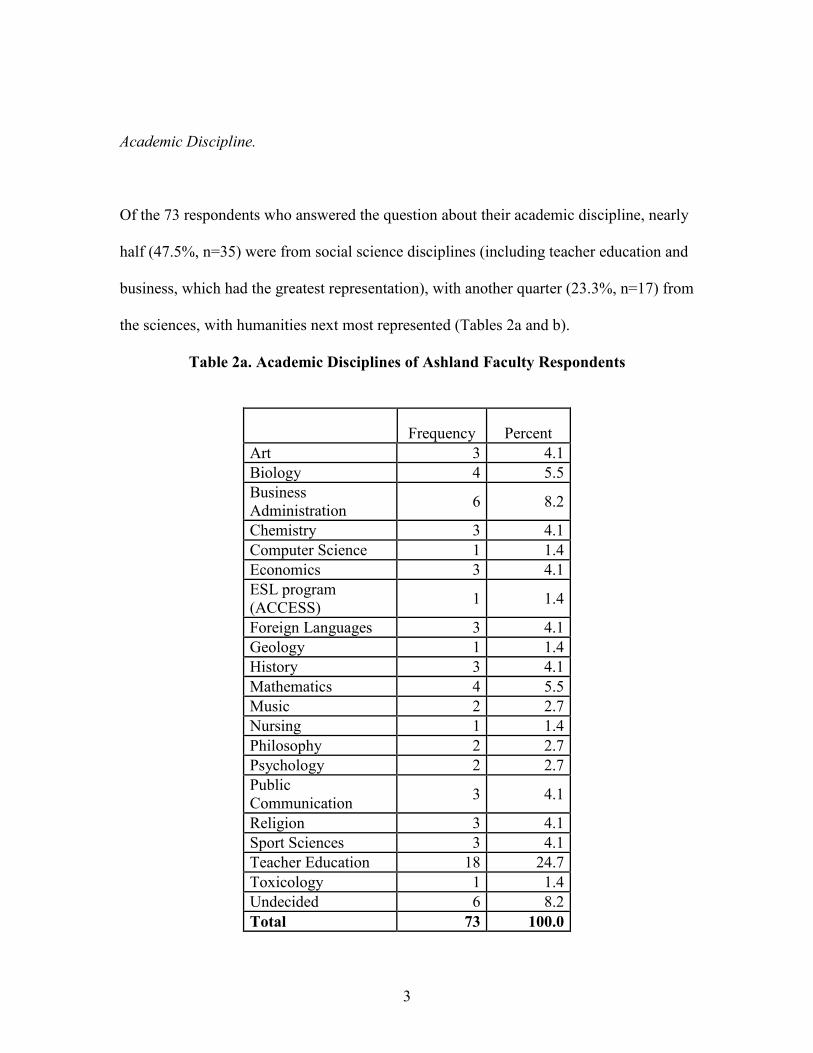
Academic Discipline.
Of the 73 respondents who answered the question about their academic discipline, nearly
half (47.5%, n=35) were from social science disciplines (including teacher education and
business, which had the greatest representation), with another quarter (23.3%, n=17) from
the sciences, with humanities next most represented (Tables 2a and b).
Table 2a. Academic Disciplines of Ashland Faculty Respondents
Frequency Percent
Art 3 4.1
Biology 4 5.5
Business
Administration 6 8.2
Chemistry 3 4.1
Computer Science 1 1.4
Economics 3 4.1
ESL program
(ACCESS) 1 1.4
Foreign Languages 3 4.1
Geology 1 1.4
History 3 4.1
Mathematics 4 5.5
Music 2 2.7
Nursing 1 1.4
Philosophy 2 2.7
Psychology 2 2.7
Public
Communication 3 4.1
Religion 3 4.1
Sport Sciences 3 4.1
Teacher Education 18 24.7
Toxicology 1 1.4
Undecided 6 8.2
Total 73 100.0
4
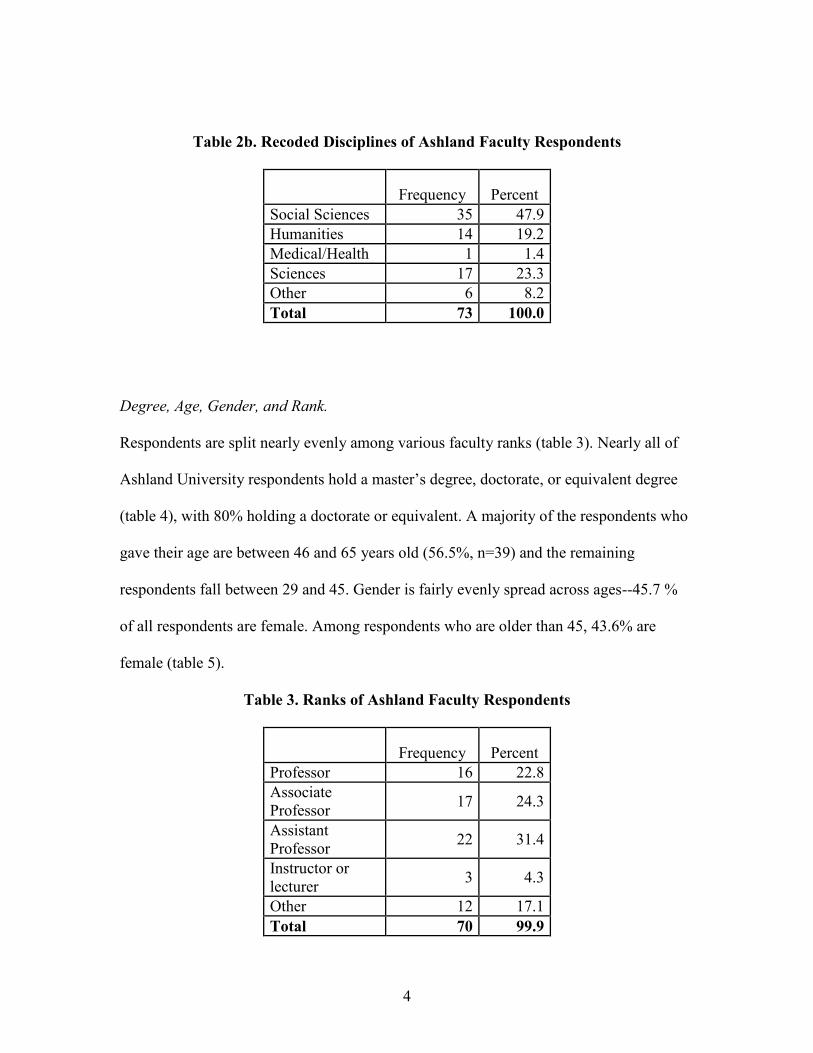
Table 2b. Recoded Disciplines of Ashland Faculty Respondents
Frequency Percent
Social Sciences 35 47.9
Humanities 14 19.2
Medical/Health 1 1.4
Sciences 17 23.3
Other 6 8.2
Total 73 100.0
Degree, Age, Gender, and Rank.
Respondents are split nearly evenly among various faculty ranks (table 3). Nearly all of
Ashland University respondents hold a master’s degree, doctorate, or equivalent degree
(table 4), with 80% holding a doctorate or equivalent. A majority of the respondents who
gave their age are between 46 and 65 years old (56.5%, n=39) and the remaining
respondents fall between 29 and 45. Gender is fairly evenly spread across ages--45.7 %
of all respondents are female. Among respondents who are older than 45, 43.6% are
female (table 5).
Table 3. Ranks of Ashland Faculty Respondents
Frequency Percent
Professor 16 22.8
Associate
Professor 17 24.3
Assistant
Professor 22 31.4
Instructor or
lecturer 3 4.3
Other 12 17.1
Total 70 99.9
5
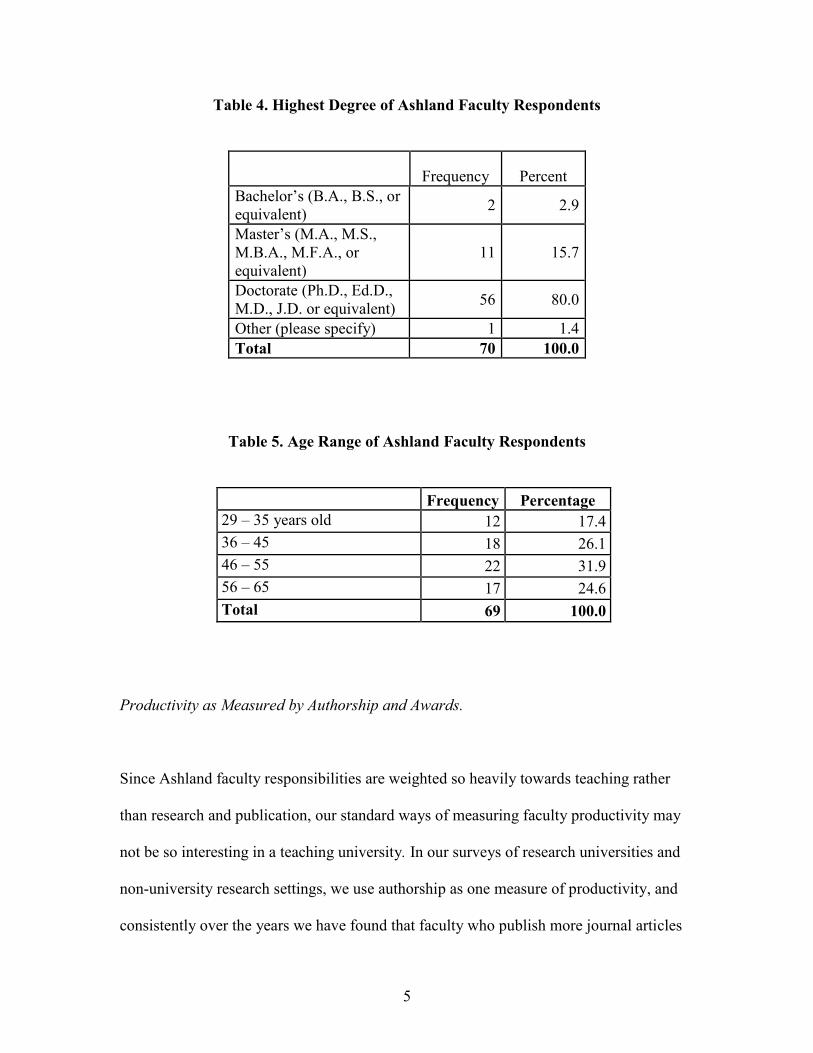
Table 4. Highest Degree of Ashland Faculty Respondents
Frequency Percent
Bachelor’s (B.A., B.S., or
equivalent) 2 2.9
Master’s (M.A., M.S.,
M.B.A., M.F.A., or
equivalent)
11 15.7
Doctorate (Ph.D., Ed.D.,
M.D., J.D. or equivalent) 56 80.0
Other (please specify) 1 1.4
Total 70 100.0
Table 5. Age Range of Ashland Faculty Respondents
Frequency Percentage
29 – 35 years old 12 17.4
36 – 45 18 26.1
46 – 55 22 31.9
56 – 65 17 24.6
Total 69 100.0
Productivity as Measured by Authorship and Awards.
Since Ashland faculty responsibilities are weighted so heavily towards teaching rather
than research and publication, our standard ways of measuring faculty productivity may
not be so interesting in a teaching university. In our surveys of research universities and
non-university research settings, we use authorship as one measure of productivity, and
consistently over the years we have found that faculty who publish more journal articles
6
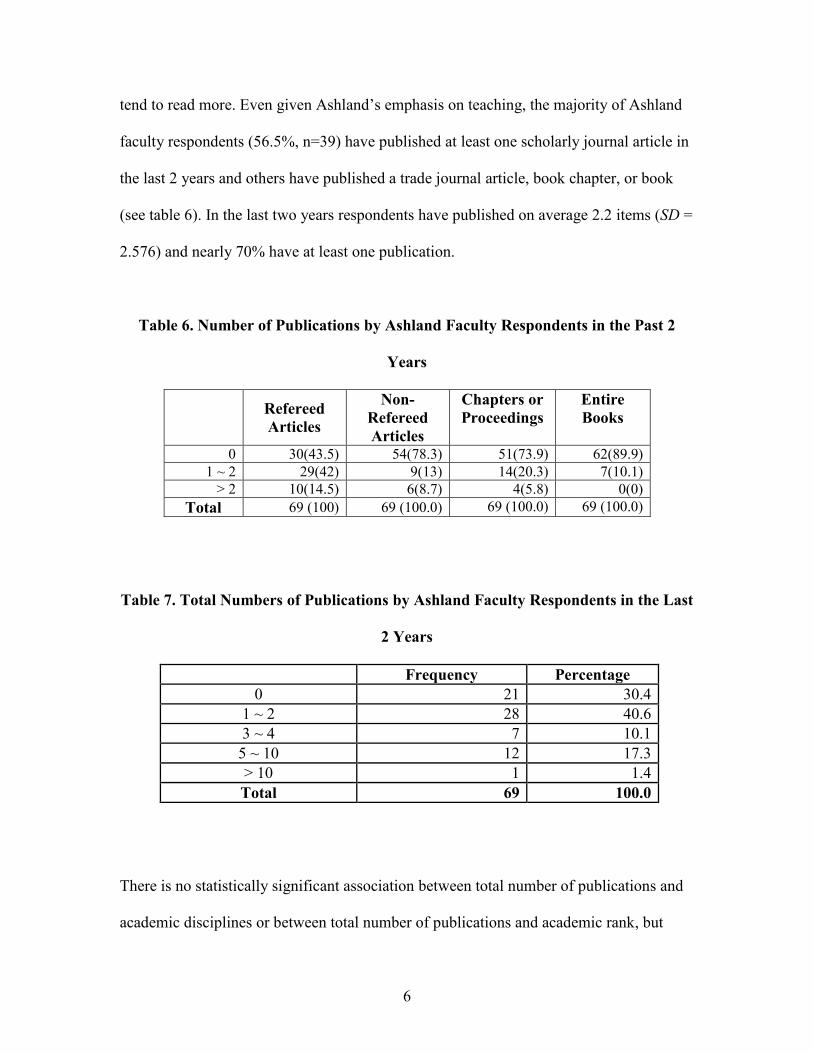
tend to read more. Even given Ashland’s emphasis on teaching, the majority of Ashland
faculty respondents (56.5%, n=39) have published at least one scholarly journal article in
the last 2 years and others have published a trade journal article, book chapter, or book
(see table 6). In the last two years respondents have published on average 2.2 items (SD =
2.576) and nearly 70% have at least one publication.
Table 6. Number of Publications by Ashland Faculty Respondents in the Past 2
Years
Refereed
Articles
Non-
Refereed
Articles
Chapters or
Proceedings
Entire
Books
0 30(43.5) 54(78.3) 51(73.9) 62(89.9)
1 ~ 2 29(42) 9(13) 14(20.3) 7(10.1)
> 2 10(14.5) 6(8.7) 4(5.8) 0(0)
Total 69 (100) 69 (100.0) 69 (100.0) 69 (100.0)
Table 7. Total Numbers of Publications by Ashland Faculty Respondents in the Last
2 Years
Frequency Percentage
0 21 30.4
1 ~ 2 28 40.6
3 ~ 4 7 10.1
5 ~ 10 12 17.3
> 10 1 1.4
Total 69 100.0
There is no statistically significant association between total number of publications and
academic disciplines or between total number of publications and academic rank, but
7
contrary to many of our studies there is a significant association between number of
publications and gender. Male faculty members at Ashland who responded to our survey
reported significantly more publications in the last two years (t = 2.726, p = .008; Mmale =
2.95, Mfemale = 1.30, MD = 1.647).
Previous studies of research universities often show the faculty who have won awards for
their work in the last two years read more. Again, this is probably not an appropriate
measure for a teaching-intensive university. Since only 11.3% of respondents reported
receiving awards we excluded this measure.
Personal Subscriptions.
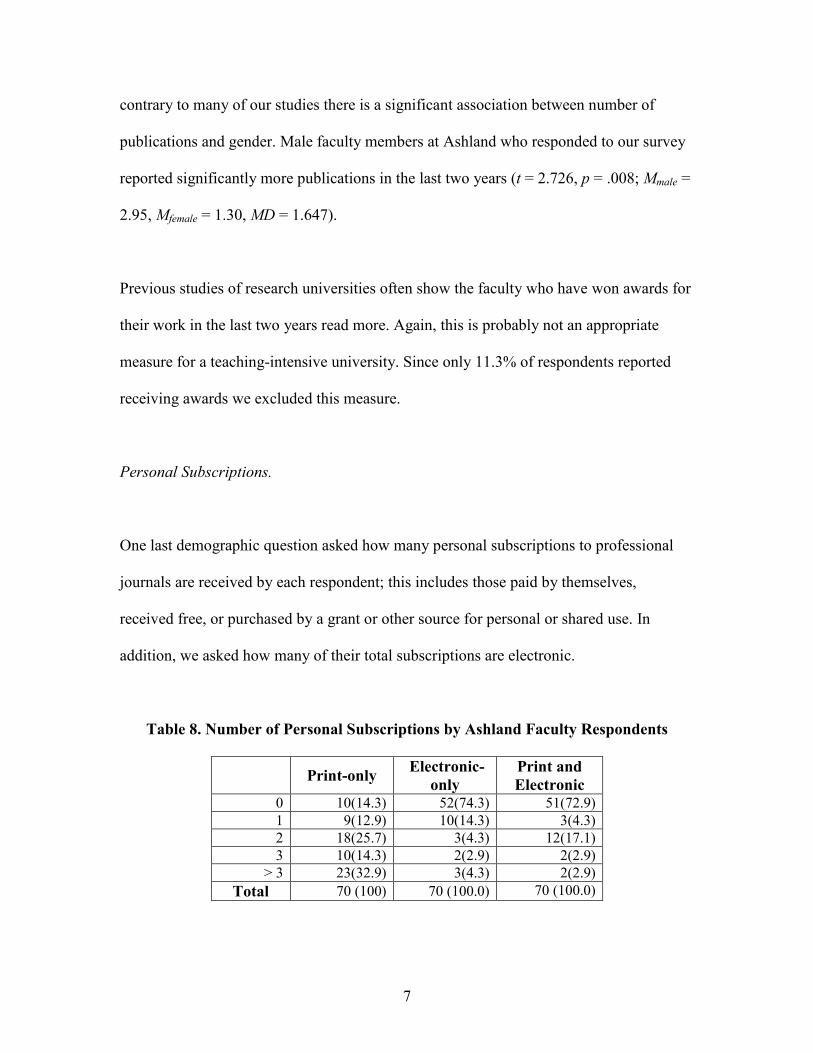
One last demographic question asked how many personal subscriptions to professional
journals are received by each respondent; this includes those paid by themselves,
received free, or purchased by a grant or other source for personal or shared use. In
addition, we asked how many of their total subscriptions are electronic.
Table 8. Number of Personal Subscriptions by Ashland Faculty Respondents
Print-only
Electronic-
only
Print and
Electronic 0 10(14.3) 52(74.3) 51(72.9)
1 9(12.9) 10(14.3) 3(4.3)
2 18(25.7) 3(4.3) 12(17.1)
3 10(14.3) 2(2.9) 2(2.9)
> 3 23(32.9) 3(4.3) 2(2.9)
Total 70 (100) 70 (100.0) 70 (100.0)
8
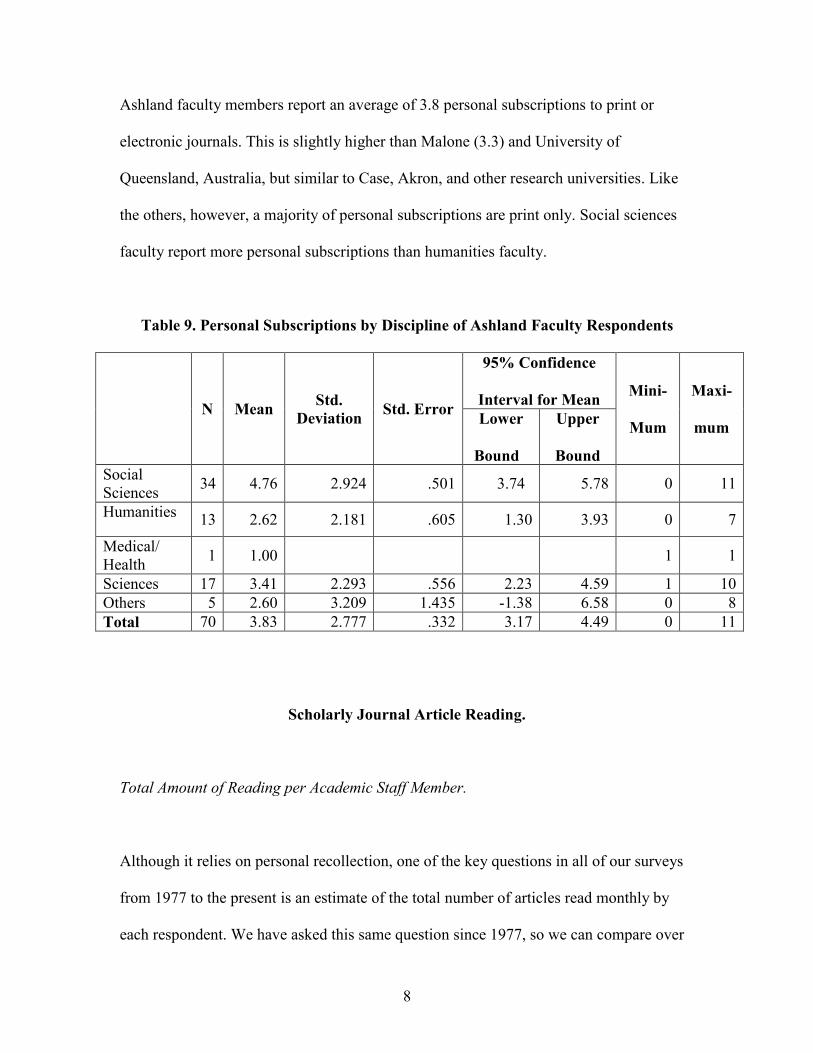
Ashland faculty members report an average of 3.8 personal subscriptions to print or
electronic journals. This is slightly higher than Malone (3.3) and University of
Queensland, Australia, but similar to Case, Akron, and other research universities. Like
the others, however, a majority of personal subscriptions are print only. Social sciences
faculty report more personal subscriptions than humanities faculty.
Table 9. Personal Subscriptions by Discipline of Ashland Faculty Respondents
N Mean Std.
Deviation Std. Error
95% Confidence
Interval for Mean Mini-
Mum
Maxi-
mum Lower
Bound
Upper
Bound
Social
Sciences 34 4.76 2.924 .501 3.74 5.78 0 11
Humanities 13 2.62 2.181 .605 1.30 3.93 0 7
Medical/
Health 1 1.00 1 1
Sciences 17 3.41 2.293 .556 2.23 4.59 1 10
Others 5 2.60 3.209 1.435 -1.38 6.58 0 8
Total 70 3.83 2.777 .332 3.17 4.49 0 11
Scholarly Journal Article Reading.
Total Amount of Reading per Academic Staff Member.
Although it relies on personal recollection, one of the key questions in all of our surveys
from 1977 to the present is an estimate of the total number of articles read monthly by
each respondent. We have asked this same question since 1977, so we can compare over
9
time and across populations. To assist memory, we ask for a relatively short period of
time and define articles and reading carefully. The first question asked is “In the last 4
weeks, approximately how many scholarly articles have you read? Articles can include
those found in journal issues, Web sites, or separate copies such as preprints, reprints,
and other electronic or paper copies. Reading is defined as going beyond the table of
contents, title, and abstract to the body of the article.” The relative amounts are more
interesting than the exact number reported. For convenience, we often report results as
readings in a year, simply by taking the monthly number reported by a respondent and
multiplying it by 12, for a crude approximation of the total amount of reading by
respondent per year.
The average amount of scholarly reading in the past four weeks at Ashland University
was 9.9 articles (SD = 8.140) with 101 responses included. The range is from 0-40
articles read in the last month, with a median of 8. Extrapolated to an entire year, the
average number of articles read by Ashland faculty across all disciplines was 119, almost
identical to the 120 average for Malone faculty.
This compares to 206 articles across all faculties in three U.S. universities that were
surveyed between 2000 and 2003. University of Tennessee in 2000 averaged 186, Drexel
University in 2002 averaged 197, and University of Pittsburgh in 2003 averaged 215. In
surveys of two research universities in Australia in 2004-2005 and research intensive
universities in Ohio and Tennessee in 2005-2006, we found an even greater amount of
reading—approximately 250 articles per year, showing a continual increase in amount of
reading in research universities since our first survey in 1977. The report comparing the
10
U.S. universities concluded: “While there is some difference in average amount of
reading among the three universities …Nevertheless, reading by faculty is substantial and,
perhaps, increasing as shown in the section on 25-year trends in university scientists' use
patterns.” (See King, Tenopir, Montgomery, and Aerni.) This trend continues in the
research intensive universities. We have no base-line data for teaching institutions.
The relative low amount of reading on average per year at Ashland and Malone is not
surprising given the relative emphasis on responsibilities other than research and is
similar to reading by research staff in non-university settings, such as pediatricians in
clinical settings. In research intensive universities most faculty read more for research
and publication.
Last Incident of Reading and Novelty of Information in the Reading.
After the question that asks for recollection of amount of reading, we ask respondents to
focus on the last scholarly article they read. This is a variation on the “critical incident”
technique, where the last article read is assumed to be random in time, and gives us
detailed information on a random sample of total readings by the Ashland faculty. Again
we try to give quite explicit instructions, by asking: “The following questions in this
section refer to the scholarly article you read most recently, even if you had read the
article previously. Note that this last reading may not be typical, but will help us
establish the range of patterns in reading.” To better focus their minds on this last article
reading, we then ask for the title of the journal from which this last article was read or, if
11
not from a journal, the topic of the article. This question is merely to focus their minds on
the reading; we do not use it in our analysis.
Since this reading could be a first-time reading or a re-reading and because reading
patterns differ for core journals in a discipline (those from which scholars read many
articles each year), we ask if this is a re-reading and, “if this article is from a journal,”
“approximately how many articles did you read from this journal in the last 12 months?”
A journal from which a reader reads more than 10 articles per year could be considered a
core journal for that reader or that reader’s subject discipline. We might examine
differences in value, form, time spent, purpose, and method of locating articles for core
journal readings vs. non-core.
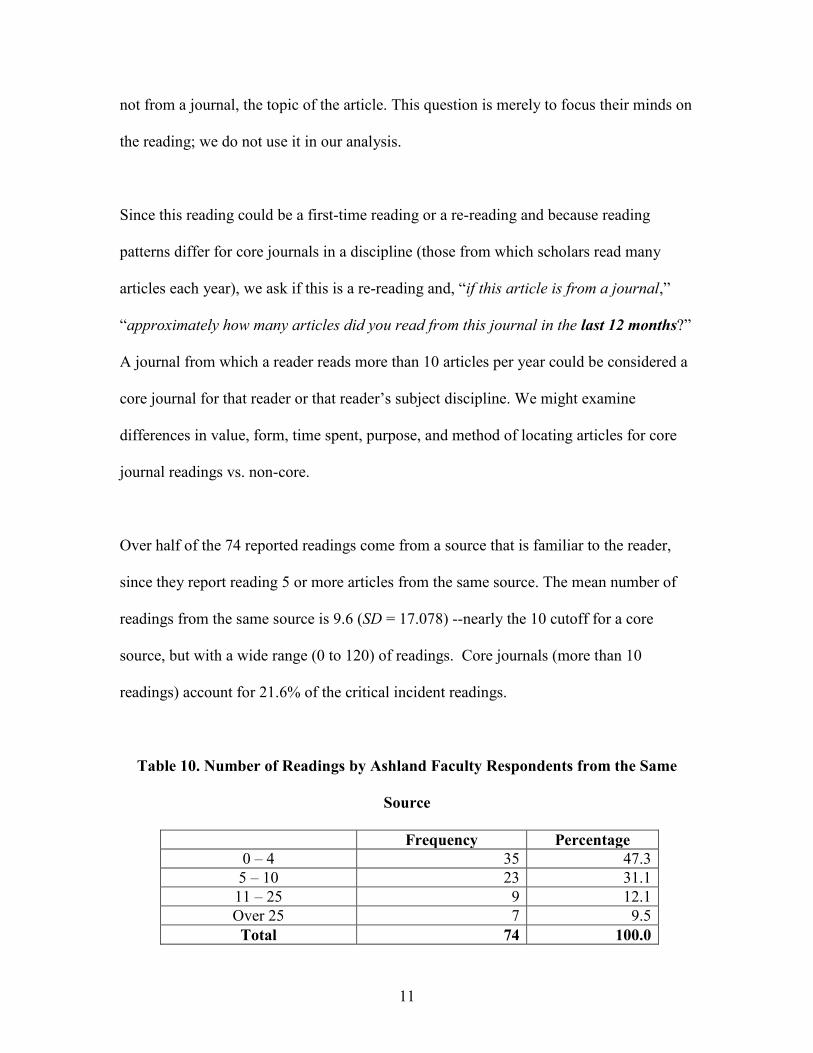
Over half of the 74 reported readings come from a source that is familiar to the reader,
since they report reading 5 or more articles from the same source. The mean number of
readings from the same source is 9.6 (SD = 17.078) --nearly the 10 cutoff for a core
source, but with a wide range (0 to 120) of readings. Core journals (more than 10
readings) account for 21.6% of the critical incident readings.
Table 10. Number of Readings by Ashland Faculty Respondents from the Same
Source
Frequency Percentage
0 – 4 35 47.3
5 – 10 23 31.1
11 – 25 9 12.1
Over 25 7 9.5
Total 74 100.0
12
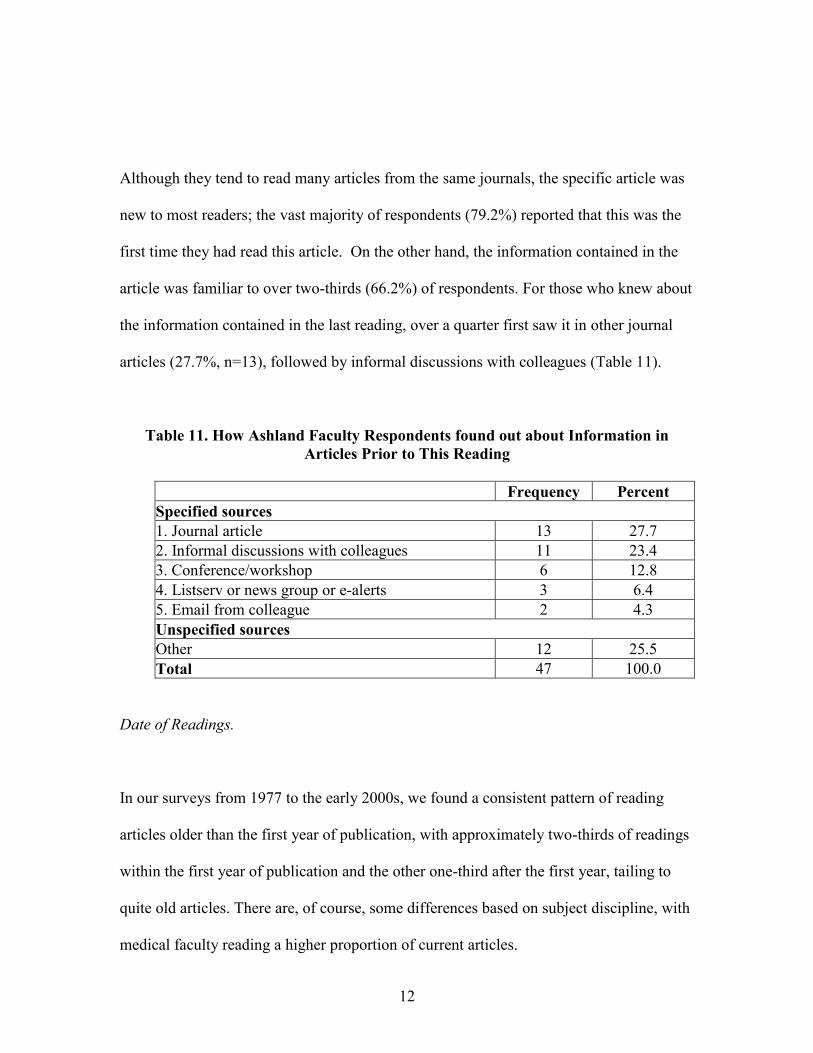
Although they tend to read many articles from the same journals, the specific article was
new to most readers; the vast majority of respondents (79.2%) reported that this was the
first time they had read this article. On the other hand, the information contained in the
article was familiar to over two-thirds (66.2%) of respondents. For those who knew about
the information contained in the last reading, over a quarter first saw it in other journal
articles (27.7%, n=13), followed by informal discussions with colleagues (Table 11).
Table 11. How Ashland Faculty Respondents found out about Information in
Articles Prior to This Reading
Frequency Percent
Specified sources
1. Journal article 13 27.7
2. Informal discussions with colleagues 11 23.4
3. Conference/workshop 6 12.8
4. Listserv or news group or e-alerts 3 6.4
5. Email from colleague 2 4.3
Unspecified sources
Other 12 25.5
Total 47 100.0
Date of Readings.
In our surveys from 1977 to the early 2000s, we found a consistent pattern of reading
articles older than the first year of publication, with approximately two-thirds of readings
within the first year of publication and the other one-third after the first year, tailing to
quite old articles. There are, of course, some differences based on subject discipline, with
medical faculty reading a higher proportion of current articles.
13
In our surveys of two Australian research universities in 2004 and 2005 and three
research universities in the U.S. in 2005 (Case, Akron, and Tennessee), we have found an
increase in the reading of older articles, with just slightly more than half of readings
within the first year of publication. This may be due to a greater availability of electronic
back files, an increase in searching, and search system features such as linking that allows
older articles to be more easily accessed.
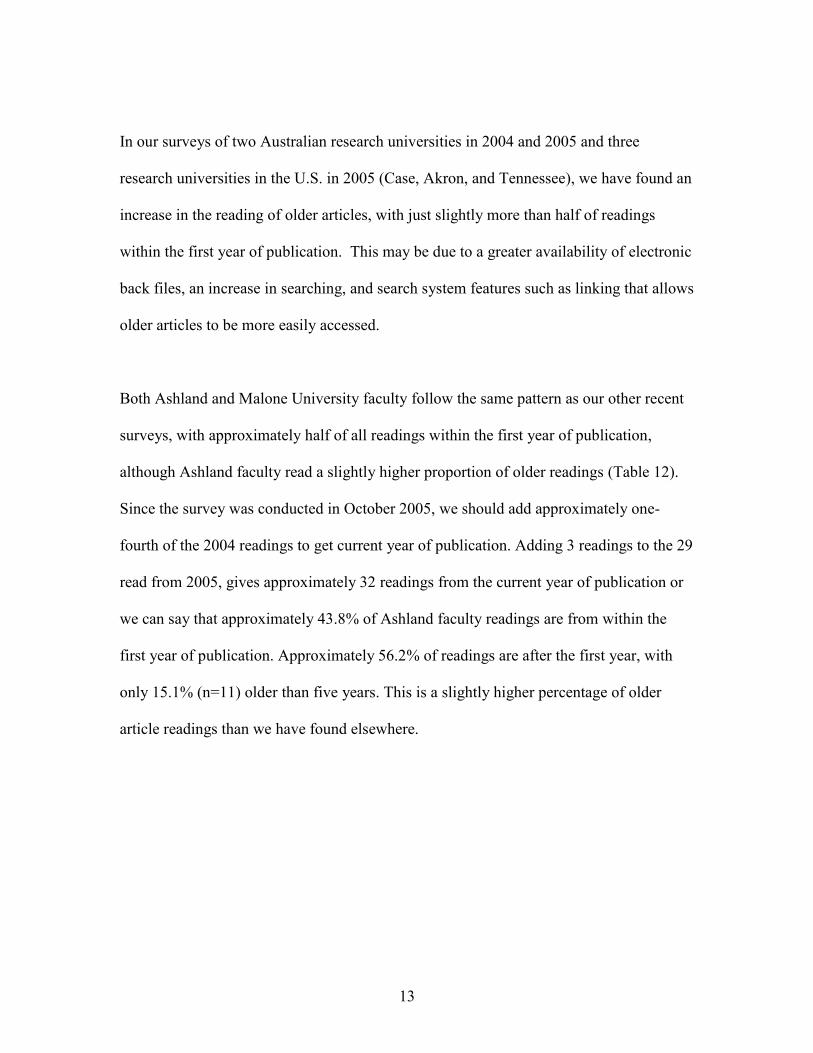
Both Ashland and Malone University faculty follow the same pattern as our other recent
surveys, with approximately half of all readings within the first year of publication,
although Ashland faculty read a slightly higher proportion of older readings (Table 12).
Since the survey was conducted in October 2005, we should add approximately one-
fourth of the 2004 readings to get current year of publication. Adding 3 readings to the 29
read from 2005, gives approximately 32 readings from the current year of publication or
we can say that approximately 43.8% of Ashland faculty readings are from within the
first year of publication. Approximately 56.2% of readings are after the first year, with
only 15.1% (n=11) older than five years. This is a slightly higher percentage of older
article readings than we have found elsewhere.
14
Table 12a. Year of Last Article Read by Ashland Faculty Respondents
Frequency Percent
1957 1 1.4
1965 1 1.4
1973 1 1.4
1978 1 1.4
1981 1 1.4
1987 1 1.4
1997 1 1.4
1998 3 4.1
1999 1 1.4
2000 1 1.4
2001 7 9.6
2002 8 11.0
2003 6 8.2
2004 11 15.1
2005 29 39.7
Total 73 100.0
Table 12b. Year of Articles Read by Ashland Faculty Respondents arranged by
Date Groupings
Year Frequency Percentage
Over 15 years
(1957~1988) 6 8.2
11 years ~ 15
years (1990~1994) 0 .0
6 years ~ 10 years
(1995~1999) 5 6.9
2 years ~ 5 years
(2000~3/4 of
2004)
19 26.0
1st year (1/4 of
2004~2005) 32 43.8
Total 73 100.0
15
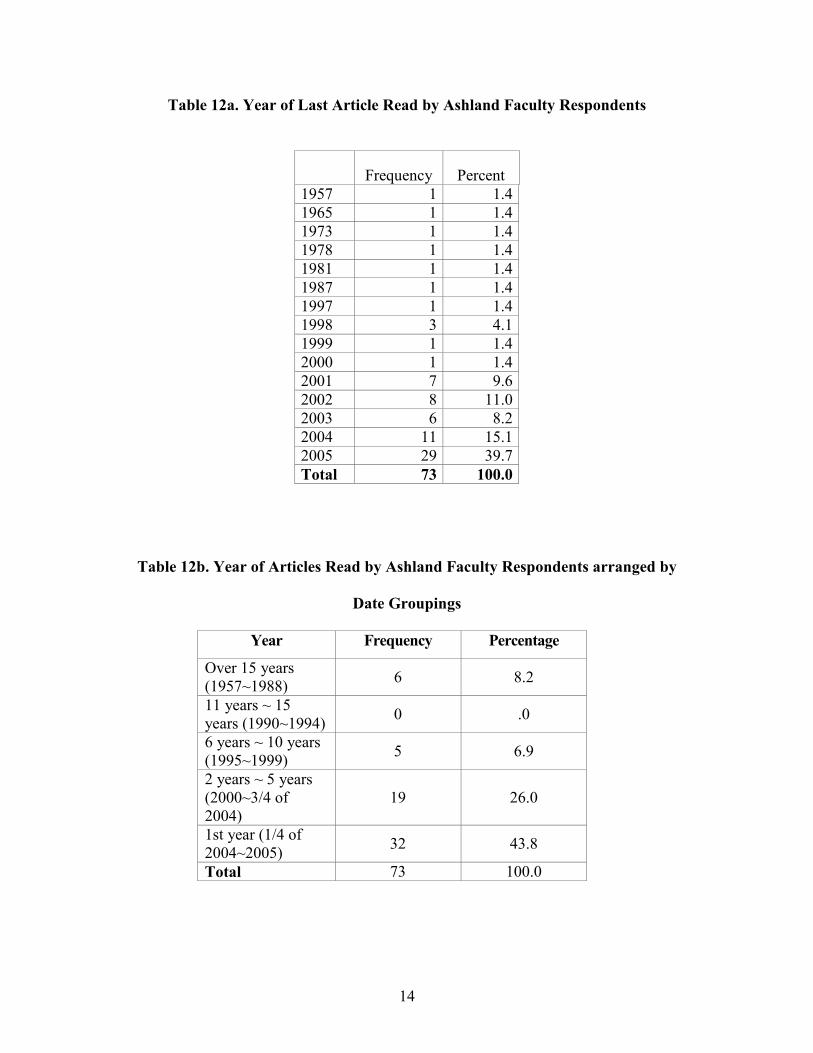
Time Spent Reading.
Ashland faculty report spending an average of approximately 33 minutes per article
reading (SD = 27.597), an amount of time consistent with our other recent surveys.
Although this may sound like a short time to read an article, the median for Ashland is
just 25 minutes, with a range of from zero to 120 minutes per article reading (Table 13).
We have 95% confidence that Ashland faculty on average spend between 26.64 and
39.61 minutes per reading.
In our surveys over the years we have observed that the amount of time spent reading has
gone down fairly steadily since 1977, when faculty reported spending on average nearly
45 minutes per reading. In the 2004-2006 surveys of research intensive universities in
Australia and the United States, that average time spent per reading has now gone down
to approximately 34 minutes, almost exactly the time reported by Ashland faculty.
Table 13. Time Spent Reading per Article by Ashland Faculty Respondents
Minutes Frequency Percent
0 1 1.4
5 6 8.3
10 4 5.6
15 12 16.7
20 11 15.3
25 3 4.2
30 15 20.8
40 1 1.4
45 5 6.9
60 7 9.7
75 1 1.4
90 3 4.2
120 3 4.2
Total 72 100.0
16
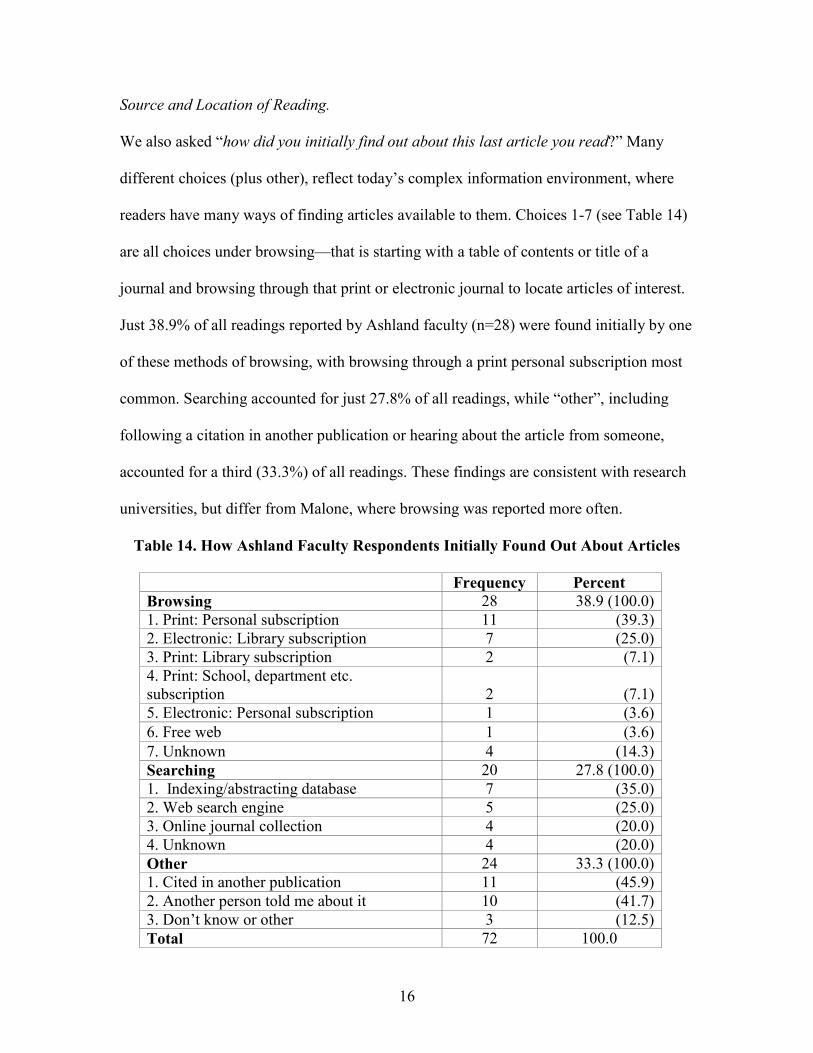
Source and Location of Reading.
We also asked “how did you initially find out about this last article you read?” Many
different choices (plus other), reflect today’s complex information environment, where
readers have many ways of finding articles available to them. Choices 1-7 (see Table 14)
are all choices under browsing—that is starting with a table of contents or title of a
journal and browsing through that print or electronic journal to locate articles of interest.
Just 38.9% of all readings reported by Ashland faculty (n=28) were found initially by one
of these methods of browsing, with browsing through a print personal subscription most
common. Searching accounted for just 27.8% of all readings, while “other”, including
following a citation in another publication or hearing about the article from someone,
accounted for a third (33.3%) of all readings. These findings are consistent with research
universities, but differ from Malone, where browsing was reported more often.
Table 14. How Ashland Faculty Respondents Initially Found Out About Articles
Frequency Percent
Browsing 28 38.9 (100.0)
1. Print: Personal subscription 11 (39.3)
2. Electronic: Library subscription 7 (25.0)
3. Print: Library subscription 2 (7.1)
4. Print: School, department etc.
subscription 2 (7.1)
5. Electronic: Personal subscription 1 (3.6)
6. Free web 1 (3.6)
7. Unknown 4 (14.3)
Searching 20 27.8 (100.0)
1. Indexing/abstracting database 7 (35.0)
2. Web search engine 5 (25.0)
3. Online journal collection 4 (20.0)
4. Unknown 4 (20.0)
Other 24 33.3 (100.0)
1. Cited in another publication 11 (45.9)
2. Another person told me about it 10 (41.7)
3. Don’t know or other 3 (12.5)
Total 72 100.0
17
Browsing or searching to find out about readings can also be categorized as coming from
library provided sources or other; or from print, electronic, or unknown sources. The 28
instances of readings located through browsing, can be categorized as 12 coming from
print or electronic personal subscriptions, 11 coming from print or electronic library or
department subscriptions, and 1 from the free web. Or, of the 28 articles found by
browsing, 15 came from print and 9 from electronic sources.
Searching, on the other hand, is all from electronic sources, with 11 of the instances
likely coming from library-provided services and 5 from a web search engine. We cannot
tell if the “other” readings come from print or electronic or from the library or other.
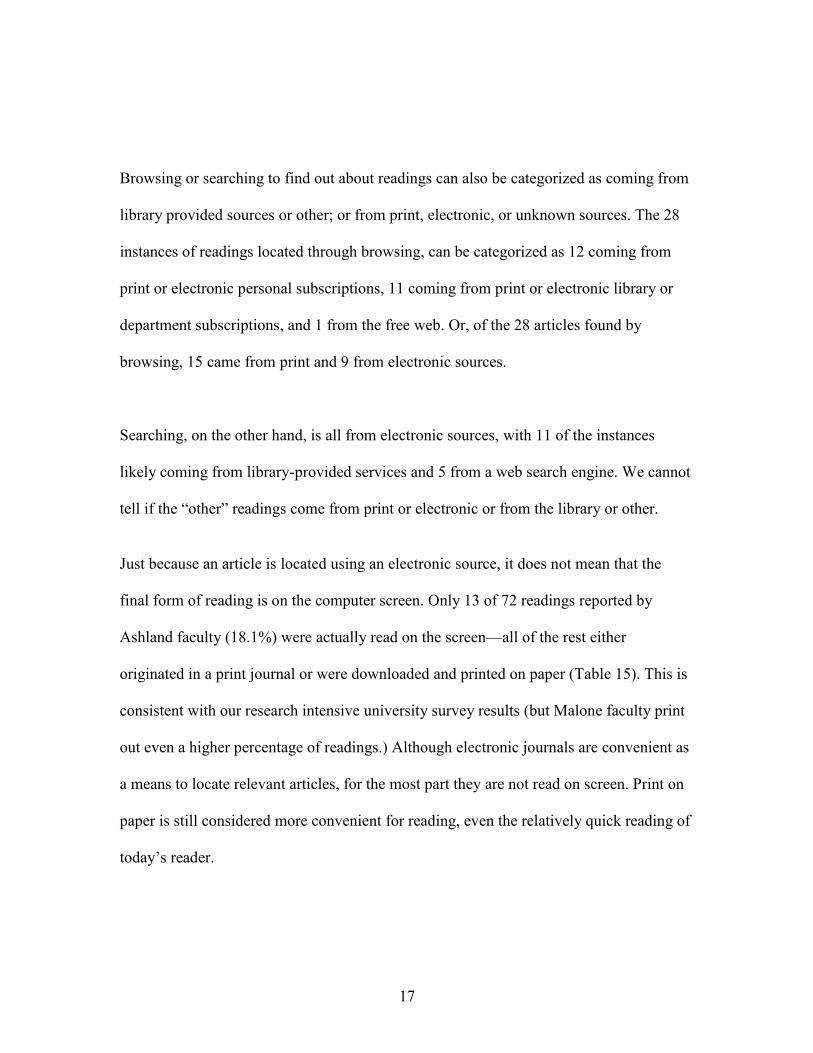
Just because an article is located using an electronic source, it does not mean that the
final form of reading is on the computer screen. Only 13 of 72 readings reported by
Ashland faculty (18.1%) were actually read on the screen—all of the rest either
originated in a print journal or were downloaded and printed on paper (Table 15). This is
consistent with our research intensive university survey results (but Malone faculty print
out even a higher percentage of readings.) Although electronic journals are convenient as
a means to locate relevant articles, for the most part they are not read on screen. Print on
paper is still considered more convenient for reading, even the relatively quick reading of
today’s reader.
18
Table 15. Final Form of Reading by Ashland Faculty Respondents
Frequency Percent
1. Downloaded and printed on paper 28 38.9
2. Print article in a print journal 25 34.7
3. Online computer screen 11 15.3
4. Photocopy 5 6.9
5. Previously downloaded/saved and
read, on computer screen 2 2.8
6. Others 1 1.4
Total 72 100.0
Many libraries have observed that faculty rarely read in the physical library, even though
their use of the virtual library collections may be substantial. Ashland faculty, like others,
rarely read from within the library; the vast majority of their article readings are from
home or their offices (94.5%, n=69) (Table 16.)
Table 16. Location of Ashland Faculty Respondents When Reading
Frequency Percent
Office or lab 43 58.9
Home 26 35.6
Library 4 5.5
Total 73 100.0
Purpose and Value of Reading.
Unlike usage log data, survey data provides a picture of purpose, value, and outcomes
from reading. We asked respondents to describe one principal purpose for which “you
have used, or do you plan to use, the information obtained from the article you last
read?” In research universities the most common principal purpose for most academic
19
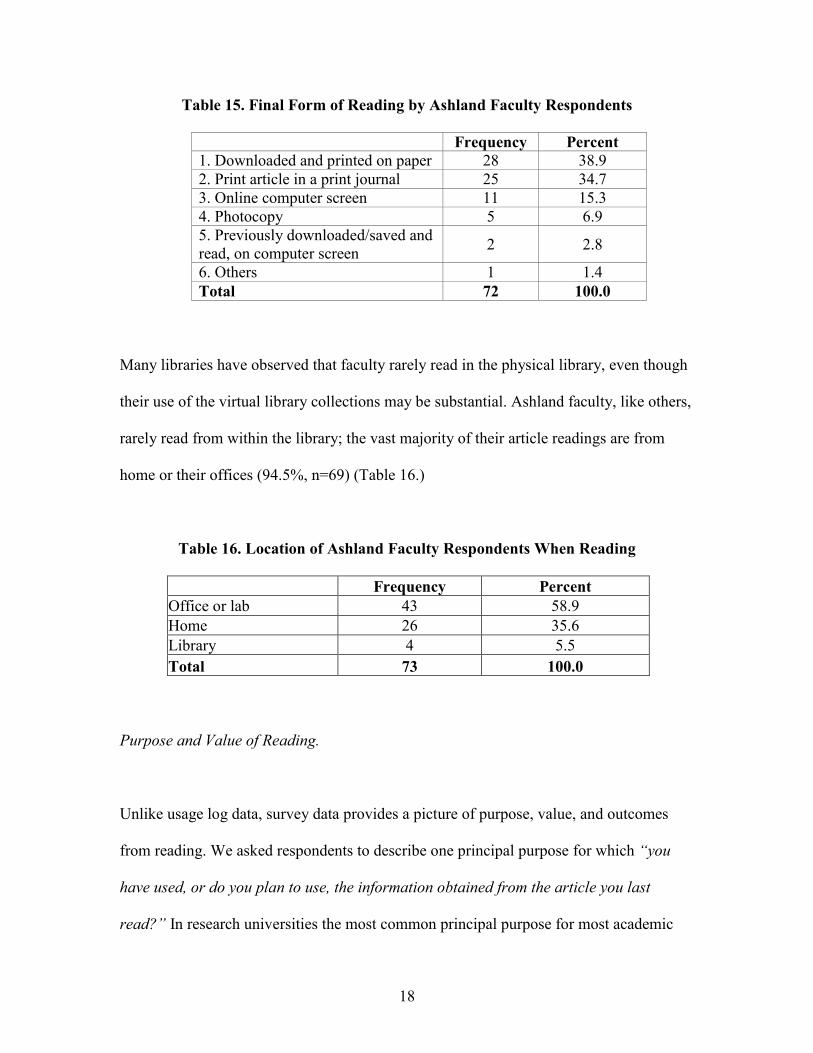
disciplines is research (although medical faculty read more for current awareness) and,
unlike Malone faculty, Ashland faculty also report reading for research as the most
frequent purpose of reading (Table 17).
Table 17. Principal Purpose of Reading for Ashland Faculty
Frequency Percent
Research 35 48.6
Teaching 15 20.8
Current awareness/keeping up 6 8.3
Writing proposals, reports, articles, etc. 5 6.9
Other 11 15.3
Total 72 100.0
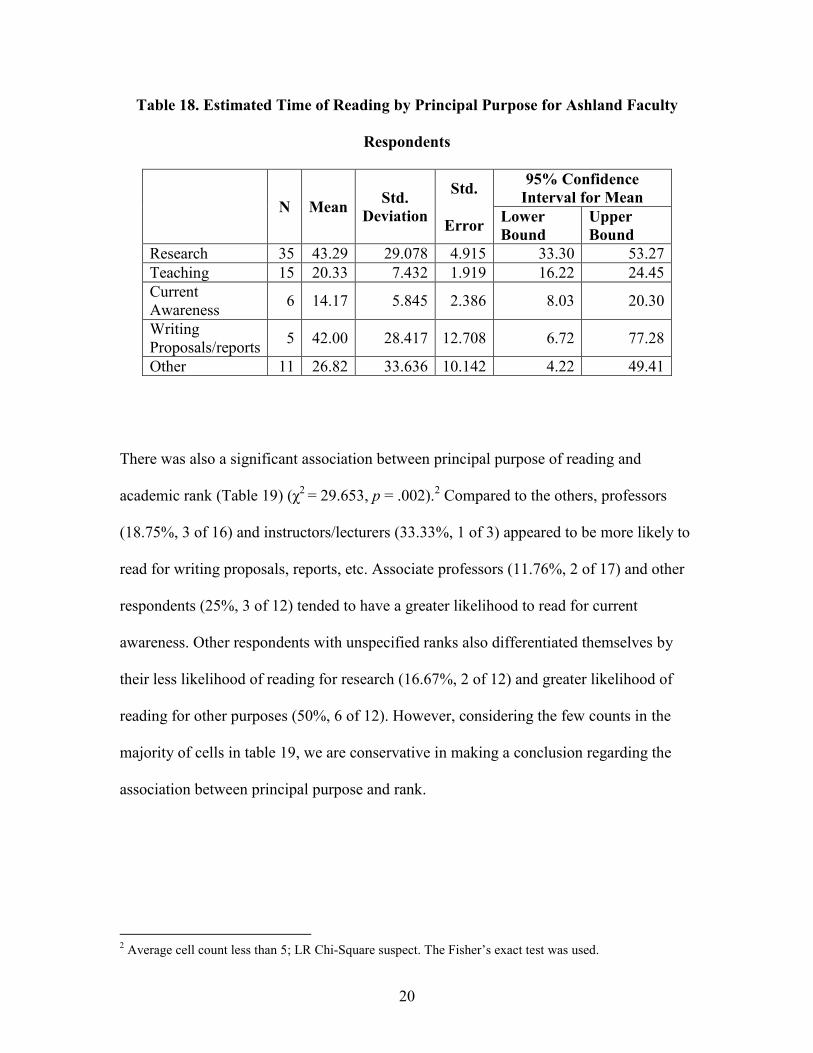
There were no statistically significant associations between principal purpose and amount
of reading. Significant differences in estimated time per reading were found across the
groups with different principal purposes (F = 3.426, p = 0.013). ANOVA comparisons
show that the differences primarily existed among the three groups: people who read for
research, teaching and keeping current awareness.1 Respondents with research as
principal purpose significantly spent more time than those reading for teaching (MD =
22.952) and current awareness (MD = 29.119) (see Table 18 for detailed information).
1 The homogeneity of variances was not guaranteed. Tamhane’s T2 that does not require equal variances
across groups was used in ANOVA.
20
Table 18. Estimated Time of Reading by Principal Purpose for Ashland Faculty
Respondents
N Mean Std.
Deviation
Std.
Error
95% Confidence
Interval for Mean
Lower
Bound
Upper
Bound
Research 35 43.29 29.078 4.915 33.30 53.27
Teaching 15 20.33 7.432 1.919 16.22 24.45
Current
Awareness 6 14.17 5.845 2.386 8.03 20.30
Writing
Proposals/reports 5 42.00 28.417 12.708 6.72 77.28
Other 11 26.82 33.636 10.142 4.22 49.41
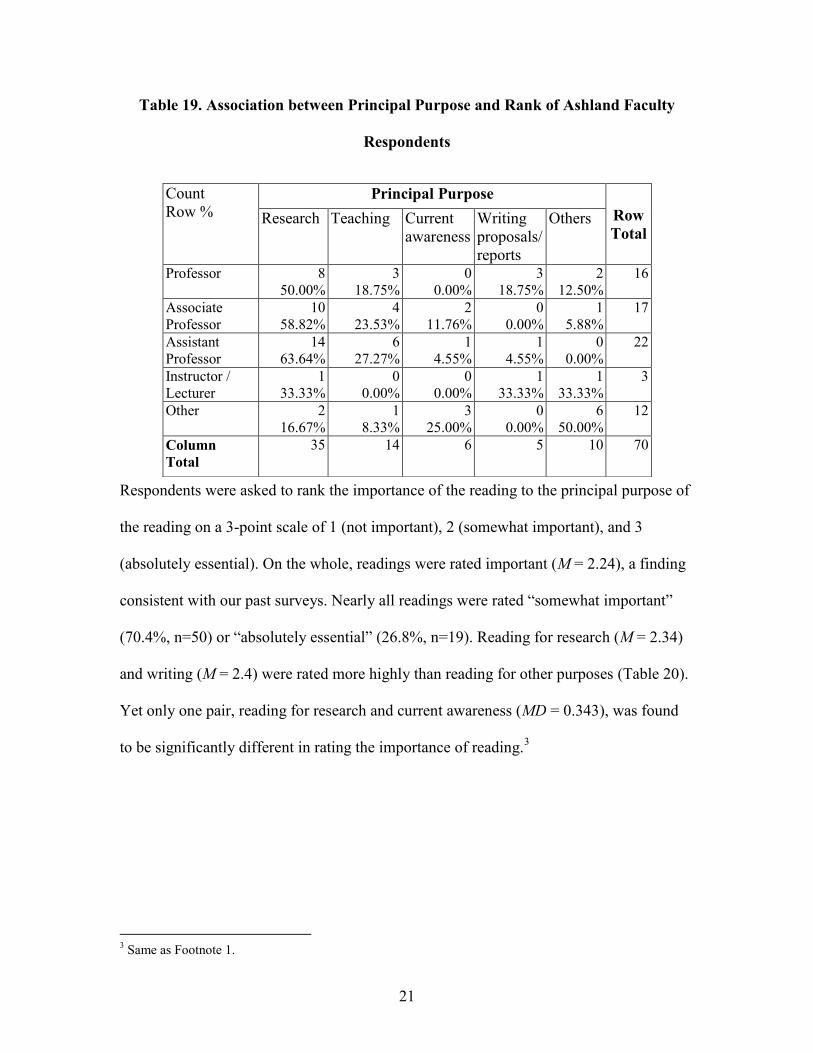
There was also a significant association between principal purpose of reading and
academic rank (Table 19) (χ2
= 29.653, p = .002).2 Compared to the others, professors
(18.75%, 3 of 16) and instructors/lecturers (33.33%, 1 of 3) appeared to be more likely to
read for writing proposals, reports, etc. Associate professors (11.76%, 2 of 17) and other
respondents (25%, 3 of 12) tended to have a greater likelihood to read for current
awareness. Other respondents with unspecified ranks also differentiated themselves by
their less likelihood of reading for research (16.67%, 2 of 12) and greater likelihood of
reading for other purposes (50%, 6 of 12). However, considering the few counts in the
majority of cells in table 19, we are conservative in making a conclusion regarding the
association between principal purpose and rank.
2 Average cell count less than 5; LR Chi-Square suspect. The Fisher’s exact test was used.
21
Table 19. Association between Principal Purpose and Rank of Ashland Faculty
Respondents
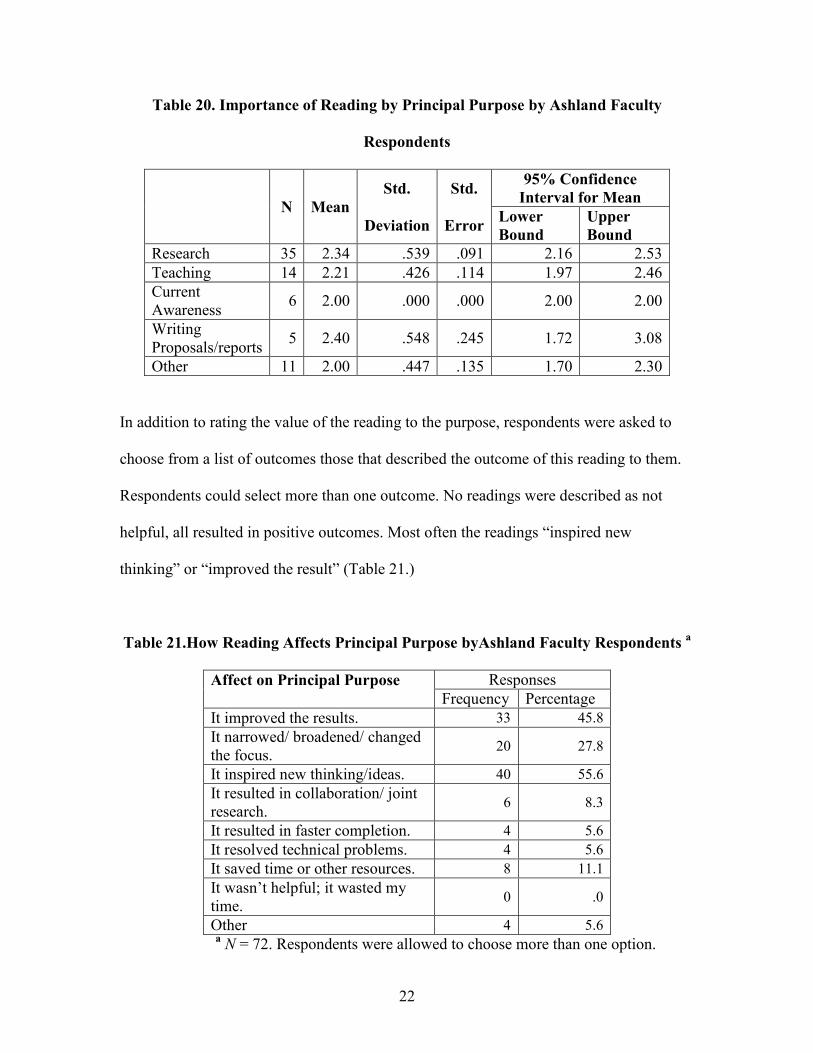
Respondents were asked to rank the importance of the reading to the principal purpose of
the reading on a 3-point scale of 1 (not important), 2 (somewhat important), and 3
(absolutely essential). On the whole, readings were rated important (M = 2.24), a finding
consistent with our past surveys. Nearly all readings were rated “somewhat important”
(70.4%, n=50) or “absolutely essential” (26.8%, n=19). Reading for research (M = 2.34)
and writing (M = 2.4) were rated more highly than reading for other purposes (Table 20).
Yet only one pair, reading for research and current awareness (MD = 0.343), was found
to be significantly different in rating the importance of reading.3
3 Same as Footnote 1.
Count
Row %
Principal Purpose
Row
Total Research Teaching Current
awareness
Writing
proposals/
reports
Others
Professor 8
50.00%
3
18.75%
0
0.00%
3
18.75%
2
12.50%
16
Associate
Professor
10
58.82%
4
23.53%
2
11.76%
0
0.00%
1
5.88%
17
Assistant
Professor
14
63.64%
6
27.27%
1
4.55%
1
4.55%
0
0.00%
22
Instructor /
Lecturer
1
33.33%
0
0.00%
0
0.00%
1
33.33%
1
33.33%
3
Other 2
16.67%
1
8.33%
3
25.00%
0
0.00%
6
50.00%
12
Column
Total 35 14 6 5 10 70
22
Table 20. Importance of Reading by Principal Purpose by Ashland Faculty
Respondents
N Mean
Std.
Deviation
Std.
Error
95% Confidence
Interval for Mean
Lower
Bound
Upper
Bound
Research 35 2.34 .539 .091 2.16 2.53
Teaching 14 2.21 .426 .114 1.97 2.46
Current
Awareness 6 2.00 .000 .000 2.00 2.00
Writing
Proposals/reports 5 2.40 .548 .245 1.72 3.08
Other 11 2.00 .447 .135 1.70 2.30
In addition to rating the value of the reading to the purpose, respondents were asked to
choose from a list of outcomes those that described the outcome of this reading to them.
Respondents could select more than one outcome. No readings were described as not
helpful, all resulted in positive outcomes. Most often the readings “inspired new
thinking” or “improved the result” (Table 21.)
Table 21.How Reading Affects Principal Purpose byAshland Faculty Respondents a
Affect on Principal Purpose Responses
Frequency Percentage
It improved the results. 33 45.8
It narrowed/ broadened/ changed
the focus. 20 27.8
It inspired new thinking/ideas. 40 55.6
It resulted in collaboration/ joint
research. 6 8.3
It resulted in faster completion. 4 5.6
It resolved technical problems. 4 5.6
It saved time or other resources. 8 11.1
It wasn’t helpful; it wasted my
time. 0 .0
Other 4 5.6
a N = 72. Respondents were allowed to choose more than one option.
23
Differences of Reading Patterns by Demographic Factors.
Differences in Reading Patterns by Subject Discipline and Faculty.
Unlike research intensive universities, but similar to Malone, there were no significant
associations between subject discipline and amount of reading, average time spent per
reading, sources for finding articles, principal purpose, or way of finding out articles.4
Differences in Reading Patterns by Rank, Highest Degree, Age, Gender, and Productivity.
No significant differences in reading patterns were found based on rank, highest degree
earned, age, or gender. There is, however, a correlation between number of articles
published in refereed scholarly journals and number of articles read. This is consistent
with most of our earlier surveys, although no correlation was found at Malone. Faculty
members who publish more also read more.
Role of Library Collections.
The sources used to find articles were recoded into three broad categories: library-
provided (print or electronic), personal subscriptions (print or electronic) and other. No
significant differences were found in principal purpose and year of articles between the
4 Same as Footnote 2.
24
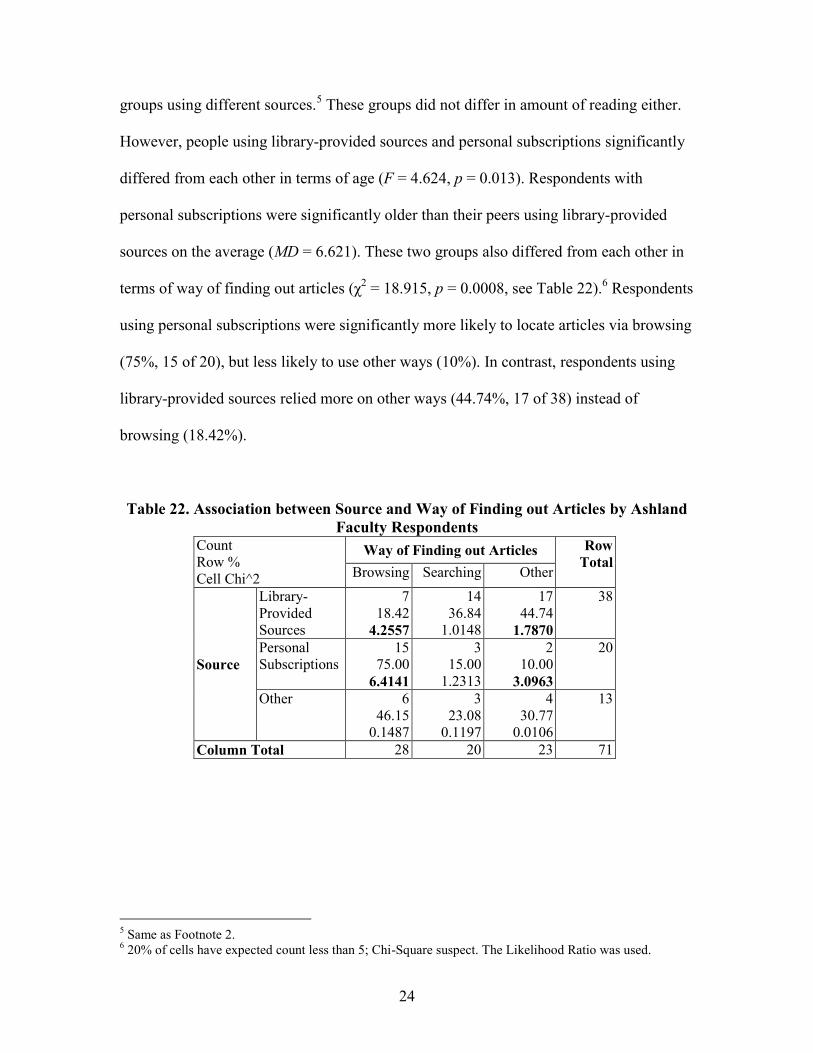
groups using different sources.5 These groups did not differ in amount of reading either.
However, people using library-provided sources and personal subscriptions significantly
differed from each other in terms of age (F = 4.624, p = 0.013). Respondents with
personal subscriptions were significantly older than their peers using library-provided
sources on the average (MD = 6.621). These two groups also differed from each other in
terms of way of finding out articles (χ2 = 18.915, p = 0.0008, see Table 22).
6 Respondents
using personal subscriptions were significantly more likely to locate articles via browsing
(75%, 15 of 20), but less likely to use other ways (10%). In contrast, respondents using
library-provided sources relied more on other ways (44.74%, 17 of 38) instead of
browsing (18.42%).
Table 22. Association between Source and Way of Finding out Articles by Ashland
Faculty Respondents Count
Row %
Cell Chi^2
Way of Finding out Articles Row
Total Browsing Searching Other
Source
Library-
Provided
Sources
7
18.42
4.2557
14
36.84
1.0148
17
44.74
1.7870
38
Personal
Subscriptions
15
75.00
6.4141
3
15.00
1.2313
2
10.00
3.0963
20
Other 6
46.15
0.1487
3
23.08
0.1197
4
30.77
0.0106
13
Column Total 28 20 23 71
5 Same as Footnote 2.
6 20% of cells have expected count less than 5; Chi-Square suspect. The Likelihood Ratio was used.
25
Open Ended Comments
As part of this study, faculty members at Ashland University were asked via open-ended
text box to comment on if and how their use of scholarly resources has changed over time.
By and large, comments demonstrated a growing tendency to make greater use of
electronic resources to access scholarly materials, often relying on the library’s e-
collections. This tendency was exemplified in several comments:
Use more diverse journals due to enhanced online availability
I use the library resources more exclusively.
It has become nearly exclusively electronic. There is no library on site at the Center
where I teach. I would be completely lost without access to electronic scholarly
materials. Such access is also invaluable to our students.
Searching for journal articles easier because of electronic capabilities; therefore, I
tend to search more often for current research via electronic journals
Certainly more attention must be paid to on-line materials. Many more journals have
been made available via online publication.
Online availability has increased the ease and frequency of obtaining relevant
scholarly materials
I do read on-line journals, though none of them require subscriptions.
The availability and accessibility of electronic journals make it easier to keep abreast
of current issues and changes in our profession.
I have increased my use of journal articles in teaching due to easier availability via
online databases, i.e. EbscoHost Academic Search through our library.
I am much more likely to begin a search online and to download an article rather than
find the print version, even if I subscribe to the journal where the information is found.
I am more likely to assign a web search than to assign an article that I selected.
I refer to more other material since it is easier to find due to web searching, journals
available electronically, and better library resources
26
I find my students and colleagues much too busy to read journals very often. I think
if these materials were available on audio CD they would be more often consumed.
Several respondents also took the opportunity to note their use and support of the
OhioLink consortium specifically:
Keep OhioLink!
Many of my major journals are not available through OhioLink. Though I subscribe
to some individually, this does not make them conveniently available to my students
(though I do encourage them to make use of my small collection for their papers, etc.).
There are some which are too expensive for individual subscription and for these I
rely on interlibrary loan.
Ashland University's OhioLink and inter-library photocopies of articles have been
absolutely essential for me to do research. They have been superb, as has been the
research librarians on staff.
I use Ohio Link databases extensively and require that my graduate students do the
same.
The online availability through the university consortium is critical. I no longer have
to wince when I set students loose on a research project, as I know that they will have
the journal resources available that they need. We can also much better support
journal clubs, knowing that all students have direct access to the papers being
discussed (they are now given the links to the papers)
Much more use of online resources (i.e. research databases and full text access). Use
if OhioLink materials delivered to my home library.
I am using online material almost exclusively. My university has a membership in
OhioLink Electronic Journal Center, which together with my own subscriptions
(printed an online) serve the majority of my research needs.
More reliance on electronic journals for fast access to material. Heavy reliance on the
OhioLink Electronic Journal Center for both research and teaching.
27
Conclusion.
Ashland University faculty are similar in some ways to research intensive university
faculty and in others they are more similar to our other master’s university, Malone
College. Faculty members at both Ashland and Malone read fewer journal articles than
their counterparts at research intensive universities, publish less on average, and read
quite a bit from personal subscriptions. On the other hand, Ashland University faculty
report more reading for the purpose of research or writing than do faculty at Malone and
read a higher percentage of articles after the first year of publication than our other
survey respondents. This may be due to the nature of the academic disciplines or research
at Ashland.
Like other faculty members, however, Ashland faculty use electronic journals from the
library, value OhioLink resources, still prefer print for personal subscriptions, and tend to
print out and read from printed sources even when the original source is electronic.
Further conclusions and comparisons will be made as the 2004-2006 findings from all 5
U.S. universities and 2 Australian universities are readied for publication.
And, finally, journals and journal articles are only one source of scholarly information.
Faculty rely on scholarly information sources of various types for their work of teaching,
research, writing, and keeping up with their discipline. The relative value of different
types of sources varies with the subject discipline and the principal purpose of reading.
Journals are one important source, but not the only one.
28
References.
King, Donald W.; Tenopir, Carol; Montgomery, Carol Hansen; and Aerni, Sarah E.
“Patterns of Journal Use by Faculty at Three Diverse Universities.” D-Lib Magazine 9,
10 (October 2003). http://www.dlib.org/dlib/october03/king/10king.html
Tenopir, Carol; and King, Donald W. Communication Patterns of Engineers. NY:
IEEE/Wiley InterScience, 2004.
Tenopir, Carol; and King, Donald W. Towards Electronic Journals: Realities for
Scientists, Librarians, and Publishers. Washington, D.C.: Special Libraries Association,
2000.
Tenopir, Carol; King, Donald W.; and Bush, Amy. “Medical Faculty’s Use of Print and
Electronic Journals: Changes Over Time and Comparison with Other Scientists.” Journal
of the Medical Library Association (JMLA), 92(2), April 2004 , 233-241.
Tenopir, Carol; King, Donald W.; Boyce, Peter; Grayson, Matt; Paulson, Keri-Lynn.
“Relying on Electronic Journals: Reading Patterns of Astronomers.” Journal of the
American Society for Information Science and Technology (JASIST) 56, 8 (June 2005):
786-802.
Tenopir, Carol; King, Donald W.; Clarke, Michael; Na, Kyoungsik; and Zhou, Xiang.
“Journal Reading Patterns and Preferences of Pediatricians.” Accepted for publication in
the Journal of The Medical Library Association, 2006.
29
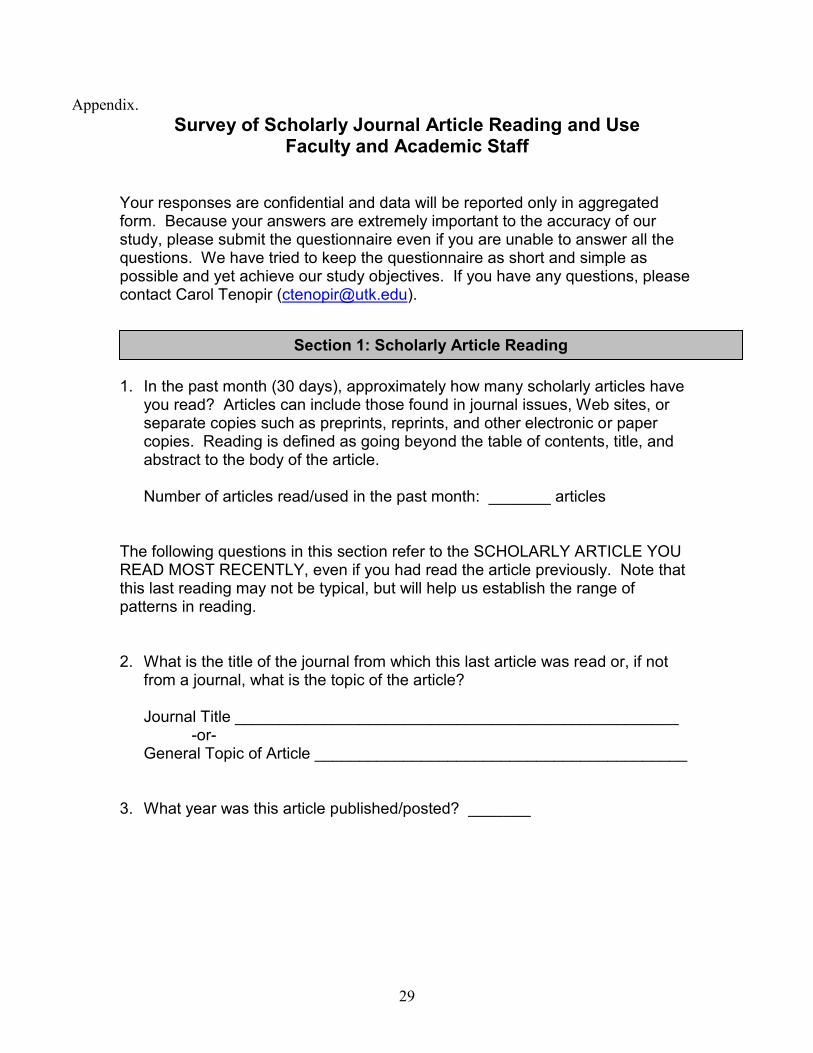
Appendix.
Survey of Scholarly Journal Article Reading and Use Faculty and Academic Staff
Your responses are confidential and data will be reported only in aggregated form. Because your answers are extremely important to the accuracy of our study, please submit the questionnaire even if you are unable to answer all the questions. We have tried to keep the questionnaire as short and simple as possible and yet achieve our study objectives. If you have any questions, please contact Carol Tenopir ([email protected]). 1. In the past month (30 days), approximately how many scholarly articles have
you read? Articles can include those found in journal issues, Web sites, or separate copies such as preprints, reprints, and other electronic or paper copies. Reading is defined as going beyond the table of contents, title, and abstract to the body of the article. Number of articles read/used in the past month: _______ articles
The following questions in this section refer to the SCHOLARLY ARTICLE YOU READ MOST RECENTLY, even if you had read the article previously. Note that this last reading may not be typical, but will help us establish the range of patterns in reading. 2. What is the title of the journal from which this last article was read or, if not
from a journal, what is the topic of the article? Journal Title __________________________________________________
-or- General Topic of Article __________________________________________
3. What year was this article published/posted? _______
Section 1: Scholarly Article Reading
30
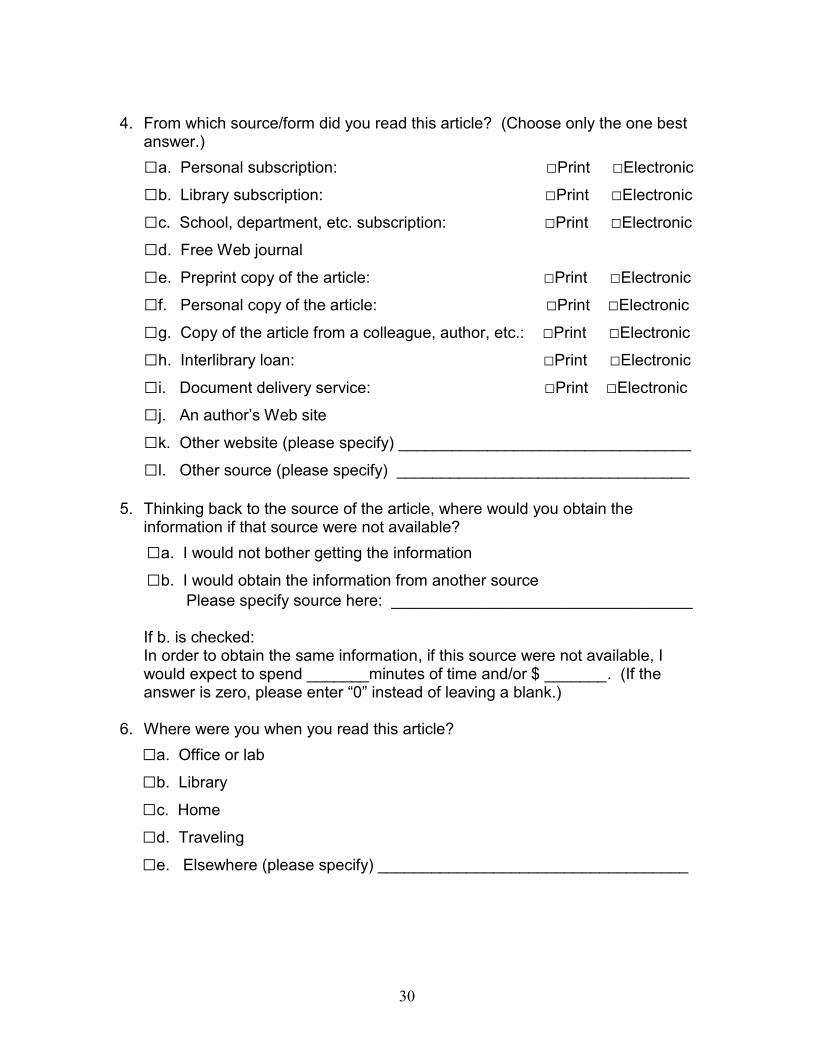
4. From which source/form did you read this article? (Choose only the one best
answer.)
□a. Personal subscription: □Print □Electronic
□b. Library subscription: □Print □Electronic
□c. School, department, etc. subscription: □Print □Electronic
□d. Free Web journal
□e. Preprint copy of the article: □Print □Electronic
□f. Personal copy of the article: □Print □Electronic
□g. Copy of the article from a colleague, author, etc.: □Print □Electronic
□h. Interlibrary loan: □Print □Electronic
□i. Document delivery service: □Print □Electronic
□j. An author’s Web site
□k. Other website (please specify) _________________________________
□l. Other source (please specify) _________________________________
5. Thinking back to the source of the article, where would you obtain the
information if that source were not available?
□a. I would not bother getting the information
□b. I would obtain the information from another source
Please specify source here: __________________________________ If b. is checked: In order to obtain the same information, if this source were not available, I would expect to spend _______minutes of time and/or $ _______. (If the answer is zero, please enter “0” instead of leaving a blank.)
6. Where were you when you read this article?
□a. Office or lab
□b. Library
□c. Home
□d. Traveling
□e. Elsewhere (please specify) ___________________________________
31
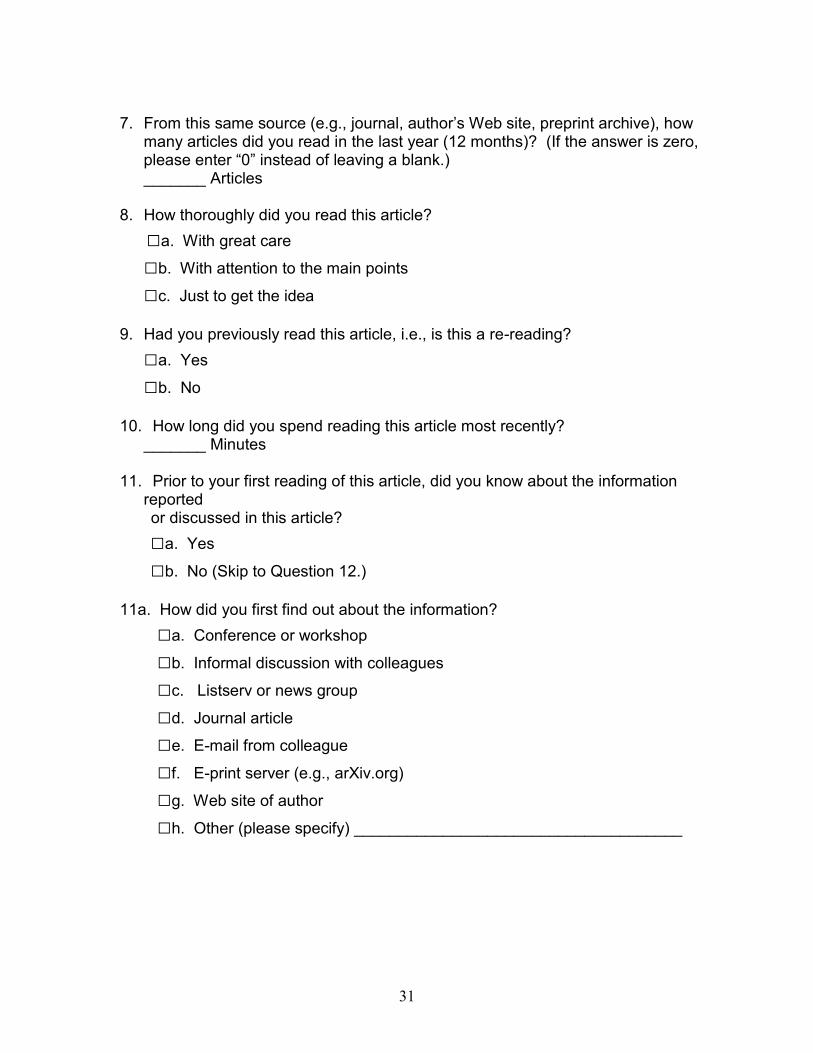
7. From this same source (e.g., journal, author’s Web site, preprint archive), how
many articles did you read in the last year (12 months)? (If the answer is zero, please enter “0” instead of leaving a blank.) _______ Articles
8. How thoroughly did you read this article?
□a. With great care
□b. With attention to the main points
□c. Just to get the idea
9. Had you previously read this article, i.e., is this a re-reading?
□a. Yes
□b. No
10. How long did you spend reading this article most recently? _______ Minutes 11. Prior to your first reading of this article, did you know about the information
reported or discussed in this article?
□a. Yes
□b. No (Skip to Question 12.)
11a. How did you first find out about the information?
□a. Conference or workshop
□b. Informal discussion with colleagues
□c. Listserv or news group
□d. Journal article
□e. E-mail from colleague
□f. E-print server (e.g., arXiv.org)
□g. Web site of author
□h. Other (please specify) _____________________________________
32
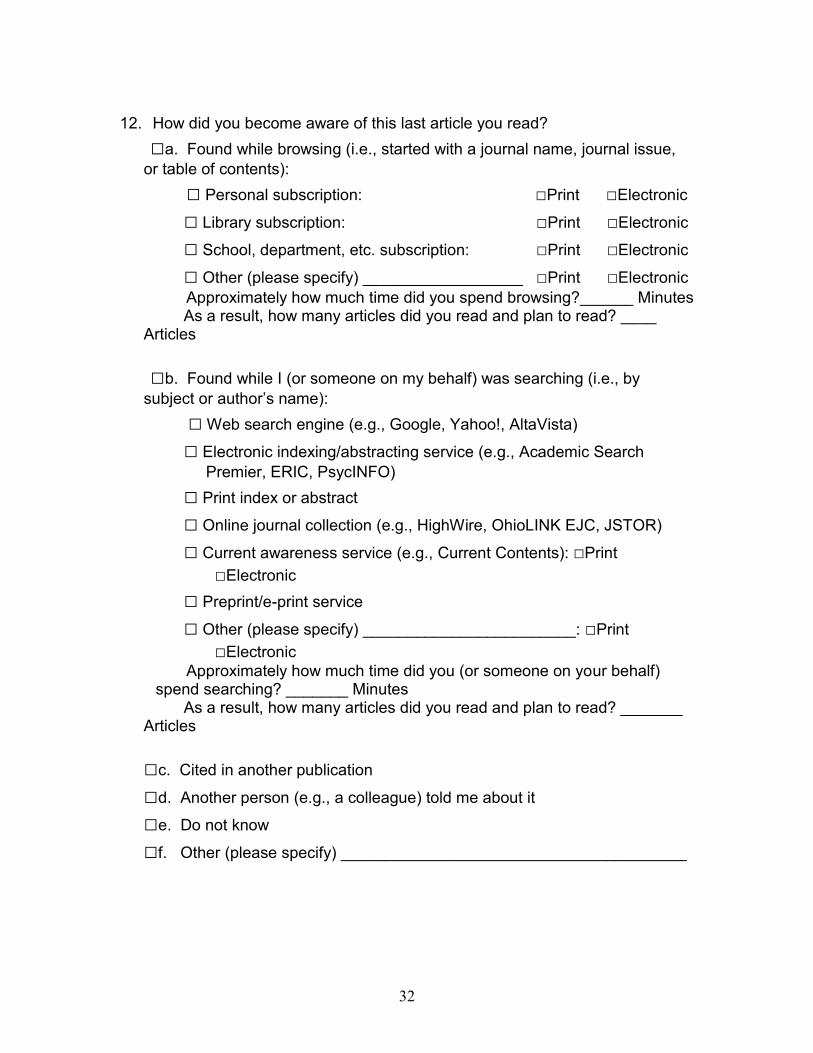
12. How did you become aware of this last article you read?
□a. Found while browsing (i.e., started with a journal name, journal issue,
or table of contents):
□ Personal subscription: □Print □Electronic
□ Library subscription: □Print □Electronic
□ School, department, etc. subscription: □Print □Electronic
□ Other (please specify) __________________ □Print □Electronic
Approximately how much time did you spend browsing?______ Minutes As a result, how many articles did you read and plan to read? ____ Articles
□b. Found while I (or someone on my behalf) was searching (i.e., by
subject or author’s name):
□ Web search engine (e.g., Google, Yahoo!, AltaVista)
□ Electronic indexing/abstracting service (e.g., Academic Search
Premier, ERIC, PsycINFO)
□ Print index or abstract
□ Online journal collection (e.g., HighWire, OhioLINK EJC, JSTOR)
□ Current awareness service (e.g., Current Contents): □Print
□Electronic
□ Preprint/e-print service
□ Other (please specify) ________________________: □Print
□Electronic
Approximately how much time did you (or someone on your behalf) spend searching? _______ Minutes
As a result, how many articles did you read and plan to read? _______ Articles
□c. Cited in another publication
□d. Another person (e.g., a colleague) told me about it
□e. Do not know
□f. Other (please specify) _______________________________________
33
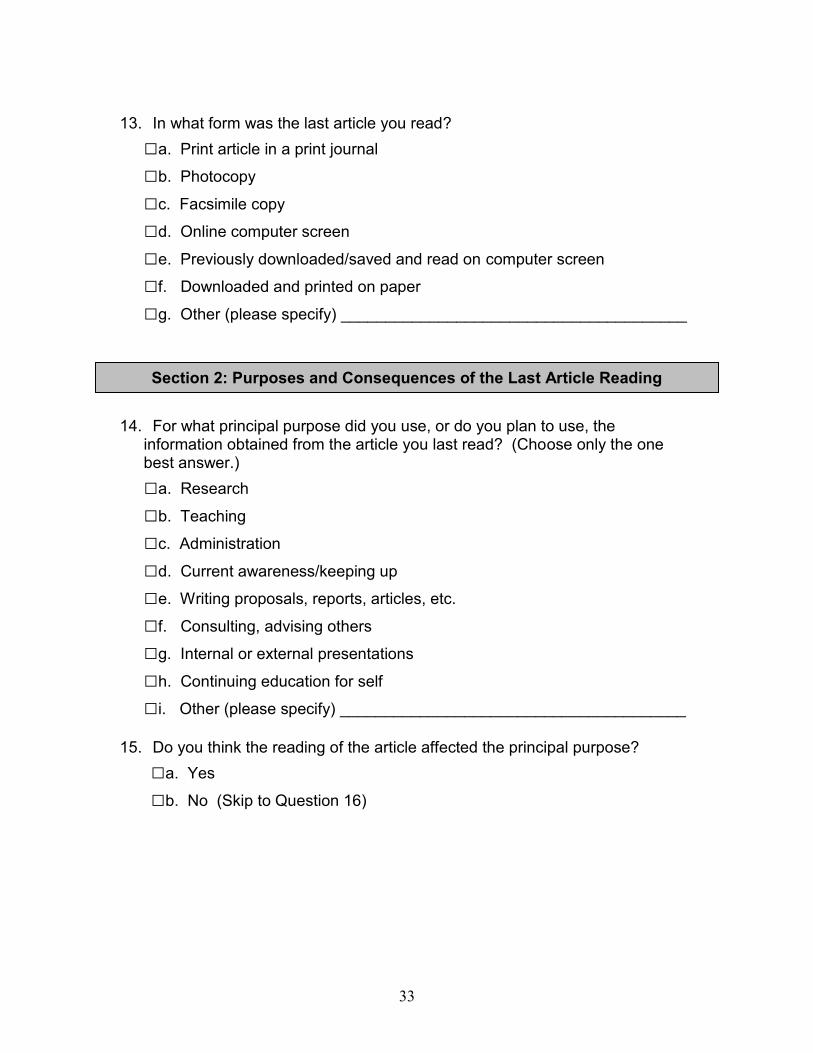
13. In what form was the last article you read?
□a. Print article in a print journal
□b. Photocopy
□c. Facsimile copy
□d. Online computer screen
□e. Previously downloaded/saved and read on computer screen
□f. Downloaded and printed on paper
□g. Other (please specify) _______________________________________
14. For what principal purpose did you use, or do you plan to use, the
information obtained from the article you last read? (Choose only the one best answer.)
□a. Research
□b. Teaching
□c. Administration
□d. Current awareness/keeping up
□e. Writing proposals, reports, articles, etc.
□f. Consulting, advising others
□g. Internal or external presentations
□h. Continuing education for self
□i. Other (please specify) _______________________________________
15. Do you think the reading of the article affected the principal purpose?
□a. Yes
□b. No (Skip to Question 16)
Section 2: Purposes and Consequences of the Last Article Reading
34
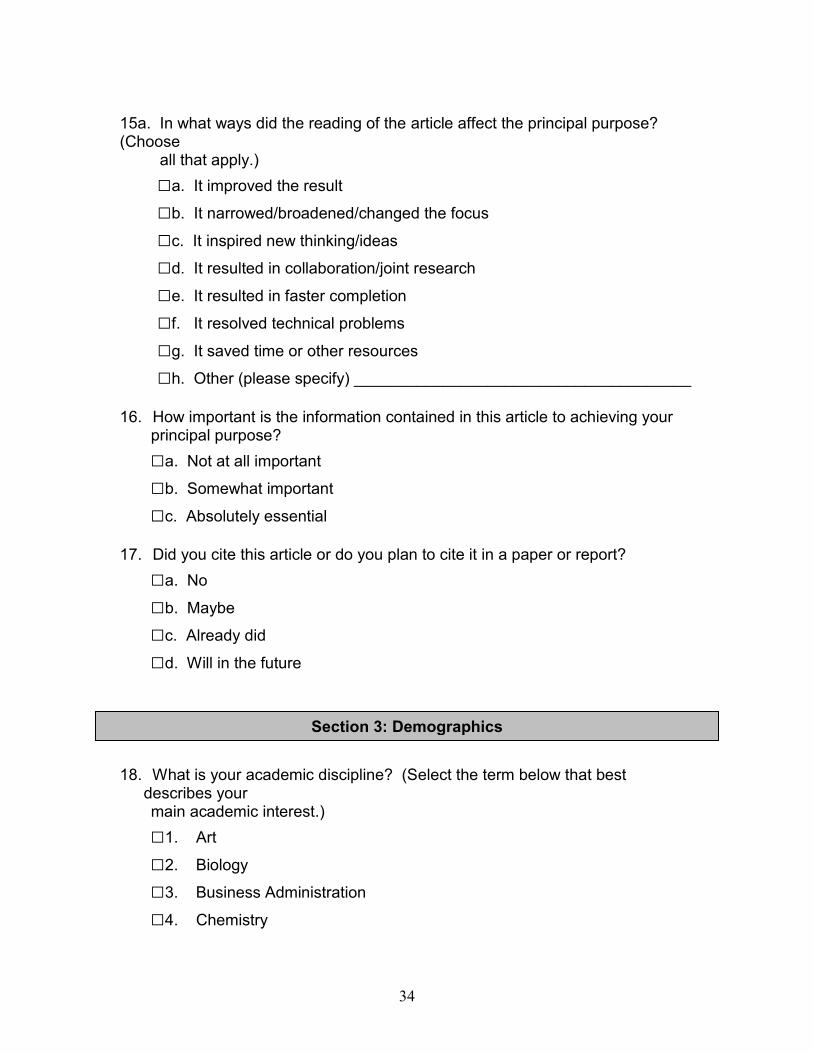
15a. In what ways did the reading of the article affect the principal purpose? (Choose all that apply.)
□a. It improved the result
□b. It narrowed/broadened/changed the focus
□c. It inspired new thinking/ideas
□d. It resulted in collaboration/joint research
□e. It resulted in faster completion
□f. It resolved technical problems
□g. It saved time or other resources
□h. Other (please specify) ______________________________________
16. How important is the information contained in this article to achieving your principal purpose?
□a. Not at all important
□b. Somewhat important
□c. Absolutely essential
17. Did you cite this article or do you plan to cite it in a paper or report?
□a. No
□b. Maybe
□c. Already did
□d. Will in the future
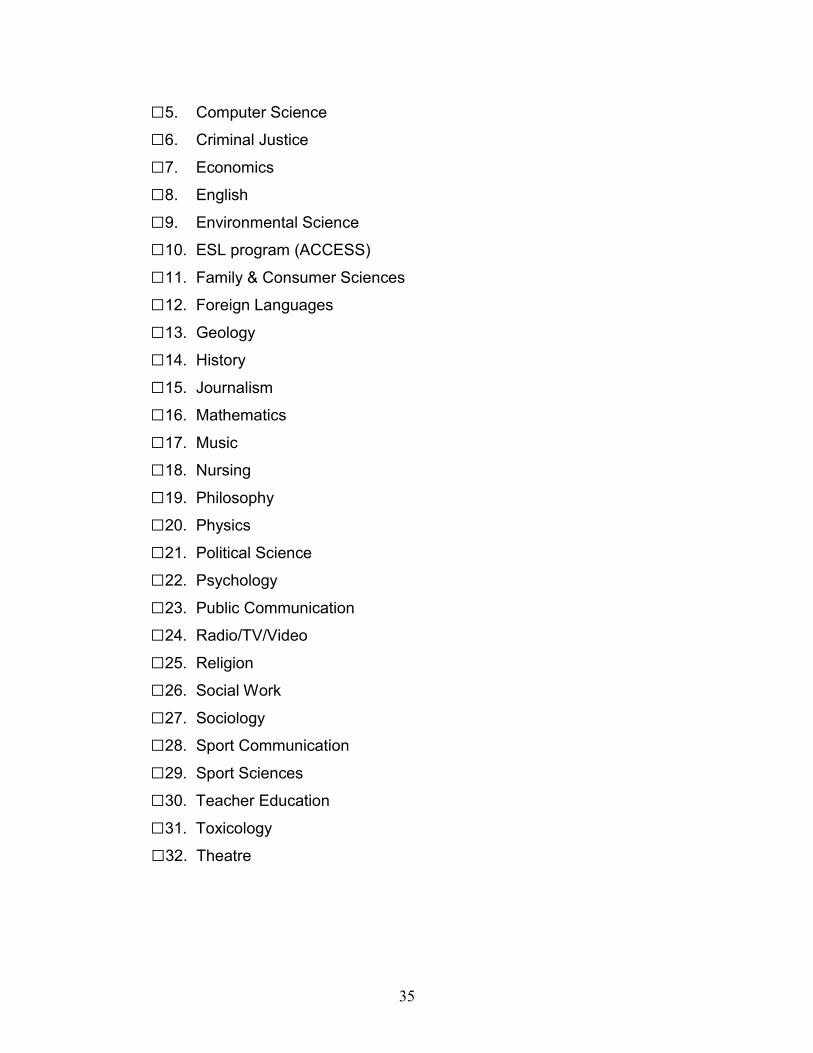
18. What is your academic discipline? (Select the term below that best
describes your main academic interest.)
□1. Art
□2. Biology
□3. Business Administration
□4. Chemistry
Section 3: Demographics
35
□5. Computer Science
□6. Criminal Justice
□7. Economics
□8. English
□9. Environmental Science
□10. ESL program (ACCESS)
□11. Family & Consumer Sciences
□12. Foreign Languages
□13. Geology
□14. History
□15. Journalism
□16. Mathematics
□17. Music
□18. Nursing
□19. Philosophy
□20. Physics
□21. Political Science
□22. Psychology
□23. Public Communication
□24. Radio/TV/Video
□25. Religion
□26. Social Work
□27. Sociology
□28. Sport Communication
□29. Sport Sciences
□30. Teacher Education
□31. Toxicology
□32. Theatre
36
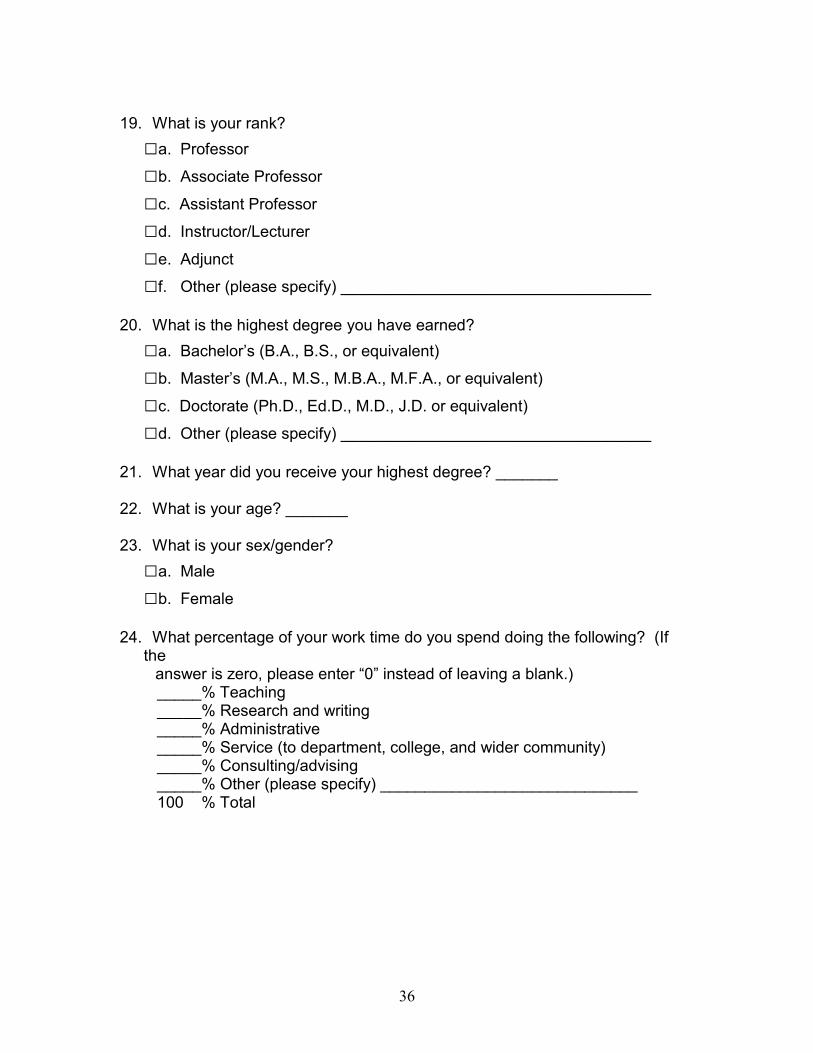
19. What is your rank?
□a. Professor
□b. Associate Professor
□c. Assistant Professor
□d. Instructor/Lecturer
□e. Adjunct
□f. Other (please specify) ___________________________________
20. What is the highest degree you have earned?
□a. Bachelor’s (B.A., B.S., or equivalent)
□b. Master’s (M.A., M.S., M.B.A., M.F.A., or equivalent)
□c. Doctorate (Ph.D., Ed.D., M.D., J.D. or equivalent)
□d. Other (please specify) ___________________________________
21. What year did you receive your highest degree? _______ 22. What is your age? _______ 23. What is your sex/gender?
□a. Male
□b. Female
24. What percentage of your work time do you spend doing the following? (If
the answer is zero, please enter “0” instead of leaving a blank.)
_____% Teaching _____% Research and writing _____% Administrative _____% Service (to department, college, and wider community) _____% Consulting/advising _____% Other (please specify) _____________________________ 100 % Total
37
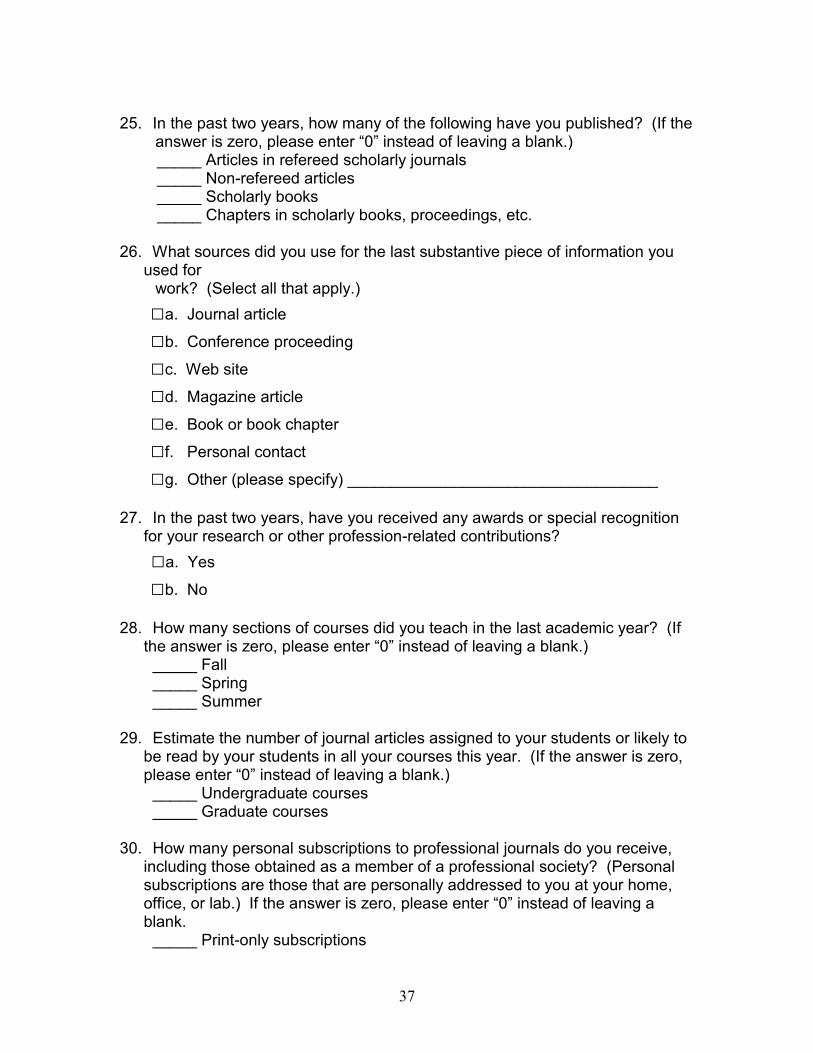
25. In the past two years, how many of the following have you published? (If the answer is zero, please enter “0” instead of leaving a blank.)
_____ Articles in refereed scholarly journals _____ Non-refereed articles _____ Scholarly books _____ Chapters in scholarly books, proceedings, etc.
26. What sources did you use for the last substantive piece of information you
used for work? (Select all that apply.)
□a. Journal article
□b. Conference proceeding
□c. Web site
□d. Magazine article
□e. Book or book chapter
□f. Personal contact
□g. Other (please specify) ___________________________________
27. In the past two years, have you received any awards or special recognition
for your research or other profession-related contributions?
□a. Yes
□b. No
28. How many sections of courses did you teach in the last academic year? (If
the answer is zero, please enter “0” instead of leaving a blank.) _____ Fall _____ Spring _____ Summer
29. Estimate the number of journal articles assigned to your students or likely to be read by your students in all your courses this year. (If the answer is zero, please enter “0” instead of leaving a blank.) _____ Undergraduate courses _____ Graduate courses
30. How many personal subscriptions to professional journals do you receive,
including those obtained as a member of a professional society? (Personal subscriptions are those that are personally addressed to you at your home, office, or lab.) If the answer is zero, please enter “0” instead of leaving a blank. _____ Print-only subscriptions
38
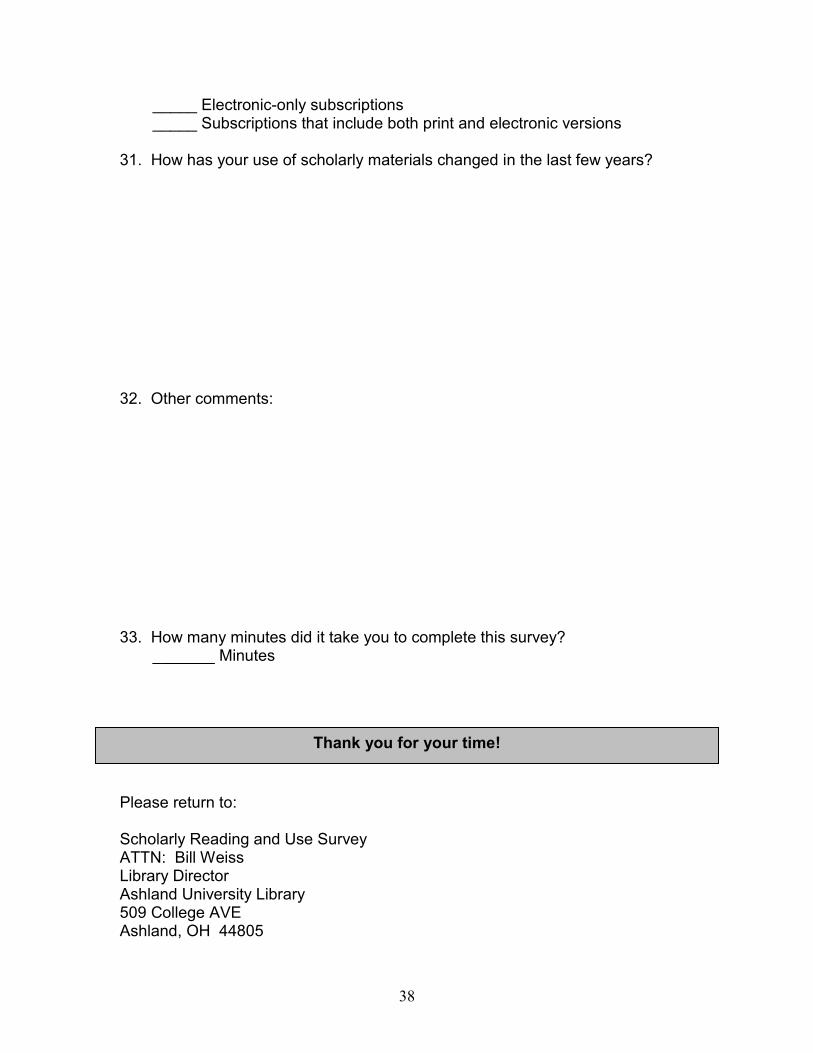
_____ Electronic-only subscriptions _____ Subscriptions that include both print and electronic versions
31. How has your use of scholarly materials changed in the last few years? 32. Other comments: 33. How many minutes did it take you to complete this survey?
_______ Minutes
Please return to: Scholarly Reading and Use Survey ATTN: Bill Weiss Library Director Ashland University Library 509 College AVE Ashland, OH 44805
Thank you for your time!


