Embed Size (px)
Citation preview

H:Health,Nutrition&Food
Ascorbic Acid Degradation in a ModelApple Juice System and in Apple Juice duringUltraviolet Processing and StorageRohan V. Tikekar, Ramaswamy C. Anantheswaran, and Luke F. LaBorde
Abstract: Ultraviolet radiation induced degradation of ascorbic acid in a model apple juice system and in apple juicewas studied using a collimated beam batch UV reactor. In the model system, ascorbic acid degradation was more rapidat higher dose levels and the reaction accelerated with increasing exposure time. Ascorbic acid degradation significantly(P < 0.05) increased as the pH was raised from 2.4 to 5.5, although no difference was observed between 2.4 and 3.3.Increasing malic acid concentration between 0.1 and 1%, increased ascorbic acid degradation (P < 0.05) although therewas no difference between 0.5 and 1.0%. Solution absorbance, varied by addition of tannic acid, decreased ascorbicacid degradation with increasing concentration due to absorption of UV radiation. Fructose at levels found in applejuice significantly increased ascorbic acid degradation while glucose and sucrose did not. Factors identified that accelerateascorbic acid degradation may at least partially explain why ascorbic acid degradation occurred more rapidly in UV-treatedapple juice than in the 0.5% malic acid model system. Ascorbic acid degradation continued after UV treatments duringdark storage. Storage decreases were faster at higher initial UV dose levels and higher storage temperature.
Keywords: fruits and vegetables, nonthermal processing, ultraviolet radiation, vitamin C
Practical Application: The present study shows the effect of UV processing on ascorbic acid, a key vitamin found in manyfruit juices. Process developers and researchers can use this study as a model for designing experiments to identify factorsthat influence the stability of vitamin C and other bioactive compounds during UV processing.
IntroductionUltraviolet (UV) processing of foods is an emerging nonther-
mal technology for enhancing the quality and safety of foods.Applications studied include extension of the shelf life of freshfruits and vegetables (Gonzalez-Aguilar and others 2001; Fon-seca and Rushing 2006), increased phytochemical content in freshfruits (Cantos and others 2000), and sanitization of food contactsurfaces (Guerrero-Beltran and Barbosa-Canovas 2004). UV radi-ation has long been used to decrease microbial levels in drinkingwater (Legrini and others 1993). However, it has more recentlybeen studied as a food processing technique for juice products(Koutchma 2009).
The UV region of the radiation spectrum consists of a range ofwavelengths between 200 and 400 nm. This region is divided into3 types—UV-A (315 to 400 nm), UV-B (280 to 315 nm), andUV-C (200 to 280 nm) (Sastry and others 2000). UV processingmethods include pulsed UV systems that utilize very high intensityradiation at wavelengths between 200 and 400 nm and continuousmonochromatic UV systems where almost 90% of the energy isfrom a single wavelength (Tikekar and others 2010). ContinuousUV-C radiation at 254 nm, which has germicidal activity, is usedin this study.
MS 20100882 Submitted 8/3/2010, Accepted 11/26/2010. Authors are withDept. of Food Science, the Pennsylvania State Univ., Univ. Park, PA 16802, U.S.A.Direct inquiries to author LaBorde (E-mail: [email protected]).
Because UV penetration is inversely proportional to the ab-sorbance of the medium, the dose required to achieve a givenmicrobial lethality treatment is affected by the presence of UV-absorbing juice constituents. Soluble chemical compounds suchas polyphenols, proteins, and vitamins in juice absorb UV radi-ation while insoluble substances such as protein, carbohydrates,and larger tissue particulates block or scatter radiation (Guerrero-Beltran and Barbosa-Canovas 2004; Koutchma 2008).
Up to 3 log reductions in total aerobic plate counts have beenreported in UV-treated orange juice, guava juice, guava/pineapplemixes, and mango nectars although doses required to achieve agiven log reduction vary considerably due to variation in turbid-ity levels and UV-absorbing constituents (Tran and Farid 2004;Murakami and others 2006; Keyser and others 2008). A commer-cially available continuous flow UV system (CiderSureTM FPE,Rochester, N.Y., U.S.A.) is capable of reducing Escherichia coliO157:H7 and Cryptosporidium parvum populations in apple ciderby 5 log units after treatment with 14.3 mJ/cm2 of UV radiation(Koutchma and others 2004; Quintero-Ramos and others 2004).This technology is therefore suitable for meeting the pathogen re-duction standard established in the Juice HACCP regulation (FDA2001).
Ascorbic acid (2-(1,2-dihydroxyethyl)-4,5-dihydroxy-furan-3-one) is naturally present in some fruit juices or is added to en-hance nutritional appeal. Although apples are not a significantsource of vitamin C (USDA 2009), most commercially avail-able apple juices are fortified to contain one or more ReferenceDietary Intake (RDI) daily values (21CFR101.9) of vitamin C
C© 2011 Institute of Food Technologists R©H62 Journal of Food Science � Vol. 76, Nr. 2, 2011 doi: 10.1111/j.1750-3841.2010.02015.x
Further reproduction without permission is prohibited
H:He
alth,
Nutrit
ion&
Food
Effect of UV processing on ascorbic acid . . .
(1 RDI = 60 ppm). The chemistry, physiological role in thebody, and the function of ascorbic acid as an antioxidant in foodshave been extensively studied (Cameron and others 1979; Englardand Seifter 1986; Buettner and Jurkiewicz 1996). Ascorbic aciddegradation in aqueous foods is a complex process that includesmultiple free radical reactions (Gregory 2008). When exposed toUV radiation, molecular excitation is induced and photochemicaldegradation reactions occur (Kagan 1993). UV induced oxidationof ascorbic acid to ascorbic radicals has been demonstrated in an-imal (Jurkiewicz and Buettner 1994, 1996) and plant (Hideg andothers 1997) tissues, and reduced UV skin damage from topicalapplication of ascorbic acid has been attributed to quenching offree radicals (Shindo and others 1993; Fuchs and Kern 1998).
There have been few studies on ascorbic acid losses in UV-treated juice products. Tran and Farid (2004) reported a 17% lossin ascorbic acid after exposure of orange juice to 100 mJ/cm2
UV radiation. Ascorbic acid destruction was found to be directlyrelated to the applied dose. In a study by Adzahan (2006), UV treat-ment of apple cider using the CiderSureTM system at a dose level of14.3 mJ/cm2 (equivalent to a 5-log reduction of E. coli O157:H7)resulted in a 30% reduction in vitamin C. Koutchma (2009) de-scribed experiments in which approximately 50% ascorbic aciddegradation occurred in enriched apple juice after 3 passes througha CiderSure 1500
R©UV system set at the lowest flow rate possible.
The author also reported that ascorbic acid degradation was greaterin apple juice compared to orange juice at identical applied UVdoses, presumably due to the greater amount of radiation absorb-ing suspended solids in the orange juice. These studies demon-strated that, similar to the effect of UV treatments on microbialpopulations, the extent to which ascorbic acid degradation occursdepends on the dose level and the physical and chemical propertiesof the juice. There have been no studies on the individual effects ofjuice chemical constituents on UV-induced ascorbic acid degrada-tion in apple juice. The objective of this article is therefore to studythe kinetics of ascorbic acid degradation in apple juice and a juicemodel system during UV-C processing and subsequent storage.
Materials and Methods
ChemicalsAscorbic acid, malic acid, tannic acid, sucrose, glucose, and
fructose were obtained from Sigma Aldrich (St. Louis, Mo.,
U.S.A). Caramel solution (Product 050) was obtained from D.D.Williamson Inc. (Louisville, Ky., U.S.A.). Acetonitrile and wa-ter used to prepare the high-performance liquid chromatography(HPLC) mobile phase were HPLC grade from Fisher (Fair Lawn,N.J., U.S.A.). Formic acid obtained from Fisher was ≥ 95% pure.
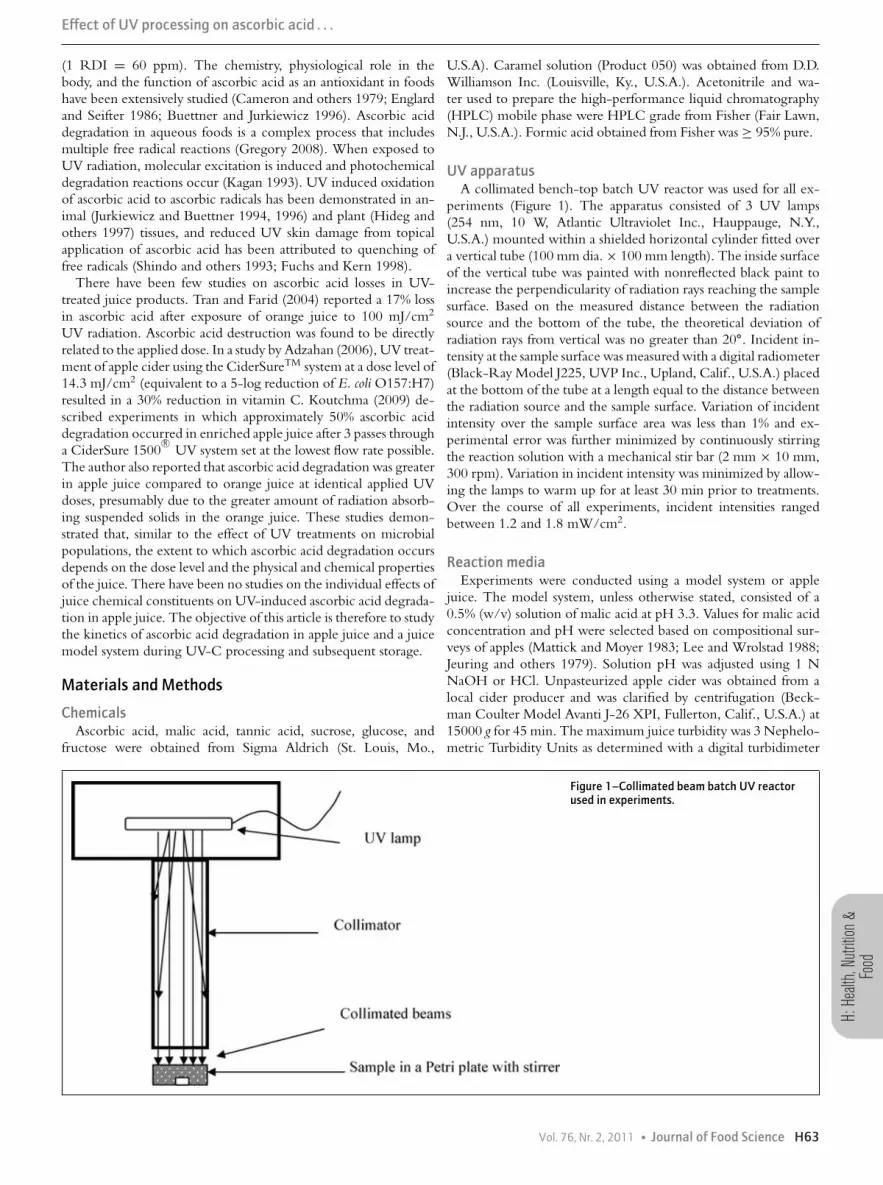
UV apparatusA collimated bench-top batch UV reactor was used for all ex-
periments (Figure 1). The apparatus consisted of 3 UV lamps(254 nm, 10 W, Atlantic Ultraviolet Inc., Hauppauge, N.Y.,U.S.A.) mounted within a shielded horizontal cylinder fitted overa vertical tube (100 mm dia. × 100 mm length). The inside surfaceof the vertical tube was painted with nonreflected black paint toincrease the perpendicularity of radiation rays reaching the samplesurface. Based on the measured distance between the radiationsource and the bottom of the tube, the theoretical deviation ofradiation rays from vertical was no greater than 20◦. Incident in-tensity at the sample surface was measured with a digital radiometer(Black-Ray Model J225, UVP Inc., Upland, Calif., U.S.A.) placedat the bottom of the tube at a length equal to the distance betweenthe radiation source and the sample surface. Variation of incidentintensity over the sample surface area was less than 1% and ex-perimental error was further minimized by continuously stirringthe reaction solution with a mechanical stir bar (2 mm × 10 mm,300 rpm). Variation in incident intensity was minimized by allow-ing the lamps to warm up for at least 30 min prior to treatments.Over the course of all experiments, incident intensities rangedbetween 1.2 and 1.8 mW/cm2.
Reaction mediaExperiments were conducted using a model system or apple
juice. The model system, unless otherwise stated, consisted of a0.5% (w/v) solution of malic acid at pH 3.3. Values for malic acidconcentration and pH were selected based on compositional sur-veys of apples (Mattick and Moyer 1983; Lee and Wrolstad 1988;Jeuring and others 1979). Solution pH was adjusted using 1 NNaOH or HCl. Unpasteurized apple cider was obtained from alocal cider producer and was clarified by centrifugation (Beck-man Coulter Model Avanti J-26 XPI, Fullerton, Calif., U.S.A.) at15000 g for 45 min. The maximum juice turbidity was 3 Nephelo-metric Turbidity Units as determined with a digital turbidimeter
Figure 1–Collimated beam batch UV reactorused in experiments.
Vol. 76, Nr. 2, 2011 � Journal of Food Science H63

H:Health,Nutrition&Food
Effect of UV processing on ascorbic acid . . .
(HachR©
; Model 2100P, Hach Inc., Loveland, Colo., U.S.A.). Theclarified juice was stored at –15 ◦C until use.
Sample preparation and treatmentThe effects of individual juice constituents were studied by
adding appropriate amounts of ascorbic acid, malic acid, tannicacid, sucrose, glucose, or fructose to the 0.5% malic acid modelsystem. Unless otherwise stated, the pH of the solutions was ad-justed to pH 3.3. Initial absorbance values for each constituentat experimental concentrations were measured spectrophotomet-rically at 254 nm (Helios Gamma, Thermo Scientific, WalthamMass., U.S.A.). When values were outside the range of the spec-trophotometer, an appropriate dilution was made, the absorbancemeasured, and the apparent absorbance was calculated based onthe dilution factor.
Treatments were carried out by adding 20.0 mL of the reactionsolution into an uncovered plastic petri dish (100 mm × 10 mm)and exposing it to UV radiation at appropriate time intervals.Ambient temperature for all experiments was 21 (± 1) ◦C. Ateach reaction time interval, 0.6 mL was withdrawn for ascorbicacid analysis. The calculated maximum reduction in sample depthover the course of experiments accounted for incident intensityreductions of no more than 0.03 mW/cm2.
Post-UV treatment storage studies were carried out in 0.5%malic acid or apple juice treated with UV radiation as de-scribed above. Following UV treatment, samples were held ina temperature-controlled Thermo Neslab HX 300 water bath(Thermo Scientific) at 4 or 25 ◦C. Ambient radiation was ex-cluded by covering samples with aluminum foil. After each storageinterval, samples were withdrawn for ascorbic acid analysis.
Ascorbic acid analysisAscorbic acid was quantified using a Waters HPLC system
(pump model: 600; Autosampler: 71P; photodiode array (PDA)detector: 2998, Waters Inc., Milford, Mass., U.S.A.) and a C-18 reverse phase/cation exchange column (Primesep-D, 4.6 mm× 150 mm, particle size 5 μm, SIELC Inc., Prospects Heights,Ill., U.S.A.). The isocratic mobile phase consisted of a wa-ter/acetonitrile/formic acid (95%) mixture (95:5:0.095 v/v/v) ad-justed to pH 1.80 with HCl. Injection volume was 20 μL. Ascorbicacid identity was confirmed by injecting samples of pure ascorbicacid solution and then comparing retention times (2.2 min) andspectral characteristics between 220 and 300 nm. Standard curveswere prepared by plotting the concentration of prepared aqueoussolutions of ascorbic acid (0 to 500 mg/L) versus peak area mea-sured at 245 nm. At each reaction time interval, model systemor juice samples were injected directly onto the column withoutprior extraction or clean up.
Dose measurement and analysisReaction rates were compared by plotting ascorbic acid con-
centrations versus time or UV dose. Linear portions of the datawere characterized using the zero-order kinetic equation:
Ct = C0 − k0(t ) (1)
where Ct = the concentration of ascorbic acid (mg/L) at time t(s), C0 = initial ascorbic acid concentration (mg/L), and t = time(s).
Dose values were obtained using the equation:
D = I × t (2)
where D = UV dose (J/cm2), I = incident intensity (W/cm2),and t = time (s). Ascorbic acid degradation was described usingthe 2nd-order polynomial function:
y = a x2 + b x + c (3)
where y = percent ascorbic acid remaining, x = UV dose (J/cm2),and a, b, c are derived coefficients. For each analysis, r2 values forthe polynomial fits versus actual data were ≥ 0.98, with no sys-tematic error observed in the plots for residuals versus fits. Tocompare reaction rates for different treatments, the UV dose re-quired to achieve a 50% reduction in ascorbic acid was calculatedfrom the polynomial equation by setting y = 50 and solving forx using the quadratic formula. This calculated dose is termed theD50 value.
Statistical analysisStatistical significance between treatments was carried out either
by single-factor analysis of variance or Student’s t-test using Mi-crosoft
R©Excel 2007 (Redmond, Wash., U.S.A.). All experiments
were performed in triplicate by exposing samples to UV radiationat 3 separate times. For each run, a single ascorbic acid concentra-tion determination was made at each sampling time interval.
Results and DiscussionThe reverse-phase analytical column used in this study con-
tained embedded basic ion-pairing groups that do not retain high-molecular weight components. This permitted direct injection ofmodel system and juice samples without observable peak inter-ference from other compounds. Based on the linearity of thestandard curve, the lower limit for quantification was 5 mg/L.Dehydroascorbic acid (DHAA), which also has vitamin C activ-ity, was not detected or quantified. In this study, we assume thatascorbic acid concentration alone provides a good estimate for vi-tamin C activity since DHAA in apple juice is low (5% to 10% ofascorbic acid) (Behrens and Medere 1987) and other ascorbic aciddegradation studies have made the same assumption for apple andcitrus juices (Tran and Farid 2004; Adzahan 2006; Burdurlu andothers 2006).
Comparison of ascorbic acid degradation in juice and themodel system
Ascorbic acid degraded more rapidly in apple juice (Co =170 mg/L, pH 3.5) than in the malic acid model system (C0 =190 mg/L, pH 3.3) (Figure 2). Previous UV microbial inactivationstudies have demonstrated that UV-absorbing compounds decreaseradiation penetration and therefore increase the dose required toachieve a target microbial reduction (Koutchma and others 2004;Murakami and others 2006). Given that the A254 value for applejuice was 250 times greater than 0.5% malic acid (Table 1), theseresults were unexpected. Apple juice is a complex mixture of phe-nolic compounds, organic acids, and sugars that absorb radiationin the UV region to varying degrees. It appears that some of thesecompounds enhance ascorbic acid degradation despite their UV-absorbing properties. To further explore this phenomenon, theeffects of individual apple juice constituents on the kinetics of UVdegradation of ascorbic acid were studied using a 0.5% malic acidmodel system.
Effect of initial ascorbic acid concentrationThe effect of initial ascorbic acid concentration (Co) at 25, 50,
100, 150, and 200 mg/L on UV-induced ascorbic acid degradation
H64 Journal of Food Science � Vol. 76, Nr. 2, 2011

H:He
alth,
Nutrit
ion&
Food
Effect of UV processing on ascorbic acid . . .
in 0.5% malic acid (pH 3.3) is shown in Figure 3. No reduction inascorbic acid was observed in untreated samples held in the darkat pH 3.3 for the same amount of time as treated samples (datanot shown). Ascorbic acid degradation did occur in UV-treated
Table 1–Absorbance (254 nm) of solutions used in experiments.
Chemicalconstituent Concentration
Absorbance254 nm
Malic acid 0.10% 0.070.50% 0.301.0% 0.50
Caramel 60 mg/L 2.98Tannic acid 25 mg/L 0.55
100 mg/L 2.24200 mg/L 4.58
Fructose 10.0% 0.16Glucose 10.0% 0.007Sucrose 10.0% 0.065Apple juice Single strength 17.5
samples at all concentrations. In samples initially containing 25and 50 mg/L ascorbic acid, the entire degradation reaction couldbe described by zero-order kinetics. However, at 100, 150, and200 mg/L, degradation rates followed zero-order kinetics for upto 40, 60, and 75 min, respectively, after which the reaction rateaccelerated. Zero-order rate constants obtained from the linearportion of each curve were not significantly (P > 0.05) different ateach C0 concentration (k0avg = 0.55 ± 0.037/min) suggesting thatdegradation followed a similar mechanism during the initial partof the reaction. Koutchma and others (2009) reported that UV-induced ascorbic acid degradation followed zero-order kineticsat C0 concentrations between 341 and 660 mg/L. However, theexperiments in that study were conducted using apple juice, andonly 20% to 40% decreases in ascorbic acid were achieved. Inthe present study, 0.5% malic acid was the reaction medium andascorbic acid reductions of up to 90% were achieved. The observedacceleration of ascorbic acid degradation with time may be thecombined result of greater penetration of UV radiation into thereaction solution as ascorbic acid levels decrease and as well as
Figure 2–UV degradation of ascorbic acid in applejuice (C0 = 170 mg/L, pH 3.5) and in 0.5% malicacid (C0 = 190 mg/L, pH 3.3). Each data pointrepresents an average of 3 measurements ±standard deviation (SD).
Figure 3–UV degradation of ascorbic acid in0.5% malic acid at varying initial C0
concentrations. Each data point represents anaverage of 3 measurements ± SD.
Vol. 76, Nr. 2, 2011 � Journal of Food Science H65
H:Health,Nutrition&Food
Effect of UV processing on ascorbic acid . . .
generation of side products that accelerate the degradation rate.UV enhanced oxidation of ascorbic acid to form ascorbic radicalshas been demonstrated in animal (Jurkiewicz and Buettner 1994,1996) and plant (Hideg and others 1997) tissues. It is possiblethat free radical reactions, enhanced by exposure to UV radiation,are important factors responsible for ascorbic acid degradation inUV-processed juices.
Because reaction rates tended to increase at longer treatmenttimes, the entire data could not be fitted to zero-, 1st-, or 2nd-order kinetic model. Therefore, the data were fitted to a quadraticfunction and the dose required to achieve a 50% reduction in ascor-bic acid (D50) were calculated for each experiment. Although theuse of a quadratic function did not help to determine reactionmechanisms, it served to quantitatively compare the effect of indi-vidual chemical constituents on UV-induced ascorbic acid degra-dation. An advantage to using dose as the independent variablewas that day-to-day and longer term variation in output intensityof the UV lamps can be corrected in reaction rate calculations.
Effect of solution absorbanceEarlier UV microbial inactivation studies utilized varying con-
centrations of UV-absorbing caramel solutions as chemical sur-rogates to demonstrate the protective effects of UV-absorbingpolyphenols, organic acids, and insoluble haze particulates thatscatter radiation (Koutchma and others 2004; Murakami and oth-ers 2006). We conducted preliminary experiments to determine ifcaramel solution had a similar protective effect on ascorbic acid. Al-though the addition of caramel to the model system increased so-lution absorbance at 254 nm (Table 1), unexpected increases in therate of ascorbic acid reduction occurred (data not shown). Caramelis a complex mixture of polymeric compounds formed from un-saturated 5- and 6-membered cyclic compounds (Schwartz andothers 2008). In this study, we did not further explore carameleffects on ascorbic acid degradation since it is not naturally presentin juice products. However, it is in agreement with our hypothesisthat UV active chemical compounds exist in juice that enhanceUV-induced ascorbic acid degradation. To avoid the confoundingeffect of caramel, tannic acid was used to study solution absorbanceeffects on UV degradation of ascorbic acid. Levels for tannic acid,a mixture of polyphenolic glucose esters of gallic acid, were cho-sen to approximate known levels of polyphenols present in applejuice (Picinelli and others 1996).
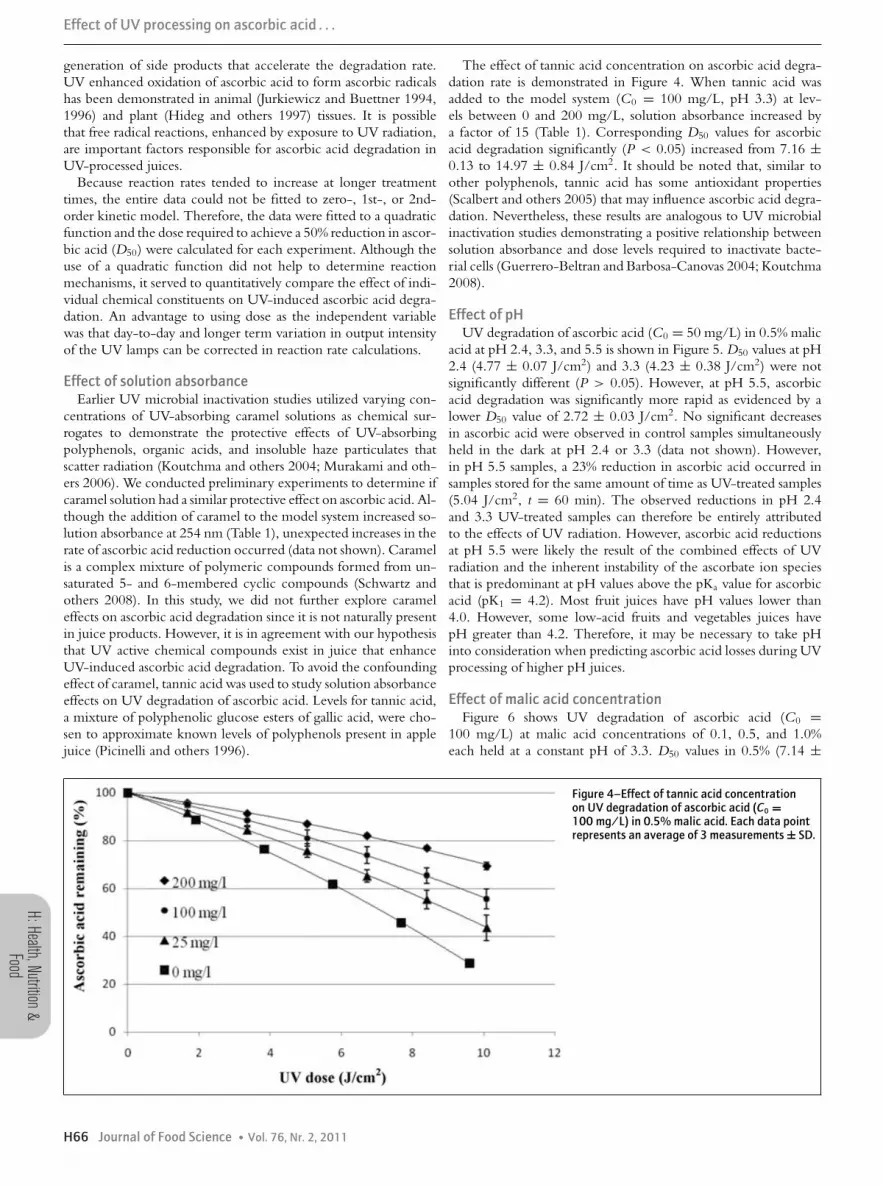
The effect of tannic acid concentration on ascorbic acid degra-dation rate is demonstrated in Figure 4. When tannic acid wasadded to the model system (C0 = 100 mg/L, pH 3.3) at lev-els between 0 and 200 mg/L, solution absorbance increased bya factor of 15 (Table 1). Corresponding D50 values for ascorbicacid degradation significantly (P < 0.05) increased from 7.16 ±0.13 to 14.97 ± 0.84 J/cm2. It should be noted that, similar toother polyphenols, tannic acid has some antioxidant properties(Scalbert and others 2005) that may influence ascorbic acid degra-dation. Nevertheless, these results are analogous to UV microbialinactivation studies demonstrating a positive relationship betweensolution absorbance and dose levels required to inactivate bacte-rial cells (Guerrero-Beltran and Barbosa-Canovas 2004; Koutchma2008).
Effect of pHUV degradation of ascorbic acid (C0 = 50 mg/L) in 0.5% malic
acid at pH 2.4, 3.3, and 5.5 is shown in Figure 5. D50 values at pH2.4 (4.77 ± 0.07 J/cm2) and 3.3 (4.23 ± 0.38 J/cm2) were notsignificantly different (P > 0.05). However, at pH 5.5, ascorbicacid degradation was significantly more rapid as evidenced by alower D50 value of 2.72 ± 0.03 J/cm2. No significant decreasesin ascorbic acid were observed in control samples simultaneouslyheld in the dark at pH 2.4 or 3.3 (data not shown). However,in pH 5.5 samples, a 23% reduction in ascorbic acid occurred insamples stored for the same amount of time as UV-treated samples(5.04 J/cm2, t = 60 min). The observed reductions in pH 2.4and 3.3 UV-treated samples can therefore be entirely attributedto the effects of UV radiation. However, ascorbic acid reductionsat pH 5.5 were likely the result of the combined effects of UVradiation and the inherent instability of the ascorbate ion speciesthat is predominant at pH values above the pKa value for ascorbicacid (pK1 = 4.2). Most fruit juices have pH values lower than4.0. However, some low-acid fruits and vegetables juices havepH greater than 4.2. Therefore, it may be necessary to take pHinto consideration when predicting ascorbic acid losses during UVprocessing of higher pH juices.
Effect of malic acid concentrationFigure 6 shows UV degradation of ascorbic acid (C0 =
100 mg/L) at malic acid concentrations of 0.1, 0.5, and 1.0%each held at a constant pH of 3.3. D50 values in 0.5% (7.14 ±
Figure 4–Effect of tannic acid concentrationon UV degradation of ascorbic acid (C0 =100 mg/L) in 0.5% malic acid. Each data pointrepresents an average of 3 measurements ± SD.
H66 Journal of Food Science � Vol. 76, Nr. 2, 2011

H:He
alth,
Nutrit
ion&
Food
Effect of UV processing on ascorbic acid . . .
0.13 J/cm2) and 1% (7.89 ± 0.43 J/cm2) malic acid were signifi-cantly (P ≤ 0.05) lower compared to the reaction in 0.1% malicacid (10.13 ± 1.01 J/cm2). Thus, malic acid at levels greater than0.5% appears to have stronger effect on the ascorbic acid degra-dation reaction. This was an interesting result given that solutionUV absorbance values increased with increasing malic acid con-centration (Table 1). It is possible that higher levels of malic acidinduced side reactions that accelerated the destruction of ascorbicacid. It should be noted that malic acid was not essential for UV-induced ascorbic acid degradation since the reaction also occurredin unbuffered distilled water (Figure 7).
Effect of sugarsUnsweetened commercial apple juice typically contains 9.6%
(w/w) total sugars with fructose (5.7%), glucose (2.6%), and su-crose (1.3%) being the most abundant types (USDA 2009). UVdegradation of ascorbic acid (C0 = 100 mg/L) in 0.5% malic acid(pH 3.3) and identical amounts (10% w/v) of glucose, fructose,or sucrose are shown in Figure 8. Compared to the control (noadded sugar) (D50 = 7.14 ± 0.13), sucrose (D50 = 6.97 ± 0.56J/cm2) did not have a significant (P > 0.05) effect on ascorbicacid degradation. Glucose (D50 = 8.86 ± 0.37 J/cm2) had a small,
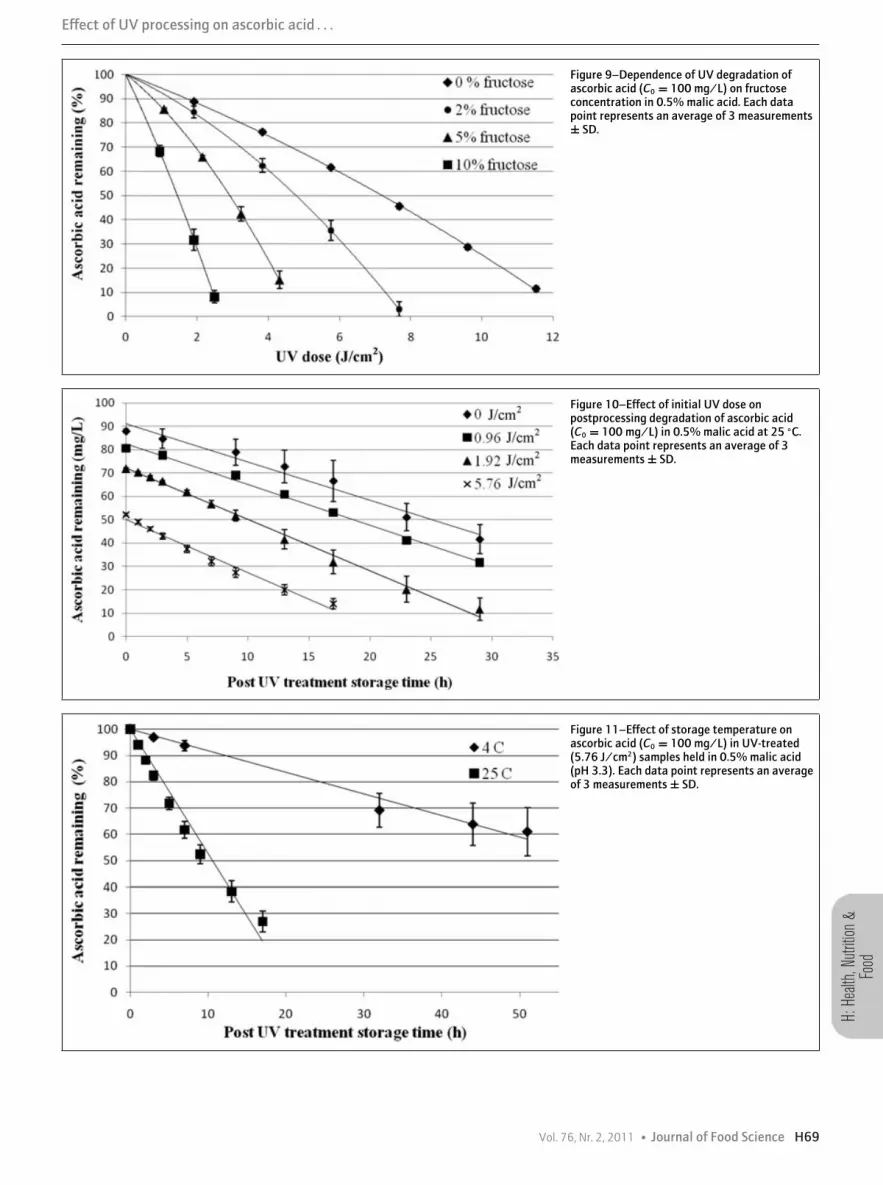
but significant (P < 0.05) protective effect. In contrast, fructose(D50 = 1.46 ± 0.09 J/cm2) resulted in a dramatic and signif-icant increase in ascorbic acid degradation and the effect wassignificantly dependent (P < 0.05) on fructose concentration(Figure 9). D50 values at 0, 2, 5, and 10% fructose were 7.14± 0.13, 4.77 ± 0.24, 2.91 ± 0.08, and 1.46 ± 0.09 J/cm2,respectively.
Because the A254 of 10% fructose was greater than that for thesame concentration of glucose or sucrose (Table 1), the observedascorbic acid degradation rate differences between sugars cannotbe explained by differences in absorbance values for each solu-tion. Triantaphylides and others (1981) reported that the carbonylgroup in the open chain configuration of fructose is highly sus-ceptible to 254-nm photolytic UV degradation, while the ringstructure is unaffected by UV radiation. Upon exposure to UVradiation, fructose undergoes Norrish type-1 reactions that leadto the formation of hydroxyalkyl and acyl radicals (Binkley andBinkley 1998). Glucose is comparatively unaffected by UV radia-tion because the proportion of glucose in the chain configuration(0.024%) is lower than that for fructose (0.8%) (Triantaphylides andothers 1981). Fan and Geveke (2007) confirmed this effect whenthey reported that among the 3 primary hexose sugars present in
Figure 5–Effect of pH on UV degradation ofascorbic acid (C0 = 50 mg/L) in 0.5% malicacid buffer. Each data point represents anaverage of 3 measurements ± SD.
Figure 6–Effect of malic acid concentration (pH3.3) on UV degradation of ascorbic acid (C0 =100 mg/L) degradation. Each data pointrepresents an average of 3 measurements ± SD.
Vol. 76, Nr. 2, 2011 � Journal of Food Science H67
H:Health,Nutrition&Food
Effect of UV processing on ascorbic acid . . .
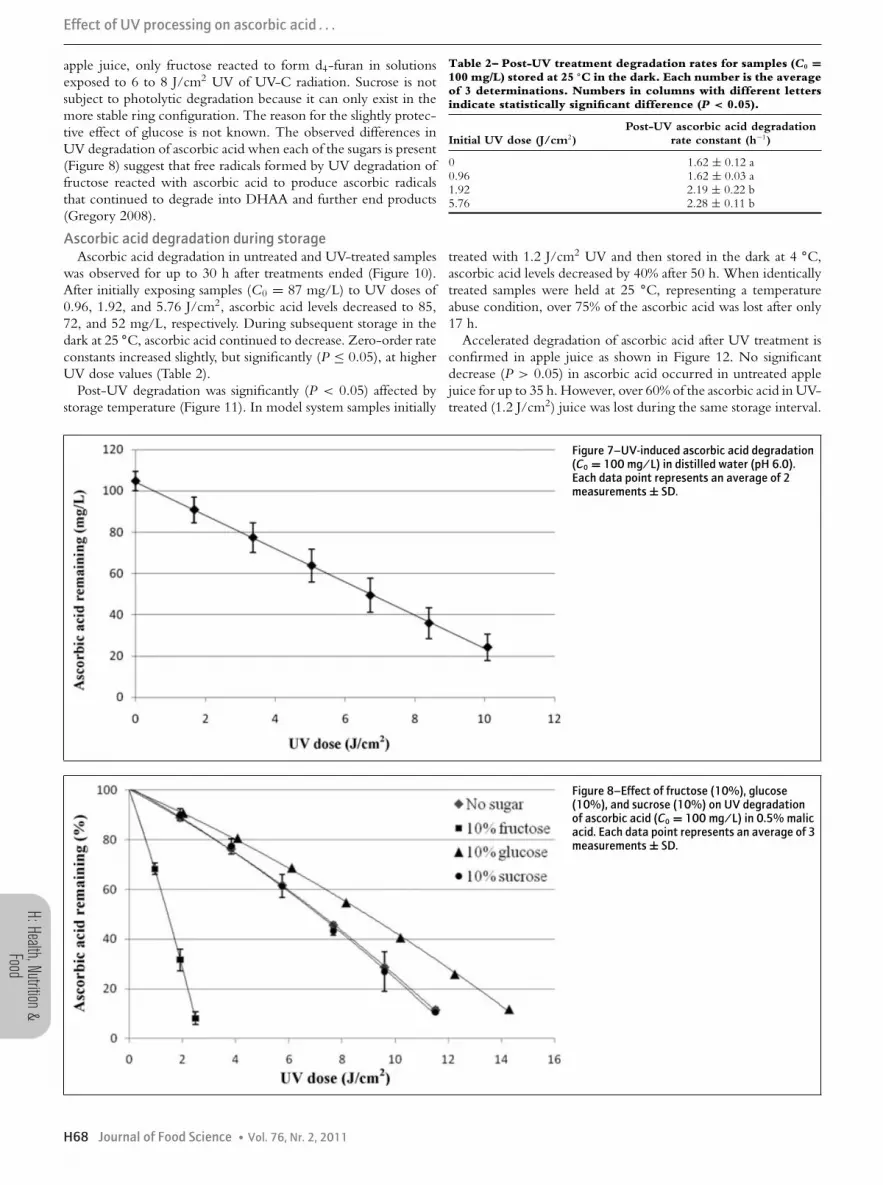
apple juice, only fructose reacted to form d4-furan in solutionsexposed to 6 to 8 J/cm2 UV of UV-C radiation. Sucrose is notsubject to photolytic degradation because it can only exist in themore stable ring configuration. The reason for the slightly protec-tive effect of glucose is not known. The observed differences inUV degradation of ascorbic acid when each of the sugars is present(Figure 8) suggest that free radicals formed by UV degradation offructose reacted with ascorbic acid to produce ascorbic radicalsthat continued to degrade into DHAA and further end products(Gregory 2008).
Ascorbic acid degradation during storageAscorbic acid degradation in untreated and UV-treated samples
was observed for up to 30 h after treatments ended (Figure 10).After initially exposing samples (C0 = 87 mg/L) to UV doses of0.96, 1.92, and 5.76 J/cm2, ascorbic acid levels decreased to 85,72, and 52 mg/L, respectively. During subsequent storage in thedark at 25 ◦C, ascorbic acid continued to decrease. Zero-order rateconstants increased slightly, but significantly (P ≤ 0.05), at higherUV dose values (Table 2).
Post-UV degradation was significantly (P < 0.05) affected bystorage temperature (Figure 11). In model system samples initially
Table 2– Post-UV treatment degradation rates for samples (C0 =100 mg/L) stored at 25 ◦C in the dark. Each number is the averageof 3 determinations. Numbers in columns with different lettersindicate statistically significant difference (P < 0.05).
Initial UV dose (J/cm2)Post-UV ascorbic acid degradation
rate constant (h−1)
0 1.62 ± 0.12 a0.96 1.62 ± 0.03 a1.92 2.19 ± 0.22 b5.76 2.28 ± 0.11 b
treated with 1.2 J/cm2 UV and then stored in the dark at 4 ◦C,ascorbic acid levels decreased by 40% after 50 h. When identicallytreated samples were held at 25 ◦C, representing a temperatureabuse condition, over 75% of the ascorbic acid was lost after only17 h.
Accelerated degradation of ascorbic acid after UV treatment isconfirmed in apple juice as shown in Figure 12. No significantdecrease (P > 0.05) in ascorbic acid occurred in untreated applejuice for up to 35 h. However, over 60% of the ascorbic acid in UV-treated (1.2 J/cm2) juice was lost during the same storage interval.
Figure 7–UV-induced ascorbic acid degradation(C0 = 100 mg/L) in distilled water (pH 6.0).Each data point represents an average of 2measurements ± SD.
Figure 8–Effect of fructose (10%), glucose(10%), and sucrose (10%) on UV degradationof ascorbic acid (C0 = 100 mg/L) in 0.5% malicacid. Each data point represents an average of 3measurements ± SD.
H68 Journal of Food Science � Vol. 76, Nr. 2, 2011
H:He
alth,
Nutrit
ion&
Food
Effect of UV processing on ascorbic acid . . .
Figure 9–Dependence of UV degradation ofascorbic acid (C0 = 100 mg/L) on fructoseconcentration in 0.5% malic acid. Each datapoint represents an average of 3 measurements± SD.
Figure 10–Effect of initial UV dose onpostprocessing degradation of ascorbic acid(C0 = 100 mg/L) in 0.5% malic acid at 25 ◦C.Each data point represents an average of 3measurements ± SD.
Figure 11–Effect of storage temperature onascorbic acid (C0 = 100 mg/L) in UV-treated(5.76 J/cm2) samples held in 0.5% malic acid(pH 3.3). Each data point represents an averageof 3 measurements ± SD.
Vol. 76, Nr. 2, 2011 � Journal of Food Science H69

H:Health,Nutrition&Food
Effect of UV processing on ascorbic acid . . .
Figure 12–Postprocessing degradation ofascorbic acid (C0 = 200 mg/L) in UV-treated(1.2 J/cm2) apple juice (pH 3.5) during storageat 4 ◦C. Each data point represents an averageof 3 measurements ± SD.
The more rapid degradation of ascorbic acid in the model systemand in apple juice after exposure to UV radiation may be causedby ascorbic acid radicals formed during the initial treatment. In-creased formation of ascorbic radicals as result of UV radiationexposure in animal and plant tissues has been demonstrated inanimal (Jurkiewicz and Buettner 1994, 1996) and plant (Hidegand others 1997) tissue although there have been no studies thatshow this effect in UV-treated food products. An analogous effectwas reported in a study by Kabasakalis and others (2000) where itwas observed that ascorbic acid degradation in thermally processedorange juice occurred more rapidly than in fresh (unheated) juice.Since the half life of ascorbic radicals is only 50 s (Buettner andJurkiewicz 1993), it is likely that a cascade of temperature depen-dent radical reactions occur which cause ascorbic acid degradationto continue for extended storage times.
ConclusionsInteractions between UV radiation and juice chemical and phys-
ical properties affect ascorbic acid degradation during and after UVtreatments. Ascorbic acid degradation occurred more rapidly athigher UV dose values and the reaction accelerated with increas-ing exposure time. Rates were also greater at higher pH values,malic acid concentrations, and fructose concentrations. Ascorbicacid degradation was slower at higher solution absorbance valuesand in the presence of glucose. Ascorbic acid continued to degradeduring postprocessing storage; the rate was more rapid at higherinitial UV dose levels and storage temperature. The data suggestthat UV-induced formation of free radicals may be responsiblefor accelerated loss of ascorbic acid during and after UV treat-ments. The factors identified in this study that accelerate ascorbicacid degradation provides insight on why ascorbic acid reduc-tions occur more rapidly in UV-treated apple juice compared to amodel system. Further studies are needed to confirm the observedeffects in commercial UV systems and to identify ascorbic aciddegradation pathways and end products that occur during UVprocessing and storage of juice systems. Processors can minimizelosses in ascorbic acid fortified juices by adding the vitamin afterUV treatments have occurred and by storing the product at lowtemperatures. Researchers who are studying ascorbic acid losesin UV-treated juices should also take care to conduct chemicalanalyses within a consistent posttreatment time interval to avoidmisinterpretation of the data. Because of differences in UV dose
measurement techniques between different research studies, it isdifficult to compare the ascorbic acid degradation kinetics withmicrobial death kinetics. Therefore, confirmation studies usingcommercial equipments such as the CiderSure are needed to com-pare the ascorbic acid degradation kinetics with microbial deathkinetics.
ReferencesAdzahan N. 2006. Effects of ultraviolet treatment on water soluble vitamin retention in aque-
ous model solutions and apple juice [PhD dissertation]. Ithaca, N.Y.: Cornell Univ. 164 p.Available from: Univ. Microfilm, Ann Arbor, Mich. AAT 3227305.
Behrens WA, Medere R. 1987. A highly sensitive high performance liquid chromatographymethod for the estimation of ascorbic and dehydroascorbic in tissues, biological fluids andfoods. Anal Biochem 165:102–7.
Binkley ER, Binkley RW. 1998. Unprotected carbohydrates. In: Binkley ER, Binkley RW,editors. Carbohydrate photochemistry. 1st ed. Washington, D.C.: ACS Publications. p 226–7.
Buettner GR, Jurkiewicz BA. 1993. Ascorbate free-radical as a marker of oxidative stress—anEpr study. Free Radical Bio Med 14(1):49–55.
Buettner GR, Jurkiewicz BA. 1996. Chemistry and biochemistry of ascorbic acid. In Cadenas E,Packer L, editors. Handbook of antioxidants: antioxidants in health and disease. 1st ed. NewYork, N.Y.: Marcel Dekker. p 91–115.
Burdurlu HS, Koca N, Karadeniz F. 2006. Degradation of vitamin C in citrus juice concentrateduring storage. J Food Eng 74:211–6.
Cameron E, Pauling L, Leibowitz B. 1979. Ascorbic acid and cancer: a review. Cancer Res39:663–81.
Cantos E, Garcia-Viguera C, Pascual-Teresa S, Tomas-Barberan FA. 2000. Effect of postharvestultraviolet radiation on resveratrol and other phenolics of cv. Napoleon table grapes. J AgricFood Chem 48:4606–12.
Englard S, Seifter S. 1986. The biochemical functions of ascorbic acid. Annu Rev Nutr6:365–406.
Fan X, Geveke D. 2007. Furan formation in sugar solution and apple cider upon ultraviolettreatment. J Agric Food Chem 55:7816–21.
FDA. 2001. Hazard Analysis and Critical Control Point (HACCP); Procedures for the Safe andSanitary Processing and Importing of Juice; Final Rule. In: Federal Register, 66(13):6137–202,January 19, 2001.
Fonseca JM, Rushing JW. 2006. Effect of ultraviolet-C on quality and microbial population offresh-cut watermelon. Postharvest Biol Tech 40:256–61.
Fuchs J, Kern H. 1998. Modulation of UV-induced skin inflammation by D-alpha-tocopheroland L-ascorbic acid: a clinical study using solar simulated radiation. Free Radical Bio Med25(9):1006–12.
Gonzalez-Aguilar GA, Wang CY, Buta JG, Krizek DT. 2001. Use of UV-C irradiation toprevent decay and maintain post-harvest quality of ripe ‘Tommy Atkins’ mangoes. Int J FoodSci Tech 36(7):767–73.
Gregory J. 2008. Vitamins. In: Damodaran S, Parkin K, Fennema O, editors. Food chemistry.4th ed. Boca Raton, Fla.: CRC press. p 439–521.
Guerrero-Beltran JA, Barbosa-Canovas GV. 2004. Advantages and limitations of processing foodsby UV light. Food Sci Technol Int 10(3):137–47.
Hideg E, Mano JM, Ohno C, Asada K. 1997. Increased Levels of monodehydroascorbate radicalin UV-B-irradiated broad bean leaves. Plant Cell Physiol 38:684–90.
Jeuring HJ, Brands A, Doorninck P. 1979. Rapid determination of malic and citric acid in applejuice by high performance liquid chromatography. Z Lebensm Unters Forsch 168:185–7.
Jurkiewicz BA, Buettner, GR. 1994. Ultraviolet light-induced free radical formation in skin: anelectron paramagnetic resonance study. Photochem Photobiol 59(1):1–4.
Jurkiewicz BA, Buettner GR. 1996. EPR detection of free radicals in UV-irradiated skin: mouseversus human. Photochem Photobiol 64(6):918–22.
Kabasakalis V, Siopidou D, Moshtou E. 2000. Ascorbic acid content of commercial fruit juicesand its rate of loss upon storage. Food Chem 70:325–8.
H70 Journal of Food Science � Vol. 76, Nr. 2, 2011

H:He
alth,
Nutrit
ion&
Food
Effect of UV processing on ascorbic acid . . .
Kagan J. 1993. The fundamentals. In: Kagan J, editor. Organic photochemistry, principles andapplications.1st ed. San Diego, Calif.: Academic Press. p 1–26.
Keyser M, Muller IA, Cilliers FP, Nel W, Gouws PA. 2008. Ultraviolet radiation as a non-thermal treatment for inactivation of microorganisms in fruit juice. Innov Food Sci EmergTechnol 9:348–54.
Koutchma T. 2008. UV light for processing foods. Ozone-Sci Eng 30:93–8.Koutchma T. 2009. Advances in ultraviolet technology for non-thermal processing of liquid
foods. Food Bioprocess Technol 2:138–55.Koutchma T, Keller S, Chirtel S, Parisi B. 2004. Ultraviolet disinfection of juice products in
laminar and turbulent flow reactors. Innov Food Sci Emerg Technol 5:179–89.Koutchma T, Forney LJ, Moraru CI. 2009. UV processing effects on quality of foods. In:
Koutchma T, Forney LJ, Moraru CI, editors. Ultraviolet light in food technology—principlesand applications.1st ed. Boca Raton, Fla.: CRC Press. p 103–23.
Lee HS, Wrolstad RE. 1988. Apple juice composition: sugar, nonvolatile acid, and phenolicprofiles. J Assoc Official Anal Chem 71(4):789–94.
Legrini O, Oliveros E, Braun AM. 1993. Photochemical processes for water treatment. ChemRev 93:671–98.
Mattick LR, Moyer JC. 1983. Composition of apple juice. J Assoc Official Anal Chem66:1251–5.
Murakami EG, Jackson L, Madsen K, Schickedanz B. 2006. Factors affecting the ultravioletinactivation of Escherichia coli K12 in apple juice and a model system. J Food Process Eng29:53–71.
Picinelli A, Suarez B, Mangas JJ. 1996. Analysis of polyphenols in apple products. Eur Food ResTechnol 204:48–51.
Quintero-Ramos A, Churey JJ, Hartman P, Bernard J, Worobo RW. 2004. Modeling of Es-cherichia coli inactivation by UV irradiation at different pH values in apple cider. J Food Protect67(6):1153–6.
Sastry SK, Datta AK, Worobo RW. 2000. Ultraviolet light. J Food Safety 65:s890–2.Scalbert A, Johnson IT, Saltmarsh M. 2005. Polyphenols: antioxidant and beyond. Am J Clin
Nutr 81: 215S–7S.Schwartz S, Von Elbe J, Giusti M. 2008. Colorants. In: Damodaran S, Parkin K, Fennema O,
editors. Food chemistry. 4th ed. Boca Raton, Fla.: CRC Press. p 571–638.Shindo Y, Witt E, Packer L. 1993. Antioxidant defense mechanisms in murine epidermis and
dermis and their response to ultraviolet light. J Invest Dermatol 100: 260–5.Tikekar RV, LaBorde LF, Anantheswaran RC. 2010. Fruit juices: ultraviolet light processing.
In: Encyclopedia of agricultural, food, and biological engineering. 2nd ed. 1(1):675–80.Tran MTT, Farid M. 2004. Ultraviolet treatment of orange juice. Innov Food Sci Emerg Technol
5:495–502.Triantaphylides C, Schuchmann H-P, Sonntag CV. 1981. Photolysis of D-fructose in aqueous
solution. Carbohyd Res 100:131–41.USDA. 2009. National nutrient database for standard reference, release 22 [Internet]. Wash-
ington, D.C.: U.S. Dept. of Agriculture, Agricultural Research Service. Available from:http://www.ars.usda.gov/nutrientdata. Accessed Jul 30, 2010.
Vol. 76, Nr. 2, 2011 � Journal of Food Science H71