Embed Size (px)
Citation preview
BLS WORKING PAPERS U.S. Department of Labor U.S. Bureau of Labor Statistics Office of Productivity and Technology
Are Those Who Bring Work Home Really Working Longer Hours? Implications for BLS Productivity Measures
Lucy P. Eldridge, U.S. Bureau of Labor Statistics Sabrina Wulff Pabilonia, U.S. Bureau of Labor Statistics
Working Paper 406 May 2007
All views expressed in this paper are those of the authors and do not necessarily reflect the views or policies of the U.S. Bureau of Labor Statistics.

Are Those Who Bring Work Home Really Working Longer Hours?
Implications for BLS Productivity Measures*
Lucy P. Eldridge U.S. Bureau of Labor Statistics
2 Massachusetts Ave., NE Rm. 2150 Washington, DC 20212
202-691-6598 [email protected]
Sabrina Wulff Pabilonia U.S. Bureau of Labor Statistics
2 Massachusetts Ave., NE Rm. 2180 Washington, DC 20212
202-691-5614 [email protected]
May 7, 2007
Abstract: An ongoing debate surrounding BLS productivity data is that official labor productivity measures may be overstating productivity growth because of an increase in unmeasured hours worked outside the traditional workplace. This paper uses both the ATUS and May CPS Work Schedules and Work at Home Supplements to determine whether the number of hours worked by nonfarm business employees are underestimated and increasing over time due to unmeasured hours worked at home. We find that 8 - 9 percent of nonfarm business employees bring some work home from the workplace. In addition, those who bring work home report working longer hours than those who work exclusively in a workplace, resulting in a 0.8 – 1.1 percent understatement of measured hours worked. However, we find no conclusive evidence that productivity trends were biased over the 1997-2005 period due to work brought home from the workplace. * The authors thank Michael Giandrea, Anastasiya Osborne, Peter Meyer, Alice Nakamura, Phyllis Otto, Anne Polivka, Larry Rosenblum, Younghwan Song, Jay Stewart, Leo Sveikauskas, and Cindy Zoghi. All data and programs are available from Sabrina Wulff Pabilonia. All views expressed in this paper are those of the authors and do not necessarily reflect the views or policies of the U.S. Bureau of Labor Statistics.

I. Introduction
Advancements in information technology have increased workers’ abilities to conduct
their jobs in multiple locations. An ongoing debate surrounding U.S. Bureau of Labor Statistics
(BLS) productivity data is that official productivity numbers may be overstated because of an
increase in unmeasured hours worked outside the traditional workplace. To shed light on this
debate, this paper examines two recent data sources for information on U.S. workers who bring
work home from their primary workplace — the 2003 - 2005 American Time Use Survey
(ATUS) and the 1997, 2001, and 2004 May Current Population Survey Work Schedules and
Work at Home Supplements (CPS Supplement). The ATUS provides detailed information on
time spent on work, work-related activities, and non-work activities on one diary day, as well as
locations for these activities. The CPS Supplements provide information on the number of hours
worked at home each week, whether or not workers had a formal arrangement to be paid for
work at home, and reasons for working at home.
Previous research on work at home has almost entirely focused on home-based workers
or part-time teleworkers. This study examines work that is brought home from the workplace.
The study achieves three goals: determines the characteristics of those who bring work home
from the workplace and sheds light on why they bring work home; determines whether those
who bring work home work longer hours or whether they are simply shifting the location of
work; and finally, assesses whether the BLS captures the hours worked at home by those who
bring work home from the workplace in its hours and productivity measures and whether
unmeasured hours worked at home affect productivity trends.
II. Prior Research
Previous research both on hours worked in other time-use surveys and on work-at-home
arrangements are relevant to this paper; however, only Callister and Dixon (2001) specifically
examined workers who work both at the workplace and at home on the same day. Using the
1999 New Zealand Time-Use Survey, they showed that 15.5 percent of non-agricultural weekday
workers combined work at a traditional workplace with work at home on their diary day. This
was much more common than working exclusively from home (8.3 percent). The majority of
work at home lasted for less than two hours and a significant proportion was done in the
evenings and on weekends.
Recent research on work-at-home arrangements in North America often includes paid
work done by home-based workers or occasional telecommuters. Oettinger (2004) used the
1980, 1990, and 2000 U.S. Census to examine the growth in home-based employment. He
showed that the wage penalty for working at home has decreased over time and that the increase
in home-based work has been greatest for highly-educated workers. Using the May 1997 CPS
Work at Home supplement, Schroeder and Warren (2004) analyzed workers who did any work at
home, including home-based workers, occasional telecommuters, and those who combine work
in a traditional workplace with work at home. They found that compared to traditional office
workers, workers who did any work at home are likely to be older, better educated, married,
white, and live in an urban area. They also found that managers and professionals are more
likely to report some work at home than other occupational groups.
Using the 2001 CPS Supplement, Wight and Bianchi (2004) examined women who did
some work at home. They found that being white, college-educated, married, and working in a
higher paying occupation increased the probability of doing some (but not all) work at home
2
versus doing no work at home. They found that for women with children there is in the
probability of working all of their hours at home versus none but no difference in the probability
of working some of their hours at home versus none.
Using the Canadian Workplace and Employee Survey, Pabilonia (2005) analyzed the
decision of employees to do paid work at home during part of their normal working hours
(referred to as telecommuters) and the decision of firms to allow these employees to
telecommute. In 2001, the 5.9 percent of telecommuters among Canadian workers were more
likely to be tech-savvy, experienced white-collar workers than their non-telecommuting
counterparts.
Evidence from older household time-use diaries indicated that respondents to labor force
surveys similar to the CPS report higher hours worked compared to estimates from time-use
diaries (Hamermesh (1990) used Michigan time use diary data for 1975 and 1981; and Robinson
and Bostrom (1994) used three separate studies in 1965, 1975, and 1985).1 Robinson and
Bostrom (1994) showed that the difference between these surveys is greater for those who work
long hours. Hamermesh (1990) and Robinson and Bostrom (1994) both showed that this
difference increased over time. However, Jacobs (1998) found that independent, self-reported
measures of working time based on time of departures to and returns from work support the
estimates obtained from hours of work questions in labor force surveys. Until recently, no
studies have compared hours worked from time diaries to hours reported to the post-redesign
(1994) CPS questions, which were changed to enhance respondents’ recall concerning their
hours of work in the prior week.2 Using similar definitions of hours worked, Frazis and Stewart
1 Note that the sample sizes in these studies are smaller than the ATUS sample. 2 In the 1994 revised CPS, the question on usual hours is asked first, followed by questions about overtime and taking time off for reasons such as illness, slack work, vacation or holiday. Polivka and Rothgeb (1993, p. 16) report that “The mean of reported hours measured with the current [pre-1994] wording was 39.0 compared to 37.9 hours
3
(2004) found that CPS reported hours of work are similar to hours constructed from the ATUS
for the 12 CPS reference weeks in 2003.3 However, Frazis and Stewart (2004) also found that
ATUS respondents worked five percent fewer hours per week than reported in the CPS for
weeks other than CPS reference weeks. Frazis and Stewart (2004) indicate that this is expected
given that these weeks include holidays whereas the reference weeks were chosen to minimize
holidays.4
III. Data Sources
Productivity trends for the U.S. are watched closely by businessmen, policymakers, and
others interested in business cycles and U.S. competitiveness. The most widely watched BLS
productivity statistics are the quarterly labor productivity measures for the nonfarm business
sector.5 Throughout this paper, we focus our study on nonfarm business employees, defined as
household survey respondents who are fifteen-years-old and older, work outside of the farm
sector, and are classified as employees of private for-profit entities. Although the self employed
and unpaid family workers are in the nonfarm business sector, we exclude them because they
may have the ability to shift freely between work and non-work activities and may lack a clear
definition of the principal workplace; therefore, for this group, the concept of bringing work
home is not well defined and beyond the scope of this study. For the ATUS, the analysis is
further restricted to nonfarm business employees who worked on their diary day.
measured with the revised [1994- and later] wording.” This is a combined survey effect of the employment and hours questions. 3 The CPS reference week is the calendar week that contains the 12th day of the month. 4 Data was compiled across all months due to the limited number of observations. 5 The BLS also produces quarterly measures of labor productivity for the U.S. business and nonfinancial corporations sectors, and durable, nondurable, and total manufacturing sectors, as well as measures of multifactor productivity for major sectors and labor productivity for select detailed industries.
4
The American Time Use Survey
The ATUS, which began collecting data in 2003, is a survey of how people living in the
United States spend their time. The ATUS sample consists of one household member aged
fifteen or older from a subset of households completing their final month of interviews for the
CPS.6 In 2003, there were 20,720 ATUS interviews. Beginning in December 2003, the sample
size was reduced by 35 percent, yielding 13,973 completed diaries in 2004. In 2005,
approximately 13,000 individual diaries were completed. The ATUS collects a 24-hour diary of
activities that a respondent was engaged in starting at 4 A.M on the day prior to their interview.
These diaries include information on work time, such as time at work, time spent on work
activities at home, and interruptions of 15 minutes or longer that took place during the work
day.7 In addition to the types of activities and the time spent doing these activities, there is
information on the demographic characteristics of the respondents, the locations where the
activities took place, and the people who were with the respondent at the time of the activity.
In order to analyze hours of work, we aggregated minutes spent on activities coded as
work at main job for each ATUS respondent by location from the ATUS activity files, and
constructed measures of work time at the workplace and at home. We restrict our analysis to
work done for a respondent’s main job in order to focus on those who bring work home rather
than those who may be doing some part-time work at home in the evenings. This restriction will
also allow us to compare results with the CPS supplement, which only collected information
6 The CPS is collected monthly for individuals in a sample of about 60,000 households. The CPS provides information on employment, hours worked, and demographics. Households are in the survey for four months, out for eight months, and back in for four months. 7 ATUS interviewers are trained to ask for work breaks of 15 minutes or longer any time a respondent reports that he or she worked. Beginning in January 2004, an automated probe was introduced into the survey instrument. If a respondent reports working for more than 4 hours at one time, the interviewer automatically is prompted to ask “Did you take any breaks of 15 minutes or longer?” If the respondent reports taking a break, the interviewer records the start and stop time and what was done on that break; if no break, the solid work episode is recorded.
5
about work at home for the main job. We may be underestimating work done at home to the
extent that people combine work at their workplace with work at home on their second jobs.
For respondents whose diary day was a nonholiday weekday, we define those who bring
work home as respondents who report any minutes of work for their main job at the workplace
and at home on the same day. This weekday group of employees represents primarily those who
work at home before or after a typical work day. For respondents whose diary day is on a
weekend or holiday, we define those who bring work home as respondents who report any
minutes of work at home on their diary day. Unfortunately, we can not identify whether those
who worked exclusively at home on a weekend diary day were home-based workers,
telecommuters, or traditional 9-5 office workers who bring extra work home to do over the
weekend. However, when we describe the relative hours worked below, it will become clear that
this group consists primarily of employees who bring work home rather than home-based
workers.
The CPS Work Schedules and Work at Home Supplements
The Work Schedules and Work at Home Supplements were collected as part of the May
CPS in 1997, 2001 and 2004. Although changes in industry and occupational coding and
changes in the sequence and wording of the questions on work at home limit the direct
comparability of some data collected in 1997, we include data from all three years, noting the
limitations as they occur. As previously mentioned, these supplements only collected
information on whether respondents do any work at home as part of their main job. Wage and
salary respondents who reported work at home were asked whether they had a formal agreement
with their employer to be paid for work at home or whether they were just taking work home.
6
We focus our analysis on those who reported that they were just taking work home, since
their hours at home are those most likely to be unmeasured. We refer to this group as those who
bring work home. We note here that this question did not allow for the possibility that an
employee had a formal arrangement to be paid for work at home and also took work home.8
Respondents were asked their reasons for working at home, how frequently they worked at
home, and the number of hours per week worked at home. In 1997, respondents were asked for
actual hours worked at home while they were asked for usual hours in 2001 and 2004. The 2001
and 2004 respondents were also given a choice of “it varies” as a possible response; therefore, it
is not possible to determine a numerical measure of work hours for all respondents.
ATUS and CPS Supplement Matched Data
CPS Supplement respondents in 2004 who were in their 5th through 8th months in the
May CPS were eligible for an ATUS interview in 2004. We are able to directly match 745
nonfarm business employees who were in the same industry and occupation in both data sets, did
not change employers between their last month in the CPS and their ATUS interview, and
worked on their diary day.9
From the directly matched respondents, there are 93 who reported that they brought
work home in the CPS supplement, and 45 that brought work home on their ATUS diary day.
However, there are definitely limitations associated with the matched data. Some respondents to
the supplement questions answered that they did not do any work at home as part of their job,
although their time diary clearly stated that they did some work at home. For example, of the 45
8 The 1997 CPS Supplement included a probing question later on in the survey asking for the existence of additional unpaid hours; however, it is unclear how this information may be appropriately analyzed. 9 Of the 13,973 ATUS interviewed in 2004, 7,558 had a May CPS Supplement interview. Of these, 2,429 were employed in both the ATUS and CPS.
7
individuals who we observed bringing work home on their diary day, only 21 reported that they
ever work at home in the CPS supplement. This may be because the nature of their job changed
between the CPS Supplement and the ATUS interviews, which could have been anywhere from
two to five months apart. Alternatively, the CPS Supplement questions may have been
misinterpreted by the respondents, or answers may be subject to proxy reporting bias. From the
2004 directly matched data, we find that 70 percent of those who worked at home on their
weekend/holiday diary day did not have a formal arrangement to be paid for work at home in the
CPS Supplement. This suggests that most employees who worked at home on the weekend are
not home-based or occasional telecommuters.
IV. Who is Bringing Work Home?
Nonfarm business employees do, in fact, bring work home from the workplace. From
the 2004 ATUS diaries, we find that although 84 percent of nonfarm business employees who
worked on their diary day worked exclusively in a workplace, 9 percent brought some of their
work home, while 3 percent worked exclusively at home during the week (Figure 1).10 The 2004
CPS Supplement data show that approximately 12 percent of nonfarm business employees do
some work at home (Figure 1). The CPS supplement specifically asked those who do work at
home whether they bring work home; 8 percent of employees reported bringing some work home
in 2004, while 4 percent reported that they had a formal arrangement to be paid for work
conducted at home. The shares of those who bring work home in the ATUS and in the CPS
10 The “other” category in Figure 1 consists of those who work at locations other than home or the workplace, such as a restaurant or someone else’s home, or those who combine other locations with the workplace. The ATUS does not ask for secondary activity, except for secondary childcare. Therefore, if a respondent reports commuting to work, there are recorded as commuting and not working.
8
Supplement are surprisingly similar.11 Throughout the paper, all ATUS estimates have been
weighted using the ATUS respondent final weight.12 All CPS Supplement estimates have been
weighted using the work schedules supplement weight.
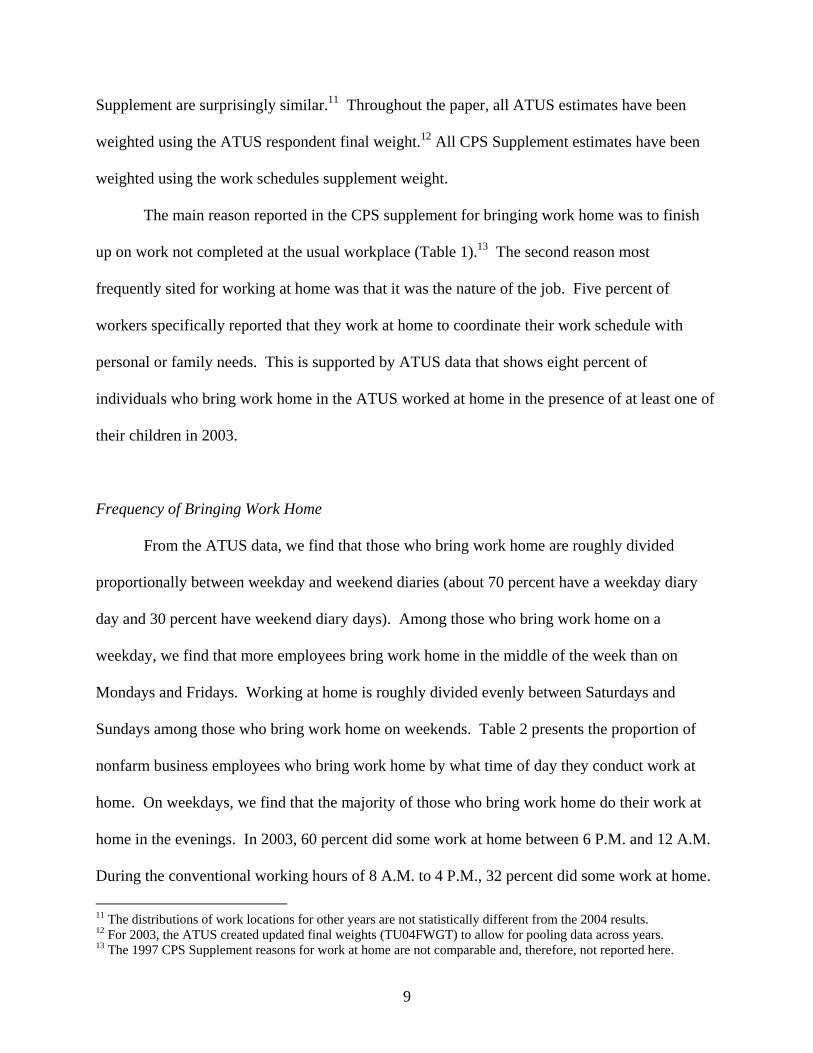
The main reason reported in the CPS supplement for bringing work home was to finish
up on work not completed at the usual workplace (Table 1).13 The second reason most
frequently sited for working at home was that it was the nature of the job. Five percent of
workers specifically reported that they work at home to coordinate their work schedule with
personal or family needs. This is supported by ATUS data that shows eight percent of
individuals who bring work home in the ATUS worked at home in the presence of at least one of
their children in 2003.
Frequency of Bringing Work Home
From the ATUS data, we find that those who bring work home are roughly divided
proportionally between weekday and weekend diaries (about 70 percent have a weekday diary
day and 30 percent have weekend diary days). Among those who bring work home on a
weekday, we find that more employees bring work home in the middle of the week than on
Mondays and Fridays. Working at home is roughly divided evenly between Saturdays and
Sundays among those who bring work home on weekends. Table 2 presents the proportion of
nonfarm business employees who bring work home by what time of day they conduct work at
home. On weekdays, we find that the majority of those who bring work home do their work at
home in the evenings. In 2003, 60 percent did some work at home between 6 P.M. and 12 A.M.
During the conventional working hours of 8 A.M. to 4 P.M., 32 percent did some work at home.
11 The distributions of work locations for other years are not statistically different from the 2004 results. 12 For 2003, the ATUS created updated final weights (TU04FWGT) to allow for pooling data across years. 13 The 1997 CPS Supplement reasons for work at home are not comparable and, therefore, not reported here.
9
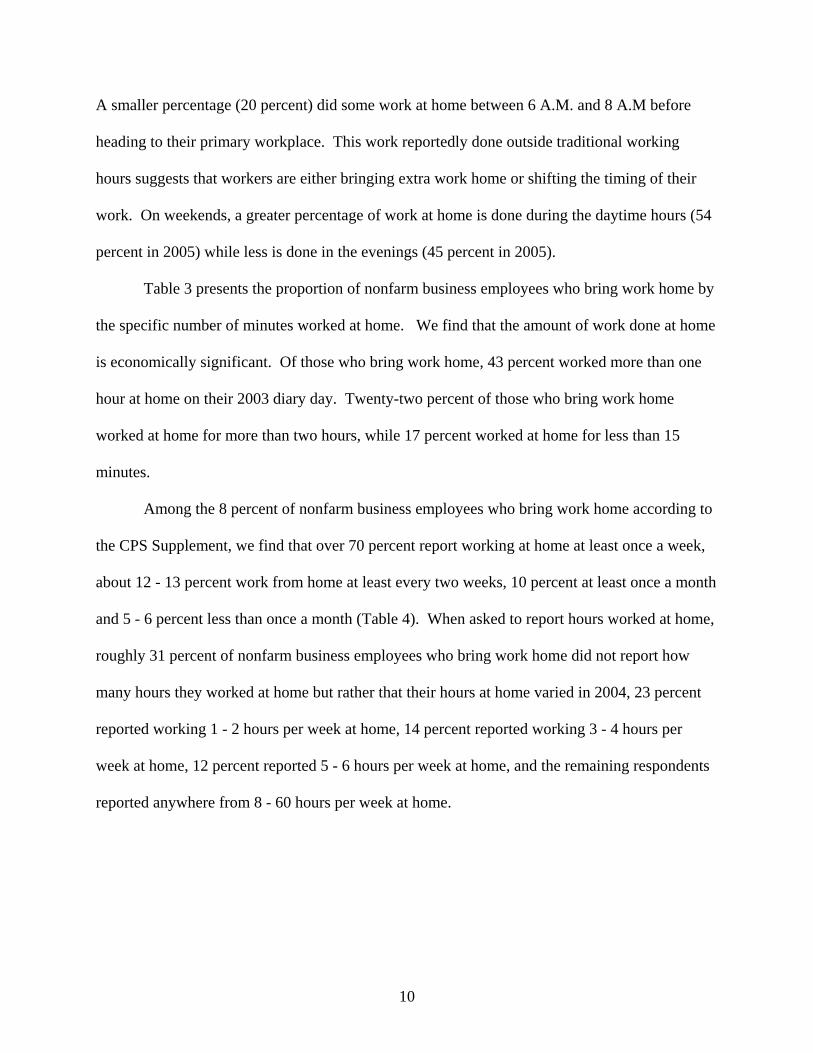
A smaller percentage (20 percent) did some work at home between 6 A.M. and 8 A.M before
heading to their primary workplace. This work reportedly done outside traditional working
hours suggests that workers are either bringing extra work home or shifting the timing of their
work. On weekends, a greater percentage of work at home is done during the daytime hours (54
percent in 2005) while less is done in the evenings (45 percent in 2005).
Table 3 presents the proportion of nonfarm business employees who bring work home by
the specific number of minutes worked at home. We find that the amount of work done at home
is economically significant. Of those who bring work home, 43 percent worked more than one
hour at home on their 2003 diary day. Twenty-two percent of those who bring work home
worked at home for more than two hours, while 17 percent worked at home for less than 15
minutes.
Among the 8 percent of nonfarm business employees who bring work home according to
the CPS Supplement, we find that over 70 percent report working at home at least once a week,
about 12 - 13 percent work from home at least every two weeks, 10 percent at least once a month
and 5 - 6 percent less than once a month (Table 4). When asked to report hours worked at home,
roughly 31 percent of nonfarm business employees who bring work home did not report how
many hours they worked at home but rather that their hours at home varied in 2004, 23 percent
reported working 1 - 2 hours per week at home, 14 percent reported working 3 - 4 hours per
week at home, 12 percent reported 5 - 6 hours per week at home, and the remaining respondents
reported anywhere from 8 - 60 hours per week at home.
10
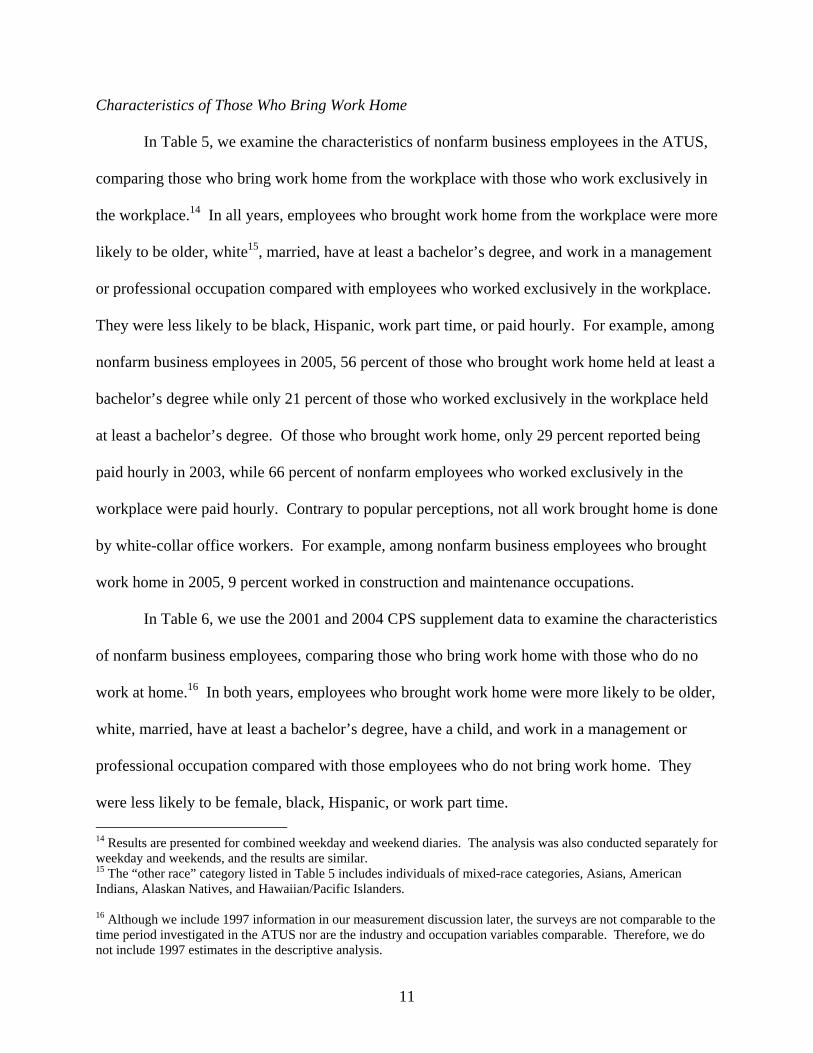
Characteristics of Those Who Bring Work Home
In Table 5, we examine the characteristics of nonfarm business employees in the ATUS,
comparing those who bring work home from the workplace with those who work exclusively in
the workplace.14 In all years, employees who brought work home from the workplace were more
likely to be older, white15, married, have at least a bachelor’s degree, and work in a management
or professional occupation compared with employees who worked exclusively in the workplace.
They were less likely to be black, Hispanic, work part time, or paid hourly. For example, among
nonfarm business employees in 2005, 56 percent of those who brought work home held at least a
bachelor’s degree while only 21 percent of those who worked exclusively in the workplace held
at least a bachelor’s degree. Of those who brought work home, only 29 percent reported being
paid hourly in 2003, while 66 percent of nonfarm employees who worked exclusively in the
workplace were paid hourly. Contrary to popular perceptions, not all work brought home is done
by white-collar office workers. For example, among nonfarm business employees who brought
work home in 2005, 9 percent worked in construction and maintenance occupations.
In Table 6, we use the 2001 and 2004 CPS supplement data to examine the characteristics
of nonfarm business employees, comparing those who bring work home with those who do no
work at home.16 In both years, employees who brought work home were more likely to be older,
white, married, have at least a bachelor’s degree, have a child, and work in a management or
professional occupation compared with those employees who do not bring work home. They
were less likely to be female, black, Hispanic, or work part time. 14 Results are presented for combined weekday and weekend diaries. The analysis was also conducted separately for weekday and weekends, and the results are similar. 15 The “other race” category listed in Table 5 includes individuals of mixed-race categories, Asians, American Indians, Alaskan Natives, and Hawaiian/Pacific Islanders. 16 Although we include 1997 information in our measurement discussion later, the surveys are not comparable to the time period investigated in the ATUS nor are the industry and occupation variables comparable. Therefore, we do not include 1997 estimates in the descriptive analysis.
11
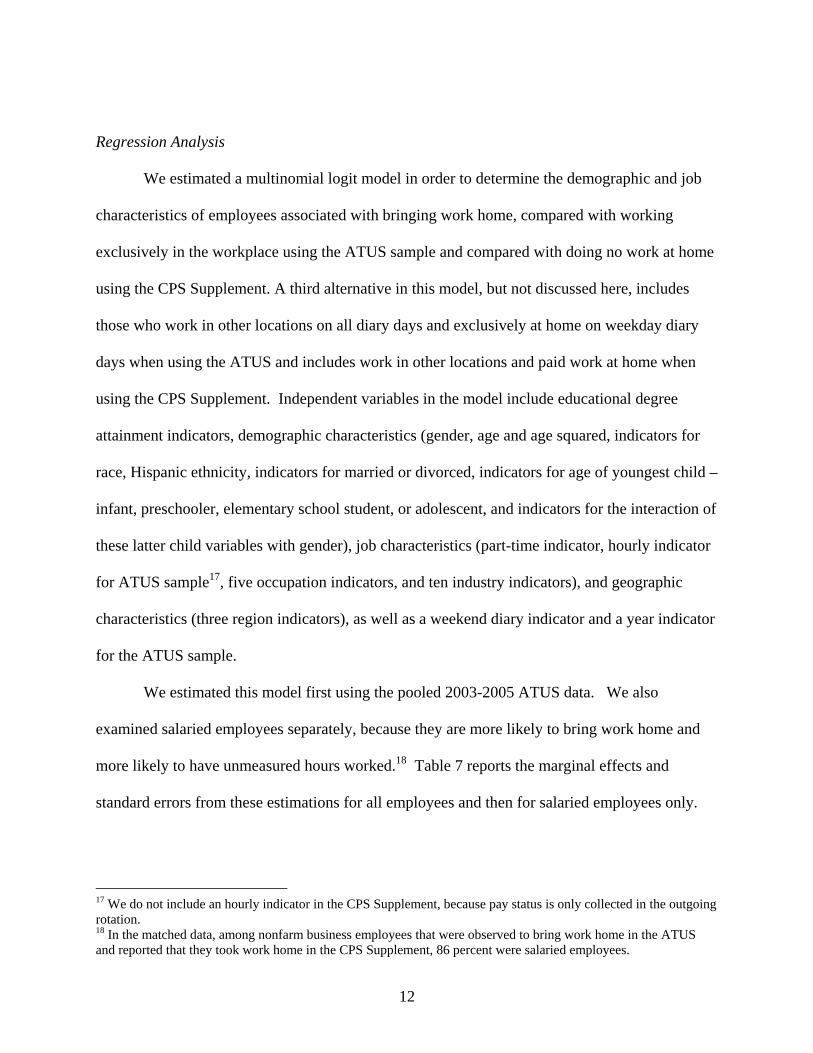
Regression Analysis
We estimated a multinomial logit model in order to determine the demographic and job
characteristics of employees associated with bringing work home, compared with working
exclusively in the workplace using the ATUS sample and compared with doing no work at home
using the CPS Supplement. A third alternative in this model, but not discussed here, includes
those who work in other locations on all diary days and exclusively at home on weekday diary
days when using the ATUS and includes work in other locations and paid work at home when
using the CPS Supplement. Independent variables in the model include educational degree
attainment indicators, demographic characteristics (gender, age and age squared, indicators for
race, Hispanic ethnicity, indicators for married or divorced, indicators for age of youngest child –
infant, preschooler, elementary school student, or adolescent, and indicators for the interaction of
these latter child variables with gender), job characteristics (part-time indicator, hourly indicator
for ATUS sample17, five occupation indicators, and ten industry indicators), and geographic
characteristics (three region indicators), as well as a weekend diary indicator and a year indicator
for the ATUS sample.
We estimated this model first using the pooled 2003-2005 ATUS data. We also
examined salaried employees separately, because they are more likely to bring work home and
more likely to have unmeasured hours worked.18 Table 7 reports the marginal effects and
standard errors from these estimations for all employees and then for salaried employees only.
17 We do not include an hourly indicator in the CPS Supplement, because pay status is only collected in the outgoing rotation. 18 In the matched data, among nonfarm business employees that were observed to bring work home in the ATUS and reported that they took work home in the CPS Supplement, 86 percent were salaried employees.
12
Next, we estimated the model using CPS supplement data for 2001 and 2004 sequentially. Table
8 presents the marginal effects and standard errors from these estimations.
Holding all else equal, overall results from both data sets indicate that highly-educated
employees are much more likely to bring work home than less-educated employees, black
employees are less likely to bring work home than white employees, and Hispanic employees are
less likely to bring work home than non-Hispanic employees. We also find that females are less
likely to bring work home than males, except in the 2001 CPS Supplement; although, the
magnitude of these gender effects is small compared with the magnitude of the education effects.
It is also possible that these gender differences may actually capture occupation and industry
differences in jobs held by gender that are not specified in our model. Several more detailed
occupation groups, such as management and computer and mathematical science, have a high
percentage of employees who bring work home, are male-dominated occupations, and constitute
a large percentage of total employees in our sample. In the ATUS, those paid hourly are seven
percent less likely to bring work home than salaried employees.
From the CPS supplement, we find that older employees are more likely to bring work
home than younger employees. We also find some small differences in the probability of
bringing work home between those who have children and those who do not. In the CPS
Supplement in both 2001 and 2004, we find that men with a child aged 0-5 are more likely to
bring work home than men without children; in 2001, fathers whose youngest child was
elementary school-aged were also more likely to bring work home than males without children.
In the ATUS only, mothers of preschooler and elementary school-aged children are more likely
to bring work home than women without children. This suggests that some parents may bring
work home to better balance work and family responsibilities when the children are young. In
13
the CPS Supplement, we also find that mothers of infants are less likely to bring work home than
fathers of infants. It is possible that mothers, as opposed to fathers, may choose not to bring
work home because they traditionally spend more time on childcare and household production
than their male spouses.
V. Do Those Who Bring Work Home Work Longer Hours?
We are interested in determining whether those who bring work home work longer hours,
or whether they are simply shifting the location of work. Using the 2003-2005 ATUS data, we
find different results for weekday diaries compared with weekend/holiday diaries. For
respondents who bring work home on a weekday, we find that their daily hours worked are
greater than the hours worked by those who work exclusively in a workplace; daily hours are 11
percent greater in 2003, 6 percent greater in 2004, and 13 percent greater in 2005. However, we
also find that daily hours worked at the workplace by those who bring work home on a
weekday are less than the daily hours worked at the workplace for those who work exclusively
at a workplace on their weekday diary day — 10 percent less in 2003, 11 percent less in 2004,
and 9 percent less in 2005 (Table 9). Thus, those who bring work home on a weekday are
shifting some hours of work from their workplace to their home, but they work more hours in
total on their diary day.
Because we only observe a single diary day, we defined those who do any work at home
on a weekend/holiday diary day as those who bring work home. For those who work at home on
a weekend or holiday, we find that their daily hours worked are significantly less than the hours
worked by those who work exclusively in the workplace. The daily hours for those who bring
work home on a weekend/holiday are 2-3 hours per day compared with a 7-hour work day by
14
those who work exclusively at the workplace. Although some of the bring-work-home weekend
respondents may be home-based workers, their hours at home are quite similar to the 1-2 hours
worked at home by weekday respondents who bring work home from the workplace.
In order to determine whether workers who bring work home on their diary day work
more hours in general than do those who work exclusively in a workplace and are not completely
off-setting hours at home on their diary day with fewer hours on another day during the week, we
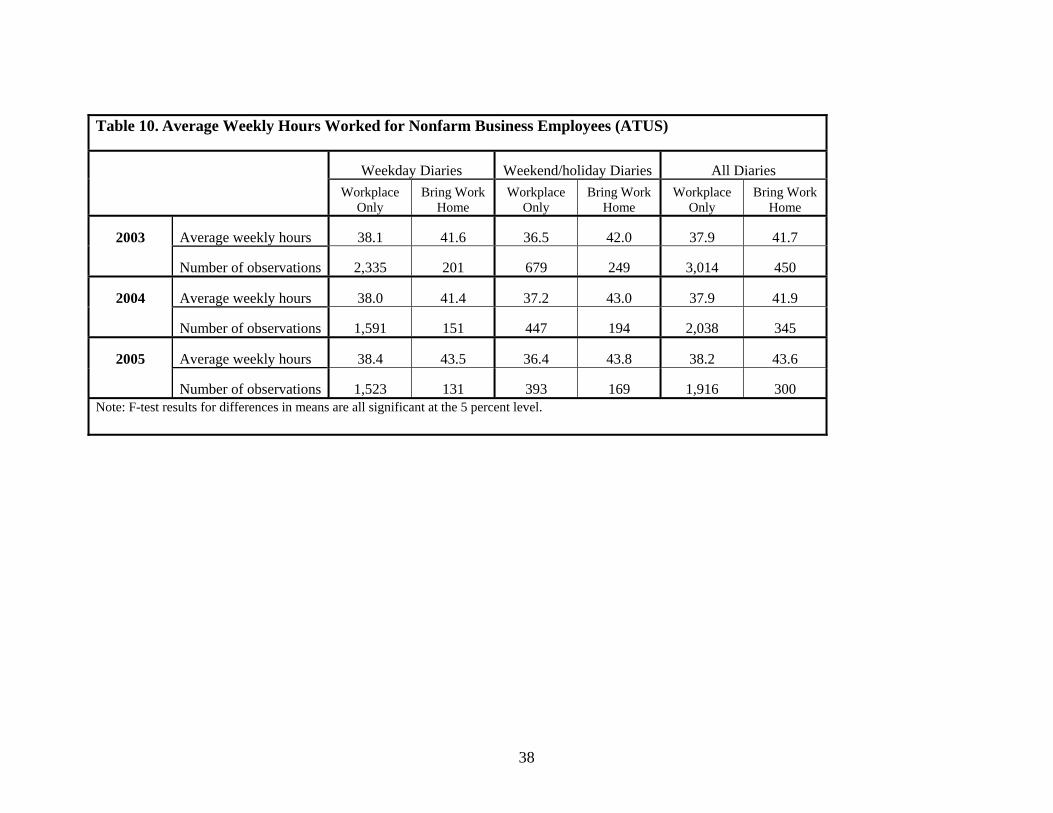
compare each group’s CPS actual average weekly hours (Table 10).19 Using either weekday or
weekend/holiday diary data, we find that those who bring work home from their workplace
reported significantly higher average weekly hours than those who work exclusively in a
workplace. From the weekday diaries, average weekly hours for those who bring work home are
9-12 percent greater than those who work exclusively in the workplace. From the
weekend/holiday diaries, the average weekly hours of those who bring work home are 15-19
percent greater than those who work exclusively in the workplace. This provides additional
evidence that those who work at home on weekends are bringing work home from the
workplace. Recall that daily hours worked for these respondents were approximately 2 hours per
weekend day, while their average weekly hours are over 42 hours per week. Assuming a five
day work week, this suggests that the average daily hours for those who are working at home on
a weekend should be about 8 hours per day. Thus, their daily and weekly hours closely resemble
those of respondents who bring work home on weekdays. This suggests that combining
weekday and weekend reports to calculate the share of workers who bring work home and their
average hours worked is appropriate.
19 To analyze hours worked, we further restrict the sample to those who have the same employer, occupation and usual duties as they reported to the CPS two to five months prior.
15
Using the CPS supplement data, we also find that those who bring work home have
statistically significant higher average weekly hours (20-21 percent higher) than those who do no
work from home (Table 11). We also report separate estimates for those who work at home at
least once a week because their hours worked at home should always be included in CPS average
weekly hours reports whereas only some of the hours from workers who do infrequent work at
home will be captured in CPS average weekly hours. The subgroup of employees who bring
work home at least once a week have slightly higher average weekly hours in 2001 and 2004
than all employees who bring work home. We do not report results for the 1997 CPS
Supplement since respondents were not asked for frequency of work at home but only whether
they worked at home last week, which would capture those working at home at least once a week
and some of those who work less than once a week at home.
The general results from the two data sources are the same; those who bring work home
do in fact work longer hours. In addition, both data sources show very little change in average
weekly hours over time. We will show these results also hold for nonproduction/supervisory
employees and production/nonsupervisory employees separately.20
VI. Use of Hours Data in U.S. Productivity Measurement
Labor productivity measures the difference between output and hours growth, and
reflects many sources, including increases in the quantities of nonlabor inputs (i.e., capital
services, fuels, other intermediate materials, and purchased services), changes in technology,
economies of scale, changes in management techniques, and changes in the skills of the labor
20 In goods-producing industries, workers are divided into production and nonproduction workers. Nonproduction workers include professional specialty and technical workers; executive, administrative, and managerial workers; sales workers, and administrative support workers, including clerical. In service-producing industries, workers are divided into supervisory and nonsupervisory workers. Supervisory workers include all executives and administrative and managerial workers
16
force. The BLS calculates labor productivity in the nonfarm business sector by combining real
output from the National Income and Product Accounts (NIPA) produced by the Bureau of
Economic Analysis (BEA) with quarterly measures prepared by the BLS Office of Productivity
and Technology (OPT) of hours worked for all persons. The primary source of data used to
construct hours worked measures for productivity purposes is the monthly payroll survey of
establishments conducted by the BLS Current Employment Statistics program (CES).21 The
CES collects data on employment for all employees and average weekly hours paid for
production workers in goods industries and for nonsupervisory workers in service industries
monthly. The data represent employment and average hours paid for the pay period including
the 12th day of the month.22 CES average weekly hours paid are adjusted to hours at work using
an hours-worked to hours-paid ratio estimated from the National Compensation Survey (NCS).
This adjustment ensures that changes in vacation, holiday, and sick pay, which are viewed as
changes in labor costs, do not affect hours growth.23 Production/nonsupervisory hours are
calculated as:
52** NAWHP
MP
(1)
where AWHPM represents measured average weekly hours for production/nonsupervisory
workers obtained from CES hours and adjusted by the hours-worked to hours-paid ratio and an
21 The CES samples 400,000 nonfarm establishments, more than six times the 60,000 households sampled in the CPS. In addition, the CES is benchmarked annually to levels based on administrative records of employees covered by state unemployment insurance tax records. There is no direct benchmark for CPS employment data. Adjustments to the CPS underlying population base are made annually using intercensal estimates and every ten years using the decennial census. Also, establishment hours data are more consistent with the measures of output used to produce productivity measures; output data are based on data collected from establishments. In addition, establishment data provide reliable reporting and coding on industries and thus are well-suited for producing industry-level measures. Measures for industries based on household reports tend to produce industry estimates with considerable variance, even in a survey as large as the CPS. Thus, the BLS’s official measures by industry come from establishment surveys wherever possible. 22 The CES program began collecting data on earnings and hours for all employees in September 2005. An experimental series including these new data is available at www.bls.gov/ces/cesaepp.htm. 23 Prior to 2000, the annual Hours at Work Survey was used.
17
adjustment to remove nonprofit institutions, and NP is the employment of nonfarm business
production/nonsupervisory employees.
Because official hours estimates are not available from the CES, the BLS estimates
average weekly hours of nonproduction/supervisory employees.24 Data from the BLS’
household survey, the CPS, are used to construct a ratio of the average weekly hours worked by
nonproduction/supervisory employees relative to the average weekly hours worked by
production/nonsupervisory employees. Together with CES hours and employment data, this
ratio is used to calculate the total hours worked by nonproduction/supervisory employees.
Nonproduction/supervisory hours are calculated as:
52*** NAWHAWHAWHAWH NPCPS
P
CPSNPM
PMNP =
(2)
where AWHNPCPS
and AWHPCPS represent CPS measures of average weekly hours for
nonproduction/supervisory and production/nonsupervisory employees respectively, and NNP is
the employment of nonfarm business nonproduction/supervisory employees. Average weekly
hours for production/nonsupervisory employees and nonproduction/supervisory employees are
constructed by OPT at the NAICS major industry group level and then aggregated. Total hours
for all persons in the nonfarm business sector are the sum of production/nonsupervisory
employee hours, nonproduction/supervisory employee hours, and hours worked by the
unincorporated self-employed, unpaid family workers and employees of government enterprises.
Average weekly hours for the unincorporated self-employed, unpaid family workers and
24 In August 2004, BLS introduced this new method of constructing estimates of hours for nonproduction and supervisory workers. See Eldridge, Manser, and Otto (2004).
18
employees of government enterprises are taken directly from the CPS; remaining data are
obtained from various sources.25
Some critics of official productivity measures have suggested that IT innovations have
allowed workers the flexibility to work outside the traditional workplace and that these hours are
not properly captured in official BLS productivity measures.26 This criticism is typically
directed toward the quarterly labor productivity in the nonfarm business sector. It is important to
note that an underestimation of hours worked affects measures of productivity growth only if
unmeasured hours grow differently from measured hours and affect a significant portion of the
working population. Eldridge (2004) found that a hypothetical hours series constructed by
combining CPS average weekly hours and CES employment data produced slightly higher levels
of hours, but hours showed a comparable trend from 2000-2003.
VII. Are Hours of Work Brought Home Measured?
Hours worked are constructed separately for production/nonsupervisory employees,
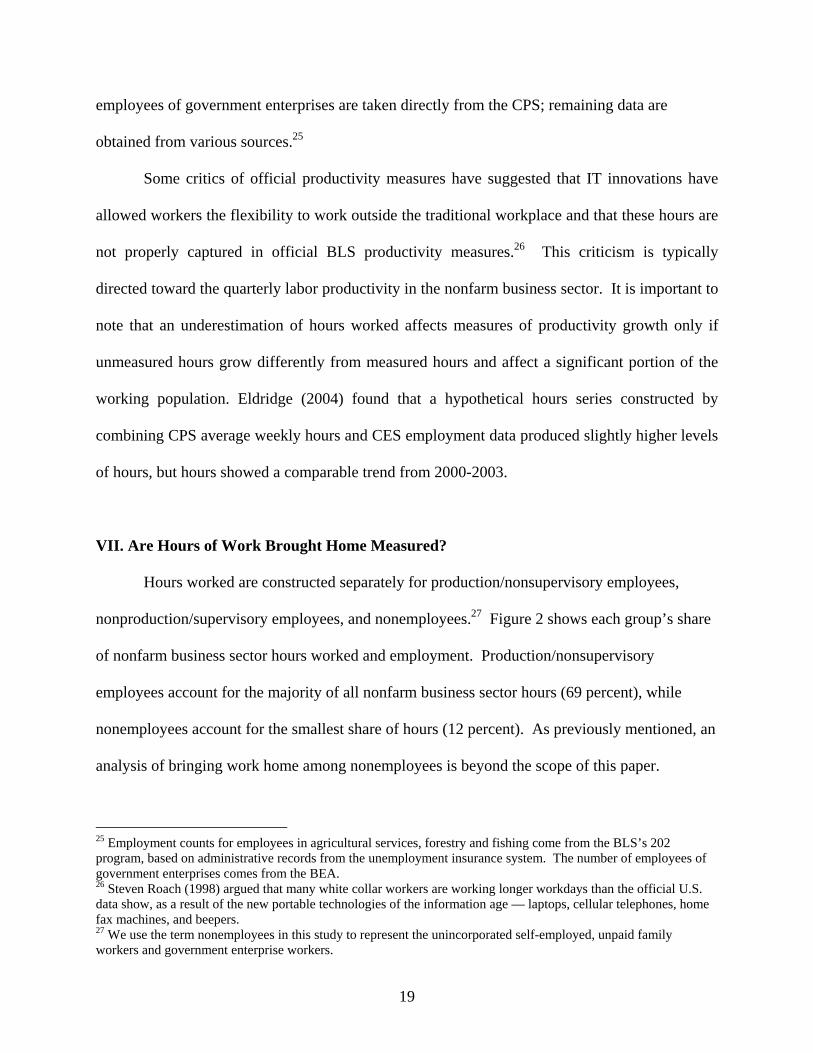
nonproduction/supervisory employees, and nonemployees.27 Figure 2 shows each group’s share
of nonfarm business sector hours worked and employment. Production/nonsupervisory
employees account for the majority of all nonfarm business sector hours (69 percent), while
nonemployees account for the smallest share of hours (12 percent). As previously mentioned, an
analysis of bringing work home among nonemployees is beyond the scope of this paper.
25 Employment counts for employees in agricultural services, forestry and fishing come from the BLS’s 202 program, based on administrative records from the unemployment insurance system. The number of employees of government enterprises comes from the BEA. 26 Steven Roach (1998) argued that many white collar workers are working longer workdays than the official U.S. data show, as a result of the new portable technologies of the information age — laptops, cellular telephones, home fax machines, and beepers. 27 We use the term nonemployees in this study to represent the unincorporated self-employed, unpaid family workers and government enterprise workers.
19
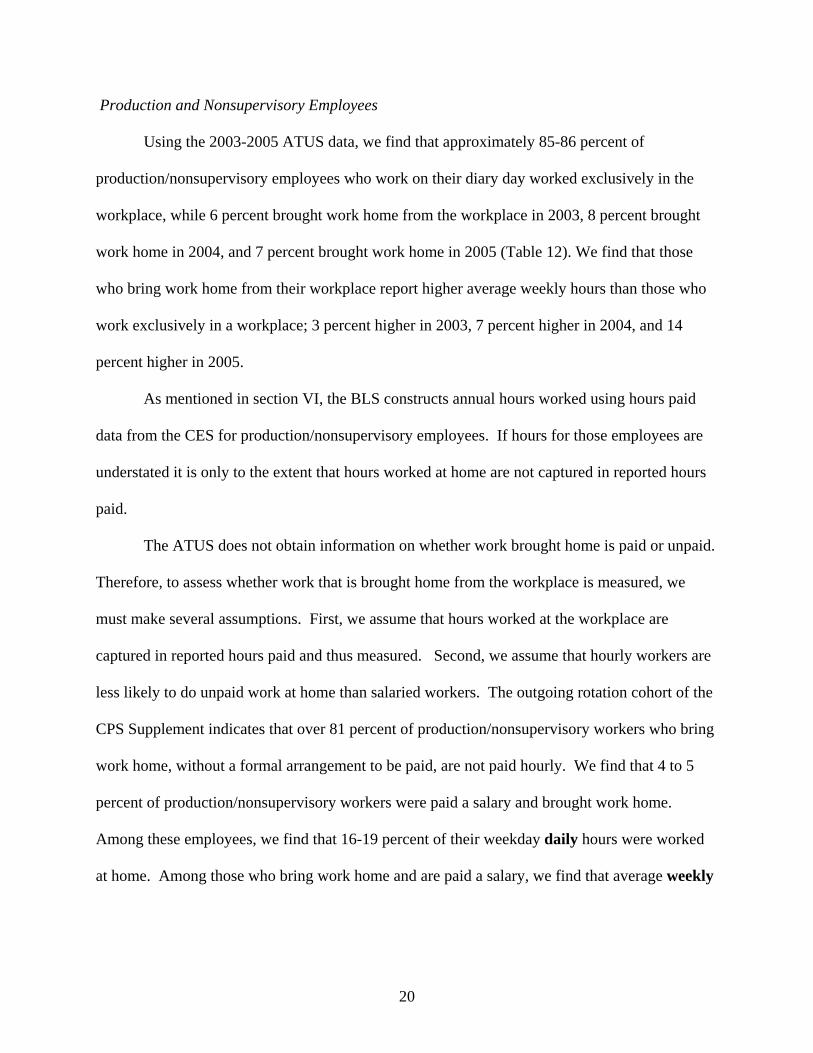
Production and Nonsupervisory Employees
Using the 2003-2005 ATUS data, we find that approximately 85-86 percent of
production/nonsupervisory employees who work on their diary day worked exclusively in the
workplace, while 6 percent brought work home from the workplace in 2003, 8 percent brought
work home in 2004, and 7 percent brought work home in 2005 (Table 12). We find that those
who bring work home from their workplace report higher average weekly hours than those who
work exclusively in a workplace; 3 percent higher in 2003, 7 percent higher in 2004, and 14
percent higher in 2005.
As mentioned in section VI, the BLS constructs annual hours worked using hours paid
data from the CES for production/nonsupervisory employees. If hours for those employees are
understated it is only to the extent that hours worked at home are not captured in reported hours
paid.
The ATUS does not obtain information on whether work brought home is paid or unpaid.
Therefore, to assess whether work that is brought home from the workplace is measured, we
must make several assumptions. First, we assume that hours worked at the workplace are
captured in reported hours paid and thus measured. Second, we assume that hourly workers are
less likely to do unpaid work at home than salaried workers. The outgoing rotation cohort of the
CPS Supplement indicates that over 81 percent of production/nonsupervisory workers who bring
work home, without a formal arrangement to be paid, are not paid hourly. We find that 4 to 5
percent of production/nonsupervisory workers were paid a salary and brought work home.
Among these employees, we find that 16-19 percent of their weekday daily hours were worked
at home. Among those who bring work home and are paid a salary, we find that average weekly
20
hours were 6 percent greater than those who worked exclusively in a workplace in 2003, 16
percent greater in 2004 and 15 percent greater in 2005.
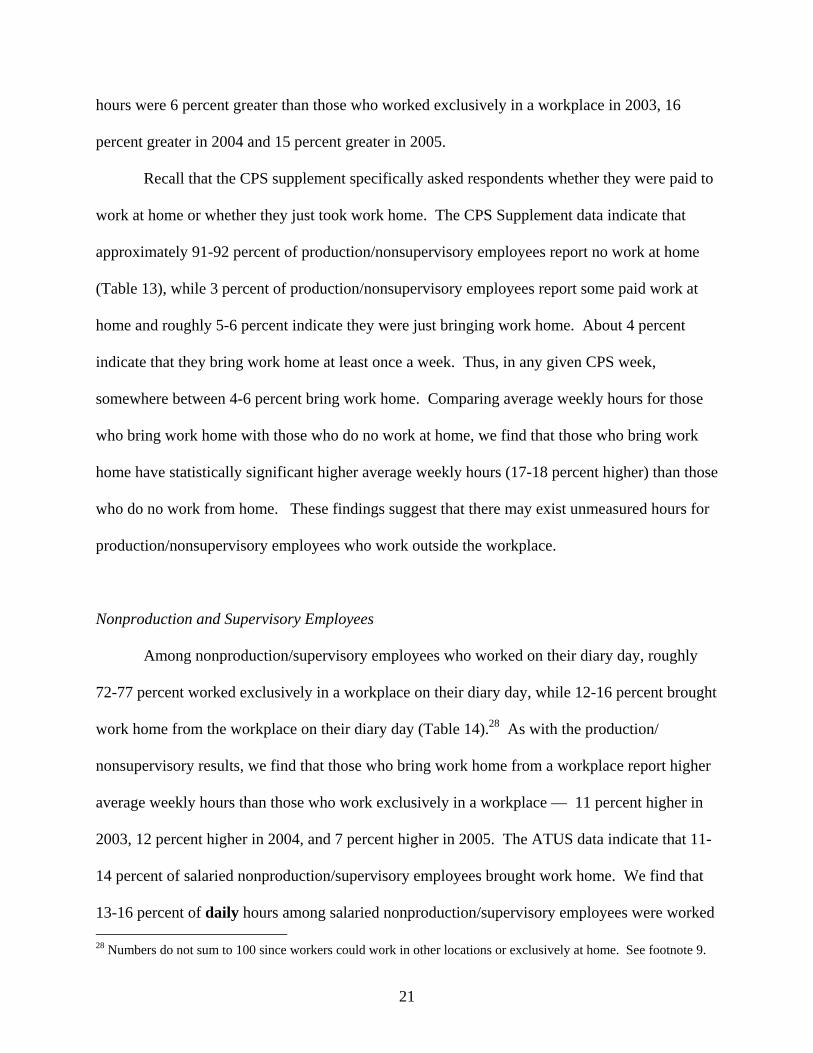
Recall that the CPS supplement specifically asked respondents whether they were paid to
work at home or whether they just took work home. The CPS Supplement data indicate that
approximately 91-92 percent of production/nonsupervisory employees report no work at home
(Table 13), while 3 percent of production/nonsupervisory employees report some paid work at
home and roughly 5-6 percent indicate they were just bringing work home. About 4 percent
indicate that they bring work home at least once a week. Thus, in any given CPS week,
somewhere between 4-6 percent bring work home. Comparing average weekly hours for those
who bring work home with those who do no work at home, we find that those who bring work
home have statistically significant higher average weekly hours (17-18 percent higher) than those
who do no work from home. These findings suggest that there may exist unmeasured hours for
production/nonsupervisory employees who work outside the workplace.
Nonproduction and Supervisory Employees
Among nonproduction/supervisory employees who worked on their diary day, roughly
72-77 percent worked exclusively in a workplace on their diary day, while 12-16 percent brought
work home from the workplace on their diary day (Table 14).28 As with the production/
nonsupervisory results, we find that those who bring work home from a workplace report higher
average weekly hours than those who work exclusively in a workplace — 11 percent higher in
2003, 12 percent higher in 2004, and 7 percent higher in 2005. The ATUS data indicate that 11-
14 percent of salaried nonproduction/supervisory employees brought work home. We find that
13-16 percent of daily hours among salaried nonproduction/supervisory employees were worked 28 Numbers do not sum to 100 since workers could work in other locations or exclusively at home. See footnote 9.
21
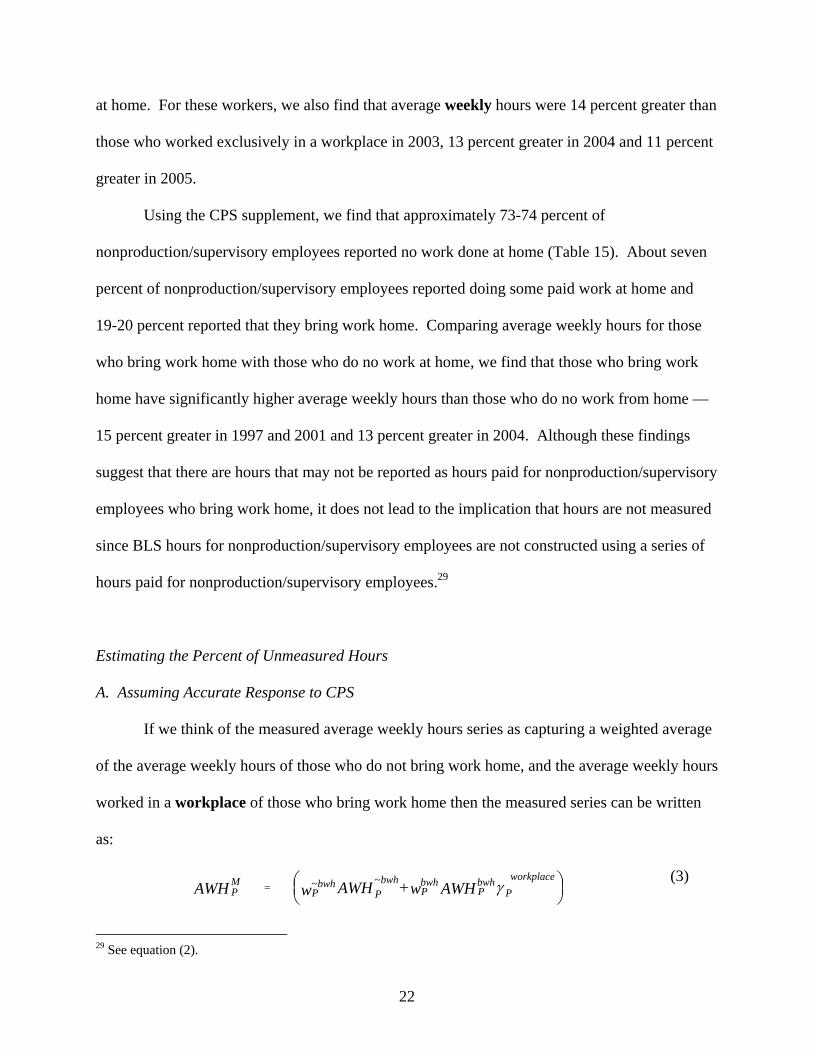
at home. For these workers, we also find that average weekly hours were 14 percent greater than
those who worked exclusively in a workplace in 2003, 13 percent greater in 2004 and 11 percent
greater in 2005.
Using the CPS supplement, we find that approximately 73-74 percent of
nonproduction/supervisory employees reported no work done at home (Table 15). About seven
percent of nonproduction/supervisory employees reported doing some paid work at home and
19-20 percent reported that they bring work home. Comparing average weekly hours for those
who bring work home with those who do no work at home, we find that those who bring work
home have significantly higher average weekly hours than those who do no work from home —
15 percent greater in 1997 and 2001 and 13 percent greater in 2004. Although these findings
suggest that there are hours that may not be reported as hours paid for nonproduction/supervisory
employees who bring work home, it does not lead to the implication that hours are not measured
since BLS hours for nonproduction/supervisory employees are not constructed using a series of
hours paid for nonproduction/supervisory employees.29
Estimating the Percent of Unmeasured Hours
A. Assuming Accurate Response to CPS
If we think of the measured average weekly hours series as capturing a weighted average
of the average weekly hours of those who do not bring work home, and the average weekly hours
worked in a workplace of those who bring work home then the measured series can be written
as:
⎟⎠⎞⎜
⎝⎛ += γ
workplaceP
bwhP
bwhP
bwhP
bwhP
MP AWHwAWHwAWH ~ ~ (3)
29 See equation (2).
22
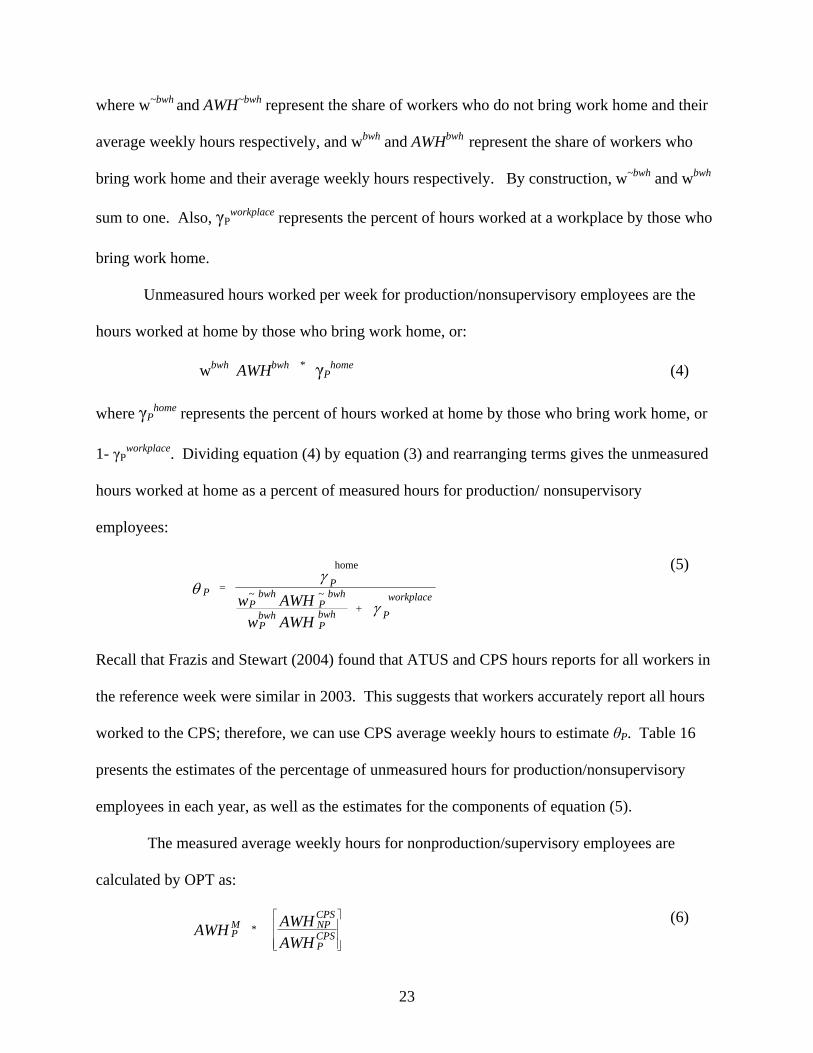
where w~bwh and AWH~bwh represent the share of workers who do not bring work home and their
average weekly hours respectively, and wbwh and AWHbwh represent the share of workers who
bring work home and their average weekly hours respectively. By construction, w~bwh and wbwh
sum to one. Also, γPworkplace represents the percent of hours worked at a workplace by those who
bring work home.
Unmeasured hours worked per week for production/nonsupervisory employees are the
hours worked at home by those who bring work home, or:
wbwh AWHbwh * γPhome (4)
where γPhome represents the percent of hours worked at home by those who bring work home, or
1- γPworkplace. Dividing equation (4) by equation (3) and rearranging terms gives the unmeasured
hours worked at home as a percent of measured hours for production/ nonsupervisory
employees:
γ
γθ workplace
PbwhP
bwhP
bwhP
bwhP
PP
AWHwAWHw +
= ~~
home (5)
Recall that Frazis and Stewart (2004) found that ATUS and CPS hours reports for all workers in
the reference week were similar in 2003. This suggests that workers accurately report all hours
worked to the CPS; therefore, we can use CPS average weekly hours to estimate θP. Table 16
presents the estimates of the percentage of unmeasured hours for production/nonsupervisory
employees in each year, as well as the estimates for the components of equation (5).
The measured average weekly hours for nonproduction/supervisory employees are
calculated by OPT as:
⎥⎥⎥
⎦
⎤
⎢⎢⎢
⎣
⎡
AWHAWHAWH CPS
P
CPSNPM
P * (6)
23

Assuming that there is no bias in the ratio of average weekly hours worked by nonproduction/
supervisory employees relative to production/nonsupervisory employees, the percent of
unmeasured hours for nonproduction/supervisory employees are the same as that of
production/supervisory employees.30 According to ATUS data, approximately 0.8-0.9 percent
of average weekly hours are unmeasured due to work brought home (Table 16). According to
the CPS supplement, the percent of unmeasured hours is a bit larger (0.9-1.1 percent); although
when we focus on those who bring work home at least once a week, the percent of unmeasured
hours is 0.8 percent.31
B. Assuming Recall Bias in the CPS
However, CPS respondents who bring work home may differ from the average CPS
respondent and may be unable to accurately recall work done at home as suggested by
inconsistencies in the directly matched data. If a recall bias among those who bring work home
exists, then the nonproduction/supervisory to production/nonsupervisory hours ratio may be
biased downward because nonproduction/supervisory employees are more likely to bring work
home than production/supervisory employees. As an upper bound, we assume that none of the
hours reported to the CPS include hours worked at home and thus we increase average weekly
hours for those who bring work home to be equal to reported hours plus the hours worked at
home. Because survey respondents should be better able to accurately recall events of the
previous day than the previous week, we use ATUS data on the percent of hours worked at home
30 CPS average weekly hours should include all hours worked regardless of location for both nonproduction/supervisory employees and nonproduction/supervisory employees. Because this is a ratio, any survey effects will cancel out. 31 However, the quality of these additional hours at home may not be of the same quality as those worked in the workplace, especially if workers are doing secondary childcare while working at home.
24

by those who bring work home on their diary day to estimate the modified average weekly
hours.32
Recall that measured average weekly hours from equation (3) include only average
weekly hours worked in a workplace. Given the assumption of CPS recall bias among those who
bring work home, the average weekly hours reported to the CPS also include only average
weekly hours worked in the workplace. Therefore, we divide equation (4) by total reported CPS
hours which are defined as:
( )AWHwAWHwAWH bwhP
bwhP
bwhP
bwhP
CPSP += ~ ~ (7)
Unmeasured hours worked at home as a percent of measured hours for production/
nonsupervisory employees assuming recall bias can be written as:
1~~
hom
+
=
AWHwAWHw
bwhP
bwhP
bwhP
bwhP
ePr
Pγ
θ (8)
Given the recall bias assumption, the percent of unmeasured hours for
nonproduction/supervisory employees is no longer equal to the percent of unmeasured hours for
production/nonsupervisory employees. Unmeasured hours for nonproduction/supervisory
employees can be written as:
⎥⎥⎥
⎦
⎤
⎢⎢⎢
⎣
⎡−
⎥⎥⎥
⎦
⎤
⎢⎢⎢
⎣
⎡
⎟⎠
⎞⎜⎝
⎛
+
++
AWHAWHAWH
AWHwAWHAWHwAWH
AWH CPSP
CPSNPCPS
PeP
bwhP
bwhP
CPSP
eNP
bwhNP
bwhNP
CPSNPr
PCPSP *1
hom*
hom***
γγ
θ(9)
Dividing equation (9) by equation (7) and rearranging terms gives the percent of
unmeasured hours for nonproduction/ supervisory employees given a recall bias as:
32 Information from the CPS Supplement is not used because respondents were directly asked how many hours they usually work at home and how many hours they usually work in total in the same survey; therefore, these responses should be consistent and we would be unable to determine the correct percentage of hours worked at home if there is a recall bias.
25
1*1
*1*1
hom
hom
−+
++=
⎥⎥⎥⎥⎥⎥⎥
⎦
⎤
⎢⎢⎢⎢⎢⎢⎢
⎣
⎡
⎟⎟⎟
⎠
⎞
⎜⎜⎜
⎝
⎛
⎟⎟⎟
⎠
⎞
⎜⎜⎜
⎝
⎛
⎟⎠⎞⎜
⎝⎛
γ
γθθ
ePCPS
P
bwhPbwh
P
eNPCPS
NP
bwhNPbwh
NPrP
rNP
AWHAWHw
AWHAWHw (10)
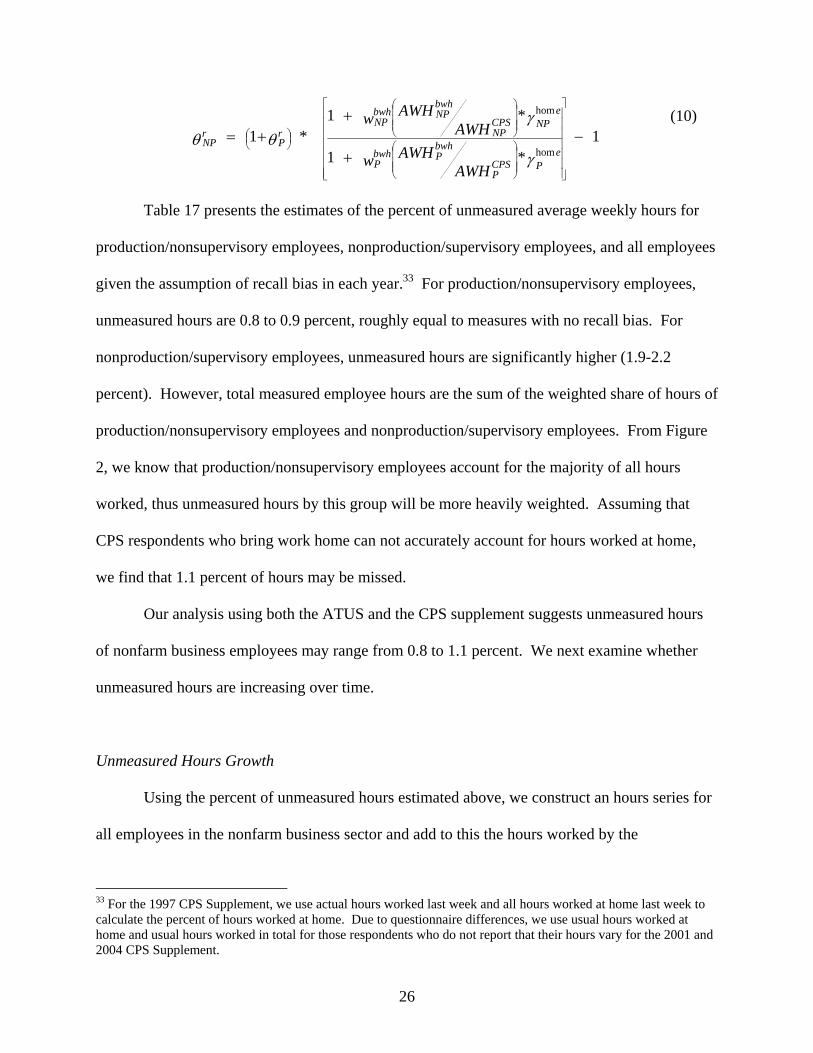
Table 17 presents the estimates of the percent of unmeasured average weekly hours for
production/nonsupervisory employees, nonproduction/supervisory employees, and all employees
given the assumption of recall bias in each year.33 For production/nonsupervisory employees,
unmeasured hours are 0.8 to 0.9 percent, roughly equal to measures with no recall bias. For
nonproduction/supervisory employees, unmeasured hours are significantly higher (1.9-2.2
percent). However, total measured employee hours are the sum of the weighted share of hours of
production/nonsupervisory employees and nonproduction/supervisory employees. From Figure
2, we know that production/nonsupervisory employees account for the majority of all hours
worked, thus unmeasured hours by this group will be more heavily weighted. Assuming that
CPS respondents who bring work home can not accurately account for hours worked at home,
we find that 1.1 percent of hours may be missed.
Our analysis using both the ATUS and the CPS supplement suggests unmeasured hours
of nonfarm business employees may range from 0.8 to 1.1 percent. We next examine whether
unmeasured hours are increasing over time.
Unmeasured Hours Growth
Using the percent of unmeasured hours estimated above, we construct an hours series for
all employees in the nonfarm business sector and add to this the hours worked by the
33 For the 1997 CPS Supplement, we use actual hours worked last week and all hours worked at home last week to calculate the percent of hours worked at home. Due to questionnaire differences, we use usual hours worked at home and usual hours worked in total for those respondents who do not report that their hours vary for the 2001 and 2004 CPS Supplement.
26
unincorporated self-employed, unpaid family workers and employees of government enterprises,
as measured by OPT. Table 18 compares the growth in measured hours worked for all persons
in the nonfarm business sector with the growth in each of our adjusted series (assuming no recall
bias in the CPS and recall bias). Official productivity growth statistics are published to the first
decimal place. We find that the growth in the ATUS-adjusted series is slightly faster than the
growth in the BLS measured hours series from 2003 to 2004, but slightly slower in 2004-2005,
using the no recall bias assumption. Over the two year period from 2003-2005 we find a
negligible downward bias in measured hours growth. Assuming recall bias, we find a small
upward bias in the measured hours growth that would have no affect on official productivity
growth statistics. The CPS Supplement-adjusted series from 1997 to 2001 grows slightly slower
than the BLS measured series, but there is very little difference between the two series for the
2001-2004 and 1997-2004 periods. Again, over all years the differences are too small to affect
the official productivity growth statistics. Therefore, any potential bias in hours levels resulting
from unmeasured hours worked at home is not a significant source of productivity growth.
VIII. Conclusion
In this paper, we used both the ATUS and May CPS Work Schedules and Work at Home
Supplements to determine whether hours worked by nonfarm business employees were
understated and increased between 1997 and 2005 because of unreported hours worked at home.
The main advantage of using the CPS Supplement is that we can determine whether work done
at home is paid. The main advantages of the ATUS are that we can observe when during the day
the work is being performed at home and get a more accurate measure of the number of hours
worked at home.
27
According to the 2003-2005 ATUS data and the CPS Supplement, 8-9 percent of
nonfarm business employees brought some of their work home from their primary workplace. A
majority of CPS supplement respondents indicated that they did work at home in order to finish
or catch up on work. We find evidence that suggests workers bring work home at least in part to
better balance work and family responsibilities. We find that men and women of young children
are more likely to bring work home than those without children. In addition, 8 percent of bring-
work-home workers reported a child in their care while working at home in 2003. Five percent
of respondents to the CPS supplement directly indicated that they do work at home to better
balance work and family responsibilities. Results from a multinomial logit model also indicate
that highly-educated, salaried workers are much more likely to bring work home than their less-
educated, hourly counterparts.
From both data sets we find that those who bring work home have higher average weekly
hours than those who work exclusively in a workplace. From the ATUS data, we find that total
daily hours at the workplace are lower for those who bring work home than for those who work
exclusively in the workplace. Thus, it does appear that those who bring work home shift some
work from their workplace to their home, yet work more hours overall.
The data suggests that there may exist a 0.8 - 1.1 percent downwards bias in measured
hours. Although both data sources suggest some hours worked at home are not captured by
official hours level series, when the official series is augmented to include these unmeasured
hours there is very little change in the hours trends. Unmeasured hours worked at home have
less than a 0.1 percent affect on productivity trends.
28
REFERENCES
Callister, Paul, and Sylvia Dixon. 2001. “New Zealanders’ Work Time and Home Work Patterns: Evidence from the Time Use Survey” New Zealand Department of Labour Occasional Paper No. 5. Eldridge, Lucy P., Marilyn E. Manser and Phyllis F. Otto. 2004. “Alternative Measures of Supervisory Employee Hours and Productivity Growth,” Monthly Labor Review, Vol. 127, No.4 (April), pp. 9-28. Eldridge, Lucy P. 2004. “Hours Measures for Productivity Measurement and National Accounting,” presented to Paris Group on Measuring Hours of Work (September). Frazis, Harley, and Jay Stewart. 2004. “What Can Time-Use Data Tell Us About Hours of Work?” Monthly Labor Review, Vol. 127, No. 12 (December), pp. 3-9. Hamermesh, Daniel S. 1990. “Shirking or Productive Schmoozing: Wages and the Allocation of Time at Work.” Industrial and Labor Relations Review, Vol. 43, No. 3, pp. 121S-133S. Jacobs, Jerry A. 1998. “Measuring Time at Work: Are Self-Reports Accurate?” Monthly Labor Review, Vol. 121, No. 12 (December), pp. 42-53. Oettinger, Gerald. 2004. “The Growth in Home-Based Wage and Salary Employment in the United States, 1980-2000: How Much and Why?” Presentation at the Society of Labor Economist Meetings, http://client.norc.org/jole/SOLEweb/oettinger.pdf, (San Antonio, April 30-May1, 2004). Pabilonia, Sabrina Wulff. 2006. “Working at Home: An Analysis of Telecommuting in Canada”, Unpublished paper, U.S. Bureau of Labor Statistics. Polivka, Anne E., and Jennifer M. Rothgeb. 1993. “Redesigning the CPS Questionnaire.” Monthly Labor Review, Vol. 16, No. 9 (September), pp. 10-28. Roach, Stephen S. 1998. “The Boom for Whom: Revisiting America’s Technology Paradox.” Morgan Stanley Dean Witter, Special Economic Study, January 9. Robinson, John, and Ann Bostrom. 1994. “The Overestimated Workweek? What Time Diary Measures Suggest.” Monthly Labor Review, Vol. 117, No. 8 (August), pp. 11-23. Schroeder, Christine, and Ronald S. Warren. 2004. “The Effect of Home-Based Work on Earnings.” Unpublished paper, University of Georgia. Wight, Vanessa R., and Suzanne M. Bianchi. 2004. “Women’s Home-Based Work Patterns: Findings from the 2001 Current Population Survey”. Unpublished paper, University of Maryland.
29
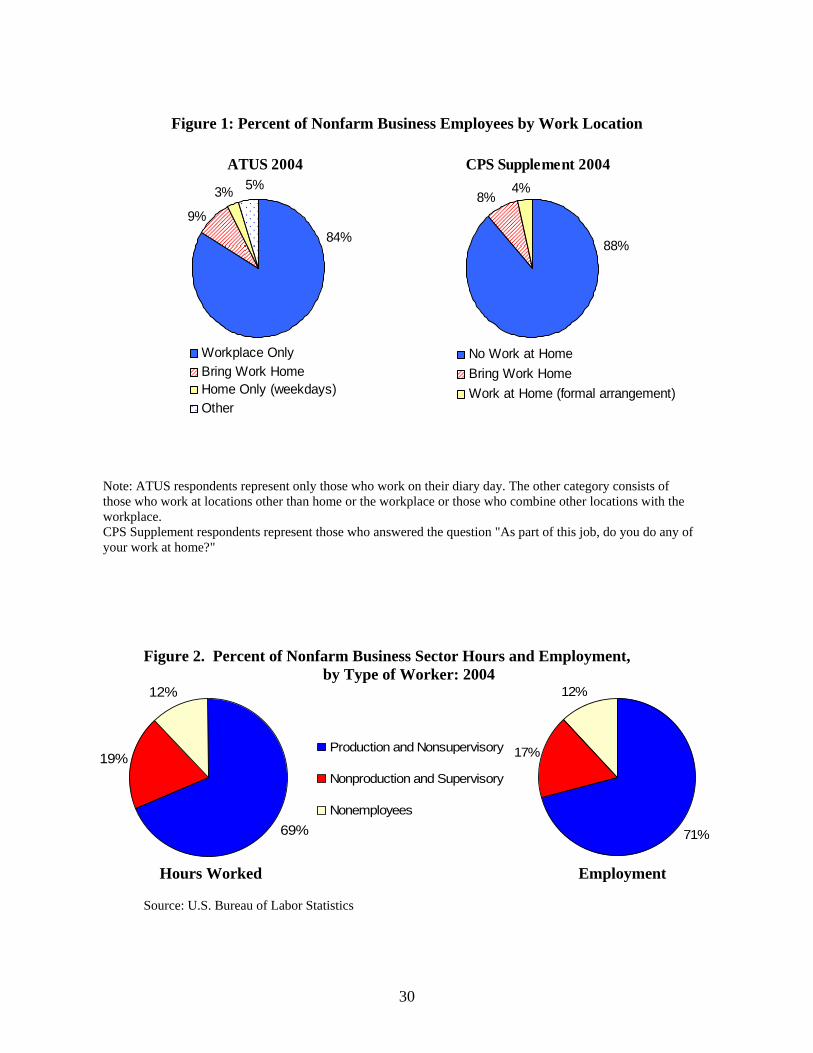
Figure 1: Percent of Nonfarm Business Employees by Work Location
CPS Supplement 2004
8%4%
88%
No Work at HomeBring Work HomeWork at Home (formal arrangement)
ATUS 2004
84%
3%
9%
5%
Workplace OnlyBring Work HomeHome Only (weekdays)Other
Note: ATUS respondents represent only those who work on their diary day. The other category consists of those who work at locations other than home or the workplace or those who combine other locations with the workplace. CPS Supplement respondents represent those who answered the question "As part of this job, do you do any of your work at home?"
Figure 2. Percent of Nonfarm Business Sector Hours and Employment,
by Type of Worker: 2004
69%
19%
12%
Production and Nonsupervisory
Nonproduction and Supervisory
Nonemployees
71%
17%
12%
Hours Worked Employment Source: U.S. Bureau of Labor Statistics
30
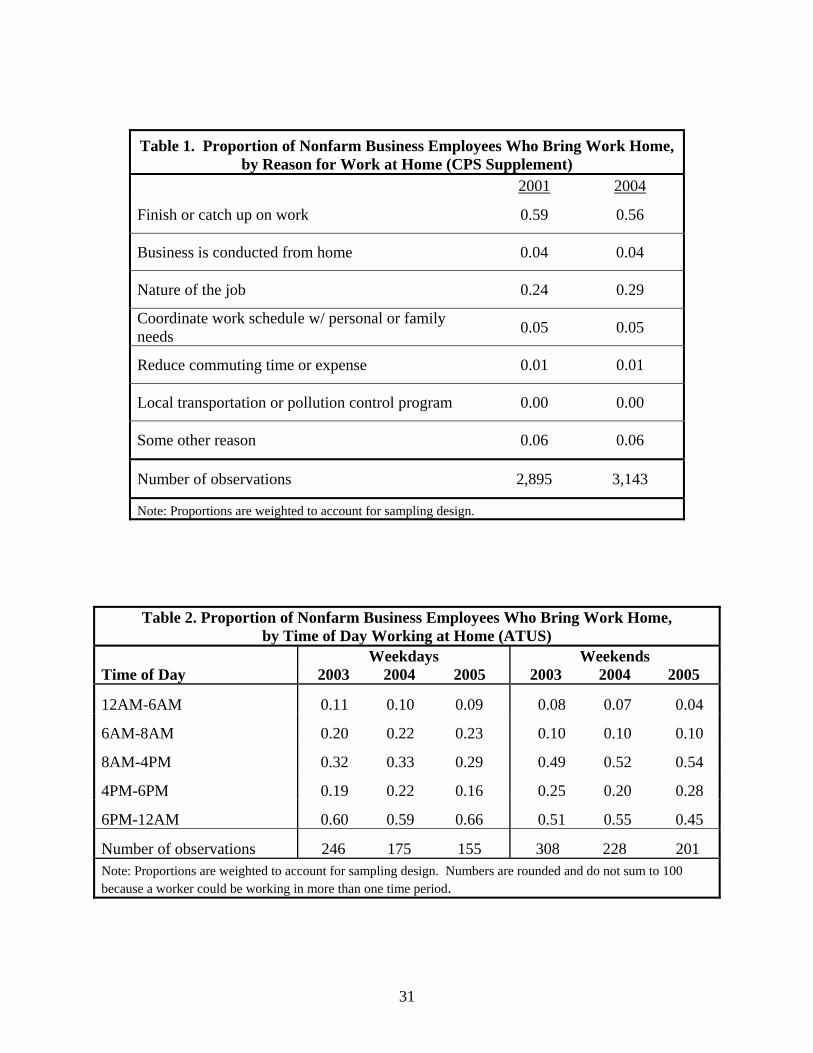
Table 1. Proportion of Nonfarm Business Employees Who Bring Work Home, by Reason for Work at Home (CPS Supplement)
2001 2004
Finish or catch up on work 0.59 0.56
Business is conducted from home 0.04 0.04
Nature of the job 0.24 0.29
Coordinate work schedule w/ personal or family needs 0.05 0.05
Reduce commuting time or expense 0.01 0.01
Local transportation or pollution control program 0.00 0.00
Some other reason 0.06 0.06
Number of observations 2,895 3,143
Note: Proportions are weighted to account for sampling design.
Table 2. Proportion of Nonfarm Business Employees Who Bring Work Home, by Time of Day Working at Home (ATUS)
Weekdays Weekends Time of Day 2003 2004 2005 2003 2004 2005
12AM-6AM 0.11 0.10 0.09 0.08 0.07 0.04
6AM-8AM 0.20 0.22 0.23 0.10 0.10 0.10
8AM-4PM 0.32 0.33 0.29 0.49 0.52 0.54
4PM-6PM 0.19 0.22 0.16 0.25 0.20 0.28
6PM-12AM 0.60 0.59 0.66 0.51 0.55 0.45
Number of observations 246 175 155 308 228 201 Note: Proportions are weighted to account for sampling design. Numbers are rounded and do not sum to 100 because a worker could be working in more than one time period.
31
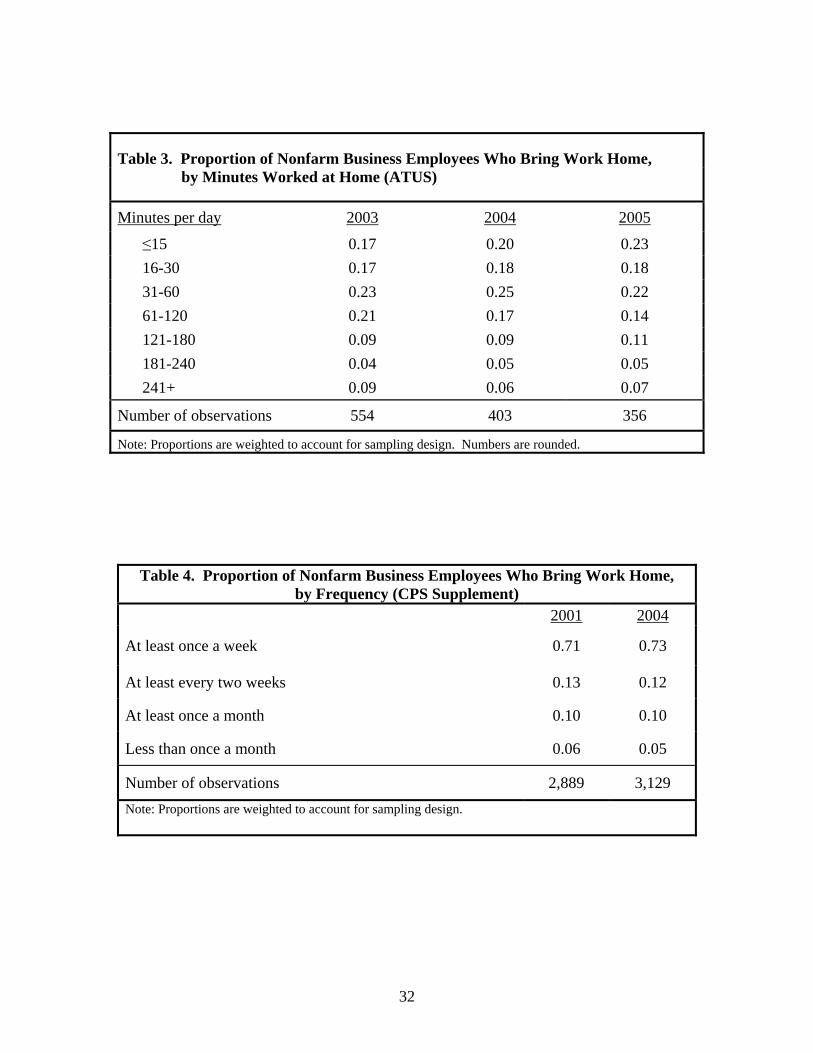
Table 3. Proportion of Nonfarm Business Employees Who Bring Work Home, by Minutes Worked at Home (ATUS)
Minutes per day 2003 2004 2005
≤15 0.17 0.20 0.23 16-30 0.17 0.18 0.18 31-60 0.23 0.25 0.22 61-120 0.21 0.17 0.14 121-180 0.09 0.09 0.11 181-240 0.04 0.05 0.05 241+ 0.09 0.06 0.07
Number of observations 554 403 356
Note: Proportions are weighted to account for sampling design. Numbers are rounded.
Table 4. Proportion of Nonfarm Business Employees Who Bring Work Home, by Frequency (CPS Supplement)
2001 2004
At least once a week 0.71 0.73
At least every two weeks 0.13 0.12
At least once a month 0.10 0.10
Less than once a month 0.06 0.05
Number of observations 2,889 3,129 Note: Proportions are weighted to account for sampling design.
32
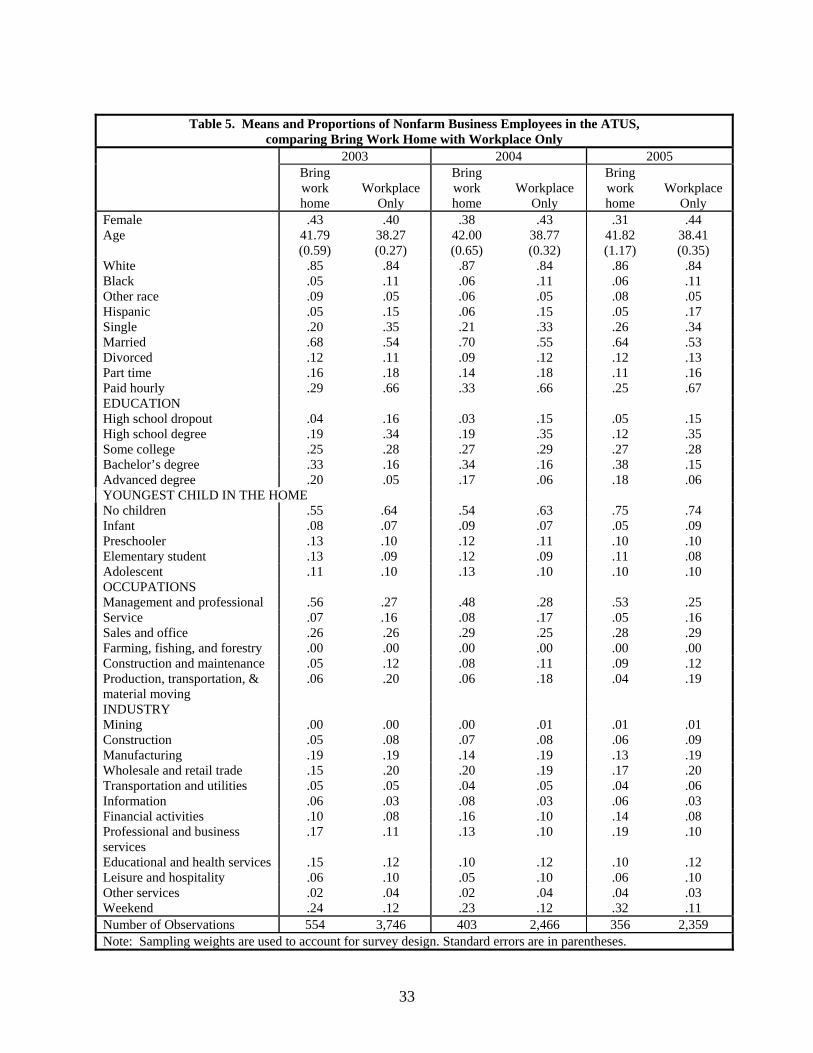
Table 5. Means and Proportions of Nonfarm Business Employees in the ATUS,
comparing Bring Work Home with Workplace Only 2003 2004 2005 Bring
work home
Workplace
Only
Bring work home
Workplace
Only
Bring work home
Workplace
Only Female .43 .40 .38 .43 .31 .44 Age 41.79
(0.59) 38.27 (0.27)
42.00 (0.65)
38.77 (0.32)
41.82 (1.17)
38.41 (0.35)
White .85 .84 .87 .84 .86 .84 Black .05 .11 .06 .11 .06 .11 Other race .09 .05 .06 .05 .08 .05 Hispanic .05 .15 .06 .15 .05 .17 Single .20 .35 .21 .33 .26 .34 Married .68 .54 .70 .55 .64 .53 Divorced .12 .11 .09 .12 .12 .13 Part time .16 .18 .14 .18 .11 .16 Paid hourly .29 .66 .33 .66 .25 .67 EDUCATION High school dropout .04 .16 .03 .15 .05 .15 High school degree .19 .34 .19 .35 .12 .35 Some college .25 .28 .27 .29 .27 .28 Bachelor’s degree .33 .16 .34 .16 .38 .15 Advanced degree .20 .05 .17 .06 .18 .06 YOUNGEST CHILD IN THE HOME No children .55 .64 .54 .63 .75 .74 Infant .08 .07 .09 .07 .05 .09 Preschooler .13 .10 .12 .11 .10 .10 Elementary student .13 .09 .12 .09 .11 .08 Adolescent .11 .10 .13 .10 .10 .10 OCCUPATIONS Management and professional .56 .27 .48 .28 .53 .25 Service .07 .16 .08 .17 .05 .16 Sales and office .26 .26 .29 .25 .28 .29 Farming, fishing, and forestry .00 .00 .00 .00 .00 .00 Construction and maintenance .05 .12 .08 .11 .09 .12 Production, transportation, & material moving
.06 .20 .06 .18 .04 .19
INDUSTRY Mining .00 .00 .00 .01 .01 .01 Construction .05 .08 .07 .08 .06 .09 Manufacturing .19 .19 .14 .19 .13 .19 Wholesale and retail trade .15 .20 .20 .19 .17 .20 Transportation and utilities .05 .05 .04 .05 .04 .06 Information .06 .03 .08 .03 .06 .03 Financial activities .10 .08 .16 .10 .14 .08 Professional and business services
.17 .11 .13 .10 .19 .10
Educational and health services .15 .12 .10 .12 .10 .12 Leisure and hospitality .06 .10 .05 .10 .06 .10 Other services .02 .04 .02 .04 .04 .03 Weekend .24 .12 .23 .12 .32 .11 Number of Observations 554 3,746 403 2,466 356 2,359 Note: Sampling weights are used to account for survey design. Standard errors are in parentheses.
33
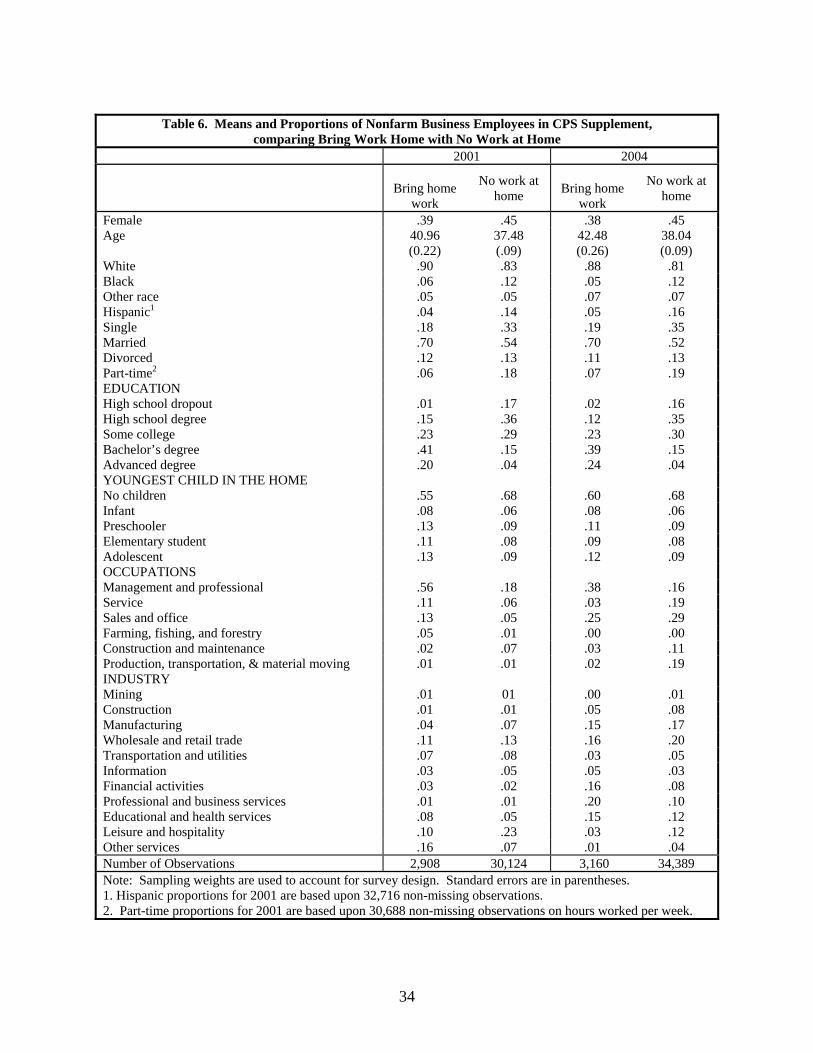
Table 6. Means and Proportions of Nonfarm Business Employees in CPS Supplement,
comparing Bring Work Home with No Work at Home 2001 2004
Bring home work
No work at home
Bring home
work
No work at home
Female .39 .45 .38 .45 Age 40.96
(0.22) 37.48 (.09)
42.48 (0.26)
38.04 (0.09)
White .90 .83 .88 .81 Black .06 .12 .05 .12 Other race .05 .05 .07 .07 Hispanic1 .04 .14 .05 .16 Single .18 .33 .19 .35 Married .70 .54 .70 .52 Divorced .12 .13 .11 .13 Part-time2 .06 .18 .07 .19 EDUCATION High school dropout .01 .17 .02 .16 High school degree .15 .36 .12 .35 Some college .23 .29 .23 .30 Bachelor’s degree .41 .15 .39 .15 Advanced degree .20 .04 .24 .04 YOUNGEST CHILD IN THE HOME No children .55 .68 .60 .68 Infant .08 .06 .08 .06 Preschooler .13 .09 .11 .09 Elementary student .11 .08 .09 .08 Adolescent .13 .09 .12 .09 OCCUPATIONS Management and professional .56 .18 .38 .16 Service .11 .06 .03 .19 Sales and office .13 .05 .25 .29 Farming, fishing, and forestry .05 .01 .00 .00 Construction and maintenance .02 .07 .03 .11 Production, transportation, & material moving .01 .01 .02 .19 INDUSTRY Mining .01 01 .00 .01 Construction .01 .01 .05 .08 Manufacturing .04 .07 .15 .17 Wholesale and retail trade .11 .13 .16 .20 Transportation and utilities .07 .08 .03 .05 Information .03 .05 .05 .03 Financial activities .03 .02 .16 .08 Professional and business services .01 .01 .20 .10 Educational and health services .08 .05 .15 .12 Leisure and hospitality .10 .23 .03 .12 Other services .16 .07 .01 .04 Number of Observations 2,908 30,124 3,160 34,389 Note: Sampling weights are used to account for survey design. Standard errors are in parentheses. 1. Hispanic proportions for 2001 are based upon 32,716 non-missing observations. 2. Part-time proportions for 2001 are based upon 30,688 non-missing observations on hours worked per week.
34
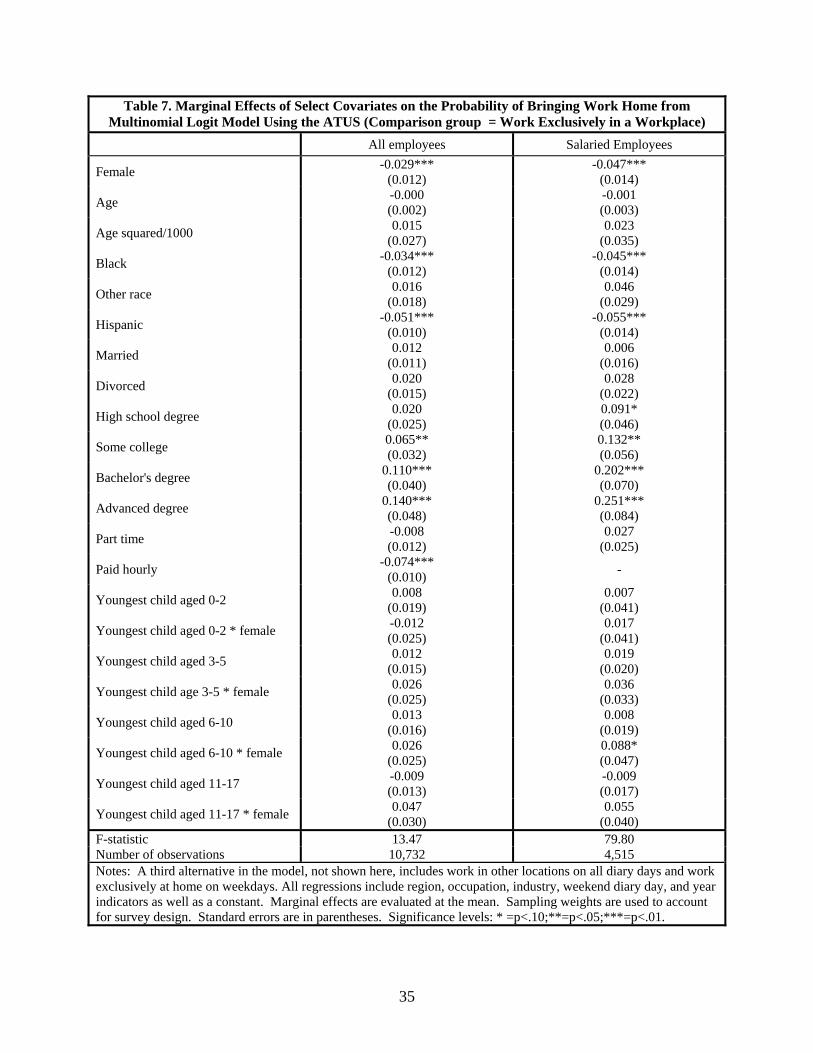
Table 7. Marginal Effects of Select Covariates on the Probability of Bringing Work Home from Multinomial Logit Model Using the ATUS (Comparison group = Work Exclusively in a Workplace)
All employees Salaried Employees
Female -0.029*** (0.012)
-0.047*** (0.014)
Age -0.000 (0.002)
-0.001 (0.003)
Age squared/1000 0.015 (0.027)
0.023 (0.035)
Black -0.034*** (0.012)
-0.045*** (0.014)
Other race 0.016 (0.018)
0.046 (0.029)
Hispanic -0.051*** (0.010)
-0.055*** (0.014)
Married 0.012 (0.011)
0.006 (0.016)
Divorced 0.020 (0.015)
0.028 (0.022)
High school degree 0.020 (0.025)
0.091* (0.046)
Some college 0.065** (0.032)
0.132** (0.056)
Bachelor's degree 0.110*** (0.040)
0.202*** (0.070)
Advanced degree 0.140*** (0.048)
0.251*** (0.084)
Part time -0.008 (0.012)
0.027 (0.025)
Paid hourly -0.074*** (0.010) -
Youngest child aged 0-2 0.008 (0.019)
0.007 (0.041)
Youngest child aged 0-2 * female -0.012 (0.025)
0.017 (0.041)
Youngest child aged 3-5 0.012 (0.015)
0.019 (0.020)
Youngest child age 3-5 * female 0.026 (0.025)
0.036 (0.033)
Youngest child aged 6-10 0.013 (0.016)
0.008 (0.019)
Youngest child aged 6-10 * female 0.026 (0.025)
0.088* (0.047)
Youngest child aged 11-17 -0.009 (0.013)
-0.009 (0.017)
Youngest child aged 11-17 * female 0.047 (0.030)
0.055 (0.040)
F-statistic 13.47 79.80 Number of observations 10,732 4,515 Notes: A third alternative in the model, not shown here, includes work in other locations on all diary days and work exclusively at home on weekdays. All regressions include region, occupation, industry, weekend diary day, and year indicators as well as a constant. Marginal effects are evaluated at the mean. Sampling weights are used to account for survey design. Standard errors are in parentheses. Significance levels: * =p<.10;**=p<.05;***=p<.01.
35
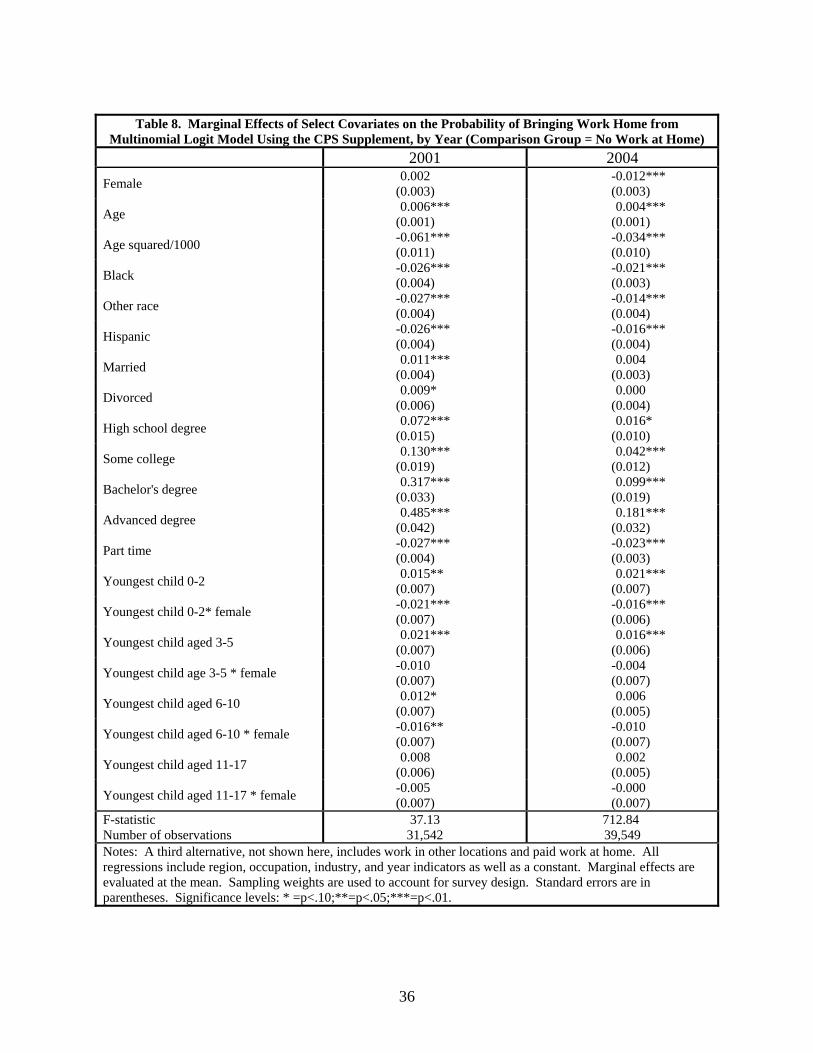
Table 8. Marginal Effects of Select Covariates on the Probability of Bringing Work Home from
Multinomial Logit Model Using the CPS Supplement, by Year (Comparison Group = No Work at Home) 2001 2004 Female 0.002
(0.003) -0.012*** (0.003)
Age 0.006*** (0.001)
0.004*** (0.001)
Age squared/1000 -0.061*** (0.011)
-0.034*** (0.010)
Black -0.026*** (0.004)
-0.021*** (0.003)
Other race -0.027*** (0.004)
-0.014*** (0.004)
Hispanic -0.026*** (0.004)
-0.016*** (0.004)
Married 0.011*** (0.004)
0.004 (0.003)
Divorced 0.009* (0.006)
0.000 (0.004)
High school degree 0.072*** (0.015)
0.016* (0.010)
Some college 0.130*** (0.019)
0.042*** (0.012)
Bachelor's degree 0.317*** (0.033)
0.099*** (0.019)
Advanced degree 0.485*** (0.042)
0.181*** (0.032)
Part time -0.027*** (0.004)
-0.023*** (0.003)
Youngest child 0-2 0.015** (0.007)
0.021*** (0.007)
Youngest child 0-2* female -0.021*** (0.007)
-0.016*** (0.006)
Youngest child aged 3-5 0.021*** (0.007)
0.016*** (0.006)
Youngest child age 3-5 * female -0.010 (0.007)
-0.004 (0.007)
Youngest child aged 6-10 0.012* (0.007)
0.006 (0.005)
Youngest child aged 6-10 * female -0.016** (0.007)
-0.010 (0.007)
Youngest child aged 11-17 0.008 (0.006)
0.002 (0.005)
Youngest child aged 11-17 * female -0.005 (0.007)
-0.000 (0.007)
F-statistic 37.13 712.84 Number of observations 31,542 39,549 Notes: A third alternative, not shown here, includes work in other locations and paid work at home. All regressions include region, occupation, industry, and year indicators as well as a constant. Marginal effects are evaluated at the mean. Sampling weights are used to account for survey design. Standard errors are in parentheses. Significance levels: * =p<.10;**=p<.05;***=p<.01.
36

37
Table 9. Daily Hours Worked for Nonfarm Business Employees (ATUS)
Weekday Diaries Weekend/holiday
Diaries
Workplace
Only
Bring Work Home
Workplace Only
Bring Work Home
2003 ATUS: daily hours 8.2 9.1 7.1 2.1
ATUS: daily workplace hours 8.2 7.4 7.1 0.6
ATUS: daily hours at home - 1.6 - 1.4
2004 ATUS: daily hours 8.2 8.7 7.4 2.7
ATUS: daily workplace hours 8.2 7.3 7.4 0.8
ATUS: daily hours at home - 1.3 - 1.8
2005 ATUS: daily hours 8.1 9.2 6.9 2.1
ATUS: daily workplace hours 8.1 7.5 6.9 0.6
ATUS: daily hours at home - 1.4 - 1.5 Note: F-test results for differences in means are all significant at the 5 percent level.
38
Table 10. Average Weekly Hours Worked for Nonfarm Business Employees (ATUS)
Weekday Diaries Weekend/holiday Diaries All Diaries
Workplace
Only Bring Work
Home Workplace
Only Bring Work
Home Workplace
Only Bring Work
Home
2003 Average weekly hours 38.1 41.6 36.5 42.0 37.9 41.7
Number of observations 2,335 201 679 249 3,014 450
2004 Average weekly hours 38.0 41.4 37.2 43.0 37.9 41.9
Number of observations 1,591 151 447 194 2,038 345
2005 Average weekly hours 38.4 43.5 36.4 43.8 38.2 43.6
Number of observations 1,523 131 393 169 1,916 300 Note: F-test results for differences in means are all significant at the 5 percent level.

Table 11. Average Weekly Hours Worked for Nonfarm Business Employees (CPS Supplement)
No Work at Home
Bring Work Home
Bring Work Home at Least Once a week
Average weekly hours 36.9 44.6 - 1997
Number of observations 32,305 2,733 -
Average weekly hours 36.8 44.5 45.1 2001
Number of observations 30,124 2,908 2,040
Average weekly hours 36.5 43.8 44.3 2004
Number of observations 34,892 3,160 2,269 Note: F-test results for differences in means are all significant at the 5 percent level.
39
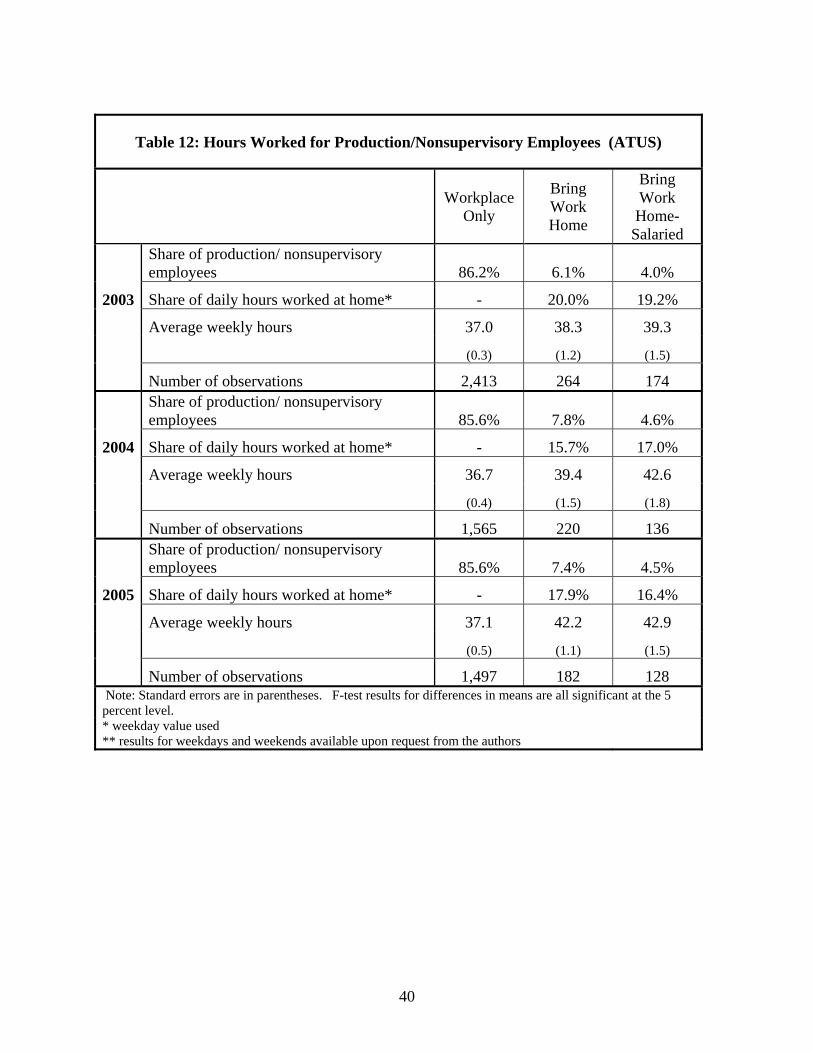
Table 12: Hours Worked for Production/Nonsupervisory Employees (ATUS)
Workplace Only
Bring Work Home
Bring Work Home-
Salaried
Share of production/ nonsupervisory employees 86.2% 6.1% 4.0%
2003 Share of daily hours worked at home* - 20.0% 19.2%
Average weekly hours 37.0 38.3 39.3
(0.3) (1.2) (1.5)
Number of observations 2,413 264 174
Share of production/ nonsupervisory employees 85.6% 7.8% 4.6%
2004 Share of daily hours worked at home* - 15.7% 17.0%
Average weekly hours 36.7 39.4 42.6
(0.4) (1.5) (1.8)
Number of observations 1,565 220 136
Share of production/ nonsupervisory employees 85.6% 7.4% 4.5%
2005 Share of daily hours worked at home* - 17.9% 16.4%
Average weekly hours 37.1 42.2 42.9
(0.5) (1.1) (1.5)
Number of observations 1,497 182 128 Note: Standard errors are in parentheses. F-test results for differences in means are all significant at the 5 percent level. * weekday value used ** results for weekdays and weekends available upon request from the authors
40
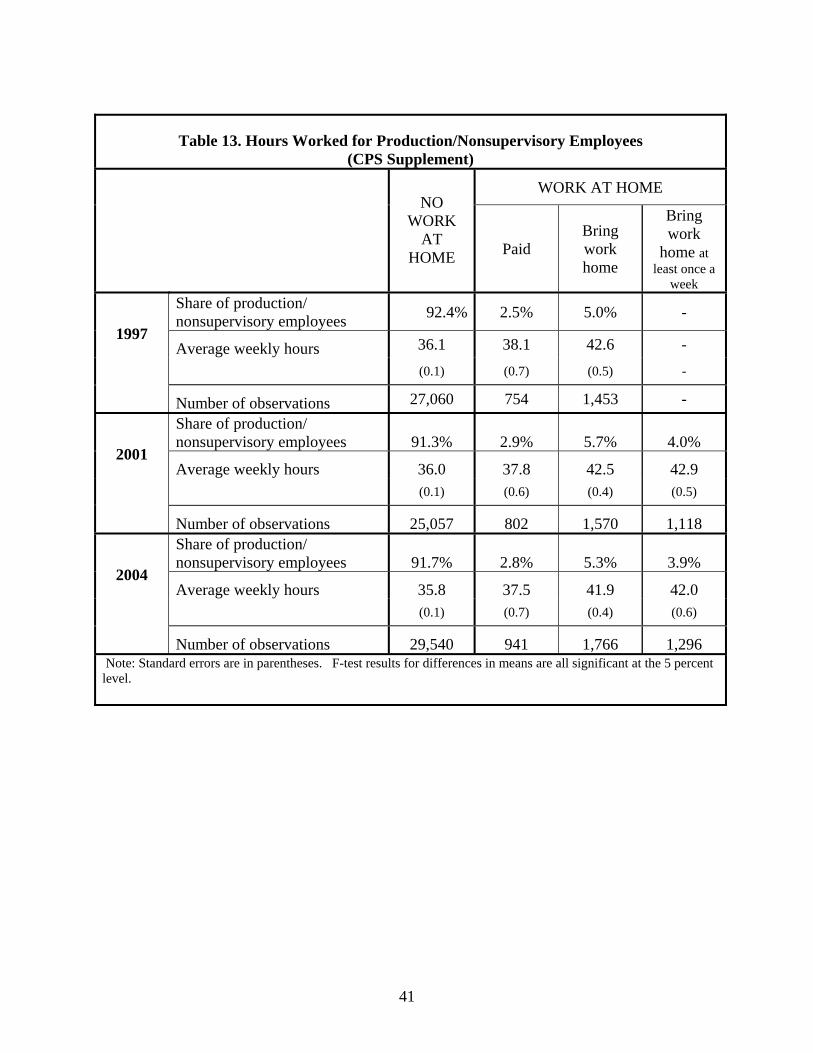
Table 13. Hours Worked for Production/Nonsupervisory Employees (CPS Supplement)
WORK AT HOME
NO WORK
AT HOME Paid
Bring work home
Bring work
home at least once a
week Share of production/ nonsupervisory employees 92.4% 2.5% 5.0% -
Average weekly hours 36.1 38.1 42.6 -
(0.1) (0.7) (0.5) -
1997
Number of observations 27,060 754 1,453 - Share of production/ nonsupervisory employees 91.3% 2.9% 5.7% 4.0%
Average weekly hours 36.0 37.8 42.5 42.9
(0.1) (0.6) (0.4) (0.5)
2001
Number of observations 25,057 802 1,570 1,118 Share of production/ nonsupervisory employees 91.7% 2.8% 5.3% 3.9%
Average weekly hours 35.8 37.5 41.9 42.0 (0.1) (0.7) (0.4) (0.6)
2004
Number of observations 29,540 941 1,766 1,296 Note: Standard errors are in parentheses. F-test results for differences in means are all significant at the 5 percent level.
41
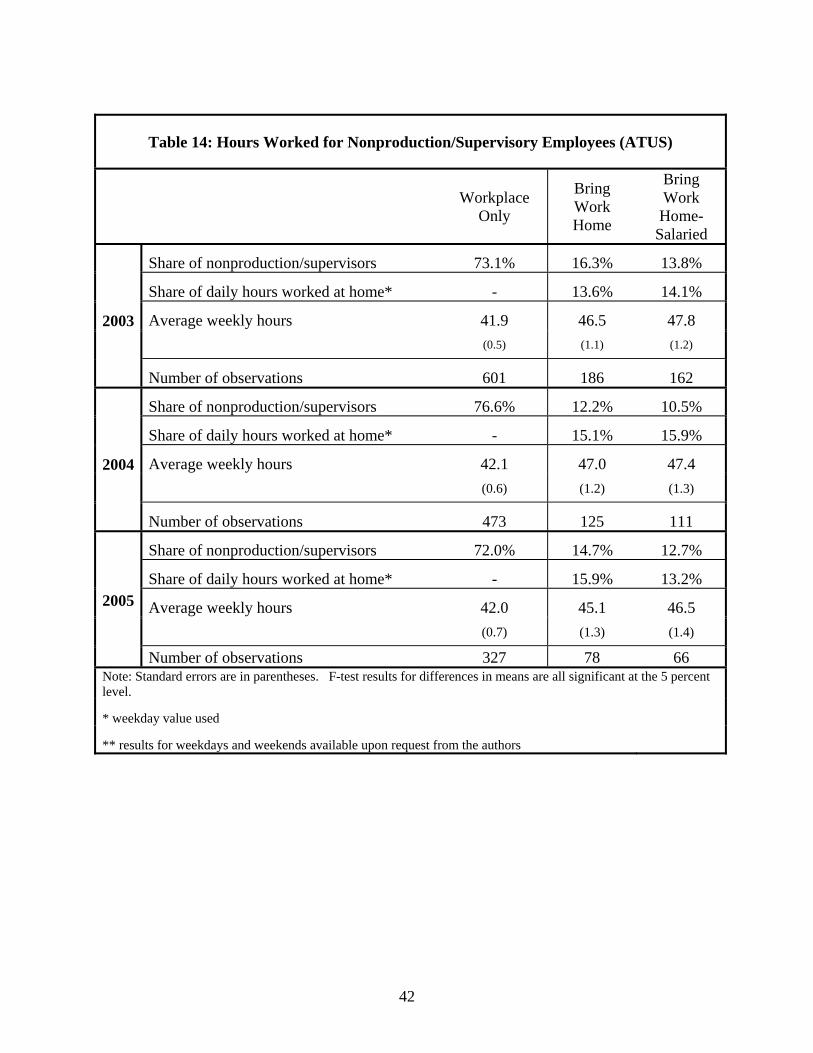
Table 14: Hours Worked for Nonproduction/Supervisory Employees (ATUS)
Workplace Only
Bring Work Home
Bring Work Home-
Salaried
Share of nonproduction/supervisors 73.1% 16.3% 13.8%
Share of daily hours worked at home* - 13.6% 14.1%
Average weekly hours 41.9 46.5 47.8
(0.5) (1.1) (1.2)
2003
Number of observations 601 186 162
Share of nonproduction/supervisors 76.6% 12.2% 10.5%
Share of daily hours worked at home* - 15.1% 15.9%
Average weekly hours 42.1 47.0 47.4
(0.6) (1.2) (1.3)
2004
Number of observations 473 125 111
Share of nonproduction/supervisors 72.0% 14.7% 12.7%
Share of daily hours worked at home* - 15.9% 13.2%
Average weekly hours 42.0 45.1 46.5
(0.7) (1.3) (1.4)
2005
Number of observations 327 78 66
Note: Standard errors are in parentheses. F-test results for differences in means are all significant at the 5 percent level.
* weekday value used
** results for weekdays and weekends available upon request from the authors
42

Table 15: Hours Worked for Nonproduction/Supervisory Employees (CPS Supplement)
WORK AT HOME
NO WORK AT HOME Paid
Bring work home
Bring work home at
least once a week
Share of nonproduction/ supervisory employees 74.4% 6.6% 18.8% -
Average weekly hours 40.6 40.2 46.8 -
(0.2) (0.9) (0.4) -
1997
Number of observations 5,245 452 1,280 - Share of nonproduction/ supervisory employees 72.8% 7.1% 19.7% 13.7%
Average weekly hours 40.6 39.9 46.6 47.5
(0.2) (0.7) (0.4) (0.5)
2001
Number of observations 5,067 505 1,338 922 Share of nonproduction/ supervisory employees 72.9% 7.2% 19.6% 13.9%
Average weekly hours 40.8 39.7 46.1 47.0
(0.2) (0.8) (0.4) (0.5)
2004
Number of observations 5,352 556 1,394 973 Note: Standard errors are in parentheses. F-test results for differences in means are all significant at the 5 percent level.
43

Table 16: Percent of Unmeasured Hours for Employees in the Nonfarm Business Sector (No Recall Bias) Production/nonsupervisory employees
Those who do not bring work home Those who do bring work home
Share of production/
nonsupervisory employees
AWHP
Percent of hours at home
Share of production/
nonsupervisory employees
AWHP
Percent of unmeasured
hours
2003 96.0% 37.0 19.2% 4.0% 39.3 0.82%
2004 95.5% 36.7 17.0% 4.6% 42.6 0.90% ATUS
2005 95.5% 37.1 16.4% 4.5% 42.9 0.85%
1997 95.0% 36.1 18.5% 5.0% 42.6 1.09%
2001 94.3% 36.0 13.3% 5.7% 42.5 0.89% CPS Supplement
2004 94.7% 35.8 14.6% 5.3% 41.9 0.91%
2001 96.0% 36.0 15.7% 4.0% 42.9 0.75% CPS
Supplement (at least once a
week)
2004 96.1% 35.8 17.1% 3.9% 42.0 0.78%
44
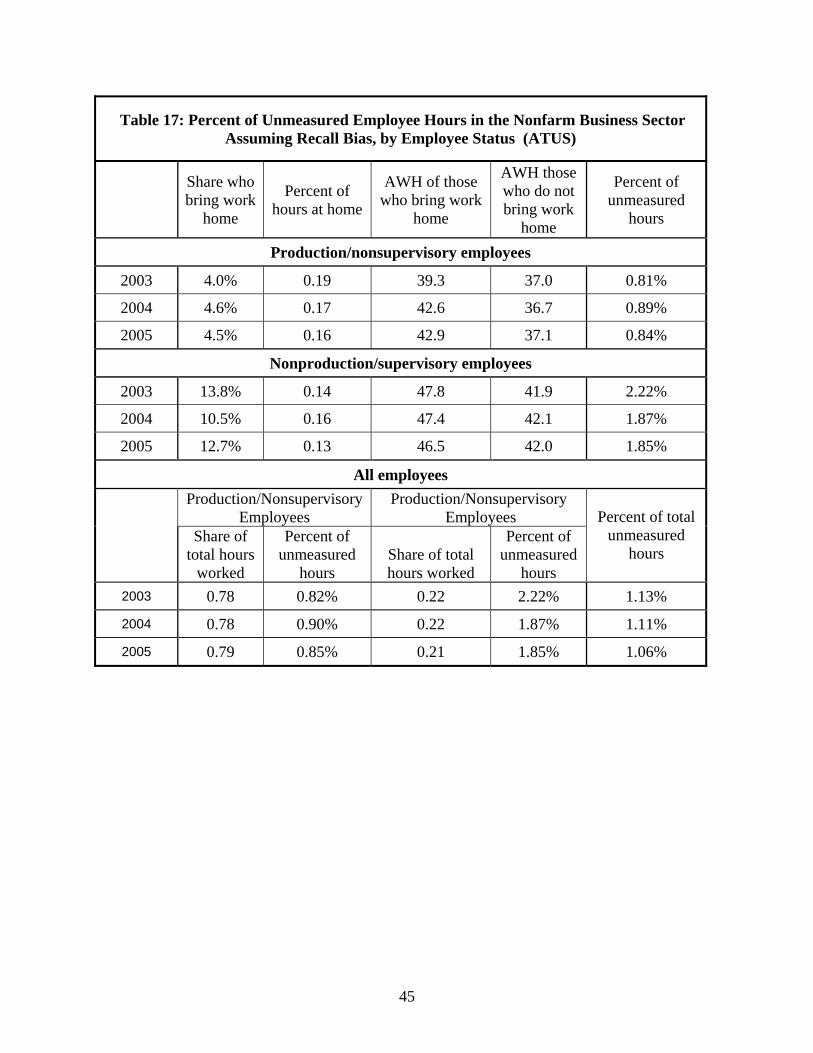
Table 17: Percent of Unmeasured Employee Hours in the Nonfarm Business Sector Assuming Recall Bias, by Employee Status (ATUS)
Share who bring work
home
Percent of hours at home
AWH of those who bring work
home
AWH those who do not bring work
home
Percent of unmeasured
hours
Production/nonsupervisory employees
2003 4.0% 0.19 39.3 37.0 0.81%
2004 4.6% 0.17 42.6 36.7 0.89%
2005 4.5% 0.16 42.9 37.1 0.84%
Nonproduction/supervisory employees
2003 13.8% 0.14 47.8 41.9 2.22%
2004 10.5% 0.16 47.4 42.1 1.87%
2005 12.7% 0.13 46.5 42.0 1.85%
All employees
Production/Nonsupervisory Employees
Production/Nonsupervisory Employees
Share of total hours
worked
Percent of unmeasured
hours Share of total hours worked
Percent of unmeasured
hours
Percent of total unmeasured
hours
2003 0.78 0.82% 0.22 2.22% 1.13%
2004 0.78 0.90% 0.22 1.87% 1.11%
2005 0.79 0.85% 0.21 1.85% 1.06%
45
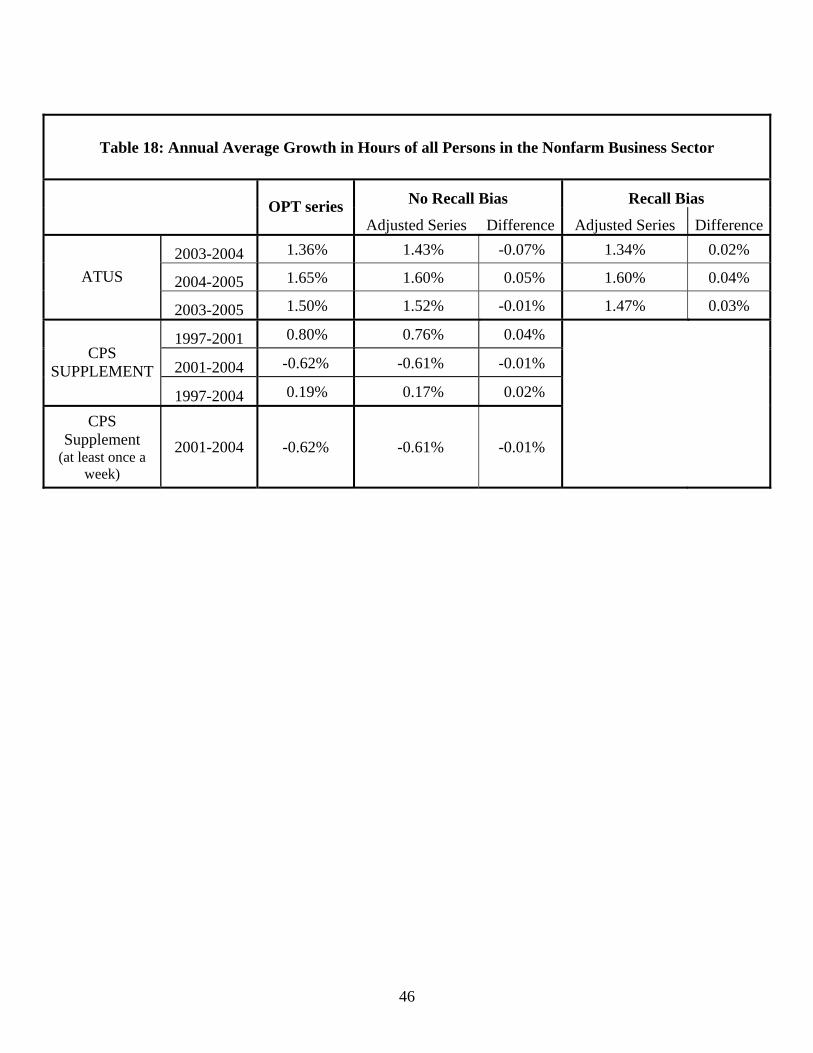
Table 18: Annual Average Growth in Hours of all Persons in the Nonfarm Business Sector
No Recall Bias Recall Bias
OPT series Adjusted Series Difference Adjusted Series Difference
2003-2004 1.36% 1.43% -0.07% 1.34% 0.02%
2004-2005 1.65% 1.60% 0.05% 1.60% 0.04% ATUS
2003-2005 1.50% 1.52% -0.01% 1.47% 0.03%
1997-2001 0.80% 0.76% 0.04%
2001-2004 -0.62% -0.61% -0.01% CPS
SUPPLEMENT 1997-2004 0.19% 0.17% 0.02%
CPS Supplement
(at least once a week)
2001-2004 -0.62% -0.61% -0.01%
46


