Embed Size (px)
Citation preview

Electronic copy available at: http://ssrn.com/abstract=1024186
Are Angels Different?
An Analysis of Early Venture Financing
Brent Goldfarb Gerard Hoberg David Kirsch Alexander Triantis ∗
November 4, 2013
Abstract
We examine the role of angel investors in early venture financing using a uniquesample of 182 Series A preferred stock rounds. Our sample includes deals in whichangels invest alone, VCs invest alone, and where both investor types co-invest. Wefind that deals with more angel investors have weaker cashflow and control rights, andexperience longer times to resolution. Among larger deals, those financed by VCs aloneare most likely to experience successful liquidation. Our overall results support theconclusion that angel objectives likely align more with entrepreneurs than VCs, andthat outcomes may be linked to to conflicts of interest.
∗All authors are from the Robert H. Smith School of Business, University of Maryland, College Park, MD20742; email: [email protected], [email protected], [email protected], [email protected] authors gratefully acknowledge support from the Alfred P. Sloan Foundation, the Robert H. SmithSchool of Business at the University of Maryland, the Library of Congress and its partners in the NationalDigital Information Infrastructure Preservation Program, and members of the Advisory Council to theDigital Archive of the Birth of the Dot Com Era, especially Jonathan Rubens of McQuaid, Bedford andvan Zandt, L.L.P. and members of the ad hoc review committee. We also thank Anthony Ramirez foroverseeing our data management efforts and Hye Sun Kim for excellent research assistance. Commentsfrom Adair Morse, Nagpurnanand R. Prabhala, J. Robert Baum, Enrico Perotti, Matthew Higgins, NilesHatch and participants in seminars at the Kauffman Foundation, the Universities of Maryland, Michigan,Minnesota, and South Carolina, Boston University, the Chicago Fed/DePaul University joint seminar series,the NBER Entrepreneurship Working Group, REER conference, UC-Davis/FMA Conference on FinancialMarkets Research, the Israeli Strategy Conference, and the Maryland Entrepreneurship Conference havebeen invaluable. All errors of fact or interpretation remain the responsibility of the authors.
1

Electronic copy available at: http://ssrn.com/abstract=1024186
I Introduction
Private equity investments of business angels represent the lion’s share of equity investments
in de-novo startups.1 Yet, due to the paucity of data on angel financing (Fenn and Liang
1998; Prowse 1998), the nature of angels’ investments in startups has largely been character-
ized based on survey evidence (Freear, Sohl, and Wetzel 2002; Wiltbank and Boeker 2007).
For instance, existing evidence and conventional wisdom suggest that angels tend to invest
in early-stage deals, hold common stock, and exert influence through social networks rather
than imposing formal control rights (Fenn and Liang 1998; Ibrahim 2008; Wilmerding 2003;
but see also Shane 2006). We find support for the conventional wisdom that angels invest
with fewer protections than do VCs and suggest that this can be explained by preferences
more closely aligned with entrepreneurs than with VCs.
We arrive at our new insights on angel investing by analyzing a unique sample of stock
purchase agreements and other legal documents pertaining to 182 “Series A” private equity
deals.2 Our data are derived from the electronic records of the now defunct law firm
Brobeck, Phleger & Harrison (Brobeck). One important characteristic of these data is the
considerable variation in the extent of angel and VC participation (ranging from all-angel
to all-VC financings). We find new relationships between investor mix and cash flow and
control rights, such as liquidation rights and redemption rights, as well as with other relevant
characteristics, including expected time to resolution and attorney billable hours. We also
find that investor mix has a systematic association with success. Our work complements a
growing number of articles studying private equity financings of small entrepreneurial firms
(Bengtsson 2012). Consistent with previous work, we find that angels obtain weaker rights
than do VCs (Shane 2008a; Wong, Bhatia, and Freeman 2009). We advance the literature
by ruling out several competing explanations for this phenomenon.
A central limitation in studying angels has been the difficulty in providing a meaningful
comparison between angels and VCs, which requires identifying samples of deals for which
both angels and VCs compete. This challenge is highlighted in a forthcoming review article
which presents a range of stylized facts regarding VCs and angels financing choices, but does
not identify evidence about the difference between the two on the margin (Da Rin, Hellmann,
1Extrapolating from the Survey of Small Business Finance, Fenn and Liang (1998) find that for everyone firm that raises a venture capital investment, six raise an angel investment. Similarly, they note thatapproximately one-third of firms that go public were funded by venture capitalists and two-thirds by angels,and conservatively conclude that there are at least double the amount of angel investments as compared toventure capital investments. Moreover, it is somewhat strange that so much of the literature has focused onBanks vs. VCs when perhaps Angels vs. VCs is a more relevant tradeoff for many entrepreneurs. Robb andRobinson (ming) find that by far the most important form of external financing for new firms is banks.
2Following convention by practitioners, a Series A deal in our context is the first sale of preferred stockby the given firm. The convention used in practice is to label the first preferred stock round as “Series A”and the second as “Series B”, etc.
2
Electronic copy available at: http://ssrn.com/abstract=1024186
and Puri 2013).3 Several characteristics of our data allow us to overcome this limitation.
First, we select on Series A financing events, and hence we have reasonable uniformity
regarding stage. Second, the companies in our sample, including those financed by angels,
inhabit the traditional VC domains of information-technology and biotechnology. Third,
the size of the angel investments in our sample overlaps with the smaller VC investments;
entrepreneurs in our sample did raise similar investment amounts from both investor types.
Our data also includes a rich set of controls including risk, firm age, deal size, alliances,
product releases, geography, and more. Fourth, at least one side in all of the deals in our
sample was represented by Brobeck, which was a prominent law firm.4 This indicates that
the angels observed in this sample are likely to be sophisticated and represent the small
slice of angels that are most like VCs. This feature of our data would likely bias our results
against our central findings of differences between angels and VCs. We do not expect our
results to be representative of angel investors in ultra small start-ups in less prestigious
markets. This is important because it is plausible that the differences identified between
VCs and angels are likely more pronounced and more biased when samples focus on deals
in which angels and VCs do not likely compete directly.5 For a large share of the deals in
our sample, entrepreneurs had a meaningful choice between both investor types. With this
context in mind, we report four central findings.
1. When firms raise smaller amounts of capital, they do so from either angels alone, VCs
alone, or from both angels and VCs. In contrast, when larger investments are needed,
even sophisticated angels are insufficient and VC participation is generally necessary.
2. In Series A rounds, high-end angels take preferred shares and negotiate similar con-
tract terms alongside VCs. Nevertheless, the presence of sophisticated angels, either
investing alone or alongside VCs, is associated with weaker cashflow and control rights.
3. Angel-only financed deals experience longer times-to-resolution (where resolution is
defined as either a successful exit or failure). These longer durations are not correlated
3For example, Wong et al. (2009) conditions on angel participation and finds that venture capitalistssometimes co-invest, while Kaplan and Stromberg (2003, 2004) condition on VC involvement. Similarly,analyses of private equity returns by Cochrane (2005), Hall and Woodward (2007), Hochberg, Ljungqvist,and Lu (2007), Kaplan and Schoar (2005), Ljungqvist and Richardson (2003), Moskowitz and Vissing-Jorgensen (2002) and Woodward and Hall (2004) are based on investments by VCs or small privately-heldbusinesses. Wiltbank and Boeker (2007) present survey evidence on angel returns. Angels and VCs competefor the same deals in Hsu (2004)’s study of competition for deals between private equity funders.
4This suggests that the deals surpassed a minimum quality threshold in the sense that Brobeck “certified”the opportunity, and indeed we find a higher incidence of successful liquidity events for this sample relativeto other firms tracked by Venture Economics.Megginson and Weiss (1991) and Brav and Gompers (1997)use a similar logic to explain the link between VC financing and successful IPOs.
5The mean investment of $150,375 made by angels in our sample is large relative to the $10,000 averageoutside equity investment made by individuals as reported by Reynolds (2005). Shane (2008b) reports thatinvestments over $200,000 fall in the top one percentile of angel investments.
3

with the degree of success, as angel-only deals are not more or less likely to experience
successful exit as compared to other deals except as described by Finding 4.
4. Among larger deals, those financed by VCs alone experience more successful exits than
those in which at least one angel participates. We do not observe a similar finding for
smaller deals. The superior performance of VC-only, larger deals is only present when
the board of directors is not firmly under the control of either common or preferred
shareholders.
The first finding indicates that in Series A investment rounds, deal size segments the
market. In particular, entrepreneurs who wish to raise funds from angels alone can do so
only when their capital requirements are modest. This situation will arise if angel investors
are liquidity constrained, which limits the amount of money they are willing to invest in
any particular deal. Alternatively, it may be more difficult to find angel investors if angels
do not advertise their presence and / or an entrepreneur’s network is limited.
Our second finding has both an important implication and raises a puzzle. First, the
many theories that have been offered to explain the nature of preferred equity in the VC
setting also appear consistent with the high-end angel setting (see Bengtsson 2012; Da Rin
et al. 2013; for reviews). However, it is puzzling that angel investors generally obtain weaker
control rights than do VCs, particularly given the commonly held assumption that angels
invest in riskier and less opaque earlier stage deals than do VCs (Ibrahim 2008; Wilmerding
2003), and the anecdotal and survey evidence that high-end angels also provide coaching
services just as VCs do (cf., Linde, Prasad, Morse, Utterback, Stevenson, and Roberts 2000;
Shane 2008a; Wong et al. 2009).
Three basic theories may explain this phenomenon. We discuss these next, and refer to
them as transaction costs, preferences and selection hypotheses.
The first class, transaction costs, assumes the standard moral hazard problem and also
that there are obstacles to its resolution through formal contractual solutions. For example
if angels invest in smaller deals, and it is too costly to involve lawyers to negotiate complex
terms, then we will be unlikely to see complex terms with angel investments (Bengtsson
2012; Casamatta 2003). Similarly, smaller investors may lack bargaining power to demand
strong rights. Alternatively, if individual angels cannot fully fund larger amounts due to
liquidity constraints, then such deals may be more likely to fall into a commons problem
with regard to the responsibility for enforcement (Rajan and Winton 1995). Angels would
then be reluctant to insist on terms that would be unlikely to be enforced.
The second class, preferences, assumes that angel preferences are more strongly aligned
with entrepreneurs than with VCs (perhaps due to a greater ability enforce contracts infor-
mally through informal social mechanisms (Freear, Sohl, and Wetzel Jr 1995), due to angels
4

choosing deals with less potential for goal conflicts, due to a lesser interest in pecuniary
rewards (cf., Linde et al. 2000), or simple angel naıvete (Shane 2008a)). If moral hazard is
reduced through this channel of alignment, then there would be a reduced need for strong
investor protection in the first place (cf., Hellmann 2002). Alternatively, if the presence
of angels signals a greater need for entrepreneurial effort, then Aghion and Bolton (1992);
Broughman and Fried (2010) predict it would be efficient to favor common shareholders
with more rights.
The third class, selection, suggests that an unobserved state variable such as the firm’s
prospects, drives both investor composition and investor rights. The most direct form of
the selection argument is that certain deals are superior (on a “fast track” toward successful
liquidation), and VCs may preclude other investors from participating in these deals. This
situation would signal higher quality and better outcomes.6
We interpret our four findings as most supportive of angel preferences aligning more
with the entrepreneur and less with VCs. If fewer investor protections are due to reduced
deal size or a commons problem, we should observe that our results weaken when controls
for size and the number of investors are included. Instead, our results are fully robust.
If angel investors are naıve, then any link to investor rights should dissipate when angels
co-invest with VCs (who presumably are not naıve). Instead, we continue to find that
investor rights are weaker in mixed deals than in VC-only deals. Similarly, naıvete might
predict that angel deals will unconditionally underperform VC deals. Instead, we only find
evidence of under performance in large deals, and only when board control is split between
preferred shareholders and common shareholders (Findings 3,4).7 The finding that deals
associated with angels also take longer to resolve, suggests that one dimension in which
angels preferences are more aligned with entrepreneurs than VCs is patience. In this sense,
our findings are most supportive of the model of Fairchild (2011), who make this very
assumption and show that angels are less likely to expropriate funds from the entrepreneur.
Although many of our unique tests support the preferences hypothesis, we also note that we
cannot rule out the selection hypothesis, and that some of our findings are also consistent
with selection. It is, perhaps, unsurprising that both mechanisms may be in play.8.
A final note of caution. Our sample is small and this limits the power of our tests.
Nevertheless, our Finding 2 concerning control rights and cashflow rights is a multi-faceted
6Note that the preferences class of explanations embeds within it a selection argument, in that we wouldexpect angels to select deals with better ex-ante interest alignment, holding the underlying prospects of suchdeals equal. In contrast, the selection class of explanations implies selection on the ex-ante quality of thedeal, holding the ex-ante perceived conflicts of interest equal.
7Using a clever identification strategy, Kerr, Lerner, and Schoar (2011) find that angels in angel groupsadd value and that they earn returns similar to VCs in the study period.
8Conflicts of interest between different types of financiers has been studied in other contexts, such asbetween bank and investment house underwriters (Puri 1996)
5

result based on a series of different measures of these variables. This reduces the likelihood
of a spurious result. Analogously, our results regarding outcomes are interesting, and in part
are strengthened by our analogous results for the time to resolution and for the existence
of successful liquidation events. Hence our findings for outcomes have the more binding
limitation that they are based on just two tests from a small sample.
In the next several sections we describe the theoretical context, the data and results.
Section II describes relevant theoretical literature and empirical literature. Section III
provides an overview of our data and Section IV presents summary statistics. Section V
summarizes our results regarding deal characteristics and control rights. Section VI presents
the relationship between investor composition and outcomes. Section VII concludes the
paper.
II Theoretical Background
Private equity contracts between financiers and entrepreneurs are generally seen as a solu-
tion to the moral hazard problems identified by Jensen and Meckling (1976), Myers (1977)
and Smith Jr and Warner (1979). The assumption is that the entrepreneur will engage
in value-destroying behavior due to limited downside risk, a desire for private consump-
tion, or risk aversion. The basic logic is illustrated by Holmstrom (1979) who shows that
given differing risk preferences, the optimal contract allocates any residual value to investors
in the case of an unsuccessful firm outcome (the same has been shown for limited liabil-
ity (Sappington 1983) and differing time horizons (Jovanovic and Szentes 2007; Lacetera
2009)).
Aghion and Tirole (1994) make the general point that when both the entrepreneur’s and
the investor’s effort can contribute to the success of the firm, the optimal effort allocation
will determine the allocation of control rights. The realization that VCs often provide
considerable value-added services led the problem to be viewed as a double-moral hazard
problem (Casamatta 2003; Gompers 1995; Hellmann 2002). As summarized by Da Rin
et al., the implications of these information-asymmetry problems is that A. investments
should be staged, B. some control rights should be allocated to the investor, and C. greater
cashflow rights should be allocated to the investor in the event of a poor outcome. The
empirical finding that VC investors stage investments (Gompers 1995) and invest with
convertible preferred equity that allocates control rights and greater cashflow rights in the
case of mediocre or poor outcomes (Kaplan and Stromberg 2003, 2004; as well as a series
of papers by Bengsston and his coauthors) is broadly interpreted as showing support for
these theories.
While the underlying theory has been focused on understanding why staging and pre-
6

ferred equity is used or not, in practice there is considerable within variation in the degree
of protections afforded by these contracts. This has led to a series of articles attempting
to relate investor and firm characteristics to contractual features. The strength of investor
protections theoretically should be a function of severity of the goal conflict between the
two parties, the optimal amount of required effort by both parties, and relative bargaining
power. For this reason, Bengtsson and Sensoy (2011) attribute their empirical finding that
more experienced VCs systematically invest with weaker formal protections to experienced
VCs’ better monitoring abilities. Supportive of this, Kaplan and Stromberg (2003) find
that VCs obtain greater board control when a firm lacks a product, though there is no
evidence that they have greater formal rights to shut down the firm.9 However, using a
broad, representative sample of US venture capital financing rounds, Bengtsson (2011) and
Bengtsson and Sensoy (2011) find that investors obtain stronger control rights for more ma-
ture firms, as proxied by firm age.10 Rajan and Winton (1995) hypothesize and Bengtsson
(2011) interprets their evidence as supportive of the hypothesis that this may be because
there is too low a salvage value to motivate allocation of rights to VCs when firms are less
mature.
Our finding that angels sometimes invest with preferred securities is also consistent with
this theory (Finding 2).11 Wong et al. (2009) also find suggestive evidence of staging. He
reports a large number of follow-on investments, with 40% of these including investors from
previous rounds. Given that many firms do not require a second round, or do not perform
well enough to warrant one, it is difficult to say if this is a high or low number.
The second part of Finding 2, that angels invest with weaker protections than VCs,
has puzzled the literature due to its apparent inconsistency with the standard theoretical
framework (Shane 2008a; Wong et al. 2009). Most evidence suggests that angel investments
are typically very early stage companies, and more rarely later stage (Shane 2008a). Early
stage companies are likely to be more risky, both offering greater opportunities for moral
hazard and greater exposure to external risk factors. In his study of VCs, Dessein (2005)
predicts that investor control will increase with both information asymmetry and ex-post
uncertainty. This theory is motivated by the findings of Kaplan and Stromberg (2003)
that VCs receive greater control rights in earlier stage firms in more volatile industries
9Formally, these rights are enshrined in “redemption” clauses by which a majority of preferred stockholders can vote to redeem their shares, which effectively shuts down the firm.
10Kaplan and Stromberg (2003) do not include a control for firm age, so this prevents a direct comparisonof the results.
11Since we select on the use of preferred securities (Series A), our data cannot inform about the pervasive-ness of this phenomenon in the general population. Fenn, Liang, and Prowse (1995) based on the Surveyof Small Business Finance, report that angels generally invest using common shares. Using a sample thatis also likely comprised of mostly higher-end investments, Wong et al. find that angels often take preferredequity or convertible notes, but also take common equity about 40% of the time. Unfortunately, we do notknow much more about how often common or preferred securities are used in general (Shane 2008a).
7

and Kaplan and Stromberg (2004)’s follow up study that finds that investor control is
increasing in moral hazard risk and external risks. Similarly, Lerner and Merges (1998)
find that principals retain more control in R&D firms in early stage projects. Thus, the
literature focused on VCs does not explain this finding well and sets up our hypothesis that
weaker angel rights are motivated by stronger ex-ante incentive alignment.
Other theoretical approaches have also examined the puzzle though they do not appear
consistent with our results and the evidence in the literature. Casamatta (2003) suggests
that common shares provide stronger incentives than preferred as downside events are less
protected. When investment amounts are low, common equity will more strongly motivate
the needed effort of common stock investors and entrepreneurs. Thus, the theory predicts
investor rights should be weaker in smaller deals. However, our results hold for angels con-
trolling for deal size. An additional solution to this empirical puzzle has been to simply
assume that angels do not provide any managerial coaching (Chemmanur and Chen 2006).
However, this assumption does not sit well with some evidence that more sophisticated
angels sit on boards and provide coaching (Freear et al. 1995; Wong 2009, as well Finding
2). An alternative solution is to assume that angels lack the ability to stage due to finan-
cial constraints (Schwienbacher 2007). Though this is consistent with Finding 1, it is not
consistent with Wong’s finding that angel investors do stage.12
III Data Sources
The law firm Brobeck, Phleger & Harrison (Brobeck) had a rich history spanning more
than seventy-five years of successful practice, and the failure of the giant firm is a signature
event in the history of American legal practice. Founded in San Francisco in 1926, Brobeck
served corporate clients in California and the western United States. In 1980, the firm
opened a satellite office in Palo Alto from which it developed one of the largest law practices
representing technology startups in Silicon Valley and elsewhere (it subsequently opened
offices in Austin and the East Coast). The Internet boom of the late 1990s led the firm to
pursue a “Big Bet, Big Debt” growth strategy that relied upon rapid growth to support
increased infrastructure costs. However, when the technology boom quickly reversed, a self-
reinforcing cycle of defections and falling revenues pitched the firm into a “death spiral,”
with lease obligations and other fixed costs soaring as a percentage of revenue. The firm
decided to cease operations in February 2003, and seven months later creditors forced the
liquidating firm to seek bankruptcy protection.13
12We cannot reliably observe whether there were follow on angel rounds, and hence cannot speak to thisissue in our study.
13Since the firm announced its intention to close, many articles in the legal and business press have lookedat the specific reasons for the failure. Kostal (2003) is the most readable account, but the perspective of the
8
In partnership with the National Digital Information Infrastructure Preservation Pro-
gram of the Library of Congress and assisted by a blue-ribbon advisory council and a team
of legal and technical experts, one of the authors has focused on preserving a subset of
the digital records of the failed firm. On August 9, 2006, Judge Dennis Montali of the
United States Bankruptcy Court, Northern District of California, San Francisco Division,
recognized the historic value of these materials and authorized the creation of a Closed
Archive allowing a significant fraction of these records to be saved. The Court Order speci-
fied that the Brobeck Closed Archive will be established under the direction of the Library
of Congress and directed the Closed Archive to maintain the confidentiality of the digital
records while allowing social science research to proceed using an access model substantially
similar to that employed by the U.S. Bureau of the Census.
The present work is the result of an experimental project designed to test the feasibility of
conducting social science under the proposed user model. According to the court-approved
methodology, access is restricted to archivists and scholars who have signed strict non-
disclosure agreements. Access takes place in an on-site, non-networked, institutional setting,
and only for specific, enumerated purposes that, among other restrictions, protects the
anonymity of investors. Only aggregated or redacted data are allowed to leave the secure
area. This solution balances the need to safeguard legal confidentiality while still supporting
approved scholarly access.
Brobeck represented both new ventures and investors. Under the experimental protocol,
we analyzed documents related to “Series A” investments, as identified by legal practition-
ers. While there may be some variance as to how this term is used broadly in practice, in
our sample it ubiquitously identified a company’s first preferred stock financing round. To
identify a research sample, an initial query was performed on a subset of the Brobeck digital
corpus. The subset consisted of approximately 3.7 million digital records which included
word processing documents, spreadsheets, and other electronic miscellany. We focus on
six categories of Brobeck representations (matters) that had usable electronic documents
concerning relevant deals for the purposes of this study.14 We identify 182 Series A funding
rounds with sufficiently complete electronic records and an indication of deal closure. The
earliest deal occurs in 1993 and the latest deal in 2002.
We carefully examine a number of documents for each deal. The Stock Purchase Agree-
ment establishes the basic terms of the sale of stock, including the type and amount of
stock being sold, its purchase price, and numerous conditions for closing and other repre-
bankruptcy trustee is also highly relevant (Murphy et al. 2005).14Each matter was categorized and also contained a short description of the nature of that particular
legal representation. The categories for which there were some matters with the words “Series A” in theirdescriptions were (with the matter counts shown in parenthesis): ”Venture Finance/Company Side” (429),”Venture Financing/Investor Side” (264), ”Venture Fund Formation” (133), ”Other Financing” (109), ”Gen-eral Business and Technology” (79), and ”General Corporate Representation” (44).
9
sentations. It also identifies the date of closing, and some information regarding the cap-
italization prior to closing. This document, along with the term sheet, identifies investors
involved in the deal in a capitalization table. The Amended and Restated Charter sets forth
investor rights including dividend rights, liquidation preferences, redemption rights, voting
rights, and conversion rights/anti-dilution protection. The Voting Agreement sets forth the
composition, size, and conditions of election of the Board of Directors. Other documents
including Co-Sale and First Refusal Agreements, and Investor’s Rights Agreements, provide
additional information including details regarding additional rights, restrictions, and option
plans. The documents in the Brobeck corpus are very similar to the samples provided by
the National Venture Capital Association on their website.15
For each firm in our sample, we also collect complete histories and outcomes based on
public sources including Lexis-Nexis, Hoovers, SEC filings, the Internet Archive (archive.org),
and Thomson Financial’s Venture Economics. In particular, we have a record of each firm’s
internet presence (from 1996 to present) as well as a complete record of every press re-
lease and article about the firm in the popular press. This allows us to identify liquidations,
bankruptcies, acquisitions, IPOs, and major company milestones such as strategic alliances,
product releases, and subsequent VC investments in the firms.
While we provide a detailed description of the companies in our sample in Section IV,
it is useful to point out at the outset that we can generally categorize these firms as high
growth potential ventures. Most deals inhabit the traditional VC domains of information-
technology and biotechnology (even those financed exclusively by angels). It is also rea-
sonable to assume that Brobeck selected deals with high-growth potential. Vronsky (2007)
finds evidence that leading Silicon Valley law firms, such as Brobeck, certified deals in the
same way that VCs certify deals at the time of IPO in the sense of Megginson and Weiss
(1991) and Brav and Gompers (1997). Hence Brobeck had both reputational and monetary
incentives to ensure that the deals it represented were of high quality.16 We also find that
VCs investing in deals in our sample were of higher prominence than the general population
of VCs, and the deals in our sample performed well relative to the universe of VC-funded
ventures, independent of whether they were financed by VCs, angels, or both.
We also note that we do not believe that the failure of Brobeck is indicative of the
quality of the investors, firms or deals in our sample. First, the causes of the bankruptcy
do not appear attributable to low quality clientele, but rather to idiosyncratic features of
the Brobeck partnership (Kostal 2003) and / or to poor strategic decisions and real-estate
investments by the firm’s senior partners (Murphy, Dillman, and Johnston 2005). Second we
15See http://www.nvca.org/model documents/model docs.html.16Law firms commonly rely on either implicit or explicit contingent payment schemes from entrepreneurial
companies they represent (Dzienkowski and Peroni 2002; Vronsky 2007). Leading law firms seek to referstrong deals if they wish to work with prominent VCs (Bernstein 1995).
10

compare the venture capitalists in our sample to the general population of VCs (below). The
evidence suggests that the investors in the sample were of high status and more successful
than the median VC investors.
IV Descriptive Statistics
A Investor Composition and Deal Size (Finding 1)
We begin with a description of the firms in our sample, in which we document support
for our first finding that deal size segments the market. We then describe the investors.
Through a comparison between our sample and the universe of venture capitalists in Venture
Economics, we ascertain that the sample is comprised of high quality, California-centric
investors and firms.
We classify participants in the Series A deals based on three major categories – founders,
VCs, and angels. Founders are identified using a two stage process. First, founders are often
explicitly identified in the records. When founders are not explicitly identified, but common
shareholders are, we identify founders using the following three step rule: (1) the largest
common shareholder is identified as a founder; (2) any other common shareholder holding at
least 30% as many shares as the largest common shareholder is also identified as a founder;17
and (3) any common shareholder holding the position of president or CEO is also identified
as a founder. Founders ubiquitously hold common shares. For the 165 companies in our
sample for which we have founder data, there were a total of 458 founders, leading to an
average of 2.78 founders per company, and a range of 1 founder (for 56 companies) up to a
maximum of 22 founders in one company (only four companies have more than 8 founders).
We identify venture capitalists primarily by cross-referencing investor names with in-
vestors appearing in the Venture Economics database, but we also label as VCs investors
with names sharing a common word root with the term “venture”.18 This category includes
VC arms of banks and corporations which are included in Venture Economics. In addition,
there are a small number of professional angel investment groups in our sample. Although
angels are the main source of capital for these groups, we put them into the VC category
given that their investment process closely resembles that of VCs. In total, there were 482
different VCs that participated in 150 of the 182 deals in our sample.
17This threshold is arbitrary, and we only include this analysis for the purposes of illustration. Ourstudy’s focus is on how VCs and angels invest in Series A financings (which almost universally do notinclude founders).
18There were a few occasions where investors had the word “venture” in their names but were not inVenture Economics and were not venture capital organizations in the institutional sense we refer to here. Ineach such case, their investment sizes were under $50,000. These small investment organizations are oftenset up for estate planning purposes. We classified these investors as angels.
11

There is considerable variation in the literature and in practice regarding the exact
definition of angel investors. We label as angels all investors who are not otherwise classified
as founders or VCs according to the definitions above. This category, which consists of
2,528 different investors across 144 of our 182 sample firms, is predominantly composed of
individuals, who invest either directly in their name, or through trusts and other investment
vehicles, such as companies set up by individuals for investment purposes.19 Although
we cannot accurately identify friends and family, we note that investors with the same
name or ethnic origin as founders appear to represent a relatively small proportion of
the angels and the overall angel investment in our sample.20 We also include as angels
universities, governments, and other non-VC entities, including Brobeck itself. Since some
of the investors we categorize as angels may be viewed as belonging to distinct classes
that should be separated from the stereotypical individual angel investors, we later conduct
robustness tests to ensure that these non-individual investors do not have a significant
impact on any of our key results, and we find that our results are indeed robust. We
provide more detailed information on both the angels and VCs in our sample in Section
C. However, the high-potential nature of deals in our sample, as well as the large average
amounts invested by angels, suggest that our sample includes sophisticated angels.
Figure 1 shows the distribution of investor composition for deals in our sample. The
histogram in the top panel shows the share of investors who are angels. Thirty-two of our
deals (18% of the 182 deals) rely solely on angel investments, 38 (21%) have only venture
capital investment, and the other 112 deals (61%) draw on both angel and VC investment,
with a reasonably uniform distribution of the mix between the two groups of investors.
Note, however, that the bottom panel of Figure 1, which is based on dollars invested
rather than number of investors, indicates that venture capitalists systematically invest
more money. This suggests that deals involving VC investments are larger, which is indeed
the case. Figure 2 shows the distribution of deal size, i.e., dollars invested in Series A
deals, for three investor composition categories: angel-only, mixed, and VC-only deals.
Angel-only deals are predominantly smaller deals, with a median of $1.12 million, relative
to the overall median of $3.5 million for our whole sample of Series A deals. Mixed deals
tend to be somewhat larger (median of $4.49 million) than VC-only deals (median of $3.53
million). While there are numerous VC-only and mixed deals with investment size below
the overall sample median, only 3 of the 32 angel-only deals have investment size larger
19Wong et al. (2009) formally defines angels as those that are “accredited investors” according to SECRegulation D, Rule 501. Rule 501 states that accredited investors must have a net worth of over $1Mor annual income of over $200,000. While most angels in our sample are accredited investors, we do findoccasional unaccredited investors participating in deals.
20Some researchers such as Fenn and Liang (1998) specifically exclude family and friends from theirdefinition of angels. Our general definition of angels, however, is intended to capture investors who are notprofessional managers of venture capital.
12
than the sample median. The presence of VCs thus appears to be virtually a necessity
for closing large deals. Interestingly, the paucity of large angel deals in our sample is
consistent with the contemporary informal impressions of practitioners of how the market
is segmented (Linde et al. 2000). Moreover, these general characteristics of our data suggest
that there are five subsamples of our overall data that deserve closer scrutiny, as they may
indicate distinctly different deal types in each category: three subsamples based on investor
composition (angel-only, VC-only, and mixed deals), and two subsamples sorted on size
(large and small deals).
B Firm Characteristics
Table I reports means (standard deviations in parentheses) for numerous characteristics of
the 182 firms in our overall sample, as well as across the five subsamples. We assess the
representativeness of our overall sample by comparing the characteristics of our firms against
those of 9,901 US-based firms with a first recorded investment occurring between 1993 and
2002 (our sample period) for firms founded between 1967 and 2002 (reflecting founding dates
in our sample) that are recorded in the Thomson Financial Venture Economics database.
We exclude deals labeled as buyout, acquisition, other or unknown. Out of the 182 deals
in our sample, 111 also appear in the Venture Economics database (but without the full
information to which we have access). We weight statistics from the Venture Economics
sample to reflect the (below described) over-representation of recent deals in our sample. A
detailed description of this comparison is found in the Appendix. Our sample is more West
Coast- and Texas-centric than the full sample of Venture Capital deals, over represents the
period 2000-2002 relative to 1998-2000 and pre 1998, and covers slightly more smaller deals
(mean $6.14 million) with younger firms. The mean age in our sample 1.8 years vs. 3.1
years in VentureXpert. This difference is not due to the angel-only deals in our sample.
Regarding industry, our sample is representative.
Panel B of Table I also shows three additional firm characteristics for which there are
no comparable Venture Economics statistics. We find that most firms did not achieve
milestones prior to Series A funding, with only 13% having products and 10% being involved
in strategic alliances. These findings are consistent with the young age of our firms. Finally,
for the firms in our sample, Brobeck represented the company 62% of the time, almost twice
as often as they represented one or more of the investors for the deals in our sample (and
this is relatively consistent across our subsamples).
13
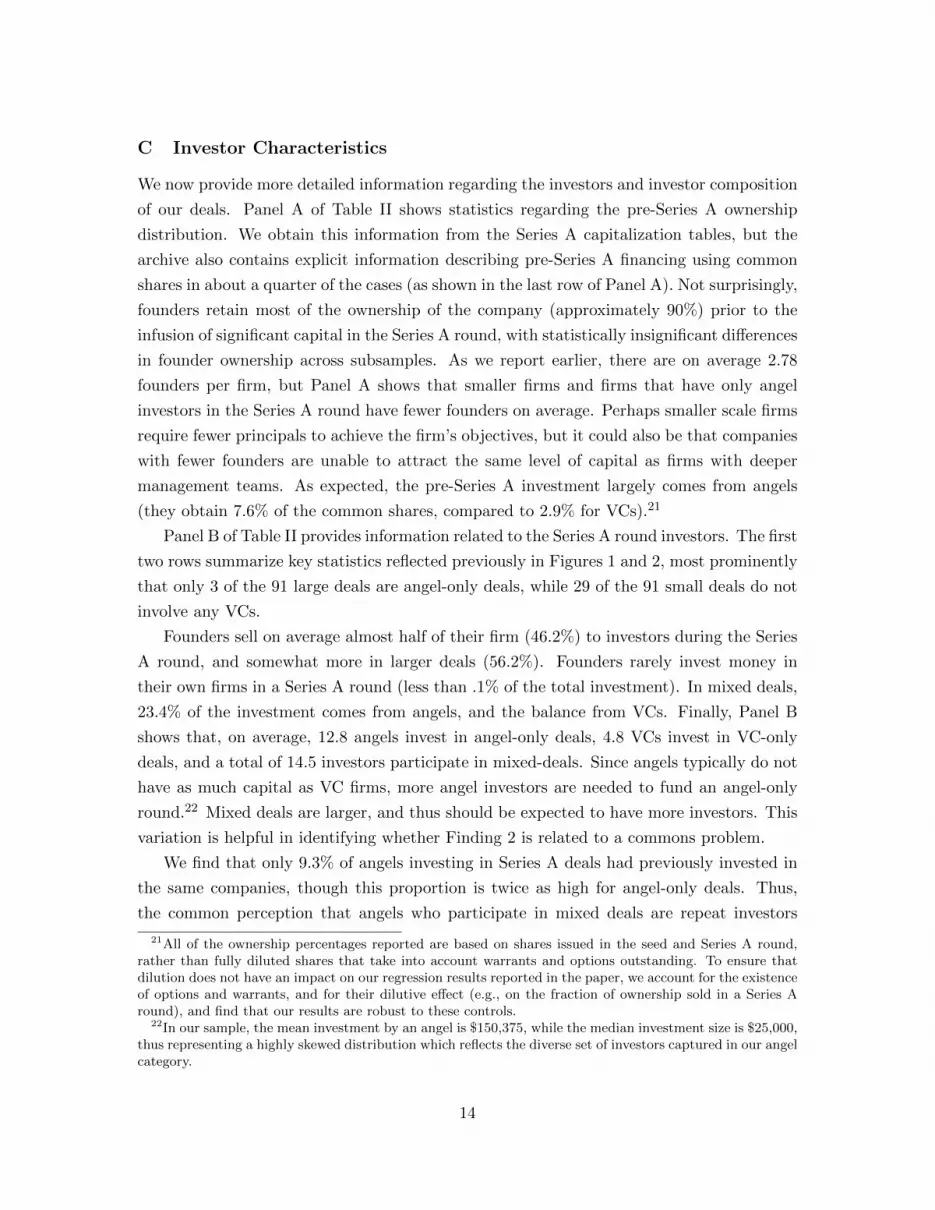
C Investor Characteristics
We now provide more detailed information regarding the investors and investor composition
of our deals. Panel A of Table II shows statistics regarding the pre-Series A ownership
distribution. We obtain this information from the Series A capitalization tables, but the
archive also contains explicit information describing pre-Series A financing using common
shares in about a quarter of the cases (as shown in the last row of Panel A). Not surprisingly,
founders retain most of the ownership of the company (approximately 90%) prior to the
infusion of significant capital in the Series A round, with statistically insignificant differences
in founder ownership across subsamples. As we report earlier, there are on average 2.78
founders per firm, but Panel A shows that smaller firms and firms that have only angel
investors in the Series A round have fewer founders on average. Perhaps smaller scale firms
require fewer principals to achieve the firm’s objectives, but it could also be that companies
with fewer founders are unable to attract the same level of capital as firms with deeper
management teams. As expected, the pre-Series A investment largely comes from angels
(they obtain 7.6% of the common shares, compared to 2.9% for VCs).21
Panel B of Table II provides information related to the Series A round investors. The first
two rows summarize key statistics reflected previously in Figures 1 and 2, most prominently
that only 3 of the 91 large deals are angel-only deals, while 29 of the 91 small deals do not
involve any VCs.
Founders sell on average almost half of their firm (46.2%) to investors during the Series
A round, and somewhat more in larger deals (56.2%). Founders rarely invest money in
their own firms in a Series A round (less than .1% of the total investment). In mixed deals,
23.4% of the investment comes from angels, and the balance from VCs. Finally, Panel B
shows that, on average, 12.8 angels invest in angel-only deals, 4.8 VCs invest in VC-only
deals, and a total of 14.5 investors participate in mixed-deals. Since angels typically do not
have as much capital as VC firms, more angel investors are needed to fund an angel-only
round.22 Mixed deals are larger, and thus should be expected to have more investors. This
variation is helpful in identifying whether Finding 2 is related to a commons problem.
We find that only 9.3% of angels investing in Series A deals had previously invested in
the same companies, though this proportion is twice as high for angel-only deals. Thus,
the common perception that angels who participate in mixed deals are repeat investors
21All of the ownership percentages reported are based on shares issued in the seed and Series A round,rather than fully diluted shares that take into account warrants and options outstanding. To ensure thatdilution does not have an impact on our regression results reported in the paper, we account for the existenceof options and warrants, and for their dilutive effect (e.g., on the fraction of ownership sold in a Series Around), and find that our results are robust to these controls.
22In our sample, the mean investment by an angel is $150,375, while the median investment size is $25,000,thus representing a highly skewed distribution which reflects the diverse set of investors captured in our angelcategory.
14

from the seed round is not supported by our data. However, it does suggest that, at least
for early rounds, these investors do stage at the same rate as VCs. We observe the same
VCs participating in both pre-Series A and Series-A rounds for a given company (7.1% on
average). Panel B also shows that Brobeck invested in approximately one quarter of the
deals it handled (either in common or preferred shares), and more so in the larger deals.
Additional investor characteristics are shown in Panel C of Table II. The post-money
ownership figures follow from the pre-Series A and Series-A ownership fractions of the
different investors, together with the fraction of the company sold in the Series A round.
On average, founders retain majority ownership of their company following the Series-
A round only in angel-only deals and small deals. Of course, as we shall see later, this
does not necessarily translate into retaining full control of the firms given that founders
hold common shares while outside investors predominantly hold preferred shares with more
powerful control rights, including board seats.
Finally, in Panel B, we report proximity measures based on the zip code of investors
relative to the zip codes of the corporate headquarters, using an automated Mapquest query
(we observe zip codes for investors only in 136 of the deals). We find that investors were
generally in similar geographic locales as the firms they invested in: 60% were within 3
hours of driving time from the firms they invested in, and 18% were within the same zip
code. Investors are closer to the firm in smaller deals, and most likely to be in the same zip
code for angel-only deals.23
Given the restrictions we face in the use of our data, there is limited additional informa-
tion that we can provide to better characterize the angels in our sample. For instance, we
are unable to conduct searches that would provide additional information regarding angels’
backgrounds (education, and technical and managerial experience), their prior investment
experience, their age and wealth, and their relationships to the founders and to the other
angels and VCs that invest with them in the deals. The only finer information we can
provide is a summary of angel types, which we show in Figure 3. Approximately 70% of
investors appear as individuals in the records documenting the Series A rounds. We believe
that most of the 10% of investors that are categorized as “small company” are also individ-
uals, investing through corporate vehicles for tax and estate-planning purposes. Together,
these two categories make up over 80% of the dollars invested by angels in the mixed and
angel-only Series A deals, and even a larger fraction in the angel-only deals. “Companies”
and “others” (which include universities, non-profits, and governments) play relatively mi-
nor roles relative to individual investors. Note also that while Brobeck invested in a quarter
of the deals, their overall stake (dollar weighted participation) in these companies is very
23We also consider (unreported) probit models examining the likelihood that a given deal will be angel-only and VC-only financed given its other characteristics, and we confirm the univariate results reported inthe paper.
15

small.
Figure 3 shows that angels who invest on their own are more likely to be individuals
(82%) than those who invest alongside VCs (66%), though the difference is much smaller
(88% versus 82%) if smaller companies and individuals are bundled together as a single
category. We have also separately calculated the mean angel investment in angel-only and
mixed deals, which are $78,016 and $55,771, respectively, for small deals, and the medians
in both cases are very close to the overall angel median investment size of $25,000 (since
there are few large angel-only deals, it is not relevant to provide the analogous comparison
for large deals). Though we have limited information about the angels in angel-only versus
mixed deals, it does not appear that there is any significant difference between angels
investing in either of these types of deals.
We consider robustness to two potential changes to our definition of angel investors.
First, some of the investors we are classifying as angels may not necessarily be angels,
and they also are likely not suitable to classify as VCs. These include the investors we
tag as Other or Unknown in Figure 3, and include Universities, governments, and banks,
for example. In our test of robustness, because these investors may not be suitable as
either angels or VCs, we consider dropping these investors from consideration regarding
our computation of our investor composition variables. Second, we examine robustness to
reclassifying the investors in the “company” category in Figure 3 as VCs. Many of these
companies are larger companies, and although they do not show up as VCs in our database
by virtue of their not being in the Venture Economics database, they may still be investing
in a manner consistent with traditional VC or CVC investment. For these investors, we thus
consider reclassifying them from angels to VCs. We also note that we control for Brobeck
itself as an investor, and hence we do not alter our consideration of this investor, which we
do not treat as an angel or a VC. In all, we find that our results are highly robust to these
alternative definitions of angels and VC investors.24
As shown in Table III, compared to the population of VCs in VentureXpert, the VCs in
our sample are more likely to be US- and California-based, more likely to manage early stage,
but not seed stage nor buyout funds, are older, and have higher prestige and performance.
This higher prestige and performance is most prominent in the subset of larger deals. Details
of this comparison are found in the Appendix.
24We summarize robustness in detail here. Our cashflow rights and control rights results are all robustexcept that our small and large subsample results for the redemption variable lose significance. All of ourresults regarding time to resolution, the prediction of successful exits, and the tests of our COI hypothesisare fully robust. Our results for billable hours are robust for the whole sample, but the small deal subsampleresult loses significance. In all, our results are robust to these alternative definitions of angel and VCinvestors.
16
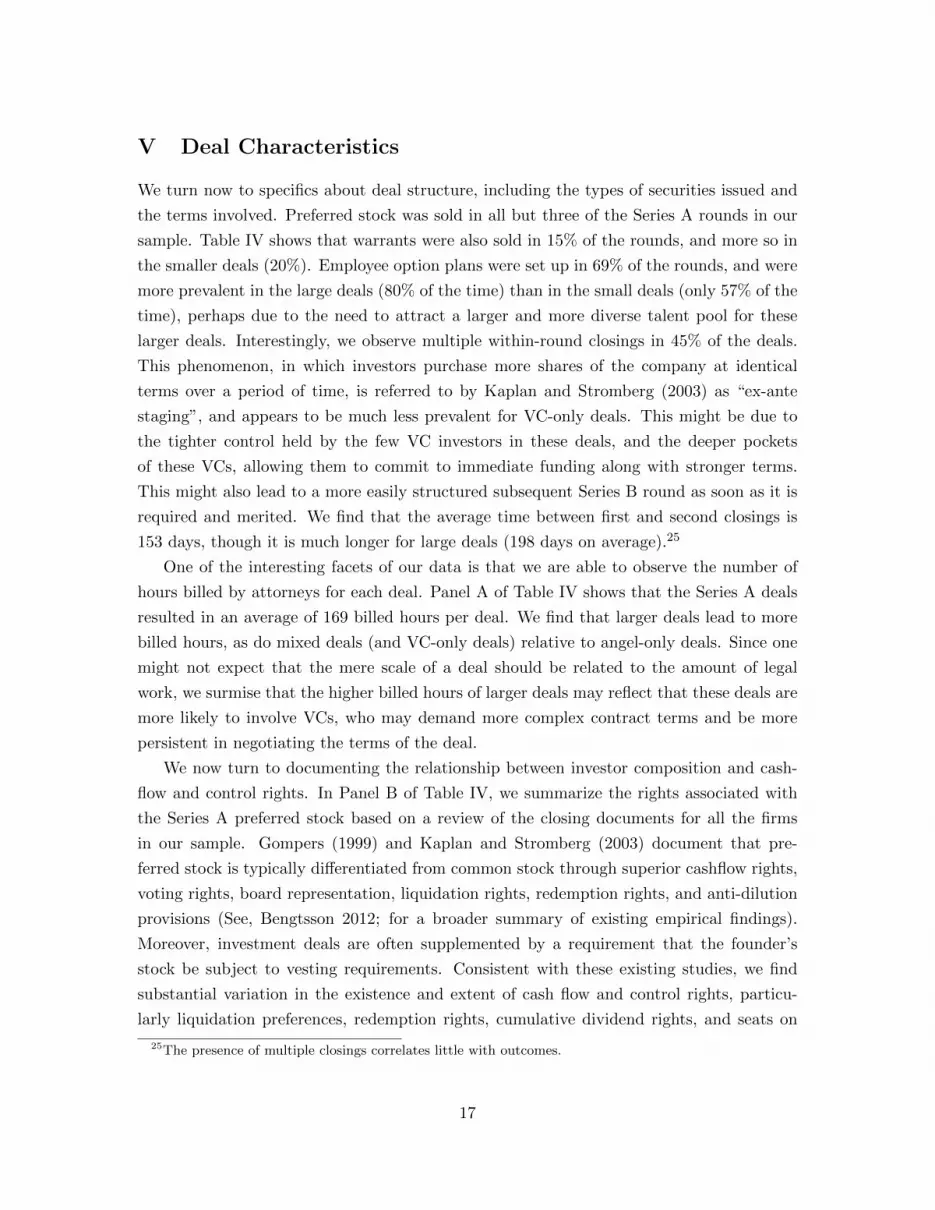
V Deal Characteristics
We turn now to specifics about deal structure, including the types of securities issued and
the terms involved. Preferred stock was sold in all but three of the Series A rounds in our
sample. Table IV shows that warrants were also sold in 15% of the rounds, and more so in
the smaller deals (20%). Employee option plans were set up in 69% of the rounds, and were
more prevalent in the large deals (80% of the time) than in the small deals (only 57% of the
time), perhaps due to the need to attract a larger and more diverse talent pool for these
larger deals. Interestingly, we observe multiple within-round closings in 45% of the deals.
This phenomenon, in which investors purchase more shares of the company at identical
terms over a period of time, is referred to by Kaplan and Stromberg (2003) as “ex-ante
staging”, and appears to be much less prevalent for VC-only deals. This might be due to
the tighter control held by the few VC investors in these deals, and the deeper pockets
of these VCs, allowing them to commit to immediate funding along with stronger terms.
This might also lead to a more easily structured subsequent Series B round as soon as it is
required and merited. We find that the average time between first and second closings is
153 days, though it is much longer for large deals (198 days on average).25
One of the interesting facets of our data is that we are able to observe the number of
hours billed by attorneys for each deal. Panel A of Table IV shows that the Series A deals
resulted in an average of 169 billed hours per deal. We find that larger deals lead to more
billed hours, as do mixed deals (and VC-only deals) relative to angel-only deals. Since one
might not expect that the mere scale of a deal should be related to the amount of legal
work, we surmise that the higher billed hours of larger deals may reflect that these deals are
more likely to involve VCs, who may demand more complex contract terms and be more
persistent in negotiating the terms of the deal.
We now turn to documenting the relationship between investor composition and cash-
flow and control rights. In Panel B of Table IV, we summarize the rights associated with
the Series A preferred stock based on a review of the closing documents for all the firms
in our sample. Gompers (1999) and Kaplan and Stromberg (2003) document that pre-
ferred stock is typically differentiated from common stock through superior cashflow rights,
voting rights, board representation, liquidation rights, redemption rights, and anti-dilution
provisions (See, Bengtsson 2012; for a broader summary of existing empirical findings).
Moreover, investment deals are often supplemented by a requirement that the founder’s
stock be subject to vesting requirements. Consistent with these existing studies, we find
substantial variation in the existence and extent of cash flow and control rights, particu-
larly liquidation preferences, redemption rights, cumulative dividend rights, and seats on
25The presence of multiple closings correlates little with outcomes.
17
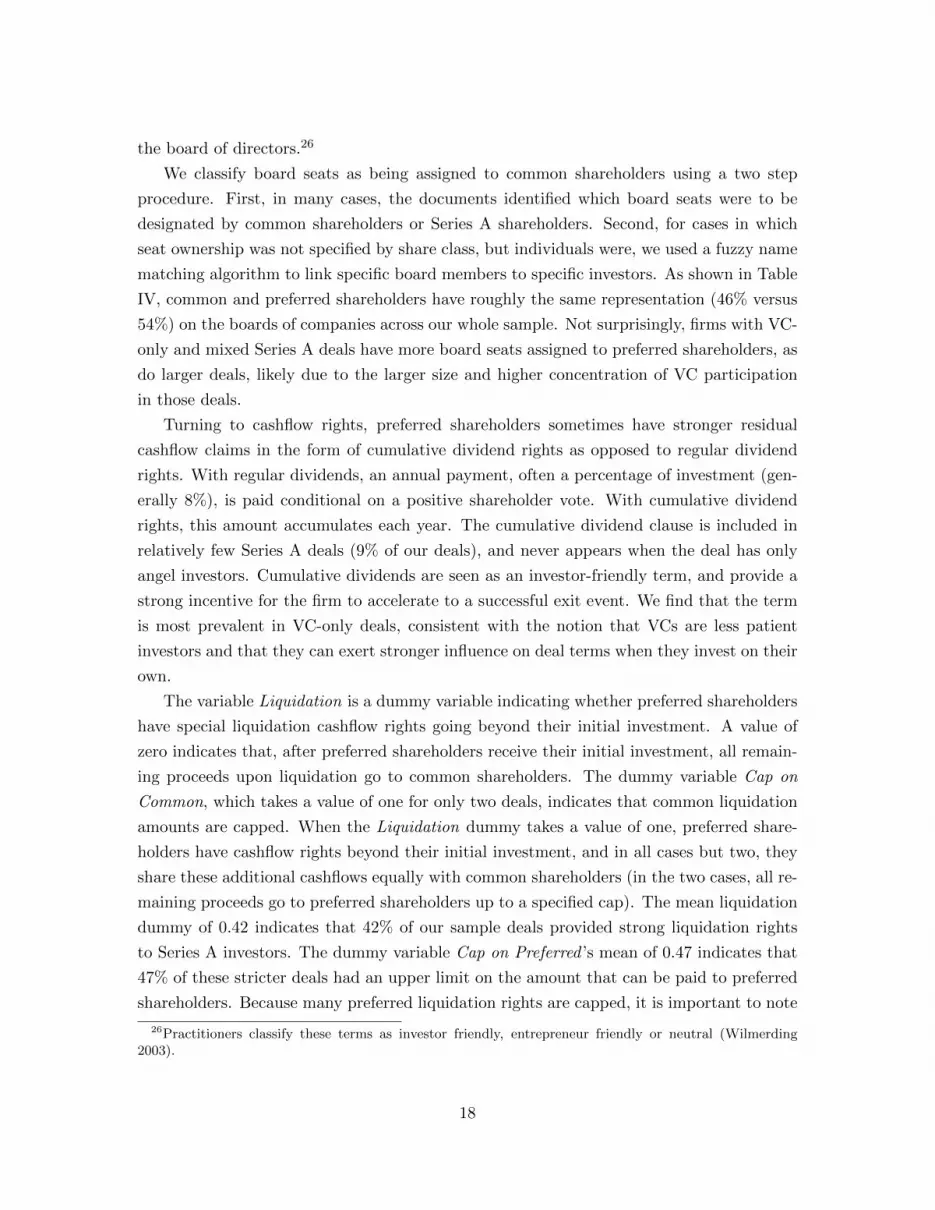
the board of directors.26
We classify board seats as being assigned to common shareholders using a two step
procedure. First, in many cases, the documents identified which board seats were to be
designated by common shareholders or Series A shareholders. Second, for cases in which
seat ownership was not specified by share class, but individuals were, we used a fuzzy name
matching algorithm to link specific board members to specific investors. As shown in Table
IV, common and preferred shareholders have roughly the same representation (46% versus
54%) on the boards of companies across our whole sample. Not surprisingly, firms with VC-
only and mixed Series A deals have more board seats assigned to preferred shareholders, as
do larger deals, likely due to the larger size and higher concentration of VC participation
in those deals.
Turning to cashflow rights, preferred shareholders sometimes have stronger residual
cashflow claims in the form of cumulative dividend rights as opposed to regular dividend
rights. With regular dividends, an annual payment, often a percentage of investment (gen-
erally 8%), is paid conditional on a positive shareholder vote. With cumulative dividend
rights, this amount accumulates each year. The cumulative dividend clause is included in
relatively few Series A deals (9% of our deals), and never appears when the deal has only
angel investors. Cumulative dividends are seen as an investor-friendly term, and provide a
strong incentive for the firm to accelerate to a successful exit event. We find that the term
is most prevalent in VC-only deals, consistent with the notion that VCs are less patient
investors and that they can exert stronger influence on deal terms when they invest on their
own.
The variable Liquidation is a dummy variable indicating whether preferred shareholders
have special liquidation cashflow rights going beyond their initial investment. A value of
zero indicates that, after preferred shareholders receive their initial investment, all remain-
ing proceeds upon liquidation go to common shareholders. The dummy variable Cap on
Common, which takes a value of one for only two deals, indicates that common liquidation
amounts are capped. When the Liquidation dummy takes a value of one, preferred share-
holders have cashflow rights beyond their initial investment, and in all cases but two, they
share these additional cashflows equally with common shareholders (in the two cases, all re-
maining proceeds go to preferred shareholders up to a specified cap). The mean liquidation
dummy of 0.42 indicates that 42% of our sample deals provided strong liquidation rights
to Series A investors. The dummy variable Cap on Preferred ’s mean of 0.47 indicates that
47% of these stricter deals had an upper limit on the amount that can be paid to preferred
shareholders. Because many preferred liquidation rights are capped, it is important to note
26Practitioners classify these terms as investor friendly, entrepreneur friendly or neutral (Wilmerding2003).
18

that when the company value upon liquidation is sufficiently high, preferred stockholders
waive their liquidation rights, and convert their stock to common. Note that the liquidation
preference specified in angel-only deals is much less favorable towards the investors, indicat-
ing that while angels enjoy some benefits of ownership of preferred, rather than common,
shares, their cashflow rights are still relatively weak.
Finally, we find that preferred shareholders have the right to redeem their shares at will
in about one quarter of our deals, typically after a period of time and usually conditional
on a Series A majority or super-majority vote. Such a right would be invoked when a firm
is not performing well, and is considered to be an investor-friendly term. Angels investing
on their own seldom demand such a redemption right in their stock purchase agreements.
Given that Kaplan and Stromberg (2003) (KS) examine cashflow and control rights for
a similar number of deals, but from a different source and an earlier time period, it is useful
to provide a quick comparison of the terms of our respective deals. Our samples differ in
important respects. Our data represent 182 series A investments in 182 portfolio firms made
by 482 distinct venture capital firms. In contrast, KS analyze 213 investments (of which
98 are series A) in 119 portfolio firms made by 14 VC firms and their affiliates (KS do not
report the total number of distinct VCs who invested in the deals in their sample). While
they do not distinguish between pure-VC and mixed deals, KS find that non-VCs own, on
average, a 20% (non-diluted) stake in investment targets following series A rounds, which
compares to the 16% for mixed deals in our sample. In general, the deals in our sample
involve weaker control right provisions.27 For example, we find that only 8.8% of deals
involve cumulative dividend rights, which is considerably below the frequency of 43.8% in
KS. We also find that 23.6% of our deals have redemption features, compared to 78.7%
reported in KS. (Interestingly, KS reported that 12.9% could redeem shares at fair market
value, which is only slightly lower than the 16.4% in our sample). Finally, we find that
85% of our deals include anti-dilution provisions, with the weighted average method used in
92% of those cases, similar to the 95% of deals in KS that include anti-dilution protection,
and the 78% of them that use the weighted average method.28 The differences between
our respective samples likely reflect the stage of the deals we analyze, and the presence of
angel-only deals in our sample.29
27It is difficult to compare the success rates of the two samples, as KS do not report outcomes as hazardswhich would allow comparison of the likelihood of a given outcome.
28We do not focus on anti-dilution provisions in our study given that there is little cross-sectional variationacross the deals.
29Gompers (1999) notes certain characteristics of his sample of fifty VC private placement agreements.These appear consistent with our sample. For instance, 51.4% of board seats are controlled by VCs, whichis between the 47.8% we find for the VC-only deals and the 60.2% we find for mixed deals in our sample.However, redemption rights are found in 68% of the deals in Gompers’ sample, which is more in line withKS than with our sample, again likely reflecting that their sample includes more later-stage rounds.
19
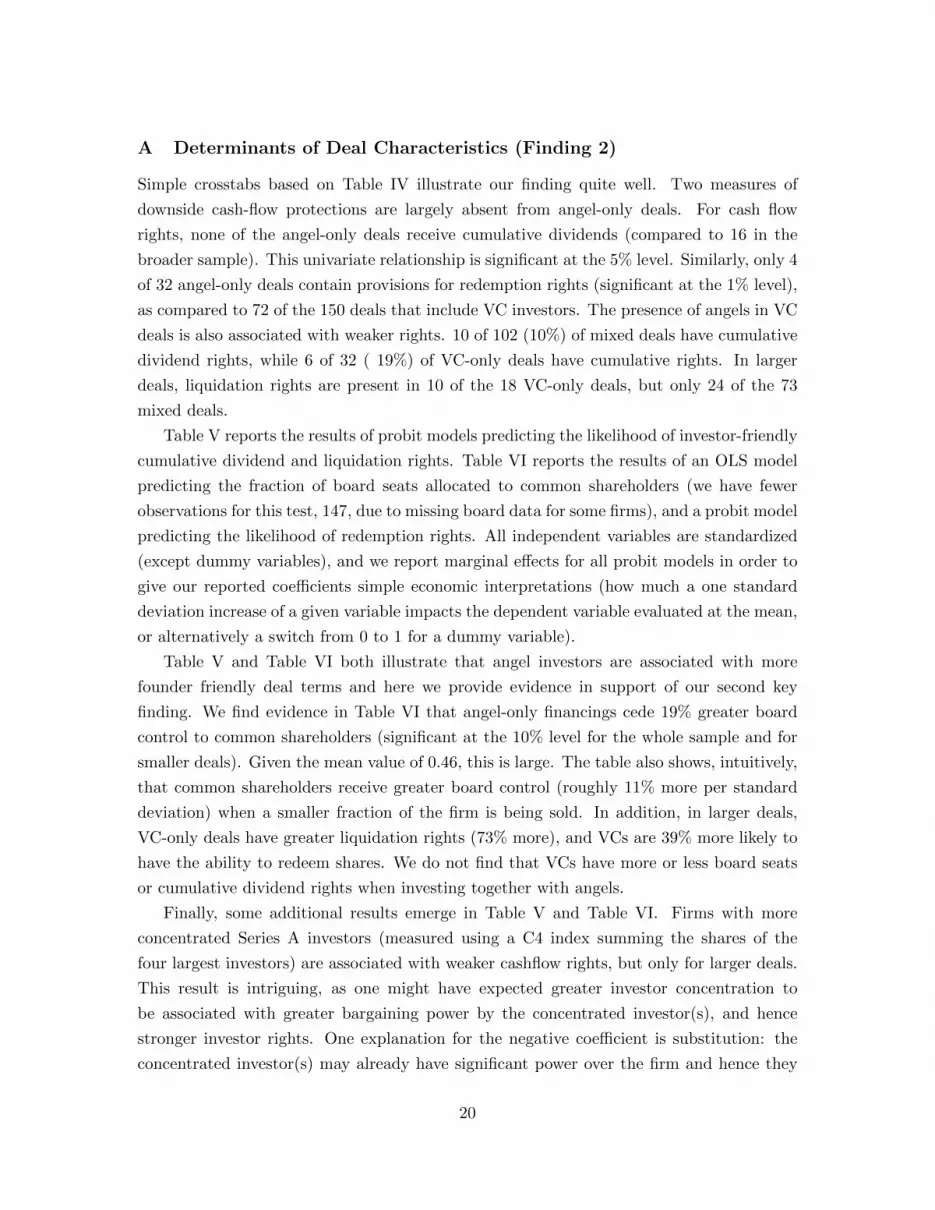
A Determinants of Deal Characteristics (Finding 2)
Simple crosstabs based on Table IV illustrate our finding quite well. Two measures of
downside cash-flow protections are largely absent from angel-only deals. For cash flow
rights, none of the angel-only deals receive cumulative dividends (compared to 16 in the
broader sample). This univariate relationship is significant at the 5% level. Similarly, only 4
of 32 angel-only deals contain provisions for redemption rights (significant at the 1% level),
as compared to 72 of the 150 deals that include VC investors. The presence of angels in VC
deals is also associated with weaker rights. 10 of 102 (10%) of mixed deals have cumulative
dividend rights, while 6 of 32 ( 19%) of VC-only deals have cumulative rights. In larger
deals, liquidation rights are present in 10 of the 18 VC-only deals, but only 24 of the 73
mixed deals.
Table V reports the results of probit models predicting the likelihood of investor-friendly
cumulative dividend and liquidation rights. Table VI reports the results of an OLS model
predicting the fraction of board seats allocated to common shareholders (we have fewer
observations for this test, 147, due to missing board data for some firms), and a probit model
predicting the likelihood of redemption rights. All independent variables are standardized
(except dummy variables), and we report marginal effects for all probit models in order to
give our reported coefficients simple economic interpretations (how much a one standard
deviation increase of a given variable impacts the dependent variable evaluated at the mean,
or alternatively a switch from 0 to 1 for a dummy variable).
Table V and Table VI both illustrate that angel investors are associated with more
founder friendly deal terms and here we provide evidence in support of our second key
finding. We find evidence in Table VI that angel-only financings cede 19% greater board
control to common shareholders (significant at the 10% level for the whole sample and for
smaller deals). Given the mean value of 0.46, this is large. The table also shows, intuitively,
that common shareholders receive greater board control (roughly 11% more per standard
deviation) when a smaller fraction of the firm is being sold. In addition, in larger deals,
VC-only deals have greater liquidation rights (73% more), and VCs are 39% more likely to
have the ability to redeem shares. We do not find that VCs have more or less board seats
or cumulative dividend rights when investing together with angels.
Finally, some additional results emerge in Table V and Table VI. Firms with more
concentrated Series A investors (measured using a C4 index summing the shares of the
four largest investors) are associated with weaker cashflow rights, but only for larger deals.
This result is intriguing, as one might have expected greater investor concentration to
be associated with greater bargaining power by the concentrated investor(s), and hence
stronger investor rights. One explanation for the negative coefficient is substitution: the
concentrated investor(s) may already have significant power over the firm and hence they
20
prefer to bargain for cashflow rights. The result is inconsistent with Rajan and Winton
(1995)’s prediction that commons problems should lead to weaker investor rights.
Biotechnology firms are associated with 23% more board control for common sharehold-
ers, especially for smaller deals (30% more). This might be due to the more knowledge-
intensive nature of this business. We also find that investors in firms that are more mature
(measured by firm age) are roughly 7% more likely to seek cumulative dividend rights,
especially when deals are large. Dividend rights strengthen incentives to speed up the com-
mercialization and exit process, and this may only be effective when firms are mature enough
to offer cashflows that might be used to pay future dividends. Deals in which Brobeck in-
vested had stronger liquidation rights, suggesting that they either encouraged terms that
were more investor-friendly, or they were more likely to invest when terms appeared to be
more favorable to investors.
VI Outcomes
We now explore the relationship between investor composition and two dimensions of the
firm’s outcome: time to resolution and the rate of successful exit via merger or IPO.
In Table VII, we provide some descriptive statistics regarding the outcomes of the 182
firms in our sample as compared to 9,902 firms in Venture Economics that recorded an initial
financing during the comparable 1993-2002 time period. We further condition the Venture
Economics comparison sample on US-based venture capital investment targets founded
after 1967 with the first investment not labeled as buyout, acquisition, other or unknown.
Outcome variables of the Venture Economics sample are as reported in that database, but
weighted to reflect the distribution of deal origination dates in the Brobeck sample. We
identify acquisitions and IPOs in our sample through archival sources such as press releases,
as does Venture Economics for their universe of firms.30
“Non-exited survival” for our firms is defined as the firm still being an ongoing private
concern, and an independent company, as of December 2012. This status is based on the
web and other public sources. Failure for firms in our sample indicates that the firm is
not surviving and did not experience a positive liquidity event. Outcome variables for the
Venture Economics sample are as reported in that database. Since firm failure is often
a silent event, only liquidity events are reported reliably in Venture Economics. Finally,
we use Venture Economics to identify which of our firms received a subsequent round of
financing involving at least one VC investor.
30Since we are unable to accurately value companies that have been acquired or continue as private com-panies, we cannot ascertain investors returns. Thus, we focus on determining the success of the companies interms of survival and profitable exits, rather than measuring the magnitude of investment returns (Gompers,Kovner, and Lerner 2009).
21
The success of the firms in our sample closely parallels that for the Venture Economics
firms. In our sample, 39.8% of the firms experience a successful liquidity event (IPO or
acquisition), 14.4% are non-exited surviving firms, and the remaining 45.9% are failures.
While the precise figures shown in Table VII for our sample and the Venture Economics
data differ somewhat, the only statistically significant difference between them is that the
incidence of acquisitions for our sample (36.5%) is significantly higher than that for the
Venture Economics firms (17%). Looking across the different subsamples in Table VII, there
are a couple of statistically significant differences in failure (larger companies have lower
incidences of failure), acquisitions (larger companies are more likely to be acquired), and
time to resolution (angel only deals are more likely to experience longer times to resolution).
We will shortly examine these differences more carefully using multivariate regressions.
Finally, note that roughly half of the firms in our sample and three-quarters of those in
Venture Economics have a subsequent financing round documented in Venture Economics
(and thus involving at least one VC), but for angel-only firms, the fraction is much lower.
Since it is known that the majority of companies having an IPO do not have VC backing,
it is possible that many of the firms in our sample with angel-only Series A rounds simply
continue to eschew VC financing over time. However, in unreported multivariate probit
regressions, we find that while the incidence of future VC-backed financing is negatively
related to angel-only Series A financing, the relationship is not statistically significant upon
controlling for other factors. We find that the incidence of future VC financing is higher
when the fraction sold at the time of the Series A round is higher (potentially indicating a
more capital intensive business), the firm is older at the time of the Series A round, there
are no product releases before the Series A round (suggesting perhaps that the firm is not
able to self-finance quite as quickly), and the firm is not in the IT industry.
A Investor Composition and Time to Resolution (Finding 3)
Table VIII examines whether investor composition at the time of a transaction can predict
the length of time it takes to observe final resolution, defined as either failure or a successful
exit via merger or IPO. This test is motivated by the fact that institutional constraints
give VCs a likely preference for faster resolution. If some firms foresee a longer time to
resolution, such as a firm focusing on R&D with a potentially long development cycle,
we would expect this firm to match more with angel investors who may not face these
constraints. Analogously, many studies suggest that VCs play an active role in managing
portfolio firms, and may “groom” these firms in a way that accelerates resolution. In this
case, we would expect that the presence of VCs should predict a faster resolution. In the
tests that follow, we include controls for various investor and firm characteristics, as well as
industry and time dummies, and in all cases we report robust standard errors.
22

Table VIII displays the results of hazard models (columns 1, 3, 5) and a basic OLS model
(columns 2, 4, 5) where the number of years to resolution is the dependent variable for all
deals, large deals, and small deals, respectively. We display results for the Cox proportional
hazards model, but we also note that our results are robust to using the Exponential Hazard
Model or the Gompertz Hazard Model (not reported). For the Cox model, the table depicts
the impact of each regression variable on the hazard rate.31 The negative and highly
significant coefficient for Angel Only financing in columns 2 and 4 indicates that hazard
rates are indeed lower when only angel investors are present and no VCs are present. This
result obtains for the overall sample and for the small deals subsample. We do not find
results for the large deal subsample because this subsample does not contain adequate angel
only deals to run this analysis per earlier discussions.
Although the hazard model offers more consistency, we also include results for an OLS
model where the dependent variable is the number of years to resolution. The results remain
highly significant when compared to the hazard model as expected. We continue to find
that deals financed by angels alone experience a longer time to resolution.
We conclude that investor composition is strongly related to the time to resolution. This
finding might be due to increased patience on the part of angels (or a more pro-active focus
on quick resolution by VCs), or it might be due to the fact that investors with weaker control
and cashflow rights might lack the power, or the will, to force a generally unsuccessful firm
to liquidate. Consistent with angels playing a more passive role, we later show that billable
legal hours are lower for deals financed by angels alone.
B Investor Composition and Successful Exit (Finding 4)
We document the evidence in support of Finding 4 with multivariate probit regressions to
further analyze the relationship between investor composition and successful exit. Table
IX displays the marginal effects for probit models for the full sample as well as the large
and small deal subsamples. The dependent variable is a dummy set equal to one for firms
experiencing an IPO or an acquisition, and zero otherwise. We find that VC-only financed
firms are more likely to experience these successful liquidity events, but only in the sample
of large deals. This suggests a unique role for transactions where non-VC investors do not
participate in the Series A round.32 The most direct explanation relates to certification, as
31As is customary with hazard models, for ease in interpretation, we report the odds ratios (OR) insteadof coefficients. For example, for a dummy variable, the OR is the odds of IPO/Merger if the dummy equals1 divided by the odds of an IPO/Merger if the dummy equals 0. ORs greater than 1 indicate a positiveeffect while ORs less than one indicate a negative effect.
32We conduct many additional (unreported) robustness checks to ensure that our categorization of angelinvestors (e.g. angel investment groups, corporations, and Brobeck itself) does not affect our results. Thesetests uniformly produce results consistent with those displayed. In addition, we examine the impact of usingcutoffs other than 100% when categorizing deals as angel-only or VC-only to see whether our results depend
23

full VC participation in a large deal could signal that the deal is on a fast track to resolution.
We examine specific channels regarding this result in the next section.
C Conflicts of Interest and Managerial Characteristics
A key finding in the last section is that large deals are more likely to exit via merger
or IPO when they have a venture capital only investor composition. Because large deals
are almost never funded by angel investors only, this finding indicates that venture only
deals outperform deals with mixed angel and VC investor composition. The most direct
explanation is a selection argument and relates to certification. The strong form of the
argument is that full VC participation in a large deal signals that the deal is on a fast track
to resolution. Savvy entrepreneurs with high quality opportunities match with VCs, and
choose not to accept funding from investors. The weaker form of this arguments adds that
these savvy entrepreneurs are successful in matching with VCs in part because they have
similar goals. The absence of angels further improves the firm’s prospects as it improves
the efficacy of firm governance.
If angels are present, and their preferences are more closely aligned with entrepreneurs
than are VCs, this may affect firm governance. Because angels typically invest less than
VCs in the Series A financing, we do not expect potential conflicts of interest to be driven
by direct battles of control among the Series A investors. Instead, we expect that angel
investors may form coalitions with the founders that might be pitted against the interest
of the VCs. Because the founders typically control the majority of the common shares,
and VCs control the majority of the Series A shares, we expect these potential conflicts of
interest to arise when founder-friendly angel investors are present, and board seats are close
to evenly split between common and preferred shareholders.33 Fortunately, sufficient data
on the strict purity investor identification. Since the lowest VC share in the mixed deal group is 26.3%, thereare no “near angel-only deals”. In contrast, there are a number of mixed deals that have relatively minorangel participation (“near VC-only deals”); for instance, there are 62 deals that have at least 95% VC shareSeries A participation, which is dramatically larger than the 38 that are pure VC-only deals. Hence, thereis some clustering near the VC-only extreme. In examining robustness to these less stringent definitions of“VC-only”, we find only minor changes in our results.
33It is worthwhile to consider why an angel’s preferences might be more closely aligned with entrepreneursthan with VCs. One clear reason is that venture capital firms are known to seek liquidation within afixed time frame, are often more pre-disposed to liquidate, and lead venture capitalists generally to seek toinfluence the way the firm is being run. In contrast, angel investors may prefer a slower and more certainresolution, may have strong opinions on management style given their technical expertise, and may still haveother perspectives given they are often industry experts or friends of the founder. (Friends of the founderare often referred to as “family & friends”, while angels are sometime considered “outside” private equity.We are unable to distinguish between these two categories in our data.) Indeed, some surveys of angelsascribe non-pecuniary motivations (in a way that have been labeled “guardian angels” Linde et al., 2000).These characteristics may generate goal conflicts between the investors, or between the investors and thefounder(s), or both. We conjecture that if angel preferences are more aligned with entrepreneurs than areVCs, the inferior performance of mixed composition deals noted in the last section should be more likely
24

exist to identify whether board seats are allocated to common or preferred shareholders,
although we are unable to reliably identify if a board seat is occupied by a specific VC or
angel investor. 34
One strategy to separate between the selection (or certification) and preferences ex-
planation is to try to control for firm quality directly. While it is quite difficult for the
econometrician to measure quality, we can make some (admittedly limited) progress on this
front. For example, if the explanation is one of simple certification, we might expect char-
acteristics of the entrepreneurs to be associated with investor composition. In particular,
we should see relationships between investor composition and performance, and manage-
rial characteristics. In particular, CEOs with more refined personal networks may be more
likely to attract angel financing, and in turn, these managerial links may jointly explain
investor composition and performance. Supportive of the first part of this prediction, Table
X shows that managers who have an MBA, or those who worked at prior startups, might
be more savvy and attract VC investors. The observation count for this test, which is also
based only on large deals, is reduced to 66 due to the availability of CEO data to include
in this study. To examine whether this link can explain outcomes, we examine if our per-
formance results are robust to controls for these managerial characteristics in the outcome
regressions.
Table XI examines the above predictions of the preferences and selections arguments.
Following Table IX, we use probit regressions in which the merger/IPO dummy is the
dependent variable. However, we restrict attention to large deals as our goal is to explain
the results in Table IX regarding the superior performance of large VC-only transactions.
The first column reproduces the key result from Table IX, but now based on the smaller
subsample of 77 large deals for which we have board data. We find that the key VC-only
variable is positive and significant in this subsample.
The second column adds the split-control dummy. We further distinguish between in-
vestor composition and split control by adding an interaction term between the split-control
dummy and the VC-only dummy as well as an interaction term between one minus the split-
control dummy and the VC-only dummy. The second column shows that only the former
when the firm’s governance is most sensitive to conflicts of interest. This problem will manifest when boardseats are more evenly balanced between common shareholders and preferred Series A shareholders.
34We thus define a split-control dummy as being equal to one if preferred shareholders hold between onethird and two thirds of board seats (inclusive of the boundaries), and zero otherwise. Close to half of thefirms in our sample qualify as split-control under this designation, indicating that we have ample power totest this hypothesis. Of course, a finding of a correlation between split-control and firm performance doesnot necessarily imply causality. For example, even though our results suggest it may be harmful to do so,VCs may work to create cleaner governance structures including split boards that alleviate potential issueswith entrenchment or agency problems related to private benefits of full control. Alternatively, firms withsplit control might reflect the need for more diverse advice and skills. These types of firms may be moredifficult to bring to successful exit.
25

term is positive and significant. In contrast, the second term is negative and insignificant.
The third column restates the same result as in the second column using a level plus cross
term approach. These findings suggest that the superior performance of VC-only deals
relative to mixed investor composition deals is most extreme for deals that have a board
composition reflecting split control between founders and VCs. This result is consistent
with both the strong and weak forms of the selection argument. If these deals are indeed
better ex-ante, then savvy entrepreneurs will match with VCs and refuse to match with
angels. Given the high deal quality they will have greater bargaining power and VCs will
invest with fewer protections. The weaker form of the argument would suggests that VC
preferences are more strongly aligned with these entrepreneurs than in other deals in which
angels are involved. This would suggest that the presence of angels either creates more
conflict between the entrepreneurs and VCs, or angels were invited by the entrepreneurs
because of better preference alignment, and weaker alignment with VCs.
The fourth column of Table XI explores one dimension in which preferences might
diverge. The hypothesis is that the time to resolution should also be longer if angels prefer-
ences differ in terms of time horizons. In particular, we thus predict that the same variables
that predict merger or IPO outcomes in the first three columns should be negatively related
to the time to resolution. We focus in particular on the Split Control x VC Only cross term.
The results show that this variable is indeed negatively related to the time to resolution,
and this result is significant at the 5% level. As was the case in the outcomes regression,
the split control dummy and the separate VC only levels variable are not significant. We
conclude that the same mixed and VC-only deals that have inferior outcomes that are re-
lated to split control also indeed have longer times to resolution. Note that while a selection
argument based on angel naıvete also predicts that angel associated deals should have in-
ferior outcomes, this inferiority should be associated with the presence of angels generally,
and not large deals that also have VCs involved.
To the degree that entrepreneur’s characteristics are associated with deal quality, the
fifth column of Table XI examines further examines the selection hypothesis. Although
some managerial characteristics are related to outcomes (managers who have an MBA are
less likely to exit via merger or IPO, significant only at the 10% level), the key finding
in this specification is that these controls do not subsume the VC-only variable. In fact,
when compared to the first column, the VC-only coefficient actually becomes stronger when
managerial characteristics are added. VC-only is also significant at the 1% level, as com-
pared to the 5% level in column one. Thus if VCs are selecting higher quality deals, these
characteristics are not easily measured by the econometrician.
We caution that this is a small sample and hence eonly a small number of deals fall into
these sub-categories. Testing whether large deals that are also VC-only with split control
26

have differing performance is pushing the limits of the information in the data. As such, we
should interpret our results regarding exits as interesting, and have a bit more confidence
in our results regarding time to resolution as this is a more high-fidelity measure. This
contrasts with our results regarding investor rights, which is tested on several different
control and cashflow rights measures.
Our final test is indirect. If angels are either naive or preferences are more closely aligned
with entrepreneurs, and this drives the weaker investor rights in angel deals, this should
be reflected in the use of legal representation in these deals. A unique characteristic of
our sample is that we can observe billable hours. We can test whether there will be fewer
billable hours due to contract simplicity and the likelihood that angel investors will raise
fewer legal issues than institution-minded venture capital investors.
Table XII displays results of regressions where the natural logarithm of total hours billed
(specifically due to the Series A financing) is the dependent variable. The table shows that
angel-only transactions indeed generate fewer billable hours. This result is significant at
the 10% level and thus only weakly supports the expanded hypothesis. In small deals,
VC-only deals are associated with significantly more billable hours. Thus, the presence of
angels is associated with less legal representation in these smaller deals. Taking into account
the similar outcomes in smaller deals, it does not appear that the angels are making poor
investment decisions relative to VCs. However, we do note that the presence of angels is
associated with fewer billable hours in larger deals. Thus, this test provides mixed support
for our hypothesis.35
We also consider one additional test of the different preferences hypothesis that focuses
on angel and founder coalitions in particular, which we do not report to conserve space. We
note that 33 of the deals in our large firm subsample have more than one closing date for
the Series A financing. The interesting question is whether angels or VCs participate more
aggressively in the first closing as compared to the second closing. If angels participate more
aggressively in the first closing, it is more likely that the particular angels in the deal were
35The table also documents that size, concentration (c4) of angel investors (in small deals) the number ofclosings, and the existence of warrants are positively correlated with the number of billable hours. Thesevariables likely proxy for deal complexity, as more complex transactions likely require additional legal pro-tection. Regarding size, potential reputation and legal risk for a law firm may be more significant whendealing with larger companies (otherwise, there are less benign explanations for why larger clients are asso-ciated with higher billed hours). These findings lend some indirect support to Rajan and Winton (1995)’shypothesis that a commons problem leads to fewer investor rights. While not reported, the relationshipbetween angel-only and billable hours is robust to the inclusion of the control rights measures Liquidation,Redemption, Cumulative and Common or VC Board seats. The table also shows that billable hours arenegatively correlated with the fraction of the firm being sold. This result might be driven by firm maturity,as firms selling a larger fraction might be younger firms, which in turn require less legal expertise due totheir simpler corporate structures. Alternatively, naive entrepreneurs may simultaneously sell large sharesof their firm and not negotiate hard on terms. Finally, note that billable hours increase somewhat in thelater periods of the sample, and are significantly higher for Californian start-ups.
27
invited to participate by the founder. In this case, the conflicts of interest we propose, in
particular those associated with the founder and the angels acting as a coalition potentially
opposing the VCs, is more likely to apply. We thus predict that deals having this “angels
lead and VCs follow” pattern in the multiple closings are more likely to experience inferior
outcomes and longer times to resolution as we found in the above tests. Analogously, if
VCs lead in the first closing, and angels invest more in the second closing, it is more likely
that the VCs invited the given angels to participate in the deal, and the given configuration
would thus be less consistent with our preferences hypothesis rooted in angel and founder
coalitions. We thus do not predict any abnormal performance for these “VCs lead and angels
follow” transactions. Of the 33 deals with multiple closings, we find that 5 are “angels lead
and VCs follow” and 12 are “VCs lead and angels follow”. Although these samples are
small and power is limited, we find suggestive support for our preferences hypothesis. In
particular, we find that the deals in which “angels lead and VCs follow” indeed experience
inferior outcomes. All five of these deals fail, and overall this status is correlated with
less successful exit and also a longer time to resolution, both being statistically significant
despite the small sample. This status also correlates positively with having a split board,
but in this case the significance level is just below the 10% level with a p-value of 14%.
Analogously, we do not find any significant results for the 12 deals that are “VCs lead and
angels follow”.
Overall, we find support for the preferences hypothesis. This suggests that VCs do
not simply certify deals, but that investor composition itself might also improve the gov-
ernance quality of the deal. We also test whether another set of observables, in particular
entrepreneurial characteristics, can subsume our VC only coefficient results and find that it
cannot. This final result suggests that if our results are due to VC certification, it is likely
that the VCs are certifying based on more difficult to observe firm intangibles.
D Additional Robustness
There are other potential explanations for our key finding that VC-only deals have a higher
incidence of successful liquidation vis a vis mixed deals. The superior performance of
larger VC-only deals might also arise if some deals require more VC-coaching effort than
others, and if VCs seek to disallow angels from free-riding when the cost of their managerial
effort is high. This hypothesis is consistent with the stronger control rights we observe for
VC-only deals, as greater control might be necessary to leverage the effectiveness of this
effort. This greater effort, in turn, can explain the superior outcomes we observe, and can
also explain why these outcomes are only superior for larger deals where the incentives to
provide effort are greatest. However, we view this as being nested within the preference-
differences hypothesis described in the last section. The issue of free riding versus reward
28
for managerial effort is a specific form of conflict of interest. Because we find some support
for hypothesis that angel preferences differ from VCs, our findings are not inconsistent with
this more specific hypothesis.
It is also possible that VC-only deals outperform in the large deal sample because such
deals attract higher quality VCs. This hypothesis rooted in heterogeneous VC quality is
distinct from the earlier discussed hypothesis suggesting that full VC participation in itself
serves as a separate form of certification. Higher quality VCs may simultaneously demand
more investor friendly terms, and due to their greater abilities, are also able to better guide
the project post-financing. Hsu (2004) finds evidence that entrepreneurs will pay more for
high status VCs. However, in contrast to the findings of Bengtsson and Sensoy (2011).
additional tests reveal that the outperformance of VC-only deals in the large deal sample
likely cannot be attributed to certification. Based on a number of measures including
age, size, successful exit rates of investments targets, and centrality (Piskorski and Anand
2007), we do find that VCs investing on their own have slightly higher prestige than those
co-investing with angels. However, the difference in prestige between VCs investing in VC-
only and mixed deals is rather small relative to the very large difference in prestige between
VCs investing in Brobeck deals relative to the non-Brobeck VCs in Venture Economics.
This likely explains the contrasting findings to Bengtsson and Sensoy. Hence, it is perhaps
not surprising that (in unreported regressions) we find that the prestige of the VCs investing
in a company is not significantly related to control rights, liquidation rights or outcomes.
Moreover, the VC-only variable remains significant when we include various controls for
prestige and ability.36 This result is also inconsistent with a bargaining power hypothesis
if we expect that top VCs simply demand greater rights as in Hsu (2004).
It is also possible that mixed deals with split boards are inherently more complex than
others, and because of this, experience inferior outcomes. If so, this would be a phenomenon
isolated among larger deals, which is not a clear prediction, as we fail to find any analogous
results for smaller deals. Nevertheless, our analysis alone cannot rule out this selection
argument.
VII Conclusion
This experimental project stemming from the proposed Brobeck archive provides a unique
opportunity to better understand the role of angels in financing startups. Two unique
features of our sample make it ideally suited to examine how VCs and angels interact when
36We use a variety of different prestige variables constructed from the statistics in Panel B of Table III,as well as an index based on these measures. The VC prestige for each of the 150 firms’ Series A deals inwhich there is non-zero VC investment is based on a dollar weighted average or an equal weighted averageof the prestige scores for the VCs investing in the deal.
29
both groups are active investors in the same group of transactions. First, our sample offers
a high degree of heterogeneity in investor composition. Second, entrepreneurs in these deals
have a meaningful choice between both investor types.
Consistent with conventional wisdom, we also find that angels make smaller investments
than do venture capitalists while obtaining weaker control and cashflow rights (Ibrahim
2008; Wiltbank and Boeker 2007; ?). However, our results do not fully support the con-
ventional wisdom that angels tend to invest only in common stock, and exert influence
mainly through social networks rather than through formal control rights (Ibrahim 2008;
Wilmerding 2003). We find that angels frequently invest alongside VC firms, purchase the
same preferred stock as VCs, and do obtain some formal control rights by doing so.
We interpret our results as supporting a hypothesis that, on average, angel investors’
preferences are more aligned with entrepreneurs than with VCs. This can explain why angels
invest with weaker investor rights than do VCs. Simply put, weaker conflicts of interests
require fewer protections. Thus, we offer a simple explanation to an apparent paradox that
angels invest with weaker rights than VCs, even under greater uncertainty. We cannot rule
out all alternative explanations, and in particular all selection arguments. However, our
results are best interpreted in the light of the extensive survey evidence, as summarized
in Shane (2008a) which describes the diversity of motives of angel investors. While some
seek only profit, most have longer time horizons, and seek non-pecuniary rewards from their
investment activities. Thus, it should not be surprising that such investors are also willing
to forgo draconian contracts.
30

Appendix: Sample Comparisons to VentureXpert Data
A Target Firm Comparison
From Panel A of Table I, one can see that our sample has a locational bias consistent with
Brobeck’s geographical footprint, with a much higher concentration of deals associated with
firms based in California (53% vs 36%) and Texas (21% vs 6%). In the “other states” cat-
egory, 7% of the Brobeck firms are from Colorado, 8% are from the Northeast Corridor
(Pennsylvania, New York and New England), and the remaining 11% are scattered in the
Midwest, South, Mid-Atlantic, and Washington State, while over 20% of the Venture Eco-
nomics deals are from the Northeast Corridor and only 2% are from Colorado. However,
there are no statistically significant differences in location across the two size subsamples
and the three investor composition subsamples.
We use the Venture Economic Industrial Classifications (VEIC) to identify industries,
and classify the 71 deals from our sample that were not also in Venture Economics using
information from the Brobeck corpus, the World Wide Web and press accounts. We classify
73% of our sample firms as Information Technology firms, as compared to 69% for the
Venture Economics firms. Another 12% of our sample firms are Medical/Health/Life Science
companies versus 13% of the Venture Economics firms. The remainder of our firms are either
non-high-technology or unclassified. Overall, our sample firms are quite representative in
terms of the concentration in technology and life science industries found for new ventures
tracked by Venture Economics. Furthermore, there are no significant differences in industry
classification across the size and investor composition subsamples.
In Panel B of Table I, we show that our sample over-represents deals from the most
recent subperiod of our study. Half of our Series A rounds occurred after March 2000
(when the Nasdaq index began its precipitous drop), as compared to 35% for the subset
of Venture Economics firms we examine (with a comparable proportion during the boom
period of 1998 to 2000). This may reflect a deliberate surge in Brobeck’s business from
2000 to 2002, or alternatively, an increasing reliance on electronic record keeping. Note
also that smaller deals are more concentrated in the earlier periods, which likely reflects
the propensity to favor larger deals over time (in part due to the fact that deal size is in
nominal dollars). However, we do not find any significant increasing or decreasing trends
in the occurrence of angel-only or VC-only deals over time.
With respect to deal size, the mean investment size for Series A deals in our sample is
$6.14 Million, which is statistically smaller than the mean of $7.15 Million for the Venture
Economics firms. While not shown in the table, key percentiles of the deal size distribution
for the Brobeck firms (and Venture Economics firms in parenthesis) are: 25th percentile is
$1.49 Million ($1.5 Million); median is $3.50 million ($3.89 Million); and 75th percentile
31
is $6.96 Million ($8.0 Million), so there is a marked similarity between the low end of the
distribution of deal size within our sample relative to the Venture Economics sample, but
the right tail of the Venture Economics sample is longer. As was also shown in Figure 2,
angel-only deals are much smaller than mixed deals. There is no statistically significant size
difference between VC-only and mixed deals. Because we also have information regarding
the fraction of each firm that is sold at the time of the Series A deal, we also can report that
the average post-money valuation of firms in our sample is $14.9 million, as compared to
$24.4 million in Venture Economics. This number is also smaller for angel-only deals ($6.1
million) versus either VC-only or mixed deals (roughly $16.5 million for both groups).
In terms of age, our sample is overwhelmingly composed of firms that are true start-ups
with very recent incorporation dates. The average age is 1.8 years (we can only identify
incorporation dates for 85% of the firms in our sample). In contrast, firms experiencing
Series A rounds in Venture Economics over the same time period have an average age of 3.1
years (97% of firms have available data). Hence, it appears that Brobeck represented firms
that were somewhat less mature than Venture Economics firms.37 In the Venture Economics
sample, deal size and valuations are correlated with firm age. Hence the differences in age
in the samples is consistent with the differences in deal size and post-money valuations.
We find that angel-only deals are just under two months older than VC-only deals on
average (2.1 years vs 1.8 years), and three months older than mixed deals (1.7 years). Thus,
the fact that Venture Economics does not track angel-only deals does not explain the higher
average age for the Venture Economics firms relative to the firms in our sample. We observe
age for 28 of the 32 angel-only deals. At time of funding, the youngest quartile of firms is less
than 4.6 months old, the median firm is 9 months old, while the top quartile is over 1.5 years
old. The oldest angel-only backed firm is 24 years old, reflecting a skewed distribution. For
the 95 mixed deals for which we observe age, the youngest quartile, median, oldest quartile,
and maximum age are two months, 6.5 months, 1.2 years and 34.5 years, respectively.
Finally, for the 32 venture only deals, these four statistics are 5 weeks, 4 months, 1.75 years
and 15 years, respectively. A cautionary note is in order. Based on public sources, it is
often not possible to ascertain the date of founding with precision. The Venture Economics
database commonly assigns January 1st as a founding date when only the founding year is
37To calculate age for companies in the Brobeck sample we first looked to documents in the Brobeckcollection, which often included incorporation dates. When dates were absent from the Brobeck records,we consulted public sources such as company websites, the Internet Archive (www.archive.org) and pressreleases. Finally, we relied on Venture Economics if the firm was venture backed and we were unable to datethe company based on other sources. To check if this caused any biases, we compared the age in VentureEconomics to that from the other sources for 102 of the companies for which we observe age from bothsources. Based on Venture Economics, these companies were approximately six months older at time offinancing than based on the other sources. However, this difference is not statistically significant. Hence,biases in the data sources do not explain the age differences between the Brobeck sample and the VentureEconomics sample.
32

known. To maintain comparability, we followed this convention.
Our sample is thus quite representative relative to firms with Series A deals in the
Venture Economics database in terms of industry, but there are also systematic differences
with regards to timing, size, age and location. Biases associated with sample selection could
affect our results if, for example, there are systematic differences in control rights between
the East and West coasts, as suggested by Gupta (2000), or changes in the structure of
deals following the peak in new technology venture creation in 2000. We thus control for
firm characteristics in the multivariate regressions we present later, both to ensure that the
unique characteristics of our sample do not drive any of our results, as well as to see whether
the cross-sectional variation in these characteristics within our sample are systematically
related to the structure of deals and company success.
VC-Firm Comparison
Since most of the VCs investing in Brobeck deals are included in the Venture Economics
database, we can provide a more in-depth comparison of the VCs that invest in the 150
Brobeck deals involving VCs relative to the other VCs tracked by Venture Economics. Table
III documents various attributes of these VC firms, and highlights any differences between
VCs investing in small versus large deals, or in VC-only versus mixed deals. All data, except
the centrality measures, are obtained directly from the Venture Economics database.38 For
each private equity fund that invested in one of our sample deals, we aggregate the fund-
level information to the VC firm level (and identify this as a “Brobeck VC Firm”). For the
universe of Venture Economics VC firms, we exclude firms whose last investment occurred
prior to 1993 or whose first investment occurred after 2002 (i.e., outside of our sample
period), which yields 5,585 “Non-Brobeck” VC firms.
Panel A of Table III shows that VCs participating in Brobeck deals are more likely to
manage US-based funds, in particular California-based funds. They are also more likely
to manage early stage funds, but not seed stage funds. In addition, these private equity
managers are more likely to manage VC funds and less likely to manage buyout funds.
Private equity firms investing in VC-only deals are more likely to manage US funds and
with slightly less of an early stage VC focus, as compared to those investing in mixed
deals in our sample (while VCs in small and large deals are fairly similar across all these
dimensions). We find that Brobeck VC firms are older, and particularly those investing in
VC-only deals.39
38We thank Mikolaj Jan Piskorski for sharing centrality measures based on Venture Economics data.Piskorski and Anand (2007) calculate eigenvector centrality (Bonacich 1972) through 1999. We matchedPiskorski and Anand’s 1999 centrality measures to VC firms in our sample.
39We have also conducted a multivariate analysis predicting whether a VC firm becomes affiliated with
33

Because age is likely related to long-term success as well as greater VC experience, it
appears that VC firms investing in Brobeck deals have higher prestige. Panel B of Table III
includes other variables that may proxy for prestige. For example, we find that VC firms
that invest in Brobeck deals have a higher incidence of IPOs and acquisitions across all of
the companies they invested in through all of their funds.40 We also find that Brobeck PE
firms have raised more venture funds, have managed more capital (per fund and overall),
and have a higher centrality measure. While VCs participating in large vs small Brobeck
deals do not differ across these dimensions, those investing in VC-only deals in our sample
have higher success through liquidity events, more funds under management, and more total
capital raised than those in mixed deals. Overall, this suggests that VC firms investing in
Brobeck deals, and particularly in deals where there are no angels, appear to have high
prestige. This is consistent with our belief that Brobeck’s reputation allowed it to attract
higher quality clients – both more prominent VCs, and higher quality start ups.
a Brobeck Series A deal, and this analysis yields similar conclusions to those indicated by the univariatestatistics.
40Ivanov, Krishnan, Masulis, and Singh (2008) find a positive relationship between IPO rates and VCreputation.
34
References
Aghion, P. and P. Bolton (1992). An incomplete contracts approach to financial contracting.
The Review of Economic Studies 59 (3), 473–494.
Aghion, P. and J. Tirole (1994). The management of innovation. The Quarterly Journal of
Economics 109 (4), 1185–1209.
Bengtsson, O. (2011). Covenants in venture capital contracts. Management Science 57 (11),
1926–1943.
Bengtsson, O. (2012). Financial contracting in U.S. venture capital: Overview and empirical
evidence. The Oxford Handbook of Venture Capital , 509–541.
Bengtsson, O. and B. A. Sensoy (2011). Investor abilities and financial contracting: Evi-
dence from venture capital. Journal of Financial Intermediation 20 (4), 477–502.
Bernstein, L. (1995). The Silicon Valley lawyer as transaction cost engineer. Oregon Law
Review 74, 239.
Bonacich, P. (1972). Factoring and weighting approaches to status scores and clique iden-
tification. Journal of Mathematical Sociology 2, 113–120.
Brav, A. and P. Gompers (1997). Myth or reality? The long-run underperformance of initial
public offerings: Evidence from venture capital and nonventure capital-backed companies.
Journal of Finance 52, 1791–1822.
Broughman, B. and J. Fried (2010). Renegotiation of cash flow rights in the sale of vc-backed
firms. Journal of Financial Economics 95 (3), 384–399.
Casamatta, C. (2003). Financing and advising: Optimal financial contracts with venture
capitalists. The Journal of Finance 58, 2059–2085.
Chemmanur, T. and Z. Chen (2006). Angels, venture capitalists, and entrepreneurs: a
dynamic model of private equity financing. Unpublished working paper, Boston College,
Boston, MA.
Cochrane, J. (2005). The risk and return of venture capital. Journal of Financial Eco-
nomics 75, 3–52.
Da Rin, M., T. Hellmann, and M. Puri (2013). A survey of venture capital research. In
Handbook of the Economics of Finance. Elsevier.
35
Dessein, W. (2005). Information and control in ventures and alliances. Journal of Fi-
nance 60 (5), 2513–2549.
Dzienkowski, J. and R. Peroni (2002). The decline in lawyer independence: Lawyer equity
investments in clients. Texas Law Review 81, 405.
Fairchild, R. (2011). An entrepreneur’s choice of venture capitalist or angel-financing: A
behavioral game-theoretic approach. Journal of Business Venturing 26 (3), 359–374.
Fenn, G. W. and N. Liang (1998). New resources and new ideas: Private equity for small
business. Journal of Banking and Finance 22, 1077–1094.
Fenn, G. W., N. Liang, and S. Prowse (1995). The economics of the private equity market.
Technical report.
Freear, J., J. E. Sohl, and W. Wetzel (2002). Angles on angels: financing technology-
based ventures - a historical perspective. Venture Capital: An International Journal of
Entrepreneurial Finance 4 (4), 275–287.
Freear, J., J. E. Sohl, and W. E. Wetzel Jr (1995). Angels: personal investors in the venture
capital market. Entrepreneurship & Regional Development 7 (1), 85–94.
Gompers, P. (1995). Optimal investment, monitoring, and the staging of venture capital.
Journal of Finance 50 (5), 1451–1490.
Gompers, P. (1999, January). Ownership and control in entrepreneurial firms: An exami-
nation of convertible securities in venture capital investments. Working Paper, Harvard
University.
Gompers, P., A. Kovner, and J. Lerner (2009). Specialization and success: Evidence from
venture capital. Journal of Economics and Management Strategy 18 (3), 817–844.
Gupta, U. (2000). Done deals: Venture capitalists tell their stories. Cambridge, Mass.:
Harvard Business School Press.
Hall, R. and S. Woodward (2007, April). The incentives to start new companies: Evidence
from venture capital. Working Paper 13056, National Bureau of Economic Research.
Hellmann, T. (2002). A theory of strategic venture investing. Journal of Financial Eco-
nomics 64 (2), 285–314.
Hochberg, Y., A. Ljungqvist, and Y. Lu (2007). Whom you know matters: Venture capital
networks and investment performance. Journal of Finance 62 (1), 251–301.
36
Holmstrom, B. (1979). Moral hazard and observability. The Bell Journal of Economics,
74–91.
Hsu, D. (2004). What do entrepreneurs pay for venture capital affiliation? The Journal of
Finance 59 (4), 1805–1844.
Ibrahim, D. M. (2008). The (not so) puzzling behavior of angel investors. Vanderbilt Law
Review 61, 1405–1452.
Ivanov, V., C. Krishnan, R. Masulis, and A. Singh (2008, February). Does venture capi-
tal reputation matter? Evidence from successful IPOs. Working Paper, Case Western
University.
Jensen, M. C. and W. H. Meckling (1976). Theory of the firm: Managerial behavior, agency
costs and ownership structure. Journal of financial economics 3 (4), 305–360.
Jovanovic, B. and B. Szentes (2007, January). On the return to venture capital. Working
Paper 12874, National Bureau of Economic Research.
Kaplan, S. and A. Schoar (2005). Private equity performance: Returns, persistence and
capital flows. Journal of Finance 60 (4), 1791–1823.
Kaplan, S. N. and P. Stromberg (2003). Financial contracting theory meets the real world:
An empirical analysis of venture capital contracts. Review of Economic Studies 70, 281–
315.
Kaplan, S. N. and P. Stromberg (2004). Characteristics, contracts, and actions: Evidence
from venture capitalist analyses. The Journal of Finance 59 (5), 2177–2210.
Kerr, W. R., J. Lerner, and A. Schoar (2011). The consequences of entrepreneurial finance:
Evidence from angel financings. Review of Financial Studies.
Kostal, S. (2003, July). The Brobeck mutiny. San Francisco Magazine, 73ff.
Lacetera, N. (2009). Different missions and commitment power in R&D organization: The-
ory and evidence on industry-university alliances. Organization Science 20 (3), 565–582.
Lerner, J. and R. P. Merges (1998). The control of technology alliances: An empirical
analysis of the biotechnology industry. Journal of Industrial Economics 46 (2), 125–156.
Linde, L., A. Prasad, K. Morse, M. Utterback, H. Stevenson, and M. Roberts (2000).
Venture support systems project: angel investors. Unpublished manuscript, MIT En-
trepreneurship Center .
37

Ljungqvist, A. and M. Richardson (2003, January). The cash flow, return and risk charac-
teristics of private equity. Working Paper 9454, National Bureau of Economic Research.
Megginson, W. and K. Weiss (1991). Venture capitalist certification in initial public offer-
ings. Journal of Finance 46 (3), 879–903.
Moskowitz, T. and A. Vissing-Jorgensen (2002). The returns to entrepreneurial investment:
A private equity premium puzzle? The American Economic Review 92 (4), 745–778.
Murphy, B. J., K. D. Dillman, and J. O. Johnston (2005, February 18). re: Brobeck, Phleger
and Harrison L.L.P., debtor, motion for order (a) approving settlement agreements with
189 former partners of the debtor... (Case 03-32715-DM7 Bankruptcy N.D. California).
Myers, S. C. (1977). Determinants of corporate borrowing. Journal of financial eco-
nomics 5 (2), 147–175.
Piskorski, M. J. and B. Anand (2007). Status without resources? Evidence from the venture
capital industry. Working Paper, Harvard University.
Prowse, S. (1998). Angel investors and the market for angel investments. Journal of Banking
and Finance 22, 785–792.
Puri, M. (1996). Commercial banks in investment banking conflict of interest or certification
role? Journal of Financial Economics 40 (3), 373–401.
Rajan, R. and A. Winton (1995). Covenants and collateral as incentives to monitor. The
Journal of Finance 50 (4), 1113–1146.
Reynolds, P. (2005). Entrepreneurship in the United States: The future is now. Miami:
Florida International University.
Robb, A. M. and D. T. Robinson (forthcoming). The capital structure decisions of new
firms. Review of Financial Studies.
Sappington, D. (1983). Limited liability contracts between principal and agent. Journal of
Economic Theory 29 (1), 1–21.
Schwienbacher, A. (2007). A theoretical analysis of optimal financing strategies for different
types of capital-constrained entrepreneurs. Journal of Business Venturing 22 (6), 753–
781.
Shane, S. (2008a). Fool’s Gold?: The Truth Behind Angel Investing in America. Oxford
University Press.
38

Shane, S. (2008b). The Illusions of Entrepreneurship: The Costly Myths that Entrepreneurs,
Investors and Policy Makers Live by. Yale University Press.
Smith Jr, C. W. and J. B. Warner (1979). On financial contracting: An analysis of bond
covenants. Journal of financial economics 7 (2), 117–161.
Vronsky, P. M. (2007, November). Venture Capital Law Firms: An Analysis of Equity
Investment and Networks. Available at SSRN: http://ssrn.com/paper=1088545D.
Wilmerding, A. (2003). Term Sheets & Valuations: An inside look at the intricacies of term
sheets & valuations. Aspatore.
Wiltbank, R. and W. Boeker (2007, November). Returns to angel investors in groups.
Available at SSRN: http://ssrn.com/paper=1028592.
Wong, A., M. Bhatia, and Z. Freeman (2009). Angel finance: The other venture capital.
Strategic Change 18 (7-8), 221–230.
Woodward, S. and R. Hall (2004, January). Benchmarking the returns to venture. Working
Paper 10202, National Bureau of Economic Research.
39

Figure 1: Angel share of deals by number of investors and dollars.
The figure depicts how deals vary in their investor composition. Top panel: frequency of different investorcompositions (fraction of angel investors in deal), unweighted by investment amounts. Bottom panel: frequency ofdifferent investor compositions weighted by dollars invested. Both graphs are based on the entire sample (182 firms).
0
0
020
20
2040
40
4060
60
60Number of Deals
Num
ber o
f Dea
ls
Number of Deals0
0
0.2
.2
.2.4
.4
.4.6
.6
.6.8
.8
.81
1
1Fraction of angel investors in deal
Fraction of angel investors in deal
Fraction of angel investors in deal0
0
020
20
2040
40
4060
60
60Number of Deals
Num
ber o
f Dea
ls
Number of Deals0
0
0.2
.2
.2.4
.4
.4.6
.6
.6.8
.8
.81
1
1Fraction of angel dollars in deal
Fraction of angel dollars in deal
Fraction of angel dollars in deal
40

Figure 2: Investment size distribution by investor composition
The figure depicts the distribution of investment size for 32 deals where only angels participated (angel-only deals),111 deals where both angels and VCs participated (mixed deals) and 38 deals in which only VCs participated(VC-only deals). The size of the deal is measured in millions of dollars. The distribution of the 20th, 40th, 60th,80th and 90th percentiles are noted by 20, 40, 60, 80 and 90 respectively. The number of deals of magnitude aboveor below the 50th percentile of all deals for each of the investor composition groups appears to either side of themedian deal size vertical line.20
20
2040
40
4060
60
6080
80
8090
90
9020
20
2040
40
4060
60
6080
80
8090
90
9020
20
2040
40
4060
60
6080
80
8090
90
90median deal size = $3.5M
median deal size = $3.5M
median deal size = $3.5Mn=29
n=29
n=29n=44
n=44
n=44n=18
n=18
n=18n=3
n=3
n=3n=68
n=68
n=68n=20
n=20
n=201
1
12
2
23
3
34
4
46
6
67
7
78
8
89
9
911
11
1112
12
1213
13
1314
14
1416
16
1617
17
1718
18
1819
19
190
0
05
5
510
10
1015
15
1520
20
20Size of deal (millions of USD)
Size of deal (millions of USD)
Size of deal (millions of USD)VC only
VC only
VC onlyMixed deal
Mixed deal
Mixed dealAngel only
Angel only
Angel only
41
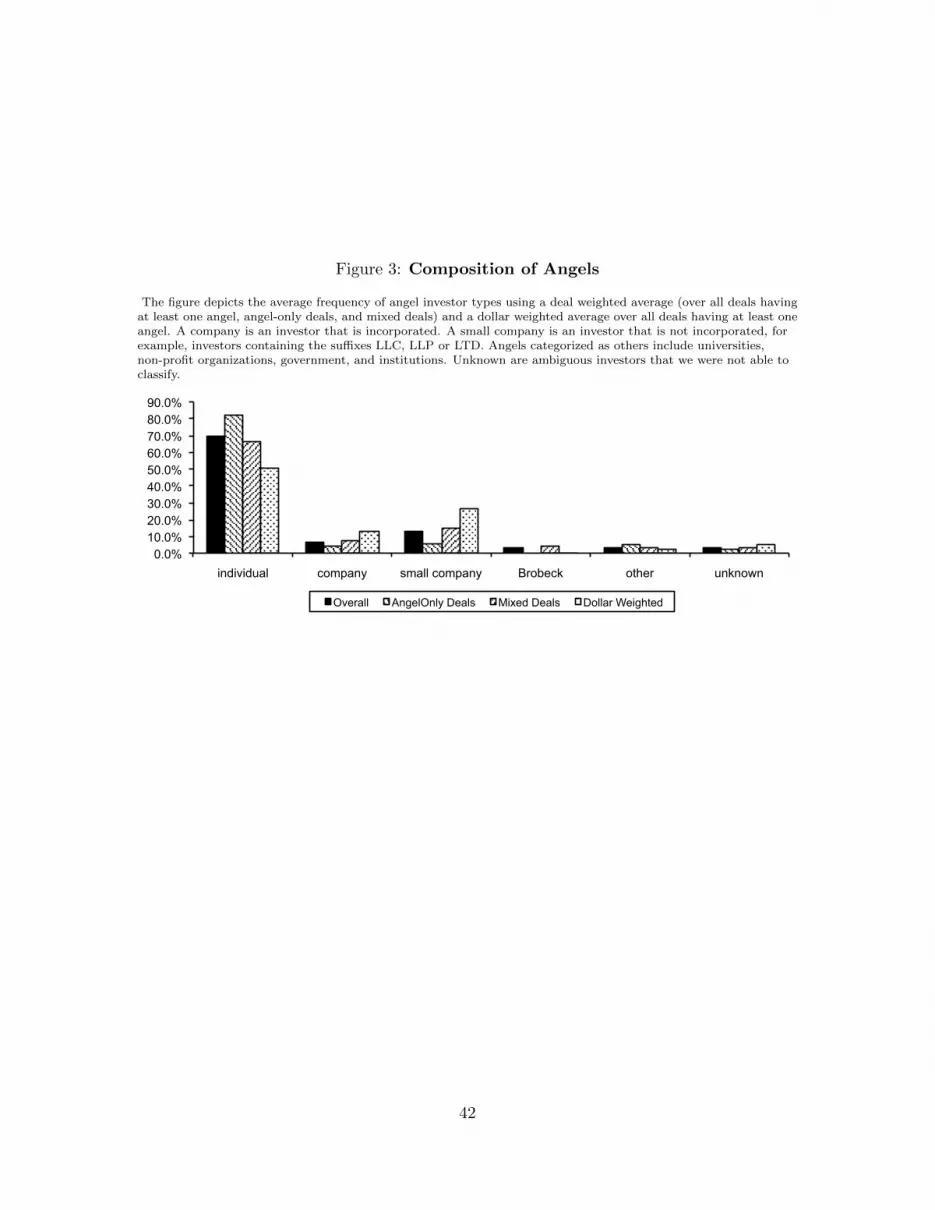
Figure 3: Composition of Angels
The figure depicts the average frequency of angel investor types using a deal weighted average (over all deals havingat least one angel, angel-only deals, and mixed deals) and a dollar weighted average over all deals having at least oneangel. A company is an investor that is incorporated. A small company is an investor that is not incorporated, forexample, investors containing the suffixes LLC, LLP or LTD. Angels categorized as others include universities,non-profit organizations, government, and institutions. Unknown are ambiguous investors that we were not able toclassify.
0.0% 10.0% 20.0% 30.0% 40.0% 50.0% 60.0% 70.0% 80.0% 90.0%
individual company small company Brobeck other unknown
Non-Venture Investor Types
Overall AngelOnly Deals Mixed Deals Dollar Weighted
42
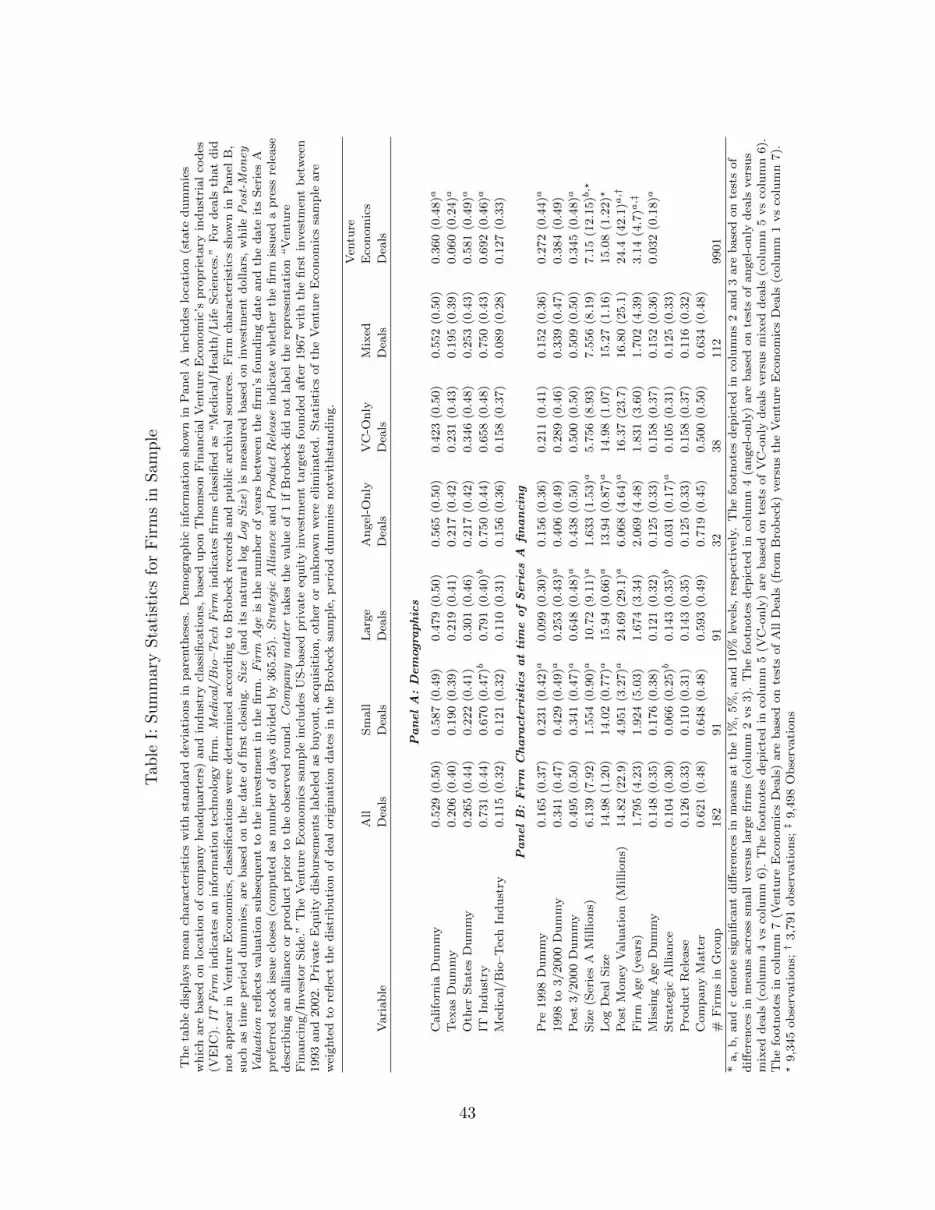
Tab
leI:
Su
mm
ary
Sta
tist
ics
for
Fir
ms
inS
amp
le
Th
eta
ble
dis
pla
ys
mea
nch
ara
cter
isti
csw
ith
stan
dard
dev
iati
on
sin
pare
nth
eses
.D
emogra
ph
icin
form
ati
on
show
nin
Pan
elA
incl
ud
eslo
cati
on
(sta
ted
um
mie
sw
hic
hare
base
don
loca
tion
of
com
pany
hea
dqu
art
ers)
an
din
du
stry
class
ifica
tion
s,b
ase
du
pon
Th
om
son
Fin
an
cial
Ven
ture
Eco
nom
ic’s
pro
pri
etary
ind
ust
rial
cod
es(V
EIC
).IT
Fir
min
dic
ate
san
info
rmati
on
tech
nolo
gy
firm
.M
edic
al/
Bio
–T
ech
Fir
min
dic
ate
sfi
rms
class
ified
as
“M
edic
al/
Hea
lth
/L
ife
Sci
ence
s.”
For
dea
lsth
at
did
not
ap
pea
rin
Ven
ture
Eco
nom
ics,
class
ifica
tion
sw
ere
det
erm
ined
acc
ord
ing
toB
rob
eck
reco
rds
an
dp
ub
lic
arc
hiv
al
sou
rces
.F
irm
chara
cter
isti
cssh
ow
nin
Pan
elB
,su
chas
tim
ep
erio
dd
um
mie
s,are
base
don
the
date
of
firs
tcl
osi
ng.
Siz
e(a
nd
its
natu
ral
log
Log
Siz
e)
ism
easu
red
base
don
inves
tmen
td
oll
ars
,w
hile
Po
st-M
on
eyV
alu
ati
on
refl
ects
valu
ati
on
sub
sequ
ent
toth
ein
ves
tmen
tin
the
firm
.F
irm
Age
isth
enu
mb
erof
yea
rsb
etw
een
the
firm
’sfo
un
din
gd
ate
an
dth
ed
ate
its
Ser
ies
Ap
refe
rred
stock
issu
ecl
ose
s(c
om
pu
ted
as
nu
mb
erof
days
div
ided
by
365.2
5).
Str
ate
gic
All
ian
cean
dP
rod
uct
Rel
ease
ind
icate
wh
eth
erth
efi
rmis
sued
ap
ress
rele
ase
des
crib
ing
an
allia
nce
or
pro
du
ctp
rior
toth
eob
serv
edro
un
d.
Co
mpa
ny
ma
tter
takes
the
valu
eof
1if
Bro
bec
kd
idn
ot
lab
elth
ere
pre
senta
tion
“V
entu
reF
inan
cin
g/In
ves
tor
Sid
e.”
Th
eV
entu
reE
con
om
ics
sam
ple
incl
ud
esU
S-b
ase
dp
rivate
equ
ity
inves
tmen
tta
rget
sfo
un
ded
aft
er1967
wit
hth
efi
rst
inves
tmen
tb
etw
een
1993
an
d2002.
Pri
vate
Equ
ity
dis
bu
rsem
ents
lab
eled
as
buyou
t,acq
uis
itio
n,
oth
eror
un
know
nw
ere
elim
inate
d.
Sta
tist
ics
of
the
Ven
ture
Eco
nom
ics
sam
ple
are
wei
ghte
dto
refl
ect
the
dis
trib
uti
on
of
dea
lori
gin
ati
on
date
sin
the
Bro
bec
ksa
mp
le,
per
iod
du
mm
ies
notw
ith
stan
din
g.
Ven
ture
All
Sm
all
Larg
eA
ngel
-On
lyV
C-O
nly
Mix
edE
con
om
ics
Vari
ab
leD
eals
Dea
lsD
eals
Dea
lsD
eals
Dea
lsD
eals
Pan
el
A:
Dem
ogra
phic
s
Califo
rnia
Du
mm
y0.5
29
(0.5
0)
0.5
87
(0.4
9)
0.4
79
(0.5
0)
0.5
65
(0.5
0)
0.4
23
(0.5
0)
0.5
52
(0.5
0)
0.3
60
(0.4
8)a
Tex
as
Du
mm
y0.2
06
(0.4
0)
0.1
90
(0.3
9)
0.2
19
(0.4
1)
0.2
17
(0.4
2)
0.2
31
(0.4
3)
0.1
95
(0.3
9)
0.0
60
(0.2
4)a
Oth
erS
tate
sD
um
my
0.2
65
(0.4
4)
0.2
22
(0.4
1)
0.3
01
(0.4
6)
0.2
17
(0.4
2)
0.3
46
(0.4
8)
0.2
53
(0.4
3)
0.5
81
(0.4
9)a
ITIn
du
stry
0.7
31
(0.4
4)
0.6
70
(0.4
7)b
0.7
91
(0.4
0)b
0.7
50
(0.4
4)
0.6
58
(0.4
8)
0.7
50
(0.4
3)
0.6
92
(0.4
6)a
Med
ical/
Bio
–T
ech
Ind
ust
ry0.1
15
(0.3
2)
0.1
21
(0.3
2)
0.1
10
(0.3
1)
0.1
56
(0.3
6)
0.1
58
(0.3
7)
0.0
89
(0.2
8)
0.1
27
(0.3
3)
Pan
el
B:
Fir
mC
hara
cte
rist
ics
at
tim
eof
Seri
es
Afi
nan
cin
g
Pre
1998
Du
mm
y0.1
65
(0.3
7)
0.2
31
(0.4
2)a
0.0
99
(0.3
0)a
0.1
56
(0.3
6)
0.2
11
(0.4
1)
0.1
52
(0.3
6)
0.2
72
(0.4
4)a
1998
to3/2000
Du
mm
y0.3
41
(0.4
7)
0.4
29
(0.4
9)a
0.2
53
(0.4
3)a
0.4
06
(0.4
9)
0.2
89
(0.4
6)
0.3
39
(0.4
7)
0.3
84
(0.4
9)
Post
3/2000
Du
mm
y0.4
95
(0.5
0)
0.3
41
(0.4
7)a
0.6
48
(0.4
8)a
0.4
38
(0.5
0)
0.5
00
(0.5
0)
0.5
09
(0.5
0)
0.3
45
(0.4
8)a
Siz
e(S
erie
sA
Million
s)6.1
39
(7.9
2)
1.5
54
(0.9
0)a
10.7
2(9
.11)a
1.6
33
(1.5
3)a
5.7
56
(8.9
3)
7.5
56
(8.1
9)
7.1
5(1
2.1
5)b
,?
Log
Dea
lS
ize
14.9
8(1
.20)
14.0
2(0
.77)a
15.9
4(0
.66)a
13.9
4(0
.87)a
14.9
8(1
.07)
15.2
7(1
.16)
15.0
8(1
.22)?
Post
Mon
eyV
alu
ati
on
(Milli
ons)
14.8
2(2
2.9
)4.9
51
(3.2
7)a
24.6
9(2
9.1
)a6.0
68
(4.6
4)a
16.3
7(2
3.7
)16.8
0(2
5.1
)24.4
(42.1
)a,†
Fir
mA
ge
(yea
rs)
1.7
95
(4.2
3)
1.9
24
(5.0
3)
1.6
74
(3.3
4)
2.0
69
(4.4
8)
1.8
31
(3.6
0)
1.7
02
(4.3
9)
3.1
4(4
.7)a
,‡
Mis
sin
gA
ge
Du
mm
y0.1
48
(0.3
5)
0.1
76
(0.3
8)
0.1
21
(0.3
2)
0.1
25
(0.3
3)
0.1
58
(0.3
7)
0.1
52
(0.3
6)
0.0
32
(0.1
8)a
Str
ate
gic
Allia
nce
0.1
04
(0.3
0)
0.0
66
(0.2
5)b
0.1
43
(0.3
5)b
0.0
31
(0.1
7)a
0.1
05
(0.3
1)
0.1
25
(0.3
3)
Pro
du
ctR
elea
se0.1
26
(0.3
3)
0.1
10
(0.3
1)
0.1
43
(0.3
5)
0.1
25
(0.3
3)
0.1
58
(0.3
7)
0.1
16
(0.3
2)
Com
pany
Matt
er0.6
21
(0.4
8)
0.6
48
(0.4
8)
0.5
93
(0.4
9)
0.7
19
(0.4
5)
0.5
00
(0.5
0)
0.6
34
(0.4
8)
#F
irm
sin
Gro
up
182
91
91
32
38
112
9901
*a,
b,
an
dc
den
ote
sign
ifica
nt
diff
eren
ces
inm
ean
sat
the
1%
,5%
,an
d10%
level
s,re
spec
tivel
y.T
he
footn
ote
sd
epic
ted
inco
lum
ns
2an
d3
are
base
don
test
sof
diff
eren
ces
inm
ean
sacr
oss
small
ver
sus
larg
efi
rms
(colu
mn
2vs
3).
Th
efo
otn
ote
sd
epic
ted
inco
lum
n4
(an
gel
-on
ly)
are
base
don
test
sof
an
gel
-on
lyd
eals
ver
sus
mix
edd
eals
(colu
mn
4vs
colu
mn
6).
Th
efo
otn
ote
sd
epic
ted
inco
lum
n5
(VC
-on
ly)
are
base
don
test
sof
VC
-on
lyd
eals
ver
sus
mix
edd
eals
(colu
mn
5vs
colu
mn
6).
Th
efo
otn
ote
sin
colu
mn
7(V
entu
reE
con
om
ics
Dea
ls)
are
base
don
test
sof
All
Dea
ls(f
rom
Bro
bec
k)
ver
sus
the
Ven
ture
Eco
nom
ics
Dea
ls(c
olu
mn
1vs
colu
mn
7).
?9,3
45
ob
serv
ati
on
s;†
3,7
91
ob
serv
ati
on
s;‡
9,4
98
Ob
serv
ati
on
s
43
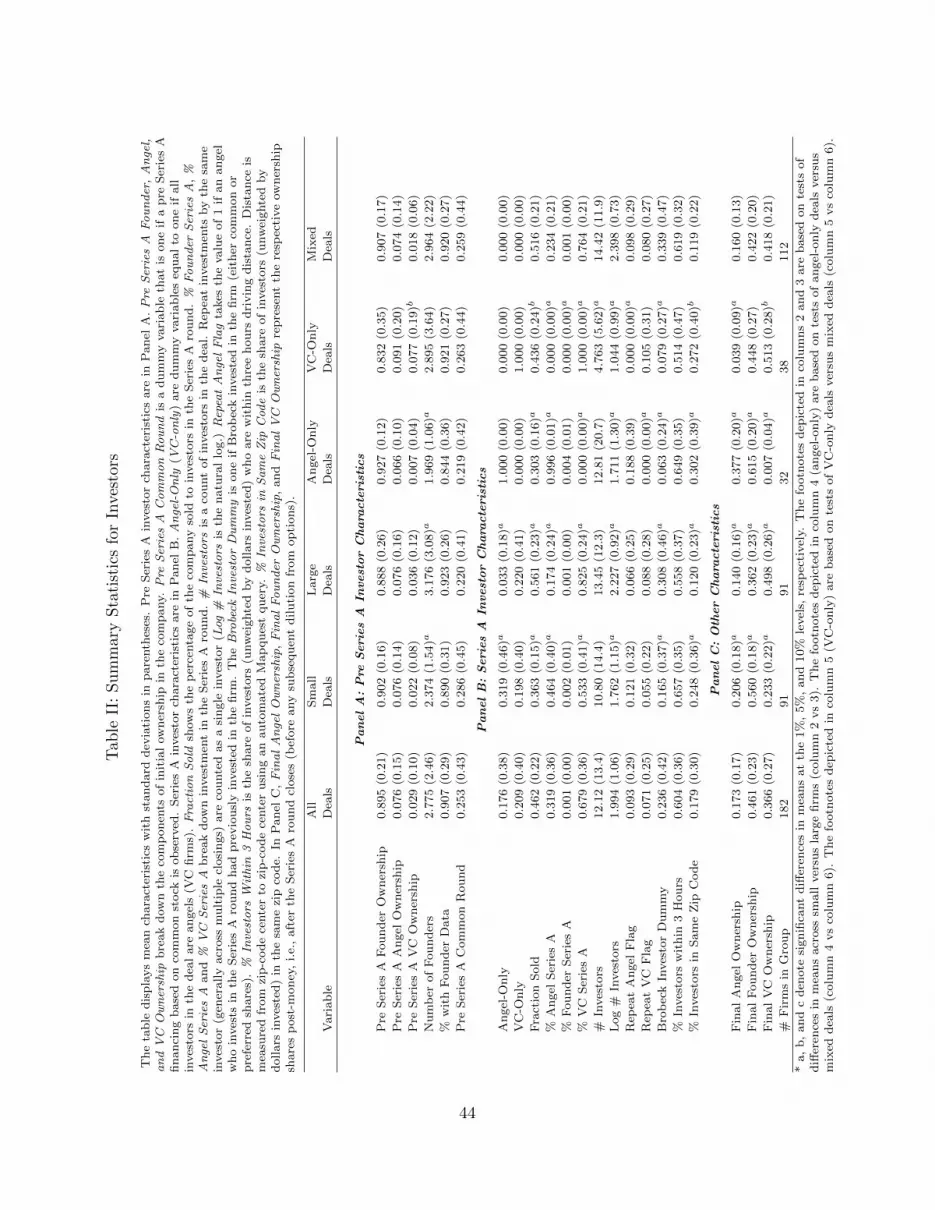
Tab
leII
:S
um
mar
yS
tati
stic
sfo
rIn
vest
ors
Th
eta
ble
dis
pla
ys
mea
nch
ara
cter
isti
csw
ith
stan
dard
dev
iati
on
sin
pare
nth
eses
.P
reS
erie
sA
inves
tor
chara
cter
isti
csare
inP
an
elA
.P
reS
erie
sA
Fo
un
der
,A
nge
l,a
nd
VC
Ow
ner
ship
bre
ak
dow
nth
eco
mp
on
ents
of
init
ial
ow
ner
ship
inth
eco
mp
any.
Pre
Ser
ies
AC
om
mo
nR
ou
nd
isa
du
mm
yvari
ab
leth
at
ison
eif
ap
reS
erie
sA
fin
an
cin
gb
ase
don
com
mon
stock
isob
serv
ed.
Ser
ies
Ain
ves
tor
chara
cter
isti
csare
inP
an
elB
.A
nge
l-O
nly
(VC
-on
ly)
are
du
mm
yvari
ab
les
equ
al
toon
eif
all
inves
tors
inth
ed
eal
are
an
gel
s(V
Cfi
rms)
.F
ract
ion
So
ldsh
ow
sth
ep
erce
nta
ge
of
the
com
pany
sold
toin
ves
tors
inth
eS
erie
sA
rou
nd
.%
Fo
un
der
Ser
ies
A,
%A
nge
lS
erie
sA
an
d%
VC
Ser
ies
Ab
reak
dow
nin
ves
tmen
tin
the
Ser
ies
Aro
un
d.
#In
vest
ors
isa
cou
nt
of
inves
tors
inth
ed
eal.
Rep
eat
inves
tmen
tsby
the
sam
ein
ves
tor
(gen
erally
acr
oss
mu
ltip
lecl
osi
ngs)
are
cou
nte
das
asi
ngle
inves
tor
(Log
#In
vest
ors
isth
en
atu
ral
log.)
Rep
eat
An
gel
Fla
gta
kes
the
valu
eof
1if
an
an
gel
wh
oin
ves
tsin
the
Ser
ies
Aro
un
dh
ad
pre
vio
usl
yin
ves
ted
inth
efi
rm.
Th
eB
robe
ckIn
vest
or
Du
mm
yis
on
eif
Bro
bec
kin
ves
ted
inth
efi
rm(e
ith
erco
mm
on
or
pre
ferr
edsh
are
s).
%In
vest
ors
Wit
hin
3H
ou
rsis
the
share
of
inves
tors
(unw
eighte
dby
dollars
inves
ted
)w
ho
are
wit
hin
thre
eh
ou
rsd
rivin
gd
ista
nce
.D
ista
nce
ism
easu
red
from
zip
-cod
ece
nte
rto
zip
-cod
ece
nte
ru
sin
gan
au
tom
ate
dM
ap
qu
est
qu
ery.
%In
vest
ors
inS
am
eZ
ipC
ode
isth
esh
are
of
inves
tors
(unw
eighte
dby
dollars
inves
ted
)in
the
sam
ezi
pco
de.
InP
an
elC
,F
ina
lA
nge
lO
wn
ersh
ip,
Fin
al
Fo
un
der
Ow
ner
ship
,an
dF
ina
lV
CO
wn
ersh
ipre
pre
sent
the
resp
ecti
ve
ow
ner
ship
share
sp
ost
-mon
ey,
i.e.
,aft
erth
eS
erie
sA
rou
nd
close
s(b
efore
any
sub
sequ
ent
dilu
tion
from
op
tion
s).
All
Sm
all
Larg
eA
ngel
-On
lyV
C-O
nly
Mix
ed
Vari
ab
leD
eals
Dea
lsD
eals
Dea
lsD
eals
Dea
ls
Pan
el
A:
Pre
Seri
es
AIn
vest
or
Chara
cte
rist
ics
Pre
Ser
ies
AF
ou
nd
erO
wn
ersh
ip0.8
95
(0.2
1)
0.9
02
(0.1
6)
0.8
88
(0.2
6)
0.9
27
(0.1
2)
0.8
32
(0.3
5)
0.9
07
(0.1
7)
Pre
Ser
ies
AA
ngel
Ow
ner
ship
0.0
76
(0.1
5)
0.0
76
(0.1
4)
0.0
76
(0.1
6)
0.0
66
(0.1
0)
0.0
91
(0.2
0)
0.0
74
(0.1
4)
Pre
Ser
ies
AV
CO
wn
ersh
ip0.0
29
(0.1
0)
0.0
22
(0.0
8)
0.0
36
(0.1
2)
0.0
07
(0.0
4)
0.0
77
(0.1
9)b
0.0
18
(0.0
6)
Nu
mb
erof
Fou
nd
ers
2.7
75
(2.4
6)
2.3
74
(1.5
4)a
3.1
76
(3.0
8)a
1.9
69
(1.0
6)a
2.8
95
(3.6
4)
2.9
64
(2.2
2)
%w
ith
Fou
nd
erD
ata
0.9
07
(0.2
9)
0.8
90
(0.3
1)
0.9
23
(0.2
6)
0.8
44
(0.3
6)
0.9
21
(0.2
7)
0.9
20
(0.2
7)
Pre
Ser
ies
AC
om
mon
Rou
nd
0.2
53
(0.4
3)
0.2
86
(0.4
5)
0.2
20
(0.4
1)
0.2
19
(0.4
2)
0.2
63
(0.4
4)
0.2
59
(0.4
4)
Pan
el
B:
Seri
es
AIn
vest
or
Chara
cte
rist
ics
An
gel
-On
ly0.1
76
(0.3
8)
0.3
19
(0.4
6)a
0.0
33
(0.1
8)a
1.0
00
(0.0
0)
0.0
00
(0.0
0)
0.0
00
(0.0
0)
VC
-On
ly0.2
09
(0.4
0)
0.1
98
(0.4
0)
0.2
20
(0.4
1)
0.0
00
(0.0
0)
1.0
00
(0.0
0)
0.0
00
(0.0
0)
Fra
ctio
nSold
0.4
62
(0.2
2)
0.3
63
(0.1
5)a
0.5
61
(0.2
3)a
0.3
03
(0.1
6)a
0.4
36
(0.2
4)b
0.5
16
(0.2
1)
%A
ngel
Ser
ies
A0.3
19
(0.3
6)
0.4
64
(0.4
0)a
0.1
74
(0.2
4)a
0.9
96
(0.0
1)a
0.0
00
(0.0
0)a
0.2
34
(0.2
1)
%F
ou
nd
erS
erie
sA
0.0
01
(0.0
0)
0.0
02
(0.0
1)
0.0
01
(0.0
0)
0.0
04
(0.0
1)
0.0
00
(0.0
0)a
0.0
01
(0.0
0)
%V
CS
erie
sA
0.6
79
(0.3
6)
0.5
33
(0.4
1)a
0.8
25
(0.2
4)a
0.0
00
(0.0
0)a
1.0
00
(0.0
0)a
0.7
64
(0.2
1)
#In
ves
tors
12.1
2(1
3.4
)10.8
0(1
4.4
)13.4
5(1
2.3
)12.8
1(2
0.7
)4.7
63
(5.6
2)a
14.4
2(1
1.9
)
Log
#In
ves
tors
1.9
94
(1.0
6)
1.7
62
(1.1
5)a
2.2
27
(0.9
2)a
1.7
11
(1.3
0)a
1.0
44
(0.9
9)a
2.3
98
(0.7
3)
Rep
eat
An
gel
Fla
g0.0
93
(0.2
9)
0.1
21
(0.3
2)
0.0
66
(0.2
5)
0.1
88
(0.3
9)
0.0
00
(0.0
0)a
0.0
98
(0.2
9)
Rep
eat
VC
Fla
g0.0
71
(0.2
5)
0.0
55
(0.2
2)
0.0
88
(0.2
8)
0.0
00
(0.0
0)a
0.1
05
(0.3
1)
0.0
80
(0.2
7)
Bro
bec
kIn
ves
tor
Du
mm
y0.2
36
(0.4
2)
0.1
65
(0.3
7)a
0.3
08
(0.4
6)a
0.0
63
(0.2
4)a
0.0
79
(0.2
7)a
0.3
39
(0.4
7)
%In
ves
tors
wit
hin
3H
ou
rs0.6
04
(0.3
6)
0.6
57
(0.3
5)
0.5
58
(0.3
7)
0.6
49
(0.3
5)
0.5
14
(0.4
7)
0.6
19
(0.3
2)
%In
ves
tors
inS
am
eZ
ipC
od
e0.1
79
(0.3
0)
0.2
48
(0.3
6)a
0.1
20
(0.2
3)a
0.3
02
(0.3
9)a
0.2
72
(0.4
0)b
0.1
19
(0.2
2)
Pan
el
C:
Oth
er
Chara
cte
rist
ics
Fin
al
An
gel
Ow
ner
ship
0.1
73
(0.1
7)
0.2
06
(0.1
8)a
0.1
40
(0.1
6)a
0.3
77
(0.2
0)a
0.0
39
(0.0
9)a
0.1
60
(0.1
3)
Fin
al
Fou
nd
erO
wn
ersh
ip0.4
61
(0.2
3)
0.5
60
(0.1
8)a
0.3
62
(0.2
3)a
0.6
15
(0.2
0)a
0.4
48
(0.2
7)
0.4
22
(0.2
0)
Fin
al
VC
Ow
ner
ship
0.3
66
(0.2
7)
0.2
33
(0.2
2)a
0.4
98
(0.2
6)a
0.0
07
(0.0
4)a
0.5
13
(0.2
8)b
0.4
18
(0.2
1)
#F
irm
sin
Gro
up
182
91
91
32
38
112
*a,
b,
an
dc
den
ote
sign
ifica
nt
diff
eren
ces
inm
ean
sat
the
1%
,5%
,an
d10%
level
s,re
spec
tivel
y.T
he
footn
ote
sd
epic
ted
inco
lum
ns
2an
d3
are
base
don
test
sof
diff
eren
ces
inm
ean
sacr
oss
small
ver
sus
larg
efi
rms
(colu
mn
2vs
3).
Th
efo
otn
ote
sd
epic
ted
inco
lum
n4
(an
gel
-on
ly)
are
base
don
test
sof
an
gel
-on
lyd
eals
ver
sus
mix
edd
eals
(colu
mn
4vs
colu
mn
6).
Th
efo
otn
ote
sd
epic
ted
inco
lum
n5
(VC
-on
ly)
are
base
don
test
sof
VC
-on
lyd
eals
ver
sus
mix
edd
eals
(colu
mn
5vs
colu
mn
6).
44

Tab
leII
I:S
um
mar
yS
tati
stic
sfo
rV
CF
irm
sin
Sam
ple
Th
eta
ble
dis
pla
ys
mea
nch
ara
cter
isti
csw
ith
stan
dard
dev
iati
on
sin
pare
nth
eses
.T
he
sam
ple
incl
ud
esall
pri
vate
equ
ity
firm
sw
hic
hm
ad
ein
ves
tmen
tsb
etw
een
1/1/1993
an
d12/31/2002
that
are
incl
ud
edin
the
Th
om
son
Fin
an
cial
Ven
ture
Eco
nom
ics
data
base
.T
he
stati
stic
sin
clu
de
the
his
tori
esof
thes
ep
rivate
equ
ity
firm
s,in
clu
din
gfu
nd
sth
at
wer
em
an
aged
ou
tsid
eth
e1993-2
002
tim
efr
am
e.S
tati
stic
sare
rep
ort
edby
wh
eth
erth
efi
rmw
as
rep
rese
nte
din
the
Bro
bec
kS
am
ple
(colu
mn
s1
an
d2,
con
dit
ion
al
on
incl
usi
on
inV
entu
reE
con
om
ics)
,w
het
her
the
firm
was
ass
oci
ate
dw
ith
asm
all
or
larg
ed
eal
inou
rsa
mp
le(c
olu
mn
s3
an
d4),
an
dw
het
her
the
firm
was
ass
oci
ate
dw
ith
am
ixed
or
VC
-on
lyd
eal
(colu
mn
s5
an
d6).
All
fun
dst
ati
stic
sare
aggre
gate
dat
the
VC
firm
level
.S
ha
reo
ffu
nd
sh
qin
no
rth
ern
CA
an
dS
ha
reo
ffu
nd
sH
Qin
US
rep
rese
nt
the
share
of
fun
ds
un
der
the
pri
vate
equ
ity
firm
’sm
an
agem
ent
that
rep
ort
hea
dqu
art
ers
inn
ort
her
nC
alifo
rnia
an
dth
eU
nit
edS
tate
sre
spec
tivel
y.S
ha
reo
ffu
nd
sw
ith
See
dS
tage
Foc
us
an
dS
ha
reo
ffu
nd
sw
ith
Ea
rly
Sta
geF
ocu
sre
pre
sent
the
share
of
fun
ds
un
der
the
firm
’sm
an
agem
ent
that
rep
ort
afo
cus
on
seed
stage
dea
lsor
earl
yst
age
dea
ls.
Sh
are
of
VC
fun
ds
an
dF
irm
’ssh
are
of
buyo
ut
fun
ds
rep
rese
nt
the
share
of
fun
ds
un
der
the
VC
firm
’sm
an
agem
ent
rep
ort
ing
that
they
are
ven
ture
cap
ital
or
bu
you
tfu
nd
s.#
fun
ds
un
der
firm
ma
na
gem
ent
isth
enu
mb
erof
fun
ds
ever
man
aged
un
der
the
pri
vate
equ
ity
firm
’sm
an
agem
ent.
Log
tota
lca
pit
al
rais
edis
the
natu
ral
log
of
the
tota
lca
pit
al
(in
mil
lion
sof
US
dollars
)ra
ised
by
thes
efu
nd
s.L
ogfu
nd
size
($M
)is
the
mea
nca
pit
al
rais
edfo
rea
chfu
nd
un
der
ap
rivate
equ
ity
firm
’sm
an
agem
ent.
Th
ese
latt
ertw
ovari
ab
les
refl
ect
asm
aller
sam
ple
size
than
som
evari
ab
les
as
on
ly87%
of
ou
rsa
mp
leV
Cs
rep
ort
thes
est
ati
stic
s.A
geis
mea
sure
dre
lati
ve
to2002.
IPO
rate
an
dA
cqu
isit
ion
rate
are
the
share
of
the
VC
’sin
ves
tmen
tta
rget
sth
at
reach
the
mu
tually
excl
usi
ve
cate
gori
esIP
Oor
mer
ged
/acq
uir
ed,
resp
ecti
vel
y.R
ate
sare
calc
ula
ted
as
the
share
of
inves
tmen
tta
rget
sin
thes
eou
tcom
eca
tegori
es,
as
rep
ort
edin
Ven
ture
Eco
nom
ics.
Cen
tra
lity
isei
gen
vec
tor
centr
ality
(Bonaci
ch1972).
Bro
bec
kN
on
-Bro
bec
kS
mall
dea
lL
arg
eD
eal
VC
sin
VC
in
VC
firm
sV
Cfi
rms
VC
sV
Cs
mix
edd
eals
VC
-on
lyd
eals
Pan
el
A:
Dem
ogra
phic
s
Sh
are
of
fun
ds
hq
inn
ort
her
nC
A0.4
14
(0.4
9)
0.0
95
(0.2
9)a
0.4
03
(0.4
8)
0.4
18
(0.4
9)
0.4
10
(0.4
9)
0.4
28
(0.4
9)
Sh
are
of
fun
ds
hq
inU
S0.9
09
(0.2
9)
0.6
39
(0.4
8)a
0.9
16
(0.2
8)
0.9
06
(0.2
9)
0.8
91
(0.3
1)
0.9
72
(0.1
7)a
Sh
are
of
fun
ds
w/
See
dS
tage
Focu
s0.0
38
(0.1
3)
0.0
61
(0.2
3)a
0.0
22
(0.1
0)
0.0
44
(0.1
4)c
0.0
43
(0.1
5)
0.0
21
(0.0
5)b
Sh
are
of
fun
ds
w/
Earl
yS
tage
Focu
s0.4
17
(0.4
0)
0.2
23
(0.3
9)a
0.4
17
(0.3
8)
0.4
17
(0.4
0)
0.4
43
(0.4
0)
0.3
26
(0.3
7)a
Sh
are
of
VC
fun
ds
0.9
35
(0.2
0)
0.8
18
(0.3
7)a
0.9
27
(0.2
2)
0.9
38
(0.1
9)
0.9
45
(0.2
0)
0.9
01
(0.2
1)c
Sh
are
of
bu
you
tfu
nd
s0.0
35
(0.1
5)
0.1
18
(0.3
1)a
0.0
56
(0.2
0)
0.0
29
(0.1
2)
0.0
31
(0.1
4)
0.0
53
(0.1
5)
Pan
el
B:
Pre
stig
e/P
rom
inen
ce
#fu
nd
su
nd
erfi
rmm
an
agem
ent
7.6
58
(6.8
4)
2.0
40
(2.1
8)a
7.0
73
(6.2
3)
7.8
58
(7.0
4)
7.1
78
(6.7
4)
9.3
58
(6.9
5)a
Log
tota
lca
pit
al
rais
ed5.3
00
(2.9
1)
2.4
82
(2.5
7)a
4.9
80
(2.8
2)
5.4
10
(2.9
4)
5.1
37
(2.8
2)
5.8
77
(3.1
7)b
Log
fun
dsi
ze3.9
24
(2.0
5)
2.1
91
(2.2
4)a
3.7
13
(1.9
4)
3.9
96
(2.0
8)
3.8
41
(2.0
1)
4.2
20
(2.1
7)
Age
13.1
37
(8.1
3)
7.0
41
(6.4
3)a
13.3
50
(7.9
7)
13.0
64
(8.1
9)
12.4
31
(8.2
1)
15.6
4(7
.31)a
IPO
rate
0.1
50
(0.1
3)
0.1
18
(0.2
1)a
0.1
54
(0.1
6)
0.1
49
(0.1
3)
0.1
41
(0.1
3)
0.1
82
(0.1
3)a
Acq
uis
itio
nra
te0.3
13
(0.1
7)
0.2
21
(0.2
7)a
0.3
22
(0.2
0)
0.3
10
(0.1
6)
0.3
03
(0.1
8)
0.3
47
(0.1
4)a
Cen
trality
0.0
74
(0.1
4)
0.0
02
(0.0
2)a
0.1
05
(0.1
9)
0.0
63
(0.1
2)b
0.0
65
(0.1
4)
0.1
06
(0.1
6)b
Ob
serv
ati
on
s482
5585
123
359
376
106
*a,
b,
an
dc
den
ote
sign
ifica
nt
diff
eren
ces
inm
ean
sat
the
1%
,5%
,an
d10%
level
s,re
spec
tivel
y.T
hes
eare
base
don
test
sof
diff
eren
ces
inm
ean
sacr
oss
Non
-Bro
bec
kV
Cfi
rms
an
dB
rob
eck
VC
firm
s(f
ootn
ote
sd
isp
layed
inco
lum
n2),
VC
saffi
liate
dw
ith
small
ver
sus
larg
ed
eals
(dis
pla
yed
inco
lum
n4),
an
dV
Cs
affi
liate
dw
ith
VC
-on
lyd
eals
ver
sus
mix
edd
eals
(dis
pla
yed
inco
lum
n6).
45

Tab
leIV
:S
um
mar
yS
tati
stic
sfo
rD
eals
Th
eta
ble
dis
pla
ys
mea
nch
ara
cter
isti
csw
ith
stan
dard
dev
iati
on
sin
pare
nth
eses
.W
arr
an
tsD
um
my
ison
eif
warr
ants
wer
eis
sued
inth
eS
erie
sA
Fin
an
cin
g.
Op
tio
ns
Du
mm
yis
on
eif
an
op
tion
pla
nw
as
set
up
con
curr
ent
wit
hth
eS
erie
sA
Fin
an
cin
g.
#cl
osi
ngs
isth
enu
mb
erof
sep
ara
teex
ecu
ted
closi
ngs
un
der
the
Ser
ies
Ate
rms
(Mu
ltip
leC
losi
ngs
ind
icate
sm
ore
than
on
e).
Ave
rage
Da
ys
toS
eco
nd
Clo
sin
gis
the
days
bet
wee
nth
efi
rst
an
dse
con
dcl
osi
ngs.
All
pre
ced
ing
vari
ab
les
are
taken
from
the
elec
tron
icre
cord
of
the
closi
ng
docu
men
tsin
the
Bro
bec
kco
rpu
s.B
ille
dH
ou
rsre
flec
tsth
eto
tal
bille
dh
ou
rsass
oci
ate
dw
ith
Bro
bec
k’s
rep
rese
nta
tion
of
eith
erth
eco
mp
any
or
its
inves
tors
inth
ed
eal.
Contr
ol
rights
inP
an
elB
an
dte
rms
are
extr
act
edfr
om
closi
ng
docu
men
tsfr
om
the
Bro
bec
kco
rpu
s.%
Co
mm
on
BO
DS
eats
isth
esh
are
of
board
seats
hel
dby
com
mon
share
hold
ers
(fro
mth
e“voti
ng
rights
agre
emen
t”,
or
wh
ensp
ecifi
cp
art
ies
are
nam
ed,
by
cross
-ref
eren
cin
gw
ith
inves
tors
).C
um
ula
tive
Div
iden
dF
lag
isa
du
mm
yeq
ual
toon
eif
pre
ferr
edsh
are
hold
ers
have
ari
ght
tod
ivid
end
sth
at
acc
um
ula
teover
the
tim
eof
thei
rin
ves
tmen
t.L
iqu
ida
tio
nF
lag
isa
du
mm
yeq
ual
toon
ew
hen
pre
ferr
edsh
are
hold
ers
have
liqu
idati
on
rights
exce
edin
gth
evalu
eof
thei
rin
itia
lin
ves
tmen
t.C
ap
on
Pre
ferr
edis
ad
um
my
equ
al
toon
eif
thes
ead
dit
ion
al
pre
ferr
edst
ock
liqu
idati
on
rights
are
cap
ped
at
am
ult
iple
of
the
init
ial
inves
tmen
t.C
ap
on
Co
mm
on
isa
du
mm
yeq
ual
toon
eif
com
mon
stock
liqu
idati
on
rights
are
cap
ped
at
am
ult
iple
of
the
inves
tmen
t.R
edee
ma
ble
Fla
gis
ad
um
my
equ
al
toon
ew
hen
pre
ferr
edsh
are
hold
ers
can
dem
an
dth
at
the
firm
rep
urc
hase
thei
rsh
are
s.D
ela
yed
Red
emp
tio
nis
ad
um
my
equ
al
toon
eif
pre
ferr
edst
ock
hold
ers’
red
emp
tion
rights
are
tim
e-d
elayed
.%
Ser
ies
AR
eq.
toV
ote
isth
ep
erce
nta
ge
of
Ser
ies
Ash
are
hold
ers
requ
ired
toin
voke
are
dem
pti
on
.
All
Sm
all
Larg
eA
ngel
-On
lyV
C-O
nly
Mix
ed
Vari
ab
leD
eals
Dea
lsD
eals
Dea
lsD
eals
Dea
ls
Pan
el
A:
Dea
lC
hara
cte
rist
ics
Warr
ants
Du
mm
y0.1
54
(0.3
6)
0.1
98
(0.4
0)b
0.1
10
(0.3
1)b
0.2
50
(0.4
4)
0.0
79
(0.2
7)
0.1
52
(0.3
6)
Op
tion
sD
um
my
0.6
87
(0.4
6)
0.5
71
(0.4
9)a
0.8
02
(0.4
0)a
0.5
94
(0.4
9)
0.6
58
(0.4
8)
0.7
23
(0.4
4)
Mu
ltip
leC
losi
ngs
Fla
g0.4
45
(0.4
9)
0.4
07
(0.4
9)
0.4
84
(0.5
0)
0.3
75
(0.4
9)
0.2
37
(0.4
3)a
0.5
36
(0.5
0)
#C
losi
ngs
1.7
69
(1.1
9)
1.7
36
(1.2
9)
1.8
02
(1.0
9)
1.7
50
(1.3
6)
1.5
53
(1.4
0)
1.8
48
(1.0
5)
Aver
age
Days
toS
econ
dC
losi
ng
153.4
(157)
103.7
(89.4
)a197.9
(190)a
138.2
(93.5
)232.9
(149)
144.5
(166)
Bille
dH
ou
rs169.0
(115)
147.3
(103)a
190.7
(123)a
109.1
(70.9
)a185.4
(155)
180.6
(105)
Log
Bille
dH
ou
rs4.8
78
(0.8
2)
4.7
37
(0.8
5)a
5.0
17
(0.7
6)a
4.4
88
(0.7
8)a
4.9
01
(0.8
8)
4.9
77
(0.7
8)
Pan
el
B:
Con
trol
Rig
hts
%C
om
mon
BO
DS
eats
0.4
64
(0.3
3)
0.5
79
(0.3
3)a
0.3
59
(0.2
9)a
0.6
75
(0.3
1)a
0.5
22
(0.3
9)
0.3
98
(0.2
9)
Cu
mu
lati
ve
Div
iden
dF
lag
0.0
88
(0.2
8)
0.0
44
(0.2
0)a
0.1
32
(0.3
4)a
0.0
00
(0.0
0)a
0.1
58
(0.3
7)
0.0
89
(0.2
8)
Liq
uid
ati
on
Fla
g0.4
18
(0.4
9)
0.3
74
(0.4
8)
0.4
62
(0.5
0)
0.1
25
(0.3
3)a
0.5
79
(0.5
0)
0.4
46
(0.4
9)
Cap
on
Pre
ferr
ed0.4
74
(0.5
0)
0.4
41
(0.5
0)
0.5
00
(0.5
0)
0.5
00
(0.5
7)
0.3
64
(0.4
9)
0.5
20
(0.5
0)
Cap
on
Com
mon
0.0
19
(0.1
3)
0.0
35
(0.1
8)
0.0
00
(0.0
0)
0.0
00
(0.0
0)
0.0
00
(0.0
0)
0.0
32
(0.1
7)
Red
eem
ab
leF
lag
0.2
36
(0.4
2)
0.2
09
(0.4
0)
0.2
64
(0.4
4)
0.0
31
(0.1
7)a
0.3
68
(0.4
8)
0.2
50
(0.4
3)
Del
ayed
Red
emp
tion
0.2
25
(0.4
1)
0.2
09
(0.4
0)
0.2
42
(0.4
3)
0.0
31
(0.1
7)a
0.3
68
(0.4
8)
0.2
32
(0.4
2)
%S
erie
sA
Req
.to
Vote
57.5
5(8
.40)
57.1
2(8
.54)
57.8
7(8
.52)
50.0
0(0
.00)
54.1
6(7
.53)a
59.9
6(8
.35)
#F
irm
sin
Gro
up
182
91
91
32
38
112
*a,
b,
an
dc
den
ote
sign
ifica
nt
diff
eren
ces
inm
ean
sat
the
1%
,5%
,an
d10%
level
s,re
spec
tivel
y.T
he
footn
ote
sd
epic
ted
inco
lum
ns
2an
d3
are
base
don
test
sof
diff
eren
ces
inm
ean
sacr
oss
small
ver
sus
larg
efi
rms
(colu
mn
2vs
3).
Th
efo
otn
ote
sd
epic
ted
inco
lum
n4
(an
gel
-on
ly)
are
base
don
test
sof
an
gel
-on
lyd
eals
ver
sus
mix
edd
eals
(colu
mn
4vs
colu
mn
6).
Th
efo
otn
ote
sd
epic
ted
inco
lum
n5
(VC
-on
ly)
are
base
don
test
sof
VC
-on
lyd
eals
ver
sus
mix
edd
eals
(colu
mn
5vs
colu
mn
6).
46

Tab
leV
:C
ash
flow
Rig
hts
Th
eta
ble
dis
pla
ys
Pro
bit
mod
elm
arg
inal
effec
tsw
ith
rob
ust
t-st
ati
stic
sin
pare
nth
esis
.W
ere
port
resu
lts
for
the
wh
ole
sam
ple
,as
wel
las
for
small
an
dla
rge
dea
lsu
bsa
mp
les
as
note
din
the
tab
leh
ead
er(s
mall
an
dla
rge
dea
lsh
ave
bel
ow
an
dab
ove
med
ian
dea
lsi
ze,
resp
ecti
vel
y).
All
ind
epen
den
tvari
ab
les
(exce
pt
du
mm
yvari
ab
les)
are
stan
dard
ized
tocl
ari
fyex
posi
tion
.T
he
dep
end
ent
vari
ab
lein
colu
mn
s1
an
d5
isa
du
mm
yvari
ab
lein
dic
ati
ng
wh
eth
erth
eS
erie
sA
stock
hold
ers
have
cum
ula
tive
div
iden
dri
ghts
(th
ecu
mu
lati
ve
div
iden
dre
gre
ssio
nca
nn
ot
be
run
for
the
small
firm
sub
sam
ple
bec
au
seon
ly9
firm
sin
this
sub
sam
ple
had
cum
ula
tive
div
iden
dri
ghts
).T
he
dep
end
ent
vari
ab
lein
colu
mn
s2,
4an
d6
isa
du
mm
yvari
ab
lein
dic
ati
ng
wh
eth
erp
refe
rred
share
hold
ers
have
liqu
idati
on
rights
exce
edin
gth
evalu
eof
thei
rin
itia
lin
ves
tmen
t.T
he
ind
epen
den
tvari
ab
les
incl
ud
evari
ou
sin
ves
tor
an
dfirm
chara
cter
isti
cs,
as
wel
las
ind
ust
ryan
dti
me
du
mm
ies,
an
dare
des
crib
edin
Tab
les
Ian
dII
.
All
Dea
lsS
mall
Dea
lsL
arg
eD
eals
Pro
bit
Mod
elP
rob
itM
od
elP
rob
itM
od
elP
rob
itM
od
elP
rob
itM
od
elP
rob
itM
od
el
Dep
.V
ar.
=D
ep.
Var.
=D
ep.
Var.
=D
ep.
Var.
=D
ep.
Var.
=D
ep.
Var.
=
Ind
epen
den
tV
ari
ab
les
Cu
mu
lati
ve
Liq
uid
ati
on
Cu
mu
lati
ve
Liq
uid
ati
on
Cu
mu
lati
ve
Liq
uid
ati
on
An
gel
On
ly–0.1
0(–
1.9
2)c
–0.3
7(–
2.5
0)b
N/A
–0.3
5(–
2.0
5)b
VC
On
ly0.0
3(0
.39)
0.3
1(2
.38)b
0.2
5(1
.13)
0.0
8(0
.79)
0.7
3(4
.64)a
Pre
ferr
edIn
ves
tor
C4
–0.1
3(–
0.8
4)
–0.2
8(–
0.8
4)
0.0
5(0
.08)
–0.4
2(–
1.7
8)c
–1.4
1(–
2.7
9)a
Pre
Ser
ies
AA
ngel
Ow
ner
ship
0.0
1(0
.35)
–0.1
1(–
2.2
9)b
–0.0
3(–
0.5
8)
–0.0
4(–
0.9
8)
–0.4
5(–
3.7
7)a
Fra
ctio
nS
old
–0.0
1(–
0.1
8)
0.0
0(0
.03)
0.1
3(1
.33)
–0.0
4(–
0.7
5)
–0.0
9(–
1.1
2)
Log
Dea
lS
ize
0.0
3(1
.15)
–0.1
3(–
2.3
7)b
–0.2
3(–
2.7
8)a
–0.0
2(–
0.2
6)
–0.5
6(–
3.5
8)a
Log
#In
ves
tors
–0.0
4(–
1.0
1)
0.0
3(0
.39)
–0.0
4(–
0.2
8)
–0.0
4(–
0.8
6)
0.2
5(1
.74)c
Log
On
eP
lus
Fir
mA
ge
0.0
7(2
.28)b
0.0
7(1
.55)
0.0
6(1
.17)
0.1
3(1
.93)c
0.2
7(2
.89)a
Log
Nu
mb
erof
Fou
nd
ers
0.0
3(1
.15)
0.0
8(1
.69)c
0.2
9(4
.00)a
0.0
5(1
.05)
–0.0
5(–
0.7
2)
Pre
Ser
ies
AC
om
mon
Rou
nd
0.0
3(0
.71)
0.0
9(0
.89)
0.0
0(0
.02)
–0.0
1(–
0.0
9)
0.1
8(1
.04)
Str
ate
gic
Allia
nce
0.0
2(0
.22)
0.2
1(1
.40)
0.3
1(1
.36)
0.2
7(1
.74)c
0.7
2(3
.63)a
Pro
du
ctR
elea
se0.1
5(1
.34)
0.2
3(1
.39)
0.5
0(2
.51)b
–0.1
4(–
0.7
3)
–0.4
3(–
1.7
6)c
ITIn
du
stry
–0.0
1(–
0.2
0)
–0.3
2(–
2.7
8)a
–0.3
7(–
2.3
6)b
–0.0
1(–
0.0
6)
–0.6
3(–
3.1
0)a
Med
ical/
Bio
–T
ech
Ind
ust
ry–0.0
6(–
0.8
3)
–0.0
8(–
0.5
5)
–0.2
1(–
1.3
8)
–0.0
7(–
0.4
4)
–0.0
8(–
0.2
7)
1998
to3/2000
Du
mm
y0.0
8(1
.73)c
0.2
4(1
.73)c
0.2
8(1
.67)c
0.1
0(1
.03)
0.6
3(2
.10)b
Post
3/2000
Du
mm
y0.0
7(1
.53)
0.3
4(2
.59)a
0.2
1(1
.11)
0.2
2(2
.16)b
0.7
6(3
.11)a
Califo
rnia
Du
mm
y–0.0
2(–
0.4
1)
0.0
9(0
.98)
0.0
3(0
.22)
–0.0
1(–
0.1
7)
0.2
4(1
.51)
Bro
bec
kIn
ves
tor
Du
mm
y–0.0
6(–
1.3
0)
0.2
6(2
.50)b
0.3
7(1
.75)c
–0.0
5(–
0.5
2)
0.3
6(2
.14)b
Ob
serv
ati
on
s182
182
91
91
91
*a,
b,
an
dc
den
ote
sign
ifica
nt
diff
eren
ces
from
zero
at
the
1%
,5%
,an
d10%
level
s,re
spec
tivel
y.
47
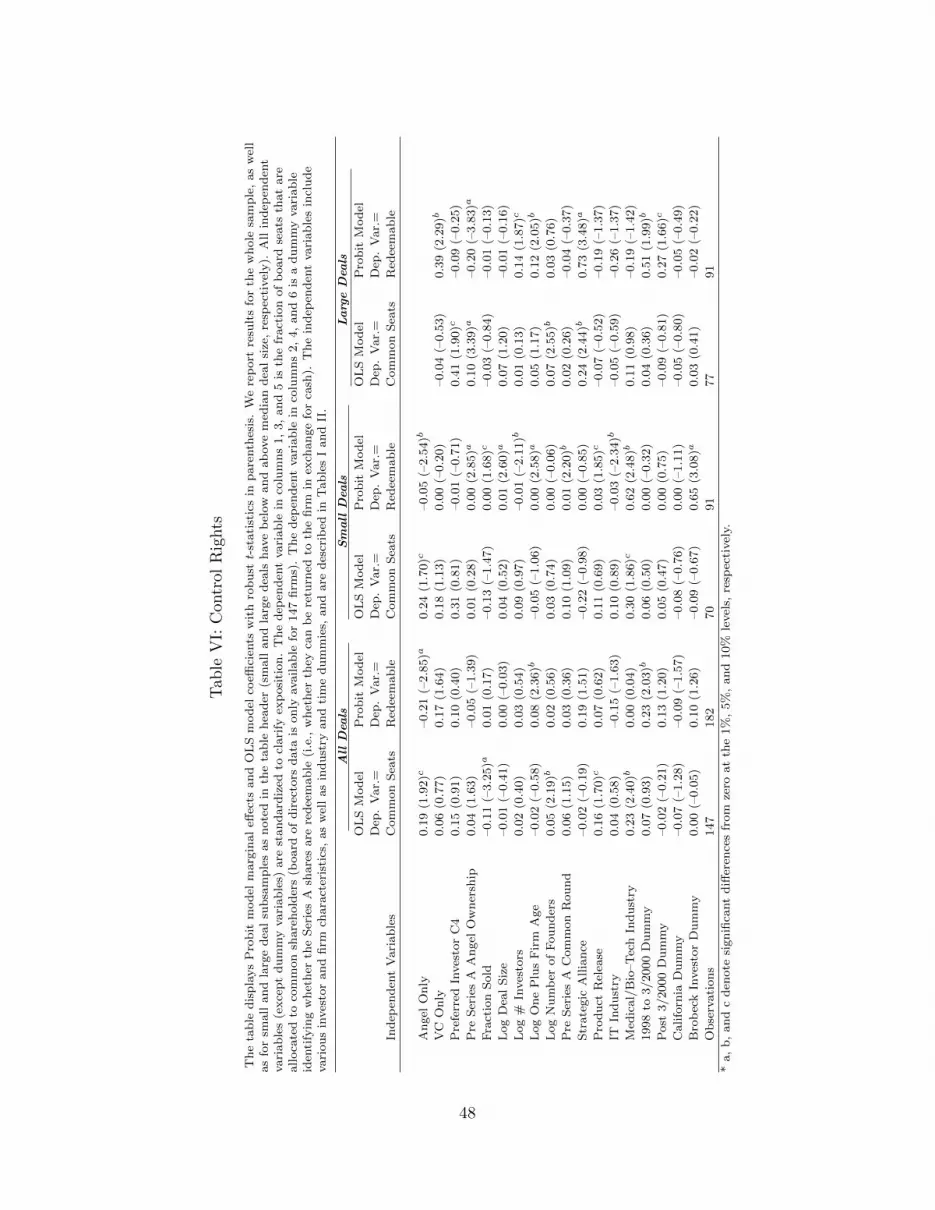
Tab
leV
I:C
ontr
olR
ights
Th
eta
ble
dis
pla
ys
Pro
bit
mod
elm
arg
inal
effec
tsan
dO
LS
mod
elco
effici
ents
wit
hro
bu
stt-
stati
stic
sin
pare
nth
esis
.W
ere
port
resu
lts
for
the
wh
ole
sam
ple
,as
wel
las
for
small
an
dla
rge
dea
lsu
bsa
mp
les
as
note
din
the
tab
leh
ead
er(s
mall
an
dla
rge
dea
lsh
ave
bel
ow
an
dab
ove
med
ian
dea
lsi
ze,
resp
ecti
vel
y).
All
ind
epen
den
tvari
ab
les
(exce
pt
du
mm
yvari
ab
les)
are
stan
dard
ized
tocl
ari
fyex
posi
tion
.T
he
dep
end
ent
vari
ab
lein
colu
mn
s1,
3,
an
d5
isth
efr
act
ion
of
board
seats
that
are
alloca
ted
toco
mm
on
share
hold
ers
(board
of
dir
ecto
rsd
ata
ison
lyavailab
lefo
r147
firm
s).
Th
ed
epen
den
tvari
ab
lein
colu
mn
s2,
4,
an
d6
isa
du
mm
yvari
ab
leid
enti
fyin
gw
het
her
the
Ser
ies
Ash
are
sare
red
eem
ab
le(i
.e.,
wh
eth
erth
eyca
nb
ere
turn
edto
the
firm
inex
chan
ge
for
cash
).T
he
ind
epen
den
tvari
ab
les
incl
ud
evari
ou
sin
ves
tor
an
dfi
rmch
ara
cter
isti
cs,
as
wel
las
ind
ust
ryan
dti
me
du
mm
ies,
an
dare
des
crib
edin
Tab
les
Ian
dII
.
All
Dea
lsS
mall
Dea
lsL
arg
eD
eals
OL
SM
od
elP
rob
itM
od
elO
LS
Mod
elP
rob
itM
od
elO
LS
Mod
elP
rob
itM
od
el
Dep
.V
ar.
=D
ep.
Var.
=D
ep.
Var.
=D
ep.
Var.
=D
ep.
Var.
=D
ep.
Var.
=
Ind
epen
den
tV
ari
ab
les
Com
mon
Sea
tsR
edee
mab
leC
om
mon
Sea
tsR
edee
mab
leC
om
mon
Sea
tsR
edee
mab
le
An
gel
On
ly0.1
9(1
.92)c
–0.2
1(–
2.8
5)a
0.2
4(1
.70)c
–0.0
5(–
2.5
4)b
VC
On
ly0.0
6(0
.77)
0.1
7(1
.64)
0.1
8(1
.13)
0.0
0(–
0.2
0)
–0.0
4(–
0.5
3)
0.3
9(2
.29)b
Pre
ferr
edIn
ves
tor
C4
0.1
5(0
.91)
0.1
0(0
.40)
0.3
1(0
.81)
–0.0
1(–
0.7
1)
0.4
1(1
.90)c
–0.0
9(–
0.2
5)
Pre
Ser
ies
AA
ngel
Ow
ner
ship
0.0
4(1
.63)
–0.0
5(–
1.3
9)
0.0
1(0
.28)
0.0
0(2
.85)a
0.1
0(3
.39)a
–0.2
0(–
3.8
3)a
Fra
ctio
nS
old
–0.1
1(–
3.2
5)a
0.0
1(0
.17)
–0.1
3(–
1.4
7)
0.0
0(1
.68)c
–0.0
3(–
0.8
4)
–0.0
1(–
0.1
3)
Log
Dea
lS
ize
–0.0
1(–
0.4
1)
0.0
0(–
0.0
3)
0.0
4(0
.52)
0.0
1(2
.60)a
0.0
7(1
.20)
–0.0
1(–
0.1
6)
Log
#In
ves
tors
0.0
2(0
.40)
0.0
3(0
.54)
0.0
9(0
.97)
–0.0
1(–
2.1
1)b
0.0
1(0
.13)
0.1
4(1
.87)c
Log
On
eP
lus
Fir
mA
ge
–0.0
2(–
0.5
8)
0.0
8(2
.36)b
–0.0
5(–
1.0
6)
0.0
0(2
.58)a
0.0
5(1
.17)
0.1
2(2
.05)b
Log
Nu
mb
erof
Fou
nd
ers
0.0
5(2
.19)b
0.0
2(0
.56)
0.0
3(0
.74)
0.0
0(–
0.0
6)
0.0
7(2
.55)b
0.0
3(0
.76)
Pre
Ser
ies
AC
om
mon
Rou
nd
0.0
6(1
.15)
0.0
3(0
.36)
0.1
0(1
.09)
0.0
1(2
.20)b
0.0
2(0
.26)
–0.0
4(–
0.3
7)
Str
ate
gic
Allia
nce
–0.0
2(–
0.1
9)
0.1
9(1
.51)
–0.2
2(–
0.9
8)
0.0
0(–
0.8
5)
0.2
4(2
.44)b
0.7
3(3
.48)a
Pro
du
ctR
elea
se0.1
6(1
.70)c
0.0
7(0
.62)
0.1
1(0
.69)
0.0
3(1
.85)c
–0.0
7(–
0.5
2)
–0.1
9(–
1.3
7)
ITIn
du
stry
0.0
4(0
.58)
–0.1
5(–
1.6
3)
0.1
0(0
.89)
–0.0
3(–
2.3
4)b
–0.0
5(–
0.5
9)
–0.2
6(–
1.3
7)
Med
ical/
Bio
–T
ech
Ind
ust
ry0.2
3(2
.40)b
0.0
0(0
.04)
0.3
0(1
.86)c
0.6
2(2
.48)b
0.1
1(0
.98)
–0.1
9(–
1.4
2)
1998
to3/2000
Du
mm
y0.0
7(0
.93)
0.2
3(2
.03)b
0.0
6(0
.50)
0.0
0(–
0.3
2)
0.0
4(0
.36)
0.5
1(1
.99)b
Post
3/2000
Du
mm
y–0.0
2(–
0.2
1)
0.1
3(1
.20)
0.0
5(0
.47)
0.0
0(0
.75)
–0.0
9(–
0.8
1)
0.2
7(1
.66)c
Califo
rnia
Du
mm
y–0.0
7(–
1.2
8)
–0.0
9(–
1.5
7)
–0.0
8(–
0.7
6)
0.0
0(–
1.1
1)
–0.0
5(–
0.8
0)
–0.0
5(–
0.4
9)
Bro
bec
kIn
ves
tor
Du
mm
y0.0
0(–
0.0
5)
0.1
0(1
.26)
–0.0
9(–
0.6
7)
0.6
5(3
.08)a
0.0
3(0
.41)
–0.0
2(–
0.2
2)
Ob
serv
ati
on
s147
182
70
91
77
91
*a,
b,
an
dc
den
ote
sign
ifica
nt
diff
eren
ces
from
zero
at
the
1%
,5%
,an
d10%
level
s,re
spec
tivel
y.
48

Tab
leV
II:
Su
mm
ary
Sta
tist
ics
ofO
utc
omes
for
Fir
ms
inS
amp
le
Th
eta
ble
dis
pla
ys
mea
nch
ara
cter
isti
csfo
rvari
ou
sd
um
my
vari
ab
les
ass
oci
ate
dw
ith
firm
ou
tcom
es.
IPO
an
dA
cqu
isit
ion
are
on
eif
aliqu
idit
yev
ent
occ
urr
edei
ther
as
an
IPO
or
as
an
acq
uis
itio
n,
resp
ecti
vel
y(f
rom
arc
hiv
al
sou
rces
,p
rim
ari
lyp
ress
rele
ase
s).
No
n-e
xite
dsu
rviv
al
ison
eif
the
firm
was
still
inb
usi
nes
sas
an
ind
epen
den
tp
rivate
enti
tyin
Dec
emb
er2012
(fro
mW
orl
dW
ide
Web
pre
sen
cean
darc
hiv
al
sou
rces
).F
irm
sare
tagged
as
Fa
ilu
reif
they
did
not
exp
erie
nce
aliqu
idit
yev
ent
an
dth
eyare
not
stil
lan
on
goin
gp
rivate
ind
epen
den
tfi
rm.
Ex
post
VC
Fin
an
cin
gis
on
eif
the
firm
secu
res
late
rfi
nan
cin
g(a
fter
Ser
ies
A)
from
ven
ture
cap
ital
firm
sas
rep
ort
edby
Ven
ture
Eco
nom
ics.
Th
eV
entu
reE
con
om
ics
sam
ple
incl
ud
esU
S-b
ase
dven
ture
cap
ital
inves
tmen
tta
rget
sfo
un
ded
aft
er1967
wit
hth
efi
rst
inves
tmen
tb
etw
een
1993
an
d2002.
Pri
vate
Equ
ity
dis
bu
rsem
ents
lab
eled
as
bu
yout,
acq
uis
itio
n,
oth
eror
un
kn
ow
nw
ere
elim
inate
d.
Ou
tcom
evari
ab
les
of
the
Ven
ture
Eco
nom
ics
sam
ple
are
as
rep
ort
edin
that
data
base
,b
ut
wei
ghte
dto
refl
ect
the
dis
trib
uti
on
of
dea
lori
gin
ati
on
date
sin
the
Bro
bec
ksa
mp
le.
Ven
ture
All
Sm
all
Larg
eA
ngel
-On
lyV
C-O
nly
Mix
edE
con
om
ics
Vari
ab
leD
eals
Dea
lsD
eals
Dea
lsD
eals
Dea
lsD
eals
IPO
0.0
33
0.0
33
0.0
33
0.0
31
0.1
05
0.0
09
0.0
57
Acq
uis
itio
n0.3
65
0.2
75a
0.4
56a
0.2
50
0.3
95
0.3
87
0.1
71a
Non
-exit
edsu
rviv
al
0.1
44
0.1
32
0.1
56
0.2
50
0.1
32
0.1
17
Failu
re0.4
59
0.5
60a
0.3
56a
0.4
69
0.3
68
0.4
86
Ex
post
VC
fin
an
cin
g0.4
86
0.4
29
0.5
44
0.2
81a
0.4
74
0.5
50
0.7
26a
Tim
eto
Res
olu
tion
5.8
75
5.9
49
5.8
12
7.2
08a
5.6
33
5.5
41
#F
irm
sin
Gro
up
181
91
90
32
38
111
9,9
02
*a,
b,
an
dc
den
ote
sign
ifica
nt
diff
eren
ces
inm
ean
sat
the
1%
,5%
,an
d10%
level
s,re
spec
tivel
y.T
he
footn
ote
sd
epic
ted
inco
lum
ns
2an
d3
are
base
don
test
sof
diff
eren
ces
inm
ean
sacr
oss
small
ver
sus
larg
efi
rms
(colu
mn
2vs
3).
Th
efo
otn
ote
sd
epic
ted
inco
lum
n4
(an
gel
-on
ly)
are
base
don
test
sof
an
gel
-on
lyd
eals
ver
sus
mix
edd
eals
(colu
mn
4vs
colu
mn
6).
Th
efo
otn
ote
sd
epic
ted
inco
lum
n5
(VC
-on
ly)
are
base
don
test
sof
VC
-on
lyd
eals
ver
sus
mix
edd
eals
(colu
mn
5vs
colu
mn
6).
Th
efo
otn
ote
sin
colu
mn
7(V
entu
reE
con
om
ics
Dea
ls)
are
base
don
test
sof
All
Dea
ls(f
rom
Bro
bec
k)
ver
sus
the
Ven
ture
Eco
nom
ics
Dea
ls(c
olu
mn
1vs
colu
mn
7).
49

Tab
leV
III:
Res
olu
tion
Rat
eve
rsu
sD
eal
Ch
arac
teri
stic
s
Th
eta
ble
dis
pla
ys
the
Cox
pro
port
ion
al
haza
rds
mod
el(c
olu
mn
s1,
3,
5)
an
dO
LS
mod
el(c
olu
mn
s2,
4,
6)
coeffi
cien
ts,
wit
hro
bu
stt-
stati
stic
sin
pare
nth
esis
,fo
rall
dea
ls,
small
dea
ls,
an
dla
rge
dea
ls,
resp
ecti
vel
y.F
or
the
Cox
mod
el,
the
coeffi
cien
tre
port
edis
the
od
ds
rati
o.
Ifit
isgre
ate
rth
an
on
e(w
ith
posi
tivet-
stati
stic
),th
ere
isa
fast
erh
aza
rdra
tean
dqu
icker
reso
luti
on
,w
hile
an
od
ds
rati
ole
ssth
an
on
e(w
ith
neg
ati
vet-
stati
stic
)im
plies
alo
nger
tim
eto
reso
luti
on
.T
he
OL
Ssp
ecifi
cati
on
isb
ase
don
usi
ng
the
nu
mb
erof
yea
rsu
nti
lre
solu
tion
as
the
dep
end
ent
vari
ab
le,
an
dw
ere
port
the
OL
Sco
effici
ents
.F
or
all
haza
rdm
od
els,
the
haza
rdto
be
exp
lain
edis
“re
solu
tion
”,
wh
ich
occ
urs
wh
enth
ed
eal’s
ou
tcom
eis
fin
ally
kn
ow
n(w
her
eou
tcom
eis
failu
re,
exit
via
mer
ger
,or
exit
via
IPO
).A
llin
dep
end
ent
vari
ab
les
(exce
pt
du
mm
yvari
ab
les)
are
stan
dard
ized
tocl
ari
fyex
posi
tion
.T
he
ind
epen
den
tvari
ab
les
incl
ud
evari
ou
sin
ves
tor
an
dfi
rmch
ara
cter
isti
cs,
as
wel
las
ind
ust
ryan
dti
me
du
mm
ies,
an
dare
des
crib
edin
Tab
les
Ian
dII
.
All
Dea
lsS
mall
Dea
lsL
arg
eD
eals
Cox
Pro
p.
OL
SM
od
elC
ox
Pro
p.
OL
SM
od
elC
ox
Pro
p.
OL
SM
od
el
Haza
rdM
od
elD
ep.
Var.
=H
aza
rdM
od
elD
ep.
Var.
=H
aza
rdM
od
elD
ep.
Var.
=
Dep
.V
ar.
=T
ime
toD
ep.
Var.
=T
ime
toD
ep.
Var.
=T
ime
to
Ind
epen
den
tV
ari
ab
les
Haza
rdR
ate
Res
olu
tion
Haza
rdR
ate
Res
olu
tion
Haza
rdR
ate
Res
olu
tion
An
gel
On
ly0.4
5(–
2.8
7)a
2.7
5(2
.84)a
0.3
3(–
2.5
5)b
3.0
0(2
.39)b
VC
On
ly0.7
1(–
1.3
7)
1.3
4(1
.47)
0.3
6(–
2.1
5)b
1.9
4(1
.12)
1.0
3(0
.07)
1.1
4(0
.93)
Log
Siz
e0.9
8(–
0.2
4)
0.0
9(0
.25)
0.7
8(–
1.6
1)
0.9
3(1
.45)
1.2
2(0
.74)
–0.5
7(–
0.6
3)
Log
#In
ves
tors
0.6
5(–
2.9
7)a
1.2
8(2
.14)b
0.5
4(–
2.2
3)b
1.0
1(1
.09)
0.7
5(–
1.2
6)
0.8
2(0
.96)
Fra
ctio
nS
old
0.9
4(–
0.5
2)
0.1
8(0
.45)
0.6
7(–
1.8
5)c
1.1
4(1
.55)
1.0
4(0
.22)
0.0
3(0
.06)
Str
ate
gic
Allia
nce
0.9
9(–
0.0
4)
0.2
0(0
.19)
2.4
9(2
.23)b
–2.8
7(–
2.0
6)b
0.3
5(–
2.4
0)b
3.8
5(2
.22)b
Pro
du
ctR
elea
se1.1
4(0
.51)
–0.5
2(–
0.5
4)
0.7
2(–
0.8
0)
0.3
3(0
.29)
2.8
0(1
.95)c
–3.6
3(–
1.9
5)c
Log
On
eP
lus
Fir
mA
ge
1.0
8(0
.83)
–0.2
8(–
0.8
0)
1.0
7(0
.67)
–0.1
9(–
0.6
3)
1.0
1(0
.07)
0.1
4(0
.21)
Mis
sin
gA
ge
Du
mm
y1.1
3(0
.54)
–0.9
6(–
1.1
9)
1.1
5(0
.47)
–0.7
3(–
0.7
6)
0.8
5(–
0.3
0)
–0.2
9(–
0.1
8)
Log
Nu
mb
erof
Fou
nd
ers
0.9
0(–
1.1
8)
0.1
9(0
.58)
0.9
1(–
0.5
9)
–0.0
8(–
0.1
4)
0.8
6(–
1.1
6)
0.1
7(0
.40)
Pre
Ser
ies
AC
om
mon
Rou
nd
1.2
7(1
.31)
–0.7
3(–
1.0
8)
1.3
2(1
.00)
–0.7
0(–
0.6
7)
1.7
7(2
.08)b
–1.7
6(–
1.8
6)c
Bro
bec
kIn
ves
tor
Du
mm
y1.6
8(2
.47)b
–1.6
3(–
2.2
2)b
1.7
7(1
.60)
–1.4
4(–
1.3
8)
1.2
9(0
.68)
–0.3
3(–
0.2
7)
Inves
tor
Con
centr
ati
on
Ind
ex0.3
0(–
1.8
5)c
3.5
1(1
.45)
0.2
5(–
1.1
2)
1.4
7(0
.33)
0.2
5(–
1.3
1)
4.1
9(1
.39)
ITIn
du
stry
0.8
912
(–0.5
6)
0.4
6(0
.63)
0.8
1(–
0.6
7)
0.6
8(0
.65)
0.5
8(–
1.6
2)
2.0
0(1
.83)c
Med
ical/
Bio
–T
ech
Ind
ust
ry0.6
1(–
1.6
7)c
1.6
0(1
.38)
1.0
4(0
.11)
–0.2
2(–
0.1
5)
0.1
8(–
2.8
2)a
5.2
2(3
.10)a
1998
to3/2000
Du
mm
y1.4
7(1
.89)c
–1.3
4(–
1.4
5)
1.6
1(1
.99)b
–1.6
1(–
1.4
3)
1.4
5(0
.85)
–0.9
3(–
0.5
8)
Post
3/2000
Du
mm
y0.8
8(–
0.5
6)
0.5
2(0
.51)
0.8
3(–
0.5
6)
0.7
7(0
.61)
0.8
1(–
0.5
9)
0.8
1(0
.52)
Califo
rnia
Du
mm
y1.1
0(0
.58)
–0.3
6(–
0.5
6)
0.7
7(–
0.8
7)
1.0
6(0
.91)
1.5
6(1
.64)
–1.5
9(–
1.6
6)c
Ob
serv
ati
on
s179
179
91
91
88
88
*a,
b,
an
dc
den
ote
sign
ifica
nt
diff
eren
ces
from
zero
at
the
1%
,5%
,an
d10%
level
s,re
spec
tivel
y.
50
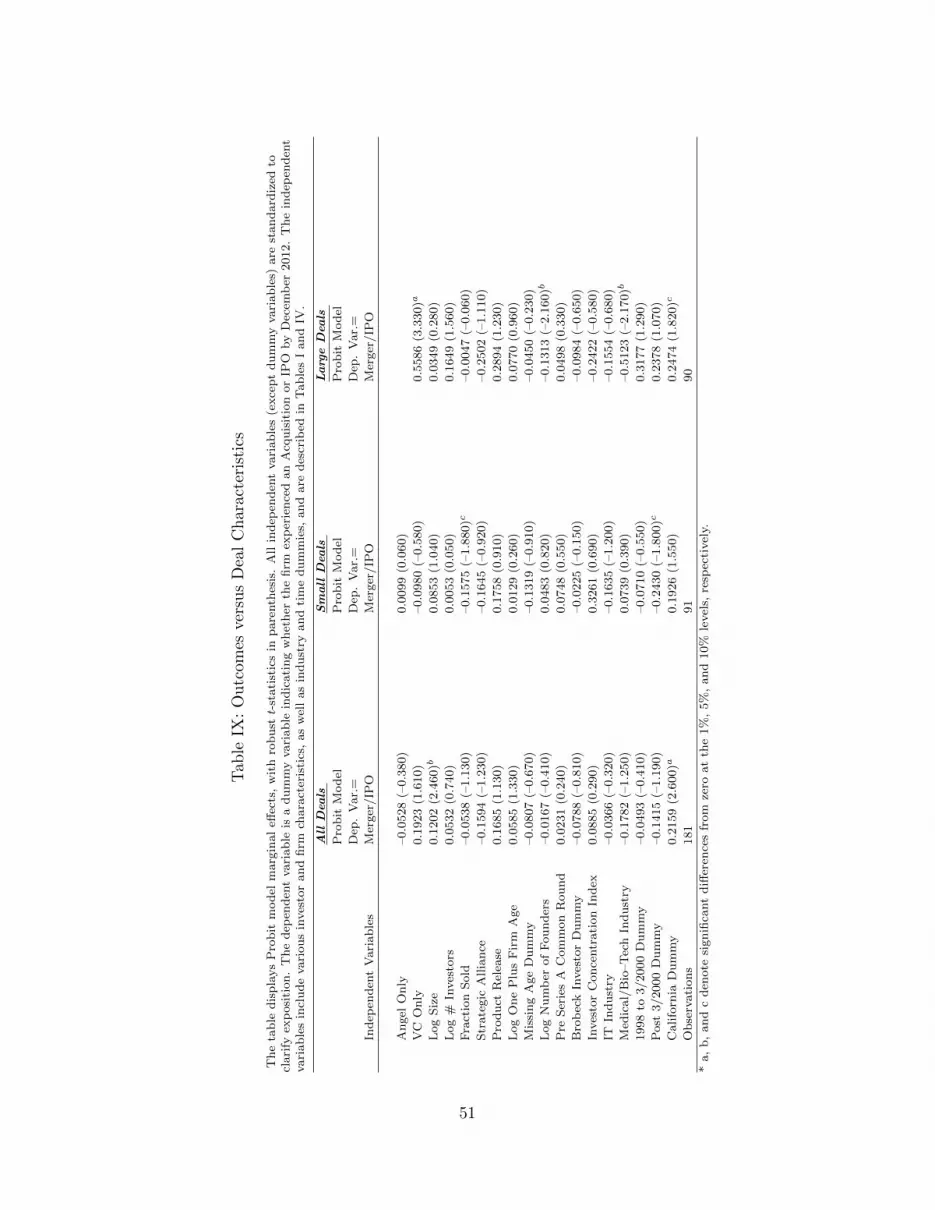
Tab
leIX
:O
utc
omes
vers
us
Dea
lC
har
acte
rist
ics
Th
eta
ble
dis
pla
ys
Pro
bit
mod
elm
arg
inal
effec
ts,
wit
hro
bu
stt-
stati
stic
sin
pare
nth
esis
.A
llin
dep
end
ent
vari
ab
les
(exce
pt
du
mm
yvari
ab
les)
are
stan
dard
ized
tocl
ari
fyex
posi
tion
.T
he
dep
end
ent
vari
ab
leis
ad
um
my
vari
ab
lein
dic
ati
ng
wh
eth
erth
efi
rmex
per
ien
ced
an
Acq
uis
itio
nor
IPO
by
Dec
emb
er2012.
Th
ein
dep
end
ent
vari
ab
les
incl
ud
evari
ou
sin
ves
tor
an
dfi
rmch
ara
cter
isti
cs,
as
wel
las
ind
ust
ryan
dti
me
du
mm
ies,
an
dare
des
crib
edin
Tab
les
Ian
dIV
.
All
Dea
lsS
mall
Dea
lsL
arg
eD
eals
Pro
bit
Mod
elP
rob
itM
od
elP
rob
itM
od
el
Dep
.V
ar.
=D
ep.
Var.
=D
ep.
Var.
=
Ind
epen
den
tV
ari
ab
les
Mer
ger
/IP
OM
erger
/IP
OM
erger
/IP
O
An
gel
On
ly–0.0
528
(–0.3
80)
0.0
099
(0.0
60)
VC
On
ly0.1
923
(1.6
10)
–0.0
980
(–0.5
80)
0.5
586
(3.3
30)a
Log
Siz
e0.1
202
(2.4
60)b
0.0
853
(1.0
40)
0.0
349
(0.2
80)
Log
#In
ves
tors
0.0
532
(0.7
40)
0.0
053
(0.0
50)
0.1
649
(1.5
60)
Fra
ctio
nS
old
–0.0
538
(–1.1
30)
–0.1
575
(–1.8
80)c
–0.0
047
(–0.0
60)
Str
ate
gic
Allia
nce
–0.1
594
(–1.2
30)
–0.1
645
(–0.9
20)
–0.2
502
(–1.1
10)
Pro
du
ctR
elea
se0.1
685
(1.1
30)
0.1
758
(0.9
10)
0.2
894
(1.2
30)
Log
On
eP
lus
Fir
mA
ge
0.0
585
(1.3
30)
0.0
129
(0.2
60)
0.0
770
(0.9
60)
Mis
sin
gA
ge
Du
mm
y–0.0
807
(–0.6
70)
–0.1
319
(–0.9
10)
–0.0
450
(–0.2
30)
Log
Nu
mb
erof
Fou
nd
ers
–0.0
167
(–0.4
10)
0.0
483
(0.8
20)
–0.1
313
(–2.1
60)b
Pre
Ser
ies
AC
om
mon
Rou
nd
0.0
231
(0.2
40)
0.0
748
(0.5
50)
0.0
498
(0.3
30)
Bro
bec
kIn
ves
tor
Du
mm
y–0.0
788
(–0.8
10)
–0.0
225
(–0.1
50)
–0.0
984
(–0.6
50)
Inves
tor
Con
centr
ati
on
Ind
ex0.0
885
(0.2
90)
0.3
261
(0.6
90)
–0.2
422
(–0.5
80)
ITIn
du
stry
–0.0
366
(–0.3
20)
–0.1
635
(–1.2
00)
–0.1
554
(–0.6
80)
Med
ical/
Bio
–T
ech
Ind
ust
ry–0.1
782
(–1.2
50)
0.0
739
(0.3
90)
–0.5
123
(–2.1
70)b
1998
to3/2000
Du
mm
y–0.0
493
(–0.4
10)
–0.0
710
(–0.5
50)
0.3
177
(1.2
90)
Post
3/2000
Du
mm
y–0.1
415
(–1.1
90)
–0.2
430
(–1.8
00)c
0.2
378
(1.0
70)
Califo
rnia
Du
mm
y0.2
159
(2.6
00)a
0.1
926
(1.5
50)
0.2
474
(1.8
20)c
Ob
serv
ati
on
s181
91
90
*a,
b,
an
dc
den
ote
sign
ifica
nt
diff
eren
ces
from
zero
at
the
1%
,5%
,an
d10%
level
s,re
spec
tivel
y.
51
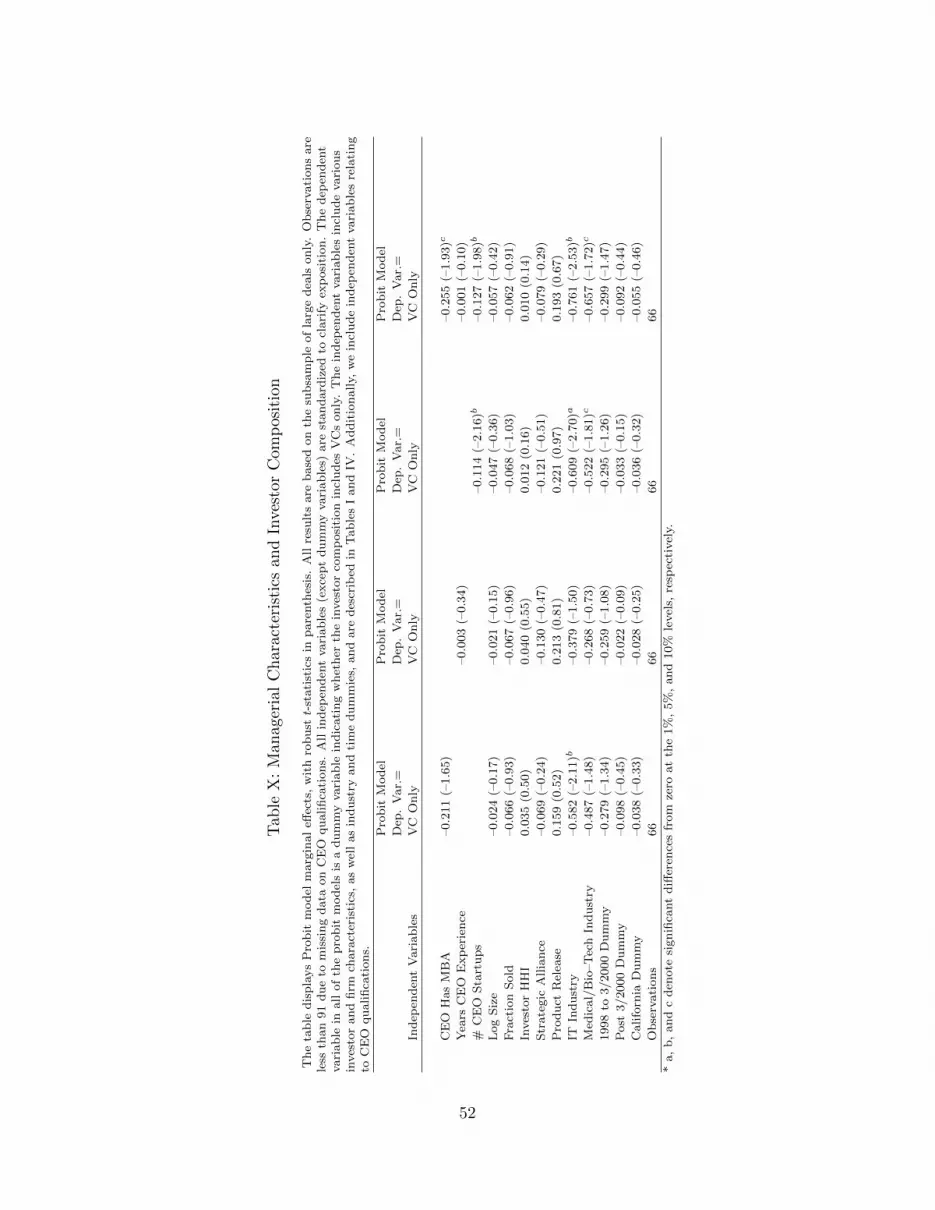
Tab
leX
:M
anag
eria
lC
har
acte
rist
ics
and
Inves
tor
Com
pos
itio
n
Th
eta
ble
dis
pla
ys
Pro
bit
mod
elm
arg
inal
effec
ts,
wit
hro
bu
stt-
stati
stic
sin
pare
nth
esis
.A
llre
sult
sare
base
don
the
sub
sam
ple
of
larg
ed
eals
on
ly.
Ob
serv
ati
on
sare
less
than
91
du
eto
mis
sin
gd
ata
on
CE
Oqu
alifi
cati
on
s.A
llin
dep
end
ent
vari
ab
les
(exce
pt
du
mm
yvari
ab
les)
are
stan
dard
ized
tocl
ari
fyex
posi
tion
.T
he
dep
end
ent
vari
ab
lein
all
of
the
pro
bit
mod
els
isa
du
mm
yvari
ab
lein
dic
ati
ng
wh
eth
erth
ein
ves
tor
com
posi
tion
incl
ud
esV
Cs
on
ly.
Th
ein
dep
end
ent
vari
ab
les
incl
ud
evari
ou
sin
ves
tor
an
dfi
rmch
ara
cter
isti
cs,
as
wel
las
ind
ust
ryan
dti
me
du
mm
ies,
an
dare
des
crib
edin
Tab
les
Ian
dIV
.A
dd
itio
nally,
we
incl
ud
ein
dep
end
ent
vari
ab
les
rela
tin
gto
CE
Oqu
alifi
cati
on
s.
Pro
bit
Mod
elP
rob
itM
od
elP
rob
itM
od
elP
rob
itM
od
el
Dep
.V
ar.
=D
ep.
Var.
=D
ep.
Var.
=D
ep.
Var.
=
Ind
epen
den
tV
ari
ab
les
VC
On
lyV
CO
nly
VC
On
lyV
CO
nly
CE
OH
as
MB
A–0.2
11
(–1.6
5)
–0.2
55
(–1.9
3)c
Yea
rsC
EO
Exp
erie
nce
–0.0
03
(–0.3
4)
–0.0
01
(–0.1
0)
#C
EO
Sta
rtu
ps
–0.1
14
(–2.1
6)b
–0.1
27
(–1.9
8)b
Log
Siz
e–0.0
24
(–0.1
7)
–0.0
21
(–0.1
5)
–0.0
47
(–0.3
6)
–0.0
57
(–0.4
2)
Fra
ctio
nS
old
–0.0
66
(–0.9
3)
–0.0
67
(–0.9
6)
–0.0
68
(–1.0
3)
–0.0
62
(–0.9
1)
Inves
tor
HH
I0.0
35
(0.5
0)
0.0
40
(0.5
5)
0.0
12
(0.1
6)
0.0
10
(0.1
4)
Str
ate
gic
Allia
nce
–0.0
69
(–0.2
4)
–0.1
30
(–0.4
7)
–0.1
21
(–0.5
1)
–0.0
79
(–0.2
9)
Pro
du
ctR
elea
se0.1
59
(0.5
2)
0.2
13
(0.8
1)
0.2
21
(0.9
7)
0.1
93
(0.6
7)
ITIn
du
stry
–0.5
82
(–2.1
1)b
–0.3
79
(–1.5
0)
–0.6
09
(–2.7
0)a
–0.7
61
(–2.5
3)b
Med
ical/
Bio
–T
ech
Ind
ust
ry–0.4
87
(–1.4
8)
–0.2
68
(–0.7
3)
–0.5
22
(–1.8
1)c
–0.6
57
(–1.7
2)c
1998
to3/2000
Du
mm
y–0.2
79
(–1.3
4)
–0.2
59
(–1.0
8)
–0.2
95
(–1.2
6)
–0.2
99
(–1.4
7)
Post
3/2000
Du
mm
y–0.0
98
(–0.4
5)
–0.0
22
(–0.0
9)
–0.0
33
(–0.1
5)
–0.0
92
(–0.4
4)
Califo
rnia
Du
mm
y–0.0
38
(–0.3
3)
–0.0
28
(–0.2
5)
–0.0
36
(–0.3
2)
–0.0
55
(–0.4
6)
Ob
serv
ati
on
s66
66
66
66
*a,
b,
an
dc
den
ote
sign
ifica
nt
diff
eren
ces
from
zero
at
the
1%
,5%
,an
d10%
level
s,re
spec
tivel
y.
52

Tab
leX
I:O
utc
omes
vers
us
Dea
lC
har
acte
rist
ics
(Zoom
inon
Lar
geD
eals
)
Th
eta
ble
dis
pla
ys
Pro
bit
mod
elm
arg
inal
effec
ts,
wit
hro
bu
stt-
stati
stic
sin
pare
nth
esis
.A
llre
sult
sare
base
don
the
sub
sam
ple
of
larg
ed
eals
on
ly.
Ob
serv
ati
on
sare
less
than
91
du
eto
mis
sin
gd
ata
on
board
of
dir
ecto
rsan
dre
solu
tion
date
s(fi
rst
fou
rco
lum
ns)
,an
dm
issi
ng
data
on
CE
Oqu
alifi
cati
on
s(fi
fth
colu
mn
).A
llin
dep
end
ent
vari
ab
les
(exce
pt
du
mm
yvari
ab
les)
are
stan
dard
ized
tocl
ari
fyex
posi
tion
.T
he
dep
end
ent
vari
ab
lein
all
of
the
pro
bit
mod
els
(all
colu
mn
sex
cep
tco
lum
nfo
ur)
isa
du
mm
yvari
ab
lein
dic
ati
ng
wh
eth
erth
efi
rmex
per
ien
ced
an
Acq
uis
itio
nor
IPO
by
Marc
h2008.
Th
ed
epen
den
tvari
ab
lein
colu
mn
fou
ris
the
nu
mb
erof
yea
rsto
reso
luti
on
as
com
pu
ted
inT
ab
leV
III.
Th
ein
dep
end
ent
vari
ab
les
incl
ud
evari
ou
sin
ves
tor
an
dfi
rmch
ara
cter
isti
cs,
as
wel
las
ind
ust
ryan
dti
me
du
mm
ies,
an
dare
des
crib
edin
Tab
les
Ian
dIV
.A
dd
itio
nally,
we
incl
ud
ein
dep
end
ent
vari
ab
les
rela
tin
gto
wh
eth
erth
eB
oard
of
Dir
ecto
rsis
close
tosp
lit
am
on
gco
mm
on
an
dp
refe
rred
share
hold
ers
(Sp
lit
Contr
ol)
,an
din
dep
end
ent
vari
ab
les
rela
tin
gto
CE
Oqu
alifi
cati
on
s.
Pro
bit
Mod
elP
rob
itM
od
elP
rob
itM
od
elO
LS
Mod
elP
rob
itM
od
el
Dep
.V
ar.
=D
ep.
Var.
=D
ep.
Var.
=D
ep.
Var.
=D
ep.
Var.
=
Ind
epen
den
tV
ari
ab
les
Mer
ger
/IP
OM
erger
/IP
OM
erger
/IP
OT
ime
toR
esolv
eM
erger
/IP
O
VC
On
ly0.3
86
(2.0
0)b
–0.2
07
(–0.9
6)
1.5
87
(0.9
6)
0.6
08
(2.7
4)a
Sp
lit
Contr
ol
–0.0
98
(–0.5
7)
–0.0
98
(–0.5
7)
0.6
73
(0.5
6)
Sp
lit
xV
CO
nly
1.6
13
(3.3
5)a
1.8
19
(3.1
7)a
–4.7
68
(–2.4
4)b
Not
Sp
lit
xV
CO
nly
–0.2
07
(–0.9
6)
CE
OH
as
MB
A–0.4
15
(–1.8
9)c
Yea
rsC
EO
Exp
erie
nce
0.0
22
(1.4
9)
#C
EO
Sta
rtu
ps
0.0
23
(0.2
1)
Log
Siz
e0.1
31
(1.1
2)
0.0
93
(0.7
5)
0.0
93
(0.7
5)
0.2
62
(0.2
5)
0.3
76
(1.8
2)c
Fra
ctio
nS
old
–0.0
25
(–0.3
3)
–0.0
17
(–0.2
2)
–0.0
17
(–0.2
2)
–0.9
94
(–1.7
9)c
–0.0
83
(–0.8
1)
Log
#In
ves
tors
–0.1
10
(–0.9
5)
–0.1
74
(–1.2
7)
–0.1
74
(–1.2
7)
1.6
54
(2.6
7)a
–0.2
08
(–1.5
1)
Pre
ferr
edIn
ves
tor
C4
–0.6
12
(–2.6
3)a
–1.1
81
(–3.2
8)a
–1.1
81
(–3.2
8)a
4.1
20
(1.4
1)
–0.8
57
(–2.2
8)b
Str
ate
gic
Allia
nce
–0.3
39
(–1.6
0)
–0.0
78
(–0.2
9)
–0.0
78
(–0.2
9)
1.5
60
(0.8
9)
–0.7
46
(–1.9
4)c
Pro
du
ctR
elea
se0.4
01
(1.6
7)c
0.1
47
(0.4
5)
0.1
47
(0.4
5)
–3.2
98
(–1.8
8)c
1.1
82
(2.6
8)a
Log
On
eP
lus
Fir
mA
ge
0.0
57
(0.8
3)
0.1
14
(1.4
3)
0.1
14
(1.4
3)
–0.3
04
(–0.5
0)
–0.1
88
(–1.5
3)
Mis
sin
gA
ge
Du
mm
y–0.0
15
(–0.0
8)
0.0
14
(0.0
7)
0.0
14
(0.0
7)
0.6
46
(0.3
6)
–0.8
12
(–2.4
0)b
Log
Nu
mb
erof
Fou
nd
ers
–0.0
23
(–0.3
8)
–0.0
23
(–0.3
4)
–0.0
23
(–0.3
4)
0.7
56
(1.6
7)
–0.1
64
(–1.9
2)c
Pre
Ser
ies
AC
om
mon
Rou
nd
0.1
29
(0.9
0)
0.1
48
(0.9
7)
0.1
48
(0.9
7)
–1.9
13
(–1.7
5)c
0.5
35
(2.6
7)a
Bro
bec
kIn
ves
tor
Du
mm
y–0.0
08
(–0.0
5)
–0.0
59
(–0.3
7)
–0.0
59
(–0.3
7)
–2.6
34
(–2.2
9)b
0.4
00
(2.0
3)b
ITIn
du
stry
–0.1
13
(–0.4
9)
–0.3
33
(–1.3
6)
–0.3
33
(–1.3
6)
3.1
92
(2.6
4)a
–0.2
52
(–0.8
1)
Med
ical/
Bio
–T
ech
Ind
ust
ry–0.5
55
(–1.6
7)c
–1.2
62
(–2.8
7)a
–1.2
62
(–2.8
7)a
6.4
07
(4.9
4)a
–1.1
70
(–2.2
1)b
1998
to3/2000
Du
mm
y0.3
49
(1.2
8)
1.1
78
(2.7
7)a
1.1
78
(2.7
7)a
–0.7
97
(–0.5
0)
0.3
48
(1.3
2)
Post
3/2000
Dum
my
0.1
23
(0.5
0)
0.8
84
(2.2
4)b
0.8
84
(2.2
4)b
2.3
01
(1.6
5)
–0.2
71
(–1.1
6)
Califo
rnia
Du
mm
y0.4
29
(3.0
8)a
0.4
98
(2.8
0)a
0.4
98
(2.8
0)a
–2.6
00
(–2.8
7)a
0.4
45
(2.1
7)b
Ob
serv
ati
on
s77
77
77
73
67
*a,
b,
an
dc
den
ote
sign
ifica
nt
diff
eren
ces
from
zero
at
the
1%
,5%
,an
d10%
level
s,re
spec
tivel
y.
53
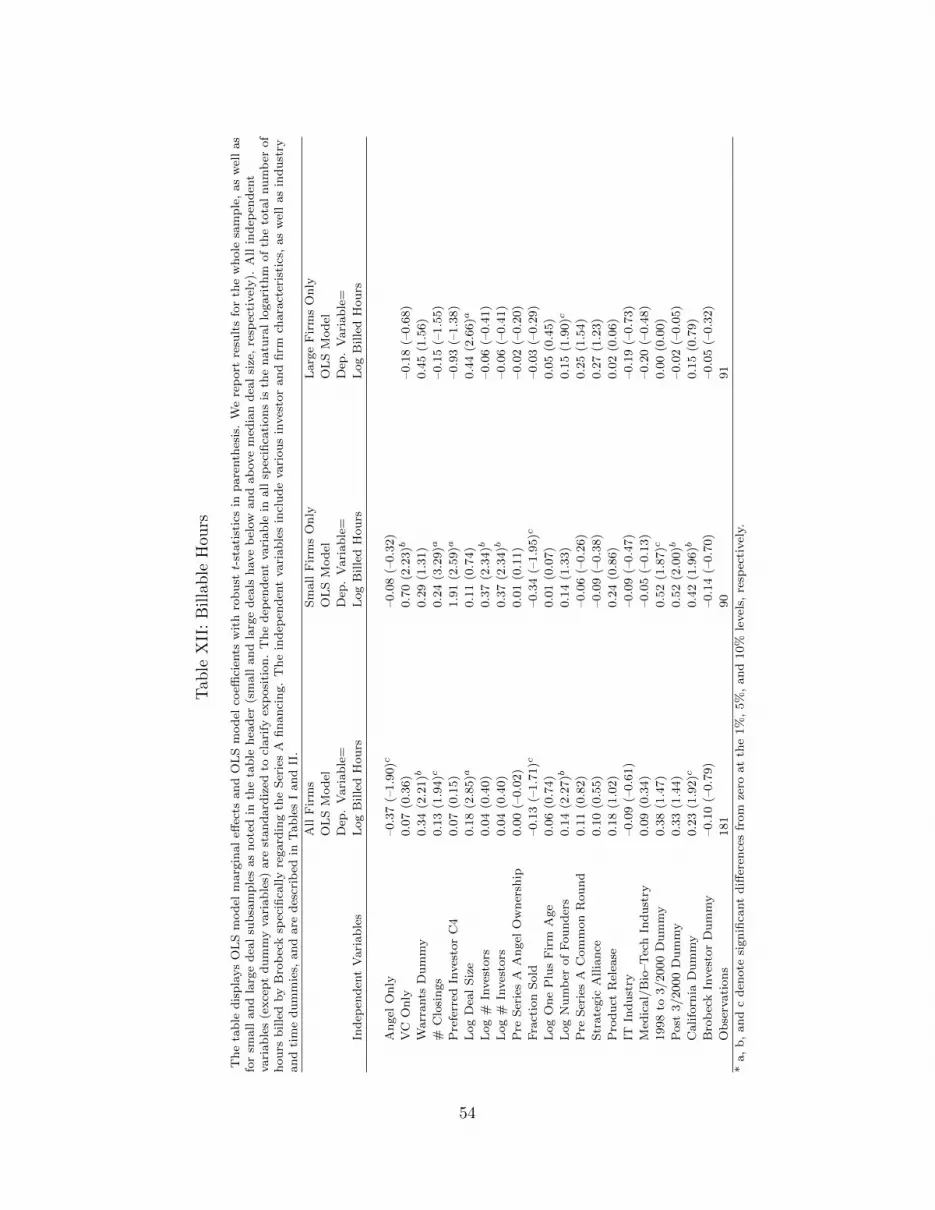
Tab
leX
II:
Bil
lab
leH
ours
Th
eta
ble
dis
pla
ys
OL
Sm
od
elm
arg
inal
effec
tsan
dO
LS
mod
elco
effici
ents
wit
hro
bu
stt-
stati
stic
sin
pare
nth
esis
.W
ere
port
resu
lts
for
the
wh
ole
sam
ple
,as
wel
las
for
small
an
dla
rge
dea
lsu
bsa
mp
les
as
note
din
the
tab
leh
ead
er(s
mall
an
dla
rge
dea
lsh
ave
bel
ow
an
dab
ove
med
ian
dea
lsi
ze,
resp
ecti
vel
y).
All
ind
epen
den
tvari
ab
les
(exce
pt
du
mm
yvari
ab
les)
are
stan
dard
ized
tocl
ari
fyex
posi
tion
.T
he
dep
end
ent
vari
ab
lein
all
spec
ifica
tion
sis
the
natu
ral
logari
thm
of
the
tota
lnu
mb
erof
hou
rsb
ille
dby
Bro
bec
ksp
ecifi
cally
regard
ing
the
Ser
ies
Afi
nanci
ng.
Th
ein
dep
enden
tvari
ab
les
incl
ud
evari
ou
sin
ves
tor
an
dfi
rmch
ara
cter
isti
cs,
as
wel
las
ind
ust
ryan
dti
me
du
mm
ies,
an
dare
des
crib
edin
Tab
les
Ian
dII
.
All
Fir
ms
Sm
all
Fir
ms
On
lyL
arg
eF
irm
sO
nly
OL
SM
od
elO
LS
Mod
elO
LS
Mod
el
Dep
.V
ari
ab
le=
Dep
.V
ari
ab
le=
Dep
.V
ari
ab
le=
Ind
epen
den
tV
ari
ab
les
Log
Bille
dH
ou
rsL
og
Bille
dH
ou
rsL
og
Bille
dH
ou
rs
An
gel
On
ly–0.3
7(–
1.9
0)c
–0.0
8(–
0.3
2)
VC
On
ly0.0
7(0
.36)
0.7
0(2
.23)b
–0.1
8(–
0.6
8)
Warr
ants
Du
mm
y0.3
4(2
.21)b
0.2
9(1
.31)
0.4
5(1
.56)
#C
losi
ngs
0.1
3(1
.94)c
0.2
4(3
.29)a
–0.1
5(–
1.5
5)
Pre
ferr
edIn
ves
tor
C4
0.0
7(0
.15)
1.9
1(2
.59)a
–0.9
3(–
1.3
8)
Log
Dea
lS
ize
0.1
8(2
.85)a
0.1
1(0
.74)
0.4
4(2
.66)a
Log
#In
ves
tors
0.0
4(0
.40)
0.3
7(2
.34)b
–0.0
6(–
0.4
1)
Log
#In
ves
tors
0.0
4(0
.40)
0.3
7(2
.34)b
–0.0
6(–
0.4
1)
Pre
Ser
ies
AA
ngel
Ow
ner
ship
0.0
0(–
0.0
2)
0.0
1(0
.11)
–0.0
2(–
0.2
0)
Fra
ctio
nS
old
–0.1
3(–
1.7
1)c
–0.3
4(–
1.9
5)c
–0.0
3(–
0.2
9)
Log
On
eP
lus
Fir
mA
ge
0.0
6(0
.74)
0.0
1(0
.07)
0.0
5(0
.45)
Log
Nu
mb
erof
Fou
nd
ers
0.1
4(2
.27)b
0.1
4(1
.33)
0.1
5(1
.90)c
Pre
Ser
ies
AC
om
mon
Rou
nd
0.1
1(0
.82)
–0.0
6(–
0.2
6)
0.2
5(1
.54)
Str
ate
gic
Allia
nce
0.1
0(0
.55)
–0.0
9(–
0.3
8)
0.2
7(1
.23)
Pro
du
ctR
elea
se0.1
8(1
.02)
0.2
4(0
.86)
0.0
2(0
.06)
ITIn
du
stry
–0.0
9(–
0.6
1)
–0.0
9(–
0.4
7)
–0.1
9(–
0.7
3)
Med
ical/
Bio
–T
ech
Ind
ust
ry0.0
9(0
.34)
–0.0
5(–
0.1
3)
–0.2
0(–
0.4
8)
1998
to3/2000
Du
mm
y0.3
8(1
.47)
0.5
2(1
.87)c
0.0
0(0
.00)
Post
3/2000
Dum
my
0.3
3(1
.44)
0.5
2(2
.00)b
–0.0
2(–
0.0
5)
Califo
rnia
Du
mm
y0.2
3(1
.92)c
0.4
2(1
.96)b
0.1
5(0
.79)
Bro
bec
kIn
ves
tor
Du
mm
y–0.1
0(–
0.7
9)
–0.1
4(–
0.7
0)
–0.0
5(–
0.3
2)
Ob
serv
ati
on
s181
90
91
*a,
b,
an
dc
den
ote
sign
ifica
nt
diff
eren
ces
from
zero
at
the
1%
,5%
,an
d10%
level
s,re
spec
tivel
y.
54