Embed Size (px)
Citation preview
Earth and Planetary Science Letters 357–358 (2012) 84–98
Contents lists available at SciVerse ScienceDirect
Earth and Planetary Science Letters
0012-82
http://d
n Corr
E-m
A.Biggin
marcell
matney
aengin@
journal homepage: www.elsevier.com/locate/epsl
Archaeomagnetic study of five mounds from Upper Mesopotamia between2500 and 700 BCE: Further evidence for an extremely strong geomagneticfield ca. 3000 years ago
P. Ertepinar a,n, C.G. Langereis a, A.J. Biggin b, M. Frangipane c, T. Matney d, T. Okse e, A. Engin f
a Paleomagnetic Laboratory Fort Hoofddijk, Department of Earth Sciences, University of Utrecht, Budapestlaan 17, 3584 CD Utrecht, the Netherlandsb Geomagnetism Laboratory, Oliver Lodge Laboratories, Department of Earth and Ocean Sciences, University of Liverpool, Liverpool L69 7ZE, UKc Department of Philosophy, Arts and Humanities and Oriental Studies, Sapienza University of Rome, Piazzale Aldo Moro 5, 00185 Rome, Italyd Department of Anthropology and Classical Studies, University of Akron, Akron, OH 44325-1910, USAe Department of Archaeology, Faculty of Arts and Sciences, Kocaeli University, Kocaeli, Turkeyf Department of Archaeology, Faculty of Letters, Cumhuriyet University, Sivas, Turkey
a r t i c l e i n f o
Article history:
Received 29 September 2011
Received in revised form
19 June 2012
Accepted 22 August 2012
Editor: DeMenocalto heating to temperatures of 700 1C. In general, the demagnetization diagrams are single component
Keywords:
archaeomagnetism
archaeointensity
secular variation
Upper Mesopotamia
Turkey
geomagnetic spikes
1X/$ - see front matter & 2012 Elsevier B.V.
x.doi.org/10.1016/j.epsl.2012.08.039
esponding author. Tel.: þ31 30 253 1361.
ail addresses: [email protected] (P. Ertepinar),
@liverpool.ac.uk (A.J. Biggin),
[email protected] (M. Frangipane),
@uakron.edu (T. Matney), tuba.okse@kocaeli.
cumhuriyet.edu.tr (A. Engin).
a b s t r a c t
The distribution of archaeomagnetic data in eastern Europe and the Near and Middle East shows a
remarkable gap in Turkey. This study presents the first archaeomagnetic results from five different
mounds in southeast Turkey, the northern part of Mesopotamia. The rock magnetic experiments
indicate that in the majority of the samples the dominant magnetic carrier is magnetite, which is stable
and all five sets display well-defined characteristic magnetizations and clustered directions. For the
period between 2500 and 700 BCE, the declinations are between 3501 and 201 while inclinations are in
the range of 49–641. The directional results are compared with the global geomagnetic field models
(CALS7k.2, ARCH3k_cst.1 and CALS3k.4) and the data from the archaeomagnetic database GEOMA-
GIA50v2. The results are coherent with both the data and the models except for two near-
contemporaneous sets dating �2000 BCE, which are offset to the east by more than 201 with respect
to CALS7k.2. Archaeointensity measurements were made using the microwave and conventional
thermal Thellier methods applied to five sets of samples (four furnaces and a mud-brick wall). These
yielded comparable and intriguing results. While those from the furnaces are slightly higher than the
CALS7k.2 model and in agreement with the GEOMAGIA50v2 and the Middle East data, the results from
the mud-brick wall suggest a high intensity of 100.8 mT (17.7�1022 Am2) at �1000 BCE. This result is
in excellent agreement with recent claims of extremely high intensity measured in other regions of the
Middle East for this time period though less consistent with these being associated with extremely
short-lived events. Finally, we discuss our new and other recently published archaeointensity results in
terms of geomagnetic intensity versus climate.
& 2012 Elsevier B.V. All rights reserved.
1. Introduction
The recent geomagnetic field is well-known from globallydistributed observatories and from satellite observations (Hulotet al., 2002), while for the past few centuries the field has beenreconstructed from historical navigational observations (Jacksonet al., 2000; Jonkers et al., 2003). Older records of the field can be
All rights reserved.
edu.tr (T. Okse),
derived through archaeomagnetism, the study of burnt or firedarcheological artifacts. These archaeomagnetic directions andintensities of the field are crucial to furthering our understandingof the behavior of the geodynamo over longer, millennial timescales. A number of global and regional field models have recentlybeen developed based on compilations of archaeomagnetic andlake sediment data like the Continuous Archaeomagnetic andLake Sediment models CALS3k (Korte and Constable, 2003; Korteet al., 2009) and CALS7k (Korte and Constable, 2005) for the past3 and 7 kyr, respectively. The most recent model for the past 3000years CALS3k.4 is based on a recently updated and improved datacompilation and considered presently to be the best model forEarth surface studies (Korte and Constable, 2011). The model isavailable through the online database GEOMAGIA50v2 (Donadini
P. Ertepinar et al. / Earth and Planetary Science Letters 357–358 (2012) 84–98 85
et al., 2006; Korhonen et al., 2008) (http://geomagia.ucsd.edu).While the CALSnK models are based on both archaeomagneticand lake sediments data, the ARCH3k.1 model is based solely onarchaeomagnetic data, and the constrained model ARCH3k_cst.1additionally uses a set of reliability criteria to minimize uncer-tainties (Donadini et al., 2009; Korte et al., 2009). The ARCH3kmodels are certain to be more reliable for the northern hemi-sphere, especially for Western Europe, since archaeomagneticdata for the southern hemisphere are sparse.
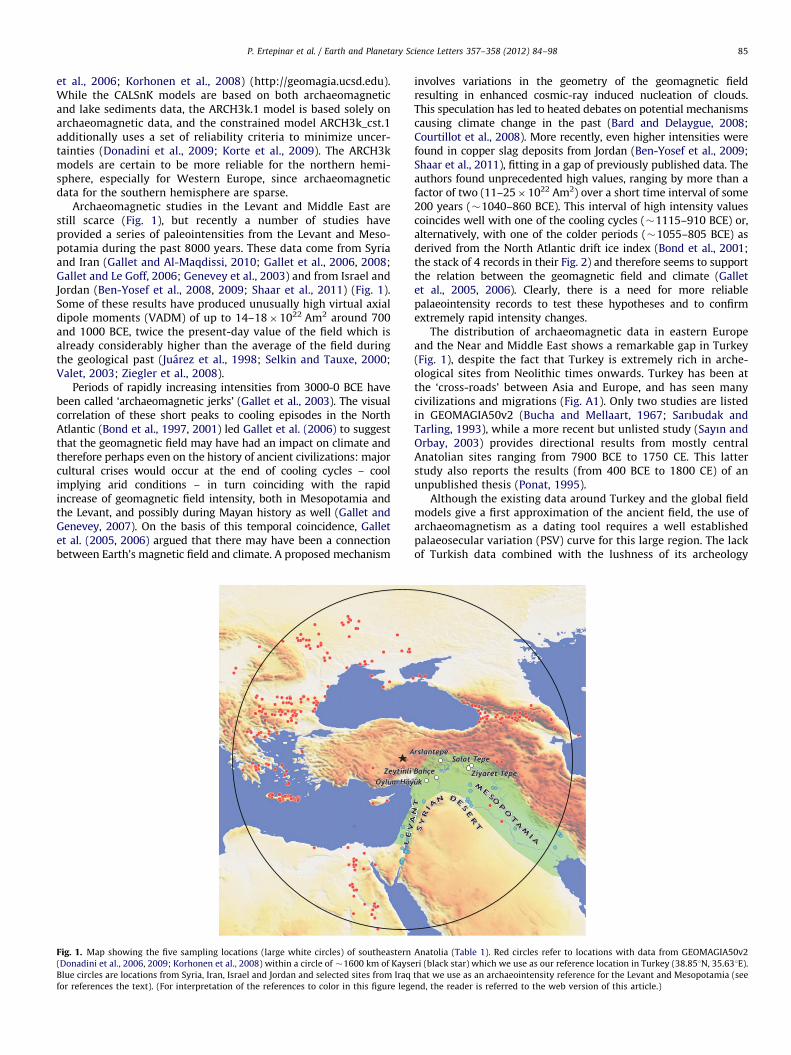
Archaeomagnetic studies in the Levant and Middle East arestill scarce (Fig. 1), but recently a number of studies haveprovided a series of paleointensities from the Levant and Meso-potamia during the past 8000 years. These data come from Syriaand Iran (Gallet and Al-Maqdissi, 2010; Gallet et al., 2006, 2008;Gallet and Le Goff, 2006; Genevey et al., 2003) and from Israel andJordan (Ben-Yosef et al., 2008, 2009; Shaar et al., 2011) (Fig. 1).Some of these results have produced unusually high virtual axialdipole moments (VADM) of up to 14–18�1022 Am2 around 700and 1000 BCE, twice the present-day value of the field which isalready considerably higher than the average of the field duringthe geological past (Juarez et al., 1998; Selkin and Tauxe, 2000;Valet, 2003; Ziegler et al., 2008).
Periods of rapidly increasing intensities from 3000-0 BCE havebeen called ‘archaeomagnetic jerks’ (Gallet et al., 2003). The visualcorrelation of these short peaks to cooling episodes in the NorthAtlantic (Bond et al., 1997, 2001) led Gallet et al. (2006) to suggestthat the geomagnetic field may have had an impact on climate andtherefore perhaps even on the history of ancient civilizations: majorcultural crises would occur at the end of cooling cycles – coolimplying arid conditions – in turn coinciding with the rapidincrease of geomagnetic field intensity, both in Mesopotamia andthe Levant, and possibly during Mayan history as well (Gallet andGenevey, 2007). On the basis of this temporal coincidence, Galletet al. (2005, 2006) argued that there may have been a connectionbetween Earth’s magnetic field and climate. A proposed mechanism
Fig. 1. Map showing the five sampling locations (large white circles) of southeastern
(Donadini et al., 2006, 2009; Korhonen et al., 2008) within a circle of �1600 km of Kayse
Blue circles are locations from Syria, Iran, Israel and Jordan and selected sites from Iraq
for references the text). (For interpretation of the references to color in this figure lege
involves variations in the geometry of the geomagnetic fieldresulting in enhanced cosmic-ray induced nucleation of clouds.This speculation has led to heated debates on potential mechanismscausing climate change in the past (Bard and Delaygue, 2008;Courtillot et al., 2008). More recently, even higher intensities werefound in copper slag deposits from Jordan (Ben-Yosef et al., 2009;Shaar et al., 2011), fitting in a gap of previously published data. Theauthors found unprecedented high values, ranging by more than afactor of two (11–25�1022 Am2) over a short time interval of some200 years (�1040–860 BCE). This interval of high intensity valuescoincides well with one of the cooling cycles (�1115–910 BCE) or,alternatively, with one of the colder periods (�1055–805 BCE) asderived from the North Atlantic drift ice index (Bond et al., 2001;the stack of 4 records in their Fig. 2) and therefore seems to supportthe relation between the geomagnetic field and climate (Galletet al., 2005, 2006). Clearly, there is a need for more reliablepalaeointensity records to test these hypotheses and to confirmextremely rapid intensity changes.
The distribution of archaeomagnetic data in eastern Europeand the Near and Middle East shows a remarkable gap in Turkey(Fig. 1), despite the fact that Turkey is extremely rich in arche-ological sites from Neolithic times onwards. Turkey has been atthe ‘cross-roads’ between Asia and Europe, and has seen manycivilizations and migrations (Fig. A1). Only two studies are listedin GEOMAGIA50v2 (Bucha and Mellaart, 1967; Sarıbudak andTarling, 1993), while a more recent but unlisted study (Sayın andOrbay, 2003) provides directional results from mostly centralAnatolian sites ranging from 7900 BCE to 1750 CE. This latterstudy also reports the results (from 400 BCE to 1800 CE) of anunpublished thesis (Ponat, 1995).
Although the existing data around Turkey and the global fieldmodels give a first approximation of the ancient field, the use ofarchaeomagnetism as a dating tool requires a well establishedpalaeosecular variation (PSV) curve for this large region. The lackof Turkish data combined with the lushness of its archeology
Anatolia (Table 1). Red circles refer to locations with data from GEOMAGIA50v2
ri (black star) which we use as our reference location in Turkey (38.851N, 35.631E).
that we use as an archaeointensity reference for the Levant and Mesopotamia (see
nd, the reader is referred to the web version of this article.)
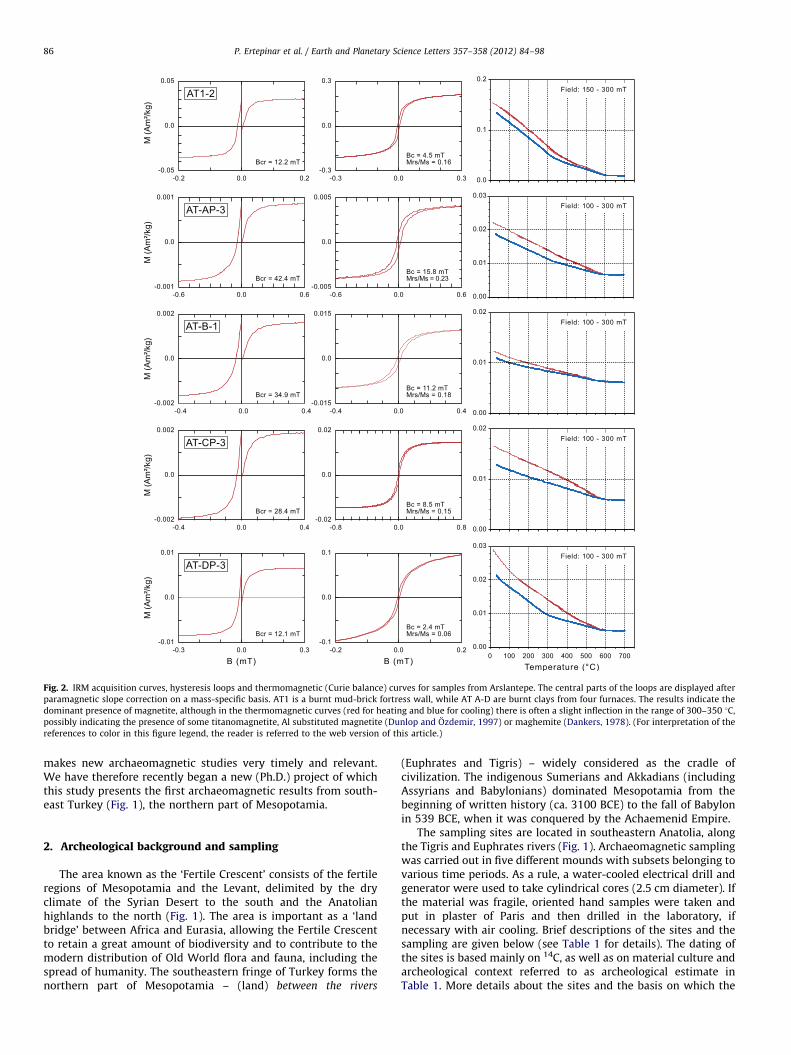
Fig. 2. IRM acquisition curves, hysteresis loops and thermomagnetic (Curie balance) curves for samples from Arslantepe. The central parts of the loops are displayed after
paramagnetic slope correction on a mass-specific basis. AT1 is a burnt mud-brick fortress wall, while AT A-D are burnt clays from four furnaces. The results indicate the
dominant presence of magnetite, although in the thermomagnetic curves (red for heating and blue for cooling) there is often a slight inflection in the range of 300–350 1C,
possibly indicating the presence of some titanomagnetite, Al substituted magnetite (Dunlop and Ozdemir, 1997) or maghemite (Dankers, 1978). (For interpretation of the
references to color in this figure legend, the reader is referred to the web version of this article.)
P. Ertepinar et al. / Earth and Planetary Science Letters 357–358 (2012) 84–9886
makes new archaeomagnetic studies very timely and relevant.We have therefore recently began a new (Ph.D.) project of whichthis study presents the first archaeomagnetic results from south-east Turkey (Fig. 1), the northern part of Mesopotamia.
2. Archeological background and sampling
The area known as the ‘Fertile Crescent’ consists of the fertileregions of Mesopotamia and the Levant, delimited by the dryclimate of the Syrian Desert to the south and the Anatolianhighlands to the north (Fig. 1). The area is important as a ‘landbridge’ between Africa and Eurasia, allowing the Fertile Crescentto retain a great amount of biodiversity and to contribute to themodern distribution of Old World flora and fauna, including thespread of humanity. The southeastern fringe of Turkey forms thenorthern part of Mesopotamia – (land) between the rivers
(Euphrates and Tigris) – widely considered as the cradle ofcivilization. The indigenous Sumerians and Akkadians (includingAssyrians and Babylonians) dominated Mesopotamia from thebeginning of written history (ca. 3100 BCE) to the fall of Babylonin 539 BCE, when it was conquered by the Achaemenid Empire.
The sampling sites are located in southeastern Anatolia, alongthe Tigris and Euphrates rivers (Fig. 1). Archaeomagnetic samplingwas carried out in five different mounds with subsets belonging tovarious time periods. As a rule, a water-cooled electrical drill andgenerator were used to take cylindrical cores (2.5 cm diameter). Ifthe material was fragile, oriented hand samples were taken andput in plaster of Paris and then drilled in the laboratory, ifnecessary with air cooling. Brief descriptions of the sites and thesampling are given below (see Table 1 for details). The dating ofthe sites is based mainly on 14C, as well as on material culture andarcheological context referred to as archeological estimate inTable 1. More details about the sites and the basis on which the
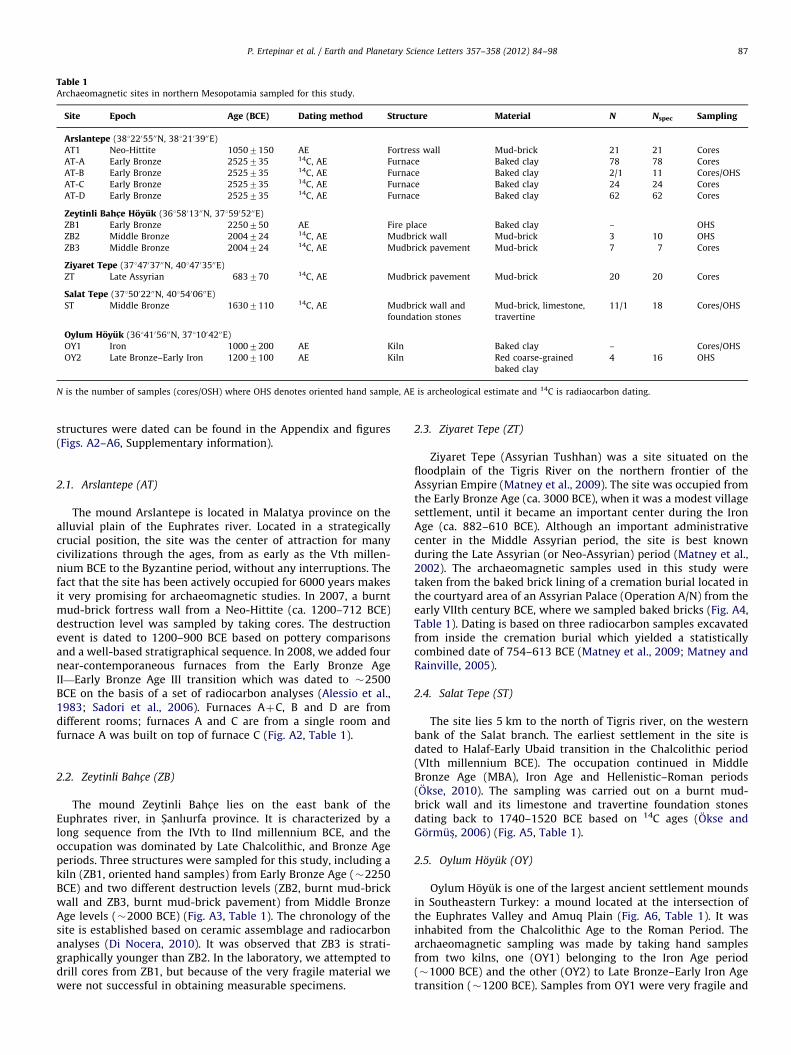
Table 1Archaeomagnetic sites in northern Mesopotamia sampled for this study.
Site Epoch Age (BCE) Dating method Structure Material N Nspec Sampling
Arslantepe (3812205500N, 3812103900E)
AT1 Neo-Hittite 10507150 AE Fortress wall Mud-brick 21 21 Cores
AT-A Early Bronze 2525735 14C, AE Furnace Baked clay 78 78 Cores
AT-B Early Bronze 2525735 14C, AE Furnace Baked clay 2/1 11 Cores/OHS
AT-C Early Bronze 2525735 14C, AE Furnace Baked clay 24 24 Cores
AT-D Early Bronze 2525735 14C, AE Furnace Baked clay 62 62 Cores
Zeytinli Bahc-e Hoyuk (3615801300N, 3715905200E)
ZB1 Early Bronze 2250750 AE Fire place Baked clay – OHS
ZB2 Middle Bronze 2004724 14C, AE Mudbrick wall Mud-brick 3 10 OHS
ZB3 Middle Bronze 2004724 14C, AE Mudbrick pavement Mud-brick 7 7 Cores
Ziyaret Tepe (3714703700N, 4014703500E)
ZT Late Assyrian 683770 14C, AE Mudbrick pavement Mud-brick 20 20 Cores
Salat Tepe (3715002200N, 4015400600E)
ST Middle Bronze 16307110 14C, AE Mudbrick wall and
foundation stones
Mud-brick, limestone,
travertine
11/1 18 Cores/OHS
Oylum Hoyuk (3614105600N, 3711004200E)
OY1 Iron 10007200 AE Kiln Baked clay – Cores/OHS
OY2 Late Bronze–Early Iron 12007100 AE Kiln Red coarse-grained
baked clay
4 16 OHS
N is the number of samples (cores/OSH) where OHS denotes oriented hand sample, AE is archeological estimate and 14C is radiaocarbon dating.
P. Ertepinar et al. / Earth and Planetary Science Letters 357–358 (2012) 84–98 87
structures were dated can be found in the Appendix and figures(Figs. A2–A6, Supplementary information).
2.1. Arslantepe (AT)
The mound Arslantepe is located in Malatya province on thealluvial plain of the Euphrates river. Located in a strategicallycrucial position, the site was the center of attraction for manycivilizations through the ages, from as early as the Vth millen-nium BCE to the Byzantine period, without any interruptions. Thefact that the site has been actively occupied for 6000 years makesit very promising for archaeomagnetic studies. In 2007, a burntmud-brick fortress wall from a Neo-Hittite (ca. 1200–712 BCE)destruction level was sampled by taking cores. The destructionevent is dated to 1200–900 BCE based on pottery comparisonsand a well-based stratigraphical sequence. In 2008, we added fournear-contemporaneous furnaces from the Early Bronze AgeII—Early Bronze Age III transition which was dated to �2500BCE on the basis of a set of radiocarbon analyses (Alessio et al.,1983; Sadori et al., 2006). Furnaces AþC, B and D are fromdifferent rooms; furnaces A and C are from a single room andfurnace A was built on top of furnace C (Fig. A2, Table 1).
2.2. Zeytinli Bahc-e (ZB)
The mound Zeytinli Bahc-e lies on the east bank of theEuphrates river, in S-anlıurfa province. It is characterized by along sequence from the IVth to IInd millennium BCE, and theoccupation was dominated by Late Chalcolithic, and Bronze Ageperiods. Three structures were sampled for this study, including akiln (ZB1, oriented hand samples) from Early Bronze Age (�2250BCE) and two different destruction levels (ZB2, burnt mud-brickwall and ZB3, burnt mud-brick pavement) from Middle BronzeAge levels (�2000 BCE) (Fig. A3, Table 1). The chronology of thesite is established based on ceramic assemblage and radiocarbonanalyses (Di Nocera, 2010). It was observed that ZB3 is strati-graphically younger than ZB2. In the laboratory, we attempted todrill cores from ZB1, but because of the very fragile material wewere not successful in obtaining measurable specimens.
2.3. Ziyaret Tepe (ZT)
Ziyaret Tepe (Assyrian Tushhan) was a site situated on thefloodplain of the Tigris River on the northern frontier of theAssyrian Empire (Matney et al., 2009). The site was occupied fromthe Early Bronze Age (ca. 3000 BCE), when it was a modest villagesettlement, until it became an important center during the IronAge (ca. 882–610 BCE). Although an important administrativecenter in the Middle Assyrian period, the site is best knownduring the Late Assyrian (or Neo-Assyrian) period (Matney et al.,2002). The archaeomagnetic samples used in this study weretaken from the baked brick lining of a cremation burial located inthe courtyard area of an Assyrian Palace (Operation A/N) from theearly VIIth century BCE, where we sampled baked bricks (Fig. A4,Table 1). Dating is based on three radiocarbon samples excavatedfrom inside the cremation burial which yielded a statisticallycombined date of 754–613 BCE (Matney et al., 2009; Matney andRainville, 2005).
2.4. Salat Tepe (ST)
The site lies 5 km to the north of Tigris river, on the westernbank of the Salat branch. The earliest settlement in the site isdated to Halaf-Early Ubaid transition in the Chalcolithic period(VIth millennium BCE). The occupation continued in MiddleBronze Age (MBA), Iron Age and Hellenistic–Roman periods(Okse, 2010). The sampling was carried out on a burnt mud-brick wall and its limestone and travertine foundation stonesdating back to 1740–1520 BCE based on 14C ages (Okse andGormus-, 2006) (Fig. A5, Table 1).
2.5. Oylum Hoyuk (OY)
Oylum Hoyuk is one of the largest ancient settlement moundsin Southeastern Turkey: a mound located at the intersection ofthe Euphrates Valley and Amuq Plain (Fig. A6, Table 1). It wasinhabited from the Chalcolithic Age to the Roman Period. Thearchaeomagnetic sampling was made by taking hand samplesfrom two kilns, one (OY1) belonging to the Iron Age period(�1000 BCE) and the other (OY2) to Late Bronze–Early Iron Agetransition (�1200 BCE). Samples from OY1 were very fragile and
P. Ertepinar et al. / Earth and Planetary Science Letters 357–358 (2012) 84–9888
did not survive sampling in the laboratory; consequently noresults are reported. OY2 consisted of a pot-shaped kiln of coarsegrained red baked clay from which we were able to extract fourhand samples.
3. Rock magnetic properties
For all the sites and for the different materials from each site,we measured thermomagnetic (Curie balance) curves and lowfield magnetic susceptibilities, and for sites that appeared pro-mising for archaeointensity research we also performed hyster-esis loop experiments, including First Order Reversal Curve(FORC) diagrams (Roberts et al., 2000) – the analysis of FORCdiagrams may increase the efficiency of paleointensity measure-ments (Carvallo et al., 2006) – and acquisition of IsothermalRemanent Magnetization (IRM), to characterize the rock magneticproperties.
3.1. Room temperature susceptibility
We measured the low field magnetic susceptibility with aKappabridge KLY-2. In general, susceptibilities are high as is oftenthe case for burnt material. The burnt mud-bricks (AT1, ZT, ST, ZB2,ZB3) and the red baked coarse material of the OY2 kiln have highsusceptibilities ranging from 1 to 16�10�3 SI, the burned clays of
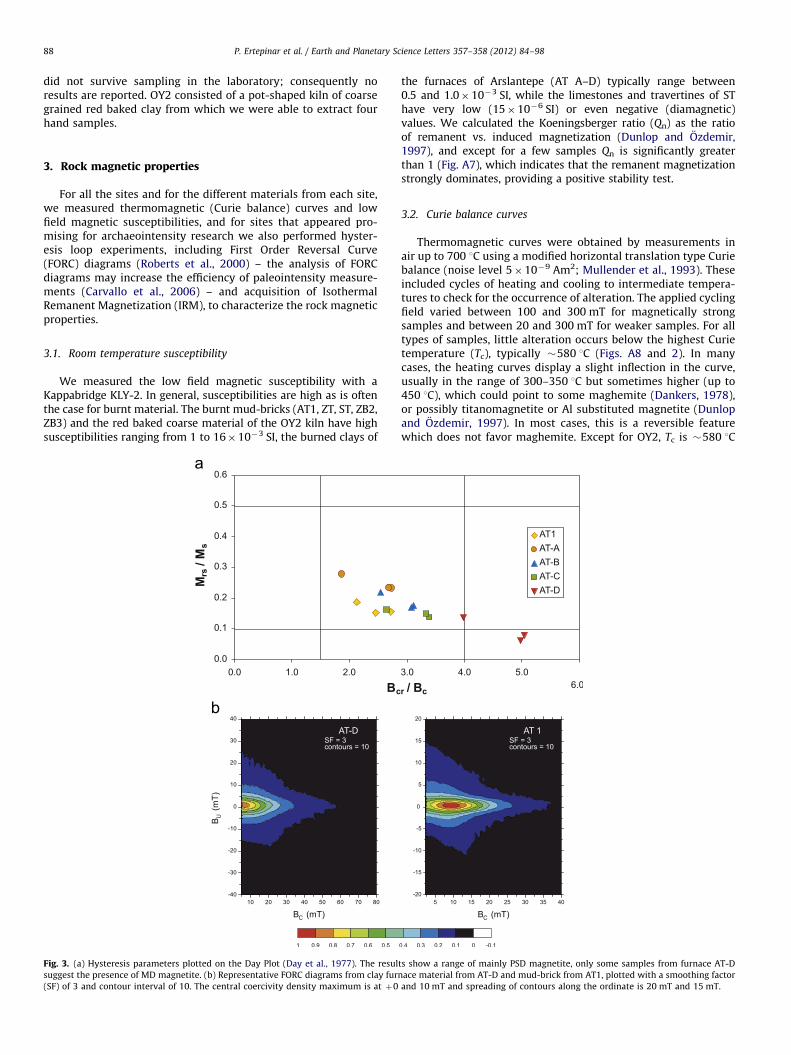
Fig. 3. (a) Hysteresis parameters plotted on the Day Plot (Day et al., 1977). The resul
suggest the presence of MD magnetite. (b) Representative FORC diagrams from clay furn
(SF) of 3 and contour interval of 10. The central coercivity density maximum is at þ0
the furnaces of Arslantepe (AT A–D) typically range between0.5 and 1.0�10�3 SI, while the limestones and travertines of SThave very low (15�10�6 SI) or even negative (diamagnetic)values. We calculated the Koeningsberger ratio (Qn) as the ratioof remanent vs. induced magnetization (Dunlop and Ozdemir,1997), and except for a few samples Qn is significantly greaterthan 1 (Fig. A7), which indicates that the remanent magnetizationstrongly dominates, providing a positive stability test.
3.2. Curie balance curves
Thermomagnetic curves were obtained by measurements inair up to 700 1C using a modified horizontal translation type Curiebalance (noise level 5�10�9 Am2; Mullender et al., 1993). Theseincluded cycles of heating and cooling to intermediate tempera-tures to check for the occurrence of alteration. The applied cyclingfield varied between 100 and 300 mT for magnetically strongsamples and between 20 and 300 mT for weaker samples. For alltypes of samples, little alteration occurs below the highest Curietemperature (Tc), typically �580 1C (Figs. A8 and 2). In manycases, the heating curves display a slight inflection in the curve,usually in the range of 300–350 1C but sometimes higher (up to450 1C), which could point to some maghemite (Dankers, 1978),or possibly titanomagnetite or Al substituted magnetite (Dunlopand Ozdemir, 1997). In most cases, this is a reversible featurewhich does not favor maghemite. Except for OY2, Tc is �580 1C
ts show a range of mainly PSD magnetite, only some samples from furnace AT-D
ace material from AT-D and mud-brick from AT1, plotted with a smoothing factor
and 10 mT and spreading of contours along the ordinate is 20 mT and 15 mT.
P. Ertepinar et al. / Earth and Planetary Science Letters 357–358 (2012) 84–98 89
indicating that the dominant magnetic carrier is magnetite. OY2has a Curie temperature of 620 1C which probably indicatesmaghemite as the main carrier. For the samples from AT-D thereis an additional low Tc at 120 1C which may imply that furnace Dalso contains some amount of goethite (Dekkers, 1988). In mostcases, the heating and cooling curves are similar indicating thatthe samples are stable to heating to temperatures of 700 1C.
On the basis of the thermomagnetic measurements, wedecided to use the samples from Arslantepe (AT1, AT A–D) forarchaeointensity measurements, since these appeared to be moststable upon heating and show no significant alteration and noevidence for maghemite. To determine the magnetic domainstate, and hence the magnetic stability of these sites, hysteresisloop parameters, FORC diagrams and IRM acquisition curves weremeasured with an alternating gradient magnetometer (MicroMagModel, Princeton, noise level 2�10�8 Am2). From each set, threesamples were measured and paramagnetic and diamagneticcorrections were applied to the hysteresis loops. The results(Table A1) are depicted in a Day plot (Day et al., 1977) (Fig. 3a),and indicate that all sets except furnace AT-D fall into the pseudosingle domain (PSD) category whereas samples from furnace Dare largely in the multi-domain (MD) category.
The IRM acquisition curves show that there is no indication of ahigh coercivity mineral: all samples are saturated well below300 mT. The FORC diagrams (Fig. 3b) support the general findingsof the hysteresis analysis. Two representative diagrams showing themost extreme MD and PSD behaviors (AT-D and AT1 respectively)are plotted in Fig. 3b. AT-D displays a symmetrical FORC diagramwith peak of distribution centered at Bc¼0 axis and the contoursstart to diverge at 35 mT. The spreading of the contours along Bu
axis is very narrow indicating minimal magnetostatic interaction.These results suggest that furnace D is dominated by small MDgrains which makes it worthwhile to perform the archaeointensityexperiments. AT1, on the other hand, has a central coercivity densitymaximum at �10 mT with narrow contour spreading along theordinate which indicates non-interacting PSD grains. The rest of thesites have domain behavior between AT-D and AT1, closer to AT1.
4. Methods
To determine the characteristic remanent magnetization direc-tion (ChRM), at least 7 (generally more than 10, and occasionally
Table 2Archaeomagnetic directions from the studied sites. All directions are corrected for IGR
Site Treatment N n/N (TH) n/N (AF) At the site
Dec
AT1 AF 17 – 15/17 356.0
AT-A TH, AF 74 32/40 28/34 351.4
AT-B AF 9 – 8/9 352.4
AT-C TH, AF 21 9/11 9/10 347.7
AT-D TH, AF 55 27/30 21/25 350.2
ZB1 – – – –
ZB2 TH, AF 10 2/2 7/8 15.0
ZB3 AF 7 – 4/7 13.2
ZT (burnt) TH, AF 14 7/10 3/4 344.5
ZT (baked) TH, AF 14 10/10 4/4 356.8
ST TH, AF 12 4/4 5/8 353.9
OY1 – – –
OY2-A AF 7 – 7/7 39.6
OY2-B TH, AF 3 1/1 2/2 173.8
OY2-C&D TH, AF 6 1/1 5/5 320.1
n/N, number of samples accepted over measured; Dec, mean declination; Inc, mean inc
inclination; a95, 95% confidence cone of mean directions.
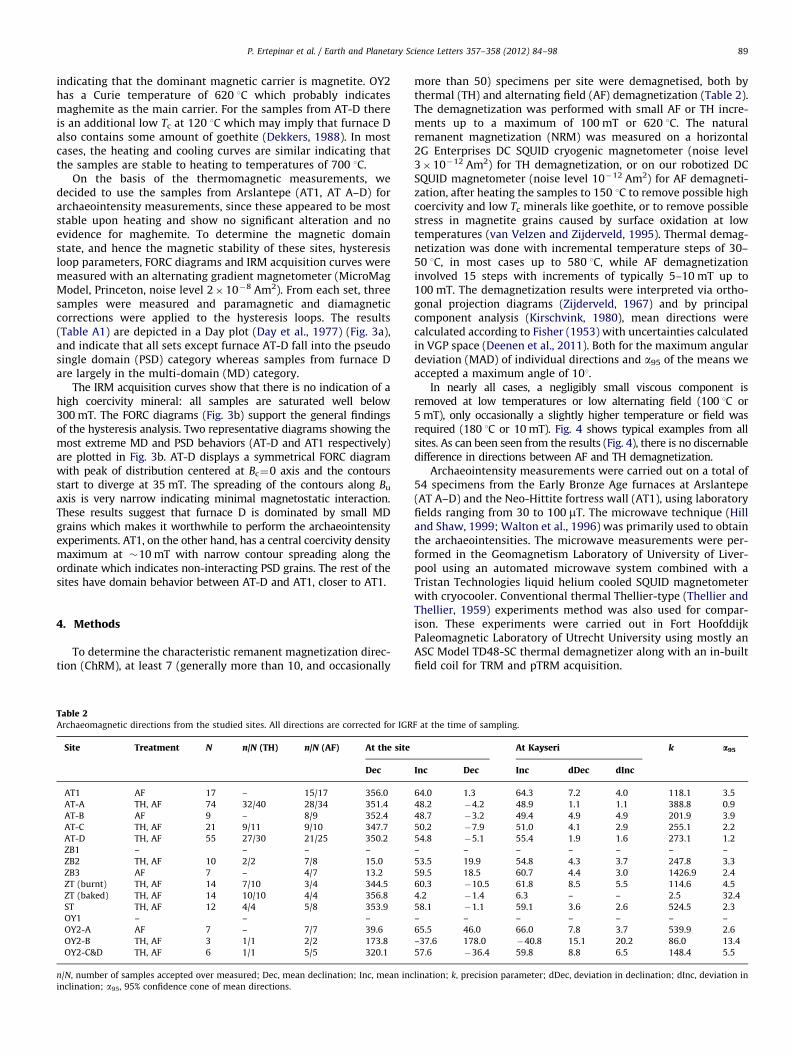
more than 50) specimens per site were demagnetised, both bythermal (TH) and alternating field (AF) demagnetization (Table 2).The demagnetization was performed with small AF or TH incre-ments up to a maximum of 100 mT or 620 1C. The naturalremanent magnetization (NRM) was measured on a horizontal2G Enterprises DC SQUID cryogenic magnetometer (noise level3�10�12 Am2) for TH demagnetization, or on our robotized DCSQUID magnetometer (noise level 10�12 Am2) for AF demagneti-zation, after heating the samples to 150 1C to remove possible highcoercivity and low Tc minerals like goethite, or to remove possiblestress in magnetite grains caused by surface oxidation at lowtemperatures (van Velzen and Zijderveld, 1995). Thermal demag-netization was done with incremental temperature steps of 30–50 1C, in most cases up to 580 1C, while AF demagnetizationinvolved 15 steps with increments of typically 5–10 mT up to100 mT. The demagnetization results were interpreted via ortho-gonal projection diagrams (Zijderveld, 1967) and by principalcomponent analysis (Kirschvink, 1980), mean directions werecalculated according to Fisher (1953) with uncertainties calculatedin VGP space (Deenen et al., 2011). Both for the maximum angulardeviation (MAD) of individual directions and a95 of the means weaccepted a maximum angle of 101.
In nearly all cases, a negligibly small viscous component isremoved at low temperatures or low alternating field (100 1C or5 mT), only occasionally a slightly higher temperature or field wasrequired (180 1C or 10 mT). Fig. 4 shows typical examples from allsites. As can been seen from the results (Fig. 4), there is no discernabledifference in directions between AF and TH demagnetization.
Archaeointensity measurements were carried out on a total of54 specimens from the Early Bronze Age furnaces at Arslantepe(AT A–D) and the Neo-Hittite fortress wall (AT1), using laboratoryfields ranging from 30 to 100 mT. The microwave technique (Hilland Shaw, 1999; Walton et al., 1996) was primarily used to obtainthe archaeointensities. The microwave measurements were per-formed in the Geomagnetism Laboratory of University of Liver-pool using an automated microwave system combined with aTristan Technologies liquid helium cooled SQUID magnetometerwith cryocooler. Conventional thermal Thellier-type (Thellier andThellier, 1959) experiments method was also used for compar-ison. These experiments were carried out in Fort HoofddijkPaleomagnetic Laboratory of Utrecht University using mostly anASC Model TD48-SC thermal demagnetizer along with an in-builtfield coil for TRM and pTRM acquisition.
F at the time of sampling.
At Kayseri k a95
Inc Dec Inc dDec dInc
64.0 1.3 64.3 7.2 4.0 118.1 3.5
48.2 �4.2 48.9 1.1 1.1 388.8 0.9
48.7 �3.2 49.4 4.9 4.9 201.9 3.9
50.2 �7.9 51.0 4.1 2.9 255.1 2.2
54.8 �5.1 55.4 1.9 1.6 273.1 1.2
– – – – – – –
53.5 19.9 54.8 4.3 3.7 247.8 3.3
59.5 18.5 60.7 4.4 3.0 1426.9 2.4
60.3 �10.5 61.8 8.5 5.5 114.6 4.5
4.2 �1.4 6.3 – – 2.5 32.4
58.1 �1.1 59.1 3.6 2.6 524.5 2.3
– – – – – – –
65.5 46.0 66.0 7.8 3.7 539.9 2.6
–37.6 178.0 �40.8 15.1 20.2 86.0 13.4
57.6 �36.4 59.8 8.8 6.5 148.4 5.5
lination; k, precision parameter; dDec, deviation in declination; dInc, deviation in
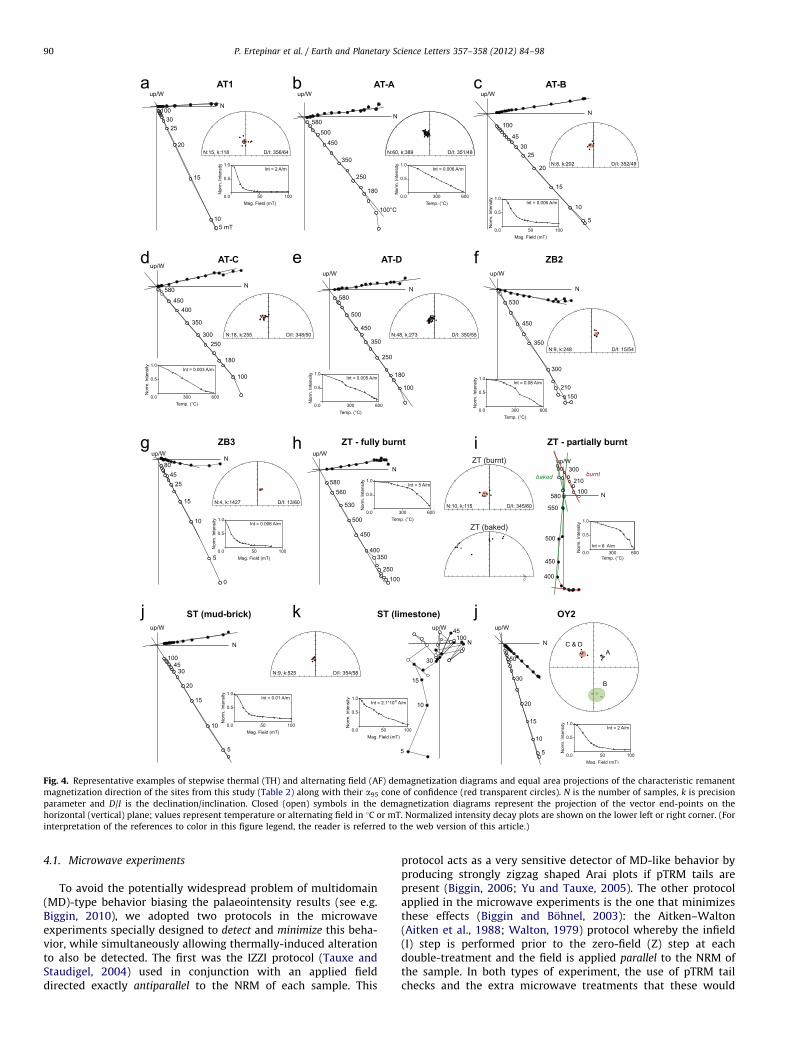
Fig. 4. Representative examples of stepwise thermal (TH) and alternating field (AF) demagnetization diagrams and equal area projections of the characteristic remanent
magnetization direction of the sites from this study (Table 2) along with their a95 cone of confidence (red transparent circles). N is the number of samples, k is precision
parameter and D/I is the declination/inclination. Closed (open) symbols in the demagnetization diagrams represent the projection of the vector end-points on the
horizontal (vertical) plane; values represent temperature or alternating field in 1C or mT. Normalized intensity decay plots are shown on the lower left or right corner. (For
interpretation of the references to color in this figure legend, the reader is referred to the web version of this article.)
P. Ertepinar et al. / Earth and Planetary Science Letters 357–358 (2012) 84–9890
4.1. Microwave experiments
To avoid the potentially widespread problem of multidomain(MD)-type behavior biasing the palaeointensity results (see e.g.Biggin, 2010), we adopted two protocols in the microwaveexperiments specially designed to detect and minimize this beha-vior, while simultaneously allowing thermally-induced alterationto also be detected. The first was the IZZI protocol (Tauxe andStaudigel, 2004) used in conjunction with an applied fielddirected exactly antiparallel to the NRM of each sample. This
protocol acts as a very sensitive detector of MD-like behavior byproducing strongly zigzag shaped Arai plots if pTRM tails arepresent (Biggin, 2006; Yu and Tauxe, 2005). The other protocolapplied in the microwave experiments is the one that minimizesthese effects (Biggin and Bohnel, 2003): the Aitken–Walton(Aitken et al., 1988; Walton, 1979) protocol whereby the infield(I) step is performed prior to the zero-field (Z) step at eachdouble-treatment and the field is applied parallel to the NRM ofthe sample. In both types of experiment, the use of pTRM tailchecks and the extra microwave treatments that these would
P. Ertepinar et al. / Earth and Planetary Science Letters 357–358 (2012) 84–98 91
require are rendered unnecessary. Furthermore, since the field isapplied (anti)parallel to the NRM it also minimizes the effects ofany magnetic anisotropy on the palaeointensity experiments. Tomonitor chemical alteration, pTRM checks were performed afterevery two double-treatments in both protocols.
4.2. Thermal Thellier and Thellier experiments
Once the behavior of the samples to IZZI antiparallel protocolis found to be considerably well-behaved in the microwaveexperiments, the rest of the thermal experiments are carried outusing the IZZI protocol with field applied parallel to the samplesNRM. Since the direction of the oven field is either parallel orantiparallel to the sample holder, to be able to attain the desiredfield direction, a custom-built orientation tray was used whereeach sample can separately be oriented with respect to the ovenfield. From each set, half of the samples were measured withpTRM checks in every two double-treatment heating steps. The
Fig. 5. Representative Arai plots (Nagata et al., 1963) with pTRM checks and associated
Solid blue (open red) symbols are vertical (horizontal) planes. Diagrams are normalized
microwave and TT stands for standard Thellier and Thellier technique. The direction o
measurements, the temperature steps are shown on the side of the data point. ThellierT
references to color in this figure legend, the reader is referred to the web version of th
other half of the samples was measured with one pTRM check atthe very end of the experiment.
The data from both experiments are interpreted using Araiplots (Nagata et al., 1963) (Fig. 5). The acceptance criteria for thelinear fit are adapted from Coe et al. (1978) and Selkin and Tauxe(2000), where the number of points (N) is greater than or equal to5, and the ratio of standard error of the slope to absolute value ofthe slope (b) is smaller than 0.1. The lower acceptance limit forthe NRM fraction (f) is increased from 0.15 to 0.4 (though mostresults had fZ0.5). We chose not to apply the fZ0.7 criterionrecently recommended by Biggin (2010) for results produced withno checks for MD behavior. We therefore cannot unequivocallyrule out MD effects causing certain results to be biased. As will beshown, however, results from sister samples, in which checkswere employed, suggest that any such effects are small. Theacceptance criterion for quality factor (q) was set to 3. Thedirectional aspects are analyzed by principle component analysis(Kirschvink, 1980). The upper acceptance limits for maximum
orthogonal vector plots showing single component directions in core coordinates.
to initial NRM intensity. The open (closed) circles are the IZ (ZI) steps. MW denotes
f the applied field is indicated as P or AP (parallel or antiparallel to NRM). For TT
ool4.0 (Leonhardt et al., 2004) was used to plot the data. (For interpretation of the
is article.)
P. Ertepinar et al. / Earth and Planetary Science Letters 357–358 (2012) 84–9892
angular deviation (MAD) and a are taken as 10%. pTRM checkswere deemed positive if the ratio of difference between the checkand the relevant TRM value to the length of the selected NRM–TRM segment (DRAT) was smaller than 10% (Selkin and Tauxe,2000). The acceptance limit for the minimum number of success-ful pTRM checks is taken as three. However, some of the thermalThellier and Thellier experiments were carried out with just onepTRM check at the end of the experiment. In that case, the sistersamples are taken as reference and the lowest temperature stepthat an alteration has occurred (if any) became the highestacceptable temperature threshold for the samples with onepTRM check.
In addition to thermally-induced alteration and MD-typebehavior, two other potential sources of bias to palaeointensityexperiments are described below.
4.3. Anisotropy of TRM
The manufacturing process of baked archeological materialsoften results in magnetic anisotropy (Rogers et al., 1979). Theeffect of anisotropy can be corrected by determining the TRManisotropy tensor or largely avoided by aligning the laboratoryfield with the NRM (Aitken et al., 1981; Chauvin et al., 2000;Veitch et al., 1984). In this study, the latter method is used tominimize the anisotropy bias. In addition, if the first step of theprotocol is a zero-field step, then the applied field direction isdetermined according to the zero-field direction. This enables anyviscous component to be removed and the applied field will alignwith the ChRM direction (Bohnel et al., 2003). For the samples inthis study, using the original NRM direction would not causeerroneous results since the influence from the viscous remanentmagnetization (VRM) is negligible, and has approximately thesame direction as the ChRM (Figs. 4 and 5).
4.4. Cooling rate dependence
The difference between the actual cooling time and thelaboratory cooling may lead to erroneous results since theblocking temperature of TRM is a function of time (Dodson andMcClelland-Brown, 1980; Halgedahl et al., 1980; Tauxe andYamazaki, 2007). To check the cooling rate dependence, formicrowave experiments only, one sample from each set washeated and cooled three times at 580 1C in the presence of thesame laboratory field used in the archaeointensity experiments.The first and last heatings (TRM1 and TRM3 respectively) areperformed in a standard oven with fast cooling of 1 h and thesecond heating (TRM2) was performed in a cooling rate oven witha cooling time of approximately 24 h. The difference between thefirst two heating would give the cooling rate effect whereas adifference between first and last heating (TRM1 and TRM3) wouldbe evidence for any alteration to have occurred. Recently, Yu(2011) observed that cooling rate effects are negligible in samplesdominated by PSD grains, which is the case for all our sampleswith the exception of furnace D.
5. Results
5.1. Demagnetization and ChRM directions
5.1.1. Arslantepe (AT)
For the furnaces AT-A, AT-C and AT-D, half of the samples weredemagnetized thermally and the other half by using alternatingfields. AT1 and AT-B were too fragile for thermal treatment,and specimens of these sites were carefully glued into perspexsample holders and demagnetized only by AF. The results are
straightforward: a single component decays straight to the origin.Samples from AT1 are completely demagnetized at 100 mT(Fig. 4a) indicating that there is no high coercivity mineral likegoethite or hematite. Samples from AT-A and AT-C show thepresence of only magnetite magnetization (Fig. 4b and d). Thethermal decay curves of samples from furnace D show a veryslight inflexion around 300 1C (Fig. 4e) similar to that which isobserved in the Curie balance curves. This and the observationthat the remanence has not been fully removed at 580 1C couldindicate a small amount of maghemite in these samples. This mayalso be consistent with the AF demagnetisations and decay curvesof samples from furnace B, where there is a rapid decay until 30–50 mT followed by a gradual decay to the highest fields (100 mT),but there is still some remanence left (Fig. 4c). All five sets displaya well-defined ChRM with declinations ranging 348–3561 andinclinations 48–641 (Table 2, Fig. 4); precision parameters (k) aretypically higher than 100 as may be expected from well-recordedspot readings of the geomagnetic field.
5.1.2. Zeytinli Bahc-e (ZB)
The samples taken from a mud-brick wall (ZB2) were treatedby both AF and TH demagnetization whereas the stratigraphicallyyounger fragile mud-brick pavement (ZB3) was demagnetizedonly by AF. The demagnetization results are typical of a singlecomponent magnetite magnetization (Fig. 4f). Although an inflec-tion in the decay curve could suggest some possible presence ofmaghemite, Tc’s higher than 580 1C are not observed, while AFdemagnetization removes nearly all remanence at 80 mT. Thenumber of successful samples from ZB3 is low: of the 7 cores only4 survived demagnetization treatment, but a value of k41000testifies to the excellent stability of the samples (Fig. 4g).
5.1.3. Ziyaret Tepe (ZT)
The samples taken from a baked brick structure, i.e., kiln-firedmud-bricks used to construct a pavement surrounding the cre-mation burial (denoted as ‘baked’ in Fig. 4), provide someinteresting results. From the 20 cores we were able to take, 10were either fully or partially heated by the last burning event ofthe level (‘burnt’ in Fig. 4) and showed either a ‘fully-burnt’ andconsistent single magnetite component (Fig. 4h), or a ‘partiallyburned’ low-temperature component that could be resolved(Fig. 4i). When the mud-bricks were not fully burnt, we wereable to determine a high-temperature component that originatedfrom the kiln-firing of the mud-bricks: they typically showrandom groups of directions in terms of declinations (Fig. 4, ZTbaked) according to their original baking position within the kiln.Interestingly, the shallow inclinations of these groups suggestthat they were baked in a (near) vertical position.
5.1.4. Salat Tepe (ST)
The site at Salat Tepe yielded burnt samples from a mud-brickwall and travertine foundation stones – with good results (Fig. 4j)– and from its limestone foundation stones with weak andrandom results (Fig. 4k). Obviously, the limestone foundationstones of the wall were not the ideal carriers of magnetization.The mud-brick and travertine samples, however, gave a consis-tent well-clustered direction with a high k-value of 525.
5.1.5. Oylum Hoyuk (OY)
Unfortunately, the samples from the Iron Age kiln (OY1) didnot survive laboratory sampling of specimens. From OY2, the 16specimens we extracted from 4 hand samples gave puzzlingresults. The demagnetization results are excellent, straight linesgoing to the origin (Fig. 4l), but the specimens from the 4 handsamples cluster in 3 distinct groups (A, B, CþD, Fig. 4). An
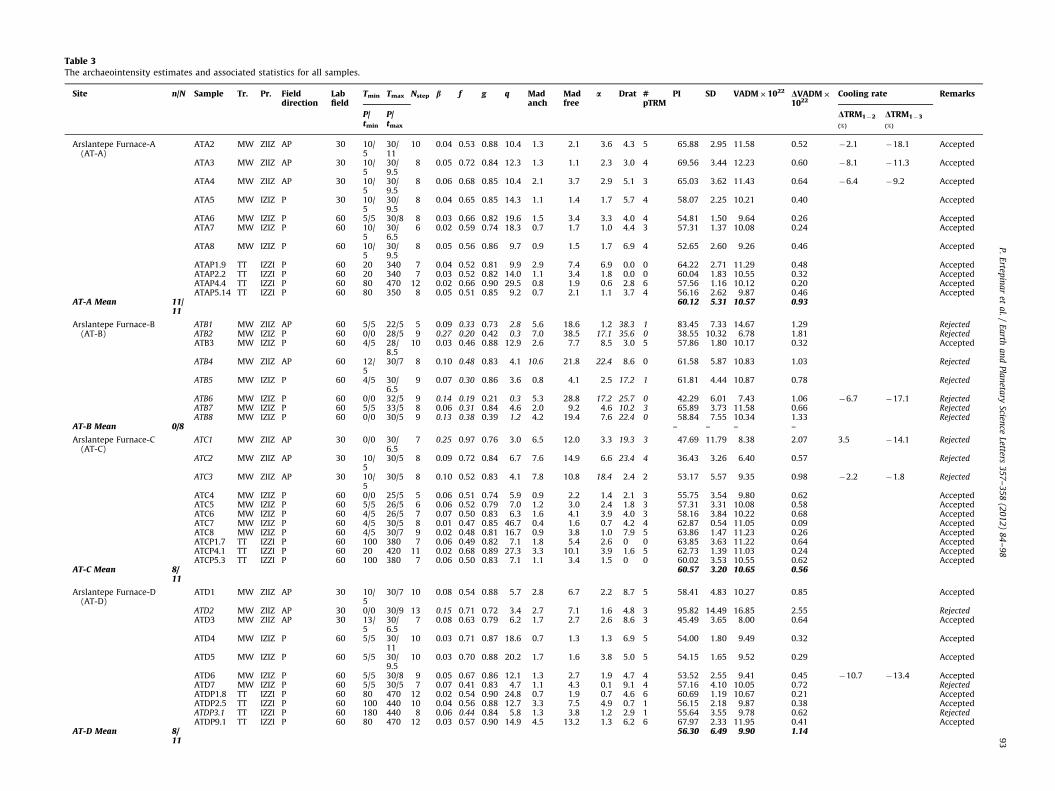
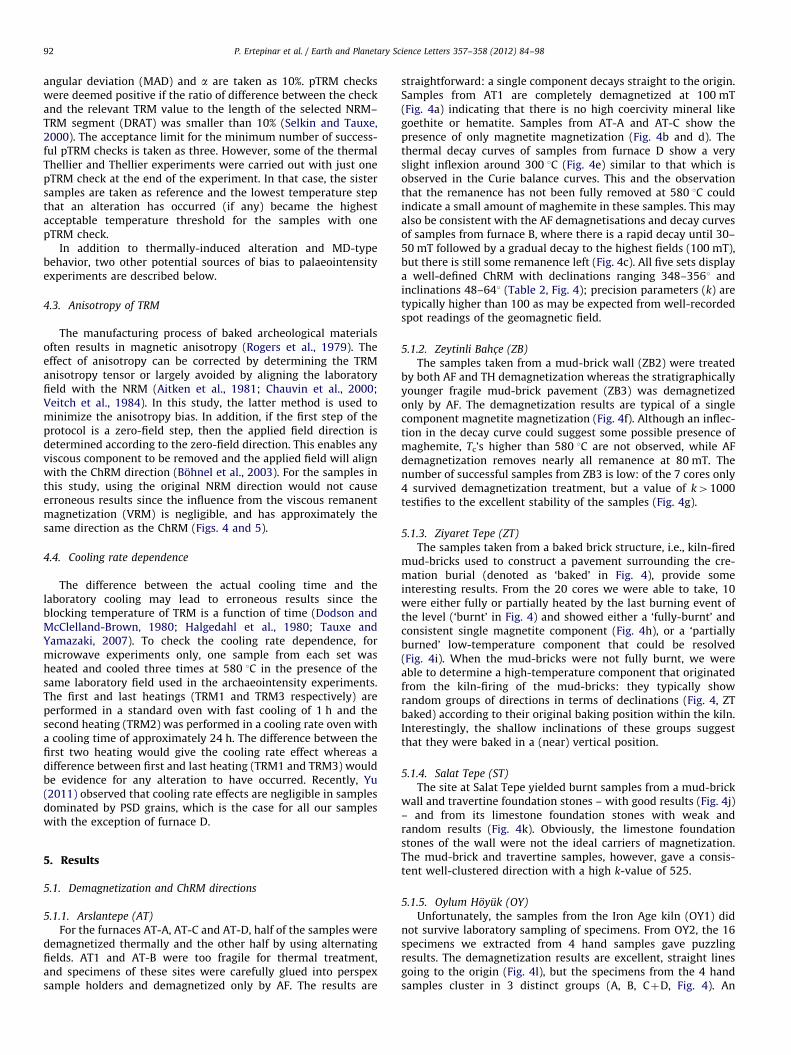
Table 3The archaeointensity estimates and associated statistics for all samples.
Site n/N Sample Tr. Pr. Fielddirection
Labfield
Tmin Tmax Nstep b f g q Madanch
Madfree
a Drat #pTRM
PI SD VADM�1022 DVADM�1022
Cooling rate Remarks
P/tmin
P/tmax
DTRM1�2
(%)
DTRM1�3
(%)
Arslantepe Furnace-A(AT-A)
ATA2 MW ZIIZ AP 30 10/5
30/11
10 0.04 0.53 0.88 10.4 1.3 2.1 3.6 4.3 5 65.88 2.95 11.58 0.52 �2.1 �18.1 Accepted
ATA3 MW ZIIZ AP 30 10/5
30/9.5
8 0.05 0.72 0.84 12.3 1.3 1.1 2.3 3.0 4 69.56 3.44 12.23 0.60 �8.1 �11.3 Accepted
ATA4 MW ZIIZ AP 30 10/5
30/9.5
8 0.06 0.68 0.85 10.4 2.1 3.7 2.9 5.1 3 65.03 3.62 11.43 0.64 �6.4 �9.2 Accepted
ATA5 MW IZIZ P 30 10/5
30/9.5
8 0.04 0.65 0.85 14.3 1.1 1.4 1.7 5.7 4 58.07 2.25 10.21 0.40 Accepted
ATA6 MW IZIZ P 60 5/5 30/8 8 0.03 0.66 0.82 19.6 1.5 3.4 3.3 4.0 4 54.81 1.50 9.64 0.26 AcceptedATA7 MW IZIZ P 60 10/
530/6.5
6 0.02 0.59 0.74 18.3 0.7 1.7 1.0 4.4 3 57.31 1.37 10.08 0.24 Accepted
ATA8 MW IZIZ P 60 10/5
30/9.5
8 0.05 0.56 0.86 9.7 0.9 1.5 1.7 6.9 4 52.65 2.60 9.26 0.46 Accepted
ATAP1.9 TT IZZI P 60 20 340 7 0.04 0.52 0.81 9.9 2.9 7.4 6.9 0.0 0 64.22 2.71 11.29 0.48 AcceptedATAP2.2 TT IZZI P 60 20 340 7 0.03 0.52 0.82 14.0 1.1 3.4 1.8 0.0 0 60.04 1.83 10.55 0.32 AcceptedATAP4.4 TT IZZI P 60 80 470 12 0.02 0.66 0.90 29.5 0.8 1.9 0.6 2.8 6 57.56 1.16 10.12 0.20 AcceptedATAP5.14 TT IZZI P 60 80 350 8 0.05 0.51 0.85 9.2 0.7 2.1 1.1 3.7 4 56.16 2.62 9.87 0.46 Accepted
AT-A Mean 11/11
60.12 5.31 10.57 0.93
Arslantepe Furnace-B(AT-B)
ATB1 MW ZIIZ AP 60 5/5 22/5 5 0.09 0.33 0.73 2.8 5.6 18.6 1.2 38.3 1 83.45 7.33 14.67 1.29 RejectedATB2 MW IZIZ P 60 0/0 28/5 9 0.27 0.20 0.42 0.3 7.0 38.5 17.1 35.6 0 38.55 10.32 6.78 1.81 RejectedATB3 MW IZIZ P 60 4/5 28/
8.510 0.03 0.46 0.88 12.9 2.6 7.7 8.5 3.0 5 57.86 1.80 10.17 0.32 Accepted
ATB4 MW ZIIZ AP 60 12/5
30/7 8 0.10 0.48 0.83 4.1 10.6 21.8 22.4 8.6 0 61.58 5.87 10.83 1.03 Rejected
ATB5 MW IZIZ P 60 4/5 30/6.5
9 0.07 0.30 0.86 3.6 0.8 4.1 2.5 17.2 1 61.81 4.44 10.87 0.78 Rejected
ATB6 MW IZIZ P 60 0/0 32/5 9 0.14 0.19 0.21 0.3 5.3 28.8 17.2 25.7 0 42.29 6.01 7.43 1.06 �6.7 �17.1 RejectedATB7 MW IZIZ P 60 5/5 33/5 8 0.06 0.31 0.84 4.6 2.0 9.2 4.6 10.2 3 65.89 3.73 11.58 0.66 RejectedATB8 MW IZIZ P 60 0/0 30/5 9 0.13 0.38 0.39 1.2 4.2 19.4 7.6 22.4 0 58.84 7.55 10.34 1.33 Rejected
AT-B Mean 0/8 – – – –
Arslantepe Furnace-C(AT-C)
ATC1 MW ZIIZ AP 30 0/0 30/6.5
7 0.25 0.97 0.76 3.0 6.5 12.0 3.3 19.3 3 47.69 11.79 8.38 2.07 3.5 �14.1 Rejected
ATC2 MW ZIIZ AP 30 10/5
30/5 8 0.09 0.72 0.84 6.7 7.6 14.9 6.6 23.4 4 36.43 3.26 6.40 0.57 Rejected
ATC3 MW ZIIZ AP 30 10/5
30/5 8 0.10 0.52 0.83 4.1 7.8 10.8 18.4 2.4 2 53.17 5.57 9.35 0.98 �2.2 �1.8 Rejected
ATC4 MW IZIZ P 60 0/0 25/5 5 0.06 0.51 0.74 5.9 0.9 2.2 1.4 2.1 3 55.75 3.54 9.80 0.62 AcceptedATC5 MW IZIZ P 60 5/5 26/5 6 0.06 0.52 0.79 7.0 1.2 3.0 2.4 1.8 3 57.31 3.31 10.08 0.58 AcceptedATC6 MW IZIZ P 60 4/5 26/5 7 0.07 0.50 0.83 6.3 1.6 4.1 3.9 4.0 3 58.16 3.84 10.22 0.68 AcceptedATC7 MW IZIZ P 60 4/5 30/5 8 0.01 0.47 0.85 46.7 0.4 1.6 0.7 4.2 4 62.87 0.54 11.05 0.09 AcceptedATC8 MW IZIZ P 60 4/5 30/7 9 0.02 0.48 0.81 16.7 0.9 3.8 1.0 7.9 5 63.86 1.47 11.23 0.26 AcceptedATCP1.7 TT IZZI P 60 100 380 7 0.06 0.49 0.82 7.1 1.8 5.4 2.6 0 0 63.85 3.63 11.22 0.64 AcceptedATCP4.1 TT IZZI P 60 20 420 11 0.02 0.68 0.89 27.3 3.3 10.1 3.9 1.6 5 62.73 1.39 11.03 0.24 AcceptedATCP5.3 TT IZZI P 60 100 380 7 0.06 0.50 0.83 7.1 1.1 3.4 1.5 0 0 60.02 3.53 10.55 0.62 Accepted
AT-C Mean 8/11
60.57 3.20 10.65 0.56
Arslantepe Furnace-D(AT-D)
ATD1 MW ZIIZ AP 30 10/5
30/7 10 0.08 0.54 0.88 5.7 2.8 6.7 2.2 8.7 5 58.41 4.83 10.27 0.85 Accepted
ATD2 MW ZIIZ AP 30 0/0 30/9 13 0.15 0.71 0.72 3.4 2.7 7.1 1.6 4.8 3 95.82 14.49 16.85 2.55 RejectedATD3 MW ZIIZ AP 30 13/
530/6.5
7 0.08 0.63 0.79 6.2 1.7 2.7 2.6 8.6 3 45.49 3.65 8.00 0.64 Accepted
ATD4 MW IZIZ P 60 5/5 30/11
10 0.03 0.71 0.87 18.6 0.7 1.3 1.3 6.9 5 54.00 1.80 9.49 0.32 Accepted
ATD5 MW IZIZ P 60 5/5 30/9.5
10 0.03 0.70 0.88 20.2 1.7 1.6 3.8 5.0 5 54.15 1.65 9.52 0.29 Accepted
ATD6 MW IZIZ P 60 5/5 30/8 9 0.05 0.67 0.86 12.1 1.3 2.7 1.9 4.7 4 53.52 2.55 9.41 0.45 �10.7 �13.4 AcceptedATD7 MW IZIZ P 60 5/5 30/5 7 0.07 0.41 0.83 4.7 1.1 4.3 0.1 9.1 4 57.16 4.10 10.05 0.72 RejectedATDP1.8 TT IZZI P 60 80 470 12 0.02 0.54 0.90 24.8 0.7 1.9 0.7 4.6 6 60.69 1.19 10.67 0.21 AcceptedATDP2.5 TT IZZI P 60 100 440 10 0.04 0.56 0.88 12.7 3.3 7.5 4.9 0.7 1 56.15 2.18 9.87 0.38 AcceptedATDP3.1 TT IZZI P 60 180 440 8 0.06 0.44 0.84 5.8 1.3 3.8 1.2 2.9 1 55.64 3.55 9.78 0.62 RejectedATDP9.1 TT IZZI P 60 80 470 12 0.03 0.57 0.90 14.9 4.5 13.2 1.3 6.2 6 67.97 2.33 11.95 0.41 Accepted
AT-D Mean 8/11
56.30 6.49 9.90 1.14
P.
Ertep
ina
ret
al.
/E
arth
an
dP
lan
etary
Science
Letters3
57
–3
58
(20
12
)8
4–
98
93
Ta
ble
3(c
on
tin
ued
)
Sit
en
/NS
am
ple
Tr.
Pr.
Fie
ldd
ire
ctio
nL
ab
fie
ldT
min
Tm
ax
Nst
ep
bf
gq
Ma
da
nch
Ma
dfr
ee
aD
rat
# pT
RM
PI
SD
VA
DM�
10
22
DV
AD
M�
10
22
Co
oli
ng
rate
Re
ma
rks
P/
t min
P/
t ma
x
DT
RM
1�
2
(%)
DT
RM
1�
3
(%)
Ars
lan
tep
eN
eo
-Hit
tite
wa
ll(A
T1
)A
T1
_1M
WZ
IIZ
AP
30
10
/5
30
/78
0.0
70
.60
.86
.60
.80
.81
.62
.54
97
.86
6.8
41
7.2
01
.20
Acc
ep
ted
AT
1_2
MW
ZII
ZA
P3
01
0/
53
0/8
90
.07
0.4
40
.79
4.9
0.4
1.5
0.2
2.7
41
04
.34
7.3
31
8.3
41
.29
Acc
ep
ted
AT
1_3
MW
IZIZ
P3
01
0/
53
0/5
70
.04
0.4
60
.56
6.1
1.0
2.9
3.0
3.4
38
7.2
93
.73
15
.35
0.6
6A
cce
pte
d
AT
1_4
MW
IZIZ
P8
04
/53
0/9
10
0.0
30
.76
0.8
41
8.7
0.4
0.8
0.5
12
39
8.5
63
.36
17
.33
0.5
9R
ejec
ted
AT
1_5
MW
IZIZ
P8
08
/53
0/
12
10
0.0
20
.68
0.8
62
8.8
0.3
0.6
0.7
5.0
51
02
.90
2.0
91
8.0
90
.37
1.6
�1
3.5
Acc
ep
ted
AT
1_6
MW
IZIZ
P8
07
/53
0/
10
10
0.0
30
.70
0.7
91
6.6
0.3
0.6
0.8
9.5
51
05
.60
3.5
21
8.5
60
.62
Acc
ep
ted
AT
1_7
MW
IZIZ
P8
07
/53
0/5
90
.03
0.3
60
.80
11
.41
.14
.33
.93
1.7
49
4.0
32
.38
16
.53
0.4
2R
ejec
ted
AT
1_8
MW
IZIZ
P8
07
/52
8/5
80
.03
0.7
40
.80
19
.70
.60
.41
.01
12
11
9.3
3.5
92
0.9
70
.63
Rej
ecte
dA
T1
.1T
TIZ
ZI
AP
10
01
10
36
08
0.1
0.3
00
.83
2.1
2.7
13
.43
.16
.54
93
.89
11
.51
6.5
12
.02
Rej
ecte
dA
T1
.15
TT
IZZ
IP
10
01
00
39
08
0.0
30
.77
0.7
51
6.8
0.8
1.2
0.3
1.7
11
03
.15
3.5
61
8.1
30
.63
Acc
ep
ted
AT
1.2
1T
TIZ
ZI
P1
00
11
03
60
80
.02
0.7
30
.84
25
.41
.22
.50
.81
.54
10
8.8
2.6
31
9.1
30
.46
Acc
ep
ted
AT
1R
M1
TT
IZZ
IP
80
10
03
90
80
.02
0.6
80
.81
29
.33
.15
.62
.32
.81
92
.10
1.7
41
6.1
90
.31
Acc
ep
ted
AT
1R
M2
TT
IZZ
IP
10
01
00
39
08
0.0
40
.73
0.7
21
2.1
1.8
3.3
1.1
0.7
11
04
.91
4.5
91
8.4
40
.81
Acc
ep
ted
AT
1M
ean
9/
13
10
0.7
77
.01
17
.72
1.2
3
n/N
,n
um
be
ro
fsa
mp
les
acc
ep
ted
ov
er
me
asu
red
;T
r.,
tre
atm
en
t;P
r.,
pro
toco
l;A
P/P
,d
ire
ctio
no
fth
ea
pp
lie
dfi
eld
an
ti-p
ara
lle
l/p
ara
lle
lw
ith
resp
ect
tosa
mp
les
NR
M;
MW
,Mic
ow
av
e;
TT
,Th
ell
ier
an
dT
he
llie
r;T
min
(P/t
min
)a
nd
Tm
ax
(P/t
ma
x),
min
imu
ma
nd
ma
xim
imh
ea
tin
g(p
ow
er/
tim
e)
ste
ps
use
din
the
arc
ha
eo
inte
nsi
tye
stim
ati
on
;N
ste
p,n
um
be
ro
fsu
cce
ssfu
lm
ea
sure
me
nt
ste
ps;b,
rati
oo
fth
ee
rro
rin
the
slo
pe
toth
esl
op
eo
fth
eli
ne
ar
be
stfi
tli
ne
;f,
fra
ctio
no
fN
RM
;g
,g
ap
fact
or;
q,
qu
ali
tyfa
cto
r;M
AD
(an
ch.)
,m
ax
imu
ma
ng
ula
rd
ev
iati
on
(an
cho
red
toth
eo
rig
in);a,
an
gle
be
twe
en
the
an
cho
red
an
dn
ot
an
cho
red
solu
tio
ns;
Dra
t,th
ed
iffe
ren
cera
tio
;#
pT
RM
,n
um
be
ro
f
40AT-A
60
80
100
120MicrowaveThellier & Thellier
Inte
nsity
(µT)
Ther
mal
Microwave Microwave Microwave0.00
0.02
0.04
0.06
0.08
0.10
0.00
Beta Values
0.02
0.04
0.06
0.08
0.10
0.000.00
Beta Values(IZZI anti-parallel excluded)
120
0
100
20
40
60
80
120200
Paleointensities(µT)
AT-C AT-D AT1
40 60 80 100 0.02 0.04 0.06 0.08 0.10 0.02 0.04 0.06 0.08 0.10
Fig. 6. Comparison of the results from the two techniques, microwave and
thermal Thellier and Thellier, for individual measurements (in diamonds and
circles) and for the site means and standard deviations (as histograms). For all
sites, the results are in excellent agreement, further supporting the equivalence of
the two methods in most cases (Hill et al., 2002). (b–d) One-to-one plots
comparing site mean averages of the palaeointensities and b values using different
subsets of results. Error bars are one standard deviation.
P. Ertepinar et al. / Earth and Planetary Science Letters 357–358 (2012) 84–9894
orientation error could perhaps explain the results of groups Aand C & D – on average they combine approximately north – butthe directions of group B are reversed. We tried to consider everypossible mistake that might have been made during sampling orlater in the laboratory but could not explain these results. Wetherefore disregard the results of this late Bronze Age–early IronAge kiln.
5.2. Archaeointensity results
Out of 54 measurements, 37 are considered to be reliable andsite mean intensities and statistical parameters are reported inTable 3. Representative Arai plots and orthogonal plots from eachset are shown in Fig. 5 and the plots from all measurements arepresented in Fig. A9. The results from the furnaces (A, C, D) arevery consistent and intensities range from 56.3 to 60.6 mT. Onlyfrom furnace B all samples except one failed the criteria probablybecause of their very low initial NRM. The one sample that passedhas an intensity of 57.9 mT, but since we cannot calculate areliable mean, we refrain from plotting this result. Samples fromAT1 produced intriguing results with a mean archaeointensityvalue as high as 100.8 mT. For all the sites, microwave and thermalThellier results are in excellent agreement, further supporting theequivalence of the two methods in most cases (Fig. 6a) (Hill et al.,2002). Arai plots produced by IZZI experiments generally dis-played only minor or no zig-zagging despite the choice of anantiparallel field to exaggerate these effects. Therefore MD-typeeffects were not considered problematic for these samples. Onlyone site (AT-D) gave even a modestly different (�14%) meanpalaeointenisity measurement in the microwave and thermalexperiments (Fig. 6b) which further supports our confidence inthese results. Though comprising a dataset too small to makerobust inferences about the efficacy of the two methods, subtledifferences are nonetheless consistent with the conclusions of
P. Ertepinar et al. / Earth and Planetary Science Letters 357–358 (2012) 84–98 95
Biggin (2010). The b values are marginally higher (indicatingmore noise in the Arai plots) for the results from the microwaveexperiments (Fig. 6c) but this difference disappears when thesubset of microwave IZZI experiments were excluded (Fig. 6d).These measurements are indeed expected to be the noisiestbecause the lab field was applied antiparallel to the NRM andmostly with a much lower applied field intensity than thepalaeointensity. This supports that the specific protocol is moreimportant than the choice of microwaves versus conventionalthermal treatments in determining the quality of results (Biggin,2010).
The results of the cooling rate experiment show a difference ofminimum 2% and maximum 10% between TRM1 and TRM2 butTRM1 and TRM3 differ by at least 10% indicating significantalteration. Since we do not have any control on the moment thealteration has started (e.g., it could have been already in thesecond heating), the cooling rate experiment is deemed incon-clusive and no correction is made in the intensity results. Sincenearly all samples are in the PSD range, cooling rate effects arelikely negligible (Yu, 2011).
6. Discussion and conclusions
6.1. Directions
The directional results from this study, corrected for localdeclination at the time of sampling, are relocated to Kayseri as theapproximate center of Turkey (lat: 38.851N, long: 35.631E), andplotted against the data from GEOMAGIA50v2 (countries within�1600 km radius), the Turkish data (Sarıbudak and Tarling, 1993;Sayın and Orbay, 2003) and the global geomagnetic field modelsCALS7k.2, CALS3k.4 and ARCH3k_cst.1 at Kayseri (Fig. 7a and b).The Turkish data from the literature are kept ‘as is’ since there isno information as to whether any correction for local declinationhas been made. The data points with a954151 or precisionparameter ko50 are rejected. The original database of Sayınand Orbay (2003) is provided in the Appendix (Table A2).
The declination values of all sites are broadly consistent withCALS7k.2, with the exception of ZB2 and ZB3 which are off to theeast by more than 201 (Fig. 7a). The consistency of the two sites –nearly contemporaneous, but from different levels – support thevalidity of the measured points. In addition, these easterlydirections fit well with the records from Sayın and Orbay (2003)and Kovacheva et al. (1998). We note, however, that the numberof data points between 2300 and 1500 BCE is very scarce, and themodel (CALS7k) therefore is poorly constrained. At present, such aglobal field model cannot adequately represent small scale butpossibly important variations. The swing is relatively small any-way, compared to historical observations which document 601swings in declination and 201 swings in inclination for the past4 kyr in the United Kingdom (Zananiri et al., 2007). Nevertheless,it is clear that additional data from this period is required toimprove the resolution and to substantiate this easterly swing.
The declination from ZT is far to the west of ARCH3k_cst.1 butwithin error of CALS3k.4, while the site has very well constrainedage but a large error in direction. This larger error is likely theconsequence of partial burning of some of the mud-bricks (seeFig. 4), causing fewer points for calculating the best fit line and apartial overlap in blocking temperatures. Once age and inclinationuncertainties are taken into account, the inclinations of almost allsites fit with the predictions of the models (Fig. 7b).
We assessed the (near) contemporaneous burning of thefurnaces from Arslantepe, by applying a common true meandirection (CTMD) test (McFadden and McElhinny, 1990). We useMonte Carlo simulation, thereby effectively applying the (Watson,
1983) Vw statistic test. We determine g, the angle between themeans, and gc, the critical angle in the test. If gogc the test ispositive and the distributions share a common true mean direc-tion. The quality of the test is expressed as A, B, C or indetermi-nate, depending on the value of gc (McFadden and McElhinny,1990). Furnaces A and B share a CTMD with classification A(gco51) and furnaces B and C also share an A classification CTMD,whereas A and C do not share a CTMD. Since we know thatfurnace A is younger than C (it was built on top of C), we maysafely assume that furnace B was built between the constructionof C (oldest) and A (youngest). Furnace D does not share a CTMDwith any of the other furnaces. Since we know the order in whichthe three furnaces were constructed (from old to young C-B-A), we can deduce a slight steepening trend while declinationsbecome more westerly. We plot the results in stratigraphical (age)order, arbitrarily taking an age difference of 10 yr (older for C andyounger for A) with respect to B, and adjust the error bars to fallinto the age error of the site. The relative age of furnace D isunknown.
6.2. Archaeointensity
For the period from 3000-0 BCE, archaeomagnetic studies inthe Levant and Middle East have provided a series of data withunusually high VADMs up to more than 20�1022 Am2, notobserved elsewhere. Periods of rapidly increasing intensitiesduring this time span have been called ‘archaeomagnetic jerks’(Gallet et al., 2003), with time characteristics intermediatebetween ‘geomagnetic jerks’ and magnetic excursions, i.e. typi-cally a few hundreds of years. In addition, Shaar et al. (2011)provided a high-resolution archaeointensity curve of the Levantthat displays two exceptionally high and very short-lived(o30 yr) spikes in geomagnetic intensity in excess of20�1022 Am2. Shaar et al. (2011) argue that their archaeomag-netic record places new constraints on maximum geomagneticintensity as well as on its rate of change, but concede that it is notyet clear whether the geomagnetic spikes are local non-dipolarfeatures or a geomagnetic dipolar phenomenon.
Our archaeointensity experiments have a success rate of 69%which is remarkably high. The results are coherent betweensamples and methods and in good agreement with existing datafrom the Middle East. Although the cooling rate experiment wasdeemed inconclusive, the agreement between microwave (cool-ing time of 10–100 s) and thermal Thellier-type experiment’s(cooling time of 10–100 min) results suggest that the cooling rateeffects are minimal.
The mean intensity values obtained from three clay furnacesand the mud-brick fortress wall (AT-A, AT-C, AT-D and AT1) wereconverted into virtual axial dipole moments (VADM). The resultsare plotted against the Middle East data (Ben-Yosef et al., 2008,2009; Gallet and Al-Maqdissi, 2010; Gallet et al., 2006, 2008;Gallet and Le Goff, 2006; Genevey et al., 2003; Shaar et al., 2011)and the field models CALS7k.2, CALS3k.4 and ARCH3k_cst.1(Fig. 7c). The results from the furnaces are coherent with theMiddle East data points around �2500 BCE, and the intensities offurnaces A and C especially are very consistent with one another(10.57 and 10.65�1022 Am2, respectively), in agreement withthe directional results and a near-contemporaneous constructionof the furnaces. They have slightly higher intensities thanthe previously published Middle East data and prolong theincreasing trend earlier observed by Gallet et al. (2008). Theyare also significantly higher than CALS7k.2 and the compilation ofGenevey et al. (2008). Furnace D, on the other hand, is clearlydifferent from the other two furnaces (VADM of 9.90�1022),which is supported by the conclusions from the directional data(Tables 2 and 3).
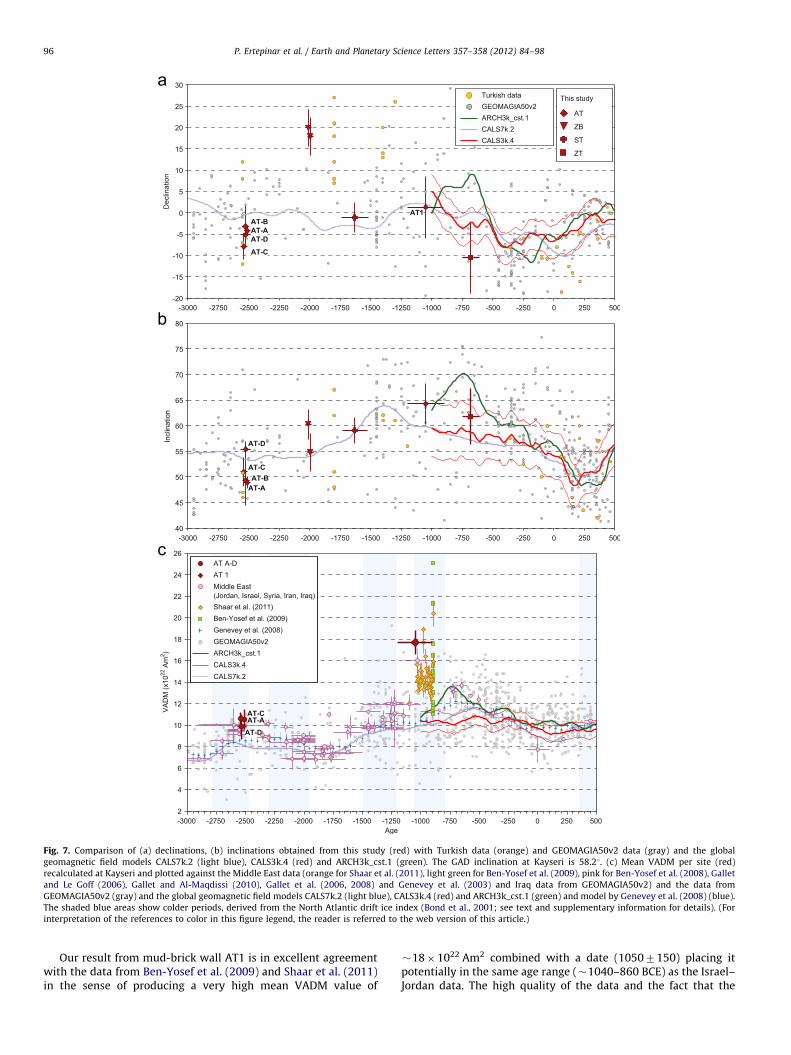
Fig. 7. Comparison of (a) declinations, (b) inclinations obtained from this study (red) with Turkish data (orange) and GEOMAGIA50v2 data (gray) and the global
geomagnetic field models CALS7k.2 (light blue), CALS3k.4 (red) and ARCH3k_cst.1 (green). The GAD inclination at Kayseri is 58.21. (c) Mean VADM per site (red)
recalculated at Kayseri and plotted against the Middle East data (orange for Shaar et al. (2011), light green for Ben-Yosef et al. (2009), pink for Ben-Yosef et al. (2008), Gallet
and Le Goff (2006), Gallet and Al-Maqdissi (2010), Gallet et al. (2006, 2008) and Genevey et al. (2003) and Iraq data from GEOMAGIA50v2) and the data from
GEOMAGIA50v2 (gray) and the global geomagnetic field models CALS7k.2 (light blue), CALS3k.4 (red) and ARCH3k_cst.1 (green) and model by Genevey et al. (2008) (blue).
The shaded blue areas show colder periods, derived from the North Atlantic drift ice index (Bond et al., 2001; see text and supplementary information for details). (For
interpretation of the references to color in this figure legend, the reader is referred to the web version of this article.)
P. Ertepinar et al. / Earth and Planetary Science Letters 357–358 (2012) 84–9896
Our result from mud-brick wall AT1 is in excellent agreementwith the data from Ben-Yosef et al. (2009) and Shaar et al. (2011)in the sense of producing a very high mean VADM value of
�18�1022 Am2 combined with a date (10507150) placing itpotentially in the same age range (�1040–860 BCE) as the Israel–Jordan data. The high quality of the data and the fact that the
P. Ertepinar et al. / Earth and Planetary Science Letters 357–358 (2012) 84–98 97
results are obtained using different techniques (microwave andThellier–Thellier) and that they are coming from a material (mud-brick) different from the copper slag used in the previous studiesstrengthens the existence of very high intensities during thisinterval. However, we realize that we seemed to have been ‘lucky’to observe an allegedly very short-lived phenomenon (o30 yr,Shaar et al., 2011), considering the large error range of the age(300 yr interval). Alternatively, high intensities may be longer-lived and are perhaps not as transient as suggested. It is difficultto say whether these geomagnetic spikes are possibly local/regional features (Shaar et al., 2011) if reliable and high qualityrecords are not available from elsewhere. And if indeed thesespikes are very short-lived, it is statistically unlikely that they arepicked up in any record.
Gallet et al. (2005, 2006) correlated the archaeomagnetic jerkswith climatic cooling trends obtained from the drift ice indexcurve of Bond et al. (2001) and speculated on a causal relationbetween the intensity peaks and the major cooling periods,leading Gallet et al. (2005, 2006) and Courtillot et al. (2007) toargue for a possible connection between Earth’s magnetic fieldand climate. More recent archaeointensity studies on copper slagdeposits from Israel and Jordan (Ben-Yosef et al., 2009; Shaaret al., 2011) argued that the field intensity may not only rapidlyincrease but may also show significant fluctuation at very shorttime scales (geomagnetic spikes). In Fig. 7c we do not show theperiods of the cooling trend (positive first derivative of the Bondet al. (2001) curve), as e.g. in Gallet et al. (2006, 2009), but wefollow the suggestion of one of the reviewers (Yves Gallet, pers.
comm.) to show the colder periods according to the same index,where the intervals are determined by arbitrarily taking an indexvalue higher than 6 percent. For details on ages of cooling trendsand colder periods, see Fig. A10 (Supplementary information).
Our new results from the furnaces at Arslantepe (�2500 BCE)fill in a data gap in the results obtained by Gallet et al. (2006) inwhich they originally suggested a decrease in geomagnetic inten-sity. However, after the cooling trend from �2950 to 2630 BCEassociated with a geomagnetic intensity increase from approxi-mately 7 to 10�1022 Am2, our data show a prolonged (by acentury, to 2525735 BCE) trend to higher values (10.7�1022 Am2) and plot on the graph with an intensity peak exactlybetween two cooling cycles. However, if we consider not thecooling cycle but the colder period (�2780–2480 BCE), it appearsthat the interval of higher and increasing intensities matches verywell. We also note that the period of high intensities in the MiddleEast data (�1040–860 BCE) correlates well – within age errors –with a colder period (1055–805 BCE). Also the interval of increasingintensities 1450–1225 BCE seems to agree quite well with a colderperiod (1495–1215). On the contrary, no such relation is seenbetween intensity and climate in the colder period 2295–1965 BCE:instead, intensities are decreasing during this period. The presentlyexisting dataset for the Middle East thus raises a number ofimportant questions that seriously require confirmation.
Acknowledgments
We are grateful to the teams of the archeological sites whowere at all times very helpful. In particular, we thank FrancescaBalossi at Zeytinli Bahc-e for her help.
Yves Gallet provided a manuscript with relevant data, while heand an anonymous reviewer provided critical comments thatgreatly helped to improve the original manuscript. NuretdinKaymakci has been an indispensable help in the field, carefullyand unrelentingly drilling with expertise the fragile archeologicalmaterial. The late Tom Mullender has been indispensable for hishelp in the laboratory and his never-ending interest and support.
Appendix A. Supporting information
Supplementary data associated with this article can be foundin the online version at http://dx.doi.org/10.1016/j.epsl.2012.08.039.
References
Aitken, M.J., Alcock, P.A., Bussell, G.D., Shaw, C.J., 1981. Archaeomagnetic determi-nation of the past geomagnetic intensity using ancient ceramics—allowancefor anisotropy. Archaeometry 23, 53–64. (FEB).
Aitken, M.J., Allsop, A.L., Bussell, G.D., Winter, M.B., 1988. Determination of theintensity of the Earth’s magnetic field during archeological times: reliability ofthe Thellier technique. Rev. Geophys. 26, 3–12.
Alessio, M., Allegri, L., Azzi, C., Bella, F., Calderoni, G., Cortesi, C., Improta, S.,Petrone, V., 1983. 14C Dating of Arslantepe, Origini, vol. XII, pp. 575–580.
Bard, E., Delaygue, G., 2008. Comment on ‘‘Are there connections between theEarth’s magnetic field and climate?’’ by V. Courtillot, Y. Gallet, J.-L. Le Mouel, F.Fluteau, A. Genevey (2007) EPSL 253, 328. Earth Planet. Sci. Lett. 265, 302–307.
Ben-Yosef, E., Ron, H., Tauxe, L., Agnon, A., Genevey, A., Levy, T.E., Avner, U., Najjar, M.,2008. Application of copper slag in geomagnetic archaeointensity research.J. Geophys. Res.—Solid Earth 113 (B8), pp. 529–539.
Ben-Yosef, E., Tauxe, L., Levy, T.E., Shaar, R., Ron, H., Najjar, M., 2009. Geomagneticintensity spike recorded in high resolution slag deposit in Southern Jordan.Earth Planet. Sci. Lett. 287, 529–539.
Biggin, A.J., 2006. First-order symmetry of weak-field partial thermoremanence inmulti-domain (MD) ferromagnetic grains: 2. Implications for Thellier-typepalaeointensity determination. Earth Planet. Sci. Lett. 245 (1–2), 454–470.
Biggin, A.J., 2010. Are systematic differences between thermal and microwaveThellier-type palaeointensity estimates a consequence of multidomain bias inthe thermal results? Phys. Earth Planet. Inter. 180 (1–2), 16–40.
Biggin, A.J., Bohnel, H.N., 2003. A method to reduce the curvature of Arai plotsproduced during Thellier palaeointensity experiments performed on multi-domain grains. Geophys. J. Int. 155 (3), F13–F19.
Bohnel, H., Biggin, A.J., Walton, D., Shaw, J., Share, J.A., 2003. Microwavepalaeointensities from a recent Mexican lava flow, baked sediments andreheated pottery. Earth Planet. Sci. Lett. 214 (1–2), 221–236.
Bond, G., Kromer, B., Beer, J., Muscheler, R., Evans, M.N., Showers, W., Hoffmann, S.,Lotti-Bond, R., Hajdas, I., Bonani, G., 2001. Persistent solar influence on NorthAtlantic climate during the Holocene. Science 294 (5549), 2130–2136.
Bond, G., Showers, W., Cheseby, M., Lotti, R., Almasi, P., deMenocal, P., Priore, P.,Cullen, H., Hajdas, I., Bonani, G., 1997. A pervasive millenial-scale cycle inNorth Atlantic Holocene and glacial climates. Science 278, 1257–1266.
Bucha, V., Mellaart, J., 1967. Archaeomagnetic intensity measurements on someNeolithic samples from C- atal Huyuk (Anatolia). Archaeometry 10, 23–25.
Carvallo, C., Roberts, A.P., Leonhardt, R., Laj, C., Kissel, C., Perrin, M., Camps, P.,2006. Increasing the efficiency of paleointensity analyses by selection ofsamples using first-order reversal curve diagrams. J. Geophys. Res.—SolidEarth 111 (B12).
Chauvin, A., Garcia, Y., Lanos, P., Laubenheimer, F., 2000. Paleointensity of thegeomagnetic field recovered on archaeomagnetic sites from France. Phys.Earth Planet. Inter. 120 (1–2), 111–136.
Coe, R.S., Gromme, S., Mankinen, E.A., 1978. Geomagnetic paleointensities fromradiocarbon-dated lava flows on Hawaii and the question of the Pacificnondipole low. J. Geophys. Res. 83, 1740–1756.
Courtillot, V., Gallet, Y., Le Mouel, J.L., Fluteau, F., Genevey, A., 2007. Are thereconnections between the Earth’s magnetic field and climate? Earth Planet. Sci.Lett. 253 (3–4), 328–339.
Courtillot, V., Gallet, Y., Le Mouel, J.L., Fluteau, F., Genevey, A., 2008. Response tocomment on ‘‘Are there connections between Earth’s magnetic field andclimate? Earth Planet. Sci. Lett. 265 (1–2), 308–311.
Dankers, P., 1978. Magnetic Properties of Dispersed Natural Iron-oxides of KnownGrain-size. Ph.D. Thesis. University of Utrecht, Utrecht, pp. 142.
Day, R., Fuller, M., Schmidt, V.A., 1977. Hysteresis properties of titanomagnetites:grain-size and compositional dependence. Phys. Earth Planet. Inter. 13,260–266.
Deenen, M.H.L., Langereis, C.G., van Hinsbergen, D.J.J., Biggin, A.J., 2011. Geomag-netic secular variation and the statistics of palaeomagnetic directions. Geo-phys. J. Int. 186, 509–520.
Dekkers, M.J., 1988. Magnetic behavior of natural goethite during thermaldemagnetization. Geophys. Res. Lett. 15 (5), 538–541.
Di Nocera, G.M., 2010. The Middle Bronze Age at Zeytinli Bahc-e Hoyuk, Birecik(Urfa, Turkey): the fortified structure. In: Proceedings of the 6th InternationalCongress on the Archeology of the Ancient Near East, Roma.
Dodson, M.H., McClelland-Brown, E., 1980. Magnetic blocking temperatures ofsingle-domain grains during slow cooling. J. Geophys. Res. 85 (B5),2625–2637.
Donadini, F., Korhonen, K., Riisager, P., Pesonen, L.J., 2006. Database for Holocenegeomagnetic intensity information. EOS Trans. AGU 87 (14), 137.
Donadini, F., Korte, M., Constable, C.G., 2009. Geomagnetic field for 0–3 ka: 1. Newdata sets for global modeling. Geochem. Geophys. Geosyst. 10.
P. Ertepinar et al. / Earth and Planetary Science Letters 357–358 (2012) 84–9898
Dunlop, D.J., Ozdemir, O., 1997. Rock Magnetism: Fundamentals and Frontiers.Cambridge University Press, Cambridge. (pp. 573).
Fisher, R.A., 1953. Dispersion on a sphere. Proc. R. Soc. London 217A, 295–305.Gallet, Y., Al-Maqdissi, M., 2010. Archeomagnetisme �a Mishirfeh-Qatna: Nouvelles
donnees sur l’evolution de l’intensite du champ magnetique terrestre auMoyen-Orient durant les derniers millenaires. Akkadica 131, 29–46.
Gallet, Y., Genevey, A., 2007. The Mayans: climate determinism or geomagneticdeterminism? EOS 88 (11), pp. 129–130.
Gallet, Y., Genevey, A., Courtillot, V., 2003. On the possible occurrence of‘archaeomagnetic jerks’ in the geomagnetic field over the past three millennia.Earth Planet. Sci. Lett. 214 (1–2), 237–242.
Gallet, Y., Genevey, A., Fluteau, F., 2005. Does Earth’s magnetic field secularvariation control centennial climate change? Earth Planet. Sci. Lett. 236 (1–2),339–347.
Gallet, Y., Genevey, A., Le Goff, M., Fluteau, F., Ali Eshraghi, S., 2006. Possibleimpact of the Earth’s magnetic field on the history of ancient civilizations.Earth Planet. Sci. Lett. 246 (1–2), 17–26.
Gallet, Y., Genevey, A., Le Goff, M., Warme, N., Gran-Aymerich, J., Lef�evre, A., 2009.On the use of archeology in geomagnetism, and vice-versa: recent develop-ments in archeomagnetism. C. R. Phys. 10 (7), 630–648.
Gallet, Y., Le Goff, M., 2006. High-temperature archeointensity measurementsfrom Mesopotamia. Earth Planet. Sci. Lett. 241 (1–2), 159–173.
Gallet, Y., Le Goff, M., Genevey, A., Margueron, J., Matthiae, P., 2008. Geomagneticfield intensity behavior in the Middle East between �3000 BC and �1500 BC.Geophys. Res. Lett. 35 (2).
Genevey, A., Gallet, Y., Margueron, J.-C., 2003. Eight thousand years of geomagneticfield intensity variations in the eastern Mediterranean. J. Geophys. Res. B: SolidEarth 108 (5). (EPM 1-1–1-18).
Genevey, A., Gallet, Y., Constable, C.G., Korte, M., Hulot, G., 2008. ArcheoInt: anupgraded compilation of geomagnetic field intensity data for the past tenmillennia and its application to the recovery of the past dipole moment.Geochem. Geophys. Geosyst. 9(4).
Halgedahl, S.L., Day, R., Fuller, M., 1980. The effect of cooling rate on the intensityof weak-field TRM in single-domain magnetite. J. Geophys. Res. 85 (B7),3690–3698.
Hill, M.J., Gratton, M.N., Shaw, J., 2002. Palaeomagnetic investigation of Tertiarylava from Barrington Tops, NSW, Australia, using thermal and microwavetechniques. Earth Planet. Sci. Lett. 198 (3–4), 245–256.
Hill, M.J., Shaw, J., 1999. Palaeointensity results for historic lavas from Mt Etnausing microwave demagnetization/remagnetization in a modified Thellier-type experiment. Geophys. J. Int. 139, 583–590.
Hulot, G., Eymin, C., Langlais, B., Mandea, M., Olsen, N., 2002. Small-scale structureof the geodynamo inferred from Oersted and Magsat satellite data. Nature 416(6881), 620–623.
Jackson, A., Jonkers, A.R.T., Walker, M.R., 2000. Four centuries of geomagneticsecular variation from historical records. Philos. Trans. R. Soc. A 358 (1768),957–990.
Jonkers, A.R.T., Jackson, A., Murray, A., 2003. Four centuries of geomagnetic datafrom historical records. Rev. Geophys. 41 (2).
Juarez, M.T., Tauxe, L., Gee, J.S., Pick, T., 1998. The intensity of the Earth’s magneticfield over the past 160 million years. Nature 394 (27 August), 878–881.
Kirschvink, J.L., 1980. The least-squares line and plane and the analysis ofpalaeomagnetic data. Geophys. J. R. Astron. Soc. 62, 699–718.
Korhonen, K., Donadini, F., Riisager, P., Pesonen, L.J., 2008. GEOMAGIA50: anarcheointensity database with PHP and MySQL. Geochem. Geophys. Geosyst. 9.
Korte, M., Constable, C., 2003. Continuous global geomagnetic field models for thepast 3000 years. Phys. Earth Planet. Inter. 140 (1–3), 73–89.
Korte, M., Constable, C., 2011. Improving geomagnetic field reconstructions for 0–3 ka. Phys. Earth Planet. Inter. 188, 247–259.
Korte, M., Constable, C.G., 2005. Continuous geomagnetic field models for the past7 millennia: 2. CALS7K. Geochem. Geophys. Geosyst. 6.
Korte, M., Donadini, F., Constable, C.G., 2009. Geomagnetic field for 0–3 ka: 2. Anew series of time-varying global models. Geochem. Geophys. Geosyst. 10.
Kovacheva, M., Jordanova, N., Karloukovski, V., 1998. Geomagnetic field variationsas determined from Bulgarian archaeomagnetic data. Part II: the last 8000years. Surv. Geophys. 19 (2–5), 431–460.
Leonhardt, R., Heunemann, C., Krasa, D., 2004. Analyzing absolute paleointensitydeterminations: acceptance criteria and the software ThellierTool4.0. Geo-chem. Geophys. Geosyst. 5.
Matney, T., Greenfield, T., Hartenberger, B., Keskin, A., Koroglu, K., MacGinnis, J.,Monroe, W., Rainville, L., Shepperson, M., Vorderstrasse, T., Wicke, D., 2009.Excavations at Ziyaret Tepe 2007–2008. Anatolica 35, 37–84.
Matney, T., Rainville, L., 2005. Archeological investigations at Ziyaret Tepe, 2003–2004. Anatolica 31, 19–68.
Matney, T., Roaf, M., MacGinnis, J., McDonald, H., 2002. Archeological excavationsat Ziyaret Tepe, 2000 and 2001. Anatolica 28, 47–89.
McFadden, P.L., McElhinny, M.W., 1990. Classification of the reversal test inpalaeomagnetism. Geophys. J. Int. 103 (3), 725–729.
Mullender, T.A.T., van Velzen, A.J., Dekkers, M.J., 1993. Continuous drift correctionand separate identification of ferrimagnetic and paramagnetic contributions inthermomagnetic runs. Geophys. J. Int. 114, 663–672.
Nagata, T., Arai, Y., Momose, K., 1963. Secular variation of geomagnetic total forceduring the last 5000 years. J. Geophys. Res. 68, 5277–5281.
Okse, T.A., 2010. Salat Tepe and its vicinity in the Middle Bronze Age: stratigraphicsequence and ceramic assemblages. In: Bonatz, D. (Ed.), The Archeology of theUpper Mesopotamian Piedmont in the Second Millennium BC, Topoi, BerlinStudies of the Ancient World. Berlin.
Okse, T.A., Gormus-, A., 2006. Excavations at Salat Tepe in the Upper Tigris Region:stratigraphical sequence and preliminary results of the 2005–2006 seasons.Akkadica 127 (2), 167–197.
Ponat, E., 1995. Archaeomagnetism in Western Turkey. Ph.D. Thesis. Bogazic- iUniversitesi.
Roberts, A.P., Pike, C.R., Verosub, K.L., 2000. First-order reversal curve diagrams: anew tool for characterizing the magnetic properties of natural samples.J. Geophys. Res.—Solid Earth 105 (B12), 28461–28475.
Rogers, J., Fox, J.M.W., Aitken, M.J., 1979. Magnetic anisotropy in ancient pottery.Nature 277 (5698), 644–646.
Sadori, L., Susanna, F., Persiani, C., 2006. Archaeobotanical data and crop storageevidence from an early Bronze Age 2 burnt house at Arslantepe, Malatya,Turkey. Veg. Hist. Archaeobot. 15, 205–215.
Sarıbudak, M., Tarling, D.H., 1993. Archaeomagnetic studies of the Urartiancivilization, eastern Turkey. Antiquity 67, 620–629.
Sayın, N., Orbay, N., 2003. Investigation of secular variations of geomagnetic fieldusing archaeomagnetic samples obtained from Central Anatolia. _Istanbul Univ.Muh. Fak. Yerbilimleri Derg. 16 (1), 33–43.
Selkin, P.A., Tauxe, L., 2000. Long-term variations in palaeointensity. Philos. Trans.R. Soc. A: Math. Phys. Eng. Sci. 358 (1768), 1065–1088.
Shaar, R., Ben-Yosef, E., Ron, H., Tauxe, L., Agnon, A., Kessel, R., 2011. Geomagneticfield intensity: how high can it get? How fast can it change? Constraints fromIron Age copper slag. Earth Planet. Sci. Lett. 301, 297–306.
Tauxe, L., Staudigel, H., 2004. Strength of the geomagnetic field in the CretaceousNormal Superchron: new data from submarine basaltic glass of the TroodosOphiolite. Geochem. Geophys. Geosyst. 5.
Tauxe, L., Yamazaki, H., 2007. Paleointensities. in: Kono, M. (Ed.), Geomagnetism,vol. 5. Elsevier, pp. 509–563.
Thellier, E., Thellier, O., 1959. Sur l’intensite du champ magnetique terrestre dansle passe historique et geologique. Ann. Geophys. 15, 285–376.
Valet, J.P., 2003. Time variations in geomagnetic intensity. Rev. Geophys. 41 (1), 4-1–4-44.
van Velzen, A.J., Zijderveld, J.D.A., 1995. Effects of weathering on single-domainmagnetite in Early Pliocene marine marls. Geophys. J. Int. 121, 267–278.
Veitch, R.J., Hedley, I.G., Wagner, J.J., 1984. An investigation of the intensity of thegeomagnetic-field during Roman times using magnetically anisotropic bricksand tiles. Arch. Sci. 37 (3), 359–373.
Walton, D., 1979. Geomagnetic intensity in Athens between 2000 BC and AD 400.Nature 277 (5698), 643–644.
Walton, D., Snape, S., Rolph, T.C., Shaw, J., Share, J., 1996. Application offerrimagnetic resonance heating to paleointensity determinations. Phys. EarthPlanet. Inter. 94 (3–4), 183–186.
Watson, G.S., 1983. Large sample theory of the Langevin distribution. J. Stat. Plann.Infer. 8, 245–256.
Yu, Y., 2011. Importance of cooling rate dependence of thermoremanence inpaleointensity determination. J. Geophys. Res. B: Solid Earth 116 (9).
Yu, Y.J., Tauxe, L., 2005. Testing the IZZI protocol of geomagnetic field intensitydetermination. Geochem. Geophys. Geosyst. 6.
Zananiri, I., Batt, C.M., Lanos, P., Tarling, D.H., Linford, P., 2007. Archaeomagneticsecular variation in the UK during the past 4000 years and its application toarchaeomagnetic dating. Phys. Earth Planet. Inter. 160 (2), 97–107.
Ziegler, L.B., Constable, C.G., Johnson, C.L., 2008. Testing the robustness andlimitations of 0–1 Ma absolute paleointensity data. Phys. Earth Planet. Inter.170 (1–2), 34–45.
Zijderveld, J.D.A., 1967. A.C. demagnetization of rocks: analysis of results.in: Collinson, D.W., Creer, K.M., Runcorn, S.K. (Eds.), Methods in Palaeomag-netism. Elsevier, Amsterdam, New York, pp. 254–286.


