Embed Size (px)
Citation preview
Evaluation of Request for Final Gap Financing April 1, 2022 600 7th Street Page 1 of 54
Citywide Affordable Housing Loan Committee San Francisco Mayor’s Office of Housing & Community Development
Department of Homelessness and Supportive Housing Office of Community Investment and Infrastructure
Controller’s Office of Public Finance
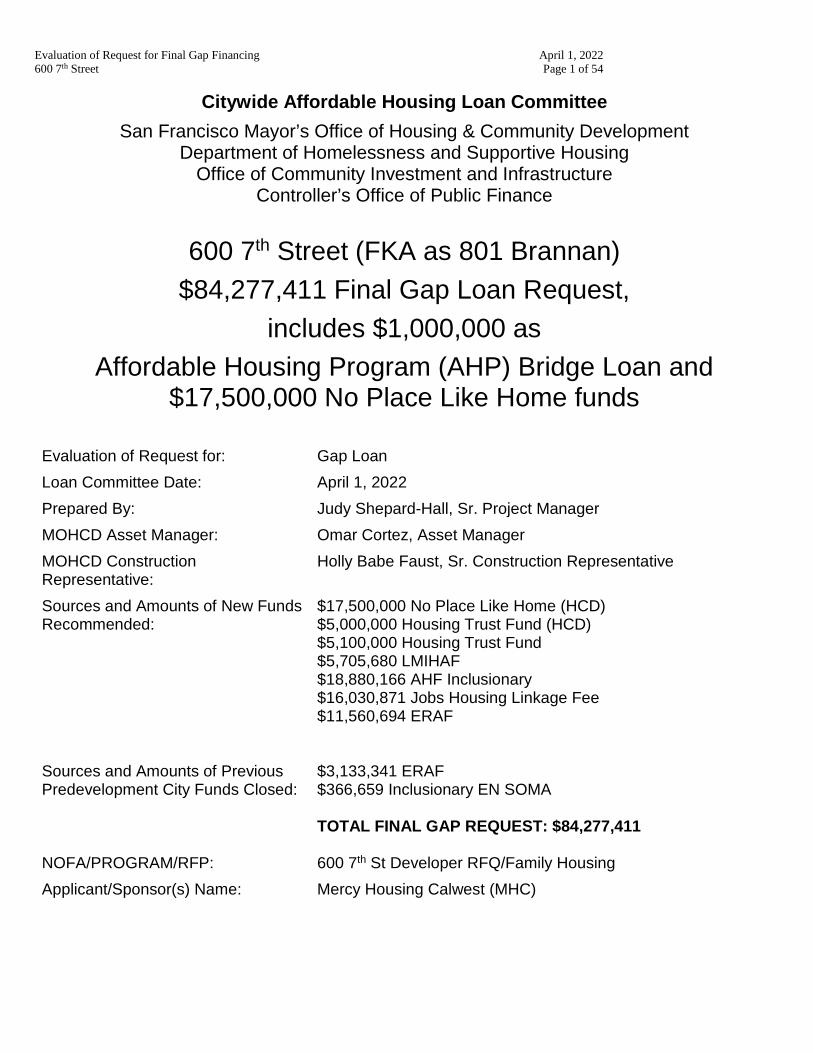
600 7th Street (FKA as 801 Brannan) $84,277,411 Final Gap Loan Request,
includes $1,000,000 as Affordable Housing Program (AHP) Bridge Loan and
$17,500,000 No Place Like Home funds Evaluation of Request for: Gap Loan Loan Committee Date: April 1, 2022 Prepared By: MOHCD Asset Manager: MOHCD Construction Representative:
Judy Shepard-Hall, Sr. Project Manager Omar Cortez, Asset Manager Holly Babe Faust, Sr. Construction Representative
Sources and Amounts of New Funds Recommended:
$17,500,000 No Place Like Home (HCD) $5,000,000 Housing Trust Fund (HCD) $5,100,000 Housing Trust Fund $5,705,680 LMIHAF $18,880,166 AHF Inclusionary $16,030,871 Jobs Housing Linkage Fee $11,560,694 ERAF
Sources and Amounts of Previous Predevelopment City Funds Closed:
$3,133,341 ERAF $366,659 Inclusionary EN SOMA TOTAL FINAL GAP REQUEST: $84,277,411
NOFA/PROGRAM/RFP: 600 7th St Developer RFQ/Family Housing Applicant/Sponsor(s) Name: Mercy Housing Calwest (MHC)
Evaluation of Request for Final Gap Financing April 1, 2022 600 7th Street Page 2 of 54
EXECUTIVE SUMMARY
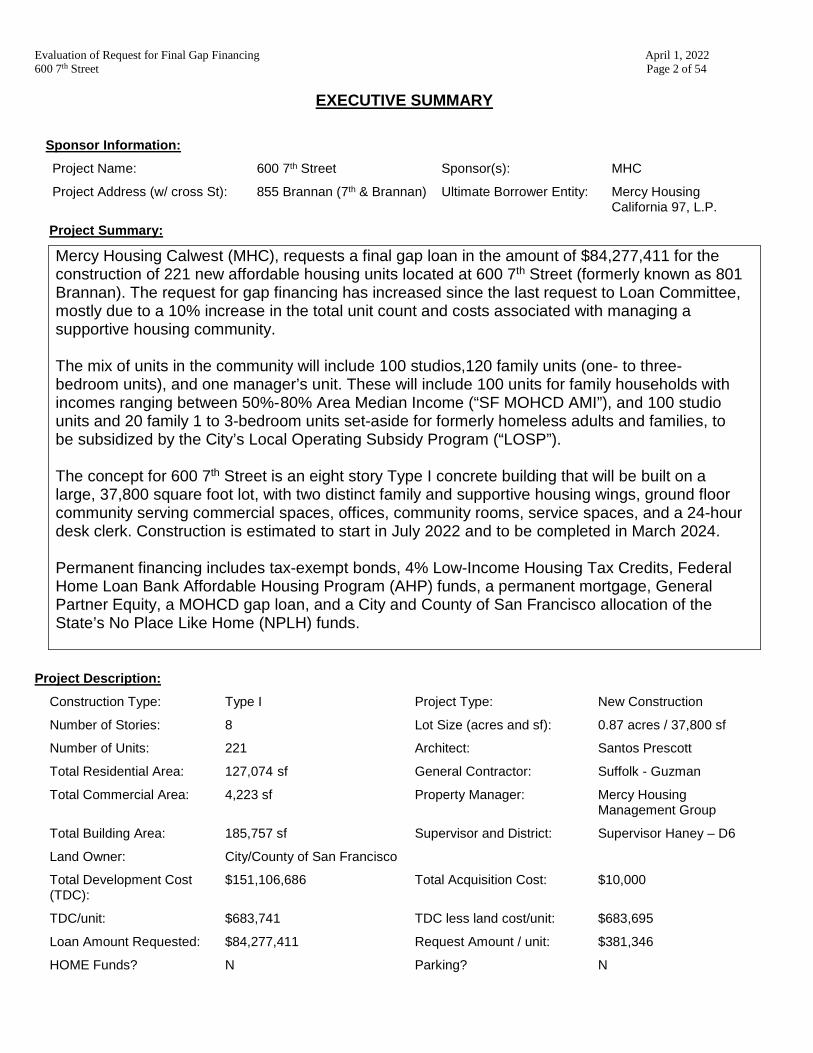
Sponsor Information: Project Name: 600 7th Street Sponsor(s): MHC
Project Address (w/ cross St): 855 Brannan (7th & Brannan) Ultimate Borrower Entity: Mercy Housing California 97, L.P.
Project Summary: Mercy Housing Calwest (MHC), requests a final gap loan in the amount of $84,277,411 for the construction of 221 new affordable housing units located at 600 7th Street (formerly known as 801 Brannan). The request for gap financing has increased since the last request to Loan Committee, mostly due to a 10% increase in the total unit count and costs associated with managing a supportive housing community. The mix of units in the community will include 100 studios,120 family units (one- to three-bedroom units), and one manager’s unit. These will include 100 units for family households with incomes ranging between 50%- 80% Area Median Income (“SF MOHCD AMI”), and 100 studio units and 20 family 1 to 3-bedroom units set-aside for formerly homeless adults and families, to be subsidized by the City’s Local Operating Subsidy Program (“LOSP”). The concept for 600 7th Street is an eight story Type I concrete building that will be built on a large, 37,800 square foot lot, with two distinct family and supportive housing wings, ground floor community serving commercial spaces, offices, community rooms, service spaces, and a 24-hour desk clerk. Construction is estimated to start in July 2022 and to be completed in March 2024.
Permanent financing includes tax-exempt bonds, 4% Low-Income Housing Tax Credits, Federal Home Loan Bank Affordable Housing Program (AHP) funds, a permanent mortgage, General Partner Equity, a MOHCD gap loan, and a City and County of San Francisco allocation of the State’s No Place Like Home (NPLH) funds.
Project Description: Construction Type: Type I Project Type: New Construction
Number of Stories: 8 Lot Size (acres and sf): 0.87 acres / 37,800 sf
Number of Units: 221 Architect: Santos Prescott
Total Residential Area: 127,074 sf General Contractor: Suffolk - Guzman
Total Commercial Area: 4,223 sf Property Manager: Mercy Housing Management Group
Total Building Area: 185,757 sf Supervisor and District: Supervisor Haney – D6
Land Owner: City/County of San Francisco
Total Development Cost (TDC):
$151,106,686 Total Acquisition Cost: $10,000
TDC/unit: $683,741 TDC less land cost/unit: $683,695
Loan Amount Requested: $84,277,411 Request Amount / unit: $381,346
HOME Funds? N Parking? N
Evaluation of Request for Final Gap Financing April 1, 2022 600 7th Street Page 3 of 54
PRINCIPAL DEVELOPMENT ISSUES
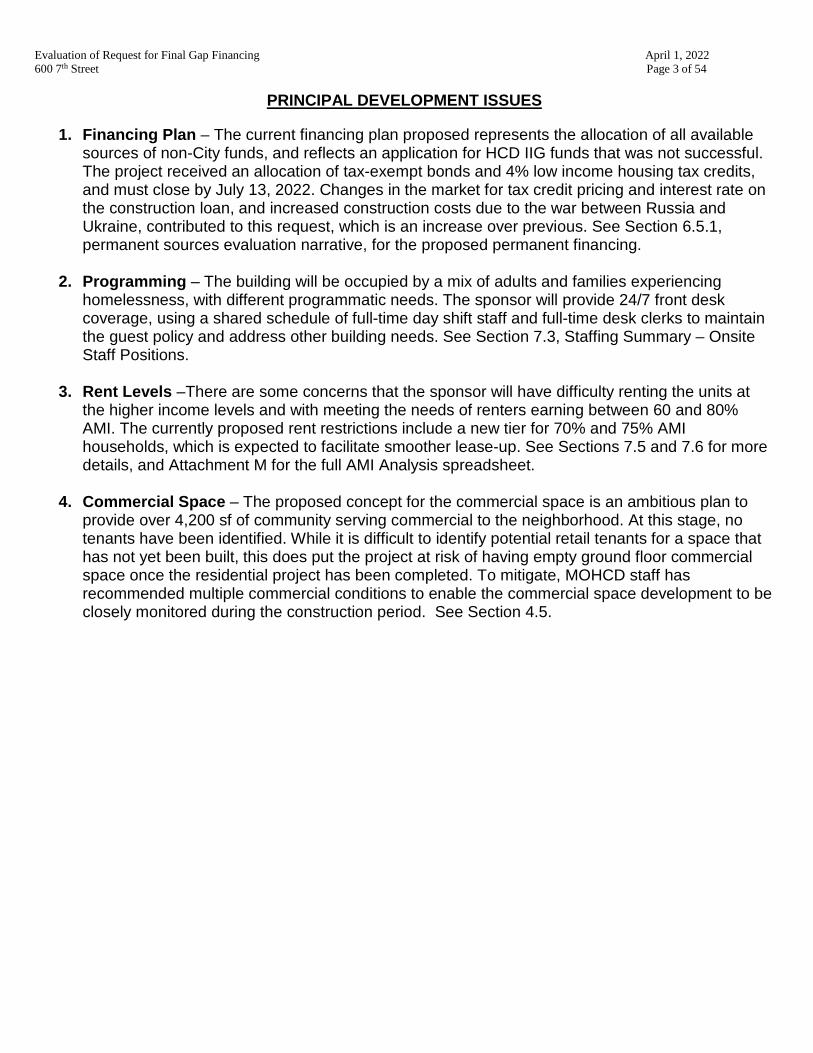
1. Financing Plan – The current financing plan proposed represents the allocation of all available sources of non-City funds, and reflects an application for HCD IIG funds that was not successful. The project received an allocation of tax-exempt bonds and 4% low income housing tax credits, and must close by July 13, 2022. Changes in the market for tax credit pricing and interest rate on the construction loan, and increased construction costs due to the war between Russia and Ukraine, contributed to this request, which is an increase over previous. See Section 6.5.1, permanent sources evaluation narrative, for the proposed permanent financing.
2. Programming – The building will be occupied by a mix of adults and families experiencing homelessness, with different programmatic needs. The sponsor will provide 24/7 front desk coverage, using a shared schedule of full-time day shift staff and full-time desk clerks to maintain the guest policy and address other building needs. See Section 7.3, Staffing Summary – Onsite Staff Positions.
3. Rent Levels –There are some concerns that the sponsor will have difficulty renting the units at the higher income levels and with meeting the needs of renters earning between 60 and 80% AMI. The currently proposed rent restrictions include a new tier for 70% and 75% AMI households, which is expected to facilitate smoother lease-up. See Sections 7.5 and 7.6 for more details, and Attachment M for the full AMI Analysis spreadsheet.
4. Commercial Space – The proposed concept for the commercial space is an ambitious plan to
provide over 4,200 sf of community serving commercial to the neighborhood. At this stage, no tenants have been identified. While it is difficult to identify potential retail tenants for a space that has not yet been built, this does put the project at risk of having empty ground floor commercial space once the residential project has been completed. To mitigate, MOHCD staff has recommended multiple commercial conditions to enable the commercial space development to be closely monitored during the construction period. See Section 4.5.
Evaluation of Request for Final Gap Financing April 1, 2022 600 7th Street Page 4 of 54
SOURCES AND USES SUMMARY
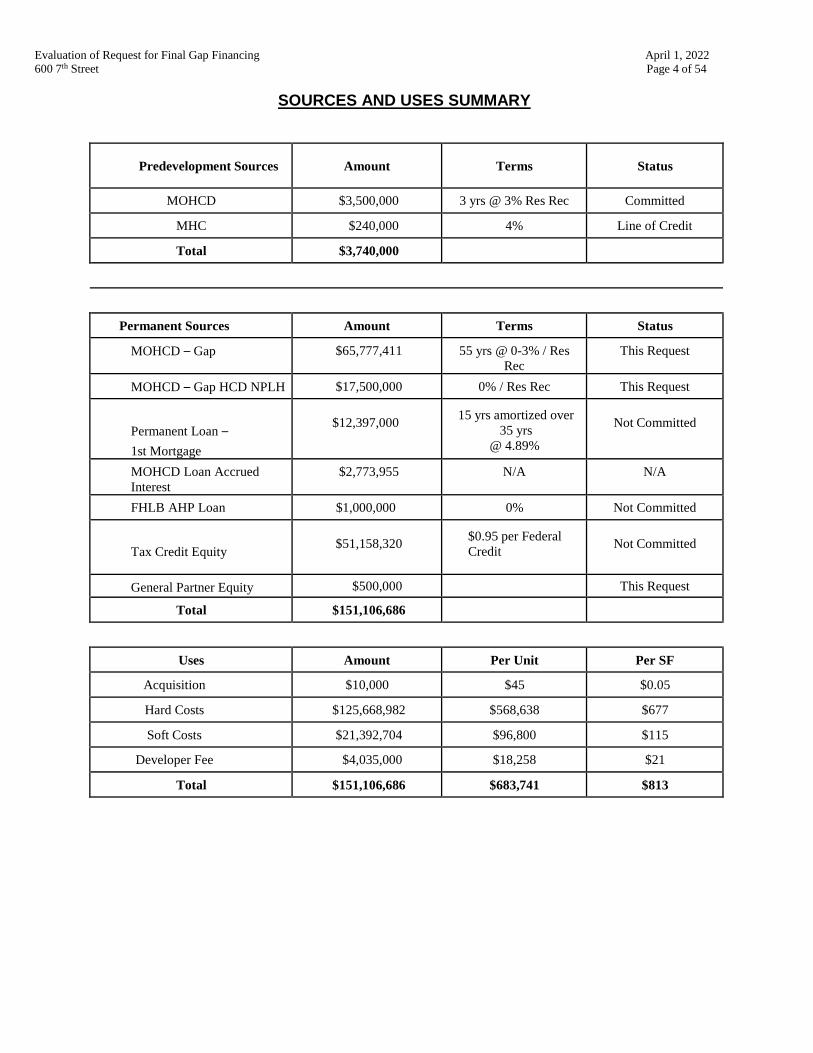
Predevelopment Sources
Amount
Terms
Status
MOHCD $3,500,000 3 yrs @ 3% Res Rec Committed
MHC $240,000 4% Line of Credit
Total $3,740,000
Permanent Sources Amount Terms Status
MOHCD – Gap $65,777,411 55 yrs @ 0-3% / Res Rec
This Request
MOHCD – Gap HCD NPLH $17,500,000 0% / Res Rec This Request
Permanent Loan – 1st Mortgage
$12,397,000 15 yrs amortized over
35 yrs @ 4.89%
Not Committed
MOHCD Loan Accrued Interest
$2,773,955 N/A N/A
FHLB AHP Loan $1,000,000 0% Not Committed
Tax Credit Equity
$51,158,320 $0.95 per Federal
Credit
Not Committed
General Partner Equity $500,000 This Request
Total $151,106,686
Uses Amount Per Unit Per SF
Acquisition $10,000 $45 $0.05
Hard Costs $125,668,982 $568,638 $677
Soft Costs $21,392,704 $96,800 $115
Developer Fee $4,035,000 $18,258 $21
Total $151,106,686 $683,741 $813
Evaluation of Request for Final Gap Financing April 1, 2022 600 7th Street Page 5 of 54
1. BACKGROUND 1.1. Project History Leading to This Request.
MHC received Loan Committee approval on November 15, 2019 for a predevelopment loan in the amount of $3,500,000, for the development of 200 units. A California Department of Housing and Community Development (“HCD”) Infill Infrastructure Grant (IIG) NOFA Application was released in July 2021; it stated a limited grant award to any Qualified Infill Project (QIP) of $7.5MM. Based on the Project’s self-score the Sponsor believed the project would not be competitive for an IIG award, however the Sponsor did apply for $7.5MM, and ultimately MHC was not awarded any IIG funds. In support of the IIG application and CDLAC application, the Loan Committee in July 2021 approved a preliminary gap request for a total City contribution of up to $72,050,000, including $17,500,000 in MOHCD administered HCD No Place Like Home (NPLH) funds, and a construction period-only bridge loan of $1,000,000. This request was based on a construction estimate from the general contractor bid process to build 221 units. With the preliminary gap loan commitment, on September 9th for the December 8th allocation meeting, the Sponsor applied for tax exempt bonds and tax credits; subsequent to the meeting, CDLAC and TCAC awarded the project as of December 31, 2021. This request for gap financing will allow MHC to seek financial commitments to bring the project to construction closing and start of construction.
1.2. Applicable NOFA/RFQ/RFP. (See Attachment E for Threshold Eligibility Requirements
and Ranking Criteria) MHC was awarded funding under their response to the 801 Brannan Parcels Request for Qualifications that was issued on May 17, 2019, with Episcopal Community Services as the service provider. The Sponsor met the minimum threshold eligibility requirements and submitted qualifications for consideration to develop the site.
1.3. Borrower/Grantee Profile. (See Attachment B for Borrower Org Chart; See Attachment C
for Developer Resume and Attachment D for Asset Management Analysis) 1.3.1. Borrower. MHC created Mercy Housing California 97, L.P., a MHC affiliate.
1.3.2. Joint Venture Partnership. N/A
Evaluation of Request for Final Gap Financing April 1, 2022 600 7th Street Page 6 of 54
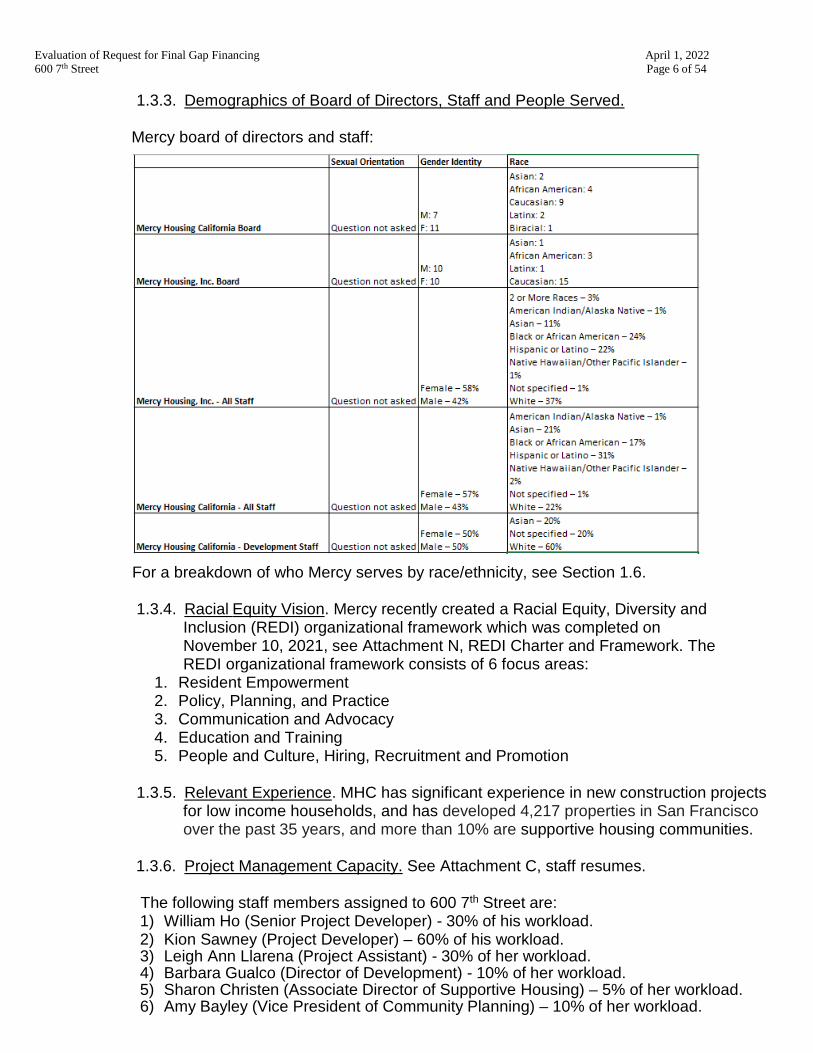
1.3.3. Demographics of Board of Directors, Staff and People Served. Mercy board of directors and staff:
For a breakdown of who Mercy serves by race/ethnicity, see Section 1.6.
1.3.4. Racial Equity Vision. Mercy recently created a Racial Equity, Diversity and Inclusion (REDI) organizational framework which was completed on November 10, 2021, see Attachment N, REDI Charter and Framework. The REDI organizational framework consists of 6 focus areas:
1. Resident Empowerment 2. Policy, Planning, and Practice 3. Communication and Advocacy 4. Education and Training 5. People and Culture, Hiring, Recruitment and Promotion
1.3.5. Relevant Experience. MHC has significant experience in new construction projects
for low income households, and has developed 4,217 properties in San Francisco over the past 35 years, and more than 10% are supportive housing communities.
1.3.6. Project Management Capacity. See Attachment C, staff resumes.
The following staff members assigned to 600 7th Street are: 1) William Ho (Senior Project Developer) - 30% of his workload. 2) Kion Sawney (Project Developer) – 60% of his workload. 3) Leigh Ann Llarena (Project Assistant) - 30% of her workload. 4) Barbara Gualco (Director of Development) - 10% of her workload. 5) Sharon Christen (Associate Director of Supportive Housing) – 5% of her workload. 6) Amy Bayley (Vice President of Community Planning) – 10% of her workload.
Evaluation of Request for Final Gap Financing April 1, 2022 600 7th Street Page 7 of 54
1.3.7 Past Performance. 1.3.7.1 City audits/performance plans. MHC participated in the citywide fiscal and compliance monitoring program in the last couple of years and last year they were monitored by DCYF. There are no known findings or issues with the audit.
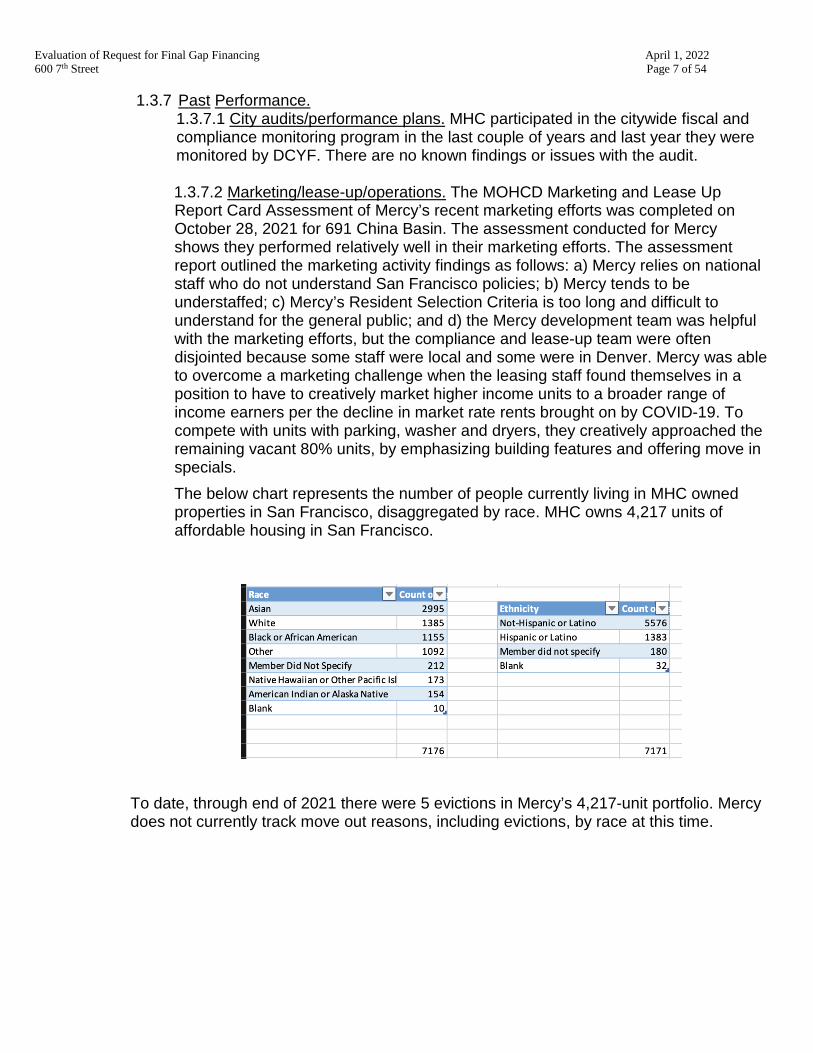
1.3.7.2 Marketing/lease-up/operations. The MOHCD Marketing and Lease Up Report Card Assessment of Mercy’s recent marketing efforts was completed on October 28, 2021 for 691 China Basin. The assessment conducted for Mercy shows they performed relatively well in their marketing efforts. The assessment report outlined the marketing activity findings as follows: a) Mercy relies on national staff who do not understand San Francisco policies; b) Mercy tends to be understaffed; c) Mercy’s Resident Selection Criteria is too long and difficult to understand for the general public; and d) the Mercy development team was helpful with the marketing efforts, but the compliance and lease-up team were often disjointed because some staff were local and some were in Denver. Mercy was able to overcome a marketing challenge when the leasing staff found themselves in a position to have to creatively market higher income units to a broader range of income earners per the decline in market rate rents brought on by COVID-19. To compete with units with parking, washer and dryers, they creatively approached the remaining vacant 80% units, by emphasizing building features and offering move in specials. The below chart represents the number of people currently living in MHC owned properties in San Francisco, disaggregated by race. MHC owns 4,217 units of affordable housing in San Francisco.
To date, through end of 2021 there were 5 evictions in Mercy’s 4,217-unit portfolio. Mercy does not currently track move out reasons, including evictions, by race at this time.
Evaluation of Request for Final Gap Financing April 1, 2022 600 7th Street Page 8 of 54
2. SITE (See Attachment F for Site Map with Amenities)
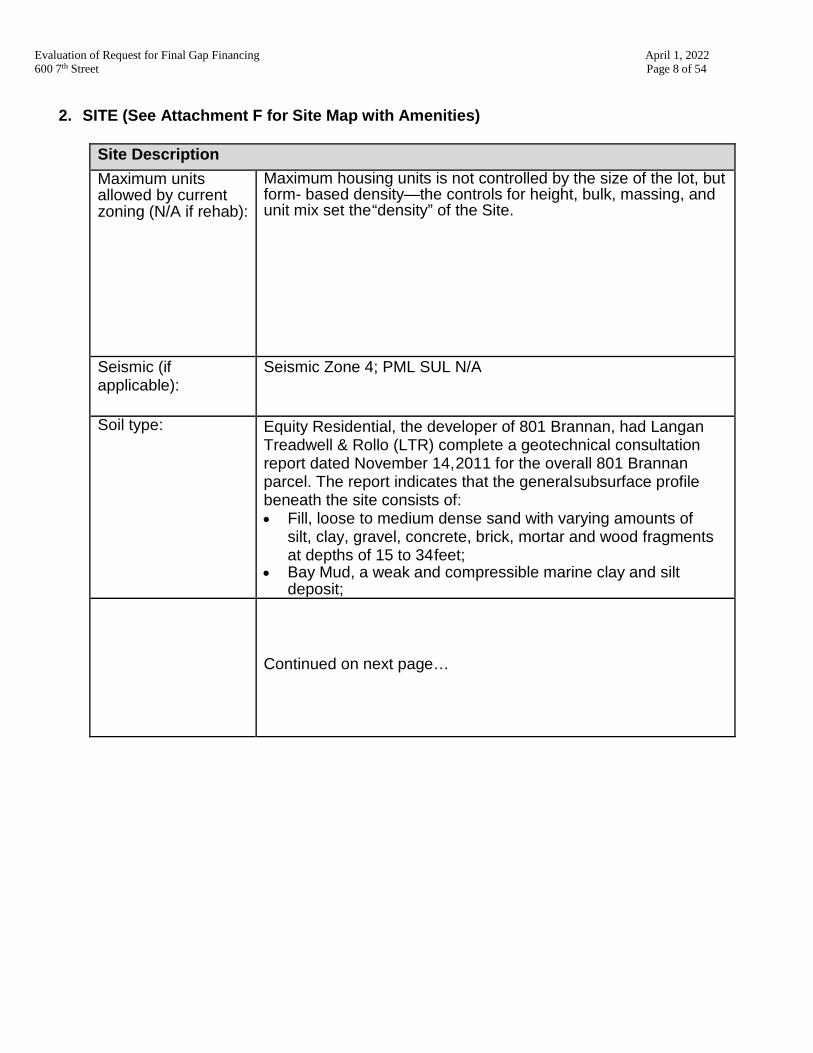
Site Description Maximum units allowed by current zoning (N/A if rehab):
Maximum housing units is not controlled by the size of the lot, but form- based density—the controls for height, bulk, massing, and unit mix set the “density” of the Site.
Seismic (if applicable):
Seismic Zone 4; PML SUL N/A
Soil type: Equity Residential, the developer of 801 Brannan, had Langan Treadwell & Rollo (LTR) complete a geotechnical consultation report dated November 14, 2011 for the overall 801 Brannan parcel. The report indicates that the general subsurface profile beneath the site consists of: • Fill, loose to medium dense sand with varying amounts of
silt, clay, gravel, concrete, brick, mortar and wood fragments at depths of 15 to 34 feet;
• Bay Mud, a weak and compressible marine clay and silt deposit;
Continued on next page…
Evaluation of Request for Final Gap Financing April 1, 2022 600 7th Street Page 9 of 54
• Old alluvium, relatively incompressible sand, stiff hard clay and silt;
• Incompressible residual soil; and • Bedrock, at elevations ranging from 102 to 180 feet
below the ground surface. Around the site, groundwater was encountered at depths of 7.5 to 10 feet, with the groundwater level anticipated to fluctuate with the water level of the San Francisco Bay. Liquefaction analyses indicate loose to medium dense sandy fill below the design groundwater.
LTR’s report stated that the developer should be prepared for dewatering, and that the foundation may require a more robust design e.g. drilled pier. See Section 4.2 for more information on the foundation system. Piles are recommended to be the most appropriate foundation for supporting. To reduce water vapor transmission through the slab-on-grade areas where moisture is undesirable, LTR recommended installing a capillary moisture break and a water vapor retarder beneath the floor.
In May 2015, as part of the land dedication and after the remediation of contaminated soils at the Site, Equity Residential agreed to remove the top 2- feet of fill soils at the Site and capped it with a temporary cap composed of crushed concrete grindings from the former Exhibition Hall that was demolished at 801 Brannan. LTR confirmed the crushed foundation grindings, would be suitable for use as a temporary cap as long as elevated metals and asbestos were not detected in the concrete. Since the material grade change between the underlying fill material and temporary cap are distinct colors, LTR determined a demarcation layer was not required. On November 10, 2017, the SF Department of Public Health (SFDPH) issued a letter approving LTR’s determination.
The developer will need to remove the temporary cap and construct a permanent cap that may include the concrete foundations, concrete paved walkways, and/or a cap of two feet of cleaned soil underneath landscaping and areas covered with the permeable pavers. An updated geotechnical report and site mitigation plan was issued January 18, 2021 during predevelopment.
Continued on next page…
Evaluation of Request for Final Gap Financing April 1, 2022 600 7th Street Page 10 of 54
Environmental Review:
Stellar Environmental Solutions, Inc. (SES) completed a Phase I /II Environmental Report on October 28, 2011 for the 801 Brannan parcel. The report indicates soil samples with the highest levels lead concentration. However, Equity Residential remediated the contaminated soils as part of the land dedication in May 2015.
A Phase I Environmental Site Assessment (ESA) was completed in October 2020 for the site and identified one REC in connection with the site. The site is located bayward of San Francisco’s original shoreline within the Maher Ordinance area, and was constructed on top of undocumented fill material. Previous investigations of properties within the Maher Ordinance have found fill material contaminated with heavy metals and/or petroleum hydrocarbons. The results of Phase II ESA indicate that the site is underlain by approximately five to 13 feet of fill material with petroleum hydrocarbons and elevated concentrations of heavy metals. Based on the analytical results from the subsurface investigation and previous environmental testing, two soil samples exceed the State of California hazardous waste criteria and if disturbed will require disposal as Class I non-RCRA hazardous waste.
Adjacent uses (North):
808 Brannan is an office building.
Adjacent uses (South):
650 7th Street is an office building for Airbnb.
Adjacent uses (East): 603 7th Street is a vacant lot fenced off with perimeter fencing. Adjacent uses (West): 855 Brannan Apartments is 434-unit market rate building
managed by Equity Apartments. Neighborhood Amenities within 0.5 miles:
Trader Joe’s is 0.3 miles away, Victoria Manalo Draves Park and Bessie Carmichael Elementary School are 0.3 miles away, Wells Fargo Bank, and several Parks.
Public Transportation within 0.5 miles:
4th Street Caltrain Station is 0.6 miles away. Muni lines within 0.5 miles are: 10, 14X 19, 27, 47, 83X
Article 34: Received Authorization for 200 units Nov 15, 2019, and new authorization Mar 3, 2022, based on new unit count (221).
Continued on next page…
Evaluation of Request for Final Gap Financing April 1, 2022 600 7th Street Page 11 of 54
2.1 Description. The infill site is a .87 acres/37,800 square foot lot adjacent on the
north side to an office building on 808 Brannan Street. Since COVID-19, the site has been used as a testing and/or vaccination location by the City’s Department of Public Health (DPH). DPH will vacate the site by April 1 so that Mercy can conduct a test pile program and then effectuate construction closing.
2.2 Zoning. On Dec 3, 2020, the Planning Department issued the Notice of Project Eligibility for SB35 approval of the final SB35 approval upon completion of the design review. The Design Review was approved on July 12, 2021. Under SB35 the project qualifies for streamlined approvals in conjunction with State Density Bonus that affords it expedited approvals for both CEQA (from which it is exempt) and land use entitlements.
2.3 Probable Maximum Loss. Not Applicable for new construction.
2.4 Local/Federal Environmental Review. Exempt from CEQA Review, per the streamlining allowed by SB35. However, MHC may complete a NEPA at a later date, in anticipation of application to the Continuum of Care, a federally funded rental subsidy that will help subsidize the formerly homeless adults and families at the Site and supplant the LOSP subsidy, reducing the need for City subsidy.
2.5 Environmental Issues.
• Phase I/II Site Assessment Status and Results. SES’s Phase I/II Environmental Report (completed on October 28, 2011) indicates soil samples with the highest concentration of lead concentration. However, Equity Residential remediated the contaminated soils as part of the land dedication in May 2015. An updated Phase I Environmental report was prepared in October 2020 during predevelopment. Further site testing is expected to begin in April 2022, after the interim uses have been closed down.
Article 38: Not exempt - The Site is located in an area with elevated pollutant concentrations. Sensitive use buildings, as defined in the Applicability section of the Ordinance, must comply with Health Code Article 38.
Accessibility: Project will meet the minimum requirements of the California Building Code Chapter 11(B).
Green Building: Project will meet the minimum TCAC Green Building requirements and the City’s Green Building Code.
Recycled Water: Exempt – see https://www.sfwater.org/index.aspx?page=687 Storm Water Management:
The Site is not located in the Storm Water Management Map.
Evaluation of Request for Final Gap Financing April 1, 2022 600 7th Street Page 12 of 54
• Potential/Known Hazards. The 600 7th Street (dba 801 Brannan) parcel
was developed in the late 1890s as warehouses, occupied by the Western Pacific Railroad Freight Depot from 1913 to 1980, and then the Concourse Exhibition Hall that was demolished for the 801 Brannan development. Asbestos- containing building materials were likely to have been used and may be contained as part of the temporary cap on the Site.
2.6 Adjacent uses and neighborhood amenities. The immediate neighborhood is comprised of mixture of industrial and commercial sites, including an auto repair, office buildings, and apartment buildings. A number of small businesses including cafes are restaurants are near the Site. Specifically, for the formerly homeless adults and families, St. Vincent De Paul Society, a non-profit organization providing direct services to people experiencing homelessness and domestic violence, is 0.5 miles away.
2.7 Green Building. The building will meet the requirements for 4% low income housing tax credits and tax-exempt bonds and the City’s Green Building Code. The project will operate on 100% electric power.
3 COMMUNITY SUPPORT 3.1 Prior Outreach. MHC developed website, conducted stakeholder meetings,
circulated mailers to the community, and worked closely and collaborated with the community for input on conceptual design.
3.2 Future Outreach. 600 7th Street is the first of at least 5 sites in SoMa that are
the result of land dedications. This neighborhood-wide opportunity to develop affordable housing and community amenities in SoMa is therefore especially important. Additionally, since this particular site was designated for land dedication, the SOMA Pilipinas Cultural District was created, which presents opportunities for MHC to collaborate with existing community organizations. Nevertheless, the Site sits kitty corner from the southeastern border of the District, though is expected to play a supporting role in the District goals.
MHC’s philosophy for community outreach is to incorporate stakeholders early and regularly through an inclusive, iterative process. MHC has a dedicated staff member to lead the community outreach process for 600 7th Street, Amy Bayley, RSM, Vice President of Community Planning. Although the project will pursue SB35 for streamlined approvals for project entitlements, MHC will maintain relationships with key community stakeholders by communicating throughout key stages of the project and will continue to meet with the community as needed through operations.
Since the Site is in the Showplace Square/Potrero Area Plan and directly adjacent to Western SoMa, MHC will engage stakeholders from both areas, including surrounding residents, businesses, property owners, the Potrero Boosters Neighborhood Association, Potrero Hill Neighborhood House, South of Market Community Action Network, SOMA Pilipinas, Bayanihan
Evaluation of Request for Final Gap Financing April 1, 2022 600 7th Street Page 13 of 54
Community Center, Bill Sorro Housing Program, South of Market Business Association, SoMa West Central Business District, United Playaz, and
Friends of Bryant Street, in addition to the SOMA Community Stabilization Fund CAC, and Eastern Neighborhoods CAC.
The project will involve additional outreach to assess the community’s
desires for the neighborhood-serving commercial spaces, as the Site offers a particularly large amount of ground floor area for potential development of community use spaces.
To kickoff this plan, the MHC team has begun collaborating with MOHCD Cultural District Specialists to schedule individual meetings with the Executive Directors of the SOMA Pilipinas, American Indian Cultural District, and Leather LGBTQ District cultural districts in April 2022. MHC will subsequently develop a schedule with the cultural districts to continue to keep the community informed on how this project is developing as well as inform them of forthcoming opportunities around the project’s public art requirement and commercial space, MHC plans to attend upcoming meetings for the cultural districts located in SoMa and the SoMa CAC. Furthermore, MHC’s engagement strategy will not be limited to
collaborating with existing community organizations, but will branch out to the broader SoMa neighborhood to cultivate new community partnerships.
3.3 Proposition I Notification. – Chapter 79 of the City’s Administrative Code
requires public noticing (Prop I) for initial City-funding made to any new construction project. MHC completed the 30-day noticing process following the Loan Committee’s approval of the pre-development request.
4 DEVELOPMENT PLAN 4.1 Site Control. The LP has executed an Option to Ground Lease and will
ground lease the site from the City at construction loan closing pending Board of Supervisors’ approval. The terms outlined in the Option Agreement are for a standard term of 75 years from the date of construction completion of the Project, with an option to extend the term for an additional 24 years. The ground lease base rent is $15,000 per year and residual rent is 10% of the land value of the Property.
4.2 Proposed Design. 600 7th St is an 8-story all concrete, all-electric building. The design is envisioned to foster an inviting, integrated community that is efficient, safe and functional for all residents. There is an entry court at the 7th Street frontage leading to two lobbies, one on each side of the entry court. The lobbies lead to distinct family and studio “wings,” forming an “F” shape building footprint, featuring units and amenity space for each target population. A 24-hour desk clerk will cover the entrance to the adult studio wing in order to meet the various programmatic needs of the homeless and
Evaluation of Request for Final Gap Financing April 1, 2022 600 7th Street Page 14 of 54
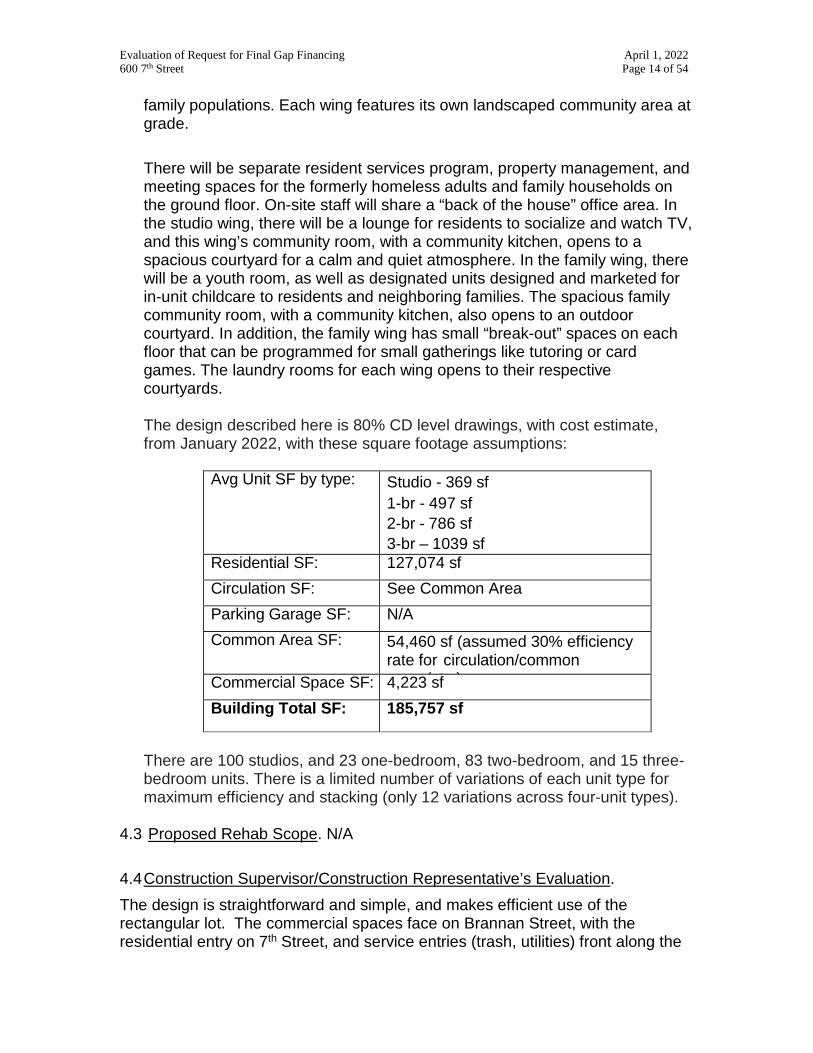
family populations. Each wing features its own landscaped community area at grade. There will be separate resident services program, property management, and meeting spaces for the formerly homeless adults and family households on the ground floor. On-site staff will share a “back of the house” office area. In the studio wing, there will be a lounge for residents to socialize and watch TV, and this wing’s community room, with a community kitchen, opens to a spacious courtyard for a calm and quiet atmosphere. In the family wing, there will be a youth room, as well as designated units designed and marketed for in-unit childcare to residents and neighboring families. The spacious family community room, with a community kitchen, also opens to an outdoor courtyard. In addition, the family wing has small “break-out” spaces on each floor that can be programmed for small gatherings like tutoring or card games. The laundry rooms for each wing opens to their respective courtyards. The design described here is 80% CD level drawings, with cost estimate, from January 2022, with these square footage assumptions:
Avg Unit SF by type: Studio - 369 sf 1-br - 497 sf 2-br - 786 sf 3-br – 1039 sf
Residential SF: 127,074 sf Circulation SF: See Common Area Parking Garage SF: N/A Common Area SF: 54,460 sf (assumed 30% efficiency
rate for circulation/common / t ) Commercial Space SF: 4,223 sf
Building Total SF: 185,757 sf
There are 100 studios, and 23 one-bedroom, 83 two-bedroom, and 15 three-bedroom units. There is a limited number of variations of each unit type for maximum efficiency and stacking (only 12 variations across four-unit types).
4.3 Proposed Rehab Scope. N/A
4.4 Construction Supervisor/Construction Representative’s Evaluation. The design is straightforward and simple, and makes efficient use of the rectangular lot. The commercial spaces face on Brannan Street, with the residential entry on 7th Street, and service entries (trash, utilities) front along the
Evaluation of Request for Final Gap Financing April 1, 2022 600 7th Street Page 15 of 54
alley. The building design is effective at separating out the two resident programs with discreet spaces (entry lobbies, community rooms, etc.) designated for each group, while minimizing redundancies and maximizing construction efficiencies where possible (grouping together trash rooms and elevator cores, sharing a front desk, etc.). The “F” shaped of the plan creates two on-grade courtyards, one for each population, a thoughtful design decision. No parking is provided, which helps reduce the cost. The soil conditions are very poor (loose sand, silt, and clay), as is typical in this area of the City, and the team has spent a substantial amount of effort investigating and designing the most cost-effective foundation system. Key to the structural integrity of the building is the system of roughly 420 drilled piles driven to depths of 135-145 feet (accounting for $8.5 M in hard costs). A piles testing program, scheduled for March 2022 will affirm the exact number of piles needed and their lengths; the current budget includes an allowance of $224K to provide longer piles (which allowance may be removed after piles testing depending on the test results). Construction is planned to start June 15, 2022, with a planned 24-month duration. Through the design process, the Project team spent a considerable amount of time exploring various unit configurations and construction typologies in an attempt to increase the Project’s competitiveness for CDLAC and reduce cost. The Project team did a comparative analysis of wood frame over Type I versus all-concrete and originally submitted plans to the Department of Building Inspections (DBI) in October 2020 for a wood-frame building. As the design progressed and the implications of the global supply chain and the pandemic affected construction costs, the premium price on lumber escalated in the market and the Project team shifted the design to Type I all concrete. Moving from the 100% DD drawings phase to the 50% Construction Documents (CD) set, the Project team had considered utilizing a Pueblo system of prefabricated steel to reduce the weight of the building and potentially add a floor, but the costs ultimately did not favor this solution. In addition to saving on materials, including for lumber and the associated fireproofing, Type I saves on overall development and long term operational and maintenance costs, and reduces the annual general liability insurance during operations. The site is vacant (currently the venue for a City COVID-19 testing operation), and there is no building demolition cost. The total construction cost estimated for the Preliminary Gap financing proposal approved in July 2021 was $118,229,595 based on the 100% Design Development (DD) drawings and included all GC costs/fees, $10 M in bid/design/plan check contingencies, and 5% hard cost owner’s contingency. Utilizing the 50% (CD) set approved by the MOHCD Construction Rep in October 2021, Suffolk Construction-Guzman General Contractors (“Suffolk-Guzman”) provided a refined hard cost estimate. With extensive Value Engineering (VE) and proactive early trade bidding (with the subs most familiar with the market
Evaluation of Request for Final Gap Financing April 1, 2022 600 7th Street Page 16 of 54
swings), Suffolk-Guzman provided a revised preliminary maximum price. With 80% CD set, approved in January 2022, the Project team conducted additional VE exercises, incorporated early buy-outs of some trades to lock in costs, and built in allowances to accommodate approximately 2% escalation for the trades which would be bid out starting in late February 2022 (with the final Guaranteed Maximum Price (GMP) scheduled for May 2022) including a scaled back COVID-19 allowance. With these efforts, the design contingency of $3.76 M was removed, escalation has been reduced, the bid contingency and plan check contingencies have been retained at 4% and 3% respectively for a total of $7M, and the total construction cost has been reduced by $974,482 from the budget presented for Loan Committee in July 2021. The total current construction cost is $117,255,113. With this, the total construction cost as of February 2022 was $117,255,113, which included all contingencies (including the hard cost 5%), the 4,223 SF commercial warm shell build-out ($2.54 M), and offsite improvements of the alleyway ($378K). At that time, the Project team believed it had appropriately accounted for market price escalation given the expert opinions provided by a reliable pool of subcontractors and the read of the industry and the volatile market. Once the subcontractors began submitting RFIs and preliminary costs for the bid sets, however, it became clear that recent international events have shaken up the industry even beyond the Covid-19-related and supply chain complications already factored in. With a comprehensive line item-by-line item reassessment reviewed by the Project team on March 15, the direct construction cost has been increased by roughly 8%. This is mostly driven by dramatically increased cost of fuel (for shipping), metals (pipe for piles, rebar, metal studs), and petroleum-based products (vinyl windows, waterproofing, insulation, roofing). Because the new costs result from very recent sub bids, the 2% escalation ($2.1M) that had been built into the previous budget is now removed, but we are retaining a 2% bid contingency (reduced from 4%) and the 3% plan check contingency for a total of $5.52M. All tolled, factoring in the percentage-based increases in construction contingency, general contractor costs, and Owner’s hard cost contingency, the total construction budget is now $125,668,982. (This total factors in $4.6 M in general contractor costs that had been misallocated to “Other Development Costs” in the February 2022 application workbook and in the analysis presented to the Credit Committee on March 8.) At $125.7 M in total construction costs, the Project comes in at $568,638 per unit, $376,254 per bedroom, and $677 per SF. When compared to the average of comparable projects of similar scale, building type, and resident populations (in pre-development, in construction, and project completed since 2018), the square foot cost is 27% higher (comparable projects’ square foot cost is $533). The per unit cost compares favorably to the comps – the 600 7th cost is 8% lower than the average of the comparable projects ($614,817/unit), which speaks to the efficient design.
Evaluation of Request for Final Gap Financing April 1, 2022 600 7th Street Page 17 of 54
The Project received the site permit in July 2021. Addendum 1 (deep foundation/piles/underground) and Addendum 2 (superstructure) were submitted in February 2022. The building permit is anticipated to be issued by June 15, 2022. The Street Improvement Plan application was submitted to the Department of Public Works in January 2022. The PG&E application for permanent power was submitted and PG&E deemed it complete in February 2022 (PG&E is underway with the next steps for temporary power, required load studies for permanent power, service designs, and approvals). 4.5 Commercial Space.
• Space Description. Per the last time this project was at Loan Committee, Mercy is proposing to create four separate commercial spaces. The corner space (at 1,822 sf) is proposed to be for a food-related business, such as a café. This space will have a separate entry, a type I hood, and a dedicated bathroom. The other three spaces (at 418 sf, 430 sf, and 1,187 sf) are proposed to be for community serving retail or artist studios. Each of these three spaces will have its own entry but they will share access to a corridor with bathrooms. The tenants have not yet been identified.
An LLC entity affiliated with Mercy will operate the commercial space and enter into subleases with individual tenants. As the master tenant, the LLC will enter into a master lease with Mercy Housing California 97, L.P., the master lessor. Per MOHCD’s Commercial Underwriting Guidelines, the master tenant will pay 40% of commercial surplus cash to the LP as master lease rent and the LP will pay this identical amount to MOHCD as an additional ground lease payment.
• Commercial Leasing Plan. Prior to the gap loan request, Mercy was to submit an updated commercial space plan, commercial financial assumptions, and commercial development timeline for MOHCD review and approval. This has not been completed and will be a condition to MOHCD approving construction closing. See Section 9.2.
Mercy is in the process of initiating outreach to cultural districts in SOMA to discuss both the project’s commercial space opportunities and public art. See Section 9.3.
• Operating Pro Forma. Per the attached commercial pro forma, Mercy is proposing the master tenant expenses to be a management fee, property insurance, real estate taxes, common area maintenance (CAM), TI reserve deposits for future tenants upon turn-over, and capital replacement reserve deposits. Estimated rents for individual tenants are estimated to be between $1.90/sf/mo and $2.10/sf/mo in addition to reimbursing the master tenant for their pro rata share of CAM, insurance, and real estate taxes. The attached pro forma assumes a 50% vacancy rate throughout the 20-year pro forma and a negative cash flow. Mercy
Evaluation of Request for Final Gap Financing April 1, 2022 600 7th Street Page 18 of 54
must submit an updated pro forma along with the commercial space plan as a condition to MOHCD going to the Board of Supervisors for gap loan approval. Furthermore, Mercy will be required to provide market data supporting the proposed rents and lease up of the various commercial uses at 50% construction completion. See Section 9.2.
• Tenant Improvement Build Out. As a condition of closing, Mercy must
submit a tenant improvement plan for MOHCD review and approval.
4.6 Service Space. MHC is proposing separate resident services program and meeting spaces for the formerly homeless adults and family households on the ground floor. Along 7th Street in the family wing, there are two service offices for the Resident Service Coordinator and Case Manager for the 20 formerly homeless families. The spacious family community room with a community kitchen opens to an outdoor courtyard—promoting family programming like after school academic support, health and wellness, and educational and community building activities. In the supportive housing wing, there are four case management offices facing the family courtyard for on-site mental health services. Nestled away from the street, the adult-wing community room with a community kitchen also opens to a spacious courtyard for a calm and quiet atmosphere. On-site medical and clinical services will be provided to the formerly homeless adults in the community room. Provisions to ensure residents’ privacy during these services include resident sign-ups for appointments, separate waiting areas, and screens/partitions.
4.7 Interim Use. Interim use of the site has been managed by DPH for Covid-19 related vaccination and testing.
4.8 Infrastructure. N/A
4.9 Communications Wiring and Internet Access. The project will provide Ethernet cable design for data/internet. Service to the building from Public Right of Way to a MPOE and to IDF is designed to adequately accommodate fiber and cabling for multiple service providers, following the minimum specs included in the MOHCD Communication Systems Design Standards. 4.10 Public Art Component. Public Art is required for this project. The development will represent a significant invest to the community and the creation of public art is an essential element. The development team is interested in introducing innovative and impactful artwork into the project that will have a positive impact to the building’s inhabitants, the local SoMa community and greater San Francisco. An important aspect of this process is the creation of a curatorial statement that will guide public art selection and potentially art within the property. The team is keenly interested in exploring how art can support economic development activities related to its commercial uses, the local artist community and placemaking within Soma. MHC identified potential project areas within
Evaluation of Request for Final Gap Financing April 1, 2022 600 7th Street Page 19 of 54
the building and solicited proposals from public art consultants. See Attachment O for details of the RFP. The project team selected Lynn Baer as its consultant. The total public art budget requirement is $404,639.
4.11 Marketing, Occupancy, and Lease-Up. MHC has committed to conducting marketing and occupancy outreach for the Project in accordance with all applicable fair housing laws. MHC will work with neighborhood-based, non-profit organizations to develop relationships with their constituencies regarding the housing opportunity. Out of the 221 total units, the non-PSH units (100) that are not subsidized by LOSP, will be entered in the San Francisco DAHLIA lottery and subject to San Francisco preferences per City Ordinance. Among all eligible applicants, additional preference will be observed in the following order:
1. San Francisco Redevelopment Agency Certificate of Preference (COP) Holders,
2. Displaced Tenant Housing Preference (Ellis Act/OMI) Certificate (DTHP) Holders,
3. Neighborhood Resident Preference1, and 4. Live or Work in San Francisco.
In order to enhance the applications by COP holders, MHC would like to do specific outreach to COP holders and rental ready trainings similar to that which has been done for OCII sponsored projects. The developer will include this in their MOHCD required Marketing Plan for MOHCDs approval.
Marketing materials will be printed in Chinese, English, Spanish and Tagalog, and published in a variety of publications that represent a broad range of non-English speaking populations. The other 120 units will be referred by HSH through its Coordinated Entry System (100 Adults and 20 Families.) Target Population and Unit Type. At initial concept design and predevelopment request, MHC proposed 200 units. Now as design has progressed and with emphasis on low per unit development costs in the CDLAC tiebreaker, the Site offers 221 units, comprised of 100 studios and 120 family units (1- to 3-bedroom units), and a manager’s unit. 120 of total units (or 54% of total units) will serve formerly homeless adults and families referred through the Coordinated Entry System administered by HSH—with 100 studios for formerly homeless adults and 20 units in 3-unit types (1-3 brs) for formerly homeless families. 70 of these studio units will be targeted to people who were either chronically homeless, homeless, or at-risk of chronic homelessness as defined by the NPLH Program, with the appropriate supportive services. The remaining 100 units (1brs, 2brs & 3brs) will serve family households earning a range between 50%-80% MOHCD AMI,
Evaluation of Request for Final Gap Financing April 1, 2022 600 7th Street Page 20 of 54
averaging to no more than 60% MOHCD AMI. The average affordability for the overall project is 51% MOHCD AMI and 64.9% MOHCD AMI for the 120 family units.
With this gap loan request, MHC proposes to add a 70% and 75% MOHCD AMI tier to the development but maintain affordability at an average AMI of 51% to not negatively impact cash flow and the project’s ability to support perm debt. The previously proposed AMI tiers were 30%, 50%, 60%, and 80%, which meant large rent jumps from 60% to 80%. From MHC’s recent experience with leasing up 691 China Basin, they found that large AMI jumps create challenges and frustrations for both applicant households and the lease up team. MOHCD staff supports having a more consistent gradient of AMI’s and the reallocation of units from the 60% and 80% AMI tiers to a newly created 70% AMI and 75% tier.
4.12 Relocation. N/A, this project is new construction.
5 DEVELOPMENT TEAM 5.1 Procurement Plan.
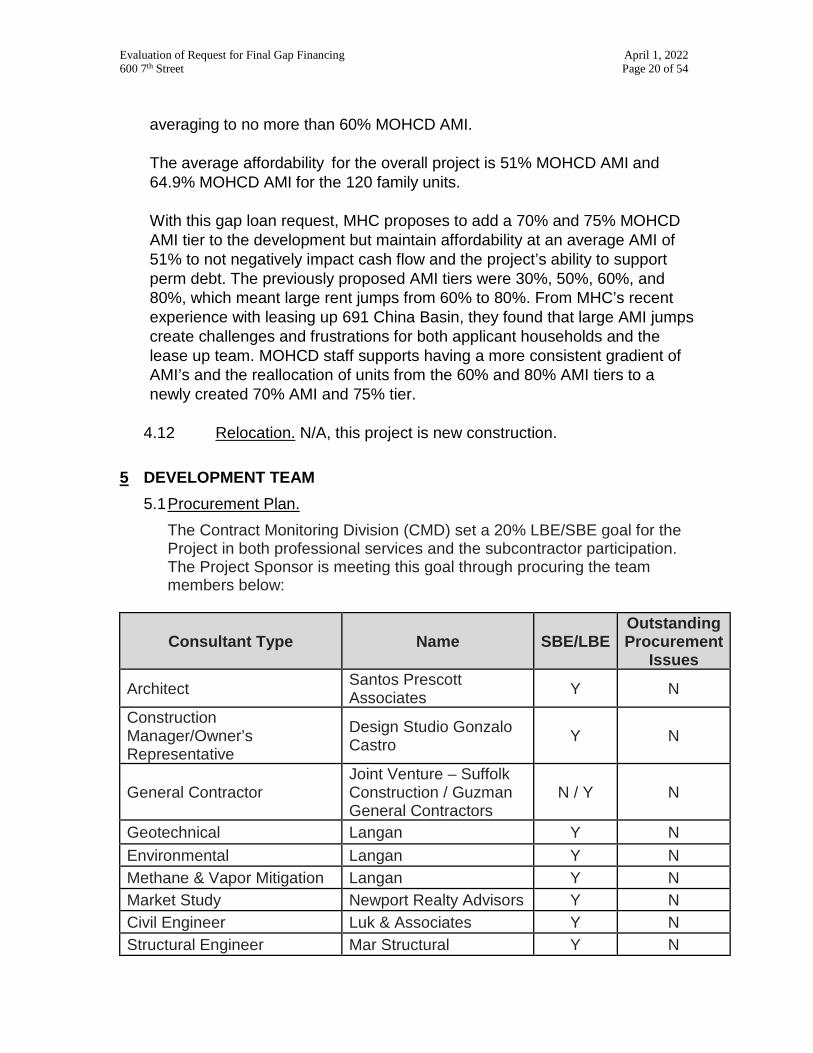
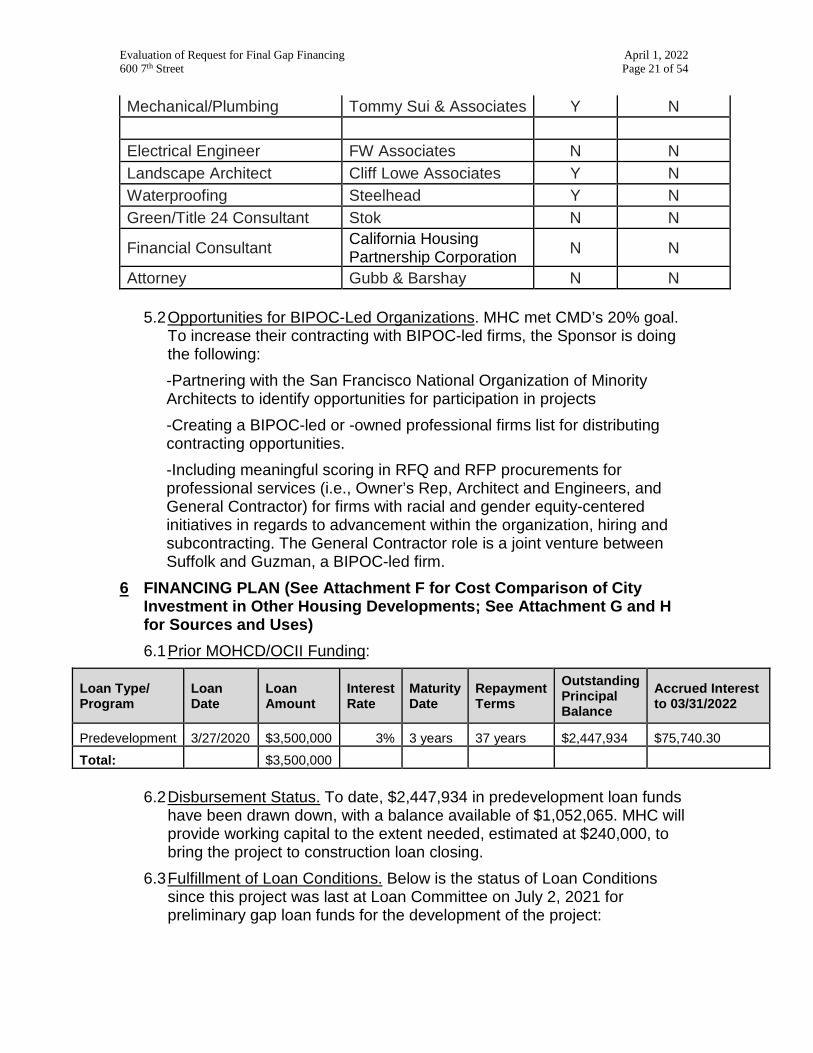
The Contract Monitoring Division (CMD) set a 20% LBE/SBE goal for the Project in both professional services and the subcontractor participation. The Project Sponsor is meeting this goal through procuring the team members below:
Consultant Type Name SBE/LBE Outstanding Procurement
Issues
Architect Santos Prescott Associates Y N
Construction Manager/Owner’s Representative
Design Studio Gonzalo Castro Y N
General Contractor Joint Venture – Suffolk Construction / Guzman General Contractors
N / Y N
Geotechnical Langan Y N Environmental Langan Y N Methane & Vapor Mitigation Langan Y N Market Study Newport Realty Advisors Y N Civil Engineer Luk & Associates Y N Structural Engineer Mar Structural Y N
Evaluation of Request for Final Gap Financing April 1, 2022 600 7th Street Page 21 of 54
Mechanical/Plumbing Tommy Sui & Associates Y N Electrical Engineer FW Associates N N Landscape Architect Cliff Lowe Associates Y N Waterproofing Steelhead Y N Green/Title 24 Consultant Stok N N
Financial Consultant California Housing Partnership Corporation N N
Attorney Gubb & Barshay N N
5.2 Opportunities for BIPOC-Led Organizations. MHC met CMD’s 20% goal. To increase their contracting with BIPOC-led firms, the Sponsor is doing the following: -Partnering with the San Francisco National Organization of Minority Architects to identify opportunities for participation in projects -Creating a BIPOC-led or -owned professional firms list for distributing contracting opportunities. -Including meaningful scoring in RFQ and RFP procurements for professional services (i.e., Owner’s Rep, Architect and Engineers, and General Contractor) for firms with racial and gender equity-centered initiatives in regards to advancement within the organization, hiring and subcontracting. The General Contractor role is a joint venture between Suffolk and Guzman, a BIPOC-led firm.
6 FINANCING PLAN (See Attachment F for Cost Comparison of City Investment in Other Housing Developments; See Attachment G and H for Sources and Uses) 6.1 Prior MOHCD/OCII Funding:
Loan Type/ Program
Loan Date
Loan Amount
Interest Rate
Maturity Date
Repayment Terms
Outstanding Principal Balance
Accrued Interest to 03/31/2022
Predevelopment 3/27/2020 $3,500,000 3% 3 years 37 years $2,447,934 $75,740.30 Total: $3,500,000
6.2 Disbursement Status. To date, $2,447,934 in predevelopment loan funds
have been drawn down, with a balance available of $1,052,065. MHC will provide working capital to the extent needed, estimated at $240,000, to bring the project to construction loan closing.
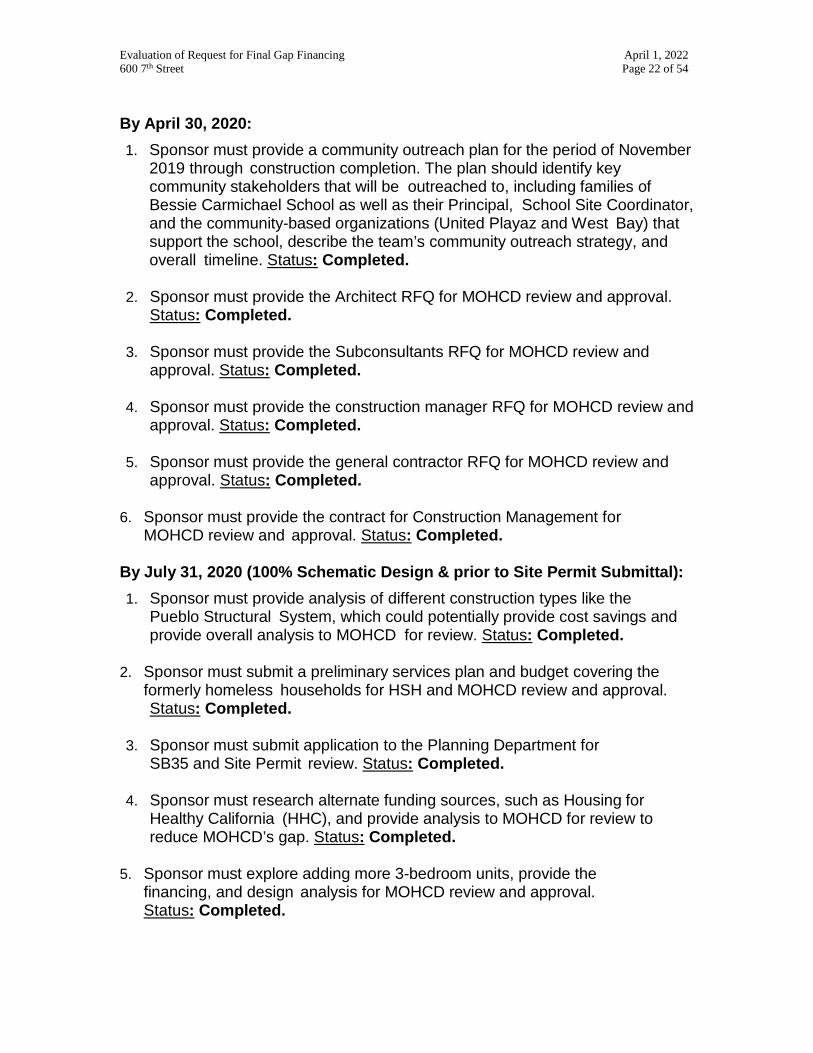
6.3 Fulfillment of Loan Conditions. Below is the status of Loan Conditions since this project was last at Loan Committee on July 2, 2021 for preliminary gap loan funds for the development of the project:
Evaluation of Request for Final Gap Financing April 1, 2022 600 7th Street Page 22 of 54
By April 30, 2020: 1. Sponsor must provide a community outreach plan for the period of November
2019 through construction completion. The plan should identify key community stakeholders that will be outreached to, including families of Bessie Carmichael School as well as their Principal, School Site Coordinator, and the community-based organizations (United Playaz and West Bay) that support the school, describe the team’s community outreach strategy, and overall timeline. Status: Completed.
2. Sponsor must provide the Architect RFQ for MOHCD review and approval.
Status: Completed.
3. Sponsor must provide the Subconsultants RFQ for MOHCD review and approval. Status: Completed.
4. Sponsor must provide the construction manager RFQ for MOHCD review and approval. Status: Completed.
5. Sponsor must provide the general contractor RFQ for MOHCD review and approval. Status: Completed.
6. Sponsor must provide the contract for Construction Management for MOHCD review and approval. Status: Completed.
By July 31, 2020 (100% Schematic Design & prior to Site Permit Submittal): 1. Sponsor must provide analysis of different construction types like the
Pueblo Structural System, which could potentially provide cost savings and provide overall analysis to MOHCD for review. Status: Completed.
2. Sponsor must submit a preliminary services plan and budget covering the formerly homeless households for HSH and MOHCD review and approval. Status: Completed.
3. Sponsor must submit application to the Planning Department for SB35 and Site Permit review. Status: Completed.
4. Sponsor must research alternate funding sources, such as Housing for Healthy California (HHC), and provide analysis to MOHCD for review to reduce MOHCD’s gap. Status: Completed.
5. Sponsor must explore adding more 3-bedroom units, provide the financing, and design analysis for MOHCD review and approval. Status: Completed.
Evaluation of Request for Final Gap Financing April 1, 2022 600 7th Street Page 23 of 54
6.5.1 Permanent Sources Evaluation Narrative: The Borrower proposes to use the following sources to permanently finance the project: • MOHCD Loan ($65,777,411) Loan – The estimated amount for
MOHCD’s gap loan on this project is $65,777,411 or $297,635 per unit.
• MOHCD No Place Like Home (NPLH) Loan – ($17,500,000) – Through a county allocation from the State of California NPLH program, MOHCD will administer $17.5MM or $250,000 per unit to support 70 studio units, which make up 35% of total units. The regulatory limit for units to be subsidized by NPLH is 49% of total units.
• Federal Home Loan Bank of San Francisco (FHLB-SF) Affordable
Housing Program (AHP) ($1,000,000) Loan – MHC believes the project will be competitive based on the unit mix and timing of submitting the application to maximize project readiness points, for a request of $1.0MM or $4,525 per unit. MHC applied for AHP financing March 10, 2022.
(Note: the total MOHCD Loan amount is $84,277,411, includes an AHP bridge loan amount, and NPLH funds.)
• Private Mortgage ($12,397,000) – A private long-term permanent
mortgage is included in the financing plan. MHC is assuming a 15-year term amortized over 35 years at 4.88%. This loan meets HCD requirements, as long as HCD’s regulatory agreement is in senior position. The mortgage is underwritten on income from the non-LOSP units only.
• Federal Tax Credit Equity ($51,158,320) – MHC is assuming $0.95
per federal credit pricing, which is consistent with the current credit market for projects with significant amounts of LOSP funding. Selection of the tax credit investor and lender is pending at same time as this evaluation process.
• General Partner Equity ($500,000) – This was the largest amount of
GP Equity that was determined to maintain competitiveness for an allocation of tax-exempt bonds from CDLAC.
• Accrued Interest on MOHCD Loan ($2,773,955).
Evaluation of Request for Final Gap Financing April 1, 2022 600 7th Street Page 24 of 54
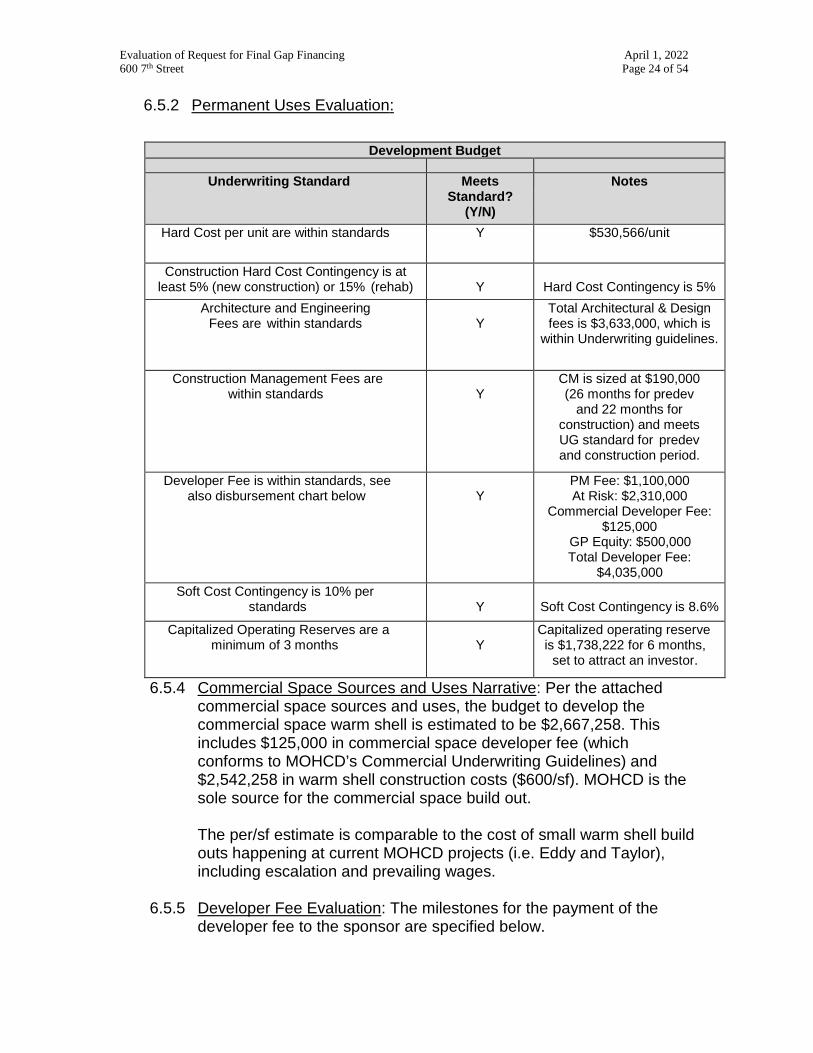
6.5.2 Permanent Uses Evaluation:
6.5.4 Commercial Space Sources and Uses Narrative: Per the attached commercial space sources and uses, the budget to develop the commercial space warm shell is estimated to be $2,667,258. This includes $125,000 in commercial space developer fee (which conforms to MOHCD’s Commercial Underwriting Guidelines) and $2,542,258 in warm shell construction costs ($600/sf). MOHCD is the sole source for the commercial space build out.
The per/sf estimate is comparable to the cost of small warm shell build outs happening at current MOHCD projects (i.e. Eddy and Taylor), including escalation and prevailing wages.
6.5.5 Developer Fee Evaluation: The milestones for the payment of the developer fee to the sponsor are specified below.
Development Budget Underwriting Standard Meets
Standard? (Y/N)
Notes
Hard Cost per unit are within standards Y $530,566/unit
Construction Hard Cost Contingency is at least 5% (new construction) or 15% (rehab)
Y
Hard Cost Contingency is 5%
Architecture and Engineering Fees are within standards
Y
Total Architectural & Design fees is $3,633,000, which is
within Underwriting guidelines.
Construction Management Fees are within standards
Y
CM is sized at $190,000 (26 months for predev
and 22 months for construction) and meets UG standard for predev and construction period.
Developer Fee is within standards, see also disbursement chart below
Y
PM Fee: $1,100,000 At Risk: $2,310,000
Commercial Developer Fee: $125,000
GP Equity: $500,000 Total Developer Fee:
$4,035,000 Soft Cost Contingency is 10% per
standards
Y
Soft Cost Contingency is 8.6%
Capitalized Operating Reserves are a minimum of 3 months
Y
Capitalized operating reserve is $1,738,222 for 6 months,
set to attract an investor.
Evaluation of Request for Final Gap Financing April 1, 2022 600 7th Street Page 25 of 54
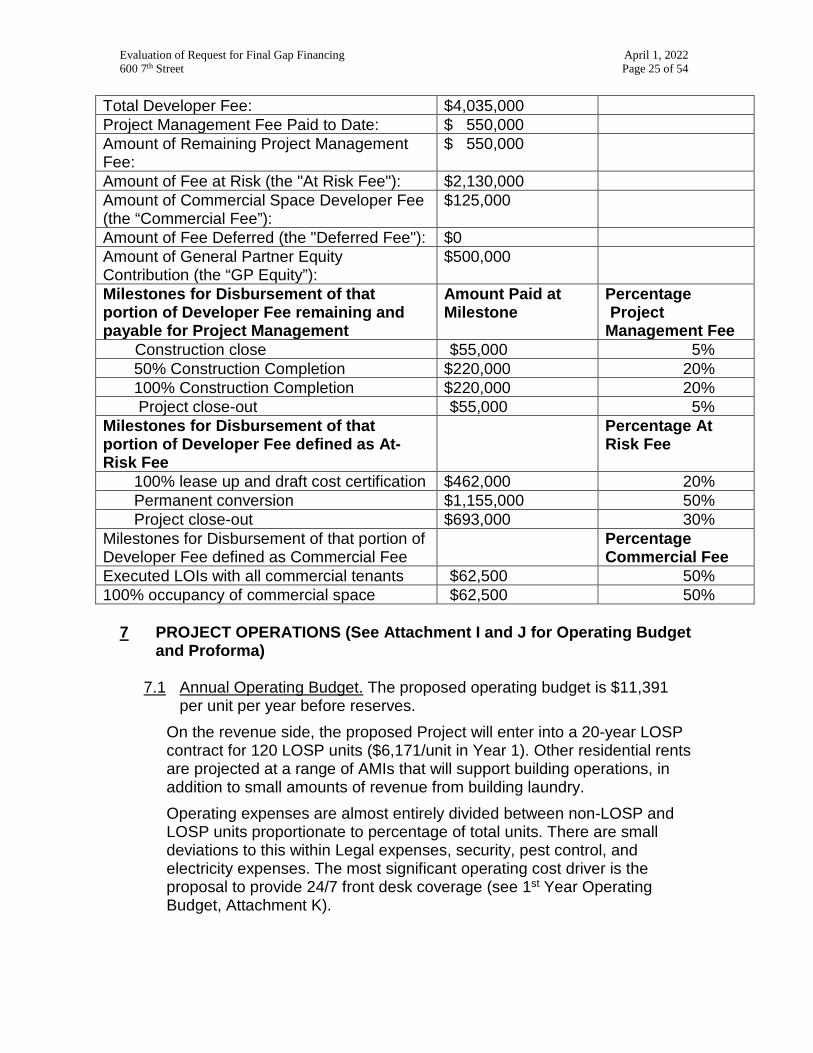
Total Developer Fee: $4,035,000 Project Management Fee Paid to Date: $ 550,000 Amount of Remaining Project Management Fee:
$ 550,000
Amount of Fee at Risk (the "At Risk Fee"): $2,130,000 Amount of Commercial Space Developer Fee (the “Commercial Fee”):
$125,000
Amount of Fee Deferred (the "Deferred Fee"): $0 Amount of General Partner Equity Contribution (the “GP Equity”):
$500,000
Milestones for Disbursement of that portion of Developer Fee remaining and payable for Project Management
Amount Paid at Milestone
Percentage Project
Management Fee Construction close $55,000 5% 50% Construction Completion $220,000 20% 100% Construction Completion $220,000 20% Project close-out $55,000 5% Milestones for Disbursement of that portion of Developer Fee defined as At-Risk Fee
Percentage At Risk Fee
100% lease up and draft cost certification $462,000 20% Permanent conversion $1,155,000 50% Project close-out $693,000 30% Milestones for Disbursement of that portion of Developer Fee defined as Commercial Fee
Percentage Commercial Fee
Executed LOIs with all commercial tenants $62,500 50% 100% occupancy of commercial space $62,500 50%
7 PROJECT OPERATIONS (See Attachment I and J for Operating Budget
and Proforma) 7.1 Annual Operating Budget. The proposed operating budget is $11,391
per unit per year before reserves. On the revenue side, the proposed Project will enter into a 20-year LOSP contract for 120 LOSP units ($6,171/unit in Year 1). Other residential rents are projected at a range of AMIs that will support building operations, in addition to small amounts of revenue from building laundry. Operating expenses are almost entirely divided between non-LOSP and LOSP units proportionate to percentage of total units. There are small deviations to this within Legal expenses, security, pest control, and electricity expenses. The most significant operating cost driver is the proposal to provide 24/7 front desk coverage (see 1st Year Operating Budget, Attachment K).
Evaluation of Request for Final Gap Financing April 1, 2022 600 7th Street Page 26 of 54
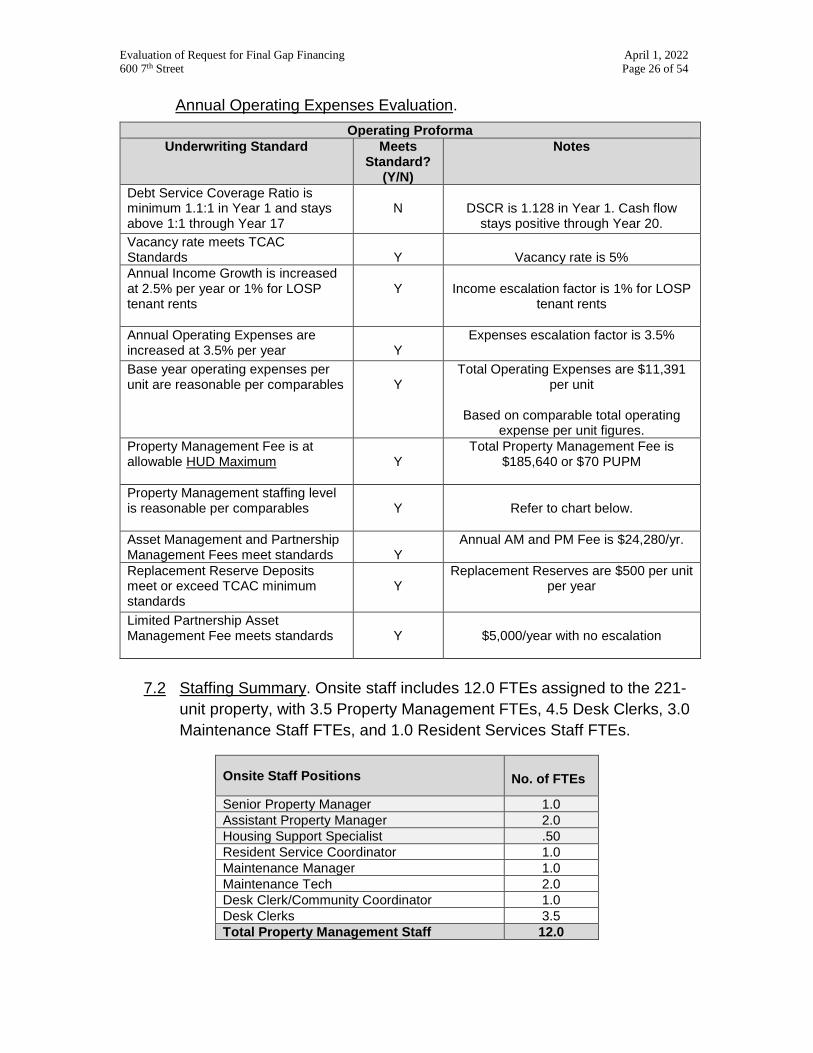
Annual Operating Expenses Evaluation. Operating Proforma
Underwriting Standard Meets Standard?
(Y/N)
Notes
Debt Service Coverage Ratio is minimum 1.1:1 in Year 1 and stays above 1:1 through Year 17
N
DSCR is 1.128 in Year 1. Cash flow
stays positive through Year 20. Vacancy rate meets TCAC Standards
Y
Vacancy rate is 5%
Annual Income Growth is increased at 2.5% per year or 1% for LOSP tenant rents
Y
Income escalation factor is 1% for LOSP
tenant rents
Annual Operating Expenses are increased at 3.5% per year
Y
Expenses escalation factor is 3.5%
Base year operating expenses per unit are reasonable per comparables
Y
Total Operating Expenses are $11,391 per unit
Based on comparable total operating
expense per unit figures. Property Management Fee is at allowable HUD Maximum
Y
Total Property Management Fee is $185,640 or $70 PUPM
Property Management staffing level is reasonable per comparables
Y
Refer to chart below.
Asset Management and Partnership Management Fees meet standards
Y
Annual AM and PM Fee is $24,280/yr.
Replacement Reserve Deposits meet or exceed TCAC minimum standards
Y
Replacement Reserves are $500 per unit per year
Limited Partnership Asset Management Fee meets standards
Y
$5,000/year with no escalation
7.2 Staffing Summary. Onsite staff includes 12.0 FTEs assigned to the 221-
unit property, with 3.5 Property Management FTEs, 4.5 Desk Clerks, 3.0 Maintenance Staff FTEs, and 1.0 Resident Services Staff FTEs.
Onsite Staff Positions No. of FTEs
Senior Property Manager 1.0 Assistant Property Manager 2.0 Housing Support Specialist .50 Resident Service Coordinator 1.0 Maintenance Manager 1.0 Maintenance Tech 2.0 Desk Clerk/Community Coordinator 1.0 Desk Clerks 3.5 Total Property Management Staff 12.0
Evaluation of Request for Final Gap Financing April 1, 2022 600 7th Street Page 27 of 54
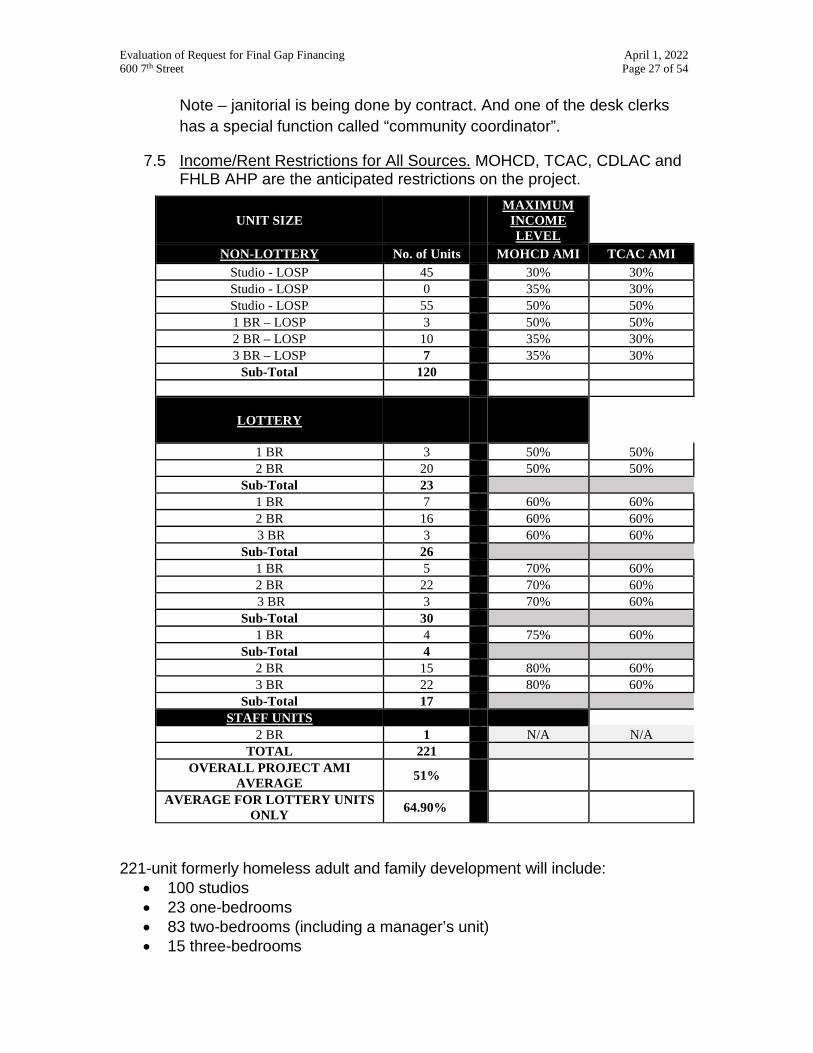
Note – janitorial is being done by contract. And one of the desk clerks has a special function called “community coordinator”.
7.5 Income/Rent Restrictions for All Sources. MOHCD, TCAC, CDLAC and FHLB AHP are the anticipated restrictions on the project.
UNIT SIZE MAXIMUM
INCOME LEVEL
NON-LOTTERY No. of Units MOHCD AMI TCAC AMI Studio - LOSP 45 30% 30% Studio - LOSP 0 35% 30% Studio - LOSP 55 50% 50% 1 BR – LOSP 3 50% 50% 2 BR – LOSP 10 35% 30% 3 BR – LOSP 7 35% 30%
Sub-Total 120
LOTTERY
1 BR 3 50% 50% 2 BR 20 50% 50%
Sub-Total 23 1 BR 7 60% 60% 2 BR 16 60% 60% 3 BR 3 60% 60%
Sub-Total 26 1 BR 5 70% 60% 2 BR 22 70% 60% 3 BR 3 70% 60%
Sub-Total 30 1 BR 4 75% 60%
Sub-Total 4 2 BR 15 80% 60% 3 BR 22 80% 60%
Sub-Total 17 STAFF UNITS
2 BR 1 N/A N/A TOTAL 221
OVERALL PROJECT AMI AVERAGE 51%
AVERAGE FOR LOTTERY UNITS ONLY 64.90%
221-unit formerly homeless adult and family development will include:
• 100 studios • 23 one-bedrooms • 83 two-bedrooms (including a manager’s unit) • 15 three-bedrooms
Evaluation of Request for Final Gap Financing April 1, 2022 600 7th Street Page 28 of 54
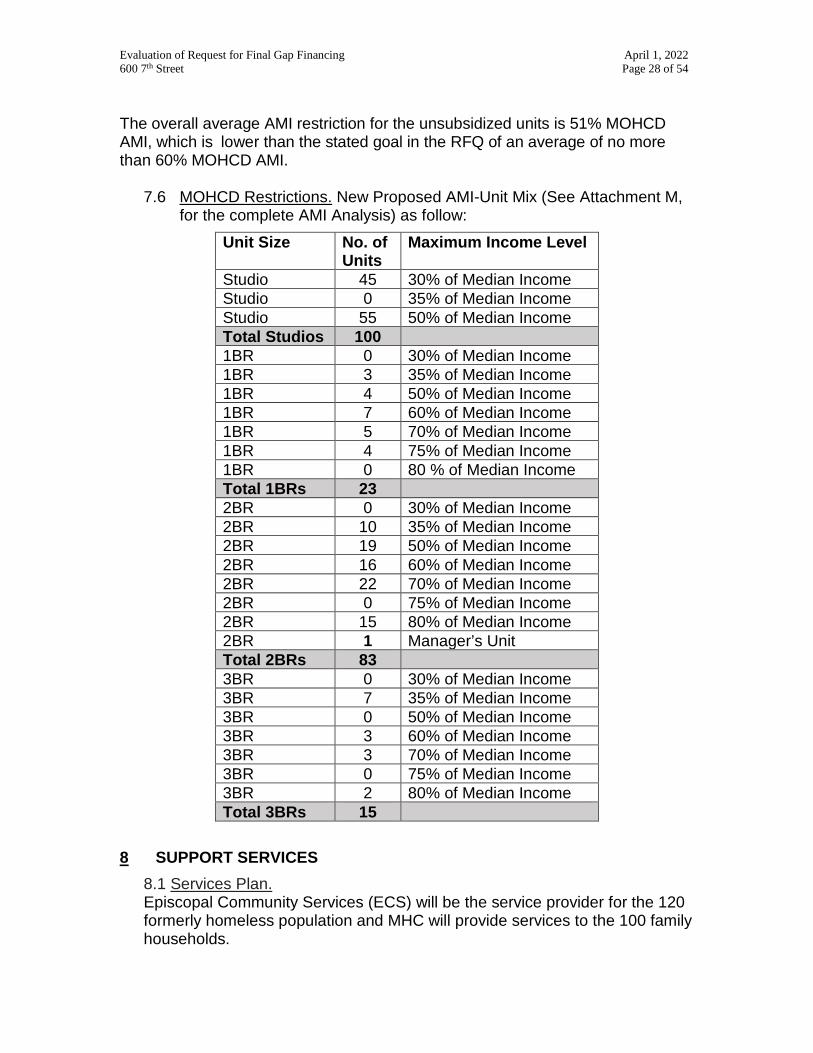
The overall average AMI restriction for the unsubsidized units is 51% MOHCD AMI, which is lower than the stated goal in the RFQ of an average of no more than 60% MOHCD AMI.
7.6 MOHCD Restrictions. New Proposed AMI-Unit Mix (See Attachment M, for the complete AMI Analysis) as follow:
Unit Size No. of Units
Maximum Income Level
Studio 45 30% of Median Income Studio 0 35% of Median Income Studio 55 50% of Median Income Total Studios 100 1BR 0 30% of Median Income 1BR 3 35% of Median Income 1BR 4 50% of Median Income 1BR 7 60% of Median Income 1BR 5 70% of Median Income 1BR 4 75% of Median Income 1BR 0 80 % of Median Income Total 1BRs 23 2BR 0 30% of Median Income 2BR 10 35% of Median Income 2BR 19 50% of Median Income 2BR 16 60% of Median Income 2BR 22 70% of Median Income 2BR 0 75% of Median Income 2BR 15 80% of Median Income 2BR 1 Manager’s Unit Total 2BRs 83 3BR 0 30% of Median Income 3BR 7 35% of Median Income 3BR 0 50% of Median Income 3BR 3 60% of Median Income 3BR 3 70% of Median Income 3BR 0 75% of Median Income 3BR 2 80% of Median Income Total 3BRs 15
8 SUPPORT SERVICES
8.1 Services Plan. Episcopal Community Services (ECS) will be the service provider for the 120 formerly homeless population and MHC will provide services to the 100 family households.
Evaluation of Request for Final Gap Financing April 1, 2022 600 7th Street Page 29 of 54
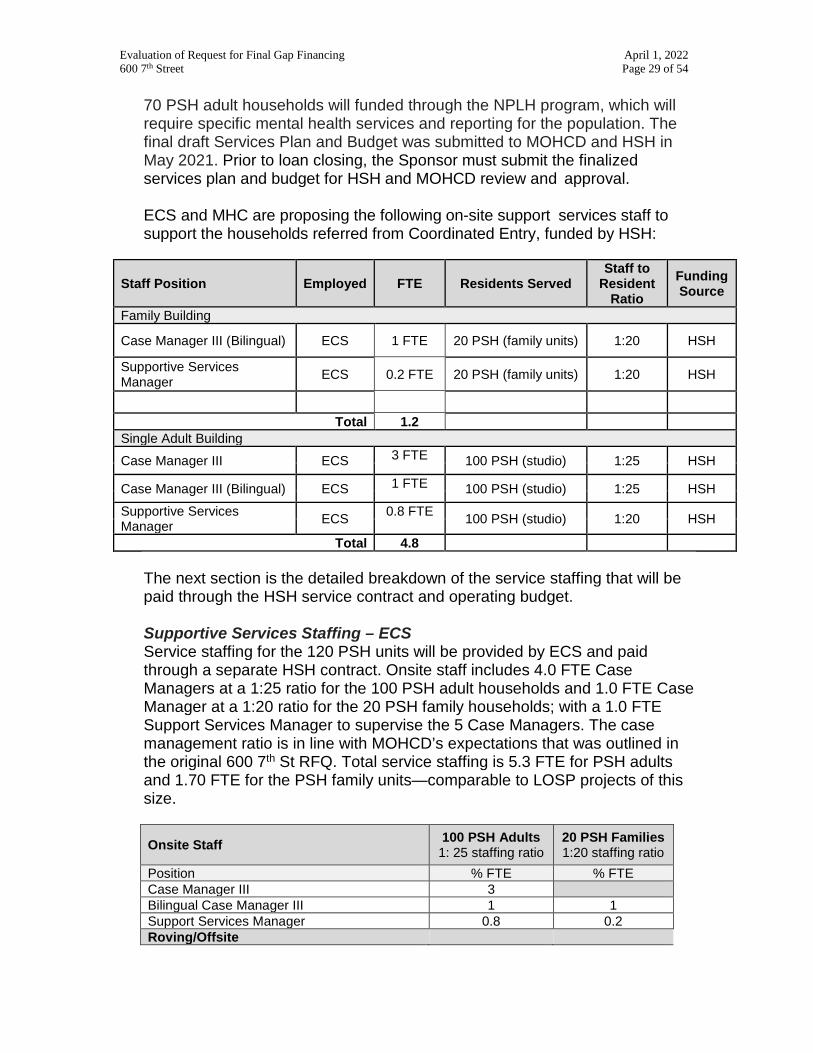
70 PSH adult households will funded through the NPLH program, which will require specific mental health services and reporting for the population. The final draft Services Plan and Budget was submitted to MOHCD and HSH in May 2021. Prior to loan closing, the Sponsor must submit the finalized services plan and budget for HSH and MOHCD review and approval. ECS and MHC are proposing the following on-site support services staff to support the households referred from Coordinated Entry, funded by HSH:
Staff Position Employed FTE Residents Served Staff to
Resident Ratio
Funding Source
Family Building
Case Manager III (Bilingual) ECS 1 FTE 20 PSH (family units) 1:20 HSH
Supportive Services Manager ECS 0.2 FTE 20 PSH (family units) 1:20 HSH
Total 1.2
Single Adult Building Case Manager III ECS 3 FTE 100 PSH (studio) 1:25 HSH
Case Manager III (Bilingual) ECS 1 FTE 100 PSH (studio) 1:25 HSH Supportive Services Manager ECS 0.8 FTE 100 PSH (studio) 1:20 HSH
Total 4.8 The next section is the detailed breakdown of the service staffing that will be paid through the HSH service contract and operating budget. Supportive Services Staffing – ECS Service staffing for the 120 PSH units will be provided by ECS and paid through a separate HSH contract. Onsite staff includes 4.0 FTE Case Managers at a 1:25 ratio for the 100 PSH adult households and 1.0 FTE Case Manager at a 1:20 ratio for the 20 PSH family households; with a 1.0 FTE Support Services Manager to supervise the 5 Case Managers. The case management ratio is in line with MOHCD’s expectations that was outlined in the original 600 7th St RFQ. Total service staffing is 5.3 FTE for PSH adults and 1.70 FTE for the PSH family units—comparable to LOSP projects of this size.
Onsite Staff 100 PSH Adults 1: 25 staffing ratio
20 PSH Families 1:20 staffing ratio
Position % FTE % FTE Case Manager III 3 Bilingual Case Manager III 1 1 Support Services Manager 0.8 0.2 Roving/Offsite
Evaluation of Request for Final Gap Financing April 1, 2022 600 7th Street Page 30 of 54
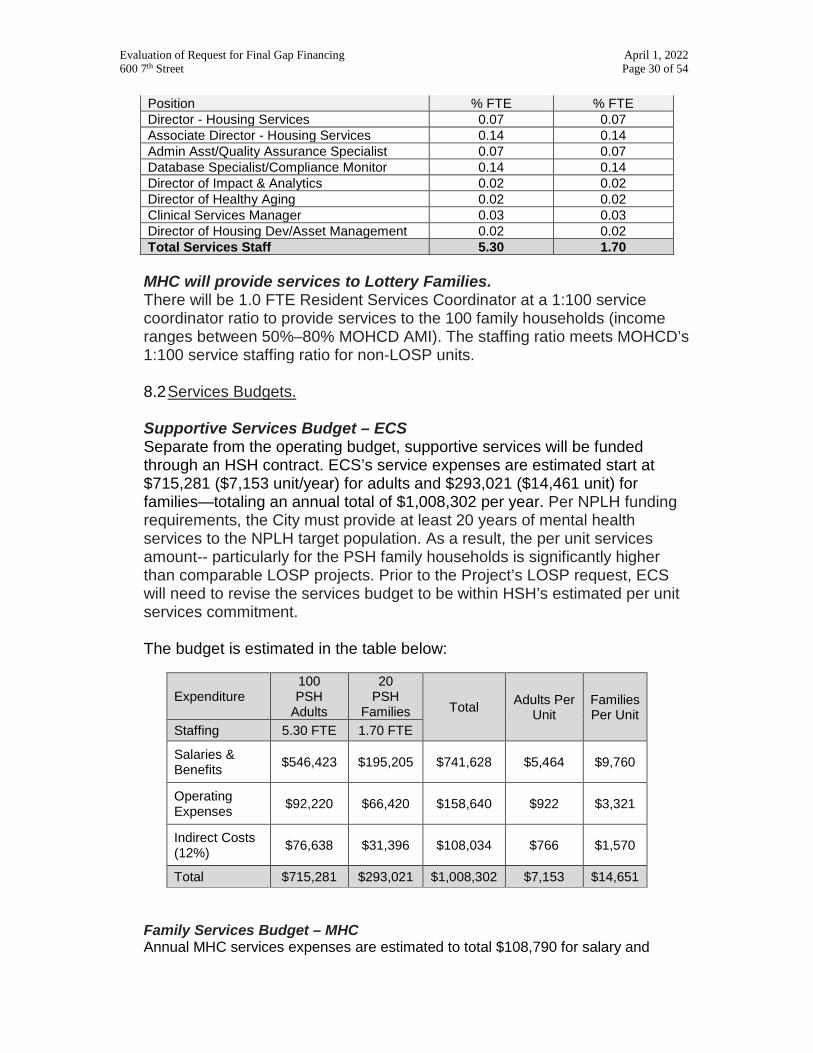
Position % FTE % FTE Director - Housing Services 0.07 0.07 Associate Director - Housing Services 0.14 0.14 Admin Asst/Quality Assurance Specialist 0.07 0.07 Database Specialist/Compliance Monitor 0.14 0.14 Director of Impact & Analytics 0.02 0.02 Director of Healthy Aging 0.02 0.02 Clinical Services Manager 0.03 0.03 Director of Housing Dev/Asset Management 0.02 0.02 Total Services Staff 5.30 1.70
MHC will provide services to Lottery Families. There will be 1.0 FTE Resident Services Coordinator at a 1:100 service coordinator ratio to provide services to the 100 family households (income ranges between 50%–80% MOHCD AMI). The staffing ratio meets MOHCD’s 1:100 service staffing ratio for non-LOSP units. 8.2 Services Budgets. Supportive Services Budget – ECS Separate from the operating budget, supportive services will be funded through an HSH contract. ECS’s service expenses are estimated start at $715,281 ($7,153 unit/year) for adults and $293,021 ($14,461 unit) for families—totaling an annual total of $1,008,302 per year. Per NPLH funding requirements, the City must provide at least 20 years of mental health services to the NPLH target population. As a result, the per unit services amount-- particularly for the PSH family households is significantly higher than comparable LOSP projects. Prior to the Project’s LOSP request, ECS will need to revise the services budget to be within HSH’s estimated per unit services commitment. The budget is estimated in the table below:
Expenditure 100 PSH
Adults
20 PSH
Families Total Adults Per Unit
Families Per Unit
Staffing 5.30 FTE 1.70 FTE
Salaries & Benefits $546,423 $195,205 $741,628 $5,464 $9,760
Operating Expenses $92,220 $66,420 $158,640 $922 $3,321
Indirect Costs (12%) $76,638 $31,396 $108,034 $766 $1,570
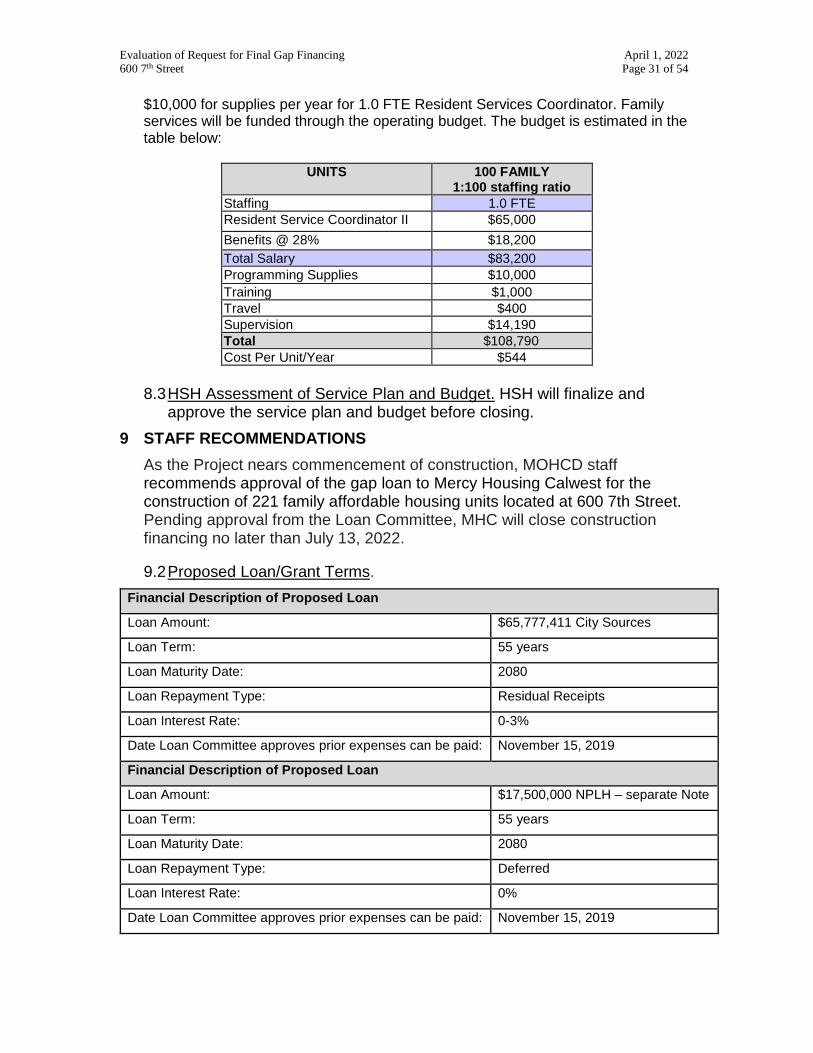
Total $715,281 $293,021 $1,008,302 $7,153 $14,651 Family Services Budget – MHC Annual MHC services expenses are estimated to total $108,790 for salary and
Evaluation of Request for Final Gap Financing April 1, 2022 600 7th Street Page 31 of 54
$10,000 for supplies per year for 1.0 FTE Resident Services Coordinator. Family services will be funded through the operating budget. The budget is estimated in the table below:
UNITS 100 FAMILY 1:100 staffing ratio
Staffing 1.0 FTE Resident Service Coordinator II $65,000 Benefits @ 28% $18,200 Total Salary $83,200 Programming Supplies $10,000 Training $1,000 Travel $400 Supervision $14,190 Total $108,790 Cost Per Unit/Year $544
8.3 HSH Assessment of Service Plan and Budget. HSH will finalize and
approve the service plan and budget before closing. 9 STAFF RECOMMENDATIONS
As the Project nears commencement of construction, MOHCD staff recommends approval of the gap loan to Mercy Housing Calwest for the construction of 221 family affordable housing units located at 600 7th Street. Pending approval from the Loan Committee, MHC will close construction financing no later than July 13, 2022. 9.2 Proposed Loan/Grant Terms.
Financial Description of Proposed Loan
Loan Amount: $65,777,411 City Sources
Loan Term: 55 years
Loan Maturity Date: 2080
Loan Repayment Type: Residual Receipts
Loan Interest Rate: 0-3%
Date Loan Committee approves prior expenses can be paid: November 15, 2019
Financial Description of Proposed Loan
Loan Amount: $17,500,000 NPLH – separate Note
Loan Term: 55 years
Loan Maturity Date: 2080
Loan Repayment Type: Deferred
Loan Interest Rate: 0%
Date Loan Committee approves prior expenses can be paid: November 15, 2019
Evaluation of Request for Final Gap Financing April 1, 2022 600 7th Street Page 32 of 54
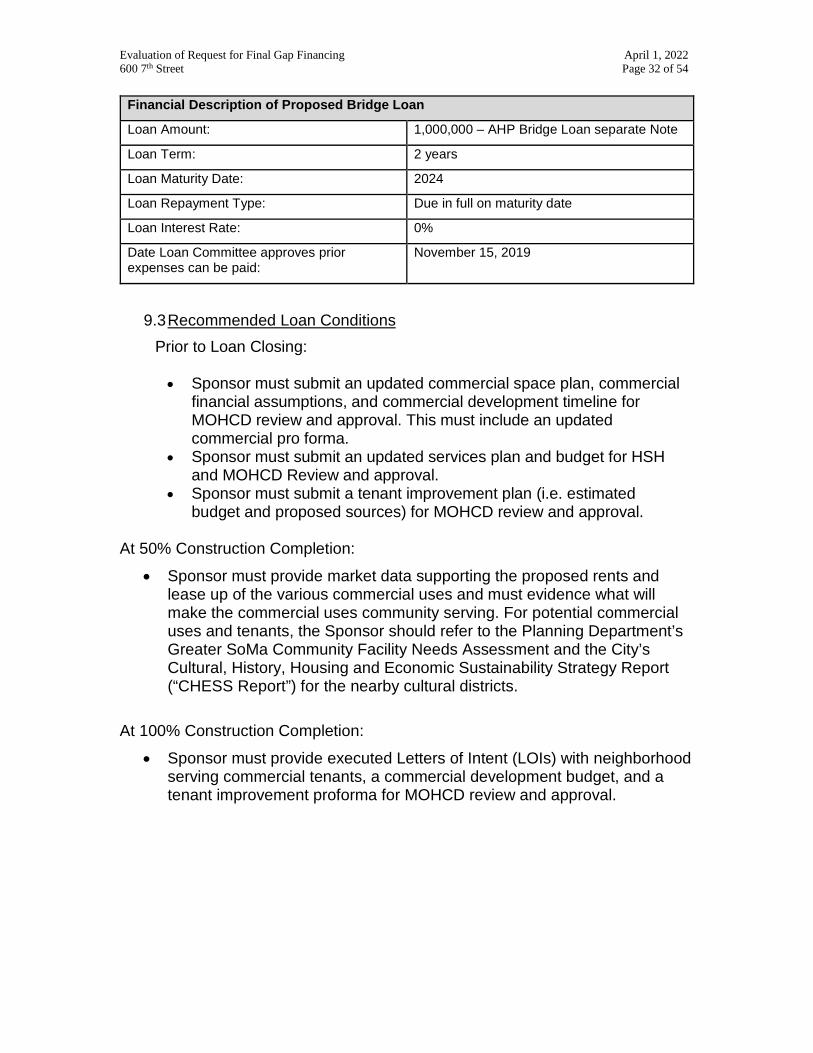
Financial Description of Proposed Bridge Loan
Loan Amount: 1,000,000 – AHP Bridge Loan separate Note
Loan Term: 2 years
Loan Maturity Date: 2024
Loan Repayment Type: Due in full on maturity date
Loan Interest Rate: 0%
Date Loan Committee approves prior expenses can be paid:
November 15, 2019
9.3 Recommended Loan Conditions
Prior to Loan Closing:
• Sponsor must submit an updated commercial space plan, commercial financial assumptions, and commercial development timeline for MOHCD review and approval. This must include an updated commercial pro forma.
• Sponsor must submit an updated services plan and budget for HSH and MOHCD Review and approval.
• Sponsor must submit a tenant improvement plan (i.e. estimated budget and proposed sources) for MOHCD review and approval.
At 50% Construction Completion:
• Sponsor must provide market data supporting the proposed rents and lease up of the various commercial uses and must evidence what will make the commercial uses community serving. For potential commercial uses and tenants, the Sponsor should refer to the Planning Department’s Greater SoMa Community Facility Needs Assessment and the City’s Cultural, History, Housing and Economic Sustainability Strategy Report (“CHESS Report”) for the nearby cultural districts.
At 100% Construction Completion:
• Sponsor must provide executed Letters of Intent (LOIs) with neighborhood serving commercial tenants, a commercial development budget, and a tenant improvement proforma for MOHCD review and approval.
Evaluation of Request for Final Gap Financing April 1, 2022 600 7th Street Page 33 of 54
10 LOAN COMMITTEE MODIFICATIONS
Evaluation of Request for Final Gap Financing April 1, 2022 600 7th Street Page 34 of 54
LOAN COMMITTEE RECOMMENDATION
Approval indicates approval with modifications, when so determined by the Committee.
[ ] APPROVE. [ ] DISAPPROVE. [ ] TAKE NO ACTION.
________________________________________ Date: ___________________ Eric D. Shaw, Director Mayor’s Office of Housing [ ] APPROVE. [ ] DISAPPROVE. [ ] TAKE NO ACTION.
________________________________________ Date: ___________________ Salvador Menjivar, Director of Housing Department of Homelessness and Supportive Housing [ ] APPROVE. [ ] DISAPPROVE. [ ] TAKE NO ACTION.
________________________________________ Date: ___________________ James Morales, Interim Executive Director Office of Community Investment and Infrastructure [ ] APPROVE. [ ] DISAPPROVE. [ ] TAKE NO ACTION.
________________________________________ Date: ___________________ Anna Van Degna, Director Controller’s Office of Public Finance Attachments: A. Project Milestones/Schedule B. Borrower Org Chart C. Developer Resumes D. Asset Management Analysis of Sponsor E. Threshold Eligibility Requirements and Ranking Criteria F. Site Map with amenities G. Elevations and Floor Plans, if available H. Comparison of City Investment in Other Housing Developments I. N/A J. Development Budget K. 1st Year Operating Budget L. 20-year Operating Pro Forma M. Area Median Income (AMI) Analysis) N. Racial, Equity, Diversity, and Inclusion (REDI) Framework O. Public Art RFP
1
Chavez, Rosanna (MYR)
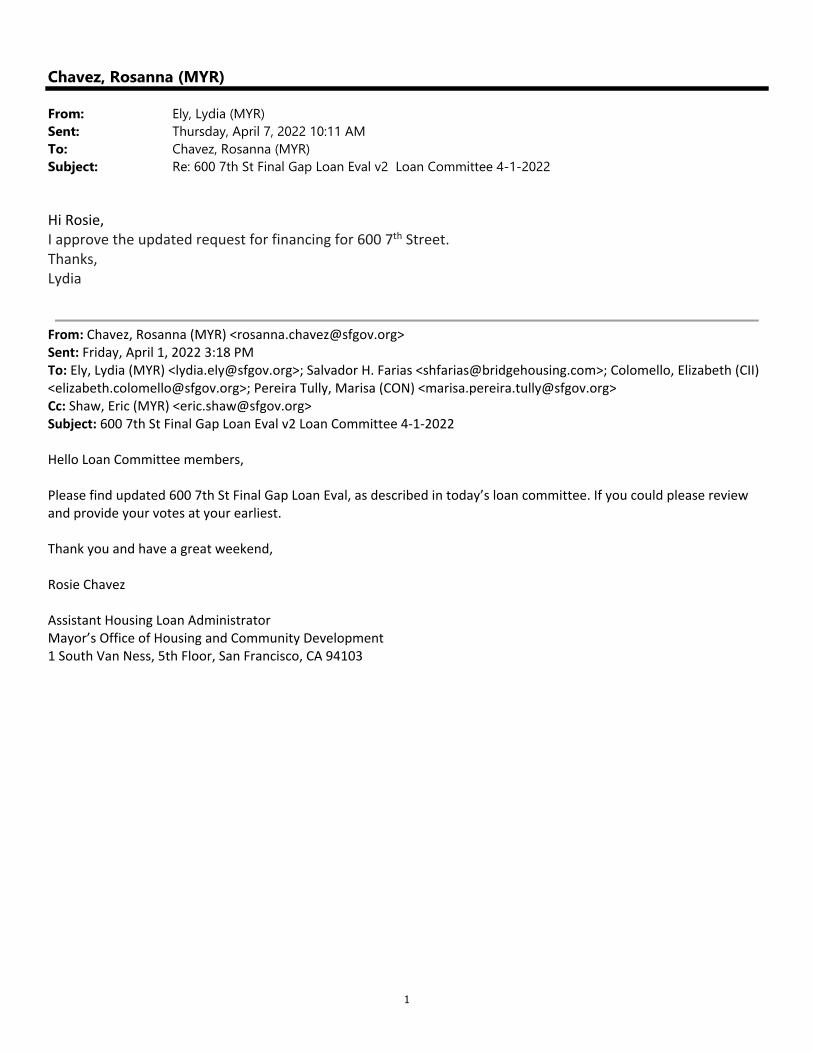
From: Ely, Lydia (MYR)Sent: Thursday, April 7, 2022 10:11 AMTo: Chavez, Rosanna (MYR)Subject: Re: 600 7th St Final Gap Loan Eval v2 Loan Committee 4-1-2022
Hi Rosie, I approve the updated request for financing for 600 7th Street. Thanks, Lydia
From: Chavez, Rosanna (MYR) <[email protected]> Sent: Friday, April 1, 2022 3:18 PM To: Ely, Lydia (MYR) <[email protected]>; Salvador H. Farias <[email protected]>; Colomello, Elizabeth (CII) <[email protected]>; Pereira Tully, Marisa (CON) <[email protected]> Cc: Shaw, Eric (MYR) <[email protected]> Subject: 600 7th St Final Gap Loan Eval v2 Loan Committee 4‐1‐2022 Hello Loan Committee members, Please find updated 600 7th St Final Gap Loan Eval, as described in today’s loan committee. If you could please review and provide your votes at your earliest. Thank you and have a great weekend, Rosie Chavez Assistant Housing Loan Administrator Mayor’s Office of Housing and Community Development 1 South Van Ness, 5th Floor, San Francisco, CA 94103
1
Chavez, Rosanna (MYR)
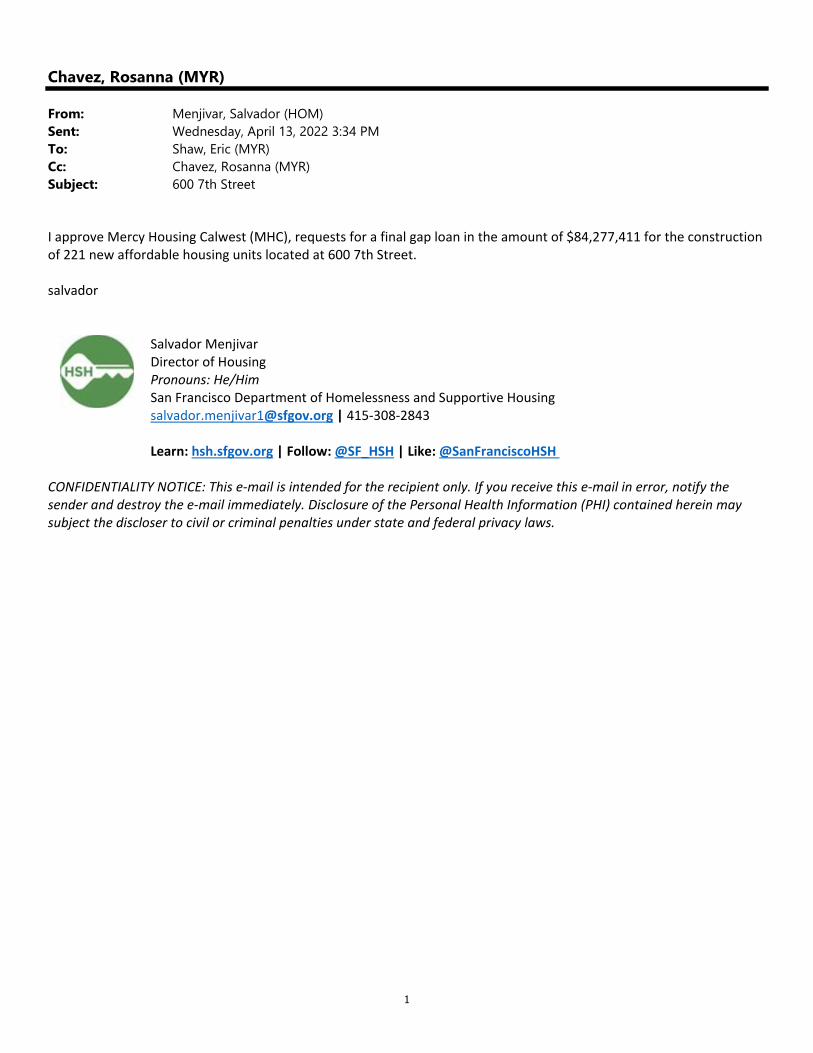
From: Menjivar, Salvador (HOM)Sent: Wednesday, April 13, 2022 3:34 PMTo: Shaw, Eric (MYR)Cc: Chavez, Rosanna (MYR)Subject: 600 7th Street
I approve Mercy Housing Calwest (MHC), requests for a final gap loan in the amount of $84,277,411 for the construction of 221 new affordable housing units located at 600 7th Street. salvador
Salvador Menjivar Director of Housing Pronouns: He/Him San Francisco Department of Homelessness and Supportive Housing [email protected] | 415‐308‐2843 Learn: hsh.sfgov.org | Follow: @SF_HSH | Like: @SanFranciscoHSH
CONFIDENTIALITY NOTICE: This e‐mail is intended for the recipient only. If you receive this e‐mail in error, notify the sender and destroy the e‐mail immediately. Disclosure of the Personal Health Information (PHI) contained herein may subject the discloser to civil or criminal penalties under state and federal privacy laws.
1
Chavez, Rosanna (MYR)
From: Colomello, Elizabeth (CII)Sent: Friday, April 1, 2022 4:18 PMTo: Chavez, Rosanna (MYR); Ely, Lydia (MYR)Cc: Shaw, Eric (MYR)Subject: RE: 600 7th St Final Gap Loan Eval v2 Loan Committee 4-1-2022
Hi Rosie, I approve the updated request for financing for the subject project on behalf of OCII. Also‐in case you haven’t noticed already, I think you included the wrong Salvador on this email. Thanks‐ Elizabeth
Elizabeth Colomello Housing Program Manager –––––––––––––––––––––––––––––––––––
One South Van Ness Avenue, 5th Floor San Francisco, CA 94103
415.701-5518, Cell 415.407-1908 www.sfocii.org
–––––––––––––––––––––––––––––––––––
From: Chavez, Rosanna (MYR) <[email protected]> Sent: Friday, April 1, 2022 3:19 PM To: Ely, Lydia (MYR) <[email protected]>; Salvador H. Farias <[email protected]>; Colomello, Elizabeth (CII) <[email protected]>; Pereira Tully, Marisa (CON) <[email protected]> Cc: Shaw, Eric (MYR) <[email protected]> Subject: 600 7th St Final Gap Loan Eval v2 Loan Committee 4‐1‐2022 Hello Loan Committee members, Please find updated 600 7th St Final Gap Loan Eval, as described in today’s loan committee. If you could please review and provide your votes at your earliest. Thank you and have a great weekend, Rosie Chavez Assistant Housing Loan Administrator Mayor’s Office of Housing and Community Development 1 South Van Ness, 5th Floor, San Francisco, CA 94103
1
Chavez, Rosanna (MYR)
From: Pereira Tully, Marisa (CON)Sent: Friday, April 1, 2022 3:20 PMTo: Chavez, Rosanna (MYR)Cc: Shaw, Eric (MYR)Subject: 600 7th St Gap Loan
Approve per revised memo Marisa Pereira Tully (she/her) Controller’s Office of Public Finance City and County of San Francisco Please note that as of 4/4/22 I will be part‐time with the Office of Public Finance and may take longer to respond to emails.
Evaluation of Request for Final Gap Financing April 1, 2022 600 7th Street Page 35 of 54
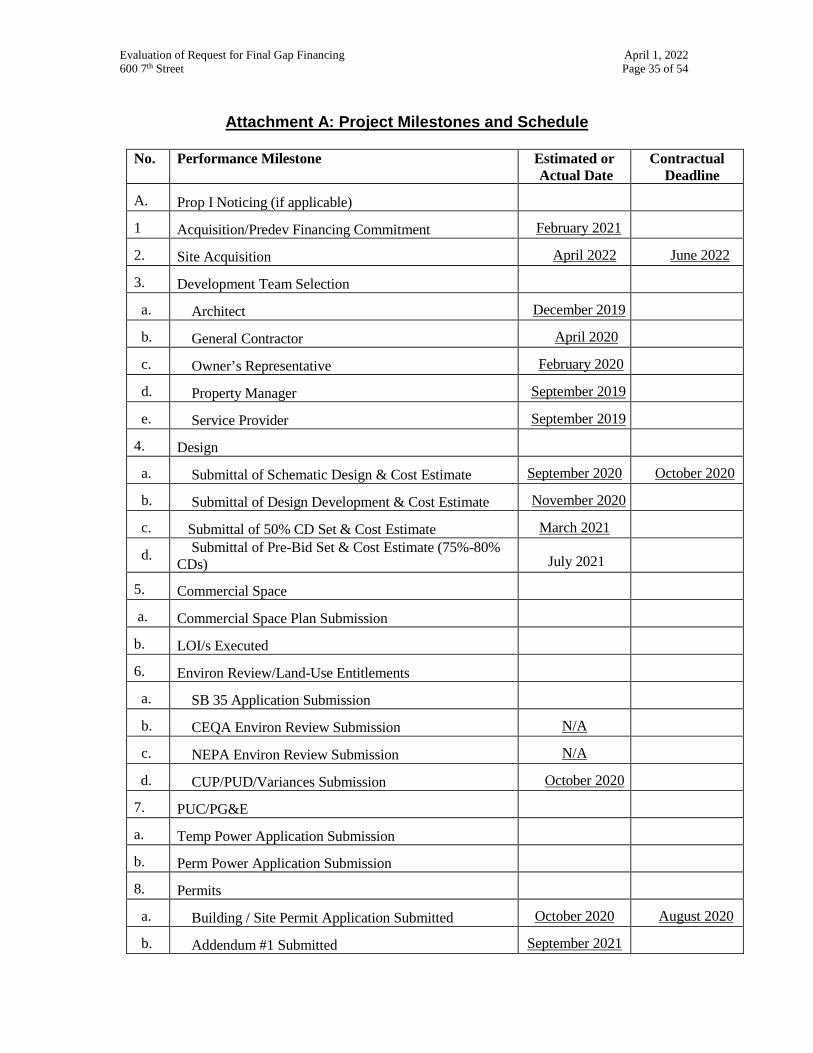
Attachment A: Project Milestones and Schedule
No. Performance Milestone Estimated or
Actual Date Contractual
Deadline
A. Prop I Noticing (if applicable)
1 Acquisition/Predev Financing Commitment February 2021
2. Site Acquisition April 2022 June 2022
3. Development Team Selection
a. Architect December 2019
b. General Contractor April 2020
c. Owner’s Representative February 2020
d. Property Manager September 2019
e. Service Provider September 2019
4. Design
a. Submittal of Schematic Design & Cost Estimate September 2020 October 2020
b. Submittal of Design Development & Cost Estimate November 2020
c. Submittal of 50% CD Set & Cost Estimate March 2021
d. Submittal of Pre-Bid Set & Cost Estimate (75%-80% CDs)
July 2021
5. Commercial Space
a. Commercial Space Plan Submission
b. LOI/s Executed
6. Environ Review/Land-Use Entitlements
a. SB 35 Application Submission
b. CEQA Environ Review Submission N/A
c. NEPA Environ Review Submission N/A
d. CUP/PUD/Variances Submission October 2020
7. PUC/PG&E
a. Temp Power Application Submission
b. Perm Power Application Submission
8. Permits
a. Building / Site Permit Application Submitted October 2020 August 2020
b. Addendum #1 Submitted September 2021
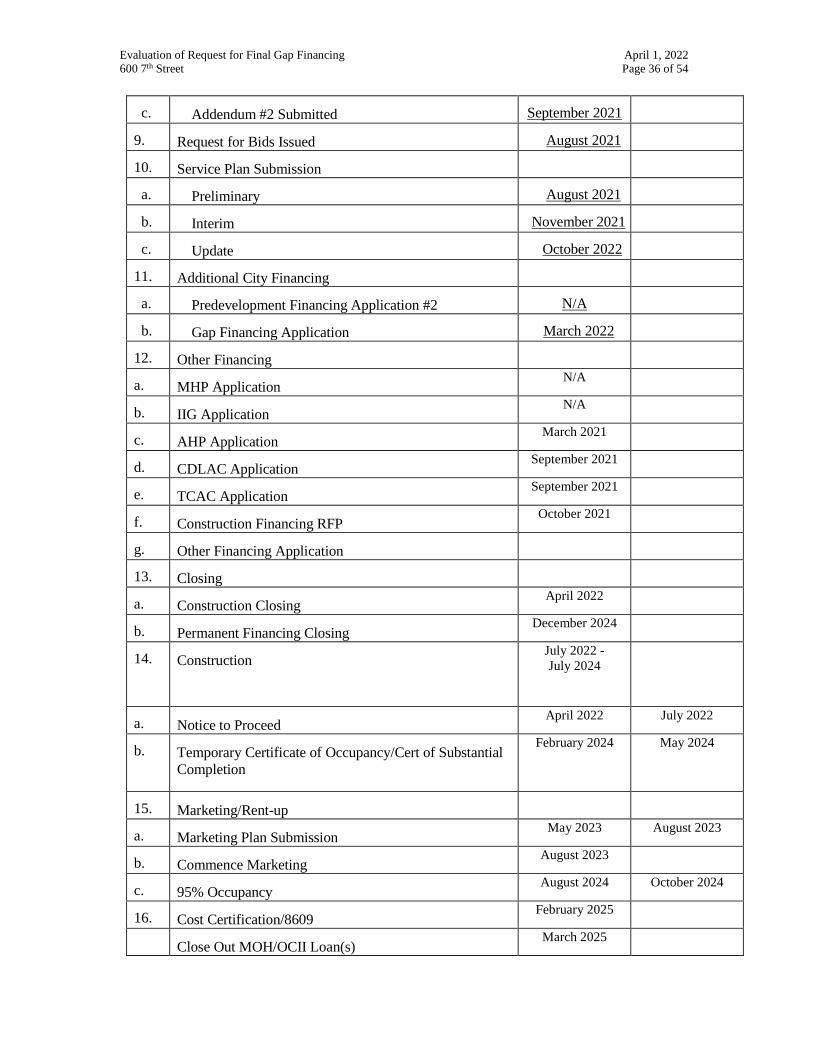
Evaluation of Request for Final Gap Financing April 1, 2022 600 7th Street Page 36 of 54
c. Addendum #2 Submitted September 2021
9. Request for Bids Issued August 2021
10. Service Plan Submission
a. Preliminary August 2021
b. Interim November 2021
c. Update October 2022
11. Additional City Financing
a. Predevelopment Financing Application #2 N/A
b. Gap Financing Application March 2022
12. Other Financing
a. MHP Application N/A
b. IIG Application N/A
c. AHP Application March 2021
d. CDLAC Application September 2021
e. TCAC Application September 2021
f. Construction Financing RFP October 2021
g. Other Financing Application
13. Closing
a. Construction Closing April 2022
b. Permanent Financing Closing December 2024
14. Construction July 2022 - July 2024
a. Notice to Proceed April 2022 July 2022
b. Temporary Certificate of Occupancy/Cert of Substantial Completion
February 2024 May 2024
15. Marketing/Rent-up
a. Marketing Plan Submission May 2023 August 2023
b. Commence Marketing August 2023
c. 95% Occupancy August 2024 October 2024
16. Cost Certification/8609 February 2025
Close Out MOH/OCII Loan(s) March 2025
Evaluation of Request for Final Gap Financing April 1, 2022 600 7th Street Page 37 of 54
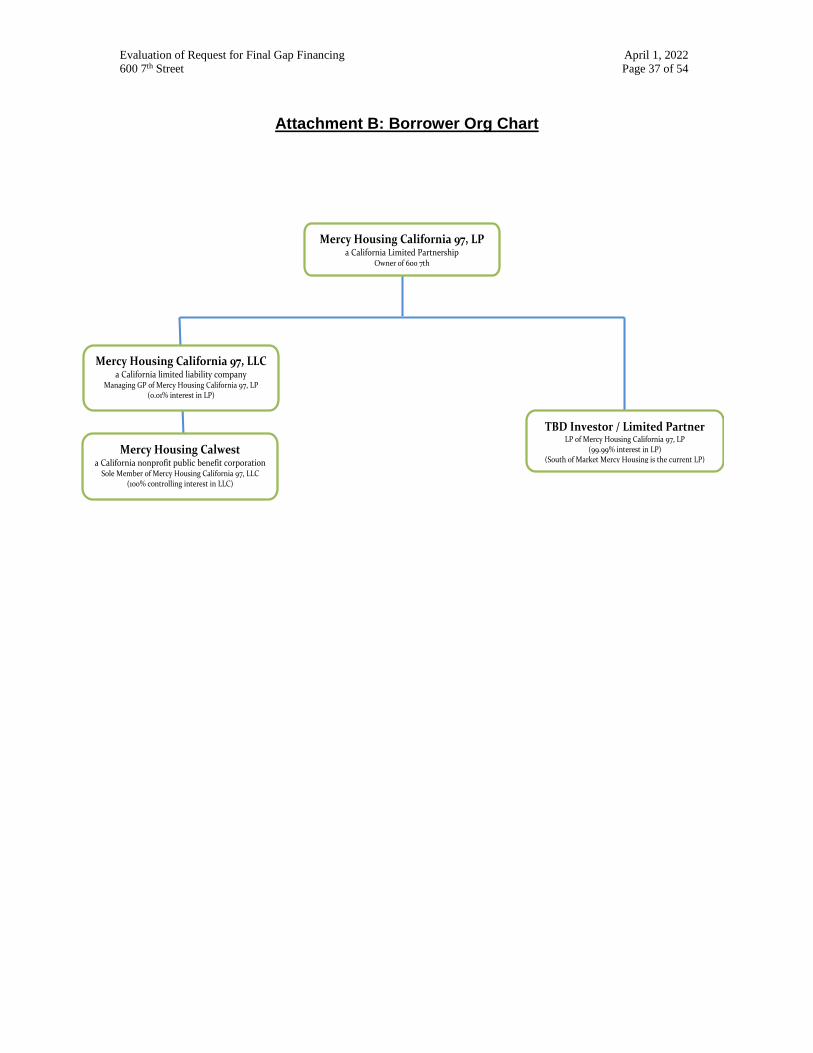
Attachment B: Borrower Org Chart
Mercy Housing California 97, LP a California Limited Partnership
Owner of 600 7th
Mercy Housing Calwest a California nonprofit public benefit corporation
Sole Member of Mercy Housing California 97, LLC (100% controlling interest in LLC)
TBD Investor / Limited Partner LP of Mercy Housing California 97, LP
(99.99% interest in LP) (South of Market Mercy Housing is the current LP)
Mercy Housing California 97, LLC a California limited liability company
Managing GP of Mercy Housing California 97, LP (0.01% interest in LP)
Evaluation of Request for Final Gap Financing April 1, 2022 600 7th Street Page 38 of 54
Attachment C: Development Staff Resumes
Mercy Housing California (MHC) will be the sole Developer, acting as Sponsor and Managing General Partner of the eventual ownership partnership. MHC has developed over 50 properties in San Francisco over the past 35 years. Many of these properties were the result of strong affordable housing expertise, commitment and perseverance to combine unique financing sources to create innovative housing models. Additionally, MHC has a long track record in developing, leasing, and managing commercial space, with a current portfolio of approximately 117,000 sq ft of community- serving retail or service spaces in San Francisco. Completing projects on time and on budget: MHC has a well-established track record of moving projects quickly through development within established budget parameters. For example, at 280 Beale, MHC was tasked with delivering 70 units in a standalone Type I building for $200k per unit in OCII subsidy. This was achieved by creating an efficient, affordable building program and exterior treatment. The project’s schedule was tied to the schedule of the neighboring market-rate tower, requiring the affordable project to break ground within 18 months from the start of predevelopment in order to coordinate the concrete pours of both projects to maximize efficiencies. MHC achieved this by working with the same contractor as the tower and working effectively with the architect and OCII to design an efficient, contextual exterior treatment. Another example is 95 Laguna, where MHC delivered 79 units of senior housing on-time and on-budget through an efficient exterior treatment and by increasing the unit count by seven within the existing building envelope by developing a more efficient interior layout. The TDC is $554k per unit including the 7,600 sq ft commercial shell but excluding land. Obtaining competitive financing terms: MHC’s success at obtaining competitive funding is evidenced by over 50 HCD loans or commitments and its strong track record in obtaining competitive 9% tax credits, AHP, and HUD 202/811. MHC accesses very competitive tax credit pricing terms due to our extensive experience and relationships with limited partners. The size and success of our portfolio assures investors that MHC has the expertise needed to ensure that their credits will not be jeopardized. MHC has a breadth of experience across California, with multiple tax credit deals a year, and is backed by the national strength of Mercy Housing, Inc. This allows us to negotiate for better terms, and MHC has received better than average pricing in numerous projects, most recently receiving $1.03 on three active deals in San Francisco. Developing Type V/I, III/I, I construction: MHC has strong experience developing a wide range of construction types, including the following: Type V/I: 1100 Ocean, Columbia Park, 1028 Howard, 1101 Howard, School House Station (Daly City), Vista Grande (Daly City). Type III/I: 1180 Fourth, 95 Laguna,
Evaluation of Request for Final Gap Financing April 1, 2022 600 7th Street Page 39 of 54
455 Fell (under construction), Mission Bay 6W (under construction). Type V/I: Bill Sorro Community, Vera Haile Senior Housing, Edith Witt Senior Community, 280 Beale, 10th and Mission Family, Mission Creek, 111 Jones, Presentation Senior. Developing for low-income families and formerly homeless households: MHC has decades of experience developing for low-income families and formerly homeless households. In San Francisco, MHC has developed 18 properties (1,493 units) for families and 11 properties (748 units) for formerly homeless households. Total in California, MHC has developed 74 properties (4,857 units) for families and 22 properties (1,414 units) for formerly homeless households. MHC has experience working with LOSP, Shelter + Care, VASH, and Project-Based Section 8 subsidies, among others, and wide range of funding sources including HCD (MHP, NPLH, AHSC, IIG), HUD, AHP, and state and federal low-income housing tax credits. Working in SoMa neighborhood: MHC has a strong history of providing family and supportive housing in SoMa. MHC has successfully developed 14 properties (1,214 units) in SoMa over the past 20 years. MHC’s pipeline includes two large projects in SoMa serving formerly homeless households: 1064 Mission (258 units) and 833 Bryant (146 units). MHC has a special relationship working with ECS in SoMa, collaborating on the development of Canon Kip Senior and Canon Barcus Community House and currently working together on 1064 Mission. Community outreach: MHC works closely and collaboratively with the community for input and support. For example, MHC led outreach for the Richardson Apartments, Essex Hotel, Bayview Hill Gardens, Arlington Hotel, and Rose Hotel, all of which are 100% permanent supportive housing. Of these, only Richardson Apartments experienced opposition and MHC worked closely with partner CHP to convene extensive community meetings to describe the services and property management approach. With this information, neighbors came to accept the proposed program. MHC formed a neighborhood advisory committee to work with those who remained concerned about the site’s use and operations. MHC worked with this group to identify a strategy for two retail spaces, resulting in an affordable eatery and a frame shop. Staffing: MHC maintains development offices in San Francisco (headquarters), Sacramento, and Los Angeles. The San Francisco office presently has over 2,622 units in development, from feasibility to project closeout, with a staff of 14 people solely devoted to new development. This project would be led William Ho, Senior Project Developer, with supervision by Barbara Gualco, Director of Development, and input from Sharon Christen, Associate Director of Supportive Housing Development.
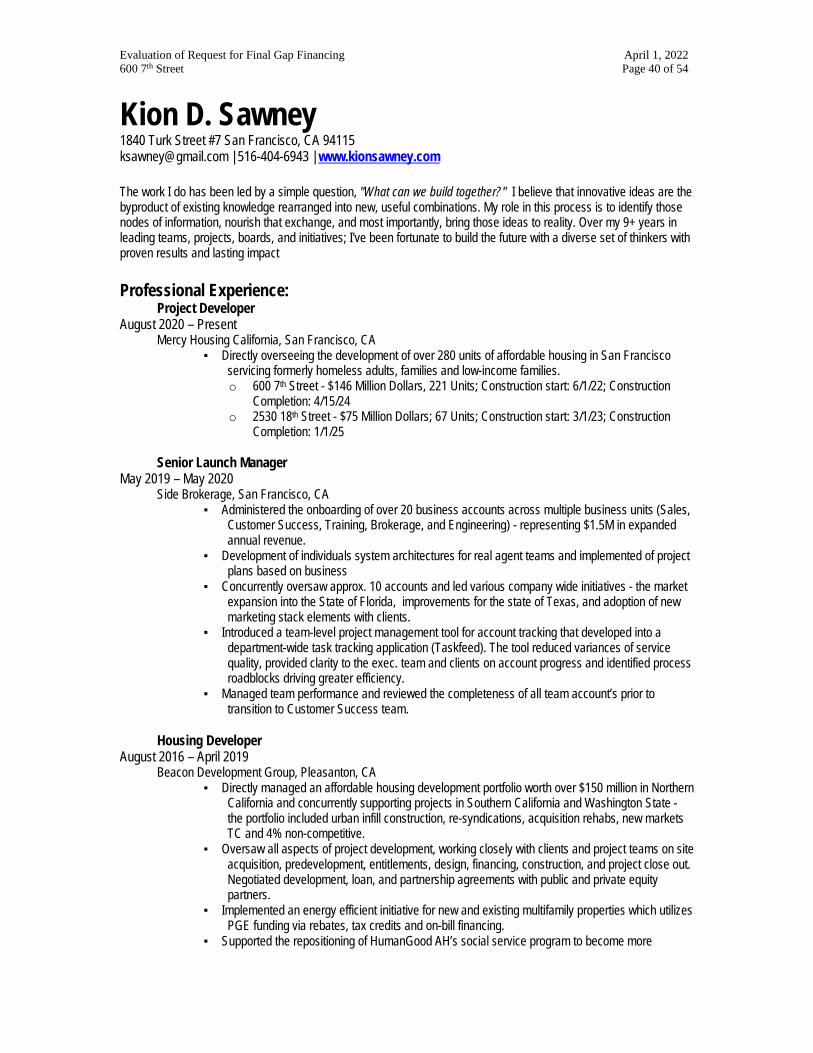
Evaluation of Request for Final Gap Financing April 1, 2022 600 7th Street Page 40 of 54
Kion D. Sawney 1840 Turk Street #7 San Francisco, CA 94115 [email protected] | 516-404-6943 | www.kionsawney.com The work I do has been led by a simple question, "What can we build together?" I believe that innovative ideas are the byproduct of existing knowledge rearranged into new, useful combinations. My role in this process is to identify those nodes of information, nourish that exchange, and most importantly, bring those ideas to reality. Over my 9+ years in leading teams, projects, boards, and initiatives; I've been fortunate to build the future with a diverse set of thinkers with proven results and lasting impact Professional Experience: Project Developer August 2020 – Present Mercy Housing California, San Francisco, CA
▪ Directly overseeing the development of over 280 units of affordable housing in San Francisco servicing formerly homeless adults, families and low-income families. o 600 7th Street - $146 Million Dollars, 221 Units; Construction start: 6/1/22; Construction
Completion: 4/15/24 o 2530 18th Street - $75 Million Dollars; 67 Units; Construction start: 3/1/23; Construction
Completion: 1/1/25
Senior Launch Manager May 2019 – May 2020 Side Brokerage, San Francisco, CA
▪ Administered the onboarding of over 20 business accounts across multiple business units (Sales, Customer Success, Training, Brokerage, and Engineering) - representing $1.5M in expanded annual revenue.
▪ Development of individuals system architectures for real agent teams and implemented of project plans based on business
▪ Concurrently oversaw approx. 10 accounts and led various company wide initiatives - the market expansion into the State of Florida, improvements for the state of Texas, and adoption of new marketing stack elements with clients.
▪ Introduced a team-level project management tool for account tracking that developed into a department-wide task tracking application (Taskfeed). The tool reduced variances of service quality, provided clarity to the exec. team and clients on account progress and identified process roadblocks driving greater efficiency.
▪ Managed team performance and reviewed the completeness of all team account’s prior to transition to Customer Success team.
Housing Developer August 2016 – April 2019 Beacon Development Group, Pleasanton, CA
▪ Directly managed an affordable housing development portfolio worth over $150 million in Northern California and concurrently supporting projects in Southern California and Washington State - the portfolio included urban infill construction, re-syndications, acquisition rehabs, new markets TC and 4% non-competitive.
▪ Oversaw all aspects of project development, working closely with clients and project teams on site acquisition, predevelopment, entitlements, design, financing, construction, and project close out. Negotiated development, loan, and partnership agreements with public and private equity partners.
▪ Implemented an energy efficient initiative for new and existing multifamily properties which utilizes PGE funding via rebates, tax credits and on-bill financing.
▪ Supported the repositioning of HumanGood AH’s social service program to become more
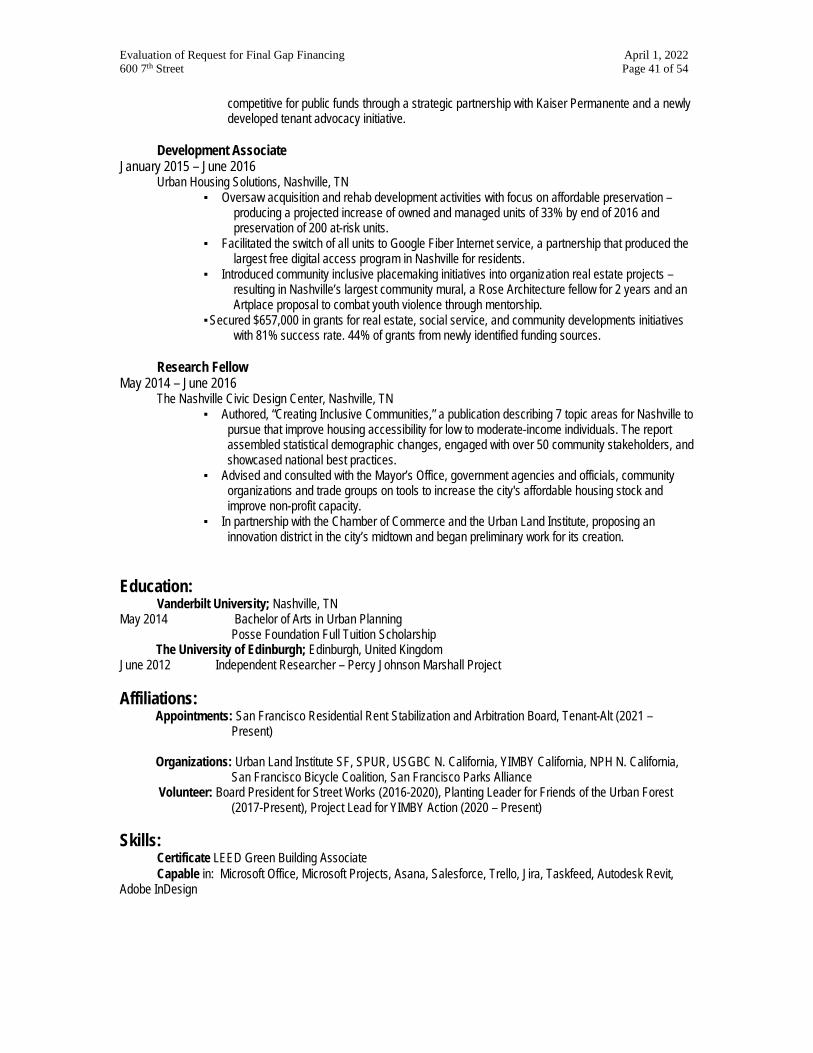
Evaluation of Request for Final Gap Financing April 1, 2022 600 7th Street Page 41 of 54
competitive for public funds through a strategic partnership with Kaiser Permanente and a newly developed tenant advocacy initiative.
Development Associate January 2015 – June 2016 Urban Housing Solutions, Nashville, TN
▪ Oversaw acquisition and rehab development activities with focus on affordable preservation – producing a projected increase of owned and managed units of 33% by end of 2016 and preservation of 200 at-risk units.
▪ Facilitated the switch of all units to Google Fiber Internet service, a partnership that produced the largest free digital access program in Nashville for residents.
▪ Introduced community inclusive placemaking initiatives into organization real estate projects – resulting in Nashville’s largest community mural, a Rose Architecture fellow for 2 years and an Artplace proposal to combat youth violence through mentorship.
▪ Secured $657,000 in grants for real estate, social service, and community developments initiatives with 81% success rate. 44% of grants from newly identified funding sources.
Research Fellow May 2014 – June 2016 The Nashville Civic Design Center, Nashville, TN
▪ Authored, “Creating Inclusive Communities,” a publication describing 7 topic areas for Nashville to pursue that improve housing accessibility for low to moderate-income individuals. The report assembled statistical demographic changes, engaged with over 50 community stakeholders, and showcased national best practices.
▪ Advised and consulted with the Mayor’s Office, government agencies and officials, community organizations and trade groups on tools to increase the city's affordable housing stock and improve non-profit capacity.
▪ In partnership with the Chamber of Commerce and the Urban Land Institute, proposing an innovation district in the city’s midtown and began preliminary work for its creation.
Education: Vanderbilt University; Nashville, TN May 2014 Bachelor of Arts in Urban Planning Posse Foundation Full Tuition Scholarship The University of Edinburgh; Edinburgh, United Kingdom June 2012 Independent Researcher – Percy Johnson Marshall Project Affiliations:
Appointments: San Francisco Residential Rent Stabilization and Arbitration Board, Tenant-Alt (2021 – Present)
Organizations: Urban Land Institute SF, SPUR, USGBC N. California, YIMBY California, NPH N. California,
San Francisco Bicycle Coalition, San Francisco Parks Alliance Volunteer: Board President for Street Works (2016-2020), Planting Leader for Friends of the Urban Forest
(2017-Present), Project Lead for YIMBY Action (2020 – Present)
Skills: Certificate LEED Green Building Associate Capable in: Microsoft Office, Microsoft Projects, Asana, Salesforce, Trello, Jira, Taskfeed, Autodesk Revit, Adobe InDesign
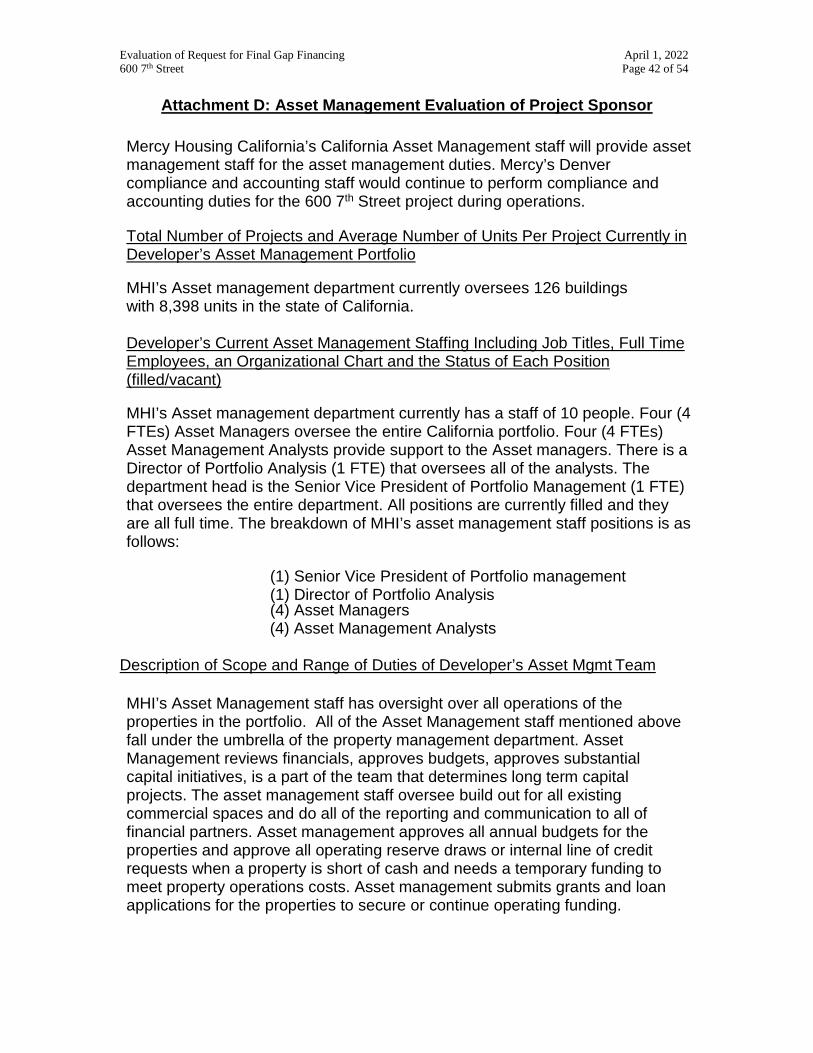
Evaluation of Request for Final Gap Financing April 1, 2022 600 7th Street Page 42 of 54
Attachment D: Asset Management Evaluation of Project Sponsor
Mercy Housing California’s California Asset Management staff will provide asset management staff for the asset management duties. Mercy’s Denver compliance and accounting staff would continue to perform compliance and accounting duties for the 600 7th Street project during operations.
Total Number of Projects and Average Number of Units Per Project Currently in Developer’s Asset Management Portfolio
MHI’s Asset management department currently oversees 126 buildings with 8,398 units in the state of California.
Developer’s Current Asset Management Staffing Including Job Titles, Full Time Employees, an Organizational Chart and the Status of Each Position (filled/vacant)
MHI’s Asset management department currently has a staff of 10 people. Four (4 FTEs) Asset Managers oversee the entire California portfolio. Four (4 FTEs) Asset Management Analysts provide support to the Asset managers. There is a Director of Portfolio Analysis (1 FTE) that oversees all of the analysts. The department head is the Senior Vice President of Portfolio Management (1 FTE) that oversees the entire department. All positions are currently filled and they are all full time. The breakdown of MHI’s asset management staff positions is as follows:
(1) Senior Vice President of Portfolio management (1) Director of Portfolio Analysis (4) Asset Managers (4) Asset Management Analysts
Description of Scope and Range of Duties of Developer’s Asset Mgmt Team
MHI’s Asset Management staff has oversight over all operations of the properties in the portfolio. All of the Asset Management staff mentioned above fall under the umbrella of the property management department. Asset Management reviews financials, approves budgets, approves substantial capital initiatives, is a part of the team that determines long term capital projects. The asset management staff oversee build out for all existing commercial spaces and do all of the reporting and communication to all of financial partners. Asset management approves all annual budgets for the properties and approve all operating reserve draws or internal line of credit requests when a property is short of cash and needs a temporary funding to meet property operations costs. Asset management submits grants and loan applications for the properties to secure or continue operating funding.
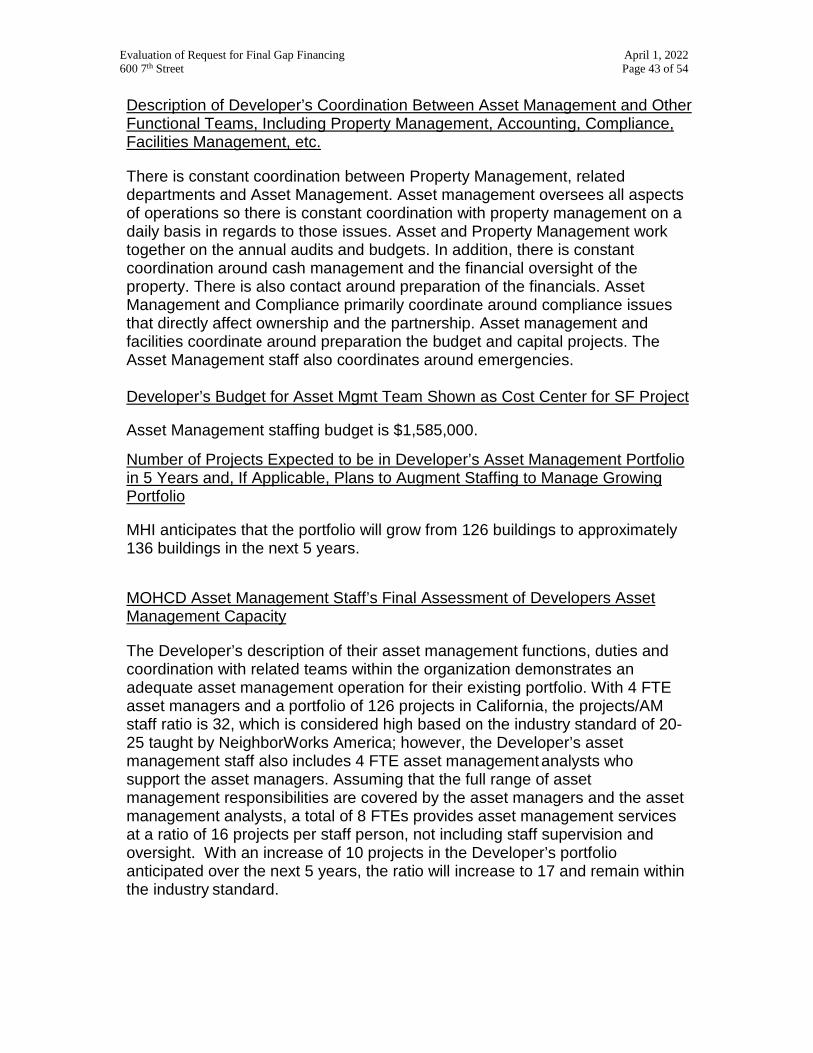
Evaluation of Request for Final Gap Financing April 1, 2022 600 7th Street Page 43 of 54
Description of Developer’s Coordination Between Asset Management and Other Functional Teams, Including Property Management, Accounting, Compliance, Facilities Management, etc.
There is constant coordination between Property Management, related departments and Asset Management. Asset management oversees all aspects of operations so there is constant coordination with property management on a daily basis in regards to those issues. Asset and Property Management work together on the annual audits and budgets. In addition, there is constant coordination around cash management and the financial oversight of the property. There is also contact around preparation of the financials. Asset Management and Compliance primarily coordinate around compliance issues that directly affect ownership and the partnership. Asset management and facilities coordinate around preparation the budget and capital projects. The Asset Management staff also coordinates around emergencies.
Developer’s Budget for Asset Mgmt Team Shown as Cost Center for SF Project
Asset Management staffing budget is $1,585,000.
Number of Projects Expected to be in Developer’s Asset Management Portfolio in 5 Years and, If Applicable, Plans to Augment Staffing to Manage Growing Portfolio
MHI anticipates that the portfolio will grow from 126 buildings to approximately 136 buildings in the next 5 years.
MOHCD Asset Management Staff’s Final Assessment of Developers Asset Management Capacity
The Developer’s description of their asset management functions, duties and coordination with related teams within the organization demonstrates an adequate asset management operation for their existing portfolio. With 4 FTE asset managers and a portfolio of 126 projects in California, the projects/AM staff ratio is 32, which is considered high based on the industry standard of 20-25 taught by NeighborWorks America; however, the Developer’s asset management staff also includes 4 FTE asset management analysts who support the asset managers. Assuming that the full range of asset management responsibilities are covered by the asset managers and the asset management analysts, a total of 8 FTEs provides asset management services at a ratio of 16 projects per staff person, not including staff supervision and oversight. With an increase of 10 projects in the Developer’s portfolio anticipated over the next 5 years, the ratio will increase to 17 and remain within the industry standard.

Evaluation of Request for Final Gap Financing April 1, 2022 600 7th Street Page 44 of 54
Attachment E: Threshold Eligibility Requirements and Ranking Criteria
(SEE ATTACHED)
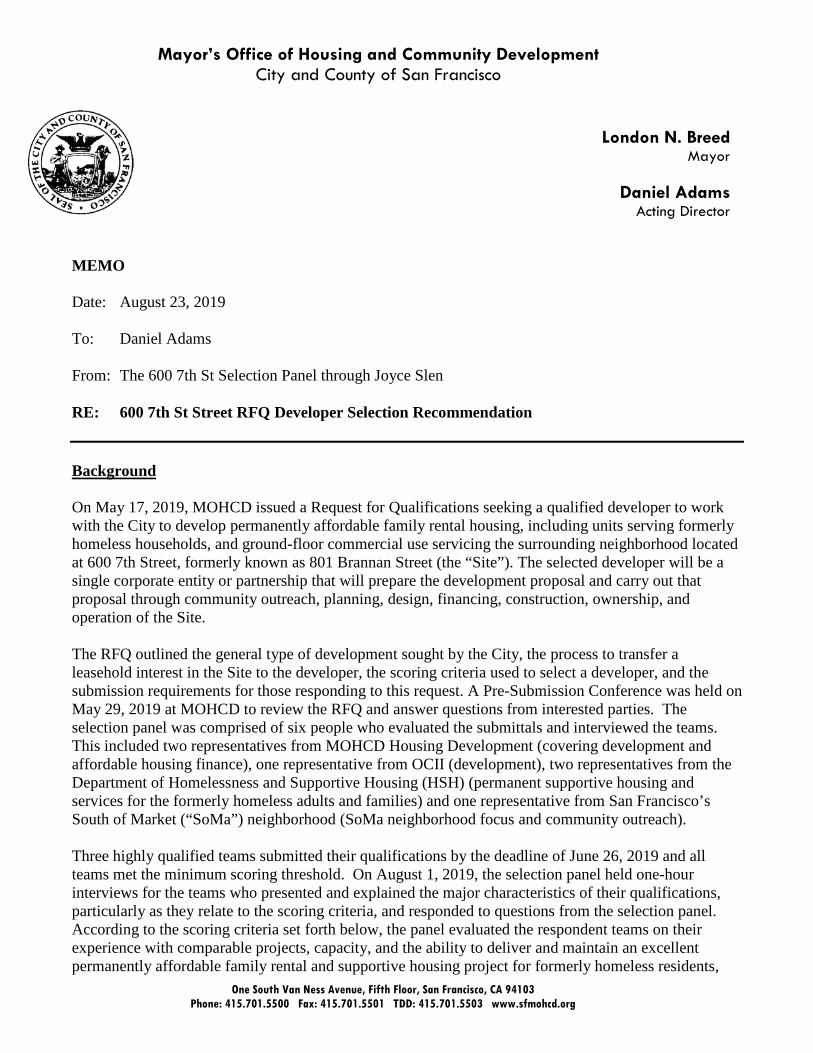
Mayor’s Office of Housing and Community Development
City and County of San Francisco
London N. Breed
Mayor
Daniel Adams Acting Director
One South Van Ness Avenue, Fifth Floor, San Francisco, CA 94103 Phone: 415.701.5500 Fax: 415.701.5501 TDD: 415.701.5503 www.sfmohcd.org
MEMO Date: August 23, 2019 To: Daniel Adams From: The 600 7th St Selection Panel through Joyce Slen RE: 600 7th St Street RFQ Developer Selection Recommendation Background On May 17, 2019, MOHCD issued a Request for Qualifications seeking a qualified developer to work with the City to develop permanently affordable family rental housing, including units serving formerly homeless households, and ground-floor commercial use servicing the surrounding neighborhood located at 600 7th Street, formerly known as 801 Brannan Street (the “Site”). The selected developer will be a single corporate entity or partnership that will prepare the development proposal and carry out that proposal through community outreach, planning, design, financing, construction, ownership, and operation of the Site. The RFQ outlined the general type of development sought by the City, the process to transfer a leasehold interest in the Site to the developer, the scoring criteria used to select a developer, and the submission requirements for those responding to this request. A Pre-Submission Conference was held on May 29, 2019 at MOHCD to review the RFQ and answer questions from interested parties. The selection panel was comprised of six people who evaluated the submittals and interviewed the teams. This included two representatives from MOHCD Housing Development (covering development and affordable housing finance), one representative from OCII (development), two representatives from the Department of Homelessness and Supportive Housing (HSH) (permanent supportive housing and services for the formerly homeless adults and families) and one representative from San Francisco’s South of Market (“SoMa”) neighborhood (SoMa neighborhood focus and community outreach). Three highly qualified teams submitted their qualifications by the deadline of June 26, 2019 and all teams met the minimum scoring threshold. On August 1, 2019, the selection panel held one-hour interviews for the teams who presented and explained the major characteristics of their qualifications, particularly as they relate to the scoring criteria, and responded to questions from the selection panel. According to the scoring criteria set forth below, the panel evaluated the respondent teams on their experience with comparable projects, capacity, and the ability to deliver and maintain an excellent permanently affordable family rental and supportive housing project for formerly homeless residents,
Page 2
with a ground floor use servicing the SoMa neighborhood. The selection panel held a two and a half hour session after the interview to evaluate the submittals and interviews, and reached a consensus scoring of the submittals on August 1, 2019. The City’s expectations of the Selected Developer are the following:
• Provide an affordable housing structure containing a minimum of 150 units with ground-floor commercial use servicing the surrounding neighborhood;
• Maximize the number of units and density within a mid-rise construction type; • Serve low-income families (in 1-3 bedroom units) unsubsidized with an income range between
30%-80% MOHCD Unadjusted San Francisco Area Median Income; • Serve formerly homeless adults in a minimum of 75 studio units, subsidized by the City’s Local
Operating Subsidy Program (“LOSP”) and a City services contract at a case management ratio of approximately 1:25;
• Serve formerly homeless families with dependent children (in 1-3 bedroom units), subsidized by the City’s Local Operating Subsidy Program (“LOSP”) and a City services contract for case management;
• Establish a building design that creates distinct wings, inclusive of common areas, for the studio (adult) units and the 1-3 bedroom (family) units;
• Income average the available and total tax-credit units to no more than 60% MOHCD Unadjusted San Francisco Area Median Income;
• Provide ground floor commercial spaces serving as neighborhood serving uses, through programs determined through a comprehensive community outreach process;
• Conduct community outreach to engender support for the Project; • Secure construction and permanent financing that minimizes City General Fund resources to the
greatest extent possible. For example, a State of California, Housing & Community Development (HCD) loan and/or the City’s No Place Like Home (NPLH) loan for homeless households;
• Commence construction on the Project as soon as possible, using streamlined ministerial approval processes. For example, SB35, which may be used in conjunction with the Affordable Housing Density Program or the State Density Bonus Program.
RFQ Respondents
Development Team Chinatown Community Development Center (Chinatown CDC) &
Catholic Charities of the Archdiocese of SF
(Catholic Charities)
Mercy Housing California (MHC) &
Episcopal Community Services (ECS)
Tenderloin Neighborhood Development
Corporation (TNDC)
Developer Chinatown CDC MHC TNDC Owner (GP) Chinatown CDC MHC TNDC
Property Manager Chinatown CDC MHC TNDC Service Provider Catholic Charities MHC TNDC Homeless Service
Provider Catholic Charities ECS TNDC
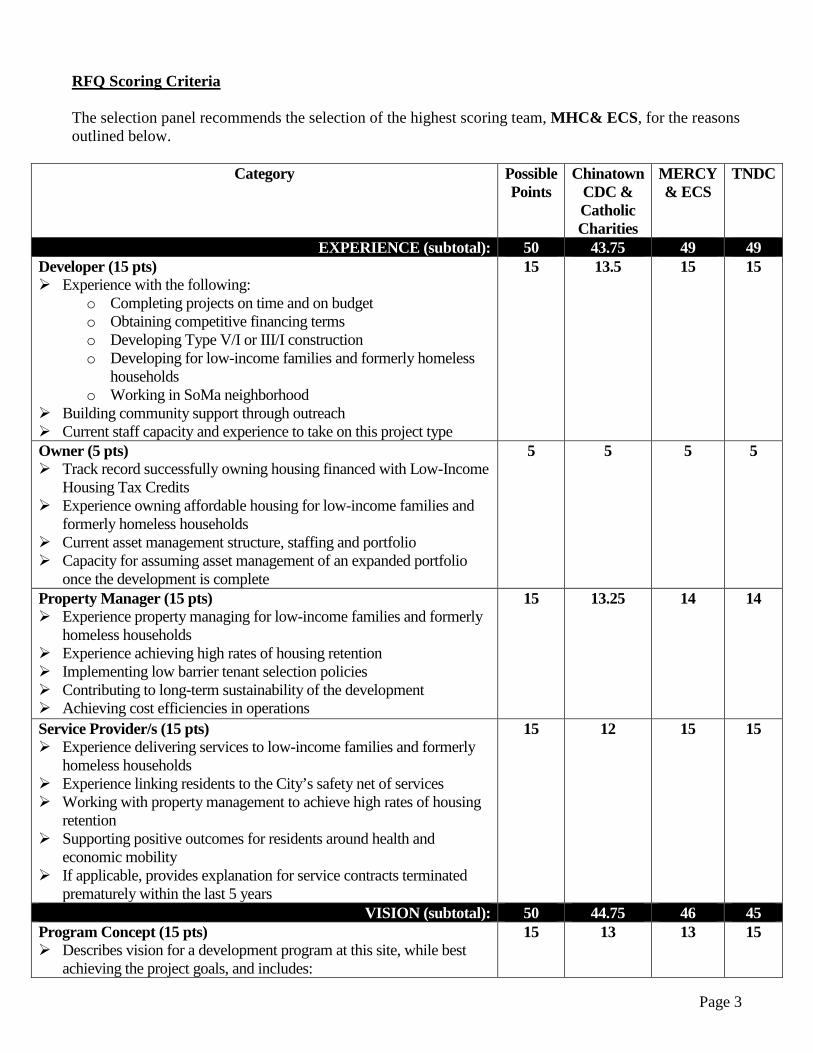
Page 3
RFQ Scoring Criteria The selection panel recommends the selection of the highest scoring team, MHC& ECS, for the reasons outlined below.
Category Possible Points
Chinatown CDC & Catholic Charities
MERCY & ECS
TNDC
EXPERIENCE (subtotal): 50 43.75 49 49 Developer (15 pts) Experience with the following:
o Completing projects on time and on budget o Obtaining competitive financing terms o Developing Type V/I or III/I construction o Developing for low-income families and formerly homeless
households o Working in SoMa neighborhood
Building community support through outreach Current staff capacity and experience to take on this project type
15 13.5 15 15
Owner (5 pts) Track record successfully owning housing financed with Low-Income
Housing Tax Credits Experience owning affordable housing for low-income families and
formerly homeless households Current asset management structure, staffing and portfolio Capacity for assuming asset management of an expanded portfolio
once the development is complete
5 5 5 5
Property Manager (15 pts) Experience property managing for low-income families and formerly
homeless households Experience achieving high rates of housing retention Implementing low barrier tenant selection policies Contributing to long-term sustainability of the development Achieving cost efficiencies in operations
15 13.25 14 14
Service Provider/s (15 pts) Experience delivering services to low-income families and formerly
homeless households Experience linking residents to the City’s safety net of services Working with property management to achieve high rates of housing
retention Supporting positive outcomes for residents around health and
economic mobility If applicable, provides explanation for service contracts terminated
prematurely within the last 5 years
15 12
15 15
VISION (subtotal): 50 44.75 46 45 Program Concept (15 pts) Describes vision for a development program at this site, while best
achieving the project goals, and includes:
15 13 13 15
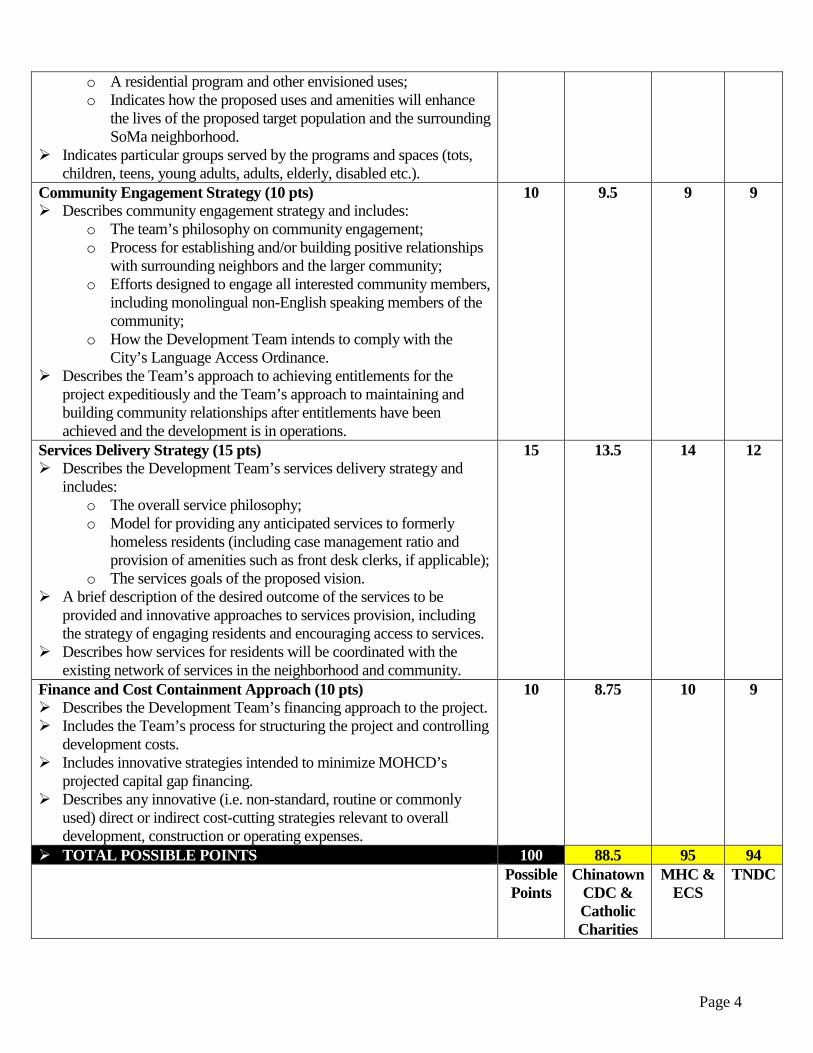
Page 4
o A residential program and other envisioned uses; o Indicates how the proposed uses and amenities will enhance
the lives of the proposed target population and the surrounding SoMa neighborhood.
Indicates particular groups served by the programs and spaces (tots, children, teens, young adults, adults, elderly, disabled etc.).
Community Engagement Strategy (10 pts) Describes community engagement strategy and includes:
o The team’s philosophy on community engagement; o Process for establishing and/or building positive relationships
with surrounding neighbors and the larger community; o Efforts designed to engage all interested community members,
including monolingual non-English speaking members of the community;
o How the Development Team intends to comply with the City’s Language Access Ordinance.
Describes the Team’s approach to achieving entitlements for the project expeditiously and the Team’s approach to maintaining and building community relationships after entitlements have been achieved and the development is in operations.
10 9.5 9 9
Services Delivery Strategy (15 pts) Describes the Development Team’s services delivery strategy and
includes: o The overall service philosophy; o Model for providing any anticipated services to formerly
homeless residents (including case management ratio and provision of amenities such as front desk clerks, if applicable);
o The services goals of the proposed vision. A brief description of the desired outcome of the services to be
provided and innovative approaches to services provision, including the strategy of engaging residents and encouraging access to services.
Describes how services for residents will be coordinated with the existing network of services in the neighborhood and community.
15 13.5
14 12
Finance and Cost Containment Approach (10 pts) Describes the Development Team’s financing approach to the project. Includes the Team’s process for structuring the project and controlling
development costs. Includes innovative strategies intended to minimize MOHCD’s
projected capital gap financing. Describes any innovative (i.e. non-standard, routine or commonly
used) direct or indirect cost-cutting strategies relevant to overall development, construction or operating expenses.
10 8.75 10 9
TOTAL POSSIBLE POINTS 100 88.5 95 94 Possible
Points Chinatown
CDC & Catholic Charities
MHC & ECS
TNDC
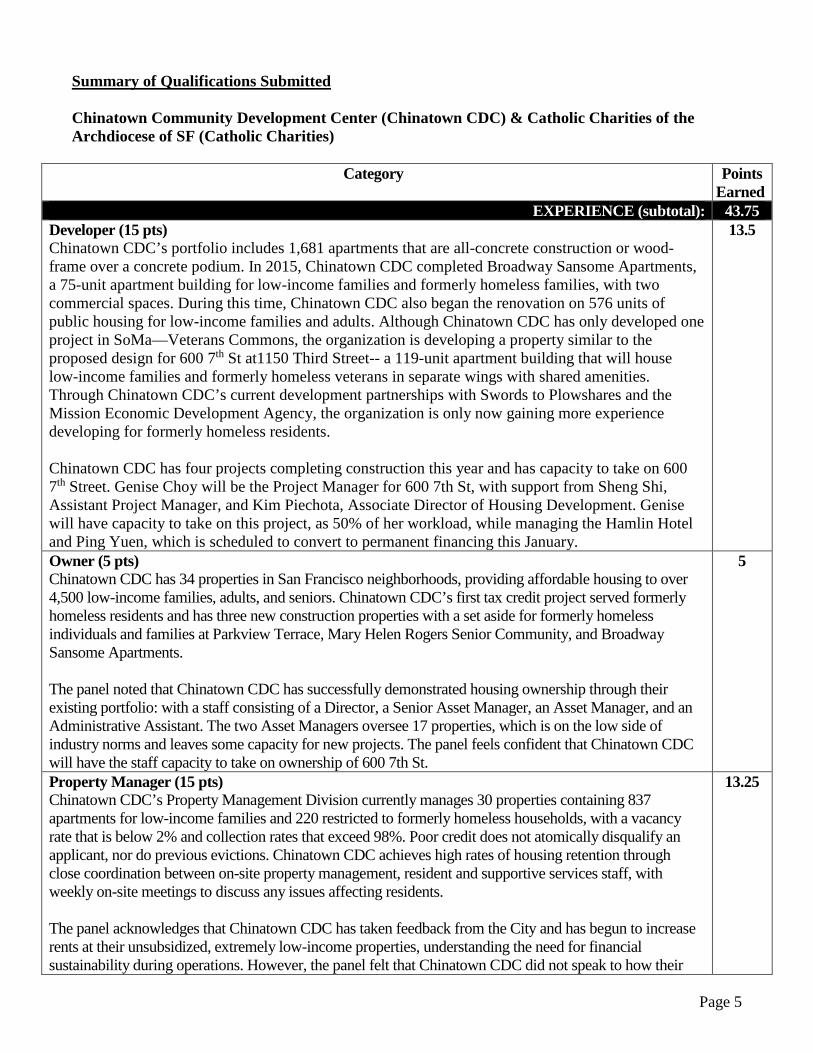
Page 5
Summary of Qualifications Submitted Chinatown Community Development Center (Chinatown CDC) & Catholic Charities of the Archdiocese of SF (Catholic Charities)
Category Points Earned
EXPERIENCE (subtotal): 43.75 Developer (15 pts) Chinatown CDC’s portfolio includes 1,681 apartments that are all-concrete construction or wood-frame over a concrete podium. In 2015, Chinatown CDC completed Broadway Sansome Apartments, a 75-unit apartment building for low-income families and formerly homeless families, with two commercial spaces. During this time, Chinatown CDC also began the renovation on 576 units of public housing for low-income families and adults. Although Chinatown CDC has only developed one project in SoMa—Veterans Commons, the organization is developing a property similar to the proposed design for 600 7th St at1150 Third Street-- a 119-unit apartment building that will house low-income families and formerly homeless veterans in separate wings with shared amenities. Through Chinatown CDC’s current development partnerships with Swords to Plowshares and the Mission Economic Development Agency, the organization is only now gaining more experience developing for formerly homeless residents.
Chinatown CDC has four projects completing construction this year and has capacity to take on 600 7th Street. Genise Choy will be the Project Manager for 600 7th St, with support from Sheng Shi, Assistant Project Manager, and Kim Piechota, Associate Director of Housing Development. Genise will have capacity to take on this project, as 50% of her workload, while managing the Hamlin Hotel and Ping Yuen, which is scheduled to convert to permanent financing this January.
13.5
Owner (5 pts) Chinatown CDC has 34 properties in San Francisco neighborhoods, providing affordable housing to over 4,500 low-income families, adults, and seniors. Chinatown CDC’s first tax credit project served formerly homeless residents and has three new construction properties with a set aside for formerly homeless individuals and families at Parkview Terrace, Mary Helen Rogers Senior Community, and Broadway Sansome Apartments. The panel noted that Chinatown CDC has successfully demonstrated housing ownership through their existing portfolio: with a staff consisting of a Director, a Senior Asset Manager, an Asset Manager, and an Administrative Assistant. The two Asset Managers oversee 17 properties, which is on the low side of industry norms and leaves some capacity for new projects. The panel feels confident that Chinatown CDC will have the staff capacity to take on ownership of 600 7th St.
5
Property Manager (15 pts) Chinatown CDC’s Property Management Division currently manages 30 properties containing 837 apartments for low-income families and 220 restricted to formerly homeless households, with a vacancy rate that is below 2% and collection rates that exceed 98%. Poor credit does not atomically disqualify an applicant, nor do previous evictions. Chinatown CDC achieves high rates of housing retention through close coordination between on-site property management, resident and supportive services staff, with weekly on-site meetings to discuss any issues affecting residents. The panel acknowledges that Chinatown CDC has taken feedback from the City and has begun to increase rents at their unsubsidized, extremely low-income properties, understanding the need for financial sustainability during operations. However, the panel felt that Chinatown CDC did not speak to how their
13.25
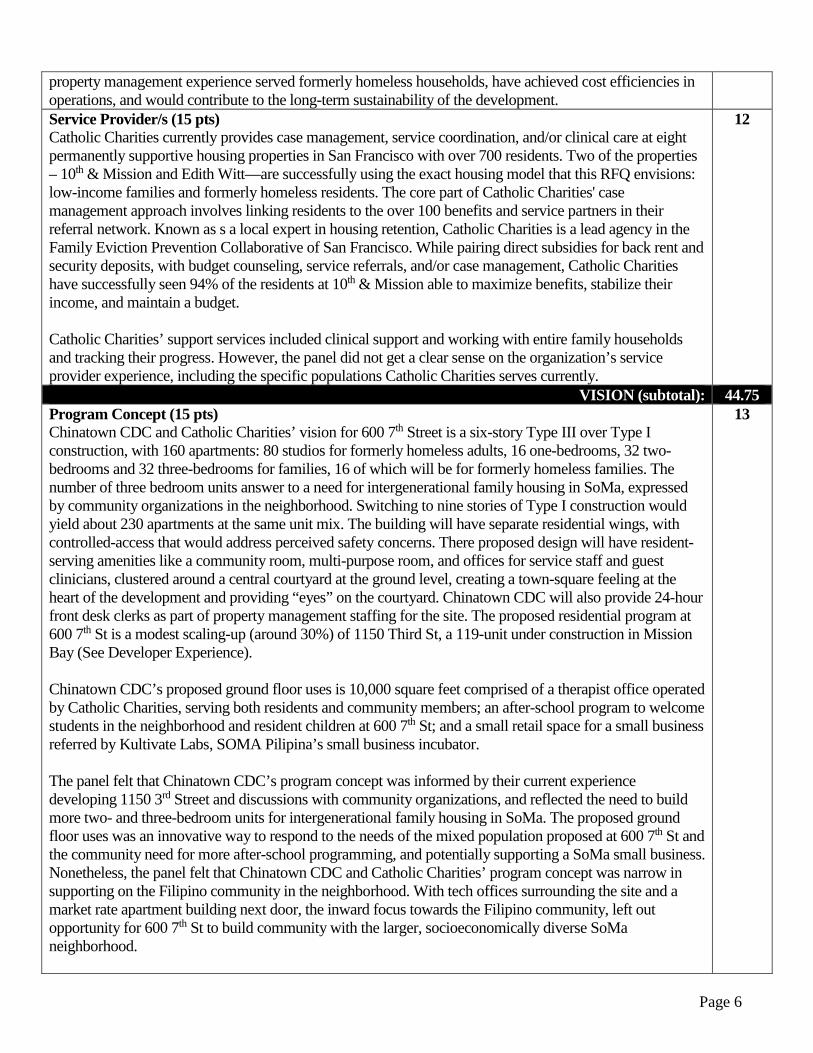
Page 6
property management experience served formerly homeless households, have achieved cost efficiencies in operations, and would contribute to the long-term sustainability of the development. Service Provider/s (15 pts) Catholic Charities currently provides case management, service coordination, and/or clinical care at eight permanently supportive housing properties in San Francisco with over 700 residents. Two of the properties – 10th & Mission and Edith Witt—are successfully using the exact housing model that this RFQ envisions: low-income families and formerly homeless residents. The core part of Catholic Charities' case management approach involves linking residents to the over 100 benefits and service partners in their referral network. Known as s a local expert in housing retention, Catholic Charities is a lead agency in the Family Eviction Prevention Collaborative of San Francisco. While pairing direct subsidies for back rent and security deposits, with budget counseling, service referrals, and/or case management, Catholic Charities have successfully seen 94% of the residents at 10th & Mission able to maximize benefits, stabilize their income, and maintain a budget. Catholic Charities’ support services included clinical support and working with entire family households and tracking their progress. However, the panel did not get a clear sense on the organization’s service provider experience, including the specific populations Catholic Charities serves currently.
12
VISION (subtotal): 44.75 Program Concept (15 pts) Chinatown CDC and Catholic Charities’ vision for 600 7th Street is a six-story Type III over Type I construction, with 160 apartments: 80 studios for formerly homeless adults, 16 one-bedrooms, 32 two-bedrooms and 32 three-bedrooms for families, 16 of which will be for formerly homeless families. The number of three bedroom units answer to a need for intergenerational family housing in SoMa, expressed by community organizations in the neighborhood. Switching to nine stories of Type I construction would yield about 230 apartments at the same unit mix. The building will have separate residential wings, with controlled-access that would address perceived safety concerns. There proposed design will have resident-serving amenities like a community room, multi-purpose room, and offices for service staff and guest clinicians, clustered around a central courtyard at the ground level, creating a town-square feeling at the heart of the development and providing “eyes” on the courtyard. Chinatown CDC will also provide 24-hour front desk clerks as part of property management staffing for the site. The proposed residential program at 600 7th St is a modest scaling-up (around 30%) of 1150 Third St, a 119-unit under construction in Mission Bay (See Developer Experience). Chinatown CDC’s proposed ground floor uses is 10,000 square feet comprised of a therapist office operated by Catholic Charities, serving both residents and community members; an after-school program to welcome students in the neighborhood and resident children at 600 7th St; and a small retail space for a small business referred by Kultivate Labs, SOMA Pilipina’s small business incubator. The panel felt that Chinatown CDC’s program concept was informed by their current experience developing 1150 3rd Street and discussions with community organizations, and reflected the need to build more two- and three-bedroom units for intergenerational family housing in SoMa. The proposed ground floor uses was an innovative way to respond to the needs of the mixed population proposed at 600 7th St and the community need for more after-school programming, and potentially supporting a SoMa small business. Nonetheless, the panel felt that Chinatown CDC and Catholic Charities’ program concept was narrow in supporting on the Filipino community in the neighborhood. With tech offices surrounding the site and a market rate apartment building next door, the inward focus towards the Filipino community, left out opportunity for 600 7th St to build community with the larger, socioeconomically diverse SoMa neighborhood.
13
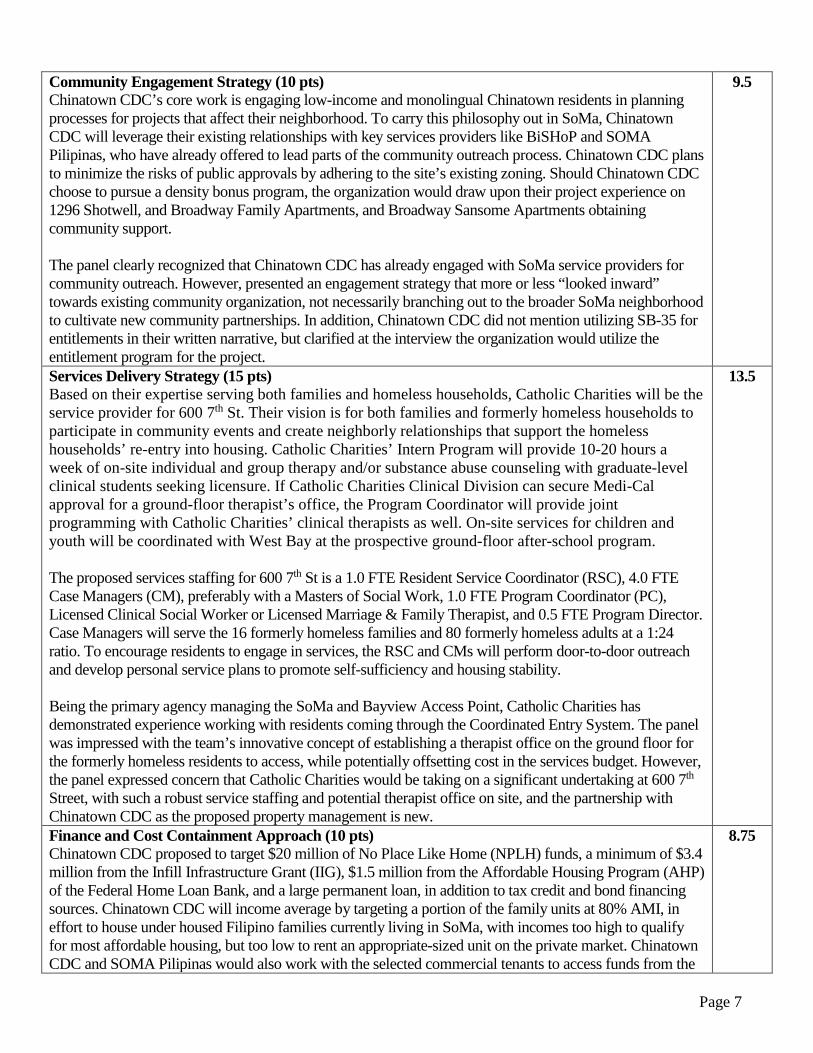
Page 7
Community Engagement Strategy (10 pts) Chinatown CDC’s core work is engaging low-income and monolingual Chinatown residents in planning processes for projects that affect their neighborhood. To carry this philosophy out in SoMa, Chinatown CDC will leverage their existing relationships with key services providers like BiSHoP and SOMA Pilipinas, who have already offered to lead parts of the community outreach process. Chinatown CDC plans to minimize the risks of public approvals by adhering to the site’s existing zoning. Should Chinatown CDC choose to pursue a density bonus program, the organization would draw upon their project experience on 1296 Shotwell, and Broadway Family Apartments, and Broadway Sansome Apartments obtaining community support. The panel clearly recognized that Chinatown CDC has already engaged with SoMa service providers for community outreach. However, presented an engagement strategy that more or less “looked inward” towards existing community organization, not necessarily branching out to the broader SoMa neighborhood to cultivate new community partnerships. In addition, Chinatown CDC did not mention utilizing SB-35 for entitlements in their written narrative, but clarified at the interview the organization would utilize the entitlement program for the project.
9.5
Services Delivery Strategy (15 pts) Based on their expertise serving both families and homeless households, Catholic Charities will be the service provider for 600 7th St. Their vision is for both families and formerly homeless households to participate in community events and create neighborly relationships that support the homeless households’ re-entry into housing. Catholic Charities’ Intern Program will provide 10-20 hours a week of on-site individual and group therapy and/or substance abuse counseling with graduate-level clinical students seeking licensure. If Catholic Charities Clinical Division can secure Medi-Cal approval for a ground-floor therapist’s office, the Program Coordinator will provide joint programming with Catholic Charities’ clinical therapists as well. On-site services for children and youth will be coordinated with West Bay at the prospective ground-floor after-school program. The proposed services staffing for 600 7th St is a 1.0 FTE Resident Service Coordinator (RSC), 4.0 FTE Case Managers (CM), preferably with a Masters of Social Work, 1.0 FTE Program Coordinator (PC), Licensed Clinical Social Worker or Licensed Marriage & Family Therapist, and 0.5 FTE Program Director. Case Managers will serve the 16 formerly homeless families and 80 formerly homeless adults at a 1:24 ratio. To encourage residents to engage in services, the RSC and CMs will perform door-to-door outreach and develop personal service plans to promote self-sufficiency and housing stability. Being the primary agency managing the SoMa and Bayview Access Point, Catholic Charities has demonstrated experience working with residents coming through the Coordinated Entry System. The panel was impressed with the team’s innovative concept of establishing a therapist office on the ground floor for the formerly homeless residents to access, while potentially offsetting cost in the services budget. However, the panel expressed concern that Catholic Charities would be taking on a significant undertaking at 600 7th Street, with such a robust service staffing and potential therapist office on site, and the partnership with Chinatown CDC as the proposed property management is new.
13.5
Finance and Cost Containment Approach (10 pts) Chinatown CDC proposed to target $20 million of No Place Like Home (NPLH) funds, a minimum of $3.4 million from the Infill Infrastructure Grant (IIG), $1.5 million from the Affordable Housing Program (AHP) of the Federal Home Loan Bank, and a large permanent loan, in addition to tax credit and bond financing sources. Chinatown CDC will income average by targeting a portion of the family units at 80% AMI, in effort to house under housed Filipino families currently living in SoMa, with incomes too high to qualify for most affordable housing, but too low to rent an appropriate-sized unit on the private market. Chinatown CDC and SOMA Pilipinas would also work with the selected commercial tenants to access funds from the
8.75
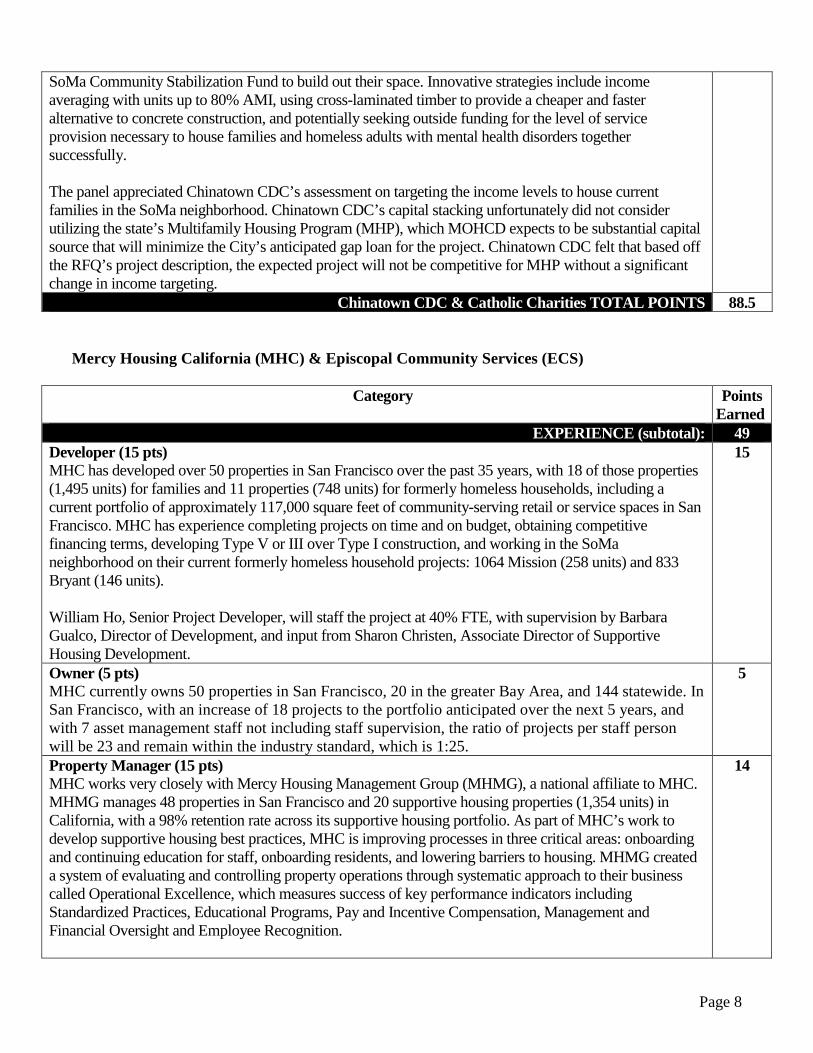
Page 8
SoMa Community Stabilization Fund to build out their space. Innovative strategies include income averaging with units up to 80% AMI, using cross-laminated timber to provide a cheaper and faster alternative to concrete construction, and potentially seeking outside funding for the level of service provision necessary to house families and homeless adults with mental health disorders together successfully. The panel appreciated Chinatown CDC’s assessment on targeting the income levels to house current families in the SoMa neighborhood. Chinatown CDC’s capital stacking unfortunately did not consider utilizing the state’s Multifamily Housing Program (MHP), which MOHCD expects to be substantial capital source that will minimize the City’s anticipated gap loan for the project. Chinatown CDC felt that based off the RFQ’s project description, the expected project will not be competitive for MHP without a significant change in income targeting.
Chinatown CDC & Catholic Charities TOTAL POINTS 88.5 Mercy Housing California (MHC) & Episcopal Community Services (ECS)
Category Points Earned
EXPERIENCE (subtotal): 49 Developer (15 pts) MHC has developed over 50 properties in San Francisco over the past 35 years, with 18 of those properties (1,495 units) for families and 11 properties (748 units) for formerly homeless households, including a current portfolio of approximately 117,000 square feet of community-serving retail or service spaces in San Francisco. MHC has experience completing projects on time and on budget, obtaining competitive financing terms, developing Type V or III over Type I construction, and working in the SoMa neighborhood on their current formerly homeless household projects: 1064 Mission (258 units) and 833 Bryant (146 units). William Ho, Senior Project Developer, will staff the project at 40% FTE, with supervision by Barbara Gualco, Director of Development, and input from Sharon Christen, Associate Director of Supportive Housing Development.
15
Owner (5 pts) MHC currently owns 50 properties in San Francisco, 20 in the greater Bay Area, and 144 statewide. In San Francisco, with an increase of 18 projects to the portfolio anticipated over the next 5 years, and with 7 asset management staff not including staff supervision, the ratio of projects per staff person will be 23 and remain within the industry standard, which is 1:25.
5
Property Manager (15 pts) MHC works very closely with Mercy Housing Management Group (MHMG), a national affiliate to MHC. MHMG manages 48 properties in San Francisco and 20 supportive housing properties (1,354 units) in California, with a 98% retention rate across its supportive housing portfolio. As part of MHC’s work to develop supportive housing best practices, MHC is improving processes in three critical areas: onboarding and continuing education for staff, onboarding residents, and lowering barriers to housing. MHMG created a system of evaluating and controlling property operations through systematic approach to their business called Operational Excellence, which measures success of key performance indicators including Standardized Practices, Educational Programs, Pay and Incentive Compensation, Management and Financial Oversight and Employee Recognition.
14
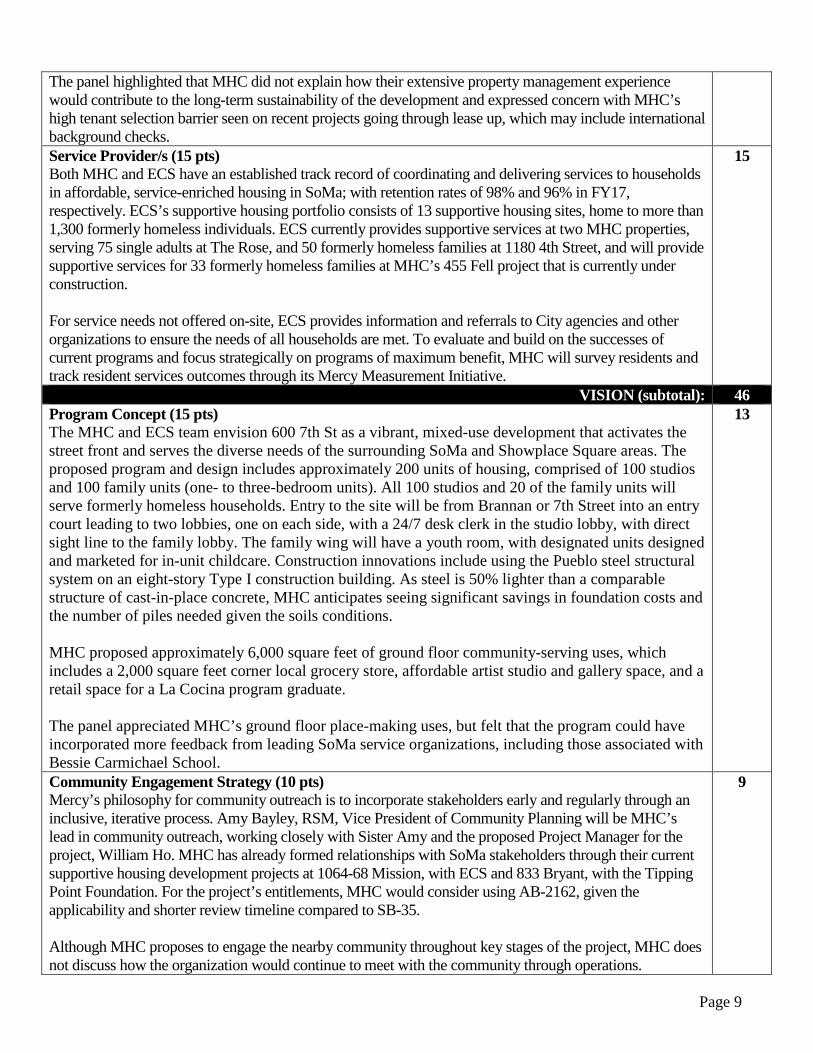
Page 9
The panel highlighted that MHC did not explain how their extensive property management experience would contribute to the long-term sustainability of the development and expressed concern with MHC’s high tenant selection barrier seen on recent projects going through lease up, which may include international background checks. Service Provider/s (15 pts) Both MHC and ECS have an established track record of coordinating and delivering services to households in affordable, service-enriched housing in SoMa; with retention rates of 98% and 96% in FY17, respectively. ECS’s supportive housing portfolio consists of 13 supportive housing sites, home to more than 1,300 formerly homeless individuals. ECS currently provides supportive services at two MHC properties, serving 75 single adults at The Rose, and 50 formerly homeless families at 1180 4th Street, and will provide supportive services for 33 formerly homeless families at MHC’s 455 Fell project that is currently under construction. For service needs not offered on-site, ECS provides information and referrals to City agencies and other organizations to ensure the needs of all households are met. To evaluate and build on the successes of current programs and focus strategically on programs of maximum benefit, MHC will survey residents and track resident services outcomes through its Mercy Measurement Initiative.
15
VISION (subtotal): 46 Program Concept (15 pts) The MHC and ECS team envision 600 7th St as a vibrant, mixed-use development that activates the street front and serves the diverse needs of the surrounding SoMa and Showplace Square areas. The proposed program and design includes approximately 200 units of housing, comprised of 100 studios and 100 family units (one- to three-bedroom units). All 100 studios and 20 of the family units will serve formerly homeless households. Entry to the site will be from Brannan or 7th Street into an entry court leading to two lobbies, one on each side, with a 24/7 desk clerk in the studio lobby, with direct sight line to the family lobby. The family wing will have a youth room, with designated units designed and marketed for in-unit childcare. Construction innovations include using the Pueblo steel structural system on an eight-story Type I construction building. As steel is 50% lighter than a comparable structure of cast-in-place concrete, MHC anticipates seeing significant savings in foundation costs and the number of piles needed given the soils conditions. MHC proposed approximately 6,000 square feet of ground floor community-serving uses, which includes a 2,000 square feet corner local grocery store, affordable artist studio and gallery space, and a retail space for a La Cocina program graduate. The panel appreciated MHC’s ground floor place-making uses, but felt that the program could have incorporated more feedback from leading SoMa service organizations, including those associated with Bessie Carmichael School.
13
Community Engagement Strategy (10 pts) Mercy’s philosophy for community outreach is to incorporate stakeholders early and regularly through an inclusive, iterative process. Amy Bayley, RSM, Vice President of Community Planning will be MHC’s lead in community outreach, working closely with Sister Amy and the proposed Project Manager for the project, William Ho. MHC has already formed relationships with SoMa stakeholders through their current supportive housing development projects at 1064-68 Mission, with ECS and 833 Bryant, with the Tipping Point Foundation. For the project’s entitlements, MHC would consider using AB-2162, given the applicability and shorter review timeline compared to SB-35. Although MHC proposes to engage the nearby community throughout key stages of the project, MHC does not discuss how the organization would continue to meet with the community through operations.
9
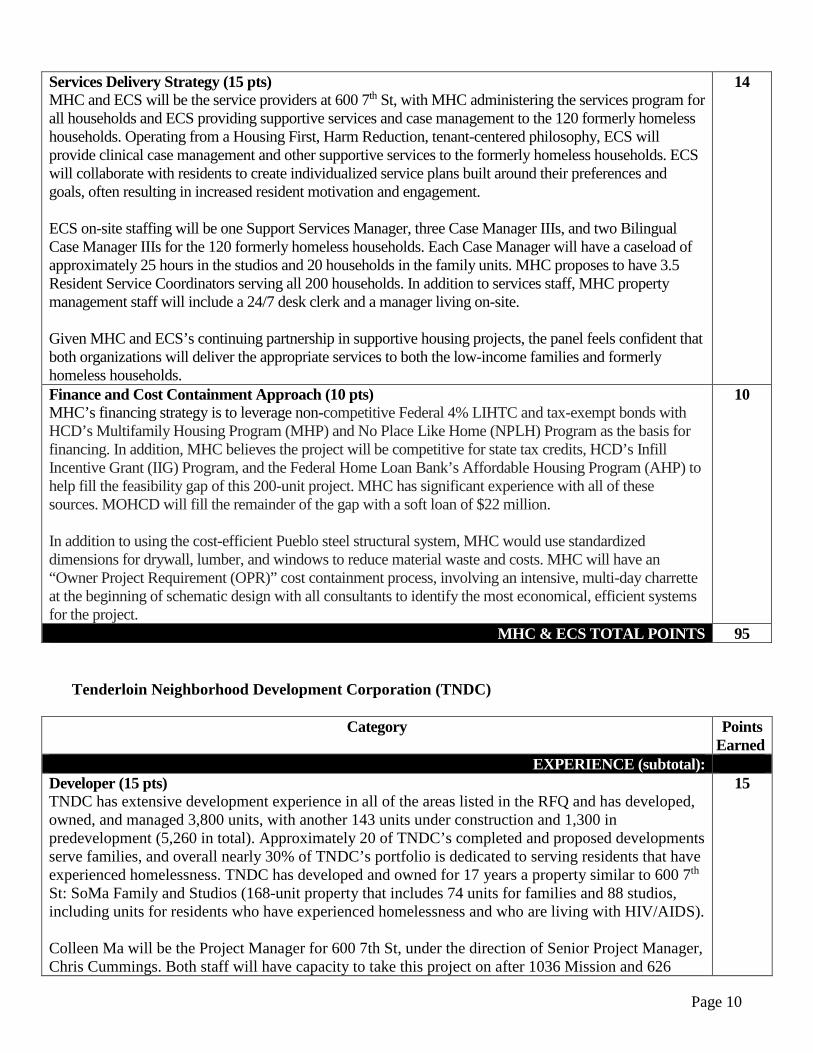
Page 10
Services Delivery Strategy (15 pts) MHC and ECS will be the service providers at 600 7th St, with MHC administering the services program for all households and ECS providing supportive services and case management to the 120 formerly homeless households. Operating from a Housing First, Harm Reduction, tenant-centered philosophy, ECS will provide clinical case management and other supportive services to the formerly homeless households. ECS will collaborate with residents to create individualized service plans built around their preferences and goals, often resulting in increased resident motivation and engagement. ECS on-site staffing will be one Support Services Manager, three Case Manager IIIs, and two Bilingual Case Manager IIIs for the 120 formerly homeless households. Each Case Manager will have a caseload of approximately 25 hours in the studios and 20 households in the family units. MHC proposes to have 3.5 Resident Service Coordinators serving all 200 households. In addition to services staff, MHC property management staff will include a 24/7 desk clerk and a manager living on-site. Given MHC and ECS’s continuing partnership in supportive housing projects, the panel feels confident that both organizations will deliver the appropriate services to both the low-income families and formerly homeless households.
14
Finance and Cost Containment Approach (10 pts) MHC’s financing strategy is to leverage non-competitive Federal 4% LIHTC and tax-exempt bonds with HCD’s Multifamily Housing Program (MHP) and No Place Like Home (NPLH) Program as the basis for financing. In addition, MHC believes the project will be competitive for state tax credits, HCD’s Infill Incentive Grant (IIG) Program, and the Federal Home Loan Bank’s Affordable Housing Program (AHP) to help fill the feasibility gap of this 200-unit project. MHC has significant experience with all of these sources. MOHCD will fill the remainder of the gap with a soft loan of $22 million. In addition to using the cost-efficient Pueblo steel structural system, MHC would use standardized dimensions for drywall, lumber, and windows to reduce material waste and costs. MHC will have an “Owner Project Requirement (OPR)” cost containment process, involving an intensive, multi-day charrette at the beginning of schematic design with all consultants to identify the most economical, efficient systems for the project.
10
MHC & ECS TOTAL POINTS 95 Tenderloin Neighborhood Development Corporation (TNDC)
Category Points Earned
EXPERIENCE (subtotal): Developer (15 pts) TNDC has extensive development experience in all of the areas listed in the RFQ and has developed, owned, and managed 3,800 units, with another 143 units under construction and 1,300 in predevelopment (5,260 in total). Approximately 20 of TNDC’s completed and proposed developments serve families, and overall nearly 30% of TNDC’s portfolio is dedicated to serving residents that have experienced homelessness. TNDC has developed and owned for 17 years a property similar to 600 7th St: SoMa Family and Studios (168-unit property that includes 74 units for families and 88 studios, including units for residents who have experienced homelessness and who are living with HIV/AIDS).
Colleen Ma will be the Project Manager for 600 7th St, under the direction of Senior Project Manager, Chris Cummings. Both staff will have capacity to take this project on after 1036 Mission and 626
15
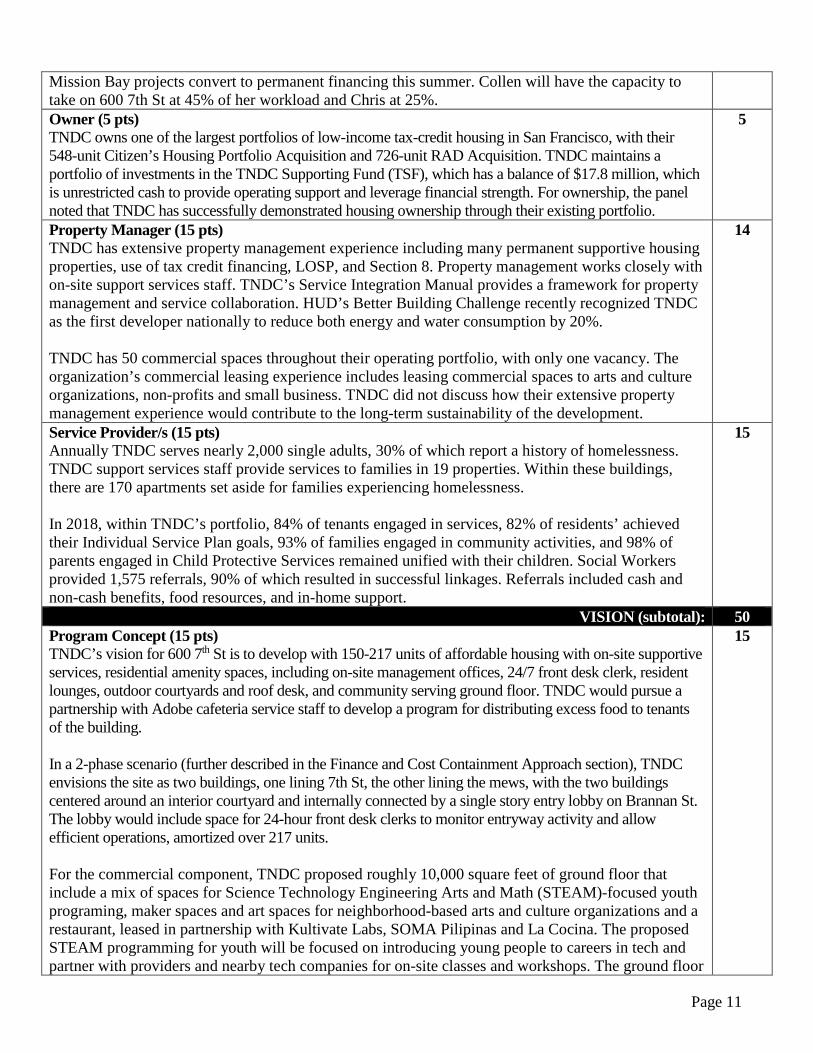
Page 11
Mission Bay projects convert to permanent financing this summer. Collen will have the capacity to take on 600 7th St at 45% of her workload and Chris at 25%. Owner (5 pts) TNDC owns one of the largest portfolios of low-income tax-credit housing in San Francisco, with their 548-unit Citizen’s Housing Portfolio Acquisition and 726-unit RAD Acquisition. TNDC maintains a portfolio of investments in the TNDC Supporting Fund (TSF), which has a balance of $17.8 million, which is unrestricted cash to provide operating support and leverage financial strength. For ownership, the panel noted that TNDC has successfully demonstrated housing ownership through their existing portfolio.
5
Property Manager (15 pts) TNDC has extensive property management experience including many permanent supportive housing properties, use of tax credit financing, LOSP, and Section 8. Property management works closely with on-site support services staff. TNDC’s Service Integration Manual provides a framework for property management and service collaboration. HUD’s Better Building Challenge recently recognized TNDC as the first developer nationally to reduce both energy and water consumption by 20%. TNDC has 50 commercial spaces throughout their operating portfolio, with only one vacancy. The organization’s commercial leasing experience includes leasing commercial spaces to arts and culture organizations, non-profits and small business. TNDC did not discuss how their extensive property management experience would contribute to the long-term sustainability of the development.
14
Service Provider/s (15 pts) Annually TNDC serves nearly 2,000 single adults, 30% of which report a history of homelessness. TNDC support services staff provide services to families in 19 properties. Within these buildings, there are 170 apartments set aside for families experiencing homelessness. In 2018, within TNDC’s portfolio, 84% of tenants engaged in services, 82% of residents’ achieved their Individual Service Plan goals, 93% of families engaged in community activities, and 98% of parents engaged in Child Protective Services remained unified with their children. Social Workers provided 1,575 referrals, 90% of which resulted in successful linkages. Referrals included cash and non-cash benefits, food resources, and in-home support.
15
VISION (subtotal): 50 Program Concept (15 pts) TNDC’s vision for 600 7th St is to develop with 150-217 units of affordable housing with on-site supportive services, residential amenity spaces, including on-site management offices, 24/7 front desk clerk, resident lounges, outdoor courtyards and roof desk, and community serving ground floor. TNDC would pursue a partnership with Adobe cafeteria service staff to develop a program for distributing excess food to tenants of the building. In a 2-phase scenario (further described in the Finance and Cost Containment Approach section), TNDC envisions the site as two buildings, one lining 7th St, the other lining the mews, with the two buildings centered around an interior courtyard and internally connected by a single story entry lobby on Brannan St. The lobby would include space for 24-hour front desk clerks to monitor entryway activity and allow efficient operations, amortized over 217 units. For the commercial component, TNDC proposed roughly 10,000 square feet of ground floor that include a mix of spaces for Science Technology Engineering Arts and Math (STEAM)-focused youth programing, maker spaces and art spaces for neighborhood-based arts and culture organizations and a restaurant, leased in partnership with Kultivate Labs, SOMA Pilipinas and La Cocina. The proposed STEAM programming for youth will be focused on introducing young people to careers in tech and partner with providers and nearby tech companies for on-site classes and workshops. The ground floor
15
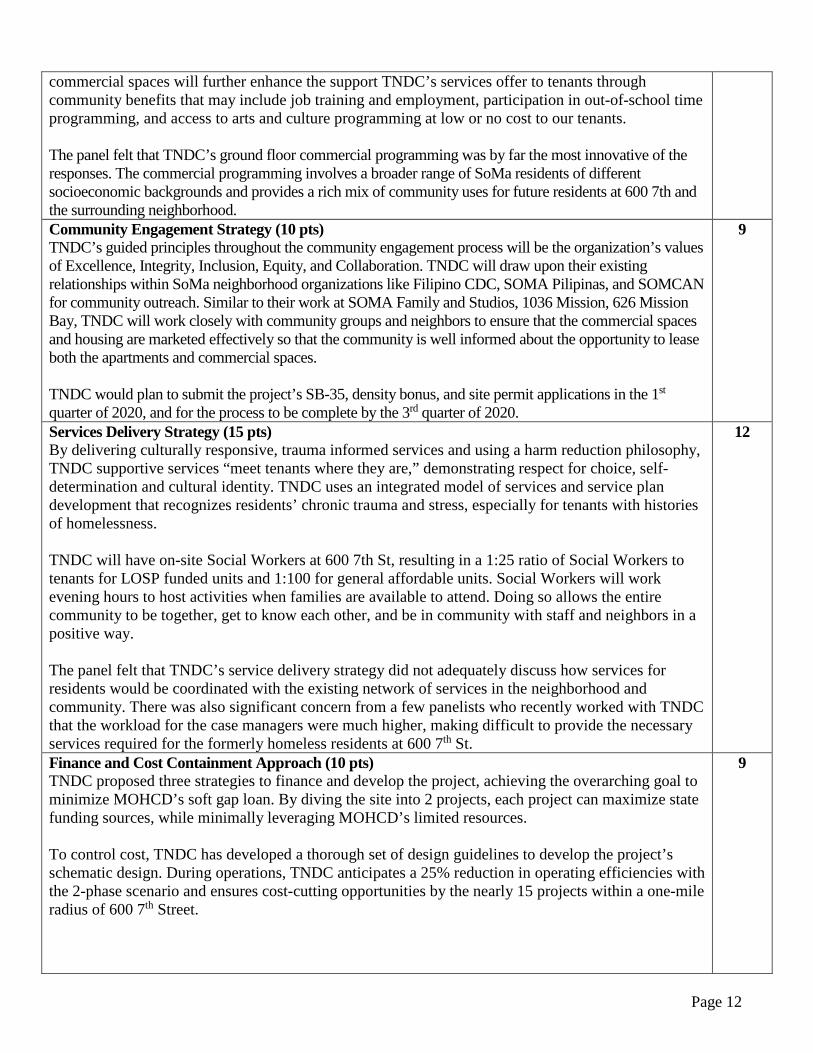
Page 12
commercial spaces will further enhance the support TNDC’s services offer to tenants through community benefits that may include job training and employment, participation in out-of-school time programming, and access to arts and culture programming at low or no cost to our tenants. The panel felt that TNDC’s ground floor commercial programming was by far the most innovative of the responses. The commercial programming involves a broader range of SoMa residents of different socioeconomic backgrounds and provides a rich mix of community uses for future residents at 600 7th and the surrounding neighborhood. Community Engagement Strategy (10 pts) TNDC’s guided principles throughout the community engagement process will be the organization’s values of Excellence, Integrity, Inclusion, Equity, and Collaboration. TNDC will draw upon their existing relationships within SoMa neighborhood organizations like Filipino CDC, SOMA Pilipinas, and SOMCAN for community outreach. Similar to their work at SOMA Family and Studios, 1036 Mission, 626 Mission Bay, TNDC will work closely with community groups and neighbors to ensure that the commercial spaces and housing are marketed effectively so that the community is well informed about the opportunity to lease both the apartments and commercial spaces. TNDC would plan to submit the project’s SB-35, density bonus, and site permit applications in the 1st quarter of 2020, and for the process to be complete by the 3rd quarter of 2020.
9
Services Delivery Strategy (15 pts) By delivering culturally responsive, trauma informed services and using a harm reduction philosophy, TNDC supportive services “meet tenants where they are,” demonstrating respect for choice, self- determination and cultural identity. TNDC uses an integrated model of services and service plan development that recognizes residents’ chronic trauma and stress, especially for tenants with histories of homelessness. TNDC will have on-site Social Workers at 600 7th St, resulting in a 1:25 ratio of Social Workers to tenants for LOSP funded units and 1:100 for general affordable units. Social Workers will work evening hours to host activities when families are available to attend. Doing so allows the entire community to be together, get to know each other, and be in community with staff and neighbors in a positive way. The panel felt that TNDC’s service delivery strategy did not adequately discuss how services for residents would be coordinated with the existing network of services in the neighborhood and community. There was also significant concern from a few panelists who recently worked with TNDC that the workload for the case managers were much higher, making difficult to provide the necessary services required for the formerly homeless residents at 600 7th St.
12
Finance and Cost Containment Approach (10 pts) TNDC proposed three strategies to finance and develop the project, achieving the overarching goal to minimize MOHCD’s soft gap loan. By diving the site into 2 projects, each project can maximize state funding sources, while minimally leveraging MOHCD’s limited resources. To control cost, TNDC has developed a thorough set of design guidelines to develop the project’s schematic design. During operations, TNDC anticipates a 25% reduction in operating efficiencies with the 2-phase scenario and ensures cost-cutting opportunities by the nearly 15 projects within a one-mile radius of 600 7th Street.
9
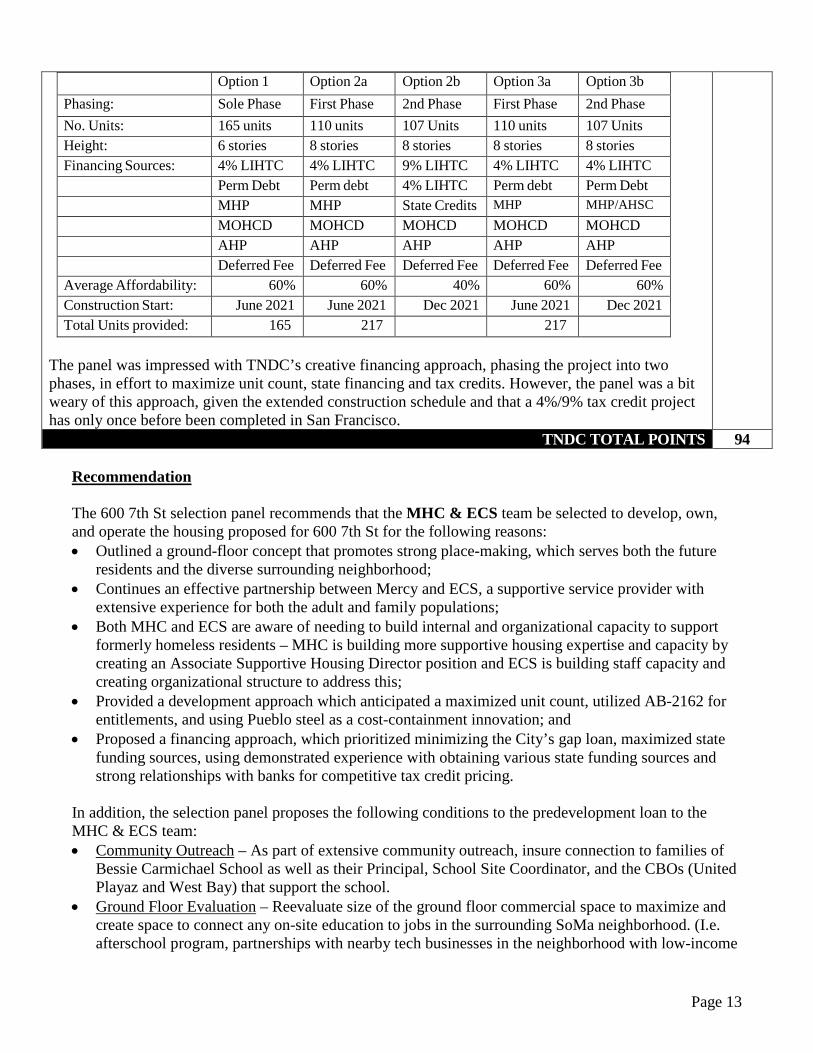
Page 13
Option 1 Option 2a Option 2b Option 3a Option 3b Phasing: Sole Phase First Phase 2nd Phase First Phase 2nd Phase No. Units: 165 units 110 units 107 Units 110 units 107 Units Height: 6 stories 8 stories 8 stories 8 stories 8 stories Financing Sources: 4% LIHTC 4% LIHTC 9% LIHTC 4% LIHTC 4% LIHTC
Perm Debt Perm debt 4% LIHTC Perm debt Perm Debt MHP MHP State Credits MHP MHP/AHSC
MOHCD MOHCD MOHCD MOHCD MOHCD AHP AHP AHP AHP AHP Deferred Fee Deferred Fee Deferred Fee Deferred Fee Deferred Fee Average Affordability: 60% 60% 40% 60% 60% Construction Start: June 2021 June 2021 Dec 2021 June 2021 Dec 2021 Total Units provided: 165 217 217
The panel was impressed with TNDC’s creative financing approach, phasing the project into two phases, in effort to maximize unit count, state financing and tax credits. However, the panel was a bit weary of this approach, given the extended construction schedule and that a 4%/9% tax credit project has only once before been completed in San Francisco.
TNDC TOTAL POINTS 94 Recommendation The 600 7th St selection panel recommends that the MHC & ECS team be selected to develop, own, and operate the housing proposed for 600 7th St for the following reasons: • Outlined a ground-floor concept that promotes strong place-making, which serves both the future
residents and the diverse surrounding neighborhood; • Continues an effective partnership between Mercy and ECS, a supportive service provider with
extensive experience for both the adult and family populations; • Both MHC and ECS are aware of needing to build internal and organizational capacity to support
formerly homeless residents – MHC is building more supportive housing expertise and capacity by creating an Associate Supportive Housing Director position and ECS is building staff capacity and creating organizational structure to address this;
• Provided a development approach which anticipated a maximized unit count, utilized AB-2162 for entitlements, and using Pueblo steel as a cost-containment innovation; and
• Proposed a financing approach, which prioritized minimizing the City’s gap loan, maximized state funding sources, using demonstrated experience with obtaining various state funding sources and strong relationships with banks for competitive tax credit pricing.
In addition, the selection panel proposes the following conditions to the predevelopment loan to the MHC & ECS team: • Community Outreach – As part of extensive community outreach, insure connection to families of
Bessie Carmichael School as well as their Principal, School Site Coordinator, and the CBOs (United Playaz and West Bay) that support the school.
• Ground Floor Evaluation – Reevaluate size of the ground floor commercial space to maximize and create space to connect any on-site education to jobs in the surrounding SoMa neighborhood. (I.e. afterschool program, partnerships with nearby tech businesses in the neighborhood with low-income
Page 14
families or a family/children’s therapist office to better connect formerly homeless residents to mental health services).
• Support Services – Start tracking implementations on the housing support plans and tools to help housing stability with the formerly homeless residents by submitting annual report to HSH and MOHCD.
• Leasing – Track implementation changes to screening process for applicants and reduce tenant selection barriers (i.e. reduce the 5-year background check to 2-3 years, per industry standard) by reviewing annually with HSH and MOHCD.

Evaluation of Request for Final Gap Financing April 1, 2022 600 7th Street Page 45 of 54
Attachment F: Site Map with Amenities
(SEE ATTACHED)
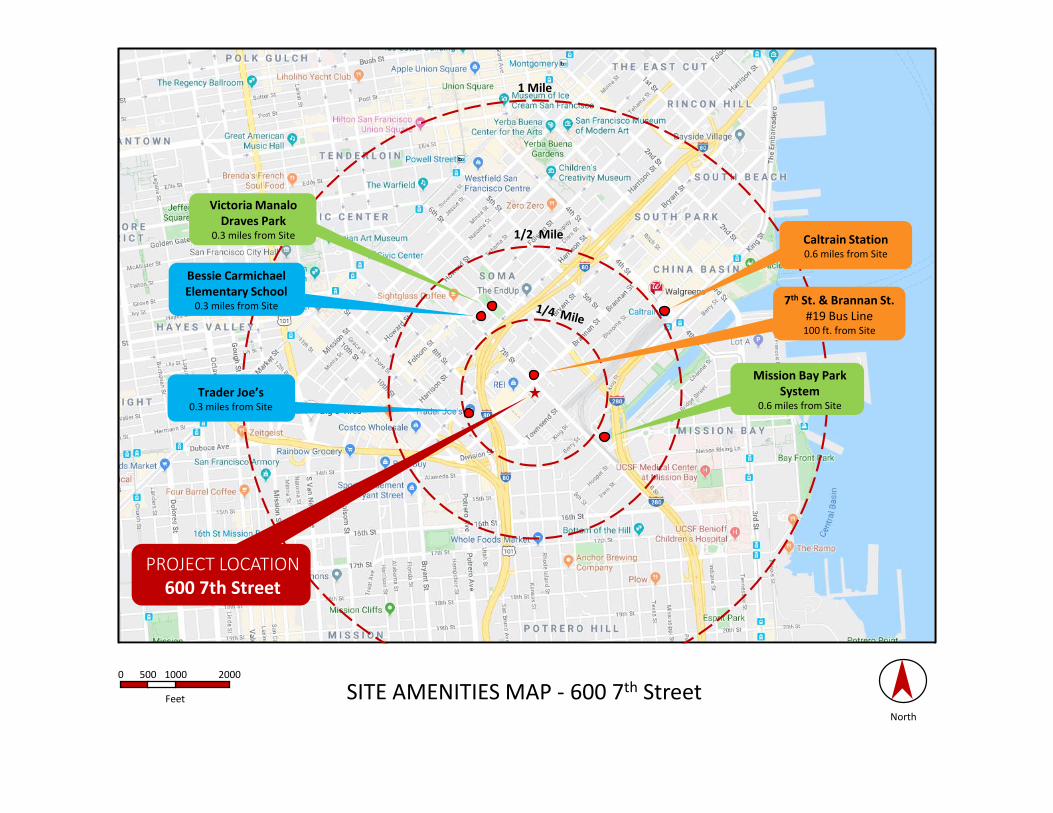
PROJECT LOCATION600 7th Street
1 Mile
1/2 Mile
Victoria Manalo Draves Park
0.3 miles from Site
Mission Bay Park System
0.6 miles from SiteTrader Joe’s
0.3 miles from Site
Caltrain Station0.6 miles from Site
Bessie Carmichael Elementary School
0.3 miles from Site 7th St. & Brannan St.#19 Bus Line
100 ft. from Site
North
0 500 1000 2000
Feet SITE AMENITIES MAP - 600 7th Street

Evaluation of Request for Final Gap Financing April 1, 2022 600 7th Street Page 46 of 54
Attachment G: Elevations and Floor Plans
(SEE ATTACHED)
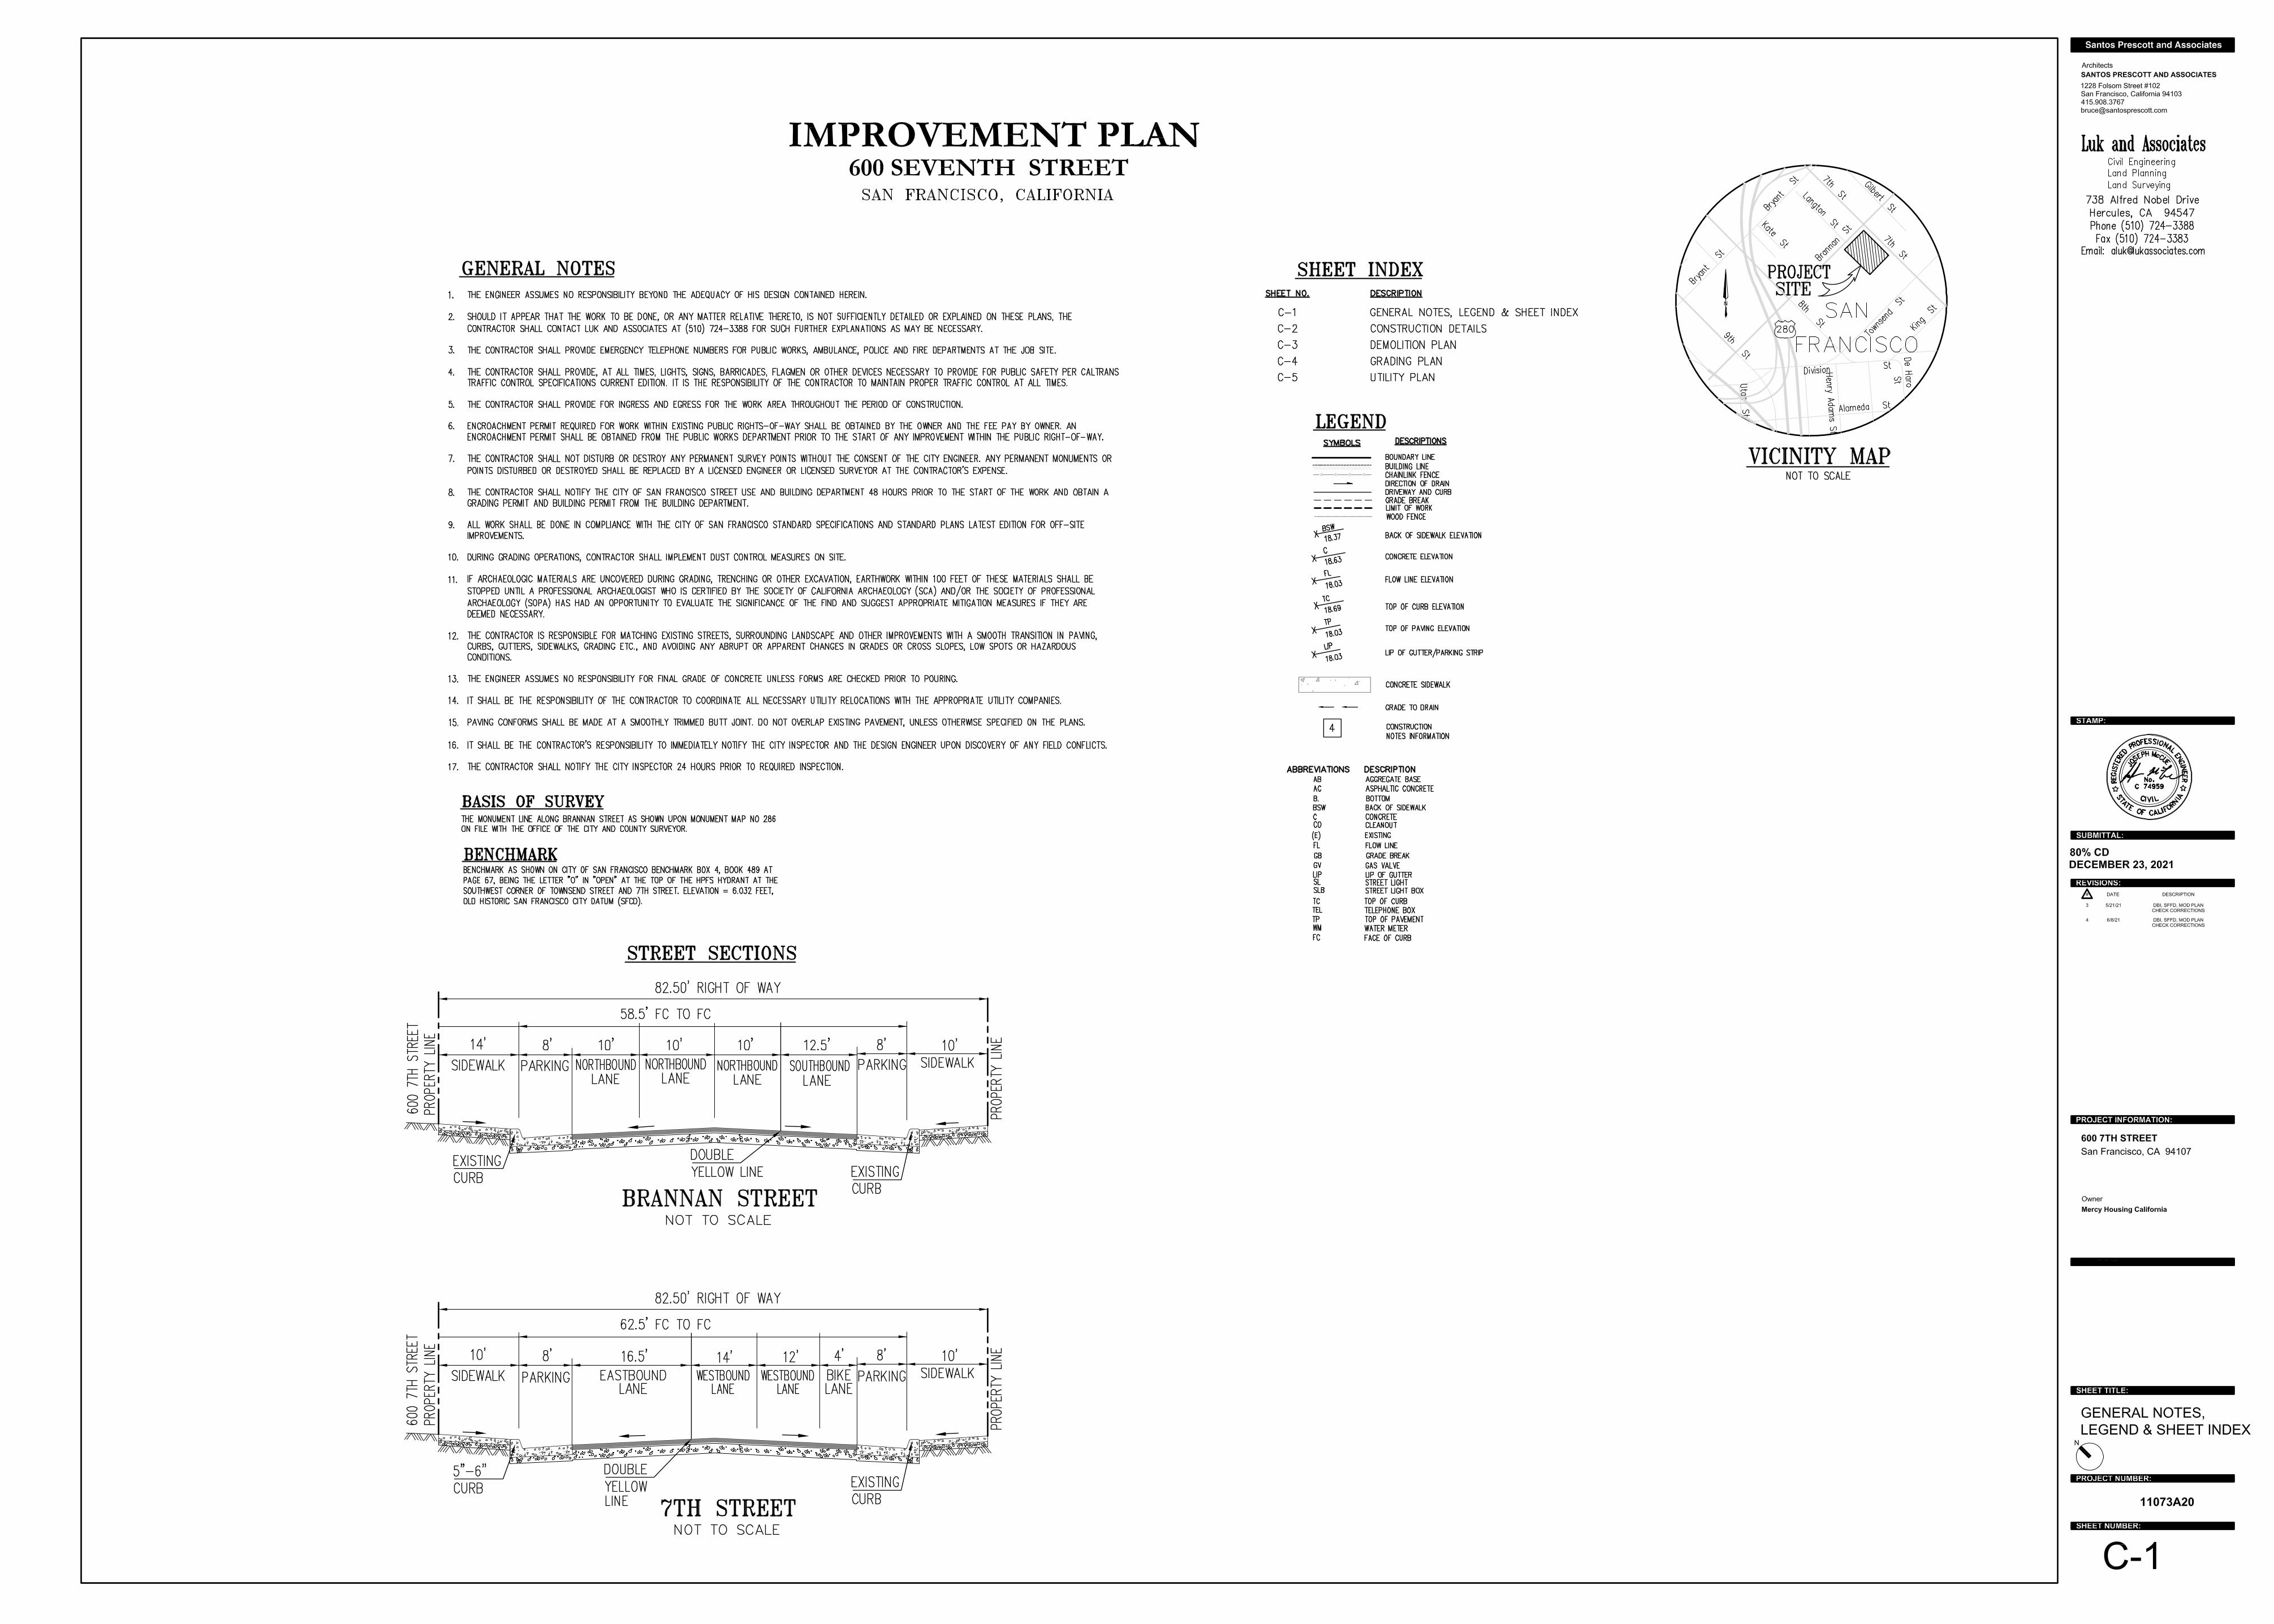
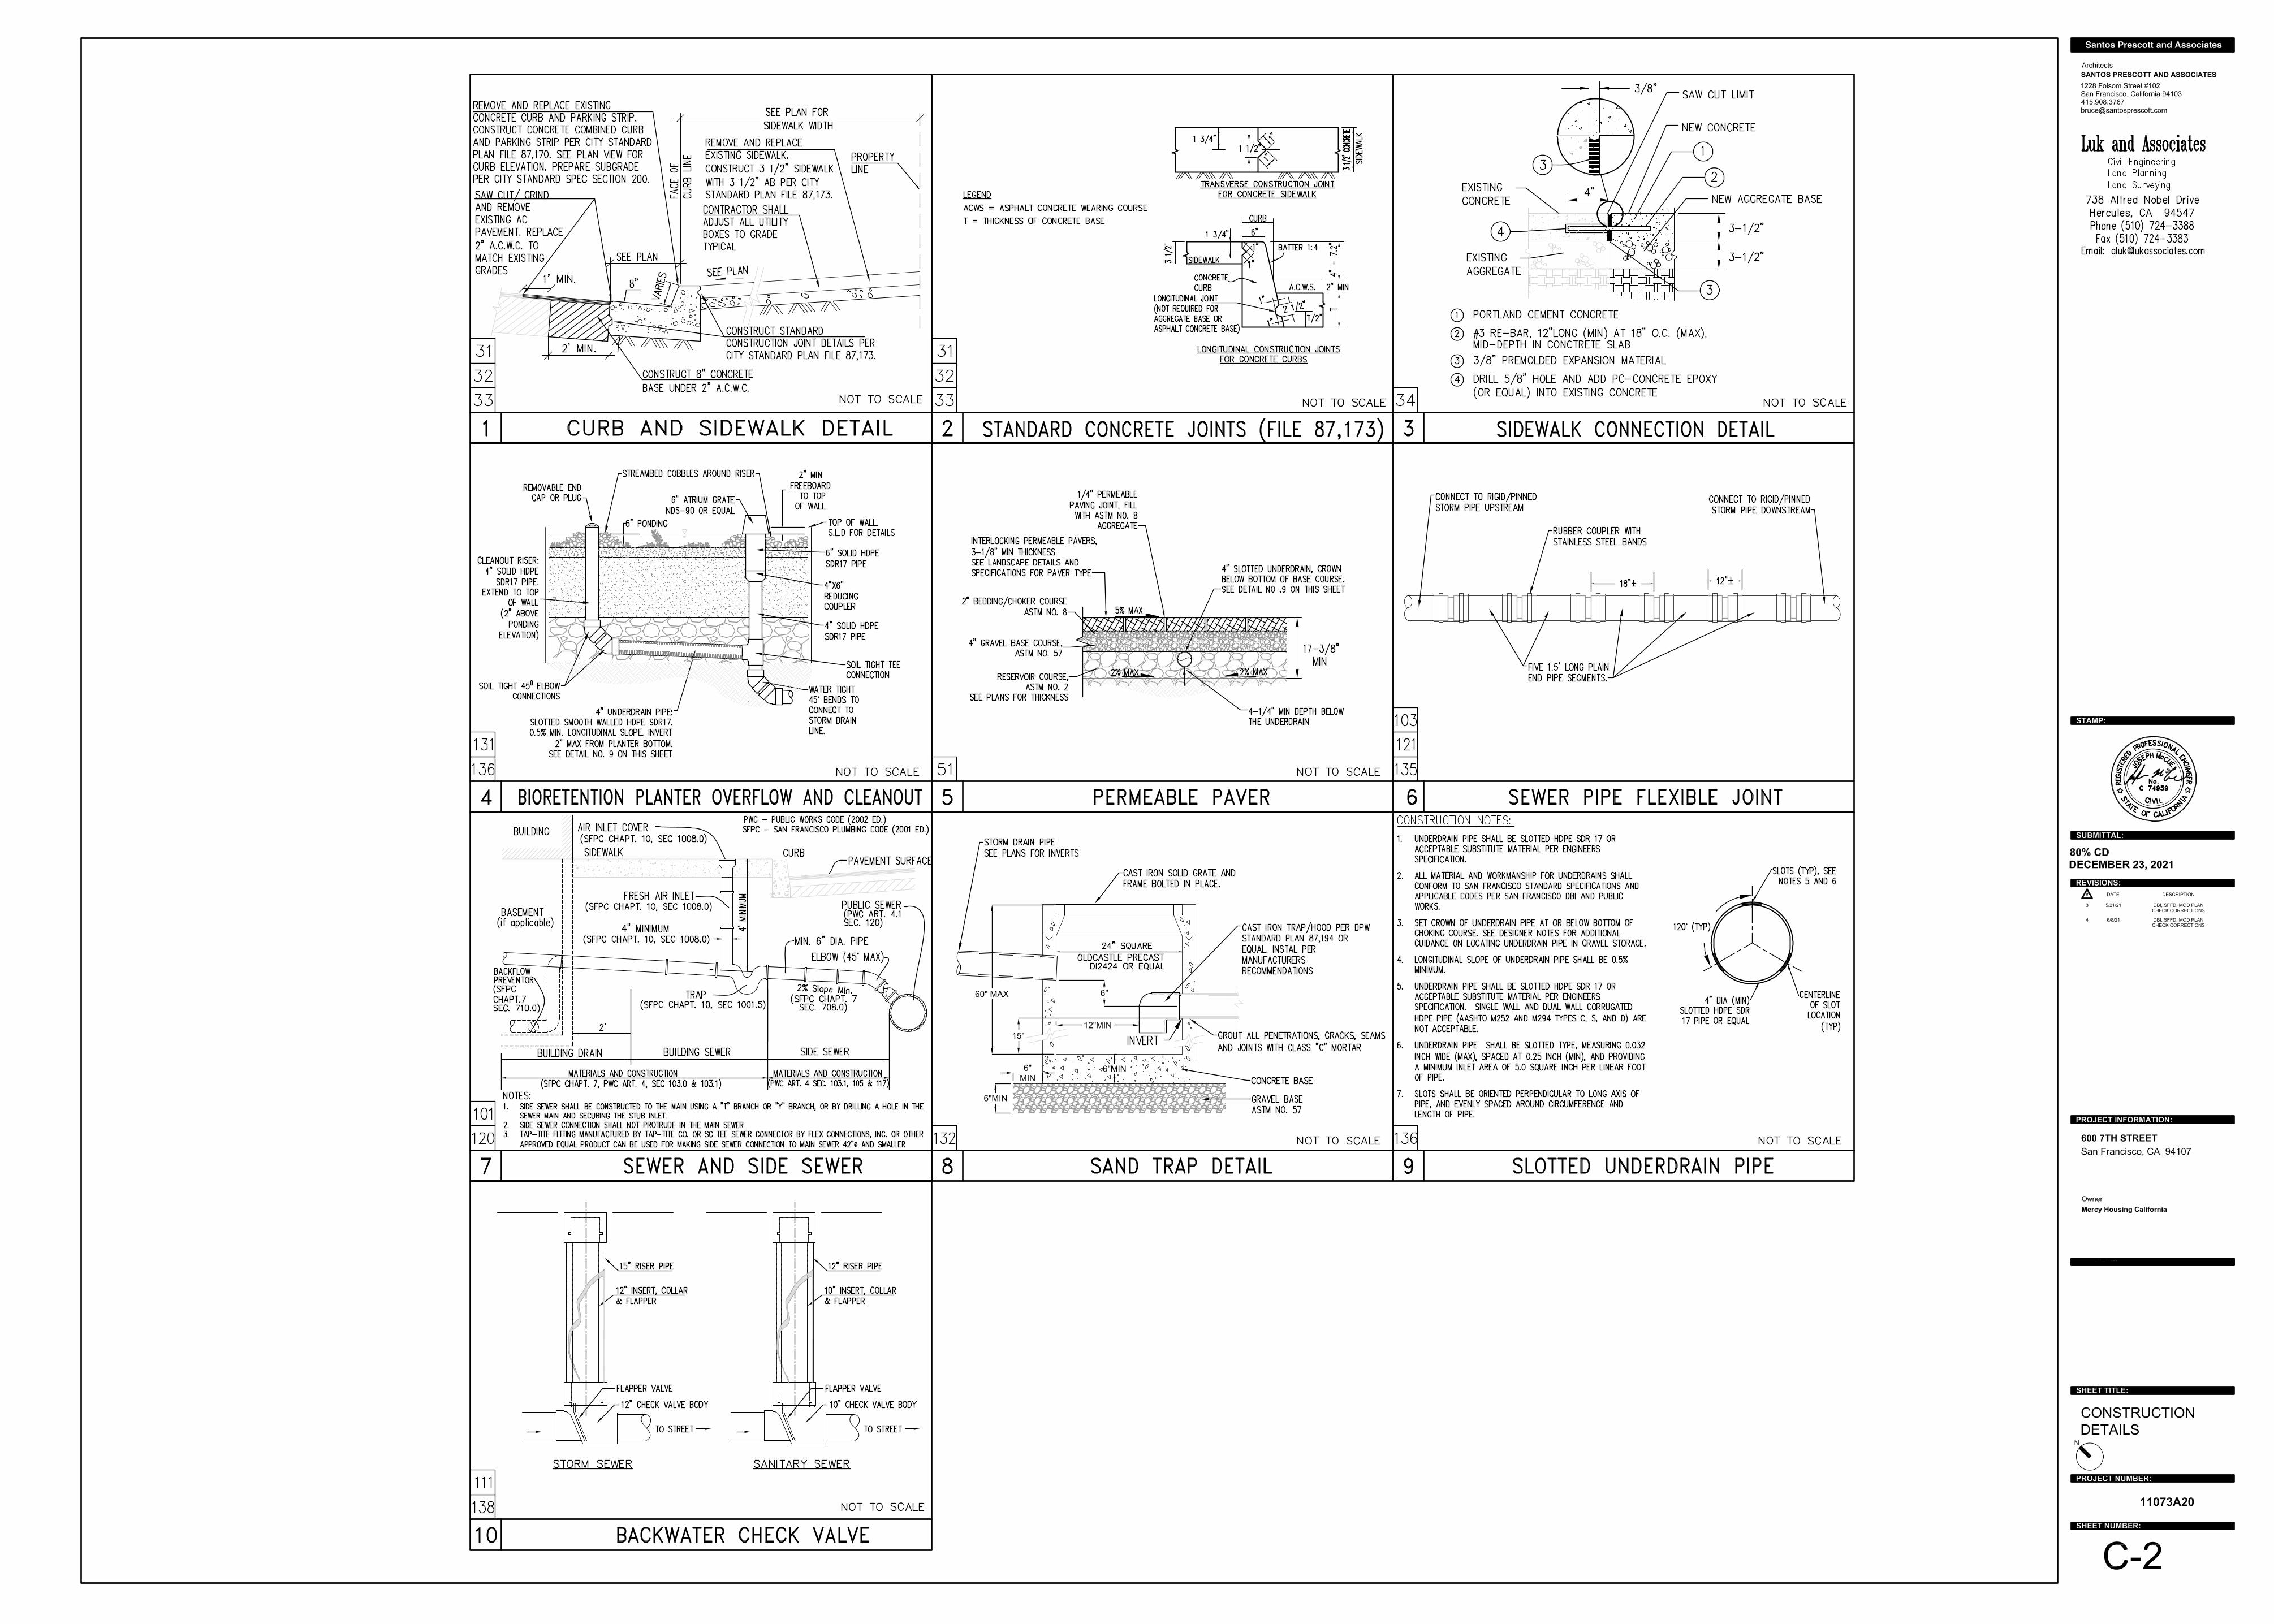
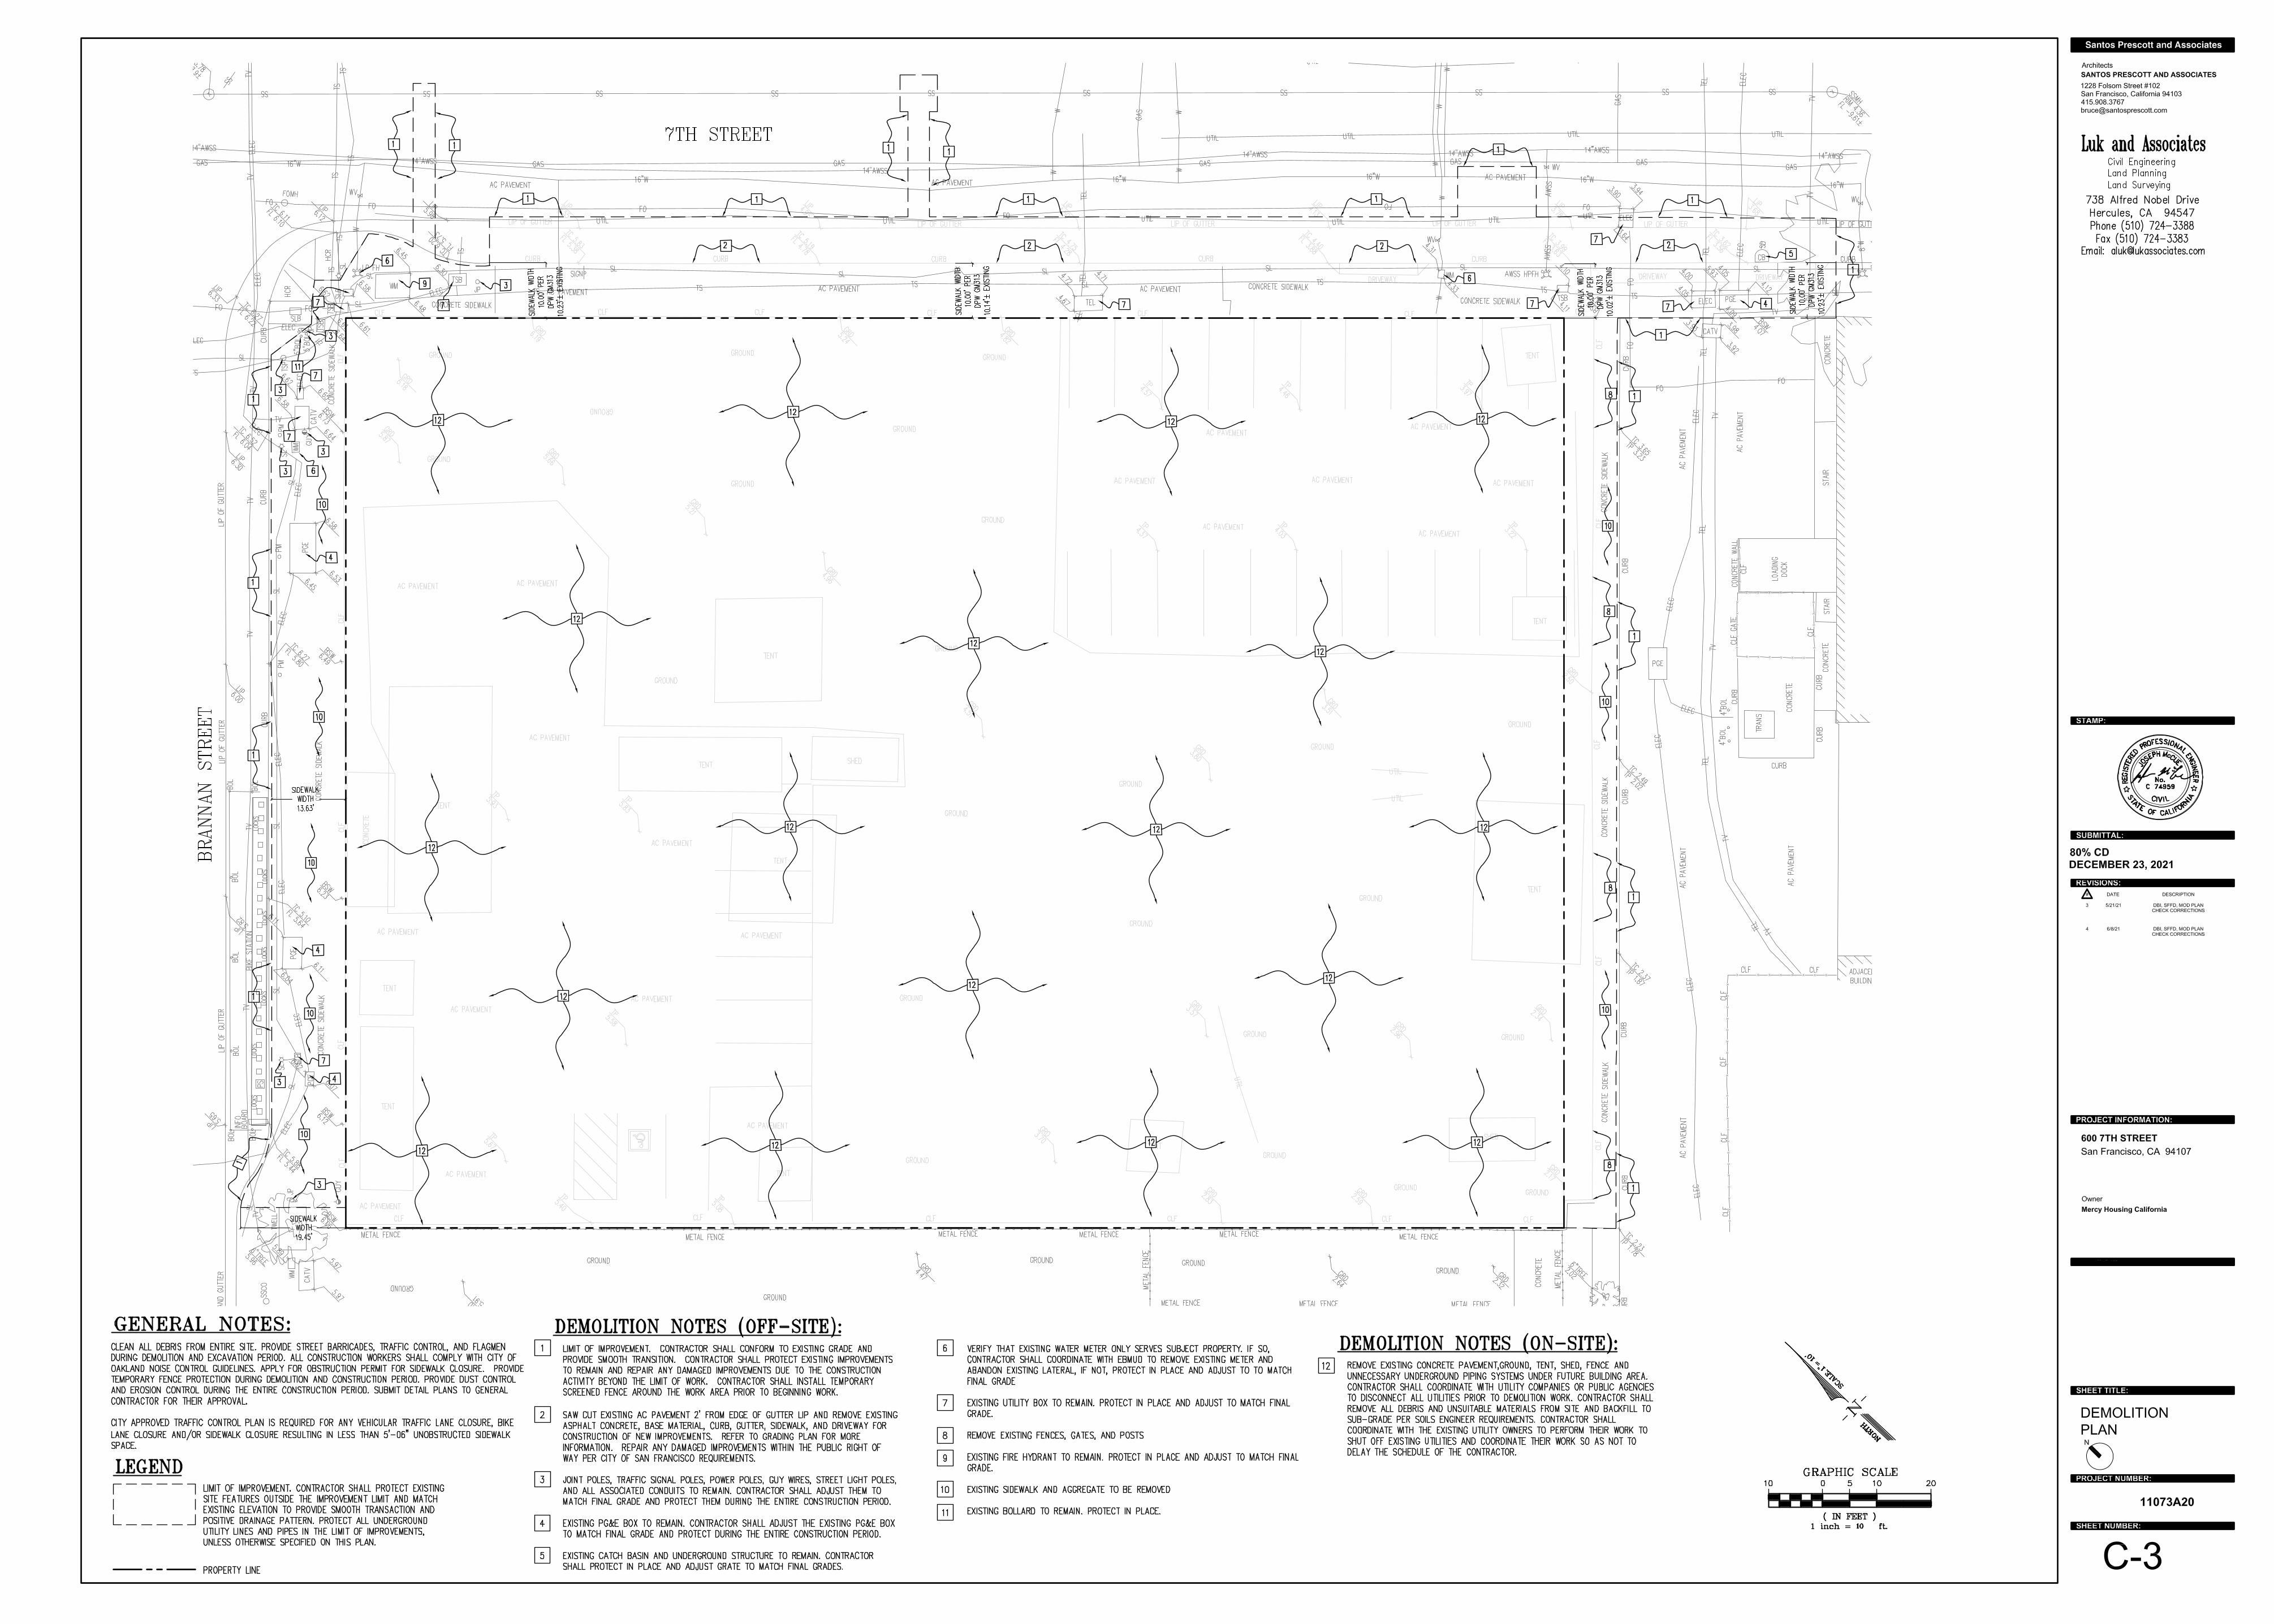
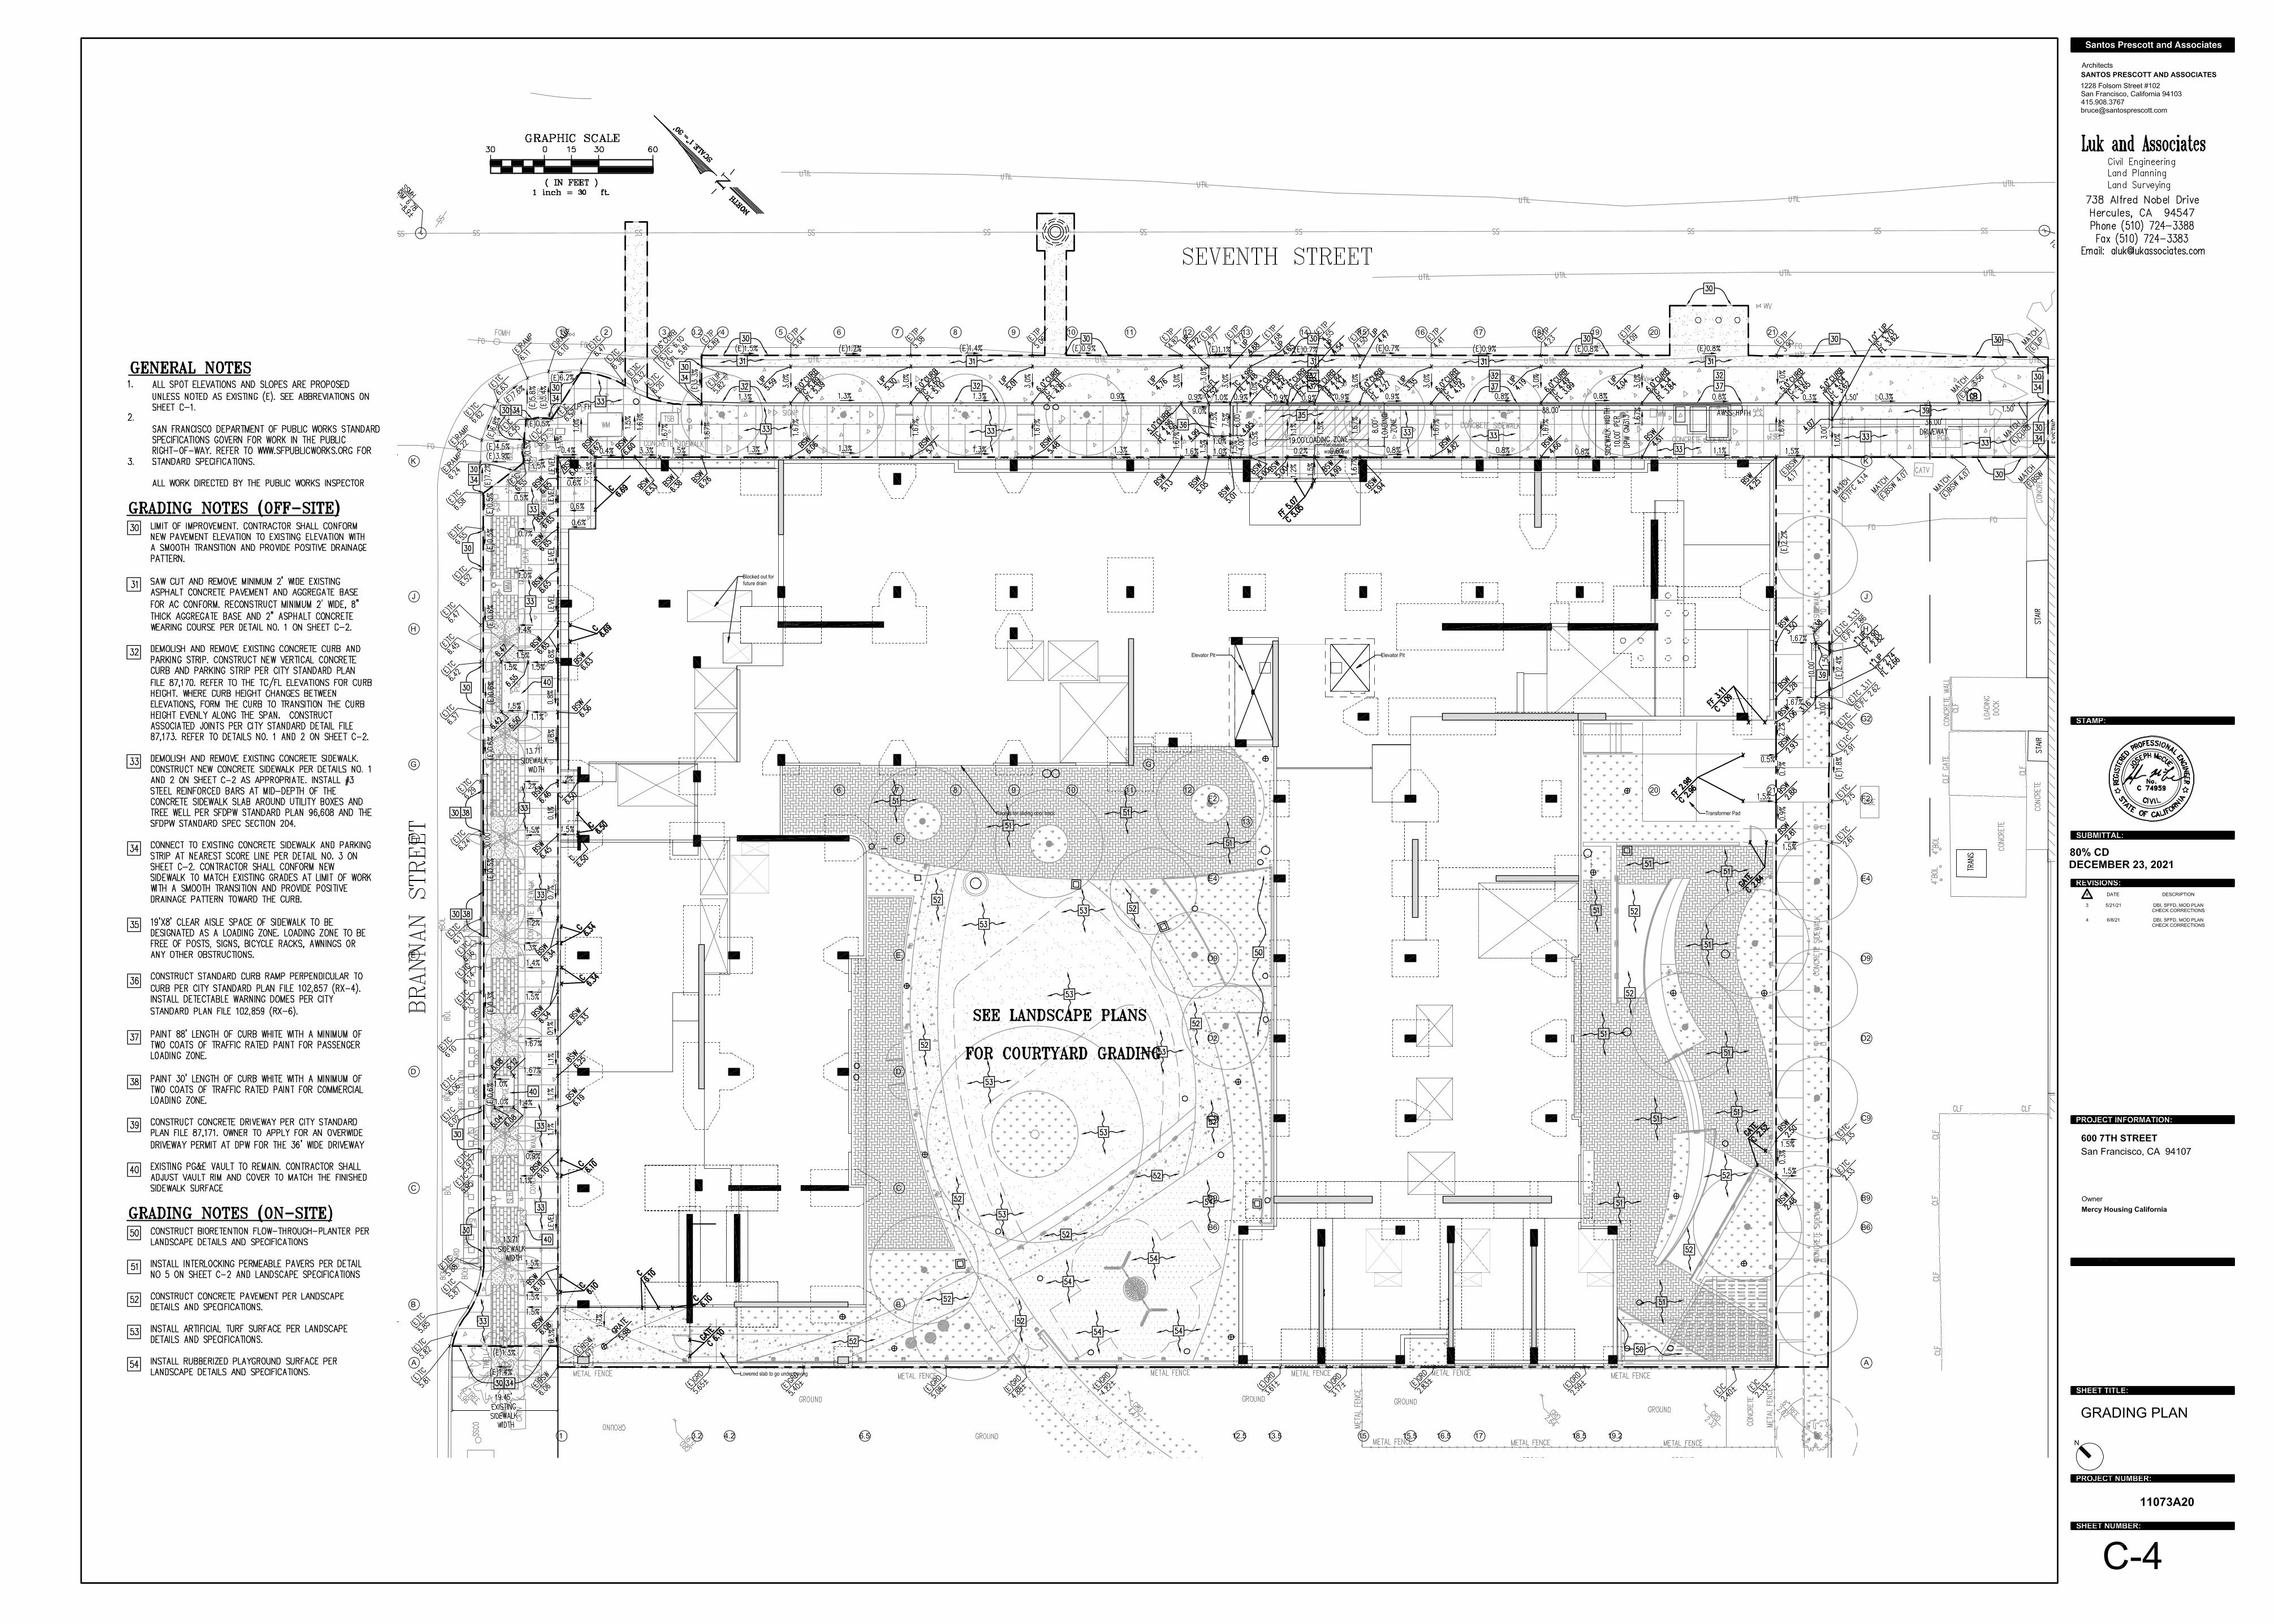
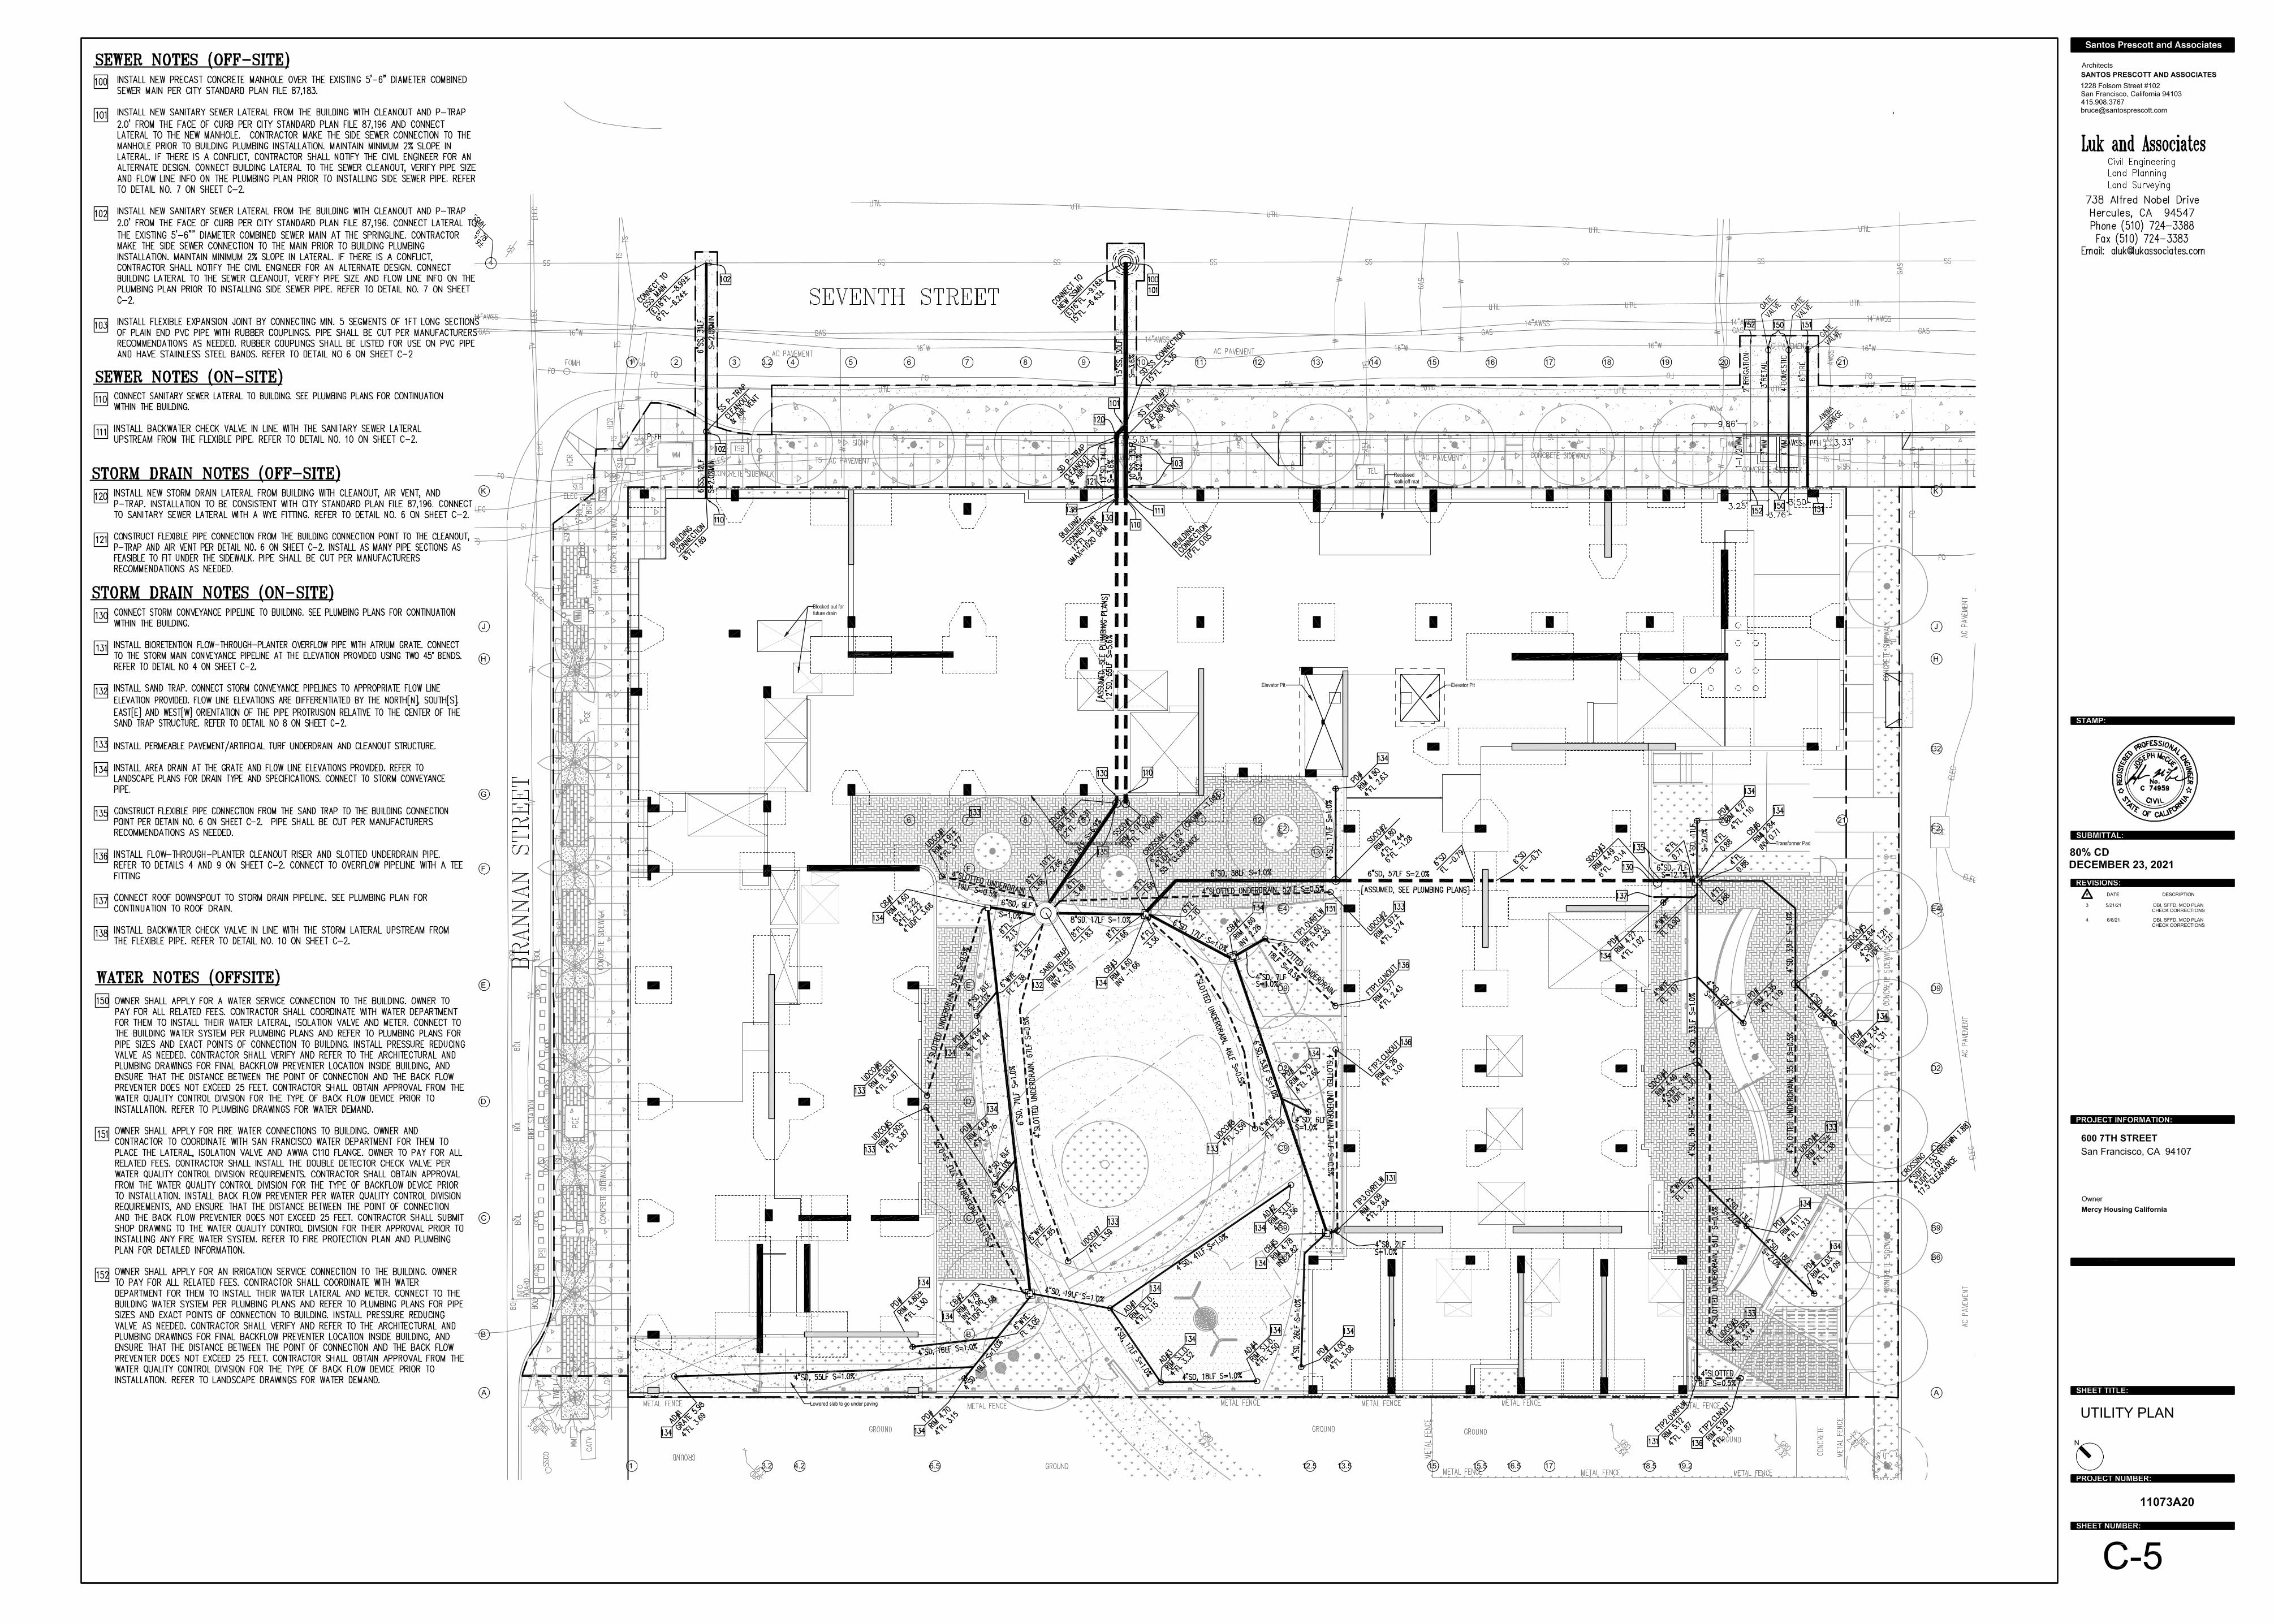
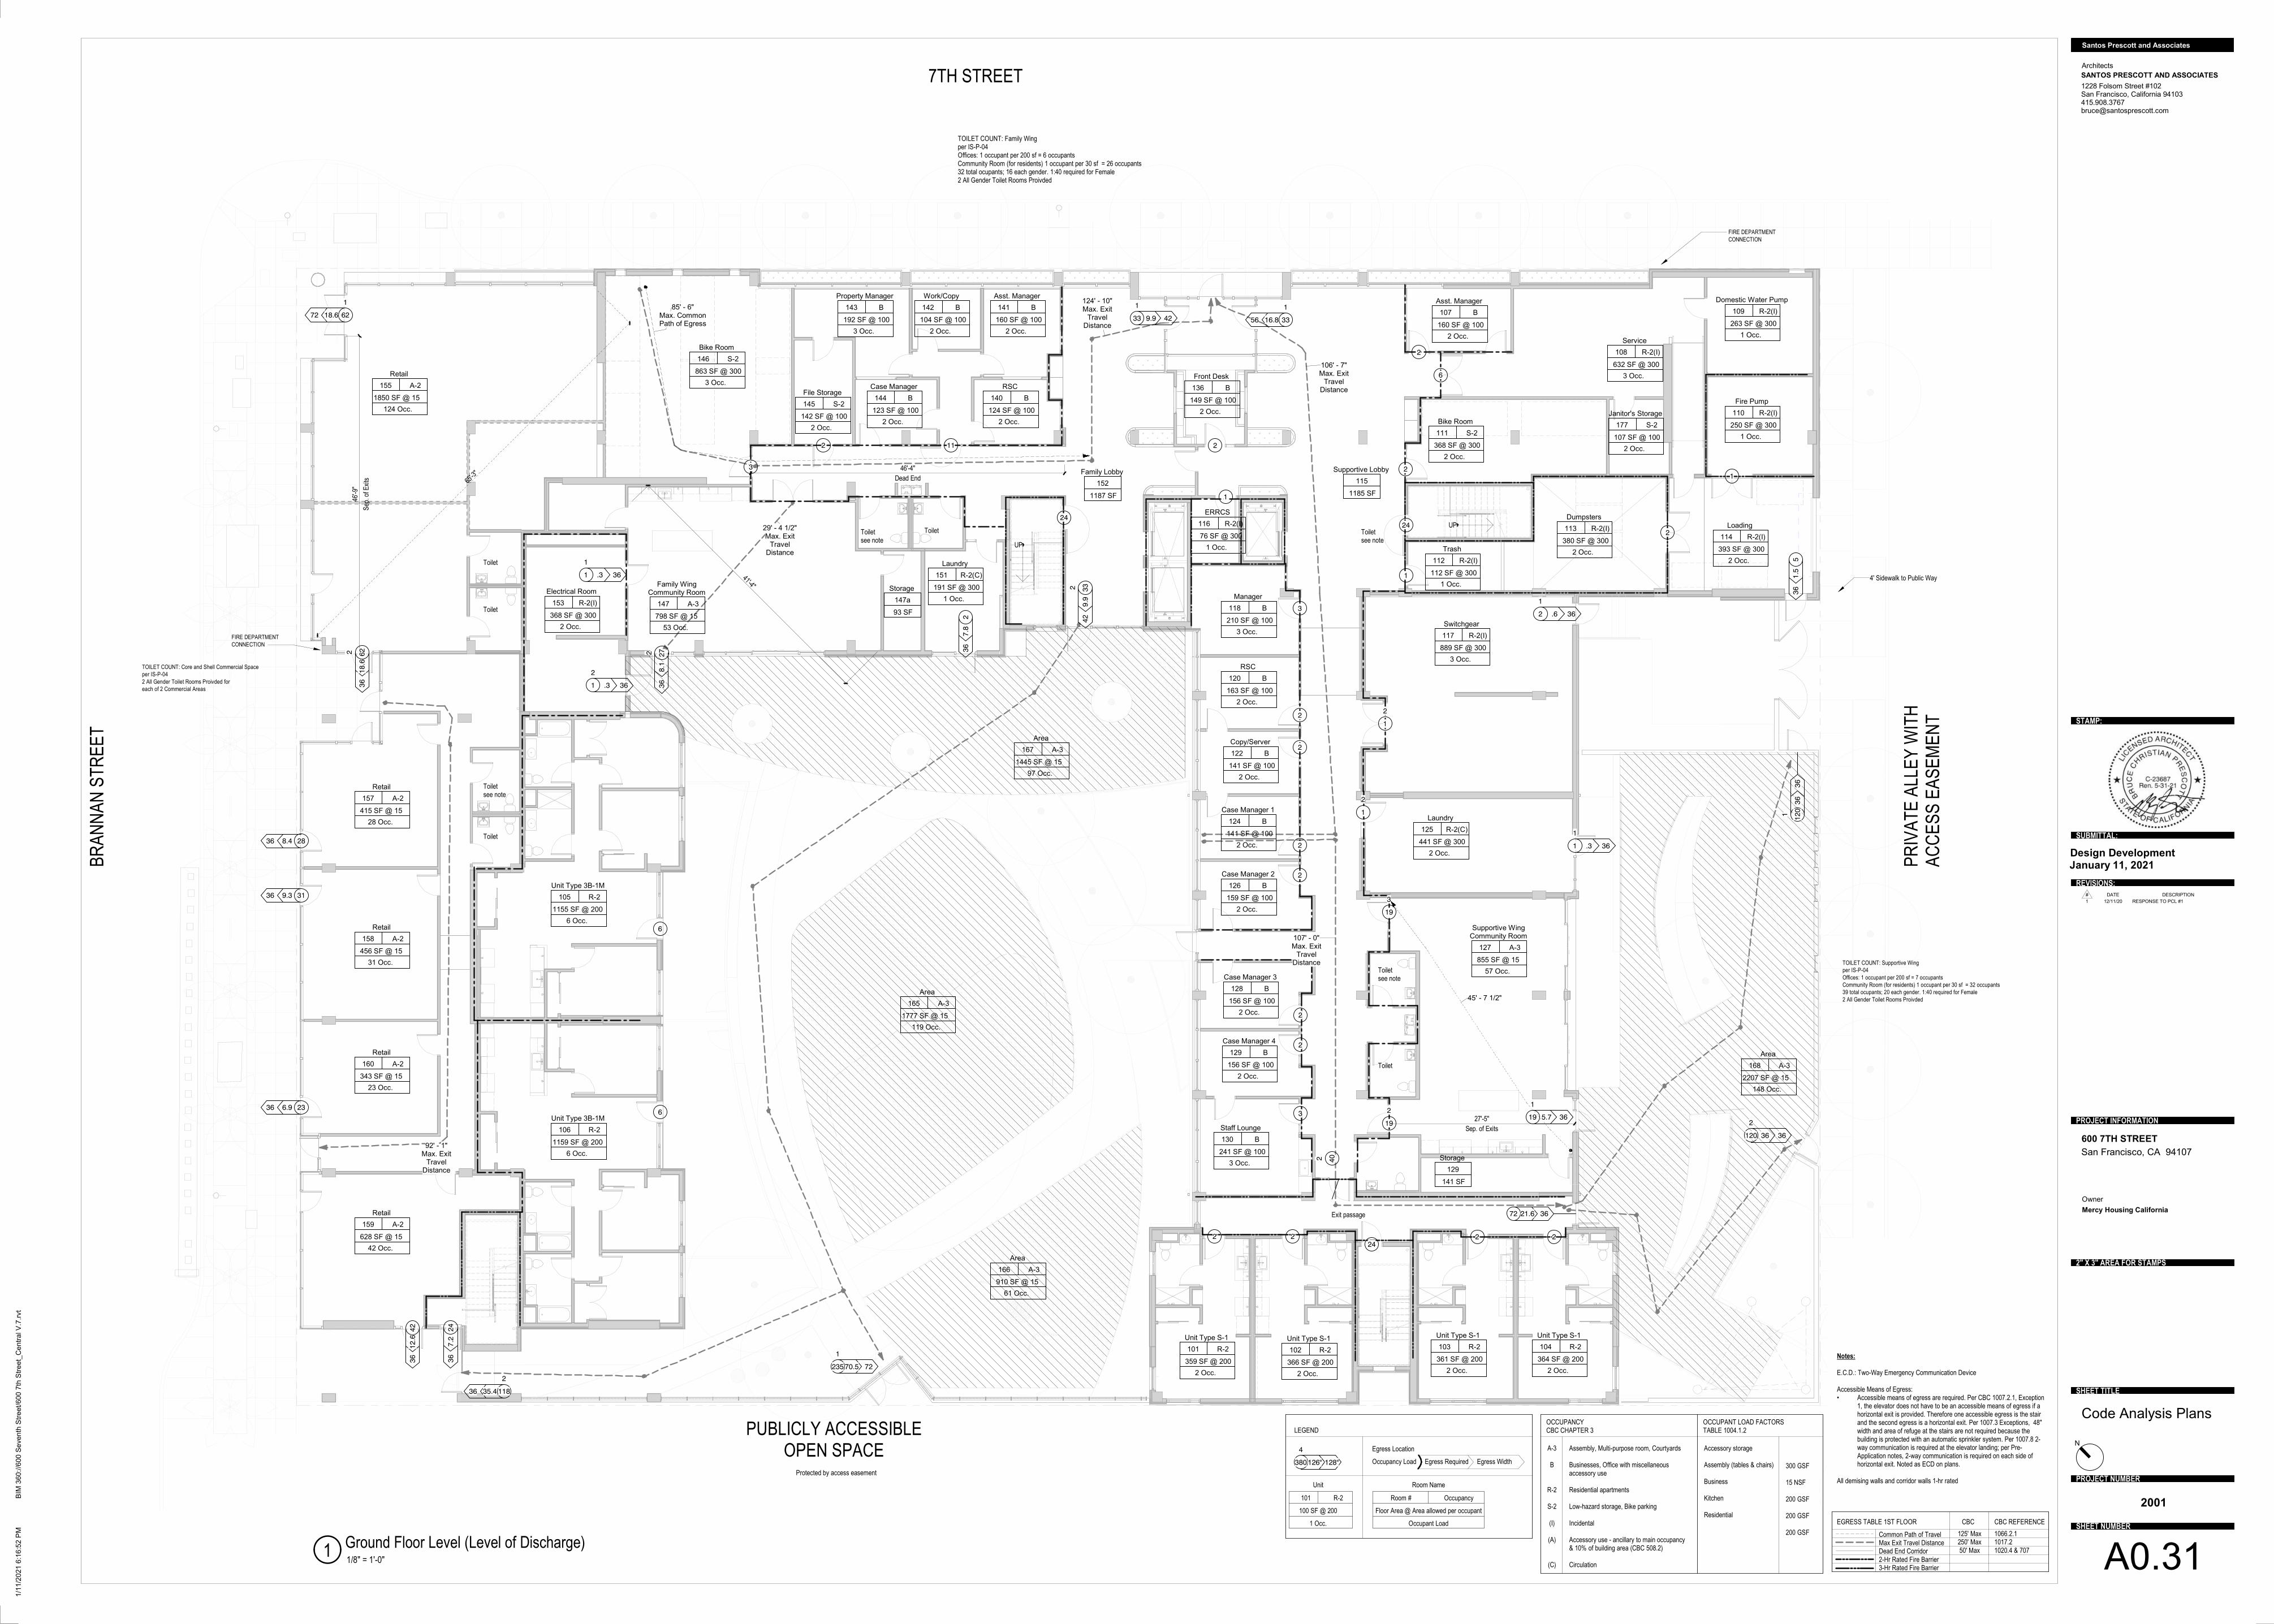
UP
UP
Notes:
E.C.D.: Two-Way Emergency Communication Device
Accessible Means of Egress:• Accessible means of egress are required. Per CBC 1007.2.1, Exception
1, the elevator does not have to be an accessible means of egress if a horizontal exit is provided. Therefore one accessible egress is the stair and the second egress is a horizontal exit. Per 1007.3 Exceptions, 48" width and area of refuge at the stairs are not required because the building is protected with an automatic sprinkler system. Per 1007.8 2-way communication is required at the elevator landing; per Pre-Application notes, 2-way communication is required on each side of horizontal exit. Noted as ECD on plans.
All demising walls and corridor walls 1-hr rated
Common Path of Travel Max Exit Travel DistanceDead End Corridor2-Hr Rated Fire Barrier3-Hr Rated Fire Barrier
125' Max250' Max50' Max
1066.2.11017.21020.4 & 707
CBC CBC REFERENCEEGRESS TABLE 1ST FLOOR
141 SF
Copy/Server
B
@ 100
2 Occ.
122
855 SF
Supportive WingCommunity Room
A-3
@ 15
57 Occ.
127
Max. Exit Travel
Distance
124' - 10"
Max. Exit Travel
Distance
107' - 0"
Exit passage
FIRE DEPARTMENT
CONNECTION
210 SF
Manager
B
@ 100
3 Occ.
118
163 SF
RSC
B
@ 100
2 Occ.
120
141 SF
Case Manager 1
B
@ 100
2 Occ.
124
159 SF
Case Manager 2
B
@ 100
2 Occ.
126
156 SF
Case Manager 3
B
@ 100
2 Occ.
128
156 SF
Case Manager 4
B
@ 100
2 Occ.
129
241 SF
Staff Lounge
B
@ 100
3 Occ.
130
441 SF
Laundry
R-2(C)
@ 300
2 Occ.
125
798 SF
Family WingCommunity Room
A-3
@ 15
53 Occ.
147
149 SF
Front Desk
B
@ 100
2 Occ.
136
889 SF
Switchgear
R-2(I)
@ 300
3 Occ.
117
160 SF
Asst. Manager
B
@ 100
2 Occ.
107
191 SF
Laundry
R-2(C)
@ 300
1 Occ.
151
192 SF
Property Manager
B
@ 100
3 Occ.
143
104 SF
Work/Copy
B
@ 100
2 Occ.
142
160 SF
Asst. Manager
B
@ 100
2 Occ.
141
124 SF
RSC
B
@ 100
2 Occ.
140
123 SF
Case Manager
B
@ 100
2 Occ.
144
142 SF
File Storage
S-2
@ 100
2 Occ.
145
863 SF
Bike Room
S-2
@ 300
3 Occ.
146
380 SF
Dumpsters
R-2(I)
@ 300
2 Occ.
113
368 SF
Bike Room
S-2
@ 300
2 Occ.
111
632 SF
Service
R-2(I)
@ 300
3 Occ.
108
263 SF
Domestic Water Pump
R-2(I)
@ 300
1 Occ.
109
250 SF
Fire Pump
R-2(I)
@ 300
1 Occ.
110
107 SF
Janitor's Storage
S-2
@ 100
2 Occ.
177
368 SF
Electrical Room
R-2(I)
@ 300
2 Occ.
153
Max. Common Path of Egress
85' - 6"
45' - 7 1/2"
112 SF
Trash
R-2(I)
@ 300
1 Occ.
112
93 SF
Storage
147a
1187 SF
Family Lobby
152
393 SF
Loading
R-2(I)
@ 300
2 Occ.
11476 SF
ERRCS
R-2(I)
@ 300
1 Occ.
116
1185 SF
Supportive Lobby
115
Max. Exit Travel
Distance
106' - 7"
628 SF
Retail
A-2
@ 15
42 Occ.
159
359 SF
Unit Type S-1
R-2
@ 200
2 Occ.
101
366 SF
Unit Type S-1
R-2
@ 200
2 Occ.
102
361 SF
Unit Type S-1
R-2
@ 200
2 Occ.
103
364 SF
Unit Type S-1
R-2
@ 200
2 Occ.
104
1155 SF
Unit Type 3B-1M
R-2
@ 200
6 Occ.
105
1159 SF
Unit Type 3B-1M
R-2
@ 200
6 Occ.
106
415 SF
Retail
A-2
@ 15
28 Occ.
157
456 SF
Retail
A-2
@ 15
31 Occ.
158
343 SF
Retail
A-2
@ 15
23 Occ.
160
1850 SF
Retail
A-2
@ 15
124 Occ.
155
Max. Exit Travel
Distance
92' - 1"
Sep
. of E
x its
46'-9
"
65'-3
"Dead End
46'-4"
Sep. of Exits
27'-5"
1777 SF
Area
A-3
@ 15
119 Occ.
165
402
36.31
2
3
112
27.8
36
332
9.9
42
24
3
19
2365.719
1
2
2
2
2
2
2
336.62
1
6
2
2
24
1
1
2
2
1
51.5
36
236.936
24
7.2
36
7270.5235
1
118
2
35.436
910 SF
Area
A-3
@ 15
61 Occ.
166
1445 SF
Area
A-3
@ 15
97 Occ.
167
141 SF
Storage
129
36
36
120
1
7TH STREET B
RA
NN
AN
ST
RE
ET
PUBLICLY ACCESSIBLE OPEN SPACE
PR
IVA
TE
ALL
EY
WIT
H
AC
CE
SS
EA
SE
ME
NT
36.31
1
1
2
3636120
2
2207 SF
Area
A-3
@ 15
148 Occ.
168
TOILET COUNT: Family Wingper IS-P-04Offices: 1 occupant per 200 sf = 6 occupantsCommunity Room (for residents) 1 occupant per 30 sf = 26 occupants32 total ocupants; 16 each gender. 1:40 required for Female2 All Gender Toilet Rooms Proivded
Toiletsee note
Toilet Toiletsee note
Toiletsee note
Toilet
TOILET COUNT: Supportive Wing
per IS-P-04
Offices: 1 occupant per 200 sf = 7 occupants
Community Room (for residents) 1 occupant per 30 sf = 32 occupants
39 total ocupants; 20 each gender. 1:40 required for Female
2 All Gender Toilet Rooms Proivded
TOILET COUNT: Core and Shell Commercial Space
per IS-P-04
2 All Gender Toilet Rooms Proivded for
each of 2 Commercial Areas
Toilet
Toilet
Toilet
Toiletsee note
Protected by access easement
429.933
1
3621.672
22
33
1
16.856
19
3
36.31
1
1
2
319.336
288.436
42
12.6
36
62
1
18.672
622
18.6
36
272
8.1
36
24
6
6
41'-4"
Max. Exit Travel
Distance
29' - 4 1/2"
4' Sidewalk to Public Way
FIRE DEPARTMENT
CONNECTION
2 2
OCCUPANCY CBC CHAPTER 3
A-3
B
R-2
S-2
(I)
(A)
(C)
Assembly, Multi-purpose room, Courtyards
Businesses, Office with miscellaneous accessory use
Residential apartments
Low-hazard storage, Bike parking
Incidental
Accessory use - ancillary to main occupancy & 10% of building area (CBC 508.2)
Circulation
OCCUPANT LOAD FACTORS TABLE 1004.1.2
Accessory storage
Assembly (tables & chairs)
Business
Kitchen
Residential
300 GSF
15 NSF
200 GSF
200 GSF
200 GSF
128"126"380
4 Egress Location
Occupancy Load Egress Required Egress Width
Unit
101 R-2
100 SF @ 200
1 Occ.
LEGEND
Room Name
Room # Occupancy
Floor Area @ Area allowed per occupant
Occupant Load
1228 Folsom Street #102San Francisco, California 94103415.908.3767 [email protected]
Architects
SANTOS PRESCOTT AND ASSOCIATES
Owner
N
2" X 3" AREA FOR STAMPS
PROJECT INFORMATION
SHEET TITLE
PROJECT NUMBER
SHEET NUMBER
REVISIONS:
SUBMITTAL:
STAMP:
Santos Prescott and Associates
1/1
1/2
021
6:1
6:5
2 P
MB
IM 3
60
://6
00
Se
ven
th S
tre
et/
60
0 7
th S
tre
et_
Ce
ntr
al V
.7.r
vt
January 11, 2021Design Development
600 7TH STREET
Mercy Housing California
San Francisco, CA 94107
Code Analysis Plans
2001
A0.311/8" = 1'-0"1
Ground Floor Level (Level of Discharge)
# DATE DESCRIPTION
1 12/11/20 RESPONSE TO PCL #1
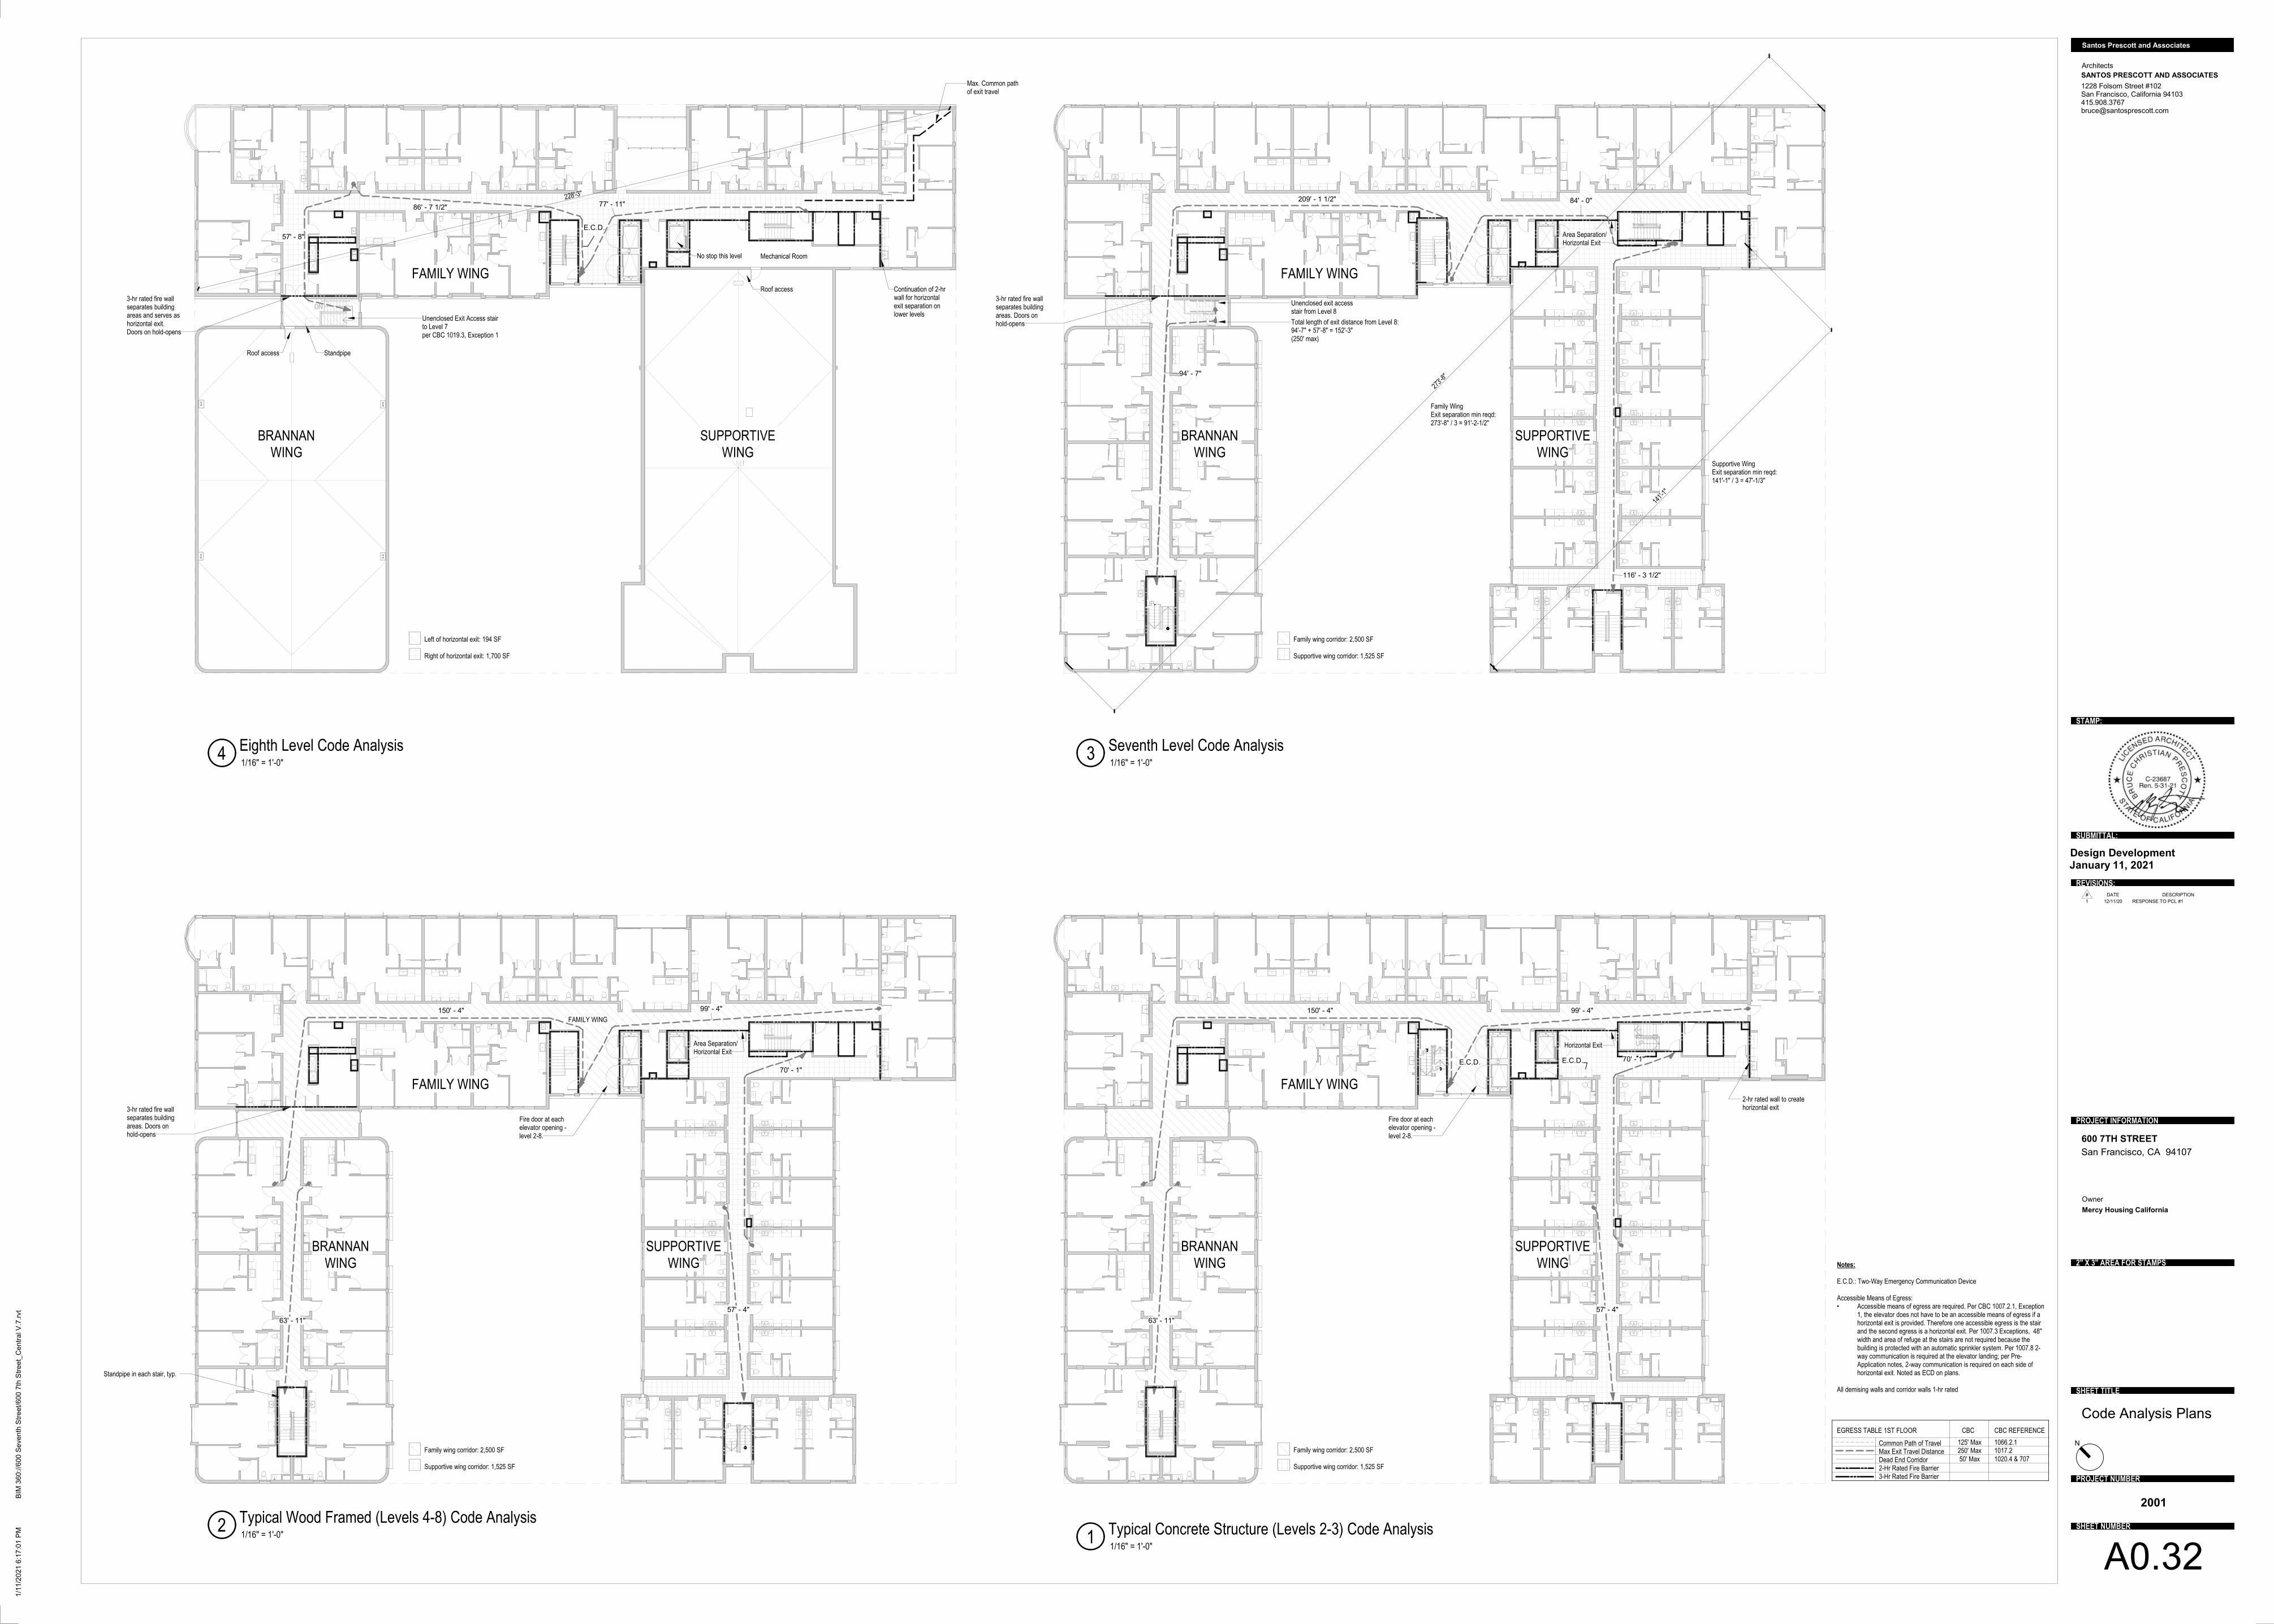
UP
BE9-2816
BE9-8707
E9-8715
BE9-8707
E9-8715
BE9-8707
E9-8715
BE9-8707
E9-8715
BE9-8707
E9-8715
BE9-2816
DN
BE9-2816 BE9-2816
BE9-8707
E9-8715
BE9-8707
E9-8715
BE9-8707
E9-8715
BE9-8707
E9-8715
BE9-8707
E9-8715
UP
UP
UP
BE9-2816 BE9-2816
BE9-8707
E9-8715
BE9-8707
E9-8715
BE9-8707
E9-8715
BE9-8707
E9-8715
BE9-8707
E9-8715
UP
BE9-2816 BE9-2816
BE9-8707
E9-8715
BE9-8707
E9-8715
BE9-8707
E9-8715
BE9-8707
E9-8715
BE9-8707
E9-8715
116' - 3 1/2"
273'-
8"
209' - 1 1/2"
Family Wing Exit separation min reqd: 273'-8" / 3 = 91'-2-1/2"
Unenclosed exit access stair from Level 8
141'-
1"
Supportive Wing Exit separation min reqd: 141'-1" / 3 = 47'-1/3"
Area Separation/ Horizontal Exit
Family wing corridor: 2,500 SF
Supportive wing corridor: 1,525 SF
Total length of exit distance from Level 8: 94'-7" + 57'-8" = 152'-3" (250' max)
94' - 7"
84' - 0"
3-hr rated fire wall separates building areas. Doors on hold-opens
FAMILY WING
BRANNAN
WING
SUPPORTIVE
WING
Continuation of 2-hr wall for horizontal exit separation on lower levels
No stop this level
Unenclosed Exit Access stair to Level 7per CBC 1019.3, Exception 1
57' - 8"
86' - 7 1/2"
Roof access
Roof access
E.C.D.
Max. Common path of exit travel
Left of horizontal exit: 194 SF
Right of horizontal exit: 1,700 SF
Mechanical Room
228'-3"
77' - 11"
3-hr rated fire wall separates building areas and serves as horizontal exit. Doors on hold-opens
FAMILY WING
BRANNAN
WING
SUPPORTIVE
WING
Standpipe
150' - 4" 99' - 4"
70' - 1"
57' - 4"
63' - 11"
Fire door at each elevator opening -level 2-8.
E.C.D.E.C.D.
Family wing corridor: 2,500 SF
Supportive wing corridor: 1,525 SF
FAMILY WING
Horizontal Exit
2-hr rated wall to create horizontal exit
BRANNAN
WING
SUPPORTIVE
WING
150' - 4" 99' - 4"
70' - 1"
57' - 4"
63' - 11"
Fire door at each elevator opening -level 2-8.
Family wing corridor: 2,500 SF
Supportive wing corridor: 1,525 SF
FAMILY WING
Area Separation/ Horizontal Exit
Standpipe in each stair, typ.
3-hr rated fire wall separates building areas. Doors on hold-opens
FAMILY WING
BRANNAN
WING
SUPPORTIVE
WING Notes:
E.C.D.: Two-Way Emergency Communication Device
Accessible Means of Egress:• Accessible means of egress are required. Per CBC 1007.2.1, Exception
1, the elevator does not have to be an accessible means of egress if a horizontal exit is provided. Therefore one accessible egress is the stair and the second egress is a horizontal exit. Per 1007.3 Exceptions, 48" width and area of refuge at the stairs are not required because the building is protected with an automatic sprinkler system. Per 1007.8 2-way communication is required at the elevator landing; per Pre-Application notes, 2-way communication is required on each side of horizontal exit. Noted as ECD on plans.
All demising walls and corridor walls 1-hr rated
Common Path of Travel Max Exit Travel DistanceDead End Corridor2-Hr Rated Fire Barrier3-Hr Rated Fire Barrier
125' Max250' Max50' Max
1066.2.11017.21020.4 & 707
CBC CBC REFERENCEEGRESS TABLE 1ST FLOOR
1228 Folsom Street #102San Francisco, California 94103415.908.3767 [email protected]
Architects
SANTOS PRESCOTT AND ASSOCIATES
Owner
N
2" X 3" AREA FOR STAMPS
PROJECT INFORMATION
SHEET TITLE
PROJECT NUMBER
SHEET NUMBER
REVISIONS:
SUBMITTAL:
STAMP:
Santos Prescott and Associates
1/1
1/2
021
6:1
7:0
1 P
MB
IM 3
60
://6
00
Se
ven
th S
tre
et/
60
0 7
th S
tre
et_
Ce
ntr
al V
.7.r
vt
January 11, 2021Design Development
600 7TH STREET
Mercy Housing California
San Francisco, CA 94107
Code Analysis Plans
2001
A0.32
1/16" = 1'-0"3
Seventh Level Code Analysis1/16" = 1'-0"
4Eighth Level Code Analysis
1/16" = 1'-0"1
Typical Concrete Structure (Levels 2-3) Code Analysis1/16" = 1'-0"2
Typical Wood Framed (Levels 4-8) Code Analysis
# DATE DESCRIPTION
1 12/11/20 RESPONSE TO PCL #1
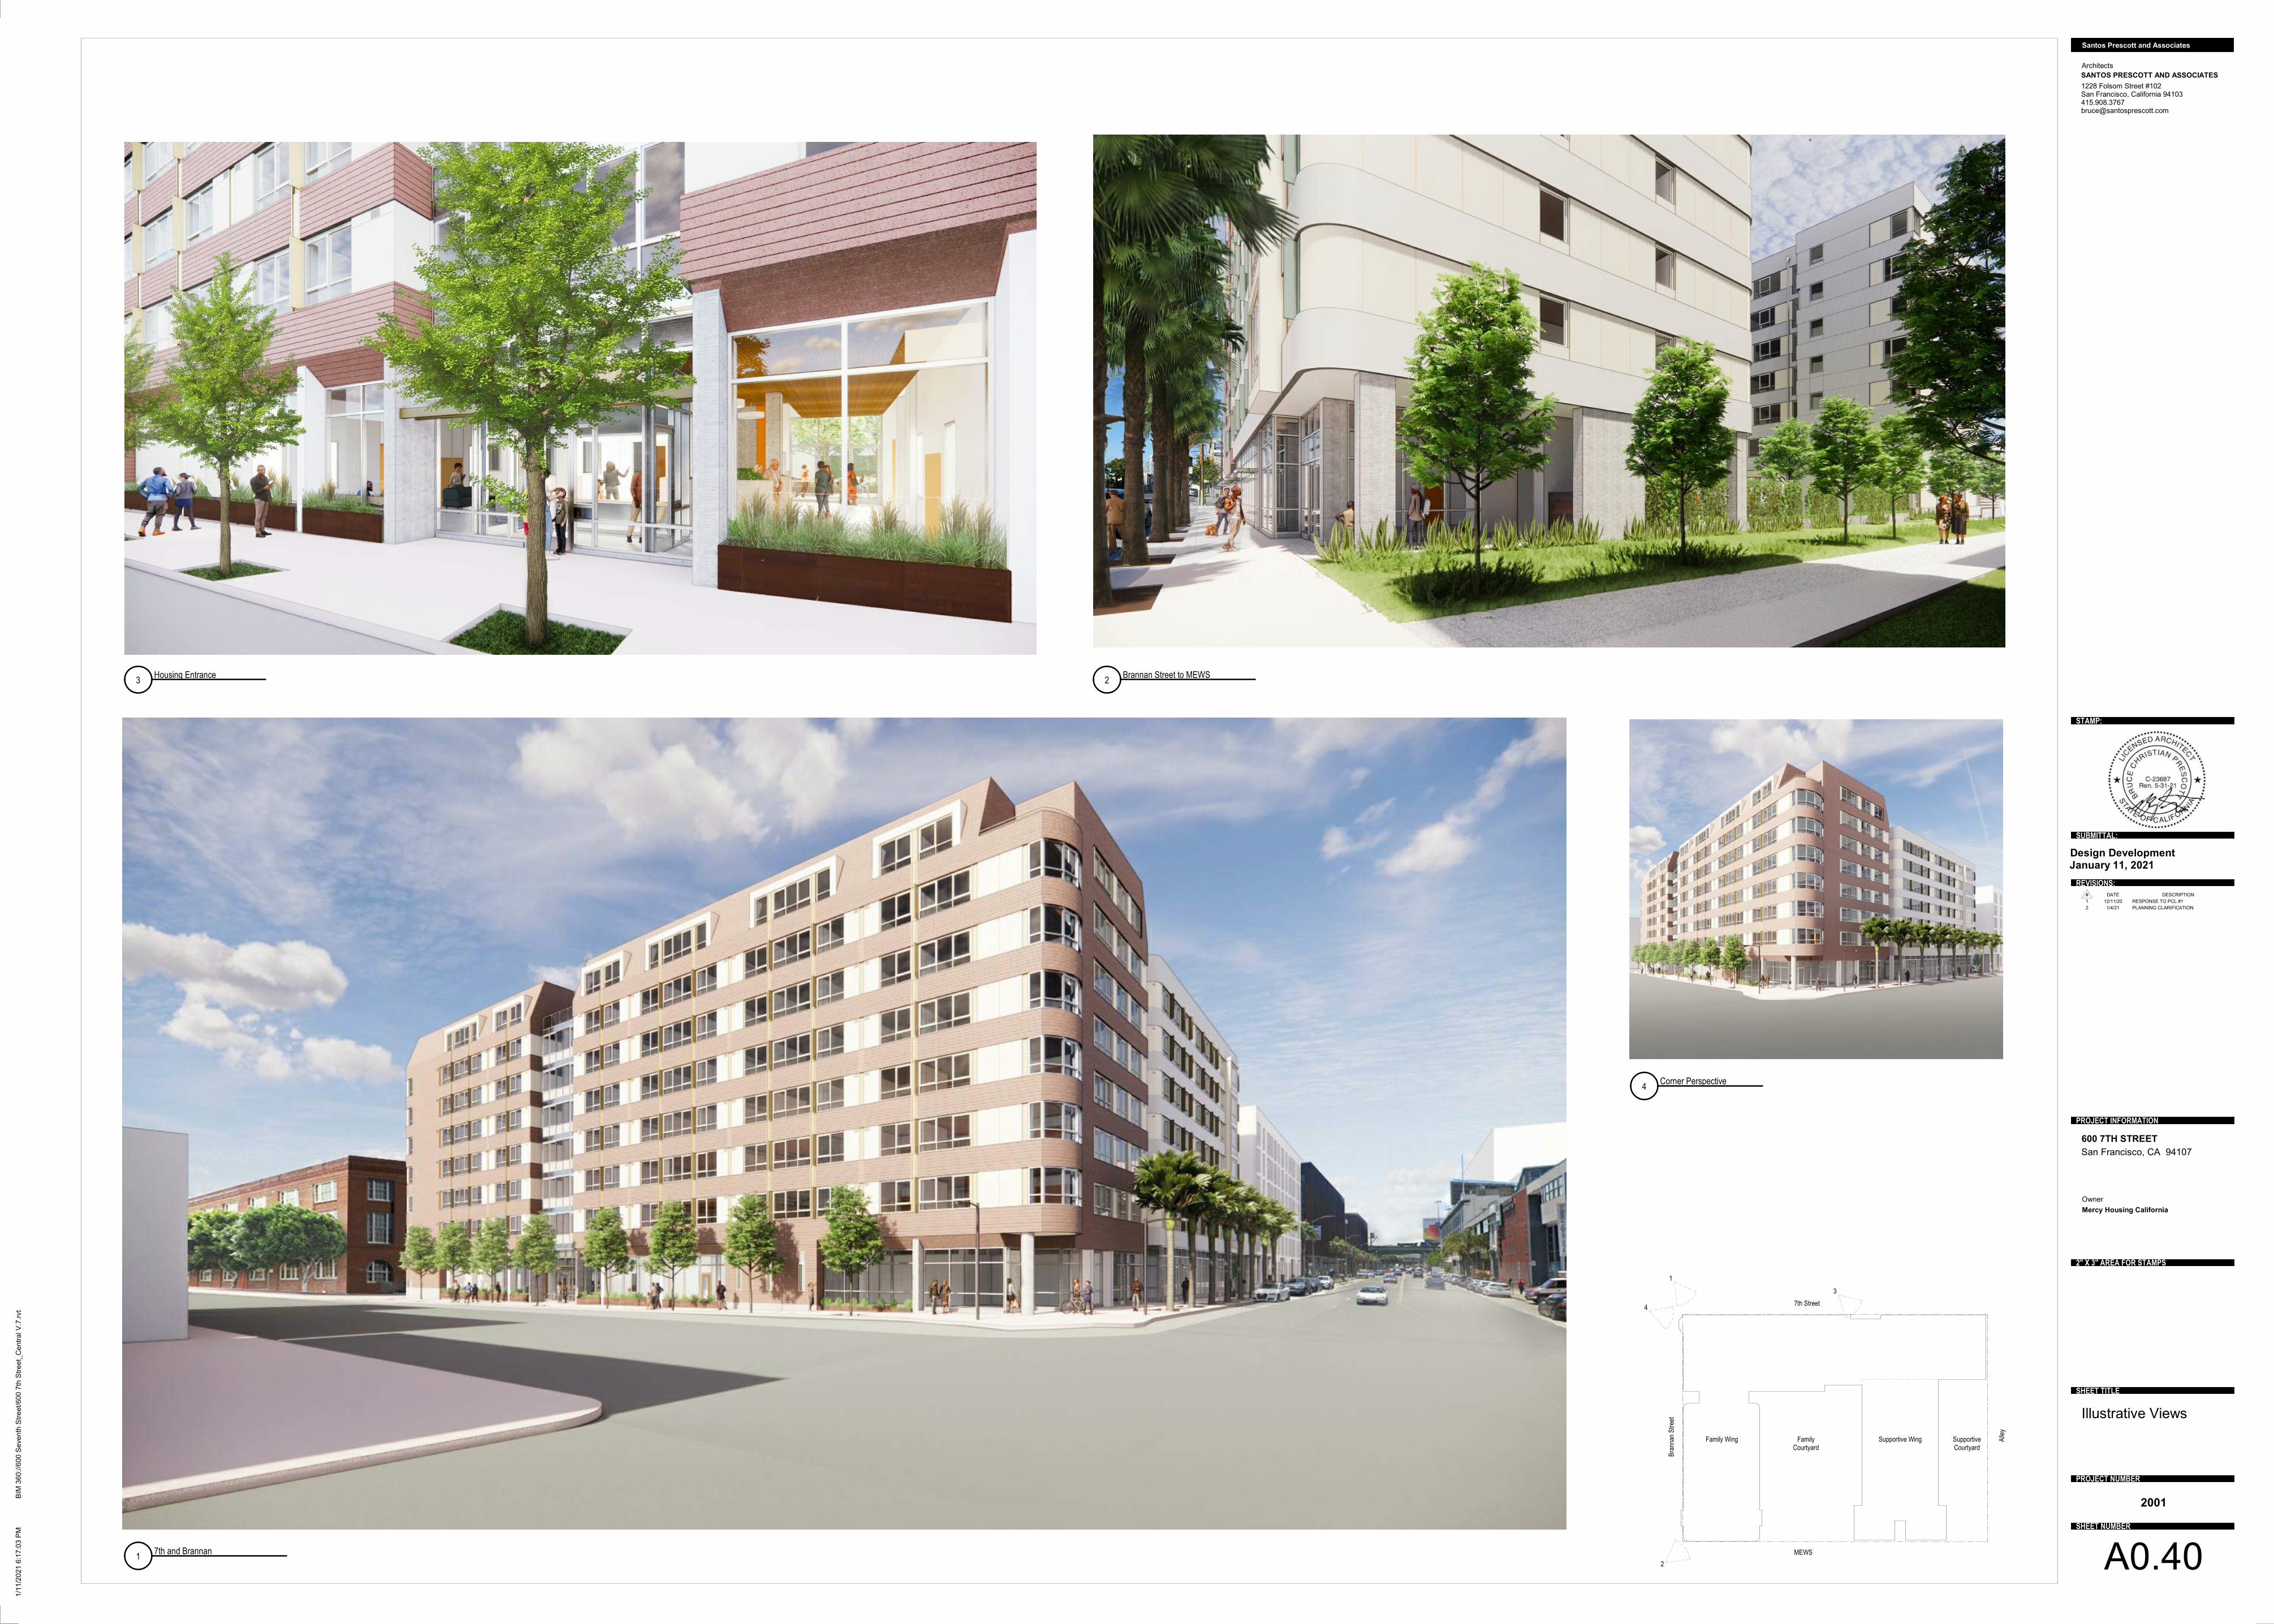
7th Street
Bra
nnan
Str
eet
Supportive WingFamily Wing
MEWS
Alle
y
Family Courtyard
Supportive Courtyard
1228 Folsom Street #102San Francisco, California 94103415.908.3767 [email protected]
Architects
SANTOS PRESCOTT AND ASSOCIATES
Owner
2" X 3" AREA FOR STAMPS
PROJECT INFORMATION
SHEET TITLE
PROJECT NUMBER
SHEET NUMBER
REVISIONS:
SUBMITTAL:
STAMP:
Santos Prescott and Associates
1/1
1/2
021
6:1
7:0
3 P
MB
IM 3
60
://6
00
Se
ven
th S
tre
et/
60
0 7
th S
tre
et_
Ce
ntr
al V
.7.r
vt
January 11, 2021Design Development
600 7TH STREET
Mercy Housing California
San Francisco, CA 94107
Illustrative Views
2001
A0.4017th and Brannan
2Brannan Street to MEWS
3Housing Entrance
1
2
3
4Corner Perspective
4
# DATE DESCRIPTION
1 12/11/20 RESPONSE TO PCL #1
2 1/4/21 PLANNING CLARIFICATION
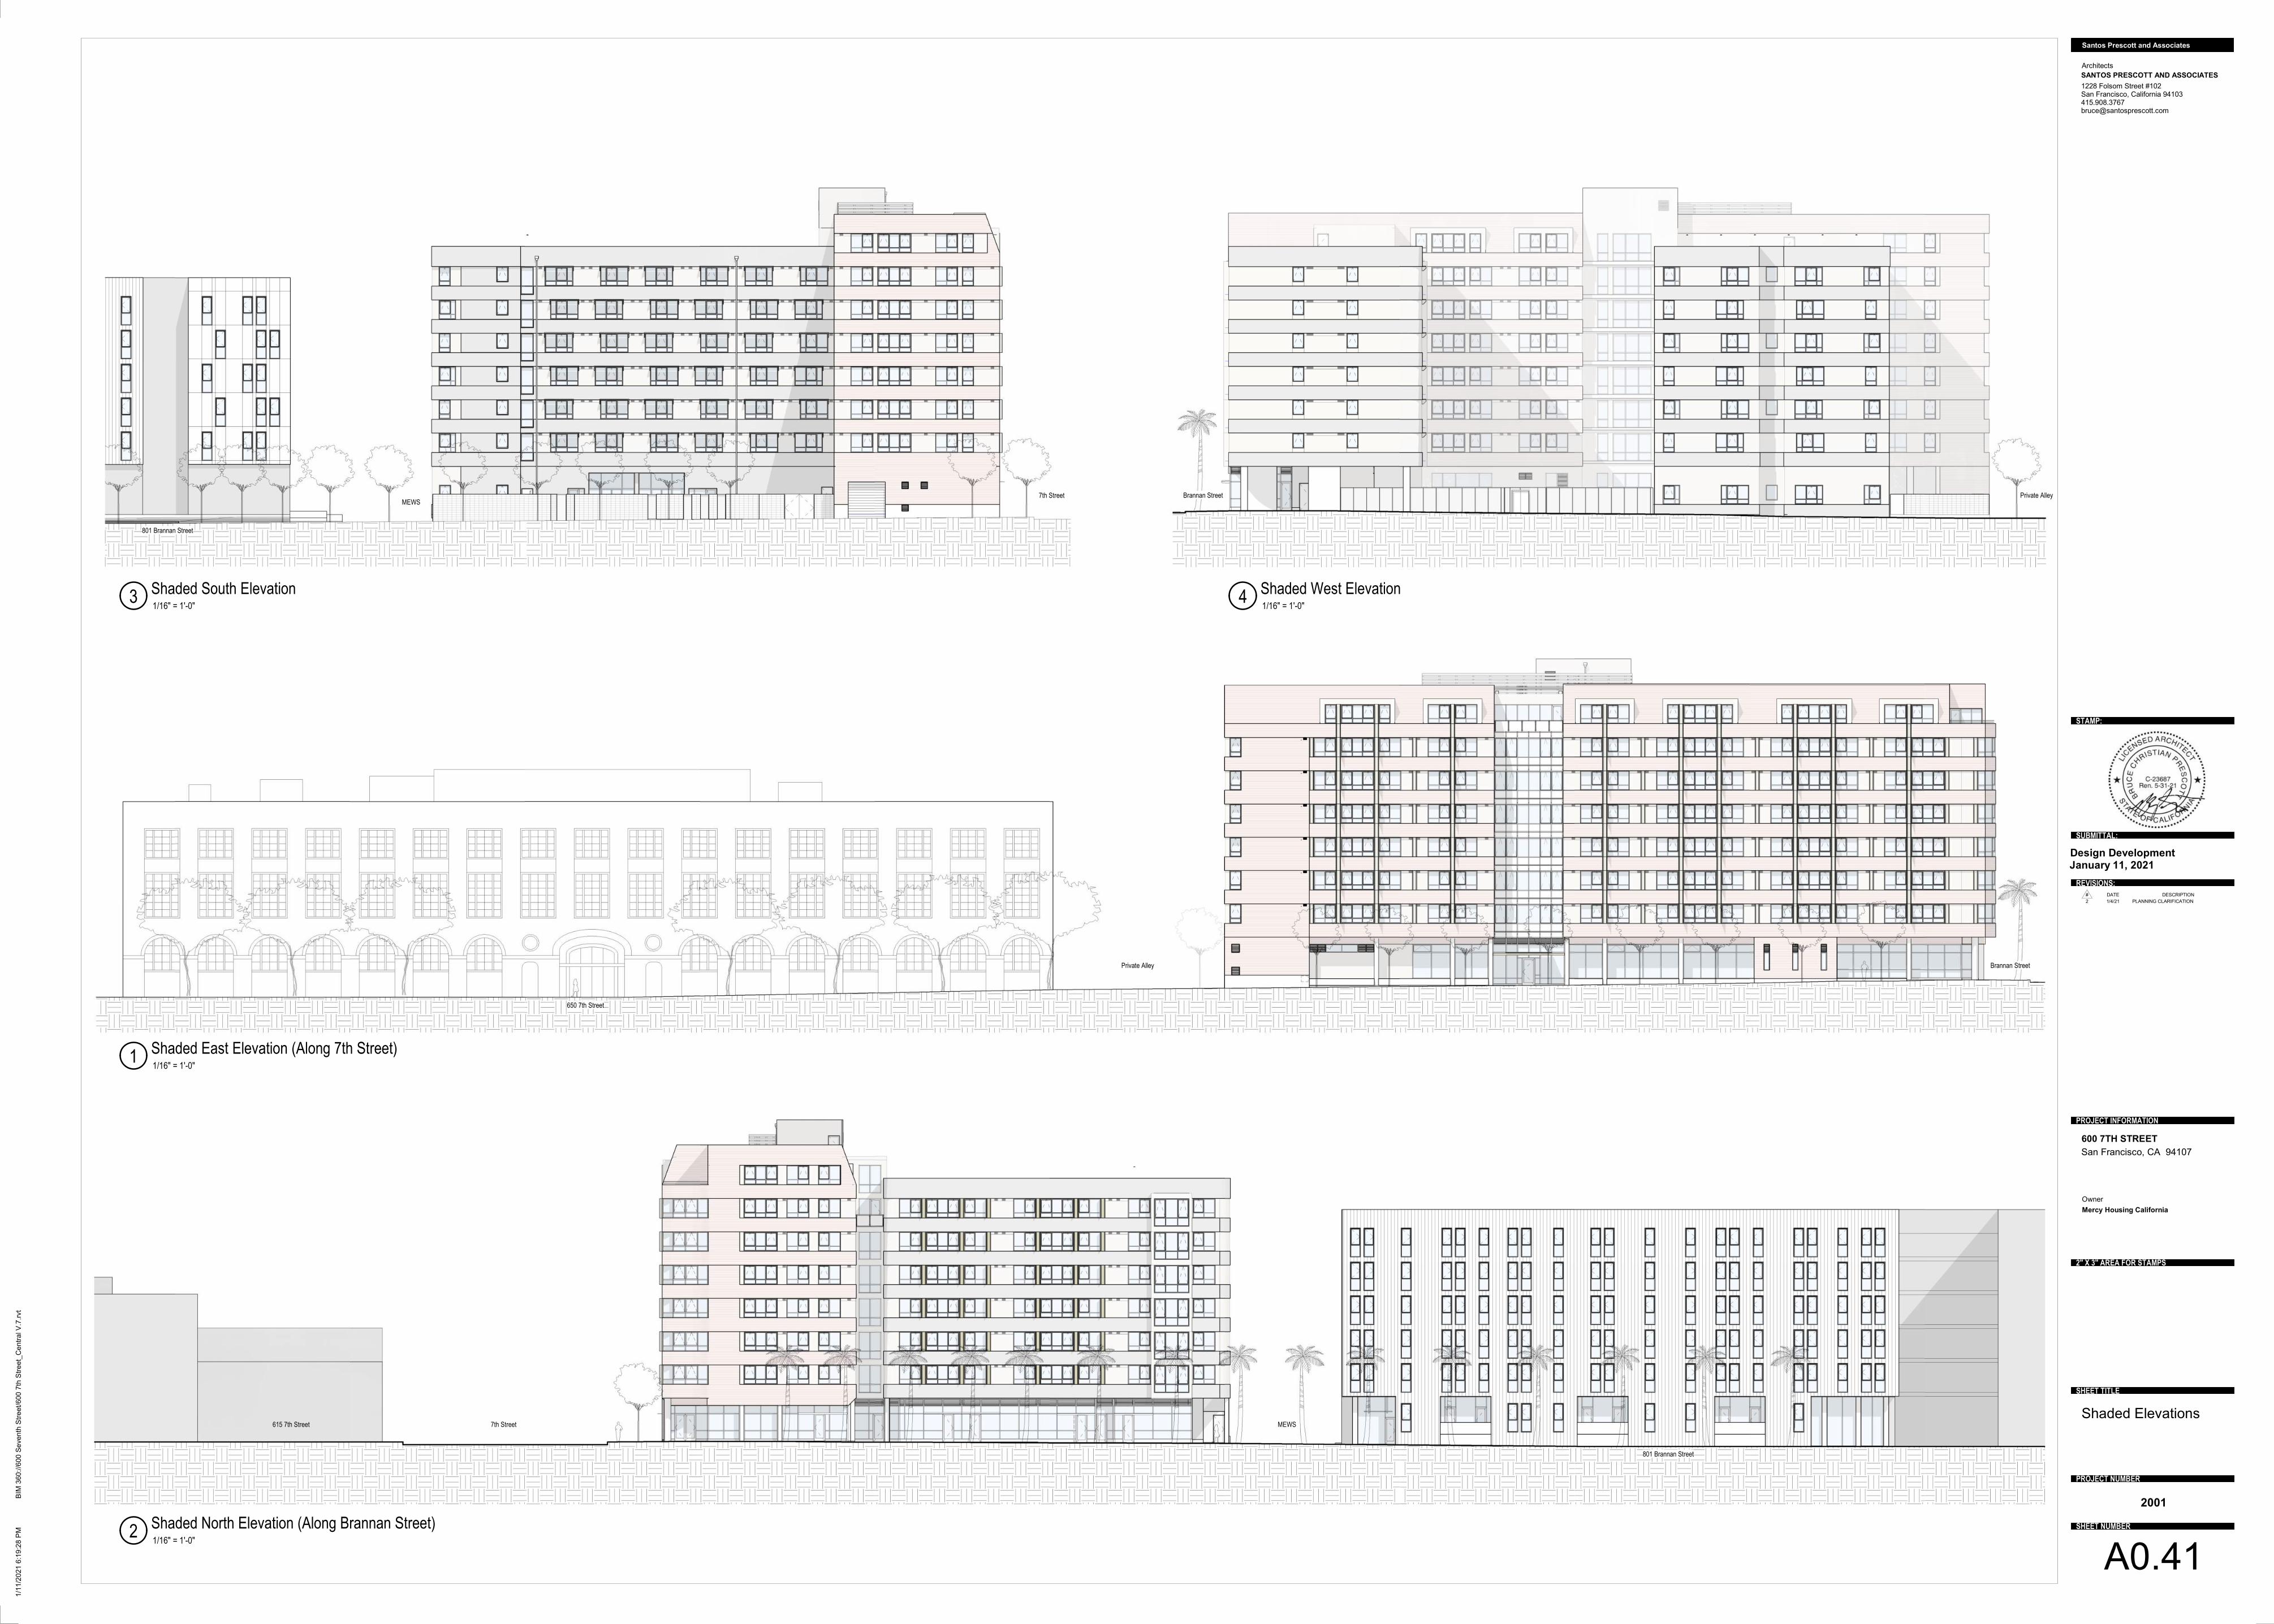
Private Alley
650 7th Street
Brannan Street
7th Street MEWS
801 Brannan Street
615 7th Street
MEWS7th Street
801 Brannan Street
Brannan Street Private Alley
1228 Folsom Street #102San Francisco, California 94103415.908.3767 [email protected]
Architects
SANTOS PRESCOTT AND ASSOCIATES
Owner
2" X 3" AREA FOR STAMPS
PROJECT INFORMATION
SHEET TITLE
PROJECT NUMBER
SHEET NUMBER
REVISIONS:
SUBMITTAL:
STAMP:
Santos Prescott and Associates
1/1
1/2
021
6:1
9:2
8 P
MB
IM 3
60
://6
00
Se
ven
th S
tre
et/
60
0 7
th S
tre
et_
Ce
ntr
al V
.7.r
vt
January 11, 2021Design Development
600 7TH STREET
Mercy Housing California
San Francisco, CA 94107
Shaded Elevations
2001
A0.41
1/16" = 1'-0"1
Shaded East Elevation (Along 7th Street)
1/16" = 1'-0"2
Shaded North Elevation (Along Brannan Street)
1/16" = 1'-0"3
Shaded South Elevation1/16" = 1'-0"
4Shaded West Elevation
# DATE DESCRIPTION
2 1/4/21 PLANNING CLARIFICATION
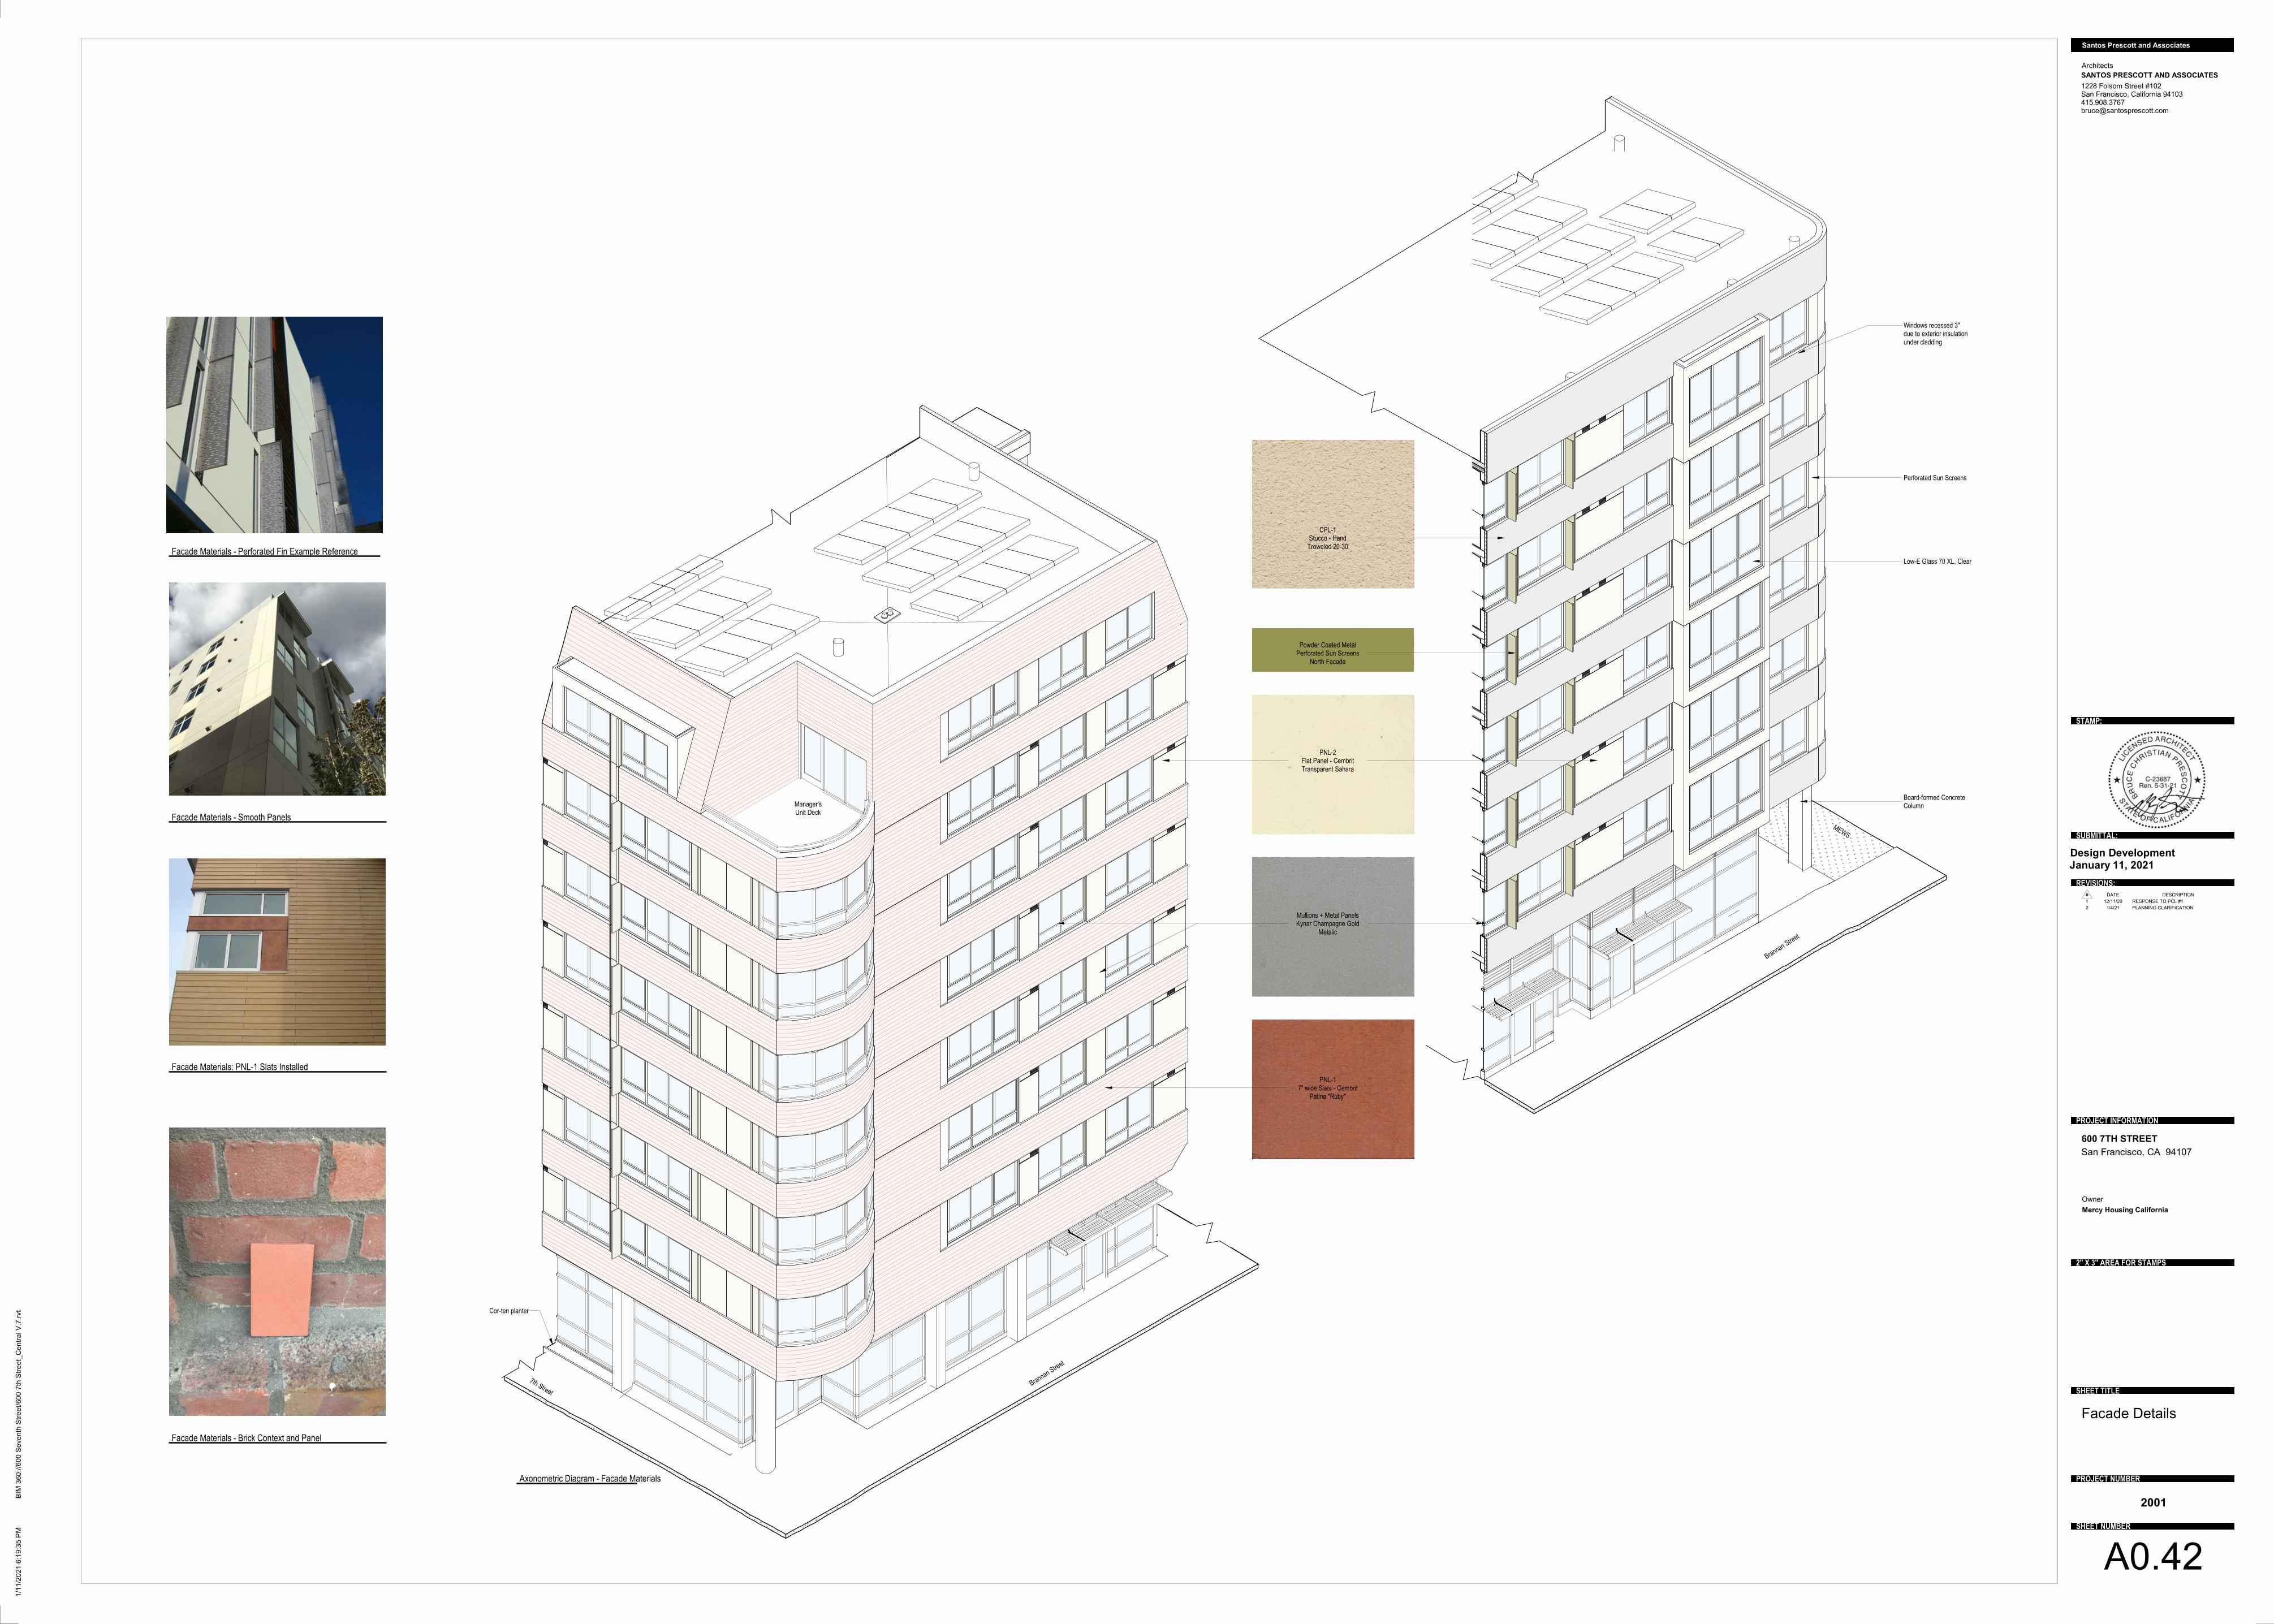
Brannan Street
7th Street
Manager's Unit Deck
MEWS
Brannan Street
1228 Folsom Street #102San Francisco, California 94103415.908.3767 [email protected]
Architects
SANTOS PRESCOTT AND ASSOCIATES
Owner
2" X 3" AREA FOR STAMPS
PROJECT INFORMATION
SHEET TITLE
PROJECT NUMBER
SHEET NUMBER
REVISIONS:
SUBMITTAL:
STAMP:
Santos Prescott and Associates
1/1
1/2
021
6:1
9:3
5 P
MB
IM 3
60
://6
00
Se
ven
th S
tre
et/
60
0 7
th S
tre
et_
Ce
ntr
al V
.7.r
vt
January 11, 2021Design Development
600 7TH STREET
Mercy Housing California
San Francisco, CA 94107
Facade Details
2001
A0.42
Axonometric Diagram - Facade Materials
PNL-2Flat Panel - Cembrit Transparent Sahara
PNL-17" wide Slats - Cembrit
Patina "Ruby"
Mullions + Metal PanelsKynar Champagne Gold
Metalic
CPL-1Stucco - Hand
Troweled 20-30
Board-formed Concrete Column
Perforated Sun Screens
Facade Materials - Perforated Fin Example ReferenceLow-E Glass 70 XL, Clear
Windows recessed 3" due to exterior insulationunder cladding
Facade Materials - Smooth Panels
Facade Materials: PNL-1 Slats Installed
Cor-ten planter
Powder Coated MetalPerforated Sun Screens
North Facade
# DATE DESCRIPTION
1 12/11/20 RESPONSE TO PCL #1
2 1/4/21 PLANNING CLARIFICATION
Facade Materials - Brick Context and Panel
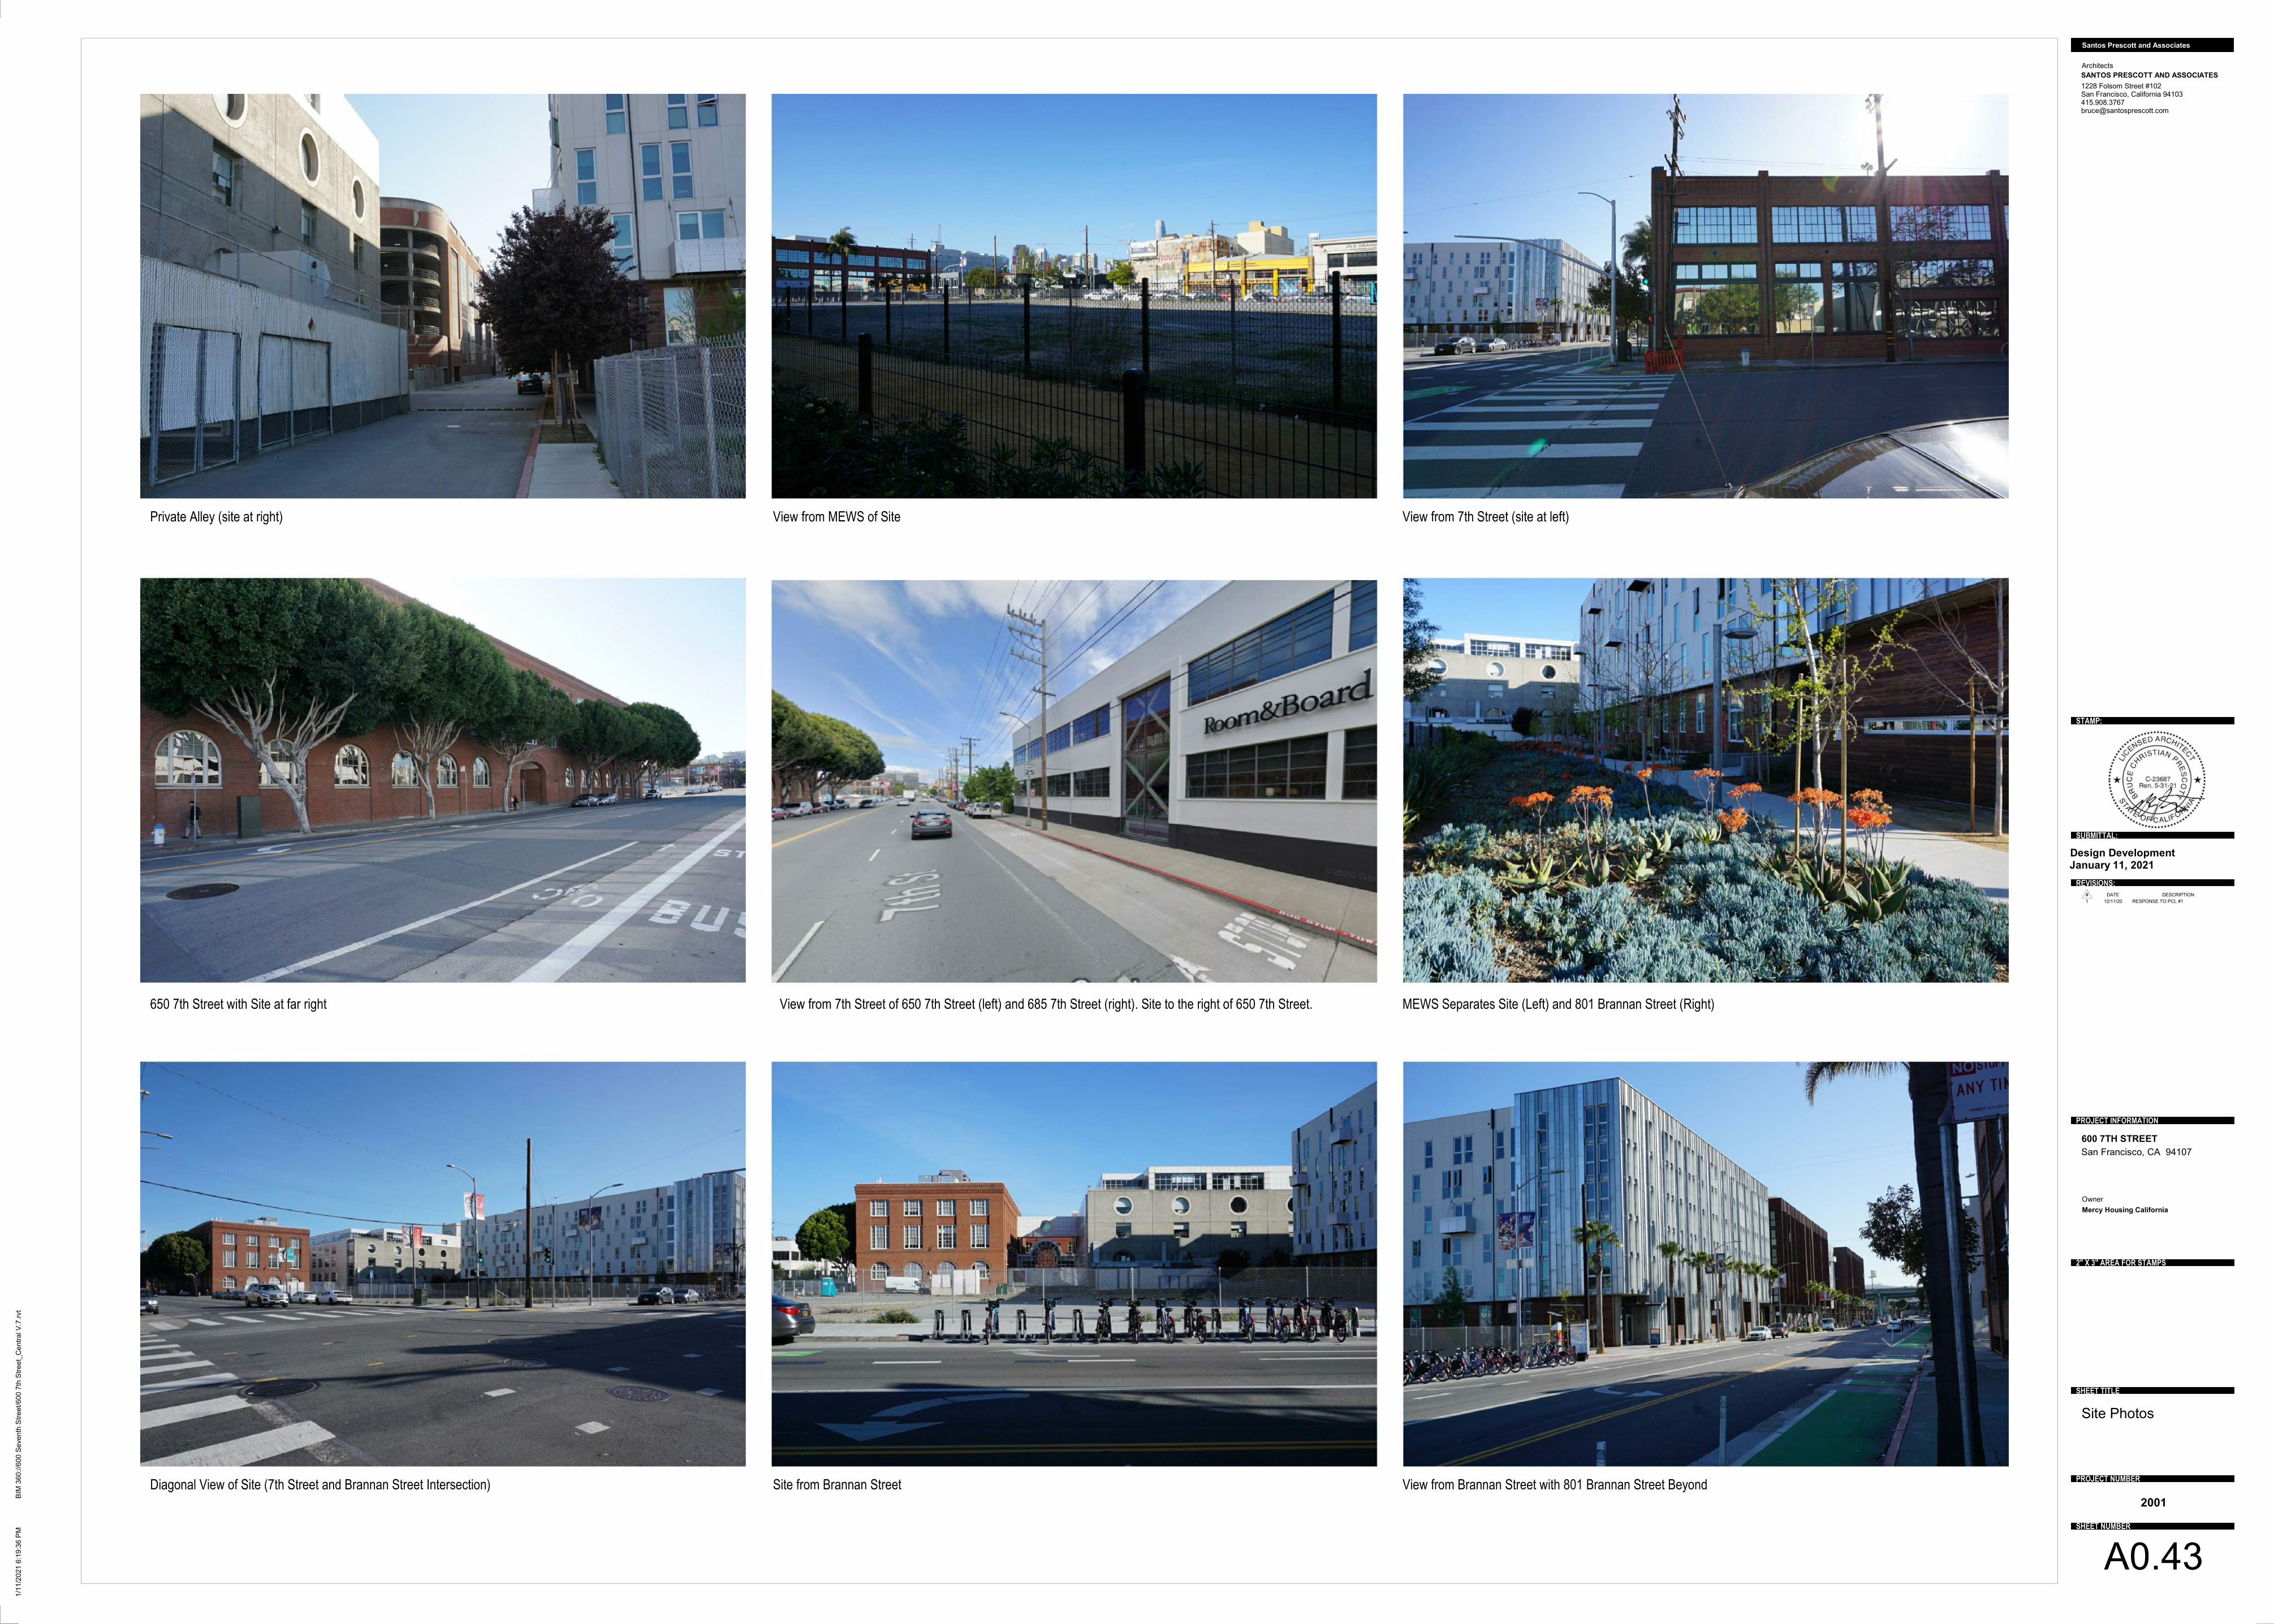
1228 Folsom Street #102San Francisco, California 94103415.908.3767 [email protected]
Architects
SANTOS PRESCOTT AND ASSOCIATES
Owner
2" X 3" AREA FOR STAMPS
PROJECT INFORMATION
SHEET TITLE
PROJECT NUMBER
SHEET NUMBER
REVISIONS:
SUBMITTAL:
STAMP:
Santos Prescott and Associates
1/1
1/2
021
6:1
9:3
6 P
MB
IM 3
60
://6
00
Se
ven
th S
tre
et/
60
0 7
th S
tre
et_
Ce
ntr
al V
.7.r
vt
January 11, 2021Design Development
600 7TH STREET
Mercy Housing California
San Francisco, CA 94107
Site Photos
2001
A0.43
Private Alley (site at right) View from MEWS of Site View from 7th Street (site at left)
650 7th Street with Site at far right View from 7th Street of 650 7th Street (left) and 685 7th Street (right). Site to the right of 650 7th Street. MEWS Separates Site (Left) and 801 Brannan Street (Right)
Diagonal View of Site (7th Street and Brannan Street Intersection) Site from Brannan Street View from Brannan Street with 801 Brannan Street Beyond
# DATE DESCRIPTION
1 12/11/20 RESPONSE TO PCL #1
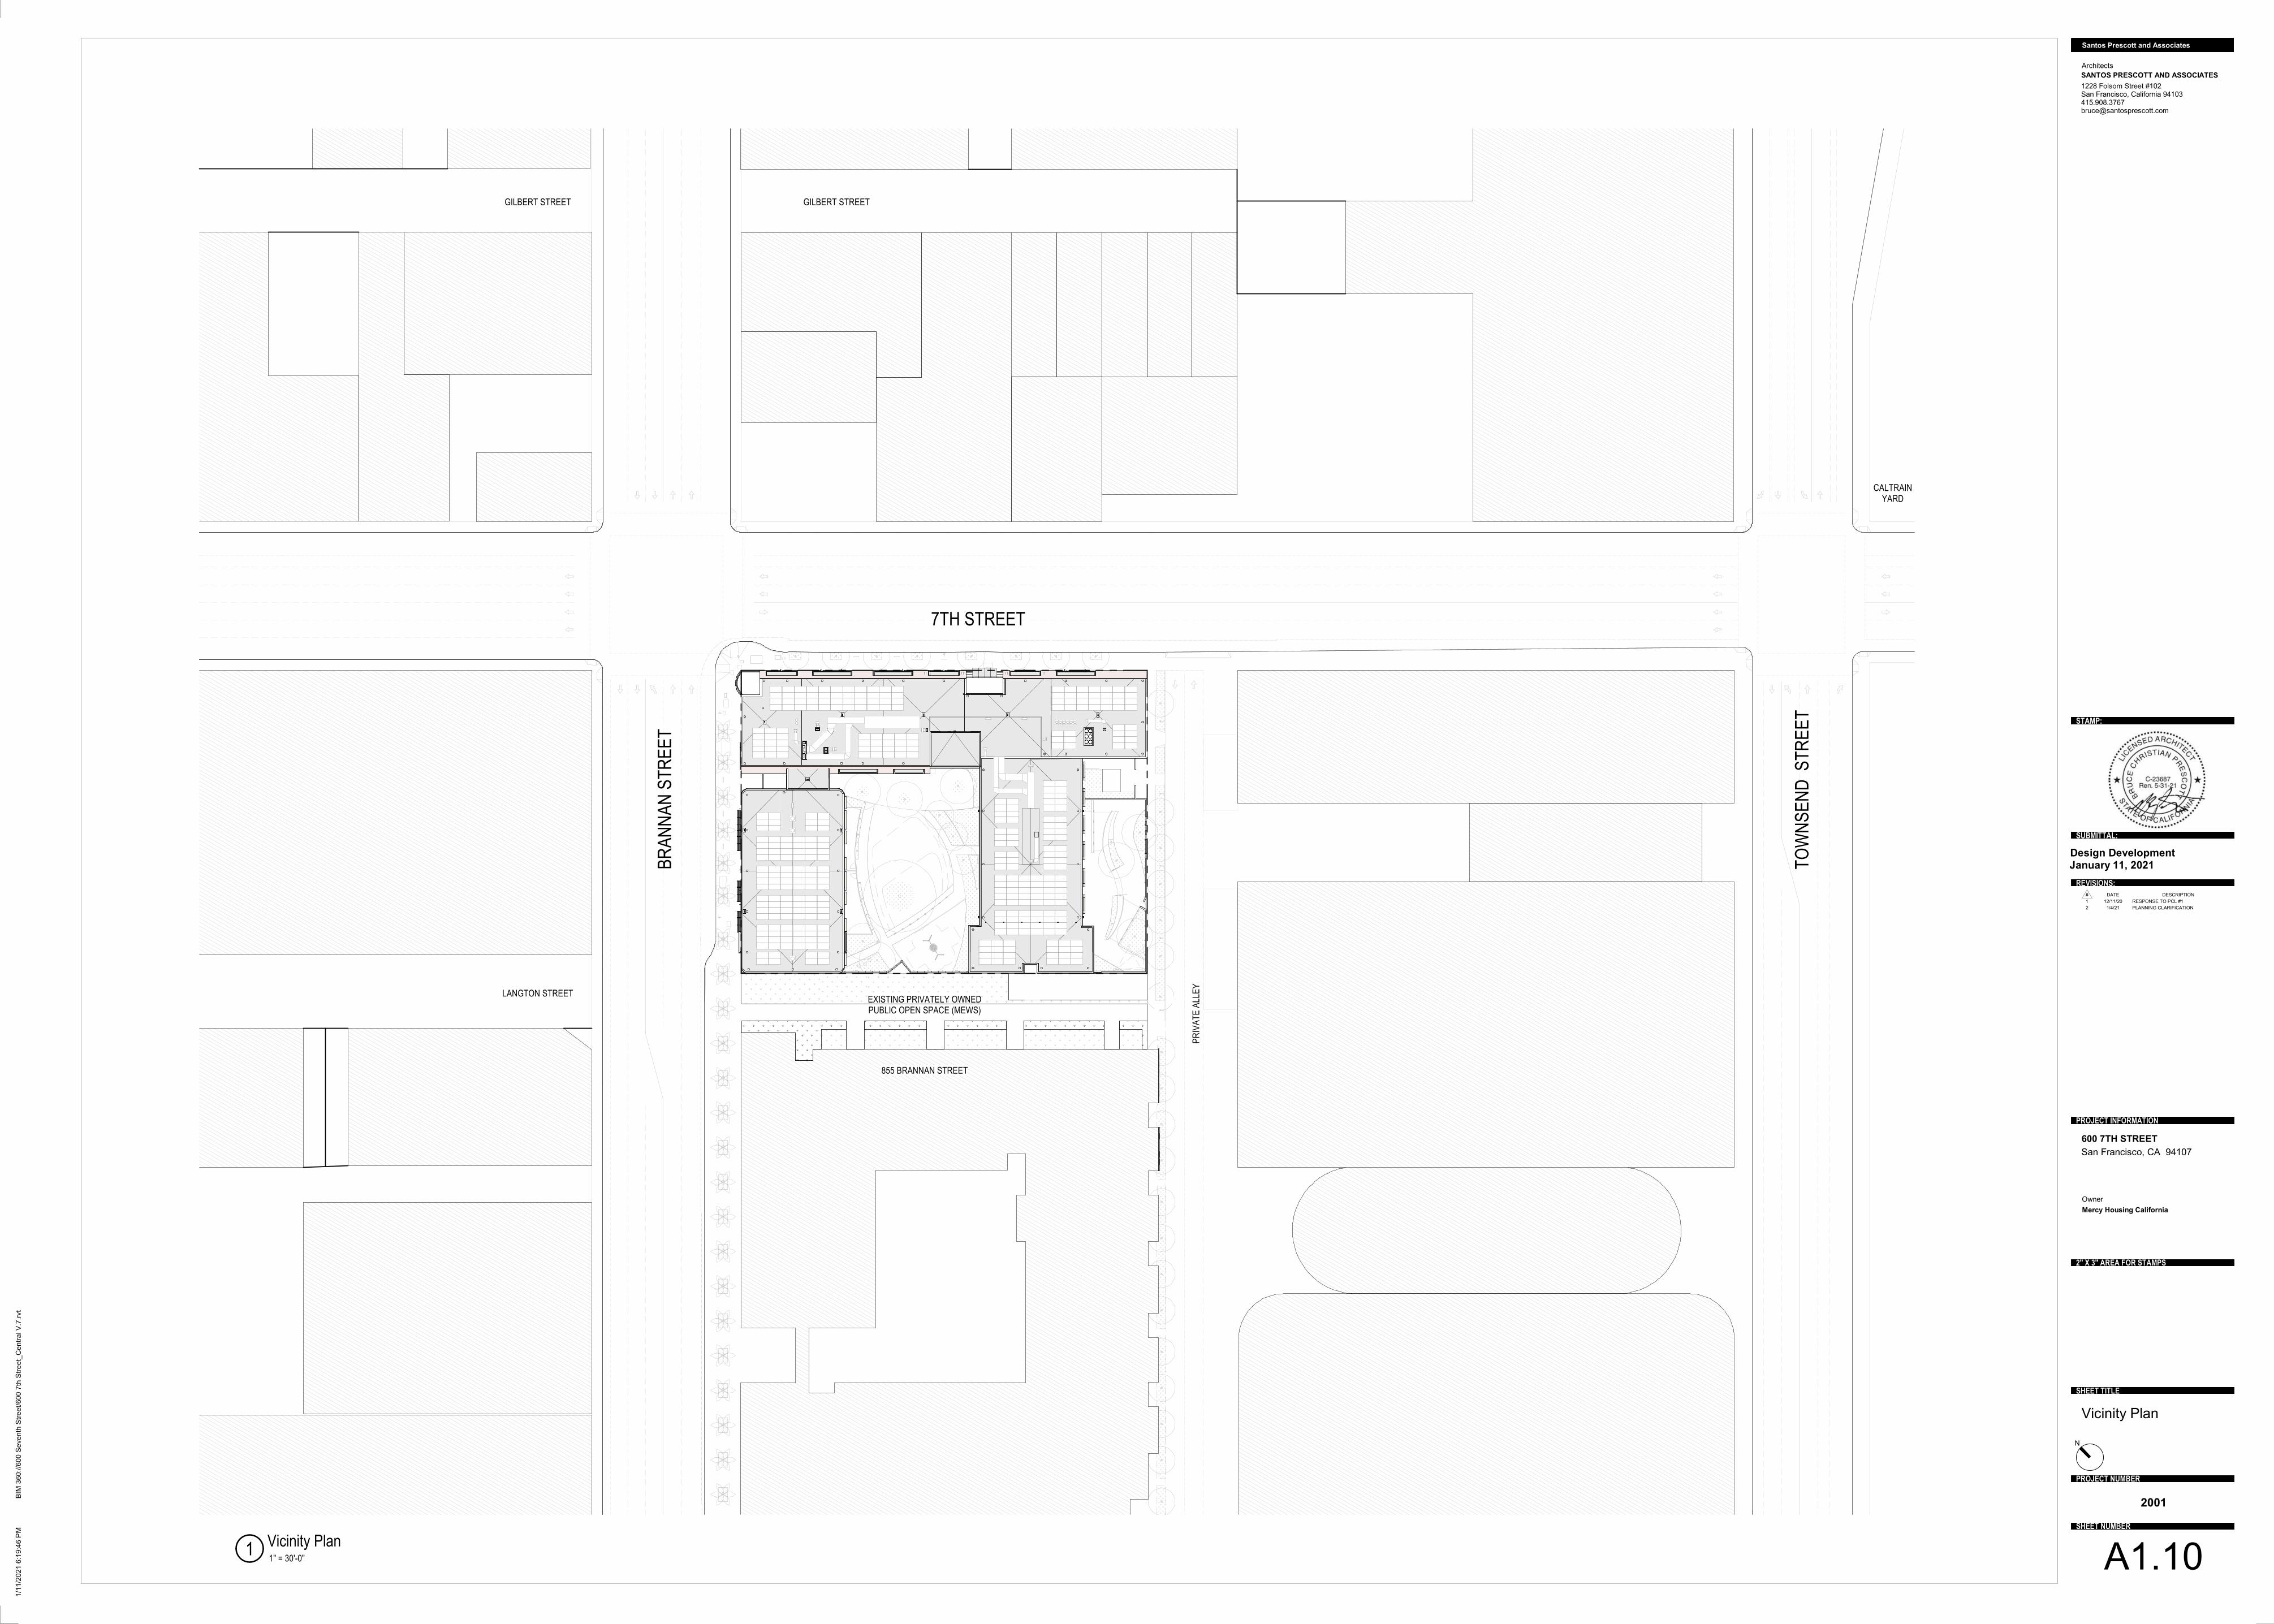
7TH STREET
BR
AN
NA
N S
TR
EE
T
855 BRANNAN STREET
LANGTON STREETEXISTING PRIVATELY OWNED PUBLIC OPEN SPACE (MEWS)
PR
IVA
TE
ALL
EY
GILBERT STREET GILBERT STREET
TO
WN
SE
ND
ST
RE
ET
CALTRAIN YARD
1228 Folsom Street #102San Francisco, California 94103415.908.3767 [email protected]
Architects
SANTOS PRESCOTT AND ASSOCIATES
Owner
N
2" X 3" AREA FOR STAMPS
PROJECT INFORMATION
SHEET TITLE
PROJECT NUMBER
SHEET NUMBER
REVISIONS:
SUBMITTAL:
STAMP:
Santos Prescott and Associates
1/1
1/2
021
6:1
9:4
6 P
MB
IM 3
60
://6
00
Se
ven
th S
tre
et/
60
0 7
th S
tre
et_
Ce
ntr
al V
.7.r
vt
January 11, 2021Design Development
600 7TH STREET
Mercy Housing California
San Francisco, CA 94107
Vicinity Plan
2001
A1.101" = 30'-0"1
Vicinity Plan
# DATE DESCRIPTION
1 12/11/20 RESPONSE TO PCL #1
2 1/4/21 PLANNING CLARIFICATION
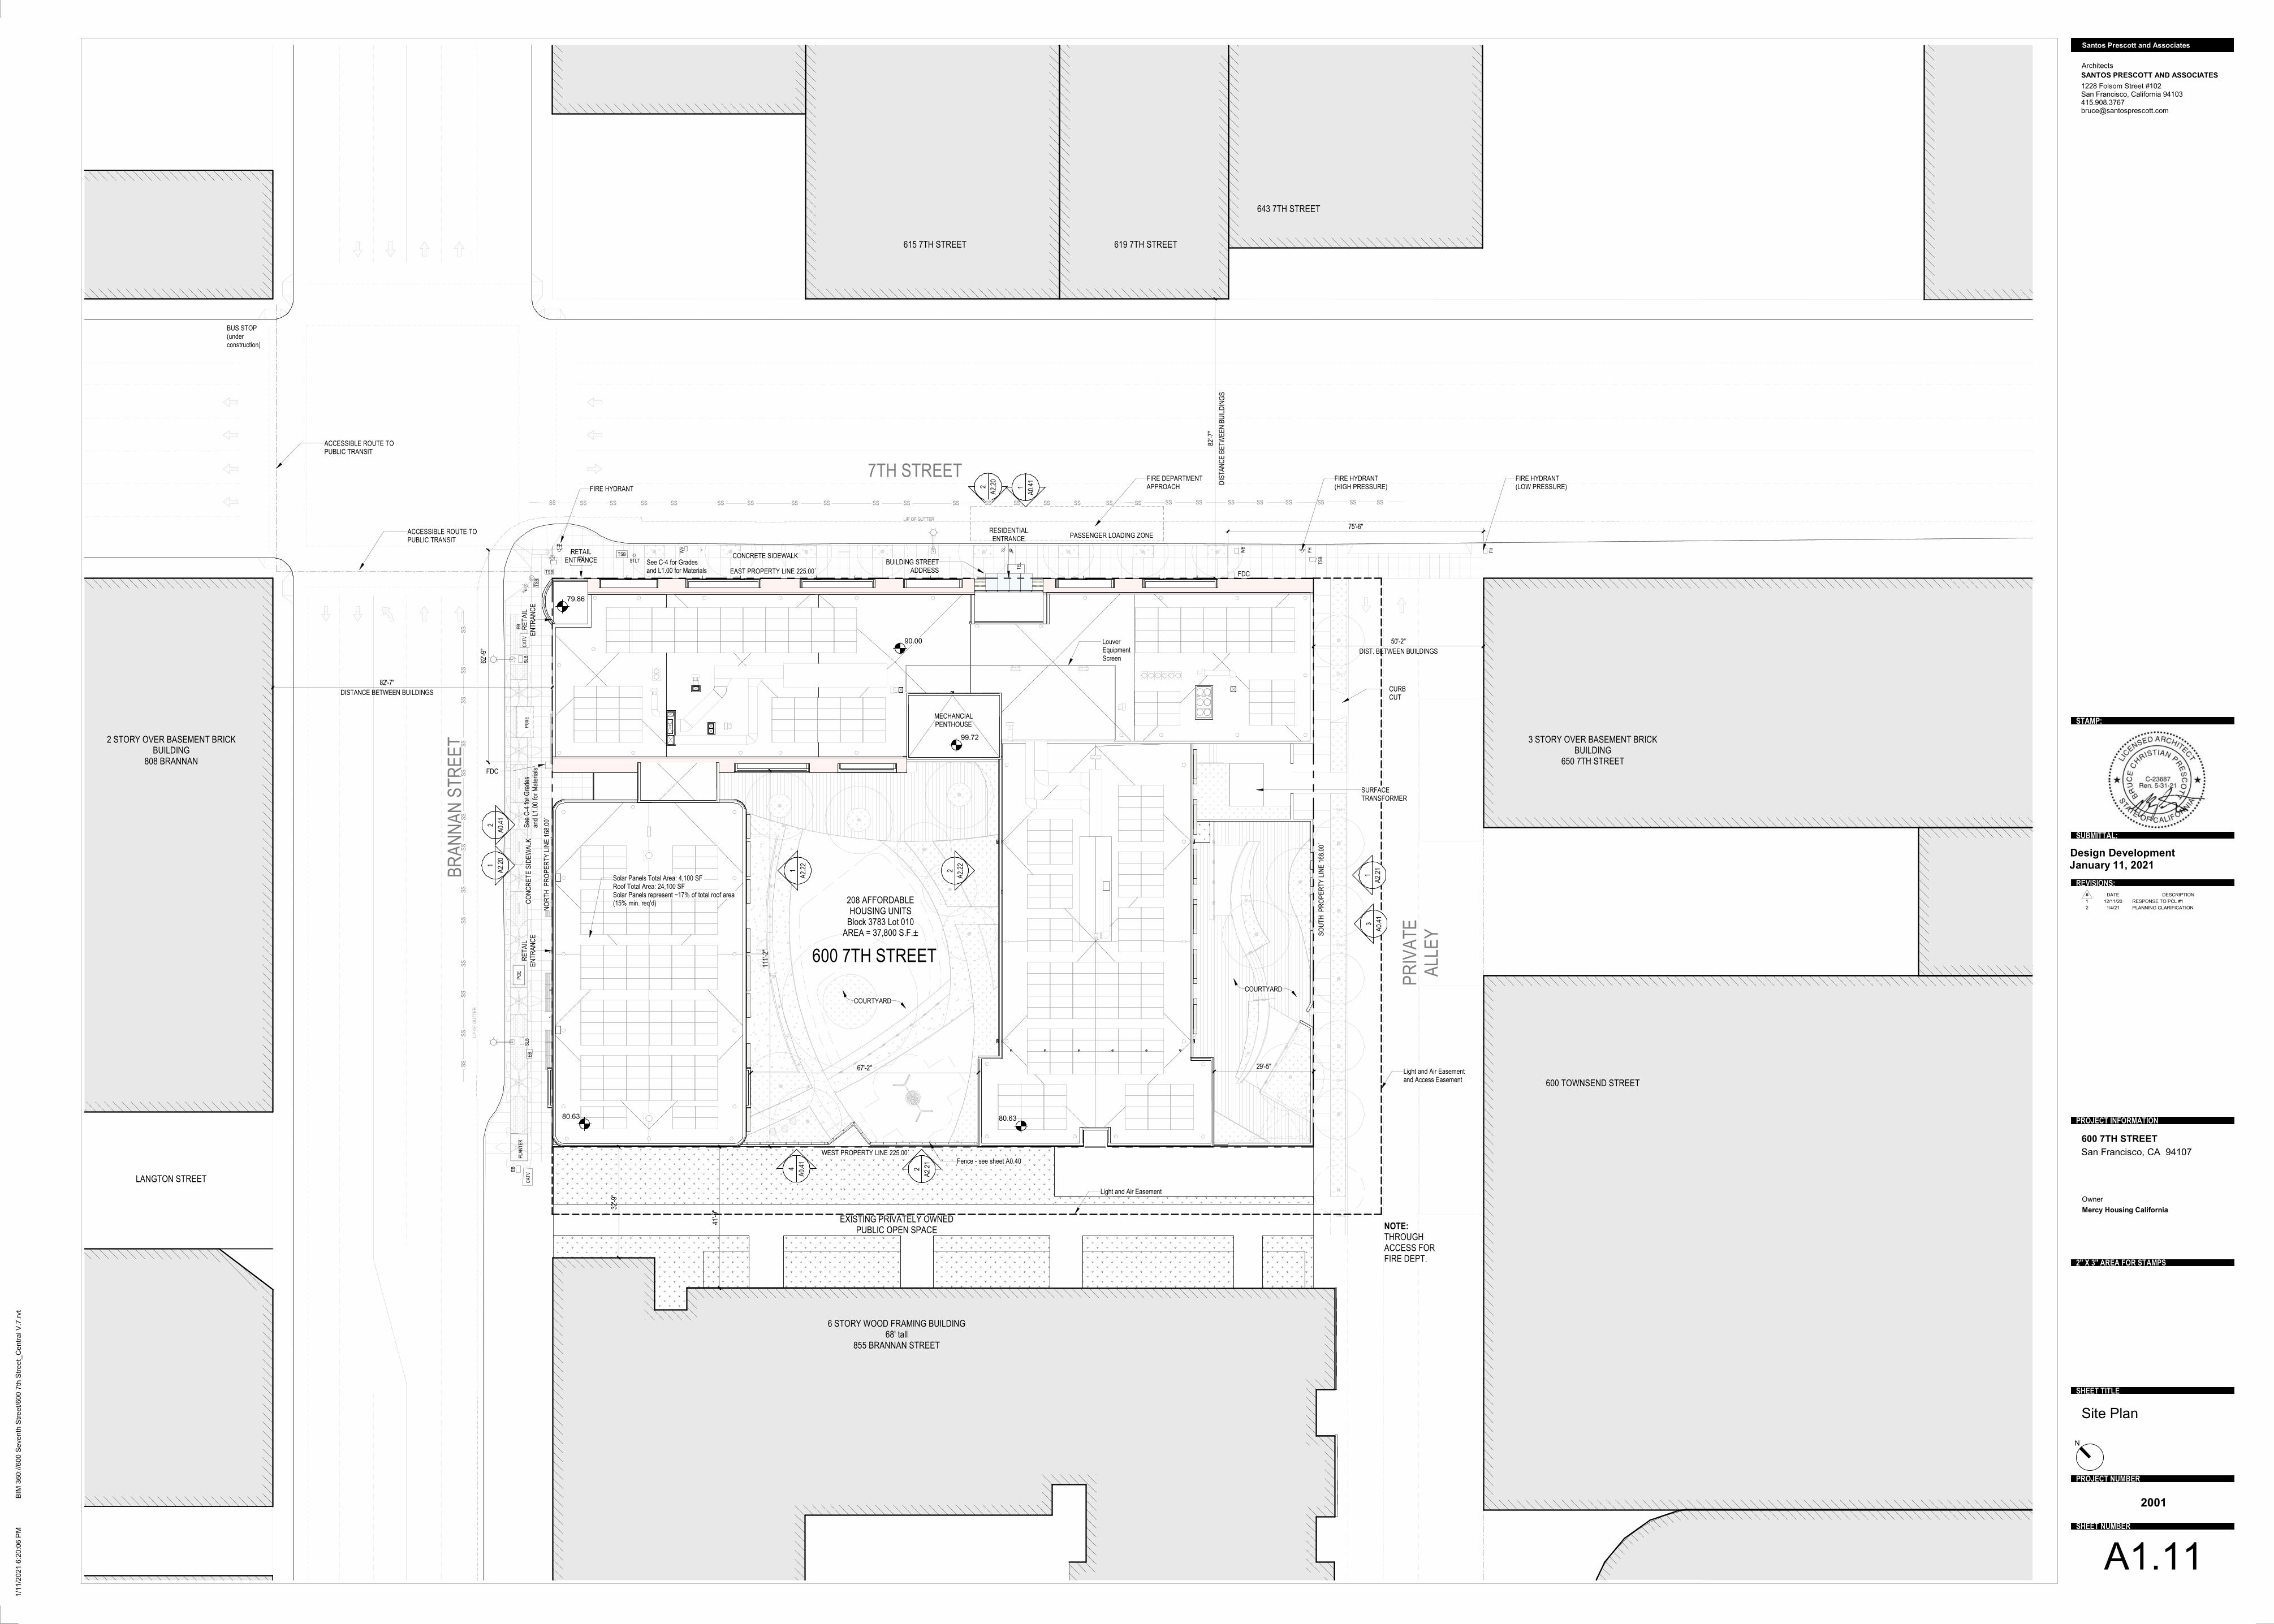
1
A2.
20
2
A2.
21
2
A2.
20
1
A2.
211
A2.
22 2
A2.
22
7TH STREET B
RA
NN
AN
ST
RE
ET
LI
P O
F G
UT
TE
R
LIP OF GUTTER
SS SS SS SS SS SS SS SS SS SS SS SS SS SS SS SS SS SS SS SS SS SS SS SS SS SS
SS
SS
SS
SS
SS
SS
SS
SS
SS
SS
SS
SS
SS
208 AFFORDABLE HOUSING UNITS
Block 3783 Lot 010AREA = 37,800 S.F.±
RETAIL ENTRANCE
600 7TH STREET
FDC
BUILDING STREET ADDRESS
3 STORY OVER BASEMENT BRICK BUILDING
650 7TH STREET
RE
TA
IL
EN
TR
AN
CE
RESIDENTIAL ENTRANCE
2 STORY OVER BASEMENT BRICK BUILDING
808 BRANNAN
6 STORY WOOD FRAMING BUILDING68' tall
855 BRANNAN STREET
DIST. BETWEEN BUILDINGS
50'-2"
DISTANCE BETWEEN BUILDINGS
82'-7"
WEST PROPERTY LINE 225.00´
SO
UT
H P
RO
PE
RT
Y L
INE
168
.00´
NO
RT
H P
RO
PE
RT
Y L
INE
168
.00´
EAST PROPERTY LINE 225.00´
CURBCUT
COURTYARD
COURTYARD
RE
TA
IL
EN
TR
AN
CE
111'
-2"
MECHANCIAL PENTHOUSE
SURFACE TRANSFORMER
BUS STOP(under construction)
LANGTON STREET
EXISTING PRIVATELY OWNED PUBLIC OPEN SPACE
PR
IVA
TE
A
LLE
Y
67'-2" 29'-5"
1
A0.
41
2
A0.
41
3
A0.
41
4
A0.
41
PG
&E
PG
EC
AT
VS
LB
TSB
JP WB
TS
B
CA
TV
EB
PLA
NT
ER
SLB
EB
JP
EVSTLT
WV
TE
L
FH
FH
TSB
TS
B
EB
41'-9
"32'-9
"
FIRE HYDRANT
FIRE HYDRANT (HIGH PRESSURE)
Fence - see sheet A0.40
80.6380.63
Light and Air Easement
Light and Air Easementand Access Easement
DIS
TA
NC
E B
ET
WE
EN
BU
ILD
ING
S
82'-7
"
Solar Panels Total Area: 4,100 SF Roof Total Area: 24,100 SFSolar Panels represent ~17% of total roof area (15% min. req'd)
Louver Equipment Screen
615 7TH STREET 619 7TH STREET
643 7TH STREET
600 TOWNSEND STREET
NOTE: THROUGH ACCESS FOR FIRE DEPT.
FH
FIRE HYDRANT (LOW PRESSURE)
FDC
ACCESSIBLE ROUTE TO PUBLIC TRANSIT
ACCESSIBLE ROUTE TO PUBLIC TRANSIT
CO
NC
RE
TE
SID
EW
ALK
CONCRETE SIDEWALK
PASSENGER LOADING ZONE
62'-9
"FIRE DEPARTMENT APPROACH
75'-6"S
ee C
-4 fo
r G
rade
s an
d L1
.00
for
Mat
eria
ls
See C-4 for Grades and L1.00 for Materials
99.72
90.00
79.86
1228 Folsom Street #102San Francisco, California 94103415.908.3767 [email protected]
Architects
SANTOS PRESCOTT AND ASSOCIATES
Owner
N
2" X 3" AREA FOR STAMPS
PROJECT INFORMATION
SHEET TITLE
PROJECT NUMBER
SHEET NUMBER
REVISIONS:
SUBMITTAL:
STAMP:
Santos Prescott and Associates
1/1
1/2
021
6:2
0:0
6 P
MB
IM 3
60
://6
00
Se
ven
th S
tre
et/
60
0 7
th S
tre
et_
Ce
ntr
al V
.7.r
vt
January 11, 2021Design Development
600 7TH STREET
Mercy Housing California
San Francisco, CA 94107
Site Plan
2001
A1.11
# DATE DESCRIPTION
1 12/11/20 RESPONSE TO PCL #1
2 1/4/21 PLANNING CLARIFICATION
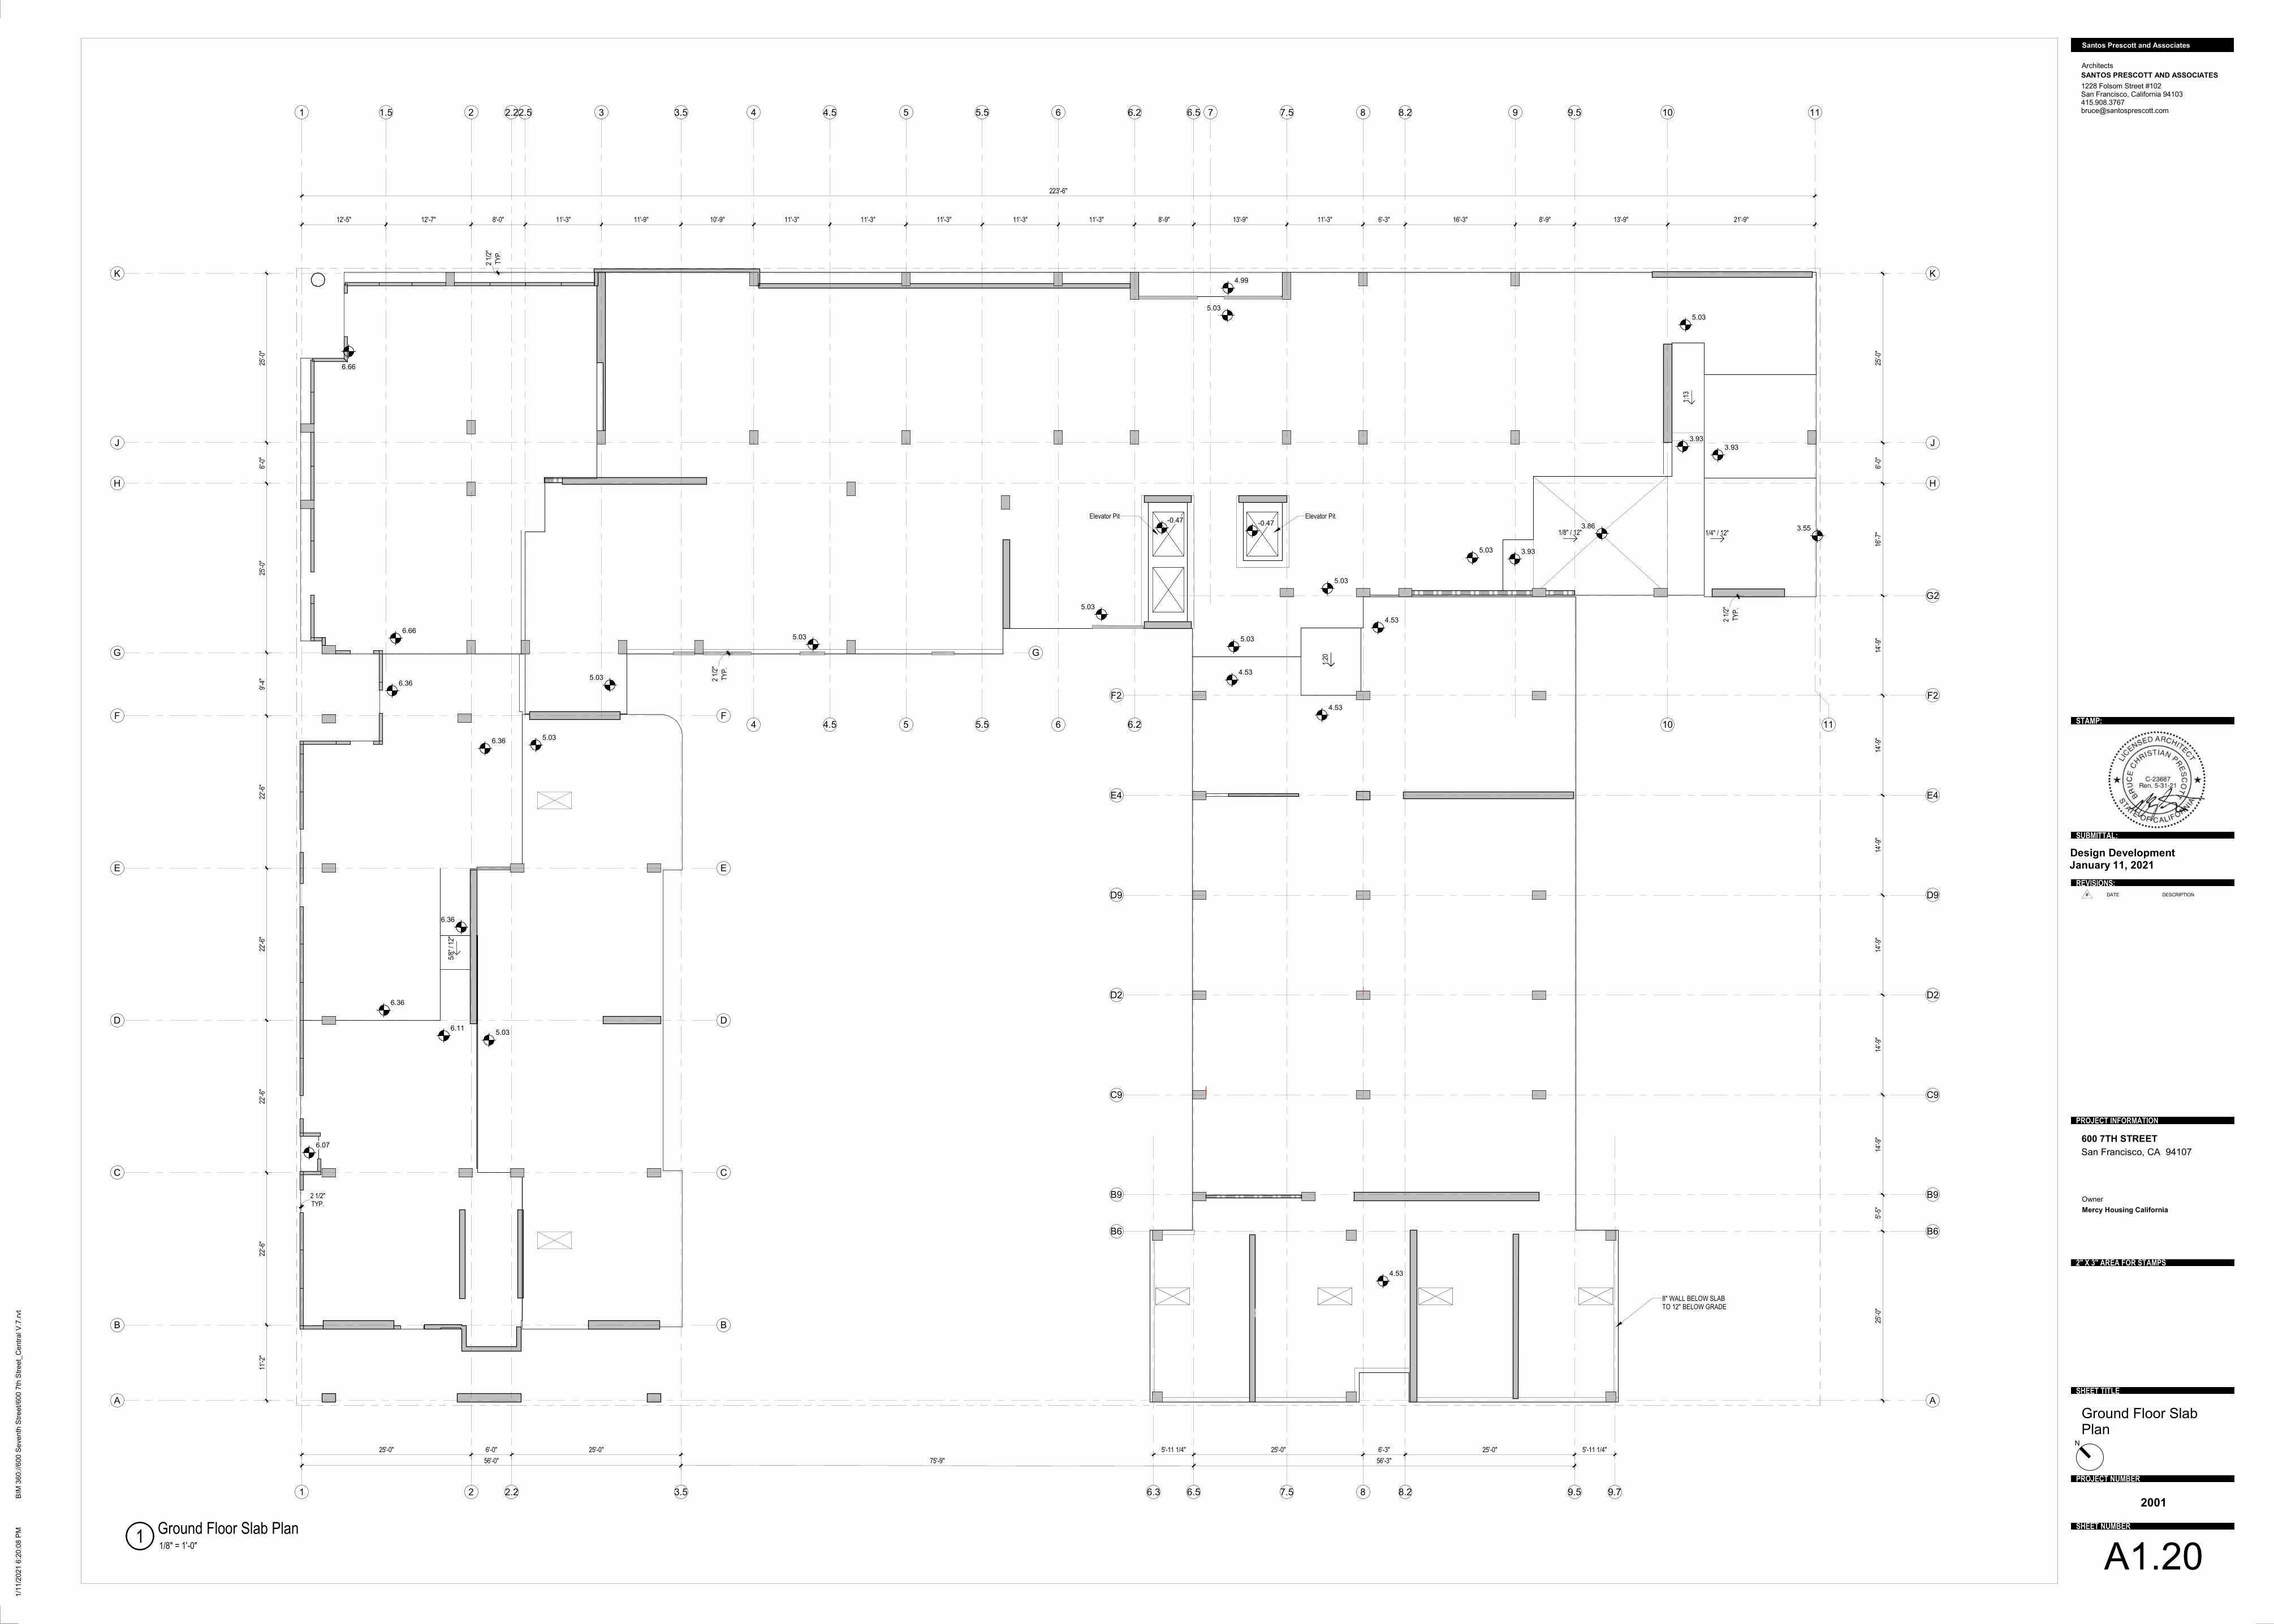
1
1 1.5
2
2
2.2
2.2
3.5
3.5
5
5
K K
H H
G G
E E
C C
B B
5.5
5.5
6
6
6.2
6.2
7.5
7.5
8
8 9
10
10
11
11
B9 B9
2.5 3
4
4
4.5
4.5
6.5
6.5
8.2
8.2
9.5
9.5
F F
D D
J J
A A
C9 C9
D2 D2
D9 D9
E4 E4
F2 F2
G2
7
B6 B6
5'-11 1/4" 25'-0" 6'-3" 25'-0" 5'-11 1/4"25'-0" 6'-0" 25'-0"
56'-0" 75'-9" 56'-3"
223'-6"
11'-2
"22
'-6"
22'-6
"22
'-6"
22'-6
"9'
-4"
25'-0
"6'
-0"
25'-0
"
25'-0
"5'
-5"
14'-9
"14
'-9"
14'-9
"14
'-9"
14'-9
"14
'-9"
16'-7
"6'
-0"
25'-0
"
6.66
5.03
6.66
6.36
5.03
5.03
5.03
5.03
3.93
1/4" / 12"
1:13
5/8"
/ 12
"
6.36
12'-5" 12'-7" 8'-0" 11'-3" 11'-9" 10'-9" 11'-3" 11'-3" 11'-3" 11'-3" 11'-3" 8'-9" 13'-9" 11'-3" 6'-3" 16'-3" 8'-9" 13'-9" 21'-9"
1/8" / 12"3.86 3.55
3.935.03
TYP.2 1/2"
TY
P.
2 1/
2"
TY
P.
2 1/
2"
TY
P.
2 1/
2"
Elevator PitElevator Pit
6.36
8" WALL BELOW SLAB TO 12" BELOW GRADE
3.93
-0.47 -0.47
4.99
6.07
6.3 9.7
5.03
5.03
1:20
1:20
4.53
6.115.03
5.036.36
4.53
4.53
4.53
1228 Folsom Street #102San Francisco, California 94103415.908.3767 [email protected]
Architects
SANTOS PRESCOTT AND ASSOCIATES
Owner
N
2" X 3" AREA FOR STAMPS
PROJECT INFORMATION
SHEET TITLE
PROJECT NUMBER
SHEET NUMBER
REVISIONS:
SUBMITTAL:
STAMP:
Santos Prescott and Associates
1/1
1/2
021
6:2
0:0
8 P
MB
IM 3
60
://6
00
Se
ven
th S
tre
et/
60
0 7
th S
tre
et_
Ce
ntr
al V
.7.r
vt
January 11, 2021Design Development
600 7TH STREET
Mercy Housing California
San Francisco, CA 94107
Ground Floor SlabPlan
2001
A1.201/8" = 1'-0"
1Ground Floor Slab Plan
# DATE DESCRIPTION
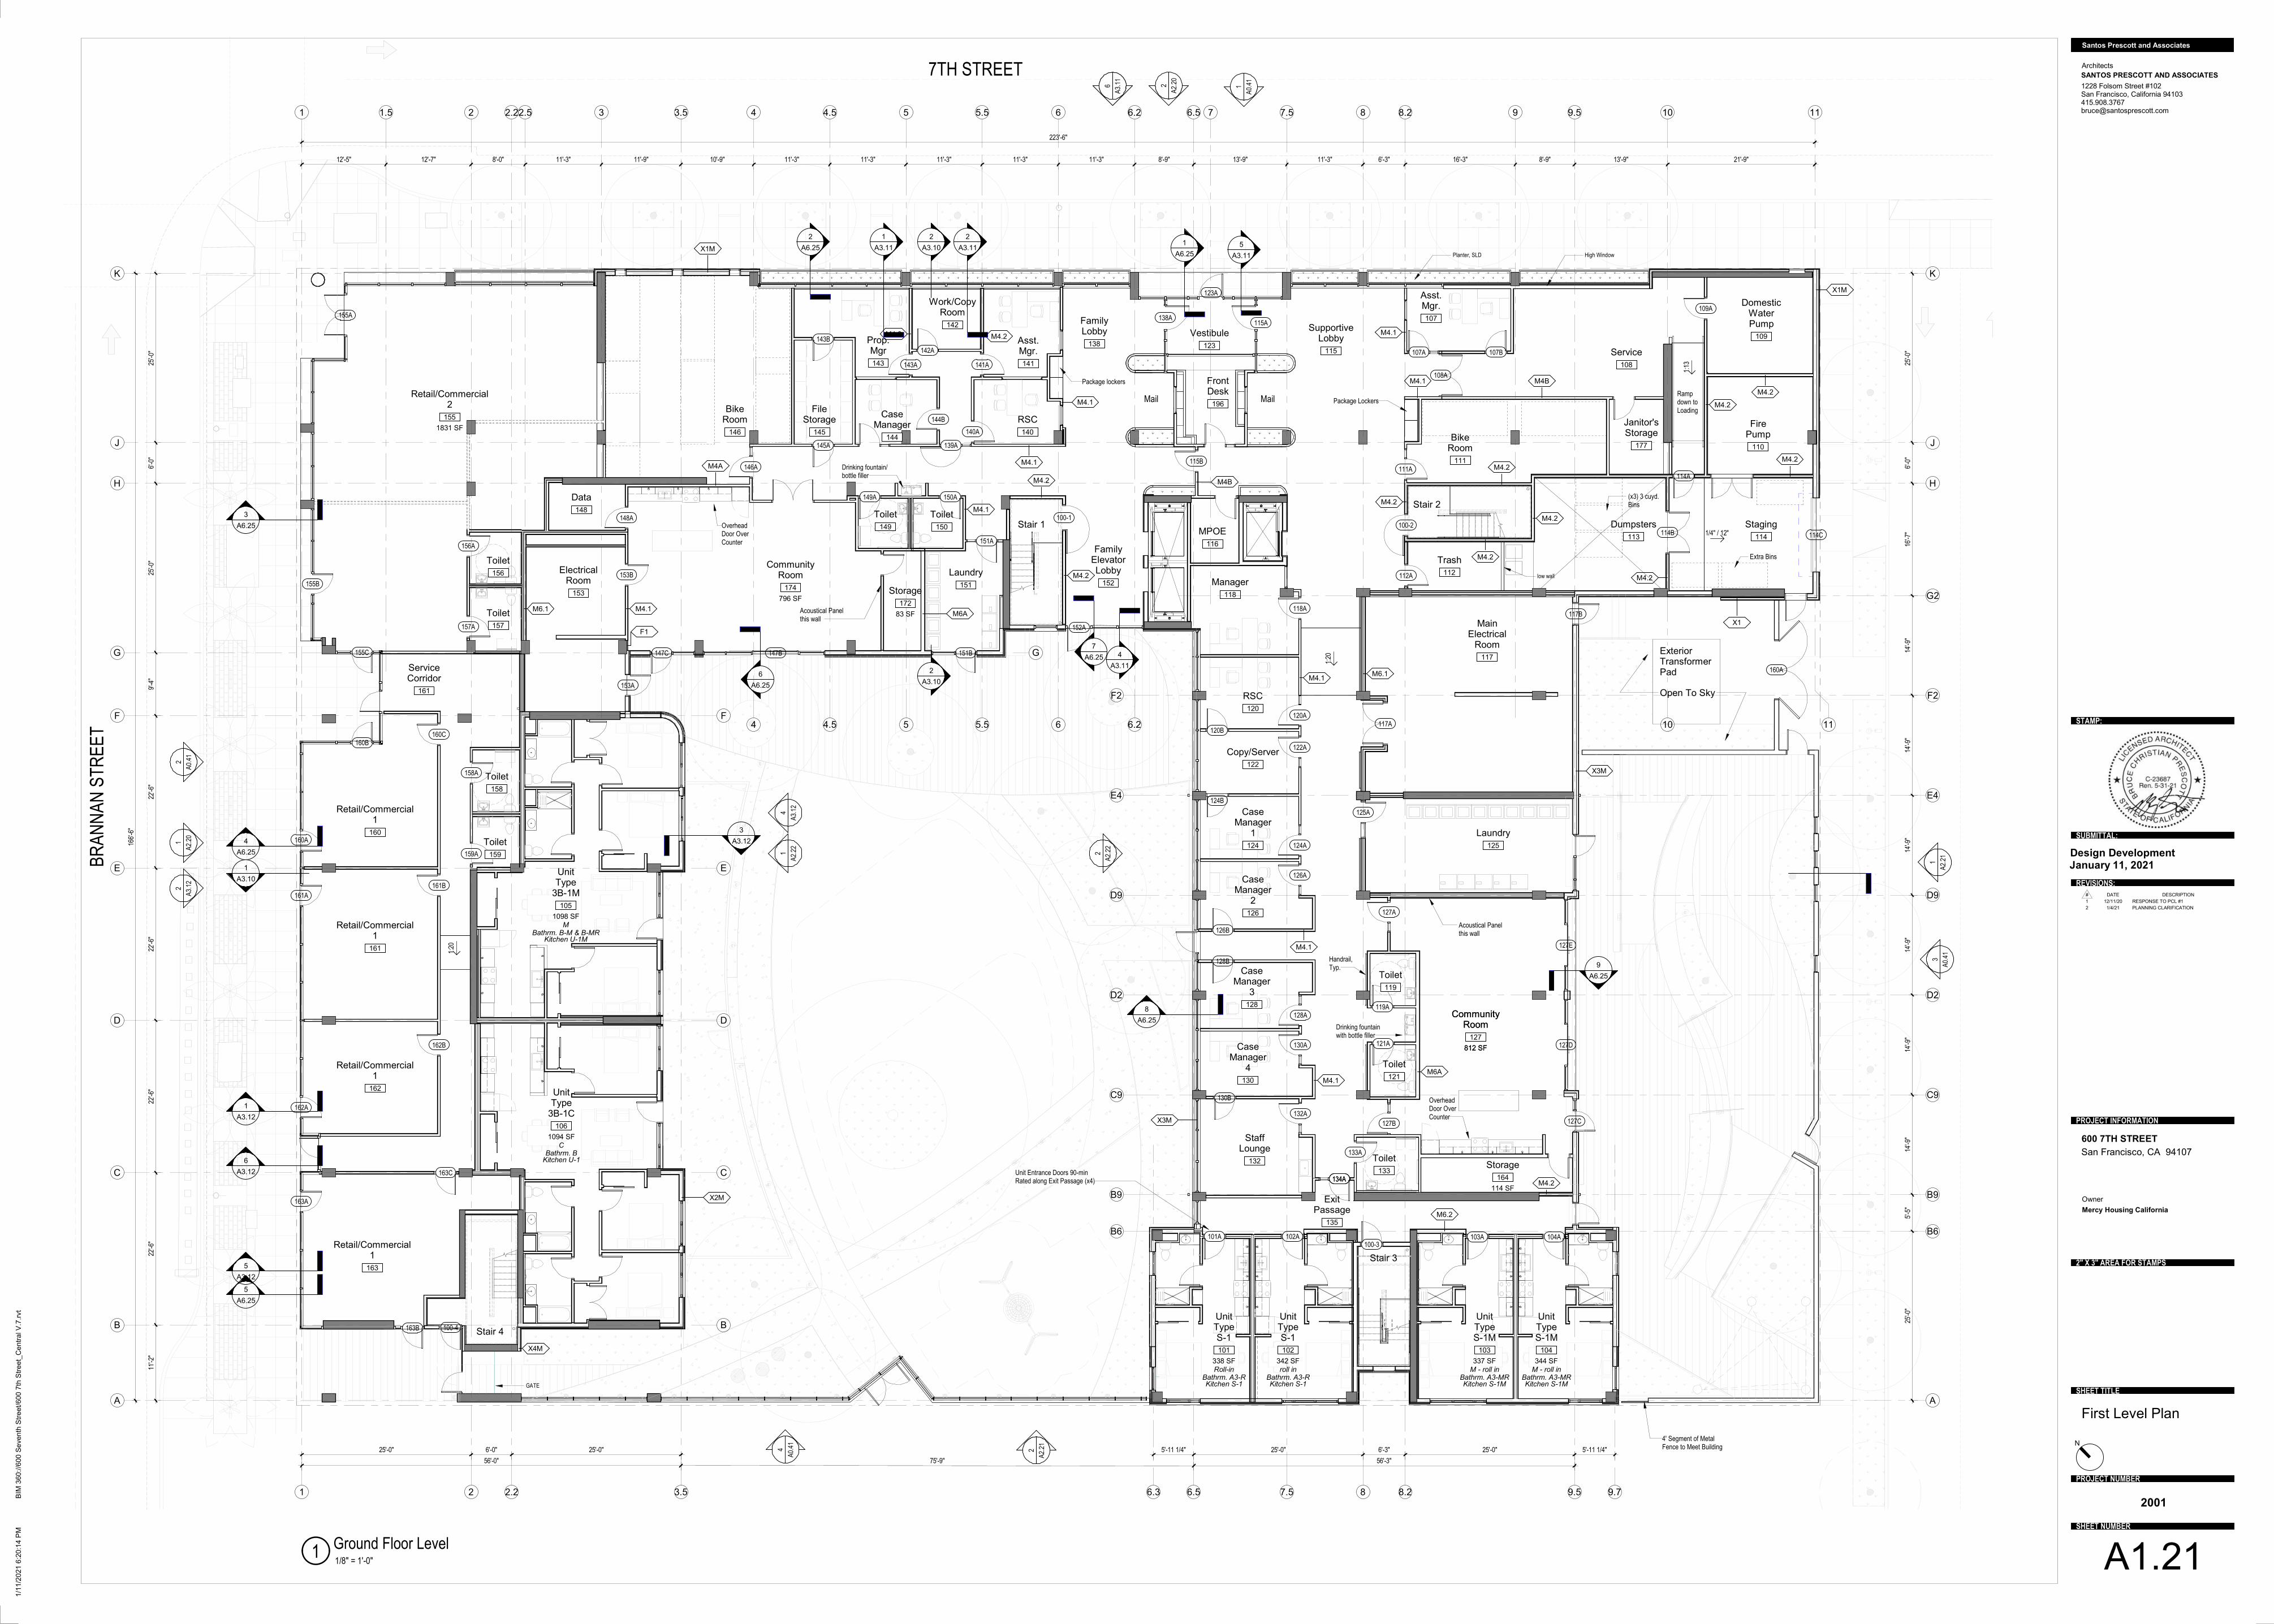
BikeRoom
111
Staging
114
Trash
112
MainElectrical
Room
117
Service
108
Laundry
125
812 SF
CommunityRoom
127
1
A2.
20
2
A2.
21
2
A2.
20
1
A2.
21
Copy/Server
122
RSC
120
Manager
118
Laundry
151
Dumpsters
113MPOE
116
1
A2.
22 2
A2.
22
7TH STREET
BR
AN
NA
N S
TR
EE
T
1
1 1.5
2
2
2.2
2.2
3.5
3.5
5
5
K K
H H
G G
E E
C C
B B
5.5
5.5
6
6
6.2
6.2
7.5
7.5
8
8 9
10
10
11
11
B9 B9
2.5 3
4
4
4.5
4.5
6.5
6.5
8.2
8.2
9.5
9.5
F F
D D
J J
A A
C9 C9
D2 D2
D9 D9
E4 E4
F2 F2
G2
ElectricalRoom
153
Ramp down to Loading
338 SF
UnitTypeS-1
101
Roll-in
Bathrm. A3-RKitchen S-1
342 SF
UnitTypeS-1
102
roll in
Bathrm. A3-RKitchen S-1
337 SF
UnitTypeS-1M
103
M - roll in
Bathrm. A3-MRKitchen S-1M
344 SF
UnitTypeS-1M
104
M - roll in
Bathrm. A3-MRKitchen S-1M
Exterior Transformer Pad
Data
148
DomesticWaterPump
109
FirePump
110
Asst.Mgr.
107
CaseManager
1
124
5'-11 1/4" 25'-0" 6'-3" 25'-0" 5'-11 1/4"25'-0" 6'-0" 25'-0"
56'-0" 75'-9" 56'-3"
223'-6"
25'-0
"5'
-5"
14'-9
"14
'-9"
14'-9
"14
'-9"
14'-9
"14
'-9"
16'-7
"6'
-0"
25'-0
"
Toilet
149
Toilet
150
ExitPassage
135
FamilyElevatorLobby
152
Stair 2
Stair 1
Stair 3
Stair 4
low wall
107B
GATE
Planter, SLD
12'-5" 12'-7" 8'-0" 11'-3" 11'-9" 10'-9" 11'-3" 11'-3" 11'-3" 11'-3" 11'-3" 8'-9" 13'-9" 11'-3" 6'-3" 16'-3" 8'-9" 13'-9" 21'-9"
7
1
A3.10
5
A3.11
1
A3.11
1
A3.12
Toilet
119
Toilet
121
Toilet
133
107A
108A
111A
109A
100-2
112A
114B
114A
114C
118A
120A
122A
120B
127A
117B
160A
133A
134A
152A
100-1
151B
151A
150A149A
100-4
134A
148A
153A
124A
Vestibule
123
Drinking fountain with bottle filler
Drinking fountain/ bottle filler
Overhead Door Over Counter
127B 127C
119A
121A
Janitor'sStorage
177
RSC
140
Asst.Mgr.
141
Prop.Mgr
143
Work/CopyRoom
142
BikeRoom
146
FileStorage
145
CaseManager
144
FrontDesk
196
CaseManager
3
128
CaseManager
4
130
StaffLounge
132
CaseManager
2
126
Retail/Commercial1
160
Retail/Commercial1
161
1831 SF
Retail/Commercial2
155
1
A0.
41
2
A0.
41
3
A0.
41
4
A0.
41
125A
3
A3.
11
2
A3.
12
3
A3.12
4
A3.
12
(x3) 3 cuyd. Bins
B6 B6
1/4" / 12"
1:13
1:20
Retail/Commercial1
162
Retail/Commercial1
163
ServiceCorridor
161
4
A6.25
3
A6.25
2
A6.251
A6.25
5
A6.25
7
A6.25
8
A6.25
9
A6.25
6
A6.25
Toilet
156
Toilet
157
Toilet
158
Toilet
159
FamilyLobby
138
SupportiveLobby
115
128B
128A
130A
130B
132A
126B
126A
117A
140A
144B
139A
141A143A
142A
143B
145A
123A
157A
156A
153B
138A115A
158A
159A
163C
163A
163B
162A
162B
161B
161A
160C
160A
160B
155A
155B
155C
146A
147B147C
Open To Sky
6.3 9.7
1:20
11'-2
"22
'-6"
22'-6
"22
'-6"
22'-6
"9'
-4"
25'-0
"6'
-0"
25'-0
"
166'
-6"
Handrail, Typ.
M4.2
M4.2
M4.2
M4.2
M4.2
M4.2
M4.2
M4.2
M4.1 M4B
M4.1
M4B
115B
M6.1M4.1
M4.1
M4.1
M6.2
102A101A
Unit Entrance Doors 90-min Rated along Exit Passage (x4) M4.2
M6A
M4.1
M4.2
M4A
M4.1
M6.1 M4.1
M4.2
X2M
X3M
X3M
X1
X1M
X1M
M4.1
1098 SF
UnitType
3B-1M
105
M
Bathrm. B-M & B-MRKitchen U-1M
1094 SF
UnitType
3B-1C
106
C
Bathrm. BKitchen U-1
Package Lockers
Package lockers
F1
M6A
100-3
114 SF
Storage
164
812 SF
CommunityRoom
127
X4M
Overhead Door Over Counter
796 SF
CommunityRoom
174
83 SF
Storage
172
2
A3.10
2
A3.10
M4.2M4.2
4
A3.11
5
A3.12
2
A3.11
6
A3.
11
6
A3.12
103A 104A
Extra Bins
124B
127D
127E
4' Segment of Metal Fence to Meet Building
High Window
Acoustical Panelthis wall
Acoustical Panelthis wall
1228 Folsom Street #102San Francisco, California 94103415.908.3767 [email protected]
Architects
SANTOS PRESCOTT AND ASSOCIATES
Owner
N
2" X 3" AREA FOR STAMPS
PROJECT INFORMATION
SHEET TITLE
PROJECT NUMBER
SHEET NUMBER
REVISIONS:
SUBMITTAL:
STAMP:
Santos Prescott and Associates
1/1
1/2
021
6:2
0:1
4 P
MB
IM 3
60
://6
00
Se
ven
th S
tre
et/
60
0 7
th S
tre
et_
Ce
ntr
al V
.7.r
vt
January 11, 2021Design Development
600 7TH STREET
Mercy Housing California
San Francisco, CA 94107
First Level Plan
2001
A1.211/8" = 1'-0"1
Ground Floor Level
# DATE DESCRIPTION
1 12/11/20 RESPONSE TO PCL #1
2 1/4/21 PLANNING CLARIFICATION
Evaluation of Request for Final Gap Financing April 1, 2022 600 7th Street Page 47 of 54
Attachment H: Comparison of City Investment in Other Housing Developments
(SEE ATTACHED)
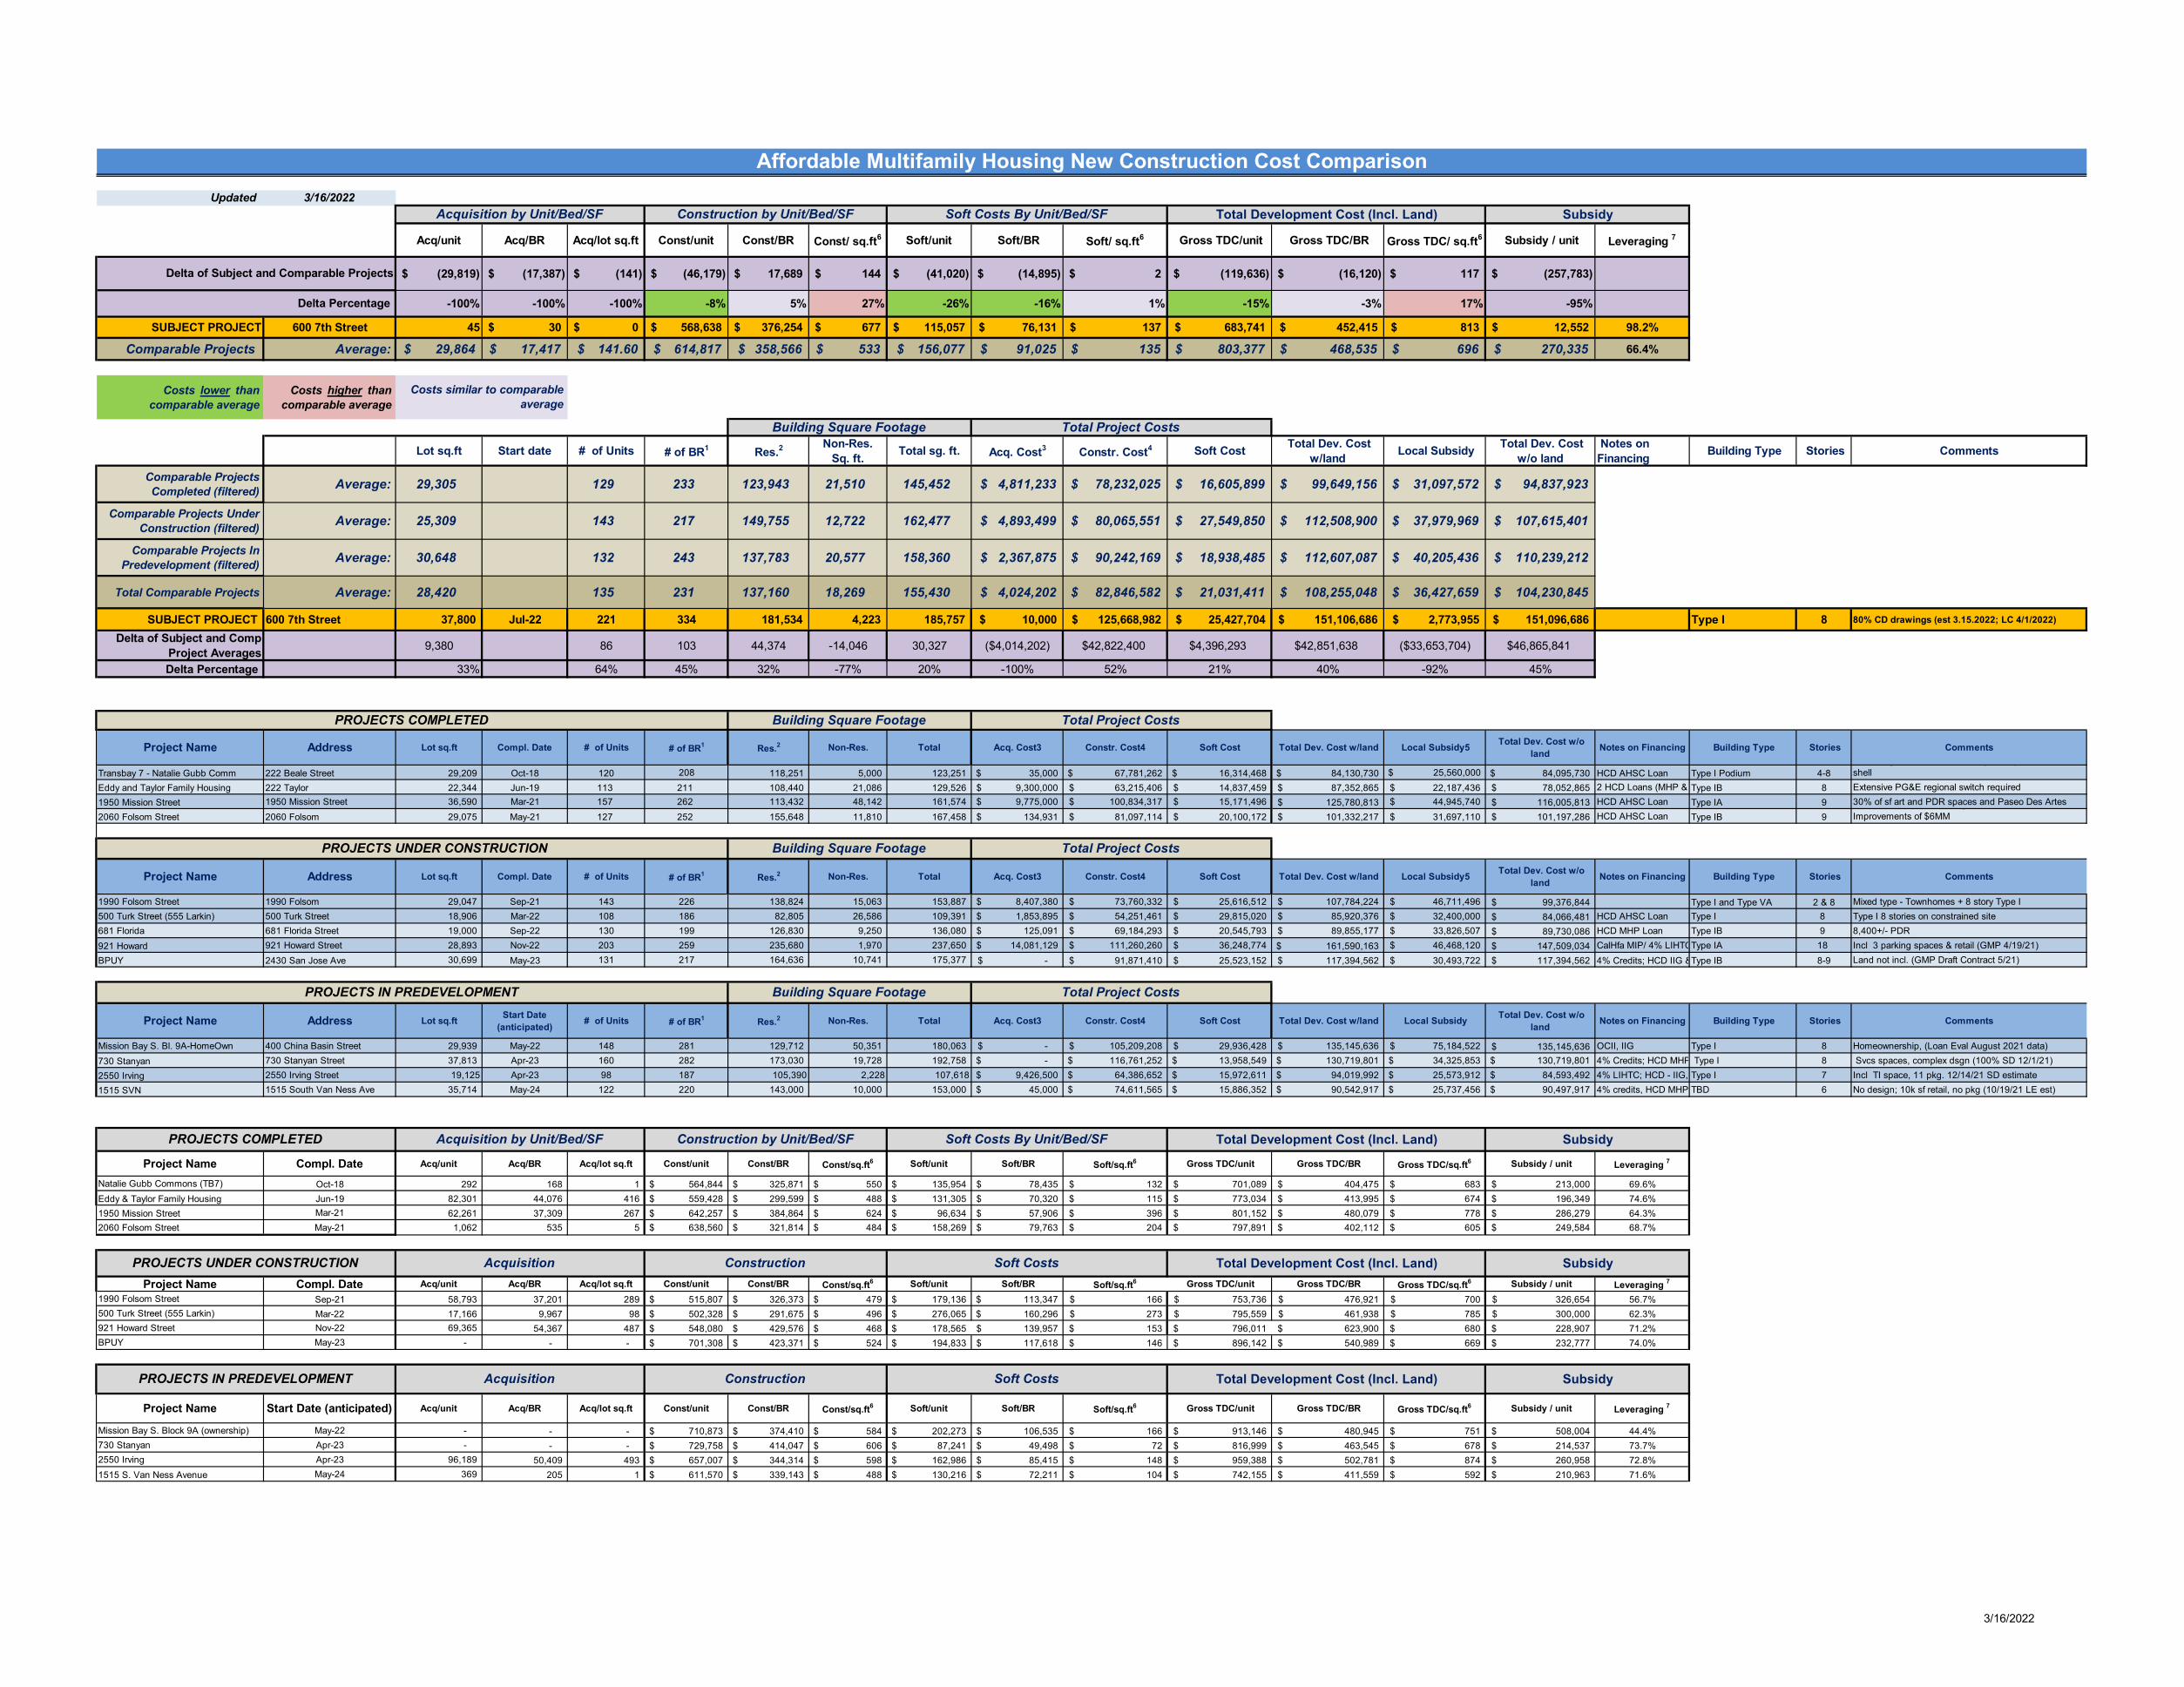
Updated 3/16/2022
Acq/unit Acq/BR Acq/lot sq.ft Const/unit Const/BR Const/ sq.ft6 Soft/unit Soft/BR Soft/ sq.ft6 Gross TDC/unit Gross TDC/BR Gross TDC/ sq.ft6 Subsidy / unit Leveraging 7
(29,819)$ (17,387)$ (141)$ (46,179)$ 17,689$ 144$ (41,020)$ (14,895)$ 2$ (119,636)$ (16,120)$ 117$ (257,783)$
-100% -100% -100% -8% 5% 27% -26% -16% 1% -15% -3% 17% -95%
SUBJECT PROJECT 600 7th Street 45 30$ 0$ 568,638$ 376,254$ 677$ 115,057$ 76,131$ 137$ 683,741$ 452,415$ 813$ 12,552$ 98.2%
Comparable Projects Average: 29,864$ 17,417$ 141.60$ 614,817$ 358,566$ 533$ 156,077$ 91,025$ 135$ 803,377$ 468,535$ 696$ 270,335$ 66.4%
Costs lower than comparable average
Costs higher than comparable average
Lot sq.ft Start date # of Units # of BR1 Res.2Non-Res.
Sq. ft. Total sg. ft. Acq. Cost3 Constr. Cost4 Soft Cost Total Dev. Cost w/land Local Subsidy Total Dev. Cost
w/o land Notes on Financing Building Type Stories Comments
Comparable Projects Completed (filtered) Average: 29,305 129 233 123,943 21,510 145,452 4,811,233$ 78,232,025$ 16,605,899$ 99,649,156$ 31,097,572$ 94,837,923$
Comparable Projects Under Construction (filtered) Average: 25,309 143 217 149,755 12,722 162,477 4,893,499$ 80,065,551$ 27,549,850$ 112,508,900$ 37,979,969$ 107,615,401$
Comparable Projects In Predevelopment (filtered) Average: 30,648 132 243 137,783 20,577 158,360 2,367,875$ 90,242,169$ 18,938,485$ 112,607,087$ 40,205,436$ 110,239,212$
Total Comparable Projects Average: 28,420 135 231 137,160 18,269 155,430 4,024,202$ 82,846,582$ 21,031,411$ 108,255,048$ 36,427,659$ 104,230,845$
SUBJECT PROJECT 600 7th Street 37,800 Jul-22 221 334 181,534 4,223 185,757 10,000$ 125,668,982$ 25,427,704$ 151,106,686$ 2,773,955$ 151,096,686$ Type I 8 80% CD drawings (est 3.15.2022; LC 4/1/2022)
Delta of Subject and Comp Project Averages 9,380 86 103 44,374 -14,046 30,327 ($4,014,202) $42,822,400 $4,396,293 $42,851,638 ($33,653,704) $46,865,841
Delta Percentage 33% 64% 45% 32% -77% 20% -100% 52% 21% 40% -92% 45%
Project Name Address Lot sq.ft Compl. Date # of Units # of BR1 Res.2 Non-Res. Total Acq. Cost3 Constr. Cost4 Soft Cost Total Dev. Cost w/land Local Subsidy5 Total Dev. Cost w/o land Notes on Financing Building Type Stories Comments
Transbay 7 - Natalie Gubb Comm 222 Beale Street 29,209 Oct-18 120 208 118,251 5,000 123,251 35,000$ 67,781,262$ 16,314,468$ 84,130,730$ $ 25,560,000 84,095,730$ HCD AHSC Loan Type I Podium 4-8 g y p
shellEddy and Taylor Family Housing 222 Taylor 22,344 Jun-19 113 211 108,440 21,086 129,526 9,300,000$ 63,215,406$ 14,837,459$ 87,352,865$ 22,187,436$ 78,052,865$ 2 HCD Loans (MHP & Type IB 8 Extensive PG&E regional switch required1950 Mission Street 1950 Mission Street 36,590 Mar-21 157 262 113,432 48,142 161,574 9,775,000$ 100,834,317$ 15,171,496$ 125,780,813$ 44,945,740$ 116,005,813$ HCD AHSC Loan Type IA 9 30% of sf art and PDR spaces and Paseo Des Artes2060 Folsom Street 2060 Folsom 29,075 May-21 127 252 155,648 11,810 167,458 134,931$ 81,097,114$ 20,100,172$ 101,332,217$ 31,697,110$ 101,197,286$ HCD AHSC Loan Type IB 9
y Improvements of $6MM
Project Name Address Lot sq.ft Compl. Date # of Units # of BR1 Res.2 Non-Res. Total Acq. Cost3 Constr. Cost4 Soft Cost Total Dev. Cost w/land Local Subsidy5 Total Dev. Cost w/o land Notes on Financing Building Type Stories Comments
1990 Folsom Street 1990 Folsom 29,047 Sep-21 143 226 138,824 15,063 153,887 8,407,380$ 73,760,332$ 25,616,512$ 107,784,224$ 46,711,496$ 99,376,844$ Type I and Type VA 2 & 8 Mixed type - Townhomes + 8 story Type I500 Turk Street (555 Larkin) 500 Turk Street 18,906 Mar-22 108 186 82,805 26,586 109,391 1,853,895$ 54,251,461$ 29,815,020$ 85,920,376$ 32,400,000$ 84,066,481$ HCD AHSC Loan Type I 8 Type I 8 stories on constrained site681 Florida 681 Florida Street 19,000 Sep-22 130 199 126,830 9,250 136,080 125,091$ 69,184,293$ 20,545,793$ 89,855,177$ 33,826,507$ 89,730,086$ HCD MHP Loan Type IB 9 8,400+/- PDR 921 Howard 921 Howard Street 28,893 Nov-22 203 259 235,680 1,970 237,650 14,081,129$ 111,260,260$ 36,248,774$ 161,590,163$ 46,468,120$ 147,509,034$ CalHfa MIP/ 4% LIHTCType IA 18 Incl 3 parking spaces & retail (GMP 4/19/21)BPUY 2430 San Jose Ave 30,699 May-23 131 217 164,636 10,741 175,377 -$ 91,871,410$ 25,523,152$ 117,394,562$ 30,493,722$ 117,394,562$ 4% Credits; HCD IIG & Type IB 8-9
j y Land not incl. (GMP Draft Contract 5/21)
Project Name Address Lot sq.ft Start Date (anticipated) # of Units # of BR1 Res.2 Non-Res. Total Acq. Cost3 Constr. Cost4 Soft Cost Total Dev. Cost w/land Local Subsidy Total Dev. Cost w/o
land Notes on Financing Building Type Stories Comments
Mission Bay S. Bl. 9A-HomeOwn 400 China Basin Street 29,939 May-22 148 281 129,712 50,351 180,063 -$ 105,209,208$ 29,936,428$ 135,145,636$ 75,184,522$ 135,145,636$ OCII, IIG Type I 8 Homeownership, (Loan Eval August 2021 data)730 Stanyan 730 Stanyan Street 37,813 Apr-23 160 282 173,030 19,728 192,758 -$ 116,761,252$ 13,958,549$ 130,719,801$ 34,325,853$ 130,719,801$ 4% Credits; HCD MHP Type I 8 Svcs spaces, complex dsgn (100% SD 12/1/21) 2550 Irving 2550 Irving Street 19,125 Apr-23 98 187 105,390 2,228 107,618 9,426,500$ 64,386,652$ 15,972,611$ 94,019,992$ 25,573,912$ 84,593,492$ 4% LIHTC; HCD - IIG, Type I 7 Incl TI space, 11 pkg. 12/14/21 SD estimate1515 SVN 1515 South Van Ness Ave 35,714 May-24 122 220 143,000 10,000 153,000 45,000$ 74,611,565$ 15,886,352$ 90,542,917$ 25,737,456$ 90,497,917$ 4% credits, HCD MHP TBD 6 No design; 10k sf retail, no pkg (10/19/21 LE est)
Project Name Compl. Date Acq/unit Acq/BR Acq/lot sq.ft Const/unit Const/BR Const/sq.ft6 Soft/unit Soft/BR Soft/sq.ft6 Gross TDC/unit Gross TDC/BR Gross TDC/sq.ft6 Subsidy / unit Leveraging 7
Natalie Gubb Commons (TB7) Oct-18 292 168 1 564,844$ 325,871$ 550$ 135,954$ 78,435$ 132$ 701,089$ 404,475$ 683$ 213,000$ 69.6%Eddy & Taylor Family Housing Jun-19 82,301 44,076 416 559,428$ 299,599$ 488$ 131,305$ 70,320$ 115$ 773,034$ 413,995$ 674$ 196,349$ 74.6%1950 Mission Street Mar-21 62,261 37,309 267 642,257$ 384,864$ 624$ 96,634$ 57,906$ 396$ 801,152$ 480,079$ 778$ 286,279$ 64.3%2060 Folsom Street May-21 1,062 535 5 638,560$ 321,814$ 484$ 158,269$ 79,763$ 204$ 797,891$ 402,112$ 605$ 249,584$ 68.7%
Project Name Compl. Date Acq/unit Acq/BR Acq/lot sq.ft Const/unit Const/BR Const/sq.ft6 Soft/unit Soft/BR Soft/sq.ft6 Gross TDC/unit Gross TDC/BR Gross TDC/sq.ft6 Subsidy / unit Leveraging 7
1990 Folsom Street Sep-21 58,793 37,201 289 515,807$ 326,373$ 479$ 179,136$ 113,347$ 166$ 753,736$ 476,921$ 700$ 326,654$ 56.7%500 Turk Street (555 Larkin) Mar-22 17,166 9,967 98 502,328$ 291,675$ 496$ 276,065$ 160,296$ 273$ 795,559$ 461,938$ 785$ 300,000$ 62.3%921 Howard Street Nov-22 69,365 54,367 487 548,080$ 429,576$ 468$ 178,565$ 139,957$ 153$ 796,011$ 623,900$ 680$ 228,907$ 71.2%BPUY May-23 - - - 701,308$ 423,371$ 524$ 194,833$ 117,618$ 146$ 896,142$ 540,989$ 669$ 232,777$ 74.0%
Project Name Start Date (anticipated) Acq/unit Acq/BR Acq/lot sq.ft Const/unit Const/BR Const/sq.ft6 Soft/unit Soft/BR Soft/sq.ft6 Gross TDC/unit Gross TDC/BR Gross TDC/sq.ft6 Subsidy / unit Leveraging 7
Mission Bay S. Block 9A (ownership) May-22 - - - 710,873$ 374,410$ 584$ 202,273$ 106,535$ 166$ 913,146$ 480,945$ 751$ 508,004$ 44.4%730 Stanyan Apr-23 - - - 729,758$ 414,047$ 606$ 87,241$ 49,498$ 72$ 816,999$ 463,545$ 678$ 214,537$ 73.7%2550 Irving Apr-23 96,189 50,409 493 657,007$ 344,314$ 598$ 162,986$ 85,415$ 148$ 959,388$ 502,781$ 874$ 260,958$ 72.8%1515 S. Van Ness Avenue May-24 369 205 1 611,570$ 339,143$ 488$ 130,216$ 72,211$ 104$ 742,155$ 411,559$ 592$ 210,963$ 71.6%
Affordable Multifamily Housing New Construction Cost Comparison
PROJECTS IN PREDEVELOPMENT
Building Square Footage Total Project Costs
Total Project CostsBuilding Square Footage
Building Square Footage Total Project Costs
Acquisition by Unit/Bed/SF Construction by Unit/Bed/SF Soft Costs By Unit/Bed/SF Total Development Cost (Incl. Land) Subsidy
PROJECTS COMPLETED
Costs similar to comparable average
Delta of Subject and Comparable Projects
Total Project Costs
Total Development Cost (Incl. Land)Soft Costs
Total Development Cost (Incl. Land)
Total Development Cost (Incl. Land)
Soft Costs By Unit/Bed/SF Subsidy
Delta Percentage
PROJECTS IN PREDEVELOPMENT Acquisition Construction
PROJECTS COMPLETED
PROJECTS UNDER CONSTRUCTION
PROJECTS UNDER CONSTRUCTION
Acquisition by Unit/Bed/SF Construction by Unit/Bed/SF
Building Square Footage
Acquisition Construction Soft Costs
Subsidy
Subsidy
3/16/2022
Evaluation of Request for Final Gap Financing April 1, 2022 600 7th Street Page 48 of 54
Attachment I: Predevelopment Budget - N/A

Evaluation of Request for Final Gap Financing April 1, 2022 600 7th Street Page 49 of 54
Attachment J: Development Budget
(SEE ATTACHED)
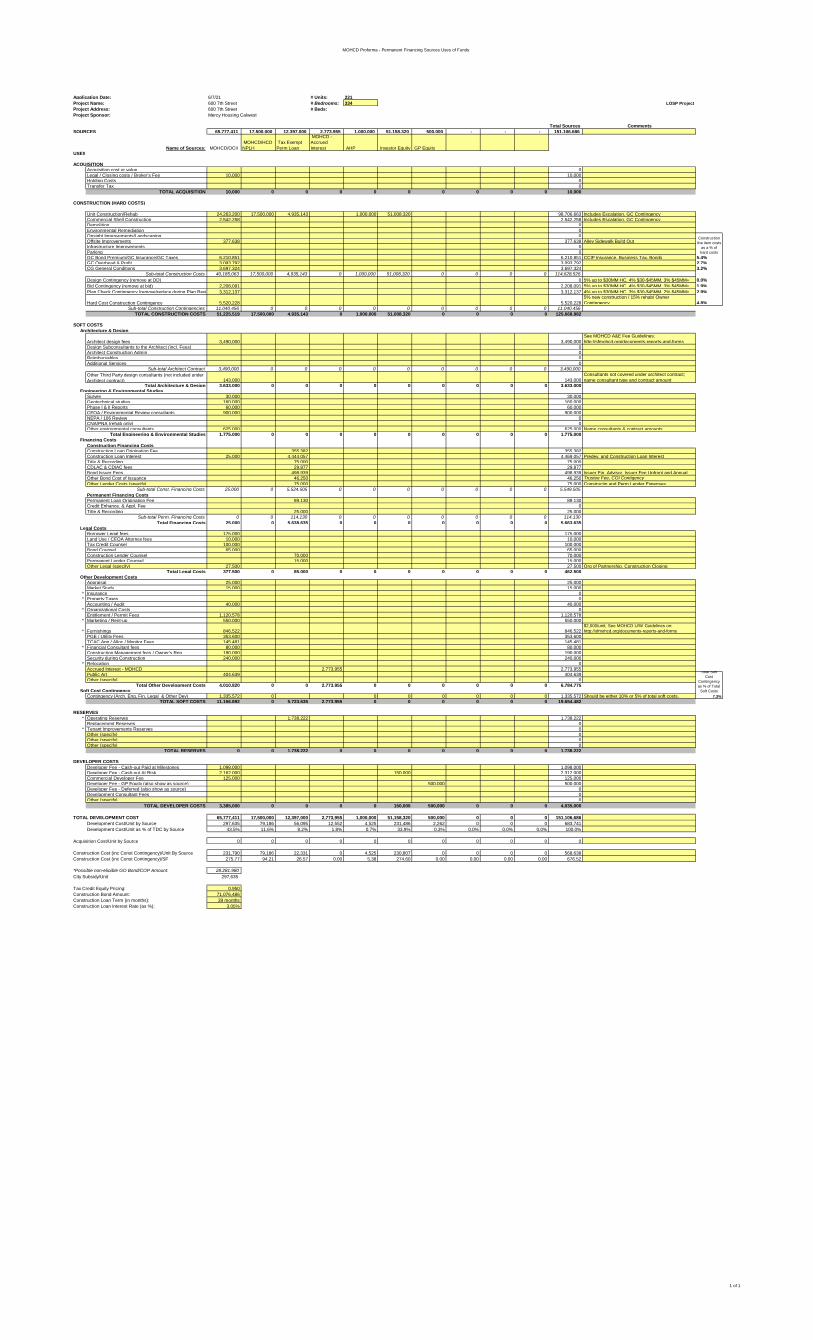
MOHCD Proforma - Permanent Financing Sources Uses of Funds
Application Date: 6/7/21 # Units: 221Project Name: 600 7th Street # Bedrooms: 334 LOSP ProjectProject Address: 600 7th Street # Beds: Project Sponsor: Mercy Housing Calwest
Total Sources CommentsSOURCES 65,777,411 17,500,000 12,397,000 2,773,955 1,000,000 51,158,320 500,000 - - - 151,106,686
Name of Sources: MOHCD/OCII MOHCD/HCD - NPLH
Tax Exempt Perm Loan
MOHCD - Accrued Interest AHP Investor Equity GP Equity
USES
ACQUISITIONAcquisition cost or value 0Legal / Closing costs / Broker's Fee 10,000 10,000Holding Costs 0Transfer Tax 0
TOTAL ACQUISITION 10,000 0 0 0 0 0 0 0 0 0 10,000
CONSTRUCTION (HARD COSTS)
Unit Construction/Rehab 24,263,200 17,500,000 4,935,143 1,000,000 51,008,320 98,706,663 Includes Escalation, GC ContingencyCommercial Shell Construction 2,542,258 2,542,258 Includes Escalation, GC ContingencyDemolition 0Environmental Remediation 0Onsight Improvements/Landscaping 0Offsite Improvements 377,638 377,638 Alley Sidewalk Build OutInfrastructure Improvements 0Parking 0GC Bond Premium/GC Insurance/GC Taxes 6,210,851 6,210,851 CCIP Insurance, Business Tax, Bonds 5.4%GC Overhead & Profit 3,093,792 3,093,792 2.7%CG General Conditions 3,697,324 3,697,324 3.2%
Sub-total Construction Costs 40,185,063 17,500,000 4,935,143 0 1,000,000 51,008,320 0 0 0 0 114,628,526Design Contingency (remove at DD) 0 5% up to $30MM HC, 4% $30-$45MM, 3% $45MM+ 0.0%Bid Contingency (remove at bid) 2,208,091 2,208,091 5% up to $30MM HC, 4% $30-$45MM, 3% $45MM+ 1.9%Plan Check Contingency (remove/reduce during Plan Revi 3,312,137 3,312,137 4% up to $30MM HC, 3% $30-$45MM, 2% $45MM+ 2.9%
Hard Cost Construction Contingency 5,520,228 5,520,2285% new construction / 15% rehab/ Owner Contingency 4.8%
Sub-total Construction Contingencies 11,040,456 0 0 0 0 0 0 0 0 0 11,040,456TOTAL CONSTRUCTION COSTS 51,225,519 17,500,000 4,935,143 0 1,000,000 51,008,320 0 0 0 0 125,668,982
SOFT COSTSArchitecture & Design
Architect design fees 3,490,000 3,490,000See MOHCD A&E Fee Guidelines: http://sfmohcd.org/documents-reports-and-forms
Design Subconsultants to the Architect (incl. Fees) 0Architect Construction Admin 0Reimbursables 0Additional Services 0
Sub-total Architect Contract 3,490,000 0 0 0 0 0 0 0 0 0 3,490,000Other Third Party design consultants (not included under Architect contract) 143,000 143,000
Consultants not covered under architect contract; name consultant type and contract amount
Total Architecture & Design 3,633,000 0 0 0 0 0 0 0 0 0 3,633,000Engineering & Environmental Studies
Survey 30,000 30,000Geotechnical studies 160,000 160,000Phase I & II Reports 60,000 60,000CEQA / Environmental Review consultants 900,000 900,000NEPA / 106 Review 0CNA/PNA (rehab only) 0Other environmental consultants 625,000 625,000 Name consultants & contract amounts
Total Engineering & Environmental Studies 1,775,000 0 0 0 0 0 0 0 0 0 1,775,000Financing Costs
Construction Financing CostsConstruction Loan Origination Fee 355,382 355,382Construction Loan Interest 25,000 4,444,057 4,469,057 Predev. and Construction Loan InterestTitle & Recording 75,000 75,000CDLAC & CDIAC fees 29,877 29,877Bond Issuer Fees 498,939 498,939 Issuer Fin. Advisor, Issuer Fee Upfront and AnnualOther Bond Cost of Issuance 46,250 46,250 Trustee Fee, COI ContigencyOther Lender Costs (specify) 75,000 75,000 Constructin and Perm Lender Expenses
Sub-total Const. Financing Costs 25,000 0 5,524,505 0 0 0 0 0 0 0 5,549,505Permanent Financing CostsPermanent Loan Origination Fee 89,130 89,130Credit Enhance. & Appl. Fee 0Title & Recording 25,000 25,000
Sub-total Perm. Financing Costs 0 0 114,130 0 0 0 0 0 0 0 114,130Total Financing Costs 25,000 0 5,638,635 0 0 0 0 0 0 0 5,663,635
Legal CostsBorrower Legal fees 175,000 175,000Land Use / CEQA Attorney fees 10,000 10,000Tax Credit Counsel 100,000 100,000Bond Counsel 65,000 65,000Construction Lender Counsel 70,000 70,000Permanent Lender Counsel 15,000 15,000Other Legal (specify) 27,500 27,500 Org of Partnership, Construction Closing
Total Legal Costs 377,500 0 85,000 0 0 0 0 0 0 0 462,500Other Development Costs
Appraisal 25,000 25,000Market Study 15,000 15,000
* Insurance 0* Property Taxes 0
Accounting / Audit 40,000 40,000* Organizational Costs 0
Entitlement / Permit Fees 1,120,578 1,120,578* Marketing / Rent-up 550,000 550,000
* Furnishings 846,522 846,522$2,000/unit; See MOHCD U/W Guidelines on: http://sfmohcd.org/documents-reports-and-forms
PGE / Utility Fees 353,600 353,600TCAC App / Alloc / Monitor Fees 145,481 145,481
* Financial Consultant fees 80,000 80,000Construction Management fees / Owner's Rep 190,000 190,000Security during Construction 240,000 240,000
* Relocation 0Accrued Interest - MOHCD 2,773,955 2,773,955Public Art 404,639 404,639Other (specify) 0
Total Other Development Costs 4,010,820 0 0 2,773,955 0 0 0 0 0 0 6,784,775Soft Cost Contingency
Contingency (Arch, Eng, Fin, Legal & Other Dev) 1,335,572 0 0 0 0 0 0 0 1,335,572 Should be either 10% or 5% of total soft costs. 7.3%TOTAL SOFT COSTS 11,156,892 0 5,723,635 2,773,955 0 0 0 0 0 0 19,654,482
RESERVES* Operating Reserves 1,738,222 1,738,222
Replacement Reserves 0* Tenant Improvements Reserves 0
Other (specify) 0Other (specify) 0Other (specify) 0
TOTAL RESERVES 0 0 1,738,222 0 0 0 0 0 0 0 1,738,222
DEVELOPER COSTSDeveloper Fee - Cash-out Paid at Milestones 1,098,000 1,098,000Developer Fee - Cash-out At Risk 2,162,000 150,000 2,312,000Commercial Developer Fee 125,000 125,000Developer Fee - GP Equity (also show as source) 500,000 500,000Developer Fee - Deferred (also show as source) 0Development Consultant Fees 0Other (specify) 0
TOTAL DEVELOPER COSTS 3,385,000 0 0 0 0 150,000 500,000 0 0 0 4,035,000
TOTAL DEVELOPMENT COST 65,777,411 17,500,000 12,397,000 2,773,955 1,000,000 51,158,320 500,000 0 0 0 151,106,686Development Cost/Unit by Source 297,635 79,186 56,095 12,552 4,525 231,486 2,262 0 0 0 683,741Development Cost/Unit as % of TDC by Source 43.5% 11.6% 8.2% 1.8% 0.7% 33.9% 0.3% 0.0% 0.0% 0.0% 100.0%
Acquisition Cost/Unit by Source 0 0 0 0 0 0 0 0 0 0 0
Construction Cost (inc Const Contingency)/Unit By Source 231,790 79,186 22,331 0 4,525 230,807 0 0 0 0 568,638Construction Cost (inc Const Contingency)/SF 275.77 94.21 26.57 0.00 5.38 274.60 0.00 0.00 0.00 0.00 676.52
*Possible non-eligible GO Bond/COP Amount: 28,281,980City Subsidy/Unit 297,635
Tax Credit Equity Pricing: 0.950Construction Bond Amount: 71,076,486Construction Loan Term (in months): 39 monthsConstruction Loan Interest Rate (as %): 3.05%
Total Soft Cost
Contingency as % of Total
Soft Costs
Construction line item costs
as a % of hard costs
1 of 1

Evaluation of Request for Final Gap Financing April 1, 2022 600 7th Street Page 50 of 54
Attachment K: 1st Year Operating Budget (Including New AMI Unit Mix)
(SEE ATTACHED)
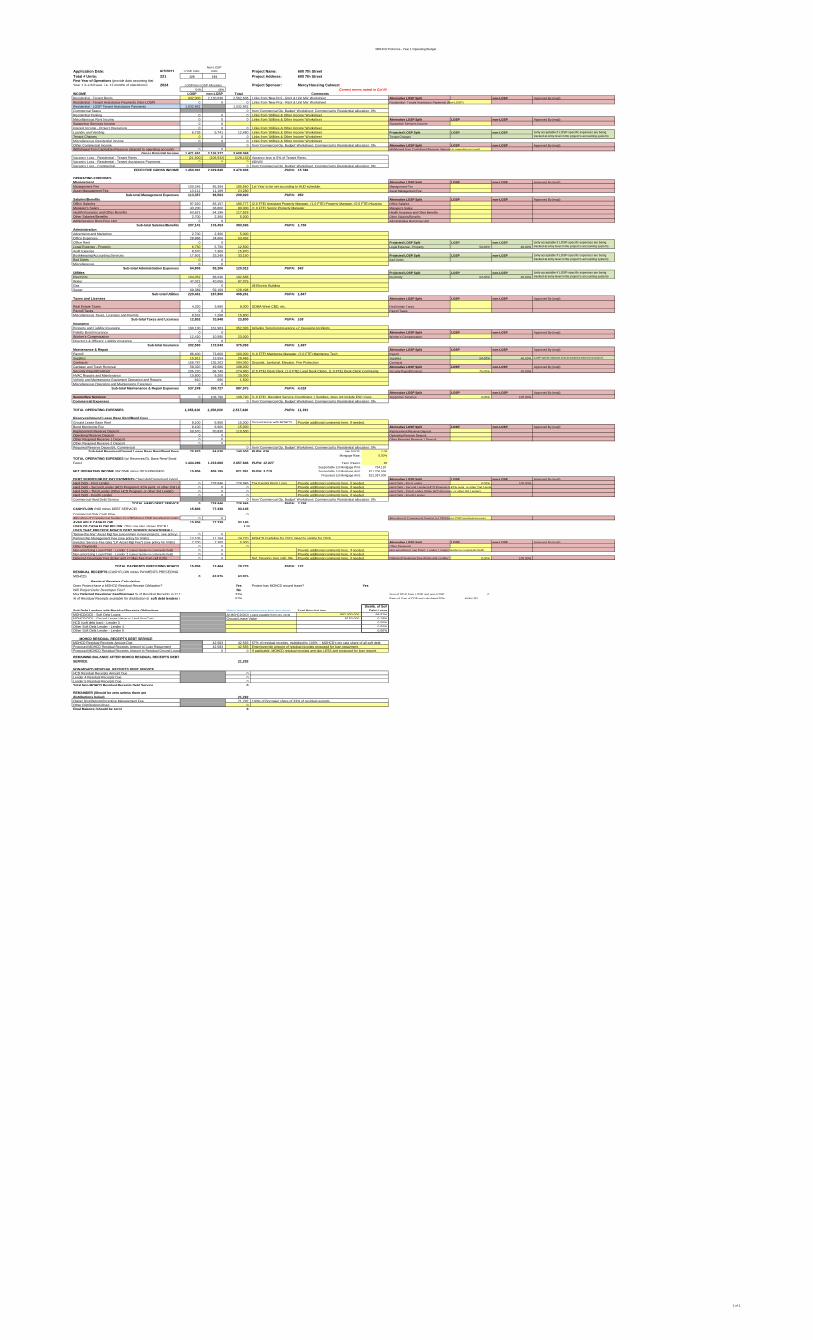
MOHCD Proforma - Year 1 Operating Budget
Application Date: 6/7/2021 LOSP UnitsNon-LOSP
Units Project Name:Total # Units: 221 120 101 Project Address:First Year of Operations (provide data assuming that Year 1 is a full year, i.e. 12 months of operations): 2024 Project Sponsor:
54% 46% Correct errors noted in Col N!INCOME LOSP non-LOSP Total Comments
432,000 2,130,636 2,562,636 Alternative LOSP Split non-LOSP Approved By (reqd)0 0 0 Residential - Tenant Assistance Payments (Non-LOSP)
1,032,952 1,032,9520
0 0 00 0 0 Alternative LOSP Split LOSP non-LOSP Approved By (reqd)0 0 Supportive Services Income0 0 0
6,739 5,741 12,480 Projected LOSP Split LOSP non-LOSP0 0 0 Tenant Charges0 0 0
0 Alternative LOSP Split LOSP non-LOSP Approved By (reqd)0 0 Withdrawal from Capitalized Reserve (deposit to operating account)
Gross Potential Income 1,471,691 2,136,377 3,608,068(21,600) (106,532) (128,132)
0 0 00
EFFECTIVE GROSS INCOME 1,450,091 2,029,845 3,479,936 PUPA: 15,746
OPERATING EXPENSESManagement Alternative LOSP Split LOSP non-LOSP Approved By (reqd)
100,246 85,394 185,640 Management Fee13,111 11,169 24,280 Asset Management Fee
Sub-total Management Expenses 113,357 96,563 209,920 PUPA: 950Salaries/Benefits Alternative LOSP Split LOSP non-LOSP Approved By (reqd)
97,620 83,157 180,777 Office Salaries43,200 36,800 80,000 Manager's Salary63,621 54,196 117,818 Health Insurance and Other Benefits
2,700 2,300 5,000 Other Salaries/Benefits0 0 Administrative Rent-Free Unit
Sub-total Salaries/Benefits 207,141 176,453 383,595 PUPA: 1,736Administration
2,700 2,300 5,00028,886 24,606 53,492
0 0 Projected LOSP Split LOSP non-LOSP6,750 5,750 12,500 Legal Expense - Property 54.00% 46.00%8,570 7,300 15,870
17,901 15,249 33,150 Projected LOSP Split LOSP non-LOSP0 0 Bad Debts0 0
Sub-total Administration Expenses 64,806 55,206 120,012 PUPA: 543Utilities Projected LOSP Split LOSP non-LOSP
104,052 88,636 192,688 Electricity 54.00% 46.00%47,021 40,055 87,075
0 069,389 59,109 128,498
Sub-total Utilities 220,461 187,800 408,261 PUPA: 1,847Taxes and Licenses Alternative LOSP Split LOSP non-LOSP Approved By (reqd)
4,320 3,680 8,000 Real Estate Taxes0 0 Payroll Taxes
8,532 7,268 15,800Sub-total Taxes and Licenses 12,852 10,948 23,800 PUPA: 108
Insurance190,130 161,963 352,093
0 0 Alternative LOSP Split LOSP non-LOSP Approved By (reqd)12,420 10,580 23,000 Worker's Compensation
0 0Sub-total Insurance 202,550 172,543 375,093 PUPA: 1,697
Maintenance & Repair Alternative LOSP Split LOSP non-LOSP Approved By (reqd)86,400 73,600 160,000 Payroll15,911 13,554 29,465 Supplies 54.00% 46.00% (LOSP-specific expenses must be tracked at entry level in project's
158,787 135,263 294,050 Contracts58,320 49,680 108,000 Alternative LOSP Split LOSP non-LOSP Approved By (reqd)
206,220 68,740 274,960 Security Payroll/Contract 75.00% 25.00%10,800 9,200 20,000
810 690 1,5000 0
Sub-total Maintenance & Repair Expenses 537,248 350,727 887,975 PUPA: 4,018Alternative LOSP Split LOSP non-LOSP Approved By (reqd)
0 108,790 108,790 Supportive Services 0.00% 100.00%0
1,358,416 1,159,030 2,517,446 PUPA: 11,391
Reserves/Ground Lease Base Rent/Bond Fees8,100 6,900 15,000 Ground lease with MOHCD8,100 6,900 15,000 Alternative LOSP Split LOSP non-LOSP Approved By (reqd)
59,670 50,830 110,500 Replacement Reserve Deposit0 0 Operating Reserve Deposit0 0 Other Required Reserve 1 Deposit0 0
0Sub-total Reserves/Ground Lease Base Rent/Bond Fees 75,870 64,630 140,500 PUPA: 636 Min DSCR: 1.09
Mortgage Rate: 5.00%
1,434,286 1,223,660 2,657,946 PUPA: 12,027 Term (Years): 30Supportable 1st Mortgage Pmt: 754,120
NET OPERATING INCOME (INCOME minus OP EXPENSES) 15,806 806,185 821,991 PUPA: 3,719 Supportable 1st Mortgage Amt: $11,706,556Proposed 1st Mortgage Amt: $12,397,000
DEBT SERVICE/MUST PAY PAYMENTS ("hard debt"/amortized loans) Alternative LOSP Split LOSP non-LOSP Approved By (reqd)0 728,846 728,846 Tax Exempt Perm Loan Hard Debt - First Lender 0.00% 100.00%0 0 0 Hard Debt - Second Lender (HCD Program 0.42% pymt, or other 2nd Lende0 0 0 Hard Debt - Third Lender (Other HCD Program, or other 3rd Lender)0 0 0 Hard Debt - Fourth Lender
0TOTAL HARD DEBT SERVICE 0 728,846 728,846 PUPA: 3,298
CASH FLOW (NOI minus DEBT SERVICE) 15,806 77,339 93,145Commercial Only Cash Flow 0Allocation of Commercial Surplus to LOPS/non-LOSP (residual income) 0 0 Allocation of Commercial Surplus to LOPS/non-LOSP (residual income)AVAILABLE CASH FLOW 15,806 77,339 93,145USES OF CASH FLOW BELOW (This row also shows DSCR.) 1.13USES THAT PRECEDE MOHCD DEBT SERVICE IN WATERFALL
0 013,106 11,164 24,270 MOHCD Guideline for 2023. Need to update for 2024
2,700 2,300 5,000 Alternative LOSP Split LOSP non-LOSP Approved By (reqd)0 0 0 Other Payments0 0 Non-amortizing Loan Pmnt - Lender 1 (select lender in comments field) 0 00 0 Def. Develop. Fee split: 0% Deferred Developer Fee (Enter amt <= Max F 0.00% 100.00%
TOTAL PAYMENTS PRECEDING MOHCD 15,806 13,464 29,270 PUPA: 132
0 63,875 63,875Residual Receipts Calculation
Yes Project has MOHCD ground lease? YesNo
Max Deferred Developer Fee/Borrower % of Residual Receipts in Yr 1: 33% Sum of DD F from LOSP and non-LOSP: 067% Ratio of Sum of DDF and calculated 50%: #VALUE!
Soft Debt Lenders with Residual Receipts Obligations (Select lender name/program from drop down) Total Principal AmtDistrib. of Soft
Debt Loans$82,000,000 99.82%
MOHCD/OCII - Ground Lease Value or Land Acq Cost $150,000 0.18%0.00%0.00%0.00%
MOHCD RESIDUAL RECEIPTS DEBT SERVICE42,583 42,58342,583 42,583
0 0
21,292
NON-MOHCD RESIDUAL RECEIPTS DEBT SERVICE000
Total Non-MOHCD Residual Receipts Debt Service 0
REMAINDER (Should be zero unless there are distributions below) 21,292
21,2920
Final Balance (should be zero) 0
Other Salaries/BenefitsAdministrative Rent-Free Unit
Advertising and MarketingOffice ExpensesOffice Rent
Management FeeAsset Management Fee
Office SalariesManager's SalaryHealth Insurance and Other Benefits
Includes Terrorism Insurance +2 Insurance Incidents
Legal Expense - Property
Bad Debts
Electricity
Audit ExpenseBookkeeping/Accounting Services
Miscellaneous
WaterGasSewer
Real Estate Taxes
Interest Income - Project Operations
Other Commercial Income
Laundry and VendingTenant ChargesMiscellaneous Residential Income
Withdrawal from Capitalized Reserve (deposit to operating account)
Vacancy Loss - Residential - Tenant RentsVacancy Loss - Residential - Tenant Assistance PaymentsVacancy Loss - Commercial
LOSP/non-LOSP Allocation
Residential - Tenant RentsResidential - Tenant Assistance Payments (Non-LOSP)Residential - LOSP Tenant Assistance PaymentsCommercial SpaceResidential ParkingMiscellaneous Rent IncomeSupportive Services Income
100% of Borrower share of 33% of residual receipts
All MOHCD/OCII Loans payable from res. rects
If applicable, MOHCD residual receipts amt due LESS amt proposed for loan repymt.
Provide additional comments here, if needed.
Enter/override amount of residual receipts proposed for loan repayment.
(1.0 FTE) Maintence Manager, (2.0 FTE) Maintence Tech
Grounds, Janitorial, Elevator, Fire Protection
(2.5 FTE) Desk Clerk, (1.0 FTE) Lead Desk Clerks, (1.0 FTE) Desk Clerk/ Community
Provide additional comments here, if needed.Provide additional comments here, if needed.Provide additional comments here, if needed.
67% of residual receipts, multiplied by 100% -- MOHCD's pro rata share of all soft debt
(1.0 FTE) Resident Service Coordinator + Supplies, does not include ESC Case
from 'Commercial Op. Budget' Worksheet; Commercial to Residential allocation: 0%
1st Year to be set according to HUD schedule.
(2.0 FTE) Assistant Property Manager, (1.0 FTE) Property Manager, (0.5 FTE) Housing (1.0 FTE) Senior Property Manager
SOMA West CBD, etc.
All Electric Building
Links from 'New Proj - Rent & Unit Mix' WorksheetLinks from 'New Proj - Rent & Unit Mix' Worksheet
from 'Commercial Op. Budget' Worksheet; Commercial to Residential allocation: 0%
(only acceptable if LOSP-specific expenses are being tracked at entry level in the project's accounting system)
(only acceptable if LOSP-specific expenses are being tracked at entry level in the project's accounting system)
(only acceptable if LOSP-specific expenses are being tracked at entry level in the project's accounting system)
(only acceptable if LOSP-specific expenses are being tracked at entry level in the project's accounting system)
Links from 'Utilities & Other Income' Worksheet
Links from 'Utilities & Other Income' WorksheetLinks from 'Utilities & Other Income' WorksheetLinks from 'Utilities & Other Income' WorksheetLinks from 'Utilities & Other Income' Worksheetfrom 'Commercial Op. Budget' Worksheet; Commercial to Residential allocation: 0%
Vacancy loss is 5% of Tenant Rents.#DIV/0!from 'Commercial Op. Budget' Worksheet; Commercial to Residential allocation: 0%
Links from 'Utilities & Other Income' Worksheet
TOTAL OPERATING EXPENSES
TOTAL OPERATING EXPENSES (w/ Reserves/GL Base Rent/ Bond Fees)
REMAINING BALANCE AFTER MOHCD RESIDUAL RECEIPTS DEBT SERVICE
from 'Commercial Op. Budget' Worksheet; Commercial to Residential allocation: 0%
from 'Commercial Op. Budget' Worksheet; Commercial to Residential allocation: 0%
Provide additional comments here, if needed.Ground Lease Base Rent Bond Monitoring Fee Replacement Reserve DepositOperating Reserve DepositOther Required Reserve 1 Deposit
Provide additional comments here, if needed.
Ground Lease Value
HVAC Repairs and MaintenanceVehicle and Maintenance Equipment Operation and RepairsMiscellaneous Operating and Maintenance Expenses
Supportive Services
Director's & Officers' Liability Insurance
Payroll
ContractsGarbage and Trash RemovalSecurity Payroll/Contract
Supplies
Payroll TaxesMiscellaneous Taxes, Licenses and Permits
Property and Liability InsuranceFidelity Bond InsuranceWorker's Compensation
Will Project Defer Developer Fee?
Commercial Expenses
Hard Debt - Fourth Lender Commercial Hard Debt Service
Deferred Developer Fee (Enter amt <= Max Fee from cell I130)
"Below-the-line" Asset Mgt fee (uncommon in new projects, see policy)Partnership Management Fee (see policy for limits)
Other Required Reserve 2 DepositRequired Reserve Deposit/s, Commercial
Hard Debt - First LenderHard Debt - Second Lender (HCD Program 0.42% pymt, or other 2nd LeHard Debt - Third Lender (Other HCD Program, or other 3rd Lender)
Investor Service Fee (aka "LP Asset Mgt Fee") (see policy for limits)Other PaymentsNon-amortizing Loan Pmnt - Lender 1 (select lender in comments field) Non-amortizing Loan Pmnt - Lender 2 (select lender in comments field)
Provide additional comments here, if needed.
600 7th Street600 7th Street
Mercy Housing Calwest
Other Distributions/Uses
Proposed MOHCD Residual Receipts Amount to Residual Ground Lease
HCD Residual Receipts Amount DueLender 4 Residual Receipts DueLender 5 Residual Receipts Due
Owner Distributions/Incentive Management Fee
Provide additional comments here, if needed.
HCD (soft debt loan) - Lender 3Other Soft Debt Lender - Lender 4 Other Soft Debt Lender - Lender 5
MOHCD Residual Receipts Amount DueProposed MOHCD Residual Receipts Amount to Loan Repayment
MOHCD/OCII - Soft Debt Loans
Does Project have a MOHCD Residual Receipt Obligation?
% of Residual Receipts available for distribution to soft debt lenders in
RESIDUAL RECEIPTS (CASH FLOW minus PAYMENTS PRECEDING MOHCD)
1 of 1
Evaluation of Request for Final Gap Financing April 1, 2022 600 7th Street Page 51 of 54
Attachment L: 20-year Operating Proforma
(SEE ATTACHED)

MOHCD Proforma - 20 Year Cash Flow
600 7th Street
Total # Units:LOSP Units
Non-LOSP Units 2024 2025 2026
221 120 10154.00% 46.00%
INCOME% annual inc LOSP
% annual increase
Comments (related to annual inc assumptions) LOSP non-LOSP Total LOSP
non-LOSP Total LOSP
non-LOSP Total
Residential - Tenant Rents 1.0% 2.5% 432,000 2,130,636 2,562,636 436,320 2,183,902 2,620,222 440,683 2,238,499 2,679,183 Residential - Tenant Assistance Payments (Non-LOSP) n/a n/a - - - - - - - Residential - LOSP Tenant Assistance Payments n/a n/a 1,032,952 1,032,952 1,076,683 1,076,683 1,122,213 1,122,213
Commercial Space n/a 3.0%from 'Commercial Op. Budget' Worksheet; Commercial to Residential allocation: 0% - - -
Residential Parking 2.5% 2.5% - - - - - - - - - Miscellaneous Rent Income 2.5% 2.5% - - - - - - - - - Supportive Services Income 2.5% 2.5% - - - - - - - - - Interest Income - Project Operations 2.5% 2.5% - - - - - - - - - Laundry and Vending 2.5% 2.5% 6,739 5,741 12,480 6,908 5,884 12,792 7,080 6,031 13,112 Tenant Charges 2.5% 2.5% - - - - - - - - - Miscellaneous Residential Income 2.5% 2.5% - - - - - - - - -
Other Commercial Income n/a 2.5%from 'Commercial Op. Budget' Worksheet; Commercial to Residential allocation: 0% - - -
Withdrawal from Capitalized Reserve (deposit to operating account) n/a n/aLink from Reserve Section below, as applicable - - - - - - -
Gross Potential Income 1,471,691 2,136,377 3,608,068 1,519,911 2,189,786 3,709,697 1,569,977 2,244,531 3,814,508 Vacancy Loss - Residential - Tenant Rents n/a n/a (21,600) (106,532) (128,132) (21,816) (109,195) (131,011) (22,034) (111,925) (133,959) Vacancy Loss - Residential - Tenant Assistance Payments n/a n/a - - - - - - - - - Vacancy Loss - Commercial n/a n/a - - -
EFFECTIVE GROSS INCOME 1,450,091 2,029,845 3,479,936 1,498,095 2,080,591 3,578,686 1,547,943 2,132,606 3,680,549 OPERATING EXPENSESManagement
Management Fee 3.5% 3.5%1st Year to be set according to HUD schedule. 100,246 85,394 185,640 103,754 88,383 192,137 107,386 91,477 198,862
Asset Management Fee 3.5% 3.5% per MOHCD policy 13,111 11,169 24,280 13,570 11,560 25,130 14,045 11,964 26,009 Sub-total Management Expenses 113,357 96,563 209,920 117,324 99,943 217,267 121,431 103,441 224,872
Salaries/BenefitsOffice Salaries 3.5% 3.5% 97,620 83,157 180,777 101,036 86,068 187,104 104,573 89,080 193,653 Manager's Salary 3.5% 3.5% 43,200 36,800 80,000 44,712 38,088 82,800 46,277 39,421 85,698 Health Insurance and Other Benefits 3.5% 3.5% 63,621 54,196 117,818 65,848 56,093 121,941 68,153 58,056 126,209 Other Salaries/Benefits 3.5% 3.5% 2,700 2,300 5,000 2,795 2,381 5,175 2,892 2,464 5,356 Administrative Rent-Free Unit 3.5% 3.5% - - - - - - - - -
Sub-total Salaries/Benefits 207,141 176,453 383,595 214,391 182,629 397,020 221,895 189,021 410,916 AdministrationAdvertising and Marketing 3.5% 3.5% 2,700 2,300 5,000 2,795 2,381 5,175 2,892 2,464 5,356 Office Expenses 3.5% 3.5% 28,886 24,606 53,492 29,897 25,468 55,364 30,943 26,359 57,302 Office Rent 3.5% 3.5% - - - - - - - - - Legal Expense - Property 3.5% 3.5% 6,750 5,750 12,500 6,986 5,951 12,938 7,231 6,160 13,390 Audit Expense 3.5% 3.5% 8,570 7,300 15,870 8,870 7,556 16,425 9,180 7,820 17,000 Bookkeeping/Accounting Services 3.5% 3.5% 17,901 15,249 33,150 18,528 15,783 34,310 19,176 16,335 35,511 Bad Debts 3.5% 3.5% - - - - - - - - - Miscellaneous 3.5% 3.5% - - - - - - - - -
Sub-total Administration Expenses 64,806 55,206 120,012 67,075 57,138 124,212 69,422 59,138 128,560 UtilitiesElectricity 3.5% 3.5% 104,052 88,636 192,688 107,693 91,739 199,432 111,463 94,950 206,412 Water 3.5% 3.5% 47,021 40,055 87,075 48,666 41,456 90,123 50,370 42,907 93,277 Gas 3.5% 3.5% - - - - - - - - - Sewer 3.5% 3.5% 69,389 59,109 128,498 71,818 61,178 132,995 74,331 63,319 137,650
Sub-total Utilities 220,461 187,800 408,261 228,177 194,373 422,550 236,163 201,176 437,339 Taxes and LicensesReal Estate Taxes 3.5% 3.5% 4,320 3,680 8,000 4,471 3,809 8,280 4,628 3,942 8,570 Payroll Taxes 3.5% 3.5% - - - - - - - - - Miscellaneous Taxes, Licenses and Permits 3.5% 3.5% 8,532 7,268 15,800 8,831 7,522 16,353 9,140 7,786 16,925
Sub-total Taxes and Licenses 12,852 10,948 23,800 13,302 11,331 24,633 13,767 11,728 25,495 InsuranceProperty and Liability Insurance 3.5% 3.5% 190,130 161,963 352,093 196,785 167,631 364,416 203,672 173,499 377,171 Fidelity Bond Insurance 3.5% 3.5% - - - - - - - - - Worker's Compensation 3.5% 3.5% 12,420 10,580 23,000 12,855 10,950 23,805 13,305 11,334 24,638 Director's & Officers' Liability Insurance 3.5% 3.5% - - - - - - - - -
Sub-total Insurance 202,550 172,543 375,093 209,639 178,582 388,221 216,977 184,832 401,809 Maintenance & RepairPayroll 3.5% 3.5% 86,400 73,600 160,000 89,424 76,176 165,600 92,554 78,842 171,396 Supplies 3.5% 3.5% 15,911 13,554 29,465 16,468 14,028 30,496 17,044 14,519 31,564 Contracts 3.5% 3.5% 158,787 135,263 294,050 164,345 139,997 304,342 170,097 144,897 314,994 Garbage and Trash Removal 3.5% 3.5% 58,320 49,680 108,000 60,361 51,419 111,780 62,474 53,218 115,692 Security Payroll/Contract 3.5% 3.5% 206,220 68,740 274,960 213,438 71,146 284,584 220,908 73,636 294,544 HVAC Repairs and Maintenance 3.5% 3.5% 10,800 9,200 20,000 11,178 9,522 20,700 11,569 9,855 21,425 Vehicle and Maintenance Equipment Operation and Repairs 3.5% 3.5% 810 690 1,500 838 714 1,553 868 739 1,607 Miscellaneous Operating and Maintenance Expenses 3.5% 3.5% - - - - - - - - -
Sub-total Maintenance & Repair Expenses 537,248 350,727 887,975 556,052 363,002 919,054 575,514 375,707 951,221
Supportive Services 3.5% 3.5% - 108,790 108,790 - 112,598 112,598 - 116,539 116,539
Commercial Expensesfrom 'Commercial Op. Budget' Worksheet; Commercial to Residential allocation: 0% - - -
TOTAL OPERATING EXPENSES 1,358,416 1,159,030 2,517,446 1,405,960 1,199,596 2,605,556 1,455,169 1,241,582 2,696,751 PUPA (w/o Reserves/GL Base Rent/Bond Fees) 11,391
Reserves/Ground Lease Base Rent/Bond Fees Note: Hidden columns are in between total columns. To update Ground Lease Base Rent 8,100 6,900 15,000 8,100 6,900 15,000 8,100 6,900 15,000 Bond Monitoring Fee 8,100 6,900 15,000 8,100 6,900 15,000 8,265 7,040 15,305 Replacement Reserve Deposit 59,670 50,830 110,500 59,670 50,830 110,500 59,670 50,830 110,500 Operating Reserve Deposit - - - - - - - - - Other Required Reserve 1 Deposit - - - - - - - - - Other Required Reserve 2 Deposit - - - - - - - - -
Required Reserve Deposit/s, Commercialfrom 'Commercial Op. Budget' Worksheet; Commercial to Residential allocation: 0% - - - - - - - - -
Sub-total Reserves/Ground Lease Base Rent/Bond Fees 75,870 64,630 140,500 75,870 64,630 140,500 76,035 64,770 140,805
TOTAL OPERATING EXPENSES (w/ Reserves/GL Base Rent/ Bond Fees) 1,434,286 1,223,660 2,657,946 1,481,830 1,264,226 2,746,056 1,531,203 1,306,352 2,837,556 PUPA (w/ Reserves/GL Base Rent/Bond Fees) 12,027
NET OPERATING INCOME (INCOME minus OP EXPENSES) 15,806 806,185 821,991 16,265 816,365 832,630 16,739 826,254 842,993
DEBT SERVICE/MUST PAY PAYMENTS ("hard debt"/amortized loans) Note: Hidden columns are in between total columns. To update Hard Debt - First Lender Enter comments re: annual increase, etc. - 728,846 728,846 - 743,675 743,675 - 743,517 743,517 Hard Debt - Second Lender (HCD Program 0.42% pymt, or other 2nd Lender) Enter comments re: annual increase, etc. - - - - - - - - - Hard Debt - Third Lender (Other HCD Program, or other 3rd Lender) Enter comments re: annual increase, etc. - - - - - - - - - Hard Debt - Fourth Lender Enter comments re: annual increase, etc. - - - - - - - - -
Commercial Hard Debt Servicefrom 'Commercial Op. Budget' Worksheet; Commercial to Residential allocation: 0% - - -
TOTAL HARD DEBT SERVICE - 728,846 728,846 - 743,675 743,675 - 743,517 743,517 CASH FLOW (NOI minus DEBT SERVICE) 15,806 77,339 93,145 16,265 72,690 88,955 16,739 82,737 99,476
Commercial Only Cash Flow 0 (0) (0) Allocation of Commercial Surplus to LOPS/non-LOSP (residual income) 0 0 (0) (0) (0) (0) AVAILABLE CASH FLOW 15,806 77,339 93,145 16,265 72,690 88,955 16,739 82,737 99,476
USES OF CASH FLOW BELOW (This row also shows DSCR.) DSCR: 1.128 1.12 1.134USES THAT PRECEDE MOHCD DEBT SERVICE IN WATERFALL Note: Hidden columns are in between total columns. To update "Below-the-line" Asset Mgt fee (uncommon in new projects, see policy) 3.5% 3.5% per MOHCD policy - - - - - - - Partnership Management Fee (see policy for limits) 3.5% 3.5% per MOHCD policy 13,106 11,164 24,270 13,565 11,555 25,119 14,039 11,959 25,999 Investor Service Fee (aka "LP Asset Mgt Fee") (see policy for limits) per MOHCD policy no annual increase 2,700 2,300 5,000 2,700 2,300 5,000 2,700 2,300 5,000 Other Payments - - - - - - - Non-amortizing Loan Pmnt - Lender 1 Enter comments re: annual increase, etc. - - - - - - - Non-amortizing Loan Pmnt - Lender 2 Enter comments re: annual increase, etc. - - - - - - - Deferred Developer Fee (Enter amt <= Max Fee from row 131) - - - - - - -
TOTAL PAYMENTS PRECEDING MOHCD 15,806 13,464 29,270 16,265 13,855 30,119 16,739 14,259 30,999
RESIDUAL RECEIPTS (CASH FLOW minus PAYMENTS PRECEDING MOHCD) 0 63,875 63,875 0 58,835 58,835 (0) 68,477 68,477 Does Project have a MOHCD Residual Receipt Obligation? YesWill Project Defer Developer Fee? NoResidual Receipts split for all years. - Lender/Owner 67% / 33%
Max Deferred Developer Fee Amt:Dist. Soft Cum. Deferred Developer Fee: - - -
MOHCD RESIDUAL RECEIPTS DEBT SERVICE Debt Loans
MOHCD Residual Receipts Amount Due 100.00%Allocation per pro rata share of all soft debt loans, and MOHCD residual receipts policy 42,583 39,223 45,652
Proposed MOHCD Residual Receipts Amount to Loan Repayment 42,583 39,223 45,652 Proposed MOHCD Residual Receipts Amount to Residual Ground Lease
Proposed Total MOHCD Amt Due less Loan Repayment - - -
NON-MOHCD RESIDUAL RECEIPTS DEBT SERVICEHCD Residual Receipts Amount Due 0.00% No HCD Financing - - - Lender 4 Residual Receipts Due 0.00% - - - Lender 5 Residual Receipts Due 0.00% - - -
Total Non-MOHCD Residual Receipts Debt Service - - -
REMAINDER (Should be zero unless there are distributions below) 21,292 19,612 22,826 Owner Distributions/Incentive Management Fee 21,292 19,612 22,826 Other Distributions/Uses - Final Balance (should be zero) - - -
REPLACEMENT RESERVE - RUNNING BALANCEReplacement Reserve Starting Balance - 110,500 221,000 Replacement Reserve Deposits 110,500 110,500 110,500 Replacement Reserve Withdrawals (ideally tied to CNA) - - - Replacement Reserve Interest
RR Running Balance 110,500 221,000 331,500 RR Balance/Unit $500 $1,000 $1,500
OPERATING RESERVE - RUNNING BALANCEOperating Reserve Starting Balance - - - Operating Reserve Deposits - - - Operating Reserve WithdrawalsOperating Reserve Interest
OR Running Balance - - - OR Balance as a % of Prior Yr Op Exps + Debt Service 0.0% 0.0%
OTHER REQUIRED RESERVE 1 - RUNNING BALANCEOther Reserve 1 Starting Balance - - Other Reserve 1 Deposits - - - Other Reserve 1 Withdrawals Other Reserve 1 Interest
Other Required Reserve 1 Running Balance - - -
OTHER RESERVE 2 - RUNNING BALANCEOther Reserve 2 Starting Balance - - Other Reserve 2 Deposits - - - Other Reserve 2 Withdrawals Other Reserve 2 Interest
Other Required Reserve 2 Running Balance - - -
Enter formulas manually per relevant MOH policy; annual incrementing usually not appropriate
Year 12024
Year 22025
Year 32026
1 of 7
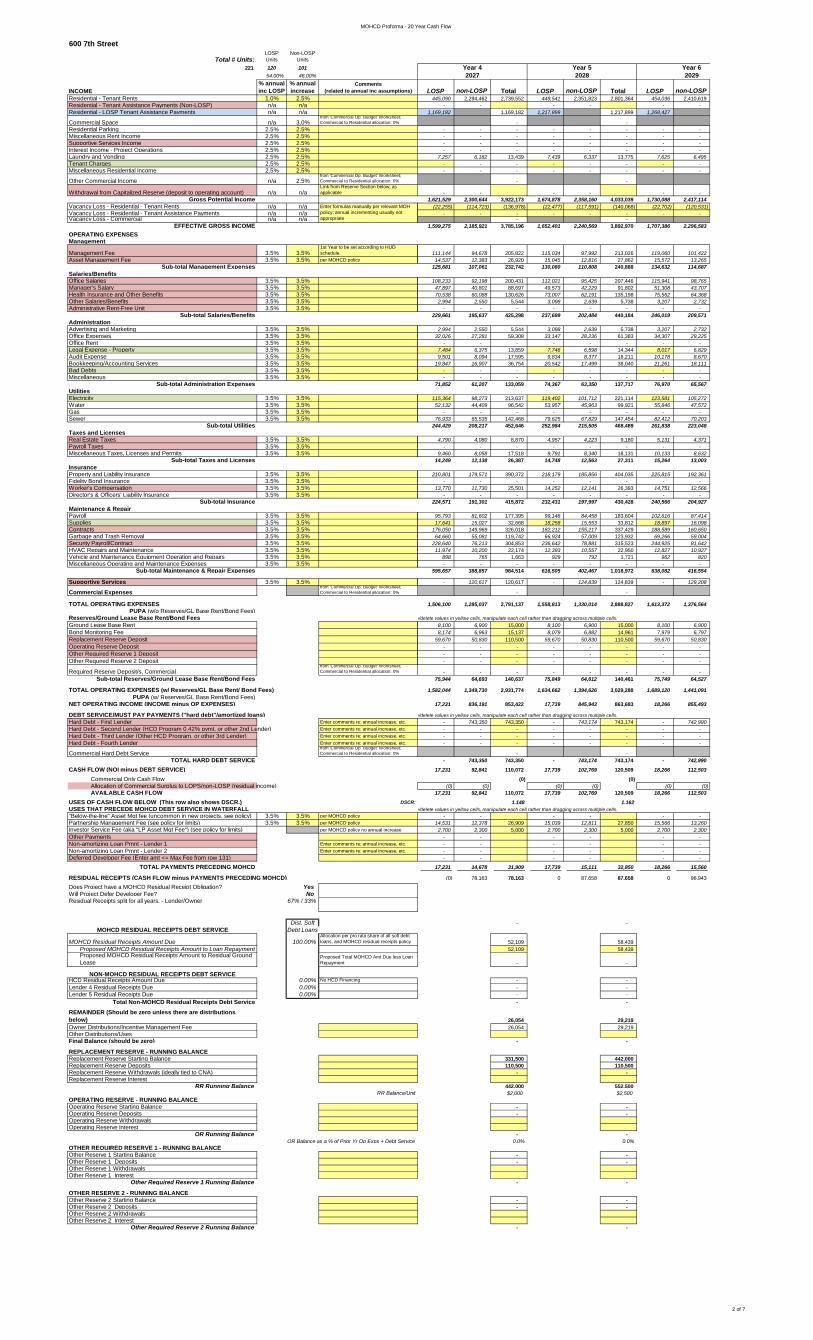
MOHCD Proforma - 20 Year Cash Flow
600 7th Street
Total # Units:LOSP Units
Non-LOSP Units
221 120 10154.00% 46.00%
INCOME% annual inc LOSP
% annual increase
Comments (related to annual inc assumptions)
Residential - Tenant Rents 1.0% 2.5%Residential - Tenant Assistance Payments (Non-LOSP) n/a n/aResidential - LOSP Tenant Assistance Payments n/a n/a
Commercial Space n/a 3.0%from 'Commercial Op. Budget' Worksheet; Commercial to Residential allocation: 0%
Residential Parking 2.5% 2.5%Miscellaneous Rent Income 2.5% 2.5%Supportive Services Income 2.5% 2.5%Interest Income - Project Operations 2.5% 2.5%Laundry and Vending 2.5% 2.5%Tenant Charges 2.5% 2.5%Miscellaneous Residential Income 2.5% 2.5%
Other Commercial Income n/a 2.5%from 'Commercial Op. Budget' Worksheet; Commercial to Residential allocation: 0%
Withdrawal from Capitalized Reserve (deposit to operating account) n/a n/aLink from Reserve Section below, as applicable
Gross Potential IncomeVacancy Loss - Residential - Tenant Rents n/a n/aVacancy Loss - Residential - Tenant Assistance Payments n/a n/aVacancy Loss - Commercial n/a n/a
EFFECTIVE GROSS INCOMEOPERATING EXPENSESManagement
Management Fee 3.5% 3.5%1st Year to be set according to HUD schedule.
Asset Management Fee 3.5% 3.5% per MOHCD policySub-total Management Expenses
Salaries/BenefitsOffice Salaries 3.5% 3.5%Manager's Salary 3.5% 3.5%Health Insurance and Other Benefits 3.5% 3.5%Other Salaries/Benefits 3.5% 3.5%Administrative Rent-Free Unit 3.5% 3.5%
Sub-total Salaries/BenefitsAdministrationAdvertising and Marketing 3.5% 3.5%Office Expenses 3.5% 3.5%Office Rent 3.5% 3.5%Legal Expense - Property 3.5% 3.5%Audit Expense 3.5% 3.5%Bookkeeping/Accounting Services 3.5% 3.5%Bad Debts 3.5% 3.5%Miscellaneous 3.5% 3.5%
Sub-total Administration ExpensesUtilitiesElectricity 3.5% 3.5%Water 3.5% 3.5%Gas 3.5% 3.5%Sewer 3.5% 3.5%
Sub-total UtilitiesTaxes and LicensesReal Estate Taxes 3.5% 3.5%Payroll Taxes 3.5% 3.5%Miscellaneous Taxes, Licenses and Permits 3.5% 3.5%
Sub-total Taxes and LicensesInsuranceProperty and Liability Insurance 3.5% 3.5%Fidelity Bond Insurance 3.5% 3.5%Worker's Compensation 3.5% 3.5%Director's & Officers' Liability Insurance 3.5% 3.5%
Sub-total InsuranceMaintenance & RepairPayroll 3.5% 3.5%Supplies 3.5% 3.5%Contracts 3.5% 3.5%Garbage and Trash Removal 3.5% 3.5%Security Payroll/Contract 3.5% 3.5%HVAC Repairs and Maintenance 3.5% 3.5%Vehicle and Maintenance Equipment Operation and Repairs 3.5% 3.5%Miscellaneous Operating and Maintenance Expenses 3.5% 3.5%
Sub-total Maintenance & Repair Expenses
Supportive Services 3.5% 3.5%
Commercial Expensesfrom 'Commercial Op. Budget' Worksheet; Commercial to Residential allocation: 0%
TOTAL OPERATING EXPENSES PUPA (w/o Reserves/GL Base Rent/Bond Fees)
Reserves/Ground Lease Base Rent/Bond FeesGround Lease Base Rent Bond Monitoring Fee Replacement Reserve DepositOperating Reserve DepositOther Required Reserve 1 DepositOther Required Reserve 2 Deposit
Required Reserve Deposit/s, Commercialfrom 'Commercial Op. Budget' Worksheet; Commercial to Residential allocation: 0%
Sub-total Reserves/Ground Lease Base Rent/Bond Fees
TOTAL OPERATING EXPENSES (w/ Reserves/GL Base Rent/ Bond Fees)PUPA (w/ Reserves/GL Base Rent/Bond Fees)
NET OPERATING INCOME (INCOME minus OP EXPENSES)
DEBT SERVICE/MUST PAY PAYMENTS ("hard debt"/amortized loans)Hard Debt - First Lender Enter comments re: annual increase, etc. Hard Debt - Second Lender (HCD Program 0.42% pymt, or other 2nd Lender) Enter comments re: annual increase, etc. Hard Debt - Third Lender (Other HCD Program, or other 3rd Lender) Enter comments re: annual increase, etc. Hard Debt - Fourth Lender Enter comments re: annual increase, etc.
Commercial Hard Debt Servicefrom 'Commercial Op. Budget' Worksheet; Commercial to Residential allocation: 0%
TOTAL HARD DEBT SERVICECASH FLOW (NOI minus DEBT SERVICE)
Commercial Only Cash FlowAllocation of Commercial Surplus to LOPS/non-LOSP (residual income)AVAILABLE CASH FLOW
USES OF CASH FLOW BELOW (This row also shows DSCR.) DSCR: USES THAT PRECEDE MOHCD DEBT SERVICE IN WATERFALL"Below-the-line" Asset Mgt fee (uncommon in new projects, see policy) 3.5% 3.5% per MOHCD policyPartnership Management Fee (see policy for limits) 3.5% 3.5% per MOHCD policyInvestor Service Fee (aka "LP Asset Mgt Fee") (see policy for limits) per MOHCD policy no annual increaseOther PaymentsNon-amortizing Loan Pmnt - Lender 1 Enter comments re: annual increase, etc. Non-amortizing Loan Pmnt - Lender 2 Enter comments re: annual increase, etc. Deferred Developer Fee (Enter amt <= Max Fee from row 131)
TOTAL PAYMENTS PRECEDING MOHCD
RESIDUAL RECEIPTS (CASH FLOW minus PAYMENTS PRECEDING MOHCD)Does Project have a MOHCD Residual Receipt Obligation? YesWill Project Defer Developer Fee? NoResidual Receipts split for all years. - Lender/Owner 67% / 33%
Dist. SoftMOHCD RESIDUAL RECEIPTS DEBT SERVICE Debt Loans
MOHCD Residual Receipts Amount Due 100.00%Allocation per pro rata share of all soft debt loans, and MOHCD residual receipts policy
Proposed MOHCD Residual Receipts Amount to Loan RepaymentProposed MOHCD Residual Receipts Amount to Residual Ground Lease
Proposed Total MOHCD Amt Due less Loan Repayment
NON-MOHCD RESIDUAL RECEIPTS DEBT SERVICEHCD Residual Receipts Amount Due 0.00% No HCD FinancingLender 4 Residual Receipts Due 0.00%Lender 5 Residual Receipts Due 0.00%
Total Non-MOHCD Residual Receipts Debt ServiceREMAINDER (Should be zero unless there are distributions below)Owner Distributions/Incentive Management FeeOther Distributions/UsesFinal Balance (should be zero)
REPLACEMENT RESERVE - RUNNING BALANCEReplacement Reserve Starting BalanceReplacement Reserve DepositsReplacement Reserve Withdrawals (ideally tied to CNA)Replacement Reserve Interest
RR Running BalanceRR Balance/Unit
OPERATING RESERVE - RUNNING BALANCEOperating Reserve Starting BalanceOperating Reserve DepositsOperating Reserve WithdrawalsOperating Reserve Interest
OR Running BalanceOR Balance as a % of Prior Yr Op Exps + Debt Service
OTHER REQUIRED RESERVE 1 - RUNNING BALANCEOther Reserve 1 Starting BalanceOther Reserve 1 DepositsOther Reserve 1 Withdrawals Other Reserve 1 Interest
Other Required Reserve 1 Running Balance
OTHER RESERVE 2 - RUNNING BALANCEOther Reserve 2 Starting BalanceOther Reserve 2 DepositsOther Reserve 2 Withdrawals Other Reserve 2 Interest
Other Required Reserve 2 Running Balance
Enter formulas manually per relevant MOH policy; annual incrementing usually not appropriate
2027 2028
LOSP non-LOSP Total LOSP non-LOSP Total LOSP non-LOSP445,090 2,294,462 2,739,552 449,541 2,351,823 2,801,364 454,036 2,410,619
- - - - - - 1,169,182 1,169,182 1,217,899 1,217,899 1,268,427
- - - - - - - - - - - - - - - - - - - - - - - - - - - - - - - - - -
7,257 6,182 13,439 7,439 6,337 13,775 7,625 6,495 - - - - - - - - - - - - - - - -
- -
- - - - - - 1,621,529 2,300,644 3,922,173 1,674,878 2,358,160 4,033,039 1,730,088 2,417,114
(22,255) (114,723) (136,978) (22,477) (117,591) (140,068) (22,702) (120,531) - - - - - - - -
- - 1,599,275 2,185,921 3,785,196 1,652,401 2,240,569 3,892,970 1,707,386 2,296,583
111,144 94,678 205,822 115,034 97,992 213,026 119,060 101,422 14,537 12,383 26,920 15,045 12,816 27,862 15,572 13,265
125,681 107,061 232,742 130,080 110,808 240,888 134,632 114,687
108,233 92,198 200,431 112,021 95,425 207,446 115,941 98,765 47,897 40,801 88,697 49,573 42,229 91,802 51,308 43,707 70,538 60,088 130,626 73,007 62,191 135,198 75,562 64,368 2,994 2,550 5,544 3,098 2,639 5,738 3,207 2,732
- - - - - - - - 229,661 195,637 425,298 237,699 202,484 440,184 246,019 209,571
2,994 2,550 5,544 3,098 2,639 5,738 3,207 2,732 32,026 27,281 59,308 33,147 28,236 61,383 34,307 29,225
- - - - - - - - 7,484 6,375 13,859 7,746 6,598 14,344 8,017 6,829 9,501 8,094 17,595 9,834 8,377 18,211 10,178 8,670
19,847 16,907 36,754 20,542 17,499 38,040 21,261 18,111 - - - - - - - - - - - - - - - -
71,852 61,207 133,059 74,367 63,350 137,717 76,970 65,567
115,364 98,273 213,637 119,402 101,712 221,114 123,581 105,272 52,132 44,409 96,542 53,957 45,963 99,921 55,846 47,572
- - - - - - - - 76,933 65,535 142,468 79,625 67,829 147,454 82,412 70,203
244,429 208,217 452,646 252,984 215,505 468,489 261,838 223,048
4,790 4,080 8,870 4,957 4,223 9,180 5,131 4,371 - - - - - - - -
9,460 8,058 17,518 9,791 8,340 18,131 10,133 8,632 14,249 12,138 26,387 14,748 12,563 27,311 15,264 13,003
210,801 179,571 390,372 218,179 185,856 404,035 225,815 192,361 - - - - - - - -
13,770 11,730 25,501 14,252 12,141 26,393 14,751 12,566 - - - - - - - -
224,571 191,301 415,872 232,431 197,997 430,428 240,566 204,927
95,793 81,602 177,395 99,146 84,458 183,604 102,616 87,414 17,641 15,027 32,668 18,258 15,553 33,812 18,897 16,098
176,050 149,969 326,018 182,212 155,217 337,429 188,589 160,650 64,660 55,081 119,742 66,924 57,009 123,932 69,266 59,004
228,640 76,213 304,853 236,642 78,881 315,523 244,925 81,642 11,974 10,200 22,174 12,393 10,557 22,950 12,827 10,927
898 765 1,663 929 792 1,721 962 820 - - - - - - - -
595,657 388,857 984,514 616,505 402,467 1,018,972 638,082 416,554
- 120,617 120,617 - 124,839 124,839 - 129,208
- -
1,506,100 1,285,037 2,791,137 1,558,813 1,330,014 2,888,827 1,613,372 1,376,564
e/delete values in yellow cells, manipulate each cell rather than dragging across multiple cells. 8,100 6,900 15,000 8,100 6,900 15,000 8,100 6,900 8,174 6,963 15,137 8,079 6,882 14,961 7,979 6,797
59,670 50,830 110,500 59,670 50,830 110,500 59,670 50,830 - - - - - - - - - - - - - - - - - - - - - - - -
- - - - - - - - 75,944 64,693 140,637 75,849 64,612 140,461 75,749 64,527
1,582,044 1,349,730 2,931,774 1,634,662 1,394,626 3,029,288 1,689,120 1,441,091
17,231 836,191 853,422 17,739 845,943 863,683 18,266 855,493
e/delete values in yellow cells, manipulate each cell rather than dragging across multiple cells. - 743,350 743,350 - 743,174 743,174 - 742,990 - - - - - - - - - - - - - - - - - - - - - - - -
- - - 743,350 743,350 - 743,174 743,174 - 742,990
17,231 92,841 110,072 17,739 102,769 120,509 18,266 112,503
(0) (0) (0) (0) (0) (0) (0) (0)
17,231 92,841 110,072 17,739 102,769 120,509 18,266 112,503
1.148 1.162 e/delete values in yellow cells, manipulate each cell rather than dragging across multiple cells.
- - - - - - 14,531 12,378 26,909 15,039 12,811 27,850 15,566 13,260 2,700 2,300 5,000 2,700 2,300 5,000 2,700 2,300
- - - - - - - - - - - - - - - - - - - - - - - -
17,231 14,678 31,909 17,739 15,111 32,850 18,266 15,560
(0) 78,163 78,163 0 87,658 87,658 0 96,943
- -
52,109 58,439 52,109 58,439
- -
- - - - - - - -
26,054 29,219 26,054 29,219
- -
331,500 442,000 110,500 110,500
- -
442,000 552,500 $2,000 $2,500
- - - -
- - 0.0% 0.0%
- - - -
- -
- - - -
- -
Year 4 Year 5 Year 62027 2028 2029
2 of 7
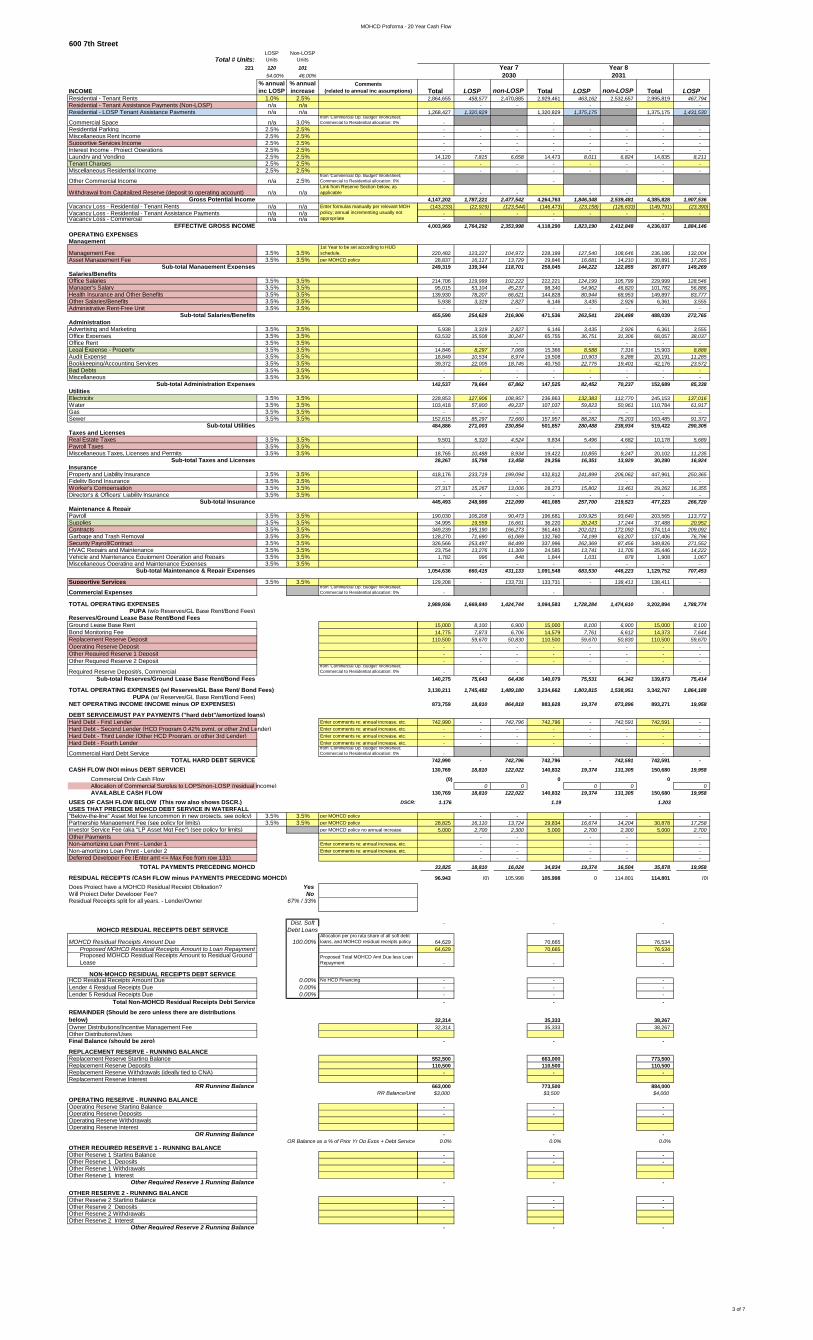
MOHCD Proforma - 20 Year Cash Flow
600 7th Street
Total # Units:LOSP Units
Non-LOSP Units
221 120 10154.00% 46.00%
INCOME% annual inc LOSP
% annual increase
Comments (related to annual inc assumptions)
Residential - Tenant Rents 1.0% 2.5%Residential - Tenant Assistance Payments (Non-LOSP) n/a n/aResidential - LOSP Tenant Assistance Payments n/a n/a
Commercial Space n/a 3.0%from 'Commercial Op. Budget' Worksheet; Commercial to Residential allocation: 0%
Residential Parking 2.5% 2.5%Miscellaneous Rent Income 2.5% 2.5%Supportive Services Income 2.5% 2.5%Interest Income - Project Operations 2.5% 2.5%Laundry and Vending 2.5% 2.5%Tenant Charges 2.5% 2.5%Miscellaneous Residential Income 2.5% 2.5%
Other Commercial Income n/a 2.5%from 'Commercial Op. Budget' Worksheet; Commercial to Residential allocation: 0%
Withdrawal from Capitalized Reserve (deposit to operating account) n/a n/aLink from Reserve Section below, as applicable
Gross Potential IncomeVacancy Loss - Residential - Tenant Rents n/a n/aVacancy Loss - Residential - Tenant Assistance Payments n/a n/aVacancy Loss - Commercial n/a n/a
EFFECTIVE GROSS INCOMEOPERATING EXPENSESManagement
Management Fee 3.5% 3.5%1st Year to be set according to HUD schedule.
Asset Management Fee 3.5% 3.5% per MOHCD policySub-total Management Expenses
Salaries/BenefitsOffice Salaries 3.5% 3.5%Manager's Salary 3.5% 3.5%Health Insurance and Other Benefits 3.5% 3.5%Other Salaries/Benefits 3.5% 3.5%Administrative Rent-Free Unit 3.5% 3.5%
Sub-total Salaries/BenefitsAdministrationAdvertising and Marketing 3.5% 3.5%Office Expenses 3.5% 3.5%Office Rent 3.5% 3.5%Legal Expense - Property 3.5% 3.5%Audit Expense 3.5% 3.5%Bookkeeping/Accounting Services 3.5% 3.5%Bad Debts 3.5% 3.5%Miscellaneous 3.5% 3.5%
Sub-total Administration ExpensesUtilitiesElectricity 3.5% 3.5%Water 3.5% 3.5%Gas 3.5% 3.5%Sewer 3.5% 3.5%
Sub-total UtilitiesTaxes and LicensesReal Estate Taxes 3.5% 3.5%Payroll Taxes 3.5% 3.5%Miscellaneous Taxes, Licenses and Permits 3.5% 3.5%
Sub-total Taxes and LicensesInsuranceProperty and Liability Insurance 3.5% 3.5%Fidelity Bond Insurance 3.5% 3.5%Worker's Compensation 3.5% 3.5%Director's & Officers' Liability Insurance 3.5% 3.5%
Sub-total InsuranceMaintenance & RepairPayroll 3.5% 3.5%Supplies 3.5% 3.5%Contracts 3.5% 3.5%Garbage and Trash Removal 3.5% 3.5%Security Payroll/Contract 3.5% 3.5%HVAC Repairs and Maintenance 3.5% 3.5%Vehicle and Maintenance Equipment Operation and Repairs 3.5% 3.5%Miscellaneous Operating and Maintenance Expenses 3.5% 3.5%
Sub-total Maintenance & Repair Expenses
Supportive Services 3.5% 3.5%
Commercial Expensesfrom 'Commercial Op. Budget' Worksheet; Commercial to Residential allocation: 0%
TOTAL OPERATING EXPENSES PUPA (w/o Reserves/GL Base Rent/Bond Fees)
Reserves/Ground Lease Base Rent/Bond FeesGround Lease Base Rent Bond Monitoring Fee Replacement Reserve DepositOperating Reserve DepositOther Required Reserve 1 DepositOther Required Reserve 2 Deposit
Required Reserve Deposit/s, Commercialfrom 'Commercial Op. Budget' Worksheet; Commercial to Residential allocation: 0%
Sub-total Reserves/Ground Lease Base Rent/Bond Fees
TOTAL OPERATING EXPENSES (w/ Reserves/GL Base Rent/ Bond Fees)PUPA (w/ Reserves/GL Base Rent/Bond Fees)
NET OPERATING INCOME (INCOME minus OP EXPENSES)
DEBT SERVICE/MUST PAY PAYMENTS ("hard debt"/amortized loans)Hard Debt - First Lender Enter comments re: annual increase, etc. Hard Debt - Second Lender (HCD Program 0.42% pymt, or other 2nd Lender) Enter comments re: annual increase, etc. Hard Debt - Third Lender (Other HCD Program, or other 3rd Lender) Enter comments re: annual increase, etc. Hard Debt - Fourth Lender Enter comments re: annual increase, etc.
Commercial Hard Debt Servicefrom 'Commercial Op. Budget' Worksheet; Commercial to Residential allocation: 0%
TOTAL HARD DEBT SERVICECASH FLOW (NOI minus DEBT SERVICE)
Commercial Only Cash FlowAllocation of Commercial Surplus to LOPS/non-LOSP (residual income)AVAILABLE CASH FLOW
USES OF CASH FLOW BELOW (This row also shows DSCR.) DSCR: USES THAT PRECEDE MOHCD DEBT SERVICE IN WATERFALL"Below-the-line" Asset Mgt fee (uncommon in new projects, see policy) 3.5% 3.5% per MOHCD policyPartnership Management Fee (see policy for limits) 3.5% 3.5% per MOHCD policyInvestor Service Fee (aka "LP Asset Mgt Fee") (see policy for limits) per MOHCD policy no annual increaseOther PaymentsNon-amortizing Loan Pmnt - Lender 1 Enter comments re: annual increase, etc. Non-amortizing Loan Pmnt - Lender 2 Enter comments re: annual increase, etc. Deferred Developer Fee (Enter amt <= Max Fee from row 131)
TOTAL PAYMENTS PRECEDING MOHCD
RESIDUAL RECEIPTS (CASH FLOW minus PAYMENTS PRECEDING MOHCD)Does Project have a MOHCD Residual Receipt Obligation? YesWill Project Defer Developer Fee? NoResidual Receipts split for all years. - Lender/Owner 67% / 33%
Dist. SoftMOHCD RESIDUAL RECEIPTS DEBT SERVICE Debt Loans
MOHCD Residual Receipts Amount Due 100.00%Allocation per pro rata share of all soft debt loans, and MOHCD residual receipts policy
Proposed MOHCD Residual Receipts Amount to Loan RepaymentProposed MOHCD Residual Receipts Amount to Residual Ground Lease
Proposed Total MOHCD Amt Due less Loan Repayment
NON-MOHCD RESIDUAL RECEIPTS DEBT SERVICEHCD Residual Receipts Amount Due 0.00% No HCD FinancingLender 4 Residual Receipts Due 0.00%Lender 5 Residual Receipts Due 0.00%
Total Non-MOHCD Residual Receipts Debt ServiceREMAINDER (Should be zero unless there are distributions below)Owner Distributions/Incentive Management FeeOther Distributions/UsesFinal Balance (should be zero)
REPLACEMENT RESERVE - RUNNING BALANCEReplacement Reserve Starting BalanceReplacement Reserve DepositsReplacement Reserve Withdrawals (ideally tied to CNA)Replacement Reserve Interest
RR Running BalanceRR Balance/Unit
OPERATING RESERVE - RUNNING BALANCEOperating Reserve Starting BalanceOperating Reserve DepositsOperating Reserve WithdrawalsOperating Reserve Interest
OR Running BalanceOR Balance as a % of Prior Yr Op Exps + Debt Service
OTHER REQUIRED RESERVE 1 - RUNNING BALANCEOther Reserve 1 Starting BalanceOther Reserve 1 DepositsOther Reserve 1 Withdrawals Other Reserve 1 Interest
Other Required Reserve 1 Running Balance
OTHER RESERVE 2 - RUNNING BALANCEOther Reserve 2 Starting BalanceOther Reserve 2 DepositsOther Reserve 2 Withdrawals Other Reserve 2 Interest
Other Required Reserve 2 Running Balance
Enter formulas manually per relevant MOH policy; annual incrementing usually not appropriate
2029 2030 2031
Total LOSP non-LOSP Total LOSP non-LOSP Total LOSP2,864,655 458,577 2,470,885 2,929,461 463,162 2,532,657 2,995,819 467,794
- - - - - 1,268,427 1,320,829 1,320,829 1,375,175 1,375,175 1,431,530
- - - - - - - - - - - - - - - - - - - - - - - - - - - - - - - - - - -
14,120 7,815 6,658 14,473 8,011 6,824 14,835 8,211 - - - - - - - - - - - - - - - -
- - -
- - - - - 4,147,202 1,787,221 2,477,542 4,264,763 1,846,348 2,539,481 4,385,828 1,907,536 (143,233) (22,929) (123,544) (146,473) (23,158) (126,633) (149,791) (23,390)
- - - - - - - - - - -
4,003,969 1,764,292 2,353,998 4,118,290 1,823,190 2,412,848 4,236,037 1,884,146
220,482 123,227 104,972 228,199 127,540 108,646 236,186 132,004 28,837 16,117 13,729 29,846 16,681 14,210 30,891 17,265
249,319 139,344 118,701 258,045 144,222 122,855 267,077 149,269
214,706 119,999 102,222 222,221 124,199 105,799 229,999 128,546 95,015 53,104 45,237 98,340 54,962 46,820 101,782 56,886
139,930 78,207 66,621 144,828 80,944 68,953 149,897 83,777 5,938 3,319 2,827 6,146 3,435 2,926 6,361 3,555
- - - - - - - - 455,590 254,629 216,906 471,536 263,541 224,498 488,039 272,765
5,938 3,319 2,827 6,146 3,435 2,926 6,361 3,555 63,532 35,508 30,247 65,755 36,751 31,306 68,057 38,037
- - - - - - - - 14,846 8,297 7,068 15,366 8,588 7,316 15,903 8,888 18,849 10,534 8,974 19,508 10,903 9,288 20,191 11,285 39,372 22,005 18,745 40,750 22,775 19,401 42,176 23,572
- - - - - - - - - - - - - - - -
142,537 79,664 67,862 147,525 82,452 70,237 152,689 85,338
228,853 127,906 108,957 236,863 132,383 112,770 245,153 137,016 103,418 57,800 49,237 107,037 59,823 50,961 110,784 61,917
- - - - - - - - 152,615 85,297 72,660 157,957 88,282 75,203 163,485 91,372 484,886 271,003 230,854 501,857 280,488 238,934 519,422 290,305
9,501 5,310 4,524 9,834 5,496 4,682 10,178 5,689 - - - - - - - -
18,765 10,488 8,934 19,422 10,855 9,247 20,102 11,235 28,267 15,798 13,458 29,256 16,351 13,929 30,280 16,924
418,176 233,719 199,094 432,812 241,899 206,062 447,961 250,365 - - - - - - - -
27,317 15,267 13,006 28,273 15,802 13,461 29,262 16,355 - - - - - - - -
445,493 248,986 212,099 461,085 257,700 219,523 477,223 266,720
190,030 106,208 90,473 196,681 109,925 93,640 203,565 113,772 34,995 19,559 16,661 36,220 20,243 17,244 37,488 20,952
349,239 195,190 166,273 361,463 202,021 172,092 374,114 209,092 128,270 71,690 61,069 132,760 74,199 63,207 137,406 76,796 326,566 253,497 84,499 337,996 262,369 87,456 349,826 271,552 23,754 13,276 11,309 24,585 13,741 11,705 25,446 14,222 1,782 996 848 1,844 1,031 878 1,908 1,067
- - - - - - - - 1,054,636 660,415 431,133 1,091,548 683,530 446,223 1,129,752 707,453
129,208 - 133,731 133,731 - 138,411 138,411 -
- - -
2,989,936 1,669,840 1,424,744 3,094,583 1,728,284 1,474,610 3,202,894 1,788,774
15,000 8,100 6,900 15,000 8,100 6,900 15,000 8,100 14,775 7,873 6,706 14,579 7,761 6,612 14,373 7,644
110,500 59,670 50,830 110,500 59,670 50,830 110,500 59,670 - - - - - - - - - - - - - - - - - - - - - - - -
- - - - - - - - 140,275 75,643 64,436 140,079 75,531 64,342 139,873 75,414
3,130,211 1,745,482 1,489,180 3,234,662 1,803,815 1,538,951 3,342,767 1,864,188
873,759 18,810 864,818 883,628 19,374 873,896 893,271 19,958
742,990 - 742,796 742,796 - 742,591 742,591 - - - - - - - - - - - - - - - - - - - - - - - - -
- - - 742,990 - 742,796 742,796 - 742,591 742,591 -
130,769 18,810 122,022 140,832 19,374 131,305 150,680 19,958
(0) 0 0 0 0 0 0 0
130,769 18,810 122,022 140,832 19,374 131,305 150,680 19,958
1.176 1.19 1.203
- - - - - 28,825 16,110 13,724 29,834 16,674 14,204 30,878 17,258 5,000 2,700 2,300 5,000 2,700 2,300 5,000 2,700
- - - - - - - - - - - - - - - - - - - -
33,825 18,810 16,024 34,834 19,374 16,504 35,878 19,958
96,943 (0) 105,998 105,998 0 114,801 114,801 (0)
- - -
64,629 70,665 76,534 64,629 70,665 76,534
- - -
- - - - - - - - - - - -
32,314 35,333 38,267 32,314 35,333 38,267
- - -
552,500 663,000 773,500 110,500 110,500 110,500
- - -
663,000 773,500 884,000 $3,000 $3,500 $4,000
- - - - - -
- - - 0.0% 0.0% 0.0%
- - - - - -
- - -
- - - - - -
- - -
Year 7 Year 8 2030 2031
3 of 7

MOHCD Proforma - 20 Year Cash Flow
600 7th Street
Total # Units:LOSP Units
Non-LOSP Units
221 120 10154.00% 46.00%
INCOME% annual inc LOSP
% annual increase
Comments (related to annual inc assumptions)
Residential - Tenant Rents 1.0% 2.5%Residential - Tenant Assistance Payments (Non-LOSP) n/a n/aResidential - LOSP Tenant Assistance Payments n/a n/a
Commercial Space n/a 3.0%from 'Commercial Op. Budget' Worksheet; Commercial to Residential allocation: 0%
Residential Parking 2.5% 2.5%Miscellaneous Rent Income 2.5% 2.5%Supportive Services Income 2.5% 2.5%Interest Income - Project Operations 2.5% 2.5%Laundry and Vending 2.5% 2.5%Tenant Charges 2.5% 2.5%Miscellaneous Residential Income 2.5% 2.5%
Other Commercial Income n/a 2.5%from 'Commercial Op. Budget' Worksheet; Commercial to Residential allocation: 0%
Withdrawal from Capitalized Reserve (deposit to operating account) n/a n/aLink from Reserve Section below, as applicable
Gross Potential IncomeVacancy Loss - Residential - Tenant Rents n/a n/aVacancy Loss - Residential - Tenant Assistance Payments n/a n/aVacancy Loss - Commercial n/a n/a
EFFECTIVE GROSS INCOMEOPERATING EXPENSESManagement
Management Fee 3.5% 3.5%1st Year to be set according to HUD schedule.
Asset Management Fee 3.5% 3.5% per MOHCD policySub-total Management Expenses
Salaries/BenefitsOffice Salaries 3.5% 3.5%Manager's Salary 3.5% 3.5%Health Insurance and Other Benefits 3.5% 3.5%Other Salaries/Benefits 3.5% 3.5%Administrative Rent-Free Unit 3.5% 3.5%
Sub-total Salaries/BenefitsAdministrationAdvertising and Marketing 3.5% 3.5%Office Expenses 3.5% 3.5%Office Rent 3.5% 3.5%Legal Expense - Property 3.5% 3.5%Audit Expense 3.5% 3.5%Bookkeeping/Accounting Services 3.5% 3.5%Bad Debts 3.5% 3.5%Miscellaneous 3.5% 3.5%
Sub-total Administration ExpensesUtilitiesElectricity 3.5% 3.5%Water 3.5% 3.5%Gas 3.5% 3.5%Sewer 3.5% 3.5%
Sub-total UtilitiesTaxes and LicensesReal Estate Taxes 3.5% 3.5%Payroll Taxes 3.5% 3.5%Miscellaneous Taxes, Licenses and Permits 3.5% 3.5%
Sub-total Taxes and LicensesInsuranceProperty and Liability Insurance 3.5% 3.5%Fidelity Bond Insurance 3.5% 3.5%Worker's Compensation 3.5% 3.5%Director's & Officers' Liability Insurance 3.5% 3.5%
Sub-total InsuranceMaintenance & RepairPayroll 3.5% 3.5%Supplies 3.5% 3.5%Contracts 3.5% 3.5%Garbage and Trash Removal 3.5% 3.5%Security Payroll/Contract 3.5% 3.5%HVAC Repairs and Maintenance 3.5% 3.5%Vehicle and Maintenance Equipment Operation and Repairs 3.5% 3.5%Miscellaneous Operating and Maintenance Expenses 3.5% 3.5%
Sub-total Maintenance & Repair Expenses
Supportive Services 3.5% 3.5%
Commercial Expensesfrom 'Commercial Op. Budget' Worksheet; Commercial to Residential allocation: 0%
TOTAL OPERATING EXPENSES PUPA (w/o Reserves/GL Base Rent/Bond Fees)
Reserves/Ground Lease Base Rent/Bond FeesGround Lease Base Rent Bond Monitoring Fee Replacement Reserve DepositOperating Reserve DepositOther Required Reserve 1 DepositOther Required Reserve 2 Deposit
Required Reserve Deposit/s, Commercialfrom 'Commercial Op. Budget' Worksheet; Commercial to Residential allocation: 0%
Sub-total Reserves/Ground Lease Base Rent/Bond Fees
TOTAL OPERATING EXPENSES (w/ Reserves/GL Base Rent/ Bond Fees)PUPA (w/ Reserves/GL Base Rent/Bond Fees)
NET OPERATING INCOME (INCOME minus OP EXPENSES)
DEBT SERVICE/MUST PAY PAYMENTS ("hard debt"/amortized loans)Hard Debt - First Lender Enter comments re: annual increase, etc. Hard Debt - Second Lender (HCD Program 0.42% pymt, or other 2nd Lender) Enter comments re: annual increase, etc. Hard Debt - Third Lender (Other HCD Program, or other 3rd Lender) Enter comments re: annual increase, etc. Hard Debt - Fourth Lender Enter comments re: annual increase, etc.
Commercial Hard Debt Servicefrom 'Commercial Op. Budget' Worksheet; Commercial to Residential allocation: 0%
TOTAL HARD DEBT SERVICECASH FLOW (NOI minus DEBT SERVICE)
Commercial Only Cash FlowAllocation of Commercial Surplus to LOPS/non-LOSP (residual income)AVAILABLE CASH FLOW
USES OF CASH FLOW BELOW (This row also shows DSCR.) DSCR: USES THAT PRECEDE MOHCD DEBT SERVICE IN WATERFALL"Below-the-line" Asset Mgt fee (uncommon in new projects, see policy) 3.5% 3.5% per MOHCD policyPartnership Management Fee (see policy for limits) 3.5% 3.5% per MOHCD policyInvestor Service Fee (aka "LP Asset Mgt Fee") (see policy for limits) per MOHCD policy no annual increaseOther PaymentsNon-amortizing Loan Pmnt - Lender 1 Enter comments re: annual increase, etc. Non-amortizing Loan Pmnt - Lender 2 Enter comments re: annual increase, etc. Deferred Developer Fee (Enter amt <= Max Fee from row 131)
TOTAL PAYMENTS PRECEDING MOHCD
RESIDUAL RECEIPTS (CASH FLOW minus PAYMENTS PRECEDING MOHCD)Does Project have a MOHCD Residual Receipt Obligation? YesWill Project Defer Developer Fee? NoResidual Receipts split for all years. - Lender/Owner 67% / 33%
Dist. SoftMOHCD RESIDUAL RECEIPTS DEBT SERVICE Debt Loans
MOHCD Residual Receipts Amount Due 100.00%Allocation per pro rata share of all soft debt loans, and MOHCD residual receipts policy
Proposed MOHCD Residual Receipts Amount to Loan RepaymentProposed MOHCD Residual Receipts Amount to Residual Ground Lease
Proposed Total MOHCD Amt Due less Loan Repayment
NON-MOHCD RESIDUAL RECEIPTS DEBT SERVICEHCD Residual Receipts Amount Due 0.00% No HCD FinancingLender 4 Residual Receipts Due 0.00%Lender 5 Residual Receipts Due 0.00%
Total Non-MOHCD Residual Receipts Debt ServiceREMAINDER (Should be zero unless there are distributions below)Owner Distributions/Incentive Management FeeOther Distributions/UsesFinal Balance (should be zero)
REPLACEMENT RESERVE - RUNNING BALANCEReplacement Reserve Starting BalanceReplacement Reserve DepositsReplacement Reserve Withdrawals (ideally tied to CNA)Replacement Reserve Interest
RR Running BalanceRR Balance/Unit
OPERATING RESERVE - RUNNING BALANCEOperating Reserve Starting BalanceOperating Reserve DepositsOperating Reserve WithdrawalsOperating Reserve Interest
OR Running BalanceOR Balance as a % of Prior Yr Op Exps + Debt Service
OTHER REQUIRED RESERVE 1 - RUNNING BALANCEOther Reserve 1 Starting BalanceOther Reserve 1 DepositsOther Reserve 1 Withdrawals Other Reserve 1 Interest
Other Required Reserve 1 Running Balance
OTHER RESERVE 2 - RUNNING BALANCEOther Reserve 2 Starting BalanceOther Reserve 2 DepositsOther Reserve 2 Withdrawals Other Reserve 2 Interest
Other Required Reserve 2 Running Balance
Enter formulas manually per relevant MOH policy; annual incrementing usually not appropriate
2032 2033 2034
non-LOSP Total LOSP non-LOSP Total LOSP non-LOSP Total LOSP2,595,973 3,063,767 472,472 2,660,872 3,133,344 477,197 2,727,394 3,204,591 481,969
- - - - - - 1,431,530 1,489,969 1,489,969 1,550,564 1,550,564 1,613,392
- - - - - - - - - - - - - - - - - - - - - - - - - - - - - - - - - - - - - - -
6,995 15,206 8,416 7,169 15,586 8,627 7,349 15,975 8,842 - - - - - - - - - - - - - - - - - -
- - -
- - - - - - 2,602,968 4,510,503 1,970,858 2,668,042 4,638,900 2,036,388 2,734,743 4,771,131 2,104,203 (129,799) (153,188) (23,624) (133,044) (156,667) (23,860) (136,370) (160,230) (24,098)
- - - - - - - - - - - -
2,473,169 4,357,315 1,947,234 2,534,998 4,482,232 2,012,528 2,598,373 4,610,901 2,080,105
112,448 244,452 136,624 116,384 253,008 141,406 120,457 261,864 146,356 14,707 31,972 17,869 15,222 33,091 18,495 15,755 34,249 19,142
127,155 276,425 154,494 131,606 286,099 159,901 136,212 296,113 165,497
109,502 238,049 133,045 113,335 246,380 137,702 117,302 255,004 142,522 48,459 105,345 58,877 50,155 109,032 60,938 51,910 112,848 63,071 71,366 155,143 86,710 73,864 160,573 89,744 76,449 166,193 92,885 3,029 6,584 3,680 3,135 6,814 3,809 3,244 7,053 3,942
- - - - - - - - - 232,356 505,121 282,312 240,488 522,800 292,193 248,905 541,098 302,420
3,029 6,584 3,680 3,135 6,814 3,809 3,244 7,053 3,942 32,402 70,439 39,368 33,536 72,904 40,746 34,710 75,456 42,172
- - - - - - - - - 7,572 16,460 9,200 7,837 17,036 9,522 8,111 17,632 9,855 9,613 20,898 11,680 9,949 21,629 12,089 10,298 22,386 12,512
20,080 43,652 24,397 20,783 45,180 25,251 21,510 46,761 26,135 - - - - - - - - - - - - - - - - - -
72,695 158,033 88,325 75,239 163,564 91,416 77,873 169,289 94,615
116,717 253,733 141,812 120,802 262,614 146,775 125,031 271,805 151,912 52,744 114,661 64,084 54,590 118,674 66,327 56,501 122,828 68,649
- - - - - - - - - 77,835 169,207 94,570 80,560 175,130 97,880 83,379 181,259 101,306
247,297 537,602 300,466 255,952 556,418 310,982 264,911 575,892 321,866
4,846 10,534 5,888 5,015 10,903 6,094 5,191 11,285 6,307 - - - - - - - - -
9,571 20,806 11,628 9,906 21,534 12,035 10,252 22,287 12,456 14,416 31,340 17,516 14,921 32,437 18,129 15,443 33,572 18,764
213,274 463,639 259,128 220,739 479,867 268,197 228,464 496,662 277,584 - - - - - - - - -
13,932 30,287 16,927 14,419 31,347 17,520 14,924 32,444 18,133 - - - - - - - - -
227,206 493,926 276,055 235,158 511,213 285,717 243,389 529,106 295,717
96,917 210,689 117,754 100,309 218,064 121,876 103,820 225,696 126,141 17,848 38,800 21,685 18,473 40,158 22,444 19,119 41,563 23,230
178,116 387,208 216,410 184,350 400,760 223,985 190,802 414,787 231,824 65,419 142,215 79,484 67,709 147,193 82,266 70,079 152,345 85,145 90,517 362,070 281,057 93,686 374,742 290,894 96,965 387,858 301,075 12,115 26,336 14,719 12,539 27,258 15,234 12,978 28,212 15,768
909 1,975 1,104 940 2,044 1,143 973 2,116 1,183 - - - - - - - - -
461,840 1,169,294 732,214 478,005 1,210,219 757,842 494,735 1,252,576 784,366
143,256 143,256 - 148,270 148,270 - 153,459 153,459 -
- - -
1,526,221 3,314,995 1,851,381 1,579,639 3,431,020 1,916,179 1,634,926 3,551,106 1,983,246
6,900 15,000 8,100 6,900 15,000 8,100 6,900 15,000 8,100 6,512 14,156 7,521 6,407 13,928 7,392 6,296 13,688 7,255
50,830 110,500 59,670 50,830 110,500 59,670 50,830 110,500 59,670 - - - - - - - - - - - - - - - - - - - - - - - - - - -
- - - - - - - - - 64,242 139,656 75,291 64,137 139,428 75,162 64,026 139,188 75,025
1,590,463 3,454,651 1,926,672 1,643,776 3,570,448 1,991,341 1,698,953 3,690,294 2,058,271
882,706 902,664 20,562 891,222 911,784 21,187 899,420 920,608 21,834
742,376 742,376 - 742,150 742,150 - 741,912 741,912 - - - - - - - - - - - - - - - - - - - - - - - - - - - -
- - - 742,376 742,376 - 742,150 742,150 - 741,912 741,912 -
140,330 160,288 20,562 149,072 169,634 21,187 157,508 178,696 21,834
0 (0) (0) 0 (0) (0) (0) (0) 0
140,330 160,288 20,562 149,072 169,634 21,187 157,508 178,696 21,834
1.216 1.229 1.241
- - - - - - 14,701 31,959 17,862 15,216 33,078 18,487 15,748 34,235 19,134 2,300 5,000 2,700 2,300 5,000 2,700 2,300 5,000 2,700
- - - - - - - - - - - - - - - - - - - - - - - -
17,001 36,959 20,562 17,516 38,078 21,187 18,048 39,235 21,834
123,329 123,329 0 131,557 131,557 0 139,460 139,460 (0)
- - -
82,219 87,705 92,974 82,219 87,705 92,974
- - -
- - - - - - - - - - - -
41,110 43,852 46,487 41,110 43,852 46,487
- - -
884,000 994,500 1,105,000 110,500 110,500 110,500
- - -
994,500 1,105,000 1,215,500 $4,500 $5,000 $5,500
- - - - - -
- - - 0.0% 0.0% 0.0%
- - - - - -
- - -
- - - - - -
- - -
Year 11
Year 9 Year 102032 2033 2034
4 of 7

MOHCD Proforma - 20 Year Cash Flow
600 7th Street
Total # Units:LOSP Units
Non-LOSP Units
221 120 10154.00% 46.00%
INCOME% annual inc LOSP
% annual increase
Comments (related to annual inc assumptions)
Residential - Tenant Rents 1.0% 2.5%Residential - Tenant Assistance Payments (Non-LOSP) n/a n/aResidential - LOSP Tenant Assistance Payments n/a n/a
Commercial Space n/a 3.0%from 'Commercial Op. Budget' Worksheet; Commercial to Residential allocation: 0%
Residential Parking 2.5% 2.5%Miscellaneous Rent Income 2.5% 2.5%Supportive Services Income 2.5% 2.5%Interest Income - Project Operations 2.5% 2.5%Laundry and Vending 2.5% 2.5%Tenant Charges 2.5% 2.5%Miscellaneous Residential Income 2.5% 2.5%
Other Commercial Income n/a 2.5%from 'Commercial Op. Budget' Worksheet; Commercial to Residential allocation: 0%
Withdrawal from Capitalized Reserve (deposit to operating account) n/a n/aLink from Reserve Section below, as applicable
Gross Potential IncomeVacancy Loss - Residential - Tenant Rents n/a n/aVacancy Loss - Residential - Tenant Assistance Payments n/a n/aVacancy Loss - Commercial n/a n/a
EFFECTIVE GROSS INCOMEOPERATING EXPENSESManagement
Management Fee 3.5% 3.5%1st Year to be set according to HUD schedule.
Asset Management Fee 3.5% 3.5% per MOHCD policySub-total Management Expenses
Salaries/BenefitsOffice Salaries 3.5% 3.5%Manager's Salary 3.5% 3.5%Health Insurance and Other Benefits 3.5% 3.5%Other Salaries/Benefits 3.5% 3.5%Administrative Rent-Free Unit 3.5% 3.5%
Sub-total Salaries/BenefitsAdministrationAdvertising and Marketing 3.5% 3.5%Office Expenses 3.5% 3.5%Office Rent 3.5% 3.5%Legal Expense - Property 3.5% 3.5%Audit Expense 3.5% 3.5%Bookkeeping/Accounting Services 3.5% 3.5%Bad Debts 3.5% 3.5%Miscellaneous 3.5% 3.5%
Sub-total Administration ExpensesUtilitiesElectricity 3.5% 3.5%Water 3.5% 3.5%Gas 3.5% 3.5%Sewer 3.5% 3.5%
Sub-total UtilitiesTaxes and LicensesReal Estate Taxes 3.5% 3.5%Payroll Taxes 3.5% 3.5%Miscellaneous Taxes, Licenses and Permits 3.5% 3.5%
Sub-total Taxes and LicensesInsuranceProperty and Liability Insurance 3.5% 3.5%Fidelity Bond Insurance 3.5% 3.5%Worker's Compensation 3.5% 3.5%Director's & Officers' Liability Insurance 3.5% 3.5%
Sub-total InsuranceMaintenance & RepairPayroll 3.5% 3.5%Supplies 3.5% 3.5%Contracts 3.5% 3.5%Garbage and Trash Removal 3.5% 3.5%Security Payroll/Contract 3.5% 3.5%HVAC Repairs and Maintenance 3.5% 3.5%Vehicle and Maintenance Equipment Operation and Repairs 3.5% 3.5%Miscellaneous Operating and Maintenance Expenses 3.5% 3.5%
Sub-total Maintenance & Repair Expenses
Supportive Services 3.5% 3.5%
Commercial Expensesfrom 'Commercial Op. Budget' Worksheet; Commercial to Residential allocation: 0%
TOTAL OPERATING EXPENSES PUPA (w/o Reserves/GL Base Rent/Bond Fees)
Reserves/Ground Lease Base Rent/Bond FeesGround Lease Base Rent Bond Monitoring Fee Replacement Reserve DepositOperating Reserve DepositOther Required Reserve 1 DepositOther Required Reserve 2 Deposit
Required Reserve Deposit/s, Commercialfrom 'Commercial Op. Budget' Worksheet; Commercial to Residential allocation: 0%
Sub-total Reserves/Ground Lease Base Rent/Bond Fees
TOTAL OPERATING EXPENSES (w/ Reserves/GL Base Rent/ Bond Fees)PUPA (w/ Reserves/GL Base Rent/Bond Fees)
NET OPERATING INCOME (INCOME minus OP EXPENSES)
DEBT SERVICE/MUST PAY PAYMENTS ("hard debt"/amortized loans)Hard Debt - First Lender Enter comments re: annual increase, etc. Hard Debt - Second Lender (HCD Program 0.42% pymt, or other 2nd Lender) Enter comments re: annual increase, etc. Hard Debt - Third Lender (Other HCD Program, or other 3rd Lender) Enter comments re: annual increase, etc. Hard Debt - Fourth Lender Enter comments re: annual increase, etc.
Commercial Hard Debt Servicefrom 'Commercial Op. Budget' Worksheet; Commercial to Residential allocation: 0%
TOTAL HARD DEBT SERVICECASH FLOW (NOI minus DEBT SERVICE)
Commercial Only Cash FlowAllocation of Commercial Surplus to LOPS/non-LOSP (residual income)AVAILABLE CASH FLOW
USES OF CASH FLOW BELOW (This row also shows DSCR.) DSCR: USES THAT PRECEDE MOHCD DEBT SERVICE IN WATERFALL"Below-the-line" Asset Mgt fee (uncommon in new projects, see policy) 3.5% 3.5% per MOHCD policyPartnership Management Fee (see policy for limits) 3.5% 3.5% per MOHCD policyInvestor Service Fee (aka "LP Asset Mgt Fee") (see policy for limits) per MOHCD policy no annual increaseOther PaymentsNon-amortizing Loan Pmnt - Lender 1 Enter comments re: annual increase, etc. Non-amortizing Loan Pmnt - Lender 2 Enter comments re: annual increase, etc. Deferred Developer Fee (Enter amt <= Max Fee from row 131)
TOTAL PAYMENTS PRECEDING MOHCD
RESIDUAL RECEIPTS (CASH FLOW minus PAYMENTS PRECEDING MOHCD)Does Project have a MOHCD Residual Receipt Obligation? YesWill Project Defer Developer Fee? NoResidual Receipts split for all years. - Lender/Owner 67% / 33%
Dist. SoftMOHCD RESIDUAL RECEIPTS DEBT SERVICE Debt Loans
MOHCD Residual Receipts Amount Due 100.00%Allocation per pro rata share of all soft debt loans, and MOHCD residual receipts policy
Proposed MOHCD Residual Receipts Amount to Loan RepaymentProposed MOHCD Residual Receipts Amount to Residual Ground Lease
Proposed Total MOHCD Amt Due less Loan Repayment
NON-MOHCD RESIDUAL RECEIPTS DEBT SERVICEHCD Residual Receipts Amount Due 0.00% No HCD FinancingLender 4 Residual Receipts Due 0.00%Lender 5 Residual Receipts Due 0.00%
Total Non-MOHCD Residual Receipts Debt ServiceREMAINDER (Should be zero unless there are distributions below)Owner Distributions/Incentive Management FeeOther Distributions/UsesFinal Balance (should be zero)
REPLACEMENT RESERVE - RUNNING BALANCEReplacement Reserve Starting BalanceReplacement Reserve DepositsReplacement Reserve Withdrawals (ideally tied to CNA)Replacement Reserve Interest
RR Running BalanceRR Balance/Unit
OPERATING RESERVE - RUNNING BALANCEOperating Reserve Starting BalanceOperating Reserve DepositsOperating Reserve WithdrawalsOperating Reserve Interest
OR Running BalanceOR Balance as a % of Prior Yr Op Exps + Debt Service
OTHER REQUIRED RESERVE 1 - RUNNING BALANCEOther Reserve 1 Starting BalanceOther Reserve 1 DepositsOther Reserve 1 Withdrawals Other Reserve 1 Interest
Other Required Reserve 1 Running Balance
OTHER RESERVE 2 - RUNNING BALANCEOther Reserve 2 Starting BalanceOther Reserve 2 DepositsOther Reserve 2 Withdrawals Other Reserve 2 Interest
Other Required Reserve 2 Running Balance
Enter formulas manually per relevant MOH policy; annual incrementing usually not appropriate
2035 2036 2037
non-LOSP Total LOSP non-LOSP Total LOSP non-LOSP Total LOSP2,795,579 3,277,548 486,788 2,865,469 3,352,257 491,656 2,937,105 3,428,762 496,573
- - - - - - 1,613,392 1,678,532 1,678,532 1,746,065 1,746,065 1,816,078
- - - - - - - - - - - - - - - - - - - - - - - - - - - - - - - - - - - - - - -
7,532 16,375 9,063 7,721 16,784 9,290 7,914 17,204 9,522 - - - - - - - - - - - - - - - - - -
- - -
- - - - - - 2,803,111 4,907,314 2,174,384 2,873,189 5,047,573 2,247,012 2,945,019 5,192,030 2,322,173 (139,779) (163,877) (24,339) (143,273) (167,613) (24,583) (146,855) (171,438) (24,829)
- - - - - - - - - - - -
2,663,332 4,743,437 2,150,044 2,729,916 4,879,960 2,222,429 2,798,164 5,020,592 2,297,344
124,673 271,029 151,478 129,037 280,515 156,780 133,553 290,333 162,267 16,306 35,448 19,812 16,877 36,689 20,505 17,468 37,973 21,223
140,979 306,477 171,290 145,914 317,204 177,285 151,021 328,306 183,490
121,407 263,929 147,510 125,657 273,166 152,673 130,055 282,727 158,016 53,727 116,798 65,278 55,607 120,885 67,563 57,554 125,116 69,928 79,125 172,010 96,136 81,894 178,030 99,501 84,760 184,261 102,984 3,358 7,300 4,080 3,475 7,555 4,223 3,597 7,820 4,370
- - - - - - - - - 257,617 560,036 313,004 266,633 579,638 323,960 275,966 599,925 335,298
3,358 7,300 4,080 3,475 7,555 4,223 3,597 7,820 4,370 35,924 78,097 43,648 37,182 80,830 45,176 38,483 83,659 46,757
- - - - - - - - - 8,395 18,250 10,200 8,689 18,888 10,557 8,993 19,549 10,926
10,658 23,170 12,950 11,031 23,981 13,403 11,417 24,820 13,872 22,263 48,398 27,050 23,042 50,092 27,996 23,849 51,845 28,976
- - - - - - - - - - - - - - - - - -
80,598 175,214 97,927 83,419 181,346 101,354 86,339 187,693 104,902
129,407 281,319 157,229 133,936 291,165 162,732 138,624 301,356 168,428 58,478 127,127 71,051 60,525 131,576 73,538 62,643 136,181 76,112
- - - - - - - - - 86,297 187,603 104,851 89,318 194,169 108,521 92,444 200,965 112,319
274,182 596,049 333,132 283,779 616,910 344,791 293,711 638,502 356,859
5,373 11,680 6,528 5,561 12,089 6,756 5,755 12,512 6,993 - - - - - - - - -
10,611 23,068 12,892 10,982 23,875 13,344 11,367 24,711 13,811 15,984 34,747 19,420 16,543 35,963 20,100 17,122 37,222 20,803
236,461 514,045 287,300 244,737 532,037 297,355 253,303 550,658 307,763 - - - - - - - - -
15,446 33,579 18,767 15,987 34,755 19,424 16,547 35,971 20,104 - - - - - - - - -
251,907 547,624 306,067 260,724 566,791 316,780 269,849 586,629 327,867
107,454 233,595 130,556 111,215 241,771 135,126 115,107 250,233 139,855 19,788 43,018 24,043 20,481 44,524 24,884 21,198 46,082 25,755
197,480 429,304 239,938 204,392 444,330 248,336 211,545 459,881 257,028 72,531 157,677 88,126 75,070 163,195 91,210 77,697 168,907 94,402
100,358 401,433 311,613 103,871 415,483 322,519 107,506 430,025 333,807 13,432 29,199 16,320 13,902 30,221 16,891 14,388 31,279 17,482 1,007 2,190 1,224 1,043 2,267 1,267 1,079 2,346 1,311
- - - - - - - - - 512,051 1,296,417 811,819 529,972 1,341,791 840,232 548,521 1,388,754 869,641
158,830 158,830 - 164,389 164,389 - 170,143 170,143 -
- - -
1,692,149 3,675,394 2,052,659 1,751,374 3,804,033 2,124,502 1,812,672 3,937,174 2,198,860
6,900 15,000 8,100 6,900 15,000 8,100 6,900 15,000 8,100 6,180 13,435 7,111 6,058 13,169 6,960 5,928 12,888 6,800
50,830 110,500 59,670 50,830 110,500 59,670 50,830 110,500 59,670 - - - - - - - - - - - - - - - - - - - - - - - - - - -
- - - - - - - - - 63,910 138,935 74,881 63,788 138,669 74,730 63,658 138,388 74,570
1,756,059 3,814,329 2,127,541 1,815,162 3,942,702 2,199,232 1,876,330 4,075,562 2,273,430
907,274 929,108 22,504 914,754 937,258 23,197 921,833 945,030 23,914
741,662 741,662 - 741,398 741,398 - 741,121 741,121 - - - - - - - - - - - - - - - - - - - - - - - - - - - -
- - - 741,662 741,662 - 741,398 741,398 - 741,121 741,121 -
165,612 187,446 22,504 173,356 195,860 23,197 180,712 203,909 23,914
0 0 0 0 0 0 0 0 0
165,612 187,446 22,504 173,356 195,860 23,197 180,712 203,909 23,914
1.253 1.264 1.275
- - - - - - 16,299 35,433 19,804 16,870 36,674 20,497 17,460 37,957 21,214 2,300 5,000 2,700 2,300 5,000 2,700 2,300 5,000 2,700
- - - - - - - - - - - - - - - - - - - - - - - -
18,599 40,433 22,504 19,170 41,674 23,197 19,760 42,957 23,914
147,012 147,012 (0) 154,186 154,186 0 160,952 160,952 (0)
- - -
98,008 102,791 107,301 98,008 102,791 107,301
- - -
- - - - - - - - - - - -
49,004 51,395 53,651 49,004 51,395 53,651
- - -
1,215,500 1,326,000 1,436,500 110,500 110,500 110,500
- - -
1,326,000 1,436,500 1,547,000 $6,000 $6,500 $7,000
- - - - - -
- - - 0.0% 0.0% 0.0%
- - - - - -
- - -
- - - - - -
- - -
Year 12 Year 13 Year 14
2035 2036 2037
5 of 7
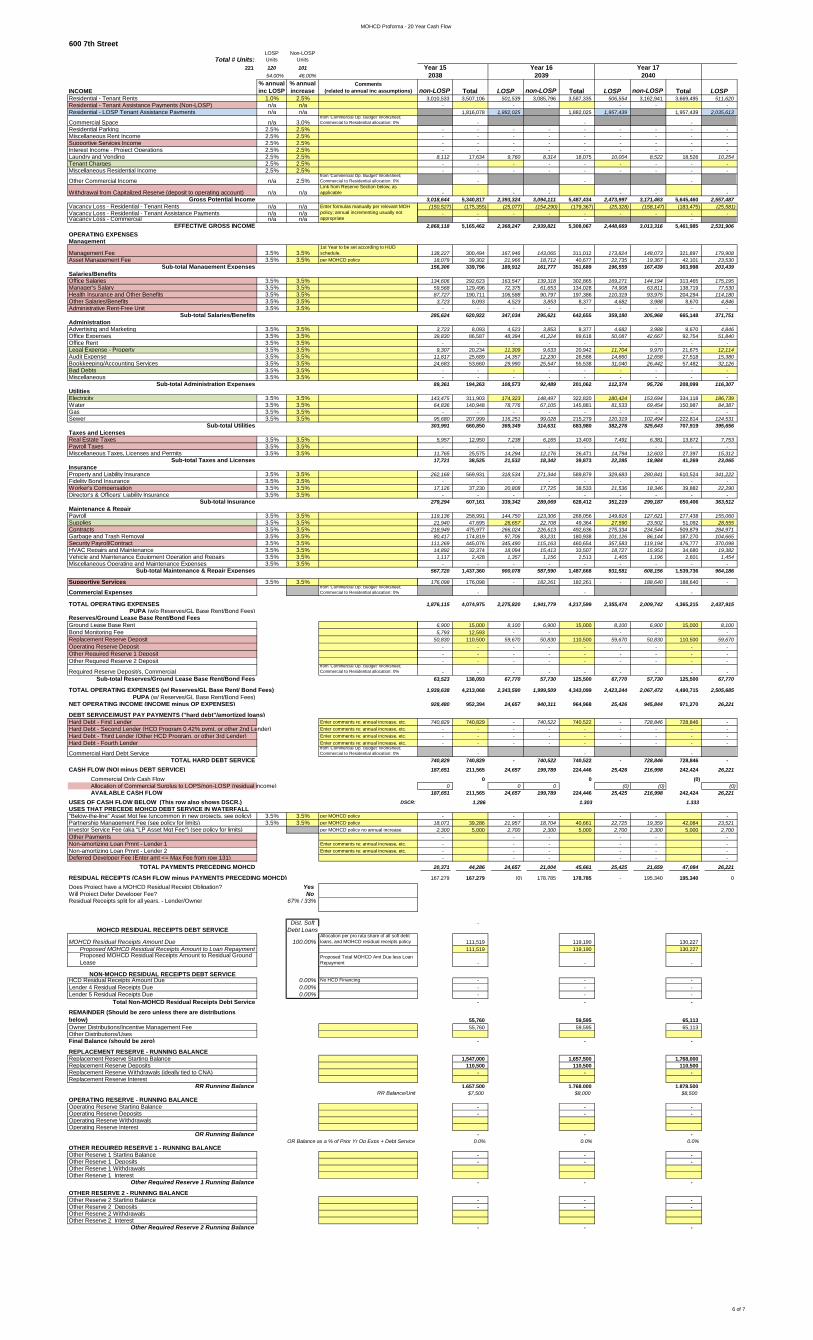
MOHCD Proforma - 20 Year Cash Flow
600 7th Street
Total # Units:LOSP Units
Non-LOSP Units
221 120 10154.00% 46.00%
INCOME% annual inc LOSP
% annual increase
Comments (related to annual inc assumptions)
Residential - Tenant Rents 1.0% 2.5%Residential - Tenant Assistance Payments (Non-LOSP) n/a n/aResidential - LOSP Tenant Assistance Payments n/a n/a
Commercial Space n/a 3.0%from 'Commercial Op. Budget' Worksheet; Commercial to Residential allocation: 0%
Residential Parking 2.5% 2.5%Miscellaneous Rent Income 2.5% 2.5%Supportive Services Income 2.5% 2.5%Interest Income - Project Operations 2.5% 2.5%Laundry and Vending 2.5% 2.5%Tenant Charges 2.5% 2.5%Miscellaneous Residential Income 2.5% 2.5%
Other Commercial Income n/a 2.5%from 'Commercial Op. Budget' Worksheet; Commercial to Residential allocation: 0%
Withdrawal from Capitalized Reserve (deposit to operating account) n/a n/aLink from Reserve Section below, as applicable
Gross Potential IncomeVacancy Loss - Residential - Tenant Rents n/a n/aVacancy Loss - Residential - Tenant Assistance Payments n/a n/aVacancy Loss - Commercial n/a n/a
EFFECTIVE GROSS INCOMEOPERATING EXPENSESManagement
Management Fee 3.5% 3.5%1st Year to be set according to HUD schedule.
Asset Management Fee 3.5% 3.5% per MOHCD policySub-total Management Expenses
Salaries/BenefitsOffice Salaries 3.5% 3.5%Manager's Salary 3.5% 3.5%Health Insurance and Other Benefits 3.5% 3.5%Other Salaries/Benefits 3.5% 3.5%Administrative Rent-Free Unit 3.5% 3.5%
Sub-total Salaries/BenefitsAdministrationAdvertising and Marketing 3.5% 3.5%Office Expenses 3.5% 3.5%Office Rent 3.5% 3.5%Legal Expense - Property 3.5% 3.5%Audit Expense 3.5% 3.5%Bookkeeping/Accounting Services 3.5% 3.5%Bad Debts 3.5% 3.5%Miscellaneous 3.5% 3.5%
Sub-total Administration ExpensesUtilitiesElectricity 3.5% 3.5%Water 3.5% 3.5%Gas 3.5% 3.5%Sewer 3.5% 3.5%
Sub-total UtilitiesTaxes and LicensesReal Estate Taxes 3.5% 3.5%Payroll Taxes 3.5% 3.5%Miscellaneous Taxes, Licenses and Permits 3.5% 3.5%
Sub-total Taxes and LicensesInsuranceProperty and Liability Insurance 3.5% 3.5%Fidelity Bond Insurance 3.5% 3.5%Worker's Compensation 3.5% 3.5%Director's & Officers' Liability Insurance 3.5% 3.5%
Sub-total InsuranceMaintenance & RepairPayroll 3.5% 3.5%Supplies 3.5% 3.5%Contracts 3.5% 3.5%Garbage and Trash Removal 3.5% 3.5%Security Payroll/Contract 3.5% 3.5%HVAC Repairs and Maintenance 3.5% 3.5%Vehicle and Maintenance Equipment Operation and Repairs 3.5% 3.5%Miscellaneous Operating and Maintenance Expenses 3.5% 3.5%
Sub-total Maintenance & Repair Expenses
Supportive Services 3.5% 3.5%
Commercial Expensesfrom 'Commercial Op. Budget' Worksheet; Commercial to Residential allocation: 0%
TOTAL OPERATING EXPENSES PUPA (w/o Reserves/GL Base Rent/Bond Fees)
Reserves/Ground Lease Base Rent/Bond FeesGround Lease Base Rent Bond Monitoring Fee Replacement Reserve DepositOperating Reserve DepositOther Required Reserve 1 DepositOther Required Reserve 2 Deposit
Required Reserve Deposit/s, Commercialfrom 'Commercial Op. Budget' Worksheet; Commercial to Residential allocation: 0%
Sub-total Reserves/Ground Lease Base Rent/Bond Fees
TOTAL OPERATING EXPENSES (w/ Reserves/GL Base Rent/ Bond Fees)PUPA (w/ Reserves/GL Base Rent/Bond Fees)
NET OPERATING INCOME (INCOME minus OP EXPENSES)
DEBT SERVICE/MUST PAY PAYMENTS ("hard debt"/amortized loans)Hard Debt - First Lender Enter comments re: annual increase, etc. Hard Debt - Second Lender (HCD Program 0.42% pymt, or other 2nd Lender) Enter comments re: annual increase, etc. Hard Debt - Third Lender (Other HCD Program, or other 3rd Lender) Enter comments re: annual increase, etc. Hard Debt - Fourth Lender Enter comments re: annual increase, etc.
Commercial Hard Debt Servicefrom 'Commercial Op. Budget' Worksheet; Commercial to Residential allocation: 0%
TOTAL HARD DEBT SERVICECASH FLOW (NOI minus DEBT SERVICE)
Commercial Only Cash FlowAllocation of Commercial Surplus to LOPS/non-LOSP (residual income)AVAILABLE CASH FLOW
USES OF CASH FLOW BELOW (This row also shows DSCR.) DSCR: USES THAT PRECEDE MOHCD DEBT SERVICE IN WATERFALL"Below-the-line" Asset Mgt fee (uncommon in new projects, see policy) 3.5% 3.5% per MOHCD policyPartnership Management Fee (see policy for limits) 3.5% 3.5% per MOHCD policyInvestor Service Fee (aka "LP Asset Mgt Fee") (see policy for limits) per MOHCD policy no annual increaseOther PaymentsNon-amortizing Loan Pmnt - Lender 1 Enter comments re: annual increase, etc. Non-amortizing Loan Pmnt - Lender 2 Enter comments re: annual increase, etc. Deferred Developer Fee (Enter amt <= Max Fee from row 131)
TOTAL PAYMENTS PRECEDING MOHCD
RESIDUAL RECEIPTS (CASH FLOW minus PAYMENTS PRECEDING MOHCD)Does Project have a MOHCD Residual Receipt Obligation? YesWill Project Defer Developer Fee? NoResidual Receipts split for all years. - Lender/Owner 67% / 33%
Dist. SoftMOHCD RESIDUAL RECEIPTS DEBT SERVICE Debt Loans
MOHCD Residual Receipts Amount Due 100.00%Allocation per pro rata share of all soft debt loans, and MOHCD residual receipts policy
Proposed MOHCD Residual Receipts Amount to Loan RepaymentProposed MOHCD Residual Receipts Amount to Residual Ground Lease
Proposed Total MOHCD Amt Due less Loan Repayment
NON-MOHCD RESIDUAL RECEIPTS DEBT SERVICEHCD Residual Receipts Amount Due 0.00% No HCD FinancingLender 4 Residual Receipts Due 0.00%Lender 5 Residual Receipts Due 0.00%
Total Non-MOHCD Residual Receipts Debt ServiceREMAINDER (Should be zero unless there are distributions below)Owner Distributions/Incentive Management FeeOther Distributions/UsesFinal Balance (should be zero)
REPLACEMENT RESERVE - RUNNING BALANCEReplacement Reserve Starting BalanceReplacement Reserve DepositsReplacement Reserve Withdrawals (ideally tied to CNA)Replacement Reserve Interest
RR Running BalanceRR Balance/Unit
OPERATING RESERVE - RUNNING BALANCEOperating Reserve Starting BalanceOperating Reserve DepositsOperating Reserve WithdrawalsOperating Reserve Interest
OR Running BalanceOR Balance as a % of Prior Yr Op Exps + Debt Service
OTHER REQUIRED RESERVE 1 - RUNNING BALANCEOther Reserve 1 Starting BalanceOther Reserve 1 DepositsOther Reserve 1 Withdrawals Other Reserve 1 Interest
Other Required Reserve 1 Running Balance
OTHER RESERVE 2 - RUNNING BALANCEOther Reserve 2 Starting BalanceOther Reserve 2 DepositsOther Reserve 2 Withdrawals Other Reserve 2 Interest
Other Required Reserve 2 Running Balance
Enter formulas manually per relevant MOH policy; annual incrementing usually not appropriate
2038 2039 2040
non-LOSP Total LOSP non-LOSP Total LOSP non-LOSP Total LOSP3,010,533 3,507,106 501,539 3,085,796 3,587,335 506,554 3,162,941 3,669,495 511,620
- - - - - - 1,816,078 1,882,025 1,882,025 1,957,439 1,957,439 2,035,613
- - - - - - - - - - - - - - - - - - - - - - - - - - - - - - - - - - - - - - -
8,112 17,634 9,760 8,314 18,075 10,004 8,522 18,526 10,254 - - - - - - - - - - - - - - - - - -
- - -
- - - - - - 3,018,644 5,340,817 2,393,324 3,094,111 5,487,434 2,473,997 3,171,463 5,645,460 2,557,487 (150,527) (175,355) (25,077) (154,290) (179,367) (25,328) (158,147) (183,475) (25,581)
- - - - - - - - - - - -
2,868,118 5,165,462 2,368,247 2,939,821 5,308,067 2,448,669 3,013,316 5,461,985 2,531,906
138,227 300,494 167,946 143,065 311,012 173,824 148,073 321,897 179,908 18,079 39,302 21,966 18,712 40,677 22,735 19,367 42,101 23,530
156,306 339,796 189,912 161,777 351,689 196,559 167,439 363,998 203,439
134,606 292,623 163,547 139,318 302,865 169,271 144,194 313,465 175,195 59,568 129,496 72,375 61,653 134,028 74,908 63,811 138,719 77,530 87,727 190,711 106,588 90,797 197,386 110,319 93,975 204,294 114,180 3,723 8,093 4,523 3,853 8,377 4,682 3,988 8,670 4,846
- - - - - - - - - 285,624 620,922 347,034 295,621 642,655 359,180 305,968 665,148 371,751
3,723 8,093 4,523 3,853 8,377 4,682 3,988 8,670 4,846 39,830 86,587 48,394 41,224 89,618 50,087 42,667 92,754 51,840
- - - - - - - - - 9,307 20,234 11,309 9,633 20,942 11,704 9,970 21,675 12,114
11,817 25,689 14,357 12,230 26,588 14,860 12,658 27,518 15,380 24,683 53,660 29,990 25,547 55,538 31,040 26,442 57,482 32,126
- - - - - - - - - - - - - - - - - -
89,361 194,263 108,573 92,489 201,062 112,374 95,726 208,099 116,307
143,475 311,903 174,323 148,497 322,820 180,424 153,694 334,118 186,739 64,836 140,948 78,776 67,105 145,881 81,533 69,454 150,987 84,387
- - - - - - - - - 95,680 207,999 116,251 99,028 215,279 120,319 102,494 222,814 124,531
303,991 660,850 369,349 314,631 683,980 382,276 325,643 707,919 395,656
5,957 12,950 7,238 6,165 13,403 7,491 6,381 13,872 7,753 - - - - - - - - -
11,765 25,575 14,294 12,176 26,471 14,794 12,603 27,397 15,312 17,721 38,525 21,532 18,342 39,873 22,285 18,984 41,269 23,065
262,168 569,931 318,534 271,344 589,879 329,683 280,841 610,524 341,222 - - - - - - - - -
17,126 37,230 20,808 17,725 38,533 21,536 18,346 39,882 22,290 - - - - - - - - -
279,294 607,161 339,342 289,069 628,412 351,219 299,187 650,406 363,512
119,136 258,991 144,750 123,306 268,056 149,816 127,621 277,438 155,060 21,940 47,695 26,657 22,708 49,364 27,590 23,502 51,092 28,555
218,949 475,977 266,024 226,613 492,636 275,334 234,544 509,879 284,971 80,417 174,819 97,706 83,231 180,938 101,126 86,144 187,270 104,665
111,269 445,076 345,490 115,163 460,654 357,583 119,194 476,777 370,098 14,892 32,374 18,094 15,413 33,507 18,727 15,953 34,680 19,382 1,117 2,428 1,357 1,156 2,513 1,405 1,196 2,601 1,454
- - - - - - - - - 567,720 1,437,360 900,078 587,590 1,487,668 931,581 608,156 1,539,736 964,186
176,098 176,098 - 182,261 182,261 - 188,640 188,640 -
- - -
1,876,115 4,074,975 2,275,820 1,941,779 4,217,599 2,355,474 2,009,742 4,365,215 2,437,915
6,900 15,000 8,100 6,900 15,000 8,100 6,900 15,000 8,100 5,793 12,593 - - - - -
50,830 110,500 59,670 50,830 110,500 59,670 50,830 110,500 59,670 - - - - - - - - - - - - - - - - - - - - - - - - - - -
- - - - - - - - - 63,523 138,093 67,770 57,730 125,500 67,770 57,730 125,500 67,770
1,939,638 4,213,068 2,343,590 1,999,509 4,343,099 2,423,244 2,067,472 4,490,715 2,505,685
928,480 952,394 24,657 940,311 964,968 25,426 945,844 971,270 26,221
740,829 740,829 - 740,522 740,522 - 728,846 728,846 - - - - - - - - - - - - - - - - - - - - - - - - - - - -
- - - 740,829 740,829 - 740,522 740,522 - 728,846 728,846 -
187,651 211,565 24,657 199,789 224,446 25,426 216,998 242,424 26,221
0 0 (0) 0 0 0 (0) (0) (0)
187,651 211,565 24,657 199,789 224,446 25,425 216,998 242,424 26,221
1.286 1.303 1.333
- - - - - - 18,071 39,286 21,957 18,704 40,661 22,725 19,359 42,084 23,521 2,300 5,000 2,700 2,300 5,000 2,700 2,300 5,000 2,700
- - - - - - - - - - - - - - - - - - - - - - - -
20,371 44,286 24,657 21,004 45,661 25,425 21,659 47,084 26,221
167,279 167,279 (0) 178,785 178,785 - 195,340 195,340 0
-
111,519 119,190 130,227 111,519 119,190 130,227
- - -
- - - - - - - - - - - -
55,760 59,595 65,113 55,760 59,595 65,113
- - -
1,547,000 1,657,500 1,768,000 110,500 110,500 110,500
- - -
1,657,500 1,768,000 1,878,500 $7,500 $8,000 $8,500
- - - - - -
- - - 0.0% 0.0% 0.0%
- - - - - -
- - -
- - - - - -
- - -
2038 2039 2040Year 15 Year 16 Year 17
6 of 7
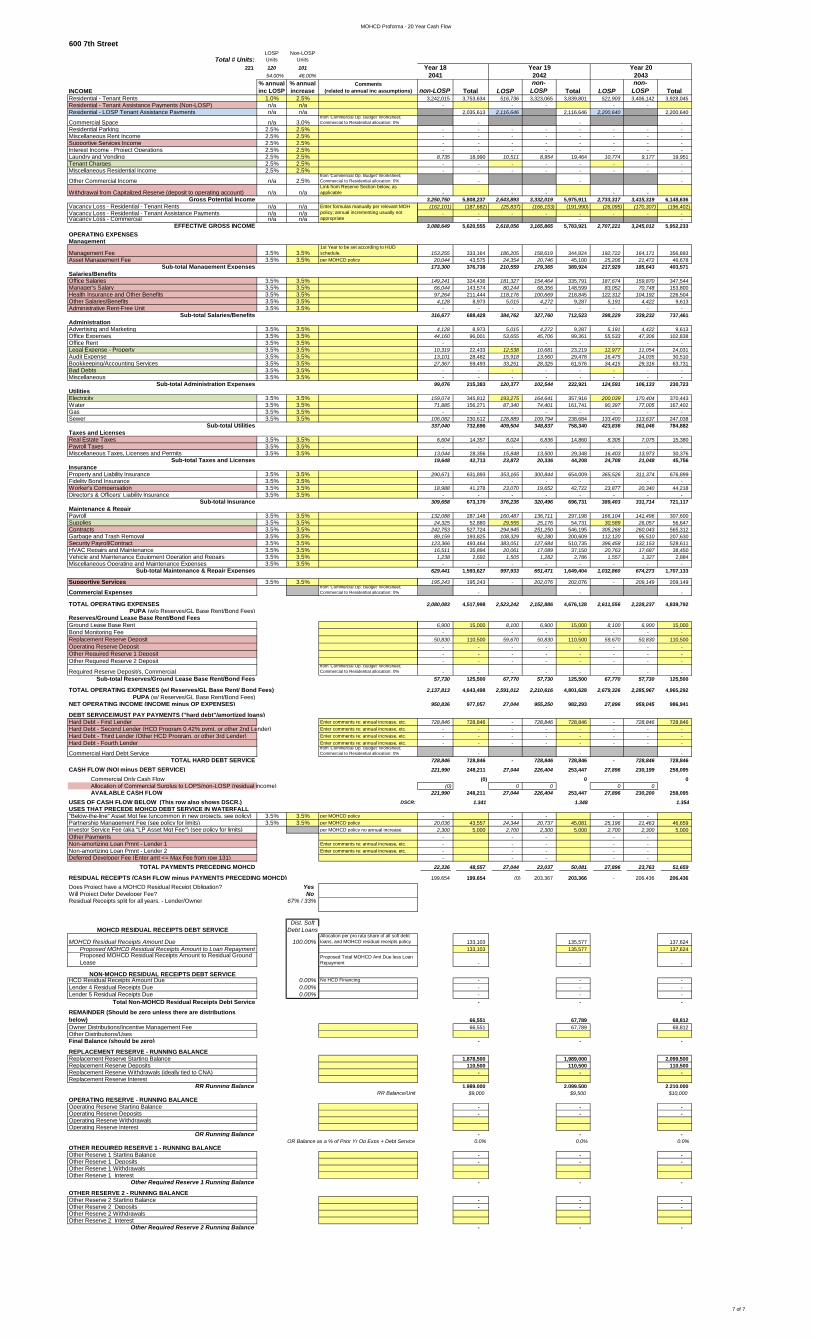
MOHCD Proforma - 20 Year Cash Flow
600 7th Street
Total # Units:LOSP Units
Non-LOSP Units
221 120 10154.00% 46.00%
INCOME% annual inc LOSP
% annual increase
Comments (related to annual inc assumptions)
Residential - Tenant Rents 1.0% 2.5%Residential - Tenant Assistance Payments (Non-LOSP) n/a n/aResidential - LOSP Tenant Assistance Payments n/a n/a
Commercial Space n/a 3.0%from 'Commercial Op. Budget' Worksheet; Commercial to Residential allocation: 0%
Residential Parking 2.5% 2.5%Miscellaneous Rent Income 2.5% 2.5%Supportive Services Income 2.5% 2.5%Interest Income - Project Operations 2.5% 2.5%Laundry and Vending 2.5% 2.5%Tenant Charges 2.5% 2.5%Miscellaneous Residential Income 2.5% 2.5%
Other Commercial Income n/a 2.5%from 'Commercial Op. Budget' Worksheet; Commercial to Residential allocation: 0%
Withdrawal from Capitalized Reserve (deposit to operating account) n/a n/aLink from Reserve Section below, as applicable
Gross Potential IncomeVacancy Loss - Residential - Tenant Rents n/a n/aVacancy Loss - Residential - Tenant Assistance Payments n/a n/aVacancy Loss - Commercial n/a n/a
EFFECTIVE GROSS INCOMEOPERATING EXPENSESManagement
Management Fee 3.5% 3.5%1st Year to be set according to HUD schedule.
Asset Management Fee 3.5% 3.5% per MOHCD policySub-total Management Expenses
Salaries/BenefitsOffice Salaries 3.5% 3.5%Manager's Salary 3.5% 3.5%Health Insurance and Other Benefits 3.5% 3.5%Other Salaries/Benefits 3.5% 3.5%Administrative Rent-Free Unit 3.5% 3.5%
Sub-total Salaries/BenefitsAdministrationAdvertising and Marketing 3.5% 3.5%Office Expenses 3.5% 3.5%Office Rent 3.5% 3.5%Legal Expense - Property 3.5% 3.5%Audit Expense 3.5% 3.5%Bookkeeping/Accounting Services 3.5% 3.5%Bad Debts 3.5% 3.5%Miscellaneous 3.5% 3.5%
Sub-total Administration ExpensesUtilitiesElectricity 3.5% 3.5%Water 3.5% 3.5%Gas 3.5% 3.5%Sewer 3.5% 3.5%
Sub-total UtilitiesTaxes and LicensesReal Estate Taxes 3.5% 3.5%Payroll Taxes 3.5% 3.5%Miscellaneous Taxes, Licenses and Permits 3.5% 3.5%
Sub-total Taxes and LicensesInsuranceProperty and Liability Insurance 3.5% 3.5%Fidelity Bond Insurance 3.5% 3.5%Worker's Compensation 3.5% 3.5%Director's & Officers' Liability Insurance 3.5% 3.5%
Sub-total InsuranceMaintenance & RepairPayroll 3.5% 3.5%Supplies 3.5% 3.5%Contracts 3.5% 3.5%Garbage and Trash Removal 3.5% 3.5%Security Payroll/Contract 3.5% 3.5%HVAC Repairs and Maintenance 3.5% 3.5%Vehicle and Maintenance Equipment Operation and Repairs 3.5% 3.5%Miscellaneous Operating and Maintenance Expenses 3.5% 3.5%
Sub-total Maintenance & Repair Expenses
Supportive Services 3.5% 3.5%
Commercial Expensesfrom 'Commercial Op. Budget' Worksheet; Commercial to Residential allocation: 0%
TOTAL OPERATING EXPENSES PUPA (w/o Reserves/GL Base Rent/Bond Fees)
Reserves/Ground Lease Base Rent/Bond FeesGround Lease Base Rent Bond Monitoring Fee Replacement Reserve DepositOperating Reserve DepositOther Required Reserve 1 DepositOther Required Reserve 2 Deposit
Required Reserve Deposit/s, Commercialfrom 'Commercial Op. Budget' Worksheet; Commercial to Residential allocation: 0%
Sub-total Reserves/Ground Lease Base Rent/Bond Fees
TOTAL OPERATING EXPENSES (w/ Reserves/GL Base Rent/ Bond Fees)PUPA (w/ Reserves/GL Base Rent/Bond Fees)
NET OPERATING INCOME (INCOME minus OP EXPENSES)
DEBT SERVICE/MUST PAY PAYMENTS ("hard debt"/amortized loans)Hard Debt - First Lender Enter comments re: annual increase, etc. Hard Debt - Second Lender (HCD Program 0.42% pymt, or other 2nd Lender) Enter comments re: annual increase, etc. Hard Debt - Third Lender (Other HCD Program, or other 3rd Lender) Enter comments re: annual increase, etc. Hard Debt - Fourth Lender Enter comments re: annual increase, etc.
Commercial Hard Debt Servicefrom 'Commercial Op. Budget' Worksheet; Commercial to Residential allocation: 0%
TOTAL HARD DEBT SERVICECASH FLOW (NOI minus DEBT SERVICE)
Commercial Only Cash FlowAllocation of Commercial Surplus to LOPS/non-LOSP (residual income)AVAILABLE CASH FLOW
USES OF CASH FLOW BELOW (This row also shows DSCR.) DSCR: USES THAT PRECEDE MOHCD DEBT SERVICE IN WATERFALL"Below-the-line" Asset Mgt fee (uncommon in new projects, see policy) 3.5% 3.5% per MOHCD policyPartnership Management Fee (see policy for limits) 3.5% 3.5% per MOHCD policyInvestor Service Fee (aka "LP Asset Mgt Fee") (see policy for limits) per MOHCD policy no annual increaseOther PaymentsNon-amortizing Loan Pmnt - Lender 1 Enter comments re: annual increase, etc. Non-amortizing Loan Pmnt - Lender 2 Enter comments re: annual increase, etc. Deferred Developer Fee (Enter amt <= Max Fee from row 131)
TOTAL PAYMENTS PRECEDING MOHCD
RESIDUAL RECEIPTS (CASH FLOW minus PAYMENTS PRECEDING MOHCD)Does Project have a MOHCD Residual Receipt Obligation? YesWill Project Defer Developer Fee? NoResidual Receipts split for all years. - Lender/Owner 67% / 33%
Dist. SoftMOHCD RESIDUAL RECEIPTS DEBT SERVICE Debt Loans
MOHCD Residual Receipts Amount Due 100.00%Allocation per pro rata share of all soft debt loans, and MOHCD residual receipts policy
Proposed MOHCD Residual Receipts Amount to Loan RepaymentProposed MOHCD Residual Receipts Amount to Residual Ground Lease
Proposed Total MOHCD Amt Due less Loan Repayment
NON-MOHCD RESIDUAL RECEIPTS DEBT SERVICEHCD Residual Receipts Amount Due 0.00% No HCD FinancingLender 4 Residual Receipts Due 0.00%Lender 5 Residual Receipts Due 0.00%
Total Non-MOHCD Residual Receipts Debt ServiceREMAINDER (Should be zero unless there are distributions below)Owner Distributions/Incentive Management FeeOther Distributions/UsesFinal Balance (should be zero)
REPLACEMENT RESERVE - RUNNING BALANCEReplacement Reserve Starting BalanceReplacement Reserve DepositsReplacement Reserve Withdrawals (ideally tied to CNA)Replacement Reserve Interest
RR Running BalanceRR Balance/Unit
OPERATING RESERVE - RUNNING BALANCEOperating Reserve Starting BalanceOperating Reserve DepositsOperating Reserve WithdrawalsOperating Reserve Interest
OR Running BalanceOR Balance as a % of Prior Yr Op Exps + Debt Service
OTHER REQUIRED RESERVE 1 - RUNNING BALANCEOther Reserve 1 Starting BalanceOther Reserve 1 DepositsOther Reserve 1 Withdrawals Other Reserve 1 Interest
Other Required Reserve 1 Running Balance
OTHER RESERVE 2 - RUNNING BALANCEOther Reserve 2 Starting BalanceOther Reserve 2 DepositsOther Reserve 2 Withdrawals Other Reserve 2 Interest
Other Required Reserve 2 Running Balance
Enter formulas manually per relevant MOH policy; annual incrementing usually not appropriate
2041 2042 2043
non-LOSP Total LOSPnon-
LOSP Total LOSPnon-
LOSP Total 3,242,015 3,753,634 516,736 3,323,065 3,839,801 521,903 3,406,142 3,928,045
- - - - - 2,035,613 2,116,646 2,116,646 2,200,640 2,200,640
- - - - - - - - - - - - - - - - - - - - - - - - - - - - - - - - - - -
8,735 18,990 10,511 8,954 19,464 10,774 9,177 19,951 - - - - - - - - - - - - - - - -
- - -
- - - - - 3,250,750 5,808,237 2,643,893 3,332,019 5,975,911 2,733,317 3,415,319 6,148,636 (162,101) (187,682) (25,837) (166,153) (191,990) (26,095) (170,307) (196,402)
- - - - - - - - - - -
3,088,649 5,620,555 2,618,056 3,165,865 5,783,921 2,707,221 3,245,012 5,952,233
153,255 333,164 186,205 158,619 344,824 192,722 164,171 356,893 20,044 43,575 24,354 20,746 45,100 25,206 21,472 46,678
173,300 376,738 210,559 179,365 389,924 217,929 185,643 403,571
149,241 324,436 181,327 154,464 335,791 187,674 159,870 347,544 66,044 143,574 80,244 68,356 148,599 83,052 70,748 153,800 97,264 211,444 118,176 100,669 218,845 122,312 104,192 226,504 4,128 8,973 5,015 4,272 9,287 5,191 4,422 9,613
- - - - - - - - 316,677 688,428 384,762 327,760 712,523 398,229 339,232 737,461
4,128 8,973 5,015 4,272 9,287 5,191 4,422 9,613 44,160 96,001 53,655 45,706 99,361 55,533 47,306 102,838
- - - - - - - - 10,319 22,433 12,538 10,681 23,219 12,977 11,054 24,031 13,101 28,482 15,918 13,560 29,478 16,475 14,035 30,510 27,367 59,493 33,251 28,325 61,576 34,415 29,316 63,731
- - - - - - - - - - - - - - - -
99,076 215,383 120,377 102,544 222,921 124,591 106,133 230,723
159,074 345,812 193,275 164,641 357,916 200,039 170,404 370,443 71,885 156,271 87,340 74,401 161,741 90,397 77,005 167,402
- - - - - - - - 106,082 230,612 128,889 109,794 238,684 133,400 113,637 247,038 337,040 732,696 409,504 348,837 758,340 423,836 361,046 784,882
6,604 14,357 8,024 6,836 14,860 8,305 7,075 15,380 - - - - - - - -
13,044 28,356 15,848 13,500 29,348 16,403 13,973 30,376 19,648 42,713 23,872 20,336 44,208 24,708 21,048 45,756
290,671 631,893 353,165 300,844 654,009 365,526 311,374 676,899 - - - - - - - -
18,988 41,278 23,070 19,652 42,722 23,877 20,340 44,218 - - - - - - - -
309,658 673,170 376,235 320,496 696,731 389,403 331,714 721,117
132,088 287,148 160,487 136,711 297,198 166,104 141,496 307,600 24,325 52,880 29,555 25,176 54,731 30,589 26,057 56,647
242,753 527,724 294,945 251,250 546,195 305,268 260,043 565,312 89,159 193,825 108,329 92,280 200,609 112,120 95,510 207,630
123,366 493,464 383,051 127,684 510,735 396,458 132,153 528,611 16,511 35,894 20,061 17,089 37,150 20,763 17,687 38,450 1,238 2,692 1,505 1,282 2,786 1,557 1,327 2,884
- - - - - - - - 629,441 1,593,627 997,933 651,471 1,649,404 1,032,860 674,273 1,707,133
195,243 195,243 - 202,076 202,076 - 209,149 209,149
- - -
2,080,083 4,517,998 2,523,242 2,152,886 4,676,128 2,611,556 2,228,237 4,839,792
6,900 15,000 8,100 6,900 15,000 8,100 6,900 15,000 - - - - - - -
50,830 110,500 59,670 50,830 110,500 59,670 50,830 110,500 - - - - - - - - - - - - - - - - - - - - - - - -
- - - - - - - - 57,730 125,500 67,770 57,730 125,500 67,770 57,730 125,500
2,137,813 4,643,498 2,591,012 2,210,616 4,801,628 2,679,326 2,285,967 4,965,292
950,836 977,057 27,044 955,250 982,293 27,896 959,045 986,941
728,846 728,846 - 728,846 728,846 - 728,846 728,846 - - - - - - - - - - - - - - - - - - - - - - - -
- - - 728,846 728,846 - 728,846 728,846 - 728,846 728,846 221,990 248,211 27,044 226,404 253,447 27,896 230,199 258,095
(0) 0 0 (0) 0 0 0 0
221,990 248,211 27,044 226,404 253,447 27,896 230,200 258,095 1.341 1.348 1.354
- - - - - 20,036 43,557 24,344 20,737 45,081 25,196 21,463 46,659 2,300 5,000 2,700 2,300 5,000 2,700 2,300 5,000
- - - - - - - - - - - - - - - - - - - -
22,336 48,557 27,044 23,037 50,081 27,896 23,763 51,659
199,654 199,654 (0) 203,367 203,366 - 206,436 206,436
133,103 135,577 137,624 133,103 135,577 137,624
- - -
- - - - - - - - - - - -
66,551 67,789 68,812 66,551 67,789 68,812
- - -
1,878,500 1,989,000 2,099,500 110,500 110,500 110,500
- - -
1,989,000 2,099,500 2,210,000 $9,000 $9,500 $10,000
- - - - - -
- - - 0.0% 0.0% 0.0%
- - - - - -
- - -
- - - - - -
- - -
2041 2042Year 18 Year 19 Year 20
2043
7 of 7
Evaluation of Request for Final Gap Financing April 1, 2022 600 7th Street Page 52 of 54
Attachment M: Area Median Income (AMI) Analysis
(SEE ATTACHED)
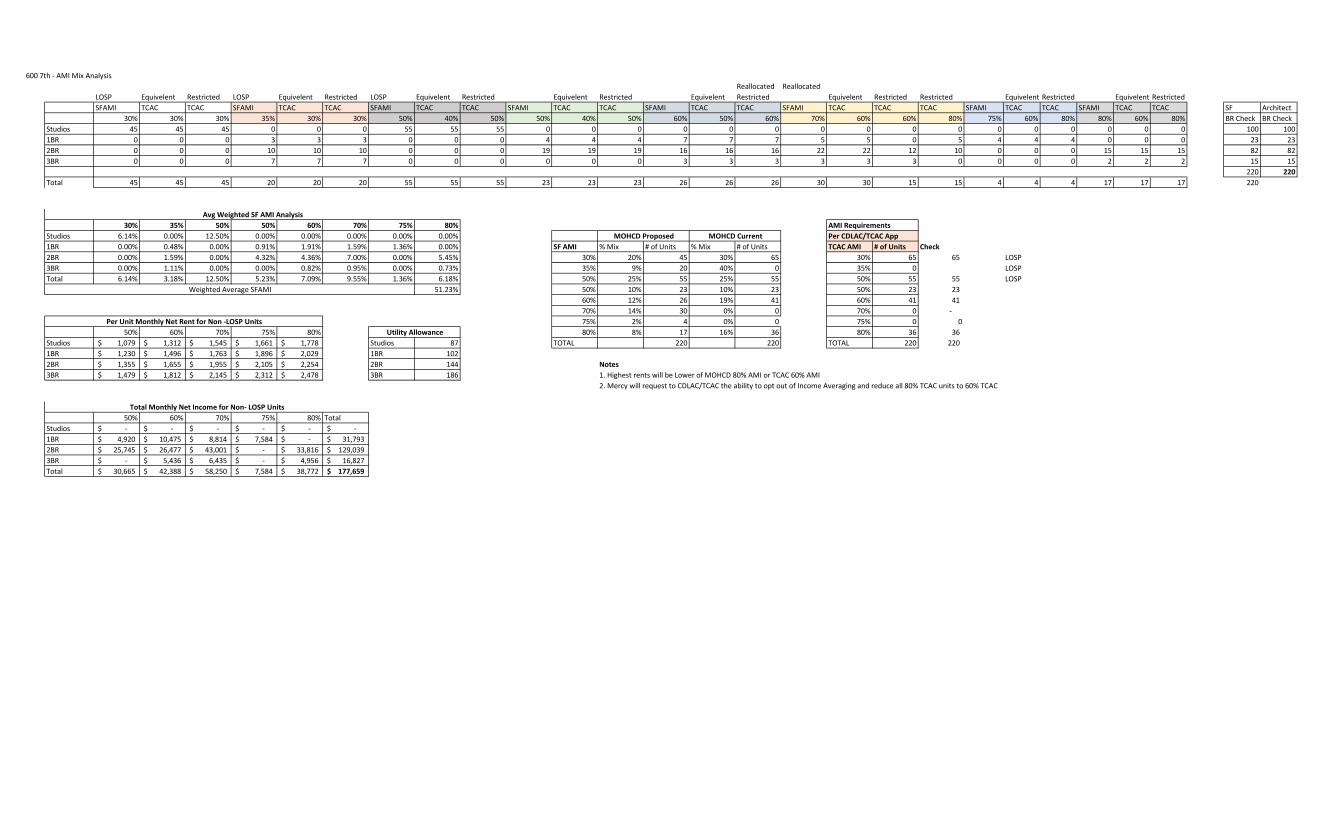
600 7th - AMI Mix AnalysisReallocated Reallocated
LOSP Equivelent Restricted LOSP Equivelent Restricted LOSP Equivelent Restricted Equivelent Restricted Equivelent Restricted Equivelent Restricted Restricted Equivelent Restricted Equivelent RestrictedSFAMI TCAC TCAC SFAMI TCAC TCAC SFAMI TCAC TCAC SFAMI TCAC TCAC SFAMI TCAC TCAC SFAMI TCAC TCAC TCAC SFAMI TCAC TCAC SFAMI TCAC TCAC SF Architect
30% 30% 30% 35% 30% 30% 50% 40% 50% 50% 40% 50% 60% 50% 60% 70% 60% 60% 80% 75% 60% 80% 80% 60% 80% BR Check BR CheckStudios 45 45 45 0 0 0 55 55 55 0 0 0 0 0 0 0 0 0 0 0 0 0 0 0 0 100 1001BR 0 0 0 3 3 3 0 0 0 4 4 4 7 7 7 5 5 0 5 4 4 4 0 0 0 23 232BR 0 0 0 10 10 10 0 0 0 19 19 19 16 16 16 22 22 12 10 0 0 0 15 15 15 82 823BR 0 0 0 7 7 7 0 0 0 0 0 0 3 3 3 3 3 3 0 0 0 0 2 2 2 15 15
220 220Total 45 45 45 20 20 20 55 55 55 23 23 23 26 26 26 30 30 15 15 4 4 4 17 17 17 220
30% 35% 50% 50% 60% 70% 75% 80% AMI RequirementsStudios 6.14% 0.00% 12.50% 0.00% 0.00% 0.00% 0.00% 0.00% Per CDLAC/TCAC App1BR 0.00% 0.48% 0.00% 0.91% 1.91% 1.59% 1.36% 0.00% SF AMI % Mix # of Units % Mix # of Units TCAC AMI # of Units Check2BR 0.00% 1.59% 0.00% 4.32% 4.36% 7.00% 0.00% 5.45% 30% 20% 45 30% 65 30% 65 65 LOSP3BR 0.00% 1.11% 0.00% 0.00% 0.82% 0.95% 0.00% 0.73% 35% 9% 20 40% 0 35% 0 LOSPTotal 6.14% 3.18% 12.50% 5.23% 7.09% 9.55% 1.36% 6.18% 50% 25% 55 25% 55 50% 55 55 LOSP
51.23% 50% 10% 23 10% 23 50% 23 23 60% 12% 26 19% 41 60% 41 41 70% 14% 30 0% 0 70% 0 - 75% 2% 4 0% 0 75% 0 0
50% 60% 70% 75% 80% 80% 8% 17 16% 36 80% 36 36 Studios 1,079$ 1,312$ 1,545$ 1,661$ 1,778$ Studios 87 TOTAL 220 220 TOTAL 220 220 1BR 1,230$ 1,496$ 1,763$ 1,896$ 2,029$ 1BR 1022BR 1,355$ 1,655$ 1,955$ 2,105$ 2,254$ 2BR 144 Notes3BR 1,479$ 1,812$ 2,145$ 2,312$ 2,478$ 3BR 186 1. Highest rents will be Lower of MOHCD 80% AMI or TCAC 60% AMI
2. Mercy will request to CDLAC/TCAC the ability to opt out of Income Averaging and reduce all 80% TCAC units to 60% TCAC
50% 60% 70% 75% 80% TotalStudios -$ -$ -$ -$ -$ -$ 1BR 4,920$ 10,475$ 8,814$ 7,584$ -$ 31,793$ 2BR 25,745$ 26,477$ 43,001$ -$ 33,816$ 129,039$ 3BR -$ 5,436$ 6,435$ -$ 4,956$ 16,827$ Total 30,665$ 42,388$ 58,250$ 7,584$ 38,772$ 177,659$
Total Monthly Net Income for Non- LOSP Units
Utility Allowance
MOHCD Proposed MOHCD Current
Weighted Average SFAMI
Avg Weighted SF AMI Analysis
Per Unit Monthly Net Rent for Non -LOSP Units

Evaluation of Request for Final Gap Financing April 1, 2022 600 7th Street Page 53 of 54
Attachment N: Racial, Equity, Diversity, and Inclusion (REDI) Framework
(SEE ATTACHED)
MERCY HOUSING NATIONAL REDI TEAM (REDI COLLABORATIVE) CHARTER
Drafted March 2, 2021
Revised: N/A
REDI Charter 1
Table of Contents 1. Background ................................................................................................................... 2
2. Purpose .......................................................................................................................... 2
3. Scope .............................................................................................................................. 2
4. Guiding Principles ........................................................................................................ 2
5. Values ............................................................................................................................. 2
6. Challenges and Opportunities ................................................................................... 3
7. Expectations of Members .......................................................................................... 3
8. Key Terms...................................................................................................................... 3
STRUCTURE ................................................................................................................................. 4
9. Structure ........................................................................................................................ 4
10. Steering Committee and REDI Collaborative Visual ............................................ 4
11. Group Agreements for REDI Collaborative and REDI Steering Committee ... 5
STEERING COMMITTEE ............................................................................................................. 5
12. REDI Steering Committee Membership .................................................................. 5
13. Role of GBC and MHMG Presidents ......................................................................... 5
14. Steering Committee Co‐Chairs ................................................................................. 5
15. Steering Committee Co-Chair Responsibilities..................................................... 6
16. Steering Committee Members Responsibilities .................................................... 6
17. Steering Committee Member Terms ....................................................................... 6
18. Steering Committee Member Meetings .................................................................. 6
19. Steering Committee Decision-Making ..................................................................... 6
REDI COLLABORATIVE AND WORKGROUPS ....................................................................... 7
20. The REDI Collaborative and Work Group Members .............................................. 7
21. Work Group Members .................................................................................................. 7
22. Formation of Ad Hoc Committees ........................................................................... 7
23. Review and Modification of the Charter ................................................................. 8
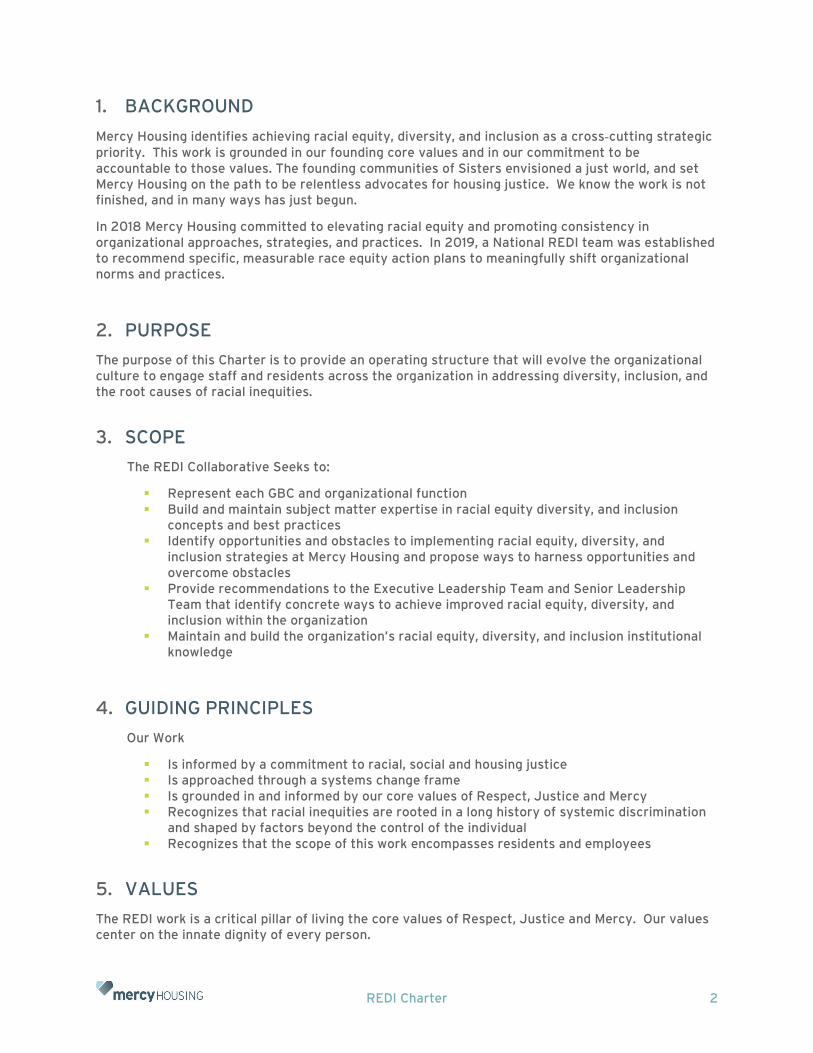
REDI Charter 2
1. BACKGROUND
Mercy Housing identifies achieving racial equity, diversity, and inclusion as a cross‐cutting strategic priority. This work is grounded in our founding core values and in our commitment to be accountable to those values. The founding communities of Sisters envisioned a just world, and set Mercy Housing on the path to be relentless advocates for housing justice. We know the work is not finished, and in many ways has just begun.
In 2018 Mercy Housing committed to elevating racial equity and promoting consistency in organizational approaches, strategies, and practices. In 2019, a National REDI team was established to recommend specific, measurable race equity action plans to meaningfully shift organizational norms and practices.
2. PURPOSE
The purpose of this Charter is to provide an operating structure that will evolve the organizational culture to engage staff and residents across the organization in addressing diversity, inclusion, and the root causes of racial inequities.
3. SCOPE
The REDI Collaborative Seeks to:
Represent each GBC and organizational function Build and maintain subject matter expertise in racial equity diversity, and inclusion
concepts and best practices Identify opportunities and obstacles to implementing racial equity, diversity, and
inclusion strategies at Mercy Housing and propose ways to harness opportunities and overcome obstacles
Provide recommendations to the Executive Leadership Team and Senior Leadership Team that identify concrete ways to achieve improved racial equity, diversity, and inclusion within the organization
Maintain and build the organization’s racial equity, diversity, and inclusion institutional knowledge
4. GUIDING PRINCIPLES
Our Work
Is informed by a commitment to racial, social and housing justice Is approached through a systems change frame Is grounded in and informed by our core values of Respect, Justice and Mercy Recognizes that racial inequities are rooted in a long history of systemic discrimination
and shaped by factors beyond the control of the individual Recognizes that the scope of this work encompasses residents and employees
5. VALUES
The REDI work is a critical pillar of living the core values of Respect, Justice and Mercy. Our values center on the innate dignity of every person.
REDI Charter 3
Every person – no matter their race or other social background – has a right to economic, social, and political power, and the right to have the access and opportunity to achieve optimal outcomes for themselves, their families, and their communities. Making bold, intentional, and systemic change is the reason Mercy Housing was founded. While centered on housing, racial justice is intertwined with housing justice. We believe that affordable housing and quality supportive programs improve the health and well-being and economic status of residents, transforms neighborhoods, and stabilizes lives.
Meaningful and relevant resident engagement, including strengthening the capacity to act, is a vital component to improving life outcomes.
6. CHALLENGES AND OPPORTUNITIES
Owning our biases, respectfully challenging processes, assumptions and stereotypes will result in better systems and programs that create opportunities for all to thrive.
Systems and policies must be changed to eliminate inequities The matrixed structure of Mercy Housing structurally maintains space for responsive
innovation and, at times, leads to siloed or disjointed efforts. All business and support centers across Mercy Housing are engaging racial equity and
housing justice; there is great energy, creativity and commitment for implementing strategies and transforming institutional norms.
7. EXPECTATIONS OF MEMBERS
Exemplify Mercy Housing’s core values of Respect, Justice and Mercy and work with intentional and effective collaboration across geographic business centers, and communities
Commit to continuously expand their knowledge and challenge assumptions of what factors create and/or contribute to inequities
Exhibit excellence and accountability to each other, our partners and the public through the use of open, responsive and authentic communication, while maintaining transparency and confidentiality
Maximize our capacities and create a unified approach to advancing racial equity, diversity, and inclusion within our organization and the communities we serve
8. KEY TERMS
Racial Equity is the condition that would be achieved if one’s racial identity no longer predicted, in a statistical sense, how one fares. When we use the term, we are thinking about racial equity as one part of racial justice, and thus we also include work to address root causes of inequities not just their manifestation. This includes elimination of polices, practices, attitudes, and cultural messages that reinforce different outcomes by face or fail to eliminate them.
Diversity is that state of being diverse or showing variety in something. Within racial equity work, diversity means representation within a group or setting by people who carry a range of different social identities, perspectives, and lives experiences.
Inclusion is the integration of diverse perspectives that provides a sense of belonging. Where diversity is an invitation to the table, inclusion actively asks and welcomes input from everyone as part of critical decision-making.
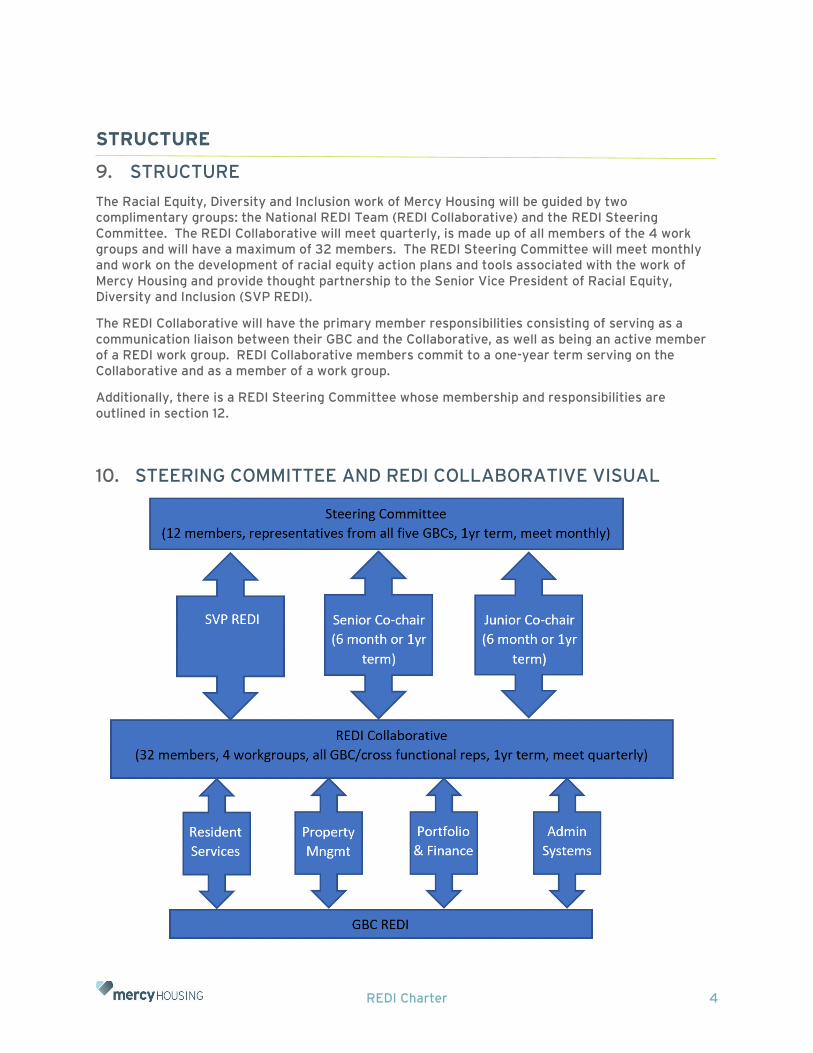
REDI Charter 4
STRUCTURE
9. STRUCTURE
The Racial Equity, Diversity and Inclusion work of Mercy Housing will be guided by two complimentary groups: the National REDI Team (REDI Collaborative) and the REDI Steering Committee. The REDI Collaborative will meet quarterly, is made up of all members of the 4 work groups and will have a maximum of 32 members. The REDI Steering Committee will meet monthly and work on the development of racial equity action plans and tools associated with the work of Mercy Housing and provide thought partnership to the Senior Vice President of Racial Equity, Diversity and Inclusion (SVP REDI).
The REDI Collaborative will have the primary member responsibilities consisting of serving as a communication liaison between their GBC and the Collaborative, as well as being an active member of a REDI work group. REDI Collaborative members commit to a one-year term serving on the Collaborative and as a member of a work group.
Additionally, there is a REDI Steering Committee whose membership and responsibilities are outlined in section 12.
10. STEERING COMMITTEE AND REDI COLLABORATIVE VISUAL
REDI Charter 5
11. GROUP AGREEMENTS FOR REDI COLLABORATIVE AND REDI STEERING COMMITTEE
Take space, make space Limited confidentiality Recognize intent, own impact Refrain from judgement Ask questions Elevate what is valuable about another person’s share or comment Be willing to grow and change Respect Justice and Mercy
STEERING COMMITTEE
12. REDI STEERING COMMITTEE MEMBERSHIP
The Steering Committee will serve as a thought partnership capacity generating ideas, working on projects, and developing tools to advance racial equity diversity and inclusion at Mercy Housing. Steering committee membership shall consist of the of the following:
The steering committee will be made up of 12 people:
Three reps from Mercy Housing Management Group Two reps form Mercy Housing California Two reps from Mercy Housing Lakefront Two reps from Mercy Housing main office One rep from Mercy Housing Northwest One rep from Mercy Housing Southeast One rep from Mercy Housing Mountain Plains
13. ROLE OF GBC AND MHMG PRESIDENTS
Each GBC/MHMG president will select 1-3 employees to serve on the Steering Committee. Using a template application process as a guide, each GBC/MHMG president should initiate a process to determine how the steering committee representative(s) are chosen. This process should include having employees express their interests in writing and having at least one other staff member conduct interviews of candidates before making a decision. The application, invitation and interview process will be provided to the GBC/MHMG Presidents to ensure consistency of REDI Steering Committee appointment process.
GBC/MHMG presidents are expected to provide Steering Committee representatives regular opportunities to share National REDI Team updates with their respective regional teams.
14. STEERING COMMITTEE CO‐CHAIRS
Two Co‐Chairs will be elected from the Steering Committee. The Co‐Chairs will participate as voting members of the Steering Committee and serve 12-month terms (6 months each as a junior co-chair and senior co-chair). After 6 months the junior co-chair becomes the senior co-chair and the senior co-chair will be replaced by a newly elected junior co-chair. As the overarching role of the co-chairs is to provide leadership, they should be effective strategists and good networkers.
REDI Charter 6
15. STEERING COMMITTEE CO-CHAIR RESPONSIBILITIES IN COLLABORATION WITH SVP REDI INCLUDE:
Set each meeting agenda Assist in facilitating the Steering Committee meetings Lead all REDI Collaborative quarterly meetings Delegate tasks to Steering Committee members and Ad HOC committee members as
necessary
16. STEERING COMMITTEE MEMBERS ARE DIVERSE ACROSS GBC’S DEPARTMENTS AND ARE RESPONSIBLE FOR:
Identifying steering committee racial equity, diversity, ad inclusion priorities Making recommendations to carry out identified priorities Monitoring the progress of the work groups- serve as problem solvers for any challenges Identifying challenges that should be elevated to SLT through the SVP REDI. Preparing for and actively participating in each Steering Committee meeting Participating in at least one workgroup Committing at least 4 hours of their time each month to REDI Team activities
17. STEERING COMMITTEE MEMBER TERMS
Each GBC will have at least one member. For those GBC’s/MHMG with two or more members there will be an effort made to avoid having all members rotating off of the steering committee at the same time. Unless extenuating circumstances exist or GBC leadership requests otherwise, members commit to serve at least six month‐ term. To ensure the opportunity for other staff to join the Steering Committee, the longest term length for any Steering Committee member will be 12 months.
18. STEERING COMMITTEE MEMBER MEETINGS
Meet every month Meetings will occur on the second Tuesday of each month to discuss the ongoing goals,
objectives, activities, and accomplishments of the Collaborative. Requested agenda topics and supporting materials are to be submitted to the Co‐ Chairs
in advance of the agenda setting (one week prior to the desired meeting) for consideration. Suggested agenda items include:
Items from/for the Senior Leadership Team Follow up on action items from previous meetings Ongoing implementation of work group activity Staff presentations on various topics and projects
19. STEERING COMMITTEE DECISION-MAKING
Decisions will be made by consensus by those at the Steering Committee meeting. All members will have input into the decision and agree to support the decision once consensus is reached. Decisions will be documented in the minutes.
Voting will be used only as a fallback decision process. A vote will require a quorum to be present (50% plus 1) and then a majority vote of the members present when decisions are made. If a decision is to be made, notice will be given to members at least one week in advance. Votes can be
REDI Charter 7
cast thumbs up (approve), or thumbs down (disapprove) or can be conducted as a silent vote. A majority positive vote of those present on a decision item is necessary to advance the decision item.
REDI COLLABORATIVE AND WORKGROUPS
20. THE REDI COLLABORATIVE AND WORK GROUP MEMBERS
Work group members who are not a part of the Steering Committee are considered a part of the REDI Collaborative. While the Steering Committee will meet monthly and have decision making authority, the REDI Collaborative will meet quarterly, and members will serve in a communication liaison role. REDI Collaborative members will be expected to:
Regularly attend workgroup and REDI Collaborative meetings Communicate GBC REDI information (successes, challenges, projects, etc.) to the REDI
Collaborative and Steering Committee Meet with cross functional co-workers, especially those whose voices may not be
considered, and encourage employee-generated ideas and solutions.
21. WORK GROUP MEMBERS
Work group members are REDI Collaborative members and other Mercy staff who participate in the work group of interest/expertise and are responsible for the following:
Committing 4 hours per month Attending and participating in scheduled meetings Implementing action steps in work plans Communicating with colleagues about work group activities Helping to identify necessary resources for work plan advancement
Work groups are expected to meet at least monthly. Work group members commit to two-year terms with half the work group members being junior (1 year) and senior (1 year) members. Once the senior members rotate off the work group, the junior members become seniors and new junior members will be recruited by the SVP REDI and the remaining work group members.
22. FORMATION OF AD HOC COMMITTEES
As needs dictate, the Steering Committee Co‐Chairs, with Steering Committee member support, may appoint ad hoc committee(s). When no longer needed or once an assigned project has been completed, the ad hoc committee(s) will be dissolved. These committees serve as a way to share and be more inclusive of the work of the Steering Committee; however, they do not hold decision‐ making authority independent of the Steering Committee. Ad hoc committees will:
Create a work plan to outline their goals, objectives, activities and method of evaluation Supply a verbal update at Steering Committee meetings as necessary Present recommendations to the Steering Committee for discussion and approval before
taking decisive action
REDI Charter 8
23. REVIEW AND MODIFICATION OF THE CHARTER
The Charter will be reviewed by the Steering Committee annually. A change to the charter requires approval by a simple majority vote of the total votes cast. Proposed changes to the charter will be presented as an agenda item and discussed during a meeting.

Evaluation of Request for Final Gap Financing April 1, 2022 600 7th Street Page 54 of 54
Attachment O: Public Art RFP
(SEE ATTACHED)
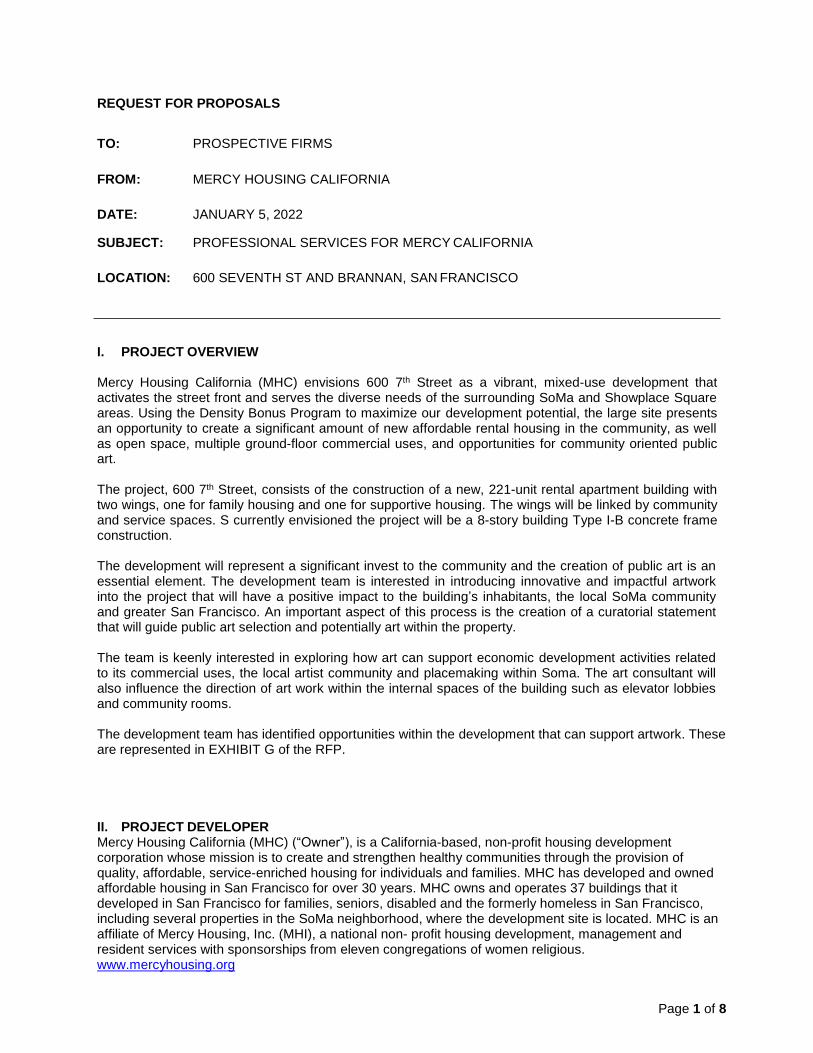
Page 1 of 8
REQUEST FOR PROPOSALS
TO: PROSPECTIVE FIRMS
FROM: MERCY HOUSING CALIFORNIA
DATE: JANUARY 5, 2022
SUBJECT: PROFESSIONAL SERVICES FOR MERCY CALIFORNIA
LOCATION: 600 SEVENTH ST AND BRANNAN, SAN FRANCISCO
I. PROJECT OVERVIEW Mercy Housing California (MHC) envisions 600 7th Street as a vibrant, mixed-use development that activates the street front and serves the diverse needs of the surrounding SoMa and Showplace Square areas. Using the Density Bonus Program to maximize our development potential, the large site presents an opportunity to create a significant amount of new affordable rental housing in the community, as well as open space, multiple ground-floor commercial uses, and opportunities for community oriented public art. The project, 600 7th Street, consists of the construction of a new, 221-unit rental apartment building with two wings, one for family housing and one for supportive housing. The wings will be linked by community and service spaces. S currently envisioned the project will be a 8-story building Type I-B concrete frame construction.
The development will represent a significant invest to the community and the creation of public art is an essential element. The development team is interested in introducing innovative and impactful artwork into the project that will have a positive impact to the building’s inhabitants, the local SoMa community and greater San Francisco. An important aspect of this process is the creation of a curatorial statement that will guide public art selection and potentially art within the property. The team is keenly interested in exploring how art can support economic development activities related to its commercial uses, the local artist community and placemaking within Soma. The art consultant will also influence the direction of art work within the internal spaces of the building such as elevator lobbies and community rooms.
The development team has identified opportunities within the development that can support artwork. These are represented in EXHIBIT G of the RFP.
II. PROJECT DEVELOPER Mercy Housing California (MHC) (“Owner”), is a California-based, non-profit housing development corporation whose mission is to create and strengthen healthy communities through the provision of quality, affordable, service-enriched housing for individuals and families. MHC has developed and owned affordable housing in San Francisco for over 30 years. MHC owns and operates 37 buildings that it developed in San Francisco for families, seniors, disabled and the formerly homeless in San Francisco, including several properties in the SoMa neighborhood, where the development site is located. MHC is an affiliate of Mercy Housing, Inc. (MHI), a national non- profit housing development, management and resident services with sponsorships from eleven congregations of women religious. www.mercyhousing.org
Page 2 of 8
III. ARCHITECT Santos Prescott and Associates is an architecture and urban design practice acclaimed for the spatial inventiveness and social responsibility of its work. Our experience includes multi-family projects in San Francisco and throughout California, and award-winning developments in various countries. San Francisco projects include 120 affordable multifamily units and with a ground floor childcare center (Natalie Gubb Commons) in the Transbay District; and 141 units of affordable senior housing (Mission Creek Senior Community) that includes amenities such as an adult health center, retail space, and a branch of the San Francisco Public Library. http://santosprescott.com IV. CONTRACT FORM The consultant selected through this RFP will contract with the Owner, Mercy Housing.
This project must comply with the Mayor’s Office of Housing and Community Development A/E fee guidelines, Exhibit E, which regulate the total architecture and engineering fee. Consultant’s contracting directly with Owner will enter into a form of contract as outlined in Exhibit F.
V. INSURANCE Consultant must carry insurance equal to that shown in Exhibit C.
VI. PROJECT SCHEDULE The following development durations are estimated at this time and subject to change:
Projected Construction Start: August 2022 Construction Duration: approx. 22 months VII. PROFESSIONAL SERVICES REQUESTED This section includes the professional services requested (not an exclusive list). Please refer to Exhibit B: Scope of Services for additional information. Scope: Concept design drawings are included with the RFQ clarifying general building layouts. See the Dropbox link above for access to the drawings.
CONSULTANTS OF OWNER: • Art Consultant
VIII. SMALL BUSINESS ENTERPRISE (SBE) GOAL The project will receive public funding from the City and County of San Francisco. The San Francisco Contract Monitoring Division (CMD) has assigned a 20% Small Business Enterprise (SBE) participation goal. The developer/sponsor is responsible for meeting the overall SBE participation goal, which includes design and pre-construction services. The selected Owner’s Representative will be responsible for assisting the developer/sponsor by providing forms regarding SBE professional services goals as it pertains to their scope of work. MHC and the City strongly desire a consulting team that represents the diversity of San Francisco and, in particular, that of the South of Market (SOMA) neighborhood. As such, consulting firms certified as DBEs, SBEs, MBEs, WBEs and LBEs are strongly encouraged to reply to this request. Please submit a copy of your certification together with the SBE Form 2 Declaration (included in Exhibit D).
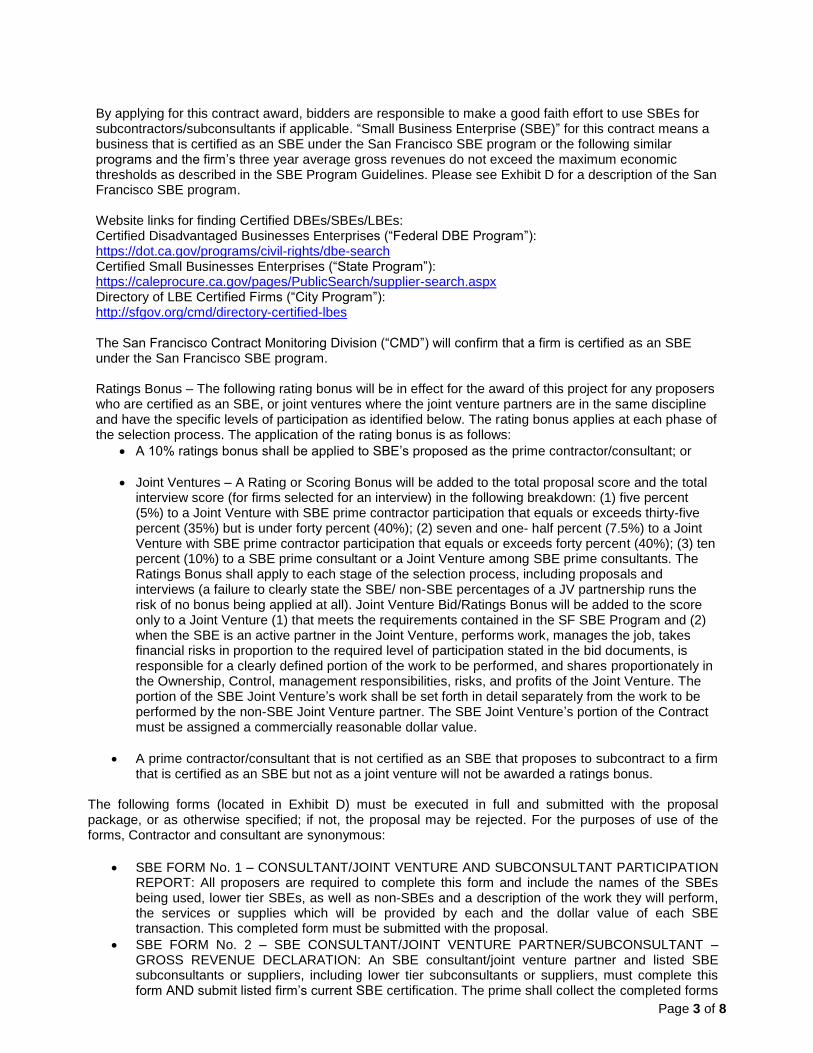
Page 3 of 8
By applying for this contract award, bidders are responsible to make a good faith effort to use SBEs for subcontractors/subconsultants if applicable. “Small Business Enterprise (SBE)” for this contract means a business that is certified as an SBE under the San Francisco SBE program or the following similar programs and the firm’s three year average gross revenues do not exceed the maximum economic thresholds as described in the SBE Program Guidelines. Please see Exhibit D for a description of the San Francisco SBE program. Website links for finding Certified DBEs/SBEs/LBEs: Certified Disadvantaged Businesses Enterprises (“Federal DBE Program”): https://dot.ca.gov/programs/civil-rights/dbe-search Certified Small Businesses Enterprises (“State Program”): https://caleprocure.ca.gov/pages/PublicSearch/supplier-search.aspx Directory of LBE Certified Firms (“City Program”): http://sfgov.org/cmd/directory-certified-lbes The San Francisco Contract Monitoring Division (“CMD”) will confirm that a firm is certified as an SBE under the San Francisco SBE program. Ratings Bonus – The following rating bonus will be in effect for the award of this project for any proposers who are certified as an SBE, or joint ventures where the joint venture partners are in the same discipline and have the specific levels of participation as identified below. The rating bonus applies at each phase of the selection process. The application of the rating bonus is as follows:
• A 10% ratings bonus shall be applied to SBE’s proposed as the prime contractor/consultant; or
• Joint Ventures – A Rating or Scoring Bonus will be added to the total proposal score and the total interview score (for firms selected for an interview) in the following breakdown: (1) five percent (5%) to a Joint Venture with SBE prime contractor participation that equals or exceeds thirty-five percent (35%) but is under forty percent (40%); (2) seven and one- half percent (7.5%) to a Joint Venture with SBE prime contractor participation that equals or exceeds forty percent (40%); (3) ten percent (10%) to a SBE prime consultant or a Joint Venture among SBE prime consultants. The Ratings Bonus shall apply to each stage of the selection process, including proposals and interviews (a failure to clearly state the SBE/ non-SBE percentages of a JV partnership runs the risk of no bonus being applied at all). Joint Venture Bid/Ratings Bonus will be added to the score only to a Joint Venture (1) that meets the requirements contained in the SF SBE Program and (2) when the SBE is an active partner in the Joint Venture, performs work, manages the job, takes financial risks in proportion to the required level of participation stated in the bid documents, is responsible for a clearly defined portion of the work to be performed, and shares proportionately in the Ownership, Control, management responsibilities, risks, and profits of the Joint Venture. The portion of the SBE Joint Venture’s work shall be set forth in detail separately from the work to be performed by the non-SBE Joint Venture partner. The SBE Joint Venture’s portion of the Contract must be assigned a commercially reasonable dollar value.
• A prime contractor/consultant that is not certified as an SBE that proposes to subcontract to a firm
that is certified as an SBE but not as a joint venture will not be awarded a ratings bonus. The following forms (located in Exhibit D) must be executed in full and submitted with the proposal package, or as otherwise specified; if not, the proposal may be rejected. For the purposes of use of the forms, Contractor and consultant are synonymous:
• SBE FORM No. 1 – CONSULTANT/JOINT VENTURE AND SUBCONSULTANT PARTICIPATION REPORT: All proposers are required to complete this form and include the names of the SBEs being used, lower tier SBEs, as well as non-SBEs and a description of the work they will perform, the services or supplies which will be provided by each and the dollar value of each SBE transaction. This completed form must be submitted with the proposal.
• SBE FORM No. 2 – SBE CONSULTANT/JOINT VENTURE PARTNER/SUBCONSULTANT – GROSS REVENUE DECLARATION: An SBE consultant/joint venture partner and listed SBE subconsultants or suppliers, including lower tier subconsultants or suppliers, must complete this form AND submit listed firm’s current SBE certification. The prime shall collect the completed forms
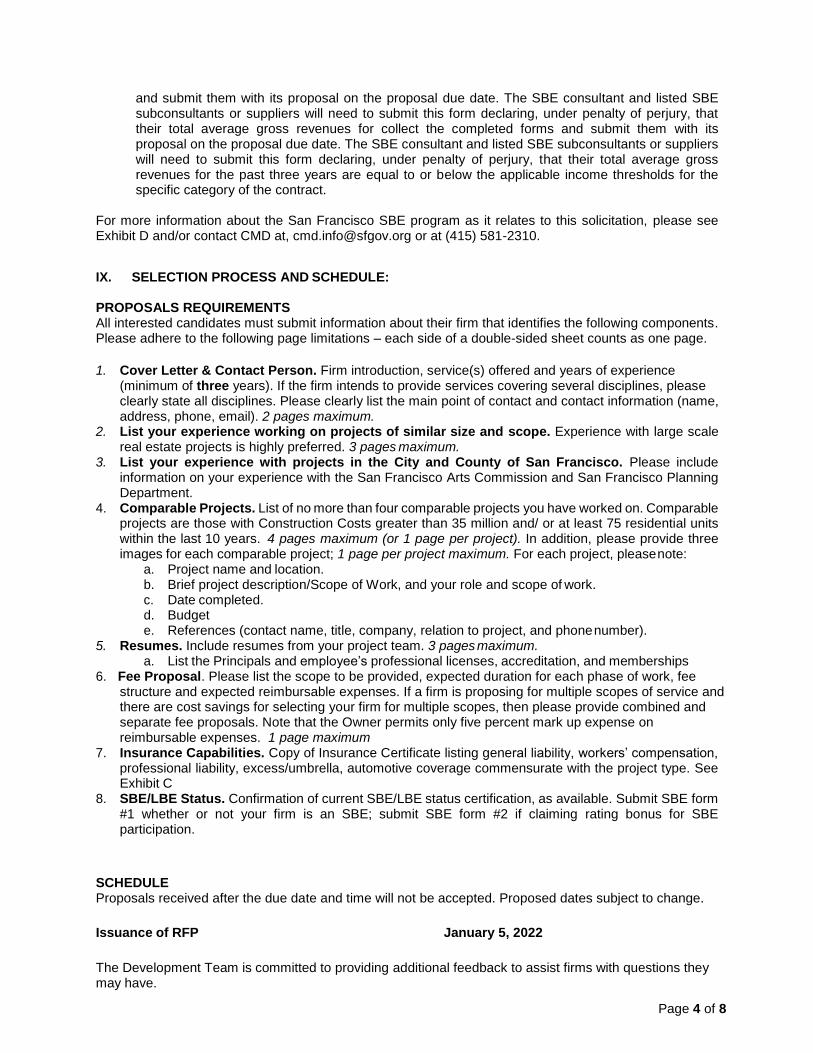
Page 4 of 8
and submit them with its proposal on the proposal due date. The SBE consultant and listed SBE subconsultants or suppliers will need to submit this form declaring, under penalty of perjury, that their total average gross revenues for collect the completed forms and submit them with its proposal on the proposal due date. The SBE consultant and listed SBE subconsultants or suppliers will need to submit this form declaring, under penalty of perjury, that their total average gross revenues for the past three years are equal to or below the applicable income thresholds for the specific category of the contract.
For more information about the San Francisco SBE program as it relates to this solicitation, please see Exhibit D and/or contact CMD at, [email protected] or at (415) 581-2310.
IX. SELECTION PROCESS AND SCHEDULE:
PROPOSALS REQUIREMENTS All interested candidates must submit information about their firm that identifies the following components. Please adhere to the following page limitations – each side of a double-sided sheet counts as one page.
1. Cover Letter & Contact Person. Firm introduction, service(s) offered and years of experience
(minimum of three years). If the firm intends to provide services covering several disciplines, please clearly state all disciplines. Please clearly list the main point of contact and contact information (name, address, phone, email). 2 pages maximum.
2. List your experience working on projects of similar size and scope. Experience with large scale real estate projects is highly preferred. 3 pages maximum.
3. List your experience with projects in the City and County of San Francisco. Please include information on your experience with the San Francisco Arts Commission and San Francisco Planning Department.
4. Comparable Projects. List of no more than four comparable projects you have worked on. Comparable projects are those with Construction Costs greater than 35 million and/ or at least 75 residential units within the last 10 years. 4 pages maximum (or 1 page per project). In addition, please provide three images for each comparable project; 1 page per project maximum. For each project, please note:
a. Project name and location. b. Brief project description/Scope of Work, and your role and scope of work. c. Date completed. d. Budget e. References (contact name, title, company, relation to project, and phone number).
5. Resumes. Include resumes from your project team. 3 pages maximum. a. List the Principals and employee’s professional licenses, accreditation, and memberships
6. Fee Proposal. Please list the scope to be provided, expected duration for each phase of work, fee structure and expected reimbursable expenses. If a firm is proposing for multiple scopes of service and there are cost savings for selecting your firm for multiple scopes, then please provide combined and separate fee proposals. Note that the Owner permits only five percent mark up expense on reimbursable expenses. 1 page maximum
7. Insurance Capabilities. Copy of Insurance Certificate listing general liability, workers’ compensation, professional liability, excess/umbrella, automotive coverage commensurate with the project type. See Exhibit C
8. SBE/LBE Status. Confirmation of current SBE/LBE status certification, as available. Submit SBE form #1 whether or not your firm is an SBE; submit SBE form #2 if claiming rating bonus for SBE participation.
SCHEDULE Proposals received after the due date and time will not be accepted. Proposed dates subject to change.
Issuance of RFP January 5, 2022
The Development Team is committed to providing additional feedback to assist firms with questions they may have.
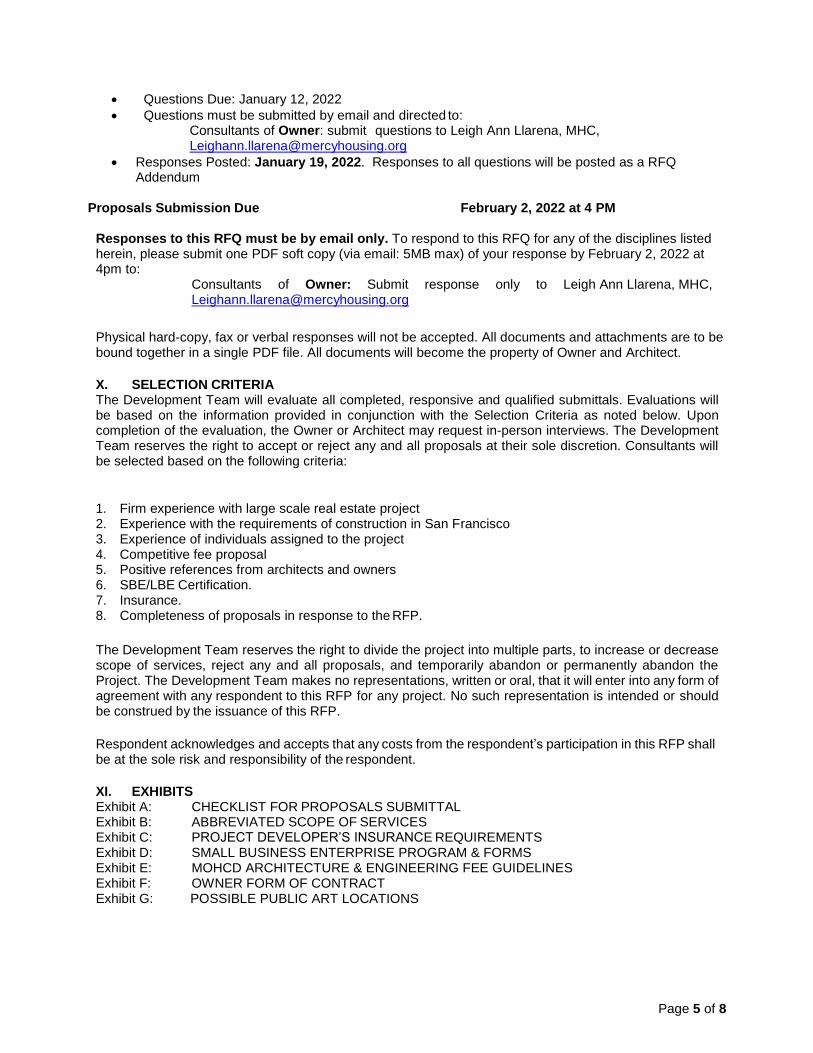
Page 5 of 8
• Questions Due: January 12, 2022 • Questions must be submitted by email and directed to:
Consultants of Owner: submit questions to Leigh Ann Llarena, MHC, [email protected]
• Responses Posted: January 19, 2022. Responses to all questions will be posted as a RFQ Addendum
Proposals Submission Due February 2, 2022 at 4 PM
Responses to this RFQ must be by email only. To respond to this RFQ for any of the disciplines listed herein, please submit one PDF soft copy (via email: 5MB max) of your response by February 2, 2022 at 4pm to:
Consultants of Owner: Submit response only to Leigh Ann Llarena, MHC, [email protected]
Physical hard-copy, fax or verbal responses will not be accepted. All documents and attachments are to be bound together in a single PDF file. All documents will become the property of Owner and Architect.
X. SELECTION CRITERIA The Development Team will evaluate all completed, responsive and qualified submittals. Evaluations will be based on the information provided in conjunction with the Selection Criteria as noted below. Upon completion of the evaluation, the Owner or Architect may request in-person interviews. The Development Team reserves the right to accept or reject any and all proposals at their sole discretion. Consultants will be selected based on the following criteria:
1. Firm experience with large scale real estate project 2. Experience with the requirements of construction in San Francisco 3. Experience of individuals assigned to the project 4. Competitive fee proposal 5. Positive references from architects and owners 6. SBE/LBE Certification. 7. Insurance. 8. Completeness of proposals in response to the RFP.
The Development Team reserves the right to divide the project into multiple parts, to increase or decrease scope of services, reject any and all proposals, and temporarily abandon or permanently abandon the Project. The Development Team makes no representations, written or oral, that it will enter into any form of agreement with any respondent to this RFP for any project. No such representation is intended or should be construed by the issuance of this RFP.
Respondent acknowledges and accepts that any costs from the respondent’s participation in this RFP shall be at the sole risk and responsibility of the respondent.
XI. EXHIBITS Exhibit A: CHECKLIST FOR PROPOSALS SUBMITTAL
Exhibit B: ABBREVIATED SCOPE OF SERVICES Exhibit C: PROJECT DEVELOPER’S INSURANCE REQUIREMENTS Exhibit D: SMALL BUSINESS ENTERPRISE PROGRAM & FORMS Exhibit E: MOHCD ARCHITECTURE & ENGINEERING FEE GUIDELINES Exhibit F: OWNER FORM OF CONTRACT Exhibit G: POSSIBLE PUBLIC ART LOCATIONS
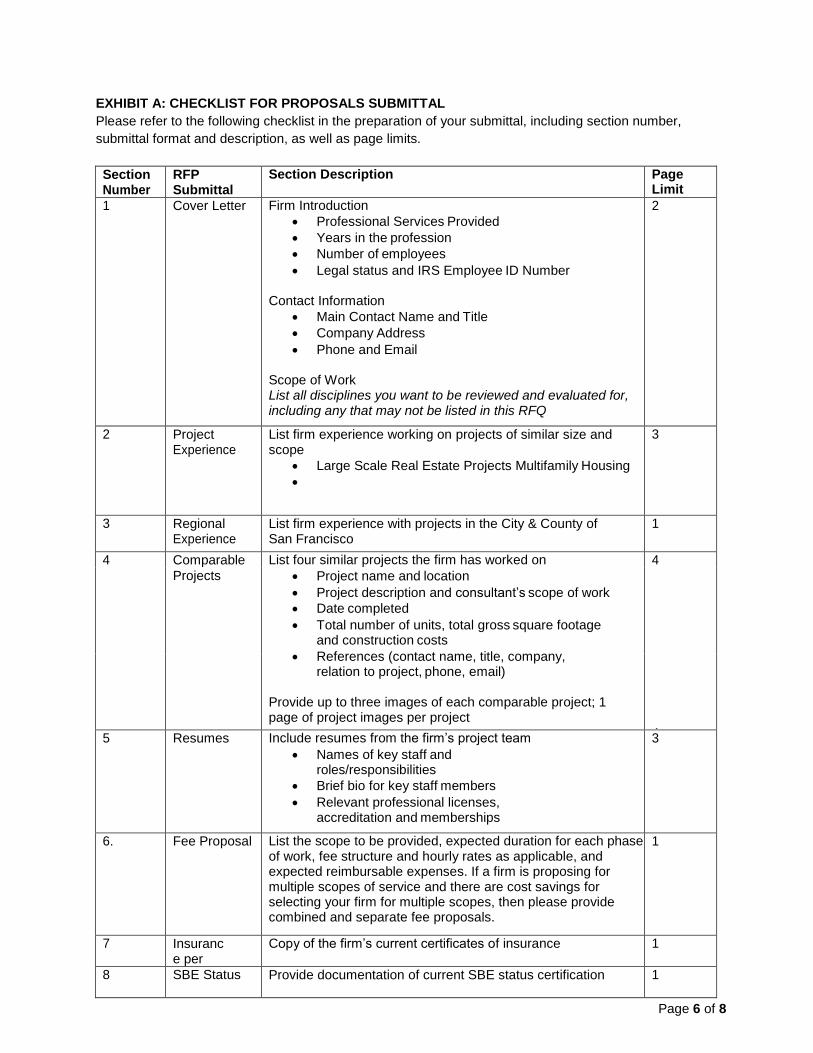
Page 6 of 8
EXHIBIT A: CHECKLIST FOR PROPOSALS SUBMITTAL Please refer to the following checklist in the preparation of your submittal, including section number, submittal format and description, as well as page limits.
Section Number
RFP Submittal Format
Section Description Page Limit
1 Cover Letter Firm Introduction • Professional Services Provided • Years in the profession • Number of employees • Legal status and IRS Employee ID Number
Contact Information
• Main Contact Name and Title • Company Address • Phone and Email
Scope of Work List all disciplines you want to be reviewed and evaluated for, including any that may not be listed in this RFQ
2
2 Project Experience
List firm experience working on projects of similar size and scope
• Large Scale Real Estate Projects Multifamily Housing •
3
3 Regional Experience
List firm experience with projects in the City & County of San Francisco
1
4 Comparable List four similar projects the firm has worked on • Project name and location • Project description and consultant’s scope of work • Date completed • Total number of units, total gross square footage
and construction costs • References (contact name, title, company,
relation to project, phone, email) Provide up to three images of each comparable project; 1 page of project images per project
4 Projects
4 5 Resumes Include resumes from the firm’s project team
• Names of key staff and roles/responsibilities
• Brief bio for key staff members • Relevant professional licenses,
accreditation and memberships
3
6. Fee Proposal List the scope to be provided, expected duration for each phase of work, fee structure and hourly rates as applicable, and expected reimbursable expenses. If a firm is proposing for multiple scopes of service and there are cost savings for selecting your firm for multiple scopes, then please provide combined and separate fee proposals.
1
7 Insurance per Exhibit C
Copy of the firm’s current certificates of insurance 1
8 SBE Status Provide documentation of current SBE status certification 1
Page 7 of 8
EXHIBIT B: SCOPE OF SERVICES
The following represents a sample of the RFP Scope of Services by discipline to be issued to the candidates Each consultant should make their proposal based on the services they see as required to produce well-coordinated construction documentation leading to a code-compliant building.
CONSULTANTS OF OWNER:
Art Consultant
1. Public Artwork Selection Process
a. Project Research and Data Gathering Month 1 i. Gather key project goals that may affect art process (e.g. tenants targeted, marketing
plan, site and community specific priorities) ii. Review project architectural and design mandate and aesthetic iii. Gather project timeline, key milestones iv. Assess construction considerations v. Review relevant permit and/or code considerations vi. Confirm Project Budget requirement vii. Develop clear decision-making criteria and process to support artwork decision making. viii. Review with Client and its consultants to select site(s) for public art ix. Meet with Planning Department for approval of site(s) selection
b. Artist Research Month 2 i. Develop curatorial statement ii. Review artwork mediums with Client and its consultants iii. Establish criteria for artist selection (e.g., experience, demographics, medium, geography) iv. Research artists who fit within curatorial and scope criteria
c. Artist Selection Process Months 3-5 i. Present possible artists within scope criteria ii. Client and its consultants select semi-finalist artists to respond to RFP and develop site-
specific proposals iii. Draft RFP for the site specific commission(s) iv. Discuss project with semi-finalist artists v. Issue RFP vi. Receive and review artists’ submissions vii. Review proposals with Client and its consultants viii. Interview select proposal semi-finalists with Client and its consultants ix. Make recommendation for selection of final artist(s) x. Client selects final artist(s)
d. Artist Under Contract Month 6 i. Facilitate execution of contract between artist(s) and Client including budget, insurance
and preliminary schedule 2. Artwork Implementation and Project Management TBD based on construction schedule
a. Establish clear lines of communication and reporting with Client, architects, construction team, and other consultants
b. Establish clear budget reporting c. Develop detailed timelines and deliverables d. Meetings and site visits with Client, artist, architect, engineer, construction team, and other
consultants during implementation phase e. Review artwork design development and structural engineering f. Work with artist(s) to select and contract vendors and subcontractors for fabrication and
installation g. Oversee artwork fabrication h. Liaison to government departments such Building and Planning Departments i. Manage permit process j. Work with artist(s), Client and its consultants to develop installation plan
k. Oversee installation to insure completion prior to Certificate of Occupancy l. Develop with artist(s) ongoing maintenance plan m. Report out Art Program expenses to Client and Planning Department


