Embed Size (px)
Citation preview
Original Articles
Application of analytic hierarchy process for measuringand comparing the global performance of intensivecare units
Seetharaman Hariharan MDa,*, Prasanta K. Dey PhDb, Deryk R. Chen FRCAa,Harley S.L. Moseley FFARCSc, Areti Y. Kumar MDc
aAnaesthesia and Intensive Care, The University of the West Indies, St. Augustine, Trinidad and TobagobAston Business School, Aston University, Birmingham, B4 7ET UKcSchool of Clinical Medicine and Research, The University of the West Indies, Barbados
0883-9441/$ – see front matter D 2005
doi:10.1016/j.jcrc.2005.04.002
T Corresponding author. Tel.: +1 868
E-mail address: hseetharaman@fms
Keywords:Analytic hierarchy
process;
Global performance;
Intensive care unit
AbstractPurpose: To develop a model for the global performance measurement of intensive care units (ICUs)
and to apply that model to compare the services for quality improvement.
Materials and Methods: Analytic hierarchy process, a multiple-attribute decision-making technique, is
used in this study to evolve such a model. The steps consisted of identifying the critical success factors
for the best performance of an ICU, identifying subfactors that influence the critical factors, comparing
them pairwise, deriving their relative importance and ratings, and calculating the cumulative
performance according to the attributes of a given ICU. Every step in the model was derived by
group discussions, brainstorming, and consensus among intensivists.
Results: The model was applied to 3 ICUs, 1 each in Barbados, Trinidad, and India in tertiary care
teaching hospitals of similar setting. The cumulative performance rating of the Barbados ICU was 1.17
when compared with that of Trinidad and Indian ICU, which were 0.82 and 0.75, respectively, showing
that the Trinidad and Indian ICUs performed 70% and 64% with respect to Barbados ICU. The model also
enabled identifying specific areas where the ICUs did not perform well, which helped to improvise
those areas.
Conclusions: Analytic hierarchy process is a very useful model to measure the global performance
of an ICU.
D 2005 Elsevier Inc. All rights reserved.
1. Introduction
Performance measurement is not easy in health care
services because the measurement of efficiency of health
Elsevier Inc. All rights reserved.
662 4030; fax: +1 868 662 4030.
.uwi.tt (S. Hariharan).
care delivery is multifactorial, the metrics are highly
variable and difficult to be defined accurately.
Until recently, performance measurement of an inten-
sive care unit (ICU) is done by prognostic scoring sys-
tems such as Acute Physiology and Chronic Health
Evaluation, Simplified Acute Physiology Score, and Mor-
tality Prediction Model [1]. All these systems consider
binomial patient outcomes, namely, survival or death, as the
Journal of Critical Care (2005) 20, 117–125

S. Hariharan et al.118
indicators of measurement. These systems incorporate
logistic regression equations to predict the mortality for a
case-mix in a particular ICU. The ratio of the predicted
mortality to the observed mortality (standardized mortality
ratio [SMR]) is used to compare the performance of differ-
ent ICUs [2].
Although validated by many prospective studies, there
are many inherent problems with these models. A study
that used all the 3 models to compare ICUs from
32 hospitals (Project IMPACT) reported that they
exhibited only fair to moderate agreement in identifying
the quality measures [3]. Most of the ICUs studied were
found to be performing very well according to these
standards. The editorial accompanying this article queried
that, bif most ICUs graduate with honors, is it genuine
quality or grade inflation?Q With the presently available
models of performance measurement, it is difficult to
distinguish between the two [4]. Many studies have
reported poor goodness of fit for the scoring systems,
implying that the prognostic models do not perform
consistently in all intensive care patients [5-10]. Although
patient outcome may be the ultimate goal of any ICU,
there are many other factors that are equally important in
the day-to-day functioning of an ICU, which are remark-
ably missed by these scoring systems when used as
performance measurement models.
Recently, some studies have tried to identify other ICU
quality indicators [11,12]. Other performance measurement
methods of ICU involve data envelopment analysis and
specific functions of ICU such as measurements and
guidelines to improve patient care and resource use in the
ICU to establish and implement best practices [13,14].
These methods will enable to improvise only specific areas
of the functioning of an ICU.
When one considers individual factors such as mortality
rate of an ICU as a measure of performance, an increase in
the mortality rate is interpreted as a reduction in the level of
overall performance. It is imperative that, before arriving at
any conclusion, one has to investigate the reasons for the
increase in the mortality rate, which may be multifactorial.
However, if the method of performance measurement itself
incorporates all the factors, it makes the identification of
deficiencies easier for a manager. In an attempt to consider
all the functions of an ICU globally and measure the
performance of every function individually, we conceptu-
alized and designed the present study. Accordingly, the
objective of the study was to develop a holistic perfor-
mance measurement model for ICU services and practically
apply the model so as to enable improvement of the quality
of services.
2. Design and methodology
Analytic hierarchy process (AHP), a multiple-criteria
decision-making technique, has been applied in this study to
measure the performance of an ICU. Although in medical
field there have been many applications of AHP [15-18], to
our knowledge it has not been applied as a performance
measurement model for an ICU.
The model was practically applied initially to a surgical
ICU of Queen Elizabeth Hospital, Barbados, a 650-bed
tertiary care teaching hospital affiliated to the University of
the West Indies. Subsequently, it was applied to ICUs in
Trinidad (Eric Williams Medical Sciences Complex,
Mount Hope) and India (University General Hospital,
Vijayawada), which are tertiary care teaching hospitals of
similar setting.
Initially, a questionnaire survey was conducted among
the clinical professionals involved in the management of
the ICU to determine what they consider the important
processes of an ICU. This included 15 anesthesiologists,
5 senior nurses (sisters-in-charge), and 10 staff nurses. Five
senior anesthesiologists, including the 3 authors who are
actively involved in the day-to-day management of the
ICU, had multiple brainstorming sessions to discuss every
step in detail. By group consensus, every aspect in one step
was agreed upon; after which, we proceeded toward the
next step.
Our model involved the following steps:
2.1. Step 1: Identifying the critical success factorsand the subfactors
Critical success factors by definition are the character-
istics, conditions, or variables that when properly sustained,
maintained, or managed can have a significant impact on the
successful management of an organization [19]. Following
the most commonly used approach suggested by Donabedian
[20] for performance evaluation in health care, namely, the
structure, process, and outcome of health care delivery, we
identified these 3 parameters as the critical success factors.
Later, we had multiple brainstorming sessions that helped
us to identify subfactors that influence the critical factors,
which in turn would facilitate the overall measurement of
the performance.
1. processes of patient care in ICU;
2. structure (resources) of ICU;
3. outcome—morbidity/mortality of patients in ICU.
2.2. Processes of ICU
We classified the processes of ICU into 2 main areas,
namely, the processes related to patient care and those
related to patient comfort.
Subfactors related to patient care are as follows:
! therapeutic intervention—aggressive interventions
such as invasive lines, early tracheostomy in deserv-
ing patients, and bedside procedures (not waiting for
other units such as operating rooms);
! monitoring—availability of constant monitoring con-
ditions for all the patient parameters;
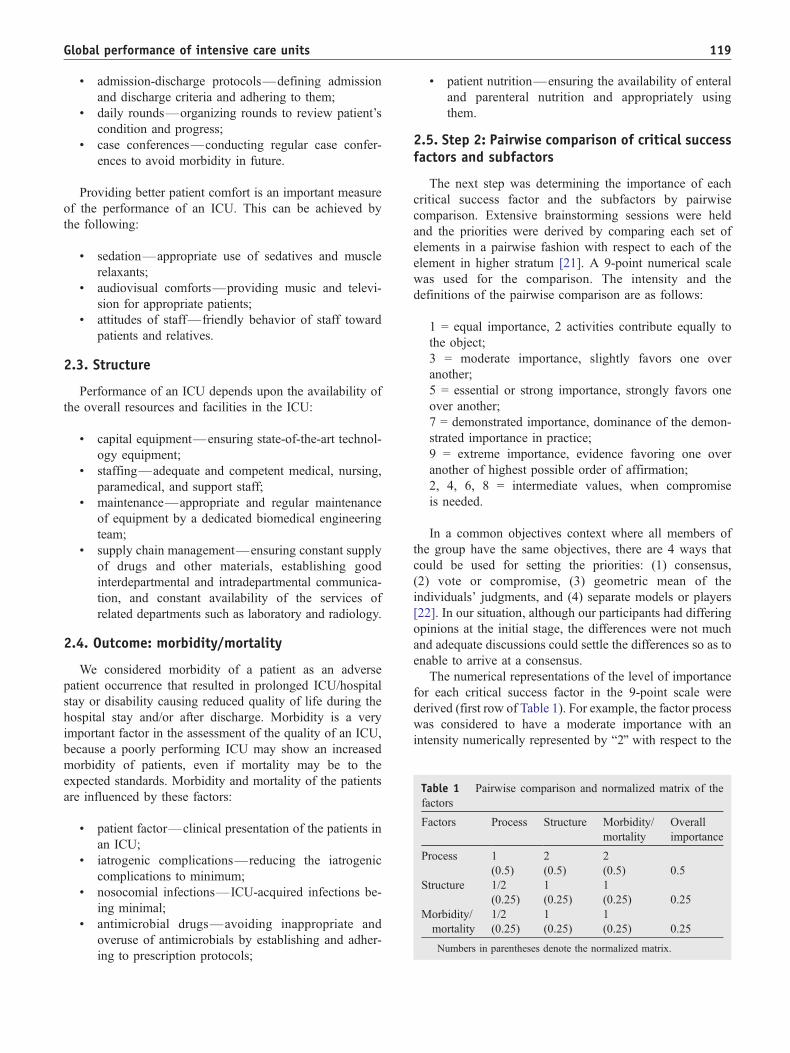
Table 1 Pairwise comparison and normalized matrix of the
factors
Factors Process Structure Morbidity/
mortality
Overall
importance
Process 1 2 2
(0.5) (0.5) (0.5) 0.5
Structure 1/2 1 1
(0.25) (0.25) (0.25) 0.25
Morbidity/
mortality
1/2 1 1
(0.25) (0.25) (0.25) 0.25
Numbers in parentheses denote the normalized matrix.
Global performance of intensive care units 119
! admission-discharge protocols—defining admission
and discharge criteria and adhering to them;
! daily rounds—organizing rounds to review patient’s
condition and progress;
! case conferences—conducting regular case confer-
ences to avoid morbidity in future.
Providing better patient comfort is an important measure
of the performance of an ICU. This can be achieved by
the following:
! sedation—appropriate use of sedatives and muscle
relaxants;
! audiovisual comforts—providing music and televi-
sion for appropriate patients;
! attitudes of staff—friendly behavior of staff toward
patients and relatives.
2.3. Structure
Performance of an ICU depends upon the availability of
the overall resources and facilities in the ICU:
! capital equipment—ensuring state-of-the-art technol-
ogy equipment;
! staffing—adequate and competent medical, nursing,
paramedical, and support staff;
! maintenance—appropriate and regular maintenance
of equipment by a dedicated biomedical engineering
team;
! supply chain management—ensuring constant supply
of drugs and other materials, establishing good
interdepartmental and intradepartmental communica-
tion, and constant availability of the services of
related departments such as laboratory and radiology.
2.4. Outcome: morbidity/mortality
We considered morbidity of a patient as an adverse
patient occurrence that resulted in prolonged ICU/hospital
stay or disability causing reduced quality of life during the
hospital stay and/or after discharge. Morbidity is a very
important factor in the assessment of the quality of an ICU,
because a poorly performing ICU may show an increased
morbidity of patients, even if mortality may be to the
expected standards. Morbidity and mortality of the patients
are influenced by these factors:
! patient factor—clinical presentation of the patients in
an ICU;
! iatrogenic complications—reducing the iatrogenic
complications to minimum;
! nosocomial infections—ICU-acquired infections be-
ing minimal;
! antimicrobial drugs—avoiding inappropriate and
overuse of antimicrobials by establishing and adher-
ing to prescription protocols;
! patient nutrition—ensuring the availability of enteral
and parenteral nutrition and appropriately using
them.
2.5. Step 2: Pairwise comparison of critical successfactors and subfactors
The next step was determining the importance of each
critical success factor and the subfactors by pairwise
comparison. Extensive brainstorming sessions were held
and the priorities were derived by comparing each set of
elements in a pairwise fashion with respect to each of the
element in higher stratum [21]. A 9-point numerical scale
was used for the comparison. The intensity and the
definitions of the pairwise comparison are as follows:
1 = equal importance, 2 activities contribute equally to
the object;
3 = moderate importance, slightly favors one over
another;
5 = essential or strong importance, strongly favors one
over another;
7 = demonstrated importance, dominance of the demon-
strated importance in practice;
9 = extreme importance, evidence favoring one over
another of highest possible order of affirmation;
2, 4, 6, 8 = intermediate values, when compromise
is needed.
In a common objectives context where all members of
the group have the same objectives, there are 4 ways that
could be used for setting the priorities: (1) consensus,
(2) vote or compromise, (3) geometric mean of the
individuals’ judgments, and (4) separate models or players
[22]. In our situation, although our participants had differing
opinions at the initial stage, the differences were not much
and adequate discussions could settle the differences so as to
enable to arrive at a consensus.
The numerical representations of the level of importance
for each critical success factor in the 9-point scale were
derived (first row of Table 1). For example, the factor process
was considered to have a moderate importance with an
intensity numerically represented by b2Q with respect to the

Therapeutic interventionsAggressive interventions in patientsGood >75% Average 50-75% Poor <50%
MonitoringGood full Average partial Poor minimal
Admission discharge protocolsGood Established protocol
followed Average Established protocol
not followed Poor No protocol
Daily roundsGood Well organized Average Not organized Poor No daily rounds
Case conferencesGood At organized
intervals Average Random Poor None
SedationGood Optimal use of
sedatives and relaxants Average Sub-optimal or
excessive use Poor Poor use of drugs
Audiovisual comfortsGood All deserving patients
receive Average Inadequate Poor None
Attitudes of staffGood Staff interaction with
patients/relatives regular
Average No regular interactions Poor None
Patient care Patient comfort
Fig. 1 Definition of ratings for the factor process.
Capital equipmentGood Fully equipped Average Partially equipped Poor Poorly equipped
StaffingGood Complete/ideal Average Partially deficient Poor Poor staffing pattern
Maintenance of equipmentGood Regular Average Irregular Poor Poor
Supply chain management
Drugs/suppliesGood Timely Average Short deficiencies Poor Long deficiencies
CommunicationGood Organized Average Not well organized Poor Poorly organized
Related departments (laboratory/radiology etc.)Good Fully equipped Average Partially equipped Poor Poorly equipped
Patient factorClinical presentation of patients Low No lead time - <50 %
patients present in a bad shape
Moderate 50-75 % patients present in a bad shape
High >75 % patients present in a bad shape
Iatrogenic complications andNosocomial infections
Low Minimal Moderate Average incidenceHigh High incidence
Antibiotic usage
Optimal Protocol followedExcessive/ Excessive/ Inadequate Indiscriminate use Poor No protocol followed
NutritionOptimal Correct use of enteral
and parenteral feeds Inadequate Indiscriminate use Poor No facilities available
for nutrition
Structure Morbidity/mortality
Fig. 2 Definition of ratings for the factors structure and
outcome.
S. Hariharan et al.120
factors structure as well as outcome. The factors structure and
outcome were considered to have equal importance, numer-
ically represented as b1.Q By this pairwise comparison, it
follows that the importance of structure and outcome with
respect to process will be 1/2. A normalized matrix was
derived from these comparisons (numbers given in paren-
theses in Table 1). This is calculated as the fraction of the
importance of each critical success factor with respect to the
sum of the overall comparison between the factors. Thus, the
sum of all the values of importance for the factor process is 2
(sum of column bProcessQ in Table 1) (1 + 1/2 + 1/2) and the
fraction of process alone will be 1 over 2 (0.5) and that of
structure will be 1/2 over 2 (0.25) and so on. The overall
importance of the factors was calculated as an average for
each factor (last column in Table 1). Thus, for process, it is 0.5
(0.5 + 0.5 + 0.5 divided by 3).
This procedure was done for all the subfactors to derive
their respective importance (local perspectives) by pairwise
comparison. The values for the individual subfactors
derived by pairwise comparison and normalization are
shown in Fig. 3 (numbers in parentheses after each
subfactor). Consistency check was done for all the
normalized matrices and was found to be less than 0.1,
which is within acceptable limits.
2.6. Step 3: Derivation of the attributes andweights for subfactors
For all the subfactors, 3 attributes were identified,
namely, good/adequate/low, average/moderate/inadequate,
and poor/nil/high. This was done by defining the catego-
ries of each subfactor by way of interviewing, brainstorm-
ing sessions, and discussions. For example, for the
subfactor staffing, we had 3 attributes, namely, good,
average, and poor. These were based on the characteristics
of the medical and nursing staffing of an ICU—good, if a
dedicated intensivist was available around the clock and
the nurse-patient ratio was 1:1; average, if an intensivist
was available part time and the nurse-patient ratio was 1:2
or 1:3; and poor, if no intensivist was available and/or
nurse-patient ratio was more than 1:3. For each subfactor,
the best attribute received a weight of 0.6, the moderate
0.3, and the poor 0.1.
Figs. 1 and 2 show the definitions we used to derive the
ratings of the subfactors.
Fig. 3 shows the entire hierarchical model in AHP
framework of the critical success factors, subfactors, their
relative importance, and the weights and ratings.
2.7. Step 4: Allocating the weights of ratings forthe 3 ICUs
The next step was to allocate the ratings of each
subfactor for the ICUs in Barbados, Trinidad, and India.
The clinicians and managers in each unit were interviewed
regarding the ratings of each subfactor. Ratings of each
subfactor were allocated to each ICU according to the

Process (0.5) Structure (0.25) Outcome (0.25)
Patient Care (0.5)
Patient comfort (0.5)
Sedation (0.4) Audiovisual comforts (0.2) Attitude of staff (0.4)
Capital equipment (0.3) Staffing (0.4) Maintenance of equipment (0.05) Supply-chain management (0.25)
Patient factor (0.3) Iatrogenic complications (0.2) Nosocomialinfections (0.2) Antibiotic usage (0.2) Nutrition(0.1)
Sub-factors
Critical success factors
Adequate (0.6) Partial (0.3) Nil (0.1)
Adequate (0.6) Inadequate (0.3) Poor (0.1)
Low (0.6) Moderate (0.3) High (0.1)
Measuring performance of an ICU Goal
Ratings and weights
Therapeutic interventions (0.25) Monitoring (0.3) Admission/ Discharge protocols (0.2) Daily rounds (0.125) Case conferences (0.125)
Good (0.6) Average (0.3) Poor (0.1)
Drugs/ supplies (0.33) Communication (0.33) Related departments (0.33)
Optimal (0.6) Excessive/ Suboptimal (0.3) Poor (0.1)
Fig. 3 Analytic hierarchy process framework with prioritizations.
Global performance of intensive care units 121
clinician’s view of where the particular unit stands
according to the attribute. For example, the subfactor
admission-discharge protocols for the critical factor process
had 3 attributes. The attribute good had a weight of 0.6;
average, 0.3; and poor, 0.1, respectively. Barbados ICU got
the weight 0.1 because we agreed that this ICU did not
have any such protocol. The weights for characteristics
that best described the performance of each ICU at each
subfactor level were thus assigned to the respective ICUs
in the 3 countries by explaining the criteria and character-
istics of each attribute to the clinicians and managers
attached to the respective ICUs.
Table 2 Weights and performance ratings for process factor and its
Subfactors Barbados ICU
Weighta Performanceb
Patient care
Therapeutic interventions Good 0.075
Monitoring Good 0.09
Admission-discharge protocols Poor 0.01
Daily rounds Poor 0.00625
Case conferences Good 0.0375
Patient comfort
Sedation Adequate 0.12
Audiovisual comforts Partial 0.03
Attitude of staff Average 0.06
Cumulative performance 0.42875a Weight of subfactor by its attribute.b The rating calculated by the steps of AHP.
2.8. Step 5: Calculating and comparing cumulativeperformance of the ICUs
By multiplying the importance (Table 1) of each critical
success factor with those of the subfactors (derived by
pairwise comparison) (Fig. 3), the overall importance
(global perspective) (GP) of individual subfactor was
derived. This GP was then multiplied by the weight each
subfactor received by its attribute, which gave the factor
level performance of each subfactor. The sum of the
performance rating of all subfactors gave the cumulative
performance of each critical success factor (Tables 2-4).
subfactors
Trinidad ICU Indian ICU
Weighta Performanceb Weighta Performanceb
Average 0.0375 Average 0.0375
Average 0.045 Average 0.045
Poor 0.01 Average 0.03
Average 0.01875 Good 0.0375
Good 0.0375 Good 0.0375
Partial 0.06 Partial 0.06
Partial 0.03 Nil 0.01
Average 0.06 Average 0.06
0.29875 0.3175
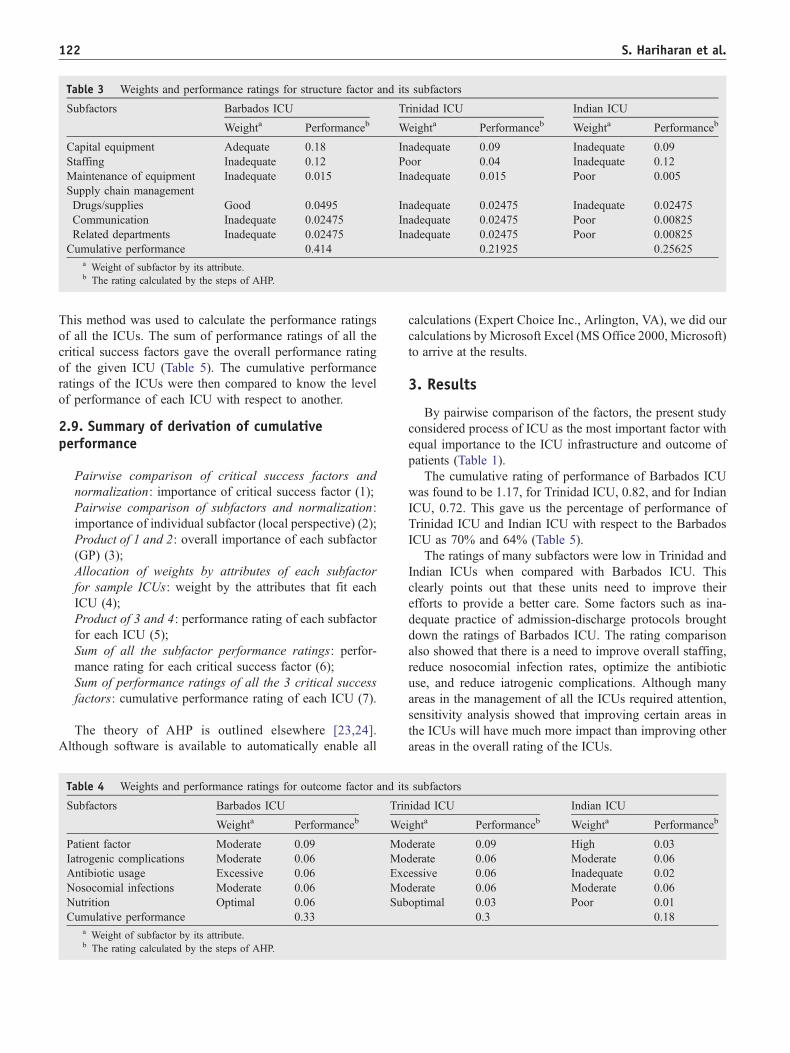
Table 3 Weights and performance ratings for structure factor and its subfactors
Subfactors Barbados ICU Trinidad ICU Indian ICU
Weighta Performanceb Weighta Performanceb Weighta Performanceb
Capital equipment Adequate 0.18 Inadequate 0.09 Inadequate 0.09
Staffing Inadequate 0.12 Poor 0.04 Inadequate 0.12
Maintenance of equipment Inadequate 0.015 Inadequate 0.015 Poor 0.005
Supply chain management
Drugs/supplies Good 0.0495 Inadequate 0.02475 Inadequate 0.02475
Communication Inadequate 0.02475 Inadequate 0.02475 Poor 0.00825
Related departments Inadequate 0.02475 Inadequate 0.02475 Poor 0.00825
Cumulative performance 0.414 0.21925 0.25625a Weight of subfactor by its attribute.b The rating calculated by the steps of AHP.
S. Hariharan et al.122
This method was used to calculate the performance ratings
of all the ICUs. The sum of performance ratings of all the
critical success factors gave the overall performance rating
of the given ICU (Table 5). The cumulative performance
ratings of the ICUs were then compared to know the level
of performance of each ICU with respect to another.
2.9. Summary of derivation of cumulativeperformance
Pairwise comparison of critical success factors and
normalization: importance of critical success factor (1);
Pairwise comparison of subfactors and normalization:
importance of individual subfactor (local perspective) (2);
Product of 1 and 2: overall importance of each subfactor
(GP) (3);
Allocation of weights by attributes of each subfactor
for sample ICUs: weight by the attributes that fit each
ICU (4);
Product of 3 and 4: performance rating of each subfactor
for each ICU (5);
Sum of all the subfactor performance ratings: perfor-
mance rating for each critical success factor (6);
Sum of performance ratings of all the 3 critical success
factors: cumulative performance rating of each ICU (7).
The theory of AHP is outlined elsewhere [23,24].
Although software is available to automatically enable all
Table 4 Weights and performance ratings for outcome factor and its
Subfactors Barbados ICU Trin
Weighta Performanceb We
Patient factor Moderate 0.09 Mo
Iatrogenic complications Moderate 0.06 Mo
Antibiotic usage Excessive 0.06 Exc
Nosocomial infections Moderate 0.06 Mo
Nutrition Optimal 0.06 Sub
Cumulative performance 0.33a Weight of subfactor by its attribute.b The rating calculated by the steps of AHP.
calculations (Expert Choice Inc., Arlington, VA), we did our
calculations byMicrosoft Excel (MS Office 2000, Microsoft)
to arrive at the results.
3. Results
By pairwise comparison of the factors, the present study
considered process of ICU as the most important factor with
equal importance to the ICU infrastructure and outcome of
patients (Table 1).
The cumulative rating of performance of Barbados ICU
was found to be 1.17, for Trinidad ICU, 0.82, and for Indian
ICU, 0.72. This gave us the percentage of performance of
Trinidad ICU and Indian ICU with respect to the Barbados
ICU as 70% and 64% (Table 5).
The ratings of many subfactors were low in Trinidad and
Indian ICUs when compared with Barbados ICU. This
clearly points out that these units need to improve their
efforts to provide a better care. Some factors such as ina-
dequate practice of admission-discharge protocols brought
down the ratings of Barbados ICU. The rating comparison
also showed that there is a need to improve overall staffing,
reduce nosocomial infection rates, optimize the antibiotic
use, and reduce iatrogenic complications. Although many
areas in the management of all the ICUs required attention,
sensitivity analysis showed that improving certain areas in
the ICUs will have much more impact than improving other
areas in the overall rating of the ICUs.
subfactors
idad ICU Indian ICU
ighta Performanceb Weighta Performanceb
derate 0.09 High 0.03
derate 0.06 Moderate 0.06
essive 0.06 Inadequate 0.02
derate 0.06 Moderate 0.06
optimal 0.03 Poor 0.01
0.3 0.18
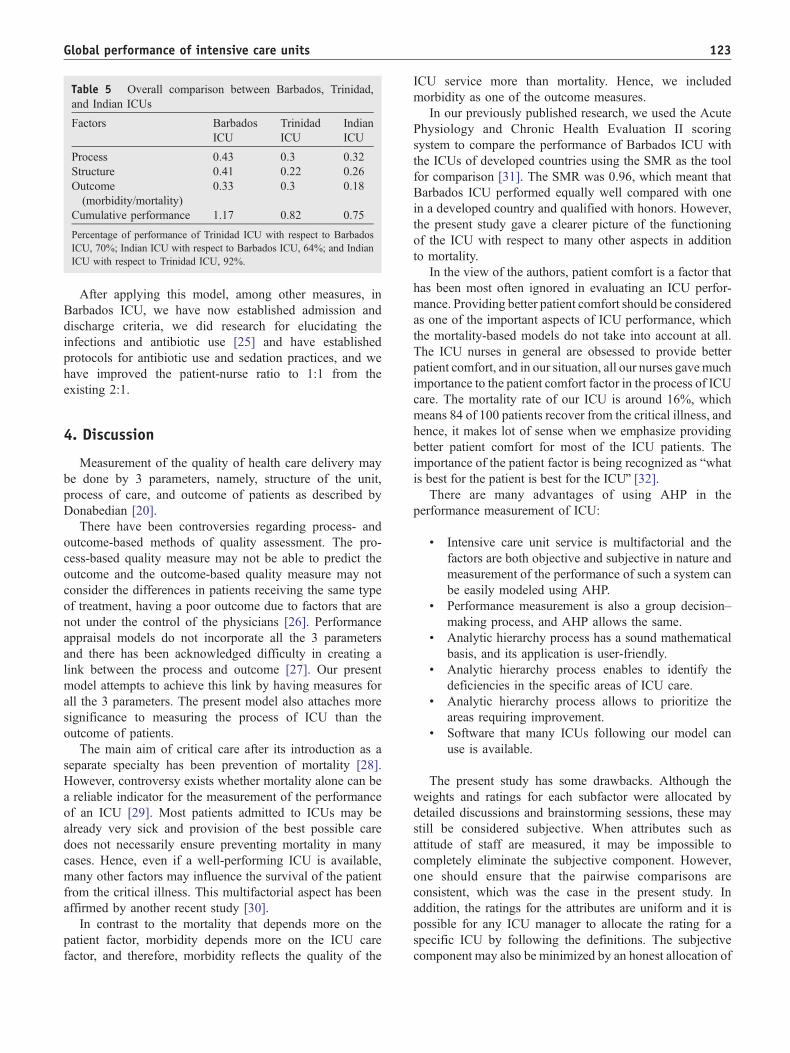
Table 5 Overall comparison between Barbados, Trinidad,
and Indian ICUs
Factors Barbados
ICU
Trinidad
ICU
Indian
ICU
Process 0.43 0.3 0.32
Structure 0.41 0.22 0.26
Outcome
(morbidity/mortality)
0.33 0.3 0.18
Cumulative performance 1.17 0.82 0.75
Percentage of performance of Trinidad ICU with respect to Barbados
ICU, 70%; Indian ICU with respect to Barbados ICU, 64%; and Indian
ICU with respect to Trinidad ICU, 92%.
Global performance of intensive care units 123
After applying this model, among other measures, in
Barbados ICU, we have now established admission and
discharge criteria, we did research for elucidating the
infections and antibiotic use [25] and have established
protocols for antibiotic use and sedation practices, and we
have improved the patient-nurse ratio to 1:1 from the
existing 2:1.
4. Discussion
Measurement of the quality of health care delivery may
be done by 3 parameters, namely, structure of the unit,
process of care, and outcome of patients as described by
Donabedian [20].
There have been controversies regarding process- and
outcome-based methods of quality assessment. The pro-
cess-based quality measure may not be able to predict the
outcome and the outcome-based quality measure may not
consider the differences in patients receiving the same type
of treatment, having a poor outcome due to factors that are
not under the control of the physicians [26]. Performance
appraisal models do not incorporate all the 3 parameters
and there has been acknowledged difficulty in creating a
link between the process and outcome [27]. Our present
model attempts to achieve this link by having measures for
all the 3 parameters. The present model also attaches more
significance to measuring the process of ICU than the
outcome of patients.
The main aim of critical care after its introduction as a
separate specialty has been prevention of mortality [28].
However, controversy exists whether mortality alone can be
a reliable indicator for the measurement of the performance
of an ICU [29]. Most patients admitted to ICUs may be
already very sick and provision of the best possible care
does not necessarily ensure preventing mortality in many
cases. Hence, even if a well-performing ICU is available,
many other factors may influence the survival of the patient
from the critical illness. This multifactorial aspect has been
affirmed by another recent study [30].
In contrast to the mortality that depends more on the
patient factor, morbidity depends more on the ICU care
factor, and therefore, morbidity reflects the quality of the
ICU service more than mortality. Hence, we included
morbidity as one of the outcome measures.
In our previously published research, we used the Acute
Physiology and Chronic Health Evaluation II scoring
system to compare the performance of Barbados ICU with
the ICUs of developed countries using the SMR as the tool
for comparison [31]. The SMR was 0.96, which meant that
Barbados ICU performed equally well compared with one
in a developed country and qualified with honors. However,
the present study gave a clearer picture of the functioning
of the ICU with respect to many other aspects in addition
to mortality.
In the view of the authors, patient comfort is a factor that
has been most often ignored in evaluating an ICU perfor-
mance. Providing better patient comfort should be considered
as one of the important aspects of ICU performance, which
the mortality-based models do not take into account at all.
The ICU nurses in general are obsessed to provide better
patient comfort, and in our situation, all our nurses gavemuch
importance to the patient comfort factor in the process of ICU
care. The mortality rate of our ICU is around 16%, which
means 84 of 100 patients recover from the critical illness, and
hence, it makes lot of sense when we emphasize providing
better patient comfort for most of the ICU patients. The
importance of the patient factor is being recognized as bwhatis best for the patient is best for the ICUQ [32].
There are many advantages of using AHP in the
performance measurement of ICU:
! Intensive care unit service is multifactorial and the
factors are both objective and subjective in nature and
measurement of the performance of such a system can
be easily modeled using AHP.
! Performance measurement is also a group decision–
making process, and AHP allows the same.
! Analytic hierarchy process has a sound mathematical
basis, and its application is user-friendly.
! Analytic hierarchy process enables to identify the
deficiencies in the specific areas of ICU care.
! Analytic hierarchy process allows to prioritize the
areas requiring improvement.
! Software that many ICUs following our model can
use is available.
The present study has some drawbacks. Although the
weights and ratings for each subfactor were allocated by
detailed discussions and brainstorming sessions, these may
still be considered subjective. When attributes such as
attitude of staff are measured, it may be impossible to
completely eliminate the subjective component. However,
one should ensure that the pairwise comparisons are
consistent, which was the case in the present study. In
addition, the ratings for the attributes are uniform and it is
possible for any ICU manager to allocate the rating for a
specific ICU by following the definitions. The subjective
component may also be minimized by an honest allocation of
S. Hariharan et al.124
the rating by attributes as well as by involving all the
clinicians and managers of an ICU and obtaining a cross-
sectional opinion. It may be argued that some factors such as
antimicrobial use and provision of nutrition are processes in
an ICU. We categorized them under morbidity/mortality
because of their close relationship to patient outcome.
Because we were able to apply the model to 3 different
ICUs, it should be possible for any manager to similarly
apply the model to the respective ICUs. Health care delivery
is highly complex and the patterns are different in every
region in accordance with the sociocultural, economic, and
political settings. When different factors take priority in
different settings and there are trade-offs between decision
criteria, AHP is one of the most useful tools for the
successful application in multiple-criteria decision-making
situations [33].
The present study establishes AHP as a valuable tool to
design amodel for the global performance measurement of an
ICU and compare it with another. Every ICU may apply this
model and have the ratings for the factors and arrive at
individual conclusions.
References
[1] Zimmerman JE. Measuring intensive care performance: a way to
move forward. Crit Care Med 2002;30:2149-50.
[2] Becker RB, Zimmerman JE. ICU scoring systems allow prediction of
patient outcomes or comparison of ICU performance. Crit Care Clin
1996;12:503-14.
[3] Glance LG, Osler TM, Dick A. Rating the quality of intensive care
units: is it a function of the intensive care scoring system? Crit Care
Med 2002;30:1976-82.
[4] Popovich MJ. If most intensive care units are graduating with
honors, is it genuine quality or grade inflation? Crit Care Med 2002;
30:2145-6.
[5] Marik PE, Varon J. Severity scoring and outcome assessment:
computerized predictive models and scoring systems. Crit Care Clin
1999;15:633-46.
[6] Rowan KM, Kerr JH, Major E, et al. Intensive Care Society’s Acute
Physiology and Chronic Health Evaluation (APACHE II) study in
Britain and Ireland: a prospective, multicenter, cohort study compar-
ing two methods for predicting outcome for adult intensive care
patients. Crit Care Med 1994;22:1392-401.
[7] Muckart DJJ, Bhagwanjee S, Neijenhuis PA. Prediction of the risk of
death by APACHE II scoring in critically ill trauma patients without
head injury. Br J Surg 1996;83:1123-7.
[8] Markgraf R, Deutschinoff G, Pientka L, Scholten T. Comparison of
acute physiology and chronic health evaluations II and III and
simplified acute physiology score II: a prospective cohort study
evaluating these methods to predict outcome in a German interdis-
ciplinary intensive care unit. Crit Care Med 2000;28:26 -33.
[9] Katsaragakis S, Papadimitropoulos K, Antonakis P, et al. Comparison
of Acute Physiology and Chronic Health Evaluation II (APACHE II)
and Simplified Acute Physiology Score II (SAPS II) scoring systems
in a single Greek intensive care unit. Crit Care Med 2000;28:426-32.
[10] Sikka P, Jaafar WM, Bozkanat E, El-Solh AA. A comparison of
severity of illness scoring systems for elderly patients with severe
pneumonia. Intensive Care Med 2000;26:1803-10.
[11] Berenholtz SM, Dorman T, Ngo K, Pronovost PJ. Qualitative review
of intensive care unit quality indicators. J Crit Care 2002;17:1 -12.
[12] Pronovost PJ, Berenholtz SM, Ngo K, et al. Developing and pilot
testing quality indicators in the intensive care unit. J Crit Care 2003;
18:145-55.
[13] Field K, Emrouznejad A. Measuring the performance of neonatal care
units in Scotland. J Med Syst 2003;27:315-24.
[14] Dlugacz YD, Stier L, Lustbader D, Jacobs MC, Hussain E,
Greenwood A. Expanding a performance improvement initiative in
critical care from hospital to system. Joint Comm J Qual Improv
2002;28:419-34.
[15] Weingarten MS. A pilot study of the use of analytic hierarchy process
for the selection of surgery residents. Acad Med 1997;72:400 -2.
[16] Hummel JM. Medical technology assessment: the use of analytic
hierarchy process as a tool for multidisciplinary evaluation of medical
devices. Int J Artif Organs 2000;23:782 -7.
[17] Carter KJ. Analysis of three decision-making methods: a breast cancer
patient as a model. Med Decis Making 1999;19:49-57.
[18] Dolan J, Frisina S. Randomized controlled trial of a patient decision
aid for colorectal cancer screening. Med Decis Making 2002;22:
125-39.
[19] Leidecker JK, Bruno AV. Identifying and using critical success
factors. Long Range Plan 1984;17:23 -32.
[20] Donabedian A. The quality of care—how can it be assessed? JAMA
1988;260:1743-8.
[21] Wind Y, Saaty TL. Marketing applications of the analytic hierarchy
process. Manag Sci 1980;26:641-58.
[22] Dyer RF, Forman EH. Group decision support with the analytic
hierarchy process. Decis Support Syst 1992;8:99-124.
[23] Dolan JG, Isselhardt Jr BJ, Cappuccio JD. Analytic hierarchy
process in medical decision making: a tutorial. Med Decis Making
1989;9:40-50.
[24] Saaty T. Axiomatic foundations of the analytic hierarchy process.
Manag Sci 1986;32:841 -55.
[25] Hariharan S, Nanduri SB, Moseley HSL, Kumar AY, Jonnalagadda R.
Spectrum of microbes and antimicrobial resistance in a surgical
intensive care unit, Barbados. Am J Infect Control 2003;31:280-7.
[26] Brook RH, McGlynn EA. Measuring quality of care. N Engl J Med
1996;335:966 -9.
[27] Lurie JD, Merrens EJ, Lee J, Splaine ME. An approach to hospital
quality improvement. Med Clin North Am 2002;86:825 -45.
[28] Nierman DM. A structure for chronically critically ill. Crit Care Clin
2002;18:477 -91.
[29] Sherck JP, Shatney CH. ICU scoring systems do not allow prediction
of patient outcomes or comparison of ICU performance. Crit Care
Clin 1996;12:515 -23.
[30] Rotondi AJ, Sirio CA, Angus DC, Pinsky MR. A new conceptual
framework for ICU performance appraisal and improvement. J Crit
Care 2002;17:16 -28.
[31] Hariharan S, Moseley HSL, Kumar AY. Outcome evaluation in a
surgical intensive care unit in Barbados. Anaesthesia 2002;57:
434-441.
[32] Green TP. What is best for the patients is the best for the intensive care
unit. Crit Care Med 2001;29:2038-9.
[33] Sloane EB, Liberatoire MJ. Medical decision support using the
analytic hierarchy process. J Healthc Inf Manag 2002;16:38 -43.
Commentary
Is what you have or how you use it or whatyou achieve the more important determinant ofquality?
In this issue of the Journal of Critical Care, Hariharan
et al [1] present an interesting decision support method for


