Embed Size (px)
Citation preview
Information Sciences 170 (2005) 191–210
www.elsevier.com/locate/ins
Fuzzy multi-attribute selectionamong transportation companies
using axiomatic design and analytichierarchy process
Osman Kulak, Cengiz Kahraman *
Department of Industrial Engineering, Istanbul Technical University, 34367 Macka, Istanbul, Turkey
Received 14 July 2003; received in revised form 18 February 2004; accepted 19 February 2004
Abstract
The basic concept in axiomatic design (AD) is the existence of design axioms. First of
these axioms is the independence axiom and the second one is the information axiom.
Information axiom proposes the selection of the best alternative that has minimum
information. Analytic hierarchy process (AHP) is another multi-attribute method which
is a decision-making method for selecting the best among a set of alternatives, given
some criteria. The method has been extensively applied, especially in large-scale prob-
lems where many criteria must be considered and where the evaluation of alternatives is
mostly subjective. Multi-attribute transportation company selection is a very important
activity for effective supply chain. Selection of the best company under determined
criteria (such as cost, time, damage/loss, flexibility and documentation ability) using
both multi-attribute AD and AHP will be realized in this study. The fuzzy multi-
attribute AD approach is also developed and it is compared by one of fuzzy AHP
methods in the literature. The selection process has been accomplished by aiding a
software that includes crisp AD and fuzzy AD.
� 2004 Elsevier Inc. All rights reserved.
Keywords: Transportation company selection; Axiomatic design; Fuzzy sets; Informa-
tion; AHP
* Corresponding author. Tel.: +90-212-293-13-00x2035; fax: +90-212-240-72-60.
E-mail address: [email protected] (C. Kahraman).
0020-0255/$ - see front matter � 2004 Elsevier Inc. All rights reserved.
doi:10.1016/j.ins.2004.02.021
192 O. Kulak, C. Kahraman / Information Sciences 170 (2005) 191–210
1. Introduction
Today’s high competitive environment forces organizations to find better
ways to create and deliver value to customers. It is a challenging process tosend products to customers in a cost-effective way. While building a trans-
portation budget, decision-makers are faced with the challenge of selecting the
most efficient transportation company. The selection of a few transportation
companies at the same time with limited resources is impossible. Thus, trans-
portation company selection becomes an efficient resources allocation proce-
dure. In this resource allocation problem, the evaluation process of alternatives
brings some difficulties. The major problem is the consideration of multiple
objectives which are generally conflicting with each other and measured indifferent scales. Another problem is about the values of benefit and cost
measures [1]. There can be fewer consensuses about the intangible measures
such as one hour of a passenger or the value of a later dispatch. Besides; it is
difficult to measure the values of qualitative aspects quantitatively. Thus the
evaluation process and methodology must handle, or support users on these
difficult steps.
The approaches to the solution of transportation company selection prob-
lems can be classified in five groups: (1) profile and checklist methods, (2)scoring methods, (3) cost-benefit analysis, (4) mathematical programming
models, (5) fuzzy approaches. Most of these methods are based on compen-
satory models that all the values of criteria are consolidated and then evalu-
ated. These methods enable tradeoffs between the criteria. Such as, a poor
value in a criterion can be offset by another criterion with a high value. On the
other hand, in non-compensatory models no tradeoffs are allowed. The pro-
jects are grouped as pass–fail categories, according to their values compared
with the threshold value of the decision-maker. In consequence, a transpor-tation company with a high overall value can be failed since one of it’s criteria
is below the threshold value.
Having to use crisp values is one of the problematic points in the crisp
evaluation process. As some criteria are difficult to measure by crisp values,
they are usually neglected during the evaluation. Another reason is about
mathematical models that are based on crisp values. These methods cannot
deal with decision makers’ ambiguities, uncertainties and vagueness which
cannot be handled by crisp values.In most of the real-world problems, some of the decision data can be pre-
cisely assessed while others cannot. Humans are unsuccessful in making
quantitative predictions, whereas they are comparatively efficient in qualitative
forecasting. Further, people are more prone to interference from biasing ten-
dencies if they are forced to provide numerical estimates since the elicitation of
numerical estimates forces an individual to operate in a mode which requires
more mental effort than that required for less precise verbal statements. Real

O. Kulak, C. Kahraman / Information Sciences 170 (2005) 191–210 193
numbers are used to represent data which can be precisely measured. For those
data which cannot be precisely assessed, Zadeh’s [29] fuzzy sets can be used to
denote them. The use of fuzzy set theory allows us to incorporate unquanti-
fiable information, incomplete information, non-obtainable information, andpartially ignorant facts into the decision model. When decision data are pre-
cisely known, they should not be faced into a fuzzy format in the decision
analysis. Applications of fuzzy sets within the field of decision making have, for
the most part, consisted of extensions or ‘‘fuzzifications’’ of the classical the-
ories of decision making. While decision-making under conditions of risk and
uncertainty have been modeled by probabilistic decision theories and by game
theories, fuzzy decision theories attempt to deal with the vagueness or fuzziness
inherent in subjective or imprecise determinations of preferences, constraints,and goals.
Verma et al. [28] proposed a method using a special type of non-linear
(hyperbolic and exponential) membership functions to solve the multi-objective
transportation problem. Teng and Tzeng [27] presented the fuzzy multi-
objective programming using the fuzzy spatial algorithm for the problem of
transportation investment project selection. Chanas and Kuchta [5] proposed
an algorithm as to solve the integer transportation problem with fuzzy supply
and demand values and integrality condition imposed on the solution. Shih [20]applied three fuzzy linear programming models as well as crisp linear pro-
gramming models to solve the cement transportation planning problem in
Taiwan. Li and Lia [15] proposed a new fuzzy compromise programming
approach to multi-objective transportation problems. Avineri et al. [1] pre-
sented a methodology for the selection and ranking of transportation projects
using fuzzy sets theory. Kikuchi [12] proposed a simple adjustment method
finding the most appropriate set of crisp numbers. The fuzzy linear program-
ming was used in this paper. Sakawa et al. [18] presented a fuzzy programmingfor the production and the transportation planning under the assumption
considering multiple production and sales bases. Sakawa et al. [19] dealt with a
transportation problem in a housing material manufacturer and derived a
solution to the problem with respect to the objectives of the housing material
manufacturer. Liu and Kao [16] developed a method to find the membership
function of the fuzzy total transportation cost. The idea was Zadeh’s extension
principle to transform the fuzzy transportation problem to a pair of mathe-
matical programs.One of the multi-attribute mathematical programming models is the analytic
hierarchy process. The purpose of the AHP is to provide vector of weights
expressing the relative importance of the transportation alternatives for each
criterion. AHP requires four steps: (1) structuring the hierarchy of criteria and
alternatives for evaluation; (2) assessing the decision-makers’ evaluations by
pairwise comparisons; (3) using the eigenvector method to yield priorities for
criteria and for alternatives by criteria; and (4) synthesizing the priorities of the

194 O. Kulak, C. Kahraman / Information Sciences 170 (2005) 191–210
alternatives by criteria into composite measures to arrive at set of ratings for
the alternatives. The scale of importance is defined according to Saaty 1–9 scale
for pairwise comparison. Readers are referred to Saaty [17] for detailed dis-
cussion of AHP modeling and solution methodology. 1, 3, 5, 7, 9 are definedrespectively as equal, moderate, strong, very strong and extreme importance.
There are many fuzzy AHP methods proposed by various authors. These
methods are systematic approaches to the alternative selection and justification
problem by using the concepts of fuzzy set theory and hierarchical structure
analysis. The earliest work in fuzzy AHP appeared in van Laarhoven and
Pedrycz [14], which compared fuzzy ratios described by triangular membership
functions. Buckley [4] determined fuzzy priorities of comparison ratios whose
membership functions trapezoidal. Stam et al. [21] explored how recentlydeveloped artificial intelligence techniques can be used to determine or
approximate the preference ratings in AHP. They conclude that the feed-for-
ward neural network formulation appears to be a powerful tool for analyzing
discrete alternative multi-criteria decision problems with imprecise or fuzzy
ratio-scale preference judgments. Chang [6] introduced a new approach for
handling fuzzy AHP, with the use of triangular fuzzy numbers for pairwise
comparison scale of fuzzy AHP, and the use of the extent analysis method for
the synthetic extent values of the pairwise comparisons. Ching-Hsue [9] pro-posed a new algorithm for evaluating naval tactical missile systems by the fuzzy
analytical hierarchy process based on grade value of membership function.
Cheng et al. [8] proposed a new method for evaluating weapon systems by
analytical hierarchy process based on linguistic variable weight. Zhu et al. [30]
make a discussion on extent analysis method and applications of fuzzy AHP.
The information axiom which is the second axiom of axiomatic design (AD)
provides the basis for decision-making when there are many choices [26]. A
new model based on this axiom is generated to support decision-makers intransportation company selection process. In order to avoid the pitfalls of
preceding methods, AD based method enables decision-makers to evaluate
both qualitative and quantitative criteria together.
Many AD applications in designing products, systems, organizations and
software have appeared in the literature in the last 10 years. Suh [22] has
introduced AD theory and principles first time. Kim et al. [13] applied AD
principles on software design. AD principles have also been used in design of
quality systems [23] and general system design [24]. Suh and Cochran [25]provided a manufacturing system design using AD principles. AD principles
have also been applied in designing flexible manufacturing systems [2]. Other
applications of Axiomatic Design include process and product development
[26]. These studies have convincingly shown the applicability and benefits of
AD in solving industrial problems.
In this paper as the first time, a fuzzy multi-attribute axiomatic design ap-
proach for selection of the best transportation company will be introduced and
O. Kulak, C. Kahraman / Information Sciences 170 (2005) 191–210 195
the implementation process will be shown by a real world example. The same
problem will be solved by crisp and fuzzy AHP approaches and the results
obtained by these three approaches will be compared.
2. Principles of axiomatic design
The most important concept in axiomatic design is the existence of the de-
sign axioms. The first design axiom is known as the Independence Axiom and
the second axiom is known as the Information axiom. They are stated as
follows [22].
Axiom 1. The Independence Axiom:Maintain the independence of functionalrequirements.
Axiom 2. The Information Axiom: Minimize the information content.
The Independence Axiom states that the independence of functional
requirements (FRs) must always be maintained, where FRs are defined as the
minimum set of independent requirements that characterizes the design goals
[22]. In the real world, engineers tend to tackle a complex problem by
decomposing it into sub-problems and attempting to maintain independentsolutions for these smaller problems. This calls for an effective method that
provides guidelines for the decomposition of complex problems and indepen-
dent mappings between problems and solutions.
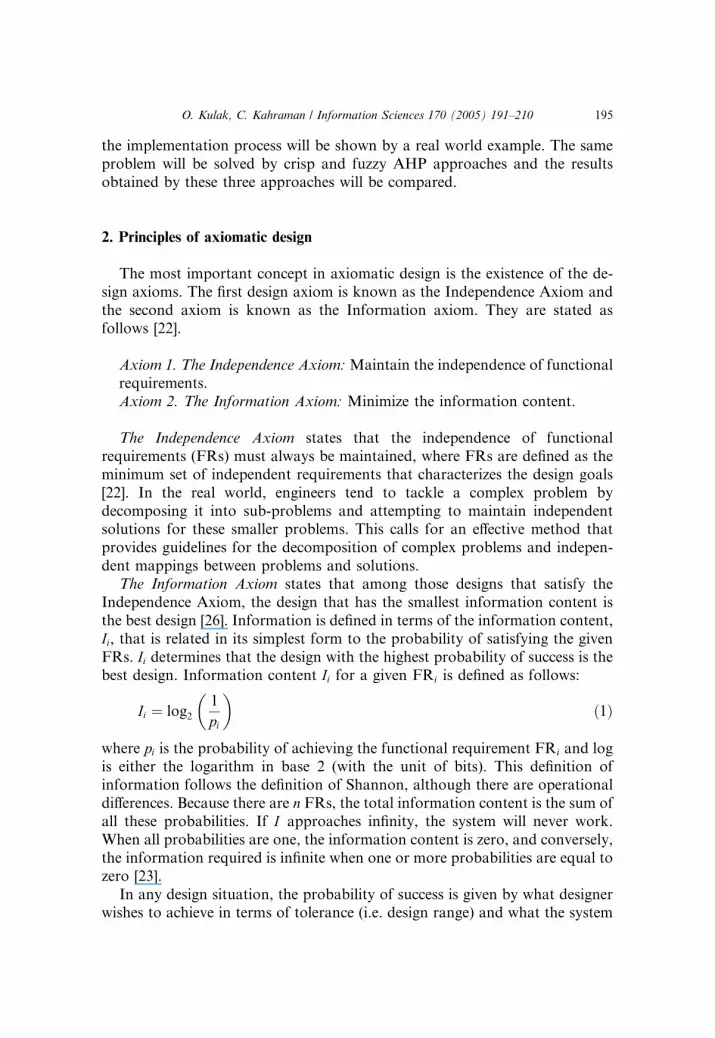
The Information Axiom states that among those designs that satisfy the
Independence Axiom, the design that has the smallest information content is
the best design [26]. Information is defined in terms of the information content,
Ii, that is related in its simplest form to the probability of satisfying the given
FRs. Ii determines that the design with the highest probability of success is thebest design. Information content Ii for a given FRi is defined as follows:
Ii ¼ log21
pi
� �ð1Þ
where pi is the probability of achieving the functional requirement FRi and logis either the logarithm in base 2 (with the unit of bits). This definition of
information follows the definition of Shannon, although there are operational
differences. Because there are n FRs, the total information content is the sum of
all these probabilities. If I approaches infinity, the system will never work.
When all probabilities are one, the information content is zero, and conversely,
the information required is infinite when one or more probabilities are equal to
zero [23].
In any design situation, the probability of success is given by what designerwishes to achieve in terms of tolerance (i.e. design range) and what the system
0 5 10 15 20 25 30 35 40 450
0.2
0.4
0.6
0.8
1
1.2
1.4
1.6
1.8
2
FR
Pro
babi
lity
dens
ity Design Range
Common Area
System pdf
Common Range
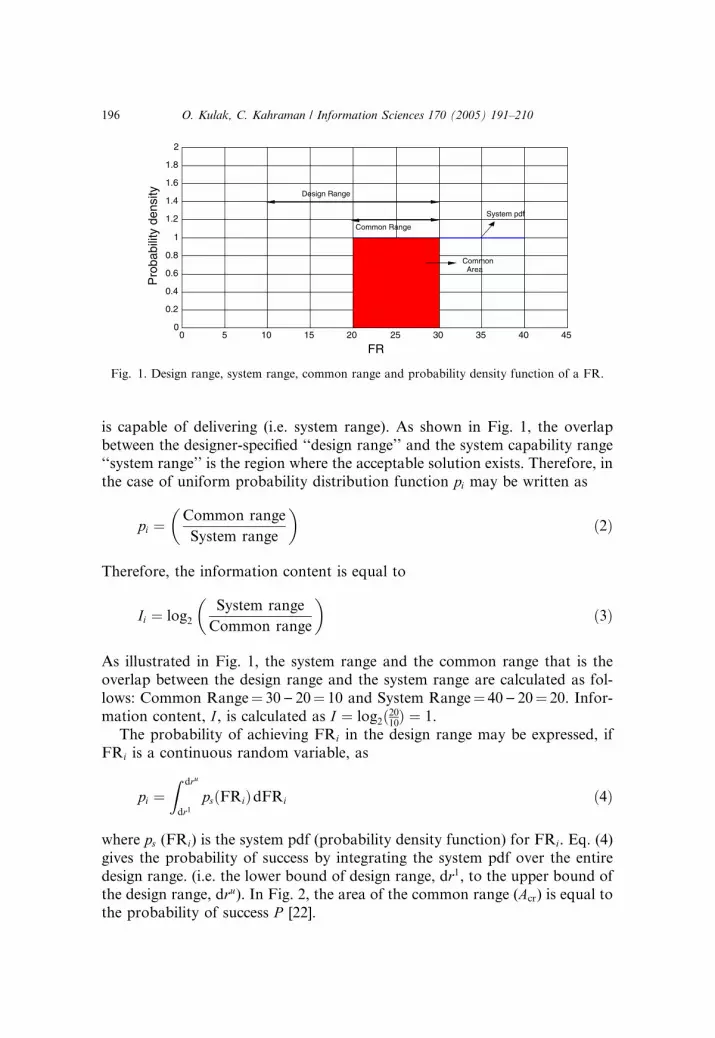
Fig. 1. Design range, system range, common range and probability density function of a FR.
196 O. Kulak, C. Kahraman / Information Sciences 170 (2005) 191–210
is capable of delivering (i.e. system range). As shown in Fig. 1, the overlap
between the designer-specified ‘‘design range’’ and the system capability range‘‘system range’’ is the region where the acceptable solution exists. Therefore, in
the case of uniform probability distribution function pi may be written as
pi ¼Common range
System range
� �ð2Þ
Therefore, the information content is equal to
Ii ¼ log2System range
Common range
� �ð3Þ
As illustrated in Fig. 1, the system range and the common range that is the
overlap between the design range and the system range are calculated as fol-
lows: Common Range¼ 30) 20¼ 10 and System Range¼ 40) 20¼ 20. Infor-
mation content, I , is calculated as I ¼ log2ð2010Þ ¼ 1.
The probability of achieving FRi in the design range may be expressed, if
FRi is a continuous random variable, as
pi ¼Z dru
dr1psðFRiÞdFRi ð4Þ
where ps (FRi) is the system pdf (probability density function) for FRi. Eq. (4)
gives the probability of success by integrating the system pdf over the entire
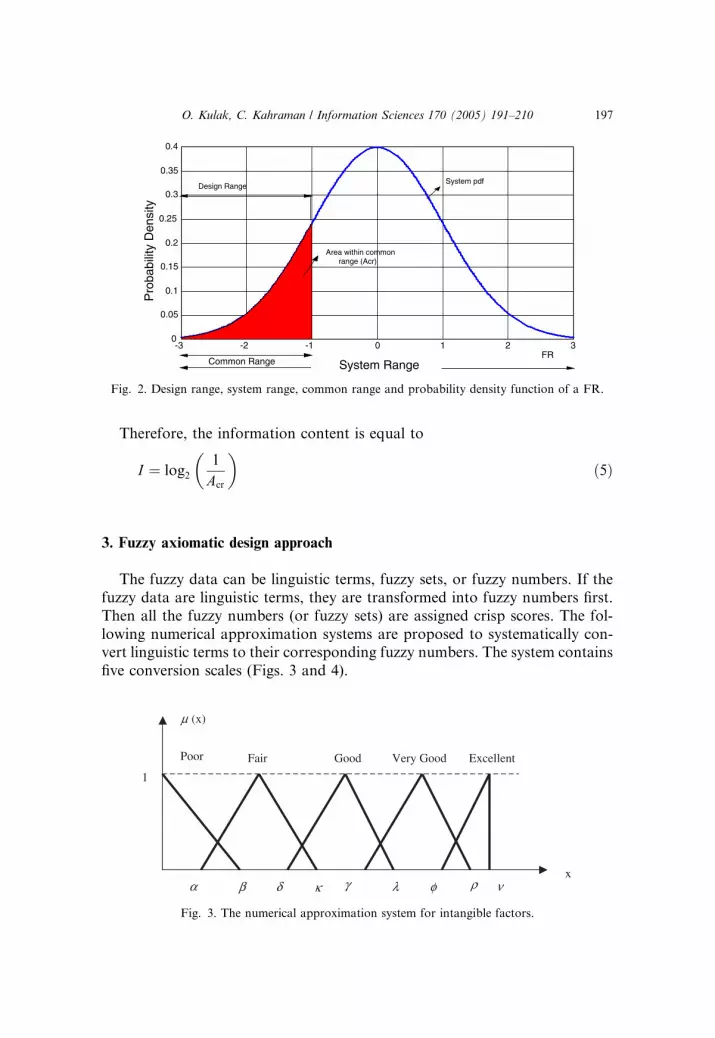
design range. (i.e. the lower bound of design range, dr1, to the upper bound ofthe design range, dru). In Fig. 2, the area of the common range (Acr) is equal to
the probability of success P [22].
-3 -2 -1 0 1 2 30
0.05
0.1
0.15
0.2
0.25
0.3
0.35
0.4
Design Range
Area within common range (Acr)
System pdf
Common Range System Range FR
Pro
babi
lity
Den
sity
Fig. 2. Design range, system range, common range and probability density function of a FR.
O. Kulak, C. Kahraman / Information Sciences 170 (2005) 191–210 197
Therefore, the information content is equal to
I ¼ log21
Acr
� �ð5Þ
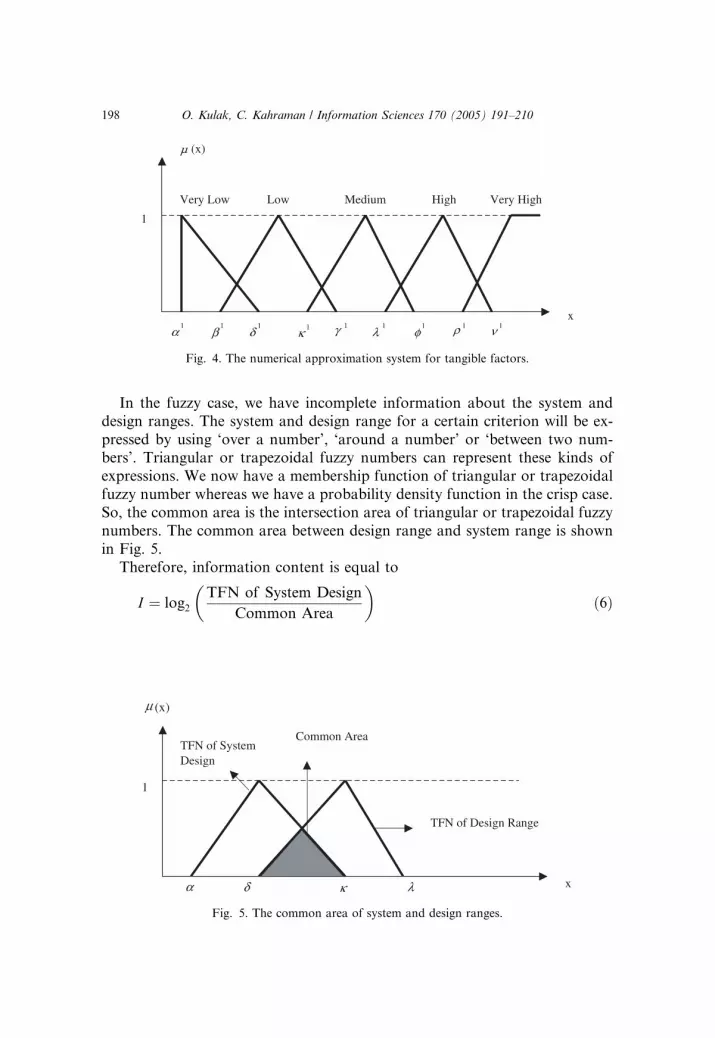
3. Fuzzy axiomatic design approach
The fuzzy data can be linguistic terms, fuzzy sets, or fuzzy numbers. If the
fuzzy data are linguistic terms, they are transformed into fuzzy numbers first.
Then all the fuzzy numbers (or fuzzy sets) are assigned crisp scores. The fol-
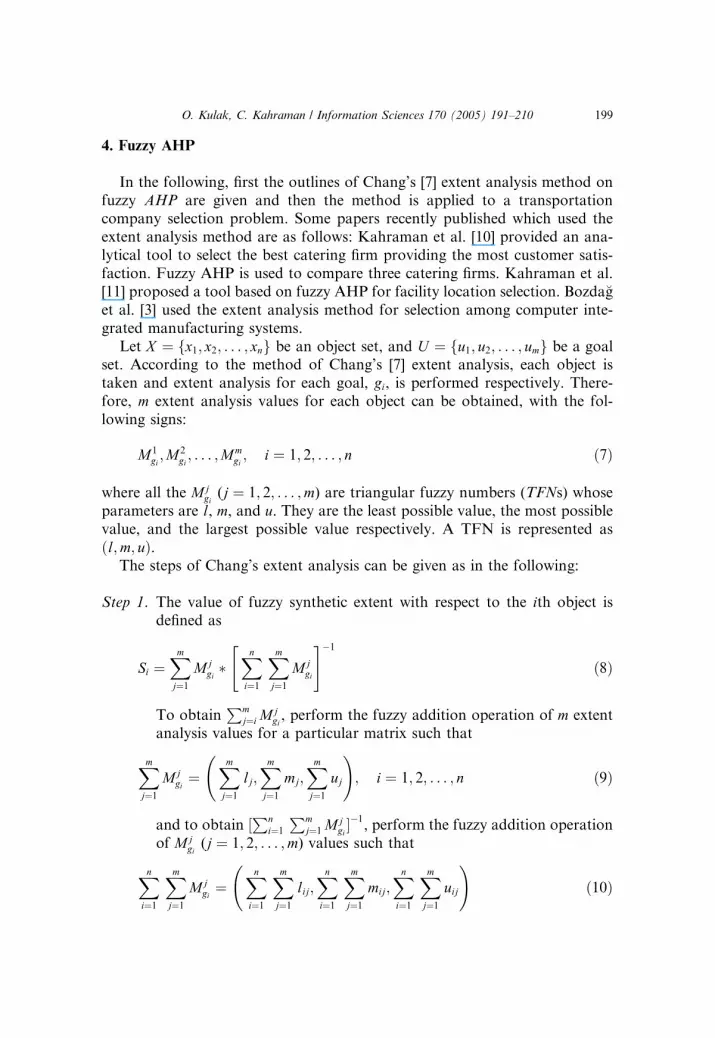
lowing numerical approximation systems are proposed to systematically con-vert linguistic terms to their corresponding fuzzy numbers. The system contains
five conversion scales (Figs. 3 and 4).
(x)µ
x
1
Poor Fair Good Very Good
Excellent
α β δ κ γ λ φ ρ ν
Fig. 3. The numerical approximation system for intangible factors.
µ (x)
x
1
Very Low
Low Medium
High Very High
1 1 1 1 1 1 1 1 1α β δ κ γ λ φ ρ ν
Fig. 4. The numerical approximation system for tangible factors.
198 O. Kulak, C. Kahraman / Information Sciences 170 (2005) 191–210
In the fuzzy case, we have incomplete information about the system and
design ranges. The system and design range for a certain criterion will be ex-
pressed by using ‘over a number’, ‘around a number’ or ‘between two num-bers’. Triangular or trapezoidal fuzzy numbers can represent these kinds of
expressions. We now have a membership function of triangular or trapezoidal
fuzzy number whereas we have a probability density function in the crisp case.
So, the common area is the intersection area of triangular or trapezoidal fuzzy
numbers. The common area between design range and system range is shown
in Fig. 5.
Therefore, information content is equal to
I ¼ log2TFN of System Design
Common Area
� �ð6Þ
µ (x)
x
1
α δ κ λ
Common Area
TFN of Design Range
TFN of System Design
Fig. 5. The common area of system and design ranges.
O. Kulak, C. Kahraman / Information Sciences 170 (2005) 191–210 199
4. Fuzzy AHP
In the following, first the outlines of Chang’s [7] extent analysis method on
fuzzy AHP are given and then the method is applied to a transportationcompany selection problem. Some papers recently published which used the
extent analysis method are as follows: Kahraman et al. [10] provided an ana-
lytical tool to select the best catering firm providing the most customer satis-
faction. Fuzzy AHP is used to compare three catering firms. Kahraman et al.
[11] proposed a tool based on fuzzy AHP for facility location selection. Bozda�get al. [3] used the extent analysis method for selection among computer inte-
grated manufacturing systems.
Let X ¼ fx1; x2; . . . ; xng be an object set, and U ¼ fu1; u2; . . . ; umg be a goalset. According to the method of Chang’s [7] extent analysis, each object is
taken and extent analysis for each goal, gi, is performed respectively. There-
fore, m extent analysis values for each object can be obtained, with the fol-
lowing signs:
M1gi;M2
gi; . . . ;Mm
gi; i ¼ 1; 2; . . . ; n ð7Þ
where all the Mjgi(j ¼ 1; 2; . . . ;m) are triangular fuzzy numbers (TFNs) whose
parameters are l, m, and u. They are the least possible value, the most possible
value, and the largest possible value respectively. A TFN is represented as
ðl;m; uÞ.The steps of Chang’s extent analysis can be given as in the following:
Step 1. The value of fuzzy synthetic extent with respect to the ith object is
defined as
Si ¼Xmj¼1
Mjgi�Xni¼1
Xmj¼1
Mjgi
" #�1
ð8Þ
To obtainPm
j¼i Mjgi, perform the fuzzy addition operation of m extent
analysis values for a particular matrix such that
Xmj¼1
Mjgi¼
Xmj¼1
lj;Xmj¼1
mj;Xmj¼1
uj
!; i ¼ 1; 2; . . . ; n ð9Þ
and to obtain ½Pn
i¼1
Pmj¼1 M
jgi�1
, perform the fuzzy addition operation
of Mjgi(j ¼ 1; 2; . . . ;m) values such that
Xni¼1
Xmj¼1
Mjgi¼
Xni¼1
Xmj¼1
lij;Xni¼1
Xmj¼1
mij;Xni¼1
Xmj¼1
uij
!ð10Þ

200 O. Kulak, C. Kahraman / Information Sciences 170 (2005) 191–210
and then compute the inverse of the vector in Eq. (11) such that
Xni¼1
Xmj¼1
Mjgi
" #�1
¼ 1Pni¼1 ui
;1Pni¼1 mi
;1Pni¼1 li
� �ð11Þ
Step 2. The degree of possibility of M2 ¼ ðl2;m2; u2ÞPM1 ¼ ðl1;m1; u1Þ is de-fined as
V ðM2 PM1Þ ¼ supyx
½minðlM1ðxÞ; lM2
ðyÞ ð12Þ
and can be equivalently expressed as follows:
V ðM2 PM1Þ ¼ hgtðM1 \M2Þ ¼ lM2ðdÞ
¼1; if m2 Pm1
0; if l1 P u2l1�u2
ðm2�u2Þ�ðm1�l1Þ; otherwise
8<: ð13Þ
where d is the ordinate of the highest intersection point D between lM1
and lM2(see Fig. 6).
To compare M1 and M2, we need both the values of V ðM1 PM2Þ andV ðM2 PM1Þ.
Step 3. The degree possibility for a convex fuzzy number M to be greater thank convex fuzzy numbers Mi (i ¼ 1; 2; . . . ; k) can be defined by
V ðM PM1;M2; . . . ;MkÞ ¼ V ½ðM PM1Þ and M PM2Þ and; . . . ; andðM PMkÞ ¼ MinV
iðM PMiÞ; i ¼ 1; 2; 3; . . . ; k: ð14Þ
Assume that
d 0ðAiÞ ¼ MinVi
ðSi P SkÞ ð15Þ
M 2 M 1
l 2m 1 u1u2dl1m 2
1
V(M 2 M1)
Fig. 6. The intersection between M1 and M2.
O. Kulak, C. Kahraman / Information Sciences 170 (2005) 191–210 201
For k ¼ 1; 2; . . . ; n; k 6¼ i. Then the weight vector is given by
W 0 ¼ ðd 0ðA1Þ; d 0ðA02Þ; . . . ; d 0ðAnÞÞT ð16Þ
where Ai (i ¼ 1; 2; . . . ; n) are n elements.Step 4. Via normalization, the normalized weight vectors are
W ¼ ðdðA1Þ; dðA2Þ; . . . ; dðAnÞTÞ ð17Þwhere W is a non-fuzzy number.
5. Numerical applications
In the following, numerical applications of fuzzy AD and weighted fuzzy
AD approaches and crisp and fuzzy AHP approaches to select the besttransportation company are given.
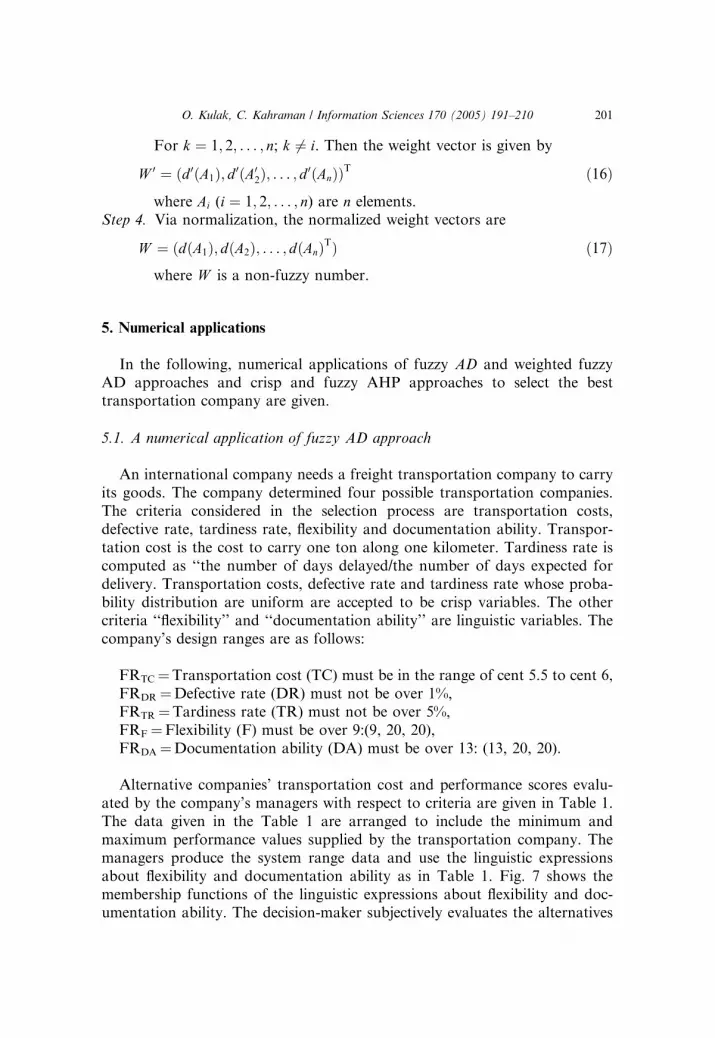
5.1. A numerical application of fuzzy AD approach
An international company needs a freight transportation company to carry
its goods. The company determined four possible transportation companies.
The criteria considered in the selection process are transportation costs,
defective rate, tardiness rate, flexibility and documentation ability. Transpor-
tation cost is the cost to carry one ton along one kilometer. Tardiness rate is
computed as ‘‘the number of days delayed/the number of days expected for
delivery. Transportation costs, defective rate and tardiness rate whose proba-
bility distribution are uniform are accepted to be crisp variables. The othercriteria ‘‘flexibility’’ and ‘‘documentation ability’’ are linguistic variables. The
company’s design ranges are as follows:
FRTC ¼Transportation cost (TC) must be in the range of cent 5.5 to cent 6,
FRDR ¼Defective rate (DR) must not be over 1%,
FRTR ¼Tardiness rate (TR) must not be over 5%,
FRF ¼Flexibility (F) must be over 9:(9, 20, 20),
FRDA ¼Documentation ability (DA) must be over 13: (13, 20, 20).
Alternative companies’ transportation cost and performance scores evalu-
ated by the company’s managers with respect to criteria are given in Table 1.
The data given in the Table 1 are arranged to include the minimum and
maximum performance values supplied by the transportation company. The
managers produce the system range data and use the linguistic expressions
about flexibility and documentation ability as in Table 1. Fig. 7 shows the
membership functions of the linguistic expressions about flexibility and doc-umentation ability. The decision-maker subjectively evaluates the alternatives

Table 1
The system range data for transportation companies
Alternative com-
panies
Criteria
Transporta-
tion cost
(cent)
Defective
rate (%)
Tardiness
rate (%)
Flexibility Documenta-
tion ability
Trans.-Comp. 1 5.5–6.5 0–1 3–8 Very good Good
Trans.-Comp. 2 5.5–6.0 2–4 0–5 Fair Excellent
Trans.-Comp. 3 5.8–6.5 0–2 1–4 Excellent Very good
Trans.-Comp. 4 5.5–5.8 0–3 2–10 Good Very good
0 2 4 6 8 10 12 14 16 18 200
0.5
1
1.5
x
f(x)
Poor Fair Good Very Good Excellent
Fig. 7. TFNs for intangible factors.
202 O. Kulak, C. Kahraman / Information Sciences 170 (2005) 191–210
with the linguistic term ‘‘poor’’ if these two criteria are assigned a score of (0, 0,
6) over 20; ‘‘fair’’ with a score of (4, 7, 10) over 20; ‘‘good’’ with a score of (8,
11, 14) over 20; ‘‘very good’’ with a score of (12, 15, 18) over 20; ‘‘excellent’’
with a score of (16, 20, 20) over 20.
Using these design and system ranges, the information content for each FR
in each Transportation company may be computed using Eqs. (3) and (6).
The information contents for the criteria with respect to the alternatives are
given in Table 2. As the transportation company with minimum informationcontent is the best one, Transportation company-3 is selected.
5.2. Weighted fuzzy AD approach
Crisp AHP was used to obtain the weight of each criterion. The scale of
importance in Saaty’s [17] crisp AHP is defined as follows: 1 for equal
importance; 3 for moderate importance; 5 for strong importance; 7 for verystrong or demonstrated importance; 9 for extreme importance; and 2, 4, 6, 8
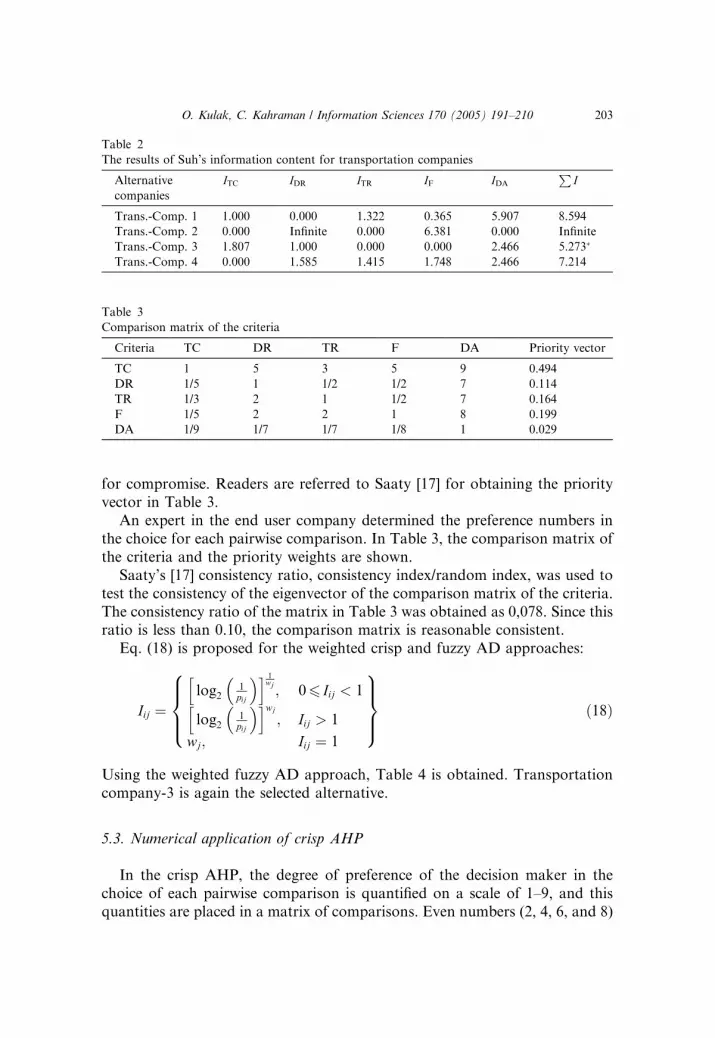
Table 2
The results of Suh’s information content for transportation companies
Alternative
companies
ITC IDR ITR IF IDA
PI
Trans.-Comp. 1 1.000 0.000 1.322 0.365 5.907 8.594
Trans.-Comp. 2 0.000 Infinite 0.000 6.381 0.000 Infinite
Trans.-Comp. 3 1.807 1.000 0.000 0.000 2.466 5.273�
Trans.-Comp. 4 0.000 1.585 1.415 1.748 2.466 7.214
Table 3
Comparison matrix of the criteria
Criteria TC DR TR F DA Priority vector
TC 1 5 3 5 9 0.494
DR 1/5 1 1/2 1/2 7 0.114
TR 1/3 2 1 1/2 7 0.164
F 1/5 2 2 1 8 0.199
DA 1/9 1/7 1/7 1/8 1 0.029
O. Kulak, C. Kahraman / Information Sciences 170 (2005) 191–210 203
for compromise. Readers are referred to Saaty [17] for obtaining the priority
vector in Table 3.
An expert in the end user company determined the preference numbers in
the choice for each pairwise comparison. In Table 3, the comparison matrix of
the criteria and the priority weights are shown.
Saaty’s [17] consistency ratio, consistency index/random index, was used to
test the consistency of the eigenvector of the comparison matrix of the criteria.
The consistency ratio of the matrix in Table 3 was obtained as 0,078. Since thisratio is less than 0.10, the comparison matrix is reasonable consistent.
Eq. (18) is proposed for the weighted crisp and fuzzy AD approaches:
Iij ¼log2
1pij
�h i 1wj; 06 Iij < 1
log21pij
�h iwj
; Iij > 1
wj; Iij ¼ 1
8>><>>:
9>>=>>; ð18Þ
Using the weighted fuzzy AD approach, Table 4 is obtained. Transportation
company-3 is again the selected alternative.
5.3. Numerical application of crisp AHP
In the crisp AHP, the degree of preference of the decision maker in the
choice of each pairwise comparison is quantified on a scale of 1–9, and this
quantities are placed in a matrix of comparisons. Even numbers (2, 4, 6, and 8)

Table 4
The results of weighted information content for transportation companies
Alternative
companies
ITC IDR ITR IF IDA
PI
Trans.-Comp. 1 0.494 0.000 1.047 0.006 1.053 2.600
Trans.-Comp. 2 0.000 Infinite 0.000 1.446 0.000 Infinite
Trans.-Comp. 3 1.339 0.114 0.000 0.000 1.027 2.480�
Trans.-Comp. 4 0.000 1.054 1.059 1.118 1.027 4.257
Selection of the best transportation company
Cost Defectiverate
Tardinessrate Flexibility Documentation
ability
Transportationcompany-1
Transportationcompany-2
Transportationcompany-3
Transportationcompany-4
Fig. 8. The hierarchy of the problem.
204 O. Kulak, C. Kahraman / Information Sciences 170 (2005) 191–210
can be used to represent to compromises among the preferences below. Fig. 8
shows the hierarchy of the problem.
The weight vector from Table 5 is calculated as WTC ¼ ð0:099; 0:284;0:099; 0:518Þ. The other matrices of pairwise comparisons and the weight
vector of each matrix are given in the following.
The weight vector from Table 6 is calculated as WDR ¼ ð0:540; 0:047;0:275; 0:138Þ.
The weight vector from Table 7 is calculated as WTR ¼ ð0:093; 0:319;0:534; 0:055Þ.
Table 5
Evaluation of the transportation companies with respect to transportation costs
Alternatives Trans.-Comp. 1 Trans.-Comp. 2 Trans.-Comp. 3 Trans.-Comp. 4
Trans.-Comp. 1 1 1/3 1 1/5
Trans.-Comp. 2 3 1 3 1/2
Trans.-Comp. 3 1 1/3 1 1/5
Trans.-Comp. 4 5 2 5 1

O. Kulak, C. Kahraman / Information Sciences 170 (2005) 191–210 205
The weight vector from Table 8 is calculated as WF ¼ ð0:251; 0:056;0:584; 0:109Þ.
The weight vector from Table 9 is calculated as WDA ¼ ð0:079; 0:519;0:201; 0:201Þ.
Table 10 shows the combination of the weight vectors obtained by pairwise
comparisons. Alternative 4 is the selected transportation company. The result
is different from the ones of crisp and fuzzy AD approaches. One reason may
Table 8
Evaluation of the transportation companies with respect to flexibility
Alternatives Trans.-Comp. 1 Trans.-Comp. 2 Trans.-Comp. 3 Trans.-Comp. 4
Trans.-Comp. 1 1 5 1/3 3
Trans.-Comp. 2 1/5 1 1/7 1/3
Trans.-Comp. 3 3 7 1 7
Trans.-Comp. 4 1/3 3 1/7 1
Table 9
Evaluation of the transportation companies with respect to documentation ability
Alternatives Trans.-Comp. 1 Trans.-Comp. 2 Trans.-Comp. 3 Trans.-Comp. 4
Trans.-Comp. 1 1 1/5 1/3 1/3
Trans.-Comp. 2 5 1 3.00 3
Trans.-Comp. 3 3 1/3 1 1
Trans.-Comp. 4 3 1/3 1 1
Table 6
Evaluation of the transportation companies with respect to defective rate
Alternatives Trans.-Comp. 1 Trans.-Comp. 2 Trans.-Comp. 3 Trans.-Comp. 4
Trans.-Comp. 1 1 7 3 5
Trans.-Comp. 2 1/7 1 1/5 1/3
Trans.-Comp. 3 1/3 5 1 3
Trans.-Comp. 4 1/5 3 1/3 1
Table 7
Evaluation of the transportation companies with respect to tardiness rate
Alternatives Trans.-Comp. 1 Trans.-Comp. 2 Trans.-Comp. 3 Trans.-Comp. 4
Trans.-Comp. 1 1 1/5 1/5 2
Trans.-Comp. 2 5 1 1/3 7
Trans.-Comp. 3 5 3 1 7
Trans.-Comp. 4 1/2 1/7 1/7 1
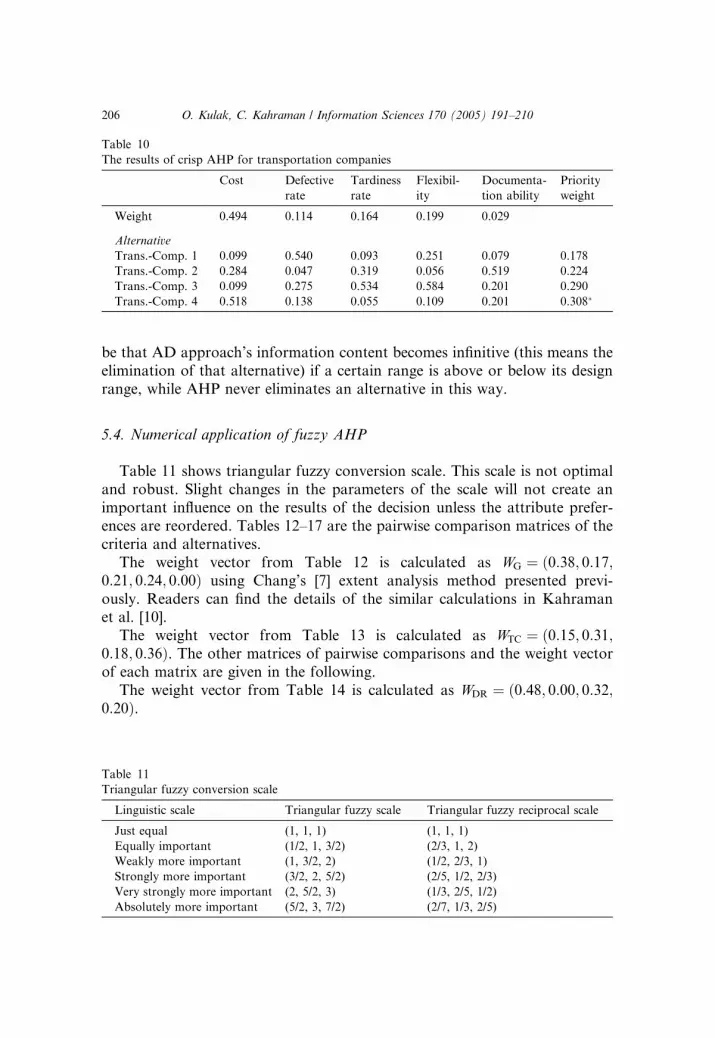
Table 10
The results of crisp AHP for transportation companies
Cost Defective
rate
Tardiness
rate
Flexibil-
ity
Documenta-
tion ability
Priority
weight
Weight 0.494 0.114 0.164 0.199 0.029
Alternative
Trans.-Comp. 1 0.099 0.540 0.093 0.251 0.079 0.178
Trans.-Comp. 2 0.284 0.047 0.319 0.056 0.519 0.224
Trans.-Comp. 3 0.099 0.275 0.534 0.584 0.201 0.290
Trans.-Comp. 4 0.518 0.138 0.055 0.109 0.201 0.308�
206 O. Kulak, C. Kahraman / Information Sciences 170 (2005) 191–210
be that AD approach’s information content becomes infinitive (this means the
elimination of that alternative) if a certain range is above or below its design
range, while AHP never eliminates an alternative in this way.
5.4. Numerical application of fuzzy AHP
Table 11 shows triangular fuzzy conversion scale. This scale is not optimal
and robust. Slight changes in the parameters of the scale will not create an
important influence on the results of the decision unless the attribute prefer-
ences are reordered. Tables 12–17 are the pairwise comparison matrices of the
criteria and alternatives.
The weight vector from Table 12 is calculated as WG ¼ ð0:38; 0:17;0:21; 0:24; 0:00Þ using Chang’s [7] extent analysis method presented previ-
ously. Readers can find the details of the similar calculations in Kahramanet al. [10].
The weight vector from Table 13 is calculated as WTC ¼ ð0:15; 0:31;0:18; 0:36Þ. The other matrices of pairwise comparisons and the weight vector
of each matrix are given in the following.
The weight vector from Table 14 is calculated as WDR ¼ ð0:48; 0:00; 0:32;0:20Þ.
Table 11
Triangular fuzzy conversion scale
Linguistic scale Triangular fuzzy scale Triangular fuzzy reciprocal scale
Just equal (1, 1, 1) (1, 1, 1)
Equally important (1/2, 1, 3/2) (2/3, 1, 2)
Weakly more important (1, 3/2, 2) (1/2, 2/3, 1)
Strongly more important (3/2, 2, 5/2) (2/5, 1/2, 2/3)
Very strongly more important (2, 5/2, 3) (1/3, 2/5, 1/2)
Absolutely more important (5/2, 3, 7/2) (2/7, 1/3, 2/5)

Table 14
Evaluation of the transportation companies with respect to defective rate
Alternatives Trans.-Comp. 1 Trans.-Comp. 2 Trans.-Comp. 3 Trans.-Comp. 4
Trans.-Comp. 1 (1, 1, 1) (2, 5/2, 3) (1, 3/2, 2) (3/2, 2, 5/2)
Trans.-Comp. 2 (1/3, 2/5, 1/2) (1, 1, 1) (2/5, 1/2, 2/3) (2/5, 1/2, 2/3)
Trans.-Comp. 3 (1/2, 2/3, 1) (3/2, 2, 5/2) (1, 1, 1) (1, 3/2, 2)
Trans.-Comp. 4 (2/5, 1/2, 2/3) (3/2, 2, 5/2) (1/2, 2/3, 1) (1, 1, 1)
Table 15
Evaluation of the transportation companies with respect to tardiness rate
Alternatives Trans.-Comp. 1 Trans.-Comp. 2 Trans.-Comp. 3 Trans.-Comp. 4
Trans.-Comp. 1 (1, 1, 1) (2/5, 1/2, 2/3) (2/5, 1/2, 2/3) (1, 3/2, 2)
Trans.-Comp. 2 (3/2, 2, 5/2) (1, 1, 1) (2/3, 1, 2) (2, 5/2, 3)
Trans.-Comp. 3 (3/2, 2, 5/2) (1/2, 1, 3/2) (1, 1, 1) (2, 5/2, 3)
Trans.-Comp. 4 (1/2, 2/3, 1) (1/3, 2/5, 1/2) (1/3, 2/5, 1/2) (1, 1, 1)
Table 16
Evaluation of the transportation companies with respect to flexibility
Alternatives Trans.-Comp. 1 Trans.-Comp. 2 Trans.-Comp. 3 Trans.-Comp. 4
Trans.-Comp. 1 (1, 1, 1) (3/2, 2, 5/2) (1/2, 2/3, 1) (1, 3/2, 2)
Trans.-Comp. 2 (2/5, 1/2, 2/3) (1, 1, 1) (1/3, 2/5, 1/2) (1/2, 2/3, 1)
Trans.-Comp. 3 (1, 3/2, 2) (2, 5/2, 3) (1, 1, 1) (3/2, 2, 5/2)
Trans.-Comp. 4 (1/2, 2/3, 1) (1, 3/2, 2) (2/5, 1/2, 2/3) (1, 1, 1)
Table 12
The fuzzy evaluation matrix with respect to the goal
Criteria Transporta-
tion cost
Defective
rate
Tardiness
rate
Flexibility Documenta-
tion ability
Cost (1, 1, 1) (3/2, 2, 5/2) (1, 3/2, 2) (3/2, 2, 5/2) (5/2, 3, 7/2)
Defective
rate
(2/5, 1/2, 2/3) (1, 1, 1) (4/7, 4/5, 4/3) (4/7, 4/5, 4/3) (2, 5/2, 3)
Tardiness
rate
(1/2, 2/3, 1) (3/4, 5/4, 7/4) (1, 1, 1) (4/7, 4/5, 4/3) (2, 5/2, 3)
Flexibility (2/5, 1/2, 2/3) (3/4, 5/4, 7/4) (3/4, 5/4, 7/4) (1, 1, 1) (9/4, 11/4, 13/
4)
Documen-
tation A.
(2/7, 1/3, 2/5) (1/3, 2/5, 1/2) (1/3, 2/5, 1/2) (4/13, 4/11, 4/9) (1, 1, 1)
Table 13
Evaluation of the transportation companies with respect to transportation costs
Alternatives Trans.-Comp. 1 Trans.-Comp. 2 Trans.-Comp. 3 Trans.-Comp. 4
Trans.-Comp. 1 (1, 1, 1) (1/2, 2/3, 1) (1/2, 1, 3/2) (2/5, 1/2, 2/3)
Trans.-Comp. 2 (1, 3/2, 2) (1, 1, 1) (1, 3/2, 2) (2/3, 1, 2)
Trans.-Comp. 3 (2/3, 1, 2) (1/2, 2/3, 1) (1, 1, 1) (2/5, 1/2, 2/3)
Trans.-Comp. 4 (3/2, 2, 5/2) (1/2, 1, 3/2) (3/2, 2, 5/2) (1, 1, 1)
O. Kulak, C. Kahraman / Information Sciences 170 (2005) 191–210 207
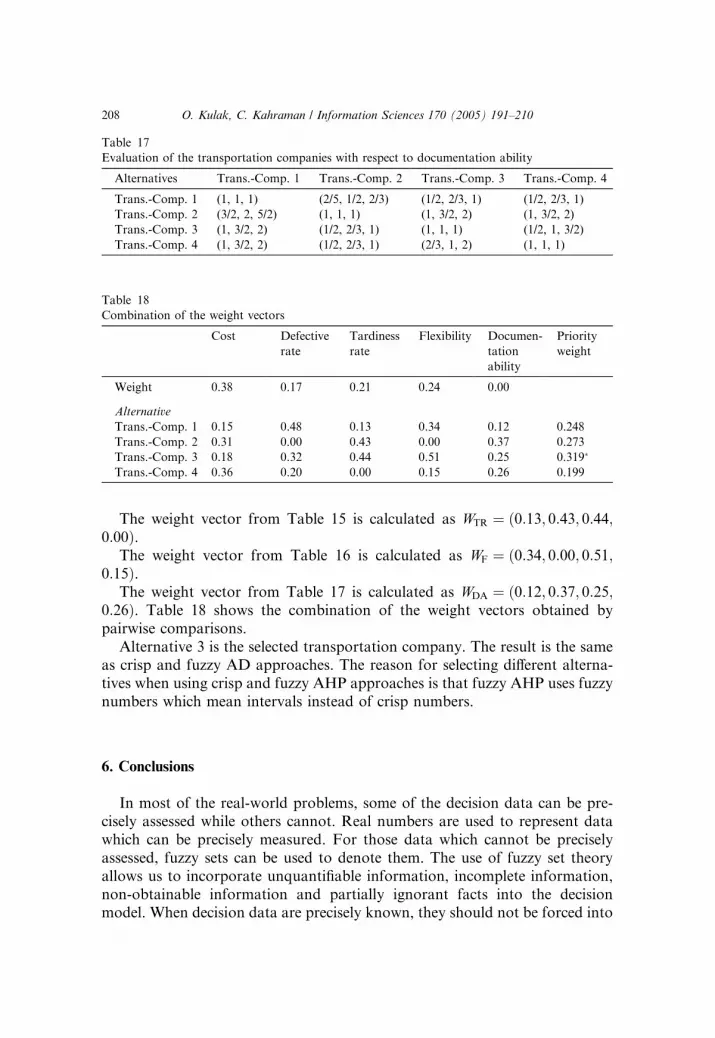
Table 18
Combination of the weight vectors
Cost Defective
rate
Tardiness
rate
Flexibility Documen-
tation
ability
Priority
weight
Weight 0.38 0.17 0.21 0.24 0.00
Alternative
Trans.-Comp. 1 0.15 0.48 0.13 0.34 0.12 0.248
Trans.-Comp. 2 0.31 0.00 0.43 0.00 0.37 0.273
Trans.-Comp. 3 0.18 0.32 0.44 0.51 0.25 0.319�
Trans.-Comp. 4 0.36 0.20 0.00 0.15 0.26 0.199
Table 17
Evaluation of the transportation companies with respect to documentation ability
Alternatives Trans.-Comp. 1 Trans.-Comp. 2 Trans.-Comp. 3 Trans.-Comp. 4
Trans.-Comp. 1 (1, 1, 1) (2/5, 1/2, 2/3) (1/2, 2/3, 1) (1/2, 2/3, 1)
Trans.-Comp. 2 (3/2, 2, 5/2) (1, 1, 1) (1, 3/2, 2) (1, 3/2, 2)
Trans.-Comp. 3 (1, 3/2, 2) (1/2, 2/3, 1) (1, 1, 1) (1/2, 1, 3/2)
Trans.-Comp. 4 (1, 3/2, 2) (1/2, 2/3, 1) (2/3, 1, 2) (1, 1, 1)
208 O. Kulak, C. Kahraman / Information Sciences 170 (2005) 191–210
The weight vector from Table 15 is calculated as WTR ¼ ð0:13; 0:43; 0:44;0:00Þ.
The weight vector from Table 16 is calculated as WF ¼ ð0:34; 0:00; 0:51;0:15Þ.
The weight vector from Table 17 is calculated as WDA ¼ ð0:12; 0:37; 0:25;0:26Þ. Table 18 shows the combination of the weight vectors obtained by
pairwise comparisons.
Alternative 3 is the selected transportation company. The result is the sameas crisp and fuzzy AD approaches. The reason for selecting different alterna-
tives when using crisp and fuzzy AHP approaches is that fuzzy AHP uses fuzzy
numbers which mean intervals instead of crisp numbers.
6. Conclusions
In most of the real-world problems, some of the decision data can be pre-
cisely assessed while others cannot. Real numbers are used to represent data
which can be precisely measured. For those data which cannot be precisely
assessed, fuzzy sets can be used to denote them. The use of fuzzy set theory
allows us to incorporate unquantifiable information, incomplete information,
non-obtainable information and partially ignorant facts into the decisionmodel. When decision data are precisely known, they should not be forced into
O. Kulak, C. Kahraman / Information Sciences 170 (2005) 191–210 209
a fuzzy format in the decision analysis. Crisp MADM methods solve problems
in which all decision data are assumed to be known and must be represented by
crisp numbers. The methods are to effectively aggregate performance scores.
Fuzzy MADM methods have difficulty in judging the preferred alternativesbecause all aggregated scores are fuzzy data. We propose crisp multi-attribute
AD approach when all decision data are known whereas we propose fuzzy
multi-attribute AD approach when unquantifiable or incomplete information
exists.
The proposed crisp and fuzzy AD approaches use the design ranges deter-
mined by the decision-makers to select best alternative. However, these ap-
proaches that depend on the minimum information axiom do not let an
alternative to be selected even if that alternative meets the design ranges of allother criteria successfully, but not any of these ranges. However, the decision-
maker can assign a numerical value instead of ‘infinitive’ in order to make
possible the selection of an alternative which meets all other criteria success-
fully, except the criterion having an ‘infinitive’ value.
References
[1] E. Avineri, J. Prashker, A. Ceder, Transportation projects selection process using fuzzy sets
theory, Fuzzy Sets and Systems 116 (2000) 35–47.
[2] B. Babic, Axiomatic design of flexible manufacturing systems, International Journal of
Production Research 37 (5) (1999) 1159–1173.
[3] C.E. Bozda�g, C. Kahraman, D. Ruan, Fuzzy group decision making for selection among
computer integrated manufacturing systems, Computers in Industry 51 (1) (2003) 13–29.
[4] J.J. Buckley, Fuzzy hierarchical analysis, Fuzzy Sets and Systems 17 (1985) 233–247.
[5] S. Chanas, D. Kuchta, Fuzzy integer transportation problem, Fuzzy Sets and Systems 98
(1998) 291–298.
[6] D.-Y. Chang, Applications of the extent analysis method on fuzzy AHP, European Journal of
Operational Research 95 (1996) 649–655.
[7] D.-Y. Chang, in: Extent Analysis and Synthetic Decision, Optimization Techniques and
Applications, vol. 1, World Scientific, Singapore, 1992, p. 352.
[8] C.-H. Cheng, K.-L. Yang, C.-L. Hwang, Evaluating attack helicopters by AHP based on
linguistic variable weight, European Journal of Operational Research 116 (2) (1999) 423–443.
[9] C. Ching-Hsue, Evaluating naval tactical missile systems by fuzzy AHP based on the grade
value of membership function, European Journal of Operational Research 96 (2) (1997) 343–
350.
[10] C. Kahraman, U. Cebeci, D. Ruan, Multi-attribute comparison of catering service companies
using fuzzy AHP: The case of Turkey, International Journal of Production Economics 87
(2004) 171–184.
[11] C. Kahraman, D. Ruan, _I. Dogan, Fuzzy group decision making for facility location selection,
Information Sciences 157 (2003) 135–153.
[12] S. Kikuchi, A method to defuzzify the fuzzy number: transportation problem application,
Fuzzy Sets and Systems 116 (2000) 3–9.
[13] S.J. Kim, N.P. Suh, S. Kim, Design of software systems based on AD, Robotics & Computer-
Integrated Manufacturing 8 (4) (1991) 243–255.

210 O. Kulak, C. Kahraman / Information Sciences 170 (2005) 191–210
[14] P.J.M. Laarhoven, W. Pedrycz, A fuzzy extension of Saaty’s priority theory, Fuzzy Sets and
Systems 11 (1983) 229–241.
[15] L. Li, K.K. Lai, A fuzzy approach to multiobjective transportation problem, Computers &
Operations Research 27 (2000) 43–57.
[16] S.-T. Liu, C. Kao, Solving fuzzy transportation problems based on extension principle,
European Journal of Operational Research, forthcoming.
[17] T.L. Saaty, The Analytic Hierarchy Process, McGraw-Hill Book Company, New York, 1980.
[18] M. Sakawa, I. Nishizaki, Y. Uemura, Case study: fuzzy programming and profit and cost
allocation for a production and transportation problem, European Journal of Operational
Research 131 (2001) 1–15.
[19] M. Sakawa, I. Nishizaki, Y. Uemura, A decentralized two-level transportation problem in a
housing material manufacturer: interactive fuzzy programming approach, European Journal
of Operational Research 141 (2002) 167–185.
[20] L.-H. Shih, Cement transportation planning via fuzzy linear programming, International
Journal of Production Economics 58 (1999) 277–287.
[21] A. Stam, S. Minghe, M. Haines, Artificial neural network representations for hierarchical
preference structures, Computers & Operations Research 23 (12) (1996) 1191–1201.
[22] N.P. Suh, The Principles of Design, Oxford University Press, New York, 1990.
[23] N.P. Suh, Designing-in of quality through axiomatic design, IEEE Transactions on Reliability
44 (2) (1995) 256–264.
[24] N.P. Suh, Design of systems, Annals of the CIRP 46 (1) (1997) 75–80.
[25] N.P. Suh, D.S. Cochran, C.L. Paulo, Manufacturing system design, Annals of the CIRP 47 (2)
(1998) 627–639.
[26] N.P. Suh, Axiomatic Design: Advances and Applications, Oxford University Press, New York,
2001.
[27] J.-Y. Teng, G.-H. Tzeng, Transportation investment project selection using fuzzy multiob-
jective programming, Fuzzy Sets and Systems 96 (1998) 259–280.
[28] R. Verma, M.P. Biswal, A. Biswas, Fuzzy programming technique to solve multi-objective
transportation problems with some non-linear membership functions, Fuzzy Sets and Systems
91 (1997) 37–43.
[29] L. Zadeh, Fuzzy sets, Information Control 8 (1965) 338–353.
[30] K.-J. Zhu, Y. Jing, D.-Y. Chang, A discussion on extent analysis method and applications of
fuzzy AHP, European Journal of Operational Research 116 (1999) 450–456.


