Embed Size (px)
Citation preview
NATIONAL TECHNICAL UNIVERSITY OF ATHENS S C H O O L O F N A V A L A R C H I T E C T U R E & M A R I N E E N G I N E E R I N G
D I V I S I O N O F S H I P D E S I G N A N D M A R I T I M E T R A N S P O R T
M A R I T I M E T R A N S P O R T L A B O R A T O R Y
APPLICATION OF
MULTI CRITERIA DECISION MAKING TECHNIQUES IN FINANCE:
THE CASE OF THE GREEK COASTAL SHIPPING COMPANIES
Orestis D. Schinas
Supervisor: Professor H.N. Psaraftis
Thesis submitted in partial fulfillment of the requirements of Doctoral Degree
Athens
February 2005

A ck n o w l ed g e m e n t s
Page i of 298
Acknowledgements
This Thesis is dedicated to the memory of my parents, who passed away
months before the completion of this effort. They were really special
persons, and I thank them for their affection and support.
I owe gratitude to my advisor Professor Harilaos Psaraftis, who played a
decisive role in my academic and professional development. His advices and
guidance expanded my interests in the broad disciplines of system
management and transportation science. This thesis could not have been
completed without his encouragement and direction.
Furthermore, I have to thank Professors Eleftherios Thalassinos and Stratos
Papadimitriou for their assistance, suggestions and accessibility for various
issues that arose during this research effort.
Finally, I am grateful to my wife Nadja, who tolerated me working at home,
as well as to my mother-in-law Hera, for her enthusiastic support.
T a b l es o f C o n t e n t s , F ig u r e s a n d T a b l e s
Page ii of 298
Tables of Contents, Figures and Tables
Table of Contents
Acknowledgements ................................................................................................... i
Tables of Contents, Figures and Tables ................................................................. ii
Table of Contents ................................................................................................... ii
List of Figures........................................................................................................ vi
List of Tables.......................................................................................................... ix
List of Tables.......................................................................................................... ix
List of Abbreviations........................................................................................... xii
List of Abbreviations........................................................................................... xii
Abstract .................................................................................................................... 14
Περίληψη ................................................................................................................. 18
1 Executive Summary ......................................................................................... 23
2 Introduction ...................................................................................................... 34
2.1 Problem Definition................................................................................... 34
2.2 Analysis Background............................................................................... 34
2.3 Structure of the Document...................................................................... 40
2.4 Literature Review..................................................................................... 45
2.4.1 Shipping Finance................................................................................. 45
2.4.2 Multi-Criteria Decision Making........................................................ 50
2.4.3 Greek Coastal Shipping ..................................................................... 56
3 Greek Coastal System ...................................................................................... 58
3.1.1 Institutional Framework .................................................................... 61
3.1.2 Market Analysis .................................................................................. 70
T a b l es o f C o n t e n t s , F ig u r e s a n d T a b l e s
Page iii of 298
3.1.3 Technical Aspects of the System....................................................... 85
4 Methodology..................................................................................................... 91
4.1 The MCDM Formulation......................................................................... 91
4.2 The Analytic Hierarchy Process Method.............................................. 96
4.2.1 Group decision-making ................................................................... 106
4.2.2 Sensitivity Analysis .......................................................................... 108
4.3 Methodology Selection Considerations .............................................. 110
5 The Challenge of Operating Risk................................................................. 116
5.1 Definition of Operational Risk ............................................................. 117
5.2 A Survey of the Greek Ship Finance Market...................................... 122
5.2.1 Analysis of the market ..................................................................... 122
5.2.2 Identification of the Risk Perception – Hierarchy Structure....... 128
5.2.3 Clustering of the Greek Banking Market....................................... 139
5.2.4 The Importance of GCS companies for the Greek Lenders ........ 148
6 Evaluating a shipping company .................................................................. 150
6.1 Hierarchy of the Criteria ....................................................................... 152
6.1.1 Internal Factors.................................................................................. 159
6.1.1.1 Fundamental Data .................................................................... 159
6.1.1.2 Logistics Services ...................................................................... 166
6.1.1.3 Management Related Criteria ................................................. 168
6.1.2 External Factors................................................................................. 181
6.1.2.1 Stock performance .................................................................... 184
6.1.2.2 Market Environment ................................................................ 189
6.1.2.3 Competition Data...................................................................... 193
T a b l es o f C o n t e n t s , F ig u r e s a n d T a b l e s
Page iv of 298
6.1.3 Data Integrity and Limitations........................................................ 194
6.1.4 Weighting the Criteria...................................................................... 197
6.2 Application of the Methodology.......................................................... 206
6.2.1 Scenario-Based Outcome ................................................................. 208
6.2.2 Simulation-based outcome .............................................................. 215
6.3 Comments on the Method .................................................................... 225
6.3.1 Theoretical Issues.............................................................................. 227
6.3.2 Validation of the model ................................................................... 230
7 Application of the Model .............................................................................. 232
7.1 Corporate Planning................................................................................ 232
7.1.1 Use of the Model ............................................................................... 233
7.1.2 Use of Elements from the Model .................................................... 237
7.1.3 Optimum Merger .............................................................................. 239
7.2 Theoretic Approaches............................................................................ 243
8 Conclusions and Further Development...................................................... 248
8.1 Conclusions ............................................................................................. 248
8.2 Further Considerations.......................................................................... 253
8.2.1 Further Research ............................................................................... 253
8.2.2 Applications-related Issues ............................................................. 256
9 References........................................................................................................ 258
10 Index ............................................................................................................. 270
11 Annexes ........................................................................................................ 271
11.1 Annex A: Concentration Indices .......................................................... 271
11.1.1 HHI Index ...................................................................................... 271
T a b l es o f C o n t e n t s , F ig u r e s a n d T a b l e s
Page v of 298
11.1.2 Gini Coefficient ............................................................................. 271
11.1.3 Shift-Share Analysis...................................................................... 273
11.1.4 Findings of the Analysis .............................................................. 274
11.2 Annex B: Questionnaires to the Banks ................................................ 277
11.3 Annex C: Data and Calculations (Financial Institutions) ................. 281
11.4 Annex D: Data (GCS Companies)........................................................ 285
11.4.1 Fundamental Accounting Data................................................... 285
11.4.2 Management Related Data .......................................................... 286
11.4.3 Logistics Service Data................................................................... 287
11.4.4 Stock Performance Data............................................................... 288
11.4.5 Market Environment Data........................................................... 289
11.4.6 Competition Data.......................................................................... 289
11.5 Annex E: Calculations (GCS Companies)........................................... 290
T a b l es o f C o n t e n t s , F ig u r e s a n d T a b l e s
Page vi of 298
List of Figures
Figure 1: The map of Greece.................................................................................. 71
Figure 2: Total Assets in Greek Drachmae.......................................................... 75
Figure 3: Growth Rates of Total Assets................................................................ 75
Figure 4: Market Share per Total Assets.............................................................. 76
Figure 5: Fixed Assets in Greek Drachmae ......................................................... 77
Figure 6: Ratio of Fixed Assets over Total Assets .............................................. 77
Figure 7: Shareholders Equity over the period 1997-2002 in GrD ................... 78
Figure 8: Long-term liabilities over the 1997-2002 period in GrD ................... 79
Figure 9: The ratio of long-term liabilities over total assets.............................. 79
Figure 10: Sales Revenue and Net Income after Tax.......................................... 80
Figure 11: Turnover over the period of analysis ................................................ 81
Figure 12: Market Shares based on Turnover Data............................................ 81
Figure 13: Average Age of the Fleet and number of Deployed Vessels ......... 87
Figure 14: Shares enjoyed by the port of Igoumenitsa ...................................... 89
Figure 15: Continuous Decision Making Problems (g1 and g2 are criteria).... 91
Figure 16: Classification Techniques.................................................................... 92
Figure 17: Decision-making process and risk management ........................... 117
Figure 18: Number of Banks Financing Greek Shipping (2003)..................... 123
Figure 19: Bank portfolio per bank category (2003)......................................... 124
Figure 20: Number of Greek Shipping Companies (2003).............................. 125
Figure 21: Breakdown per Operated Vessels (2003) ........................................ 125
Figure 22: Breakdown per Age-range (2003) .................................................... 126
Figure 23: Level I and Level II analysis ............................................................. 131
T a b l es o f C o n t e n t s , F ig u r e s a n d T a b l e s
Page vii of 298
Figure 24: Level II (marketing), Level III and Level IV analysis – 1st branch131
Figure 25: Level II (assurance), Level III and Level IV analysis – 2nd branch
......................................................................................................................... 132
Figure 26: Level II (quality), Level III and Level IV analysis – 3rd branch.... 132
Figure 27: Flowchart of the Mapping Process .................................................. 140
Figure 28: Relative position of FI in the market (quality – assurances) ........ 145
Figure 29: Relative position of FI in the market (marketing-assurances) ..... 145
Figure 30: Radar Chart indicating the attributes of FI..................................... 146
Figure 31: Simple clustering of FI (color-related)............................................. 146
Figure 32: Levels I, II and III of the hierarchy................................................... 156
Figure 33: Level IV – Fundamental Data........................................................... 156
Figure 34: Level IV – Logistics Service Data ..................................................... 157
Figure 35: Level IV – Management Data ........................................................... 157
Figure 36: Level IV – Stock Performance Data ................................................. 158
Figure 37: Level IV – Market Environment Data ............................................. 158
Figure 38: Level IV – Competition Data ............................................................ 159
Figure 39: Typical supply functions – Adopted from Sussman (2000, p. 81)183
Figure 40: The ‘story’ and the ‘credibility gap’ of stocks against an index .. 185
Figure 41: Under- and Out-performance Data of the GCS stocks ................. 185
Figure 42: External Forces.................................................................................... 189
Figure 43: Internal Forces..................................................................................... 189
Figure 44 : Relative Position of Every GCS company on an annual base..... 213
Figure 45: Total Performance Index of every GCS per annum ...................... 214
Figure 46: Individual and Group Interval Judgments..................................... 217
Figure 47: Graphical Representation of a TFN ................................................. 218
T a b l es o f C o n t e n t s , F ig u r e s a n d T a b l e s
Page viii of 298
Figure 48: Discrete Distribution.......................................................................... 221
Figure 49: Uniform Distribution ......................................................................... 221
Figure 50: Simulation Flowchart......................................................................... 223
Figure 51: Simulation Results for ANEK -1997 ................................................ 224
Figure 52: Relative Improvement due to the new ship ................................... 236
Figure 53: Determining the future position of a company – Forward Planning
......................................................................................................................... 238
Figure 54: Determining Policies and Actions - Backward Planning ............. 239
Figure 55: Choosing among merger candidates – sample hierarchy ............ 240
Figure 56: Selecting a target company based on Porter’s theory ................... 242
Figure 57: Dominance with two attributes (Keeney & Raiffa, 1993, p. 70)... 244
Figure 58: The efficient frontier for various sets of consequences with two
attributes (X1 – X2 axes) ................................................................................ 244
Figure 59: Lorenz and Perfect Inequalities Difference .................................... 273
T a b l es o f C o n t e n t s , F ig u r e s a n d T a b l e s
Page ix of 298
List of Tables
Table 1: Major Operators per sub-system in the Aegean.................................. 73
Table 2: Revenues Classification........................................................................... 81
Table 3: Breakdown of Revenues per Market..................................................... 82
Table 4: Total Volumes of Traffic Served by the Companies under
Examination..................................................................................................... 82
Table 5: Findings from the Application of Concentration Indices................... 84
Table 6: Decision Matrix for a Discrete Decision-Making Problem................. 94
Table 7: Fundamental Scale for Pair Wise Comparison .................................. 103
Table 8: Random Consistencies – Indicative sample ....................................... 105
Table 9: 5-point rating (sample table) ................................................................ 140
Table 10: Decision table at level II ...................................................................... 142
Table 11: Decision table at level III (sample of the marketing criterion) ...... 143
Table 12: Capitals drawn from ASE up to 2002 (in GrD) ................................ 149
Table 13: Management-related criteria .............................................................. 173
Table 14: Fundamental Data – Criteria Weighting .......................................... 198
Table 15: Criteria weights (vector and idealized vector) – Fundamental Data
......................................................................................................................... 199
Table 16: Logistics Service Data – Criteria Weighting..................................... 200
Table 17: Criteria weights (vector and idealized vector) – Logistics Service
Data ................................................................................................................. 201
Table 18: Management Data – Criteria Weighting........................................... 202
Table 19: Criteria weights (vector and idealized vector) – Management Data
......................................................................................................................... 202
Table 20: Stock Performance Data – Criteria Weighting................................. 203
T a b l es o f C o n t e n t s , F ig u r e s a n d T a b l e s
Page x of 298
Table 21: Criteria weights (vector and idealized vector) – Stock Performance
Data ................................................................................................................. 203
Table 22: Market Environment Data – Criteria Weighting............................. 204
Table 23: Criteria weights (vector and idealized vector) – Market
Environment Data......................................................................................... 204
Table 24: Competition Data – Criteria Weighting............................................ 205
Table 25: Criteria weights (vector and Idealized vector) – Competition Data
......................................................................................................................... 205
Table 26: Sample data – ANEK / Fundamental Data...................................... 206
Table 27: Level II elements - internal ................................................................. 211
Table 28: Level II elements – external ................................................................ 211
Table 29: Level I-final results............................................................................... 212
Table 30: Level I-final results normalized ......................................................... 212
Table 31: Level I-deviation from the ‘leader’ .................................................... 212
Table 32: Simulation Results ............................................................................... 224
Table 33: Normalized results – simulation........................................................ 224
Table 34: Rank comparison between the results of Table 33 and Table 30... 225
Table 35: Findings from the Application of Concentration Indices............... 274
Table 36: Shift-Share Analysis - Turnover......................................................... 275
Table 37: Shift-Share Analysis – Passengers (Total)......................................... 275
Table 38: Shift-Share Analysis – Cars (Total) .................................................... 275
Table 39: Shift-Share Analysis – Trucks (Total) ................................................ 275
Table 40: Shift-Share Analysis – Passengers (Aegean) .................................... 275
Table 41: Shift-Share Analysis – Cars (Aegean)................................................ 276
Table 42: Shift-Share Analysis – Trucks (Aegean)............................................ 276

T a b l es o f C o n t e n t s , F ig u r e s a n d T a b l e s
Page xi of 298
Table 43: Shift-Share Analysis – Passengers (Adriatic) ................................... 276
Table 44: Shift-Share Analysis – Cars (Adriatic)............................................... 276
Table 45: Shift-Share Analysis – Trucks (Adriatic) .......................................... 276

T a b l es o f C o n t e n t s , F ig u r e s a n d T a b l e s
Page xii of 298
List of Abbreviations
AHP Analytic Hierarchy Process
ANP Analytic Network Process
ASE Athens Stock Exchange
CAPM Capital Asset Pricing Model
DEA Data Envelopment Analysis
DSS Decision Support System
EC European Commission
ELECTRE Elimination and Choice Translating Reality
EMH Efficient Market Hypothesis
EU European Union
FI Financial Institution
GCS Greek Coastal Shipping
IAS International Accounting Standards
IRR Internal Rate of Return
ISO International Standardization Organization
LOS Level of Service
MA Multi-Criteria Analysis
MADM Multi-Attribute Decision Making
MARAD Maritime Administration – USA
MARPOL Marine Pollution / International Convention
MCDM Multi-Criteria Decision Making
MCDSS Multi-Criteria Decision Support System
T a b l es o f C o n t e n t s , F ig u r e s a n d T a b l e s
Page xiii of 298
MMM Minister (or Ministry) of Mercantile Marine
MODM Multi-Objective Decision Making
MTO Multi-modal Transport Operator
NPV Net Present Value
NTUA National Technical University of Athens
OECD Organization for Economic Co-Operation and Development
PEST Political-Economic-Social-Technical
SOLAS Safety of Life at Sea / International Convention
SSS Short Sea Shipping
STCW Standard Training & Certification of Watchkeepers /
International Convention
TEN Trans-European Networks
TFN Triangular Fuzzy Number
TOPSIS Technique for Order Preference by Similarity to Ideal Solution
ULCC Ultra-Large Crude Carrier
US-GAAP US – Generally Accepted Accounting Principles
VLCC Very-Large Crude Carrier
WPM Weighted Product Method
WSM Weighted Sum Method
A bs t r a c t
Page 14 of 298
Abstract
This thesis deals with the application of Multi-Criteria Decision
Making (MCDM) techniques for the problem of the overall evaluation
of the Greek Coastal Shipping (GCS) companies, and it focuses on the
needs of lenders and investors. The importance of GCS is very high
for the Greek society, as it demands regulation consistent also with
European practices. It also demands efficient network operations for
social and economic reasons and close financial monitoring as the
important actors are listed at the Athens Stock Exchange (ASE).
Lately, these companies have experienced growth, as a result of the
partial deregulation of the industry, of the equity inflow from the ASE
and the introduction of new vessels in service. In this thesis, it is also
proven that the market is not concentrated, and is equally carved into
niches for all actors in the market. The analysis period is extended
from the fiscal year of 1997 up to 2002; this is a result of the
availability of the data and their integrity check.
As revealed from the literature, there is no prior work on this issue, as
well as there is no MCDM approach reported for the niche market of
the GCS. Shipping finance literature is basically focused on time-
series analyses and the lending (risk assessment) criteria are drafted
in textbooks for many decades already. The literature on the GCS is
considered as stagnant in the last years, as researchers with active
presence in the mid-90s have not presented valuable new ideas in the
academic community.
The selected MCDM method is the Analytic Hierarchy Process (AHP).
This method was preferred from other established methodologies as it
does not demand prior knowledge of the utility function, it is based
on a hierarchy of criteria and attributes reflecting the understanding
of the problem, and finally, because it allows relative and absolute
A b s t r a c t
Page 15 of 298
comparisons, thus making this method a very robust tool. AHP is
adequately discussed and reviewed; the method allows combinations
with other techniques, as well as, scenario analysis and simulation
exercises. Last but not least, AHP allows group decision-making and
is convenient in numerical handling.
The issue of the operational risk and of the risk assessment of the
lenders is critical. Most of the capital gearing this industry is coming
from lending financial institutions (FI); the capital inflow from ASE
amounts only to less than 10% of the total liabilities of these
companies. Taking as a basis the criteria and the risk structure as
described in the textbooks, and by soliciting data by using
questionnaires, a ranking model for the lending institution is derived.
This model is based on simulations for the assignment of weights at
the upper levels of the hierarchy and provides a mapping of the
lenders’ market according to basic attributes: quality of the lending
portfolio, assurance required on the loans and marketing. This permit
also further clustering of this market. It is also easy to add alternatives
(lenders) as the model is based on absolute comparisons, in order to
facilitate alterations of the mix of the lenders.
The main issue of evaluating the overall ranking of GCS companies is
addressed with the construction of a rather expanded hierarchy. A
hierarchy with four main levels of criteria is used; two major
categories of criteria are considered: those referring to the internal
and those referring to the external forces of the company. Under the
‘internal’ group fall the criteria of the fundamental accounting, of the
logistics services offered, and of the management related ones. The
criteria subsets of stock performance, market environment and of the
competition fall under the ‘external’ group of criteria. Under these
clusters almost seventy attributes are taken into account. A full
justification for the selection as well as for the relative weighting is
A b s t r a c t
Page 16 of 298
provided. In most cases this was a result of the availability of data.
For the upper levels of the criteria both scenario analyses and
simulation exercises have been considered. The resulting ranking and
indices provide a clear track of the course of the companies over the
period of analysis (1997-2002). It is possible to monitor their course
over time (overall index), as well as over partial attributes, such as the
external and the internal criteria. A deeper degree of analysis is also
possible but it cannot be visualized in planar graphs.
The model can be validated according to the shift-share calculations.
In 60% of the cases, the shift-share analysis of the turnover data may
explain the differences of the indices and in the rest cases there is a
consistency with the shift-share calculations of the traffic. Apart from
the overall ranking and monitoring over the years it is possible to use
the same hierarchy or elements of the structure for practical problems,
such as the corporate planning and mergers. In corporate planning it
is possible to estimate the final position of the company if some
tactical movements occur or to foresee the result of these movements,
by using the same hierarchy and weights. In cases, where new actors
or new parameters shall be taken into account, elements from the
hierarchy may assist in the planning. This is also the case for the
selection of the optimum merger-alternative. The model aims to have
capabilities for practical use; nevertheless, it is consistent with the
basic theory as described in the textbooks.
In all cases the consistency of the judgments remained under the limit
of 10% as demanded from the theory, so there is confidence in the
final numerical results. Different opinions or approximations may
stem out of different sets of criteria. It is possible to include more
alternatives and more criteria in the hierarchy as is but there is always
the question over the availability and the integrity of the data for all
companies in the set and for all years of the analysis.
A b s t r a c t
Page 17 of 298
Apart from suggestions for further development of the application as
well as for further theoretical consideration, this manuscript includes
large lists of indices, tables, figures and annexes aiming to assist the
reader in understanding the depth of the analysis, the effort dedicated
and in providing a solid data-base for these GCS companies.
The findings are also flourished with suggestions for further research
and development of the prototype modeling. It is interesting to note
that some applications may have different beneficiaries and may
support more complex decisions.
The contribution of this thesis in the state of the art is evident. For the
first time in the academic literature, a market analysis of the most
significant actors in the GCS is provided. Furthermore, the analysis of
their financial and operational course into sub-criteria reveals
differences of their structure and their decisions. The classification of
these companies according to a rational set of criteria comprises, also,
a very powerful tool for managerial decisions. This tool may easily be
used by the management of the company for comparison or planning
reasons, as well as by academics and policy-makers as monitoring
tool of the market. The tool is validated through a shift-share analysis
of historical data, thus strengthening the belief that the appointed
weights are reflecting actual conditions. Of course, an MCDM tool
remains a subjective tool and the hierarchy reveals the understanding
of the problem, as well as the indented goals. Further research and
adjustments may easily be launched on the basis of this prototype.
Last, but not least, the analysis of the lenders’ market, as well as, side
results of the analysis, such as the market concentration analysis
appear for the first time in the academic and business literature.
Περίληψη
Page 18 of 298
Περίληψη
Η διατριβή έχει ως θέµα την εφαρµογή πολυκριτηριακών µεθόδων
λήψης απόφασης στο πρόβληµα της συνολικής αξιολόγησης των
ελληνικών ακτοπλοϊκών εταιρειών, και εστιάζεται στις ανάγκες των
δανειστών και των επενδυτών. Η σηµασία των ακτοπλοϊκών
συγκοινωνιών (ΑΣ) είναι πολύ µεγάλη για την Ελληνική κοινωνία
και απαιτεί κανονιστικά µέτρα σύµφωνα µε τις Ευρωπαϊκές
πρακτικές. Επίσης οι ΑΣ απαιτούν αποδοτικές λειτουργίες δικτύου
για λόγους οικονοµικούς και κοινωνικούς καθώς και στενή
χρηµατοοικονοµική παρακολούθηση, διότι οι κυριότερες εταιρείες
που δραστηριοποιούνται είναι εισηγµένες στο Χρηµατιστήριο Αξιών
Αθηνών (ΧΑΑ). Κατά τα τελευταία χρόνια, οι εταιρείες αυτές
αναπτύχθηκαν δυναµικά, ως αποτέλεσµα της µερικής απελευθέρωσης
της αγοράς και την εισαγωγή νέων πλοίων στις γραµµές.
Αποδεικνύεται ότι η αγορά δεν είναι συγκεντρωµένη, και ότι είναι
µοιρασµένη σε ίσα µερίδα για όλες τις σηµαντικές εταιρείες. Η
περίοδος ανάλυσης περιλαµβάνεις τις οικονοµικές χρήσεις από το
1997 έως το 2002. Αυτό οφείλεται στα διαθέσιµα στοιχεία και τον
έλεγχο ακεραιότητας τους.
Όπως προκύπτει από τη βιβλιογραφική αναζήτηση, δεν υπάρχει
παρόµοια εργασία σε αυτό το πεδίο. Η βιβλιογραφία της ναυτιλιακής
χρηµατοδότησης εστιάζεται κυρίως σε θέµατα ανάλυσης χρονοσειρών
και σε θέµατα κριτηρίων δανεισµού (αξιολόγηση κινδύνων) για
πολλά έτη. Η βιβλιογραφική πρόοδος σε θέµατα ΑΣ είναι µάλλον
στάσιµη τα τελευταία έτη, αφού ερευνητές µε ενεργή παρουσία στις
αρχές της δεκαετίας 1990 δεν έχουν παρουσιάσει αξιόλογες νέες ιδέες
στην ακαδηµαϊκή κοινότητα.
Η επιλεγµένη πολυκριτηριακή µέθοδος είναι η Analytic Hierarchy
Process (ΑΗΡ). Η µέθοδος προτιµήθηκε από άλλες καθιερωµένες

Περίληψη
Page 19 of 298
µεθοδολογίες, διότι δεν απαιτεί πρότερη γνώση της συνάρτησης
χρησιµότητας, βασίζεται σε ιεραρχικά δοµηµένα κριτήρια και
χαρακτηριστικά, που αποκαλύπτουν την αντίληψη που έχει ο λήπτης
της απόφασης για το πρόβληµα, και τελικά, γιατί επιτρέπει σχετικές
και απόλυτες συγκρίσεις. Η ΑΗΡ έχει συζητηθεί εκτεταµένα στη
βιβλιογραφία και από ερευνητές. Η µέθοδος επιτρέπει τον συνδυασµό
µε άλλες τεχνικές, τη κατάστρωση σεναρίων καθώς και
προσοµοιώσεις. Κλείνοντας, η µέθοδος επιτρέπει συλλογική λήψη
απόφασης και είναι ευέλικτη σε αριθµητικούς χειρισµούς.
Το ζήτηµα του λειτουργικού κινδύνου (operational risk) και της
αξιολόγησης κινδύνων από τους δανειστές είναι κρίσιµο. Το
µεγαλύτερο ποσοστό των κεφαλαίων χρηµατοδότησης των ΑΣ
προέρχεται από τα πιστωτικά ιδρύµατα. Η εισροή κεφαλαίων από το
ΧΑΑ ανήλθε κατά τη περίοδο ανάλυσης µόλις στο 10% των
συνολικών υποχρεώσεων (µακροπρόθεσµα δάνεια) των εταιρείων υπό
µελέτη. Με βάση τα κριτήρια και τη δοµή του κινδύνου όπως
περιγράφεται στη βιβλιογραφία καθώς και µε χρήση δεδοµένων που
παρήχθησαν από τη συµπλήρωση ερωτηµατολογίων κατασκευάστηκε
ένα µοντέλο ταξινόµησης των πιστωτικών ιδρυµάτων. Το µοντέλο
βασίζεται σε προσοµοιώσεις για την απόδοση βαρών στα κριτήρια
των ανωτέρω τµηµάτων της ιεραρχίας και παρέχει µια απεικόνιση της
αγοράς των πιστωτών σύµφωνα µε βασικά χαρακτηριστικά: η
ποιότητα του χαρτοφυλακείου δανείων, εξασφαλίσεις επί των
δανείων και marketing. Το µοντέλο επιτρέπει και περαιτέρω
ταξινόµηση (clustering) της αγοράς. Είναι εύκολο να προστεθούν
εναλλακτικές (πιστωτικά ιδρύµατα δηλαδή) αφού το µοντέλο
βασίζεται σε απόλυτες συγκρίσεις ούτως ώστε να µπορεί να
διαχειρίζεται αλλαγές στο µείγµα των εναλλακτικών.
Το κύριο πρόβληµα της ταξινόµησης των ακτοπλοικών εταρειών
αντιµετωπίζεται µε την κατασκευή µιας αρκετά ανεπτυγµένης

Περίληψη
Page 20 of 298
ιεραρχίας. Χρησιµοποιείται µια ιεραρχία µε τέσσερα διακριτά
επίπεδα κριτηρίων. ∆υο κύριες κατηγορίες κριτηρίων λαµβάνονται
υπ΄όψιν: η πρώτη αναφέρεται στις δυνάµεις του εσωτερικού
περιβάλλοντος και η δεύτερη στου εξωτερικού. Κάτω από την
κατηγορία ‘εσωτερικού περιβάλλοντος’ εµπίπτουν τα κριτήρια που
σχετίζονται µε τα θεµελιώδη λογιστικά µεγέθη, τις προσφερόµενες
υπηρεσίες logistics, και τη διοίκηση της επιχείρησης. Τα κρίσιµα
υποσύνολα κριτηρίων της απόδοσης της µετοχής, των συνθηκών της
αγοράς και του ανταγωνισµού εµπίπτουν στη κατηγορία κριτηρίων
του ΄εξωτερικού περιβάλλοντος΄. Σε αυτές τις κατηγορίες κριτηρίων
αναφέρονται και χρησιµοποιούνται περίπου εβδοµήντα διακριτά και
ανεξάρτητα χαρακτηριστικά των εταιρείων. Πλήρης δικαιολόγηση
για την επιλογή των κριτηρίων καθώς και τη σύγκριση µεταξύ τους
παρέχεται όπου χρειάζεται. Τις περισσότερες φορές είναι αποτέλεσµα
της διαθεσιµότητας και της ακεραιότητας των δεδοµένων. Για τα
ανώτερα επίπεδα της ιεραρχίας η απόδοση βαρών µεταξύ των
κριτηρίων γίνεται και µε ανάλυση σεναρίων και µε προσοµοίωση. Η
καταληκτική ταξινόµηση και οι δείκτες παρέχουν καθαρή εικόνα για
την πορεία των εταιρείων κατά την περίοδο ανάλυσης (1997 – 2002).
Καθίσταται δυνατή η παρακολούθηση συνολικώς ή µερικώς, ήτοι η
ανάλυση επιµέρους χαρακτηριστικών όπως τα κριτήρια εσωτερικού
και εξωτερικού περιβάλλοντος. Βαθύτερη και περαιτέρω ανάλυση
είναι δυνατή αλλά δεν µπορεί να αναπαρασταθεί σε επίπεδα
διαγράµµατα.
Το µοντέλο επιβεβαιώνεται από τα αποτελέσµατα αναλύσης µεριδίων
(shift-share analysis). Στο 60% των περιπτώσεων η ανάλυση των
µεριδίων κύκλου εργασιών εξηγεί τις µεταβολές των δεικτών του
µοντέλου και στις υπόλοιπες περιπτώσεις συµβαδίζει µε ανάλυση
µεριδίων του διακινούµενου µεταφορικού όγκου. Εκτός από την
εφαρµογή ταξινόµησης και παρακολούθησης της πορείας των

Περίληψη
Page 21 of 298
εταιρείων κατά οικονοµικές περιόδους είναι δυνατή η χρήση της
ιεραρχίας ή στοιχείων της για την αντιµετώπιση πρακτικών
προβληµάτων όπως είναι ο στρατηγικός σχεδιασµός και οι
συγχωνεύσεις. Για τις ανάγκες στρατηγικού σχεδιασµού είναι δυνατή
η εκτίµηση της θέσης της εταιρείας ως αποτέλεσµα τακτικών κινήσεων
ή για ανάγκες πρόβλεψης, χρησιµοποιώντας την ίδια ιεραρχία και τα
ίδια βάρη. Σε περιπτώσεις όπου νέες εναλλακτικές (εταιρείες) ή νέες
παράµετροι (κριτήρια) πρέπει να ληφθούν υπ΄όψιν στοιχεία της
ιεραρχίας µπορούν να χρησιµοποιηθούν άµεσα για τις ανάγκες του
σχεδιασµού. Αυτή είναι κιόλας η περίπτωση της επιλογής άλλης
εταρείας στο πρόβληµα της βέλτιστης συγχώνευσης. Το µοντέλο
σκοπεύει να έχει δυνατότητες πρακτικής εφαρµογής αλλά είναι και
απολύτως σύµφωνο µε την θεωρία όπως περιγράφεται στη
βιβλιογραφία.
Σε όλες τις περιπτώσεις ο βαθµός συνέπειας (consistency ratio)
διατηρείται κάτω από το όριο του 10%, όπως απαιτεί η θεωρία, έτσι
ώστε να υπάρχει εµπιστοσύνη στο τελικό αποτέλεσµα. ∆ιαφορετικές
γνώµες ή προσεγγίσεις οφείλονται σε διαφορετικό σύνολο κριτηρίων
ή διαφορετικές τεχνικές αξιολόγησης. Είναι δυνατό να εισαχθούν στο
µοντέλο εναλλακτικές και κριτήρια αλλά πρέπει κανείς να επιλύσει
πολλά επιµέρους προβλήµατα διαθεσιµότητας και ακεραιότητας
στοιχείων των εταρείων για όλα τα χρόνια της ανάλυσης.
Εκτός από τις προτάσεις για περαιτέρω ανάπτυξη της εφαρµογής
καθώς και για θεωρητικές προσεγγίσεις, το κείµενο της διατριβής
περιλαµβάνει µακρείς καταλόγους από δείκτες, πίνακες,
διαγράµµατα και παραρτήµατα που στοχεύουν στην καλύτερη
κατανόηση, στην βαθύτερη ανάλυση και την επενδεδυµένη
προσπάθεια για µια σταθερή βάση αναφοράς στοιχείων των
εταιρειών ΑΣ. Τα ευρήµατα έχουν επενδυθεί µε προτάσεις για την
περαιτέρω ανάπτυξη του πρωτοτύπου. Είναι ενδιαφέρον ότι κάποιες

Περίληψη
Page 22 of 298
εφαρµογές του έχουν διαφορετικούς αποδέκτες – χρήστες και ότι
µπορούν να υποστηρίξουν και πιο σύνθετες αποφάσεις.
Η συµβολή της διατριβής στην επιστηµονική ανάλυση των ΑΣ είναι
προφανής. Για πρώτη φορά στην ακαδηµαική βιβλιογραφία
παρέχεται εργαλείο για την εις βάθος ανάλυση της αγοράς ΑΣ και
των σηµαντικών συντελεστών της. Επίσης η ανάλυση των
χρηµατοοικονοµικών και λειτουργικών παραµέτρων σε κατηγορίες
κριτηρίων φανερώνει τις διαφορές στην δοµή και στην πορεία των
εταιρείων ΑΣ. Η ταξινόµηση των εταιρείων ΑΣ σύµφωνα µε µια
ορθολογική ιεραρχία κριτηρίων αποτελεί ισχυρό εργαλείο διοίκησης.
Αυτό το εργαλείο µπορεί να χρησιµοποιηθεί για σχεδιασµό και
συγκρίσεις καθώς και για τη δοµηµένη παρακολούθησης της αγοράς.
Η επιβεβαίωση του µοντέλου µέσα από ανάλυση µεριδίων, δηλαδή
µέσα από ιστορικά στοιχεία, ενδυναµώνει την πεποίθηση της ορθής
απόδοσης βαρών µεταξύ κριτηρίων. Το µοντέλο αντικατοπτρίζει σε
µεγάλο βαθµό τις πραγµατικές συνθήκες. Φυσικά ένα
πολυκριτηριακό εργαλείο παραµένει υποκειµενικό σε κάποιο βαθµό
και η ιεραρχία των κριτηρίων αποκαλύπτει την κατανόηση και την
εµπειρία επί του προβλήµατος αλλά και υποδεικνύει τους στόχους
που έχουν τεθεί. Περαιτέρω έρευνα και προσαρµογές επί την βάση
του πρωτοτύπου είναι εύκολες και εφικτές τόσο για την ταξινόµηση
των εταιρείων ΑΣ όσο και των πιστωτικών ιδρυµάτων εµφανίζονται
για πρώτη φορά στη σχετική βιβλιογραφία.
E x e cu t i v e S u m m ar y
Page 23 of 298
1 Executive Summary
This thesis deals with the application of Multi-Criteria Decision
Making (MCDM) techniques for the problem of the overall evaluation
of the Greek Coastal Shipping (GCS) companies, and it focuses on the
needs of lenders and investors. The importance of GCS is very high
for Greek society, as it demands regulation consistent also with
European practices. It also demands efficient network operations for
social and economic reasons and close financial monitoring as the
important actors are listed at the Athens Stock Exchange (ASE).
Lately, these companies have experienced growth, as a result of the
partial deregulation of the industry, of the equity inflow from the ASE
and the introduction of new vessels in service. It is proven that the
market is not concentrated, and is equally carved into niches for all
actors in the market. The analysis period is extended from the fiscal
year of 1997 up to 2002; this is a result of the availability of the data
and their integrity check.
As revealed from the literature, there is no prior work on this issue.
Some papers are dealing with the overall performance of shipping
companies, yet only academically. These application of MCDM
techniques in finance and risk assessment as conventional modeling,
does not take into account subjective points of view (expert influence)
and behavioral issues. Shipping finance literature is basically focused
on time-series analyses and the lending (risk assessment) criteria are
drafted in textbooks for many decades long. Although there are
significant developments in the market, the basic risk assessment
methodologies are heavily depended on the expertise of the officer in
charge. The literature on the GCS is considered as stagnant in the last
years, as researchers with active presence in the mid-90s have not
presented valuable new ideas in the academic community.
E x e cu t i v e S u m m ar y
Page 24 of 298
The selected MCDM method is the Analytic Hierarchy Process (AHP).
This method was preferred from other established methodologies as it
does not demand prior knowledge of the utility function, it is based
on a hierarchy of criteria and attributes reflecting the understanding
of the problem and finally because it allows relative and absolute
comparisons. AHP is adequately discussed and reviewed, where
necessary, from researchers and allows combinations with other
techniques as well as scenario analysis and simulation exercises. Last
but not least, AHP allows group decision-making and is convenient in
numerical handling. As there is no requirement for specialized
software, the whole application was developed in common
spreadsheets for sufficient control of the steps, supervision of the
rationality of the judgments, and transparency reasons. Furthermore
as the model is developed on spreadsheets it is easy to add or to test
data; this function is very helpful in scenario analyses as well as in the
case of introducing more data (even for companies not listed at ASE
or not active in this market).
The issue of the operational risk and of the risk assessment of the
lenders is critical. Most of the capital gearing this industry is coming
from lending financial institutions; the capital inflow from ASE
amounts only to less than 10% of the total liabilities of these
companies. Taking as a basis the criteria and the risk structure as
described in the textbooks, and by soliciting data by using
questionnaires, a ranking model for the lending institution is derived.
This model is based on simulations for the assignment of weights at
the upper levels of the hierarchy and provides a mapping of the
lenders’ market according to basic attributes: quality of the lending
portfolio, assurance required on the loans and marketing. This permit
also further clustering of this market. It is also easy to add alternatives
(lenders) as the model is based on absolute comparisons, in order to
E x e cu t i v e S u m m ar y
Page 25 of 298
facilitate alterations of the mix of the lenders. The names of the
lenders are known to the researcher but are not revealed in this study
due to disclosure agreements.
The main issue of evaluating the overall ranking of GCS companies is
addressed with the construction of a rather expanded hierarchy. A
hierarchy with four main levels of criteria is used; two major
categories of criteria are considered: those referring to the internal
and those referring to the external forces of the company. Under the
‘internal’ group fall the criteria of the fundamental accounting, of the
logistics services offered, and of the management related ones. The
criteria subsets of stock performance, market environment and of the
competition fall under the ‘external’ group of criteria. Under these
clusters almost seventy attributes are taken into account. A full
justification for the selection as well as for the relative weighting is
provided. In most cases this was a result of the availability of data.
For the upper levels of the criteria both scenario analyses and
simulation exercises have been considered. The resulting ranking and
indices provide a clear track of the course of the companies over the
period of analysis (1997-2002). It is possible to monitor their course
over time (overall index) as well as over partial attributes, such as the
external and the internal criteria. A deeper degree of analysis is also
possible but it cannot be visualized in planar graphs.
The model can be validated according to the shift-share calculations.
In 60% of the cases, the shift-share analysis of the turnover data may
explain the differences of the indices and in the rest cases there is a
consistency with the shift-share calculations of the traffic. Generally it
is not possible to validate a MCDM ranking method as from the
theory it is known that different methods may yield different results
and in practice only experience and historical data may assist towards
validation exercises. Apart from the overall ranking and monitoring
E x e cu t i v e S u m m ar y
Page 26 of 298
over the years it is possible to use the same hierarchy or elements of
the structure for practical problems, such as the corporate planning
and mergers. In corporate planning it is possible to estimate the final
position of the company if some tactical movements occur or to
foresee the result of these movements, by using the same hierarchy
and weights. In cases, where new actors or new parameters shall be
taken into account, elements from the hierarchy may assist in the
planning. This is also the case for the selection of the optimum
merger-alternative. The model aims to have capabilities for practical
use; nevertheless, it is consistent with the basic theory as described in
the textbooks.
In all cases the consistency of the judgments remained under the limit
of 10% as demanded from the theory, so there is confidence in the
final numerical results. Different opinions or approximations may
stem out of different sets of criteria. It is possible to include more
alternatives and more criteria in the hierarchy as is but there is always
the question over the availability and the integrity of the data for all
companies in the set and for all years of the analysis.
Apart from suggestions for further development of the application as
well as for further theoretical consideration, this manuscript includes
large lists of indices, tables, figures and annexes aiming to assist the
reader in understanding the depth of the analysis, the effort dedicated
and in providing a solid data-base for these GCS companies.
The structure of this Thesis is the following, considering this chapter –
Executive Summary – as the first one:
1. In the second chapter, the problem is adequately defined. The
background presentation includes an analysis of the forces and
the characteristics of the GCS. The chapter concludes with a
thorough literature review, broken down into three distinctive
E x e cu t i v e S u m m ar y
Page 27 of 298
parts: shipping finance, MCDM and GCS. These fields are not
directly related, but for the needs and purposes of this thesis it
is essential to present papers, books and work of specific
interest. It is also necessary to note, that the presentation of the
broad academic field of MCDM is limited to the needs of this
work.
2. In the third chapter, the Greek Coastal System (GCS) is
thoroughly presented. Special analysis of the institutional
framework, novel market analysis including also scrutiny of
concentration indices and shift-share analysis, and some
technical aspects of the system comprise the main
characteristics of interest. All these data are ‘official’ ones, i.e.
these are the original ones presented to the stock-exchange
authorities and the companies bear liabilities for negligence or
errors in these data-sets.
3. A chapter on the methodology follows. In this chapter, the
general MCDM problem is presented first. Then the AHP is
discussed; the aim of this presentation is not to include all
theoretic and practical issues discussed in the literature, but
rather to present the AHP as a technique and a tool for the
purposes of this thesis. Nevertheless, the critical issues of
group decision-making and of the sensitivity analysis are
presented in greater detail, as they determine simulation and
sensitivity analyses goals and limitations.
4. Chapter 5 is devoted on the issue of the Operating Risk. This is
a critical concern for the lending institutions as they have to
implement new risk-assessment and management rules.
Furthermore it was also required to map the Greek lending
market. The collection of questionnaires was the first step, and
E x e cu t i v e S u m m ar y
Page 28 of 298
then the creation of information out of these data-sets was
achieved through the use of AHP, based on absolute
comparisons. The use of simulation techniques at the upper
levels was necessary, since there was the goal of an unbiased
final result. The analysis concludes with clustering of the
lending institutions, as well as with a stressing of the
importance of the lender’s capitals in the GCS.
5. Chapter six deals with the main problem of evaluating a GCS
company. Large part of this chapter is devoted to a thorough
analysis of the hierarchy as well as of the respective criteria.
Then follows the application of the methodology; the
simulation and scenario-based outcomes are developed and
presented. The chapter concludes with comments on
theoretical issues as well as with the validation remarks.
6. A chapter on the application of the model follows. In the
previous chapters the ranking problems have been numerically
dealt, but in this one the focus lies with its wider applications.
By taking parts of the hierarchy or by altering slightly the
hierarchy it is possible to expand the capabilities of the tool.
Nevertheless, a detailed analysis of its current capabilities as
planning tool is presented. Finally, this chapter includes also
some theoretical considerations. Although AHP is rather well-
discussed method, one can seldom find MCDM considerations
in the literature. Most of the work performed is on the
numerical handling and on the soundness of specific steps. It
was, therefore, necessary to consider some theoretical aspects
of the method.
7. The thesis concludes with a chapter summarizing the
conclusions and suggesting further research and applications.
E x e cu t i v e S u m m ar y
Page 29 of 298
References, annexes, questionnaires, data and calculations are
also available for further research or justification of the work
performed.
The main results of this research work are thoroughly analyzed in the
respected chapter; however the following findings are considered as
the most value adding ones:
1 Literature Review
1.1 There are many but out of date texts regarding the risk
structure and the criteria for financing shipping
ventures. None is specifically addressed to SSS and
coastal shipping.
1.2 There is a lot of literature in the field of MCDM but no
MCDSS tool or MA methodology relevant to the
shipping company evaluation is reported. Some
attempts in the literature are limited to relative
comparisons or to academic purposes. The use of
MCDM techniques as well as the academic interest in
the risk related problems is increased lately.
1.3 The issue of GCS in the literature has not appeared
lately. Only papers and studies of the mid-90s’ are
reported and set the basis for further research and
elaboration. Most of them are presented by Greek
research institutions.
2 The Greek Coastal System:
2.1 The GCS companies have benefited from their listing at
the ASE and have experienced enormous growth during
the period 1997-2002.
E x e cu t i v e S u m m ar y
Page 30 of 298
2.2 The market-shares based on turnover are shifted from
the dominant Cretan companies MINOAN and ANEK
in the 90s’ to the group of companies of EPATT
(Superfast Ferries and Blue Star Lines – STRINTZIS).
2.3 Most of the revenues are attributed to fares charged
(approximately 87%) and are accrued in the Adriatic
(approximately 70%), although this market represents
almost 30% of the total passenger traffic reported, 40%
of the total car traffic and 55% of the total truck traffic.
2.4 The market is not oligopolistic. According to HHI and
Gini coefficient methodologies, the market is not
concentrated to some carriers.
2.5 There are not many and important developments
regarding the ports servicing the vessels of these
companies.
3 Methodology
3.1 AHP has been selected on the following grounds:
3.1.1 in absolute comparison mechanisms it is
not possible to experience rank-
preservation problems;
3.1.2 the set of data is very large and the relative
comparison of every alternative for every
year available would increase the
numerical and decisional burden
exponentially;
3.1.3 it is easy to add alternatives (existing or
dummy ones), to experiment with the
sensitivity of parameters, or to estimate
E x e cu t i v e S u m m ar y
Page 31 of 298
the outcome of an action (element
sensitivity);
3.1.4 the focal attention lies on the hierarchy, i.e.
on the insights and on the parameters
determining the phenomenon
3.1.5 AHP can be combined with other methods
3.1.6 AHP-required hierarchies can be further
developed to networks and systems with
dependencies and influences (commonly
addressed by ANP)
3.2 The sensitivity analysis is critical and has been
addressed on the basis of specialized research on
the AHP, in order to proceed in the:
3.2.1 Determination of the most critical
criterion,
3.2.2 Determination of the most critical element
in the decision matrix.
4 The lenders’ market
4.1 Financial Institutions have to face risks in a totally
different way and specifically deal with the operational
risk.
4.2 Financial Institutions with lending interests in shipping
are reduced in number but the overall portfolio is
expanded.
4.3 Shipping companies will experience consolidation in
number and simultaneous increase of their size. This is
partially the result of splitting the market in risk-tiers in
accordance to the new lending rules and strategies.

E x e cu t i v e S u m m ar y
Page 32 of 298
4.4 The importance of the GCS sector to the lenders is rather
limited, as it represents about 6% of the total portfolio
available and about 9% of the Greek FI active in the
market (€1.64bn in 2001 and €2.15bn in 2002). According
to data provided by the ASE, the GCS listed companies
have acquired 220bn GrD (€645m) from the market up
to the end of 2002. Obviously bank lending is
considered as the most important source of financing.
5 The shipping company evaluation model and its applications:
5.1 The developed model can yield an overall evaluation of
GCS companies according to a criteria structure
(hierarchy).
5.2 The most critical criterion, i.e. the one that can alter the
ranking with the minimum relative change is the one of
the fundamental data (for the base-year).
5.3 Both simulation and scenario analysis yield the same
ranking practically, with slight differences for a specific
year of analysis. This is an interesting validating point.
5.4 The resulting index can be explained from the shift-
share analysis. From the available data for the turnover,
almost 60% of all results can be explained. For the rest of
the elements a conjoint analysis with the shift-share
analysis for the traffic is required.
5.5 The model can be used as is for the determination of
overall rankings, corporate planning (‘what-if’
scenarios) and comparison with other companies not
included in the current sample (say companies from
other markets and or not listed GCS companies)
E x e cu t i v e S u m m ar y
Page 33 of 298
5.6 The model after adjustment of its hierarchy may also
assist in corporate planning and focused cases, such as
merger between companies.
The above findings are also flourished with suggestions for further
research and development of the prototype modeling. It is interesting
to note that some applications may have different beneficiaries and
may support more complex decisions.
The contribution of this thesis in the state of the art is evident. For the
first time in the academic literature, a market analysis of the most
significant actors is provided. Furthermore, the analysis of their
financial and operational course into sub-criteria reveals differences
of their structure and their decisions. The classification of these
companies according to a rational set of criteria comprises, also, a
very powerful tool for managerial decisions. This tool may easily be
used by the management of the company for comparison or planning
reasons, as well as by academics and policy-makers as monitoring
tool of the market. The tool is validated through a shift-share analysis
of historical data, thus strengthening the belief that the appointed
weights are reflecting actual conditions. Of course, an MCDM tool
remains a subjective tool and the hierarchy reveals the understanding
of the problem, as well as the indented goals. Further research and
adjustments may easily be launched on the basis of this prototype.
Last, but not least, the analysis of the lenders’ market, as well as, side
results of the analysis, such as the market concentration analysis
appear for the first time in the academic and business literature.
I n t r od u c t i on
Page 34 of 298
2 Introduction
2.1 Problem Definition
This study is focused on the application of multi-criteria decision
making (MCDM) techniques on the complex problem of shipping
finance. As the field of shipping finance is rather expanded, the
research effort is devoted on the Greek Coastal System (GCS). GCS is
very important for the Greek national economy and almost all of the
important shipping operators are listed at the Athens Stock Exchange
(ASE). With the help of similar MCDM modeling, the market of
lenders has been analyzed and mapped as well. Both MCDM
applications are considered as innovative as there is no such work
referred in the literature.
2.2 Analysis Background
Financing industries, businesses and projects are very appealing
operations and demand attention, cautiousness and deep
understanding. Financing has been traditionally the core activity of
banks and other lending institutions, such as state-operated financial
institutions granting capitals for various purposes. In the waterborne
transportation sector, the main sources of finance have been the
commercial banks, private placements, stock-markets, State-agencies
(for instance MARAD in the US) as well as international bodies (such
as OECD) through a system of subsidies and grants.
Lately, financing has become more innovative. Operations or projects
have been widely financed through equity rising at organized
markets, and return-seeking sources, such as private placements,
venture capitals, etc. This trend reveals only the need of modern
businesses to get capitals and merely the inability or the reluctance of
the banking system to support financially the whole market. The

I n t r o d u ct i o n
Page 35 of 298
shipping market is a good example for tracing the capabilities and the
limitations of banks. From the very beginning of shipping, as it is in
these days, it was and still is conceived as a high risk industry.
In the late 1950s the image of shipping changed; shipping was, and
still is, a risky venture, but the financing of new vessels upon
contracted transport commissions changed the pattern of business.
This was also an effect of the 1959 Greek proposal to the wider
shipping market on the tax regime that is more or less still valid as
well as the growth of the Eurodollar market and of the increase of
capital needs. More on the subject can be found in the classic
textbooks, such as those of Rinman and Brodefors (1983, pp.112-117),
and of Stokes (1992, pp 12-20).
Financing has experienced sturdy progress due to theoretical
advances and the blatant need to cover the needs of the financial
institutions, the market and the States. Nevertheless, shipping finance
has been wedged to a conventional form of business, based on the
expertise of the bank officer and on a set of attributes of the loan-
applicant: character , collateral, capacity and capital . More on these
issues can be found in coming paragraphs (§5.2.2). So, despite the
advances in the science and practice of finance, shipping finance
remained a field with few research progress and all efforts have been
focus on analyzing the market (see also §2.4.1). Evidently, the
financial and research institutions invest in the market analysis, trying
to get a better feeling of the trends as well as to model niches of the
market, in order to rationalize their intuition. Towards such analysis,
the book of Beenstock and Vergottis (1993) is invaluable, as it sums up
all the efforts up to 1993 and the proposed modeling can be adjusted
to the data streams banks own and retrieve.
I n t r o d u ct i o n
Page 36 of 298
In all forms of financing and in modern management, evaluation and
benchmarking has become integral part in every-day decision making
process. Whether financing comes from a financial institution, public
or private placements, investors and creditors are primarily dealing
with a multi-criteria decision making problem (MCDM) of discrete
nature. Depending on the case, this problem is categorized as choice of
the better alternative, ranking of alternatives, classification or sorting and as
simple description. In the terminology of MCDM and in the case of
financing, a specific company is understood as alternative. Problems of
choice, ranking and classification lead to the evaluation of a set of
alternatives. Furthermore, problems of choice and ranking are based
on relative comparisons among alternatives, while classification on
absolute ones. An interesting theoretical observation is that relative
comparisons are dependent on the set of the alternatives, i.e. if it is
changed, then the outcome of the procedure might alter, which is not
the case in the absolute ones.
In the case of financing, absolute comparisons and classification
problems may apply in larger sets of potential clients, such as in
housing, and commercial loans. In these cases banks have a list of
thousands and the task is to sort the customers into categories.
Whether the customers are corporations, households or persons, it is
irrelevant as the methodology is similar and what changes is the final
sum of weights and attributes. Contrary to this ‘mass’ problem of
classification, where usually the alternatives are thousands1 financing
industrial customers (including shipping) is a problem of ranking and
selection of the better option. As stated before, in the former case the
1 In a recent business exercise, a major Greek private bank elaborated about 75,000
personal loans, 18,000 housing loans and 110,000 credit cards.
I n t r o d u ct i o n
Page 37 of 298
formulation is based on absolute comparisons, and in the latter on
relative ones. That means, the financial institution has a set of few
customer’ applications and has to select the best ones. This selection
procedure does not only include data on the project, the financial
standing of the customer and of the specific market but also bears
marketing and strategic options of the lender. In many cases financial
institutions undertake risks in order to penetrate markets or
industries, aiming at the satisfaction of a customer. As a result the
selection procedure is too relative, as it does not only include relative
comparisons per attribute and per customers’ pairs, but also
subjective understandings, beliefs and intuitions of the decision-
maker.
The trigger for this study was this very selection procedure; having
spent a couple of years close to the final decision-makers of a large
bank institution it became clear that the selection procedure was not
always rational and in most cases non-uniform. Furthermore, there
were too few supporting arguments for a selection and in most cases
subjective perceptions determined the outcome. Nevertheless, big
lending deals affect the loan-portfolio of the financial institution
heavily and disastrous outcomes can very seldom be easily absorbed.
The idea that the selection of alternatives was not a very sound one
was amalgamated during careful attendance of shipping finance
seminars abroad. There, it became evident that, the institutions
invested heavily in the market analysis trying to rationalize their
biases and to get armored with arguments and knowledge through
observations. Contrary to the author’s experiences and training, in the
Greek market, personal relations were more important than any other
factor and the ‘business’ should be furnished with the appropriate
‘story’. This critique towards the Greek lenders would be easily
characterized as biased, if only there were not so many articles in the
I n t r o d u ct i o n
Page 38 of 298
financial press over defaulted loans. Most of these loans were linked
directly or indirectly with the Greek Coastal System (GCS) and
politics were also involved in such a sensitive social issue. Therefore,
the analysis and the in-depth understanding of the GCS companies is
a subject of special academic and business interest.
This study had to deal with two separate subjects: the mapping of the
GCS market in terms of sector analysis as well as the understanding
of the Greek lender market, i.e. of the main supply of capitals. This
mapping is understood also as a ranking analysis between
alternatives on the basis of specific attributes. The focus on GCS
companies listed at the Athens Stock Exchange Market (ASE) was
compulsory as most of their data are of adequate quality and
available freely in the various annual reports and information
memoranda. The analysis of the lender market was possible only
through questionnaires that were querying for information commonly
discussed in academic textbooks but also referred as ‘business
practice’. It is not possible to get actual figures on customers,
especially in such a specific market, that practically every financial
movement is monitored by the press. For the ranking mechanism
(selection tool) a MCDM approach was selected as international
experience leads to these tools and techniques. The choice of a
technique is often debatable but not the wider ideas of the MCDM
field as such. It has to be highlighted that some Greek financial
institutions are gradually introducing MCDM techniques but mainly
for large classification problems. The chosen MCDM methodology,
the Analytic Hierarchy Process (AHP) addressed practically all
problems emerged during research.
Both problems, the mapping of a market and the selection procedure
are of static nature, i.e. the outcome of the selection is valid for a given
environment. In both cases there is a set of attributes per alternative
I n t r o d u ct i o n
Page 39 of 298
(either bank or customer) and the ranking mechanism draws data
from the past. In order to surpass this problem at least, for the
ranking mechanism of GCS-companies, the model runs for every
company and for every fiscal year available. So there is a track
recording and conclusions can be extracted. The same would have
been an approach for the financial institutions, though changes are
slower and less hastily. In that sense the ranking mechanism can also
be used by the companies in order to improve their position given a
set of weights (judgments over criteria) as they can estimate the
changes for practically every action or procedure included in the
model. So if the model includes as many as possible attributes of the
company that correspond to procedures, actions or facts, then the
management has a relatively easy-to-use but robust tool to estimate
the outcome of decisions. Furthermore, the bank can also indicate to
the customer what has to be changed in order to get a better ranking.
Such services are very lucrative and build confidence between lenders
and customers. In addition, one can also estimate the future standing
of a company, thus predicting competition characteristics in a market.
In financing, as in other scientific fields, such as transportation,
forecasting and predictions are subject to the parameters involved in
the model and of their dynamic nature. As predictions and
forecasting have to address a specific need, for example to predict the
traffic in real time conditions and send the proper signaling to traffic
lights, the system (or the algorithm) has to respond in a suitable time
interval and within proper accuracy levels. So, in this example from
the transportation science, the analyst has to take into account the
dynamic nature of the data as well as the need for a rapid response.
However, in financing the response time of lender to a request is only
a matter of marketing to a customer’s request, because what really
matters is the unpredictability of the parameters. In academic texts
I n t r o d u ct i o n
Page 40 of 298
and in traditional bank spreadsheets, the estimation of running
expenses, the financial outcome of the employment of the vessel are
taken into account and a spreadsheet with normal project calculations
is drafted; the capital, the operational and other extra expenses are
taken into account, the revenues out of the employment are
considered, and finally some criteria, such as NPV, IRR, payback
period have to fall within a specific range. Nevertheless, the time
frame is rather long, ten years and more are the usual amortization
period, and many parameters can drastically change. The prediction
of the ranges is a way to secure the results and the decisions,
therefore, simulation techniques or sensitivity analysis complete the
drafting of the calculations. However this is only a way to estimate
the possibility of the final outcome with a priori given probabilities or
distributions.
The value of perfect prediction in such systems is a very interesting
subject and melts down to the very question, how much is it worth to
have better information? Sussman links this issue with control
methods. The spending of research resources is crucial for the
prediction of the behavior of a system. Ultimately, Sussman suggests
that this is a subjective issue as it depends on our best understanding
(Sussman, 2000, p.345). In other words, it depends on the analysis and
the assignment of weights among the criteria. That is also the main
point of all MCDM techniques or the basic consideration for practical
decision making.
2.3 Structure of the Document
In this chapter the very first sections were committed to the definition
of the problem and the scope of the study.
The literature review section follows in order to set the limits of the
research effort up today in this field. This review-section was split
I n t r o d u ct i o n
Page 41 of 298
into three distinct categories for research purposes. A thorough
analysis of the shipping finance and investment risk review preceded
the survey over the MCDM and the GCS. The MCDM literature
review was focused on subjects and techniques relevant to the needs
of the study; as the MCDM is a very wide and ‘gray’ academic zone it
is quite impossible to monitor all papers, books and references of that
field. The reader will find some references in other sections that are
not reported in this appropriate section (2.4.2); these references are
solely useful for the justification of numerical handling of the selected
MCDM technique. A full reference of papers and works over the
numerical handling is out of the purposes of this analysis and would
demand a state-of-the-art-seeking effort that involves many scientific
disciplines, such s mathematics and psychometric techniques. Finally,
the review over the GCS aims to include only works with a significant
impact on the academic evolution. Studies and other research efforts
with a minimal add-value are excluded.
A chapter -3- on the Greek Coastal System follows; this presentation
aims to outline the system for the non-familiar reader, as well as, to
set the limits of the research and of the analysis. The market analysis
and the calculations of concentration indices can be considered as
pioneering work too, as there is no relevant work reported in the
academic or business literature. Supplementary information on
concentration indices and shift-share analyses is presented in the
respective annex (Annex A: Concentration Indices).
The methodology of the analysis is presented in the next chapter -4-.
The presentation of the Analytical Hierarchy Process (AHP) will be as
thorough as necessary for the needs of the non-familiar reader, as
there are many books and references over the fundamentals and the
foundation of the methodology. Readers who may desire a more
detailed, formal or strict development of the methodology are
I n t r o d u ct i o n
Page 42 of 298
directed to the literature. As AHP is known to the academic
community since early 1980s’ and international congresses are
biannually held, it is therefore considered as a well-known and
discussed methodology. This does not imply its universal application.
The methodological analysis on the AHP includes also two very
interesting subjects: the sensitivity analysis section as well as a brief
discussion over the ‘usual’ methodological considerations. The
sensitivity analysis is based on the work of Triantaphyllou (primarily)
and of other researchers. All these papers are published in scientific
journals in the US. The importance of sensitivity analysis is critical
and therefore researchers provide basic definitions. This study adopts
the definitions of the most critical criterion and of the most critical
element when seeking a rank reversal. The issue of rank reversal and
the ‘fallacy’ of preserving ranking when some initial conditions
change are discussed in the coming section. This issue is a rather
vehement subject among the MCDM academic community and is
discussed in the respective paragraph (4.3).
In the fifth chapter - The Challenge of Operating Risk – follows a
presentation of the modern operational pattern of banks due to the
new rules and regulations regarding the risk management. The issue
of operational risk gets focal attention. The effort concentrates on the
qualitative aspects as it is not possible to apply the rules unless details
of the loan-portfolio of the bank are available. The discussion
proceeds with the basic aspects of risk structure in the shipping
industry. Up to that point the presentation does not provide any
insights of the Greek market. In the following paragraphs (§5.2), a
thorough analysis of the Greek lenders market completes this chapter.
As stated in the problem definition section (§2.1), the supply side
analysis is limited to a mapping through questionnaires. The
questionnaire is available as respective annex (Annex B:
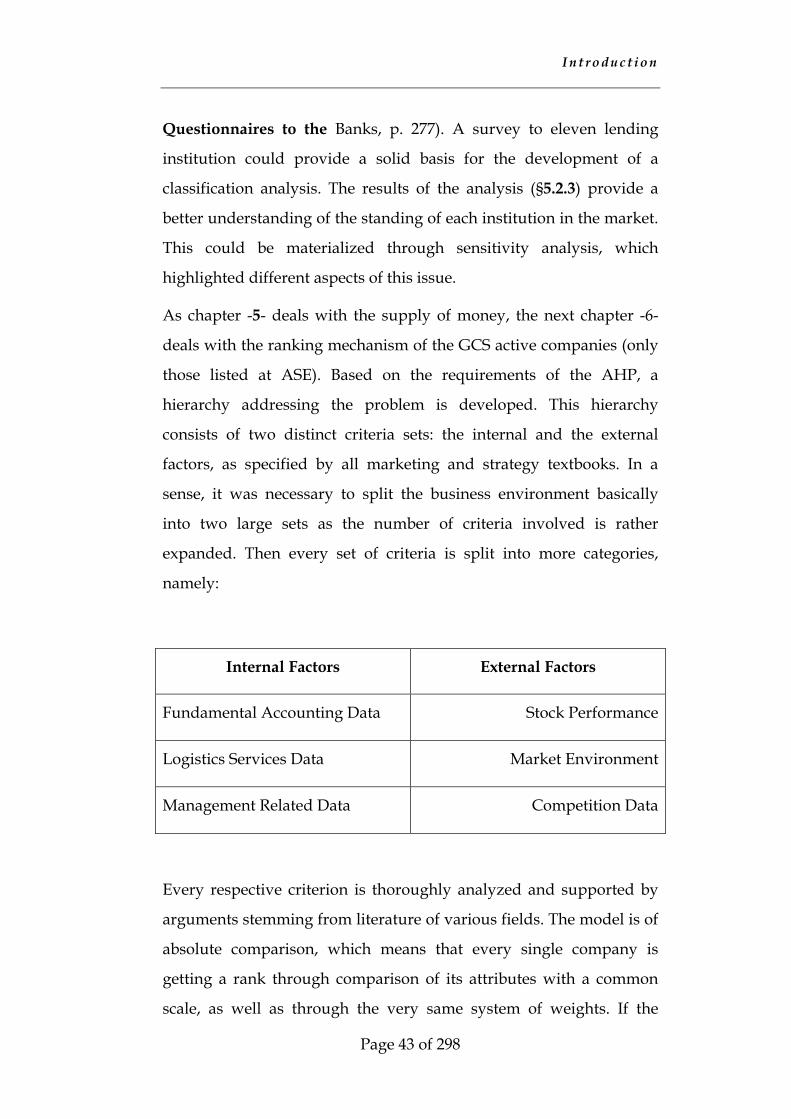
I n t r o d u ct i o n
Page 43 of 298
Questionnaires to the Banks, p. 277). A survey to eleven lending
institution could provide a solid basis for the development of a
classification analysis. The results of the analysis (§5.2.3) provide a
better understanding of the standing of each institution in the market.
This could be materialized through sensitivity analysis, which
highlighted different aspects of this issue.
As chapter -5- deals with the supply of money, the next chapter -6-
deals with the ranking mechanism of the GCS active companies (only
those listed at ASE). Based on the requirements of the AHP, a
hierarchy addressing the problem is developed. This hierarchy
consists of two distinct criteria sets: the internal and the external
factors, as specified by all marketing and strategy textbooks. In a
sense, it was necessary to split the business environment basically
into two large sets as the number of criteria involved is rather
expanded. Then every set of criteria is split into more categories,
namely:
Internal Factors External Factors
Fundamental Accounting Data Stock Performance
Logistics Services Data Market Environment
Management Related Data Competition Data
Every respective criterion is thoroughly analyzed and supported by
arguments stemming from literature of various fields. The model is of
absolute comparison, which means that every single company is
getting a rank through comparison of its attributes with a common
scale, as well as through the very same system of weights. If the
I n t r o d u ct i o n
Page 44 of 298
model was based on relative comparisons then every alternative
should have been compared with all the other ones. The absolute
comparison method was selected for the following reasons:
1. in absolute comparison mechanisms, it is not possible to
experience rank-preservation problems;
2. the set of data is very large and the relative comparison of
every alternative for every year available would increase the
numerical and decisional burden exponentially;
3. it is easy to add alternatives (existing or dummy ones), to
experiment with the sensitivity of parameters, or to estimate
the outcome of an action (element sensitivity);
4. the focal attention lies on the hierarchy, i.e. on the insights and
on the parameters determining the phenomenon;
A sensitivity analysis, according to the findings and guidelines of
researchers, is performed, in order to highlight the most critical
elements and criteria. This chapter concludes with the presentation of
the results of scenario based analysis and a simulation procedure.
Data and calculations can be found in the respected annexes (pages
281 and 290 respectively).
The next chapter -7- deals with the application of the model. The
interest lies with results that can be derived from the model as such
(given the hierarchy drafted in chapter 6) as well as from its elements.
There is clear intention to make this model useful to actual decision-
makers and to expand their analytical capabilities for critical
decisions, such as planning and mergers. This chapter concludes with
some theoretic remarks; the quest for objectivity and the inherent
capability of the AHP to produce results without a prior knowledge
of the utility function are discussed in view of the classical theory of
Keeney and Raiffa.
I n t r o d u ct i o n
Page 45 of 298
In the last chapter -8- the reader can find a sum-up of conclusions and
suggestions for further research. Apart from the list of conclusions
that offers interesting points for academic and practical discussion,
the paragraphs on further research recommend, not only practical
approaches to the problem, but also some methodological
considerations. It is known to the MCDM community that the
problem is not the handling of the data, but the way the decision is
taken. To that perspective this study covenants to suggest ways
mitigating errors or improving the outcome. Many annexes and
supportive lists and indices are provided for validation of the input
data, of the derived outcome, and for further research use.
2.4 Literature Review
2.4.1 Shipping Finance
Shipping has been traditionally considered a risky industry with
relatively low profit margins. However, recent studies suggest that
the systematic risk of the shipping industry is similar or lower than
other industries, such as gas, electricity (utilities), trucks and air
(transportation) and that its average returns appear to be higher than
the average return of those industries (Kavussanos and Marcoulis,
1998). Under the basic assumption of unequivocal returns across the
industry, such findings enhance the attractiveness of the industry but
are limited within the microeconomic approach. Kavussanos and
Marcoulis extended their approach considering macroeconomic
factors (2000). From a mathematical point of view, this research has
been based on the well-known Capital Asset Pricing Model (CAPM)
and on Fama-MacBeth methodology for cross-industry regressions.
The conclusions of the macroeconomic approach justify and quantify
I n t r o d u ct i o n
Page 46 of 298
the common belief that industrial production, interest rates, oil prices,
consumption and inflation influence returns across sectors. At the
same wavelength, Grammenos and Arkoulis attempt to link the
above mentioned macroeconomic factors and laid-up tonnage to
shipping stock returns (2002). Their findings are interesting given the
sample, the used statistical techniques, yet they contradict basic
figures; for example Grammenos suggests that oil-prices are
negatively related to shipping stocks (p. 95 and 97), while
Kavussanos’ approach claims that oil-prices are positively related to
returns (p. 246 and 250). Such disagreements may stem from
differences in the sample and the formulation of the problem and do
not deprive novelty from these efforts. Lately, Kavussanos has
investigated also the sub-sectors of the maritime industry using
similar methodological approach as in the previous works and
observed that the β factors were significantly lower than that of the
market (Kavussanos, et al, 2003). However, these papers are basically
addressed to the academic community and take into account only
listed companies. In most papers, the authors conclude with the
suggestion to further collect data for many periods, with upturns and
downturns of the market, so to achieve a better outcome.
A publication on the long run performance of shipping initial public
offerings highlighted the underperformance of shipping shares to the
local stock market of Athens, Oslo, New York, Stockholm and Hong
Kong (Grammenos and Arkoulis, 1999). This very interesting
empirical research validates the notion that the shipping industry is
not attractive to investors. It is interesting to note that different
markets displayed similar performance in the aftermarket and similar
performance has been documented across different fleet
compositions, at least in the first year. Gearing, fleet age, equity
offered are only some of the factors analyzed in this paper and
I n t r o d u ct i o n
Page 47 of 298
provided some evidence of relation with the performance of the stock.
Another interesting approach regarding listed shipping companies is
that of Panayides and Gong on the reaction of stock markets to
mergers and acquisition announcements (2002). Although the data-
sample is limited to liner companies, the results of the investigation
can be of particular importance to the shareholders, the investors and
the management and the methodology can be adjusted so to offer a
solid basis for investigation of the effects of industry or company
specific events, such as emerging regulation or deal disclosure.
Though beta and returns comparisons as well as the behavior of
stocks after perturbing information release are investigated to the
benefit of investors and shareholders including creditors, bond
financing has not been advocated enough. Within the five recent
years, only Leggate has investigated the suitability of bond financing
directed from the high financial requirements of the European
shipping industry (2000). The rational of Leggate’s work is that as
European fleet grows older and needs renewal, the number of
financial institutions active in the shipping finance market is
shrinking, and the debt financing schemes will not be adequate or
sufficient to cover the needs. Leggate discusses the issue of rating and
links it with company performance. Although this is not a novel
concept Leggate stimulates that financing will become more dynamic
as it demands monitoring of the performance of the company.
Commending this, every financing method takes into account the
track record of the debtor or of the issuing company, but bonds and
stocks are dynamically linked to performance; a banker monitors the
debtor but enjoys mortgages and well-structured information.
Leggate has also explored the exchange risk in the shipping industry
(in 1999 and with Akatsuka in 2001). In both papers, where the
Norwegian Krone and the Japanese Yen were examined against the
I n t r o d u ct i o n
Page 48 of 298
US dollar, the result is the equivalent: the exchange rate risk is a
determinant factor of the corporate performance.
Almost simultaneously two papers on the assessment of efficient
market hypothesis (EMH) appeared in the Journal Maritime Policy
and Management; by using expectation theory Dikos and
Papapostolou (2002) justified previous work of Kavussanos and
demonstrated that the volatility of spot and time-charter freights of
the VLCC and ULCC market segment is higher than of Handymax,
Aframax and Suezmax (2002). Kavussanos and Alizadeh investigated
the validity of EMH in asset play of the dry bulk sector (2002). The
result of their statistical tests was more than appealing and with
practical application; the assumption of EMH in the new-building and
second-hand dry-bulk market shall be rejected due to time-varying
risk premia, thus signaling arbitrage opportunities and formation of
trading strategy. It is obvious that the investigation of the EMH is
important for both academic and professional reasons.
Finally, a paper of Gilje et al. (2002) investigated the consolidation of
crude carriers through financial criteria. The survey was based on
questionnaires and revealed that long-term employment of the
vessel(s) concerns all involved capital providers. However, debt-
providers, the bankers, were more supportive of consolidation
practices contrary to equity-providers, who seek opportunities for
speculation and asset play. The authors support the idea that
‘managerial experience’ and balance sheet performance are among
the primary considerations; although balance sheet performance
implies a rather clear and straightforward set of quantitative criteria
‘managerial performance’ is not. This issue will be discussed
thoroughly in latter sections (168).
I n t r o d u ct i o n
Page 49 of 298
Shipping finance is not a very alluring subject for authors; relatively
only few books have been published on this very interesting subject
both for shipping and banking. Stopford’s Maritime Economics is a not
a book solely dedicated to shipping finance, though it provides sound
beginning for the basic knowledge acquisition: the supply and
demand in the shipping industry, basic calculations and most
importantly, the pattern of business (Stopford, 1995). Although it is
not a book on finance, it is a book written by somebody active in this
field, having renowned expertise and deep knowledge. At the same
wavelength lies the book of Cheng too (1979). Cheng’s book on the
financial management of shipping is quite old and obsolete, with
interesting structure and analysis. Cheng’s book handles not only
macroeconomic and microeconomic issues of the industry, but also
provides basic insights and comparisons of the accounting and
taxation systems in various legislations. It offers a unique ground for
evaluation and understanding of several regimes. Last in this
category, is the book of Evans and Marlow (1990) on quantitative
methods in shipping. This book provides simple modeling of several
examples and day-to-day operations and completes what is left of the
previous books. These three books are complementary to each other
and provide some tools to support decisions or to assess a case.
A very interesting book on shipping finance is the book of Stokes,
which focuses on the history and basic mechanisms (Stokes, 1992). It
is practically the only book focused on this subject without involving
other fields or disciplines. Although it is almost 10 years old, the book
offers a very interesting description of the facts and the drives behind
the evolution of shipping finance. However, the résumé of the book is
also that shipping finance has not been really evolved but changed or
transformed as a relationship. New mechanisms and tools are
I n t r o d u ct i o n
Page 50 of 298
practical applications of other forms of finance dressed-up for the
needs of the shipping industry.
Another very interesting book is the one on economic modeling of
shipping by Beenstock and Vergottis (1993), which is a treatment of
the basic micro-economic modeling of shipping combined with data
streams. The authors provide very interesting description of the first
attempts by Tinbergen and Koopmans, and others, as well as
thorough methodological analysis of the each shipping market. It is a
valuable tool for modeling the market, in deed, and along with
adequate data such a modeling can assist in getting the insights of a
wider market. However, such an approach could not be of real
assistance in a problem structured as the GCS.
The book of Sloggett (1984) on shipping finance and the books of
Gray (1986 and 1987) are considered outdated, but evidently unique,
as no other book refers to shipping futures and other risk hedging
instruments.
Finally, there are no texts on the financing of SSS and coastal shipping
operations. In reality, there is no academic and practical interest as
these issues are appropriately handled as corporate and project
financing.
2.4.2 Multi-Criteria Decision Making
The literature on MCDM methods is very wide, as topics of MCDM
can be found in fuzzy set applications, operations research
methodological subjects and in pure mathematical books. Although
there is a clear trend of using MCDM methods for financial decisions
(Hallerbach et. all, 2002a and 2002b as well as Zopounidis et al., 2002),
there were very few cases found associating MCDM with shipping or
even transport related subjects. Lately, the works of Lirn et al. (2004),
as well as of Dimitras et al. (2002), are using MCDM techniques for
I n t r o d u ct i o n
Page 51 of 298
the selection of transshipment hubs and for the evaluation of shipping
loans respectively. As the quest for this research work is the setting-
up of a mechanism adequate to support financial decisions for
shipping companies, it is interesting to note that there are not many
papers and sources in this field. Recently, only few authors have dealt
with this issue: Chou and Liang have combined fuzzy-logic, the
analytic hierarchy process (AHP) and the entropy techniques, in order
to evaluate liner companies (2001). This paper is pioneering but it fails
to address the real-world problem; the use of the AHP is not fully
justified, although it is a very powerful method. However, research
and academic debate has led to improved versions of this method; the
use of the original version of the method denotes the importance of
the results. Furthermore, the mixing of fuzzy-logic techniques makes
possible to skip the problem of dealing with qualitative criteria in the
evaluation procedure, though it is not the only way and complicates
the algorithm. Finally, the authors suggest that three evaluators are
getting involved and avoid discussing the issue of ‘group decision’ as
it is commonly addressed in the jargon of the MCDM field. Panayides
and Cullinane do not get into the MCDM techniques in order to
assess the criteria used for third party ship management selection and
evaluation (2002). They collect data on various criteria and perform
simple statistical analysis. It is interesting to note, that at least in this
paper, qualitative criteria, such as technical ability, reputation,
competency, trustworthiness, etc, have only been dealt as attributes;
the responses from the questionnaires were figures within a specific 1
to 5 scale. ‘Gray’ zones and intuitions were not really discussed; for
example, there are gray zones in the competency criteria where
experience, qualifications of the personnel and service quality has
been identified. This paper provides though a very interesting insight
of the ship management market. Finally, Mangan et al. (2001)
I n t r o d u ct i o n
Page 52 of 298
presented their work on discussing the variables in the modal choice
problem in freight transportation. Their work is substantial as they
present data of extended literature review and criticizes the various
modeling approaches.
The issue of measuring company performance and credit-evaluating
is not a new one in the literature. However, only one paper, that of
Chou et al. (2001) focuses on shipping companies. Performance
measurement is a rather common topic in the economic literature, and
in journals, such as the International Journal of Business, one can find
many articles. Indicatively, Yang and Shi presented lately a similar
performance measurement mechanism in Chinese industries (2002).
One can find other applications as well, but on waterborne
transportation.
The issue of modeling risk and uncertainty with the help of MCDM
techniques receives much attention in the decision-making literature.
In most cases, the problem was restricted in states of nature
(uncontrollable events) and their treatment from a methodology.
Nevertheless, AHP was never used in such cases, despite its inherent
capabilities in treating uncertainty through relative and scalar
measurements. Regardless if AHP is used towards the elicitation of
subjective probabilities or the estimation of outcomes, the method
results measures on a ratio scales. This was also the main feature
enabling the conjunction of the method with other decision-making
techniques, such as linear and integer programming, data
envelopment analysis (DEA), balanced scorecards, genetic algorithms
and neural networks. Saaty has presented a technique dealing with
risk through the construction of separate hierarchies dedicated to
befits, costs and risks respectively (Saaty, 1994, pp. 164-166), but this
technique has been thoroughly criticized, as unclear and not
meaningful to the decision maker in the general case. In a recent
I n t r o d u ct i o n
Page 53 of 298
publication, AHP assists in modeling risk and uncertainty in four
prototypical cases:
1. expected values with relative probabilities
2. decision trees and expected values
3. adjustment for variance, regret and risk aversion
4. risk as a criterion (Millet and Wedley, 2003)
Millet and Wedley also, dedicate some space in pointing out future
research and necessary theoretical investigations before generalizing
their approach, but having linked AHP with risk they shed light on
some gray zones of risk analysis and decision support. This
publication has to be evaluated in combination with the trends in risk
analysis. For many years, the practice of risk analysis has been
focused on financial issues, such as portfolio selection, credit analysis
and relevant issues. Many researchers strive to fine-tune and combine
methodologies using high-performance computing, methods and
techniques of machine learning and soft computing and diverse
classification (Leigh, et. al, 2002). Such research works try to put
together as many techniques as necessary in order to fine-tune
empirical methods, namely technical analysis, and to support
decisions relative to portfolio management of any kind. Apart from
the complexity of the approach and the necessary scientific effort, a
huge stream of data is demanded, not always available in the market
or in several archives and data-warehouses. On the other hand, credit
risk measurements have been traditionally heavily depended upon
accounting data and concepts, even in the last years, where logit
modeling has also been applied. In Altman et al, it is stated that the
practice of financial institutions (FI) was based on subjective analysis
and more specifically on the 4 “Cs”: character (reputation), capital
(leverage), capacity (volatility of earnings) and collateral. The same
I n t r o d u ct i o n
Page 54 of 298
approach can still be found in the shipping finance literature (see, e.g.
Grammenos and Xilas, 1997 and 1999). The same source reports that
FIs themselves have increasingly moved away from subjective/expert
systems over the past 20 years towards more objective systems. Then,
accounting based credit-scoring systems have replaced the traditional
subjective systems and four methodological approaches appeared:
linear probability model, logit model, probit model and discrete
models. Discrete and logit modeling have been widely applied yet
there was the issue of failure/non-failure approach, i.e. the result was
either negative or positive for the customer under investigation.
Generally, the input-data were accounting parameters and ratios as
there was no focus on a specific industry but on loan-categories (say
housing) or other classification ranges. The models were empirical at
a large extent and were based on bankruptcy criteria. The repayment
of loan can fail even if the company does not go bankrupt. Altman,
argues that credit risk modeling fails because it can not pick up the
fast and subtle changes of borrowers conditions, as it takes into
account only book value accounting data and the world is inherently
non-linear (Altman et al, 1998). Finally, there is research in process
aiming at dealing with classical problems, such as portfolio selection,
by using MCDM procedures as they incorporate behavioral elements
in contrast to the conventional ones, such as the theory of Markowitz
(Bouri et. al, 2002).
Another set of papers, of direct interest for this study, are the
methodological papers regarding the sensitivity analysis and the
linkages with the fuzzy set theory. Getting back to the basics, MCDM
and AHP are ideas and techniques within the wider family of
solutions offered by operations research. Operations research is an
application-driven filed, that means research is conducted in order to
solve a specific problem. In a comprehensive survey of the purposes
I n t r o d u ct i o n
Page 55 of 298
of an encyclopedia, it is stated that sensitivity analysis is a
fundamental concept. This idea originates from Dantzig, but has also
been elaborated by other researchers. The interesting point is that
sensitivity analysis in a MCDM problem is not solely focused on the
response of the final result to input perturbations, but also focuses on
the preservation of the ranking (Triantaphyllou et al., 1998, p. 182).
Therefore, research has also included empirical approaches through
tests and numerical experiments, in order not only to highlight
differences and characteristics of the various MCDM approach, but
also to set criteria. Triantaphyllou and Sánchez have expanded the
work of others and have proposed four criteria, determining the most
critical decision-criterion and element (Triantaphylou et al, 1997).
Following this methodological discussion, issues of pairwise
comparisons and of the numerical handling will be dealt within the
sections on methodology (4.2), but it is important to mention the
linking of MCDM problems with fuzzy set theory. The endeavor to
quantify subjective notions is the main characteristic of both theories.
Fuzzy set theory quantifies successfully linguistic variables and
MCDM techniques, especially AHP, consider subjectivity over
decision-criteria. Furthermore, group decision making is required in
many practical cases and AHP incorporates it easily in the
calculations. So by combining fuzzy-set theory and AHP, one can use
fuzzy input (linguistic variables, such as tall-short, etc.) and then
process them through AHP mechanisms with a certain degree of
accuracy or certainty. Ben-Arieh et al classified equipment and items
by using fuzzy-set input and then AHP (absolute measurements) for
the final classification problem (Ben-Arieh et al, 1992). Tsaur et al
have used similar methodologies for modal selection (Tsaur et al,
2002).
I n t r o d u ct i o n
Page 56 of 298
There are not many studies published in the related maritime
economics literature on the issue of freight transport choice. There are
some attempts to investigate the reasons why shippers choose a route
or a port, mainly as a discrete choice analysis (Tiwari et al., 2003).
Generally, the approach is qualitative and the quantification is
commonly succeeded through dummy variables in a regression
model. Last but not least, shipping and particularly passenger
shipping has many commons and similarities with air-industry. The
air industry attracts practical and theoretical interest as it represents
almost 90% of the passenger market (US data but the international
figures for intercity traveling is almost similar). Tsaur et al have
recently evaluated airlines by using a mix of fuzzy techniques, AHP
and TOPSIS, another MCDM method. The followed methodology
aimed to bypass the inherent problems in clustering, which is the
assignment of a relative weight of criteria. AHP was the key and the
other tools, fuzzy techniques and TOPSIS assisted in collecting and
inserting the data and then in the evaluation of the result.
2.4.3 Greek Coastal Shipping
The factual study of the Greek Coastal System (GCS) was initiated
through a research grant to NTUA and Professor Psaraftis from the
Hellenic Industrial Development Bank in 1992 (Psaraftis, 1993). The
outcome of the study was not only a deliverable but a series of papers
presented to the academic and policy making community during the
first and second roundtable on short sea shipping (SSS) in Delft and
Vouliagmeni (1992 and 1994 respectively). Results and findings have
also been presented to other conferences and journals. The paper of
Psaraftis (1994) is a direct outcome of the study while others have
based arguments on it, such as that of Sturmey (1994). Earlier
Psaraftis (1992) has presented a paper on the impact of new
I n t r o d u ct i o n
Page 57 of 298
technologies, mainly based on previous research initiatives (COST
310) and work of Professor Papanikolaou at the NTUA (see European
Short Sea Shipping and FAST Conferences).
At the same time papers, have been presented by Goulielmos (1992)
and (1994) of the University of Piraeus, mainly describing the
structure of the market and some of the effects of the common
European space. Interestingly enough in the 3rd roundtable in Bergen
in 1996, no paper on the GCS was presented but generally only some
on the Adriatic Corridor and SSS.
Within the academic and research framework of the Maritime
Transport Laboratory at NTUA, various diploma theses have been
conducted on this issue. Most of them were focused on the financial
viability of routing innovative vessel designs in specific segments of
the market. Methodologically there is no real deviation from the
study of Psaraftis and there is an add-value to the researcher in terms
of data collection.
Last but not least, the Greek State has financed a study on the new
network operations, but apart from pieces of this study, the results are
not known and clear to the author (ΣΕΘΑΜ study).
G r e ek C o a s t a l S y s t e m
Page 58 of 298
3 Greek Coastal System
The Greek Coastal Shipping (GCS) system is a very interesting case
for research, not only within the Greek business pattern but also from
a European perspective. The problem of the system is not solely of
financial or transportation efficiency but embraces also a variety of
interests of the State and of the society. The State and rest actors, such
as carriers, local communities, and port authorities have to find an
equilibrium that all partial interests can be merely satisfied and
operate within a compromise pattern.
From a carrier perspective, the fleet has to serve ports with adequate
traffic volumes. Furthermore, as the traffic is seasonal, a rational
carrier would operate the fleet only during those months with
adequate volumes. From a local community perspective, vessels have
to connect their island with many other destinations for tourist-
related purposes and to the mainland for commercial and social
cohesion purposes. Local port authorities are the new players in the
game and increase their significance steadily. Local ports have not
only to serve the traffic but also to ensure funding from the State for
local investments. Despite the fact that not all ports have been
converted according to the Law 2932/2001 to corporations (Societe
Anonyme), local interests participating in the management of the port
(in most cases these are just harbors2) can seriously affect the
operation of any fleet. Last but most important actor is the State
expressed through the Minister of Mercantile Marine (MMM), the
2 The quality of port infrastructure and facilities is critical for safety, operational,
security and economic grounds. Although most of the facilities are treated as ‘ports’
by the Law, they only offer harboring and in some cases of a very low quality (e.g.
in the Cycladic complex of islands).
G r e ek C o a s t a l S y s t e m
Page 59 of 298
Coast Guard and various other agencies, authorities, etc. that regulate
or operate the system (e.g. for the construction of port infrastructure
the Ministry of Public Works is also involved, for the lighting of ports,
passages and corridors the Hellenic Navy, etc).
The interest for the GCS is really not new for the Greek State. After
the Revolution and during the first period as independent State, a
Decree of 1836 retains the privilege of cabotage to home shipping.
Considering the status after the ending of the war periods 1912-13,
1916-18 and 1918-22 the Greek mainland was expanded to the west
and the north but the new republic of Turkey seized the east. The
traditional major trade centers to the major Greek islands of the
eastern Aegean were now under Turkish rule; Lesbos and Chios were
trading directly with Smyrna (Izmir) for centuries and now these
islands are cut off from their natural markets in the nearby coast. On
the other hand, these Greek islands had to establish adequate links
with the major center of the State: Athens and the port of Piraeus. The
new status in the Aegean forced new cohesion problems and the
operation of GCS had to become more efficient, as travel distances
were multiplied and it was vital to establish economic links among
the islands and the mainland. The rules of the game were set in the
amalgamative Law 6059/1934. Ever since, this Law has been in force
and its provisos were also included in the Public Maritime Law
(Κ∆Ν∆, § 165, 166, 187 of 1973).
After the turmoil of World War II and of the civil war, the GCS
became even more centralized and Piraeus was connected to all major
destinations directly. This was not the case before the war, as Syros
and other islands, served a premature hub-and-spoke local system.
The hub-and-spoke operations supported the local economies of the
islands, as happened for centuries and enhanced social cohesion. The
new centralized system forced even neighboring islands to isolation
G r e ek C o a s t a l S y s t e m
Page 60 of 298
as they were not properly connected. As transport infrastructure
projects were commenced in the ‘50s GCS connections among various
small mainland ports and the islands were abolished. For example,
there was no connection of ports at the east side of Peloponnesus with
the islands of the Saronic Gulf and of the central Aegean. Before the
war, coastal links were necessary as the land infrastructure was not
efficient. With the booming of the economy in the ‘60s the Aegean
islands attracted also many tourists and therefore an immense
seasonal traffic could lure private interests in the GCS. The entire
above are valid for the total of the system though with exceptions of
local nature. A distinct exception is the link of Crete with the
mainland, due to the size and the importance of the island.
The implementation of EU Regulation 3577/92 on maritime cabotage
aimed to liberalize the maritime services to the benefit of shipowners
who have their ships registered and flying a flag of a Member State
provided that their ships comply with the conditions for carrying out
cabotage in the Aegean. It is interesting to note that Greece and other
Mediterranean States have been granted temporal exception by
means of derogation. Thus in 2004 the GCS should have been
liberalized and the institutional framework harmonized with EU
legislation. During these twelve years of grant-period too many
things have been changed in the Greek economy and the GCS
respectively. Last but not least, the changes did not resolve any
problems of the past: the State has to find ways to ensure proper
connection of the islands to the mainland and the carriers have to
operate profitably in total, even when servicing destinations of no
commercial interest.
G r e ek C o a s t a l S y s t e m
Page 61 of 298
3.1.1 Institutional Framework
The right of cabotage is an outcome of protectionism in shipping. It is
a privilege granted to home shipping operators to undertake
exclusively, specific sea-transport services, such as trade and
passenger traffic within the limits of the territory (Farthing, 1993, p.
139). The cabotage rules were dully supported by various Decrees
and legal documents and the excuse for the state intervention was the
social character of the service. The notion of social character was not
innovative in the legal practice but was one of the very few
instruments the State had to enforce the adequate service of the ‘thin
lines’3.
The system was based on a license-granting procedure. There were
various technical requirements for the ships to qualify the process of
application of service a specific route under a given tariff structure.
The master of the game was the Minister and a consultative body
(Consultative Committee for Coastal Shipping - ΓΕΑΣ4) with
representatives of various stakeholders: the Coast Guard, the MMM,
the Hellenic Tourism Organization, the Ministry of Aegean, the
Chamber of Shipping, etc. It is interesting to note that the application
was not directly examined by this group of representatives and only
the Minister could take the decision.
The Minister also had to determine the routes, the number of ports of
call, the frequency and the schedule of the voyages. A shipping
operator granted a license for a specific route had usually to serve a
couple of islands that normally were not of commercial interest (thin-
3 The literal translation of the Greek term άγονες γραµµές (infertile lines) is ‘thin lines’
according to Sturmey et al. (1994)
4 The Greek term is Γνωµοδοτική Επιτροπή Ακτοπλοϊκών Συγκοινωνιών.

G r e ek C o a s t a l S y s t e m
Page 62 of 298
line islands). So the State secured a minimum connection of these
islands to the system at no cost or budgetary outlay.
Apart from the fares of the first class passengers, the Minister
determined also the fares of passengers, cars, trucks, mail and cargo
on the ships servicing the GCS through a Decree. The State was
interfering with the tariff structure with the excuse of the protection
of the social interest, as carriers could form cartels or practice
monopoly techniques.
Last, but also important, is the fact that among various technical
requirements the vessels should be of age less than 35 years, fly the
Greek Flag (thus making the operations more expensive) and operate
for 10 months per annum. Furthermore, the State retained the right,
through the Coast Guard, to preclude sailings due to bad weather
conditions, although the ships had to remain within a range of 10 sea-
miles from the coastline.
Although there is adequate literature (see §2.4.3, p. 56) where the
researcher can go deeper in the definition and the aspects of the
problem, it has to be clearly stated that the State through agencies and
bodies had (and still has) a tremendous regulatory power. The power
of the ship operator was the monopolistic right to serve a specific
route. From a critical point of view, various technical requirements,
such as the age of the vessel, the design of the routes, the manning of
the vessels, the fare structure, and the schedules were not either
appropriate or capable to maximize the utility out of the service.
Some of them were not even adequately justified from a scientific
point of view, such as the age limit of 35 years. Even the departure-
bar, due to bad weather is not scientifically justified. However, the
system operated for long at an adequate level of service despite
problems experienced in peak times.
G r e ek C o a s t a l S y s t e m
Page 63 of 298
In 1992 a Regulation (3577/92) of the European Council brought into
force the principle of freedom to provide transport services within a
Member State. Before this act, several other acts based on the Treaty
of Rome (1957), on decisions of the Court of Justice and of Council
Regulations affected the maritime transport. The regulation provided
the freedom to all ships registered in and flying the flag of Member
State to provide services within a Member State. Passenger ro/ro
vessels servicing the GCS were exempted up to December 31, 2003.
The regulation provided the rights of a State to provide licenses and
contracts or impose public service obligations but a non-
discriminatory basis.
In 2001 the new Law (2932/2001) introduced many innovations that
changed the structure of the system but basically the system was still
regulated. This Law prescribed the institutional pattern of the GCS, as
well as, established a Secretary for Ports and Port Policy in addition to
the conversion of ten main ports to corporations following the model
used for the Port Authorities of Piraeus and Thessaloniki. From a
political point of view, there was a clear intention to balance the
interests and needs for the harmonization according to the Regulation
3577/92. The Law provided the following:
1. the deregulation would occur on the 1st of January 2004, due to:
a. the need of smooth transition of the system because of
the Olympic Games in 2004 (according to the official
Press Releases – see also egov.yen.gr/shipping/12-
shmarit/02-law/)
b. the need to update and improve the level of service
2. The principles of the Law are the protection of the social
interest and the simultaneous encouragement of competition,
so:

G r e ek C o a s t a l S y s t e m
Page 64 of 298
a. The State can secure the social and spatial cohesion
b. The competition could improve the level of service and
encourage local interest to entrepreneurship.
3. A global network is considered that includes all ports and
secures a minimum level of service for all ports (frequency of
call).
4. The licenses are abolished.
5. The Minister can impose public interest requirements after
consultation of a special body (Committee for Coastal
Transportation), that affect mainly the ports of call, the
frequency, the fares, the manning and the ability to provide
services.
6. There are some requirements for the ‘regular’ routing, such as:
a. Ability to provide transportation service
b. The vessel can be accommodated to the ports of call
c. The service begins on November 1st and has to be
provided for a year long
d. The mariners have to employed for ten months and
shall have a certificate for their ability to communicate
in Greek
e. The maximum age of the vessels will become 30 years
gradually up to 2008
f. There are some ‘free routing’ services, i.e. services
companies decide to provide and do not fall into the
‘regular schedule’ of the global network.
g. The Minister can intervene the ‘free’ services when they
destruct the ‘regular’ ones, in terms of port services

G r e ek C o a s t a l S y s t e m
Page 65 of 298
adequacy (not only to ships but also to the passengers
and the access to the port), special conditions as well as
of fare structure (expensive fare for coach seats).
h. Companies apply to the Ministry for ‘regular’ routes in
January.
7. A Committee for the Coastal Transport Services will prescribe
policies in the GCS -Συµβούλιο Ακτοπλοϊκών Συγκοινωνιών-.
8. A Secretary for Ports and Port Policy -Γενική Γραµµατεία
Λιµένων και Λιµενικής Πολιτικής- will concert all actions of
various bodies of the Government5.
9. An independent body of the regulation of the system will
safeguard the terms of free competition (Regulatory Body for
Coastal Shipping – Ρυθµιστική Αρχή Θαλασσίων
Ενδοµεταφορών6).
10. Major ports in the GSC, such as Rafina, Lavrio, Iraklio, Rhodes
are legally transformed to corporations (among other ports).
Although this decision is presented in a separate part of this
Law, it is considered as an important development for the
GCS. These ports along with Piraeus handle most of the
volume of the system and serve many vessels. Furthermore it
is a first step towards liberalization of the port industry as well
as for erudite commercial management of these gateways. All
5 This Secretariat has not concerted all governmental actions or decisions on ports
up to today. The drafting and implementation of policies is still fragmented.
However in the Press Release of the MMM it is clearly stated that this Secretariat
concerts all governmental bodies.
6 The Government abolished this Body in 2004, although the Law 2932 was not
changed.
G r e ek C o a s t a l S y s t e m
Page 66 of 298
of them were not commercially managed; local Coast Guard
authorities exercised the usual police and traffic-regulating
duties.
The basic provisos of the system are currently in force, but the
unfortunate event of the ‘Express Samina’ disaster forced the Minister
to deregulate the market earlier to 2004. Nevertheless, companies and
other actors were not satisfied from the provisos of the new Law. The
most significant reaction came from Brussels. The Commission has
warned the Greek government that the Law was not fully compatible
with EC legislation (mainly with the Regulation 3577/92).
The main point of friction is no other than the framework the
imposition of public interest requirements when the market (the
companies) cannot provide adequate service. Companies also
expressed their reservation of their rights for remuneration from the
State (Press Releases February 4th, 2004). Furthermore, the certification
of the ability of mariners to communicate in Greek is not consistent to
the EU legislation. These are some of the point of friction emerged in
the press. However, there are also some more points that could create
friction in the future; a critical one is the adequacy of the port to
handle simultaneously a vessel of a ‘regular’ and one of a ‘free’ route.
Another one is the intervention of the Minister when the fare of a
‘free’ route is considered as excessively high. In a sense, there is no
deregulation when a company cannot decide freely on the charged
fares (and the services it provides) or on the ports it serves.
Setting apart the political friction that is presented in the press,
Sturmey et al. (1994) have presented an interesting pattern of thinking
although there was no consideration for the local forces. Nevertheless,
there is the excuse that local forces could not directly express their
interest back in 1994 and only the central government through the

G r e ek C o a s t a l S y s t e m
Page 67 of 298
MMM expressed all interests. Since 1994 many things have changed
in the local communities in the Aegean and the system experienced
frictions due to local interests (e.g. in the case of Santorini). Sturmey et
al. concluded that what was basically necessary was a plan that
should define the public service operations, the policy and the
requirements for the operation in the system. There was also the idea
in the paper about using ‘slots’ at ports, though there was no
mentioning, who would decide and operate the slots: the central
government as the one monitoring the whole network or the local
authorities aiming to maximize the benefits for the local community.
Furthermore, there is also an issue of pricing the slot; expensive slot
plus necessary routing or call would create an exploding mix.
Sturmey proceeded also in a very interesting analysis of the reaction
of shipping operators from other Member States.
From an institutional point of view, the GCS is a very interesting and
difficult problem to solve. In the author’s opinion, the system can
adopt practices from other transportation industries, such as the
airlines, but it is necessary to take into account the degree of
sophistication of technology at ports and in companies of the carriers.
Furthermore, it is necessary to understand that the system is not
easily brought into ‘design’ conditions as happens practically every
night in the airborne transportation system of a region. Every night
the airplanes, even the delayed ones, are grounded and the next day
begins as planned. By using some of the ideas of Sussman on traveler
transportation by air (2002, p. 409-11), one could consider the
following operational and institutional issues:
• The hub-and-spoke system is probably the best one when
optimizing the functions with a clear trade-off between cost
and level of service (LOS). The LOS of direct connection is
considerably higher than that with a stop (or more). However,

G r e ek C o a s t a l S y s t e m
Page 68 of 298
it is not really possible to establish a trunk line, say from
Piraeus to Syros and then to serve this traffic with connecting
services. There are no such facilities for the accommodation of
passengers, cars and trucks, and most probably it is financially
not a sound decision, due to the extreme seasonality of the
service. In addition the GCS has currently a problem of
capacity and such a design would exacerbate it, as more
vessels would be necessary. This affects the size of the vessels
and will increase high peak loads at ports. Currently, only the
port of Piraeus experiences bunched arrivals and departures by
‘design’.
• In the airline industry there is a network control. Authorities
can hold to the ground a significant number of flights due to
scheduling, weather conditions, safety and many other
technical reasons. Every airport provides some support to the
aircraft and every local control tower communicates
adequately with a central network control, as well as, with the
aircraft. The central control is not flawless but it keeps the
system going sufficiently.
The stochastic nature of the system due to the weather, limits also the
predictability of the time of arrival. The airborne industry has
successfully integrated new technology and techniques in contrast to
the GCS industry. A central network dynamic control of the
schedules, as well as, of the slots could improve the system in total
though there are destinations that would encounter problems.
However, it is not easy to integrate many ports in a system that
practically cannot offer even safe anchorage to the ships at all ports of
call during all months of operation.
G r e ek C o a s t a l S y s t e m
Page 69 of 298
Another interesting point is social and economic cohesion of the
country. Historically, there was no real social and economic cohesion
of the Greek islands with the today mainland. Of course, there was
national, ethnic and religious cohesion. The various complexes of
islands were cohesive to each other and formed groups. From a
political point of view, it would be more effective probably to
encourage the deeper cohesion of the complexes than an artificial one
with the capital of country. Then it would be critical for the
development of the country to establish more connections to other
ports in the mainland, such as Thessaloniki, Volos, Nafplion. Such
public interest services could strengthen the cohesion of the whole
country and reduce the loads at main ports. Financially, it is currently
not wise but a system of subsidies, that can be justified under the
3577/92 regulation could alter the structure of the network.
The GCS services are directly linked with the tourist industry of
Greece. Inadequate services would diminish any investment in
tourism, and no tourism-related investment would diminish the
revenues for the GCS operators. So it is necessary to take into account
the peak times of the system. Although transportation planning is not
based on peaks, in that respective case it is imperative to take into
account peaks. The institutional framework shall allow operators to
serve the peaks and prepare the ports in term of operations to handle
the excess traffic.
Last but not least, deregulation shall serve the customers of the
system who are primarily islanders. A deregulation of the fare
structure would not necessarily raise the fares, but more possibly
would lower them, as there is a large difference of available capacity
and of the accrued income per capacity unit. The operators would
seek ways to attract travelers and offer higher level of service, if only
there are at least two operators servicing the same destination.
G r e ek C o a s t a l S y s t e m
Page 70 of 298
3.1.2 Market Analysis
As stated in a previous paragraph, this study is based on the listed
coastal shipping companies, due to the lack of adequate data for the
non-listed companies. From data provided to the public, the
following tables and charts are induced. Most of these data will be
taken into account in a coming chapter. The period of the analysis is
the fiscal years 1997 – 2002.
The presentation is focused on the financial attributes of the listed
GCS companies. The companies under evaluation are ANEK,
MINOAN Lines, NEL, Strintzis Lines (Blue Star Ferries) and EPATT
(Attica Enterprizes). It is interesting to note for the reader who is not
familiar with the GCS, that ANEK and MINOAN are operators based
on the island of Crete, enjoying dominant position in the lucrative
Piraeus – Chania and Piraeus – Heraklion lines respectively. ANEK
and MINOAN used to enjoy monopolistic status in these respective
lines up to 2002. Furthermore, ANEK and MINOAN are powerful
players in the Adriatic routes, as well as expand their interests to
other sub-systems of the GCS. For simplicity reasons, one may
distinct the GCS into the following sub-systems (see also the map):
1. Piraeus – Crete
2. Piraeus – Cycladic Islands
3. Piraeus – Dodecanese Islands
4. Piraeus – Eastern Aegean Islands
5. Piraeus – Northern Aegean Islands
6. Piraeus – Argosaronic Islands
7. Thessaloniki (and other northern ports) – various destinations
in Central and South Aegean Sea (including Crete)
8. Ionian Islands (to/from Patras and Igoumenitsa)
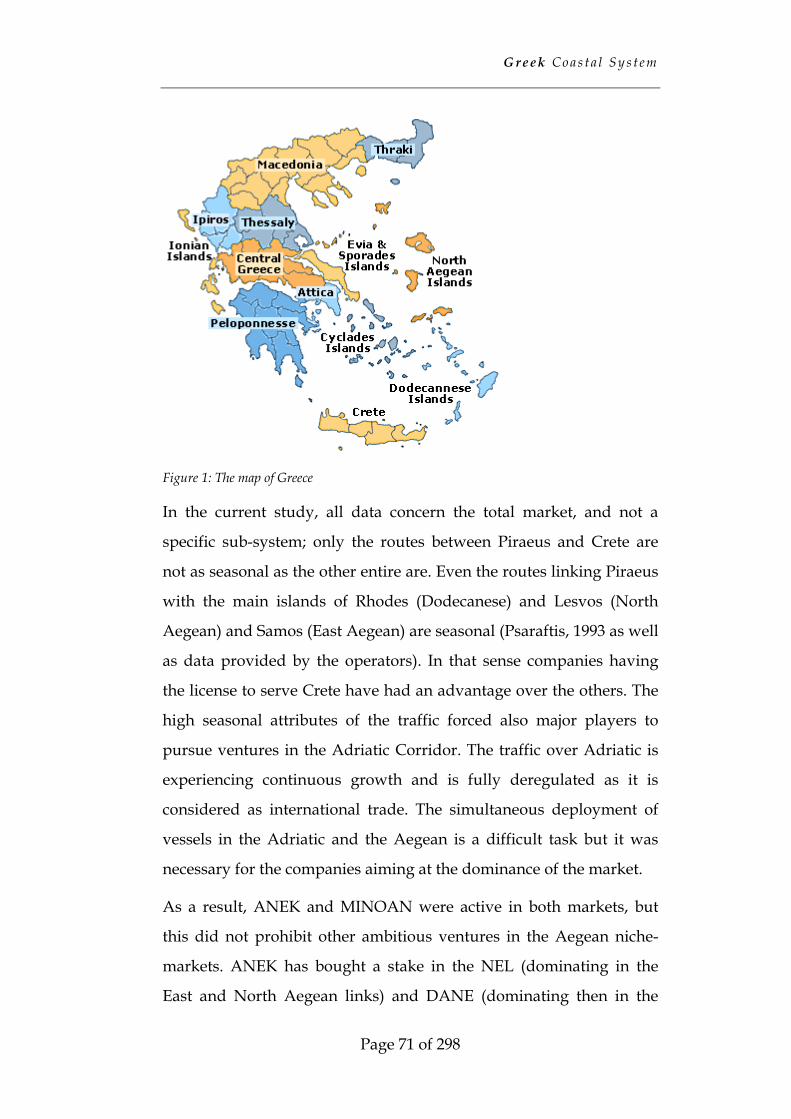
G r e ek C o a s t a l S y s t e m
Page 71 of 298
Figure 1: The map of Greece
In the current study, all data concern the total market, and not a
specific sub-system; only the routes between Piraeus and Crete are
not as seasonal as the other entire are. Even the routes linking Piraeus
with the main islands of Rhodes (Dodecanese) and Lesvos (North
Aegean) and Samos (East Aegean) are seasonal (Psaraftis, 1993 as well
as data provided by the operators). In that sense companies having
the license to serve Crete have had an advantage over the others. The
high seasonal attributes of the traffic forced also major players to
pursue ventures in the Adriatic Corridor. The traffic over Adriatic is
experiencing continuous growth and is fully deregulated as it is
considered as international trade. The simultaneous deployment of
vessels in the Adriatic and the Aegean is a difficult task but it was
necessary for the companies aiming at the dominance of the market.
As a result, ANEK and MINOAN were active in both markets, but
this did not prohibit other ambitious ventures in the Aegean niche-
markets. ANEK has bought a stake in the NEL (dominating in the
East and North Aegean links) and DANE (dominating then in the
G r e ek C o a s t a l S y s t e m
Page 72 of 298
market of Dedecanese); MINOAN has been pulling the strings behind
the risky experiment of Hellas Flying Dolphins (HFD). The senior
management of MINOAN took the control of many conventional but
old vessels that used to serve various routes (mainly in the Cycladic
sub-systems) with an aggressive buy-out spree in 1997 and 1998.
Owners of these vessels exchanged their vessels with shares in HFD.
HFD became a very big company controlled by MINOAN. Although
there were many ambitious plans for the future of HFD, the ‘Samina’
disaster stalled the plans and the company encountered financial
difficulties that affected also MINOAN.
Another major player in the market has been traditionally Strintzis
Lines (currently Blue Star Ferries). Strintzis was, and still is, active in
the Ionian and the central Cycladic sub-system. The company was
also active in the Adriatic Corridor. In 1999 EPATT became the major
shareholder of STRINTZIS and therefore its consolidated accounts
include the figures of STRINTZIS from this point on. The background
of EPATT is a very interesting one as it is not a shipping company (as
all the above are) but it is a holding company. In 1991 EPATT bought
out a ‘shell-company’ listed at ASE and in 1992 ordered new
conventional but fast vessels for the Adriatic routes. EPATT through
the shipping and shi management company SuperFast Ferries became
and still is one of the major players in the Adriatic Corridor. The
deregulation wind that was blowing in the whole EU allowed the
management of various shipping companies to envisage a
deregulated Aegean market. Taking into account all technical and
institutional issues, as well as the relatively ‘low’ quality of service,
many people considered that too many investment opportunities
were to come up.
From a shareholders’ perspective STRINTZIS and EPATT were listed
first (in 1991) while the Cretan companies in 1997. NEL was listed in
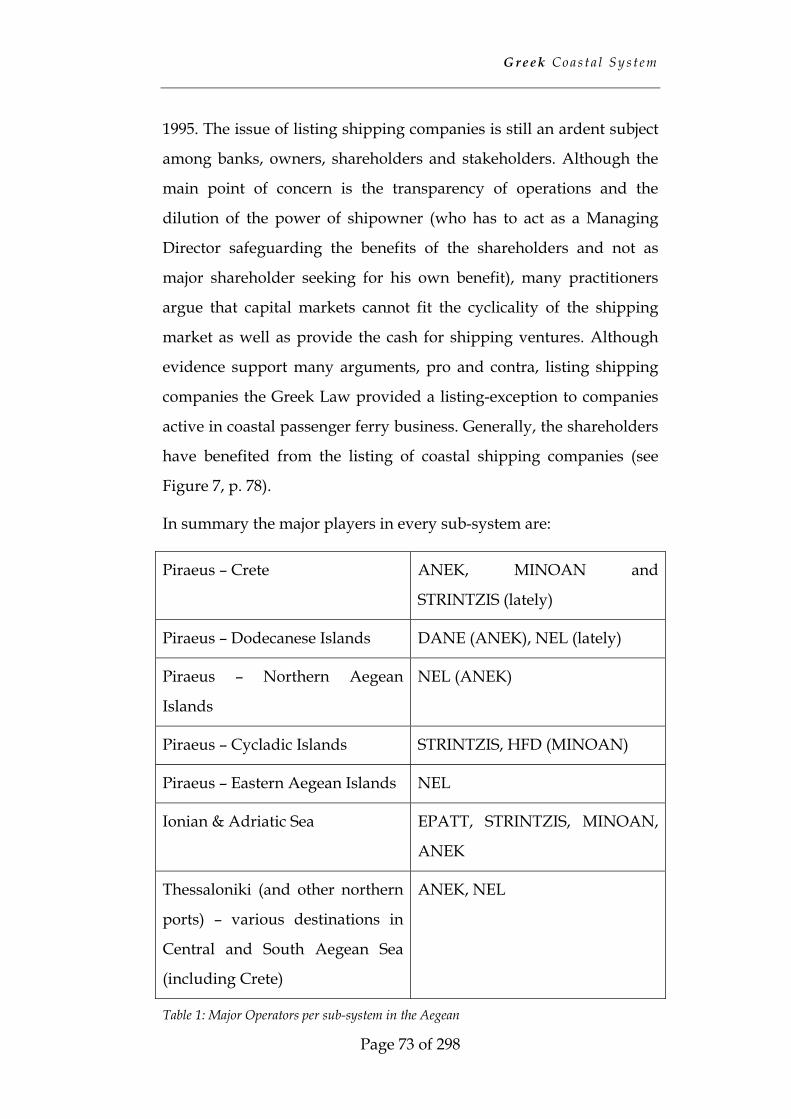
G r e ek C o a s t a l S y s t e m
Page 73 of 298
1995. The issue of listing shipping companies is still an ardent subject
among banks, owners, shareholders and stakeholders. Although the
main point of concern is the transparency of operations and the
dilution of the power of shipowner (who has to act as a Managing
Director safeguarding the benefits of the shareholders and not as
major shareholder seeking for his own benefit), many practitioners
argue that capital markets cannot fit the cyclicality of the shipping
market as well as provide the cash for shipping ventures. Although
evidence support many arguments, pro and contra, listing shipping
companies the Greek Law provided a listing-exception to companies
active in coastal passenger ferry business. Generally, the shareholders
have benefited from the listing of coastal shipping companies (see
Figure 7, p. 78).
In summary the major players in every sub-system are:
Piraeus – Crete ANEK, MINOAN and
STRINTZIS (lately)
Piraeus – Dodecanese Islands DANE (ANEK), NEL (lately)
Piraeus – Northern Aegean
Islands
NEL (ANEK)
Piraeus – Cycladic Islands STRINTZIS, HFD (MINOAN)
Piraeus – Eastern Aegean Islands NEL
Ionian & Adriatic Sea EPATT, STRINTZIS, MINOAN,
ANEK
Thessaloniki (and other northern
ports) – various destinations in
Central and South Aegean Sea
(including Crete)
ANEK, NEL
Table 1: Major Operators per sub-system in the Aegean
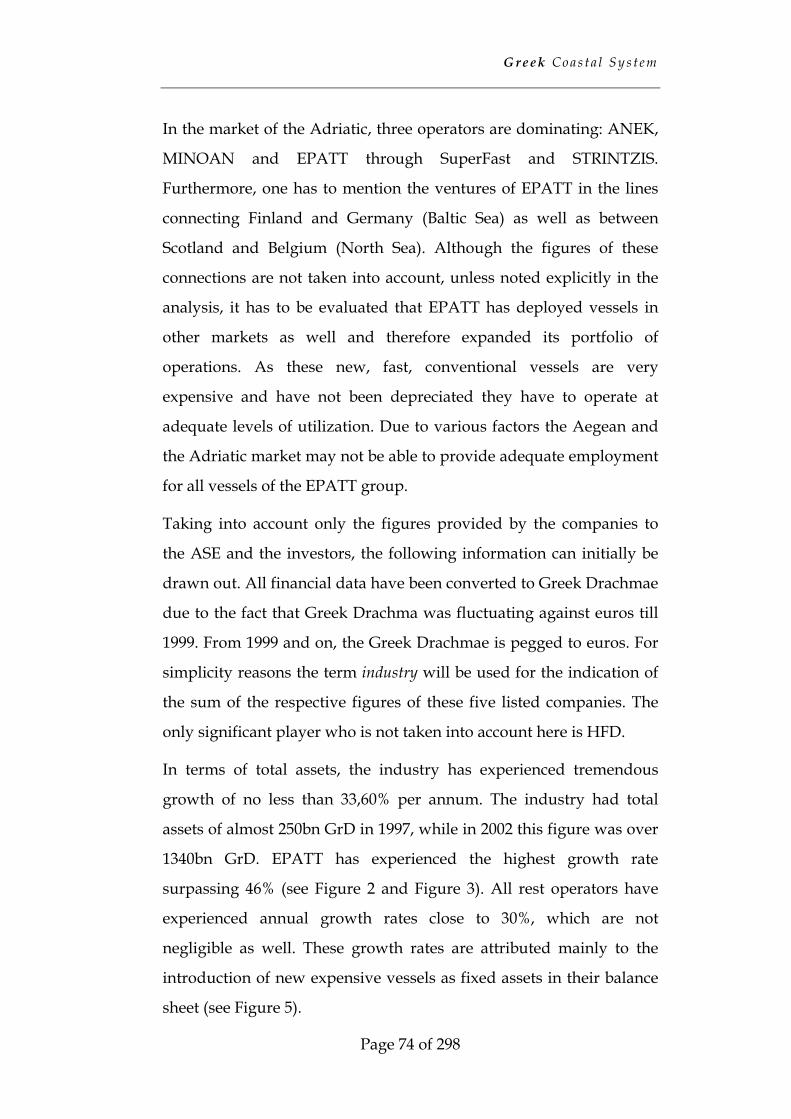
G r e ek C o a s t a l S y s t e m
Page 74 of 298
In the market of the Adriatic, three operators are dominating: ANEK,
MINOAN and EPATT through SuperFast and STRINTZIS.
Furthermore, one has to mention the ventures of EPATT in the lines
connecting Finland and Germany (Baltic Sea) as well as between
Scotland and Belgium (North Sea). Although the figures of these
connections are not taken into account, unless noted explicitly in the
analysis, it has to be evaluated that EPATT has deployed vessels in
other markets as well and therefore expanded its portfolio of
operations. As these new, fast, conventional vessels are very
expensive and have not been depreciated they have to operate at
adequate levels of utilization. Due to various factors the Aegean and
the Adriatic market may not be able to provide adequate employment
for all vessels of the EPATT group.
Taking into account only the figures provided by the companies to
the ASE and the investors, the following information can initially be
drawn out. All financial data have been converted to Greek Drachmae
due to the fact that Greek Drachma was fluctuating against euros till
1999. From 1999 and on, the Greek Drachmae is pegged to euros. For
simplicity reasons the term industry will be used for the indication of
the sum of the respective figures of these five listed companies. The
only significant player who is not taken into account here is HFD.
In terms of total assets, the industry has experienced tremendous
growth of no less than 33,60% per annum. The industry had total
assets of almost 250bn GrD in 1997, while in 2002 this figure was over
1340bn GrD. EPATT has experienced the highest growth rate
surpassing 46% (see Figure 2 and Figure 3). All rest operators have
experienced annual growth rates close to 30%, which are not
negligible as well. These growth rates are attributed mainly to the
introduction of new expensive vessels as fixed assets in their balance
sheet (see Figure 5).
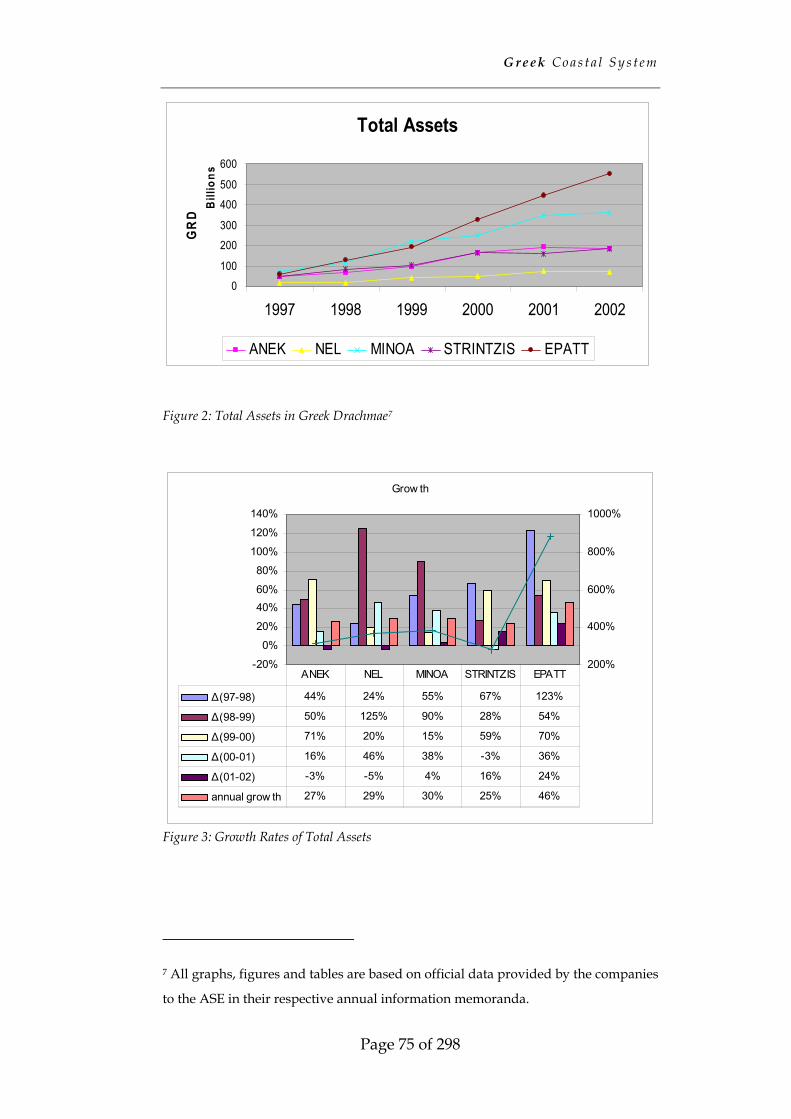
G r e ek C o a s t a l S y s t e m
Page 75 of 298
Figure 2: Total Assets in Greek Drachmae7
Figure 3: Growth Rates of Total Assets
7 All graphs, figures and tables are based on official data provided by the companies
to the ASE in their respective annual information memoranda.
Total Assets
0
100
200
300
400
500
600
1997 1998 1999 2000 2001 2002
Bill
ions
GR
D
ANEK NEL MINOA STRINTZIS EPATT
Grow th
-20%
0%
20%
40%60%
80%
100%
120%
140%
200%
400%
600%
800%
1000%
∆(97-98) 44% 24% 55% 67% 123%
∆(98-99) 50% 125% 90% 28% 54%
∆(99-00) 71% 20% 15% 59% 70%
∆(00-01) 16% 46% 38% -3% 36%
∆(01-02) -3% -5% 4% 16% 24%
annual grow th 27% 29% 30% 25% 46%
ANEK NEL MINOA STRINTZIS EPATT
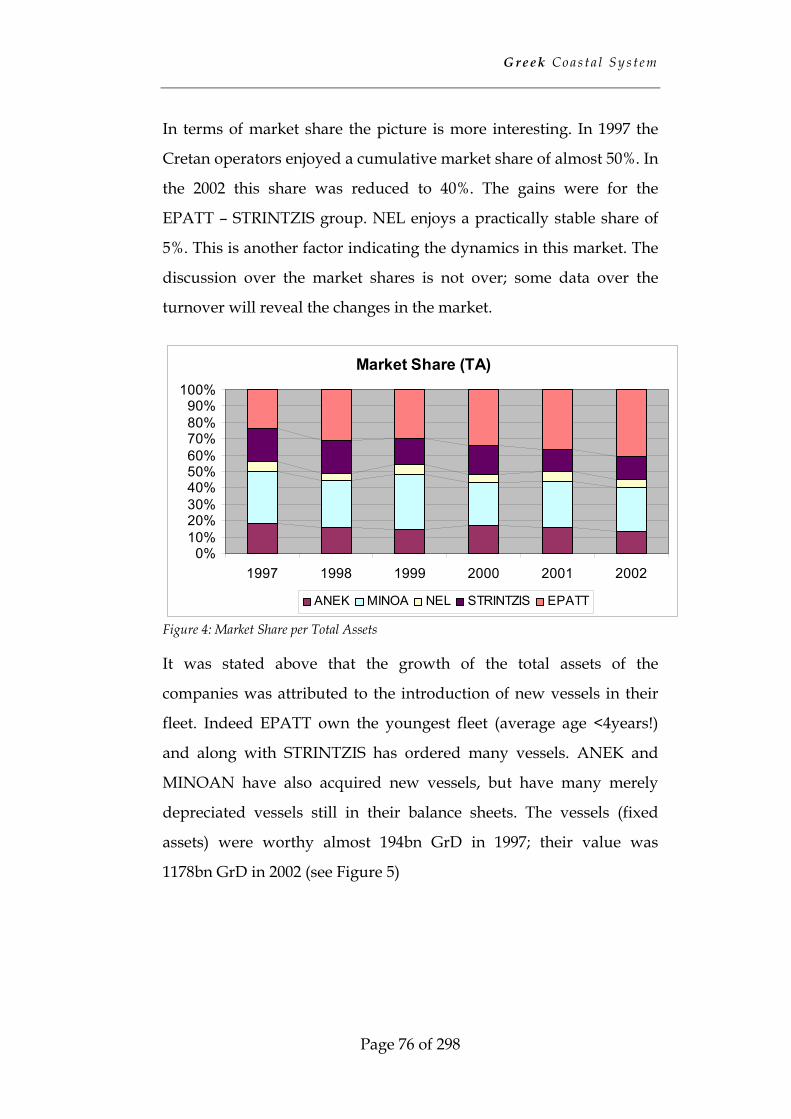
G r e ek C o a s t a l S y s t e m
Page 76 of 298
In terms of market share the picture is more interesting. In 1997 the
Cretan operators enjoyed a cumulative market share of almost 50%. In
the 2002 this share was reduced to 40%. The gains were for the
EPATT – STRINTZIS group. NEL enjoys a practically stable share of
5%. This is another factor indicating the dynamics in this market. The
discussion over the market shares is not over; some data over the
turnover will reveal the changes in the market.
Figure 4: Market Share per Total Assets
It was stated above that the growth of the total assets of the
companies was attributed to the introduction of new vessels in their
fleet. Indeed EPATT own the youngest fleet (average age <4years!)
and along with STRINTZIS has ordered many vessels. ANEK and
MINOAN have also acquired new vessels, but have many merely
depreciated vessels still in their balance sheets. The vessels (fixed
assets) were worthy almost 194bn GrD in 1997; their value was
1178bn GrD in 2002 (see Figure 5)
Market Share (TA)
0%10%20%30%40%50%60%70%80%90%
100%
1997 1998 1999 2000 2001 2002
ANEK MINOA NEL STRINTZIS EPATT
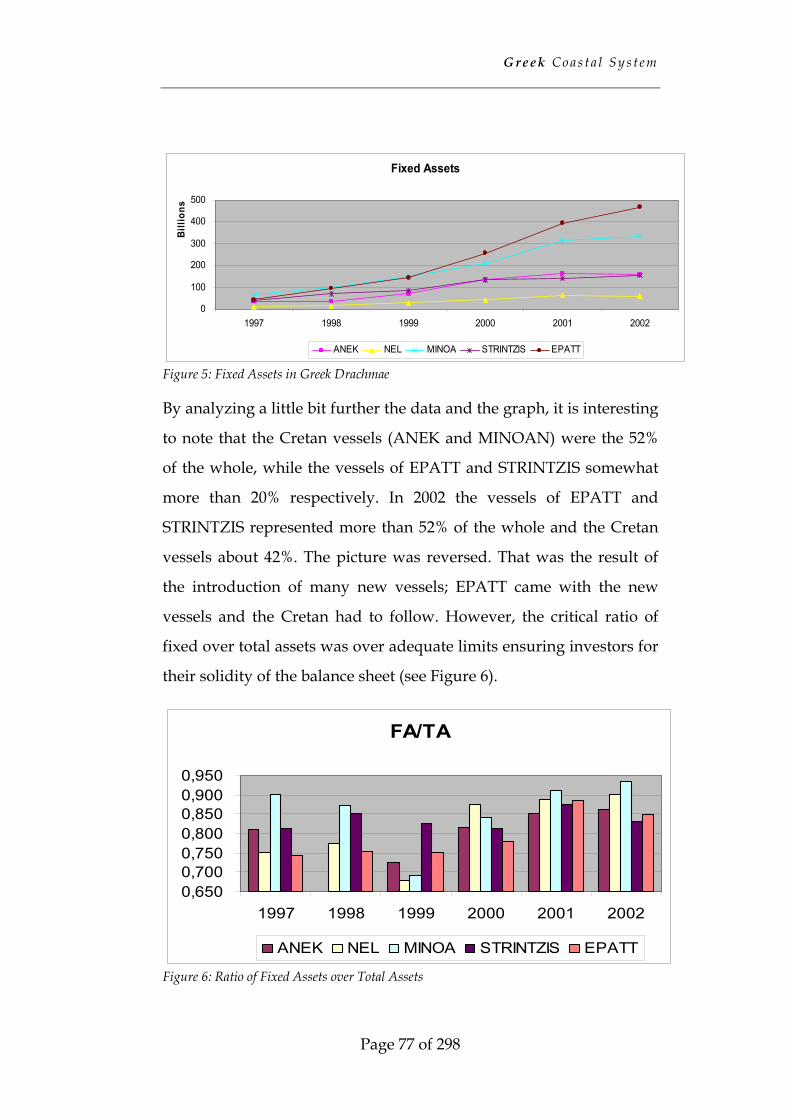
G r e ek C o a s t a l S y s t e m
Page 77 of 298
Figure 5: Fixed Assets in Greek Drachmae
By analyzing a little bit further the data and the graph, it is interesting
to note that the Cretan vessels (ANEK and MINOAN) were the 52%
of the whole, while the vessels of EPATT and STRINTZIS somewhat
more than 20% respectively. In 2002 the vessels of EPATT and
STRINTZIS represented more than 52% of the whole and the Cretan
vessels about 42%. The picture was reversed. That was the result of
the introduction of many new vessels; EPATT came with the new
vessels and the Cretan had to follow. However, the critical ratio of
fixed over total assets was over adequate limits ensuring investors for
their solidity of the balance sheet (see Figure 6).
Figure 6: Ratio of Fixed Assets over Total Assets
Fixed Assets
0
100
200
300
400
500
1997 1998 1999 2000 2001 2002
Billi
ons
ANEK NEL MINOA STRINTZIS EPATT
FA/TA
0,6500,7000,7500,8000,8500,9000,950
1997 1998 1999 2000 2001 2002
ANEK NEL MINOA STRINTZIS EPATT
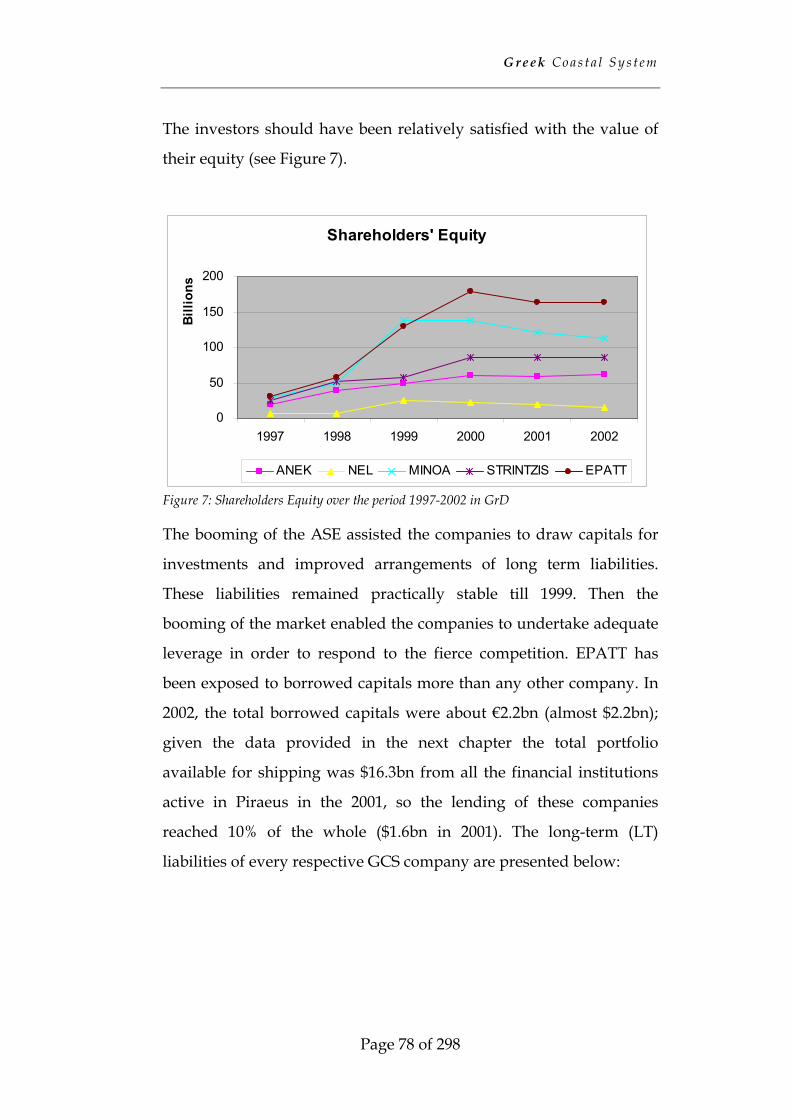
G r e ek C o a s t a l S y s t e m
Page 78 of 298
The investors should have been relatively satisfied with the value of
their equity (see Figure 7).
Figure 7: Shareholders Equity over the period 1997-2002 in GrD
The booming of the ASE assisted the companies to draw capitals for
investments and improved arrangements of long term liabilities.
These liabilities remained practically stable till 1999. Then the
booming of the market enabled the companies to undertake adequate
leverage in order to respond to the fierce competition. EPATT has
been exposed to borrowed capitals more than any other company. In
2002, the total borrowed capitals were about €2.2bn (almost $2.2bn);
given the data provided in the next chapter the total portfolio
available for shipping was $16.3bn from all the financial institutions
active in Piraeus in the 2001, so the lending of these companies
reached 10% of the whole ($1.6bn in 2001). The long-term (LT)
liabilities of every respective GCS company are presented below:
Shareholders' Equity
0
50
100
150
200
1997 1998 1999 2000 2001 2002
Billi
ons
ANEK NEL MINOA STRINTZIS EPATT
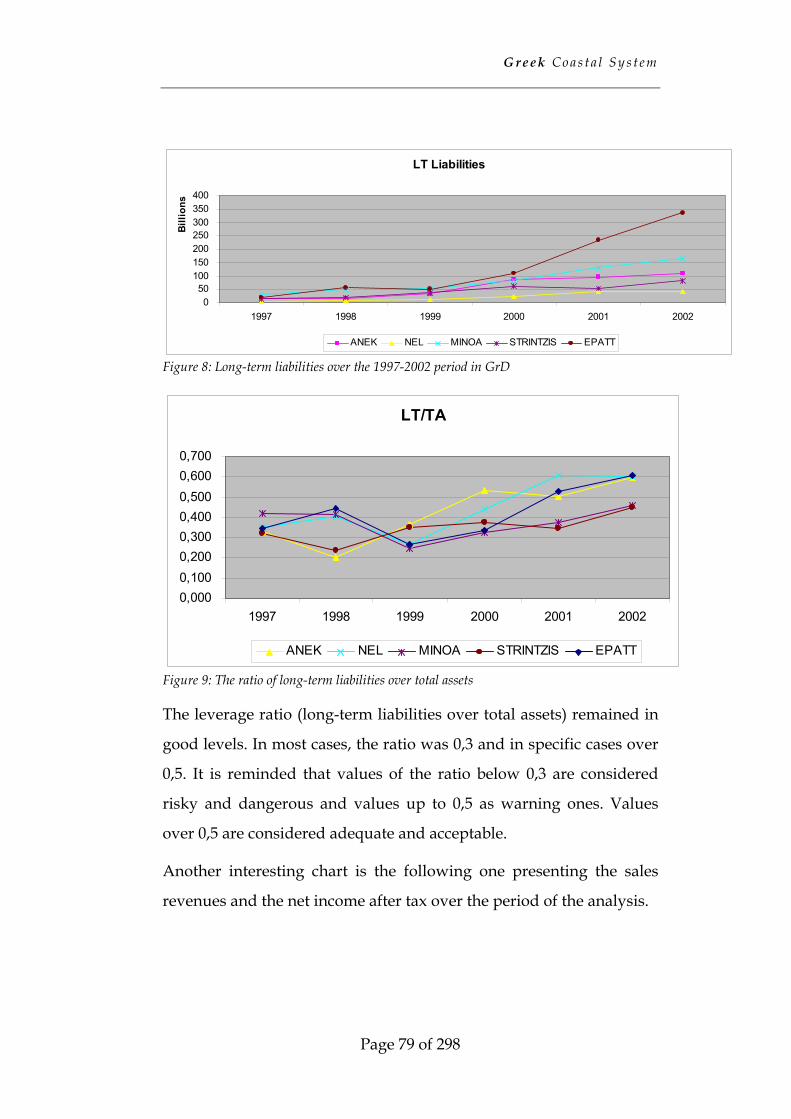
G r e ek C o a s t a l S y s t e m
Page 79 of 298
Figure 8: Long-term liabilities over the 1997-2002 period in GrD
Figure 9: The ratio of long-term liabilities over total assets
The leverage ratio (long-term liabilities over total assets) remained in
good levels. In most cases, the ratio was 0,3 and in specific cases over
0,5. It is reminded that values of the ratio below 0,3 are considered
risky and dangerous and values up to 0,5 as warning ones. Values
over 0,5 are considered adequate and acceptable.
Another interesting chart is the following one presenting the sales
revenues and the net income after tax over the period of the analysis.
LT Liabilities
050
100150200250300350400
1997 1998 1999 2000 2001 2002
Billi
ons
ANEK NEL MINOA STRINTZIS EPATT
LT/TA
0,0000,1000,2000,3000,4000,5000,6000,700
1997 1998 1999 2000 2001 2002
ANEK NEL MINOA STRINTZIS EPATT
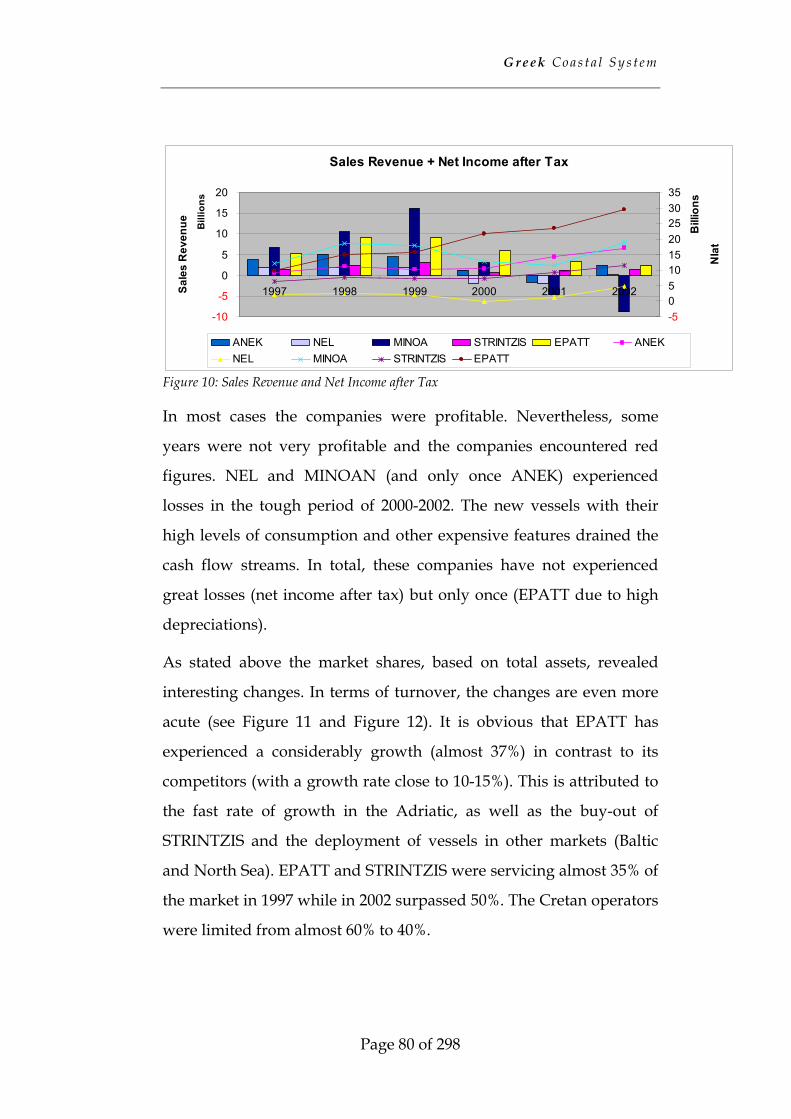
G r e ek C o a s t a l S y s t e m
Page 80 of 298
Figure 10: Sales Revenue and Net Income after Tax
In most cases the companies were profitable. Nevertheless, some
years were not very profitable and the companies encountered red
figures. NEL and MINOAN (and only once ANEK) experienced
losses in the tough period of 2000-2002. The new vessels with their
high levels of consumption and other expensive features drained the
cash flow streams. In total, these companies have not experienced
great losses (net income after tax) but only once (EPATT due to high
depreciations).
As stated above the market shares, based on total assets, revealed
interesting changes. In terms of turnover, the changes are even more
acute (see Figure 11 and Figure 12). It is obvious that EPATT has
experienced a considerably growth (almost 37%) in contrast to its
competitors (with a growth rate close to 10-15%). This is attributed to
the fast rate of growth in the Adriatic, as well as the buy-out of
STRINTZIS and the deployment of vessels in other markets (Baltic
and North Sea). EPATT and STRINTZIS were servicing almost 35% of
the market in 1997 while in 2002 surpassed 50%. The Cretan operators
were limited from almost 60% to 40%.
Sales Revenue + Net Income after Tax
-10
-5
0
5
10
15
20
1997 1998 1999 2000 2001 2002
Bill
ions
Sale
s R
even
ue
-5 05101520253035
Bill
ions
NIa
t
ANEK NEL MINOA STRINTZIS EPATT ANEKNEL MINOA STRINTZIS EPATT
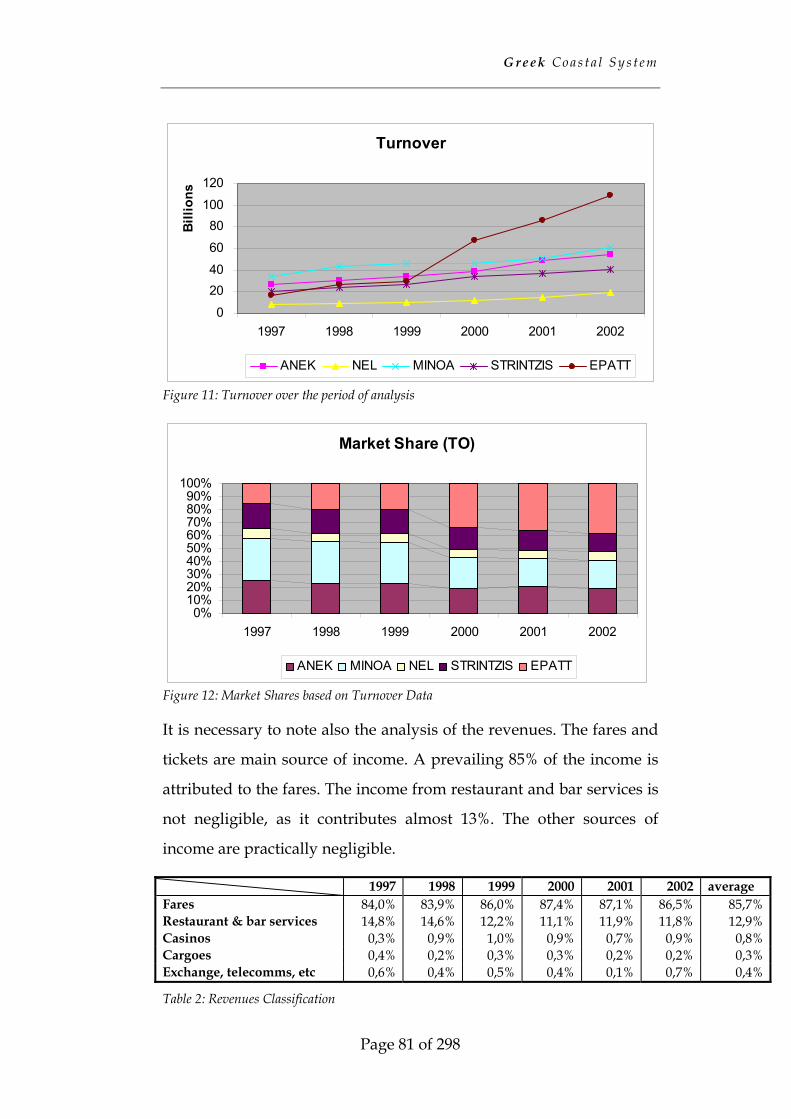
G r e ek C o a s t a l S y s t e m
Page 81 of 298
Figure 11: Turnover over the period of analysis
Figure 12: Market Shares based on Turnover Data
It is necessary to note also the analysis of the revenues. The fares and
tickets are main source of income. A prevailing 85% of the income is
attributed to the fares. The income from restaurant and bar services is
not negligible, as it contributes almost 13%. The other sources of
income are practically negligible.
1997 1998 1999 2000 2001 2002 average Fares 84,0% 83,9% 86,0% 87,4% 87,1% 86,5% 85,7% Restaurant & bar services 14,8% 14,6% 12,2% 11,1% 11,9% 11,8% 12,9% Casinos 0,3% 0,9% 1,0% 0,9% 0,7% 0,9% 0,8% Cargoes 0,4% 0,2% 0,3% 0,3% 0,2% 0,2% 0,3% Exchange, telecomms, etc 0,6% 0,4% 0,5% 0,4% 0,1% 0,7% 0,4%
Table 2: Revenues Classification
Turnover
0
2040
60
80100
120
1997 1998 1999 2000 2001 2002
Billi
ons
ANEK NEL MINOA STRINTZIS EPATT
Market Share (TO)
0%10%20%30%40%50%60%70%80%90%
100%
1997 1998 1999 2000 2001 2002
ANEK MINOA NEL STRINTZIS EPATT
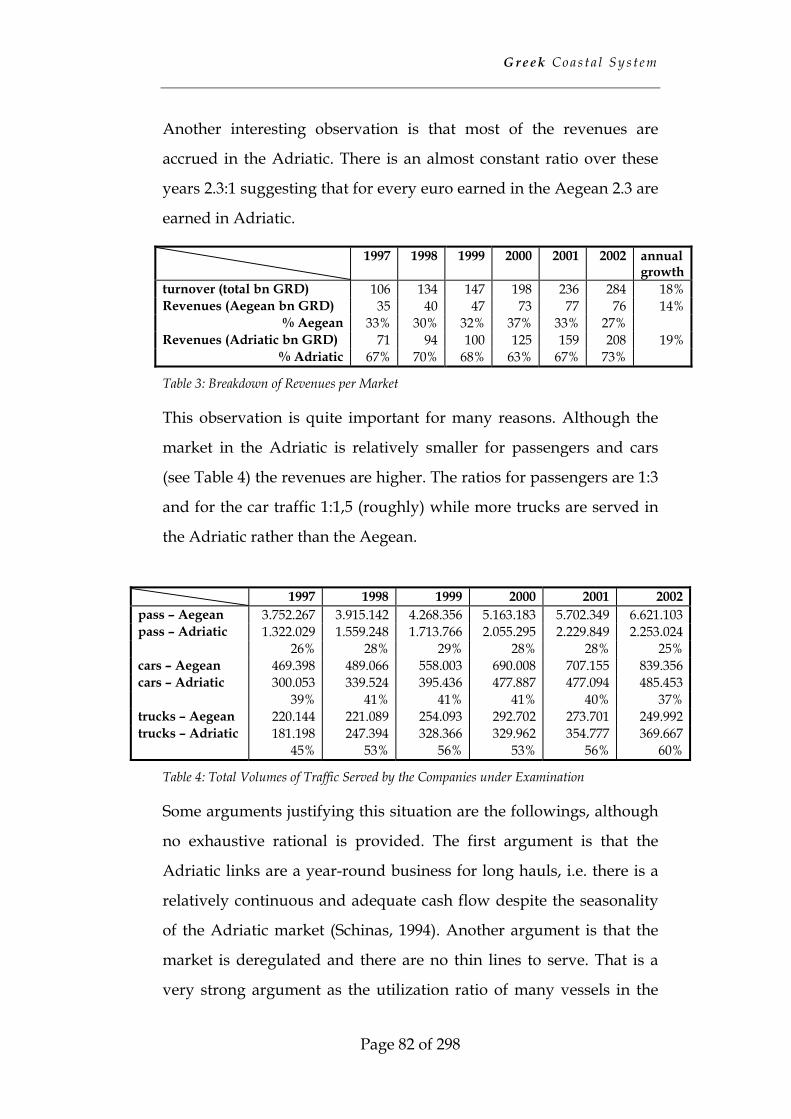
G r e ek C o a s t a l S y s t e m
Page 82 of 298
Another interesting observation is that most of the revenues are
accrued in the Adriatic. There is an almost constant ratio over these
years 2.3:1 suggesting that for every euro earned in the Aegean 2.3 are
earned in Adriatic.
1997 1998 1999 2000 2001 2002 annual growth
turnover (total bn GRD) 106 134 147 198 236 284 18% Revenues (Aegean bn GRD) 35 40 47 73 77 76 14%
% Aegean 33% 30% 32% 37% 33% 27% Revenues (Adriatic bn GRD) 71 94 100 125 159 208 19%
% Adriatic 67% 70% 68% 63% 67% 73%
Table 3: Breakdown of Revenues per Market
This observation is quite important for many reasons. Although the
market in the Adriatic is relatively smaller for passengers and cars
(see Table 4) the revenues are higher. The ratios for passengers are 1:3
and for the car traffic 1:1,5 (roughly) while more trucks are served in
the Adriatic rather than the Aegean.
Table 4: Total Volumes of Traffic Served by the Companies under Examination
Some arguments justifying this situation are the followings, although
no exhaustive rational is provided. The first argument is that the
Adriatic links are a year-round business for long hauls, i.e. there is a
relatively continuous and adequate cash flow despite the seasonality
of the Adriatic market (Schinas, 1994). Another argument is that the
market is deregulated and there are no thin lines to serve. That is a
very strong argument as the utilization ratio of many vessels in the
1997 1998 1999 2000 2001 2002 pass – Aegean 3.752.267 3.915.142 4.268.356 5.163.183 5.702.349 6.621.103 pass – Adriatic 1.322.029 1.559.248 1.713.766 2.055.295 2.229.849 2.253.024 26% 28% 29% 28% 28% 25% cars – Aegean 469.398 489.066 558.003 690.008 707.155 839.356 cars – Adriatic 300.053 339.524 395.436 477.887 477.094 485.453 39% 41% 41% 41% 40% 37% trucks – Aegean 220.144 221.089 254.093 292.702 273.701 249.992 trucks – Adriatic 181.198 247.394 328.366 329.962 354.777 369.667 45% 53% 56% 53% 56% 60%
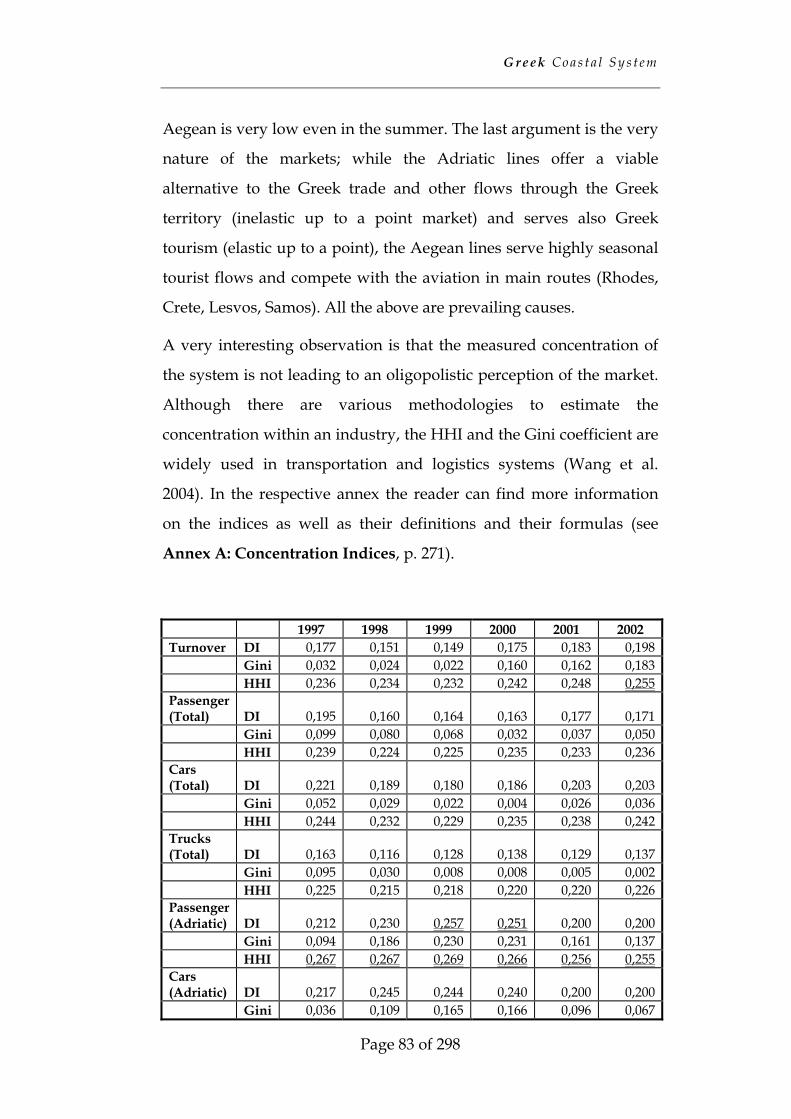
G r e ek C o a s t a l S y s t e m
Page 83 of 298
Aegean is very low even in the summer. The last argument is the very
nature of the markets; while the Adriatic lines offer a viable
alternative to the Greek trade and other flows through the Greek
territory (inelastic up to a point market) and serves also Greek
tourism (elastic up to a point), the Aegean lines serve highly seasonal
tourist flows and compete with the aviation in main routes (Rhodes,
Crete, Lesvos, Samos). All the above are prevailing causes.
A very interesting observation is that the measured concentration of
the system is not leading to an oligopolistic perception of the market.
Although there are various methodologies to estimate the
concentration within an industry, the HHI and the Gini coefficient are
widely used in transportation and logistics systems (Wang et al.
2004). In the respective annex the reader can find more information
on the indices as well as their definitions and their formulas (see
Annex A: Concentration Indices, p. 271).
1997 1998 1999 2000 2001 2002 Turnover DI 0,177 0,151 0,149 0,175 0,183 0,198 Gini 0,032 0,024 0,022 0,160 0,162 0,183 HHI 0,236 0,234 0,232 0,242 0,248 0,255 Passenger (Total) DI 0,195 0,160 0,164 0,163 0,177 0,171 Gini 0,099 0,080 0,068 0,032 0,037 0,050 HHI 0,239 0,224 0,225 0,235 0,233 0,236 Cars (Total) DI 0,221 0,189 0,180 0,186 0,203 0,203 Gini 0,052 0,029 0,022 0,004 0,026 0,036 HHI 0,244 0,232 0,229 0,235 0,238 0,242 Trucks (Total) DI 0,163 0,116 0,128 0,138 0,129 0,137 Gini 0,095 0,030 0,008 0,008 0,005 0,002 HHI 0,225 0,215 0,218 0,220 0,220 0,226 Passenger (Adriatic) DI 0,212 0,230 0,257 0,251 0,200 0,200 Gini 0,094 0,186 0,230 0,231 0,161 0,137 HHI 0,267 0,267 0,269 0,266 0,256 0,255 Cars (Adriatic) DI 0,217 0,245 0,244 0,240 0,200 0,200 Gini 0,036 0,109 0,165 0,166 0,096 0,067
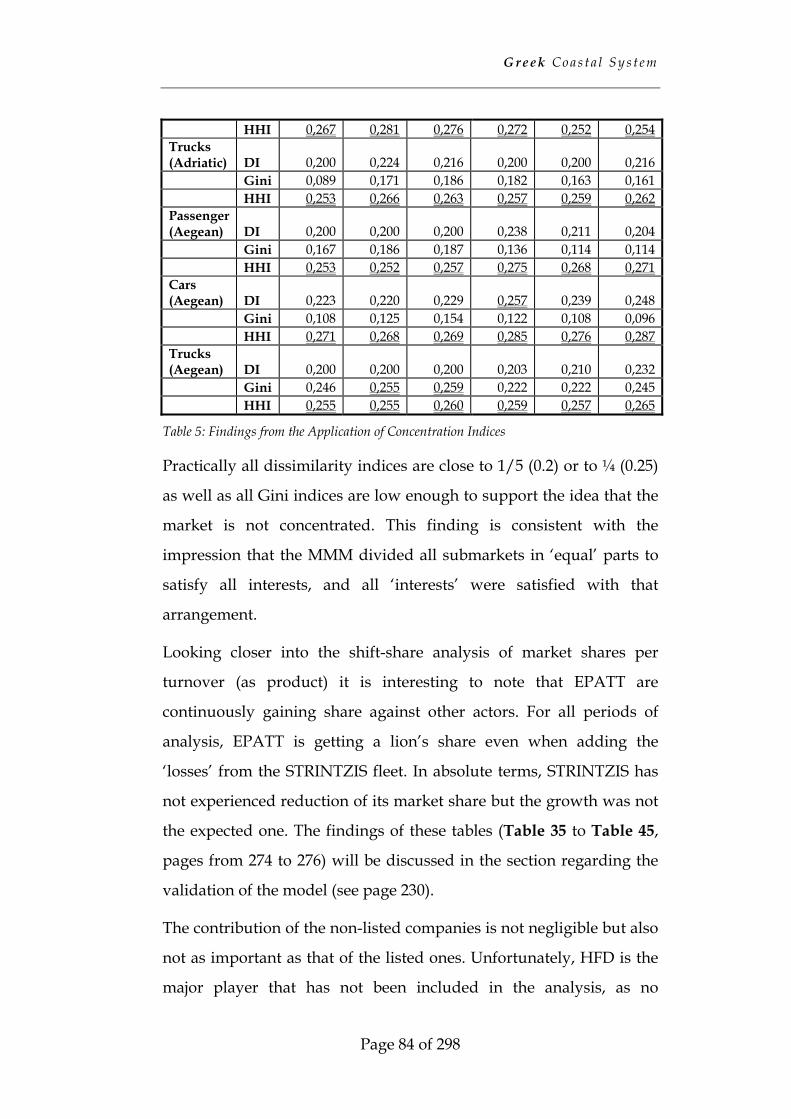
G r e ek C o a s t a l S y s t e m
Page 84 of 298
HHI 0,267 0,281 0,276 0,272 0,252 0,254 Trucks (Adriatic) DI 0,200 0,224 0,216 0,200 0,200 0,216 Gini 0,089 0,171 0,186 0,182 0,163 0,161 HHI 0,253 0,266 0,263 0,257 0,259 0,262 Passenger (Aegean) DI 0,200 0,200 0,200 0,238 0,211 0,204 Gini 0,167 0,186 0,187 0,136 0,114 0,114 HHI 0,253 0,252 0,257 0,275 0,268 0,271 Cars (Aegean) DI 0,223 0,220 0,229 0,257 0,239 0,248 Gini 0,108 0,125 0,154 0,122 0,108 0,096 HHI 0,271 0,268 0,269 0,285 0,276 0,287 Trucks (Aegean) DI 0,200 0,200 0,200 0,203 0,210 0,232 Gini 0,246 0,255 0,259 0,222 0,222 0,245 HHI 0,255 0,255 0,260 0,259 0,257 0,265
Table 5: Findings from the Application of Concentration Indices
Practically all dissimilarity indices are close to 1/5 (0.2) or to ¼ (0.25)
as well as all Gini indices are low enough to support the idea that the
market is not concentrated. This finding is consistent with the
impression that the MMM divided all submarkets in ‘equal’ parts to
satisfy all interests, and all ‘interests’ were satisfied with that
arrangement.
Looking closer into the shift-share analysis of market shares per
turnover (as product) it is interesting to note that EPATT are
continuously gaining share against other actors. For all periods of
analysis, EPATT is getting a lion’s share even when adding the
‘losses’ from the STRINTZIS fleet. In absolute terms, STRINTZIS has
not experienced reduction of its market share but the growth was not
the expected one. The findings of these tables (Table 35 to Table 45,
pages from 274 to 276) will be discussed in the section regarding the
validation of the model (see page 230).
The contribution of the non-listed companies is not negligible but also
not as important as that of the listed ones. Unfortunately, HFD is the
major player that has not been included in the analysis, as no
G r e ek C o a s t a l S y s t e m
Page 85 of 298
information has been provided at any stage of the research (see also
p.74). Nevertheless another important actor G&A ferries provides a
comparison basis. In terms of market share based on the total assets,
G&A would only carve less than 5%of the total market. This
percentage is decreasing in the last years as new vessels owned by
listed companies enter the system. The fixed assets of G&A amount
less than 10% of the average fixed assets of the listed companies (fiscal
year 2002). The shareholders equity shrinks with an annual rate of
almost 10% for the period of analysis 1999-2002, as the company
reports losses every year. The long-term liabilities of G&A amount
about 12% of the average long-term liabilities of the listed companies.
However, in terms of sales revenues, G&A amounts around 80% of
the average sales revenues of listed companies. By risking a
generalization of the findings based only on G&A, it is obvious that
the non-listed companies are contributing into the system in terms of
sales, consequently in terms of services offered, but they cannot
support their further growth. This is reflected in the delayed or stalled
fleet-renewal, as well as in the reported losses every year.
3.1.3 Technical Aspects of the System
The vessels serving the system, as well as the port infrastructure, are
considered as the hardware of the system. It is interesting to note that
the operation of specific vessel types, as well as the design of the port
facilities, is strongly inter-related. However, the improved operation
of the system will not be solely attributed to new vessels and better
ports but from the software of the system, either in the form of
network control, or as knowledge-based elements (ticketing and
relevant systems).
G r e ek C o a s t a l S y s t e m
Page 86 of 298
The fleet of the GCS had to be younger than 35 years and fulfill
specific requirements, and then could be deployed in the Adriatic
lines. This was the case up to the early 1990s’ when the Adriatic
corridor became an efficient sea-motorway. Then the old ships could
not compete and only new fast and modern vessels could serve the
market adequately. According to the available fleet data (all out the
official information memoranda up to the fiscal year 2002) the
following fleet features are produced:
1. The fleet belonging to the listed GCS companies consists of
almost 65 vessels (new and old, conventional and non-
conventional, deployed in the Aegean or the Adriatic) during
the period of analysis. Almost 93% of them (60) are considered
conventional. The vessels belonging to the listed GCS
companies of the sample and were operating in 2002 are 48.
2. The average speed of the sample is around 24,6 knots. This
figure is considered ‘exaggerated’ for the vessels deployed in
the Aegean but close to reality for the vessels deployed in the
Adriatic. A closer analysis suggests that the average speed for
the conventional vessels is 24,4 knots and 37,6 knots for the
non-conventional. Obviously this is the reported speed and not
the actual operating one. It shall be noticed that most of these
vessels are new ones (31 of them are less than 10 years old.)
3. The total capacity of passengers is around 93000 and the
average around 1330. This figure reflects reality although the
extracted statistics for bed, car and truck number do not. A
rather not reliable statistic suggests that every ship offers
around 390 beds, carries 330 private cars or a combination of
121 cars and 76 trucks. The measurement would be more
accurate if only the available lane meters were known.
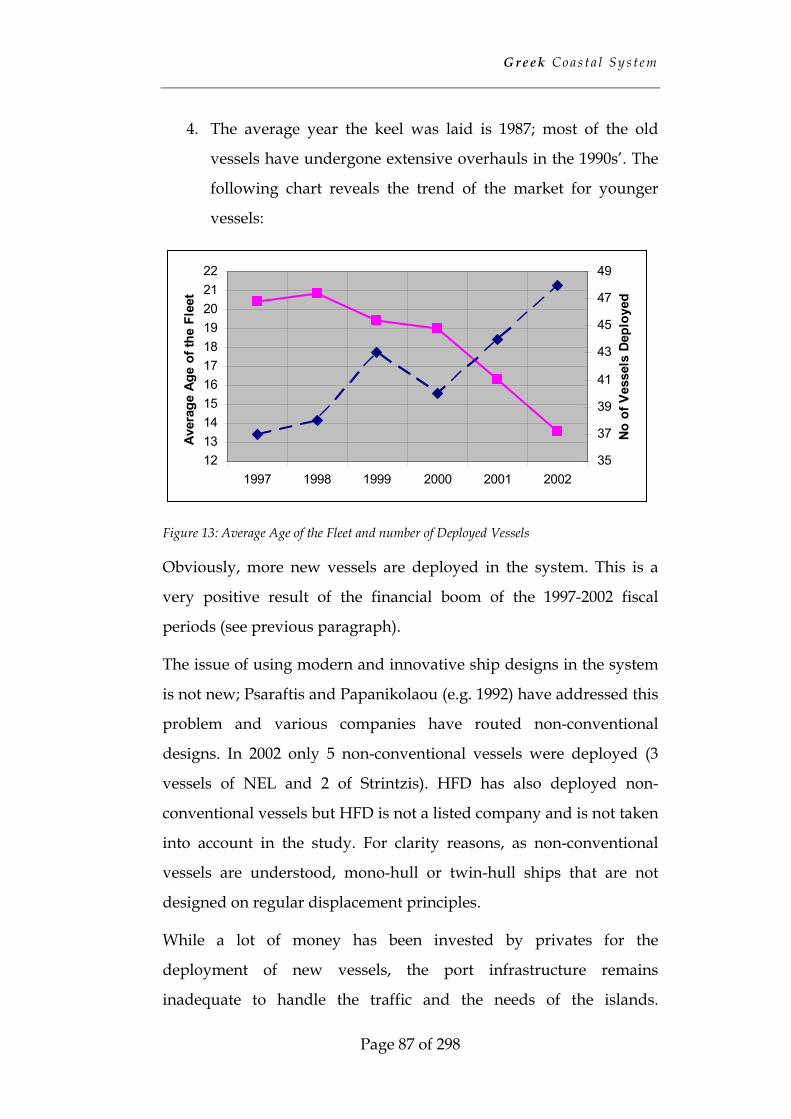
G r e ek C o a s t a l S y s t e m
Page 87 of 298
4. The average year the keel was laid is 1987; most of the old
vessels have undergone extensive overhauls in the 1990s’. The
following chart reveals the trend of the market for younger
vessels:
1213141516171819202122
1997 1998 1999 2000 2001 2002
Aver
age
Age
of th
e Fl
eet
35
37
39
41
43
45
47
49
No
of V
esse
ls D
eplo
yed
Figure 13: Average Age of the Fleet and number of Deployed Vessels
Obviously, more new vessels are deployed in the system. This is a
very positive result of the financial boom of the 1997-2002 fiscal
periods (see previous paragraph).
The issue of using modern and innovative ship designs in the system
is not new; Psaraftis and Papanikolaou (e.g. 1992) have addressed this
problem and various companies have routed non-conventional
designs. In 2002 only 5 non-conventional vessels were deployed (3
vessels of NEL and 2 of Strintzis). HFD has also deployed non-
conventional vessels but HFD is not a listed company and is not taken
into account in the study. For clarity reasons, as non-conventional
vessels are understood, mono-hull or twin-hull ships that are not
designed on regular displacement principles.
While a lot of money has been invested by privates for the
deployment of new vessels, the port infrastructure remains
inadequate to handle the traffic and the needs of the islands.
G r e ek C o a s t a l S y s t e m
Page 88 of 298
Although no aggregate figures are available, only some major
investments are worth-mentioning:
• In the Ionian Sea, the port of Igoumenitsa is experiencing
extensive improvements as a result of the Egnatia axis and its
increasing importance in the Trans-European Networks (TEN)
(axis X). The port infrastructure at the ports of Patras and
Igoumenitsa has been improved; no sophisticated intelligent
system has been deployed in order to support ‘smart’
movements of the trailers carrying the cargo. The real
development in the Greek mainland is the completion of the
North-South road axis as well as of the East-West axis of
Egnatia (not over yet) that connects the interesting and
growing market of Istanbul with Thessalonica and
Igoumenitsa. The completion of Egnatia axis will definitely
encourage trucks from Bulgaria and Turkey to use the port of
Igoumenitsa as a gateway. Experience shows that Turkish
trucks have already exploited the new Greek road and air
infrastructure, as well as Turkish families have used the old
network to Igoumenitsa, as a gateway to Central Europe for
tourism mainly. From press reports, it is known to the authors
that almost 80,000 trucks of Turkish interests have used
Igoumenitsa as gateway in 2002 and almost 1000 private cars
per week in 2003. The figures are not negligible and the
following graph highlights the increasing importance of
Igoumenitsa at the Greek side (Figure 14):
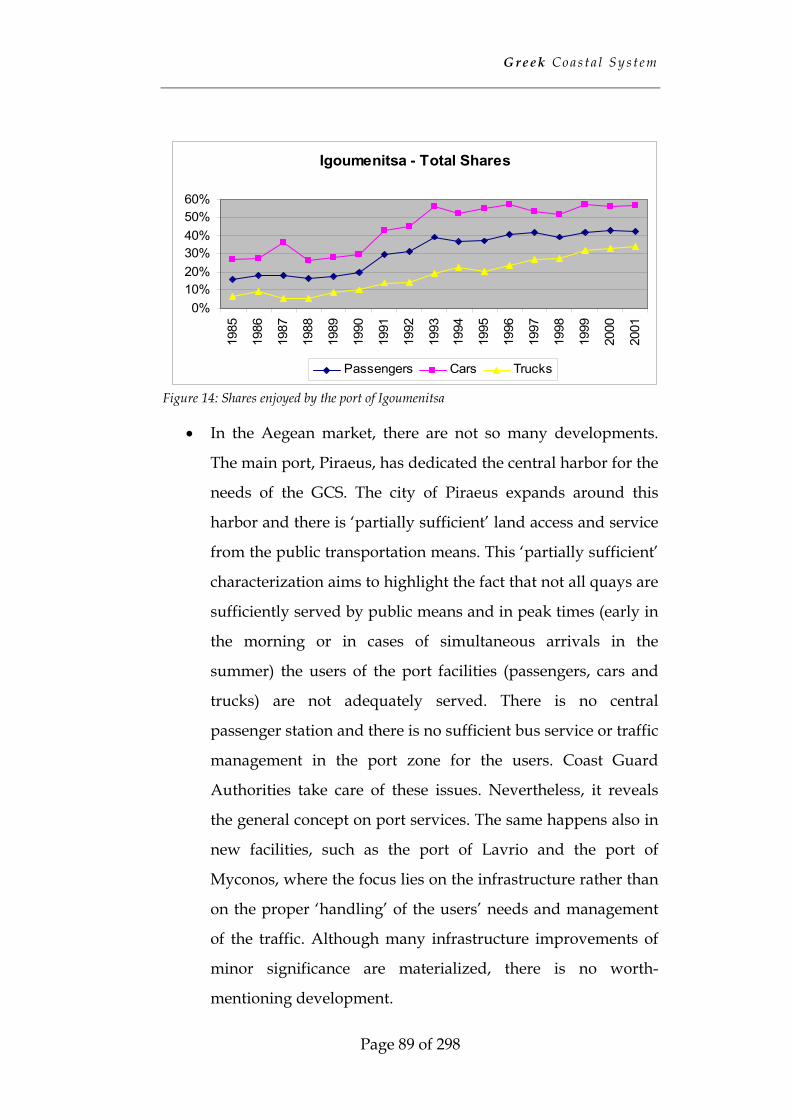
G r e ek C o a s t a l S y s t e m
Page 89 of 298
Figure 14: Shares enjoyed by the port of Igoumenitsa
• In the Aegean market, there are not so many developments.
The main port, Piraeus, has dedicated the central harbor for the
needs of the GCS. The city of Piraeus expands around this
harbor and there is ‘partially sufficient’ land access and service
from the public transportation means. This ‘partially sufficient’
characterization aims to highlight the fact that not all quays are
sufficiently served by public means and in peak times (early in
the morning or in cases of simultaneous arrivals in the
summer) the users of the port facilities (passengers, cars and
trucks) are not adequately served. There is no central
passenger station and there is no sufficient bus service or traffic
management in the port zone for the users. Coast Guard
Authorities take care of these issues. Nevertheless, it reveals
the general concept on port services. The same happens also in
new facilities, such as the port of Lavrio and the port of
Myconos, where the focus lies on the infrastructure rather than
on the proper ‘handling’ of the users’ needs and management
of the traffic. Although many infrastructure improvements of
minor significance are materialized, there is no worth-
mentioning development.
Igoumenitsa - Total Shares
0%10%20%30%40%50%60%
1985
1986
1987
1988
1989
1990
1991
1992
1993
1994
1995
1996
1997
1998
1999
2000
2001
Passengers Cars Trucks
G r e ek C o a s t a l S y s t e m
Page 90 of 298
It is necessary to mention that in the GCS complex of service, port
facilities have never attracted the interest of investors and of
operators. This is a result of the suffocating control of the State and of
the design of the system. In very few and specific cases, operators
expressed interest for the port facilities, as happened in the case of
Patras. In that specific case, the poor port facilities were diminishing
the advantages of the new vessels and therefore reducing the returns
of their investment. In the Aegean complex, the interest of the
operators was focused on the poor operational safety offered by the
harbors. Furthermore, there was also the issue of the license; it was
never sure that the same operator would serve the same line for a
specific time period that would make the investment worthy.
As a result, it was rather impossible to introduce successful
techniques and practices from other industries, such as advanced
services for the users at ports, yield management for the perishable
asset of the seats, the beds, the lane meters on board, advanced
advertising, etc. These services are widely offered in the air-industry,
as well as in other coastal systems, for instance in the Baltic Sea. The
obsolete design and management approach from the State
condemned the local port industry to poor services. Of course, not all
ports could be benefited from the operators, but it is definite that
some at least would, and at least they would raise the standards for
the whole system. This question becomes even more interesting and
acute as the new and innovatively designed vessels require better
harboring and traffic management at the port zone in order to be
efficient and competitive.
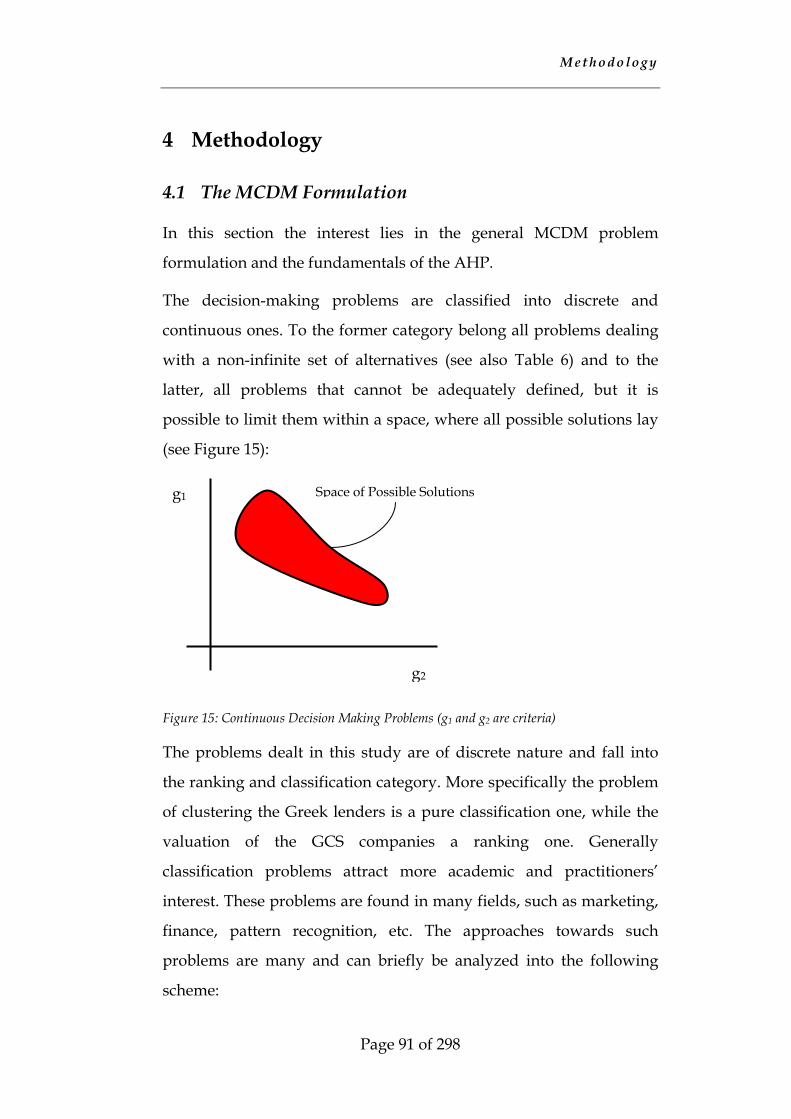
M et h o d o l o g y
Page 91 of 298
4 Methodology
4.1 The MCDM Formulation
In this section the interest lies in the general MCDM problem
formulation and the fundamentals of the AHP.
The decision-making problems are classified into discrete and
continuous ones. To the former category belong all problems dealing
with a non-infinite set of alternatives (see also Table 6) and to the
latter, all problems that cannot be adequately defined, but it is
possible to limit them within a space, where all possible solutions lay
(see Figure 15):
Figure 15: Continuous Decision Making Problems (g1 and g2 are criteria)
The problems dealt in this study are of discrete nature and fall into
the ranking and classification category. More specifically the problem
of clustering the Greek lenders is a pure classification one, while the
valuation of the GCS companies a ranking one. Generally
classification problems attract more academic and practitioners’
interest. These problems are found in many fields, such as marketing,
finance, pattern recognition, etc. The approaches towards such
problems are many and can briefly be analyzed into the following
scheme:
g2
g1 Space of Possible Solutions
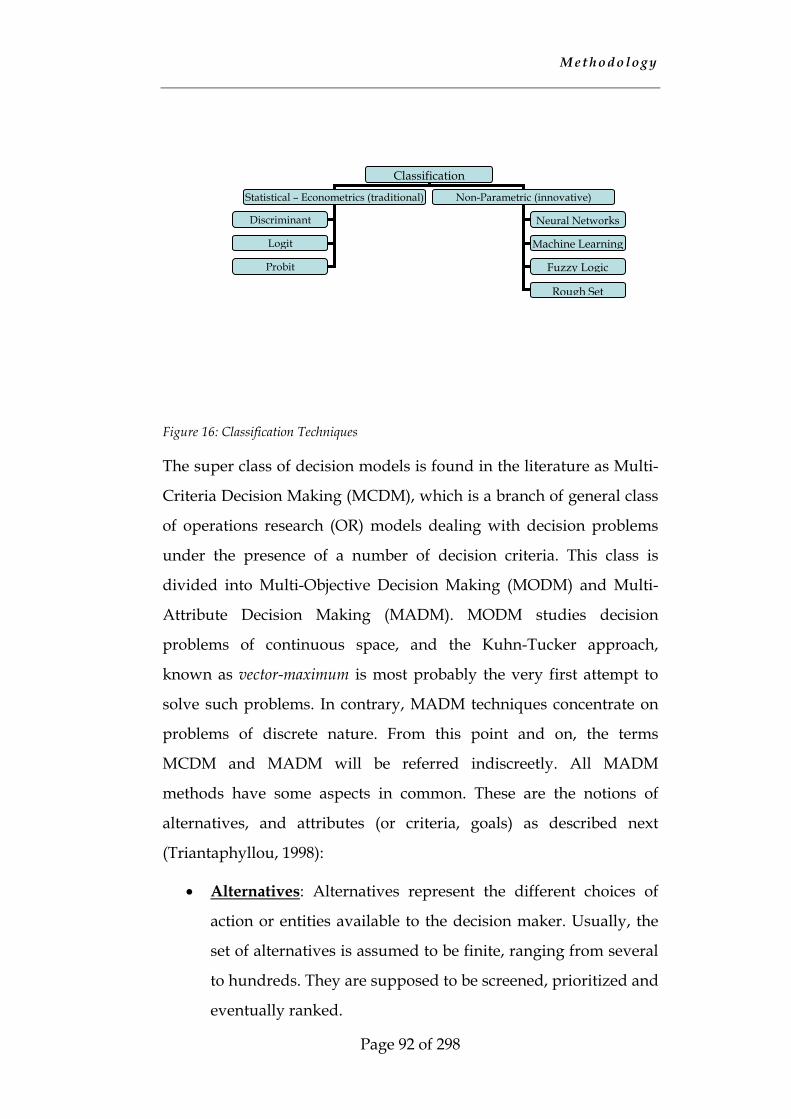
M et h o d o l o g y
Page 92 of 298
Figure 16: Classification Techniques
The super class of decision models is found in the literature as Multi-
Criteria Decision Making (MCDM), which is a branch of general class
of operations research (OR) models dealing with decision problems
under the presence of a number of decision criteria. This class is
divided into Multi-Objective Decision Making (MODM) and Multi-
Attribute Decision Making (MADM). MODM studies decision
problems of continuous space, and the Kuhn-Tucker approach,
known as vector-maximum is most probably the very first attempt to
solve such problems. In contrary, MADM techniques concentrate on
problems of discrete nature. From this point and on, the terms
MCDM and MADM will be referred indiscreetly. All MADM
methods have some aspects in common. These are the notions of
alternatives, and attributes (or criteria, goals) as described next
(Triantaphyllou, 1998):
• Alternatives: Alternatives represent the different choices of
action or entities available to the decision maker. Usually, the
set of alternatives is assumed to be finite, ranging from several
to hundreds. They are supposed to be screened, prioritized and
eventually ranked.
Classification
Statistical – Econometrics (traditional) Non-Parametric (innovative)
Discriminant
Logit
Probit
Neural Networks
Machine Learning
Fuzzy Logic
Rough Set

M et h o d o l o g y
Page 93 of 298
• Multiple attributes: Each MADM problem is associated with
multiple attributes. Attributes are also referred to as "goals" or
"decision criteria" and are commonly understood as
parameters or characteristics. Attributes represent the different
dimensions from which the alternatives can be viewed. In cases
in which the number of attributes is large (e.g., more than a
few dozens), attributes may be arranged in a hierarchical
manner. That is, some attributes may be major attributes. Each
major attribute may be associated with several sub-attributes.
Similarly, each sub-attribute may be associated with several
sub-sub-attributes and so on. Although some MADM methods
may explicitly consider a hierarchical structure in the attributes
of a problem, most of them assume a single level of attributes
(e.g., no hierarchical structure).
• Conflict among attributes: Since different attributes represent
different dimensions of the alternatives, they may conflict with
each other. For instance, cost may conflict with profit, etc.
• Incommensurable units: Different attributes may be
associated with different units of measure. For instance, in the
case of buying a used car, the attributes "cost" and "mileage"
may be measured in terms of dollars and thousands of miles,
respectively. It is this nature of having to consider different
units which makes MADM to be intrinsically hard to solve.
• Decision weights: Most of the MADM methods require that
the attributes be assigned weights of importance. Usually,
these weights are normalized to add up to one.
• Decision matrix: An MADM problem can be easily expressed
in matrix format. A decision matrix A is an (M × N) matrix in
which element aij indicates the performance of alternative Ai
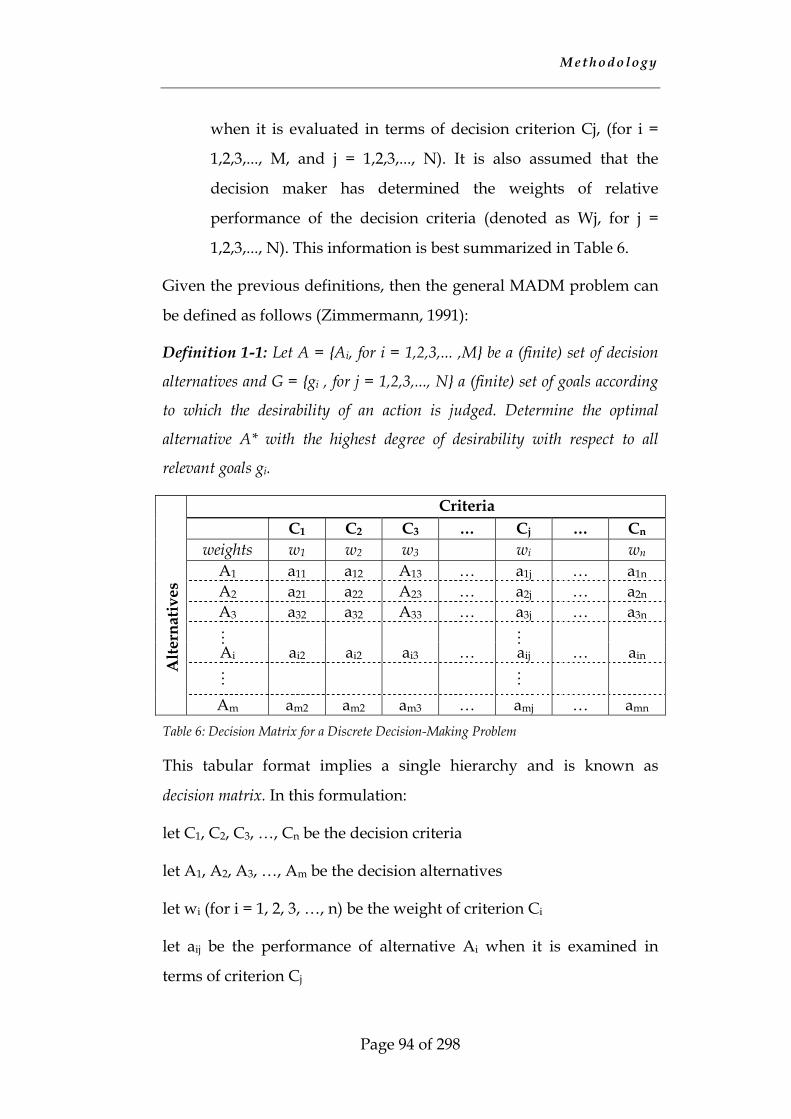
M et h o d o l o g y
Page 94 of 298
when it is evaluated in terms of decision criterion Cj, (for i =
1,2,3,..., M, and j = 1,2,3,..., N). It is also assumed that the
decision maker has determined the weights of relative
performance of the decision criteria (denoted as Wj, for j =
1,2,3,..., N). This information is best summarized in Table 6.
Given the previous definitions, then the general MADM problem can
be defined as follows (Zimmermann, 1991):
Definition 1-1: Let A = {Ai, for i = 1,2,3,... ,M} be a (finite) set of decision
alternatives and G = {gi , for j = 1,2,3,..., N} a (finite) set of goals according
to which the desirability of an action is judged. Determine the optimal
alternative A* with the highest degree of desirability with respect to all
relevant goals gi.
Criteria C1 C2 C3 … Cj … Cn weights w1 w2 w3 wi wn
A1 a11 a12 A13 … a1j … a1n A2 a21 a22 A23 … a2j … a2n A3 a32 a32 A33 … a3j … a3n
…
…
Ai ai2 ai2 ai3 … aij … ain
Alte
rnat
ives
… …
Am am2 am2 am3 … amj … amn Table 6: Decision Matrix for a Discrete Decision-Making Problem
This tabular format implies a single hierarchy and is known as
decision matrix. In this formulation:
let C1, C2, C3, …, Cn be the decision criteria
let A1, A2, A3, …, Am be the decision alternatives
let wi (for i = 1, 2, 3, …, n) be the weight of criterion Ci
let aij be the performance of alternative Ai when it is examined in
terms of criterion Cj
M et h o d o l o g y
Page 95 of 298
The concealed meaning of the above formulation is that an MCDM
problem, with a given decision matrix, is in essence a problem for a
set of known alternatives and for a set of known criteria. Other
alternatives and analysis under other criteria is not the case in the
MCDM formulation and the decision-maker has to determine both
alternatives and criteria before proceeding to further steps. The
problem formulation goes through a three-phase procedure:
1. determination of the pertinent data
2. process of the data
3. interpretation of the results and the feedback mechanism
In the first phase, the decision maker has to evaluate the quality and
the availability of data. Given or calculated data may be taken into
account indifferently of their nature: stochastic – deterministic,
qualitative – quantitative, stable – dynamic, etc. The second phase
deals with the selection of the proper technique and the execution of
the necessary calculations. It is interesting to note that there is no
single method considered as the most suitable or the most
acknowledged for the general problem. Furthermore, the results for a
given set alternatives and attributes may significantly vary when
comparing different methods. Popular MCDM methods, such as the
weighted sum model (WSM), the weighted product model (WPM),
the analytical hierarchy process (AHP) and its revisions or alterations,
the family of techniques ELECTRE (Elimination Et Choix Traduisant
la Realité), UTADIS, TOPSIS, etc may lead to different conclusions.
This has also been proven in the MCDM literature (Triantaphyllou
and Mann, 1989). Of course there are some criteria ensuring the
stability of the final solution as well as the validity of both the mere
decisions and the whole procedure, but this is not the case in the text.
Finally, in the third phase, the decision maker has to interpret the
M et h o d o l o g y
Page 96 of 298
results and find the most critical criterion. The outcome of this phase
is most commonly the results of a sensitivity analysis under specific
rules.
The MCDM methods are classified according to the available data as
well; so deterministic, stochastic and even fuzzy MCDM methods can
be applied to various problems. Another common way to classify
MCDM problems is the number of the decision makers involved in
the process. Hence, if there is only one decision maker, then the
method is called single and if there are more decision makers then it
is called group MCMD method. Common deterministic, single
MCDM methods are the Weighted Sum Method (WSM), the
Weighted Product Method (WPM) AHP, Elimination and Choice
Translating Reality (ELECTRE) and Technique for Order Preference
by Similarity to Ideal Solution (TOPSIS). There are other ways to
classify MCDM problems as well as other categories the above
mentioned methods may fall into. For example, AHP can easily
incorporate fuzzy data as well as assist in group decision making.
4.2 The Analytic Hierarchy Process Method
The analytic hierarchy process (AHP) is a relatively old method,
developed and presented by Thomas L. Saaty in mid-1970s (Saaty,
1977). Then the method has been discussed and revised from various
scientists in the world; the first collection of papers on the method
along with the mathematical founding has been presented by Saaty in
1980 (Saaty, 1980). AHP works by developing priorities for
alternatives and the criteria. Generally, the criteria are set by the
decision-maker, who constructs the hierarchy. The subjective point of
view of decision-maker consist a weakness for every methodology.
Usually methodologies demand a certain level of expertise from the
decision-maker. In some cases this necessary, as algorithms depend
M et h o d o l o g y
Page 97 of 298
on the first guess of the decision-maker for the soundness of the
method or the easiness of extracting data. Such procedures are of
heuristic type. In other cases, where relative comparisons are part of
the procedure, the subjective point of view is critical for the outcome;
the more subjective perception tends to objective acuity the better the
outcome, assuming that objectivity is under quest. It has to be noted
that decisions shall also reflect personal and subjective perceptions in
many cases as well and objectivity is desired only when the decision-
maker is neutral or indifferent, when selecting the alternative.
The hierarchy of the criteria reflects also the understanding of the
decision-maker of the problem and of the parameters affecting the
final judgment. A critical point for all MCDM methods is the
combination of criteria measured on different scales; measurements of
different scales cannot be directly combined. In AHP priorities
between criteria are first extracted and then priorities for the
performance of every alternative on each criterion are derived. These
priorities are nothing but pair-wise assessments using judgment or
ratios from a measurement scale, if one exists. There are many
measurement scales available for decision-makers; Saaty has
proposed a linear scale, well accepted in the academia and widely
used in application. Lootsma has proposed another non-linear scale,
and other researchers have based their scales primarily on
psychological research. As a general comment, what Saaty has
achieved with AHP is appealing: the decision-maker can combine
criteria with different measurement scales, introduce qualitative
criteria revealing biases and, last but not least, numerically is the
transformation of multidimensional scaling problem to one-
dimensional. This has also been achieved through the use of a
common scale –the fundamental one-, proportionality and the
introduction of ideal and distributive modeling.
M et h o d o l o g y
Page 98 of 298
A critical issue of all MCDM problems is the one of hierarchy; there
are many sources suggesting that decision-making is a hierarchical
process. All problems, from the simplest to the most complicated, can
be represented in a multilevel structure, a hierarchy, whose first level
is the goal followed by levels of factor, criteria, sub criteria and so on.
Its representation can be used in order to describe how changes, at
upper levels, can affect the priority at lower levels. Hierarchical
representation gives a clear picture to the decision-maker about the
structure and functions of the system in its lower levels and provides
an overview of the actor and their purposes in the upper levels.
Therefore, the main objective of a hierarchy is either to assess the
impact of an element in levels higher than those that are characterized
lower, or alternatively the contribution of elements in the lower levels
to the importance of the elements in the upper level. This technique is
based on the breaking down of a decision into smaller parts, from the
goal to criteria, to sub criteria and so on. This procedure enables
decision-makers to set up priorities and to create problem’s model by
developing a hierarchy decomposition representation. At the top of
the hierarchy is the overall goal that is trying to fulfill. The lower
levels represent the progressive decomposition of the problem. The
decision-maker completes a pair-wise comparison of all elements in
the next higher level of the hierarchy. The composition of all these
elements determines the most relevant priority of elements in the
lowest level in order to achieve the most objective. Therefore, one of
the main objectives of AHP is the development of priorities for
alternatives and of criteria that are used in order to judge the
alternatives.
The method can also accommodate group decision making and
judgments from various experts. The advantages of the method have
been widely and sternly discussed and debated among academics.
M et h o d o l o g y
Page 99 of 298
The main point of friction is the extraction of the priority eigenvectors
and other numerical issues. In conclusion, the AHP is based on seven
pillars described briefly above and analyzed further in the following
paragraphs:
1. Ratio Scales
2. Paired Comparisons
3. The establishment of priority vector
4. Alternative’s Comparison
5. The establishment of priority vectors for alternatives
6. The achievement of the overall ranking
7. Group decision making
It shall be noted that AHP is a convenient and rather accurate tool
when alternatives are not many, i.e. when the relative comparison
between alternatives remains within a range humans can easily
handle. Supposing that a decision-maker has to elicit the priorities or
the weights of n entities (criteria or alternatives) then he has to elicit
the value of n(n-1)/2 pairwise comparisons. In a generic form, with m
alternatives and n criteria, then this number equals to n (n-1)
2 +
n m (m-1)2 , which can be a rather large number. For n=m=10 then the
number of the required pairwise comparisons equals to 495; for n=10
and m=15 the number becomes 1095. This high number of
comparisons can make the data elicitation procedure tedious and thus
it may jeopardize the accuracy of the whole procedure. Small
inaccuracies may become critical as numerical errors are diffused and
have a magnified effect in the outcome. Researchers have attempted
to skip certain comparisons (Harker, 1987) and Triantaphyllou has
proposed lately an alternative approach by formulating a dual

M et h o d o l o g y
Page 100 of 298
problem (Triantaphyllou, 1999). This issue will not be discussed
further as there is no relevant need. Yet the advantages of AHP in a
small sample of alternatives over other methods were the main
trigger for approaching the subject with this method. If the sample of
the alternatives was bigger then AHP would be critically contrasted
with other MCDM methods.
As it is known, a ratio is the relative value or a quotient of two
quantities of the same kind and it is called commensurate if it is a
rational number, otherwise it is incommensurate. A ratio is either the
relative value or the quotient ab of two quantities a and b of the same
kind. The statement of the equality of the equality of two ratios ab and
cd is proportionality. A ratio scale is a set of numbers that is invariant
under a similarity transformation. Ratio scales can be considered
central to the generation and synthesis of priorities, as far as AHP is
concerned, but also in any multi-criteria method that has to combine
existing ratio scale measurements with its own scales. They are
characterized as the only way that can be used to the generalization of
a decision theory when the case of dependence and feedback is
examined. The main reason is the ability of ratio scales to be both
multiplied and added when they belong to the same scale. When two
judges arrive at two different ratio scales for the same problem, the
next step is the testing of their answer’s compatibility in order either
to accept or reject them.
Ratio scales may also be used to make decisions that follow a more
general framework, which involves several hierarchies and by using a
common criteria. Generally, the ratio of two numbers that belong to
the same ratio scale is an absolute number and so, ratio scales create
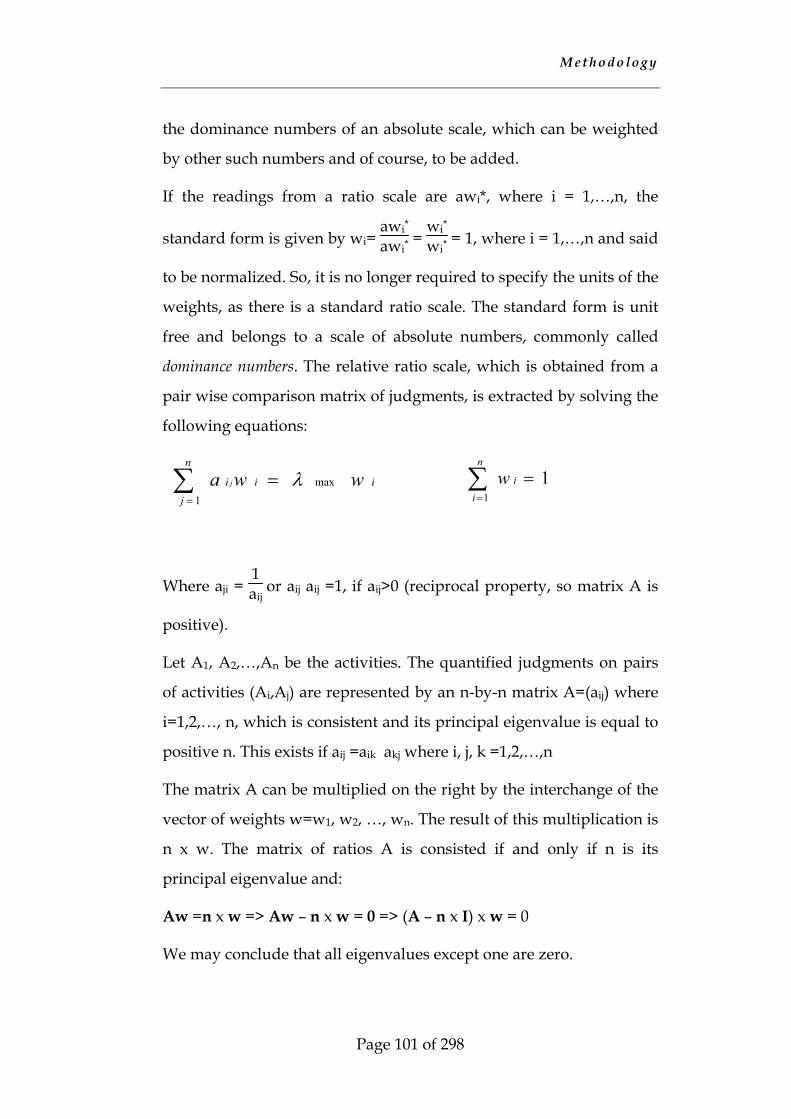
M et h o d o l o g y
Page 101 of 298
the dominance numbers of an absolute scale, which can be weighted
by other such numbers and of course, to be added.
If the readings from a ratio scale are awi*, where i = 1,…,n, the
standard form is given by wi= awi*
awi* =
wi*
wi* = 1, where i = 1,…,n and said
to be normalized. So, it is no longer required to specify the units of the
weights, as there is a standard ratio scale. The standard form is unit
free and belongs to a scale of absolute numbers, commonly called
dominance numbers. The relative ratio scale, which is obtained from a
pair wise comparison matrix of judgments, is extracted by solving the
following equations:
Where aji = 1aij
or aij aij =1, if aij>0 (reciprocal property, so matrix A is
positive).
Let A1, A2,…,An be the activities. The quantified judgments on pairs
of activities (Ai,Aj) are represented by an n-by-n matrix A=(aij) where
i=1,2,…, n, which is consistent and its principal eigenvalue is equal to
positive n. This exists if aij =aik akj where i, j, k =1,2,…,n
The matrix A can be multiplied on the right by the interchange of the
vector of weights w=w1, w2, …, wn. The result of this multiplication is
n x w. The matrix of ratios A is consisted if and only if n is its
principal eigenvalue and:
Aw =n x w => Aw – n x w = 0 => (A – n x I) x w = 0
We may conclude that all eigenvalues except one are zero.
∑=
=n
jiii wwa j
1maxλ 1
1
=∑=
n
i
iw
M et h o d o l o g y
Page 102 of 298
Paired comparisons allow the expression of comparisons in verbal
term that are then translated in the corresponding numbers. Decision-
makers synthesize the comparisons in order to get the dominance of
each element in relation to other elements. The most structured way
of doing this comparison is the preparation of a matrix whose factors
have to be listed at the top and on the left. This comparison is based
on surveyed information and on the resulting judgment of the
decision-maker. The next step is the filling of the matrix with
numerical values that indicate the factor’s importance on the left,
relative to the factor’s importance on the top. Therefore, a high value
means that the factor on the left is more important that the factor at
the top. When the matrix has been filled out, the decision-maker can
move to the next step.
Paired comparisons permit the expression of comparisons in verbal
terms that are translated in the corresponding numbers. Decision-
makers synthesize these comparisons in order to get the dominance of
each element in relation to other elements. The most structured way
of doing these comparisons is the preparation of a matrix whose
factors have to be listed at the top and on the left. These comparisons
are based on surveyed information and on the judgment of the
decision-maker. The filling of the matrix with numerical values
denotes the factor’s importance on the left, relative to the factor’s
importance on the top. The high value of the factor on the left means,
that it is more important than the factor at the top.
The matrix is consisted of numerical values. These numerical values
can be denoted as wi and wj and their ratio wi / wj represents the
relative importance of the ith criterion over the jth criterion. Instead of
determining two numbers wi and wj and their ratio, decision-maker
can select a single number taken out from the fundamental 1 - 9 scale
of absolute numbers in order to represent the ratio ( wi / wj ) / 1. This
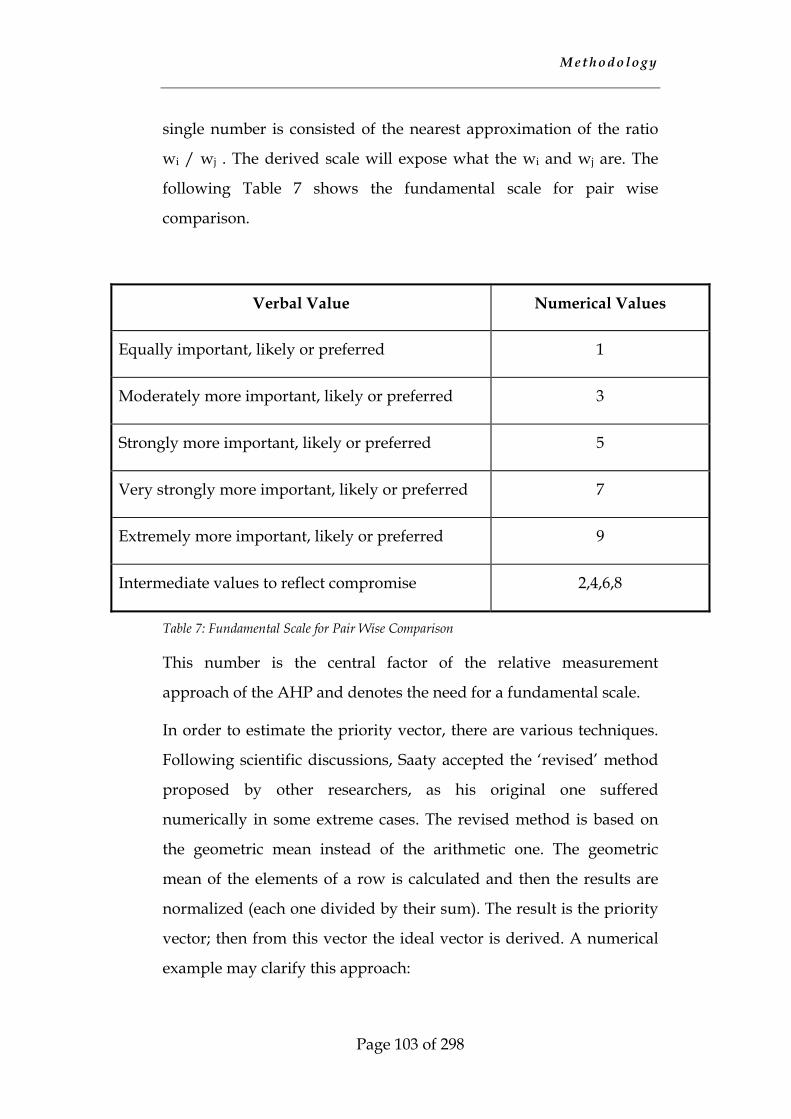
M et h o d o l o g y
Page 103 of 298
single number is consisted of the nearest approximation of the ratio
wi / wj . The derived scale will expose what the wi and wj are. The
following Table 7 shows the fundamental scale for pair wise
comparison.
Verbal Value Numerical Values
Equally important, likely or preferred 1
Moderately more important, likely or preferred 3
Strongly more important, likely or preferred 5
Very strongly more important, likely or preferred 7
Extremely more important, likely or preferred 9
Intermediate values to reflect compromise 2,4,6,8
Table 7: Fundamental Scale for Pair Wise Comparison
This number is the central factor of the relative measurement
approach of the AHP and denotes the need for a fundamental scale.
In order to estimate the priority vector, there are various techniques.
Following scientific discussions, Saaty accepted the ‘revised’ method
proposed by other researchers, as his original one suffered
numerically in some extreme cases. The revised method is based on
the geometric mean instead of the arithmetic one. The geometric
mean of the elements of a row is calculated and then the results are
normalized (each one divided by their sum). The result is the priority
vector; then from this vector the ideal vector is derived. A numerical
example may clarify this approach:
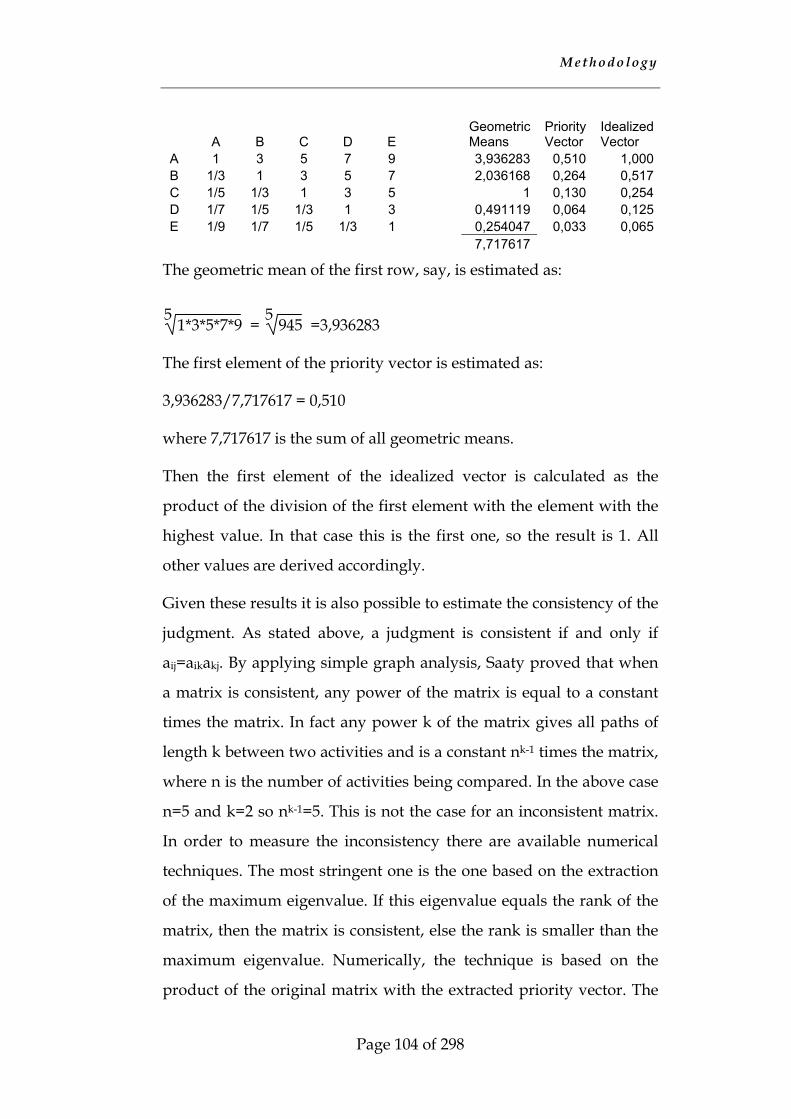
M et h o d o l o g y
Page 104 of 298
A B C D E Geometric Means
Priority Vector
Idealized Vector
A 1 3 5 7 9 3,936283 0,510 1,000B 1/3 1 3 5 7 2,036168 0,264 0,517C 1/5 1/3 1 3 5 1 0,130 0,254D 1/7 1/5 1/3 1 3 0,491119 0,064 0,125E 1/9 1/7 1/5 1/3 1 0,254047 0,033 0,065 7,717617
The geometric mean of the first row, say, is estimated as:
5 1*3*5*7*9 = 5 945 =3,936283
The first element of the priority vector is estimated as:
3,936283/7,717617 = 0,510
where 7,717617 is the sum of all geometric means.
Then the first element of the idealized vector is calculated as the
product of the division of the first element with the element with the
highest value. In that case this is the first one, so the result is 1. All
other values are derived accordingly.
Given these results it is also possible to estimate the consistency of the
judgment. As stated above, a judgment is consistent if and only if
aij=aikakj. By applying simple graph analysis, Saaty proved that when
a matrix is consistent, any power of the matrix is equal to a constant
times the matrix. In fact any power k of the matrix gives all paths of
length k between two activities and is a constant nk-1 times the matrix,
where n is the number of activities being compared. In the above case
n=5 and k=2 so nk-1=5. This is not the case for an inconsistent matrix.
In order to measure the inconsistency there are available numerical
techniques. The most stringent one is the one based on the extraction
of the maximum eigenvalue. If this eigenvalue equals the rank of the
matrix, then the matrix is consistent, else the rank is smaller than the
maximum eigenvalue. Numerically, the technique is based on the
product of the original matrix with the extracted priority vector. The
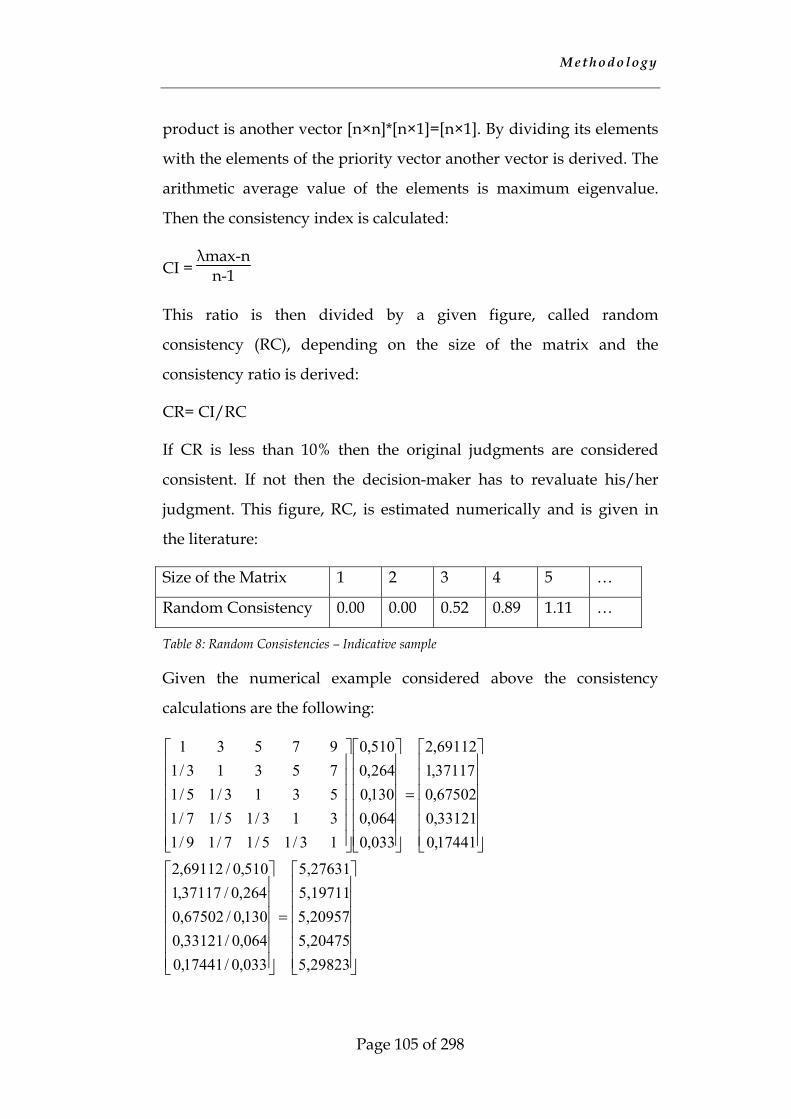
M et h o d o l o g y
Page 105 of 298
product is another vector [n×n]*[n×1]=[n×1]. By dividing its elements
with the elements of the priority vector another vector is derived. The
arithmetic average value of the elements is maximum eigenvalue.
Then the consistency index is calculated:
CI = λmax-n
n-1
This ratio is then divided by a given figure, called random
consistency (RC), depending on the size of the matrix and the
consistency ratio is derived:
CR= CI/RC
If CR is less than 10% then the original judgments are considered
consistent. If not then the decision-maker has to revaluate his/her
judgment. This figure, RC, is estimated numerically and is given in
the literature:
Size of the Matrix 1 2 3 4 5 …
Random Consistency 0.00 0.00 0.52 0.89 1.11 …
Table 8: Random Consistencies – Indicative sample
Given the numerical example considered above the consistency
calculations are the following:
=
=
5,298235,204755,209575,197115,27631
033,0/17441,0064,0/33121,0130,0/67502,0264,0/37117,1510,0/69112,2
17441,033121,067502,037117,169112,2
033,0064,0130,0264,0510,0
13/15/17/19/1313/15/17/15313/15/175313/197531

M et h o d o l o g y
Page 106 of 298
Then the average of the elements of the vector is calculated as:
(5,276307+5,197107+5,209569+5,204755+5,298233)/5 = 5,23719
By applying the formulas:
CI = λmax-n
n-1 = 5,23719-5
5-1 =0,05929 ≈ 0,06
and
CR = CI/RC = 0,06/1.11≈ 5,3%
The original judgments are considered as sound enough to proceed to
further elaboration.
These procedures are repeated for the comparison of all alternatives
and weights. The final ranking of the alternatives is based on the
formula:
Ai = Σwjaij
This linear formula conceals much theoretical information. The first
one is that the attributes are independent and therefore it is possible
to sum them numerically. Furthermore they bear no dimensions or
units. Additive and rest assumptions are also held. Last, but not least,
this linear also relation assumes linear utility functions. More details
can be found in the literature (e.g. Keeney and Raiffa, Saaty, Pardalos)
as well as in the coming chapter on the application of the model.
4.2.1 Group decision-making
In many cases, it is necessary to combine the judgments of many
experts or to extract the judgment from of a team of persons. The
issue of group judgment is not so easy, as it may seem to the
inexperienced researcher, as the judgments have to satisfy the
reciprocal properties. Group decision-making must be carefully
designed and taking into account the experience and the knowledge

M et h o d o l o g y
Page 107 of 298
of persons that are involved in the decision-making, as well as by
avoiding the need to use the classical ways such as voting.
Usually, group decision making comes up in two forms or types of
problems: how to aggregate individual judgments and how to
construct a group choice out of individual ones. Aczel and Roberts in
1989 proposed the conditions to produce meaningful statements from
merged functions; the conditions are symmetry, linear homogeneity
and agreement (Aczel, et al, 1989).
The symmetry axiom demands that the merging function does not
change if the functions giving individual judgments are interchanged.
The linear homogeneity specifies that if a group multiplies its
preference by a constant r, then the resulting group preference is also
multiplied by r. The agreement axiom specifies that if all individuals
agree, then the group agrees with all individuals. As there is no
specific interest in this issue in this document, there will be no
mathematical justification of the above axioms or discussion over the
soundness of this approach. However, it has to be highlighted that
Saaty implies, in many of his documents, that in most cases arithmetic
or geometric mean are the most usable and possible functions to cover
such needs (Saaty, 2001b, p61). Saaty also discusses some qualitative
issues in group decision making: the unequal power and expertise of
the participants, the bargaining of votes or support on issues with
specific interest (variability of preference), the change of preference
due to external factors, and the unwillingness to reveal preferences
(Saaty, 2001a).
AHP is used widely in group decision making situations through
questionnaires. The implementation of such a technique demands
some expertise from the researcher or the decision maker, and the
issue of the merging function, may easily be bypassed with the use of
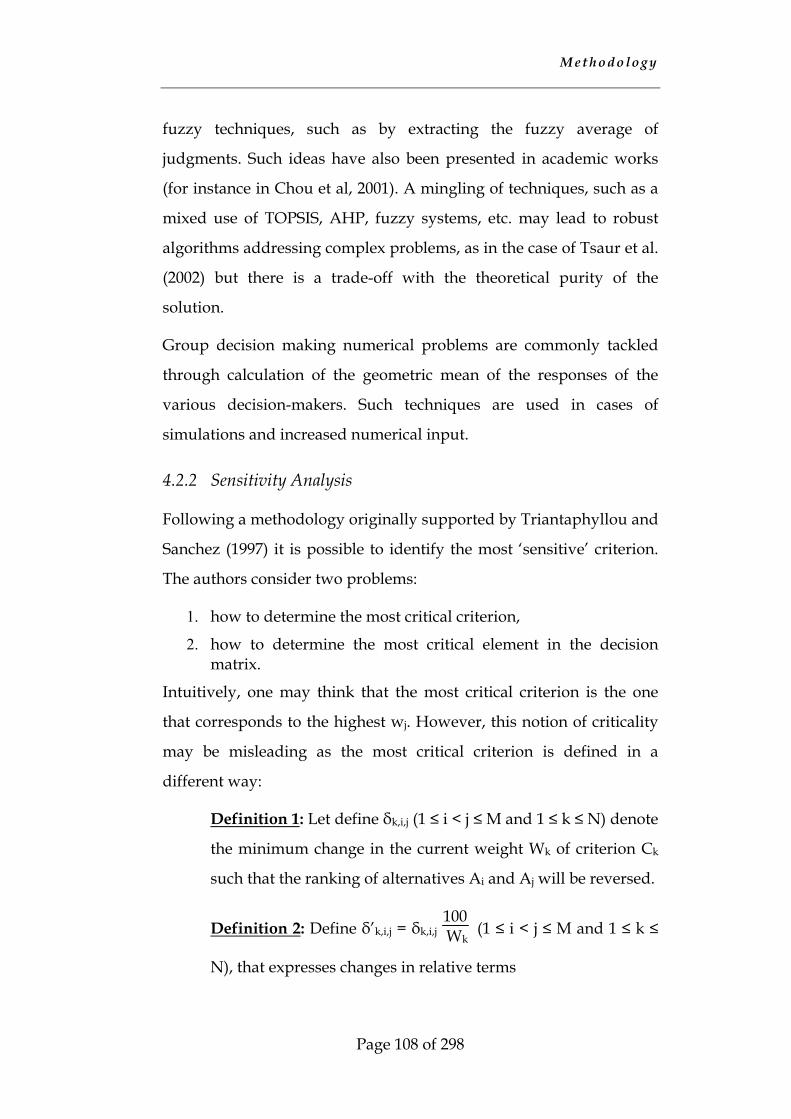
M et h o d o l o g y
Page 108 of 298
fuzzy techniques, such as by extracting the fuzzy average of
judgments. Such ideas have also been presented in academic works
(for instance in Chou et al, 2001). A mingling of techniques, such as a
mixed use of TOPSIS, AHP, fuzzy systems, etc. may lead to robust
algorithms addressing complex problems, as in the case of Tsaur et al.
(2002) but there is a trade-off with the theoretical purity of the
solution.
Group decision making numerical problems are commonly tackled
through calculation of the geometric mean of the responses of the
various decision-makers. Such techniques are used in cases of
simulations and increased numerical input.
4.2.2 Sensitivity Analysis
Following a methodology originally supported by Triantaphyllou and
Sanchez (1997) it is possible to identify the most ‘sensitive’ criterion.
The authors consider two problems:
1. how to determine the most critical criterion,
2. how to determine the most critical element in the decision matrix.
Intuitively, one may think that the most critical criterion is the one
that corresponds to the highest wj. However, this notion of criticality
may be misleading as the most critical criterion is defined in a
different way:
Definition 1: Let define δk,i,j (1 ≤ i < j ≤ M and 1 ≤ k ≤ N) denote
the minimum change in the current weight Wk of criterion Ck
such that the ranking of alternatives Ai and Aj will be reversed.
Definition 2: Define δ’k,i,j = δk,i,j 100 Wk
(1 ≤ i < j ≤ M and 1 ≤ k ≤
N), that expresses changes in relative terms
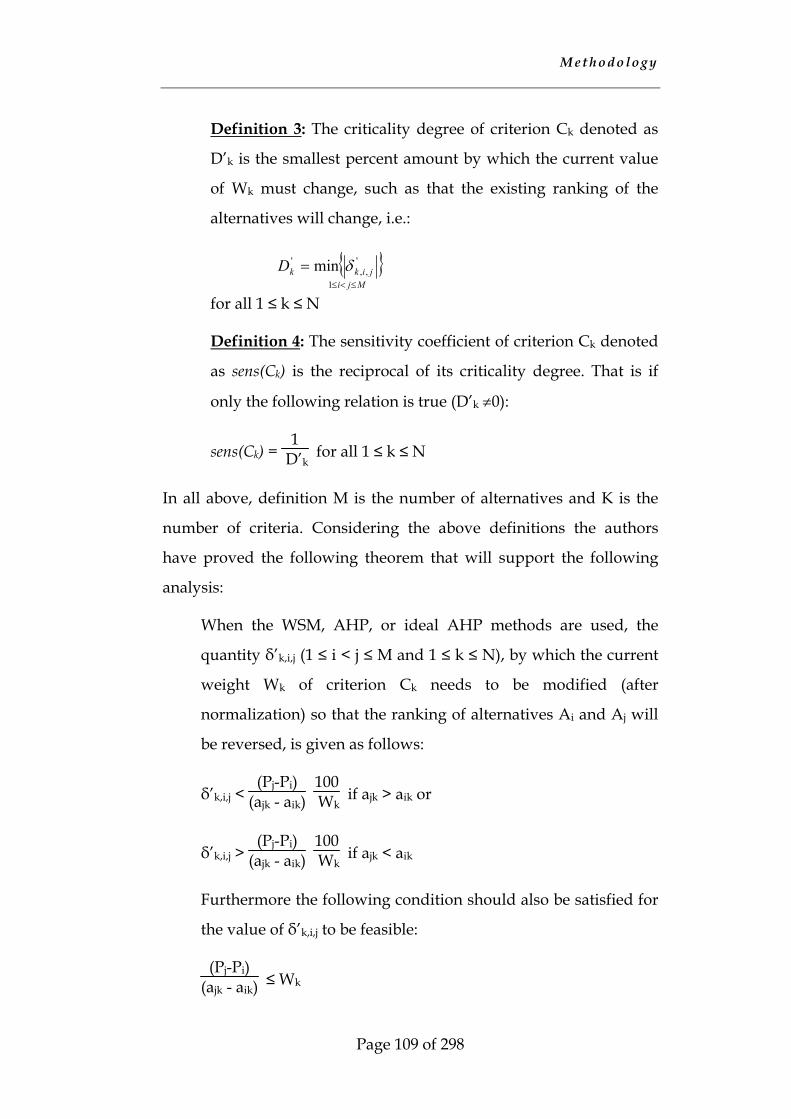
M et h o d o l o g y
Page 109 of 298
Definition 3: The criticality degree of criterion Ck denoted as
D’k is the smallest percent amount by which the current value
of Wk must change, such as that the existing ranking of the
alternatives will change, i.e.:
for all 1 ≤ k ≤ N
Definition 4: The sensitivity coefficient of criterion Ck denoted
as sens(Ck) is the reciprocal of its criticality degree. That is if
only the following relation is true (D’k ≠0):
sens(Ck) = 1
D’k for all 1 ≤ k ≤ N
In all above, definition M is the number of alternatives and K is the
number of criteria. Considering the above definitions the authors
have proved the following theorem that will support the following
analysis:
When the WSM, AHP, or ideal AHP methods are used, the
quantity δ’k,i,j (1 ≤ i < j ≤ M and 1 ≤ k ≤ N), by which the current
weight Wk of criterion Ck needs to be modified (after
normalization) so that the ranking of alternatives Ai and Aj will
be reversed, is given as follows:
δ’k,i,j < (Pj-Pi)
(ajk - aik) 100 Wk
if ajk > aik or
δ’k,i,j > (Pj-Pi)
(ajk - aik) 100 Wk
if ajk < aik
Furthermore the following condition should also be satisfied for
the value of δ’k,i,j to be feasible:
(Pj-Pi)(ajk - aik) ≤ Wk
{ }MjijikkD
≤<≤
=1
',,
' min δ
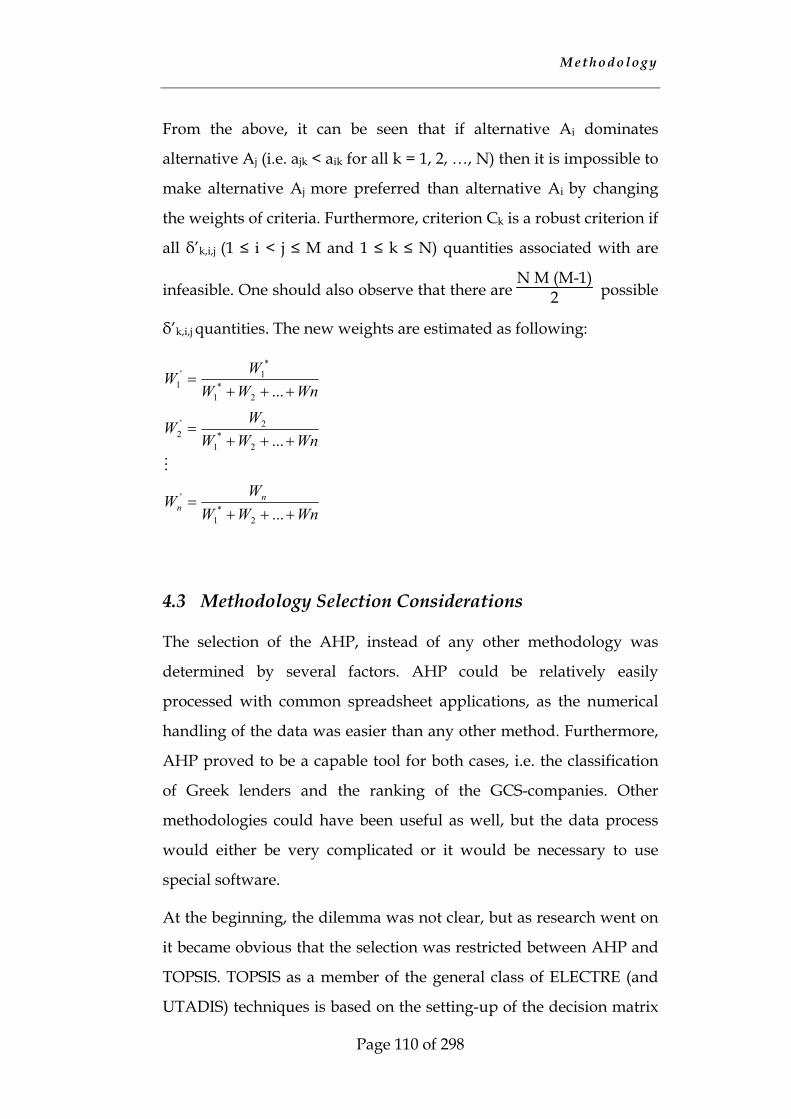
M et h o d o l o g y
Page 110 of 298
From the above, it can be seen that if alternative Ai dominates
alternative Aj (i.e. ajk < aik for all k = 1, 2, …, N) then it is impossible to
make alternative Aj more preferred than alternative Ai by changing
the weights of criteria. Furthermore, criterion Ck is a robust criterion if
all δ’k,i,j (1 ≤ i < j ≤ M and 1 ≤ k ≤ N) quantities associated with are
infeasible. One should also observe that there are N M (M-1)
2 possible
δ’k,i,j quantities. The new weights are estimated as following:
WnWWW
W
WnWWWW
WnWWWW
nn +++=
+++=
+++=
...
...
...
2*
1
'
2*
1
2'2
2*
1
*1'
1
M
4.3 Methodology Selection Considerations
The selection of the AHP, instead of any other methodology was
determined by several factors. AHP could be relatively easily
processed with common spreadsheet applications, as the numerical
handling of the data was easier than any other method. Furthermore,
AHP proved to be a capable tool for both cases, i.e. the classification
of Greek lenders and the ranking of the GCS-companies. Other
methodologies could have been useful as well, but the data process
would either be very complicated or it would be necessary to use
special software.
At the beginning, the dilemma was not clear, but as research went on
it became obvious that the selection was restricted between AHP and
TOPSIS. TOPSIS as a member of the general class of ELECTRE (and
UTADIS) techniques is based on the setting-up of the decision matrix
M et h o d o l o g y
Page 111 of 298
before the solution. In contrast AHP demanded a clear hierarchy, an
analysis of the factors before proceeding to the formation of the
matrix. Basically, this argument is not really accurate. When a
decision-maker sets up a problem, then the formulation of the
hierarchy is necessary and then follows the decision, which method
shall be selected. Nevertheless in a research work like this, the
structure of the hierarchy is neither clear from the beginning nor has
the decision-maker the experience to direct the solution through a
technique, so the most comprehensive way was selected. AHP is very
comprehensive and there are too many textbooks and examples
assisting in the understanding of its essence. As a result AHP was
initially selected because it was more user-friendly at the beginning.
Nevertheless, at latter research stages the method was tested and
proved flexible enough.
Generally, TOPSIS and the other techniques of this family are based
on quantitative and ‘dummy’ data per criterion. These techniques are
capable of handling large matrices. Of course, it is possible to extract
the weights of the criteria by using hierarchies and techniques similar
to the AHP. However, it is necessary to mention that practically all
rows of data are compared to each other in order to yield a result. For
very large samples, comparisons among rows are theoretically and
practically favored, while for smaller samples techniques, such as the
AHP are preferred, mainly for rank preservation reasons. Saaty has
provided many arguments on the fallacy of rank preservation, based
on experiences and ideas of other researchers (2001b, p.41 and 361-8).
The next dilemma was whether to use AHP in combination with any
other technique. In recent literature many scientists combine AHP
with other methods. For the problems set in this study, AHP was
combined only with fuzzy numbers, in order to improve the input
procedure of the replies to the questionnaires (first case: the lenders
M et h o d o l o g y
Page 112 of 298
market). No other combination was really necessary due to the
relatively small samples of alternatives. In the case that the sample of
alternatives was considerably bigger, then TOPSIS would have
refined the output, as AHP in ideal mode is numerically similar to
WSM, i.e. considerably less sophisticated than TOPSIS.
The issue of combining techniques is not so simple. Fuzzy set theory
provides researchers with capable tools for the quantification of
qualitative and subjective data. So it is wise to design the
questionnaires with a clear numerical scope. This theory may also
assist researchers in gathering necessary data for the ‘extraction’ of
utility functions; nevertheless, a repetitive procedure is usually
required. Then AHP and other methods, such WSM, WPM, yield an
index for every alternative, which is furthermore compared and
ranked. The comparison is relative, i.e. an alternative is considered in
comparison to the rest sample-members. There are cases where
deviation from expected goals is required or preferred. This also
introduces a notion of absolute measurement and refines the selection
according to specific standards. That is the reason why parts of the
TOPSIS algorithm are combined with other methods. The planar
geometric representation of this method is also very helpful for the
understanding of the rankings.
The research was faced with the above issues and it was obligatory to
consider the actual facts of the inherent incapability of collecting
questionnaires and proceed to repetitive procedures for the extraction
of utility functions, as well as the relatively small sample under
consideration. Last, but not least, it was necessary to build the
methodology in such a way that scenarios and future or imaginary
data could be taken into account.
M et h o d o l o g y
Page 113 of 298
It was stated that AHP requires no direct knowledge or assumption
over the utility function. Therefore, it was selected and the attributes
of the utility function would be clarified from the weights among
criteria. In the case of the mapping of the lenders’ market the
questionnaires were necessary for the collection of the data, and not
for the extraction of the utility function. In both cases the data-sets
were gathered and ‘translated’ into relative grades in order to feed the
model. The issue of ‘relative grades’ is very important for the
understanding of the problem and the solution. From the available
data there is information on the ranges of the values and the use of
statistical functions make clustering as objective as possible. That
means new data will only affect the sample if only they affect it limits
and therefore the adjustment of grades will only happen in ‘extreme’
cases.
As the sample of the alternatives is rather small, it was possible to
directly compare attributes per criterion. But the consideration of a
scenario or future fiscal years would require a new loop of relative
comparisons and would possibly recede previous ranking. Despite
the theoretic approaches on ranking preservations (fallacy or not) it is
necessary to base results and further steps on some data. It is not
practical to change the pillar figures, results and foundations. So the
consideration of absolute measurement, i.e. the appointment of
grades per attribute was necessary in order to support scenarios and
imaginary data (planning purposes). The objectivity of the technique
is secured and the ‘subjectivity’ was taken into account as well as the
sample could alter in extreme cases. Of course, it is possible for the
decision-maker to exclude extreme values, yet the model can by
default take them into account. A practical application of the above is
the consideration of non-listed companies. Non-listed companies
have normally lower values of the equity and of the shareholders’

M et h o d o l o g y
Page 114 of 298
capital than listed ones. In the case that non-listed companies should
be taken into account, the decision-maker can easily adjust the sample
and therefore the relative grades. It is a fine-tuning ‘device’ for the
data-input of the model.
Two more issues shall be further considered here; the issue of
weighting the criteria and the issue of the compatibility with wider
and more popular or renowned theoretic approaches. The first issue is
intertwined with the hierarchy and the selection of the criteria.
Undoubtedly, the most critical weights are those in the upper levels,
and for those levels it is wise to consider scenarios that better describe
the reality the decision-maker feels, conceives and desires. That is the
reason why scenario-analyses are taken into account in this study and
the literature. Another approach would be to gather expert opinions
(group decision-making). However, this was not possible in that case
and it would create more theoretical difficulties on the response-
gathering process, the weight of opinions, the dominance of an
opinion, etc. A hidden assumption of that approach is that the
decision-makers should primarily agree on the hierarchy and the
criteria. Feedback from the management literature is discouraging for
such ventures, unless there is an imminent goal and strong leadership
of the team.
However, the group decision-making approach was not fully
abandoned as it provides excellent data-input capabilities for
simulation purposes. Random numbers (responses) can feed input
formulas and therefore the input to the model can be as randomized
as possible. This is also a technique used in the literature for mapping
or predicting situations that are determined by a set of factors but
their interrelationship is not known.
M et h o d o l o g y
Page 115 of 298
The criteria in the lower levels have been determined by the decision-
maker (the author) in order to reduce numerical burdens, as well as to
safeguard some rationality of the judgments. The issue was not really
numerical but factual; hence, weights at these levels have been
thoroughly discussed in the analysis.
Last but not least, AHP and its revisions are adequately discussed in
the literature and are considered as ‘classic’ decision-making tools.
Basic literature, such as papers and books of Keeney and Raiffa and
others, discuss the issue of the utility function. Other methods also
require some assumptions on the utility function. AHP with its
inherent advantage not to require prior knowledge or assumption of
the utility function, does not fall into the context of these renown
approaches, although it satisfies their basic assumptions and
statements. This is also the reason, why the academic community has
launched specialized conferences, and congresses for conferring its
developments.

T h e C h a l l e n g e o f O p e r a t i n g R i s k
Page 116 of 298
5 The Challenge of Operating Risk
Banking is the business of managing risk. The recent trend in banking is the
adoption of an offensive and proactive posture in which risks are actively
managed at a firm-wide level in contrast to the obsolete defensive and
reactive view of risk. That is an effect of the deregulation as well as of the
globalization of financial markets. In order to manage risks financial
institutions (FI) should adopt or establish:
• Clear management risk policies
• Proper rules and procedures
• Separation of execution and settlement functions
• Credible and independent risk management functions
• Credible and independent audit
• Appropriate incentive structures, and
• Appropriate risk controls and limits
A FI faces many risks that usually are classified as credit, market, liquidity,
operational, regulatory and human-factor. Of course, it is possible to
further analyze the risks into sub-categories, such as on- and off-balance
sheet credit risk. Despite the different types of risks stemming out of totally
different sources, generally, the decision-making process and risk
management evolve in two stages as shown in the figure below:
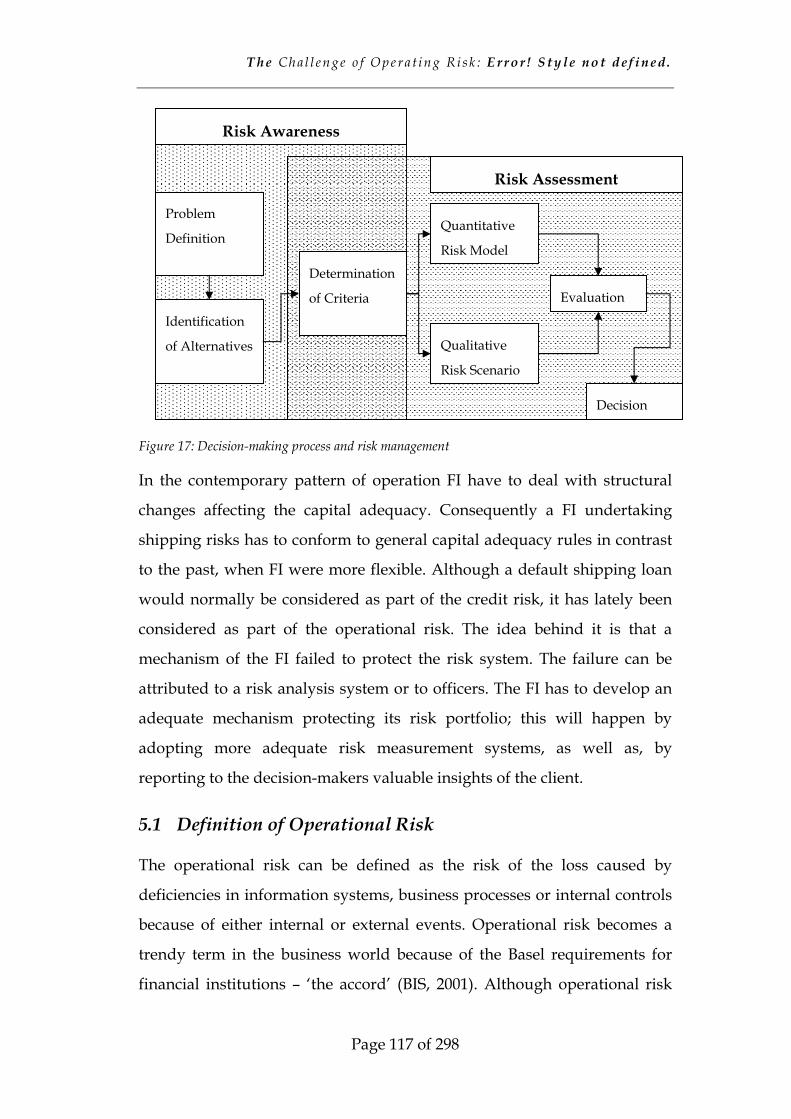
T h e Ch a l l e n g e o f O p e r a t i n g R i s k : E r r o r ! S t y l e n o t d e f i n e d .
Page 117 of 298
Figure 17: Decision-making process and risk management
In the contemporary pattern of operation FI have to deal with structural
changes affecting the capital adequacy. Consequently a FI undertaking
shipping risks has to conform to general capital adequacy rules in contrast
to the past, when FI were more flexible. Although a default shipping loan
would normally be considered as part of the credit risk, it has lately been
considered as part of the operational risk. The idea behind it is that a
mechanism of the FI failed to protect the risk system. The failure can be
attributed to a risk analysis system or to officers. The FI has to develop an
adequate mechanism protecting its risk portfolio; this will happen by
adopting more adequate risk measurement systems, as well as, by
reporting to the decision-makers valuable insights of the client.
5.1 Definition of Operational Risk
The operational risk can be defined as the risk of the loss caused by
deficiencies in information systems, business processes or internal controls
because of either internal or external events. Operational risk becomes a
trendy term in the business world because of the Basel requirements for
financial institutions – ‘the accord’ (BIS, 2001). Although operational risk
Risk Awareness
Problem
Definition
Identification
of Alternatives
Determination
of Criteria
Quantitative
Risk Model
Qualitative
Risk Scenario
Evaluation
Decision
Risk Assessment

T h e Ch a l l e n g e o f O p e r a t i n g R i s k : E r r o r ! S t y l e n o t d e f i n e d .
Page 118 of 298
measurement and handling is currently constrained to financial services,
the basic principles and axes of thinking can be transplanted into other
businesses as well, due to the link of borrower-lender relationship.
Historically, most financial services companies have concentrated their risk
management efforts on credit and market risk. Today, most of the largest
institutions have developed initiatives aimed at improving their
management of operational risk—an exposure that few industry executives
had given much attention in the recent past.
Although there is no formal definition of operational risk, it provides a
broader concept, as operations risk is considered only as a subset of
operational risk. Operations risk relates to the back-office activities
generally performed by operations departments. Operational risk
encompasses risks emanating from all areas of the organization, from the
front office to the back office and support areas. Examples include systems
failures, the faulty execution of a transaction, incorrect data entry, fraud,
human errors, natural disasters and regulatory changes. Operational risk
modeling, as defined by the accord, corresponds to the operations risk
distribution in every company. In practice, this identification is of little
value, as every bank or financial institution (and non-financial enterprise as
well) clearly distinguishes between small and large losses. First, small
losses are frequent in contrast to the very few large ones. This implies that
financial institutions know a lot about the small losses and their causes but
they have no real experience with large losses. Hence, typically, an efficient
organization can tolerate small losses and no further modeling at all is
practically necessary. Therefore, the value added to quantitative
operational risk management for banks, lies in the domain of large losses
(low intensity, high severity). This is the reason, why there is a
differentiation between operations and operational risk.
T h e Ch a l l e n g e o f O p e r a t i n g R i s k : E r r o r ! S t y l e n o t d e f i n e d .
Page 119 of 298
Operational risks for a set of production processes are those operations risks
associated with these processes which can be quantified and presented on a directed
graph and which exceed a given threshold value. (Ebnöther et. al., 2001)
Though this definition seems a bit pedantic, it stresses the fact that analysis
shall concentrate on well defined processes with resulting losses exceeding
some minimal, preset values. Furthermore, it is interesting to note that this
approach and definition may help other industries to improve. The
transportation industry, in general, can be one case; it involves large
amounts of invested money, deals with millions of consumers per day and
has a relatively similar structure. A short PEST8 analysis provides some
evidence (more on PEST in paragraph 6.1.2, page 181):
• Barriers to Entry: low to high
• Buyer Power: medium to high
• Supplier Power: low to medium
• Substitutes: low
• Rivalry: high
Both financial and transportation service industries present the same
attributes. The wide range in ‘barriers to entry’ reveals also the issue of
relative size or segments in the market.
What is interesting to note, are the common drivers of change and
therefore the importance of operational risk. While operational risk is not
new, the increased recognition of such risks in executive suites is being
driven by changes in the business, regulatory and operating environment.
Financial and transport services experience some common trends affecting
their risks:
8 PEST: Political – Economical – Social – Technical

T h e Ch a l l e n g e o f O p e r a t i n g R i s k : E r r o r ! S t y l e n o t d e f i n e d .
Page 120 of 298
1. E-commerce has made business activities more transparent to the
customer, while increasing the need to achieve speed to market with
products and services, gain efficiencies in business processes, and
allocate capital to activities that have a higher return/risk ratio.
These changes are placing greater stress on infrastructure, increasing
the level of exposure to operational risks, such as failures in product,
process, and system design, new kinds of fraud, reputation risk, and
customer service failures. E-commerce has direct effect on logistic
services as well. As a more general conclusion, one could argue that
this is the outcome of information dissemination and diffusion. The
more freely information circulates, the more important such
frictionless trading systems become.
2. Mergers, acquisitions and consolidation, with their related impact
on people, processes, technology and overall organizational
structure, are also creating operational risk and the need for better
management information to improve decision-making. At the same
time, the trend toward decentralization and employee
empowerment, which results in more decisions being made by
individual business-line managers, is increasing the need for
management to understand the risk posed by these isolated
decisions, to create transparency around decision-making processes,
and to monitor the enterprise-wide exposure to risk.
3. Financial modernization and market pressures are accelerating the
pace of convergence, creating pressures for companies to broaden
product or service offerings, increasing competition, and forcing
less-regulated entities toward more structured regulatory oversight
that necessitates improved risk management and enhanced
management information.
These factors are placing pressure on management to develop more
dynamic and effective tools for identifying, measuring and managing

T h e Ch a l l e n g e o f O p e r a t i n g R i s k : E r r o r ! S t y l e n o t d e f i n e d .
Page 121 of 298
operational risk. Furthermore, there is an apprehension that operational
risk management shall be introduced to clients of financial institutions who
may turn out to big losses, if not handled properly. Shipping companies
and ventures are steeped in history; big fortunes have been made and lost!
The interest in this study for the operational risk is actually twin-fold: as
banks have to rationalize their operations and decisions, it is not easy to
support an argument on the ‘character’ of a customer, say. It is necessary to
quantify things, as clearly implied by the definition. Of course, banks have
already, and for many years long, tried to quantify credit and market risk,
but in the case of shipping finance, personal relations were always the
issue. Nevertheless, banks have experienced great losses in the shipping
sector, and lately the companies of GCS as customers of the Greek financial
institutions have caused many troubles and worries. On the other hand, the
focus on the operations in a financial institution creates a culture within the
lending community that will be ‘transplanted’ to the customers as well. As
a result, critical elements of today, such as accounting, employment,
certification and experience parameters will not be the sole decision
making parameters. The focus on the operations will also demand a
considerably better understanding of the business of the respective
industry (or niche market) as well as of the company as such.
The structure of risk in the shipping industry is not uniform across its
segments, but some basic characteristics are common. Shipping deals
primarily with the commercial control over tonnage and what is paid for it.
The focus must be on the asset, i.e. the vessel, when analyzing a specific
sector or a company. While there is a large variety of vessels of different
sizes, purposes, capacity, etc. all vessels are similar from an economic point
of view. First, all vessels are envisaged with a very high fixed cost. The cost
of capital required for the acquisition or even charter-in of the vessel is
high and influences all relevant calculations for ‘breakeven’ rates. Timing
also affects the cost of capital. In general the return on capital, regardless of
T h e Ch a l l e n g e o f O p e r a t i n g R i s k : E r r o r ! S t y l e n o t d e f i n e d .
Page 122 of 298
the source, directs shipowners to offer a rate, most commonly, affixed to
his minimum cash-flow requirements. When the market is low, shipowners
may decide to operate at cash losses or even lay up tonnage, so to minimize
the cash outflow. In case that the vessels are chartered-in operators enjoy
access to profits without capital employment, but they lack the flexibility of
the shipowner when the market is low, and may loose some cash until the
contract expire. Another common aspect is that ships are long-lived assets
with relatively low scrap values and exposed to value fluctuations.
The issue of risks in shipping is adequately dealt in many textbooks (e.g.
those of Stokes, Stopford, Sloggett, etc.) However, there are two different
kinds of risks involved: the risk of shipowner, and therefore of the rest
investors owning the vessel(s) and consider it as an asset, and the risk of
the operations, i.e. the vessel(s) as money-making instrument. In most cases
shipowners are also the operators, as in the case of the GCS companies.
These companies own and operate their vessels. However, there is a sturdy
trend in the market for exclusive ship-management contracts and
operations, revealing also the strategy for risk-fragmentation, for control
purposes.
5.2 A Survey of the Greek Ship Finance Market
5.2.1 Analysis of the market
The Greek ship finance market is a very interesting one for three reasons.
First of all, it attracts foreign interest as there are many foreign banks active
in the market with or without physical presence in Greece (namely in
Piraeus and Athens). Secondly it closely follows international practices,
which is not common in a country like Greece, and the thirdly it
experiences continuous increases of the lending portfolio. Most of the data
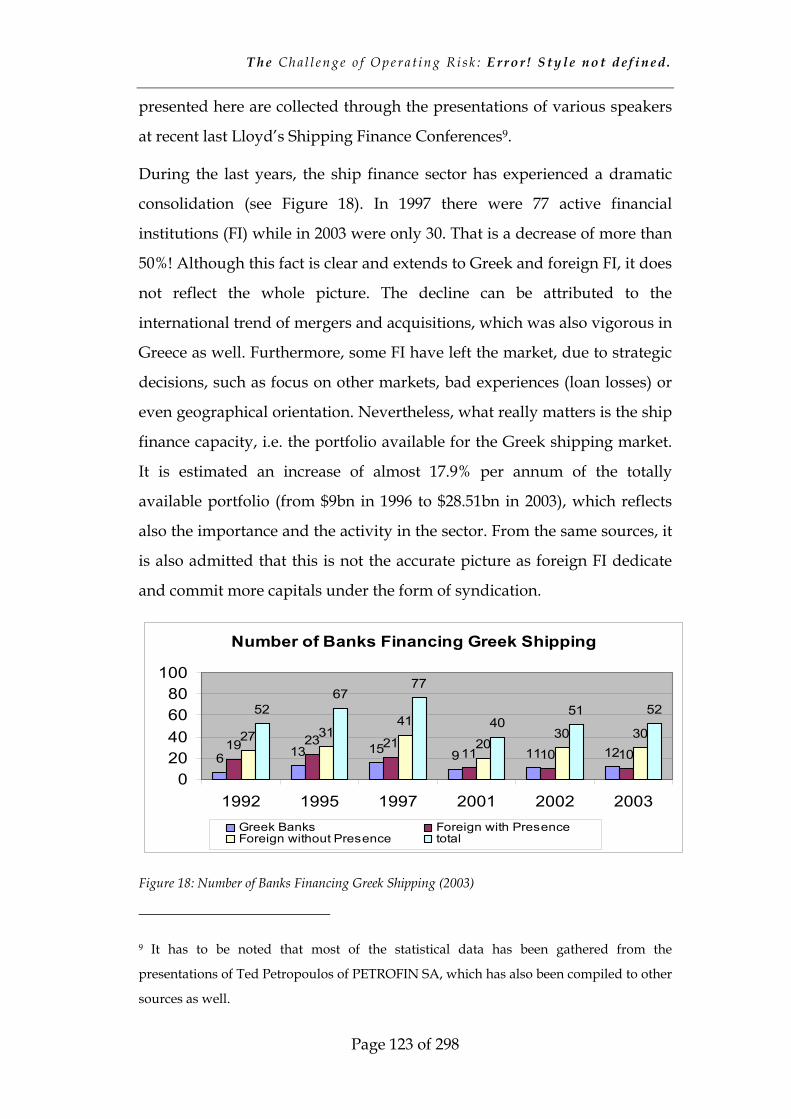
T h e Ch a l l e n g e o f O p e r a t i n g R i s k : E r r o r ! S t y l e n o t d e f i n e d .
Page 123 of 298
presented here are collected through the presentations of various speakers
at recent last Lloyd’s Shipping Finance Conferences9.
During the last years, the ship finance sector has experienced a dramatic
consolidation (see Figure 18). In 1997 there were 77 active financial
institutions (FI) while in 2003 were only 30. That is a decrease of more than
50%! Although this fact is clear and extends to Greek and foreign FI, it does
not reflect the whole picture. The decline can be attributed to the
international trend of mergers and acquisitions, which was also vigorous in
Greece as well. Furthermore, some FI have left the market, due to strategic
decisions, such as focus on other markets, bad experiences (loan losses) or
even geographical orientation. Nevertheless, what really matters is the ship
finance capacity, i.e. the portfolio available for the Greek shipping market.
It is estimated an increase of almost 17.9% per annum of the totally
available portfolio (from $9bn in 1996 to $28.51bn in 2003), which reflects
also the importance and the activity in the sector. From the same sources, it
is also admitted that this is not the accurate picture as foreign FI dedicate
and commit more capitals under the form of syndication.
Number of Banks Financing Greek Shipping
6 13 15 9 11 1219 23 2111 10 10
27 3141
2030 30
5267
77
4051 52
020406080
100
1992 1995 1997 2001 2002 2003Greek Banks Foreign with PresenceForeign without Presence total
Figure 18: Number of Banks Financing Greek Shipping (2003)
9 It has to be noted that most of the statistical data has been gathered from the
presentations of Ted Petropoulos of PETROFIN SA, which has also been compiled to other
sources as well.
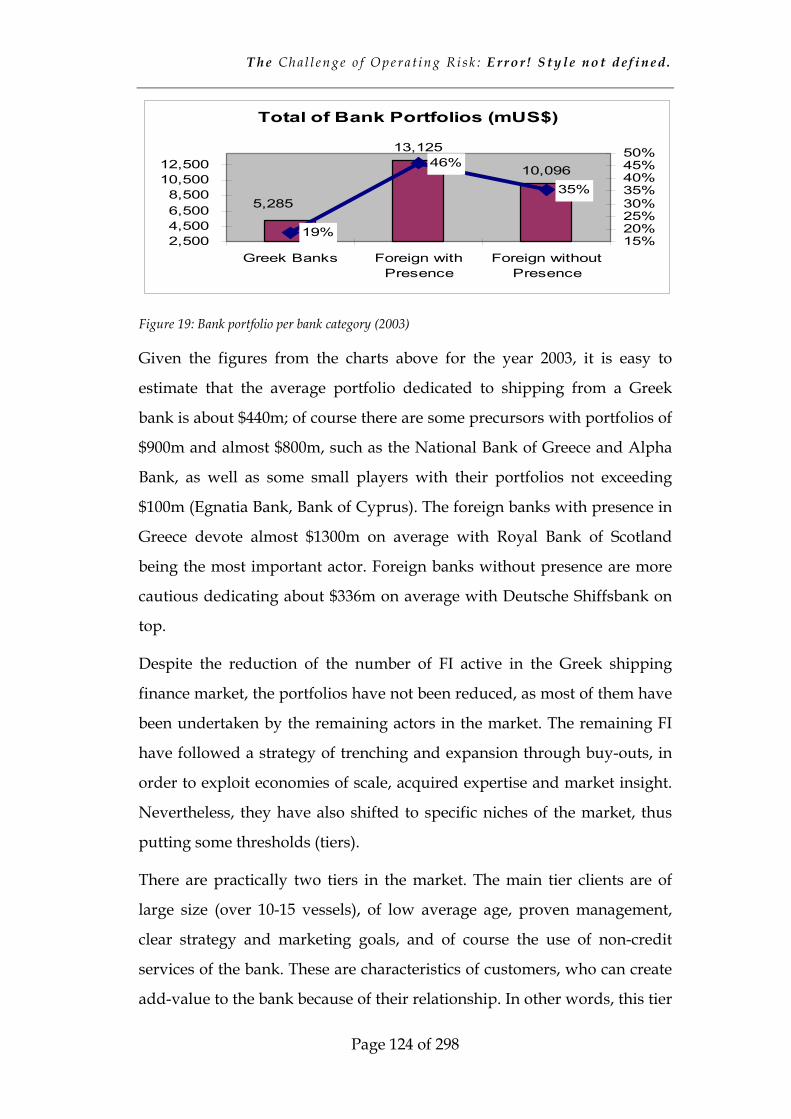
T h e Ch a l l e n g e o f O p e r a t i n g R i s k : E r r o r ! S t y l e n o t d e f i n e d .
Page 124 of 298
Total of Bank Portfolios (mUS$)
13,125
10,096
5,285
19%
46%
35%
2,5004,5006,5008,500
10,50012,500
Greek Banks Foreign withPresence
Foreign withoutPresence
15%20%25%30%35%40%45%50%
Figure 19: Bank portfolio per bank category (2003)
Given the figures from the charts above for the year 2003, it is easy to
estimate that the average portfolio dedicated to shipping from a Greek
bank is about $440m; of course there are some precursors with portfolios of
$900m and almost $800m, such as the National Bank of Greece and Alpha
Bank, as well as some small players with their portfolios not exceeding
$100m (Egnatia Bank, Bank of Cyprus). The foreign banks with presence in
Greece devote almost $1300m on average with Royal Bank of Scotland
being the most important actor. Foreign banks without presence are more
cautious dedicating about $336m on average with Deutsche Shiffsbank on
top.
Despite the reduction of the number of FI active in the Greek shipping
finance market, the portfolios have not been reduced, as most of them have
been undertaken by the remaining actors in the market. The remaining FI
have followed a strategy of trenching and expansion through buy-outs, in
order to exploit economies of scale, acquired expertise and market insight.
Nevertheless, they have also shifted to specific niches of the market, thus
putting some thresholds (tiers).
There are practically two tiers in the market. The main tier clients are of
large size (over 10-15 vessels), of low average age, proven management,
clear strategy and marketing goals, and of course the use of non-credit
services of the bank. These are characteristics of customers, who can create
add-value to the bank because of their relationship. In other words, this tier
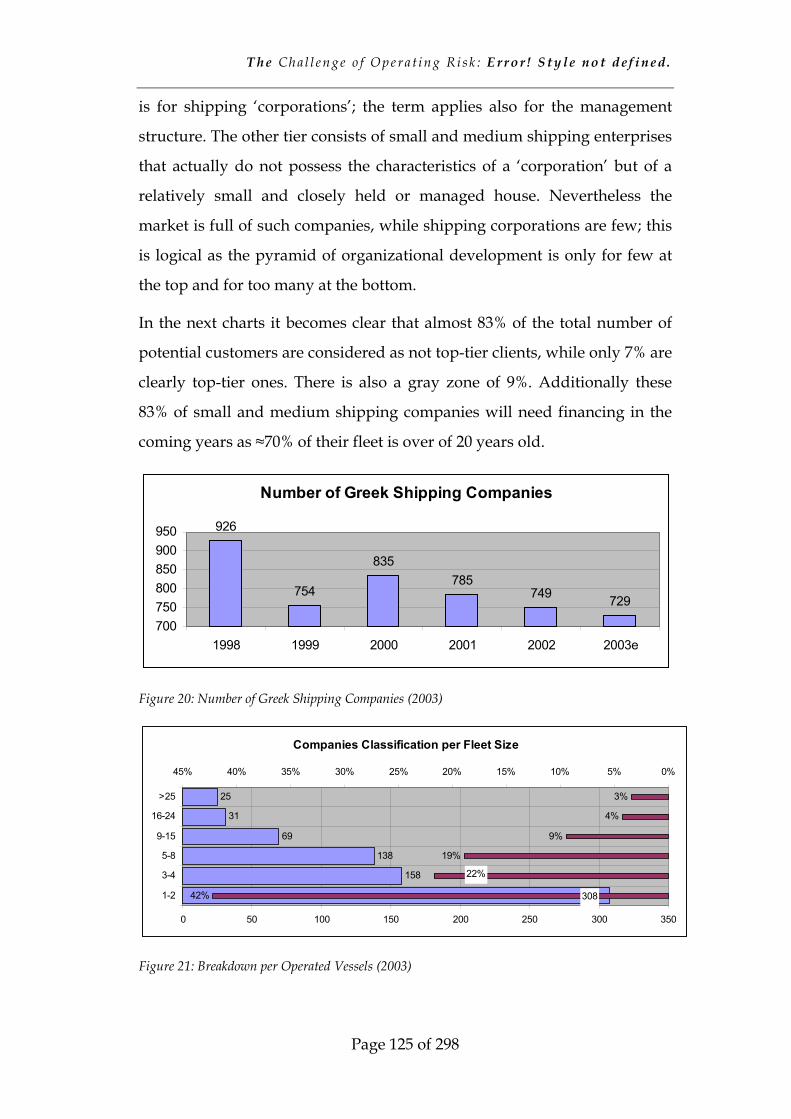
T h e Ch a l l e n g e o f O p e r a t i n g R i s k : E r r o r ! S t y l e n o t d e f i n e d .
Page 125 of 298
is for shipping ‘corporations’; the term applies also for the management
structure. The other tier consists of small and medium shipping enterprises
that actually do not possess the characteristics of a ‘corporation’ but of a
relatively small and closely held or managed house. Nevertheless the
market is full of such companies, while shipping corporations are few; this
is logical as the pyramid of organizational development is only for few at
the top and for too many at the bottom.
In the next charts it becomes clear that almost 83% of the total number of
potential customers are considered as not top-tier clients, while only 7% are
clearly top-tier ones. There is also a gray zone of 9%. Additionally these
83% of small and medium shipping companies will need financing in the
coming years as ≈70% of their fleet is over of 20 years old.
Number of Greek Shipping Companies
926
754
835785
749 729
700750800850900950
1998 1999 2000 2001 2002 2003e
Figure 20: Number of Greek Shipping Companies (2003)
Companies Classification per Fleet Size
158
138
69
31
25
30842%
19%
9%
4%
3%
22%
0 50 100 150 200 250 300 350
1-2
3-4
5-8
9-15
16-24
>25
0%5%10%15%20%25%30%35%40%45%
Figure 21: Breakdown per Operated Vessels (2003)
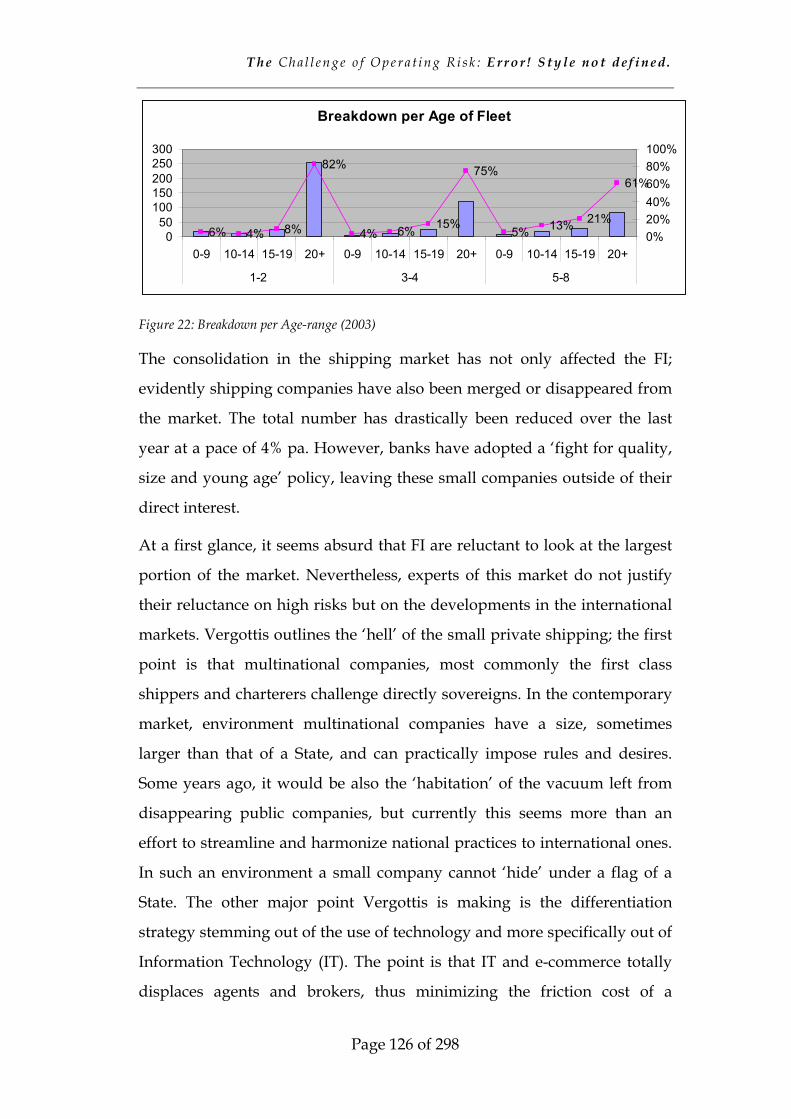
T h e Ch a l l e n g e o f O p e r a t i n g R i s k : E r r o r ! S t y l e n o t d e f i n e d .
Page 126 of 298
Breakdown per Age of Fleet
6% 4% 8%
82%
4% 6% 15%
75%
5% 13% 21%
61%
050
100150200250300
0-9 10-14 15-19 20+ 0-9 10-14 15-19 20+ 0-9 10-14 15-19 20+
1-2 3-4 5-8
0%20%40%60%80%100%
Figure 22: Breakdown per Age-range (2003)
The consolidation in the shipping market has not only affected the FI;
evidently shipping companies have also been merged or disappeared from
the market. The total number has drastically been reduced over the last
year at a pace of 4% pa. However, banks have adopted a ‘fight for quality,
size and young age’ policy, leaving these small companies outside of their
direct interest.
At a first glance, it seems absurd that FI are reluctant to look at the largest
portion of the market. Nevertheless, experts of this market do not justify
their reluctance on high risks but on the developments in the international
markets. Vergottis outlines the ‘hell’ of the small private shipping; the first
point is that multinational companies, most commonly the first class
shippers and charterers challenge directly sovereigns. In the contemporary
market, environment multinational companies have a size, sometimes
larger than that of a State, and can practically impose rules and desires.
Some years ago, it would be also the ‘habitation’ of the vacuum left from
disappearing public companies, but currently this seems more than an
effort to streamline and harmonize national practices to international ones.
In such an environment a small company cannot ‘hide’ under a flag of a
State. The other major point Vergottis is making is the differentiation
strategy stemming out of the use of technology and more specifically out of
Information Technology (IT). The point is that IT and e-commerce totally
displaces agents and brokers, thus minimizing the friction cost of a
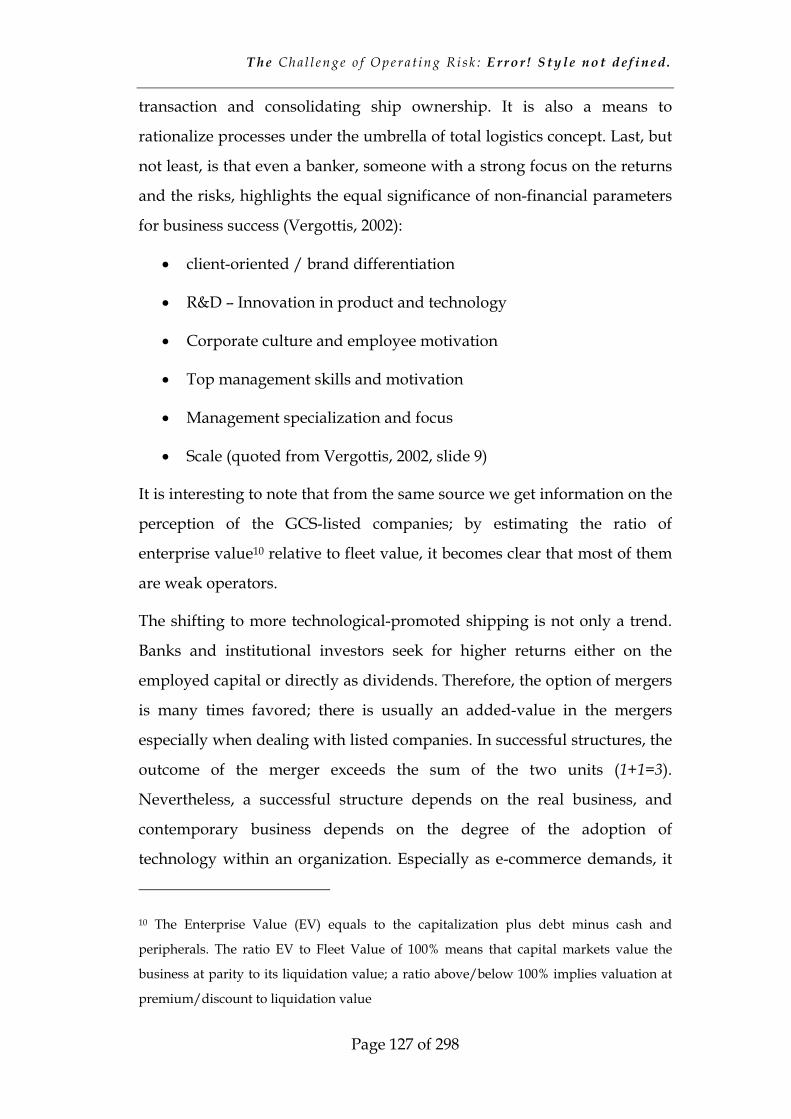
T h e Ch a l l e n g e o f O p e r a t i n g R i s k : E r r o r ! S t y l e n o t d e f i n e d .
Page 127 of 298
transaction and consolidating ship ownership. It is also a means to
rationalize processes under the umbrella of total logistics concept. Last, but
not least, is that even a banker, someone with a strong focus on the returns
and the risks, highlights the equal significance of non-financial parameters
for business success (Vergottis, 2002):
• client-oriented / brand differentiation
• R&D – Innovation in product and technology
• Corporate culture and employee motivation
• Top management skills and motivation
• Management specialization and focus
• Scale (quoted from Vergottis, 2002, slide 9)
It is interesting to note that from the same source we get information on the
perception of the GCS-listed companies; by estimating the ratio of
enterprise value10 relative to fleet value, it becomes clear that most of them
are weak operators.
The shifting to more technological-promoted shipping is not only a trend.
Banks and institutional investors seek for higher returns either on the
employed capital or directly as dividends. Therefore, the option of mergers
is many times favored; there is usually an added-value in the mergers
especially when dealing with listed companies. In successful structures, the
outcome of the merger exceeds the sum of the two units (1+1=3).
Nevertheless, a successful structure depends on the real business, and
contemporary business depends on the degree of the adoption of
technology within an organization. Especially as e-commerce demands, it
10 The Enterprise Value (EV) equals to the capitalization plus debt minus cash and
peripherals. The ratio EV to Fleet Value of 100% means that capital markets value the
business at parity to its liquidation value; a ratio above/below 100% implies valuation at
premium/discount to liquidation value

T h e Ch a l l e n g e o f O p e r a t i n g R i s k : E r r o r ! S t y l e n o t d e f i n e d .
Page 128 of 298
is expected that logistics needs will boost, and therefore, inflate the annual
ton-miles. The same applies also for people, as there is a clear trend for
expanded mobility world-wide. The logistics nightmare is similar to the
last-mile problem in the telecommunication and as shipping lines serve
trunk routes of various sizes, they feel the effect of limited ‘capacity’ at
distribution networks. Modern IT technology can easily assist in B2B
situation, thus implying cooperation and flexibility with other parties. This
rule does not only apply in the container market but in practically every
shipping niche. In the discussions about GCS the idea of hub-and-spoke
subsystems has also been raised; however, there are no adequate port
facilities, reliable connections and there is an obvious decrease of the LOS.
It is expected, though, that some IT technologies related to tickets and
marketing will allow users to enjoy more flexible connections and services
of local nature, thus making the whole service more attractive.
This is also the interest of venture capitalists, who invest heavily in e-
logistics and similar applications. Shipping companies have to get into
‘transactional business’ in order to find a place in the future business
patterns. So if venture capitals are into this kind of business after a time-
lag, this will also become a stream at stock-markets and investment
banking, and it is remained to be gradually observed.
5.2.2 Identification of the Risk Perception – Hierarchy Structure
As the ultimate goal is to map the Greek shipping finance market, this will
be approached by soliciting responses from the banks on their attributes.
The questionnaires will include all possible aspects reported in various
textbooks and sources, thus extracting directly the ruling ideas of lenders.
The questionnaires are structured in such a way, permitting both the
identification of the risk, i.e. replies from the banks, as well as a ranking of
the FI, given a set of criteria, potential customers would use.
For analysis purposes, as well as for the enabling of the use of AHP, it is
necessary to draft a hierarchy that will highlight all aspects of this issue.

T h e Ch a l l e n g e o f O p e r a t i n g R i s k : E r r o r ! S t y l e n o t d e f i n e d .
Page 129 of 298
The hierarchy structured for this problem consists of four levels; the
alternatives, i.e. the responses from the bank officers (elements aij, see Table
6: Decision Matrix for a Discrete Decision-Making Problem, page 94) by
using a quantification technique per question of interest. This
quantification is widely used in the literature and will be explained on a
latter stage. Given the hierarchy, some basic criteria weight assignment
follows (wj), with a rather indifferent approach, despite some ‘coloring’
from experiences gained at seminars, conferences and the praxis.
Nevertheless, the approach is as neutral as possible. Then at the highest
level of the hierarchy, a Monte Carlo simulation procedure11, will produce
the outcome, i.e. the ranking and clustering of banks into categories. This is
necessary in order to diffuse subjectivity from the selection.
As stated, the hierarchy consists of four levels that include many and
different in nature criteria. These criteria are found in the literature and
correspond to groups of attributes a client must have or a bank seeks into a
customer or a bank has to take into account, such as generic risk attributes.
Level I Initially, the objective or the overall goal of the decision is
presented at the top level of hierarchy. Specifically, the
overall goal of this application is to assign a total value
that ranks the alternative and highlights the clusters.
Level II The second level represents the three major goals of a FI.
Specifically a FI aims to maintain adequate levels of
assurance and quality of the portfolio and to exercise
strategies or techniques for marketing. The weights as
well as the side-goals reflect also the importance a FI
assigns to each one characteristic. An illustrative set of
charts provides also a better understanding and insight
11 Precisely it is a tabular iterative Monte Carlo two-input and multiple output procedure.
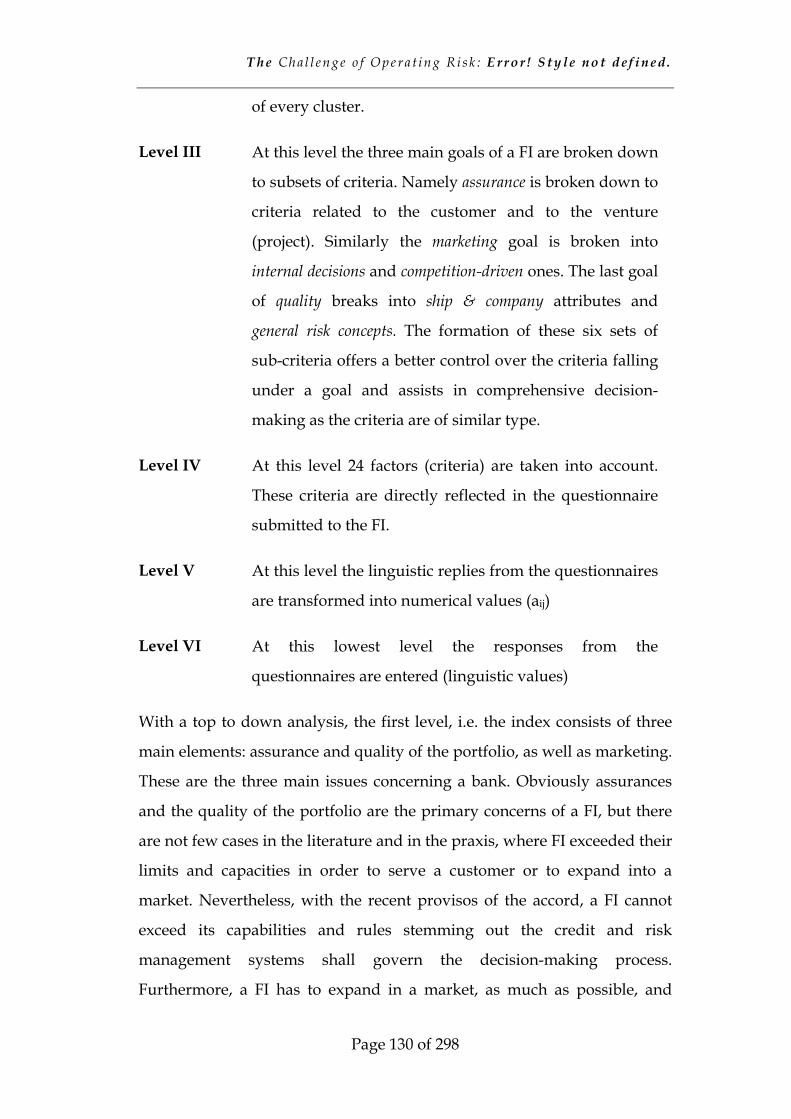
T h e Ch a l l e n g e o f O p e r a t i n g R i s k : E r r o r ! S t y l e n o t d e f i n e d .
Page 130 of 298
of every cluster.
Level III At this level the three main goals of a FI are broken down
to subsets of criteria. Namely assurance is broken down to
criteria related to the customer and to the venture
(project). Similarly the marketing goal is broken into
internal decisions and competition-driven ones. The last goal
of quality breaks into ship & company attributes and
general risk concepts. The formation of these six sets of
sub-criteria offers a better control over the criteria falling
under a goal and assists in comprehensive decision-
making as the criteria are of similar type.
Level IV At this level 24 factors (criteria) are taken into account.
These criteria are directly reflected in the questionnaire
submitted to the FI.
Level V At this level the linguistic replies from the questionnaires
are transformed into numerical values (aij)
Level VI At this lowest level the responses from the
questionnaires are entered (linguistic values)
With a top to down analysis, the first level, i.e. the index consists of three
main elements: assurance and quality of the portfolio, as well as marketing.
These are the three main issues concerning a bank. Obviously assurances
and the quality of the portfolio are the primary concerns of a FI, but there
are not few cases in the literature and in the praxis, where FI exceeded their
limits and capacities in order to serve a customer or to expand into a
market. Nevertheless, with the recent provisos of the accord, a FI cannot
exceed its capabilities and rules stemming out the credit and risk
management systems shall govern the decision-making process.
Furthermore, a FI has to expand in a market, as much as possible, and
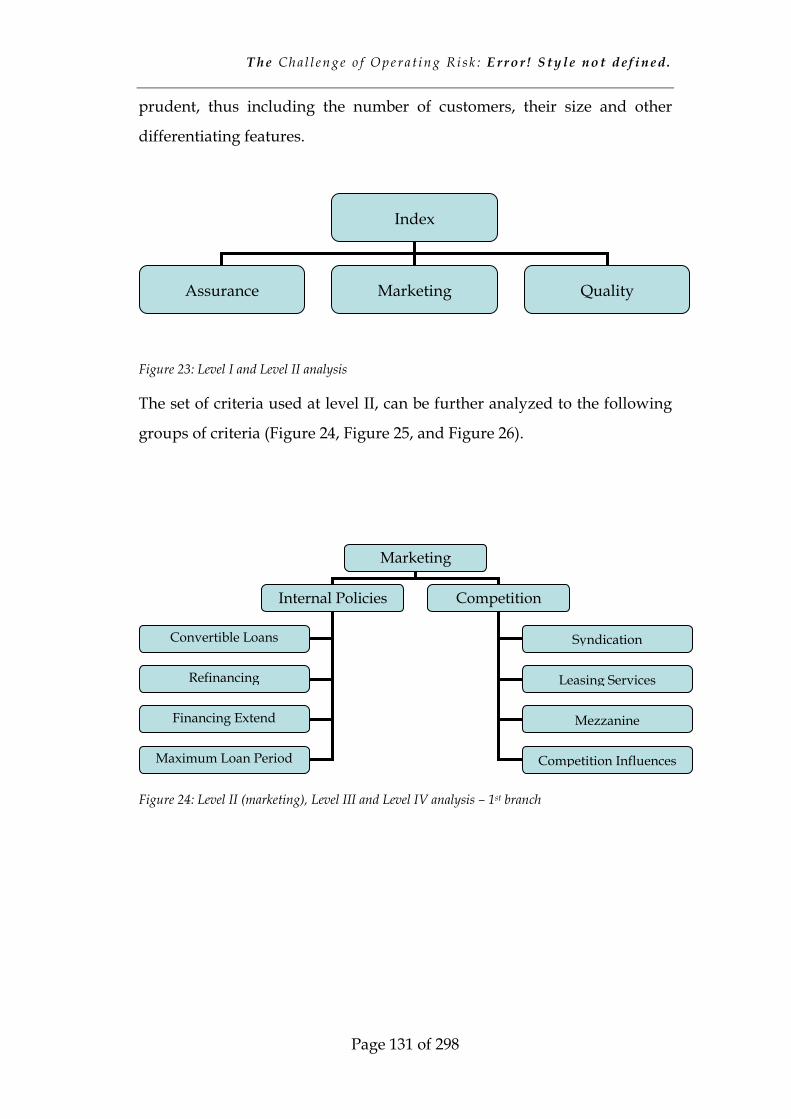
T h e Ch a l l e n g e o f O p e r a t i n g R i s k : E r r o r ! S t y l e n o t d e f i n e d .
Page 131 of 298
prudent, thus including the number of customers, their size and other
differentiating features.
Figure 23: Level I and Level II analysis
The set of criteria used at level II, can be further analyzed to the following
groups of criteria (Figure 24, Figure 25, and Figure 26).
Figure 24: Level II (marketing), Level III and Level IV analysis – 1st branch
Index
Assurance Marketing Quality
Marketing
Internal Policies Competition
Convertible Loans
Refinancing
Financing Extend
Maximum Loan Period
Syndication
Leasing Services
Mezzanine
Competition Influences
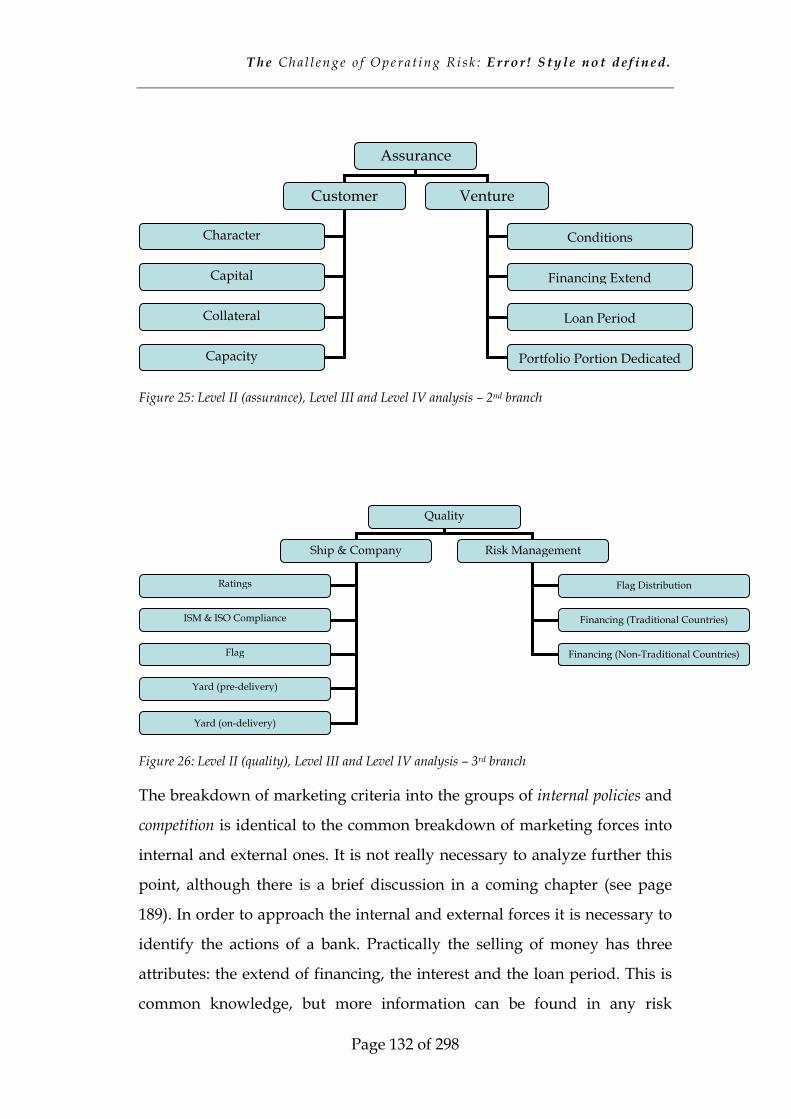
T h e Ch a l l e n g e o f O p e r a t i n g R i s k : E r r o r ! S t y l e n o t d e f i n e d .
Page 132 of 298
Figure 25: Level II (assurance), Level III and Level IV analysis – 2nd branch
Figure 26: Level II (quality), Level III and Level IV analysis – 3rd branch
The breakdown of marketing criteria into the groups of internal policies and
competition is identical to the common breakdown of marketing forces into
internal and external ones. It is not really necessary to analyze further this
point, although there is a brief discussion in a coming chapter (see page
189). In order to approach the internal and external forces it is necessary to
identify the actions of a bank. Practically the selling of money has three
attributes: the extend of financing, the interest and the loan period. This is
common knowledge, but more information can be found in any risk
Quality
Ship & Company Risk Management
Ratings
ISM & ISO Compliance
Flag
Yard (pre-delivery)
Flag Distribution
Financing (Traditional Countries)
Financing (Non-Traditional Countries)
Yard (on-delivery)
Assurance
Customer Venture
Character
Capital
Collateral
Capacity
Conditions
Financing Extend
Loan Period
Portfolio Portion Dedicated
T h e Ch a l l e n g e o f O p e r a t i n g R i s k : E r r o r ! S t y l e n o t d e f i n e d .
Page 133 of 298
management textbook. However, money is not solely sold for a specific
development purpose, say a project, but also for the repayment of other
debts (refinancing). The risk involved in project refinancing is considerably
different than that of a start-up one. The same problem comes up when
loans can possibly be converted to preferred stock. However, these are
problems that are addressed by the internal risk management system. In
this decision structure –hierarchy - there is no mentioning to the interest, as
this is considered very sensitive information. Generally, the interest is
estimated as premium upon LIBOR12 or a similar basis, such as EURIBOR.
The premium depends strongly on the customer and the project and it
varies a lot from customer to customer, project to project and period to
period. In the general literature one can find many sources referring to
these issues (e.g. Grammenos et al., 1999, p. 9/13).
As external influences a bank usually faces the case of syndication and
mezzanine. When it comes to syndication, a financial institution faces a
dilemma: another FI has accepted the project but wishes to split the risk,
mainly because of the financing extent and the involved risk. That means,
the case is prominent but not so attractive to undertake the whole risk.
Usually syndication is established on ‘best-effort’ basis. Naturally, concerns
over the quality and the viability of the project come up, as well as over the
decision of the leading bank to split the risk. The continuous or systematic
or a priori refusal of syndication suggests that customers seeking relatively
large amounts of money will avoid this bank and direct their interest to a
bolder FI. The same applies to mezzanine structures, while the case is
usually clearer: it is clear approval-rejection decision as there is a small
portion of risk for the bank to undertake, but the collateral is degraded. In
both cases it is a decision largely based on the risk management and risk
12 LIBOR: London Interbank Borrowing Rate

T h e Ch a l l e n g e o f O p e r a t i n g R i s k : E r r o r ! S t y l e n o t d e f i n e d .
Page 134 of 298
perception of the leading FI, but a bank has to follow the market and risk a
portion of its portfolio seeking high yields.
At the opposite direction of risk management lays the issue of leasing
services. In that case a FI is primarily acting as financial and legal
consultant aiming to find the best off-balance-sheet solution for the project
of customer. In that kind of business there is not only a single goal but a set
of goals depending the customer and the investors. The most common case
is tax-evasion and increase of bank assurances. The scheme shall minimize
the tax-burden to the client and save the assets of the bank in case of failure
of the project. Often such schemes include non-shipping assets, such asset
portfolios in tax-havens or personal guarantees. Also, such schemes boil
down to networks of legal ties between off-shore companies creating
accounting and legal hassle to auditors and controllers. In any case, the
bank does not only profit from traditional business, i.e. by selling money
but also by offering very expensive services. As stated above,
contemporary banking aims to the maximum utilization of the global
network of FI. In other cases, where leasing schemes aim to protect the
investors, banks undertake, primarily, a role of custodian. Custody is
another niche market of banking with different risk attributes from
lending, but in any case it surely involves some risk.
Last but not least, a parameter taken into account in the structure and the
questionnaire is the influence of competition. Banks are private firms as
well and have to profit within a specific market. Therefore, if another bank
launches a strategy affecting the share or the clientele of a respective FI,
then this FI has to respond. In Greece, the banking market was not so
sophisticated and in most cases it was driven by ‘example’. A perpetual
customer running a specific fleet, say bulkers, has also strong interests in
another market, say passenger shipping. A bank would like to get a link
with the customer for the bulk market but the chance is only given for the
passenger. The bank may decide to risk some money in order to satisfy the
T h e Ch a l l e n g e o f O p e r a t i n g R i s k : E r r o r ! S t y l e n o t d e f i n e d .
Page 135 of 298
customer and get into the club of ‘his bankers’. This kind of personal
relationship was most commonly the trigger.
Nevertheless, as ship-finance departments belong to wider financial
organizations, strategies and marketing evolve and the game becomes
more complicated. So a bank that had a ‘permanent’ position against
refinancing, say, may have to reevaluate its position given the conditions in
the market and not because of its risk profile. Syndication and leasing
services are the most common cases.
As far as it concerns the analysis of marketing –related set of criteria, there
will be no further breakdown. The other two elements at the same level of
the decision structure, the assurance and the quality closely intertwined. The
issue of assurance and quality of the loan portfolio fails under the category
of credit analysis problems. In general, this credit analysis distinguishes the
elements related to the ship and the company (or directly to the beneficiary
owner as in the case of Greek shipping), to the venture as such and the risk
attributes of the portfolio. The attributes of the customer are commonly
called as ‘4Cs’, namely character, capacity, capital and collateral. In
Grammenos and Xilas (1999) one can find a detailed analysis of these
attributes (Chapter 10). Nevertheless, these attributes are highly subjective
or quite thorny to be quantified. Therefore, there are some sub-criteria for
all Cs’ but for character. In the same source there is a reference to the
conditions13. The conditions in this analysis are treated separately. A
further analysis of the term conditions shall include all elements that may
affect the credit elements, whether these are macro-economic affecting the
country-risk or micro-economic, such as availability of the personal wealth
13 Grammenos and Xilas are referring to the ‘5Cs’ as they include ‘conditions’. However
conditions are not related to the customer but to the market generally. The same analysis
can be found in many other textbooks and the most completed one in the book of Cheng
(1979).
T h e Ch a l l e n g e o f O p e r a t i n g R i s k : E r r o r ! S t y l e n o t d e f i n e d .
Page 136 of 298
of the shipowner. This term has an ‘umbrella’ meaning in this structure as
it would be impossible to include all these aspects in the questionnaire due
to differences between clients and conditions within the very same loan
portfolio.
As all other aspects, financing extend, conditions and the ‘4Cs’ can be
found in any textbook of financing and not only of ship-finance, it is
interesting to highlight the importance of some shipping focused ones.
First of all, quality in shipping is widely accepted to be measured through
certificates. The more quality certificates a company holds the better
quality perception for this company is. A company that does not only hold
the necessary ISM certificate but operates under well-known quality
assurance standards is considered as a better counter-party for any
transaction. So FI ask for relevant certification.
In ship-finance there was always a concern over the experience of the
customer and the yard constructing the ship. These issues are very well-
known to the shipping community, and deviations from traditional paths
leads often to increase of the bank premium as there is an increase of the
country risk or the risk related to the construction (see also Grammenos et
al, 1998 and 1999, as well as Stopford, 1995). Last, but not least is the issue
of the distribution of ‘flags’ in the portfolio. While it is generally known
that there is no clear and linear relationship of a flag (with some distinct
exceptions) to the quality of a ship and her seaworthiness, banks try to
invest in ships flying flags of higher standards. In most cases the issue of
flag is closer linked to the crew, in terms of quality and quantity, rather
than to the vessel as such, which usually has been certified by a perpetual
classification society. Although flag distribution is not an adequate
measure for the risk involved in a portfolio, banks seek to get customers
flying a ‘good’ flag or at least keeping some minimum standards, even if
there is no such requirement from the Flag State.

T h e Ch a l l e n g e o f O p e r a t i n g R i s k : E r r o r ! S t y l e n o t d e f i n e d .
Page 137 of 298
The issue of rating is a very appealing one. As shipping and mainly Greek
shipping was opaque to others, inside information and personal
relationships were very important. However, as the amounts of money
increase significantly local banks cannot cover all needs and solicitations in
the international market shall be accompanied by independent assessors.
The rating issue goes along with the ‘globalization’ procedure of the
company or its services. Shipping has been traditionally a global business
and often highlighted in policy issues. Nevertheless, shipping was not
really a global industry from a financial point of view, as only few large
corporations had either the need for global capital or the profile of a global
customer. The gradual integration of national capital markets into a global
one, as well as technological and political breakthrough (securitization,
deregulation, IT revolution) converge the international markets (assets,
bonds, currency, etc.)
The rating, either of a bond issuance or of the credit ability of a company
goes through internationally renowned institutes14. One of the very first
facts an investor (or a lender) interested in a company is its ability to meet
its payment obligations. Investors should know that creditworthiness
varies greatly among cases and these professional institutes offer their
impartial judgments. Until recently most companies and their bonds were
not rated and the creditworthiness was based on similar securities issues
(or loans) in their domestic markets were used as guides. Needless to say,
credit agencies are not of the reach of criticism but they offer good services
generally. The first step towards rating is not only the opening-up of
accounting books but also the presentation of the management structure
and of the decision-making procedure to the officers of the rating. In a
sense these officers are the ears and the eyes of investors. It is common to
14 Practically there are only three: Standards & Poor’s, Moody’s and FITCH

T h e Ch a l l e n g e o f O p e r a t i n g R i s k : E r r o r ! S t y l e n o t d e f i n e d .
Page 138 of 298
call lenders as ‘investors’ as in many cases the loans are secured with
financial assets.
In various sources (e.g. Grammenos et al, Vergottis, Petropoulos) the issue
of rating of the shipping companies is linked to the size of the loan.
Petropoulos suggests also that as the market will experience consolidation
and only 300 companies out of 750, will survive the consolidation and
corporatization, these companies will have to get rated in order to raise
capitals through innovative structures. In the current analysis, rating is
considered a very important issue, not only for the ability of a company to
raise capitals but also for following reasons:
• A company, which has been rated, acknowledges that modern
corporate governance principles, that increase transparency and
managerial quality, can be applied successfully and there is an effort
to adopt them.
• A company that allows third parties to scrutiny accounting books
and procedures is committed to transparency and the rate will offer
a benchmark for further improvement.
• By getting rated a company enters a global financial market and
shipping experience or excellence of the lender is not necessary; the
company can seek money from practically every source available
and not only in the domestic market.
• The cost of money will in most cases decrease as there is no reason
for FI to impose further risk premiums.
Last but not least, shipping companies have had experiences with ratings
in the past. The issue of ‘junk-bonds’ or ‘high-risk – high-yield’ bonds is an
old one in shipping. There are many success and disastrous cases in the
past, but these were exceptions in the generally conceived relationship of
lenders and borrowers. As the markets go global and the banks seek
quality, rating is the only means towards this direction.
T h e Ch a l l e n g e o f O p e r a t i n g R i s k : E r r o r ! S t y l e n o t d e f i n e d .
Page 139 of 298
5.2.3 Clustering of the Greek Banking Market
The hierarchy can offer a quite interesting perspective of the market if only
it can be combined with a simulation procedure. The complexity of real-
world problems, as the one of mapping a market, can easily create an
analytical nightmare when many uncertainties are involved. As many
parameters are involved in the above hierarchy, it is useful to proceed with
a simple simulation. As sampling method for the simulation was selected
the Latin Hypercube; the sample size for correlation was 500. Latin
Hypercube Sampling is generally more precise for producing random
samples than conventional Monte Carlo Sampling because the full range of
the distribution is sampled in a more even and consistent manner. Thus,
with Latin Hypercube Sampling, a smaller number of trials is required to
achieve the same accuracy. The added expense of this method is the extra
memory required to hold each assumption's sample while the simulation is
running, but this is not a burden with contemporary home-PCs. When all
the values from each sample have been used, a new batch of samples is
generated. For this reason, the simulation will appear to stop while the PC
calculates the new samples.
The distributions used were discrete ones with an equal possibility of
occurrence (1/9, 1/7,…, 7, 9). This simulation is only a process that
generates random number inputs for uncertain values but within a specific
range as implied by the pairwise comparisons (see 4.2, page 103). These
random numbers are processed in the mathematical model, i.e. the
hierarchy, and produce a set of outcomes. The whole structure has been
developed on MS-Excel spreadsheets with the help of built-in functions15.
The analysis of the model is based on the following flowchart:
15 The whole procedure could easily be developed as a Visual Basic program or of a
similar application.
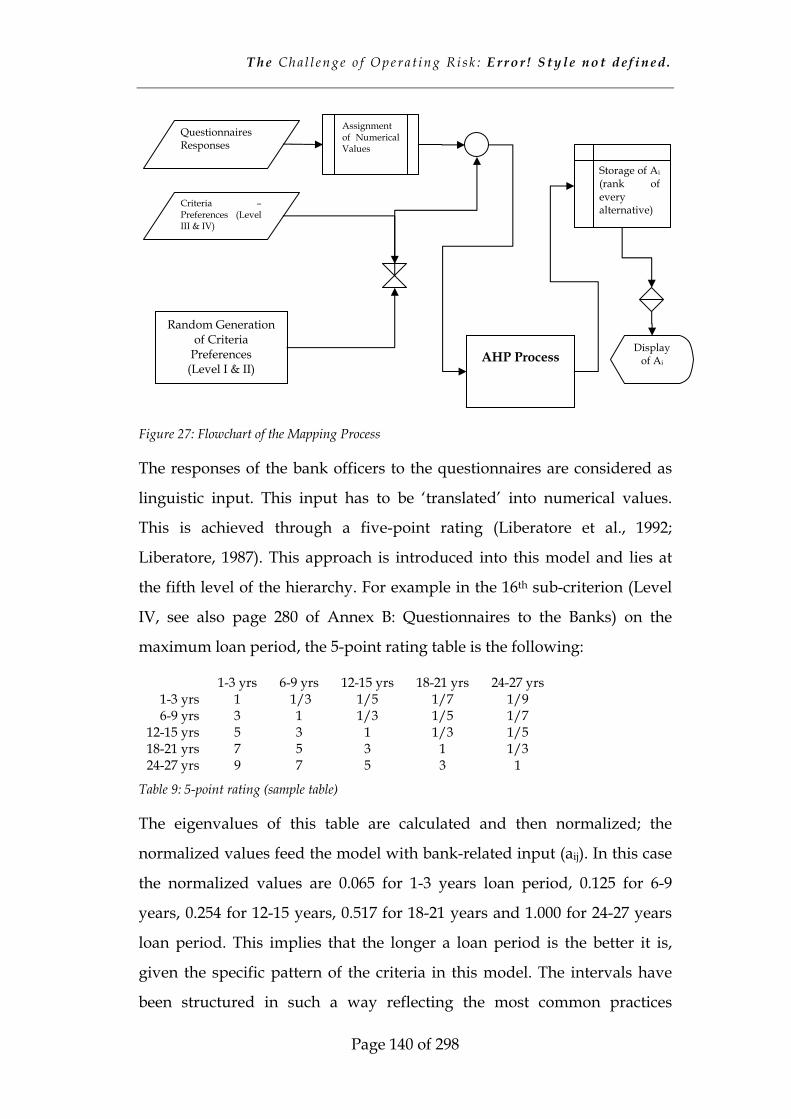
T h e Ch a l l e n g e o f O p e r a t i n g R i s k : E r r o r ! S t y l e n o t d e f i n e d .
Page 140 of 298
Figure 27: Flowchart of the Mapping Process
The responses of the bank officers to the questionnaires are considered as
linguistic input. This input has to be ‘translated’ into numerical values.
This is achieved through a five-point rating (Liberatore et al., 1992;
Liberatore, 1987). This approach is introduced into this model and lies at
the fifth level of the hierarchy. For example in the 16th sub-criterion (Level
IV, see also page 280 of Annex B: Questionnaires to the Banks) on the
maximum loan period, the 5-point rating table is the following:
1-3 yrs 6-9 yrs 12-15 yrs 18-21 yrs 24-27 yrs 1-3 yrs 1 1/3 1/5 1/7 1/9 6-9 yrs 3 1 1/3 1/5 1/7
12-15 yrs 5 3 1 1/3 1/5 18-21 yrs 7 5 3 1 1/3 24-27 yrs 9 7 5 3 1
Table 9: 5-point rating (sample table)
The eigenvalues of this table are calculated and then normalized; the
normalized values feed the model with bank-related input (aij). In this case
the normalized values are 0.065 for 1-3 years loan period, 0.125 for 6-9
years, 0.254 for 12-15 years, 0.517 for 18-21 years and 1.000 for 24-27 years
loan period. This implies that the longer a loan period is the better it is,
given the specific pattern of the criteria in this model. The intervals have
been structured in such a way reflecting the most common practices
Questionnaires Responses
Assignment of Numerical Values
AHP Process
Random Generation of Criteria
Preferences (Level I & II)
Criteria – Preferences (Level III & IV)
Storage of Ai
(rank of every alternative)
Display of Ai
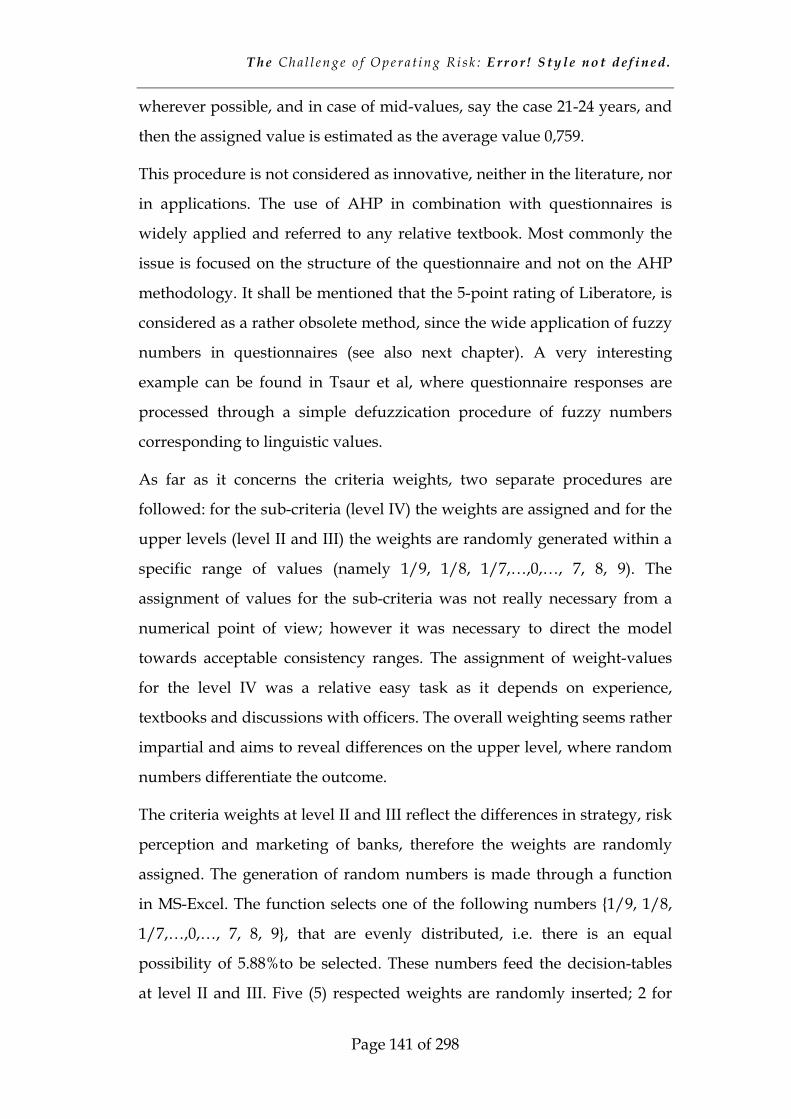
T h e Ch a l l e n g e o f O p e r a t i n g R i s k : E r r o r ! S t y l e n o t d e f i n e d .
Page 141 of 298
wherever possible, and in case of mid-values, say the case 21-24 years, and
then the assigned value is estimated as the average value 0,759.
This procedure is not considered as innovative, neither in the literature, nor
in applications. The use of AHP in combination with questionnaires is
widely applied and referred to any relative textbook. Most commonly the
issue is focused on the structure of the questionnaire and not on the AHP
methodology. It shall be mentioned that the 5-point rating of Liberatore, is
considered as a rather obsolete method, since the wide application of fuzzy
numbers in questionnaires (see also next chapter). A very interesting
example can be found in Tsaur et al, where questionnaire responses are
processed through a simple defuzzication procedure of fuzzy numbers
corresponding to linguistic values.
As far as it concerns the criteria weights, two separate procedures are
followed: for the sub-criteria (level IV) the weights are assigned and for the
upper levels (level II and III) the weights are randomly generated within a
specific range of values (namely 1/9, 1/8, 1/7,…,0,…, 7, 8, 9). The
assignment of values for the sub-criteria was not really necessary from a
numerical point of view; however it was necessary to direct the model
towards acceptable consistency ranges. The assignment of weight-values
for the level IV was a relative easy task as it depends on experience,
textbooks and discussions with officers. The overall weighting seems rather
impartial and aims to reveal differences on the upper level, where random
numbers differentiate the outcome.
The criteria weights at level II and III reflect the differences in strategy, risk
perception and marketing of banks, therefore the weights are randomly
assigned. The generation of random numbers is made through a function
in MS-Excel. The function selects one of the following numbers {1/9, 1/8,
1/7,…,0,…, 7, 8, 9}, that are evenly distributed, i.e. there is an equal
possibility of 5.88%to be selected. These numbers feed the decision-tables
at level II and III. Five (5) respected weights are randomly inserted; 2 for

T h e Ch a l l e n g e o f O p e r a t i n g R i s k : E r r o r ! S t y l e n o t d e f i n e d .
Page 142 of 298
the decision table at level II and 3 for the decision-tables at level III. The
following tables clarify the structure:
assurances Marketing quality assurances 1 w12 w13 marketing 1/w12 1
w23 = w13
w12
quality 1/w13 1/w23 1 Table 10: Decision table at level II
The structure of the above matrix reflects the basic principles of the AHP.
The upper triangle of the matrix is the one with the preferences; the values
in the lower triangle are the reciprocals of the upper ones. The values w12
and w13 are randomly selected within the specific range that stems out the
fundamental scale (see Table 7). In order to achieve acceptable levels of
consistency, it is necessary w23 value to conform with the basic consistency
rule:
wij = wik wkj ⇒ w13 = w12 w23 ⇒ w23 = w13
w12
In order to secure the soundness of the result, the value of w23 is
determined through a simple if – then command:
If remarks
w13
w12 > 9 OR
w13
w12 < 1/9
is the ratio within the range of the fundamental scale?
Then w23 = K if the ratio is out of the range of the fundamental
scale then assign a large value (that diminishes the consistency of the decision table)
Else
w23 = w13
w12
if the ratio is within the range then assign the value of the ratio
All relevant tables are attached as Annex C: Data and Calculations ( in page
281. The numerical trick is simple: since MS-Excel can easily handle
iterative processes, it is easy to run an ‘if-then’ command. If the outcome is
within the range of the fundamental scale then the outcome of the table, i.e.
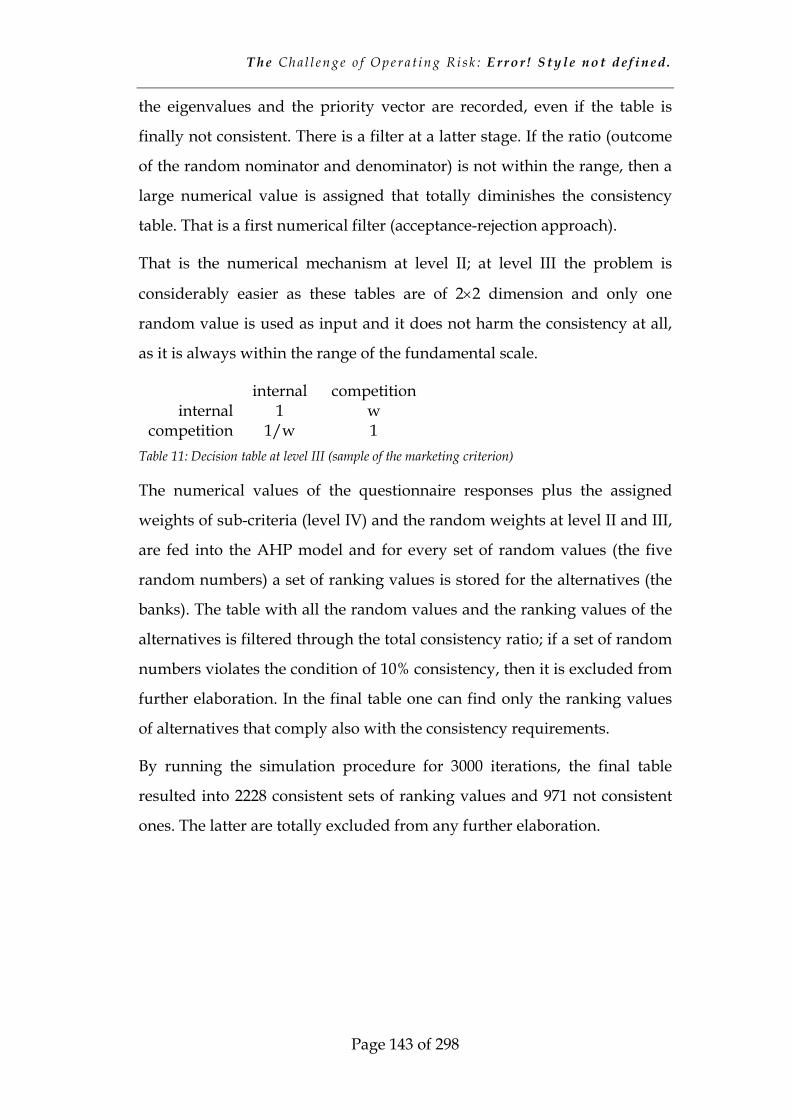
T h e Ch a l l e n g e o f O p e r a t i n g R i s k : E r r o r ! S t y l e n o t d e f i n e d .
Page 143 of 298
the eigenvalues and the priority vector are recorded, even if the table is
finally not consistent. There is a filter at a latter stage. If the ratio (outcome
of the random nominator and denominator) is not within the range, then a
large numerical value is assigned that totally diminishes the consistency
table. That is a first numerical filter (acceptance-rejection approach).
That is the numerical mechanism at level II; at level III the problem is
considerably easier as these tables are of 2×2 dimension and only one
random value is used as input and it does not harm the consistency at all,
as it is always within the range of the fundamental scale.
internal competition internal 1 w
competition 1/w 1 Table 11: Decision table at level III (sample of the marketing criterion)
The numerical values of the questionnaire responses plus the assigned
weights of sub-criteria (level IV) and the random weights at level II and III,
are fed into the AHP model and for every set of random values (the five
random numbers) a set of ranking values is stored for the alternatives (the
banks). The table with all the random values and the ranking values of the
alternatives is filtered through the total consistency ratio; if a set of random
numbers violates the condition of 10% consistency, then it is excluded from
further elaboration. In the final table one can find only the ranking values
of alternatives that comply also with the consistency requirements.
By running the simulation procedure for 3000 iterations, the final table
resulted into 2228 consistent sets of ranking values and 971 not consistent
ones. The latter are totally excluded from any further elaboration.
T h e Ch a l l e n g e o f O p e r a t i n g R i s k : E r r o r ! S t y l e n o t d e f i n e d .
Page 144 of 298
Out of 19 banks with physical presence in the Greek market (see Figure 18,
page 123) only 9 have responded to the questionnaire16. Practically all
Greek FI, but two of minor importance, have responded to the
questionnaire and two foreign banks of major importance. The names of
the banks are known but cannot be revealed due to disclosure purposes. So
for simplicity reasons the FI will get a Xi tag {X1, X2, …, X9}. In general, the
sampling procedure is regarded as highly successful, as it is known from
experience that many Greek and foreign financial houses are seeking their
opaqueness in their market. Nevertheless, the sample is considered as
capable to support decisions; the Greek FI included in the sample represent
82% of the total portfolio (US$2960m17) and 62.5% of the total number. The
foreign FI with a physical presence in the Greek market, included in the
sample, represent 22% of the total loan portfolio and 20% in terms of
numbers.
The results of the simulation model are rather interesting. The stored
outcomes of the AHP process is filtered in order to keep only the sets of
ranking under a specific consistency range. Then with the help of a simple
average function the mere values of assurance, marketing, quality and total
index are extracted. These values produce the following charts:
16 The collection of the questionnaires could not have been achieved without the help of
Alex Orfanidis, who was preparing his diploma thesis on this subject and within the
research goals of this doctoral thesis.
17 See also Figure 18, Figure 19, and Figure 20, pages 123, 124, and 125 respectively
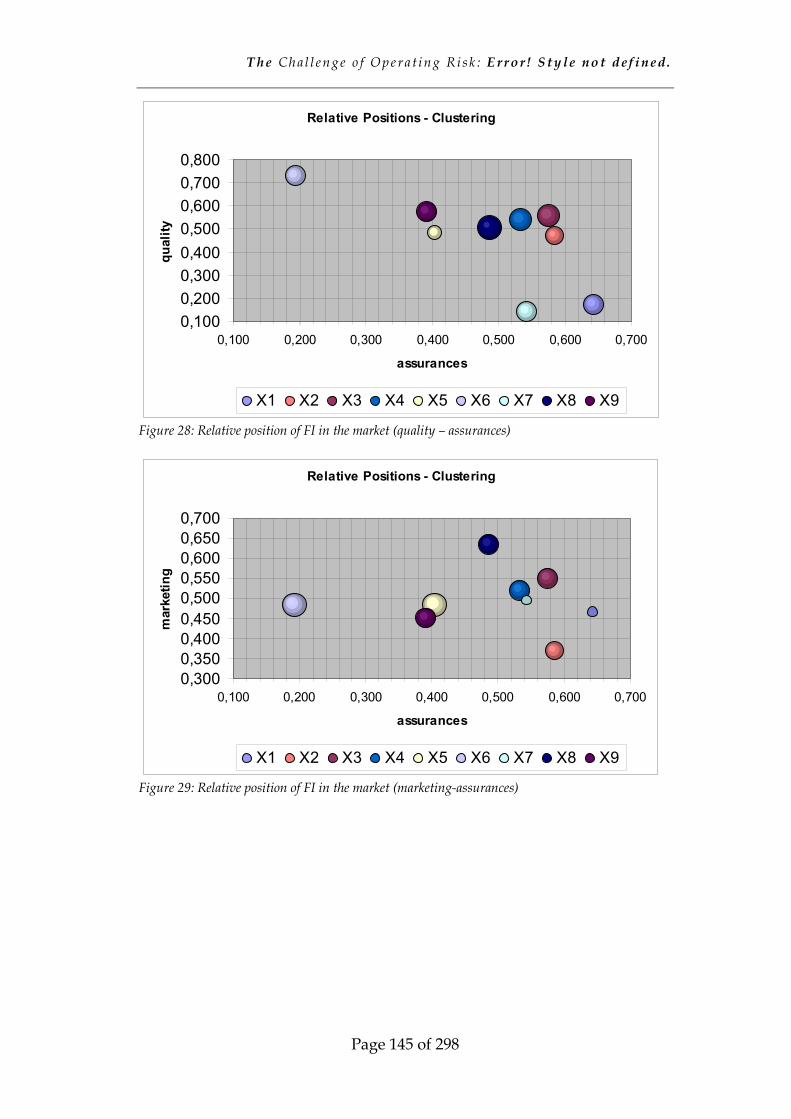
T h e Ch a l l e n g e o f O p e r a t i n g R i s k : E r r o r ! S t y l e n o t d e f i n e d .
Page 145 of 298
Figure 28: Relative position of FI in the market (quality – assurances)
Figure 29: Relative position of FI in the market (marketing-assurances)
Relative Positions - Clustering
0,1000,2000,3000,4000,5000,6000,7000,800
0,100 0,200 0,300 0,400 0,500 0,600 0,700
assurances
qual
ity
X1 X2 X3 X4 X5 X6 X7 X8 X9
Relative Positions - Clustering
0,3000,3500,4000,4500,5000,5500,6000,6500,700
0,100 0,200 0,300 0,400 0,500 0,600 0,700
assurances
mar
ketin
g
X1 X2 X3 X4 X5 X6 X7 X8 X9
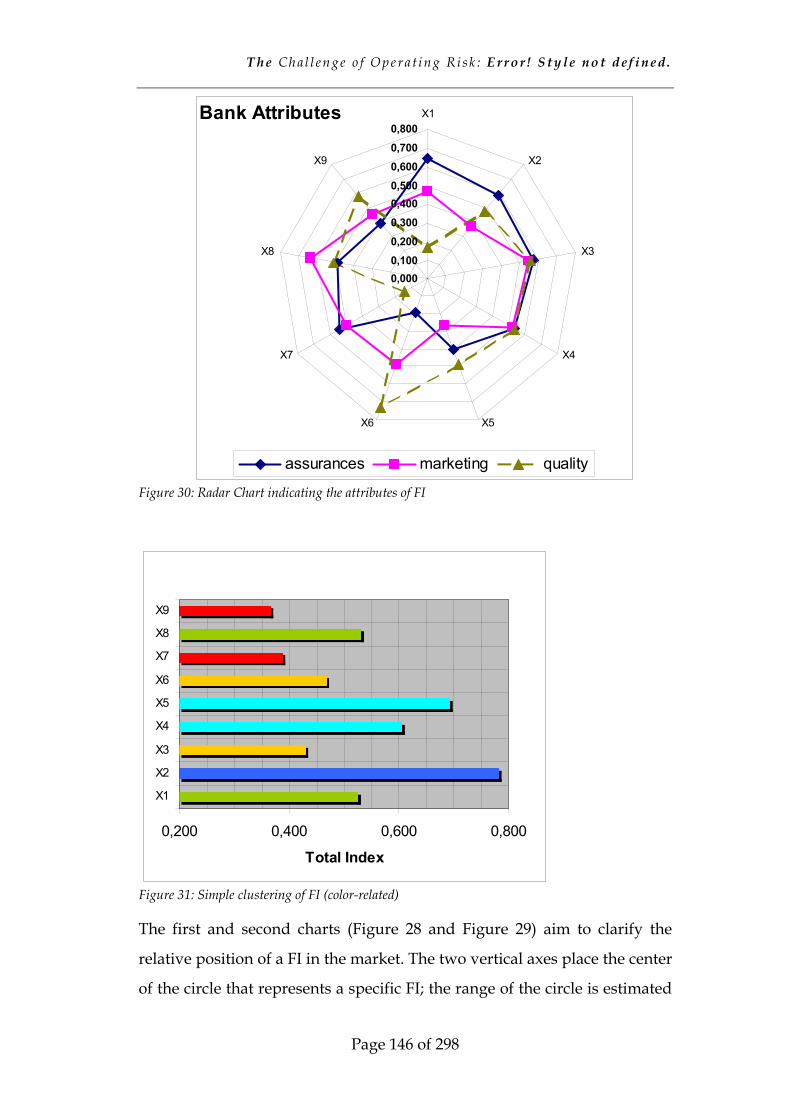
T h e Ch a l l e n g e o f O p e r a t i n g R i s k : E r r o r ! S t y l e n o t d e f i n e d .
Page 146 of 298
Figure 30: Radar Chart indicating the attributes of FI
Figure 31: Simple clustering of FI (color-related)
The first and second charts (Figure 28 and Figure 29) aim to clarify the
relative position of a FI in the market. The two vertical axes place the center
of the circle that represents a specific FI; the range of the circle is estimated
Bank Attributes
0,0000,1000,2000,3000,4000,5000,6000,7000,800
X1
X2
X3
X4
X5X6
X7
X8
X9
assurances marketing quality
0,200 0,400 0,600 0,800
X1
X2
X3
X4
X5
X6
X7
X8
X9
Total Index
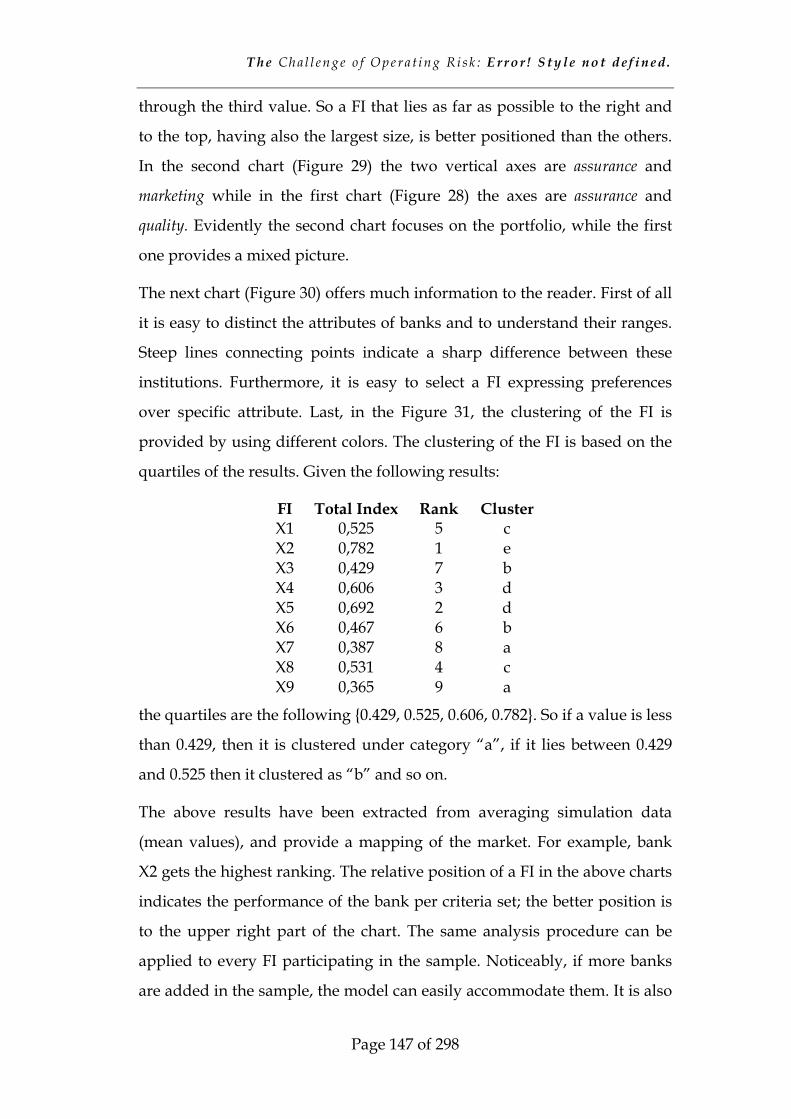
T h e Ch a l l e n g e o f O p e r a t i n g R i s k : E r r o r ! S t y l e n o t d e f i n e d .
Page 147 of 298
through the third value. So a FI that lies as far as possible to the right and
to the top, having also the largest size, is better positioned than the others.
In the second chart (Figure 29) the two vertical axes are assurance and
marketing while in the first chart (Figure 28) the axes are assurance and
quality. Evidently the second chart focuses on the portfolio, while the first
one provides a mixed picture.
The next chart (Figure 30) offers much information to the reader. First of all
it is easy to distinct the attributes of banks and to understand their ranges.
Steep lines connecting points indicate a sharp difference between these
institutions. Furthermore, it is easy to select a FI expressing preferences
over specific attribute. Last, in the Figure 31, the clustering of the FI is
provided by using different colors. The clustering of the FI is based on the
quartiles of the results. Given the following results:
FI Total Index Rank Cluster X1 0,525 5 c X2 0,782 1 e X3 0,429 7 b X4 0,606 3 d X5 0,692 2 d X6 0,467 6 b X7 0,387 8 a X8 0,531 4 c X9 0,365 9 a
the quartiles are the following {0.429, 0.525, 0.606, 0.782}. So if a value is less
than 0.429, then it is clustered under category “a”, if it lies between 0.429
and 0.525 then it clustered as “b” and so on.
The above results have been extracted from averaging simulation data
(mean values), and provide a mapping of the market. For example, bank
X2 gets the highest ranking. The relative position of a FI in the above charts
indicates the performance of the bank per criteria set; the better position is
to the upper right part of the chart. The same analysis procedure can be
applied to every FI participating in the sample. Noticeably, if more banks
are added in the sample, the model can easily accommodate them. It is also
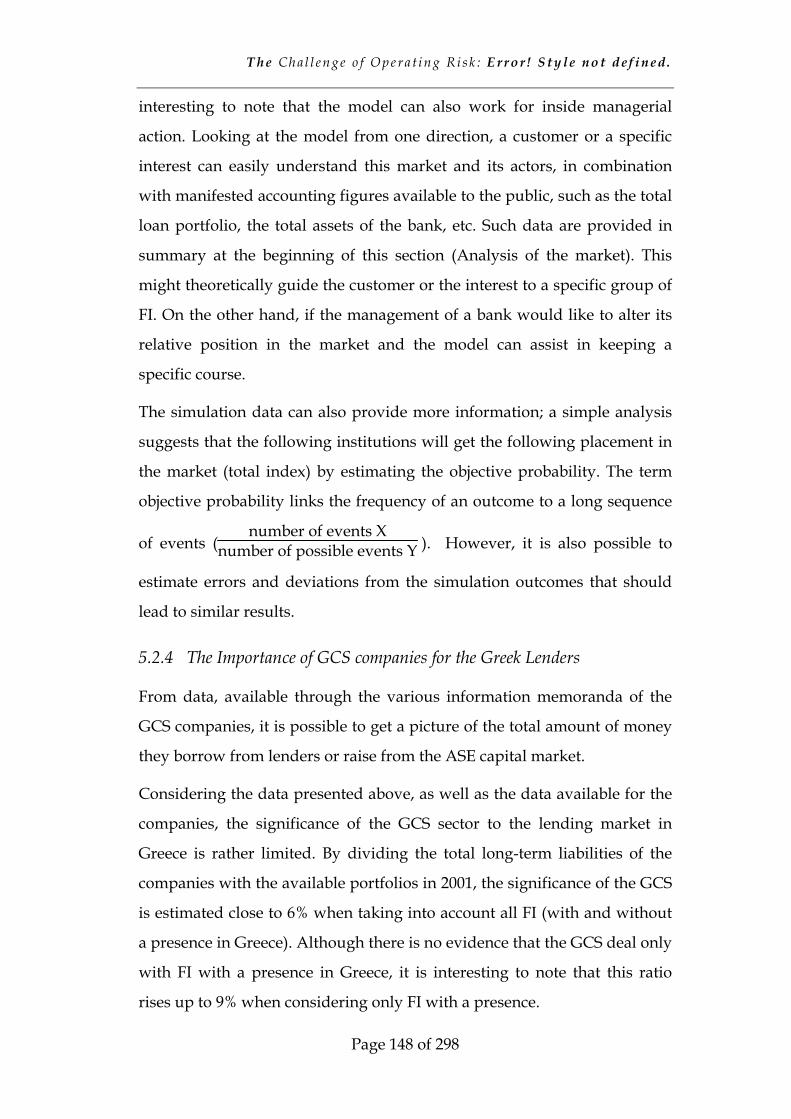
T h e Ch a l l e n g e o f O p e r a t i n g R i s k : E r r o r ! S t y l e n o t d e f i n e d .
Page 148 of 298
interesting to note that the model can also work for inside managerial
action. Looking at the model from one direction, a customer or a specific
interest can easily understand this market and its actors, in combination
with manifested accounting figures available to the public, such as the total
loan portfolio, the total assets of the bank, etc. Such data are provided in
summary at the beginning of this section (Analysis of the market). This
might theoretically guide the customer or the interest to a specific group of
FI. On the other hand, if the management of a bank would like to alter its
relative position in the market and the model can assist in keeping a
specific course.
The simulation data can also provide more information; a simple analysis
suggests that the following institutions will get the following placement in
the market (total index) by estimating the objective probability. The term
objective probability links the frequency of an outcome to a long sequence
of events (number of events X
number of possible events Y ). However, it is also possible to
estimate errors and deviations from the simulation outcomes that should
lead to similar results.
5.2.4 The Importance of GCS companies for the Greek Lenders
From data, available through the various information memoranda of the
GCS companies, it is possible to get a picture of the total amount of money
they borrow from lenders or raise from the ASE capital market.
Considering the data presented above, as well as the data available for the
companies, the significance of the GCS sector to the lending market in
Greece is rather limited. By dividing the total long-term liabilities of the
companies with the available portfolios in 2001, the significance of the GCS
is estimated close to 6% when taking into account all FI (with and without
a presence in Greece). Although there is no evidence that the GCS deal only
with FI with a presence in Greece, it is interesting to note that this ratio
rises up to 9% when considering only FI with a presence.

T h e Ch a l l e n g e o f O p e r a t i n g R i s k : E r r o r ! S t y l e n o t d e f i n e d .
Page 149 of 298
According to data provided by the ASE, the GCS listed companies have
acquired 220bn GrD (€645m) from the market up to the end of 2002 (see
table below):
ANEK 28.656.000.000 13% NEL 17.050.000.000 8% MINOAN 77.381.000.000 35% STRINTZIS 29.673.891.200 14% EPATT 66.939.648.000 30% Total 219.700.539.200 Table 12: Capitals drawn from ASE up to 2002 (in GrD)
It is interesting to note that EPATT and MINOAN have drawn the largest
sums of capitals during the last years. All companies have financed their
growth by renewing or building new vessels as well as by lowering their
long-term liabilities. As long-term liabilities of all companies are close to
560bn GrD in 2001 it seems that the GCS companies finance their growth
primarily through the lender’s market, although the amounts drawn from
ASE are in no case negligible. As pointed out by many researchers,
professionals and academics, despite the growth of capital markets, are not
capable of financing shipping ventures. The limited liquidity of capital
markets during periods of recession, the underperformance of shipping
stocks are some of the reasons. Nevertheless, it is considered that public
equity will follow if only large private placements emerge that will lock
investors in.

E v a l u a t i n g a s h i p p in g c om p a n y
Page 150 of 298
6 Evaluating a shipping company
In most cases the evaluation of any company is solely based on financial
ratios as well as on the ‘story’ behind the company. Although financial ratios
offer a quantitative yet incomplete approach, this ‘story’ notion encompasses
a rather vague and duly qualitative set of attributes of the company under
scrutiny. These attributes are usually some of the following, although the list
is not exhaustive:
• Capabilities and track-record of the top management team
• Sector perspectives
• Perspectives of the company within this sector
• Business strategy
• Market perception - image
• Familiarity with the investors
In the shipping market these attributes are commonly discussed among
investors, lenders and borrowers, as both keep a very close track of the
respective market. In cases of a public offering these are the critical points for
an underwriter to communicate with the investors, who are not really aware
or do not monitor this sector.
In the modern business environment, financial ratios and relevant analyses
are not reflecting the whole picture; statements, structures and financial
instruments are very complicated as companies expand operations to several
institutional, legal and tax settings. Furthermore, the use of options and other
off-balance-sheet risk tools may easily hide the actual risk exposure and
financial status of the company. Nevertheless, financial ratios are important
elements for the analyst to take into account but not the sole ones.
The ‘story’ set of attributes is extremely vague and is in no case uniform.
‘Good’ and ‘bad’ are very subjective notions. Furthermore, it is very difficult
E v a l u a t i n g a s h i p p i n g c o m p a n y
Page 151 of 298
to quantify the above mentioned attributes, although there are some ideas
and approaches for some of them.
As shipping is a cyclical market, financiers are monitoring the cycles and
trying to predict future prices of indices or time-charter rates. The market is
classified into several niches and modeling based on time-series is
performed. This approach may provide a basis for further discussion on the
demand as well as on the supply side, yet it can highlight only some aspects
of the problem. Financiers translate the market and the company data into a
risk figure that will feed a risk management system and yield a result
suggesting the acceptance or the rejection of the project or provide the basis
for a sensitivity analysis and guidance to the client.
The evaluation of a company is of pure multi-criteria analysis (MA) nature.
Pardalos stresses the importance of development of multi-criteria decision
support systems (MCDSS) as a future direction. A MCDSS is defined as a
decision support system (DSS) that helps to implement MCDM methods
(1995, p. xvi). In that sense what Chou and Liang have theoretically
presented is an MCDSS (2001). The same applies for the evaluation model
developed here. It is interesting to note that apart from any theoretical
classification, MCDSS aim to include as many as possible parameters bearing
information, while the traditional approaches disaggregate the problem into
a set of quantitative elements, (financial and risk related ones) as well as, of
qualitative attributes (‘good’ management team, perspectives, strategy). Any
MCDSS quantifies the problem and therefore it harmonizes the approach
and draws attention to other elements not included in the analysis yet. The
added-value from any MCDSS is the foundation of knowledge, as the criteria
and the hierarchies used underline our understanding; redundant elements
are eliminated and new elements are entered in order to explain deviations
and gray zones.
E v a l u a t i n g a s h i p p i n g c o m p a n y
Page 152 of 298
6.1 Hierarchy of the Criteria The most creative part of decision making and the most critical one is the
structuring of the hierarchy. This process has a significant effect on the
outcome of the model as well as on explaining the phenomenon under
scrutiny. Saaty (2001b, p. 58) proposes a basic principle in the form of a
question: can I compare elements on a lower level meaningfully in terms of some or
all of the elements of the next higher level? Then Saaty proposes a set of
suggestions for the design of the hierarchy; some of them are applicable to
this case and are presented as well as commented on the basis of the
structure used for the evaluation of coastal companies (2001b, p.59):
1 Identify an overall goal. What are you trying to accomplish? What is the main goal?
The main goal is to extract an index of annual performance for
every coastal company, thus enabling a classification based on
quantified data.
2 Identify subgoals of the overall goal. If relevant, identify time horizons that affect the decision.
There are subgoals; the major ones are to monitor the
performance of the company per annum as well as to extract
‘what if scenarios’. Furthermore, there is another subgoal to use
subsets of data as input to other models for further elaboration.
There is a need for quantified data required for running other
models. The issue of time horizon is critical in this decision-
making process as well. The approach is static, i.e. independent
of time. There are some reasons justifying this approach. First
of all the criteria used are time-enduring; fundamental and all
the rest data-sets are used for many years long and there is no
sign of not using them in the future. There is information
available to fill the necessary vectors, too. By implementing
time-element in the criteria-set the complexity of the problem
would increase exponentially. There would be no hierarchy but
E v a l u a t i n g a s h i p p i n g c o m p a n y
Page 153 of 298
a network aiming to model the problem. A hierarchy concerns
the distribution of a property (the goal) among the elements
being compared, to judge which one more influences the
property. Networks concern the distribution of the influence
with respect to a given property. A network would respond to
a question of dominance of influence among alternatives with
respect to a criterion. In that case, the Analytic Network Process
method would be used.
3 Identify criteria and subcriteria.
The criteria and the subcriteria are thoroughly analyzed below.
It is interesting to note that the issue of building hierarchies is not largely
discussed in the literature; in a sense the decision-maker is ‘uncontrolled’
from any expert or academic guidance in structuring a hierarchy. In the book
of Keeney and Raiffa there is a brief discussion on this issue (1993, p. 41).
They base their comments on an essay of Manheim and Hall (1969), who
prompted the issue of specification and means. By specification, one
understands the subdivision of an objective into lower-level objectives or
more details, thus clarifying the intended meaning of the general objective
(goal). These lower-level objectives are considered as means to the end, thus by
identifying them to very precise objectives, one can build the whole
hierarchy up to the highest level. Keeney and Raiffa highlight also the
importance of setting a sound and achievable overall goal, so to point the
upper end of the hierarchy. A vague goal such as ‘the good life’ is not a very
successful example for further elaboration. However they suggest going
down the hierarchy as long as the advantages of doing so are more than the
disadvantages. Complexity and data availability are the most common
disadvantages. Regarding the formalization of the problem, Keeney and
Raiffa discuss also the ‘test of importance’ of Ellis (1970). Ellis suggests before
adding any objective (sub-criterion according to Saaty’s terminology) into the
hierarchy to consider whether this would change the course of action. This
E v a l u a t i n g a s h i p p i n g c o m p a n y
Page 154 of 298
approach offers a basis for eliminating or including criteria into the
hierarchy, yet it is not necessarily correct. It is possible to include criteria that
fail the test of importance separately but collectively they are important. Last
but not least, hierarchies for a specific problem are not unique. Their
differences may be attributed to the degree of formalization as well as the
point of view (subjectivity) of the decision-maker. In the case of the Greek
coastal shipping it is possible (if not certain) that investors and financiers
have a totally different structure of criteria from the users of the GCS
services; even between them there would be a different structure between the
residents of the islands and the tourists. In this context the interest lies
currently with the financiers and the investors.
Before proceeding to the analysis of the hierarchy and of its criteria, it is
important to note the approach of other sciences to the field of MCDM. Plous
(1993) presents many different aspects of decision making that differ from
the ‘rational’ and normative approach of engineers and scientists. The
paradoxes violate the principles of rationality and question normative
approaches. The paradoxes of Allais and Ellsberg, intransitivity and
preference reversals are some of the cases where rationality (and in these
cases the expected utility theory) is violated. Plous quoting other
psychologists suggests that people’s decisions are not unreasonable and
there is no clear link between ‘rational’ and ‘logical’ always. It is very
interesting to note also the structure of questions, when asking for feedback
as well as considering qualitative data. In responding to this issue in this
hierarchy there were no ‘qualitative’ data required. As there is no
requirement for the estimation of a utility function, there is no point in
discussing any further the issue of qualitative versus quantitative approach.
It was stated in a previous section (§4.3) that the reasons for the selection of
AHP were the following:
1 in absolute comparison mechanisms it is not possible to experience
rank-preservation problems;
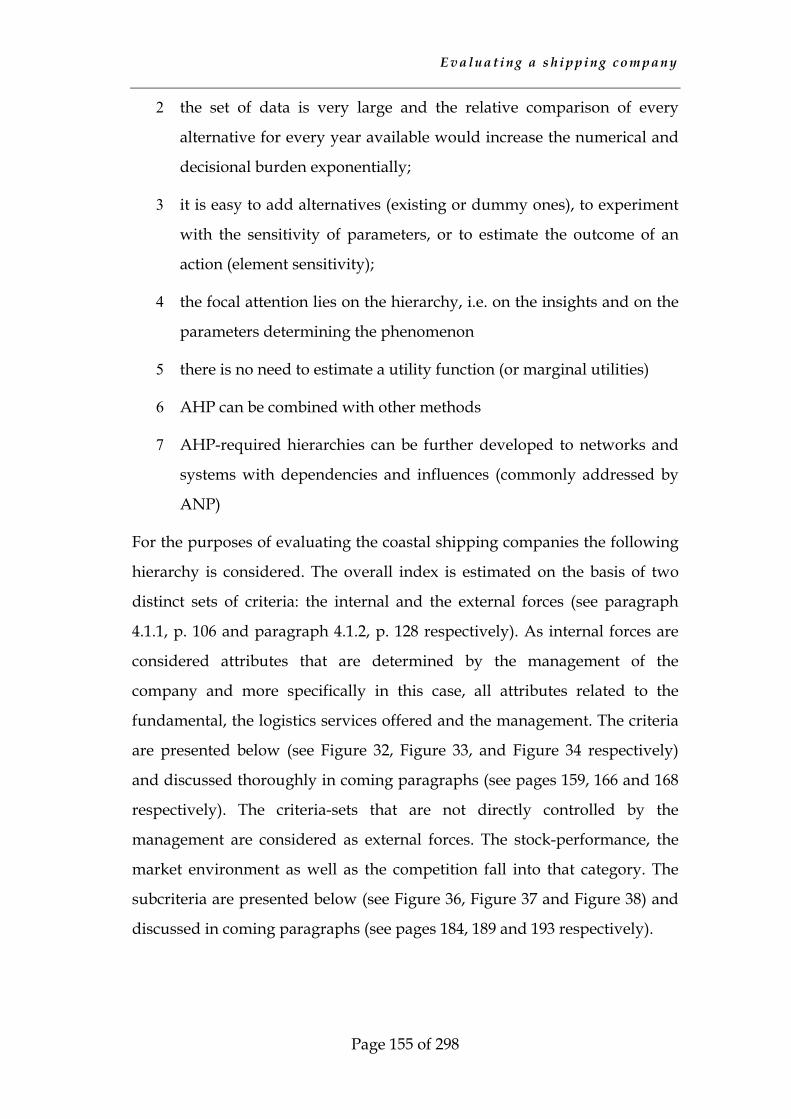
E v a l u a t i n g a s h i p p i n g c o m p a n y
Page 155 of 298
2 the set of data is very large and the relative comparison of every
alternative for every year available would increase the numerical and
decisional burden exponentially;
3 it is easy to add alternatives (existing or dummy ones), to experiment
with the sensitivity of parameters, or to estimate the outcome of an
action (element sensitivity);
4 the focal attention lies on the hierarchy, i.e. on the insights and on the
parameters determining the phenomenon
5 there is no need to estimate a utility function (or marginal utilities)
6 AHP can be combined with other methods
7 AHP-required hierarchies can be further developed to networks and
systems with dependencies and influences (commonly addressed by
ANP)
For the purposes of evaluating the coastal shipping companies the following
hierarchy is considered. The overall index is estimated on the basis of two
distinct sets of criteria: the internal and the external forces (see paragraph
4.1.1, p. 106 and paragraph 4.1.2, p. 128 respectively). As internal forces are
considered attributes that are determined by the management of the
company and more specifically in this case, all attributes related to the
fundamental, the logistics services offered and the management. The criteria
are presented below (see Figure 32, Figure 33, and Figure 34 respectively)
and discussed thoroughly in coming paragraphs (see pages 159, 166 and 168
respectively). The criteria-sets that are not directly controlled by the
management are considered as external forces. The stock-performance, the
market environment as well as the competition fall into that category. The
subcriteria are presented below (see Figure 36, Figure 37 and Figure 38) and
discussed in coming paragraphs (see pages 184, 189 and 193 respectively).
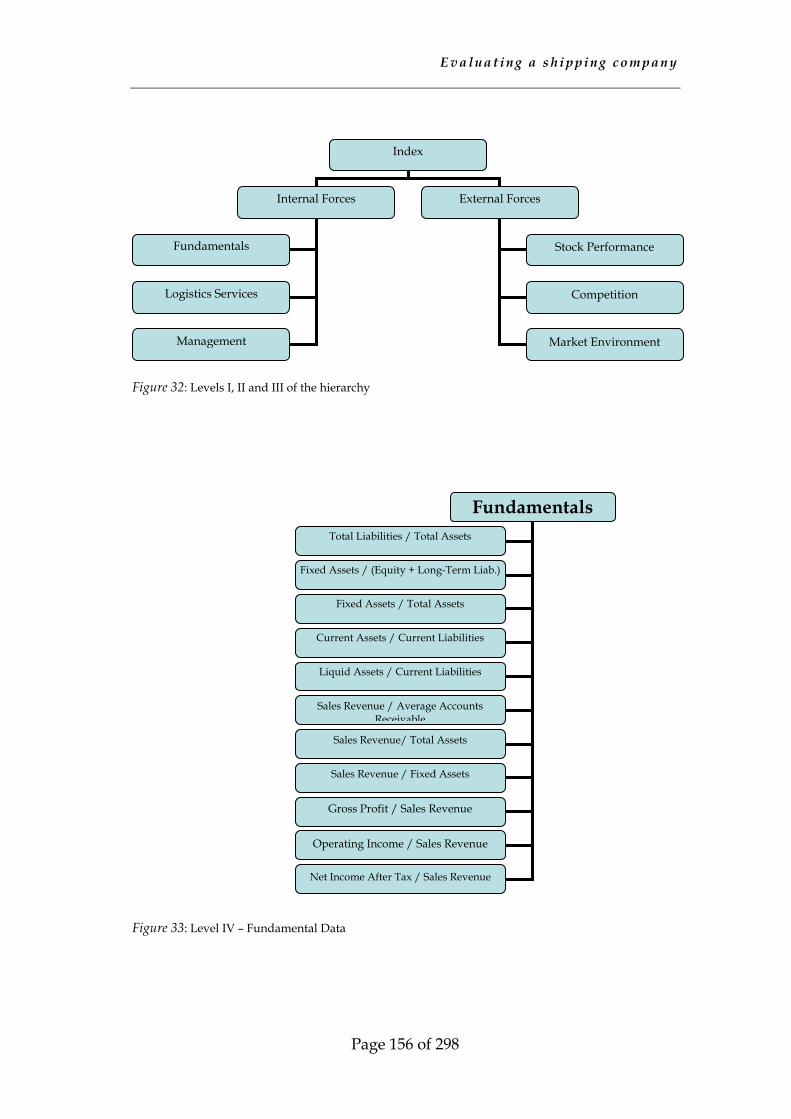
E v a l u a t i n g a s h i p p i n g c o m p a n y
Page 156 of 298
Figure 32: Levels I, II and III of the hierarchy
Figure 33: Level IV – Fundamental Data
Fundamentals Total Liabilities / Total Assets
Fixed Assets / (Equity + Long-Term Liab.)
Fixed Assets / Total Assets
Current Assets / Current Liabilities
Liquid Assets / Current Liabilities
Sales Revenue / Average Accounts Receivable
Sales Revenue/ Total Assets
Sales Revenue / Fixed Assets
Gross Profit / Sales Revenue
Operating Income / Sales Revenue
Net Income After Tax / Sales Revenue
Index
Internal Forces External Forces
Fundamentals
Logistics Services
Management
Stock Performance
Competition
Market Environment
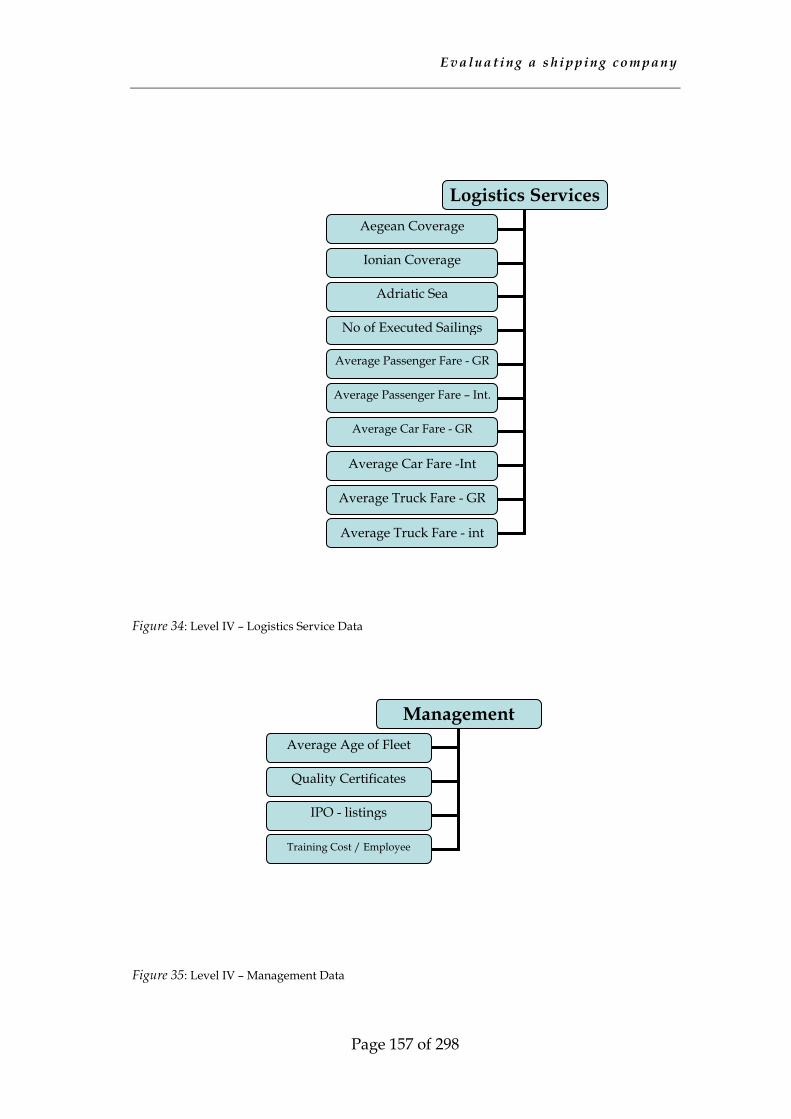
E v a l u a t i n g a s h i p p i n g c o m p a n y
Page 157 of 298
Figure 34: Level IV – Logistics Service Data
Figure 35: Level IV – Management Data
Management Average Age of Fleet
Quality Certificates
IPO - listings
Training Cost / Employee
Logistics Services Aegean Coverage
Ionian Coverage
Adriatic Sea
No of Executed Sailings
Average Passenger Fare - GR
Average Passenger Fare – Int.
Average Car Fare - GR
Average Car Fare -Int
Average Truck Fare - GR
Average Truck Fare - int
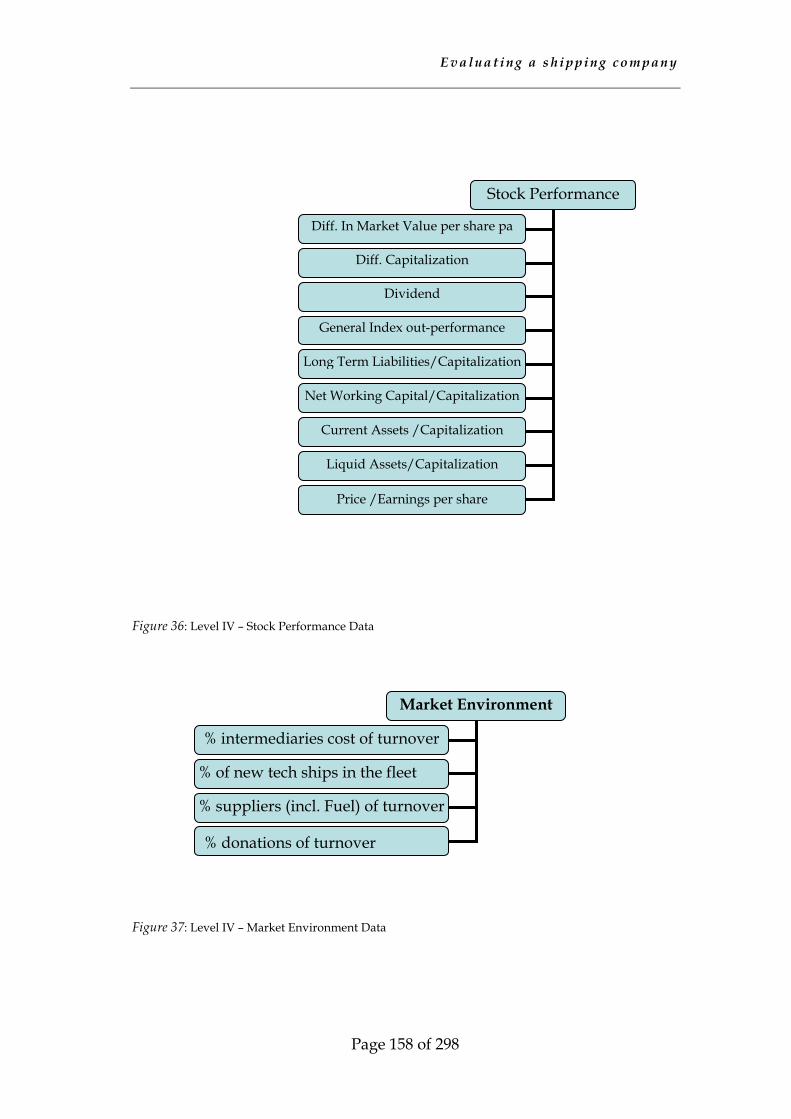
E v a l u a t i n g a s h i p p i n g c o m p a n y
Page 158 of 298
Figure 36: Level IV – Stock Performance Data
Figure 37: Level IV – Market Environment Data
Market Environment
% intermediaries cost of turnover
% of new tech ships in the fleet
% suppliers (incl. Fuel) of turnover
% donations of turnover
Stock Performance Diff. In Market Value per share pa
Diff. Capitalization
Dividend
General Index out-performance
Long Term Liabilities/Capitalization
Net Working Capital/Capitalization
Current Assets /Capitalization
Liquid Assets/Capitalization
Price /Earnings per share
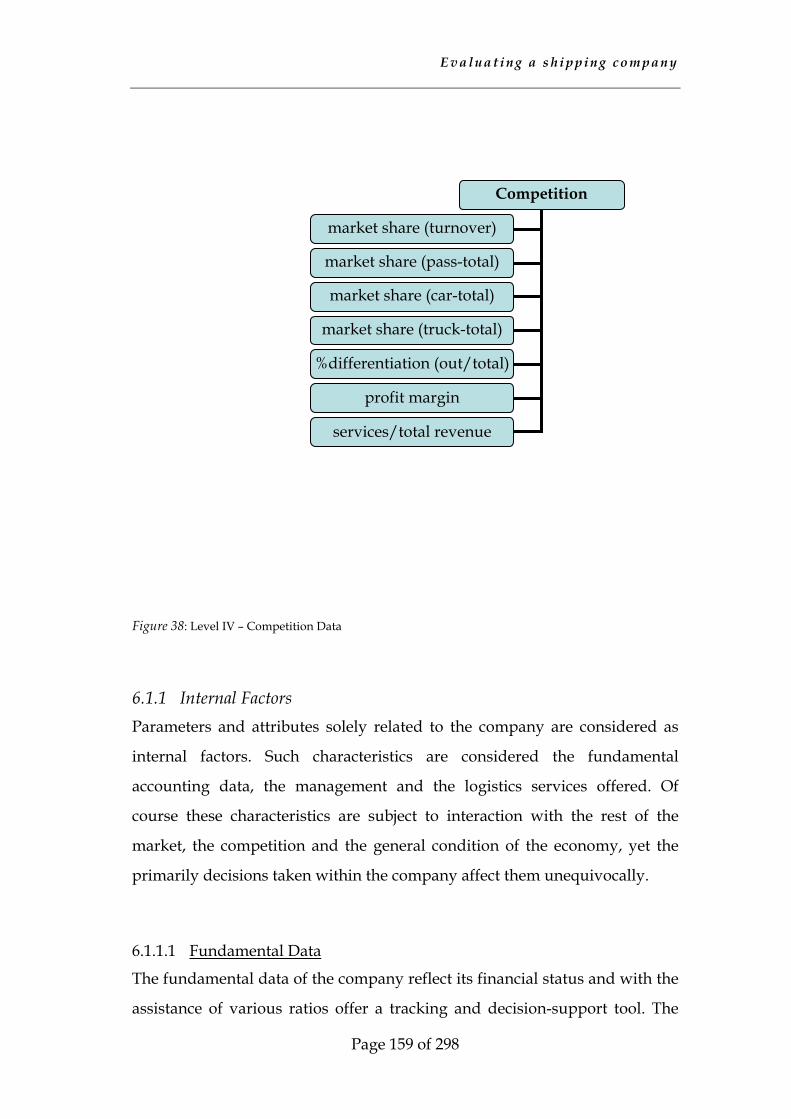
E v a l u a t i n g a s h i p p i n g c o m p a n y
Page 159 of 298
Figure 38: Level IV – Competition Data
6.1.1 Internal Factors Parameters and attributes solely related to the company are considered as
internal factors. Such characteristics are considered the fundamental
accounting data, the management and the logistics services offered. Of
course these characteristics are subject to interaction with the rest of the
market, the competition and the general condition of the economy, yet the
primarily decisions taken within the company affect them unequivocally.
6.1.1.1 Fundamental Data
The fundamental data of the company reflect its financial status and with the
assistance of various ratios offer a tracking and decision-support tool. The
Competition
market share (turnover)
market share (pass-total)
market share (car-total)
market share (truck-total)
%differentiation (out/total)
profit margin
services/total revenue
E v a l u a t i n g a s h i p p i n g c o m p a n y
Page 160 of 298
information extracted from financial reporting is vital for the communication
between the management, the shareholders, investors and debtors. However,
a balance sheet is only a static picture of the status at a given data, and profit
and loss (P&L) statement justifies the change of the relative position between
the dates the balance sheet is drafted, without any further details on the
course between these two points. Lately, interim reports and cash flow
analysis have been widely adopted, and have undeniably improved the
quality and the quantity of information. In the cyclical business of shipping
there are arguments against and for, basically as a resistance or support to
change towards corporate practice.
Although information is a crucial parameter for transparency purposes as
well as for the participation of shareholders in the decision-making process,
there is an issue with its limitations. A critical approach takes under
consideration the content and the obsolescence of the data provided (latest
update). In fact, accounting information demands also an understanding and
some basic knowledge of the accounting principles, otherwise, decision-
makers and shareholders can easily be lured. Usually, managers possess
basic accounting skills while small-stake investors most commonly do not.
The diffusion of business information theoretically leads to an improvement
of market efficiency yet there is the question of information interpretation.
Accounting reports, including balance-sheets, profit and loss statements, as
well as sources and uses of capitals, aim to inform the management and the
investors in order to make rational decisions. Fundamentally, there are two
principles behind reporting: relevance and verifiability. Under the principle
of relevance, there is a link between data and needs. All data are relevant and
all data are provided in order to reflect better the standing of the company.
Information is relevant when it is important, in other words, when induced
decisions can be rationally justified. Thus information shall be updated and
on-time. Furthermore, the principle of verifiability implies that analysts and
accountants using the same data will conclude to the same information.
E v a l u a t i n g a s h i p p i n g c o m p a n y
Page 161 of 298
Before analyzing some of issues of the accounting report content that may
mislead investors, it is interesting to note that in literature, accounting
reporting is considered as the sole source for external audit (Breton and
Taffer, 1995). Furthermore, the high corporate disclosure quality influences
leverage and protects the company during hard times or uncertainty
(Sengpurta, 1998). The use of financial ratios, as well as the synthesis from
accounting data by analysts, strengthens these ideas. Ratios such as of
earnings to book value reveal the use of capitals and its productivity.
As markets evolve, the issue of the content of accounting reports becomes
more important. The issue of adequacy of accounting rules, as well as the
provided information on market values, is the first point of concern. Another
one is the ability to predict situation through these data. The prediction of
cash-flows is necessary and essential in valuating the company. Furthermore,
the publication time is an issue. Quarterly and interim reporting becomes
necessary for listed companies (Rogdaki and Kazantzis, 1999).
Referring to the content the most common misunderstanding lies in the
reckoning and understanding of earnings, as calculated through accounting
rules, and economic income. Balance-sheets reveal accounting earnings based
on historical cost, thus presenting the difference in value of accrued
transactions. Analysts seek to find the economic income, which is the
difference of the value of the company. Economic income does not always
equal to the dividends. This issue affects also other book values and their
role in influencing market values. Good news stemming out of the
publication of earnings and well-being of the company influence only some
investors and a relatively moderate correlation of reported earnings and
market value of shares is reported in the literature (Francis and Shipper,
1999). Every day practice justifies this correlation, as good news is
‘incorporated’ in the market value before the publication of the accounting
results. Today’s markets benefit from the available information wealth.
Relevant issues are considered the historical cost principle, the allocation of
E v a l u a t i n g a s h i p p i n g c o m p a n y
Page 162 of 298
inflows and derivatives. The historical cost principle provides the basis for
comparison and verification of the data, yet presenting values of the past but
during the fiscal period. The commonly discussed issues of inventory and
liquid assets, say deposits and bonds, are thoroughly analyzed in the
literature. The allocation of inflows is relevant with the mix of inputs
necessary for the production or the delivery of the final product or service to
the client. There is always the question that a different mix of resources could
lead to an economically better result. Inventory and fixed asset management
are also discussed, while analysts and investors may demand more
clarification information apart from the final numbers. Finally, derivatives
and their effect in the balance sheet are under discussion and consideration.
Most analysts and investors cannot really handle that kind of information as
rules are vague and companies are not obliged to follow a specific pattern of
reporting. Academic and professional literature, as well as market
experience, agrees that external analysts cannot understand the risk levels or
critically examine decisions taken or predict the outcome of the actions taken,
as derivatives are off-balance sheet risk management instruments and
deviate from accounting orthodoxy.
As information is time dependent, three issues are risen in most cases of
interpretation and conflict: the historic character of data, the lag between
book and market values, and the matching of inflows and outflows during
reengineering or relevant processes. The most debatable issue among these is
the historic character of data. Non-accountants claim that the mission of
accounting is to provide information about the future of the company. This
breaches the principle of verifiability and in no case is possible to draft
general rules for the future-prediction procedure. It shall be reminded that
balance sheets reflect only a specific snapshot of the financial status of the
company. It resembles the pictures taken by physicists when studying the
course and track of a moving body in time. The lag between the observed
point and the current point is common in science yet accounting reporting is
not only addressed to scientists. The handling of such lags in science has also

E v a l u a t i n g a s h i p p i n g c o m p a n y
Page 163 of 298
led to complicated theories and modeling, which is not the case in business
reporting. Rapid changes of the business environment, irrelevant if
attributed to competition, suppliers, entrants or customers are not reflected
in the balance sheet. In best cases, they are merely reflected in the profit and
loss statements or in the notes underneath. This problem becomes even more
unconcealed, when the company undergoes a major or minor reengineering
process. Even the training of employees affects the fiscal outcome, as it is
considered resource improvement. Nevertheless, such investments accrued
during this period, as R&D projects, training, reengineering, etc. will mature
in the coming fiscal periods. Accounting reporting cannot grasp their
importance and quantify the actual or potential benefit. Such information
remains subjective in nature and is interpreted in a different way from
investors.
Last but no least, in the international environment, where capitals freely
flow, there is an issue with the lack of uniformity in reporting. Although the
US-GAAP and IAS standards have been adopted by stock markets and large
multinational enterprises, the vast majority of companies follow the national
standards, thus hampering the understanding of financial reports. In
addition, several accounting standards offer options in handling specific
issues; consequently, the same or similar action may be carried differently on
the balance sheet.
The interesting development while market matures and information flushes
is the use of non-financial measures, the discussions on the internal corporate
structure and the allocation of resources. Non-financial measures, such as
background information, historical results, non-financial statistics (say the
market share), various analyses (say inventory management) are used as
feedback in traditional multivariable decision matrices as the ‘balanced score
card’. This kind of tools uses various data as input and commonly offer a
subjective perspective as there is no objective relationship. If there was any

E v a l u a t i n g a s h i p p i n g c o m p a n y
Page 164 of 298
then accounting techniques could incorporate this information in traditional
reporting.
Furthermore, the analyses and discussions on internal organizational
structures, managerial levels, and techniques, as well as, the use and
allocation of resources, provide the basis for further thinking and
consideration on the future of the company. As investment risks are spread
among more people, such discussions flourish and investors become more
educated and aware. Case studies, presentations, newspaper information are
consolidating knowledge and awake reflects. Accounting cannot become so
popular and massive.
For the purposes of this modeling the evaluation criteria will be ratios
defined by the Joint Credit Information Centre and used by other researchers
in the field of maritime economics as well (e.g. Shim et al., 1986 and Chou et
al., 2001, p. 383). These are the following:
Evaluation Ratio Index Character Comment
1 Total Liabilities /
Total Assets
Financial Structure The less the debt ratio is the better
for the financial standing of the
company. The ratio implies that
most of the capital structure of the
company is shareholders equity,
thus the cost of capital is at lowest
level.
2 Fixed Assets / (Equity
+ Long-Term Liab.)
Financial Structure The importance of fixed assets in
the balance-sheet is considered as
very important to investors.
Especially in shipping where
company valuations are frequently
based on the Net-Asset-Value
(NAV), i.e. on the value of the
ships. The importance of fixed

E v a l u a t i n g a s h i p p i n g c o m p a n y
Page 165 of 298
assets is merely linked also to the
issue of liquidity; capitals
committed to vessels are illiquid
but in case of financial distress or
bankruptcy investors will regain
part of their capital. Generally the
higher the ratio is the better for the
investors.
3 Fixed Assets / Total
Assets
Financial Structure The same comment as above.
4 Current Assets /
Current Liabilities
Debt Payment Ability The current ratio measures the
ability of the company to meet the
current liabilities out of current
assets. A high ratio is needed when
the firm has difficulty borrowing
on short notice.
5 Liquid Assets /
Current Liabilities
Debt Payment Ability The quick ratio, also known as
acid-test is a stringent test of
liquidity.
6 Sales Revenue /
Average Accounts
Receivable
Operational Efficiency This ratio is a measurement of the
number of times accounts
receivable are collected during a
year. In general the higher the ratio
is the better since the company
collects more quickly from the
customers.
7 Sales Revenue/ Total
Assets
Operational Efficiency This ratio is helpful in evaluating
the company’s ability to use its
asset base efficiently to generate
revenue.
8 Sales Revenue / Fixed
Assets
Profit-making Ability This ratio is similar to the previous
one, but it measures the ability to
use the vessels (main fixed assets)
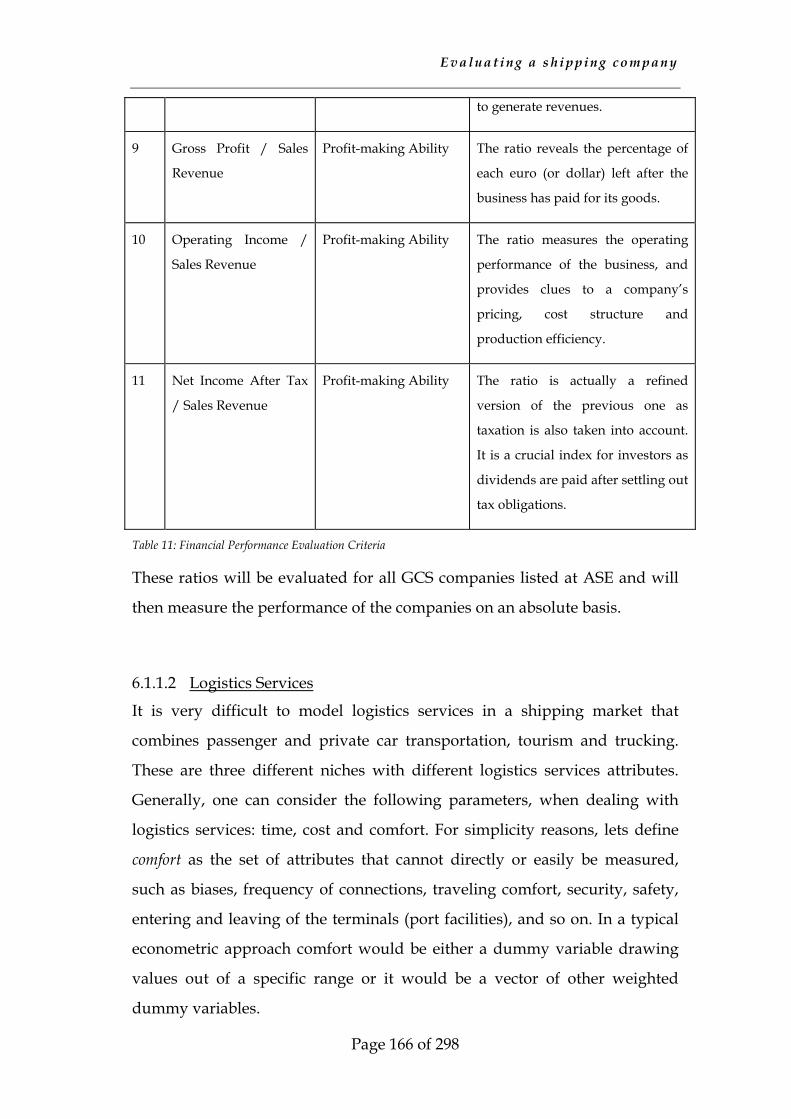
E v a l u a t i n g a s h i p p i n g c o m p a n y
Page 166 of 298
to generate revenues.
9 Gross Profit / Sales
Revenue
Profit-making Ability The ratio reveals the percentage of
each euro (or dollar) left after the
business has paid for its goods.
10 Operating Income /
Sales Revenue
Profit-making Ability The ratio measures the operating
performance of the business, and
provides clues to a company’s
pricing, cost structure and
production efficiency.
11 Net Income After Tax
/ Sales Revenue
Profit-making Ability The ratio is actually a refined
version of the previous one as
taxation is also taken into account.
It is a crucial index for investors as
dividends are paid after settling out
tax obligations.
Table 11: Financial Performance Evaluation Criteria
These ratios will be evaluated for all GCS companies listed at ASE and will
then measure the performance of the companies on an absolute basis.
6.1.1.2 Logistics Services
It is very difficult to model logistics services in a shipping market that
combines passenger and private car transportation, tourism and trucking.
These are three different niches with different logistics services attributes.
Generally, one can consider the following parameters, when dealing with
logistics services: time, cost and comfort. For simplicity reasons, lets define
comfort as the set of attributes that cannot directly or easily be measured,
such as biases, frequency of connections, traveling comfort, security, safety,
entering and leaving of the terminals (port facilities), and so on. In a typical
econometric approach comfort would be either a dummy variable drawing
values out of a specific range or it would be a vector of other weighted
dummy variables.

E v a l u a t i n g a s h i p p i n g c o m p a n y
Page 167 of 298
Nevertheless, passenger and car transportation has a different set of
characteristics from tourism and trucking. It practically lies between the two;
tourism is at the one end and trucking is at the other. The difference lies with
the value of time, the on-board services, the proximity of locations to the
terminals, as well as on many other aspects. Furthermore, these attributes are
totally different between routes. Obviously the Cretan routes do not have the
same attributes with those of the Cyclades, etc. So, in order to extract a
common set of attributes, given also the restrictions and limitations
stemming out of the availability of data, it is decided to use the following
criteria:
1. Aegean network coverage
2. Ionian network coverage
3. Adriatic Sea network coverage
4. number of executed sailings
5. average pass fare - GCS
6. average pass fare – International routes
7. average car fare - GCS
8. average car fare - International routes
9. average truck fare - GCS
10. average truck fare - International routes
The criteria 1 to 3 aim to reveal the coverage of the network a company
offers. The larger the coverage is, the better to the customer. The number of
executed sailings is directly linked to the frequency of the service. Lastly,
criteria 5 to 10 reveal the average cost. This average cost is estimated and
provided by the companies, by combining traffic and revenue data per
geographical area and per niche (passengers, cars, trucks).
E v a l u a t i n g a s h i p p i n g c o m p a n y
Page 168 of 298
This set of criteria provides a macroscopic analysis of the logistics services
offered in the system. In order to cover all respected aspects one should have
data or devote time and efforts in the following:
1. cost, time, correspondent links and frequency per route and port;
2. comfort and other qualitative factors per route and port; and
3. customer satisfaction index per route and port
Then it is necessary for the researcher to find a way to quantify all these data.
This point needs further research (see paragraph 8.2, p. 253), although there
are some notions of using fuzzy calculus. In this study, the coverage of the
network is estimated through simple calculations: this company has served
these ports in this geographical area, so this is the percentage of network
coverage. This is a naive approach as it does not reveal any connections and
frequencies between the ports. Nevertheless, it is still a first order
approximation. Regarding the cost element, the average cost per
geographical area is enough to extract conclusions on an aggregated base.
6.1.1.3 Management Related Criteria
This set of criteria aims to highlight issues closely related to the management
of the company. Although the issue of management in the shipping industry
has been widely considered as a differentiation factor with other industries,
due to the fact that shipping companies are commonly closely held by the
owner and his relatives, in the case of the Greek Coastal Shipping (GCS), this
is not true. The biggest players in the market have already been listed at the
Athens Stock Exchange (ASE) market as they were seeking for capitals for
the acquisition of new vessels, so to respond to the deregulation imposed by
national and European policies. Furthermore, to the listing and to the ability
to draw capitals from the market, diverting from the traditional lending
institutions, this has also brought a revolutionary set of obligations to the
upper management regarding the corporate governance. The issue of
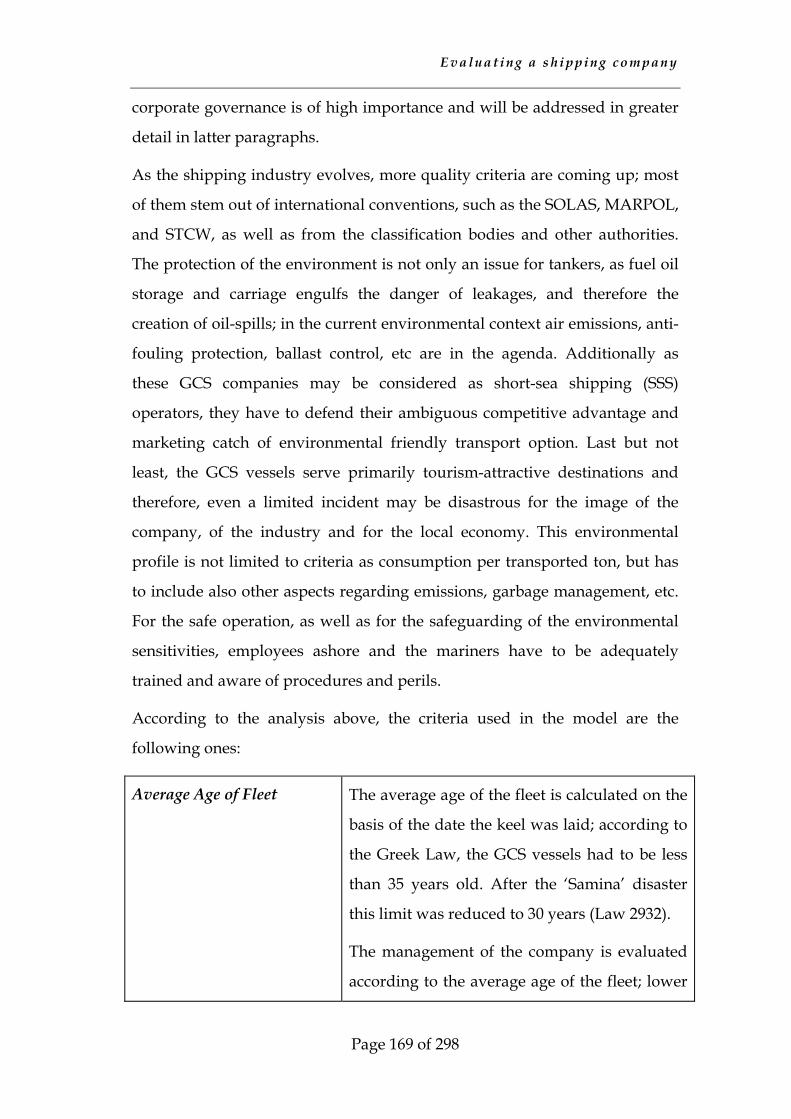
E v a l u a t i n g a s h i p p i n g c o m p a n y
Page 169 of 298
corporate governance is of high importance and will be addressed in greater
detail in latter paragraphs.
As the shipping industry evolves, more quality criteria are coming up; most
of them stem out of international conventions, such as the SOLAS, MARPOL,
and STCW, as well as from the classification bodies and other authorities.
The protection of the environment is not only an issue for tankers, as fuel oil
storage and carriage engulfs the danger of leakages, and therefore the
creation of oil-spills; in the current environmental context air emissions, anti-
fouling protection, ballast control, etc are in the agenda. Additionally as
these GCS companies may be considered as short-sea shipping (SSS)
operators, they have to defend their ambiguous competitive advantage and
marketing catch of environmental friendly transport option. Last but not
least, the GCS vessels serve primarily tourism-attractive destinations and
therefore, even a limited incident may be disastrous for the image of the
company, of the industry and for the local economy. This environmental
profile is not limited to criteria as consumption per transported ton, but has
to include also other aspects regarding emissions, garbage management, etc.
For the safe operation, as well as for the safeguarding of the environmental
sensitivities, employees ashore and the mariners have to be adequately
trained and aware of procedures and perils.
According to the analysis above, the criteria used in the model are the
following ones:
Average Age of Fleet The average age of the fleet is calculated on the
basis of the date the keel was laid; according to
the Greek Law, the GCS vessels had to be less
than 35 years old. After the ‘Samina’ disaster
this limit was reduced to 30 years (Law 2932).
The management of the company is evaluated
according to the average age of the fleet; lower

E v a l u a t i n g a s h i p p i n g c o m p a n y
Page 170 of 298
average age leads to higher ‘marking’.
However it is debatable from a financial point
of view that a young fleet is a good attribute for
a company; young fleets have usually not been
amortized and depreciated, thus bearing high
capital costs. Considerably lower expenses for
maintenance, operation (consumption) do not
cover adequate part of the capital expenses.
Business and market experience suggests that a
mix of ages of vessels is the best practice with
increased financial capability. This sounds
normal as the company spreads risks of various
kinds.
In the context of GCS system, the average age
of the fleet as a distinct criterion will not
jeopardize the soundness of the model; most
companies were operating old vessels and
during the last period have acquired new
vessels and extensively maintained the old
ones. This criterion is usually used by groups
exercising pressures to the Ministry and related
to the quality of services customers enjoy.
Quality Certificates The issue of quality in shipping is one of the
most crucial and highlighted one. Safety and
quality have been closely intertwined in legal
documents; the issue of seaworthiness
extensively treated in the Hague, Hague-Visby
and Hamburg Rules, limits the liability of the
company regarding the cargo and other
damages. The IMO Convention of SOLAS
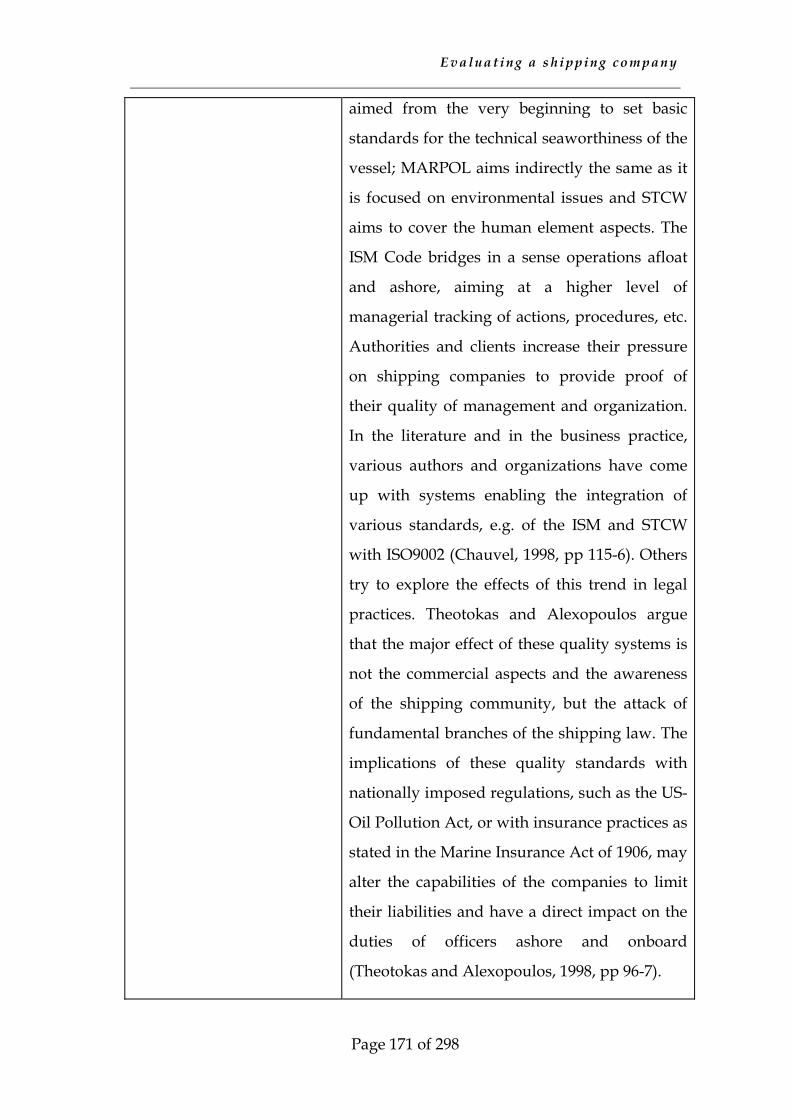
E v a l u a t i n g a s h i p p i n g c o m p a n y
Page 171 of 298
aimed from the very beginning to set basic
standards for the technical seaworthiness of the
vessel; MARPOL aims indirectly the same as it
is focused on environmental issues and STCW
aims to cover the human element aspects. The
ISM Code bridges in a sense operations afloat
and ashore, aiming at a higher level of
managerial tracking of actions, procedures, etc.
Authorities and clients increase their pressure
on shipping companies to provide proof of
their quality of management and organization.
In the literature and in the business practice,
various authors and organizations have come
up with systems enabling the integration of
various standards, e.g. of the ISM and STCW
with ISO9002 (Chauvel, 1998, pp 115-6). Others
try to explore the effects of this trend in legal
practices. Theotokas and Alexopoulos argue
that the major effect of these quality systems is
not the commercial aspects and the awareness
of the shipping community, but the attack of
fundamental branches of the shipping law. The
implications of these quality standards with
nationally imposed regulations, such as the US-
Oil Pollution Act, or with insurance practices as
stated in the Marine Insurance Act of 1906, may
alter the capabilities of the companies to limit
their liabilities and have a direct impact on the
duties of officers ashore and onboard
(Theotokas and Alexopoulos, 1998, pp 96-7).
E v a l u a t i n g a s h i p p i n g c o m p a n y
Page 172 of 298
For the ‘marking’ of the GCS company, the
following certificates and internal policies are
taken into account: ISO 900x, ISM, any
Environmental Certificate (such as ISO 14000),
Drug & Alcohol Policy, other quality standards
(such as DNV-SEP), ballast management plan,
garbage management plan, TBT-antifouling
paints, incinerators plans for the burning of
PVC-PCB, Halon fire extinguishing systems.
IPO-listing The listing of a company at any organized and
regulated market comes along with changes in
the corporate governance. The issue of
corporate governance is discussed in this
paragraph, as OECD has adopted new strategy
for the safeguarding of shareholders and the
deepening of international economic relations.
In this context the companies are evaluated
according to the number of years listed in an
organized market, and specifically at ASE. The
longer a company is listed the higher the mark
will be, as this reflects a better corporate culture
and communication with the shareholders. Of
course, this criterion is debatable, yet it offers a
basis for further elaboration.
Training cost per employee The annual cost of training per employee offers
a basis for further discussion on the
commitment of the management to the training
of mariners and employees. The annual
expenses for training, as reported in the annual

E v a l u a t i n g a s h i p p i n g c o m p a n y
Page 173 of 298
report and accounts to the shareholders, is
divided by the total number of employees
(ashore and onboard), thus providing a
measurement of the per employee cost.
Table 13: Management-related criteria
In the above analysis of the management related criteria, the issue of
corporate governance came up. This is, in deed, a very sensitive issue for
almost every company in the waterborne transport sector, either terminal or
carrier or forwarder or multi-modal transport operator (MTO), is corporate
governance. Under the term corporate governance nothing really
complicated or extraordinary is hidden; it is only a term for describing the
operational pattern for companies and most commonly responds to indirect
but very sensitive and important subjects, such as:
1. What is the role of the Board of Director (BoD)?
2. Who shall participate in the BoD?
3. What is the role of the Chief Executive Officer (CEO)?
4. What is the order of power in the senior management level?
5. What is the actual goal of the company?
6. Is there any evaluation procedure for the senior management and is it
linked to their fees and wages?
These questions are very often in a company, yet they get a special meaning
when the company has gone public or simply evaluated for financing in the
credit procedure of a prudent bank. In the case of shipping companies all
these questions can melt down to the phrases ‘who is at the helm’ and ‘who
knows the true course of the ship’, though both apply to almost every
company.
Under an OECD instruction all listed companied in Stock Exchange Market
shall comply specific managerial criteria for the protection of their
E v a l u a t i n g a s h i p p i n g c o m p a n y
Page 174 of 298
shareholders and the reputation of the market as well as of the institutions of
the free market system (OECD, 2004). So, OECD defines corporate
governance as a system of corporate structures and procedures, leading and
controlling the company while defending and protecting the interests and
rights of the shareholders.
The same source identifies also BoD as the main governance body.
Experience and practice induce three types of BoD:
1. ‘Watchdog’ boards
2. Trustee boards
3. Pilot boards
‘Watchdog’ boards identify themselves as guards of the investors’ rights and
benefits. The members of the board exercise mainly control tasks and
participate seldom actively in the strategic planning or decision making of
the company. Their role is considered as more passive as they have a
posteriori approach. At the same direction but with a different focus, trustee
boards exercise ‘custody’ over the assets of the investors. This scheme
appears frequently in corporations of the financial sector or state controlled
enterprises. The assets in many cases are not tangible or financial, but also of
social interest, and therefore representatives of State or local authorities
participate in the BoD, as in the case of ports. In both cases, CEOs usually
suggest or propose subjects for discussion to the BoD and their deeds are
under scrutiny at the end of the fiscal year. The role is promoted under the
circumstances, but there is always the handicap of protracted procedures and
in many cases, incompetent and/or inexperienced members impede the
sequence of necessary decisions and actions.
The third kind of BoD is the most interesting one, as their members
participate actively in the decision making procedure and CEO’s role is
demoted; CEOs have to analyze and convince the members about the
suggested policy or action. Despite the fact that CEOs have to discuss and

E v a l u a t i n g a s h i p p i n g c o m p a n y
Page 175 of 298
justify almost everything, they are faced with a group of experts and
qualified people guarding the interests of their representatives but at the
same time understanding the subject matter. That is very relieving for the
CEO, as this splits his/her share of responsibility to the members of the
board as well. This is also the case with the other types of BoD, but as this
type of BoD consists of ‘experts’ then responsibility get a character of
collectivity.
The board itself commonly decides the type of BoD. There is a trend to act
advisory to the CEO and the President of the board as well offers interaction
by discussing the subjects suggested by the President and the CEO. At this
point, a crucial relationship has to be defined for every case respectively, that
of the President and the CEO. In many cases, and more frequently when
there is a gap of experience and knowledge between the President and the
CEO, CEOs are not willing to discuss subjects at the BoD. They prefer not to
waste time and act fast, while other members of the BoD and the President
need more time to compromise the contrary interests of their representatives.
It becomes obvious that the character, the skills and the personality of the
CEO as a decisive factor towards the necessary balance and equilibrium of
power in any organization. The other factor is the capabilities and skills of
the members of the BoD. In many cases, the selection of a member does not
lie on the rational approach of skills and knowledge, but on trust and social
acknowledgement. Generally, a crucial parameter determining the behavior
of the BoD is the existence of prescribed skills and experiences for the
member of board as well as for the CEO. This becomes obvious in companies
closely held by families or state-owned ones, where personal, political and
subjective criteria dominate.
Last but not least is the intertwined issue of transparency and of small-
shareholders’ participation in the corporate life. Before briefly examining the
basic facts, it shall be understood that a country’s institutional corporate
governance framework can be described by the following main elements:
E v a l u a t i n g a s h i p p i n g c o m p a n y
Page 176 of 298
1. Statutory law and regulations
2. Voluntary standard contracts and self-regulation
3. Implicit rules, social norms and business culture.
Statutory laws and regulations belong to the public policy domain and in
that context corporate governance in generally regarded a mean advancing
private sector returns and relations towards the benefit of the wider society.
Corporate governance as day-to-day corporate practice stems out of a
credible and enforceable legal environment. This legal foundation outlines
the basic rights and responsibilities of different parties, clarifies the operation
of the law and assures compliance. Most commonly, these arrangements are
provisos of the company law. Although there are issues making the
distinction between civil law and common law countries, such as the
flexibility and the rigidity in many legal instances, regulators try to find
shortcuts or to compromise situations favoring new business and initiatives.
The second element in corporate governance is the voluntary adoption of
norms and self-regulation. This is most common in listed companies, where
‘going public’ means that the company shall comply with a rather long list of
criteria and perform specific internal-audit and reporting operations. Since
listing is not mandatory, the ‘going public’ decision can be seen as entering a
voluntary standard contract.
Finally, as corporations and investors always form part of a wider social
context their interactions are always influenced by prevailing implicit rules,
social norms and business culture. While the immediate and exact impact of
such value-systems may be hard to measure, their importance for evolving
corporate governance practices is increasingly recognized. Their existence
may in fact be an important explanation why technically similar legal
frameworks may result in quite different corporate governance outcomes. An
often referred to example is the public perception of the mission of the
corporation. In some countries, corporations are often expected to serve a
range of social functions that in other countries has become the responsibility

E v a l u a t i n g a s h i p p i n g c o m p a n y
Page 177 of 298
of the public sector. Such implicit commitments may concern job tenure,
education and training. Implicit liabilities are sometimes expected to go also
outside the actual workforce and include such services as providing for
apprenticeship positions
Under the influence of increased market and global competition, financial
markets and OECD countries have experienced a range of initiatives aiming
to improve corporate governance practices. These initiatives have aimed at
both the insider model and the outsider model. The main objective in insider
oriented countries has been to reconcile the strengths of traditional
governance practices with the recognized economic advantages that stem
from corporate access to developed equity markets. In countries that
primarily have relied on the outside approach, the ambition has been to
overcome the incentive and collective action problems related to disperse
ownership by promoting shareholder visibility and participation.
While shareholder supremacy has been seen as the hallmark of the outsider
model, the reality is that the emergence of much dispersed ownership
structures usually left them with little influence over corporate affairs. The
profound separation of ownership from control gave increasing discretionary
power to hired management that could not always be expected to act in the
best interest of the company and its shareholders. Although this
development was widely recognized as a genuine problem, it was also
assumed that the lack of direct shareholder monitoring through voting and
board representation, could be compensated by the stock market’s ability to
discipline management behavior. This argument builds on the assumption
that if management can take care of the company, strict disclosure
requirements in combination with liquid stock markets will take care of the
stock. If shareholders are able to trade a company’s stock on the basis of high
quality information, they will also be able to evaluate and sanction
management performance. If there is reason to believe that management is
underperforming, shareholders will sell their stock; the price will fall and
E v a l u a t i n g a s h i p p i n g c o m p a n y
Page 178 of 298
eventually pave the way for a take-over bid aiming to realize the
fundamental values of the company. Such takeovers, which are triggered,
when management is not able to make the best possible use of company
assets, will typically result in a change of management and therefore serve as
an ultimate check on their ability to equivocate. The best protection for
managers against this fate would be to keep stock prices up by running the
company in the interest of the shareholders. This notion engulfs confusions;
it is important to maximize the company value and not the company equity.
Exclusive reliance on the exit mechanism as a disciplining factor has also
been mitigated by the presence of large institutional investors that hold a
large portion of their assets in the form of indexed portfolios. Such an
investment strategy often makes investors less flexible when it comes to
selling the shares of an individual company. This has in turn triggered the
search for alternative corporate governance strategies among several large
institutions, notably the US public pension funds. With limited possibilities
to exit specific companies, the principal governance-avenue has been to
“move the herd” or “lift all boats”. The main tool to achieve this has been to
identify a set of governance safeguards, which are assumed to minimize the
risk of abuse, waste and moral hazard, and then request all portfolio
companies to comply with these pre-established standards. Common
elements of such standards include board practices, disclosure provisions
and the character of compensation schemes. To gain additional leverage,
some institutional investors also publish “black-lists” of companies that lag
in performance and acceptable corporate governance practices.
In addition, or rather as an alternative, to pre-established governance
standards in individual companies, some large institutions, notably in the
UK, describe their ownership strategy as relational investing. These investors
(still holding fairly small stakes in individual companies) prefer to influence
the company through direct and informal discussions with the directors or
the management. For investors with large and diversified portfolios such a

E v a l u a t i n g a s h i p p i n g c o m p a n y
Page 179 of 298
strategy may indeed be very time consuming and for this reason it may
become the case that such focused ownership will be carried out by
specialized departments or subsidiaries.
During the last decade, market oriented countries have also experience a
surge in more “hands on” governance strategies designed to deal with
specific information, monitoring and incentive problems. Such strategies are
typically pursued by an intermediary owner, which pools capital from
various sources in order to acquire large ownership stakes in a limited
number of companies. Private equity partnerships and buy-out funds are
examples of such specialized governance owners. In their search for
competitive rates of return, many large institutional investors, including
major US pension funds, have over the last years substantially increased
their participation in such targeted and less liquid investment ventures.
The intermediary governance owner operates in active and ad-hoc
collaboration with the entrepreneur and other insiders. The strategy focuses
on maximizing shareholder returns via customized contracts aiming at a
more complete sharing of risks and better alignment of interests among the
participants. This governance technique should not be confused with the
traditional insider approach. Ownership structures and fiduciary obligations
are clearly defined and the contractual rights, including exit possibilities, of
different parties are thoroughly elaborated and explicit.
Traditionally used in small and mid-size companies in the high-tech
industry, increased familiarity with more “hands on” governance techniques
has made it an interesting strategy for ownership also in larger companies,
not least as an efficient tool during restructuring. Commitment to this
ownership strategy typically requires practical business experience, which is
then transferred to the company in very concrete forms. The owners will
certainly provide competent candidates for the board of directors, select the
executive and if necessary form part of the management team. When carried
out across borders, this ownership strategy does not only include transfer of
E v a l u a t i n g a s h i p p i n g c o m p a n y
Page 180 of 298
financial capital but also of industrial know-how, management skills and
business networks.
While much attention has been given to corporate governance in the market
based system, companies, stock exchanges, regulators and controlling
investors are seriously beginning to tackle those aspects of the insider model
that creates obstacles to outside investment or hamper corporate dynamism.
Unlike in the outsider model, the central problem in the insider model is not
the separation of ownership from control. The main areas of concern are
instead:
1. Effective protection of minority shareholder’s rights
2. More transparent corporate structures, and
3. Market access to high quality financial information
This analysis proves the complexity of the issue of the corporate governance,
and the difficulties to quantify such attributes. A way to include several
criteria or sub-criteria into an analysis would be to use fuzzy-logic
techniques, which easily transform linguistic judgments to figures. This issue
will be discussed in a coming paragraph (page 217). However, it would not
add sufficient accuracy to this model, unless there was inside information
and extended solicitation of opinions from shareholders and potential
investors. Therefore, the criteria used for the evaluation of the management
have been limited to the ones described and analyzed above.
It is interesting to note that some first attempts to quantify the results of
management styles and corporate governance have already appeared in the
literature. Recently, Randøy et al. have published a paper over the corporate
governance and the effectiveness of the board taking as example Nordic
experiences (Randøy et al., 2003). In Greece, no relevant approach or attempt
has been noted and as induced from paragraph 3.1.2 -Market Analysis- in
page 70, in Greece there are many shipping companies of various sizes and
E v a l u a t i n g a s h i p p i n g c o m p a n y
Page 181 of 298
risk profiles, so it would be interesting from an analytical point of view to get
a picture.
In the case of the listed GCS companies it would be interesting to include a
criterion related to the corporate governance. Nevertheless, as the market is
currently structured this would have a very limited contribution to the
estimation of the overall index. According to the test of importance (see p.
100) the inclusion of a criterion over the governance of the company can be
excluded as it would not affect the overall ranking due to the fact that all
BoD are controlled by major shareholders and the members do not have
executive power unless they are shareholders too. The only exception to the
rule of the ‘uniform’ governance style is ANEK; ANEK is a company of
‘popular base’, i.e. the shares are dispersed among many shareholders.
However, the power of a shareholder’s group that includes the local
Orthodox Church is profound and indisputable. As there is lack of diverse
data to feed the model, the relevant criteria are not taken into account.
However, researchers are suggested to conduct research in this field
(paragraph 8.2.2).
6.1.2 External Factors Opposite to the internal factors, where the company can basically affect them
through its decision-making mechanisms, external factors are practically
independent from the decisions of the management. In this modeling, the
external factors are broken down to the following set of criteria: stock
performance, market environment and the competition.
As expected and as in the case of internal factors, these groups of attributes
may raise debates over the interaction of the decisions of the company with
this external environment. One can easily argue that stock performance is
based on the fundamentals and that competition is affected from the actions
of one sole player in this high concentrated market. The truth is that in small
markets and segmented sectors as in the case of GCS, the movements of the
E v a l u a t i n g a s h i p p i n g c o m p a n y
Page 182 of 298
actors are interrelated. The same applies in some extent to the relatively
small and illiquid market of ASE. Nevertheless, economics and economic
theory can not be explained adequately with rationalism and the notion of
‘economic climate’ is dominant in open systems, as the stock market. If there
is an upward trend, a bullish market, then all shares will get a benefit,
regardless the status of each respective company.
Additionally to this idea, competition does not respond spontaneously or
immediately to a strategic or a tactical movement. In shipping, and in
transportation generally, an increase of the level of service (LOS), practically
increase of the service frequency and/or of the reliability and/or of the
comfort level and/or decrease of price and/or of the travel time is achieved
mainly through increase of the offered capacity (in pass-miles). The LOS is a
complex concept and multidimensional, and therefore it integrates and
internalizes different variables, such as the value of time of the users, their
generalized cost which involves also the accessibility of the ports and their
services, and a bias. Furthermore, the LOS is dynamic, as it strongly depends
from the time variant. As in the urban system with peak hour service
offering lower levels of comfort, summer seasonality of the GCS is
characterized by great volumes of travelers and vehicles, users tend to get
services of lower quality. Moreover, schedules are not regularly driven by
customers’ demand, except specific days and weekends, where carriers and
authorities are aware of the transportation demand and route more vehicles
in specific lines. There is a sensitivity of the GCS as in the case of the airlines,
but not so high. This is also a characteristic of the structure of the network; if
the network was designed on a hub-and-spoke architecture, then this
sensitivity would have been further reduced. Travelers generally avoid
transit stations and have a clear bias over the direct connections (Sussman,
2000, pp 37-41).
The increase of the LOS will practically come with the increase of the offered
capacity (practically number of seats or lane meters offered). As the LOS
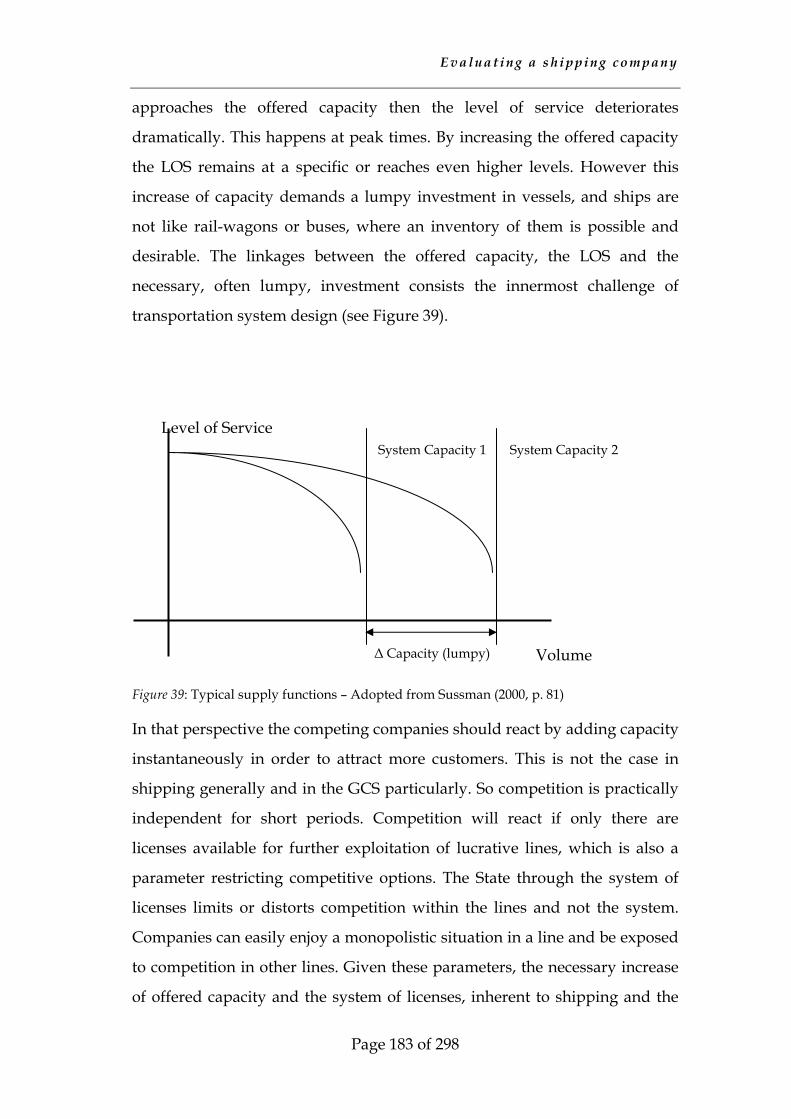
E v a l u a t i n g a s h i p p i n g c o m p a n y
Page 183 of 298
approaches the offered capacity then the level of service deteriorates
dramatically. This happens at peak times. By increasing the offered capacity
the LOS remains at a specific or reaches even higher levels. However this
increase of capacity demands a lumpy investment in vessels, and ships are
not like rail-wagons or buses, where an inventory of them is possible and
desirable. The linkages between the offered capacity, the LOS and the
necessary, often lumpy, investment consists the innermost challenge of
transportation system design (see Figure 39).
Figure 39: Typical supply functions – Adopted from Sussman (2000, p. 81)
In that perspective the competing companies should react by adding capacity
instantaneously in order to attract more customers. This is not the case in
shipping generally and in the GCS particularly. So competition is practically
independent for short periods. Competition will react if only there are
licenses available for further exploitation of lucrative lines, which is also a
parameter restricting competitive options. The State through the system of
licenses limits or distorts competition within the lines and not the system.
Companies can easily enjoy a monopolistic situation in a line and be exposed
to competition in other lines. Given these parameters, the necessary increase
of offered capacity and the system of licenses, inherent to shipping and the
∆ Capacity (lumpy) Volume
System Capacity 2 System Capacity 1 Level of Service

E v a l u a t i n g a s h i p p i n g c o m p a n y
Page 184 of 298
local regulatory conditions, competition is considered an independent factor,
therefore an external one.
6.1.2.1 Stock performance
The performance of the stock of a listed company at an organized secondary
market, in that particular case the Athens Stock Exchange (ASE), reflects the
market perception of the asset and the story behind the company. The
performance of the stock is not always or necessarily linked to the
fundamental accounting and operating data. The markets, institutional and
retail investors are trading the asset not only because of the earnings per
share or the dividend they may collect in the near future, but also because of
a story that implies higher performance than the general average, as well as
because of the perspectives of the market as such irrelevantly to the asset.
The risk of an asset has been thoroughly analyzed and approximated by
various researchers; the most known approach is that of Markowitz.
Nevertheless, the whole theory melts down to a factor, the well known β-
factor. If an asset has a β over 1 then it is more risky than the general index
(or any other relevant base-index). The risk of an asset is directly linked with
its volatility. In practice the risk of assets is not easy to be estimated. The
calculation of β-factor demands normal distributions; most if not all time-
series of assets traded at ASE are not normal ones. This is attributed to their
very short trading history as well as to the effects of the transformation-
process of ASE from an emerging market to a mature one.
The reader can find numerous books, papers and studies over the risk related
to assets, yet the basic idea is reflected in the following figure:
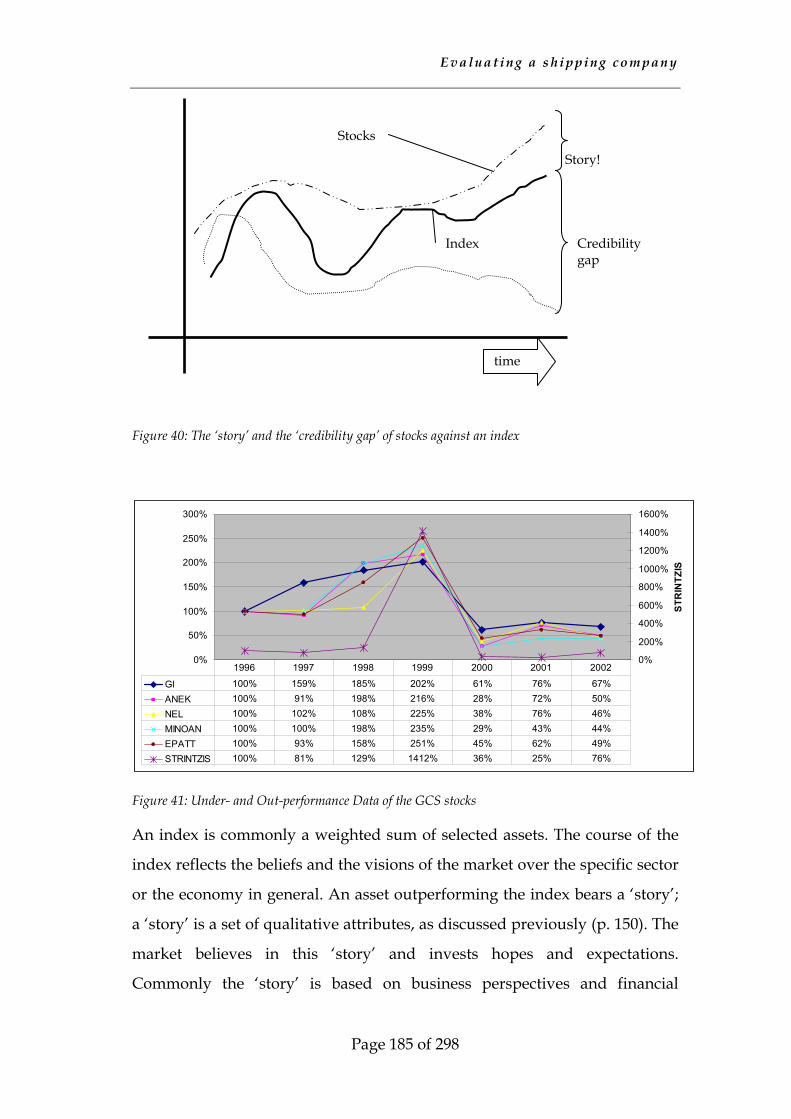
E v a l u a t i n g a s h i p p i n g c o m p a n y
Page 185 of 298
Figure 40: The ‘story’ and the ‘credibility gap’ of stocks against an index
0%
50%
100%
150%
200%
250%
300%
0%
200%
400%
600%
800%
1000%
1200%
1400%
1600%
STR
INTZ
ISGI 100% 159% 185% 202% 61% 76% 67%ANEK 100% 91% 198% 216% 28% 72% 50%NEL 100% 102% 108% 225% 38% 76% 46%MINOAN 100% 100% 198% 235% 29% 43% 44%EPATT 100% 93% 158% 251% 45% 62% 49%STRINTZIS 100% 81% 129% 1412% 36% 25% 76%
1996 1997 1998 1999 2000 2001 2002
Figure 41: Under- and Out-performance Data of the GCS stocks
An index is commonly a weighted sum of selected assets. The course of the
index reflects the beliefs and the visions of the market over the specific sector
or the economy in general. An asset outperforming the index bears a ‘story’;
a ‘story’ is a set of qualitative attributes, as discussed previously (p. 150). The
market believes in this ‘story’ and invests hopes and expectations.
Commonly the ‘story’ is based on business perspectives and financial
time
Credibility gap
Story!
Index
Stocks
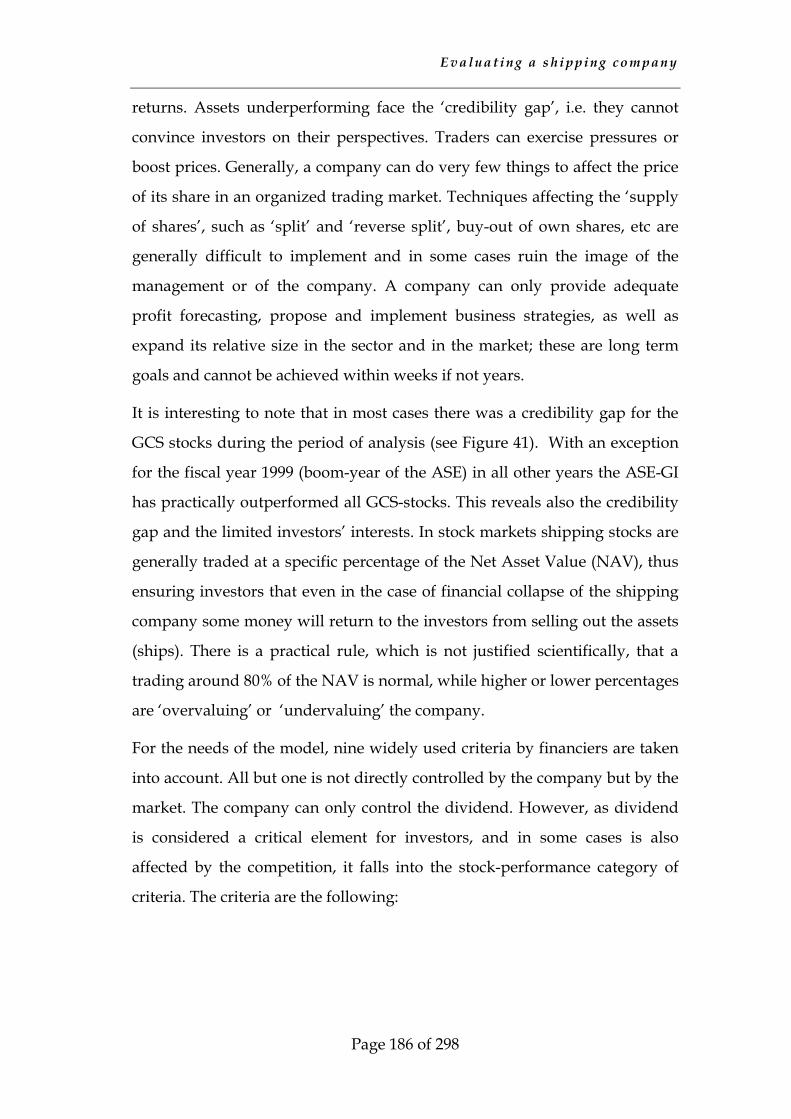
E v a l u a t i n g a s h i p p i n g c o m p a n y
Page 186 of 298
returns. Assets underperforming face the ‘credibility gap’, i.e. they cannot
convince investors on their perspectives. Traders can exercise pressures or
boost prices. Generally, a company can do very few things to affect the price
of its share in an organized trading market. Techniques affecting the ‘supply
of shares’, such as ‘split’ and ‘reverse split’, buy-out of own shares, etc are
generally difficult to implement and in some cases ruin the image of the
management or of the company. A company can only provide adequate
profit forecasting, propose and implement business strategies, as well as
expand its relative size in the sector and in the market; these are long term
goals and cannot be achieved within weeks if not years.
It is interesting to note that in most cases there was a credibility gap for the
GCS stocks during the period of analysis (see Figure 41). With an exception
for the fiscal year 1999 (boom-year of the ASE) in all other years the ASE-GI
has practically outperformed all GCS-stocks. This reveals also the credibility
gap and the limited investors’ interests. In stock markets shipping stocks are
generally traded at a specific percentage of the Net Asset Value (NAV), thus
ensuring investors that even in the case of financial collapse of the shipping
company some money will return to the investors from selling out the assets
(ships). There is a practical rule, which is not justified scientifically, that a
trading around 80% of the NAV is normal, while higher or lower percentages
are ‘overvaluing’ or ‘undervaluing’ the company.
For the needs of the model, nine widely used criteria by financiers are taken
into account. All but one is not directly controlled by the company but by the
market. The company can only control the dividend. However, as dividend
is considered a critical element for investors, and in some cases is also
affected by the competition, it falls into the stock-performance category of
criteria. The criteria are the following:
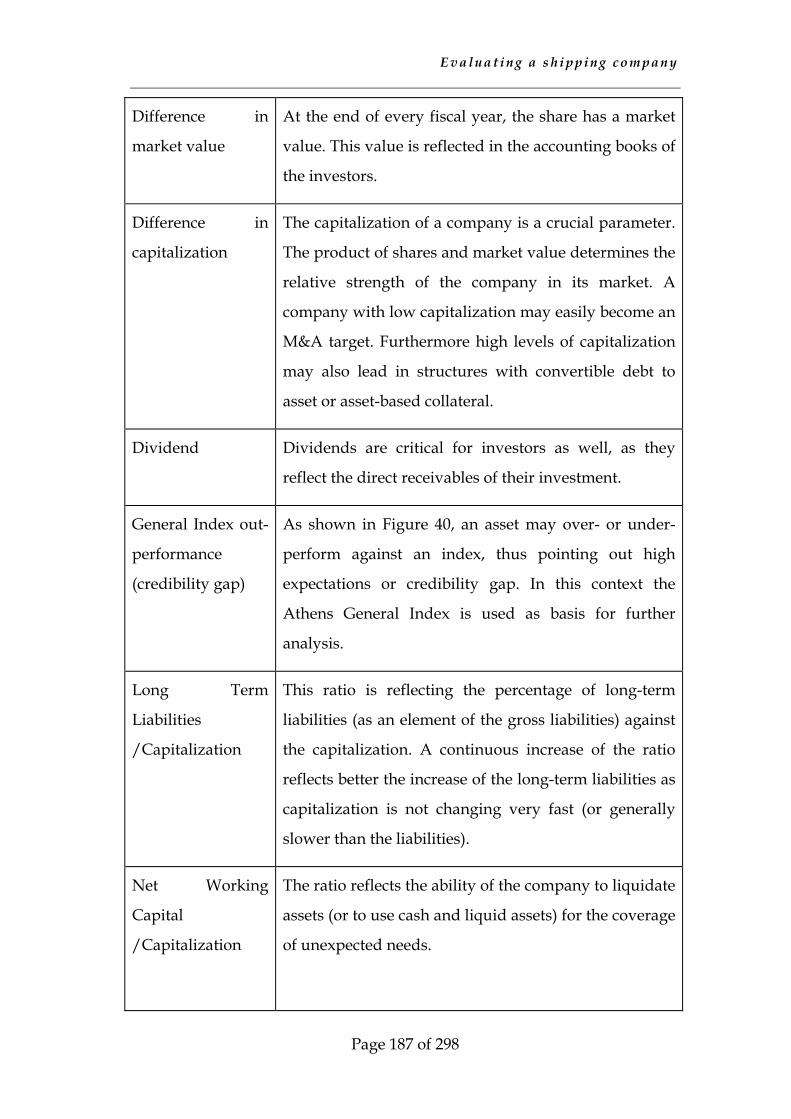
E v a l u a t i n g a s h i p p i n g c o m p a n y
Page 187 of 298
Difference in
market value
At the end of every fiscal year, the share has a market
value. This value is reflected in the accounting books of
the investors.
Difference in
capitalization
The capitalization of a company is a crucial parameter.
The product of shares and market value determines the
relative strength of the company in its market. A
company with low capitalization may easily become an
M&A target. Furthermore high levels of capitalization
may also lead in structures with convertible debt to
asset or asset-based collateral.
Dividend Dividends are critical for investors as well, as they
reflect the direct receivables of their investment.
General Index out-
performance
(credibility gap)
As shown in Figure 40, an asset may over- or under-
perform against an index, thus pointing out high
expectations or credibility gap. In this context the
Athens General Index is used as basis for further
analysis.
Long Term
Liabilities
/Capitalization
This ratio is reflecting the percentage of long-term
liabilities (as an element of the gross liabilities) against
the capitalization. A continuous increase of the ratio
reflects better the increase of the long-term liabilities as
capitalization is not changing very fast (or generally
slower than the liabilities).
Net Working
Capital
/Capitalization
The ratio reflects the ability of the company to liquidate
assets (or to use cash and liquid assets) for the coverage
of unexpected needs.
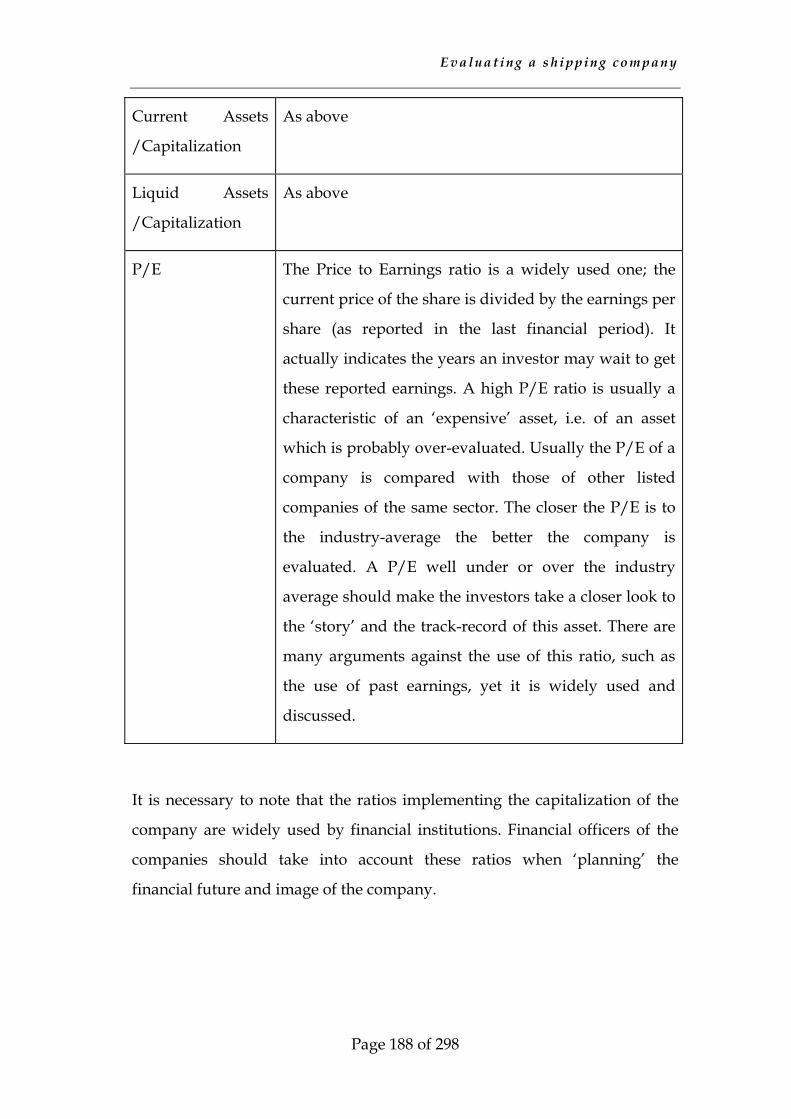
E v a l u a t i n g a s h i p p i n g c o m p a n y
Page 188 of 298
Current Assets
/Capitalization
As above
Liquid Assets
/Capitalization
As above
P/E The Price to Earnings ratio is a widely used one; the
current price of the share is divided by the earnings per
share (as reported in the last financial period). It
actually indicates the years an investor may wait to get
these reported earnings. A high P/E ratio is usually a
characteristic of an ‘expensive’ asset, i.e. of an asset
which is probably over-evaluated. Usually the P/E of a
company is compared with those of other listed
companies of the same sector. The closer the P/E is to
the industry-average the better the company is
evaluated. A P/E well under or over the industry
average should make the investors take a closer look to
the ‘story’ and the track-record of this asset. There are
many arguments against the use of this ratio, such as
the use of past earnings, yet it is widely used and
discussed.
It is necessary to note that the ratios implementing the capitalization of the
company are widely used by financial institutions. Financial officers of the
companies should take into account these ratios when ‘planning’ the
financial future and image of the company.
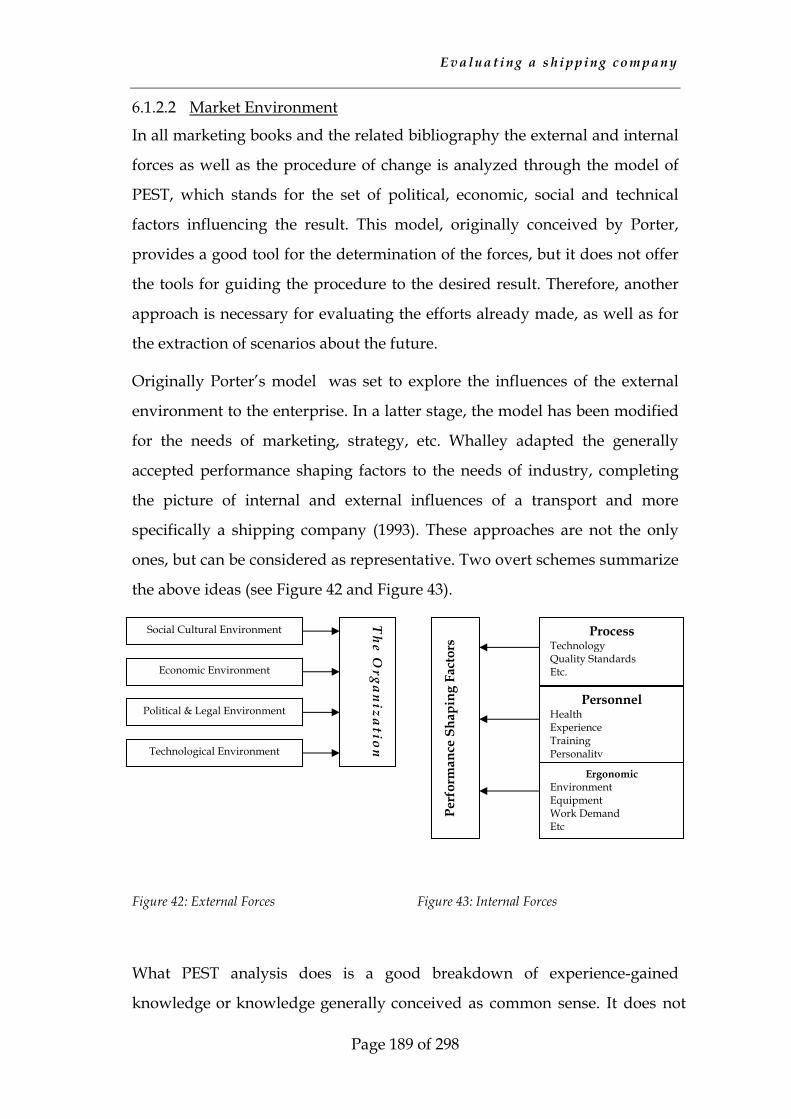
E v a l u a t i n g a s h i p p i n g c o m p a n y
Page 189 of 298
6.1.2.2 Market Environment
In all marketing books and the related bibliography the external and internal
forces as well as the procedure of change is analyzed through the model of
PEST, which stands for the set of political, economic, social and technical
factors influencing the result. This model, originally conceived by Porter,
provides a good tool for the determination of the forces, but it does not offer
the tools for guiding the procedure to the desired result. Therefore, another
approach is necessary for evaluating the efforts already made, as well as for
the extraction of scenarios about the future.
Originally Porter’s model was set to explore the influences of the external
environment to the enterprise. In a latter stage, the model has been modified
for the needs of marketing, strategy, etc. Whalley adapted the generally
accepted performance shaping factors to the needs of industry, completing
the picture of internal and external influences of a transport and more
specifically a shipping company (1993). These approaches are not the only
ones, but can be considered as representative. Two overt schemes summarize
the above ideas (see Figure 42 and Figure 43).
Figure 42: External Forces Figure 43: Internal Forces
What PEST analysis does is a good breakdown of experience-gained
knowledge or knowledge generally conceived as common sense. It does not
Economic Environment
Technological Environment
Social Cultural Environment
Political & Legal Environment
The O
rganization
Ergonomic Environment Equipment Work Demand Etc
Personnel Health Experience Training Personality
Process Technology Quality Standards Etc.
Perf
orm
ance
Sha
ping
Fac
tors
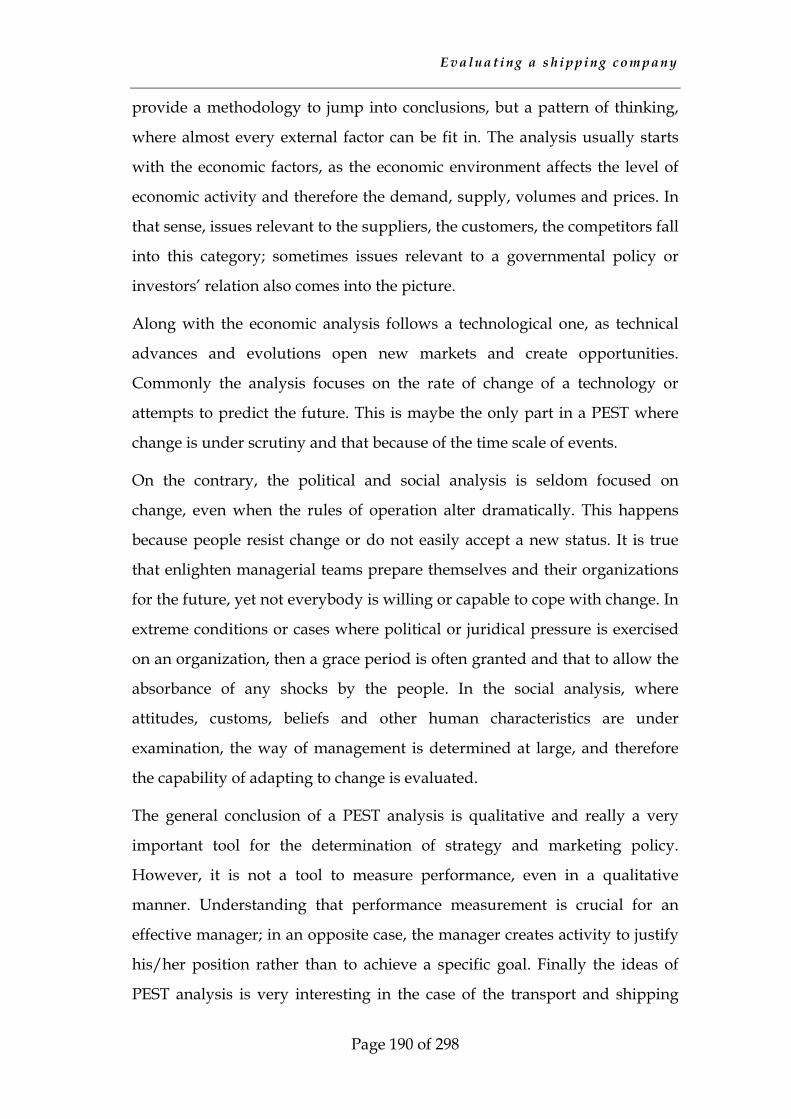
E v a l u a t i n g a s h i p p i n g c o m p a n y
Page 190 of 298
provide a methodology to jump into conclusions, but a pattern of thinking,
where almost every external factor can be fit in. The analysis usually starts
with the economic factors, as the economic environment affects the level of
economic activity and therefore the demand, supply, volumes and prices. In
that sense, issues relevant to the suppliers, the customers, the competitors fall
into this category; sometimes issues relevant to a governmental policy or
investors’ relation also comes into the picture.
Along with the economic analysis follows a technological one, as technical
advances and evolutions open new markets and create opportunities.
Commonly the analysis focuses on the rate of change of a technology or
attempts to predict the future. This is maybe the only part in a PEST where
change is under scrutiny and that because of the time scale of events.
On the contrary, the political and social analysis is seldom focused on
change, even when the rules of operation alter dramatically. This happens
because people resist change or do not easily accept a new status. It is true
that enlighten managerial teams prepare themselves and their organizations
for the future, yet not everybody is willing or capable to cope with change. In
extreme conditions or cases where political or juridical pressure is exercised
on an organization, then a grace period is often granted and that to allow the
absorbance of any shocks by the people. In the social analysis, where
attitudes, customs, beliefs and other human characteristics are under
examination, the way of management is determined at large, and therefore
the capability of adapting to change is evaluated.
The general conclusion of a PEST analysis is qualitative and really a very
important tool for the determination of strategy and marketing policy.
However, it is not a tool to measure performance, even in a qualitative
manner. Understanding that performance measurement is crucial for an
effective manager; in an opposite case, the manager creates activity to justify
his/her position rather than to achieve a specific goal. Finally the ideas of
PEST analysis is very interesting in the case of the transport and shipping
E v a l u a t i n g a s h i p p i n g c o m p a n y
Page 191 of 298
sector, especially in GCS case, as the industry is regulated by various
international and national bodies.
In this model only four criteria are taken into account. The political and
social forces are considered as similar for all companies during the period of
examination. So, they are practically out of consideration. However the
companies are dependent on suppliers, including those providing fuel and
lubricants, and other intermediates, mainly those promoting and selling the
tickets. These are two basic relations with the external environment. These
forces are considered as part of the six-market model of relationship
marketing (Stokes, 1997, pp.64-5).
From a theoretical point of view, as well as from experience, companies try to
influence their macro- and micro-environment. In the regulated context of
GCS, companies lobby towards safeguarding of their interest, but such
information and action cannot be modeled and basically be proven. The only
traceable and dynamically evolved actions are the relations with suppliers,
with intermediates, with the wider community and the adoption of new
technology. The relations with suppliers, intermediates and the community
are reflected through the relevant expenditures. A high expenditure related
with suppliers may result from increased volume of trade, depending on the
number of the vessels, as well as from policy issues. However, what really
matters is the comparison with other companies operating in the GCS
context. The expenditure attributed to the intermediaries is directly linked
with the number of tickets sold. Nevertheless, the same applies as in the case
of suppliers; the relative percentage is under scrutiny. High or low levels of
expenditures may also be linked with push and pull marketing policies. The
policy of every company is not reviewed in this study.
The commitment and the ability of the company to adopt new technologies
are exposed primarily with the implementation of new IT and organizational
practices and systems, as well as, with the operation of high-tech vessels.
From the available information, it was impossible to quantify or qualitatively
E v a l u a t i n g a s h i p p i n g c o m p a n y
Page 192 of 298
evaluate IT systems and organizational methods, although certifications are
taken into account in the managerial set of criteria. However, it is easy to
trace the new high-tech vessels in the fleet and therefore the adaptation of the
company to the new technology. Under the term high-tech vessels are
considered non-conventional designs, such as fast mono-hulls, SWATH,
catamarans, etc.
It is a debatable point that the adoption of new high-tech vessels is a sign of
maturity and better approaching of the users’ needs. The new high-tech
vessels cannot offer services as reliable and financially viable to the company
as the conventional ones. Many researchers have argued on this subject (see
European Short Sea Conferences). However, the companies are reluctant to
replace their conventional fleet with high-tech vessels. From a marketing
point of view, these new vessels shall not be conceived as vessels for trunk
and everyday all-year-round service. These are vessels for the peak time,
where users with high value of time are willing to pay more. Additionally,
there are some specific lines, say Piraeus to Crete and the Adriatic Sea
Corridor that can accommodate such vessels with financial interest for the
shareholders. Nevertheless, such a venture has firstly to be proven
technically, especially from a reliability point of view, and to overcome the
restriction of sailings due to severe weather conditions, as decided according
to the Greek Law by the Hellenic Coast Guard for the GCS pattern of
operation.
It is interesting to note that the decision of deploying new technology ships
lies with the management of the company, so it would be sounder to include
this criterion to the management-related criteria. However, this is not always
the case. In the Aegean market, and especially in the Cycladic segment, it
was proven that the deployment of new technology ships was triggered by
the competition and the market conditions. The unexpected routing of a new
technology ship in the early 1990s forced dominant companies of that era to
route such vessels. However, the permanent deployment of these vessels was
E v a l u a t i n g a s h i p p i n g c o m p a n y
Page 193 of 298
intertwined with financial aspects of the operations, specifically the cost of
fuels and the cost of agencies. Therefore, this criterion falls into the market
environment category (see also 4.3 on this issue)
Last but not least is the money a company donates to various social groups
and interests. This is a way to increase the visibility of the company and to
spread messages to the wider public. Furthermore, most of the GCS
companies have also a strong local character: ANEK and MINOAN Lines are
companies dominated by Cretes and serve historically Cretan lines, NEL
serves the Northern Aegean market with Mytilene on Lesvos Island, as
operational centre. Other non-listed companies are also linked traditionally,
financially, and operationally with other parts of the Greek coastline or
islands. Consequently, money donated to various social interests and goals is
conceived as a ‘payback’ to the local community for the support. There is a
marketing catch, linking a specific line with a destination. However, this has
also been enforced by the fragmentation of the market and the policies of the
central government in Piraeus. The percentage of money donated to various
social activities, consists a solid criterion revealing the attempt of a company
to change attributes of the local social and political environment.
Summarizing, four criteria will be used for the evaluation of the market
environment, which are:
1. the percentage of intermediaries cost over the turnover
2. the percentage of suppliers including fuel cost over the turnover
3. the percentage of new high-tech ships in the fleet
4. the percentage of donations over the turnover
6.1.2.3 Competition Data
The last subset of criteria aims to provide a better understanding over the
competition in this sector. Taking into account the listed companies, the
market shares are estimated per category of revenues (passengers, cars and
E v a l u a t i n g a s h i p p i n g c o m p a n y
Page 194 of 298
trucks) as well as on turnover basis. Furthermore, a differentiation
percentage is also estimated. This ratio highlights the dependence of the
company from a specific market (the Aegean or the Adriatic one). Another
important criterion in this field is the profit margin; although this is an
element depending heavily on decisions and financial planning of the
management, it points out the relative position of a company in its sector. A
company with a high profit margin may undergo several strategies (either
differentiation or cost leadership) or proceed to tactical movements (e.g. fleet
renewal) and keep on returning profits to its shareholders. The last criterion
is also very important as it reveals the percentage of income stemming out of
services on board and not fares. Revenues from services, such of restaurants,
bars, casinos, telecommunications, etc. are summed and divided by the total
turnover. This criterion is significant as hotel and such services may become
more important sources of income in the future.
In summary the following criteria will be used:
1. market share (turnover)
2. market share (pass-total)
3. market share (cars-total)
4. market share (trucks-total)
5. %differentiation (out/total)
6. profit margin
7. on board services/total revenue
6.1.3 Data Integrity and Limitations It is very important to note that the available data are not of the best quality
and some of them are estimated indirectly from sources available from the
companies though. However, all data are ‘certified’ as they are provided in
the official annual reports and information memoranda. This part of the
E v a l u a t i n g a s h i p p i n g c o m p a n y
Page 195 of 298
work was very time- and effort-demanding, as the information provided to
the investors is not of scientific standards but merely for promotion and
accounting reporting purposes.
The issue of the data quality is critical. The fundamental accounting data do
not present generally any setback, although there are slight inaccuracies or
corrections between several versions of the statements. However, this is not
the case with the data related to the stock-performance. One should be very
careful with these data, as various sources estimate them on different base-
years or milestones. The same applies to the data of the market-environment
category; in this category data, such as intermediaries costs (selling agencies’
costs) suppliers’ cost (stores, fuels, lubricants, etc,) are either provided by the
company or are estimated though information provided in the speeches,
forwards and analysis of the BoD to the public and the investors. These data
engulf inaccuracies as not all companies define these costs the same way. A
lot of time and effort has been devoted in order to mitigate this problem.
Data on donations and social purposes are not reported in the last reports,
and the respective elements have been excluded from further calculations.
However these data are important for the local societies and reports of
ANEK and MINOAN contained relevant information in the past.
In the model all financial data are converted in Greek Drachmae; the reason
is that it would be not accurate enough to convert Drachmae into euros for
the years with currency fluctuation. As the euro to drachmae rate is fixed it is
accurate and easy to convert statements in euros into Greek Drachmae.
The data used for the logistic services are of adequate quality although
average prices have been estimated in some cases. It is very important to note
that there is no harmonized format of data presentation over the years, as
well as between the companies. Lately, there is an effort to harmonize the
format, yet not for all data categories. For example, there are no data for the
sailings executed in the annual reports of recent years, although there were
in the reports of 1997 and 1998. Some companies have never provided this
E v a l u a t i n g a s h i p p i n g c o m p a n y
Page 196 of 298
figure. Unfortunately this figure cannot be estimated from other data.
Regarding the coverage of the Aegean, the Ionian and the Adriatic market a
straightforward approach was employed: the percentage of coverage is the
ratio of the ports of call in the respective market against the total. In the
Aegean 35 ports comprise the market, 4 (Corfu, Patras, Zakynthos, Kefalonia)
in the Ionian and 5 (Brindizi, Bari, Ancona, Trieste, Venice) in the Adriatic.
Another hard-to-collect data set is the one related to the management of the
company. The data related to certification are commonly not clearly stated in
the reports and correspondence with the companies was necessary. The
training cost per employee could not be estimated. Companies do not
provide relevant data in their recent reports. Nevertheless, it shall be
highlighted that companies, such as ANEK and MINOAN, reported the total
amount spent on personnel training, while none of the rest has ever provided
a relevant figure. Even though the cost per employee is extremely low as it is
around €65 and €17 for ANEK and MINOAN respectively. Finally it has to
be noted that the average age of the ships was not hard to estimate but it
required some specialized knowledge because some old ships have
undergone extended conversions and renewed their licenses.
The data availability and integrity revealed the limits of formalization at least
for the purposes of this study. The only truly reliable data-set is the one of
the fundamental accounting data. All the other data-sets especially those
related to traffic and the services are of questionable quality. This is a well
known problem in the GCS. In the paragraph devoted to further research
proposals (8.2.2, p. 256) there is a suggestion on the data collection and
presentation.
As the model can expand to the ‘bottom’ as much as the available data
allows, one would ask why not including more criteria and data, so to better
explain the ultimate index a company achieves. The response is that there is
very few (if none) official data to include in the model. Of course one could
use estimations for other significant data, such as executed sailings,
E v a l u a t i n g a s h i p p i n g c o m p a n y
Page 197 of 298
frequency of call (critical data for the quality of the logistics services
delivered), as well as for cost elements per ship or route. Nevertheless such
an approach would import inaccuracies and therefore increase the overall
error of the modeling.
6.1.4 Weighting the Criteria The weighting of the criteria is a very difficult and critical task as well. In the
AHP methodology one compares criteria the same way as for the attributes
of the alternatives. It is a relative comparison that practically responds to the
question ‘which criterion is more important’. Mosseau (1995) discusses the
notion of Relative Importance of Criteria (RIC) and the Elicitation Techniques
for Importance Parameters (EITP). When analyzing the RIC notion it appears
that there should be a form of regularity in the link between the preferences,
especially in techniques that incorporate a Multiple Criteria Aggregation
Procedure (MCAP), as the AHP does. Several EITP have been developed for
other MCDM methods, such as DIVAPIME for PROMETHE, but none for
AHP. In AHP it seems that a questioning procedure is followed that allows
both a descriptivist and constructivist approach. By descriptivist approach one
assumes that the decision maker has already a well-defined order of
preferences while by constructivist approach the decision-maker makes up his
mind during the process.
Both approaches have been used in this model, although it is easy (both
theoretically and practically) to alter the weights and therefore the outcome.
It was decided that for lower level criteria a descriptivist approach would be
followed while for upper levels (the ones that make the difference) scenarios
and simulation of response will be used. In this paragraph only the lower
level criteria will be discussed.
The eleven criteria of the fundamental data-set have been weighed as shown
in the table below and the justification follows:
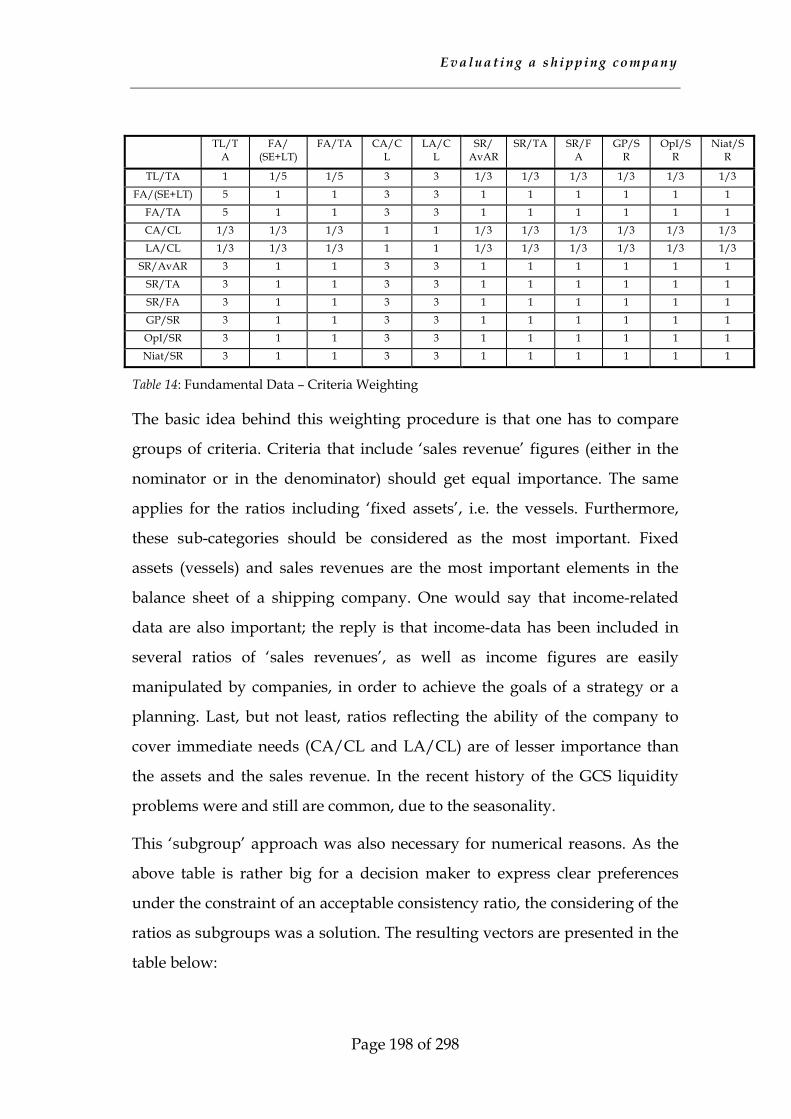
E v a l u a t i n g a s h i p p i n g c o m p a n y
Page 198 of 298
TL/TA
FA/ (SE+LT)
FA/TA CA/CL
LA/CL
SR/ AvAR
SR/TA SR/FA
GP/SR
OpI/SR
Niat/SR
TL/TA 1 1/5 1/5 3 3 1/3 1/3 1/3 1/3 1/3 1/3
FA/(SE+LT) 5 1 1 3 3 1 1 1 1 1 1
FA/TA 5 1 1 3 3 1 1 1 1 1 1
CA/CL 1/3 1/3 1/3 1 1 1/3 1/3 1/3 1/3 1/3 1/3
LA/CL 1/3 1/3 1/3 1 1 1/3 1/3 1/3 1/3 1/3 1/3
SR/AvAR 3 1 1 3 3 1 1 1 1 1 1
SR/TA 3 1 1 3 3 1 1 1 1 1 1
SR/FA 3 1 1 3 3 1 1 1 1 1 1
GP/SR 3 1 1 3 3 1 1 1 1 1 1
OpI/SR 3 1 1 3 3 1 1 1 1 1 1
Niat/SR 3 1 1 3 3 1 1 1 1 1 1
Table 14: Fundamental Data – Criteria Weighting
The basic idea behind this weighting procedure is that one has to compare
groups of criteria. Criteria that include ‘sales revenue’ figures (either in the
nominator or in the denominator) should get equal importance. The same
applies for the ratios including ‘fixed assets’, i.e. the vessels. Furthermore,
these sub-categories should be considered as the most important. Fixed
assets (vessels) and sales revenues are the most important elements in the
balance sheet of a shipping company. One would say that income-related
data are also important; the reply is that income-data has been included in
several ratios of ‘sales revenues’, as well as income figures are easily
manipulated by companies, in order to achieve the goals of a strategy or a
planning. Last, but not least, ratios reflecting the ability of the company to
cover immediate needs (CA/CL and LA/CL) are of lesser importance than
the assets and the sales revenue. In the recent history of the GCS liquidity
problems were and still are common, due to the seasonality.
This ‘subgroup’ approach was also necessary for numerical reasons. As the
above table is rather big for a decision maker to express clear preferences
under the constraint of an acceptable consistency ratio, the considering of the
ratios as subgroups was a solution. The resulting vectors are presented in the
table below:
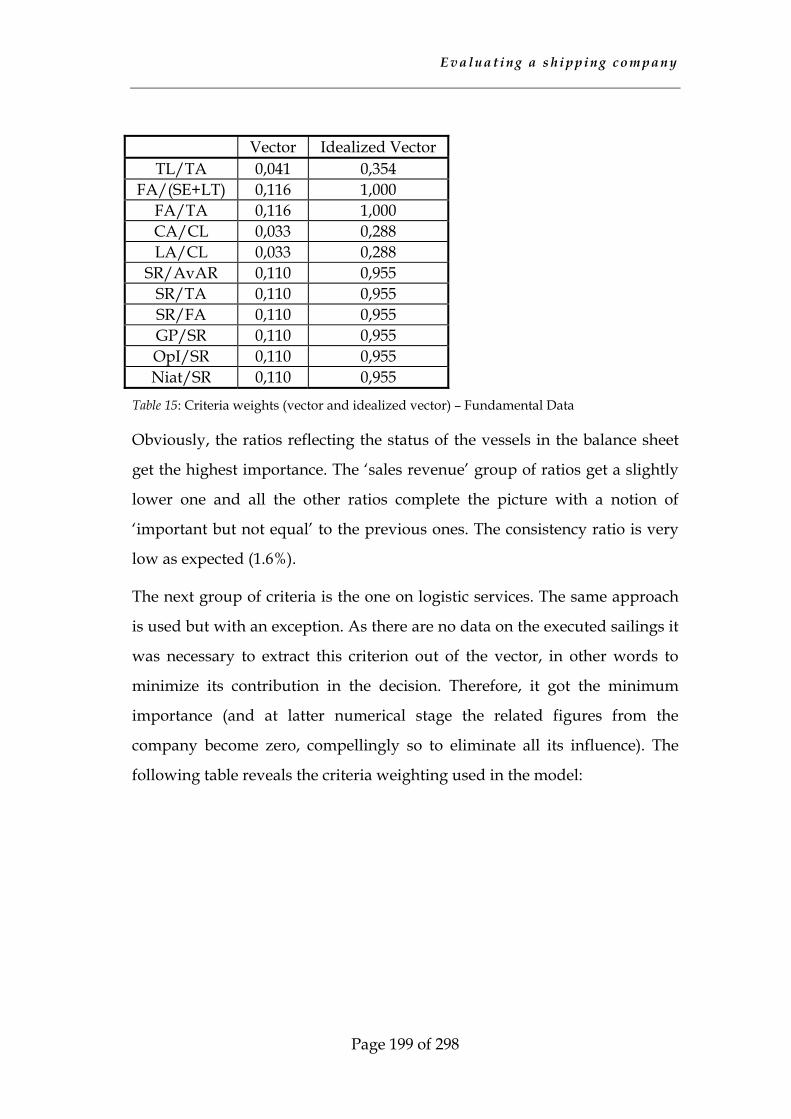
E v a l u a t i n g a s h i p p i n g c o m p a n y
Page 199 of 298
Vector Idealized Vector TL/TA 0,041 0,354
FA/(SE+LT) 0,116 1,000 FA/TA 0,116 1,000 CA/CL 0,033 0,288 LA/CL 0,033 0,288
SR/AvAR 0,110 0,955 SR/TA 0,110 0,955 SR/FA 0,110 0,955 GP/SR 0,110 0,955 OpI/SR 0,110 0,955 Niat/SR 0,110 0,955
Table 15: Criteria weights (vector and idealized vector) – Fundamental Data
Obviously, the ratios reflecting the status of the vessels in the balance sheet
get the highest importance. The ‘sales revenue’ group of ratios get a slightly
lower one and all the other ratios complete the picture with a notion of
‘important but not equal’ to the previous ones. The consistency ratio is very
low as expected (1.6%).
The next group of criteria is the one on logistic services. The same approach
is used but with an exception. As there are no data on the executed sailings it
was necessary to extract this criterion out of the vector, in other words to
minimize its contribution in the decision. Therefore, it got the minimum
importance (and at latter numerical stage the related figures from the
company become zero, compellingly so to eliminate all its influence). The
following table reveals the criteria weighting used in the model:
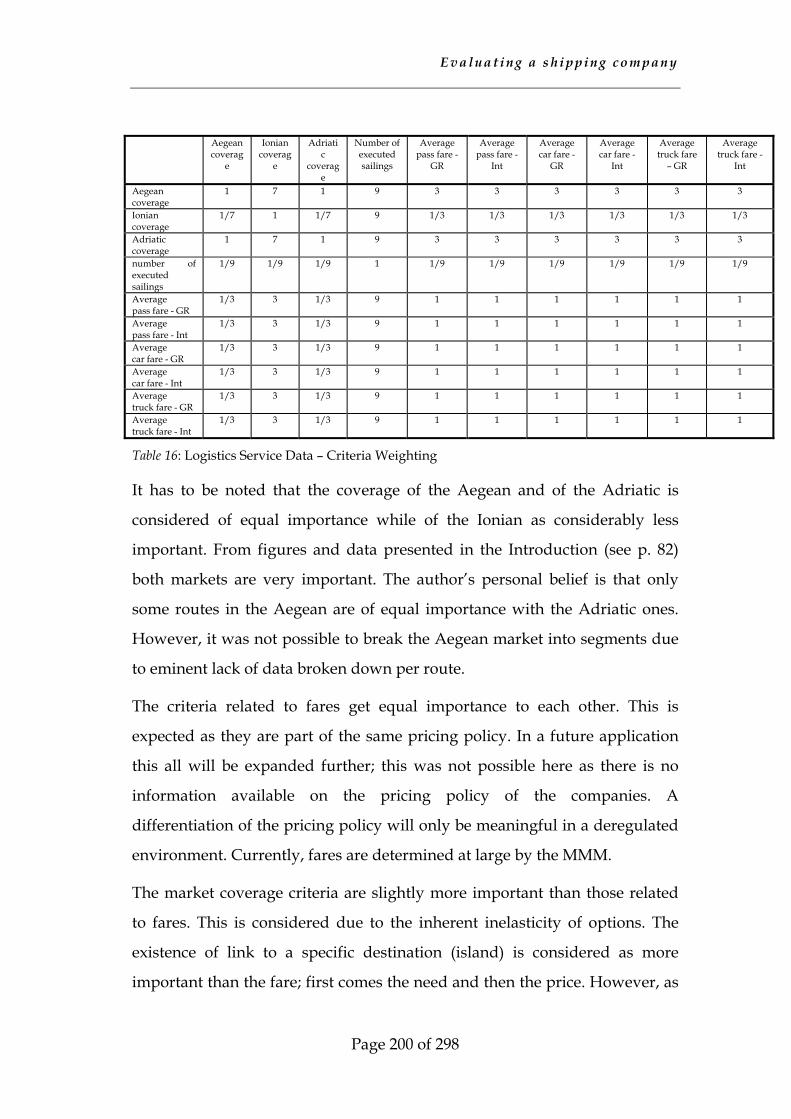
E v a l u a t i n g a s h i p p i n g c o m p a n y
Page 200 of 298
Aegean coverag
e
Ionian coverag
e
Adriatic
coverage
Number of executed sailings
Average pass fare -
GR
Average pass fare -
Int
Average car fare -
GR
Average car fare -
Int
Average truck fare
– GR
Average truck fare -
Int
Aegean coverage
1 7 1 9 3 3 3 3 3 3
Ionian coverage
1/7 1 1/7 9 1/3 1/3 1/3 1/3 1/3 1/3
Adriatic coverage
1 7 1 9 3 3 3 3 3 3
number of executed sailings
1/9 1/9 1/9 1 1/9 1/9 1/9 1/9 1/9 1/9
Average pass fare - GR
1/3 3 1/3 9 1 1 1 1 1 1
Average pass fare - Int
1/3 3 1/3 9 1 1 1 1 1 1
Average car fare - GR
1/3 3 1/3 9 1 1 1 1 1 1
Average car fare - Int
1/3 3 1/3 9 1 1 1 1 1 1
Average truck fare - GR
1/3 3 1/3 9 1 1 1 1 1 1
Average truck fare - Int
1/3 3 1/3 9 1 1 1 1 1 1
Table 16: Logistics Service Data – Criteria Weighting
It has to be noted that the coverage of the Aegean and of the Adriatic is
considered of equal importance while of the Ionian as considerably less
important. From figures and data presented in the Introduction (see p. 82)
both markets are very important. The author’s personal belief is that only
some routes in the Aegean are of equal importance with the Adriatic ones.
However, it was not possible to break the Aegean market into segments due
to eminent lack of data broken down per route.
The criteria related to fares get equal importance to each other. This is
expected as they are part of the same pricing policy. In a future application
this all will be expanded further; this was not possible here as there is no
information available on the pricing policy of the companies. A
differentiation of the pricing policy will only be meaningful in a deregulated
environment. Currently, fares are determined at large by the MMM.
The market coverage criteria are slightly more important than those related
to fares. This is considered due to the inherent inelasticity of options. The
existence of link to a specific destination (island) is considered as more
important than the fare; first comes the need and then the price. However, as
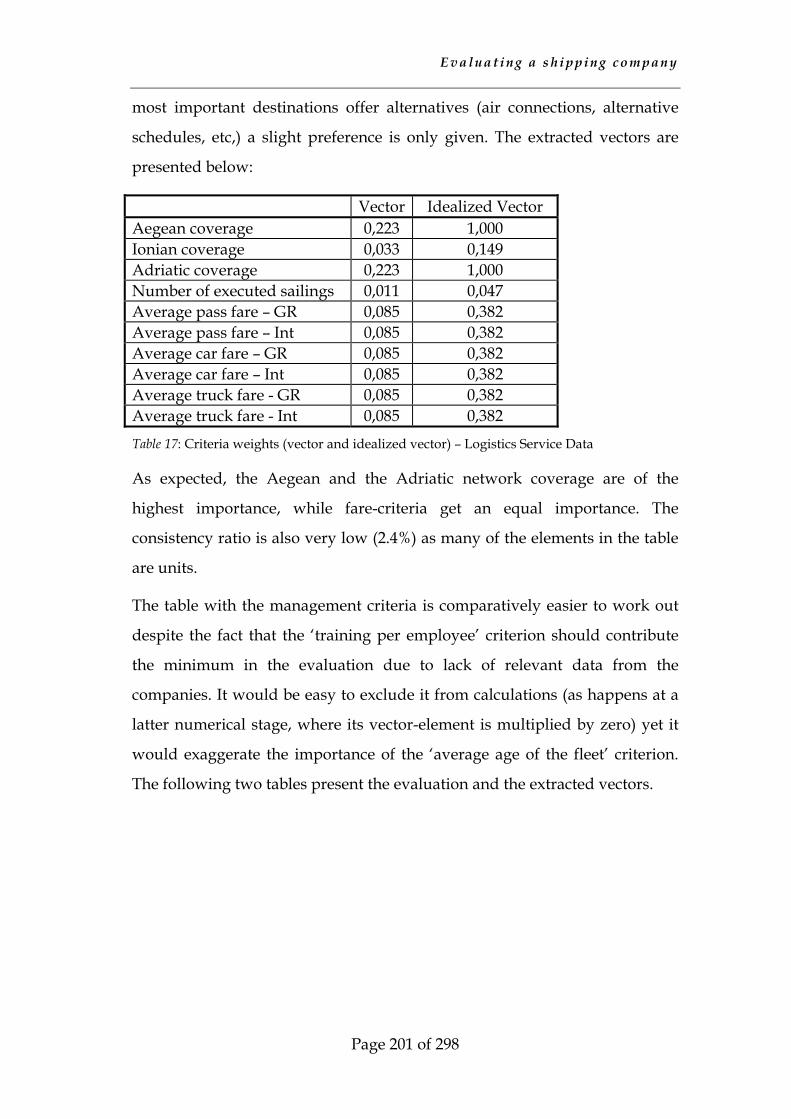
E v a l u a t i n g a s h i p p i n g c o m p a n y
Page 201 of 298
most important destinations offer alternatives (air connections, alternative
schedules, etc,) a slight preference is only given. The extracted vectors are
presented below:
Vector Idealized Vector Aegean coverage 0,223 1,000 Ionian coverage 0,033 0,149 Adriatic coverage 0,223 1,000 Number of executed sailings 0,011 0,047 Average pass fare – GR 0,085 0,382 Average pass fare – Int 0,085 0,382 Average car fare – GR 0,085 0,382 Average car fare – Int 0,085 0,382 Average truck fare - GR 0,085 0,382 Average truck fare - Int 0,085 0,382
Table 17: Criteria weights (vector and idealized vector) – Logistics Service Data
As expected, the Aegean and the Adriatic network coverage are of the
highest importance, while fare-criteria get an equal importance. The
consistency ratio is also very low (2.4%) as many of the elements in the table
are units.
The table with the management criteria is comparatively easier to work out
despite the fact that the ‘training per employee’ criterion should contribute
the minimum in the evaluation due to lack of relevant data from the
companies. It would be easy to exclude it from calculations (as happens at a
latter numerical stage, where its vector-element is multiplied by zero) yet it
would exaggerate the importance of the ‘average age of the fleet’ criterion.
The following two tables present the evaluation and the extracted vectors.
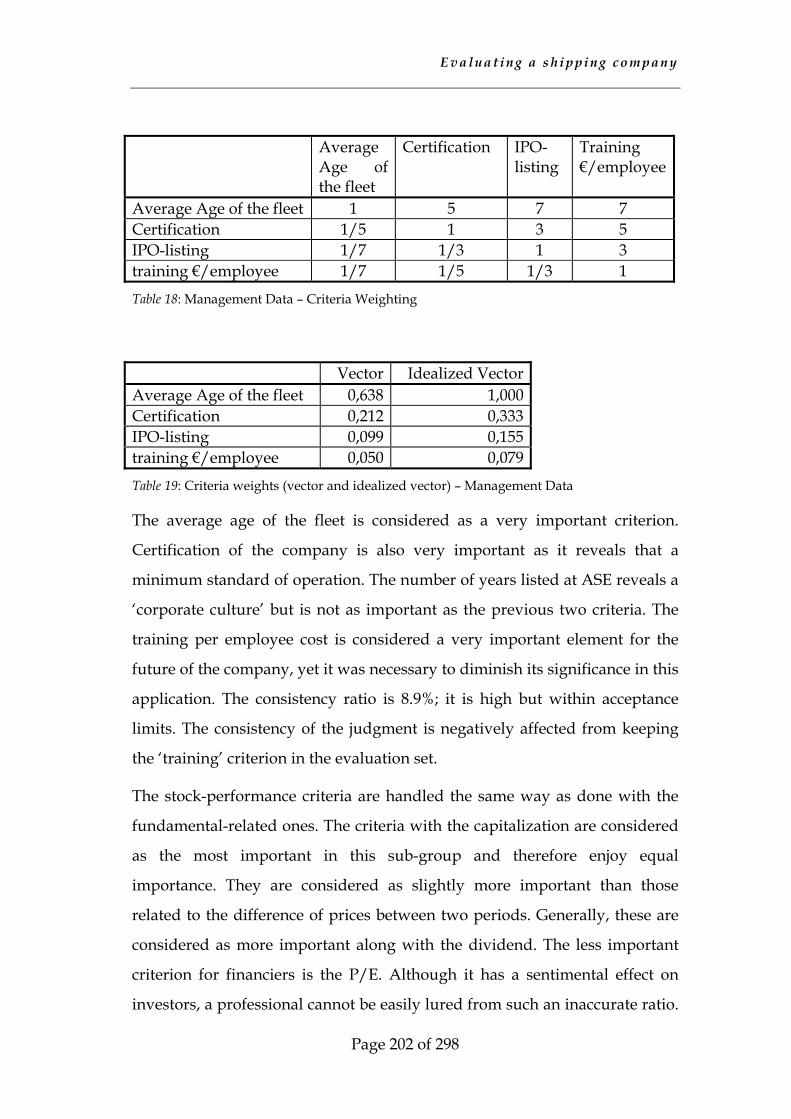
E v a l u a t i n g a s h i p p i n g c o m p a n y
Page 202 of 298
Average Age of the fleet
Certification IPO-listing
Training €/employee
Average Age of the fleet 1 5 7 7 Certification 1/5 1 3 5 IPO-listing 1/7 1/3 1 3 training €/employee 1/7 1/5 1/3 1
Table 18: Management Data – Criteria Weighting
Vector Idealized Vector Average Age of the fleet 0,638 1,000 Certification 0,212 0,333 IPO-listing 0,099 0,155 training €/employee 0,050 0,079
Table 19: Criteria weights (vector and idealized vector) – Management Data
The average age of the fleet is considered as a very important criterion.
Certification of the company is also very important as it reveals that a
minimum standard of operation. The number of years listed at ASE reveals a
‘corporate culture’ but is not as important as the previous two criteria. The
training per employee cost is considered a very important element for the
future of the company, yet it was necessary to diminish its significance in this
application. The consistency ratio is 8.9%; it is high but within acceptance
limits. The consistency of the judgment is negatively affected from keeping
the ‘training’ criterion in the evaluation set.
The stock-performance criteria are handled the same way as done with the
fundamental-related ones. The criteria with the capitalization are considered
as the most important in this sub-group and therefore enjoy equal
importance. They are considered as slightly more important than those
related to the difference of prices between two periods. Generally, these are
considered as more important along with the dividend. The less important
criterion for financiers is the P/E. Although it has a sentimental effect on
investors, a professional cannot be easily lured from such an inaccurate ratio.
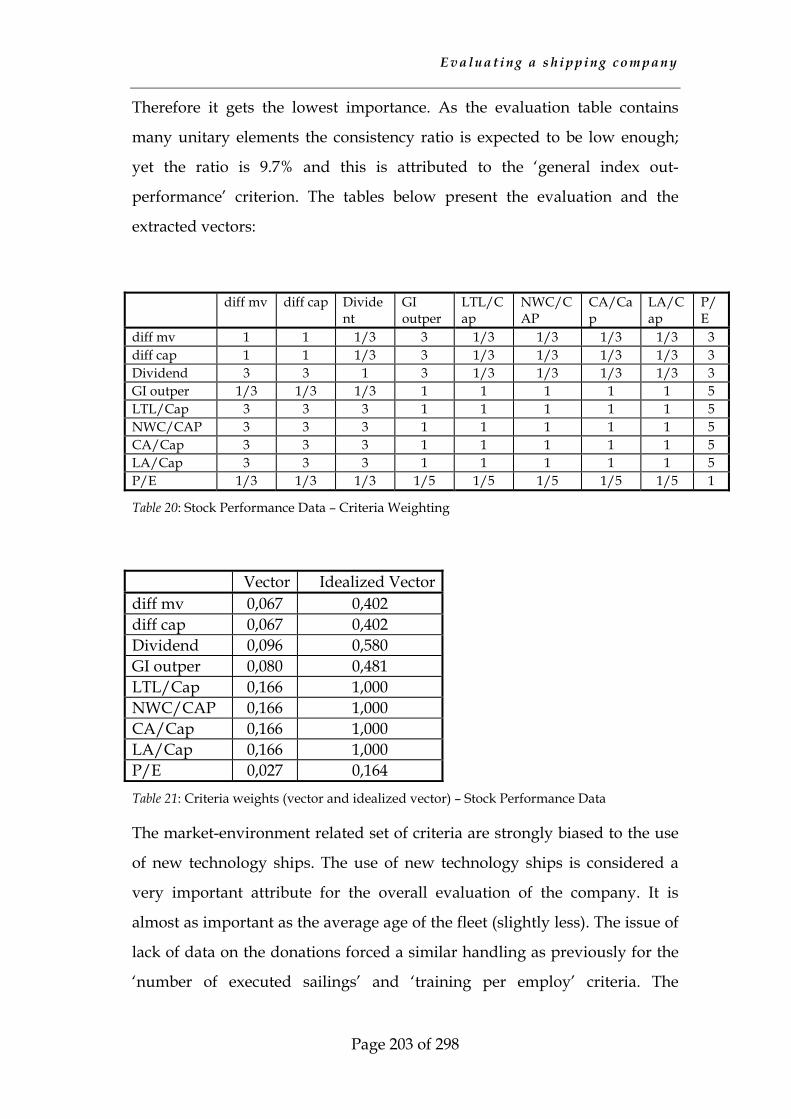
E v a l u a t i n g a s h i p p i n g c o m p a n y
Page 203 of 298
Therefore it gets the lowest importance. As the evaluation table contains
many unitary elements the consistency ratio is expected to be low enough;
yet the ratio is 9.7% and this is attributed to the ‘general index out-
performance’ criterion. The tables below present the evaluation and the
extracted vectors:
diff mv diff cap Divident
GI outper
LTL/Cap
NWC/CAP
CA/Cap
LA/Cap
P/E
diff mv 1 1 1/3 3 1/3 1/3 1/3 1/3 3 diff cap 1 1 1/3 3 1/3 1/3 1/3 1/3 3 Dividend 3 3 1 3 1/3 1/3 1/3 1/3 3 GI outper 1/3 1/3 1/3 1 1 1 1 1 5 LTL/Cap 3 3 3 1 1 1 1 1 5 NWC/CAP 3 3 3 1 1 1 1 1 5 CA/Cap 3 3 3 1 1 1 1 1 5 LA/Cap 3 3 3 1 1 1 1 1 5 P/E 1/3 1/3 1/3 1/5 1/5 1/5 1/5 1/5 1
Table 20: Stock Performance Data – Criteria Weighting
Vector Idealized Vector diff mv 0,067 0,402 diff cap 0,067 0,402 Dividend 0,096 0,580 GI outper 0,080 0,481 LTL/Cap 0,166 1,000 NWC/CAP 0,166 1,000 CA/Cap 0,166 1,000 LA/Cap 0,166 1,000 P/E 0,027 0,164
Table 21: Criteria weights (vector and idealized vector) – Stock Performance Data
The market-environment related set of criteria are strongly biased to the use
of new technology ships. The use of new technology ships is considered a
very important attribute for the overall evaluation of the company. It is
almost as important as the average age of the fleet (slightly less). The issue of
lack of data on the donations forced a similar handling as previously for the
‘number of executed sailings’ and ‘training per employ’ criteria. The
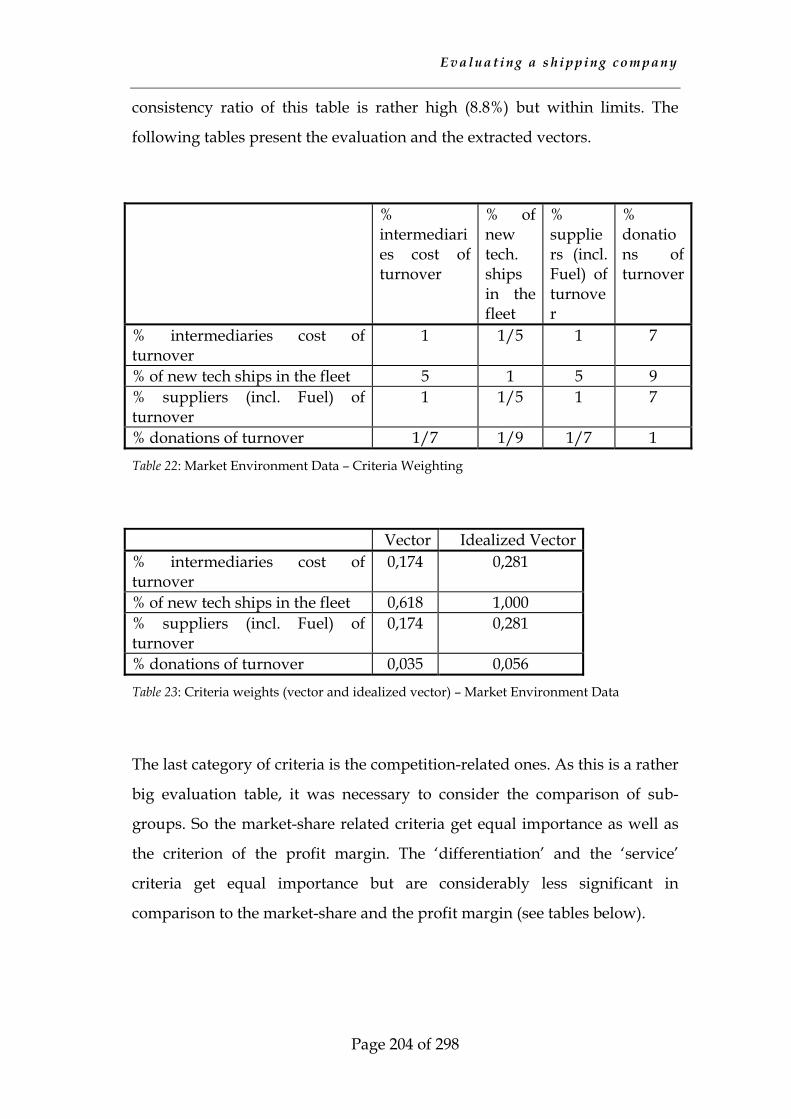
E v a l u a t i n g a s h i p p i n g c o m p a n y
Page 204 of 298
consistency ratio of this table is rather high (8.8%) but within limits. The
following tables present the evaluation and the extracted vectors.
% intermediaries cost of turnover
% of new tech. ships in the fleet
% suppliers (incl. Fuel) of turnover
% donations of turnover
% intermediaries cost of turnover
1 1/5 1 7
% of new tech ships in the fleet 5 1 5 9 % suppliers (incl. Fuel) of turnover
1 1/5 1 7
% donations of turnover 1/7 1/9 1/7 1
Table 22: Market Environment Data – Criteria Weighting
Vector Idealized Vector % intermediaries cost of turnover
0,174 0,281
% of new tech ships in the fleet 0,618 1,000 % suppliers (incl. Fuel) of turnover
0,174 0,281
% donations of turnover 0,035 0,056
Table 23: Criteria weights (vector and idealized vector) – Market Environment Data
The last category of criteria is the competition-related ones. As this is a rather
big evaluation table, it was necessary to consider the comparison of sub-
groups. So the market-share related criteria get equal importance as well as
the criterion of the profit margin. The ‘differentiation’ and the ‘service’
criteria get equal importance but are considerably less significant in
comparison to the market-share and the profit margin (see tables below).
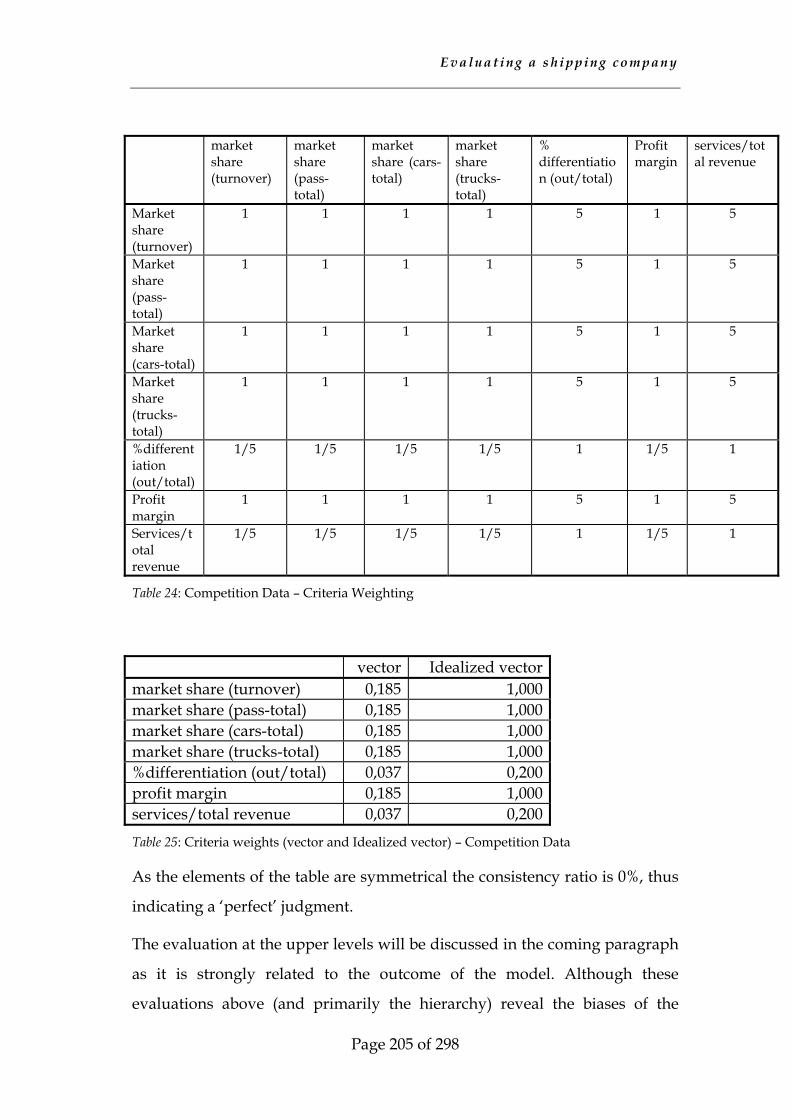
E v a l u a t i n g a s h i p p i n g c o m p a n y
Page 205 of 298
market share (turnover)
market share (pass-total)
market share (cars-total)
market share (trucks-total)
% differentiation (out/total)
Profit margin
services/total revenue
Market share (turnover)
1 1 1 1 5 1 5
Market share (pass-total)
1 1 1 1 5 1 5
Market share (cars-total)
1 1 1 1 5 1 5
Market share (trucks-total)
1 1 1 1 5 1 5
%differentiation (out/total)
1/5 1/5 1/5 1/5 1 1/5 1
Profit margin
1 1 1 1 5 1 5
Services/total revenue
1/5 1/5 1/5 1/5 1 1/5 1
Table 24: Competition Data – Criteria Weighting
vector Idealized vector market share (turnover) 0,185 1,000 market share (pass-total) 0,185 1,000 market share (cars-total) 0,185 1,000 market share (trucks-total) 0,185 1,000 %differentiation (out/total) 0,037 0,200 profit margin 0,185 1,000 services/total revenue 0,037 0,200
Table 25: Criteria weights (vector and Idealized vector) – Competition Data
As the elements of the table are symmetrical the consistency ratio is 0%, thus
indicating a ‘perfect’ judgment.
The evaluation at the upper levels will be discussed in the coming paragraph
as it is strongly related to the outcome of the model. Although these
evaluations above (and primarily the hierarchy) reveal the biases of the
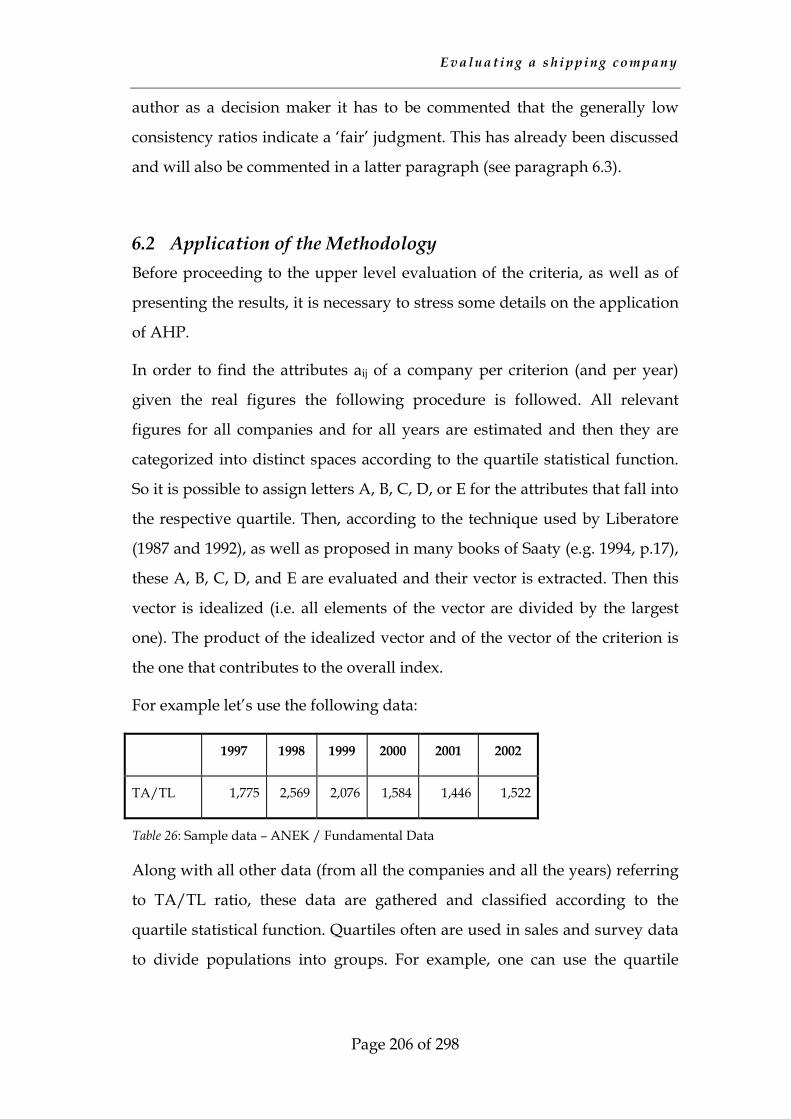
E v a l u a t i n g a s h i p p i n g c o m p a n y
Page 206 of 298
author as a decision maker it has to be commented that the generally low
consistency ratios indicate a ‘fair’ judgment. This has already been discussed
and will also be commented in a latter paragraph (see paragraph 6.3).
6.2 Application of the Methodology Before proceeding to the upper level evaluation of the criteria, as well as of
presenting the results, it is necessary to stress some details on the application
of AHP.
In order to find the attributes aij of a company per criterion (and per year)
given the real figures the following procedure is followed. All relevant
figures for all companies and for all years are estimated and then they are
categorized into distinct spaces according to the quartile statistical function.
So it is possible to assign letters A, B, C, D, or E for the attributes that fall into
the respective quartile. Then, according to the technique used by Liberatore
(1987 and 1992), as well as proposed in many books of Saaty (e.g. 1994, p.17),
these A, B, C, D, and E are evaluated and their vector is extracted. Then this
vector is idealized (i.e. all elements of the vector are divided by the largest
one). The product of the idealized vector and of the vector of the criterion is
the one that contributes to the overall index.
For example let’s use the following data:
1997 1998 1999 2000 2001 2002
TA/TL 1,775 2,569 2,076 1,584 1,446 1,522
Table 26: Sample data – ANEK / Fundamental Data
Along with all other data (from all the companies and all the years) referring
to TA/TL ratio, these data are gathered and classified according to the
quartile statistical function. Quartiles often are used in sales and survey data
to divide populations into groups. For example, one can use the quartile
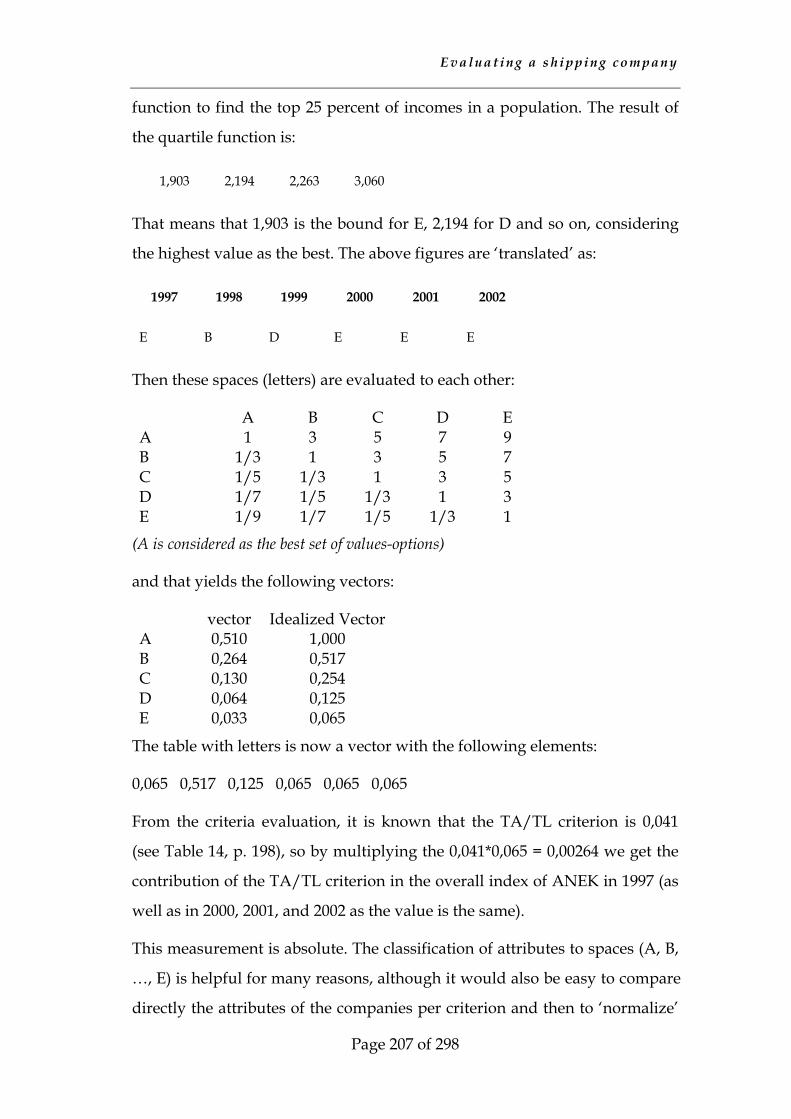
E v a l u a t i n g a s h i p p i n g c o m p a n y
Page 207 of 298
function to find the top 25 percent of incomes in a population. The result of
the quartile function is:
1,903 2,194 2,263 3,060
That means that 1,903 is the bound for E, 2,194 for D and so on, considering
the highest value as the best. The above figures are ‘translated’ as:
1997 1998 1999 2000 2001 2002
E B D E E E
Then these spaces (letters) are evaluated to each other:
A B C D E A 1 3 5 7 9 B 1/3 1 3 5 7 C 1/5 1/3 1 3 5 D 1/7 1/5 1/3 1 3 E 1/9 1/7 1/5 1/3 1
(A is considered as the best set of values-options)
and that yields the following vectors:
vector Idealized Vector A 0,510 1,000 B 0,264 0,517 C 0,130 0,254 D 0,064 0,125 E 0,033 0,065
The table with letters is now a vector with the following elements:
0,065 0,517 0,125 0,065 0,065 0,065
From the criteria evaluation, it is known that the TA/TL criterion is 0,041
(see Table 14, p. 198), so by multiplying the 0,041*0,065 = 0,00264 we get the
contribution of the TA/TL criterion in the overall index of ANEK in 1997 (as
well as in 2000, 2001, and 2002 as the value is the same).
This measurement is absolute. The classification of attributes to spaces (A, B,
…, E) is helpful for many reasons, although it would also be easy to compare
directly the attributes of the companies per criterion and then to ‘normalize’

E v a l u a t i n g a s h i p p i n g c o m p a n y
Page 208 of 298
them by using the fundamental scale (see 9.2.1 and 9.2.2). Saaty considers
this an approach that exploits accumulated experience (1997, p. 18).
The assignment of letters for a given set of data (per criterion) enables the
decision-maker to have a clear picture of the values and the averages in the
sector (i.e. of all companies under analysis). Extreme values that occurred,
because of many uncontrolled reasons, are only assigned a letter A or E and
can therefore be evaluated with the rest. Furthermore the use of absolute
measurements leads to a better understanding of the evaluation problem. It
is like having a button with five options; extremes and inaccuracies are
allayed in that sense. Last, but not least, is that by using the absolute
measurements in such a large model, it is possible to keep the overall
consistency as low as possible. The table above has a consistency ratio of
5.29%, which is acceptable and well below the limit of 10%. In the relative
measurement approach we could never be sure of the consistency as the
numerical burden would be considerably higher.
So the elements aij of every alternative (and per year) are the elements of the
idealized vectors. It is reminded that the index will be derived as the sum of
the product wj aij , where wj the criteria weights. Up to this point, the weights
of the Level III have been estimated. The focus now shifts to the estimation of
Level II and Level I (index), so the wj vector will be estimated.
The first approach is descriptivist as some evaluations reflecting the biases
and the beliefs of the decision maker will be presented and analyzed through
a sensitivity analysis. Then for the same values of the first approach (lower
levels) a simulation procedure will yield the possible response of a group of
decision makers.
6.2.1 Scenario-Based Outcome As the criteria weights have been set for the lower levels III and IV, the
decision-maker has to decide on the level II and level III criteria. At these
levels, decisions are critical and reveal biases as well as ‘stimuli’ towards the

E v a l u a t i n g a s h i p p i n g c o m p a n y
Page 209 of 298
final outcome. More specifically, the decision-maker has to make the
following comparisons:
1. Internal (INT) vs External (EXT)
2. Fundamentals (F) vs Logistics Services (LS)
3. Fundamentals vs Management Related Criteria (M)
4. Logistics Services vs Management Related Data
5. Stock Performance (SP) vs Market Environment (ME)
6. Stock Performance vs Competition (C)
7. Market Environment vs Competition
The above seven comparisons are the ones missing in the two decision tables
of level II and the one of level I. It is obvious that any judgment would be
very subjective; commonly groups of decision makers focus on the criteria
they understand better. Most probably an accountant would consider
fundamentals as the most important set. A customer (client of the system)
would consider the LS set as the most important.
The discussion over internal and external factors would have to take into
account psychological perspectives; it is not only an issue of utilities but also
of many other factors.
In order to come to a conclusion and to expose the capabilities of the model
the following scenarios (values) will be discussed:
1 INT / EXT ∈ [1/5, 1/3, 1, 3, 5]
2 F / LS ∈ [3, 5]
3 F / M ∈ [3, 5]
4 SP / ME ∈ [3, 5]
5 SP / C ∈ [3, 5]
E v a l u a t i n g a s h i p p i n g c o m p a n y
Page 210 of 298
The values considered (3 and 5) aim to highlight pure and clear preferences
as well as to avoid extreme values, such as 1, 7 and 9. Obviously there is a
bias towards financial criteria, as the fundamental accounting data (F) and
the stock performance (SP) is considered as more important than the level of
the service offered (LS), of the management (M), of the competition (C) and
of the market environment (ME).
The results are presented in the respective annex (see p. 290). However some
highlights are presented below. It has to be mentioned that no extreme
values have been taken into account. Furthermore, in order to keep the
inconsistency ratio as low as possible and to minimize the possible
combinations of judgments, the values LS/M and ME/C are calculated as:
LSM =
LSF
FM
MEC =
MESP
SPC
in accordance to the consistency relation aij = aikakj (see p. 101). For all n×n
matrices this formula is valid, the consistency ratio is zero. A violation of this
relation will be reflected in the consistency ratio.
By taking a closer look at the results one may get some very interesting
conclusions. Considering the biased case with the following values:
1. INT/EXT = 3
2. F/LS = F/M = 5
3. SP/ME = 3
4. SP/C = 1/3
the yielded result is presented in the coming tables (Table 27 -Table 30) and
the justification of this judgment is as follows:
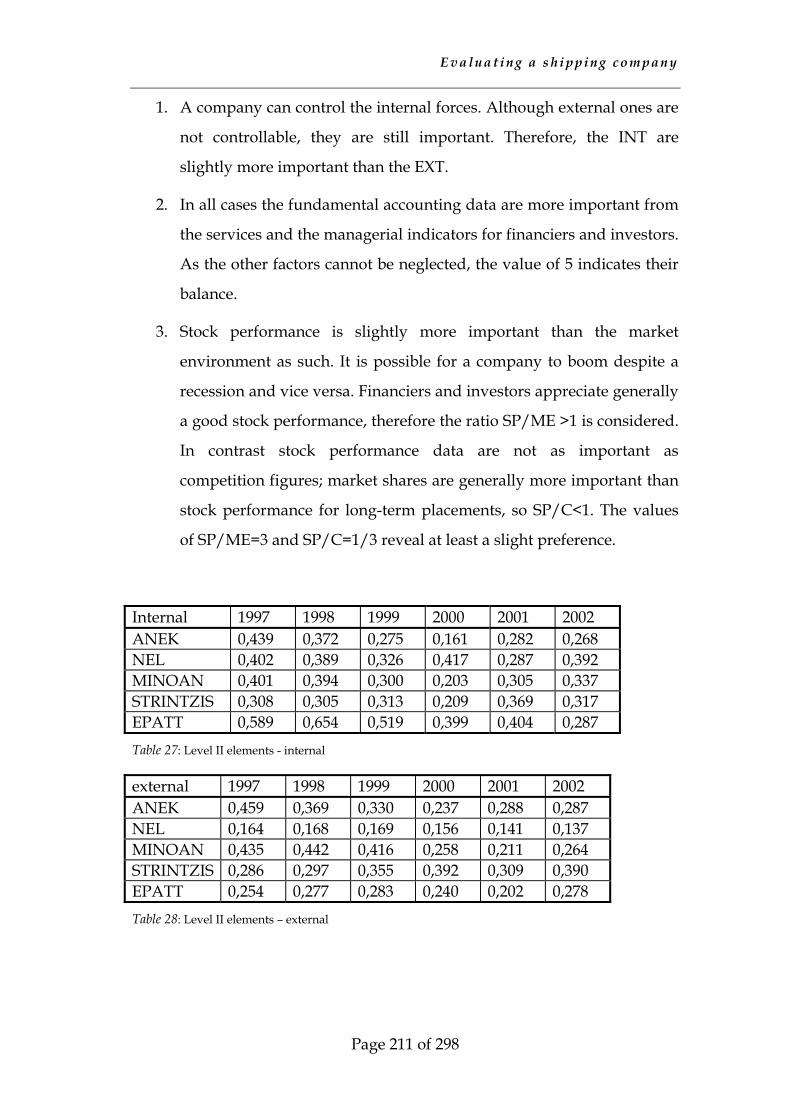
E v a l u a t i n g a s h i p p i n g c o m p a n y
Page 211 of 298
1. A company can control the internal forces. Although external ones are
not controllable, they are still important. Therefore, the INT are
slightly more important than the EXT.
2. In all cases the fundamental accounting data are more important from
the services and the managerial indicators for financiers and investors.
As the other factors cannot be neglected, the value of 5 indicates their
balance.
3. Stock performance is slightly more important than the market
environment as such. It is possible for a company to boom despite a
recession and vice versa. Financiers and investors appreciate generally
a good stock performance, therefore the ratio SP/ME >1 is considered.
In contrast stock performance data are not as important as
competition figures; market shares are generally more important than
stock performance for long-term placements, so SP/C<1. The values
of SP/ME=3 and SP/C=1/3 reveal at least a slight preference.
Internal 1997 1998 1999 2000 2001 2002 ANEK 0,439 0,372 0,275 0,161 0,282 0,268 NEL 0,402 0,389 0,326 0,417 0,287 0,392 MINOAN 0,401 0,394 0,300 0,203 0,305 0,337 STRINTZIS 0,308 0,305 0,313 0,209 0,369 0,317 EPATT 0,589 0,654 0,519 0,399 0,404 0,287 Table 27: Level II elements - internal
external 1997 1998 1999 2000 2001 2002 ANEK 0,459 0,369 0,330 0,237 0,288 0,287 NEL 0,164 0,168 0,169 0,156 0,141 0,137 MINOAN 0,435 0,442 0,416 0,258 0,211 0,264 STRINTZIS 0,286 0,297 0,355 0,392 0,309 0,390 EPATT 0,254 0,277 0,283 0,240 0,202 0,278 Table 28: Level II elements – external
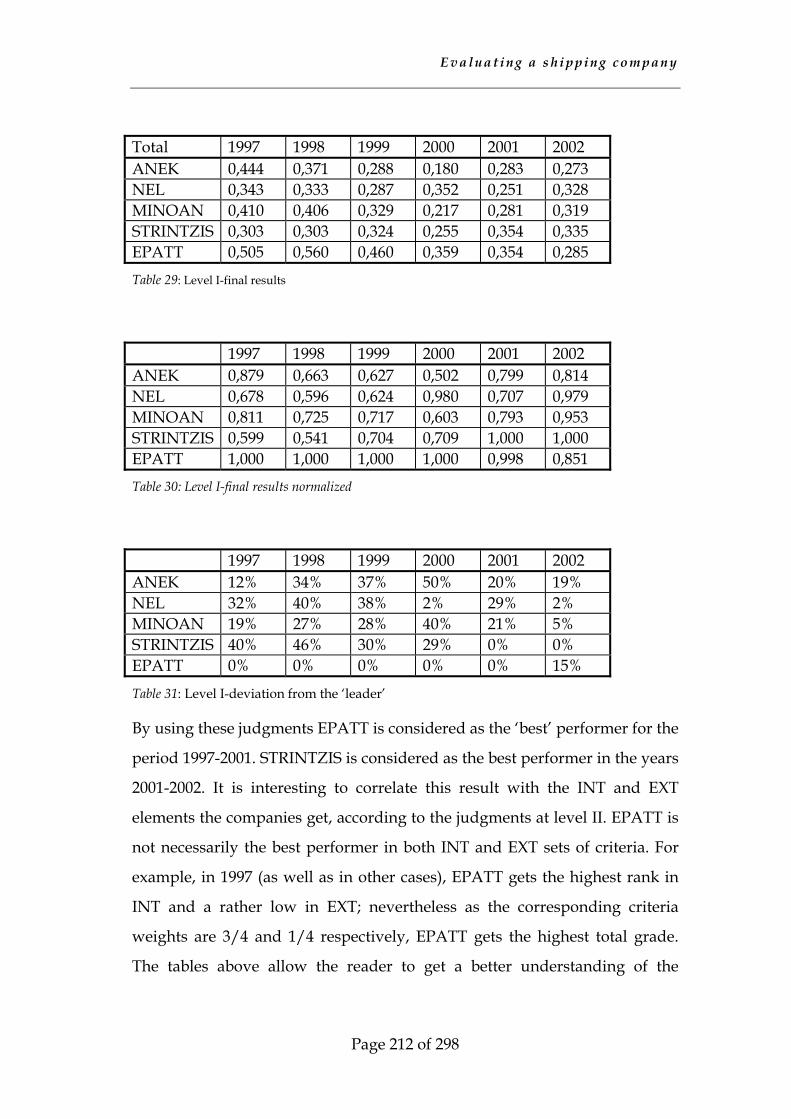
E v a l u a t i n g a s h i p p i n g c o m p a n y
Page 212 of 298
Total 1997 1998 1999 2000 2001 2002 ANEK 0,444 0,371 0,288 0,180 0,283 0,273 NEL 0,343 0,333 0,287 0,352 0,251 0,328 MINOAN 0,410 0,406 0,329 0,217 0,281 0,319 STRINTZIS 0,303 0,303 0,324 0,255 0,354 0,335 EPATT 0,505 0,560 0,460 0,359 0,354 0,285 Table 29: Level I-final results
1997 1998 1999 2000 2001 2002 ANEK 0,879 0,663 0,627 0,502 0,799 0,814 NEL 0,678 0,596 0,624 0,980 0,707 0,979 MINOAN 0,811 0,725 0,717 0,603 0,793 0,953 STRINTZIS 0,599 0,541 0,704 0,709 1,000 1,000 EPATT 1,000 1,000 1,000 1,000 0,998 0,851 Table 30: Level I-final results normalized
1997 1998 1999 2000 2001 2002 ANEK 12% 34% 37% 50% 20% 19% NEL 32% 40% 38% 2% 29% 2% MINOAN 19% 27% 28% 40% 21% 5% STRINTZIS 40% 46% 30% 29% 0% 0% EPATT 0% 0% 0% 0% 0% 15%
Table 31: Level I-deviation from the ‘leader’
By using these judgments EPATT is considered as the ‘best’ performer for the
period 1997-2001. STRINTZIS is considered as the best performer in the years
2001-2002. It is interesting to correlate this result with the INT and EXT
elements the companies get, according to the judgments at level II. EPATT is
not necessarily the best performer in both INT and EXT sets of criteria. For
example, in 1997 (as well as in other cases), EPATT gets the highest rank in
INT and a rather low in EXT; nevertheless as the corresponding criteria
weights are 3/4 and 1/4 respectively, EPATT gets the highest total grade.
The tables above allow the reader to get a better understanding of the
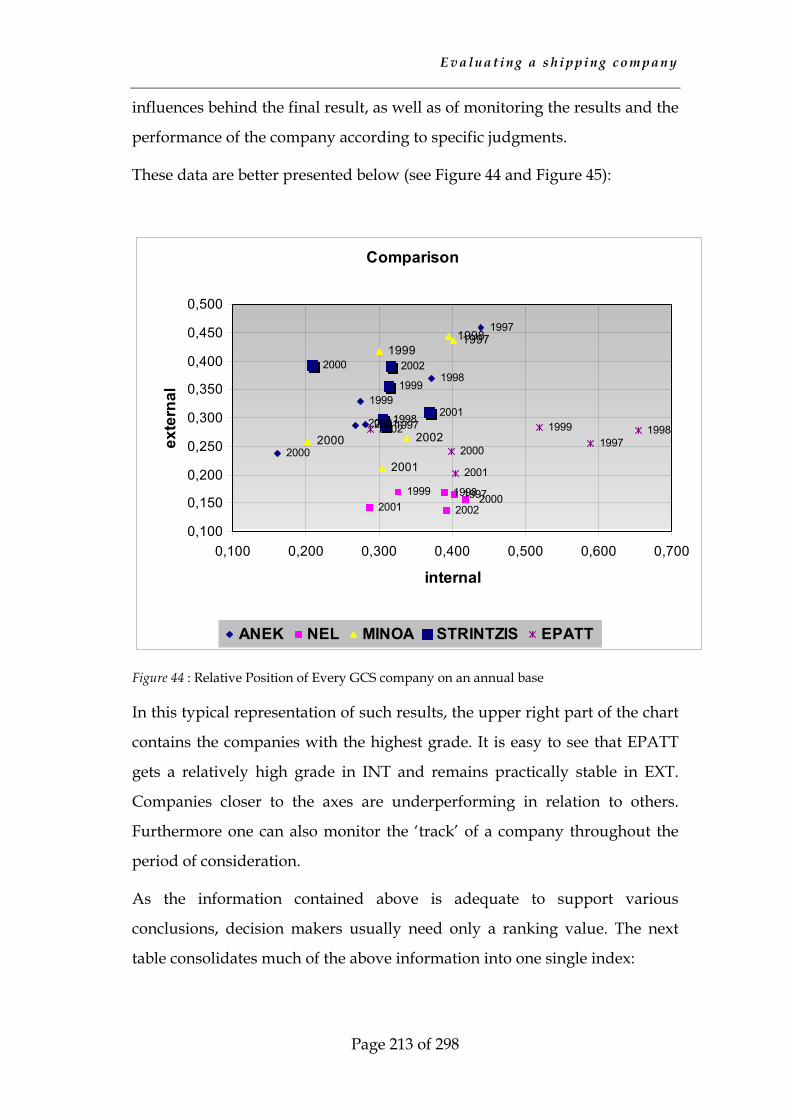
E v a l u a t i n g a s h i p p i n g c o m p a n y
Page 213 of 298
influences behind the final result, as well as of monitoring the results and the
performance of the company according to specific judgments.
These data are better presented below (see Figure 44 and Figure 45):
Comparison
1997
1998
1999
2000
20012002
1997199819992000
2001 2002
199719981999
2000
2001
200219971998
1999
2000
2001
2002
199719981999
2000
2001
2002
0,100
0,150
0,200
0,250
0,300
0,350
0,400
0,450
0,500
0,100 0,200 0,300 0,400 0,500 0,600 0,700
internal
exte
rnal
ANEK NEL MINOA STRINTZIS EPATT
Figure 44 : Relative Position of Every GCS company on an annual base
In this typical representation of such results, the upper right part of the chart
contains the companies with the highest grade. It is easy to see that EPATT
gets a relatively high grade in INT and remains practically stable in EXT.
Companies closer to the axes are underperforming in relation to others.
Furthermore one can also monitor the ‘track’ of a company throughout the
period of consideration.
As the information contained above is adequate to support various
conclusions, decision makers usually need only a ranking value. The next
table consolidates much of the above information into one single index:
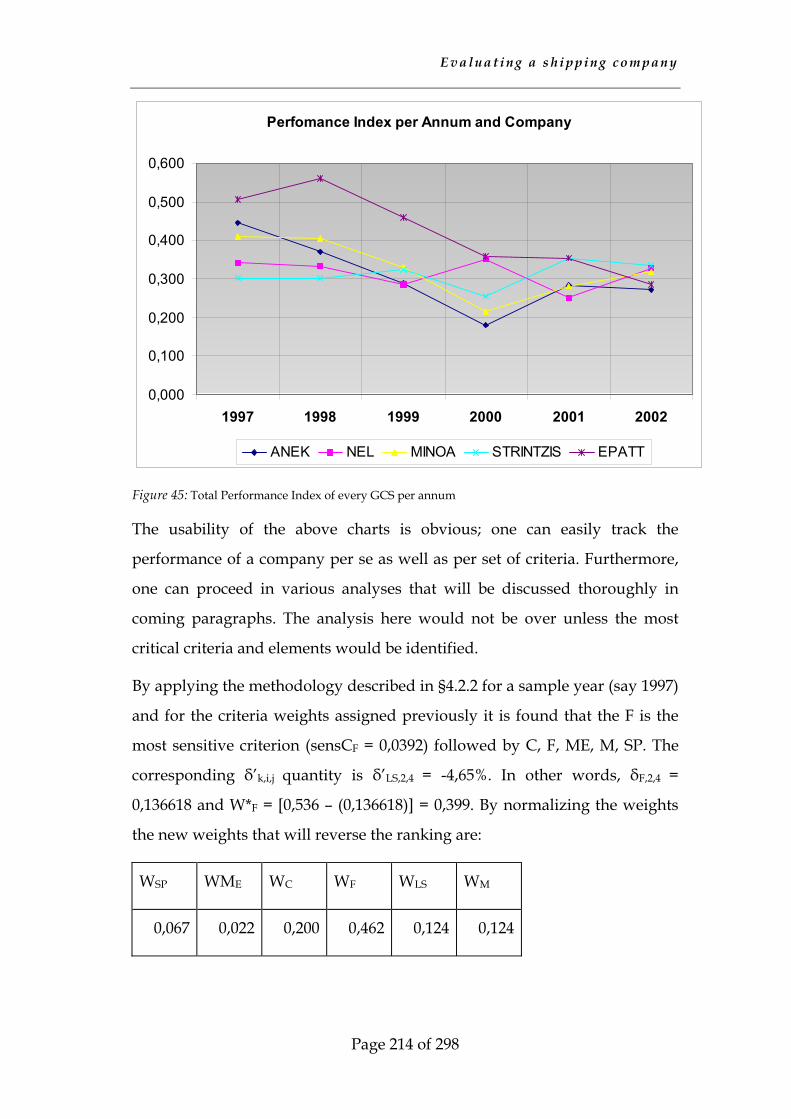
E v a l u a t i n g a s h i p p i n g c o m p a n y
Page 214 of 298
Perfomance Index per Annum and Company
0,000
0,100
0,200
0,300
0,400
0,500
0,600
1997 1998 1999 2000 2001 2002
ANEK NEL MINOA STRINTZIS EPATT
Figure 45: Total Performance Index of every GCS per annum
The usability of the above charts is obvious; one can easily track the
performance of a company per se as well as per set of criteria. Furthermore,
one can proceed in various analyses that will be discussed thoroughly in
coming paragraphs. The analysis here would not be over unless the most
critical criteria and elements would be identified.
By applying the methodology described in §4.2.2 for a sample year (say 1997)
and for the criteria weights assigned previously it is found that the F is the
most sensitive criterion (sensCF = 0,0392) followed by C, F, ME, M, SP. The
corresponding δ’k,i,j quantity is δ’LS,2,4 = -4,65%. In other words, δF,2,4 =
0,136618 and W*F = [0,536 – (0,136618)] = 0,399. By normalizing the weights
the new weights that will reverse the ranking are:
WSP WME WC WF WLS WM
0,067 0,022 0,200 0,462 0,124 0,124
E v a l u a t i n g a s h i p p i n g c o m p a n y
Page 215 of 298
With the new weights the previous ranking A5>A1>A3>A2>A4 (where ‘>’
stands for ‘better than’) becomes A5>A1>A3>A4>A2. It is reminded that
A1≡ANEK, A2≡NEL, A3≡MINOAN, A4≡STRINTZIS, A5≡EPATT.
Triantaphyllou and Sanchez expanded the above technique in order to
estimate the most critical element. In a similar way definitions were given
and similar theorem proven. By applying their methodology, it is estimated
that the most critical element is a24, i.e. the element of NEL for the
fundamental criterion. Originally, its value was 0,456 and it was estimated
that a reduction to the value of 0,400 would reverse the rank of A2 and A4. So
the original rank of A5>A1>A3>A2>A4 (where ‘>’ stands for ‘better than’)
becomes again A5>A1>A3>A4>A2
6.2.2 Simulation-based outcome The scenario-based solution is biased from the decision-maker. That does not
necessarily scrap the applicability of the model. However, some times it is
desired to get a more objective perspective. The issue of objectivity will be
discussed in a coming paragraph (see page 227) as it is considered significant
enough for the analysis. By looking back into the AHP the basic formula is:
that implements ‘objective’ elements aij and the weights wj. This is similar to
the ‘weighted sum method’ (WSM); the only difference is that in WSM is
based on absolute weights (weights assigned by the decision maker directly)
while in AHP come from a relative comparison procedure. The method is
based on the assumption of the additive utility. That means, according to
Keeney and Raiffa (1993, p. 231) that the attributes Y and Z are independent
(two-attributes case that can easily be considered for N attributes). This
assumption is the basis for almost all MCDM methods used in practice and
in the academia. Furthermore, the issue of weights is dealt in most (if not all)
cases by direct solicitation from the decision-maker. This is a means to
∑= ijji awIndex
E v a l u a t i n g a s h i p p i n g c o m p a n y
Page 216 of 298
understand the utility function of the decision-maker; in some cases the
weights stem out a utility-function determination procedure, which is mostly
derived by using questionnaires and structured questions.
In many cases it is necessary to combine the judgments of many persons or
decision makers in order to get a better understanding of the problem as well
as to achieve criteria-weighting that is considered as ‘generally’ acceptable.
In the literature, such issues are called ‘group decision making’ (see p.106 for
introductory comments). Saaty is suggesting the use of geometric mean in
order to synthesize the judgments of individuals in to a group property. He
bases this argument on the work of Kenneth Arrow (Saaty, 2001, p. 62).
Identical approach is adopted by Keeney and Raiffa (1993, p. 523). The
following is an illustrative example: say that three decision makers are
assigning the following values according to the fundamental scale 2, 3, 7,
then the group decision is estimated as 3 2*3*7 = 3,476 and the outcome is
rounded to 3.
The above approach has been used in many cases and applications, yet more
interesting and practical applications have been developed lately. A very
interesting approach is the one of fuzzy sets. More on the theory of fuzzy sets
can be found in the literature (e.g. Bojadziev et al., 1997). As a decision maker
is asked for his judgment, this can happen in three different ways:
1. Each individual judgment is modeled with a probability distribution.
For example, a decision maker may use the triangular distribution,
where only the high, the low and the most likely value is asked. Then
the mean of all judgments is estimated and therefore the group value
is obtained.
2. All decision-makers are asked for a point-estimation. This assumes
that all decision-makers have an equal probability of being correct, as
the group decision is derived as average of all point-judgments.

E v a l u a t i n g a s h i p p i n g c o m p a n y
Page 217 of 298
3. All decision makers are asked to estimate high and low values and
their judgment is assumed to be with equal probability within that
range. The group decision judgment is derived by using the minimum
lower and the maximum upper bounds of each individual judgment.
The following figure is explanatory:
Figure 46: Individual and Group Interval Judgments
In the above figure, one can see the way a group decision is extracted out of
individual responses. At the left side, individual triangular responses are
combined into a new consolidated one. The same applies for the right side,
where range-responses are combined. In the middle, individual point-
estimations are the same with the group one before the averaging procedure.
Generally the averaging procedure attracts the interest of researchers as
weights and approaches influence heavily the final result. In the literature
simple fuzzy averaging is widely used. The most ‘complicated’ case from the
above group decision making option is the triangular one.
When the triangular distribution is used, it is better to consider the use of
fuzzy sets and of their numerical operations. A triangular fuzzy number
(TFN) A has the following membership function µA(x):
Individual
Group
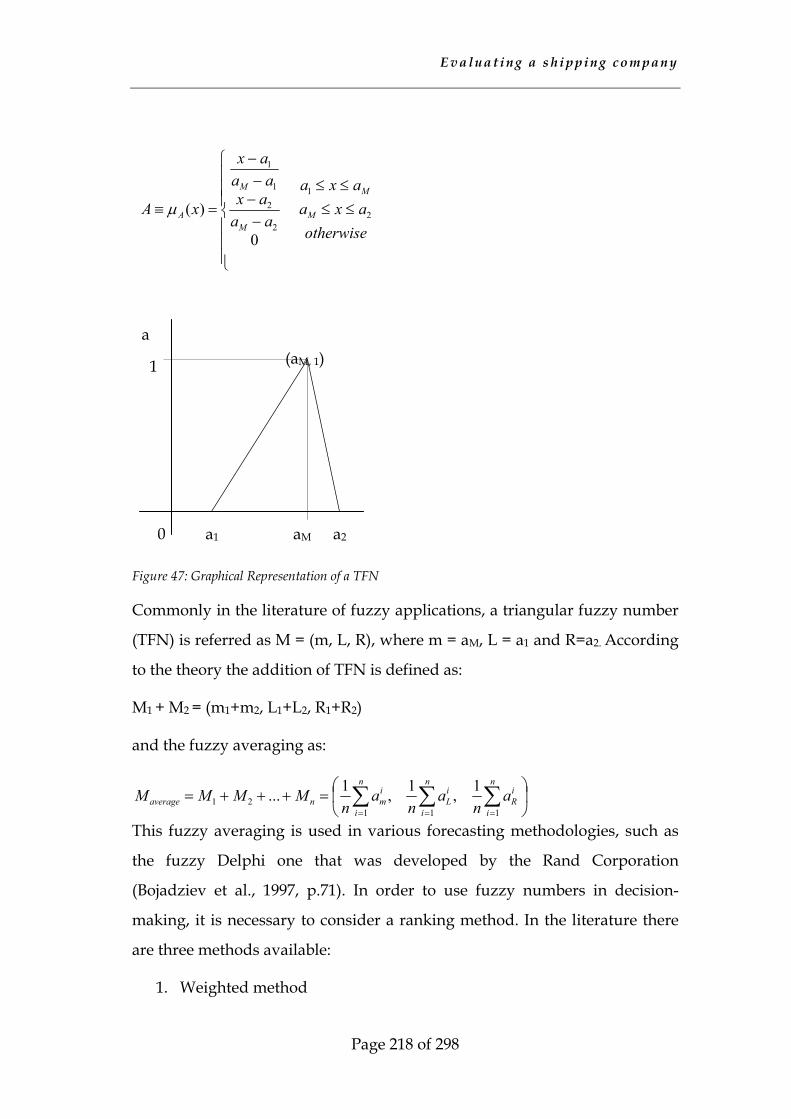
E v a l u a t i n g a s h i p p i n g c o m p a n y
Page 218 of 298
Figure 47: Graphical Representation of a TFN
Commonly in the literature of fuzzy applications, a triangular fuzzy number
(TFN) is referred as M = (m, L, R), where m = aM, L = a1 and R=a2. According
to the theory the addition of TFN is defined as:
M1 + M2 = (m1+m2, L1+L2, R1+R2)
and the fuzzy averaging as:
This fuzzy averaging is used in various forecasting methodologies, such as
the fuzzy Delphi one that was developed by the Rand Corporation
(Bojadziev et al., 1997, p.71). In order to use fuzzy numbers in decision-
making, it is necessary to consider a ranking method. In the literature there
are three methods available:
1. Weighted method
a2
a
1
0 a1 aM
(aM, 1)
otherwiseaxaaxa
aaaxaaax
xA M
M
M
M
A 2
1
2
2
1
1
0
)( ≤≤≤≤
−−−−
=≡ µ
=+++= ∑∑∑
===
n
i
iR
n
i
iL
n
i
imnaverage a
na
na
nMMMM
11121
1,1,1...
E v a l u a t i n g a s h i p p i n g c o m p a n y
Page 219 of 298
2. The method of Chang, and
3. Kaufmann – Gupta method
All of them are thoroughly described in the literature. Although there are no
significant numerical differences between them, the method of Chang is
preferred because the dominant alternative is the one with the largest
mathematical expectation Ej:
Triantaphyllou and Lin (1996) proceeded into the fuzzification of crisp
MCDM methods, such as WSM, WPM, AHP and TOPSIS and used the fuzzy
ranking approach for determining the best alternative. They run the models
with TFN and the outcome was a new TFN for every alternative. Then the
ranking of TFNs yielded the outcome. In other applications ‘defuzzification’
techniques have been employed that yielded the final ranking (e.g. in
Bojadziev et al., 1997, p.147). The entire above are very useful in structuring
the simulation procedure, as they provide options and alternatives to the
modeler. More specifically by using the above tools the model may select one
(or a combination) of the below options:
1) To select a number of decision makers (say S), then simulate their
response and finally to enter the geometric mean as input to the final
AHP decision matrix. The distribution of the response can be:
a) discrete values (1/9, 1.7, …, 7, 9)
b) uniform (1/9, 9)
c) triangular (1/9, random value, 9)
2) To select a number of decision makers (say S), then to simulate their
response as a TFN. Then a fuzzy AHP procedure (identical with the
normal one but with numerical hurdles) can follow. The result can be
ranked according to:
a) The method of Chang
( )( )6
jjjjjj
LRmLRE
−+−=
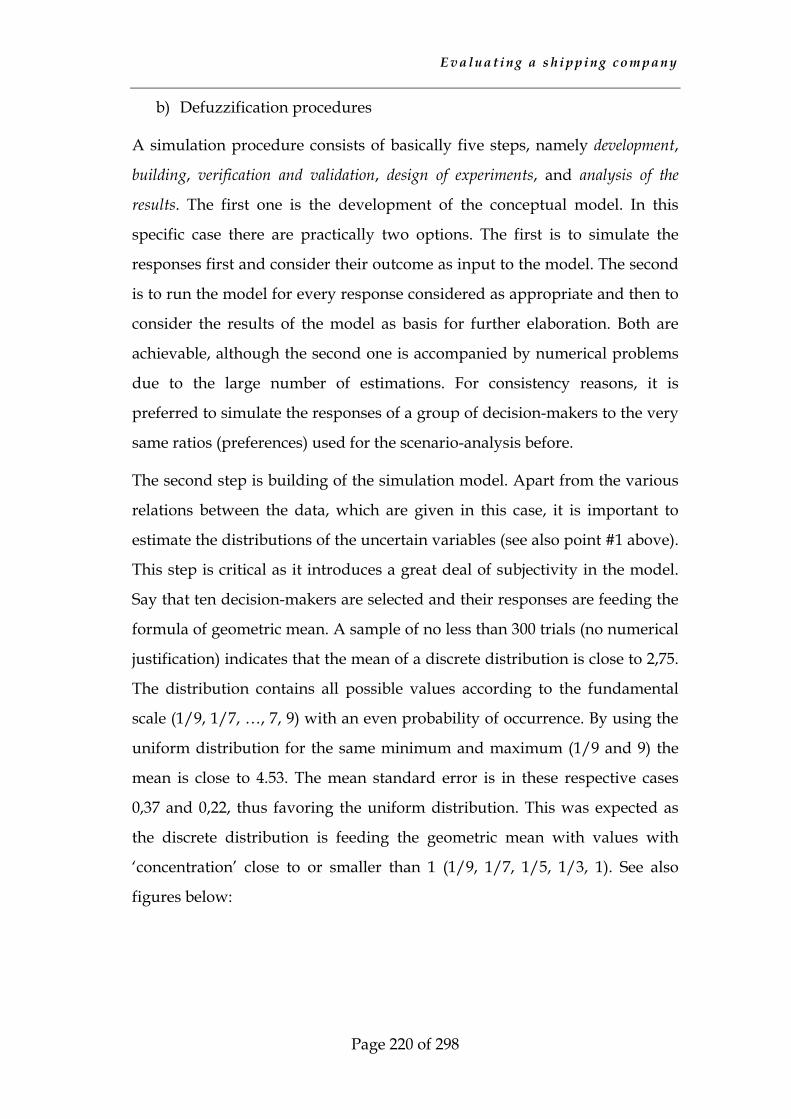
E v a l u a t i n g a s h i p p i n g c o m p a n y
Page 220 of 298
b) Defuzzification procedures
A simulation procedure consists of basically five steps, namely development,
building, verification and validation, design of experiments, and analysis of the
results. The first one is the development of the conceptual model. In this
specific case there are practically two options. The first is to simulate the
responses first and consider their outcome as input to the model. The second
is to run the model for every response considered as appropriate and then to
consider the results of the model as basis for further elaboration. Both are
achievable, although the second one is accompanied by numerical problems
due to the large number of estimations. For consistency reasons, it is
preferred to simulate the responses of a group of decision-makers to the very
same ratios (preferences) used for the scenario-analysis before.
The second step is building of the simulation model. Apart from the various
relations between the data, which are given in this case, it is important to
estimate the distributions of the uncertain variables (see also point #1 above).
This step is critical as it introduces a great deal of subjectivity in the model.
Say that ten decision-makers are selected and their responses are feeding the
formula of geometric mean. A sample of no less than 300 trials (no numerical
justification) indicates that the mean of a discrete distribution is close to 2,75.
The distribution contains all possible values according to the fundamental
scale (1/9, 1/7, …, 7, 9) with an even probability of occurrence. By using the
uniform distribution for the same minimum and maximum (1/9 and 9) the
mean is close to 4.53. The mean standard error is in these respective cases
0,37 and 0,22, thus favoring the uniform distribution. This was expected as
the discrete distribution is feeding the geometric mean with values with
‘concentration’ close to or smaller than 1 (1/9, 1/7, 1/5, 1/3, 1). See also
figures below:
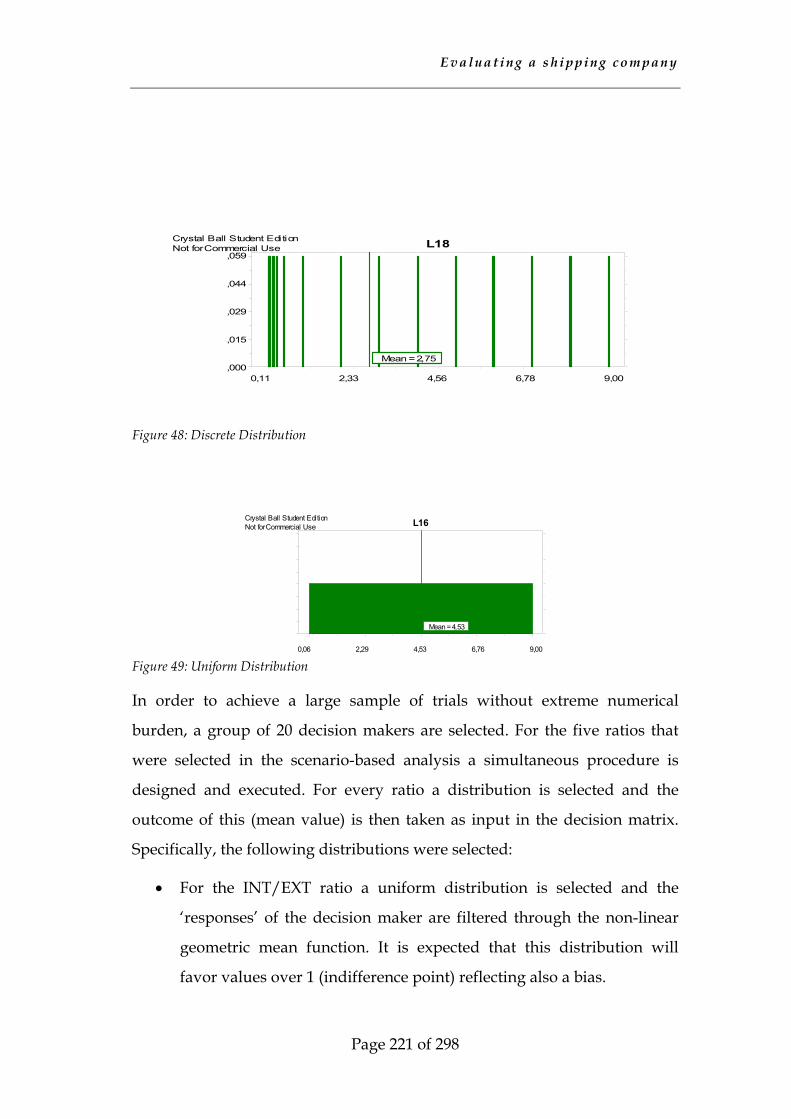
E v a l u a t i n g a s h i p p i n g c o m p a n y
Page 221 of 298
Figure 48: Discrete Distribution
Figure 49: Uniform Distribution
In order to achieve a large sample of trials without extreme numerical
burden, a group of 20 decision makers are selected. For the five ratios that
were selected in the scenario-based analysis a simultaneous procedure is
designed and executed. For every ratio a distribution is selected and the
outcome of this (mean value) is then taken as input in the decision matrix.
Specifically, the following distributions were selected:
• For the INT/EXT ratio a uniform distribution is selected and the
‘responses’ of the decision maker are filtered through the non-linear
geometric mean function. It is expected that this distribution will
favor values over 1 (indifference point) reflecting also a bias.
Crystal Ball Student EditionNot for Commercial Use
Mean = 4,53
0,06 2,29 4,53 6,76 9,00
L16
Crystal Ball Student EditionNot for Commercial Use
Mean = 2,75,000
,015
,029
,044
,059
0,11 2,33 4,56 6,78 9,00
L18
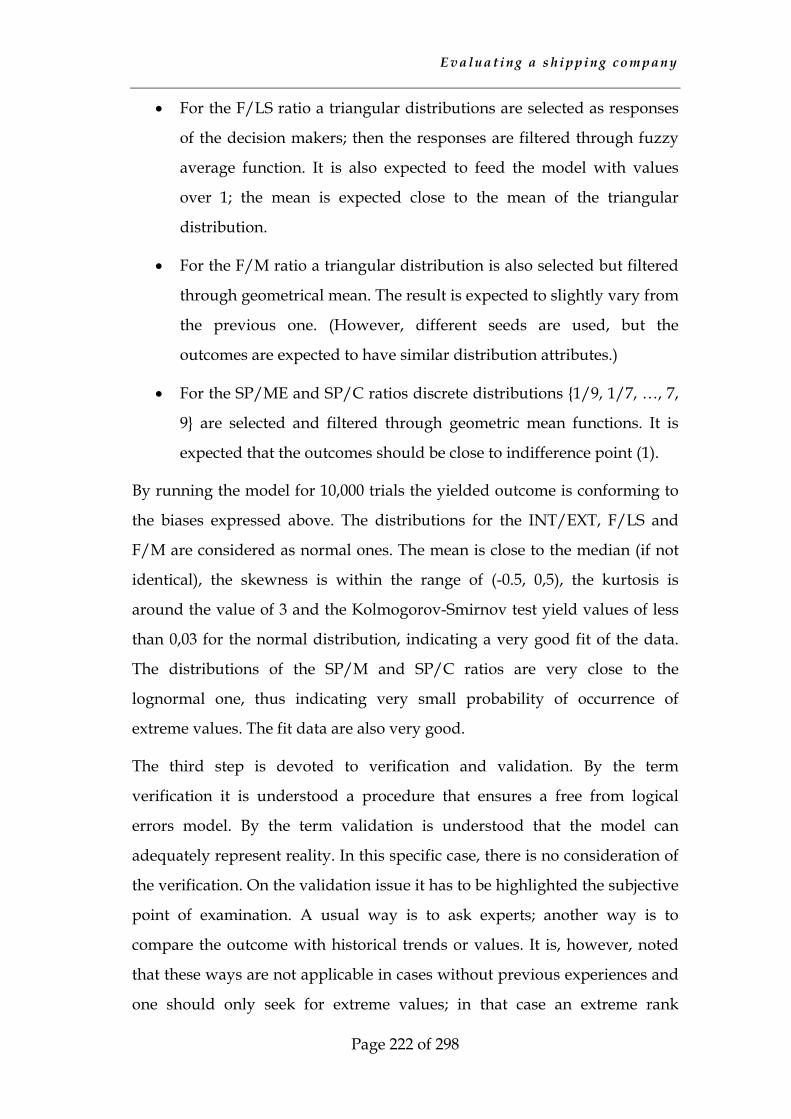
E v a l u a t i n g a s h i p p i n g c o m p a n y
Page 222 of 298
• For the F/LS ratio a triangular distributions are selected as responses
of the decision makers; then the responses are filtered through fuzzy
average function. It is also expected to feed the model with values
over 1; the mean is expected close to the mean of the triangular
distribution.
• For the F/M ratio a triangular distribution is also selected but filtered
through geometrical mean. The result is expected to slightly vary from
the previous one. (However, different seeds are used, but the
outcomes are expected to have similar distribution attributes.)
• For the SP/ME and SP/C ratios discrete distributions {1/9, 1/7, …, 7,
9} are selected and filtered through geometric mean functions. It is
expected that the outcomes should be close to indifference point (1).
By running the model for 10,000 trials the yielded outcome is conforming to
the biases expressed above. The distributions for the INT/EXT, F/LS and
F/M are considered as normal ones. The mean is close to the median (if not
identical), the skewness is within the range of (-0.5, 0,5), the kurtosis is
around the value of 3 and the Kolmogorov-Smirnov test yield values of less
than 0,03 for the normal distribution, indicating a very good fit of the data.
The distributions of the SP/M and SP/C ratios are very close to the
lognormal one, thus indicating very small probability of occurrence of
extreme values. The fit data are also very good.
The third step is devoted to verification and validation. By the term
verification it is understood a procedure that ensures a free from logical
errors model. By the term validation is understood that the model can
adequately represent reality. In this specific case, there is no consideration of
the verification. On the validation issue it has to be highlighted the subjective
point of examination. A usual way is to ask experts; another way is to
compare the outcome with historical trends or values. It is, however, noted
that these ways are not applicable in cases without previous experiences and
one should only seek for extreme values; in that case an extreme rank
E v a l u a t i n g a s h i p p i n g c o m p a n y
Page 223 of 298
reversal would be the case. The fourth step can be omitted in this specific
case; fifth step is analyzed thoroughly below.
Figure 50: Simulation Flowchart
The outcome of the simulation procedure was yielded after few minutes,
thus ensuring that similar exercises in a future application will also demand
little time. The simulated responses also yielded results that could easily be
fitted with normal and lognormal distributions. All distributions have been
tested by using Kolmogorov-Smirnov criterion.
Attributes of Alternatives per Criterion
Assignment of Numerical Values (Eigenvalues)
AHP Process
Random Generation of Criteria
Preferences (Level I & II)
Criteria Weights (Lower Levels)
Storage of INDEXi
(Performance per company per year)
Display of
INDEXi
Decision Maker 1
Decision Maker 2
Decision Maker 10
Criterion K
Decision Maker 1
Decision Maker 2
Decision Maker 10
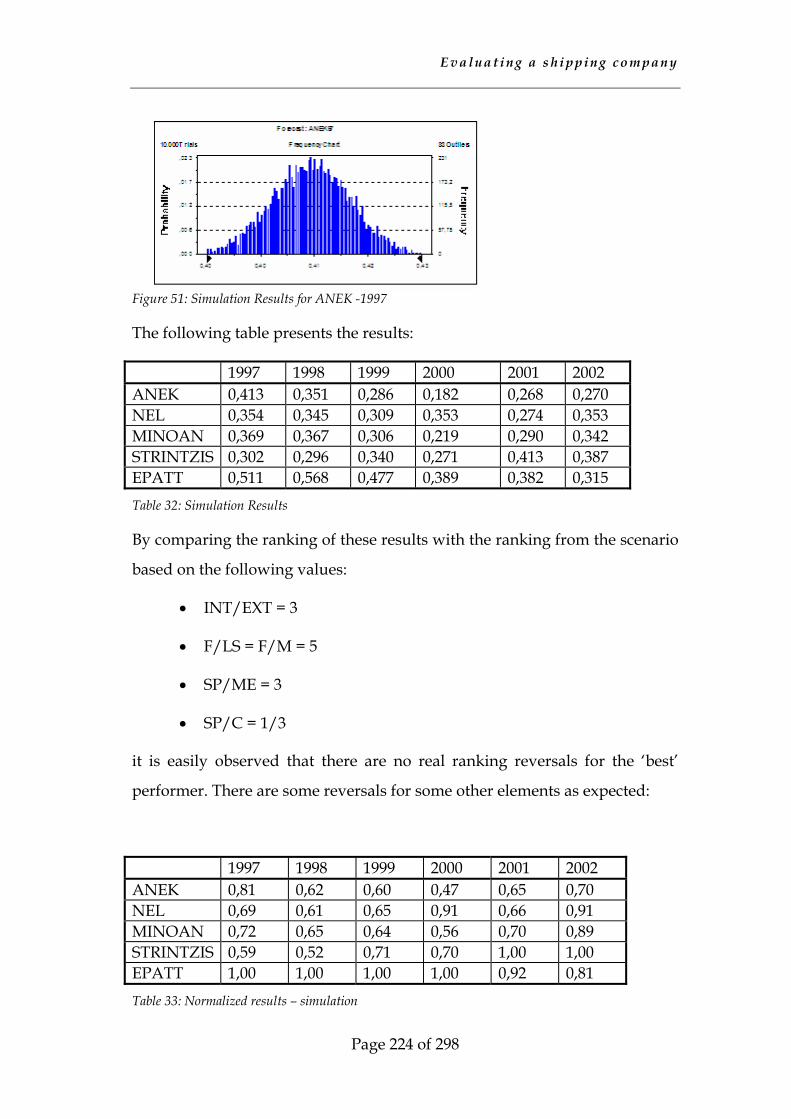
E v a l u a t i n g a s h i p p i n g c o m p a n y
Page 224 of 298
Figure 51: Simulation Results for ANEK -1997
The following table presents the results:
1997 1998 1999 2000 2001 2002 ANEK 0,413 0,351 0,286 0,182 0,268 0,270 NEL 0,354 0,345 0,309 0,353 0,274 0,353 MINOAN 0,369 0,367 0,306 0,219 0,290 0,342 STRINTZIS 0,302 0,296 0,340 0,271 0,413 0,387 EPATT 0,511 0,568 0,477 0,389 0,382 0,315 Table 32: Simulation Results
By comparing the ranking of these results with the ranking from the scenario
based on the following values:
• INT/EXT = 3
• F/LS = F/M = 5
• SP/ME = 3
• SP/C = 1/3
it is easily observed that there are no real ranking reversals for the ‘best’
performer. There are some reversals for some other elements as expected:
1997 1998 1999 2000 2001 2002 ANEK 0,81 0,62 0,60 0,47 0,65 0,70 NEL 0,69 0,61 0,65 0,91 0,66 0,91 MINOAN 0,72 0,65 0,64 0,56 0,70 0,89 STRINTZIS 0,59 0,52 0,71 0,70 1,00 1,00 EPATT 1,00 1,00 1,00 1,00 0,92 0,81 Table 33: Normalized results – simulation
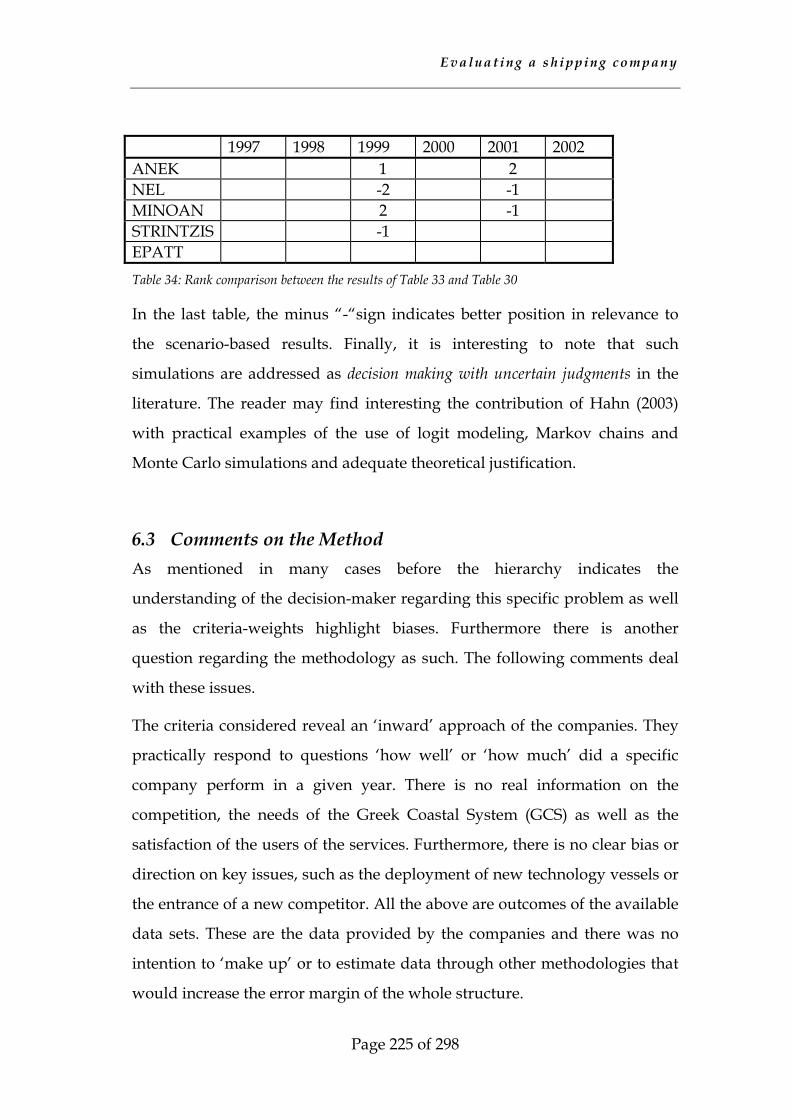
E v a l u a t i n g a s h i p p i n g c o m p a n y
Page 225 of 298
1997 1998 1999 2000 2001 2002 ANEK 1 2 NEL -2 -1 MINOAN 2 -1 STRINTZIS -1 EPATT Table 34: Rank comparison between the results of Table 33 and Table 30
In the last table, the minus “-“sign indicates better position in relevance to
the scenario-based results. Finally, it is interesting to note that such
simulations are addressed as decision making with uncertain judgments in the
literature. The reader may find interesting the contribution of Hahn (2003)
with practical examples of the use of logit modeling, Markov chains and
Monte Carlo simulations and adequate theoretical justification.
6.3 Comments on the Method As mentioned in many cases before the hierarchy indicates the
understanding of the decision-maker regarding this specific problem as well
as the criteria-weights highlight biases. Furthermore there is another
question regarding the methodology as such. The following comments deal
with these issues.
The criteria considered reveal an ‘inward’ approach of the companies. They
practically respond to questions ‘how well’ or ‘how much’ did a specific
company perform in a given year. There is no real information on the
competition, the needs of the Greek Coastal System (GCS) as well as the
satisfaction of the users of the services. Furthermore, there is no clear bias or
direction on key issues, such as the deployment of new technology vessels or
the entrance of a new competitor. All the above are outcomes of the available
data sets. These are the data provided by the companies and there was no
intention to ‘make up’ or to estimate data through other methodologies that
would increase the error margin of the whole structure.
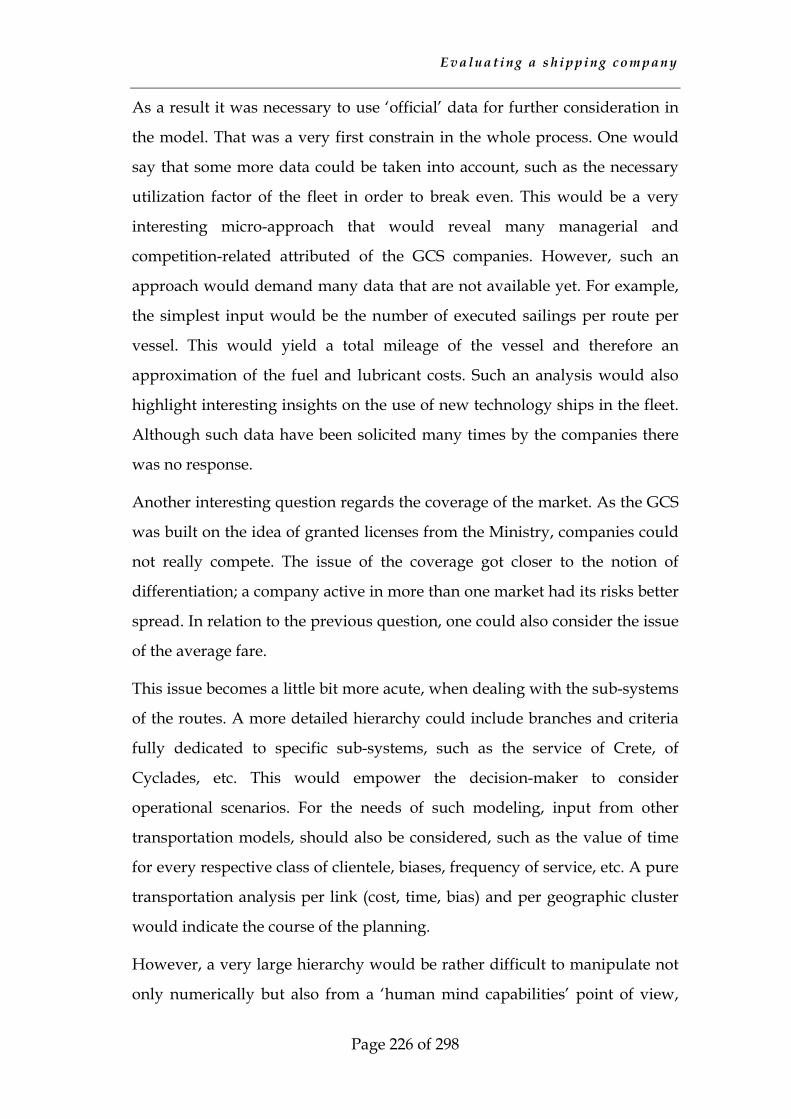
E v a l u a t i n g a s h i p p i n g c o m p a n y
Page 226 of 298
As a result it was necessary to use ‘official’ data for further consideration in
the model. That was a very first constrain in the whole process. One would
say that some more data could be taken into account, such as the necessary
utilization factor of the fleet in order to break even. This would be a very
interesting micro-approach that would reveal many managerial and
competition-related attributed of the GCS companies. However, such an
approach would demand many data that are not available yet. For example,
the simplest input would be the number of executed sailings per route per
vessel. This would yield a total mileage of the vessel and therefore an
approximation of the fuel and lubricant costs. Such an analysis would also
highlight interesting insights on the use of new technology ships in the fleet.
Although such data have been solicited many times by the companies there
was no response.
Another interesting question regards the coverage of the market. As the GCS
was built on the idea of granted licenses from the Ministry, companies could
not really compete. The issue of the coverage got closer to the notion of
differentiation; a company active in more than one market had its risks better
spread. In relation to the previous question, one could also consider the issue
of the average fare.
This issue becomes a little bit more acute, when dealing with the sub-systems
of the routes. A more detailed hierarchy could include branches and criteria
fully dedicated to specific sub-systems, such as the service of Crete, of
Cyclades, etc. This would empower the decision-maker to consider
operational scenarios. For the needs of such modeling, input from other
transportation models, should also be considered, such as the value of time
for every respective class of clientele, biases, frequency of service, etc. A pure
transportation analysis per link (cost, time, bias) and per geographic cluster
would indicate the course of the planning.
However, a very large hierarchy would be rather difficult to manipulate not
only numerically but also from a ‘human mind capabilities’ point of view,
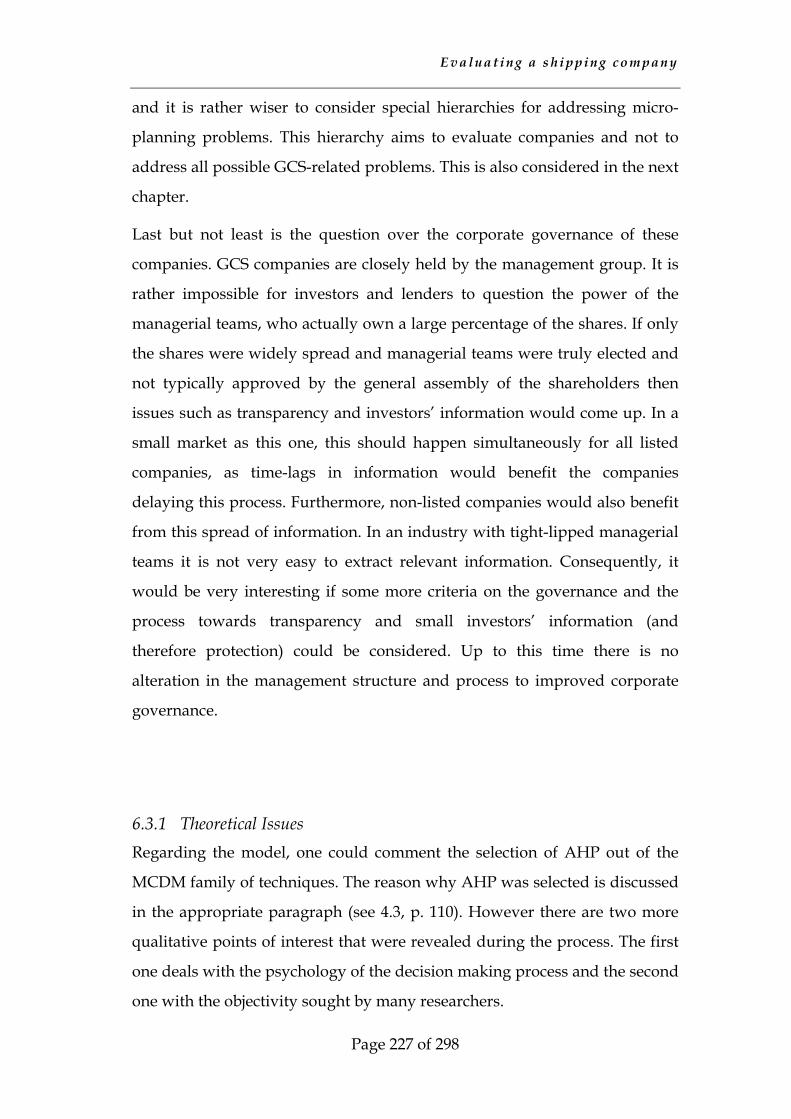
E v a l u a t i n g a s h i p p i n g c o m p a n y
Page 227 of 298
and it is rather wiser to consider special hierarchies for addressing micro-
planning problems. This hierarchy aims to evaluate companies and not to
address all possible GCS-related problems. This is also considered in the next
chapter.
Last but not least is the question over the corporate governance of these
companies. GCS companies are closely held by the management group. It is
rather impossible for investors and lenders to question the power of the
managerial teams, who actually own a large percentage of the shares. If only
the shares were widely spread and managerial teams were truly elected and
not typically approved by the general assembly of the shareholders then
issues such as transparency and investors’ information would come up. In a
small market as this one, this should happen simultaneously for all listed
companies, as time-lags in information would benefit the companies
delaying this process. Furthermore, non-listed companies would also benefit
from this spread of information. In an industry with tight-lipped managerial
teams it is not very easy to extract relevant information. Consequently, it
would be very interesting if some more criteria on the governance and the
process towards transparency and small investors’ information (and
therefore protection) could be considered. Up to this time there is no
alteration in the management structure and process to improved corporate
governance.
6.3.1 Theoretical Issues Regarding the model, one could comment the selection of AHP out of the
MCDM family of techniques. The reason why AHP was selected is discussed
in the appropriate paragraph (see 4.3, p. 110). However there are two more
qualitative points of interest that were revealed during the process. The first
one deals with the psychology of the decision making process and the second
one with the objectivity sought by many researchers.

E v a l u a t i n g a s h i p p i n g c o m p a n y
Page 228 of 298
In the literature of decision-making there are practically two distinct classes:
the mathematical and the psychological one. Models and techniques
supported or used by mathematicians, engineers and scientists are based
upon mathematics. Psychologists and relevant scientist base their modeling
on psychological attributes. The common ground of these approaches is the
normative theory of behavior. By the term normative is answered the question
how people would behave if they followed certain requirements of rational
decision making. It is not meant to describe how people actually behave. The
most famous example of the normative theory is the expected utility of von
Neumann and Morgenstern.
On the basis of the expected utility theory, decision researchers have built
and expanded theories and techniques and suggested solutions to selection
and classification problems. In that sense they indicated the solution a
rational decision maker would prefer if and only if certain requirements were
considered. Descriptive and prescriptive theories considered by
psychologists analyze the actual behavior of people, yet they practically fail
to respond to real-world problems. The major disadvantage of the utility
theory is that probabilities have been treated as objective ones in the classical
way (i.e. based on the relative frequency). Savage (1954) generalized the
theory of von Neumann and Morgenstern by including subjective
probabilities of an outcome. Luce (1959) improved this theory by importing
stochastic choice modeling.
The contribution of Savage and Luce is considered very important at
practical and theoretical level as well, where problems could not be treated
with the expected utility theory. If, for example, an objective probability
cannot be determined or the outcome will only occur once then the modeling
of von Neumann and Morgenstern cannot be applied. In practice though the
estimation of the utility function is not a very trouble-free task and cannot be
representative for an expanded set of decision-makers. The estimation of the
utility functions is thoroughly analyzed by Keeney and Raiffa (1993).
E v a l u a t i n g a s h i p p i n g c o m p a n y
Page 229 of 298
For those not familiar with the MCDM techniques the developed and above
presented models lack ‘objectivity’. They would point out the subjective
estimation of weights related to the criteria. Practically, all MCDM models
are ‘subjective’ in that perspective as they seek to include the biases of the
decision-maker. Families of widely used methods, such as WSM, WPM,
AHP, ELECTRE, TOPSIS, and many other consider the weights of the criteria
as input from the decision maker. Whether these weights stem out of relative
or absolute comparison is irrelevant as it is purely a technical issue. The
outcomes of these methods depend on biases of the decision maker. Other
families of methods, such as UTA, UTADIS, UTADIS II, etc, consider a shape
of utility functions per criterion and the characteristics of these functions are
given by the decision-maker. Keeney and Raiffa (1993, p.77) point out the
subjectivity of the weight assignment. They use the word ‘manipulation’ in
order to highlight the bias of the decision-maker. They stress that ‘he is asked
informally to balance what he would like to get with what he thinks he can
achieve’18. It is interesting, from an academic point of view, to examine which
method is more sensitive on the criteria-weights assigned by the decision-
maker, but is out of the context of this study.
The quest for objectivity might also be considered a ‘fallacy’ in practical
problems. A decision-maker is not objective and in most cases there is no
need for ‘objectiveness’. Taking as an example the problem of the evaluation
of the performance of a company, one would practically consider the
deployment of the well-known method Data Envelopment Analysis (DEA).
This method considers a set of inputs and a set of outputs for a given set of
units (commonly called as Decision Making Units - DMU). The weights are
estimated by using fractional programming. The result of the method is an
efficiency envelope that indicates the ‘efficient’ members as well as the
reduction of the input or the increase of the output mix non-efficient
18 It is marked as in the original.
E v a l u a t i n g a s h i p p i n g c o m p a n y
Page 230 of 298
members shall achieve in order to become efficient. DEA has been widely
used for the estimation of the relative efficient branch offices of a bank, of
retail networks, of hospitals and many other service-related cases. It has also
been used in the port industry (e.g. Roll et al., 1996 and Schinas et al., 1999).
The result of such an exercise is also strongly depended on the decision-
maker; a different mix of inputs or outputs as well as of DMUs will alter the
outcome. The method yields relative efficiency as practically happens to all
approaches. A method cannot consider all alternatives (global application)
but only the ones given by the decision-maker. Saaty has analyzed this
problem thoroughly and presents a very interesting list of comments of
various researchers (2001b, p. 361-372).
6.3.2 Validation of the model It is very difficult if not impossible to validate an MCDM model; even
theoretically it is known and widely accepted that different MCDM methods
may yield different results for the same input data. Experience and practice
are most commonly validating such modeling.
In order to implement elements stemming out of experience it is appealing to
use facts and data from the shift-share analysis, which reflects the differences
of traffic and turnover per annum and per company (see §11.1.3, Shift-Share
Analysis, p. 273). From the tables it is possible to understand the resulting
figures (see Figure 45: Total Performance Index of every GCS per annum, p.
214).
In most cases the positive or negative change of the total index yielded can
be attributed to a positive or negative difference in the shift-share analysis.
By calculating all differences, it is easy to see that in 60% of all cases the
turnover and the traffic analysis are consistent to the changes of the total
yielded index. This means without any further elaboration, two of three
differences are explained by the shift-share analysis. This result is valid for
almost all years of consideration, and strengthens the belief of the unbiased
E v a l u a t i n g a s h i p p i n g c o m p a n y
Page 231 of 298
model. In cases, where the differences of the index are not explained by the
shift-share analysis, one should look deeper in the results. In 5 cases there is
full accord among the analyses (20%) and in 18 cases (72%) partial accord.
There are only two cases where the shift-share analysis is not consistent with
the differences of the index (2/25 = 8%); both figures refer to STRINTZIS
(years 1996-7 and 1999-2000).
In most cases, where the shift-share analysis of the turnover is not explaining
the index, there are strong indications from the traffic analyses. So a
thorough and more elaborated analysis may lead to specific conclusions per
case and per fiscal year.
Another interesting observation is that the ranking yielded from both
approaches, the simulation and the scenario analyses are practically
identical. There are few ranking reversals, suggesting that the selection of the
weights is close to ‘normality’, as expressed by random responses (see also
Table 34: Rank comparison between the results of Table 33 and Table 30, in
page 225).
Both validation observations are very encouraging about the soundness of
the result, as yielded from the model. However, it is once again highlighted
that there is no theoretical way to validate a MCDM model but only practice
and experience may support arguments and claims.
A p p l i ca t i o n o f t h e M o d e l
Page 232 of 298
7 Application of the Model
In the previous chapter the decision support model was thoroughly analyzed
and explained. The aim of this chapter is to present some applications and to
highlight the importance of this modeling for possible users. Two major
applications will be discussed in the coming paragraphs: a corporate
planning and an approach to optimum mergers.
7.1 Corporate Planning
The issue of corporate planning by using AHP has been widely discussed in
the literature. Saaty (2001a, p. 153) has proposed several hierarchies and
approaches for that task. Generally, there are two major categories of
planning: forward and backward planning. By forward planning is understood
a descriptive process that includes all or some actors pursuing certain
objectives and implementing certain policies towards a specific objective.
This approach leads to a feasible or a likely future. In contrast, backward
planning aims at the desired future. The desired outcome is achieved by
applying policies influencing actors. This process is normative (or
prescriptive). Usually corporations and decision-makers implement a two
stage analysis involving forward and backward planning processes. The first
step is to project the likely or feasible future by implementing forward
planning. Then a backward process is employed to determine the influences
on the actors. In that case the desired future goal is the outcome of the first
step. This process can be repetitive to obtain greater convergence. Practically
there are also two limits: one is fixed in the present with actors and the
available resources. The other is fixed in the future with the desired
objectives. In both cases the preparation of scenarios and their analysis is
required. The scenarios must include an adequate account of interaction of
the system with relevant factors (in that case internal and external, and so on
as the analysis of the hierarchy processes).
A p p l i ca t i o n o f t h e M o d e l
Page 233 of 298
Saaty considers planning process as a boundary problem and identifies three
variables: planning policies, outcomes and efficiencies. These variables are self-
explained but efficiencies, which indicate the probabilistic relationship
between planning policies and outcomes. The variables are common to all
decision processes but the relationship among them is different in projected
and desired planning processes. For projected processes the policies are
defined, and the efficiencies are estimated and the outcomes deduced. For
the desired process the outcomes are valued, the efficiencies are influenced
and the policies are developed. The difference is fundamental due to the
different structure of the hierarchy.
As stated above, scenario analysis is an indispensable step in the analysis.
There are practically two general kinds of scenarios: exploratory and
anticipatory scenarios. Exploratory scenarios start from present work and
forward to the future illuminating outcomes based on trends or beliefs.
Anticipatory scenarios portray feasible and desirable futures; they start from
the future and work backwards discovering what alternatives and actions are
necessary to attain these futures. Anticipatory scenarios are further broken
down to normative and contrast. In normative scenarios the objectives are
determined at the beginning. In contrast scenarios, feasible future scenarios
are sketched by using a range of assumptions. The desired future scenario is
derived as a combination of contrast anticipatory ones.
7.1.1 Use of the Model
The modeling developed in the previous chapter can easily accommodate
more companies and fiscal years for further analysis. One can input data of
the new company or of the new fiscal year and estimate its relative position.
That is a straightforward procedure and is not sophisticated. The model can
lead to a comparison of ‘non-accrued’ operations or even fictitious data.
Nevertheless, one can also proceed in exploratory analysis. Say that a
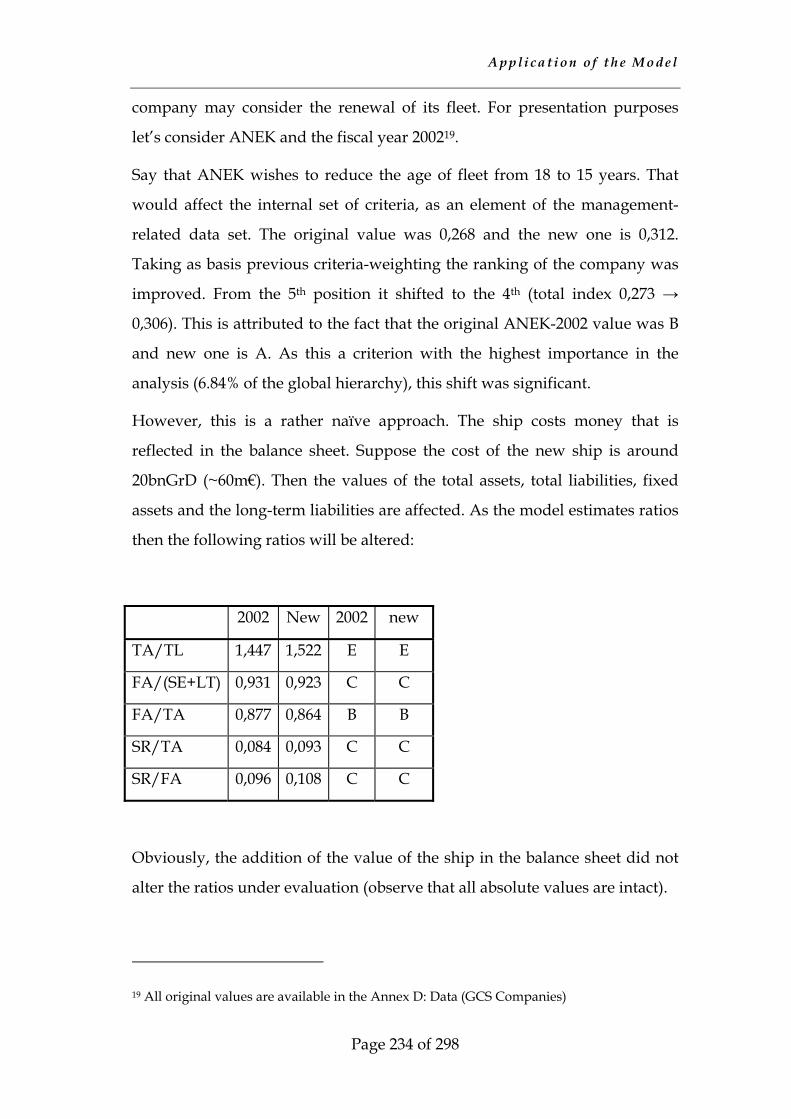
A p p l i ca t i o n o f t h e M o d e l
Page 234 of 298
company may consider the renewal of its fleet. For presentation purposes
let’s consider ANEK and the fiscal year 200219.
Say that ANEK wishes to reduce the age of fleet from 18 to 15 years. That
would affect the internal set of criteria, as an element of the management-
related data set. The original value was 0,268 and the new one is 0,312.
Taking as basis previous criteria-weighting the ranking of the company was
improved. From the 5th position it shifted to the 4th (total index 0,273 →
0,306). This is attributed to the fact that the original ANEK-2002 value was B
and new one is A. As this a criterion with the highest importance in the
analysis (6.84% of the global hierarchy), this shift was significant.
However, this is a rather naïve approach. The ship costs money that is
reflected in the balance sheet. Suppose the cost of the new ship is around
20bnGrD (~60m€). Then the values of the total assets, total liabilities, fixed
assets and the long-term liabilities are affected. As the model estimates ratios
then the following ratios will be altered:
2002 New 2002 new
TA/TL 1,447 1,522 E E
FA/(SE+LT) 0,931 0,923 C C
FA/TA 0,877 0,864 B B
SR/TA 0,084 0,093 C C
SR/FA 0,096 0,108 C C
Obviously, the addition of the value of the ship in the balance sheet did not
alter the ratios under evaluation (observe that all absolute values are intact).
19 All original values are available in the Annex D: Data (GCS Companies)
A p p l i ca t i o n o f t h e M o d e l
Page 235 of 298
By elaborating this exercise further one would say that the impact of a new
vessel is not only financial but also affects other factors. For example, one
would estimate (or assume) that the addition of the new vessel in the fleet
affects the logistics services offered and the competition pattern. The new
vessel may call four (4) new ports in the Aegean (say in the Cycladic complex
of destinations) and improve the market shares of the company by 3%. The
new values would alter the ranking, from the 4th position to the 1st! Although
the addition of the new ports of call does not alter the absolute value (it
remains C), so the internal value is not altered, the external one is
significantly affected. The new values in the competition set of criteria shifts
the absolute values from the original set (D, C, C, B, D, C, D) to the new one
(C, B, B, A, D, C, D) that alters the final value of the external criteria from to
0,303 to 0,446. Thus the final index value equals 0,446*0,25+0,312*0,75=0,345
(0,273 originally).
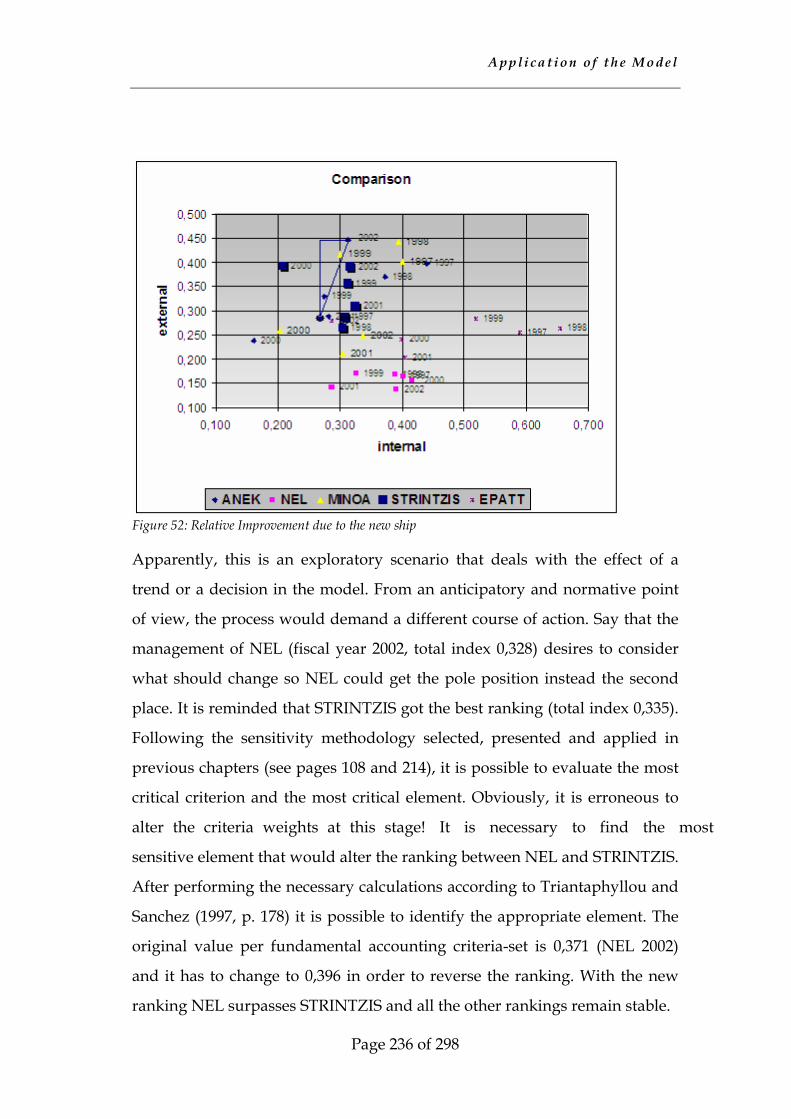
A p p l i ca t i o n o f t h e M o d e l
Page 236 of 298
Figure 52: Relative Improvement due to the new ship
Apparently, this is an exploratory scenario that deals with the effect of a
trend or a decision in the model. From an anticipatory and normative point
of view, the process would demand a different course of action. Say that the
management of NEL (fiscal year 2002, total index 0,328) desires to consider
what should change so NEL could get the pole position instead the second
place. It is reminded that STRINTZIS got the best ranking (total index 0,335).
Following the sensitivity methodology selected, presented and applied in
previous chapters (see pages 108 and 214), it is possible to evaluate the most
critical criterion and the most critical element. Obviously, it is erroneous to
alter the criteria weights at this stage! It is necessary to find the most
sensitive element that would alter the ranking between NEL and STRINTZIS.
After performing the necessary calculations according to Triantaphyllou and
Sanchez (1997, p. 178) it is possible to identify the appropriate element. The
original value per fundamental accounting criteria-set is 0,371 (NEL 2002)
and it has to change to 0,396 in order to reverse the ranking. With the new
ranking NEL surpasses STRINTZIS and all the other rankings remain stable.
A p p l i ca t i o n o f t h e M o d e l
Page 237 of 298
It is clear that something has to change in the fundamental data-set so the
management can proceed into further elaboration. As the fundamental data
are filtered through ratios that feed absolute values, it is unlikely to match
the ‘desired’ value (0,396) with a specific new input value. Normally a value
close to the desired one is assigned. For example, the management of NEL
would like to approximate this value by ‘perturbing’ the sales-revenues or
the net income after taxes. The result would be the following: the sales
revenue should increase by 11% (from €13,7m to €15,2m) in order to achieve
the value of 0,399 (it is numerically impossible to reach the exact value of
0,396) or the net income after tax should increase by 911% (from €351k to
€3,552k). Obviously, the increase of the net income after taxes by that
percentage is out of question, while the increase of the sales revenue is not
impossible. In a more elaborated accounting exercise a set of values could
slightly alter in order to achieve the desired total index value.
7.1.2 Use of Elements from the Model
The previous example is based on the assumption that the hierarchy is given;
it is actually the very same one used for the evaluation and classification of
the GCS companies. Scenario analysis is only an approach. A more
sophisticated approach would alter levels or elements of the original
approach in order to extract structured responses from the model. An idea
could be the following:
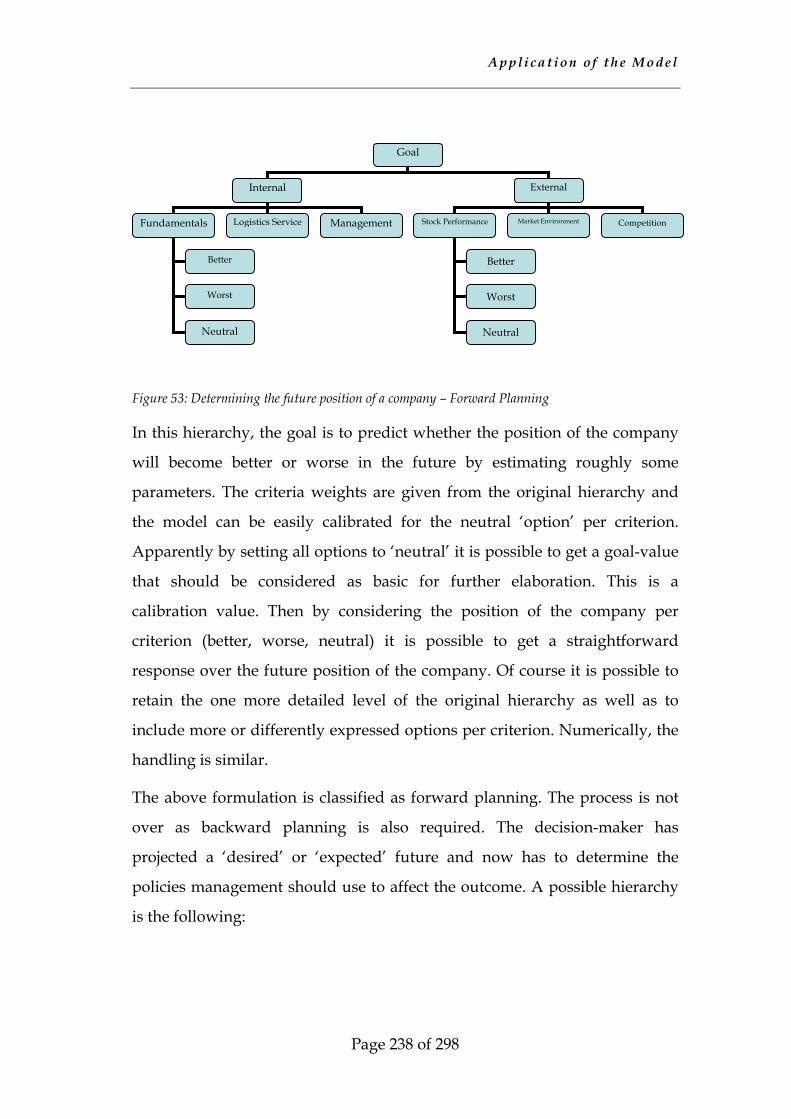
A p p l i ca t i o n o f t h e M o d e l
Page 238 of 298
Figure 53: Determining the future position of a company – Forward Planning
In this hierarchy, the goal is to predict whether the position of the company
will become better or worse in the future by estimating roughly some
parameters. The criteria weights are given from the original hierarchy and
the model can be easily calibrated for the neutral ‘option’ per criterion.
Apparently by setting all options to ‘neutral’ it is possible to get a goal-value
that should be considered as basic for further elaboration. This is a
calibration value. Then by considering the position of the company per
criterion (better, worse, neutral) it is possible to get a straightforward
response over the future position of the company. Of course it is possible to
retain the one more detailed level of the original hierarchy as well as to
include more or differently expressed options per criterion. Numerically, the
handling is similar.
The above formulation is classified as forward planning. The process is not
over as backward planning is also required. The decision-maker has
projected a ‘desired’ or ‘expected’ future and now has to determine the
policies management should use to affect the outcome. A possible hierarchy
is the following:
Goal
Internal External
Fundamentals Logistics Service Management Stock Performance Market Environment Competition
Better
Worst
Neutral
Better
Worst
Neutral
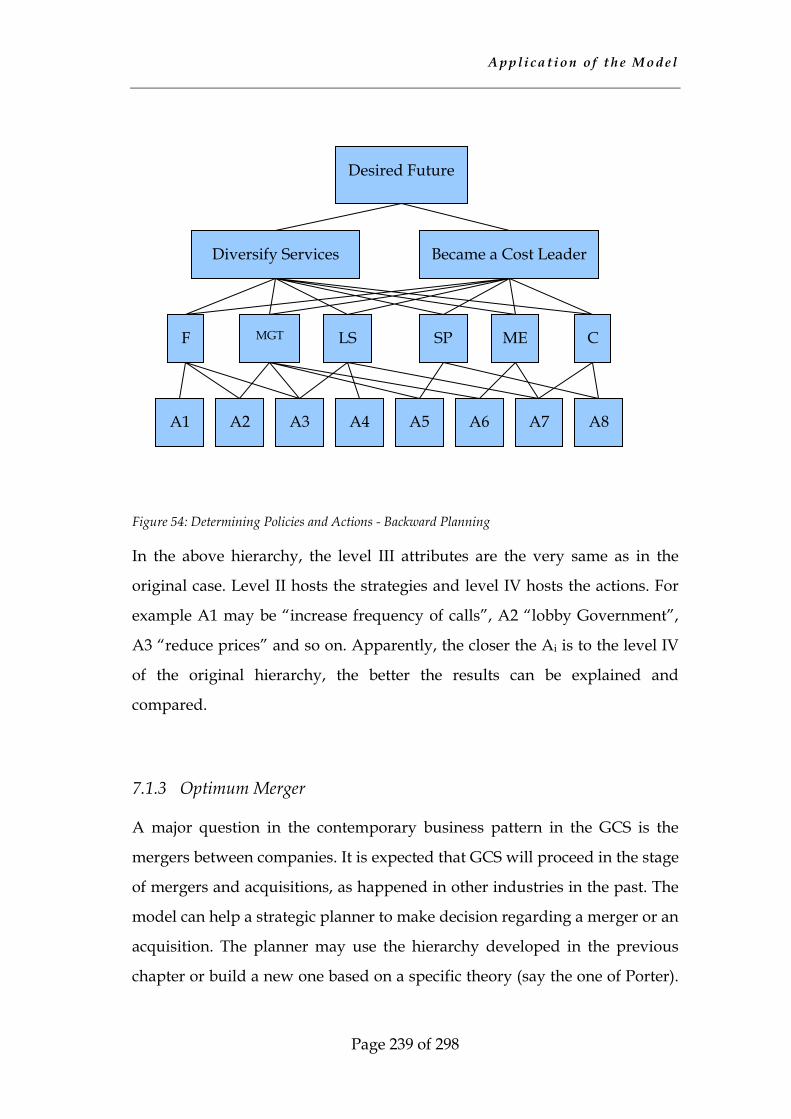
A p p l i ca t i o n o f t h e M o d e l
Page 239 of 298
Figure 54: Determining Policies and Actions - Backward Planning
In the above hierarchy, the level III attributes are the very same as in the
original case. Level II hosts the strategies and level IV hosts the actions. For
example A1 may be “increase frequency of calls”, A2 “lobby Government”,
A3 “reduce prices” and so on. Apparently, the closer the Ai is to the level IV
of the original hierarchy, the better the results can be explained and
compared.
7.1.3 Optimum Merger
A major question in the contemporary business pattern in the GCS is the
mergers between companies. It is expected that GCS will proceed in the stage
of mergers and acquisitions, as happened in other industries in the past. The
model can help a strategic planner to make decision regarding a merger or an
acquisition. The planner may use the hierarchy developed in the previous
chapter or build a new one based on a specific theory (say the one of Porter).
Desired Future
Became a Cost Leader Diversify Services
F MGT LS
A2
ME SP
A3 A4 A5 A6 A7
C
A1 A8
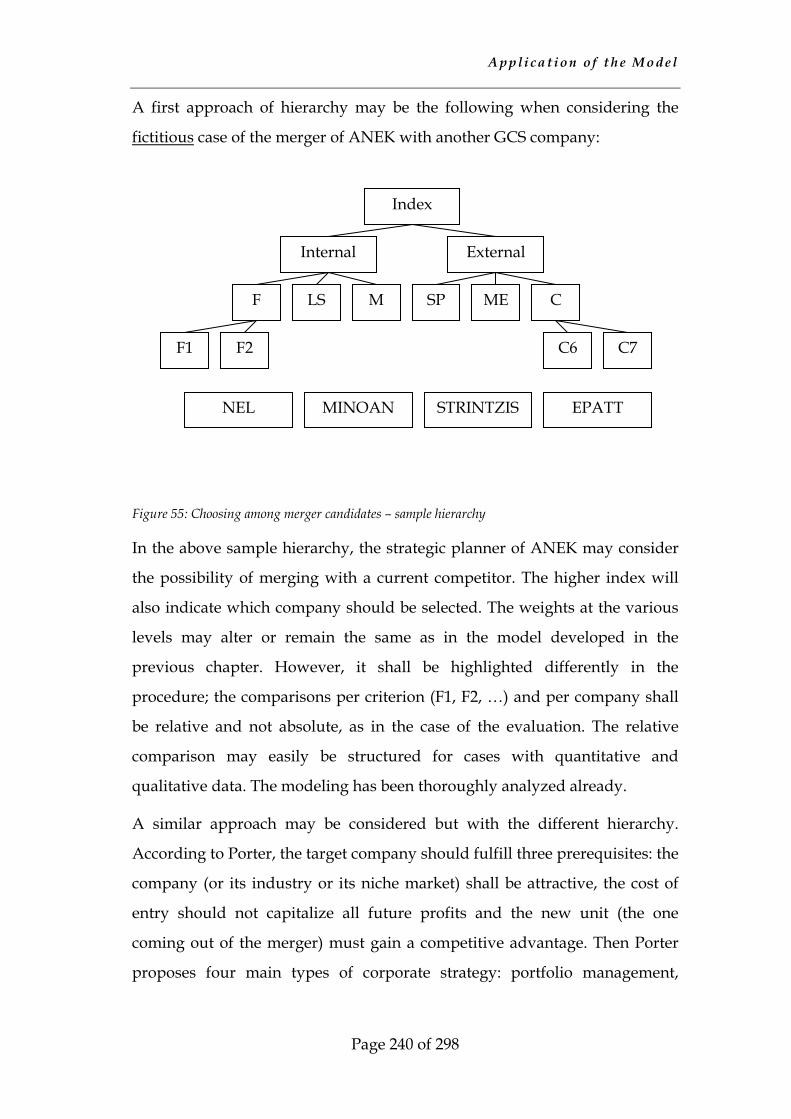
A p p l i ca t i o n o f t h e M o d e l
Page 240 of 298
A first approach of hierarchy may be the following when considering the
fictitious case of the merger of ANEK with another GCS company:
Figure 55: Choosing among merger candidates – sample hierarchy
In the above sample hierarchy, the strategic planner of ANEK may consider
the possibility of merging with a current competitor. The higher index will
also indicate which company should be selected. The weights at the various
levels may alter or remain the same as in the model developed in the
previous chapter. However, it shall be highlighted differently in the
procedure; the comparisons per criterion (F1, F2, …) and per company shall
be relative and not absolute, as in the case of the evaluation. The relative
comparison may easily be structured for cases with quantitative and
qualitative data. The modeling has been thoroughly analyzed already.
A similar approach may be considered but with the different hierarchy.
According to Porter, the target company should fulfill three prerequisites: the
company (or its industry or its niche market) shall be attractive, the cost of
entry should not capitalize all future profits and the new unit (the one
coming out of the merger) must gain a competitive advantage. Then Porter
proposes four main types of corporate strategy: portfolio management,
Index
Internal External
F LS M SP ME C
F1 F2 C7 C6
NEL MINOAN STRINTZIS EPATT

A p p l i ca t i o n o f t h e M o d e l
Page 241 of 298
restructuring, transferring skills and sharing activities. Their main attributes
are analyzed as following:
P1: Need of Cash
P2: Need of Management Expertise
P3: Capacity of the new company to handle business
R1: Does the new company need new management?
R2: Likelihood of future occurrences making the target company more
attractive
R3: Does the new company need new strategy?
T1: Common skills (need/have/etc.)
T2: Are the skills/activities important for a competitive advantage
T3: Likelihood of successful attempt
S1: Prospects
S2: Prospects important for a competitive advantage
S3: Likelihood of degrading the resources (or other aspects, accordingly)
The following hierarchy considers the above theory and some of its main
axes of development:
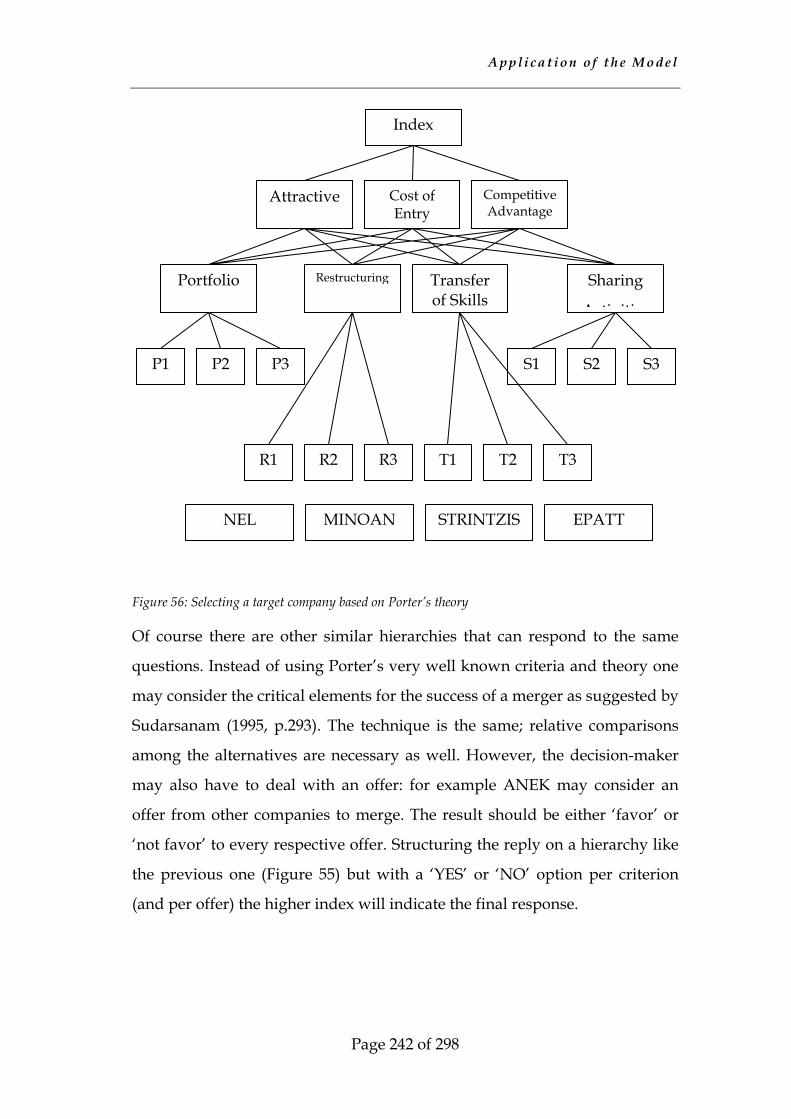
A p p l i ca t i o n o f t h e M o d e l
Page 242 of 298
Figure 56: Selecting a target company based on Porter’s theory
Of course there are other similar hierarchies that can respond to the same
questions. Instead of using Porter’s very well known criteria and theory one
may consider the critical elements for the success of a merger as suggested by
Sudarsanam (1995, p.293). The technique is the same; relative comparisons
among the alternatives are necessary as well. However, the decision-maker
may also have to deal with an offer: for example ANEK may consider an
offer from other companies to merge. The result should be either ‘favor’ or
‘not favor’ to every respective offer. Structuring the reply on a hierarchy like
the previous one (Figure 55) but with a ‘YES’ or ‘NO’ option per criterion
(and per offer) the higher index will indicate the final response.
Sharing
A ti iti
S3
Index
Portfolio
P1 P2 P3 S1 S2
NEL MINOAN STRINTZIS EPATT
Restructuring Transfer of Skills
Attractive Cost of Entry
Competitive Advantage
R1 R2 R3 T1 T2 T3
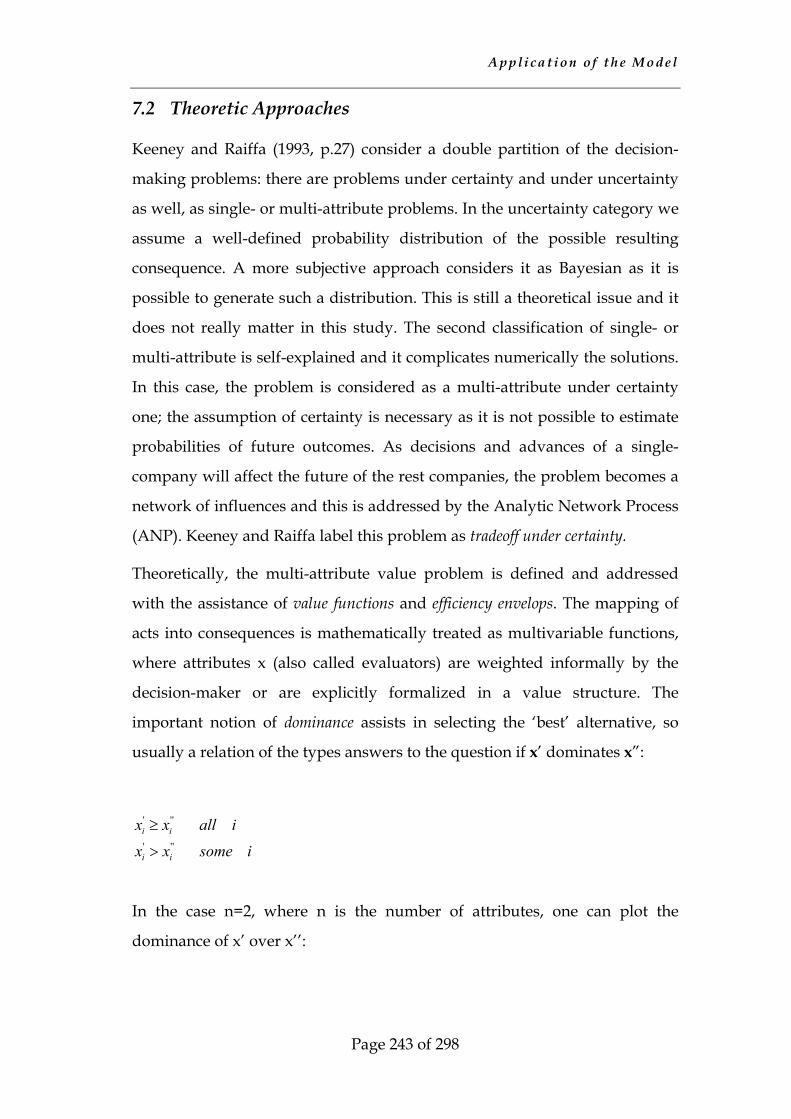
A p p l i ca t i o n o f t h e M o d e l
Page 243 of 298
7.2 Theoretic Approaches
Keeney and Raiffa (1993, p.27) consider a double partition of the decision-
making problems: there are problems under certainty and under uncertainty
as well, as single- or multi-attribute problems. In the uncertainty category we
assume a well-defined probability distribution of the possible resulting
consequence. A more subjective approach considers it as Bayesian as it is
possible to generate such a distribution. This is still a theoretical issue and it
does not really matter in this study. The second classification of single- or
multi-attribute is self-explained and it complicates numerically the solutions.
In this case, the problem is considered as a multi-attribute under certainty
one; the assumption of certainty is necessary as it is not possible to estimate
probabilities of future outcomes. As decisions and advances of a single-
company will affect the future of the rest companies, the problem becomes a
network of influences and this is addressed by the Analytic Network Process
(ANP). Keeney and Raiffa label this problem as tradeoff under certainty.
Theoretically, the multi-attribute value problem is defined and addressed
with the assistance of value functions and efficiency envelops. The mapping of
acts into consequences is mathematically treated as multivariable functions,
where attributes x (also called evaluators) are weighted informally by the
decision-maker or are explicitly formalized in a value structure. The
important notion of dominance assists in selecting the ‘best’ alternative, so
usually a relation of the types answers to the question if x’ dominates x”:
In the case n=2, where n is the number of attributes, one can plot the
dominance of x’ over x’’:
isomexx
iallxx
ii
ii'''
'''
>
≥
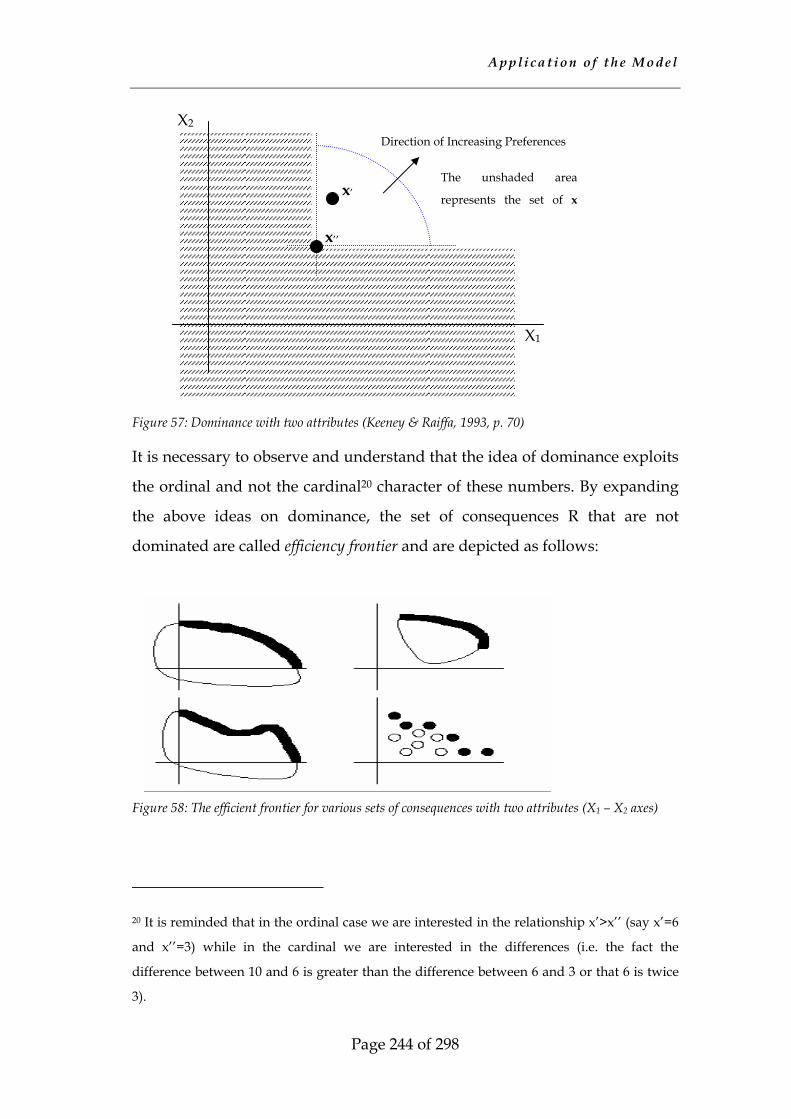
A p p l i ca t i o n o f t h e M o d e l
Page 244 of 298
Figure 57: Dominance with two attributes (Keeney & Raiffa, 1993, p. 70)
It is necessary to observe and understand that the idea of dominance exploits
the ordinal and not the cardinal20 character of these numbers. By expanding
the above ideas on dominance, the set of consequences R that are not
dominated are called efficiency frontier and are depicted as follows:
Figure 58: The efficient frontier for various sets of consequences with two attributes (X1 – X2 axes)
20 It is reminded that in the ordinal case we are interested in the relationship x’>x’’ (say x’=6
and x’’=3) while in the cardinal we are interested in the differences (i.e. the fact the
difference between 10 and 6 is greater than the difference between 6 and 3 or that 6 is twice
3).
X2
X1
Direction of Increasing Preferences
x’
x’’
The unshaded area
represents the set of x
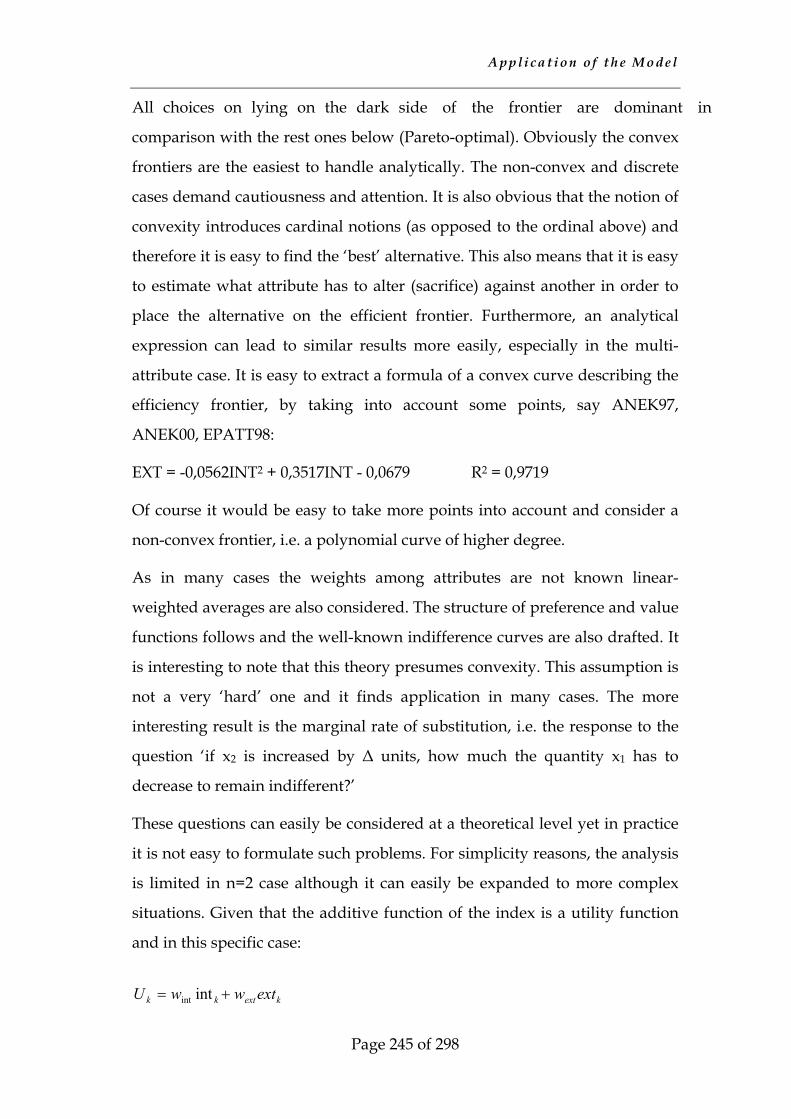
A p p l i ca t i o n o f t h e M o d e l
Page 245 of 298
All choices on lying on the dark side of the frontier are dominant in
comparison with the rest ones below (Pareto-optimal). Obviously the convex
frontiers are the easiest to handle analytically. The non-convex and discrete
cases demand cautiousness and attention. It is also obvious that the notion of
convexity introduces cardinal notions (as opposed to the ordinal above) and
therefore it is easy to find the ‘best’ alternative. This also means that it is easy
to estimate what attribute has to alter (sacrifice) against another in order to
place the alternative on the efficient frontier. Furthermore, an analytical
expression can lead to similar results more easily, especially in the multi-
attribute case. It is easy to extract a formula of a convex curve describing the
efficiency frontier, by taking into account some points, say ANEK97,
ANEK00, EPATT98:
EXT = -0,0562INT2 + 0,3517INT - 0,0679 R2 = 0,9719
Of course it would be easy to take more points into account and consider a
non-convex frontier, i.e. a polynomial curve of higher degree.
As in many cases the weights among attributes are not known linear-
weighted averages are also considered. The structure of preference and value
functions follows and the well-known indifference curves are also drafted. It
is interesting to note that this theory presumes convexity. This assumption is
not a very ‘hard’ one and it finds application in many cases. The more
interesting result is the marginal rate of substitution, i.e. the response to the
question ‘if x2 is increased by ∆ units, how much the quantity x1 has to
decrease to remain indifferent?’
These questions can easily be considered at a theoretical level yet in practice
it is not easy to formulate such problems. For simplicity reasons, the analysis
is limited in n=2 case although it can easily be expanded to more complex
situations. Given that the additive function of the index is a utility function
and in this specific case:
kextkk extwwU += intint
A p p l i ca t i o n o f t h e M o d e l
Page 246 of 298
where k is indicating the year and the company then the maximization
problem of this utility function is formulated as:
In the general case where U(x1, x2, x3…,xn) and the weights are wj (1, 2, 3, …,
n) the optimization problem is formulated as:
This is a many-input one-output optimization problem and it is easily
derived that the ratio of marginal utilities of two inputs equals the ratio of
their weights:
Given U as constant then the iso-utility (indifference curve) is estimated as:
In other words the slope at the maximazing point has to be equal to -3 (-
0,75/0,25) for the maximazation of the U function. By having all this
information it is easy to extract marginal rates of substitution. This is a
special case of linear indifference curves. However, one can theoretically find
indifference curves in more general and complicated cases, such in the case
of 6 inputs (level III criteria).
Theoretically, it is also possible to consider dynamic problems, i.e. by
introducing time-variants in the analysis or to use conjoint analysis for the
j
k
j
k
k
j
ww
xUxU
dxdx
=
∂∂∂∂
=−
1int
)intmax(
int
int
=+
+=
extwwst
extwwMaxU
ext
ext
j
k
j
k
ww
xUxU
=
∂∂∂∂
Exwxwxwst
xxxUMaxU
nn
n
=+++
=
...
),...,,(
2211
21

A p p l i ca t i o n o f t h e M o d e l
Page 247 of 298
better estimation of trade-offs. However, all these tools are solely interesting
to researchers and mathematicians.
Another observation is that one can assume that the discrete case of the
efficiency frontier can produce a more ‘elegant’ analytical formulation. It is
possible to estimate a polynomial expression that can further assist in
mathematical explorations. It has to be noted that continuity is critical for
further elaboration and non-convex expressions will increase the analytical
complexity. However once again, it has to be highlighted that such
approaches are left to the ‘creative judgment’ of the researcher (Keeney and
Raiffa, 1993, p. 74) as there is only ad-hoc approximations and the practical
result or the usability of the outcome is questionable.
C o n c l u s i o n s a n d F u r t h er D e v e l o p m e n t
Page 248 of 298
8 Conclusions and Further Development
8.1 Conclusions
The conclusions of this study will be listed below as derived from the
research and clustered in relevant subgroups in accordance to the structure
of the document.
1. The Greek Coastal System:
1.1. The GCS companies have benefited from their listing at the ASE and
have experienced enormous growth during the period 1997-2002.
Growth rates of their assets are estimated within the range of 25-46%.
The fixed assets of these companies have increased in value as new
vessels came into operation. The shareholders’ equity has also
expanded dramatically. However, not all years have been profitable,
and perpetual carriers experienced losses, especially in the 2000-2
period.
1.2. The long-term liabilities of the companies have also been increased as
result of the fleet renewal. Nevertheless, the leverage ratio remained
within acceptable levels.
1.3. The market-shares based on turnover are shifted from the dominant
Cretan companies MINOAN and ANEK in the 90s’ to the group of
companies of EPATT (Superfast Ferries and Blue Star Lines –
STRINTZIS). Looking closer into the shift-share analysis of market
shares per turnover (as product) it is interesting to note that EPATT
are continuously gaining share against other actors. In absolute terms,
STRINTZIS has not experienced reduction of its market share but the
growth was not the expected one. All other carriers have lost part of
their market share per turnover in favor of EPATT.
1.4. Most of the revenues are attributed to fares charged (approximately
87%) and are accrued in the Adriatic (approximately 70%), although
C o n c l u s i o n s a n d F u r t h er D e v e l o p m e n t
Page 249 of 298
this market represents almost 30% of the total passenger traffic
reported, 40% of the total car traffic and 55% of the total truck traffic.
1.5. The market is not oligopolistic. According to HHI and Gini coeffient
methodologies, the market is not concentrated to some carriers. This
finding is consistent with the perspective of the market that the
MMM curved the all markets in ‘equal’ parts to satisfy all interests
and all ‘interests’ were satisfied with that arrangement.
1.6. The fleet consists of almost 70 vessels (new and old, conventional and
non-conventional, deployed in the Aegean or the Adriatic). Almost
93% of them (65) are considered as conventional. The average
reported speed is around 24 knots. This figure is considered as
‘exaggerated’ for the vessels deployed in the Aegean but close to
reality for the vessels deployed in the Adriatic. The total capacity of
passengers is around 93000 and the average around 1330. This figure
reflects reality; this is not the case with the extracted results for beds,
cars and trucks. A rather not reliable statistic suggests that every ship
offers around 390 beds, carries 330 private cars or a combination of
121 cars and 76 trucks. The measurement would be more accurate if
only the available line meters were known. The average year the keel
was laid is 1987; most of the old vessels have undergone extensive
overhauls in the 1990s’.
1.7. There are not many and important developments regarding the ports
servicing the vessels of these companies. The developments in the
port industry have not yet affected the GCS system, although they
will definitely do so in the near future. In the Ionian Sea the
increasing importance of Igoumenitsa may affect planning and
operations. In the Aegean, it is expected that new ports, such as
Lavrio may undertake some traffic and relieve the main-hub of
Piraeus. As the system currently operates in the Aegean most of the
expected developments remain speculatory.
C o n c l u s i o n s a n d F u r t h er D e v e l o p m e n t
Page 250 of 298
2. Literature Review
2.1. There are many, but obsolete texts, regarding the risk structure and
the criteria for financing shipping ventures. None is specifically
addressed to SSS and coastal shipping.
2.2. There is a lot of literature in the field of MCDM but no MCDSS tool or
MA methodology relevant to the shipping company evaluation as
reported. Some attempts in the literature are limited to relative
comparisons or to academic purposes. The use of MCDM techniques,
as well as the academic interest in the risk related problems, is
increased lately.
2.3. The issue of GCS in the literature has not appeared lately. Only
papers and studies of the mid-90s’ are reported and set the basis for
further research and elaboration. Most of them are presented by
Greek research institutions.
3. Methodology
3.1. AHP has been selected on the following grounds:
3.1.1. in absolute comparison mechanisms it is not possible to
experience rank-preservation problems;
3.1.2. the set of data is very large and the relative comparison of
every alternative for every year available would increase the
numerical and decisional burden exponentially;
3.1.3. it is easy to add alternatives (existing or dummy ones), to
experiment with the sensitivity of parameters, or to estimate the
outcome of an action (element sensitivity);
3.1.4. the focal attention lies on the hierarchy, i.e. on the insights and
on the parameters determining the phenomenon
3.1.5. AHP can be combined with other methods
3.1.6. AHP-required hierarchies can be further developed to

C o n c l u s i o n s a n d F u r t h er D e v e l o p m e n t
Page 251 of 298
networks and systems with dependencies and influences
(commonly addressed by ANP)
3.2. The sensitivity analysis is critical and has been addressed on the basis
of specialized research on the AHP, in order to proceed in the:
3.2.1. Determination of the most critical criterion,
3.2.2. Determination of the most critical element in the decision
matrix.
4. The lenders’ market
4.1. Financial Institutions have to face risks in a totally different way and
specifically deal with the operational risk.
4.2. Financial Institutions with lending interests in shipping are reduced
in number, but the overall portfolio is expanded.
4.3. Shipping companies will experience consolidation in number and
simultaneous increase of their size. This is partially the result of
splitting the market in risk-tiers in accordance to the new lending
rules and strategies.
4.4. A hierarchy with six levels has been used in order to map the Greek
lending market. Questionnaires have been used in order to collect
answers; their structure is based solely on the theory as described in
the literature and on experiences. Due to lack of experts to assign
weights a simulation procedure has determined the weights of the
upper level. The results are interesting as banks are clustered and
preferences are revealed21.
4.5. The importance of the GCS sector to the lenders is rather limited, as it
represents about 6% of the total portfolio available and about 9% of
21 The names of the banks are known to the author but for disclosure reasons they are not
revealed.
C o n c l u s i o n s a n d F u r t h er D e v e l o p m e n t
Page 252 of 298
the Greek FI active in the market (€1.64bn in 2001 and €2.15bn in
2002). According to data provided by the ASE, the GCS listed
companies have acquired 220bn GrD (€645m) from the market up to
the end of 2002. Obviously, bank lending is considered as the most
important source of financing.
5. The shipping company evaluation model and its applications:
5.1. The developed model can yield an overall evaluation of GCS
companies according to a criteria structure (hierarchy).
5.2. As the weighting of criteria at lower levels is assigned by the
decision-maker for simplicity and consistency reasons, weights at
higher levels that affect the final ranking the most, are allotted
through sensitivity analysis and simulation.
5.3. The most critical criterion, i.e. the one that can alter the ranking with
the minimum relative change is the one of fundamental data. The
most critical element is the one with the assigned grade of
performance at fundamental accounting criterion for NEL.
5.4. Both simulation and scenario analysis yield the same ranking
practically, with slight differences in a specific year of analysis. This is
an interesting validating point.
5.5. The resulting index can be explained from the shift-share analysis.
From the available data for the turnover, almost 60% of all results can
be explained. For the rest of the elements a conjoint analysis with the
shift-share analysis for the traffic is required.
5.6. The model, can be used as is for the determination of overall
rankings, corporate planning (‘what-if’ scenarios) and comparison
with other companies not included in the current sample (say
companies from other markets and or not listed GCS companies)
C o n c l u s i o n s a n d F u r t h er D e v e l o p m e n t
Page 253 of 298
5.7. The model after adjustment of its hierarchy may also assist in
corporate planning and focused cases, such as merger between
companies.
As a last comment, the contribution of this thesis in the state of the art is
evident. For the first time in the academic literature, a market analysis of the
most significant actors is provided. Furthermore, the analysis of their
financial and operational course into sub-criteria reveals differences of their
structure and their decisions. The classification of these companies according
to a rational set of criteria comprises, also, a very powerful tool for
managerial decisions. This tool may easily be used by the management of the
company for comparison or planning reasons, as well as by academics and
policy-makers as monitoring tool of the market. The tool is validated through
a shift-share analysis of historical data, thus strengthening the belief that the
appointed weights are reflecting actual conditions. Of course, an MCDM tool
remains a subjective tool and the hierarchy reveals the understanding of the
problem, as well as the indented goals. Further research and adjustments
may easily be launched on the basis of this prototype. Last, but not least, the
analysis of the lenders’ market, as well as, side results of the analysis, such as
the market concentration analysis appear for the first time in the academic
and business literature.
8.2 Further Considerations
The conclusions listed in the previous paragraph lead also to some further
considerations. These considerations are classified into two major categories:
those related to the theory and those related to the application.
8.2.1 Further Research
The AHP and most other MCDM methods are primarily products of research
in the fields of mathematics, operations research and engineering. Most of
the researchers behind this modeling are economists, mathematicians or
engineers, therefore these models are normative and biased to rationality, the
C o n c l u s i o n s a n d F u r t h er D e v e l o p m e n t
Page 254 of 298
way mathematics define it. Decision-making is a field that psychology and
psychiatry contribute as well. It has to be highlighted, that Saaty and other
researchers base their arguments on the scales required for the pairwise
comparisons on stimuli analyses, an absolutely psychometric field. The
justification of the use of a specific scale is usually considered by scientists of
such fields in the literature; their approach may be enlightening for engineers
and mathematicians.
As a result of the above, it is necessary to implement interdisciplinary
approaches in such problems in order to deviate from a normative
perspective to a more realistic one. This is also critical for the extraction of
utility functions of decision-makers at various levels. A proposal for further
research should absolutely be the extraction of group utility functions; this
would assist in considering other methods in these interesting MCDM
problems.
A clear split between corporate decision-makers and other important actors
in the GCS system, such as lenders and policy-makers, as well as the
revelation of their preferences on specific issues, (situations or states) would
enable more complex decision-making approaches, more informative on the
relations between actors, their conflicts and their dependencies. One could
argue that ANP could also provide such information, if only hierarchies are
further expanded to holarchies (networks with influences and
dependencies). Theoretically this is true, and numerically is also easily
possible. However, the network of dependencies demands a deep
consideration of the needs and the goals of every actor. In cases, where
several managerial groups are involved, as in this case with five different
BoD, it is very difficult to get the clear picture, but only assume some of these
characteristic. From a more macroscopic approach, one could consider a set
of interests and needs for specific groups, say the lenders, the MMM as
regulator, the users, the operators, and the employees. Even from that
perspective this would lead to theoretic results, as there are many differences
C o n c l u s i o n s a n d F u r t h er D e v e l o p m e n t
Page 255 of 298
between the members of the same group (truckers, tourists, islander,
investors, lenders, etc. to name some).
Once again the issue of combining input techniques and ranking
methodologies shall be highlighted and suggested for further elaboration.
This issue has been adequately dealt in previous paragraphs (see §4.3 and
§6.3.1).
Another issue for further theoretic elaboration is the issue of corporate
management; there is no real academic work on the issue of the corporate
governance of GCS industry and in Greek shipping generally. In other
shipping-oriented nations, such as Norway, some research activities are in
process already. The issue of the corporate governance is critical, not only for
the inclusion of shipping in wider political and financial planning, as in the
case of grants, sector promotion as in the case of SSS, but also for the
understanding of internal forces within the corporation. It was clearly stated
in the chapter devoted to the lenders’ market, that there is a trend of
consolidation of the shipping operators and that will demand clear corporate
structures, strategies and relationships. Currently, the GCS companies are
following some corporate governance rules, as listing obligations. However,
a deeper look and study of their information memoranda, i.e. their official
communication with the investors, reveals the absence of the active
participation from the investors. Most of these companies are practically held
by the original shareholders; no representative of the investors is in the board
and the memoranda are not as transparent as they should be on the
operations. The lack of simple data, such as of the sailings, the vessels’
service of a specific route, etc. prohibit the reader from understanding the
real operations. The argument that these data are obscured or should remain
hidden for competition purposes is not really valid, as all operators closely
monitor the tactical movements of their competitors.
In conclusion, it is necessary to study the corporate governance of this
industry in order to understand the internal forces and to predict the future

C o n c l u s i o n s a n d F u r t h er D e v e l o p m e n t
Page 256 of 298
of the decision-making process as these companies are listed and shall follow
some transparency and investors’ communication procedures (see also p.
173). Furthermore, it is appealing to suggest to the Authorities and the
industry the structure for the various texts and documents that shall be
communicated with the investors, so to improve transparency and
understanding of the core business yet hiding the necessary information
from the competitors.
8.2.2 Applications-related Issues
The very first issue one can discuss is the use of the model and its adjustment
towards a specific goal. As the model is constructed, one can extract rankings
for the overall evaluation of a GCS company. Furthermore one can monitor
their course in the previous years and finally forecast their future standing,
given a specific set of criteria and attributes. That can be of use to lenders, to
investors, to the management of these companies and to the researchers
monitoring this market. Some more criteria can be added in order to include
more ‘beneficiaries’, such as regulators. In that case, one could consider
customer-satisfaction indices focused on the services provided. That would
be of direct interest to regulators, who grant licenses and consider inclusion
of the GCS industry in wider political planning. Minor adjustments of the
model, such as employment figures, pension and health benefits numbers
may shift the focus to issues interesting policy-makers.
By adjusting a little bit more, i.e. by distorting the hierarchies at upper levels,
one can include route-specific data as well as customer-satisfaction indices
and focus on operations, rather than on overall performance. However, the
data availability and their integrity are questionable. The issue of data
availability shall be addressed from the regulating Ministry; the data
available to the public are aggregated figures of the routes. There is no real
information on the embarkation and the disembarkation of users among
destinations and only rough estimates are in use. Furthermore, there are no
statistics of users who used two operators and mid-destination (transit) in

C o n c l u s i o n s a n d F u r t h er D e v e l o p m e n t
Page 257 of 298
order to reach their destination. For example, there is no real information on
the number of users, who used Syros or Mykonos for transit destination in
order to reach other islands, not directly connected to their point of origin.
Without this information it is not really possible to design the network, as
well as to grant licenses without misrepresent physical and economic
parameters. The issue of data-collection is thorny but simply stated
preference questionnaires on-board vessels and at ports would enhance our
understanding of the flows in the network.
Another interesting suggestion for further research related to the application
is the incorporation of the index (more possibly adjusted) in formulas used
by the Ministry or financial institutions for their purposes. One has to adjust
the results of the model with the needs of each respective user and most
probably to alter weights or adjust the hierarchy.
Finally, this is only a prototype and it can definitely be upgraded and
improved. As our understanding deepens, and the availability of data
increases there is a potential to expand this model and its capabilities. It
strongly depends on the needs of the decision-makers, the goals set and the
improvements of the methodology (input, consistency, ranking as
explained). The sections on the mergers and the planning (see pages 237 and
239) show some of the capabilities of the model and the way to other
researchers and practitioners for further elaboration.
R e f e r e n c e s
Page 258 of 298
9 References
[1] Abhyankar, J. and Bijwadia, S. I., editors (1994). Maritime Joint
Ventures. Paris: International Chamber of Commerce Publications
[2] Aczel, J., Roberts, F.S. (1989). On the Possible Merging Functions.
Mathematical Social Sciences, 17, p205-243
[3] Akatsuka, K., Leggate, H.K. (2001). Perceptions of Foreign Exchange
Rate Risk in the Shipping Industry. Maritime Policy & Management,
28, (3), 235-249
[4] Alidi, A.S. (1996). Use of the Analytic Hierarchy Process to Measure
the Initial Viability of Industrial Projects. Journal of Project
Management, Vol. 14, No 4, pp. 205-208
[5] Altman, E.I., Saunders, A. (1998). Credit Risk Measurement:
Developments over the Last 20 Years. Journal of Banking and Finance,
21, 1721-1742
[6] Beck, A. (1998). RARORAC. Presentation. Det Norske Bank, Oslo,
Norway
[7] Beenstock, M., Vergottis, A. (1993) ‘Economic Modeling of World
Shipping’. Chapman & Hall, London
[8] Ben-Arieh, D., Triantaphyllou, E. (1992). Quantifying Data for Group
Technology with Weighted Fuzzy Features. International Journal of
Production Research, Vol. 30, No6, pp. 1285-1299
[9] Bouri, A., Martel, J.M., Chabchoub, H. (2002) A Multi-Criterion
Approach for Selecting Attractive Portfolio. Journal of Multi-Criteria
Decision Analysis, Vol. 11, p.p. 269-277
[10] Breton, G., Taffler, R.J., (1995), ‘Creative Accounting and Investment
Analysis Response’, Accounting and Business Research, Vol. 25, No. 98,
pp. 81-92
R ef e r en ce s
Page 259 of 298
[11] Chauvel, A-M., (1997). Managing Safety and Quality in Shipping.
London: The Nautical Institute
[12] Cheng, P. (1979). Financial Management in the Shipping Industry.
Cornell Maritime Press
[13] Chou, T.-Y., Liang, G.-S. (2001). Application of a fuzzy multi-criteria
decision-making model for shipping company performance
evaluation. Maritime Policy & Management, 28, (4), 375-392
[14] Commission of the European Communities, Regulation 3577/1992
[15] Dikos, G, Papapostolou, N. (2002). The Assessment of Market
Efficiency in The Shipping Sector: A New Approach. Maritime Policy
& Management, 29, (2), 179-181
[16] Dimitras, A., Petropoulos, T., Constantinidou, I. (2002) Multi-Criteria
Evaluation of Loan Applications in Shipping. Journal of Multi-Criteria
Decision Analysis, Vol. 11, p.p. 237-246
[17] European Short-Sea Shipping, Proceedings of the First European
Research Roundtable Conference on Short-Sea Shipping, 1992,
Lloyd’s of London Press Ltd
[18] European Short-Sea Shipping, Proceedings of the Second European
Research Roundtable Conference on Short-Sea Shipping, 1994, Delft
University Press and Lloyd’s of London Press Ltd
[19] European Short-Sea Shipping, Proceedings of the Third European
Research Roundtable Conference on Short-Sea Shipping, 1996, Delft
University Press
[20] Evans, J.J. and Marlow, D.B. (1990). Quantitative methods in shipping.
Surrey: Fairplay Publications Ltd.
[21] Farthing, B. (1993). International Shipping. Second Edition, Lloyd’s of
London Press Ltd

R ef e r en ce s
Page 260 of 298
[22] Francis, J C and Taylor, R W (1992).Investments. New York: McGraw-
Hill.
[23] Francis, J., Shipper, K., (1999), ‘Have Financial Statements Lost Their
Relevance?’, Journal of Accounting Research, Vol. 37, No. 2, pp. 319-352
[24] Gilje, T.T., Diwoodie, J., Challacombe, J. (2002). Crude Carrier
Consolidation and Capital Cost. International Journal of Maritime
Economics, 4, (1), 35-54
[25] Goulielmos, A. (1998). Shipping Finance, in Greek, Stamoulis Editions,
Athens, GR
[26] Grammenos, C.T, Xilas, M. (1997). Shipping Investment and Finance.
Class Notes, Part I and II, City University Business School, London
[27] Grammenos, C.T, Xilas, M. (1999). Shipping Investment and Finance.
Class Notes, Part III and IV, City University Business School, London
[28] Grammenos, C.T., Arkoulis, A.G. (1999). The Long Run Performance
of Shipping Initial Public Offerings. International Journal of Maritime
Economics, 1, (1), 71-93
[29] Grammenos, C.T., Arkoulis, A.G. (2002). Macroeconomic Factors and
International Shipping Stock Returns. International Journal of Maritime
Economics, 4, (1), 81-99
[30] Gray W. J. (1986). ‘Financial risk management’. London: Fairplay
Publications
[31] Gray, W. J. (1987). ‘Futures and options for shipping’. London:
Lloyd’s List Press
[32] Goulielmos, A.M., Lekakos, M. (1992). The Economic Structure of Greek
Passenger Coastal Shipping. European Short Sea Shipping, 1st
Roundtable, Lloyd’s of London Press
[33] Goulielmos, A.M., Milliaraki, M. (1994). The Economic and Social Impact
on Greek Passenger Coastal Shipping of the Free Movement of Marine Labor
R ef e r en ce s
Page 261 of 298
in European Union. European Short Sea Shipping, 2nd Roundtable,
Delft University Press and Lloyd’s of London Press
[34] Hahn, E. (2003) Decision Making with Uncertain Judgments: A Stochastic
Formulation of the Analytic Hierarchy Process. Decision Sciences, Vol. 34,
No 3
[35] Hallerbach, W., Spronk, J. (2002). A Mutlidimensional Framework for
Financial-Economic Decisions. Journal of Multi-Criteria Decision
Analysis, 11, 111-124
[36] Hallerbach, W., Spronk, J. (2002). The Relevance of MCDM for
Financial Decisions. Journal of Multi-Criteria Decision Analysis, 11, 187-
195
[37] Harker, P.T. (1987). Incomplete pairwise comparisons in the analytic
hierarchy process. Mathematical Modelling, 9 (11), pp 837-848
[38] Hellenic Republic, Maritime Law
[39] Hellenic Republic, Presidential Decree 6059/1934
[40] Hellenic Republic, Presidential Decree 2932/2001
[41] Hellenic Republic, Public Maritime Law
[42] Kavoussanos, M.G., Alizadeh, A.H. (2002). Efficient Pricing of Ships
in the Dry Bulk Sector of the Shipping Industry. Maritime Policy &
Management, 29, (3), 303-330
[43] Kavussanos, M.G., Juell-Skielse, A., Forrest, M. (2003). International
Comparison of Market Risks across Shipping-Related Industries.
Maritime Policy & Management, 30, (2), 107-122
[44] Kavussanos, M.G., Marcoulis, S.N. (1998) Beta Comparisons across
Industries. Maritime Policy & Management, 25, (2), 175-184
[45] Kavussanos, M.G., Marcoulis, S.N. (2000). The Stock Market
Perception of Industry Risk and Macroeconomic Factors: The Case of
R ef e r en ce s
Page 262 of 298
Us Water and Other Transportation Stocks. International Journal of
Maritime Economics, 2, (3), 235-255
[46] Keeney, R. L., Raiffa, H. (1993). Decisions with Multiple Objectives.
Preferences and Value Tradeoffs. Cambridge University Press (reprinted
1999)
[47] Leggate, H.K. (1999). Norwegian Shipping: Measuring Foreign
Exchange Risk. Maritime Policy & Management, 26, (1), 81-91
[48] Leggate, H.K. (2000). A European Perspective on Bond Finance for
the Maritime Industry. Maritime Policy & Management, 27, (4), 353-362
[49] Leigh, W., Purvis, R., Ragusa, J.M. (2002). Forecasting the NYSE
Composite Index with Technical Analysis, Pattern Recognizer, Neural
Network, and Genetic Algorithm: A Case Study in Romantic Decision
Support. Decision Support Systems, 32, 361-377
[50] Liberatore, M. J., (1987). An Extension of the Analytical Hierarchy
Process for Industrial R&D Project Selection and Resource Allocation.
IEEE Transactions on Engineering Management, EM-34 (1), pp. 12-18.
[51] Liberatore, M. J., Nydick, R. L. and Sanchez, P.M., (1992). The
Evaluation of Research Papers (Or How to Get an Academic
Committee Agree on Something). Interfaces, 22(2), pp.92-100.
[52] Lirn, TC., Thanopoulou, H., Beynon, MJ, Beresford, AKC (2004). An
Application of AHP on Transshipment Port Selection: A Global
Perspective. Maritime Economics & Logistics, 6, 70-91
[53] Mangan, J., Lalwani, C. Gardner, B. (2001). Identifying Relevant
Variables and Modellingthe Choice Process in Freight Transportation.
International Journal of Maritime Economics, 3, (3), 278-297
[54] Millet, I., Wedley, W.C. (2003). Modeling Risk and Uncertainty with
the Analytic Hierarchy Process. Journal of Multi-Criteria Decision
Analysis, 11, 97-107
R ef e r en ce s
Page 263 of 298
[55] Mousseau, V. (1995). Eliciting Information Concerning the Relative
Importance of Criteria. ‘Advances of Multicriteria Analysis’ edited by
Pardalos and Zoponidis. Kluwer Academic Publishers
[56] Muller, G. (1995). ‘Intermodal Freight Transportation’. Lansdowne,
VA: ENO
[57] Organization for Economic Co-operation and Development, OECD
Principles of Corporate Governance, 2004
[58] Panayides, P.M., Cullinane, K.P.B. (2002). The vertical disintegration
of ship management choice criteria for third party selection and
evaluation. Maritime Policy & Management, 29, (1), 45-64
[59] Panayides, P.M., Gong, X. (2002). The Stock Market Reaction to
Merger and Acquisition Announcements in Liner Shipping.
International Journal of Maritime Economics, 4, (1), 55-80
[60] Petropoulos, T (2001). ‘Ship Finance in Greece: Where do we go from
here?’. Lloyd’s Shipping Economist Ship Finance in Greece
Conference (June 2001). Athens, Greece
[61] Petropoulos, T (2003). ‘Evolution of Greek Shipping: Opportunities
and Challenges?’. International Shipping and Bunker Conference
(June 2003). Athens, Greece
[62] Plous, S. (1993). The Psychology of Judgment and Decision Making.
McGraw Hill Series in Social Psychology
[63] Preston, C., Gautron, A. and Lowe, C. (1997). “Ship-leasing structures
in UK, France and Denmark’. In Shipping Finance Annual 1997/98.
Essex: Euromoney Publications.
[64] Psaraftis, H.N., Papanikolaou, A.D. (1992). Impact of New Technologies
on Shortsea Shipping in Greece. European Short Sea Shipping, 1st
Roundtable, Lloyd’s of London Press
R ef e r en ce s
Page 264 of 298
[65] Psaraftis, H.N. (1993). Greek Coastal Shipping: Status, Prospects and
Investment Opportunities. Final Report to ETBA (in Greek), December
1993
[66] Psaraftis, H.N., Magirou, V.F., Nassos, G.C., Nellas, G.J., Panagakos,
G., Papanikolaou, A.D. (1994). Modal Split in Greek Shortsea Passenger
Car Transport. European Short Sea Shipping, 2nd Roundtable, Delft
University Press and Lloyd’s of London Press
[67] Randøy, T., Down, J., Jenssen, J.I. (2003). Corporate Governance and
Board Effectiveness in Maritime Firms. Maritime Economics and
Logistics, 5, (1), 40-54
[68] Rinman, T., Brodefors, R. (1983). The Commercial History of Shipping.
Rinman & Lindén AB, Gothenburg, Sweden
[69] Rogdaki, E., I., Kazantzis, Ch. (1999), ‘The Interim Financial
Statements: The Case of Greece’, European Research Studies, Vol. II,
issue 1-4, p.p. 43-57
[70] Roll (199x) Ports-DEA -MPM
[71] Saaty, T. (1977) A Scaling Method for Priorities in Hierarchical Structures.
J. Math. Psychology, Vol. 15, No 3, pp234-281
[72] Saaty, T. (1980) The Analytic Hierarchy Process, McGraw-Hill, New
York
[73] Saaty, T. L. (1994) Fundamentals of Decision Making and Priority Theory
with the Analytic Hierarchy Process. RWS Publications, Pittsburgh, PA
[74] Saaty, T. L. (2001a) Decision Making for Leaders. Third Edition. RWS
Publications, Pittsburgh, PA
[75] Saaty, T.L, Vargas, L.G. (1994). Decision Making in Economic, Political
Social and Technological Environments. The Analytic Hierarchy Process
Series, Vol. VII. RWS Publications, Pittsburgh, PA
R ef e r en ce s
Page 265 of 298
[76] Saaty, T. L. (2001b) Decision Making with Dependence and Feedback: The
Analytic Network Process. RWS Publications, Pittsburgh, PA
[77] Saaty, T.L. (1999). Fundamentals of the Analytic Network Process.
International Symposium on the Analytic Hierarchy Process (ISAHP),
Kobe, Japan, August 12-14
[78] Schinas, O. (1994). The Adriatic Intermodal Link: Status and Prospects.
Diploma Thesis (in Greek) submitted to the Department of Naval
Architecture and Marine Engineering, Supervisor Prof. H. Psaraftis,
National Technical University of Athens
[79] Schinas, O., Papadimitriou, S. (2000) Approaching the Relative
Productivity of Infrastructure in Mediterranean Container Terminals with
the Use of DEA. European Research Studies Journal, Vol. I, Issue 4,
[80] Sengupta, P., (1998), ‘Corporate Disclosure Quality and the Cost of
Dept’, Accounting Review, Vol. 73, No. 4, pp. 459-474
[81] Shim, J K and Siegel, J G (1986).Managerial Finance. New York:
McGraw-Hill.
[82] Sloggett, J.E. (1984). Shipping finance. London: Fairplay Publications
[83] Stokes, D. (1997) Marketing: A Case Study Approach. 2nd Edition. Letts
Educational
[84] Stokes, P. (1992). Ship Finance. London: Lloyd’s List Press
[85] Stopford, M. (1995) Maritime Economics. Routledge
[86] Sturmey, S.G., Panagakos, G., Psaraftis, H.N. (1994). Institutional and
Socioeconomic issues in Greek Ferry Services. European Short Sea
Shipping, 2nd Roundtable, Delft University Press and Lloyd’s of
London Press
[87] Sudarsanam, P.S. (1995). The Essence of Mergers and Acquisitions.
Prentice Hall

R ef e r en ce s
Page 266 of 298
[88] Theotokas, I., Alexopoulos, A. (1998) Safety and Quality in the Shipping
Industry: A Legal Analysis of the ISM Code’s Principles and Applications.
European Research Studies, Vol. 1, Issue 3, pp. 81-98
[89] Tiwari, P., Itoh, H., Doi, M. (2003). Shipper’s Port and Carrier
Selection Behavior in China: A Discrete Choice Analysis. Maritime
Economics and Logistics, 5, (1), 23-29
[90] Triantaphyllou, E. (1999). Reduction of Pairwise Comparisons in Decision
Making Via a Duality Approach. Journal of Multi-Criteria Decision
Analysis, 8, pp299-310
[91] Triantaphyllou, E., Lin, CT (1996). Development and Evaluation of Five
Fuzzy Multi-attribute Decision-Making Methods. International Journal of
Approximate Reasoning, 14, pp281-310
[92] Triantaphyllou, E., Sánchez, A., (1997). A Sensitivity Analysis Approach
for Some Deterministic Multi-Criteria Decision Making Methods Decision
Sciences, Vol. 28, No 1, pp. 151-194
[93] Triantaphyllou, E., Shu, B., Sanchez, S.N., Ray, T. (1998). Multi-
Criteria Decision Making: An Operations Research Approach.
Encyclopedia of Electrical and Electronics Engineering (J.G. Webster,
Ed.), John Wiley & Sons, NY, Vol.15, pp. 175-186
[94] Tsaur, S-H, Chang, T-Y, Yen, C-H. (2002). The Evaluation of Airline
Service Quality by Fuzzy MCDM. Tourism Management, 23, pp 107-
115
[95] Vergottis, A., (2002). ‘Institutional Investor Perspective’. Marine
Money Conference (June 2003). London, UK
[96] Wang, T-F, Cullinane, K. (2004) Industrial Concentration in Container
Ports. Proceedings of the IAME International Conference 2004, Izmir,
Turkey, p.p. 1165-1175

R ef e r en ce s
Page 267 of 298
[97] Wind, Y., Saaty, T.L. (1980). Marketing Applications of the Analytic
Hierarchy Process. Management Science, Vol. 26, No 7, pp 641-658
[98] Yang, J., Shi, P. (2002). Applying Analytical Hierarchy Process in Firm’s
Overall Performance Evaluation: A Case Study in China. International
Journal of Business, Vol. 7, No 1, pp 29-46
[99] Zopounidis, C., Doumpos, M. (2002) Multi-criteria Decision Aid in
Financial Decision Making: Methodologies and Literature Review. Journal
of Multi-Criteria Decision Analysis, 11, pp. 167-186
I n d ex
Page 268 of 298
10 Index
Accord...........................................117
acquisitions .................................120
AHP See analytic hierarchy process
Alternatives....................................92
analytic hierarchy process ...........96
Analytic Hierarchy Process .........38
anticipatory.... See Scenario Analysis
backward ......See corporate planning
balanced score card.....................163
capacity.........See Debtor's Attributes
capital............See Debtor's Attributes
character .......See Debtor's Attributes
choice of the better alternative ........See
multi-criteria decision making
problem
classificationSee multi-criteria
decision making problem
collateral .......See Debtor's Attributes
commensurate ................................100
Committee for Coastal
Transportation............................64
Conflict among attributes ............93
consistency index ........................105
consistency ratio..........................105
consolidation ............................... 120
constructivist approach ................. 197
contrast...........See Scenario Analysis
corporate governance ................ 173
corporate planning ..................... 232
creditworthiness ......................... 137
Data Envelopment Analysis ..... 229
DEASee Data Envelopment
Analysis
Decision Making UnitsSee Data
Enevelopment Analysis
Decision matrix ............................. 93
decision support system............ 151
Decision weights........................... 93
descriptionSee multi-criteria
decision making problem
descriptivist approach.................... 197
dominance...................................... 243
dominance numbers ...................... 101
E-commerce................................. 120
efficiency envelop....................... 243
efficiency frontier........................... 244
ELECTRE ....................................... 95
I n d ex
Page 269 of 298
Elicitation Techniques for
Importance Parameters...........197
Eurodollar ......................................35
exploratory ..... See Scenario Analysis
FITCH ................................ See rating
forward.........See corporate planning
Gini coefficient...............................83
Gini Coefficient ........................... See
Greek Coastal System...................38
HHI .................................................83
HHI Index ....................................271
high-risk – high-yieldSee junk-
bonds
IAS.................................................163
Incommensurable units................93
incommensurate.............................100
Information Technology ............126
IRR...................................................40
junk-bonds ...................................138
Latin Hypercube .........................139
level of service ...............................67
MARAD..........................................34
MCDMSee multi-criteria decision
making problem
Mergers ........................................120
Monte Carlo Sampling............... 139
Moody’s .............................See rating
Multi-Attribute Decision Making
...................................................... 92
multi-criteria analysis ................ 151
Multi-Criteria Decision Making . 92
multi-criteria decision making
problem...................................... See
multi-criteria decision support
systems...................................... 151
Multiple attributes........................ 93
Multiple Criteria Aggregation
Procedure ................................. 197
normative232, See Scenario
Analysis
NPV ................................................ 40
OECD ............................................. 34
Olympic Games 2004 ................... 63
Operational Risk ................. 117, 119
operations risksSee Operational
Risk
Optimum Merger ....................... 239
payback period ............................. 40
PEST.............................................. 189
Porter .................................... 189, 240
proportionality .............................. 100
I n d ex
Page 270 of 298
random consistency ....................105
ranking of alternativesSee multi-
criteria decision making problem
rating.............................................137
Relative Importance of Criteria.197
relevance.......................................160
Samina ............................................66
Scenario Analysis ........................232
Shift-Share Analysis....................273
social character.................................61
sortingSee multi-criteria decision
making problem
standard form ..............................101
Standards & Poor’s ..........See rating
TFN ...See triangular fuzzy number
thin lines ........................................See
TOPSIS ........................................... 95
tradeoff under certainty............. 243
Trans-European Networks (TEN)
...................................................... 88
triangular fuzzy numberSee Fuzzy
Sets
US-GAAP..................................... 163
UTADIS.......................................... 95
value function ............................. 243
value of perfect prediction .......... 40
vector-maximumSee Multi-Objective
Decision Making
verifiability .................................. 160
Weighted Product Method.......... 96
weighted sum method............... 215
Weighted Sum Method................ 96
WSM ..... See weighted sum method
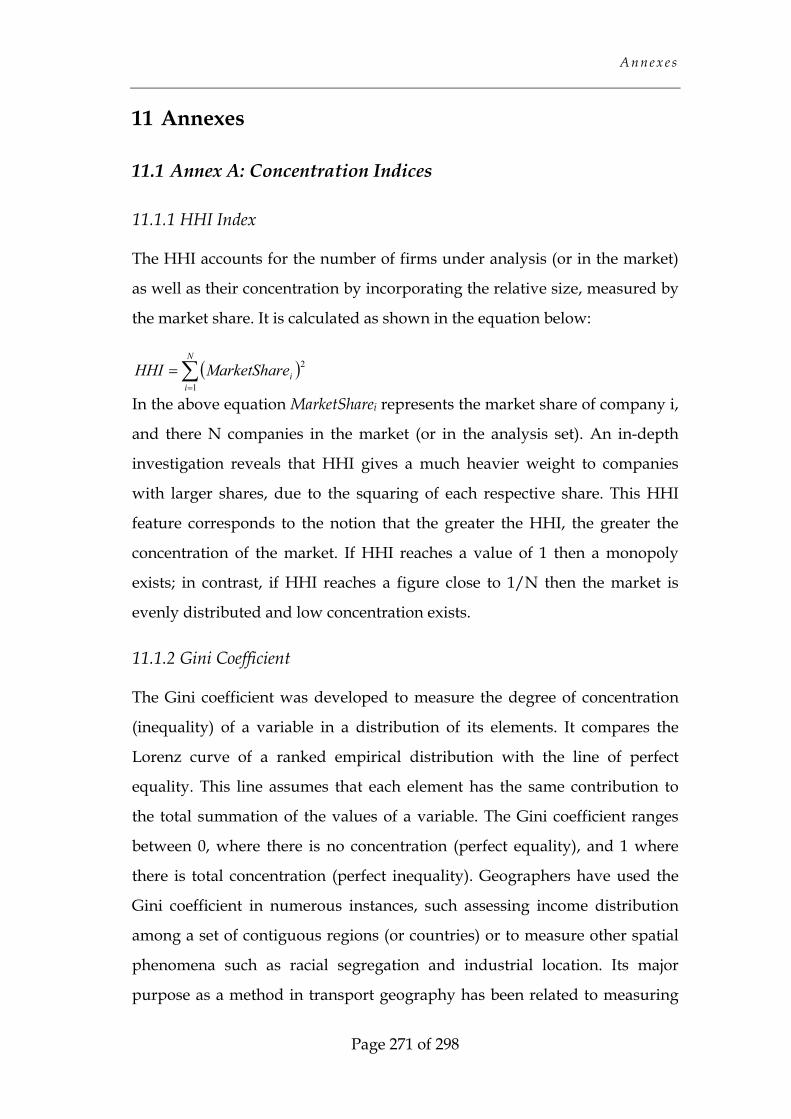
A n n e x e s
Page 271 of 298
11 Annexes
11.1 Annex A: Concentration Indices
11.1.1 HHI Index
The HHI accounts for the number of firms under analysis (or in the market)
as well as their concentration by incorporating the relative size, measured by
the market share. It is calculated as shown in the equation below:
In the above equation MarketSharei represents the market share of company i,
and there N companies in the market (or in the analysis set). An in-depth
investigation reveals that HHI gives a much heavier weight to companies
with larger shares, due to the squaring of each respective share. This HHI
feature corresponds to the notion that the greater the HHI, the greater the
concentration of the market. If HHI reaches a value of 1 then a monopoly
exists; in contrast, if HHI reaches a figure close to 1/N then the market is
evenly distributed and low concentration exists.
11.1.2 Gini Coefficient
The Gini coefficient was developed to measure the degree of concentration
(inequality) of a variable in a distribution of its elements. It compares the
Lorenz curve of a ranked empirical distribution with the line of perfect
equality. This line assumes that each element has the same contribution to
the total summation of the values of a variable. The Gini coefficient ranges
between 0, where there is no concentration (perfect equality), and 1 where
there is total concentration (perfect inequality). Geographers have used the
Gini coefficient in numerous instances, such assessing income distribution
among a set of contiguous regions (or countries) or to measure other spatial
phenomena such as racial segregation and industrial location. Its major
purpose as a method in transport geography has been related to measuring
( )∑=
=N
iiShareMarketHHI
1
2
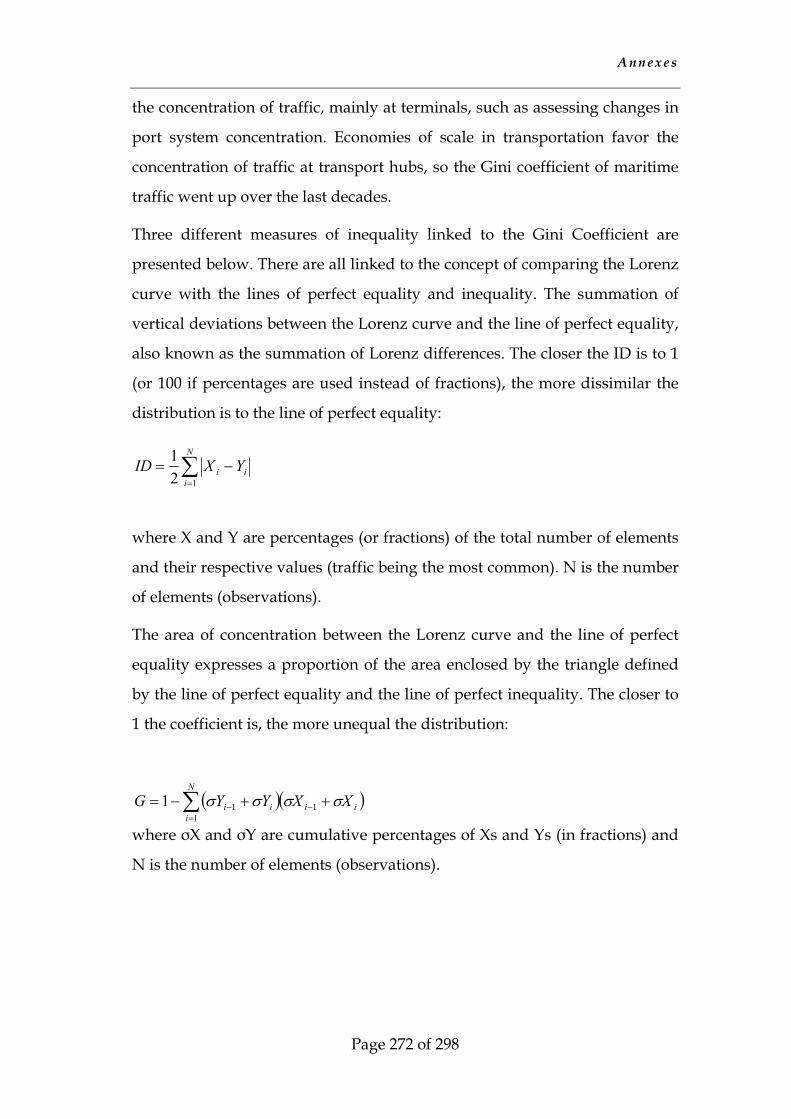
A n n e x e s
Page 272 of 298
the concentration of traffic, mainly at terminals, such as assessing changes in
port system concentration. Economies of scale in transportation favor the
concentration of traffic at transport hubs, so the Gini coefficient of maritime
traffic went up over the last decades.
Three different measures of inequality linked to the Gini Coefficient are
presented below. There are all linked to the concept of comparing the Lorenz
curve with the lines of perfect equality and inequality. The summation of
vertical deviations between the Lorenz curve and the line of perfect equality,
also known as the summation of Lorenz differences. The closer the ID is to 1
(or 100 if percentages are used instead of fractions), the more dissimilar the
distribution is to the line of perfect equality:
where X and Y are percentages (or fractions) of the total number of elements
and their respective values (traffic being the most common). N is the number
of elements (observations).
The area of concentration between the Lorenz curve and the line of perfect
equality expresses a proportion of the area enclosed by the triangle defined
by the line of perfect equality and the line of perfect inequality. The closer to
1 the coefficient is, the more unequal the distribution:
where σX and σY are cumulative percentages of Xs and Ys (in fractions) and
N is the number of elements (observations).
∑=
−=N
iii YXID
121
( )( )∑=
−− ++−=N
iiiii XXYYG
1111 σσσσ
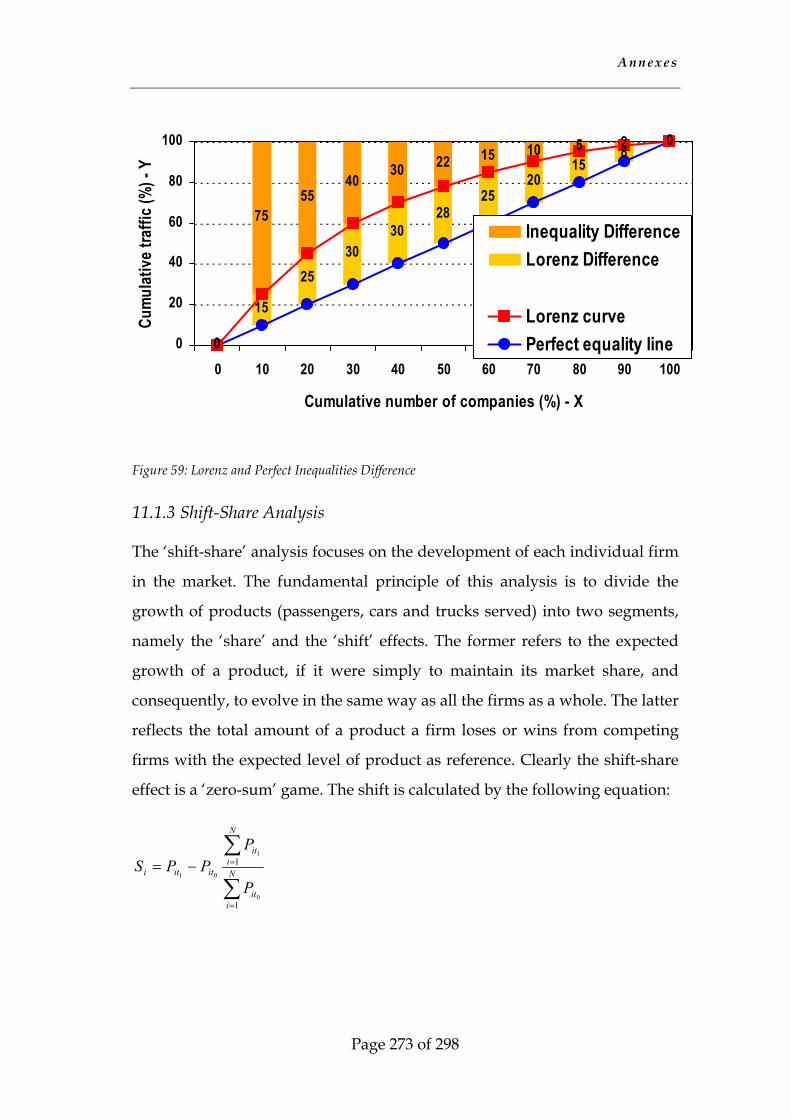
A n n e x e s
Page 273 of 298
Figure 59: Lorenz and Perfect Inequalities Difference
11.1.3 Shift-Share Analysis
The ‘shift-share’ analysis focuses on the development of each individual firm
in the market. The fundamental principle of this analysis is to divide the
growth of products (passengers, cars and trucks served) into two segments,
namely the ‘share’ and the ‘shift’ effects. The former refers to the expected
growth of a product, if it were simply to maintain its market share, and
consequently, to evolve in the same way as all the firms as a whole. The latter
reflects the total amount of a product a firm loses or wins from competing
firms with the expected level of product as reference. Clearly the shift-share
effect is a ‘zero-sum’ game. The shift is calculated by the following equation:
0
15
2530
3028
2520
158
0
0
7555
4030 22 15 10 5 2
0
20
40
60
80
100
0 10 20 30 40 50 60 70 80 90 100
Cumulative number of companies (%) - X
Cumu
lativ
e tra
ffic
(%) -
Y
Inequality DifferenceLorenz Difference
Lorenz curvePerfect equality line
∑
∑
=
=−= N
iit
N
iit
ititi
P
PPPS
1
1
0
1
01
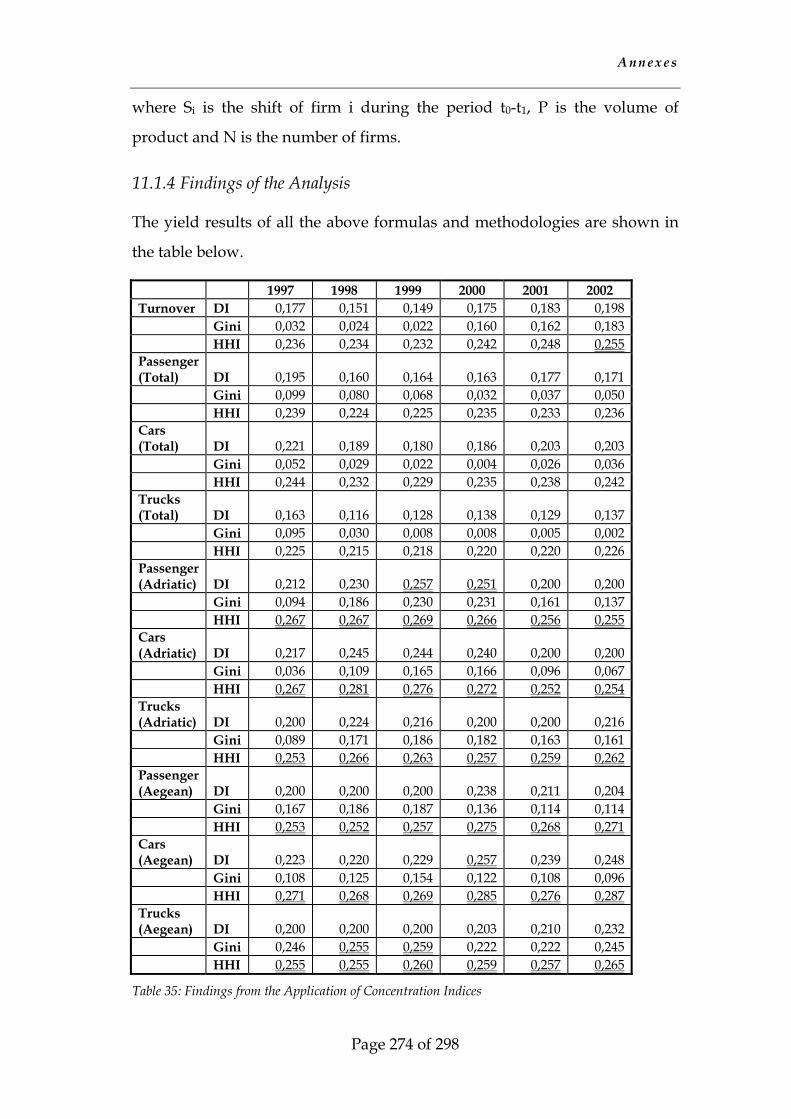
A n n e x e s
Page 274 of 298
where Si is the shift of firm i during the period t0-t1, P is the volume of
product and N is the number of firms.
11.1.4 Findings of the Analysis
The yield results of all the above formulas and methodologies are shown in
the table below.
1997 1998 1999 2000 2001 2002 Turnover DI 0,177 0,151 0,149 0,175 0,183 0,198 Gini 0,032 0,024 0,022 0,160 0,162 0,183 HHI 0,236 0,234 0,232 0,242 0,248 0,255 Passenger (Total) DI 0,195 0,160 0,164 0,163 0,177 0,171 Gini 0,099 0,080 0,068 0,032 0,037 0,050 HHI 0,239 0,224 0,225 0,235 0,233 0,236 Cars (Total) DI 0,221 0,189 0,180 0,186 0,203 0,203 Gini 0,052 0,029 0,022 0,004 0,026 0,036 HHI 0,244 0,232 0,229 0,235 0,238 0,242 Trucks (Total) DI 0,163 0,116 0,128 0,138 0,129 0,137 Gini 0,095 0,030 0,008 0,008 0,005 0,002 HHI 0,225 0,215 0,218 0,220 0,220 0,226 Passenger (Adriatic) DI 0,212 0,230 0,257 0,251 0,200 0,200 Gini 0,094 0,186 0,230 0,231 0,161 0,137 HHI 0,267 0,267 0,269 0,266 0,256 0,255 Cars (Adriatic) DI 0,217 0,245 0,244 0,240 0,200 0,200 Gini 0,036 0,109 0,165 0,166 0,096 0,067 HHI 0,267 0,281 0,276 0,272 0,252 0,254 Trucks (Adriatic) DI 0,200 0,224 0,216 0,200 0,200 0,216 Gini 0,089 0,171 0,186 0,182 0,163 0,161 HHI 0,253 0,266 0,263 0,257 0,259 0,262 Passenger (Aegean) DI 0,200 0,200 0,200 0,238 0,211 0,204 Gini 0,167 0,186 0,187 0,136 0,114 0,114 HHI 0,253 0,252 0,257 0,275 0,268 0,271 Cars (Aegean) DI 0,223 0,220 0,229 0,257 0,239 0,248 Gini 0,108 0,125 0,154 0,122 0,108 0,096 HHI 0,271 0,268 0,269 0,285 0,276 0,287 Trucks (Aegean) DI 0,200 0,200 0,200 0,203 0,210 0,232 Gini 0,246 0,255 0,259 0,222 0,222 0,245 HHI 0,255 0,255 0,260 0,259 0,257 0,265
Table 35: Findings from the Application of Concentration Indices
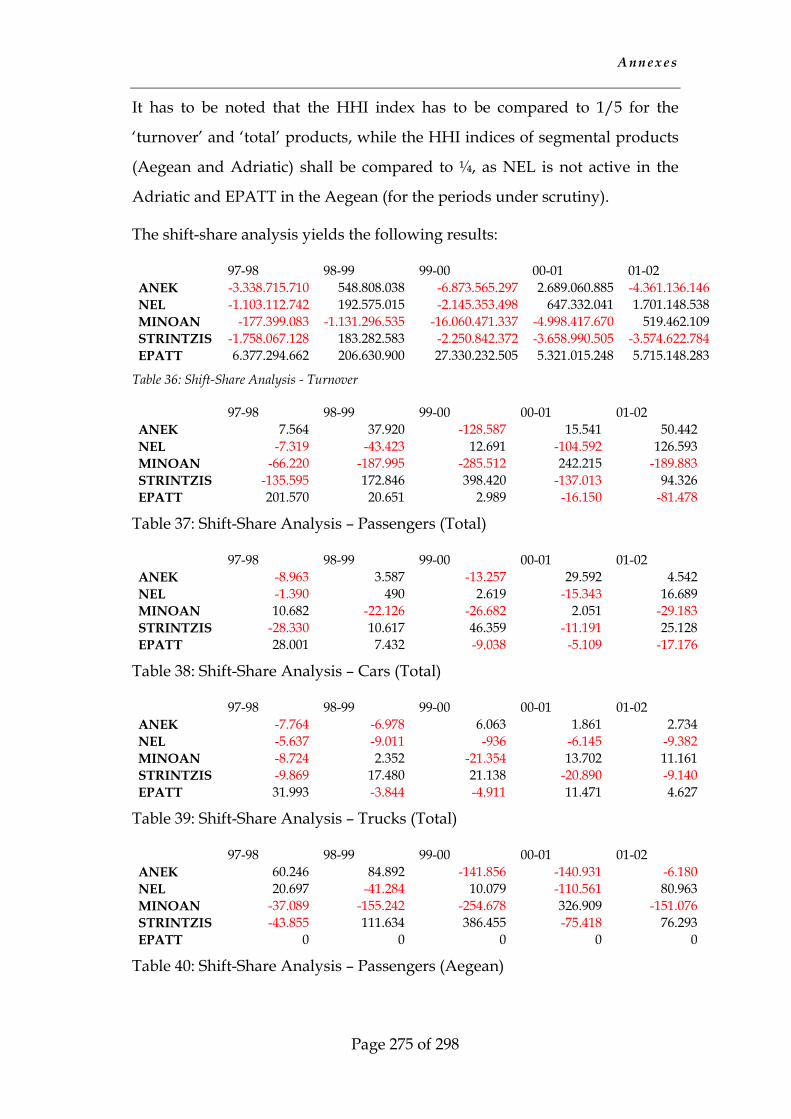
A n n e x e s
Page 275 of 298
It has to be noted that the HHI index has to be compared to 1/5 for the
‘turnover’ and ‘total’ products, while the HHI indices of segmental products
(Aegean and Adriatic) shall be compared to ¼, as NEL is not active in the
Adriatic and EPATT in the Aegean (for the periods under scrutiny).
The shift-share analysis yields the following results:
97-98 98-99 99-00 00-01 01-02 ANEK -3.338.715.710 548.808.038 -6.873.565.297 2.689.060.885 -4.361.136.146 NEL -1.103.112.742 192.575.015 -2.145.353.498 647.332.041 1.701.148.538 MINOAN -177.399.083 -1.131.296.535 -16.060.471.337 -4.998.417.670 519.462.109 STRINTZIS -1.758.067.128 183.282.583 -2.250.842.372 -3.658.990.505 -3.574.622.784 EPATT 6.377.294.662 206.630.900 27.330.232.505 5.321.015.248 5.715.148.283
Table 36: Shift-Share Analysis - Turnover
97-98 98-99 99-00 00-01 01-02 ANEK 7.564 37.920 -128.587 15.541 50.442 NEL -7.319 -43.423 12.691 -104.592 126.593 MINOAN -66.220 -187.995 -285.512 242.215 -189.883 STRINTZIS -135.595 172.846 398.420 -137.013 94.326 EPATT 201.570 20.651 2.989 -16.150 -81.478
Table 37: Shift-Share Analysis – Passengers (Total)
97-98 98-99 99-00 00-01 01-02 ANEK -8.963 3.587 -13.257 29.592 4.542 NEL -1.390 490 2.619 -15.343 16.689 MINOAN 10.682 -22.126 -26.682 2.051 -29.183 STRINTZIS -28.330 10.617 46.359 -11.191 25.128 EPATT 28.001 7.432 -9.038 -5.109 -17.176
Table 38: Shift-Share Analysis – Cars (Total)
97-98 98-99 99-00 00-01 01-02 ANEK -7.764 -6.978 6.063 1.861 2.734 NEL -5.637 -9.011 -936 -6.145 -9.382 MINOAN -8.724 2.352 -21.354 13.702 11.161 STRINTZIS -9.869 17.480 21.138 -20.890 -9.140 EPATT 31.993 -3.844 -4.911 11.471 4.627
Table 39: Shift-Share Analysis – Trucks (Total)
97-98 98-99 99-00 00-01 01-02 ANEK 60.246 84.892 -141.856 -140.931 -6.180 NEL 20.697 -41.284 10.079 -110.561 80.963 MINOAN -37.089 -155.242 -254.678 326.909 -151.076 STRINTZIS -43.855 111.634 386.455 -75.418 76.293 EPATT 0 0 0 0 0
Table 40: Shift-Share Analysis – Passengers (Aegean)
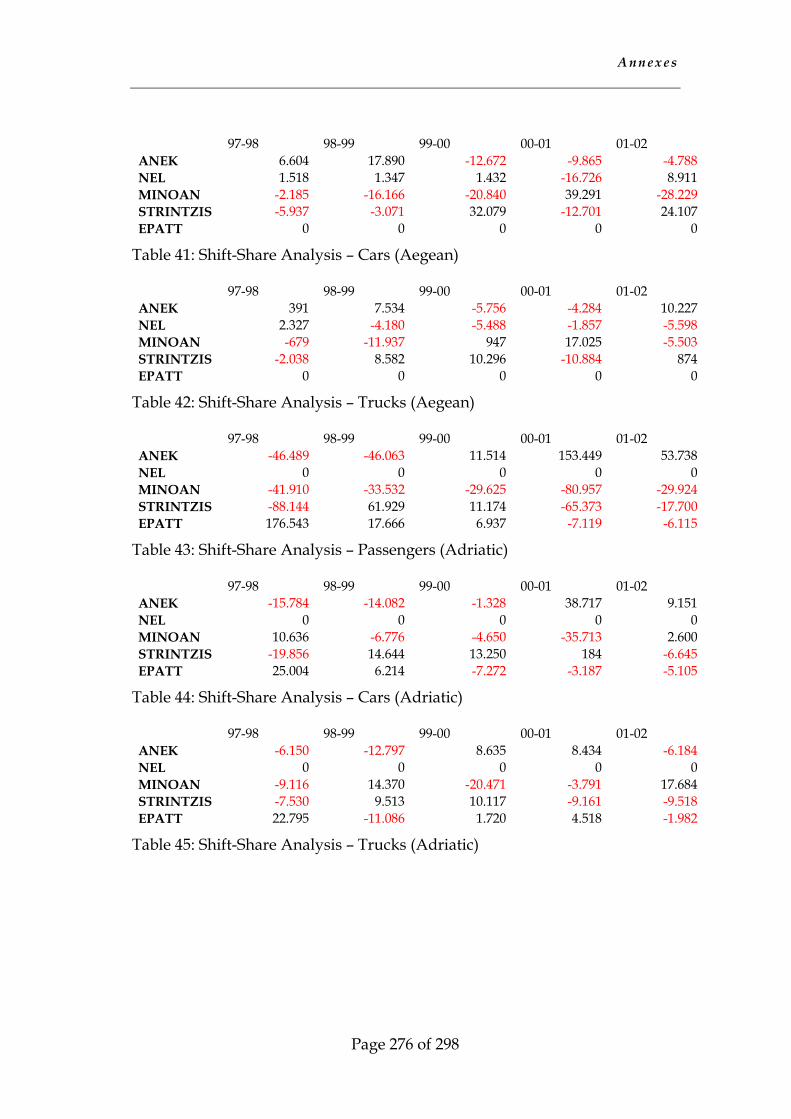
A n n e x e s
Page 276 of 298
97-98 98-99 99-00 00-01 01-02 ANEK 6.604 17.890 -12.672 -9.865 -4.788 NEL 1.518 1.347 1.432 -16.726 8.911 MINOAN -2.185 -16.166 -20.840 39.291 -28.229 STRINTZIS -5.937 -3.071 32.079 -12.701 24.107 EPATT 0 0 0 0 0
Table 41: Shift-Share Analysis – Cars (Aegean)
97-98 98-99 99-00 00-01 01-02 ANEK 391 7.534 -5.756 -4.284 10.227 NEL 2.327 -4.180 -5.488 -1.857 -5.598 MINOAN -679 -11.937 947 17.025 -5.503 STRINTZIS -2.038 8.582 10.296 -10.884 874 EPATT 0 0 0 0 0
Table 42: Shift-Share Analysis – Trucks (Aegean)
97-98 98-99 99-00 00-01 01-02 ANEK -46.489 -46.063 11.514 153.449 53.738 NEL 0 0 0 0 0 MINOAN -41.910 -33.532 -29.625 -80.957 -29.924 STRINTZIS -88.144 61.929 11.174 -65.373 -17.700 EPATT 176.543 17.666 6.937 -7.119 -6.115
Table 43: Shift-Share Analysis – Passengers (Adriatic)
97-98 98-99 99-00 00-01 01-02 ANEK -15.784 -14.082 -1.328 38.717 9.151 NEL 0 0 0 0 0 MINOAN 10.636 -6.776 -4.650 -35.713 2.600 STRINTZIS -19.856 14.644 13.250 184 -6.645 EPATT 25.004 6.214 -7.272 -3.187 -5.105
Table 44: Shift-Share Analysis – Cars (Adriatic)
97-98 98-99 99-00 00-01 01-02 ANEK -6.150 -12.797 8.635 8.434 -6.184 NEL 0 0 0 0 0 MINOAN -9.116 14.370 -20.471 -3.791 17.684 STRINTZIS -7.530 9.513 10.117 -9.161 -9.518 EPATT 22.795 -11.086 1.720 4.518 -1.982
Table 45: Shift-Share Analysis – Trucks (Adriatic)
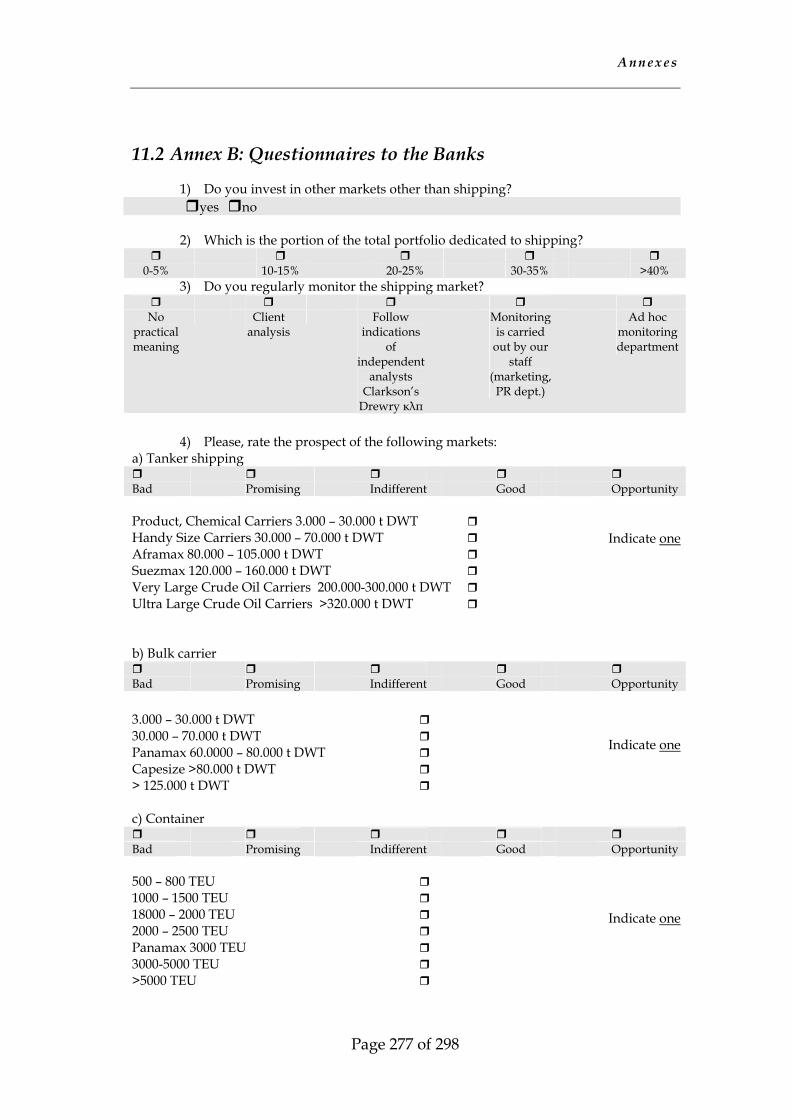
A n n e x e s
Page 277 of 298
11.2 Annex B: Questionnaires to the Banks
1) Do you invest in other markets other than shipping? yes no
2) Which is the portion of the total portfolio dedicated to shipping?
0-5% 10-15% 20-25% 30-35% >40%
3) Do you regularly monitor the shipping market?
No practical meaning
Client analysis
Follow indications
of independent
analysts Clarkson’s
Drewry κλπ
Monitoring is carried
out by our staff
(marketing, PR dept.)
Ad hoc monitoring department
4) Please, rate the prospect of the following markets:
a) Tanker shipping
Bad Promising Indifferent Good Opportunity Product, Chemical Carriers 3.000 – 30.000 t DWT Handy Size Carriers 30.000 – 70.000 t DWT Aframax 80.000 – 105.000 t DWT Suezmax 120.000 – 160.000 t DWT Very Large Crude Oil Carriers 200.000-300.000 t DWT Ultra Large Crude Oil Carriers >320.000 t DWT b) Bulk carrier
Bad Promising Indifferent Good Opportunity 3.000 – 30.000 t DWT 30.000 – 70.000 t DWT Panamax 60.0000 – 80.000 t DWT Capesize >80.000 t DWT > 125.000 t DWT c) Container
Bad Promising Indifferent Good Opportunity 500 – 800 TEU 1000 – 1500 TEU 18000 – 2000 TEU 2000 – 2500 TEU Panamax 3000 TEU 3000-5000 TEU >5000 TEU
Indicate one
Indicate one
Indicate one
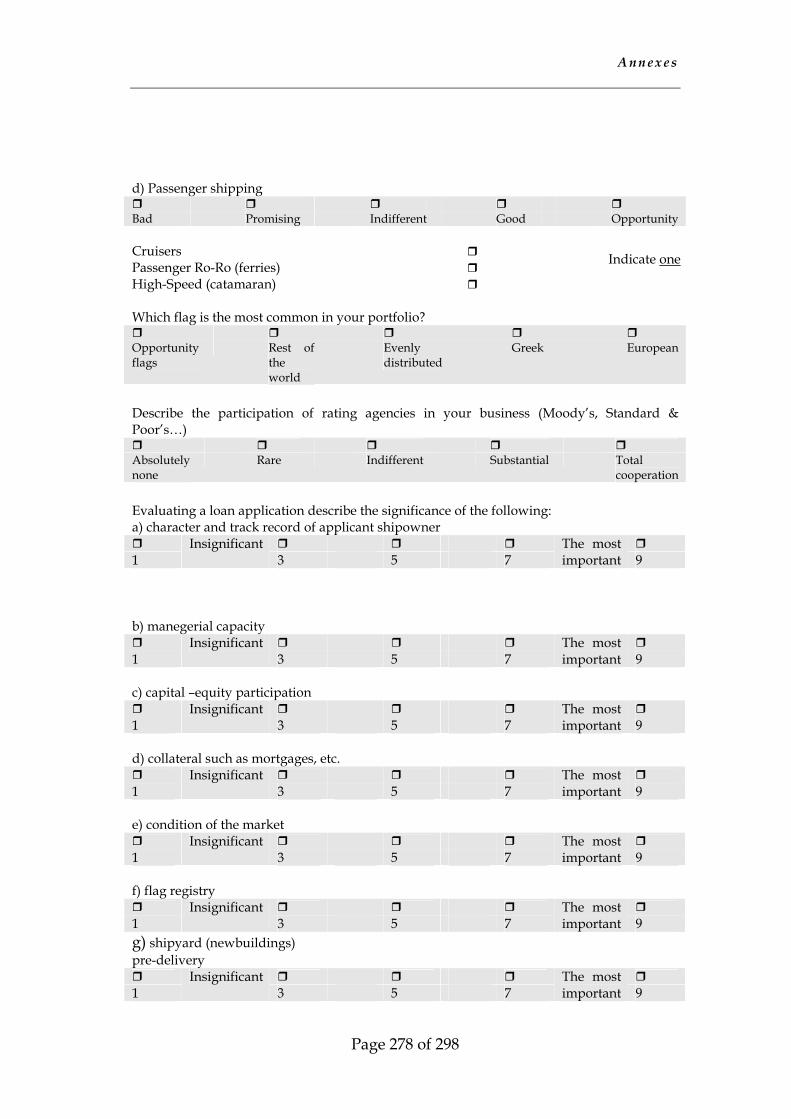
A n n e x e s
Page 278 of 298
d) Passenger shipping
Bad Promising Indifferent Good Opportunity Cruisers Passenger Ro-Ro (ferries) High-Speed (catamaran) Which flag is the most common in your portfolio?
Opportunity flags
Rest of the world
Evenly distributed
Greek European
Describe the participation of rating agencies in your business (Moody’s, Standard & Poor’s…)
Absolutely none
Rare Indifferent Substantial Total cooperation
Evaluating a loan application describe the significance of the following: a) character and track record of applicant shipowner
1
Insignificant 3 5 7
The most important 9
b) manegerial capacity
1
Insignificant 3 5 7
The most important 9
c) capital –equity participation
1
Insignificant 3 5 7
The most important 9
d) collateral such as mortgages, etc.
1
Insignificant 3 5 7
The most important 9
e) condition of the market
1
Insignificant 3 5 7
The most important 9
f) flag registry
1
Insignificant 3 5 7
The most important 9
g) shipyard (newbuildings) pre-delivery
1
Insignificant 3 5 7
The most important 9
Indicate one
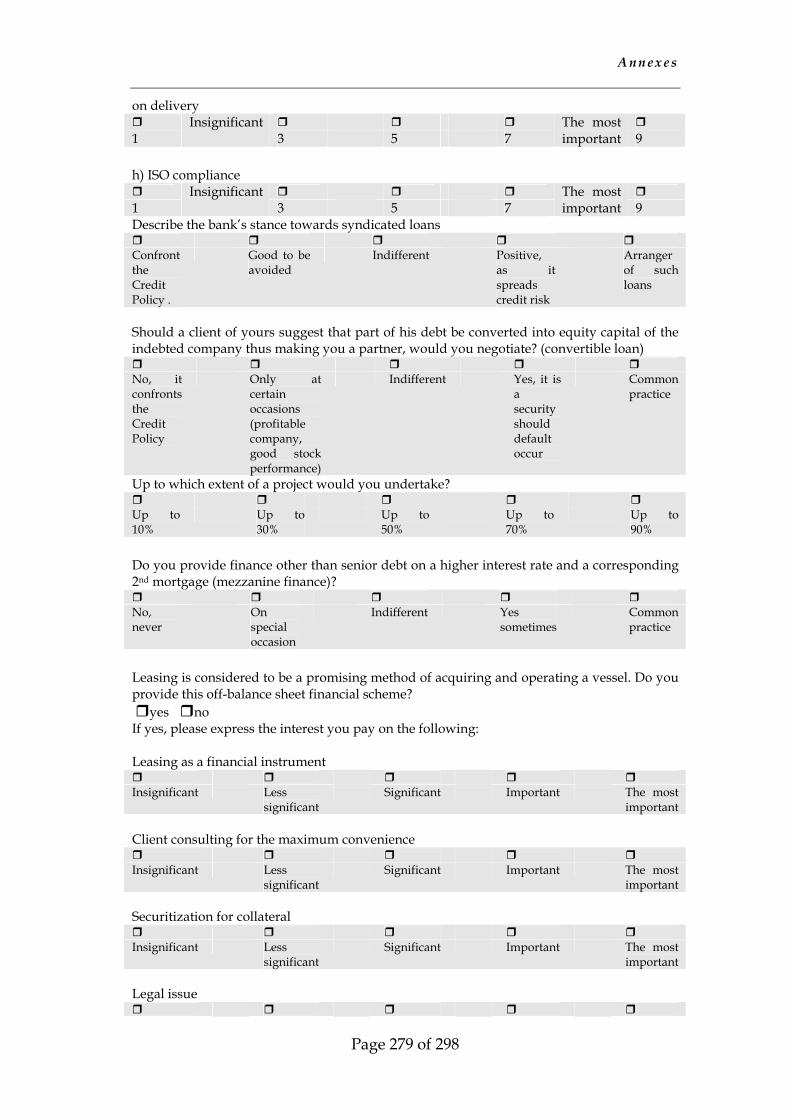
A n n e x e s
Page 279 of 298
on delivery
1 Insignificant
3 5 7 The most important 9
h) ISO compliance
1
Insignificant 3 5 7
The most important 9
Describe the bank’s stance towards syndicated loans
Confront the Credit Policy .
Good to be avoided
Indifferent Positive, as it spreads credit risk
Arranger of such loans
Should a client of yours suggest that part of his debt be converted into equity capital of the indebted company thus making you a partner, would you negotiate? (convertible loan)
No, it confronts the Credit Policy
Only at certain occasions (profitable company, good stock performance)
Indifferent Yes, it is a security should default occur
Common practice
Up to which extent of a project would you undertake?
Up to 10%
Up to 30%
Up to 50%
Up to 70%
Up to 90%
Do you provide finance other than senior debt on a higher interest rate and a corresponding 2nd mortgage (mezzanine finance)?
No, never
On special occasion
Indifferent Yes sometimes
Common practice
Leasing is considered to be a promising method of acquiring and operating a vessel. Do you provide this off-balance sheet financial scheme? yes no If yes, please express the interest you pay on the following: Leasing as a financial instrument
Insignificant Less
significant Significant Important The most
important Client consulting for the maximum convenience
Insignificant Less
significant Significant Important The most
important Securitization for collateral
Insignificant Less
significant Significant Important The most
important Legal issue
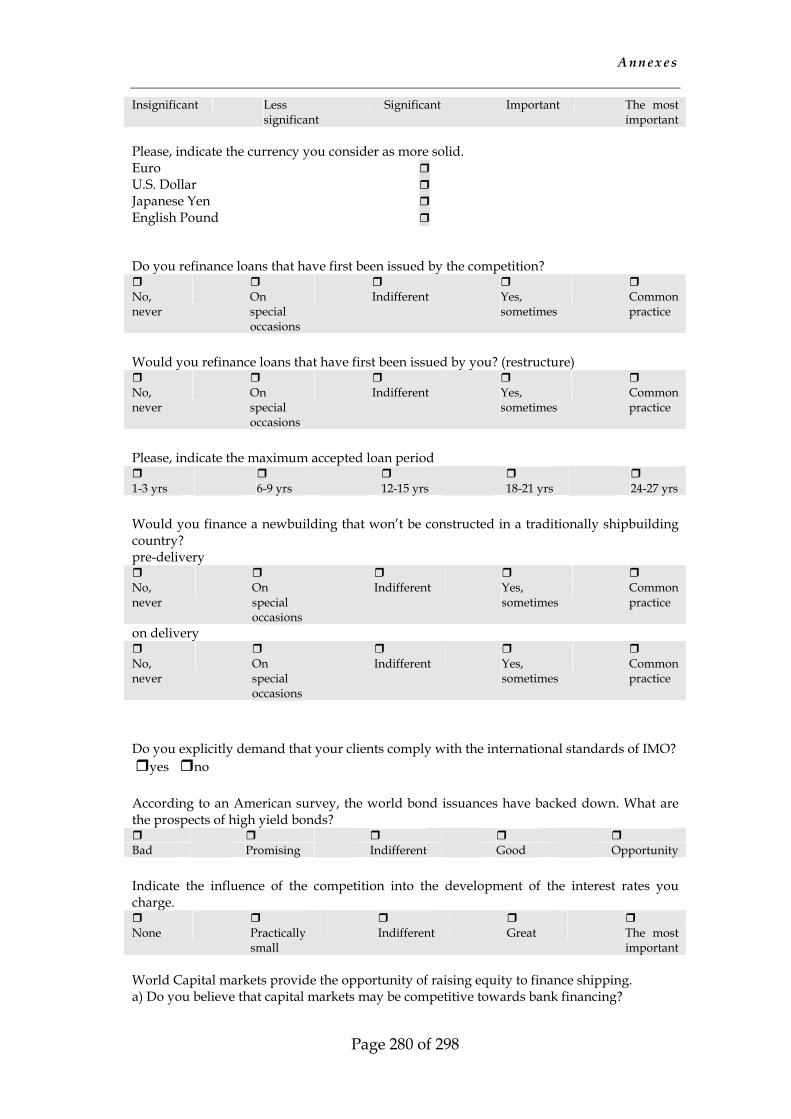
A n n e x e s
Page 280 of 298
Insignificant Less significant
Significant Important The most important
Please, indicate the currency you consider as more solid. Euro U.S. Dollar Japanese Yen English Pound Do you refinance loans that have first been issued by the competition?
No, never
On special occasions
Indifferent Yes, sometimes
Common practice
Would you refinance loans that have first been issued by you? (restructure)
No, never
On special occasions
Indifferent Yes, sometimes
Common practice
Please, indicate the maximum accepted loan period
1-3 yrs 6-9 yrs 12-15 yrs 18-21 yrs 24-27 yrs Would you finance a newbuilding that won’t be constructed in a traditionally shipbuilding country? pre-delivery
No, never
On special occasions
Indifferent Yes, sometimes
Common practice
on delivery
No, never
On special occasions
Indifferent Yes, sometimes
Common practice
Do you explicitly demand that your clients comply with the international standards of IMO? yes no According to an American survey, the world bond issuances have backed down. What are the prospects of high yield bonds?
Bad Promising Indifferent Good Opportunity Indicate the influence of the competition into the development of the interest rates you charge.
None Practically
small Indifferent Great The most
important World Capital markets provide the opportunity of raising equity to finance shipping. a) Do you believe that capital markets may be competitive towards bank financing?
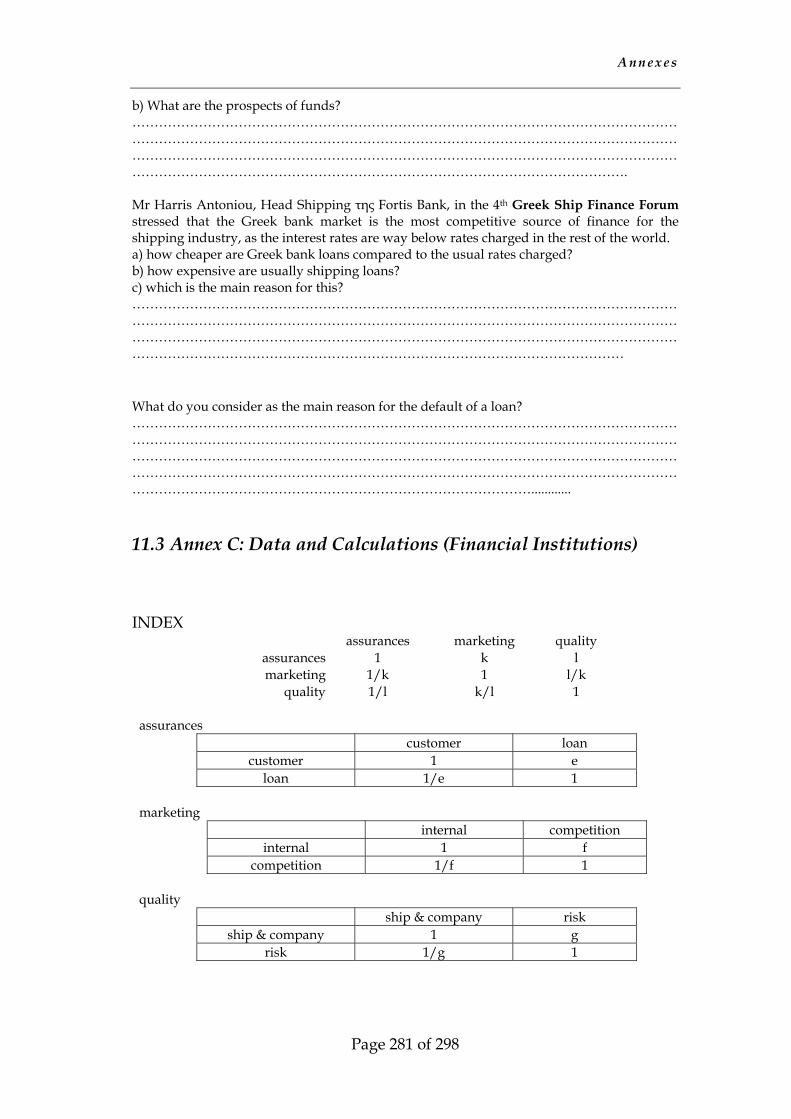
A n n e x e s
Page 281 of 298
b) What are the prospects of funds? …………………………………………………………………………………………………………………………………………………………………………………………………………………………………………………………………………………………………………………………………………………………………………………………………………………………………………. Mr Harris Antoniou, Head Shipping της Fortis Bank, in the 4th Greek Ship Finance Forum stressed that the Greek bank market is the most competitive source of finance for the shipping industry, as the interest rates are way below rates charged in the rest of the world. a) how cheaper are Greek bank loans compared to the usual rates charged? b) how expensive are usually shipping loans? c) which is the main reason for this? ………………………………………………………………………………………………………………………………………………………………………………………………………………………………………………………………………………………………………………………………………………………………………………………………………………………………………… What do you consider as the main reason for the default of a loan? ……………………………………………………………………………………………………………………………………………………………………………………………………………………………………………………………………………………………………………………………………………………………………………………………………………………………………………………………………………………………………………………………………............
11.3 Annex C: Data and Calculations (Financial Institutions)
INDEX assurances marketing quality assurances 1 k l marketing 1/k 1 l/k quality 1/l k/l 1
assurances customer loan customer 1 e loan 1/e 1 marketing internal competition internal 1 f competition 1/f 1 quality ship & company risk ship & company 1 g risk 1/g 1
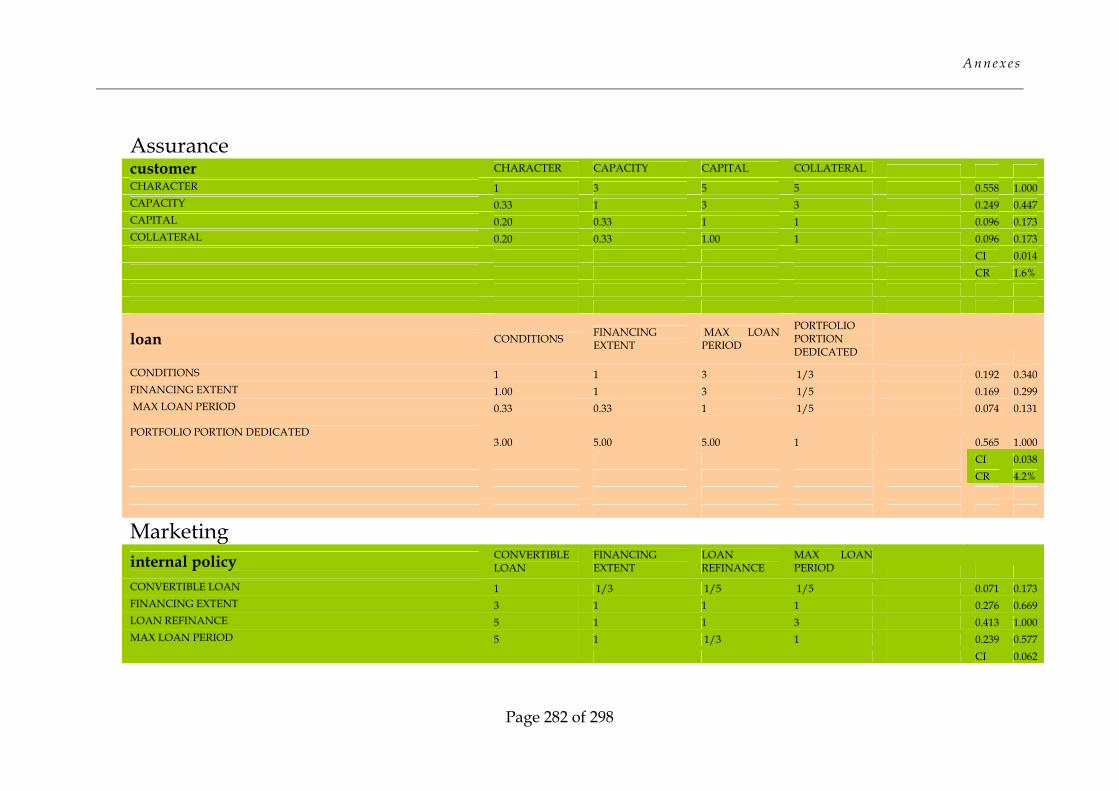
A n n e x e s
Page 282 of 298
Assurance
customer CHARACTER CAPACITY CAPITAL COLLATERAL CHARACTER 1 3 5 5 0.558 1.000 CAPACITY 0.33 1 3 3 0.249 0.447 CAPITAL 0.20 0.33 1 1 0.096 0.173 COLLATERAL 0.20 0.33 1.00 1 0.096 0.173 CI 0.014 CR 1.6%
loan CONDITIONS FINANCING
EXTENT MAX LOAN PERIOD
PORTFOLIO PORTION DEDICATED
CONDITIONS 1 1 3 1/3 0.192 0.340 FINANCING EXTENT 1.00 1 3 1/5 0.169 0.299 MAX LOAN PERIOD 0.33 0.33 1 1/5 0.074 0.131
PORTFOLIO PORTION DEDICATED
3.00 5.00 5.00 1 0.565 1.000 CI 0.038 CR 4.2%
Marketing
internal policy
CONVERTIBLE LOAN
FINANCING EXTENT
LOAN REFINANCE
MAX LOAN PERIOD
CONVERTIBLE LOAN 1 1/3 1/5 1/5 0.071 0.173 FINANCING EXTENT 3 1 1 1 0.276 0.669 LOAN REFINANCE 5 1 1 3 0.413 1.000 MAX LOAN PERIOD 5 1 1/3 1 0.239 0.577 CI 0.062
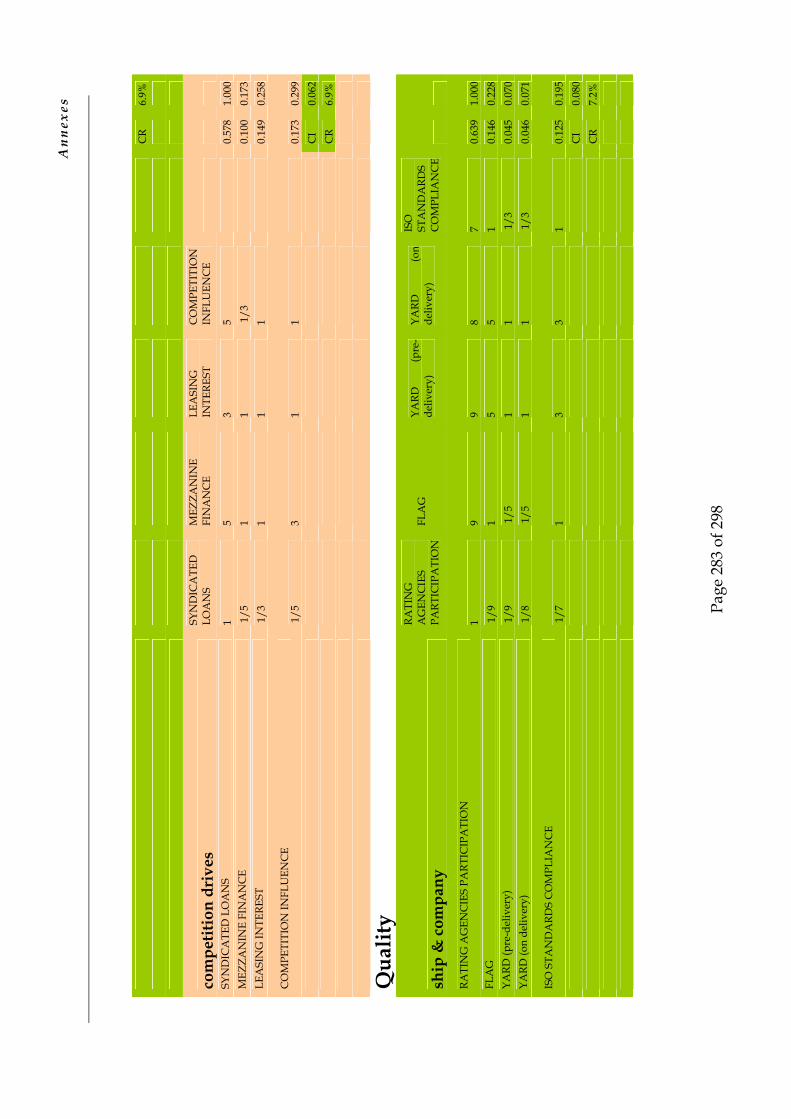
Ann
exes
Page
283
of 2
98
C
R 6.
9%
co
mpe
titio
n dr
ives
SY
ND
ICA
TED
LO
AN
S M
EZZA
NIN
E FI
NA
NC
E LE
ASI
NG
IN
TERE
ST
CO
MPE
TITI
ON
IN
FLU
ENC
E
SY
ND
ICA
TED
LO
AN
S 1
5
3
5
0.57
8 1.
000
M
EZZA
NIN
E FI
NA
NC
E 1
/5
1
1
1/3
0.10
0 0.
173
LE
ASI
NG
INTE
REST
1
/3
1
1
1
0.14
9 0.
258
C
OM
PETI
TIO
N IN
FLU
ENC
E 1
/5
3
1
1
0.17
3 0.
299
C
I 0.
062
C
R 6.
9%
Q
ualit
y
sh
ip &
com
pany
RATI
NG
A
GEN
CIE
S PA
RTIC
IPA
TIO
N
FLA
G
YARD
(p
re-
deliv
ery)
YA
RD
(on
deliv
ery)
ISO
ST
AN
DA
RDS
CO
MPL
IAN
CE
RA
TIN
G A
GEN
CIE
S PA
RTIC
IPA
TIO
N
1
9
9
8
7
0.
639
1.00
0
FLA
G
1/9
1
5
5
1
0.
146
0.22
8
YARD
(pre
-del
iver
y)
1/9
1
/5
1
1
1/3
0.
045
0.07
0
YARD
(on
deliv
ery)
1
/8
1/5
1
1
1
/3
0.04
6 0.
071
IS
O S
TAN
DA
RDS
CO
MPL
IAN
CE
1/7
1
3
3
1
0.
125
0.19
5
CI
0.08
0
CR
7.2%
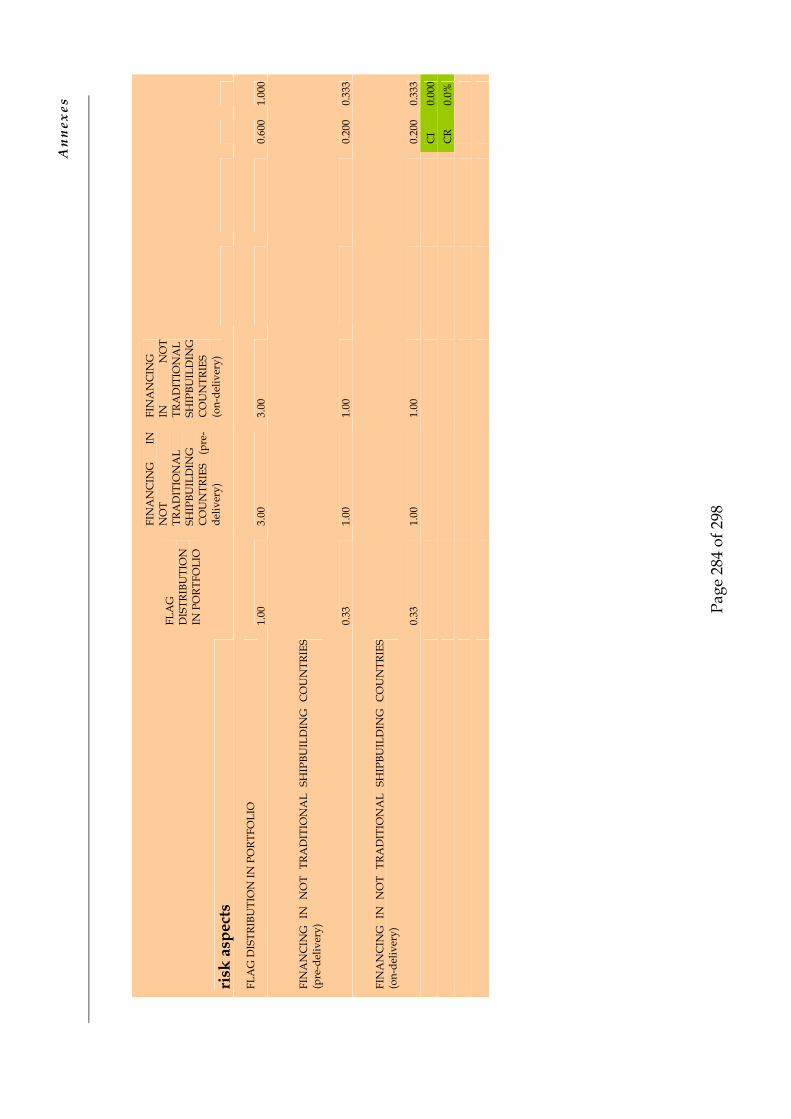
Ann
exes
Page
284
of 2
98
ri
sk a
spec
ts
FLA
G
DIS
TRIB
UTI
ON
IN
PO
RTFO
LIO
FIN
AN
CIN
G
IN
NO
T TR
AD
ITIO
NA
L SH
IPBU
ILD
ING
C
OU
NTR
IES
(pre
-de
liver
y)
FIN
AN
CIN
G
IN
NO
T TR
AD
ITIO
NA
L SH
IPBU
ILD
ING
C
OU
NTR
IES
(on-
deliv
ery)
FL
AG
DIS
TRIB
UTI
ON
IN P
ORT
FOLI
O
1.00
3.
00
3.00
0.
600
1.00
0
FIN
AN
CIN
G I
N N
OT
TRA
DIT
ION
AL
SHIP
BUIL
DIN
G C
OU
NTR
IES
(pre
-del
iver
y)
0.33
1.
00
1.00
0.
200
0.33
3
FIN
AN
CIN
G I
N N
OT
TRA
DIT
ION
AL
SHIP
BUIL
DIN
G C
OU
NTR
IES
(on-
deliv
ery)
0.33
1.
00
1.00
0.
200
0.33
3
CI
0.00
0
CR
0.0%
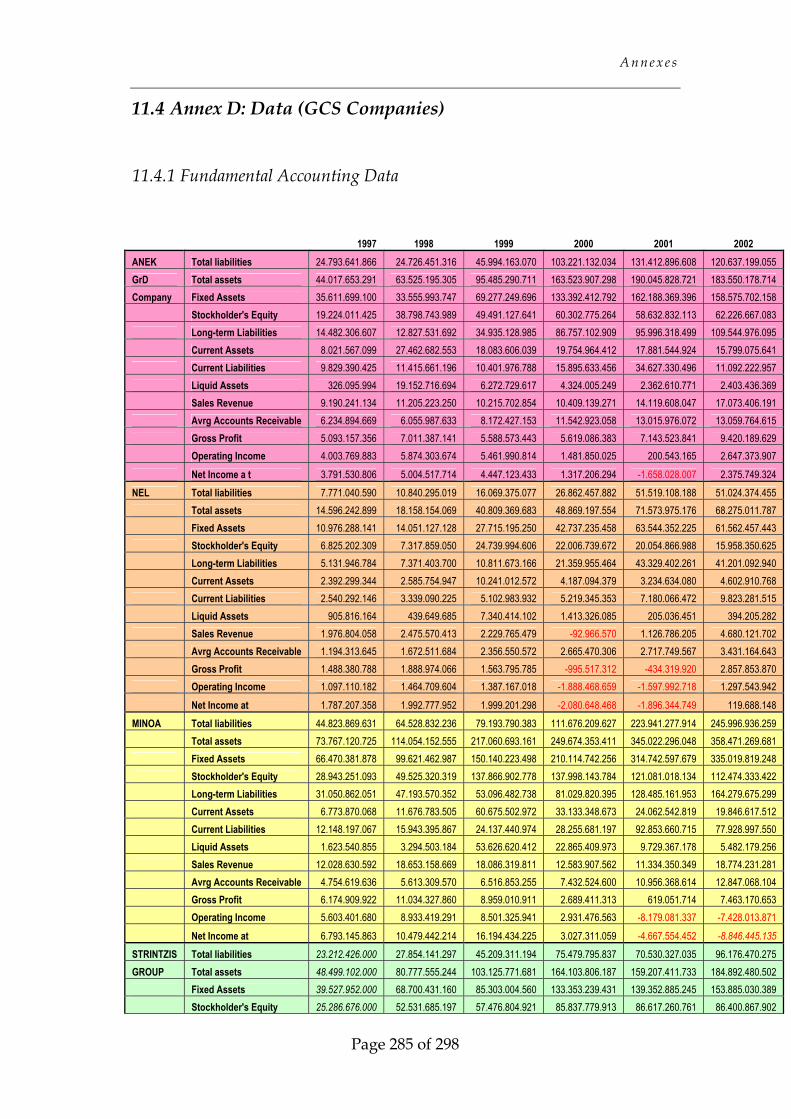
A n n e x e s
Page 285 of 298
11.4 Annex D: Data (GCS Companies)
11.4.1 Fundamental Accounting Data
1997 1998 1999 2000 2001 2002 ANEK Total liabilities 24.793.641.866 24.726.451.316 45.994.163.070 103.221.132.034 131.412.896.608 120.637.199.055 GrD Total assets 44.017.653.291 63.525.195.305 95.485.290.711 163.523.907.298 190.045.828.721 183.550.178.714 Company Fixed Assets 35.611.699.100 33.555.993.747 69.277.249.696 133.392.412.792 162.188.369.396 158.575.702.158 Stockholder's Equity 19.224.011.425 38.798.743.989 49.491.127.641 60.302.775.264 58.632.832.113 62.226.667.083 Long-term Liabilities 14.482.306.607 12.827.531.692 34.935.128.985 86.757.102.909 95.996.318.499 109.544.976.095 Current Assets 8.021.567.099 27.462.682.553 18.083.606.039 19.754.964.412 17.881.544.924 15.799.075.641 Current Liabilities 9.829.390.425 11.415.661.196 10.401.976.788 15.895.633.456 34.627.330.496 11.092.222.957 Liquid Assets 326.095.994 19.152.716.694 6.272.729.617 4.324.005.249 2.362.610.771 2.403.436.369 Sales Revenue 9.190.241.134 11.205.223.250 10.215.702.854 10.409.139.271 14.119.608.047 17.073.406.191 Avrg Accounts Receivable 6.234.894.669 6.055.987.633 8.172.427.153 11.542.923.058 13.015.976.072 13.059.764.615 Gross Profit 5.093.157.356 7.011.387.141 5.588.573.443 5.619.086.383 7.143.523.841 9.420.189.629 Operating Income 4.003.769.883 5.874.303.674 5.461.990.814 1.481.850.025 200.543.165 2.647.373.907
Net Income a t 3.791.530.806 5.004.517.714 4.447.123.433 1.317.206.294 -1.658.028.007 2.375.749.324 NEL Total liabilities 7.771.040.590 10.840.295.019 16.069.375.077 26.862.457.882 51.519.108.188 51.024.374.455 Total assets 14.596.242.899 18.158.154.069 40.809.369.683 48.869.197.554 71.573.975.176 68.275.011.787 Fixed Assets 10.976.288.141 14.051.127.128 27.715.195.250 42.737.235.458 63.544.352.225 61.562.457.443 Stockholder's Equity 6.825.202.309 7.317.859.050 24.739.994.606 22.006.739.672 20.054.866.988 15.958.350.625 Long-term Liabilities 5.131.946.784 7.371.403.700 10.811.673.166 21.359.955.464 43.329.402.261 41.201.092.940 Current Assets 2.392.299.344 2.585.754.947 10.241.012.572 4.187.094.379 3.234.634.080 4.602.910.768 Current Liabilities 2.540.292.146 3.339.090.225 5.102.983.932 5.219.345.353 7.180.066.472 9.823.281.515 Liquid Assets 905.816.164 439.649.685 7.340.414.102 1.413.326.085 205.036.451 394.205.282 Sales Revenue 1.976.804.058 2.475.570.413 2.229.765.479 -92.966.570 1.126.786.205 4.680.121.702 Avrg Accounts Receivable 1.194.313.645 1.672.511.684 2.356.550.572 2.665.470.306 2.717.749.567 3.431.164.643 Gross Profit 1.488.380.788 1.888.974.066 1.563.795.785 -995.517.312 -434.319.920 2.857.853.870 Operating Income 1.097.110.182 1.464.709.604 1.387.167.018 -1.888.468.659 -1.597.992.718 1.297.543.942
Net Income at 1.787.207.358 1.992.777.952 1.999.201.298 -2.080.648.468 -1.896.344.749 119.688.148 MINOA Total liabilities 44.823.869.631 64.528.832.236 79.193.790.383 111.676.209.627 223.941.277.914 245.996.936.259 Total assets 73.767.120.725 114.054.152.555 217.060.693.161 249.674.353.411 345.022.296.048 358.471.269.681 Fixed Assets 66.470.381.878 99.621.462.987 150.140.223.498 210.114.742.256 314.742.597.679 335.019.819.248 Stockholder's Equity 28.943.251.093 49.525.320.319 137.866.902.778 137.998.143.784 121.081.018.134 112.474.333.422 Long-term Liabilities 31.050.862.051 47.193.570.352 53.096.482.738 81.029.820.395 128.485.161.953 164.279.675.299 Current Assets 6.773.870.068 11.676.783.505 60.675.502.972 33.133.348.673 24.062.542.819 19.846.617.512 Current Liabilities 12.148.197.067 15.943.395.867 24.137.440.974 28.255.681.197 92.853.660.715 77.928.997.550 Liquid Assets 1.623.540.855 3.294.503.184 53.626.620.412 22.865.409.973 9.729.367.178 5.482.179.256 Sales Revenue 12.028.630.592 18.653.158.669 18.086.319.811 12.583.907.562 11.334.350.349 18.774.231.281 Avrg Accounts Receivable 4.754.619.636 5.613.309.570 6.516.853.255 7.432.524.600 10.956.368.614 12.847.068.104 Gross Profit 6.174.909.922 11.034.327.860 8.959.010.911 2.689.411.313 619.051.714 7.463.170.653 Operating Income 5.603.401.680 8.933.419.291 8.501.325.941 2.931.476.563 -8.179.081.337 -7.428.013.871
Net Income at 6.793.145.863 10.479.442.214 16.194.434.225 3.027.311.059 -4.667.554.452 -8.846.445.135
STRINTZIS Total liabilities 23.212.426.000 27.854.141.297 45.209.311.194 75.479.795.837 70.530.327.035 96.176.470.275 GROUP Total assets 48.499.102.000 80.777.555.244 103.125.771.681 164.103.806.187 159.207.411.733 184.892.480.502 Fixed Assets 39.527.952.000 68.700.431.160 85.303.004.560 133.353.239.431 139.352.885.245 153.885.030.389 Stockholder's Equity 25.286.676.000 52.531.685.197 57.476.804.921 85.837.779.913 86.617.260.761 86.400.867.902
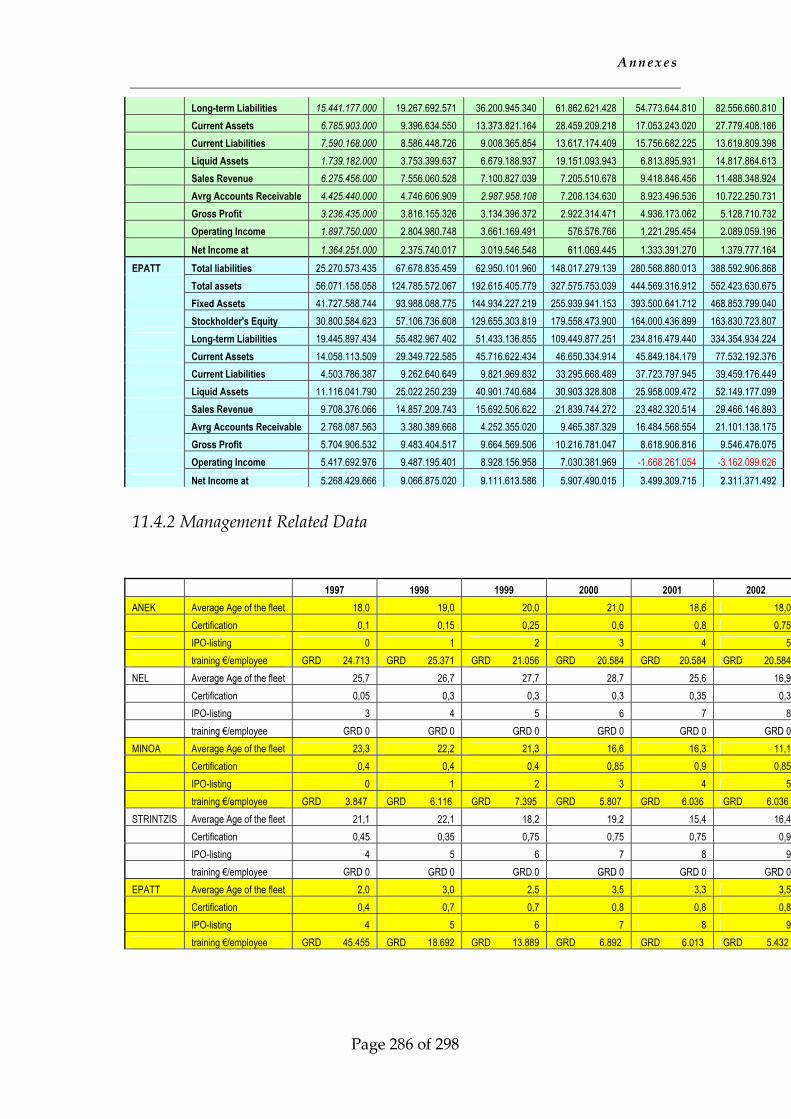
A n n e x e s
Page 286 of 298
Long-term Liabilities 15.441.177.000 19.267.692.571 36.200.945.340 61.862.621.428 54.773.644.810 82.556.660.810 Current Assets 6.785.903.000 9.396.634.550 13.373.821.164 28.459.209.218 17.053.243.020 27.779.408.186 Current Liabilities 7.590.168.000 8.586.448.726 9.008.365.854 13.617.174.409 15.756.682.225 13.619.809.398 Liquid Assets 1.739.182.000 3.753.399.637 6.679.188.937 19.151.093.943 6.813.895.931 14.817.864.613 Sales Revenue 6.275.456.000 7.556.060.528 7.100.827.039 7.205.510.678 9.418.846.456 11.488.348.924 Avrg Accounts Receivable 4.425.440.000 4.746.606.909 2.987.958.108 7.208.134.630 8.923.496.536 10.722.250.731 Gross Profit 3.236.435.000 3.816.155.326 3.134.396.372 2.922.314.471 4.936.173.062 5.128.710.732 Operating Income 1.897.750.000 2.804.980.748 3.661.169.491 576.576.766 1.221.295.454 2.089.059.196
Net Income at 1.364.251.000 2.375.740.017 3.019.546.548 611.069.445 1.333.391.270 1.379.777.164 EPATT Total liabilities 25.270.573.435 67.678.835.459 62.950.101.960 148.017.279.139 280.568.880.013 388.592.906.868 Total assets 56.071.158.058 124.785.572.067 192.615.405.779 327.575.753.039 444.569.316.912 552.423.630.675 Fixed Assets 41.727.588.744 93.988.088.775 144.934.227.219 255.939.941.153 393.500.641.712 468.853.799.040 Stockholder's Equity 30.800.584.623 57.106.736.608 129.655.303.819 179.558.473.900 164.000.436.899 163.830.723.807 Long-term Liabilities 19.445.897.434 55.482.967.402 51.433.136.855 109.449.877.251 234.816.479.440 334.354.934.224 Current Assets 14.058.113.509 29.349.722.585 45.716.622.434 46.650.334.914 45.849.184.179 77.532.192.376 Current Liabilities 4.503.786.387 9.262.640.649 9.821.969.832 33.295.668.489 37.723.797.945 39.459.176.449 Liquid Assets 11.116.041.790 25.022.250.239 40.901.740.684 30.903.328.808 25.958.009.472 52.149.177.099 Sales Revenue 9.708.376.066 14.857.209.743 15.692.506.622 21.839.744.272 23.482.320.514 29.466.146.893 Avrg Accounts Receivable 2.768.087.563 3.380.389.668 4.252.355.020 9.465.387.329 16.484.568.554 21.101.138.175 Gross Profit 5.704.906.532 9.483.404.517 9.664.569.506 10.216.781.047 8.618.906.816 9.546.476.075 Operating Income 5.417.692.976 9.487.195.401 8.928.156.958 7.030.381.969 -1.668.261.054 -3.162.099.626
Net Income at 5.268.429.666 9.066.875.020 9.111.613.586 5.907.490.015 3.499.309.715 2.311.371.492 11.4.2 Management Related Data
1997 1998 1999 2000 2001 2002 ANEK Average Age of the fleet 18,0 19,0 20,0 21,0 18,6 18,0 Certification 0,1 0,15 0,25 0,6 0,8 0,75 IPO-listing 0 1 2 3 4 5 training €/employee GRD 24.713 GRD 25.371 GRD 21.056 GRD 20.584 GRD 20.584 GRD 20.584NEL Average Age of the fleet 25,7 26,7 27,7 28,7 25,6 16,9 Certification 0,05 0,3 0,3 0,3 0,35 0,3 IPO-listing 3 4 5 6 7 8 training €/employee GRD 0 GRD 0 GRD 0 GRD 0 GRD 0 GRD 0MINOA Average Age of the fleet 23,3 22,2 21,3 16,6 16,3 11,1 Certification 0,4 0,4 0,4 0,85 0,9 0,85 IPO-listing 0 1 2 3 4 5 training €/employee GRD 3.847 GRD 6.116 GRD 7.395 GRD 5.807 GRD 6.036 GRD 6.036 STRINTZIS Average Age of the fleet 21,1 22,1 18,2 19,2 15,4 16,4 Certification 0,45 0,35 0,75 0,75 0,75 0,9 IPO-listing 4 5 6 7 8 9 training €/employee GRD 0 GRD 0 GRD 0 GRD 0 GRD 0 GRD 0EPATT Average Age of the fleet 2,0 3,0 2,5 3,5 3,3 3,5 Certification 0,4 0,7 0,7 0,8 0,8 0,8 IPO-listing 4 5 6 7 8 9 training €/employee GRD 45.455 GRD 18.692 GRD 13.889 GRD 6.892 GRD 6.013 GRD 5.432
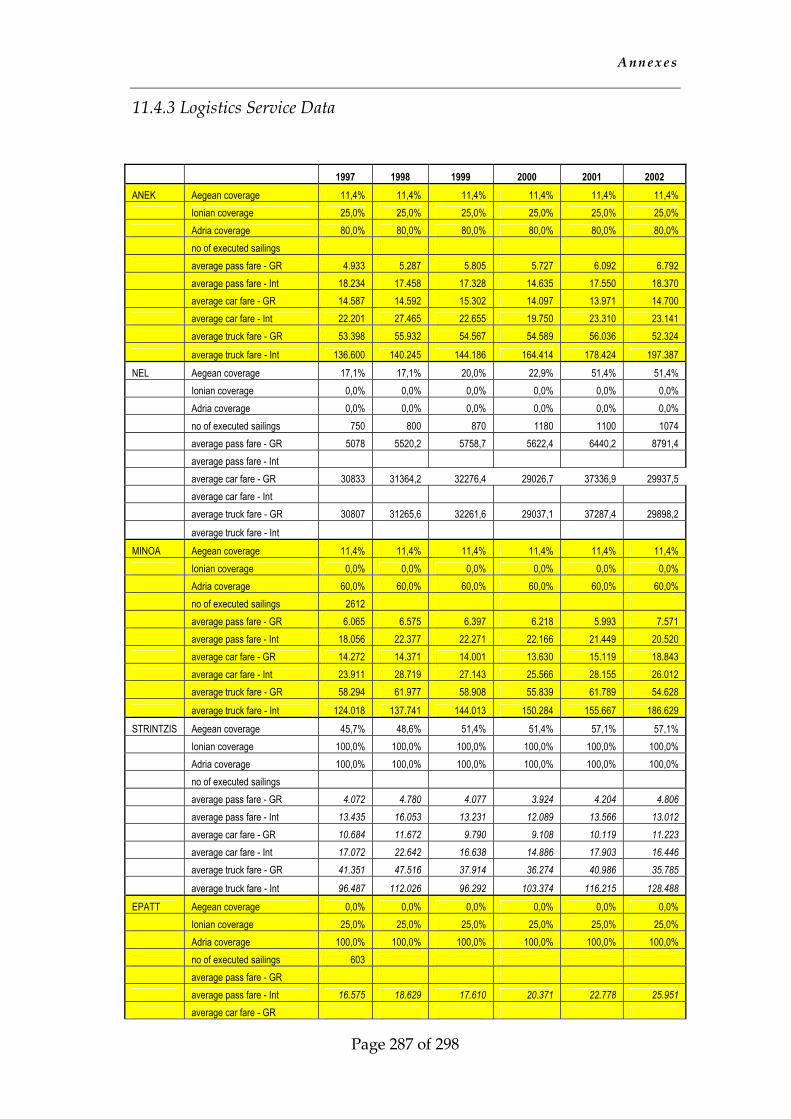
A n n e x e s
Page 287 of 298
11.4.3 Logistics Service Data
1997 1998 1999 2000 2001 2002 ANEK Aegean coverage 11,4% 11,4% 11,4% 11,4% 11,4% 11,4% Ionian coverage 25,0% 25,0% 25,0% 25,0% 25,0% 25,0% Adria coverage 80,0% 80,0% 80,0% 80,0% 80,0% 80,0% no of executed sailings average pass fare - GR 4.933 5.287 5.805 5.727 6.092 6.792 average pass fare - Int 18.234 17.458 17.328 14.635 17.550 18.370 average car fare - GR 14.587 14.592 15.302 14.097 13.971 14.700 average car fare - Int 22.201 27.465 22.655 19.750 23.310 23.141 average truck fare - GR 53.398 55.932 54.567 54.589 56.036 52.324
average truck fare - Int 136.600 140.245 144.186 164.414 178.424 197.387 NEL Aegean coverage 17,1% 17,1% 20,0% 22,9% 51,4% 51,4% Ionian coverage 0,0% 0,0% 0,0% 0,0% 0,0% 0,0% Adria coverage 0,0% 0,0% 0,0% 0,0% 0,0% 0,0% no of executed sailings 750 800 870 1180 1100 1074 average pass fare - GR 5078 5520,2 5758,7 5622,4 6440,2 8791,4 average pass fare - Int average car fare - GR 30833 31364,2 32276,4 29026,7 37336,9 29937,5 average car fare - Int average truck fare - GR 30807 31265,6 32261,6 29037,1 37287,4 29898,2
average truck fare - Int MINOA Aegean coverage 11,4% 11,4% 11,4% 11,4% 11,4% 11,4% Ionian coverage 0,0% 0,0% 0,0% 0,0% 0,0% 0,0% Adria coverage 60,0% 60,0% 60,0% 60,0% 60,0% 60,0% no of executed sailings 2612 average pass fare - GR 6.065 6.575 6.397 6.218 5.993 7.571 average pass fare - Int 18.056 22.377 22.271 22.166 21.449 20.520 average car fare - GR 14.272 14.371 14.001 13.630 15.119 18.843 average car fare - Int 23.911 28.719 27.143 25.566 28.155 26.012 average truck fare - GR 58.294 61.977 58.908 55.839 61.789 54.628
average truck fare - Int 124.018 137.741 144.013 150.284 155.667 186.629 STRINTZIS Aegean coverage 45,7% 48,6% 51,4% 51,4% 57,1% 57,1% Ionian coverage 100,0% 100,0% 100,0% 100,0% 100,0% 100,0% Adria coverage 100,0% 100,0% 100,0% 100,0% 100,0% 100,0% no of executed sailings average pass fare - GR 4.072 4.780 4.077 3.924 4.204 4.806 average pass fare - Int 13.435 16.053 13.231 12.089 13.566 13.012 average car fare - GR 10.684 11.672 9.790 9.108 10.119 11.223 average car fare - Int 17.072 22.642 16.638 14.886 17.903 16.446 average truck fare - GR 41.351 47.516 37.914 36.274 40.986 35.785
average truck fare - Int 96.487 112.026 96.292 103.374 116.215 128.488
EPATT Aegean coverage 0,0% 0,0% 0,0% 0,0% 0,0% 0,0% Ionian coverage 25,0% 25,0% 25,0% 25,0% 25,0% 25,0% Adria coverage 100,0% 100,0% 100,0% 100,0% 100,0% 100,0% no of executed sailings 603 average pass fare - GR average pass fare - Int 16.575 18.629 17.610 20.371 22.778 25.951 average car fare - GR
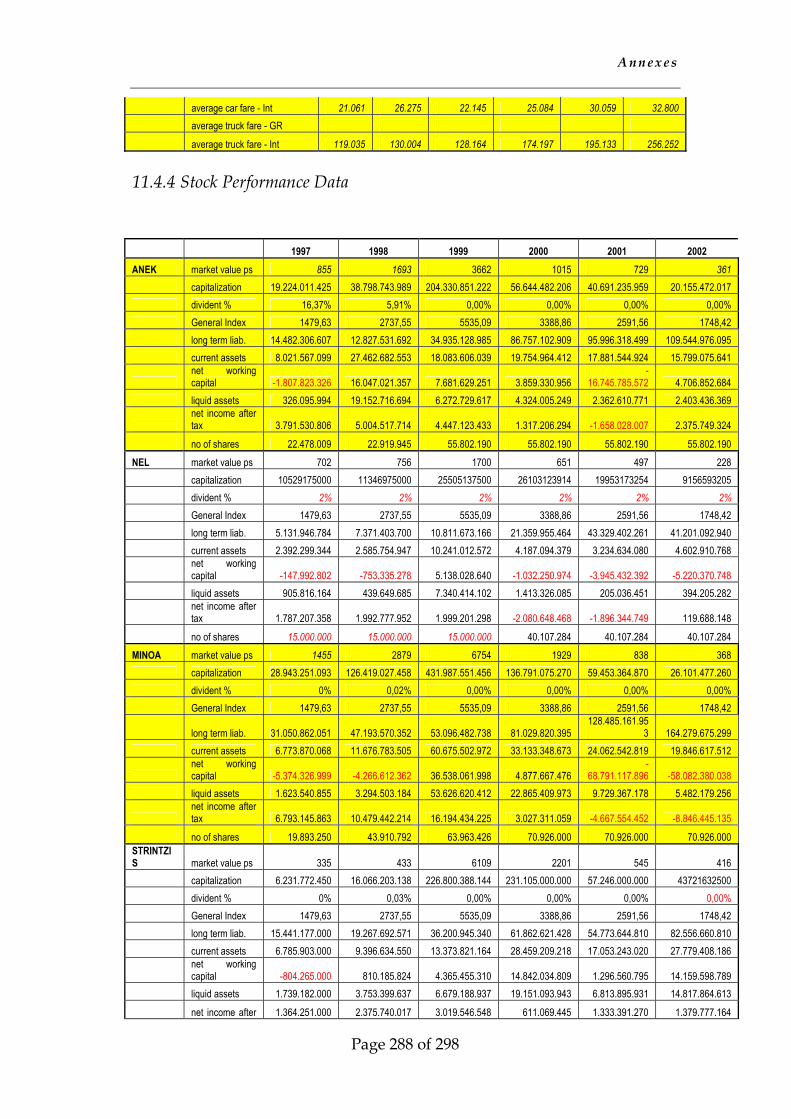
A n n e x e s
Page 288 of 298
average car fare - Int 21.061 26.275 22.145 25.084 30.059 32.800 average truck fare - GR
average truck fare - Int 119.035 130.004 128.164 174.197 195.133 256.252
11.4.4 Stock Performance Data
1997 1998 1999 2000 2001 2002 ANEK market value ps 855 1693 3662 1015 729 361 capitalization 19.224.011.425 38.798.743.989 204.330.851.222 56.644.482.206 40.691.235.959 20.155.472.017 divident % 16,37% 5,91% 0,00% 0,00% 0,00% 0,00% General Index 1479,63 2737,55 5535,09 3388,86 2591,56 1748,42 long term liab. 14.482.306.607 12.827.531.692 34.935.128.985 86.757.102.909 95.996.318.499 109.544.976.095 current assets 8.021.567.099 27.462.682.553 18.083.606.039 19.754.964.412 17.881.544.924 15.799.075.641
net working capital -1.807.823.326 16.047.021.357 7.681.629.251 3.859.330.956
-16.745.785.572 4.706.852.684
liquid assets 326.095.994 19.152.716.694 6.272.729.617 4.324.005.249 2.362.610.771 2.403.436.369
net income after tax 3.791.530.806 5.004.517.714 4.447.123.433 1.317.206.294 -1.658.028.007 2.375.749.324
no of shares 22.478.009 22.919.945 55.802.190 55.802.190 55.802.190 55.802.190 NEL market value ps 702 756 1700 651 497 228 capitalization 10529175000 11346975000 25505137500 26103123914 19953173254 9156593205 divident % 2% 2% 2% 2% 2% 2% General Index 1479,63 2737,55 5535,09 3388,86 2591,56 1748,42 long term liab. 5.131.946.784 7.371.403.700 10.811.673.166 21.359.955.464 43.329.402.261 41.201.092.940 current assets 2.392.299.344 2.585.754.947 10.241.012.572 4.187.094.379 3.234.634.080 4.602.910.768
net working capital -147.992.802 -753.335.278 5.138.028.640 -1.032.250.974 -3.945.432.392 -5.220.370.748
liquid assets 905.816.164 439.649.685 7.340.414.102 1.413.326.085 205.036.451 394.205.282
net income after tax 1.787.207.358 1.992.777.952 1.999.201.298 -2.080.648.468 -1.896.344.749 119.688.148
no of shares 15.000.000 15.000.000 15.000.000 40.107.284 40.107.284 40.107.284 MINOA market value ps 1455 2879 6754 1929 838 368 capitalization 28.943.251.093 126.419.027.458 431.987.551.456 136.791.075.270 59.453.364.870 26.101.477.260 divident % 0% 0,02% 0,00% 0,00% 0,00% 0,00% General Index 1479,63 2737,55 5535,09 3388,86 2591,56 1748,42
long term liab. 31.050.862.051 47.193.570.352 53.096.482.738 81.029.820.395 128.485.161.95
3 164.279.675.299 current assets 6.773.870.068 11.676.783.505 60.675.502.972 33.133.348.673 24.062.542.819 19.846.617.512
net working capital -5.374.326.999 -4.266.612.362 36.538.061.998 4.877.667.476
-68.791.117.896 -58.082.380.038
liquid assets 1.623.540.855 3.294.503.184 53.626.620.412 22.865.409.973 9.729.367.178 5.482.179.256
net income after tax 6.793.145.863 10.479.442.214 16.194.434.225 3.027.311.059 -4.667.554.452 -8.846.445.135
no of shares 19.893.250 43.910.792 63.963.426 70.926.000 70.926.000 70.926.000 STRINTZIS market value ps 335 433 6109 2201 545 416 capitalization 6.231.772.450 16.066.203.138 226.800.388.144 231.105.000.000 57.246.000.000 43721632500 divident % 0% 0,03% 0,00% 0,00% 0,00% 0,00% General Index 1479,63 2737,55 5535,09 3388,86 2591,56 1748,42 long term liab. 15.441.177.000 19.267.692.571 36.200.945.340 61.862.621.428 54.773.644.810 82.556.660.810 current assets 6.785.903.000 9.396.634.550 13.373.821.164 28.459.209.218 17.053.243.020 27.779.408.186
net working capital -804.265.000 810.185.824 4.365.455.310 14.842.034.809 1.296.560.795 14.159.598.789
liquid assets 1.739.182.000 3.753.399.637 6.679.188.937 19.151.093.943 6.813.895.931 14.817.864.613
net income after 1.364.251.000 2.375.740.017 3.019.546.548 611.069.445 1.333.391.270 1.379.777.164
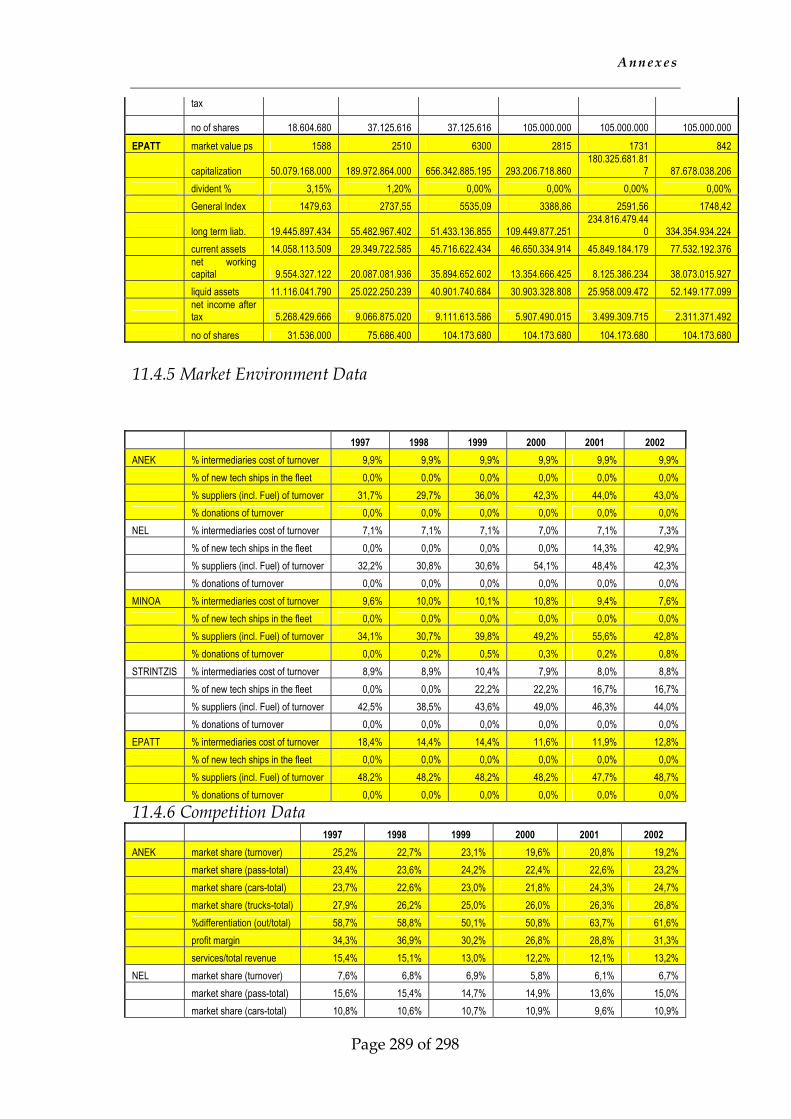
A n n e x e s
Page 289 of 298
tax
no of shares 18.604.680 37.125.616 37.125.616 105.000.000 105.000.000 105.000.000 EPATT market value ps 1588 2510 6300 2815 1731 842
capitalization 50.079.168.000 189.972.864.000 656.342.885.195 293.206.718.860 180.325.681.81
7 87.678.038.206 divident % 3,15% 1,20% 0,00% 0,00% 0,00% 0,00% General Index 1479,63 2737,55 5535,09 3388,86 2591,56 1748,42
long term liab. 19.445.897.434 55.482.967.402 51.433.136.855 109.449.877.251 234.816.479.44
0 334.354.934.224 current assets 14.058.113.509 29.349.722.585 45.716.622.434 46.650.334.914 45.849.184.179 77.532.192.376
net working capital 9.554.327.122 20.087.081.936 35.894.652.602 13.354.666.425 8.125.386.234 38.073.015.927
liquid assets 11.116.041.790 25.022.250.239 40.901.740.684 30.903.328.808 25.958.009.472 52.149.177.099
net income after tax 5.268.429.666 9.066.875.020 9.111.613.586 5.907.490.015 3.499.309.715 2.311.371.492
no of shares 31.536.000 75.686.400 104.173.680 104.173.680 104.173.680 104.173.680
11.4.5 Market Environment Data
1997 1998 1999 2000 2001 2002 ANEK % intermediaries cost of turnover 9,9% 9,9% 9,9% 9,9% 9,9% 9,9% % of new tech ships in the fleet 0,0% 0,0% 0,0% 0,0% 0,0% 0,0% % suppliers (incl. Fuel) of turnover 31,7% 29,7% 36,0% 42,3% 44,0% 43,0% % donations of turnover 0,0% 0,0% 0,0% 0,0% 0,0% 0,0% NEL % intermediaries cost of turnover 7,1% 7,1% 7,1% 7,0% 7,1% 7,3% % of new tech ships in the fleet 0,0% 0,0% 0,0% 0,0% 14,3% 42,9% % suppliers (incl. Fuel) of turnover 32,2% 30,8% 30,6% 54,1% 48,4% 42,3% % donations of turnover 0,0% 0,0% 0,0% 0,0% 0,0% 0,0% MINOA % intermediaries cost of turnover 9,6% 10,0% 10,1% 10,8% 9,4% 7,6% % of new tech ships in the fleet 0,0% 0,0% 0,0% 0,0% 0,0% 0,0% % suppliers (incl. Fuel) of turnover 34,1% 30,7% 39,8% 49,2% 55,6% 42,8% % donations of turnover 0,0% 0,2% 0,5% 0,3% 0,2% 0,8% STRINTZIS % intermediaries cost of turnover 8,9% 8,9% 10,4% 7,9% 8,0% 8,8% % of new tech ships in the fleet 0,0% 0,0% 22,2% 22,2% 16,7% 16,7% % suppliers (incl. Fuel) of turnover 42,5% 38,5% 43,6% 49,0% 46,3% 44,0% % donations of turnover 0,0% 0,0% 0,0% 0,0% 0,0% 0,0% EPATT % intermediaries cost of turnover 18,4% 14,4% 14,4% 11,6% 11,9% 12,8% % of new tech ships in the fleet 0,0% 0,0% 0,0% 0,0% 0,0% 0,0% % suppliers (incl. Fuel) of turnover 48,2% 48,2% 48,2% 48,2% 47,7% 48,7% % donations of turnover 0,0% 0,0% 0,0% 0,0% 0,0% 0,0%
11.4.6 Competition Data 1997 1998 1999 2000 2001 2002 ANEK market share (turnover) 25,2% 22,7% 23,1% 19,6% 20,8% 19,2% market share (pass-total) 23,4% 23,6% 24,2% 22,4% 22,6% 23,2% market share (cars-total) 23,7% 22,6% 23,0% 21,8% 24,3% 24,7% market share (trucks-total) 27,9% 26,2% 25,0% 26,0% 26,3% 26,8% %differentiation (out/total) 58,7% 58,8% 50,1% 50,8% 63,7% 61,6% profit margin 34,3% 36,9% 30,2% 26,8% 28,8% 31,3% services/total revenue 15,4% 15,1% 13,0% 12,2% 12,1% 13,2% NEL market share (turnover) 7,6% 6,8% 6,9% 5,8% 6,1% 6,7% market share (pass-total) 15,6% 15,4% 14,7% 14,9% 13,6% 15,0% market share (cars-total) 10,8% 10,6% 10,7% 10,9% 9,6% 10,9%
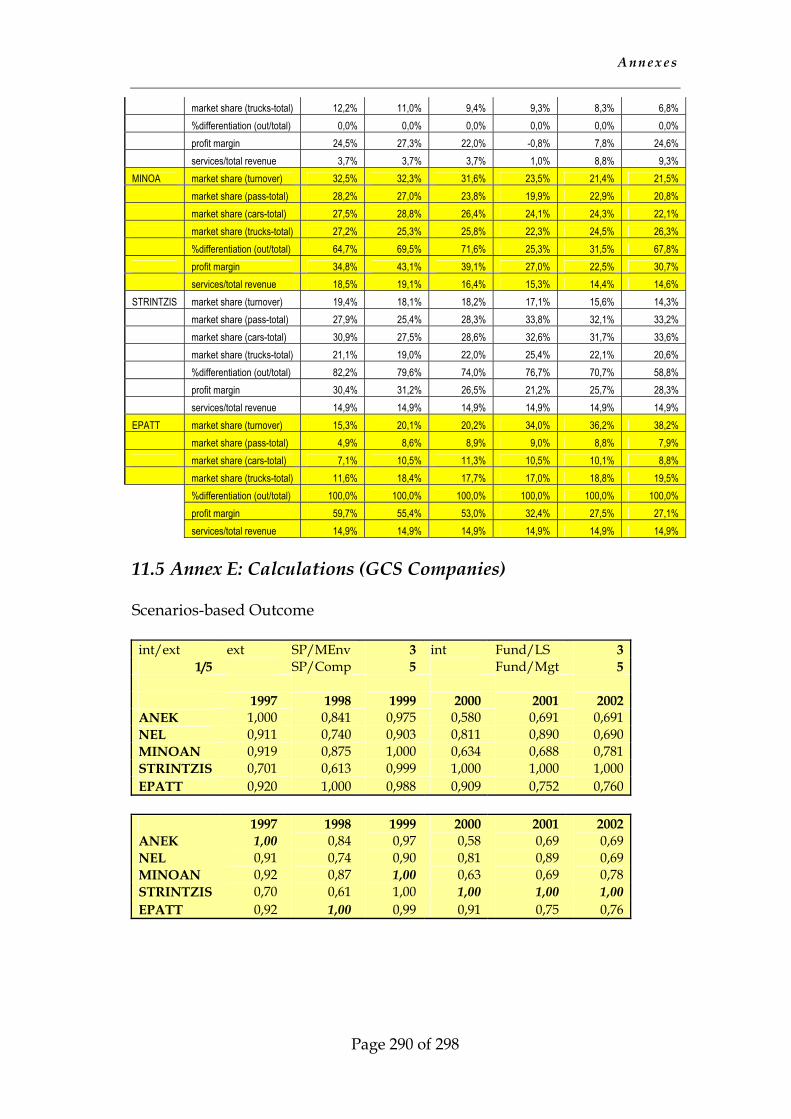
A n n e x e s
Page 290 of 298
market share (trucks-total) 12,2% 11,0% 9,4% 9,3% 8,3% 6,8% %differentiation (out/total) 0,0% 0,0% 0,0% 0,0% 0,0% 0,0% profit margin 24,5% 27,3% 22,0% -0,8% 7,8% 24,6% services/total revenue 3,7% 3,7% 3,7% 1,0% 8,8% 9,3% MINOA market share (turnover) 32,5% 32,3% 31,6% 23,5% 21,4% 21,5% market share (pass-total) 28,2% 27,0% 23,8% 19,9% 22,9% 20,8% market share (cars-total) 27,5% 28,8% 26,4% 24,1% 24,3% 22,1% market share (trucks-total) 27,2% 25,3% 25,8% 22,3% 24,5% 26,3% %differentiation (out/total) 64,7% 69,5% 71,6% 25,3% 31,5% 67,8% profit margin 34,8% 43,1% 39,1% 27,0% 22,5% 30,7% services/total revenue 18,5% 19,1% 16,4% 15,3% 14,4% 14,6% STRINTZIS market share (turnover) 19,4% 18,1% 18,2% 17,1% 15,6% 14,3% market share (pass-total) 27,9% 25,4% 28,3% 33,8% 32,1% 33,2% market share (cars-total) 30,9% 27,5% 28,6% 32,6% 31,7% 33,6% market share (trucks-total) 21,1% 19,0% 22,0% 25,4% 22,1% 20,6% %differentiation (out/total) 82,2% 79,6% 74,0% 76,7% 70,7% 58,8% profit margin 30,4% 31,2% 26,5% 21,2% 25,7% 28,3% services/total revenue 14,9% 14,9% 14,9% 14,9% 14,9% 14,9% EPATT market share (turnover) 15,3% 20,1% 20,2% 34,0% 36,2% 38,2% market share (pass-total) 4,9% 8,6% 8,9% 9,0% 8,8% 7,9% market share (cars-total) 7,1% 10,5% 11,3% 10,5% 10,1% 8,8% market share (trucks-total) 11,6% 18,4% 17,7% 17,0% 18,8% 19,5% %differentiation (out/total) 100,0% 100,0% 100,0% 100,0% 100,0% 100,0% profit margin 59,7% 55,4% 53,0% 32,4% 27,5% 27,1% services/total revenue 14,9% 14,9% 14,9% 14,9% 14,9% 14,9% 11.5 Annex E: Calculations (GCS Companies) Scenarios-based Outcome int/ext ext SP/MEnv 3 int Fund/LS 3
1/5 SP/Comp 5 Fund/Mgt 5 1997 1998 1999 2000 2001 2002 ANEK 1,000 0,841 0,975 0,580 0,691 0,691 NEL 0,911 0,740 0,903 0,811 0,890 0,690 MINOAN 0,919 0,875 1,000 0,634 0,688 0,781 STRINTZIS 0,701 0,613 0,999 1,000 1,000 1,000 EPATT 0,920 1,000 0,988 0,909 0,752 0,760 1997 1998 1999 2000 2001 2002 ANEK 1,00 0,84 0,97 0,58 0,69 0,69 NEL 0,91 0,74 0,90 0,81 0,89 0,69 MINOAN 0,92 0,87 1,00 0,63 0,69 0,78 STRINTZIS 0,70 0,61 1,00 1,00 1,00 1,00 EPATT 0,92 1,00 0,99 0,91 0,75 0,76
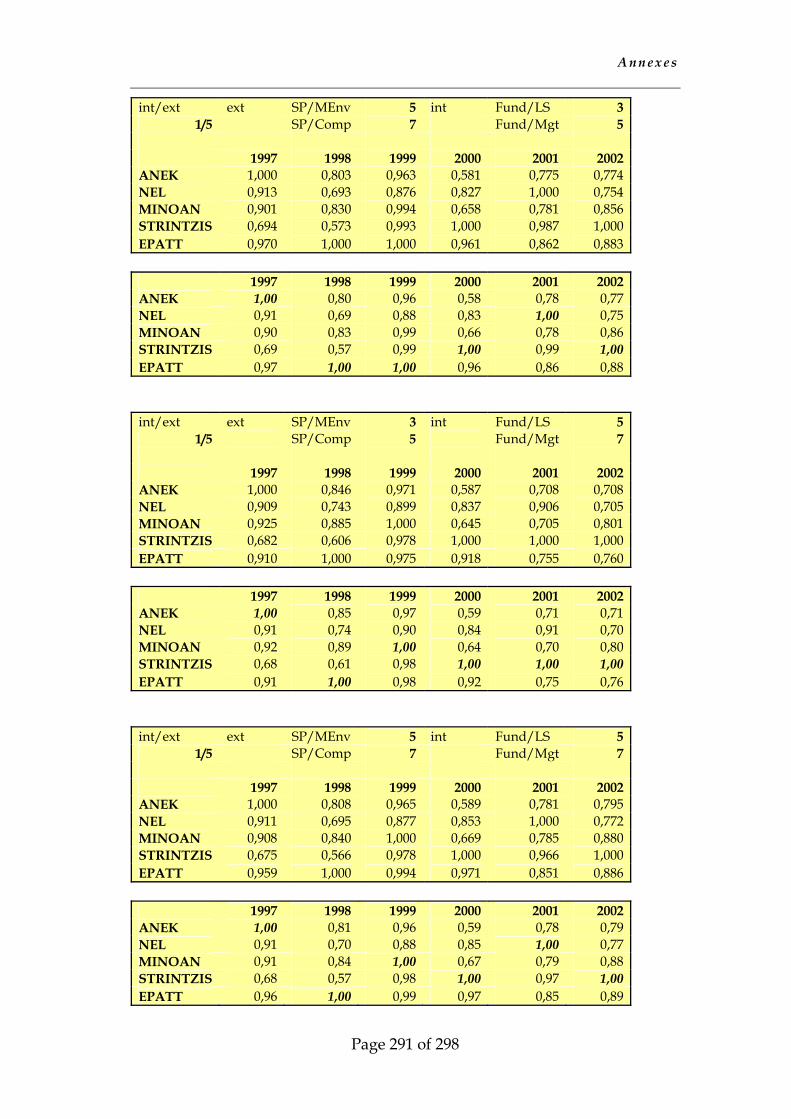
A n n e x e s
Page 291 of 298
int/ext ext SP/MEnv 5 int Fund/LS 3 1/5 SP/Comp 7 Fund/Mgt 5
1997 1998 1999 2000 2001 2002 ANEK 1,000 0,803 0,963 0,581 0,775 0,774 NEL 0,913 0,693 0,876 0,827 1,000 0,754 MINOAN 0,901 0,830 0,994 0,658 0,781 0,856 STRINTZIS 0,694 0,573 0,993 1,000 0,987 1,000 EPATT 0,970 1,000 1,000 0,961 0,862 0,883 1997 1998 1999 2000 2001 2002 ANEK 1,00 0,80 0,96 0,58 0,78 0,77 NEL 0,91 0,69 0,88 0,83 1,00 0,75 MINOAN 0,90 0,83 0,99 0,66 0,78 0,86 STRINTZIS 0,69 0,57 0,99 1,00 0,99 1,00 EPATT 0,97 1,00 1,00 0,96 0,86 0,88 int/ext ext SP/MEnv 3 int Fund/LS 5
1/5 SP/Comp 5 Fund/Mgt 7 1997 1998 1999 2000 2001 2002 ANEK 1,000 0,846 0,971 0,587 0,708 0,708 NEL 0,909 0,743 0,899 0,837 0,906 0,705 MINOAN 0,925 0,885 1,000 0,645 0,705 0,801 STRINTZIS 0,682 0,606 0,978 1,000 1,000 1,000 EPATT 0,910 1,000 0,975 0,918 0,755 0,760 1997 1998 1999 2000 2001 2002 ANEK 1,00 0,85 0,97 0,59 0,71 0,71 NEL 0,91 0,74 0,90 0,84 0,91 0,70 MINOAN 0,92 0,89 1,00 0,64 0,70 0,80 STRINTZIS 0,68 0,61 0,98 1,00 1,00 1,00 EPATT 0,91 1,00 0,98 0,92 0,75 0,76 int/ext ext SP/MEnv 5 int Fund/LS 5
1/5 SP/Comp 7 Fund/Mgt 7 1997 1998 1999 2000 2001 2002 ANEK 1,000 0,808 0,965 0,589 0,781 0,795 NEL 0,911 0,695 0,877 0,853 1,000 0,772 MINOAN 0,908 0,840 1,000 0,669 0,785 0,880 STRINTZIS 0,675 0,566 0,978 1,000 0,966 1,000 EPATT 0,959 1,000 0,994 0,971 0,851 0,886 1997 1998 1999 2000 2001 2002 ANEK 1,00 0,81 0,96 0,59 0,78 0,79 NEL 0,91 0,70 0,88 0,85 1,00 0,77 MINOAN 0,91 0,84 1,00 0,67 0,79 0,88 STRINTZIS 0,68 0,57 0,98 1,00 0,97 1,00 EPATT 0,96 1,00 0,99 0,97 0,85 0,89
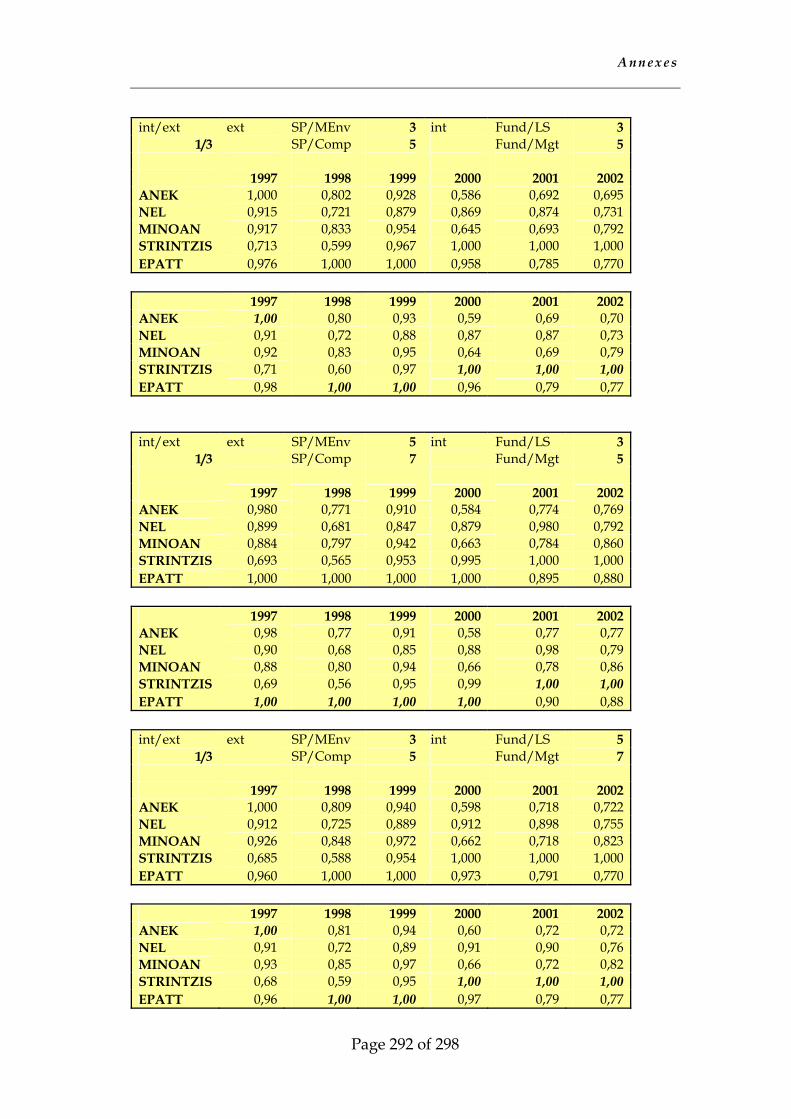
A n n e x e s
Page 292 of 298
int/ext ext SP/MEnv 3 int Fund/LS 3
1/3 SP/Comp 5 Fund/Mgt 5 1997 1998 1999 2000 2001 2002 ANEK 1,000 0,802 0,928 0,586 0,692 0,695 NEL 0,915 0,721 0,879 0,869 0,874 0,731 MINOAN 0,917 0,833 0,954 0,645 0,693 0,792 STRINTZIS 0,713 0,599 0,967 1,000 1,000 1,000 EPATT 0,976 1,000 1,000 0,958 0,785 0,770 1997 1998 1999 2000 2001 2002 ANEK 1,00 0,80 0,93 0,59 0,69 0,70 NEL 0,91 0,72 0,88 0,87 0,87 0,73 MINOAN 0,92 0,83 0,95 0,64 0,69 0,79 STRINTZIS 0,71 0,60 0,97 1,00 1,00 1,00 EPATT 0,98 1,00 1,00 0,96 0,79 0,77 int/ext ext SP/MEnv 5 int Fund/LS 3
1/3 SP/Comp 7 Fund/Mgt 5 1997 1998 1999 2000 2001 2002 ANEK 0,980 0,771 0,910 0,584 0,774 0,769 NEL 0,899 0,681 0,847 0,879 0,980 0,792 MINOAN 0,884 0,797 0,942 0,663 0,784 0,860 STRINTZIS 0,693 0,565 0,953 0,995 1,000 1,000 EPATT 1,000 1,000 1,000 1,000 0,895 0,880 1997 1998 1999 2000 2001 2002 ANEK 0,98 0,77 0,91 0,58 0,77 0,77 NEL 0,90 0,68 0,85 0,88 0,98 0,79 MINOAN 0,88 0,80 0,94 0,66 0,78 0,86 STRINTZIS 0,69 0,56 0,95 0,99 1,00 1,00 EPATT 1,00 1,00 1,00 1,00 0,90 0,88 int/ext ext SP/MEnv 3 int Fund/LS 5
1/3 SP/Comp 5 Fund/Mgt 7 1997 1998 1999 2000 2001 2002 ANEK 1,000 0,809 0,940 0,598 0,718 0,722 NEL 0,912 0,725 0,889 0,912 0,898 0,755 MINOAN 0,926 0,848 0,972 0,662 0,718 0,823 STRINTZIS 0,685 0,588 0,954 1,000 1,000 1,000 EPATT 0,960 1,000 1,000 0,973 0,791 0,770 1997 1998 1999 2000 2001 2002 ANEK 1,00 0,81 0,94 0,60 0,72 0,72 NEL 0,91 0,72 0,89 0,91 0,90 0,76 MINOAN 0,93 0,85 0,97 0,66 0,72 0,82 STRINTZIS 0,68 0,59 0,95 1,00 1,00 1,00 EPATT 0,96 1,00 1,00 0,97 0,79 0,77
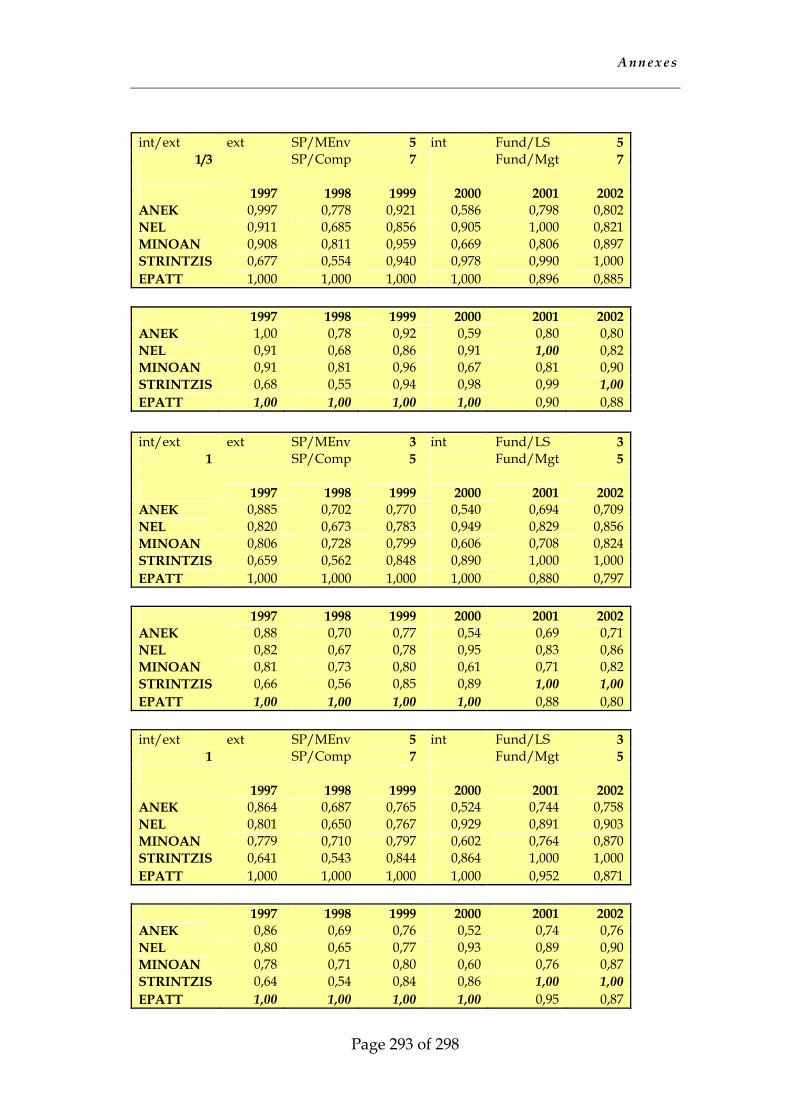
A n n e x e s
Page 293 of 298
int/ext ext SP/MEnv 5 int Fund/LS 5
1/3 SP/Comp 7 Fund/Mgt 7 1997 1998 1999 2000 2001 2002 ANEK 0,997 0,778 0,921 0,586 0,798 0,802 NEL 0,911 0,685 0,856 0,905 1,000 0,821 MINOAN 0,908 0,811 0,959 0,669 0,806 0,897 STRINTZIS 0,677 0,554 0,940 0,978 0,990 1,000 EPATT 1,000 1,000 1,000 1,000 0,896 0,885 1997 1998 1999 2000 2001 2002 ANEK 1,00 0,78 0,92 0,59 0,80 0,80 NEL 0,91 0,68 0,86 0,91 1,00 0,82 MINOAN 0,91 0,81 0,96 0,67 0,81 0,90 STRINTZIS 0,68 0,55 0,94 0,98 0,99 1,00 EPATT 1,00 1,00 1,00 1,00 0,90 0,88
int/ext ext SP/MEnv 3 int Fund/LS 3
1 SP/Comp 5 Fund/Mgt 5 1997 1998 1999 2000 2001 2002 ANEK 0,885 0,702 0,770 0,540 0,694 0,709 NEL 0,820 0,673 0,783 0,949 0,829 0,856 MINOAN 0,806 0,728 0,799 0,606 0,708 0,824 STRINTZIS 0,659 0,562 0,848 0,890 1,000 1,000 EPATT 1,000 1,000 1,000 1,000 0,880 0,797 1997 1998 1999 2000 2001 2002 ANEK 0,88 0,70 0,77 0,54 0,69 0,71 NEL 0,82 0,67 0,78 0,95 0,83 0,86 MINOAN 0,81 0,73 0,80 0,61 0,71 0,82 STRINTZIS 0,66 0,56 0,85 0,89 1,00 1,00 EPATT 1,00 1,00 1,00 1,00 0,88 0,80 int/ext ext SP/MEnv 5 int Fund/LS 3
1 SP/Comp 7 Fund/Mgt 5 1997 1998 1999 2000 2001 2002 ANEK 0,864 0,687 0,765 0,524 0,744 0,758 NEL 0,801 0,650 0,767 0,929 0,891 0,903 MINOAN 0,779 0,710 0,797 0,602 0,764 0,870 STRINTZIS 0,641 0,543 0,844 0,864 1,000 1,000 EPATT 1,000 1,000 1,000 1,000 0,952 0,871 1997 1998 1999 2000 2001 2002 ANEK 0,86 0,69 0,76 0,52 0,74 0,76 NEL 0,80 0,65 0,77 0,93 0,89 0,90 MINOAN 0,78 0,71 0,80 0,60 0,76 0,87 STRINTZIS 0,64 0,54 0,84 0,86 1,00 1,00 EPATT 1,00 1,00 1,00 1,00 0,95 0,87
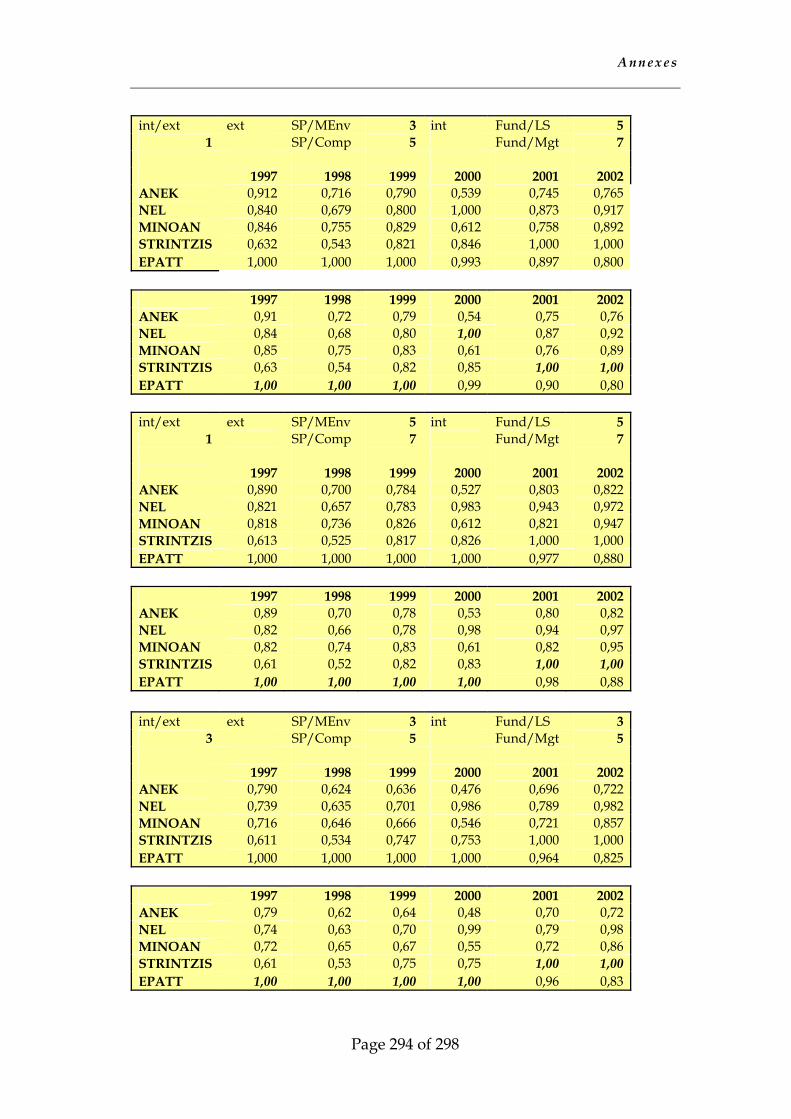
A n n e x e s
Page 294 of 298
int/ext ext SP/MEnv 3 int Fund/LS 5
1 SP/Comp 5 Fund/Mgt 7 1997 1998 1999 2000 2001 2002 ANEK 0,912 0,716 0,790 0,539 0,745 0,765 NEL 0,840 0,679 0,800 1,000 0,873 0,917 MINOAN 0,846 0,755 0,829 0,612 0,758 0,892 STRINTZIS 0,632 0,543 0,821 0,846 1,000 1,000 EPATT 1,000 1,000 1,000 0,993 0,897 0,800 1997 1998 1999 2000 2001 2002 ANEK 0,91 0,72 0,79 0,54 0,75 0,76 NEL 0,84 0,68 0,80 1,00 0,87 0,92 MINOAN 0,85 0,75 0,83 0,61 0,76 0,89 STRINTZIS 0,63 0,54 0,82 0,85 1,00 1,00 EPATT 1,00 1,00 1,00 0,99 0,90 0,80 int/ext ext SP/MEnv 5 int Fund/LS 5
1 SP/Comp 7 Fund/Mgt 7 1997 1998 1999 2000 2001 2002 ANEK 0,890 0,700 0,784 0,527 0,803 0,822 NEL 0,821 0,657 0,783 0,983 0,943 0,972 MINOAN 0,818 0,736 0,826 0,612 0,821 0,947 STRINTZIS 0,613 0,525 0,817 0,826 1,000 1,000 EPATT 1,000 1,000 1,000 1,000 0,977 0,880 1997 1998 1999 2000 2001 2002 ANEK 0,89 0,70 0,78 0,53 0,80 0,82 NEL 0,82 0,66 0,78 0,98 0,94 0,97 MINOAN 0,82 0,74 0,83 0,61 0,82 0,95 STRINTZIS 0,61 0,52 0,82 0,83 1,00 1,00 EPATT 1,00 1,00 1,00 1,00 0,98 0,88
int/ext ext SP/MEnv 3 int Fund/LS 3
3 SP/Comp 5 Fund/Mgt 5 1997 1998 1999 2000 2001 2002 ANEK 0,790 0,624 0,636 0,476 0,696 0,722 NEL 0,739 0,635 0,701 0,986 0,789 0,982 MINOAN 0,716 0,646 0,666 0,546 0,721 0,857 STRINTZIS 0,611 0,534 0,747 0,753 1,000 1,000 EPATT 1,000 1,000 1,000 1,000 0,964 0,825 1997 1998 1999 2000 2001 2002 ANEK 0,79 0,62 0,64 0,48 0,70 0,72 NEL 0,74 0,63 0,70 0,99 0,79 0,98 MINOAN 0,72 0,65 0,67 0,55 0,72 0,86 STRINTZIS 0,61 0,53 0,75 0,75 1,00 1,00 EPATT 1,00 1,00 1,00 1,00 0,96 0,83
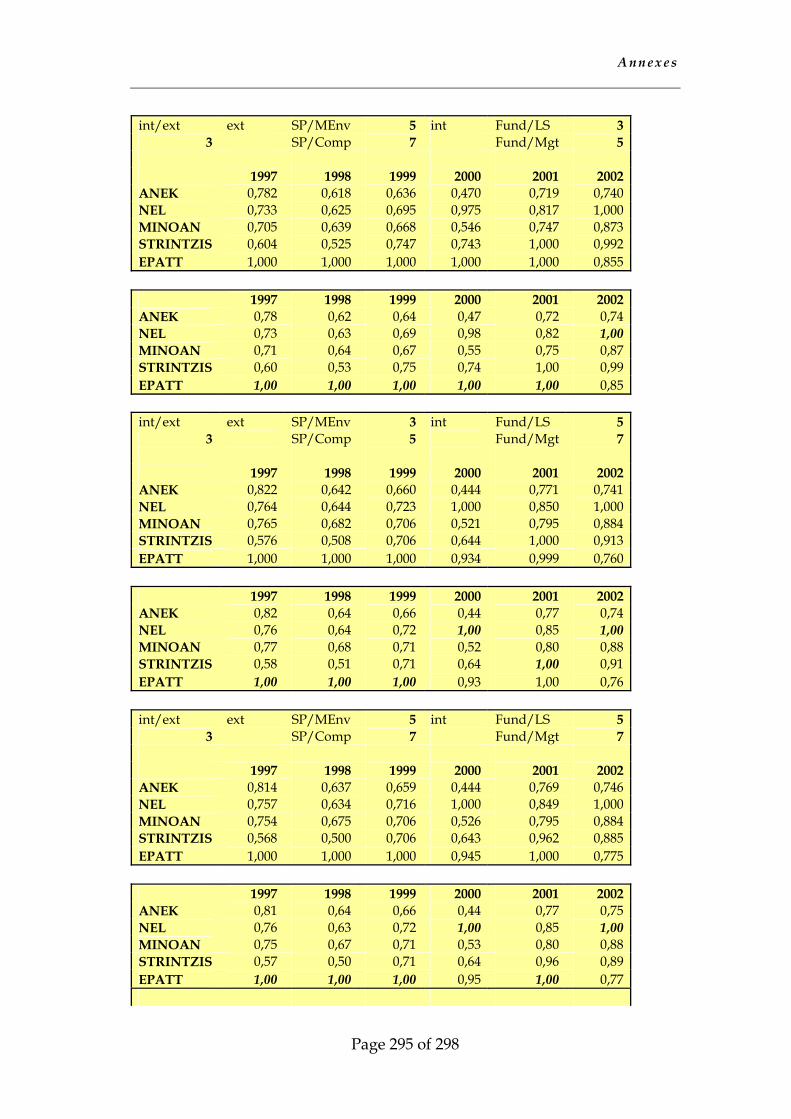
A n n e x e s
Page 295 of 298
int/ext ext SP/MEnv 5 int Fund/LS 3
3 SP/Comp 7 Fund/Mgt 5 1997 1998 1999 2000 2001 2002 ANEK 0,782 0,618 0,636 0,470 0,719 0,740 NEL 0,733 0,625 0,695 0,975 0,817 1,000 MINOAN 0,705 0,639 0,668 0,546 0,747 0,873 STRINTZIS 0,604 0,525 0,747 0,743 1,000 0,992 EPATT 1,000 1,000 1,000 1,000 1,000 0,855 1997 1998 1999 2000 2001 2002 ANEK 0,78 0,62 0,64 0,47 0,72 0,74 NEL 0,73 0,63 0,69 0,98 0,82 1,00 MINOAN 0,71 0,64 0,67 0,55 0,75 0,87 STRINTZIS 0,60 0,53 0,75 0,74 1,00 0,99 EPATT 1,00 1,00 1,00 1,00 1,00 0,85 int/ext ext SP/MEnv 3 int Fund/LS 5
3 SP/Comp 5 Fund/Mgt 7 1997 1998 1999 2000 2001 2002 ANEK 0,822 0,642 0,660 0,444 0,771 0,741 NEL 0,764 0,644 0,723 1,000 0,850 1,000 MINOAN 0,765 0,682 0,706 0,521 0,795 0,884 STRINTZIS 0,576 0,508 0,706 0,644 1,000 0,913 EPATT 1,000 1,000 1,000 0,934 0,999 0,760 1997 1998 1999 2000 2001 2002 ANEK 0,82 0,64 0,66 0,44 0,77 0,74 NEL 0,76 0,64 0,72 1,00 0,85 1,00 MINOAN 0,77 0,68 0,71 0,52 0,80 0,88 STRINTZIS 0,58 0,51 0,71 0,64 1,00 0,91 EPATT 1,00 1,00 1,00 0,93 1,00 0,76 int/ext ext SP/MEnv 5 int Fund/LS 5
3 SP/Comp 7 Fund/Mgt 7 1997 1998 1999 2000 2001 2002 ANEK 0,814 0,637 0,659 0,444 0,769 0,746 NEL 0,757 0,634 0,716 1,000 0,849 1,000 MINOAN 0,754 0,675 0,706 0,526 0,795 0,884 STRINTZIS 0,568 0,500 0,706 0,643 0,962 0,885 EPATT 1,000 1,000 1,000 0,945 1,000 0,775 1997 1998 1999 2000 2001 2002 ANEK 0,81 0,64 0,66 0,44 0,77 0,75 NEL 0,76 0,63 0,72 1,00 0,85 1,00 MINOAN 0,75 0,67 0,71 0,53 0,80 0,88 STRINTZIS 0,57 0,50 0,71 0,64 0,96 0,89 EPATT 1,00 1,00 1,00 0,95 1,00 0,77
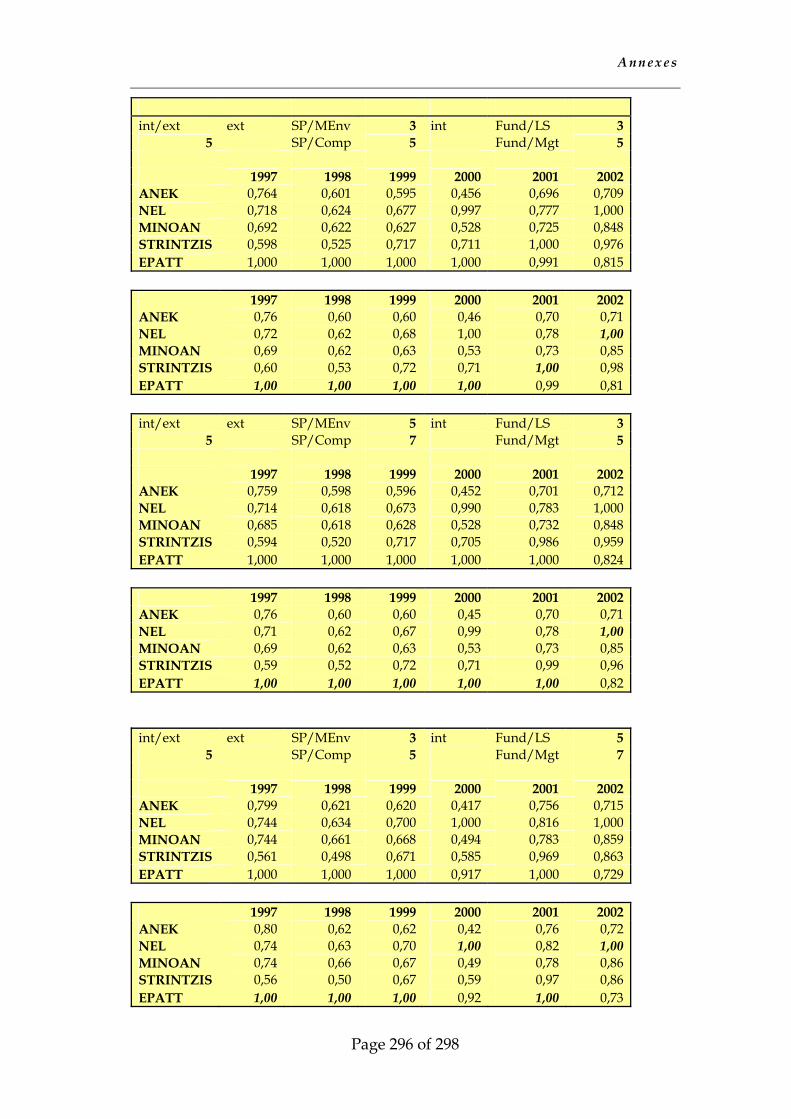
A n n e x e s
Page 296 of 298
int/ext ext SP/MEnv 3 int Fund/LS 3
5 SP/Comp 5 Fund/Mgt 5 1997 1998 1999 2000 2001 2002 ANEK 0,764 0,601 0,595 0,456 0,696 0,709 NEL 0,718 0,624 0,677 0,997 0,777 1,000 MINOAN 0,692 0,622 0,627 0,528 0,725 0,848 STRINTZIS 0,598 0,525 0,717 0,711 1,000 0,976 EPATT 1,000 1,000 1,000 1,000 0,991 0,815 1997 1998 1999 2000 2001 2002 ANEK 0,76 0,60 0,60 0,46 0,70 0,71 NEL 0,72 0,62 0,68 1,00 0,78 1,00 MINOAN 0,69 0,62 0,63 0,53 0,73 0,85 STRINTZIS 0,60 0,53 0,72 0,71 1,00 0,98 EPATT 1,00 1,00 1,00 1,00 0,99 0,81 int/ext ext SP/MEnv 5 int Fund/LS 3
5 SP/Comp 7 Fund/Mgt 5 1997 1998 1999 2000 2001 2002 ANEK 0,759 0,598 0,596 0,452 0,701 0,712 NEL 0,714 0,618 0,673 0,990 0,783 1,000 MINOAN 0,685 0,618 0,628 0,528 0,732 0,848 STRINTZIS 0,594 0,520 0,717 0,705 0,986 0,959 EPATT 1,000 1,000 1,000 1,000 1,000 0,824 1997 1998 1999 2000 2001 2002 ANEK 0,76 0,60 0,60 0,45 0,70 0,71 NEL 0,71 0,62 0,67 0,99 0,78 1,00 MINOAN 0,69 0,62 0,63 0,53 0,73 0,85 STRINTZIS 0,59 0,52 0,72 0,71 0,99 0,96 EPATT 1,00 1,00 1,00 1,00 1,00 0,82 int/ext ext SP/MEnv 3 int Fund/LS 5
5 SP/Comp 5 Fund/Mgt 7 1997 1998 1999 2000 2001 2002 ANEK 0,799 0,621 0,620 0,417 0,756 0,715 NEL 0,744 0,634 0,700 1,000 0,816 1,000 MINOAN 0,744 0,661 0,668 0,494 0,783 0,859 STRINTZIS 0,561 0,498 0,671 0,585 0,969 0,863 EPATT 1,000 1,000 1,000 0,917 1,000 0,729 1997 1998 1999 2000 2001 2002 ANEK 0,80 0,62 0,62 0,42 0,76 0,72 NEL 0,74 0,63 0,70 1,00 0,82 1,00 MINOAN 0,74 0,66 0,67 0,49 0,78 0,86 STRINTZIS 0,56 0,50 0,67 0,59 0,97 0,86 EPATT 1,00 1,00 1,00 0,92 1,00 0,73
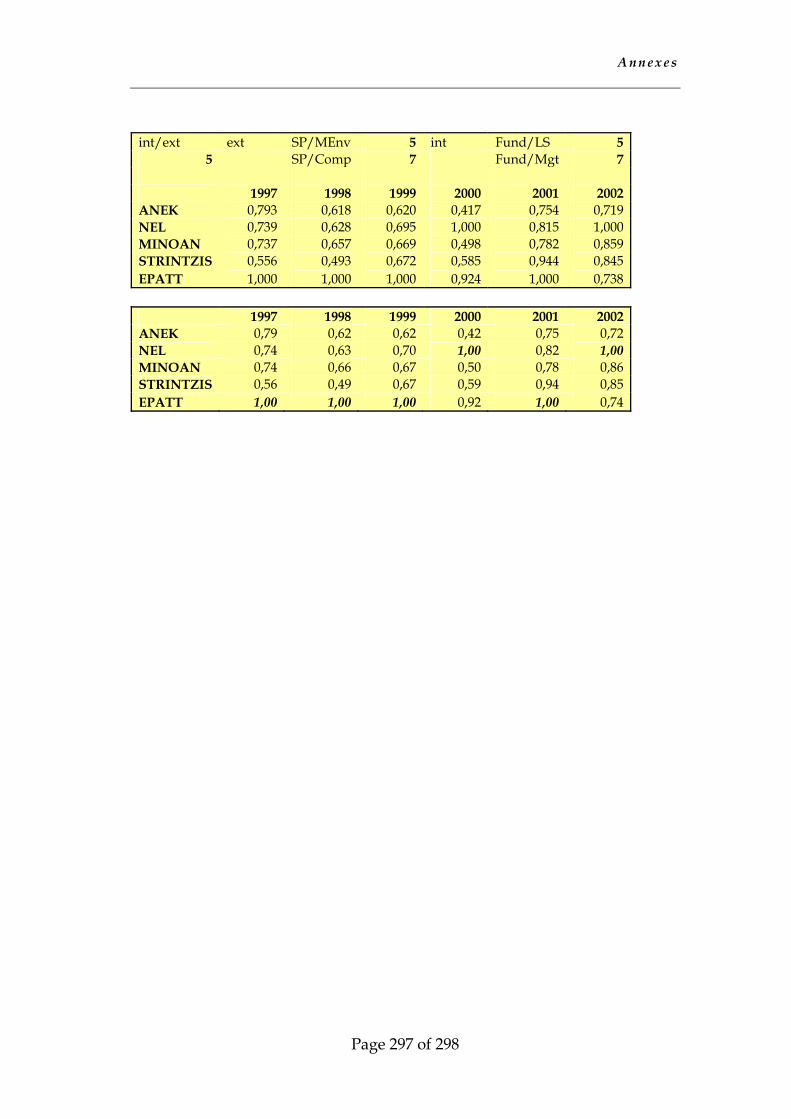
A n n e x e s
Page 297 of 298
int/ext ext SP/MEnv 5 int Fund/LS 5
5 SP/Comp 7 Fund/Mgt 7 1997 1998 1999 2000 2001 2002 ANEK 0,793 0,618 0,620 0,417 0,754 0,719 NEL 0,739 0,628 0,695 1,000 0,815 1,000 MINOAN 0,737 0,657 0,669 0,498 0,782 0,859 STRINTZIS 0,556 0,493 0,672 0,585 0,944 0,845 EPATT 1,000 1,000 1,000 0,924 1,000 0,738 1997 1998 1999 2000 2001 2002 ANEK 0,79 0,62 0,62 0,42 0,75 0,72 NEL 0,74 0,63 0,70 1,00 0,82 1,00 MINOAN 0,74 0,66 0,67 0,50 0,78 0,86 STRINTZIS 0,56 0,49 0,67 0,59 0,94 0,85 EPATT 1,00 1,00 1,00 0,92 1,00 0,74


