Embed Size (px)
Citation preview

Page 1/19
Application of miniature �ber near infrared spectroscopycombined with chemometrics in predicting antioxidantactivity of Sagittaria sagittifolia L. polysaccharidesYuqin Feng
Jiangsu UniversityYating Song
Jiangsu UniversityYujie Qiu
Jiangsu UniversityYuqing Duan ( [email protected] )
Jiangsu UniversityHaihui Zhang
Jiangsu University
Research Article
Keywords: polysaccharides, structural, ultrasonic extract, near infrared (NIR) spectroscopy, antioxidant activity
Posted Date: June 14th, 2022
DOI: https://doi.org/10.21203/rs.3.rs-1734131/v1
License: This work is licensed under a Creative Commons Attribution 4.0 International License. Read Full License

Page 2/19
AbstractOxidative stress associated with the imbalance between the production of reactive oxygen species and the antioxidantcapacity. It is important to select and employ a stable and rapid method to assay antioxidant activity. The aim of this studywas to accurately predict the antioxidant activity of S. sagittaria. L polysaccharide (Sap) by miniature �ber near-infrared(NIR) spectroscopy combined with chemometrics. The optimal extraction conditions of Sap through multi-mode divergentultrasound assisted method were as follows: ultrasonic power 180 W, liquid-to-material ratio 40 mL/g, extraction time 16min and extraction temperature 77 ℃, and the yield of Sap was 21.24%. The molecular weight of Sap was approximately120.5 kDa, and its monosaccharide components predominantly consisted of Rha (15.7%), Ara (12.9%), Man (1.6%), Glc(36.4%), and Gal (33.4%). The application of NIR spectroscopy for determination of DPPH, ABTS and hydroxyl radicalscavenging rate of Sap solution (0.125-1 mg/mL), and the coe�cient of prediction (Rp) were 0.9568, 0.9667 and 0.9652,respectively. In developing model, �ve spectra preprocessing methods and three different linear regressions tools (i.e.,partial least squares (PLS), interval Partial least Squares (iPLS), synergy interval partial least square (Si-PLS)) wereoptimized to improve the predictability and stability of the models. The overall results revealed the miniature �ber NIRspectroscopy with PLS and Si-PLS regression tools showed better predictive property, which has the potential to measureantioxidant activity in Sap.
1. IntroductionSagittaria sagittifolia L. (S. sagittifolia L.) is an important medicinal and edible functional food, containing multiplechemical compositions, especially its bulb is rich in total sugar (54.6%), protein (16.4%), fat (0.47%) and other nutrientsbene�cial to human health including, triterpenes, �avonoids and polysaccharides, etc [1]. Among them, S. sagittifolia L.polysaccharides (Sap) have attracted much attention due to their has great medicinal potential such as antioxidation [2],restraining hepatic injury [3], antibacterial [4] and anticarcinogen [5]. Due to these potential effects, S. sagittaria L. has beenapplied in functional foods, pharmaceuticals and cosmetics industries [6].
Oxidation is an important process associated with the reactive oxygen species (ROS) including ABTS, hydroxyl, DPPH andsuperoxide anion radicals in living organisms. When ROS has accumulated to certain degree in the living organisms andexceeds their antioxidant capacity, the question of oxidative stress disease result would arise naturally, some side effectsmay occur (cancer, aging and other diseases) [7]. Hence, it is of high importance in developing effective, safe and naturalantioxidants for scavenging excessive ROS for keeping the organism healthy. Antioxidant capacity is an essentialbiological indicator of bioactive substances. At present, different types of colorimetric assays are employed to measure theantioxidant capacity of polysaccharides, such as 2,2-diphenyl-picrylhydrazyl (DPPH) radicals scavenging, 2, 2′-Azino-bis (3-ethylbenzothiazoline-6-sulphonic acid) diammonium salt (ABTS) radicals scavenging, hydroxyl free radicals scavenging[8–11]. The conventional wet-chemical analysis (test kit, antioxidant reagent) is well known and routinely used in differentlab. However, each of these methods has disadvantages, including complex operation, expensive, and the molecularstructures which may be altered or compromised by chemical reagent. In this regard, it is urgent to develop a high precision,economic, non-destructive and simple indirect determination technology for the antioxidant activity of polysaccharides, andthis new technology will be bound to promote the development of food industry.
NIR spectroscopy combined with quantitative data and mathematical models has been proved to be an e�cient, reliableand green method [12, 13]. The success of NIR spectroscopy derives from subtle differences in vibrational modes ofchemical bond, functional groups on these samples [14]. Then, NIR spectroscopy converts absorb radiation into spectraldata in the wavelength range of 800–2500 nm, and the content and structure of bioactive components can be predictedthrough combining the spectral data with mathematical models [14]. Currently, increasing evidence highlights that NIRspectroscopy has been successfully applied to enhance or replace antioxidant activity analysis. Chen, et al. applied NIRspectroscopy combined with different regression tools to determine the antioxidant activity of green tea [15]. Di, et al. triedto predict the antioxidant activity (DPPH, FARP, and ABTS) in bamboo leaf extract using NIR spectroscopy combined with

Page 3/19
�ve regression methods [16]. In another study, Caramês et al. attempted to measure the bioactivity potential in freeze-driedBrazilian berry pulp using NIR spectroscopy and smartphone imaging [17]. All of the above studies showed that NIRspectroscopy may be a practicable in measurement of antioxidant activity. Our previous research found that S. sagittaria L.polysaccharides (Sap) possess potential antioxidant activity in the development of functional foods [18], and multi-modedivergent ultrasound treatment can effectively improve the composition, structure and antioxidant activity of Sap [5].However, during the research process, the traditional analysis methods of antioxidant activity of polysaccharides broughtus a lot of trouble because of their complex operation, low accuracy, high price and destruction of the components to betested, which makes a better method more necessary. Inspired by the above studies, we intend to determine the antioxidantactivity of Sap by NIR, which is believed to be a useful supplement in related �elds.
In the present study, optimize the conditions for multi-mode divergent ultrasound assisted extraction Sap and itsphysicochemical structure was characterized through Mw, monosaccharide composition and FT-IR, as well as the surfacemorphology through SEM and AFM. The antioxidant properties of Sap in vitro have been determined by use of ABTS,hydroxyl and DPPH radicals scavenging assays. Here, we present a novel approach that attempts to evaluate and predictthe antioxidant (DPPH, ABTS, hydroxyl radicals scavenging) potential of Sap by miniature �ber optical NIR spectroscopy.
2. Materials And Methods
2.1. MaterialsS. sagittifolia L. was collected from a local Farmer's market (Jiangsu province, China). Standard monosaccharides, sulfuricacid, sodium chloride, 1, 1-diphenyl-2-picrylhydrazyl (DPPH), 2, 2′-Azino-bis (3-ethylbenzothiazoline-6-sulphonic acid)diammonium salt (ABTS) were obtained from Sigma Chemical Co. (St. Louis, MO, USA). Other reagents of analytical gradewere purchased from Sinopharm Chemical Reagent Co., Ltd. (Beijing, China).
2.2. Process design
2.2.1. Single factor experimental designSap was extracted by a divergent ultrasound device as previously described [5]. The effects of extraction temperature,ultrasonic time, material to liquid ration and ultrasonic power on the extraction process of Sap was studied. Among thesefactors, extraction temperature ranged from 70 to 90 ℃, ultrasonic time ranged from 5 to 25 min, ratio of liquid to rawmaterial ranged from 10 to 50 mL /g, ultrasonic power ranged from 60 to 180 W, ultrasonic frequency was set at doublefrequency (28/40 kHz).
2.2.2. Box-Behnken experimental designBased on single factor experiments, a Box-Behnken experimental design (BBD) including 17 experiments was used todetermine the optimal values of each variable to obtain the max yield of Sap. The design of experimental was shown inTable 1S. The experimental data were applied for the model and processed according to the equation [19]:
Y = β0 +k
∑j=1
βjXj +k
∑j=1
βjjX2j + ∑ ∑ i< jβijXjXj
Where Y represents the estimated response, β0, is intercept, βj, βjj and βij are the model coe�cients of the linear, quadraticand interaction, respectively, while Xi and Xj are the coded independent variables.
2.2.3. Sample solution preparationBased on the optimal preparation process, the Sap (1.25-10 mg) was allowed to fully disperse with distilled water (10 mL),prepare different concentrations of Sap solution (0.125-1 mg/mL). Then, Sap solutions was centrifuged at 8000 r /min for

Page 4/19
15 min, and the supernatant was stored at 4 ℃ in a refrigerator and measured the antioxidant activity of sample.
2.3. Physicochemical characterization
2.3.1. Chemical analysisTotal carbohydrate was measured by phenol-sulfuric acid method [20]. A carbazole-sulfuric acid method assay was appliedto quantify uronic acid content [21]. Coomassie brilliant blue assay was applied to determine protein content ofpolysaccharides [22]. The total phenolic contents of polysaccharides was measured by the Folin-Ciocalteau method [23].
2.3.2. Molecular weight determinationThe molecular weight of Sap fraction were measured by high-performance size-exclusion chromatograph (HPSEC)instrument according to our previous method with some modi�cations [18]. The apparatus consists of a multiangle laserscattering (DH-II, Wyatt Technology, USA), differential refractive index detector (Agilent G1362A, USA) and two columns(shodex OHpak SB-805 and shodex OHpak SB-806). Determining of the weight average molecular weight (Mw)distributions of Sap was performed with Astra software.
2.3.3 Monosaccharide compositionThe monosaccharide composition of samples was analyzed by gas chromatography (GC) according Wang et al. withminor modi�cation [24]. In Brief, the polysaccharide was hydrolyzed with 5 mL of 3 mol/L tri�uoroacetic acid solution (TFA)at 110°C for 120 min. The resulting solutions was washed 3 to 4 times with 5 mL methanol until the TFA was completelyremoved. Whereafter, the reaction solution was blended with hydroxylamine hydrochloride (10.0 mg), pyridine (1.0 mL) at90 ℃ for 30 min. The reaction was initiated by the addition of 1.0 mL of acetic anhydride lasted approximately 30 min.Derivatives were analyzed on an Agilent GC 7890A instrument (2010A, Shimadzu, Kyoto, Japan).
2.3.4. UV and FT-IR spectroscopyMake up to 0.5 mg/mL of Sap solution with deionized water. The UV-Vis spectra of the samples were determined using anultraviolet-visible spectrophotometer (C100, Varian, USA) in the 190–400 nm range. About 2 mg of the Sap was mixed withKBr (200 mg) was ground to a �ne powder, and this mixture was determined by a Fourier transform infrared (FT-IR) (IS50,Nicolet, USA) at the vibration region of 4000 − 400 cm− 1.
2.3.5. Molecular morphology observationThe morphological identi�cation of Sap was accomplished using the atomic force microscope (AFM) and scanningelectronic microscope (SEM). The Sap solutions (10 ug/mL) were �ltered through a 0.22 µm �lter membrane. A 10 µL ofSap solution was dropped on the surface of fresh mica and dried naturally before determination. Then, topographicalimages of sample on mica were recorded by AFM equipment (Multimode 8 instrument, USA). Dried samples of the Sapwere sputter-coated with gold �lm before observation, and the sample powder was conducted with a S3400N SEMequipment (Hitachi, Japan). Images were captured at a magni�cation of 200 and 1000 ×.
2.4 Prediction of antioxidant activity
2.4.1 Spectral acquisitionIn this experiment, the spectra of all the Sap solutions were obtained by a NIRQUEST256-2.5 Vis-NIR spectrometer. Thedevice consists of TP-300 immersed �ber optic probe and DH-2000-BAL UV-Vis-NIR light source (Ocean Optics., USA).Approximately 5 mL of the various concentrations of Sap solution was put in a sample cup (with dimensions of 1 cm ofdiameter and 10 cm of depth). The spectrum parameters were: resolution of 6.4 cm− 1, optical path length of 4 mm,recorded rang of 800–2500 nm, and scanning times of 32. The schematic diagram of miniature �ber NIR spectroscopysystem for determination of antioxidant activity in Sap (Fig. S1.). The spectral data of Sap were divided into two subsets:

Page 5/19
all 120 samples contained calibration and prediction set. Among them, 90 samples as calibration set to establish thecalibrating models, 1 sample of every 4 samples were selected as an independent prediction set (30 samples) to evaluatethe performance of the test models. In addition, the range of y-value of the calibration set should close to the prediction set(Table 1).
Table 1Statistics of calibration and validation data set.
Parameter Units Subsets S. N Range (y-value) Mean S.D.
DPPH % Calibration set 90 44.356–76.154 56.684 8.445
Prediction set 30 44.813–73.001 55.761 7.952
ABTS % Calibration set 90 23.177–95.547 66.003 22.12
Prediction set 30 23.471–94.130 63.484 22.428
Hydroxyl radical % Calibration set 90 28.503–77.663 53.113 15.355
Prediction set 30 29.744–74.565 51.138 14.887
a SD = standard deviation
b S. N = sample number
2.4.2 Reference measurementThe Sap was determined by the phenol-sulfuric acid method using glucose as a reference [25]. The yield of Sap wascalculated as follows:
Yield (%) =mM × 100
Where m is the weight of the Sap, and M is the weight of S sagittifolia L.
The DPPH radical scavenging capacity was performed based on a reported method [11]. Brie�y, 1 mL of Sap solutions ofdifferent concentrations (mentioned in section 2.2.3) and 1 mL of DPPH ethanol solution (0.1 mM) were mixed for 30 minin the dark. The absorbance of the mixture was measured at 517 nm (A1), ethanol was used as a blank control (A0) and theabsorbance of distill water instead of DPPH solution (A2). The calculation is as follows:
DPPHradicalscavengingactivity(\%) = 1 −A1 − A2
A0× 100
The ABTS radical scavenging capacity was determined as previously described [26]. 15 mL ABTS (7 mM) was reacted with15 mL of K2S2O8 (5 mM) solution for 12 h in the dark. After reaction, the ABTS solution was diluted to 15 times withdistilled water. Then, 1 mL of Sap solution (mentioned in section 2.2.3) with different concentrations and equal volumes (1mL) of ABTS+ solution was mixed for 30 min in the dark. The absorbance of mixture was measured at 734 nm (A1), Sapsolution was used as blank control (A0), ABTS solution was instead by distill water to determine the absorbance (A2). Thecalculation is as follows:
ABTSradicalscavengingactivity(\%) = 1 −A1 − A2
A0× 100
( )
( )

Page 6/19
Hydroxyl radical scavenging was determined as described by Wu et al [27]. Brie�y, 10 mL FeSO4 solution (6 mM) wasmixed with 10 mL salicylic acid ethanol solution (6 mM) and H2O2 (0.1%) at room temperature. After that, equal volumes (1mL) of Sap solution with different concentrations (mentioned in section 2.2.3) was mixed at 37 ℃ for 30 min. Theabsorbance at 510 nm was measured using a microplate analyzer. The absorbance of the sample was replaced by distillwater (A0), the absorbance of sample (A1) and the blank reagent (replace H2O2 with distilled water) (A2). The calculation isas follows:
Hydroxylradicalscavengingactivity(\%) = 1 −A1 − A2
A0× 100
2.4.3 Spectral preprocessingSince NIR spectral may provide irrelevant information such as noise, overlapping bands, background, and light scatteringso on, which impact directly the model performance. Therefore, the use of appropriate spectra preprocessing methods isvery essential as it weaken or remove interference in the spectra. In this study, the original spectrum was performed usingUnscrambler X 10.4 software to carry out the standard normal variate (SNV) to correct spectral focuses and scalesindividual [28]. Multiplicative scatter correction (MSC) was used for correct discrete differentiation effects in originalspectrum [29]. The baseline correction is mainly contained two steps, offset correction and null-space projection with theoffset-corrected spectra [30]. The Derivative (1st, 2nd Der) can effectively reduce spectral multiplicative and additive effects[31]. Then, on the basis of partial least squares (PLS) regression method, the performance of original spectrum and �vepreprocessing methods were compared, and then selected the optimal pretreatment method.
2.4.4 Multivariate calibration methodsPLS is an interactive multiple linear regression model has been widely used in the quantitative analysis [32]. In the currentstudy, the dimension reduction of high-dimensional data by spatial projection. The orthogonal eigenvectors of theindependent and dependent variables is obtained, and then the unary linear regression is constructed. It not only overcomesthe collinearity problem, but also eliminates the in�uence of noise on regression, so that the number of variables containedin the model is the least. The interval partial least Squares (iPLS), based on the PLS algorithm in which the full-spectrumdata of sample is subdivided in several equally spaced intervals, and use of the PLS algorithm to select one interval of thehighest predictive correlation [33]. Thus, the effects of no relevant or interference information was eliminated, whichimproved the prediction effect. The Synergy interval partial least square (Si-PLS) are commonly used as e�cient variableselection methods to the non-destructive quantitative analysis �elds [34]. The Si-PLS model is characterized by fastcalculation speed and high precision, which can divide full-spectrum data into multiple e�cient spectral subintervals, andequidistant interval combination.
2.4.5 Evaluation of the performance of the modelsIn this study, the coe�cient of determination in calibration (RMSEC, Rc) or prediction (RMSECP, Rp) to evaluate theperformance of calibration model. A good model shows higher Rp and lower RMSEP. Root mean square errors arecalculated by:
RMSE =∑n
i=1(yp − yq)2
n
where n is the training sample, yp are the referenced value and yq are the predicted value by the calibration set (RMSECV)or by an independent validation test (RMSEP), respectively.
( )
√

Page 7/19
R is calculated as follows:
R = 1 −(yp − yq)2
(yp −−y q)
2
yp and yq denote the measured and predicted value of the sample set; −y q denotes the mean of the measured value in
sample set.
2.5. SoftwareAll NIR spectra data were preprocessed and multivariate analyzed using the Unscrambler X10.4 and MATLAB R2014asoftware (Mathworks, Natick, USA). The models’ tools refer to the method of Chen [14].
3. Results And Discussions
3.1 Single factor analysisTo study the effect of the extraction temperature of 70, 75, 80, 85 and 90°C on the extraction yield of Sap when theextraction power (120 W), time (15 min) and liquid to material ratio (30:1). The result shows that the yield of Sap increasedwhen temperature increased from 70 to 80 ℃, but then decreased (Fig. S2A). This may be because that the solubility ofsolute in solvent increases with the increase of temperature [35]. In addition, the viscosity of solvent decreased, whichimproved the diffusivity of solvent in the tissue [36]. With further increase in extraction temperature, the cavitation effect isgradually weakened, which led to the yield decreased. Therefore, the extraction temperature was selected 80 ℃.
Extraction was carried out at different extraction time (5, 10, 15, 20 and 25 min) when the extraction temperature, power,and material to liquid ratio was 80℃, 120 W, 1:30, respectively. The yield of Sap increased when extraction time increasedfrom 5 to 15 min and then the yield decreased (Fig. S2B). These results can be explained that the increasing ultrasonic timeled to solvent permeated into the dried raw materials, which promote the release and diffusion of Sap [37]. However, theultrasound treatment for the prolonged may result in the destruction of Sap structure and decrease the extraction rate [38].Therefore, the extraction time was selected 15 min as the central point of the RSM experiments.
To study the effect of the different liquid to material ratio (10, 20, 30, 40 and 50) on the extraction yield of Sap whentemperature, time and power was set at 80 ℃, 15 min, 120 W, respectively. The yield of Sap increased when LMR increasedfrom 10 to 40 mL/g and then decreased (Fig. S2C). The extraction rate of Sap increase, on the one hand, can be attributedto the increase of cavitation effect with the decrease of solvent concentration, resulting in the diffusion of polysaccharidesshow more quickly [39]. On the other hand, the concentration difference between the intracellular and extracellular of plantcells can also promote the diffusion of polysaccharides [2]. However, the excess solvents may cause the decrease indistribution of energy of the ultrasonic wave and has a negative effect on the yield of polysaccharides [2, 38]. Thus, theLMR was set as 40 mL/g.
The effects of extraction power on Sap yield were investigated when the experiments conditions were �xed at 80 ℃, 15min, 40:1 and the extraction power was set at 60, 90, 120, 150 and 180 W. The result shows that the yield of Sap increasedwith the increase in ultrasonic power from 60 to 150 W and then decreased (Fig. S2D). This may be due to the bubble sizeincreases with the increase in the ultrasonic power, resulting in the implosion also intensi�es [40]. The cells are broken andcan effectively improve the diffusivity and extraction yield. In addition to that the high ultrasound intensity may damage thestructure of polysaccharides reducing the yield [41]. Therefore, the extraction power is selected 150 W.
3.2. Optimization of Sap extracting conditions
√

Page 8/19
Based on the results of single factor experiments. The main independent variables (A: ultrasonic power, B: ultrasonic time,and C: ultrasonic temperature) on the yield of Sap was displayed in Table 1. The yields of Sap ranged from 13.99–21.09%in the 17 experiments, such relatively great difference in extraction yield could be because the surface damage degree ofthe sample is different with the change of ultrasonic condition, and the amount of polysaccharide from the particles to thesolution is also changed [2]. Thus, the optimized ultrasonic extraction parameter are required to improve the yield of Sap. Inthis study, multiple regression analysis and a second-order polynomial equation, generated by Design-Expert 12.0 software,were used to explain the relationship among three factors and responses. The �nal simpli�ed equation for Sap extractionyield Y1 in terms of coded parameters is:
Y1=20.06+1.59 A+0.65 B-1.38 C+0.12 AB-1.18 AC+0.35 BC-1.29 A2-1.99 B2-1.91 C2
Where Y1, A, B, C is extraction yield, ultrasonic power (W), ultrasonic time (min), and ultrasonic temperature (℃),respectively.
The �tting degree of model plays an important role in statistics. The Variance (ANOVA) and correlation coe�cients (Forcoe�cients R2 and adjusted R2) were the main methods of expression. Y1 is highly signi�cant with a high F value (62.77)and low p-values (p < 0.0001), which proved that the regression model is signi�cant (Table S2),. Moreover, the value ofcorrelation coe�cient R2 (0.9878) and adjusted R2
Adj (0.972) are almost 1, which can explain the model is a high degree ofcorrelation. The affecting of parameters on extraction process: A > C > B (p > 0.05), which might be due to the largepolysaccharide particles are decomposed into smaller particles led to improving the yield under the diffusion of strongsplitting force [2]. In terms of the interactions, the synergistic (positive) effect between the ultrasonic power andtemperature (AC) is the most prominent (p < 0.01), which can improve the polysaccharide yield. This may be because bothfactors (AC) possess the capacity of destructive. As the power and temperature increases, yielded higher overall drivingforce, which led to the effect of extraction time is more signi�cant. This means that the mild extraction conditions (lowlevel) may yield a positive effect. When the extraction conditions are harsher, the effect of AC as the dominant factor. Onthe other hand, the coe�cient variation (C.V.: 2.24%) and Adeq. precision (23.79) demonstrated experimental values showshigh reliability and precision. The linear coe�cient (AB, BC: >0.05) were non-signi�cant, and the term coe�cients (A2, B2, C2:<0.05) was found to be at a signi�cant.
3.3. Response surface analysisThe 3D response surface and two-dimension contour plots are mainly applied to express the interactions between thedependent /independent variables when other variables are �xed at zero level. The trend of response values kept increasingwith increase values of variables, and then decreased, that illustrates the response surface is steady (Fig. S3). The effect ofinteractions extraction time and power had no signi�cant effect on extraction rates when the temperature was �xed. Theyield of Sap gradually increased when time increased from 10 to 15.68 min and power increased from 120 to 177.11 W(Fig. S3A and S3B). The further increase of extraction time and power had the negative effect on Sap yield. The extractiontemperature and power exhibited quadratic effects on the Sap yields (Fig. S3C and S3D). The extraction rate increasedsigni�cantly with the increased of extraction temperature over the range of 75 ℃-76.86 ℃ and power increased over therange of 120-177.11 W. The extraction yield didn’t increase when extraction time and power reached the maximum yield,which may be due to the polysaccharides degraded under the synergistic effect of higher temperature and higher ultrasonicpower. The interactions of extraction temperature and time on the extraction yield of Sap. The extraction rate increasedwhen the temperature and time increased in the ranges of 75 ℃ to 76.86 ℃ and 10 to 15.68 min, respectively (Fig. S3Eand S3F). Then, the yield declined gradually when the extraction temperature and time exceeded the ranges. This could bebecause polysaccharides were decomposed under higher temperature and longer extraction time. Based on the predictionof mathematical model, the optimal conditions for obtaining the maximum yield of Sap (21.24%) were as follows: 177.11W, 15.68 min, 40 mL/g, 76.86 ℃. To simplify the actual operation parameters, extraction power, temperature, time, andliquid to material ratio set at 180 W, 77 ℃, 16 min; 40 mL/g.

Page 9/19
3.4. Physicochemical properties of SapAfter analysis, the total carbohydrate content of the Sap extracted from the S sagittifolia L. was 79.26 ± 0.39% asdetermined by the phenol‐sulfuric acid colorimetric method (Table 2). Moreover, the polyphenolic composition has beenshown to affect the antioxidant activity of active substance, we also investigated whether the polyphenolic composition ofSap affects their antioxidant capacity. But no phenolic content was detected in Sap. Protein content was determined to be2.67 ± 0.06%, these �ndings are consistent with the UV weak absorption peak was recorded at 280 nm for protein (Fig .1A).Additionally, the uronic acid was also detected, the content of uronic acid in Sap 1.33 ± 0.24%. Mw play an important role inbiological activities of polysaccharides. The Mw and the molecular weight distribution coe�cients (Mw/Mn) of Sap was120.5 kDa and 1.591 (Fig. 1B). Moreover, it was shown that when the polydispersity index of the samples are smaller than 2could imply that samples is less likely to form large sized agglomerate in aqueous solution [18]. The monosaccharidecomposition of Sap was determined to be mainly composed of rhamnose, arabinose, mannose, glucose, galactose and themolar ratio was 15.7: 12.9: 1.6: 36.4: 33.4 in Sap (Fig. 1C, Table 2). The Sap has the characteristic absorption peaks ofcarbohydrates as determined by FT-IR (Fig. 1D). In detail, the signal at 3422 cm− 1 (O-H stretching vibration) and 2933 cm− 1
(C-H stretching vibration) represents the characteristic groups of polysaccharides [24]. In particular, the absorption at 1735cm− 1 and 1654 cm− 1 is related to the uronic acid (C = O stretching vibrations) and proteins, respectively. The band at1000–1200 cm− 1 are attributed to the bond stretching vibrations of C-O-C and O-C-O bonds re�ects the presence ofpyranose [42]. The signal at 900 cm− 1 and 836 cm− 1 represents the feature of β-glycosidic linkages and α-type glycosidiclinkages, respectively [43].
Table 2
Composition of Sap.Totalcarbohydrate(%)
Totalphenolic
Protein
(%)
Uronicacid(%)
Mw
(kDa)
Mn Mw/Mn Monosaccharide compositions(mol%)
Rha Ara Man Glc Gal
79.26 ± 0.39 N. D 2.67 ± 0.06
1.33 ± 0.24
120.5
(± 0.804%)
75.76
(± 0.317%)
1.591
(± 0.865%)
15.7 12.9 1.6 36.4 33.4
Note: Each value represents the mean ± standard deviation (n = 3). N.D.: Not detected or below the limit ofquanti�cation. (Rha:Rhamnose, Ara:Arabinose, Man:Mannose, Glc:Glucose, Gal:Galactose)
The morphology and chain conformation are a critical indicator of polysaccharides involved in a variety of biologicalactivities. We made use of AFM to visualize Sap has a compact globular architecture and a vast number of uneven lumpsstructure (Fig. 2A). The characteristic structures of Sap were examined by SEM image of 200 and 1000-fold magni�cationand its displayed as non-uniform and broken microsphere fragment’s structure (Fig. 2B). The action of ultrasonic cavitationmay be destructive to the microstructure of samples to expose more active sites, which may enhance biological activity.
3.5. Analysis of spectral preprocessingThe DPPH, ABTS and hydroxyl radical scavenging rate increased with the increase of Sap concentration (Fig. S3). The freeradical scavenging rate trends of Sap at varied concentrations was in agreement with the reported results [18]. It can beobserved that the original spectra of Sap changed when different preprocessing were employed (Fig. 3, Table 3). Thecorrelation coe�cients of the models of DPPH antioxidant activities were signi�cantly improved by using MSCpreprocessing. The reason for this phenomenon is because the scattered light of different particle sizes was removed bylinear �tting each individual and reference spectrum. Therefore, the optimum PLS model was achieved when 8 PLS factors
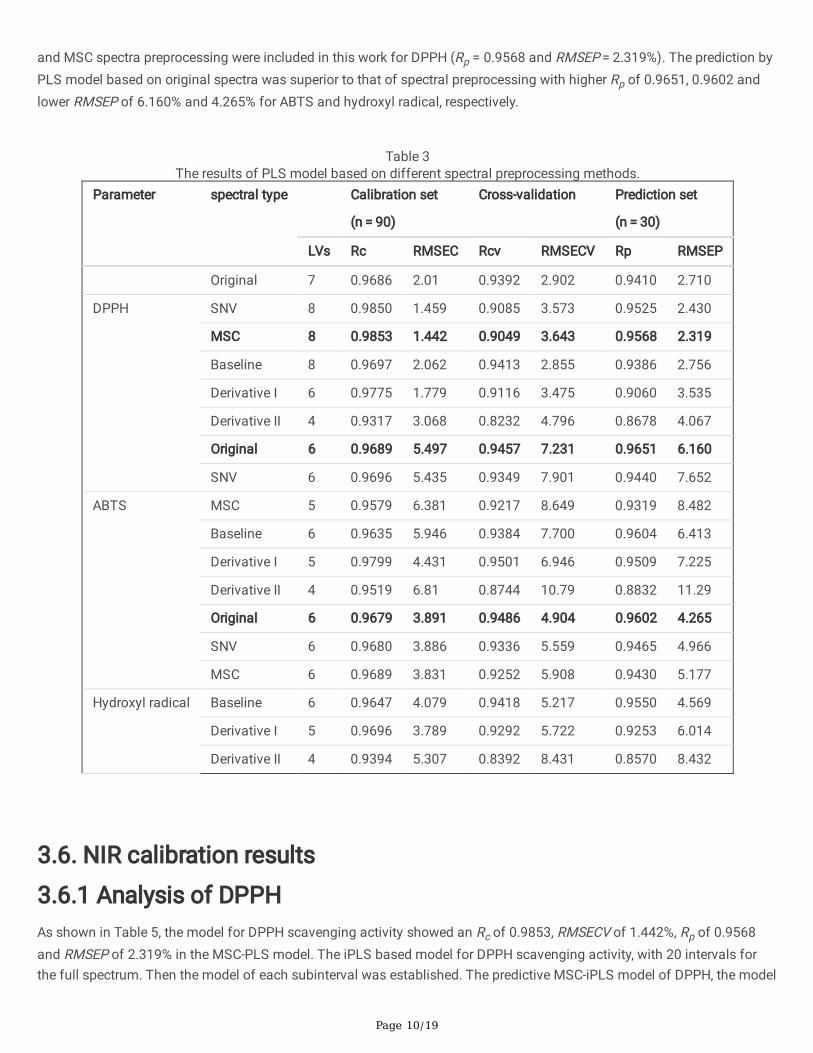
Page 10/19
and MSC spectra preprocessing were included in this work for DPPH (Rp = 0.9568 and RMSEP = 2.319%). The prediction byPLS model based on original spectra was superior to that of spectral preprocessing with higher Rp of 0.9651, 0.9602 andlower RMSEP of 6.160% and 4.265% for ABTS and hydroxyl radical, respectively.
Table 3
The results of PLS model based on different spectral preprocessing methods.Parameter spectral type Calibration set
(n = 90)
Cross-validation Prediction set
(n = 30)
LVs Rc RMSEC Rcv RMSECV Rp RMSEP
Original 7 0.9686 2.01 0.9392 2.902 0.9410 2.710
DPPH SNV 8 0.9850 1.459 0.9085 3.573 0.9525 2.430
MSC 8 0.9853 1.442 0.9049 3.643 0.9568 2.319
Baseline 8 0.9697 2.062 0.9413 2.855 0.9386 2.756
Derivative I 6 0.9775 1.779 0.9116 3.475 0.9060 3.535
Derivative II 4 0.9317 3.068 0.8232 4.796 0.8678 4.067
Original 6 0.9689 5.497 0.9457 7.231 0.9651 6.160
SNV 6 0.9696 5.435 0.9349 7.901 0.9440 7.652
ABTS MSC 5 0.9579 6.381 0.9217 8.649 0.9319 8.482
Baseline 6 0.9635 5.946 0.9384 7.700 0.9604 6.413
Derivative I 5 0.9799 4.431 0.9501 6.946 0.9509 7.225
Derivative II 4 0.9519 6.81 0.8744 10.79 0.8832 11.29
Original 6 0.9679 3.891 0.9486 4.904 0.9602 4.265
SNV 6 0.9680 3.886 0.9336 5.559 0.9465 4.966
MSC 6 0.9689 3.831 0.9252 5.908 0.9430 5.177
Hydroxyl radical Baseline 6 0.9647 4.079 0.9418 5.217 0.9550 4.569
Derivative I 5 0.9696 3.789 0.9292 5.722 0.9253 6.014
Derivative II 4 0.9394 5.307 0.8392 8.431 0.8570 8.432
3.6. NIR calibration results
3.6.1 Analysis of DPPHAs shown in Table 5, the model for DPPH scavenging activity showed an Rc of 0.9853, RMSECV of 1.442%, Rp of 0.9568and RMSEP of 2.319% in the MSC-PLS model. The iPLS based model for DPPH scavenging activity, with 20 intervals forthe full spectrum. Then the model of each subinterval was established. The predictive MSC-iPLS model of DPPH, the model

Page 11/19
built on the 19 subintervals of the whole spectral interval was the best, which corresponds to the spectral interval of1358.34-1439.97 nm, with the highest value of Rp =0.81 and RMSEP = 4.82% in the prediction.
The results showed that Si-PLS model of DPPH scavenging activity showed that the optimal number of LVs selected fromthe 4 intervals from 15 (Table 4). The optimal PCs was 9, and combinations of intervals selected were [1, 5, 10, 13], whichcorresponding to 868.6-977.4, 1303.8-1412.6, 1847.8-2065.4 and 2174.2–2283.0 nm in the spectral regions (Fig. 4A), theSi-PLS model yielded Rc= 0.9459, RMSEC = 2.76%, Rp= 0.9455 and RMSEP = 2.70%. The spectra regions are features ofvarious unique constituents, mainly related to the combination of some functional group and overtones and vibrationalmodes such as -CH, -NH, -SH and -OH groups [44, 45]. We observed that the spectra regions 868.6-977.4 nm commonlyassociated to third C-H overtone of polysaccharides. At 1303.8-1412.6 nm, speculate that the variation of is related to the O-H �rst overtone. At 1847.8-2065.4 nm is due to the O-H stretching vibration and at 2174.2–2283.0 nm are derived from theC-H stretching vibration and CH2 deformation. Compared with Si-PLS model of full spectra, MSC-PLS model showed goodprediction effect. Figure 4D is the scatter plots that show DPPH estimated by MSC-PLS model in the prediction sets.

Page 12/19
Table 4Spectral subinterval of Si-PLS calibration model.
Parameters Number of subintervals PCs Selected subintervals RC RMSEC RP RMSEP
DPPH 15 9 [ 1, 5, 10, 13] 0.9459 2.76 0.9455 2.70
16 11 [ 5, 10, 11, 16] 0.9321 3.08 0.8837 4.06
17 7 [ 1, 8, 11, 16] 0.9378 2.94 0.9361 2.95
18 9 [ 6, 12, 15, 16] 0.931 3.10 0.8855 3.81
19 10 [ 2, 5, 6, 12] 0.9347 3.01 0.8842 3.8
20 9 [ 7, 13, 16, 17] 0.9375 2.95 0.9132 3.31
21 9 [ 7, 13, 14, 18] 0.9246 3.24 0.9197 3.22
22 10 [ 6, 7, 14, 18] 0.945 2.78 0.8928 3.84
23 12 [ 7, 15, 16, 23] 0.9462 2.75 0.8389 5.54
24 9 [ 8, 15, 16, 20] 0.9346 3.01 0.9306 3.17
25 9 [ 8, 16, 17, 21] 0.9388 3.02 0.9259 3.21
26 7 [ 1, 13, 16, 24] 0.9404 2.72 0.9360 2.97
27 10 [ 8, 17, 18, 22] 0.9357 3.01 0.9249 3.22
28 9 [ 9, 18, 19, 23] 0.9354 3.00 0.9163 3.38
29 6 [ 1, 10, 14, 17] 0.9248 3.21 0.9251 3.03
30 8 [ 9, 18, 19, 25] 0.9345 3.01 0.9226 3.07
ABTS 15 12 [ 2, 6, 10, 14] 0.9771 4.73 0.9214 9.06
16 10 [ 1, 6, 11, 16] 0.9717 5.25 0.9617 7.57
17 10 [ 2, 7, 11, 17] 0.9716 5.27 0.9542 7.46
18 9 [ 2, 7, 12, 17] 0.9753 4.92 0.9351 8.12
19 8 [ 2, 7, 9, 12] 0.9727 5.16 0.9607 6.4
20 12 [ 2, 8, 17, 20] 0.9702 5.42 0.9514 7.02
21 9 [ 2, 8, 9, 21] 0.971 5.32 0.9534 7.3
22 9 [ 2,8, 9, 22] 0.9704 5.37 0.9507 7.45
23 6 [ 2, 9, 12, 15] 0.9682 5.56 0.9457 7.58
24 7 [ 2, 7, 9, 15] 0.9704 5.37 0.9408 8.09
25 9 [ 1, 12, 17, 24] 0.9693 5.47 0.9667 6.75
26 11 [ 3, 10. 17. 24] 0.9664 5.72 0.9016 10.6
27 10 [ 3, 10, 12, 17] 0.9725 5.19 0.9352 8.31
28 9 [ 2, 18, 19, 27] 0.967 5.66 0.9416 9.24
29 10 [ 3, 11, 19, 27] 0.9669 5.68 0.9291 8.89

Page 13/19
Parameters Number of subintervals PCs Selected subintervals RC RMSEC RP RMSEP
30 9 [ 3, 11, 13, 19] 0.9706 5.41 0.9316 8.6
Hydroxyl radical 15 10 [ 1, 7, 10, 15] 0.9644 4.11 0.9542 4.67
16 9 [ 1, 8, 11, 15] 0.9507 4.83 0.9614 4.29
17 9 [ 1, 8, 11, 17] 0.9693 3.81 0.9617 4.23
18 8 [ 2, 5, 7, 9] 0.969 3.83 0.958 4.37
19 9 [ 1, 9, 12, 19] 0.9696 3.79 0.9437 5.15
20 8 [ 2, 8, 9, 17] 0.9691 3.82 0.9532 4.7
21 8 [ 2, 6, 8, 10] 0.9702 3.75 0.9526 4.65
22 11 [ 2, 6, 13, 19] 0.9681 3.89 0.9043 7.21
23 9 [ 2, 9, 10, 16] 0.9688 3.84 0.9652 4.22
24 7 [ 2, 7, 9, 12] 0.9709 3.71 0.955 4.55
25 10 [ 2, 6, 11, 17] 0.9669 3.98 0.9537 4.93
26 8 [ 2, 6, 17, 18] 0.9655 4.04 0.9426 6.13
27 8 [ 2, 10, 11, 18] 0.9705 3.74 0.9568 4.84
28 9 [ 2, 3, 12, 19] 0.9714 0.368 0.9651 4.91
29 7 [ 2, 8, 11, 14] 0.9646 4.09 0.9582 4.46
30 8 [ 2, 3, 13, 20] 0.9668 3.96 0.9532 5.01
Table 5Comparison of different algorithms.
Parameter Spectral type LVs Rc RMSEC Rp RMSEP
DPPH MSC-PLS 8 0.9853 1.442 0.9568 2.319
MSC-iPLS 5 0.8376 4.61 0.8100 4.82
MSC-Si-PLS 9 0.9459 2.76 0.9455 2.70
ABTS PLS 6 0.9689 5.497 0.9651 6.160
iPLS 6 0.8836 10.40 0.8747 12.00
Si-PLS 9 0.9693 5.47 0.9667 6.75
Hydroxyl radical PLS 6 0.9679 3.891 0.9602 4.265
iPLS 5 0.8737 7.53 0.8712 7.59
Si-PLS 9 0.9688 3.84 0.9652 4.22
3.6.2 Analysis of ABTSAs for ABTS scavenging activity, PLS model yielded Rc= 0.9689, RMSECV = 5.497% and Rp= 0.9651 and RMSEP = 6.16%. IniPLS model, the optimal model was built on the 19 subintervals of the full spectral interval, which corresponds to the

Page 14/19
spectral interval of 1848.08-1929.70 nm, with Rc= 0.8836, RMSECV = 10.40% and Rp= 0.8747, RMSEP = 12% (Table 5). Asshown in Table 4, the optimal spectral intervals selected by Si-PLS model for the prediction of ABTS. The optimalparameter of Si-PLS model was a combination of 4 from 25 intervals, the optimal LVs was 9, and combination of intervalsselected were [1, 12, 17, 24], corresponding to 868.6-933.9, 1586.9-1652.2, 1913.4-1978.7 and 2370.5-2435.8 nm (Fig. 4B).The spectra regions at 868.6-933.9 nm are connected with the third C-H overtone. 1586.9-1652.2 nm is due to the �rst C-Hovertone. The spectra regions around 1913.4-1978.7 nm were assigned to O-H stretching vibration, and that at 2370.5-2435.8 nm were assigned to C-H stretching vibration and CH2 deformation. Figure 4E was the scatter plot showing ABTSestimated by Si-PLS model in the prediction sets. The highest Rp= 0.9667 and lowest RMSEP = 6.75%.
3.6.3 Analysis of Hydroxyl radicalAs for the hydroxyl radical inhibition activity, the PLS model yielded Rc= 0.9679, RMSECV = 3.891% and Rp= 0.9602, RMSEP = 4.265%. In the iPLS model, the best model was built on 19 subintervals of the whole spectral interval, which correspondsto the spectral interval of 1358.34-1439.97 nm, with Rc= 0.8737, RMSECV = 7.53% and Rp= 0. 8712, RMSEP = 7.59%(Table 5). The optimal parameter of Si-PLS model was a combination of 4 intervals from 23 interval, the optimal LVs was 9,and the combinations of intervals selected were [2, 9, 10, 16], corresponding to 939.5-1010.4 nm, 1435.8-1506.7 nm,1506.7-1577.6 nm and 1932.1–2003.0 nm (Fig. 4C), respectively. The spectra regions 939.5-1010.4 nm is mainly attributedto the second O-H overtone. 1435.8-1506.7 nm and 1506.7-1577.6 nm is due to the CH3, CH2, CH of polysaccharides. Thespectra regions around 1932.1–2003.0 nm contributed from O-H stretching vibration. The scatter plot showing hydroxylradical estimated by Si-PLS model in the prediction sets (Fig. 4F). Here, the Rp= 0.9652 and RMSEP = 4.22%. Compared withPLS and iPLS method, the Si-PLS models of values of Rp and Rc are higher, and RMSECV and RMSEP are lower.
4. DiscussionThree models showed good performance by using NIR spectrum acquisition and stoichiometric calculation, and theantioxidant activity of Sap is quickly detected in predictive set. The prediction performance of the three models varies indifferent degrees, and the reasons are as follows:
The PLS model of DPPH was better than that of iPLS and Si-PLS, which may be due to the effective spectral range of themain factors affecting DPPH was wide, and most useful information has not been selected. On the other hand, it may bebecause the correlation coe�cient between the correction and prediction set of the full spectrum modeling is in the middle,no data will be lost when the full spectrum is used for modeling.
However, this full spectrum modeling method will introduce a lot of spectral information (information about impurities suchas starch) that is independent of ABTS and hydroxyl radical scavenging rate. These irrelevant parameters and redundantvariables could increase the computation burden, while lower the accuracy of modeling effect of PLS and reduce theprediction performance. In addition, there is also a high degree of collinearity among the full spectrum variables, and theintervention of these redundant information is bound to reduce the stability of the model to some extent. For ABTS andhydroxyl radical, compared with PLS and iPLS model, Si-PLS model cannot only eliminate a lot of useless spectralinformation, but also extract and use as much useful information as possible to establish the best prediction model bycombining four relevant subintervals.
Compared with PLS and Si-PLS, iPLS model was the least effective. The main reason is that iPLS only used the data onone subinterval in modeling, and a large amount of data is deleted, and many characteristic data are not used. In addition,the parameters re�ected by the spectral information in the extraction process collected by NIR mainly come from thefrequency doubling and absorption of stretching vibration of different groups in Sap, and any single interval cannotcompletely re�ect the spectral information. The iPLS model only selects a subinterval of the full spectrum to establish the

Page 15/19
correction model, which will lose a lot of useful information. Ultimately, led to poor performance of both the correction setmodel and the prediction set model.
5. ConclusionsThe study investigated an effective and feasible of the miniature �ber NIR spectra for the prediction of antioxidant activityof Sap. The result showed that the MSC-PLS model present excellent performance for DPPH. Si-PLS model is the mostpotential predictive model for ABTS and hydroxyl. It means that the NIR spectra is an applicable and good potential forrapid evaluation method of antioxidant activities.
In general, the content of polysaccharides extracted from raw materials is low and contains other active components andimpurities, which may contribute less to the anti-oxidation effect, making it the di�cult to monitor the antioxidation activityof polysaccharides online. Therefore, the obtained polysaccharides must be increased the concentration through alcoholprecipitation, deproteinization, concentration and other processes. The off-line detection can provide guidance andreference for online monitoring of antioxidant activity of polysaccharides, and provide a new idea for online monitoring ofbiological activity in the future.
DeclarationsAcknowledgement
This work is funded by the Postgraduate Research & Practice Innovation Program of Jiangsu Province, China(KYCX21_3397); National Natural Science Foundation of China (32072354); The Key R & D Program of Ningxia HuiAutonomous Region (2022BBF03016); National Key Research and Development Program of China (2016YFD0400303);Priority Academic Program Development of Jiangsu Higher Education Institutions (PAPD).
Authors’ Contributions Yuqin Feng: Funding acquisition, Project administration, Writing Original draft preparation. YatingSong: Validation. Yujie Qiu: Methodology. Yuqing Duan: Funding acquisition, Supervision, Writing-Review & Editing. HaihuiZhang, Investigation.
Con�ict of Interest The authors declare that they have no known competing �nancial interests or personal relationships thatcould have appeared to in�uence the work reported in this paper.
References1. J. Zhang, C. Wen, Y. Duan, H. Zhang, H. Ma, Int. J. Biol. Macromol. 134(1), 172–179 (2019)
2. J. Gu, H. Zhang, J. Zhang et al., Carbohydr Polym. 246, 116595 (2020a)
3. J. Wang, W. Luo, B. Li, Y. Liao, J. Ethnopharmacol. 227(5), 237–245 (2018)
4. X. Liu, Q. Pan, Y. Shi, I. Williams, H. Sung, Z. Min, J. Nat. Prod. 69(2), 255–260 (2006)
5. Y. Feng, I. Juliet, Y. Duan, H. Zhang, H. Ma, Food Bioscience 42, 101145 (2021)
�. W. Ahmed, W. Ali, A. Gani, M. Ahmad, W. Ahmad, Food Bioscience 11(1), 23–32 (2015)
7. C. Giorgi, S. Marchi, M. Simoes et al., Int. Rev. Cell. Mol. Biol. 340, 209–344 (2018)
�. O. Yarley, A. Kojo, C. Zhou, H. Kwadwo, O. Richard, Int. J. Biol. Macromol. 183(31), 2262–2271 (2021)
9. M. Ahmad, Carbohydr. Polym. Technol. Appl. 2, 100045 (2021)
10. S. Milardovi, D. Ivekovi, B. Grabari, Bioelectrochemistry 68(2), 175–180 (2006)
11. N. Khalaf, A. Shakya, A. Othman, Z. Agbar, H. Farah, Turkish J. Biology 32(1), 51 (2008)
12. M. Andrew, P. Martinsen, C. Clark, R. Jordan, Postharvest Biol. Technol. 37(2), 142–151 (2005)

Page 16/19
13. H. Schulz, U. Engelhardt, A. Wegent, H. Drews, S. Lapczynski, J. Agric. Food Chem. 47(12), 5064–5067 (1999)
14. Q. Chen, J. Zhao, M. Liu, J. Cai, J. Liu, J. Pharm. Biomedical Anal. 46(3), 568–573 (2008)
15. Q. Chen, Z. Guo, J. Zhao, O. Qin, J. Pharm. Biomedical Anal. 60(23), 92–97 (2012)
1�. D. Wu, J. Chen, B. Lu, L. Xiong, Y. He, Y. Zhang, Food Chem. 135(4), 2147–2156 (2012)
17. E. Caramês, M. Baqueta, D. Conceição, J. Pallone, Food Res. Int. 140, 109792 (2021)
1�. J. Gu, J. Zhang, Y. Duan, H. Ma, H. Zhang, Carbohydr. Polym. 235(1), 115939 (2020b)
19. G. Box, D. Behnken, Technometrics 2(4), 455–475 (2012)
20. A.-P.T. Miafo, B.B. Koubala, G. Kansci, G. Muralikrishna, J. Cereal Sci. 87, 124–131 (2019)
21. T. BitterH, M. Muir, Anal. Biochem. 4(4), 330–334 (1962)
22. C.Y. Liau, C.S. Lin, J. Biosci. Bioeng. 106(1), 111–113 (2008)
23. E. Zambrzycka, E. Nalewajko, M. Zaremba, A. Bajguz, B. Godlewska, Molecules 25 (15) (2020)
24. K. Wang, J. Guo, J. Cheng et al., Int. J. Biol. Macromol. 191, 1038–1045 (2021)
25. M. Dubois, K. Gilles, J. Hamilton, P. Rebers, F. Smith, Anal. Chem. 28(3), 350–356 (1956)
2�. R. Re, N. Pellegrini, A. Proteggente, Free Radic. Biol. Med. 26(9–10), 1231–1237 (1999)
27. W. Wu, Y. Zhu, Z. Li, R. Yang, Y. Zhou, Carbohydr. Polym. 87(2), 1348–1353 (2012)
2�. B. Lu, X. Wang, N. Liu, C. Hu, X. Tang, Infrared Phys. Technol. 111, 103482 (2020)
29. M. Zhu, Y. Long, Y. Chen et al., J. Food Compos. Anal. 102, 104055 (2021)
30. H. Shinzawa, J. Mizukado, J. Mol. Struct. 1069(1), 171–175 (2020)
31. S. Jun, Z. Xin, X. Wu, J. Shen, Spectrochim. Acta Part A Mol. Biomol. Spectrosc. 212(5), 215–221 (2019)
32. G. Rossi, V. Lozano, LWT 126, 109290 (2020)
33. R. Anisur, K. Naoshi, O. Yuichi, S. Tetsuhito, K. Katsuhiro, Biosyst. Eng. 141, 12–18 (2016)
34. Y. Yang, L. Wang, Y. Wu, Y. Chen, Spectrochim. Acta Part A Mol. Biomol. Spectrosc. 182(5), 73–80 (2017)
35. K. Kumar, S. Srivastav, V. Sharanagat, Ultrason. Sonochem. 70, 105325 (2021)
3�. C. Jiang, X. Li, Y. Jiao, D. Jiang, Q. Zhang, Carbohydr. Polym. 110(22), 10–17 (2014)
37. C. Zhu, X. Zhai, L. Li, X. Wu, B. Li, Food Chem. 177(15), 139–146 (2015)
3�. A. Raza, L. Feng, X. Xu, J. Tang, International journal of biological macromolecules 94 (Part A), 335–344 (2017)
39. Z. Ying, X. Han, J. Li, Food Chem. 127(3), 1273–1279 (2011)
40. J. Maran, B. Priya, Int. J. Biol. Macromol. 70, 530–536 (2014)
41. R. Contamine, A. Wilhelm, J. Berlan, H. Delmas, Ultrason. Sonochem. 2(1), S43–S47 (1995)
42. J. Zhang, C. Wen, W. Qin, P. Qin, H. Zhang, Y. Duan, Int J Biol Macromol 118 (Pt B), 2269–2277 (2018)
43. W. Sheng, Z. Ling, L. Qing et al., Food Hydrocoll. 91, 34–39 (2019)
44. Y. Yi, H. Hua, X. Sun, Y. Guan, C. Chen, Spectrochim. Acta Part A Mol. Biomol. Spectrosc. 240(15), 118623 (2020)
45. X. Zou, J. Zhao, M. Povey, M. Holmes, H. Mao, Anal. Chim. Acta 667(1), 14–32 (2010)
Figures
Figure 1
Ultraviolet, molecular weight, monosaccharide composition, FT-IR spectrometric of S.sagittifolia L. polysaccharides (Sap).(A) The UV scanning wavelength was in the range of 200-400 nm; (B) High performance size exclusion chromatograph

Page 17/19
pro�le of Sap; (C) Gas chromatographic pro�le of Sap; (D) The FT-IR spectra of sample was in the range of 4000-500 cm-1.
Figure 2
Morphological properties of Sap. (A) AFM images, (B) Scanning electron micrographs (200×, 1000×).

Page 18/19
Figure 3
The NIR spectral preprocessing Sap. (A) Raw spectra; (B) SNV spectra; (C) MSC spectra; (D) Baseline spectra; (E) DerivativeI spectra; (F) Derivative II spectra.

Page 19/19
Figure 4
The optimal spectral intervals of Si-PLS and the scatter plot of the optimal model in the prediction sets. (A) the optimalspectral intervals of DPPH; (B) the optimal spectral intervals of ABTS; (C) the optimal spectral intervals of hydroxyl radical;(D) MSC-PLS model of DPPH; (E) Si-PLS model of ABTS; (F) Si-PLS model of hydroxyl radical.
Supplementary Files
This is a list of supplementary �les associated with this preprint. Click to download.
Supplementarymaterial.docx


![l]ber die alkalische Verseifung der Ester der ... - Zenodo](https://img.dokumen.tips/doc/110x75/6326e6a0051fac18490dfc3a/lber-die-alkalische-verseifung-der-ester-der-zenodo.jpg)


